Embed Size (px)
Citation preview

A n n u a lR e p o r t2 0 1 7 / 2 0 1 8

BUSINESS ARE AS
~ € 42.7 billion
6 regional HQs
78 countries ~ 1,900 locations
employees work every day to ensure thyssenkrupp can implement unique projects.
(as at September 30, 2018)
sales generated by thyssenkrupp in fiscal 2017 / 2018
thyssenkrupp at a glance
THYSSENKRUPP IN F IGURES(Group without Steel Americas)
2017 / 2018 Change in %
Order intake € million 42,754 0
Sales € million 42,745 3
Adjusted EBIT € million 1,551 – 10
Net income € million 60 – 78
Earnings per share € 0.01 – 96
Free cash flow before M & A € million – 134 84
Net financial debt 1 € million 2,364 21
tkVA 1 € million – 217 67
Market capitalization € million 13,534 – 13
Dividend per share € 0.15 2) –
1 Full Group 2 Proposal to the Annual General Meeting
161,096
42,754
ORDER INTAKE in € million
Components Technology
Industrial Solutions
Materials Services
Elevator Technology
Steel Europe 1
1 Discontinued operation
Order intake in 2017/2018 at high prior-year level

T h e m o r e s p e c i f i c t h e t a r g e t s , t h e b e t t e r t h e p e r f o r m a n c e . S o l e t ’ s t a l k s p e c i f i c s .

F r o m t h y s s e n k r u p pi n t r a n s i t i o n
G u i d o K e r k h o f f , D o n a t u s K a u f m a n n a n d O l i v e r B u r k h a r d h a v e b e e n o u t a n d a b o u t a l o t i n r e c e n t w e e k s . A r o u n d t h e w o r l d t h e y b e e n t a l k i n g w i t h e m p l o y e e s , a n s w e r i n g q u e s t i o n s , a n d e x p l a i n i n g t h e s e p a r a t i o n o f t h y s s e n k r u p p a n d t h e n e x t s t e p s . H e r e t h e y t a l k a b o u t c u r r e n t d e v e l o p m e n t s i n t h e c o m p a n y – a n d w h y “ b e s t f o r b o t h ” a l s o m e a n s t h e b e s t f o r o u r s h a r e h o l d e r s .
I.2

Looking back, last fiscal year was very eventful, and the past few weeks have been turbulent too. Is thyssenkrupp ever going to settle down again?
Guido Kerkhoff: After last summer it
was obvious that we need a clear decision
on which direction thyssenkrupp should
take and agreement at the top on how to
move the company forward. This clarity
has been achieved with the full support of
the Supervisory Board. We are deciding
thyssenkrupp’s future ourselves. For this
we initiated the biggest transformation in
the company’s history at the end of the past
fiscal year.
Also, over recent months we have provided
transparency into a number of problem
areas in the Group – also in our operating
business – and addressed the challenges.
In my personal experience, problems that
are put off get bigger over time. So we
are tackling the issues and have also set
ourselves ambitious three-year targets.
What makes you optimistic?
Guido Kerkhoff: In a year’s time when
we report on the current fiscal year we
should have already completed work on
a number of problem areas and made
significant progress on others. By then the
steel joint venture should have long been
operating independently, the turnaround in
plant engineering should be well on track,
the quality problems in the components
business should be resolved, and the
elevator business should once again be
focusing fully on improving its margin.
Donatus Kaufmann: In a year’s time
thyssenkrupp Materials and thyssenkrupp
Industrials will have taken shape: They
will be positioned as separate operating
businesses with their own brand and
their own strategy. Our plan is for our two
thyssenkrupps to then be ready for a future
in which they are both stronger, more
focused and faster.
t o t h y s s e n k r u p po n t h e r i s e .
I.3
thyssenkrupp annual report 2017 / 2018
Magazine

We can only achieve our common goal , i f ever yone works on achiev ing i t .
Oliver Burkhard: We will approach all the
issues with a basic attitude of confidence:
thyssenkrupp has undergone an incredible
transformation in recent years thanks to the
hard work and motivation of all employees.
That’s something we can be proud of,
and we will continue to follow this path.
We now have a strategy that meets both
the expectations of our customers and
shareholders and our responsibility towards
our employees. thyssenkrupp has huge
potential, and I am convinced that with
the path we are taking we will exploit this
potential significantly better than we have in
the past.
Sounds good, but what specifically needs tackling?
Guido Kerkhoff: An honest assessment
shows that we need to improve in several
areas. Forecasts don’t need to be adjusted
when everything is going well. In the past
fiscal year we increased our sales and
order intake, and significantly reduced our
G&A costs. Our materials businesses –
particularly our steel business – profited
from the positive cyclical upturn in the
market. But Industrial Solutions was a
serious cause for concern. We conducted
an extensive analysis to reassess our
projects and create transparency. In plant
engineering in particular we now need to
deal carefully with the problems that have
accumulated. We have also addressed
operating issues at Elevator Technology
and Components Technology. And for
thyssenkrupp AG as a whole we must
achieve a breakthrough in adjusted EBIT
and free cash flow. That will be key to the
profitability of thyssenkrupp and to enabling
us to build two strong companies.
After the changes on the Board of Industrial Solutions in summer, you announced two further changes in early November.
Oliver Burkhard: In recent years Elevator
Technology has improved in many areas.
Nevertheless there are still strategic
discussions about the direction of the
business. At the same time the earnings
situation at Elevator Technology is not as it
should be. In this context we have decided
to make a fresh start in terms of personnel.
At Materials Services we have started an
orderly process to find a successor to Mr.
Limberg, who is entering retirement, to
reflect the new role of Materials Services
against the background of the separation.
Materials and Industrials – two new companies: Why is that the right step for thyssenkrupp?
Guido Kerkhoff: We are creating two
companies each with a clear profile and
a clear focus. These two companies will
be financially viable and build on joint
strengths, but will have different success
factors: On the one hand we have the
capital goods businesses characterized by
their engineering and service capabilities.
thyssenkrupp Industrials will consist
of three units: Elevator Technology will
remain unchanged in its current set-
up. Components Technology will be
focused on the automotive business.
I.4
thyssenkrupp annual report 2017 / 2018
Magazine

Bearings and Forged Technologies will be
transferred out of Industrials and integrated
into thyssenkrupp Materials. System
Engineering, which for example develops
production lines for the auto industry, will
join Industrials from the current Industrial
Solutions business area. As a result our
automotive capabilities will be combined in
one area, enabling us to offer all products
and services from a single source and
focus more strongly on the latest customer
requirements and technology trends. The
third pillar of the capital goods businesses
will be Plant Engineering, which in its new
structure will be able to focus on its core
competencies.
The second company – thyssenkrupp
Materials – will comprise the following
units: Materials Services, the 50 percent
interest in the future steel joint venture with
Tata Steel, Bearings, Forged Technologies
and Marine Systems. This will create a
powerful, viable materials group that will
bring together carbon and stainless steel
production, materials distribution and
steel-related processing. In the materials
distribution and steel businesses we hold
leading market positions in Europe, while
our forging and bearings businesses are
among the world’s leading suppliers. In
the new set-up we can grow these market
positions and utilize opportunities for
consolidation from a position of strength.
So in the future there will be two strong
thyssenkrupps. We are convinced that
this will open up new prospects for
thyssenkrupp and give all our businesses
better opportunities for development.
After the separation our companies will be
less complex and able to operate faster
on the market. We regard our strategy
as a continuation of the Strategic Way
Forward we have been following for the
past seven years. We are confident that our
shareholders will profit from our new set-up
– in particular through our greater financial
strength, clear growth and profitability
targets, a clear strategy with different
industrial logic for the two companies, and
consequently clear profiles on the capital
market.
Are the employees supportive of these changes? Can you understand that some of them are feeling uneasy?
Oliver Burkhard: Focusing our businesses
is something we have been pursuing for
years, in materials we divested our stainless
steel operations and the overseas steel
mills, so this is a logical next step. But it
is also understandable that many people
have been asking themselves in the past
few months just where the company is
headed. We have now answered this
question with our clear strategic decision.
We have concluded a basic agreement
with the IG Metall trade union that provides
security for everyone going forward.
People at thyssenkrupp traditionally have
a special bond with their company. Some
160,000 women and men come to work
every morning and give their all. Our people
weren’t shell-shocked. Things didn’t grind
to a halt. Our company has been around
for over 200 years – with many highs and
also a few lows. We always carried on. And
this is not me trying to boost morale from
above, it’s what our people are telling me.
“Now more than ever” is something I hear
very frequently. At thyssenkrupp we have
a culture of moving closer together in more
difficult times. That’s pretty extraordinary,
and it’s a great source of motivation for us
on the Board.
How exactly will thyssenkrupp be separated?
Guido Kerkhoff: We will proceed very
carefully and responsibly, because we
attach great importance to giving both
companies a good start and solid prospects
for the future. And we will apply the
principle of “best for both” to everything we
do.
Donatus Kaufmann: Our aim is for the
Annual General Meeting at the end of
January 2020 to be able to decide on the
separation of our Group. For this we need
to have already set up the two parts of the
company as separate stock corporations.
So the aim is for thyssenkrupp Materials
AG and thyssenkrupp Industrials AG to be
operational at the start of the next fiscal
year on October 1, 2019, though formally
still under the roof of thyssenkrupp AG.
I.5
thyssenkrupp annual report 2017 / 2018
Magazine

Just before publication of the annual financial statements thyssenkrupp recognized provisions for possible antitrust fines in the steel business. Has the company not learned anything since the rail cartel?
Donatus Kaufmann: We recognized these
provisions because as a corporation we are
obliged to set aside provisions for risks in
this way. It is true that thyssenkrupp Steel
Europe AG has long been the subject of
ongoing investigations by the Federal Cartel
Office into alleged cartel agreements from
many years ago relating to the product
groups heavy plate and flat carbon steel.
We reported on this last year. We have
taken this matter very seriously from the
outset, and with the help of an external law
firm we undertook an internal investigation.
None of the relevant persons is still working
in their former area of responsibility and
some left the company a long time ago.
But these investigations show that despite
all our successful efforts in recent years to
prevent antitrust violations from happening
in the first place, possible misconduct from
the past can still come back to haunt us.
That’s why we remain firm: For us, cartel
agreements are not a means of doing
business. Anyone who sees that differently
has no place at thyssenkrupp.
Will thyssenkrupp’s values and corporate culture only be half as important on each side in the future?
Oliver Burkhard: Our corporate culture is
indivisible – and in the restructuring we will
ensure that our values continue to be lived
at both companies. This continuity is also
expressed by the thyssenkrupp brand: Both
companies will remain thyssenkrupp – with
the same DNA. Our special responsibility for
our colleagues, our courage to change, and
our roots and history – all these will help us
on our way forward and provide a strong
foundation for both companies.
thyssenkrupp needs to further improve its performance before the new set-up takes effect. What needs to happen?
Guido Kerkhoff: We still cannot measure
ourselves against our best competitors in all
areas, and that is also reflected in our EBIT
margin and cash flow. This has to change,
and it will change. Our target for the end
of the 2020/2021 fiscal year is to achieve
free cash flow before M&A of at least
1 billion euros. That is ambitious but
realistic. We have set clear EBIT margin
and cash conversion targets for all our
businesses. These targets continue to
apply. Since I joined thyssenkrupp we have
I.6
thyssenkrupp annual report 2017 / 2018
Magazine

managed to reduce our costs year by year –
by more than five billion euros in total. And
now we are taking this a step further by
sticking to our ambitious savings targets for
our central administrative costs. For the two
new companies, 1 plus 1 will have to be less
than 2.
Oliver Burkhard: We obviously expect
the biggest improvement at Industrial
Solutions. So it’s all the more important
that the reorganization there is implemented
uncompromisingly. We have divided
Industrial Solutions by activity – plant
engineering will do plant engineering,
Marine Systems will do naval shipbuilding,
and System Engineering will be allocated
to the automotive components business.
So each of these areas can concentrate on
what they do best. But we also want to see
better results. The new leadership team at
Industrial Solutions will help achieve this.
The joint venture documents have been submitted to the authorities. The creation of a new steel company with Tata Steel is gathering momentum. What do you feel is important?
Donatus Kaufmann: First of all, it’s
important not to let ourselves be put
under pressure to meet deadlines. We are
doing everything we can to ensure that
the competition authorities complete their
merger control procedures as quickly as
possible and give their approval for the joint
venture to start up. But official examinations
of this kind take time. And from a legal point
of view it’s important that the joint venture
does not start work before the closing has
taken place. Until then Tata Steel Europe
remains a competitor and the rules of
competition law continue to apply in full.
And after the closing, the global activities
of Tata Steel will then be in competition with
the European joint venture. So compliance
will continue to be an important issue.
thyssenkrupp annual report 2017 / 2018
Magazine

I.8
thyssenkrupp annual report 2017 / 2018
Magazine

Regarding the steel joint venture: What are the next steps? And how will the joint venture advance thyssenkrupp as a whole?
Guido Kerkhoff : Alongside the merger
control procedures we are working hard to
set up our steel business as an independent
entity in preparation for the joint venture.
The aim of this is to ensure that the units
being contributed to the joint venture, above
all Steel Europe, are fully functional and can
operate independently from the fi rst day
after the closing. With the new company we
are creating a powerful number two on the
European fl at steel market with excellent
prospects going forward. At the same time
the joint venture is a major milestone in the
transformation of thyssenkrupp. That will
also be refl ected sustainably in our fi gures.
Occupational safety and health is a key area of your work. But there are still too many accidents in the company, aren’t there?
Oliver Burkhard: The safety and health
of our employees is paramount, wherever
they work in the world and regardless
of whether they are on our payroll or
not. We are already doing a great deal
to raise awareness of this issue and to
improve working conditions. The “Safety
Moments” are a good example of this,
where managers talk about their most
emotional moments relating to safety
and symbolically pass on a baton.
But we still need to improve signifi cantly
in the area of health and safety. We want
to reduce the number of accidents to a
minimum. And that means everyone acting
as a role model for safety and looking
out for each other. We need to apply this
standard worldwide, not just in certain
regions. To this end we have launched
the “Vision2Zero” initiative. Its aim is to
reduce the accident frequency rate – that’s
the number of accidents per 1 million
hours worked – to 2 and the number of
fatal accidents to 0. We’ve already made
big progress here, but we are still not
good enough. Accidents will continue to
happen, but every life lost is one too many.
To you all: To close, what motivates you to work for thyssenkrupp?
Donatus Kaufmann: At thyssenkrupp
performance and values are part of the
same vision – and that’s very important
to me. The transformation phase will
present us with new challenges in this
regard. I see it as my job to ensure we
have the right processes, structures and
mindset for this – and that motivates me!
Oliver Burkhard: thyssenkrupp is an
emotional company that inspires and moves
people – few other companies have this on
that scale. It’s not just what we do that’s
important, it’s how we do it: with decency,
respect, openness and also the fun of
creating something together. Living and
working in this culture and developing it
further – that motivates me.
Guido Kerkhoff : I feel a great commitment
to this company and our customers
and shareholders. I am aware of the
responsibility that goes with being CEO
of thyssenkrupp, especially during
the major changes that lie ahead of
us. Our employees give their all for
thyssenkrupp every day – that’s a
unique mentality, and one that makes
us on the Board even more committed.
The trust of our customers constantly
motivates me to give my all for the team.
I.9
thyssenkrupp annual report 2017 / 2018
Magazine

Each of our business areas is unique and holds great potential. That’s
something we’re fi rmly convinced of. We want to measure ourselves
against the best in each of our markets.
Together with our business areas we are working systematically to
identify ways of improving performance in every single one of our
activities. This is nothing new, it’s something we’ve been doing for
years – with visible success. Over the next few pages we want to show
you how our business areas have constantly reinvented themselves
over the past few years. The fi gures for the past fi scal year are
presented transparently in the fi nancial section of this Annual Report.
As a group and in each of our business areas we have come a long way
in recent years. But we also know that we still need to improve further.
Together with our business areas we have defi ned ambitious targets
to be met by the 2020/2021 fi scal year – with constant evolution,
innovation and engineering expertise as the hallmarks of our group.
Business Areas
I.10
thyssenkrupp annual report 2017 / 2018
Magazine

ComponentsTechnology
On track to success with a clear
commitment to the auto business
Our Components Technology business area
supplies parts and systems for cars, trucks,
construction machinery, wind turbines and
numerous other engineering applications. Most
of these sectors have been growing steadily for
several years. Our products support the global
trend towards effi cient mobility and meet the
need for ecological power generation from
renewable resources.
Our clear commitment to the automotive business has helped
position us as a recognized Tier 1 supplier. Our major investments
and the continuous expansion of our international production
network are paying dividends, with sales now up for the fi fth year
in succession.
Our order books are already looking very healthy up to 2020/2021.
Now we need to ensure that this growth is refl ected in our earnings.
Our target is an adjusted EBIT margin of more than 7% and we are
working hard to achieve it. Right now our biggest program launches
are in electric steering systems, but we will shortly also be opening
important new plants for dampers, springs, stabilizers and
industrial components. We expect these to have a positive impact
on our earnings.
At present we are focused on implementing numerous customer
projects, for which we will further streamline the organizational
structures of our production and IT operations. We will also be
pressing ahead with the digitization of our production processes,
for example making greater use of autonomous logistics concepts,
machine learning to improve product quality, and collaborative
robot applications. The next step will be to standardize and
modularize our product portfolio and optimize the use of intelligent
software solutions. In the future we will also be expanding
our capabilities in the chassis area, enabling us to become a
dependable partner to customers in the area of autonomous
driving, for example.
Modular test vehicle for the agile development of integrated chassis functions
Production of electric power steering systems
thyssenkrupp annual report 2017 / 2018
Magazine

Elevator Technology
Through sustained investment in research and development, the
business area has positioned itself successfully as an innovator
in recent years. We operate in global growth markets and focus in
particular on the industry drivers of urbanization and digitization to
expand our business.
Our predictive maintenance solution MAX is a prime example of
how we are using digitization to transform our business. More than
120,000 elevator systems were already connected up to MAX by
the end of the 2017/2018 fi scal year. Predictive maintenance helps
signifi cantly reduce system downtimes for our customers. The
rope-free elevator MULTI shows that our sustained investment in
innovations is creating stand-out technologies. The establishment
of a dedicated company unit will create further opportunities to
win new customers for MULTI in line with our goal of bringing
innovations to market profi tably and defi ning new standards for
a 160-year-old sector.
We are also focused on improving our business in Europe. Among
other things we will be streamlining our administrative functions
to eliminate ineffi ciencies and unnecessary expense, resulting in
planned cost savings of 100 million euros.
Our target for the 2020/2021 fi scal year is an adjusted EBIT margin
of more than 13%. In the longer term we are aiming for 15%.
In the MULTI system, multiple cabs can move vertically and
horizontally in a single shaft
Transforming the sector and increasing
profi tability with innovations for urban
mobility
Our industry moves around 1 billion people
every day. Our portfolio includes passenger
and freight elevators, escalators, moving
walks, passenger boarding bridges, stair lifts,
platform lifts and tailored services for the
entire range. We create innovative solutions for
intelligent cities.
I.12
thyssenkrupp annual report 2017 / 2018
Magazine

Our customers know and value our expertise.
Around 70% of our employees are engineers and
technicians. Outstanding engineering capabilities
are central to what thyssenkrupp stands for, so the
expectations for our business area are high. We will
do everything we can to make Industrial Solutions
a strong, integrated engineering and construction
organization. The ingredients are all there.
We have built a vast number of plants around the
world – over 2,500 in the chemical sector alone.
That’s a good platform from which to further
expand our increasingly important service business,
grow faster than the market and thus generate
more stable earnings in the long-term. For this
we plan to double our global service network over
the next three years. We also intend to utilize the
opportunities provided by digitization to move into
new fi elds of business and develop new business
models.
Industrial Solutions operates in growth markets, and
we intend to systematically tap into this growth. Our
priority is to improve our profi tability by enhancing
our sales effi ciency and expanding our service
business. At the same time we will be adjusting
our structures in line with market conditions and
our strategic goals. Our target for the Industrial
Solutions business area is an adjusted EBIT margin
of around 6% by the 2020/2021 fi scal year.
Industrial Solutions
Bastion of engineering expertise
The Industrial Solutions business area is a
leading partner for the engineering, construction
and servicing of industrial plants and systems.
With our global network we supply turnkey plants
worldwide that set new standards in terms of
effi ciency and resource-friendly technology. The
carve-out of Marine Systems enables us to focus
fully on plant engineering.
Groundbreaking fully automated polysius® bulk material storage system
thyssenkrupp annual report 2017 / 2018
Magazine
I.13

Materials ServicesOver the past ten years we have greatly
simplifi ed our structure, reducing from
235 to 74 companies. At the same time
we have signifi cantly improved our
productivity. A further key to our success
is the trust of our customers, built up over
many years.
And our quest for greater effi ciency goes
on, for example with dedicated project
teams managing optimization processes
around the world and supporting their
colleagues on the ground with methods
developed specifi cally for Materials
Services. Digitization is a key effi ciency
driver at Materials Services, opening
up completely new possibilities. In the
2016/2017 and 2017/2018 fi scal years
we realized two groundbreaking projects:
connecting up all our machines via the
in-house developed IoT platform “toii”
and launching the world’s biggest virtual
material warehouse. Our aim is to digitize
our entire portfolio. But there’s more to
Materials Services than just the global
distribution of materials.
We already generate over 50% of our
sales in the growing, high-margin service
business, which we are expanding
systematically and which encompasses a
broad range of materials and supply chain
management services. A new AI solution
enables us to analyze huge amounts of
data much more effi ciently and better
understand the needs of our customers:
Ultimately we will think in completely
new business dimensions. Through our
ongoing digital transformation, effi ciency
improvements and the expansion of our
services we aim to achieve an adjusted
EBIT margin of 3% by fi scal 2020/2021.
Tailored solutions for customers
IoT platform toii connects machines
Moving into a digital future
As one of Europe’s leading materials
distributors Materials Services off ers an
unrivalled range of materials and extended
services – from high-quality raw materials
to technical services to the development of
intelligent processes for automation, the
extended supply chain and warehouse/
inventory management.
I.14
thyssenkrupp annual report 2017 / 2018
Magazine

Steel Europe has undergone major changes
in recent years. We have signifi cantly
improved our performance and effi ciency
and focused our business more fi rmly than
ever on customers and the entire value chain.
That includes data harmonization, which is
simplifying our business processes. We are
driving the consolidation of the European
steel industry from a position of strength:
thyssenkrupp achieved an important milestone
in the reporting year with the signing of
an agreement to combine its European
steel activities in the 50/50 joint venture
thyssenkrupp Tata Steel. Together we want to
create a powerful no. 2 on the European fl at
steel market and thus create a solid future
for our employees. Following approval by
the antitrust authorities and the closing of
the deal, we will focus on growing the joint
venture. We plan to strengthen our position in
markets of the future such as e-mobility. This
strategy will be backed by continuous targeted
investments in our technological capabilities,
strengthening our sites so that we can
continue to serve the rising demand for high-
quality materials.
Steel Europe (discontinued operation)
New ladle furnace at the Duisburg steel mill
Fresh tailwind for a powerful European fl at
steel specialist
With around 27,000 employees we supply
high-quality fl at steel products for innovative
and demanding applications in a wide range
of industries. Custom solutions and services
around steel round out our range. We operate
in important industries such as the automotive,
engineering, packaging and energy sectors.
I.15
thyssenkrupp annual report 2017 / 2018
Magazine

I.1
I.2
I.10
I.11
I.12
I.13
I.14
I.15
2
3
4
11
29
Magazine
Interview with the Executive Board
Business areas
Components Technology
Elevator Technology
Industrial Solutions
Materials Services
Steel Europe (discontinued operation)
To our shareholders
Executive Board
Report by the Supervisory Board
Corporate governance
thyssenkrupp stock
31
32
32
40
77
82
85
87
89
95
96
99
100
126
Combined
management report
Preliminary remarks
Fundamental information about the Group
Report on the economic position
Annual financial statements of thyssenkrupp AG
Technology and innovations
Environment, climate and energy
Purchasing
Employees
Social responsibility
Compliance
Overview of non-financial disclosures
Forecast, opportunity and risk report
Legal information

Our f iscal year begins on October 1
and ends on September 30 of the
fol lowing year.
135
136
138
139
140
141
143
219
226
227
228
230
231
234
236
Consolidated financial statements
Consolidated statement of financial position
Consolidated statement of income
Consolidated statement of comprehensive income
Consolidated statement of changes in equity
Consolidated statement of cash flows
Notes to the consolidated financial statements
Independent Auditors’ Report
Responsibility statement
Additional information
Multi-year overview
Executive Board
Supervisory Board
Glossary
Contact and 2019 / 2020 financial calendar

To our shareholders
3
4
11
29
Executive Board
Report by the Supervisory Board
Corporate governance
thyssenkrupp stock

E xecut ive Board
Guido Kerkhof f*1967, CEO and CFO,appointed until September 2023
O l iver Burkhard*1972, responsible for Human Resources,Labor Director, appointed untilSeptember 2023
Résumés of the Executive Board members can be found atthyssenkrupp.com > Company > Management > Executive Board
Dr. Donatus Kaufmann*1962, responsible for Legal & Compliance,appointed until January 2022

P r o f . D r . B e r n h a r d P e l l e n s C h a i r m a n o f t h e S u p e r v i s o r y B o a r d
thyssenkrupp annual report 2017 / 2018
1 To our shareholders I Report by the Supervisory Board
thyssenkrupp annual report 2017 / 2018
1 To our shareholders | Report by the Supervisory Board
5
Report by the Supervisory Board
Dear Shareholders,
Before informing you about the work of the Supervisory Board and its committees in fiscal
year 2017 / 2018, allow me to make one or two remarks on the past fiscal year: losing the chair-
man of the Executive Board and the chairman of the Supervisory Board within a short space of time
were major events which we members of the Supervisory Board very much regret.
In our responsibility for the Company and its employees, however, we now turn our attention to the
future. On June 29, 2018 we decided to form a joint venture with Tata Steel for the steel business.
In addition, on September 30, 2018 the Executive Board and Supervisory Board decided to sepa-
rate thyssenkrupp into two new companies. We will now take this path together. The realignment
makes economic sense and is borne out of responsibility to the Company, its employees and all its
shareholders.
Cooperation between Supervisory Board and Executive Board
In fiscal year 2017 / 2018 the Supervisory Board again regularly advised the Executive Board on
the management of the Company and continuously supervised its conduct of business. We satis-
fied ourselves that the Executive Board’s work complied with all legal and regulatory requirements
at all times. The Executive Board fulfilled its duty to inform. It furnished us with regular written and
verbal reports containing up-to-date and comprehensive information on all issues of relevance to
the Company and the Group relating to strategy, planning, business performance, the risk situation
and compliance. This also included information on variances between actual performance and
previously reported targets as well as on budget variances (follow-up reporting). In the committees
and in full Supervisory Board meetings, the members of the Supervisory Board always had ample
opportunity to critically examine the reports and resolution proposals submitted by the Executive
Board and contribute suggestions. In particular, we discussed intensively and examined the plausi-
bility of all transactions of importance to the Company on the basis of written and verbal reports by
the Executive Board. On numerous occasions the Supervisory Board dealt at length with the risk
situation of the Company, the liquidity planning and the equity situation. Thanks to an analysis of
the value potential of the Group’s businesses and the opportunities and risks of strategic steps,
critical operating issues were presented to the Supervisory Board in a clear and differentiated way.
Where required by law, the Articles of Association or the rules of procedure for the Executive Board,
the Supervisory Board provided its approval of individual business transactions.
In the periods between meetings, the Chairmen of the Supervisory Board, Audit Committee and
Strategy, Finance and Investment Committee engaged in a close and regular exchange of views
and information with the Executive Board and were informed about major developments. Important
facts were reported immediately to the following Supervisory Board or Committee meetings. Before
the Supervisory Board meetings the shareholder and the employee representatives each held
separate meetings to discuss the agenda items. The members of the Supervisory Board were

thyssenkrupp annual report 2017 / 2018
1 To our shareholders | Report by the Supervisory Board
6
regularly advised of the confidentiality of the content of all meetings. Conflicts of interest of Execu-
tive Board and Supervisory Board members, which must be disclosed to the Supervisory Board
immediately, did not occur in the past fiscal year.
Supervisory Board meetings
Ten Supervisory Board meetings were held in the reporting year. The average attendance rate at
the meetings of the Supervisory Board and its committees was 93%. No Supervisory Board mem-
ber attended fewer than half the meetings of the Supervisory Board and the relevant committees.
The members of the Executive Board took part in the Supervisory Board meetings unless otherwise
determined by the Supervisory Board Chairman. The position of Supervisory Board Chairman was
held by Prof. Dr. Ulrich Lehner until his departure on July 31, 2018. Until the election of Prof. Dr.
Bernhard Pellens as Chairman in the meeting on September 30, 2018, the business of the Super-
visory Board was conducted by Vice Chairman Markus Grolms.
The range of topics that the Supervisory Board dealt with in fiscal year 2017 / 2018 included the
current business and earnings situation and the parent-company and consolidated financial state-
ments for the year ended September 30, 2017. On the recommendation of the Audit Committee
and after discussion with the auditors PricewaterhouseCoopers GmbH Wirtschaftsprüfungsgesell-
schaft (PwC) the Supervisory Board approved the parent-company and consolidated financial
statements for the 2016 / 2017 fiscal year. At the end of the reporting year the Supervisory Board
also discussed and approved the parent-company and consolidated financial statements for the
year ended September 30, 2018. Further topics discussed by the Supervisory Board included the
corporate and investment planning for fiscal year 2017 / 2018, the preparation of the Annual Gen-
eral Meeting on January 19, 2018, questions of Executive Board compensation and the diversity
strategy for the Executive Board and Supervisory Board, which the Supervisory Board adopted. The
Supervisory Board regularly received reports from the committees and on the subject of compli-
ance. In addition the focus was on corporate governance, the thyssenkrupp Internal Control System
(ICS) and the 2017 EMIR compliance audit pursuant to § 32 WpHG.
In connection with the report on the state of the thyssenkrupp Group and the strategic way forward,
the discussions on the planned establishment of a joint venture with Tata Steel Europe played a
major role. The Supervisory Board dealt intensively with important topics – including pension obli-
gations at Tata Steel UK, the sustainable profitability of Tata Steel UK, the environmental situation
at the Port Talbot steel mill in Wales and the indebtedness and economic viability of the joint ven-
ture. External reports were commissioned for each of these topics. After intensive and in part
fiercely debated discussions in the Supervisory Board, in its committees and in a working group –
partly with the participation of external experts – the Supervisory Board approved the combination
of the European flat steel activities of the thyssenkrupp Group and the Tata Steel Group in a 50 / 50
joint venture, called thyssenkrupp Tata Steel, on June 29, 2018.
Shortly afterwards in its meeting on July 6, 2018 the Supervisory Board with great regret accepted
Dr. Heinrich Hiesinger’s request for the termination by mutual consent of his appointment as
Chairman and member of the Executive Board of thyssenkrupp AG with immediate effect. In the
following meeting on July 13, 2018 the Supervisory Board appointed Guido Kerkhoff as Chairman
of the Executive Board of thyssenkrupp AG and approved an amended organization chart. A short
time later Prof. Dr. Ulrich Lehner announced his resignation as Chairman of the Supervisory Board
effective July 31, 2018. From August 1, 2018 the Vice Chairman Markus Grolms took over the
chair of the Supervisory Board.

thyssenkrupp annual report 2017 / 2018
1 To our shareholders | Report by the Supervisory Board
7
The Supervisory Board dealt with the activities and strategy of the Industrial Solutions business
area twice in the reporting year, namely on January 18 and September 11, 2018. In the second
meeting the focus was on the status of the necessary restructuring measures and recent develop-
ments in the business area which had necessitated the replacement of members of the Industrial
Solutions business area board and a reorganization of the Marine Systems business unit. The
Supervisory Board decided to allocate Marine Systems directly to the Executive Board of
thyssenkrupp AG. Since then this unit has been headed directly by Oliver Burkhard.
In the last meeting of the Supervisory Board in the reporting year on September 30, 2018, Prof. Dr.
Bernhard Pellens was elected as the new Chairman of the Supervisory Board of thyssenkrupp AG.
In addition, the Supervisory Board approved the plan proposed by the Executive Board for the
strategic development of the Group, separating the current thyssenkrupp AG into two listed compa-
nies (in the future: thyssenkrupp Materials and thyssenkrupp Industrials). Implementation will be
carried out taking into account the general agreement made between the Executive Board of
thyssenkrupp AG and IG Metall on September 29, 2018.
In fiscal year 2017 / 2018 the Supervisory Board, after reviewing the recommendations and sug-
gestions of the German Corporate Governance Code (GCGC) as amended on February 7, 2017,
decided to issue and publish declarations of conformity – also during the year. The most recently
issued joint declaration of conformity by the Executive Board and Supervisory Board has been
available on the thyssenkrupp website since October 1, 2018. In addition, the Executive Board and
Supervisory Board report on corporate governance at thyssenkrupp in the corporate governance
report and the corporate governance statement.
As part of its further education the Supervisory Board dealt on May 04, 2018 with the Materials
Services business area and visited the TechCenter Additive Manufacturing (3D printing) in Mül-
heim/Ruhr and thyssenkrupp Materials Processing Europe GmbH in Krefeld in order to obtain a
direct impression of production conditions and the work of management on site.
Report on the work of the committees
The primary task of the Supervisory Board’s six committees is to prepare decisions and topics for
discussion at the full meetings. The Supervisory Board has delegated decision-making powers to
the committees where this is legally permissible. The powers of the committees and the require-
ments on committee members are set out in the rules of procedure for the respective committees.
The chairmen of the committees provided the Supervisory Board with regular detailed reports on
the work of the committees in the reporting year. The compositions of the six committees are
shown in the section “Supervisory Board”. The chairmen of the committees were also in close
contact with the other members of their committees outside the regular meetings to coordinate
special projects.
The Executive Committee (Praesidium) met eight times in the past fiscal year. In addition to pre-
paring the full Supervisory Board meetings, the main subjects of deliberation were the financial
position and earnings performance of the Group, the strategic development of the individual busi-
ness areas, and the Groupwide projects to optimize effectiveness, efficiency and performance.

thyssenkrupp annual report 2017 / 2018
1 To our shareholders | Report by the Supervisory Board
8
The Personnel Committee held twelve meetings in the 2017 / 2018 fiscal year to prepare person-
nel matters concerning the Executive Board for the Supervisory Board. Where required, resolutions
were passed or recommendations for resolutions were made to the Supervisory Board. The meet-
ings addressed general Executive Board matters and – in fulfilment of our duty of care – succession
planning. In addition, proposals for establishing the performance bonus and additional bonus and
the structuring of pensions for the members of the Executive Board were dealt with. Details of
Executive Board compensation are presented in the compensation report.
The Audit Committee met seven times in the 2017 / 2018 fiscal year. Alongside Executive Board
members, the meetings were also attended by representatives of the auditors PwC, who were
elected by the 2018 Annual General Meeting and subsequently appointed by the Audit Committee.
The auditors declared to the Audit Committee that no circumstances exist that could lead to the
assumption of prejudice on their part. The Audit Committee obtained the required auditors’ state-
ment of independence, reviewed their qualification, and concluded the fee agreement. In addition a
Groupwide survey of auditing quality was carried out; the results of this as well as the additional
services provided by PwC alongside the audit of the financial statements were discussed in the
Audit Committee. The Chairman of the Audit Committee was also in regular contact with the audi-
tors between meetings. Heads of corporate functions were also available to provide reports and
take questions in committee meetings on individual agenda items.
In the reporting year the committee’s work focused on examining the 2017 / 2018 parent-company
and consolidated financial statements along with the combined management report, the proposal
for the appropriation of net income and the auditors’ reports, and preparing the Supervisory Board
resolution on these items. In addition, the interim financial reports (half-year and quarterly reports)
were also discussed in detail and adopted, taking into account the auditors’ review report. With
regard to PwC the catalogue of non-audit services by the financial statement auditor requiring
approval was established, and the budget for the performance of non-audit services for the
2017 / 2018 fiscal year was set at a maximum amount of 30% of the agreed audit fee. In addition
PwC reported in detail on the new rules for audit reports and on procedures and quality manage-
ment in connection with the audit of the financial statements.
In several meetings the Audit Committee monitored the accounting process and discussed the
effectiveness of the internal control system and optimizations made to it, the risk management
system and the internal auditing system. It also dealt in detail with the main legal disputes and
compliance in the Group and discussed at length the strategic compliance measures at
thyssenkrupp. In addition in the presence of the head of Corporate Internal Auditing the committee
discussed the internal audit results, the audit processes and the audit planning of the Group inter-
nal auditing team for the 2017 / 2018 fiscal year. Further main topics were the determination of the
key audit area for the financial statement audit (introduction of new IFRS 15 rules for complete and
correct revenue recognition in accounting), the implementation of the CSR directive, the equity
capital and rating situation, the EMIR compliance audit for the 2016 / 2017 fiscal year in accord-
ance with § 20 WpHG, and the status of the tax inspections. Regular reports were provided on the
status of the corporate initiatives. The committee members dealt in detail with governance matters
in relation to the planned joint venture with Tata Steel.

thyssenkrupp annual report 2017 / 2018
1 To our shareholders | Report by the Supervisory Board
9
The Strategy, Finance and Investment Committee held five meetings in the 2017 / 2018 fiscal
year. Discussions focused on the strategic development of thyssenkrupp and portfolio optimization
measures. The committee also discussed in detail reports presented to the Supervisory Board on
the business activities and strategy of the individual business areas and corporate functions, in
particular on the formation of a joint venture with Tata Steel Europe. Further, the Group’s corporate
and investment planning for the reporting year was discussed, taking into account the Group’s
current rating and financial situation, and corresponding Supervisory Board resolutions were pre-
pared.
The members of the Nomination Committee convened for eleven meetings in the past fiscal year.
Discussions focused in particular on preparing the appointments that had become necessary on
the shareholder side of the Supervisory Board. Other main areas of discussion included succession
planning for the Supervisory Board – taking into account the recommendations of the German
Corporate Governance Code – and the preparation of a competency profile for the Supervisory
Board as a whole and a diversity strategy for the Executive Board and Supervisory Board.
There was once again no cause to convene the Mediation Committee under § 27 (3) Codetermi-
nation Act in the reporting year.
Audit of the parent-company and consolidated financial statements
Elected by the Annual General Meeting on January 19, 2018 to audit the financial statements for
the 2017 / 2018 fiscal year, PwC audited the parent-company financial statements for the fiscal
year October 1, 2017 to September 30, 2018 prepared by the Executive Board in accordance with
HGB (German GAAP) rules, and the management report on thyssenkrupp AG, which is combined
with the management report on the Group. The auditors issued an unqualified audit opinion. In
accordance with § 315a HGB, the consolidated financial statements of thyssenkrupp AG for the
fiscal year from October 1, 2017 to September 30, 2018, and the management report on the
Group, which is combined with the management report on the Company, were prepared on the
basis of International Financial Reporting Standards (IFRS) as applicable in the European Union.
The consolidated financial statements and the combined management report were also given an
unqualified audit opinion by PwC. The auditors also confirmed that the Executive Board has in-
stalled an appropriate reporting and monitoring system which is suitable in its design and handling
to identify at an early stage developments which could place the continued existence of the Com-
pany at risk.
The financial statement documents and audit reports for the 2017 / 2018 fiscal year were discussed
in detail in the meetings of the Audit Committee on November 15, 2018 and the Supervisory Board
on November 20, 2018. The auditors reported on the main findings of their audit. They also out-
lined their findings on the internal control system and risk management in relation to the account-
ing process and were available to answer questions and provide additional information. The Chair-
man of the Audit Committee reported in depth at the full Supervisory Board meeting on the Audit
Committee’s examination of the parent-company and consolidated financial statements. Following
examination and discussion of the parent-company financial statements, the consolidated financial
statements, and the combined management report by the Supervisory Board no objections were

thyssenkrupp annual report 2017 / 2018
1 To our shareholders | Report by the Supervisory Board
10
raised. In line with the recommendation by the Audit Committee, the Supervisory Board then ap-
proved the result of the audit by the financial statement auditors. Following completion of our ex-
amination we came to the conclusion that no objections were to be raised and we established the
financial statements of thyssenkrupp AG and approved the consolidated financial statements.
Following our own examination and taking the earnings and financial situation of the Group into
account, the Supervisory Board concurred with the Executive Board’s proposal to allocate an
amount from net income to other retained earnings and for the appropriation of the remaining
unappropriated income including a dividend of €0.15 per share for the 2017 / 2018 fiscal year.
Personnel changes on the Supervisory Board
The following changes took place on the shareholder side: Upon the close of the Annual General
Meeting on January 19, 2018 Dr. Ralf Nentwig, who was delegated by the Alfried Krupp von
Bohlen und Halbach Foundation, left the Supervisory Board. At the time of the close of the Annual
General Meeting the Alfried Krupp von Bohlen und Halbach Foundation delegated Prof. Dr. Dr. h. c.
Ursula Gather as a new member to the Supervisory Board. Prof. Dr. Ulrich Lehner left the Supervi-
sory Board on July 31 and René Obermann on August 31 of the reporting year. On the employee
side Wilhelm Segerath left the Supervisory Board at the end of fiscal year 2017 / 2018 after over
20 years of membership. Dirk Sievers was court-appointed as his successor with effect from Octo-
ber 2, 2018. The members of the Supervisory Board thanked all departing members for their good
and constructive work over many years. The compositions of the committees at September 30,
2018 are shown in the Notes to the Annual Report. The two vacancies on the shareholder side will
be filled in a structured process. The successors are to be initially appointed by court and put up
for election at the Annual General Meeting on February 1, 2019.
The Supervisory Board thanks the Executive Board members, all employees of the Group worldwide
and the employee representatives of all Group companies for their efforts and achievements in the
2017 / 2018 fiscal year.
The Supervisory Board
Prof. Dr. Bernhard Pellens
Chairman
Essen, November 20, 2018

thyssenkrupp annual report 2017 / 2018
1 To our shareholders | Corporate governance
11
Corporate governance
In the following section, the Executive Board and Supervisory Board report on corporate govern-
ance at thyssenkrupp in accordance with section 3.10 of the German Corporate Governance Code.
In the thyssenkrupp Group, corporate governance stands for responsible corporate management
and control geared to long-term value creation. At thyssenkrupp good corporate governance takes
in all areas of the company.
Key corporate governance principles
thyssenkrupp Code of Conduct While the Group mission statement describes our goals and standards, the concrete principles and
ground rules for our work and our behavior towards business partners and the public are summa-
rized in the thyssenkrupp Code of Conduct. This provides employees, managers, and board mem-
bers with guidelines on subjects such as the requirements for compliance, equality and non-
discrimination, cooperation with the employee representatives, occupational safety and health,
environmental and climate protection, as well as data protection and information security. Suppliers
are required to follow the thyssenkrupp Supplier Code of Conduct. In addition, thyssenkrupp has
signed the United Nations Global Compact, the BME Code of Conduct, and the Diversity Charter.
All these principles are implemented with the aid of the existing programs and management sys-
tems and the Indirect Financial Targets. Details are presented in the sustainability section of our
website as well as in this annual report (in the sections “Fundamental information about the Group”,
“Targets”).
Integrated governance, risk management, and compliance model Dealing responsibly with risks is part of corporate governance at thyssenkrupp, because the con-
tinuous and systematic management of business risks – but also opportunities – is fundamental to
professional governance. An integrated governance, risk management and compliance (GRC)
model, embedded in the Groupwide GRC Policy, provides the basis for risk management in the
Group. As a framework for this, thyssenkrupp uses the internationally established three lines of de-
fense model adapted to the Group’s specific organizational structure. This model shows the respon-
sibilities for risk management in the Group within each line of defense and how these are segregat-
ed within the GRC model.
www.thyssenkrupp.com > Company > Sustainability > Sustainability strategy and targets
The risk management system is designed on the basis of international standards.

thyssenkrupp annual report 2017 / 2018
1 To our shareholders | Corporate governance
12
Risks have to be prevented where they occur. If this is not practicable they must be identified and
reduced to an appropriate level. Systematic risk management on the 1st line of defense must be
strengthened with automated internal controls in the business processes wherever possible. As
there are cases where this is not fully possible, further control measures have to be performed by
management to ensure the effectiveness of the control system.
The 2nd line of defense includes functions such as Controlling, Accounting & Risk, Compliance,
and Legal. These provide the framework for the internal control system, the risk management
system, and compliance – for example via binding internal documents – and support the 1st line of
defense with implementation. At the same time these functions oversee and manage the Group’s
risks from the viewpoint of the Group as a whole. Close integration of the internal control system,
risk management system and compliance maximizes the efficiency of risk prevention and man-
agement.
Compliance, in the sense of all Groupwide measures to ensure adherence to statutory requirements
and binding internal regulations, is a key management and oversight duty at thyssenkrupp. The
Executive Board of thyssenkrupp AG has unequivocally expressed its rejection of antitrust violations
and corruption in the thyssenkrupp Compliance Commitment. We treat violations, in particular
antitrust or corruption violations, with zero tolerance.
The importance attached to compliance at thyssenkrupp is underlined by the fact that a dedicated
Executive Board member is responsible for the corporate functions Legal & Compliance. This Board
member reports regularly to the Supervisory Board and Audit Committee on compliance issues.
The Chief Compliance Officer is responsible for the management of the compliance program and
reports directly to the Executive Board member for Legal & Compliance. More information on com-
pliance at thyssenkrupp can be found in the “Compliance” section of the combined management
report.
Compliance is a question of mindset.
supportreview
Supervisory Board/Audit Committee
Executive Board/Business Area Boards
THREE LINES OF DEFENSE MODEL
External auditing
Functions that own and manage risks
Management controls
Internal controls
1st line of defense
Functions that oversee risks and help proactively manage them
Controlling, Accounting & Risk
Compliance
Legal
Other corporate functions
…
2nd line of defense
Functions that provide independent assurance
Internal Auditing
3rd line of defense

thyssenkrupp annual report 2017 / 2018
1 To our shareholders | Corporate governance
13
The 3rd line of defense is Corporate Function Internal Auditing, which independently reviews the
appropriateness and efficiency of the processes and systems implemented by the other two lines of
defense. The head of Corporate Internal Auditing reports on the auditing function to the Audit
Committee once a year. Internal Auditing itself is subject to an external quality audit every five
years; the last audit took place in spring 2015.
The three lines of defense model is supplemented by the work of the external financial statement
auditors.
Key features of our control and risk management system are described in the opportunity and risk
report.
Further development of corporate governance in the Group thyssenkrupp continuously develops its understanding of good and responsible corporate
governance. One element of this is the project governance@thyssenkrupp, in which the corporate
governance structures throughout the Group are being harmonized, tightened and optimized
beyond the established understanding of corporate governance defined in the German Corporate
Governance Code. The focus is on increasing transparency and ensuring full compliance with our
binding internal regulations and supporting managers in the use of internal corporate governance
instruments.
Corporate management and control
In the two-tier governance system prescribed by German stock corporation law, the Executive
Board of thyssenkrupp AG is responsible for managing the Company. The Supervisory Board of
thyssenkrupp AG is responsible for advising and overseeing the Executive Board. The Company has
taken out directors and officers (D&O) liability insurance with an appropriate deductible for the
members of the Executive Board and Supervisory Board.
Executive Board On the basis of the management structure it has adopted, the Executive Board bears responsibility
for managing the Company in the interest of the Company, i.e. taking into account the concerns of
the shareholders, employees and other stakeholders, with the aim of sustainable value creation. It
makes provisions for compliance with the statutory requirements and binding internal regulations,
and works to ensure that these are observed by the Group companies. The Executive Board has
established appropriate compliance and risk management systems. Significant business transac-
tions are subject to the approval of the Supervisory Board; they are listed in Annex 2 of the Rules of
Procedure for the Executive Board.
The Executive Board of thyssenkrupp AG must consist of at least two members. The Executive
Board members bear joint responsibility for overall business management; they decide on key
management measures such as corporate strategy and corporate planning. The Executive Board
Chairman is responsible for coordinating all the directorates of the Executive Board and for com-
municating with the Supervisory Board; he also represents the Executive Board. More detailed
information on the individual members of the Executive Board and their areas of responsibility
www.thyssenkrupp.com > Company > Management > Executive Board

thyssenkrupp annual report 2017 / 2018
1 To our shareholders | Corporate governance
14
(directorates) can be found on the Company’s website (www.thyssenkrupp.com). The Executive
Board has not formed any committees.
Supervisory Board The Supervisory Board advises and oversees the Executive Board in its management of the Com-
pany. It determines the number of members the Executive Board has above the minimum number,
appoints and dismisses the members of the Executive Board, and defines their directorates. It also
determines the compensation of the Executive Board members (details of Executive Board com-
pensation are provided in the compensation report). The Supervisory Board reviews the parent-
company and consolidated financial statements along with the combined management report of
thyssenkrupp AG, adopts the parent-company financial statements and approves the consolidated
financial statements and the combined management report. It examines the proposal for the ap-
propriation of net income and with the Executive Board submits it to the Annual General Meeting for
resolution. On the substantiated recommendation of the Audit Committee, the Supervisory Board
proposes the auditors for election by the Annual General Meeting. After the corresponding resolu-
tion is passed by the Annual General Meeting, the Audit Committee awards the contract to the
auditors and monitors the audit of the financial statements together with the independence, qualifi-
cations, rotation and efficiency of the auditors. Details of the activities of the Supervisory Board in
the 2017 / 2018 fiscal year are contained in the report by the Supervisory Board. The compensation
of the Supervisory Board members is determined by the Annual General Meeting. It was last re-
solved in the Annual General Meeting of January 17, 2014. The compensation paid to the individu-
al Supervisory Board members is presented in the compensation report.
The composition of the Supervisory Board of thyssenkrupp AG is governed by law and the detailed
provisions of § 9 of the Articles of Association. In accordance with the German Codetermination Act,
it must be composed of 10 shareholder representatives and 10 employee representatives. Under
the Articles of Association, the Alfried Krupp von Bohlen und Halbach Foundation has a designation
right.
In accordance with § 27 (1) of the Codetermination Act, the chairman of the Supervisory Board is
elected from among the Supervisory Board members. The task of the Supervisory Board chairman
is to coordinate the work of the Supervisory Board and chair the Supervisory Board meetings.
Public statements by the Supervisory Board are issued by the Supervisory Board chairman. At
thyssenkrupp at least one Supervisory Board member must have expertise in the fields of account-
ing or auditing. All members of the Supervisory Board are subject to a statutory secrecy obligation.
More detailed information on the individual members of the Supervisory Board and its six commit-
tees can be found on the Company’s website (www.thyssenkrupp.com).
Shareholders and Annual General Meeting The shareholders of thyssenkrupp AG exercise their rights at the Company’s Annual General Meet-
ing. At the Annual General Meeting the shareholders regularly pass resolutions on the appropriation
of net income, the ratification of the acts of the Executive Board and Supervisory Board, and the
election of the financial-statement auditors. Shareholders can exercise their voting rights at the
www.thyssenkrupp.com > Company > Management > Supervisory Board
www.thyssenkrupp.com > Investors > Annual General Meeting

thyssenkrupp annual report 2017 / 2018
1 To our shareholders | Corporate governance
15
Annual General Meeting in person or by proxy, for which they can authorize a person of their choice
or a Company-nominated proxy acting on their instructions. They can also cast their votes in writ-
ing by postal vote. The Annual General Meeting can be viewed live and in full on the Company’s
website (www.thyssenkrupp.com). Also on our website we make all documents and information on
the Annual General Meeting available to shareholders in good time.
Accounting and financial statement auditing In line with European Union requirements, thyssenkrupp prepares the consolidated financial
statements and interim reports in accordance with the International Financial Reporting Standards
(IFRS). However, the parent-company financial statements of thyssenkrupp AG, on which the dividend
payment is based, are drawn up in accordance with German GAAP (HGB).
In accordance with the statutory provisions the auditor is elected each year by the Annual General
Meeting for a period of one year. At the proposal of the Supervisory Board, the Annual General
Meeting on January 19, 2018 elected PwC to audit the annual financial statements and review the
interim financial reports for fiscal year 2017 / 2018 and to review the interim financial reports
for fiscal year 2018 / 2019 drawn up before the 2019 Annual General Meeting. PwC has been
auditing the parent-company financial statements and consolidated financial statements of
thyssenkrupp AG since fiscal 2012 / 2013. PwC was engaged in 2012 following an external bidding
process. The signatory auditors for the parent-company and consolidated financial statements of
thyssenkrupp AG are Harald Kayser (since fiscal year 2017 / 2018) and Michael Preiß (since fiscal
year 2015 / 2016). The statutory provisions and rotation requirements under §§ 319 and 319a HGB
are fulfilled.
Avoiding conflicts of interest In the reporting year there were no consulting or other service agreements between Supervisory
Board members and the Company. There were no conflicts of interest that Executive Board or
Supervisory Board members would have had to disclose immediately to the Supervisory Board.
Details of the other directorships held by Executive Board and Supervisory Board members on
statutory supervisory boards or comparable German and non-German control bodies of business
enterprises are provided in the sections of the same name under “Additional information”. Details
of related party transactions are given in Note 22 to the consolidated financial statements.
Directors’ dealings Members of the Executive Board and Supervisory Board and persons close to them are required to
disclose the purchase and sale of thyssenkrupp AG shares and debt certificates or related financial
instruments whenever the value of the transactions amounts to €5,000 or more within a calendar
year. No transactions were reported to us in the 2017 / 2018 fiscal year.
More information on corporate governance More information on corporate governance can be found in the corporate governance declaration
on the Company’s website (www.thyssenkrupp.com).
PwC audits the parent-company and consolidated financial statements of thyssenkrupp AG.
www.thyssenkrupp.com > Investors > Reporting and publications
thyssenkrupp annual report 2017 / 2018
1 To our shareholders | Corporate governance
16
Compensation report
The following compensation report, which is part of the combined management report, explains the
compensation system for the Executive Board and Supervisory Board. In addition the compensa-
tion received by the members of the Executive Board and Supervisory Board of thyssenkrupp AG
for the fiscal year 2017 / 2018 is disclosed individually, also taking into account the recommenda-
tions of the German Corporate Governance Code (GCGC).
Fundamentals of the Executive Board compensation system The current compensation system for the members of the Executive Board of thyssenkrupp AG has
been in place since fiscal year 2014 / 2015. It was resolved by the Supervisory Board following
preparation by the Personnel Committee and was approved by the Annual General Meeting on
January 30, 2015 with a majority of 98.79% of the capital represented.
The compensation of the individual Executive Board members is determined by the Supervisory
Board following preparation by the Personnel Committee. The Personnel Committee regularly re-
views the appropriateness of the compensation – both as a whole and in terms of the individual
compensation components – and proposes adjustments to the Supervisory Board where required.
Criteria for the appropriateness of the compensation include the duties of the individual Executive
Board members, their personal performance, the business situation, the success and prospects of
the Company and also the prevailing level of compensation at peer companies and the compensa-
tion structure applying otherwise in the Company. In all compensation decisions the Personnel
Committee and the Supervisory Board observe the requirements of the Stock Corporation Act (AktG)
as well as the recommendations and suggestions of the GCGC. In reviewing the market position of
the system and the appropriateness of the level of compensation the Personnel Committee is ad-
vised by an independent external compensation expert.
The aim of the compensation system is to support successful and sustainable corporate govern-
ance by linking the compensation of Executive Board members to both the short and long-term
performance of the Company. The compensation system includes performance-related and com-
pany success-oriented parameters which are also found in the compensation systems for man-
agement levels below the Executive Board. The variable compensation components are mainly
based on performance over several years and therefore set long-term incentives. The design of the
long-term variable compensation, which also recognizes the performance of the stock price, also
reconciles the objectives of management with the direct interests of shareholders.
The compensation system for the Executive Board of thyssenkrupp AG is geared to sustainable long-term company development.

thyssenkrupp annual report 2017 / 2018
1 To our shareholders | Corporate governance
17
Overview of compensation components
COMPENSATION COMPONENT
Assessment basis/parameters
Performance-independent compensation
Fixed compensation Chairman of the Executive Board: €1,340,000
Member of the Executive Board: €700,000
Fringe benefits Company car, security services, insurance premiums
Pension plans
Defined benefit plans (Guido Kerkhoff, Dr. Heinrich Hiesinger)
Pension in the amount of 50% of fixed compensation for fiscal year 2014 / 2015
– For Guido Kerkhoff: pension entitlement of €350,000 p.a.
– For Dr. Heinrich Hiesinger: pension entitlement of €670,000 p.a.
Widow’s allowance in the amount of 60% and orphan’s allowance in the amount of 20% each of the respective pension entitlement, max. 100%
Defined contribution plans (Oliver Burkhard, Dr. Donatus Kaufmann)
Provision of annual contributions in the amount of €280,000 (corresponds to 40% of fixed compensation for fiscal year 2014 / 2015)
– For Oliver Burkhard: maximum attainable pension entitlement capped at €350,000 p.a. (corresponds to 50% of fixed salary for fiscal year 2014 / 2015)
– For Dr. Donatus Kaufmann: pension benefits to be paid in the form of a lump sum
Performance-related compensation
Annual bonus (short-term incentive; STI)
Target bonus for 100% target achievement:
– For the Executive Board chairman: €1,250,000
– For the members of the Executive Board: €630,000 – €680,000
Level of target achievement dependent on:
– Company’s financial performance targets: EBIT, ROCE and FCF before M&A
– Targets derived from corporate planning and set annually by the Supervisory Board
Bonus-malus factor in a band of +/- 20%:
– Sustainability multiplier: indirect financial targets in the areas people, innovations, environment and procurement
– Discretionary factor: assessment of overall performance of Executive Board
Cap: 200% of target bonus
Possibility of special bonus
For exceptional achievements and successes at the discretion of the Supervisory Board and within the applicable overall cap
Long-term incentive (LTI)
Award of virtual shares in the company with three-year tkVA performance period:
– Initial value for the Executive Board chairman: €2,000,000
– Initial value for the members of the Executive Board: €950,000 – €1,050,000
The number of virtual shares provisionally granted at the beginning of each installment is obtained by dividing the initial value by the average thyssenkrupp share price during the 1st quarter of the fiscal year in which the tkVA performance period begins.
The final number of virtual shares after the end of the performance period depends on the average tkVA achieved over the performance period.
The average thyssenkrupp share price during the 1st quarter of the fiscal year after the end of the three-year tkVA performance period determines the final value of the payout.
Cap: 250% of the target value
Other compensation rules
Overall cap Upper limit of €9,000,000 for the Executive Board chairman and €4,500,000 for each of the other members of the Executive Board in relation to overall compensation including pension service cost per fiscal year – GCGC-compliant
Severance payment cap Severance payments limited to a maximum of two years’ compensation, compensation over remaining contract term may not be exceeded – GCGC-compliant
Severance in case of change of control Severance payments in the case of a change of control may not exceed 100% of the severance payment cap – GCGC-compliant
Clawback rule Supervisory Board right to reduce compensation in case of deterioration in company’s situation pursuant to § 87 (2) AktG

thyssenkrupp annual report 2017 / 2018
1 To our shareholders | Corporate governance
18
Structure and components of the Executive Board compensation system The compensation of Executive Board members is made up of performance-independent and
performance-related elements. The former comprise fixed compensation, fringe benefits and pen-
sion plans. The performance-related compensation includes the bonus (short-term incentive plan;
STI) and the long-term incentive plan (LTI). The individual components are explained below.
The target direct compensation (fixed compensation + bonus + LTI) of the Executive Board mainly
comprises performance-related compensation elements. The fixed compensation makes up around
30% of the target direct compensation, the bonus around 28%, and LTI around 42%. The ratio of
long-term to short-term performance-related compensation is around 60 : 40. Executive Board
compensation therefore complies with the GCGC recommendations that the compensation structure
be aligned to sustainable company development and that the variable compensation components
be generally measured over several years.
Performance-independent compensation Fixed compensation
The fixed compensation is paid to the Executive Board members monthly as a salary. Since the last
review at October 1, 2014 it has been €700,000 per year for an ordinary Executive Board member
and €1,340,000 per year for the Executive Board chairman.
Fringe benefits
In addition to the fixed compensation the Executive Board members receive fringe benefits, mainly
comprising a company car, security services, and insurance premiums. The benefits apply in prin-
ciple to all Executive Board members; the amount varies according to personal situation.
Retirement benefits
Retirement benefits are paid to former Executive Board members who have either reached retire-
ment age or become permanently incapacitated for work. thyssenkrupp does not pay transitional
allowances upon early termination or non-renewal of service contracts.
Guido Kerkhoff and the former Executive Board member Dr. Heinrich Hiesinger who left in the year
under review have a pension entitlement of 50% of their respective fixed salaries in fiscal year
2014 / 2015. The pension entitlements of Oliver Burkhard and Dr. Donatus Kaufmann are based on
a defined contribution pension plan; the annual pension contribution is 40% of their annual fixed
salary in fiscal year 2014 / 2015. For Oliver Burkhard it has additionally been agreed that his maxi-
mum pension entitlement is capped at 50% of his fixed salary in fiscal year 2014 / 2015. The pen-
sion of Dr. Donatus Kaufmann will be paid in principle in the form of a lump sum.
The retirement age is 60, provided a service contract with the Company no longer exists at this
time. If the service contract ends on or after the member’s 60th birthday, the retirement benefits
can only be claimed after the service contract ends. In the case of Guido Kerkhoff and Dr. Heinrich
Hiesinger current pension payments will be adjusted annually in line with the consumer price index
and in the case of Oliver Burkhard will be increased by 1% per year.

thyssenkrupp annual report 2017 / 2018
1 To our shareholders | Corporate governance
19
In the case of Guido Kerkhoff, Oliver Burkhard and Dr. Heinrich Hiesinger the surviving dependants’
benefits plan provides for a payment of 60% of the pension for the partner and 20% for each de-
pendent child, up to a maximum of 100% of the regular pension entitlement. In the case of
Dr. Donatus Kaufmann surviving dependants will receive the amount of the pension contributions
plus interest at the time the benefits become payable.
In the case of new contracts and contract renewals the Personnel Committee regularly reviews the
level of benefits of Executive Board members and the annual and long-term service costs deriving
therefrom, and proposes adjustments to the plans to the Supervisory Board as necessary. This
procedure complies with the recommendations of the GCGC.
Performance-related compensation Bonus (short-term incentive; STI)
The first performance-related compensation element is the annual bonus. The amount of the bonus
is dependent on three key performance indicators of the Group for the respective fiscal year. Earn-
ings before interest and taxes (EBIT) and free cash flow before M&A (FCF before M&A) are each
weighted at 40%, while return on capital employed (ROCE) accounts for the remaining 20%. Total
target achievement for the three financial targets is therefore determined from the weighted aver-
age of the three parameters.
To reflect the overall performance of the Executive Board members more accurately and include
non-financial, strategically important as well as direct financial aspects, the bonus also includes a
bonus-malus factor, which is multiplied by the total target achievement for the financial targets.
This factor consists of a sustainability multiplier as well as a discretionary factor, each weighted
equally. The sustainability multiplier is based on Indirect Financial Targets from the areas people,
innovations, environment and procurement. The discretionary factor allows the Supervisory Board
to evaluate the overall performance of the Executive Board. The bonus-malus factor lies in a range
from 0.8 to 1.2 and can therefore correct financial target achievement either upwards or down-
wards; it also allows individual differentiation. The Supervisory Board decides on target achieve-
ment in respect of this part of the bonus at its own discretion, taking into account in particular the
appropriateness criteria of § 87 AktG and the GCGC.
BONUS CALCULATION
EBIT
(40 %)
FCF before M&A
(40 %)
ROCE
(20 %)
Sustainability multiplier
(50 %)
Discretionary factor
(50 %)
Bonus-malus factor
(0.8 – 1.2)Target achievement fi nancial
targets
Payout
(0 – 200 %)Target
amount
Annual bonus target amounts for
the 2017 / 2018 fiscal year
Guido Kerkhoff €680,000
Oliver Burkhard €630,000
Dr. Donatus Kaufmann €630,000
Dr. Heinrich Hiesinger1 €955,480
1) Prorated compensation until July 6, 2018
Details on the individual sustainability targets can be found in the section Fundamental information about the Group > Targets > Sustainability and Indirect Financial Targets.

thyssenkrupp annual report 2017 / 2018
1 To our shareholders | Corporate governance
20
Total target achievement and the resultant payout on the bonus are capped at 200% of the target
value. There is no guaranteed minimum bonus, so there may be no payout at all.
The target values for the financial targets are derived from the corporate planning; in addition
threshold values are defined for all three indicators, above or below which a further improvement or
deterioration of the result has no effect on the level of target achievement. At the beginning of each
fiscal year the Supervisory Board, based on preparations by the Personnel Committee, decides on
the target and threshold values with a view to setting challenging targets.
Long-Term Incentive (LTI)
The second performance-related compensation element is the LTI, which has a long-term incentive
effect. Determining factors here are value generation – measured on the key performance indicator
thyssenkrupp Value Added (tkVA) – and the performance of the thyssenkrupp stock. The design of
the LTI and the link to stock performance reconcile the objectives of management and the direct
interests of shareholders. The LTI is based on virtual shares and is granted to Executive Board
members in annual installments. The term of the individual installments begins October 1 of each
year and extends in total over four fiscal years (three-year tkVA performance period and stock price
performance in the 1st quarter of the following fiscal year), so creating incentives for the long-term
development of the Company.
At the beginning of each installment a certain number of virtual shares is granted, initially provi-
sionally. This number is obtained by dividing the initial value (target amount) by the average
thyssenkrupp stock price in the 1st quarter of the fiscal year in which the tkVA performance period
begins, with the number being rounded half even. The provisionally granted number of virtual
shares can therefore vary from year to year.
The number of virtual shares finally awarded to the Executive Board members at the end of the
three-year tkVA performance period may be higher or lower than the provisionally granted number.
The parameter used to determine the final number of virtual shares is the development of average
tkVA over the three-year performance period.
LTI initial values for the
2017 / 2018 fiscal year
Guido Kerkhoff €1,050,000
Oliver Burkhard €950,000
Dr. Donatus Kaufmann €950,000
Dr. Heinrich Hiesinger1 €1,528,767
1) Prorated compensation until July 6, 2018

thyssenkrupp annual report 2017 / 2018
1 To our shareholders | Corporate governance
21
For every €20 million of average actual tkVA above the target value set by the Supervisory Board,
the number of virtual shares increases by 1%. For every €10 million of average actual tkVA below
the target value set by the Supervisory Board, the number of virtual shares decreases by 1%.
Intermediate values are linearly interpolated and the obtained number of virtual shares is rounded
half even. The number of virtual shares can fall to zero, meaning there is no payout.
To determine the payout amount the final number of virtual shares achieved at the end of the per-
formance period is multiplied by the average thyssenkrupp stock price in the 1st quarter of the
fiscal year immediately after the three-year tkVA performance period. The payout amount calculat-
ed in this way is capped at 250% of the target value.
In the case of the LTI, too, the Supervisory Board – based on preparations by the Personnel Com-
mittee – decides on the target and threshold values for each new annual installment at the be-
ginning of each fiscal year with a view to setting challenging targets. The target value for the LTI
installment granted to the Executive Board members in January 2018 relates to the tkVA perfor-
mance period 2017 / 2018 through 2019 / 2020. The Supervisory Board set an average tkVA of zero
as the target value. A tkVA of zero means that the cost of capital has been earned by the level of
EBIT achieved and at the same time a sufficiently high net income has been attained.
Compensation caps In accordance with the recommendation of the GCGC the compensation system for the Executive
Board provides for caps for both total compensation and the individual components of Executive
Board compensation. In addition to the caps applying to the variable compensation elements the
Company has therefore set the following caps for total compensation received by Executive Board
members per fiscal year – including fixed compensation, fringe benefits, performance-related
compensation (bonus and LTI), retirement benefit costs and any special compensation: €9 million
for the Executive Board chairman and €4.5 million each for the other Executive Board members.
Details on tkVA can be found in the section “Management of the Group”
In accordance with the recommendation of the GCGC thyssenkrupp has set caps for total compensation of Executive Board members.
LONG-TERM INCENTIVE (LTI) CALCULATION
Average share
price Q1 1st
FY of tkVA
performance
period
Provisional
number of
virtual shares
Final
number
of virtual
shares
Average share
price Q1 1st
FY after expiry
of tkVA perfor-
mance period
Target achievement tkVA
+1% for every €20 million average tkVA above target tkVA-1% for every €10 million average tkVA below target tkVA
Payout
(0 – 250 %)
Target amount
3 year performance period
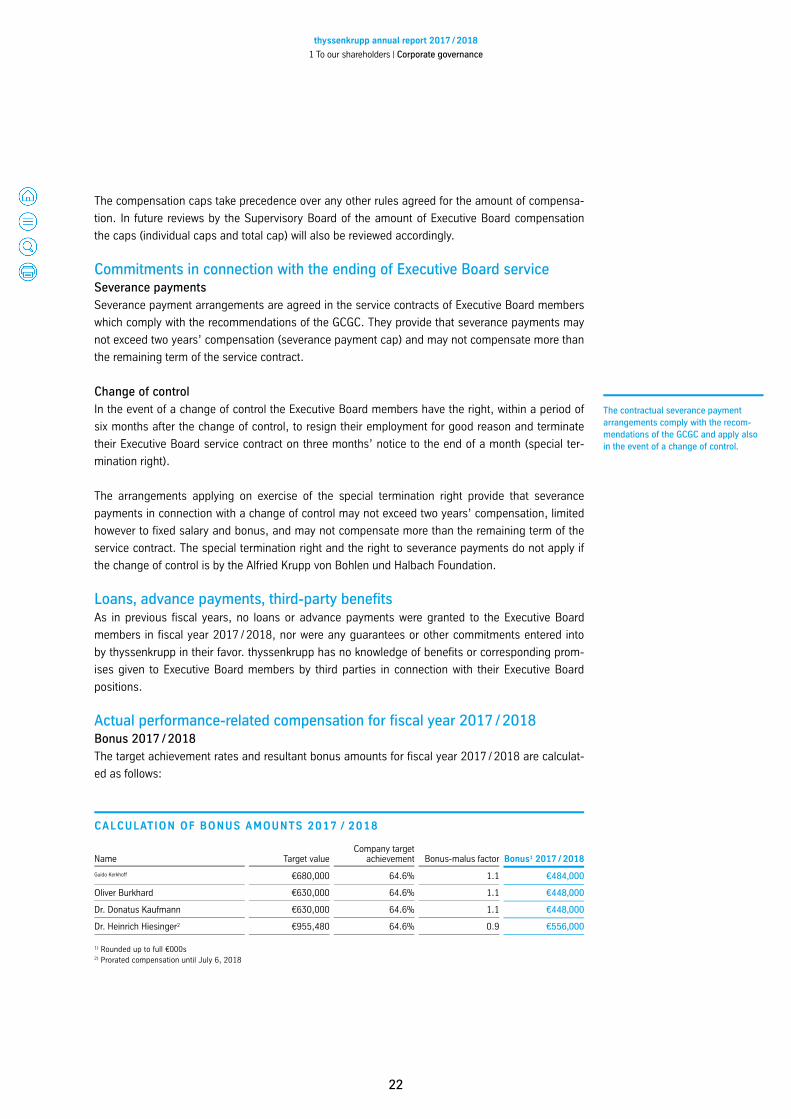
thyssenkrupp annual report 2017 / 2018
1 To our shareholders | Corporate governance
22
The compensation caps take precedence over any other rules agreed for the amount of compensa-
tion. In future reviews by the Supervisory Board of the amount of Executive Board compensation
the caps (individual caps and total cap) will also be reviewed accordingly.
Commitments in connection with the ending of Executive Board service Severance payments
Severance payment arrangements are agreed in the service contracts of Executive Board members
which comply with the recommendations of the GCGC. They provide that severance payments may
not exceed two years’ compensation (severance payment cap) and may not compensate more than
the remaining term of the service contract.
Change of control
In the event of a change of control the Executive Board members have the right, within a period of
six months after the change of control, to resign their employment for good reason and terminate
their Executive Board service contract on three months’ notice to the end of a month (special ter-
mination right).
The arrangements applying on exercise of the special termination right provide that severance
payments in connection with a change of control may not exceed two years’ compensation, limited
however to fixed salary and bonus, and may not compensate more than the remaining term of the
service contract. The special termination right and the right to severance payments do not apply if
the change of control is by the Alfried Krupp von Bohlen und Halbach Foundation.
Loans, advance payments, third-party benefits As in previous fiscal years, no loans or advance payments were granted to the Executive Board
members in fiscal year 2017 / 2018, nor were any guarantees or other commitments entered into
by thyssenkrupp in their favor. thyssenkrupp has no knowledge of benefits or corresponding prom-
ises given to Executive Board members by third parties in connection with their Executive Board
positions.
Actual performance-related compensation for fiscal year 2017 / 2018 Bonus 2017 / 2018
The target achievement rates and resultant bonus amounts for fiscal year 2017 / 2018 are calculat-
ed as follows:
CALCULATION OF BONUS AMOUNTS 2017 / 2018
Name Target valueCompany target
achievement Bonus-malus factor Bonus1 2017 / 2018
Guido Kerkhoff €680,000 64.6% 1.1 €484,000
Oliver Burkhard €630,000 64.6% 1.1 €448,000
Dr. Donatus Kaufmann €630,000 64.6% 1.1 €448,000
Dr. Heinrich Hiesinger2 €955,480 64.6% 0.9 €556,000
1) Rounded up to full €000s 2) Prorated compensation until July 6, 2018
The contractual severance payment arrangements comply with the recom-mendations of the GCGC and apply also in the event of a change of control.

thyssenkrupp annual report 2017 / 2018
1 To our shareholders | Corporate governance
23
LTI 2014 / 2015
The 5th installment of the LTI due in fiscal year 2017 / 2018 was issued for the fiscal year
2014 / 2015 and is the first installment where the average tkVA during the performance period is
compared with a set target value. The associated payment amount is calculated as follows:
CALCULATION OF THE LTI PAYOUT FOR THE INSTALLMENT 2014 / 20151
Performance targets thyssenkrupp Value Added (tkVA)
Performance of thyssenkrupp stock
tkVA performance period 2014 / 2015 – 2016 / 2017
Relevant stock price Avg. stock price Q1 FY 2017 / 2018 vs. average stock price Q1 FY 2014 / 2015
Link Multiplicative
Possible target achievement 0–250%
Provisionally granted number of virtual shares
Initial value: €950,000
47,835 virtual shares
Avg. stock price Q1 FY 2014 / 2015: €19.86
Target achievement tkVA Average tkVA actually achieved is €378.3 million below the target tkVA leading to a reduction in the number of awarded virtual shares by 37.83%
Finally granted number of virtual shares
(100% – 37.83%) x 47,835 virtual shares = 29,739 virtual shares
Payout
29,739 virtual shares
€689,945
Avg. stock price Q1 FY 2017 / 2018: €23.20
1) Example of an ordinary Executive Board member
2) Rounded half even
On the basis of achieved tkVA and the stock performance, €689,945 was paid out to each of Guido
Kerkhoff, Oliver Burkhard and Dr. Donatus Kaufmann. The former Executive Board member
Dr. Heinrich Hiesinger who left in the year under review received a payout of €1,307,250.
Total Executive Board compensation in accordance with HGB The following table shows total Executive Board compensation in accordance with HGB rules. It
accords with the GCGC Table 1 (benefits granted) shown below, with the difference that the payout
amounts for the bonuses according to GCGC Table 2 (allocations) are included. In accordance with
HGB the service cost is not included.
EXECUTIVE BOARD COMPENSATION 2017 / 2018 IN ACCORDANCE WITH HGB
Guido Kerkhoff Oliver Burkhard Dr. Donatus Kaufmann Dr. Heinrich Hiesinger
Chairman of the Executive boardsince July 13, 2018
Ordinary member of the executive board since February 01, 2013
Ordinary member of the executive board since February 01, 2014
Chairman of the Executive boarduntil July 06, 2018
2016 / 2017 2017 / 2018 2016 / 2017 2017 / 2018 2016 / 2017 2017 / 2018 2016 / 2017 2017 / 2018
Executive board compensation in accordance with HGB in €000s 2,498 2,326 2,328 2,198 2,348 2,198 4,709 3,323

thyssenkrupp annual report 2017 / 2018
1 To our shareholders | Corporate governance
24
The total compensation paid to the active Executive Board members in the respective fiscal year in
accordance with HGB for their work in the reporting year amounted to €10.0 million. The corre-
sponding prior-year figure was €11.9 million.
Executive Board benefits granted and allocations in accordance with GCGC The following two tables show total Executive Board compensation in accordance with the recom-
mendations of Section 4.2.5 (3) of the GCGC in the form of the GCGC model tables:
■ GCGC Table 1 shows the benefits granted for fiscal year 2017 / 2018, i.e. the individual compen-
sation promised in the case of 100% target achievement as well as the minimum and maximum
values for the individual Executive Board members.
■ GCGC Table 2 (allocations) shows the compensation actually paid out to the individual Executive
Board members for fiscal year 2017 / 2018.
GCGC-TABLE 1: EXECUTIVE BOARD COMPENSATION 2017 / 2018 (BENEFITS GRANTED)
Guido Kerkhoff Oliver Burkhard Dr. Donatus Kaufmann Dr. Heinrich Hiesinger
Chairman of the Executive board since July 13, 2018
Ordinary member of the executive board since February 01, 2013
Ordinary member of the executive board since February 01, 2014
Chairman of the Executive board until July 06, 2018
all figures in €000s
2016 /2017Initial value
2017 /2018Initial value
2017 /2018Mini-mum
2017 /2018Maxi-
mum1)
2016 /2017Initial value
2017 /2018Initial value
2017 /2018Mini-mum
2017 /2018Maxi-
mum1)
2016 /2017Initial value
2017 /2018Initial value
2017 /2018Mini-mum
2017 /2018Maxi-
mum1)
2016 /2017Initial value
2017 /2018Initial value
2017 /2018Mini-mum
2017 /2018Maxi-
mum1)
Fixed compensation 700 700 700 700 700 700 700 700 700 700 700 700 1,340 1,027 1,027 1,027
Fringe benefits 51 44 44 44 34 57 57 57 54 57 57 57 83 142 142 142
Total 751 744 744 744 734 757 757 757 754 757 757 757 1,423 1,169 1,169 1,169
One-year variable compensation
Performance bonus (cash) 680 680 – 1,360 630 630 – 1,260 630 630 – 1,260 1,250 955 – 1,911
Multiple-year variable compensation
8th installment LTI 2017 / 2018 – 2020 / 2021 – 1,098 – 2,625 – 993 – 2,375 – 993 – 2,375 – 1,598 – 3,822
7th installment LTI 2016 / 2017 – 2019 / 2020 1,122 – – – 1,015 – – – 1,015 – – – 2,137 – – –
Total 2,553 2,522 744 4,729 2,379 2,380 757 4,392 2,399 2,380 757 4,392 4,810 3,722 1,169 6,902
Service costs in accordance with IFRS 2) 716 610 610 610 1,198 924 924 924 291 280 280 280 2,254 1,543 1,543 1,543
Total 3,269 3,132 1,354 5,339 3,577 3,304 1,681 5,316 2,690 2,660 1,037 4,672 7,064 5,265 2,712 8,445
1) In addition to the individual caps stated in the “Maximum” column, total annual compensation is limited to €9.0 million for the Executive Board chairman and €4.5 million for the ordinary Executive Board members.
2) To apply the compensation caps and improve the comparability of the defined benefit plans and defined contribution pension plans as well as comparability with the prior-year figures, the service cost in accordance with IFRS shown for Guido Kerkhoff and Dr. Heinrich Hiesinger is prorated in line with the Executive Board work performed in the fiscal year. To take account of the vested contractual pension rights of the Executive Board members further provisions were recognized for Guido Kerkhoff and Dr. Heinrich Hiesinger in the past. Taking these provisions into account and without proration, the service costs come to the amounts shown in the table below “Executive Board pension provisions 2017 / 2018”.

thyssenkrupp annual report 2017 / 2018
1 To our shareholders | Corporate governance
25
1) See footnote 2 to GCGC Table 1.
Stock-based Executive Board compensation 2017 / 2018 In January 2018 the Executive Board members were granted new virtual shares from the 8th in-
stallment of the LTI. In total the Executive Board members now possess 687,658 virtual shares
granted but not yet payable from the 6th to 8th installments of the LTI.
STOCK-BASED EXECUTIVE BOARD COMPENSATION 2017 / 2018
(number of stock rights granted and cost of stock-based compensation in fiscal year)
Guido Kerkhoff Oliver Burkhard Dr. Donatus Kaufmann Dr. Heinrich Hiesinger
Chairman of the Executive boardsince July 13, 2018
Ordinary member of the executive board since February 01, 2013
Ordinary member of the executive board since February 01, 2014
Chairman of the Executive boarduntil July 06, 2018
2016 / 2017 2017 / 2018 2016 / 2017 2017 / 2018 2016 / 2017 2017 / 2018 2016 / 2017 2017 / 2018
Number of stock rights granted
LTI 2017 / 2018 – 2020 / 2021 – 45,259 – 40,948 – 40,948 – 65,895
LTI 2016 / 2017 – 2019 / 2020 47,901 – 43,339 – 43,339 – 91,241 –
Cost of stock-based compensation in fiscal year in €000s 1,304 748 1,187 656 1,138 656 2,495 860
GCGC-TABLE 2: EXECUTIVE BOARD COMPENSATION 2017 / 2018 (ALLOCATIONS)
Guido Kerkhoff Oliver Burkhard Dr. Donatus Kaufmann Dr. Heinrich Hiesinger
Chairman of the Executive boardsince July 13, 2018
Ordinary member of the executive board since February 01, 2013
Ordinary member of the executive board since February 01, 2014
Chairman of the Executive boarduntil July 06, 2018
all figures in €000s 2016 / 2017 2017 / 2018 2016 / 2017 2017 / 2018 2016 / 2017 2017 / 2018 2016 / 2017 2017 / 2018
Fixed compensation 700 700 700 700 700 700 1,340 1,027
Fringe benefits 51 44 34 57 54 57 83 142
Total 751 744 734 757 754 757 1,423 1,169
One-year variable compensation
Performance bonus (cash) 625 484 579 448 579 448 1,149 556
Multiple-year variable compensation
Performance bonus in stock rights 2013 / 2014 – 2016 / 2017 321 – 321 – 214 – 642 –
Additional bonus in stock rights 2013 / 2014 – 2016 / 2017 269 – 269 – 179 – 538 –
5th installment LTI 2014 / 2015 – 2017 / 2018 – 690 – 690 – 690 – 1,307
4th installment LTI 2013 / 2014 – 2016 / 2017 1,120 – 1,120 – 746 – 2,239 –
Total 3,086 1,918 3,023 1,895 2,472 1,895 5,991 3,032
Service costs in accordance with IFRS 1) 716 610 1,198 924 291 280 2,254 1,543
Total 3,802 2,528 4,221 2,819 2,763 2,175 8,245 4,575

thyssenkrupp annual report 2017 / 2018
1 To our shareholders | Corporate governance
26
1) To apply the compensation caps and improve the comparability of the defined benefit plans and defined contribution pension plans as well as comparability with the prior-year figures, the service cost in accordance with IFRS shown for Guido Kerkhoff and Dr. Heinrich Hiesinger in the GCGC Tables 1 and 2 is prorated in line with the Executive Board work performed in the fiscal year. Under this approach the service cost is €610K (IFRS)/ €384K (HGB) (prior year: €716K [IFRS]/ €348K [HGB]) for Guido Kerkhoff and €1,543K (IFRS)/ €1,114K (HGB) (prior year: €2,254K [IFRS]/ €1,349K [HGB]) for Dr. Heinrich Hiesinger. The present values of the obligations at September 30, 2018 are then €4,681K (IFRS)/ €3,106K (HGB) (prior year: €3,970K [IFRS]/ €2,459K [HGB]) for Guido Kerkhoff and €16,401K (IFRS)/ €12,213K (HGB) (prior year: €14,267K [IFRS]/ €10,134K [HGB]) for Dr. Heinrich Hiesinger.
Benefits in connection with the ending of Executive Board service Effective July 6, 2018 Dr. Heinrich Hiesinger’s position as chairman and member of the Executive
Board of thyssenkrupp AG was ended by mutual agreement. Based on his service contract, which
was due to expire at the end of September 2020, Dr. Heinrich Hiesinger received a severance
payment of €4,555,250. As provided for in the service contract a cap of two years’ compensation
(fixed salary and bonus) served as the basis for agreeing the amount of the severance payment.
The severance payment is therefore in line with the recommendations of the GCGC. Dr. Heinrich
Hiesinger will receive the compensation for fiscal year 2017 / 2018 (fixed compensation, fringe
benefits, bonus and 8th installment LTI) on a pro rata basis. In accordance with the GCGC, the
stock rights (virtual shares) of LTI installments 6 and 7 granted in previous years continue to apply
in full and will be settled at the regular end of the plan. The retirement benefits are vested and can
be claimed in full from October 1, 2020.
None of the Executive Board members have been promised benefits beyond those stated in the
event that they end their employment relationship.
Compensation paid to former Executive Board members Total compensation paid to former members of the Executive Board and their surviving dependants
amounted to €19.0 million for fiscal year 2017 / 2018 (prior year: €14.5 million). For pension obli-
gations benefiting former members of the Executive Board and their surviving dependants,
€279.8 million (prior year: €270.1 million) was accrued in the financial statements under IFRS and
€223.1 million (prior year: €208.2 million) in the financial statements under German GAAP (HGB).
EXECUTIVE BOARD PENSION PROVISIONS 2017 / 2018
Guido Kerkhoff 1) Oliver Burkhard Dr. Donatus Kaufmann Dr. Heinrich Hiesinger 1)
Chairman of the Executive boardsince July 13, 2018
Ordinary member of the executive board since February 01, 2013
Ordinary member of the executive board since February 01, 2014
Chairman of the Executive boarduntil July 06, 2018
all figures in €000s 2016 / 2017 2017 / 2018 2016 / 2017 2017 / 2018 2016 / 2017 2017 / 2018 2016 / 2017 2017 / 2018
Figures in accordance with IFRS
Service costs 3 2 1,198 924 291 280 5 4
Present value of the obligation 9,466 9,762 5,753 7,379 1,094 1,411 19,380 19,656
Figures in accordance with HGB
Service costs 1 1 513 547 256 262 3 3
Present value of the obligation 5,848 6,495 3,367 4,657 1,003 1,327 13,762 14,756

thyssenkrupp annual report 2017 / 2018
1 To our shareholders | Corporate governance
27
Adjusted compensation for Guido Kerkhoff and Oliver Burkhard from fiscal year 2018 / 2019 In its meeting on September 30, 2018 the Supervisory Board prematurely extended the Executive
Board appointments of Guido Kerkhoff and Oliver Burkhard for a further five years until Septem-
ber 30, 2023 and confirmed Guido Kerkhoff permanently as Executive Board chairman. In connec-
tion with these reappointments the following adjustments to compensation from fiscal year
2018 / 2019 were resolved:
■ From October 1, 2018 Guido Kerkhoff will receive fixed compensation of €1,340,000 per year, an
annual target bonus of €1,250,000 and an LTI initial value of €2,000,000 per installment. His
previous pension plan was terminated effective September 30, 2018, with the pension entitle-
ment earned up to that point remaining intact. From the start of the new appointment period
Guido Kerkhoff will receive a defined contribution plan with an annual pension contribution of
€350,000; this pension will be paid in the form of a lump sum.
■ From October 1, 2018 Oliver Burkhard will receive an annual target bonus of €680,000 and an
LTI initial value of €1,050,000 per installment. The previous fixed compensation of €700,000 per
year and the existing pension plan remain unchanged.
■ New share ownership guidelines have been introduced: Guido Kerkhoff and Oliver Burkhard
undertake in principle to purchase thyssenkrupp shares to the value of one year’s fixed salary
(Guido Kerkhoff) and half a year’s fixed salary (Oliver Burkhard) within their appointment period
and to keep them for a certain period, set by the Supervisory Board at its equitable discretion,
during the term of their employment relationship.
Supervisory Board compensation The compensation of the Supervisory Board is subject to § 14 of the Articles of Association. In
addition to reimbursement of their expenses and a meeting attendance fee of €500, Supervisory
Board members receive annual base compensation of €50,000.
The annual compensation for the Supervisory Board chairman is €200,000 and for the vice chair-
man €150,000. This also covers memberships and chairs of committees. The other Supervisory
Board members receive premiums for the chairs/memberships of specified committees which are
also defined in § 14 of the Articles of Association. Supervisory Board members who serve on the
Supervisory Board or a committee for only part of the fiscal year receive prorated compensation.
The members of the Supervisory Board will receive total compensation, including meeting attend-
ance fees, for the reporting year of €1.74 million (prior year: €1.68 million). This includes compen-
sation paid to Supervisory Board members for directorships at Group companies in the amount of
€60,965 (prior year: €55,618). The trade union affiliated employee representatives have declared
they will pass their compensation to the Hans Böckler Foundation in accordance with the guidelines
of the German Trade Union Confederation.

thyssenkrupp annual report 2017 / 2018
1 To our shareholders | Corporate governance
28
The individual members will receive the amounts listed in the following table:
SUPERVISORY BOARD COMPENSATION 2017 / 2018
Fixed compensationCompensation for committee work Meeting fee
Compensation from directorships within the group Total remuneration
all figures in € 2016 / 2017 2017 / 2018 2016 / 2017 2017 / 2018 2016 / 2017 2017 / 2018 2016 / 2017 2017 / 2018 2016 / 2017 2017 / 2018
Prof. Dr. Bernhard Pellens (Chairman since September 30, 2018) 50,000 62,500 52,500 49,167 7,500 14,500 - - 110,000 126,167
Prof. Dr. Ulrich Lehner (Chairman) (until July 31, 2018) 200,000 166,667 -1) -1) 12,000 15,000 - - 212,000 181,667
Markus Grolms (Vice Chairman) 150,000 150,000 -1) -1) 11,000 17,500 - - 161,000 167,500
Prof. Dr. Dr. h. c. Ursula Gather (since January 19, 2018) - 37,500 - 14,167 - 7,000 - - - 58,667
Achim Hass 33,333 50,000 - - 1,500 4,500 12,613 21,550 47,446 76,050
Dr. Ingrid Hengster 50,000 50,000 - - 2,500 5,000 - - 52,500 55,000
Susanne Herberger 50,000 50,000 12,500 12,500 5,000 7,000 16,000 16,000 83,500 85,500
Tanja Jacquemin 50,000 50,000 20,000 20,000 4,500 6,000 - - 74,500 76,000
Prof. Dr. Hans-Peter Keitel 50,000 50,000 50,000 50,000 7,500 16,000 - - 107,500 116,000
Ernst-August Kiel (until January 31, 2017) 16,667 - - - 1,000 - 5,305 - 22,972 -
Dr. Norbert Kluge 50,000 50,000 - - 2,500 5,000 - - 52,500 55,000
Tekin Nasikkol 50,000 50,000 - - 2,500 5,000 - 1,315 52,500 56,315
Dr. Ralf Nentwig (until January 19, 2018) 50,000 16,667 32,500 10,833 7,000 3,000 - - 89,500 30,500
René Obermann (until August 31, 2018) 50,000 45,833 - - 2,500 3,500 - - 52,500 49,333
Peter Remmler 50,000 50,000 12,500 12,500 5,000 7,500 16,250 16,500 83,750 86,500
Carola v. Schmettow 50,000 50,000 - 6,250 2,500 9,000 - - 52,500 65,250
Wilhelm Segerath (until September 30, 2018) 50,000 50,000 57,500 57,500 11,000 17,500 - - 118,500 125,000
Carsten Spohr 50,000 50,000 - - 2,500 3,000 - - 52,500 53,000
Dr. Lothar Steinebach 50,000 50,000 25,000 23,125 5,500 8,000 - - 80,500 81,125
Jens Tischendorf 50,000 50,000 12,500 16,250 4,000 9,500 - - 66,500 75,750
Friedrich Weber 50,000 50,000 - - 2,500 5,000 5,450 5,600 57,950 60,600
Isolde Würz 50,000 50,000 - - 2,500 5,000 - - 52,500 55,000
Total 1,250,000 1,229,167 275,000 272,292 102,500 173,500 55,618 60,965 1,683,118 1,735,923
1) Covered by fixed compensation in accordance with § 14 (3) of the Articles of Association
In the reporting year Supervisory Board members received no further compensation or benefits for
personal services rendered, in particular advisory and agency services. As in previous years, no
loans or advance payments were granted to members of the Supervisory Board, nor were any
guarantees or other commitments entered into in their favor.

thyssenkrupp annual report 2017 / 2018
1 To our shareholders | thyssenkrupp stock
29
thyssenkrupp stock
1) Proposal to the Annual General Meeting 2) Weighted average
At the center of the dialogue between Investor Relations and the capital market is the Group’s value
proposition. The aim of our Investor Relations work is to provide financial indicators and other
valuation-relevant facts fully, equally and promptly to all target groups. To ensure this, Investor
Relations has a direct reporting line to the Executive Board. Together with the management – in-
cluding management of the business areas – Investor Relations is in regular and intensive dialogue
with capital market participants worldwide in roadshows and investor conferences, on Capital Mar-
ket Day, in conference calls on the publication of interim and annual reports and whenever the
situation demands. Venues, dates, presentations, audio and video recordings of conference calls
and events as well as news on current developments in the Group can be found on the Investor
Relations website.
Stock performance In fiscal year 2017 / 2018 the performance of thyssenkrupp’s stock was initially driven by further
operating earnings improvements and strategic progress. The negotiations with Tata Steel on a
joint venture of the European steel activities and the signing of the transaction at the end of June
were important milestones in this context. These positive developments were overshadowed by
protectionist measures of individual countries which had a negative impact on the entire global
economy and also on the capital markets. Towards the end of the fiscal year thyssenkrupp’s stock
was unable to keep pace with the benchmark indexes, also due to the unexpected changes on the
Executive Board and Supervisory Board. In the final days of the fiscal year the stock received a
boost from the announcement of the separation of the Group.
KEY DATA OF THYSSENKRUPP STOCK
2013 / 2014 2014 / 2015 2015 / 2016 2016 / 2017 2017 / 2018
Capital stock million € 1,449 1,449 1,449 1,593 1,593
Number of shares (total) million shares 565.9 565.9 565.9 622.5 622.5
Market capitalization end September million € 11,754 8,873 12,008 15,613 13,534
Closing price end September € 20.78 15.68 21.22 25.08 21.74
High € 22.72 26.30 22.27 26.83 26.41
Low € 16.60 15.25 12.84 19.77 18.86
Dividend per share € 0.11 0.15 0.15 0.15 0.151)
Dividend yield % 0.5 1.0 0.7 0.6 0.7
Dividend payout million € 62 85 85 93 931)
Earnings per share (EPS) € 0.38 0.55 0.52 (1.15) 0.01
Number of shares (outstanding 2)) million shares 557.1 565.9 565.9 566.3 622.5
Trading volume (daily average) million shares 2.4 2.6 2.7 2.6 3.1
thyssenkrupp stock master data
ISIN1)
Shares DE 000 750 0001
ADRs2) US88629Q2075
Symbols
TKA Frankfurt, Düsseldorf
TKAMY ADRs (over-the-counter trading)
1) International Stock Identification Number 2) American Depositary Receipt

thyssenkrupp annual report 2017 / 2018
1 To our shareholders | thyssenkrupp stock
30
On January 26, 2018 thyssenkrupp’s stock reached its fiscal year high at €26.41. At Septem-
ber 30, 2018 the stock stood at €21.74, down 13% from a year earlier; the DAX and STOXX 600
fell by only 3.1% and 1.3% respectively in the course of the fiscal year.
Shareholder structure The capital stock of thyssenkrupp AG amounts to €1,593,681,256.96 and is divided into
622,531,741 no-par bearer shares. Each share grants one vote at the Annual General Meeting.
The biggest shareholder in thyssenkrupp AG is the Alfried Krupp von Bohlen und Halbach Founda-
tion, Essen. The remaining shares are widely held internationally with focal points in North America
and the UK. thyssenkrupp AG holds no treasury shares. The free float generally taken into account
in the weighting of thyssenkrupp’s stock in stock indexes accounts for approx. 79% of the capital
stock. The share held by the Krupp Foundation is not included in the free float.
Dividend proposal of €0.15 per share The Executive Board and Supervisory Board will propose to the Annual General Meeting on Febru-
ary 1, 2019 that a dividend of €0.15 per share be paid for the 2017 / 2018 fiscal year.
www.thyssenkrupp.com > Investors > Shares & ADRs > Shareholder structure
Investor Relations Telephone: +49 201 844-536367 Email: [email protected] www.thyssenkrupp.com > Investors
PERFORMANCE OF THYSSENKRUPP STOCK RELATIVE TO DAX AND STOXX 600
Indexed, fiscal year 2017/ 2018
100
85
70
thyssenkrupp DAX STOXX 600
10 11 12 01 02 03 04 05 06 07 08 092017 2018

32
32
32
34
37
38
40
40
46
49
52
58
65
Preliminary remarks
Fundamental information about the Group
Profile and organizational structure
Strategy
Management of the Group
Targets
Report on the economic position
Macro and sector environment
Summarized assessment by the Executive Board
Forecast-actual comparison
Group review
Business area review
Results of operations and financial position
Combined management repor t
Annual financial statements of thyssenkrupp AG
Technology and innovations
Environment, climate and energy
Purchasing
Employees
Social responsibility
Compliance
Overview of non-financial disclosures
Forecast, opportunity and risk report
2018/2019 forecast
Opportunity and risk report
Legal information
77
82
85
87
89
95
96
99
100
100
105
126

thyssenkrupp annual report 2017 / 2018
2 Combined management report | Preliminary remarks
32
Preliminary remarks
Combined management report This management report combines the management report on the Group and the management report
on thyssenkrupp AG. In it we report on the course of business including business performance as well
as the position and the expected development of the Group and of thyssenkrupp AG. The information
on thyssenkrupp AG is presented in a separate section of the report on the economic position with
disclosures in accordance with HGB. The German Accounting Standard 20 (GAS 20) “Group Manage-
ment Report” was applied. Based on the integrated reporting approach we have used for many years,
the combined non-financial disclosures pursuant to § 289b HGB are included in the combined manage-
ment report. An overview chart can be found in the section “Overview of non-financial disclosures”.
This report follows thyssenkrupp’s internal management model which continues to be based on the
current structure of the business areas and thus on the full Group in its structure up to September
30, 2018 (Group without Steel Americas (AM)).
In addition, the continuing operations are presented, comprising the full Group without the discon-
tinued steel operations; the latter include the Steel Europe business area, thyssenkrupp
MillServices & Systems GmbH from the Materials Services business area, and individual Corporate
companies.
The links are not part of the management report unless otherwise stated.
Fundamental information about the Group
Profile and organizational structure
Profile and value proposition We work with passion and expertise to develop high-quality products and intelligent industrial
processes and services. We combine our engineering craftsmanship with traditionally strong mate-
rials capabilities. Together with our customers we want to develop competitive solutions to the
challenges of the future in their individual sectors. Our aim is to promote efficient use of resources,
produce consumer and capital goods in a more eco-friendly way, and help create sustainable infra-
structures. Our technologies and innovations are key to meeting the wide-ranging needs of our
customers and markets around the world, achieving growth on the markets of the future, and gen-
erating strong and stable earnings, cash flows and value added. Diversity and global reach define
thyssenkrupp. We engage as entrepreneurs with a passion to perform.

thyssenkrupp annual report 2017 / 2018
2 Combined management report | Fundamental information about the Group
33
The high standards we set ourselves and our shared values are documented in our mission state-
ment, which can be found on our website.
Organizational and management structure Our business operations are organized in five business areas: Components Technology, Elevator
Technology, Industrial Solutions, Materials Services, and the discontinued operation Steel Europe.
The business areas are divided into business units and operating units. In 78 countries, 449 com-
panies and 23 investments accounted for by the equity method are included in the consolidated
financial statements.
Since the joint venture agreement to combine the European steel activities in the 50 / 50 joint ven-
ture with Tata Steel was signed at the end of June 2018, the Steel Europe business area,
thyssenkrupp MillServices & Systems GmbH from the Materials Services business area, and indi-
vidual companies from Corporate have been reported as discontinued operations. Further details
on how this is accounted for in the consolidated financial statements and on the joint venture can
be found in the sections “Preliminary remarks” and “Strategy”. In connection with the realignment
of the Industrial Solutions business area, the Marine Systems business was separated at October 1,
2018 and is now directly managed by thyssenkrupp AG. This will allow Industrial Solutions to con-
centrate on the transformation process in plant engineering and the associated restructuring
measures.
thyssenkrupp AG
THYSSENKRUPP GROUP
Business areas
Corporate headquarters
Industrial Solutions
Sales €5.0 billion
Adjusted EBIT
€-255 million
Construction of plants for the chemical, cement and minerals industries
Development of automated production systems for the auto industry
Construction of non-nuclear naval sub-marines and ships 2)
Components Technology
Sales €7.9 billion
Adjusted EBIT
€197 million
Development and manufacture of high-tech components for the automotive indus-try, wind turbines, and the engineering sector worldwide
MaterialsServices
Sales €14.7 billion
Adjusted EBIT
€317 million
Global materials distribution
Custom services such as quality manage-ment, logistics services and supply chain solutions
Stainless steel pro-duction
Elevator Technology
Sales €7.6 billion
Adjusted EBIT
€866 million
Development, pro-duction, installation, maintenance and modernization of passenger and freight elevators, escalators and moving walks, passenger boarding bridges, stair and platform lifts
Steel Europe 1)
Sales €9.5 billion
Adjusted EBIT
€687 million
Production of fl at-rolled carbon steel for the auto industry and other sectors
1) Discontinued operation2) From October 1, 2018 separated and managed by thyssenkrupp AG
www.thyssenkrupp.com > Company > Corporate culture
78 Companies in 78 countries are included in the consolidated financial statements

thyssenkrupp annual report 2017 / 2018
2 Combined management report | Fundamental information about the Group
34
As part of its strategic realignment, thyssenkrupp AG resolved on September 30, 2018 to separate
the Group into two independent, listed companies. The exact structure will be worked out in a care-
fully considered process in consultation with the employee representatives. The separation must
then be decided by the Annual General Meeting of thyssenkrupp AG. This could take place in 12 to
18 months from the September 2018 announcement. More information is provided in the next
section “Strategy”.
The Group is led strategically by thyssenkrupp AG. The Executive Board of thyssenkrupp AG sets
the strategy for the Group’s development and steers the business areas, the corporate functions,
the regions and the service units. We define our strategic growth regions as North and South Amer-
ica, India, Asia/Pacific, Greater China, the Middle East and Africa. Our headquarters in these
growth regions are located in Chicago, São Paulo, Mumbai, Beijing, Singapore and Istanbul. The
regions of West Europe, Central and East Europe, the Commonwealth of Independent States, and
the German-speaking region are managed from our headquarters in Essen via the various corpo-
rate functions.
We operate in a multidimensional management structure (matrix structure) made up of operating
businesses, corporate functions, regions, and service units. Within this structure clear roles and
responsibilities, rules and standards for cooperation, and processes and reporting lines have been
defined. The “Global Shared Services” unit combines selected transaction and administration
processes in in-house service centers – this ensures that on the administrative side too we stay
competitive in terms of efficiency and performance. These are generally site-independent tasks
such as certain accounting, IT, real estate service; HR, purchasing, and project-related sub-
processes. Alongside the two German locations in Essen and Bochum we also operate service
centers in Gdansk (Poland), Porto Alegre (Brazil), and Thane (India). Further centers are currently
being established in the North America and Asia/Pacific regions.
Strategy
Strategic realignment The 2017 / 2018 fiscal year was a year of major strategic decisions for thyssenkrupp. At the end of
June we signed an agreement with Tata Steel to combine our European steel activities in a 50 / 50
joint venture. We expect several clear advantages from the joint venture:
■ For our steel businesses we are creating a sustainable future in a challenging market environ-
ment. ■ For the Group, key balance sheet ratios – particularly equity ratio and capital employed – will
improve significantly with the launch of the joint venture; at the same time the transfer of pension
obligations from existing or former steel activities will almost halve the Group’s pension provi-
sions. ■ The remaining businesses will gain more latitude to act flexibly and seize growth opportunities.
www.thyssenkrupp.com > Company > Strategy
Multidimensional manage-
ment structure with network
character
Business areas Global corporate responsibility for
businesses Support for cross-business measures
Corporate functions Strategic development of the Group Governance framework Coordination and support
Regions Support for growth strategies Advice and support for businesses
in the regions
Service units
Standardization and provision of transac-
tional processes with focus on effi ciency Transparent costs, performance and pricing
Corporate
functionsRegions
Service
units
Business
areas

thyssenkrupp annual report 2017 / 2018
2 Combined management report | Fundamental information about the Group
35
With the joint venture agreement we created the conditions to evolve the strategy the Group has
pursued since 2011. On September 30, 2018, thyssenkrupp AG decided to divide the Group into
two separate and much more focused companies: The capital goods and materials businesses are
to be managed in the future as independent, listed companies with direct access to the capital
markets. The separation combines industrial logic with the requirements of the capital market. The
Executive Board is convinced that this new structure will allow the businesses to develop better and
concentrate on their strengths. Both companies will continue to use the name thyssenkrupp, but
will evolve their strategies separately and independently of each other.
■ thyssenkrupp Industrials will consist of three units: the elevator business, the automotive com-
ponents business, and plant engineering. Elevator Technology will remain unchanged in its
current configuration. Components Technology will be focused on the automotive business. As
materials-related activities, the Bearings and Forged Technologies units will be transferred to
thyssenkrupp Materials. A new addition is System Engineering, which develops for example pro-
duction lines for cars and is currently part of Industrial Solutions. This means our automotive
expertise will be concentrated in one area. The third pillar of our industrials business will be
focused plant engineering. thyssenkrupp Industrials will then be a pure capital goods company.
Its globally positioned businesses will have attractive growth opportunities from megatrends
such as urbanization, globalization, and digitization. We want to profit from this with our engi-
neering expertise, service know-how, and digital innovations. ■ thyssenkrupp Materials will consist of the following units: Materials Services, the 50% interest in
the future steel joint venture, Bearings, Forged Technologies, and Marine Systems. The result will
be a materials group that combines steel and stainless steel production, materials distribution,
and steel-related processing. In materials distribution and steel we hold leading market positions
in Europe; in forgings, bearings, and naval shipbuilding we are among the leading suppliers
worldwide. The new setup will allow us to expand these market positions and take advantage of
consolidation opportunities from a position of strength.
The separation into two companies will take the form of a spin-off. After the separation,
thyssenkrupp AG shareholders will hold shares in two companies: thyssenkrupp Materials AG (for-
merly thyssenkrupp AG) and thyssenkrupp Industrials AG. Existing shareholders will continue to
hold 100% of thyssenkrupp Materials AG, and initially a clear majority of thyssenkrupp Industrials
AG. The remaining interest will initially be held by thyssenkrupp Materials AG and will serve to
strengthen thyssenkrupp Materials AG’s capital base. This will give both companies a good start.
Regardless of the planned separation, thyssenkrupp will carry on working continuously to improve
the performance of all its businesses. The initiatives and measures to achieve this are combined in
our Groupwide efficiency program “impact”. The growth and profitability targets issued for the
individual business areas at the beginning of August 2018 remain valid and are to be achieved by
the end of the 2020 / 2021 fiscal year (see section “Targets”). We are also adhering to the savings
program for general and administrative costs we initiated in the 2016 / 2017 fiscal year. Successes
are already being seen in particular at the Group’s headquarters, where costs were reduced by over
€158 million to €377 million in the reporting year. Further significant savings are targeted by the
end of fiscal 2020 / 2021.
€890 million
With savings of €890 million, the 2017 / 2018 “impact” target of €750 million was again clearly exceeded.

thyssenkrupp annual report 2017 / 2018
2 Combined management report | Fundamental information about the Group
36
Business opportunities Business opportunities are arising for thyssenkrupp from global mega trends that require more and
better solutions: Demographic change, urbanization, the rapid growth of mega cities, and globali-
zation mean that global demand is rising (“more”). At the same time the requirements to be met by
the solutions offered are increasing (“better”). The result is that we need to use resources efficient-
ly, reduce the environmental impact of producing consumer and capital goods, and build more
sustainable infrastructure. At the same time an increasingly connected world requires intelligent
products and solutions.
We use our engineering expertise and materials capabilities to develop tailored technological and
competitive solutions to meet the current and future requirements of our customers and markets
and to satisfy the demand for “more” in a “better” way. We do this in many areas with our technol-
ogies, industrial processes, materials, and services, both in industrialized countries and in emerg-
ing markets. A key role is played by our brand and our brand promise summed up in our slogan
“engineering.tomorrow.together.”
More information on the business opportunities of our business areas can be found in the “Oppor-
tunity and risk report” section, subsection “Operational opportunities of the business areas”.
BUSINESS OPPORTUNITIES FOR THYSSENKRUPP
Demography
More consumer and capital goods
Climate change
Reduced CO2 emissions,
renewable energies
Urbanization
More infrastructure and buildings
Finite resources
Effi cient resource and energy use, alternative energies
Globalization
More resources and energy use
Regulatory and political
Compliant products and services
Digitization
More digital value creation
Increasing connectivity
Intelligent products and holistic solutions
through leading
engineering expertise
Meeting demand for “more” in a “better” way.
Business opportunities are resulting from global mega trends that require more and better solutions.

thyssenkrupp annual report 2017 / 2018
2 Combined management report | Fundamental information about the Group
37
Management of the Group
The indicators used throughout the Group for profitability, value added and liquidity form the basis
for operational and strategic management decisions at thyssenkrupp. We use them to set targets,
measure performance and determine variable components of management compensation. For us,
the most important financial indicators – the key performance indicators in accordance with GAS 20
– are adjusted earnings before interest and taxes (adjusted EBIT), thyssenkrupp Value Added (tkVA)
and free cash flow before M & A (FCF before M & A).
As part of the annual strategy process the Group’s Executive Board defines long-term targets, also
for the business areas. These form the framework for the short and medium term financial targets
and also for the budget and medium term plans which have to be prepared by all units.
Adjusted EBIT EBIT provides information on the profitability of a unit. It contains all elements of the income state-
ment relating to operating performance. This also includes items of financial income/expense that
can be characterized as operational, including income and expense from investments where there
is a long-term intention to hold the assets. Adjusted EBIT is EBIT adjusted for special items, i.e.
excluding disposal losses/gains from M & A (mergers & acquisitions) transactions, restructuring
expenses, impairment charges/impairment reversals and other non-operating expenses and income.
It is more suitable than EBIT for comparing operating performance over several periods.
THYSSENKRUPP – KEY PERFORMANCE INDICATORS
Operating earnings
+/ – operational components of fi nancial income
EBIT
+/ – special items
Adjusted EBIT
EBIT
+/– cost of capital
tkVA
Operating cash fl ow
+/– cash fl ows from investing activities
Free cash fl ow
+/– cash infl ows / outfl ows from material M & A transactions
Free cash fl ow before M & A
Profi tability LiquidityValue added

thyssenkrupp annual report 2017 / 2018
2 Combined management report | Fundamental information about the Group
38
The adjusted EBIT of the Group and the business areas and the special items are described in
detail in the sections “Group review” and “Business area review” in the report on the economic
position. Please also refer to the reconciliation in the segment reporting (Note 23).
tkVA tkVA is the value created in a reporting year. This indicator enables us to compare the financial
performance of businesses with different capital intensity. tkVA is calculated as EBIT minus or plus
the cost of capital employed in the business. Capital employed mainly comprises fixed assets,
inventories and receivables. Deducted from this are certain non-interest-bearing liability items such
as trade accounts payable. To obtain the cost of capital, capital employed is multiplied by the
weighted average cost of capital (WACC), which includes equity, debt and the interest rate for pen-
sion provisions.
Information on tkVA in the reporting year can also be found in the section “Group review”.
FCF before M & A FCF before M & A permits a liquidity-based assessment of performance in a period by measuring
cash flows from operating activities excluding income and expenditures from material portfolio
measures. It is measured as operating cash flow less cash flows from investing activities excluding
cash inflows or outflows from material M & A transactions. This too links more directly to operating
activities and facilitates comparability in multi-period analyses.
A reconciliation and details on the development of FCF before M & A are provided in the analysis of
the statement of cash flows in the section “Results of operations and financial position”.
Targets
Financial targets Our goal is to increase the efficiency of all our business areas in order to generate stable positive
value added and cash flow for the Group. To crystallize our vision, we have for the first time set a
clear timeline for our financial targets. With our growth and earnings targets, the individual busi-
ness areas and our share in the planned steel joint venture are aiming to achieve total free cash
flow before M & A of at least €1 billion in the 2020 / 2021 fiscal year. The targets for the business
areas and for Corporate are derived from comparisons with best-in-class peers and in their current
configuration and taking into account the reclassification of Marine Systems are as follows:
■ Components Technology – Annual sales growth in mid single-digit percentage range through suc-
cessful ramp-up of new plants and production lines for steering systems; increase in adjusted
EBIT margin to over 7%
Capital employed x WACC = cost of capital
≥ €1 billionfree cash flow before M & A by 2020 / 2021 is our minimum requirement.

thyssenkrupp annual report 2017 / 2018
2 Combined management report | Fundamental information about the Group
39
■ Elevator Technology – Annual sales growth in low to mid single-digit percentage range as well as
efficiency and restructuring measures to increase EBIT contribution to more than €1 billion with
an EBIT margin of over 13% (long-term target 15%) ■ Industrial Solutions (without Marine Systems) – Return to an adjusted EBIT margin of around 6%
through refocusing of the division on smaller and medium-size orders as well as growth in high-
margin service business ■ Marine Systems – Return to at least a positive adjusted EBIT margin through better project execu-
tion and continuation of the transformation process already underway ■ Materials Services – Improvement in adjusted EBIT margin to around 3% through continuation of
the digitization initiatives with efficiency gains throughout the value chain; at the same time re-
duction in general and administrative costs ■ Corporate – Reduction of costs to clearly below €400 million ■ Steel Europe (discontinued operation) – Ramp-up of the dividend from the joint venture with Tata
Steel to a low to mid three-digit million € amount through rigorous implementation of the synergy
plan; until the closing of the steel joint venture, positive contribution to adjusted EBIT and normal
seasonal build-up of net working capital weighing on free cash flow
We expect further progress will again be reflected positively in our key performance indicators in
fiscal 2018 / 2019. Sales and earnings in large parts of our materials and components businesses
may be subject to short-term fluctuations. Nevertheless for our continuing operations we expect a
strong improvement in adjusted EBIT and free cash flow before M & A as well as positive tkVA for
the Group.
More information on our key performance indicators can be found in this section under “Manage-
ment of the Group”, and details on the forecast for the current fiscal year are provided in the fore-
cast report.
Sustainability and Indirect Financial Targets Sustainability is a core component of our corporate strategy. In our strategic sustainability man-
agement we continuously identify the requirements of our stakeholders and develop corresponding
targets and measures to improve our performance. Sustainability activities in the Group are man-
aged by the Sustainability Committee. It consists of the Group Executive Board, the CEOs of the
business areas, and heads of various corporate functions, and decides on measures and on our
Indirect Financial Targets (IFTs). Implementation is the responsibility of the corresponding depart-
ments and business units, who report regularly on their progress.
Indirect Financial Targets to secure continuous improvement
The Sustainability Committee has set Indirect Financial Targets in the areas technology and innova-
tions, environment, climate, energy, purchasing and people. Progress towards these targets is fac-
tored into variable compensation for the Group Executive Board and business area boards via the
sustainability multiplier (more information can be found in the compensation report). In the reporting
year most of the Indirect Financial Targets were achieved or are on track to being met.
Society
Economy
Environment
ProductsProcesses
Supply chain
Our understanding
of sustainability

thyssenkrupp annual report 2017 / 2018
2 Combined management report | Report on the economic position
40
A new target has been adopted for energy efficiency: in the 2018 / 2019 fiscal year energy efficien-
cy gains of 100 GWh are to be achieved (continuing operations only). The R&D intensity target was
also adjusted: the new adjusted R&D intensity target is 3.0% (continuing operations only).
Details on the individual targets can be found in the sections of this Annual Report listed in the
table and on our website.
Report on the economic position
Macro and sector environment
Global economic growth continues, but momentum has peaked After a moderate start, global economic growth initially strengthened this year, but momentum now
appears to have peaked. After increasing clearly by 3.6% in 2017, global GDP is expected to show
slightly weaker growth of 3.5% in 2018. For the coming year a further slowdown to 3.3% is fore-
cast. At the same time regional differences increased against the prior year. With continuing rela-
tively expansionary monetary policy, the average growth rate in the industrialized countries is ex-
pected to be 2.3% in 2018 and 2.0% in 2019, while in the emerging markets economic output
should increase by 4.5% (2018) and 4.4% (2019).
OVERVIEW OF INDIRECT FINANCIAL TARGETS
Group overall Sept. 30, 2017 Sept. 30, 2018 Change Section
Annual energy efficiency gains of 150 GWh in 2017 / 2018 GWh 330 253 - Environment, energy, climate
100% of relevant activities covered by ISO 50001 energy management system by 2019 / 2020 % 66 83 + 17% points Environment, energy, climate
100% of relevant activities covered by ISO 14001 environmental management system by 2019 / 2020 % 85 91 +6% points Environment, energy, climate
Sustainable adjusted R&D intensity of around 2.5% % 2.7 2.5 (0.2) % points Technology and Innovations
15% share of women in leadership positions by 2019 / 2020 % 11.6 12 +0.4% points Employees
2.0 accidents per million hours worked by 2020 / 2021 and improvement of at least 10% a year
Accidents per million hours worked 3.1 3.0 (3.3)% Employees
100 supplier sustainability audits each year # 161 173 +12 Purchasing
www.thyssenkrupp.com > Company > Sustainability
3.5% The global economy is expected to grow at a rate of 3.5% in 2018 before slowing slightly in 2019.

thyssenkrupp annual report 2017 / 2018
2 Combined management report | Report on the economic position
41
The global growth outlook remains marked by major uncertainty. Current risk factors mainly result
from geopolitical imponderables: it is unclear how the numerous flashpoints will unfold or whether
the trade conflicts will escalate further. The planned normalization of monetary policy could stifle
global economic growth. A sharper slowdown in China could also have a dampening effect. De-
pendent on the price situation for oil and raw materials, the economy in numerous raw materials
exporting countries remains fragile. The political uncertainties in the euro zone have also increased,
especially with the change of government in Italy. Following the Brexit referendum, uncertainty over
the further course of the exit negotiations could weigh on investment – above all in Britain itself but
also in the other countries of the European Union. Recently the currency crisis in Turkey and other
emerging economies has stoked fears of instabilities on the international financial markets, espe-
cially with the mushrooming of some countries’ foreign debts due to high trade deficits in recent
years.
Economic activity in the euro zone noticeably lost momentum recently. After quarter-on-quarter
growth of 0.4% in each of the first two quarters of 2018, provisional figures for the 3rd quarter of
the current year indicate a growth rate of only 0.2%. The impending trade conflict with the USA
weighed above all on exports. While leading indicators point to continued economic growth in the
euro zone, the exceptionally strong momentum of the prior year will not be repeated. Overall we
anticipate economic growth rates in the euro zone of 2.1% in 2018 and 1.7% in 2019.
In the 2nd quarter of this year German GDP showed quarter-on-quarter growth of 0.5%, up from
0.4% in the 1st quarter. The main reason was strong consumer spending. Exports also increased,
but not as steeply as imports so the net trade balance dampened GDP growth. Capital spending
was moderately higher. In the coming quarters the German economy is expected to show signifi-
cantly lower growth, and according to provisional data even contracted slightly in the 3rd quarter.
As a result overall economic output is forecast to increase by around 1.8% in 2018. With the slow-
down in the global economy, we expect growth to weaken again to 1.6% in the coming year.
The US economy remained robust. After a weak start to the year, output picked up considerably in
the 2nd quarter. With employment and incomes rising, consumer spending remains buoyant. On
the back of the tax reform which came into effect at the start of the year, brisk investment activity
additionally fueled expansion. However, the economic momentum is expected to peak this year and
then gradually weaken as interest rates rise and fiscal stimulus diminishes. Overall the US economy
is expected to expand by 2.9% in 2018 and 2.5% in 2019.
After 6.9% growth last year, economic growth in China is expected to slow to 6.6% in 2018; for
2019 a further decline in the growth rate to 6.2% is forecast. The background is the government’s
intention to curb risks such as high corporate debt and the property market bubble. There are also
plans to accelerate the structural change towards higher value-added industries and services.
Growth in 2018 bolstered by consum-er spending and investment activity

thyssenkrupp annual report 2017 / 2018
2 Combined management report | Report on the economic position
42
India’s economy has been expanding strongly to date, aided by buoyant consumer spending and
increased investment activity. However, the outlook has deteriorated slightly as uncertainty on the
global financial markets is making financing conditions less favorable. Overall Indian GDP growth is
expected to be strong at 7.2% in 2018, slowing slightly to 7.1% in 2019.
In Brazil the economy was near stagnation in the first two quarters of 2018. Among other things
the political situation and uncertainty regarding the future course of the new government are
weighing on the economy. For 2018 as a whole we therefore expect weak growth of just 1.2%, and
for 2019 a moderate 2.2% rise in GDP.
Russia’s economic upturn continues, but cannot develop any real momentum. The current investor
withdrawal from the emerging markets and the announcement of further US sanctions are inhibit-
ing growth. After 1.8% this year, slightly slower growth of 1.6% is expected in 2019.
GROSS DOMESTIC PRODUCT 2018 1) 2019 1)
Real change compared with previous year in %
Euro zone 1.7 2.1
Germany 1.6 1.8
Russia 1.6 1.8
Rest of Central /Eastern Europe
3.0 3.8
USA 2.5 2.9
Brazil 2.2 1.2
Japan 0.9 1.1
China 6.2 6.6
India 7.1 7.2
Middle East 3.1 3.1
World 3.3 3.5
1) Forecast

thyssenkrupp annual report 2017 / 2018
2 Combined management report | Report on the economic position
43
Uncertainties mark trend in industrial activity Automotive – Growth in global car and light truck production will slow in 2018 and 2019. Output is
expected to increase by only 0.5% to 92.7 million units in 2018, and by less than 2% to 94.3 mil-
lion units in 2019. The global markets continue to show a mixed picture: For the world’s biggest
producer China, a slowdown in the second half has led to an unexpected forecast of stagnation for
the full-year 2018. For 2019 moderate growth of almost 3% to 28.6 million units is expected, sig-
nificantly lower than the growth rates of previous years. In Western Europe the introduction of new
emission standards led to unforeseen pull-forward effects in the first half of 2018. However, with
the opposite effect anticipated for the second half of 2018, a 1.6% decline in vehicle production is
predicted overall for 2018. For 2019 stagnation is currently forecast for the Western European
market. From the weak prior year, German auto production is expected to decrease by a further
5.8% in 2018 to no more than 5.4 million units. Observers currently anticipate sideways movement
of the market in 2019. In the USA, where a drastic 8.5% fall in output was reported in 2017, the
situation is expected to stabilize. Weak growth of 0.7% is forecast for 2018 and 0.8% for 2019.
India’s auto industry continues to expand strongly. With output expected to rise by 8.2% this year
and by 5.4% in 2019, the 5 million unit milestone could soon be passed. After bottoming out in
2016, auto production in Brazil bounced back, rising by roughly 26% in 2017. Growth of 8.7% is
forecast for 2018 and 3.6% for 2019. This would see an increase in output to over 2.9 million units
in 2019, around 85% of the record production level of 2013.
92.7 million
Global car and light truck production to reach around 92.7 million units in 2018.

thyssenkrupp annual report 2017 / 2018
2 Combined management report | Report on the economic position
44
1) Forecast Sources: IHS Markit, Oxford Economics, national associations, own estimates
Machinery – The global machinery sector will expand in 2018. However, in the coming year produc-
tion growth will slow noticeably due mainly to a loss of momentum on the capital goods markets. In
China for example the pace of expansion in 2018 will be only slightly down from the year before at
around 9%, but is expected to fall to just 4% in 2019 with the general economic slowdown. After a
strong prior year, the US machinery sector is expected to report solid production growth of 3.7% in
2018 on the back of increased capital investment. For 2019 we anticipate slightly lower growth. In
Europe, too, a steep rise in machinery production in 2017 will be followed by more moderate
growth of just over 4% in the current year; in 2019 the pace of expansion will drop to around 2% as
a result of the global economic slowdown.
The German machinery sector reported robust 3.9% production growth in 2017, with order growth
even higher at 8%. In the period to September 2018 order intake was up 6% year-on-year, reflect-
ing a 9% rise in domestic orders and 5% higher exports. At 91%, capacity utilization exceeded the
record level of 2009. In view of the stable order situation – a result of generally brisk investment
activity – production is expected to increase by 4.5% this year. However, with rising protectionist
measures and increased trade conflicts, significantly weaker growth of around 2% is forecast for
2019.
IMPORTANT SALES MARKETS
2017 20181) 20191)
Vehicle production, million cars and light trucks
World 92.2 92.7 94.3
Western Europe (incl. Germany) 14.7 14.5 14.5
Germany 5.7 5.4 5.4
USA 10.9 11.0 11.1
Mexico 3.9 4.0 4.0
Japan 9.2 9.2 9.2
China 27.7 27.7 28.6
India 4.4 4.7 5.0
Brazil 2.6 2.8 2.9
Machinery production, real, in % versus prior year
Germany 3.9 4.5 2.1
USA 7.2 3.7 3.1
Japan 8.2 4.9 1.5
China 11.0 8.8 4.0
Construction output, real, in % versus prior year
Germany 3.2 2.9 2.8
USA 0.7 3.0 2.1
China 4.4 4.8 4.2
India 1.9 8.8 7.5
Global machinery production growth will slow noticeably in the coming year

thyssenkrupp annual report 2017 / 2018
2 Combined management report | Report on the economic position
45
Construction – Construction activity in the euro zone is expected to grow by 3.3% in 2018 and 2.6%
in 2019. After increasing by 3.2% last year, German construction output is up year-on-year by
2.8% in 2018 to date. For the foreseeable future, housing construction should continue to profit
from numerous factors, above all sustained demand for rented homes in metropolitan areas, the
solid labor market, and continuing low mortgage rates. Public sector construction too should in-
crease further due to the strong cash reserves available to local authorities and higher investment
in roads, railways and waterways. Overall construction output in Germany is expected to rise by
around 3% in both 2018 and 2019. Increasingly, stronger growth is now being inhibited by capa-
city bottlenecks. After rising to around 5% in 2018, construction growth in China will fall again to
around 4% next year on account of the government’s efforts to cool the overheating property mar-
ket, particularly in the big cities. The US real estate market shows a mixed picture, with no clear
trend in building starts and building permits in recent months. However, house prices have in-
creased year-on-year by around 6.5% (according to S&P Case-Shiller 20-City Composite Home
Price Index). After a weak year in 2017, US construction output is forecast to grow by around 3% in
2018 and around 2% next year.
Steel – With the global economy largely robust despite increasing geopolitical and foreign trade
tensions and uncertainties, steel demand will rise again in 2018, though the pace of growth is
expected to slow in the second half of the year. For the full year, there are signs that demand
worldwide will increase by around 2% to around 1.66 billion tons of finished steel. Defying the
forecasts at the start of the year, the steel market in China continues to expand, mainly thanks to
the construction sector and its high steel consumption. Overall Chinese steel demand in real terms,
adjusted for statistical effects, is expected to rise by 2%. Up to 2% growth in steel demand is also
forecast for both the USA and EU, though demand for steel in Germany, which is already at a high
level, will rise by no more than 1%. The steel markets in the emerging economies excluding China,
in particular in India and the ASEAN states, are growing at above-average rates. By contrast, de-
mand for steel is expected to stagnate in Japan and contract for the second year in succession in
South Korea. In Turkey, too, there are now signs of a decrease in demand. Since mid-2018 the
global steel markets have been increasingly impacted by exchange-rate and (trade) policy devel-
opments. Persistent structural overcapacities and increasing dislocations in international steel trade
flows – a result of the US tariffs on steel imports – continue to weigh on the markets, particularly in
Europe.
In the first eight months of 2018 the flat carbon steel market in the EU grew by around 2% year-on-
year, supported by continued solid growth in the steel-processing sectors, particularly the auto
industry. For the European steel industry, which achieved slightly higher shipments, the competitive
situation nevertheless remained challenging. While imports from China continued to fall due to the
trade measures, there was an increase in imports to the EU from other countries – mainly Turkey
and Russia, but also smaller, increasingly export-oriented countries. On average over the first eight
months of 2018, total flat carbon steel imports from third countries to the EU exceeded the already
high prior-year volume by around 2%. For the coming months at least no further increase in import
pressure is expected because the provisional safeguard measures to prevent trade diversion into
the EU as a consequence of the US tariff policy came into force in July. Prices for flat steel on the
European spot markets have largely been firm in 2018 – with initial raw materials price increases,
robust steel demand, and limited availability of competitively priced imports. After weakening in
early summer – mainly due to uncertain market expectations – steel prices mostly recovered slight-
ly in August and September.
3.3% Construction activity in the euro zone expected to grow by almost 3.3% in 2018.
Global steel demand to grow by 2% to 1.66 billion tons in 2018.

thyssenkrupp annual report 2017 / 2018
2 Combined management report | Report on the economic position
46
With the global economic outlook deteriorating and significantly increased risks, growth in global
steel demand is expected to slow to around 1% to 2% in 2019. The steel market in China will stag-
nate at a high level; for the other emerging economies we anticipate solid and above-average
growth in demand, with India and the ASEAN states again showing the strongest expansion. In the
industrialized countries, growth in steel demand will be subdued. In the USA we forecast growth of
1%, in the EU and in Germany roughly 2%. With continued overcapacities worldwide and rising
protectionism, import pressure on the European steel market is likely to remain high.
Summarized assessment by the Executive Board
thyssenkrupp paves the way for new strategic setup thyssenkrupp achieved an important milestone in the reporting year with the signing of the joint
venture agreement to combine the European steel activities in the 50 / 50 joint venture
thyssenkrupp Tata Steel. To now move the transformation of the Group further forward and help
create a focused setup for the businesses, it was decided near the end of the fiscal year to sepa-
rate the Group into thyssenkrupp Industrials AG and thyssenkrupp Materials AG. In the future the
companies are to be managed as independent listed companies with direct access to the capital
market. As well as reducing the complexity of the organization, the separation will enable the two
companies, operating independently of each other, to respond to their respective customers and
markets faster and more effectively and address investors with different interests. More information
on our strategic restructuring can be found in the section “Fundamental information about the
Group”, subsection “Strategy”.
In the reporting year our targets for adjusted EBIT were not met. In particular the inadequate order
situation and additional project expenses at Industrial Solutions and provisions for quality issues at
Components Technology weighed on earnings. Other factors at Components Technology were
lower demand with strong price competition for wind turbine components, weaker productivity in
springs and stabilizers, and a flatter start-up curve for new plants due to factors on the customer
side. Significant adverse currency effects and the rise in material costs over the course of the year
impacted both Components Technology and Elevator Technology. By contrast our materials busi-
nesses Materials Services and Steel Europe (discontinued operation) reported a clear earnings
improvement overall, thanks mainly to continued stable and high prices on the material markets.
However at Steel Europe (discontinued operation) production restrictions due to the low water
levels on the Rhine and reduced shipments following the introduction of new emission standards
(WLTP) in the auto industry weighed on earnings in the 4th quarter. Adjusted EBIT at Corporate
improved significantly, mainly due to the faster than planned implementation of measures to re-
duce G&A costs. EBIT effects of €890 million were achieved across all businesses under our effi-
ciency program “impact”.
Our targets for adjusted EBIT were not met.

thyssenkrupp annual report 2017 / 2018
2 Combined management report | Report on the economic position
47
Net income was down sharply year-on-year, mainly reflecting the development of adjusted EBIT. In
addition a provision for risks from a cartel case and valuation allowances for deferred tax assets on
tax loss carryforwards in connection with the steel joint venture weighed on earnings, while net
interest improved.
FCF before M & A improved clearly against the prior year but remained negative over the full year
mainly due to low order intake and high expenditures on projects from orders in hand at Industrial
Solutions. Strongly positive FCF before M & A in the 4th quarter was unable to offset this.
The Group’s net financial debt at €2.4 billion was clearly higher than the prior-year figure
(€2.0 billion), mainly reflecting the Group’s negative FCF before M & A and the dividend payment.
The Group’s equity amounted to €3.3 billion (prior year €3.4 billion). Above all the losses recog-
nized in other comprehensive income from currency translation and from the remeasurement of
pensions and similar obligations as well as dividend distributions outweighed the net income
achieved in the reporting year.
At the balance-sheet date gearing was 72.2% (prior year: 57.5%). With cash and cash equivalents
and undrawn committed credit lines totaling €6.6 billion (September 30, 2018) and a balanced ma-
turity profile, thyssenkrupp remains solidly financed.
Performance profile improved thyssenkrupp’s performance profile improved in many areas. Components Technology continued
its growth and regionalization strategy. However, the positive earnings trend over recent years could
not be maintained due to the factors described above. However, with the investments made in
recent years Components Technology has built a solid basis to drive further growth in the future;
this should also be reflected in earnings. Elevator Technology continued its efficiency and restruc-
turing measures and achieved important milestones in its growth strategy. However, negative cur-
rency effects and higher material prices in China are weighing on earnings and margin. At Industri-
al Solutions a comprehensive transformation program was initiated on top of the measures already
underway aimed at further reducing costs and reversing the trend in order intake by focusing on
smaller and medium-size orders. Materials Services continued work on initiatives for the digital
transformation designed to increase productivity and efficiency throughout the supply chain. At
Corporate the measures to reduce general and administrative costs are progressing faster than
planned. Steel Europe (discontinued operation) increased its earnings and margin significantly
thanks to higher average net selling prices, supported by efficiency measures. The signing of the
joint venture agreement with Tata Steel will create a sustainable future and tackle the structural
challenges facing the European steel industry.
The signing of the joint venture agreement will create a sustainable future for our steel business.

thyssenkrupp annual report 2017 / 2018
2 Combined management report | Report on the economic position
48
In view of what has been achieved we look forward to the new fiscal year with optimism and expect
an increase in adjusted EBIT for our continuing operations.
More information on our target achievement in the reporting year can be found in the “Forecast-
actual comparison”. Details of our business performance are included in the “Group review” and
“Business area review”. Details of our forecast for the current fiscal year and our opportunities and
risks are contained in the “Forecast, opportunity and risk report”.
Key figures for the full Group, the Group without Steel Americas (AM), and the continuing opera-
tions versus the prior year are shown in the following tables:
THYSSENKRUPP IN FIGURES
Full Group1) Group without Steel Americas (AM)1)
Year ended
Sept. 30, 2017Year ended
Sept. 30, 2018 Change in %Year ended
Sept. 30, 2017Year ended
Sept. 30, 2018 Change in %
Order intake million € 44,288 42,754 (1,534) (3) 42,756 42,754 (3) 0
Net sales million € 42,971 42,745 (226) (1) 41,447 42,745 1,298 3
EBIT2) million € 687 1,045 358 52 1,150 1,045 (105) (9)
EBIT margin % 1.6 2.4 0.8 53 2.8 2.4 (0.3) (12)
Adjusted EBIT2) million € 1,910 1,551 (359) (19) 1,722 1,551 (171) (10)
Adjusted EBIT margin % 4.4 3.6 (0.8) (18) 4.2 3.6 (0.5) (13)
Income/(loss) before tax million € 61 668 607 ++ 765 668 (97) (13)
Net income/(loss) or earnings after tax million € (591) 60 650 ++ 271 60 (211) (78)
attributable to thyssenkrupp AG's shareholders million € (649) 8 658 ++ 212 8 (204) (96)
Earnings per share (EPS) € (1.15) 0.01 1.16 ++ 0.37 0.01 (0.36) (96)
Operating cash flows million € 610 1,184 575 94 483 1,184 701 145
Cash flow for investments million € (1,666) (1,386) 280 17 (1,535) (1,386) 149 10
Cash flow from divestments million € 1,545 87 (1,458) (94) 1,539 87 (1,452) (94)
Free cash flow 3) million € 489 (115) (603) -- 487 (115) (602) --
Free cash flow before M & A 3) million € (798) (134) 665 83 (855) (134) 721 84
Net financial debt (Sept. 30) million € 1,957 2,364 407 21
Total equity (Sept. 30) million € 3,404 3,274 (130) (4)
Gearing (Sept. 30) % 57.5 72.2 14.7 26
ROCE % 4.1 6.6 2.5 61
thyssenkrupp Value Added million € (651) (217) 434 67
Dividend per share € 0.15 0.154) — —
Dividend payout million € 93 934) — —
Employees (Sept. 30) 158,739 161,096 2,357 1
1) See preliminary remarks. 2) See reconciliation in segment reporting (Note 23). 3) See reconciliation in the analysis of the statement of cash flows. 4) Proposal to the Annual General Meeting

thyssenkrupp annual report 2017 / 2018
2 Combined management report | Report on the economic position
49
1) See preliminary remarks. 2) See reconciliation in the analysis of the statement of cash flows.
Forecast-actual comparison
The targets set at the start of the reporting year for the key performance indicators adjusted EBIT
and free cash flow before M & A and the target for net income were not met. The target for the key
performance indicator thyssenkrupp Value Added (tkVA) was met.
The main reason we missed our target for adjusted EBIT were additional project expenses at Indus-
trial Solutions in the 3rd quarter. In addition, due to the unsatisfactory order situation, sales at
Industrial Solutions were lower than expected, which resulted in underutilization and corresponding
pressure on earnings. Accordingly, in the 9-month report we lowered our adjusted EBIT target to
the bottom end of the target range forecast at the start of the fiscal year. This also reflects signifi-
cant exchange-rate effects not included in our assumptions and higher than anticipated material
costs at Components Technology and Elevator Technology. Other factors at Components Technolo-
gy were lower demand with strong price competition for wind turbine components, weaker produc-
tivity in springs and stabilizers, and a flatter start-up curve for our new plants due to factors on the
customer side. At the same time Materials Services and Steel Europe (discontinued operation)
performed better than expected, mainly as a result of continued stable and high prices on the
material markets. However, we were unable to meet the target formulated in the 9-month report
owing to provisions for quality issues at Components Technology. Also production restrictions due
to the low water levels on the Rhine and reduced shipments following the introduction of new emis-
sion standards (WLTP) in the auto industry weighed on earnings at Steel Europe (discontinued
operation). Earnings at Elevator Technology were also lower than planned due to persistent cost
pressure.
THYSSENKRUPP IN FIGURES
Group - continuing operations1)
Year ended
Sept. 30, 2017Year ended
Sept. 30, 2018 Change in %
Order intake million € 35,357 35,133 (224) (1)
Net sales million € 33,993 34,777 785 2
EBIT million € 658 464 (194) (29)
EBIT margin % 1.9 1.3 (0.6) (31)
Adjusted EBIT million € 1,164 706 (459) (39)
Adjusted EBIT margin % 3.4 2.0 (1.4) (41)
Income/(loss) before tax million € 329 163 (165) (50)
Income/(loss) (net of tax) million € 12 (198) (210) --
attributable to thyssenkrupp AG's shareholders million € (39) (245) (206) --
Earnings per share (EPS) € (0.07) (0.39) (0.33) --
Operating cash flows million € 27 185 157 ++
Cash flow for investments million € (959) (935) 24 2
Cash flow from divestments million € 1,511 66 (1,445) (96)
Free cash flow2) million € 579 (684) (1,264) --
Free cash flow before M & A2) million € (763) (678) 84 11
Employees (Sept. 30) 129,441 131,606 2,165 2
Adjusted EBIT, FCF before M & A and net income were lower than planned.

thyssenkrupp annual report 2017 / 2018
2 Combined management report | Report on the economic position
50
Our corporate program again made a major contribution to earnings: The “impact” target of reduc-
ing costs by €750 million that we set for 2017 / 2018 at the beginning of the fiscal year was again
substantially exceeded with savings of €890 million.
Our target of achieving a clear increase in net income was not met mainly due to the development
of adjusted EBIT. In addition a provision for risks from a cartel case and write-downs of deferred tax
assets on loss carryforwards in connection with the steel joint venture weighed on earnings.
The target set at the start of the fiscal year of generating positive free cash flow before M & A (FCF
before M & A) was not achieved. This was mainly due to the situation at Industrial Solutions – lower
than expected order intake and high expenditures on projects from orders in hand. The updated fore-
cast for FCF before M & A given in the 9-month report was achieved.
The tkVA of the Group increased clearly but remained negative. The year-on-year improvement result-
ed mainly from the absence of the negative tkVA contribution from the sold Steel Americas business
area and higher contributions from Elevator Technology and Materials Services.
More information on the factors that influenced the development of earnings is contained in the
sections “Group review” and “Business area review”.
The following chart contains details on the forecasts, updated in each case on publication of the
interim reports on the 1st half and the first 9 months of the reporting year, and the actual results in
2017 / 2018:
The Group’s business performance was again strongly supported by our corporate program “impact”

thyssenkrupp annual report 2017 / 2018
2 Combined management report | Report on the economic position
51
FORECAST AND ACTUAL RESULTS FOR FISCAL YEAR 2017 / 2018
Forecast in annual report 2016 / 2017
Update in interim report 1st half 2017 / 2018
Update in interim report 9 months 2017 / 2018 Actual fiscal year 2017 / 2018
Group sales Growth in low to mid single-digit percentage range
Increase in low single-digit percentage range
+ 3% On comparable basis: +5%
Components Technology Growth in mid to high single-digit percentage range
Growth in mid single-digit percentage range
+4% On comparable basis: +8%
Elevator Technology Growth in low to mid single-digit percentage range At prior-year level Slightly lower year-on-year
(2)% On comparable basis: +4%
Industrial Solutions Increase in almost double-digit percentage range At prior-year level Slightly lower year-on-year
(9)% On comparable basis: (10%)
Materials Services +7% On comparable basis: +9%
Steel Europe (discontinued operation)
+6% On comparable basis: +7%
Adjusted EBIT (Group) €1.8 – €2.0 billion Around €1.8 billion
Year-on-year decline by €171 million to €1,551 million
Components Technology Improvement from increase in sales and margin Margin at prior-year level
Adjusted EBIT lower year-on-year; before exchange-rate effects and increased material costs higher year-on-year
Decline by €180 million to €197 million
Elevator Technology
Improvement from increase in sales and margin by 0.5 to 0.7 percentage points
Margin at prior-year level or higher
Adjusted EBIT and margin slightly lower year-on-year; on comparable basis higher year-on-year
Decline by €56 million to €866 million with 0.5 percentage point declinein margin to 11.5%
Industrial Solutions
Clear improvement; improvement in margin but noticeably below target range
Significant earnings increase over 2nd half Adjusted EBIT clearly negative
Decline by €366 million to €(255) million with decline in margin to (5.1)%
Materials Services Slight decline versus prior year Close to prior-year figure Improvement by €5 million to €317 million
Steel Europe (discontinued operation)
Subject to limited visibility, at prior-year level; assuming prices remain stable at a high level, higher than prior year
Assuming continued stable and high prices, clearly higher year-on-year
Clearly higher year-on-year, also absence of amortization and depreciation
Improvement by €140 million to €687 million
Net income (Group) Significant increase Decline by €211 million to €60 million
tkVA (Group) Significant improvement Increase by €434 million to €(217) million
FCF before M & A (Group) Positive Negative Improvement by €721 million to €(134) million
Investments (Group) Around €1.5 billion Decline by €149 million to €1,386 million

thyssenkrupp annual report 2017 / 2018
2 Combined management report | Report on the economic position
52
Group review
Course of business Slight growth in sales with stable orders in hand, adjusted EBIT down sharply year-on-year
Order intake matched the high prior-year level. While Components Technology achieved a new
record, the weak market environment at Industrial Solutions and associated absence of major
orders had a negative impact. The Group’s sales increased year-on-year by 3%, with the strong,
mainly price-related, increase in sales of the materials businesses outweighing the decline in sales
at Industrial Solutions. Adjusted EBIT was down sharply year-on-year, mainly due to additional
expenses at Industrial Solutions in connection with a major project review and revaluation of indi-
vidual projects, and provisions for quality issues at Components Technology. Support was provided
by EBIT effects from cost reductions and efficiency gains in the amount of €890 million from the
corporate program “impact”. Of this around €700 million related to the continuing operations.
ORDER INTAKE BY BUSINESS AREA
million € 2016 / 2017 2017 / 2018 Change in %
Change on a comparable basis1)
in %
Components Technology 7,674 7,861 2 6
Elevator Technology 7,834 7,853 0 5
Industrial Solutions 6,490 5,188 (20) (21)
Materials Services 13,760 14,544 6 8
Steel Europe 8,969 9,157 2 3
Corporate 287 190 (34) (34)
Consolidation (2,257) (2,040) — —
Group without AM 42,756 42,754 0 2
Discontinued operations Steel Americas 1,531 0 -- --
Full Group 44,288 42,754 (3) (1)
Discontinued steel operations 7,399 7,621 3
Discontinued operations Steel Americas 1,531 0 --
Group continuing operations 35,357 35,133 (1) 2
1) Excluding material currency and portfolio effects
Order intake at high prior-year level
The order intake of the capital goods businesses Components Technology, Elevator Technology
and Industrial Solutions remained below the high prior-year level overall. At Components Technolo-
gy order intake reached a new high despite adverse currency effects. Generally robust growth in
demand for car components in Western Europe and China offset declining demand in the USA. The
market environment for heavy truck components remained positive thanks mainly to the good
situation in the USA. Demand for industrial components in the wind energy sector remained weak,
while the market for construction machinery components continued to recover from a low level. At
Elevator Technology order intake was at the strong prior-year level despite adverse currency effects
(mainly US dollar, Chinese yuan, Brazilian real); on a comparable basis order intake increased. At
€5.1 billion (excl. service), orders in hand were higher than the year before.
New record level of orders at Compo-nents Technology.

thyssenkrupp annual report 2017 / 2018
2 Combined management report | Report on the economic position
53
Order intake at Industrial Solutions was clearly down from the year before due to the slowdown in
major project awards. In particular Marine Systems, which profited from two major orders in the
submarine and surface vessel business in the prior year, booked only smaller and medium-size
orders in the reporting year. While the market for cement plants slowed due to the buildup of ca-
pacities in recent years, demand for mining equipment continued to pick up. In chemical plant
engineering orders were higher year-on-year due to a major contract for a chemical complex in
Hungary and a medium-size refinery contract in Germany, but the order situation for major projects
remains difficult due to customers’ reluctance to invest, particularly in the area of fertilizers. At
System Engineering order intake reached a new high, mainly reflecting continuing high demand for
production systems for the automotive industry.
At our materials businesses Materials Services and Steel Europe (discontinued operation) order
intake was higher year-on-year, primarily due to continuing stable and high prices on the material
markets.
NET SALES BY BUSINESS AREA
million € 2016 / 2017 2017 / 2018 Change in %
Change on a comparable basis1)
in %
Components Technology 7,571 7,875 4 8
Elevator Technology 7,674 7,554 (2) 4
Industrial Solutions 5,522 5,020 (9) (10)
Materials Services 13,665 14,652 7 9
Steel Europe 8,915 9,470 6 7
Corporate 278 329 18 18
Consolidation (2,179) (2,156) — —
Group without AM 41,447 42,745 3 5
Discontinued operations Steel Americas 1,525 0 --
Full Group 42,971 42,745 (1) 2
Discontinued steel operations 7,454 7,968 7
Discontinued operations Steel Americas 1,525 0 --
Group continuing operations 33,993 34,777 2 5
1) Excluding material currency and portfolio effects
Slight sales growth
Sales of the capital goods businesses followed the trend in order intake. Despite adverse currency
effects, higher shipments of auto components and crankshafts for heavy trucks, mainly in the USA,
led to record sales at Components Technology. At Elevator Technology sales were slightly lower
year-on-year due to adverse currency effects, but on a comparable basis higher. At Industrial
Solutions, weaker order intake and slower progress on projects at Marine Systems led to a clear
downturn in sales. At System Engineering, cement plant engineering, and Mining, sales were
stable year-on-year.
Customers’ reluctance to invest in major projects weighing on Industrial Solutions.

thyssenkrupp annual report 2017 / 2018
2 Combined management report | Report on the economic position
54
SALES BY CUSTOMER GROUP 2017/2018
in %
SALES BY REGION
in million € (prior-year fi gures in brackets)
North America
India
South America
Western Europe
German-speaking area1) Commonwealth
of Independent States
Middle East & Africa
1) Germany, Austria, Switzerland, Liechtenstein
Asia / Pacifi c
Central and Eastern Europe
Greater China
1,137(1,306)
441(518)
314(391)
2,737
13,540(12,837)
(2,401)
8,136(7,597)
8,762(8,733)
2,412(3,078)
3,206(3,022)
2,061(1,564)
Steel and related processing
11Packaging
3Construction
10Energy and
utilities
2Public sector
3
Trading
13Other customer
groups
18Engineering
12
Automotive
28

thyssenkrupp annual report 2017 / 2018
2 Combined management report | Report on the economic position
55
The materials businesses Materials Services and Steel Europe (discontinued operation) increased
their sales significantly. In particular, higher average net selling prices along with stable shipments
led to a clear increase in sales at Steel Europe.
The regional breakdown of sales of the continuing operations was largely unchanged. The most im-
portant sales market for thyssenkrupp with a slightly higher 32% of sales was once again the German-
speaking region (Germany, Austria, Switzerland and Liechtenstein). It was followed by sales to customers
in North America, which were stable at around 20%, and sales in Western Europe. The share of sales in
the greater China region remained unchanged at 7%.
Accounting for a share of now 28%, the automotive industry remained the most important custom-
er group, with particular significance for our components and steel business (discontinued opera-
tion). It was followed by trading and the engineering sector, which gained in relative and absolute
importance. The share of sales accounted for by steel and related processing declined slightly,
while the share of sales to the construction industry remained unchanged.
Adjusted EBIT down sharply year-on-year
ADJUSTED EBIT BY BUSINESS AREA
million € 2016 / 2017 2017 / 2018 Change in %
Components Technology 377 197 (48)
Elevator Technology 922 866 (6)
Industrial Solutions 111 (255) --
Materials Services 312 317 2
Steel Europe 547 687 26
Corporate (535) (377) 29
Consolidation (12) 117 —
Group without AM 1,722 1,551 (10)
Discontinued operations Steel Americas 189 0 --
Full Group 1,910 1,551 (19)
Discontinued steel operations 558 846 52
Discontinued operations Steel Americas 189 0 --
Group continuing operations1) 1,164 706 (39)
1) See reconciliation in segment reporting (Note 23).
The adjusted EBIT of the capital goods businesses was clearly lower year-on-year despite the
success of sustainable efficiency and cost-reduction measures. The main factors weighing on
earnings were additional expenses at Industrial Solutions in connection with a major project review
and the revaluation of individual projects in the 3rd quarter. Earnings were impacted in particular by
higher anticipated total costs, particularly for a naval project in Turkey, a cement plant in Saudi
Arabia, and a biomass power plant in Australia. In addition, lower than expected sales due to the
absence of major projects, an unfavorable sales mix, and partial underutilization contributed to the
clearly negative earnings of Industrial Solutions. Adjusted EBIT margin in the reporting year was an
unacceptable (5.1)%. At Elevator Technology performance measures could not fully offset highly
adverse currency effects and material cost increases particularly in China: Margin fell to 11.5% and

thyssenkrupp annual report 2017 / 2018
2 Combined management report | Report on the economic position
56
remained below the medium- and long-term targets, but was robust compared with competitors. At
Components Technology adjusted EBIT was down sharply year-on-year, primarily reflecting provi-
sions for quality issues as well as adverse currency effects and material price increases. Other
factors were lower demand for wind turbine components with strong price competition, weaker
productivity in springs and stabilizers, and a flatter start-up curve for new plants due to factors on
the customer side. These influences were only partly offset by improvements in camshaft modules,
damper systems, crankshafts and construction machinery components. At 2.5%, margin was
significantly below the 7% target, due partly to mix effects.
In the materials businesses overall, adjusted EBIT was significantly higher year-on-year in a posi-
tive market environment, also supported by cost-saving programs. Materials Services achieved a
slight increase in earnings year-on-year; margin remained stable but below the 3% target. AST’s
contribution to earnings was down from the high prior year due to pressure from imports and high-
er raw material costs, but still at a high level thanks to profitable growth in end consumer business
and operating performance improvements. With clear gains over the course of the fiscal year, ad-
justed EBIT at Steel Europe (discontinued operation) was up significantly from the already good
prior-year figure due to higher selling prices. The margin trend was correspondingly positive. How-
ever, production restrictions mainly as a result of the low water levels on the Rhine and lower ship-
ments following the introduction of new emission standards (WLTP) in the auto industry weighed on
earnings in the final quarter.
Adjusted EBIT at Corporate showed a significant year-on-year improvement at €(377) million.
Alongside the faster than planned implementation of measures to reduce G&A costs, lower project
expenses for IT infrastructure standardization and data and process harmonization led to lower
costs.
Earnings impacted by special items
The Group’s EBIT was impacted by special items totaling €507 million in the reporting year.
SPECIAL ITEMS BY BUSINESS AREA
million € 2016 / 2017 2017 / 2018 Change
Components Technology 80 76 (4)
Elevator Technology 185 90 (95)
Industrial Solutions 147 (12) (160)
Materials Services 91 47 (44)
Steel Europe 55 216 162
Corporate 35 89 54
Consolidation (22) 0 22
Group without AM 572 507 (66)
Discontinued operations Steel Americas 651 0 (651)
Full Group 1,224 507 (717)
Discontinued steel operations 66 265 200
Discontinued operations Steel Americas 651 0 (651)
Group continuing operations 507 241 (265)
Adjusted EBIT of the materials businesses was significantly higher year-on-year.
Special items down from prior year.

thyssenkrupp annual report 2017 / 2018
2 Combined management report | Report on the economic position
57
Special items at Components Technology in the reporting period were mainly in connection with
closure costs and impairment charges on operating assets. At Elevator Technology special items
were recognized for the restructuring and reorganization in Europe. At Industrial Solutions special
expenses for a legacy contract were partly offset by the reversal of restructuring provisions. Materi-
als Services reported further, mainly restructuring-related measures, among other things in materi-
als distribution in Germany. Steel Europe (discontinued operation) recognized a provision for risks
from a cartel case. This was partly offset by a disposal gain from divestment projects. Special
items at Corporate mainly reflect the sale of an investment and expenses from M&A divestment
projects, particularly for the steel joint venture.
thyssenkrupp Value Added (tkVA) clearly higher year-on-year
In the reporting year, the tkVA of the Group improved significantly but remained negative. The year-
on-year improvement resulted mainly from the absence of the negative tkVA contribution of the
now sold Steel Americas business area. The highest tkVA was once again generated by Elevator
Technology. At Components Technology tkVA was clearly lower year-on-year: alongside clearly
lower earnings, capital employed increased due to growth investments. At Industrial Solutions
capital employed was also significantly higher: with negative operating earnings, tkVA was down
sharply from the year before. The tkVA of Materials Services improved year-on-year – particularly
thanks to the increase in earnings – but remained negative. At Steel Europe (discontinued opera-
tion) average capital employed was higher year-on-year, mainly due to the price-related increase in
net working capital. As a provision for risks from a cartel case weighed on earnings, tkVA was lower
year-on-year. Details on tkVA and its main components are shown in the following table.
THYSSENKRUPP VALUE ADDED (TKVA) BY BUSINESS AREA
2016 / 2017 2017 / 2018
EBIT
(million €)
Capital employed(million €)
WACC(%)
tkVA (million €)
EBIT(million €)
Capital employed (million €)
WACC (%)
tkVA (million €)
Change tkVA (million €)
Group 687 16,728 8.0 (651) 1,045 15,773 8.0 (217) 434
Thereof:
Components Technology 297 3,740 8.5 (21) 120 3,897 8.5 (211) (190)
Elevator Technology 736 1,127 7.5 652 775 1,143 7.5 690 38
Industrial Solutions (36) 430 8.0 (71) (243) 762 8.0 (304) (233)
Materials Services 220 3,652 8.0 (72) 270 3,623 8.0 (20) 52
Steel Europe 493 5,286 8.5 43 471 5,545 8.5 (1) (44)
Steel Americas (444) 1,654 10.0 (609) 0 0 0.0 0 609
More information on the importance of tkVA and EBIT for the management of the Group is con-
tained in the section “Fundamental information about the Group”, subsection “Management of the
Group”.

thyssenkrupp annual report 2017 / 2018
2 Combined management report | Report on the economic position
58
Business area review
Components Technology
COMPONENTS TECHNOLOGY IN FIGURES
Year ended
Sept. 30, 2017Year ended
Sept. 30, 2018 Change in %
Order intake million € 7,674 7,861 2
Net sales million € 7,571 7,875 4
EBIT million € 297 120 (59)
EBIT margin % 3.9 1.5 —
Adjusted EBIT million € 377 197 (48)
Adjusted EBIT margin % 5.0 2.5 —
Employees (Sept. 30) 32,904 34,481 5
Growth and regionalization strategy continued In a mixed market environment, order intake at Components Technology was up slightly by 2%
from the prior year, sales by around 4%. The markets for car components in Western Europe were
robust, in China the climate deteriorated towards the end of the fiscal year, while demand in the
USA weakened. After years of recession, demand picked up in Brazil, albeit from a low level. The
heavy truck markets benefited from the positive trend in the USA, particularly in the Class 8 market
(> 15 t). Demand also strengthened in Brazil, and remained robust in Europe. In the industrial com-
ponents business we registered a sustained slowdown in demand for bearings for the wind energy
sector, particularly in Brazil and India. However, the pick-up in demand for construction equipment
components continued.
We continued our growth and regionalization strategy in the reporting year. Our global automotive
production network is progressing further: Among other things the new plant for electric steering
systems in China started production. The expansion of our damper system site in Romania and the
establishment of new plants for three product groups in Hungary and a further production plant for
springs and stabilizers in China are well advanced. The Hungarian plant for cylinder head cover
modules with integrated camshafts has already started production supplies to our customers.
Earnings under pressure as a result of several quality issues, currency effects and material price increases Adjusted EBIT of Components Technology was clearly lower year-on-year, due mainly to provisions
for quality issues. Other factors weighing on earnings were currency effects (US dollar and Chinese
yuan), material price increases which could not be passed on in full to our customers, lower de-
mand for wind turbine components alongside strong price competition, and a flatter start-up curve
for new plants in the automotive sector. In springs and stabilizers, productivity was down due
among other things to an overload situation at plants in Germany together with new product
launches. Bottlenecks in material logistics in Mexico also weighed heavily on earnings and were
only partly offset by improvements in camshafts, damper systems, crankshafts and construction
machinery components.
www.thyssenkrupp.com > Company > Corporate structure > Components Technology
Provisions for quality issues, currency effects and increased material costs weighed on adjusted EBIT.

thyssenkrupp annual report 2017 / 2018
2 Combined management report | Report on the economic position
59
Elevator Technology
ELEVATOR TECHNOLOGY IN FIGURES
Year ended
Sept. 30, 2017Year ended
Sept. 30, 2018 Change in %
Orders in hand (Sept. 30) million € 4,814 5,066 5
Order intake million € 7,834 7,853 0
Net sales million € 7,674 7,554 (2)
EBIT million € 736 775 5
EBIT margin % 9.6 10.3 —
Adjusted EBIT million € 922 866 (6)
Adjusted EBIT margin % 12.0 11.5 —
Employees (Sept. 30) 52,660 53,013 1
Adjusted for currency effects, order intake and sales higher
At €7.9 billion, the business area’s order intake in the reporting year was level with the prior year
despite negative currency effects. On a comparable basis – i.e. excluding the negative exchange-
rate effects – orders grew by 5%. As in previous years, Elevator Technology profited from increased
demand mainly for new installations in North and Latin America. The number of new installations
was level with the year before in China but slightly lower year-on-year in Europe and South Korea.
Service business, which is particularly important for the business area, showed growth in Asia and
Europe. At €5.1 billion (excl. service) on September 30, 2018, orders in hand were higher than a
year earlier despite negative currency effects.
Due to adverse currency effects, sales at €7.6 billion were down slightly year-on-year. On a compa-
rable basis sales showed 4% growth. Excluding currency factors, sales increased in all markets,
particularly in the service business; in the new installations business in China sales fell slightly due
to price pressure.
Further milestones achieved in Elevator Technology’s global strategy
We achieved further milestones in the implementation of our major growth strategy.
At the start-up conference “StartupCon” in October 2017 Elevator Technology presented its vision
for Industry 4.0 in elevator maintenance: The aim is to reduce downtime by up to 50%. A key part
of this vision is MAX, the first cloud-based predictive maintenance solution for elevators: By means
of real-time diagnostics, service technicians are informed in advance when old or defective compo-
nents and systems need replacing. More than 120,000 elevators worldwide have already been
fitted with MAX technology. After the USA, Germany and Spain, South Korea is now also part of the
MAX network. In addition we have started using the Microsoft HoloLens mixed reality headset,
which provides remote support to help local service technicians perform challenging maintenance
work more efficiently. We have also begun to use HoloLens technology for measuring stairlifts to
further reduce lead and delivery times.
www.thyssenkrupp.com > Company > Corporate structure > Elevator Technology
On a comparable basis, order intake and sales higher.

thyssenkrupp annual report 2017 / 2018
2 Combined management report | Report on the economic position
60
In October 2017 Elevator Technology opened Germany’s highest viewing platform on the test tower
in Rottweil. In the test tower, which is now fully up and running, engineers are testing the rope-free,
sideways moving elevator system MULTI, as well as high-speed elevators. In addition the MULTI
unit acquired its own leadership team this fiscal year.
In March 2018 the official opening of a high-speed test tower took place at our new Zhongshan site
in China. This underlines thyssenkrupp’s commitment to research and development (R&D) in China.
At 248 meters, the test tower is one of the tallest in the world and is specially designed for high-
speed tests and rope-less elevator systems.
In addition to the above two test towers in Rottweil and Zhongshan, thyssenkrupp is planning to
build a third test tower for high-speed elevators in Atlanta/USA. As a world leader in urban mobility,
thyssenkrupp Elevator Technology is expanding its presence in the USA: The building complex,
which also houses further R&D capacities, will also be the new headquarters of Elevator Technolo-
gy Americas.
Earnings under pressure from currency effects and material price increases
Adjusted EBIT was down year-on-year due to lower sales and margin. This mainly reflected nega-
tive currency effects and higher material prices in China. These adverse effects were partly offset
by efficiency and restructuring measures under the corporate program “impact”. Adjusted EBIT
margin was down year-on-year by 0.5 percentage points to 11.5%. However, EBIT improved by
€39 million to €775 million.
Industrial Solutions
INDUSTRIAL SOLUTIONS IN FIGURES
Year ended
Sept. 30, 2017Year ended
Sept. 30, 2018 Change in %
Orders in hand (Sept. 30) million € 11,341 11,281 (1)
Order intake million € 6,490 5,188 (20)
Net sales million € 5,522 5,020 (9)
EBIT million € (36) (243) --
EBIT margin % (0.7) (4.8) —
Adjusted EBIT million € 111 (255) --
Adjusted EBIT margin % 2.0 (5.1) —
Employees (Sept. 30) 21,777 21,535 (1)
Order intake down from high prior-year level in difficult market environment
In the reporting year the business area’s order intake was down from the high prior-year level.
Above all there was a slowdown in project awards in plant engineering owing among other things to
difficult political and economic conditions and volatile oil and gas prices.
In the mining business demand for equipment and components was positive overall. Among other
things we won medium-size orders for coal handling and power plant equipment in India, a port
handling system in Russia, a bucket-wheel excavator system in Thailand, and belt conveyors in
Peru. At the same time investment in new mine openings remained subdued. This is one of the
main reasons we are continuously evolving our service offering for the mining industry.
Adjusted EBIT was down year-on-year due to lower sales and margin.
www.thyssenkrupp.com > Company > Corporate structure > Industrial Solutions

thyssenkrupp annual report 2017 / 2018
2 Combined management report | Report on the economic position
61
In the cement plant business demand was down overall. The market environment was character-
ized by overcapacities together with increasing competitive pressure from Asia. Nevertheless we
succeeded in winning medium-size orders for two production lines in Mexico as well as smaller
orders for systems and components, mainly for customers in West Africa and India.
In the chemical plant business we registered an increase in order intake in the reporting year, mainly
on the back of a major order for a chemical complex in Hungary in the 4th quarter and a medium-
size refinery contract in Germany. In addition we won smaller orders for plants and services in
China, India, and Tanzania. Although we are still observing a reluctance to invest on the part of our
customers, in the medium term we see growth opportunities for the entire chemical plant engineer-
ing business.
Order intake at System Engineering once again exceeded the 1 billion euro mark and reached a
new record high. This reflected continued brisk demand for automated production systems for the
automotive industry, mainly in Europe and Asia. Alongside several major orders for body-in-white
production lines, we succeeded in winning medium-size and smaller orders for engine and battery
assembly lines.
Marine Systems reported a sharp downturn in order intake in the reporting year, with the prior year
benefiting from two major orders in the submarine and surface vessel business. We received
smaller and medium-size orders mainly in marine electronics, maintenance and service.
Sales in the Industrial Solutions business area were down year-on-year at €5 billion. This was
mainly the result of weaker order intake and slower progress on projects at Marine Systems. How-
ever, in the chemical plant, mining and cement businesses and at System Engineering, sales were
near stable.
Earnings and margin down clearly year-on-year – focus on turnaround
Adjusted EBIT and adjusted EBIT margin were down sharply year-on-year. The main reason was
that after a major project review and revaluation in the 3rd quarter, higher expenses had to be
recognized for some projects. These were mainly a naval project in Turkey, a cement plant in Saudi
Arabia, and a biomass power plant in Australia. Adjusted EBIT was additionally impacted by lower
sales, a weaker margin mix on billed projects, and partial underutilization.
In line with our market expectations, the transformation process at Industrial Solutions so far has
been geared to sales growth, above all with major projects in the chemical and cement plant busi-
nesses. However, recently there has been a sharp drop in the number of major projects awarded;
in addition the time from the announcement of projects to their realization has almost doubled.
These changed circumstances create the need for a larger restructuring at Industrial Solutions.
Moving forward we want to focus on smaller and medium-size projects and further strengthen our
high-margin service business in plant construction. To do so we have to adapt our structures in line
with market requirements. That means reducing costs and complexity, making order execution
better, faster and more flexible, and optimizing our technology portfolio in plant construction –
particularly with a view to the digital transformation. In this connection the Marine Systems busi-
ness unit was separated from the business area effective October 1, 2018 and is now managed
directly by thyssenkrupp AG. As a result Industrial Solutions will concentrate exclusively on plant
construction in the future. With this strategic refocusing, the board of Industrial Solutions was also
reorganized.
€1 bn Order intake at System Engineering again exceeded the €1 billion mark.

thyssenkrupp annual report 2017 / 2018
2 Combined management report | Report on the economic position
62
Materials Services
MATERIALS SERVICES IN FIGURES
Year ended
Sept. 30, 2017Year ended
Sept. 30, 2018 Change in %
Order intake million € 13,760 14,544 6
Net sales million € 13,665 14,652 7
EBIT million € 220 270 23
EBIT margin % 1.6 1.8 —
Adjusted EBIT million € 312 317 2
Adjusted EBIT margin % 2.3 2.2 —
Employees (Sept. 30) 19,861 20,273 2
Order intake and sales up year-on-year
In a positive market environment with appreciably higher volumes, order intake and sales showed a
clearly positive trend. This was true of almost all areas of Materials Services and particularly the
warehousing and service businesses in North America, Eastern Europe, and the auto-related ser-
vice centers. AST also achieved further year-on-year growth in sales. Only the aerospace business
was impacted by lower orders from the aviation industry. The trend in shipments was positive
across all units, particularly in the important warehousing and service business with growth of
4.5%. In total 11.1 million tons of materials were sold. Shipments of flat-rolled stainless steel
products at AST were stable at 0.9 million tons. The net sales of the continuing operations of Mate-
rials Services, i.e. excluding the discontinued thyssenkrupp MillServices & Systems GmbH, which is
to be transferred in connection with the planned steel joint venture, came to €14,458 million in the
reporting year.
Digitization as an element of customer focus and efficiency enhancement
In our business, customer and service focus and strong reliability are key success factors. Accord-
ingly, creating added value for our customers is central to our brand promise and our initiatives.
One example is the ongoing digitization of our business processes and distribution channels, based
on sophisticated warehousing, logistics and IT systems: Our entire range is being digitized and
consolidated in the world’s biggest virtual materials warehouse at 271 operating sites worldwide,
putting Materials Services within close reach of its customers at all times. Thanks to the omnichan-
nel architecture, our 250,000 customers also have 24 / 7 access to bespoke services and supplies
from whichever channel or point of contact they choose.
www.thyssenkrupp.com > Company > Corporate structure > Materials Services

thyssenkrupp annual report 2017 / 2018
2 Combined management report | Report on the economic position
63
Adjusted EBIT higher year-on-year
Materials Services achieved a slight increase in earnings from the high prior-year level. The vol-
ume-related growth in sales and further measures to enhance performance and earnings out-
weighed the lower effects from weaker price momentum versus the prior year. Materials Services
also benefited from property disposals, while currency effects weighed on earnings. AST’s contri-
bution to earnings was down from the high prior year due to import pressure and higher material
costs but still at a high level thanks to profitable growth in end consumer business and operating
performance improvements. The adjusted EBIT of the continuing operations of Materials Services
came to €308 million.
Steel Europe (discontinued operation)
STEEL EUROPE IN FIGURES
Year ended
Sept. 30, 2017Year ended
Sept. 30, 2018 Change in %
Order intake million € 8,969 9,157 2
Net sales million € 8,915 9,470 6
EBIT million € 493 471 (4)
EBIT margin % 5.5 5.0 —
Adjusted EBIT million € 547 687 26
Adjusted EBIT margin % 6.1 7.3 —
Employees (Sept. 30) 27,646 27,764 0
Business expanded on higher market prices
Although the market environment remained structurally difficult and uncertain in the reporting year,
Steel Europe further expanded its business volume and achieved significantly higher earnings year-
on-year. Continued robust activity in the main steel-using industries was reflected in higher market
prices and higher average selling prices. With volumes down slightly, order intake and sales in-
creased.
Order intake at Steel Europe increased by 2% to €9.2 billion. The higher market price level was
reflected in our newly negotiated contracts. At 10.8 million tons, order volumes were around 4%
lower year-on-year: In the 1st quarter our scope for booking orders was limited due to investment
and repair shutdowns; in the following months we were able to serve demand more fully again.
Towards the end of the fiscal year – in August and September – production was again limited, this
time by logistical problems due to low water levels on the River Rhine.
Steel Europe clearly increased its sales to €9.5 billion. We profited above all from the higher prices
agreed with our customers. Shipments were down slightly year-on-year at 11.3 million tons alto-
gether. Volume growth was achieved mainly with customers in the automotive industry and their
suppliers, while supplies to other industrial customers were mostly slightly lower. However, ship-
ments of heavy plate were down sharply: partly due to the closure of two cut-to-length lines and
partly to production disruptions. The downturn in shipments was offset in part by higher prices.
www.thyssenkrupp.com Company > Corporate structure > Steel

thyssenkrupp annual report 2017 / 2018
2 Combined management report | Report on the economic position
64
At 11.8 million tons, crude steel production including supplies from Hüttenwerke Krupp Mannes-
mann was down by around 2% year-on-year. Temporary problems created a difficult supply situa-
tion for starting materials, but this was overcome with the purchase of slabs. In the final quarter
production fell sharply: Due to the Rhine’s low water levels in August and September, supplies of
raw materials were severely disrupted, which meant output on our blast furnaces, meltshops and
downstream units had to be scaled back. Rolled steel production for customers was down 4% year-
on-year at 11.3 million tons.
Earnings significantly higher
Steel Europe’s earnings in the reporting year again significantly exceeded the already good prior-
year figure. Positive factors were above all the pleasing market price trend which resulted in a year-
on-year increase in average net selling prices. Added to this were effects from earnings-securing
measures and this year also from the “one steel” initiative, which among other things introduced
improvements in sales management. The cost-side impacts remained high overall, but in the sec-
ond half of the fiscal year, with slightly reduced volatility, prices for iron ore and coking coal sof-
tened slightly. In the final quarter temporary production restrictions due to the low Rhine water
levels, and lower shipments due to the introduction of new emissions standards (WLTP) led to a
negative earnings effect.
Corporate at thyssenkrupp AG The Group is managed centrally by thyssenkrupp AG. To further improve control structures and in
the interests of more transparent presentation, as of the 2016 / 2017 fiscal year Corporate is divid-
ed into Corporate Headquarters (CorpHQ), Regions, Service Units and Special Units.
CorpHQ mainly comprises the corporate functions. It also includes the management of the Group-
wide transformation programs for the standardization of the IT infrastructure, data and process
harmonization, and the harmonization of HR processes.
The Regions include our regional headquarters (“RHQs”) in North and South America, Greater
China, India, the Asia/Pacific region, and the Middle East & Africa region, as well as the regional
offices and Group representative offices.
The Service Units mainly include Global Shared Services, Regional Services Germany and Corpo-
rate Services.
The Special Units include asset management for the Group’s real estate, cross-business area tech-
nology projects as well as non-operating entities needed for example for Group financing.
Adjusted EBIT at Corporate improved significantly year-on-year, coming to €(377) million in the
reporting year. Alongside the faster than planned implementation of measures to reduce G&A costs,
significantly lower project expenses for IT infrastructure standardization and data and process
harmonization contributed to the earnings improvement. In addition a real estate sale bolstered
earnings in the 1st quarter. EBIT was €(466) million and included special items of altogether
€89 million.
thyssenkrupp AG manages the Group centrally.

thyssenkrupp annual report 2017 / 2018
2 Combined management report | Report on the economic position
65
Adjusted EBIT of the continuing operations of Corporate – i.e. without Krupp Hoesch Stahl GmbH
and without Thyssen Stahl GmbH, which are to be transferred to the planned steel joint venture –
came to €(370) million in the reporting year.
Results of operations and financial position
Analysis of the statement of income Net sales from continuing operations in fiscal year 2017 / 2018 were 2% higher than a year earlier.
Above all the continuing materials operations contributed to the rise; this was partly offset by the
overall decline in net sales at the capital goods businesses. Cost of sales from continuing opera-
tions increased at a higher rate than net sales, particularly in connection with material expenses.
Gross margin decreased to 14.2%.
The decrease in selling expenses from continuing operations was mainly due to reduced personnel
expenses and lower allowances for trade accounts receivable. The decline in general and administra-
tive expenses from continuing operations mainly reflected lower restructuring expenses and re-
duced consulting and IT expenses. The main reason for the decrease in other income was the
absence of the prior-year gain from the remeasurement of the investment in Atlas Elektronik in
connection with the switch to full consolidation as a result of the acquisition of the remaining
shares.
The improvement in income from equity-method investments of the continuing operations mainly
reflected the absence of the losses from the equity-method investment in Atlas Elektronik recog-
nized in the prior year until the switch to full consolidation. The overall improvement in net financial
expense of the continuing operations mainly reflected reduced interest expense for financial debt.
Tax expense from continuing operations was substantially impacted by one-time effects from the
US tax reform and by valuation allowances for deferred tax assets on tax loss carryforwards in
Germany. After taking into account income taxes there was a loss from continuing operations of
€198 million, compared with income of €12 million in the prior year.
The strong €651 million improvement to a net income of €60 million mainly resulted from the ab-
sence of the losses of Steel Americas recognized in the prior year in loss from discontinued opera-
tions (net of tax). Earnings per share therefore increased strongly by €1.16 to a profit of €0.01.
2% Net sales increased by 2%.

thyssenkrupp annual report 2017 / 2018
2 Combined management report | Report on the economic position
66
Consolidated statement of income
million €, earnings per share in € Year ended
Sept. 30, 20171)
Year ended Sept. 30, 2018
Net sales 33,993 34,777
Cost of sales (28,543) (29,847)
Gross margin 5,449 4,930
Research and development cost (285) (259)
Selling expenses (2,326) (2,218)
General and administrative expenses (2,321) (2,077)
Other income 246 195
Other expenses (122) (136)
Other gains/(losses), net 42 36
Income/(loss) from operations 684 472
Income from companies accounted for using the equity method (16) (1)
Finance income 768 703
Finance expense (1,107) (1,010)
Financial income/(expense), net (355) (308)
Income/(loss) from continuing operations before tax 329 163
Income tax (expense)/income (317) (362)
Income/(loss) from continuing operations (net of tax) 12 (198)
Income/(loss) from discontinued operations (net of tax) (603) 258
Net income/(loss) (591) 60
Thereof:
thyssenkrupp AG’s shareholders (649) 8
Non-controlling interest 59 51
Net income/(loss) (591) 60
Basic and diluted earnings per share based on
Income/(loss) from continuing operations (attributable to thyssenkrupp AG’s shareholders) (0.07) (0.39)
Net income/(loss) (attributable to thyssenkrupp AG's shareholders) (1.15) 0.01
See accompanying notes to consolidated financial statements. 1) Figures have been adjusted (cf. Note 03).

thyssenkrupp annual report 2017 / 2018
2 Combined management report | Report on the economic position
67
Analysis of the statement of financial position Total assets decreased significantly from September 30, 2017.
The sharp decrease in non-current assets mainly reflected reclassifications of property, plant and
equipment and intangible assets to assets held for sale in connection with the discontinued steel
operations. The significant reduction in deferred taxes also reflected reclassifications in connection
with the discontinued steel operations but mainly one-time effects due to the US tax reform as well
as the valuation allowances for deferred tax assets on tax loss carryforwards in Germany.
The significant increase in current assets mainly reflected the above mentioned reclassifications
from non-current assets in connection with the discontinued steel operations. The decreases in
inventories and in trade accounts receivable were also impacted to a large extent by reclassifica-
tions to assets held for sale in connection with the discontinued steel operations; at the same time
there were overall increases at the continuing materials and capital goods operations. The addi-
tional sharp decline in cash and cash equivalents resulted mainly from the repayment of financial
debt and from the negative free cash flow of the continuing operations in the reporting year; the
financing of the discontinued operations had an increasing effect.
Total equity at September 30, 2018 was slightly lower year-on-year at €3,274 million. This was main-
ly due to losses from currency translation and remeasurement of pensions and similar obligations
recognized in other comprehensive income, and dividend payments. The net profit achieved in the
reporting year as well as gains from cash flow hedges included in other comprehensive income had
an increasing effect. The equity ratio was unchanged at 9.7%.
The sharp decrease in non-current liabilities mainly reflected reclassifications to liabilities associat-
ed with assets held for sale in connection with the discontinued steel operations, in particular re-
garding accrued pension and similar obligations.
The strong increase in current liabilities mainly reflected the above mentioned reclassifications of
non-current liabilities in connection with the discontinued steel operations. Such reclassifications
were also the main reason for the decreases in other provisions and other financial and non-
financial liabilities. In the case of trade accounts payable, reclassifications in connection with the
discontinued steel operations were partly offset in particular by increases at the continuing materi-
als operations. The additional significant decrease in current financial debt mainly reflected the
repayment of a bond in August 2018 and the repayment of liabilities to financial institutions.
€3,274 m Total equity decreased slightly from €3,404 million to €3,274 million.

thyssenkrupp annual report 2017 / 2018
2 Combined management report | Report on the economic position
68
Consolidated statement of financial position
ASSETS
million € Sept. 30, 2017 Sept. 30, 2018
Intangible assets 4,813 4,393
Property, plant and equipment (inclusive of investment property) 7,605 4,791
Investments accounted for using the equity method 154 48
Other financial assets 43 32
Other non-financial assets 207 144
Deferred tax assets 1,680 1,116
Total non-current assets 14,502 10,524
Inventories 6,957 5,159
Trade accounts receivable 5,734 5,529
Other financial assets 420 330
Other non-financial assets 1,923 1,838
Current income tax assets 220 249
Cash and cash equivalents 5,292 2,987
Assets held for sale 0 7,252
Total current assets 20,546 23,344
Total assets 35,048 33,868
See accompanying notes to consolidated financial statements.

thyssenkrupp annual report 2017 / 2018
2 Combined management report | Report on the economic position
69
See accompanying notes to consolidated financial statements.
Financing Principles and aims of financial management
The financing of the Group is handled centrally by thyssenkrupp AG. It is based on a multi-year
financial planning system and a monthly rolling liquidity planning system covering a planning peri-
od of up to a year. The cash inflows from our operating activities are our main source of liquidity.
Our cash management systems allow Group companies to use surplus funds of other units to cover
their liquidity requirements. This reduces the volume of external financing and thus interest ex-
pense. External financing requirements are covered using money and capital market instruments
such as bonds, loan notes or commercial papers. We also make use of committed credit facilities in
various currencies and with various terms, as well as selected off-balance financing instruments
such as factoring programs and operating leases. Information on the available credit facilities is
provided in Note 16.
EQUITY AND LIABILITIES
million € Sept. 30, 2017 Sept. 30, 2018
Capital stock 1,594 1,594
Additional paid-in capital 6,664 6,664
Retained earnings (5,401) (5,535)
Cumulative other comprehensive income 33 82
[thereof discontinued operations] [—] [97]
Equity attributable to thyssenkrupp AG’s stockholders 2,890 2,805
Non-controlling interest 515 469
Total equity 3,404 3,274
Accrued pension and similar obligations 7,924 4,128
Provisions for other employee benefits 354 182
Other provisions 645 295
Deferred tax liabilities 111 28
Financial debt 5,326 5,087
Other financial liabilities 182 157
Other non-financial liabilities 5 4
Total non-current liabilities 14,546 9,882
Provisions for current employee benefits 357 334
Other provisions 1,183 1,067
Current income tax liabilities 254 207
Financial debt 1,930 147
Trade accounts payable 5,729 5,266
Other financial liabilities 842 635
Other non-financial liabilities 6,802 6,626
Liabilities associated with assets held for sale 0 6,430
Total current liabilities 17,097 20,711
Total liabilities 31,643 30,593
Total equity and liabilities 35,048 33,868
Cash inflows from operating activities are our main source of liquidity.

thyssenkrupp annual report 2017 / 2018
2 Combined management report | Report on the economic position
70
The aim of our central financing system is to strengthen our negotiating position vis-à-vis banks
and other market players and to raise or invest capital on the best possible terms and conditions.
Net financial debt and available liquidity
Net financial debt is calculated as the difference between cash and cash equivalents shown in the
statement of financial position plus current other financial assets available for sale, and non-
current and current financial debt. The corresponding assets and liabilities of the disposal groups –
where applicable – are also taken into account.
The net financial debt of the full Group at September 30, 2018 stood at €2,364 million,
€407 million higher than the level at September 30, 2017 (€1,957 million). The main reasons for
the increase were the negative FCF before M & A and the dividend payment. Taking into account
cash, cash equivalents, committed undrawn credit lines and the balanced maturity structure,
thyssenkrupp remains solidly financed.
At September 30, 2018 the Group’s available liquidity came to €6.6 billion, consisting of
€3.0 billion cash and cash equivalents and €3.6 billion committed undrawn credit lines. Additional
financing possibilities were available to us under a commercial paper program with a limit of
€1.5 billion. Under the program commercial papers can be issued with a term of up to 364 days
depending on investor demand. At September 30, 2018 we had not made use of the program.
The available liquidity offers enough scope to cover debt maturities. The gross financial debt re-
payable in the 2018 / 2019 fiscal year amounts to €0.2 billion.
The financing and liquidity of the Group were secured at all times in the reporting year.
thyssenkrupp AG has agreements with banks which contain certain conditions in the event that the
gearing ratio (net financial debt to equity) in the consolidated financial statements exceeds an
applicable limit at the closing date (September 30). The applicable limit lies in a range from 150%
to 200% and depends on the discount rate used to calculate thyssenkrupp’s pension obligations in
Germany. At September 30, 2018 the applicable gearing limit for thyssenkrupp AG based on these
agreements was 165%.
At the balance sheet date the gearing ratio was 72.2% and therefore below the agreed limit.
Rating
We have been rated by Moody’s and Standard & Poor’s since 2001 and by Fitch since 2003. Our
ratings are currently below investment grade.
In light of the announcement made in September 2018 regarding the planned separation of the
thyssenkrupp Group into two independent companies all three rating agencies revised their rating
outlook at the beginning of October. Moody’s downgraded its Ba2 rating outlook from “stable” to
thyssenkrupp remains solidly financed.
€6.6 bn The Group’s available liquidity came to €6.6 billion.
72.2% The gearing ratio was 72.2%.

thyssenkrupp annual report 2017 / 2018
2 Combined management report | Report on the economic position
71
“negative, while Fitch downgraded its BB+ rating outlook from “watch positive” to “watch negative”.
The changes reflect the agencies’ expectation that in connection with the separation of the
thyssenkrupp Group the current ratings of thyssenkrupp AG will transfer to the future thyssenkrupp
Materials AG. The agencies expect a weaker credit profile and higher cyclicality for this unit. Stand-
ard & Poor’s changed its BB rating outlook from “watch positive” to “developing”, not specifying
the direction of a possible rating change due to uncertainty over the exact form of the planned
separation of the Group.
RATING
Long-term rating Short-term rating Outlook
Standard & Poor’s BB B developing
Moody’s Ba2 Not Prime negative
Fitch BB+ B watch negative
Analysis of the statement of cash flows The amounts taken into account in the statement of cash flows correspond to the item “Cash and
cash equivalents” as reported in the statement of financial position.
Operating cash flows
In the reporting year net cash inflow from operating activities was up significantly from the prior year.
The increase reflected higher cash inflows at both the continuing and discontinued operations, in each
case mainly due to releases of funds via operating assets and liabilities.
Cash flows from investing activities
Investments in the reporting year were down from the prior year, mainly due to lower investments
at Steel Europe (discontinued operation). The share of the capital goods businesses in total in-
vestments increased to 55%. In all business areas and at Corporate forward-looking projects were
carried out in connection with digitization, IT modernization and harmonization of the systems
landscape to enhance efficiency, lower costs and as a basis for Industry 4.0.

thyssenkrupp annual report 2017 / 2018
2 Combined management report | Report on the economic position
72
Components Technology – Investments in the Automotive business focused mainly on existing facili-
ties and building additional production capacities for electric steering systems, in particular in
China, Mexico and Hungary. In the business with active and passive damping systems the focus
was on the construction of the new plant in Mexico and expansion of damper technology in Roma-
nia. The construction of two new plants in China and Hungary to produce springs and stabilizers is
at an advanced stage. In addition, capacities for cylinder head modules in Mexico and Hungary
were expanded. The focus in the industrial components business was on equipment rationalization
and modernization.
Elevator Technology – The business area is implementing an extensive innovation and growth strat-
egy involving investment in innovative products such as MAX and MULTI and in the international
expansion of the service network and production facilities. Details of the strategy are presented in
the section “Business area review”.
Industrial Solutions – To strengthen our market position and exploit growth opportunities we contin-
ued to invest in infrastructure and the expansion of our technology portfolio in the mining and
cement businesses as well as in chemical plant construction. System Engineering also invested in
growth with the construction of a new body-in-white components plant for a new electric car model.
The main focus at Marine Systems was on the continuing modernization of the Kiel shipyard, with
investments in particular in infrastructure measures and IT.
Materials Services – In the reporting year we invested above all in smart storage, logistics and IT
systems and in the digitization of business processes and sales channels in order to open up new
possibilities of dialogue and cooperation and leverage efficiency advantages by digitally connecting
customers and suppliers. Further funds were invested in the purchase of land for a new logistics
center for thyssenkrupp Schulte and in site modernization and maintenance.
INVESTMENTS BY BUSINESS AREA
million € 2016 / 2017 2017 / 2018 Change in %
Components Technology 551 523 (5)
Elevator Technology 144 113 (21)
Industrial Solutions 82 122 49
Materials Services 132 113 (14)
Steel Europe 566 442 (22)
Corporate 58 66 14
Consolidation 3 6 —
Group without AM 1,535 1,386 (10)
Discontinued operations Steel Americas 131 0 --
Full Group 1,666 1,386 (17)
Discontinued steel operations 576 450 (22)
Discontinued operations Steel Americas 131 0 --
Group continuing operations 959 935 (2)
The construction of two new plants in China and Hungary to produce springs and stabilizers is at an advanced stage.

thyssenkrupp annual report 2017 / 2018
2 Combined management report | Report on the economic position
73
Steel Europe (discontinued operation) – A new ladle furnace to produce high-quality steels, among
others high-strength grades for the auto industry, was successfully commissioned at BOF meltshop
2 in Duisburg. As a new strategic investment project we decided to build a hot-dip coating plant
(FBA 10) at the Dortmund site to serve increasing auto industry demand for high-quality hot-dip
coated products. The Packaging Steel business unit is building a new coating facility meeting high-
er environmental standards to continue the production of chromium-coated blackplate. Steel Eu-
rope also invests continuously in equipment modernization, for example in connection with the
quality offensive at the Electrical Steel business unit, and in improving environmental protection:
Among other things a new sinter belt dust collector is being built at the Duisburg site.
Corporate – Investment is currently focused on the two major projects Carbon2Chem and Additive
Manufacturing being carried out by Corporate in the area of technology development. The aim of
Carbon2Chem is to use steel mill off-gases, including the CO2 they contain, as raw materials for
chemical products. More information on Carbon2Chem can be found in the section “Technology
and innovations”. Additive manufacturing allows 3D objects to be built up layer by layer to form
innovative parts. There was also spending in the reporting year in the area of real estate, which is
consolidated centrally – independently of the business areas – at Asset Management. One example
is the elevator test and development tower in Rottweil for the Elevator Technology business area.
Further investments related to the IT area, for example standardizing the IT infrastructure, data and
process harmonization and the central purchasing of software licenses. In addition, fractional
shares were purchased in connection with the planned steel joint venture.
The net cash outflow from investing activities in the reporting year was significantly higher than a
year earlier, mainly due to the proceeds from the sale of Steel Americas recognized in the prior year
at the continuing operations and the year-on-year decrease in investments in property, plant and
equipment at the discontinued operations.
Free cash flow
In the reporting year free cash flow in total and at the continuing operations was negative. This was
mainly due to the above mentioned high cash outflow from investing activities of the continuing
operations, partly offset in particular by cash inflows from operating activities at the discontinued
operations.
The Group’s overall free cash flow before M & A, i.e. cash inflow from operating activities excluding
proceeds and expenditures due to major portfolio measures, improved significantly year-on-year
but remained negative. Positive cash flow contributions, in particular from Materials Services and
the discontinued operation Steel Europe, were unable to offset the negative effects at Industrial
Solutions due to the continued low order intake and high expenditures on existing projects.
Negative free cash flow

thyssenkrupp annual report 2017 / 2018
2 Combined management report | Report on the economic position
74
Cash flows from financing activities
Financing activities in the reporting year resulted in a significant cash outflow, in particular due to
the repayment of financial debt. The overall high cash inflow in the prior year was influenced in
particular by the increase of the capital stock of thyssenkrupp AG in September 2017.
RECONCILIATION TO FREE CASH FLOW BEFORE M & A
million € 2016 / 2017 2017 / 2018 Change
Operating cash flows – continuing operations (consolidated statement of cash flows) 27 185 157
Cash flow from investing activities – continuing operations (consolidated statement of cash flows) 552 (869) (1,421)
Free cash flow from continuing operations (FCF) 579 (684) (1,264)
–/+ Cash inflow/cash outflow resulting from material M&A transactions (1,342) 6 1,348
Free cash flow before M&A – continuing operations (FCF before M&A) (763) (678) 84
Discontinued steel operations (92) 545 ++
Discontinued operations Steel Americas 57 0 --
Free cash flow before M&A – Group (FCF before M & A) (798) (134) 665

thyssenkrupp annual report 2017 / 2018
2 Combined management report | Report on the economic position
75
CONSOLIDATED STATEMENT OF CASH FLOWS
million € Year ended
Sept. 30, 20171)
Year ended Sept. 30, 2018
Net income/(loss) (591) 60
Adjustments to reconcile net income/(loss) to operating cash flows:
Income/(loss) from discontinued operations (net of tax) 603 (258)
Deferred income taxes, net 75 88
Depreciation, amortization and impairment of non-current assets 688 688
Reversals of impairment losses of non-current assets (1) 0
Income/(loss) from companies accounted for using the equity method, net of dividends received 16 1
(Gain)/loss on disposal of non-current assets (44) (28)
Changes in assets and liabilities, net of effects of acquisitions and divestitures and other non-cash changes
– Inventories (397) (539)
– Trade accounts receivable (677) (557)
– Accrued pension and similar obligations (44) (23)
– Other provisions 116 (23)
– Trade accounts payable 692 672
– Other assets/liabilities not related to investing or financing activities (409) 105
Operating cash flows – continuing operations 27 185
Operating cash flows – discontinued operations 583 1,000
Operating cash flows – total 610 1,184
Purchase of investments accounted for using the equity method and non-current financial assets (4) (2)
Expenditures for acquisitions of consolidated companies net of cash acquired 4 (8)
Capital expenditures for property, plant and equipment (inclusive of advance payments) and investment property (839) (801)
Capital expenditures for intangible assets (inclusive of advance payments) (121) (124)
Proceeds from disposals of investments accounted for using the equity method and non-current financial assets 5 3
Proceeds from disposals of previously consolidated companies net of cash disposed 1,418 0
Proceeds from disposals of property, plant and equipment and investment property 90 63
Proceeds from disposals of intangible assets (1) 1
Cash flows from investing activities – continuing operations 552 (869)
Cash flows from investing activities – discontinued operations (673) (430)
Cash flows from investing activities – total (121) (1,299)

thyssenkrupp annual report 2017 / 2018
2 Combined management report | Report on the economic position
76
CONSOLIDATED STATEMENT OF CASH FLOWS
million € Year ended
Sept. 30, 20171)
Year ended Sept. 30, 2018
Proceeds from issuance of bonds 1,250 0
Repayments of bonds (1,250) (1,600)
Proceeds from liabilities to financial institutions 3,470 366
Repayments of liabilities to financial institutions (3,722) (551)
Proceeds from/(repayments on) loan notes and other loans (21) (75)
Increase/(decrease) in bills of exchange 9 (11)
(Increase)/decrease in current securities 0 1
Payment of thyssenkrupp AG dividend (85) (93)
Proceeds from capital increase 1,375 0
Profit attributable to non-controlling interest (37) (38)
Expenditures for acquisitions of shares of already consolidated companies (1) (2)
Financing of discontinued operations (162) 568
Other financing activities 33 (66)
Cash flows from financing activities – continuing operations 858 (1,501)
Cash flows from financing activities – discontinued operations (74) (613)
Cash flows from financing activities – total 784 (2,114)
Net increase/(decrease) in cash and cash equivalents – total 1,273 (2,229)
Effect of exchange rate changes on cash and cash equivalents – total (86) (57)
Cash and cash equivalents at beginning of year – total 4,105 5,292
Cash and cash equivalents at end of year – total 5,292 3,006
[thereof cash and cash equivalents within the discontinued operations] [63] [19]
Additional information regarding cash flows from interest, dividends and income taxes which are included in operating cash flows of continuing operations:
Interest received 60 37
Interest paid (319) (232)
Dividends received 34 34
Income taxes paid (332) (354)
See accompanying notes to consolidated financial statements. 1) Figures have been adjusted (cf. Note 03).
Assets not recognized and off-balance financing instruments In addition to the assets recognized on the balance sheet, the Group also uses non-recognized
assets. These are mainly leased or rented assets (operating leases). More details on this can be
found under Note 20. Our off-balance financing instruments also include factoring programs. More
details can be found under Note 09. Should financing instruments of this kind no longer be avail-
able in the future, we have adequate available credit lines. This also applies to the nonrecourse
factoring of receivables, which the Group as a whole sold in connection with ordinary business
activities in the amount of €1.8 billion at the closing date (prior year: €1.6 billion); €1.4 billion was
attributable to the continuing operations (prior year: €1.1 billion).

thyssenkrupp annual report 2017 / 2018
2 Combined management report | Report on the economic position
77
Annual financial statements of thyssenkrupp AG
thyssenkrupp AG is the parent company of the thyssenkrupp Group. The Executive Board of
thyssenkrupp AG is responsible for the management of the Company and the Group. This includes
above all defining corporate strategy and allocating resources as well as executive development
and financial management. The annual financial statements of thyssenkrupp AG were prepared
according to the rules of the German Commercial Code (HGB) and the German Stock Corporation
Act (AktG); the management report is combined with the management report on the Group. The
parent-company financial statements are used to calculate unappropriated income and thus the
amount of the possible dividend payment.
Course of business, future development and risk position Course of business 2017 / 2018
The business performance and position of thyssenkrupp AG is mainly determined by the business
performance and success of the Group. We report on this in detail in the sections “Group review”,
“Business area review”, and “Results of operations and financial position”.
Expected development 2018 / 2019 with material opportunities and risks
In June an agreement was signed with Tata Steel to combine the European steel activities in a joint
venture. thyssenkrupp AG will hold a 50% stake in this joint venture via thyssenkrupp Technologies
Beteiligungen GmbH. Moreover thyssenkrupp AG decided to separate the Group into two independ-
ent listed companies in the form of a spin-off. After the separation, thyssenkrupp AG’s sharehold-
ers will hold shares in both companies. More details on the joint venture with Tata Steel and the
separation are provided in the “Strategy” section.
The expected development of thyssenkrupp AG in the 2018 / 2019 fiscal year depends mainly on
the development of the Group as a whole and its opportunity and risk position. This is the subject
of the forecast, opportunity and risk report of the Group. To this extent the information provided
there on the expected development and risk position of the Group also applies to the future devel-
opment and risk position of thyssenkrupp AG.
As parent company of the Group, thyssenkrupp AG receives income in particular from its equity
investments. Net income from investments comprises profits and losses transferred from domestic
subsidiaries and dividends distributed particularly by foreign subsidiaries. Accordingly, the positive
expectations for the Group’s business performance in 2018 / 2019 should also be reflected in the
income of thyssenkrupp AG. Overall we expect an unappropriated profit at thyssenkrupp AG in
2018 / 2019 that will allow our shareholders to share appropriately in the earnings of the Group.
Results of operations thyssenkrupp AG reported net income of €1,579 million in the 2017 / 2018 fiscal year, compared
with net income of €59 million a year earlier.
Net sales mainly included income from amounts charged on in accordance with the corporate
design, company naming and trademark policy for the corporate mark (€353 million), income from
insurance services (€68 million), and usage fees for Group licenses (€56 million).

thyssenkrupp annual report 2017 / 2018
2 Combined management report | Report on the economic position
78
General administrative expenses decreased by €55 million to €589 million. This was mainly due to
lower expenses in the IT area and reflects above all an around €50 million reduction in expenses
for the Group’s IT strategy. Personnel expense reported under general administrative expenses was
lower mainly on account of a €7 million decrease in allocations to provisions for share-based com-
pensation (LTI).
The €1,675 million increase in other operating income mainly included income of €1,751 million
from the contribution in kind at fair value of the share in Thyssen Stahl GmbH to thyssenkrupp
Technologies Beteiligungen GmbH.
Other operating expenses fell by €373 million to €86 million and include expenses for maintenance
and other services for non-operating real estate in the amount of €20 million. The prior-year figure
includes currency translation differences of €301 million in connection with the sale of
thyssenkrupp Companhia Siderúrgica do Atlantico Ltda. In accordance with the hedging strategy,
this transaction did not impact income at Group level due to offsetting effects at other Group com-
panies.
Income from investments was €497 million lower at €476 million.
Income from profit and loss transfer agreements was up by €574 million to €758 million. In particular
Thyssen Stahl GmbH’s profit transfer increased by €407 million to €559 million on account of
higher profit transfers from the Steel Europe business area companies it holds. This was partly
offset by a €543 million increase in expenses from loss transfers to €659 million. This was mainly
due to thyssenkrupp Technologies Beteiligungen GmbH, which transferred negative earnings of
€631 million after positive earnings of €20 million in the prior year, on account of higher loss ab-
sorptions, lower profit transfers, and write-downs on the companies held by thyssenkrupp Techno-
logies Beteiligungen GmbH.
In addition, a total of €378 million income from investments resulted in particular from dividend
payments of thyssenkrupp North America Inc. and thyssenkrupp (China) Ltd.
In the course of fiscal 2017 / 2018 there were impairment charges on financial assets of €84 million
relating to the shares of thyssenkrupp Business Services GmbH and €53 million relating to the
shares of thyssenkrupp UK Plc.
Income taxes related to corporation and trade income tax as well as comparable foreign income
taxes.
Financial position Total assets decreased year-on-year by €7,157 million to €30,213 million. At September 30, 2018,
fixed assets as a percentage of total assets were unchanged from a year earlier at 74%.

thyssenkrupp annual report 2017 / 2018
2 Combined management report | Report on the economic position
79
Fixed assets decreased by €5,423 million to €22,285 million. Shares in affiliated companies were
€5,397 million lower at €18,953 million, mainly reflecting a capital repayment of €6,832 million at
thyssenkrupp Nederland Holding B.V. This was partly offset by a contribution in kind of the share
held in Thyssen Stahl GmbH to thyssenkrupp Technologies Beteiligungen GmbH, which increased
the carrying value of this investment by €3,190 million.
Receivables and liabilities from/to affiliated companies are significant items in the balance sheet of
thyssenkrupp AG. They reflect the central importance of thyssenkrupp AG in the Group’s cash
management system.
At September 30, 2018 receivables from affiliated companies were €289 million higher at
€5,705 million. This was mainly due to increased receivables from profit and loss transfer agreements.
thyssenkrupp AG bears liability from the internal transfer of pension obligations. The indemnifica-
tion right created by transfer of responsibility for meeting the obligations recognized under miscel-
laneous assets decreased by €31 million in the past fiscal year to €284 million. This was recog-
nized under pension obligations accordingly.
At September 30, 2018 cash in hand and cash at banks was €1,986 million down from a year
earlier at €1,858 million due to the repayment of financial liabilities.
Total equity increased by €1,485 million to €8,677 million at September 30, 2018. This change
resulted from the year-on-year increase in net profit to €2,097 million and the allocation of
€789 million of net income to other retained earnings by the Executive Board and Supervisory Board.
The equity ratio therefore rose to 29% (prior year: 19%).
The €17 million reduction in pension provisions was mainly due to payments (€51 million) and the
change in the aforementioned internally transferred pension obligations (€32 million). This was partly
offset by €41 million additions and €28 million accrued interest. As thyssenkrupp AG adopted the
role of Groupwide hedging platform for currency risks as of the 2017 / 2018 fiscal year, other provi-
sions contain provisions for unrealized exchange-rate losses in the amount of €16 million.
Liabilities to affiliated companies are mainly deposits by subsidiaries in the Group’s central financial
clearing system. Liabilities to affiliated companies were €6,940 million lower year-on-year at
€14,840 million. This was mainly due to a €7,431 million reduction in intercompany liabilities.
More information on the financial position of thyssenkrupp AG is contained in the Notes to the
parent-company financial statements.
29%The equity ratio rose to 29%.

thyssenkrupp annual report 2017 / 2018
2 Combined management report | Report on the economic position
80
Unappropriated income and proposal for the appropriation of net income The legal basis for the distribution of a dividend is the unappropriated income of thyssenkrupp AG
calculated in accordance with HGB. It is calculated from the €1,579 million net income for the year
of thyssenkrupp AG, less the €789 million allocation to other retained earnings decided by the
Executive Board and Supervisory Board under § 58 (2) AktG, plus the profit carried forward from
the prior year. The annual financial statements therefore show unappropriated income of
€2,097 million.
The Executive Board and Supervisory Board propose to the Annual General Meeting that the unap-
propriated income for the 2017 / 2018 fiscal year in the amount of €2,097 million be used as fol-
lows: Distribution of a dividend of €0.15 per eligible share and the remaining amount to be carried
forward.
Statement of financial position of thyssenkrupp AG
ASSETS
million € Sept. 30, 2017 Sept. 30, 2018
Fixed assets
Intangible assets 73 71
Property, plant and equipment 328 312
Financial assets 27,307 21,902
27,708 22,285
Operating assets
Receivables and other assets 5,773 6,032
Cash on hand and cash at banks 3,844 1,858
9,617 7,890
Prepaid expenses and deferred charges 45 38
Total assets 37,370 30,213

thyssenkrupp annual report 2017 / 2018
2 Combined management report | Report on the economic position
81
EQUITY AND LIABILITIES
million € Sept. 30, 2017 Sept. 30, 2018
Total equity
Capital stock 1,594 1,594
Additional paid-in capital 2,703 2,703
Other retained earnings 1,494 2,283
Unappropriated income 1,401 2,097
7,192 8,677
Provisions
Accrued pension and similar obligations 1,093 1,076
Other provisions 193 232
1,286 1,308
Liabilities
Bonds 6,300 4,700
Liabilities to financial institutions 347 252
Liabilities to affiliated companies 21,780 14,840
Other liabilities 462 435
28,889 20,227
Deferred income 3 1
Total equity and liabilities 37,370 30,213
STATEMENT OF INCOME
million € Year ended
Sept. 30, 2017Year ended
Sept. 30, 2018
Net sales 441 515
Cost of sales (133) (144)
Gross profit 308 371
General administrative expenses (644) (589)
Other operating income 155 1,830
Other operating expense (459) (86)
Income from investments 973 476
Net interest (235) (254)
Write-downs of financial assets and securities classed as operating assets (51) (143)
Income taxes 12 (26)
Earnings after taxes / Net income 59 1,579
Profit appropriation
Net income/ loss 59 1,579
Profit carried forward 1,342 1,308
Transfer to other retained eanings 0 789
Unappropriated income 1,401 2,097

thyssenkrupp annual report 2017 / 2018
2 Combined management report | Technology and innovations
82
Technology and innovations
Innovation strategy Our cross-Group research and development work is driven by the Corporate Function “Technology,
Innovation & Sustainability”, or TIS for short. This function is established in all business areas and
the regions. TIS formulates and coordinates joint procedures for research and development (R&D)
and secures patent protection. At the same time it introduces new topic areas in the Group and
provides initial support in addressing them. Using a standardized digitally supported Product
Lifecycle Management (PLM) process we coordinate product development from idea to market.
Our global research and development network includes some 5,000 employees at around 90 sites.
We supplement this network by cooperating with external partners such as universities, research
institutes and other industrial enterprises.
In the reporting period we registered around 2,200 new patents and utility models. As a result
thyssenkrupp’s patent portfolio now contains some 20,700 patents and utility models. In the
trademark area there were around 300 new filings, including designs, bringing the overall portfolio
to around 10,500 property rights.
Total spending on R&D at the thyssenkrupp Group came to €787 million in the reporting year, a
decline of 3% year-on-year. Adjusted R&D intensity – the ratio of R&D costs to sales excluding
trading and distribution – was 2.5%, exactly in line with our goal of a sustainable adjusted R&D
intensity of around 2.5%. Spending at the continuing operations came to €688 million with an
adjusted R&D intensity of 3%, including research and development costs of the continuing
operations of €259 million. Due to the initial application of IFRS 15 (International Financial
Reporting Standard) from the following fiscal year and the steel joint venture, the target for
adjusted R&D intensity has been raised to 3% from fiscal year 2018 / 2019.
In the 2017 / 2018 fiscal year we capitalized development costs of €63 million, compared with €33
million in 2016 / 2017. The share of capitalized costs in overall R&D costs – the capitalization ratio –
rose to 15.3% from 8% a year ago. The capitalized development costs of the continuing operations
came to €57 million with a capitalization ratio of 18%.
2,200We registered some 2,200 new industrial property rights.

thyssenkrupp annual report 2017 / 2018
2 Combined management report | Technology and innovations
83
Key development areas Our research and development work is focused on fundamental technological and social challenges
of the future. Central among these are the digital transformation of industry, climate change and
energy transition, and mobility in increasingly densely populated cities.
Digitization thyssenkrupp is systematically utilizing the opportunities opened up by the digital transformation.
Smart products and optimized processes play a key part in this. We are also defining new business
models. On this basis we are developing a consistent digitization strategy for the Group, driven by
our eight Centers of Competence (CoC) which make knowledge of digitization trends available
throughout the Group.
The most recent addition to our CoCs is the TechCenter Analytics and Software Engineering
established in Pune, India in response to the growing number of big data applications in the Group
and corresponding analysis requirements. Pune, India’s ninth biggest city, is regarded as a center
of software development on the subcontinent.
In materials distribution we are digitizing our entire range and consolidating it in the world’s biggest
virtual warehouse. thyssenkrupp’s omnichannel model provides round-the-clock access to more
than 150,000 products and services. Customers can place orders via individual customer portals,
EDI interfaces, online shops and in the future also via external platforms. This is made possible by
a powerful AI (artificial intelligence) solution developed in-house. With toii, a platform to connect all
its machinery, thyssenkrupp Materials Services last year reached a key milestone in its digital
transformation along the entire value chain.
In cement plant engineering we started using digital 3D models in the reporting year, created using
drones, cameras, laser scanners and modeling technologies. Among other things this concept is
used on projects to extend existing plants that have undergone numerous changes since they were
originally built. The models can be processed as required on a computer and extended with made-
to-measure plant parts. The new technology also makes it easier to document construction
progress on new plants. This innovation is in part the result of the “Beyond Conventions” initiative
we launched during the reporting period which represents a creative form of cooperation with
external start-ups. The aim is to develop unconventional solutions for forward-looking digital
projects in the Group. Beyond Conventions is a new method adding to the previously established
concepts for identifying disruptive innovations –TechCenters and thyssenkrupp Garage.
RESEARCH AND DEVELOPMENT
million € 2016 / 2017 2017 / 2018 Change in %
Research and development costs 383 348 (9)
Amortization of capitalized development costs 56 37 (34)
Order-related development costs 377 402 7
Full Group 816 787 (3)
Discontinued steel operations 108 99 (8)
Group continuing operations 708 688 (3)
www.thyssenkrupp.com > Company > Innovation
The omnichannel concept offers round-the-clock access to more than 150,000 products and services.

thyssenkrupp annual report 2017 / 2018
2 Combined management report | Technology and innovations
84
INDIGO (Industrial Digital Governance) is a platform we have developed for our core plant
engineering business. Machinery and equipment are fitted with sensors and communications
technology and the data they collect analyzed centrally. This enables us to offer our customers
added value, e.g. through predictive maintenance and process optimization. The platform is in the
prototype phase and currently includes around 40 machines around the world in areas such as
mining and cement production.
Climate change/energy transition
Under the Carbon2Chem project we started operation of the new technical center in the reporting
year with a two megawatt water electrolysis unit and a gas cleaning system, producing the
synthetic fuel methanol from steel mill gases. This is the first time anywhere in the world that gases
from steel production – including the CO2 they contain – are being converted into chemicals. The
technology replaces the use of fossil carbon from natural gas and coal and is a first step towards a
circular carbon economy. Carbon2Chem is a major project initiated by thyssenkrupp and involving
17 further partners from research and industry. The goal is to convert steel mill gases into various
basic chemicals.
In plant engineering we have developed a new concept for small-scale ammonia plants that allows
ammonia to be produced using renewable energies. Ammonia consists of hydrogen and nitrogen.
As well as being an intermediate product in the production of fertilizer, it is also a high-density
energy carrier. Whereas in conventional ammonia plants the required hydrogen is mainly produced
from natural gas, thyssenkrupp’s concept is based on water electrolysis fed by electricity and water.
The nitrogen required for ammonia synthesis is produced from ambient air by an air separation unit.
Sustainable mobility
To allow new solutions for the auto industry to be developed more quickly and with greater agility
we developed the Mobility Research Platform (MRP), a modular vehicle in which chassis parts such
as steering, brakes and dampers can be replaced in just a few minutes and tested under practical
conditions at a very early stage of development. An on-board computer evaluates data from
sensors that provide information on the driving and steering properties of the respective systems.
While it has previously been common practice to integrate prototype parts into existing vehicles,
MRP can significantly speed up the development of new chassis components.
In the Open Hybrid Lab Factory (OHLF) in Wolfsburg we are working with Volkswagen, component
suppliers, die makers and plastics manufacturers on hybrid materials of steel and plastic for mass
production. thyssenkrupp is contributing new steel materials to the OHLF. Predevelopment projects
can be tested and initial production applications designed together with the OEM. For example
designs are being investigated in which materials such as CFRPs (carbon fiber-reinforced plastics)
can be applied to steel using established processes such as injection or compression molding. The
aim is to further drive down weight in automobile production while ensuring extremely high
production reliability.
We started operation of the technical center with a 2 MW water electrolysis unit and gas cleaning system.
MRP is a research platform designed to speed up the development of new chassis components.

thyssenkrupp annual report 2017 / 2018
2 Combined management report | Environment, climate and energy
85
Environment, climate and energy
thyssenkrupp attaches great importance to environmental and climate protection and energy
efficiency – from supply chain to internal processes to products. With our solutions we want to help
meet rising demand for goods and services in a resource-efficient way. Environmental and climate
protection are therefore a core component of thyssenkrupp’s sustainability approach and thus its
corporate strategy.
Our environmental, climate and energy management systems are based on the Group’s global
environment and energy policy and a corresponding Group Regulation. We have defined three
indirect financial targets (IFTs) for the areas of environmental management, energy management
and energy efficiency on the basis of our general strategic requirements. Implementation of these
targets is supported by internal committees at various levels; in addition we provide corresponding
training for auditors and promote regular exchanges of experience by organizing international and
regional conferences within the Group.
Environmental management at our sites
thyssenkrupp has set itself the binding target for all Group companies with environmentally relevant
activities to have implemented an ISO 14001 environmental management system by fiscal year
2019 / 2020. This international standard covers all relevant environmental aspects, from the
reduction of wastewater, waste and emissions to the environmental impact of products during use
through to disposal. We have set out clear requirements for our Group companies: They must
continuously improve their environmental performance and at the same time meet legal and other
requirements and concrete environmental goals at their individual sites.
Activities regarded as environmentally relevant are defined in our Group Regulation. At September
30, 2018 almost 70 thyssenkrupp companies (around 60 in the continuing operations) were
determined as environmentally relevant in line with this Regulation. Of these around 90% already
comply with the required standard (continuing operations: around 90%). Related to the overall
workforce the Group therefore handles around 60% of its environmental management activities in
accordance with ISO 14001.
Continuous improvements in energy efficiency and energy management
The Group’s energy consumption came to more than 70 terawatt hours (TWh) in the 2017 / 2018
fiscal year, with the continuing operations accounting for more than 6 TWh.
Energy efficiency has always played an important role at thyssenkrupp. Launched four years ago,
the global Groupwide Energy Efficiency Program (GEEP) includes measures such as better use of
waste heat, the reduction of stand-by times and the replacement of plant components. In the
reporting year we set ourselves the goal under GEEP of increasing energy efficiency in the Group as
Internationally recognized standards of environmental management implemented worldwide
Clear increase in energy efficiency through the corporate program GEEP

thyssenkrupp annual report 2017 / 2018
2 Combined management report | Environment, climate and energy
86
a whole by 150 GWh. At 253 GWh we exceeded this goal. Mathematically these efficiency gains
enabled us to avoid more than 80,000 tons of greenhouse gas emissions. For the continuing
operations, the goal for the current fiscal year 2018 / 2019 is to achieve efficiency gains of 100 GWh.
In addition, all energy-relevant activities are to be covered by an ISO 50001 energy management
system by 2019 / 2020. Among other things this means setting concrete energy targets for each
site, measuring energy flows and optimizing organizational and technical processes. At September
30, 2018 this applies to almost 60 companies in the Group; more than 80% of them already
comply with the standard. In the continuing operations this applies to around 50 companies, of
these around 80% comply with the requirements. In terms of energy consumption this means that
more than 90% of energy management activities at thyssenkrupp are covered by the ISO 50001
standard.
Climate protection in production and products
The Group’s emissions (Scope 1 and 2 emissions as per Greenhouse Gas Protocol) amounted to
more than 20 million tons in the reporting period (incl. the discontinued operations). This will
change significantly when the steel joint venture starts up: In the future the Group’s share in the
steel joint venture will be treated as an investment, so going forward the corresponding greenhouse
gas emissions under the Greenhouse Gas Protocol will count as indirect emissions and thus as
Scope 3 emissions. For the continuing operations emissions (scope 1 and 2) will then be around
2 million tons.
thyssenkrupp’s commitment to climate protection is demonstrated by the Groupwide climate
program CAPS (Climate Action for Sustainable Solutions) that was launched in the reporting year.
We support the goals formulated in the Paris Climate Agreement – keeping the global temperature
rise to well below two degrees and achieving net greenhouse gas neutrality in the second half of
the century – and aim to make our contribution to this with CAPS. The best way thyssenkrupp can
do this is by providing products and services that significantly reduce greenhouse gas emissions
during use by customers. So CAPS not only stipulates efficiency improvements in our own
production processes, it also defines concrete targets for existing solutions, such as the use of
alternative fuels in cement production and the development of innovative disruptive technologies
such as Carbon2Chem for the steel industry. In addition we are planning to work closely with
relevant partners and stakeholders to improve the global conditions for climate protection.
Further information on environment, climate and energy can be found in the Opportunity and risk
report and on our website.
Groupwide climate program CAPS launched
www.thyssenkrupp.com > Company > Sustainability > Environment, climate and energy

thyssenkrupp annual report 2017 / 2018
2 Combined management report | Purchasing
87
Purchasing
thyssenkrupp buys in a wide variety of products, product groups and services. Our goal is not just
to achieve an optimum price/quality ratio; we also look at our own products and design them from
the outset to allow necessary components to be procured as cost-efficiently as possible.
Almost half our purchasing volume is for commodities such as raw materials or materials for our
distribution businesses. The other half is used for technological products and services.
Materials expense
Materials expense comprises the Group’s total spend on products and services. In the reporting year
it increased year-on-year by 7% to €27 billion (€23 billion continuing operations). Materials ex-
pense as a percentage of sales of the continuing operations came to 65% (prior year: 63%). De-
pending on business model, the percentages of the business areas ranged between 36% (Elevator
Technology) and 83% (Materials Services). The following table shows the materials expense of each
business area in absolute figures:
MATERIALS EXPENSE BY BUSINESS AREA
million € 2016 / 2017 2017 / 2018 Change in %
Components Technology 4,751 5,004 5
Elevator Technology 2,656 2,705 2
Industrial Solutions 3,142 3,059 (3)
Materials Services 11,135 12,136 9
Steel Europe 5,291 5,877 11
Corporate/ consolidation (1,926) (1,882) 2
Group without AM 25,049 26,900 7
Discontinued operations Steel Americas 900 0
Full Group 25,949 26,900 4
Discontinued steel operations 3,745 4,277
Discontinued operations Steel Americas 900 0
Group continuing operations 21,304 22,623 6
63% Materials expense as a percentage of sales came to 63%.

thyssenkrupp annual report 2017 / 2018
2 Combined management report | Purchasing
88
Our global purchasing organization once again reliably secured the supply of materials to
thyssenkrupp’s plants in the reporting year. More information is provided in the “Opportunity and
risk report” under “Procurement risks”.
Corporate initiative “synergize+”
We manage our global purchasing volume strategically via our Groupwide procurement organization.
“synergize+”, the corporate initiative to reduce material costs, was again responsible for roughly
half the total EBIT effects of the corporate program “impact” in fiscal year 2017 / 2018.
The core of “synergize+” is strategic cluster management, which consolidates purchasing volumes
across businesses, regions and functions using commercial and technical levers such as complex
negotiation strategies and standardization and optimization of our own products. This is supported
by in-depth procurement market analyses to provide supply market intelligence, a further develop-
ment of purchasing market research. Following standardized analyses of demand in the respective
material or service field, detailed reports are prepared, for example on suppliers or general product
cost structures. Already roughly 40% of the entire Group’s purchasing volume was analyzed and
evaluated in this way in the reporting year. Based on this the Group’s material cluster teams devel-
oped suitable measures to strategically utilize the respective procurement markets.
The digitization of purchasing continues to be a key issue for thyssenkrupp. Based on our devel-
opment partnership with a world leading software supplier further purchasing processes will be
digitized step and step and rolled out across the Group via five modules (sourcing, contracts, sup-
pliers, catalogs and document exchange). With the introduction of a standard online procurement
platform for the entire Group we have taken an important step in the digitization of the purchase-to-
pay process. Via the platform we carry out online tenders and auctions and use a large and steadily
growing spectrum of catalogs. Increasingly documents are being exchanged with suppliers by
electronic means. In addition, our contract management system is already in use worldwide; we
use it to administer contracts centrally. The introduction of the modules as cloud solutions is being
driven forward in more and more Group units. We are also working on the full integration of the
modules into Group companies’ local ERP systems. Pilot projects have already been implemented
successfully.
In our first event in the “Beyond Conventions” series we identified further topics in the area of
digitization which we are now addressing together with start-up companies. They include for exam-
ple the design of a digital supply chain and the use of bots for robot-controlled process automation.
Sustainability in supplier management
To be able to work with thyssenkrupp, suppliers must sign our Supplier Code of Conduct or comply
with equivalent standards. The Supplier Code of Conduct addresses possible risks and negative
impacts along the supply chain, including areas such as human rights, fair working conditions,
www.thyssenkrupp.com > Company > Procurement
Each year at least 100 suppliers are selected where we carry out sustaina-bility audits.
Materials Expense of thebusiness areasas % of sales 2017/ 2018
1 Components Technology 64%
2 Elevator Technology 36%
3 Industrial Solutions 61%
4 Materials Services 83%
5 Steel Europe 62%
64
36
61
83
62
1 2 3 4 5

thyssenkrupp annual report 2017 / 2018
2 Combined management report | Employees
89
environmental protection, combating corruption, and transparency into the origin of conflict miner-
als. We expect all our suppliers to comply with the principles set out in the code. Based on stand-
ard Groupwide risk criteria for specific countries and sectors, the business areas and Corporate
select at least 100 suppliers a year where we carry out sustainability audits to check they comply
with the above principles and consistently meet the requirements; this process is part of strategic
supplier management at thyssenkrupp. More than 170 sustainability audits were carried out in the
reporting year. Where necessary, improvement measures are agreed during the audits and then
followed up. Important themes in fiscal year 2017 / 2018 were working hours, occupational safety
and the documentation of business processes. In this way we support supplier development and
reduce our risks and possible negative impacts along the supply chain.
Employees
Employees in figures On September 30, 2018 thyssenkrupp employed 161,096 people worldwide, 2,357 (1.5%) more
than a year earlier. Components Technology registered an increase of 1,577 employees (4.8%),
mainly reflecting the growth in business and associated ramp-up of plants in China, Mexico and
Hungary as well as the expansion of a plant of thyssenkrupp Bilstein in Romania. Elevator Technol-
ogy increased its headcount by 353 (0.7%) altogether, mainly to handle the rising number of ser-
vice contracts in China. Under a restructuring plan, Industrial Solutions scaled back 242 jobs (1.1%)
– fewer than planned to date. A reduction in plant engineering was partly offset by an increase in
growth areas, mainly the service business. At Materials Services the number of employees was up
by 338 (1.9%), above all due to the growth in project business in North America. At Corporate the
workforce increased by 139 (3.6%) – partly because of employees returning to thyssenkrupp at the
end of a major IT project, and partly because extra staff were needed for work on projects at our
TechCenters. At the same time jobs at the headquarters were scaled back in connection with an
ongoing efficiency program. The number of employees at Steel Europe increased by 118, partly
because apprentices (also from the outplacement service PEAG) and temporary employees who
have worked for the company for a long time were given permanent contracts. At the same time
the headcount was reduced in connection with restructuring at Heavy Plate and preparations for
implementing the 33-hour week. Vacancies created through normal employee turnover were left
unfilled.
www.thyssenkrupp.com > Company > Sustainability > Employees

thyssenkrupp annual report 2017 / 2018
2 Combined management report | Employees
90
EMPLOYEES BY REGION – TOTAL
Sept. 30, 2017 Sept. 30, 2018 Change in %
Asia/Pacific 4,184 4,346 4
Central and Eastern Europe 5,090 5,736 13
Commonwealth of Independent States 887 846 (5)
German-speaking region 66,951 67,354 1
Greater China 17,019 17,307 2
India 6,246 6,499 4
Middle East & Africa 4,551 4,750 4
North America 22,545 23,698 5
South America 9,792 9,872 1
Western Europe 21,474 20,688 (4)
thyssenkrupp full Group 158,739 161,096 1
No compromise on safety and health: Vision2Zero The safety and health of every employee is of primary importance to us. We want to reduce the
number of accidents by employing exemplary practices, showing concern for each other, and sys-
tematically eliminating unsafe conditions and potentially dangerous activities. This requires us to
identify safety weaknesses and risks to health in order to discuss ways of making targeted im-
provements. We implement improvement ideas and monitor their effect. In the area of safety and
health, we measure our performance against best-in-class peers.
EMPLOYEES BY BUSINESS AREA
Sept. 30, 2017 Sept. 30, 2018 Change in %
Components Technology 32,904 34,481 5
Elevator Technology 52,660 53,013 1
Industrial Solutions 21,777 21,535 (1)
Materials Services 18,209 18,547 2
Corporate 3,891 4,030 4
Employees of the continuing operations 129,441 131,606 2
Germany 35,470 35,627 0
Other countries 93,971 95,979 2
Employees of the discontinued operations 29,298 29,490 1
Steel Europe (Germany) 25,827 25,918 0
Steel Europe (other contries) 1,819 1,846 1
tk MillServices & Systems (Germany) 1,652 1,726 4
Total employees 158,739 161,096 1
Germany 62,949 63,271 1
Other countries 95,790 97,825 2

thyssenkrupp annual report 2017 / 2018
2 Combined management report | Employees
91
“Vision2Zero” is the name we have given to our safety and health initiative. Our aim is to reduce
accident frequency to 2.0 (number of accidents per 1 million hours worked) and bring the number
of fatal accidents down to zero. We are making good progress. In the fiscal year our accident rate
was 3.0.
The number of fatal accidents decreased slightly, from five in the prior year to four in fiscal
2017 / 2018. We rely on our managers to take particular responsibility: On visits to their sites, they
are required to schedule in time for so-called Safety Gemba Walks – inspections of production
operations, storage facilities and job sites – to get a first-hand impression and talk about safety to
the people who work there. Safety is also top of the agenda at big meetings: Leaders share with
the group their own personal “safety moments”. These emotional messages and appeals are
passed on in the company – together with a symbolic baton inscribed with the words “It’s cool to
follow the rules”. Top executives are closely involved in the investigation of accidents and high-
potential incidents (incidents that could lead to fatal accidents or serious injuries). Furthermore in
the event of a fatal accident we have a 48-hour rule which requires the responsible business area
board member or CEO of the region concerned to go immediately to the scene of the accident for
initial talks. This rule now also applies for accidents involving employees of contractors and partner
companies.
To further improve our safety culture, we continued work on various activities and systems. One
example is the thyssenkrupp Academy’s learning program “Pathways to a Sustainable Safety Cul-
ture” which offers employees across the world support with the use of self-evaluations and incident
analyses; it is based on scientific findings from organizations with particularly high safety require-
ments. In the 2017 / 2018 fiscal year the program drew participants from seven countries, above all
China and India. Under our “we care” campaign we have been taking part in the “World Day for
Safety and Health at Work” organized by the International Labor Organization (ILO) since 2015. For
this year’s events in April, we asked our managers to reflect with their teams on their own safety
and health behaviors, agree concrete steps for improvements, and make a conscious and con-
sistent effort to “Be a role model” in line with this year’s campaign motto. We also held a photo
competition calling on managers and employees to share photos of themselves acting as role
models either as part of a group or alone. Managers from 81 countries took part, more than 3,000
photos were entered from 52 countries, and 21 prizes were awarded in seven categories.
We presented our “we care Award” for outstanding achievements in occupational safety and health
management for the third time. Prizes were awarded to thyssenkrupp units in Germany and Mexico
(Materials Services) as well as Saudi Arabia (Industrial Solutions).
At thyssenkrupp, promoting health initiatives involves more than just monitoring quantitative key
performance indicators such as the number of addiction prevention or stress management pro-
grams. For the first time we have now also developed qualitative minimum standards for these
programs, which we published in a guide in nine languages for our “we care” day.
Employee Assistance Programs (EAP) aim to strengthen individual motivation and performance.
They meet with strong interest, particularly in China and India. In Germany, our work on the contin-
uous improvement of working conditions is currently focused on addressing possible mental work-
loads. For the reliable risk assessment of mental workloads, target agreements going beyond the
Accident rate Number of occupational acci-dents resulting in lost time ≥ 1 day per 1 million hours worked 1)
14
07/08
3.7
15/16 16/17 17/18[ 7 years ]
3.0 3.0
1) incl. discontinued operation

thyssenkrupp annual report 2017 / 2018
2 Combined management report | Employees
92
statutory requirements exist at all German Group companies. To help companies achieve these
targets, we provide information and communication materials for experts and executives, and offer
employees the opportunity to talk to colleagues and work psychologists.
HR strategy
The goal of thyssenkrupp’s mission statement is delivered through the combined effort of our
motivated and highly skilled employees: “engineering.tomorrow.together”. The goal of our HR work
is to create optimum conditions for this at all times. As our global HR strategy is based on our
corporate strategy, it is tailored to the needs of our businesses. However, the environments in
which they operate are constantly changing on all markets, and production systems are also
changing, which is changing the way we work together. This also requires changes from our em-
ployees, a process our HR work supports.
Demographic change, growing diversity in society, and digitization are further important develop-
ments for thyssenkrupp which we address in our HR strategy. Demographic change offers opportu-
nities and risks on our various markets. thyssenkrupp prepares for these changes in its recruitment
and personnel development activities. We want to offer our employees in all age groups interesting
work and bespoke training and development programs to enable them to deliver their top perfor-
mance. Attracting the right talents to our company is a fundamental aspect of our HR work. How
we build and nurture networks, also with our customers, increasingly depends on our ability to use
digital work forms and resources. This applies across the board from purchasing to research and
development through to sales and services.
At the same time our workforce is also growing in diversity. The HR function fosters and promotes a
corporate culture that accommodates people with different talents and strengths. What we want to
achieve are networks instead of hierarchies, a culture of experimenting and cooperating, and a fluid
exchange of ideas, also across teams. To us good leadership therefore means fostering trust and
collaboration. HR work should provide security but at the same time also show clearly what is re-
quired of employees and credibly represent the company’s values.
We have structured our HR services and products based on our employees’ progression through
the company – from applying for a job to eventually joining our Senior Expert Service. HR work
focuses on thyssenkrupp’s attractiveness as an employer and the development of our experts and
executives worldwide.
Training in more than 60 occupations: Work as an engine of integration
Training young people is a top priority at thyssenkrupp. In the 2017 / 2018 fiscal year we had
3,162 apprentices (prior year: 3,194) in 62 different occupations, mostly in Germany but also in
Spain and Hungary. At 5.0% the apprentice training rate is stable (prior year: 5.1%). The trend
towards integrated degree courses continues, with more than 340 of our apprentices (2016 / 2017:
235) enrolled on these programs, mainly in economics and engineering. In December 2017 we
concluded a collective agreement with IG Metall for apprentices on integrated degree courses
which will ensure consistent high quality standards at our sites.
www.thyssenkrupp.com > Career > discover career opportunities around the globe.
What we want to achieve: networks instead of hierarchies

thyssenkrupp annual report 2017 / 2018
2 Combined management report | Employees
93
As a founding member of German industry’s integration initiative “We Together” (“Wir-Zusammen –
Die Integrations-Initiative der deutschen Wirtschaft”) we pledged to create an additional 150 ap-
prenticeship places and 230 internships for refugees on top of our existing apprenticeship places.
We have done more than that. Under the “we.help” program thyssenkrupp has given 150 appren-
ticeship places and more than 400 internships to refugees – including 55 introductory training
measures. The first apprentices have successfully completed their training and now work for us.
With this we are making a concrete contribution to the integration of refugees in Germany.
Attracting the right people quickly and efficiently
The competition for talent is rising in the recruitment fields most important to thyssenkrupp: engi-
neering and IT. To improve speed and efficiency, we have expanded the HR function under a major
specialization and professionalization transformation project (HR Transformation).
The newly formed Global Functional Team Sourcing & Recruiting (GFT S&R) has been operating in
China, Germany and the USA since October 1, 2017. It is centrally managed and ensures the use
of globally consistent recruitment standards and processes; for this it works with a unified IT sys-
tem. In terms of quality and costs, GFT already achieved important targets in the reporting year.
Examples include:
■ Costs: In the three countries in which GFT has been rolled out, expenses for headhunters have
been reduced by around 35%. Additional personnel expenses for new experts (e.g. talent
sourcers who – like headhunters – approach interested candidates directly) have already been
recouped. ■ Transparency: In all three countries we can make increased use of data to optimize our recruit-
ment work because for the first time we can now measure parameters such as candidate experi-
ence, time to hire, and conversion rates. ■ One face to the market: Our efforts to further strengthen thyssenkrupp as a unified employer
brand have paid off. This is reflected in the company’s rise in the relevant rankings (“Potential-
park” Online Talent Communication in Germany: number 58 in 2016, number 5 in 2017, number
3 in 2018; “trendence” IT ranking: number 87 in 2017, number 52 in 2018). ■ For the professionalization of our global recruiting processes, thyssenkrupp was awarded second
place in the 2018 German HR management prize.
GFT S&R is a pilot project under the HR Transformation program which is to be rolled out further.
Talent management, learning & transformation
Offering our employees attractive prospects for the future and meeting the workforce requirements
of the global organization is the core mission of our talent management program. For this we use
established assessment and development processes as well as specific talent pools and programs
for the different levels in the company. We systematically and therefore quickly identify profession-
als and managers with above-average performance and a willingness to change, strengthen their
Groupwide visibility to promote diversity in key positions, and offer them development opportunities
to motivate and empower them so that they would always choose thyssenkrupp as an employer.
We provided an additional 150 ap-prenticeship places and 400 intern-ships for refugees.
Core mission of talent management: to offer attractive prospects for the future and meet the workforce requirements of the global organization.

thyssenkrupp annual report 2017 / 2018
2 Combined management report | Employees
94
With the “tk Talents” program we are rolling out these structures worldwide up to 2020. In the
2017 / 2018 fiscal year we identified more than 1,500 new talents, over 900 more than the year
before. As the share of women is 23% (up by 3 percentage points), we hope to achieve our target
for the proportion of women in leadership positions in the medium term.
The “Job Swap” program established in 2017 is developing into a success story. Under the pro-
gram all employees have the opportunity to exchange places for an agreed time with a colleague
from a different part of the company. As well as injecting impetus into the development of our
employees, this strengthens Groupwide collaboration.
Employees can search for a job swap partner using a fully automated matching platform; feedback
apps and other online tools are used to support our modern and efficient talent development.
thyssenkrupp Academy: Learning programs for everyone
The thyssenkrupp Academy is driving the Group’s transformation with business-focused strategic
and cultural programs. In the 2017 / 2018 fiscal year the thyssenkrupp Academy made good pro-
gress with the establishment of its Global Functional Team Learning & Transformation (GFT L&T),
made up of all the Group’s internal learning providers. Among other things the learning programs
for skills and capabilities needed in all business areas were expanded. Together the learning pro-
viders ensure that a core curriculum specifically for thyssenkrupp is available everywhere.
Our training program for middle management is now established in more than 20 countries. Our
new virtual platform “L&T home base” provides a functional home for around 450 learning and
transformation management employees: Here they can widen their network, find tools for their
daily work, share best practices, find Group-internal experts, and obtain information on the Group-
wide L&T organization. The platform also provides access to numerous new digital learning instru-
ments made available by the thyssenkrupp Academy.
Together for diversity
thyssenkrupp employs around 161,000 people from 144 nations. A culture of equal opportunities,
trust and mutual respect is of great importance to us. We want everyone who works for us to be
able to reach their full potential – irrespective of origin, gender, religious beliefs or sexual orienta-
tion. Three current examples:
■ Increasing the proportion of women in leadership positions, equal opportunities, and helping
people balance family and work commitments are key aspects of our diversity management.
Currently around 15% of our employees are women; on this basis we aim to fill at least 15% of
leadership positions with women by 2020 (at September 30, 2018 the share was 12%, up from
11.6% a year earlier). ■ In May 2018 thyssenkrupp sent a signal by adopting the United Nations 2017 standards against
the discrimination of lesbian, gay, bi, trans and intersex (LGBTI) people. thyssenkrupp is one of
the first 100 companies worldwide to support the UN’s “Free&Equal” initiative.
We want everyone who works for us to be able to reach their full potential.

thyssenkrupp annual report 2017 / 2018
2 Combined management report | Social responsibility
95
■ In 2018 the new thyssenkrupp Senior Experts GmbH began building a pool of retired or soon-to-
retire experts and executives who are prepared to work on a project for thyssenkrupp for an
agreed period – whether as interim manager, project leader, deputy or coach. The senior experts
provide decades of experience on demand. The program is directed at people from all areas and
all levels of the company. This allows us to keep expertise in the company while raising the pro-
file of older experts and supporting the success of entrepreneurial projects in accordance with
the needs of our business. Senior Expert GmbH acts as employer and takes care of contractual
arrangements and pay. As of September 30, 2018 the pool numbered more than 130 former
employees. In the fiscal year some 60 contracts were signed for work in the Group.
Social responsibility
thyssenkrupp regards itself as an active corporate citizen. The Group and its companies want to
engage positively with the communities around our locations and support the people who live there.
At thyssenkrupp, contributing to the creation of a sustainable society is a must. Accordingly the
Group is actively involved in various local projects, collaborations, multi-stakeholder initiatives and
associations.
In our corporate citizenship activities, we are guided by our slogan “engineering.tomorrow.together”.
For this reason thyssenkrupp promotes enthusiasm for technology and innovation, education, and
local engagement. To ensure we maintain our high compliance standards in all our work, we have
among other things a global documentation and approval system for corporate citizenship activities.
More than 400 measures were documented worldwide in the reporting year. Donations to political
parties or organizations, elected representatives or candidates for political office at home or abroad
are not compatible with the Group’s values and are therefore not permitted.
www.thyssenkrupp.com > Career > Your career > Senior Experts

thyssenkrupp annual report 2017 / 2018
2 Combined management report | Compliance
96
Compliance
thyssenkrupp has a broad understanding of compliance: Observance of the law and internal regu-
lations is a must for us, and part of our corporate culture. Compliance creates the framework for
our business actions and serves to safeguard our long-term business success. As well as providing
comprehensive support for the core compliance areas antitrust law, corruption prevention, money
laundering prevention, and data protection, compliance work in the 2017 / 2018 fiscal year focused
on three main tasks:
■ the continuing implementation of our Compliance 2020 strategy, ■ the implementation and Europe-wide observance of the extensive requirements of the General Data
Protection Regulation (GDPR), ■ competition law support for the planned joint venture of our steel operations with our competitor
Tata Steel Europe.
Compliance firmly embedded in our corporate structure Our compliance strategy is aimed at embedding a sustainable value culture at thyssenkrupp – a
culture in which reliability, honesty, credibility, and integrity are the cornerstones of our actions. To
ensure that this value culture is supported and lived by all employees, open communications are
essential.
Our managers play a key part in this as compliance ambassadors: They are role models – not just
for our employees but also for our suppliers, customers and other stakeholders. They create
awareness that our value culture is important and right. All managers at thyssenkrupp are therefore
expected to live up to this role at all times. Because to us compliance is more than just abiding by
the law: Compliance is a question of mindset. This includes our clear commitment that
thyssenkrupp stands exclusively for fair and straight business. We would rather sacrifice a contract
than win it by breaking the law.
But at the same time we also want to support entrepreneurial risk-taking within a defined frame-
work – the willingness to take calculable entrepreneurial risks, and in doing so to possibly make
mistakes and (to a reasonable extent) accept mistakes by others.
In a healthy corporate and management culture, commitment and shared values go hand-in-hand.
Violations of the law or internal rules are not compatible with our understanding of compliance. The
following rules therefore apply unequivocally:
■ We systematically investigate all reports of legal violations and clear up the facts. ■ Employees who report possible legal violations in good faith enjoy special protection from unfair
treatment. ■ Any violations identified are stopped without delay. ■ Any violations identified are systematically and appropriately sanctioned as necessary, regard-
less of the name and function of the person involved.
www.thyssenkrupp.com > Company > Compliance

thyssenkrupp annual report 2017 / 2018
2 Combined management report | Compliance
97
Compliance 2020 Strategy Developed in fiscal 2013 / 2014, our “Compliance 2020 Strategy” is aimed at establishing a behav-
ior-guiding, sustainable integrity culture in the Group and systematically embedding compliance
within the Group. This is to be achieved through numerous measures, such as the further devel-
opment of our global training programs, the integration of compliance in our business processes,
and targeted communications.
Numerous Compliance 2020 Strategy measures were implemented in the past fiscal year. One was
the company-wide roll-out of an e-learning program for compliance managers. It is designed to
inform them about their duties in even more detail and – in combination with our new compliance
toolbox – provide them with a wide range of aids to help them perform their role effectively and
efficiently.
The Compliance function also performs the role of advisor, coordinator and consolidator in areas
such as occupational safety, supplier compliance, use of contractors, and environmental protection,
and ensures uniform reporting to the Executive Board. Substantive compliance responsibility in
these areas remains with the competent corporate functions and business areas. This ensures that
in all areas of the company compliance is understood in accordance with the thyssenkrupp mission
statement, an intensive exchange of knowledge takes place between the compliance function and
those responsible for content, and the resultant synergies in organization, processes and methods
are utilized.
Compliance program and key areas of compliance work thyssenkrupp’s compliance program comprises the three elements “inform & advise”, “identify”, and
“report & act”. It is closely interlinked with risk management and with our internal control system. In
this way we ensure that compliance is an integral component of every single business process. The
program focuses on the key areas antitrust law and corruption prevention, money laundering pre-
vention, and data protection.
As the EU General Data Protection Regulation (GDPR) came into force in May 2018, data security
was a particular focus of our compliance work in the past fiscal year. We optimized our organiza-
tional structure and supported our Group companies throughout Europe with implementation of the
requirements. In the business units around 260 people were established as data protection officers
and data protection coordinators. The continued practical implementation of the GDPR, in particular
process improvements, will remain a focus of our compliance activities in the coming year.
A further important compliance task in the reporting year was providing in-depth competition law
support to the corporate functions in connection with the project to contribute our steel operations
to a joint venture with Tata Steel Europe. Since Tata Steel Europe is a competitor of thyssenkrupp,
the central question was what exchange of information is permissible between the future partners
and in what form.
Further compliance activities in each of the following three program elements in the reporting year
were as follows:
■ “Inform & advise”: Our compliance officers trained and advised employees around the world on
applicable statutory requirements, internal Groupwide policies, and also looked at concrete indi-
vidual cases. In the reporting year around 5,500 employees worldwide attended classroom courses,
Antitrust law and corruption preven-tion are the focus of compliance work at thyssenkrupp.

thyssenkrupp annual report 2017 / 2018
2 Combined management report | Compliance
98
mainly on antitrust law and corruption prevention. In addition we continued the fourth cycle of the e-
learning program on corruption prevention and antitrust law launched in November 2015. A total of
more than 112,000 courses, net of disposals, were completed by the end of the fiscal year.
■ “Identify”: In the reporting year our compliance officers once again conducted proactive and
event-driven audits and investigations. The aim of these is to regularly examine critical business
operations based on a risk-oriented, structured audit process. Key elements in the identification
of compliance risks are our internal whistleblower system and the ombudsman. Alongside the
options of directly contacting a supervisor or the compliance department, these provide employ-
ees with additional channels for reporting possible infringements of laws or policies without re-
vealing their identity. Our new ombudsman since October 2017 is attorney-at-law Dr. Carsten
Thiel von Herff. He succeeded attorney-at-law Dr. Dietrich Max an, who had held this function since
April 2013.
■ “Report & act”: As well as our regular reports to the Supervisory Board and Audit Committee, our
intensive compliance reporting covers all levels of our organizational matrix: Executive Board of
thyssenkrupp AG, business area boards, Group company managements, and regional officers and
project managers with market responsibility. In the event of proven infringements, our “zero toler-
ance” policy applies: Where necessary, sanctions are systematically imposed on those concerned.
Compliance organization Our Compliance function has the important job of strategic business partner, advising on relevant
strategic decisions from an early stage. In addition to the compliance program, this requires a
needs-based compliance organization with clearly allocated roles and responsibilities, effective,
efficient and appropriately staffed program management, and in particular structures and tasks
based on the requirements of the Group .
thyssenkrupp employs more than 75 full-time compliance employees worldwide. They are support-
ed by a network of nearly 350 compliance managers. The latter are generally top executives of the
individual Group companies who ensure the compliance program is implemented at operating level
in their area of responsibility. Together they play a key role in permanently embedding compliance
in the Group and are available to employees seeking advice.
Selected official investigations Since November 2016 the Israeli state attorney has been carrying out investigations in connection
with Israeli naval projects of thyssenkrupp Marine Systems, also into its local sales agent. Accord-
ing to current knowledge there are no investigations into thyssenkrupp companies or employees.
We immediately launched an in-house investigation. We have passed on the results of the prelimi-
nary investigation report to the authorities and will continue to cooperate with the authorities. Fur-
ther measures will be taken as necessary.
>75thyssenkrupp has more than 75 full-time compliance employees.
350Nearly 350 compliance managers promote compliance at work and act as our mouthpiece in the business units around the world.

thyssenkrupp annual report 2017 / 2018
2 Combined management report | Overview of non-financial disclosures
99
The discontinued operation thyssenkrupp Steel Europe AG, alongside other steel companies and
associations, is the subject of ongoing investigations by the Federal Cartel Office into alleged cartel
agreements relating to the product groups heavy plate and flat carbon steel. A further investigation
relating to stainless steel was dropped against thyssenkrupp Steel Europe AG in October 2017. The
investigations still ongoing concern alleged antitrust violations in determining surcharges and
premiums for certain steel prices. thyssenkrupp takes this matter very seriously and has pursued
its own internal investigation with external support. Due to developments in the investigation pro-
cess, thyssenkrupp has decided to set aside a risk provision in its consolidated financial state-
ments. Based on current knowledge, we are still unable to rule out substantial adverse effects on
the Group’s financial position.
Overview of non-financial disclosures
The full non-financial disclosures pursuant to § 289b HGB are integrated in the various sections of
the combined management report as this information is important for understanding the business
performance and position of the Group. The combined disclosures relating to the Group apply
equally to thyssenkrupp AG. In compiling the information, various frameworks, e.g. UN Global
Compact, were used as guidance. Risks of negative environmental and social impacts from
thyssenkrupp’s business activities are also addressed in the various sections of the management
report. Based on this, there are no additional risks to be reported in the risk report. Respect for
human rights and social issues in the meaning of German GAAP (HGB) are addressed as cross-
cutting issues which have large overlaps with each other and with employee issues. Beyond this,
the aspect of social issues is important but not necessary for an understanding of our business
performance, the situation of the Group, or the impacts of business activity.

thyssenkrupp annual report 2017 / 2018
2 Combined management report | Forecast, opportunity and risk report
100
Forecast, opportunity and risk report
2018 / 2019 forecast
The following forecast relates to the continuing operations, i.e. the full Group without the
discontinued steel activities; the latter include the Steel Europe business area, thyssenkrupp
MillServices & Systems GmbH from the Materials Services business area and individual Corporate
companies.
In addition we report on the discontinued steel activities that are fully consolidated until the closing
of the transaction. After the closing our 50% share in the joint venture will be accounted for by the
equity method.
Overall assessment by the Executive Board Overall we expect that further operating progress in our segments will be reflected in our key
performance indicators in fiscal 2018 / 2019. However, it must be kept in mind that sales and
earnings in many parts of our materials and components businesses may be subject to short-term
fluctuations. Uncertainties surrounding the economic conditions have increased recently. These
uncertainties arise among other things from geopolitical flashpoints and the global economic
situation and concern in particular
OVERVIEW OF NON-FINANCIAL DISCLOSURES
Environmental issues Employee issues Respect for human rights Social issues Anti-corruption and prevention of bribery
Section Sustainability and Indirect Financial Targets
Environment, climate and energy
Sustainability in supplier management
Opportunity and risk report
Regulatory risks
Production risks
Procurement risks
Provisions for employee benefits and other provisions
Sustainability and Indirect Financial Targets
Employees
Sustainability in supplier management
Opportunity and risk report
– Production risks
– Personnel risks
– Procurement risks
Provisions for pensions and similar obligations
Provisions for employee benefits and other provisions
Sustainability and Indirect Financial Targets
Sustainability in supplier management
Employees
Opportunity and risk report
– Procurement risks
See respect for human rights and labor standards, also
Social responsibility
Sustainability and Indirect Financial Targets
Compliance
Sustainability in supplier management
Opportunity and risk report
– Legal risks and compli-ance risks
– Procurement risks
Provisions for employee benefits and other provisions

thyssenkrupp annual report 2017 / 2018
2 Combined management report | Forecast, opportunity and risk report
101
■ the future economic policy of the USA, above all a further escalation of the existing trade
conflicts with corresponding protectionist countermeasures by China and the EU that may
appreciably impact global economic growth ■ the slowing growth of the Chinese economy as a key factor for global growth and as an important
sales market ■ the outcome of the Brexit negotiations on economic growth in Europe, on exports and on future
investment – above all in the UK itself but also in the other countries of Europe; also the conflict
in the euro zone regarding Italy’s proposed budget and increasing concerns about the country’s
financial stability ■ the targeted normalization of monetary policy ■ dislocations in the automotive sector, in part due to the introduction of new emissions standards
and measuring procedures (WLTP) ■ the volatility and level of raw material prices as an important cost factor in our materials businesses
and as a key factor for our plant engineering customers in the award of major projects ■ the continuing structural overcapacities in the steel industry, the corresponding competitive and
import pressure on the European market and increasing dislocations in international steel trade
flows, among other things as a result of the US tariffs on steel imports.
The forecasts for our key performance indicators are predicated on the assumption that impacts from
possible changes to the economic conditions described will remain manageable and there will be no
significant effects from exchange rate changes. However, if these uncertainties exert a clearly
negative influence on economic growth and risks build up in particular for our main customer sector,
the automotive industry, our key performance indicators may come in significantly below the following
forecast.
Nevertheless on the whole we take a cautiously optimistic view of developments in the 2018 / 2019
fiscal year and expect a significant improvement in adjusted EBIT and free cash flow before M & A
and positive tkVA for the Group’s continuing operations.
Key assumptions For 2019 we assume weaker growth in the euro zone, slower growth in China and slightly weaker
momentum in the emerging countries overall. For the USA we expect lower but still relatively solid
growth.
Global production of cars and light trucks shows a mixed picture. Due in particular to the slowdown
in China and the new test procedures for fuel and electricity consumption and vehicle emissions
(WLTP), there is a risk of temporary production declines at individual customers which will
particularly impact our components business. We see growth opportunities from the ramp-up of
new plants and production lines, including increasing deliveries of our electromechanical steering
systems. In addition demand for our slewing bearings is expected to pick up again. This will be
flanked by efficiency measures, mainly in the areas of steering systems and slewing bearings.

thyssenkrupp annual report 2017 / 2018
2 Combined management report | Forecast, opportunity and risk report
102
The high order backlog and the high volume of service contracts at Elevator Technology already
ensure that planned sales are secured well into the new fiscal year. Particularly in Europe we will
continue our restructuring measures and optimize our service, production and administrative
processes. In addition we will reduce the complexity of our product portfolio in terms of platforms
and components and improve our earnings quality. Our growth expectations will be supported by
construction activity in China, the USA and Europe.
At Industrial Solutions (excluding Marine Systems) we expect an improvement in orders and sales
by focusing mainly on smaller and medium-size projects and service business. As part of the
refocusing of our engineering operations we will greatly simplify organizational structures to enable
decisions to be made more quickly and to increase accountability and transparency. In addition to
expanding our service network in selected growth regions we will also raise the long-term capacity
utilization of our business units to more appropriate levels.
At Marine Systems we expect an improvement in order intake in particular due to our nomination as
an exclusive strategic partner to the Norwegian-German submarine program and other potential
surface vessel projects. Depending on the order situation, capacity utilization in the surface vessel
activities – in conjunction with further performance measures such as integration of production
sites and simplification of the organizational structure – will enhance the quality of earnings.
With economic growth prospects subdued overall we expect global demand for steel to rise slightly
again in the coming year, with moderate low single-digit percentage increases in both Europe and
the USA. While the Chinese market will likely stagnate at a high level, we expect solid, above-
average growth in the other emerging countries such as India and the ASEAN nations. Import
pressure on the European market is expected to remain high. We assume there will be no lasting
dislocations on the raw materials markets, with continued stable high prices and intense
competition.
At Materials Services we will continue to drive the digitization of our business processes and
distribution channels. With the further roll-out of the B2B portal and other digital applications such
as toii – our “Industrial Internet of Things” platform – we aim to improve productivity and efficiency
along the entire value chain.
At Steel Europe (discontinued operation) we expect a temporary fall in production at the start of the
fiscal year due to logistics problems resulting from low water levels on the Rhine and the
introduction of new emissions standards (WLTP). The efficiency measures planned for the
production operations in the coming fiscal year are aimed above all at improving melt shop
performance with an associated increase in slab production. A further project will address ways of
optimizing logistics.
More information on expected future economic developments can be found in the section “Macro
and sector environment” in the report on the economic position.

thyssenkrupp annual report 2017 / 2018
2 Combined management report | Forecast, opportunity and risk report
103
2018 / 2019 forecast: Significant improvement in earnings and FCF before M & A at the continuing operations; tkVA in the Group positive Sales of the continuing operations – adjusted for effects from the adoption of IFRS 15 – are expected
to increase year-on-year in the low single-digit percentage range (prior year, continuing activities,
adjusted for effects of IFRS 15: €33.6 billion). The potential decline at Materials Services due to the
effects of restructuring and trade restrictions is expected to be more than offset by growth in the
other segments.
Adjusted EBIT of the continuing operations is expected to be >€1 billion (prior year, continuing
operations: €706 million); supported by initiatives from the corporate program “impact”.
■ At Components Technology – assuming a largely stable automotive market – we expect a
significant recovery of adjusted EBIT (prior year €197 million) from a sales increase in the mid-
single-digit percentage range (prior year, adjusted for effects of IFRS 15: €6.6 billion) and a
significant improvement in margin (prior year, adjusted for effects of IFRS 15: 3.0%). This will
reflect in particular the absence of additional expense for quality-related risk provisions and the
further ramp-up of the new plants, supported by efficiency and restructuring programs. ■ At Elevator Technology we expect an improvement in adjusted EBIT (prior year: €866 million) from
sales growth in the low single-digit percentage range and an increase in adjusted EBIT margin
(prior year: 11.5%) from restructuring and efficiency measures, also depending on effects of
materials prices – particularly in China – and tariffs on imports of materials to the USA. ■ At Industrial Solutions depending on order intake we expect a significant recovery in sales in the
almost double-digit percentage range. Supported by extensive transformation and restructuring
measures and without the additional expenses incurred in the prior year for an extensive project
analysis and reassessment of individual projects we expect a significant improvement in adjusted
EBIT with gradual progress over the course of the year towards break-even earnings (prior year:
€(127) million). ■ At Materials Services with signs of a slowing economy we expect adjusted EBIT to be slightly
lower year-on-year (prior year: €317 million; prior year continuing activities of Materials Services
€308 million). ■ At Marine Systems we expect a significant recovery in order intake. Supported by an extensive
performance program and without the additional costs of the project analysis and reassessment
in the prior year we anticipate a clear improvement towards break-even adjusted EBIT (prior year:
€(128) million). ■ At Corporate with continued cost reductions adjusted EBIT, which benefited in the prior year from
positive nonrecurring items, is expected to be roughly level with the prior year (prior year:
€(377) million; prior year continuing operations of Corporate €(370) million).
With continuing restructuring expenses we expect income net of tax of the continuing operations to
improve significantly and return to positive (prior-year income net of tax, continuing operations:
€(198) million).
Our goal is to achieve a significant increase in earnings and FCF before M&A of the continuing operations.

thyssenkrupp annual report 2017 / 2018
2 Combined management report | Forecast, opportunity and risk report
104
Capital spending before M & A of the continuing operations is expected to total around €1 billion in the
current fiscal year (prior year, continuing operations: €935 million).
As a result of the improved earnings and depending on order intake and payment profiles for
individual major orders, in particular at Marine Systems, FCF before M & A of the continuing operations
(prior year, continuing operations: €(678) million) is expected to improve significantly year-on-year but
remain negative overall.
For the FCF of the full Group (prior year, Group FCF: €(115) million) we expect additional negative
effects in particular from portfolio changes.
Until the closing of the steel joint venture we expect from Steel Europe (discontinued operation):
– a clearly positive contribution to the Group’s adjusted EBIT
– a negative impact on FCF in the mid to high 3-digit million euro range also due to the typical
seasonal increase in net working capital.
FCF could be further impacted depending on the outcome of the Federal Cartel Office’s
investigations into alleged cartel agreements at tk Steel Europe AG relating to the product groups
heavy plate and flat carbon steel.
Following the closing and initial recognition of our share in the joint venture we expect a significant
positive effect on the net income of the full Group and a correspondingly positive effect on total
equity.
The creation of the transaction structures for the separation of the Group will significantly impact net
income and FCF. Based on current preliminary calculations we expect an impact in the high three-
digit million euro range.
We expect the Group’s net financial debt to increase sharply year-on-year (prior year: €2,364 million)
due in particular to the aforementioned effects.
At the same time our pension liabilities will be reduced almost by half upon closing of the joint
venture deal.
Net income of the Group is expected to improve significantly year-on-year (prior year: €60 million);
expense from the preparation of the separation of the Group will be comfortably offset by the earn-
ings increases of the continuing operations and the positive effects of the closing of the steel joint
venture.
Due to the operational improvements at our continuing operations, the positive contribution of the
discontinued operation Steel Europe and positive effects upon closing of the steel joint venture, we
expect tkVA for the Group to be positive and significantly higher than a year earlier (prior year:
€(217) million).
We will take into account the development of our key performance indicators – also keeping in mind
economic justifiability – in preparing our dividend proposal to the Annual General Meeting.

thyssenkrupp annual report 2017 / 2018
2 Combined management report | Forecast, opportunity and risk report
105
Opportunity and risk report
Opportunities thyssenkrupp defines opportunities as events or developments that enable us to exceed the
Group’s forecasts and targets. Opportunity management encompasses all measures required for
the systematic and transparent management of opportunities. As it is integrated with the strategy,
planning and reporting processes, opportunity management is an important element of the strate-
gic and value-based management of the Group.
Overall assessment by the Executive Board: thyssenkrupp with opportunities from strategic
realignment
For thyssenkrupp new opportunities open up as a result of the separation of the Group into two
independent and much more focused companies resolved on September 30, 2018. The separation
combines industrial logic with the requirements of the capital market. We are convinced that our
businesses can develop better and concentrate on their strengths in this new setup.
Opportunity management process
In the Strategic Dialogue, a structured and standardized annual Groupwide process, all business
areas identify opportunities arising from relevant market and technology trends and discuss corre-
sponding strategies. Close integration of opportunity management with the Strategic Dialogue
means that opportunity management is based on a strategic medium- to long-term approach in
some cases going far beyond the forecast period.
Following on from the Strategic Dialogue, all business areas record opportunities and risks in oper-
ational plans and monthly reports to facilitate assessment of the current earnings and liquidity
situation of the individual businesses. The graphic “Opportunity and risk reporting at thyssenkrupp”
in the “Risks” section of this report shows how these elements are integrated in the standard re-
porting system.
The management of our opportunities is a task shared by the Group’s decision makers – from the
Executive Board of thyssenkrupp AG to the business area management boards and managements
of the Group companies through to regional officers and project leaders with market responsibility.
Roles and responsibilities within the thyssenkrupp matrix organization are clearly defined and de-
marcated. This structured involvement of numerous experts in decision-making processes in the
Group ensures that opportunities are reliably identified and systematically exploited.
Strategic opportunities for the Group
Our employees are the basis of our success. In a volatile environment we continuously evolve our
company in order to meet the global challenges of the future with competitive solutions.
As a Group we see opportunities particularly in the implementation of the resolved separation of
the Group. In addition to reducing complexity the separation will allow the two companies to re-
spond independently, faster and in a more targeted way to their respective customers and markets,
and to speak to investors with different interests. thyssenkrupp Industrials, as a pure-play capital
goods company with globally positioned businesses, will have attractive growth potential through
megatrends such as urbanization, globalization and digitization. thyssenkrupp Materials with its
materials businesses will have a leading market position in Europe and be able to utilize consolida-
tion opportunities from a position of strength.
Opportunities through strategic realignment.
Due to close integration of opportunity management with the Strategic Dialogue opportunities are mainly of a strategic nature and are relevant also beyond the forecast period.

thyssenkrupp annual report 2017 / 2018
2 Combined management report | Forecast, opportunity and risk report
106
Information on our corporate strategy and the corresponding opportunities is contained in the
section “Fundamental information about the Group”.
thyssenkrupp stands for efficient processes and production methods with high product quality.
Many of our plants set global standards in terms of resource efficiency and environmental
protection. Advancing digitization means that previously separate value chains are increasingly
converging because new products, services and business models can be developed best within a
mix of different capabilities. thyssenkrupp with its global research and development network and its
collaborations with external partners is well positioned here. Detailed information on current
initiatives and key development areas is presented in the section “Technology and innovations”.
We also see opportunities in the systematic and focused continuation of the corporate initiatives
launched in previous years. We continue to work on maximizing the efficiency of purchasing and
harmonizing our business processes. Our corporate program “impact” remains an important foun-
dation of our Strategic Way Forward and can play a major long-term role – together with business
and theme-specific programs – in increasing the efficiency of the Group and reducing costs across
all business areas and corporate functions.
In our development projects we are also always guided by the Group’s financial scope. Unfavorable
economic conditions may result in delays or compromises in implementing existing opportunities.
More on this and on other risks can be found in the “Risks” section.
Operational opportunities of the business areas
Components Technology – A key factor for the Components Technology business area’s future busi-
ness performance is the development of personal mobility and freight transportation. Demand is
growing in both sectors, creating growth opportunities worldwide for us as an engineering partner
and component and module supplier to the auto industry. This applies particularly to the emerging
markets in Asia and the Americas, where we have positioned ourselves well with new production
sites. Our products can support the global trend towards an efficient and environmentally friendly
kind of mobility that also meets challenging political targets to reduce vehicle emissions. In the
relevant areas of weight reduction and optimization of drive technologies, we offer our customers
state-of-the-art solutions and are working to steadily extend our lead. With the further development
of our chassis systems we are creating the conditions for new approaches and solutions. We want
to actively shape the path towards increasingly automated and autonomous vehicles. We see
growth opportunities here across all vehicle classes.
All business areas have operational opportunities in their specific business models and markets.

thyssenkrupp annual report 2017 / 2018
2 Combined management report | Forecast, opportunity and risk report
107
In the wind industry growth opportunities are opening up in both the onshore and offshore sectors.
Wind power is one of the fastest growing renewable energy forms in the world. In Europe this trend
is supported by mandatory renewable energy targets set by the EU. The technological trend to-
wards ever bigger and more efficient turbines reinforces the need for high-performance compo-
nents, which we serve with our global production network.
If the relevant markets and sectors (particularly the automotive markets) or our efficiency or growth
programs perform better than expected or the ramp-up of our new plants is accelerated, the fore-
casts for our key performance indicators could be moderately exceeded.
Elevator Technology – The markets for elevators, escalators, moving walks, passenger boarding
bridges and stair and platform lifts offer attractive growth and profit opportunities for the Elevator
Technology business area in times of increasing globalization and urbanization. Thanks to its broad
product range, which includes standard systems, custom solutions as well as full service and mod-
ernization packages, and its local presence with more than 50,000 employees at over 1,000 loca-
tions, the business area can open up new market and customer opportunities around the world.
With innovative products and service solutions we strive to meet customers’ highest technological
and ecological requirements. With MAX, the first cloud-based maintenance solution in the sector,
we are increasing the digitization and efficiency of our service business and can thus achieve addi-
tional competitive advantages.
In addition, we expect continuous improvements in the efficiency and competitiveness of Elevator
Technology through implementation of the measures defined in the “impact” program.
If the global economy (particularly the construction sector) performs better than expected or our
efficiency or growth programs prove more effective than originally thought, the forecasts for our key
performance indicators could be moderately exceeded.
Industrial Solutions – If we continue to advance our innovative technologies, global growth opportu-
nities could open up for the Industrial Solutions business area in turnkey industrial plants and
services despite the deterioration of the investment climate, increasingly fierce competition and
political uncertainties on the relevant markets. To increase the competitiveness of the business
area and exploit the growth opportunities in our markets even more effectively, we are driving for-
ward the regionalization of our business. At the same time we are continuously standardizing and
optimizing our project management methods. To deploy our top engineers even more effectively we
have created a global engineering network which opens up additional opportunities for us.
In the medium term, opportunities could arise around the targeted market entries in chemical plant
construction (for example water electrolysis and methanol). In addition, wider public funding for
eco-friendly technologies would benefit us, here primarily in plant construction for the chemical and
cement industries.

thyssenkrupp annual report 2017 / 2018
2 Combined management report | Forecast, opportunity and risk report
108
Further opportunities are arising through the expansion of our high-margin service business. All the
initiatives of the business area for more growth and higher efficiency have been brought together in
a wide-ranging transformation program, for which we selected and accelerated focus themes in the
year under review.
If the relevant markets and sectors, the efficiency and growth programs, the investment activity of
our customers or contract execution perform better than expected, the forecasts for our key per-
formance indicators could be moderately exceeded.
Materials Services – Services are gaining further importance for Materials Services as producers
and processors focus more strongly on their core business. Materials Services is increasingly also
taking on the management of customers’ supply chains. Higher service shares generally offer
Materials Services increased profitability in a materials market characterized by low margins. Op-
portunities for the business area therefore arise from customer orientation, specific market and
sector know-how, a global network, and broad and profound expertise in project management.
The continuous development and implementation of tailored digital solutions offers many opportu-
nities for Materials Services to be an even better and more efficient partner to its customers. One
example of this is the “omnichannel architecture”: through individual customer portals, interfaces
for electronic data interchange, online shops and in the future also external platforms, customers
worldwide have 24 / 7 access to the business area’s products and services. Materials Services is
continuously driving its digital transformation area along the entire supply chain. Interconnected
collaboration and interactive processes are already day-to-day routine in many areas – from logis-
tics to warehousing, equipment utilization and purchasing to administration. In all Materials Ser-
vices’ offerings, the focus is always on customers and their individual needs.
Under its efficiency programs, Materials Services has identified opportunities and defined extensive
measures to further improve the cost and earnings situation. Key elements of this are the further
structural optimization of materials warehousing and service operations in Germany, the pooling of
purchasing activities and the establishment of a business area-wide project management organiza-
tion for the structured, sustainable implementation of improvement opportunities.
With the optimization programs for AST now at an advanced stage of implementation, further op-
portunities are opening up in this business, especially in sales.
If the relevant materials markets, the efficiency and restructuring programs or the sales initiatives
perform better than expected, the forecasts for our key performance indicators could be moderately
exceeded.
Marine Systems – In the marine sector, orders for the German Navy and in particular submarine
projects for export provide a good market outlook for the next few years. If our various campaigns
for submarine programs around the world succeed, this will benefit our order backlog and capacity
utilization.

thyssenkrupp annual report 2017 / 2018
2 Combined management report | Forecast, opportunity and risk report
109
Steel Europe (discontinued operation) – The Steel Europe business area is focused on the market for
premium flat carbon steel, the performance of which mainly depends on economic activity in Eu-
rope.
Even in a difficult market environment, Steel Europe is well placed overall to participate sustainably
in the major global trends of urbanization, increasing mobility, and more efficient use of scarce
resources – all of which require the use of intelligent steel products.
The business area’s strategy program “one steel” also provides for the strengthening of Steel
Europe’s technological capabilities through targeted investment projects. These will enable Steel
Europe to optimize its product and customer portfolio in accordance with the requirements of the
market. For example a decision was made in the year under review to build a new hot-dip coating
line to meet the auto industry’s rising demand for high-quality steel. Steel Europe also sees oppor-
tunities, albeit more in the medium term, in the area of e-mobility, where high potential exists
through wider uses for electrical steel.
In addition, the increasing digitization of the steel value chain provides opportunities for Steel Eu-
rope, both through the increasing connectedness of production and through the ability to develop
new digital business models. These opportunities are being leveraged as part of the digitization
initiative in the “one steel” strategy program.
Although the foreign trade environment is marked by increased risks, there is the chance that the
dislocations caused by US tariff policy following the introduction of 25% import duties on European
steel products from June 1, 2018 will be contained more effectively than expected by the European
Commission’s provisional – and later perhaps permanent – safeguard measures.
If the measures defined under “one steel” and the relevant steel market environment perform
better than expected and in particular import pressure weakens, Steel Europe could exceed its
forecasts for its key performance indicators.
Risks thyssenkrupp defines risks as events or developments that reduce our ability to achieve the
Group’s forecasts and targets. Risk management encompasses all measures involved in the sys-
tematic and transparent management of risks. With its link to planning and reporting processes in
controlling, risk management is an important element of the value-based management of the
Group and goes far beyond the early identification of risks required by law. Efficient, forward-
looking risk management therefore also serves the interests of capital providers and other stake-
holders.
Overall assessment by the Executive Board: No risks that threaten thyssenkrupp’s ability to
continue as a going concern
Our transparent and systematic risk management system with structured processes ensured overall
risks in the Group were efficiently managed.

thyssenkrupp annual report 2017 / 2018
2 Combined management report | Forecast, opportunity and risk report
110
From the current perspective there are no risks that threaten the Company’s ability to continue as a
going concern.
Risk strategy and risk policy
Our risk strategy is focused on securing the existence of the company long-term and increasing the
value of the company sustainably. Business success requires opportunities to be recognized and
associated risks to be identified and evaluated. Business risks should be entered into consciously
and responsibly and managed proactively by all employees. Risks threatening the Group’s ability to
continue as a going concern must be avoided.
Our “Governance, Risk and Compliance (GRC) Policy” defines basic principles for corporate gov-
ernance and risk management and also describes the universally applicable risk policy principles in
the Group as a framework for meeting the requirements of proper, consistent and proactive risk
management. The principles are based on the thyssenkrupp Group mission statement and the
strategic goals for the various business models; they serve as guidelines for professional and
responsible risk management.
The aims of risk management at thyssenkrupp are to increase risk awareness and establish a
value-based risk culture at all corporate levels. Risks and opportunities in the Group are therefore
analyzed transparently and are systematically incorporated into business decisions.
Risk management process
Corporate risk management continuously enhances thyssenkrupp’s risk management system,
aligns it with the internationally recognized COSO model and integrates it with our internal control
system. In our GRC Policy, our risk management system methodology is embedded in the three
lines of defense model and the roles of the individual lines of defense are clearly defined. Details of
the model can be found in the corporate governance report. All other binding requirements for the
risk management process are defined in the Group policy on risk management.
The efficient design of our various risk management instruments ensures that the sub-processes
are integrated in a continuous risk management loop and all risk managers are involved
appropriately in the risk management process. Our methods and tools to identify, assess, control
and report risks are implemented throughout the Group and are continually improved.
The organizational anchoring of corporate risk management in operational and strategic controlling
facilitates holistic risk management integrated with planning and reporting processes. Our main
focus in using the risk management instruments is to assess possible deviations in the key perfor-
mance indicators “adjusted EBIT” and “free cash flow before M & A”. The following graphic outlines
our various approaches, which are explained briefly below:
No risks that threaten thyssenkrupp’s ability to continue as a going concern.
Risk management throughout the Group is based on standardized sub-processes and procedures.

thyssenkrupp annual report 2017 / 2018
2 Combined management report | Forecast, opportunity and risk report
111
The opportunities and risks not included in the monthly updated projections or in the budget are
part of standard business area reporting. Regular discussion of opportunities and risks makes an
important contribution to integrated business management during the year and to corporate plan-
ning by highlighting bands for the key performance indicators “adjusted EBIT” and “free cash flow
before M & A” related to the current and the subsequent fiscal year.
As part of the planning process and on an ad hoc basis we also analyze macroeconomic concen-
tration risks taking into account centrally defined interdependencies and risk premises. These
Group-wide risk scenarios mainly address slumps of major economies and other exogenous shocks
and their impacts on thyssenkrupp.
To record relevant event risks in a structured way in specific areas of responsibility, all Group com-
panies worldwide use a standardized IT risk management application to prepare risk maps. The
assessment period used for the risk map goes beyond the period covered by the forecast and
provides multiple-year transparency into the local risk assessments. The regular reporting and
updating of risks at local level also ensures that risk awareness remains high throughout the Group.
Risks already recognized in the form of balance sheet provisions are also the subject of standard-
ized analyses and risk reporting, ensuring systematic control of these risks too.
OPPORTUNITY AND RISK REPORTING AT THYSSENKRUPP
in estimation
Identifi cation and assessment of opportunities and risks not included in current estimation
Current fi scal year
Monthly
Monthly reporting
in budget
Identifi cation and assessment of opportunities and risks not included in budget
Following fi scal year
Yearly
Budget reporting
Risk scenarios
Analysis of concentration risks based on defi ned common scenarios
Scenario-dependent
At least yearly
Interval
Four meetings yearly
Risk inventory
Identifi cation, assessment and management of risks in all operating units not included in estimation and budget planning
Planning period
Twice yearly
Provisions
for risks
Analysis of main provisions for risks/measures monitoring
Current fi scal year
Four times yearly
Opportunities and risks
Standard reporting
Risks
Risk and Internal Control Committee and Audit Committee
Go
al/c
on
ten
tIn
terv
alT
ime
ho
rizo
n
thyssenkrupp annual report 2017 / 2018
2 Combined management report | Forecast, opportunity and risk report
112
Ad hoc risks are communicated immediately to the risk management officers and are also docu-
mented via the established reporting channels.
These standardized risk management processes ensure that the Executive Board and Supervisory
Board are informed promptly and in a structured way about the Group’s current risk situation.
However, despite comprehensive risk analysis, the occurrence of risks cannot be systematically
ruled out.
Roles and responsibilities
Risk management at thyssenkrupp is a combined top-down/bottom-up process. Binding system
standards are formulated centrally by the Group and apply to all operating entities. Responsibility
for measuring and controlling risks along the value chain lies at local level with the functional man-
agers in the operating entities.
The material Group risks are discussed and validated in meetings of the interdisciplinary Risk and
Internal Control Committee (RICC) held once every quarter and chaired by the CFO. At the same
time this forms the preparation for risk reporting to the Executive Board and Audit Committee. The
RICC meetings are attended by all Group officers responsible for governance, risk and compliance.
This interdisciplinary approach at committee level makes a key contribution to improving corporate
governance processes in the Group.
Employees responsible for risk management receive regular training on using the various instru-
ments. We also use our Groupwide web-based IT risk management tool to provide targeted infor-
mation and training material.
Internal Auditing uses the information from the risk maps for its risk-oriented audit planning. The
internal audits structured on this basis contribute to the efficient monitoring of the risk manage-
ment system and deliver insights to further improve risk management in the Group.
Risk assessment
Identified risks are assessed consistently according to the Group risk management rules as follows:
Based on probability of occurrence and impact on the key performance indicators “adjusted EBIT”
and “free cash flow before M&A” in the planning period we define risk classes according to the
following graphic. The main individual risks in defined risk categories, which we address in the
following sections, are classified in accordance with this system as “high”, “medium”, “low” or
“very low”.
The Group’s standardized risk man-agement system is a combined top-down/bottom-up process.

thyssenkrupp annual report 2017 / 2018
2 Combined management report | Forecast, opportunity and risk report
113
Risk control
In the risk mapping process all consolidated Group entities are required to formulate risk control
measures for the individual risks identified and assessed in the three-year planning period and
systematically monitor their implementation.
Risk presentation at thyssenkrupp is by the net method, i.e. taking into account existing risk control
measures that reduce gross risk.
We prevent risks by following the risk policy principles and not entering into transactions if they
infringe thyssenkrupp codes of conduct or policies.
We transfer risks in cases where the financial scale of a risk can be minimized by central measures
such as insurance policies. More information is contained in the section below on risk transfer.
We reduce risks by taking appropriate targeted measures and for example by continuously improv-
ing our internal control system. More information on the individual initiatives can be found in the
sections “Internal control system in the Group accounting process” and “Operational risks of the
business areas”.
RISK MANAGEMENT MEASURES AT THYSSENKRUPP
Gross risks
Net risks
Prevent risks
Transfer risks
Reduce risks
RISK CLASSES AT THYSSENKRUPP Low risk Medium risk High risk
Probability in %
< 50 (very slight)
≥ 50 to < 250 (slight)
≥ 250 to ≤ 500 (medium)
> 500 (high)
< 10 (very slight) ≥ 10 to < 25 (slight) ≥ 25 to ≤ 50 (medium) > 50 (high)
Impa
ct in
mill
ion
€

thyssenkrupp annual report 2017 / 2018
2 Combined management report | Forecast, opportunity and risk report
114
Risk transfer
Risk transfer to insurers is handled centrally at thyssenkrupp AG. The scope and design of insur-
ance cover are determined on the basis of structured risk assessments in which insurable risks at
the Group companies are identified, evaluated and reduced or eliminated through specific protec-
tion plans. A balanced portfolio reduces the risk of insurer insolvency.
Binding standards are in place for all Group companies to keep risk prevention at a sustainable and
appropriately high level. These standards are developed by experts from all areas of the Group
under the leadership of thyssenkrupp AG and are updated as required. Internal and external audi-
tors regularly check compliance with these standards.
Internal control system in the Group accounting process
The internal control system comprises all the systematically defined controls and monitoring activi-
ties aimed at ensuring the security and efficiency of business management, the reliability of finan-
cial reporting, and compliance of all activities with laws and policies. An effective and efficient
internal control system is key to the successful management of risks in our business processes.
As part of the harmonization of business processes at thyssenkrupp we are also continuously
developing the requirements the internal control system must meet throughout the Group using a
standardized risk control matrix and a structured self-assessment process.
Various monitoring measures and controls in the accounting process help ensure compliant finan-
cial reporting. For consolidation we use a Group tool based on standard software. In this way we
ensure consistent procedures and minimize the risk of misstatements in the Group’s accounting
and external reporting. An appropriate segregation of functions and application of the dual-control
principle reduce the risk of fraudulent conduct.
thyssenkrupp has clearly defined the sub-processes involved in financial reporting and assigned
clear responsibilities for them. Corporate Function Controlling, Accounting & Risk is responsible for
the preparation of the consolidated financial statements and issues binding instructions to the local
units with regard to content and timing. Group-owned shared service centers support the local
units in preparing local financial statements. All employees involved in the accounting process
undergo regular training.
We perform regular central system backups on the IT systems used in the consolidation process in
order to avoid data losses and system failures. The security strategy also includes system controls,
manual spot checks by experienced employees, and custom authorizations and access controls.
Internal Auditing regularly checks the effectiveness of the internal control and risk management
systems and is therefore integrated in the overall process.
The Group’s internal insurance provid-er organizes the transfer of risk.
The internal control system reduces process-related risks.

thyssenkrupp annual report 2017 / 2018
2 Combined management report | Forecast, opportunity and risk report
115
By means of these coordinated processes, systems and controls we ensure that the Group’s ac-
counting is reliable and complies with IFRS, German GAAP (HGB) and other relevant standards and
laws.
Risk categorization
We have pooled the types of risks relevant to thyssenkrupp in the following categories: ■ Risks from external parameters ■ Financial risks ■ Legal risks and compliance risks ■ Risks from operating activities
We deal in detail with the risk categories and risk types in the following sections.
Risks from external parameters
The external risks mainly include macroeconomic risks and regulatory risks.
Macroeconomic risks – Economic risks for our business models exist when positive impetus is not
forthcoming from the global economy and markets of relevance for thyssenkrupp and growth rates
fall below the economic forecasts.
In Europe there are continuing uncertainties regarding the further course of the exit negotiations
after the Brexit referendum in the UK and Europe-critical developments in individual member states.
Individual debt crises in the euro zone also remain unresolved, so a crisis of confidence in the
institutions of the EU and lower growth rates in the European economies are conceivable.
Additional risks arise from a further escalation of the trade conflict between the USA and China,
slower growth rates in China, and a prolonged recession in emerging economies, for example
caused by further rising interest rates or currency crises as in Turkey. Exogenous shocks such as a
further escalation of violence in crisis regions could have major effects on the global economy; this
would also affect thyssenkrupp. In the event of a severe exogenous shock the individual economic
risks would be medium. We continuously monitor the corresponding country-specific conditions
based on wide-ranging early warning indicators. In Groupwide risk scenarios we simulate the im-
pacts of lower growth rates and changed exchange rates on our business models to enable us to
take action and minimize risks at an early stage when necessary.
Our current economic assessment is presented in detail in the section “Macro and sector environ-
ment”.
Regulatory risks – New laws and other changes in the legal framework at national and international
level could entail risks as well as opportunities for our business activities if they lead to higher costs
or other disadvantages for thyssenkrupp compared with our competitors directly or in respect of
our value chain. Overall the regulatory risks for thyssenkrupp are classified as medium.
Risk scenarios simulate the impact of economic risks and exogenous shocks.
Risks for our business models could result from national and international regulations.
thyssenkrupp annual report 2017 / 2018
2 Combined management report | Forecast, opportunity and risk report
116
As an energy-intensive industrial and services group, we face earnings risks on the global markets
if additional costs are imposed under energy- and climate-related rules which we are not able to
pass onto our customers, or only to a limited extent, or if demand for products and technologies is
absent in the long term. thyssenkrupp supports effective climate protection efforts and a sustaina-
ble energy transition in which climate protection, security of supply, and competitiveness are equal
priorities. We support the relevant discussion processes on regulatory efforts through close working
contacts with the relevant national and international institutions and also cooperate with industry
associations at all levels to reduce possible risks. Concrete risks for Steel Europe in this connection
are described in the section “Operational risks of the business areas”.
Further regulatory risks may ensue from tax framework conditions where there is legal uncertainty
and which may change over time. For example certain tax benefits are currently being examined by
the constitutional court. Should the court cases result in the benefits being removed and/or re-
duced, substantial back taxes cannot be excluded.
Financial risks
The central responsibilities of thyssenkrupp AG include coordinating and managing finance re-
quirements within the Group and securing the financial independence of the company as a whole.
This involves optimizing Group financing and limiting the financial risks.
Default risks – We enter into financial instrument transactions in the financing area only with coun-
terparties which have a very high credit standing and/or are covered by a deposit guarantee fund.
Transactions are concluded only within specified counterparty risk limits. Outstanding receivables
and default risks in connection with supplies and services are constantly monitored by the Group
companies; in some cases they are additionally insured under commercial credit policies. The
credit standing of key account customers is monitored particularly closely.
Liquidity risks – To secure the solvency and financial flexibility of the Group at all times, we maintain
long-term credit facilities and cash funds on the basis of a multi-year financial planning system and
a liquidity planning system on a rolling monthly basis. The cash pooling system and external fi-
nancings are concentrated mainly on thyssenkrupp AG and specific foreign companies. We use the
cash pooling system to allocate resources to the Group companies internally according to require-
ments.
Market risks – To hedge market risks (currency, interest rate and commodity price risks) we enter
into derivative hedging instruments. These mainly include off-exchange traded foreign currency
forward contracts, interest rate swaps, interest-rate/foreign currency swaps and commodity forward
contracts with banks and commercial partners. To hedge against commodity price risks we also
use exchange-traded futures. The use of derivative financial instruments is extensively monitored.
Financial risks are contained by centrally managed measures.

thyssenkrupp annual report 2017 / 2018
2 Combined management report | Forecast, opportunity and risk report
117
Currency risks – To contain the risks of our numerous payment flows in different currencies – in
particular in US dollars – we have developed Groupwide policies for foreign currency management.
All companies of the Group are required to hedge foreign currency positions at the time of their
inception. They mainly use our central hedging platform for this. Translation risks arising from the
conversion of foreign currency positions are generally not hedged.
Interest rate risks – To cover our capital requirements we have procured funds on the international
money and capital markets in different currencies and with various maturities. The task of central
interest rate management is to control and optimize the risk of changing interest rates. For this,
regular interest rate risk analyses are prepared, the results of which feed into our risk management
system.
Taking into account the control measures selected, the financial risks outlined above are assessed
as low.
Valuation risks – Active portfolio management is one of the key pillars of our Strategic Way Forward.
The disposal and acquisition of businesses as well as restructurings within our existing businesses
are associated with risks; in addition our strategic business units are regularly tested for impair-
ment. The risks identified in this category, which we classify in each case as medium, are moni-
tored continuously and provisions are recognized where required.
Risks associated with pension obligations – The fund assets used to cover pension liabilities are
exposed to capital market risks. To minimize these risks, the individual investment forms are se-
lected and weighted with the support of independent experts. In addition, parts of the investments
are aligned with the structure of the pension obligations in selected countries for the purposes of
risk management (liability-driven investment).
In connection with the valuation of pensions, thyssenkrupp is exposed to the risk of falling interest
rates. Lower discount rates for pension obligations result in pension provisions increasing and
weighing on equity.
Further risks exist in connection with the payment of life-long pensions due to the rising life expec-
tancies of beneficiaries and the need to adjust pension amounts on a regular basis. In addition,
payments to pension funds could increase substantially in some countries in the future due to
stricter statutory requirements, or additional allocations to pension plans could become necessary
in individual cases if pension plans are terminated prematurely.
Overall we classify the risks associated with pension obligations as medium.
Legal risks and compliance risks
Legal and compliance risks include litigation risks, compliance risks focused on antitrust and cor-
ruption violations, and risks from trade restrictions.
Litigation risks – We define litigation risks as risks in connection with pending or imminent lawsuits
or regulatory or administrative court proceedings brought against thyssenkrupp. The thyssenkrupp
Group uses a software tool with which litigation risks are systematically identified, categorized,
Falling interest rates could represent an accounting risk in connection with the valuation of pension obligations.

thyssenkrupp annual report 2017 / 2018
2 Combined management report | Forecast, opportunity and risk report
118
evaluated and reported under the established risk management system to the Executive Board and
the Audit Committee on a quarterly basis. We carefully examine claims asserted by third parties for
merit. Legal disputes in and out of court are supported by in-house counsel and where necessary
external counsel.
With the exception of the compliance cases below, based on current estimates we classify litigation
risks individually and cumulatively as medium. Cumulative litigation risks are combined risks from
lawsuits brought by numerous claimants and from regulatory proceedings against thyssenkrupp
which relate to the same matter and can be classified as a single litigation risk. Information on
further litigation risks for which we have recognized provisions or which are classified as contingent
liabilities is provided in Notes 15 and 20.
Compliance risks – We operate a strict compliance program focused on reducing the risk of antitrust
and corruption violations, because these offenses have enormous potential for damage, both
financial and in terms of reputation. Compliance risks also include possible infringements of the EU
General Data Protection Regulation which came into force in 2018. We classify general compliance
risks overall as high.
The discontinued operation thyssenkrupp Steel Europe AG, alongside other steel companies and
associations, is the subject of ongoing investigations by the Federal Cartel Office into alleged cartel
agreements relating to the product groups heavy plate and flat carbon steel. A further investigation
relating to stainless steel was dropped against thyssenkrupp Steel Europe AG in October 2017. The
investigations still ongoing concern alleged antitrust violations in determining surcharges and
premiums for certain steel prices. thyssenkrupp takes this matter very seriously and has pursued
its own internal investigation with external support. Due to developments in the investigation pro-
cess, thyssenkrupp has decided to recognize a provision in its consolidated financial statements.
Based on current knowledge we are still unable to rule out substantial adverse effects on the
Group’s financial position.
Risks from trade restrictions – Due to the global nature of its business thyssenkrupp is exposed to
possible risks stemming from trade restrictions such as anti-dumping/anti-subsidy tariffs, export
restrictions, special monitoring measures, embargoes, far-reaching economic sanctions against
certain countries, persons, businesses and organizations, as well as other protectionist or political-
ly motivated restraints. These restrictions can not only impede our business activities in individual
national markets; violations could lead to severe penalties, sanctions, reputational damage and
damage claims. We therefore take strict care to comply with customs and export control regulations
and other trade restrictions.
Risks from operating activities
Risks from operating activities include procurement risks, production risks, sales risks, order risks,
risks associated with information security and personnel risks.
A strict compliance program is the answer to the high potential for damage from antitrust and corruption violations.

thyssenkrupp annual report 2017 / 2018
2 Combined management report | Forecast, opportunity and risk report
119
Procurement risks – To manufacture our high-quality products, we procure raw materials and other
starting materials. Depending on market situation, procurement prices can vary considerably and
impact on our cost structures. Also, suppliers may be lost, which might in turn jeopardize our pro-
duction and the fulfilment of contractual obligations towards our customers. The individual risks
identified in this category are low. We counteract these risks through margin-securing measures
and alternative procurement sources.
Risks related to rising energy prices are countered by structured energy procurement. We operate
sustainably and are working across the Group to save energy and recycle waste.
Further information on procurement risks can be found in the section “Operational risks of the
business areas”.
Production risks – In the event of unfavorable constellations and developments, our plants can be
exposed to the risk of business interruptions and property damage. In addition to the cost of repair-
ing damage, there is above all the risk that a business interruption might result in production losses
and thus jeopardize the fulfilment of our contractual obligations towards our customers. We counter
these risks through regular preventive maintenance and through modernization and investment in
our machinery and production facilities. In addition we take out appropriate insurance and so trans-
fer risks to external service providers. The remaining financial risks in this category are classified as
medium.
Accident risks during the production, installation, maintenance and use of our products cannot be
completely ruled out. A safety-oriented corporate culture and a comprehensive bundle of measures
related to occupational safety and health help minimize the accident risks faced by our employees
and subcontractors. However accidents cannot be completely prevented with these organizational
measures.
In our production plants there are process-related risks that can lead to air and water pollution.
Furthermore, some of the Group’s real estate no longer used for operations is subject to risks from
past pollution and mining subsidence. To minimize risks thyssenkrupp invests continuously and
sustainably in environmental protection and scheduled remediation and maintains a close dialogue
with authorities, local communities and political representatives. We recognize adequate provisions
for past pollution.
Further details on production risks can be found in the section “Operational risks of the business
areas”.
Sales risks – The risks described in the section “Macroeconomic risks” may diminish our business
prospects on individual markets and therefore lead to sales risks. In the event of sustained devel-
opments, we carry out market-oriented adjustments or relocate capacities.
We counter the risk of business interruptions through regular maintenance and investment in our equipment to ensure we fulfill our contractual obligations towards our customers.

thyssenkrupp annual report 2017 / 2018
2 Combined management report | Forecast, opportunity and risk report
120
We counter sales risks resulting from dependence on individual markets and industries by focusing
systematically on the markets of the future. As an industrial group with leading engineering exper-
tise, thyssenkrupp operates globally, maintains good, long-term customer relationships, and pur-
sues active strategic market and customer development. Our diversified product and customer
structures help ensure that we remain largely independent of regional crises on our sales markets.
We therefore classify the sales risks as low.
Product and process quality and meeting the corresponding quality requirements of our customers
are a top priority for us. The possibility cannot be excluded that we will not always be able to meet
these quality standards. We therefore counter the risks arising from this by setting aside provisions
in our financial statements.
Further details on sales risks and on our professional receivables management system to counter
the risk of bad debt are provided in the section “Operational risks of the business areas”.
Order risks – The management of major contracts involving a high degree of complexity and long
project lead times is a core challenge in the Industrial Solutions business area. Cost overruns
and/or delays in individual project phases cannot be ruled out. Individual identified order risks are
currently classified collectively as high. To minimize these risks we continuously improve our man-
agement instruments so that we are aware of current order status at all times and able to take
project-related measures quickly if required.
Before entering into contracts we check the credit standing of our customers carefully. We deploy
experienced project managers for order execution. Through transparent monitoring of order status
we ensure that payments are made promptly according to order progress and payment defaults are
minimized.
Risks associated with information security – Our IT-based business processes are exposed to various
risks associated with information security, which we classify as medium. Human error, organiza-
tional or technical processes and/or security vulnerabilities in information processing can create
risks that threaten the confidentiality, availability and integrity of information. For this reason we
continually review our processes and technologies. Systems are updated and processes modified
immediately as necessary. The IT-based integration of our business processes is subject to the
condition that the risks involved for our Group companies and business partners are continuously
minimized. This is all the more important when entire value chains are transformed through ad-
vancing digitization.
The number of attacks by criminals and external services on the IT infrastructure of major German
companies continues to increase. In this connection we have carried out measures to further im-
prove our information security management and security technologies. One focus is to protect our
production operations from unauthorized access for the purpose of espionage or sabotage. A
group of IT security experts which has been continuously increased supports the Group with the
early identification of risks. In addition, vulnerability analyses are carried out regularly with the
support of our IT security team and external experts to verify the security of the infrastructure and if
necessary take corrective action.
Our management tools help minimize risks in the execution of major orders.
thyssenkrupp annual report 2017 / 2018
2 Combined management report | Forecast, opportunity and risk report
121
Sensitizing our employees to the risks involved in handling business-related information is a very
important issue to us. In this connection we carry out internal communication campaigns and
ensure that the confidentiality of information is guaranteed through appropriate technical support.
Together with the Group’s data protection officer, our experts ensure that personal data are pro-
cessed in accordance with the rules of the EU General Data Protection Regulation and the new
German Data Protection Act.
All these measures will allow us to continue to protect the Group’s business data as well as the
privacy of our business partners and employees, and to respond appropriately to potential new
risks.
Personnel risks – As an industrial group with leading engineering expertise, thyssenkrupp aims to
be successful on a sustainable basis. For this we need dedicated and highly qualified employees
and managers in all business units. There is a risk of not being able to find key personnel to fill
vacancies or losing competent employees; we classify the individual personnel risks overall as
medium.
thyssenkrupp positions itself as an attractive employer and promotes the long-term retention of
employees in the Group. This involves offering management development programs, career
prospects and attractive incentive systems. We provide targeted support for our employees, inform
interested young people about career opportunities at thyssenkrupp from an early stage, and
support apprentices as they start work. We cooperate with key universities and establish contact
with students from an early stage to secure the young talent we need.
Operational risks of the business areas
Components Technology – The Components Technology business area is a global supplier of auto-
motive and industrial components and as such is dependent on the performance of the corre-
sponding markets.
Components Technology is a leading player in the powertrain sector. This position could be jeop-
ardized in part by the increasing trend towards electrification, in particular with regard to compo-
nents for internal combustion engines, for example camshafts. The business area is therefore
intensifying its research and development efforts in the area of e-mobility and in the development
of alternative products to counter possible sales declines in traditional products by building new
areas of business.
For the core markets of the business area we expect stable growth in all product segments. Howev-
er, this is subject to major uncertainty. For example, slowing momentum of the markets in China
could jeopardize our business prospects there. The United States is also a key sales market for our
products. A weakening of this market would therefore also carry risks. To lessen dependency on
individual markets the business area is expanding its customer base, developing technical innova-
tions, and strengthening its international presence.

thyssenkrupp annual report 2017 / 2018
2 Combined management report | Forecast, opportunity and risk report
122
In addition to the economic risks, further risks come from consolidation processes and further
increasing price pressure both in the auto components industry and in the wind energy sector.
Government trade restrictions such as possible tariffs on automobile exports or auto parts as well
as the planned Brexit pose a risk. The new Worldwide Harmonized Light Vehicles Test Procedure for
fuel/electricity consumption and emissions also presents a risk of temporary production declines at
individual customers.
A general risk in the wind energy industry lies in dependence on national support systems. In Ger-
many uncertainties remain regarding grid connection and financing of further offshore projects. We
are countering this risk with new technologies and innovations to access new areas of application.
At the same time pressure on selling prices remains high as a result of intense competition and the
auctioning of contracts. We are countering this price pressure with continuous optimizations and
sustainable efficiency enhancements under the corporate program “impact”.
On the procurement side there are risks that rising raw material prices cannot be passed on in full
to customers or only with delays. The business area counters these risks by framing contracts with
customers accordingly.
With regard to ongoing technological innovations and improvements and the ramp-up of new
plants, risks from unplanned earnings impacts cannot be ruled out. Strong growth also carries the
risk of organizational weak points, for example inadequately resourced internal control systems. On
top of this there are potential risks from unexpected yield and quality problems and the associated
warranty obligations. The business area uses extensive production and quality assurance systems
to avoid or limit such risks as far as possible.
Further general risks of the business area relate to the effects of changing exchange rates on sales
and earnings, both translation and transaction effects, particularly with regard to the US dollar, the
Chinese yuan and the Brazilian real.
Elevator Technology – Due to the international nature of Elevator Technology’s business operations
the uncertain global economy poses risks that could be reflected mainly in bad debt and project
delays. As an additional effect, competition could intensify on all markets and increase price pres-
sure. The business area counters these risks with professional project management in association
with extensive checks of customers’ credit standing. Protection against strong price pressure is
provided by customer retention strategies, high service quality, efficiency programs and not least
innovative and sustainable product solutions.
Both the service and modernization businesses are largely independent of economic fluctuations.
Customer retention strategies help prevent possible losses of maintenance units. In addition the
business area continuously implements efficiency programs to offset rising personnel and pro-
curement costs.
The new installations business is closely linked with the construction sector and is therefore ex-
posed to greater fluctuations. However, due to the longer project times in this business, downturns
can be largely anticipated so countermeasures and capacity adjustments can be carried out at an
early stage. Inherent risks in the execution of complex major projects are countered by the use of
project management measures. Risks from rising material prices can be offset by efficiency im-
provements in production and optimized procurement strategies.

thyssenkrupp annual report 2017 / 2018
2 Combined management report | Forecast, opportunity and risk report
123
Risks from increasing business activities in the Asian markets, where business is more dependent
on new installations and therefore on construction activity, are largely offset by our presence on the
established markets in Europe and the Americas. Possible economic risks in the emerging nations
are countered by expanding the modernization and service business and improving efficiency.
Exchange rate risks resulting from the international nature of our business are reduced to a very
large extent by a high level of local value creation and hedged using financial instruments.
Accidents cannot be ruled out completely during the installation, maintenance and use of the busi-
ness area’s products. A safety-oriented corporate culture, appropriate employee selection and
training programs on safe conduct on job sites (Safety First) minimize the risk of employee acci-
dents. We carefully select and train our installation and service employees to ensure maximum
safety and quality of the products we install and service, providing users with best-possible protec-
tion.
Industrial Solutions – Following a recovery in oil, fertilizer and raw material prices, the environment
for the markets of Industrial Solutions is generally improved, with the exception of the cement and
gas-based fertilizer businesses. This picture is not significantly impaired by the renewed sanctions
against Iran.
General economic risks could arise from the escalating international trade conflicts, which could
pose a threat to the investment climate. This could also further intensify the push of low-cost Far
Eastern competitors onto western markets, which could also put market prices under pressure
again and impact our chemical plant and mining businesses in particular.
The special risks described in the section “Order risks” in the execution of major long-term con-
tracts and technically complex orders are countered by professional and result-oriented project and
claims management, intensive project monitoring, and the increased use of project management
measures. Particular technological risks are associated with “first of their kind” contracts.
If in addition unexpected delays occur in the programs launched to optimize costs, these could
have negative effects on our key performance indicators.
Materials Services – The global materials and service business of Materials Services is subject to
cyclical swings in demand and prices on the procurement and sales sides – in some cases to a
greater extent than other businesses. This influences our earnings situation and our net working
capital. Fast delivery with minimum capital employed is a key success factor for our business mod-
el. We therefore work continually to optimize and digitize our logistics and the entire supply chain,
e.g. through the further consolidation and central coordination of our purchasing activities as the
biggest materials distributor in the western world.

thyssenkrupp annual report 2017 / 2018
2 Combined management report | Forecast, opportunity and risk report
124
In addition we contain cyclical risks by our worldwide presence, broad customer base and high
degree of diversification. This results in a significant spread of risks. The cost reduction measures
developed as part of Group and business area programs are raising the efficiency and profitability
of the business area. At the same time we are intensifying our service and digitization activities for
materials.
Systematic improvements to net working capital management and efficient receivables manage-
ment help us minimize the risks of bad debt.
The production sites of our unit AST are exposed to a risk of business interruptions and production
losses. We are countering these risks mainly through preventive maintenance, modernization and
investment. Unless the European Union imposes safeguard measures against stainless steel im-
ports from Asia, price-related risks will arise in particular for AST.
Marine Systems – In the marine business, there are risks relating to a number of existing export
contracts suffering significant delays; attribution of the causes is disputed due to complex contrac-
tual structures with government procurement agencies for military equipment, local shipyards and
supplies by the Marine Systems business unit. In addition, political developments in customer
countries or surrounding regions could pose the risk of export approvals not being granted.
Steel Europe (discontinued operation) – To contain the risk of cyclical demand fluctuations Steel
Europe optimizes costs in all areas, adjusts production levels in good time and focuses on less
cyclical high-end market segments. The business area counters sales risks with appropriate stag-
gering of contract terms and periods.
Steel Europe counters intense competition on the market for flat steel products with its technologi-
cal expertise and an even stronger focus on markets and customers, allowing differentiation from
the competition. This includes constant optimization of supply chains and systematic investment in
research and development projects aimed at developing innovative products and customer solu-
tions and bringing them to market quickly. In addition, a quality management system geared to the
requirements of the market ensures steady improvements in product quality and helps secure a
competitive market position.
The business area reduces the risks from customer insolvencies through intensive monitoring and
appropriate hedging instruments.

thyssenkrupp annual report 2017 / 2018
2 Combined management report | Forecast, opportunity and risk report
125
Steel Europe counters the risk of rising raw materials prices by using alternative procurement
sources, risk-reducing procurement strategies, active risk management, and margin-securing
measures.
The already implemented strategy of hedging transactions counters the current price increase for
emissions allowances in the third trading period of the EU emissions trading system (2013 to 2020)
and the associated risk of further costs in connection with the need to purchase allowances. How-
ever considerable risks could arise from the adopted revision of the emissions trading directive for
the fourth trading period (2021 to 2030).
To reduce business interruption risks and improve preventive fire safety, funds are made available
for ongoing preventive maintenance and for modernization and investment. In the event of busi-
ness interruptions, business continuity plans as well as emergency and crisis plans are in place
specifying measures for remedying damage. The business area has integrated a business and
technical risk controlling system for property insurance into its risk management process.
In addition, the move towards an energy system dominated by renewables in Germany is creating
major challenges for energy-intensive industries in general and the steel sector in particular. Alt-
hough general planning certainty has been achieved by the continuation of exemptions for produc-
ers of in-house electricity in the Renewable Energies Act (EEG 2017), energy-intensive industry still
sees itself faced with cost-driving developments associated with the integration of renewable ener-
gies, such as the necessary expansion of the electricity grids and the storage of reserve capacities
to provide security of supply.
Regulatory requirements placed on the electricity and gas networks of our large production sites
and our power plants could result in further cost impacts. The risk of rising wholesale electricity
prices is being countered by increasing the supply of in-house produced electricity. In response to
the risk of increasing natural gas prices, the Group is pursuing a centrally managed price hedging
strategy.

thyssenkrupp annual report 2017 / 2018
2 Combined management report | Legal information
126
Legal information
Corporate governance statement
The corporate governance statement issued in accordance with §§ 289f, 315d HGB is part of
the combined management report and is published on the Company’s website at
www.thyssenkrupp.com.
Compensation report
The compensation report in accordance with §§ 289 a (2), 315 a (2) HGB is part of the combined
management report.
Takeover-related disclosures
The following information, valid September 30, 2018, is presented in accordance with §§ 289a (1),
315a (1) HGB. Details under §§ 289a (1), 315a (1) HGB which do not apply at thyssenkrupp are not
mentioned.
Composition of capital stock
The capital stock of thyssenkrupp AG amounts to €1,593,681,256.96 and consists of 622,531,741
no-par value bearer shares. Each share carries the same rights and grants one vote at the Annual
General Meeting.
Direct and indirect shareholdings exceeding 10% of the voting rights
At the date of issuance the following shareholdings in the Company exceed 10% of the voting
rights:
■ Direct shareholding of Alfried Krupp von Bohlen und Halbach Foundation, Essen, in the amount
of around 21% of the voting rights of thyssenkrupp AG according to a voluntary notification of
October 2018;
■ Indirect shareholding of Cevian Capital II GP Limited, St. Helier, Jersey, in the amount of 15.08%
of the voting rights according to a WpHG announcement of March 2014. Voting rights are at-
tributed to it by its controlled company Cevian Capital II Master Fund LP, Cayman Islands, which
has a direct shareholding of 12.23% of the voting rights of thyssenkrupp AG.
www.thyssenkrupp.com > Company > Management > Corporate governance > Corpo-rate governance declaration > ezu2017-2018

thyssenkrupp annual report 2017 / 2018
2 Combined management report | Legal information
127
Appointment and dismissal of Executive Board members, amendments to the Articles of
Association
The appointment and dismissal of members of the Executive Board of thyssenkrupp AG is subject
to § 84 and § 85 AktG and § 31 Codetermination Act (MitbestG) in conjunction with § 6 of the Arti-
cles of Association. Amendments to the Articles of Association are subject to the approval of the
Annual General Meeting with a majority of at least three quarters of the capital stock represented;
§§ 179 ff. AktG apply. Under § 11 (9) of the Articles of Association, the Supervisory Board is au-
thorized to resolve amendments to the Articles of Association which relate only to their wording. If
the authorized capital pursuant to § 5 (5) of the Articles of Association has not been used or has
been only partly used by the end of the authorization period on January 16, 2019, the Supervisory
Board may also amend the wording of § 5.
Authorization of the Executive Board to issue shares and exclude subscription rights
Authorized capital – Under § 5 (5) of the Articles of Association, the Executive Board is authorized,
with the approval of the Supervisory Board, to increase the Company’s capital stock on one or
more occasions on or before January 16, 2019 by up to €225,119,887.36 by issuing up to
87,937,456 new no-par value bearer shares in exchange for cash and/or contributions in kind
(authorized capital).
It may exclude shareholders’ subscription rights with the approval of the Supervisory Board in the
following cases:
■ to round off fractional amounts ■ to the extent necessary to grant holders, or creditors in the case of registered securities, of op-
tion or conversion rights or conversion obligations issued by thyssenkrupp AG or its Group com-
panies subscription rights to new shares as would be due to them as shareholders after exercise
of the option or conversion rights or after fulfillment of the conversion obligations ■ if the issue price of new shares issued for capital increases in exchange for cash contributions is
not significantly lower than the stock market price of already listed shares at the time the final
issue price is determined, which should be as close as possible to the time the shares are issued,
and the shares issued in total do not exceed 10% of the capital stock either at the time this au-
thorization becomes effective or at the time it is exercised. There shall be counted towards this
limit of 10% of the capital stock the share of the capital stock attributable to treasury shares
which are sold from the time this authorization becomes effective in direct or analogous applica-
tion of § 186 (3) sentence 4 AktG, as well as the share of the capital stock attributable to shares
relating to conversion and/or option rights and/or conversion obligations from bonds issued with
exclusion of subscription rights according to § 186 (3) sentence 4 AktG from the time this author-
ization becomes effective in accordance with the authorization of the Annual General Meeting on
January 17, 2014. ■ in the event of capital increases in exchange for contributions in kind
Under the aforesaid authorizations the total shares issued with subscription rights excluded for
capital increases in exchange for cash and/or contributions in kind may not exceed 20% of the
capital stock either at the time the authorization becomes effective or at the time it is exercised. Up

thyssenkrupp annual report 2017 / 2018
2 Combined management report | Legal information
128
to the issue of shares without subscription rights, there shall be counted towards the aforesaid
20% limit (i) treasury shares sold with subscription rights excluded, and (ii) shares to be issued to
service bonds with conversion and/or option rights, insofar as the bonds were issued on the basis
of the authorization of the Annual General Meeting of January 17, 2014 with shareholder subscrip-
tion rights excluded.
The Executive Board is authorized, with the approval of the Supervisory Board, to determine the
further content and conditions of the share issue.
Conditional capital – Under § 5 (6) of the Articles of Association the Company’s capital stock is
conditionally increased by up to €250,000,000, divided into up to 97,656,250 no-par bearer
shares (conditional capital). The conditional capital increase will only be implemented to the extent
that the holders or creditors of option or conversion rights or those with an obligation to convert
warrant or convertible bonds issued against cash contribution that are issued or guaranteed by the
Company or a subordinate Group company on or before January 16, 2019 based on the authoriza-
tion of the Executive Board by resolution by the Annual General Meeting passed on January 17,
2014 actually use their option or conversion rights or, to the extent that they are obliged to convert,
fulfill their obligation to convert or to the extent that the Company exercises an option to grant
shares of the Company in whole or in part instead of payment of the cash amount due provided no
cash compensation is granted or no treasury shares or shares of another listed company are used
for servicing in each case. New shares are issued at the option or conversion price to be deter-
mined in each case according to the above mentioned authorization resolution. The new shares
participate in profits from the start of the fiscal year in which they are created. To the extent legally
permissible the Executive Board, subject to the approval of the Supervisory Board, may determine
the profit participation of new shares differently than § 60 (2) AktG. The Executive Board is author-
ized, subject to the approval of the Supervisory Board, to determine the further details of the condi-
tional capital increase.
Authorization of the Executive Board to repurchase stock
By resolution of the Annual General Meeting of January 30, 2015 the Company was authorized
until January 29, 2020 to purchase for all legally permissible purposes treasury shares up to a
total of 10% of the capital stock at the time of the resolution of €1,448,801,144.32 or – if lower –
at the time the authorization is exercised. The authorization may be exercised in whole or in install-
ments, once or several times, directly by the Company or by controlled enterprises or enterprises
majority-owned by the Company or by third parties acting for the Company’s account or for the
account of controlled enterprises or enterprises majority-owned by the Company. The purchase
may be effected on the open market or by means of a public offer or public invitation to tender or
by issue of tender rights to shareholders or by using equity derivatives (put or call options or a
combination of the two). If the shares are purchased on the open market, the countervalue per
share paid by the Company (excluding incidental costs) may not be more than 5% higher or lower
than the price determined on the day of trading by the opening auction in the Xetra trading system
(or a comparable successor system).

thyssenkrupp annual report 2017 / 2018
2 Combined management report | Legal information
129
If the shares are purchased by means of a public offer, the purchase price or the limits of the price
range per share (excluding incidental costs) may not be more than 10% higher or lower than the
average closing price in the Xetra trading system (or a comparable successor system) on the three
trading days before the date of the announcement of the offer. If, after announcement of an offer,
the relevant price or the limits of the price range are subject to significant changes, the offer may
be modified. In this case the price is based on the average price over the three days of trading
before the announcement of a modification and may not be more than 10% higher or lower than
this amount. The volume of a public offer may be limited. Insofar as the volume of shares tendered
exceeds the volume to be repurchased, tender rights may be partially excluded to the extent that
shares may be purchased in proportion to the number of shares tendered (tender quota) instead of
in proportion to the number of shares held in the company (shareholding quota). In addition tender
rights may be partially excluded to the extent that priority is given to smaller lots of up to 100
shares per shareholder or the number of shares is rounded to avoid fractions of shares.
If the shares are purchased by means of a public invitation to all shareholders to tender, the Com-
pany specifies a purchase price range per share within which shares may be tendered. The pur-
chase price range may be modified if the share price changes significantly during the term of the
offer from the share price at the time of publication of the invitation to tender. The purchase price
per share to be paid by the Company (excluding incidental costs), which is calculated by the Com-
pany on the basis of the tenders received, may not be more than 10% higher or lower than the
average closing price in the Xetra trading system (or a comparable successor system) on the three
trading days before the cut-off date described below. The cut-off date is the date on which the
Executive Board of the Company finalizes its formal decision to publish or modify the invitation to
tender. The volume of tenders accepted may be limited. If due to the limited volume not all of sev-
eral equal tenders can be accepted, tender rights may be partially excluded to the extent that
shares are purchased on the basis of tender quotas instead of shareholding quotas. In addition
tender rights may be partially excluded to the extent that priority is given to smaller lots of up to
100 shares per shareholder or the number of shares is rounded to avoid fractions of shares.
If the shares are purchased by means of issuing tender rights to shareholders, these may be allo-
cated for each share of the Company. A fixed number of tender rights based on the ratio of the
Company’s capital stock to the volume of shares to be repurchased by the Company will entitle a
shareholder to sell one share of the Company back to the Company. Tender rights may also be
allocated in such a way that one tender right is allocated for a certain number of shares based on
the ratio of capital stock to the buy-back volume. Fractions of tender rights are not allocated; in
these cases any partial tender rights are excluded. The price or the limits of the price range (in
each case excluding incidental costs) for which a share of the Company may be sold when exercis-
ing a tender right are subject to the provisions of the above paragraph, with the relevant cutoff date
being the date of publication of the buyback offer with associated tender rights, and in the event of
modifications the relevant cut-off date being the date of publication of the modification. Further
details of the tender rights, in particular their content, term and if appropriate their tradability, are
determined by the Executive Board of the Company.

thyssenkrupp annual report 2017 / 2018
2 Combined management report | Legal information
130
If the shares are purchased using equity derivatives (put options, call options, combinations of put
and call options, or forward contracts), the equity derivatives must be agreed with one or several
banks, one or several enterprises operating in accordance with § 53 (1) sentence 1 or § 53b (1)
sentence 1 or (7) of the German Banking Act or a group or consortium of banks and/or such enter-
prises. The terms and conditions must ensure that the equity derivatives are based only on shares
acquired in accordance with the principle of equal treatment for shareholders; this is satisfied by
acquiring the shares on the open market. The term of each individual equity derivative may not
exceed 18 months, may end no later than January 29, 2020 and must be selected in such a way
that the purchase of shares to exercise or fulfill the options cannot take place later than January 29,
2020. The authorization may be exercised in whole or in part, once or in several different transac-
tions by the Company, and also by an entity dependent on or majority-owned by the Company or
by third parties acting on behalf of the Company or enterprises dependent on or majority-owned by
the Company. Each share purchase by means of equity derivatives is limited to a maximum of 5%
of the capital stock of €1,448,801,144.32 at the time of the resolution or – if lower – at the time
the authorization is exercised. If treasury shares are purchased by means of equity derivatives in
accordance with the authorization provisions, all rights of shareholders to enter into such equity
derivatives with the Company and all shareholder tender rights are excluded.
The Executive Board is authorized to use the repurchased treasury shares for all legally permissible
purposes. In particular it may cancel the shares, sell them by means other than on the open mar-
ket, by offer to the shareholders or in exchange for contributions in kind, use them to fulfill option
and/or conversion rights/obligations in respect of warrant and convertible bonds issued by the
Company or the Company’s subsidiaries, grant the holders of such warrant and/or convertible
bonds a subscription right to the shares as would be due to them after exercise of the option or
conversion rights or after fulfilment of a conversion obligation, and offer them for sale to employees
of the Company and its affiliated companies. With the exception of cancelation shareholders’ sub-
scription rights are excluded in the cases stated. In addition if treasury shares are sold by means of
a tender offer to all shareholders, the Executive Board may exclude shareholders’ subscription
rights for fractional amounts. The Supervisory Board may determine that measures by the Execu-
tive Board under this authorization to purchase and use treasury shares are subject to its approval.

thyssenkrupp annual report 2017 / 2018
2 Combined management report | Legal information
131
Authorization of the Executive Board to issue warrant and convertible bonds and to exclude
subscription rights
By resolution of the Annual General Meeting of January 17, 2014 the Executive Board was author-
ized, with the approval of the Supervisory Board, to take the following measures on or before Janu-
ary 16, 2019:
■ to issue once or several times bearer or registered warrant and/or convertible bonds (together
“bonds”) in the total par value of up to €2 billion with or without limited terms, and to grant to or
impose on the holders or creditors of convertible bonds conversion rights or obligations for no-
par bearer shares of the Company with a total share of the capital stock of up to €250 million in
accordance with the conditions of these bonds. The bonds can also be issued by a subordinate
Group company of the Company; in this event the Executive Board is authorized, with the ap-
proval of the Supervisory Board, to guarantee the bonds for the Company and to grant to or im-
pose on the holders or creditors of these bonds option or conversion rights or obligations for no-
par bearer shares of the Company. ■ The bonds are divided into partial bonds. In the event of a warrant bond issue, one or several
options are attached to each partial bond which entitle the holder or creditor to purchase no-par
bearer shares of the Company in accordance with the option conditions determined by the Ex-
ecutive Board. The option conditions may specify that the option price can also be settled by
transfer of partial bonds and if appropriate a cash surcharge. Where fractional shares occur, the
option or bond conditions may specify that these fractional shares can be added together for the
purchase of whole shares, if appropriate subject to payment of a surcharge. ■ In the event of a convertible bond issue, the holders of bearer bonds or creditors of partial bonds
obtain the right to convert their partial bonds into no-par bearer shares of the Company in ac-
cordance with the convertible bond conditions determined by the Executive Board. The conver-
sion ratio is calculated by dividing the par value or, if lower, the issuing amount of a partial bond
by the fixed conversion price for a no-par bearer share of the Company. The ratio may be round-
ed up or down; in addition, it may be specified that a cash surcharge must be paid and that non-
convertible fractional amounts must be grouped together and/or compensated in cash. The bond
conditions can specify a variable conversion ratio (subject to the minimum price specified below)
within a pre-defined range depending on the development of the price of the no-par shares of
the Company during the term of the bond.

thyssenkrupp annual report 2017 / 2018
2 Combined management report | Legal information
132
■ The bond conditions may also provide the Company with the right in the event of a conversion or
exercise of an option not to issue new no-par shares, but to pay a cash amount corresponding to
the weighted average closing price of the shares in the electronic trading system of Frankfurt
Stock Exchange over a period specified in the bond conditions in lieu of the shares which would
otherwise be issued. The bond conditions may also specify that, at the Company’s discretion,
the bond with option rights or conversion rights or obligations attached is to be converted not
into new shares from conditional capital but into existing shares of the Company or another listed
company, or that the option right can be fulfilled by delivering such shares. The bond conditions
may also include a combination of these performance options. ■ The bond conditions may also provide the Company with the right to grant the holders or credi-
tors of a bond with option rights or conversion rights or obligations which has reached maturity
(this also includes maturity due to termination) no-par shares of the Company or another listed
company in lieu of part or all of the payable cash payment. ■ The convertible bond conditions may also include an obligation to convert at the end of the term
(or earlier or at the time of a specified event). The convertible bond conditions may entitle the
Company to fully or partly offset in cash any difference between the par value or lower issuing
amount of the convertible bond and the product of conversion price and conversion ratio. ■ With the exception of cases where a right to offer alternative performance or a conversion obliga-
tion applies, the fixed option or conversion price for a no-par share of the Company must be no
lower than 80% of the weighted average closing price of the no-par shares of the Company in
the electronic trading system of Frankfurt Stock Exchange over the last 10 trading days before
the Executive Board passes the resolution to issue the bond with option or conversion rights or
conversion obligations attached, or – in the event that a subscription right is granted – no lower
than 80% of the weighted average trading price of the no-par shares of the Company in the elec-
tronic trading system of Frankfurt Stock Exchange during the subscription period with the excep-
tion of the days of the subscription period necessary to ensure the option or conversion price can
be announced in due time in accordance with § 186 (2) sentence 2 AktG. § 9 (1) AktG and § 199
AktG remain unaffected. ■ In the cases where a right to offer alternative performance or a conversion obligation applies, the
option or conversion price in accordance with the bond conditions must correspond at least to
the above minimum price or the weighted average closing price of the no-par shares of the
Company in the electronic trading system of Frankfurt Stock Exchange over the 10 trading days
before the final maturity date or another specified date, even if this average price is lower than
the aforesaid minimum price (80%). § 9 (1) AktG and § 199 AktG remain unaffected. ■ Notwithstanding § 9 (1) AktG, the option or conversion price may be reduced under a dilution
protection clause as defined in the conditions if during the option or conversion period the Com-
pany (i) increases the capital stock through a capital increase from Company funds or (ii) in-
creases the capital stock or sells treasury stock granting an exclusive subscription right to its
shareholders or (iii) issues, grants or guarantees further bonds with option or conversion rights
or obligations granting an exclusive subscription right to its shareholders, and in cases (ii) and (iii)
the owners of existing option or conversion rights or obligations are not granted subscription
rights such as they would have held after exercising the option or conversion right or after ful-
filling the conversion obligation. The reduction of the option or conversion price may also be ef-
fected by a cash payment upon exercise of the option or conversion right or upon fulfillment of a

thyssenkrupp annual report 2017 / 2018
2 Combined management report | Legal information
133
conversion obligation. In addition, the conditions may require modification of the option or con-
version rights or conversion obligations in the case of a capital reduction or other measures or
events which are associated with an economic dilution of the value of the option rights or conver-
sion rights or conversion obligations (e.g. dividends, third parties gaining control). ■ To the extent that shareholders are not permitted to subscribe to the bonds directly, the statutory
subscription rights will be granted to shareholders in such a way that the bonds are acquired by
a bank or banking syndicate which undertakes to offer them to the shareholders for subscription.
If the bonds are issued by a subordinate Group company, the Company must ensure that statu-
tory subscription rights are granted to the shareholders of the Company within the meaning of
the sentence above. ■ However, the Executive Board is authorized, subject to the approval of the Supervisory Board, to
exclude shareholders’ subscription rights in the following cases:
– to eliminate fractional amounts
– to the extent necessary to grant holders, or creditors in the case of registered securities, of op-
tion or conversion rights or obligations previously issued by thyssenkrupp AG or its Group
companies subscription rights to new shares as would be due to them as shareholders after
exercise of the option or conversion rights or after fulfillment of a conversion obligation
– in the case of bonds issued against cash payment, to the extent that the Executive Board, after
due review, reaches the conclusion that the issuing price of the bonds is not significantly lower
than their theoretical fair value, calculated using recognized, in particular financial mathemat-
ics methods. However, this authorization to exclude subscription rights only applies to bonds
issued with an option right or conversion right or obligation, with an option or conversion right
or a conversion obligation for shares with a share of the capital stock that may not exceed 10%
of the capital stock in total either on the date this authorization becomes effective or – if this
value is lower – on the date the authorization is exercised. There shall be counted towards this
limit of 10% of the capital stock the share of the capital stock attributable to shares which dur-
ing the period between granting of this authorization and the issue excluding subscription
rights in accordance with § 186 (3) sentence 4 AktG utilizing this authorization of bonds with
conversion and/or option rights or conversion obligations excluding subscription rights are ei-
ther issued under an authorization of the Executive Board to exclude subscription rights in di-
rect or analogous application of § 186 (3) sentence 4 AktG or sold as acquired treasury stock
in corresponding application of § 186 (3) sentence 4 AktG ■ The total number of bonds issued excluding subscription rights under the above authorizations is
limited to the number of bonds with an option or conversion right or a conversion obligation for
shares with a share of the capital stock that must not exceed 20% of the capital stock in total,
either at the time this authorization enters into force or – if this value is lower – at the time it is
exercised. There shall be counted towards the above 20% limit (i) treasury shares which during
the term of this authorization until the issue excluding subscription rights of the bonds with op-
tion and/or conversion rights or obligations are sold excluding subscription rights, and (ii) shares
which during the term of this authorization until the issue excluding subscription rights of bonds
with option and/or conversion rights or obligations are issued excluding subscription rights from
authorized capital.

thyssenkrupp annual report 2017 / 2018
2 Combined management report | Legal information
134
■ The Executive Board is authorized, subject to Supervisory Board approval, to determine the
further details of the issuing of the bonds, in particular interest rate, issuing price, term and de-
nomination, dilution protection provisions, option or conversion period as well as the conversion
and option price within the above framework, or to fix them in agreement with the boards of the
Group company issuing the option or convertible bond.
Key agreements subject to conditions
thyssenkrupp AG is party to the following agreements that contain certain conditions in the event of
a change of control as a result of a takeover bid:
■ The Company has concluded an agreement with a banking consortium on a committed credit
facility in the amount of €2.0 billion. Each member of the banking consortium has the right under
certain conditions to cancel its share in the credit facility and its share in outstanding loans and
demand their repayment if one or more shareholders who act in a concerted manner towards
thyssenkrupp AG with shareholders other than the Alfried Krupp von Bohlen und Halbach Foun-
dation, together hold more than 50% of the voting rights or capital stock of thyssenkrupp AG.
Such an arrangement also applies in respect of the majority of the committed bilaterally agreed
credit facilities in the amount of €1.6 billion. ■ The Company has bonds and private placements outstanding in the nominal amount of
€4.9 billion. A change of control, i.e. cases where a third party or third parties acting in a con-
certed manner towards thyssenkrupp AG acquire or hold more than 50% of the capital stock or
more than 50% of the voting shares of thyssenkrupp AG, may under certain conditions lead to
the early redemption including interest. ■ Compensation arrangements for the event of a takeover bid (change of control clause) have been
agreed in the service contracts of all Executive Board members. A change of control exists when
(i) a shareholder has acquired control within the meaning of the Securities Acquisition and Take-
over Act (WpÜG) by holding at least 30% of the voting shares in the Company, (ii) an enterprise
agreement in accordance with § 291 AktG has been entered into with the Company as a depend-
ent enterprise or (iii) the Company has been merged with another non-Group legal entity in ac-
cordance with § 2 Transformation Act (UmwG), unless the value of the other legal entity is less
than 50% of the value of the Company as evidenced by the agreed exchange ratio. The compen-
sation arrangements are presented in the compensation report in the section “Commitments in
connection with the ending of Executive Board service”.

210
216
216
217
219
226
136
138
139
140
141
143
166
Consolidated statement of financial position
Consolidated statement of income
Consolidated statement of comprehensive income
Consolidated statement of changes in equity
Consolidated statement of cash flows
Notes to the consolidated financial statements
Notes to the consolidated statement of financial position
Notes to the consolidated statement of income
Notes to the consolidated statement of cash flows
Subsequent events
Other information
Independent Auditors’ Report
Responsibility statement
Consol idated f inanc ial s tatements

thyssenkrupp annual report 2017 / 2018
3 Consolidated financial statements | thyssenkrupp AG – Consolidated statement of financial position
136
thyssenkrupp AG – Consolidated statement of financial position
ASSETS
million € Note Sept. 30, 2017 Sept. 30, 2018
Intangible assets 04 4,813 4,393
Property, plant and equipment (inclusive of investment property) 05 7,605 4,791
Investments accounted for using the equity method 06 154 48
Other financial assets 10 43 32
Other non-financial assets 11 207 144
Deferred tax assets 29 1,680 1,116
Total non-current assets 14,502 10,524
Inventories 08 6,957 5,159
Trade accounts receivable 09 5,734 5,529
Other financial assets 10 420 330
Other non-financial assets 11 1,923 1,838
Current income tax assets 220 249
Cash and cash equivalents 5,292 2,987
Assets held for sale 03 0 7,252
Total current assets 20,546 23,344
Total assets 35,048 33,868

thyssenkrupp annual report 2017 / 2018
3 Consolidated financial statements | thyssenkrupp AG – Consolidated statement of financial position
137
EQUITY AND LIABILITIES
million € Note Sept. 30, 2017 Sept. 30, 2018
Capital stock 1,594 1,594
Additional paid-in capital 6,664 6,664
Retained earnings (5,401) (5,535)
Cumulative other comprehensive income 33 82
[thereof discontinued operations] [—] [97]
Equity attributable to thyssenkrupp AG’s stockholders 2,890 2,805
Non-controlling interest 515 469
Total equity 12 3,404 3,274
Accrued pension and similar obligations 14 7,924 4,128
Provisions for other employee benefits 15 354 182
Other provisions 15 645 295
Deferred tax liabilities 29 111 28
Financial debt 16 5,326 5,087
Other financial liabilities 182 157
Other non-financial liabilities 5 4
Total non-current liabilities 14,546 9,882
Provisions for current employee benefits 15 357 334
Other provisions 15 1,183 1,067
Current income tax liabilities 254 207
Financial debt 16 1,930 147
Trade accounts payable 17 5,729 5,266
Other financial liabilities 18 842 635
Other non-financial liabilities 19 6,802 6,626
Liabilities associated with assets held for sale 03 0 6,430
Total current liabilities 17,097 20,711
Total liabilities 31,643 30,593
Total equity and liabilities 35,048 33,868
See accompanying notes to consolidated financial statements.

thyssenkrupp annual report 2017 / 2018
3 Consolidated financial statements | thyssenkrupp AG – Consolidated statement of income
138
thyssenkrupp AG – Consolidated statement of income
million €, earnings per share in € Note Year ended
Sept. 30, 20171)
Year endedSept. 30, 2018
Net sales 23, 24 33,993 34,777
Cost of sales 04, 05 (28,543) (29,847)
Gross margin 5,449 4,930
Research and development cost (285) (259)
Selling expenses (2,326) (2,218)
General and administrative expenses (2,321) (2,077)
Other income 25 246 195
Other expenses 26 (122) (136)
Other gains/(losses), net 27 42 36
Income/(loss) from operations 684 472
Income from companies accounted for using the equity method (16) (1)
Finance income 768 703
Finance expense (1,107) (1,010)
Financial income/(expense), net 28 (355) (308)
Income/(loss) from continuing operations before tax 329 163
Income tax (expense)/income 29 (317) (362)
Income/(loss) from continuing operations (net of tax) 12 (198)
Income/(loss) from discontinued operations (net of tax) 03 (603) 258
Net income/(loss) (591) 60
Thereof:
thyssenkrupp AG’s shareholders (649) 8
Non-controlling interest 59 51
Net income/(loss) (591) 60
Basic and diluted earnings per share based on 30
Income/(loss) from continuing operations (attributable to thyssenkrupp AG’s shareholders) (0.07) (0.39)
Net income/(loss) (attributable to thyssenkrupp AG's shareholders) (1.15) 0.01
See accompanying notes to consolidated financial statements. 1) Figures have been adjusted (cf. Note 03).

thyssenkrupp annual report 2017 / 2018
3 Consolidated financial statements | thyssenkrupp AG – Consolidated statement of comprehensive income
139
thyssenkrupp AG – Consolidated statement of comprehensive income
million € Year ended
Sept. 30, 2017Year ended
Sept. 30, 2018
Net income/(loss) (591) 60
Items of other comprehensive income that will not be reclassified to profit or loss in future periods:
Other comprehensive income from remeasurements of pensions and similar obligations
Change in unrealized gains/(losses), net 857 (59)
Tax effect (237) 5
Other comprehensive income from remeasurements of pensions and similar obligations, net 620 (54)
Share of unrealized gains/(losses) of investments accounted for using the equity-method 6 0
Subtotals of items of other comprehensive income that will not be reclassified to profit or loss in future periods 627 (54)
Items of other comprehensive income that will be reclassified to profit or loss in future periods:
Foreign currency translation adjustment
Change in unrealized gains/(losses), net (253) (100)
Net realized (gains)/losses (219) (2)
Net unrealized (gains)/losses (472) (101)
Unrealized gains/(losses) from available-for-sale financial assets
Change in unrealized gains/(losses), net 2 0
Net realized (gains)/losses 0 0
Tax effect 2 (1)
Net unrealized (gains)/losses 4 (1)
Unrealized gains/(losses) on derivative financial instruments (cash flow hedges)
Change in unrealized gains/(losses), net 61 172
Net realized (gains)/losses (35) 2
Tax effect (10) (58)
Net unrealized (gains)/losses 15 116
Share of unrealized gains/(losses) of investments accounted for using the equity-method (8) 0
Subtotals of items of other comprehensive income that will be reclassified to profit or loss in future periods (461) 14
Other comprehensive income 166 (40)
Total comprehensive income (425) 20
Thereof:
thyssenkrupp AG’s shareholders (465) 4
Non-controlling interest 40 16
Total comprehensive income attributable to thyssenkrupp AG’s stockholders refers to:
Continuing operations 139 (350)
Discontinued operations1) (604) 354
See accompanying notes to consolidated financial statements. 1) Prior-year figures have been adjusted (cf. Note 03).

thyssenkrupp annual report 2017 / 2018
3 Consolidated financial statements | thyssenkrupp AG – Consolidated statement of changes in equity
140
thyssenkrupp AG – Consolidated statement of changes in equity
Equity attributable to thyssenkrupp AG’s stockholders
Cumulative other comprehensive income
million €, (except number of shares)
Number of shares outstanding Capital stock
Additional paid-in capital
Retainedearnings
Foreigncurrency
translationadjustment
Available-for-sale financial
assets
Derivative financial
instruments (cash flow
hedges)
Share of investments
accounted for using the
equity method Total
Non-controlling
interest Total equity
Balance as of Sept. 30, 2016 565,937,947 1,449 5,434 (5,255) 484 6 (64) 48 2,102 507 2,609
Net income/(loss) (649) (649) 59 (591)
Other comprehensive income 625 (450) 2 14 (7) 184 (18) 166
Total comprehensive income (24) (450) 2 14 (7) (465) 40 (425)
Profit attributable to non-controlling interest 0 (37) (37)
Payment of thyssenkrupp AG dividend (85) (85) 0 (85)
Capital increase 56,593,794 145 1,230 (3) 1,373 1,373
Changes of shares of already consolidated companies (3) (3) 3 0
Other changes (31) (31) 1 (30)
Balance as of Sept. 30, 2017 622,531,741 1,594 6,664 (5,401) 34 8 (50) 41 2,890 515 3,404
Net income/(loss) 8 8 51 60
Other comprehensive income (54) (69) (1) 119 0 (5) (35) (40)
Total comprehensive income (45) (69) (1) 119 0 4 16 20
Profit attributable to non-controlling interest 0 (38) (38)
Payment of thyssenkrupp AG dividend (93) (93) 0 (93)
Changes of shares of already consolidated companies 5 5 (24) (19)
Balance as of Sept. 30, 2018 622,531,741 1,594 6,664 (5,535) (34) 8 69 40 2,805 469 3,274
See accompanying notes to consolidated financial statements.

thyssenkrupp annual report 2017 / 2018
3 Consolidated financial statements | thyssenkrupp AG – Consolidated statement of cash flows
141
thyssenkrupp AG – Consolidated statement of cash flows
million € Year ended
Sept. 30, 20171)
Year endedSept. 30, 2018
Net income/(loss) (591) 60
Adjustments to reconcile net income/(loss) to operating cash flows:
Income/(loss) from discontinued operations (net of tax) 603 (258)
Deferred income taxes, net 75 88
Depreciation, amortization and impairment of non-current assets 688 688
Reversals of impairment losses of non-current assets (1) 0
Income/(loss) from companies accounted for using the equity method, net of dividends received 16 1
(Gain)/loss on disposal of non-current assets (44) (28)
Changes in assets and liabilities, net of effects of acquisitions and divestitures and other non-cash changes
– Inventories (397) (539)
– Trade accounts receivable (677) (557)
– Accrued pension and similar obligations (44) (23)
– Other provisions 116 (23)
– Trade accounts payable 692 672
– Other assets/liabilities not related to investing or financing activities (409) 105
Operating cash flows – continuing operations 27 185
Operating cash flows – discontinued operations 583 1,000
Operating cash flows – total 610 1,184
Purchase of investments accounted for using the equity method and non-current financial assets (4) (2)
Expenditures for acquisitions of consolidated companies net of cash acquired 4 (8)
Capital expenditures for property, plant and equipment (inclusive of advance payments) and investment property (839) (801)
Capital expenditures for intangible assets (inclusive of advance payments) (121) (124)
Proceeds from disposals of investments accounted for using the equity method and non-current financial assets 5 3
Proceeds from disposals of previously consolidated companies net of cash disposed 1,418 0
Proceeds from disposals of property, plant and equipment and investment property 90 63
Proceeds from disposals of intangible assets (1) 1
Cash flows from investing activities – continuing operations 552 (869)
Cash flows from investing activities – discontinued operations (673) (430)
Cash flows from investing activities – total (121) (1,299)

thyssenkrupp annual report 2017 / 2018
3 Consolidated financial statements | thyssenkrupp AG – Consolidated statement of cash flows
142
million € Year ended
Sept. 30, 20171)
Year endedSept. 30, 2018
Proceeds from issuance of bonds 1,250 0
Repayments of bonds (1,250) (1,600)
Proceeds from liabilities to financial institutions 3,470 366
Repayments of liabilities to financial institutions (3,722) (551)
Proceeds from/(repayments on) loan notes and other loans (21) (75)
Increase/(decrease) in bills of exchange 9 (11)
(Increase)/decrease in current securities 0 1
Payment of thyssenkrupp AG dividend (85) (93)
Proceeds from capital increase 1,375 0
Profit attributable to non-controlling interest (37) (38)
Expenditures for acquisitions of shares of already consolidated companies (1) (2)
Financing of discontinued operations (162) 568
Other financing activities 33 (66)
Cash flows from financing activities – continuing operations 858 (1,501)
Cash flows from financing activities – discontinued operations (74) (613)
Cash flows from financing activities – total 784 (2,114)
Net increase/(decrease) in cash and cash equivalents – total 1,273 (2,229)
Effect of exchange rate changes on cash and cash equivalents – total (86) (57)
Cash and cash equivalents at beginning of year – total 4,105 5,292
Cash and cash equivalents at end of year – total 5,292 3,006
[thereof cash and cash equivalents within the discontinued operations] [63] [19]
Additional information regarding cash flows from interest, dividends and income taxes which are included in operating cash flows of continuing operations:
Interest received 60 37
Interest paid (319) (232)
Dividends received 34 34
Income taxes paid (332) (354)
See also Note 32 to the consolidated financial statements. 1) Figures have been adjusted (cf. Note 03).

thyssenkrupp annual report 2017 / 2018
3 Consolidated financial statements | thyssenkrupp AG – Notes to the consolidated financial statements
143
thyssenkrupp AG – Notes to the consolidated financial statements
Corporate information
thyssenkrupp Aktiengesellschaft (“thyssenkrupp AG” or “Company”) is a publicly traded corporation domiciled in Duisburg and Essen in
Germany. The consolidated financial statements of thyssenkrupp AG and its subsidiaries, collectively the “Group”, for the year ended
September 30, 2018, were authorized for issuance in accordance with a resolution of the Executive Board on November 16, 2018.
Statement of compliance
Applying Art. 315e of the German Commercial Code (HGB), the Group’s consolidated financial statements have been prepared in
accordance with International Financial Reporting Standards (IFRS) and its interpretations of the International Accounting Standards Board
(IASB) effective within the EU in accordance with the Regulation No. 1606 / 2002 of the European Parliament and the Council concerning
the use of International Accounting Standards.
01 Summary of significant accounting policies The consolidated financial statements are presented in euros since this is the currency in which the majority of the Group’s transactions are
denominated, with all amounts rounded to the nearest million except when otherwise indicated; this may result in differences compared to
the unrounded figures.
Consolidation
The Group’s consolidated financial statements include the accounts of thyssenkrupp AG and all significant entities which are directly or
indirectly controlled by thyssenkrupp AG (subsidiaries). This typically occurs when thyssenkrupp AG possesses more than half of the voting
rights of a company. As far as structured entities are concerned, the ability to control does not result from a majority of voting rights but
from contractual agreements.
The financial statements of subsidiaries are included in the consolidated financial statements from the date that control commences until
the date that control ceases. Capital consolidation is performed by offsetting the carrying amounts of subsidiaries against their attributable
equity. On acquisition, the identifiable assets, liabilities and contingent liabilities of a subsidiary are measured at their fair values at the
date of acquisition.
The interest of minority shareholders (non-controlling interest) is stated at the minority’s proportion of the fair values of the identifiable
assets, liabilities and contingent liabilities recognized.
All significant intercompany transactions and balances between Group entities are eliminated on consolidation.
Joint arrangements where two or more parties jointly control an activity either classify as joint operations or as joint ventures. Joint
operations result in including the assets and liabilities as well as the related income and expense on a pro rata basis in the Group’s
consolidated financial statements. Joint ventures are accounted for using the equity method of accounting. Where the Group transacts with
its joint operations or joint ventures, unrealized profits and losses are eliminated to the extent of the Group’s interest.
Investments in associates are also accounted for using the equity method of accounting. Here the Group is in a position to exercise
significant influence that is presumed when the Group holds between 20% and 50% of the voting rights (“Associated Companies”). Where

thyssenkrupp annual report 2017 / 2018
3 Consolidated financial statements | thyssenkrupp AG – Notes to the consolidated financial statements
144
a Group entity transacts with an associate of the Group, unrealized profits and losses are eliminated to the extent of the Group’s interest in
the relevant associate.
Subsidiaries, joint operations, joint ventures and associates which influence the Group’s net assets, financial position and results of
operations are only immaterial. Such entities are measured at fair value or at cost when the fair value of unlisted equity instruments cannot
be reliably measured; they are presented under the “Other financial assets, non-current” line item. Goodwill arising on acquisition is
recognized as an asset and is tested for impairment annually, or on such other occasions that events or changes in circumstances indicate
that it might be impaired.
Goodwill arising on the acquisition of a joint venture or an associate is included within the carrying amount of the joint venture or the
associate, respectively. Goodwill arising on the acquisition of subsidiaries or joint operations is presented separately in the balance sheet.
Foreign currency translation
The functional and reporting currency of thyssenkrupp AG and its relevant European subsidiaries is the euro (€). Transactions denominated
in foreign currencies are initially recorded at the rates of exchange prevailing on the dates of the transactions. Monetary assets and
liabilities denominated in such currencies are retranslated at the rates prevailing on the balance sheet date. Profits and losses arising on
exchange are included in the net profit or loss for the period.
Financial statements of the foreign subsidiaries included in the Group consolidated financial statements where the functional currency is
other than the euro are translated using their functional currency which is generally the respective local currency. The translation is
performed using the current rate method. Net exchange gains or losses resulting from the translation of foreign financial statements are
accumulated and included in equity. Such translation differences are recognized as income or as expenses in the period in which the
subsidiary is disposed of.
Companies that manage their sales, purchases, and financing substantially not in their local currency use the currency of their primary
economic environment as their functional currency. Financial statements prepared in local currency are translated into the functional
currency using the temporal method. The resulting translation differences are included in the consolidated statement of income as “Other
income or expenses”. Thereafter, the functional currency financial statements are translated into the reporting currency using the current
rate method.
The exchange rates of those currencies significant to the Group have developed as follows:
CURRENCIES
Exchange rate as of (Basis €1)
Annual average exchange rate for the (Basis €1)
Sept. 30, 2017 Sept. 30, 2018 Year ended
Sept. 30, 2017Year ended
Sept. 30, 2018
US Dollar 1.18 1.16 1.10 1.19
Chinese Renminbi Yuan 7.85 7.97 7.52 7.78
Swiss Franc 1.15 1.13 1.09 1.16
Intangible assets
Intangible assets with finite useful lives are capitalized at cost and amortized on a straight-line basis generally over a period of 3 to 15
years, depending on their estimated useful lives. Useful lives are examined on an annual basis and adjusted when applicable on a
prospective basis. The amortization expense of intangible assets is primarily included in cost of sales in the consolidated statement of
income.

thyssenkrupp annual report 2017 / 2018
3 Consolidated financial statements | thyssenkrupp AG – Notes to the consolidated financial statements
145
Goodwill is stated at cost and tested for impairment annually or on such other occasions that events or changes in circumstances indicate
that it might be impaired. Goodwill impairment losses are included in other expenses.
Property, plant and equipment
Fixtures and equipment are stated at cost less accumulated depreciation and impairment losses. Capitalized production costs for self-
constructed assets include costs of material, direct labour, and allocable material and manufacturing overhead. Borrowing costs directly
attributable to the production of assets that necessarily take a substantial period of time to get ready for their intended use, are added to
the cost of those assets, until such time as the assets are substantially ready for their intended use. Administrative costs are capitalized
only if such costs are directly related to production. Maintenance and repair costs (day-to-day servicing) are expensed as incurred. The
Group recognizes in the carrying amount of an item of property, plant and equipment the cost of replacing parts and major inspection of
such an item if it is probable that the future economic benefits embodied within the item will flow to the Group and the cost of the item can
be measured reliably. Where fixtures and equipment comprise of significant parts having different useful lives those parts are depreciated
separately.
Fixtures and equipment are depreciated over the customary useful life using the straight-line method. The following useful lives are used as
a basis for calculating depreciation:
Useful lives
Buildings (inclusive of investment property) 10 to 50 years
Buildings and land improvements 15 to 25 years
Technical machinery and equipment 8 to 25 years
Factory and office equipment 3 to 10 years
Investment property consists of investments in land and buildings that are held to earn rental income or for capital appreciation, rather
than for use in the production or supply of goods or services or for administrative purposes or sale in the ordinary course of business.
Investment property is stated at cost less accumulated depreciation and impairment losses. The fair value of the Group’s investment
property is stated in Note 05.
Impairment
At each balance sheet date, the Group reviews the carrying amounts of its intangible assets, property, plant and equipment and investment
property to determine whether there is any indication that those assets have suffered an impairment loss. If any such indication exists, the
recoverable amount of the asset is estimated in order to determine the extent of the impairment loss (if any). Where it is not possible to
estimate the recoverable amount of an individual asset, the Group estimates the recoverable amount of the Cash Generating Unit to which
the asset belongs.
Goodwill arising on acquisition is allocated to the Cash Generating Units that are expected to benefit from the synergies of the acquisition.
Those groups of Cash Generating Units represent the lowest level within the Group at which goodwill is monitored for internal management
purposes. The recoverable amount of the Cash Generating Unit that carries a goodwill is tested for impairment annually as of
September 30, or on such other occasions that events or changes in circumstances indicate that it might be impaired. For more details
refer to Note 04.

thyssenkrupp annual report 2017 / 2018
3 Consolidated financial statements | thyssenkrupp AG – Notes to the consolidated financial statements
146
If the recoverable amount of an asset is estimated to be less than its carrying amount, the carrying amount of the asset is reduced to its
recoverable amount. Impairment losses are recognized as an expense immediately.
In case of impairment losses related to Cash Generating Units that carry a goodwill the carrying amount of any goodwill allocated to the
Cash Generating Unit is reduced first. If the amount of impairment losses exceeds the carrying amount of goodwill, the difference is
generally allocated proportionally to the remaining non-current assets of the Cash Generating Unit to reduce their carrying amounts
accordingly.
Where an impairment loss subsequently reverses, the carrying amount of the asset (Cash Generating Unit) is increased to the revised
estimate of its recoverable amount. The revised amount cannot exceed the carrying amount that would have been determined had no
impairment loss been recognized for the asset (Cash Generating Unit) in prior years. A reversal of an impairment loss is recognized as
income immediately. However, impairment losses of goodwill may not be reversed.
Leases
On initial recognition leases are classified as either finance or operating. Lease transactions whereby the Group is the lessee and bears
substantially all the risks and rewards incidental to ownership of an asset are accounted for as a finance lease. Accordingly, the Group
capitalizes the leased asset at the lower of the fair value or the present value of the minimum lease payments and subsequently
depreciates the leased asset over the shorter of the lease term and its useful life. In addition, the Group records a corresponding lease
obligation on the balance sheet which is subsequently settled and carried forward using the effective interest method. All other lease
agreements entered into by the Group, as a lessee, are accounted for as operating leases whereby the lease payments are expensed on a
straight-line basis.
Lease transactions whereby the Group is the lessor and does not transfer substantially all of the benefits and risks incident to the
ownership of property to the lessee, are accounted for as operating leases whereby the leased asset remains on the Group’s balance sheet
and is depreciated. Scheduled lease payments are recognized in income on a straight-line basis over the lease term.
Inventories
Inventories are stated at the lower of acquisition/manufacturing cost or net realizable value. In general, inventories are valued using the
average cost method. Manufacturing cost includes direct material, labor and allocable material and manufacturing overhead based on
normal operating capacity.
Financial instruments
A financial instrument is any contract that at the same time gives rise to a financial asset of one entity and a financial liability or equity
instrument of another entity. Financial instruments are recognized as soon as thyssenkrupp becomes a contracting party to the financial
instrument. In cases where trade date and settlement date do not coincide, for non-derivative financial instruments the settlement date is
used for initial recognition or derecognition, while for derivatives the trade date is used. Financial instruments stated as financial assets or
financial liabilities are generally not offset; they are only offset when a legal right to set-off exists at that time and settlement on a net basis
is intended.
Financial assets
In particular, financial assets include trade accounts receivable, cash and cash equivalents, derivative financial assets, as well as equity
instruments and bonds held. Financial assets are initially recognized at fair value. This includes any transaction costs directly attributable
to the acquisition of financial assets, which are not carried at fair value through profit or loss in future periods. The fair values recognized
on the balance sheet usually reflect the market prices of the financial assets.

thyssenkrupp annual report 2017 / 2018
3 Consolidated financial statements | thyssenkrupp AG – Notes to the consolidated financial statements
147
Trade accounts receivable and other current receivables
Receivables are accounted for at amortized cost less valuation allowances.
Impairments in the form of individual allowances for doubtful accounts adequately consider default risk. When there is objective evidence
of default, the receivable concerned is derecognized. Receivables that are immaterial, and receivables of similar default risk, are grouped
together and tested collectively for impairment based on past experience.
Receivables that do not bear interest or bear below market interest rates and have an expected term of more than one year are discounted
with the discount subsequently amortized to interest income over the term of the receivable.
The Group sells undivided interests in certain trade accounts and notes receivable both on an ongoing and one-time basis to structured
entities, which are not required to be consolidated, or to other lending institutions.
Cash and cash equivalents
Cash and cash equivalents include cash on hand and demand deposits as well as financial assets that are readily convertible to cash and
which are only subject to an insignificant risk of change in value, they are measured at amortized cost.
Financial assets held for trading
Derivatives that are not part of an effective hedge accounting in accordance with IAS 39 must be assigned to this category when the fair
value is positive as of measurement date. Gains or losses resulting from changes in fair value are recognized in profit or loss.
Available-for-sale financial assets
Available-for-sale financial assets are those non-derivative financial assets not assigned to any of the above categories. This category
includes primarily equity and debt instruments which are in general measured at fair value. Gains or losses resulting from the
measurement of available-for-sale financial assets are recognized directly in equity, with the exception of foreign currency conversion
effects on monetary items as well as impairment losses on monetary and non-monetary items. On disposal of these financial assets, a
cumulative gain or loss recognized directly in equity until then is recognized in profit or loss of the respective period. When the fair value of
unlisted equity instruments cannot be reliably measured, they are measured at cost.
Financial assets measured at fair value through profit or loss
The Group does not use the option to categorize financial assets at fair value through profit or loss when initially recognized.
Impairment of financial assets
At each balance sheet date, an assessment is made of whether there is any objective evidence that the carrying amounts of financial
assets not carried at fair value through profit or loss are impaired. Objective evidence includes, for example, considerable financial
difficulty of the debtor obligor, disappearance of an active market, and significant changes in the technological, market, economic or legal
environment. A significant or prolonged decline in the fair value of an equity instrument is an objective evidence of impairment.
The impairment loss on a financial asset carried at amortized cost is measured as the difference between the asset’s carrying amount and
the present value of estimated future cash flows discounted at the financial asset’s original effective interest rate. An impairment loss is
recognized in profit or loss.

thyssenkrupp annual report 2017 / 2018
3 Consolidated financial statements | thyssenkrupp AG – Notes to the consolidated financial statements
148
If in a subsequent period, the amount of the impairment loss decreases and the decrease can be related objectively to an event occurring
after the impairment was recognized, the previously recognized impairment loss is reversed through profit or loss.
Financial liabilities
Financial liabilities are liabilities that must be settled in cash or other financial assets. Financial liabilities are initially carried at fair value.
This includes any transaction costs directly attributable to the acquisition of financial liabilities, which are not carried at fair value through
profit or loss in future periods.
Trade accounts payable and other non-derivative financial liabilities
Trade accounts payable and other non-derivative financial liabilities are in general measured at amortized cost using the effective interest
method. Finance charges, including premiums payable on redemption or settlement, are periodically accrued using the effective interest
method and increase the liabilities’ carrying amounts unless they have already been settled in the period in which they were incurred.
Financial liabilities carried at fair value through profit or loss
The Group does not use the option to categorize financial liabilities at fair value through profit or loss when initially recognized.
Financial liabilities held for trading
Derivatives that are not part of an effective hedge accounting in accordance with IAS 39 must be classified as “held for trading” and thus
carried at fair value through profit or loss.
Derivative financial instruments
Derivatives are used generally to hedge existing or anticipated underlying transactions. Such derivatives and so-called “embedded
derivatives”, which are an integral part of a non-derivative host contract and must be accounted for separately, are measured initially and
subsequently at fair value through profit or loss. Gains or losses due to fluctuations in fair value are recognized immediately in profit or
loss. The Group uses cash flow hedge accounting and to a very limited extent fair value hedge accounting but does not apply hedging of a
net investment in a foreign operation.
More information about financial instruments is provided in Note 21.
Income taxes
Income taxes comprise all current and deferred taxes based on taxable profit. They are calculated taking into account the statutory
provisions applying in the countries in which thyssenkrupp operates. Interest and other surcharges in connection with income taxes are not
recognized in income tax expense.
In this connection management judgments are required which may differ from the interpretations of local tax authorities. If this results in
changes to income taxes from the past, these are reported in the period in which sufficient information is available for an adjustment.
Generally income taxes are calculated on the basis of the profits reported for the fiscal year.
To the extent that items are credited or charged directly to other comprehensive income in equity, the corresponding income tax is also
recognized directly in equity.

thyssenkrupp annual report 2017 / 2018
3 Consolidated financial statements | thyssenkrupp AG – Notes to the consolidated financial statements
149
Current income taxes are recognized in the amount in which it is assumed they will be paid to the tax authorities in the future.
Deferred taxes are accounted for in respect of temporary differences between the carrying amount of an asset or liability in the statement
of financial position and its tax bases. They also include unused tax losses carried forward and credits. Where deferred tax assets occur,
they are measured and adjusted according to an assessment of their future recoverability using forecast calculations and realizable tax
strategies. Deferred taxes are calculated at the enacted or substantially enacted tax rates that are expected to apply when the asset or
liability is settled.
Cumulative other comprehensive income
The equity line item “Cumulative other comprehensive income” includes changes in the equity of the Group that were not recognized in the
consolidated statement of income of the period, except those resulting from capital transactions with the owners. Cumulative other
comprehensive income includes foreign currency translation adjustments, unrealized holding gains and losses on available-for-sale
financial assets and on derivative financial instruments as well as the share of the other comprehensive income of associates and joint
ventures accounted for using the equity method. Remeasurements of pensions and similar obligations are reported in retained earnings in
the period that they are recognized as other comprehensive income.
Accrued pension and similar obligations
The Group’s net obligation for defined benefit and other postretirement benefit plans have been calculated for each plan using the
projected unit credit method as of the balance sheet date. A quarterly valuation of pensions is performed on the basis of updated interest
rates and fair values of plan assets.
As far as the fair value of plan assets related to pensions or similar obligations exceeds the corresponding obligation, the recognition of an
asset in respect to such surplus is limited. As far as in connection with plan assets minimum funding requirements related to past service
exist, an additional liability may need to be recognized in case the economic benefit of a surplus – already taking into account the
contributions to be made in respect of the minimum funding requirements – is limited. The limit is determined by the present value of any
future refunds from the plan or reductions in future contributions to the plan asset (asset ceiling).
With the exception of net interest, all income and expenses related to defined benefit plans are recognized in income/(loss) from
operations. Net interest included in net periodic pension cost is recognized in net financial income/(expense) in the Group’s consolidated
statement of income.
The Group’s obligations for contributions to defined contribution plans are recognized as expense in income/(loss) from operations as
incurred.
The effects of remeasurements of pensions and similar obligations are recognized in other comprehensive income and reported in retained
earnings. They consist of actuarial gains and losses, the return on plan assets and changes in the effects of asset ceiling excluding
amounts already included in net interest. Deferred taxes relating to remeasurements are also recognized in other comprehensive income.
The Group also maintains multi-employer plans. In principle, these multi-employer plans contain defined benefit plans as well as defined
contribution plans. With respect to defined benefit multi-employer plans these are accounted for in the same way as any other defined
benefit plan in case the required information is available. Otherwise these plans are accounted for as defined contribution plans. In
particular in the USA and in the Netherlands, there exist multi-employer defined benefit plans that are accounted for as defined
contribution plans due to the fact that the pension obligations and the plan assets cannot be assigned to the participating employers.

thyssenkrupp annual report 2017 / 2018
3 Consolidated financial statements | thyssenkrupp AG – Notes to the consolidated financial statements
150
Other provisions
Provisions are recognized when the Group has a present obligation as a result of a past event which will result in a probable outflow of
economic benefits that can be reasonably estimated. The amount recognized represents best estimate of the settlement amount of the
present obligation as of the balance sheet date. Expected reimbursements of third parties are not offset but recorded as a separate asset if
it is virtually certain that the reimbursements will be received. Where the effect of the time value of money is material, provisions are
discounted using a market rate.
A provision for warranties is recognized when the underlying products or services are sold. The provision is based on historical warranty
data and a weighting of all possible outcomes against their associated probabilities.
Provisions for restructuring costs are recognized when the Group has a detailed formal plan for the restructuring and has notified the
affected parties.
A provision for onerous contracts is recognized when the expected benefits to be derived by the Group from a contract are lower than the
unavoidable cost of meeting its obligations under the contract.
Share-based compensation
The Group has management incentive plans which grant stock rights to executive and senior employees that are exclusively settled in cash
after the end of the respective performance period. The fair value of these rights is calculated on the date of grant and on each balance
sheet date and recognized as an expense on a straight-line basis over the vesting period with a corresponding increase in provisions.
Furthermore a portion of the variable compensation was granted as share appreciation rights to the Executive Board members of
thyssenkrupp AG inclusive of fiscal year 2013 / 2014 and was granted to additional selected executive employees inclusive of fiscal year
2014 / 2015. For both types of compensation, the provision is remeasured at each balance sheet date and at settlement date. Any changes
in the fair value of the provision are recognized as part of income from operations.
See also information provided in Note 13.
Revenue recognition
Revenue from the sale of goods is recognized when the significant risks and rewards of ownership have been transferred to the buyer and
the amount of revenue can be measured reliably. Revenue from services is recognized when services are rendered. No revenue is
recognized if there are significant uncertainties regarding recovery of the consideration due or the possible return of goods. Revenue is
recognized net of applicable provisions for discounts and allowances.
Construction contract revenue and expense are accounted for using the percentage-of-completion method, which recognizes revenue as
performance of the contract progresses. In general the contract progress is determined based on the percentage of costs incurred to date
to total estimated cost for each contract after giving effect to the most recent estimates of total cost. If the construction takes a substantial
period of time, contract costs also include borrowing costs that are directly attributable.
Contracts where the Group provides engineering services are also accounted for like construction contracts. Construction contracts under
the percentage-of-completion method are measured at construction cost plus profits earned based on the percentage of the contract
completed. Revenues net of advance payments received are recognized as trade accounts receivable in the balance sheet. Variations in

thyssenkrupp annual report 2017 / 2018
3 Consolidated financial statements | thyssenkrupp AG – Notes to the consolidated financial statements
151
contract work and claims are included to the extent that it is probable that they will be approved by the customer and the amount can be
reliably measured. Reliably measurable incentive payments are recognized if it is probable that the specified performance standards will be
met or exceeded.
Where the income of a construction contract cannot be estimated reliably, contract revenue that is probable to be recovered is recognized
to the extent of contract costs incurred. Contract costs are recognized as expenses in the period in which they are incurred. Where it is
probable that total contract costs will exceed total contract revenue, the expected loss is recognized as an expense immediately.
Revenues from contracts with multiple element arrangements, such as those including both goods and services, are recognized as each
element is earned based on objective evidence of the relative fair value of each element.
Interest income is accrued on a time basis by reference to the principal outstanding and at the interest rate applicable. Dividend income
from investments is recognized when the shareholders’ rights to receive payment have been established.
Research and development costs
Research costs are expensed as incurred.
Development costs, whereby research findings are applied to a plan or design for the production of new or substantially improved products
and processes, are capitalized if the product or process is technically and commercially feasible, it is intented to complete the intangible
asset, there is a market for the output of the intangible asset, the attributable expenditure can be measured reliably, and the Group has
sufficient resources to complete development. Other development costs are expensed as incurred. Capitalized development costs of
completed projects are stated at cost less accumulated amortization and impairment losses.
Earnings per share
Basic earnings per share amounts are calculated by dividing net income/(loss) attributable to thyssenkrupp AG’s shareholders by the
weighted average number of shares outstanding. Shares issued during the period are weighted for the portion of the period that they were
outstanding.
Segment reporting
In accordance with the so-called management approach, segment reporting of the thyssenkrupp Group is based on the internal
organizational and reporting structure. The data used to determine the internal key figures are derived from the IFRS consolidated financial
statements.
Single assets held for sale, disposal groups and discontinued operations
A single non-current asset is classified as held for sale if its carrying amount will be recovered principally through a sale transaction rather
than through continuing use. The Group reports assets and liabilities as a disposal group, that will be disposed of by sale or otherwise in a
single transaction, which collectively meet the held for sale criteria as specified in IFRS 5 “Non-current Assets Held for Sale and
Discontinued Operations”. The Group reports the assets and liabilities of a disposal group separately in the balance sheet line item “assets
held for sale/disposal” and “liabilities associated with assets held for sale/disposal”, respectively. Unless a disposal group qualifies for
discontinued operations reporting, the revenues and expenses of the disposal group remain within continuing operations until the date of
disposal. The Group reports the results of a disposal group that also qualifies as a component of the Group as discontinued operations if it
represents a separate major line of business or geographical area of operations. The Group reports the results of discontinued operations

thyssenkrupp annual report 2017 / 2018
3 Consolidated financial statements | thyssenkrupp AG – Notes to the consolidated financial statements
152
in the period in which they occur separately within the consolidated statement of income as “discontinued operations (net of tax)”. All prior
period consolidated statements of income are adjusted to report the results of the component within discontinued operations. In the
consolidated statement of cash flows the cash flows resulting from discontinued operations are presented separately from cash flows
resulting from continuing operations; prior year presentation has been adjusted accordingly.
On initial classification as held for sale, non-current assets are recognized at the lower of the carrying amount and fair value less costs to
sell and depreciation and amortization ceases. A disposal group is initially measured in line with the respective IFRS standards to
determine the carrying amount of the disposal group which is then compared to the fair value less costs to sell of the group in order to
recognize the group at the lower of both amounts. Impairment losses on initial classification as held for sale are included in profit or loss,
as are gains and losses on subsequent remeasurement, but not in excess of the cumulative impairment loss.
Financial statement classification
Certain line items on the consolidated balance sheet and in the consolidated statement of income have been combined. These items are
disclosed separately in the Notes to the consolidated financial statements. Certain reclassifications have been made to the prior year
presentation to conform to that of the current year.
In general the Group classifies assets and liabilities as current when they are expected to be realized or settled within twelve months after
the balance sheet date. Group companies that have operating cycles longer than twelve months classify assets and liabilities as current if
they are expected to be realized within the company’s normal operating cycle.
Estimates and judgments
The preparation of the Group consolidated financial statements requires management to make judgements, estimates and assumptions
that affect the application of policies and reported amounts of assets and liabilities, income and expenses. All estimates and assumptions
are made to the best of management’s knowledge and belief in order to fairly present the Groups financial position and results of
operations; they are reviewed on an ongoing basis. Actual results may differ from these estimates.
Accounting estimates and judgments made by management in the application of IFRS that have a significant effect on the consolidated
financial statements are in particular relevant for the following issues:
Business combinations
As a result of acquisitions the Group recognized goodwill in its balance sheet. In a business combination, all identifiable assets, liabilities
and contingent liabilities acquired are recorded at the date of acquisition at their respective fair value. One of the most significant estimates
relates to the determination of the fair value of these asset and liabilities. Land, buildings and equipment are usually independently
appraised while marketable securities are valued at market price. If any intangible assets are identified, depending on the type of
intangible asset and the complexity of determining its fair value, the Group either consults with an independent external valuation expert or
develops the fair value internally, using an appropriate valuation technique which is generally based on a forecast of the total expected
future net cash flows. These evaluations are linked closely to the assumptions made by management regarding the future performance of
the assets concerned and any changes in the discount rate applied.
Recoverability of goodwill
As stated in the accounting policy, the Group tests annually and in addition if any indicators exist, whether goodwill has suffered an
impairment loss. If there is an indication, the recoverable amount of the cash-generating unit has to be estimated which is the greater of
the fair value less costs to sell and the value in use. The determination of the value in use involves making adjustments and estimates

thyssenkrupp annual report 2017 / 2018
3 Consolidated financial statements | thyssenkrupp AG – Notes to the consolidated financial statements
153
related to the projection and discounting of future cash flows (cf. Note 04). Although management believes the assumptions used to
calculate recoverable amounts are appropriate, any unforeseen changes in these assumptions could result in impairment charges to
goodwill which could adversely affect the future financial position and operating results.
Recoverability of assets
At each balance sheet date, the Group assesses whether there is any indication that the carrying amounts of its property, plant and
equipment, investment property or intangible assets may be impaired. If any such indication exists, the recoverable amount of the asset is
estimated. The recoverable amount is the greater of the fair value less costs to sell and the value in use. In assessing the value in use,
discounted future cash flows from the related assets have to be determined. Estimating the discounted future cash flows involves
significant assumptions, including particularly those regarding future sale prices and sale volumes, costs and discount rates (Cf. Note 03,
04 and 05). Although management believes that its estimates of the relevant expected useful lives, its assumptions concerning the
economic environment and developments in the industries in which the Group operates and its estimations of the discounted future cash
flows are appropriate, changes in the assumptions or circumstances could require changes in the analysis. This could lead to additional
impairment charges in the future or to reversal of impairments if the trends identified by management reverse or the assumptions or
estimates prove incorrect.
Other provisions
The recognition and measurement of other provisions are based on the estimation of the probability of a future outflow of resources as well
as empirical values and the circumstances known at the reporting date. This means that the actual later outflow of resources may differ
from the other provisions, cf. also the remarks under Note 15.
Measurement of single assets held for sale, disposal groups and discontinued operations
Single assets held for sale as well as disposal groups and discontinued operations are measured at fair value less costs to sell. The
determination of fair value less costs to sell can be based on estimations and assumptions of the management that carry a certain degree
of uncertainty.
Revenue recognition on construction contracts
Certain Group entities, particularly in the Elevator Technology and Industrial Solutions business areas, conduct a portion of their business
under construction contracts which are accounted for using the percentage-of-completion method, recognizing revenue as performance on
the contract progresses. This method requires accurate estimates of the extent of progress towards completion. Depending on the
methodology to determine contract progress, the significant estimates include total contract costs, remaining costs to completion, total
contract revenues, contract risks and other judgements. The managements of the operating companies continually review all estimates
involved in such construction contracts and adjust them as necessary.
Income taxes
The recognition and measurement of current and deferred tax receivables and liabilities depend on management estimates of tax
uncertainties and future business performance. This includes both the interpretation of existing tax regulations and the testing of deferred
tax assets for impairment. These estimates are adjusted when there is sufficient evidence of the need for such adjustment.

thyssenkrupp annual report 2017 / 2018
3 Consolidated financial statements | thyssenkrupp AG – Notes to the consolidated financial statements
154
Employee benefits
The Group accounts for pension and other postretirement benefits in accordance with actuarial valuations. These valuations rely on
statistical and other factors in order to anticipate future events. These factors include key actuarial assumptions including the discount
rate, expected salary increases, mortality rates and health care cost trend rates. These actuarial assumptions may differ materially from
actual developments due to changing market and economic conditions and therefore result in a significant change in postretirement
employee benefit obligations, of equity and the related future expense. (Cf. Note 14 for further information).
Legal contingencies
thyssenkrupp companies are parties to litigations related to a number of matters as described in Note 20. The outcome of these matters
may have a material effect on the financial position, results of operations or cash flows. Management regularly analyzes current
information about these matters and provides provisions for probable contingent losses including the estimate of legal expense to resolve
the matters. For the assessments internal and external lawyers are used. In making the decision regarding the need for loss provisions,
management considers the degree of probability of an unfavorable outcome and the ability to make a sufficiently reliable estimate of the
amount of loss. The filing of a suit or formal assertion of a claim against thyssenkrupp companies or the disclosure of any such suit or
assertions, does not automatically indicate that a provision of a loss may be appropriate.
Recently adopted accounting standards
In fiscal year 2017 / 2018 thyssenkrupp adopted the following amendments to already existing standards that did not have a material
impact on the Group’s consolidated financial statements:
■ Amendments to IAS 12 “Income Taxes”: “Recognition of Deferred Tax Assets for Unrealised Losses”, issued in January 2016
■ Amendments to an IAS 7 “Statements of Cash Flows”: “Disclosure Initivative”, issued in January 2016
Issued accounting standards that have not been adopted in fiscal year 2017 / 2018
The following standards, interpretations and amendments of standards and interpretations have been issued by the IASB. Their adoption
has not been mandatory for 2017 / 2018 and they still must be partially endorsed by the EU:
In July 2014 the IASB issued the final version of IFRS 9 “Financial Instruments”. The new standard includes revised requirements for the
classification and measurement of financial assets, fundamental changes to the regulations on the impairment of financial assets, and
revised rules on hedge accounting. The new regulations must be applied for fiscal years beginning on or after January 1, 2018. In general
they must be applied retrospectively, but various transition options are allowed; earlier application is permitted.
The Group will adopt IFRS 9 in the fiscal year beginning on October 1, 2018 and, in accordance with the transition options, comparative
information on classification, measurement and impairment according to IFRS 9 for prior periods will not be restated. Resultant transition
effects will be reported in retained earnings. The new hedge accounting rules will be applied prospectively.
Regarding the classification of financial assets, a part of trade accounts receivable, currently accounted for exclusively at amortized cost,
will in the future be recognized at fair value in equity through other comprehensive income. Equity instruments which are recognized at
amortized cost will to be recognized at fair value in profit or loss in the future. This will not impact earnings.

thyssenkrupp annual report 2017 / 2018
3 Consolidated financial statements | thyssenkrupp AG – Notes to the consolidated financial statements
155
Under the new impairment model (expected loss model) expected losses are reported and forward-looking information is used to a greater
extent. To implement the new rules on impairment, suitable models were developed in particular to determine the expected loss rates for
trade accounts receivable. thyssenkrupp will apply the simplified impairment model under IFRS 9 and report lifetime expected losses for all
trade accounts receivable and contract assets. The reporting of expected losses under the new model will likely result in earlier recognition
of loss allowances. The transition is expected to result in a €55 million increase in loss allowances, reported in equity under retained
earnings in the opening balance sheet as of October 1, 2018; €1 million of this is attributable to the discontinued operations.
All existing designated hedges meet the requirements of IFRS 9 and can be continued. In some cases the hedging of components will be
possible in the future. The option of reporting hedge costs in connection with designated hedges initially in other comprehensive income
will be used. This will further reduce earnings volatility.
In May 2014 the IASB issued the new standard IFRS 15 “Revenue from Contracts with Customers”. The purpose of the new standard on
revenue recognition is to bring together the large number of existing guidelines contained in various standards and interpretations. At the
same time it establishes uniform core principles to be applied to all industries and all types of revenue transactions. In April 2016
clarifications to IFRS 15 were issued relating mainly to the identification of separate performance obligations as well as the definition of
principal and agent.
IFRS 15 must be applied for fiscal years beginning on or after January 1, 2018. The Group is not making use of the option for early
application of IFRS 15 but adopts IFRS 15 for the 2018 / 2019 fiscal year beginning on October 1, 2018 (IFRS 15 effective date). The full
retrospective approach to initial application is applied, i.e. the cumulative transition effects will be included directly in retained earnings at
the start of the comparative period on October 1, 2017. With this the Group is making use of the practical expedients provided in IFRS 15.
In this connection at October 1, 2017 in particular contracts that begin and are completed within the same fiscal year or are completed at
October 1, 2017 were not restated.
Based on current knowledge, at the start of the comparative period on October 1, 2017 the IFRS 15 transition effects versus the
consolidated balance sheet on September 30, 2017 are as follows:
■ Equity is overall immaterially lower by €1 million due to the reporting of cumulative adjustment effects (after deferred taxes) in equity as
a result of IFRS 15 adoption. The IFRS 15 requirement to capitalize the costs of obtaining a contract when certain conditions are met
results in an €11 million increase in non-current non-financial assets. This is offset mainly by decreases due to revenue and income
deferrals. These result from the use of certain Incoterms in contracts with customers for the supply of products which under IFRS 15 lead
to the recognition of separate performance obligations for the provision of transportation and/or insurance services. Under IFRS 15 the
revenue for these services is recognized over time and not, as under IAS 18, at the time of delivery of the corresponding products. In
addition, in cases where certain Incoterms are agreed for the supply of products to customers control transfers to the customer under
IFRS 15 only when the products concerned are transferred to the customer; earlier revenue recognition at the point in time the significant
rewards and risks are transferred to the customer, as previously allowed under IAS 18, is no longer possible under IFRS 15.
■ Total assets are overall €638 million higher as a result of IFRS 15 adoption. €601 million of this is due to the recognition, explicitly required
under IFRS 15, of due prepayments not yet received in cash from customers in the Elevator Technology and Industrial Solutions business
areas. This recognition resulted in a corresponding increase in trade accounts receivable and in contract liabilities required to be presented
separately in the statement of financial position under IFRS 15.

thyssenkrupp annual report 2017 / 2018
3 Consolidated financial statements | thyssenkrupp AG – Notes to the consolidated financial statements
156
■ Despite the above-mentioned increases due to the recognition of due customer prepayments, trade accounts receivable overall are
€897 million lower. This is due mainly to the reclassification of €1,403 million receivables under construction contracts of the Elevator
Technology and Industrial Solutions business areas to the contract assets required to be presented separately under IFRS 15, as well as in
the amount of 103 Mio € to the existence of agent activity under IFRS 15 – unlike under IAS 18 – in certain business models in the
automotive supply business of the Components Technology business area as a result of the concretized definition of principal and agent
in IFRS 15 based on the control concept.
■ The application of IFRS 15 results in contract assets in the total amount of €1,367 million, mainly relating to the above-mentioned
reclassifications of receivables from construction contracts.
■ Current other financial assets are €164 million higher. The increase is mainly due to receivables from customers in connection with the
above-mentioned agent activity for certain business models in the automotive supply business.
■ Current other provisions are overall €137 million higher, mainly due to the changed presentation of losses from construction contracts
under IFRS 15.
■ The application of IFRS 15 results in contract liabilities in the total amount of €4,858 million. This is mainly due to reclassifications from
current non-financial liabilities, which relate in the amount of €3,356 million to reclassifications of liabilities under construction contracts
in the Elevator Technology and Industrial Solutions business areas and in the amount of €991 million to reclassifications of prepayments
received. In addition, due prepayments not yet received in cash from customers in the Elevator Technology and Industrial Solutions
business areas are recognized here in the amount of €601 million, as explicitly required by IFRS 15. This is partly offset by the previously
mentioned changed presentation of losses from construction contracts.
■ Current other non-financial liabilities are significantly lower by €4,343 million. This is mainly due to the previously mentioned
reclassifications of liabilities under construction contracts and of prepayments received to the contract liabilities to be presented
separately under IFRS 15.
Based on current knowledge, the IFRS 15 transition effects with regard to the consolidated statement of income for the comparative fiscal
year 2017 / 2018 are as follows:
■ Owing to the previously mentioned concretized definition of principal and agent in IFRS 15 based on the control concept, for certain
business models in the automotive supply business of the Components Technology business area there is a significant reduction in
reported revenue of the continuing operations by €1,210 million due to the extended net presentation of agent revenue. However there is
no effect on income due to a corresponding reduction in cost of sales of the continuing operations. The reported percentage sales
margin (related to adjusted EBIT of the continuing operations) increases in total by 0.1%-points, with the sales margin (related to
adjusted EBIT) of the Components Technology business area being reported 0.5%-points higher.
Adjusted EBIT of the continuing operations at €706 million and net income at €60 million are unchanged overall.
In January 2016 the IASB issued the new standard IFRS 16 “Leases”, which will replace the current lease standard IAS 17 and the
associated interpretations. Application of the new standard is mandatory for fiscal years beginning on or after January 1, 2019. Earlier
application is permitted as long as IFRS 15 is also applied. The Group will apply IFRS 16 for the first time in the fiscal year beginning
October 1, 2019.

thyssenkrupp annual report 2017 / 2018
3 Consolidated financial statements | thyssenkrupp AG – Notes to the consolidated financial statements
157
For the transition the Group has chosen to use the modified retrospective approach. This does not require adjustment of comparative
information. The cumulative transition effects at October 1, 2019 will be recognized in retained earnings. Also, on initial application of
IFRS 16 it is intended to recognize the rights of use at an amount equal to the lease liability.
For the lessee a uniform accounting model applies under the new standard: For each lease a right-of-use asset and a lease liability are
recognized. Where corresponding options are exercised, exceptions apply for leases of low-value assets and leases with a term of less than
12 months. For lessors, the rules of IFRS 16 differ very little from those of IAS 17. Lessors must continue to differentiate between finance
leases and operating leases.
Most of thyssenkrupp’s leases are operating leases under which it is the lessee. The application of IFRS 16 will have the following effects
on the presentation of the Group’s financial position and earnings performance: With regard to the minimum rental payments from
operating leases reported under commitments, the adoption of the new standard will lead to an increase in non-current assets due to
recognition of rights of use. Accordingly financial debt will increase due to recognition of the corresponding liabilities. In addition the
classification of expenses from these leases will change because IFRS 16 replaces the current straight-line expenses for operating leases
with depreciation of the rights of use and interest expense for the liabilities. In addition under IFRS 16 the principal portion of lease
payments is reported under cash flows from financing activities, meaning that operating cash flow will improve.
The Group has launched a Groupwide project to implement the new standard. A reliable estimate of the quantitative impact on the
consolidated financial statements cannot yet be made. The current operating lease volume is shown in Note 20.
In addition to the standards presented above in detail, the IASB has issued further standards, interpretations and amendments to
standards and interpretations whose application is also not yet mandatory and which in part require EU endorsement before they can be
applied. Management currently assumes that the application of these standards, interpretations and amendments will not have a material
impact on the presentation of the consolidated financial statements:
■ Amendments to IFRS 10 “Consolidated Financial Statements” and IAS 28 “Investments in Associates and Joint Ventures (2011)”: “Sale
or Contribution of Assets between an Investor and its Associate or Joint Venture”, issued in September 2014, initial application deferred
indefinitely
■ Amendments to IFRS 2 “Share-based Payment”: “Classification and Measurement of Share-based Payment Transactions”, issued in
June 2016, initial application in fiscal year 2018 / 2019
■ Annual Improvements to IFRSs 2014-2016 Cycle, issued in December 2016, initial application in fiscal year 2017 / 2018 and
2018 / 2019 , respectively
■ IFRIC 22: “Foreign Currency Transactions and Advance Consideration”, issued in December 2016, initial application in fiscal year
2018 / 2019
■ Amendments to IAS 40: “Transfers of Investment Property”, issued in December 2016, initial application in fiscal year 2018 / 2019
■ IFRIC 23: “Uncertainty over Income Tax Treatments”, issued in June 2017, issued in December 2016, initial application in fiscal year
2019 / 2020

thyssenkrupp annual report 2017 / 2018
3 Consolidated financial statements | thyssenkrupp AG – Notes to the consolidated financial statements
158
■ Amendments to IFRS 9 “Financial Instruments”, issued in October 2017, initial application in fiscal year 2019 / 2020
■ Amendments to IAS 28: “Investments in Associates and Joint Ventures”, issued in October 2017, not yet endorsed, expected initial
application in fiscal year 2019 / 2020
■ Annual Improvements to IFRSs 2015-2017 Cycle, issued in December 2017, not yet endorsed, expected initial application in fiscal year
2019 / 2020
■ Amendments to IAS 19: “Plan Amendment, Curtailment or Settlement”, issued in February 2018, not yet endorsed, expected initial
application in fiscal year 2019 / 2020
■ Amendments to IFRS Framework: “Amendments to References to the Conceptual Framework in IFRS Standards”, issued in March 2018,
not yet endorsed, expected initial application in fiscal year 2020 / 2021
■ Amendments to IFRS 3: “Definition of a Business (Amendments to IFRS 3)”, issued in October 2018, not yet endorsed, expected initial
application to acquisitions that occur on or after January 1, 2020
■ Amendments to IAS 1 und IAS 8: “Definition of Material (Amendments to IAS 1 and IAS 8)”, issued in October 2018, not yet endorsed,
expected initial application in fiscal year 2020 / 2021
02 Consolidated companies and equity interests
Composition of the scope of consolidation
The changes in the scope of consolidation in fiscal 2016 / 2017 and 2017 / 2018, respectively are presented in the table below:
ACQUISITIONS/DIVESTITURES OF BUSINESSES
Number of consolidated companies Germany Abroad Total
Balance as of Sept. 30, 2016 122 349 471
Additions 4 26 30
Disposals (18) (22) (40)
Balance as of Sept. 30, 2017 108 353 461
Additions 4 6 10
Disposals (9) (13) (22)
Balance as of Sept. 30, 2018 103 346 449
The additions in 2017 / 2018 mainly result from acquisitions and incorporations, while the disposals result from internal merging of Group
entities. To further details see “acquisitions and disposals” in this Note and in Note 03.

thyssenkrupp annual report 2017 / 2018
3 Consolidated financial statements | thyssenkrupp AG – Notes to the consolidated financial statements
159
6 (prior year: 7) controlled subsidiaries are not consolidated because their combined influence on the Group’s net assets, financial position
and results of operations is not material. Their net sales amount to 0.004%, their income/(loss) before tax amounts to 0.02% and their
total equity amounts to 0.68% of the Group’s respective balances.
The Group has 11 (prior year: 12) associated companies and 12 (prior year: 13) joint ventures that are accounted for using the equity
method of accounting. Another 7 (prior year: 8) associated companies are not accounted for using the equity method of accounting
because their combined influence on the Group’s net assets, financial position and results of operations is not material. The income before
tax of the immaterial associated companies amounts to 0.34% and their total equity to 0.26% of the Group’s respective balances.
A complete listing of the Group’s subsidiaries and equity interests is published in the German Federal Gazette and is available on the
thyssenkrupp website at www.thyssenkrupp.com.
Structured entities
thyssenkrupp includes 4 (prior year: 4) structured entities in the consolidated financial statements. One of these structured entities is the
operating company of a leased facility for the production of coke. This operating company is the lessee under an operating lease, so
liabilities from future minimum rental payments are part of the commitments included in the consolidated financial statements. The
maximum loss risk to the Group from this facility is €61 million, resulting from the residual value guarantee – mainly transferred to third
parties – for the facility up to the end of the lease contract (cf. Note 20). Another of the structured entities is a special purpose leasing
company established to realize the second construction phase of the thyssenkrupp Quarter. The lease object and the corresponding
liabilities are included in the consolidated financial statements. There are no obligations to provide financial support. The two other
structured entities do not have a material influence on the Group’s net assets, financial position and results of operations.
thyssenkrupp also has contractual relationships with 3 (prior year: 3) non-controlled structured entities. The Group holds a maximum 1%
share in these entities. One of these entities is the owner company and operating lessor of the coke production facility leased by the
thyssenkrupp Group. Under factoring programs, contractual relationships exist with a structured entity in which the company holds no
interests. The other non-controlled structured entity has a service contract with a Group company. Potential losses from these contracts are
already included in the purchasing commitments stated under commitments (cf. Note 20).
Acquisitions and disposals
Year ended September 30, 2018
After the completion of the analysis of the individual projects the purchase price allocation of the complete acquisition of Atlas Elektronik in
April 2017 was finalized in the 2nd quarter ended March 31, 2018. Compared to the preliminary purchase price allocation it resulted in
increased other current assets of €4 million and increased other current provisions of €5 million, while deferred tax liabilities decreased by
€2 million.

thyssenkrupp annual report 2017 / 2018
3 Consolidated financial statements | thyssenkrupp AG – Notes to the consolidated financial statements
160
In total, the final purchase price allocation is presented below:
ACQUISITION OF ATLAS ELEKTRONIK GROUP
million €
Goodwill 93
Other intangible assets 192
Property, plant and equipment 86
Other non-current financial assets 3
Other non-current non-financial assets 1
Deferred tax assets 13
Inventories 132
Trade accounts receivable 235
Other current financial assets 47
Other current non-financial assets 37
Current income tax assets 10
Cash and cash equivalents 167
Total assets 1,017
Accrued pension and similar obligations 176
Deferred tax liabilities 62
Other non-current financial liabilities 2
Provisions for current employee benefits 1
Other current provisions 104
Current income tax liabilities 9
Trade accounts payable 34
Other current financial liabilities 18
Other current non-financial liabilities 296
Total liabilities 700
Net assets 316
Non-controlling interest 0
Purchase price (paid via cash and fair value of equity-investment) 316
Thereof: paid in cash and cash equivalents 155
In the year ended September 30, 2018 , the Group acquired only some smaller companies that are, on an individual basis, immaterial. The
total of the purchase prices amounted to €29 million and refers to intangible assets in the amount of €27 million and to trade accounts
receivable in the amount of €3 million. Furthermore there weren’t any disposals in the year ended September 30, 2018 .
Year ended September 30, 2017
At the beginning of April 2017 thyssenkrupp completed the full takeover of Atlas Elektronik after approval for the acquisition of the 49%
share held by Airbus was also given by the German government and the competition authorities. thyssenkrupp already held a 51% share in
Atlas Elektronik and managed the company together with Airbus as a joint venture, which was accounted for in the consolidated financial
statements using the equity method. Following the full acquisition, the Atlas Elektronik group is now fully consolidated.
The Atlas Elektronik group is an international maritime high-tech supplier of ships’ electronic systems and has been a technology partner
of thyssenkrupp Marine systems for many years. With the takeover the Marine Systems business of the Industrial Solutions business area
is repositioning itself as an integrated system provider and developing strategic advantages in the global market for submarines and naval
surface vessels.

thyssenkrupp annual report 2017 / 2018
3 Consolidated financial statements | thyssenkrupp AG – Notes to the consolidated financial statements
161
Immediately before the acquisition of the remaining share, the value of the investment accounted for using the equity-method amounted to
€111 million. Following remeasurement in connection with the acquisition, this increased to €161 million taking into account the purchase
price for the 49% share; the resultant profit of €50 million is reported under other income in the consolidated statement of income. The
purchase price for the 49% share amounted to €155 million. Based on the preliminary values at the time of acquisition, the ongoing
purchase price allocation has led to an increase particularly in other intangible assets. This was the main reason preliminary goodwill,
which contains items such as know-how, decreased by €162 million to €93 million. The purchase price allocation has not yet been finalized
because the complex and customized structure of the individual projects and the large volume of information required meant that the
analysis could not yet be completed; to this extent in particular intangible assets, provisions in connection with projects, and the
corresponding goodwill are preliminary.
Taking into account the not yet finalized purchase price allocation, the acquisition affected the consolidated financial statements as follows:
ACQUISITION OF ATLAS ELEKTRONIK GROUP
million €
Goodwill 93
Other intangible assets 192
Property, plant and equipment 86
Other non-current financial assets 3
Other non-current non-financial assets 1
Deferred tax assets 13
Inventories 132
Trade accounts receivable 235
Other current financial assets 44
Other current non-financial assets 37
Current income tax assets 10
Cash and cash equivalents 167
Total assets 1,013
Accrued pension and similar obligations 176
Deferred tax liabilities 63
Other non-current financial liabilities 2
Provisions for current employee benefits 1
Other current provisions 99
Current income tax liabilities 9
Trade accounts payable 34
Other current financial liabilities 18
Other current non-financial liabilities 296
Total liabilities 697
Net assets 316
Non-controlling interest 0
Purchase price (paid via cash and fair value of equity-investment) 316
Thereof: paid in cash and cash equivalents 155
Since it was fully consolidated in the Group’s financial statements effective April 3, 2017, the Atlas Elektronik group has generated sales of
around €168 million and earnings before taxes of around €(4) million, which are contained in the consolidated income statement for the
fiscal year ended September 30, 2017. If the acquisition had taken place instead as of October 1, 2016, the Atlas Elektronik group would
have contributed additional sales of around €196 million and earnings before taxes of around €(17) million to the Group.

thyssenkrupp annual report 2017 / 2018
3 Consolidated financial statements | thyssenkrupp AG – Notes to the consolidated financial statements
162
In the year ended September 30, 2017, the Group acquired furthermore the two Brazilian Ecosteel companies in December 2016 and
acquired additional smaller companies that are, on an individual basis, immaterial. Based on the values as of acquisition date, these
acquisitions affected in total the Group’s consolidated financial statements as presented below:
ADDITIONAL ACQUISITIONS
million € Year ended
Sept. 30, 2017
Goodwill 14
Other intangible assets 5
Property, plant and equipment (including investment property) 31
Other non-current financial assets 20
Deferred tax assets 1
Trade accounts receivable 3
Current income tax assets 1
Cash and cash equivalents 5
Total assets 80
Deferred tax liabilities 1
Other non-current non-financial liabilities 3
Trade accounts payable 1
Other current financial liabilities 1
Other current non-financial liabilities 3
Total liabilities 9
Net assets 71
Non-controlling interest 0
Purchase prices 71
Thereof: paid in cash and cash equivalents 67
With the exception of the disposal of the Brazilian steel mill CSA Siderúrgica do Atlantico (CSA) (cf. Note 03), in fiscal year ended
September 30, 2017, the Group had only some smaller disposals that were, on an individual basis und in total, immaterial.
03 Discontinued operations
Year ended September 30, 2018
In addition at the end of June 2018 thyssenkrupp signed an agreement with Tata Steel to create a new company by combining their
European steel activities in a 50 / 50 joint venture. The aim for the new company is to create a European flat steel provider positioned as a
quality and technology leader. Annual recurring synergies of €400 to €500 million are expected alongside further synergies in capital
expenditure and the optimization of working capital. Closing is subject to merger control clearance.
The transaction meets the criteria of IFRS 5 for reporting a discontinued operation. This comprises the Steel Europe business area,
thyssenkrupp MillServices & Systems GmbH from the Materials Services business area, and individual Corporate companies. In
accordance with IFRS 5, in the current reporting periods all expense and income of the discontinued steel operations are reported
separately in the income statement and all cash flows reported separately in the statement of cash flows; prior-period figures are adjusted
accordingly. In the statement of financial position, assets and liabilities attributable to the discontinued steel operations are only reported
separately at the current balance sheet date. In connection with the initiated disposal, the assets and liabilities continue to be measured at
their carrying amount as this is lower than the fair value less costs to sell. On the classification as a discontinued operation, non-current
assets are no longer amortized or depreciated.

thyssenkrupp annual report 2017 / 2018
3 Consolidated financial statements | thyssenkrupp AG – Notes to the consolidated financial statements
163
The assets and liabilities of the discontinued steel operations are presented in the table below:
DISCONTINUED STEEL OPERATIONS
million € Sept. 30, 2018
Intangible assets 457
Property, plant and equipment (inclusive of investment property) 3,040
Investments accounted for using the equity method 84
Other financial assets 13
Other non-financial assets 90
Deferred tax assets 136
Inventories 2,250
Trade accounts receivable 832
Other current financial assets 243
Other current non-financial assets 67
Current income tax assets 21
Cash and cash equivalents 19
Assets held for sale 7,252
Accrued pension and similar obligations 3,709
Provisions for other employee benefits 163
Other non-current provisions 279
Deferred tax liabilities 31
Non-current financial debt 104
Provisions for current employee benefits 8
Other current provisions 359
Current income tax liabilities 18
Current financial debt 38
Trade accounts payable 1,266
Other current financial liabilities 169
Other current non-financial liabilities 285
Liabilities associated with assets held for sale 6,430

thyssenkrupp annual report 2017 / 2018
3 Consolidated financial statements | thyssenkrupp AG – Notes to the consolidated financial statements
164
The results of the discontinued steel operations are as following:
DISCONTINUED STEEL OPERATIONS
million € Year ended
Sept. 30, 2017Year ended
Sept. 30, 2018
Net sales 7,454 7,968
Other income 58 84
Expenses (7,075) (7,547)
Ordinary income/(loss) from discontinued operations (before tax) 437 505
Income tax (expense)/income (178) (247)
Ordinary income/(loss) from discontinued operations (net of tax) 259 258
Gain/(loss) recognized on disposal of discontinued operations (before tax) 0 0
Income tax (expense)/income 0 0
Gain/(loss) recognized on disposal of discontinued operations (net of tax) 0 0
Income/(loss) from discontinued operations (net of tax) 259 258
Thereof:
thyssenkrupp AG’s shareholders 251 254
Non-controlling interest 7 4
Year ended September 30, 2017
As part of the Strategic Way Forward, thyssenkrupp reached agreement with Ternium on the sale of the Brazilian steel mill CSA as essential
part of the Steel Americas business area at the end of February 2017. After the approval of the responsible competition authorities the sale
was closed at the beginning of September 2017. The transaction meets the criteria of IFRS 5 for presentation of the Steel Americas
business area as a discontinued operation. Consequently in the current reporting period all expense and income of Steel Americas until the
disposal is reported separately in the income statement and all cash flows reported separately in the statement of cash flows; prior-period
figures are adjusted accordingly. As a result of the disposal at the beginning of September 2017, the otherwise required separate
presentation of the assets and liabilities attributable to Steel Americas in the statement of financial position is not applicable at the current
balance sheet date; under IFRS 5 an adjustment of the prior-year period of the statement of financial position is not required.
In connection with the initiated disposal, the assets and liabilities of the discontinued operation are measured at fair value less costs to
sell; this amounted to €1.5 billion (enterprise value). This resulted in an impairment loss of €808 million in accordance with IAS 36
immediately prior to the reclassification in the 2nd quarter ended March 31, 2017. Of this €8 million relates to goodwill, €1 million to other
intangible assets, €83 million to land and buildings, €555 million to technical equipment and machinery, €1 million to other assets and
€160 million to other non-financial assets. The expenses are included in the consolidated statement of income in the line “Income/(loss)
from discontinued operations (net of tax)”.

thyssenkrupp annual report 2017 / 2018
3 Consolidated financial statements | thyssenkrupp AG – Notes to the consolidated financial statements
165
The assets and liabilities of Steel Americas business area classified as a discontinued operation are presented in the following table at the
time of disposal:
DISCONTINUED OPERATION STEEL AMERICAS
million €
Intangible assets 2
Property, plant and equipment (including investment property) 1,077
Other non-financial assets 102
Deferred tax assets 16
Inventories 380
Trade accounts receivable 59
Other current financial assets 9
Other current non-financial assets 173
Cash and cash equivalents 235
Total assets disposed of 2,053
Other current provisions 185
Current income tax liabilities 1
Trade accounts payable 186
Other current financial liabilities 80
Other current non-financial liabilities 55
Total liabilities disposed of 508
Net assets disposed of 1,545
Cumulative other comprehensive income (223)
Gain on disposal 327
Selling price 1,649
Thereof: paid in cash and cash equivalents 1,649
The results of the Steel Americas business area until the disposal are as follows:
DISCONTINUED OPERATION STEEL AMERICAS
million € Year ended
Sept. 30, 2016Year ended
Sept. 30, 2017
Net sales 1,263 1,525
Other income 225 325
Expenses (1,527) (2,880)
Ordinary income/(loss) from discontinued operations (before tax) (39) (1,031)
Income tax (expense)/income (56) (86)
Ordinary income/(loss) from discontinued operations (net of tax) (96) (1,117)
Gain/(loss) recognized on disposal of discontinued operations (before tax) 0 327
Income tax (expense)/income 0 (71)
Gain/(loss) recognized on disposal of discontinued operations (net of tax) 0 256
Income/(loss) from discontinued operations (net of tax) (96) (861)
Thereof:
thyssenkrupp AG’s shareholders (15) (861)
Non-controlling interest (80) 0

thyssenkrupp annual report 2017 / 2018
3 Consolidated financial statements | thyssenkrupp AG – Notes to the consolidated financial statements
166
Notes to the consolidated statement of financial position
04 Intangible assets Changes in the Group’s intangible assets were as follows:
CHANGES IN INTANGIBLE ASSETS
million €
Franchises, trademarks andsimilar rights and values as
well as licenses thereto
Development costs, internally developed
software and website Goodwill Total
Gross amounts
Balance as of Oct. 1, 2016 1,845 757 4,413 7,015
Currency differences (36) (19) (112) (167)
Acquisitions/divestitures of businesses 195 1 109 306
Additions 99 64 0 163
Transfers 50 3 1 54
Disposals (22) (7) 0 (28)
Reclassification due to the presentation as assets held for sale (25) 0 (8) (33)
Balance as of Sept. 30, 2017 2,104 800 4,405 7,309
Currency differences (2) 4 9 12
Acquisitions/divestitures of businesses 10 0 18 27
Additions 48 68 0 115
Transfers 24 18 (2) 40
Disposals (35) (3) 0 (38)
Reclassification due to the presentation as assets held for sale (180) (280) (378) (838)
Balance as of Sept. 30, 2018 1,969 607 4,052 6,629
Accumulated amortization and impairment losses
Balance as of Oct. 1, 2016 1,273 522 650 2,445
Currency differences (24) (14) (22) (61)
Acquisitions/divestitures of businesses (1) 0 0 (1)
Amortization expense 97 39 0 136
Impairment losses 8 16 8 32
Reversals of impairment losses 0 0 0 0
Transfers 5 (3) 0 3
Disposals (19) (7) 0 (26)
Reclassification due to the presentation as assets held for sale (24) 0 (8) (32)
Balance as of Sept. 30, 2017 1,315 554 628 2,497
Currency differences 0 4 4 8
Acquisitions/divestitures of businesses (1) 0 0 (1)
Amortization expense 104 45 0 149
Impairment losses 3 1 0 4
Reversals of impairment losses 0 0 0 0
Transfers 0 0 (4) (4)
Disposals (34) (3) 0 (36)
Reclassification due to the presentation as assets held for sale (158) (164) (58) (381)
Balance as of Sept. 30, 2018 1,229 436 570 2,235
Net amounts
Balance as of Oct. 1, 2016 573 235 3,763 4,570
Balance as of Sept. 30, 2017 790 246 3,777 4,813
Balance as of Sept. 30, 2018 740 171 3,482 4,393

thyssenkrupp annual report 2017 / 2018
3 Consolidated financial statements | thyssenkrupp AG – Notes to the consolidated financial statements
167
Impairment of goodwill
Goodwill impairment losses are included in other expenses.
In 2016 / 2017 an €8 million impairment loss was recorded in the Steel Americas business area outside the annual impairment test in
connection with the initiated disposal of the Brazilian steel mill CSA relating to goodwill from the acquisition of the Brazilian Ecosteel
companies within the fiscal year (cf. Note 03).
Goodwill
Goodwill (excluding goodwill of equity method investments) has been allocated to cash generating units (CGU) of all business areas. The
recoverable amount of each cash generating unit is determined based on a value in use calculation using after-tax cash flow projections
based on bottom-up prepared financial budgets approved by thyssenkrupp AG’s management covering a three-year period. The last
budget year is generally used to determine the cash flows beyond the budget period and modified to calculate the perpetuity considering
additional assumptions. A business specific, sustained growth rate is taken into account; as a rule this growth rate amounts to 1.5%. The
weighted average cost of capital discount rate is based on a risk-free interest rate of 1.0% (prior year: 1.25%) and an unchanged market
risk premium of 6.5%. Moreover for each CGU the beta, the cost of debt and the capital structure is derived individually from the relevant
peer group. In addition CGU specific tax rates and country risk premiums are used. To discount cash flows after-tax discount rates are
applied. Based on an iterative calculation the following pre-tax discount rates are derived from the after-tax discount rates:
PRE-TAX DISCOUNT RATES
Ranges
in % Sept. 30, 2017 Sept. 30, 2018
Components Technology 8,5 – 11,7 7,4 – 10,6
Elevator Technology 10,3 – 13,4 10,2 – 13,2
Industrial Solutions 9,1 – 12,9 8,2 – 12,5
Materials Services 6,2 – 10,9 6,3 – 11,4
Corporate 8.3 7.3
The values in use for the CGUs are determined based on both historical data and expected forecast market performance. The values
assigned to the key assumptions are generally consistent with external information sources.

thyssenkrupp annual report 2017 / 2018
3 Consolidated financial statements | thyssenkrupp AG – Notes to the consolidated financial statements
168
20 CGUs were identified in the thyssenkrupp Group for the continuing operations, of which 16 report goodwill. Total goodwill of the
continuing operations amounts to €3,482 million as of September 30, 2018. 68% of this goodwill relates to the CGUs Americas, Europe /
Africa and Marine Systems, as shown in the following table:
SIGNIFICANT GOODWILL
CGU (Business Area)
Carrying amount of goodwill
allocated to CGU in million €
Proportion of total goodwill
in %
Pre-taxdiscount rate
in %
Growth ratein %
Description of key assumptions of budgeting Procedure used to determine key assumptions
Americas (Elevator Technology)
948 27% 10.2% 1.4% – Procurement prices – Exchange and interest rates
Consideration of economic assumptions set by thyssenkrupp AG and external market studies
Europe / Africa (Elevator Technology)
366 11% 10.8% 1.4% – Market growth rates – Business cycles
Consideration of economic assumptions set by thyssenkrupp AG and external market studies
Marine Systems (Industrial Solutions)
1,041 30% 8.2% 1.5% – Market growth rates – Realisation of scheduled measures
Consideration of long-term budget plans of potential customers ans if appropriate concrete negotiations with customers
For none of the CGUs a goodwill impairment resulted from the annual impairment test because the recoverable amount of all CGUs was
higher than the respective carrying amount.
As in the prior year, as of September 30, 2018 the recoverable amount of each CGU exceeded the carrying amount by more than 10%.
Impairment of other intangible assets
Impairment losses of intangible assets other than goodwill are included in cost of sales.
In 2016 / 2017 an €11 million impairment loss was recorded for capitalized development costs in the Camshafts business unit of the
Components Technology business area because the amount was no longer recoverable due to the absence of future cash flows.

thyssenkrupp annual report 2017 / 2018
3 Consolidated financial statements | thyssenkrupp AG – Notes to the consolidated financial statements
169
05 Property, plant and equipment (inclusive of investment property) Changes in the Group’s property, plant and equipment were as follows:
CHANGES IN PROPERTY, PLANT AND EQUIPMENT
million €
Land, leasehold rights andbuildings including
buildings on third-partyland
Technical machinery and
equipment
Other equipment, factory and
office equipmentAssets under finance lease
Assets under operating lease
Construction in progress Total
Gross amounts
Balance as of Oct. 1, 2016 6,202 24,500 2,203 127 104 898 34,035
Currency differences (96) (525) (24) (1) 0 (25) (672)
Acquisitions/divestitures of businesses 13 37 20 1 0 4 75
Additions 73 490 155 5 0 674 1,397
Transfers 215 433 41 (1) (7) (606) 75
Disposals (57) (300) (83) (11) (4) (2) (457)
Reclassification due to the presentation as assets held for sale (806) (6,537) (29) (5) 0 (69) (7,445)
Balance as of Sept. 30, 2017 5,545 18,098 2,283 115 93 875 27,009
Currency differences (12) (66) (10) 0 0 (4) (92)
Acquisitions/divestitures of businesses 10 (8) 1 0 (5) (3) (5)
Additions 79 336 158 2 0 555 1,131
Transfers 98 426 78 (13) (10) (557) 22
Disposals (54) (120) (123) (6) (11) (1) (314)
Reclassification due to the presentation as assets held for sale (2,491) (12,084) (1,016) (30) (30) (170) (15,821)
Balance as of Sept. 30, 2018 3,176 6,581 1,372 69 38 695 11,931
Accumulated depreciation and impairment losses
Balance as of Oct. 1, 2016 3,646 19,589 1,723 84 48 7 25,098
Currency differences (60) (461) (17) (1) 0 0 (538)
Acquisitions/divestitures of businesses (24) (14) (1) 1 0 0 (38)
Depreciation expense 124 698 155 7 1 0 984
Impairment losses 85 567 5 0 2 0 659
Reversals of impairment losses (1) 0 0 0 0 0 (1)
Transfers 27 (12) (3) (2) (2) 0 8
Disposals (38) (274) (76) (10) (2) (1) (401)
Reclassification due to the presentation as assets held for sale (630) (5,713) (20) (4) 0 0 (6,368)
Balance as of Sept. 30, 2017 3,129 14,380 1,766 75 48 7 19,403
Currency differences (2) (43) (7) 0 0 0 (52)
Acquisitions/divestitures of businesses 4 (10) 0 0 (4) 0 (10)
Depreciation expense 114 578 140 5 0 0 837
Impairment losses 3 6 1 0 0 9 18
Reversals of impairment losses 0 0 0 0 0 0 0
Transfers 10 2 (1) (8) (3) 0 0
Disposals (38) (116) (109) (6) (7) 0 (277)
Reclassification due to the presentation as assets held for sale (1,844) (10,088) (815) (20) (14) 0 (12,781)
Balance as of Sept. 30, 2018 1,375 4,708 975 47 19 15 7,139
Net amounts
Balance as of Oct. 1, 2016 2,556 4,911 480 43 56 891 8,938
Balance as of Sept. 30, 2017 2,416 3,718 516 41 46 868 7,605
Balance as of Sept. 30, 2018 1,800 1,874 397 22 19 680 4,791

thyssenkrupp annual report 2017 / 2018
3 Consolidated financial statements | thyssenkrupp AG – Notes to the consolidated financial statements
170
Impairment losses of property, plant and equipment are for the most part included in cost of sales and to a minor extent in selling and
administrative expenses.
In the 2nd quarter ended March 31, 2017, the sale of the Brazilian steel mill CSA was initiated and consummated in the 4th quarter. The
transaction met the criteria of IFRS 5 for presentation of the Steel Americas business area as a discontinued operation. In connection with
the initiated disposal, the assets and liabilities of the discontinued operation were measured at fair value less costs to sell based on the
enterprise value. This resulted in impairment losses in accordance with IAS 36 immediately prior to the reclassification of €83 million to
land and buildings, €555 million to technical equipment and machinery as well as €1 million to other assets that is included in the
consolidated statement of income in the line “Income/(loss) from discontinued operations (net of tax)” (cf. Note 03).
Property, plant and equipment include leased land and buildings of €18 million (prior year: €32 million), technical machinery and
equipment of €3 million (prior year: €6 million) and other equipment, factory and office equipment of €2 million (prior year: €3 million) that
have been capitalized, where the terms of the lease require the Group, as lessee, to assume substantially all of the benefits and risks of
use of the leased asset (finance lease).
Property, plant and equipment have been pledged as security for financial debt of €167 million (prior year: €173 million).
Investment property
Investment property located in Germany is primarily determined based on internally prepared valuations using the gross rental method
which is regulated in Germany by the “Verordnung über die Grundsätze für die Ermittlung der Verkehrswerte von Grundstücken –
(Immobilienwertermittlungsverordnung – ImmoWertV)”. Investment property located outside Germany is generally determined by external
appraisers.
As of September 30, 2018, the carrying amount of thyssenkrupp’s investment property amounts to €30 million (prior year: €58 million).
The total fair value of this investment property is €35 million (prior year: €71 million); thereof €20 million (prior year: €24 million) are
assigned to level 2 and €15 million (prior year: €47 million) are assigned to level 3 valuations methods of the fair value hierarchy. Of the
fair value €10 million (prior year: €14 million) are based on valuations of external appraisers.
06 Investments accounted for using the equity method The investments accounted for using the equity method are, on an individual basis, immaterial. As of September 30, 2018, the carrying
amount of associates is €31 million (prior year: €40 million) and of joint ventures is €17 million (prior year: €114 million).
Summarized financial information of the immaterial investments accounted for using the equity method at the respective balance sheet
date is presented in the table below. The information given represents the Group’s interest. In line with the presentation of the investments
accounted for using the equity method on the balance sheet, the financial information stated for 2017 / 2018 relates only to the
investments held by the continuing operations:

thyssenkrupp annual report 2017 / 2018
3 Consolidated financial statements | thyssenkrupp AG – Notes to the consolidated financial statements
171
In 2017 / 2018, the unrecognized share of losses of associates and joint ventures accounted for using the equity method was €0 million
(prior year: €3 million). There were cumulative unrecognized losses of €4 million (prior year: €4 million).
The associates and joint ventures are included in the list of the Group’s subsidiaries and equity interests that is published in the German
Federal Gazette and is available on the thyssenkrupp website at www.thyssenkrupp.com.
07 Operating lease as lessor The Group is the lessor of various commercial real estates under operating lease agreements.
As of September 30, the future minimum lease payments to be received on non-cancellable operating leases are as follows:
FUTURE MINIMUM LEASE PAYMENTS
million € Sept. 30, 2017 Sept. 30, 2018
Not later than one year 8 9
Between one and five years 15 17
Later than five years 28 38
Total 51 64
08 Inventories
INVENTORIES
million € Sept. 30, 2017 Sept. 30, 2018
Raw materials 1,610 1,109
Supplies 438 315
Work in process 1,399 1,252
Finished products, merchandise 3,510 2,484
Total 6,957 5,159
Inventories of €7 million (prior year: €15 million) have a remaining term of more than one year. Inventories of €29,794 million (prior year:
€34,487 million) are recognized as cost of sales during the period. Included in cost of sales are write-downs of inventories of €93 million
(prior year: €84 million).
SUMMARIZED FINANCIAL INFORMATION OF INVESTMENTS ACCOUNTED FOR USING THE EQUITY METHOD
Associates Joint ventures
million € Year ended
Sept. 30, 2017Year ended
Sept. 30, 2018 Year ended
Sept. 30, 2017Year ended
Sept. 30, 2018
Income/(loss) from continuing operations (net of tax) 1 (4) 30 6
Income/(loss) from discontinued operations (net of tax) 0 0 0 0
Other comprehensive income 0 2 (6) 0
Total comprehensive income 1 (3) 24 6

thyssenkrupp annual report 2017 / 2018
3 Consolidated financial statements | thyssenkrupp AG – Notes to the consolidated financial statements
172
09 Trade accounts receivable
TRADE ACCOUNTS RECEIVABLE
million € Sept. 30, 2017 Sept. 30, 2018
Trade accounts receivable (excluding construction work) 4,333 3,728
Amounts due from customers for construction work 1,401 1,801
Total 5,734 5,529
Receivables from the sales of goods and services in the amount of €752 million (prior year: €403 million) have a remaining term of more
than one year. As of September 30, 2018 cumulative impairment losses of €330 million (prior year: €358 million) are recognized for
doubtful accounts.
As of the reporting date trade accounts receivable were as follows:
ANALYSIS OF STRUCTURE
Carrying amount thereof: thereof: not impaired but past due as of balance sheet date thereof:
million € Trade accounts
receivable
neither impaired norpast due as of balance
sheet datepast due up to
30 dayspast due 31 to
60 dayspast due 61 to
90 dayspast due 91 to
180 dayspast due 181
to 360 days past due more than 360 days
impaired as of balance sheet date
Sept. 30, 2017 5,734 4,697 372 117 79 89 135 107 138
Sept. 30, 2018 5,529 4,510 370 112 77 124 62 141 133
Amounts due from customers for construction work are calculated as follows:
RECEIVABLES FOR CONSTRUCTION WORK
million € Sept. 30, 2017 Sept. 30, 2018
Contract costs incurred and recognized contract profits (less recognized losses) 5,291 6,439
Less advance payments received (3,890) (4,637)
Total 1,401 1,801
Sales from construction contracts of €7,946 million were recognized in the period (prior year: €8,410 million).
The Group primarily sells credit insured trade accounts receivable under existing programs on a revolving basis as well as under one-time
transactions.
The amount of receivables sold and derecognized from the balance sheet as of September 30, 2018, was €248 million (prior year:
€212 million), resulting in net proceeds in the amount of €248 million (prior year: €211 million). In some cases, when the Group sells
receivables it retains rights and immaterial obligations; these retained interests mainly consist of servicing as well as providing limited cash
reserve accounts.

thyssenkrupp annual report 2017 / 2018
3 Consolidated financial statements | thyssenkrupp AG – Notes to the consolidated financial statements
173
10 Other financial assets
OTHER FINANCIAL ASSETS
Sept. 30, 2017 Sept. 30, 2018
million € current non-current current non-current
Loans and receivables 296 15 255 11
Available-for-sale financial assets 6 28 6 21
Derivatives not qualifying for hedge accounting 65 — 65 —
Derivatives qualifying for hedge accounting 52 — 4 —
Total 420 43 330 32
Other financial assets in the amount of €41 million (prior year: €54 million) have a remaining term of more than one year. As of
September 30, 2018 cumulative impairments amount to €0 million (prior year: €9 million) regarding current other financial assets and
€37 million (prior year: €37 million) regarding non-current other financial assets.
11 Other non-financial assets
OTHER NON-FINANCIAL ASSETS
Sept. 30, 2017 Sept. 30, 2018
million € current non-current current non-current
Advance payments on intangible assets — 31 — 9
Advance payments on property, plant and equipment — 158 — 105
Advance payments to suppliers of inventories and to other current non-financial assets 1,257 — 1,144 —
Prepayments 158 — 178 —
Miscellaneous 508 18 516 31
Total 1,923 207 1,838 144
Other non-financial assets in the amount of €587 million (prior year: €606 million) have a remaining term of more than one year. As of
September 30, 2018 cumulative impairments amount to €34 million (prior year: €36 million) regarding current other non-financial assets
and €8 million (prior year: €5 million) regarding non-current other non-financial assets.
12 Total equity
Capital stock
The capital stock of thyssenkrupp AG consists of 622,531,741 (prior year: 622,531,741) no-par bearer shares of stock, all of which have
been issued and are fully paid, with 622,531,741 outstanding as of September 30, 2018 and 2017, respectively. Each share of common
stock has a stated value of €2.56.
All shares grant the same rights. The stockholders are entitled to receive dividends as declared and are entitled to one vote per share at the
stockholders’ meetings.
On September 25, 2017, the Executive Board of thyssenkrupp AG with the approval of the Executive Committee of the Supervisory Board
resolved in accordance with the authorization under § 5, par 5 of the Articles of Association of thyssenkrupp AG to increase the capital

thyssenkrupp annual report 2017 / 2018
3 Consolidated financial statements | thyssenkrupp AG – Notes to the consolidated financial statements
174
stock of thyssenkrupp AG by 10% by issuing 56,593,794 new no par bearer shares in thyssenkrupp AG and to exclude subscription rights.
The announced capital increase was already successfully completed in an accelerated bookbuilding process as of September 25, 2017.
The newly issued no par shares were placed with German and international institutional investors at a price of €24.30 per share. The
placement resulted in gross proceeds of €1,375 million, the transaction costs incurred were recognized directly in equity.
Additional paid-in capital
Additional paid-in capital includes the effects of the business combination of Thyssen and Krupp as well as premiums resulting from capital
increases at subsidiaries with non-controlling interest.
Retained earnings
Retained earnings include prior years’ undistributed consolidated income. In addition, this line item includes the remeasurement effects of
pensions and similar obligations.
Management of capital
As of September 30, 2018 the Group’s equity ratio was 9.7% (prior year: 9.7%) and its gearing was 72.2% (prior year: 57.5%). As in the
previous year, the gearing agreed upon was met as of September 30, 2018. Among the thyssenkrupp Group’s most important financial
goals are a sustainable appreciation of entity value and ensuring solvency at all times. Creating sufficient liquidity reserves is therefore of
great importance.
Currently the thyssenkrupp Group has the following ratings:
RATING
Long-term rating Short-term rating Outlook
Standard & Poor’s BB B developing
Moody’s Ba2 Not Prime negative
Fitch BB+ B watch negative
In light of the announcement made in September 2018 regarding the planned separation of the thyssenkrupp Group into two independent
companies, all the rating agencies revised their rating outlook at the beginning of October. Moody’s downgraded its Ba2 rating outlook
from “stable” to “negative”, while Fitch downgraded its BB+ rating outlook from “watch positive” to “watch negative”. The changes reflect
the agencies’ expectation that in connection with the separation of the thyssenkrupp Group the current ratings of thyssenkrupp AG will
transfer to the future thyssenkrupp Materials. The agencies expect a weaker credit profile and higher cyclicality for this unit. S&P changed
its BB rating outlook from “watch positive” to “developing”, not specifying the direction of a possible rating change due to uncertainty over
the exact form of the planned separation of the Group.
Currently, all ratings are below investment grade. For the financing of the thyssenkrupp Group, an investment grade rating in the “BBB”
range leads to an optimum of capital costs. Capital management at thyssenkrupp is based on debt ratios published by rating agencies,
which measure cash-flow-to-debt ratios for a specific period. thyssenkrupp is not subject to capital requirements under its articles of
association.
Authorizations
Through resolution of the Annual General Meeting of January 30, 2015, the Executive Board of thyssenkrupp AG is authorized until
January 29, 2020 to acquire treasury shares up to a total of 10% of the capital stock at the time of the resolution or – if lower – at the time
the authorization is exercised and use them for the purposes expressly stated in the authorization resolution and for all legally permissible
purposes. The Executive Board is authorized under certain circumstances to exclude shareholders’ tender rights when purchasing treasury
shares or subscription rights when using treasury shares. The resolution also includes authorization to use equity derivatives (put or call

thyssenkrupp annual report 2017 / 2018
3 Consolidated financial statements | thyssenkrupp AG – Notes to the consolidated financial statements
175
options or a combination of both) in connection with the purchase of treasury shares and to exclude tender and subscription rights. The
Supervisory Board of thyssenkrupp AG may determine that measures of the Executive Board under these shareholder resolutions are
subject to its approval.
The following authorizations were issued by resolution of the Annual General Meeting on January 17, 2014:
In revocation of the partly used authorization to increase the capital stock issued by the Annual General Meeting on January 20, 2012, the
Executive Board was authorized, with the approval of the Supervisory Board, to increase the capital stock on one or more occasions on or
before January 16, 2019 by up to €370 million by issuing up to 144,531,250 new no-par bearer shares in exchange for cash and/or
contributions in kind (authorized capital). The shareholders are in principle entitled to subscription rights. However, the Executive Board is
authorized, with the approval of the Supervisory Board, to exclude shareholder subscription rights in certain cases; the option of excluding
subscription rights is limited to 20% of the capital stock. § 5, par. 5 of the Articles of Association of thyssenkrupp AG has been reworded
accordingly.
The Executive Board was authorized, with the approval of the Supervisory Board, to issue once or several times bearer of registered
warrant and/or convertible bonds in the total par value of up to €2 billion with or without limited terms, and to grant to or impose on the
holders or creditors of convertible bonds conversion rights or obligations for no-par bearer shares of thyssenkrupp AG with a total share of
the capital stock up to €250 million in accordance with the conditions of these bonds. The authorization is valid until January 16, 2019.
The Executive Board is authorized, subject to the approval of the Supervisory Board, to exclude shareholders’ subscription rights in certain
cases.
Furthermore, the Executive Board was authorized to conditionally increase the capital stock by up to €250 million by issue of up to
97,626,250 new no-par bearer shares (conditional capital). The conditional capital increase serves the granting of no-par bearer shares
upon exercise of conversion or option rights, upon fulfilment of corresponding conversion obligations or upon exercise of an option of the
thyssenkrupp AG to grant no-par shares of the thyssenkrupp AG in whole or in part instead of payment of the cash amount due to the
holders or creditors of convertible or warrant bonds that are issued by thyssenkrupp AG or a subordinate Group company against cash
contribution on or before January 16, 2019 as a result of the authorization resolution passed by the Annual General Meeting on
January 17, 2014. New shares are issued at the option or conversion price to be determined in each case according to the above
mentioned authorization resolution. A new paragraph 6 has been inserted in § 5 of the Articles of Association of thyssenkrupp AG.
Dividend
The Executive Board and Supervisory Board have agreed to propose to the Annual General Meeting a dividend in the amount of €0.15 per
share entitled to dividend to be distributed from unappropriated net income of the stand-alone entity thyssenkrupp AG for fiscal year
2017 / 2018 as determined in conformity with the principles of the German Commercial Code (HGB) and to carry forward the remaining net
income. This would result in a dividend payout of €93 million in total. A dividend of €0.15 was paid for fiscal year 2016 / 2017
(2015 / 2016: €0.15).
13 Share-based compensation
Management incentive plans
The long-term incentive plan (LTI) is a long-term oriented compensation component which issues stock rights to eligible participants. Plan
participants are Executive Board members and several other selected executive employees. As of September 30, 2018, 2,350,912 stock
rights were issued in the 6th installment, 2,214,926 stock rights in the 7th installment and 2,155,796 stock rights in the 8th installment of
the LTI.

thyssenkrupp annual report 2017 / 2018
3 Consolidated financial statements | thyssenkrupp AG – Notes to the consolidated financial statements
176
For installments of the LTI granted inclusive of fiscal year 2013 / 2014 (inclusive of the 4th installment), the number of stock rights issued
based on individually fixed euro amounts will be adjusted at the end of each three-year tkVA performance period based on the average
thyssenkrupp Value Added (tkVA) over this period, beginning October 1 of the year the stock rights were granted, compared to the average
tkVA over the previous three fiscal year period. For the installments of the LTI granted beginning with fiscal year 2014 / 2015 (starting with
the 5th installment) the number of stock rights issued will be adjusted at the end of the respective three-year tkVA performance period
based on the average tkVA over this period compared with a tkVA target value set in advance. The amount of payment for an installment is
calculated by multiplying the adjusted number of stock rights by the average price of thyssenkrupp’s stock in the first three months after
the end of the tkVA performance period, with the result that the term of each installment extends over four fiscal years in total.
To determine the fair value of the stock rights used to calculate the pro-rata liability as of the balance sheet date forward prices of the
thyssenkrupp stock are calculated taking into account the existing caps. The forward calculation is carried out for predefined periods
(averaging periods) taking into account the thyssenkrupp stock price and the euro interest rate curve as of the balance sheet date and the
dividends assumed to be paid until the maturity of the stock rights. The following assumptions were used for the determination of the fair
values as of September 30, 2017 and as of September 30, 2018, respectively:
INCENTIVE PLANS – YEAR ENDED SEPT. 30, 2017
5th installment LTI 6th installment LTI 7th installment LTI
Maturity 12 / 31 / 2017 12 / 31 / 2018 12 / 31 / 2019
Averaging period Oct. 1 to Dec. 31, 2017 Oct. 1 to Dec. 31, 2018 Oct. 1 to Dec. 31, 2019
thyssenkrupp stock price as of balance sheet date €25.08 €25.08 €25.08
Assumed dividend payment(s) per stock until maturity — €0.15 on Jan. 22, 2018€0.15 on Jan. 22, 2018€0.26 on Jan. 28, 2019
Average dividend yield — 0.54% 0.78%
Average interest rate (averaging period) (0.16)% (0.24)% (0.14)%
Fair value as of Sept. 30, 2017
– without caps €25.09 €24.93 €24.66
– with caps €25.09 €24.93 €24.66
INCENTIVE PLANS – YEAR ENDED SEPT. 30, 2018
6th installment LTI 7th installment LTI 8th installment LTI
Maturity 12 / 31 / 2018 12 / 31 / 2019 12 / 31 / 2020
Averaging period Oct. 1 to Dec. 31, 2018 Oct. 1 to Dec. 31, 2019 Oct. 1 to Dec. 31, 2020
thyssenkrupp stock price as of balance sheet date €21.74 €21.74 €21.74
Assumed dividend payment(s) per stock until maturity — €0.15 on Feb. 4, 2019€0.15 on Feb. 4, 2019€0.22 on Feb. 3, 2020
Average dividend yield — 0.62% 0.81%
Average interest rate (averaging period) (0.18)% (0.21)% (0.08)%
Fair value as of Sept. 30, 2018
– without caps €21.75 €21.59 €21.36
– with caps €21.75 €21.59 €21.36

thyssenkrupp annual report 2017 / 2018
3 Consolidated financial statements | thyssenkrupp AG – Notes to the consolidated financial statements
177
In the 2nd quarter of 2017 / 2018, the 5th installment of the LTI was settled with a payment of €23.20 per stock right and a payment of
€27.2 million in total, respectively. In the 2nd quarter of 2016 / 2017, the 4th installment of the LTI was settled with a payment of €21.92
per stock right and a payment of €84.0 million in total, respectively. Also in fiscal 2017 / 2018 the 8th installment of the LTI was granted to
the Executive Board and additional executive employees. In total in fiscal year 2017 / 2018 the Group recorded an expense of €34 million
from the obligations of the incentive plans (prior year: €46 million); thereof €5 million (prior year: €7 million) are presented in income/(loss)
from discontinued operations. The liability arising from the LTI amounts to €113 million as of September 30, 2018 (prior year:
€106 million).
For fiscal years 2009 / 2010 until 2013 / 2014, 25% of the performance bonus granted to the Executive Board members of
thyssenkrupp AG for each fiscal year was compulsorily converted into thyssenkrupp AG stock rights to be paid out after a three-year lock-
up period. The number of stock rights was calculated by dividing 25% of the performance bonus by the average thyssenkrupp share price
in the 4th quarter of the fiscal year for which the performance bonus is granted. After expiration of three fiscal years, the payout amount is
calculated by multiplying the number of stock rights by the average thyssenkrupp share price in the 4th quarter of the 3rd fiscal year. In
addition, for each stock right the dividend amount which would have been paid for these three fiscal years per share is also paid out.
Insofar as the Executive Board members of thyssenkrupp AG were granted an additional bonus alongside the performance bonus, as in
fiscal years 2009 / 2010 until 2013 / 2014, 55% of this additional bonus was also converted into stock rights and treated in accordance
with the performance bonus model. In fiscal 2010 / 2011 the structure of the variable compensation for additional executive employees
was also modified. 20% of the performance bonus granted for the respective fiscal year will be obligatorily converted into thyssenkrupp AG
stock rights to be paid out after the expiration of three fiscal years based on the average thyssenkrupp share price in the 4th quarter of the
3rd fiscal year. Effective as of fiscal 2014 / 2015, the compensation system of the Executive Board members of thyssenkrupp AG has been
adjusted in such a way that stock rights are no longer granted for a portion of the current variable compensation. For further selected
executives this was the last conversion into stock rights, which was finally discontinued from fiscal year 2015 / 2016. In 2017 / 2018 the
Group recorded an income of €0.2 million (prior year: expenses of €1 million) associated with this compensation component; the resultant
obligation as of September 30, 2018 amounts to €3 million (prior year: €8 million). In 2017 / 2018 a payment of €5 million occurred
relating to the stock rights granted in 2013 / 2014 (prior year: €5 million).
14 Accrued pension and similar obligations
ACCRUED PENSION AND SIMILAR OBLIGATIONS
million € Sept. 30, 2017 Sept. 30, 2018
Accrued pension obligations 7,684 7,607
Partial retirement 193 188
Other accrued pension-related obligations 46 43
Reclassification due to the presentation as liabilities associated with assets held for sale 0 (3,709)
Total 7,924 4,128
Accrued pension liability
The Group maintains defined benefit pension plans and defined contribution plans that mainly cover employees in Germany, the USA,
Great Britain and Liechtenstein and represent approx. 95% of the thyssenkrupp Group’s total pension obligations, so the information below
mainly applies to the above-mentioned countries. In some other countries, eligible employees also receive benefits in accordance with the
respective local requirements.

thyssenkrupp annual report 2017 / 2018
3 Consolidated financial statements | thyssenkrupp AG – Notes to the consolidated financial statements
178
For historical reasons a wide variety of voluntary defined benefit pension plans (DB plans) exist in Germany based on different risk profiles.
As a rule they provide benefits in the event of invalidity and/or death or on reaching a specified age limit, and are mainly based on
individual or collective arrangements. In the past the employer-funded pension plans in Germany generally provided a life-long pension
based on defined benefits.
These defined benefit plans (including final-salary pension plans, career-average pension plans, etc.) were created many years ago and
replaced at the turn of the millennium by defined contribution pension plans with a risk-optimized payout form (lump sum, installments, or
life-long pension). Particularly for newly recruited professionals and managers, the “flexplan” was introduced at January 1, 2017 and
replaces the last open “benefits plan” at thyssenkrupp. The “flexplan” is a share-based pension plan in which a minimum of 1% interest is
guaranteed by thyssenkrupp.
A key element in increasing employees’ share in responsibility for their company retirement benefits is salary conversion, which is an
option under all pension schemes currently open and for which employer-funded matching contributions are offered as an incentive.
With regard to the funding of the company pension plans, particularly the “flexplan” is to be funded through the Group’s Contractual Trust
Agreement (CTA), which will have a positive effect on the external funding level. At the same time payments under the former pension
plans are funded through the CTA insofar as they exceed the protection limits of the mutual pension guarantee association
(Pensionssicherungsverein a.G. (PSV)).
The majority of Group companies outside Germany also provide pension plans for their employees. These plans are in some cases based
on statutory requirements or collective agreements, but in other cases they are provided by the Group companies on a voluntary basis. The
range of benefits provided under the plans differs widely depending on local arrangements, extending from DC plans to final-salary
defined-benefit schemes with regular pension payment.
Outside Germany pension obligations mainly exist in the form of DB plans in the USA, Great Britain, and Liechtenstein. Under statutory
requirements in Liechtenstein, pension plans have to be offered to all employees in the mandatory social insurance scheme and are
therefore also available to new employees of thyssenkrupp. By contrast, the mainly voluntary DB plans offered in Great Britain and the USA
have now been closed to new employees and as far as possible frozen in respect of future service years. This means that the obligations
under the DB plans relate mainly to the vested rights of former employees and pensioners. As a rule all active employees in Great Britain
and the majority of employees in the USA now only accrue company benefit rights under DC plans.
To secure the payment obligations, the pension funds outside Germany are funded to a much greater extent by externally separated
assets. This is due in part to legal minimum funding standards, which require full external funding of the obligations or a financing under a
capital funding system. For further information regarding the composition and investment strategy refer to the disclosures of the plan
assets.
Material risks associated with the different types of pension plans include above all financial risks as well as risks in the areas of inflation
and biometrics.
Inflation risks which could lead to an increase in benefit obligations exist because some of the plans are based on (final) salary and in
some cases annual pension modules are directly linked to current salaries (defined contribution plans). To this extent a rise in salaries
above the salary/career trends assumed in the valuation of the obligation would also require a direct increase in the provisions (past
service effect in the case of (final) salary pensions) or the future service cost (defined contribution plans).

thyssenkrupp annual report 2017 / 2018
3 Consolidated financial statements | thyssenkrupp AG – Notes to the consolidated financial statements
179
In addition, further charges could result from the need for a cost-of-living adjustment in excess of the assumed pension trend during the
pension payment phase, which would lead to an immediate increase in the provisions. A significant number of the pension plans in
Germany are required by law to provide a cost-of-living adjustment. A cost-of-living adjustment may also be required under (collective
bargaining) agreements or agreed on a voluntary/discretionary basis.
Biometric risks can result either from early benefit claims (risk of sudden changes to the balance sheet after death or invalidity) or from
underestimated life expectancies (longevity risk) and could likewise result in costs to the company due to unexpected increases in
provisions and early cash outflows.
Risks from changes to the discount rate are purely balance sheet-related, i.e. the provisions are adjusted directly against equity without
affecting income. Cash outflows are not affected.
Under the pension plans in Germany, individual beneficiaries are in part counted more than once due to entitlements under different
components of the pension systems. The breakdown of total of pension plans is as follows:
BREAKDOWN OF THE TOTAL OF PENSION PLANS BY BENEFICIARIES
Sept. 30, 2017 Sept. 30, 2018
GermanyOutside
Germany Total Germany Outside
Germany Total
Active employees 115,062 27,704 142,766 116,419 28,279 144,698
Terminated employees with vested benefits 22,669 4,746 27,415 23,203 4,279 27,482
Pensioners 115,164 12,333 127,497 101,524 11,973 113,497
Total 252,895 44,783 297,678 241,146 44,531 285,677

thyssenkrupp annual report 2017 / 2018
3 Consolidated financial statements | thyssenkrupp AG – Notes to the consolidated financial statements
180
Changes in defined benefit obligations and plan assets
The reconciliation of the changes in the defined benefit obligations and the fair value of plan assets are as follows:
CHANGE IN DEFINED BENEFIT OBLIGATIONS AND PLAN ASSETS
Sept. 30, 2017 Sept. 30, 2018
million € GermanyOutside
Germany Total Germany Outside
Germany Total
Change in defined benefit obligations (DBO):
DBO at beginning of fiscal year 7,999 2,879 10,878 7,414 2,505 9,920
Service cost 153 57 210 144 50 194
Interest expense 102 55 157 136 55 191
Remeasurement: Actuarial (gains)/losses from experience adjustments (35) 32 (3) (34) (1) (35)
Remeasurement: Actuarial (gains)/losses from changes in demographic assumptions (2) (48) (50) 0 (22) (22)
Remeasurement: Actuarial (gains)/losses from changes in financial assumptions (569) (150) (719) 164 (75) 89
Past service cost (inclusive of curtailments) 0 0 0 0 (2) (2)
Settlements 0 (21) (21) (2) (2) (4)
Currency differences 0 (108) (108) 0 19 19
Participant contributions 1 19 20 0 19 19
Benefit payments (404) (128) (532) (399) (134) (532)
Settlement payments (1) (82) (83) (36) (29) (64)
Acquisitions/divestitures of businesses 169 0 170 2 0 2
Others 0 0 0 0 0 0
DBO at end of fiscal year 7,414 2,505 9,920 7,389 2,384 9,773
Change in plan assets:
Fair value of plan assets at beginning of fiscal year 185 2,163 2,348 225 2,046 2,271
Interest income 3 43 45 4 46 50
Remeasurement: Actuarial gains/(losses) on plan assets, excluding amounts included in interest income 12 37 49 (2) (1) (3)
Currency differences 0 (86) (86) 0 15 15
Employer contributions 24 82 105 5 62 66
Participant contributions 1 19 20 3 19 22
Benefit payments 0 (121) (121) (22) (126) (148)
Settlement payments 0 (82) (82) 0 (29) (29)
Acquisitions/divestitures of businesses 1 0 1 0 0 0
Administration cost 0 (9) (9) 0 (7) (7)
Fair value of plan assets at end of fiscal year 225 2,046 2,271 214 2,025 2,238
As of the balance sheet date, defined benefit obligations of €9,773 million (prior year: €9,920 million) in total related to plans that are
wholly unfunded in the amount of €6,482 million (prior year: €6,597 million) and to plans that are wholly or partly funded in the amount of
€3,291 million (prior year: €3,323 million).

thyssenkrupp annual report 2017 / 2018
3 Consolidated financial statements | thyssenkrupp AG – Notes to the consolidated financial statements
181
The settlements and settlement payments in the reporting year result from the settlement of current pensions in Germany and the USA. In
the prior year they mainly related to the replacement of a DB plan for the active workforce and simultaneous transition to a DC plan as well
as settlements of vested pension rights of former employees in the USA.
Changes of net defined liability and asset ceiling
The net defined benefit liability changed as follows:
CHANGE IN NET DEFINED BENEFIT LIABILITY
Sept. 30, 2017 Sept. 30, 2018
million € GermanyOutside
Germany Total Germany Outside
Germany Total
Net defined benefit liability at beginning of fiscal year 7,814 716 8,530 7,189 460 7,649
Service cost plus net interest income/(expense) 253 69 322 276 59 335
Remeasurements (618) (204) (822) 132 (74) 59
Currency differences 0 (22) (22) 0 4 4
Past service cost (inclusive of curtailments) 0 0 0 0 (2) (2)
Settlements 0 (21) (21) (2) (2) (4)
Employer contributions (24) (82) (105) (8) (62) (69)
Benefit payments (404) (7) (411) (377) (7) (384)
Settlement payments (1) 0 (1) (36) 0 (36)
Acquisitions/divestitures of businesses 168 0 168 2 0 2
Administration cost 0 9 9 0 7 7
Net defined benefit liability at end of fiscal year 7,189 460 7,649 7,176 383 7,559
thereof: accrued pension liability 7,189 495 7,684 7,176 431 7,607
thereof: other non-financial assets 0 (36) (36) 0 (48) (48)
The amount calculated in accordance with the asset ceiling rules and minimum funding requirements changed as follows:
CHANGE IN ASSET CEILING ( INCLUSIVE OF MINIMUM FUNDING)
Sept. 30, 2017 Sept. 30, 2018
million € Germany Outside Germany Total Germany Outside Germany Total
Net amount at beginning of fiscal year 0 1 1 0 0 0
Interest expense/(income) 0 0 0 0 0 0
Remeasurement: Limitation of asset ceiling exclusive of amounts included in interest expense/income 0 (1) (1) 0 24 24
Currency differences 0 0 0 0 0 0
Net amount at end of fiscal year 0 0 0 0 24 24
The asset ceiling mainly refers to plan assets in Great Britain.

thyssenkrupp annual report 2017 / 2018
3 Consolidated financial statements | thyssenkrupp AG – Notes to the consolidated financial statements
182
Net periodic pension cost
The net periodic pension cost for the defined benefit plans were as follows:
NET PERIODIC PENSION COST
Year ended Sept. 30, 2017
Year ended Sept. 30, 2018
million € GermanyOutside
Germany Total Germany Outside
Germany Total
Service cost 153 57 210 144 50 194
Net interest cost 99 12 112 132 9 141
Administration cost 0 9 9 0 7 7
Past service cost (inclusive of curtailments) 0 0 0 0 (2) (2)
Settlement loss/(gain) 0 (21) (21) (2) (2) (4)
Net periodic pension cost 253 58 311 273 62 336
The above presented net periodic pension cost for defined benefit plans in the amount of €273 million (prior year: €253 million) in
Germany and of €62 million (prior year: €58 million) outside Germany include €121 million (prior year: €111 million) and €2 million (prior
year: €2 million), respectively, attributable to discontinued operations. These costs are presented in income/(loss) from discontinued
operations in the consolidated statement of income.
Assumptions
The assumptions for discount rates, the rates of compensation increase and the rates of pension progression on which the calculation of
the obligations is based were derived in accordance with standard principles and established for each country as a function of their
respective economic conditions. Discount rates are generally determined based on market yields of AA-rated corporate bonds of
appropriate term and currency. As of September 30, 2018, the discount rate for pension obligations in Germany was 1.70%, compared
with 1.90% in the prior year.
The Group applied the following weighted average assumptions to determine benefit obligation:
WEIGHTED AVERAGE ASSUMPTIONS
Sept. 30, 2017 Sept. 30, 2018
in % GermanyOutside
Germany Total Germany Outside
Germany Total
Discount rate 1.90 2.29 2.00 1.70 2.54 1.91
Rate of compensation increase 2.50 1.37 2.27 2.50 1.37 2.28
Rate of pension progression 1.50 1.51 1.50 1.50 1.59 1.51
Accrued pension obligations in Germany are recognized on the basis of the “2005 G tables” of Prof. Dr. Klaus Heubeck, adapted to Group-
specific circumstances. As the use of the Group-specific tables allows more individual estimates, the “2018 G tables” of Heubeck-
Richttafeln-GmbH were not used. In the other countries the following biometric tables were generally used: USA: Modified version of the
RP-2014 Mortality Base Table and MP-2014 Mortality Projection Scale; Great Britain: Series Tables adjusted to the CMI2016 Model, and
Liechtenstein: BVG2015 Gen.
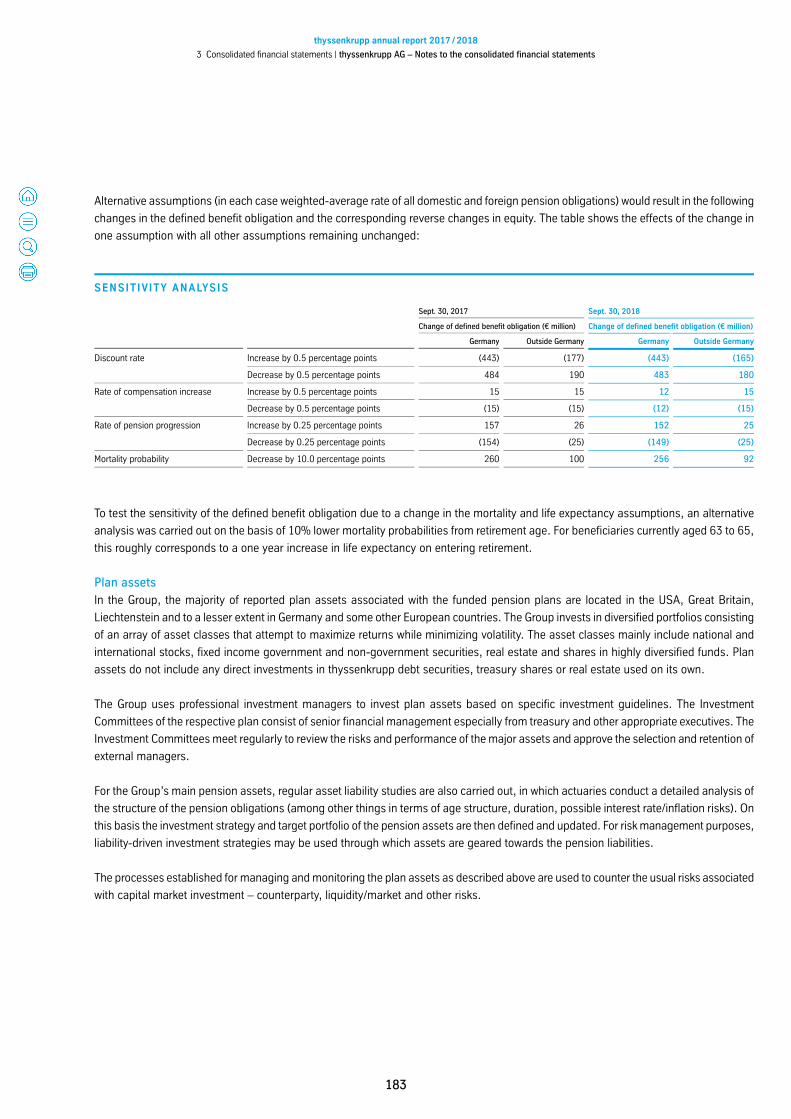
thyssenkrupp annual report 2017 / 2018
3 Consolidated financial statements | thyssenkrupp AG – Notes to the consolidated financial statements
183
Alternative assumptions (in each case weighted-average rate of all domestic and foreign pension obligations) would result in the following
changes in the defined benefit obligation and the corresponding reverse changes in equity. The table shows the effects of the change in
one assumption with all other assumptions remaining unchanged:
SENSITIVITY ANALYSIS
Sept. 30, 2017 Sept. 30, 2018
Change of defined benefit obligation (€ million) Change of defined benefit obligation (€ million)
Germany Outside Germany Germany Outside Germany
Discount rate Increase by 0.5 percentage points (443) (177) (443) (165)
Decrease by 0.5 percentage points 484 190 483 180
Rate of compensation increase Increase by 0.5 percentage points 15 15 12 15
Decrease by 0.5 percentage points (15) (15) (12) (15)
Rate of pension progression Increase by 0.25 percentage points 157 26 152 25
Decrease by 0.25 percentage points (154) (25) (149) (25)
Mortality probability Decrease by 10.0 percentage points 260 100 256 92
To test the sensitivity of the defined benefit obligation due to a change in the mortality and life expectancy assumptions, an alternative
analysis was carried out on the basis of 10% lower mortality probabilities from retirement age. For beneficiaries currently aged 63 to 65,
this roughly corresponds to a one year increase in life expectancy on entering retirement.
Plan assets
In the Group, the majority of reported plan assets associated with the funded pension plans are located in the USA, Great Britain,
Liechtenstein and to a lesser extent in Germany and some other European countries. The Group invests in diversified portfolios consisting
of an array of asset classes that attempt to maximize returns while minimizing volatility. The asset classes mainly include national and
international stocks, fixed income government and non-government securities, real estate and shares in highly diversified funds. Plan
assets do not include any direct investments in thyssenkrupp debt securities, treasury shares or real estate used on its own.
The Group uses professional investment managers to invest plan assets based on specific investment guidelines. The Investment
Committees of the respective plan consist of senior financial management especially from treasury and other appropriate executives. The
Investment Committees meet regularly to review the risks and performance of the major assets and approve the selection and retention of
external managers.
For the Group’s main pension assets, regular asset liability studies are also carried out, in which actuaries conduct a detailed analysis of
the structure of the pension obligations (among other things in terms of age structure, duration, possible interest rate/inflation risks). On
this basis the investment strategy and target portfolio of the pension assets are then defined and updated. For risk management purposes,
liability-driven investment strategies may be used through which assets are geared towards the pension liabilities.
The processes established for managing and monitoring the plan assets as described above are used to counter the usual risks associated
with capital market investment – counterparty, liquidity/market and other risks.

thyssenkrupp annual report 2017 / 2018
3 Consolidated financial statements | thyssenkrupp AG – Notes to the consolidated financial statements
184
As described above, the major pension obligations exist in Germany, the USA, Great Britain and Liechtenstein. The plan assets in these
countries amount to 84% of the total plan assets as of September 30, 2018 (prior year: 84%). As of the balance sheet date the portfolio of
these major plan assets comprises the following asset categories:
ASSET ALLOCATION OF MA JOR PLAN ASSETS
Sept. 30, 2017 Sept. 30, 2018
Fair value (€ million) Fair value (€ million)
Asset categories Total
Quoted market price in an
active market
No quoted market price in
an active market
Portion of major plan
assets (in %) Total
Quoted market price in an
active market
No quoted market price in an active
market
Portion of major plan
assets (in %)
Equity securities 697 676 21 37 678 658 20 36
Bonds 948 945 3 50 936 930 6 50
Derivatives 0 0 0 0 11 11 0 1
Cash and cash equivalents 44 44 0 2 53 53 0 3
Others 217 165 52 11 200 152 49 11
Total 1,906 1,830 76 100 1,878 1,803 75 100
In general, the Group’s funding policy is to contribute amounts to the plans sufficient to meet the minimum statutory funding requirements
relevant in the country in which the plan is located. In the USA, minimum funding is partially based on collective bargaining agreements.
The Group may from time to time make additional contributions at its own discretion. thyssenkrupp’s expected contribution in fiscal year
2018 / 2019 is €63 million (prior year: €58 million) related to its plan assets.
Pension benefit payments
In fiscal year 2017 / 2018, pension benefit payments for plans in Germany of €399 million (prior year: €404 million) were mainly from
provisions, and pension benefit payments for non-German plans of €134 million (prior year: €128 million) were made mainly from plan
assets. The estimated future pension benefits to be paid by the Group’s defined benefit pension plans are as follows:
ESTIMATED FUTURE PENSION BENEFIT PAYMENTS
million € Germany Outside Germany Total
(for fiscal year)
2018 / 2019 444 126 570
2019 / 2020 413 123 536
2020 / 2021 412 125 537
2021 / 2022 404 127 531
2022 / 2023 402 127 529
2023 / 2024 – 2027 / 2028 1,901 647 2,548
Total 3,977 1,275 5,251
The duration of defined benefit plans amounts to 13 years for Germany (prior year: 13 years) and to 15 years (prior year: 15 years) for the
other countries.

thyssenkrupp annual report 2017 / 2018
3 Consolidated financial statements | thyssenkrupp AG – Notes to the consolidated financial statements
185
Defined contribution plans (DC plans)
The Group also maintains domestic and foreign defined contribution plans. Amounts contributed by the Group under such plans are based
upon percentage of the employees’ salary or the amount of contributions made by the employees. The total cost of pension plans
accounted for as defined contribution plans in the current fiscal year was €160 million (prior year: €162 million). In addition, contributions
paid to public/state pension insurance institutions amounted to €641 million (prior year: €644 million).
Partial retirement
In particular German companies have obligations resulting from partial retirement agreements. Under these agreements, employees work
additional time prior to retirement, which is subsequently paid for in installments after retirement. In addition, employees receive a
supplement on top of their pay. For these obligations, accruals were recognized in accordance with IAS 19 “Employee Benefits”.
15 Provisions for employee benefits and other provisions
PROVISIONS FOR EMPLOYEE BENEFITS AND OTHER PROVISIONS
million € Employee
benefits
Product warranties
and product defects
Other contractual
costsRestruc-
turing
Decom- missioning obligations Others Total
Balance as of Sept. 30, 2017 711 413 101 353 270 691 2,539
Currency differences (6) 0 (2) (2) 0 (9) (19)
Acquisitions/divestitures of businesses 9 (29) 7 1 0 (24) (36)
Additions 756 293 187 75 6 551 1,868
Accretion 4 0 0 0 (5) 1 0
Amounts utilized (655) (117) (91) (149) (8) (182) (1,201)
Reversals (133) (79) (98) (76) (10) (66) (463)
Reclassification due to the presentation as liabilities associated with assets held for sale (171) (14) (34) (53) (240) (297) (810)
Balance as of Sept. 30, 2018 515 467 69 148 14 664 1,877
As of September 30, 2018, €1,400 million (prior year: €1,540 million) of the total of provisions for employee benefits and other provisions
are current, while €477 million (prior year: €999 million) are non-current. Provisions of €666 million (prior year: €1,162 million) have a
remaining term of more than one year.
Provisions for employee compensation and benefit costs primarily represent employment anniversary bonuses and obligations for the
management incentive plans, while social plan and related costs pertaining to personnel related structural measures are reflected in the
provision for restructuring activities. Pension related obligations for partial retirement agreements and early retirement programs, partly
resulting from restructurings, are part of the provision for pensions and similar obligations.
Product warranties and product defects represent the Group’s responsibility for the proper functioning of the goods sold (product warranty)
as well as the obligation that arise from the use of the products sold (product defect).

thyssenkrupp annual report 2017 / 2018
3 Consolidated financial statements | thyssenkrupp AG – Notes to the consolidated financial statements
186
Provisions for other contractual costs represent pending losses from uncompleted contracts.
The provision for restructurings consists of provisions for employee termination benefits and exit costs which have been established by
operating divisions for costs incurred in connection with activities which do not generate any future economic benefits for the Group.
Restructurings are being carried out in all business areas The additions to restructuring provisions in the fiscal year in the amount of
€75 million in total consists of €31 million within the Elevator Technology business area, €18 million within the Materials Services business
area, €16 million within the Industrial Solutions business area and €5 million within the Components Technology business area.
The provision for decommissioning obligations mainly consists of obligations associated with mining activities and recultivating landfills.
Obligations associated with mining activities and recultivating landfills are generally handled over long periods of time, in some cases more
than 30 years. The technical parameters are very complex. As a result, uncertainty exists with regard to the timing and concrete amount of
the expenses.
Other provisions include provisions for litigation risks, environmental obligations and other risks from individual items not allocable to other
positions. Provisions for the following items are included:
Claims for damages have been filed both in and out of court against thyssenkrupp AG and companies of the thyssenkrupp Group by
potential injured parties in connection with the elevator cartel. A part of the claims has not yet been quantified. The court proceedings are
pending in Belgium, Austria and the Netherlands and are at various stages; in part proceedings have already been settled or the actions
have been withdrawn or dismissed. For the part of the claims thyssenkrupp assesses will probably result in cash outflows, thyssenkrupp
has recognized provisions for risks.
In connection with the rail cartel, which concerned prohibited cartel agreements in the period 2001-2011 with regard to the supply of rails,
sleepers and turnouts to private companies, including construction companies and companies operating private rail operations as well as
local transport authorities (the so-called “private market”), various companies, particularly local transport services, have also asserted or
announced damage claims in or mostly out of court as potential injured parties. Proceedings are at various stages; in part proceedings
have already been settled or otherwise brought to an end. thyssenkrupp has recognized provisions for the damage claims.
The discontinued operation thyssenkrupp Steel Europe AG, alongside other steel companies and associations, is the subject of ongoing
investigations by the Federal Cartel Office into alleged cartel agreements. Due to developments in the investigation process, thyssenkrupp
has decided to recognize a provision in its consolidated financial statements. With reference to IAS 37.92, we are disclosing no further
information about this provision.

thyssenkrupp annual report 2017 / 2018
3 Consolidated financial statements | thyssenkrupp AG – Notes to the consolidated financial statements
187
16 Financial debt
FINANCIAL DEBT
Carrying amounts in million € Sept. 30, 2017 Sept. 30, 2018
Bonds 4,670 4,678
Loan notes 252 139
Liabilities to financial institutions 154 69
Finance lease liabilities 20 10
Other loans 230 192
Non-current financial debt 5,326 5,087
Bonds 1,599 0
Loan notes 75 113
Liabilities to financial institutions 231 29
Acceptance payables 11 0
Finance lease liabilities 6 4
Other loans 8 2
Current financial debt 1,930 147
Financial debt 7,255 5,234
Current financial debt includes financial debt with a remaining term up to one year, while non-current financial debt has a remaining term
of more than one year.
Financial debt in the amount of €167 million (prior year: €173 million) is collateralized by real estate.
As of September 30, 2018, the financial debt reflects a total discount in the amount of €23 million (prior year: €33 million), which is offset
by a total premium in the amount of €0 million (prior year: €0 million). Amortization of discounts and premiums of financial debt is included
in “financial income/(expense), net”.
In the context of the presentation of the discontinued steel operations financial debt of €142 million were reclassified to the balance sheet
line item “liabilities associated with assets held for sale”. As of Sept. 30, 2017 financial debt includes €150 million attributable to the
discontinued steel operations.

thyssenkrupp annual report 2017 / 2018
3 Consolidated financial statements | thyssenkrupp AG – Notes to the consolidated financial statements
188
As of September 30, 2018, the financing structure of liabilities to financial institutions and other loans comprise the following:
LIABILITIES TO FINANCIAL INSTITUTIONS AND OTHER LOANS
Carrying amount in
million €as of
Sept. 30, 2017
Carrying amount in
million €as of
Sept. 30, 2018thereof
in €
Weighted average
interest rate in % as of
Sept. 30, 2018
thereofin other
currencies
Fair value in million €
as of Sept. 30, 2018
Credits at variable interest rates 220 96 87 2.3 9 96
Credits at fixed interest rates 403 195 108 4.9 87 211
Total 623 291 195 3.7 96 307
Under a syndicated joint credit multi-currency facility agreement, thyssenkrupp has access to funds of €2.0 billion with variable interest
rates. The facility, which has a term until March 14, 2021, was not utilized as of the balance sheet date.
In addition to the syndicated joint credit multi-currency-facility agreement there are revolving credit agreements of €1.6 billion in total with
banking institutions whereby thyssenkrupp AG can borrow in euros, U.S. dollars or in British pounds Sterling. As of September 30, 2018,
the credit agreements were not drawn.
In total the Group has available unused, committed credit lines amounting to €3.6 billion.
The Group’s Commercial Paper Program also provides up to €1.5 billion in additional financing. Commercial papers are debt instruments
which can be issued under our program with a term of up to 364 days depending on investor demand. As of September 30, 2018, the
program was not used.
BONDS AND LOAN NOTES
Carrying amount in
million €as of
Sept. 30, 2017
Carrying amount in
million €as of
Sept. 30, 2018
Notional amount in
million €as of
Sept. 30, 2018Interest rate
in %
Fair value in million €
as of Sept. 30, 2018 Maturity
thyssenkrupp AG bond (€1,600 million) 2013 / 2018 1,599 — — — — 08 / 27 / 2018
thyssenkrupp AG bond (€1,250 million) 2014 / 2019 1,244 1,247 1,250 3.1250 1,280 10 / 25 / 2019
thyssenkrupp AG bond (€750 million) 2015 / 2020 746 747 750 1.7500 769 11 / 25 / 2020
thyssenkrupp AG bond (€600 million) 2015 / 2025 593 594 600 2.5000 632 02 / 25 / 2025
thyssenkrupp AG bond (€850 million) 2016 / 2021 845 847 850 2.7500 890 03 / 08 / 2021
thyssenkrupp AG bond (€1,250 million) 2017 / 2022 1,242 1,243 1,250 1.3750 1,264 03 / 03 / 2022
thyssenkrupp AG loan note (€70 million) 2012 / 2017 70 — — — — 10 / 02 / 2017
thyssenkrupp AG loan note (€8 million) 2014 / 2018 8 8 8 2.2500 8 12 / 30 / 2018
thyssenkrupp AG loan note (€4 million) 2014 / 2019 4 4 4 2.5000 4 12 / 30 / 2019
thyssenkrupp AG loan note (€100 million) 2015 / 2018 100 100 100 0.9310 101 12 / 14 / 2018
thyssenkrupp AG loan note (€145 million) 2016 / 2021 145 140 140 1.7500 144 03 / 11 / 2021
Total 6,596 4,930 4,952 5,092

thyssenkrupp annual report 2017 / 2018
3 Consolidated financial statements | thyssenkrupp AG – Notes to the consolidated financial statements
189
Maturity of financial debt is as follows:
MATURITY OF FINANCIAL DEBT
million € (for fiscal year) Total financial debt
Thereof:Liabilities to financial
institutions
2018 / 2019 147 29
2019 / 2020 1,268 6
2020 / 2021 1,732 6
2021 / 2022 1,352 6
2022 / 2023 8 6
nach 2022 / 2023 727 45
Total 5,234 98
17 Trade accounts payable Trade accounts payable in the amount of €256 million (prior year: €399 million) have a remaining term of more than one year.
18 Other financial liabilities
OTHER FINANCIAL LIABILITIES
Sept. 30, 2017 Sept. 30, 2018
million € current non-current current non-current
Financial liabilities measured at amortized cost 751 182 548 157
Derivatives not qualifying for hedge accounting 59 — 67 —
Derivatives qualifying for hedge accounting 33 — 20 —
Total 842 182 635 157
Other financial liabilities amounting to €166 million (prior year: €184 million) have a remaining term of more than one year.

thyssenkrupp annual report 2017 / 2018
3 Consolidated financial statements | thyssenkrupp AG – Notes to the consolidated financial statements
190
19 Other non-financial liabilities
OTHER NON-FINANCIAL LIABILITIES
Sept. 30, 2017 Sept. 30, 2018
million € current non-current current non-current
Amounts due to customers for construction work 3,359 — 3,412 —
Advance payments 991 — 1,087 —
Selling and buying market related liabilities 839 — 691 —
Liabilities due to put options 16 0 18 0
Liabilities to the employees 871 — 731 —
Liabilities for social security 133 — 88 —
Deferred income 45 — 28 —
Tax liabilities (without income taxes) 290 — 265 —
Miscellaneous 258 5 305 4
Total 6,802 5 6,626 4
Other non-financial liabilities amounting to €2,441 million (prior year: €2,518 million) have a remaining term of more than one year.
Amounts due to customers for construction work are calculated as follows:
LIABILITIES FOR CONSTRUCTION WORK
million € Sept. 30, 2017 Sept. 30, 2018
Contract costs incurred and recognized contract profits (less recognized losses) 6,326 3,541
Less advance payments received (9,686) (6,953)
Total (3,359) (3,412)
20 Contingencies and commitments
Contingencies
thyssenkrupp AG as well as, in individual cases, its subsidiaries have issued or have had guarantees issued in favour of customers or
lenders. The following table shows obligations under guarantees where the principal debtor is not a consolidated Group company:
CONTINGENCIES
Maximum potential amount of future payments as of Provision as of
million € Sept. 30, 2017 Sept. 30, 2018 Sept. 30, 2017 Sept. 30, 2018
Advance payment bonds 33 20 1 1
Performance bonds 2 1 0 0
Residual value guarantees 61 61 15 15
Other guarantees 7 3 0 0
Total 103 85 16 16

thyssenkrupp annual report 2017 / 2018
3 Consolidated financial statements | thyssenkrupp AG – Notes to the consolidated financial statements
191
The terms of these guarantees depend on the type of guarantee and may range from three months to ten years (e.g. rental payment
guarantees).
The basis for possible payments under the guarantees is the non-performance of the principal debtor under a contractual agreement, e.g.
late delivery, delivery of non-conforming goods under a contract or non-performance with respect to the warranted quality.
All guarantees are issued by or issued by instruction of thyssenkrupp AG or subsidiaries upon request of the principal debtor obligated by
the underlying contractual relationship and are subject to recourse provisions in case of default. Is such a principal debtor is a company
owned fully or partially by a foreign third party, such third party is generally requested to provide additional collateral in a corresponding
amount.
thyssenkrupp bears joint and several liability as a member of certain civil law partnerships, ordinary partnerships and consortiums.
thyssenkrupp has contingencies for the following material legal disputes:
In connection with the majority interest previously held by the Industrial Solutions business area in the Greek shipyard Hellenic Shipyards
(HSY) and the construction of submarines for the Greek Navy, the Greek government has filed legal and arbitration actions to claim
compensation of €2.2 billion and reimbursement of a €115 million installment payment from thyssenkrupp Industrial Solutions AG and
thyssenkrupp Marine Systems GmbH as well as from HSY and the current majority shareholder of HSY. To date the Greek government has
only concretized the receivables to a minor extent, relating exclusively to its contract with HSY. The claims asserted against the
thyssenkrupp companies appear unfounded. All contractual obligations of thyssenkrupp Marine Systems and other thyssenkrupp
companies vis-à-vis the Greek government have been fulfilled since 2010.
The discontinued operation thyssenkrupp Steel Europe AG, alongside other steel companies and associations, is the subject of ongoing
investigations by the Federal Cartel Office into alleged cartel agreements. Based on current knowledge we are still unable to rule out
substantial adverse effects on the Group’s financial position.
In addition further legal and arbitration actions and official investigations and proceedings as well as claims have been filed against
thyssenkrupp companies or may be initiated or filed in the future. Disputes in connection with the acquisition or disposal of companies or
company units which may lead to partial repayment of the purchase price or to the payment of damages or to tax charges. Furthermore,
damage claims may be payable to contractual partners, customers, consortium partners and subcontractors under performance contracts.
Predicting the progress and results of lawsuits involves considerable difficulties and uncertainties. This means that lawsuits, official
investigations and proceedings as well as claims not disclosed separately could also individually or together with other legal disputes,
official investigations and proceedings as well as claims have a negative and also potentially major future impact on the Group’s net
assets, financial position and results of operations. However, at present thyssenkrupp does not expect pending lawsuits, official
investigations and proceedings as well as claims not explained separately in this section to have a major negative impact on the Group’s
net assets, financial position and results of operations.

thyssenkrupp annual report 2017 / 2018
3 Consolidated financial statements | thyssenkrupp AG – Notes to the consolidated financial statements
192
Commitments and other contingencies
The Group is the lessee to property, plant and equipment classified as operating leases. Rental expense amounting to €282 million (prior
year: €278 million) resulting from rental contracts, long-term leases and leasing contracts classified as operating leases, comprises as
follows:
EXPENSE RESULTING FROM OPERATING LEASE CONTRACTS
million € Year ended
Sept. 30, 20171)
Year endedSept. 30, 2018
Minimum rental payments 271 277
Contingent rentals 8 6
less income from sublease agreements (1) (1)
Total 278 282
1) Figures have been adjusted (cf. Note 03).
The future minimum rental payments, excluding accrued interest from such non-cancellable contracts that have an initial or remaining term
of more than one year as of the balance sheet date are (at face amounts):
FUTURE MINIMUM LEASE PAYMENTS
million € Sept. 30, 2017 Sept. 30, 2018
Not later than one year 211 287
Between one and five years 429 471
Later than five years 93 385
Total 734 1,142
The commitment to enter into investment projects amounts to €601 million (prior year: €396 million) as of September 30, 2018 and
relates mainly to property, plant and equipment of the Components Technology business area and of the discontinued steel operations.
Payment commitments and obligations to make further contributions to corporations and cooperative associations exist in the total amount
of €0 million (prior year: €11 million). In addition, other financial commitments exist in the amount of €1,538 million (prior year:
€1,713 million), primarily from the purchasing commitments resulting from the Group’s long term electricity and gas supply contracts. In
addition, in the Steel Europe business area (part of the discontinued steel operations) long term iron ore and iron ore pellets supply
contracts exist which will result in purchasing commitments over a period of up to two years. Due to the high volatility of iron ore prices, the
measurement of the complete purchasing commitments is based on the iron ore price as of the current balance sheet date resulting in
purchasing commitments of €1,253 million (prior year: €2,136 million).
Based on the risk bearing ability of the Group or the Group companies, there exist adequate deductibles in the various classes of
insurance. One or more damages at these units could impact the Group’s net assets, financial position and results of operations.

thyssenkrupp annual report 2017 / 2018
3 Consolidated financial statements | thyssenkrupp AG – Notes to the consolidated financial statements
193
21 Financial instruments The following table shows financial assets and liabilities by measurement categories and classes. Finance lease receivables and liabilities,
and derivatives that qualify for hedge accounting are also included although they are not part of any IAS 39 measurement category.
FINANCIAL INSTRUMENTS AS OF SEPT. 30, 2017
Measurement in accordance with IAS 39
Measurement in accordance with IAS 17
million €
Carrying amount on
balance sheet as of
Sept. 30, 2017(Amortized)
cost
Fair value recognized in profit or loss
Fair value recognized in
equity Amortized cost
Fair value as of
Sept. 30, 2017
Trade accounts receivable (excluding finance lease) 5,733 5,733 5,733
Loans and receivables 5,733 5,733
Finance lease receivables 1 1 1
Other financial assets 463 326 85 52 463
Loans and receivables 312 312
Available-for-sale financial assets 15 20 34
Derivatives not qualifying for hedge accounting (Financial assets held for trading) 65 65
Derivatives qualifying for hedge accounting 20 32 52
Cash and cash equivalents 5,292 5,292 5,292
Loans and receivables 5,292 5,292
Total of financial assets 11,489
thereof by measurement categories of IAS 39:
Loans and receivables 11,337 11,337 11,337
Available-for-sale financial assets 34 15 20 34
Derivatives not qualifying for hedge accounting (Financial assets held for trading) 65 65 65
Financial debt (excluding finance lease) 7,230 7,230 7,608
Financial liabilities measured at amortized cost 7,230 7,608
Finance lease liabilities 25 25 25
Trade accounts payable 5,729 5,729 5,729
Financial liabilities measured at amortized cost 5,729 5,729
Other financial liabilities 1,024 932 70 22 1,024
Financial liabilities measured at amortized cost 932 932
Derivatives not qualifying for hedge accounting (Financial assets held for trading) 59 59
Derivatives qualifying for hedge accounting 10 22 33
Total of financial liabilities 14,009
thereof by measurement categories of IAS 39:
Financial liabilities measured at amortized cost 13,892 13,892 14,270
Derivatives not qualifying for hedge accounting (Financial assets held for trading) 59 59 59

thyssenkrupp annual report 2017 / 2018
3 Consolidated financial statements | thyssenkrupp AG – Notes to the consolidated financial statements
194
The carrying amounts of trade accounts receivable, other current receivables as well as cash and cash equivalents equal their fair values.
The fair value of loans equals the present value of expected cash flows which are discounted on the basis of interest rates prevailing on the
balance sheet date.
Available-for-sale financial assets primarily include equity and debt instruments. They are in general measured at fair value, which is based
to the extent available on market prices as of the balance sheet date. When no quoted market prices in an active market are available and
the fair value cannot be reliably measured, equity instruments are measured at cost.
FINANCIAL INSTRUMENTS AS OF SEPT. 30, 2018
Measurement in accordance with IAS 39
Measurement in accordance with IAS 17
million €
Carrying amount on
balance sheet as of
Sept. 30, 2018(Amortized)
cost
Fair value recognized in profit or loss
Fair value recognized in
equity Amortized cost
Fair value as of
Sept. 30, 2018
Trade accounts receivable (excluding finance lease) 5,529 5,529 5,529
Loans and receivables 5,529 5,529
Finance lease receivables 0 0 0
Other financial assets 362 274 65 23 362
Loans and receivables 266 266
Available-for-sale financial assets 8 19 27
Derivatives not qualifying for hedge accounting (Financial assets held for trading) 65 65
Derivatives qualifying for hedge accounting 0 4 4
Cash and cash equivalents 2,987 2,987 2,987
Loans and receivables 2,987 2,987
Total of financial assets 8,878
thereof by measurement categories of IAS 39:
Loans and receivables 8,782 8,782 8,782
Available-for-sale financial assets 27 8 19 27
Derivatives not qualifying for hedge accounting (Financial assets held for trading) 65 65 65
Financial debt (excluding finance lease) 5,221 5,221 5,399
Financial liabilities measured at amortized cost 5,221 5,399
Finance lease liabilities 13 13 13
Trade accounts payable 5,266 5,266 5,266
Financial liabilities measured at amortized cost 5,266 5,266
Other financial liabilities 791 705 67 19 791
Financial liabilities measured at amortized cost 705 705
Derivatives not qualifying for hedge accounting (Financial assets held for trading) 67 67
Derivatives qualifying for hedge accounting 0 19 20
Total of financial liabilities 11,292
thereof by measurement categories of IAS 39:
Financial liabilities measured at amortized cost 11,193 11,193 11,371
Derivatives not qualifying for hedge accounting (Financial assets held for trading) 67 67 67
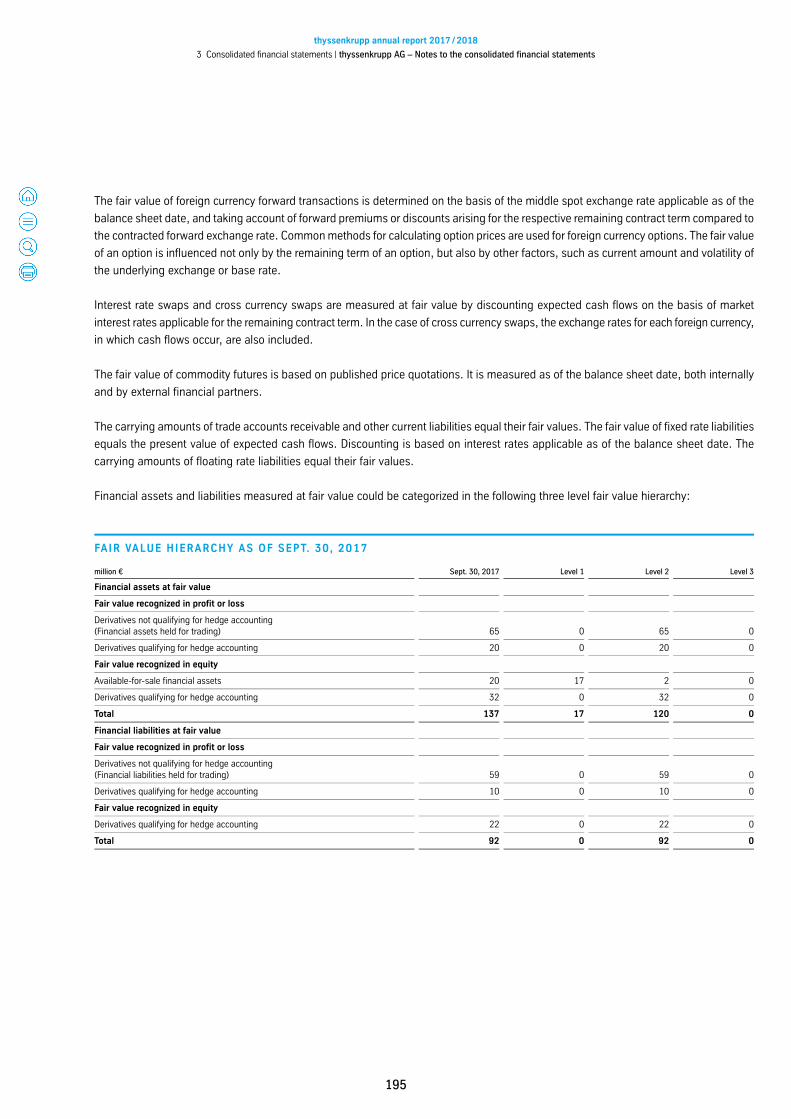
thyssenkrupp annual report 2017 / 2018
3 Consolidated financial statements | thyssenkrupp AG – Notes to the consolidated financial statements
195
The fair value of foreign currency forward transactions is determined on the basis of the middle spot exchange rate applicable as of the
balance sheet date, and taking account of forward premiums or discounts arising for the respective remaining contract term compared to
the contracted forward exchange rate. Common methods for calculating option prices are used for foreign currency options. The fair value
of an option is influenced not only by the remaining term of an option, but also by other factors, such as current amount and volatility of
the underlying exchange or base rate.
Interest rate swaps and cross currency swaps are measured at fair value by discounting expected cash flows on the basis of market
interest rates applicable for the remaining contract term. In the case of cross currency swaps, the exchange rates for each foreign currency,
in which cash flows occur, are also included.
The fair value of commodity futures is based on published price quotations. It is measured as of the balance sheet date, both internally
and by external financial partners.
The carrying amounts of trade accounts receivable and other current liabilities equal their fair values. The fair value of fixed rate liabilities
equals the present value of expected cash flows. Discounting is based on interest rates applicable as of the balance sheet date. The
carrying amounts of floating rate liabilities equal their fair values.
Financial assets and liabilities measured at fair value could be categorized in the following three level fair value hierarchy:
FAIR VALUE HIERARCHY AS OF SEPT. 30, 2017
million € Sept. 30, 2017 Level 1 Level 2 Level 3
Financial assets at fair value
Fair value recognized in profit or loss
Derivatives not qualifying for hedge accounting (Financial assets held for trading) 65 0 65 0
Derivatives qualifying for hedge accounting 20 0 20 0
Fair value recognized in equity
Available-for-sale financial assets 20 17 2 0
Derivatives qualifying for hedge accounting 32 0 32 0
Total 137 17 120 0
Financial liabilities at fair value
Fair value recognized in profit or loss
Derivatives not qualifying for hedge accounting (Financial liabilities held for trading) 59 0 59 0
Derivatives qualifying for hedge accounting 10 0 10 0
Fair value recognized in equity
Derivatives qualifying for hedge accounting 22 0 22 0
Total 92 0 92 0

thyssenkrupp annual report 2017 / 2018
3 Consolidated financial statements | thyssenkrupp AG – Notes to the consolidated financial statements
196
The fair value hierarchy reflects the significance of the inputs used to determine fair values. Financial instruments with fair value
measurement based on quoted prices in active markets are disclosed in level 1. In level 2 determination of fair values is based on
observable inputs, e.g. foreign exchange rates. level 3 comprises financial instruments for which the fair value measurement is based on
unobservable inputs.
Financial liabilities measured at amortized cost with a carrying amount of €11,193 million (prior year: €13,892 million) have a fair value of
€11,371 million (prior year: €14,270 million) that was determined based on fair value measurement attributable to Level 2.
Netting of financial assets and financial liabilities
In general, master netting arrangements exist only for derivative financial instruments in the thyssenkrupp Group that however totally or
partially do not meet the offsetting criteria under IAS 32.
In these cases a right of offsetting is enforceable only on termination of the contract on the grounds of a major breach of contract or
insolvency of one of the contractual parties. The gross amounts for these derivatives are therefore presented separately in the statement of
financial position. Potential offsetting exists in the amount of €47 million (prior year: €46 million). An exception from this are futures, for
which the fair values are settled daily on the basis of margin calls. These derivatives meet the offsetting criteria under IAS 32 and are
therefore shown as net amounts in the statement of financial position; they amount of €0 million (prior year: €6 million). Cash collateral
exists in the amount of €0 million (prior year: €6 million).
The following table shows net gains and losses from financial instruments by measurement categories. Gains or losses arising from
finance lease and from derivatives that qualify for hedge accounting are not included, as they are not part of any IAS 39 measurement
category.
FAIR VALUE HIERARCHY AS OF SEPT. 30, 2018
million € Sept. 30, 2018 Level 1 Level 2 Level 3
Financial assets at fair value
Fair value recognized in profit or loss
Derivatives not qualifying for hedge accounting (Financial assets held for trading) 65 0 65 0
Derivatives qualifying for hedge accounting 0 0 0 0
Fair value recognized in equity
Available-for-sale financial assets 19 16 3 0
Derivatives qualifying for hedge accounting 4 0 4 0
Total 88 16 72 0
Financial liabilities at fair value
Fair value recognized in profit or loss
Derivatives not qualifying for hedge accounting (Financial liabilities held for trading) 67 0 67 0
Derivatives qualifying for hedge accounting 0 0 0 0
Fair value recognized in equity
Derivatives qualifying for hedge accounting 19 0 19 0
Total 86 0 86 0

thyssenkrupp annual report 2017 / 2018
3 Consolidated financial statements | thyssenkrupp AG – Notes to the consolidated financial statements
197
1) Der Ausweis wurde angepasst (vgl. Anhang-Nr. 03).
Net gains under “loans and receivables” mainly comprise interest income on financial receivables, individual allowances for trade accounts
receivable as well as gains and losses on foreign currency receivables.
The category “available-for-sale financial assets” mainly includes current earnings from equity and debt instruments.
Gains and losses arising from changes in fair value of foreign currency, interest rate and commodity derivatives that do not comply with the
hedge accounting requirements under IAS 39 are included in the “derivatives that do not qualify for hedge accounting” category.
The category “financial liabilities measured at amortized cost” mainly comprises of interest expenses on financial liabilities as well as gains
and losses on foreign currency liabilities.
Included in net gains and losses are exchange differences of €3 million (prior year: €116 million).
Derivative financial instruments
The Group uses various derivative financial instruments, including foreign currency forward contracts, foreign currency options, interest
rate swaps, cross currency swaps and commodity forward contracts. Derivative financial instruments are generally used to hedge existing
or anticipated underlying transactions so as to reduce foreign currency, interest rate and commodity price risks.
NET GAINS AND LOSSES FROM FINANCIAL INSTRUMENTS
million € Year ended
Sept. 30, 20171)
Year endedSept. 30, 2018
Loans and receivables 79 63
Available-for-sale financial assets 3 3
Derivatives not qualifying for hedge accounting (Financial assets/liabilities held for trading) (162) 8
Financial liabilities measured at amortized cost (295) (297)

thyssenkrupp annual report 2017 / 2018
3 Consolidated financial statements | thyssenkrupp AG – Notes to the consolidated financial statements
198
The following table shows the notional amounts and fair values of derivatives used within the Group:
DERIVATIVE FINANCIAL INSTRUMENTS
million €
Notional amountas of
Sept. 30, 2017
Carrying amount as of
Sept. 30, 2017
Notional amountas of
Sept. 30, 2018
Carrying amountas of
Sept. 30, 2018
Assets
Foreign currency derivatives that do not qualify for hedge accounting 1,071 33 1,816 26
Foreign currency derivatives qualifying as cash flow hedges 404 19 195 3
Embedded derivatives 89 3 124 2
Interest rate derivatives that do not qualify for hedge accounting 13 0 28 3
Interest rate derivatives qualifying as cash flow hedges1) 106 4 0 0
Commodity derivatives that do not qualify for hedge accounting 335 28 686 34
Commodity derivatives qualifying as cash flow hedges 62 9 46 1
Commodity derivatives qualifying as fair value hedges 212 20 101 0
Total 2,292 117 2,997 69
Equity and liabilities
Foreign currency derivatives that do not qualify for hedge accounting 1,109 27 1,315 25
Foreign currency derivatives qualifying as cash flow hedges 244 10 538 16
Embedded derivatives 129 7 106 2
Interest rate derivatives that do not qualify for hedge accounting 11 0 0 0
Interest rate derivatives qualifying as cash flow hedges1) 10 0 0 0
Commodity derivatives that do not qualify for hedge accounting 294 25 771 40
Commodity derivatives qualifying as cash flow hedges 146 12 66 3
Commodity derivatives qualifying as fair value hedges 152 10 25 0
Total 2,095 92 2,822 86
1) Inclusive of cross currency swaps
Derivates that quality for hedge accounting
Hedge accounting in accordance with IAS 39 is used to hedge foreign currency risks of firm commitments, future receivables and liabilities
denominated in foreign currency, commodity price risks arising from sales and purchase transactions, and interest rate and foreign
currency risks from non-current financings.
Cash flow hedges
Cash flow hedges are mainly used to hedge future cash flows against foreign currency and commodity price risks arising from future sales
and purchase transactions as well as interest rate and foreign currency risks from non-current liabilities. These derivatives are measured at
fair value, divided into an effective and ineffective portion. Until realization of the hedged underlying transaction, the effective portion of
fluctuations in fair value of these derivatives is recognized directly in equity in the cumulative other comprehensive income position, while
the ineffective portion is recognized in profit or loss. The cumulative gain or loss recognized in equity is reclassified to profit or loss in the
same period during which the future underlying transactions (hedged items) affect profit or loss. As of September 30, 2018, hedging
instruments with positive fair value totaled €4 million (prior year: €32 million) and those with negative fair value totaled €19 million (prior
year: €22 million). For the 2017 / 2018 fiscal year, €(98) million (prior year: €82 million) (before tax) in unrealized gains or losses have
been recognized directly in equity in the cumulative other comprehensive income position. Cash flows from future transactions are currently
hedged for a maximum of 69 months.

thyssenkrupp annual report 2017 / 2018
3 Consolidated financial statements | thyssenkrupp AG – Notes to the consolidated financial statements
199
During the current fiscal year, €(2) million (prior year: €11 million) of cumulative other comprehensive income were reclassified to sales in
profit or loss as a result of the underlying transactions being realized during the year; thereof €4 million (prior year: €8 million) are included
in discontinued operations. In addition, €1 million (prior year: €3 million) of cumulative other comprehensive income were reclassified to
decrease cost of inventories, as the hedged commodities were recognized, although the underlying transaction had not yet been taken to
profit or loss. This resulted in increased expenses of €0 million; thereof €1 million reduced expenses of the discontinued operations in
2017 / 2018 . Furthermore, €(1) million in 2018 / 2019 and €0 million in the following fiscal years impacted earnings; thereof €2 million in
2018 / 2019 and €0 million in the following fiscal years are included in discontinued operations.
As of September 30, 2018, net income from the ineffective portions of derivatives classified as cash flow hedges totaled €(6) million (prior
year: €0 million); thereof €(3) million (prior year: €0 million) relates to discontinued operations.
In the subsequent fiscal year fluctuations in fair value of derivatives included in cumulative other comprehensive income as of the reporting
date is expected to impact earnings by income of €7 million. During the 2019 / 2020 fiscal year, earnings are expected to be impacted by
income of €47 million, during the 2020 / 2021 fiscal year by income of €24 million and during the following fiscal years by income of
€22 million. Thereof in the following fiscal year income of €13 million, in the 2019 / 2020 fiscal year income of €47 million, in the
2020 / 2021 fiscal year income of €24 million and in the following fiscal years income of €22 million relates to the discontinued operations.
Fair value hedges
Fair value hedges are mainly used to hedge the exposure to changes in fair value of a firm commitment and exposure to inventory price
risks as well as to hedge interest rate risks. These commodity and interest rate derivatives are measured at fair value. The carrying
amounts of the corresponding underlying transactions are adjusted for the change of the fair values of the hedged risks. As of September
30, 2018 hedging instruments with positive fair value totaled €0 million (prior year: €20 million) and with negative fair value totaled €0
million (prior year: €10 million). During the fiscal year, income/(expense), net from the measurement of fair value hedging instruments
totaled €(13) million (prior year: €(28) million), while income/(expense), net from the corresponding underlying transactions during the
same period amounted to €13 million (prior year: €28 million); all earnings impacts are recognized in discontinued operations.
Derivate that do not qualify for hedge accounting
If a hedging relationship does not meet the requirements for hedge accounting in accordance with the conditions under IAS 39 or hedge
accounting is economically not reasonable, the derivative financial instrument is recognized as a derivative that does not qualify for hedge
accounting. The resulting impact on profit or loss is shown in the table on net gains and losses from financial instruments by measurement
categories. This item also includes embedded derivatives. They exist in the thyssenkrupp Group in the way that regular supply and service
transactions with suppliers and customers abroad are not concluded in the functional currency (local currency) of either contracting parties.
Financial risks
Being a global Group, thyssenkrupp is exposed to financial risks in the form of credit risks (default risk), liquidity risks and market risks
(foreign currency, interest rate and commodity price risks) during the course of ordinary activities. The aim of risk management is to limit
the risks arising from operating activities and associated financing requirements by applying selected derivate and non-derivative hedging
instruments. Details are provided in the opportunity and risk report of the management report.
Maturity analysis
Liquidity risk is the risk that the Group is unable to meet its existing or future obligations due to insufficient availability of cash or cash
equivalents.

thyssenkrupp annual report 2017 / 2018
3 Consolidated financial statements | thyssenkrupp AG – Notes to the consolidated financial statements
200
The following table shows future undiscounted cash outflows from financial liabilities based on contractual agreements:
FUTURE UNDISCOUNTED CASH OUTFLOWS AS OF SEPT. 30, 2017
million €
Carrying amount
Sept. 30, 2017Cash flows in 2017 / 2018
Cash flows in 2018 / 2019
Cash flows between
2019 / 2020 and
2021 / 2022
Cash flows after
2021 / 2022
Bonds 6,269 1,772 108 4,309 645
Liabilities to financial institutions 385 307 35 68 59
Finance lease liabilities 25 8 7 9 14
Other financial debt 577 109 137 303 110
Trade accounts payable 5,729 5,330 345 46 9
Derivative financial liabilities not qualifying for hedge accounting 59 56 3 2 0
Derivative financial liabilities qualifying for hedge accounting 33 22 0 10 0
Other financial liabilities 932 930 1 0 2
FUTURE UNDISCOUNTED CASH OUTFLOWS AS OF SEPT. 30, 2018
million €
Carrying amount
Sept. 30, 2018Cash flows in 2018 / 2019
Cash flows in 2019 / 2020
Cash flows between
2020 / 2021 and
2022 / 2023
Cash flows after
2022 / 2023
Bonds 4,678 108 1,358 2,966 630
Liabilities to financial institutions 98 32 9 27 40
Finance lease liabilities 13 4 2 5 5
Other financial debt 445 127 21 255 101
Trade accounts payable 5,266 5,010 220 29 7
Derivative financial liabilities not qualifying for hedge accounting 67 65 2 0 0
Derivative financial liabilities qualifying for hedge accounting 20 19 0 0 0
Other financial liabilities 705 696 7 1 0
Cash flows from derivatives are offset by cash flows from hedged underlying transactions, which have not been considered in the analysis
of maturities. If cash flows from the hedged underlying transactions were also considered, the cash flows shown in the table would be
accordingly lower.
Sensitivity analysis
Market risk is the risk that fair values or future cash flows of non-derivative or derivative financial instruments will fluctuate due to changes
in risk factors. Among market risks relevant to thyssenkrupp are foreign currency, interest rate, procurement (commodity price), and
especially raw material price risks. Associated with these risks are fluctuations in income, equity and cash flow.
The following analyses and amounts determined by means of sensitivity analyses represent hypothetical, future-oriented data that can
differ from actual outcomes because of unforeseeable developments in financial markets. Moreover, non-financial or non-quantifiable
risks, such as business risks, are not considered here.

thyssenkrupp annual report 2017 / 2018
3 Consolidated financial statements | thyssenkrupp AG – Notes to the consolidated financial statements
201
Foreign currency risk exposure – Foreign currency hedging is used to fix prices on the basis of hedging rates as protection against any
unfavorable exchange rate fluctuations in the future. Hedging periods are generally based on the maturities of underlying transactions.
Foreign currency derivative contracts usually have maturities of twelve months or less, but can also be up to six years in single exceptional
cases.
The US dollar is the only relevant risk variable for sensitivity analyses under IFRS 7, as the vast majority of foreign currency cash flows
occurs in US dollars. As hedging transactions are generally used to hedge underlying transactions, opposite effects in underlying and
hedging transactions are almost entirely offset over the total period. Thus, the currency risk exposure described here results from hedging
relationships with off-balance sheet underlying transactions, i.e. hedges of firm commitments and forecasted sales. Based on our analysis,
the US dollar exposure as of September 30, 2018 was as follows:
If the euro had been 10% stronger against the US dollar as of September 30, 2018, the hedge reserve in equity and fair value of hedging
transactions would have been €9 million (prior year: €8 million) higher and earnings resulting from the measurement as of the balance
sheet date €9 million (prior year: €28 million) higher. If the euro had been 10% weaker against the US dollar as of September 30, 2018,
the hedge reserve in equity and fair value of hedging transactions would have been €10 million (prior year: €10 million) lower and earnings
resulting from the measurement as of the balance sheet date €9 million (prior year: €32 million) lower.
Interest rate risk – To hedge interest rate risk, in some cases the Group uses derivatives. These instruments are contracted with the
objective of minimizing interest rate volatilities and finance costs for underlying transactions.
As of September 30, 2017 and 2018, respectively, all interest derivatives are immediately and directly allocated to particular financings as
cash flow hedges. As of the current balance sheet date almost all interest rate derivatives are accounted for as cash flow hedges, while as
of the prior year’s balance sheet date all interest derivatives qualified for hedge accounting.
Cross currency swaps have been contracted in connection with the financing of foreign activities, mainly for US dollars.
Interest rate instruments can result in cash flow risks, opportunity effects, as well as interest rate risks affecting the balance sheet and
earnings. Refinancing and variable-rate financial instruments are subject to cash flow risk which expresses the uncertainty of future interest
payments. Cash flow risk is measured by means of cash flow sensitivity. Opportunity effects arise from non-derivatives, as these are
measured at amortized cost rather than fair value, in contrast to interest derivatives. This difference, the so-called opportunity effect,
affects neither the balance sheet nor the statement of income. On-balance sheet interest rate risks affecting equity result from the
measurement of interest derivatives qualifying as cash flow hedges. Interest rate risks affecting earnings arise from the remaining interest
rate derivatives not qualifying for hedge accounting. Opportunity effects and interest rate risks affecting the balance sheet and earnings
are determined by calculating fair value sensitivity analyses and changes.

thyssenkrupp annual report 2017 / 2018
3 Consolidated financial statements | thyssenkrupp AG – Notes to the consolidated financial statements
202
As of September 30, 2018, a +100 /(20) basis point parallel shift in yield curves is assumed for all currencies in interest analyses. The
parallel downward shift is limited to (20) basis points to account for continued low interest rates with in part negative interest rates.
Negative interest rates are included in the current analysis. The analysis results in the opportunities (positive values) and risks (negative
values) shown in the following table:
INTEREST ANALYSIS
Changes in all yield curves as of
Sept. 30, 2017 by Sept. 30, 2018 by
million € + 100 basis points (20) basis points + 100 basis points (20) basis points
Cash flow risk 51 (10) 30 (6)
Opportunity effects 220 (45) 150 (31)
Interest rate risks resulting from interest rate derivatives affecting balance sheet (1) 0 0 0
Interest rate risks resulting from interest rate derivatives affecting earnings 0 0 0 0
If, as of September 30, 2018, all yield curves combined had been 100 basis points higher, the hedge reserve in equity and fair value of the
relevant interest derivatives would have been €0 million (prior year: €1 million) lower and earnings resulting from the measurement as of
the balance sheet date €30 million (prior year: €51 million) higher. If, as of September 30, 2018, all yield curves combined had been
20 basis points lower, the hedge reserve in equity and fair value of the relevant interest derivatives would have been unchanged and
earnings resulting from the measurement as of the balance sheet date €6 million (prior year: €10 million) lower.
Procurement risk (commodity price risk) – To minimize risks arising from commodity price volatilities, the Group also uses derivatives,
especially for ore, copper, nickel, zinc, aluminium and tin.
To minimize the risk of fluctuating freight prices, the Group uses among other things long-term fixed price contracts, of which one contract
was recognized as a commodity forward transaction measured at fair value.
Only hypothetical changes in market prices for derivatives are included in scenario analysis, required for financial instruments under
IFRS 7. Offsetting effects from underlying transactions are not taken into account and would reduce their effect significantly.
As of September 30, 2018 a +20%/(20)% shift in market prices for non-ferrous metals is assumed. If an increase of 20% in market prices
for said non-ferrous metals is assumed, the estimated hypothetical impact on profit or loss resulting from the measurement as of the
balance sheet date is €(26) million (prior year: €(6) million), and on equity €(1) million (prior year: €(1) million). If a decrease of 20% in
market prices for said non-ferrous metals is assumed, the estimated hypothetical impact on profit or loss resulting from the measurement
as of the balance sheet date is €13 million (prior year: €11 million), and on equity €(4) million (prior year: €12 million).

thyssenkrupp annual report 2017 / 2018
3 Consolidated financial statements | thyssenkrupp AG – Notes to the consolidated financial statements
203
22 Related parties Based on the notification received in accordance with German Securities Trade Act (WpHG) Art. 21 para. 1 as of December 3, 2013, the
Alfried Krupp von Bohlen und Halbach Foundation holds an interest of 23.03% in thyssenkrupp AG; based on a voluntary disclosure of the
Foundation as of October 2018, the interest in thyssenkrupp AG is around 21%. Outside the services and considerations provided for in the
by-laws (Article 21 of the Articles of Association of thyssenkrupp AG), there are no other significant delivery and service relations.
In 2016 / 2017 and 2017 / 2018 , the Group has business relations with non-consolidated subsidiaries, associates and joint ventures.
Transactions with these related parties result in general from the delivery and service relations in the ordinary course of business; the
extent of the business relations is presented in the following table:
RELATED PARTY TRANSACTIONS
Sales Supplies and services Receivables Total liabilities
million € Year ended
Sept. 30, 2017Year ended
Sept. 30, 2018Year ended
Sept. 30, 2017Year ended
Sept. 30, 2018 Sept. 30, 2017 Sept. 30, 2018 Sept. 30, 2017 Sept. 30, 2018
Non-consolidated subsidiaries 0 0 1 1 0 0 0 0
Associates 39 49 4 3 3 3 2 6
Joint ventures 17 28 3 2 3 8 0 0
Compensation of current Executive and Supervisory Board members
The Group’s key management personnel compensation which has to be disclosed in accordance with IAS 24 comprises of the
compensation of the current Executive and Supervisory Board members.
Compensation of the current Executive Board members is as follows:
COMPENSATION OF EXECUTIVE BOARD MEMBERS
Thousand € Year ended
Sept. 30, 2017Year ended
Sept. 30, 2018
Short-term benefits (excluding share-based compensation) 6,594 5,363
Post-employment benefits 1,497 1,210
Termination benefits 0 4,555
Share-based compensation 5,289 4,682
Total 13,380 15,810
Service cost and past service cost resulting from the pension obligations of the current members of the Executive Board are disclosed as
post-employment benefits. The disclosure of share-based compensation refers to the fair value at grant date.
As of September 30, 2017 and 2018, respectively, no loans or advance payments were granted to members of the Executive Board; also
as in the previous year no contingencies were assumed for the benefit of Executive Board members.

thyssenkrupp annual report 2017 / 2018
3 Consolidated financial statements | thyssenkrupp AG – Notes to the consolidated financial statements
204
Compensation of the current Supervisory Board members is as follows:
COMPENSATION OF SUPERVISORY BOARD MEMBERS
Thousand € Year ended
Sept. 30, 2017Year ended
Sept. 30, 2018
Short-term benefits (inclusive of meeting attendance fees) 1,628 1,675
In addition, members of the Supervisory Board of thyssenkrupp AG received compensation of €61 thousand in fiscal 2017 / 2018 (prior
year: €56 thousand) for supervisory board mandates at Group subsidiaries.
As of September 30, 2017 and 2018, respectively, no loans or advance payments were granted to members of the Supervisory Board;
also as in the previous year no contingencies were assumed for the benefit of Supervisory Board members.
For individualized presentation and further details of Executive and Supervisory Board compensation refer to the compensation report
presented in the “Corporate Governance” chapter that is part of the combined management report.
Compensation of former Executive and Supervisory Board members
Total compensation paid to former members of the Executive Board and their surviving dependants amounted to €19.0 million (prior year:
€14.5 million). Under IFRS an amount of €279.8 million (prior year: €270.1 million) is accrued for pension obligations benefiting former
Executive Board members and their surviving dependants.
23 Segment reporting thyssenkrupp is organized in the following operating business areas that represent the Group’s activities within capital goods and
materials. The business areas are in line with the internal organizational and reporting structure and represent the segments in accordance
with IFRS 8. The Steel Europe business area and in addition until the closing of the disposal at the beginning of September 2017, the Steel
Americas business area are classified as a discontinued operations.
Components Technology
This business area offers efficient and innovative components for the automotive, construction and engineering sectors as well as for wind
turbines.
Elevator Technology
This business area is active in the construction, modernization and servicing of elevators, escalators, moving walks, stair and platform lifts
as well as passenger boarding bridges. Alongside a full range of installations for the volume market, the business area also delivers
customized solutions.
Industrial Solutions
Industrial Solutions is a leading international supplier in special and large-scale plant construction as well as naval shipbuilding.
Materials Services
The business area is focused on the global distribution of materials and the provision of complex technical services for the production and
manufacturing sectors.

thyssenkrupp annual report 2017 / 2018
3 Consolidated financial statements | thyssenkrupp AG – Notes to the consolidated financial statements
205
Steel Europe (discontinued operation)
The business brings together the premium flat carbon steel activities, from intelligent materials solutions to finished parts.
Corporate
Corporate comprises the Group’s head office including the Regional Headquarters. Corporate also includes the Service Units which mainly
perform processes in accounting, IT and HR, and the Special Units, among other things for the management of the Group’s real estate.
Steel Americas (discontinued operation)
This business area mainly consisted of the steel mill in Brazil (CSA). It runs the production, processing and marketing of high-quality steel.
Consolidation
Consolidation essentially contains the elimination of intercompany profits in inventories and the reversal of intercompany interest income.
The accounting principles for the segments are the same as those described for the Group in the summary of significant accounting
principles. In accordance with the management approach which is applicable to segment reporting all figures presented are inclusive of
disposal groups and discontinued operations. Intersegment pricing is determined on an arm’s length basis.
thyssenkrupp’s key earnings performance indicator is EBIT (Earnings Before Interest and Taxes) and adjusted EBIT. EBIT is calculated
according to economic criteria and is independent from IFRS rules. It provides information on the profitability of a unit and contains all
elements of the income statement relating to operating performance. This also includes items of financial income/expense that can be
characterized as operational, including income and expense from investments where there is a long-term intention to hold the assets.
Adjusted EBIT is EBIT adjusted for special items, i.e. excluding disposal losses/gains from M&A, restructuring expenses, impairment
losses/impairment reversals and other non-operating expenses and income. It is more suitable than EBIT for comparing operating
performance over several periods.

thyssenkrupp annual report 2017 / 2018
3 Consolidated financial statements | thyssenkrupp AG – Notes to the consolidated financial statements
206
Capital employed is the key indicator for capital tied up in operating activities. It mainly comprises fixed assets, inventories and
receivables. Deducted from this are certain non-interest-bearing liability items such as trade accounts payable; cf. the following
reconciliation.
SEGMENT INFORMATION FOR THE YEAR ENDED SEPT. 30, 2017
million € Components
TechnologyElevator
TechnologyIndustrial Solutions
Materials Services2) Steel Europe1) Corporate2)
Steel Americas1) Consolidation Group
For the fiscal year year ended Sept. 30, 2017
Net sales 7,561 7,660 5,487 13,364 7,378 (2) 1,525 0 42,971
Internal sales within the Group 11 14 35 301 1,537 280 323 (2,502) 0
Total sales 7,571 7,674 5,522 13,665 8,915 278 1,848 (2,502) 42,971
Income from companies accounted for using the equity method 0 2 (20) 2 31 0 0 0 15
Aggregate investment in investees accounted for using the equity method 0 2 6 42 101 2 0 0 154
EBIT 297 736 (36) 220 493 (569) (444) (9) 687
Adjusted EBIT 377 922 111 312 547 (535) 186 (9) 1,910
Average capital employed 3,740 1,127 430 3,652 5,286 849 1,654 (9) 16,728
Depreciation and amortization expense 328 85 79 111 410 54 60 (5) 1,121
Impairment losses of intangible assets, property, plant and equipment inclusive of investment property 20 3 6 7 2 5 648 0 691
Reversals of impairment losses of intangible assets, property, plant and equipment inclusive of investment property 1 0 0 0 0 0 0 0 1
Significant non-cash items (141) (552) (257) (86) (145) (135) (1) 0 (1,316)
Capital expenditures (intangible assets, property, plant and equipment inclusive of investment property) 551 136 92 132 566 58 75 1 1,610
1) Discontinued operation 2) Includes discontinued steel operations

thyssenkrupp annual report 2017 / 2018
3 Consolidated financial statements | thyssenkrupp AG – Notes to the consolidated financial statements
207
1) Discontinued operation 2) Includes discontinued steel operations
SEGMENT INFORMATION FOR THE YEAR ENDED SEPT. 30, 2018
million € Components
TechnologyElevator
TechnologyIndustrial Solutions
Materials Services2) Steel Europe1) Corporate2)
Steel Americas1) Consolidation Group
For the fiscal year year ended Sept. 30, 2018
Net sales 7,870 7,551 5,005 14,374 7,896 51 — 0 42,745
Internal sales within the Group 5 3 15 278 1,575 278 — (2,156) 0
Total sales 7,875 7,554 5,020 14,652 9,470 329 — (2,156) 42,745
Income from companies accounted for using the equity method 0 2 0 (3) 16 0 — 0 15
Aggregate investment in investees accounted for using the equity method 0 2 6 39 84 0 — 0 132
EBIT 120 775 (243) 270 471 (466) — 117 1,045
Adjusted EBIT 197 866 (255) 317 687 (377) — 117 1,551
Average capital employed 3,897 1,143 762 3,623 5,545 831 — (28) 15,773
Depreciation and amortization expense 332 88 89 107 423 60 — (112) 985
Impairment losses of intangible assets, property, plant and equipment inclusive of investment property 13 0 5 0 1 4 — 0 23
Reversals of impairment losses of intangible assets, property, plant and equipment inclusive of investment property 0 0 0 0 0 0 — 0 0
Significant non-cash items (279) (496) (163) (40) (297) (131) — 0 (1,405)
Capital expenditures (intangible assets, property, plant and equipment inclusive of investment property) 523 105 122 113 442 66 — 4 1,375

thyssenkrupp annual report 2017 / 2018
3 Consolidated financial statements | thyssenkrupp AG – Notes to the consolidated financial statements
208
The reconciliations of net sales and of the earnings figure EBIT to EBT according to the statement of income are presented below:
RECONCILIATION NET SALES
million € Year ended
Sept. 30, 2017Year ended
Sept. 30, 2018
Net sales as presented in segment reporting 42,971 42,745
– Net sales discontinued operation Steel Americas (1,525) —
– Net sales discontinued steel operations (7,454) (7,968)
Net sales as presented in the statement of income 33,993 34,777
RECONCILIATION EBIT TO EBT
million € Year ended
Sept. 30, 20171)
Year endedSept. 30, 2018
Adjusted EBIT as presented in segment reporting 1,910 1,551
Special items2) (1,224) (507)
EBIT as presented in segment reporting 687 1,045
+ Finance income 1,019 745
– Finance expense (1,619) (1,101)
– Items of finance income assigned to EBIT based on economic classification (52) (27)
+ Items of finance expense assigned to EBIT based on economic classification 26 6
EBT-Group 61 668
– EBT discontinued operation Steel Americas 705 —
– EBT discontinued steel operations (437) (505)
EBT from continuing operations as presented in the statement of income 329 163
1) Figures have been adjusted (cf. Note 03). 2) Refer to the explanation of the special items in the “Group review” as part of the „Report on the economic position“ of the Combined management report.

thyssenkrupp annual report 2017 / 2018
3 Consolidated financial statements | thyssenkrupp AG – Notes to the consolidated financial statements
209
Total assets in accordance with the consolidated statement of financial position can be reconciled to average capital employed as follows:
RECONCILIATION TOTAL ASSETS TO CAPITAL EMPLOYED
million € Sept. 30, 2017 Sept. 30, 2018
Total assets 35,048 33,868
Deferred tax assets (1,680) (1,116)
Current income tax assets (220) (249)
Cash and cash equivalents (5,292) (2,987)
Adjustments due to included assets classified as non-operating items (198) (214)
Liability items reducing capital employed:
Provisions for other non-current employee benefits (354) (182)
Other provisions, non-current (645) (295)
Other non-financial liabilities, non-current (5) (4)
Provisions for current employee benefits (357) (334)
Other provisions, current (1,183) (1,067)
Trade accounts payable (5,729) (5,266)
Other financial liabilities, current (842) (635)
Other non-financial liabilities, current (6,802) (6,626)
Adjustments due to included liabilities classified as non-operating items 522 392
Adjustments of assets/liabilities due to presentation of discontinued operations 0 (2,664)
Capital employed as of balance sheet date 12,261 12,622
Impact from adjusting average capital employed to capital employed as of balance sheet date 2,267 982
Average capital employed (5-points-average) 14,528 13,603
Correction factors with increasing impact on performance requirements for positive value added 2,200 2,170
Average capital employed as presented in segment reporting 16,728 15,773
In presenting information for geographical areas, allocation of sales is based on the location of the customer. Allocation of segment assets
and capital expenditures is based on the location of the assets. Capital expenditures are presented in line with the definition of the cash
flow statement.
There are no individual customers that generate sales values that are material to the Group’s consolidated net sales.
EXTERNAL SALES BY REGIONS1 )
million € Germany USA China Outside Germany Group
External sales (location of customer)
Year ended Sept. 30, 2017 12,006 7,755 2,891 20,319 42,971
Year ended Sept. 30, 2018 12,648 6,693 3,051 20,352 42,745
1) Inclusive of discontinued operations

thyssenkrupp annual report 2017 / 2018
3 Consolidated financial statements | thyssenkrupp AG – Notes to the consolidated financial statements
210
1) Inclusive of discontinued operations
Notes to the consolidated statement of income
24 Net sales Net sales include revenues resulting from the sale of goods of €21,901 million (prior year: €19,962 million), the rendering of services of
€4,531 million (prior year: €5,077 million) as well as sales from construction contracts of €7,946 million (prior year: €8,410 million).
25 Other income
OTHER INCOME
million € Year ended
Sept. 30, 20171)
Year endedSept. 30, 2018
Gains from premiums and from grants 7 14
Insurance compensation 16 8
Miscellaneous 222 173
Total 246 195
1) Figures have been adjusted (cf. Note 03).
In 2016 / 2017 miscellaneous other income contained a gain of €50 million from the remeasurement of the investment in Atlas Elektronik in
connection with the switch to full consolidation. Furthermore miscellaneous other income includes a multitude of minor single items
resulting from the 419 (prior year: 431) consolidated companies of the continuing operations.
26 Other expenses
OTHER EXPENSES
million € Year ended
Sept. 30, 20171)
Year endedSept. 30, 2018
Additions to/reversals of provisions (17) 24
Other taxes 20 17
Miscellaneous 119 95
Total 122 136
1) Figures have been adjusted (cf. Note 03).
NON-CURRENT ASSETS BY REGIONS1 )
million € Germany USA China Outside
Germany Group
Non-current assets (intangible assets, property, plant and equipment inclusive of investment property and other non-financial assets) (location of assets)
Sept. 30, 2017 6,963 1,355 859 3,447 12,625
Sept. 30, 2018 3,857 1,371 910 3,191 9,329

thyssenkrupp annual report 2017 / 2018
3 Consolidated financial statements | thyssenkrupp AG – Notes to the consolidated financial statements
211
Miscellaneous other expenses include a multitude of minor single items resulting from the 419 (prior year: 431) consolidated companies of
the continuing operations.
27 Other gains/(losses), net
OTHER GAINS/(LOSSES), NET
million € Year ended
Sept. 30, 20171)
Year endedSept. 30, 2018
Gain/(loss) on disposal of intangible assets, net (1) (1)
Gain/(loss) on disposal of property, plant and equipment, net 38 26
Gain/(loss) on disposal of investment property, net 1 2
Gain/(loss) on disposal of subsidiaries, net 5 2
Miscellaneous (1) 8
Total 42 36
1) Figures have been adjusted (cf. Note 03).
28 Financial income/(expense), net
FINANCIAL INCOME/(EXPENSE) , NET
million € Year ended
Sept. 30, 20171)
Year endedSept. 30, 2018
Income from companies accounted for using the equity method (16) (1)
Interest income from financial receivables 59 38
Income from investments 1 1
Other finance income 708 664
Finance income 768 703
Interest expense from financial debt (273) (209)
Net interest cost of pensions and similar obligations (62) (74)
Expense from investments 0 0
Other finance expenses (772) (727)
Finance expense (1,107) (1,010)
Total (355) (308)
1) Figures have been adjusted (cf. Note 03).
For the investments accounted for using the equity method of accounting cf. also Note 06.
The line item “other finance income” includes interest income from financial assets that are not measured at fair value through profit or
loss of €8 million (prior year: €8 million) and the line item “other finance expenses” include interest expense from financial liabilities that
are not measured at fair value through profit or loss of €27 million (prior year: €29 million).

thyssenkrupp annual report 2017 / 2018
3 Consolidated financial statements | thyssenkrupp AG – Notes to the consolidated financial statements
212
29 Income taxes Income tax expense/(benefit) consists of the following:
BREAKDOWN OF INCOME TAX EXPENSE/(BENEFIT)
million € Year ended
Sept. 30, 20171)
Year endedSept. 30, 2018
Current income tax expense/(benefit) 242 274
Deferred income tax expense/(benefit) 75 88
Total 317 362
1) Figures have been adjusted (cf. Note 03).
Tax expense was allocated to the continuing and discontinued operations depending on its economic nature. Accordingly tax expense was
allocated to the companies of the discontinued steel operations based on the earnings achieved by these companies.
The effects of the US tax reform legislation enacted in December 2017 have been taken into account. In particular the valuation of the
deferred tax items was adjusted by €114 million.
The components of income taxes recognized in total equity are as follows:
INCOME TAXES RECOGNIZED IN TOTAL EQUITY
million € Year ended
Sept. 30, 20171)
Year endedSept. 30, 2018
Income tax expense/(benefit) as presented on the statement of income 317 362
Income tax expense on discontinued operations 335 247
Income non-effective tax effect on other comprehensive income
Continuing operations 150 27
Discontinued operations 96 27
Total 898 663
1) Figures have been adjusted (cf. Note 03).
As of September 30, 2018, taxable temporary differences from undistributed profits of subsidiaries in the Group for which no deferred tax
liability is recognized, as such profits are not to be distributed in the foreseeable future, amount to €434 million (prior year: €397 million).

thyssenkrupp annual report 2017 / 2018
3 Consolidated financial statements | thyssenkrupp AG – Notes to the consolidated financial statements
213
Components of the deferred tax assets and liabilities are as follows:
INVENTORY OF DEFERRED TAX ASSETS AND LIABILITIES
Deferred tax assets Deferred tax liabilities
million € Sept. 30, 2017 Sept. 30, 2018 Sept. 30, 2017 Sept. 30, 2018
Deferred income taxes on non-current items
Intangible assets 66 48 546 396
Property, plant and equipment (inclusive of investment property) 108 106 466 179
Financial assets 81 65 18 12
Other assets 576 448 856 677
Accrued pension and similar obligations 1,130 676 6 3
Other provisions 136 56 43 23
Other liabilities 243 260 103 495
Deferred income taxes on current items
Inventories 395 398 151 57
Other assets 36 81 5 3
Other provisions 154 184 340 272
Other liabilities 899 940 568 437
Valuation allowance – temporary differences (29) (15)
Subtotal 3,795 3,247 3,102 2,554
Tax loss carried forward 1,475 1,094 — —
Interest carried forward 257 223 — —
Foreign tax credits 69 28 — —
Valuation allowance – tax loss carried forward etc. (925) (950)
Subtotal 876 395 0 0
Gross amount before offsetting 4,671 3,642 3,102 2,554
Offsetting (2,991) (2,526) (2,991) (2,526)
Balance sheet amount 1,680 1,116 111 28
As of September 30, 2018, tax losses carried forward for which no deferred tax asset is recognized amount to €3,403 million (prior year:
€3,749 million). According to tax legislation as of September 30, 2018, an amount of €3,244 million (prior year: €3,731 million) of these
tax losses may be carried forward indefinitely and in unlimited amounts whereas an amount of €159 million (prior year: €18 million) of
these tax losses carried forward will expire over the next 20 years if not utilized.
After being partly utilized in 2017 / 2018, the deferred tax assets on tax loss and interest carried forwards were completely impaired in
connection with the discontinued steel operations. In total, it resulted in a deferred income tax expense of €247 million. Deferred taxes on
balance sheet differences of €565 million were recognized because management expects that in the long run sufficient taxable income will
be available.
As of September 30, 2018, based on the existing tax losses carried forward, the following deferred tax assets are recognized among
others, because these are supported by substantial evidence for sufficient future taxable income: Rotek Incorporated €17 million (prior
year: €17 million) and thyssenkrupp Steering Changzhou Ltd. (China) €17 million (prior year: €14 million).

thyssenkrupp annual report 2017 / 2018
3 Consolidated financial statements | thyssenkrupp AG – Notes to the consolidated financial statements
214
The German corporate income tax law applicable for 2017 / 2018 sets a statutory income tax rate of 32.1% (prior year: 32.0%) taking into
account the different German municipal tax rates. Due to the discontinued steel operations and thus after some companies leaving the
German tax group, the applicable tax rate will decrease to 31.2%. The applicable tax rates for companies outside Germany range from
9.0% to 39.4% (prior rate: 10.0% to 39.0%).
TAX RATE RECONCILIATION
million € Year ended
Sept. 30, 20171) in % Year ended
Sept. 30, 2018 in %
Expected income tax expense/(benefit) 105 32.0 53 32.1
Tax rate differentials to the German combined income tax rate (10) (3.0) (30) (18.4)
Changes in tax rates or laws 1 0.3 84 51.5
Change in valuation allowance 232 70.5 153 93.9
Permanent items 56 17.2 72 44.2
Tax consequences of disposal of businesses (2) (0.7) (1) (0.6)
Income/(loss) from companies accounted for using the equity method 5 1.5 1 0.6
Non-creditable withholding taxes 53 16.2 44 27.0
Tax benefit related to prior periods (125) (38.1) (17) (10.4)
Others 2 0.6 3 1.9
Income tax expense/(benefit) as presented on the statement of income 317 96.4 362 222.1
1) Figures have been adjusted (cf. Note 03).
30 Earnings per share Basic earnings per share are calculated as follows:
EARNINGS PER SHARE
Year ended Sept. 30, 20171)
Year ended Sept. 30, 2018
Total amount
in million €Earnings per
share in € Total amount
in million €Earnings per
share in €
Income/(loss) from continuing operations (net of tax) (attributable to thyssenkrupp AG’s shareholders) (39) (0.07) (245) (0.39)
Income/(loss) from discontinued operations (net of tax) (attributable to thyssenkrupp AG’s shareholders) (610) (1.08) 254 0.41
Net income/(loss) (attributable to thyssenkrupp AG's shareholders) (649) (1.15) 8 0.01
Weighted average shares 566,252,357 622,531,741
1) Figures have been adjusted (cf. Note 03).
The weighted average number of shares increased as a result of the capital increase carried out at the end of September 2017
(cf. Note 12).
There were no dilutive securities in the periods presented.

thyssenkrupp annual report 2017 / 2018
3 Consolidated financial statements | thyssenkrupp AG – Notes to the consolidated financial statements
215
31 Additional disclosures on the consolidated statement of income Personnel expenses included in the consolidated statement of income are comprised of:
PERSONNEL EXPENSES
million € Year ended Sept. 30, 2017 Year ended Sept. 30, 2018
Wages and salaries 7,305 7,481
Social security taxes 1,284 1,283
Net periodic pension cost – defined benefit 1) 0 0
Net periodic pension costs – defined contribution 162 160
Other expenses for pensions and retirements 537 283
Related fringe benefits 417 402
Total 9,705 9,608
1) Excluding net interest that is recognized as part of financial expenses.
The annual average number of employees is as follows:
ANNUAL AVERAGE NUMBER OF EMPLOYEES
Year ended Sept. 30, 2017 Year ended Sept. 30, 2018
Components Technology 31,913 33,804
Elevator Technology 52,281 52,846
Industrial Solutions 20,553 21,647
Materials Services 19,784 20,108
Steel Europe 27,418 27,345
Corporate 3,715 4,016
Steel Americas 3,761 0
Total 159,424 159,766
Thereof:
Wage earners 83,718 83,183
Salary earners 72,050 72,706
Trainees 3,657 3,877
Auditors’ fees and services
For the services performed by the Group auditors PricewaterhouseCoopers GmbH Wirtschaftsprüfungsgesellschaft and the companies of
the worldwide PricewaterhouseCoopers association the following fees (including expenses) were recognized as expenses:
FEES OF GROUP AUDITOR
Year endedSept. 30, 2017 Year endedSept. 30, 2018
million € Total thereof Germany Total thereof Germany
Audit fees 16 8 16 9
Audit-related fees 0 0 2 1
Tax fees 0 0 0 0
Fees for other services 1 0 0 0
Total 17 8 18 10

thyssenkrupp annual report 2017 / 2018
3 Consolidated financial statements | thyssenkrupp AG – Notes to the consolidated financial statements
216
The audit fees include primarily fees for the year-end audit of the consolidated financial statements, the auditors’ review of the interim
consolidated financial statements and the statutory auditing of thyssenkrupp AG and the subsidiaries included in the consolidated financial
statements. The audit-related fees mainly cover audits in connection with the introduction of IT systems and other audit-related services.
The tax fees include in particular fees for the preparation of tax returns as well as for tax advice in connection with projects and Group-
internal reorganizations. The fees for other services are mainly fees for project-related consulting services.
Notes to the consolidated statement of cash flows
32 Additional information on the consolidated statement of cash flows The liquid funds considered in the consolidated statement of cash flows correspond to the “Cash and cash equivalents” line item in the
consolidated statement of financial position inclusive of cash and cash equivalents attributable to the discontinued operations. As of
September 30, 2018 cash and cash equivalents of €8 million (prior year: €52 million) result from the joint operation HKM.
Non-cash investing activities
In fiscal year 2017 / 2018 , the acquisition and first-time consolidation of companies created an increase in non-current assets of €8 million
(prior year: €458 million).
Changes of liabilities/assets from financing activities
The following table shows the changes of liabilities/assets from financing activities including the changes of cash flows and non-cash
items:
RECONCILIATION IN ACCORDANCE WITH IAS 7
Sept. 30, 2017
Cash flows from financing activities Non-cash changes Sept. 30, 2018
million €
Acquisitions/divestitures of
businessesCurrency
differencesFair value
changes Other changes
Bonds 6,269 (1,600) 0 0 0 10 4,678
Loan notes / other loans 520 (75) 0 0 0 0 445
Liabilities to financial institutions 290 (185) (4) (3) 0 0 98
Other financial liabilities 27 (14) 0 0 0 0 13
Subtotal financial debt 7,105 (1,874) (4) (3) 0 10 5,234
Assets/liabilities from other financing activities 201 (61) (23) 0 14 33 163
Total 7,306 (1,935) (27) (3) 14 42 5,397
Subsequent events
33 Subsequent events No reportable events occured.

thyssenkrupp annual report 2017 / 2018
3 Consolidated financial statements | thyssenkrupp AG – Notes to the consolidated financial statements
217
Other information
34 Declarations of conformity with the German Corporate Goverance Code in accordance with Art. 161 of the German Stock Corporation Act (AktG) The Executive Board and the Supervisory Board of thyssenkrupp AG issued the declaration of conformity in accordance with Art. 161 of the
Stock Corporation Act (AktG) and made it publicly available to the shareholders on the company’s website on September 30, 2018.
The declaration of conformity of our exchange-listed subsidiary Eisen- und Hüttenwerke AG was issued on October 1, 2018 and is now
publicly available to the shareholders on the company’s website.
35 Application of Art. 264 Par. 3 and Art. 264b of German Commercial Code (HGB) The following domestic subsidiaries in the legal form of a capital corporation or a commercial partnership as defined in Art. 264a partly
made use of the exemption clause included in Art. 264 Par. 3 and Art. 264b of German Commercial Code:
A
ATLAS ELEKTRONIK GmbH Bremen
AWG Industrieanlagen und Wassertechnik GmbH Berlin Berlin
B
Becker & Co. GmbH Neuwied
BERCO Deutschland GmbH Ennepetal
Blohm + Voss Shipyards & Services GmbH Hamburg
D
DWR – Deutsche Gesellschaft für Weißblechrecycling mbH Andernach
E
EH Güterverkehr GmbH Duisburg
ELEG Europäische Lift + Escalator GmbH Düsseldorf
G
German Marine Systems GmbH Hamburg
H
Hagenuk Marinekommunikation GmbH Flintbek
J
Jacob Bek GmbH Ulm
K
KBS Kokereibetriebsgesellschaft Schwelgern GmbH Duisburg
L
LiftEquip GmbH Elevator Components Neuhausen a.d.F.
M
Max Cochius GmbH Berlin
P
PSL Wälzlager GmbH Dietzenbach
R
Rasselstein Verwaltungs GmbH Neuwied
Reisebüro Dr. Tigges GmbH Essen
T
Tepper Aufzüge GmbH Münster
Thyssen Liegenschaften Verwaltungs- und Verwertungs GmbH & Co. KG Industrie Essen
Thyssen Liegenschaften Verwaltungs- und Verwertungs GmbH & Co. KG Stahl Essen
Thyssen Stahl GmbH Düsseldorf
thyssenkrupp Academy GmbH Düsseldorf
thyssenkrupp Access Solutions GmbH Essen
thyssenkrupp Aerospace Germany GmbH Rodgau
thyssenkrupp Aufzüge GmbH Neuhausen a.d.F.
thyssenkrupp Aufzugswerke GmbH Neuhausen a.d.F.
thyssenkrupp Automotive Systems GmbH Essen
thyssenkrupp Bilstein GmbH Ennepetal
thyssenkrupp Business Services GmbH Essen
thyssenkrupp Components Tech GmbH Essen
thyssenkrupp DeliCate GmbH Düsseldorf
thyssenkrupp Edelstahl-Service-Center GmbH Willich
thyssenkrupp Electrical Steel GmbH Gelsenkirchen
thyssenkrupp Electrical Steel Verwaltungsgesellschaft mbH Gelsenkirchen
thyssenkrupp Elevator Europe Africa GmbH Essen
thyssenkrupp Elevator Europe Africa Services GmbH Essen
thyssenkrupp Elevator AG Düsseldorf
thyssenkrupp Elevator Innovation GmbH Essen
thyssenkrupp Facilities Services GmbH Essen
thyssenkrupp Fahrtreppen GmbH Hamburg
thyssenkrupp Federn GmbH Hagen
thyssenkrupp Federn und Stabilisatoren GmbH Hagen
thyssenkrupp Fertilizer Technology GmbH Dortmund
thyssenkrupp Gerlach GmbH Homburg/Saar
thyssenkrupp GfT Gleistechnik GmbH Essen
thyssenkrupp Group Services Ruhr GmbH Bochum
thyssenkrupp Grundbesitz Verwaltungs GmbH Essen

thyssenkrupp annual report 2017 / 2018
3 Consolidated financial statements | thyssenkrupp AG – Notes to the consolidated financial statements
218
The following Dutch subsidiaries made use of the exemption clause
included in Art. 2:403 of the Civil Code of the Netherlands:
T
thyssenkrupp Liften B.V. Krimpen an den Ijssel
thyssenkrupp Materials Nederland B.V. Amsterdam
thyssenkrupp Nederland Holding B.V. Roermond
thyssenkrupp Participations B.V. Veghel
36 List of the Group’s subsidiaries and equity investments A complete listing of the Group’s subsidiaries and equity interests is published in the German Federal Gazette and is available on the
thyssenkrupp website at www.thyssenkrupp.com.
thyssenkrupp Hohenlimburg GmbH Hagen
thyssenkrupp Immobilien Verwaltungs GmbH & Co. KG Stahl Essen
thyssenkrupp Industrial Solutions AG Essen
thyssenkrupp Infrastructure GmbH Essen
thyssenkrupp Intellectual Property GmbH Essen
thyssenkrupp Management Consulting GmbH Düsseldorf
thyssenkrupp Marine Systems GmbH Kiel
thyssenkrupp Materials Processing Europe GmbH Krefeld
thyssenkrupp Materials Services GmbH Essen
thyssenkrupp Materials Trading EMEA GmbH Essen
thyssenkrupp Plastics GmbH Essen
thyssenkrupp Presta Chemnitz GmbH Chemnitz
thyssenkrupp Presta Ilsenburg GmbH Ilsenburg
thyssenkrupp Presta Mülheim GmbH Mülheim
thyssenkrupp Presta Schönebeck GmbH Schönebeck
thyssenkrupp Rasselstein GmbH Andernach
thyssenkrupp Raw Materials GmbH Essen
thyssenkrupp Regional Services Germany GmbH Essen
thyssenkrupp Rothe Erde GmbH Dortmund
thyssenkrupp Schulte GmbH Essen
thyssenkrupp Senior Experts GmbH Essen
thyssenkrupp Stainless GmbH Essen
thyssenkrupp Steel Europe AG Duisburg
thyssenkrupp System Engineering GmbH Essen
thyssenkrupp Technologies Beteiligungen GmbH Essen
thyssenkrupp Transrapid GmbH Kassel
thyssenkrupp Uhde Engineering Services GmbH Haltern am See
thyssenkrupp Valvetrain GmbH Ilsenburg
thyssenkrupp Vermietungs GmbH Duisburg
U
Uhde High Pressure Technologies GmbH Hagen
Uhde Inventa-Fischer GmbH Berlin
Uhde Services and Consulting GmbH Dortmund
V
Vermögensverwaltungsgesellschaft TAUS mbH Grünwald

thyssenkrupp Geschäftsbericht 2017 / 2018
3 Consolidated financial statements | Independent Auditors’ Report
219
Independent Auditors’ Report
To thyssenkrupp AG, Duisburg and Essen
Report on the audit of the Consolidated Financial Statements and the Group Management Report Audit Opinions We have audited the consolidated financial statements of thyssenkrupp AG, Duisburg and Essen, and its subsidiaries (the Group), which
comprise the consolidated statement of financial position as at September 30, 2018 and the consolidated statement of income, the
consolidated statement of comprehensive income, the consolidated statement of changes in equity and the consolidated statement of cash
flows for the fiscal year from October 1, 2017 to September 30, 2018 and notes to the consolidated financial statements, including a
summary of significant accounting policies. In addition, we have audited the group management report of thyssenkrupp AG, which is
combined with the Company’s management report, including the non-financial statement pursuant to § [Article] 289b Abs. [paragraph] 1
HGB [Handelsgesetzbuch: German Commercial Code] and § 315b Abs. 1 HGB for the fiscal year from October 1, 2017 to September 30,
2018. We have not audited the content of the statement on corporate governance pursuant to § 289f HGB and § 315d HGB in accordance
with the German legal requirements.
,In our opinion, on the basis of the knowledge obtained in the audit,
■ the accompanying consolidated financial statements comply, in all material respects, with the IFRSs as adopted by the EU, and the
additional requirements of German commercial law pursuant to § Article 315e Abs.1 HGB and, in compliance with these requirements,
give a true and fair view of the assets, liabilities, and financial position of the Group as at September 30, 2018, and of its financial
performance for the fiscal year from October 1, 2017 to September 30, 2018, and ■ the accompanying group management report as a whole provides an appropriate view of the Group’s position. In all material respects,
this group management report is consistent with the consolidated financial statements, complies with German legal requirements and
appropriately presents the opportunities and risks of future development. Our audit opinion on the group management report does not
cover the content of the statement on corporate governance referred to above.
Pursuant to § 322 Abs. 3 Satz [sentence] 1 HGB, we declare that our audit has not led to any reservations relating to the legal compliance
of the consolidated financial statements and of the group management report.
Basis for Audit Options We conducted our audit of the consolidated financial statements and of the group management report in accordance with § 317 HGB and
the EU Audit Regulation (No. 537 / 2014, referred to subsequently as “EU Audit Regulation”) and in compliance with German Generally
Accepted Standards for Financial Statement Audits promulgated by the Institut der Wirtschaftsprüfer [Institute of Public Auditors in
Germany] (IDW). We performed the audit of the consolidated financial statements in supplementary compliance with the International
Standards on Auditing (ISAs). Our responsibilities under those requirements, principles and standards are further described in the
“Auditor’s Responsibilities for the Audit of the Consolidated Financial Statements and of the Group Management Report” section of our
auditor’s report. We are independent of the group entities in accordance with the requirements of European law and German commercial
and professional law, and we have fulfilled our other German professional responsibilities in accordance with these requirements. In
addition, in accordance with Article 10 (2) point (f) of the EU Audit Regulation, we declare that we have not provided non-audit services
prohibited under Article 5 (1) of the EU Audit Regulation. We believe that the audit evidence we have obtained is sufficient and appropriate
to provide a basis for our audit opinions on the consolidated financial statements and on the group management report.

thyssenkrupp Geschäftsbericht 2017 / 2018
3 Consolidated financial statements | Independent Auditors’ Report
220
Key Audit Matters in the Audit of the Consolidated Financial Statements
Key audit matters are those matters that, in our professional judgment, were of most significance in our audit of the consolidated financial
statements for the fiscal year from October 1, 2017 to September 30, 2018. These matters were addressed in the context of our audit of
the consolidated financial statements as a whole, and in forming our audit opinion thereon; we do not provide a separate audit opinion on
these matters.
In our view, the matters of most significance in our audit were as follows:
①Planned contribution of steel activities into a joint venture with TATA Steel
②Recoverability of goodwill
③Presentation of deferred tax assets
Our presentation of these key audit matters has been structured in each case as follows:
①Matter and issue ②Audit approach and findings ③Reference to further information
Hereinafter we present the key audit matters:
①Recoverability of goodwill planned contribution of steel activities into a joint venture with TATA Steel
①As part of the strategic development, the thyssenkrupp Group signed an agreement with TATA Steel Limited, Mumbai, India (hereinafter
"TATA Steel") on June 30, 2018 concerning the contribution of its European steel activities into the joint venture thyssenkrupp TATA
Steel (hereinafter "tk TS"). The European steel activities of the thyssenkrupp Group include in particular the Steel Europe Business Area
as well as the majority shareholding in ThyssenKrupp MillServices & Systems GmbH, Duisburg, and individual companies from the
Corporate division (hereinafter "European steel activities"). Based on the contractual arrangements, tk TS is managed jointly by the
thyssenkrupp Group and TATA Steel and is therefore classified as a joint venture in accordance with IFRS 11. Since the thyssenkrupp
Group will lose control over the European steel activities following the planned contribution of these activities into tk TS, the European
steel activities have been classified as at June 30, 2018as a disposal group within the thyssenkrupp Group in accordance with IFRS 5
and as a discontinued operation. The impairment test conducted at that time did not indicate any signs of impairment. Since not all
necessary approvals for the completion of the agreement have been granted, yet the closing of the transaction is still considered highly
probable, the European steel activities are presented and measured as a disposal group and discontinued operation also as at
September 30, 2018. In our view, this matter was of particular importance for our audit due to the complexity and the material effects
on the Group's assets, liabilities, financial position and financial performance.
②As part of our audit, we first obtained an understanding of the underlying provisions of the sale agreement and assessed the proper
accounting treatment of the planned contribution of the European steel activities into a joint venture on the basis, among other things,
of the principles of company law. In this context, we also assessed and evaluated whether the requirements for recognition as a
disposal group in accordance with IFRS 5 have been met, the resulting effects on the measurement of assets and liabilities and the
requirements for classification as a discontinued operation. We were able to satisfy ourselves that the presentation of the European
steel activities as a disposal group in accordance with IFRS 5 in connection with the planned contribution of the European steel
activities into a joint venture with TATA Steel was sufficiently documented and justified.

thyssenkrupp Geschäftsbericht 2017 / 2018
3 Consolidated financial statements | Independent Auditors’ Report
221
③The Company's disclosures relating to the disposal of the interest in the European steel activities are contained in section 03 of the
notes to the consolidated financial statements.
②Recoverability of goodwill
① In the consolidated financial statements of thyssenkrupp AG, goodwill amounting to €3,482 million (106.4% of Group equity) is
reported under the balance sheet item “Intangible assets” of the statement of financial position. The Company allocates the goodwill
to the relevant groups of cash-generating units in each of the respective business areas. Goodwill is subject to an impairment test at
least once annually as of the balance sheet date and if there are indications of impairment to determine any possible need for write-
downs. During the impairment test, the value in use determined for the respective group of cash-generating units is generally
compared against the carrying amounts reported for that group of cash-generating units. The discounted cash flow method is used to
determine the values in use for the respective group of cash-generating units on the basis of the thyssenkrupp Group's medium-term
planning adopted by the executive directors. The discount rate used is the weighted average cost of capital for the relevant group of
cash-generating units. The result of this measurement depends to a large extent on the executive directors’ assessment of future cash
flows of the respective group of cash-generating units and the discount rate used, and is therefore subject to considerable uncertainty.
Against this background and due to the underlying complexity of the measurement models, this matter was of particular importance
for our audit. ②As part of our audit, we evaluated, among other things, the method used for performing impairment tests and assessed the calculation
of the weighted average cost of capital. In addition, we assessed the appropriateness of the future cash flows used in the
measurement, specifically by reconciling this information to the medium-term planning and by comparing selected planning
assumptions with general and sector-specific market expectations. In the knowledge that even relatively small changes in the discount
rate applied can have a material impact on the value in use calculated in this way, we also focused our testing in particular on the
parameters used to determine the discount rate applied, and evaluated the measurement model. In addition, we carried out a detailed
examination of the measurement model and the planning for selected groups of cash-generating units as of the balance sheet date.
The selection was based on qualitative criteria and the amount by which the value in use exceeded the respective carrying amount. In
this connection, among other things, we analyzed on the basis of further evidence the consistency of planning assumptions and the
viability of planned measures to increase future cash flows, and discussed this in detail with the management. We assessed the
feasibility of the material measures which have an impact on value against the backdrop of, among other things, the business concept
to date as well as current and expected market conditions. In addition, we conducted our own sensitivity analyses. We have found that
as of the balance sheet date the discounted future cash flows were sufficient to cover the respective goodwill and, in general, the
carrying amounts of the relevant groups of cash-generating units.
③The Company’s disclosures on goodwill and goodwill impairment are contained in section 04 of the notes to the consolidated financial
statements.
③Presentation of deferred tax assets
① After set-offs and impairments, a total of €1,116 million in deferred tax assets (34.1% of Group equity) and €28 million in deferred tax
liabilities (0.9% of Group equity) are reported in the consolidated financial statements of thyssenkrupp AG. Deferred tax assets were
recognized to the extent that the executive directors consider it probable that taxable profit will be available in the foreseeable future
through which deductible temporary differences, unused tax losses and interest carryforwards can be utilized. For this purpose, if
insufficient deferred tax liabilities are available, future taxable profits are projected on the basis of the adopted business plan.
Deferred taxes are calculated using future tax rates, to the extent they have already been enacted or substantively enacted. Of the
€4,607 million in the thyssenkrupp Group's total deferred tax assets before impairments and set-offs, €1,094 million was attributable
to loss carryforwards and €223 million was attributable to interest carryforwards. €950 million of these deferred tax assets for loss
carryforwards and interest carryforwards were adjusted, because it was not expected that sufficient taxable profit would be available

thyssenkrupp Geschäftsbericht 2017 / 2018
3 Consolidated financial statements | Independent Auditors’ Report
222
to the relevant legal unit of the thyssenkrupp Group. In addition, due to a change in tax law in the United States of America, the
carrying amount of deferred tax assets was adjusted by €114 million. In our view, this matter was of particular importance for our
audit given the amounts involved and their dependence on the executive directors’ estimates and assumptions.
②As part of our audit, we assessed, among other things, the processes and controls implemented for recording tax matters and the
appropriateness of the accounting treatment. In instances where sufficient deferred tax liabilities were not available, we have assessed
the recoverability of deferred tax assets in relation to loss carryforwards and temporary differences between the IFRS and tax accounts,
on the basis the tax projections for the thyssenkrupp Group prepared by the executive directors, and have evaluated the
appropriateness of the underlying budget assumptions. When assessing the changes to tax law in the United States of America, we
replicated the underlying measurement. On the basis of our audit procedures, we were able to follow the executive directors’ estimates
and assumptions relating to the recognition and measurement of deferred taxes and to satisfy ourselves as of the appropriateness of
those estimates and assumptions.
③The Company’s disclosures relating to deferred taxes are contained in section 29 of the notes to the consolidated financial statements.
Other Information
The executive directors are responsible for the other information. The other information comprises the statement on corporate governance
pursuant to § 289f HGB and § 315d HGB.
The other information comprises further the remaining parts of the annual report, – excluding cross-references to external information –
with the exception of the audited consolidated financial statements, the audited group management report and our auditor’s report.
Our audit opinions on the consolidated financial statements and on the group management report do not cover the other information, and
consequently we do not express an audit opinion or any other form of assurance conclusion thereon.
In connection with our audit, our responsibility is to read the other information and, in doing so, to consider whether the other information
■ is materially inconsistent with the consolidated financial statements, with the group management report or our knowledge obtained in
the audit; or ■ otherwise appears to be materially misstated.
If, based on the work we have performed, we conclude that there is a material misstatement of this other information, we are required to
report that fact. We have nothing to report in this regard.
Responsibilities of Executive Directors and the Supervisory Board for the Consolidated Financial Statements and the Group
Management Report
The executive directors are responsible for the preparation of the consolidated financial statements that comply, in all material respects,
with IFRSs as adopted by the EU and the additional requirements of German commercial law pursuant to § 315e Abs. 1 HGB and that the
consolidated financial statements, in compliance with these requirements, give a true and fair view of the assets, liabilities, financial
position, and financial performance of the Group. In addition the executive directors are responsible for such internal control as they have
determined necessary to enable the preparation of consolidated financial statements that are free from material misstatement, whether
due to fraud or error.

thyssenkrupp Geschäftsbericht 2017 / 2018
3 Consolidated financial statements | Independent Auditors’ Report
223
In preparing the consolidated financial statements, the executive directors are responsible for assessing the Group’s ability to continue as a
going concern. They also have the responsibility for disclosing, as applicable, matters related to going concern. In addition, they are
responsible for financial reporting based on the going concern basis of accounting unless there is an intention to liquidate the Group or to
cease operations, or there is no realistic alternative but to do so.
Furthermore, the executive directors are responsible for the preparation of the group management report that, as a whole, provides an
appropriate view of the Group’s position and is, in all material respects, consistent with the consolidated financial statements, complies
with German legal requirements, and appropriately presents the opportunities and risks of future development. In addition, the executive
directors are responsible for such arrangements and measures (systems) as they have considered necessary to enable the preparation of a
group management report that is in accordance with the applicable German legal requirements, and to be able to provide sufficient
appropriate evidence for the assertions in the group management report.
The supervisory board is responsible for overseeing the Group’s financial reporting process for the preparation of the consolidated financial
statements and the group management report.
Auditor’s Responsibilities for the Audit of the Consolidated Financial Statements and the Group Management Report
Our objectives are to obtain reasonable assurance about whether the consolidated financial statements as a whole are free from material
misstatement, whether due to fraud or error, and whether the group management report as a whole provides an appropriate view of the
Group’s position and, in all material respects, is consistent with the consolidated financial statements and the knowledge obtained in the
audit, complies with the German legal requirements and appropriately presents the opportunities and risks of future development, as well
as to issue an auditor’s report that includes our audit opinions on the consolidated financial statements and on the group management
report.
Reasonable assurance is a high level of assurance, but is not a guarantee that an audit conducted in accordance with § 317 HGB and the
EU Audit Regulation and in compliance with German Generally Accepted Standards for Financial Statement Audits promulgated by the
Institut der Wirtschaftsprüfer (IDW) and supplementary compliance with the ISAs will always detect a material misstatement.
Misstatements can arise from fraud or error and are considered material if, individually or in the aggregate, they could reasonably be
expected to influence the economic decisions of users taken on the basis of these consolidated financial statements and this group
management report.
We exercise professional judgment and maintain professional skepticism throughout the audit. We also:
■ Identify and assess the risks of material misstatement of the consolidated financial statements and of the group management report,
whether due to fraud or error, design and perform audit procedures responsive to those risks, and obtain audit evidence that is sufficient
and appropriate to provide a basis for our audit opinions. The risk of not detecting a material misstatement resulting from fraud is higher
than for one resulting from error, as fraud may involve collusion, forgery, intentional omissions, misrepresentations, or the override of
internal control. ■ Obtain an understanding of internal control relevant to the audit of the consolidated financial statements and of arrangements and
measures (systems) relevant to the audit of the group management report in order to design audit procedures that are appropriate in the
circumstances, but not for the purpose of expressing an audit opinion on the effectiveness of these systems. ■ Evaluate the appropriateness of accounting policies used by the executive directors and the reasonableness of estimates made by the
executive directors and related disclosures. ■ Conclude on the appropriateness of the executive directors’ use of the going concern basis of accounting and, based on the audit
evidence obtained, whether a material uncertainty exists related to events or conditions that may cast significant doubt on the Group’s
ability to continue as a going concern. If we conclude that a material uncertainty exists, we are required to draw attention in the auditor’s
report to the related disclosures in the consolidated financial statements and in the group management report or, if such disclosures are
inadequate, to modify our respective audit opinions. Our conclusions are based on the audit evidence obtained up to the date of our
auditor’s report. However, future events or conditions may cause the Group to cease to be able to continue as a going concern.

thyssenkrupp Geschäftsbericht 2017 / 2018
3 Consolidated financial statements | Independent Auditors’ Report
224
■ Evaluate the overall presentation, structure and content of the consolidated financial statements, including the disclosures, and whether
the consolidated financial statements present the underlying transactions and events in a manner that the consolidated financial
statements give a true and fair view of the assets, liabilities, financial position and financial performance of the Group in compliance with
IFRSs as adopted by the EU and the additional requirements of German commercial law pursuant to § 315e Abs. 1 HGB. ■ Obtain sufficient appropriate audit evidence regarding the financial information of the entities or business activities within the Group to
express audit opinions on the consolidated financial statements and on the group management report. We are responsible for the
direction, supervision and performance of the group audit. We remain solely responsible for our audit opinions. ■ Evaluate the consistency of the group management report with the consolidated financial statements, its conformity with German law,
and the view of the Group’s position it provides. ■ Perform audit procedures on the prospective information presented by the executive directors in the group management report. On the
basis of sufficient appropriate audit evidence we evaluate, in particular, the significant assumptions used by the executive directors as a
basis for the prospective information, and evaluate the proper derivation of the prospective information from these assumptions. We do
not express a separate audit opinion on the prospective information and on the assumptions used as a basis. There is a substantial
unavoidable risk that future events will differ materially from the prospective information.
We communicate with those charged with governance regarding, among other matters, the planned scope and timing of the audit and
significant audit findings, including any significant deficiencies in internal control that we identify during our audit.
We also provide those charged with governance with a statement that we have complied with the relevant independence requirements, and
communicate with them all relationships and other matters that may reasonably be thought to bear on our independence, and where
applicable, the related safeguards.
From the matters communicated with those charged with governance, we determine those matters that were of most significance in the
audit of the consolidated financial statements of the current period and are therefore the key audit matters. We describe these matters in
our auditor’s report unless law or regulation precludes public disclosure about the matter.

thyssenkrupp Geschäftsbericht 2017 / 2018
3 Consolidated financial statements | Independent Auditors’ Report
225
Other legal and regulatory requirements Further information pursuant to Article 10 of the EU Audit Regulation
We were elected as group auditor by the annual general meeting on January 19, 2018. We were engaged by the supervisory board on
February 15, 2018. We have been the group auditor of the thyssenkrupp AG, Duisburg and Essen, without interruption since the fiscal year
2012 / 2013 .
We declare that the audit opinions expressed in this auditor’s report are consistent with the additional report to the audit committee
pursuant to Article 11 of the EU Audit Regulation (long-form audit report).
German Public Auditor responsible for the engagement The German Public Auditor responsible for the engagement is Michael Preiß.
Essen, November 19, 2018
PricewaterhouseCoopers GmbH
Wirtschaftsprüfungsgesellschaft
Harald Kayser Michael Preiß
Wirtschaftsprüfer Wirtschaftsprüfer
(German Public Auditor) (German Public Auditor)

thyssenkrupp Geschäftsbericht 2017 / 2018
3 Consolidated financial statements | Responsibility statement
226
Responsibility statement
To the best of our knowledge, and in accordance with the applicable reporting principles, the consolidated financial statements give a true
and fair view of the assets, liabilities, financial position and profit and loss of the Group, and the combined management report includes a
fair review of the development and performance of the business and the position of the Group, together with a description of the principal
opportunities and risks associated with the expected development of the Group.
Essen, November 16, 2018
thyssenkrupp AG
The Executive Board
Kerkhoff
Burkhard Kaufmann

Addi t ional in format ion
228
230
231
234
236
Multi-year overview
Executive Board
Supervisory Board
Glossary
Contact and 2019 / 2020 financial calendar

thyssenkrupp annual report 2017 / 2018
4 Additional information | Multi-year overview
228
Multi-year overview
THYSSENKRUPP GROUP
Full Group Continuing operations
2017 / 2018 vs. 2016 / 2017
2017 / 2018 vs. 2016 / 2017
2013 / 2014 2014 / 2015 2015 / 2016 2016 / 2017 2017 / 2018 Change in % 2016 / 2017 2017 / 2018 Change in %
Results of operations
Net sales million € 41,212 42,778 39,263 42,971 42,745 (226) (1) 33,993 34,777 785 2
Gross profit million € 6,205 6,874 6,625 6,210 6,698 488 8 5,449 4,930 (519) (10)
EBIT million € 1,145 1,050 1,189 687 1,045 358 52 658 464 (194) (29)
EBT million € 429 485 652 61 668 607 ++ 329 163 (165) (50)
Net income/(loss) million € 195 268 261 (591) 60 650 ++
Earnings per share (EPS) € 0.38 0.55 0.52 (1.15) 0.01 1.2 ++ (0.07) (0.39) (0.3) --
Gross margin % 15.1 16.1 16.9 14.5 15.7 1.2 8 16.0 14.2 (1.9) (12)
EBIT margin % 2.8 2.5 3.0 1.6 2.4 0.8 53 1.9 1.3 (0.6) (31)
EBT margin % 1.0 1.1 1.7 0.1 1.6 1.4 ++ 1.0 0.5 (0.5) (51)
Return on equity (before taxes) % 13.4 14.7 25.0 1.8 20.4 19 ++
Personnel expense per employee € 53,351 54,436 57,476 60,876 60,140 (736) (1)
Sales per employee € 257,069 272,805 252,356 269,541 267,546 (1,994) (1)
Assets/ liabilities situation
Non-current assets million € 15,992 16,220 16,604 14,502 14,344 (158) (1)
Current assets million € 20,438 19,474 18,468 20,546 19,524 (1,022) (5)
Total assets million € 36,430 35,694 35,072 35,048 33,868 (1,180) (3)
Total equity million € 3,199 3,307 2,609 3,404 3,274 (130) (4)
Liabilities million € 33,231 32,387 32,463 31,643 30,593 (1,050) (3)
Accrued pension and similar obligations million € 7,122 7,654 8,754 7,924 7,838 (86) (1)
Financial debt non-current million € 6,651 6,385 6,157 5,326 5,191 (135) (3)
Financial debt current million € 1,071 1,570 1,455 1,930 185 (1,744) (90)
Financial debt non-current/ current million € 7,722 7,955 7,611 7,255 5,377 (1,879) (26)
Trade accounts payable million € 4,945 4,985 5,119 5,729 6,476 747 13
Equity ratio % 8.8 9.3 7.4 9.7 9.7 0.0 0
Gearing % 114.9 103.2 134.2 57.5 72.2 14.7 26
Inventory turnover days 65.8 58.4 58.1 58.3 62.4 4.1 7
Average collection period days 50.4 42.7 45.9 48.0 53.6 5.5 12

thyssenkrupp annual report 2017 / 2018
4 Additional information | Multi-year overview
229
THYSSENKRUPP GROUP
Full Group Continuing operations
2017 / 2018 vs. 2016 / 2017
2017 / 2018 vs. 2016 / 2017
2013 / 2014 2014 / 2015 2015 / 2016 2016 / 2017 2017 / 2018 Change in % 2016 / 2017 2017 / 2018 Change in %
Value management
Capital employed (average) million € 15,853 16,106 15,933 16,728 15,773 (955) (6)
ROCE % 7.2 6.5 7.5 4.1 6.6 3 61
Weighted average cost of capital (WACC) % 9.0 9.0 8.0 8.0 8.0 0 0
Cash flow/ financing situation
Operating cash flows million € 903 1,300 1,387 610 1,184 575 94 27 185 157 ++
Cash flow for investments million € (1,260) (1,235) (1,387) (1,666) (1,386) 280 17 (959) (935) 24 2
Free cash flow before divestments million € (357) 65 — — — — — — — — —
Free cash flow before M & A 1) — 115 198 (798) (134) 665 83 (763) (678) 84 11
Cash flow from divestments million € 1,054 597 191 1,545 87 (1,458) (94) 1,511 66 (1,445) (96)
Free cash flow million € 697 662 191 489 (115) (603) -- 579 (684) (1,264) --
Cash flows from financing activities million € (558) (78) (658) 784 (2,114) (2,899) -- 858 (1,501) (2,360) --
Cash and cash equivalents million € 4,045 4,541 4,111 5,298 3,012 (2,286) (43)
Net financial debt million € 3,677 3,414 3,500 1,957 2,364 407 21
Internal financing capability 4.4 2.0 1.2 5.0 0.9 (4.1) (82)
Debt to cash flow ratio 4.1 2.6 2.5 3.2 2.0 (1.2) (38)
thyssenkrupp AG
Net income/(loss) million € 1,535 (122) 161 59 1,579 1,520 ++
Dividend per share € 0.11 0.15 0.15 0.15 0.151) — —
Dividend payout million € 62 85 85 93 931) — —
1) Proposal to the Annual General Meeting

thyssenkrupp annual report 2017 / 2018
4 Additional information | Executive Board
230
Executive Board
Guido Kerkhoff
Chairman (since July 13, 2018)
Appointed until September 2023 // German
Within the Group: ■ thyssenkrupp Elevator AG (Chair) ■ thyssenkrupp Materials Services GmbH (Chair) ■ thyssenkrupp Steel Europe AG (Chair)
▫ thyssenkrupp (China) Ltd./PR China (Chair)
Oliver Burkhard
Appointed until September 2023 // German
▫ PEAG Holding GmbH (Chair)
Within the Group: ■ thyssenkrupp Elevator AG ■ thyssenkrupp Industrial Solutions AG (Chair) ■ thyssenkrupp Materials Services GmbH ■ thyssenkrupp Steel Europe AG
Dr. Donatus Kaufmann
Appointed until January 2022 // Swiss
Within the Group: ■ thyssenkrupp Industrial Solutions AG
▫ thyssenkrupp North America, Inc./USA (Chair)
At the close of July 6, 2018
Dr. Heinrich Hiesinger
German
left the Executive Board. At the time of his
departure he held the following directorships:
● BMW AG
Within the Group: ■ thyssenkrupp Elevator AG (Chair) ■ thyssenkrupp Steel Europe AG (Chair)
▫ thyssenkrupp (China) Ltd./PR China (Chair)
■ Membership of supervisory boards within the meaning of § 125 of the German Stock Corporation Act (AktG) (as of September 30, 2018)
▫ Membership of comparable German and non-German control bodies of business enterprises within the meaning of § 125 of the German Stock Corporation Act
(AktG) (as of September 30, 2018)
● / ○ Company listed on the stock exchange

thyssenkrupp annual report 2017 / 2018
4 Additional information | Supervisory Board
231
Supervisory Board
Prof. Dr. Bernhard Pellens, Bochum
Chairman (since September 30, 2018) // Professor of Business Stud-
ies and International Accounting, Ruhr University Bochum
Appointed until 2020 // German
■ LVM Landwirtschaftlicher Versicherungsverein Münster aG ■ LVM Krankenversicherungs-AG
Markus Grolms, Frankfurt/Main
Vice Chairman // Trade union secretary at IG Metall
Appointed until 2019 // German
Prof. Dr. Dr. h.c. Ursula Gather, Dortmund
(since January 19, 2018) // Rector of the Technical University of
Dortmund
Appointed until 2023 // German
● Munich Re
Achim Hass, Kiel
Power electronics technician // Chairman of the Works Council of
thyssenkrupp Marine Systems GmbH (Kiel) // Chairman of the
General Works Council of thyssenkrupp Marine Systems GmbH // Vice
Chairman of the Works Council Union Industrial Solutions
Appointed until 2019 // German
■ Babcock Pensionskasse VvaG
Within the Group: ■ thyssenkrupp Industrial Solutions AG ■ thyssenkrupp Marine Systems GmbH
Dr. Ingrid Hengster, Frankfurt/Main
Member of the Executive Board of KfW Bankengruppe
Appointed until 2020 // Austrian
■ Deutsche Bahn AG
▫ European Investment Bank (EIB)/Luxembourg
(Expert on the Board of Directors)
Susanne Herberger, Dresden
Engineer (FH) – information technology // Chairwoman of the Works
Council of thyssenkrupp Aufzüge GmbH (Dresden) // Chairwoman of
the Works Council Union Elevator Technology // Vice Chairwoman of
the Group Works Council of thyssenkrupp AG
Appointed until 2019 // German
Within the Group: ■ thyssenkrupp Elevator AG
Tanja Jacquemin, Frankfurt/Main
Dipl.-Kauffrau // Head of the Union Educational Activities Department
at IG Metall
Appointed until 2019 // German
■ Vinci Energies Deutschland GmbH
Prof. Dr. Hans-Peter Keitel, Essen
Former Chairman of the Executive Board of Hochtief AG
Appointed until 2020 // German
■ National-Bank AG
● RWE AG ■ Voith GmbH & Co. KGaA (Chair)
Dr. Norbert Kluge, Ratingen
Diplom-Sozialwirt // Director of the Institute for Codetermination and
Corporate Governance (I.M.U.) of the Hans Böckler Foundation
Appointed until 2019 // German
Tekin Nasikkol, Ratingen
Bachelor of Arts (Business Administration) // Chairman of the
Works Council of thyssenkrupp Steel Europe AG (Duisburg-Hamborn)
// Chairman of the General Works Council of thyssenkrupp Steel
Europe AG // Chairman of the Works Council Union Steel Europe
Appointed until 2019 // German
■ thyssenkrupp Steel Europe AG
Peter Remmler, Wolfsburg
Wholesale and export trader // Vice Chairman of the Works Council of
thyssenkrupp Schulte GmbH (Braunschweig) // Chairman of the
Works Council Union Materials Services
Appointed until 2019 // German
Within the Group: ■ thyssenkrupp Materials Services GmbH
Carola v. Schmettow, Düsseldorf
CEO of HSBC Trinkaus & Burkhardt AG
Appointed until 2020 // German
▫ HSBC France SA Paris

thyssenkrupp annual report 2017 / 2018
4 Additional information | Supervisory Board
232
Carsten Spohr, Munich
Chairman of the Executive Board of Deutsche Lufthansa AG
Appointed until 2020 // German
■ Lufthansa Technik AG (Chair)
▫ Dr. August Oetker KG (Member of the Advisory Board)
▫ SN Airholding SA/NV, Belgium (Chair)
Dr. Lothar Steinebach, Leverkusen
Former member of the Management Board of Henkel AG & Co. KGaA
Appointed until 2023 // German
■ Carl Zeiss AG ■ Ralf Schmitz GmbH & Co. KGaA
▫ Diem Client Partner AG/Switzerland
(Member of the Management Board)
Jens Tischendorf, Zurich
Partner at Cevian Capital Ltd.
Appointed until 2020 // German
● Bilfinger SE
Friedrich Weber, Schöndorf
Machine setter // Chairman of the General Works Council of
thyssenkrupp Bilstein GmbH // Chairman of the Works Council Union
Components Technology // Vice Chairman of the European Works
Council of thyssenkrupp AG // Vice Chairman of the Group Works
Council of thyssenkrupp AG
Appointed until 2019 // German
Within the Group: ■ thyssenkrupp Bilstein GmbH
Isolde Würz, Mülheim/Ruhr
Attorney // General Counsel and Head of Governance, Corporate
Function Legal at thyssenkrupp AG // Chairwoman of the Executives’
Committee of thyssenkrupp AG and executive member of the Group
Executives’ Committee
Appointed until 2019 // German
In the course of the fiscal year 2017 / 2018 the following mem-
bers left the Supervisory Board. Where they held other director-
ships at the time of departure these are listed below:
Prof. Dr. Ulrich Lehner, Düsseldorf
(until July 31, 2018)
Chairman // Member of the Shareholders’ Committee of
Henkel AG & Co. KGaA
● Deutsche Telekom AG (Chair)
● Porsche Automobil Holding SE
○ Henkel AG & Co. KGaA
(Member of the Shareholders’ Committee)
Dr. Ralf Nentwig, Essen
(until January 19, 2018)
Member of the Executive Committee of the Alfried Krupp von Bohlen
und Halbach Foundation
▫ Margarethe Krupp-Stiftung für Wohnungsfürsorge
(Vice Chairman of the Supervisory Board)
René Obermann, Berlin
(until August 31, 2018)
Partner at Warburg Pincus LLC // Managing Director of Warburg
Pincus Deutschland GmbH
■ Inexio Beteiligungs GmbH & Co. KGaA (Chair) ■ 1&1 Internet SE (Chair) ■ Strato AG (Chair) ■ Allianz Deutschland AG □ Telenor ASA
● Airbus SE/Netherlands
Wilhelm Segerath, Duisburg
(until September 30, 2018)
Automotive body maker // Chairman of the Group Works Council of
thyssenkrupp AG (until September 18, 2018)
▫ PEAG Holding GmbH (Member of the Advisory Board)
■ Membership of supervisory boards within the meaning of § 125 of the German Stock Corporation Act (AktG) (as of September 30, 2018)
▫ Membership of comparable German and non-German control bodies of business enterprises within the meaning of § 125 of the German Stock Corporation Act
(AktG) (as of September 30, 2018)
● / ○ Company listed on the stock exchange

thyssenkrupp annual report 2017 / 2018
4 Additional information | Supervisory Board
233
Supervisory Board committees
Executive Committee
Prof. Dr. Bernhard Pellens (Chair)
Markus Grolms
Prof. Dr. Hans-Peter Keitel
Wilhelm Segerath
Mediation Committee under
§ 27 (3) Codetermination Act
Prof. Dr. Bernhard Pellens (Chair)
Markus Grolms
Prof. Dr. Hans-Peter Keitel
Wilhelm Segerath
Personnel Committee
Prof. Dr. Bernhard Pellens (Chair)
Markus Grolms
Prof. Dr. Hans-Peter Keitel
Wilhelm Segerath
Audit Committee
Prof. Dr. Bernhard Pellens (Chair)
Markus Grolms
Tanja Jacquemin
Wilhelm Segerath
Dr. Lothar Steinebach
Jens Tischendorf
Strategy, Finance and Investment Committee
Markus Grolms (Chair)
Prof. Dr. Dr. h. c. Ursula Gather
Susanne Herberger
Prof. Dr. Bernhard Pellens
Peter Remmler
Wilhelm Segerath
Dr. Lothar Steinebach
Jens Tischendorf
Nomination Committee
Prof. Dr. Bernhard Pellens (Chair)
Prof. Dr. Dr. h. c. Ursula Gather
Prof. Dr. Hans-Peter Keitel
Carola v. Schmettow
Jens Tischendorf
(as of September 30, 2018)

thyssenkrupp annual report 2017 / 2018
4 Additional information | Glossary
234
Glossary
List of definitions and abbreviations
Beyond Conventions:
An internet platform launched in November 2017 in collaboration
with four partner companies on which the companies publish
concrete digital challenges from their businesses. Aimed at start-
up companies around the world. Any start-up that believes it has
a solution is invited to make a pitch. The selected solutions are
applied in the business processes of the companies.
Capital employed
Interest-bearing invested capital
Cluster management
Joint strategic management of purchasing requirements.
Clusters are groups of outsourced products and services that due
to their similarity (e.g. comparable technical requirements or
same suppliers) can be managed jointly.
COSO
Committee of Sponsoring Organizations of the Treadway
Commission
GCGC
German Corporate Governance Code
EBIT margin
Earning power in the period under review; ratio of EBIT to sales
Equity ratio
Ratio of total equity to balance sheet total (the higher the ratio,
the lower the indebtedness)
EMIR audit
European Market Infrastructure Regulation. Adopted in August
2012. Designed to make over-the-counter trading in derivatives
more transparent and secure. Compliance is audited annually.
FCF before divestments
Free cash flow before divestments = operating cash flows less
cash flow from investing activities excluding cash inflows from
divestments
FCF before M & A
Free cash flow before mergers & acquisitions = operating cash
flows less cash flow from investing activities excluding cash
inflows and outflows from major M & A transactions
Gearing
Ratio of net financial debt to total equity (the lower the ratio, the
higher the share of total equity in capital employed)
Gemba Safety Walk
“Gemba” is Japanese and means “the actual place”. In business
gemba refers to the place where value is created. Gemba Safety
Walks at thyssenkrupp are undertaken by managers e.g. at pro-
duction facilities or construction sites to raise awareness of
health & safety and discuss concrete situations.
Greater China
Mainland China, Hong Kong, Mongolia, Macau and Taiwan
impact
Corporate program to enhance performance and execute the
corporate strategy
Internal financing strength
Ratio of operating cash flows to cash flow from investing activi-
ties
Weighted average cost of capital (WACC)
Minimum rate of return expected by investors
Long Term Incentive plan (LTI)
Long term variable compensation for Executive Board members
and other selected executives through stock rights
NAFTA
North American Free Trade Agreement
Net financial debt
Difference between the cash and cash equivalents shown in the
statement of financial position plus current other financial assets
available for sale, and non-current and current financial debt.
The corresponding assets and liabilities of the disposal groups –
where applicable – are also taken into account.

thyssenkrupp annual report 2017 / 2018
4 Additional information | Glossary
235
Operating cash flows
Inflow/outflow of cash and cash equivalents outside of investing,
divesting or financing activities.
Rating
Ratings are used to assess the future ability of a company to
meet its payment obligations on time and in full. They are based
on an analysis of quantitative and qualitative factors.
ROCE
Return on Capital Employed. EBIT divided by average capital
employed
STI
Short Term Incentive plan
synergize+
Program for the Groupwide management of all purchasing activi-
ties. Part of the “impact” initiative.
thyssenkrupp Garage
The thyssenkrupp Garage is an instrument aimed at promoting
the start-up culture in the Group and achieving disruptive new
solutions quickly. For six months employees can spend half their
working time on a start-up project, continuing their normal job
part-time. We provide financial and other support for promising
ideas and successful ones go on to become prototypes for new
technologies.
tkVA
tkVA = EBIT less/plus capital employed
Inventory turnover
Inventories divided by sales, multiplied by 360 (the lower the
ratio, the faster the inventory turnover)
Average collection period
Trade accounts receivable divided by sales, multiplied by 360
(the lower the ratio, the faster customers pay)

thyssenkrupp annual report 2017 / 2018
4 Additional information | Glossary
236
Contact and 2019 / 2020 financial calendar
For more information please contact:
Communications Telephone: +49 201 844-536043
Email: [email protected]
Investor Relations Email: [email protected]
Institutional investors and analysts Telephone: +49 201 844-536464
Fax: +49 201 8456-531000
Private investors Telephone: +49 201 844-536367
Fax: +49 201 8456-531000
Published by thyssenkrupp AG
thyssenkrupp Allee 1, 45143 Essen, Germany
Postfach, 45063 Essen
Telephone: +49 201 844-0
Email: [email protected]
www.thyssenkrupp.com
2019 / 2020 financial calendar
February 1, 2019 Annual General Meeting
February 12, 2019 Interim report 1st quarter 2018 / 2019 (October to December)
May 14, 2019 Interim report 1st half 2018 / 2019 (October to March)
August 8, 2019 Interim report 9 months 2018 / 2019 (October to June)
November 21, 2019 Annual report 2018 / 2019 (October to September)
January 31, 2020 Annual General Meeting
This annual report was published on November 21, 2018.
Summarized management report and consolidated financial statements produced in-house using firesys.
Photo credits: Michael Haegele (Supervisory Board, Executive Board, cover, section dividers) and
thyssenkrupp
The paper used for this report comes from socially beneficial, economically
viable and environmentally appropriate sources and thus bears the Forest
Stewardship Council® logo. 100% recycled fibers were used to make the
paper in the inner section – this is guaranteed by the EU Ecolabel certification
(paper reg. no. FR / 011 / 003).
Forward-looking statements
This document contains forward-looking statements that reflect management’s
current views with respect to future events. Such statements are subject to risks
and uncertainties that are beyond thyssenkrupp’s ability to control or estimate
precisely, such as future market and economic conditions, the behavior of other
market participants, the ability to successfully integrate acquired businesses and
achieve anticipated synergies and the actions of government regulators. If any of
these or other risks and uncertainties occur, or if the assumptions underlying any
of these statements prove incorrect, then actual results may be materially different
from those expressed or implied by such statements. thyssenkrupp does not
intend or assume any obligation to update any forward-looking statements to
reflect events or circumstances after the date of these materials.
Rounding differences and rates of change
Percentages and figures in this report may include rounding differences, meaning
that the total of the individual figures stated may not always be exactly the same
as the total shown or that it may not be possible to calculate the stated percent-
ages from the individual figures shown to which they relate. The signs used to
indicate rates of change are based on economic aspects: Improvements are
indicated by a plus (+) sign, deteriorations are shown in brackets ( ). Very high
positive and negative rates of change (≥500% or ≤(100)%) are indicated by ++
and −− respectively.
Variances for technical reasons
Due to statutory disclosure requirements the Company must submit this annual
report electronically to the Federal Gazette (Bundesanzeiger). For technical rea-
sons there may be variances in the accounting documents published in the
Federal Gazette.
German and English versions of the annual report can be downloaded from the
internet at www.thyssenkrupp.com. In the event of variances, the German version
shall take precedence over the English translation.
thyssenkrupp annual report 2017 / 2018
4 Additional information | Contact and 2019 / 2020 financial calendar

www.thyssenkrupp.com