Embed Size (px)
Citation preview


Annual Report 2017

JS Bank won the ‘Best Environmental, Social and Governance Bank’ award at the Pakistan Banking Awards 2017. This award recognizes the overall environmental, social and governance impact that JS Bank initiatives have had in the areas such as health, education, sustainable development and relief efforts across the country.

Table of ContentsCompany Information 03
Directors’ Profile 04
Corporate Social Responsibility 10
Notice of Twelfth Annual General Meeting 24
Financial Highlights 28
Graphical Presentation of Financial Information 30
Directors’ Report 34
Directors’ Report Urdu 49
Statement of Compliance 52
Review Report to the Members on the Statement of Compliance 56
Unconsolidated Financial Statements 57
Auditors’ Report to the Members 58
Unconsolidated Statement of Financial Position 60
Unconsolidated Profit and Loss Account 61
Unconsolidated Statement of Comprehensive Income 62
Unconsolidated Statement of Changes in Equity 63
Unconsolidated Cash Flow Statement 64
Notes to the UnconsolidatedFinancial Statements 65
Consolidated Financial Statements 159
Directors’ Report on Consolidated Financial Statements 160
Directors’ Report on Consolidated Financial Statements Urdu 163
Auditors’ Report on the Consolidated Financial Statements 164
Consolidated Statement of Financial Position 165
Consolidated Profit and Loss Account 166
Consolidated Statement of Comprehensive Income 167
Consolidated Statement of Changes in Equity 168
Consolidated Cash Flow Statement 169
Notes to the Consolidated Financial Statements 170
Annexure I 274
Annexure II 278
Pattern of Shareholding 279
Branch Network 281
Form of Proxy


Company Information
Board of Directors Mr. Ali Jehangir Siddiqui Chairman Mr. Adil Matcheswala Non-Executive DirectorMr. Ashraf Nawabi Non-Executive Director Mr. G.M. Sikander Independent Non-Executive DirectorMr. Kalim-ur-Rahman Non-Executive DirectorMr. Munawar Alam Siddiqui Non-Executive DirectorMs. Nargis Ghaloo Independent Non-Executive Director Mr. Shahab Anwar Khawaja Independent Non-Executive Director Mr. Khalid Imran President & CEO Audit Committee Mr. Shahab Anwar Khawaja Chairman Mr. Adil Matcheswala Member Mr. G.M. Sikander Member Human Resource, Remuneration & Nomination CommitteeMr. G.M. Sikander Chairman Mr. Ali Jehangir Siddiqui Member Ms. Nargis Ghaloo Member
Risk Management Committee Mr. Ashraf Nawabi ChairmanMr. Kalim-ur-Rahman MemberMr. Khalid Imran MemberMr. Munawar Alam Siddiqui Member
Chief Financial Officer Mr. Muhammad Yousuf Amanullah
Company Secretary Mr. Ashraf Shahzad
Auditors EY Ford Rhodes, Chartered Accountants(Member firm of Ernst & Young Global Limited)
Legal Advisors Bawaney & PartnersHaidermota BNRLiaquat Merchant Associates
Share Registrar Central Depository Company of Pakistan Limited CDC House, 99 – B, Block ‘B’, S.M.C.H.S., Main Shahra-e-Faisal Karachi.
Registered Office JS Bank LimitedShaheen Commercial ComplexDr. Ziauddin Ahmed RoadP.O. Box 4847 Karachi-74200, PakistanUAN: +92 21 111 JS Bank (572-265)0800-011-22www.jsbl.com
3JS Bank Annual Report 2017

Directors’ ProfileMr. Ali Jehangir Siddiqui Chairman
Mr. Ali Jehangir Siddiqui is Chairman of the Board of Directors and also a Member of the HR, Remuneration & Nomination Committee of the Bank.
Mr. Siddiqui currently serves as Special Assistant to the Prime Minister of Pakistan. He founded and formerly was Chairman of JS Private Equity Management, Pakistan’s largest private equity firm. From 2002-2003 he was an Executive Director of JS Investments, at the time the largest private sector mutual fund manager in Pakistan. Prior to JS Group, Mr. Siddiqui was a Director with Crosby, a private equity firm, and was based in Hong Kong. In 2014, he was honored by the World Economic Forum as a Young Global Leader.
Mr. Siddiqui holds a B.A. in Economics from Cornell University.
Mr. Adil Matcheswala Non- Executive Director
Mr. Adil Matcheswala is a Member of the Audit Committee.
He is the CEO and founding Director of Speed (Private) Limited, a retail and distribution company that is incorporated in Pakistan. It has amongst it’s portfolio, numerous leading international brands such as Nike, Adidas, Tag Heuer, Charles & Keith, Pedro and Timex.
He started his professional career in the financial services industry in 1992 and until 2002 was the Head of the Equity Sales Division of Jahangir Siddiqui & Co. Ltd. (formerly Bear Stearns Jahangir Siddiqui Limited).
He has previously served as the Chairman of the Board and Chairman of the Audit Committee of JS Global Capital Ltd. as well as a Director of BSJS Balanced Fund Ltd.
Mr. Matcheswala graduated from Brown University with an A.B. in Economics.
Mr. Ashraf Nawabi Non- Executive Director
Mr. Ashraf Nawabi is Chairman of the Risk Management Committee.
He is a senior banker with over 40 years of banking experience. He was a founder of Prime Commercial Bank Limited and remained on its Board of Directors for three years. Since 1990, he has been the Advisor to Emirates NBD Bank PJSC which is one of the largest banks in the Middle East. Since 1989, he has also been one of the major shareholders and a Director of Alliance Insurance Co. PSC in the UAE. For five years he was a Director of Union National Bank PJSC, the fourth largest bank in the UAE. He was the Chief Executive Officer of United Bank Limited – Middle East for seven years.
He is also a Director and Chief Executive Officer of First Jamia Services Limited in Lahore since 1991. The institution provides education related services.
Mr. Nawabi graduated from the University of Karachi.
Mr. G.M. SikanderIndependent Non-Executive Director
Mr. G.M. Sikander is a Member of the Audit and HR, Remuneration & Nomination Committees. He has been a career civil servant having served the Government of Pakistan in various capacities for 39 years. He retired as Federal Secretary of the Housing and Works Division.
He has served as Assistant Commissioner and Deputy Commissioner in various districts of Punjab and contributed significantly towards social sector development. While serving as Deputy Commissioner of Kasur he single handedly established a public school on self-help basis
4 JS Bank Annual Report 2017

which has now become a degree college with almost 5,000 students.
Mr. Sikander has previously served as Secretary to the Government of the Punjab and (KPK) provinces and headed the departments of Services, Establishment, Information & Tourism, Housing & Physical Planning, Baitul Maal, Social Security and Cooperatives. He also served as Principal Secretary to five Chief Ministers of Punjab for a record period of nearly 10 years.
After retirement, he now serves as a Director and Chairman of the Audit Committee of JS Bank and is on the Board of Directors of National Fertilizer Marketing Limited. He is also a Trustee of the Hamza Foundation in Lahore which is a foundation dedicated to supporting and educating deaf and mute students and a Life Trustee of the Marafie Foundation Pakistan which is engaged in the development of public health and education sectors in Gilgit-Baltistan.
Mr. Sikander received his M.A. in Political Science from Punjab University and completed a Diploma in Development Administration from the University of Birmingham. He has also completed the Advanced National Management Course from the former Pakistan Administrative Staff College Lahore and a special course in Development Administration from The National Institute of Public Administration, Lahore. He holds the Director’s Certification from the Institute of Chartered Accountants of Pakistan (ICAP).
Mr. Kalim-ur-RahmanNon- Executive Director
Mr. Kalim-ur-Rahman was formerly President & CEO of JS Bank Limited from 2010 to 2013. He is a Member of the Risk Management Committee.
He is a seasoned banker with 50 years of experience in both international and domestic banking. He has served in various leading international and domestic banks, including Grindlays Bank PLC in the UK and Pakistan, Middle East Bank Ltd. in the
UAE and Pakistan as General Manager - South Asia, Emirates Investment Bank in the UAE as General Manager. Mr. Rahman served as President and CEO of Askari Commercial Bank in Pakistan.
Mr. Rahman did his Senior Cambridge from Burn Hall School, Abbottabad and B.Sc. (Hons) from Government College, Lahore. He had a first class academic career throughout, and his name is inscribed on the College Roll of Honor. He is a Fellow of the Institute of Bankers in Pakistan as well as the Institute of Chartered Secretaries and Managers, Pakistan. He holds the Director’s certification from (PICG) as well as the Institute of Directors, UK. Mr. Munawar Alam SiddiquiNon- Executive Director
Mr. Munawar Alam Siddiqui is a Member of the Risk Management Committee.
He retired as an Air Commodore from the Pakistan Air Force (PAF) in 2003. His last post was Assistant Chief of Air Staff (Administration) at Pakistan Air Force Headquarters. For his meritorious services to the PAF, he was awarded Tamgha-e-Imtiaz (Military) and Sitara-e-Imtiaz (Military).
He was commissioned in the GD (P) Branch of the Pakistan Air Force in 1974. He is a qualified flying instructor and has flown over 8000 hours on different aircraft types including C-130, Boeing and Dassault aircraft. He has served as a VVIP and Presidential Pilot during his tenure of service and has held various key command and staff appointments in the PAF. He served as Director of Air Transport at Air Headquarters from 1996 to 1998 and commanded an operational air force base with over 8,500 personnel from 2000 to 2002.Presently Mr. Siddiqui is Advisor to JS Investments Limited and was Chairman of JS Investments Limited from 2004 to 2013. Currently he is Chairman of Peregrine Aviation (Pvt.) Limited and serves as a director on the boards of Jahangir Siddiqui & Co. Limited and JS Bank Limited.
5JS Bank Annual Report 2017

As part of his social commitment, he works as a director on the boards of Fakhr-e-Imdad Foundation, Karachi Education Initiative, Karachi School for Business & Leadership and Karigar Training Institute. He is also a Trustee of the Cardiovascular Foundation.
Mr. Siddiqui holds a B. Sc. (Honours) in War Studies from Karachi University, a B. Sc. Avionics from Peshawar University, an M. Sc. in Defence and Strategic Studies from Quaid-e-Azam University and an M. Sc. in Strategic Studies from Karachi University. He is also an alumnus of the National Defence University.
Ms. Nargis GhalooIndependent Non- Executive Director
Ms. Nargis Ghaloo is a Member of the HR, Remuneration & Nomination Committee of the Bank. She is at present Managing Director, Public Procurement Regulatory Authority, Government of Pakistan. Ms. Ghaloo was Chairperson of State Life Insurance Corporation of Pakistan, Pakistan’s largest life assurer, from 2014 to 2016.
Ms. Ghaloo joined the Civil Services of Pakistan in 1982, and has many years of professional experience serving in senior management positions with provincial as well as federal government departments in diversified fields such as public sector management, administration, financial, judicial, health, insurance and planning.
Ms. Ghaloo did her Masters in English from University of Sindh in 1981 and is a Certified Director from The Pakistan Institute of Corporate Governance (PICG) and has also holds a Certificate in Company Direction from Institute of Directors, UK.
Mr. Shahab Anwar KhawajaIndependent Non- Executive Director
Mr. Shahab Anwar Khawaja is the Chairman of the Audit Committee. Mr. Khawaja is a retired senior civil servant and served the Government of Pakistan in various capacities for 36 years. He retired as Federal Secretary to Government of Pakistan.
As Secretary Privatisation, he supervised the privatisation program of public sector enterprises in the country. Earlier he served as Secretary Ministry of Industries and Production. After retirement, he served as CEO of the Competiveness Support Fund – a joint venture of Government of Pakistan & USAID.
Previously, Mr. Khawaja served as CEO of Small and Medium Enterprises Development Authority (SMEDA), where he managed all Federal Government support initiatives to the SME sector of the economy. During these years a number of developments were achieved to help SME growth especially for higher value addition through the acquisition of improved technology.
Mr. Khawaja has represented Pakistan in a number of international seminars, conferences and in various UNDP, UNHCR and UNFPA Board meetings. He has also served on number of corporate boards including SME Bank and Pak Libya Investment Company.
His last engagement was in the private sector where he headed the Fertilizer Manufacturers Pakistan Advisory Council as its Executive Director from 2012 to 2015.
Mr. Khawaja holds a Master of Science degree in Chemistry and holds a Post Graduate Diploma in Development Administration from Birmingham University, UK.
6 JS Bank Annual Report 2017

Mr. Khalid ImranPresident and CEO
Mr. Khalid Imran is the President and CEO of JS Bank Limited and a non-elected Executive Director. He has over 40 years of diversified banking experience in Pakistani and foreign banks. Mr. Imran started his career with BCCI, where he worked for 16 years in different capacities. He was Joint General Manager of BCCI Middle East Region. Mr. Imran then worked with Commercial Bank of Dubai PJSC. On his return to Pakistan in 1991, he
was a member of the core team which established Prime Commercial Bank Limited. He served Prime Bank in the capacity of Senior Executive Vice President and continued with Prime Bank through its acquisition by and merger into ABN Amro Bank in Pakistan and the subsequent acquisition of ABN Amro Bank in Pakistan by Royal Bank of Scotland. He joined the JS Bank team in 2012 and became President and CEO in July 2013.
Mr. Imran received his BBA (Hons) and MBA from Karachi University.
7JS Bank Annual Report 2017

Creating Greater Value Through Environmental Initiatives
8 JS Bank Annual Report 2017

JS Bank is the first commercial bank in Pakistan to be certified by the World Wide Fund for Nature (WWF Pakistan) for their Green Office Initiative
JS Bank was approved by the Green Climate Fund (GCF) Pakistan Board in 2017 to become the first commercial bank from Pakistan to apply for GCF funding
9JS Bank Annual Report 2017

As a responsible corporate citizen, JS Bank strives to support Corporate Social Responsibility (CSR) initiatives for economic growth, social progress and environmental protection.
JS Bank carries out major philanthropic activities in partnership with the Mahvash and Jahangir Siddiqui Foundation (MJSF) and Future Trust. The Bank provides financial and human resources to both organizations.
Categories Key Initiatives
Promoting Sustainable Ventures
Applying for Climate FinancePartnering with USAID for Clean Energy FinancingBringing Basic Financial Services to the UnderservedSupporting Young Digital EntrepreneursSolar Energy Financing for Homes
Supporting Communities
Financing Micro LendersPromoting SMEsIftaar for the UnderprivilegedSharing the Gift of Vision and Good Health Being the First to Respond to Emergencies Educating the FutureRecognizing People’s Potential Lending to the YouthSponsoring Opportunities for Social Changemakers Promoting the Arts
Managing Operational FootprintSolarizing BranchesReducing our Carbon FootprintMinimizing Use of Resources through IT Initiatives
Investing in Employee Development
JS Bank Learning AcademyGrowth and Diversity Management Trainee ProgramEmployee Snapshots
Employee Snapshots
Corporate Social Responsibility
10 JS Bank Annual Report 2017

Our Year at a GlanceThese are the CSR issues that JS Bank reported on during the year
* Mahvash and Jahangir Siddiqui Foundation
JS Bank becomes the first bank in Pakistan to be approved by the Green Climate Fund (GCF) Pakistan Board to apply for funding from GCF, an international fund on climate change
JS Bank’s BoD updates its Procurement Policy to integrate environmentally and socially responsible vendors into its procurement process
JS Bank finances thefirst car underPMYBL forride-sharing inpartnership withCareem Networks
JS Bank’s BoD approves its Environmental and Social Safeguards Policy
JS Bank becomesthe first commercialbank in Pakistan tobe accredited byWWF as a Green Office
JS Bank launchesits ManagementTrainee (MT)program
94,000 Ramadan Iftaarmeals donated throughJS Bank branches
JS Bank’s Board ofDirectors (BoD)updates its EqualOpportunityEmployment andGender Policies
JS Bank starts implementing managed printing solutions across its branches in Pakistan to reduce its carbon footprint and printing cost
JS Bank and NestlePakistan sign an agreementto generate opportunitiesfor young dairy farmers byhelping them develop newor grow existing businessesthrough PMYBL loans
Number of cars financed by JS Bank for Careem Networks reaches 1000
JS Bank and MJSF* host the Karachi Biennale, Pakistan’s largest international contemporary art event
JS Bank’s BoD approves including an ‘Environmental Sustainability’ sectionin its Code of Conduct. and the Fair Treatment of Customers Initiative
Q1 Q3
Q2 Q4
11JS Bank Annual Report 2017

Environmental and Social EngagementsPromoting Sustainable VenturesJS Bank is keen in supporting our client’s sustainability initiatives and is taking steps towards being a leader in climate finance.
Applying for Climate Finance JS Bank was approved by the Green Climate Fund (GCF) Pakistan Board in February 2017 to become the first commercial bank to apply for GCF funding.
Benefits of being an accredited entity of the GCF:
• Access to international climate change funds• Enhancing local climate change resilience• Developing and implementing environmental standards for the banking industry
Partnering with USAID for Clean Energy FinancingIn sync with its sustainability policy, JS Bank is collaborating with USAID to create a sustainable and efficient renewable energy environment in a clean, responsible and environmentally friendly manner by allowing small scale energy projects access to long term rupee financing through the Bank. This also encourages private investments in clean energy.
This is in line with our strategy to engage with various stakeholders that range from non-profits to government bodies to multilateral organizations. This allows us to not only help them in improving their sustainability performance but allows us at the same time to deepen our expertise while creating opportunity for sustainability.
Bringing Basic Financial Services to the UnderservedIn line with Pakistan’s National Strategy of Financial Inclusion, JS Bank has launched its branchless banking initiative J-Cash with an agent network of over 32,000 agents across the country and has been providing mobile financial services since July 2016. Customers can access J-Cash services by visiting any J-Cash agent or by downloading the Mobile Wallet mobile application, JS Consumer Wallet. With the advent of 3G and rise in smartphone penetration in Pakistan, JS Bank strongly believes in the development and growth of a digital financial services ecosystem.
JS Bank is one of the few banks to offer biometric verification for opening mobile accounts. Biometric verification allows customers to receive funds directly into their accounts.
JS Bank has also been granted a funding of USD 450,000 (PKR 46.8 Million) from Karandaaz Pakistan under the Digitization of International Remittances project. Through J-Cash, JS Bank is digitizing international remittances being received in Pakistan allowing them to land directly into the customers mobile wallets. Customers will not be required to visit any branch or agent to get their remittance into their mobile wallets and an SMS alert will be sent to the customer to alert them of the transaction. The remittance can be easily cashed out through any J-Cash agent location or in the near future by using their debit cards. This also allows overseas Pakistanis to remit their money to relatives even in the most underrepresented regions of Pakistan without ever having to visit a bank branch.
12 JS Bank Annual Report 2017

JS Bank Promotes Sustainable Energy Production Across Pakistan
Supporting Young Digital EntrepreneursJS Bank is the first bank in Pakistan with a fully functional Open Banking developer portal. Open Banking seeks to improve customer satisfaction and speed while lowering banking costs for consumers. This developer portal is expected to encourage young programmers and digital entrepreneurs to develop digital payments apps. 13 digital payments APIs (Application Programming Interfaces) are available for freelancers and local fintechs with more in the pipeline.
Solar Energy Financing for HomesJS Bank has increased its focus on alternative and renewable energy such as solar power which is a key element of improving air quality and the sustainability of the mix of the country’s energy sources. As the demand for clean energy continues to increase, JS Bank has come up with a solution, JS Ghar Apna Solar Panels to help its customers reduce their dependence on the grid for their energy requirements and utilize sustainable sources of energy. The core objective of JS Ghar Apna solar panels is to help increase awareness of alternate energy resources and help the country reduce its overall carbon footprint. Customers can obtain financing to acquire solar panels as a part of the JS Ghar Apna home loan, a mortgage finance facility.
13JS Bank Annual Report 2017

Our strategy is to engage with various stakeholders that range from non-profits to government bodies to multilateral organizations. This allows us to not only help them in improving their sustainability performance but allows us at the same time to deepen our expertise while creating opportunities for sustainability.
Financing Micro LendersJS Bank is one of the largest lenders of microfinance in Pakistan through its lending to institutions like NRSP Bank, KASHF Foundation and Khushali Bank. JS Bank has been supporting microfinance since 2010 and is playing its part in helping to increase financial inclusion in the country.
Promoting SMEsJS Bank is strategically aligned with USAID on developing & providing credit to the SME clientele of Pakistan. It is a partnership where the real beneficiaries are the people of Pakistan. Historically, the SME segment has remained an under–banked segment; where energy crisis, scarce resources, limited knowledge and lack of credit create bottlenecks. The partnership with USAID has added tremendous value in changing attitudes and acceptance of SMEs by acting as a catalyst and strengthening the national economy.
Iftaar for the UnderprivilegedJS Bank along with the Mahvash and Jahangir Siddiqui Foundation (MJSF) arranged iftaar meals for the less privileged during the holy month of Ramadan in 2017. These iftaar meals are being provided on an annual basis since 2013.
Sharing the Gift of Vision and Good HealthThe Mahvash and Jahangir Siddiqui Foundation (MJSF) medical and eye camps program initiated in collaboration with JS Bank is in response to the critical health care needs of the rural population who are deprived of basic health services due to non-availability and access issues. The program is being implemented by a dedicated health team comprising of doctors, eye surgeons, paramedics and volunteers and the designated JS Bank branch staffs since 2009, mainly in remote rural areas of Sindh, lower Punjab and Baluchistan. These camps attract patients from and around the respective camp locations and are announced publically through newspaper ads, pamphlets, hand-bills distribution, electronic media and megaphones. In 2017, over 18,000 patients were examined in these camps and almost 4,000 cataract surgeries were performed. In addition, 9,500 patients were screened for Hepatitis B and C.
Supporting Communities
65,000
94,000
Iftar
Mea
ls
'2017''2013'
14 JS Bank Annual Report 2017

Being The First To Respond To EmergenciesJS Bank and MJSF are active supporters of the First Response Initiative of Pakistan (FRIP). FRIP is a medical student-run organization that uses young doctors and medical students, already having medical knowledge, to prepare and train the general population in basic life-saving skills.
Educating the FutureJS Bank and Mahvash & Jahangir Siddiqui Foundation (MJSF) provided laptops to various DIL (Developments in Literacy) schools to support the right of education for underprivileged children. Operating 126 school campuses across three provinces in Pakistan, DIL provides education from primary to matric level. DIL actively promotes female education with an enrollment rate of 67% along with employing nearly 90% women as a part of the school staff. DIL model focuses on a child-centered approach, emphasizing on gender sensitivity and inclusiveness for all, relying heavily on community support and participation.
MJSF has also collaborated with the Uqaily Family & Friends Association (UFFA) to adopt an existing government school in Thatta. The project has been undertaken through the cooperation of Sindh Education Foundation along with Education & Literacy Department Sindh. The school will cater to the educational needs of 200 children with state-of-the-art facilities being provided such as modern computers and audio visuals labs, a library & sports ground.
JS Bank and MJSF created a unique redeemable endowment fund for Sukkur IBA (Institute of Business Administration). The seed capital for the endowment was handed over to IBA enabling them to earn a return on the funds and therefore to build a permanent endowment while IBA pledged to put in efforts to raise matching funds to grant scholarships to deserving students. Over 7 years, this endowment is expected to grow to a sustainable size where it can continue to support students in perpetuity without fund raising. The scheme is completely replicable and adaptable to any institute and discipline.
JS Bank and Careem have Disbursed Over PKR 1 Billion for a Thousand Cars to Enable Entrepreneurship.
15JS Bank Annual Report 2017

Recognising People’s PotentialJS Bank through MJSF supports the Karigar Training Institute (KTI). KTI was established in response to the urgent need to provide specialized skills to underprivileged segments of society to help them earn an honest living.
Lending to the YouthPrime Minister’s Youth Business Loan (PMYBL) is a loan scheme which has been introduced by the Government of Pakistan. JS Bank as a lender to the PMYBL program is empowering youth by offering them loan facilities in order to establish or expand their businesses. The loan facility is being offered for a period of eight years with a grace period of twelve months at extremely competitive pricing in order to make the loan facility practical and viable for the youth. JS Bank at present has 14 dedicated branches which cater to all PMYBL applications throughout Pakistan.The goal of JS PMYBL is to enable the youth of Pakistan by providing opportunities of financial independence through self-employment and creating entrepreneurs and future leaders. Since the start of the PMYBL program in 2015, JS Bank has made a difference in many lives through the PMYBL program by enabling the youth to create their own success stories.
NestleJS Bank strongly believes that the sustainable development of agriculture and dairy will allow Pakistan to achieve food and nutrition security. To further this cause, JS Bank has joined hands with Nestle Pakistan under the Prime Minister Youth Business Loan (PMYBL) program to generate opportunities for young dairy farmers, between the ages of 21 and 45 years, by helping them develop new or grow their existing businesses.
One use of this loan will be to assist farmers in enhancing milk production utilizing best practices and knowledge shared by Nestle Pakistan and enabled by JS Bank through rebated PMYBL loans. Loans to these farmers will be given out at a low mark-up in order to improve livelihoods in communities.
This partnership will allow JS Bank to provide financing to support farmers through a range of activities, including improving access to markets, training and technical support, helping them develop alternative income streams, and supporting young farmers. By understanding and managing issues farmers and their communities face, the partnership hopes to better support rural development, promote better agricultural practices and address issues such as rural poverty.
CareemUnder the PMYBL program, JS Bank has entered into partnership with Careem Networks (Pvt.) Limited. The objective behind this is to empower Pakistani youth by financing vehicles at highly subsidized markup rates for use on the Careem Network as an owner-driver. This is a part of the Bank’s efforts to offer unprecedented potential for self-employment, business development and poverty reduction. Careem drivers (or Captains) clearing a performance criterion are eligible to apply for loans through JS Bank to purchase their own vehicles and drive independently for Careem. The program has proved to be immensely popular with Careem Captains and has already contributed over PKR 1 billion to the automotive industry through the purchase of our 1,000 cars.
16 JS Bank Annual Report 2017

Sponsoring Opportunities for Social ChangemakersJS Bank is one of the leading sponsors of the Acumen Pakistan Fellows Program having supported this initiative since 2013. The Acumen Pakistan Fellows Program is a one-year leadership development program designed to build the next generation of social leaders who will be able to transform society and create a better and more inclusive world.
Every year, the Acumen Pakistan Fellows Program equips 20 extraordinary individuals with the knowledge, support system and practical wisdom to drive positive change in society. Over the course of a year, Fellows remain in their jobs while taking part in a rigorous program where they receive the tools, training and space to innovate new ideas, accelerate their impact, and build a strong network of social leaders from across their region and around the world.
There have been 88 Acumen Pakistan Fellows since the program started. They work in diverse fields ranging from education and health to energy and women’s empowerment.
Some Acumen investee companies:Sehat Kahani: A social impact initiative working to improve basic health care in communities through a spectrum of services focused on primary health care consultation, health awareness and health counselling.
Roshni Helpline: A social venture which helps families in the search and recovery of missing children and offers psycho-social support to the victims and their families.
Peshawar 2.0: A social enterprise fostering the startup ecosystem in Peshawar. Amal Academy: An education venture that helps Pakistani youth realize their dreams.
Amal Academy: An education venture that helps Pakistani youth realize their dreams.
JS Bank and MJSF support the Acumen Fellows Program
17JS Bank Annual Report 2017

Promoting the ArtsJS Bank as a part of the JS Group was the main sponsor for the Karachi Biennale. The Karachi Biennale 2017 was the city’s biggest and most exciting art event. The primary objective of the event was to bring together diverse cultures using the nation’s art in order to create a sense of togetherness and familiarity. Various art enthusiasts from all over the world took part in showcasing their work, hoping to develop a sense of communal togetherness among all diverse cultures of the country.
Artist Ali Kazim was Awarded the Mahvash and Jahangir Siddiqui Juried Art Prize
18 JS Bank Annual Report 2017

Managing Our Operational FootprintAs we grow, we are looking to manage our offices and branches in an efficient and sustainable manner. We are focusing on reducing our energy use, paper wastage and using renewable energy to manage and limit our carbon footprint.
Solarizing BranchesJS Bank has more than 100 of its branches operating on solar power. That means all computers, servers, ATMs and teller stations in these branches are powered by solar energy. JS Bank’s Administration department manages the physical locations and makes efforts to incorporate energy efficiency and renewable energy initiatives in our branches so that they function efficiently while reducing operational costs.
Reducing our Carbon FootprintThe Green Office Initiative is a practical and simple Environmental Management System developed by WWF (World Wildlife Fund) specifically for office conditions. In 2017, JS Bank became the first commercial bank in Pakistan to be certified for the Green Office Initiative by WWF Pakistan and is one of the 47 companies to have adopted the Initiative. As a part of the certification process, WWF undertook a comprehensive audit using stringent guidelines to check all the processes and procedures adopted by JS Bank for energy conversation & waste management at its Head Office. The Bank successfully met all the requirements set by WWF and was declared as being Green Office certified. The Green Office Initiative also educates employees to be better and responsible citizens and understand their civic and environmental responsibilities.JS Bank is working actively with WWF Pakistan to reduce its environmental footprint. Not only does the certification help to cut down on energy costs, reduce waste and make better procurement choices, it also increases environmental awareness among employees.
Minimizing Use of Resources through IT InitiativesDigitization and Archiving of Bank RecordsConverting bank records to digital files has helped the Bank in reducing required storage space while at the same time it has cut down on paper consumption and the ‘on-time’ needed to sort and search through files. The introduction of this solution has also increased electronic document sharing between different offices and regions cutting down cost of paper print & dispatch and sharing of document over emails. This has also controlled and reduced data storage requirements.
Server Virtualization 170 application servers have been virtualized in JS Bank’s data center; saving electricity, space and heat generation.
Virtual Desktop Interface (VDI)A majority of JS Bank branches have zero/thin hardware clients instead of desktop computers to save power consumption and space.
Document Management System (DMS)A DMS is in place for paperless account opening and other electronic document management.
Enhancing Procure-to-PayThe Bank has enhanced its Procure-to-Pay system by digitizing the integration of the procurement process with the Accounts Payable department. Not only has this led to a huge reduction in paper consumption but also in the time taken for requisition & payment approvals.
19JS Bank Annual Report 2017

JS Bank Learning AcademyJS Bank Learning Academy started in October of 2016 with the sole purpose of driving the Bank forward by utilizing and training human capital. In 2017, over 28,000 man-hours of training were conducted using e-learning and other platforms. The Academy focuses on technical, skills and soft skills trainings.The goal is to focus on:
• Technical and behavioral skills of the team members• Devising a succession plan by identifying potential leaders• Hiring, training and developing teams to fulfill the Bank’s HR needs
Investing in Employee DevelopmentFor gaining a sustained competitive advantage in today’s banking industry, it is imperative for organizations to build a high-quality human capital talent pool. Retaining key talent means motivating and developing staff by imparting additional knowledge and skills to keep them abreast of the latest developments in banking and finance. Keeping this in view, JS Bank has made the Learning & Organizational Development (L&OD) function an integral part of the employee development process.
20 JS Bank Annual Report 2017

Our Bank’s success depends on our human capital which we believe is our most important capital. We push our people to continuously learn and grow while upholding the highest levels of integrity.
Our Employees
Our Female Employees
Present2017
605 employees
Midway2012
198 employees
Beginning2007
30 employees
281Employees
Beginning2007
Midway2012
Present2017
1,715Employees
4,998Employees
Female Employees Total Employees
Growth and Diversity
21JS Bank Annual Report 2017

Management Trainee ProgramFuture success requires attracting the most talented individuals. For us, that means finding dynamic people with the right skillset who share our corporate values and are committed to the highest standards of ethics and integrity. In 2017, JS Bank launched its Management Trainee (MT) program to equip these new hires with the required skills, judgment, and know-how of being effective and responsible managers. Our training program ended at the end of the year with MTs being incorporated into the workforce at the Bank in various departments.
Employee SnapshotsKiran JalilBusiness Conduct ManagerAs a Business Conduct Manager, I have been responsible for managing the ‘Fair Treatment of Customers’ initiative. The concept is still relatively nascent in the banking landscape of Pakistan however JS Bank has taken the lead in spearheading this initiative for its customers. The goal is to establish the right culture within the Bank and to ensure fair outcomes for consumers and stakeholders. The feedback received regarding the initiative is highly encouraging and I hope to use the support and momentum to ensure that JS Bank delivers the best possible services to its customers.
Soofi Saifullah AkberSenior Dealer, Money Market TreasuryComing from a rural background, I had the opportunity to win a scholarship to one of Pakistan’s top business schools. After that, I started my professional journey with JS Bank as an entry level resource on the Bank’s Treasury Sales Desk. Since then I have grown professionally as well as personally to become an experienced financial markets’ professional while working on different functions within the bank’s Treasury Front Office which include liquidity management, asset liability management, equity trading, fixed income trading and sales as well as foreign exchange trading and sales. I strongly believe that JS Bank has refined me into who I am today.
Farah DeebaArea Manager, SukkurSince becoming a part of JS Bank, I have found the Bank’s management to be extremely appreciative and supportive of its employees. This constant source of motivation and inspiration has been a driving factor for the tremendous growth that the Bank has achieved during the past decade. I would like to take this opportunity to applaud the Bank’s management team for its focus on continuous improvement and investment in information technology, business development and strategy and I look forward to greater success in the future.
Ahsan AmjadHead of Retail AssetsI have worked at many other banks but JS Bank is different. The reason for this can be summed up in two words: innovation & culture. I have been associated with JS Bank for the past 5 years and the challenge of delivering innovative, vibrant and personalized solutions is what makes this Bank an exceptional place to work at. The employees are encouraged to add value to lives of the customers and deliver outstanding service. With its strategic vision, JS Bank is heading towards becoming the best with an unparallaled experience in the area of retail banking.
22 JS Bank Annual Report 2017

23JS Bank Annual Report 2017
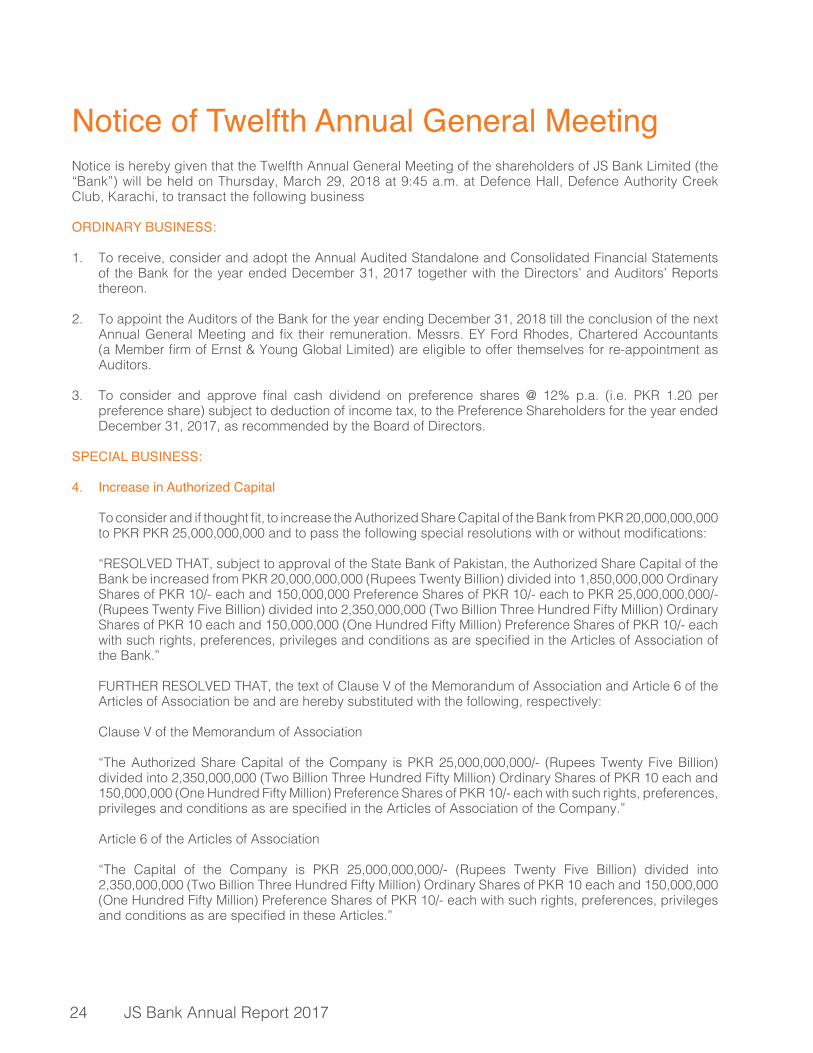
Notice of Twelfth Annual General MeetingNotice is hereby given that the Twelfth Annual General Meeting of the shareholders of JS Bank Limited (the “Bank”) will be held on Thursday, March 29, 2018 at 9:45 a.m. at Defence Hall, Defence Authority Creek Club, Karachi, to transact the following business
ORDINARY BUSINESS:
1. To receive, consider and adopt the Annual Audited Standalone and Consolidated Financial Statements of the Bank for the year ended December 31, 2017 together with the Directors’ and Auditors’ Reports thereon.
2. To appoint the Auditors of the Bank for the year ending December 31, 2018 till the conclusion of the next Annual General Meeting and fix their remuneration. Messrs. EY Ford Rhodes, Chartered Accountants (a Member firm of Ernst & Young Global Limited) are eligible to offer themselves for re-appointment as Auditors.
3. To consider and approve final cash dividend on preference shares @ 12% p.a. (i.e. PKR 1.20 per preference share) subject to deduction of income tax, to the Preference Shareholders for the year ended December 31, 2017, as recommended by the Board of Directors.
SPECIAL BUSINESS:
4. Increase in Authorized Capital
To consider and if thought fit, to increase the Authorized Share Capital of the Bank from PKR 20,000,000,000 to PKR PKR 25,000,000,000 and to pass the following special resolutions with or without modifications:
“RESOLVED THAT, subject to approval of the State Bank of Pakistan, the Authorized Share Capital of the Bank be increased from PKR 20,000,000,000 (Rupees Twenty Billion) divided into 1,850,000,000 Ordinary Shares of PKR 10/- each and 150,000,000 Preference Shares of PKR 10/- each to PKR 25,000,000,000/- (Rupees Twenty Five Billion) divided into 2,350,000,000 (Two Billion Three Hundred Fifty Million) Ordinary Shares of PKR 10 each and 150,000,000 (One Hundred Fifty Million) Preference Shares of PKR 10/- each with such rights, preferences, privileges and conditions as are specified in the Articles of Association of the Bank.”
FURTHER RESOLVED THAT, the text of Clause V of the Memorandum of Association and Article 6 of the Articles of Association be and are hereby substituted with the following, respectively:
Clause V of the Memorandum of Association “The Authorized Share Capital of the Company is PKR 25,000,000,000/- (Rupees Twenty Five Billion)
divided into 2,350,000,000 (Two Billion Three Hundred Fifty Million) Ordinary Shares of PKR 10 each and 150,000,000 (One Hundred Fifty Million) Preference Shares of PKR 10/- each with such rights, preferences, privileges and conditions as are specified in the Articles of Association of the Company.”
Article 6 of the Articles of Association
“The Capital of the Company is PKR 25,000,000,000/- (Rupees Twenty Five Billion) divided into 2,350,000,000 (Two Billion Three Hundred Fifty Million) Ordinary Shares of PKR 10 each and 150,000,000 (One Hundred Fifty Million) Preference Shares of PKR 10/- each with such rights, preferences, privileges and conditions as are specified in these Articles.”
24 JS Bank Annual Report 2017

FURTHER RESOLVED THAT, the Company Secretary be and is hereby authorized and empowered on behalf of the Bank to take all steps and actions necessary, ancillary and incidental for the increase in authorised capital of the Bank and to do all acts, matters, deeds and things as may be necessary or expedient for the purpose of giving effect to the special resolution in letter and spirit, including but not limited to paying the fee to the SECP for the increase in authorised capital and submission of Form 7.
5. Amendment in Memorandum of Association To consider and if thought fit, amend Clause 2 of Memorandum of Association of the Bank and to pass
following special resolution with or without modifications:
“RESOLVED THAT, subject to the approval of the State Bank of Pakistan and the Securities & Exchange Commission of Pakistan, Clause 2 of Memorandum of Association of the Bank be and is hereby amended by inserting following new sub clause (g) and accordingly renumbering existing sub clauses from (g) to (t):
(g) To act as ‘banker to the issue’ under the provisions of Section 63 of the Securities Act, 2015 read with the Regulations 2(1)(iv) and 6(3) of Public Offering (Regulated Securities Activities Licensing) Regulations 2017 , as may be amended from time to time.
Karachi: March 7, 2018 By Order of the Board Ashraf Shahzad Company SecretaryNotes:
1. Share transfer books of the Bank will remain closed from March 22, 2018 to March 28, 2018 (both days inclusive). Transfers received in order at Bank’s Independent Share Registrar, Central Depository Company of Pakistan Limited, CDC House, Shahra-e-Faisal, Karachi at the close of business on March 21, 2018 will be treated in time for purposes of payment of the final cash dividend (subject to approval of the members) and to attend and vote at the Meeting.
2. A member of the Bank entitled to attend and vote may appoint another member as his/her proxy to attend and vote instead of him/her.
3. Proxies must be received at the Registered Office of the Bank not later than 48 hours before the time of the Meeting.
4. Beneficial owners of the shares registered in the name of Central Depository Company of Pakistan (CDC) and/or their proxies will have to follow the following guidelines as laid down by the Securities and Exchange Commission of Pakistan:
For Attending the Meeting
• In case of Individuals, the account holder and/or sub-account holder whose registration details are uploaded as per the CDC Regulations, shall authenticate his/her identity by showing his/her original CNIC or original Passport along with Participant ID number and the account number at the time of attending the Meeting.
• In case of corporate entity, the Board’s resolution / power of attorney with specimen signature of the nominee shall be produced (unless it has been provided earlier) at the time of the Meeting.
25JS Bank Annual Report 2017

For Appointing Proxies
• In case of individuals, the account holder and/or sub-account holder whose registration details are uploaded as per the CDC Regulations, shall submit the proxy form as per above requirements.
• The proxy form shall be witnessed by two persons, whose names, addresses and CNIC numbers shall be mentioned on the form.
• Attested copies of the CNIC or the passport of beneficial owners and the proxy shall be furnished with the proxy form.
• The proxy shall produce his original CNIC or original passport at the time of the Meeting. • In case of corporate entity, the Board’s resolution / power of attorney with specimen signature
shall be furnished (unless it has been provided earlier) along with proxy form to the Bank. • Shareholders are requested to notify immediately for any change in their address.
Notice to Shareholders who have not provided CNIC:
The directive of the Securities and Exchange Commission of Pakistan contained in S.R.O. 831(I)/2012 dated 5 July 2012 requires that the dividend warrants should bear the Computerized National Identity Card Numbers (CNIC) of the registered shareholders or the authorized person except in the case of minor(s) and corporate shareholders. CNIC number of the shareholders is, therefore, mandatory for the issuance of dividend warrants and in the absence of such information, payment of dividend may be withheld in term of SECP’s above mentioned directive. Therefore, the shareholders who have not yet provided their CNICs are advised to provide the attested copies of their CNICs (if not already provided) directly to our Independent Share Registrar at the address given herein above without any further delay.
Placement of Financial Statements
The Bank has placed the annual Audited Financial Statements for the year ended December 31 2017, along with the Auditors and Directors Reports on its website: www.jsbl.com.
Mandate for E-DIVIDENDS for shareholders
In order to make the process of payment of cash dividend more efficient, e-dividend mechanism has been envisaged where shareholders can get amount of dividend credited into their respective bank accounts electronically without any delay. In this way, dividends may be instantly credited to respective bank accounts and there are no chances of dividend warrants getting lost in the post, undelivered or delivered to the wrong address, etc. The Securities and Exchange Commission of Pakistan (SECP) through Notice No. 8(4) SM/CDC 2008 dated 5 April 2013 has advised all Listed Companies to adopt e-dividend mechanism. In view of the above, you are hereby encouraged to provide a dividend mandate in favour of e-dividend by providing dividend mandate form duly filled in and signed.
Deduction of Income Tax from Dividend at Revised Rates
Pursuant to the provisions of the Finance Act deduction of income tax from dividend payments shall be made on the basis of filers and non-filers as follows:
S. no Nature of Shareholders Rate of deduction1 Filers of Income Tax Return 15%2 Non- Filers of Income Tax Return 20%
Income Tax will be deducted on the basis of Active Tax Payers List posted on the Federal Board of Revenue website.
26 JS Bank Annual Report 2017

Members seeking exemption from deduction of income tax or are eligible for deduction at a reduced rate are requested to submit a valid tax certificate or necessary documentary evidence, as the case may be.
Statement Under Section 134(3) of the Companies Act, 2017This statement sets out the material facts pertaining to the special business to be transacted at the Annual General Meeting of JS Bank Limited (the “Bank”) to be held on March 29, 2018.
Increase in authorized Capital
JS Bank Limited on December 29, 2017 issued Privately Placed Term Finance Certificates (PPTFC) as Tier II Capital. Basel III as implemented vide SBP’s Circular BPRD Circular No. 06 dated August 15, 2013 (“SBP Circular”), which prescribes a mandatory loss absorption feature for Tier II capital instruments pursuant to which the PPTFCs will be mandatorily converted into Ordinary Shares of the Bank at the Point of Non-Viability (PONV) trigger event as defined in the Basel III regulations. In accordance with the requirements of SBP Circular, the Bank has agreed with the SBP for the issuance of a maximum of 320 million shares against PPTFC in case of the occurrence of a PONV trigger event and the Bank is required to ensure there are no impediments to the conversion of the PPTFCs, such that the Bank is required to ensure there is sufficient room in the authorized capital of the Bank and all necessary authorizations for conversion are obtained prior to the conversion of the PPTFCs into Ordinary Shares.
In order to create sufficient room in the authorized capital of the Bank, to enable mandatory conversion of PPTFCs into ordinary shares on the PONV trigger event, it is proposed to increase the authorized capital of the Bank from PKR 20,000,000,000/- (Rupees Twenty Billion) to PKR 25,000,000,000 (Rupees Twenty Five Billion) divided into 2,350,000,000 (Two Billion Three Hundred Fifty Million) Ordinary Shares of PKR 10 each and 150,000,000 (One Hundred Fifty Million) Preference Shares of PKR 10/- each. Total increase in authorized capital will be by PKR 5 Billion (500 Million Ordinary Shares).
Amendment in Memorandum of Association
The Securities & Exchange Commission of Pakistan (SECP) has granted license to JS Bank Limited to act as Banker to the Issue under the provisions of regulations 6(3) of Public Offering (Regulated Securities Activities Licensing) Regulations 2017 subject to the condition that the Bank shall amend its Memorandum of Association to incorporate a specific clause authorizing the Bank to act as Banker to the Issue and provide the certified true copy of the amended Memorandum of Association & Articles of Association of the Bank to SECP latest by June 30, 2018.
Statement under Regulation 4 (2) of the Companies (Investment in Associated Companies or Associated Undertaking) Regulation, 2012
The Bank in its Annual General Meeting held on March 29, 2017 had approved long term equity investments of up to PKR 675 million in ordinary shares of each of the following associated companies of the Bank. The resolution is valid for a period of three years commencing from March 29, 2017.
S. no Name ofCompany
TotalInvestment
approved uptoPKR
Amount ofInvestment tillDec. 31,2017
PKR
Reasons for not making completeinvestment in the
specified time
Material changein Financial
Statement ofAssociatedCompanies
1 EFU LifeAssurance Ltd 675 million 190.6 million Time remaining No
2 EFU GeneralInsurance Ltd. 675 million 489 million Time remaining No
27JS Bank Annual Report 2017

Six Years’ Horizontal Analysis
6 YearsCAGR
2017 2016 2015 2014 2013 2012PKR Millions
Statement of Financial PositionAssetsCash and balances with treasury banks 28% 17,334 15,509 11,159 9,041 7,774 5,027 Balances with other banks 40% 1,034 753 584 412 515 1,179 Lendings to financial institutions -4% 3,116 11,334 3,581 11,080 21,586 3,941 Investments - net 40% 169,612 133,727 116,030 84,258 42,679 46,259 Advances - net 47% 184,140 93,794 76,666 62,433 33,763 20,055 Operating fixed assets 15% 7,113 5,837 4,574 3,767 3,628 3,165 Deferred tax assets - net -100% - - - - 884 699 Other assets 33% 5,961 3,746 5,882 5,726 1,942 1,244 Total Assets 39% 388,309 264,700 218,476 176,717 112,770 81,570
Liabilities
Bills payable 21% 3,824 2,544 1,609 1,380 1,415 714 Borrowings 67% 64,557 10,320 54,638 50,538 20,151 8,222 Deposits and other accounts 38% 290,078 226,099 141,840 108,740 80,916 62,544 Sub-ordinated loans 0% 4,999 3,000 - - - - Deferred tax liabilities 0% 797 1,205 1,695 445 - - Other liabilities 46% 7,385 4,883 2,724 2,535 1,354 1,123 Total Liabilities 41% 371,640 248,051 202,508 163,637 103,836 72,603
Net Assets 14% 16,669 16,650 15,968 13,080 8,934 8,967
Represented by:
Share capital 1% 10,725 10,725 10,725 10,725 10,725 10,725 Discount on issue of shares 1% (2,105) (2,105) (2,105) (2,105) (2,105) (2,105)Preference shares 0% 1,500 1,500 1,500 1,500 - -Reserves 61% 1,541 1,334 919 514 302 231 Accumulated profits / (losses) 0% 4,519 3,973 2,529 1,071 218 (65)Surplus / (deficit) on revaluation of assets - net of tax 0% 490 1,223 2,401 1,376 (205) 181 Total Equity 14% 16,669 16,650 15,968 13,080 8,934 8,967
Profit & Loss AccountMark-up / return / interest earned 30% 20,381 15,081 15,328 11,113 6,850 6,023 Fee, commission and brokerage income 35% 2,124 1,427 1,124 835 652 566 Gain on sale of securities - net 31% 1,236 2,965 1,799 1,514 339 826 Income from dealing in foreign currencies 24% 357 313 288 272 269 205 Dividend income 42% 167 98 85 135 378 163 Other Income 23% 169 59 (6) (165) 40 46 Total Gross Income 30% 24,434 19,942 18,618 13,704 8,528 7,829
Mark-up / return / interest expensed 33% 14,139 9,353 9,738 7,259 4,525 3,758 Provision/ (reversal) against non-performing loans and advances 0% 203 (64) 675 658 430 458 Provision / (reversal) of diminution in value of investments 0% 123 415 141 161 23 52 Non-mark-up / interest expenses 26% 8,347 6,848 4,890 4,017 3,049 2,582 Total Operating Expenses 31% 22,812 16,552 15,444 12,095 8,026 6,850
Profit Before Taxation 20% 1,621 3,390 3,174 1,608 501 980
Taxation 24% 647 1,313 1,148 548 150 270
Profit After Taxation 18% 973 2,077 2,026 1,060 351 709
Financial Highlights
28 JS Bank Annual Report 2017

Six Years’ Vertical Analysis
2017 % 2016 % 2015 % 2014 % 2013 % 2012 %PKR Millions
Statement of Financial PositionAssetsCash and balances with treasury banks 17,334 4% 15,509 6% 11,159 5% 9,041 5% 7,774 7% 5,027 6%Balances with other banks 1,034 0% 753 0% 584 0% 412 0% 515 0% 1,179 1%Lendings to financial institutions 3,116 1% 11,334 4% 3,581 2% 11,080 6% 21,586 19% 3,941 5%Investments - net 169,612 44% 133,727 51% 116,030 53% 84,258 48% 42,679 38% 46,259 57%Advances - net 184,140 47% 93,794 35% 76,666 35% 62,433 35% 33,763 30% 20,055 25%Operating fixed assets 7,113 2% 5,837 2% 4,574 2% 3,767 2% 3,628 3% 3,165 4%Deferred tax assets - net - 0% - 0% - 0% - 0% 884 1% 699 1%Other assets 5,961 2% 3,746 1% 5,882 3% 5,726 3% 1,942 2% 1,244 2%Total Assets 388,309 100% 264,700 100% 218,476 100% 176,717 100% 112,770 100% 81,570 100%
LiabilitiesBills payable 3,824 1% 2,544 1% 1,609 1% 1,380 1% 1,415 1% 714 1%Borrowings 64,557 17% 10,320 4% 54,638 25% 50,538 29% 20,151 18% 8,222 10%Deposits and other accounts 290,078 75% 226,099 85% 141,840 65% 108,740 62% 80,916 72% 62,544 77%Sub-ordinated loans 4,999 1% 3,000 1% - 0% - 0% - 0% - 0%Deferred tax liabilities 797 0% 1,205 0% 1,695 1% 445 0% - 0% - 0%Other liabilities 7,385 2% 4,883 2% 2,724 1% 2,535 1% 1,354 1% 1,123 1%Total Liabilities 371,640 96% 248,051 94% 202,508 93% 163,637 93% 103,836 92% 72,603 89%
Net Assets 16,669 4% 16,650 6% 15,968 7% 13,080 7% 8,934 8% 8,967 11%
Represented by:Share capital 10,725 3% 10,725 4% 10,725 5% 10,725 6% 10,725 10% 10,725 13%Discount on issue of shares (2,105) -1% (2,105) -1% (2,105) -1% (2,105) -1% (2,105) -2% (2,105) -3%
Preference shares 1,500 0% 1,500 1% 1,500 1% 1,500 1% - - - -Reserves 1,541 0% 1,334 1% 919 0% 514 0% 302 0% 231 0%Accumulated profits / (losses) 4,519 1% 3,973 2% 2,529 1% 1,071 1% 218 0% (65) -0%Surplus / (deficit) on revaluation of assets - net of tax 490 0% 1,223 0% 2,401 1% 1,376 1% (205) -0% 181 0%Total Equity 16,669 4% 16,650 6% 15,968 7% 13,080 7% 8,934 8% 8,967 11%
Profit & Loss AccountMark-up / return / interest earned 20,381 83% 15,081 76% 15,328 82% 11,113 81% 6,850 80% 6,023 77%Fee, commission and brokerage income 2,124 9% 1,427 7% 1,124 6% 835 6% 652 8% 566 7%Gain on sale of securities - net 1,236 5% 2,965 15% 1,799 10% 1,514 11% 339 4% 826 11%Income from dealing in foreign currencies 357 1% 313 2% 288 2% 272 2% 269 3% 205 3%Dividend income 167 1% 98 0% 85 0% 135 1% 378 4% 163 2%Other Income 169 1% 59 0% (6) -0% (165) -1% 40 0% 46 1%Total Gross Income 24,434 100% 19,942 100% 18,618 100% 13,704 100% 8,528 100% 7,829 100%
Mark-up / return / interest expensed 14,139 58% 9,353 47% 9,738 52% 7,259 53% 4,525 53% 3,758 48%Provision/ (reversal) against non-performing loans and advances 203 1% (64) -0% 675 4% 658 5% 430 5% 458 6%
Provision / (reversal) of diminution in value of investments 123 1% 415 2% 141 1% 161 1% 23 0% 52 1%Non-mark-up / interest expenses 8,347 34% 6,848 34% 4,890 26% 4,017 29% 3,049 36% 2,582 33%Total Operating Expenses 22,812 93% 16,552 83% 15,444 83% 12,095 88% 8,026 94% 6,850 87%
Profit Before Taxation 1,621 7% 3,390 17% 3,174 17% 1,608 12% 501 6% 980 13%
Taxation 647 3% 1,313 7% 1,148 6% 548 4% 150 2% 270 3%
Profit After Taxation 973 4% 2,077 10% 2,026 11% 1,060 8% 351 4% 709 9%
29JS Bank Annual Report 2017

Financial Information
Balance Sheet PKR Million
201720162015201420132012
Deposits - CAGR 38%
141,840
108,740
80,91662,544
226,099
290,078
201720162015201420132012
Advances - CAGR 47%
76,666 62,433
33,763 20,055
93,794
184,140
201720162015201420132012
Investments - CAGR 40%
116,030
84,258
42,679 46,259
133,727
169,612
201720162015201420132012
13,567
11,704
9,1398,786
15,42716,179
Shareholders Equity - CAGR 14%
201720162015201420132012
196,277
157,771
98,02870,255
238,855
356,867Earning Assets - CAGR 41%
201720162015201420132012
Trade Volumes - CAGR 37%
149,050
114,153
77,901
222,963
297,962
57,789
30 JS Bank Annual Report 2017

201720162015201420132012
Net Markup Interest Incomeafter provisions - CAGR 21%
4,774
3,035
1,872
5,3765,916
1,755
201720162015201420132012
Non Markup InterestIncome - CAGR 32%
3,290
2,590
1,6781,806
4,861
4,051
201720162015201420132012
1,124
835652
1,427
2,124
Fee Income - CAGR 35%
566
201720162015201420132012
Administrative Expenses - CAGR 32%
4,824
3,951
3,0382,552
6,748
8,256
Profit Before & After Tax
201720162015201420132012
3,174
1,608
501
980709
3,390
2,077
1,621
973
2,026
1,060
351
Profit Before TaxProfit After Tax
201720162015201420132012
1.74
0.99
0.33
0.70
1.77
0.74
Basic Earnings Per Share (EPS)Rupees
PKR MillionProfit and Loss Account
31JS Bank Annual Report 2017

Financial Information
201720162015201420132012
12%13%12%
16%
14%
12%
Capital Adequacy Ratio (CAR)
201720162015201420132012
9%
4%
10%
16%
14%
6%
Return on Average Equity (ROE)
201720162015201420132012
4%4%
8%
14%
3%
2%
Infection Ratio(Non performing loans / Gross Advances)
201720162015201420132012
54%57%
42%
32%
41%
63%
Advances to Deposits Ratio (ADR)
201720162015201420132012
1.03%
0.73%
0.36%
1.05%
0.86%
0.30%
Return on Average Assets (ROA)
201720162015201420132012
90%89%87%
86%
90%92%
Earning Assets to Total Assets
Ratios Analysis
32 JS Bank Annual Report 2017

Ratios Analysis
201720162015201420132012
3%3%
4%
5%
3%
1%
Provisions / Gross Advances
201720162015201420132012
91%
73%
51%
32%
80% 84%
Non Perfoming Loans Coverage Ratio
201720162015201420132012
83%88%
94%87%
83%
93%
Cost / Income Ratio
201720162015201420132012
1,715
2,082
2,442
2,946
4,163
4,998
Staff Strength
201720162015201420132012
138122112100
185211
238
277307
152
323
161
Branch Network
CitiesBranches
201720162015201420132012
7.757.14
4.50
5.87
10.81
7.52
Market Value per share as of December 31,Rupees
33JS Bank Annual Report 2017

Directors’ ReportWe are pleased to present the twelfth Annual Report of JS Bank Limited (“JSBL”) along with the audited accounts and auditors’ report for the year ended December 31, 2017.
The EconomyThe year 2017 saw a fairly consistent upward economic trajectory. According to a report by the State Bank of Pakistan (SBP), the economy is expected to achieve a growth target of 6% for FY 2017 - 18. This is indicative of future employment generation and a sign that the growth momentum should stay strong in the medium term. This was further complimented by a stable interest rate regime and inflation levels that averaged 4.09% over the year. Rising income levels of domestic consumers and a growing middle class fueled retail sales and commercial activities. On the fiscal front, revenue collection for the year improved by 18% in the first half of FY 2017-18 (1HFY18). Electricity generation and demand gap has narrowed
and is expected to progressively reduce as fast-track work on energy projects included in the China Pakistan Economic Corridor (CPEC) continues.
Signs of fragility are however present. Despite improvement, revenue collection has still fallen short of its target. With a recovery in global crude oil prices and increased machinery imports, the import bill has ballooned. Workers remittances have stagnated amidst deteriorating global fundamentals, especially in the Middle East and North Africa (MENA) region (remittances declined by 0.7% year-on-year (YoY) to USD 19.6 billion in the year 2017). This has resulted in an overall Balance of Payments (BoP) situation that remains precarious as foreign exchange reserves clocked in at USD 20.17 billion (as at December 31, 2017), reflecting a decline of 13% YoY from 2016. The PKR has succumbed to this pressure and depreciated from USD/PKR exchange rate parity of 1/105 to 1/111.
0.74Earnings Per Share (PKR)
Deposits (Million) PKR
290,0781,621
Profit Before Tax (Million) PKR
34 JS Bank Annual Report 2017

Banking Sector Review SBP kept the ‘Policy Rate’ stable at 5.75% for 2017 while banking spreads during 2017 dropped further, averaging 4.94% over the year, a 17 basis points (bps) YoY decline. Banking sector deposits for the year touched PKR 12,362 billion, registering a growth of 10% YoY. Advances depicted a 17% YoY growth, clocking in at PKR 6,530 billion, taking the Advances-to-Deposit Ratio (ADR) for the industry up to 53%. Private sector credit growth clocked in at 18% YoY as of November 2017, fueled by growth in food, textile and consumer segments lending. Moreover, where Non-Performing Loans (NPLs) for the industry increased from the level of PKR 605 billion as of December 2016 to PKR 631 billion as of September 2017, infection ratio for the industry decreased from 10.9% to 10% due to a rapid increase in total advances. Investments increased by 18% YoY reaching PKR 8,542 billion, as
a result the Investment-to-Deposit Ratio (IDR) inched up to 69%. The Government’s domestic debt profile tilted towards short-term paper with the rollover risk relatively increased, as a heavy borrowing shift was observed in Market Treasury Bills (MTBs) from Pakistan Investment Bonds (PIBs) during the second half of FY2017 (2HFY17). This was due to the fact that market participants remained reluctant to participate heavily in the medium to long-term government securities at relatively lower yields, which were not compensating for any potential upward interest rate movement ahead.
Financial Performance Despite an increase in the operating expenses incurred on launching new initiatives, the Bank posted satisfactory results for 2017 as summarized below:
2017 2016Profit Before Tax – PKR million 1,621 3,390 Profit After Tax – PKR million 973 2,077 Earnings Per Share (Basic) – PKR 0.74 1.77 Earnings Per Share (Diluted) – PKR 0.74 1.60 Return on Avg. Assets (ROAA) 0.30% 0.86%Return on Avg. Equity (ROAE) 6.16% 14.33%Capital Adequacy Ratio (CAR) 11.95% 14.05%Advances to Deposits Ratio (ADR) 63.48% 41.48%
Summarized financial data for the last six years is summarized below:
PKR ‘Million’Particulars 2017 2016 2015 2014 2013 2012Deposits 290,078 226,099 141,840 108,740 80,916 62,544Equity 16,179 15,427 13,567 11,704 9,139 8,786Total Assets 388,309 264,700 218,476 176,717 112,770 81,570Investments-Net 169,612 133,727 116,030 84,258 42,679 46,259Advances- Net 184,140 93,794 76,666 62,433 33,762 20,055Gross Mark-up Income 20,381 15,081 15,328 11,113 6,850 6,023Net Mark-up Income 6,242 5,728 5,590 3,854 2,325 2,265Non-Mark-up Income 4,051 4,861 3,290 2,590 1,678 1,806Profit Before Tax 1,621 3,390 3,174 1,608 501 980Profit After Tax 973 2,077 2,026 1,060 351 709Branches 323 307 277 238 211 185Employees 4,998 4,163 2,946 2,442 2,082 1,715
35JS Bank Annual Report 2017

Earnings per Share (EPS)The EPS for the year ended December 31, 2017 is PKR 0.74 per share as compared to EPS of PKR 1.77 per share in 2016.
Capital AdequacyAs at December 31, 2017, JS Bank’s Capital Adequacy Ratio (CAR) stood at 11.95% as compared to 14.05% in 2016. Minimum required CAR (including Capital Conservation Buffer) as prescribed by SBP is 11.28%.
Business OverviewJS Bank continued with its exceptional balance sheet growth trajectory, achieving 46.7% growth YoY, backed by prudent expansion in advances, aggressive deposit mobilization and diversified fee business. The Bank’s strategy is based on identifying and fulfilling customer needs through product innovation, alliances and automation of service delivery. Customer accessibility was strengthened through expansion in branch network, digital channels and branchless banking agents to provide customers an efficient and satisfying banking experience. JS Bank operates 323 branches and 294 ATMs across 161 cities including one overseas wholesale banking branch in Manama, Bahrain.
DepositsJS Bank remained focused on core deposit mobilization, particularly targeting growth in low cost deposit (Current and Savings Accounts – CASA). Despite challenging economic conditions, the Bank was able to close 2017 with deposits of PKR 290 billion, a growth of 28.3% over 2016. Significant growth in the CASA deposit base has been augmented by growth in the Term Deposit portfolio, providing greater stability and strength to the Bank.
The Bank has embarked on several initiatives to strengthen its product line including variants of value-added current accounts to expand its deposit relationships in several segments including business accounts, employee banking, cash management relationships, corporate deposits and technology-based solutions.
AdvancesOn the assets side, there was increased focus on prudent expansion in advances with a holistic product range designed around customer needs. Overall net advances grew by 96.3% to PKR 184.1 billion, with diversified growth in public sector lending (GoP backed), corporate, commercial, Small and Medium Enterprises (SME) and consumer banking.
In addition to traditional lending segments, the Bank enhanced its focus on the SME landscape through a relationship lending model, operating through
several SME hub branches. Furthermore, the secured consumer lending volumes picked up substantially through 2017. The leasing business has also developed a healthy portfolio catering to all industrial sectors of the economy.
The Bank grew its Prime Minister’s Youth Business Loans (PMYBL) portfolio by forming multiple alliances with Pakistan’s leading businesses in order to promote self-employment within their value chains. JS Bank exceeded its SBP-assigned Agriculture Credit targets with a clean portfolio, paving the way for sustainable expansion in the coming years. The Bank continued to develop its gold finance portfolio and extended the proposition to its agri-based customers.
Fee BusinessThe Bank is making concerted efforts to optimize the revenue mix between interest and fee-based income. In addition to growing traditional fee income streams, the Bank has increased focus on cross selling various fee-based products to existing and new customers.
Trade business has remained a key growth area for the Bank where teams were focused on maximizing trade business reciprocity vis-a-vis advances. Resultantly, JS Bank grew its trade volume by PKR 75 billion, an increase of 33.6% and expanded its correspondent banks network to 90 countries.
Investment banking closed a total of eight capital market transactions and a host of advisory and syndicated arrangements in various sectors. JS Bank’s market share for new issuance in debt capital markets reached an all-time high of over 75%. Additionally, the Bank is focused on growing partnerships with global DFIs to meet the financial needs of emerging businesses.
The Bank strengthened its payments business by introducing cash management solutions for its medium and large customers, offering a complete range of payments and collections backed by a state-of-the-art online Cash Management Portal. Alongside, digital banking solutions are being introduced to keep pace with the rapid innovation in payments and the broader transformation in systems enabled by digital technologies.
The Bank enhanced its wealth management cross-sell business including mutual funds and bancassurance, with significant expansion in product range and fee income.
Another area of significant growth was the home remittances business, where the Bank grew transactions by 23%, with an expanded global partner network.
36 JS Bank Annual Report 2017

SustainabilityJS Bank is at the forefront of introducing environmentally and socially responsible banking solutions in Pakistan.
The Institute of Bankers Pakistan (IBP) awarded JS Bank the first ever “Best Environmental, Social and Governance Bank” award in 2017, backed by initiatives undertaken in collaboration with Mahvash & Jahangir Siddiqui Foundation (MJSF) at the second Pakistan Banking Awards 2017.
JS Bank also became the first bank to receive the Green Office certification in Pakistan, awarded by WWF Pakistan.
Service Management and Fair Treatment of CustomersJS Bank is committed to providing its customers with the highest level of service quality and satisfaction.The Bank established an independent service management function that oversees service quality, phone banking, problem resolution and the fair treatment of customers.
The Bank’s Complaint Handling Policy and Grievance Redressal Mechanism ensure that complaints are resolved in a timely manner and recurrence of complaints is prevented where possible. Customers have the option of registering their complaints at the Bank’s branches, phone banking center, JS Bank’s website or via email. The process includes registration, acknowledgement, interim response where applicable, resolution and root cause analysis of recurring complaints. The Bank has a Service Quality Council (SQC) that functions as a standing committee on customer service. The SQC is chaired by the President & CEO of the Bank and it includes senior management committee members. The SQC reviews all service level and complaint reports and initiatives and focuses on simplifying processes for improvements in service levels and overall customer satisfaction. Customers are also given the option of contacting the Banking Mohtasib office in case they are dissatisfied with the response received from the Bank.
To create enhanced visibility of the recourse mechanism available to its customers, JS Bank has incorporated awareness messages of its complaint handling function in several customer communications such as account statements, ATM screens, letters and SMS messages. A complete Grievance Redressal Mechanism, contact channels and online feedback forms have been made available through the JS Bank website, and email broadcasts have been sent to the customers for customer education and awareness. ‘Fair Treatment of Customers’ is an integral part of our corporate culture. The Bank has institutionalized a ‘Consumer Protection Framework’. Our priority is to keep customer benefits in mind while designing, selling and managing products and services, without any discrimination. We also focus on financial literacy
of our customers, for promoting responsible conduct and informed financial decisions by consumers, through our ‘Consumer Education and Financial Literacy Program’.
Risk Management The Board is committed to adopting the best risk management practices in letter and spirit. To maintain effective risk management practices, the Bank follows an appropriate risk management framework according to the regulatory directives issued by SBP and other related guidelines under the Basel II / III framework. In this regard, the Bank has a comprehensive set of risk management policies, practices and procedures which enable the Bank to take into consideration, in an appropriate manner, all major kinds of risks including credit, market, liquidity, operational and IT security.
The overall risk management framework of the Bank is under the supervision of the Board of Directors (BoD)/Board Risk Management Committee (BRMC) while the operational level day-to-day functioning is carried out by the senior management of the Bank. In order to develop a holistic integrated risk management approach, a dedicated and independent Credit & Risk Management Group, is in place to manage various aspects of risk management in the Bank. To formalize and strengthen the risk management approach within the Bank, the following significant policies were developed / reviewed and approved by the Board:
• Credit Policy• Collateral Management Policy• Market Risk Management Policy• Operational Risk Management Framework• Liquidity Risk Management Policy• Business Continuity Policy
BRMC keeps an eye on the overall risk profile of the Bank. The Integrated Risk Management Committee (IRMC) and Assets & Liabilities Committee (ALCO) of the management operate within an established framework in order to monitor the Bank’s activities and maintain the risk level within predefined limits, meeting on a regular basis to review market developments and the level of financial risk exposure of the Bank.
Market risk measurement, monitoring and management reporting is done on a regular basis. The Market Risk Unit supported by the Treasury Middle Office is involved in daily monitoring of all related financial risk exposures in the form of interest rate risk, equity exposure risk, currency or foreign exchange risk, cross border or country risk, financial institutions (FI) exposure risks and liquidity risk. The Bank is in the process of upgrading its system capabilities and plans to implement Temenos Insight Risk Intelligence Solutions providing analytical capabilities for regulatory capital, market analytics and asset & liability management in the coming years.
37JS Bank Annual Report 2017

Operational risk management function also maintains the business continuity policy and facilitates the annual testing of mission-critical systems and services that may be disrupted due to any eventuality or disaster. The Bank has also developed a new Disaster Recovery (DR) site to ensure maximum availability of system and services to customers and partners for critical (time sensitive) and support functions.
In terms of information security, the Information Security and IT Risk Management Unit facilitates risk identification, assessment and monitoring of IT and information security-specific risks across the bank. To further improve the information security footprint, database encryption, Advance Threat Protection and Privileged Access Management systems are under implementation.Credit risk management is an ongoing process. The overall credit policy and the credit risk management guidelines are issued by the Board of Directors. In this regard, a Central Credit Committee (CCC) is entrusted with the responsibility of monitoring credit risk in the Bank. CCC meets regularly to actively supervise credit risk across the lending portfolio. In order to maintain a healthy growth of the credit portfolio, the Bank’s Credit Risk Management processes are consistently upgraded and improved to meet future challenges. Further, in order to bolster credit risk management monitoring activities, a Credit Risk Monitoring Unit is in place for regular portfolio monitoring, formulating and implementing credit risk management tools including setting up of industry, geographic and sectorial limits, and devising credit risk quantification / statistical techniques to meet SBP and Basel II/III requirements.
The management of risks and uncertainties associated with problem credits requires a different and more intense approach than normal management. In this regard, a Special Asset Management Unit is in place following SBP’s regulatory guidelines to focus on remedial management issues, take ownership of classified portfolio for effective management and to determine the work-out modes for settlements, as stipulated in the Remedial Management Policy of the Bank.
On capital management side, the Bank’s practices ensure that it has sufficient capital to cover the risks associated with its activities. It is the prime objective of the Bank’s capital management to ensure that the Bank complies with all regulatory capital requirements and at the same time maintains strong credit ratings and healthy capital ratios in order to support its business and to maximize shareholders’ value.
Learning and Organizational DevelopmentThe Bank is committed to ensuring that the Bank attracts, recruits, develops, and retains a high
performing and diverse work force. In 2017 the Bank implemented its first Management Trainee program to develop the Bank’s future leadership. The Bank also established its Learning Academy to centralize and formalize training needs for the organization.
Statement on Internal ControlsJS Bank has placed the utmost emphasis on establishing stringent controls in all its operations. It is the cornerstone of the Bank’s policies to adhere to the best industry practices, ethical standards and regulatory requirements. In this context, the Board of Directors has promulgated policies that provide for taking risk of an acceptable level in various areas. The senior management accordingly able to identify risks at appropriate stages and put in place necessary procedures to monitor and control the risks. This necessarily entails a periodical review of policies, systems and procedures to cope with a dynamic banking environment.
It is the continuing responsibility of the senior management to evolve systems and procedures that ensure overall comprehensive controls in the light of the Board of Directors guidelines. The success of such procedures is ensured by disseminating the requirements of various processes to the grass roots level. Another component of controls that is strictly adhered to is the effective delegation and segregation of duties with checks and balances properly in place. All staff is encouraged to participate and come up with ideas for developing better procedures. The continuing review of systems and procedures enables improvements that rectify possible control lapses. The Bank’s initiative to establish a learning academy will go a long way in improving compliance with systems.
Internal controls are intended to provide a reasonable measure of assurance regarding the effectiveness and efficiency of the Bank’s operations, reliability of financial information and compliance with applicable laws and regulations. However, it is acknowledged that the systems put in place can only provide reasonable but not absolute assurances against material misstatement or loss since they are designed to manage, rather than eliminate, the risk of unforeseen loss in seeking to achieve the business objectives.
An independent and effective internal audit function reviews the effectiveness and adequacy of internal controls and continues to monitor compliance with policies and procedures. The Board of Directors is regularly kept up to date about the state of compliance through the Board Audit Committee. As a priority, all significant and material findings of the internal and external auditors and regulators are addressed by the management ensuring that appropriate corrective actions have been implemented. Adequate systems are put in place to minimize repetition and strengthen
38 JS Bank Annual Report 2017
the control environment. In addition, the Compliance Department is performing its due role to ensure regulatory compliance across the Bank.
The Bank diligently followed SBP’s Guidelines on Internal Controls to evaluate the effectiveness of the overall set of internal controls including financial reporting controls. A detailed documentation of bank-wide processes and controls has been completed. Furthermore, the Bank has developed a comprehensive management testing and reporting framework for ensuring operating effectiveness of key controls and has significantly addressed the identified design improvement opportunities.
Upon satisfactory completion of the Internal Controls over Financial Reporting (ICFR) Roadmap, SBP granted exemption to the Bank in August 2016 from the submission of Long Form Report (LFR) by external auditors. Annual assessment report for December 31, 2017 on efficacy of ICFR shall henceforth be submitted to SBP duly approved by the Board Audit Committee.
The management considers that the internal control system presently existing is adequate, implemented effectively and continuously monitored. This statement is also hereby endorsed by the Board of Directors. The management will endeavor to continue enhancing its coverage and compliance with the SBP guidelines on Internal Controls and thereby strengthening its control environment on an ongoing basis.
Corporate and Financial Reporting FrameworkThe Directors confirm compliance with the Corporate and Financial Reporting Framework of the Securities & Exchange Commission of Pakistan Code of Corporate Governance for the following:
- The Financial statements prepared by the management present fairly the state of affairs of the Bank, the results of its operations, Cash Flow Statement and Statement of Changes in Equity.
- Proper books of accounts of the Bank have been maintained.
- Accounting policies as stated in the notes to the accounts have been consistently applied in the preparation of financial statements and accounting estimates are based on reasonable and prudent judgment.
- International Accounting Standards as applicable in Pakistan have been followed in preparation of the financial statements.
- The system of internal controls is sound in design and has been effectively implemented and monitored.
- There are no doubts about the Bank’s ability as a going concern.
- There has been no material departure from the best practices of corporate governance, as detailed in the listing regulations.
- The details of outstanding statutory payments, if any, have been adequately disclosed in the financial statements.
- Outstanding statutory payments on account of taxes, duties, levies and changes have been fully disclosed in the Financial Statements.
Holding CompanyJahangir Siddiqui & Co. Limited, listed on the Pakistan Stock Exchange Limited, is the holding company of JS Bank Limited, owning 70.4% of the ordinary shares and 96.9% un-listed, convertible, irredeemable, perpetual, non-cumulative preference shares.
Subsidiary CompaniesJS Global Capital Limited and JS Investments Limited are subsidiaries of JS Bank with shareholdings of 67.16% and 65.16% respectively. Performance of these companies has been reviewed under the consolidated Directors’ Report.
Attendance of Directors in the Board meetingsSix meetings of the Board of Directors were held during the year 2017. The attendance of directors at Board Meetings was as follows:
39JS Bank Annual Report 2017

Name of Director Eligible to attend Meetings attendedMr. Ali Jehangir Siddiqui 6 6Mr. Adil Matcheswala 6 6Mr. Ashraf Nawabi 6 6Mr. G.M. Sikandar 6 6Mr. Kalim-ur-Rahman 6 6Mr. Munawar Alam Siddiqui 6 6Ms. Nargis Ghaloo 6 6Mr. Shahab A. Khawaja 6 6Mr. Khalid Imran, President & CEO 6 6
The attendance of directors at Board Sub-Committees meetings was as follows:
Name of Director Audit Committee Risk Committee HR Committee Eligible
to attendMeetings attended
Eligible to attend
Meetings attended
Eligible to attend
Meetings attended
Mr. Ali Jehangir Siddiqui - - - - 2 2Mr. Adil Matcheswala 4 4 - - - -Mr. Ashraf Nawabi - - 4 4 - -Mr. G.M. Sikandar 4 4 - - 2 2Mr. Kalim-ur-Rahman - - 4 4 - -Mr. Munawar Alam Siddiqui - - 4 4 - -Ms. Nargis Ghaloo - - - - 2 2Mr. Shahab A. Khawaja 4 4 - - - -Mr. Khalid Imran, President & CEO - - 4 4 - -
Pattern of ShareholdingThe pattern of shareholding at the close of December 31, 2017 as required u/s 227 (f) of the Companies Act, 2017 is given on page number 279.
Corporate & Social ResponsibilityStatement of Corporate & Social Responsibility is disclosed in Annual Report.
Credit RatingsThe Pakistan Credit Rating Agency Limited (PACRA) has maintained the long term rating of the Bank at ‘AA-‘ (Double A Minus) and the short-term rating of “A1+” (A One Plus) which is the highest possible short-term rating.
Dividend to Preference ShareholdersThe Bank on February 19, 2014 issued 150 million un-listed, convertible, irredeemable, perpetual, non-cumulative preference shares at a par value of PKR 10 each with a fixed return of 12% per annum for a period of four years. The preference shares after four years will be converted into ordinary shares of the Bank at a price
of PKR 6.67 per share (a discount to face value of PKR 3.33 per share). The distribution of dividend to preference shareholders is non-obligatory and non-cumulative and will be allowed only if the Bank has earned sufficient profit in the current year to pay dividend and is in compliance with all the regulatory capital and provisioning requirements.
Since all the conditions for payment of dividend are complied with, therefore the Board of Directors has recommended for the shareholders’ approval at 12th Annual General Meeting payment of dividend of 12% to the preference shareholders. No dividend is paid on ordinary shares.
40 JS Bank Annual Report 2017

Employee Benefits SchemesJS Bank operates Staff Provident Fund (the Fund) and funded Gratuity Scheme (the Scheme) covering all its permanent employees.
The contribution made toward the Fund during the year 2017 is PKR 137 million (2016 PKR 101.4 million).The un-audited balance as at December 31, 2017 of the Fund was PKR 1,042 million (2016: PKR 778.3 million).
The contribution to be made to the Scheme is PKR 175 million for 2017 (2016: PKR 118.3 million). The un-audited balance of the plan assets of the Scheme as at December 31, 2017 was PKR 377 million (2016: PKR 236.4 million).
AuditorsThe present auditors of JS Bank are EY Ford Rhodes, Chartered Accountants (a Member of Ernst & Young Global Limited).
Compliance with Code of Corporate GovernanceThe requirements of the Code of Corporate Governance set out by the PSX in its listing regulations relevant for the year ended December 31, 2017 have been adopted by the Bank and have been duly complied with. A statement in this effect is annexed with the report.
Events after the Date of Statement of Financial PositionThere have not been any material events that occurred subsequent to the date of the Statement of Financial Position that require adjustments to the enclosed financial statements.
AcknowledgementsOn behalf of JS Bank, I would like to extend our gratitude to our customers and stakeholders for their patronage. I would also like to thank the Ministry of Finance, the State Bank of Pakistan (SBP), the Securities & Exchange Commission of Pakistan (SECP) and other regulatory authorities for their support to our Bank. Finally, I extend our appreciation to the management team and staff for their persistent commitment to working together as a winning team.
For and on behalf of the Board,
Khalid ImranPresident & CEO
March 3, 2018
41JS Bank Annual Report 2017

FFFF,,,,ƒƒƒƒ®®®®~~~~iiii++++++++ÅÅÅÅe �Åk5åHH‡.ps**‡.E¦F,»H 150 âÆ 10 ¡½hå
EHñÆ‚ 12% Ãe‚Åæ 2014 � 19 F,ƒ®~i++Å 0*Ŭe$Æ‚ 3.33 0*ƒÏ° 6.67 ‚ÆtF,Ƭ~psƒYNÐÅ°
Z#¦t~�YNФ/i++ÆÅæ~‚»°o«c*ƒÓF,¢c*Å�_rƒ
‚Ñ:¬~ƒ®ÅÅm, 12 Æi++ÅÃ], 12% èi++ÅÓ_ÅÅ®F,ƒ®~
""""555544443333¨4444øøøøEEEEGGGGEEEEGGGGEEEEHHHH]]]]¼¼¼¼,,,,ççççGGGGEEEE
LÓx5}Ã66,i++¤/�¨�™@*
~2016 �å‚ 1,042 J»” 2017 31 � 101.4 ~t¶ 2016 �ŶYÅ 137 ~ 2017 ‚� 778.3
�å 377 JÆÆU*»” 2017 31 � 118.3~2016 �ŶYÅ 175 ~ 2017 ‚� 236.4~2016
ññññÆ Ernst & Young Global Limited ÷ EY Ford Rhodes, Chartered Accountants Æñ�ñ
»»»»ffff$$$$ÍÍÍÍSSSSÆÆÆÆ2222ÅY+$°*Å„~Gûf$ÍSÅ¢c*ÃCc*Æ_H PSX ÃႠ2017 31
~qÆ‚Ý
ccccÅÅÅÅÅÅÅÅ@@@@****ÆÆÆÆÆÆÆÆcÅÅ@*ÆÃāÆ�v
_54.54øHGHEG
~oÅ¢ƒ
ÖÖÖÖv ÅY+$~L™ƒ®»Æ¬6,]¦/ƒ~î÷0*_5½3ð GGâ0*
»Ã¬�™ƒ~[YxÆ‚qÆ6,»™á5}»Åœ6,]t™**eƒÇ
+$
{{{{−−−− 6,j+i+.$2018 â 3
42 JS Bank Annual Report 2017

279
43JS Bank Annual Report 2017

9²»Æ6,âàâ»!*ƒ**‡.:2°*ÅÆW,»¤/ƒÃoƒŠâ™@*@*!*ÃHY@*āÃÇHHÂvc*ñÅÆ~Æoƒ¢;�™t»!*£œÆ~vÆÙÆ÷
qW,:99²ÆW,ƒñ+M»Y,80*§i»Æ_Å™@*Æ)],Ã!*‡°ÏÆqÑ!*3Y@*F,6,0+ñÆÓâ}[ÅY+$ÅY÷�ā!*ÃāÓoƒqŠâÑÍG÷ÃÁÁ™òÃoƒÂÃÇGY÷'h+tā².5Õä F0*¹~ÅÃC™™;
²9²Æ¦ÃLÅW,e$»0+Î0*Æ9Éß6,Hm,Æ{»¦‹t¶K0+„G{àÆ�CÆF,Âq*m,ÅÆ
²ÅW,6,ÃqYì[�c*m,~¶K0+„GÆñŠâG÷
¦™~ LFR ~ÃñÅY+$Ñ8à 2016 Æ6, ICFR 9²Å‚Ñ:~¦™YÏ 2017 31 Æ»¤/ƒ ICFR
»āñ�9ñW,§jÑ̓@*™@*Ã6,],ÅY+$HY@*[9²ÅÇàÑÆ_Kò.5Õä F~Ùϧ»òâC6,ƒÇ
»»»»ffff$$$$����»f$�',�k,â0*ûf$ÍSÅ],qsÅï÷
ÅY+$”Æ5Æ6,Æ}Sr¨~p~»6,™@* •
Æ»ÅÃ',Œ3H •
»Æ~™»0*É4lç GEÅ~!*‡°ÏÑÍG÷»»‡.Ÿ6,F •
Å~0*~‡.:»ÆÑòÅcÅ •
9²»Â§m,HHW,§jÑÍHHW,§j„ÅÅY„ •
ñ�)bÅA6,× •
ñ�°*ÅÆ�»f$ÍSƧh~Ãâ% •
~Z#чŤ/ÃÂoƒ6,]HH •
pÅæ~c*Z#чÃ~6,ªCHH •
ƒƒƒƒ®®®®8888Åk5åHH‡.ps**‡.E¦F,Å 96.9% ¬ 70.4% 0*6â~œjÃŃ®8�
â´
]]]]4444hhhhåååå EEEEHHHH!*nMÆ‚Å~÷Å»™Ï»Y,ā],Å 65.16% 65.16% .$o.3ï GHEH
~H
44 JS Bank Annual Report 2017

âL‹»0+ò%C6,ÅYâL‹.$R,õç~Å$†f$‹r¨‹™c*I!Æ™!*c*‹âi+¨‹Å~ÓâàÅ%™@*LÃ'h+L™;á‚ß~âL‹c*U*ÆÆáÅ�#.3ð HGEK"3ï JGH‹
&45ÍC4øEHGGEE|c.ç IEE6,æ»/r
6,‹[),÷ÆÅ0*Ã',Œr™&41¹ÿ GHGÅ‚Ñ:YõÆqÆ!*)dƒÅ~ÅYõ~$�™@*�¹c*qU*6,dƒ÷W,‡�Å$L0*ìÃÅc*c*7Ã
‚V$c* DR *7r
‹[.$~ŶK0+„ÅYõâÆŶK0+„™@* IT Î_5½3ð GG¨Åæ~Î_5½3ð GG¨âÆðB‰Å¶K0+„6,&ÑCå GEH&½mø G[~'h+ÑY„~Šâk,÷™i+‹[q
à CCC $+2Y�Ñ6,¦™i+0*™i+‹[ÅÉ@c*],ÅY+$YÅY÷~ç™i+~™i+‹ÅÅ){÷ç™i+ŒÆ™i+‹Å!*‡°Ï»™™i+Æ�Ã',ŒpÆ™i+‹[6,Ãx6,�c*Y;w~âƒ~'h+ÑY„'h+tā™i+‹[¤/~$™i+‹â�8.$c*H@*ā™i+‹[²ÃF,Mc*Y6,æHY�
Å»¢c*ÙÆÑc*2Æ6,Œ Basel II/III _5½3ð GH"5ÿ GJu™i+‹ÅYõ0*
.$ SAM ŒÆ)bq»òÆ£~c*ÂÔr~q$miï GH[c*H�0*Å°*ÅÉ@c*6,cƒ™D+Åò5dÅÆ6,KÂ%Ù@*YÆW,§i»ÅYõ™@*āÅD+Åò0*~Ÿs#Å
âÆÆá»»!*Ÿ!*Ã@*āq{§âtr»!*¤/!*‚ûÆâÆ»!*Ã**āâÓ¢°*6,cƒ@*ÆqL™i+',ŒpÆ‚â»dÚƒ',Œr@*ā»!*Å'h+ƒc*ÆÆâÅ~c*c*Ÿ†ƒ
°°°°))))HHHH^,,,,wwwwCCCC~L[R,6,¤/6,æH@*āw~d 2017 5½d»™ÏÆqïÃL™'h+%æFN³
H,cR,¢c*Ùq°)Oò‡Å n qƒ
'''',,,,9999²²²²LÓ6,~J²‡™6,•c*Å0*É4n.ç GGEÅCtā+7Ƨh¹Å¢c*6,æ™Ú~],2÷�k,c*~‡.÷‘[Æ_oƒ%6,ŶK0+„
Å™¢§i»ÑÍ™tÆâ0*É4lç GEbo,çHE§i»ÆqæY,6,Ñò6,Ñ̓@*
‘[Åt)ā§i»Ã��],ÆÉßÅÝ~ÓF,Yì²Ã§i»Å»x¤/6,§Å¢c*Æ�Æ)Y²»qb6,HY@*W,ÆBÆ‚�»ƒ**Ó6Å‚ÅYā§i»Ã~Làc*™Â§i»»Y,Å{~Ã@*ÅY+$q°)OòÆ»¸�āÂ_Ã~»°æÇU*"$ƒÇ
45JS Bank Annual Report 2017

[[[[ÆÆÆÆËËË˧§§§iiii»t³āLÃdÅqï}.âÅ�™q[c*�ÆÆ JS
)bÆƂ˧iÅ™@*
ÅDc*ÆYÅ0*¤/ß$hÿ G!5½2.ç GGEE!*Ã@*āDc*»',‰YHYDc*Ã!*:ƒJƒ»YÆÅd$‚V$c*éÆ)™%~De$»0+xæ~De$ JS 0*t(āKDc*Å',+?ç
EFEç
SQC ÆY»‡&ÿEL:ƒDe$»Dc*Æ!*úƒÆC»‹t÷ï÷Æ%æGLÃy»±ÆœÐÆ%æGL~dòÆ÷ï÷ JS œ8Åñ�îÃy»±Åœ
Ãy»±ÅR6,ÓDc*Å~GYáŠâ~Ѧ6,ÆÅ�»Y,Ãt(qāÅY+$De$Æ�ñƒÅ~Æ~™h÷
L².5Ó43ï FGEH~Æ‚¼"5»4n.çEGGIEEā».$
_54.54øHGHEHh JS ÆÃ$½2.çGEEÅ7~ÂÆ
Åd$‚V$Æ)7G÷Æé',»† JS $4o?ç GEE»¸Hq¤/ß$hÿ G!5½2.ç GEGEÆ745Îæ FGEEÑÃ'ÃÇ„�™÷˧i»f$»qÑòb%6,"5½jè
HGIE�ÃÅ~±H6,ÆÅm,�|#ÆF,8Cé EGSÆ¢ÃL‚~p÷%�6,¤/Æ)â6,ÅÇ„âÆKÂ%Ù÷@*ā%ÆâàÇ„q™q):|ÃC
»»»»»t³āÆò§i»ÃÓ°*Æ‚',»ÑqW,‹[Ƨi»Ã',Œp0*Å
�Å@c*Æ�qW,‹[�6,™@*~Åq• Basel II/III ¸°*ÅY™@c*vYì7À.ïGL6,F§i»F,Mc*ÅæÃÓ(,ÎÆ~™i+âLi+¨6,_5½3ð GG¨÷ï÷6,6,%æGL¨Ñ»ñ
»¦‹[�],‹[Æk,6,Æ%ñÅdÆk,÷ƒÅk5ëH&45¾æEHG
Y"5å GHH‹
[Ã'h+q™i+‹[¤/~Š/páâC÷ï÷~‹[ƼÆÄ°Æñ�Æ0+‹[Ã!*ŸL™s7À.ïGLF,M$�ç
EELU*ÅÅ
™i+0* •
ò0* Ã •
âL‹[0* •
6,‹[� •
i+¨‹[0* •
),÷ÆÅ0* •
q‡”�Æ0+d@*ā ALCO U*Å IRMC Ŧ‹6,ÃbÅr[Å&45¾æEHG‹[ BRMC
Ť/ÅÅY™uÆ0+ÅRÃÁ3Y:C6,»™ÆâLCÆâà»Y,Y
46 JS Bank Annual Report 2017

iiii++++IIIIU*ÆáÅ¢c*ÃæÃpƒÅ6,ÅYìÆ)i+I~Ÿ±6,{ÂøÆŒ£Y#0*Æ
÷ 184.1 JŸ±Æ‚ 96.3% %~Ÿ±¦,Mi+I SME »f$#x6,,
',+?çE
FE6,FŒÆVàÆ)Æ],»6,KÂ~'h+Ÿ†H (SME) ÆYÆ~F~_5½3ð GG%ŒÆŸ†ƒÆÓ+7søÅ¢c*™Æ8),÷»qHH 2017 'h+',‚
Å~ÂÅ PMYBL KÆ0+»!*Æ�0*ÆŸ»!*Æ‚¼Æ)6,î),÷ßÅY+$ºGYá™i+@ËÆ‚™á‚ß~qLŸ†ƒÇLÍ®÷ SBPJS
~Ÿ†™;Æ‚‚Lv~'h+Ÿ†H
6666,,,,FFFF»»»»!!!!****†Åæ~qƒàæÆŸ±Ã÷ÅDÅæ~Ÿ±Lñ�6ÃÅC6,¼6,Å�|#6,KÂ%Ã
Lˆ JS ˆ»!*ÅF,¹•;Æ�ˆ»!*ÃŒÆnáÆ)ÂÂ%ÃÅÆ~´~C,M 90 Ÿ† 33.6 »Ÿ†H�āÀ 75 »!*~
»âL JS ât»ÀâLR,4,¶¼Y~āâÆ‚!5+k,ƒf$â54øGH~6Æ‚(,ƒ0*ì’6,KÂ%à DFIs Z+;�J»ƒ(,'h+tāF,¹5+k,»!*Åâà¢c*Ù. 75
Lz(,S[|c.ç IEEÙ™L#.3ï FGEH),÷ÃLH~•].h+ÑS[TÅ$¶¦™ÅÅÆ‚‚ßÅæ~à].~(,p~ƻÙ|c.ç IEE
™Y÷
6,–ÅC6,æ~',„ÂÆ‚L&Íô GG[™_5Ò5ë GEY),÷~Ÿ†H~b÷÷ï÷
Ÿ†H 23% {§Ÿ±Æv~R6,F,»»!*.0*ì,MÆ‚KR,4,~
~œj 2017 0*~â)Å|c.ç IEE™~ƒÐ;0* JS
~],ÍS» 2017 à JS IBP ÆGŠâÃTƒ30* MJSF Ã+cc*
0*ÅY+$¤/~껳c*H WWF 0*» JS
47JS Bank Annual Report 2017

2017
290,078
16,179
388,309
169,612
184,140
20,381
6,242
4,051
1,621
973
323
4,998
2016
226,099
15,427
264,700
133,727
93,794
15,081
5,728
4,861
3,390
2,077
307
4,163
2015
141,840
13,567
218,476
116,030
76,666
15,328
5,590
3,290
3,174
2,026
277
2,946
2014
108,740
11,704
176,717
84,258
62,433
11,113
3,854
2,590
1,608
1,060
238
2,442
2013
80,916
9,139
112,770
42,679
33,762
6,850
2,325
1,678
501
351
211
2,082
2012
62,544
8,786
81,570
46,259
20,055
6,023
2,265
1,806
980
709
185
1,715
qY0*r¨¦U*
$o.54øGHEH{Ø
i+I{Øæ { â
{Øâæ**âæo«o«',+?ç
EFE
5}
�0*
EPS °°°°oooo««««å 0.74 ÃႻ°o« 2017 31 Æ£~ 1.77 Æ°o« 2016
(Capital Adequacy) eeee$$$$ââââtttt0*ÅY+$m,™ÁÁ»e$ 11.95%à 2017 31 Æ£~ 14.05%Å 2016CAR Åe$ât JS
11.28% âtøc
»»»»!!!!****YYYY^,,,,‚Ο†qH].h+6, 46.7% ÅL$4èG�àŸ†Y3i+I~Ÿ±0*ÅYq:),÷Åæ JS
»Æ)Å¢Ã'™**Å7À.ïGLÅCûW,Š/�™',õ,M~6,Fq,M 294 ',v 323 à~ 161» JS Ÿ±745Îæ FGEE',õ5Æ)Å‚Ã'h+‚c*H
~oƒ−',+?çE
FEâ**:Å÷ï÷
0000****Æ2017 ~Ÿ†ÃÆ!*� CASA 0*~Ÿ±6,Â;»C@Á0*™.$±» JS
Ÿ†ªC™@*R,0*Æ~Ÿ±»‚0*~÷0+Ÿ†ƒ�Æ 28.3% Æ£~ 2016 � 290 !6,Æ0*»!*)
K6,–ÑÃ'h+FŠâG÷~Ÿ°œÆ‚™.$»÷ï÷@*āFø),÷»S[&Ó4jè GGIEm»f$0*ß6,F|c.ç IEEÆ0*~Ÿ†HYn
48 JS Bank Annual Report 2017

]]]],,,,Å!*ƒ‚Ñ:”»ñ™÷ JSBL JS ÃႠ2017 31 •Æ‚
» 6% 0* 2017-18 ÅÆ_Âāâà‚ SBP ~$+2ÅY+$Ç'Ã0* 2017 ‚
tw~5ÆñaƒÅ#¶K0+„™@*āÅxæ~YÏ~ÃL q™áÏ @ » „wâqƒàæ(,ƒç#¤/~Ÿ†ƒâ 4.09% �ÅR'h+¾e$�‚Æ
JŸ±Æ‚‚Ñ:æ~ðÅaÔ»ÁƒeÑ0*O@ 18% Å�„~ 2017-18 áâà‚~÷ïÂ**Æ6,»ƒÅÁƒÅ CPEC
°Åâ@*ñ�÷Æ!*�‚Ñ:æL@Á{ŬÅà�Åæ~Ÿ±æ.~Ÿ†ƒ‚ÎJÁƒ 0.7 ~F,− 2017 Y~F,−~Æ!*)5}ÅF,−Æ~¶‚ MENA ¬R6,!*Ñà�i
Ã� 2017 31 %° 20.17 Ŧ�6,W,Ñ�„YèI!Æ{], BOP %°#.54øFGEH 19.6™
ƒ 1/111 ¤/™ 1/105 ‚ζªC™@*0*t!*',“™~**»;°0*I! 13%2016
»»»»YYYY^,,,,‚ &4lç EGE 17 � 4.94% ¶‚~ 'h+ ~~ 2017 ',Œ3 5.75% 0*f$ 2017 0*
‚Ο†ªC™÷ 17% Æi+I 6,530 ‚Ο† 10% � 12,362 ζªC™‚~Æ0*åÅb%Æ~Œ£Y~ 18% Ã6,f$øÆ™i+~Ÿ† 2017 J`H 53%ADR +7»i+I0*
J¦i+I~Ÿ± 631à 2017 ÅR™Æ 605Æ2016 NPLs Ÿ†å'h+',+7Æ”ŒJÆ~ 8 , 5 4 2 J‚Ο±Æ‚ 1 8 % ƒH
$o.54øGHEH
1 0 . 0 % Áƒ™ 1 0 . 9 % +7»$©5½jèEE
GIE
Å�„ 2017 JH0+Œ»÷R,ÅY+$;‹~Ÿ†ƒYèâà‚ 69%IDR $o.3ï GHEH0*ÅY+$ŒÆ~ÅtāâL0*&4k5454ø
HGFGEH£&Ò5é EGMMÁo«6,x MTBs âLR,n, PIBs Æ0*
$o)454øGHEHE!*+
sæÅÍ_5½3ð GG~c*•?»DƆf$~Ÿ±»ÃÃ;å
ââââ»»»»™™™™ÏÏÏÏ~}qG»āqs 2017 6ŠâƸÅ6,Y~Ÿ±Æ!*�
o«�o«�°æ°æQ+
ROAA ‰U*6,ñROAE ‰r¨6,ñ
CAR i+rADR i+IÃ0*
2017
1,621
973
0.74
0.74
0.30%
6.16%
11.95%
63.48%
2016
3,390
2,077
1.77
1.60
0.86%
14.33%
14.05%
41.48%
‚ßÅâ»āqs 6 ¦/¸
49JS Bank Annual Report 2017

Creating Greater Value Through Social Efforts
50 JS Bank Annual Report 2017

JS Bank has made a difference in many lives through the PMYBL program by enabling youth to create their own success stories.
JS Bank is empowering Pakistani youth by financing vehicles for use on the Careem Network
JS Bank has joined hands with Nestle Pakistan to generate opportunities for young dairy farmers, between the ages of 21and 45 years, by helping them develop new or grow their existing businesses.
51JS Bank Annual Report 2017

Statement of Compliance with the Code of Corporate Governance(See clause (5.19.24)
Category Names
Independent DirectorsMr. G.M. Sikander Ms. Nargis Ali Akbar Ghaloo Mr. Shahab Anwar Khawaja
Mr. Khalid Imran (President & CEO)Executive Director
Non-Executive Directors
Mr. Ali Jehangir Siddiqui Mr. Adil MatcheswalaMr. Ashraf NawabiMr. Kalim-ur-Rahman Mr. Munawar Alam Siddiqui
Name of company: JS Bank Limited (the ‘Company’) Year ended: December 31, 2017
This statement is being presented to comply with the Code of Corporate Governance (CCG) contained contain in Regulation No.19 of Chapter 5 (Listing of Companies and Securities Regulations) of Rule Book of Pakistan Stock Exchange Limited, for the purpose of establishing a framework of good governance, whereby a listed company is managed in compliance with the best practices of corporate governance.
The Bank has applied the principles contained in the CCG in the following manner:
1. The Bank encourages representation of independent, non-executive directors and directors representing minority interests on its Board of Directors. At present the Board includes:
The independent directors meet the criteria of independence under clause 5.19.1(b) of the Rule Book of Pakistan Stock Exchange Limited.
2. The directors have confirmed that none of them is serving as a director on more than seven listed companies, including the Bank (excluding the listed subsidiaries of listed holding companies where applicable).
3. All the resident directors of the Bank are registered as taxpayers and none of them has defaulted in payment of any loan to a banking company, a DFI or NBFI or, being a broker of a stock exchange, has been declared as a defaulter by that stock exchange.
4. No casual vacancy occurred on the Board during the year 2017.
5. The Bank has prepared a “Code of Conduct” and has ensured that appropriate steps have been taken to disseminate it throughout the
Bank along with its supporting policies and procedures.
6. The Board has developed a vision/mission statement, overall corporate strategy and significant policies of the Bank. A complete record of particulars of significant policies along with the dates on which they were approved or amended has been maintained.
7. All the powers of the Board have been duly exercised and decisions on material transactions, including appointment and determination of remuneration and terms and conditions of employment of the CEO, other executive and non-executive directors, have been taken by the board/shareholders.
8. The meetings of the Board were presided over by the Chairman and the Board met at least once in every quarter. Written notices of the board meetings, along with agenda and working papers, were circulated at least seven days
52 JS Bank Annual Report 2017
before the meetings. The minutes of the meetings were appropriately recorded and circulated.
9. The directors on the Board are fully conversant with their duties and responsibilities as directors of the Bank. Further, in accordance with the criteria specified in rule 5.19.7 of the Rule Book of Pakistan Stock Exchange Limited, five directors have completed Directors’ Training Program and three directors of the Bank are exempt from the requirement of Directors’ Training Program.
10. No new appointment of CEO, CFO and Company Secretary has been made during the financial year.
11. The Directors Report for this year has been prepared in compliance with the requirements of the CCG and fully describes the salient matters required to be disclosed.
12. The Financial Statements of the Bank were duly endorsed by CEO and CFO before approval of the Board.
13. The Directors, CEO and executives do not hold any interest in the shares of the Bank other than that disclosed in the pattern of shareholding.
14. The Bank has complied with all the corporate and financial reporting requirements of the CCG.
15. The Board has formed an Audit Committee. It comprises of three members, of whom two are independent directors and one is a non-executive director. The Chairman of the Audit Committee is an independent director.
16. The meetings of the Audit Committee were held at least once every quarter prior to approval of interim and final results of the Bank as required by the CCG. The terms of reference of the committee have been formed and advised to the committee for compliance.
17. The Board has formed a Human Resource, Remuneration & Nomination Committee. It comprises of three members, two of which are independent directors and one is a non-executive director. The Chairman of the committee is an independent director.
18. The Board has set up an effective internal audit function comprising of suitably qualified and experienced persons who are conversant with the policies and procedures of the Bank.
19. The statutory auditors of the Bank have confirmed that they have been given a satisfactory rating under the quality control review program of the ICAP, that they or any of the partners of the firm, their spouses and minor children do not hold shares of the Bank and that the firm and all its partners are in compliance with International Federation of Accountants (IFAC) guidelines on code of ethics as adopted by the ICAP.
20. The statutory auditors or the persons associated with them have not been appointed to provide other services except in accordance with the Listing Regulations and the auditors have confirmed that they have observed IFAC guidelines in this regard.
21. The ‘closed period’, prior to the announcement of interim/final results, and business decisions, which may materially affect the market price of the Bank’s securities, was determined and intimated to directors, employees and the Pakistan Stock Exchange.
22. Material/price sensitive information has been disseminated among all market participants at once through the Pakistan Stock Exchange.
23. The Bank has complied with the requirements relating to maintenance of register of persons having access to inside information by designated senior management officer in a timely manner and maintained proper record including basis for inclusion or exclusion of names of persons from the said list.
24. We confirm that all other material principles enshrined in the CCG have been complied with.
Khalid Imran President & Chief Executive Officer
Dated: March 3, 2018
53JS Bank Annual Report 2017

Creating Greater Value Through Good Governance
54 JS Bank Annual Report 2017

JS Bank has amended its Equal Opportunity Employment and Gender Policy to incorporate gender sensitive issues throughout the Bank as well as in potential investments.
JS Bank recognizes the importance and relevance of social and environmental risk management and has passed an Environmental and Social Policy to identify and address all environmental risks associated with its activities
55JS Bank Annual Report 2017

56 JS Bank Annual Report 2017

UnconsolidatedFinancial Statements
57JS Bank Annual Report 2017

58 JS Bank Annual Report 2017

59JS Bank Annual Report 2017

60 JS Bank Annual Report 2017
As at December 31, 2017
Unconsolidated Statement of Financial Position
2017 2016 2017 2016 ---- US Dollars in '000 ---- Note ------- Rupees in '000 -------
ASSETS
156,984 140,458 Cash and balances with treasury banks 7 17,333,788 15,508,968 9,367 6,817 Balances with other banks 8 1,034,266 752,710
28,222 102,651 Lendings to financial institutions 9 3,116,199 11,334,414 1,536,097 1,211,103 Investments - net 10 169,611,558 133,726,610 1,667,671 849,452 Advances - net 11 184,139,582 93,794,134
64,418 52,865 Operating fixed assets 12 7,112,821 5,837,181 - - Deferred tax assets - net - -
53,983 33,930 Other assets 13 5,960,662 3,746,476 3,516,742 2,397,276 388,308,876 264,700,493
LIABILITIES
34,635 23,040 Bills payable 14 3,824,278 2,544,028 584,665 93,464 Borrowings 15 64,557,043 10,320,047
2,627,105 2,047,679 Deposits and other accounts 16 290,077,566 226,098,931 45,272 27,170 Sub-ordinated loans 17 4,998,800 3,000,000
Liabilities against assets subject - - to finance lease - -
7,216 10,916 Deferred tax liabilities - net 18 796,803 1,205,362 66,883 44,219 Other liabilities 19 7,385,057 4,882,600
3,365,776 2,246,488 371,639,547 248,050,968
150,966 150,788 NET ASSETS 16,669,329 16,649,525
REPRESENTED BY
97,128 97,128 Share capital 20 10,724,643 10,724,643 (19,068) (19,068) Discount on issue of shares (2,105,401) (2,105,401) 13,585 13,585 Preference shares 21 1,500,000 1,500,000 13,956 12,083 Reserves 1,540,988 1,334,122 40,925 35,985 Unappropriated profit 4,518,820 3,973,341
146,526 139,713 16,179,050 15,426,705 Surplus on revaluation of
4,440 11,075 assets - net of tax 22 490,279 1,222,820
150,966 150,788 16,669,329 16,649,525
CONTINGENCIES AND COMMITMENTS 23
The annexed notes from 1 to 46 and annexure I and II form an integral part of these unconsolidated financial statements.
Chairman President and Director Director Chief Financial OfficerChief Executive Officer

61JS Bank Annual Report 2017
For the year ended December 31, 2017
Unconsolidated Profit and Loss Account
2017 2016 2017 2016 ---- US Dollars in '000 ---- Note ------- Rupees in '000 -------
184,583 136,582 Mark-up / return / interest earned 24 20,381,171 15,081,015 128,053 84,709 Mark-up / return / interest expensed 25 14,139,220 9,353,282
56,530 51,873 Net mark-up / interest income 6,241,951 5,727,733
(Provision) / reversal against non-performing (1,837) 577 loans and advances - net 11.4 (202,814) 63,687
Provision for diminution in value of (1,114) (3,759) investments - net 10.4 (123,031) (415,027)
- (1) Bad debts written off directly - (83) (2,951) (3,183) (325,845) (351,423) 53,579 48,690 Net mark-up / interest income after provisions 5,916,106 5,376,310
NON MARK-UP / INTEREST INCOME
19,239 12,920 Fee, commission and brokerage income 26 2,124,308 1,426,594 1,511 885 Dividend income 166,858 97,703 3,236 2,832 Income from dealing in foreign currencies 357,347 312,753
11,195 26,866 Gain on sale of securities - net 27 1,236,163 2,966,474 Unrealised loss on revaluation of investments
(23) (12) classified as held-for-trading - net 10.5 (2,488) (1,297) 1,532 535 Other income - net 28 169,152 59,042
36,690 44,026 Total non mark-up / interest income 4,051,340 4,861,269 90,269 92,716 9,967,446 10,237,579
NON MARK-UP / INTEREST EXPENSES
74,774 61,118 Administrative expenses 29 8,256,335 6,748,444 406 - Other provisions / write offs 13.7 44,806 - 414 898 Other charges 30 45,741 99,199
75,594 62,016 Total non-mark-up / interest expenses 8,346,882 6,847,643 14,675 30,700 1,620,564 3,389,936
- - Extraordinary / unusual items - -
14,675 30,700 PROFIT BEFORE TAXATION 1,620,564 3,389,936
Taxation (4,667) (9,336) - Current (515,275) (1,030,882)
(664) (873) - Prior years (73,298) (96,422) (533) (1,685) - Deferred 18.1 (58,842) (186,016)
(5,864) (11,894) 31 (647,415) (1,313,320) 8,811 18,806 PROFIT AFTER TAXATION 973,149 2,076,616
35,985 22,905 Unappropriated profit brought forward 3,973,341 2,529,092 44,796 41,711 Profit available for appropriation 4,946,490 4,605,708
---- US Dollars ---- ---- Rupee(s) ----
0.01 0.02 Basic earnings per share 32 0.74 1.77 0.01 0.01 Diluted earnings per share 32 0.74 1.60
The annexed notes from 1 to 46 and annexure I and II form an integral part of these unconsolidated financial statements.
Chairman President and Director Director Chief Financial OfficerChief Executive Officer

62 JS Bank Annual Report 2017
For the year ended December 31, 2017
Unconsolidated Statement of Comprehensive Income
2017 2016 2017 2016 ---- US Dollars in '000 ---- Note ----- Rupees in '000 -----
8,811 18,806 Profit after taxation 973,149 2,076,616
Other comprehensive income
Items that are not to be reclassified to profit or loss in subsequent periods
(775) (516) Actuarial loss on defined benefit plan 35.5 (85,542) (56,991) 271 181 Related current tax 29,940 19,947 (504) (335) (55,602) (37,044)
Items that may be reclassified to profit or loss in subsequent periods
Effect of translation of net investment in 111 - foreign branches 12,236 (17)
(393) (335) (43,366) (37,061)
8,418 18,471 Comprehensive income transferred to equity 929,783 2,039,555
Component of comprehensive income not reflected in equity
Items that are or may be reclassified to profit or loss in subsequent periods
Net change in fair value of available-for-sale (16,988) (17,553) securities (1,875,788) (1,938,155)
5,946 6,144 Related deferred tax 656,526 678,354 (11,042) (11,409) (1,219,262) (1,259,801)
Total comprehensive (loss) / (2,624) 7,062 income for the year (289,479) 779,754
The annexed notes from 1 to 46 and annexure I and II form an integral part of these unconsolidated financial statements.
Chairman President and Director Director Chief Financial OfficerChief Executive Officer

63JS Bank Annual Report 2017
For the year ended December 31, 2017
Unconsolidated Statement of Changes in Equity
Discount on Reserves issue of Preference Exchange Unappro-
Share capital shares shares Statutory * translation priated profit Total
------------------------------------------------- Rupees in '000 -------------------------------------------------
Balance as at January 01, 2016 10,724,643 (2,105,401) 1,500,000 918,816 - 2,529,092 13,567,150
Total comprehensive income for the year ended December 31, 2016Profit after taxation - - - - - 2,076,616 2,076,616 Other comprehensive loss - net of tax - - - - (17) (37,044) (37,061)
- - - - (17) 2,039,572 2,039,555 Transaction with owners recorded
directly in equity
Preference dividend for the year ended December 31, 2015 @ 12% p.a - - - - - (180,000) (180,000)
TransfersTransfer to statutory reserve - - - 415,323 - (415,323) -
Balance as at December 31, 2016 10,724,643 (2,105,401) 1,500,000 1,334,139 (17) 3,973,341 15,426,705
Total comprehensive income for the year ended December 31, 2017Profit after taxation - - - - - 973,149 973,149 Other comprehensive income /
(loss) - net of tax - - - - 12,236 (55,602) (43,366) - - - - 12,236 917,547 929,783
Transfer from surplus on revaluation of operating fixed assets (note 6.8.2) - - - - - 2,348 2,348
Transfer from surplus on revaluation of non-banking assets to unappropriated profit - net of tax - - - - - 214 214
Transaction with ownersrecorded directly in equity
Preference dividend for the year ended December 31, 2016 @ 12% p.a - - - - - (180,000) (180,000)
TransfersTransfer to statutory reserve - - - 194,630 - (194,630) -
Balance as at December 31, 2017 10,724,643 (2,105,401) 1,500,000 1,528,769 12,219 4,518,820 16,179,050
* This represents reserve created under Section 21(i)(a) of the Banking Companies Ordinance, 1962.
The annexed notes from 1 to 46 and annexure I and II form an integral part of these unconsolidated financial statements.
Chairman President and Director Director Chief Financial OfficerChief Executive Officer

64 JS Bank Annual Report 2017
2017 2016 2017 2016 -- US Dollars in '000 -- Note -------- Rupees in '000 --------
CASH FLOWS FROM OPERATING ACTIVITIES
14,675 30,700 Profit before taxation 1,620,564 3,389,936 (1,511) (885) Less: Dividend income (166,858) (97,703)
13,164 29,815 1,453,706 3,292,233 Adjustments for non-cash items:
5,305 4,668 Depreciation 12.2 585,785 515,479 12 10 Depreciation on non-banking assets 13.4 1,300 1,122
548 446 Amortisation of intangible assets 12.3 60,556 49,297 811 555 Charge for defined benefit plan 35.5 89,576 61,317
Unrealised loss on revaluation of investments classified 23 12 as held-for-trading - net 10.5 2,488 1,297
1,837 (577) Provision / (reversal) against non-performing advances - net 11.4 202,814 (63,687) 1,114 3,759 Provision for diminution in value of investments - net 10.4 123,031 415,027
406 - Other provisions / write offs 13.7 44,806 - 294 614 Provision for Sindh Workers' Welfare Fund 30 32,411 67,799
(598) (172) Unrealised gain on revaluation of derivative instruments 28 (66,026) (19,026) - (1) Gain on recovery of non banking assets - (152)
(683) (361) Gain on sale of operating fixed assets 28 (75,441) (39,864) 9,069 8,953 1,001,300 988,609
22,233 38,768 2,455,006 4,280,842 (Increase) / decrease in operating assets
74,429 (70,216) Lendings to financial institutions 8,218,215 (7,753,085) 518,822 (391,442) Held-for-trading securities 57,286,846 (43,221,891) (820,056) (154,544) Advances (90,548,262) (17,064,267)
(20,472) 18,703 Other assets (excluding advance taxation) (2,260,442) 2,065,101 (247,277) (597,499) (27,303,643) (65,974,142)
Increase / (decrease) in operating liabilities 11,595 8,464 Bills payable 1,280,250 934,603
489,765 (401,243) Borrowings 54,078,528 (44,304,114) 579,426 763,092 Deposits 63,978,635 84,258,444
18,102 27,170 Sub-ordinated loans 1,998,800 3,000,000 22,454 18,615 Other liabilities 2,479,262 2,055,387
1,121,342 416,098 123,815,475 45,944,320 874,065 (181,401) 96,511,832 (20,029,822)
(1,071) (580) Gratuity paid (118,308) (64,005) (4,937) (8,675) Income tax paid (545,087) (957,880)
890,290 (151,888) Net cash flows from / (used in) operating activities 98,303,443 (16,770,865)
CASH FLOWS FROM INVESTING ACTIVITIES
(487,013) 209,846 Net investment in available-for-sale securities (53,774,616) 23,170,627 (374,928) - Net investment in held-to-maturity securities (41,398,485) -
1,511 885 Dividend income received 166,858 97,703 (11,681) (16,758) Investments in operating fixed assets (1,289,829) (1,850,378)
- 33 Proceeds from sale of non-banking assets - 3,653 981 561 Proceeds from sale of operating fixed assets 108,301 61,956
(871,130) 194,567 Net cash flows (used in) / from investing activities (96,187,771) 21,483,561
CASH FLOWS FROM FINANCING ACTIVITIES
(1,630) (1,630) Dividend paid on preference shares (180,000) (180,000)
(1,630) (1,630) Net cash flows used in financing activities (180,000) (180,000)
111 - Effect of translation of net investment in foreign branches 12,236 (17)
17,641 41,049 Increase in cash and cash equivalents 1,947,908 4,532,679 146,905 105,856 Cash and cash equivalents at beginning of the year 16,221,150 11,688,471 164,546 146,905 Cash and cash equivalents at end of the year 33 18,169,058 16,221,150
The annexed notes from 1 to 46 and annexure I and II form an integral part of these unconsolidated financial statements.
For the year ended December 31, 2017
Unconsolidated Cash Flow Statement
Chairman President and Director Director Chief Financial OfficerChief Executive Officer

65JS Bank Annual Report 2017
1. STATUS AND NATURE OF BUSINESS
1.1 JS Bank Limited (the Bank/JSBL), incorporated in Pakistan, is a scheduled bank, engaged in commercial banking and related services. The Bank's ordinary shares are listed on Pakistan Stock Exchange Limited (PSX). The Bank is a subsidiary of Jahangir Siddiqui & Co. Ltd. (JSCL). The registered office of the Bank is situated at Shaheen Commercial Complex, Dr. Ziauddin Ahmed Road, Karachi.
The Bank operates with 322 (December 31, 2016: 306) branches / sub-branches in Pakistan and one wholesale banking branch in Bahrain (December 31, 2016: one). The Pakistan Credit Rating Agency Limited (PACRA) has assigned the long-term entity rating of the Bank to 'AA-’ (Double A Minus) whereas short-term rating is maintained at 'A1+' (A One Plus), which is the highest possible short-term rating. The ratings denote a very low expectation of credit risk and indicate very strong capacity for timely payment of financial commitments.
1.2 Jahangir Siddiqui Investment Bank Limited, JSIBL, (formerly Citicorp Investment Bank Limited which was acquired by JSCL on February 01, 1999), and its holding company, JSCL, entered into a Framework Agreement with American Express Bank Limited, New York (AMEX) on November 10, 2005 for acquisition of its American Express Bank Limited - Pakistan Branches, (AEBL). Consequently, a new banking company, JSBL was incorporated on March 15, 2006 and a restricted Banking License was issued by the State Bank of Pakistan (SBP) on May 23, 2006.
A Transfer Agreement was executed on June 24, 2006 between JSIBL and JSBL for the transfer of entire business and undertaking of JSIBL to JSBL and a separate Transfer Agreement was also executed on June 24, 2006, between AMEX and JSBL for the transfer of AEBL’s commercial banking business in Pakistan with all assets and liabilities (other than certain excluded assets and liabilities) (AEBL business). The shareholders of JSIBL and JSBL in their respective extra ordinary general meetings held on July 31, 2006 approved a Scheme of Amalgamation (the Scheme) under Section 48 of the Banking Companies Ordinance, 1962. The Scheme was initially approved by the Securities and Exchange Commission of Pakistan vide its letter No. SC/NBFC(J)-R/JSIBL/2006/517 dated September 28, 2006. Subsequently, the Scheme was sanctioned by the SBP vide its order dated December 02, 2006 and, in accordance therewith, the effective date of amalgamation was fixed at December 30, 2006.
2. BASIS OF PRESENTATION
2.1 These financial statements are unconsolidated financial statements of the Bank in which the investments in subsidiary are stated at cost and have not been accounted for on the basis of reported results and net assets of the investees which is done in the consolidated financial statements.
2.2 These unconsolidated financial statements have been prepared on the format prescribed by SBP vide BSD Circular No. 4 dated February 17, 2006, ‘Revised Forms of Annual Financial statements’ effective from the accounting year ended December 31, 2006. The SBP vide BPRD circular no. 2 dated January 25, 2018 has specified the new reporting format for the financial statements of banking companies. The new format has revised the disclosure requirements and will become applicable for the financial statements of the Bank for the year ending December 31, 2018.
2.3 The US Dollar amounts shown on the statement of financial position, profit and loss account, statement of comprehensive income and cash flow statement are stated as additional information solely for the convenience of readers and have not been subject to audit by the external auditors. For the purpose of conversion to US Dollars, the rate of Rs.110.4172 to 1 US Dollar has been used for 2017 and 2016 as it was the prevalent rate as on December 31, 2017.
For the year ended December 31, 2017
Notes to the Unconsolidated Financial Statements

66 JS Bank Annual Report 2017
4. STATEMENT OF COMPLIANCE
4.1 These unconsolidated financial statements have been prepared in accordance with approved accounting standards as applicable in Pakistan. Approved accounting standards comprise of such International Financial Reporting Standards IFRS issued by the International Accounting Standards Board (IASB) as are notified under the repealed Companies Ordinance, 1984 provisions of and directives issued under the Banking Companies Ordinance, 1962, the Companies Ordinance, 1984 and directives issued by the SBP and the Securities and Exchange Commission of Pakistan (SECP). Whenever the requirements of the Banking Companies Ordinance, 1962, repealed Companies Ordinance, 1984 or the directives issued by the SBP and the SECP differ with the requirements of IFRS, requirements of the Banking Companies Ordinance, 1962, repealed Companies Ordinance, 1984 and the said directives shall prevail.
4.2 Effective May 30, 2017, the Companies Act, 2017 (the Act) has been promulgated, however, the Securities and Exchange Commission of Pakistan (SECP) vide its circular No. 23 of 2017 dated October 04, 2017 decided that the companies whose financial year closes on or before December 31, 2017 shall prepare their financial statements in accordance with the provisions of the repealed Companies Ordinance, 1984.
Currently, the Bank is assessing the impact of the requirements of the Companies Act, 2017, on the financial statements for the future periods in terms of accounting as well as disclosure requirements.
4.3 The SBP vide BSD Circular No. 10, dated August 26, 2002 has deferred the applicability of International Accounting Standard 39, Financial Instruments: Recognition and Measurement (IAS 39) and International Accounting Standard 40, Investment Property (IAS 40) for Banking companies till further instructions. Further, according to the notification of the Securities and Exchange Commission of Pakistan (SECP) dated April 28, 2008, the IFRS - 7 "Financial Instruments: Disclosures" has not been made applicable for banks. Accordingly, the requirements of these standards have not been considered in the preparation of these unconsolidated financial statements. However, investments have been classified and valued in accordance with the requirements of various circulars issued by the SBP.
4.4 IFRS 8, ‘Operating Segments’ is effective for the Bank’s accounting period beginning on or after January 01, 2009. All banking companies in Pakistan are required to prepare their annual financial statements in line with the format prescribed under BSD Circular No. 4 dated February 17, 2006, ‘Revised Forms of Annual Financial Statements’, effective from the accounting year ended December 31, 2006. The management of the Bank believes that as the SBP has defined the segment categorization in the above mentioned circular, the SBP’s requirements prevail over the requirements specified in IFRS 8. Accordingly, segment information disclosed in these financial statements is based on the requirements laid down by the SBP.
4.5 IFRS10 "Consolidated Financial Statements" was made applicable from period beginning on or after January 01, 2015 vide S.R.O 633(I)/2014 dated July 10, 2014 by SECP. However, SECP has directed that the requirements of consolidation under section 237 of the Companies Ordinance 1984 and IFRS-10 "Consolidated Financial Statements" are not applicable in case of investment by companies in mutual funds established under trust structure, through S.R.O 56(I) /2016 dated January 28, 2016. Accordingly, the requirements of these standards have not been considered in the preparation of these unconsolidated financial statements.
For the year ended December 31, 2017
Notes to the Unconsolidated Financial Statements
3. BASIS OF MEASUREMENT
These unconsolidated financial statements have been prepared under the historical cost convention except that certain assets are stated at revalued amounts / fair value as disclosed in their respective notes.

67JS Bank Annual Report 2017
4.6 The Bank has adopted the following accounting standards, amendments and interpretations of IFRSs which became effective for the current year:
Standard or Interpretation
IAS 7 Statement of Cash Flow - Disclose Initiative - (Amendments)
IAS 12 Income Taxes - Recognition of Deferred Tax Assets for Unrealised Losses (Amendments)
Improvements to Accounting Standards Issued by the IASB
IFRS 12 Disclosure of Interests in Other Entities - Clarification of the scope of the disclosure requirements in IFRS 12
The adoption of the above amendments, improvements to accounting standards and interpretations did not have any effect on the financial statements.
4.6.1 The Bank has changed its accounting policy for fixed assets as referred in note 6.8.2.
4.6.2 New accounting standards / amendments and IFRS interpretations that are not yet effective
The following standards, amendments and interpretations with respect to the approved accounting standards as applicable in Pakistan would be effective from the dates mentioned below against the respective standard or interpretation:
Effective date (annual Standard or Interpretation periods beginning
on or after)IFRS 2 – Share-based Payments – Classification and Measurement
of Share-based Payments Transactions – (Amendments) January 01, 2018
IFRS 10 – Consolidated Financial Statements and IAS 28 – Investment in Associates and Joint Ventures - Sale or Contribution of Assets between an Investor and its Associate or Joint Venture – (Amendment) Not yet finalized
IFRS 15 – Revenue from Contracts with Customers July 01, 2018
IFRIC Interpretation 22 – Foreign Currency Transactions and Advance Consideration January 01, 2018
IFRIC 23 – Uncertainty over Income Tax Treatments January 01, 2019
The above standards, amendments and interpretations are not expected to have any material impact on the Bank's financial statements in the period of initial application.
In addition to the above standards and amendments, improvements to various accounting standards have also been issued by the IASB in December 2016. Such improvements are generally effective for accounting periods beginning on or after January 01, 2018 and January 01, 2019. The Bank expects that such improvements to the standards will not have any impact on the Bank's financial statements in the period of initial application.
Further, following new standards have been issued by IASB which are yet to be notified by the SECP for the purpose of applicability in Pakistan.
For the year ended December 31, 2017
Notes to the Unconsolidated Financial Statements

68 JS Bank Annual Report 2017
For the year ended December 31, 2017
Notes to the Unconsolidated Financial Statements
IASB Effective date (annualStandard periods beginning
on or after)
IFRS 14 – Regulatory Deferral Accounts January 01, 2016
IFRS 16 – Leases January 01, 2019
IFRS 17 – Insurance Contracts January 01, 2021
5. CRITICAL ACCOUNTING ESTIMATES AND KEY SOURCES OF ESTIMATION UNCERTAINTY
The preparation of financial statements in conformity with approved accounting standards requires the use of certain critical accounting estimates. It also requires management to exercise its judgment in the process of applying the Bank’s accounting policies. Estimates and judgments are continually evaluated and are based on historic experience and other factors, including expectations of future events that are believed to be reasonable under the circumstances. Revisions in accounting estimates are recognised in the period in which the estimate is revised and in any future periods affected.
The areas where various assumptions and estimates are significant to the Bank's financial statements or where judgment was exercised in application of accounting policies are as follows:
i) Classification of investments
- In classifying investments as 'held-for-trading' the Bank has determined securities which are acquired with an intention to trade by taking advantage of short-term market / interest rate movements and are to be sold within 90 days of acquisition.
- In classifying investments as 'held-to-maturity' the Bank follows the guidance provided in SBP circulars on classifying non-derivative financial assets with fixed or determinable payments and fixed maturity. In making this judgment, the Bank evaluates its intention and ability to hold such investments to maturity.
- The investments which are not classified as 'held-for-trading' or 'held-to-maturity' are classified as 'available-for-sale'.
ii) Provision against non performing loans and advances
The Bank reviews its loan portfolio to assess amount of non-performing loans and advances and provision required there-against. While assessing this requirement various factors including the delinquency in the account, financial position of the borrowers, the value of securities and the requirements of the Prudential Regulations are considered. For portfolio impairment / provision on consumer advances, the Bank follows requirements set out in Prudential Regulations.
iii) Impairment on investments
The Bank determines that investments are impaired when there has been a significant or prolonged decline in the fair value below its cost. This determination of what is significant or prolonged requires judgment. In making this judgment, the Bank evaluates among other factors, the normal volatility in securities price. In addition, impairment may be appropriate when there is an evidence of deterioration in the financial health of the investee, industry and sector performance, changes in technology and operational and financing cash flows.

69JS Bank Annual Report 2017
For the year ended December 31, 2017
Notes to the Unconsolidated Financial Statements
iv) Income taxes
In making the estimates for income taxes currently payable by the Bank, the management considers the current income tax laws and the decisions of appellate authorities on certain issues in the past. In making the provision for deferred taxes, estimates of the Bank's future taxable profits are taken into account.
v) Fair value of derivatives
The fair value of derivatives which are not quoted in active markets are determined by using valuation techniques. The valuation techniques take into account the relevant interest rates in effect at the balance sheet date and the contracted rates.
vi) Depreciation and amortisation of operating fixed assets
In making estimates of the depreciation / amortisation method, the management uses a method which reflects the pattern in which economic benefits are expected to be consumed by the Bank. The method applied is reviewed at each financial year end and if there is a change in the expected pattern of consumption of the future economic benefits embodied in the underlying assets, the method is changed to reflect the change in pattern. Such change is accounted for as change in accounting estimates in accordance with International Accounting Standard - 8, "Accounting Policies, Changes in Accounting Estimates and Errors".
vii) Defined benefits plans and other benefits
Liability is determined on the basis of actuarial advice using the Projected Unit Credit Method.
viii) Impairment of investment in subsidiaries
In assessing its investment in subsidiaries for impairment, the Bank determines if there is any objective evidence that investment may be impaired. Impairment loss is recognised as a difference between carrying amount of the investment and its recoverable amount which is determined as higher of value-in-use and fair value less cost to sell.
ix) Impairment of Goodwill
Impairment testing involves a number of judgmental areas which are subject to inherent significant uncertainty, including the preparation of cash flow forecasts for periods that are beyond the normal requirements of management reporting and the assessment of the discount rate appropriate to the business. The carrying amount of goodwill at the balance sheet date was Rs.1,464 million. The detailed assumptions underlying impairment testing of goodwill are given in note 12.3.2 to these unconsolidated financial statements.
6. SUMMARY OF SIGNIFICANT ACCOUNTING POLICIES
6.1 Cash and cash equivalents
Cash and cash equivalents represent cash and balances with treasury banks and balances with other banks net of any overdrawn nostro accounts.
6.2 Lendings to / borrowings from financial institutions
The Bank enters into transactions of lendings to / borrowings from financial institutions at contracted rates for a specified period of time. These are recorded as under:

70 JS Bank Annual Report 2017
For the year ended December 31, 2017
Notes to the Unconsolidated Financial Statements
(a) Sale under repurchase obligationSecurities sold subject to a repurchase agreement (repo) are retained in the financial statements as investments and liability to counter party is included in borrowings. The difference in sale and repurchase value is accrued over the period of the contract and recorded as an expense using effective interest rate method.
(b) Other lendingsOther lendings include term lendings and unsecured lendings to financial institutions. These are stated net of provision. Mark-up on such lendings is charged to profit and loss account on a time proportionate basis using effective interest rate method except mark-up on impaired/delinquent lendings, which are recognized on receipt basis in accordance with the requirements of the Prudential Regulations of the SBP.
(c) Purchase under resale obligationSecurities purchased under agreement to resell (reverse repo) are not included in statement of financial position as the Bank does not obtain control over the securities. Amount paid under these agreements is included in lendings to financial institutions or advances as appropriate. The difference between the contracted price and resale price is amortised over the period of the contract and recorded as income using effective interest method.
(d) Other borrowingsOther borrowings include borrowings from the SBP and unsecured call borrowings which are recorded at the proceeds received. Mark-up paid on such borrowings is charged to the profit and loss account over the period of borrowings on time proportionate basis using effective interest method.
6.3 Investments
6.3.1 Initial recognition and measurement
The Management determines the appropriate classification of its investments at the time of purchase and classifies these investments as held-for-trading, available-for-sale or held-to-maturity. These are initially recognised at cost, being the fair value of the consideration given plus, in the case of investments not held-for-trading, directly attributable acquisition costs.
(a) Held-for-tradingThese are securities which are either acquired for generating profit from short-term fluctuations in market prices, interest rate movements, dealer's margin or are securities included in a portfolio in which a pattern of short-term profit taking exists. These securities are carried at fair value with any related gain or loss being recognized in profit and loss account.
(b) Held-to-maturityThese are securities with fixed or determinable payments and fixed maturities that are held with the intention and ability to hold till maturity. Investments classified as held-to-maturity are carried at amortised cost.
(c) Available-for-saleThese are investments that do not fall under the held-for-trading or held-to-maturity categories. These are initially recognised at cost, being the fair value of the consideration given including the acquisition cost.

71JS Bank Annual Report 2017
For the year ended December 31, 2017
Notes to the Unconsolidated Financial Statements
(d) Associates
Associate is an entity over which the Bank has significant influence but not control. Investment in associate is carried at cost less accumulated impairment losses, if any.
(e) Subsidiaries
Subsidiary is an entity over which the Bank has control. Investment in subsidiary is carried at cost less accumulated impairment losses, if any.
(f) Regular way contracts
All 'regular way' purchases and sales of financial assets are recognised on the trade date, i.e. the date on which commitment to purchase / sale is made by the Bank. Regular way purchases or sales of financial assets are those, the contract for which requires delivery of assets within the time frame generally established by regulation or convention in the market place.
(g) Premium or discount on acquisition of investments
Premium or discount on acquisition of investments is capitalised and amortised through the profit and loss account using effective yield over the remaining period of the investment.
6.3.2 Subsequent measurement
In accordance with the requirements of the State Bank of Pakistan, SBP, quoted securities other than those classified as 'held-to-maturity' and investment in associates and subsidiaries, are subsequently remeasured to market value. Investments classified as 'held-to-maturity' are carried at amortised cost using the effective interest method (less impairment, if any).
Further, in accordance with the requirements of the SBP, gain or loss on revaluation of the Bank's held-for-trading investments is taken to the profit and loss account. In case of investments classified as available-for-sale, surplus or deficit is taken directly to equity. The surplus or deficit arising on these securities is taken to the profit and loss account when actually realised upon disposal.
Unquoted equity securities, excluding invetment in subsidiaries and associates are valued at lower of cost and the break-up value in accordance with the requirements of the Prudential Regulations issued by the SBP. Break-up value of equity securities is calculated with referencce to the net assets of the investee company as per the latest available audited financial statements. Investment in subsidiaries and associates are carried at cost, less accumulated impairment losses, if any.
6.3.3 Impairment / diminution in the value of securities
Impairment loss in respect of quoted equity securities classified as available for sale, associates, subsidiaries and held to maturity is recognised based on management's assessment of objective evidence of impairment as a result of one or more events that may have an impact on the estimated future cash flows of the investments. Objective evidence that the cost may not be recovered, in addition to qualitative impairment criteria, includes a significant or prolonged decline in the fair value below average cost. A decline to be considered as:
- Significant if the fair value is below the weighted average cost by more than 30 percent.- Prolonged if the fair value is below the weighted average cost for a period of more than one year.

72 JS Bank Annual Report 2017
For the year ended December 31, 2017
Notes to the Unconsolidated Financial Statements
(a) Available-for-sale
If an available-for-sale of equity security is impaired, the cumulative loss that had been recognised in equity, shall be reclassified from equity to profit or loss as a reclassification adjustment even though the financial asset has not been derecognised, any further declines in the fair value at subsequent reporting dates are recognised as impairments. Therefore, at each reporting period, for an equity security that was determined to be impaired, additional impairments are recognised for the difference between the fair value and the original cost basis, less any previously recognised impairment.
If, in subsequent period, impairment losses recognised in profit or loss for an investment in an equity instrument classified as available for sale shall not be reversed through profit or loss except in case of derecognition.
(b) Held to maturity, Subsidiaries and Associates
Impairment losses are incurred if, and only if, there is objective evidence of impairment after initial recognition of the investment. The impairment loss is recognised in the profit and loss account. If, in a subsequent period, any indication that an impairment loss recognised in prior periods no longer exist or may have decreased, the impairment loss shall be reversed, with the amount of the reversal recognised in profit or loss.
(c) Debt Securities
PTCs, TFCs, Sukuk and other debt securities will be classified on the valuation date on the basis of default in their repayment in line with the criteria prescribed for classification of medium and long-term facilities in accordance with the requirements of the Prudential Regulations issued by the SBP.
6.4 Financial instruments
6.4.1 Financial assets and financial liabilities
Financial assets and financial liabilities are recognized at the time when the Bank becomes party to the contractual provision of the instrument. Financial assets are de-recognized when the contractual right to future cash flows from the asset expires or is transferred along with the risk and reward of the asset. Financial liabilities are de-recognized when obligation specified in the contract is discharged, cancelled or expired. Any gain or loss on de-recognition of the financial asset and liability is recognized in the profit and loss account at the time of de-recognition. The particular recognition and subsequent measurement method for significant financial assets and financial liabilities are disclosed in the individual policy statements associated with them.
6.4.2 Derivative financial instruments
Derivative financial instruments are initially recognised at fair value on the date on which the derivative contract is entered into and are subsequently re-measured at fair value using valuation techniques. All derivative financial instruments are carried as assets when fair value is positive and liabilities when fair value is negative. Any change in the fair value of derivative financial instruments is taken to the profit and loss account.
6.5 Off-setting of financial assets and financial liabilities
Financial assets and financial liabilities are set off and the net amount is reported in the financial statements when there is a legally enforceable right to set off and the Bank intends either to settle the assets and liabilities on a net basis or to realise the assets and to settle the liabilities simultaneously. Income and expenses arising from such assets and liabilities are accordingly offset.

73JS Bank Annual Report 2017
For the year ended December 31, 2017
Notes to the Unconsolidated Financial Statements
6.6 Advances
6.6.1 Loan and advances
Advances are stated net of general and specific provisions. General and specific provisions against funded loans are determined in accordance with the requirements of the Prudential Regulations issued by the SBP and charged to the profit and loss account. Advances are written off when there are no realistic prospects of recovery.
6.6.2 Finance lease receivables
Leases, where the bank transfers substantially all the risks and rewards incidental to ownership of an asset to the lessee are classified as finance leases. A receivable is recognised at an amount equal to the present value of the lease payment including any guaranteed residual value, if any. Net investment in finance lease is included in loans and advances to customers.
6.7 Non-banking assets acquired in satisfaction of claims
6.7.1 Non-banking assets acquired in satisfaction of claims under Debt Property Swap (DPS) transactions, against the loans in category of loss, are carried at the revalued amounts, being the fair value at the date of revaluation less subsequent accumulated depreciation and subsequent accumulated impairment losses, if any.
All direct cost inclulding legal fees, valuation and transfer costs of acquiring title to property shall be expensed when incurred through profit and loss account.
Subsequent costs are included in the asset’s carrying amounts only when it is probable that future benefits associated with the item will flow to the Bank and the cost of the item can be measured reliably. All other subsequent costs including repair and maintenance are charged to the profit and loss account as and when incurred.
6.7.2 Surplus / deficit on revaluation of non banking assets
The surplus arising on revaluation of non-banking assets is credited to the “Surplus on Revaluation of Fixed Assets Account” shown below equity in the statement of financial position in accordance with the requirements of section 235 of the repealed Companies Ordinance 1984. However, the increase shall be recognised in profit or loss to the extent that it reverses a revaluation decrease of the same asset previously recognised in profit and loss account.
The deficit as a result of a revaluation is recognised in profit and loss account. However, the decrease to be recognised in other comprehensive income to the extent of any credit balance existing in the revaluation surplus in respect of that asset.
Furthermore, revaluation surplus on such assets shall not be admissible for calculating Bank’s Capital Adequacy Ratio (CAR) and exposure limits under the Prudential Regulations. However, the surplus can be adjusted upon realization of sale proceeds.
The Bank has adopted the following accounting treatment for depreciation on revalued assets, keeping in view the requirements of the repealed Companies Ordinance, 1984 and SECP’s SRO 45(1)/2003 dated January 13, 2003.
Depreciation on assets which are revalued is determined with reference to the value assigned to such assets on revaluation and depreciation charge for the year is taken to the profit and loss account; and

74 JS Bank Annual Report 2017
For the year ended December 31, 2017
Notes to the Unconsolidated Financial Statements
An amount equal to incremental depreciation for the year net of deferred taxation is transferred from “Surplus on Revaluation of Fixed Assets account” to unappropriated profit through statement of changes in equity to record realization of surplus to the extent of the incremental depreciation charge for the year.
6.7.3 Gains or losses on disposal of assets are included in the profit and loss account currently, except that the related surplus on revaluation of fixed assets (net of deferred tax) is transferred directly to equity.
6.8 Operating fixed assets and depreciation
6.8.1 Property and equipment
Operating fixed assets except office premises are shown at historical cost less accumulated depreciation and accumulated impairment losses, if any. Historical cost includes expenditures that are directly attributable to the acquisition of the items. Office premises (which includes leasehold land and buildings) are stated at revalued amount less accumulated depreciation.
Depreciation is calculated and charged to profit and loss account using the straight-line method so as to write down the cost of the assets to their residual values over their estimated useful lives at the rates given in note 12.2. A full month’s depreciation is charged from the month in which assets are brought into use and no depreciation is charged for the month in which the disposal is made. The residual values, useful lives and depreciation methods are reviewed and changes, if any, are treated as change in accounting estimates, annually.
Subsequent costs are included in the asset’s carrying amount or recognised as a separate asset, as appropriate, only when it is probable that future economic benefits associated with the item will flow to the Bank and the cost of the item can be measured reliably. The carrying amount of the replaced part is de-recognised. All other repairs and maintenance are charged to the profit and loss account during the period in which they are incurred.
An item of property and equipment is de-recognised upon disposal or when no future economic benefits are expected from its use or disposal. Any gain or loss arising on de-recognition of the asset is recognised in the profit and loss account in the year the asset is de-recognised.
6.8.2 Surplus / deficit on revaluation of operating fixed assets
During the year, the Bank changed its accounting policy from cost model to revaluation model in respect of leasehold land and building. With effect from the current year, these are carried at revalued amounts, being fair value at the date of revaluation less accumulated depreciation and accumulated impairment losses.
The Bank has carried out the revaluation exercise by an independent valuator, which has resulted in surplus on land and buildings of Rs.124.654 million and Rs.540.358 million over their existing written down values of Rs.964.306 million and Rs.823.554 million, respectively.
The fair values were determined with reference to market based evidence, based on active market prices and relevant enquiries and information as considered necessary, and adjusted for any difference in nature, location or condition of the specific properties. Management takes the view that this policy provides reliable and more relevant information because it deals more accurately with the components of property and is based on up-to-date values.
Had there been no revaluation, the carrying value of leasehold land and building would have been lower by Rs.124.654 million and Rs.536.745 million respectively, and net surplus on revaluation of fixed assets, deferred tax liability and increamental depreciation would have been lower by Rs.473.538 million, Rs.187.861 million and Rs.3.613 million respectively.

75JS Bank Annual Report 2017
For the year ended December 31, 2017
Notes to the Unconsolidated Financial Statements
The surplus arising on revaluation of operating assets is credited to the “Surplus on Revaluation of Fixed Assets Account” shown below equity in the statement of financial position in accordance with the requirements of section 235 of the repealed Companies Ordinance, 1984. However, the increase shall be recognised in profit or loss to the extent that it reverses a revaluation decrease of the same asset previously recognised in profit and loss account.
The deficit as a result of a revaluation is recognised in profit and loss account. However, the decrease to be recognised in other comprehensive income to the extent of any credit balance existing in the revaluation surplus in respect of that asset.
The said section was amended through the Companies (Amendment) Ordinance, 2002 and, accordingly, the Bank has adopted the following accounting treatment of depreciation on revalued assets, keeping in view the Securities and Exchange Commission of Pakistan’s (SECP) SRO 45(1)/2003 dated January 13, 2003:
Depreciation on buildings which are revalued is determined with reference to the value assigned to such assets on revaluation and depreciation charge for the year is taken to the profit and loss account; and an amount equal to incremental depreciation for the year net of deferred taxation is transferred from “Surplus on Revaluation of Fixed Assets Account” to unappropriated profit through Statement of Changes in Equity to record realization of surplus to the extent of the incremental depreciation charge for the year.
Intangible assets
Intangible assets are stated at cost less accumulated amortisation and impairment, if any. Intangible assets are amortised from the month when the assets are available for use, using the straight line method, whereby the cost of the intangible asset is amortised over its estimated useful life over which economic benefits are expected to flow to the Bank. The useful life and amortisation method are reviewed and adjusted, if appropriate, annually.
Intangible assets having an indefinite useful life are carried at cost less any impairment in value and are not amortised. Intangible assets having an indefinite useful life are reviewed for impairment annually or more frequently if events or changes in circumstances indicate that the carrying value may be impaired.
Capital work-in-progress
Capital work-in-progress is stated at cost less impairment losses, if any. These are transferred to specified assets as and when assets are available for use.
6.9 Impairment
At each balance sheet date, the Bank reviews the carrying amounts of its assets (other than investment and deferred tax asset) to determine whether there is an indication that those assets have suffered an impairment loss. If any such indication exists, the recoverable amount of the assets is estimated in order to determine the extent of the impairment loss, if any. Recoverable amount is the higher of net selling price (being fair value less cost to sell) and value-in-use. If the recoverable amount of an asset is estimated to be less than its carrying amount, the carrying amount of the assets is reduced to its recoverable amount. Impairment losses are recognised as an expense in profit and loss account immediately.
Where impairment loss subsequently reverses, the carrying amount of the asset is increased to the revised recoverable amount but limited to the extent of the amount which would have been determined had there been no impairment. Reversal of impairment loss is recognized as income.

76 JS Bank Annual Report 2017
For the year ended December 31, 2017
Notes to the Unconsolidated Financial Statements
6.10 Taxation
Current
The charge for current taxation is based on taxable income at the current rate of taxation after taking into account applicable tax credit, rebates and exemptions available, if any, or minimum tax on turnover, whichever is higher. The charge for current tax also includes adjustments, where considered necessary, relating to prior years arising from assessments made during the year.
Deferred
Deferred tax is recognised using the balance sheet liability method on all temporary differences arising between tax bases of assets and liabilities and their carrying amounts appearing in the financial statements. Deferred tax liability is recognized on taxable temporary differences. Deferred tax asset is recognised for all deductible temporary differences and carry forward of unused tax losses, if any only to the extent that it is probable that future taxable profits will be available against which the asset can be utilised. Deferred tax assets are reduced to the extent that it is no longer probable that the related tax benefits will be realised.
Deferred tax is calculated at the rates that are expected to apply to the period when the differences are expected to reverse, based on tax rates that have been enacted or substantively enacted by the balance sheet date. Deferred tax is charged or credited to the profit and loss account.
Deferred tax, if any, on revaluation of investments is recognised as an adjustment to surplus / (deficit) arising on revaluation in accordance with the requirements of IAS-12 "Income Taxes".
6.11 Provisions
Provisions are recognised when the Bank has a legal or constructive obligation as a result of past events, it is probable that an outflow of resources will be required to settle the obligation and a reliable estimate of the amount can be made. Provisions are reviewed at each balance sheet date and are adjusted to reflect the current best estimate.
Provision against identified non-funded losses is recognised when intimated and reasonable certainty exists for the Bank to settle the obligation. The loss is charged to profit and loss account net of expected recovery.
6.12 Staff retirement benefits
Defined contribution plan
The Bank has established a provident fund scheme for all permanent employees effective from January 01, 2007. Equal monthly contributions are made, both by the Bank and the employees, to the fund at the rate of 10 percent of basic salary which has been revised to 7.1 percent with effect from July 01, 2015 due to change in salary structure. Contribution by the Bank is charged to profit and loss account.
Defined benefit plan
The Bank operates an approved funded gratuity scheme covering all its eligible employees who have completed minimum qualifying period. An actuarial valuation of defined benefit scheme is conducted at the end of every year or on occurrence of any significant change. The most recent valuation in this regard was carried out as at December 31, 2017, using the projected unit credit actuarial valuation method. Under this method cost of providing for gratuity is charged to profit and loss account so as to spread the cost over the service lives of the employees in accordance with the actuarial valuation. Past-service costs are recognised immediately in profit and loss account and actuarial gains and losses are recognised immediately in other comprehensive income.

77JS Bank Annual Report 2017
For the year ended December 31, 2017
Notes to the Unconsolidated Financial Statements
6.13 Revenue recognition
Revenue is recognized to the extent that economic benefits will flow to the Bank and the revenue can be reliably measured. These are recognized as follows;
- Mark-up / return / interest income on loans and advances and investments is recognised on accrual basis using effective interest method. Mark-up / return / interest income on non-performing loans and advances and investments is recognised on receipt basis.
- "Financing method is used in accounting for income from lease financing. Under this method, the unearned lease income (excess of the sum of total lease rentals and estimated residual value over the cost of leased assets) is deferred and taken to income over the term of the lease period so as to produce a constant periodic rate of return on the outstanding net investment in lease.
Gains / losses on termination of lease contracts, documentation charges, front-end fees and other lease income are recognized as income on receipt basis.
- Commission is recognised as income at the time of affecting the transaction to which it relates. Fees are recognised when earned.
- Dividend income is recognised when the right to receive the dividend is established.
6.14 Dividend and appropriation to reserves
Dividend and appropriation to reserves except for statutory reserves are recognised in the financial statements in the periods in which these are approved.
6.15 Foreign currencies
Functional and presentation currency
Items included in the financial statements are measured using the currency of the primary economic environment in which the Bank operates. The financial statements are presented in Pakistani Rupees, which is the Bank's functional and presentation currency.
Foreign currency transactions
Transactions in foreign currencies are translated into rupees at the foreign exchange rates ruling on the transaction date. Monetary assets and liabilities in foreign currencies are expressed in rupee terms at the rates of exchange ruling on the balance sheet date. Forward foreign exchange contracts are valued at forward rates applicable to their respective maturities.
Foreign operations
The assets and liabilities of foreign branches are translated to Rupees at exchange rates prevailing at the balance sheet date. The results of foreign operations are translated to Rupees at the average rate of exchange for the year.
Translation gains and losses
Translation gains and losses are included in the profit and loss account except those arising on the translation of the Bank’s net investment in foreign branches which are taken to exchange translation reserve in the statement of comprehensive income until the disposal of the net investment, at which time these are recognised in the profit and loss account.

78 JS Bank Annual Report 2017
For the year ended December 31, 2017
Notes to the Unconsolidated Financial Statements
Commitments
Commitments for outstanding forward foreign exchange contracts disclosed in these financial statements are translated at contracted rates. Contingent liabilities/commitments for letters of credit and letters of guarantee denominated in foreign currencies are expressed in rupee terms at the rates of exchange ruling on the balance sheet date.
6.16 Goodwill
Goodwill acquired in a business combination before July 01, 2009 is initially measured at cost, being the excess of the cost of the business combination over the Bank’s interest in the net fair value of the identifiable assets, liabilities and contingent liabilities acquired. Following initial recognition, goodwill is measured at cost less any accumulated impairment losses. Goodwill is reviewed for impairment, annually or more frequently if events or changes in circumstances indicate that the carrying value may be impaired.
For the purpose of impairment testing, goodwill acquired in a business combination is, from the acquisition date, allocated to each of the Bank’s cash-generating units, or groups of cash-generating units, that are expected to benefit from the synergies of the combination, irrespective of whether other assets or liabilities of the acquirer are assigned to those units or groups of units.
6.17 Earnings per share
The Bank presents basic and diluted earnings per share (EPS). Basic EPS is calculated by dividing the profit or loss attributable to ordinary shareholders of the Bank by the weighted average number of ordinary shares outstanding during the period / year. Diluted EPS is determined by adjusting the profit or loss attributable to ordinary shareholders and the weighted average number of ordinary shares outstanding for the effects of all dilutive potential ordinary shares, if any.
6.18 Borrowings / deposits and their cost
Borrowings / deposits are recorded at the proceeds received. Borrowing / deposit costs are recognised as an expense in the period in which these are incurred to the extent that they are not directly attributable to the acquisition of or construction of qualifying assets. Borrowing costs that are directly attributable to the acquisition, construction or production of a qualifying asset (one that takes a substantial period of time to get ready for use or sale) is capitalised as part of the cost of the asset.
6.19 Segment reporting
A segment is a distinguishable component of the Bank that is subject to risks and rewards that are different from those of other segments. A business segment is one that is engaged either in providing certain products or services, whereas a geographical segment is one engaged in providing certain products or services within a particular economic environment. Segment information is presented as per the Bank's functional structure and the guidance of State Bank of Pakistan. The Bank comprises of the following main business segments:
6.19.1 Business segments
Corporate finance
This includes investment banking activities such as mergers and acquisitions, underwriting, privatization, securitization, Initial Public Offers (IPOs) and secondary private placements.
Trading and sales
This segment undertakes the Bank's treasury, money market and capital market activities.

79JS Bank Annual Report 2017
For the year ended December 31, 2017
Notes to the Unconsolidated Financial Statements
Retail banking
Retail banking provides services to small borrowers i.e. consumers, small and medium enterprises (SMEs) and agricultural sector. It includes loans, deposits and other transactions with retail customers.
Commercial banking
This includes loans, deposits and other transactions with corporate customers.
Payment and settlement
This includes activities such as payment and collections, fund transfer, clearing and settlement etc.
6.19.2 Geographical segment
The Bank operates with 322 (December 31, 2016: 306) branches / sub-branches in Pakistan region and one wholesale banking branch in Bahrain (December 31, 2016: one).
6.20 Fiduciary assets
Assets held in a fiduciary capacity are not treated as assets of the Bank in statement of financial position.
2017 2016Note ------- Rupees in '000 -------
7. CASH AND BALANCES WITH TREASURY BANKS
In handLocal currency 4,067,249 2,877,681 Foreign currencies 659,116 625,326
4,726,365 3,503,007 With State Bank of Pakistan in:Local currency current account 7.1 8,594,102 8,536,187 Foreign currency current account - non remunerative 7.2 615,576 449,774 Foreign currency deposit account - remunerative 7.3 1,890,381 1,385,332
11,100,059 10,371,293
With National Bank of Pakistan in:Local currency current accounts 1,506,393 1,628,057
National Prize Bonds 971 6,611 17,333,788 15,508,968
7.1 These include local currency current accounts maintained with SBP as per the requirements of Section 22 of the Banking Companies Ordinance, 1962.
7.2 This represents current account maintained with the SBP under the requirements of BSD Circular No. 14 dated June 21, 2008.
7.3 This represents deposit accounts maintained with SBP under the requirements of BSD Circular No. 14 dated June 21, 2008 and mandatory reserve maintained to facilitate collection and settlement of foreign currency accounts under FE-25, as prescribed by the SBP. Profit rates on this deposit account are fixed on a monthly basis by the SBP. It carries profit of 0% (2016: 0%) per annum.

80 JS Bank Annual Report 2017
For the year ended December 31, 2017
Notes to the Unconsolidated Financial Statements
2017 2016Note ------- Rupees in '000 -------
8. BALANCES WITH OTHER BANKS
In Pakistan
On current accounts 65,187 216,262 On deposit accounts 68 67
65,255 216,329 Outside Pakistan
On current accounts 780,092 295,022 On deposit accounts 8.1 188,919 241,359
969,011 536,381
1,034,266 752,710
8.1 This represents deposit accounts / term placements outside Pakistan, carrying mark-up rate ranging between 0% to 1% p.a (2016: 0%).
2017 2016Note ------- Rupees in '000 -------
9. LENDINGS TO FINANCIAL INSTITUTIONS
Call money lendings 9.2 3,003,443 2,634,489 Due against bills re-discounting 9.3 112,756 - Repurchase agreement lendings (Reverse Repo) 9.4 & 9.5 - 8,699,925
3,116,199 11,334,414
9.1 Particulars of lendings
In local currency - 10,549,925 In foreign currency 3,116,199 784,489
3,116,199 11,334,414
9.2 These represent unsecured call money lendings to financial institutions carrying interest at the rates ranging from 1.38% to 6.93% (2016: 0.17% to 6.00%) per annum. These will mature between January 02, 2018 and June 07, 2018 (January 03, 2017 and April 19, 2017).
9.3 This represents the obligation of the foreign corresponding banks on the discounting of foreign documentary bills purchased by the Bank on discount. These will mature between January 02, 2018 and June 18, 2018 (2016: Nil) and carry interest at the rates ranging from 3.75% to 4.29% per annum.
9.4 These are secured short-term lendings to various financial institutions, carrying mark-up rate Nil (2016: 5.8% to 6.1%) per annum. These are collateralized by Market Treasury Bills and Pakistan Investment Bonds as shown in note 9.5 below.

81JS Bank Annual Report 2017
For the year ended December 31, 2017
Notes to the Unconsolidated Financial Statements
Cost of securities held as collateral against repurchase lendings to financial institutions are as under:
2017 2016Further Further
Held by given as Held by given as bank collateral Total bank collateral Total
-------------------------------------- Rupees in '000 ---------------------------------------
Market Treasury Bills - - - 5,969,925 - 5,969,925 Pakistan Investment Bonds - - - 2,730,000 - 2,730,000
- - - 8,699,925 - 8,699,925
9.5.1 The market value of securities held as collateral against lendings to financial institutions amounted to Rs.Nil (2016: Rs.8,811.414 million).
2017 2016 Held by Given as Held by Given as
10. INVESTMENTS - net bank collateral Total bank collateral Total---------------------------------------- Rupees in '000 -------------------------------------------
10.1 Investments by type
Held-for-trading securitiesMarket treasury bills 6,835,735 926,032 7,761,767 64,346,568 1,413,214 65,759,782 Pakistan investment bonds 709,872 - 709,872 - - -
7,545,607 926,032 8,471,639 64,346,568 1,413,214 65,759,782 Available-for-sale securitiesMarket treasury bills 11,501,193 2,991,504 14,492,697 4,885,943 - 4,885,943 Pakistan investment bonds 54,600,373 39,372,049 93,972,422 49,784,339 - 49,784,339 Ordinary shares of listed companies 3,681,463 - 3,681,463 2,626,343 - 2,626,343 Ordinary shares of unlisted companies 13,406 - 13,406 553,191 - 553,191 Preference shares of listed companies 136,589 - 136,589 136,589 - 136,589 Term finance certificates - listed 182,322 - 182,322 182,322 - 182,322 Term finance certificates - unlisted 575,596 - 575,596 911,869 - 911,869 Sukuk certificates - unlisted 1,631,000 - 1,631,000 360,000 - 360,000 Open end mutual funds - - - 100,000 - 100,000 Foreign currency bonds 1,899,702 2,431,932 4,331,634 5,701,917 - 5,701,917
74,221,644 44,795,485 119,017,129 65,242,513 - 65,242,513 Held-to-maturity securitiesPakistan investment bonds 41,398,485 - 41,398,485 - - -
Investment in subsidiaries 1,919,121 - 1,919,121 1,919,121 - 1,919,121 Total investments at cost 125,084,857 45,721,517 170,806,374 131,508,202 1,413,214 132,921,416 Less: Provision for diminution in
value of investments (1,071,851) - (1,071,851) (948,820) - (948,820)Investments (net of provision) 124,013,006 45,721,517 169,734,523 130,559,382 1,413,214 131,972,596 Unrealised loss on revaluation
of investments classified as held-for-trading securities (2,474) (14) (2,488) (1,261) (36) (1,297)
Surplus / (deficit) on revaluation of available-for-sale securities 75,006 (195,483) (120,477) 1,755,311 - 1,755,311
Total investments at market value 124,085,538 45,526,020 169,611,558 132,313,432 1,413,178 133,726,610
9.5 Securities held as collateral against repurchase agrement lendings to financial institutions

82 JS Bank Annual Report 2017
For the year ended December 31, 2017
Notes to the Unconsolidated Financial Statements
2017 201610.2 Investments by segments Note ------- Rupees in '000 -------
Federal government securitiesMarket treasury bills 10.2.1 22,254,464 70,645,725 Pakistan investment bonds 10.2.1 136,080,779 49,784,339
158,335,243 120,430,064 Fully paid ordinary sharesListed companies 10.2.2 3,681,463 2,626,343 Unlisted companies 10.2.3 13,406 553,191
3,694,869 3,179,534 Fully paid preference sharesListed companies 10.2.4 136,589 136,589
Term finance and sukuk certificates Term finance certificates – listed 10.2.5 182,322 182,322 Term finance certificates – unlisted 10.2.6 575,596 911,869 Sukuk certificates – unlisted 10.2.7 1,631,000 360,000
2,388,918 1,454,191 Mutual fundsOpen end mutual funds 10.2.8 - 100,000
OthersForeign currency bonds 10.2.9 4,331,634 5,701,917
Investment in subsidiaries 10.2.10 1,919,121 1,919,121 Total investments at cost 170,806,374 132,921,416 Less: Provision for diminution in value of investments 10.4 (1,071,851) (948,820)Investments (net of provision) 169,734,523 131,972,596 Unrealized loss on revaluation of
held-for-trading securities 10.4.2 (2,488) (1,297)(Deficit) / surplus on revaluation of
available-for-sale securities 22.1 (120,477) 1,755,311 Total investments at market value 169,611,558 133,726,610
10.2.1 Details of investment in Federal Government SecuritiesMarket value
2017 2016 Held by Given as Held by Given as
bank collateral Total bank collateral Total---------------------------------------- Rupees in '000 -------------------------------------------
Held-for-trading securitiesMarket treasury bills 6,835,535 926,018 7,761,553 64,345,307 1,413,178 65,758,485 Pakistan investment bonds 707,598 - 707,598 - - -
7,543,133 926,018 8,469,151 64,345,307 1,413,178 65,758,485 Available-for-sale securitiesMarket treasury bills 11,501,067 2,991,645 14,492,712 4,884,060 - 4,884,060 Pakistan investment bonds 54,278,753 39,151,006 93,429,759 49,834,951 - 49,834,951
65,779,820 42,142,651 107,922,471 54,719,011 - 54,719,011 Held-to-maturity securitiesPakistan investment bonds * 41,033,889 - 41,033,889 - - -
114,356,842 43,068,669 157,425,511 119,064,318 1,413,178 120,477,496
* These are carried at amortised cost in these unconsolidated financial statements.

83JS Bank Annual Report 2017
For the year ended December 31, 2017
Notes to the Unconsolidated Financial Statements
10.2.1.1 Principal terms of investment in Federal Government Securities
Name of investment Maturity Redemption Coupon
Market treasury bills January 04, 2018 to August 30, 2018 On maturity On maturity
Pakistan investment bonds March 26, 2018 to December 29, 2026 On maturity Half yearly
10.2.1.2 Market Treasury Bills are for the periods of three months, six months and one year. The effective rates of profit on Market Treasury Bills range from 5.91% to 6.10% per annum (2016: 5.85% to 6.23% per annum) with maturities between January 04, 2018 and August 30, 2018 (2016: January 05, 2017 and November 23, 2017).
10.2.1.3 Pakistan Investment Bonds (PIBs) are for the periods of three, five, seven, ten and fifteen years. The rates of profit ranging from 6.02% to 10.42% per annum (2016: 6.08% to 10.42% per annum) with maturities between March 26, 2018 and December 29, 2026 (2016: July 17, 2017 to April 21, 2026).
10.2.2 Details of investment in ordinary shares of listed companies
Name of the company Shares of Rs.10 each Rating Cost Market value2017 2016 2017 2016 2017 2016 2017 2016
------- Numbers ------- ----------------- Rupees in '000 -----------------
- National Foods Limited 265,900 68,800 AA- AA- 95,885 24,990 86,194 25,800 - Amreli Steels Limited 761,200 3,000,000 A A 71,244 214,269 70,533 199,770 - Fauji Fertilizer Company Limited 2,510,100 - AA - 246,261 - 198,574 - - D.G. Khan Cement Limited
(note 10.2.2.1) 1,759,500 - Unrated - 424,293 - 235,280 - - Shifa International Hospitals 118,700 - Unrated - 35,720 - 35,610 - - Pakistan State Oil Limited 1,125,360 - AA - 433,401 - 329,854 - - Power Cement Limited (note 10.2.2.1) 33,602,500 - A- - 611,078 - 293,686 - - IGI Insurance Limited - 2,407,100 - AA - 572,524 - 741,122
Investment in related parties
- EFU General Insurance Limited 3,943,875 3,943,875 AA+ AA+ 488,978 488,978 603,018 595,525 - EFU Life Assurance Limited 982,000 982,000 AA+ AA+ 190,595 190,595 248,927 211,592 - Sitara Chemical Industries Limited 1,651,250 1,896,400 A+ A+ 493,697 544,676 496,993 1,099,912 - TRG Pakistan Limited 32,023,760 32,023,760 Unrated Unrated 590,311 590,311 947,903 1,417,372
3,681,463 2,626,343 3,546,572 4,291,093
10.2.2.1 During the year, the Bank has recognized impairment loss on D.G.Khan Cement Limited and Power Cement Limited by Rs. 189.013 million and 317.392 million respectively due to significant / prolong decline in the fair value of these securities.

84 JS Bank Annual Report 2017
For the year ended December 31, 2017
Notes to the Unconsolidated Financial Statements
10.2.3 Details of investment in ordinary shares of unlisted companies
Name of Chief Executive / Break-up value Number of Cost / break-Name of the company Note Managing Director per share shares up value
2017 2016 2017 2016 2017 2016 ------- Rupees ------- ------- Numbers ------- ----- Rupees in '000 -----
- ISE Towers REIT Management Limited(formerly Islamabad StockExchange Limited) 10.2.3.1 Mr. Aftab Ahmad Chaudhry 11.76 * 11.67 1,213,841 1,213,841 11,000 11,000
- Society for Worldwide InterbankFinancial Telecomunication(SWIFT) 10.2.3.2 Mr. Gottfried Leibbrandt **495,821 387,225 6 6 2,406 2,406
- AGP Limited (formerly AppolloPharma Limited) 10.4 Mr. Nusrat Munshi - 14.05 - 13,400,000 - 539,785
13,406 553,191 * Based on unaudited accounts as of June 30, 2017** Based on audited accounts as of December 31, 2016
10.2.3.1 In accordance with the requirements of the Stock Exchanges (Corporatization, Demutualization and Integration) Act, 2012 (the Act), the Bank has received 3,034,603 shares of Rs.10 each including trading right entitlement certificate (TREC) of the Islamabad Stock Exchange (ISE), in lieu of its Membership Card held by the Bank. Further, upon integration of Islamabad Stock Exchange under the "ISE Scheme of Integration" in 2016 TRE Certificates holders of ISE have been issued 1,213,841 shares of "ISE Towers REIT Management Limited".
10.2.3.2 The Bank qualified as a member based on the financial contribution to SWIFT for network-based services. The Bank has made an investment as per the requirements of By-Laws of SWIFT, under the Share Re-allocation Process, as a result becoming entitled to invest in for six shares. The participation is mandatory to avail the desired network-based services for financial message transmission for cross-border payments and receipt. Further, the share re-allocation occurs every three years and will result in either an increase, decrease, or a status quo in individual shareholding.
10.2.4 Details of investment in preference shares of listed companies
FacePercentage value per Number of
Name of the company of holding share shares Cost Market value2017 2016 2017 2016
------------------------ Rupees in '000 ---------------------- Available-for-sale securitiesAgritech Limited (note 10.2.4.1 & 10.2.4.3) 3.03% 10 4,823,746 48,236 48,236 - - Chenab Limited (note 10.2.4.2 & 10.2.4.3) 15.45% 10 12,357,000 88,353 88,353 - -
136,589 136,589 - -

85JS Bank Annual Report 2017
For the year ended December 31, 2017
Notes to the Unconsolidated Financial Statements
10.2.4.1 These are non-voting cumulative preference shares, carrying preference dividend @ 10% p.a and are convertible into ordinary shares at the option of the Bank after five years from the date of issuance i.e. February 2012. The investee company also has the option to redeem these preference shares plus any unpaid dividend in full or in part, within ninety days after expiry of each anniversary of the issue date. The Bank has recognised full impairment on these shares amounting to Rs.48.236 million (2016: Rs.48.236 million) due to weak financial position of the company.
10.2.4.2 These are cumulative preference shares, carrying preference dividend @ 9.25% p.a and are redeemable in part after four years from the date of issuance i.e. August 2008. The investee company also has an option to redeem, in part, cumulative preference shares after August 2008. The Bank has recognized full impairment on these shares amounting to Rs.88.353 million (2016: Rs.88.353 million) due to weak financial position of the company.
10.2.4.3 Surplus arising due to re-measurement of these shares to the market value has not been recognized as the management believes that the market value may not be realized while selling them in open market.
10.2.5 Details of investment in term finance certificates - listed *
Name of the company Number of certificates Rating Cost Market value2017 2016 2017 2016 2017 2016 2017 2016
---------------- Rupees in '000 ---------------- Available-for-sale securitiesWorldcall Telecom Limited
(note 10.2.5.1 & 10.2.5.2) 90,650 90,650 Unrated Unrated 182,322 182,322 - - 182,322 182,322 - -
* Secured and have a face value of Rs.5,000 each unless specified otherwise.
10.2.5.1 Other particulars of listed term finance certificates are as follows:
Name of the company Repayment frequency Profit rate per annum Maturity date
Worldcall Telecom Limited Semi-annually 6 Month KIBOR ask rate plus 1.60% October 15, 2021
10.2.5.2 Due to weak financial position of the company the Bank has recognised full impairment loss on these term finance certificates.
10.2.6 Details of investment in term finance certificates - unlisted, secured
FaceNumber of value per
Name of the company Note certificates Rating certificate Cost2017 2016 2017 2016 2017 2016
Rupees ----- Rupees in '000 -----
Azgard Nine Limited (related party) 10.2.6.1 29,998 29,998 Unrated Unrated 5,000 65,022 65,022 Agritech Limited 10.2.6.1 30,000 30,000 Unrated Unrated 5,000 149,860 149,860 NRSP Microfinance Bank Limited 60,000 60,000 A A 5,000 75,000 225,000 Water & Power Development
Authority (WAPDA) 100,000 100,000 AAA AAA 5,000 285,714 357,143 Askari Bank Limited - 4th Issue - 75 - AA- 1,000,000 - 75,047 Bank Alfalah Limited - 4th Issue - 1,440 - AA- 5,000 - 4,797 Independent Media
Corporation (Pvt.) Limited - 20,000 - BBB- 5,000 - 35,000
575,596 911,869

86 JS Bank Annual Report 2017
For the year ended December 31, 2017
Notes to the Unconsolidated Financial Statements
10.2.6.1 Due to weak financial position of the company the Bank has recognised full impairment loss on these term finance certificates.
10.2.6.2 Other particulars of unlisted term finance certificates are as follows:
RepaymentName of the company frequency Profit rate per annum Maturity date
Azgard Nine Limited - related party Semi-annually 6 Month KIBOR ask rate plus 1.75%. December 04, 2017(Chief Executive: Mr. Ahmed H. Shaikh)
Agritech Limited Semi-annually 6 Month KIBOR ask rate plus 1.75%. November 29, 2019(Chief Executive: Mr. Faisal Muzammil)
NRSP Microfinance Bank Limited Quarterly 3 Month KIBOR ask rate plus 2.35%. June 30, 2018(Chief Executive: Mr. Zahoor Hussain Khan)
Pakistan Water & Power Development Semi-annually 6 Month KIBOR ask rate plus 1.00%. September 27, 2021Authority (WAPDA)
(Chairman: Lieutenant General Muzammil Hussain (Retd.))
10.2.7 Sukuk certificates - unlistedNumber of Face value per
Name of the company certificates Rating certificate Cost2017 2016 2017 2016 2017 2016
Rupees ----- Rupees in '000 ----- Available-for-sale securities
Engro Fertilizers Limited 80,000 80,000 AA- AA- 3,500 280,000 360,000
Byco Oil Pakistan Limited 6,810 - AAA - 100,000 681,000 -
Ghani Gases Limited 2,000 - A - 87,500 175,000 -
AGP Limited 5,500 - A - 90,000 495,000 -
1,631,000 360,000
10.2.7.1 Other particulars of unlisted term finance certificates are as follows:
Name of the company Repayment Profit rate per annum Maturity date
Engro Fertilizers Limited Semi-annually 6 Month KIBOR ask rate plus 1.75%. July 09, 2019(Chief Executive: Mr. Ruhail Muhammad)
Byco Oil Pakistan Limited Quarterly 3 Month KIBOR ask rate plus 1.05%. January 18, 2022(Chief Executive: Mr. Amir Abbassciy)
Ghani Gases Limited Quarterly 3 Month KIBOR ask rate plus 1.00%. February 03, 2023(Chief Executive: Mr. Atique Ahmad Khan)
AGP Limited Quarterly 3 Month KIBOR ask rate plus 1.30%. June 09, 2022(Chief Executive: Mr. Nusrat Munshi)
10.2.8 Open End Mutual FundsNet asset
value MarketName of Fund Net Asset Rating per unit Cost value
2017 2016 2017 2016 2017 2016 2017 2016------------------ Rupees in '000 -----------------
Available-for-saleNAFA Government
Securities Liquid Fund - 9,325,314 - AAA (f) Rs.10.42 - 100,000 - 97,157
- 100,000 - 97,157

87JS Bank Annual Report 2017
For the year ended December 31, 2017
Notes to the Unconsolidated Financial Statements
10.2.9 Foreign currency bondsCoupon
Name of Bond Rating rate p.a Date of Maturity Cost Market Value2017 2016 % 2017 2016 2017 2016
Available for sale ----------------- Rupees in '000 ------------------
African Export - Import Bank Baa1 - 4.13% June 20, 2024 223,514 - 222,592 - Islamic Republic of Pakistan B - 6.88% December 5, 2027 55,209 - 55,354 - Turkiye Is Bankasi A.S BB+ - 5.50% April 21, 2022 389,917 - 389,799 - Turkiye Is Bankasi A.S BB+ - 5.38% October 6, 2021 55,025 - 55,655 - Turkiye Is Bankasi A.S BB+ - 6.13% April 25, 2024 224,545 - 222,519 - State Oil Company of the Azerbaijan BB+ - 4.75% March 13, 2023 148,044 - 151,830 - Export Credit Bank of Turkey BB+ - 5.38% October 24, 2023 108,844 - 111,566 - PTA Bank Baa3 - 5.38% March 14, 2022 112,662 - 115,171 - Rosneft International Finance DAC Ba1 - 4.20% March 6, 2022 178,092 - 178,227 - Arab Republic of Egypt B - 7.50% January 31, 2027 235,088 - 243,892 - Petrobras Global Finance BB - 7.38% January 17, 2027 118,759 - 121,354 - Russian Federation BBB- - 4.25% June 23, 2027 110,417 - 113,698 - Arab Republic of Egypt B - 5.88% June 11, 2025 218,116 - 222,727 - Gazprom via Gaz Capital SA BBB- - 4.25% April 6, 2024 153,547 - 154,245 - Banco BTG Pactual S.A. Ba3 - 4.00% January 16, 2020 65,010 - 65,551 - DIB Sukuk Ltd. A - 3.66% February 14, 2022 23,519 - 23,723 - BOS Funding Ltd. BBB+ - 4.23% March 7, 2022 110,492 - 112,055 - Saudi International Bond A+ - 2.88% March 4, 2023 30,639 - 30,271 - Akbank Tas BB+ - 5.00% October 24, 2022 168,014 - 166,663 - Turkiye Garanti Bankasi A.S BBB- - 5.25% September 13, 2022 227,874 - 225,090 - Turkiye Garanti Bankasi A.S BBB- - 5.88% March 16, 2023 115,941 - 114,418 - African Export - Import Bank Baa1 Baa2 4.00% May 24, 2021 232,521 220,151 235,918 220,049 Deutches Bank AG BBB+ BBB+ 3.38% May 12, 2021 138,943 131,544 140,275 130,013 CBD (Cayman) Ltd. A- A- 4.00% November 17, 2020 224,056 213,242 226,086 213,048 Turkiye Is Bankasi A.S BB+ Ba1 5.50% April 21, 2019 111,381 106,174 112,458 105,351 Akbank Tas BB+ Ba1 4.00% January 24, 2020 54,883 51,851 55,327 50,691 Turkiye Garanti Bankasi A.S BBB- Ba1 4.75% October 17, 2019 55,623 52,898 56,017 51,931 Republic of Kazakhstan BBB BBB- 5.13% July 21, 2025 117,360 111,905 122,883 111,457 Turkiye Halk Bankasi A.S BB+ Ba1 3.88% February 5, 2020 68,761 65,031 65,894 60,971 Bankpozitif Kredi Ve
Kalkinma Bankasi A.S BBB- BBB- 5.00% February 7, 2018 115,938 109,828 115,816 106,501 Samarco Mineracao SA
(note 10.2.9.1) CC C 5.38% September 26, 2024 53,527 52,374 37,696 28,184 Abu Dhabi National Energy
Company PJSC A3 A- 3.63% June 22, 2021 30,181 28,572 30,717 28,920 Bankpozitif Kredi Ve
Kalkinma Bankasi A.S BBB- BBB- 5.00% February 7, 2018 55,192 52,129 55,151 50,715 Yapi Ve Kredi Bankasi - Ba1 - - - 104,366 - 99,297 Barclays Bank Plc - BBB - - - 102,273 - 104,464 Deutches Bank AG - BBB+ - - - 204,309 - 205,478 Credit Suisse Group Funding - BBB+ - - - 103,284 - 104,295 HSBC Holdings Plc - A1 - - - 23,385 - 23,747 Perusahaan Penerbit SBSN - Baa3 - - - 104,599 - 104,110 Oman Government International - BBB - - - 51,875 - 52,235 Islamic Republic of Pakistan - B - - - 657,554 - 662,968 Islamic Republic of Pakistan - B - - - 668,085 - 687,118 Islamic Republic of Pakistan - B - - - 779,606 - 792,346 Federal Republic of Brazil - BB - - - 105,372 - 107,815 Islamic Republic of Pakistan - B - - - 317,841 - 317,153 EA Partners II BV - B - - - 209,197 - 210,406 Emirates NBD PJSC - A3 - - - 104,599 - 104,814 Gazprombank (OJSC) - BB+ - - - 69,767 - 71,841 Banco BTG Pactual - BB- - - - 61,051 - 57,893 Africa Finance Corporation - A3 - - - 211,879 - 213,853 IBQ Finance Limited - A+ - - - 208,782 - 211,251 The Third Pakistan International
Sukuk Co. Ltd. - B - - - 418,394 - 426,026 4,331,634 5,701,917 4,350,638 5,714,941

88 JS Bank Annual Report 2017
For the year ended December 31, 2017
Notes to the Unconsolidated Financial Statements
10.2.9.1 The Bank has recognised partial impairment on this bond amounting to Rs.31.653 million (2016: Rs.31.653 million) due to weak financial position of the company.
10.2.10 Investment in subsidiaries Rating Number of shares Percentage holding Cost
2017 2016 2017 2016 2017 2016Rupees in '000
JS Global Capital Limited (JSGCL) AA AA 25,525,169 67.16% 67.16% 1,357,929 1,357,929 JS Investments Limited (JSIL)
(note 10.2.10.1) A+ A+ 52,236,978 65.16% 65.16% 561,192 561,192 1,919,121 1,919,121
10.2.10.1 The Bank also controls JS ABAMCO Commodities Limited (JSACL) indirectly through its subsidiary JS Investments Limited which has 100% holding in JSACL.
10.3 Investments include certain approved / government securities which are held by the Bank to comply with the Statutory Liquidity Requirement determined on the basis of the Bank’s demand and time liabilities as set out under section 29 of the Banking Companies Ordinance, 1962.
2017 2016Note ------- Rupees in '000 -------
10.4 Particulars of provision for diminution in value of investments
Opening balance 948,820 533,793 Charge for the year 506,405 415,027 Reversal on disposal of investments (383,374) -
123,031 415,027 Closing balance 1,071,851 948,820
10.4.1 Particulars of provision for diminution in value
of investments by type and segment
Ordinary shares - listed 10.2.2 506,405 -Ordinary shares - unlisted 10.2.3 - 383,374 Preference shares of listed company 10.2.4 136,589 136,589 Term finance certificates - unlisted 10.2.6 214,882 214,882 Term finance certificates - listed 10.2.5 182,322 182,322 Foreign currency bonds 10.2.9.1 31,653 31,653
1,071,851 948,820
10.5 Unrealised loss on revaluation of investmentsclassified as held-for-trading securities -net
Market treasury bills (214) (1,297)Pakistan investment bonds (2,274) -
(2,488) (1,297)

89JS Bank Annual Report 2017
For the year ended December 31, 2017
Notes to the Unconsolidated Financial Statements
2017 2016Note ------- Rupees in '000 -------
11. ADVANCES - net
Loans, cash credits, running finances, etc. In Pakistan 160,635,485 84,694,538 Outside Pakistan 702,934 2,139
161,338,419 84,696,677
Net investment in finance lease in Pakistan 11.2 13,781,334 7,532,153
Bills discounted and purchased (excluding treasury bills) payable in Pakistan 6,174,461 1,444,580 payable outside Pakistan 5,584,681 2,780,065
11,759,142 4,224,645
Advances - gross 11.1 186,878,895 96,453,475
Provision against non-performing advances - specific 11.4 (2,638,960) (2,618,353)Provision against advances - general 11.4 (100,353) (40,988)
(2,739,313) (2,659,341)
Advances - net of provision 184,139,582 93,794,134
11.1 Particulars of advances (gross)
11.1.1 In local currency 180,504,654 92,885,670 In foreign currencies 6,374,241 3,567,805
186,878,895 96,453,475
11.1.2 Short term (for upto one year) 123,066,393 77,178,825 Long term (for over one year) 63,812,502 19,274,650
186,878,895 96,453,475

90 JS Bank Annual Report 2017
For the year ended December 31, 2017
Notes to the Unconsolidated Financial Statements
11.2 Particulars of net investment in finance lease
2017 2016Later than Later than
Not later one and Not later one andthan less than than less than
one year five years Total one year five years Total------------------------------------ Rupees in '000 ------------------------------------
Lease rentals receivable 5,222,208 6,584,317 11,806,525 2,619,528 3,804,142 6,423,670 Guaranteed residual value 412,388 2,911,823 3,324,211 150,701 1,732,591 1,883,292 Minimum lease payments 5,634,596 9,496,140 15,130,736 2,770,229 5,536,733 8,306,962
Finance charges for future periods (776,285) (573,117) (1,349,402) (435,151) (339,658) (774,809)
Present value of minimum lease payments 4,858,311 8,923,023 13,781,334 2,335,078 5,197,075 7,532,153
11.3 Advances include Rs.3,257.997 million (2016: Rs.3,327.942 million) which have been placed under non-performing status as detailed below:
2017Provision Provision
Category of classification Domestic Overseas Total required heldNote ----------------------------- Rupees in '000 -----------------------------
Other assets especially mentioned 5,222 - 5,222 - - Substandard 336,818 - 336,818 44,307 44,307 Doubtful 131,328 - 131,328 7,333 7,333 Loss 2,784,629 - 2,784,629 2,587,320 2,587,320
11.4 3,257,997 - 3,257,997 2,638,960 2,638,960
2016Provision Provision
Category of classification Domestic Overseas Total required held----------------------------- Rupees in '000 -----------------------------
Other assets especially mentioned - - - - - Substandard 384,986 - 384,986 46,076 46,076 Doubtful 48,302 - 48,302 531 531 Loss 2,894,654 - 2,894,654 2,571,746 2,571,746
11.4 3,327,942 - 3,327,942 2,618,353 2,618,353

91JS Bank Annual Report 2017
For the year ended December 31, 2017
Notes to the Unconsolidated Financial Statements
11.4 Particulars of provision against non-performing advances
2017 2016Specific General Total Specific General Total
Note ------------------------------------- Rupees in '000 ---------------------------------------
Opening balance 2,618,353 40,988 2,659,341 2,705,929 17,252 2,723,181 Charge for the year 178,071 59,365 237,436 183,923 23,736 207,659 Reversals (34,622) - (34,622) (271,346) - (271,346)
143,449 59,365 202,814 (87,423) 23,736 (63,687)Amount written off from
the opening balance 11.5 (122,842) - (122,842) (153) - (153)
Closing balance 2,638,960 100,353 2,739,313 2,618,353 40,988 2,659,341
11.4.1 Particulars of provision against non-performing advances
2017 2016Specific General Total Specific General Total
------------------------------------- Rupees in '000 ---------------------------------------
In local currency 2,638,960 100,353 2,739,313 2,618,353 40,988 2,659,341 11.4.2 The general provision is maintained to create general reserves against following advances portfolios in
accordance with the prudential regulations issued by State Bank of Pakistan as follows:
2017 2016 2017 2016Secured portfolio Unsecured portfolio
--------------------- Percentages --------------------Small enterprises financing - 1% - -Consumer financing 1% 1% 4% 4%Housing finance 0.5% 0.5% - -
11.4.3 The State Bank of Pakistan through various circulars has allowed benefit of the forced sale value (FSV) of Plant and Machinery under charge, pledged stock and mortgaged residential, commercial and industrial properties (land and building only) held as collateral against non-performing loans (NPLs) for a maximum of five years from the date of classification. As at December 31, 2017, the Bank has availed cumulative benefit of FSV of Rs.295.536 million (2016: Rs.398.690 million) under the directives of the SBP. Had the benefit not been taken the unappropriated profit after tax would have reduced by Rs.192.098 million (2016: Rs.259.149 million). Further, as required by the SBP directives, this unappropriated profit will not be available for distribution as dividend or other appropriations.

92 JS Bank Annual Report 2017
For the year ended December 31, 2017
Notes to the Unconsolidated Financial Statements
2017 2016 ------- Rupees in '000 -------
11.5 Particulars of Write Offs:
11.5.1 Against provisions 122,842 153 Directly charged to profit and loss account - 83
122,842 236
11.5.2 Write offs of Rs.500,000 and above 122,703 - Write offs of below Rs.500,000 139 236
122,842 236
11.5.3 During the period, the Board of Directors in their meeting held on April 27, 2017 authorised the Bank to write-off the fully provided non-performing loans amounting to Rs. 122.842 million. These loans are written-off as a book entry without prejudice to the Bank's right of recovery against the customers. In terms of sub-section (3) of section 33A of the Banking Companies Ordinance, 1962 the statement in respect of written-off loans or any other financial relief of five hundred thousand rupees or above allowed to a person during the year ended December 31, 2017 is given in Annexure 'II' to these financial statements.
11.6 Particulars of loans and advances to directors, associated companies, subsidiaries, etc.
Debts due by directors, executives or officers of the Bank or any of them either severally or jointly with any other person:
2017 2016Note ------- Rupees in '000 -------
Balance at the beginning of the year 1,714,606 1,319,024 Loans granted during the year 1,125,376 865,153 Repayments (509,516) (469,571)Balance at the end of the year 2,330,466 1,714,606
Debts due by subsidiaries and associates are disclosed in note 40.
12. OPERATING FIXED ASSETS
Capital work-in-progress 12.1 295,973 227,808 Property and equipment 12.2 4,957,926 3,841,485 Intangible assets 12.3 1,858,922 1,767,888
7,112,821 5,837,181 12.1 Capital work-in-progress
Civil works 110,247 114,941 Advance for purchase of furniture and fixtures 290 1,785 Advance for purchase of vehicles 59,190 26,405 Advance for purchase of equipment and software 126,246 84,677
295,973 227,808
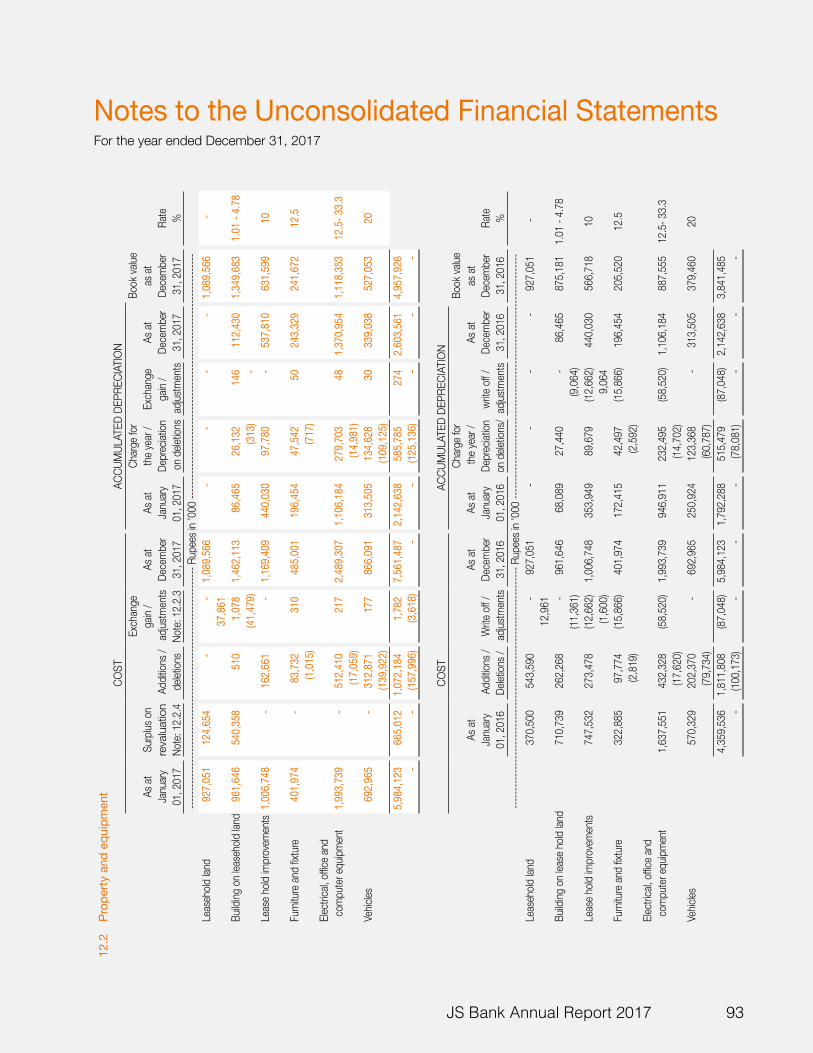
93JS Bank Annual Report 2017
For the year ended December 31, 2017
Notes to the Unconsolidated Financial Statements12
.2Pr
oper
ty a
nd e
quip
men
tCO
ST
ACC
UMUL
ATED
DEP
RECI
ATIO
NEx
chan
geCh
arge f
orBo
ok va
lueAs
at
Surp
lus on
gain
/As
at
As at
the
year
/Ex
chan
geAs
at
as at
Janu
aryre
valu
atio
n A
dditio
ns /
adjus
tmen
ts De
cemb
erJa
nuary
Depr
eciat
ionga
in /
Dece
mber
Dece
mber
Rate
01, 2
017
Note:
12.2.
4 d
eletio
ns
Note:
12.2.
331
, 201
701
, 201
7 on
dele
tions
adju
stmen
ts 31
, 201
731
, 201
7%
------
------
------
------
------
------
------
------
------
------
------
-- Ru
pees
in '0
00 --
------
------
------
------
------
------
------
------
------
------
------
-Le
aseh
old la
nd 92
7,051
12
4,654
-
-
1,
089,5
66
-
-
-
-
1,08
9,566
-
37
,861
Build
ing on
leas
ehold
land
961,6
46
540,3
58
510
1,07
8 1,
462,1
13
86,46
5 26
,132
146
112,4
30
1,34
9,683
1.0
1 - 4.
78 (4
1,479
) (3
13)
-
Leas
e hold
impr
ovem
ents
1,00
6,748
-
16
2,661
-
1,
169,4
09
440,0
30
97,78
0 -
53
7,810
63
1,599
10
Furn
iture
and
fixtur
e 40
1,974
-
83
,732
310
485,0
01
196,4
54
47,54
2 50
24
3,329
24
1,672
12
.5 (1
,015)
(717
)Ele
ctrica
l, offic
e and
c
ompu
ter eq
uipme
nt 1,
993,7
39
-
512,4
10
217
2,48
9,307
1,
106,1
84
279,7
03
48
1,37
0,954
1,
118,3
53
12.5-
33.3
(17,0
59)
(14,9
81)
Vehic
les 69
2,965
-
31
2,871
17
7 86
6,091
31
3,505
13
4,628
30
33
9,038
52
7,053
20
(139
,922)
(109
,125)
5,98
4,123
66
5,012
1,
072,1
84
1,78
2 7,
561,4
87
2,14
2,638
58
5,785
274
2,60
3,561
4,
957,9
26
-
-
(157
,996)
(3,61
8) -
-
(1
25,13
6) -
-
-
COST
ACCU
MUL
ATED
DEP
RECI
ATIO
NCh
arge f
orBo
ok va
lueAs
at
As at
As
at
the y
ear /
As
at
as at
Janu
ary A
dditio
ns /
Write
off /
Dece
mber
Janu
aryDe
prec
iation
write
off /
Dece
mber
Dece
mber
Rate
01, 2
016
Delet
ions /
adjus
tmen
ts 31
, 201
601
, 201
6on
dele
tions
/ ad
justm
ents
31, 2
016
31, 2
016
%---
------
------
------
------
------
------
------
------
------
------
-----
Rupe
es in
'000
-----
------
------
------
------
------
------
------
------
------
------
----
Leas
ehold
land
370,5
00
543,5
90
-
927,0
51
-
-
-
-
927,0
51
-
12,96
1 Bu
ilding
on le
ase h
old la
nd 71
0,739
26
2,268
-
96
1,646
68
,089
27,44
0 -
86
,465
875,1
81
1.01 -
4.78
(11,3
61)
(9,06
4)Le
ase h
old im
prov
emen
ts 74
7,532
27
3,478
(1
2,662
) 1,
006,7
48
353,9
49
89,67
9 (1
2,662
) 44
0,030
56
6,718
10
(1,60
0) 9,
064
Furn
iture
and
fixtur
e 32
2,885
97
,774
(15,8
66)
401,9
74
172,4
15
42,49
7 (1
5,866
) 19
6,454
20
5,520
12
.5 (2
,819)
(2,59
2)Ele
ctrica
l, offic
e and
c
ompu
ter eq
uipme
nt 1,
637,5
51
432,3
28
(58,5
20)
1,99
3,739
94
6,911
23
2,495
(5
8,520
) 1,
106,1
84
887,5
55
12.5-
33.3
(17,6
20)
(14,7
02)
Vehic
les 57
0,329
20
2,370
-
69
2,965
25
0,924
12
3,368
-
31
3,505
37
9,460
20
(79,7
34)
(60,7
87)
4,35
9,536
1,
811,8
08
(87,0
48)
5,98
4,123
1,
792,2
88
515,4
79
(87,0
48)
2,14
2,638
3,
841,4
85
-
(100
,173)
-
-
-
(78,0
81)
-
-
-

94 JS Bank Annual Report 2017
For the year ended December 31, 2017
Notes to the Unconsolidated Financial Statements
12.2.1 Included in cost of property and equipment are fully depreciated items still in use having cost of Rs.539.849 million (2016: Rs.568.479 million).
12.2.2 The details of disposals of assets whose original cost or book value exceeds one million rupees or two hundred and fifty thousand rupees respectively, whichever is lower, are given in Annexure I of these unconsolidated financial statements.
12.2.3 During the year, the Bank has reclassified Rs. 37.861 million into lands which was earlier classified in the buildings, resultantly the excess depreciation charged on land of Rs. 14.931 million is reversed accordingly.
12.2.4 The properties of the Bank are revalued by independent professional valuers as at September 30, 2017. The revaluation was carried out by M/s. Tristar International Consultants Pvt Ltd on the basis of professional assessment of present market values and resulted in an increase in surplus by Rs.665.012 million. The total surplus arising against revaluation of fixed assets as at December 31, 2017 amounts to Rs.661.399 million. Had there been no revaluation, the carrying value of revalued land and building on land as at December 31, 2017 would have been lower by Rs.124.654 million and Rs.536.745 million respectively, and net surplus on revaluation of fixed assets, deferred tax liability and incremental depreciation would have been lower by Rs.473.538 million, Rs.187.861 million and Rs.3.613 million respectively.
12.3 Intangible assetsCOST ACCUMULATED AMORTISATION
Book valueAs at Additions / As at As at Deletions / Amortisation As at as at
January Exchange December January Exchange for the December December Rate01, 2017 gain 31, 2017 01, 2017 gain year 31, 2017 31, 2017 %
Note ----------------------------------------------------- Rupees in '000 ------------------------------------------------------
Computer software 521,692 151,360 673,321 217,428 - 60,556 278,023 395,298 10
269 39 Goodwill 12.3.1 1,463,624 - 1,463,624 - - - - 1,463,624 -
1,985,316 151,629 2,136,945 217,428 - 60,556 278,023 1,858,922 269 39
COST ACCUMULATED AMORTISATIONBook value
As at Additions / As at As at Amortisation As at as atJanuary Exchange December January Deletions / for the December December Rate01, 2016 gain 31, 2016 01, 2016 Exchange gain year 31, 2016 31, 2016 %
Note ----------------------------------------------------- Rupees in '000 ------------------------------------------------------
Computer software 472,587 49,105 521,692 168,131 - 49,297 217,428 304,264 10
Goodwill 12.3.1 1,463,624 - 1,463,624 - - - - 1,463,624 -
1,936,211 49,105 1,985,316 168,131 - 49,297 217,428 1,767,888

95JS Bank Annual Report 2017
For the year ended December 31, 2017
Notes to the Unconsolidated Financial Statements
12.3.1 For impairment testing, goodwill has been allocated to 'Trading and Sales' Segment as Cash Generating Unit (CGU), which is also a reportable segment.
12.3.2 Key assumptions used in value in use calculationThe recoverable amount of the CGU has been determined based on value in use calculation, using cash flow projections based on business plan approved by the Board of Directors of the Bank covering a five year period. The discount rates applied to cash flows beyond five years are extrapolated using a terminal growth rate. The following rates are used by the Bank.
2017 2016Percentages
Discount rate 19.33 16.33 Terminal growth rate 10.00 10.00
The calculation of value in use is most sensitive to following assumptions:
a) Interest margins
Interest margins are based on prevailing industry trends and anticipated market conditions.
b) Discount ratesDiscount rates reflect management estimates of the rate of return required for each business and are calculated after taking into account the prevailing risk free rate, industry risk and business risk. Discount rates are calculated by using cost of equity of the Bank.
c) Key business assumptionsThe assumptions are important as they represent management assessment of how the unit's position might change over the projected period. Based on the expansion plans, management expects aggressive growth in advances, investments and deposits during the projected periods and thereafter stabilisation in line with industry trends.
Management believes that any significant change in key assumptions, on which CGU's recoverable amount is based, may impact the carrying amount to further exceed its recoverable amount. Value in use calculation of the CGU are sensitive to changes in assumptions for interest rate spreads, Non Funded Income (NFI), long term growth rates and discount rates.
d) Sensitivity to changes in assumptionThe estimated recoverable amount of the 'Trading and Sales' CGU exceeds its carrying amount by approximately Rs.1,336.8 million. Management has identified two key assumptions for which there could be a reasonably possible change that could cause the carrying amount to exceed the recoverable amount. The following table shows the amount that these two assumptions are required to change individually in order for the estimated recoverable amount to be equal to the carrying amount.
Changes required for carrying amount to equal recoverable
amount (%)
2017 2016
- Discount rate 1.02 1.41 - Terminal growth rate (1.49) (1.92)

96 JS Bank Annual Report 2017
For the year ended December 31, 2017
Notes to the Unconsolidated Financial Statements
2017 2016Note ------- Rupees in '000 -------
13. OTHER ASSETS
Mark-up / income accrued in local currency 13.1 4,054,291 2,314,307 Mark-up / income accrued in foreign currency 67,337 85,801 Advances, deposits, advance rent and other prepayments 473,329 393,740 Taxation (payments less provision) 315,931 329,477 Receivable against bancassurance / bancatakaful 13.2 89,727 19,278 Stationery and stamps in hand 13,212 13,215 Receivable from other banks in respect of remittance 13.3 202,282 154,760 Non-banking assets acquired in satisfaction of claims 13.4 203,339 175,808 Unrealised loss on revaluation of derivative instruments 72,078 - Advance for subscription of TFC - unsecured 13.5 133,333 - ATM settlement account 226,827 171,428 Others 13.6 164,643 99,523
6,016,329 3,757,337 Less: Provision held against other assets 13.7 (55,667) (10,861)Other assets (net of provisions) 5,960,662 3,746,476
13.1 This includes an amount of Rs.25.199 million (2016: Rs.60.787 million) due from related parties.
13.2 This includes an amount of Rs.74.240 million (2016: Rs.19.132 million) due from related parties.
13.3 This includes an amount of Rs.132.069 million (2016: Rs.123.486 million) receivable from State Bank of Pakistan in respect of home remittance services provided by the Bank.
13.4 Movement of Non banking assets acquired in satisfaction of claims at market value:
2017 2016Note ------- Rupees in '000 -------
As at January 01 175,808 182,455 Revaluation surplus arise during the year - net 13,395 84,175 Additions during the year 13.4.2 15,436 39,948 Deletions during the year - (129,648)Depreciation during the year (1,300) (1,122)
203,339 175,808
13.4.1 Non-banking assets acquired in satisfaction of claims are carried at revalued amount according to the requirements of the ‘Regulation for Debt Property Swap’ (the regulations) issued by SBP vide the BPRD Circular No. 1 of 2016, dated January 01, 2016. Had there been no revaluation, the carrying value of non-banking assets acquired in satisfaction of claims would have been lower by Rs.97.241 million (2016: Rs.91.634 million), and surplus on revaluation of assets net, deferred tax liability and depreciation expense would have been lower by Rs.95.049 million (2016: Rs.84.175 million), Rs.2.192 million (2016: Rs.2.304 million) and Rs.0.329 million (2016: Rs.1.122 million) respectively.
2017 2016 ------- Rupees in '000 -------
Leasehold land 88,640 73,206 Building 17,457 18,427
106,097 91,633

97JS Bank Annual Report 2017
For the year ended December 31, 2017
Notes to the Unconsolidated Financial Statements
13.4.2 This represents property acquired under satisfaction of claims against which non-performing loan was reduced and specific provision has been reversed by Rs.15.436 million (2016: Rs.39.948 million).
13.5 This represents, the advance given against subscription of the TFCs of the FINCA Microfinance Bank by agreement dated October 19, 2017 carrying interest at the rate of average of three months KIBOR + 1.5% p.a.
13.6 This includes an amount of Rs.7.073 million (2016: Rs.2.505 million) due from subsidiary companies.
2017 201613.7 Provision held against other assets Note ------- Rupees in '000 -------
Opening balance 10,861 10,861 Charge for the year 13.7.1 44,806 - Reversal for the year - - Net charge for the year 44,806 - Closing balance 55,667 10,861
13.7.1 This represents receivable against insurance claim from a related party.
14. BILLS PAYABLE
In Pakistan 3,669,463 2,539,715 Outside Pakistan 154,815 4,313
3,824,278 2,544,028 15. BORROWINGS
In Pakistan 59,291,448 8,152,229 Outside Pakistan 5,265,595 2,167,818
15.1 & 15.2 64,557,043 10,320,047 15.1 Particulars of borrowings
In local currency 59,291,448 8,152,229 In foreign currencies 5,265,595 2,167,818
64,557,043 10,320,047 15.2 Details of borrowings from financial institutions
SecuredBorrowings from State Bank of Pakistan under: Export refinancing scheme (ERF) 15.2.1 10,970,007 5,962,976 Long-Term Finance Facility (LTFF) 15.2.2 1,390,366 735,734 Financing Facility for Storage of Agricultural Produce (FFSAP) 15.2.3 69,365 40,845
12,429,738 6,739,555
Repurchase agreement borrowings 15.2.4 44,802,031 1,412,674
UnsecuredCall borrowings 15.2.5 5,637,284 805,408 Due against bills re-discounting 15.2.6 1,488,994 1,321,882 Overdrawn nostro accounts 198,996 40,528
7,325,274 2,167,818
64,557,043 10,320,047

98 JS Bank Annual Report 2017
For the year ended December 31, 2017
Notes to the Unconsolidated Financial Statements
15.2.1 The Bank has entered into agreement with the State Bank of Pakistan (SBP) for extending export finance to customers. As per the terms of the agreement, the Bank has granted SBP the right to recover the outstanding amount from the Bank at the date of maturity of finances by directly debiting the current account maintained by the Bank with SBP. These borrowings are repayable on a quarterly basis and to be matured between January 09, 2018 and June 26, 2018. These carry mark-up at the rate from 1% to 2% (December 31, 2016: 2%) per annum.
15.2.2 These borrowings have been obtained from the SBP for providing financing facilities to exporters for adoption of new technologies and modernization of their plant and machinery. These borrowings will mature between August 25, 2019 and October 18, 2027 (2016: August 25, 2019 and December 31, 2026). These carry mark-up at rates ranging from 3.5% to 6% (2016: 3.5% to 6.0%) per annum.
15.2.3 These borrowings have been obtained from SBP under “Financing Facility for Storage of Agricultural Produce (FFSAP)” to encourage Private Sector to establish Silos, Warehouses and Cold Storages. These borrowings will mature between May 09, 2020 and July 31, 2024 and carry mark-up at the rate ranging between 2.00% to 2.50% (December 31, 2016: 3.5%) per annum.
15.2.4 This represents collateralised borrowing from various financial institutions against Market Treasury Bills, Pakistan Investment Bonds and Foreign Currency Bonds (2016: Treasury Bills) carrying mark-up at the rates ranging from 2.30% to 6.20% (2016: 5.6% to 5.75%) per annum and will mature between January 02, 2018 and March 20, 2018 (2016: January 03, 2017). The carrying value of securities given as collateral against these borrowings is given in note 10.1.
15.2.5 These represent call money borrowings from financial institutions which will mature between January 02, 2018 and January 29, 2018 (2016: January 05, 2017 and March 28, 2017), carrying interest at the rates ranging from 1.10% to 5.8% (2016: 1.80% to 2.76%) per annum.
15.2.6 This represents obligation to the foreign corresponding banks on the discounting of foreign documentary bills purchased by the Bank on discount. These will mature between January 19, 2018 to March 05, 2019 (2016: January 06, 2017 to March 14, 2017) and carry interest at the rates ranging from 1.65% to 4.22% (2016: 2.30% to 2.54%) per annum.
2017 201616. DEPOSITS AND OTHER ACCOUNTS ------- Rupees in '000 -------
CustomersFixed deposits 131,902,422 101,194,427 Savings deposits 47,266,416 35,751,988Current accounts - non-remunerative 70,197,106 49,123,501 Margin accounts 3,967,204 4,185,137
253,333,148 190,255,053 Financial Institutions
Remunerative deposits 35,724,471 35,131,540Non-remunerative deposits 1,019,947 712,338
36,744,418 35,843,878 290,077,566 226,098,931
16.1 Particulars of deposits
In local currency 276,922,230 215,434,075 In foreign currencies 13,155,336 10,664,856
290,077,566 226,098,931
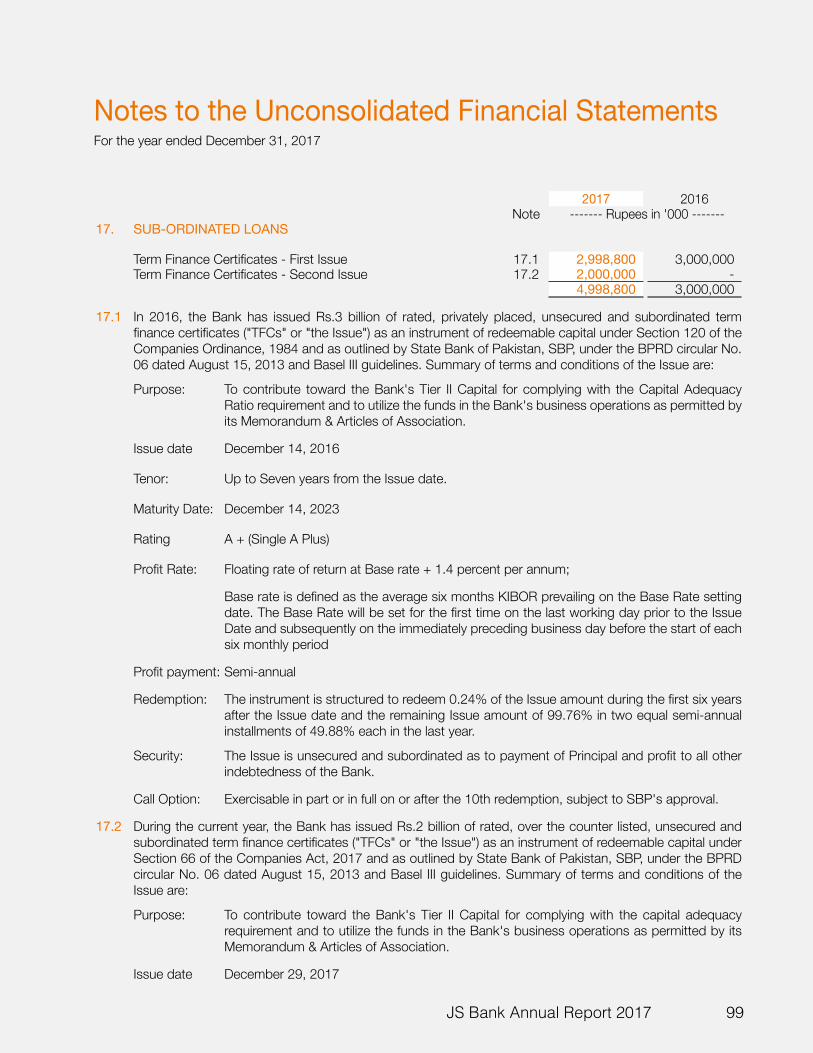
99JS Bank Annual Report 2017
For the year ended December 31, 2017
Notes to the Unconsolidated Financial Statements
2017 2016Note ------- Rupees in '000 -------
17. SUB-ORDINATED LOANS
Term Finance Certificates - First Issue 17.1 2,998,800 3,000,000 Term Finance Certificates - Second Issue 17.2 2,000,000 -
4,998,800 3,000,000
17.1 In 2016, the Bank has issued Rs.3 billion of rated, privately placed, unsecured and subordinated term finance certificates ("TFCs" or "the Issue") as an instrument of redeemable capital under Section 120 of the Companies Ordinance, 1984 and as outlined by State Bank of Pakistan, SBP, under the BPRD circular No. 06 dated August 15, 2013 and Basel III guidelines. Summary of terms and conditions of the Issue are:
Purpose: To contribute toward the Bank's Tier II Capital for complying with the Capital Adequacy Ratio requirement and to utilize the funds in the Bank's business operations as permitted by its Memorandum & Articles of Association.
Issue date December 14, 2016
Tenor: Up to Seven years from the Issue date.
Maturity Date: December 14, 2023
Rating A + (Single A Plus)
Profit Rate: Floating rate of return at Base rate + 1.4 percent per annum;
Base rate is defined as the average six months KIBOR prevailing on the Base Rate setting date. The Base Rate will be set for the first time on the last working day prior to the Issue Date and subsequently on the immediately preceding business day before the start of each six monthly period
Profit payment: Semi-annual
Redemption: The instrument is structured to redeem 0.24% of the Issue amount during the first six years after the Issue date and the remaining Issue amount of 99.76% in two equal semi-annual installments of 49.88% each in the last year.
Security: The Issue is unsecured and subordinated as to payment of Principal and profit to all other indebtedness of the Bank.
Call Option: Exercisable in part or in full on or after the 10th redemption, subject to SBP's approval.
17.2 During the current year, the Bank has issued Rs.2 billion of rated, over the counter listed, unsecured and subordinated term finance certificates ("TFCs" or "the Issue") as an instrument of redeemable capital under Section 66 of the Companies Act, 2017 and as outlined by State Bank of Pakistan, SBP, under the BPRD circular No. 06 dated August 15, 2013 and Basel III guidelines. Summary of terms and conditions of the Issue are:
Purpose: To contribute toward the Bank's Tier II Capital for complying with the capital adequacy requirement and to utilize the funds in the Bank's business operations as permitted by its Memorandum & Articles of Association.
Issue date December 29, 2017

100 JS Bank Annual Report 2017
For the year ended December 31, 2017
Notes to the Unconsolidated Financial Statements
Tenor: Up to Seven years from the Issue date.
Maturity Date: December 29, 2024
Rating A + (Single A Plus)
Profit Rate: Floating rate of return at Base rate + 1.4 percent per annum;
Base rate is defined as the average six months KIBOR prevailing on the Base Rate setting date. The Base Rate will be set for the first time on the last working day prior to the Issue Date and subsequently on the immediately preceding business day before the start of each six monthly period
Profit payment: Semi-annual
Redemption: The instrument is structured to redeem 0.24% of the Issue amount during the first six years after the Issue date and the remaining Issue amount of 99.76% in two equal semi-annual installments of 49.88% each in the last year.
Security: The Issue is unsecured and subordinated as to payment of Principal and profit to all other indebtedness of the Bank.
Call Option: Exercisable in part or in full on or after the 10th redemption, subject to SBP's approval.
2017 2016 ------- Rupees in '000 -------
18. DEFERRED TAX LIABILITIES - net
Deferred tax (debits) arising from:
Provision against investments (57,149) (57,149)Provision against loans and advances (3,523) (16,092)Provision against other assets (15,682) - Unrealised loss on revaluation of investment classified
as held-for-trading (871) (454)Provision for Workers' Welfare Fund (26,145) (26,145)(Deficit) / surplus on revaluation of investment classified
as available-for-sale (42,167) 614,359
(145,537) 514,519 Deferred tax credits arising due to:
Operating fixed assets 214,793 184,050 Goodwill 512,268 512,268 Unrealised gain / (loss) on revaluation of derivative Instruments 25,227 (7,782)Surplus on revaluation of operating fixed assets 187,861 - Surplus on revaluation of non-banking assets acquired
in satisfaction of claims 2,191 2,307 942,340 690,843 796,803 1,205,362

101JS Bank Annual Report 2017
For the year ended December 31, 2017
Notes to the Unconsolidated Financial Statements
18.1 Movement in temporary differences during the year:
Balance as at Recognised Balance as Recognised Balance asJanuary 01, in profit and Recognised at December in profit and Recognised at December
2016 loss account in equity 31, 2016 loss account in equity 31, 2017 ----------------------------------------------- Rupees in '000 -----------------------------------------------
Deferred tax debits arising from:Provision against investments (57,149) - - (57,149) - - (57,149)Provision against loans and advances (94,246) 78,154 - (16,092) 12,569 - (3,523)Provision against other assets - - - - (15,682) - (15,682)Unrealised (loss) / gain on revaluation of
investments classified as held-for-trading 2,559 (3,013) - (454) (417) - (871)Surplus / (Deficit) on revaluation of investments
classified assets as available-for-sale 1,292,713 - (678,354) 614,359 - (656,526) (42,167)Provision for Workers' Welfare Fund (48,362) 22,217 - (26,145) - - (26,145)
1,095,515 97,358 (678,354) 514,519 (3,530) (656,526) (145,537)
Deferred tax credits arising due to:Operating fixed assets 152,922 31,128 - 184,050 30,743 - 214,793 Goodwill 461,322 50,946 - 512,268 - - 512,268 Surplus on revaluation of operating
fixed assets - - - - (1,264) 189,125 187,861 Surplus on revaluation of non-banking
assets acquired in satisfaction of claims - - 2,307 2,307 (116) - 2,191 Unrealized (loss) / gain on revaluation of
derivative financial instruments (14,366) 6,584 - (7,782) 33,009 - 25,227 599,878 88,658 2,307 690,843 62,372 189,125 942,340
1,695,393 186,016 (676,047) 1,205,362 58,842 (467,401) 796,803
2017 2016Note ------- Rupees in '000 -------
19. OTHER LIABILITIES
Mark-up / return / interest payable in local currency 19.1 2,096,404 1,400,359 Mark-up / return / interest payable in foreign currency 47,076 16,445 Accrued expenses 19.2 694,761 605,698 Payable in respect of defined benefit obligation - net 35.5 175,118 118,308 Unrealised loss on revaluation of derivative instruments - 22,235 Unclaimed dividends 4,207 4,207 Government duties 115,517 96,909 Donation payable 29.1 32,000 67,800 Lease key money deposit 3,320,317 1,877,773 Provision for Workers' Welfare Fund 19.3 238,385 205,974 Payable against remittance 361,808 286,973 Visa debit card payable 148,650 42,907 Retention money payable 29,245 24,860 Others 121,569 112,152
7,385,057 4,882,600

102 JS Bank Annual Report 2017
For the year ended December 31, 2017
Notes to the Unconsolidated Financial Statements
19.1 Included herein is a sum of Rs.72.114 million (2016: Rs.51.564 million) payable to related parties.
19.2 Included herein is a sum of Rs.1.907 million (2016: Rs.1,734 million) payable to subsidiary companies.
19.3 In 2016, the Honorable Supreme Court of Pakistan (SCP) passed a judgment on November 10, 2016, declaring the insertion of amendments introduced in the Finance Act, 2008 pertaining to WWF as unlawful for the reason that the WWF is not in the nature of tax and therefore, could not be introduced through money bill under the Constitution. The Federal Board of Revenue has filed a petition in the SCP against the said judgment, which is pending hearing.
In view of the above developments regarding the applicability of Federal WWF on Banks, the Pakistan Bankers’ Association (PBA) sought a legal opinion to conclude on the reversal of Federal WWF provision. However, based on legal advice, the Bank has decided to retain the provision for WWF in the financial statements.
Further, as a consequence of the 18th amendment to the Constitution, levy for the WWF was also introduced by the Government of Sindh through the Sindh WWF Act, 2014. As per Sindh WWF Act, 2014, Banks are liable to pay SWWF. The Bank has challenged issue of jurisdiction before the Honorable High Court of Sindh (the Court) through Constitutional Petition 1546/2017. The Court has restrained the Sindh Revenue Board to collect / recover Sindh Worker Welfare Fund till the next date of hearing. However, on a prudent basis, the Bank has recognised full provision in the financial statements in respect of Sindh WWF.
20. SHARE CAPITAL
20.1 Authorised capital
2017 2016 2017 2016 Number of shares Note ----- Rupees in '000 -----
1,850,000,000 1,350,000,000 Ordinary shares of Rs.10 each 20.1.1 18,500,000 13,500,000
20.1.1 During the year after having SBP approval, the shareholders of the Bank in their Annual General Meeting held on March 29, 2017 increased its authorised capital by Rs.5 billion, divided into 500 million shares of Rs.10 each.
20.2 Issued, subscribed and paid-up capital
2017 2016 2017 2016 Number of shares ----- Rupees in '000 -----
538,558,965 538,558,965 Issued for cash 5,385,590 5,385,590 Issued for consideration
533,905,297 533,905,297 other than cash 5,339,053 5,339,053
1,072,464,262 1,072,464,262 10,724,643 10,724,643
20.3 As at December 31, 2017, Jahangir Siddiqui & Co. Ltd. (the parent company) held 755,245,007 ordinary shares of Rs.10 each (70.42% holding).

103JS Bank Annual Report 2017
For the year ended December 31, 2017
Notes to the Unconsolidated Financial Statements
21. PREFERENCE SHARES
21.1 Authorised capital
2017 2016 2017 2016 Number of shares ----- Rupees in '000 -----
Convertible preference shares 150,000,000 150,000,000 of Rs.10 each 1,500,000 1,500,000
21.2 On February 19, 2014, the Bank issued 150 million preference shares of Rs.10 each. As a result of this transaction, the paid-up capital of the Bank has increased by Rs.1.5 billion. The major terms and conditions of the preference shares are as follows:
Instrument: Un-listed, convertible, irredeemable, perpetual, non-cumulative, non-voting preference shares.
Issue Price: Issued at par value of Rs.10 per share.
Tenure: Four years from the date of issuance of preference shares i.e. February 18, 2018
Conversion ratio: For every one preference share, 1.5 ordinary shares will be issued i.e. 1:1.5.
Dividend: Non-cumulative at the fixed rate of 12% per annum. No compensation would be available to the preference shareholders other than the agreed return i.e. 12% p.a. which will be paid in the form of cash dividend. The distribution of dividend is not obligatory and will be allowed only if the Bank has earned sufficient profit in the current year to pay dividend and is in compliance with all the regulatory capital (MCR and CAR) and provisioning requirements.
21.3 As at December 31, 2017, Jahangir Siddiqui & Co. Ltd. (the parent company) held 145,374,878 preference shares of Rs.10 each (96.92% holding).
2017 2016Note ----- Rupees in '000 -----
22. SURPLUS ON REVALUATION OF ASSETS - net of tax
Available-for-sale securities 22.1 (78,310) 1,140,952 Operating fixed assets 22.2 473,539 - Non-banking assets acquired in satisfaction of claims 22.3 95,050 81,868
490,279 1,222,820 22.1 Available-for-sale securities:
Government securities (542,648) 48,729 Ordinary shares - listed 371,514 1,664,750 Foreign currency bonds 50,657 44,675 Open end mutual funds - (2,843)
(120,477) 1,755,311 Related deferred tax asset / (liability) 18 42,167 (614,359)
(78,310) 1,140,952

104 JS Bank Annual Report 2017
For the year ended December 31, 2017
Notes to the Unconsolidated Financial Statements
2017 201622.2 Operating fixed assets ----- Rupees in '000 -----
Surplus on revaluation of assets recognised during the year 665,012 -
Less: Transferred to unappropriated profit:Incremental depreciation during the year (2,348) - Related deferred tax liability (1,264) -
(3,612) - 661,400 -
Less: Related deferred tax liability on:Surplus arised during the year (189,125) - Transferred to profit and loss account on account of increamental depreciation 1,264 -
(187,861) - 473,539 -
22.3 Non-banking assets acquired In satisfaction of claimsSurplus on revaluation as at January 01 84,175 - Surplus on revaluation recognised during the year 13,396 84,175
97,571 84,175 Less: Transferred to unappropriated profit:Incremental depreciation during the year (214) - Related deferred tax liability (115) -
(329) - Less: Related deferred tax liability on:Surplus arised during the year (2,307) - Transferred to profit and loss account on account of incremental depreciation 115 (2,307)
(2,192) (2,307)
95,050 81,868 22.3.1 During the year, the surplus arose under specific requirements of 'Debt Property Swap (DPS)' regulations
issued by State Bank of Pakistan effective January 01, 2016.
23. CONTINGENCIES AND COMMITMENTS
23.1 Transaction-related contingent liabilities
Includes performance bonds, bid bonds, warranties, advance payment guarantees, shipping guarantees and standby letters of credit related to particular transactions.
i) Government 31,008,823 18,055,350 ii) Banking companies and other financial institutions 5,532,988 2,777,027 iii) Others 8,477,789 6,673,175
45,019,600 27,505,552
23.1.1 Included herein the outstanding guarantees of Rs.31.454 million (2016: Rs.17.140 million) of related parties.
23.2 Trade-related contingent liabilities
Documentary credits 21,558,098 20,505,270
23.2.1 Included herein the outstanding letter of credits of Rs.44.016 million (2016: Rs.2,194.048 million) of related parties.

105JS Bank Annual Report 2017
For the year ended December 31, 2017
Notes to the Unconsolidated Financial Statements
23.3 Tax related contingencies are disclosed in notes 31.2 to 31.5.2017 2016
----- Rupees in '000 ----- 23.4 Commitments in respect of forward lending
Forward commitment to extend credit 21,398,301 234,062
23.4.1 Included herein the commitment of Rs.Nil (2016: Rs.170 million) of related parties.
23.5 Commitment in respect of capital expenditure 94,975 59,876
23.6 Commitments in respect of derivative instruments
23.6.1 Forward exchange contracts
Purchase 6,689,099 9,872,524
Sale 4,960,361 10,004,614
The Bank utilises foreign exchange instruments to meet the needs of its customers and as part of its asset and liability management activity to hedge its own exposure to currency risk. At year end, all foreign exchange contracts have a remaining maturity of less than one year.
23.6.2 Forward government securities
Purchase 1,496,072 3,989,680
Sale 115,811 4,998,400
23.6.3 Cross currency swaps (notional principal) 4,223,400 1,753,050
23.6.4 Options (notional principal) 2,421,402 -
23.7 Derivative Instruments
Derivative instruments, such as Forward Rate Agreement, Interest Rate Swaps, Cross Currency Swaps and Options, are forward transactions that provide market making opportunities / hedge against the adverse movement of interest and exchange rates. Derivatives business also provides risk solutions for the existing and potential customers of the Bank.
The Bank has entered into a Cross Currency Swap transaction with its customer on back-to-back basis with an Authorized Derivative Dealer (ADD) without carrying any open position in its books. Specific approvals for the transactions have been granted by State Bank of Pakistan. Policies in line with SBP instructions have been formulated and are operative.
The transaction carries credit risk which is the risk that a party to a derivative contract will fail to perform its obligation. There are two types of credit risk associated with derivative transactions; 1) settlement, and 2) pre-settlement risk. Bank’s Central Credit Committee is responsible for reviewing and managing associated Counterparty Credit Risks of the transaction.
The Bank has also entered into Foreign Currency & Commodity Options from its Wholesale Banking Branch Bahrain for market making activities. The policy guidelines for taking derivative exposures are approved by the Board of Directors (BOD). Bank's Asset & Liability Committee (ALCO) is responsible for reviewing and managing associated risks of the transactions.

106 JS Bank Annual Report 2017
For the year ended December 31, 2017
Notes to the Unconsolidated Financial Statements
The transactions mainly carries credit risk (in the form of settlement & pre-settlement risk), market & liquidity risk and are managed by Treasury and monitored by Market Risk / Treasury Middle Office in line with Board of Directors approved limit framework. The Bank can hedge its risk by taking on & off balance sheet position in interbank market, where available.
Accounting policies in respect of derivative financial instruments are described in note 6.4.2.
23.7.1 Product analysis2017 2016
Number of Notional Mark to Number of Notional Mark toCounterparties Derivative Products contracts principal Market contracts principal Market
--------Rupees '000 -------- --------Rupees '000 --------With Banks and FIs
Hedging Cross currency swaps 8 4,223,400 6,118 6 1,753,050 5,832 Market making Options 18 2,421,402 4,874 - - - Market making Forward rate agreements 197 11,649,458 61,523 277 19,877,138 (28,399)Market making Forward securities 2 1,611,882 (437) 2 8,988,080 332
225 19,906,142 72,078 285 30,618,268 (22,235)
At the exchange rate prevailing at the end of the reporting period.
23.7.2 Maturity analysis2017
Remaining maturity of Contracts Number of Notional Mark to marketcontracts principal Positive Negative Net
Upto 1 month 101 9,074,420 112,801 (75,269) 37,532 1 to 3 months 56 2,537,559 10,865 (26,079) (15,214)3 to 6 months 37 1,253,820 31,561 (1,977) 29,584 6 months to 1 year 25 3,026,643 25,272 (11,063) 14,209 1 to 2 years 2 831,200 32,563 (30,458) 2,105 2 to 3 years - - - - - 3 to 5 years 4 3,182,500 96,426 (92,565) 3,862 5 to 10 years - - - - - Above 10 years - - - - -
225 19,906,142 309,488 (237,411) 72,078
2016Remaining maturity of Contracts Number of Notional Mark to market
contracts principal Positive Negative Net
Upto 1 month 110 23,375,701 36,140 (34,574) 1,566 1 to 3 months 74 4,439,924 5,914 (32,416) (26,502)3 to 6 months 67 895,151 102 (3,857) (3,755)6 months to 1 year 30 658,792 5,675 (3,624) 2,046 1 to 2 years 2 209,700 13,859 (13,589) 270 2 to 3 years 2 1,039,000 59,989 (55,849) 4,140 3 to 5 years - - - - - 5 to 10 years - - - - - Above 10 years - - - - -
285 30,618,268 121,679 (143,909) (22,235)

107JS Bank Annual Report 2017
For the year ended December 31, 2017
Notes to the Unconsolidated Financial Statements
2017 2016Note ----- Rupees in '000 -----
24. MARK-UP / RETURN / INTEREST EARNED
On loans and advances 10,007,332 6,219,466 On investments in:
Held-for-trading securities 1,514,829 916,072 Available-for-sale securities 7,408,799 7,842,096 Held-to-maturity securities 1,194,135 -
10,117,763 8,758,168 On lendings to financial institutions 78,244 19,901 On deposits with financial institutions 3,613 151 On securities purchased under resale agreements 174,219 83,329
20,381,171 15,081,015 25. MARK-UP / RETURN / INTEREST EXPENSED
Deposits 11,775,496 7,530,868 Securities sold under repurchase agreements 1,734,670 1,504,055 Export refinancing scheme (ERF) 140,359 125,424 Long-Term Finance Facility (LTFF) 24,727 2,967 Financing Facility for Storage of Agricultural Produce (FFSAP) 1,897 1,000 Sub-ordinated loans 227,917 11,110 Other short term borrowings 234,154 177,858
14,139,220 9,353,282 26. FEE, COMMISSION AND BROKERAGE INCOME
Advisory fee 456,930 169,729 Trustee fee 5,713 5,471 Other fees, commission and charges 26.1 1,661,665 1,251,394
2,124,308 1,426,594
26.1 This includes Rs.33.462 million (2016: Rs.31.580 million) in respect of commission income from home remittance services provided by the Bank. The amount is receivable from State Bank of Pakistan at the rate of Saudi Riyal 20 (2016: Saudi Riyal 20) per transaction over USD 200 (2016: USD 200) and is shared between the Bank and various exchange companies as per terms of agreement with them.
2017 201627. GAIN / (LOSS) ON SALE OF SECURITIES - net ----- Rupees in '000 -----
Federal Government Securities- Market treasury bills 6,677 9,915 - Pakistan investment bonds 132,137 2,760,642 - Ijara sukuk certificates 2,074 699
Ordinary shares - listed 312,492 172,380 Ordinary shares - unlisted 599,215 - Term finance certificates (108) 3,749 Foreign currency bonds 187,795 7,878 Mutual fund units (4,119) 11,211
1,236,163 2,966,474

108 JS Bank Annual Report 2017
For the year ended December 31, 2017
Notes to the Unconsolidated Financial Statements
2017 2016Note ----- Rupees in '000 -----
28. OTHER INCOME / (LOSS) - NET
Gain on sale of operating fixed assets 75,441 39,864 Gain on recovery of non banking assets - 152
Income from derivative instruments
RealisedForward rate agreements 27,685 51,654
UnrealisedCross currency swaps 66 (4,561)Currency options 4,874 - Forward rate agreements 61,524 (28,399)Forward securities (438) 332
66,026 (32,628)
93,711 19,026
169,152 59,042 29. ADMINISTRATIVE EXPENSES
Salaries, wages, allowances, etc. 3,467,781 2,634,435 Contractor wages 453,088 351,155 Charge for defined benefit plan - net 35.5 89,576 61,317 Contribution to defined contribution plan 137,059 101,438 Non-executive directors' fee, allowances
and other expenses 37.1 13,000 14,751 Brokerage, fee and commission 66,439 51,073 Rent, taxes, insurance, electricity, etc. 1,332,146 1,033,498 Legal and professional charges 57,184 160,761 Donations 29.1 32,000 67,800 Communications 116,825 149,665 Repairs and maintenance 568,855 497,024 Travel, conveyance and other related expenses 70,548 70,600 Stationery and printing 181,529 135,895 Advertisement and publicity 307,461 298,822 Postage and courier service 56,832 41,248 Stamp duty 13,066 16,548 CDC and other charges 17,070 4,209 Bank and clearing house charges 81,765 61,553 Consultancy fee 64,020 68,763 Security services charges 289,858 238,065 Fees and subscription 46,939 32,000 Auditors' remuneration 29.2 11,560 8,307 Depreciation 12.2 585,785 515,479 Depreciation on non banking assets 13.4 1,300 1,122 Amortisation 12.3 60,556 49,297 Staff training 48,960 12,985 Entertainment expenses 39,138 33,862 Outsourced record management services 4,249 8,433 Others 41,746 28,339
8,256,335 6,748,444

109JS Bank Annual Report 2017
For the year ended December 31, 2017
Notes to the Unconsolidated Financial Statements
29.1 This represents donation to Future Trust, wherein Mr. Kalim-ur-Rehman, the director of the Bank and Mr. Suleman Lalani, the Chief Executive Officer of Jahangir Siddiqui & Co. Ltd, the parent company of the Bank, are trustees. The registered office of the donee is located at 7th Floor, The Forum, Block 9, Clifton, Karachi.
2017 2016Note ----- Rupees in '000 -----
29.2 Auditors' remuneration
Audit fee - Pakistan 1,450 1,450 Audit fee - Bahrain 2,030 - Half-yearly review 500 500 Special certification and sundry advisory services 5,910 4,770 Taxation services 190 190 Out of pocket expenses and sales tax on services 1,480 1,397
29.2.1 11,560 8,307 29.2.1 Geographical analysis
Pakistan 7,575 8,307 Bahrain 3,985 -
11,560 8,307 30. OTHER CHARGES
Penalties imposed by State Bank of Pakistan 12,833 31,030 Provision for Sindh Workers' Welfare Fund 19.3 & 30.1 32,411 67,799 Others 497 370
45,741 99,199
30.1 Provision held at 2% of the higher of profit before tax or taxable income under Sindh Workers' Welfare Act, 2014.
2017 2016 ----- Rupees in '000 -----
31. TAXATION
31.1 Relationship between income tax expense and accounting profit
Profit before taxation 1,620,564 3,389,936
Tax on income @ 35% (2016: 35%) (566,854) (1,186,478)Effect of permanent differences (4,947) (11,201)Effects of prior year deferred taxation 35,602 9,159 Effects of prior year current taxation (111,216) (124,800)
Tax charge for the year (647,415) (1,313,320)

110 JS Bank Annual Report 2017
For the year ended December 31, 2017
Notes to the Unconsolidated Financial Statements
31.2 Income Tax
The Bank has filed income tax returns under Section 114 of the Income Tax Ordinance, 2001 for the tax years 2008 through 2017. The said returns so filed were deemed to have been assessed in terms of the returns filed under the provisions of prevailing income tax laws as applicable in Pakistan. However, the Officers of Inland Revenue Services (OIR) conducted the proceedings for making certain amendments in the deemed assessments for tax years 2008 to 2015. This was done by taking recourse of conducting tax audit or alternatively a direct amendment in the assessment contending that certain matters in the deemed assessments were not admissible as not conforming to the law and prejudiced the interest of revenue.
Based on the amended assessments in tax year 2008 to tax year 2014, the department has made certain dis-allowances of expenses and tax deductible claims besides creating minimum tax and Workers’ Welfare Fund liabilities in the tax years 2010 & 2011 and tax years 2009 & 2012 respectively.
In respect of WWF, the Supreme Court of Pakistan has held that the amendments in the WWF Ordinance through Finance Act, 2006 and 2008 were not validly made. Accordingly, as of now the Bank’s contention is mandated and it is likely that its pending appeals in this will be decided favorably. As a consequence of introduction of Sindh Workers’ Welfare Fund Act, the Bank is required to pay WWF to Sindh Revenue Board effective from tax year 2015. The Bank has filed petition before the High Court of Sindh to contest applicability of SWWF in its case who has granted stay against recovery of SWWF from the Bank.
For tax year 2008, CIRA has admitted the contention of the Bank that the amended order is barred by time and decided that any addition made in impugned order is annulled and not required to be further adjudicated. However, the department has filed an appeal against the decision of CIRA in ATIR where it is pending for hearing and decision.
For tax year 2009-2015, the Bank has not accepted the amendments and have filed appeals before the Commissioner Inland Revenue-Appeals (the CIRA). With regard to appeals filed for tax year 2009 to 2014, the CIRA has decided the appeals accepting the Bank’s contentions in respect of significant issues. Whereas, the contentious matter of levy of workers welfare fund and disallowance of amortization claim of goodwill have been decided in favor of department. However, the Bank is contesting the matters in further appeals before Appellate Tribunal Inland Revenue (ATIR) which are pending for hearing. Appeal for tax year 2015 is filed before CIRA subesequent to year end, where it is pending for hearing and decision.
Further for the tax year 2013, the ATIR has decided appeal filed by tax department in respect of calculating the amount of provisions against advances as allowable under Rule 1(c) of Seventh Schedule to the Income Tax Ordinance, 2001 and has maintained the CIRA decision that the allowability of provision for advances to be calculated at 1% of gross amount of advances as against the tax department contention that the same is to be calculated on net advances after deducting the amount of provisions created and allowed against advances.
The matter of allowability of amortization relating to goodwill is contentious issue, therefore based on the opinion of lawyer there are arguments available to contend that goodwill on merger is a tax claimable deduction. Especially in the recent decision given by the High Court of Sindh in the case of merger of other bank in Pakistan where the court has ruled favorably that goodwill generated in merger is ‘intangible’ and amortization relating to goodwill is allowable deduction.
The management of Bank is confident that the apeals filed on various forums in respect of the above matters will be decided in the Bank's favor and accordingly no demand for payment would arise.

111JS Bank Annual Report 2017
For the year ended December 31, 2017
Notes to the Unconsolidated Financial Statements
31.3 Withholding tax monitoring
Withholding tax monitoring was initiated against the Bank for tax year 2015 and an order has been passed against which appeal is filed before CIRA which is pending for hearing.
31.4 Sales tax
The Bank as a registered person under Sindh Sales Tax on Services Act, 2011 has been issued a Sales Tax Order from the Sindh Revenue Board (SRB) creating a demand of Rs.48.838 million (besides Rs.4.440 million is charged as penalty) against the Bank for allegedly non-payment of Sindh sales tax on certain ‘presumed non-taxable services / incomes’ amounting to Rs.277.488 million for the tax periods from July 2011 to December 2013. The issue is common amongst the banking industry. An appeal was filed by the Bank before Commissioner SRB (Appeals) which has been decided in favor of the tax department except tax imposed on FX gain on Western Union remittance. The Bank and tax department have filed appeals before Appellate Tribunal which are pending for hearing.
The management of Bank is confident that the apeals filed in respect of the above matter will be decided in the Bank's favor and accordingly no demand for payment would arise.
31.5 Azad Jammu & Kashmir Operations
The Bank has commenced operations in Azad Jammu & Kashmir from tax year 2009 and has filed returns for the tax years 2009 to 2017 with the tax authorities of such region. The Commissioner has issued notices for amendment of assessment under section 122 of the Income Tax Ordinance, 2001 (as adopted in AJK Region) for the tax year 2011 to 2016. All assessments orders are rectified and no additional demand has been raised.
2017 2016Note ----- Rupees in '000 -----
32. EARNINGS PER SHARE - BASIC AND DILUTED
Profit after taxation for the year - attributable to ordinaryequity holders of the Bank for diluted earnings 973,149 2,076,616
Preference dividend paid for the year ended December 31, 2016 @ 12% p.a (2015: @ 12% p.a.) 32.1 (180,000) (180,000)
Profit after taxation for the year - attributable to ordinaryequity holders of the Bank for basic earnings 793,149 1,896,616
----- Numbers ----- Weighted average number of basic outstanding
ordinary shares during the year 1,072,464,262 1,072,464,262
Weighted average number of diluted outstanding ordinary shares during the year 1,072,464,262 1,297,464,262
----- Rupee(s) -----
Basic earnings per share 0.74 1.77
Diluted earnings per share 32.2 0.74 1.60

112 JS Bank Annual Report 2017
For the year ended December 31, 2017
Notes to the Unconsolidated Financial Statements
32.1 The shareholders of the Bank in their meeting held on March 29, 2017 approved non-cumulative preference dividend of Rs.180 million (2016: Rs.180 million) for the preference shareholders. Since it was not recognised as a liability at reporting period as of December 31, 2016 due to non-adjusting event in accordance with International Accounting Standard - IAS 10 “Events after the Reporting Period”, the basic earnings per share of the current period has been adjusted accordingly.
32.2 In 2017, the diluted earnings per share increases when taking the convertible preference shares into account, therefore the convertible preference shares are anti-dilutive and are excluded from the weighted average number of ordinary shares for the purpose of diluted earnings per share.
2017 2016Note ----- Rupees in '000 -----
33. CASH AND CASH EQUIVALENTS
Cash and balances with treasury banks 7 17,333,788 15,508,968 Balances with other banks 8 1,034,266 752,710 Overdrawn nostro accounts 15.2 (198,996) (40,528)
18,169,058 16,221,150 34. STAFF STRENGTH
Permanent 3,099 2,336 Contractual basis 1,421 336 Bank's own staff strength at the end of the year 4,520 2,672 Third party contract 478 1,491
4,998 4,163 35. DEFINED BENEFIT PLAN
35.1 General description
The Bank operates a recognized gratuity fund for all employees who opted for this scheme introduced by the management with effect from January 01, 2007.
The defined benefit is administered by a separate fund that is legally separate from the Bank. The plan is governed by the trust deed dated September 01, 2007. The trustees of the gratuity fund are composed of representatives from employers. The trustees of the gratuity fund are required by the trust deed to act in the interest of the fund and of all relevant stakeholders in the scheme, i.e. active employees, inactive employees, retirees and employers. The trustees of the gratuity fund are responsible for the investment policy with regard to the assets of the fund.
35.2 The plan in Pakistan typically exposes the Bank to actuarial risks such as: salary risk, discount rate risk, mortality risk and investment risk defined as follow:
- Salary increase risk:This is a risk to the Bank, because the benefits are based on the final salary, if the final salary is higher it will impacts the liability accordingly.
- Discount rate riskThe discount rate is based on the yield on government bonds. If the market yield of bonds varies, the discount rate would vary in the same manner and would affect the present value of obligation and fair value of assets.

113JS Bank Annual Report 2017
For the year ended December 31, 2017
Notes to the Unconsolidated Financial Statements
- Withdrawal risk:This is the risk that actual withdrawals experience is different than expected and will impact the obligation accordingly.
- Longevity RiskThis is the risk that actual lifetime of retirees is longer than expectation. The risk is measured at plan level over the entire population.
- Investment riskThis is the risk that the assets are under-performing and are not sufficient to meet the liabilities.
- Maturity profileThe weighted average duration of the defined benefit obligation works out to 11 years.
35.3 Number of employees under the schemes
The number of employees covered under defined benefit scheme is 3,095 (2016: 2,325).
35.4 Principal actuarial assumptions
Principal actuarial assumptions at the end of the reporting period expressed as weighted averages. The actuarial valuations were carried out on December 31, 2017 based on the Projected Unit Credit Method, using the following significant assumptions:
2017 2016
Valuation discount rate for year end obligation per annum 9.50% 8.00%
Valuation discount rate for interest cost for the year per annum 8.00% 9.00%
Expected return on plan assets per annum 9.50% 8.00%
Future salary increase rate per annum 10.50% 9.00%
Effective duration of the discounted future cash flows years 11 9.31
Normal retirement age years 60 60
Withdrawal rates Moderate Moderate
Mortality rates SLIC2001-2005,
Setback1 Year
SLIC 2001-2005,
Setback 1 Year

114 JS Bank Annual Report 2017
For the year ended December 31, 2017
Notes to the Unconsolidated Financial Statements
35.5 Movement in defined benefit obligations, fair value of plan assets and their components
Defined benefit Fair value of plan Net defined benefitobligations assets liability / (asset)
2017 2016 2017 2016 2017 2016--------------------------- Rupees in '000 ---------------------------
Balance as at January 01 367,635 235,572 249,327 171,567 118,308 64,005
Included in profit or lossCurrent service cost 84,931 58,437 - - 84,931 58,437 Interest cost / income 29,076 21,022 24,431 18,142 4,645 2,880
114,007 79,459 24,431 18,142 89,576 61,317 Included in other comprehensive incomeActuarial gains / losses arising from:- financial assumptions 611 31,859 (10,273) (393) 10,884 32,252 - experience adjustments 74,658 24,739 - - 74,658 24,739
75,269 56,598 (10,273) (393) 85,542 56,991 Other movements
Contribution made during the year - - 118,308 64,005 (118,308) (64,005)Benefits paid / payable during the year (6,182) (3,994) (6,182) (3,994) - -
(6,182) (3,994) 112,126 60,011 (118,308) (64,005)
Balance as at December 31 550,729 367,635 375,611 249,327 175,118 118,308
35.6 The composition of the plan assets at the end of the reporting period for each category, are as follows:
Cost Fair value of plan assets2017 2016 2017 2016 2017 2016
Note Rupees in '000 Rupees in '000 Percentage
Cash and cash equivalents 9,146 13,298 9,146 13,298 2.4% 5.3%Debt securities 35.6.1 368,046 223,111 366,465 236,029 97.6% 94.7%
377,192 236,409 375,611 249,327 100% 100%
35.6.1 This represents investments held in Pakistan Investment Bonds (PIBs) and Term Finance Certificates (TFCs). The fair values of these securities are determined based on quoted market prices in active markets.
35.7 Maturity profile
35.7.1 Expected maturity analysis of undiscounted defined benefit obligation for the gratuity fund is as follows:
Over Up to Over Over Over 10 andone 1-2 2- 5 6-10 above year years years years years Total--------------------------- Rupees in '000 ---------------------------
Balance as at December 31, 2017 17,411 21,450 130,589 469,756 9,092,944 9,732,150
35.8 Sensitivity analysis
35.8.1 Significant actuarial assumptions for the determination of the defined obligation are discount rate, and expected rate of salary increase. The sensitivity analysis below have been determined based on reasonably possible changes of the respective assumptions occurring at the end of the reporting period, while holding all other assumptions constant:

115JS Bank Annual Report 2017
For the year ended December 31, 2017
Notes to the Unconsolidated Financial Statements
Particulars Rate
Present value of defined
benefit obligation
Fair value of plan assets
Net defined benefit liability
------------- Rupees in '000 -------------
Current results - 550,729 375,611 175,118
Discount rate1% Increase 10.5% 493,611 375,611 118,000 1% Decrease 8.5% 612,313 375,611 236,702
Salary Rate1% Increase 10.5% 612,313 375,611 236,702 1% Decrease 8.5% 492,727 375,611 117,116
Withdrawal rate10% Increase Moderate + one year 532,944 375,611 157,333 10% Decrease Moderate - one year 565,531 375,611 189,920
Mortality rateOne year age set back Adjusted SLIC 2001-05
- one year 549,331 375,611 173,720 Adjusted SLIC 2001-05
One year age set forward + one year 547,637 375,611 172,026
Furthermore in presenting the above sensitivity analysis, the present value of the defined benefit obligation has been calculated using the projected unit credit method at the end of the reporting period, which is the same as applied in calculating the defined benefit obligation liability recognised in this unconsolidated statement of financial position.
35.9 Experience Adjustments
The re-measurement gains / losses arise due to actual experience varying from the actuarial assumptions for the year.
2017 2016 2015 2014 2013-------------------- Rupees in '000 --------------------
ParticularsDefined benefit obligation 550,729 367,635 235,572 154,368 116,676 Fair value of plan assets (375,611) (249,327) (171,567) (133,019) (115,387)
Net defined benefit liability 175,118 118,308 64,005 21,349 1,289
Re-measurement loss / (gain) on obligation 75,269 56,598 12,774 3,493 (740)Re-measurement loss / (gain) on plan assets 10,273 393 (3,104) 3,655 2,408
Other comprehensive income 85,542 56,991 9,670 7,148 1,668
35.10 The average duration of the payment of benefit obligation at December 31, 2017 is with in one year.

116 JS Bank Annual Report 2017
For the year ended December 31, 2017
Notes to the Unconsolidated Financial Statements
35.11 The Bank contributes to the gratuity fund as per actuarial's expected charge for the next financial year. Based on actuarial advice and management estimates, the charge in respect of defined benefit obligation for the next one year works out to be Rs.123.419 million. The amount of re-measurements to be recognised in other comprehensive income for year ending December 31, 2017 will be worked out as at the next valuation.
36. DEFINED CONTRIBUTION PLAN
The Bank operates a contributory provident fund for all permanent employees. The employer and employee both contribute 7.1% of the basic salaries (2016: 7.1% of the basic salaries) to the funded scheme every month. Number of employees covered under this plan are 2,481 (2016: 1,870). During the year, employees made a contribution of Rs.137.05 million (2016: Rs.101.438 million) to the fund. The Bank has also made a contribution of equal amount to the fund.
37. COMPENSATION OF DIRECTORS AND EXECUTIVES
37.1 The aggregate amount charged in the financial statements for the year in respect of the remuneration and benefits to the President and Chief Executive Officer, Directors and Executives are as follows:
37.2 This represents meeting fees, allowances and other expenses paid to independent or non-executive directors for attending the meetings of the Board of Directors, Audit Committees and other Board Committees held during the year.
37.3 The President and certain executives are also provided with other facilities, including free use of the Bank maintained cars.
Non-executivePresident and CEO directors Executives2017 2016 2017 2016 2017 2016
Note ------------------------------ Rupees in '000 ------------------------------
Managerial remuneration 19,636 17,727 - - 1,802,041 1,317,938 Defined contribution plan - - - - 111,251 80,626 Charge for defined benefit plan - - - - 101,468 70,982 Medical allowance 1,964 1,773 - - 180,204 131,794 Conveyance and vehicle maintenance - - - - 109,077 83,219 Performance bonus 20,000 20,000 - - 336,810 278,485 Fees, allowances and other expenses 37.2 - - 13,000 14,751 - -
41,600 39,500 13,000 14,751 2,640,851 1,963,044
Number of persons 1 1 8 8 1,400 1,025

117JS Bank Annual Report 2017
For the year ended December 31, 2017
Notes to the Unconsolidated Financial Statements
38. FAIR VALUE OF FINANCIAL INSTRUMENTS
IFRS 13 "Fair Value Measurement" defines fair value as the price that would be received to sell an asset or paid to transfer a liability in an orderly transaction between market participants at the measurement date.
The fair value of quoted securities other than those classified as held to maturity, is based on quoted market price. Fair value of fixed term loans, other assets, other liabilities and fixed term deposits cannot be calculated with sufficient reliability due to absence of current and active market for assets and liabilities and reliable data regarding market rates for similar instruments. The provision for impairment of loans and advances has been calculated in accordance with the Bank's accounting policy as stated in note 6.6.1 to these unconsolidated financial statements.
The repricing profile, effective rates and maturity are stated in note 42.3.4 to these financial statements.
In the opinion of the management, the fair value of the remaining financial assets and liabilities are not significantly different from their carrying values since assets and liabilities are either short term in nature or in the case of customer loans and deposits are frequently repriced.
Fair value hierarchy
IFRS 13 requires the Bank to classify fair value measurement using a fair value hierarchy that reflects the significance of the inputs used in making the measurements. The fair value hierarchy has following levels:
Level 1: Quoted prices (unadjusted) in active markets for identical assets or liabilities that the entity can access at the measurement date.
Level 2: Inputs other than quoted prices included within Level 1 that are observable for the asset or liability, either directly or indirectly.
Level 3: Unobservable inputs for the asset or liability.
38.1 Valuation techniques used in determination of fair values
Item Valuation approach and input usedUnits of mutual funds Fair values of investments in units of mutual funds are determined based on
redemption prices disclosed at the Mutual Funds Association of Pakistan (MUFAP) as at the close of the business days.
Shares of listed companies Fair values of investments in listed equity securities are valued on the basis of closing quoted market prices available at the Pakistan Stock Exchange.
“Pakistan Investment Bonds/ Market Treasury Bills"
Fair values of Pakistan Investment Bonds and Market Treasury Bills are derived using PKRV rates (Reuters page).
Term Finance Certificatesand Bonds
Investments in debt securities (comprising Term Finance Certificates, Bonds and any other security issued by a company or a body corporate for the purpose of raising funds in the form of redeemable capital) are valued on the basis of the rates announced by the Mutual Funds Association of Pakistan (MUFAP) in accordance with the methodology prescribed by the SECP.
Derivatives The fair values of derivatives which are not quoted in active markets are determined by using valuation techniques. The valuation techniques take into account the relevant underlying parameters including foreign currency involved, interest rates, yield curves, volatilities, contracts duration, etc.

118 JS Bank Annual Report 2017
For the year ended December 31, 2017
Notes to the Unconsolidated Financial Statements
38.2 The following table provides an analysis of financial instruments that are measured subsequent to initial recognition at fair value, grouped into Levels 1 to 3 based on the degree to which the fair value is observable.
As at December 31, 2017Level 1 Level 2 Level 3 Total
------------------------- Rupees in '000 -------------------------On balance sheet financial instruments
Items carried at fair value
Financial assets classified as ‘held-for-trading securities’
Government Securities
Market treasury bills - 7,761,553 - 7,761,553 Pakistan investment bonds - 707,598 - 707,598
- 8,469,151 - 8,469,151 Financial assets classified as ‘available-
for-sale securities'
Government Securities
Market treasury bills - 14,492,712 - 14,492,712 Pakistan investment bonds - 93,429,759 - 93,429,759
- 107,922,471 - 107,922,471 Ordinary shares of listed companies 3,546,572 - - 3,546,572 Foreign currency bonds - 4,350,638 - 4,350,638
3,546,572 120,742,260 - 124,288,832 Non-Financial Assets
Operating fixed assets (Lease holdlands and buildings) - - 2,439,249 2,439,249
Non banking asset under satisfactionof claims - - 203,339 203,339
3,546,572 120,742,260 2,642,588 126,931,420 Off balance sheet financial instruments
Forward government securities
Purchase - 1,495,823 - 1,495,823
Sale - 116,000 - 116,000
Forward exchange contracts
Purchase - 6,851,332 - 6,851,332
Sale - 5,061,071 - 5,061,071
Cross currency swaps (notional principal) - 4,489,958 - 4,489,958
Options (notional principal) - 2,426,276 - 2,426,276

119JS Bank Annual Report 2017
For the year ended December 31, 2017
Notes to the Unconsolidated Financial Statements
As at December 31, 2016Level 1 Level 2 Level 3 Total
------------------------- Rupees in ‘000 -------------------------On balance sheet financial instruments
Items carried at fair value
Financial assets classified as ‘held-for-trading securities’
Government Securities
Market treasury bills - 65,758,485 - 65,758,485
Financial assets classified as'available-for-sale securities'
Government Securities
Market treasury bills - 4,884,060 - 4,884,060 Pakistan investment bonds - 49,834,951 - 49,834,951
- 54,719,011 - 54,719,011
Ordinary shares of listed companies 4,291,093 - - 4,291,093 Open end mutual funds - 97,157 - 97,157 Foreign currency bonds - 5,714,939 - 5,714,939
4,291,093 126,289,592 - 130,580,685 Non-Financial Assets
Non banking asset under satisfactionof claims - - 175,808 175,808
4,291,093 126,289,592 175,808 130,756,493
Off balance sheet financial instruments
Forward government securities
Purchase - 3,988,403 - 3,988,403
Sale - 4,996,791 - 4,996,791
Forward exchange contracts
Purchase - 9,816,883 - 9,816,883
Sale - 9,977,367 - 9,977,367
Cross currency swaps (notional principal) - 1,758,882 - 1,758,882

120 JS Bank Annual Report 2017
For the year ended December 31, 2017
Notes to the Unconsolidated Financial Statements
39. SEGMENT DETAILS WITH RESPECT TO BUSINESS ACTIVITIES
The segment analysis with respect to business activities is as follows:
2017Corporate Trading and Retail Commercial Payment and
finance sales banking banking settlement Others Total--------------------------------------------------- Rupees in '000 ---------------------------------------------------
Total income - external 460,281 11,856,298 4,627,752 7,224,520 188,534 75,126 24,432,511 Inter-segment revenues - net - (8,720,051) 8,416,392 303,659 - - -
Total income 460,281 3,136,247 13,044,144 7,528,179 188,534 75,126 24,432,511 Total expenses (96,476) (2,152,942) (12,373,591) (7,207,277) (81,791) (574,025) (22,486,102)Provisions - (295,623) (6,111) (24,111) - - (325,845)Current taxation - - - - - (515,275) (515,275)Prior years - - - - - (73,298) (73,298)Deferred tax - - - - - (58,842) (58,842)
Net income / (loss) 363,805 687,682 664,442 296,791 106,743 (1,146,314) 973,149 Segment assets (gross) - 187,440,326 82,645,783 108,870,958 - 13,118,287 392,075,354 Segment non performing assets - 1,622,691 613,448 2,644,549 - 10,861 4,891,549 Segment provision required - (1,071,851) (283,887) (2,355,075) - (55,665) (3,766,478)Segment liabilities - 57,126,105 219,370,286 83,137,017 3,824,278 8,181,861 371,639,547
Segment return on net assets (ROA) (%) 6.34% 8.26% 7.43%Segment cost of funds (%) 6.30% 3.94% 4.68%
2016Corporate Trading and Retail Commercial Payment and
finance sales banking banking settlement Others Total--------------------------------------------------- Rupees in '000 ---------------------------------------------------
Total income - external 227,441 12,093,862 3,280,867 4,137,521 162,775 39,818 19,942,284 Inter-segment revenues - net - (5,688,503) 5,267,564 420,939 - - -
Total income 227,441 6,405,359 8,548,431 4,558,460 162,775 39,818 19,942,284 Total expenses (27,004) (1,995,985) (8,931,035) (4,262,553) (81,974) (902,374) (16,200,925)Provisions - (415,027) (104,085) 167,689 - - (351,423)Current taxation - - - - - (1,030,882) (1,030,882)Prior years - - - - - (96,422) (96,422)Deferred tax - - - - - (186,016) (186,016)
Net income / (loss) 200,437 3,994,347 (486,689) 463,596 80,801 (2,175,876) 2,076,616
Segment assets (gross) - 157,133,847 37,737,239 63,853,911 - 9,594,518 268,319,515 Segment non performing assets - 1,125,952 315,703 3,012,239 - 10,861 4,464,755 Segment provision required - (948,820) (181,830) (2,477,511) - (10,861) (3,619,022)Segment liabilities - 3,040,528 156,713,850 79,664,600 2,544,028 6,087,962 248,050,968
Segment return on net assets (ROA) (%) 7.91% 8.22% 7.72%Segment cost of funds (%) 5.90% 4.02% 5.48%

121JS Bank Annual Report 2017
For the year ended December 31, 2017
Notes to the Unconsolidated Financial Statements
40. RELATED PARTY TRANSACTIONSThe Bank has related party relationship with its associates, parent, subsidiaries, companies having common directors, companies in which parent holds more than 20% shares, employee benefit plans, and its key management personnel (including their associates). The details of investments in subsidiaries and associates are stated in note 10.2.10 to these unconsolidated financial statements.Contributions to the accounts in respect of staff retirement benefits are made in accordance with terms of the contribution plans. Remuneration of the key management personnel are in accordance with the terms of their employment. Other transactions are carried out as per agreed terms.The details of transactions with related parties, other than those which have been specifically disclosed elsewhere in these uncosolidated financial statements are as follows:
December 31, 2017Opening balance
Disbursements / deposits
Repayments / withdrawals
Closing balance
Mark-up earned / expense
-------------------------------------- Rupees in '000 --------------------------------------AdvancesKey management personnel 478,064 426,791 (196,488) 708,367 27,865 Subsidiary companies - 1,600,000 (1,600,000) - 999 Companies having common directorship 5,673 - (2,276) 3,397 171 Parent company holds 20% or more 437,564 1,230,400 (1,488,289) 179,675 22,262 Other related parties 1,300,223 4,120,420 (3,483,515) 1,937,128 183,087 Total 2,221,524 7,377,611 (6,770,568) 2,828,567 234,384
BorrowingsParent company holds 20% or more - 110,840,000 (106,840,000) 4,000,000 61,900
DepositsParent 767,243 6,109,040 (5,373,705) 1,502,578 101,339 Key management personnel 56,583 1,235,286 (1,224,262) 67,607 2,471 Subsidiary companies 1,094,276 633,323,678 (632,705,401) 1,712,553 118,350 Companies having common directorship 956,255 36,189,984 (32,472,240) 4,673,999 163,237 Parent company holds 20% or more 3,617,557 69,326,794 (69,109,961) 3,834,390 205,565 Other related parties 3,438,466 30,187,288 (30,831,763) 2,793,991 220,707 Total 9,930,380 776,372,070 (771,717,332) 14,585,118 811,669
December 31, 2016
Opening balance
Disbursements / deposits
Repayments / withdrawals
Closing balance
Mark-up earned / expense
-------------------------------------- Rupees in '000 --------------------------------------AdvancesKey management personnel 395,639 279,095 (196,670) 478,064 19,250 Companies having common directorship 395,763 18,640,900 (19,030,990) 5,673 92,052 Parent company holds 20% or more - 1,155,846 (718,282) 437,564 25,566 Other related parties 2,044,664 4,576,609 (5,321,050) 1,300,223 151,306 Total 2,836,066 24,652,450 (25,266,992) 2,221,524 288,174
Lendings to financial institutionsParent company holds 20% or more - 700,000 (700,000) - 115
BorrowingsParent company holds 20% or more - 47,800,000 (47,800,000) - 43,384
DepositsParent 2,016,612 11,429,643 (12,679,012) 767,243 100,823 Key management personnel 76,534 1,213,860 (1,233,811) 56,583 2,654 Subsidiary companies 1,485,323 322,996,015 (323,387,062) 1,094,276 75,047 Companies having common directorship 1,097,580 27,432,054 (27,573,379) 956,255 64,321 Parent company holds 20% or more 2,510,501 59,785,999 (58,678,943) 3,617,557 194,164 Other related parties 2,308,568 33,645,004 (32,515,106) 3,438,466 125,815 Total 9,495,118 456,502,575 (456,067,313) 9,930,380 562,824

122 JS Bank Annual Report 2017
The
relat
ed p
arty
sta
tus
of o
utst
andi
ng re
ceiva
bles
and
pay
ables
as
at D
ecem
ber 3
1, 2
017
is in
clude
d in
resp
ectiv
e no
tes
to th
ese
unco
nsol
idat
ed fi
nanc
ial s
tate
men
ts.
Mat
erial
tran
sact
ions
with
relat
ed p
artie
s ar
e gi
ven
belo
w:
Subs
idiar
y co
mpa
nies
Com
pani
es h
avin
g co
mm
on d
irect
orsh
ip
Com
pani
es in
whi
ch
pare
nt c
ompa
ny h
olds
20
% o
r mor
eO
ther
relat
ed p
artie
sTo
tal
2017
2016
2017
2016
2017
2016
2017
2016
2017
2016
------
------
------
------
------
------
------
------
------
------
------
---- R
upee
s in '
000
------
------
------
------
------
------
------
------
------
------
------
----
Natu
re o
f tra
nsac
tions
Sale
of Go
vern
men
t Sec
uritie
s 3
0,48
6 1
16,2
51
-
1,7
21,0
49
68,
804,
288
26,
513,
047
2,5
63,4
12
1,8
17,1
47
71,
398,
186
30,
167,
494
Purch
ase o
f Gov
ernm
ent S
ecur
ities
4,0
78
43,
136
-
-
714
,727
1
,125
,937
5
16,5
86
507
,494
1
,235
,391
1
,676
,567
Sa
le of
Suku
k -
-
-
-
5
1,19
7 2
95,9
77
-
-
51,
197
295
,977
Sa
le of
share
s / un
its -
-
-
-
-
-
-
1
02,3
70
-
102
,370
Sa
le of
forwa
rd fo
reign
exch
ange
cont
racts
-
-
-
-
8,8
46,5
24
12,
741,
355
-
-
8,8
46,5
24
12,
741,
355
Purch
ase o
f forw
ard fo
reign
exch
ange
cont
racts
-
-
-
-
5,7
25,4
13
6,9
41,6
59
-
-
5,7
25,4
13
6,9
41,6
59
Rent
rece
ived
/ rec
eivab
le 3
,393
3
,004
-
-
-
-
-
-
3
,393
3
,004
Le
tter o
f cred
it -
-
9
2,26
7 4
2,68
8 -
-
1
04,9
37
95,
890
197
,204
1
38,5
78
Lette
r of g
uara
ntee
s -
-
-
-
5
17
-
1,1
84
-
1,7
01
-
Rent
expe
nse p
aid /
accr
ued
6,3
89
3,0
03
-
-
-
-
-
-
6,3
89
3,0
03
Reim
burse
men
t of e
xpen
ses
1,9
98
421
-
-
-
-
7
,703
3
,233
9
,701
3
,654
Ex
pens
es in
curre
d on
beh
alf 1
,210
1
,019
-
-
-
-
-
-
1
,210
1
,019
Se
rvice
s ren
dered
4,2
00
3,6
00
-
-
-
-
-
-
4,2
00
3,6
00
Paym
ent t
o sta
ff ben
efit p
lan -
-
-
-
-
-
1
18,3
08
64,
005
118
,308
6
4,00
5 Pa
ymen
t to
staff c
ontrib
ution
plan
-
-
-
-
-
-
137
,059
1
01,4
38
137
,059
1
01,4
38
Rem
uner
ation
of k
ey m
anag
emen
t per
sonn
el -
-
-
-
-
-
5
17,2
95
429
,797
5
17,2
95
429
,797
Di
recto
r fee
s and
allow
ance
s -
-
-
-
-
-
1
3,00
0 1
4,75
0 1
3,00
0 1
4,75
0 Ins
uran
ce cl
aimed
rece
ived
-
-
-
-
23,
352
10,
621
-
-
23,
352
10,
621
Insur
ance
prem
ium p
aid -
-
-
-
1
61,7
12
104
,398
5
3,04
2 4
6,31
6 2
14,7
54
150
,714
Co
mm
ission
paid
/ ac
crue
d 2
,180
2
,177
-
-
-
-
-
-
2
,180
2
,177
Co
mm
ission
inco
me
4,05
7 -
2
3,52
6 7
2 1
51,1
69
80,
721
17,
676
96
196
,428
8
0,88
9 Di
viden
d inc
ome
26,
118
-
-
-
57,
864
35,
850
20,
641
21,
809
104
,623
5
7,65
9 Ad
visor
y fee
-
-
-
-
-
-
42,
000
36,
000
42,
000
36,
000
Prefe
rence
divi
dend
paid
-
-
-
-
-
-
1,4
79
1,4
79
1,4
79
1,4
79
Servi
ces r
eceiv
ed -
-
-
-
-
-
5
14
586
5
14
586
Paren
t com
pany
2017
2016
--- R
upee
s in '
000
---
Natu
re o
f tra
nsac
tions
Rent
expe
nse p
aid /
accr
ued
1,5
24
1,3
98
Reim
burse
men
t of e
xpen
ses
6,8
44
7,3
63
Prefe
rence
divi
dend
paid
174
,450
1
74,4
50
For the year ended December 31, 2017
Notes to the Unconsolidated Financial Statements
123JS Bank Annual Report 2017
41. CAPITAL ASSESSMENT AND ADEQUACY
41.1 Scope of Application
SBP Capital Adequacy Frameworks (Basel II and III) are applicable to JS Bank Limited on Standalone basis as well as on Consolidated basis by consolidating its partly owned subsidiaries - JS Global Capital Limited and JS Investments Limited. Standardised Approach is used for calculating the Capital Adequacy for Credit and Market risk, whereas, Basic Indicator Approach (BIA) is used for Operational Risk Capital Adequacy purposes.
41.2 Capital Structure- Basel III
Bank’s regulatory capital is analyzed into two tiers:
Tier I capital (going concern capital) Which comprises of:
a. Common equity Tier I which includes fully issued, subscribed and paid up capital, balance in share premium account, reserve for bonus issue, general reserves as per the financial statements and net un-appropriated profits etc. after deductions of investments in equity of subsidiary companies engaged in banking and financial activities, goodwill & other intangible assets and deficit on revaluation of available for sale investments due to insufficiency of Additional Tier I and Tier II to cover deductions.
b. Additional Tier I which includes Instruments issued in the form of perpetual non-cumulative preference shares by the banks, share premium resulting from the issuance of the instruments after deduction of goodwill & other intangible assets, deficit on revaluation of available for sale investments and deferred tax assets.
Tier II capital (going concern or supplementary capital), which includes general provision for loan losses (up to maximum of 1.25% of risk weighted assets), reserve on the revaluation of fixed assets, equity investments and foreign exchange translation reserve and subordinated debt.
41.3 Capital Adequacy
Capital Management
The primary objective of the Bank’s capital management is to ensure that the Bank complies with all regulatory capital requirements and at the same time maintains strong credit ratings and healthy capital ratios in order to support its business and to maximize shareholders’ value.
Statutory Minimum Capital Requirement (MCR) and Capital Adequacy Ratio (CAR)
The State Bank of Pakistan (SBP) through its BSD Circular no. 7 dated April 15, 2009 require Banks / Development Financial Institutions (DFIs) to raise and maintain their paid up capital (net of losses) equivalent to Rs.10 billion. The paid-up capital (free of losses) of the Bank as at December 31, 2017 stood at Rs.10.119 billion including un-listed, convertible, irredeemable, perpetual, non-cumulative, non-voting preference shares of Rs.1.5 billion. In addition banks are also required to maintain a minimum Capital Adequacy Ratio (CAR) of 11.28% of their risk weighted exposure. The Bank’s CAR as at December 31, 2017 was approximately 11.95% of its risk weighted assets.
For the year ended December 31, 2017
Notes to the Unconsolidated Financial Statements

124 JS Bank Annual Report 2017
Basel III transition
The Basel III instructions issued by SBP has been adopted by the banks as per the phase-in arrangements prescribed by SBP, starting from December 31, 2013, with full implementation of capital ratios by the year-end 2019. During the transition period banks shall maintain the required capital ratios in following manner:
Phase-in Arrangement and Full implementation of the minimum capital requirements
As of December 31,
Sr Ratio 2013 2014 2015 2016 2017 2018 2019
1 CET1 5.0% 5.5% 6.0% 6.0% 6.0% 6.0% 6.0%
2 ADT-1 1.5% 1.5% 1.5% 1.5% 1.5% 1.5% 1.5%
3 Tier 1 6.5% 7.0% 7.5% 7.5% 7.5% 7.5% 7.5%
4 Total Capital 10.0% 10.0% 10.0% 10.0% 10.0% 10.0% 10.0%
5CCB (Consisting of CETI only)
- - 0.25% 0.65% 1.275% 1.900% 2.5%
6 Total Capital plus CCB 10.0% 10.0% 10.25% 10.65% 11.275% 11.90% 12.5%
The Phase in arrangement for regulatory capital adjustment required under Basel III Instructions has started from December 31, 2014 at 20% per annum with full deduction from CET 1 to take effect from December 2018. During the transition period, the part which is not deducted from CET1/ Additional Tier 1 / Tier 2 will attract existing treatment. The regulatory Capital Deductions are mostly applied at the level of common equity tier-1. In this regard, following is the transitional arrangement as prescribed by SBP:
Phase-in of all deductions from CET1 (in percentage terms)
As of December 31,
2012 2013 2014 2015 2016 2017 2018
- - 20% 40% 60% 80% 100%
For the year ended December 31, 2017
Notes to the Unconsolidated Financial Statements

125JS Bank Annual Report 2017
Note 41.4 Capital Adequacy Ratio (CAR) disclosure:CAPITAL ADEQUACY RETURN AS OF DECEMBER 31, 2017
2017 2016------------ Rupees in ‘000 ------------
Amount Amount Common Equity Tier 1 capital (CET1): Instruments and reserves
1 Fully Paid-up Capital/ Capital deposited with SBP 10,724,643 10,724,643 2 Balance in Share Premium Account - - 3 Reserve for issue of Bonus Shares - - 4 Discount on Issue of shares (2,105,401) (2,105,401)5 General/ Statutory Reserves 1,540,988 1,334,139 6 Gain/(Losses) on derivatives held as Cash Flow Hedge - - 7 Unappropriated/unremitted profits/ (losses) 4,518,821 3,973,324 8 Minority Interests arising from CET1 capital instruments issued to third parties by consolidated bank subsidiaries
(amount allowed in CET1 capital of the consolidation group) - -
9 CET 1 before Regulatory Adjustments 14,679,051 13,926,705 10 Total regulatory adjustments applied to CET1 (Note 41.4.1) 1,636,376 1,861,897 11 Common Equity Tier 1 13,042,675 12,064,808
Additional Tier 1 (AT 1) Capital12 Qualifying Additional Tier-1 capital instruments plus any related share premium13 of which: Classified as equity 1,500,000 1,500,000 14 of which: Classified as liabilities - - 15 Additional Tier-1 capital instruments issued to third parties by consolidated subsidiaries (amount allowed in group AT 1) - - 16 of which: instrument issued by subsidiaries subject to phase out17 AT1 before regulatory adjustments 1,500,000 1,500,000 18 Total regulatory adjustment applied to AT1 capital (Note 41.4.2) 191,912 383,824 19 Additional Tier 1 capital after regulatory adjustments 1,308,088 1,116,176 20 Additional Tier 1 capital recognized for capital adequacy 1,308,088 1,116,176 21 Tier 1 Capital (CET1 + admissible AT1) (11+20) 14,350,763 13,180,984
Tier 2 Capital22 Qualifying Tier 2 capital instruments under Basel III plus any related share premium 4,998,800 3,000,000 23 Tier 2 capital instruments subject to phaseout arrangement issued under pre-Basel 3 rules24 Tier 2 capital instruments issued to third parties by consolidated subsidiaries (amount allowed in group tier 2) - - 25 of which: instruments issued by subsidiaries subject to phase out26 General provisions or general reserves for loan losses-up to maximum of 1.25% of Credit Risk Weighted Assets 100,352 40,988 27 Revaluation Reserves (net of taxes)28 of which: Revaluation reserves on fixed assets 421,450 - 29 of which: Unrealized gains/losses on AFS (69,695) 889,943 30 Foreign Exchange Translation Reserves31 Undisclosed/Other Reserves (if any)32 T2 before regulatory adjustments 5,450,906 3,930,931 33 Total regulatory adjustment applied to T2 capital (Note 41.4.3) 191,912 390,627 34 Tier 2 capital (T2) after regulatory adjustments 5,258,994 3,540,304 35 Tier 2 capital recognized for capital adequacy 4,592,639 3,540,304 36 Portion of Additional Tier 1 capital recognized in Tier 2 capital - - 37 Total Tier 2 capital admissible for capital adequacy 4,592,639 3,540,304 38 TOTAL CAPITAL (T1 + admissible T2) (21+37) 18,943,402 16,721,288 39 Total Risk Weighted Assets (RWA) {for details refer Note 41.7} 158,457,703 118,992,435
Capital Ratios and buffers (in percentage of risk weighted assets)40 CET1 to total RWA 8.23% 10.14%41 Tier-1 capital to total RWA 9.06% 11.08%42 Total capital to total RWA 11.95% 14.05%43 Bank specific buffer requirement (minimum CET1 requirement plus capital conservation buffer plus any other buffer requirement) 7.275% 6.65%44 of which: capital conservation buffer requirement 1.275% 0.65%45 of which: countercyclical buffer requirement 0.00% 0.00%46 of which: D-SIB or G-SIB buffer requirement 0.00% 0.00%47 CET1 available to meet buffers (as a percentage of risk weighted assets) 8.23% 10.14%
National minimum capital requirements prescribed by SBP48 CET1 minimum ratio 7.275% 6.65%49 Tier 1 minimum ratio 7.50% 7.50%50 Total capital minimum ratio 11.28% 10.65%
For the year ended December 31, 2017
Notes to the Unconsolidated Financial Statements

126 JS Bank Annual Report 2017
2017 2016-------------- Rupees in ‘000 --------------
Regulatory Adjustments and Additional Information Amount
Amounts subject to
Pre-Basel III treatment
Amount
Note 41.4.1Common Equity Tier 1 capital: Regulatory adjustments1 Goodwill (net of related deferred tax liability) 951,356 - 951,356 2 All other intangibles (net of any associated deferred tax liability) 513,887 - 388,941 3 Shortfall in provisions against classified assets - - -4 Deferred tax assets that rely on future profitability excluding those arising from temporary differences
(net of related tax liability) - - -
5 Defined-benefit pension fund net assets - - -6 Reciprocal cross holdings in CET1 capital instruments of banking, financial and insurance entities - - -7 Cash flow hedge reserve - - -8 Investment in own shares/ CET1 instruments - - -9 Securitization gain on sale - - -10 Capital shortfall of regulated subsidiaries - - -11 Deficit on account of revaluation from bank’s holdings of fixed assets/ AFS - - -12 Investments in the capital instruments of banking, financial and insurance entities that are outside the scope of
regulatory consolidation, where the bank does not own more than 10% of the issued share capital (amount above10% threshold)
- - 113,919
13 Significant investments in the common stocks of banking, financial and insurance entities that are outside the scope of regulatory consolidation (amount above 10% threshold) 171,133 597,740 407,681
14 Deferred Tax Assets arising from temporary differences (amount above 10% threshold, net of related tax liability) - - -15 Amount exceeding 15% threshold - - -16 of which: significant investments in the common stocks of financial entities - - - 17 of which: deferred tax assets arising from temporary differences - - -18 National specific regulatory adjustments applied to CET1 capital - - - 19 Investments in TFCs of other banks exceeding the prescribed limit - - - 20 Any other deduction specified by SBP (mention details) - - 21 Adjustment to CET1 due to insufficient AT1 and Tier 2 to cover deductions - - - 22 Total regulatory adjustments applied to CET1 (sum of 1 to 21) 1,636,376 1,861,897
Note 41.4.2Additional Tier-1 & Tier-1 Capital: regulatory adjustments23 Investment in mutual funds exceeding the prescribed limit [SBP specific adjustment] - - - 24 Investment in own AT1 capital instruments - - - 25 Reciprocal cross holdings in Additional Tier 1 capital instruments of banking, financial and insurance entities - - - 26 Investments in the capital instruments of banking, financial and insurance entities that are outside the scope of
regulatory consolidation, where the bank does not own more than 10% of the issued share capital (amount above 10% threshold)
- - -
27 Significant investments in the capital instruments of banking, financial and insurance entities that are outside the scope of regulatory consolidation - - -
28 Portion of deduction applied 50:50 to Tier-1 and Tier-2 capital based on pre-Basel III treatment which, during transitional period, remain subject to deduction from additional tier-1 capital 191,912 - 383,824
29 Adjustments to Additional Tier 1 due to insufficient Tier 2 to cover deductions - - - 30 Total regulatory adjustment applied to AT1 capital (sum of 23 to 29) 191,912 - 383,824
For the year ended December 31, 2017
Notes to the Unconsolidated Financial Statements

127JS Bank Annual Report 2017
2017 2016-------------- Rupees in ‘000 --------------
Amount
Amounts subject to
Pre- Basel III treatment
Amount
Note 41.4.3Tier 2 Capital: regulatory adjustments31 Portion of deduction applied 50:50 to Tier-1 and Tier-2 capital based on pre-Basel III treatment which, during
transitional period, remain subject to deduction from tier-2 capital 191,912 - 383,824 32 Reciprocal cross holdings in Tier 2 instruments of banking, financial and insurance entities - 33 Investment in own Tier 2 capital instrument - 34 Investments in the capital instruments of banking, financial and insurance entities that are outside the scope of
regulatory consolidation, where the bank does not own more than 10% of the issued share capital (amount above 10% threshold) - - 6,803
35 Significant investments in the capital instruments issued by banking, financial and insurance entities that are outside the scope of regulatory consolidation - -
36 Total regulatory adjustment applied to T2 capital (sum of 31 to 35) 191,912 390,627
Note 41.4.4Additional InformationRisk Weighted Assets subject to pre-Basel III treatment
37 Risk weighted assets in respect of deduction items (which during the transitional period will be risk weighted subject to Pre-Basel III Treatment)
(i) of which: deferred tax assets - - (ii) of which: Defined-benefit pension fund net assets - (iii) of which: Recognized portion of investment in capital of banking, financial and insurance entities where
holding is less than 10% of the issued common share capital of the entity - 75,946 (iv) of which: Recognized portion of investment in capital of banking, financial and insurance entities where
holding is more than 10% of the issued common share capital of the entity 426,607 271,787 Amounts below the thresholds for deduction (before risk weighting)
38 Non-significant investments in the capital of other financial entities - - 39 Significant investments in the common stock of financial entities - - 40 Deferred tax assets arising from temporary differences (net of related tax liability) -
Applicable caps on the inclusion of provisions in Tier 241 Provisions eligible for inclusion in Tier 2 in respect of exposures subject to standardized approach
(prior to application of cap) 100,352 40,988 42 Cap on inclusion of provisions in Tier 2 under standardized approach 1,767,306 1,288,452 43 Provisions eligible for inclusion in Tier 2 in respect of exposures subject to internal ratings-based approach
(prior to application of cap) - 44 Cap for inclusion of provisions in Tier 2 under internal ratings-based approach -
For the year ended December 31, 2017
Notes to the Unconsolidated Financial Statements

128 JS Bank Annual Report 2017
41.5 Capital Structure Reconciliation
Step: 1 As Per Balance Sheet
Under regulatory scope of
consolidation
December 31, 2017
Rupees in ‘000AssetsCash and balances with treasury banks 17,333,788 17,333,788 Balanced with other banks 1,034,266 1,034,266 Lending to financial institutions 3,116,199 3,116,199 Investments 169,611,558 169,611,558 Advances 184,139,582 184,139,582 Operating fixed assets 7,112,821 7,112,821 Deferred tax assets - - Other assets 5,960,662 5,960,662 Total assets 388,308,876 388,308,876
Liabilities & EquityBills payable 3,824,278 3,824,278 Borrowings 64,557,043 64,557,043 Deposits and other accounts 290,077,566 290,077,566 Sub-ordinated loans 4,998,800 4,998,800 Liabilities against assets subject to finance lease - - Deferred tax liabilities 796,803 796,803 Other liabilities 7,385,057 7,385,057 Total liabilities 371,639,547 371,639,547
Share capital/ Head office capital account 10,119,242 10,119,242 Reserves 1,540,988 1,540,988 Unappropriated profit 4,518,820 4,518,820 Minority Interest - - Surplus on revaluation of assets 490,279 490,279 Total Equity 16,669,329 16,669,329 Total liabilities & equity 388,308,876 388,308,876
For the year ended December 31, 2017
Notes to the Unconsolidated Financial Statements

129JS Bank Annual Report 2017
Step : 2As Per
Balance Sheet
Under regulatory scope of
consolidation
Reference
December 31, 2017
Rupees in ‘000
Assets
Cash and balances with treasury banks 17,333,788 17,333,788 Balances with other banks 1,034,266 1,034,266 Lending to financial institutions 3,116,199 3,116,199 Investments 169,611,558 169,611,558 of which: Non-significant capital investments in capital of other financial institutions exceeding 10% threshold - - a
of which: significant capital investments in financial sector entities exceeding regulatory threshold 171,133 171,133 b
of which: Mutual Funds exceeding regulatory threshold - - c of which: reciprocal crossholding of capital instrument - d of which: Investment in TFCs of other banks exceeding the precribed limit - - e
Advances 184,139,582 184,139,582 shortfall in provisions/ excess of total EL amount over eligible provisions under IRB - - f
general provisions reflected in Tier 2 capital 100,352 95,610 gFixed Assets 7,112,821 7,112,821 Deferred Tax Assets - - of which: DTAs excluding those arising from temporary differences - - h
of which: DTAs arising from temporary differences exceeding regulatory threshold - - i
Other assets 5,960,662 5,960,662 of which: Goodwill 951,356 953,352 j of which: Intangibles 513,887 513,887 k of which: Defined-benefit pension fund net assets - - lTotal assets 388,308,876 388,308,876
For the year ended December 31, 2017
Notes to the Unconsolidated Financial Statements

130 JS Bank Annual Report 2017
As Per Balance Sheet
Under regulatory scope of
consolidation
Reference
December 31, 2017
Rupees in ‘000
Liabilities & EquityBills payable 3,824,279 3,824,279 Borrowings 64,557,043 64,557,043 Deposits and other accounts 290,077,566 290,077,566 Sub-ordinated loans 4,998,800 4,998,800 of which: eligible for inclusion in AT1 - - m of which: eligible for inclusion in Tier 2 - - nLiabilities against assets subject to finance lease - - Deferred tax liabilities 796,803 796,803 of which: DTLs related to goodwill (512,268) (512,268) o of which: DTLs related to intangible assets - - p of which: DTLs related to defined pension fund net assets - - q
of which: other deferred tax liabilities (300,217) (300,217) rOther liabilities 7,385,057 7,385,057 Total liabilities 371,639,548 371,639,548
Share capital 10,119,242 10,119,242 of which: amount eligible for CET1 8,619,242 8,619,242 s of which: amount eligible for AT1 1,500,000 1,500,000 tReserves 1,540,988 1,540,988 of which: portion eligible for inclusion in CET1(provide breakup) 1,540,988 1,540,988 u
of which: portion eligible for inclusion in Tier 2 - - vUnappropriated profit/ (losses) 4,518,821 4,518,821 wMinority Interest - - of which: portion eligible for inclusion in CET1 - - x of which: portion eligible for inclusion in AT1 - - y of which: portion eligible for inclusion in Tier 2 - - zSurplus on revaluation of assets 490,279 490,279 of which: Revaluation reserves on Property - - aa of which: Unrealized Gains/Losses on AFS - - ab In case of Deficit on revaluation (deduction from CET1) - - Total liabilities & Equity 388,308,878 388,308,878
For the year ended December 31, 2017
Notes to the Unconsolidated Financial Statements

131JS Bank Annual Report 2017
Component of regulatory capital reported by bank
Reference
Rupees in ‘000Common Equity Tier 1 capital (CET1): Instruments and reservesFully Paid-up Capital/ Capital deposited with SBP 10,724,643 (s)Balance in Share Premium Account - Reserve for issue of Bonus Shares - Discount on issue of Shares (enter negative number) (2,105,401)General/ Statutory Reserves 1,540,988 (u)Gain/(Losses) on derivatives held as Cash Flow Hedge - Unappropriated/unremitted profits/(losses) 4,518,821 (w)Minority Interests arising from CET1 capital instruments issued to third
party by consolidated bank subsidiaries (amount allowed in CET1 capital of the consolidation group)
- (x)
CET 1 before Regulatory Adjustments 14,679,051 Common Equity Tier 1 capital: Regulatory adjustmentsGoodwill (net of related deferred tax liability) 951,356 (j) - (o)All other intangibles (net of any associated deferred tax liability) 513,887 (k) - (p)Shortfall of provisions against classified assets - (f)Deferred tax assets that rely on future profitability excluding those arising
from temporary differences (net of related tax liability) - {(h) - (r} * x%Defined-benefit pension fund net assets - {(l) - (q)} * x%Reciprocal cross holdings in CET1 capital instruments - (d)Cash flow hedge reserve - Investment in own shares/ CET1 instruments - Securitization gain on sale - Capital shortfall of regulated subsidiaries - Deficit on account of revaluation from bank’s holdings of property/ AFS - (ab)Investments in the capital instruments of banking, financial and insurance
entities that are outside the scope of regulatory consolidation, where the bank does not own more than 10% of the issued share capital (amount above 10% threshold)
-
(a) - (ac) - (ae)Significant investments in the capital instruments issued by banking,
financial and insurance entities that are outside the scope of regulatory consolidation (amount above 10% threshold)
171,133 (b) - (ad) - (af)
Deferred Tax Assets arising from temporary differences (amount above 10% threshold, net of related tax liability) - (i)
Amount exceeding 15% threshold - of which: significant investments in the common stocks of financial
entities -
of which: deferred tax assets arising from temporary differences - National specific regulatory adjustments applied to CET1 capital - Investment in TFCs of other banks exceeding the prescribed limit - Any other deduction specified by SBP (mention details) - Regulatory adjustment applied to CET1 due to insufficient AT1 and Tier 2
to cover deductions -
Total regulatory adjustments applied to CET1 (sum of 9 to 25) 1,636,376 Common Equity Tier 1 13,042,675
For the year ended December 31, 2017
Notes to the Unconsolidated Financial Statements

132 JS Bank Annual Report 2017
Component of regulatory capital reported by bank
Reference
Rupees in ‘000Additional Tier 1 (AT 1) CapitalQualifying Additional Tier-1 instruments plus any related share premium 1,500,000 of which: Classified as equity 1,500,000 (t) of which: Classified as liabilities - (m)Additional Tier-1 capital instruments issued by consolidated subsidiaries
and held by third parties (amount allowed in group AT 1) - (y) of which: instrument issued by subsidiaries subject to phase out - AT1 before regulatory adjustments 1,500,000 Additional Tier 1 Capital: regulatory adjustmentsInvestment in mutual funds exceeding the prescribed limit (SBP specific
adjustment) - Investment in own AT1 capital instruments - Reciprocal cross holdings in Additional Tier 1 capital instruments - Investments in the capital instruments of banking, financial and insurance
entities that are outside the scope of regulatory consolidation, where the bank does not own more than 10% of the issued share capital (amount above 10% threshold)
-
(ac)Significant investments in the capital instruments issued by banking,
financial and insurance entities that are outside the scope of regulatory consolidation
- (ad)
Portion of deduction applied 50:50 to core capital and supplementary capital based on pre-Basel III treatment which, during transitional period, remain subject to deduction from tier-1 capital
191,912
Regulatory adjustments applied to Additional Tier 1 due to insufficient Tier 2 to cover deductions -
Total of Regulatory Adjustment applied to AT1 capital 191,912 Additional Tier 1 capital 1,308,088 Additional Tier 1 capital recognized for capital adequacy 1,308,088 Tier 1 Capital (CET1 + admissible AT1) 14,350,762 Tier 2 CapitalQualifying Tier 2 capital instruments under Basel III 4,998,800
(n)Capital instruments subject to phase out arrangement from tier 2 (Pre-Basel III instruments) -
Tier 2 capital instruments issued to third party by consolidated subsidiaries (amount allowed in group tier 2) - (z)
of which: instruments issued by subsidiaries subject to phase out - General Provisions or general reserves for loan losses-up to maximum of
1.25% of Credit Risk Weighted Assets 100,352 (g)Revaluation Reserves eligible for Tier 2 351,754 of which: portion pertaining to Property 421,450 portion of (aa) of which: portion pertaining to AFS securities (69,695)Foreign Exchange Translation Reserves - (v)Undisclosed/Other Reserves (if any) - T2 before regulatory adjustments 5,450,906
For the year ended December 31, 2017
Notes to the Unconsolidated Financial Statements

133JS Bank Annual Report 2017
Component of regulatory capital reported by bank
Reference
Rupees in ‘000Tier 2 Capital: regulatory adjustmentsPortion of deduction applied 50:50 to core capital and supplementary
capital based on pre-Basel III treatment which, during transitional period, remain subject to deduction from tier-2 capital 191,912
Reciprocal cross holdings in Tier 2 instruments - Investment in own Tier 2 capital instrument - Investments in the capital instruments of banking, financial and insurance
entities that are outside the scope of regulatory consolidation, where the bank does not own more than 10% of the issued share capital (amount above 10% threshold) - (ae)
Significant investments in the capital instruments issued by banking, financial and insurance entities that are outside the scope of regulatory consolidation - (af)
Amount of Regulatory Adjustment applied to T2 capital 191,912 Tier 2 capital (T2) 191,912 Tier 2 capital recognized for capital adequacy 4,592,639 Excess Additional Tier 1 capital recognized in Tier 2 capital - Total Tier 2 capital admissible for capital adequacy 4,592,639 TOTAL CAPITAL (T1 + admissible T2) 18,943,402
For the year ended December 31, 2017
Notes to the Unconsolidated Financial Statements

134 JS Bank Annual Report 2017
41.6 Main Features of Regulatory Capital Instruments
S.No Main Features Common Shares Preference Shares Sub-debt -1 Sub-debt - 2
1 Issuer JS Bank JS Bank JS Bank JS Bank
2 Unique identifier (eg KSE Symbol or Bloomberg identifier etc.) JSB JSB JSB JSB
3 Governing law(s) of the instrument SECP SECP SECP SECPRegulatory treatment
4 Transitional Basel III rules Common Equity Tier-1 Additional Tier-1 Tier-2 Tier-2
5 Post-transitional Basel III rules Common Equity Tier-1 Additional Tier-1 Tier-2 Tier-2
6 Eligible at solo/ group/ group&solo Solo and Group Solo and Group Solo and Group Solo and Group7 Instrument type Ordinary Shares Preference Shares Subordinated Debt Subordinated Debt8 Amount recognized in regulatory capital
(Currency in PKR thousands, as of reporting date)
8,619,242 1,500,000 3,000,000 2,000,000
9 Par value of instrument 10 10 5,000 100,00010 Accounting classification Shareholders
EquityShareholders
EquityLiability Liability
11 Original date of issuance 2006 2014 14-Dec-16 29-Dec-1712 Perpetual or dated No Maturity NA Dated Dated13 Original maturity date NA NA 14-Dec-23 29-Dec-2414 Issuer call subject to prior supervisory
approvalNo No Yes Yes
15 Optional call date, contingent call dates and redemption amount
NA NA On or after 10th redemption, on any profit date, partially or fully
On or after 10th redemption, on any profit date, partially or fully
16 Subsequent call dates, if applicable NA NA NA NACoupons / dividends
17 Fixed or floating dividend/ coupon NA Fixed Floating Floating18 coupon rate and any related index/
benchmarkNA NA Floating at 6 Months KIBOR*(Base Rate)
plus 140 basis points per annum without any floor or CAP
Floating at 6 Months KIBOR*(Base Rate) plus 140 basis points per annum without any
floor or CAP
19 Existence of a dividend stopper NA NA NA NA
20 Fully discretionary, partially discretionary or mandatory
NA NA Mandatory Mandatory
21 Existence of step up or other incentive to redeem
NA NA NA NA
22 Noncumulative or cumulative NA Non-Cumulative Cumulative Cumulative23 Convertible or non-convertible NA Convertible Convertible Convertible
For the year ended December 31, 2017
Notes to the Unconsolidated Financial Statements

135JS Bank Annual Report 2017
S.No Main Features Common Shares Preference Shares Sub-debt -1 Sub-debt - 2
24 If convertible, conversion trigger (s) NA NA At the option of supervisor it can be converted into common equity upon occurrence of certain trigger events , called point of non viability(PONV). The PONV is the earlier of; 1. A decision made by SBP that a conversion or temporary/ permanent write off is necessary without which the bank would become non viable. 2. the decision to make a public sector injection of capital, or equivalent support, without which the bank would have become non viable, as determined by SBP.
At the option of supervisor it can be converted into common equity upon occurrence of certain trigger events , called point of non viability(PONV). The PONV is the earlier of; 1. A decision made by SBP that a conversion or temporary/ permanent write off is necessary without which the bank would become non viable. 2. the decision to make a public sector injection of capital, or equivalent support, without which the bank would have become non viable, as determined by SBP.
25 If convertible, fully or partially NA Fully May convert fully or partially May convert fully or partially
26 If convertible, conversion rate NA 1:1.5 To be determined in the case of trigger event To be determined in the case of trigger event
27 If convertible, mandatory or optional conversion
NA Mandatory Optional Optional
28 If convertible, specify instrument type convertible into
NA Ordinary Shares Ordinary Shares Ordinary Shares
29 If convertible, specify issuer of instrument it converts into
NA NA NA NA
30 Write-down feature NA NA Yes Yes31 If write-down, write-down trigger(s) NA NA At the option of supervisor it can be
converted into common equity upon occurrence of certain trigger events , called point of non viability(PONV). The PONV is the earlier of; 1. A decision made by SBP that a conversion or temporary/ permanent write off is necessary without which the bank would become non viable. 2. the decision to make a public sector injection of capital, or equivalent support, without which the bank would have become non viable, as determined by SBP.
At the option of supervisor it can be converted into common equity upon occurrence of certain trigger events , called point of non viability(PONV). The PONV is the earlier of; 1. A decision made by SBP that a conversion or temporary/ permanent write off is necessary without which the bank would become non viable. 2. the decision to make a public sector injection of capital, or equivalent support, without which the bank would have become non viable, as determined by SBP.
32 If write-down, full or partial NA NA Either partially or fully Either partially or fully
33 If write-down, permanent or temporary NA NA Permanent Permanent
34 If temporary write-down, description of write-up mechanism
NA NA NA NA
35 Position in subordination hierarchy in liquidation (specify instrument type immediately senior to instrument)
NA NA Deposits Deposits
36 Non-compliant transitioned features NA NA No No37 If yes, specify non-compliant features NA NA NA NA
For the year ended December 31, 2017
Notes to the Unconsolidated Financial Statements

136 JS Bank Annual Report 2017
41.7 Capital Adequacy Capital Requirements Risk Weighted Assets
December 31, December 31, December 31, December 31, 2017 2016 2017 2016
-------------------- Rupees in ‘000 -------------------- Credit Risk
On balance sheetCorporate 7,554,444 5,722,057 75,544,441 57,220,574 Retail 2,799,388 1,029,394 27,993,877 10,293,935 Banks and DFIs 404,648 287,574 4,046,478 2,875,736 Public sector entity 36,402 71,459 364,018 714,591 Sovereign (include GoP and SBP) 158,660 344,147 1,586,600 3,441,471 Residential mortgage finance 245,288 88,765 2,452,879 887,648 Past due loans 77,207 88,463 772,074 884,631 Fixed assets 513,531 398,462 5,135,309 3,984,616 Other assets 119,165 75,688 1,191,649 756,877
11,908,733 8,106,008 119,087,325 81,060,079
Off balance sheetNon market related 1,574,193 1,552,561 15,741,927 15,525,614 Market related 32,972 8,929 329,722 89,286
1,607,165 1,561,490 16,071,649 15,614,900
Equity Exposure Risk in the Banking BookListed 618,845 603,665 6,188,448 6,036,654 Unlisted 2,058 36,456 20,584 364,558
620,903 640,121 6,209,032 6,401,212 Total Credit Risk 14,136,801 10,307,619 141,368,006 103,076,191
Market RiskInterest rate risk 59,078 294,020 590,780 2,940,204 Equity position risk etc. - - - - Foreign exchange risk 151,226 20,640 1,512,263 206,399
Total Market Risk 210,304 314,660 2,103,043 3,146,603
Operational Risk
Capital Requirement for operational risks 1,498,665 1,276,964 14,986,654 12,769,641
Total 15,845,770 11,899,244 158,457,703 118,992,435
Capital Adequacy Ratio
Total eligible common equity tier 1 capital held (e) 13,042,675 12,064,809 Total eligible tier 1 capital held (f) 14,350,762 13,180,984 Total eligible regulatory capital held (e) 18,943,402 16,721,288
Total Risk Weighted Assets (i) 158,457,703 118,992,435
For the year ended December 31, 2017
Notes to the Unconsolidated Financial Statements

137JS Bank Annual Report 2017
December 31, 2017 December 31, 2016 Required Actual Required Actual
CET1 to total RWA 7.275% 8.23% 6.65% 10.14%Tier-1 capital to total RWA 7.50% 9.06% 7.50% 11.08%Total capital to total RWA 11.28% 11.95% 10.65% 14.05%
41.8 Leverage Ratio
Total eligible tier 1 capital held 14,350,762 13,180,984 Total Exposure 462,328,540 322,403,541 Leverage Ratio 3.10% 4.09%
42. RISK MANAGEMENT
Risk Management is a discipline at the core of every financial institution and encompasses all the activities that affect its risk profile. At the Bank, it involves identification, measurement, monitoring and controlling risks to ensure that:
a) The individuals who take or manage risks clearly understand it;
b) The Bank’s risk exposure is within the limits established by Board of Directors (BoD);
c) Risk taking decisions are in line with the business strategy and objectives set by BoD;
d) The expected payoffs compensate for the risks taken;
e) Risk taking decisions are explicit and clear;
f) Sufficient capital as a buffer is available to take risk; and
g) Risk management function is independent of risk taking unit.
Bank has a comprehensive set of Risk Management Policies, practices and procedures which enable the Bank to take into consideration, in an appropriate manner, all major kinds of risks mainly credit, market, liquidity, operational and IT security risks. Keeping in view the dynamics of internal and external environment, we regularly review and update our Risk Management policies and procedures in accordance with regulatory environment and international standards.
Risk Management activities remain at the forefront of all activities of the Bank which places the highest priority on conducting its business in a prudent manner in line with the relevant laws and regulatory requirements.
Risk management framework of Bank includes:
a) Clearly defined risk management policies and procedures covering risk identification, acceptance, measurement, monitoring, reporting and control;
b) Well constituted organizational structure, defining clearly roles and responsibilities of individuals involved in risk taking as well as managing it. The bank, in addition to risk management functions for various risk categories, has instituted an Integrated Risk Management Committee (IRMC) as well as Central Credit Committee (CCC). IRMC oversees the overall risk management at the bank and provide guidance in
For the year ended December 31, 2017
Notes to the Unconsolidated Financial Statements

138 JS Bank Annual Report 2017
setting strategic targets as well as concentration limits and monitor progress related to earnings growth, keeping in view the capital constraints and also adhere to the concentration limits. The IRMC monitors the strategic target and aggregate limits at the Business Group level and concentration limits (by industry, geography, size, tenor) so that one category of assets or dimension of risk cannot materially harm the performance of the Bank. Whereas, Central Credit Committee (CCC) is entrusted with the responsibility of monitoring lending risk profile of the bank. CCC meets regularly to actively supervise credit risk across its lending portfolio.
c) An effective management information system that ensures flow of information from operational level to top management and a system to address any exceptions observed; and
d) A mechanism to ensure an ongoing review of systems, policies and procedures for risk management and procedures to adopt changes.
While the overall responsibility of risk management rests with the BoD, it is the duty of Senior Management to devise risk management strategy by setting up well defined policies and procedures for mitigating / controlling risks, duly approved by the Board.
Giving due consideration to the above, the Bank has put in place the following hierarchy of Risk Management:
- Board Risk Management Committee (BRMC);
- Integrated Risk Management Committee (IRMC) which comprises of the President / Chief Executive Officer (CEO), Deputy CEO, Group Head Credit & Risk Management, Chief Financial Officer, Group Head Corporate & Retail Banking, Group Head Operations and Head of Compliance.
- Asset - Liability Committee which comprises of the President / Chief Executive Officer (CEO), Deputy CEO, Treasurer, Group Head Risk Management, Other Business Heads.
- Central Credit Committee comprising of the President / CEO, Deputy CEO, Group Head Credit & Risk Management, Chief Financial Officer and Group Head Corporate & Retail Banking.
- Operational Risk Steering Committee which comprises of the Group Head, Credit & Risk Management, Head of Operations, Head of Information Technology and Head of Compliance.
- Risk Management Group (RMG), a dedicated and independent set-up that comprises of Regional Credit Heads, Heads of Market & Liquidity Risks, Operational Risk and Treasury Middle Office.
RMG is managed by Group Head Credit & Risk Management to supervise the following Divisions:
a) Credit Risk Management (CRM) covering Corporate / Commercial and Retail Banking Risks
b) Operational Risk Management
c) Market Risk Management (MRM)
d) Treasury Middle Office
e) Basel II / III Implementation Unit
f) Credit Administration Department
g) Special Assets Management (SAM)
For the year ended December 31, 2017
Notes to the Unconsolidated Financial Statements

139JS Bank Annual Report 2017
The Bank’s RMG generates the requisite risk reporting for the different tiers of management. These are also subjected to internal audit review.
Risk Matrix / Categories
Bank, in common with other banks, generates its revenues by accepting Country, Credit, Liquidity, Interest Rate Risk in the Banking Book, Market, Operational and other risks. Effective management of these risks is the decisive factor in the Bank’s profitability.
Risk Appetite
The Bank’s risk appetite is reflected in its endeavours to maintain a favourable credit rating and encompasses the following:
- The business strategy
- The expectations of stakeholders at different time horizons
- The characteristics of the risk-bearing entities
- The nature and characteristics of the risks undertaken - The possible spread of risk situations across organizational units, assets-at-risk, and future time horizons.
Risk appetite drives business activity. It combines anticipations in risk and profitability with management preferences to control capital and resource allocation, as well as the distribution of exposure across activities and portfolios.
Bank’s hedging strategy is embedded in its risk management practices for addressing material categories of risk.
42.1 Credit Risk
Credit risk is the risk which arises with the possibility that one party to a financial instrument will fail to discharge its obligation and cause the other party to incur a financial loss. Credit risk is managed in terms of credit policies, approved by the BoD and regulations issued by the SBP. The bank is exposed to credit risk on loans and advances, fund placements with financial institutions and certain investments.
Credit risk management is an ongoing process. The overall credit policy and the credit risk instructions are issued by the Board of Directors. In this regards, a Central Credit Committee (CCC) is entrusted with the responsibility of monitoring lending risk profile of the bank. In order to maintain healthy growth of the credit portfolio, the Bank’s Credit Risk Management processes are consistently upgraded and improved to meet future challenges.
The Bank’s strategy is to minimise credit risk through product, geography, industry and customer diversification. Credit limits are established for all counter-parties after a careful assessment of their credit worthiness. An effective credit granting procedure, which requires pre-sanction evaluation of credit proposal, adequacy of security and pre-disbursement examination of charge documents is in place and managed by Risk Management Group (RMG) & Credit Administration Department (CAD). The Bank maintains a sound portfolio diversified in nature to counter the risk of credit concentration and further confines risk through diversification of its assets by geographical and industrial sector. For managing impaired assets in the portfolio, the Bank follows the Prudential Regulations and Risk Management guidelines issued by SBP and the Remedial Management Policy approved by the Board.
For the year ended December 31, 2017
Notes to the Unconsolidated Financial Statements

140 JS Bank Annual Report 2017
42.1.1.1 Segment by class of business
2017Advances Contingencies and
(gross) Deposits commitmentsRupees Percent Rupees Percent Rupees Percentin ‘000 % in ‘000 % in ‘000 %
Agri finance 2,584,965 1.38 7,017 0.00 - -Automobile and transportation equipment 3,599,906 1.93 2,935,187 1.01 2,680,780 2.48 Brokerage 2,681,932 1.44 2,247,868 0.77 625,700 0.58 Cement 209,356 0.11 1,955,604 0.67 1,357,619 1.26 Chemical 2,365,522 1.27 3,068,426 1.06 583,005 0.54 Construction 3,711,869 1.99 8,383,926 2.89 24,731,408 22.90 Electronics and electrical appliances 301,375 0.16 4,004,788 1.38 711,868 0.66 Engineering, IT and other services 4,639,050 2.48 16,666,461 5.75 2,850,006 2.64 Fertilizer 3,206,664 1.72 4,552,980 1.57 2,354,865 2.18 Financial 3,005,047 1.61 22,601,206 7.79 21,638,686 20.04 Food / confectionery / beverages 36,076,698 19.30 2,341,565 0.81 1,797,201 1.66 Individuals 20,136,724 10.78 86,970,986 29.98 2,796,610 2.59 Insurance and security 159,353 0.09 5,020,213 1.73 27,245 0.03 Metal and steel 6,477,004 3.47 311,126 0.11 3,220,008 2.98 Mining and quarrying 57,529 0.03 2,806,004 0.97 882,839 0.82 Paper / board / furniture 1,125,618 0.60 544,587 0.19 585,175 0.54 Petroleum, oil and gas 3,837,523 2.05 11,992,285 4.13 419,202 0.39 Pharmaceuticals 4,836,857 2.59 705,238 0.24 629,771 0.58 Plastic 1,898,580 1.02 27,871 0.01 350,709 0.32 Power and water 12,940,341 6.92 5,388,005 1.86 22,626,105 20.95 Real estate 1,767,479 0.95 217,142 0.07 68,352 0.06 Rubber - 0.00 5,314 0.00 12,743 0.01 Shipbreaking 4,166,705 2.23 48,161 0.02 58,004 0.05 Storage 114,685 0.06 252,282 0.09 - 0.00 Sugar 2,176,604 1.16 219,343 0.08 117,518 0.11 Telecommunication 1,239,201 0.66 9,699,646 3.34 494,461 0.46 Textile Composite 5,418,311 2.90 10,931 0.00 1,759,328 1.63 Ginning 1,310,409 0.70 53,415 0.02 275,140 0.25 Spinning 7,977,933 4.27 29,806 0.01 1,875,447 1.74 weaving 8,600,624 4.60 923,112 0.32 1,200,908 1.11
23,307,277 12.47 1,017,264 0.35 5,110,823 4.73
Transportation 24,214,240 12.96 3,409,731 1.18 - 0.00 Trust and non-profit organisations 361,330 0.19 40,014,982 13.79 49,233 0.05 Tyre 278,180 0.15 191,114 0.07 81,506 0.08 Wholesale and retail trade 11,037,390 5.91 10,501,057 3.62 4,369,688 4.05 Others 4,363,891 2.32 41,970,187 14.47 6,745,989 6.26
186,878,895 100 290,077,566 100 107,977,119 100
42.1.1 Segmental Information
Segmental information is presented in respect of the class of business and geographical distribution of advances, deposits, contingencies and commitments.
For the year ended December 31, 2017
Notes to the Unconsolidated Financial Statements

141JS Bank Annual Report 2017
2016Advances Deposits Contingencies and
(gross) commitmentsRupees Percent Rupees Percent Rupees Percentin ‘000 % in ‘000 % in ‘000 %
Agri finance 1,510,356 1.57 112,058 0.05 - - Automobile and transportation equipment 1,958,955 2.03 2,365,241 1.05 981,223 1.24 Brokerage 3,937,097 4.08 1,876,867 0.83 258,798 0.33 Cement 844,558 0.88 4,211,769 1.86 245,496 0.31 Chemical 1,229,418 1.27 1,012,913 0.45 1,648,062 2.09 Construction 2,288,680 2.37 5,754,072 2.54 14,745,517 18.68 Electronics and electrical appliances 200,835 0.21 7,361,674 3.26 80,927 0.10 Engineering, IT and other services 1,092,591 1.13 9,413,690 4.16 2,752,056 3.49 Fertilizer 3,276,123 3.40 3,868,031 1.71 2,632,751 3.34 Financial 3,252,827 3.37 29,501,571 13.05 31,059,501 39.35 Food / confectionery / beverages 14,760,439 15.30 8,603,882 3.81 680,708 0.86 Individuals 8,032,695 8.33 70,871,762 31.35 427,849 0.54 Insurance and security 29,804 0.03 5,577,677 2.47 17,028 0.02 Metal and steel 3,441,932 3.57 1,127,398 0.50 2,019,820 2.56 Mining and quarrying 71,326 0.07 2,504,794 1.11 - 0.00 Paper / board / furniture 737,077 0.76 133,281 0.06 549,427 0.70 Petroleum, oil and gas 1,970,862 2.04 3,340,190 1.48 331,278 0.42 Pharmaceuticals 3,328,405 3.45 462,395 0.20 710,845 0.90 Plastic 1,684,546 1.75 64,557 0.03 373,088 0.47 Power and water 1,798,162 1.86 577,451 0.26 767,921 0.97 Real estate 1,662,335 1.72 117,573 0.05 97,391 0.12 Rubber - 0.00 250,325 0.11 - 0.00 Shipbreaking 5,142,954 5.33 57,548 0.03 11,965 0.02 Storage - 0.00 325,599 0.14 - 0.00 Sugar 2,981,865 3.09 893,435 0.40 196,992 0.25 Tele-communication 1,703,603 1.77 7,482,512 3.31 1,269,223 1.61 Textile Composite 1,523,936 1.58 88,837 0.04 387,438 0.49 Ginning 356,199 0.37 3,055 0.00 274,963 0.35 Spinning 5,311,379 5.51 106,642 0.05 1,181,228 1.50 weaving 5,470,711 5.67 1,010,836 0.45 2,228,999 2.82
12,662,225 13.13 1,209,370 0.54 4,072,628 5.16
Transportation 4,235,834 4.39 4,571,854 2.02 39,117 0.05 Trust and non-profit organisations 289,779 0.30 26,118,955 11.55 2,000 0.00 Tyre 173,285 0.18 101,377 0.04 155,748 0.20 Wholesale and retail trade 4,272,828 4.43 3,403,998 1.51 460,082 0.58 Others 7,882,079 8.19 22,825,112 10.07 12,335,587 15.64
96,453,475 100 226,098,931 100 78,923,028 100
For the year ended December 31, 2017
Notes to the Unconsolidated Financial Statements

142 JS Bank Annual Report 2017
42.1.1.2 Segment by sector2017
Advances Contingencies and (gross) Deposits commitments
Rupees Percent Rupees Percent Rupees Percentin ‘000 % in ‘000 % in ‘000 %
Public / Government 37,342,990 19.98 49,068,231 16.92 - - Private 149,535,905 80.02 241,009,335 83.08 107,977,119 100
186,878,895 100 290,077,566 100 107,977,119 100
2016Advances Contingencies and
(gross) Deposits commitmentsRupees Percent Rupees Percent Rupees Percentin ‘000 % in ‘000 % in ‘000 %
Public / Government 4,999,999 5.18 33,490,281 14.81 - - Private 91,453,476 94.82 192,608,650 85.19 78,923,028 100
96,453,475 100 226,098,931 100 78,923,028 100
Details of non-performing advances and specific provisions by class of business segment
2017 2016Specific Specific
Classified provisions Classified provisionsadvances held advances held
------------------------- Rupees in ‘000 ------------------------Automobile and transportation equipment 74,875 61,875 61,875 61,875 Engineering, IT and other services 21,683 16,857 183,711 183,711 Brokerage 167,596 167,596 - - Fertilizer 1,260,418 1,260,418 1,258,256 1,258,256 Food 134,370 79,968 110,138 91,398 Individuals 364,142 75,397 254,433 68,352 Metal and steel 154,067 23,161 139,892 8,208 Power and water, oil and gas 21,448 21,448 21,448 21,448 Ship breaking 157,926 125,658 157,926 98,814 Sugar 200,000 200,000 200,000 100,000 Tele-communication - - 172,628 - Textile
Composite 315,665 304,153 373,211 370,462 Ginning 29,999 - - - Spinning 278,441 278,441 278,441 278,441 Weaving 3,500 - - -
627,605 582,594 651,652 648,903 Transportation services 22,928 17,681 13,348 13,348 Wholesale and retail trade 14,360 6,307 44,573 32,282 Others 36,579 - 58,062 31,758
3,257,997 2,638,960 3,327,942 2,618,353
Details of non-performing advances and specific provisions by sector
Public / Government - - - - Private 3,257,997 2,638,960 3,327,942 2,618,353
3,257,997 2,638,960 3,327,942 2,618,353
For the year ended December 31, 2017
Notes to the Unconsolidated Financial Statements

143JS Bank Annual Report 2017
Geographical segment analysis2017 2016
Total assets Net assets Total assets Net assetsemployed employed employed employed
------------------------- Rupees in ‘000 ------------------------
Pakistan 380,989,982 16,131,487 260,433,902 16,384,851 Bahrain 7,318,894 537,842 4,266,591 264,674
388,308,876 16,669,329 264,700,493 16,649,525
2017 2016Profit Contingencies Contingencies before and Profit before and
taxation commitments taxation commitments------------------------- Rupees in ‘000 ------------------------
Pakistan 1,376,196 106,261,877 3,377,428 77,703,976 Bahrain 244,368 1,715,242 12,508 1,219,052
1,620,564 107,977,119 3,389,936 78,923,028
42.1.2 Credit risk: Standardised approach
The Bank has adopted the Standardised Approach of Basel II for risk weighing its Credit Risk Exposures.
The following table illustrates the approved External Credit Assessment Institutions (ECAIs) whose ratings are being utilised by the Bank with respect to material categories of exposures:
Exposures JCR-VIS PACRA MOODY’S FITCH S&P
Corporate P P - - -Banks P P P P PSME’s (retailexposures) P P - - -Sovereigns N/A N/A P P PSecuritisations N/A N/A N/A N/A N/AOthers (specify) N/A N/A N/A N/A N/A
The Bank has used Issue Specific Ratings for rating / risk weighing Issue Specific Exposures and Entity Ratings for rating / risk weighing claims against specific counterparties. Both short and long term ratings have been used to rate corresponding short and long term exposures. For this purpose, Mapping Grid provided by SBP as given below is used:
For the year ended December 31, 2017
Notes to the Unconsolidated Financial Statements

144 JS Bank Annual Report 2017
For the year ended December 31, 2017
Notes to the Unconsolidated Financial Statements
Long - Term Ratings Grades Mapping
SBP Rating Grade PACRA JCR-VIS Fitch Moody’s S&P ECA Scores
1 AAAAA+AAAA-
AAAAA+AAAA-
AAAAA+AAAA-
AaaAa1Aa2Aa3
AAAAA+AAAA-
1
2 A+AA-
A+AA-
A+AA-
A1A2A3
A+AA-
2
3 BBB+BBBBBB-
BBB+BBBBBB-
BBB+BBBBBB-
Baa1Baa2Baa3
BBB+BBBBBB-
3
4 BB+BBBB-
BB+BBBB-
BB+BBBB-
Ba1Ba2Ba3
BB+BBBB-
4
5 B+BB-
B+BB-
B+BB-
B1B2B3
B+BB-
5,6
6 CCC+ and below
CCC+ and below
CCC+ and below
Caa1 and below
CCC+ and below
7
Short - Term Ratings Grades Mapping
SBP PACRA JCR-VIS Fitch Moody’s S&P
S1 A-1 A-1 F-1 P-1 A-1+, A-1
S2 A-2 A-2 F-2 P-2 A-2
S3 A-3 A-3 F-3 P-3 A-3
S4 Others Others Others Others Others

145JS Bank Annual Report 2017
41.1.2.1 Credit exposures and comparative figures subject to the standardised approach
2017
Exposures Rating
category No.Rating
risk weightedAmount
outstandingDeduction
CRM * Net amountRisk weighted
asset------------------ Rupees in ‘000 -----------------------
Cash and Cash Equivalents 0% 4,727,336 - 4,727,336 -
Corporate 0 0% - - - - 1 20% 5,500,307 (395,068) 5,895,376 1,179,075 2 50% 17,441,032 1,465,077 15,975,955 7,987,978
3,4 100% 5,788,035 469,847 5,318,188 5,318,188 5,6 150% 37,696 - 37,696 56,545
Unrated 100% 58,311,942 7,980,335 50,331,607 50,331,607 Unrated-2 125% 10,708,740 2,171,901 8,536,839 10,671,048
97,787,752 11,692,092 86,095,661 75,544,441
Retail 0% - - - - 20% - - - - 50% - (12,177) 12,177 6,089 75% 40,579,962 3,262,911 37,317,051 27,987,788
40,579,962 3,250,734 37,329,228 27,993,877 Banks- Over 3 Months 0% - - - -
1 20% 1,789,292 (1,675) 1,790,967 358,193 2,3 50% 2,584,221 298,661 2,285,560 1,142,780 4,5 100% 1,536,984 - 1,536,984 1,536,984 6 150% - - - -
Unrated 50% 2,076,819 1,512,305 564,514 282,257 7,987,316 1,809,291 6,178,025 3,320,214
- Maturity Upto and under 3 Months in FCY
0% - - - - 1,2,3 20% 1,857,790 (106,218) 1,964,008 392,802 4,5 50% 79,142 (36,934) 116,075 58,038 6 150% - - - -
unrated 20% 598,384 (373,803) 972,187 194,437 2,535,316 (516,955) 3,052,270 645,277
- Maturity Upto and under 3 Months in PKR 0% - - - - - Maturity Upto and under 3 Months in PKR 20% 404,936 - 404,936 80,987
404,936 - 404,936 80,987
Residential Mortgage Finance 35% 7,008,225 - 7,008,225 2,452,879
Public Sector Entity0%
1 20% 563,651 - 563,651 112,730 2,3 50% - - - - 4,5 100% - - - - 6 150% - - - -
Unrated 50% 37,637,425 37,134,848 502,576 251,288 38,201,076 - 1,066,227 364,018
Sovereigns (SBP / GoP) 0% 164,749,656 85,584 164,663,008 1,586,600
Equity Investments - Listed 100% 3,546,574 - 3,546,574 3,546,574 - Unlisted 150% 13,722 - 13,722 20,584 Significant Investment and DTA 250% 1,056,750 - 1,056,750 2,641,874
4,617,046 - 4,617,046 6,209,032
Past Due Loans (Not Secured by Residential Mortgages)
S.P less than 20% 150% 341,754 - 341,754 512,631 S.P between 20% to 50% 100% 241,604 - 241,604 241,604
S.P greater than 50% 50% 35,677 - 35,677 17,839 619,035 - 619,035 772,074
Investment in fixed assets 100% 5,135,309 - 5,135,309 5,135,309 Other assets 100% 1,191,649 - 1,191,649 1,191,649 Total 375,544,614 16,320,746 322,087,955 125,296,357 * Credit Risk Mitigation (CRM)
For the year ended December 31, 2017
Notes to the Unconsolidated Financial Statements

146 JS Bank Annual Report 2017
Credit exposures subject to Standardised approach2016
Exposures Rating
category No.Rating
risk weightedAmount
outstandingDeduction
CRM * Net amountRisk weighted
asset------------------ Rupees in ‘000 -----------------------
Cash and Cash Equivalents 0% 3,509,618 - 3,509,618 -
Corporate 0 0% - - - - 1 20% 4,632,038 - 4,632,038 926,408 2 50% 1,179,061 515,029 664,033 332,016
3,4 100% 1,146,866 304,406 842,461 842,461 5,6 150% 28,184 - 28,184 42,275
Unrated 100% 52,133,815 6,807,878 45,325,937 45,325,937 Unrated-2 125% 8,542,609 741,427 7,801,182 9,751,477
67,662,573 8,368,740 59,293,835 57,220,574
Retail 0% - - - - 20% - - - - 50% - - - - 75% 15,741,146 2,015,900 13,725,247 10,293,935
15,741,146 2,015,900 13,725,247 10,293,935 Banks- Maturity over 3 Months 0% - - - -
1 20% 1,194,772 (1,311) 1,196,082 239,216 2,3 50% 2,486,858 350,301 2,136,558 1,068,279 4,5 100% 446,671 - 446,671 446,671 6 150% - - - -
Unrated 50% 300,851 - 300,851 150,425 4,429,152 348,990 4,080,162 1,904,591
- Maturity Upto and under 3 Months in FCY 0% - - - - 1,2,3 20% 1,984,117 (415) 1,984,532 396,906 4,5 50% - - - - 6 150% 49,300 - 49,300 73,950
unrated 20% 257,626 - 257,626 51,525 2,291,043 (415) 2,291,458 522,381
- Maturity upto and under 3 months in PKR 0% - - - - 20% 2,302,675 58,856 2,243,819 448,764
2,302,675 58,856 2,243,819 448,764
Residential Mortgage Finance 35% 2,536,136 - 2,536,136 887,648
Public Sector Entity0%
1 20% 1,991,822 - 1,991,822 398,364 2,3 50% - - - - 4,5 100% - - - - 6 150% - - - -
Unrated 50% 5,688,773 5,056,319 632,453 316,227 7,680,595 5,056,319 2,624,275 714,591
Sovereigns (SBP / GoP) 0% 60,397,436 - 60,397,436 - 20% - - - - 50% 166,159 - 166,159 83,080
100% 3,358,391 - 3,358,391 3,358,391 63,921,987 - 63,921,987 3,441,471
Equity Investments - Listed 100% 4,177,173 - 4,177,173 4,177,173 - Unlisted 150% 243,038 - 243,038 364,558 Significant Investment and DTA 250% 743,793 - 743,793 1,859,481
5,164,004 - 5,164,004 6,401,212
S.P less than 20% 150% 409,704 - 409,704 614,556 S.P between 20% to 50% 100% 240,265 - 240,265 240,265
S.P greater than 50% 50% 59,620 - 59,620 29,810 709,589 - 709,589 884,631
Investment in fixed assets 100% 3,984,616 - 3,984,616 3,984,616 Other assets 100% 756,877 - 756,877 756,877 Total 180,690,011 - 164,841,622 87,461,291 * Credit Risk Mitigation (CRM)
For the year ended December 31, 2017
Notes to the Unconsolidated Financial Statements

147JS Bank Annual Report 2017
42.1.3 Policies and processes for collateral valuation and management as regards Basel II;
For Credit Risk Mitigation purposes the Bank uses only the eligible collaterals under Comprehensive Approach of Credit Risk Mitigation under Standardised Approach as prescribed by SBP under Circular No. 8 of 2006, which includes Cash and Cash Equivalent Securities including Government Securities (like Cash Margins, Lien on Bank Accounts, Foreign Deposit Receipts, Term Deposit Receipts, Pledge of Defense Saving Certificates, Regular Income Certificates, Special Saving Certificates, T-Bills and Pakistan Investment Bonds etc.) and Shares Listed on the Main Index.Under Bank’s policy all collaterals are subject to periodic valuations to monitor the adequacy of margins held. Shares / Marketable securities are valued by the Bank on daily basis to calculate the Drawing Power (DP). In case of any shortfall in the requisite margins, the DP is adjusted to the appropriate level and the business units are informed to take appropriate action as per the agreement with the customer.
42.2 Equity position risk in the banking book
Equity positions in the banking book include Investment in equities that are available-for-sale or held for strategic investment purposes. These investments are generally regarded as riskier relative to fixed income securities owing to the inherent volatility of stock market prices. The Bank mitigates these risks through diversification and capping maximum exposures in a single company, compliance with regulatory requirement, following the guidelines laid down in the Bank’s Investment Policy as set by the Board of Directors (BoD). The Bank follows a delivery versus payment settlement system thereby minimizing risk available in relation to settlement risk.
42.3 Market risk
42.3.1 Market risk is the risk of loss due to adverse changes in interest rates, foreign exchange rates, equity prices and market conditions. From the perspective of a Bank, market risk comprises of interest rate risk, foreign exchange risk and equity position risk, which the Bank is exposed to in its trading book.The Bank has an approved market risk policy wherein the governance structure for managing market risk, measurement tools used and the market risk exposure limits have been addressed. The Bank’s strategy for managing market risk is to relate the level of risk exposures to their risk appetite and the capital at hand.The Board of Directors (BoD) and the Asset and Liability Committee (ALCO) are responsible for addressing market risk from a strategic perspective and are assisted by the market risk function in meeting these objectives.The Market Risk function is also supported by personnel in the Middle Office function and directly report to Group Head Risk Management. Its responsibility includes ensuring the implementation of the market risk policy above in line with the Bank’s strategy.
Risk reporting undertaken by the market risk function includes:
a) Portfolio Reportsb) Limit monitoring reportsc) Sensitivity analysis ; andd) Stress testing of the portfolio
Currently, the Bank is using the market risk standardised approach for the purpose of computing regulatory capital, the details of which are set out above.
42.3.2 Foreign exchange risk
Main objective of foreign exchange risk management is to ensure that the foreign exchange exposure of the Bank lies within the defined appetite of the Bank.
For the year ended December 31, 2017
Notes to the Unconsolidated Financial Statements

148 JS Bank Annual Report 2017
2017Net foreign
Off-balance currencyAssets Liabilities sheet items exposure
--------------------- Rupees in ‘000 --------------------
Pakistan Rupee 370,136,791 352,992,264 (1,012,388) 16,132,139 United States Dollar 16,159,391 14,305,112 (1,405,232) 449,047 Great Britain Pound 1,147,121 3,735,250 2,546,068 (42,061)Euro 778,748 738,975 (100,213) (60,440)Other currencies 86,825 137,143 (28,235) (78,553)
18,172,085 18,916,480 1,012,388 267,993 388,308,876 371,908,744 - 16,400,132
2016
Net foreignOff-balance currency
Assets Liabilities sheet items exposure--------------------- Rupees in ‘000 --------------------
Pakistan Rupee 250,332,275 234,084,260 228,778 16,476,793 United States Dollar 12,520,840 9,640,001 (2,701,681) 179,158 Great Britain Pound 314,656 1,461,624 1,122,628 (24,340)Euro 326,070 1,650,304 1,327,343 3,109 Other currencies 1,206,652 1,214,779 22,932 14,805
14,368,218 13,966,708 (228,778) 172,732 264,700,493 248,050,968 - 16,649,525
42.3.3 Equity position risk in trading book
The Bank’s objective with regard to holding equity investments in its trading book is to earn income from favourable market movements. Positions in the equity market are substantiated by sound fundamental and technical research.Equity price risk is managed by applying trading limit and scrip-wise and portfolio wise nominal limits.
Daily reports are generated to monitor the internal and regulatory limits with respect to the overall foreign currency exposures. The overall net open position, whether short or long has the potential to negatively impact the profit and loss depending upon the direction of movement in foreign exchange rates.
Foreign exchange open and mismatched positions are marked to market on a daily basis.
Currency risk arises where the value of financial instruments changes due to changes in foreign exchange rates. In order to manage currency risk exposure the bank enters into ready / spot, forward and swap transactions with SBP and in the interbank market. The Bank’s foreign exchange exposure comprises of forward contracts, foreign currencies cash in hand, balances with banks abroad, foreign placement with SBP and foreign currencies assets and liabilities. The net open position is managed within the statutory limits, as fixed by SBP. Counter parties limit are also fixed to limit risk concentration. Appropriate segregation of duties exists between the front and back office functions while compliance with the net open position limit is independently monitored on an ongoing basis.
For the year ended December 31, 2017
Notes to the Unconsolidated Financial Statements

149JS Bank Annual Report 2017
42.3.
4Mi
smatc
h of in
teres
t rate
sens
itive a
ssets
and l
iabilit
ies
Intere
st rat
e risk
is th
e risk
that
the va
lue of
a fin
ancia
l instr
umen
t will fl
uctua
te du
e to c
hang
es in
the m
arket
intere
st rat
es. T
he B
ank i
s exp
osed
to in
teres
t / m
ark-u
p rate
risk a
s a re
sult o
f mism
atche
s or g
aps i
n the
amou
nt of
intere
st / m
ark up
ba
sed a
ssets
and l
iabiliti
es th
at ma
ture o
r re-p
rice i
n a gi
ven p
eriod
. The
Ban
k man
ages
this
risk b
y matc
hing/r
e-pric
ing of
asse
ts an
d liab
ilities
. The
asse
ts an
d liab
ilities
comm
ittee (
ALCO
) of th
e Ban
k mon
itors
and m
anag
es th
e inte
rest ra
te ris
k with
the
objec
tive o
f limi
ting t
he po
tentia
l adv
erse e
ffects
on th
e profi
tability
of th
e Ban
k.
2017
Non-
intere
stEff
ectiv
eOv
er 1
Over
3Ov
er 6
Over
1Ov
er 2
Over
3Ov
er 5
beari
ng
yield
Up to
1to
3to
6mo
nths t
oto
2to
3to
5to
10Ab
ove
finan
cial
intere
stTo
talmo
nthmo
nths
month
s1 y
ear
years
years
years
years
10 ye
arsins
trume
nt
rate -
%---
------
------
------
------
------
------
------
------
------
------
------
------
------
------
------
Rup
ees i
n ‘00
0 ----
------
------
------
------
------
------
------
------
------
------
------
------
------
------
-----
On-b
alanc
e she
et fin
ancia
l instr
umen
ts
Asse
tsCa
sh an
d bala
nces
with
treas
ury ba
nks
- 17
,333,7
88
1,89
0,381
-
-
-
-
-
-
-
-
15
,443,4
07
Balan
ces w
ith ot
her b
anks
0 - 1
1,03
4,266
18
8,987
-
-
-
-
-
-
-
-
84
5,279
Le
nding
s to fi
nanc
ial ins
titutio
ns1.3
8 - 6.
93 3,
116,1
99
1,28
1,177
1,
181,4
64
653,5
58
-
-
-
-
-
-
-
Inves
tmen
ts2.8
8 - 12
.00 16
7,692
,437
10,67
4,489
10
,828,8
12
2,93
5,205
1,
368,0
48
87,64
7,283
17
,976,7
85
30,26
8,133
2,
433,7
02
-
3,55
9,980
Ad
vanc
es4.0
0 - 40
.00 18
4,139
,582
125,6
40,80
7 17
,565,3
11
23,95
6,131
3,
363,0
19
4,56
5,945
3,
360,4
75
2,39
0,429
92
5,085
1,
753,3
43
619,0
37
Othe
r ass
ets-
5,27
0,782
-
-
-
-
-
-
-
-
-
5,
270,7
82
378,5
87,05
4 13
9,675
,841
29,57
5,587
27
,544,8
94
4,73
1,067
92
,213,2
28
21,33
7,260
32
,658,5
62
3,35
8,787
1,
753,3
43
25,73
8,485
Lia
bilitie
sBil
ls pa
yable
- 3,
824,2
78
-
-
-
-
-
-
-
-
-
3,82
4,278
Bo
rrowi
ngs
1.00 -
6.20
64,55
7,043
49
,798,1
26
8,09
2,537
5,
204,9
67
14,28
9 31
,234
16,83
9 46
4,313
93
4,738
-
-
De
posit
s and
othe
r acc
ounts
0.75 -
11.00
290,0
77,56
6 10
3,912
,554
37,77
8,647
37
,710,6
25
32,62
1,440
1,
949,1
63
850,2
07
70,67
4 -
-
75
,184,2
56
Sub-
ordina
ted lo
ans
7.57 -
7.61
4,99
8,800
-
-
4,
998,8
00
-
-
-
-
-
-
-
Othe
r liab
ilities
- 7,
385,0
57
-
-
-
-
-
-
-
-
-
7,38
5,057
37
0,842
,744
153,7
10,68
0 45
,871,1
84
47,91
4,392
32
,635,7
29
1,98
0,397
86
7,046
53
4,987
93
4,738
-
86
,393,5
91
On-b
alanc
e she
et fin
ancia
l instr
umen
ts 7,
744,3
10
(14,0
34,83
9) (1
6,295
,597)
(20,3
69,49
8) (2
7,904
,662)
90,23
2,831
20
,470,2
14
32,12
3,575
2,
424,0
49
1,75
3,343
(6
0,655
,106)
Comm
itmen
ts in
respe
ct of
forwa
rd p
urcha
se, c
urren
cy sw
aps,
optio
ns an
d c
ommi
tmen
ts to
exten
t cred
its 30
,348,3
78
4,47
4,661
1,
557,9
91
21,87
9,036
88
8,207
75
2,858
53
0,417
26
5,208
-
-
-
Comm
itmen
ts in
respe
ct of
forwa
rd sa
le,
curre
ncy s
waps
and o
ption
s (9
,344,1
85)
(4,10
0,495
) (1
,187,3
68)
(58,1
17)
(2,46
4,363
) (7
38,21
7) (5
30,41
7) (2
65,20
8) -
-
-
Off-b
alanc
e she
et ga
p 21
,004,1
93
374,1
66
370,6
23
21,82
0,919
(1
,576,1
56)
14,64
1 -
-
-
-
-
Total
yield
/ inte
rest r
isk se
nsitiv
ity ga
p (1
3,660
,673)
(15,9
24,97
4) 1,
451,4
21
(29,4
80,81
8) 90
,247,4
72
20,47
0,214
32
,123,5
75
2,42
4,049
1,
753,3
43
(60,6
55,10
6)
Cumu
lative
yield
/ inte
rest r
iskse
nsitiv
ity ga
p (1
3,660
,673)
(29,5
85,64
7) (2
8,134
,226)
(57,6
15,04
4) 32
,632,4
28
53,10
2,642
85
,226,2
17
87,65
0,266
89
,403,6
09
For the year ended December 31, 2017
Notes to the Unconsolidated Financial Statements

150 JS Bank Annual Report 2017
2016
Non-
intere
stEff
ectiv
eOv
er 1
Over
3Ov
er 6
Over
1Ov
er 2
Over
3Ov
er 5
beari
ng
yield
Up to
1to
3to
6mo
nths t
oto
2to
3to
5to
10Ab
ove
finan
cial
intere
stTo
talmo
nthmo
nths
month
s1 y
ear
years
years
years
years
10 ye
arsins
trume
nt
rate -
%---
------
------
------
------
------
------
------
------
------
------
------
------
------
------
------
Rup
ees i
n ‘00
0 ----
------
------
------
------
------
------
------
------
------
------
------
------
------
------
-----
On-b
alanc
e she
et fin
ancia
l instr
umen
ts
Asse
ts
Cash
and b
alanc
es w
ith tre
asury
bank
s-
15,50
8,968
1,
385,3
32
- -
- -
- -
- -
14,12
3,636
Ba
lance
s with
othe
r ban
ks-
752,7
10
241,4
26
- -
- -
- -
- -
511,2
84
Lend
ings t
o fina
ncial
institu
tions
0.17 -
6.1
11,33
4,414
10
,654,5
23
522,9
93
156,8
98
- -
- -
- -
- Inv
estm
ents
- net
2.95 -
12.00
131,8
07,48
9 15
,796,3
74
53,16
0,239
1,
188,7
30
8,30
3,972
10
,977,2
27
27,97
6,498
7,
610,4
87
2,23
5,896
-
4,55
8,066
Ad
vanc
es -
net
0.4 -
39 93
,794,1
34
67,68
3,642
7,
858,8
01
5,19
4,022
1,
794,4
66
2,56
8,462
2,
525,9
85
2,34
0,457
98
0,250
2,
138,4
60
709,5
89
Othe
r ass
ets-
3,33
9,521
-
- -
- -
- -
- -
3,33
9,521
25
6,537
,236
95,76
1,297
61
,542,0
33
6,53
9,650
10
,098,4
38
13,54
5,689
30
,502,4
83
9,95
0,944
3,
216,1
46
2,13
8,460
23
,242,0
96
Liabil
ities
Bills
paya
ble-
2,54
4,028
-
- -
- -
- -
- -
2,54
4,028
Bo
rrowi
ngs
1.8 -
6.00
10,32
0,047
2,
408,6
22
4,19
4,410
2,
910,1
21
10,21
1 20
,422
31,43
7 23
4,580
46
9,716
-
40,52
8 De
posit
s and
othe
r acc
ounts
0.1 -
9.11
226,0
98,93
1 89
,321,2
28
31,65
1,681
33
,769,4
94
16,21
2,383
40
3,922
12
7,844
60
5,424
-
- 54
,006,9
55
Sub-
ordina
ted lo
ans
7.53
3,00
0,000
-
- 3,
000,0
00
- -
- -
- -
- Ot
her li
abiliti
es-
4,87
8,393
-
- -
- -
- -
- -
4,87
8,393
24
6,841
,399
91,72
9,850
35
,846,0
91
39,67
9,615
16
,222,5
94
424,3
44
159,2
81
840,0
04
469,7
16
- 61
,469,9
04
On-b
alanc
e she
et fin
ancia
l instr
umen
ts 9,
695,8
37
4,03
1,447
25
,695,9
42
(33,1
39,96
5) (6
,124,1
56)
13,12
1,345
30
,343,2
02
9,11
0,940
2,
746,4
30
2,13
8,460
(3
8,227
,808)
Comm
itmen
ts in
respe
ct of
forwa
rd pu
rchas
e con
tacts
and c
ommi
tmen
ts to
exten
t cred
its 14
,738,7
29
9,45
7,255
3,
355,3
55
1,02
1,239
38
4,430
31
2,650
20
7,800
-
- -
-
Comm
itmen
ts in
respe
ct of
forwa
rd ex
chan
ge co
ntrac
ts - s
ale (1
5,879
,540)
(13,9
18,44
5) (9
77,88
9) (2
32,76
8) (2
29,98
8) (3
12,65
0) (2
07,80
0) -
- -
-
Off-b
alanc
e she
et ga
p (1
,140,8
11)
(4,46
1,190
) 2,
377,4
66
788,4
71
154,4
42
- -
- -
- -
Total
yield
/ inte
rest r
isk se
nsitiv
ity ga
p (4
29,74
3) 28
,073,4
08
(32,3
51,49
4) (5
,969,7
14)
13,12
1,345
30
,343,2
02
9,11
0,940
2,
746,4
30
2,13
8,460
(3
8,227
,808)
Cumu
lative
yield
/ inte
rest r
iskse
nsitiv
ity ga
p (4
29,74
3) 27
,643,6
65
(4,70
7,829
) (1
0,677
,543)
2,44
3,802
32
,787,0
04
41,89
7,944
44
,644,3
74
46,78
2,834
2017
2016
2017
2016
------
- Rup
ees i
n ‘00
0 ----
------
---- R
upee
s in ‘
000 -
------
Reco
ncilia
tion t
o tota
l ass
etsRe
conc
iliatio
n to t
otal li
abilit
ies
Balan
ce as
per b
alanc
e she
et 38
8,308
,876
264,7
00,49
3 Ba
lance
as pe
r bala
nce s
heet
371,6
39,54
7 24
8,050
,968
Less
: Non
finan
cial a
ssets
Less
: Non
finan
cial li
abilit
iesInv
estm
ents
- net
1,91
9,121
1,
919,1
21
Othe
r liab
ilities
- 4,
207
Opera
ting fi
xed a
ssets
7,11
2,821
5,
837,1
81
Defer
red ta
x liab
ilities
- ne
t 79
6,803
1,
205,3
62
Defer
red ta
x ass
ets -
net
- -
796,8
03
1,20
9,569
Ot
her a
ssets
689,8
80
406,9
55
9,72
1,822
8,
163,2
57
378,5
87,05
4 25
6,537
,236
370,8
42,74
4 24
6,841
,399
For the year ended December 31, 2017
Notes to the Unconsolidated Financial Statements

151JS Bank Annual Report 2017
42.4
Liquid
ity ris
k
Liquid
ity ris
k is t
he ris
k tha
t the B
ank w
ill not
be ab
le to
raise
fund
s to m
eet it
s com
mitm
ents.
The B
ank’s
Ass
et an
d Liab
ility C
ommi
ttee (
ALCO
) man
ages
the l
iquidi
ty po
sition
on a
conti
nuou
s bas
is.
Bank
’s po
licy to
liquid
ity m
anag
emen
t is to
main
tain a
dequ
ate liq
uidity
at al
l time
s and
in al
l curr
encie
s und
er bo
th no
rmal
and s
tress
cond
itions
, to m
eet o
ur co
ntrac
tual a
nd po
tentia
l pay
ment
oblig
ation
s wi
thout
incurr
ing ad
dition
al an
d una
ccep
table
cost
to the
busin
ess.
Treas
ury is
resp
onsib
le for
the m
anag
ing liq
uidity
risk u
nder
the gu
idanc
e of A
sset-
Liabil
ity C
ommi
ttee o
f the B
ank.
The B
ank’s
liquid
ity ris
k man
agem
ent a
pproa
ch st
arts a
t the i
ntrad
ay le
vel (o
perat
ional
liquid
ity) m
anag
ing th
e daily
paym
ents
queu
e and
facto
ring i
n our
acce
ss to
the q
ualify
ing se
curiti
es of
Stat
e Ban
k of P
akist
an. It
then
cove
rs tac
tical
liquid
ity ris
k man
agem
ent d
ealin
g with
the a
cces
s to
unse
cured
fund
ing so
urces
and t
he liq
uidity
chara
cteris
tics o
f our
asse
t inve
ntory
(asse
t liqu
idity)
. Fina
lly, th
e stra
tegic
persp
ectiv
e com
prise
s the
matu
rity pr
ofile
of all
asse
ts an
d liab
ilities
on ou
r stat
emen
t of
finan
cial p
ositio
n.
For m
onito
ring a
nd co
ntroll
ing liq
uidity
risk,
the Ba
nk ge
nerat
es a
scen
ario s
ensit
ive m
aturity
state
ment
of fin
ancia
l pos
ition,
and r
un co
ntroll
ed m
ismatc
hes t
hat a
re mo
nitore
d and
disc
usse
d by A
LCO
memb
ers
regula
rly. Th
e Ban
k prep
ares v
ariou
s typ
es of
repo
rts an
d ana
lysis
for as
sistin
g ALC
O in
taking
nece
ssary
strat
egic
actio
ns fo
r man
aging
liquid
ity ris
k in t
he B
ank.
Thes
e inc
lude l
iquidi
ty rat
ios, C
once
ntrati
on
analy
sis, G
ap re
ports
, Stre
ss te
sting
, Liqu
idity
Cove
rage r
atio &
Net
Stab
le Fu
nding
Rati
o ana
lysis
etc.
2017
Ove
r 1
Ove
r 3
Ove
r 6
Ove
r 1
Ove
r 2
Ove
r 3
Ove
r 5
Upto
1
to 3
to 6
mon
ths to
to
2 to
3 to
5 to
10
Abo
ve
Total
m
onth
mon
ths
mon
ths
1 ye
ar y
ears
yea
rs y
ears
yea
rs 10
years
---
------
------
------
------
------
------
------
------
------
------
------
------
- Rup
ees i
n ‘00
0 ----
------
------
------
------
------
------
------
------
------
------
------
------
Asse
tsCa
sh an
d bala
nces
with
treas
ury ba
nks
17,33
3,788
17
,333,7
88
- -
- -
- -
- -
Balan
ces w
ith ot
her b
anks
1,03
4,266
1,
034,2
66
- -
- -
- -
- -
Lend
ings t
o fina
ncial
institu
tions
3,11
6,199
1,
281,1
77
1,18
1,464
65
3,558
-
- -
- -
- Inv
estm
ents
169,6
11,55
8 10
,464,4
89
13,46
8,003
3,
009,4
15
1,54
7,184
87
,494,8
03
18,42
2,055
30
,852,7
86
2,43
3,702
1,
919,1
21
Adva
nces
184,1
39,58
2 32
,620,2
74
27,63
4,542
32
,606,3
64
27,46
5,900
14
,458,9
27
16,16
7,589
24
,279,2
18
6,10
2,823
2,
803,9
45
Opera
ting fi
xed a
ssets
7,11
2,821
62
,310
418,5
19
178,5
26
345,7
89
613,3
96
504,6
67
789,3
23
942,4
54
3,25
7,837
De
ferred
tax a
ssets
- ne
t -
- -
- -
- -
- -
- Ot
her a
ssets
5,96
0,662
4,
184,5
77
1,40
7 35
51
,231
527,2
94
443,7
71
740,9
82
11,36
5 -
388,3
08,87
6 66
,980,8
81
42,70
3,935
36
,447,8
98
29,41
0,104
10
3,094
,420
35,53
8,082
56
,662,3
09
9,49
0,344
7,
980,9
03
Liabil
ities
Bills
paya
ble
3,82
4,278
3,
824,2
78
- -
- -
- -
- -
Borro
wing
s 64
,557,0
43
49,79
8,126
8,
092,5
37
5,20
4,967
14
,289
31,23
4 16
,839
464,3
13
934,7
38
- De
posit
s and
othe
r acc
ounts
290,0
77,56
6 17
5,129
,606
37,77
8,647
41
,677,8
29
32,62
1,440
1,
949,1
63
850,2
07
70,67
4 -
- Su
b-ord
inated
loan
s 4,
998,8
00
- -
1,00
0 1,
000
2,00
0 2,
000
4,00
1 4,
988,7
99
- Lia
bilitie
s aga
inst a
ssets
subje
ctto
finan
ce le
ase
- -
- -
- -
- -
- -
Defer
red ta
x liab
ilities
- ne
t 79
6,803
4,
829
2,11
7 7,
148
2,51
3 4,
207
19,44
4 6,
707
49,85
7 69
9,981
Ot
her li
abiliti
es 7,
385,0
57
4,08
3,751
51
,778
105,5
45
232,3
33
1,02
0,464
1,
280,4
11
610,7
75
- -
371,6
39,54
7 23
2,840
,590
45,92
5,079
46
,996,4
89
32,87
1,575
3,
007,0
68
2,16
8,901
1,
156,4
70
5,97
3,394
69
9,981
Ne
t ass
ets 16
,669,3
29
(165
,859,7
09)
(3,22
1,144
) (1
0,548
,591)
(3,46
1,471
) 10
0,087
,352
33,36
9,181
55
,505,8
39
3,51
6,950
7,
280,9
22
Share
capit
al 10
,724,6
43
Disco
unt o
n iss
ue of
share
s (2
,105,4
01)
Prefe
rence
Sha
re 1,
500,0
00
Statu
tory r
eserv
e 1,
540,9
88
Unap
propri
ated p
rofit
4,51
8,820
Su
rplus
on re
valua
tion o
f ass
ets -
net
490,2
79
16,66
9,329
For the year ended December 31, 2017
Notes to the Unconsolidated Financial Statements

152 JS Bank Annual Report 2017
2016
Ove
r 1
Ove
r 3
Ove
r 6
Ove
r 1
Ove
r 2
Ove
r 3
Ove
r 5
Upto
1
to 3
to 6
mon
ths to
to
2 to
3 to
5 to
10
Abo
ve
Total
m
onth
mon
ths
mon
ths
1 ye
ar y
ears
yea
rs y
ears
yea
rs 10
years
---
------
------
------
------
------
------
------
------
------
------
------
------
- Rup
ees i
n ‘00
0 ----
------
------
------
------
------
------
------
------
------
------
------
------
Asse
tsCa
sh an
d bala
nces
with
treas
ury ba
nks
15,50
8,968
15
,508,9
68
- -
- -
- -
- -
Balan
ces w
ith ot
her b
anks
752,7
10
752,7
10
- -
- -
- -
- -
Lend
ing to
finan
cial in
stitut
ions
11,33
4,414
10
,654,5
23
522,9
93
156,8
98
- -
- -
- -
Inves
tmen
ts 13
3,726
,610
15,43
6,577
56
,594,7
60
1,12
1,097
9,
199,2
01
11,22
2,414
28
,206,6
84
7,79
0,860
2,
235,8
96
1,91
9,121
Ad
vanc
es 93
,794,1
34
56,42
5,484
8,
627,6
38
5,57
7,305
3,
889,0
57
5,50
4,828
5,
115,6
87
3,98
0,740
2,
534,9
35
2,13
8,460
Op
eratin
g fixe
d ass
ets 5,
837,1
81
51,20
5 32
9,566
14
8,925
27
9,710
49
5,075
40
1,894
57
1,067
60
9,625
2,
950,1
14
Defer
red ta
x ass
ets -
net
- -
- -
- -
- -
- -
Othe
r ass
ets 3,
746,4
76
2,66
2,712
-
- 30
4,036
27
2,131
38
7,678
96
,310
23,60
9 -
264,7
00,49
3 10
1,492
,179
66,07
4,957
7,
004,2
25
13,67
2,004
17
,494,4
48
34,11
1,943
12
,438,9
77
5,40
4,065
7,
007,6
95
Liabil
ities
Bills
paya
ble
2,54
4,028
2,
544,0
28
- -
- -
- -
- -
Borro
wing
s 10
,320,0
47
2,44
9,151
4,
194,4
09
2,91
0,121
10
,211
20,42
2 31
,437
234,5
80
469,7
16
- De
posit
s and
othe
r acc
ounts
226,0
98,93
1 13
9,143
,034
31,65
1,693
37
,954,6
31
16,21
2,383
40
3,922
12
7,844
60
5,424
-
- Su
b-ord
inated
loan
s 3,
000,0
00
- -
600
600
1,20
0 1,
200
2,40
0 2,
994,0
00
- Lia
bilitie
s aga
inst a
ssets
subje
ctto
finan
ce le
ase
- -
- -
- -
- -
- -
Defer
red ta
x liab
ilities
- ne
t 1,
205,3
61
65,01
8 12
4,442
12
8,173
63
,300
64,55
6 13
7,294
66
,410
36,98
0 51
9,188
Ot
her li
abiliti
es 4,
882,6
00
- 3,
022,4
96
31,81
4 10
1,218
42
4,195
94
1,680
26
7,282
93
,915
- 24
8,050
,967
144,2
01,23
1 38
,993,0
40
41,02
5,339
16
,387,7
12
914,2
95
1,23
9,455
1,
176,0
96
3,59
4,611
51
9,188
Ne
t ass
ets 16
,649,5
26
(42,7
09,05
2) 27
,081,9
17
(34,0
21,11
4) (2
,715,7
08)
16,58
0,153
32
,872,4
88
11,26
2,881
1,
809,4
54
6,48
8,507
Share
capit
al 10
,724,6
43
Disco
unt o
n iss
ue of
share
s (2
,105,4
01)
Prefe
rence
share
s 1,
500,0
00
Statu
tory r
eserv
e 1,
334,1
39
Unap
propri
ated p
rofit
3,97
3,324
Su
rplus
on re
valua
tion o
f ass
ets -
net
1,22
2,820
16
,649,5
25
For the year ended December 31, 2017
Notes to the Unconsolidated Financial Statements

153JS Bank Annual Report 2017
Matur
ity of
asse
ts an
d liab
ilities
- Ba
sed o
n wor
king p
repare
d by t
he A
sset
and L
iabilit
y Com
mitte
e (AL
CO) o
f the B
ank
2017
Ove
r 1
Ove
r 3
Ove
r 6
Ove
r 1
Ove
r 2
Ove
r 3
Ove
r 5
Upto
1
to 3
to 6
mon
ths to
to
2 to
3 to
5 to
10
Abo
ve
Total
m
onth
mon
ths
mon
ths
1 ye
ar y
ears
yea
rs y
ears
yea
rs 10
years
---
------
------
------
------
------
------
------
------
------
------
------
------
- Rup
ees i
n ‘00
0 ----
------
------
------
------
------
------
------
------
------
------
------
------
Asse
tsCa
sh an
d bala
nces
with
treas
ury ba
nks
17,33
3,788
17
,333,7
88
- -
- -
- -
- -
Balan
ces w
ith ot
her b
anks
1,03
4,266
1,
034,2
66
- -
- -
- -
- -
Lend
ings t
o fina
ncial
institu
tions
3,11
6,199
1,
281,1
77
1,18
1,464
65
3,558
-
- -
- -
- Inv
estm
ents
169,6
11,55
8 10
,464,4
89
13,46
8,003
3,
009,4
15
1,54
7,184
87
,494,8
03
18,42
2,055
30
,852,7
86
2,43
3,702
1,
919,1
21
Adva
nces
184,1
39,58
2 26
,049,2
57
32,52
9,303
32
,298,1
82
32,00
6,484
13
,087,0
47
14,98
6,272
24
,276,2
69
6,10
2,823
2,
803,9
45
Opera
ting fi
xed a
ssets
7,11
2,821
62
,310
418,5
19
178,5
26
345,7
89
613,3
96
504,6
67
789,3
23
942,4
54
3,25
7,837
De
ferred
tax a
ssets
- ne
t -
- -
- -
- -
- -
- Ot
her a
ssets
5,96
0,662
4,
184,5
77
1,40
7 35
51
,231
527,2
94
443,7
71
740,9
82
11,36
5 -
388,3
08,87
6 60
,409,8
64
47,59
8,696
36
,139,7
16
33,95
0,688
10
1,722
,540
34,35
6,765
56
,659,3
60
9,49
0,344
7,
980,9
03
Liabil
ities
Bills
paya
ble
3,82
4,278
3,
824,2
78
- -
- -
- -
- -
Borro
wing
s 64
,557,0
43
49,79
8,126
8,
092,5
37
5,20
4,967
14
,289
31,23
4 16
,839
464,3
13
934,7
38
- De
posit
s and
othe
r acc
ounts
290,0
77,56
6 46
,170,6
85
43,57
9,674
48
,699,1
65
39,64
3,889
12
,176,8
63
13,51
4,535
86
,292,7
55
- -
Sub-
ordina
ted lo
ans
4,99
8,800
-
- 1,
000
1,00
0 2,
000
2,00
0 4,
001
4,98
8,799
-
Liabil
ities a
gains
t ass
ets su
bject
to fin
ance
leas
e -
- -
- -
- -
- -
- De
ferred
tax l
iabiliti
es -
net
796,8
03
4,82
9 2,
117
7,14
8 2,
513
4,20
7 19
,444
6,70
7 49
,857
699,9
81
Othe
r liab
ilities
7,38
5,057
4,
083,7
51
51,77
8 10
5,545
23
2,333
1,
020,4
64
1,28
0,411
61
0,775
-
- 37
1,639
,547
103,8
81,66
9 51
,726,1
06
54,01
7,825
39
,894,0
24
13,23
4,768
14
,833,2
29
87,37
8,551
5,
973,3
94
699,9
81
Net a
ssets
16,66
9,329
(4
3,471
,805)
(4,12
7,410
) (1
7,878
,109)
(5,94
3,336
) 88
,487,7
72
19,52
3,536
(3
0,719
,191)
3,51
6,950
7,
280,9
22
Share
capit
al 10
,724,6
43
Disco
unt o
n iss
ue of
share
s (2
,105,4
01)
Prefe
rence
Sha
re 1,
500,0
00
Statu
tory r
eserv
e 1,
540,9
88
Unap
propri
ated p
rofit
4,51
8,820
Su
rplus
on re
valua
tion o
f ass
ets -
net
490,2
79
16,66
9,329
To id
entify
the b
ehav
ioural
matu
rities
of no
n-co
ntrac
tual a
ssets
and l
iabiliti
es, th
e Ban
k has
used
the f
ollow
ing m
ethod
ology
:
For d
eterm
ining
the c
ore po
rtion o
f non
contr
actua
l liabil
ities (
non-
volat
ile po
rtion),
the b
ank h
as us
ed th
e ave
rage m
ethod
whe
reby a
verag
e bala
nce m
aintai
ned o
ver p
ast fi
ve ye
ar ha
s bee
n clas
sified
as
core
and h
as be
en pl
aced
in ‘o
ver 3
to 5
years
’ matu
rity bu
cket.
Non
contr
actua
l ass
ets an
d rem
aining
volat
ile po
rtion o
f non
contr
actua
l liabil
ities h
ave b
een s
tratifi
ed in
relev
ant m
aturity
buck
et us
ing
buck
et wi
se pe
rcenta
ges d
eterm
ined b
y usin
g ave
rage v
olatilit
y in r
espe
ctive
perio
d / bu
cket.
Ove
r 1
Ove
r 3
Ove
r 6
Ove
r 1
Ove
r 2
Ove
r 3
Upto
1
to 3
to 6
mon
ths to
to
2 to
3 to
5 m
onth
mon
ths
mon
ths
1 ye
ar y
ears
yea
rs y
ears
Weig
hted a
verag
e3%
4%5%
5%8%
10%
65%
For the year ended December 31, 2017
Notes to the Unconsolidated Financial Statements

154 JS Bank Annual Report 2017
2016
Ove
r 1
Ove
r 3
Ove
r 6
Ove
r 1
Ove
r 2
Ove
r 3
Ove
r 5
Upto
1
to 3
to 6
mon
ths to
to
2 to
3 to
5 to
10
Abo
ve
Total
m
onth
mon
ths
mon
ths
1 ye
ar y
ears
yea
rs y
ears
yea
rs 10
years
---
------
------
------
------
------
------
------
------
------
------
------
------
- Rup
ees i
n ‘00
0 ----
------
------
------
------
------
------
------
------
------
------
------
------
Asse
tsCa
sh an
d bala
nces
with
treas
ury ba
nks
15,50
8,968
15
,508,9
68
- -
- -
- -
- -
Balan
ces w
ith ot
her b
anks
752,7
10
752,7
10
- -
- -
- -
- -
Lend
ing to
finan
cial in
stitut
ions
11,33
4,414
10
,654,5
23
522,9
93
156,8
98
- -
- -
- -
Inves
tmen
ts 13
3,726
,610
15,43
6,577
56
,594,7
60
1,12
1,097
9,
199,2
01
11,22
2,414
28
,206,6
84
7,79
0,860
2,
235,8
96
1,91
9,121
Ad
vanc
es 93
,794,1
34
17,86
7,248
18
,592,1
26
19,87
4,179
18
,185,9
31
5,50
4,828
5,
115,6
87
3,98
0,740
2,
534,9
35
2,13
8,460
Op
eratin
g fixe
d ass
ets 5,
837,1
81
51,20
5 32
9,566
14
8,925
27
9,710
49
5,075
40
1,894
57
1,067
60
9,625
2,
950,1
14
Defer
red ta
x ass
ets -
net
- -
- -
- -
- -
- -
Othe
r ass
ets 3,
746,4
76
2,66
2,712
-
- 30
4,036
27
2,131
38
7,678
96
,310
23,60
9 -
264,7
00,49
3 62
,933,9
43
76,03
9,445
21
,301,0
99
27,96
8,878
17
,494,4
48
34,11
1,943
12
,438,9
77
5,40
4,065
7,
007,6
95
Liabil
ities
Bills
paya
ble
2,54
4,028
2,
544,0
28
- -
- -
- -
- -
Borro
wing
s 10
,320,0
47
2,44
9,150
4,
194,4
10
2,91
0,121
10
,211
20,42
2 31
,437
234,5
80
469,7
16
- De
posit
s and
othe
r acc
ounts
226,0
98,93
1 39
,323,7
23
37,07
0,093
44
,371,3
35
22,28
0,294
8,
437,8
39
11,63
7,437
62
,978,2
10
- -
Sub-
ordina
ted lo
ans
3,00
0,000
-
- 60
0 60
0 1,
200
1,20
0 2,
400
2,99
4,000
-
Liabil
ities a
gains
t ass
ets su
bject
to fin
ance
leas
e -
- -
- -
- -
- -
- De
ferred
tax l
iabiliti
es -
net
1,20
5,361
65
,018
124,4
42
128,1
73
63,30
0 64
,556
137,2
94
66,41
0 36
,980
519,1
88
Othe
r liab
ilities
4,88
2,600
-
3,02
2,496
31
,814
101,2
18
424,1
95
941,6
80
267,2
82
93,91
5 -
248,0
50,96
7 44
,381,9
19
44,41
1,441
47
,442,0
43
22,45
5,623
8,
948,2
12
12,74
9,048
63
,548,8
82
3,59
4,611
51
9,188
Ne
t ass
ets 16
,649,5
26
18,55
2,024
31
,628,0
04
(26,1
40,94
4) 5,
513,2
55
8,54
6,236
21
,362,8
95
(51,1
09,90
5) 1,
809,4
54
6,48
8,507
Share
capit
al 10
,724,6
43
Disco
unt o
n iss
ue of
share
s (2
,105,4
01)
Prefe
rence
share
s 1,
500,0
00
Statu
tory r
eserv
e 1,
334,1
39
Unap
propri
ated p
rofit
3,97
3,324
Su
rplus
on re
valua
tion o
f ass
ets -
net
1,22
2,820
16
,649,5
25
Ove
r 1
Ove
r 3
Ove
r 6
Ove
r 1
Ove
r 2
Ove
r 3
Upto
1
to 3
to 6
mon
ths to
to
2 to
3 to
5 m
onth
mon
ths
mon
ths
1 ye
ar y
ears
yea
rs y
ears
Weig
hted a
verag
e3%
5%6%
6%8%
11%
61%
For the year ended December 31, 2017
Notes to the Unconsolidated Financial Statements

155JS Bank Annual Report 2017
42.5 Apart from monitoring maturity gap analysis, the Bank is also required to monitor and maintain Liquidity Coverage Ratio (LCR) and Net Stable Funding Ratio (NSFR) as introducted under Basel III liquidity Standards introduced by SBP. The LCR is intended to promote the short term resilience of a bank’s liquidity risk profile over a 30 day stress scenario. The ratio is defined as the amount of High Quality Liquid Assets (“HQLA”) that could be used to raise liquidity, measured against the total volume of net cash outflows, arising from both actual and contingent exposures, in a stressed scenario. As of December 31, 2017, Bank’s were required to maintain LCR greater than and equal to 90%. The requirement will increase to 100% after full implementation of Basel III in December 2018.
LCR
(in local currency)
TOTAL UNWEIGHTED
VALUE (average)TOTAL WEIGHTED VALUE (average)
HIGH QUALITY LIQUID ASSETS 1 Total high quality liquid assets (HQLA) 123,802,090.75
CASH OUTLFLOWS2 Retail deposits and deposits from small business
customers of which: - - 2.1 stable deposit 5,027,564.07 251,378.20 2.2 Less stable deposit 81,284,946.43 8,128,494.64 3 Unsecured wholesale funding of which: - -
3.1 Operational deposits (all counterparties) - - 3.2 Non-operational deposits (all counterparties) 81,929,020.27 36,146,340.10 3.3 Unsecured debt - - 4 Secured wholesale funding - 46,412.19 5 Additional requirements of which: - -
5.1 Outflows related to derivative exposures and other collateral requirements 1,932,468.56 1,932,468.56
5.2 Outflows related to loss of funding on debt products - - 5.3 Credit and Liquidity facilities 170,319,324.82 2,804,660.40 6 Other contractual funding obligations 5,466,574.65 5,466,574.65 7 Other contingent funding obligations - - 8 TOTAL CASH OUTFLOWS - 54,776,328.75
CASH INFLOWS 9 Secured lending - - 10 Inflows from fully performing exposures 10,714,365.50 5,691,584.02 11 Other Cash inflows 2,359,890.21 1,478,838.21 12 TOTAL CASH INFLOWS 13,074,255.71 7,170,422.22
21 TOTAL HQLA 123,802,090.75 22 TOTAL NET CASH OUTFLOWS 47,605,906.52 23 LIQUIDITY COVERAGE RATIO 260%
For the year ended December 31, 2017
Notes to the Unconsolidated Financial Statements

156 JS Bank Annual Report 2017
42.6 The NSFR is intended to reduce medium to long-term funding risks by requiring bank to maintain a stable funding profile in relation to their on- and off-balance sheet activities. The NSFR is defined as the amount of Available Stable Funding (the portion of capital and liabilities expected to be a stable source of funding), relative to the amount of Required Stable Funding (a function of the liquidity characteristics of various assets held). Banks are required to maintain NSFR equal and above 100% at all times.
NSFR Disclosure LR IX
(Amount in PKR in thousands) unweighted value by residual maturity weighted
valueNo Maturity < 6 months 6 months to < 1 yr ≥ 1 yr
ASF Item 1 Capital:2 Regulatory capital 10,119,242 10,119,242 3 Other capital instruments 11,576,461 11,554,4034 Retail deposits and deposit from small business customers:5 Stable deposits 5,720,313 5,396,305 1,378,437 631,468 12,470,196 6 Less stable deposits 80,069,816 16,314,942 4,864,152 200,627 91,304,584 7 Wholesale funding: 8 Operational deposits9 Other wholesale funding 51,052,889 96,031,817 26,378,851 2,037,949 87,750,753 10 Other liabilities: 11 NSFR derivative liabilities 9,889,848 - 12 All other liabilities and equity not included in other categories 6,215,143 65,542,624 555,655 4,249,759 24,574,22213 Total ASF 237,773,400
RSF item 14 Total NSFR high-quality liquid assets (HQLA)15 Deposits held at other financial institutions for operational purposes16 Performing loans and securities:17 Performing loans to financial institutions secured by Level 1 HQLA18 Performing loans to financial institutions secured by non-Level 1 HQLA and
unsecured performing loans to financail institutions - 3,631,813 48,042 - 568,793 19 Performing loans to non- financial corporate clients, loans to retail and
small business customers, and loans to sovereigns, central banks and PSEs, of which:
20 With a risk weight of less than or equal to 35% under the Basel II Standardised Approach for credit risk 1,129,830 3,191,950 661,313 6,435,937 7,422,370
21 Securities that are not in default and do not qualify as HQLA including exchange-traded equities. 64,876,882 41,990,838 8,284,136 53,253,799 143,144,807
22 Other assets:23 Physical traded commodities, including gold24 Assets posted as initial margin for derivative contracts25 NSFR derivative assets - 9,823,359 -26 NSFR derivative liabilities before deduction of variation margin posted 1,977,970 1,977,970 27 All other assets not included in the above categories 32,879,700 30,851,039 1,492,184 138,818,346 64,787,083 28 Off-balance sheet items 156,307,402 7,815,370 29 Total RSF 225,716,392 30 Net Stable Funding Ratio (%) 105%
For the year ended December 31, 2017
Notes to the Unconsolidated Financial Statements

157JS Bank Annual Report 2017
42.7 Operational risk
The Bank currently uses Basic Indicator Approach to Operational Risk for regulatory capital calculations. We define operational risk as the risk of loss resulting from inadequate or failed internal processes, people and system or from external events. With the evolution of Operational Risk Management into a separate distinct discipline, the Bank’s strategy is to further strengthen its risk management system along new industry standards. Accordingly the Bank has set up a separate Operational Risk Management (ORM) Unit. ORM Unit resides within Risk Management Group (RMG). Its responsibility is to implement Operational Risk management tools across the bank for effective measurement and monitoring of operational risk faced by different areas of the Bank.
Bank’s operational risk management process involves a structured and uniform approach across the bank. It includes risk identification and assessments, the monitoring of Key Risk Indicators (KRIs) and Risk Control Self-Assessment (RCSA) activities for key operational risks. In order to build a robust operational risk monitoring mechanism, an Operational Risk Steering Committee (ORSC) has been constituted to effectively address operational risk issues.
The bank has implemented a comprehensive “Operational Risk Management Framework” which has also been approved by the Board of Directors. The purpose of bank-wide Operational Risk Management Framework is aimed at laying out clearly defined roles and responsibilities of individuals / units across different functions of the bank that are involved in performing various operational risk management tasks. Operational risk is much more pervasive in a financial institution and every operating unit is exposed to operational risk, regardless of whether it is a business or a support function. This framework has been devised to explain the various building blocks of the operational risk management processes, and their inter-relationships. The framework also captures both qualitative and quantitative guidelines for managing and quantifying operational risks across the Bank.
The ORM Unit conducts operational risk profiling for all major operational areas of the bank and assists various functions of the bank in developing KRIs which are monitored against predefined thresholds. Findings from KRIs are used as predictive indicators of potential operational risks.
Operation risk loss data collection is governed by bank’s Transaction in Difficulty (TID) Policy which has been developed and implemented to collate operational losses and near misses in a systematic and organized way.
The bank’s Business Continuity (BCP) Policy includes risk management strategies to mitigate inherent risks and prevent interruption of mission critical services caused by disaster events. The resilience of BCP is tested and rehearsed on an annual basis by the bank.
43. CUSTOMER SATISFACTION AND FAIR TREATMENT
We are committed to providing our customers with the highest level of service quality satisfaction and have therefore set-up an independent service management function that oversees service quality, phone banking, problem resolution and the fair treatment of customers.
A total of 11,512 complaints were received by the Bank in 2017 and the average time taken to resolve these complaints was 5 days. Our complaint handling policy and grievance redressal mechanism ensures that complaints are resolved in a timely manner and recurrence of complaints is prevented where possible. Customers have the option of registering their complaints at our Branches, phone banking center, the Bank’s website and via email. Complaint management process is kept as transparent as possible through
For the year ended December 31, 2017
Notes to the Unconsolidated Financial Statements

158 JS Bank Annual Report 2017
registration, acknowledgement, interim response where applicable, resolution and root cause analysis of recurring complaints. Customers are also given the option of contacting the Banking Mohtasib office in case they are dissatisfied with the response received from the Bank.
To create enhanced visibility of the recourse mechanism available to its customers, the Bank has incorporated awareness messages of its complaint handling function in several customer communications such as account statements, ATM screens, letters and SMS messages. Complete grievance redressal mechanism, contact channels and online feedback forms have been made available through the the Bank website, and email broadcasts have been sent to the customers for customer education and awareness.
Fair Treatment of Customers is an integral part of our corporate culture. The Bank has institutionalized a ‘Consumer Protection Framework’. Our priority is to keep customer benefits in mind while designing, selling and managing products and services, without any discrimination. Our focus is to maintain fairness in our customer dealings, clarity in communication, develop a service culture and design an effective grievance handling mechanism. We also focus on financial literacy of our customers, for promoting responsible conduct and informed financial decisions by consumers, through our Consumer Education and Financial Literacy Program.
44. GENERAL
44.1 These accounts have been prepared in accordance with the revised forms of annual financial statements of the Banks issued by the State Bank of Pakistan through its BSD Circular No. 04 dated February 17, 2006.
44.2 The figures in the unconsolidated financial statements have been rounded off to the nearest thousand.
45. NON-ADJUSTING EVENT AFTER THE BALANCE SHEET DATE
The Board of Directors have proposed cash preference dividend of 12% (December 31, 2016: 12%) amounting to Rs.180 million (December 31, 2016: Rs.180 million) in their meeting held on March 03, 2018. This appropriation will be approved in the forth coming Annual General Meeting.
46. DATE OF AUTHORISATION FOR ISSUE
These unconsolidated financial statements were authorised for issue by the Board of Directors of the Bank in their meeting held on March 03, 2018.
Chairman President and Director Director Chief Financial OfficerChief Executive Officer
For the year ended December 31, 2017
Notes to the Unconsolidated Financial Statements

ConsolidatedFinancial Statements
159JS Bank Annual Report 2017

160 JS Bank Annual Report 2017
For the year ended December 31, 2017
Directors’ Report onConsolidated Financial Statement
On behalf of the Board of Directors I am pleased to present the consolidated annual report of JS Bank Limited (holding company), JS Global Capital Limited and JS Investments Limited (subsidiary companies).
Consolidated financial highlights 2017 2016
(PKR Million)
Profit before taxation 1,862.7 3,854.1Taxation (795.8) (1,395.5)Profit after taxation 1,066.9 2,458.6Profit attributable to non-controlling interest (40.0) (129.7)Profit attributable to equity holders of the Bank 1,026.9 2,328.9Earnings per share - Basic (Rupees) 0.79 2.00 Diluted (Rupees) 0.79 1.80Investments - net 170,288.8 135,038.9Total assets 390,953.9 268,825.6Deposits 288,365.0 225,004.7Shareholders’ equity 18,587.0 17,746.4
Pattern of Shareholding
The pattern of shareholding as at December 31, 2017 is included in the annual report
Subsidiaries Companies
JS Global Capital Limited
JS Global Capital Limited is one of the largest securities brokerage and investment banking firms in Pakistan with a leadership position in the domestic capital markets. It is in the business of equity, fixed income, currencies and commodities brokerage and investment banking. It was incorporated in Pakistan on June 28, 2000 and is the successor to the securities business of Jahangir Siddiqui & Co. Ltd. and Bear Stearns Jahangir Siddiqui Limited. JS Bank has 67.16% ownership in the company.
JS Global has a paid up capital of PKR 380 million and shareholder equity of PKR 2,601 million as at December 31, 2017. It is listed on the Pakistan Stock Exchange.

161JS Bank Annual Report 2017
PACRA has assigned long-term and short-term entity ratings to JS Global of “AA” (Double A) and “A1+” (A One plus), respectively. The ratings denote a very low expectation of credit risk emanating from very strong capacity for timely payment of financial commitments.
Summarized results of the company are set out below:
PKR MillionParticulars December 31,2017 (Audited) December 31,2016 (Audited)Profit Before Tax 198.4 239Profit After Tax 85.5 171EPS (Rupees) 2.25 4.13
JS Investments Limited
JS Investments has a paid up capital of PKR 802 million and shareholder equity of PKR 2,162 million as on December 31, 2017. It is listed on the Pakistan Stock Exchange. JS Bank has 65.16% ownership in the company.
The Company has a Management Quality Rating of “AM2, with stable outlook” assigned by JCR-VIS and Credit Rating of “A+/A1” (Long/Short - term) assigned by PACRA.
The Company holds a license of an Investment Adviser and Asset Management Company under the Non-Banking Finance Companies (Establishment and Regulation) Rules, 2003 (the NBFC Rules) and the Non-Banking Finance Companies and Notified Entities Regulations, 2008 (the NBFC Regulations). In addition, the Company is also a licensed Pension Fund Manager under the Voluntary Pension System Rules 2005, to manage voluntary pension schemes.
Summarized results of the Company are set out below: PKR Million
Particulars December 31,2017 (Audited) December 31,2016 (Audited)Profit before tax 67.5 209.8Profit after tax 32.2 199.7EPS (Rupees) 0.40 2.49
For and on behalf of the Board,
Khalid ImranPresident & CEO
March 3, 2018

162 JS Bank Annual Report 2017
&ÒøF!*MYt° A1+ 0*™i+0*™.s.
',‰A™i+‹**ªC™
sā�
����”””” 2016 31 ”””” 2017 31 YYYY239 198.4 171 85.5 4.13 2.25
$$$$oooo55554444
øøøø
GGGGHHHHEEEEHHHH�ƒ®t0*â�0* 2,162 �t 802J2017 31
$o54ø
GHEH 65.16%
s� "A+/A1" 0*™Y+$Y AM-2 Y+$Y™ JCR-VIS 0*
p�$o3ïGHEH 2008 p²**à"542.ç
EHGHGEÉ4n.ç G
IEE 2003 0***²�"54j
èFG
EIEÁq 2005 i+,$miï GH÷'h+tā"54j
èFG
EIE]¼çGEŸ:"54j
èFG
EIE²
ās
����”””” 2016 31 ”””” 2017 31 YYYY209.8 67.5 199.7 32.2 2.49 0.40
+$
{{{{−−−− 6,j+i+.$2018 3

163JS Bank Annual Report 2017
®®®®""""5555åååå GGGGHHHHHHHH]]]],,,,
ƒƒƒƒ‚‚‚‚ 2017 31
],Y+$=ƒ®8.$o3ïGHEH]4hå E
H‚:®"5å GHH™
ƒuƒ„
2016 2017
����3,854.1 1,862.7
(1,395.5) (795.8)
2,458.6 1,066.9 (129.7) (40.0) **†2,328.9 1,026.9 ƒ®
2.00 0.79 1.80 0.79 Q+
135,038.9 170,288.8 $o54
ø
GHEHM268,825.6 390,953.9 t225,004.7 288,365.0 0*
17,746.4 18,587.0 Ĩ
ƒƒƒƒ®®®®8888
Jƒ®8‚:c*H 2017 31
]]]]4444hhhhåååå EEEEHHHH
....´4444555544445555ÿÿÿÿGGGGFFFF
GGGGHHHH
.0*Ÿ_5½3ð GG',™$o3ï
GHEH�'q4k5 GH´4545
ÿGF
GH54ø
GH„t¡½hå
EH™$n.ç
E
GE',™
ƒtœ4,œ_5½3ð GG),Y 2000 � 28 $o3ï
GHEH!*0*q 67.16%
�ƒ® 2,601 �t 380 J. 2017 31

164 JS Bank Annual Report 2017

165JS Bank Annual Report 2017
As at December 31, 2017
Consolidated Statement of Financial Position
Chairman President and Director Director Chief Financial OfficerChief Executive Officer
2017 2016 2017 2016 ---- US Dollars in '000 ---- Note -------- Rupees in '000 --------
ASSETS 156,987 140,461 Cash and balances with treasury banks 8 17,334,111 15,509,263
9,505 6,953 Balances with other banks 9 1,049,496 767,747 28,222 102,651 Lendings to financial institutions 10 3,116,199 11,334,414
1,542,231 1,222,988 Investments - net 11 170,288,835 135,038,901 1,667,867 849,619 Advances - net 12 184,161,175 93,812,506
68,737 54,535 Operating fixed assets 13 7,589,702 6,021,563 - - Deferred tax assets - net - -
67,149 57,429 Other assets 14 7,414,358 6,341,197 3,540,698 2,434,636 390,953,876 268,825,591
LIABILITIES 34,635 23,040 Bills payable 15 3,824,278 2,544,028
584,665 93,464 Borrowings 16 64,557,043 10,320,047 2,611,595 2,037,768 Deposits and other accounts 17 288,365,014 225,004,655
45,272 27,170 Sub-ordinated loans 18 4,998,800 3,000,000 Liabilities against assets
46 - subject to finance lease 19 5,032 - 6,221 9,807 Deferred tax liabilities - net 20 686,941 1,082,885
80,141 64,408 Other liabilities 21 8,848,854 7,111,582 3,362,575 2,255,657 371,285,962 249,063,197
178,123 178,979 NET ASSETS 19,667,914 19,762,394
REPRESENTED BY 97,128 97,128 Share capital 22 10,724,643 10,724,643
(19,068) (19,068) Discount on issue of shares (2,105,401) (2,105,401) 13,585 13,585 Preference shares 23 1,500,000 1,500,000 13,956 12,083 Reserves 1,540,987 1,334,121 49,479 44,002 Unappropriated profit 5,463,357 4,858,613
155,080 147,730 17,123,586 16,311,976 13,254 12,991 Non-controlling interest 1,463,454 1,434,391
168,334 160,721 18,587,040 17,746,367 Surplus on revaluation
9,789 18,258 of assets - net of tax 24 1,080,874 2,016,027
178,123 178,979 19,667,914 19,762,394
CONTINGENCIES AND COMMITMENTS 25
The annexed notes from 1 to 48 and annexure I and II form an integral part of these consolidated financial statements.

166 JS Bank Annual Report 2017
For the year ended December 31, 2017
Consolidated Profit and Loss Account
Chairman President and Director Director Chief Financial OfficerChief Executive Officer
2017 2016 2017 2016 ---- US Dollars in '000 ---- Note -------- Rupees in '000 --------
185,544 137,387 Mark-up / return / interest earned 26 20,487,216 15,169,894 127,496 84,029 Mark-up / return / interest expensed 27 14,077,742 9,278,234
58,048 53,358 Net mark-up / interest income 6,409,474 5,891,660
(Provision) / reversal against non-performing (1,837) 577 loans and advances - net 12.4 (202,814) 63,687
Provision for diminution in (768) (3,078) value of investments - net 11.3 (84,797) (339,904)
- (1) Bad debts written off directly - (83) (2,605) (2,502) (287,611) (276,300) 55,443 50,856 Net mark-up / interest income after provisions 6,121,863 5,615,360
NON MARK-UP / INTEREST INCOME
25,961 18,869 Fee, commission and brokerage income 28 2,866,534 2,083,432 2,280 1,644 Dividend income 251,733 181,522 3,236 2,832 Income from dealing in foreign currencies 357,337 312,719
12,466 28,858 Gain on sale of securities - net 29 1,376,441 3,186,450 Unrealised (loss) / gain on revaluation of
(36) 162 investments classified as held-for-trading - net 11.4 (3,958) 17,854 1,788 730 Other income - net 30 197,426 80,591
45,695 53,095 Total non mark-up / interest income 5,045,513 5,862,568 101,138 103,951 11,167,376 11,477,928
NON MARK-UP / INTEREST EXPENSES 83,399 68,016 Administrative expenses 31 9,208,732 7,510,102
406 48 Other provisions / write offs 44,806 5,281 463 982 Other charges 32 51,161 108,423
84,268 69,046 Total non-mark-up / interest expenses 9,304,699 7,623,806 16,870 34,905 1,862,677 3,854,122
- - Extra ordinary / unusual items - -
16,870 34,905 PROFIT BEFORE TAXATION 1,862,677 3,854,122
Taxation (6,084) (10,386) - Current (671,821) (1,146,823)
(796) (806) - Prior years (87,938) (88,993) (326) (1,446) - Deferred 20.1 (36,032) (159,672)
(7,206) (12,638) 33 (795,791) (1,395,488) 9,664 22,267 PROFIT AFTER TAXATION 1,066,886 2,458,634
Attributable to: 9,300 21,092 Equity holders of the Bank 1,026,839 2,328,959
364 1,175 Non-controlling interest 40,047 129,675 9,664 22,267 1,066,886 2,458,634
---------- US Dollar ---------- ----------- Rupees -----------
0.01 0.02 Basic earnings per share 34 0.79 2.00 0.01 0.02 Diluted earnings per share 34 0.79 1.80
The annexed notes from 1 to 48 and annexure I and II form an integral part of these consolidated financial statements.

167JS Bank Annual Report 2017
For the year ended December 31, 2017
Consolidated Statement of Comprehensive Income
Chairman President and Director Director Chief Financial OfficerChief Executive Officer
2017 2016 2017 2016 ---- US Dollars in '000 ---- Note ----- Rupees in '000 -----
9,664 22,267 Profit after tax for the year 1,066,886 2,458,634
Other comprehensive income
Items that will not be reclassified to profit and loss account
(775) (516) Actuarial loss on defined benefit plan 37.5 (85,542) (56,991) 271 181 Related deferred tax 29,940 19,947
(504) (335) (55,602) (37,044)
Items that may be reclassified to profit or loss in subsequent periods
Effect of translation of net investment in 111 - foreign branches 12,236 (17)
(393) (335) (43,366) (37,061)
9,271 21,932 Comprehensive income transferred to equity 1,023,520 2,421,573
Component of comprehensive income not reflected in equity
Items that are or may be reclassified subsequently to profit and loss account
Net change in fair value of (20,904) (15,105) available-for-sale securities (2,308,109) (1,667,860)
6,368 5,890 Related deferred tax 703,176 650,346 (14,536) (9,215) (1,604,933) (1,017,514) (5,265) 12,717 Total comprehensive (loss) / income for the year (581,413) 1,404,059
Attributable to:
(4,984) 10,797 Equity holders of the Bank (550,334) 1,192,175 (281) 1,920 Non-controlling interest (31,079) 211,884
(5,265) 12,717 (581,413) 1,404,059
The annexed notes from 1 to 48 and annexure I and II form an integral part of these consolidated financial statements.

168 JS Bank Annual Report 2017
For the year ended December 31, 2017
Consolidated Statement of Changes in Equity
Chairman President and Director Director Chief Financial OfficerChief Executive Officer
Attributable to shareholders of the BankReserves
Share capitalDiscount on
issue of sharesPreference
shares Statutory * Exchange translation
Unappro-priated (loss) / profit Sub-total
Non-controlling interest Total
------------------------------------------------------------------ Rupees in '000 ------------------------------------------------------------------
Balance as at January 01, 2016 10,724,643 (2,105,401) 1,500,000 918,815 - 3,066,149 14,104,206 1,952,266 16,056,472
Total comprehensive income for the yearended December 31, 2016
Profit after taxation - - - - - 2,328,959 2,328,959 129,675 2,458,634 Other comprehensive loss - - - - (17) (37,044) (37,061) - (37,061)
- - - - (17) 2,291,915 2,291,898 129,675 2,421,573
Transaction with owners recorded directly in equity
Buy-back of shares by subsidiary from NCI - - - - - - - (694,430) (694,430)
Gain arised on buy back of shares by subsidiary - - - - - 95,872 95,872 46,880 142,752
Preference dividend paid for the yearended December 31, 2015 @ 12% p.a. - - - - - (180,000) (180,000) - (180,000)
Transfers
Transfer to statutory reserve - - - 415,323 - (415,323) - - -
Balance as at December 31, 2016 10,724,643 (2,105,401) 1,500,000 1,334,138 (17) 4,858,613 16,311,976 1,434,391 17,746,367
Total comprehensive income for the year ended December 31, 2017
Profit after taxation - - - - - 1,026,839 1,026,839 40,047 1,066,886 Other comprehensive income / (loss) net of tax - - - - 12,236 (55,602) (43,366) - (43,366)
- - - - 12,236 971,237 983,473 40,047 1,023,520 Transfer from surplus on revaluation of
operating fixed assets net of tax (note 7.8.2) - - - - - 7,923 7,923 2,981 10,904
Transfer from surplus on revaluation of non-banking assets to unappropriated profit - net of tax - - - - - 214 214 - 214
Transaction with owners recorded directly in equity
Preference dividend paid for the yearended December 31, 2016 @ 12% p.a. - - - - - (180,000) (180,000) - (180,000)
Dividend paid to non controlling interest for theyear ended December 31, 2016 @ Rs.0.5 - - - - - - - (13,965) (13,965)
Transfers
Transfer to statutory reserve - - - 194,630 - (194,630) - - -
Balance as at December 31, 2017 10,724,643 (2,105,401) 1,500,000 1,528,768 12,219 5,463,357 17,123,586 1,463,454 18,587,040
* This represents reserve created under Section 21(i)(a) of the Banking Companies Ordinance, 1962.
The annexed notes from 1 to 48 and annexure I and II form an integral part of these consolidated financial statements.

169JS Bank Annual Report 2017
For the year ended December 31, 2017
Consolidated Cash Flow Statement
2017 2016 2017 2016 -- US Dollars in '000 -- Note ------- Rupees in '000 -------
CASH FLOWS FROM OPERATING ACTIVITIES 16,870 34,905 Profit before taxation 1,862,677 3,854,122 (2,280) (1,644) Less: Dividend income (251,733) (181,522)
14,590 33,261 1,610,944 3,672,600 Adjustments:
5,828 4,992 Depreciation 13.2 643,503 551,223 12 10 Depreciation on non-banking assets 14.5 1,300 1,122
582 489 Amortisation of intangible assets 13.3 64,242 53,942 811 555 Charge for defined benefit plan 37.5 89,576 61,317
1,837 (577) Provision / (reversal) against non-performing advances - net 12.4 202,814 (63,687)Unrealised gain / (loss) on revaluation of investments
36 (162) classified as held-for-trading 11.4 3,958 (17,854) 768 3,078 Provision for diminution in value of investments - net 11.3 84,797 339,904 406 48 Other provisions / write offs 14.7 44,806 5,281 343 698 Provision for Sindh Workers' Welfare Fund 32 37,831 77,023
Unrealised gain on revaluation (598) (44) of derivative instruments 30 (66,026) (4,853) 378 - Finance cost 41,698 - (690) (386) Gain on sale of operating fixed assets 30 (76,156) (42,657)
9,713 8,701 1,072,343 960,761 24,303 41,962 2,683,287 4,633,361
(Increase) / decrease in operating assets 74,429 (70,216) Lendings to financial institutions 8,218,215 (7,753,085)
521,172 (391,874) Held-for-trading securities 57,546,369 (43,269,625) (820,085) (154,595) Advances (90,551,483) (17,069,955)
(9,600) 7,171 Other assets (excluding advance taxation) (1,060,055) 791,751 (234,084) (609,514) (25,846,954) (67,300,914)
Increase / (decrease) in operating liabilities 11,595 8,464 Bills payable 1,280,250 934,603
489,765 (401,243) Borrowings 54,078,528 (44,304,114) 573,827 766,633 Deposits and other accounts 63,360,359 84,649,480
18,102 27,170 Sub-ordinated loans 1,998,800 3,000,000 14,877 30,437 Other liabilities 1,642,627 3,360,738
1,108,166 431,461 122,360,564 47,640,707 874,082 (178,053) 96,513,610 (19,660,207)
(1,071) (580) Gratuity Paid 37.5 (118,308) (64,005) (378) - Financial cost paid (41,698) -
(6,355) (10,215) Income tax paid (701,666) (1,127,882) 890,581 (146,886) Net cash flows from / (used in) operating activities 98,335,225 (16,218,733)
CASH FLOW FROM INVESTING ACTIVITIES (487,195) 209,440 Net investment in available-for-sale securities (53,794,682) 23,125,798 (374,928) - Net investment in held-to-maturity securities (41,398,485) -
2,208 1,623 Dividend income received 243,790 179,157 (10) - Capital repayment of finance lease obligations (1,143) -
(12,364) (17,388) Investments in operating fixed assets (1,365,174) (1,919,931) 999 607 Proceeds from sale of operating fixed assets 110,327 66,995
(871,290) 194,282 Net cash flows (used in) / from investing activities (96,205,367) 21,452,019
CASH FLOW FROM FINANCING ACTIVITIES (1,630) (1,630) Dividend paid on preference shares (180,000) (180,000)
(126) - Dividend paid to non controlling interest (13,965) - - (4,996) Shares bought back from non-controlling interest - (551,678)
(1,756) (6,626) Net cash flows used in financing activities (193,965) (731,678) - - Effect of translation of net investment in foreign branches 12,236 (17)
17,535 40,770 Increase in cash and cash equivalents 1,948,129 4,501,591 147,048 106,278 Cash and cash equivalents at beginning of the year 16,236,482 11,734,891 164,583 147,048 Cash and cash equivalents at end of the year 35 18,184,611 16,236,482
The annexed notes from 1 to 48 and annexure I and II form an integral part of these consolidated financial statements.
Chairman President and Director Director Chief Financial OfficerChief Executive Officer

170 JS Bank Annual Report 2017
For the year ended December 31, 2017
Notes to the Consolidated Financial Statements
1. STATUS AND NATURE OF BUSINESS
1.1 The "Group" consists of:
1.1.1 Holding Company
JS Bank Limited (the Bank/JSBL), incorporated in Pakistan, is a scheduled bank, engaged in commercial banking and related services. The Bank's ordinary shares are listed on Pakistan Stock Exchange Limited (PSX). The Bank is a subsidiary of Jahangir Siddiqui & Co. Ltd. (JSCL). The registered office of the Bank is situated at Shaheen Commercial Complex, Dr. Ziauddin Ahmed Road, Karachi.
The Bank operates with 322 (December 31, 2016: 306) branches / sub-branches in Pakistan and one wholesale banking branch in Bahrain (December 31, 2016: one). The Pakistan Credit Rating Agency Limited (PACRA) has assigned the long-term entity rating of the Bank to ‘AA’ (Double A Minus) whereas short-term rating is maintained at 'A1+' (A One Plus), which is the highest possible short-term rating. The ratings denote a very low expectation of credit risk and indicate very strong capacity for timely payment of financial commitments.
1.1.2 Jahangir Siddiqui Investment Bank Limited, JSIBL, (formerly Citicorp Investment Bank Limited which was acquired by JSCL on February 01, 1999), and its holding company, JSCL, entered into a Framework Agreement with American Express Bank Limited, New York (AMEX) on November 10, 2005 for acquisition of its American Express Bank Limited - Pakistan Branches, (AEBL). Consequently, a new banking company, JSBL was incorporated on March 15, 2006 and a restricted Banking License was issued by the State Bank of Pakistan (SBP) on May 23, 2006.
A Transfer Agreement was executed on June 24, 2006 between JSIBL and JSBL for the transfer of entire business and undertaking of JSIBL to JSBL and a separate Transfer Agreement was also executed on June 24, 2006, between AMEX and JSBL for the transfer of AEBL’s commercial banking business in Pakistan with all assets and liabilities (other than certain excluded assets and liabilities) (AEBL business). The shareholders of JSIBL and JSBL in their respective extra ordinary general meetings held on July 31, 2006 approved a Scheme of Amalgamation (the Scheme) under Section 48 of the Banking Companies Ordinance, 1962. The Scheme was initially approved by the Securities and Exchange Commission of Pakistan vide its letter No. SC/NBFC(J)-R/JSIBL/2006/517 dated September 28, 2006. Subsequently, the Scheme was sanctioned by the SBP vide its order dated December 02, 2006 and, in accordance therewith, the effective date of amalgamation was fixed at December 30, 2006.
The ultimate parent of the Group is Jahangir Siddiqui & Co. Ltd. which holds 70.42% shares of the Bank.
1.1.3 Composition of the group
The group has three subsidiaries having composition as follows:
2017 2016Ownership interest andvoting power held by
The Group NCI The Group NCIName of Subsidiary
JS Global Capital Limited 67.16% 32.84% 67.16% 32.84%JS Investment Limited 65.16% 34.84% 65.16% 34.84%JS ABAMCO Commodities Limited 65.16% 34.84% 65.16% 34.84%

171JS Bank Annual Report 2017
1.1.4 Subsidiary Companies
JS Global Capital Limited (JSGCL)
JS Global Capital Limited, JSGCL, is principally owned by the Bank, holding 67.16% of its equity interest. The Bank acquired effective controlling interest in JSGCL on December 21, 2011 and April 15, 2016 of 51.05% and 16.11% respectively. The ownership interest has increased by 16.11%, without any change in the cost of investment, due to the fact that JSGCL has bought back its 11,993,000 ordinary shares out of its 50 million ordinary shares in 2016. JSGCL is a public listed company incorporated in Pakistan under the replead Companies Ordinance, 1984. The shares of the JSGCL are listed on Pakistan Stock Exchange (PSX). Further, the JSGCL is a corporate member of PSX and member of Pakistan Mercantile Exchange. The principal business of the JSGCL is to carry out share brokerage, money market, forex and commodity brokerage, advisory and consultancy services. Other activities include investment in a mix of listed and unlisted equity and debt securities and reverse repurchase transactions. The registered office of the JSGCL is situated at 6th floor, Faysal House, Shahra-e-Faisal, Karachi, Pakistan.
JS Investments Limited (JSIL)
JS Investments Limited, JSIL, is principally owned by the Bank, holding 65.16% of its equity interest. The Bank acquired effective controlling interest in JSIL on November 01, 2012 and December 22, 2015 of 52.24% and 12.92% respectively. The ownership interest has increased by 12.92%, without any change in the cost of investment, due to the fact that JSIL has bought back its 19,828,182 ordinary shares out of its 100 million ordinary shares in 2016. JSIL is a public listed company incorporated in Pakistan on February 22, 1995 under the replead Companies Ordinance, 1984. The shares of the JSIL are listed on the Pakistan Stock Exchange (PSX), formerly since April 24, 2007. The registered office of the JSIL is situated at 7th Floor, The Forum, Khayaban-e-Jami, Clifton, Karachi.
The JSIL has obtained the license of an “Investment Advisor” and “Asset Management Company” (AMC) under the Non-Banking Finance Companies (Establishment and Regulation) Rules, 2003 (the NBFC Rules) and the Non-Banking Finance Companies and Notified Entities Regulations, 2008 (the NBFC Regulations). In addition, the Company has also obtained registration to act as Pension Fund Manager under the Voluntary Pension System Rules, 2005.
JSIL is an asset management company of the following funds:
Open end funds:
- JS Growth Fund- JS Value Fund- Unit Trust of Pakistan- JS Income Fund- JS Islamic Fund- JS Fund of Funds- JS Islamic Income Fund- JS Cash Fund- JS Large Cap Fund- JS Capital Protected Fund V- JS Islamic Hybrid Fund of Funds- JS Islamic Hybrid Fund of Funds -2
These funds have been treated as related parties in these consolidated financial statements.
Pension fund
- JS Pension Savings Fund- JS Islamic Pension Savings Fund
For the year ended December 31, 2017
Notes to the Consolidated Financial Statements

172 JS Bank Annual Report 2017
JS ABAMCO Commodities Limited
JS Bank owns JS ABAMCO Commodities Limited, JSACL, indirectly through its subsidiary JS Investment Limited (JSIL) which has 100% holding in JSACL. JSACL was incorporated on September 25, 2007 as a public unlisted company under the replead Companies Ordinance, 1984 and is a wholly owned subsidiary company of JSIL (a subsidiary of Holding Company). The principal activities of JSACL are to deal and effectuate commodity contracts; to become member of commodity exchange including National Commodity Exchange Limited (NCEL) and to carry on the business as brokers, advisory and consultancy services, dealers and representative of all kinds of commodity contracts and commodity backed securities. The registered office of the Company is situated at 7th Floor, ‘The Forum’, Khayaban-e-Jami, Clifton, Karachi. The Company has not commenced its commercial operations up to the balance sheet date.
2. BASIS OF CONSOLIDATION
- The consolidated financial statements include the financial statements of the Bank (The Holding Company) and its subsidiary companies together - "the Group".
- Subsidiary companies are fully consolidated from the date on which more than 50% of voting rights are transferred to the Group or power to control the company is established and excluded from consolidation from the date of disposal or when the control is lost.
- The financial statements of the subsidiary companies are prepared for the same reporting year as the holding company for the purpose of consolidation, using consistent accounting policies.
- The assets, liabilities, income and expenses of subsidiary companies have been consolidated on a line by line basis.
- Non-controlling interest in equity of the subsidiary companies is measured at proportionate share of net assets of the acquiree as of the acquisition date.
- Material intra-group balances and transactions have been eliminated.
3. BASIS OF PRESENTATION
3.1 These unconsolidated financial statements have been prepared on the format prescribed by SBP vide BSD Circular No. 4 dated February 17, 2006, ‘Revised Forms of Annual Financial statements’ effective from the accounting year ended December 31, 2006. The SBP vide BPRD circular no. 2 dated January 25, 2018 has specified the new reporting format for the financial statements of banking companies. The new format has revised the disclosure requirements and will become applicable for the financial statements of the Bank for the year ending December 31, 2018.
3.2 The US Dollar amounts shown on the statement of financial position, profit and loss account, statement of comprehensive income and cash flow statement are stated as additional information solely for the convenience of readers and have not been subject to audit by the external auditors. For the purpose of conversion to US Dollars, the rate of Rs.110.4172 to 1 US Dollar has been used for 2017 and 2016 as it was the prevalent rate as on December 31, 2017.
4. BASIS OF MEASUREMENT
These consolidated financial statements have been prepared under the historical cost convention except that certain assets are stated at revalued amounts / fair value as disclosed in their respective notes.
For the year ended December 31, 2017
Notes to the Consolidated Financial Statements

173JS Bank Annual Report 2017
5. STATEMENT OF COMPLIANCE
5.1 These consolidated financial statements have been prepared in accordance with approved accounting standards as applicable in Pakistan. Approved accounting standards comprise of such International Financial Reporting Standards ( IFRSs ) issued by the International Accounting Standards Board (IASB) as are notified under the repealed Companies Ordinance, 1984 provisions of and directives issued under the Banking Companies Ordinance, 1962, the Companies Ordinance, 1984 and directives issued by the SBP and the Securities and Exchange Commission of Pakistan (SECP). Whenever the requirements of the Banking Companies Ordinance, 1962, repealed Companies Ordinance, 1984 or the directives issued by the SBP and the SECP differ with the requirements of IFRS, requirements of the Banking Companies Ordinance, 1962, repealed Companies Ordinance, 1984 and the said directives shall prevail.
5.2 Effective May 30, 2017, the Companies Act, 2017 (the Act) has been promulgated, however, the Securities and Exchange Commission of Pakistan (SECP) vide its circular No. 23 of 2017 dated October 04, 2017 decided that the companies whose financial year closes on or before December 31, 2017 shall prepare their financial statements in accordance with the provisions of the repealed Companies Ordinance, 1984.
Currently, the Holding Company is assessing the impact of the requirements of the Companies Act, 2017, on the financial statements for the future periods in terms of accounting as well as disclosure requirements.
5.3 The SBP vide BSD Circular No. 10, dated August 26, 2002 has deferred the applicability of International Accounting Standard 39, Financial Instruments: Recognition and Measurement (IAS 39) and International Accounting Standard 40, Investment Property (IAS 40) for Banking companies till further instructions. Further, according to the notification of the Securities and Exchange Commission of Pakistan (SECP) dated April 28, 2008, the IFRS - 7 "Financial Instruments: Disclosures" has not been made applicable for banks. Accordingly, the requirements of these standards have not been considered in the preparation of these unconsolidated financial statements. However, investments have been classified and valued in accordance with the requirements of various circulars issued by the SBP.
5.4 IFRS 8, ‘Operating Segments’ is effective for the Bank’s accounting period beginning on or after January 01, 2009. All banking companies in Pakistan are required to prepare their annual financial statements in line with the format prescribed under BSD Circular No. 4 dated February 17, 2006, ‘Revised Forms of Annual Financial Statements’, effective from the accounting year ended December 31, 2006. The management of the Bank believes that as the SBP has defined the segment categorization in the above mentioned circular, the SBP’s requirements prevail over the requirements specified in IFRS 8. Accordingly, segment information disclosed in these financial statements is based on the requirements laid down by the SBP.
5.5 IFRS10 "Consolidated Financial Statements" was made applicable from period beginning on or after January 01, 2015 vide S.R.O 633(I)/2014 dated July 10, 2014 by SECP. However, SECP has directed that the requirements of consolidation under section 237 of the repealed Companies Ordinance 1984 and IFRS-10 "Consolidated Financial Statements" are not applicable in case of investment by companies in mutual funds established under trust structure, through S.R.O 56(I) /2016 dated January 28, 2016. Accordingly, the requirements of these standards have not been considered in the preparation of these unconsolidated financial statements.
5.6 The Group has adopted the following accounting standards, amendments and interpretations of IFRSs which became effective for the current year.
For the year ended December 31, 2017
Notes to the Consolidated Financial Statements

174 JS Bank Annual Report 2017
Standard or Interpretation
IAS 7 Statement of Cash Flows - Disclosure Initiative - (Amendment)
IAS 12 Income Taxes – Recognition of Deferred Tax Assets for Unrealized losses (Amendments)
Improvements to Accounting Standards Issued by the IASB
IFRS 12 Disclosure of Interests in Other Entities - Clarification of the scope of the disclosure requirements in IFRS 12
The adoption of the above amendments, improvements to accounting standards and interpretations did not have any effect on the financial statements.
5.6.1 The Group has changed its accounting policy for fixed assets as referred in note 7.8.2.
5.6.2 New accounting standards / amendments and IFRS interpretations that are not yet effective
The following standards, amendments and interpretations with respect to the approved accounting standards as applicable in Pakistan would be effective from the dates mentioned below against the respective standard or interpretation:
Effective date (annual Standard or Interpretation periods beginning on or after)
IFRS 2 – Share-based Payments – Classification and Measurement of Share-based Payments Transactions – (Amendments) January 01, 2018
IFRS 10 – Consolidated Financial Statements and IAS 28 – Investment in Associates and Joint Ventures - Sale or Contribution of Assets between an Investor and its Associate or Joint Venture – (Amendment) Not yet finalized
IFRS 15 – Revenue from Contracts with Customers July 01, 2018
IFRIC Interpretation 22 – Foreign Currency Transactions and Advance Consideration January 01, 2018
IFRIC 23 – Uncertainty over Income Tax Treatments January 01, 2019
The above standards, amendments and interpretations are not expected to have any material impact on the Group's financial statements in the period of initial application.
In addition to the above standards and amendments, improvements to various accounting standards have also been issued by the IASB in December 2016. Such improvements are generally effective for accounting periods beginning on or after January 01, 2018 and January 01, 2019. The Bank expects that such improvements to the standards will not have any impact on the Bank's financial statements in the period of initial application.
Further, following new standards have been issued by IASB which are yet to be notified by the SECP for the purpose of applicability in Pakistan.
For the year ended December 31, 2017
Notes to the Consolidated Financial Statements
175JS Bank Annual Report 2017
IASB Effective date (annualStandard periods beginning on or after)
IFRS 14 – Regulatory Deferral Accounts January 01, 2016
IFRS 16 – Leases January 01, 2019
IFRS 17 – Insurance Contracts January 01, 2021
6. CRITICAL ACCOUNTING ESTIMATES AND KEY SOURCES OF ESTIMATION UNCERTAINTY
The preparation of consolidated financial statements in conformity with approved accounting standards requires the use of certain critical accounting estimates. It also requires management to exercise its judgment in the process of applying the Group’s accounting policies. Estimates and judgments are continually evaluated and are based on historic experience and other factors, including expectations of future events that are believed to be reasonable under the circumstances. Revisions in accounting estimates are recognised in the period in which the estimate is revised and in any future periods affected.
The areas where various assumptions and estimates are significant to the Group's consolidated financial statements or where judgement was exercised in application of accounting policies are as follows:
i) Classification of investments
- In classifying investments as 'held-for-trading' the Group has determined securities which are acquired with an intention to trade by taking advantage of short-term market / interest rate movements and are to be sold within 90 days of acquisition.
- In classifying investments as 'held-to-maturity' the Group follows the guidance provided in SBP circulars on classifying non-derivative financial assets with fixed or determinable payments and fixed maturity. In making this judgment, the Bank evaluates its intention and ability to hold such investments to maturity.
- The investments which are not classified as 'held-for-trading' or 'held-to-maturity' are classified as 'available-for-sale'.
ii) Provision against non performing loans and advances
The Group reviews its loan portfolio to assess amount of non-performing loans and advances and provision required there-against. While assessing this requirement various factors including the delinquency in the account, financial position of the borrowers, the value of securities and the requirement of the Prudential Regulations are considered.
iii) Impairment on investments
The Group determines that investments are impaired when there has been a significant or prolonged decline in the fair value below its cost. This determination of what is significant or prolonged requires judgment. In making this judgment, the Bank evaluates among other factors, the normal volatility in securities price. In addition, impairment may be appropriate when there is an evidence of deterioration in the financial health of the investee, industry and sector performance, changes in technology and operational and financing cash flows.
For the year ended December 31, 2017
Notes to the Consolidated Financial Statements

176 JS Bank Annual Report 2017
iv) Income taxes
In making the estimates for income taxes currently payable by the Group, the management considers the current income tax laws and the decisions of appellate authorities on certain issues in the past. In making the provision for deferred taxes, estimates of the Group's future taxable profits are taken into account.
v) Fair value of derivatives
The fair value of derivatives which are not quoted in active markets are determined by using valuation techniques. The valuation techniques take into account the relevant interest rates in effect at the balance sheet date and the contracted rates.
vi) Depreciation and amortisation of operating fixed assets
In making estimates of the depreciation / amortisation method, the management uses a method which reflects the pattern in which economic benefits are expected to be consumed by the Group. The method applied is reviewed at each financial year end and if there is a change in the expected pattern of consumption of the future economic benefits embodied in the underlying assets, the method is changed to reflect the change in pattern. Such change is accounted for as change in accounting estimates in accordance with International Accounting Standard - 8, "Accounting Policies, Changes in Accounting Estimates and Errors".
vii) Impairment of Goodwill
Impairment testing involves a number of judgmental areas which are subject to inherent significant uncertainty, including the preparation of cash flow forecasts for periods that are beyond the normal requirements of management reporting and the assessment of the discount rate appropriate to the business. The carrying amount of goodwill at the balance sheet date was Rs.1,464 million. The detailed assumptions underlying impairment testing of goodwill are given in note 13.3.4 to these consolidated financial statements.
viii) Defined benefits plans and other benefits
Liability is determined on the basis of actuarial advice using the Projected Unit Credit Method.
7. SUMMARY OF SIGNIFICANT ACCOUNTING POLICIES
7.1 Basis of Consolidation
Subsidiary
Subsidiary is an entity controlled by the Group. Control exists when the Group has power to govern the financial and operating policies of an entity so as to obtain benefits from its activities. The financial statements of subsidiary is included in the consolidated financial statements from the date that control commences until the date that control ceases.
For the year ended December 31, 2017
Notes to the Consolidated Financial Statements

177JS Bank Annual Report 2017
Acquisition of business not under common control
Acquisitions of businesses not under common control are accounted for using the acquisition method. The consideration transferred in a business combination is measured at fair value, which is calculated as the sum of the acquisition-date fair values of the assets transferred by the bank, liabilities incurred by the bank to the former owners of the acquiree and the equity interests issued by the bank in exchange for control of the acquiree. Acquisition-related costs are recognised in profit and loss account as incurred.
At the acquisition date, the identifiable assets acquired and the liabilities assumed are recognised at their fair value at the acquisition date.
Goodwill on acquisition after July 01, 2009 is measured as the excess of the sum of the consideration transferred, the amount of any non-controlling interests in the acquiree, and the fair value of the acquirer's previously held equity interest in the acquiree (if any) over the net of the acquisition-date amounts of the identifiable assets acquired and the liabilities assumed. If, after reassessment, net of the acquisition-date amounts of the identifiable assets acquired and liabilities assumed exceeds the sum of the consideration transferred, the amount of any non-controlling interests in the acquiree and the fair value of the acquirer's previously held interest in the acquiree (if any), the excess is recognised immediately in profit or loss as a bargain purchase gain.
Goodwill acquired in a business combination before July 01, 2009 is initially measured at cost, being the excess of the cost of business combination over the Bank's interest in the net fair value of the identifiable assets, liabilities and contingent liabilities acquired.
Non-controlling interests that are present ownership interests and entitle their holders to a proportionate share of the Group's net assets in the event of liquidation is measured at proportionate share of net assets of the acquiree at the date of the acquisition.
Acquisition of business under common control
Acquisition of business under common control are accounted for under 'pooling of interest method'. The assets and liabilities of the combining businesses for the period in which the combination occurs are merged on the date of combination at their respective book values. Appropriate adjustments are made to the book values to reflect application consistent accounting policies in the combining businesses. Any difference between the amount of net assets merged and consideration transferred in form of cash or other assets are adjusted against equity.
Expenditure incurred in relation to the business combination are recognized as expenses in the period in which they are incurred.
7.2 Cash and cash equivalents
Cash and cash equivalents represent cash and balances with treasury banks, balances with other banks net of any overdrawn nostro accounts.
7.3 Lendings to / borrowings from financial institutions
The Group enters into transactions of lendings to / borrowings from financial institutions at contracted rates for a specified period of time. These are recorded as under:
For the year ended December 31, 2017
Notes to the Consolidated Financial Statements

178 JS Bank Annual Report 2017
a) Sale under repurchase obligation
Securities sold subject to a re-purchase agreement (repo) are retained in the consolidated financial statements as investments and the counter party liability is included in borrowings. The difference in sale and re-purchase value is accrued over the period of the contract and recorded as an expense using effective interest rate method.
b) Other lendings
Other lendings include term lendings and unsecured lendings to financial institutions. These are stated net of provision. Mark-up on such lendings is charged to profit and loss account on a time proportionate basis using effective interest rate method except mark-up on impaired / delinquent lendings, which are recognized on receipt basis.
c) Purchase under resale obligation
Securities purchased under agreement to resell (reverse repo) are not included in consolidated statement of financial position as the Group does not obtain control over the securities. Amount paid under these agreements is included in lendings to financial institutions or advances as appropriate. The difference between the contracted price and resale price is amortised over the period of the contract and recorded as income using effective interest method.
d) Other borrowings
Other borrowings include borrowings from the SBP and unsecured call borrowings which are recorded at the proceeds received. Mark-up paid on such borrowings is charged to the profit and loss account over the period of borrowings on time proportionate basis using effective interest method.
7.4 Investments
7.4.1 Initial recognition and measurement
The Management determines the appropriate classification of its investments at the time of purchase and classifies these investments as held-for-trading, available-for-sale or held-to-maturity. These are initially recognised at cost, being the fair value of the consideration given plus, in the case of investments not held-for-trading, directly attributable acquisition costs.
(a) Held-for-trading
These are securities which are either acquired for generating profit from short-term fluctuations in market prices, interest rate movements, dealer's margin or are securities included in a portfolio in which a pattern of short-term profit taking exists. These securities are carried at fair value with any related gain or loss being recognized in profit and loss account.
(b) Held-to-maturity
These are securities with fixed or determinable payments and fixed maturities that are held with the intention and ability to hold till maturity. Investments classified as held-to-maturity are carried at amortised cost.
For the year ended December 31, 2017
Notes to the Consolidated Financial Statements

179JS Bank Annual Report 2017
(c) Available-for-sale
These are investments that do not fall under the held-for-trading or held-to-maturity categories. These are initially recognised at cost, being the fair value of the consideration given including the acquisition cost.
(d) Associates
Associates are all entities over which the Group has significant influence but not control, generally accompanying a shareholding of between 20% and 50% of the voting rights. Investments in associates are accounted for under the equity method of accounting. However, in case where associates are considered as fully impaired and financial statements are not available these investments are stated at cost less provision.
Under the equity method, the Group’s share of its associates’ post-acquisition profits or losses is recognized in the consolidated profit and loss account, its share of post-acquisition movements in reserves is recognized in reserves. The cumulative post-acquisition movements are adjusted against the carrying amount of the investment. When the Group’s share of losses in an associate equals or exceeds its interest in the associate, including any other unsecured receivables, the Group does not recognize further losses, unless it has incurred obligations or made payments on behalf of the associate.
(e) Regular way contracts
All 'regular way' purchases and sales of financial assets are recognised on the trade date, i.e. the date on which commitment to purchase / sale is made by the Group. Regular way purchases or sales of financial assets are those, the contract for which requires delivery of assets within the time frame generally established by regulation or convention in the market place.
Premium or discount on acquisition of investments is capitalised and amortised through the consolidated profit and loss account using effective yield over the remaining period of the investment.
7.4.2 Subsequent measurement
In accordance with the requirements of the State Bank of Pakistan, SBP, quoted securities other than those classified as 'held-to-maturity' and investment in associates and subsidiaries, are subsequently remeasured to market value. Investments classified as 'held-to-maturity' are carried at amortised cost using the effective interest method (less impairment, if any).
Further, in accordance with the requirements of the SBP, gain or loss on revaluation of the Group's held-for-trading investments is taken to the profit and loss account. In case of investments classified as available-for-sale, surplus or deficit is taken directly to equity. The surplus or deficit arising on these securities is taken to the profit and loss account when actually realised upon disposal.
Unquoted equity securities, excluding investment in subsidiaries and associates are valued at lower of cost and the break-up value in accordance with the requirements of the Prudential Regulations issued by the SBP. Break-up value of equity securities is calculated with reference to the net assets of the investee company as per the latest available audited financial statements.
7.4.3 Impairment / diminution in the value of securities
Impairment loss in respect of quoted equity securities classified as available for sale, associates, subsidiaries and held to maturity is recognised based on management's assessment of objective evidence of impairment as a result of one or more events that may have an impact on the estimated future cash flows of the investments. Objective evidence that the cost may not be recovered, in addition to qualitative impairment criteria, includes a significant or prolonged decline in the fair value below average cost. A decline to be considered as:
For the year ended December 31, 2017
Notes to the Consolidated Financial Statements

180 JS Bank Annual Report 2017
- Significant if the fair value is below the weighted average cost by more than 30 percent.- Prolonged if the fair value is below the weighted average cost for a period of more than one year.
(a) Available-for-sale
If an available-for-sale of equity security is impaired, the cumulative loss that had been recognised in equity, shall be reclassified from equity to profit or loss as a reclassification adjustment even though the financial asset has not been derecognised, any further declines in the fair value at subsequent reporting dates are recognised as impairments. Therefore, at each reporting period, for an equity security that was determined to be impaired, additional impairments are recognised for the difference between the fair value and the original cost basis, less any previously recognised impairment.
If, in subsequent period, impairment losses recognised in profit or loss for an investment in an equity instrument classified as available for sale shall not be reversed through profit or loss except in case of derecognition.
(b) Held to maturity, Subsidiaries and Associates
Impairment losses are incurred if, and only if, there is objective evidence of impairment after initial recognition of the investment. The impairment loss is recognised in the profit and loss account. If, in a subsequent period, any indication that an impairment loss recognised in prior periods no longer exist or may have decreased, the impairment loss shall be reversed, with the amount of the reversal recognised in profit or loss.
(c) Debt Securities
PTCs, TFCs, Sukuk and other debt securities will be classified on the valuation date on the basis of default in their repayment in line with the criteria prescribed for classification of medium and long-term facilities in accordance with the requirements of the Prudential Regulations issued by the SBP.
7.5 Financial instruments
7.5.1 Financial assets and financial liabilities
Financial assets and liabilities are recognized at the time when the Group becomes party to the contractual provision of the instrument. Financial assets are de-recognized when the contractual right to future cash flows from the asset expires or is transferred along with the risk and reward of the asset. Financial liabilities are de-recognised when obligation specific in the contract is discharged, cancelled or expired. Any gain or loss on de-recognition of the financial asset and liability is recognized in the consolidated profit and loss account of the current period. The particular recognition and subsequent measurement method for significant financial assets and financial liabilities are disclosed in the individual policy statements associated with them.
7.5.2 Derivative financial instruments
Derivative financial instruments are initially recognised at fair value on the date on which the derivative contract is entered into and are subsequently re-measured at fair value using valuation techniques. All derivative financial instruments are carried as assets when fair value is positive and liabilities when fair value is negative. Any change in the fair value of derivative financial instruments is taken to the profit and loss account.
For the year ended December 31, 2017
Notes to the Consolidated Financial Statements

181JS Bank Annual Report 2017
7.6 Off-setting of financial assets and financial liabilities
Financial assets and liabilities are set off and the net amount is reported in the consolidated financial statements when there exists a legally enforceable right to set off and the Group intends either to settle the assets and liabilities on a net basis or to realise the assets and to settle the liabilities simultaneously. Income and expenses arising from such assets and liabilities are accordingly offset.
7.7 Advances (including net investment in finance lease)
Loan and advances
Advances are stated net of general and specific provision. General and specific provisions against funded loans are determined in accordance with the requirements of the Prudential Regulations issued by the SBP and charged to the profit and loss account. Advances are written off when there are no realistic prospects of recovery.
Finance lease receivables
Leases, where the Group transfers substantially all the risks and rewards incidental to ownership of an asset to the lessee are classified as finance leases. A receivable is recognised at an amount equal to the present value of the lease payment including any guaranteed residual value, if any.
7.8 Operating fixed assets and depreciation
7.8.1 Property and equipment
Operating fixed assets except office premises are shown at historical cost less accumulated depreciation and accumulated impairment losses, if any. Historical cost includes expenditures that are directly attributable to the acquisition of the items. Office premises (which includes leasehold land and buildings) are stated at revalued amount less accumulated depreciation.
Depreciation is calculated and charged to profit and loss account using the straight-line method so as to write down the cost of the assets to their residual values over their estimated useful lives at the rates given in note 13.2. A full month’s depreciation is charged from the month in which assets are brought into use and no depreciation is charged for the month in which the disposal is made. The residual values, useful lives and depreciation methods are reviewed and changes, if any, are treated as change in accounting estimates, annually.
Subsequent costs are included in the asset’s carrying amount or recognised as a separate asset, as appropriate, only when it is probable that future economic benefits associated with the item will flow to the Group and the cost of the item can be measured reliably. The carrying amount of the replaced part is de-recognised. All other repairs and maintenance are charged to the profit and loss account during the period in which they are incurred.
An item of property and equipment is de-recognised upon disposal or when no future economic benefits are expected from its use or disposal. Any gain or loss arising on de-recognition of the asset is recognised in the profit and loss account in the year the asset is de-recognised.
7.8.2 Surplus / deficit on revaluation of operating fixed assets
During the year, the Group changed its accounting policy from cost model to revaluation model in respect of leasehold land and building. With effect from the current year, these are carried at revalued amounts, being fair value at the date of revaluation less accumulated depreciation and accumulated impairment losses.
For the year ended December 31, 2017
Notes to the Consolidated Financial Statements

182 JS Bank Annual Report 2017
The Group has carried out the revaluation exercise by independent valuators, which has resulted in surplus on land and buildings of Rs.124.654 million and Rs.919.193 million over their existing written down values of Rs.964.306 million and Rs.868.058 million, respectively.
The fair values were determined with reference to market based evidence, based on active market prices and relevant enquiries and information as considered necessary, and adjusted for any difference in nature, location or condition of the specific properties. Management takes the view that this policy provides reliable and more relevant information because it deals more accurately with the components of property and is based on up-to-date values.
Had there been no revaluation, the carrying value of leasehold land and building would have been lower by Rs.124.654 million and Rs.798.216 million respectively, and net surplus on revaluation of fixed assets, deferred tax liability and incremental depreciation would have been lower by Rs.656.597 million, Rs.266.273 million and Rs.15.836 million respectively.
The surplus arising on revaluation of operating assets is credited to the “Surplus on Revaluation of Fixed Assets Account” shown below equity in the statement of financial position in accordance with the requirements of section 235 of the repealed Companies Ordinance, 1984. However, the increase shall be recognised in profit or loss to the extent that it reverses a revaluation decrease of the same asset previously recognised in profit and loss account.
The deficit as a result of a revaluation is recognised in profit and loss account. However, the decrease to be recognised in other comprehensive income to the extent of any credit balance existing in the revaluation surplus in respect of that asset.
The said section was amended through the Companies (Amendment) Ordinance, 2002 and, accordingly, the Group has adopted the following accounting treatment of depreciation on revalued assets, keeping in view the Securities and Exchange Commission of Pakistan’s (SECP) SRO 45(1)/2003 dated January 13, 2003:
Depreciation on buildings which are revalued is determined with reference to the value assigned to such assets on revaluation and depreciation charge for the year is taken to the profit and loss account; and an amount equal to incremental depreciation for the year net of deferred taxation is transferred from “Surplus on Revaluation of Fixed Assets Account” to unappropriated profit through Statement of Changes in Equity to record realization of surplus to the extent of the incremental depreciation charge for the year.
Intangible assets
Intangible assets are stated at cost less accumulated amortisation and impairment, if any. Intangible assets are amortised from the month when the assets are available for use, using the straight line method, whereby the cost of the intangible asset is amortised over its estimated useful life over which economic benefits are expected to flow to the Group. The useful life and amortisation method are reviewed and adjusted, if appropriate annually.
Intangible assets having an indefinite useful life are carried at cost less any impairment in value and are not amortised. Intangible assets having an indefinite useful life are reviewed for impairment annually or more frequently if events or changes in circumstances indicate that the carrying value may be impaired.
Capital work-in-process
Capital work-in-process is stated at cost less impairment losses, if any. These are transferred to specified assets as and when assets are available for use.
For the year ended December 31, 2017
Notes to the Consolidated Financial Statements

183JS Bank Annual Report 2017
Assets subject to finance leases
Assets held under finance leases are initially recorded at the lower of the present value of minimum lease payments under the lease agreements and the fair value of the leased assets. The related obligations under the lease, net of financial charges allocated to future periods, are shown as a liability.
The financial charges are allocated to accounting periods in a manner so as to provide a period rate of interest on the outstanding liability.
7.9 Non-banking assets acquired in satisfaction of claims
7.9.1 Non-banking assets acquired in satisfaction of claims under Debt Property Swap (DPS) transactions, against the loans in category of loss, are carried at the revalued amounts, being the fair value at the date of revaluation less subsequent accumulated depreciation and subsequent accumulated impairment losses, if any.
All direct cost including legal fees, valuation and transfer costs of acquiring title to property shall be expensed when incurred through profit and loss account.
Subsequent costs are included in the asset's carrying amounts only when it is probable that future benefits associated with the item will flow to the Group and the cost of the item can be measured reliably. All other subsequent costs including repair and maintenance are charged to the profit and loss account as and when incurred.
7.9.2 Surplus / deficit on revaluation of non banking assets
7.9.2.1 The surplus arising on revaluation of non-banking assets is credited to the “Surplus on Revaluation of Fixed Assets Account” shown below equity in the statement of financial position in accordance with the requirements of section 235 of the repealed Companies Ordinance 1984. However, the increase shall be recognised in profit or loss to the extent that it reverses a revaluation decrease of the same asset previously recognised in profit and loss account.
The deficit as a result of a revaluation is recognised in profit and loss account. However, the decrease to be recognised in other comprehensive income to the extent of any credit balance existing in the revaluation surplus in respect of that asset.
Furthermore, revaluation surplus on such assets shall not be admissible for calculating Bank’s Capital Adequacy Ratio (CAR) and exposure limits under the Prudential Regulations. However, the surplus can be adjusted upon realization of sale proceeds.
7.9.2.2 The Group has adopted the following accounting treatment for depreciation on revalued assets, keeping in view the requirements of the repealed Companies Ordinance, 1984 and SECP's SRO 45(1)/2003 dated January 13, 2003.
Depreciation on assets which are revalued is determined with reference to the value assigned to such assets on revaluation and depreciation charge for the year is taken to the profit and loss account; and
An amount equal to incremental depreciation for the year net of deferred taxation is transferred from “Surplus on Revaluation of Fixed Assets account” to unappropriated profit through statement of changes in equity to record realization of surplus to the extent of the incremental depreciation charge for the year.
Gains or losses on disposal of assets are included in the profit and loss account currently, except that the related surplus on revaluation of fixed assets (net of deferred tax) is transferred directly to equity.
For the year ended December 31, 2017
Notes to the Consolidated Financial Statements

184 JS Bank Annual Report 2017
7.10 Impairment
At each balance sheet date, the Group reviews the carrying amounts of its assets (other than investment and deferred tax asset) to determine whether there is an indication that those assets have suffered an impairment loss. If any such indication exists, the recoverable amount of the assets is estimated in order to determine the extent of the impairment loss, if any. Recoverable amount is the higher of net selling price (being fair value less cost to sell) and value-in-use. If the recoverable amount of an asset is estimated to be less than its carrying amount, the carrying amount of the assets is reduced to its recoverable amount. Impairment losses are recognised as an expense in profit and loss account immediately.
Where impairment loss subsequently reverses, the carrying amount of the asset is increased to the revised recoverable amount but limited to the extent of the amount which would have been determined had there been no impairment. Reversal of impairment loss is recognized as income.
7.11 Taxation
Current
Provision for current taxation is based on taxable income for the year determined in accordance with the prevailing laws for taxation on income. For income covered under final tax regime, taxation is based on applicable tax rate under such regime. The charge for current tax also includes adjustments, where considered necessary, relating to prior years arising from assessments made during the year.
Deferred
Deferred tax is recognised using the balance sheet liability method on all temporary differences arising between tax bases of assets and liabilities and their carrying amounts appearing in the consolidated financial statements. Deferred tax liability is recognized on taxable temporary differences. Deferred tax asset is recognised for all deductible temporary differences and carry forward of unused tax losses, if any only to the extent that it is probable that future taxable profits will be available against which the asset can be utilised. Deferred tax assets are reduced to the extent that it is no longer probable that the related tax benefits will be realised.
Deferred tax is calculated at the rates that are expected to apply to the period when the differences are expected to reverse, based on tax rates that have been enacted or substantively enacted by the balance sheet date. Deferred tax is charged or credited to the consolidated profit and loss account.
Deferred tax, if any, on revaluation of investments is recognised as an adjustment to surplus / (deficit) arising on revaluation in accordance with the requirements of IAS-12 "Income Taxes".
7.12 Provisions
Provisions are recognised when the Group has a legal or constructive obligation as a result of past events, it is probable that an outflow of resources will be required to settle the obligation and a reliable estimate of the amount can be made. Provisions are reviewed at each balance sheet date and are adjusted to reflect the current best estimate.
Provision against identified non-funded losses is recognised when intimated and reasonable certainty exists for the Group to settle the obligation. The loss is charged to consolidated profit and loss account net of expected recovery.
For the year ended December 31, 2017
Notes to the Consolidated Financial Statements

185JS Bank Annual Report 2017
7.13 Staff retirement benefits
Defined contribution plan - the Group
The Group has established a provident fund scheme for all its permanent employees in accordance with the trust deed and rules made there under. Equal monthly contributions are made, both by the Group and the employees, to the fund at the rate defined below of basic salary. Contribution by the Group is charged to profit and loss account.
- The Bank (Holding Company) 7.1%- JS Global Capital Limited (Subsidiary) 10%- JS Investment Limited (Subsidiary) 8%
Defined benefit plan as revised (Holding Company)
The Bank operates an approved funded gratuity scheme covering all its eligible employees who have completed minimum qualifying period. An actuarial valuation of defined benefit scheme is conducted at the end of every year or on occurrence of any significant change. The most recent valuation in this regard was carried out as at December 31, 2017, using the projected unit credit actuarial valuation method. Under this method cost of providing for gratuity is charged to profit and loss account so as to spread the cost over the service lives of the employees in accordance with the actuarial valuation. Past-service costs are recognised immediately in profit and loss account and actuarial gains and losses are recognised immediately in other comprehensive income.
7.14 Revenue recognition
Revenue is recognized to the extent that economic benefits will flow to the Group and the revenue can be reliably measured. These are recognized as follows:
- Mark-up / return / interest income on loans and advances, investments and continuous funding system transactions is recognised on accrual basis using effective interest method. Mark-up / return / interest income on non-performing loans and advances and investments is recognised on receipt basis.
- "Financing method is used in accounting for income from lease financing. Under this method, the unearned lease income (excess of the sum of total lease rentals and estimated residual value over the cost of leased assets) is deferred and taken to income over the term of the lease period so as to produce a constant periodic rate of return on the outstanding net investment in lease.
- Gains / losses on termination of lease contracts, documentation charges, front-end fees and other lease income are recognized as income on receipt basis.
- Commission is generally recognised as income at the time of affecting the transaction to which it relates, except on guarantees on which the commission is recognised as income over the period of the guarantee. Fees are recognised when earned.
- Dividend income is recognised when the right to receive the dividend is established.
- Remuneration for management services and asset investment advisory services are recognized when services are rendered.
- Commission income from open end funds is recognised at the time of sale of units
For the year ended December 31, 2017
Notes to the Consolidated Financial Statements

186 JS Bank Annual Report 2017
- Commission income and share of profit from management of discretionary client portfolios is recognised when services are rendered.
- Brokerage, consultancy and advisory fee, commission on foreign exchange dealings and government securities etc. are recognised as and when such services are provided.
- Gains and losses arising on revaluation of derivatives to fair value are taken to profit and loss account.
- Late payment surcharge on overdue balance of trade debts is recognised on receipt basis.
7.15 Dividend and appropriation to reserves
Dividend and appropriation to reserves except for statutory reserves are recognised in the consolidated financial statements in the periods in which these are approved.
7.16 Foreign currencies
Functional and presentation currency
Items included in the consolidated financial statements are measured using the currency of the primary economic environment in which the Group operates. The consolidated financial statements are presented in Pakistani Rupees, which is the Group's functional and presentation currency.
Foreign currency transactions
Transactions in foreign currencies are translated into rupees at the foreign exchange rates ruling on the transaction date. Monetary assets and liabilities in foreign currencies are expressed in rupee terms at the rates of exchange ruling on the balance sheet date. Forward foreign exchange contracts are valued at forward rates applicable to their respective maturities.
Translation gains and losses
Translation gains and losses are included in the consolidated profit and loss account.
Commitments
Commitments for outstanding forward foreign exchange contracts disclosed in these consolidated financial statements are translated at contracted rates. Contingent liabilities / commitments for letters of credit and letters of guarantee denominated in foreign currencies are expressed in rupee terms at the rates of exchange ruling on the consolidated statement of financial position date.
7.17 Goodwill
Goodwill acquired in a business combination before July 01, 2009 is initially measured at cost, being the excess of the cost of the business combination over the Bank’s interest in the net fair value of the identifiable assets, liabilities and contingent liabilities acquired. Following initial recognition, goodwill is measured at cost less any accumulated impairment losses. Goodwill is reviewed for impairment, annually or more frequently if events or changes in circumstances indicate that the carrying value may be impaired.
For the purpose of impairment testing, goodwill acquired in a business combination is, from the acquisition date, allocated to each of the Bank’s cash-generating units, or groups of cash-generating units, that are expected to benefit from the synergies of the combination, irrespective of whether other assets or liabilities of the acquiree are assigned to those units or groups of units.
For the year ended December 31, 2017
Notes to the Consolidated Financial Statements

187JS Bank Annual Report 2017
7.18 Segment reporting
A segment is a distinguishable component of the Group that is subject to risks and rewards that are different from those of other segments. A business segment is one that is engaged either in providing certain products or services, whereas a geographical segment is one engaged in providing certain products or services within a particular economic environment. Segment information is presented as per the Group's functional structure and the guidance of State Bank of Pakistan. The Group comprises of the following main business segments:
7.18.1 Business segments:
Corporate finance
This includes investment banking activities such as mergers and acquisitions, underwriting, privatization, securitization, Initial Public Offers (IPOs) and secondary private placements.
Trading and sales
This segment undertakes the Group's treasury, money market and capital market activities.
Retail banking
Retail banking provides services to small borrowers i.e. consumers, small and medium enterprises (SMEs) and borrowers' and agricultural sector. It includes loans, deposits and other transactions with retail customers.
Commercial banking
This includes loans, deposits and other transactions with corporate customers.
Payment and settlement
This includes activities such as payment and collections, fund transfer, clearing and settlement etc.
Brokerage
This includes brokerage commission earned on transactions in capital, money, foreign exchange and commodity markets.
Asset management
This includes fee for services rendered in connection with advisory and management of mutual funds.
7.18.2 Geographical segment
The Group has 322 (2016: 306) branches / sub-branches in Pakistan region and one whole sale banking branch in Bahrain (2016: 01)
7.19 Fiduciary assets
Assets held in a fiduciary capacity are not treated as assets of the Group in consolidated statement of financial position.
For the year ended December 31, 2017
Notes to the Consolidated Financial Statements

188 JS Bank Annual Report 2017
7.20 Operating leases / ijarah
Operating leases / Ijarah in which a significant portion of the risks and rewards of ownership are retained by the lessor / Muj'ir are classified as operating leases / Ijarah. Payments made during the period are charged to profit and loss account on straight-line basis over the period of the lease / Ijarah.
7.21 Borrowings / deposits and their cost
Borrowings / deposits are recorded at the proceeds received. Borrowing / deposit costs are recognised as an expense in the period in which these are incurred to the extent that they are not directly attributable to the acquisition of or construction of qualifying assets. Borrowing costs that are directly attributable to the acquisition, construction or production of a qualifying asset (one that takes a substantial period of time to get ready for use or sale) is capitalised as part of the cost of the asset.
7.22 Earnings per share
The holding company presents basic and diluted earnings per share (EPS). Basic EPS is calculated by dividing the profit or loss attributable to ordinary shareholders of the holding company by the weighted average number of ordinary shares outstanding during the year. Diluted EPS is determined by adjusting the profit or loss attributable to ordinary shareholders and the weighted average number of ordinary shares outstanding for the effects of all dilutive potential ordinary shares, if any.
2017 2016Note ------- Rupees in '000 -------
8. CASH AND BALANCES WITH TREASURY BANKS
In handLocal currency 4,067,572 2,877,976 Foreign currencies 659,116 625,326
4,726,688 3,503,302
With State Bank of Pakistan in:Local currency current account 8.1 8,594,102 8,536,187 Foreign currency current account - non remunerative 8.2 615,576 449,774 Foreign currency deposit account - remunerative 8.3 1,890,381 1,385,332
11,100,059 10,371,293
With National Bank of Pakistan in:Local currency current accounts 1,506,393 1,628,057
National Prize Bonds 971 6,611
17,334,111 15,509,263
8.1 These include local currency current accounts maintained with SBP as per the requirements of Section 22 of the Banking Companies Ordinance, 1962.
8.2 This represents current account maintained with the SBP under the requirements of BSD Circular No. 14 dated June 21, 2008.
8.3 This represents deposit accounts maintained with SBP under the requirements of BSD Circular No. 14 dated June 21, 2008 and mandatory reserve maintained to facilitate collection and settlement of foreign currency accounts under FE-25, as prescribed by the SBP. Profit rates on this deposit account are fixed on a monthly basis by the SBP. It carries profit of 0% (2016: 0%) per annum.
For the year ended December 31, 2017
Notes to the Consolidated Financial Statements

189JS Bank Annual Report 2017
2017 2016Note ------- Rupees in '000 -------
9. BALANCES WITH OTHER BANKSIn PakistanOn current accounts 68,304 220,595 On deposit accounts 9.1 12,181 10,771
80,485 231,366 Outside PakistanOn current accounts 780,092 295,022 On deposit accounts 9.2 188,919 241,359
969,011 536,381 1,049,496 767,747
9.1 These carry mark-up at the rate of 0% to 6.25% (2016: 0% to 6.5%) per annum.9.2 This represents deposit accounts / term placements outside Pakistan, carrying mark-up rate ranging
between 0% to 1% p.a (2016: 0%).2017 2016
Note ------- Rupees in '000 ------- 10. LENDINGS TO FINANCIAL INSTITUTIONS
Call money lendings 10.2 3,003,443 2,634,489 Due against bills re-discounting 10.3 112,756 - Repurchase agreement lendings (Reverse Repo) 10.4 - 8,699,925
3,116,199 11,334,414 10.1 Particulars of lendings
In local currency - 10,549,925 In foreign currency 3,116,199 784,489
3,116,199 11,334,414 10.2 These represent unsecured call money lendings to financial institutions carrying interest at the rates ranging
from 1.38% to 6.93% (2016: 0.17% to 6.00%) per annum. These will mature between January 02, 2018 and June 07, 2018 (January 03, 2017 and April 19, 2017).
10.3 This represents the obligation of the foreign corresponding banks on the discounting of foreign documentary bills purchased by the Bank on discount. These will mature between January 02, 2018 and June 18, 2018 (2016: Nil) and carry interest at the rates ranging from 3.75% to 4.29% per annum.
10.4 These are secured short-term lendings to various financial institutions, carrying mark-up rate Nil (2016: 5.8% to 6.1%) per annum. These are collateralized by Market Treasury Bills and Pakistan Investment Bonds as shown in note 10.5 below.
10.5 Securities held as collateral against repurchase agreement lendings to financial institutions
Cost of securities held as collateral against reverse repurchase lendings to financial institutions are as under:
2017 2016Further Further
Held by given as Held by given as Group collateral Total Group collateral Total
---------------------------------- Rupees in '000 ----------------------------------
Market Treasury Bills - - - 5,969,925 - 5,969,925 Pakistan Investment Bonds - - - 2,730,000 - 2,730,000
- - - 8,699,925 - 8,699,925
For the year ended December 31, 2017
Notes to the Consolidated Financial Statements

190 JS Bank Annual Report 2017
11. INVESTMENTS - net2017 2016
Held by Given as Held by Given as Group collateral Total Group collateral Total
11.1 Investments by type ------------------------------------------ Rupees in '000 ------------------------------------------
Held-for-trading securitiesMarket treasury bills 6,835,735 926,032 7,761,767 64,346,568 1,413,214 65,759,782 Pakistan investment bonds 709,872 - 709,872 - - - Ordinary shares of listed companies 326,570 - 326,570 732,684 - 732,684 Term finance certificates - listed 14,263 - 14,263 21,023 - 21,023 Sukuk certificates - listed 55,512 - 55,512 12,116 - 12,116 Open end mutual funds 423,465 - 423,465 294,359 - 294,359
8,365,417 926,032 9,291,449 65,406,750 1,413,214 66,819,964
Available-for-sale securitiesMarket treasury bills 11,501,193 2,991,504 14,492,697 4,885,943 - 4,885,943 Pakistan investment bonds 54,600,373 39,372,049 93,972,422 49,784,339 - 49,784,339 Ordinary shares of listed companies 3,704,524 - 3,704,524 2,626,343 - 2,626,343 Ordinary shares of unlisted companies 13,406 - 13,406 568,464 - 568,464 Preference shares of listed company 136,589 - 136,589 136,589 - 136,589 Term finance certificates - listed 182,322 - 182,322 182,322 - 182,322 Term finance certificates - unlisted 902,052 - 902,052 1,238,325 - 1,238,325 Sukuk certificates - unlisted 1,631,000 - 1,631,000 360,000 - 360,000 Open end mutual funds 1,378,107 - 1,378,107 1,465,829 - 1,465,829 Foreign currency bonds 1,899,702 2,431,932 4,331,634 5,701,917 - 5,701,917
75,949,268 44,795,485 120,744,753 66,950,071 - 66,950,071 Held-to-maturity securitiesPakistan investment bonds 41,398,485 - 41,398,485 - - -
Total investments at cost 125,713,170 45,721,517 171,434,687 132,356,821 1,413,214 133,770,035 Less: Provision for diminution in value
of investments (1,504,819) - (1,504,819) (1,420,022) - (1,420,022)
Investments (net of provision) 124,208,351 45,721,517 169,929,868 130,936,799 1,413,214 132,350,013
Unrealised (loss) / gain on revaluation of investments classified as held-for-trading securities (3,944) (14) (3,958) 17,890 (36) 17,854
Surplus / (deficit) on revaluation of available-for-sale securities - net 558,408 (195,483) 362,925 2,671,034 - 2,671,034
Total investments at market value 124,762,815 45,526,020 170,288,835 133,625,723 1,413,178 135,038,901
11.1.1 This includes surplus on revaluation of available for sale investments of subsidiaries amounting to Rs.80.378 million (2016: Rs.80.378 million) which represents the pre-acquisition surplus and has been included here only for meeting with requirement of the prescribed format of Banks / DFIs issued by the State Bank of Pakistan.
10.5.1 The market value of securities held as collateral against lendings to financial institutions amounted to Rs.Nil (2016: Rs.8,811.414 million).
For the year ended December 31, 2017
Notes to the Consolidated Financial Statements

191JS Bank Annual Report 2017
2017 2016 11.2 Investments by segments Note ------- Rupees in '000 -------
Federal government securitiesMarket treasury bills 11.2.1 22,254,464 70,645,725 Pakistan investment bonds 11.2.1 136,080,779 49,784,339
158,335,243 120,430,064 Fully paid ordinary sharesListed companies 11.2.2 4,031,094 3,359,027 Unlisted companies 11.2.3 13,406 568,464
4,044,500 3,927,491 Fully paid preference sharesListed companies 11.2.4 136,589 136,589
Term finance and sukuk certificates Term finance certificates – listed 11.2.5 196,585 203,345 Term finance certificates – unlisted 11.2.6 902,052 1,238,325 Sukuk certificates - listed 11.2.7 55,512 12,116 Sukuk certificates - unlisted 11.2.8 1,631,000 360,000
2,785,149 1,813,786 Mutual fundsOpen end mutual funds 11.2.9 1,801,572 1,760,188
OthersForeign currency bonds 11.2.10 4,331,634 5,701,917
Total investments at cost 171,434,687 133,770,035
Less: Provision for diminution in value of investments 11.3 (1,504,819) (1,420,022)
Investments (net of provisions) 169,929,868 132,350,013
Unrealised (loss) / gain on revaluation of held-for-trading securities 11.4 (3,958) 17,854
Surplus on revaluation of available-for-sale securities 11.1.1 362,925 2,671,034
Total investments at market value 170,288,835 135,038,901
For the year ended December 31, 2017
Notes to the Consolidated Financial Statements

192 JS Bank Annual Report 2017
11.2.1 Details of investment in Federal Government Securities
Market value2017 2016
Held by Given as Held by Given as Group collateral Total Group collateral Total
---------------------------------------------- Rupees in '000 --------------------------------------------Held-for-trading securitiesMarket treasury bills 6,835,535 926,018 7,761,553 64,345,307 1,413,178 65,758,485 Pakistan investment bonds 707,598 - 707,598 - - -
7,543,133 926,018 8,469,151 64,345,307 1,413,178 65,758,485 Available-for-sale securitiesMarket treasury bills 11,501,067 2,991,645 14,492,712 4,884,060 - 4,884,060 Pakistan investment bonds 54,278,753 39,151,006 93,429,759 49,834,951 - 49,834,951
65,779,820 42,142,651 107,922,471 54,719,011 - 54,719,011 Held-to-maturity securitiesPakistan investment bonds * 41,033,889 - 41,033,889 - - -
114,356,842 43,068,669 157,425,511 119,064,318 1,413,178 120,477,496
* These are carried at amortised cost in these consolidated financial statements
11.2.1.1 Principal terms of investment in Federal Government Securities
Name of investment Maturity Redemption period Coupon
Market treasury bills January 04, 2018 to August 30, 2018 On maturity On maturityPakistan investment bonds March 26, 2018 to December 29, 2026 On maturity Half yearly
11.2.1.2 Market Treasury Bills are for the periods of three months, six months and one year. The effective rates of profit on Market Treasury Bills range from 5.91% to 6.10% per annum (2016: 5.85% to 6.23% per annum) with maturities between January 04, 2018 and August 30, 2018 (2016: January 05, 2017 and November 23, 2017).
11.2.1.3 Pakistan Investment Bonds (PIBs) are for the periods of three, five, seven, ten and fifteen years. The rates of profit ranging from 6.02% to 10.42% per annum (2016: 6.08% to 10.42% per annum) with maturities between March 26, 2018 and December 29, 2026 (2016: July 17, 2017 to April 21, 2026).
For the year ended December 31, 2017
Notes to the Consolidated Financial Statements

193JS Bank Annual Report 2017
11.2.2 Details of investment in ordinary shares of listed companies
Number of shares ofName of the company Rs.10 each Rating Cost Market value
2017 2016 2017 2016 2017 2016 2017 2016 --------- Numbers --------- -------------------- Rupees in '000 ---------------
----- Held-for-trading securitiesAttock Refinery Limited 56,500 78,000 AA AA 13,062 32,294 13,228 33,173 Engro Fertilizer Limited 163,000 523,000 AA- AA- 10,747 34,673 11,038 35,554 D.G. Khan Cement Limited 118,000 380,000 Unrated Unrated 14,917 81,713 15,779 84,257 Engro Corporation Limited 129,000 342,000 AA AA 35,777 107,533 35,443 108,103 Fauji Fertilizer Company Limited 353,500 304,500 AA AA 27,415 31,915 27,965 31,781 Fauji Cement Company Limited 165,500 258,000 Unrated Unrated 4,132 11,507 4,139 11,631 International Steels Limited 1,000 - A+ - 100 - 106 - Maple Leaf Cement Factory Limited 27,000 - A+ - 1,915 - 1,848 - National Bank of Pakistan Limited 21,500 176,500 AAA AAA 1,045 13,203 1,044 13,218 Oil & Gas Development Company Limited 239,500 291,500 AAA AAA 39,069 47,924 38,988 48,200 Pakistan State Oil Limited 263,500 132,500 AA AA 78,352 56,626 77,234 57,533 Pak Elektron Limited 1,736,000 1,938,000 A+ A+ 87,437 133,082 82,443 138,141 United Bank Limited 70,000 - AAA - 12,602 - 13,158 - Engro Foods Limited - 14,500 - Unrated - 2,578 - 2,783 Ghani Global Glass Limited - 94,012 - Unrated - 940 - 2,204 Hascol Petroleum Limited - 126,500 - A+ - 41,246 - 42,696 MCB Bank Limited - 82,000 - AAA - 19,391 - 19,501 Nishat Mills Limited - 73,000 - AA - 11,033 - 11,116 Nishat Chunian Limited - 300,000 - Unrated - 18,723 - 18,729 Pakistan Oilfields Limited - 57,000 - Unrated - 30,414 - 30,473 Pakistan Petroleum Limited - 7,000 - Unrated - 1,324 - 1,317 The Bank of Punjab - 2,224,000 - AA - 39,382 - 39,254 TPL Trakker Limited - 940,000 - A- - 17,183 - 16,572
326,570 732,684 322,413 746,236 Available-for-sale securitiesNational Foods Limited 265,900 68,800 AA- AA- 95,885 24,990 86,194 25,800 Amreli Steels Limited 761,200 3,000,000 A A 71,244 214,269 70,533 199,770 Fauji Fertilizer Company Limited 2,510,100 - AA - 246,261 - 198,574 - D. G. Khan Cement Limited
(note 11.2.2.1) 1,759,500 - Unrated - 424,293 - 235,280 - Shifa International Hospitals 118,700 - Unrated - 35,720 - 35,610 - Pakistan State Oil Limited 1,125,360 - AA - 433,401 - 329,854 - Power Cement Limited (note 11.2.2.1) 33,602,500 A- - 611,078 - 293,686 - Pakistan Stock Exchange
Limited (PSXL) (note 11.2.2.2) 2,202,953 - Unrated - 23,061 - 49,346 - IGI Insurance Limited - 2,407,100 - AA - 572,524 - 741,122
Investment in related partiesEFU General Insurance Limited 3,943,875 3,943,875 AA+ AA+ 488,978 488,978 603,018 595,525 EFU Life Assurance Limited 982,000 982,000 AA+ AA+ 190,595 190,595 248,927 211,592 Sitara Chemical Industries Limited 1,651,250 1,896,400 A+ A+ 493,697 544,676 496,993 1,099,912 TRG Pakistan Limited 32,023,760 32,023,760 Unrated Unrated 590,311 590,311 947,903 1,417,372
3,704,524 2,626,343 3,595,918 4,291,093
4,031,094 3,359,027 3,918,331 5,037,329
11.2.2.1 During the year, the Bank has recognized impairment loss on D.G.Khan Cement Limited and Power Cement Limited by Rs. 189.013 million and 317.392 million respectively due to significant / prolong decline in the fair value of these securities.
11.2.2.2 On June 23, 2017 SECP approved PSX’s application for listing and thereafter, the shares were successfully listed on June 29, 2017. Accordingly, after that these are carried at market value.
For the year ended December 31, 2017
Notes to the Consolidated Financial Statements

194 JS Bank Annual Report 2017
11.2.3 Details of investment in ordinary shares of unlisted companies
Name of Chief Executive / Name of the company Managing Director Break-up value per share Number of shares Cost / break-up value
2017 2016 2017 2016 2017 2016Note -------- Rupees -------- ------- Numbers ------- ----- Rupees in '000 -----
- ISE Towers REIT Management Limited(formerly Islamabad StockExchange Limited) 11.2.3.1 Mr. Aftab Ahmad Chaudhry * 11.76 11.67 1,213,841 1,213,841 11,000 11,000
- Society for Worldwide Interbank Financial Telecommunication(SWIFT) 11.2.3.2 Mr. Gottfried Leibbrandt **495,821 387,225 6 6 2,406 2,406
- Pakistan Stock Exchange Limited (PSX) 11.2.2.1 - - - 4,007,383 - 15,273
- AGP Limited (formerly AppolloPharma Limited) Mr. Nusrat Munshi - 14.05 - 13,400,000 - 539,785
13,406 568,464
* Based on unaudited accounts as of June 30, 2017** Based on audited accounts as of December 31, 2016
11.2.3.1 In accordance with the requirements of the Stock Exchanges (Corporatization, Demutualization and Integration) Act, 2012 (the Act), the Group has received 3,034,603 shares of Rs.10 each including trading right entitlement certificate (TREC) of the Islamabad Stock Exchange (ISE), in lieu of its Membership Card held by the Bank. Further, upon integration of Islamabad Stock Exchange under the "ISE Scheme of Integration" in 2016 TRE Certificates holders of ISE have been issued 1,213,841 shares of "ISE Towers REIT Management Limited".
11.2.3.2 The Holding Company qualified as a member based on the financial contribution to SWIFT for network-based services. The Holding Company has made an investment as per the requirements of By-Laws of SWIFT, under the Share Re-allocation Process, as a result becoming entitled to invest in for six shares. The participation is mandatory to avail the desired network-based services for financial message transmission for cross-border payments and receipt. Further, the share re-allocation occurs every three years and will result in either an increase, decrease, or a status quo in individual shareholding.
For the year ended December 31, 2017
Notes to the Consolidated Financial Statements

195JS Bank Annual Report 2017
11.2.4 Details of investment in preference shares of listed companies
Percentage Face value Number ofName of the company of holding per share shares Cost Market value
2017 2016 2017 2016 ------------------ Rupees in '000 ------------------
Available-for-sale securities
Agritech Limited (note 11.2.4.1 & 11.2.4.3) 3.03% 10 4,823,746 48,236 48,236 - -
Chenab Limited (note 11.2.4.2 & 11.2.4.3) 15.45% 10 12,357,000 88,353 88,353 - -
136,589 136,589 - -
11.2.4.1 These are non-voting cumulative preference shares, carrying preference dividend @ 10% p.a and are convertible into ordinary shares at the option of the Group after five years from the date of issuance i.e. February 2012. The investee company also has the option to redeem these preference shares plus any unpaid dividend in full or in part, within ninety days after expiry of each anniversary of the issue date. The Group has recognised full impairment on these shares amounting to Rs.48.236 million (2016: Rs.48.236 million) due to weak financial position of the company.
11.2.4.2 These are cumulative preference shares, carrying preference dividend @ 9.25% p.a and are redeemable in part after four years from the date of issuance i.e. August 2008. The investee company also has an option to redeem, in part, cumulative preference shares after August 2008. The Group has recognized full impairment on these shares amounting to Rs.88.353 million (2016: Rs.88.353 million) due to weak financial position of the company.
11.2.4.3 Surplus arising due to re-measurement of these shares to the market value has not been recognized as the management believes that the market value may not be realized while selling them in open market.
11.2.5 Details of investment in term finance certificates - listed *
Name of the company Number of certificates Rating Cost Market value2017 2016 2017 2016 2017 2016 2017 2016
----- Numbers ----- ---------------- Rupees in '000 ---------------- Held-for-trading securities
Jahangir Siddiqui Co. Ltd. - VIII- related party 6,000 6,000 AA+ AA+ 14,263 21,023 14,307 21,013
Available-for-sale securities
Worldcall Telecom Limited (note 11.2.5.1) 90,650 90,650 Unrated Unrated 182,322 182,322 - -
196,585 203,345 14,307 21,013
* Secured and have a face value of Rs.5,000 each unless specified otherwise.
For the year ended December 31, 2017
Notes to the Consolidated Financial Statements

196 JS Bank Annual Report 2017
11.2.5.1 Due to weak financial position of the company the Group has recognised full impairment loss on these term finance certificates.
11.2.5.2 Other particulars of listed term finance certificates are as follows:
RepaymentName of the company frequency Rate per annum Maturity date
Held-for-trading securities
Jahangir Siddiqui Co. Ltd. - 8th issue Semi-annually 6 Months KIBOR ask rate plus 1.75% April 08, 2019 - related party
Available-for-sale securities
Worldcall Telecom Limited Semi-annually 6 Month KIBOR ask rate plus 1.60% October 15, 2021
11.2.6 Details of investment in term finance certificates - unlisted, secured
Number of Face value perName of the company certificates Rating certificate Cost
2017 2016 2017 2016 Rupees 2017 2016----- Numbers ----- ------- Rupees in '000 -------
Available-for-sale securitiesAgritech Limited 11.2.6.1 30,000 30,000 Unrated Unrated 5,000 149,860 149,860 NRSP Microfinance Bank Limited 60,000 60,000 A A 5,000 75,000 225,000 Pakistan Water & Power
Development Authority (WAPDA) 100,000 100,000 AAA AAA 5,000 285,714 357,143 Azgard Nine Limited (related party) 11.2.6.1 29,998 29,998 Unrated Unrated 5,000 65,022 65,022 Azgard Nine Limited (related party)
(privately placed TFCs) 11.2.6.2 12 12 Unrated Unrated N/A 326,456 326,456 Askari Bank Limited - 4th Issue - 75 - AA- 1,000,000 - 75,047 Bank Alfalah Limited - 4th issue - 1,440 - AA- 5,000 - 4,797 Independent Media Corporation
(Pvt.) Limited - 20,000 - BBB- 5,000 - 35,000
902,052 1,238,325
11.2.6.1 Due to weak financial position of the company the Group has recognised full impairment loss on these term finance certificates.
11.2.6.2 These PPTFCs are held by JS Global Capital Limited has recognised full provision considering the financial position of the issuer amounting to Rs.326.456 million (2016: Rs.326.456 million).
For the year ended December 31, 2017
Notes to the Consolidated Financial Statements

197JS Bank Annual Report 2017
11.2.6.3 Other particulars of unlisted term finance certificates are as follows:
Name of the company Repayment frequency Rate per annum Maturity date
Available-for-sale securities
Agritech Limited Semi-annually 6 Month KIBOR ask rate November 29, 2019(Chief Executive: Mr. Faisal Muzammil) plus 1.75%.
NRSP Microfinance Bank Limited Quarterly 3 Month KIBOR ask rate June 30, 2018(Chief Executive: Mr. Zahoor Hussain Khan) plus 2.35%.
Pakistan Water & Power Development Semi-annually 6 Month KIBOR ask rate September 27, 2021Authority (WAPDA) plus 1.00%.(Chairman: Lieutenant General
Muzammil Hussain (Retd.))
Azgard Nine Limited - related party Semi-annually 6 Month KIBOR ask rate December 04, 2017(Chief Executive: Mr. Ahmed H. Shaikh) plus 1.75% and 11% and October 19, 2020
11.2.7 Sukuk certificates - listed
Name of the company Number of certificates Rating Cost Market value2017 2016 2017 2016 2017 2016 2017 2016
----- Numbers ----- ------------- Rupees in '000 -------------Held-for-trading securities
Engro Corporation Limited - Islamic Rupiya I - 1,635 AA+ AA+ - 8,704 - 8,566 Engro Corporation Limited - Islamic Rupiya II 597 597 AA+ AA+ 3,512 3,412 3,371 3,512 Dawood Hercules Corporation Limited
(note 11.2.7.2) 520 - Unrated 52,000 - 52,000 - 55,512 12,116 55,371 12,078
11.2.7.1 Details of investments in listed sukuk certificateRepayment Rate per Maturity
Name of the company frequency annum date
Engro Corporation Limited - Islamic Rupiya II Semi-annually 13.50% July 10, 2019
11.2.7.2 This represents, the advance against subscription of sukuk certificates of the Dawood Hercules Corporation Limited, having tenor of five years and carrying mark-up at the rate of 1% plus 3 months KIBOR. Subsequent to year end, the units are allocated into the CDC account of the JS Global, the Company.
11.2.8 Sukuk certificates - unlisted
Number of Face value perName of the company certificates Rating certificate Cost
2017 2016 2017 2016 2017 2016 ----- Numbers ----- Rupees ---- Rupees in '000 ----
Available-for-sale securities
Engro Fertilizers Limited 80,000 80,000 AA- AA- 3,500 280,000 360,000 Byco Oil Pakistan Limited 6,810 - AAA - 100,000 681,000 - Ghani Gases Limited 2,000 - A - 87,500 175,000 - AGP Limited 5,500 - A - 90,000 495,000 -
1,631,000 360,000
For the year ended December 31, 2017
Notes to the Consolidated Financial Statements

198 JS Bank Annual Report 2017
For the year ended December 31, 2017
Notes to the Consolidated Financial Statements
11.2.8.1 Other particulars of unlisted term finance certificates are as follows:
RepaymentName of the company frequency Profit rate per annum Maturity date
Engro Fertilizers Limited Semi-annually 6 Month KIBOR ask rate July 09, 2019(Chief Executive: Mr. Ruhail Muhammad) plus 1.75%.
Byco Oil Pakistan Limited Quarterly 3 Month KIBOR ask rate January 18, 2022(Chief Executive: Mr. Amir Abbassciy) plus 1.05%.
Ghani Gases Limited Quarterly 3 Month KIBOR ask rate February 03, 2023(Chief Executive: Mr. Atique Ahmad Khan) plus 1.00%.
AGP Limited Quarterly 3 Month KIBOR ask rate June 09, 2022(Chief Executive: Mr. Nusrat Munshi) plus 1.30%.
11.2.9 Details of investment in units of open end mutual funds
Net assetvalue
Name of fund Number of units Rating per unit Cost Market value2017 2016 2017 2016 Rupees 2017 2016 2017 2016 ----- Numbers ----- --------------------- Rupees in '000 ---------------------
Held-for-trading securities
ABL Cash Fund 21,806,577 - AA (f) - 10.32 225,000 - 225,000
Held-for-trading securities - related parties
JS Cash Fund 418,688 55,020 AA (f) A+ 104.18 42,501 5,638 43,619 5,790 JS Income Fund 552,774 1,439,650 A+ (f) A1 98.44 53,000 138,974 54,415 143,346 JS Islamic Income Fund 1,007,964 1,469,339 Unrated A1 102.40 102,964 149,747 103,216 150,872
423,465 294,359 426,250 300,008 Available-for-sale securitiesNAFA Government Securities - 9,325,314 AAA (f) AAA (f) Rs.10.42 - 100,000 - 97,157
Liquid Fund
Related parties (note: 11.2.9.1)JS IAAP2 100,000 - Unrated - 100.16 10,000 - 10,016 - JS Value Fund 2,565,210 2,745,548 Unrated A+ 200.43 465,731 464,320 514,145 705,935 JS Growth Fund 3,554,958 3,606,837 Unrated A+ 180.36 597,685 601,851 641,172 804,830 JS Fund of Funds 3,441,521 3,355,325 Unrated A+ 50.63 181,553 176,520 174,244 193,770 JS Islamic Pension Savings
Fund - Equity 240,000 200,000 Unrated A+ 454.01 24,000 20,000 108,962 152,800 JS Islamic Pension Savings
Fund - Debt 177,761 213,852 Unrated A+ 232.96 17,776 21,385 41,411 41,263 JS Islamic Pension Savings
Fund - Money Market 177,463 222,303 Unrated A+ 187.25 17,746 22,230 33,230 36,969 JS Pension Savings Fund -
Money Market 222,303 177,463 Unrated A+ 171.07 22,230 17,746 38,029 32,144 JS Pension Savings Fund - Debt 213,852 177,761 Unrated A+ 197.87 21,386 17,777 42,315 39,591 JS Pension Savings Fund - Equity 200,000 240,000 Unrated A+ 625.93 20,000 24,000 125,186 129,504
1,378,107 1,465,829 1,728,710 2,233,963
1,801,572 1,760,188 2,154,960 2,533,971
11.2.9.1 The Group has recognised impairment on these units amounting to Rs.106.513 million (2016: Rs.144.746).

199JS Bank Annual Report 2017
11.2.10 Details of investment in foreign currency bonds
Coupon Name of Bond Rating Rate % Date of maturity Cost Market value
2017 2016 2017 2016 2017 2016Available for sale --------------------- Rupees in '000 ---------------------
African Export - Import Bank Baa1 - 4.13% June 20, 2024 223,514 - 222,592 - Islamic Republic of Pakistan B - 6.88% December 5, 2027 55,209 - 55,354 - Turkiye Is Bankasi A.S BB+ - 5.50% April 21, 2022 389,917 - 389,799 - Turkiye Is Bankasi A.S BB+ - 5.38% October 6, 2021 55,025 - 55,655 - Turkiye Is Bankasi A.S BB+ - 6.13% April 25, 2024 224,545 - 222,519 - State Oil Company of the Azerbaijan BB+ - 4.75% March 13, 2023 148,044 - 151,830 - Export Credit Bank of Turkey BB+ - 5.38% October 24, 2023 108,844 - 111,566 - PTA Bank Baa3 - 5.38% March 14, 2022 112,662 - 115,171 - Rosneft International Finance DAC Ba1 - 4.20% March 6, 2022 178,092 - 178,227 - Arab Republic of Egypt B - 7.50% January 31, 2027 235,088 - 243,892 - Petrobras Global Finance BB - 7.38% January 17, 2027 118,759 - 121,354 - Russian Federation BBB- - 4.25% June 23, 2027 110,417 - 113,698 - Arab Republic of Egypt B - 5.88% June 11, 2025 218,116 - 222,727 - Gazprom via Gaz Capital SA BBB- - 4.25% April 6, 2024 153,547 - 154,245 - Banco BTG Pactual S.A. Ba3 - 4.00% January 16, 2020 65,010 - 65,551 - DIB Sukuk Ltd. A - 3.66% February 14, 2022 23,519 - 23,723 - BOS Funding Ltd BBB+ - 4.23% March 7, 2022 110,492 - 112,055 - Saudi International Bond A+ - 2.88% March 4, 2023 30,639 - 30,271 - Akbank Tas BB+ - 5.00% October 24, 2022 168,014 - 166,663 - Turkiye Garanti Bankasi A.S BBB- - 5.25% September 13, 2022 227,874 - 225,090 - Turkiye Garanti Bankasi A.S BBB- - 5.88% March 16, 2023 115,941 - 114,418 - African Export - Import Bank Baa1 Baa2 4.00% May 24, 2021 232,521 220,151 235,918 220,049 Deutches Bank AG BBB+ BBB+ 3.38% May 12, 2021 138,943 131,544 140,275 130,013 CBD (Cayman) Ltd A- A- 4.00w% November 17, 2020 224,056 213,242 226,086 213,048 Turkiye Is Bankasi A.S BB+ Ba1 5.50% April 21, 2019 111,381 106,174 112,458 105,351 Akbank Tas BB+ Ba1 4.00% January 24, 2020 54,883 51,851 55,327 50,691 Turkiye Garanti Bankasi A.S BBB- Ba1 4.75% October 17, 2019 55,623 52,898 56,017 51,931 Republic Of Kazakhstan BBB BBB- 5.13% July 21, 2025 117,360 111,905 122,883 111,457 Turkiye Halk Bankasi A.S BB+ Ba1 3.88% February 5, 2020 68,761 65,031 65,894 60,971 Bankpozitif Kredi Ve
Kalkinma Bankasi A.S BBB- BBB- 5.00% February 7, 2018 115,938 109,828 115,816 106,501 Samarco Mineracao SA (note 11.2.10.1) CC C 5.38% September 26, 2024 53,527 52,374 37,696 28,184 Abu Dhabi National Energy Company PJSC A3 A- 3.63% June 22, 2021 30,181 28,572 30,717 28,920 Bankpozitif Kredi Ve
Kalkinma Bankasi A.S BBB- BBB- 5.00% February 7, 2018 55,192 52,129 55,151 50,715 Yapi Ve Kredi Bankasi - Ba1 - - - 104,366 - 99,297 Barclays Bank Plc - BBB - - - 102,273 - 104,464 Deutches Bank AG - BBB+ - - - 204,309 - 205,478 Credit Suisse Group Funding - BBB+ - - - 103,284 - 104,295 HSBC Holdings Plc - A1 - - - 23,385 - 23,747 Perusahaan Penerbit SBSN - Baa3 - - - 104,599 - 104,110 Oman Government International - BBB - - - 51,875 - 52,235 Islamic Republic of Pakistan - B - - - 657,554 - 662,968 Islamic Republic of Pakistan - B - - - 668,085 - 687,118 Islamic Republic of Pakistan - B - - - 779,606 - 792,346 Federal Republic Of Brazil - BB - - - 105,372 - 107,815 Islamic Republic of Pakistan - B - - - 317,841 - 317,153 EA Partners II BV - B - - - 209,197 - 210,406 Emirates NBD PJSC - A3 - - - 104,599 - 104,814 Gazprombank (OJSC) - BB+ - - - 69,767 - 71,841 Banco BTG Pactual - BB- - - - 61,051 - 57,893 Africa Finance Corporation - A3 - - - 211,879 - 213,853 IBQ Finance Limited - A+ - - - 208,782 - 211,251 The Third Pakistan International
Sukuk Co. Ltd. - B - - - 418,394 - 426,026
4,331,634 5,701,917 4,350,638 5,714,941
11.2.10.1 The Bank has recognised partial impairment on this bond amounting to Rs.31.653 million (2016: Rs.31.653 million) due to weak financial position of the company.
For the year ended December 31, 2017
Notes to the Consolidated Financial Statements

200 JS Bank Annual Report 2017
2017 201611.3 Particulars of provision for diminution Note ------- Rupees in '000 -------
in value of investments
Opening balance 1,420,022 1,080,118
Charge for the year 506,405 415,027 Reversal on disposal of investments (421,608) (75,123)
84,797 339,904 Closing balance 1,504,819 1,420,022
11.3.1 Particulars of provision for diminution in value of investments by type and segment
Available-for-sale
Ordinary shares - listed 11.2.2 506,405 -Ordinary shares - unlisted 11.2.3 - 383,374 Preference shares - listed 11.2.4 136,589 136,589 Open end mutual funds 11.2.9 106,512 144,746 Term Finance Certificates - unlisted 11.2.6 541,338 541,338 Term Finance Certificates - listed 11.2.5 182,322 182,322 Foreign currency bonds 11.2.10.1 31,653 31,653
1,504,819 1,420,022 11.4 Unrealised gain / (loss) on revaluation of investments
classified as held-for-trading - net
Market treasury bills (214) (1,297)Pakistan investment bonds (2,274) - Ordinary shares - listed (4,156) 13,551 Term finance certificates - listed 44 (10)Open end mutual funds 2,783 5,648 Sukuk certificates - listed (141) (38)
(3,958) 17,854
11.5 Details of non-wholly owned subsidiaries that have material non-controlling interest (NCI) to the Group
The table below shows non-wholly owned subsidiaries that have material non-controlling interest to the group based on quantum of NCI.
Ownership interests held by Name of Subsidiary non- controlling interest
2017 2016
JS Global Capital Limited 32.84% 32.84%JS Investment Limited 34.84% 34.84%
The following is summarised financial information for JSGCL and JSIL, prepared in accordance with approved accounting standards as applicable in Pakistan, modified for differences in group accounting policies. The information is before inter-company eliminations with other companies in the group.
For the year ended December 31, 2017
Notes to the Consolidated Financial Statements

201JS Bank Annual Report 2017
JSGCL JSIL2017 2016 2017 2016
----------------------- Rupees' in 000 -----------------------
Total income 891,228 748,413 386,380 493,733 Profit after tax 85,530 171,038 32,216 199,698 Profit attributable to NCI 28,088 56,169 11,223 69,575
Total assets 3,762,455 4,391,037 2,599,123 3,074,008 Total liabilities 1,161,038 1,901,962 254,122 308,653 Net assets 2,601,417 2,489,075 2,345,001 2,765,355
Cash flow from operating activities 460,402 166,142 (99,084) (104,965)Cash flow from investing activities 170,371 (46,832) 143,566 103,384 Cash flow from financing activities 5 (551,684) (40,092) (18)Net increase in cash and cash equivalents 630,778 (432,374) 4,390 (1,599)
11.6 Investments include certain approved / government securities which are held by the Bank to comply with the Statutory Liquidity Requirement determined on the basis of the Bank’s demand and time liabilities as set out under section 29 of the Banking Companies Ordinance, 1962.
2017 201612. ADVANCES Note ------- Rupees in '000 -------
Loans, cash credit, running finances, etc.In Pakistan 160,657,078 84,712,910 Outside Pakistan 702,934 2,139
161,360,012 84,715,049
Net investment in finance lease in Pakistan 12.2 13,781,334 7,532,153
Bills discounted and purchased (excluding market treasury bills)payable in Pakistan 6,174,461 1,444,580 payable outside Pakistan 5,584,681 2,780,065
11,759,142 4,224,645 Advances - gross 12.1 186,900,488 96,471,847
Provision against non-performing advances - specific 12.3 (2,638,960) (2,618,353)Provision against advances - general 12.4 (100,353) (40,988)
(2,739,313) (2,659,341)
Advances - net of provision 184,161,175 93,812,506
12.1 Particulars of advances (gross)
12.1.1 In local currency 180,526,247 92,904,042 In foreign currencies 6,374,241 3,567,805
186,900,488 96,471,847
12.1.2 Short term (for up to one year) 122,523,127 77,188,912 Long term (for over one year) 64,377,361 19,282,935
186,900,488 96,471,847
For the year ended December 31, 2017
Notes to the Consolidated Financial Statements

202 JS Bank Annual Report 2017
12.2 Particulars of net investment in finance lease
2017 2016Later than Later than
Not later one and Not later one andthan less than than less than
one year five years Total one year five years Total------------------------------------ Rupees in '000 ------------------------------------
Lease rentals receivable 5,222,208 6,584,317 11,806,525 2,619,528 3,804,142 6,423,670 Guaranteed residual value 412,388 2,911,823 3,324,211 150,701 1,732,591 1,883,292 Minimum lease payments 5,634,596 9,496,140 15,130,736 2,770,229 5,536,733 8,306,962
Finance charges for future periods (776,285) (573,117) (1,349,402) (435,151) (339,658) (774,809)
Present value of minimum lease payments 4,858,311 8,923,023 13,781,334 2,335,078 5,197,075 7,532,153
12.3 Advances include Rs.3,257.997 million (2016: Rs.3,327.942 million) which have been placed under non-performing status as detailed below:
2017Provision Provision
Category of classification Domestic Overseas Total required heldNote ----------------------------- Rupees in '000 -----------------------------
Other assets especially mentioned 5,222 - 5,222 - - Substandard 336,818 - 336,818 44,307 44,307 Doubtful 131,328 - 131,328 7,333 7,333 Loss 2,784,629 - 2,784,629 2,587,320 2,587,320
12.4 3,257,997 - 3,257,997 2,638,960 2,638,960
2016Provision Provision
Category of classification Domestic Overseas Total required held----------------------------- Rupees in '000 -----------------------------
Other assets especially mentioned - - - - - Substandard 384,986 - 384,986 46,076 46,076 Doubtful 48,302 - 48,302 531 531 Loss 2,894,654 - 2,894,654 2,571,746 2,571,746
12.4 3,327,942 - 3,327,942 2,618,353 2,618,353
For the year ended December 31, 2017
Notes to the Consolidated Financial Statements

203JS Bank Annual Report 2017
12.4 Particulars of provision against non-performing advances
2017 2016Specific General Total Specific General Total
Note ------------------------------------- Rupees in '000 ---------------------------------------
Opening balance 2,618,353 40,988 2,659,341 2,705,929 17,252 2,723,181 Charge for the year 178,071 59,365 237,436 183,923 23,736 207,659 Reversals (34,622) - (34,622) (271,346) - (271,346)
143,449 59,365 202,814 (87,423) 23,736 (63,687)Amount written off from
the opening balance 12.6 (122,842) - (122,842) (153) - (153)
Closing balance 2,638,960 100,353 2,739,313 2,618,353 40,988 2,659,341
12.4.1 Particulars of provision against non-performing advances
In local currency 2,638,960 100,353 2,739,313 2,618,353 40,988 2,659,341
12.4.2 The general provision is maintained to create general reserves against following advances portfolios in accordance with the prudential regulations issued by State Bank of Pakistan as follows:
2017 2016 2017 2016Secured portfolio Unsecured portfolio
--------------------- Percentages --------------------Small enterprises financing - 1% - -Consumer financing 1% 1% 4% 4%Housing finance 0.5% 0.5% - -
12.5 The State Bank of Pakistan through various circulars has allowed benefit of the forced sale value (FSV) of Plant and Machinery under charge, pledged stock and mortgaged residential, commercial and industrial properties (land and building only) held as collateral against non-performing loans (NPLs) for a maximum of five years from the date of classification. As at December 31, 2017, the Bank has availed cumulative benefit of FSV of Rs.295.536 million (2016: Rs.398.690 million) under the directives of the SBP. Had the benefit not been taken the unappropriated profit after tax would have reduced by Rs.192.098 million (2016: Rs.259.149 million). Further, as required by the SBP directives, this unappropriated profit will not be available for distribution as dividend or other appropriations.
2017 2016 ------- Rupees in '000 -------
12.6 Particulars of Write Offs:
12.6.1 Against provisions 122,842 153 Directly charged to profit and loss account - 83
122,842 236
12.6.2 Write offs of Rs.500,000 and above 122,703 - Write offs of Below Rs.500,000 139 236
122,842 236
For the year ended December 31, 2017
Notes to the Consolidated Financial Statements

204 JS Bank Annual Report 2017
12.6.3 During the period, the Board of Directors in their meeting held on April 27, 2017 authorised the Bank to write-off the fully provided non-performing loans amounting to Rs.122.842 million. These loans are written-off as a book entry without prejudice to the Bank's right of recovery against the customers. In terms of sub-section (3) of section 33A of the Banking Companies Ordinance, 1962 the statement in respect of written-off loans or any other financial relief of five hundred thousand rupees or above allowed to a person during the year ended December 31, 2017 is given in Annexure 'II' to these financial statements.
12.7 Particulars of loans and advances to directors, associated companies, etc.
Debts due by directors, executives or officers of the Bank or any of them either severally or jointly with any other person:
2017 2016Note ------- Rupees in '000 -------
Balance at the beginning of the year 1,732,978 1,331,708 Loans granted during the year 1,142,255 883,950 Repayments (524,834) (482,680)Balance at the end of the year 2,350,399 1,732,978
13. OPERATING FIXED ASSETS
Capital work-in-progress 13.1 315,285 247,505 Property and equipment 13.2 5,397,430 3,992,811 Intangible assets 13.3 1,876,987 1,781,247
7,589,702 6,021,563 13.1 Capital work-in-progress
Property and equipment
Civil works 125,840 129,015 Advances for purchase of building - 5,377 Advances for purchase of furniture and fixtures 290 1,785 Advance for purchase of vehicles 59,190 26,405 Advance for purchase of equipment and software 129,965 84,923
315,285 247,505
For the year ended December 31, 2017
Notes to the Consolidated Financial Statements

205JS Bank Annual Report 2017
13.
2 Pr
oper
ty a
nd e
quip
men
tCO
ST
ACC
UMUL
ATED
DEP
RECI
ATIO
NEx
chan
ge
Charg
e for
Book
value
As at
Su
rplus
onga
in /
As at
As
at
the ye
ar /
Exch
ange
As
at
as at
Janu
aryrev
aluati
on A
dditio
ns /
adjus
tmen
ts De
cemb
erJa
nuary
Depr
eciat
ionga
in /
Dece
mber
Dece
mber
Rate
01, 2
017
Note:
13.2.
4 d
eletio
ns
Note:
13.2.
331
, 201
701
, 201
7on
dele
tions
adjus
tmen
ts 31
, 201
731
, 201
7%
------
------
------
------
------
------
------
------
------
------
------
-- Ru
pees
in '0
00 --
------
------
------
------
------
------
------
------
------
------
------
-
Leas
e hold
land
927,0
51
124,6
54
-
-
1,08
9,566
-
-
-
-
1,
089,5
66
- -
37
,861
-
-
Build
ing on
leas
e hold
land
1,10
0,277
81
4,053
51
0 1,
078
1,87
4,439
17
4,265
44
,765
146
218,8
63
1,65
5,576
1.0
2 - 4.
78 -
(4
1,479
) (3
13)
-
Leas
e hold
impr
ovem
ents
1,01
0,179
-
16
2,661
-
1,
172,8
40
443,4
62
97,78
0 -
54
1,242
63
1,598
10
- 20
-
-
-
-
Furn
iture
and
fixtur
e 45
1,481
-
91
,975
310
542,7
51
234,4
99
50,11
1 50
28
3,943
25
8,808
10
- 12
.5 (1
,015)
-
(717
) -
Ele
ctrica
l, offic
e and
co
mpute
r equ
ipmen
t 2,
204,1
72
-
526,6
91
217
2,70
7,825
1,
276,1
70
299,3
69
48
1,55
4,613
1,
153,2
12
12.5
- 33.3
(23,2
55)
-
(20,9
74)
-
Vehic
les 76
8,021
-
36
3,859
17
7 99
0,166
33
9,974
15
1,478
30
38
1,496
60
8,670
20
(141
,891)
-
(109
,986)
-
6,46
1,181
93
8,707
1,
145,6
96
1,78
2 8,
377,5
87
2,46
8,370
64
3,503
27
4 2,
980,1
57
5,39
7,430
(1
66,16
1) (3
,618)
(131
,990)
-
COST
A
CCUM
ULAT
ED D
EPRE
CIAT
ION
Charg
e for
Book
value
As at
As
at
As at
the
year
/As
at
as at
Janu
ary A
dditio
ns /
Write
off /
Dece
mber
Janu
aryDe
prec
iation
Write
off /
Dece
mber
Dece
mber
Rate
01, 2
016
dele
tions
ad
justm
ents
31, 2
016
01, 2
016
on d
eletio
nsad
justm
ents
31, 2
016
31, 2
016
%---
------
------
------
------
------
------
------
------
------
- Rup
ees i
n '00
0 ----
------
------
------
------
------
------
------
------
------
Land
and
freeh
old
370,5
00
543,5
90
-
927,0
51
-
-
-
-
927,0
51
- -
12
,961
-
-
Build
ing on
leas
e hold
land
849,3
70
262,2
68
-
1,10
0,277
14
9,479
33
,850
-
174,2
65
926,0
12
1.01 -
4.78
-
(11,36
1)
-
(9,06
4)
Leas
e hold
impr
ovem
ents
750,9
63
273,4
78
(12,66
2)
1,01
0,179
35
7,381
89
,679
(12,66
2)
443,4
62
566,7
17
10 -
20 -
(1,
600)
-
9,
064
Furn
iture
and
fixtur
e 36
6,846
10
3,320
(1
5,866
) 45
1,481
20
7,883
45
,074
(15,8
66)
234,4
99
216,9
82
10 -
12.5
(2,81
9) -
(2
,592)
-
Ele
ctrica
l, offic
e and
co
mpute
r equ
ipmen
t 1,
827,7
02
453,0
73
(58,5
20)
2,20
4,172
1,
100,8
11
249,0
07
(58,5
20)
1,27
6,170
92
8,002
12
.5 - 3
3.3 (1
8,083
) -
(1
5,128
) -
Vehic
les 62
2,047
23
1,549
-
76
8,021
27
0,780
13
3,613
-
33
9,974
42
8,047
20
(85.57
5)
(64,4
19)
4,78
7,428
1,
867,2
78
(87,0
48)
6,46
1,181
2,
086,3
34
551,2
23
(87,0
48)
2,46
8,370
3,
992,8
11
(106
,477)
-
(82,1
39)
-
For the year ended December 31, 2017
Notes to the Consolidated Financial Statements

206 JS Bank Annual Report 2017
13.2.1 Included in cost of property and equipment are fully depreciated items still in use having cost of Rs.718.360 million (2016: Rs.731.763 million).
13.2.2 The details of disposals of assets whose original cost or book value exceeds one million rupees or two hundred and fifty thousand rupees respectively, whichever is lower, are given in Annexure I of these consolidated financial statements.
13.2.3 During the year, the Holding Company has reclassified Rs. 37.861 million into lands which was earlier classified in the buildings, resultantly the excess depreciation charged on land of Rs. 14.931 million is reversed accordingly.
13.2.4 The properties of the Group are revalued by independent professional valuers as at May 31, 2014 and September 30, 2017 by M/s. KG Traders (Pvt) Limited and M/s. Tristar International Consultants Pvt Ltd respectively on the basis of professional assessment of present market values and resulted in an increase in surplus by Rs.1,043.847 million. The total surplus arising against revaluation of fixed assets as at December 31, 2017 amounts to Rs.922.870 million. Had there been no revaluation, the carrying value of revalued land and building on land as at December 31, 2017 would have been lower by Rs.124.654 million and Rs.798.216 million respectively, and net surplus on revaluation of fixed assets, deferred tax liability and incremental depreciation would have been lower by Rs.656.597 million, Rs.266.273 million and Rs.15.836 million respectively.
13.3 Intangible assets
COST ACCUMULATED AMORTISATION Book valueAs at As at As at Amortisation Charge As at as at
January 01, Additions / December 31, January 01, on deletions/ for the December 31, December 31, RateNote 2017 adjustment Deletions 2017 2017 adjustment year 2017 2017 %
--------------------------------------------------------------- Rupees in '000 ---------------------------------------------------------------
Trading right entitlementcertificate (TREC) 13.3.1 5,727 - - 5,727 - - - - 5,727 -
Membership card -Pakistan MercantileExchange Limited 13.3.2 3,500 - - 3,500 - - - - 3,500 -
Computer software 568,327 159,752 - 728,348 259,931 - 64,242 324,212 404,136 10 - 33.34 269 39
Goodwill 13.3.3 1,463,624 - - 1,463,624 - - - - 1,463,624 -
2,041,178 159,752 - 2,201,199 259,931 64,242 324,212 1,876,987 269 39 -
COST ACCUMULATED AMORTISATION Book valueAs at As at As at Charge As at as at
January 01, December 31, January 01, Amortisation for the December 31, December 31, Rate2016 Additions Deletions 2016 2016 on deletions year 2016 2016 %
--------------------------------------------------------------- Rupees in '000 ---------------------------------------------------------------
Trading right entitlementcertificate (TREC) 13.3.1 5,727 - - 5,727 - - - - 5,727 -
Membership card - Pakistan MercantileExchange Limited 13.3.2 3,500 - - 3,500 - - - - 3,500 -
Computer software 518,583 49,744 - 568,327 205,988 - 53,943 259,931 308,396 10 - 33.34
Goodwill 13.3.3 1,463,624 - - 1,463,624 - - - - 1,463,624 -
1,991,434 49,744 - 2,041,178 205,988 - 53,943 259,931 1,781,247
For the year ended December 31, 2017
Notes to the Consolidated Financial Statements

207JS Bank Annual Report 2017
13.3.1 This represents Trading Right Entitlement Certificate (TREC) received from PSX in accordance with the requirements of the Stock Exchanges (Corporatisation, Demutalization and integration) Act, 2012 (the Act). The company has also received shares of PSX after completion of the demutualisation process.
13.3.2 This represents membership cards of Pakistan Mercantile Exchange. It has an indefinite useful life and is carried at cost.
13.3.3 For impairment testing, goodwill has been allocated to 'Trading and Sales' segment as Cash Generating Unit (CGU), which is also a reportable segment.
13.3.4 Key assumptions used in value in use calculation
The recoverable amount of the CGU has been determined based on value in use calculation, using cash flow projections based on business plan approved by the Board of Directors of the Bank covering a five year period. The discount rates applied to cash flows beyond five years are extrapolated using a terminal growth rate. The following rates are used by the Bank.
2017 2016Percentages
Discount rate 19.33 16.33 Terminal growth rate 10.00 10.00
The calculation of value in use is most sensitive to following assumptions:
a) Interest margins
Interest margins are based on prevailing industry trends and anticipated market conditions.
b) Discount rates
Discount rates reflect management estimates of the rate of return required for each business and are calculated after taking into account the prevailing risk free rate, industry risk and business risk. Discount rates are calculated by using cost of equity of the Bank.
c) Key business assumptions
The assumptions are important as they represent management assessment of how the unit's position might change over the projected period. Based on the expansion plans, management expects aggressive growth in advances, investments and deposits during the projected periods and thereafter stabilisation in line with industry trends.
Management believes that any significant change in key assumptions, on which CGU's recoverable amount is based, may impact the carrying amount to further exceed its recoverable amount. Value in use calculation of the CGU are sensitive to changes in assumptions for interest rate spreads, Non Funded Income (NFI), long term growth rates and discount rates.
d) Sensitivity to changes in assumption
The estimated recoverable amount of the 'Trading and Sales' CGU exceeds its carrying amount by approximately Rs.1,336.8 million. Management has identified two key assumptions for which there could be a reasonably possible change that could cause the carrying amount to exceed the recoverable amount. The following table shows the amount that these two assumptions are required to change individually in order for the estimated recoverable amount to be equal to the carrying amount.
For the year ended December 31, 2017
Notes to the Consolidated Financial Statements

208 JS Bank Annual Report 2017
Changes required for carrying amount to equal recoverable
amount (%)
2017 2016
- Discount rate 1.02 1.41 - Terminal growth rate (1.49) (1.92)
2017 201614. OTHER ASSETS Note ------- Rupees in '000 -------
Mark-up / income accrued in local currency 14.1 4,055,364 2,331,591 Mark-up / income accrued in foreign currencies 67,337 85,801 Trade receivable from brokerage and advisory business - net 14.2 1,307,031 2,181,728 Advances, deposits, advance rent and other prepayments 725,902 882,029 Taxation (payments less provision) 462,440 490,593 Receivable against bancassurance / bancatakaful 14.3 89,727 19,278 Dividend receivable 7,943 - Stationery and stamps in hand 13,212 13,215 Balances due from funds under management 110,222 115,189 Receivable from other banks in respect of remittance 14.4 202,282 154,760 Non-banking assets acquired in satisfaction of claims 14.5 203,339 175,808 Unrealised loss on revaluation of derivative instruments 74,587 - Advance for subscription of TFC - unsecured 14.6 133,333 - ATM settlement account 226,827 171,428 Others 209,807 149,966
7,889,353 6,771,386 Less: Provision held against other assets 14.7 (474,995) (430,189)
7,414,358 6,341,197
14.1 This includes an amount of Rs. 24.890 million (2016: Rs.60.787 million) due from related parties.
14.2 Included herein is a sum of Rs. 2.448 million (2016: Rs.26.368 million) receivable from related parties.
14.3 This includes an amount of Rs. 74.240 million (2016: Rs.19.132 million) due from related parties.
14.4 This includes an amount of Rs.132.069 million (2016: Rs.123.486 million) receivable from State Bank of Pakistan in respect of home remittance services provided by the Bank.
14.5 Movement of Non banking assets acquired in satisfaction of claims at market value:
2017 2016Note ------- Rupees in '000 -------
As at January 01 175,808 182,455 Revaluation surplus arise during the year - net 13,395 84,175 Additions during the year 14.5.1 15,436 39,948 Deletions during the year - (129,648)Depreciation during the year (1,300) (1,122)
203,339 175,808
For the year ended December 31, 2017
Notes to the Consolidated Financial Statements

209JS Bank Annual Report 2017
14.5.1 Non-banking assets acquired in satisfaction of claims are carried at revalued amount according to the requirements of the ‘Regulation for Debt Property Swap’ (the regulations) issued by SBP vide the BPRD Circular No. 1 of 2016, dated January 01, 2016. Had there been no revaluation, the carrying value of non-banking assets acquired in satisfaction of claims would have been lower by Rs.97.241 million (2016: Rs.91.634 million), and surplus on revaluation of assets net, deferred tax liability and depreciation expense would have been lower by Rs.95.049 million (2016: Rs.84.175 million), Rs.2.192 million (2016: Rs.2.304 million) and Rs.0.329 million (2016: Rs.1.122 million) respectively.
2017 2016 ------- Rupees in '000 -------
Leasehold Land 88,640 73,206 Building 18,427 18,427
107,067 91,633
14.5.2 This represents property acquired under satisfaction of claims against which non-performing loan was reduced and specific provision has been reversed by Rs.15.436 million (2016: Rs.39.948 million).
14.6 This represents, the advance given against subscription of the TFCs of the FINCA Microfinance Bank by agreement dated October 19, 2017 carrying interest at the rate of average of three months KIBOR + 1.5% p.a.
2017 2016Note ------- Rupees in '000 -------
14.7 Provision held against other assets
Opening balance 430,189 424,908 Charged during the year 14.7.1 44,806 7,714 Reversed during the year - (2,433)
44,806 5,281 Closing balance 474,995 430,189
14.7.1 This represents receivable against insurance claim from a related party.
15. BILLS PAYABLE
In Pakistan 3,669,463 2,539,715 Outside Pakistan 154,815 4,313
3,824,278 2,544,028 16. BORROWINGS
In Pakistan 59,291,448 8,152,229 Outside Pakistan 5,265,595 2,167,818
16.1 & 16.2 64,557,043 10,320,047 16.1 Particulars of borrowings
In local currency 59,291,448 8,152,229 In foreign currencies 5,265,595 2,167,818
64,557,043 10,320,047
For the year ended December 31, 2017
Notes to the Consolidated Financial Statements

210 JS Bank Annual Report 2017
16.2 Details of borrowings from financial institutions 2017 2016Note ------- Rupees in '000 -------
SecuredBorrowings from State Bank of Pakistan under: Export refinancing scheme (ERF) 16.2.1 10,970,007 5,962,976 Long-Term Finance Facility (LTFF) 16.2.2 1,390,366 735,734 Financing Facility for Storage of Agricultural produce (FFSAP) 16.2.3 69,365 40,845
12,429,738 6,739,555
Repurchase agreement borrowings 16.2.4 44,802,031 1,412,674
UnsecuredCall borrowings 16.2.5 5,637,284 805,408 Due against bills re-discounting 16.2.6 1,488,994 1,321,882 Overdrawn nostro accounts 198,996 40,528
7,325,274 2,167,818 64,557,043 10,320,047
16.2.1 The Bank has entered into agreement with the State Bank of Pakistan (SBP) for extending export finance to customers. As per the terms of the agreement, the Bank has granted SBP the right to recover the outstanding amount from the Bank at the date of maturity of finances by directly debiting the current account maintained by the Bank with SBP. These borrowings are repayable on a quarterly basis and to be matured between January 09, 2018 and June 26, 2018. These carry mark-up at the rate from 1% to 2% (December 31, 2016: 2%) per annum.
16.2.2 These borrowings have been obtained from the SBP for providing financing facilities to exporters for adoption of new technologies and modernization of their plant and machinery. These borrowings will mature between August 25, 2019 and October 18, 2027 (2016: August 25, 2019 and December 31, 2026). These carry mark-up at rates ranging from 3.5% to 6% (2016: 3.5% to 6.0%) per annum.
16.2.3 These borrowings have been obtained from SBP under “Financing Facility for Storage of Agricultural Produce (FFSAP)” to encourage Private Sector to establish Silos, Warehouses and Cold Storages. These borrowings will mature between May 09, 2020 and July 31, 2024 and carry mark-up at the rate ranging between 2.00% to 2.50% (December 31, 2016: 3.5%) per annum.
16.2.4 This represents collateralised borrowing from various financial institutions against Market Treasury Bills, Pakistan Investment Bonds and Foreign Currency Bonds (2016: Treasury Bills) carrying mark-up at the rates ranging from 2.30% to 6.20% (2016: 5.6% to 5.75%) per annum and will mature between January 02, 2018 and March 20, 2018 (2016: January 03, 2017). The carrying value of securities given as collateral against these borrowings is given in note 11.1.
16.2.5 These represent call money borrowings from financial institutions which will mature between January 02, 2018 and January 29, 2018 (2016: January 05, 2017 and March 28, 2017), carrying interest at the rates ranging from 1.10% to 5.8% (2016: 1.80% to 2.76%) per annum.
16.2.6 This represents obligation to the foreign corresponding banks on the discounting of foreign documentary bills purchased by the Bank on discount. These will mature between January 19, 2018 to March 05, 2019 (2016: January 06, 2017 to March 14, 2017) and carry interest at the rates ranging from 1.65% to 4.22% (2016: 2.30% to 2.54%) per annum.
For the year ended December 31, 2017
Notes to the Consolidated Financial Statements

211JS Bank Annual Report 2017
17. DEPOSITS AND OTHER ACCOUNTS 2017 2016Note ------- Rupees in '000 -------
CustomersFixed deposits 131,902,422 101,194,427 Savings deposits 47,266,416 35,751,988Current accounts - non-remunerative 70,197,106 49,123,501 Margin accounts 3,967,204 4,185,137
253,333,148 190,255,053 Financial Institutions
Remunerative deposits 34,012,154 34,037,696 Non-remunerative deposits 1,019,712 711,906
35,031,866 34,749,602 288,365,014 225,004,655
17.1 Particulars of deposits
In local currency 275,209,678 214,339,799 In foreign currencies 13,155,336 10,664,856
288,365,014 225,004,655 18. SUB-ORDINATED LOANS
Term Finance Certificates - First Issue 18.1 2,998,800 3,000,000 Term Finance Certificates - Second Issue 18.2 2,000,000 -
4,998,800 3,000,000
18.1 In 2016, the Bank has issued Rs.3 billion of rated, privately placed, unsecured and subordinated term finance certificates ("TFCs" or "the Issue") as an instrument of redeemable capital under Section 120 of the Companies Ordinance, 1984 and as outlined by State Bank of Pakistan, SBP, under the BPRD circular No. 06 dated August 15, 2013 and Basel III guidelines. Summary of terms and conditions of the Issue are:
Purpose:To contribute toward the Bank's Tier II Capital for complying with the Capital Adequacy Ratio requirement and to utilize the funds in the Bank's business operations as permitted by its Memorandum & Articles of Association.
Issue date December 14, 2016
Tenor: Up to Seven years from the Issue date.
Maturity Date: December 14, 2023
Rating A + (Single A Plus)
Profit Rate: Floating rate of return at Base rate + 1.4 percent per annum;
Base rate is defined as the average six months KIBOR prevailing on the Base Rate setting date. The Base Rate will be set for the first time on the last working day prior to the Issue Date and subsequently on the immediately preceding business day before the start of each six monthly period
Profit payment: Semi-annual
For the year ended December 31, 2017
Notes to the Consolidated Financial Statements

212 JS Bank Annual Report 2017
Redemption: The instrument is structured to redeem 0.24% of the Issue amount during the first six years after the Issue date and the remaining Issue amount of 99.76% in two equal semi-annual installments of 49.88% each in the last year.
Security: The Issue is unsecured and subordinated as to payment of Principal and profit to all other indebtedness of the Bank.
Call Option: Exercisable in part or in full on or after the 10th redemption, subject to SBP's approval.18.2 During the current year, the Bank has issued Rs.2 billion of rated, over the counter listed, unsecured and
subordinated term finance certificates ("TFCs" or "the Issue") as an instrument of redeemable capital under Section 66 of the Companies Act, 2017 and as outlined by State Bank of Pakistan, SBP, under the BPRD circular No. 06 dated August 15, 2013 and Basel III guidelines. Summary of terms and conditions of the Issue are:Purpose: To contribute toward the Bank's Tier II Capital for complying with the capital adequacy
requirement and to utilize the funds in the Bank's business operations as permitted by its Memorandum & Articles of Association.
Issue date December 29, 2017
Tenor: Up to Seven years from the Issue date.
Maturity Date: December 29, 2024
Rating A + (Single A Plus)
Profit Rate: Floating rate of return at Base rate + 1.4 percent per annum;Base rate is defined as the average six months KIBOR prevailing on the Base Rate setting date. The Base Rate will be set for the first time on the last working day prior to the Issue Date and subsequently on the immediately preceding business day before the start of each six monthly period
Profit payment: Semi-annualRedemption: The instrument is structured to redeem 0.24% of the Issue amount during the first six
years after the Issue date and the remaining Issue amount of 99.76% in two equal semi-annual installments of 49.88% each in the last year.
Security: The Issue is unsecured and subordinated as to payment of Principal and profit to all other indebtedness of the Bank.
Call Option: Exercisable in part or in full on or after the 10th redemption, subject to SBP's approval.
19. LIABILITIES AGAINST ASSETS SUBJECT TO FINANCE LEASE
2017 2016
Minimum lease
payment
Financial charges for future periods
Principal outstanding
Minimum lease
payment
Financial charges for future periods
Principal outstanding
Note -------------------------- Rupees in '000 ------------------------------
Not later than one year 1,837 313 1,524 - - - Later than one year and not
later than five years 3,785 277 3,508 - - - 19.1 5,622 590 5,032 - - -
For the year ended December 31, 2017
Notes to the Consolidated Financial Statements

213JS Bank Annual Report 2017
19.1 The liability against asset subject to finance lease represents the lease entered with a Modaraba for vehicle for a related party. The periodic lease payments include rates of mark up of KIBOR 6M plus 1.5% with floor of 7.5% and ceiling of 20% (2016: Nil) per annum. JS Investments, the Company, shall subject to compliance with the conditions specified in the lease agreement, purchase the asset from the lessor. There are no financial restriction in the lease agreements.
20. DEFERRED TAX LIABILITIES - net 2017 2016 ------- Rupees in '000 -------
Deferred tax debits arising from:
Unused tax losses (48,043) (30,541)Provision against investments (57,149) (57,149)Provision against other assets (15,682) - Unrealised gain on revaluation of investment classified as held-for-trading (620) 215 Surplus on revaluation of investment classified assets as available-for-sale (46,941) 656,497 Provision against loans, advances and trade debts (124,518) (137,558)Provision for donation (197) (1,222)Provision for Workers' Welfare Fund (46,332) (45,935)
(339,482) 384,307 Deferred tax credits arising due to:
Operating fixed assets 220,463 191,785 Goodwill 512,268 512,268 Unrealised loss on derivative instruments 25,227 (7,782)Surplus on revaluation of operating fixed assets 266,274 - Surplus on revaluation of non-banking assets acquired in satisfaction of claims 2,191 2,307
1,026,423 698,578 686,941 1,082,885
20.1 Movement in temporary differences during the year:
Balance as at January 01, 2016
Recognised in profit and loss account
Recognised in equity
Balance as at December
31, 2016
Recognised in profit and loss account
Recognised in equity
Balance as at December
31, 2017 --------------------------------------------- Rupees in '000 -----------------------------------------------
Deferred tax debits arising from:Unused tax losses (9,532) (21,009) - (30,541) (17,502) - (48,043)Provision against investments (57,149) - - (57,149) - - (57,149)Provision against other assets - - - - (15,682) - (15,682)Unrealised gain of revaluation of investment
classified as held-for-trading 3,809 (3,594) - 215 (835) - (620)(Surplus) / deficit on revaluation of investment
classified assets as available-for-sale 1,306,843 - (650,346) 656,497 (262) (703,176) (46,941)Provision against loans and trade debts (213,679) 76,121 - (137,558) 13,040 - (124,518)Provision for donation (1,067) (155) - (1,222) 1,025 - (197)Provision for Workers' Welfare Fund (66,938) 21,003 - (45,935) (397) - (46,332)
962,287 72,366 (650,346) 384,307 (20,613) (703,176) (339,482)Deferred tax credits arising due to:Operating fixed assets 162,221 29,564 - 191,785 28,678 - 220,463 Goodwill 461,110 51,158 - 512,268 - - 512,268 Unrealised loss on derivative instruments (14,366) 6,584 - (7,782) 33,009 - 25,227 Surplus on revaluation of
operating fixed assets - - - - (4,926) 271,200 266,274 Surplus on revaluation of non-banking
assets acquired in satisfaction of claims - - 2,307 2,307 (116) - 2,191 608,965 87,306 2,307 698,578 56,645 271,200 1,026,423
1,571,252 159,672 (648,039) 1,082,885 36,032 (431,976) 686,941
For the year ended December 31, 2017
Notes to the Consolidated Financial Statements

214 JS Bank Annual Report 2017
2017 2016Note -------- Rupees in ‘000 --------
21. OTHER LIABILITIES
Mark-up / return / interest payable in local currency 21.1 2,121,637 1,416,897 Mark-up / return / interest payable in foreign currency 47,076 16,445 Accrued expenses 829,778 730,698 Trade payable from brokerage business 21.2 1,021,060 1,791,818 Payable in respect of defined benefit plan 37.5 175,118 118,308 Unrealised loss on revaluation of derivative instruments - 36,408 Unclaimed dividends 11,043 10,753 Donation payable 31.2 32,657 71,874 Lease key money deposit 3,320,317 1,877,773 Provision for Workers’ Welfare Fund 21.3 342,377 304,594 Government duties 225,819 212,980 Payable against remittance 361,808 286,973 Retention money payable 29,245 24,860 Visa debit card payable 148,650 42,907 Others 182,269 168,294
8,848,854 7,111,582
21.1 Included herein is a sum of Rs.72.114 million (2016: Rs.51.564 million) payable to related parties.
21.2 Included herein is a sum of Rs.10.306 million (2016: Rs.144.491 million) payable to related parties.
21.3 In 2016, the Honorable Supreme Court of Pakistan (SCP) passed a judgment on November 10, 2016, declaring the insertion of amendments introduced in the Finance Act, 2008 pertaining to WWF as unlawful for the reason that the WWF is not in the nature of tax and therefore, could not be introduced through money bill under the Constitution. The Federal Board of Revenue has filed a petition in the SCP against the said judgment, which is pending hearing.
In view of the above developments regarding the applicability of Federal WWF on the Group, the Pakistan Bankers’ Association (PBA) sought a legal opinion to conclude on the reversal of Federal WWF provision. However, based on legal advice, the Group has decided to retain the provision for WWF in the financial statements.
Further, as a consequence of the 18th amendment to the Constitution, levy for the WWF was also introduced by the Government of Sindh through the Sindh WWF Act, 2014. As per Sindh WWF Act, 2014, the Group is liable to pay SWWF. The Group has challenged issue of jurisdiction before the Honorable High Court of Sindh (the Court) through Constitutional Petition 1546/2017. The Court has restrained the Sindh Revenue Board to collect / recover Sindh Worker Welfare Fund till the next date of hearing. However, on a prudent basis, the Group has recognised full provision in the financial statements in respect of Sindh WWF.
For the year ended December 31, 2017
Notes to the Consolidated Financial Statements

215JS Bank Annual Report 2017
22. SHARE CAPITAL
22.1 Authorised capital
2017 2016 2017 2016Number of shares Note -------- Rupees in ‘000 --------
1,850,000,000 1,350,000,000 Ordinary shares of Rs.10 each 22.1.1 18,500,000 13,500,000
22.1.1 During the year after having SBP approval, the shareholders of the Bank in their Annual General Meeting held on March 29, 2017 increased its authorised capital by Rs.5 billion, divided into 500 million shares of Rs.10 each.
22.2 Issued, subscribed and paid-up capital
538,558,965 538,558,965 Issued for cash 5,385,590 5,385,590 533,905,297 533,905,297 Issued for consideration other than cash 5,339,053 5,339,053
1,072,464,262 1,072,464,262 10,724,643 10,724,643
22.3 As at December 31, 2017, Jahangir Siddiqui & Co. Ltd. (the parent company) held 755,245,007 ordinary shares of Rs.10 each (70.42% holding).
23. PREFERENCE SHARES
23.1 Authorised capital
2017 2016 2017 2016Number of shares Note -------- Rupees in ‘000 --------
Convertible preference shares 150,000,000 150,000,000 of Rs.10 each 23.2 1,500,000 1,500,000
23.2 On February 19, 2014, the Bank has issued 150 million preference shares of Rs.10 each. As a result of this transaction, the paid-up capital of the Bank has increased by Rs.1.5 billion. The major terms and conditions of the preference shares are as follows:
Instrument: Un-listed, convertible, irredeemable, perpetual, non-cumulative, non-voting preference shares.
Issue Price: Issued at par value of Rs.10 per share.
Tenure: Four years from the date of issuance of preference shares i.e. February 18, 2018.
Conversion ratio: For every one preference share, 1.5 ordinary shares will be issued i.e. 1:1.5.
Dividend: Non-cumulative at the fixed rate of 12% per annum. No compensation would be available to the preference shareholders other than the agreed return i.e. 12% p.a. which will be paid in the form of cash dividend. The distribution of dividend is not obligatory and will be allowed only if the Bank has earned sufficient profit in the current year to pay dividend and is in compliance with all the regulatory capital (MCR and CAR) and provisioning requirements.
For the year ended December 31, 2017
Notes to the Consolidated Financial Statements
23.3 As at December 31, 2017, Jahangir Siddiqui & Co. Ltd. (the parent company) held 145,374,878 preference shares of Rs.10 each (96.92% holding).

216 JS Bank Annual Report 2017
2017 2016Note -------- Rupees in ‘000 --------
24. SURPLUS / (DEFICIT) ON REVALUATION OF ASSETS - net of tax
Available-for-sale securities 24.1 329,226 1,934,159 Operating fixed assets 24.2 656,598 - Non-banking assets acquired in satisfaction of claims 24.3 95,050 81,868
24.4 1,080,874 2,016,027 24.1 Available-for-sale securities:
Government securities (542,648) 48,729 Ordinary shares - listed 397,799 1,664,750 Foreign currency bonds 50,657 44,675 Open end mutual funds 376,739 832,502
282,547 2,590,656 Related deferred tax asset / (liability) 46,679 (656,497)
329,226 1,934,159 24.2 Operating fixed assets
Surplus on revaluation of assets recognised during the year 938,706 -
Less: Transferred to unappropriated profit:Incremental depreciation during the year (10,904) - Related deferred tax liability (4,931) -
(15,835) - 922,871 -
Less: Related deferred tax liability on:Surplus arised during the year (271,204) - Transferred to profit and loss account on account of incremental depreciation 4,931 -
(266,273) -
656,598 - 24.3 Non-banking assets acquired In satisfaction of claims
Surplus on revaluation as at January 01, 84,175 Surplus on revaluation recognised during the year 13,396 84,175
97,571 84,175 Less: Transferred to unappropriated profit:Incremental depreciation during the year (214) - Related deferred tax liability (115) -
(329) - 97,242 84,175
Less: Related deferred tax liability on:Surplus arised during the year (2,307) (2,307)Transferred to profit and loss account on account of incremental depreciation 115 -
(2,192) (2,307)
95,050 81,868
For the year ended December 31, 2017
Notes to the Consolidated Financial Statements

217JS Bank Annual Report 2017
2017 2016 -------- Rupees in ‘000 --------
24.4 Group’s share 875,647 1,739,674Non-controlling interest 205,227 276,353
1,080,874 2,016,027
25. CONTINGENCIES AND COMMITMENTS
25.1 Transaction-related contingent liabilities
Includes performance bonds, bid bonds, warranties, advance payment guarantees, shipping guarantees and standby letters of credit related to particular transactions.
i) Government 31,008,823 18,055,350 ii) Banking companies and other financial institutions 5,532,988 2,777,027 iii) Others 8,477,789 6,673,175
45,019,600 27,505,552
25.1.1 Included herein the outstanding guarantees of Rs.31.454 million (2016: Rs.17.140 million) of related parties.
25.2 Trade-related contingent liabilities
Documentary credits 21,558,098 20,505,270
25.2.1 Included herein the outstanding letter of credits of Rs.44.016 million (2016: Rs.2,194.048 million) of related parties.
25.3 Tax related contingencies are disclosed in notes 33.2 to 33.4.
25.4 Commitments in respect of forward lending
Forward commitments to extend credit 21,398,301 234,062
25.4.1 Included herein the commitment of Rs.Nil (2016: Rs.170 million) of related parties.
25.5 Other commitments
Commitment in respect of capital expenditure 94,975 59,876
25.6 Commitments in respect of derivative instruments
25.6.1 Forward exchange contracts
Purchase 6,689,099 9,872,524
Sale 4,960,361 10,004,614
For the year ended December 31, 2017
Notes to the Consolidated Financial Statements

218 JS Bank Annual Report 2017
The Holding company utilises foreign exchange instruments to meet the needs of its customers and as part of its asset and liability management activity to hedge its own exposure to currency risk. At year end, all foreign exchange contracts have a remaining maturity of less than one year.
2017 2016 -------- Rupees in ‘000 --------
25.6.2 Forward government and equity securities
Purchase 1,496,072 3,989,680
Sale 439,443 5,749,329
25.6.3 Cross currency swaps (notional principal) 4,223,400 1,753,050
25.6.4 Options (notional principal) 2,421,402 -
25.7 Bank Guarantee from a commercial Bank in favorof National Clearing Company of Pakistan Limited 400,000 -
25.8 Outstanding settlements against margin financing contracts - net 4,529 (180,189)
25.9 DERIVATIVE INSTRUMENTS
Derivative instruments, such as Forward Rate Agreement, Interest Rate Swaps, Cross Currency Swaps and Options, are forward transactions that provide market making opportunities / hedge against the adverse movement of interest and exchange rates. Derivatives business also provides risk solutions for the existing and potential customers of the Bank.
The Group has entered into a Cross Currency Swap transaction with its customer on back-to-back basis with an Authorized Derivative Dealer (ADD) without carrying any open position in its books. Specific approvals for the transactions have been granted by State Bank of Pakistan. Policies in line with SBP instructions have been formulated and are operative.
The transaction carries credit risk which is the risk that a party to a derivative contract will fail to perform its obligation. There are two types of credit risk associated with derivative transactions; 1) settlement, and 2) pre-settlement risk. Bank’s Central Credit Committee is responsible for reviewing and managing associated Counterparty Credit Risks of the transaction.
The Group has also entered into Foreign Currency & Commodity Options from its Wholesale Banking Branch Bahrain for market making activities. The policy guidelines for taking derivative exposures are approved by the Board of Directors (BOD). Bank’s Asset & Liability Committee (ALCO) is responsible for reviewing and managing associated risks of the transactions.
The transactions mainly carries credit risk (in the form of settlement & pre-settlement risk), market & liquidity risk and are managed by Treasury and monitored by Market Risk / Treasury Middle Office in line with Board of Directors approved limit framework. The Group can hedge its risk by taking on & off balance sheet position in interbank market, where available.
Accounting policies in respect of derivative financials instruments are described in note 7.5.2.
For the year ended December 31, 2017
Notes to the Consolidated Financial Statements

219JS Bank Annual Report 2017
25.9.1 Product Analysis2017 2016
Counterparties Derivative ProductsNumber of contracts
Notional principal
Mark to market
Number of contracts
Notional principal
Mark to market
------------- Rupees ‘000 ------------- ------------- Rupees ‘000 -------------With Banks and FIs Hedging Cross currency swaps 8 4,223,400 6,118 6 1,753,050 5,832 Market making Options 18 2,421,402 4,874 - - - Market making Forward rate agreements 197 11,649,458 61,523 277 19,877,138 (28,399)Market making Forward securities 15 1,935,515 2,072 2 8,988,080 332
238 20,229,775 74,587 285 30,618,268 (22,235)
At the exchange rate prevailing at the end of the reporting period.
25.9.2 Maturity Analysis
2017Number of contracts
Notional principal
Mark to marketRemaining maturity of contracts Positive Negative Net
------------------------- Rupees ‘000 ------------------------Upto 1 month 114 9,398,052 115,311 (75,269) 40,042 1 to 3 months 56 2,537,559 10,865 (26,079) (15,214)3 to 6 months 37 1,253,820 31,561 (1,977) 29,584 6 month to 1 years 25 3,026,643 25,272 (11,063) 14,209 1 to 2 years 2 831,200 32,563 (30,458) 2,105 2 to 3 years - - - - - 3 to 5 years 4 3,182,500 96,426 (92,565) 3,861 5 to 10 years - - - - - Above 10 years - - - - -
238 20,229,774 311,998 (237,411) 74,587
2016Number of contracts
Notional principal
Mark to marketRemaining maturity of contracts Positive Negative Net
------------------------- Rupees ‘000 ------------------------Upto 1 month 110 23,375,701 36,140 (34,574) 1,566 1 to 3 months 74 4,439,924 5,914 (32,416) (26,502)3 to 6 months 67 895,151 102 (3,857) (3,755)6 month to 1 year 30 658,792 5,675 (3,624) 2,051 1 to 2 year 2 209,700 13,859 (13,589) 270 2 to 3 years 2 1,039,000 59,989 (55,849) 4,140 3 to 5 years - - - - - 5 to 10 years - - - - - Above 10 years - - - - -
285 30,618,268 121,679 (143,909) (22,230)
For the year ended December 31, 2017
Notes to the Consolidated Financial Statements

220 JS Bank Annual Report 2017
2017 2016Note -------- Rupees in ‘000 --------
26. MARK-UP / RETURN / INTEREST EARNED
On loans and advances 10,106,910 6,315,527
On investments in:
Held-for-trading securities 1,514,829 921,032 Available-for-sale securities 7,411,911 7,842,123 Held-to-maturity securities 1,194,135 -
10,120,875 8,763,155
On lendings to financial institutions 78,244 19,901 On deposits with financial institutions 6,968 (12,018)On securities purchased under resale agreements 174,219 83,329
20,487,216 15,169,894
27. MARK-UP / RETURN / INTEREST EXPENSED
Deposits 11,672,611 7,455,820 Securities sold under repurchase agreements 1,734,670 1,504,055 Export refinancing scheme (ERF) 140,359 125,424 Long-Term Finance Facility (LTFF) 24,727 2,967 Financing Facility for Storage of Agricultural produce (FFSAP) 1,897 1,000 Sub-ordinated Loans 227,917 11,110 Borrowings 275,561 177,858
14,077,742 9,278,234
28. FEE, COMMISSION AND BROKERAGE INCOME
Advisory fee 463,415 182,733 Brokerage income 523,139 474,031 Trustee fee 5,713 5,471 Management fee 212,356 160,982 Other fees, commission and charges 28.1 1,661,911 1,260,215
2,866,534 2,083,432
28.1 This includes Rs.33.462 million (2016: Rs.31.580 million) in respect of commission income from home remittance services provided by the Bank. The amount is receivable from State Bank of Pakistan at the rate of Saudi Riyal 20 (2016: Saudi Riyal 20) per transaction over USD 200 (2016: USD 200) and is shared between the Bank and various exchange companies as per terms of agreement with them.
For the year ended December 31, 2017
Notes to the Consolidated Financial Statements

221JS Bank Annual Report 2017
2017 2016Note -------- Rupees in ‘000 --------
29. GAIN ON SALE OF SECURITIES - NET
Federal government securities- Market treasury bills 6,681 9,928 - Pakistan investment bonds 134,656 2,761,234 - Ijara sukuk certificates 2,074 699
Ordinary shares - listed 319,239 195,821 Ordinary shares - unlisted 652,889 - Term finance certificates 29.1 15,295 10,535 Foreign currency bonds 187,795 7,878 Mutual fund units 29.2 57,812 200,355
1,376,441 3,186,450
29.1 This includes gain arised of Rs. 10 million (2016: Rs. Nil million) on sale of Term Finance Certificate of related parties.
29.2 This includes gain arised of Rs. 61.414 million (2016: Rs. 188.597 million) on sale of units of related parties.
2017 201630. OTHER INCOME - NET -------- Rupees in ‘000 --------
Gain on sale of fixed assets 76,156 42,657 Gain on recovery of non banking assets - 152 Rental income from properties 15,813 17,876 Others 9,237 15,053
101,206 75,738 Income from derivative instruments
Realised
Equity futures 2,509 (14,173)Forward rate agreements 27,685 51,654
30,194 37,481 Unrealised
Cross currency swaps 66 (4,561)Currency options 4,874 - Forward rate agreements 61,524 (28,399)Forward securities (438) 332
66,026 (32,628)
96,220 4,853
197,426 80,591
For the year ended December 31, 2017
Notes to the Consolidated Financial Statements

222 JS Bank Annual Report 2017
2017 2016Note -------- Rupees in ‘000 --------
31. ADMINISTRATIVE EXPENSES
Salaries, wages, allowances, etc. 3,929,604 2,990,432 Charge for defined benefit plan - net 37.5 89,576 61,317 Contribution to defined contribution plan 157,299 116,682 Non-executive directors’ fee, allowances
and other expenses 15,475 16,101 Contractor wages 457,138 354,760 Brokerage, fee and commission 66,667 48,972 Royalty 31.1 20,000 20,000 Rent, taxes, insurance, electricity, etc. 1,447,088 1,130,382 Legal and professional charges 74,209 196,631 Donations 31.2 32,857 71,874 Communication 129,383 160,354 Ijarah rentals 287 - Repairs and maintenance 605,842 527,916 Travel, conveyance and other related expenses 116,298 97,084 Stationery and printing 188,931 143,086 Advertisement and publicity 324,102 327,733 Postage and courier service 61,032 45,389 Stamp duty 13,066 16,548 CDC and other charges 24,958 11,900 Bank charges and clearing house charges 133,972 89,826 Consultancy fee 69,720 74,463 Security services charges 291,247 239,551 Fees and subscription 91,922 60,440 Auditors’ remuneration 31.3 14,649 10,679 Depreciation 13.2 643,503 551,223 Depreciation on non banking assets 14.5 1,300 1,122 Amortisation of intangible assets 13.3 64,242 53,942 Staff training 49,925 13,466 Entertainment expenses 44,246 40,002 Outsourced services 6,487 8,433 Others 43,707 29,794
9,208,732 7,510,102
31.1 Royalty represents amounts payable to Mr. Jahangir Siddiqui on account of use of name in the subsidiaries of the Bank.
31.2 This includes donation to Future Trust, wherein Mr. Kalim-ur-Rehman, the director of the holding company and Mr. Suleman Lalani, the Chief Executive Officer of Jahangir Siddiqui & Co. Ltd, the parent company of the Group, are trustees. The registered office of the donee is located at 7th Floor, The Forum, Block 9, Clifton, Karachi.
For the year ended December 31, 2017
Notes to the Consolidated Financial Statements

223JS Bank Annual Report 2017
For the year ended December 31, 2017
Notes to the Consolidated Financial Statements
2017 2016Note -------- Rupees in ‘000 --------
31.3 Auditors’ remuneration
Audit fee - Pakistan 2,970 2,783 Audit fee - Bahrain 2,030 - Half-yearly review 980 900 Special certification and sundry advisory services 6,587 5,129 Taxation services 190 190 Out of pocket expenses and sales tax on services 1,892 1,677
31.3.1 14,649 10,679 31.3.1 Geographical analysis
Pakistan 10,664 10,679 Bahrain 3,985 -
14,649 10,679 32. OTHER CHARGES
Penalties imposed by State Bank of Pakistan 12,833 31,030 Provision for Workers’ Welfare Fund and Sindh WWF 21.3 & 32.1 37,831 77,023 Others 497 370
51,161 108,423
32.1 Provision held at 2% of the higher of profit before tax or taxable income under Sindh Workers’ Welfare Act, 2014.
33. TAXATION
33.1 Relationship between income tax expense and accounting profit
Profit before taxation 1,862,677 3,854,122
Tax on income (646,811) (1,330,252)Effect of permanent differences (91,253) (37,173)Tax effect of income charged at reduce rate 34,637 15,921 Tax effect of exempt income 23,436 63,164 Effect of prior year deferred taxation 37,758 12,885 Effect of prior year current taxation (148,845) (117,371)Others (4,713) (2,662)
33.1.1 (795,791) (1,395,488)
33.1.1 The Group has recognised taxation impact on the basis of deemed tax return to be file on applicable tax rate with tax authorities, which are as follows:
Tax Rate2017 2016
JS Bank Limited 35% 35%JS Investments Limited 30% 31%JS Global Capital Limited 30% 31%JS ABAMCO Commodities limited 30% 31%

224 JS Bank Annual Report 2017
33.2 JS Bank Limited (Holding Company, the Bank)
33.2.1 Income tax
The Bank has filed income tax returns under Section 114 of the Income Tax Ordinance, 2001 for the tax years 2008 through 2017. The said returns so filed were deemed to have been assessed in terms of the returns filed under the provisions of prevailing income tax laws as applicable in Pakistan. However, the Officers of Inland Revenue Services (OIR) conducted the proceedings for making certain amendments in the deemed assessments for tax years 2008 to 2015. This was done by taking recourse of conducting tax audit or alternatively a direct amendment in the assessment contending that certain matters in the deemed assessments were not admissible as not conforming to the law and prejudiced the interest of revenue.
Based on the amended assessments in tax year 2008 to tax year 2014, the department has made certain dis-allowances of expenses and tax deductible claims besides creating minimum tax and Workers’ Welfare Fund liabilities in the tax years 2010 & 2011 and tax years 2009 & 2012 respectively.
In respect of WWF, the Supreme Court of Pakistan has held that the amendments in the WWF Ordinance through Finance Act, 2006 and 2008 were not validly made. Accordingly, as of now the Bank’s contention is mandated and it is likely that its pending appeals in this will be decided favorably. As a consequence of introduction of Sindh Workers’ Welfare Fund Act, the Bank is required to pay WWF to Sindh Revenue Board effective from tax year 2015. The Bank has filed petition before the High Court of Sindh to contest applicability of SWWF in its case who has granted stay against recovery of SWWF from the Bank.
For tax year 2008, CIRA has admitted the contention of the Bank that the amended order is barred by time and decided that any addition made in impugned order is annulled and not required to be further adjudicated. However, the department has filed an appeal against the decision of CIRA in ATIR where it is pending for hearing and decision.
For tax year 2009-2015, the Bank has not accepted the amendments and have filed appeals before the Commissioner Inland Revenue-Appeals (the CIRA). With regard to appeals filed for tax year 2009 to 2014, the CIRA has decided the appeals accepting the Bank’s contentions in respect of significant issues. Whereas, the contentious matter of levy of workers welfare fund and disallowance of amortization claim of goodwill have been decided in favor of department. However, the Bank is contesting the matters in further appeals before Appellate Tribunal Inland Revenue (ATIR) which are pending for hearing. Appeal for tax year 2015 is filed before CIRA subsequent to year end, where it is pending for hearing and decision.
Further for the tax year 2013, the ATIR has decided appeal filed by tax department in respect of calculating the amount of provisions against advances as allowable under Rule 1(c) of Seventh Schedule to the Income Tax Ordinance, 2001 and has maintained the CIRA decision that the allowability of provision for advances to be calculated at 1% of gross amount of advances as against the tax department contention that the same is to be calculated on net advances after deducting the amount of provisions created and allowed against advances.
The matter of allowability of amortization relating to goodwill is contentious issue, therefore based on the opinion of lawyer there are arguments available to contend that goodwill on merger is a tax claimable deduction. Especially in the recent decision given by the High Court of Sindh in the case of merger of other bank in Pakistan where the court has ruled favorably that goodwill generated in merger is ‘intangible’ and amortization relating to goodwill is allowable deduction.
The management of Bank is confident that the appeals filed on various forums in respect of the above matters will be decided in the Bank’s favor and accordingly no demand for payment would arise.
For the year ended December 31, 2017
Notes to the Consolidated Financial Statements

225JS Bank Annual Report 2017
33.2.2 Withholding tax monitoring
Withholding tax monitoring was initiated against the Bank for tax year 2015 and an order has been passed against which appeal is filed before CIRA which is pending for hearing.
33.2.3 Sales Tax
The Bank as a registered person under Sindh Sales Tax on Services Act, 2011 has been issued a Sales Tax Order from the Sindh Revenue Board (SRB) creating a demand of Rs.48.838 million (besides Rs.4.440 million is charged as penalty) against the Bank for allegedly non-payment of Sindh sales tax on certain ‘presumed non-taxable services / incomes’ amounting to Rs.277.488 million for the tax periods from July 2011 to December 2013. The issue is common amongst the banking industry. An appeal was filed by the Bank before Commissioner SRB (Appeals) which has been decided in favor of the tax department except tax imposed on FX gain on Western Union remittance. The Bank and tax department have filed appeals before Appellate Tribunal which are pending for hearing.
The management of Bank is confident that the appeals filed in respect of the above matter will be decided in the Bank’s favor and accordingly no demand for payment would arise.
33.2.4 Azad Jammu & Kashmir Operations
The Bank has commenced operations in Azad Jammu & Kashmir from tax year 2009 and has filed returns for the tax years 2009 to 2017 with the tax authorities of such region. The Commissioner has issued notices for amendment of assessment under section 122 of the Income Tax Ordinance, 2001 (as adopted in AJK Region) for the tax year 2011 to 2016. All assessments orders are rectified and no additional demand has been raised.
33.3 JS Global Capital Limited (Subsidiary, the Company)
33.3.1 Except for tax year 2009, 2014, 2015, 2016 and 2017 income tax assessments have been filed and are deemed to have been assessed under the Income Tax Ordinance, 2001 (the Ordinance) unless selected by taxation authorities for audit purposes.
For tax year 2009, an ITRA no. 07/2013 was filed by the Commissioner Inland Revenue against an order passed by the Learned Appellate Tribunal Inland Revenue (ATIR) in ITA no. 923/KB/2011 dated August 28, 2012 which was related to the apportionment of expenses, allowability of expenses and claiming of tax deducted at source aggregating to Rs. 61.16 million. However, the same is pending for decision before the Sindh High Court (SHC).
For tax year 2014, an amended assessment order dated April 28, 2016, has been passed under section 122 (5A) of the Ordinance by the Additional Commissioner Inland Revenue (ACIR). Through said order, the ACIR raised demand amounting to Rs. 20.081 million. The Company has filed rectification application identifying various errors / details not considered by the ACIR and requested ACIR to rectify the same. In addition to that, the Company has also filed an appeal to the Commissioner Inland Revenue Appeals (CIRA) which is pending. The Company has also obtained stay against recovery of demand from SHC till the decision of CIRA.
For the year ended December 31, 2017
Notes to the Consolidated Financial Statements

226 JS Bank Annual Report 2017
For tax year 2015, an order dated November 23, 2016 was passed under section 4B of the Ordinance by the Deputy Commissioner Inland Revenue (DCIR). Through said order, an income of Rs.810.584 million was computed under section 4B of the Ordinance and resultant demand of super tax of Rs. 24.318 million was raised. An appeal was filed against the above order before CIR-A on December 01, 2016 identifying various errors / details not considered. The CIR-A, has confirmed DCIR’s order vide his order dated May 30, 2017. In pursuance of the order of CIR-A, the Company has filed appeal before ATIR along with application for stay against recovery of demand. The appeal before ATIR has been heard and order is reserved whilst ATIR vide order dated July 18, 2017 has granted stay for 60 days and subsequently the said stay was further extended vide various orders by the ATIR until February 14, 2018.
For tax year 2016 and 2017, notices dated December 27, 2016 and January 03, 2018 were issued under section 4B of the Ordinance by the DCIR. In the said notices the DCIR has contended that the Company is liable to pay Super Tax amounting to Rs.24.483 million and Rs.19.490 million on ‘income’ of Rs.816.122 million and Rs.649.676 million for Tax Years 2016 and 2017 respectively. The Company has challenged both notices through writ petition before SHC on constitutional grounds wherein the SHC has, vide its orders dated January 16, 2017 and January 11, 2018 for Tax Years 2016 and 2017 respectively, has stated that no coercive action shall be taken against the Company.
Further, amended assessment order, has been passed under section 122(5A) of the Ordinance by the Additional Commissioner Inland Revenue (ACIR) for the tax year 2016. Through the said order, the ACIR raised demand amounting to Rs.241.217 million. The CIR-A confirmed the ACIR’s order vide order dated December 12, 2017. In pursuance of the order of CIR-A, the Company has filed appeal before ATIR which is pending for hearing. However, the recovery of aforesaid tax demands has been stayed by SHC vide order dated December 26, 2017.
33.3.2 Sales Tax
During 2013, the Company received a show cause notice from the Sindh Revenue Board (SRB) demanding payment of sales tax amounting to Rs.19.65 million for fiscal year 2012, under section 47 of the Sindh Sales Tax on Services Act, 2011. Subsequently an order was passed reducing the demand to Rs.9.86 million along with default surcharge. The Company filed an appeal before the CIR-A and after being decided against the Company, it subsequently filed an appeal before Appellate Tribunal SRB. During the year 2014, the Company paid an amount of Rs.7.15 million in respect of the abovementioned liability before June 25, 2014 under the notification SRB 3-4/8/2014 to avail the exemption from application of penalty and 75% of default surcharge. However, during the year Appellate Tribunal SRB vide order dated November 29, 2017 has decided the issue of Sindh Sales Tax (SST) in favor of the Company. However, the issue of SST on advisory and consultancy services and commission earned on purchase/sale of mutual funds have been remanded back whilst the issue relating to SST on commission on foreign exchange dealing , services rendered outside Sindh and levy of default surcharge and penalty have been decided against the Company. The Company has filed a reference application before SHC in respect of the issues decided against the Company and remanded back.
During 2014, the Company also received another show cause notice from SRB demanding payment of sales tax amounting to Rs.34.69 million for fiscal year 2013 under section 47 of the Sindh Sales Tax on Services Act, 2011. Subsequently, an order was passed reducing demand to Rs.10.77 million. The Company has filed an appeal against the order with CIR-A which is pending. Further, in respect of the same, rectification application has also been filed with the department. The Company and other stock brokers have also filed petition with the SHC and has been granted interim stay against recovery of demand. However, the Company has paid an amount of Rs.9.24 million before June 25, 2014 under the notification SRB 3-4/8/2014 to avail the exemption of penalty and 75% of default surcharge. It is expected that CIR-A will follow the abovementioned decision of Appellate Tribunal SRB while disposing the appeal.
For the year ended December 31, 2017
Notes to the Consolidated Financial Statements

227JS Bank Annual Report 2017
Furthermore, for fiscal year 2014 and 2015, SRB alleged short payment of SST vide notice dated February 02, 2017. The Company has submitted all the required details in response to the notice and no order in this respect has been passed.
33.3.3 Federal Excise Duty (FED)
Tax department has issued show cause notice dated June 08, 2015 confronting (alleged) non payment of Federal Excise Duty (FED) on Company’s services under Federal Excise Act, 2005. In response thereto, an extension request was filed. The department however issued order without rejecting the application and raised FED demand of Rs.78.003 million on account of non-payment of Federal Excise Duty (FED) for tax year 2010 to tax year 2013. The Company filed a rectification appeal amounting to Rs.55.3 million against the said order on account of certain computational errors as the remaining demand of Rs.22.526 million represented duplicate levy which the Company had already paid as SST under Sindh Sales Tax on Services Act, 2011 on such services. The Company has also filed an appeal in the SHC, through Stockbroker Association (of which the Company is also the member) against aforementioned order on the grounds that after 18th amendment to the Constitution, the services that were previously subjected to FED under the federal laws are now subject to the provincial sales tax and the Company has accordingly discharged its tax obligation. The SHC initially, stayed Federal Board of Revenue from demanding sales tax on services from stockbrokers and subsequently, disposed of the order in Company’s favor. However, during the year an appeal filed before CIR-A against the said order by the relevant tax authorities was adjudicated in their favor vide order dated January 31, 2017. In pursuance of the order of CIR-A the Company has filed an appeal before Appellate Tribunal SRB along with application for stay of demand which was granted initially for 30 days and was subsequently extended vide various orders.
33.4 JS Investments Limited (Subsidiary, the Company)
33.4.1 In respect of the appeals filed by the Company before Commissioner Inland Revenue (Appeals) [CIR (Appeals)] against orders passed for tax years 2006 and 2009 against demand of Rs.162 million and 66 million respectively, the CIR (Appeals) had not accepted the basis of additions by tax authorities and set aside both the orders in respect of allocation of expenses between various sources of income for fresh proceedings with the directions to apportion the common expenditure according to actual incurrence of expenditure to the various sources of income.
In respect of above said order of CIR (Appeals) for tax year 2006 and 2009, the Company filed second appeal before the Appellate Tribunal Inland Revenue (ATIR) in respect of apportionment of expenses. The ATIR vide order dated April 20, 2017 deleted the additions on proration of expenses for tax year 2006 however, confirmed the CIR(A)’s order whereby CIR(A) remanded back / set-aside the issue of apportionment of expenses.
The Appellate Tribunal Inland Revenue vide order dated May 21, 2016 was deleted the additions of tax amortization of management rights and remand back the issues of disallowed provisions and advertisement expenses for the tax year 2009.
The tax authorities issued orders giving effect (hereinafter referred collectively as ‘appeal effect orders’) to the order of CIR (Appeals) for both tax year 2006 and 2009 whereby demands for these tax years were reduced at Rs.77.33 million and Rs.59.93 million respectively. As the allocation of expenditure in the said appeal effect orders were not made according to actual incurrence of expenditure to the various sources of income, therefore, the Company again filed appeals before the CIR (Appeals) against the said orders.
For the year ended December 31, 2017
Notes to the Consolidated Financial Statements

228 JS Bank Annual Report 2017
In respect of second appeal filed by the Company before CIR (Appeals) against appeal effect orders for tax year 2006 and 2009, the CIR (Appeals) for tax year 2006 confirmed apportionment of expenditure made by the tax authorities in appeal effect order, however, adjustment of allowable expenses were set aside. For tax year 2009, CIR (Appeals) had set aside the appeal effect order in entirety for fresh assessment, which is yet to be made by tax authorities.
The CIR (Appeals) also rectified the order passed by his predecessor for tax Year 2006, whereby the addition regarding the portion of capital gain included in dividend received from mutual funds was held deleted. Resulted appeal effect order reflects refund of Rs.29 million. The tax authorities have filed an appeal before ATIR against said order of CIR (Appeals) in respect of deletion of addition regarding the portion of capital gain included in dividend. The ATIR vide order dated December 07, 2016 set-aside with the direction that the ACIR should examine the issue in the light of FBR Circular letter dated September 10, 2002.
In respect of tax year 2006, management contends, based on views of its tax advisor, that amendment of assessment for such tax year by tax authorities is time barred. Accordingly, the Company has filed an appeal before the Appellate Tribunal Inland Revenue. The ATIR of the view that the amendment of assessment is not time bared however, the ATIR deleted the addition of tax amortization of management right vide order dated February 10, 2017.
Order under section 122(1)/(5) dated December 30, 2017 for the tax year 2015 passed by the DCIR created demand of Rs.40 million against which Company filed appeal before the CIR(A).
Management, based on views of its legal counsel, is confident of a favorable outcome in respect of above matters.
2017 2016Note -------- Rupees in ‘000 --------
34. EARNINGS PER SHARE - BASIC AND DILUTED
Profit after taxation for the year - attributable to ordinaryequity holders of the Group for diluted earnings 1,026,839 2,328,959
Preference dividend for the year endedDecember 31, 2016 @ 12% p.a (2015: @ 12% p.a.) 34.1 (180,000) (180,000)
Profit after taxation for the year - attributable to ordinaryequity holders of the Group for basic earnings 846,839 2,148,959
------------ Numbers ------------ Weighted average number of basic outstanding
ordinary shares during the year 1,072,464,262 1,072,464,262
Weighted average number of diluted outstanding ordinary shares during the year 1,072,464,262 1,297,464,262
------------- Rupees -------------
Basic earnings per share 0.79 2.00
Diluted earnings per share 34.2 0.79 1.80
For the year ended December 31, 2017
Notes to the Consolidated Financial Statements

229JS Bank Annual Report 2017
34.1 The shareholders of the Group in their meeting held on March 29, 2017 approved non-cumulative preference dividend of Rs.180 million (2016: Rs.180 million) for the preference shareholders. Since it was not recognised as a liability at reporting period as of December 31, 2016 due to non-adjusting event in accordance with International Accounting Standard - IAS 10 “Events after the Reporting Period”, the basic earnings per share of the current period has been adjusted accordingly.
34.2 In 2017, the diluted earnings per share increases when taking the convertible preference shares into account, therefore the convertible preference shares are anti-dilutive and are excluded from the weighted average number of ordinary shares for the purpose of diluted earnings per share.
2017 2016Note -------- Rupees in ‘000 --------
35. CASH AND CASH EQUIVALENTS
Cash and balances with treasury banks 8 17,334,111 15,509,263 Balances with other banks 9 1,049,496 767,747 Overdrawn nostro account 16.2 (198,996) (40,528)
18,184,611 16,236,482
37. DEFINED BENEFIT PLAN
37.1 General descriptionThe Bank operates a recognized gratuity fund for all employees who opted for this scheme introduced by the management with effect from January 01, 2007.
The defined benefit is administered by a separate fund that is legally separate from the Bank. The plan is governed by the trust deed dated September 01, 2007. The trustees of the gratuity fund are composed of representatives from employers. The trustees of the gratuity fund are required by the trust deed to act in the interest of the fund and of all relevant stakeholders in the scheme, i.e. active employees, inactive employees, retirees and employers. The trustees of the gratuity fund are responsible for the investment policy with regard to the assets of the fund.
37.2 The plan in Pakistan typically exposes the Bank to actuarial risks such as: salary risk, discount rate risk, mortality risk and investment risk defined as follow:
- Salary increase risk:
This is a risk to the Bank, because the benefits are based on the final salary, if the final salary is higher it will impacts the liability accordingly.
36. STAFF STRENGTH
Permanent 3,420 2,682 Contractual basis 1,421 336 Group’s own staff strength at the end of the year 4,841 3,018 Third party contract 523 1,491
5,364 4,509
For the year ended December 31, 2017
Notes to the Consolidated Financial Statements

230 JS Bank Annual Report 2017
- Discount rate riskThe discount rate is based on the yield on government bonds. If the market yield of bonds varies, the discount rate would vary in the same manner and would affect the present value of obligation and fair value of assets.
- Withdrawal risk:This is the risk that actual withdrawals experience is different than expected and will impact the obligation accordingly.
- Longevity Risk
This is the risk that actual lifetime of retirees is longer than expectation. The risk is measured at plan level over the entire population.
- Investment risk
This is the risk that the assets are under-performing and are not sufficient to meet the liabilities.
- Maturity profile
The weighted average duration of the defined benefit obligation works out to 11 years.
37.3 Number of employees under the schemes
The number of employees covered under defined benefit scheme is 3,095 (2016: 2,325).
37.4 Principal actuarial assumptions
Principal actuarial assumptions at the end of the reporting period expressed as weighted averages. The actuarial valuations were carried out on December 31, 2017 based on the Projected Unit Credit Method, using the following significant assumptions:
2017 2016Percentage
Valuation discount rate for year end obligation per annum 9.50% 8.00%Valuation discount rate for interest cost for the year per annum 8.00% 9.00%Expected return on plan assets per annum 9.50% 8.00%Future salary increase rate per annum 10.50% 9.00%Effective duration of the discounted future cash flows years 11 9.31Normal retirement age years 60 60Withdrawal rates Moderate ModerateMortality rates SLIC 2001-
2005, Setback 1 Year
SLIC 2001-2005, Setback
1 Year
For the year ended December 31, 2017
Notes to the Consolidated Financial Statements

231JS Bank Annual Report 2017
37.5 Movement in defined benefit obligations, fair value of plan assets and their components
Defined benefit obligations
Fair value of plan assets
Net defined benefit liability (asset)
2017 2016 2017 2016 2017 2016 ---------------------------------------- Rupees in ‘000 ----------------------------------------
Balance as at January 01 367,635 235,572 249,327 171,567 118,308 64,005
Included in profit or lossCurrent service cost 84,931 58,437 - - 84,931 58,437 Interest cost / income 29,076 21,022 24,431 18,142 4,645 2,880
114,007 79,459 24,431 18,142 89,576 61,317 Included in other comprehensive incomeActuarial gains / losses arising from:- financial assumptions 611 31,859 (10,273) (393) 10,884 32,252 - experience adjustments 74,658 24,739 - - 74,658 24,739
75,269 56,598 (10,273) (393) 85,542 56,991 Other movementsContribution made during the year - - 118,308 64,005 (118,308) (64,005)Benefits paid during the year (6,182) (3,994) (6,182) (3,994) - -
(6,182) (3,994) 112,126 60,011 (118,308) (64,005)
Balance as at December 31 550,729 367,635 375,611 249,327 175,118 118,308
37.6 The composition of the plan assets at the end of the reporting period for each category, are as follows:
Cost Fair value of plan assets2017 2016 2017 2016 2017 2016
Note Rupees in ‘000 Rupees in ‘000 Percentage
Cash and cash equivalents 9,146 13,298 9,146 13,298 2.4% 5.3%Debt securities 37.6.1 368,046 236,029 366,465 236,029 97.6% 94.7%
377,192 249,327 375,611 249,327 100% 100%
37.6.1 This represents investments held in Pakistan Investment Bonds (PIBs) and Term Finance Certificates (TFCs). The fair values of these securities are determined based on quoted market prices in active markets.
37.7 Maturity profile
37.7.1 Expected maturity analysis of undiscounted defined benefit obligation for the gratuity fund is as follows:
Over10 and
Up to Over Over Over above one year 1-2 years 2- 5 years 6-10 years years Total
------------------------------------ Rupees in ‘000 ------------------------------------
Balance as at December 31, 2017 17,411 21,450 130,589 469,756 9,092,944 9,732,150
For the year ended December 31, 2017
Notes to the Consolidated Financial Statements

232 JS Bank Annual Report 2017
37.8 Sensitivity analysis
37.8.1 Significant actuarial assumptions for the determination of the defined obligation are discount rate, and expected rate of salary increase. The sensitivity analysis below have been determined based on reasonably possible changes of the respective assumptions occurring at the end of the reporting period, while holding all other assumptions constant:
Particulars Rate
Present value of defined
benefit obligation
Fair value of any plan
assetsNet defined
benefit liability
------------- Rupees in ‘000 -------------
Current results - 550,729 375,611 175,118
Discount rate1% Increase 10.5% 493,611 375,611 118,000 1% Decrease 8.5% 612,313 375,611 236,702
Salary Rate1% Increase 10.5% 612,313 375,611 236,702 1% Decrease 8.5% 492,727 375,611 117,116
Withdrawal rate10% Increase Moderate + one year 532,944 375,611 157,333 10% Decrease Moderate + one year 565,531 375,611 189,920
Mortality rateOne year age set back Adjusted SLIC 2001-05 - one year 549,331 375,611 173,720 One year age set forward Adjusted SLIC 2001-05 + one year 547,637 375,611 172,026
Furthermore in presenting the above sensitivity analysis, the present value of the defined benefit obligation has been calculated using the projected unit credit method at the end of the reporting period, which is the same as applied in calculating the defined benefit obligation liability recognised in this consolidated statement of financial position.
37.9 Experience AdjustmentsThe re-measurement gains / losses arise due to actual experience varying from the actuarial assumptions for the year.
2017 2016 2015 2014 2013------------------------ Rupees in ‘000 ------------------------
ParticularsDefined benefit obligation 550,729 367,635 235,572 154,368 116,676 Fair value of plan assets (375,611) (249,327) (171,567) (133,019) (115,387)Net defined benefit liability 175,118 118,308 64,005 21,349 1,289
Remeasurement gain / (loss) on obligation 75,269 56,598 12,774 3,493 (740)Remeasurement gain / (loss) on plan assets 10,273 393 (3,104) 3,655 2,408 Other comprehensive income 85,542 56,991 9,670 7,148 1,668
37.10 The average duration of the payment of benefit obligation at December 31, 2017 is with in one year.
37.11 The Bank contributes to the gratuity fund as per actuarial’s expected charge for the next financial year. Based on actuarial advice and management estimates, the charge in respect of defined benefit obligation for the next one year works out to be Rs.123.419 million. The amount of re-measurements to be recognised in other comprehensive income for year ending December 31, 2017 will be worked out as at the next valuation.
For the year ended December 31, 2017
Notes to the Consolidated Financial Statements

233JS Bank Annual Report 2017
38. DEFINED CONTRIBUTION PLANThe Group operates a contributory provident fund scheme for all permanent employees. The employer and employee both make a contribution of equal amount to the fund as follows:
Contribution basic salary
Number of employees
Contribution made during the year
2017 2016 2017 2016Percentages ------- Numbers ------- ----- Rupees in ‘000 -----
Holding company
- JS Bank Limited 7.1% 2,481 1,870 137,059 101,438
Subsidiary companies
- JS Global Capital Limited 10% 174 172 13,059 9,811 - JS Investments Limited 8% 101 83 7,181 5,433
39. COMPENSATION OF DIRECTORS AND EXECUTIVESThe aggregate amount charged in the financial statements for the year in respect of the remuneration and benefits to the President / Chief Executive, Directors and Executives are as follows:
President & CEO Directors Executives2017 2016 2017 2016 2017 2016
Note ----------------------------------- Rupees in ‘000 -----------------------------------
Managerial remuneration 19,636 17,727 - - 2,044,181 1,463,342 Defined contribution plan - - - - 124,942 89,789 Charge for defined benefit plan - - - - 118,536 72,627 Rent and house maintenance - - - - 1,375 6,167 Utilities - - - - 4,944 2,443 Medical 1,964 1,773 - - 189,265 145,059 Conveyance and vehicle maintenance - - - - 109,553 89,304 Performance bonus 20,000 20,000 - - 368,922 308,818 Non-executive directors’
fee, allowances and other expenses 39.1 - - 15,475 16,101 - -
41,600 39,500 15,475 16,101 2,961,718 2,177,549
Number of persons 39.2 1 1 22 22 1,558 1118
39.1 This represents meeting fees, allowances and other expenses paid to independent or non-executive directors for attending the meetings of the Board of Directors, Audit Committees and other Board Committees held during the year.
39.2 The Presidents, Director and certain executives are also provided with other facilities, including free use of the Group and / or Company maintained cars.
For the year ended December 31, 2017
Notes to the Consolidated Financial Statements

234 JS Bank Annual Report 2017
40. FAIR VALUE OF FINANCIAL INSTRUMENTS
IFRS 13 “Fair Value Measurement” defines fair value as the price that would be received to sell an asset or paid to transfer a liability in an orderly transaction between market participants at the measurement date.The fair value of quoted securities other than those classified as held to maturity, is based on quoted market price. Fair value of fixed term loans, other assets, other liabilities and fixed term deposits cannot be calculated with sufficient reliability due to absence of current and active market for assets and liabilities and reliable data regarding market rates for similar instruments. The provision for impairment of loans and advances has been calculated in accordance with the Bank’s accounting policy as stated in note 7.12 to these consolidated financial statements.
The repricing profile, effective rates and maturity are stated in note 43.3.4 to these financial statements.
In the opinion of the management, the fair value of the remaining financial assets and liabilities are not significantly different from their carrying values since assets and liabilities are either short term in nature or in the case of customer loans and deposits are frequently repriced.
Fair value hierarchy
IFRS 13 requires the Group to classify fair value measurement using a fair value hierarchy that reflects the significance of the inputs used in making the measurements. The fair value hierarchy has following levels:
Level 1 Quoted prices (unadjusted) in active markets for identical assets or liabilities that the entity can access at the measurement date.
Level 2 Inputs other than quoted prices included within Level 1 that are observable for the asset or liability, either directly or indirectly.
Level 3 Unobservable inputs for the asset or liability.
40.1 Valuation techniques used in determination of fair values
Item Valuation approach and input usedUnits of mutual funds Fair values of investments in units of mutual funds are determined based on
redemption prices disclosed at the Mutual Funds Association of Pakistan (MUFAP) as at the close of the business days.
Shares of listed companies
Fair values of investments in listed equity securities are valued on the basis of closing quoted market prices available at the Pakistan Stock Exchange.
Pakistan Investment Bonds / Market Treasury Bills
Fair values of Pakistan Investment Bonds and Market Treasury Bills are derived using PKRV rates (Reuters page).
Term Finance Certificates and Bonds
Investments in debt securities (comprising Term Finance Certificates, Bonds and any other security issued by a company or a body corporate for the purpose of raising funds in the form of redeemable capital) are valued on the basis of the rates announced by the Mutual Funds Association of Pakistan (MUFAP) in accordance with the methodology prescribed by the SECP.
Derivatives The fair values of derivatives which are not quoted in active markets are determined by using valuation techniques. The valuation techniques take into account the relevant underlying parameters including foreign currency involved, interest rates, yield curves, volatilities, contracts duration, etc.
For the year ended December 31, 2017
Notes to the Consolidated Financial Statements

235JS Bank Annual Report 2017
40.2 The following table provides an analysis of financial instruments that are measured subsequent to initial recognition at fair value, grouped into Levels 1 to 3 based on the degree to which the fair value is observable.
As at December 31, 2017Level 1 Level 2 Level 3 Total----------------------------- Rupees in ‘000 -----------------------------
On balance sheet financial instruments
Items carried at fair value
Financial assets classified as held-for-trading securities
Government securities
Market treasury bills - 7,761,553 - 7,761,553 Pakistan investment bonds - 707,598 - 707,598
- 8,469,151 - 8,469,151 Ordinary shares of listed companies 322,414 - - 322,414 Sukuk certificates - listed - 69,678 - 69,678 Open end mutual funds - 426,249 - 426,249
322,414 8,965,078 - 9,287,492
Financial assets classified as available-for-sale securities
Government securities
Market treasury bills - 14,492,712 - 14,492,712 Pakistan investment bonds - 93,429,759 - 93,429,759
- 107,922,471 - 107,922,471 Ordinary shares of listed companies 3,595,918 - - 3,595,918 Open end mutual funds - 1,728,711 - 1,728,711 Foreign currency bonds - 4,350,638 - 4,350,638
3,918,332 122,966,898 - 126,885,230Non-Financial Assets
Operating fixed assets (Lease hold lands and buildings) - - 2,745,141 2,745,141 Non banking asset under satisfaction of claims - - 203,339 203,339
3,918,332 122,966,898 2,948,480 129,833,710
Off balance sheet financial instruments
Forward government and equity securities
Purchase - 1,495,823 - 1,495,823
Sale - 439,632 - 439,632
Forward exchange contracts
Purchase - 6,851,332 - 6,851,332
Sale - 5,061,071 - 5,061,071
Cross currency swaps (notional principal) - 4,489,958 - 4,489,958
Options (notional principal) - 2,426,276 - 2,426,276
For the year ended December 31, 2017
Notes to the Consolidated Financial Statements

236 JS Bank Annual Report 2017
As at December 31, 2016Level 1 Level 2 Level 3 Total
------------------------- Rupees in ‘000 -------------------------On balance sheet financial instruments
Items carried at fair value
Financial assets classified as held-for-trading securities
Government securities
Market treasury bills - 65,758,485 - 65,758,485 Ordinary shares of listed companies 746,234 - - 746,234
Term finance certificates and sukuks
Sukuk certificates - listed - 12,078 - 12,078 Term finance certificates - listed - 21,013 - 21,013
- 33,091 - 33,091 Open end mutual funds - 300,008 - 300,008
746,234 66,091,584 - 66,837,818 Financial assets classified as available-for-sale securities
Government securities
Market treasury bills - 4,884,060 - 4,884,060 Pakistan investment bonds - 49,834,951 - 49,834,951 Ijara sukuk - - - -
- 54,719,011 - 54,719,011
Ordinary shares of listed companies 4,291,093 - - 4,291,093 Open end mutual funds - 2,233,963 - 2,233,963 Foreign currency bonds - 5,714,939 - 5,714,939
5,037,327 128,759,497 - 133,796,824 Non-financial assets
Non banking asset under satisfaction of claims - - 175,808 175,808 5,037,327 128,759,497 175,808 133,972,632
Off balance sheet financial instruments
Forward government and equity securities
Purchase - 3,988,403 - 3,988,403
Sale - 4,996,791 - 4,996,791
Forward exchange contracts
Purchase - 9,816,883 - 9,816,883
Sale - 9,977,367 - 9,977,367
Cross currency swaps (notional principal) - 1,758,882 - 1,758,882
For the year ended December 31, 2017
Notes to the Consolidated Financial Statements

237JS Bank Annual Report 2017
41. SEGMENT DETAILS WITH RESPECT TO BUSINESS ACTIVITIES
The segment analysis with respect to business activities is as follows:
2017Corporate Trading and Retail Commercial Payment and
BrokerageAsset
managementfinance sales banking banking settlement Others Total------------------------------------------------------------------------------- Rupees in ‘000 -------------------------------------------------------------------------------
Total income - external 460,281 11,856,298 4,627,752 7,224,520 188,534 783,438 316,780 75,126 25,532,729 Inter-segment revenues - net - (8,720,051) 8,416,392 303,659 - - - - - Total income 460,281 3,136,247 13,044,144 7,528,179 188,534 783,438 316,780 75,126 25,532,729
Total expenses (96,476) (2,050,057) (12,373,591) (7,207,277) (81,791) (692,783) (319,356) (516,304) (23,337,635)(Provisions) / reversal for
the year - (295,623) (6,111) (24,111) - 38,233 (44,805) (332,417)Current taxation - - - - - - - (671,821) (671,821)Prior year charge - - - - - - - (87,938) (87,938)Deferred tax - - - - - - - (36,032) (36,032)
Net income / (loss) 363,805 790,567 664,442 296,791 106,743 90,655 35,657 (1,281,774) 1,066,886
Attributable to:Equity holders of the Group 1,026,839 Non-controlling interest 40,047
1,066,886
Segment assets (gross) - 185,483,705 82,645,783 108,870,958 - 2,710,777 2,743,142 13,118,285 395,572,650 Segment non performing assets - 1,622,691 613,448 2,644,549 - 745,784 106,512 10,861 5,743,845 Segment total provisions - (1,071,851) (283,887) (2,355,075) - (745,784) (106,512) (55,665) (4,618,774)Segment liabilities - 57,126,105 219,370,286 83,137,017 3,824,278 (636,426) 233,340 8,231,362 371,285,962 Segment return on
net assets (ROA) (%) 6.34% 8.26% 7.43%Segment cost of funds (%) 6.30% 3.94% 4.68%
2016Corporate Trading and Retail Commercial Payment and
BrokerageAsset
managementfinance sales banking banking settlement Others Total------------------------------------------------------------------------------- Rupees in ‘000 -------------------------------------------------------------------------------
Total income - external 227,441 12,093,862 3,280,867 4,137,521 162,775 672,203 417,975 39,818 21,032,462 Inter-segment revenues - net - (5,688,503) 5,267,564 420,939 - - - - - Total income 227,441 6,405,359 8,548,431 4,558,460 162,775 672,203 417,975 39,818 21,032,462 Total expenses (27,004) (1,918,504) (8,931,035) (4,262,553) (81,974) (504,124) (272,195) (899,370) (16,896,759)(Provisions) / reversal for
the year - (415,027) (104,085) 167,689 - - 75,123 (5,281) (281,581)Current taxation - - - - - - - (1,146,823) (1,146,823)Prior year charge - - - - - - - (88,993) (88,993)Deferred tax - - - - - - - (159,672) (159,672)
Net income / (loss) 200,437 4,071,828 (486,689) 463,596 80,801 168,079 220,903 (2,260,321) 2,458,634
Attributable to:Equity holders of the Group 2,328,959 Non-controlling interest 129,675
2,458,634
Segment assets (gross) - 155,177,226 37,737,239 63,853,911 - 3,979,810 2,992,441 9,594,516 273,335,143 Segment non performing assets - 1,125,952 315,703 3,012,239 - 745,784 144,746 10,861 5,355,285 Segment total provisions - (948,820) (181,830) (2,477,511) - (745,784) (144,746) (10,861) (4,509,552)Segment liabilities - 1,946,252 156,713,850 79,664,600 2,544,028 1,790,842 265,135 6,138,490 249,063,197 Segment return on
net assets (ROA) (%) 7.91% 8.22% 7.72%Segment cost of funds (%) 5.90% 4.02% 5.48%
For the year ended December 31, 2017
Notes to the Consolidated Financial Statements

238 JS Bank Annual Report 2017
42 RELATED PARTY TRANSACTIONS
The Group has related party relationship with its associates, parent, subsidiaries, companies having common directors, companies in which parent holds more than 20% shares, employee benefit plans, and its key management personnel (including their associates).
Contributions to the accounts in respect of staff retirement benefits are made in accordance with terms of the contribution plans. Remuneration of the key management personnel are in accordance with the terms of their employment. Other transactions are carried out as per agreed terms.
The details of transactions with related parties, other than those which have been specifically disclosed elsewhere in the financial statements are as follows:
December 31, 2017
Opening balance Disbursements / deposits
Repayments / withdrawals Closing balance Mark-up earned /
expense--------------------------------- Rupees in ‘000 ---------------------------------
AdvancesKey management personnel 479,860 676,082 (445,611) 710,331 27,865 Companies having common directorship 5,673 - (2,276) 3,397 171 Companies in which parent company holds 20% or more 437,564 1,230,400 (1,488,289) 179,675 22,262 Other related parties 1,303,405 3,502,947 (2,817,093) 1,989,259 183,087 Total 2,226,502 5,409,429 (4,753,269) 2,882,662 233,385
BorrowingsCompanies in which parent company holds 20% or more - 110,840,000 (106,840,000) 4,000,000 61,900
DepositsParent 767,243 11,429,643 (12,679,012) (482,126) 100,823 Key management personnel 56,583 1,213,860 (1,233,811) 36,632 2,654 Companies having common directorship 956,255 36,189,984 (32,472,240) 4,673,999 163,237 Companies in which parent company holds 20% or more 3,617,557 69,326,794 (69,109,961) 3,834,390 205,565 Other related parties 3,438,466 30,187,288 (30,831,763) 2,793,991 220,707 Total 8,836,104 148,347,569 (146,326,787) 10,856,886 692,986
December 31, 2016
Opening balance Disbursements / Deposits
Repayments / withdrawals Closing balance Mark-up earned /
expense--------------------------------------- Rupees in ‘000 ---------------------------------------
AdvancesKey management personnel 397,435 292,193 (209,768) 479,860 19,250 Companies having common directorship 395,763 18,640,900 (19,030,990) 5,673 92,052 Companies in which parent company holds 20% or more - 1,155,846 (718,282) 437,564 25,566 Other related parties 2,047,846 4,576,609 (5,321,050) 1,303,405 151,306 Total 2,841,044 24,665,548 (25,280,090) 2,226,502 288,174
Lendings to financial institutionsCompanies in which parent company holds 20% or more - 700,000 (700,000) - 155
BorrowingsCompanies in which parent company holds 20% or more - 47,800,000 (47,800,000) - 43,384
DepositsParent 2,016,612 11,429,643 (12,679,012) 767,243 100,823 Key management personnel 76,534 1,213,860 (1,233,811) 56,583 2,654 Companies having common directorship 1,097,580 27,432,054 (27,573,379) 956,255 64,321 Companies in which parent company holds 20% or more 2,510,501 59,785,999 (58,678,943) 3,617,557 194,164 Other related parties 2,308,568 33,645,004 (32,515,106) 3,438,466 125,815 Total 8,009,795 133,506,560 (132,680,251) 8,836,104 487,777
For the year ended December 31, 2017
Notes to the Consolidated Financial Statements

239JS Bank Annual Report 2017
The related party status of outstanding receivables and payables as at December 31, 2017 is included in respective notes to the financial statements. Material transactions with related parties are given below:
Companies having common directorship
Companies in which parent company holds
20% or more Other related parties Total2017 2016 2017 2016 2017 2016 2017 2016
------------------------------------------------------- Rupees in ‘000 -------------------------------------------------------Nature of transactions
Purchase of term finance certificates - - - 83,200 - - - 83,200 Sale of government securities - 1,721,049 68,804,288 26,513,047 2,563,412 1,906,936 71,367,700 30,141,032 Purchase of government securities - - 714,727 1,125,937 516,586 523,545 1,231,313 1,649,482 Purchase of sukuk - - 51,197 295,977 - - 51,197 295,977 Sale of sukuk / ijara - - 1,012,500 295,977 - - 1,012,500 295,977 Sale of shares / units - - - - 778,189 989,572 778,189 989,572 Purchase of shares / units - - - - 627,512 771,731 627,512 771,731 Purchase of forward foreign
exchange contracts - - 5,725,413 6,109,906 - - 5,725,413 6,109,906 Sale of forward foreign
exchange contracts - - 8,846,524 10,613,895 - - 8,846,524 10,613,895 Letter of credits 92,267 42,688 - - 104,937 95,890 197,204 138,578 Letter of guarantees - - 517 - 1,184 - 1,701 - Reimbursement of expenses 1,561 1,072 - - 29,184 18,117 30,745 19,189 Payment to staff benefit plan - - - - 118,308 64,005 118,308 64,005 Payment to staff contribution plan - - - - 157,299 116,682 157,299 116,682 Remuneration of key
management personnel - - - - 591,174 484,949 591,174 484,949 Director fees and allowances - - - - 15,475 16,101 15,475 16,101Rent received / receivables 1,516 2,072 - - 14,285 12,883 15,801 14,955 Expenses incurred on behalf 1,413 1,449 - - 27,260 20,186 28,673 21,635 Services rendered - - 23,352 10,621 - - 23,352 10,621 Payment of insurance premium - - 165,979 107,466 53,042 46,316 219,021 153,782 Commission income 23,526 72 170,716 86,791 13,287 17,445 207,529 104,308 Dividend income - - 57,864 35,850 61,387 48,688 119,251 84,538 Advisory fee - - - - 42,000 36,000 42,000 36,000 Royalty - - - - 20,000 10,000 20,000 10,000 Preference dividend paid - - - - 1,479 1,479 1,479 1,479 Remunerative income - - - - 199,439 155,353 199,439 155,353 Services received - - - - 514 586 514 586
Parent company2017 2016
---- Rupees in ‘000 ----
Nature of transactions
Purchase of Government Securities - 25,080Mark-up / commission income 2,850 -Rent expense paid / accrued 46,630 44,002 Expenses incurred on behalf 61 74 Reimbursement of expenses 17,213 24,267Preference dividend paid 174,450 174,450
For the year ended December 31, 2017
Notes to the Consolidated Financial Statements

240 JS Bank Annual Report 2017
43. CAPITAL ASSESSMENT AND ADEQUACY
43.1 Scope of Application
SBP Capital Adequacy Frameworks (Basel II and III) are applicable to JS Bank Limited on Standalone basis as well as on Consolidated basis by consolidating its partly owned subsidiaries - JS Global Capital Limited and JS Investments Limited. Standardised Approach is used for calculating the Capital Adequacy for Credit and Market risk, whereas, Basic Indicator Approach (BIA) is used for Operational Risk Capital Adequacy purposes.
43.2 Capital Structure- Basel III
Bank’s regulatory capital is analyzed into two tiers:
Tier I capital (going concern capital) Which comprises of:
a. Common equity Tier I which includes fully issued, subscribed and paid up capital, balance in share premium account, reserve for bonus issue, general reserves as per the financial statements and net un-appropriated profits etc. after deductions of investments in equity of subsidiary companies engaged in banking and financial activities, goodwill & other intangible assets and deficit on revaluation of available for sale investments due to insufficiency of Additional Tier I and Tier II to cover deductions.
b. Additional Tier I which includes Instruments issued in the form of perpetual non-cumulative preference shares by the banks, share premium resulting from the issuance of the instruments after deduction of goodwill & other intangible assets, deficit on revaluation of available for sale investments and deferred tax assets.
Tier II capital (going concern or supplementary capital), which includes general provision for loan losses (up to maximum of 1.25% of risk weighted assets), reserve on the revaluation of fixed assets, equity investments and foreign exchange translation reserve and subordinated debt.
43.3 Capital Adequacy
Capital Management
The primary objective of the Bank’s capital management is to ensure that the Bank complies with all regulatory capital requirements and at the same time maintains strong credit ratings and healthy capital ratios in order to support its business and to maximize shareholders’ value.
Statutory Minimum Capital Requirement (MCR) and Capital Adequacy Ratio (CAR)
The State Bank of Pakistan (SBP) through its BSD Circular no. 7 dated April 15, 2009 require Banks / Development Financial Institutions (DFIs) to raise and maintain their paid up capital (net of losses) equivalent to Rs.10 billion. The paid-up capital (free of losses) of the Bank as at December 31, 2017 stood at Rs.10.119 billion including un-listed, convertible, irredeemable, perpetual, non-cumulative, non-voting preference shares of Rs.1.5 billion. In addition banks are also required to maintain a minimum Capital Adequacy Ratio (CAR) of 11.28% of their risk weighted exposure. The Bank’s CAR as at December 31, 2017 was approximately 12.77% of its risk weighted assets.
For the year ended December 31, 2017
Notes to the Consolidated Financial Statements

241JS Bank Annual Report 2017
Basel III transition
The Basel III instructions issued by SBP has been adopted by the banks as per the phase-in arrangements prescribed by SBP, starting from December 31, 2013, with full implementation of capital ratios by the year-end 2019. During the transition period banks shall maintain the required capital ratios in following manner:
Phase-in Arrangement and Full implementation of the minimum capital requirements
As of December 31,
Sr Ratio 2013 2014 2015 2016 2017 2018 2019
1 CET1 5.0% 5.5% 6.0% 6.0% 6.0% 6.0% 6.0%
2 ADT-1 1.5% 1.5% 1.5% 1.5% 1.5% 1.5% 1.5%
3 Tier 1 6.5% 7.0% 7.5% 7.5% 7.5% 7.5% 7.5%
4 Total Capital 10.0% 10.0% 10.0% 10.0% 10.0% 10.0% 10.0%
5 “CCB (Consisting of CETI only)" - - 0.25% 0.65% 1.275% 1.9% 2.5%
6 Total Capital plus CCB 10.0% 10.0% 10.25% 10.65% 11.275% 11.9% 12.5%
The Phase in arrangement for regulatory capital adjustment required under Basel III Instructions has started from December 31, 2014 at 20% per annum with full deduction from CET1 to take effect from December, 2018. During the transition period, the part which is not deducted from CET1/ Additional Tier 1/ Tier 2 will attract existing treatment. The regulatory Capital Deductions are mostly applied at the level of common equity tier-1. In this regard, following is the transitional arrangement as prescribed by SBP:
Phase-in of all deductions from CET1 (in percentage terms)
As of December 31,
2012 2013 2014 2015 2016 2017 2018
- - 20% 40% 60% 80% 100%
For the year ended December 31, 2017
Notes to the Consolidated Financial Statements

242 JS Bank Annual Report 2017
Note 43.4 Capital Adequacy Ratio (CAR) disclosure:CAPITAL ADEQUACY RETURN AS OF DECEMBER 31, 2017
2017 2016------------ Rupees in ‘000 ------------
Amount Amount Common Equity Tier 1 capital (CET1): Instruments and reserves
1 Fully Paid-up Capital/ Capital deposited with SBP 10,724,643 10,724,643 2 Balance in Share Premium Account - - 3 Reserve for issue of Bonus Shares - - 4 Discount on Issue of shares (2,105,401) (2,105,401)5 General/ Statutory Reserves 1,540,987 1,334,138 6 Gain/(Losses) on derivatives held as Cash Flow Hedge - - 7 Unappropriated/unremitted profits/ (losses) 5,466,338 4,858,596 8 Minority Interests arising from CET1 capital instruments issued to third parties by consolidated bank subsidiaries
(amount allowed in CET1 capital of the consolidation group) 445,061 1,061,785 9 CET 1 before Regulatory Adjustments 16,071,628 15,873,761 10 Total regulatory adjustments applied to CET1 (Note 41.4.1) 1,483,308 1,674,651 11 Common Equity Tier 1 14,588,319 14,199,110
Additional Tier 1 (AT 1) Capital12 Qualifying Additional Tier-1 capital instruments plus any related share premium13 of which: Classified as equity 1,500,000 1,500,000 14 of which: Classified as liabilities - 15 Additional Tier-1 capital instruments issued to third parties by consolidated subsidiaries (amount allowed in group AT 1) 18,689 43,363 16 of which: instrument issued by subsidiaries subject to phase out17 AT1 before regulatory adjustments 1,518,689 1,543,363 18 Total regulatory adjustment applied to AT1 capital (Note 41.4.2) 487,620 609,328 19 Additional Tier 1 capital after regulatory adjustments 1,031,068 934,035 20 Additional Tier 1 capital recognized for capital adequacy 1,031,068 934,035 21 Tier 1 Capital (CET1 + admissible AT1) (11+20) 15,619,388 15,133,145
Tier 2 Capital22 Qualifying Tier 2 capital instruments under Basel III plus any related share premium 4,998,800 3,000,000 23 Tier 2 capital instruments subject to phaseout arrangement issued under pre-Basel 3 rules24 Tier 2 capital instruments issued to third parties by consolidated subsidiaries (amount allowed in group tier 2) 72,193 167,692 25 of which: instruments issued by subsidiaries subject to phase out26 General provisions or general reserves for loan losses-up to maximum of 1.25% of Credit Risk Weighted Assets 100,352 40,988 27 Revaluation Reserves (net of taxes)28 of which: Revaluation reserves on fixed assets 584,372 29 of which: Unrealized gains/losses on AFS 293,020 1,508,644 30 Foreign Exchange Translation Reserves31 Undisclosed/Other Reserves (if any)32 T2 before regulatory adjustments 6,048,737 4,717,324 33 Total regulatory adjustment applied to T2 capital (Note 41.4.3) - 14,168 34 Tier 2 capital (T2) after regulatory adjustments 6,048,737 4,703,156 35 Tier 2 capital recognized for capital adequacy 5,211,580 4,703,156 36 Portion of Additional Tier 1 capital recognized in Tier 2 capital - - 37 Total Tier 2 capital admissible for capital adequacy 5,211,580 4,703,156 38 TOTAL CAPITAL (T1 + admissible T2) (21+37) 20,830,968 19,836,301 39 Total Risk Weighted Assets (RWA) {for details refer Note 41.7} 163,178,634 127,010,221
Capital Ratios and buffers (in percentage of risk weighted assets)40 CET1 to total RWA 8.94% 11.18%41 Tier-1 capital to total RWA 9.57% 11.91%42 Total capital to total RWA 12.77% 15.62%43 Bank specific buffer requirement (minimum CET1 requirement plus capital conservation buffer plus any other buffer requirement) 7.275% 6.65%44 of which: capital conservation buffer requirement 1.275% 0.65%45 of which: countercyclical buffer requirement 0.00% 0.00%46 of which: D-SIB or G-SIB buffer requirement 0.00% 0.00%47 CET1 available to meet buffers (as a percentage of risk weighted assets) 8.94% 11.18%
National minimum capital requirements prescribed by SBP48 CET1 minimum ratio 7.275% 6.65%49 Tier 1 minimum ratio 7.50% 7.50%50 Total capital minimum ratio 11.28% 10.65%
For the year ended December 31, 2017
Notes to the Consolidated Financial Statements

243JS Bank Annual Report 2017
2017 2016-------------- Rupees in ‘000 --------------
Regulatory Adjustments and Additional Information Amount
Amounts subject to
Pre- Basel III treatment
Amount
Note 43.4.1 Common Equity Tier 1 capital: Regulatory adjustments1 Goodwill (net of related deferred tax liability) 951,356 951,356 2 All other intangibles (net of any associated deferred tax liability) 531,952 402,300 3 Shortfall in provisions against classified assets - 4 Deferred tax assets that rely on future profitability excluding those arising from temporary differences
(net of related tax liability) - - - 5 Defined-benefit pension fund net assets - - 6 Reciprocal cross holdings in CET1 capital instruments of banking, financial and insurance entities - - 7 Cash flow hedge reserve - - 8 Investment in own shares/ CET1 instruments - 9 Securitization gain on sale - 10 Capital shortfall of regulated subsidiaries - 11 Deficit on account of revaluation from bank’s holdings of fixed assets/ AFS - - 12 Investments in the capital instruments of banking, financial and insurance entities that are outside the scope of
regulatory consolidation, where the bank does not own more than 10% of the issued share capital (amount above10% threshold) - - 320,995
13 Significant investments in the common stocks of banking, financial and insurance entities that are outside the scope of regulatory consolidation (amount above 10% threshold) - - -
14 Deferred Tax Assets arising from temporary differences (amount above 10% threshold, net of related tax liability) - - 15 Amount exceeding 15% threshold - - 16 of which: significant investments in the common stocks of financial entities - - 17 of which: deferred tax assets arising from temporary differences - - 18 National specific regulatory adjustments applied to CET1 capital - - 19 Investments in TFCs of other banks exceeding the prescribed limit - - - 20 Any other deduction specified by SBP (mention details) - - 21 Adjustment to CET1 due to insufficient AT1 and Tier 2 to cover deductions - - 22 Total regulatory adjustments applied to CET1 (sum of 1 to 21) 1,483,308 1,674,651
Note 43.4.2 Additional Tier-1 & Tier-1 Capital: regulatory adjustments23 Investment in mutual funds exceeding the prescribed limit [SBP specific adjustment] 487,620 609,328 24 Investment in own AT1 capital instruments - 25 Reciprocal cross holdings in Additional Tier 1 capital instruments of banking, financial and insurance entities - 26 Investments in the capital instruments of banking, financial and insurance entities that are outside the scope of
regulatory consolidation, where the bank does not own more than 10% of the issued share capital (amount above 10% threshold) - -
27 Significant investments in the capital instruments of banking, financial and insurance entities that are outside the scope of regulatory consolidation - -
28 Portion of deduction applied 50:50 to Tier-1 and Tier-2 capital based on pre-Basel III treatment which, during transitional period, remain subject to deduction from additional tier-1 capital - - 575,736
29 Adjustments to Additional Tier 1 due to insufficient Tier 2 to cover deductions - - 30 Total regulatory adjustment applied to AT1 capital (sum of 23 to 29) 487,620 1,185,065
For the year ended December 31, 2017
Notes to the Consolidated Financial Statements

244 JS Bank Annual Report 2017
2017 2016-------------- Rupees in ‘000 --------------
Amount
Amounts subject to
Pre- Basel III treatment
Amount
Note 43.4.3Tier 2 Capital: regulatory adjustments31 Portion of deduction applied 50:50 to Tier-1 and Tier-2 capital based on pre-Basel III treatment which, during
transitional period, remain subject to deduction from tier-2 capital - - - 32 Reciprocal cross holdings in Tier 2 instruments of banking, financial and insurance entities - 33 Investment in own Tier 2 capital instrument - 34 Investments in the capital instruments of banking, financial and insurance entities that are outside the scope of
regulatory consolidation, where the bank does not own more than 10% of the issued share capital (amount above 10% threshold) - - 14,168
35 Significant investments in the capital instruments issued by banking, financial and insurance entities that are outside the scope of regulatory consolidation - -
36 Total regulatory adjustment applied to T2 capital (sum of 31 to 35) - 14,168
Note 43.4.4Additional InformationRisk Weighted Assets subject to pre-Basel III treatment
37 Risk weighted assets in respect of deduction items (which during the transitional period will be risk weighted subject to Pre-Basel III Treatment)
(i) of which: deferred tax assets - - (ii) of which: Defined-benefit pension fund net assets - (iii) of which: Recognized portion of investment in capital of banking, financial and insurance entities where
holding is less than 10% of the issued common share capital of the entity - 213,997 (iv) of which: Recognized portion of investment in capital of banking, financial and insurance entities where
holding is more than 10% of the issued common share capital of the entity - - Amounts below the thresholds for deduction (before risk weighting)
38 Non-significant investments in the capital of other financial entities - - 39 Significant investments in the common stock of financial entities - - 40 Deferred tax assets arising from temporary differences (net of related tax liability) -
Applicable caps on the inclusion of provisions in Tier 241 Provisions eligible for inclusion in Tier 2 in respect of exposures subject to standardized approach
(prior to application of cap) 100,352 40,988 42 Cap on inclusion of provisions in Tier 2 under standardized approach 1,757,058 1,299,676 43 Provisions eligible for inclusion in Tier 2 in respect of exposures subject to internal ratings-based approach
(prior to application of cap) - 44 Cap for inclusion of provisions in Tier 2 under internal ratings-based approach -
For the year ended December 31, 2017
Notes to the Consolidated Financial Statements

245JS Bank Annual Report 2017
43.5 Capital Structure Reconciliation
Step: 1 As per balance sheet
Under regulatory scope of
consolidation
December 31, 2017
Rupees in ‘000AssetsCash and balances with treasury banks 17,334,111 17,334,111 Balanced with other banks 1,049,496 1,049,496 Lending to financial institutions 3,116,199 3,116,199 Investments 170,288,835 170,288,835 Advances 184,161,175 184,161,175 Operating fixed assets 7,589,702 7,589,702 Deferred tax assets - - Other assets 7,414,358 7,414,358 Total assets 390,953,876 390,953,876
Liabilities & EquityBills payable 3,824,278 3,824,278 Borrowings 64,557,043 64,557,043 Deposits and other accounts 288,365,014 288,365,014 Sub-ordinated loans 4,998,800 4,998,800 Liabilities against assets subject to finance lease 5,032 5,032 Deferred tax liabilities 686,941 686,941 Other liabilities 8,848,854 8,848,854 Total liabilities 371,285,962 371,285,962
Share capital/ Head office capital account 10,119,242 10,119,242 Reserves 1,540,987 1,540,987 Unappropriated profit 5,463,357 5,463,357 Minority Interest 1,463,454 1,463,454Surplus on revaluation of assets 1,080,874 1,080,874 Total Equity 19,667,914 19,667,914 Total liabilities & equity 390,953,876 390,953,876
For the year ended December 31, 2017
Notes to the Consolidated Financial Statements

246 JS Bank Annual Report 2017
Step : 2 As per balance sheet
Under regulatory scope of
consolidation
Reference
December 31, 2017
Rupees in ‘000
AssetsCash and balances with treasury banks 17,334,111 17,334,111 Balances with other banks 1,049,496 1,049,496 Lending to financial institutions 3,116,199 3,116,199 Investments 170,288,835 170,288,835 of which: Non-significant capital investments in capital of other financial institutions exceeding 10% threshold - - a
of which: significant capital investments in financial sector entities exceeding regulatory threshold - - b
of which: Mutual Funds exceeding regulatory threshold 487,620 487,620 c of which: reciprocal crossholding of capital instrument - d of which: Investment in TFCs of other banks exceeding the prescribed limit - - e
Advances 184,161,175 184,161,175 shortfall in provisions/ excess of total EL amount over eligible provisions under IRB - - f
general provisions reflected in Tier 2 capital 100,352 100,352 gFixed Assets 7,589,702 7,589,702 Deferred Tax Assets - - of which: DTAs excluding those arising from temporary differences - - h
of which: DTAs arising from temporary differences exceeding regulatory threshold - - i
Other assets 7,414,358 7,414,358 of which: Goodwill 951,356 951,356 j of which: Intangibles 531,952 531,952 k of which: Defined-benefit pension fund net assets - - lTotal assets 390,953,876 390,953,876
For the year ended December 31, 2017
Notes to the Consolidated Financial Statements

247JS Bank Annual Report 2017
As per balance sheet
Under regulatory scope of
consolidation
Reference
December 31, 2017
Rupees in ‘000Liabilities & EquityBills payable 3,824,278 3,824,278 Borrowings 64,557,043 64,557,043 Deposits and other accounts 288,365,014 288,365,014 Sub-ordinated loans 4,998,800 4,998,800 of which: eligible for inclusion in AT1 - - m of which: eligible for inclusion in Tier 2 - - nLiabilities against assets subject to finance lease 5,032 5,032 Deferred tax liabilities 686,941 686,941 of which: DTLs related to goodwill 512,268 512,268 o of which: DTLs related to intangible assets - - p of which: DTLs related to defined pension fund net assets - - q
of which: other deferred tax liabilities 174,673 174,673 rOther liabilities 8,848,854 8,848,854 Total liabilities 371,280,930 371,280,930
Share capital 10,119,242 10,119,242 of which: amount eligible for CET1 8,619,242 8,619,242 s of which: amount eligible for AT1 1,500,000 1,500,000 tReserves 1,540,987 1,540,987 of which: portion eligible for inclusion in CET1(provide breakup) 1,540,987 1,540,987 u
of which: portion eligible for inclusion in Tier 2 - - vUnappropriated profit/ (losses) 5,463,357 5,463,357 wMinority Interest 1,463,454 1,463,454 of which: portion eligible for inclusion in CET1 - - x of which: portion eligible for inclusion in AT1 - - y of which: portion eligible for inclusion in Tier 2 - - zSurplus on revaluation of assets 1,080,874 1,080,874 of which: Revaluation reserves on Property - - aa of which: Unrealized Gains/Losses on AFS - - ab In case of Deficit on revaluation (deduction from CET1) - - Total liabilities & Equity 390,948,844 390,948,844
For the year ended December 31, 2017
Notes to the Consolidated Financial Statements

248 JS Bank Annual Report 2017
Component of regulatory
capital reported by bank
(Rupees in ‘000)
Reference
Common Equity Tier 1 capital (CET1): Instruments and reservesFully Paid-up Capital/ Capital deposited with SBP 10,724,643 (s)Balance in Share Premium Account - Reserve for issue of Bonus Shares - Discount on issue of Shares (enter negative number) (2,105,401)General/ Statutory Reserves 1,540,987 (u)Gain/(Losses) on derivatives held as Cash Flow Hedge - Unappropriated/unremitted profits/(losses) 5,466,338 (w)Minority Interests arising from CET1 capital instruments issued to third
party by consolidated bank subsidiaries (amount allowed in CET1 capital of the consolidation group)
445,061 (x)
CET 1 before Regulatory Adjustments 16,071,628 Common Equity Tier 1 capital: Regulatory adjustmentsGoodwill (net of related deferred tax liability) 951,356 (j) - (o)All other intangibles (net of any associated deferred tax liability) 531,952 (k) - (p)Shortfall of provisions against classified assets - (f)Deferred tax assets that rely on future profitability excluding those arising
from temporary differences (net of related tax liability) - {(h) - (r} * x%Defined-benefit pension fund net assets - {(l) - (q)} * x%Reciprocal cross holdings in CET1 capital instruments - (d)Cash flow hedge reserve - Investment in own shares/ CET1 instruments - Securitization gain on sale - Capital shortfall of regulated subsidiaries - Deficit on account of revaluation from bank's holdings of property/ AFS - (ab)Investments in the capital instruments of banking, financial and insurance
entities that are outside the scope of regulatory consolidation, where the bank does not own more than 10% of the issued share capital (amount above 10% threshold)
-
(a) - (ac) - (ae)Significant investments in the capital instruments issued by banking,
financial and insurance entities that are outside the scope of regulatory consolidation (amount above 10% threshold)
- (b) - (ad) - (af)
Deferred Tax Assets arising from temporary differences (amount above 10% threshold, net of related tax liability) - (i)
Amount exceeding 15% threshold - of which: significant investments in the common stocks of financial
entities -
of which: deferred tax assets arising from temporary differences - National specific regulatory adjustments applied to CET1 capital - Investment in TFCs of other banks exceeding the prescribed limit - Any other deduction specified by SBP (mention details) - Regulatory adjustment applied to CET1 due to insufficient AT1 and Tier 2
to cover deductions -
Total regulatory adjustments applied to CET1 (sum of 9 to 25) 1,483,308 Common Equity Tier 1 14,588,320
For the year ended December 31, 2017
Notes to the Consolidated Financial Statements

249JS Bank Annual Report 2017
Component of regulatory
capital reported by bank
(Rupees in ‘000)
Reference
Additional Tier 1 (AT 1) CapitalQualifying Additional Tier-1 instruments plus any related share premium 1,500,000 of which: Classified as equity 1,500,000 (t) of which: Classified as liabilities - (m)Additional Tier-1 capital instruments issued by consolidated subsidiaries
and held by third parties (amount allowed in group AT 1) 18,689 (y)
of which: instrument issued by subsidiaries subject to phase out - AT1 before regulatory adjustments 1,518,689 Additional Tier 1 Capital: regulatory adjustmentsInvestment in mutual funds exceeding the prescribed limit (SBP specific
adjustment) 487,620 Investment in own AT1 capital instruments - Reciprocal cross holdings in Additional Tier 1 capital instruments - Investments in the capital instruments of banking, financial and insurance
entities that are outside the scope of regulatory consolidation, where the bank does not own more than 10% of the issued share capital (amount above 10% threshold)
-
(ac)Significant investments in the capital instruments issued by banking,
financial and insurance entities that are outside the scope of regulatory consolidation
- (ad)
Portion of deduction applied 50:50 to core capital and supplementary capital based on pre-Basel III treatment which, during transitional period, remain subject to deduction from tier-1 capital
-
Regulatory adjustments applied to Additional Tier 1 due to insufficient Tier 2 to cover deductions -
Total of Regulatory Adjustment applied to AT1 capital 487,620 Additional Tier 1 capital 1,031,068 Additional Tier 1 capital recognized for capital adequacy 1,031,068 Tier 1 Capital (CET1 + admissible AT1) 15,619,387 Tier 2 CapitalQualifying Tier 2 capital instruments under Basel III 4,998,800
(n)Capital instruments subject to phase out arrangement from tier 2 (Pre-Basel III instruments) -
Tier 2 capital instruments issued to third party by consolidated subsidiaries (amount allowed in group tier 2) 72,193 (z)
of which: instruments issued by subsidiaries subject to phase out - General Provisions or general reserves for loan losses-up to maximum of
1.25% of Credit Risk Weighted Assets 100,352 (g)Revaluation Reserves eligible for Tier 2 877,392 of which: portion pertaining to Property 584,372 portion of (aa) of which: portion pertaining to AFS securities 293,020 Foreign Exchange Translation Reserves - (v)Undisclosed/Other Reserves (if any) - T2 before regulatory adjustments 6,048,737
For the year ended December 31, 2017
Notes to the Consolidated Financial Statements

250 JS Bank Annual Report 2017
Component of regulatory
capital reported by bank
(Rupees in ‘000)
Reference
Tier 2 Capital: regulatory adjustmentsPortion of deduction applied 50:50 to core capital and supplementary
capital based on pre-Basel III treatment which, during transitional period, remain subject to deduction from tier-2 capital -
Reciprocal cross holdings in Tier 2 instruments - Investment in own Tier 2 capital instrument - Investments in the capital instruments of banking, financial and insurance
entities that are outside the scope of regulatory consolidation, where the bank does not own more than 10% of the issued share capital (amount above 10% threshold) - (ae)
Significant investments in the capital instruments issued by banking, financial and insurance entities that are outside the scope of regulatory consolidation - (af)
Amount of Regulatory Adjustment applied to T2 capital - Tier 2 capital (T2) - Tier 2 capital recognized for capital adequacy 5,211,580 Excess Additional Tier 1 capital recognized in Tier 2 capital - Total Tier 2 capital admissible for capital adequacy 5,211,580 TOTAL CAPITAL (T1 + admissible T2) 20,830,967
For the year ended December 31, 2017
Notes to the Consolidated Financial Statements

251JS Bank Annual Report 2017
43.6 Main Features of Regulatory Capital Instruments
S.No Main Features Common Shares Preference Shares Sub-debt -1 Sub-debt - 2
1 Issuer JS Bank JS Bank JS Bank JS Bank2 Unique identifier (eg KSE Symbol
or Bloomberg identifier etc.)JSB JSB JSB JSB
3 Governing law(s) of the instrument SECP SECP SECP SECPRegulatory treatment
4 Transitional Basel III rules Common Equity Tier-1
Additional Tier-1 Tier-2 Tier-2
5 Post-transitional Basel III rules Common Equity Tier-1
Additional Tier-1 Tier-2 Tier-2
6 Eligible at solo/ group/ group&solo Solo and Group Solo and Group Solo and Group Solo and Group7 Instrument type Ordinary Shares Preference
SharesSubordinated Debt Subordinated Debt
8 Amount recognized in regulatory capital (Currency in PKR thousands, as of reporting date)
8,619,242 1,500,000 3,000,000 2,000,000
9 Par value of instrument 10 10 5,000 100,00010 Accounting classification Shareholders
EquityShareholders Equity
Liability Liability
11 Original date of issuance 2006 2014 14-December-16 29-December-1712 Perpetual or dated No Maturity NA Dated Dated13 Original maturity date NA NA 14-December-23 29-December-2414 Issuer call subject to prior
supervisory approvalNo No Yes Yes
15 Optional call date, contingent call dates and redemption amount
NA NA On or after 10th redemption, on any profit date, partially or fully
On or after 10th redemption, on any profit date, partially or fully
16 Subsequent call dates, if applicable
NA NA NA NA
Coupons / dividends17 Fixed or floating dividend/ coupon NA Fixed Floating Floating18 coupon rate and any related index/
benchmarkNA NA Floating at 6 Months KIBOR*(Base
Rate) plus 140 basis points per annum without any floor or CAP
Floating at 6 Months KIBOR*(Base Rate) plus 140 basis points per annum without any floor or CAP
19 Existence of a dividend stopper NA NA NA NA20 Fully discretionary, partially
discretionary or mandatoryNA NA mandatory mandatory
21 Existence of step up or other incentive to redeem
NA NA NA NA
22 Noncumulative or cumulative NA Non-Cumulative Cumulative Cumulative23 Convertible or non-convertible NA Convertible Convertible Convertible
For the year ended December 31, 2017
Notes to the Consolidated Financial Statements

252 JS Bank Annual Report 2017
S.No Main Features Common Shares Preference Shares Sub-debt -1 Sub-debt - 2
24 If convertible, conversion trigger (s) NA NA At the option of supervisor it can be converted into common equity upon occurrence of certain trigger events , called point of non viability(PONV). The PONV is the earlier of; 1. A decision made by SBP that a conversion or temporary/ permanent write off is necessary without which the bank would become non viable. 2. the decision to make a public sector injection of capital, or equivalent support, without which the bank would have become non viable, as determined by SBP.
At the option of supervisor it can be converted into common equity upon occurrence of certain trigger events , called point of non viability(PONV). The PONV is the earlier of; 1. A decision made by SBP that a conversion or temporary/ permanent write off is necessary without which the bank would become non viable. 2. the decision to make a public sector injection of capital, or equivalent support, without which the bank would have become non viable, as determined by SBP.
25 If convertible, fully or partially NA Fully May convert fully or partially May convert fully or partially26 If convertible, conversion rate NA 1:1.5 To be determined in the case of trigger
eventTo be determined in the case of trigger event
27 If convertible, mandatory or optional conversion
NA Mandatory Optional Optional
28 If convertible, specify instrument type convertible into
NA Ordinary Shares Ordinary Shares Ordinary Shares
29 If convertible, specify issuer of instrument it converts into
NA NA NA NA
30 Write-down feature NA NA Yes Yes31 If write-down, write-down trigger(s) NA NA At the option of supervisor it can be
converted into common equity upon occurrence of certain trigger events, called point of non viability(PONV). The PONV is the earlier of: 1. A decision made by SBP that a conversion or temporary/ permanent write off is necessary without which the bank would become non viable. 2. the decision to make a public sector injection of capital, or equivalent support, without which the bank would have become non viable, as determined by SBP.
At the option of supervisor it can be converted into common equity upon occurrence of certain trigger events, called point of non viability(PONV). The PONV is the earlier of: 1. A decision made by SBP that a conversion or temporary/ permanent write off is necessary without which the bank would become non viable. 2. the decision to make a public sector injection of capital, or equivalent support, without which the bank would have become non viable, as determined by SBP.
32 If write-down, full or partial NA NA Either partially or fully Either partially or fully33 If write-down, permanent or
temporaryNA NA Permanent Permanent
34 If temporary write-down, description of write-up mechanism
NA NA NA NA
35 Position in subordination hierarchy in liquidation (specify instrument type immediately senior to instrument)
NA NA Deposits Deposits
36 Non-compliant transitioned features
NA NA No No
37 If yes, specify non-compliant features
NA NA NA NA
For the year ended December 31, 2017
Notes to the Consolidated Financial Statements

253JS Bank Annual Report 2017
43.7 Capital Adequacy Capital Requirements Risk Weighted Assets
December 31, December 31, December 31, December 31, 2017 2016 2017 2016
-------------------- Rupees in ‘000 -------------------- Credit Risk
On balance sheetCorporate 7,555,127 5,722,129 75,551,272 57,221,293 Retail 2,799,388 1,029,394 27,993,877 10,293,935 Banks and DFIs 404,953 311,560 4,049,525 3,115,598 Public sector entity 43,543 72,068 435,428 720,680 Sovereign (include GoP and SBP) 158,660 344,147 1,586,600 3,441,471 Residential mortgage finance 245,367 88,917 2,453,672 889,167 Past due loans 77,207 88,463 772,074 884,631 Fixed assets 559,041 415,564 5,590,406 4,155,640 Other assets 234,780 317,728 2,347,797 3,177,281
12,078,065 8,389,970 120,780,651 83,899,696
Off balance sheetNon market related 1,580,253 1,552,561 15,802,532 15,525,614 Market related 34,076 11,848 340,761 118,482
1,614,329 1,564,410 16,143,293 15,644,096
Equity Exposure Risk in the Banking BookListed 354,657 405,383 3,546,574 4,053,834 Unlisted 9,413 37,642 94,129 376,419
364,070 443,025 3,640,703 4,430,253 Total Credit Risk 14,056,465 10,397,405 140,564,647 103,974,045
Market RiskInterest rate risk 63,458 296,718 634,575 2,967,178 Equity position risk etc. 345,813 482,079 3,458,126 4,820,788 Foreign exchange risk 151,226 19,356 1,512,263 193,555
Total Market Risk 560,496 798,152 5,604,964 7,981,521
Operational Risk
Capital Requirement for operational risks 1,700,902 1,505,466 17,009,023 15,054,655
Total 16,317,863 12,701,022 163,178,634 127,010,221
2017 2016 ------- Rupees in '000 -------
Capital Adequacy Ratio
Total eligible common equity tier 1 capital held (e) 14,588,320 14,199,110 Total eligible tier 1 capital held (f) 15,619,387 15,133,144 Total eligible regulatory capital held (e) 20,830,967 19,836,300
Total Risk Weighted Assets (i) 163,178,634 127,010,221
For the year ended December 31, 2017
Notes to the Consolidated Financial Statements

254 JS Bank Annual Report 2017
December 31, 2017 December 31, 2016 Required Actual Required Actual
CET1 to total RWA 7.275% 8.94% 6.65% 11.18%Tier-1 capital to total RWA 7.50% 9.57% 7.50% 11.91%Total capital to total RWA 11.28% 12.77% 10.65% 15.62%
2017 201643.8 Leverage Ratio
Total eligible tier 1 capital held Rupees in ‘000 15,619,387 15,133,144 Total Exposure Rupees in ‘000 463,731,398 327,711,191 Leverage Ratio 3.37% 4.62%
44. RISK MANAGEMENT
Risk Management is a discipline at the core of every financial institution and encompasses all the activities that affect its risk profile. At the Bank, it involves identification, measurement, monitoring and controlling risks to ensure that:
a) The individuals who take or manage risks clearly understand it;
b) The Bank’s Risk exposure is within the limits established by Board of Directors (BoD);
c) Risk taking decisions are in line with the business strategy and objectives set by BoD;
d) The expected payoffs compensate for the risks taken;
e) Risk taking decisions are explicit and clear;
f) Sufficient capital as a buffer is available to take risk; and
g) Risk management function is independent of risk taking unit.
Bank has a comprehensive set of Risk Management Policies, practices and procedures which enable the Bank to take into consideration, in an appropriate manner, all major kinds of risks mainly credit, market, liquidity, operational and IT security risks. Keeping in view the dynamics of internal and external environment, we regularly review and update our Risk Management policies and procedures in accordance with regulatory environment and international standards.
Risk Management activities remain at the forefront of all activities of the Bank which places the highest priority on conducting its business in a prudent manner in line with the relevant laws and regulatory requirements.
Risk management framework of Bank includes:
a) Clearly defined risk management policies and procedures covering risk identification, acceptance, measurement, monitoring, reporting and control;
b) Well constituted organizational structure, defining clearly roles and responsibilities of individuals involved in risk taking as well as managing it. The bank, in addition to risk management functions for various risk categories, has instituted an Integrated Risk Management Committee (IRMC) as well as Central Credit Committee (CCC). IRMC oversees the overall risk management at the bank and provide guidance in
For the year ended December 31, 2017
Notes to the Consolidated Financial Statements

255JS Bank Annual Report 2017
setting strategic targets as well as concentration limits and monitor progress related to earnings growth, keeping in view the capital constraints and also adhere to the concentration limits. The IRMC monitors the strategic target and aggregate limits at the Business Group level and concentration limits (by industry, geography, size, tenor) so that one category of assets or dimension of risk cannot materially harm the performance of the Bank. Whereas, Central Credit Committee (CCC) is entrusted with the responsibility of monitoring lending risk profile of the bank. CCC meets regularly to actively supervise credit risk across its lending portfolio;
c) An effective management information system that ensures flow of information from operational level to top management and a system to address any exceptions observed; and
d) A mechanism to ensure an ongoing review of systems, policies and procedures for risk management and procedures to adopt changes.
While the overall responsibility of risk management rests with the BoD, it is the duty of Senior Management to devise risk management strategy by setting up well defined policies and procedures for mitigating / controlling risks, duly approved by the Board.
Giving due consideration to the above, the Bank has put in place the following hierarchy of Risk Management:
- Board Risk Management Committee (BRMC);
- Integrated Risk Management Committee (IRMC) which comprises of the President / Chief Executive Officer (CEO), Deputy CEO, Group Head Credit & Risk Management, Chief Financial Officer, Group Head Corporate & Retail Banking, Group Head Operations and Head of Compliance.
- Asset - Liability Committee which comprises of the President / Chief Executive Officer (CEO), Deputy CEO, Treasurer, Group Head Risk Management, Other Business Heads.
- Central Credit Committee comprising of the President / CEO, Deputy CEO, Group Head Credit & Risk Management, Chief Financial Officer and Group Head Corporate & Retail Banking.
- Operational Risk Steering Committee which comprises of the Group Head, Credit & Risk Management, Head of Operations, Head of Information Technology and Head of Compliance.
- Risk Management Group (RMG), a dedicated and independent set-up that comprises of Regional Credit Heads, Heads of Market & Liquidity Risks, Operational Risk and Treasury Middle Office.
RMG is managed by Group Head Credit & Risk Management to supervise the following Divisions:
a) Credit Risk Management (CRM) covering Corporate / Commercial and Retail Banking Risks
b) Operational Risk Management
c) Market Risk Management (MRM)
d) Treasury Middle Office
e) Basel II / III Implementation Unit
f) Credit Administration Department
g) Special Assets Management (SAM)
For the year ended December 31, 2017
Notes to the Consolidated Financial Statements

256 JS Bank Annual Report 2017
The Bank’s RMG generates the requisite risk reporting for the different tiers of management. These are also subjected to internal audit review.
Risk Matrix / Categories
Bank, in common with other banks, generates its revenues by accepting Country, Credit, Liquidity, Interest Rate Risk in the Banking Book, Market, Operational and other risks. Effective management of these risks is the decisive factor in the Bank’s profitability.
Risk Appetite
The Bank’s risk appetite is reflected in its endeavours to maintain a favourable credit rating and encompasses the following:
- The business strategy
- The expectations of stakeholders at different time horizons
- The characteristics of the risk-bearing entities
- The nature and characteristics of the risks undertaken
- The possible spread of risk situations across organizational units, assets-at-risk, and future time horizons.
Risk appetite drives business activity. It combines anticipations in risk and profitability with management preferences to control capital and resource allocation, as well as the distribution of exposure across activities and portfolios.
Bank’s hedging strategy is embedded in its risk management practices for addressing material categories of risk.
44.1 Credit Risk
Credit risk is the risk which arises with the possibility that one party to a financial instrument will fail to discharge its obligation and cause the other party to incur a financial loss. Credit risk is managed in terms of credit policies, approved by the BoD and regulations issued by the SBP. The bank is exposed to credit risk on loans and advances, fund placements with financial institutions and certain investments.
Credit risk management is an ongoing process. The overall credit policy and the credit risk instructions are issued by the Board of Directors. In this regards, a Central Credit Committee (CCC) is entrusted with the responsibility of monitoring lending risk profile of the bank. In order to maintain healthy growth of the credit portfolio, the Bank’s Credit Risk Management processes are consistently upgraded and improved to meet future challenges.
The Bank’s strategy is to minimise credit risk through product, geography, industry and customer diversification. Credit limits are established for all counter-parties after a careful assessment of their credit worthiness. An effective credit granting procedure, which requires pre-sanction evaluation of credit proposal, adequacy of security and pre-disbursement examination of charge documents is in place and managed by Risk Management Group (RMG) & Credit Administration Department (CAD). The Bank maintains a sound portfolio diversified in nature to counter the risk of credit concentration and further confines risk through diversification of its assets by geographical and industrial sector. For managing impaired assets in the portfolio, the Bank follows the Prudential Regulations and Risk Management guidelines issued by SBP and the Remedial Management Policy approved by the Board.
For the year ended December 31, 2017
Notes to the Consolidated Financial Statements

257JS Bank Annual Report 2017
44.1.1.1 Segment by class of business
2017Advances Deposits Contingencies and
(gross) commitmentsRupees Percent Rupees Percent Rupees Percentin ‘000 % in ‘000 % in ‘000 %
Agri finance 2,584,965 1.38 7,017 0.00 - - Automobile and transportation equipment 3,599,906 1.93 2,935,187 1.02 2,680,780 2.47 Brokerage 2,681,932 1.43 563,083 0.20 625,700 0.58 Cement 209,356 0.11 1,955,604 0.68 1,357,619 1.25 Chemical 2,365,522 1.27 3,068,426 1.06 583,005 0.54 Construction 3,711,869 1.99 8,383,926 2.91 24,731,408 22.75 Electronics and electrical appliances 301,375 0.16 4,004,788 1.39 711,868 0.65 Engineering, IT and other services 4,639,050 2.48 16,666,461 5.78 2,850,006 2.62 Fertilizer 3,206,664 1.72 4,552,980 1.58 2,354,865 2.17 Financial 3,005,047 1.61 22,573,439 7.83 22,362,318 20.57 Food / confectionery / beverages 36,076,698 19.30 2,341,565 0.81 1,797,201 1.65 Individuals 20,158,317 10.79 86,970,986 30.16 2,796,610 2.57 Insurance and security 159,353 0.09 5,020,213 1.74 27,245 0.03 Metal and steel 6,477,004 3.47 311,126 0.11 3,220,008 2.96 Mining and quarrying 57,529 0.03 2,806,004 0.97 882,839 0.81 Paper / board / furniture 1,125,618 0.60 544,587 0.19 585,175 0.54 Petroleum, oil and gas 3,837,523 2.05 11,992,285 4.16 419,202 0.39 Pharmaceuticals 4,836,857 2.59 705,238 0.24 629,771 0.58 Plastic 1,898,580 1.02 27,871 0.01 350,709 0.32 Power and water 12,940,341 6.92 5,388,005 1.87 22,626,105 20.81 Real estate 1,767,479 0.95 217,142 0.08 68,352 0.06 Rubber - - 5,314 0.00 12,743 0.01 Shipbreaking 4,166,705 2.23 48,161 0.02 58,004 0.05 Storage 114,685 0.06 252,282 0.09 - - Sugar 2,176,604 1.16 219,343 0.08 117,518 0.11 Telecommunication 1,239,201 0.66 9,699,646 3.36 494,461 0.45 Textile Composite 5,418,311 2.90 10,931 0.00 1,759,328 1.62 Ginning 1,310,409 0.70 53,415 0.02 275,140 0.25 Spinning 7,977,933 4.27 29,806 0.01 1,875,447 1.73 weaving 8,600,624 4.60 923,112 0.32 1,200,908 1.10
23,307,277 12.47 1,017,264 0.35 5,110,823 4.70 Transportation 24,214,240 12.96 3,409,731 1.18 - - Trust and non-profit organisations 361,330 0.19 40,014,982 13.88 49,233 0.05 Tyre 278,180 0.15 191,114 0.07 81,506 0.08 Wholesale and retail trade 11,037,390 5.91 10,501,057 3.64 4,369,688 4.02 Others 4,363,891 2.32 41,970,187 14.54 6,750,518 6.21
186,900,488 100 288,365,014 100 108,705,280 100
44.1.1 Segmental Information
Segmental information is presented in respect of the class of business and geographical distribution of advances, deposits, contingencies and commitments.
For the year ended December 31, 2017
Notes to the Consolidated Financial Statements

258 JS Bank Annual Report 2017
2016Advances Deposits Contingencies and
(gross) commitmentsRupees Percent Rupees Percent Rupees Percentin ‘000 % in ‘000 % in ‘000 %
Agri finance 1,510,356 1.57 112,058 0.05 - - Automobile and transportation equipment 1,958,955 2.03 2,365,241 1.05 981,223 1.23 Brokerage 3,937,097 4.08 1,876,867 0.83 258,798 0.32 Cement 844,558 0.88 4,211,769 1.87 245,496 0.31 Chemical 1,229,418 1.27 1,012,913 0.45 1,648,062 2.07 Construction 2,288,680 2.37 5,754,072 2.56 14,745,517 18.51 Electronics and electrical appliances 200,835 0.21 7,361,674 3.27 80,927 0.10 Engineering, IT and other services 1,092,591 1.13 9,413,690 4.18 2,752,056 3.45 Fertilizer 3,276,123 3.40 3,868,031 1.72 2,632,751 3.30 Financial 3,271,199 3.39 28,407,296 12.63 31,810,430 39.93 Food / confectionery / beverages 14,760,439 15.30 8,603,882 3.82 680,708 0.85 Individuals 8,032,695 8.33 70,871,762 31.50 427,849 0.54 Insurance and security 29,804 0.03 5,577,677 2.48 17,028 0.02 Metal and steel 3,441,932 3.57 1,127,398 0.50 2,019,820 2.54 Mining and quarrying 71,326 0.07 2,504,794 1.11 - - Paper / board / furniture 737,077 0.76 133,281 0.06 549,427 0.69 Petroleum, oil and gas 1,970,862 2.04 3,340,190 1.48 331,278 0.42 Pharmaceuticals 3,328,405 3.45 462,395 0.21 710,845 0.89 Plastic 1,684,546 1.75 64,557 0.03 373,088 0.47 Power and water 1,798,162 1.86 577,451 0.26 767,921 0.96 Real estate 1,662,335 1.72 117,573 0.05 97,391 0.12 Rubber - - 250,325 0.11 - - Shipbreaking 5,142,954 5.33 57,548 0.03 11,965 0.02 Storage - - 325,599 0.14 - - Sugar 2,981,865 3.09 893,435 0.40 196,992 0.25 Tele-communication 1,703,603 1.77 7,482,512 3.33 1,269,223 1.59 Textile Composite 1,523,936 1.58 88,837 0.04 387,438 0.49 Ginning 356,199 0.37 3,055 - 274,963 0.35 Spinning 5,311,379 5.51 106,642 0.05 1,181,228 1.48 weaving 5,470,711 5.67 1,010,836 0.45 2,228,999 2.80
12,662,225 13.13 1,209,370 0.54 4,072,628 5.12 Transportation 4,235,834 4.39 4,571,854 2.03 39,117 0.05 Trust and non-profit organisations 289,779 0.30 26,118,955 11.61 2,000 - Tyre 173,285 0.18 101,377 0.05 155,748 0.20 Wholesale and retail trade 4,272,828 4.43 3,403,998 1.51 460,082 0.58 Others 7,882,079 8.17 22,825,111 10.14 12,335,587 15.47
96,471,847 100 225,004,655 100 79,673,957 100
For the year ended December 31, 2017
Notes to the Consolidated Financial Statements

259JS Bank Annual Report 2017
44.1.1.2 Segment by sector2017
Advances Deposits Contingencies and (gross) commitments
Rupees Percent Rupees Percent Rupees Percentin ‘000 % in ‘000 % in ‘000 %
Public / Government 37,342,990 19.98 49,068,231 17.02 - - Private 149,557,498 80.02 239,296,783 82.98 108,705,280 100.00
186,900,488 100 288,365,014 100 108,705,280 100
2016Advances Deposits Contingencies and
(gross) commitmentsRupees Percent Rupees Percent Rupees Percentin ‘000 % in ‘000 % in ‘000 %
Public / Government 4,999,999 5.18 33,490,281 14.88 - - Private 91,471,848 94.82 191,514,374 85.12 79,673,957 100.00
96,471,847 100 225,004,655 100 79,673,957 100
44.1.1.3 Details of non-performing advances and specific provisions by class of business segment
2017 2016Specific Specific
Classified provisions Classified provisionsadvances held advances held
------------------------- Rupees in ‘000 ------------------------Automobile and transportation equipment 74,875 61,875 61,875 61,875 Engineering, IT and other services 21,683 16,857 183,711 183,711 Brokerage 167,596 167,596 - - Fertilizer 1,260,418 1,260,418 1,258,256 1,258,256 Food 134,370 79,968 110,138 91,398 Individuals 364,142 75,397 254,433 68,352 Metal and steel 154,067 23,161 139,892 8,208 Power and water, oil and gas 21,448 21,448 21,448 21,448 Ship breaking 157,926 125,658 157,926 98,814 Sugar 200,000 200,000 200,000 100,000 Tele-communication - - 172,628 - Textile
Composite 315,665 304,153 373,211 370,462 Ginning 29,999 - - - Spinning 278,441 278,441 278,441 278,441 Weaving 3,500 - - -
627,605 582,594 651,652 648,903 Transportation services 22,928 17,681 13,348 13,348 Wholesale and retail trade 14,360 6,307 44,573 32,282 Others 36,579 - 58,062 31,758
3,257,997 2,638,960 3,327,942 2,618,353
44.1.1.4 Details of non-performing advances and specific provisions by sector
Public / Government - - - - Private 3,257,997 2,638,960 3,327,942 2,618,353
3,257,997 2,638,960 3,327,942 2,618,353
For the year ended December 31, 2017
Notes to the Consolidated Financial Statements

260 JS Bank Annual Report 2017
44.1.1.5 Geographical segment analysis2017 2016
Total assets Net assets Total assets Net assetsemployed employed employed employed
------------------------- Rupees in ‘000 ------------------------
Pakistan 383,634,982 19,130,072 264,559,000 19,497,720 Bahrain 7,318,894 537,842 4,266,591 264,674
390,953,876 19,667,914 268,825,591 19,762,394
2017 2016Profit before Contingencies Profit before Contingencies
taxation and taxation and commitments commitments
------------------------- Rupees in ‘000 ------------------------
Pakistan 1,618,309 106,990,038 3,841,612 78,454,905 Bahrain 244,368 1,715,242 12,508 1,219,052
1,862,677 108,705,280 3,854,120 79,673,957
44.1.2 Credit risk: Standardised approach
The Bank has adopted the Standardised Approach of Basel II for risk weighing its Credit Risk Exposures.
The following table illustrates the approved External Credit Assessment Institutions (ECAIs) whose ratings are being utilised by the Bank with respect to material categories of exposures:
Exposures JCR-VIS PACRA MOODY’S FITCH S&P
Corporate P P - - -Banks P P P P P
SME’s (retailexposures) P P - - -Sovereigns N/A N/A P P P
Securitisations N/A N/A N/A N/A N/AOthers (specify) N/A N/A N/A N/A N/A
The Bank has used Issue Specific Ratings for rating / risk weighing Issue Specific Exposures and Entity Ratings for rating / risk weighing claims against specific counterparties. Both short and long term ratings have been used to rate corresponding short and long term exposures. For this purpose, Mapping Grid provided by SBP as given below is used:
For the year ended December 31, 2017
Notes to the Consolidated Financial Statements

261JS Bank Annual Report 2017
Long - Term Ratings Grades Mapping
SBP Rating Grade PACRA JCR-VIS Fitch Moody’s S&P ECA Scores
1 AAAAA+AAAA-
AAAAA+AAAA-
AAAAA+AAAA-
AaaAa1Aa2Aa3
AAAAA+AAAA-
1
2 A+AA-
A+AA-
A+AA-
A1A2A3
A+AA-
2
3 BBB+BBBBBB-
BBB+BBBBBB-
BBB+BBBBBB-
Baa1Baa2Baa3
BBB+BBBBBB-
3
4 BB+BBBB-
BB+BBBB-
BB+BBBB-
Ba1Ba2Ba3
BB+BBBB-
4
5 B+BB-
B+BB-
B+BB-
B1B2B3
B+BB-
5,6
6 CCC+ and below
CCC+ and below
CCC+ and below
Caa1 and below
CCC+ and below
7
Short - Term Ratings Grades Mapping
SBP PACRA JCR-VIS Fitch Moody’s S&P
S1 A-1 A-1 F-1 P-1 A-1+, A-1
S2 A-2 A-2 F-2 P-2 A-2
S3 A-3 A-3 F-3 P-3 A-3
S4 Others Others Others Others Others
For the year ended December 31, 2017
Notes to the Consolidated Financial Statements

262 JS Bank Annual Report 2017
44.1.2.1 Credit exposures and comparative figures subject to the standardised approach
2017
Exposures Rating
category No.Rating
risk weightedAmount
outstandingDeduction
CRM * Net amountRisk weighted
asset------------------ Rupees in ‘000 -----------------------
Cash and Cash Equivalents 0% 4,727,659 - 4,727,659 -
Corporate 0 0% - - - - 1 20% 5,500,567 (395,068) 5,895,635 1,179,127 2 50% 17,441,491 1,465,077 15,976,414 7,988,207
3,4 100% 5,788,035 469,847 5,318,188 5,318,188 5,6 150% 37,696 - 37,696 56,545
Unrated 100% 58,318,493 7,980,335 50,338,157 50,338,157 Unrated-2 125% 10,708,740 2,171,901 8,536,839 10,671,048
97,795,022 11,692,092 86,102,929 75,551,272
Retail 0% - - - - 20% - - - - 50% - (12,177) 12,177 6,089 75% 40,599,287 3,282,236 37,317,051 27,987,788
40,599,287 3,270,059 37,329,228 27,993,877 Banks- Over 3 Months 0% - - - -
1 20% 1,789,294 (1,675) 1,790,969 358,194 2,3 50% 2,584,221 298,661 2,285,560 1,142,780 4,5 100% 1,536,984 - 1,536,984 1,536,984 6 150% - - - -
Unrated 50% 2,076,819 1,512,305 564,514 282,257 7,987,318 1,809,291 6,178,027 3,320,215
- Maturity Upto and under 3 Months in FCY
0% - - - - 1,2,3 20% 1,857,790 (106,218) 1,964,008 392,802 4,5 50% 79,142 (36,934) 116,075 58,038 6 150% - - - -
unrated 20% 598,384 (373,803) 972,187 194,437 2,535,316 (516,955) 3,052,270 645,277
- Maturity Upto and under 3 Months in PKR 0% - - - - - Maturity Upto and under 3 Months in PKR 20% 420,166 - 420,166 84,033
420,166 - 420,166 84,033
Residential Mortgage Finance 35% 7,010,492 - 7,010,492 2,453,672
Public Sector Entity0%
1 20% 565,234 - 565,234 113,047 2,3 50% - - - - 4,5 100% - - - - 6 150% - - - -
Unrated 50% 37,779,610 37,134,848 644,762 322,381 38,344,844 - 1,209,996 435,428
Sovereigns (SBP / GoP) 0% 164,850,356 85,584 164,763,708 1,586,600
Equity Investments - Listed 100% 3,546,574 - 3,546,574 3,546,574 - Unlisted 150% 62,752 - 62,752 94,129 Significant Investment and DTA 250% - - - -
3,609,326 - 3,609,326 3,640,703
Past Due Loans (Not Secured by Residential Mortgages)
S.P less than 20% 150% 341,754 - 341,754 512,631 S.P between 20% to 50% 100% 241,604 - 241,604 241,604 S.P greater than 50% 50% 35,677 - 35,677 17,839
619,035 - 619,035 772,074 Investment in fixed assets 100% 5,590,406 - 5,590,406 5,590,406 Other assets 100% 2,347,797 - 2,347,797 2,347,797 Total 376,437,024 16,340,071 322,961,039 124,421,354 * Credit Risk Mitigation (CRM)
For the year ended December 31, 2017
Notes to the Consolidated Financial Statements

263JS Bank Annual Report 2017
Credit exposures subject to Standardised approach2016
Exposures Rating
category No.Rating
risk weightedAmount
outstandingDeduction
CRM * Net amountRisk weighted
asset---------------------------- Rupees in ‘000 ---------------------------------
Cash and Cash Equivalents 0% 3,509,913 - 3,509,913 -
Corporate 0 0% - - - - 1 20% 4,632,415 - 4,632,415 926,483 2 50% 1,179,061 515,029 664,033 332,016
3,4 100% 1,146,866 304,406 842,461 842,461 5,6 150% 28,184 - 28,184 42,275
Unrated 100% 52,134,459 6,807,878 45,326,581 45,326,581 Unrated-2 125% 8,542,609 741,427 7,801,182 9,751,477
67,663,594 8,368,740 59,294,856 57,221,293
Retail 0% - - - - 20% - - - - 50% - - - - 75% 15,755,180 2,029,933 13,725,247 10,293,935
15,755,180 2,029,933 13,725,247 10,293,935 Banks- Maturity over 3 Months 0% - - - -
1 20% 1,194,772 (1,311) 1,196,082 239,216 2,3 50% 2,486,858 350,301 2,136,558 1,068,279 4,5 100% 446,671 - 446,671 446,671 6 150% - - - -
Unrated 50% 300,851 - 300,851 150,425 4,429,152 348,990 4,080,162 1,904,591
- Maturity Upto and under 3 Months in FCY 0% - - - - 1,2,3 20% 1,984,117 (415) 1,984,532 396,9064,5 50% - - - - 6 150% 49,300 - 49,300 73,950
unrated 20% 257,626 - 257,626 51,525 2,291,043 (415) 2,291,458 522,381
- Maturity upto and under 3 months in PKR 0% 8,702,731 3,686,267 5,016,465 - 20% 2,317,649 57,067 2,260,582 452,116
11,020,380 3,743,334 7,277,047 452,116
Residential Mortgage Finance 35% 2,540,476 - 2,540,476 889,167
Public Sector Entity0% - - - -
1 20% 1,991,822 - 1,991,822 398,364 2,3 50% - - - - 4,5 100% - - - - 6 150% - - - -
Unrated 50% 5,700,952 5,056,319 644,633 322,316 7,692,774 5,056,319 2,636,455 720,680
Sovereigns (SBP / GoP) 0% 60,558,616 - 60,558,616 -20% - - - -50% 166,159 - 166,159 83,080
100% 3,358,392 - 3,358,392 3,358,392 64,083,167 - 64,083,167 3,441,472
Equity Investments - Listed 100% 4,053,834 - 4,053,834 4,053,834 - Unlisted 150% 250,946 - 250,946 376,419Significant Investment and DTA 250% - - - -
4,304,780 - 4,304,780 4,430,253
Past Due Loans (Not Secured by Residential Mortgages)
S.P less than 20% 150% 409,704 - 409,704 614,556 S.P between 20% to 50% 100% 240,265 - 240,265 240,265
S.P greater than 50% 50% 59,620 - 59,620 29,810 709,589 - 709,589 884,631
Investment in fixed assets 100% 4,155,640 - 4,155,640 4,155,640 Other assets 100% 3,177,281 - 3,177,281 3,177,281Total 191,332,969 19,546,901 171,786,071 88,093,440 * Credit Risk Mitigation (CRM)
For the year ended December 31, 2017
Notes to the Consolidated Financial Statements

264 JS Bank Annual Report 2017
44.1.3 Policies and processes for collateral valuation and management as regards Basel II;For Credit Risk Mitigation purposes the Bank uses only the eligible collaterals under Comprehensive Approach of Credit Risk Mitigation under Standardised Approach as prescribed by SBP under Circular No. 8 of 2006, which includes Cash and Cash Equivalent Securities including Government Securities (like Cash Margins, Lien on Bank Accounts, Foreign Deposit Receipts, Term Deposit Receipts, Pledge of Defense Saving Certificates, Regular Income Certificates, Special Saving Certificates, T-Bills and Pakistan Investment Bonds etc.) and Shares Listed on the Main Index.Under Bank’s policy all collaterals are subject to periodic valuations to monitor the adequacy of margins held. Shares / Marketable securities are valued by the Bank on daily basis to calculate the Drawing Power (DP). In case of any shortfall in the requisite margins, the DP is adjusted to the appropriate level and the business units are informed to take appropriate action as per the agreement with the customer.
44.2 Equity position risk in the banking bookEquity positions in the banking book include Investment in equities that are available-for-sale or held for strategic investment purposes. These investments are generally regarded as riskier relative to fixed income securities owing to the inherent volatility of stock market prices. The Bank mitigates these risks through diversification and capping maximum exposures in a single company, compliance with regulatory requirement, following the guidelines laid down in the Bank’s Investment Policy as set by the Board of Directors (BoD). The Bank follows a delivery versus payment settlement system thereby minimizing risk available in relation to settlement risk.
44.3 Market risk44.3.1 Market risk is the risk of loss due to adverse changes in interest rates, foreign exchange rates, equity prices
and market conditions. From the perspective of a Bank, market risk comprises of interest rate risk, foreign exchange risk and equity position risk, which the Bank is exposed to in its trading book.The Bank has an approved market risk policy wherein the governance structure for managing market risk, measurement tools used and the market risk exposure limits have been addressed. The Bank’s strategy for managing market risk is to relate the level of risk exposures to their risk appetite and the capital at hand.The Board of Directors (BoD) and the Asset and Liability Committee (ALCO) are responsible for addressing market risk from a strategic perspective and are assisted by the market risk function in meeting these objectives.The Market Risk function is also supported by personnel in the Middle Office function and directly report to Group Head Risk Management. Its responsibility includes ensuring the implementation of the market risk policy above in line with the Bank’s strategy.Risk reporting undertaken by the market risk function includes:a) Portfolio Reportsb) Limit monitoring reportsc) Sensitivity analysis; andd) Stress testing of the portfolioHedging measures are undertaken to maintain limits set out in the risk management policy.Currently, the Bank is using the market risk standardised approach for the purpose of computing regulatory capital, the details of which are set out above.
44.3.2 Foreign exchange risk Main objective of foreign exchange risk management is to ensure that the foreign exchange exposure of the Bank lies within the defined appetite of the Bank.
For the year ended December 31, 2017
Notes to the Consolidated Financial Statements

265JS Bank Annual Report 2017
2017Net foreign
Off-balance currencyAssets Liabilities sheet items exposure
--------------------- Rupees in ‘000 --------------------
Pakistan Rupee 372,781,791 352,638,679 228,778 20,371,890 United States Dollar 16,159,391 14,305,112 (1,405,232) 449,047 Great Britain Pound 1,147,121 3,735,250 2,546,068 (42,061)Euro 778,748 738,975 (100,213) (60,440)Other currencies 86,825 137,143 (28,235) (78,553)
18,172,085 18,916,480 1,012,388 267,993 390,953,876 371,555,159 1,241,166 20,639,883
2016
Net foreignOff-balance currency
Assets Liabilities sheet items exposure--------------------- Rupees in ‘000 --------------------
Pakistan Rupee 254,457,373 235,096,489 228,778 19,589,662 United States Dollar 12,520,840 9,640,001 (2,701,681) 179,158 Great Britain Pound 314,656 1,461,624 1,122,628 (24,340)Euro 326,070 1,650,304 1,327,343 3,109 Other currencies 1,206,652 1,214,779 22,932 14,805
14,368,218 13,966,708 (228,778) 172,732 268,825,591 249,063,197 - 19,762,394
44.3.3 Equity position risk in trading book
The Bank’s objective with regard to holding equity investments in its trading book is to earn income from favourable market movements. Positions in the equity market are substantiated by sound fundamental and technical research.Equity price risk is managed by applying trading limit and scrip-wise and portfolio wise nominal limits.
Daily reports are generated to monitor the internal and regulatory limits with respect to the overall foreign currency exposures. The overall net open position, whether short or long has the potential to negatively impact the profit and loss depending upon the direction of movement in foreign exchange rates.
Foreign exchange open and mismatched positions are marked to market on a daily basis.
Currency risk arises where the value of financial instruments changes due to changes in foreign exchange rates. In order to manage currency risk exposure the bank enters into ready / spot, forward and swap transactions with SBP and in the interbank market. The Bank’s foreign exchange exposure comprises of forward contracts, foreign currencies cash in hand, balances with banks abroad, foreign placement with SBP and foreign currencies assets and liabilities. The net open position is managed within the statutory limits, as fixed by SBP. Counter parties limit are also fixed to limit risk concentration. Appropriate segregation of duties exists between the front and back office functions while compliance with the net open position limit is independently monitored on an ongoing basis.
For the year ended December 31, 2017
Notes to the Consolidated Financial Statements

266 JS Bank Annual Report 2017
44.3.
4Mi
smatc
h of in
teres
t rate
sens
itive a
ssets
and l
iabilit
ies
Intere
st rat
e risk
is th
e risk
that
the va
lue of
a fin
ancia
l instr
umen
t will fl
uctua
te du
e to c
hang
es in
the m
arket
intere
st rat
es. T
he B
ank i
s exp
osed
to in
teres
t / m
ark-u
p rate
risk a
s a re
sult o
f mism
atche
s or g
aps i
n the
amou
nt of
intere
st / m
ark up
ba
sed a
ssets
and l
iabiliti
es th
at ma
ture o
r re-p
rice i
n a gi
ven p
eriod
. The
Ban
k man
ages
this
risk b
y matc
hing/r
e-pric
ing of
asse
ts an
d liab
ilities
. The
asse
ts an
d liab
ilities
comm
ittee (
ALCO
) of th
e Ban
k mon
itors
and m
anag
es th
e inte
rest ra
te ris
k with
the
objec
tive o
f limi
ting t
he po
tentia
l adv
erse e
ffects
on th
e profi
tability
of th
e Ban
k.
2017
Non-
intere
stEff
ectiv
eOv
er 1
Over
3Ov
er 6
Over
1Ov
er 2
Over
3Ov
er 5
beari
ng
yield
Up to
1to
3to
6mo
nths t
oto
2to
3to
5to
10Ab
ove
finan
cial
intere
stTo
talmo
nthmo
nths
month
s1 y
ear
years
years
years
years
10 ye
arsins
trume
nt
rate -
%---
------
------
------
------
------
------
------
------
------
------
------
------
------
------
------
Rup
ees i
n ‘00
0 ----
------
------
------
------
------
------
------
------
------
------
------
------
------
------
-----
On-b
alanc
e she
et fin
ancia
l instr
umen
ts
Asse
tsCa
sh an
d bala
nces
with
trea
sury
bank
s -
17,33
4,111
1,
890,3
81
-
-
-
-
-
-
-
-
15,44
3,730
Ba
lance
s with
othe
r ban
ks 0
- 6.25
1,
049,4
96
188,9
87
-
-
-
-
-
-
-
-
860,5
09
Lend
ings t
o fina
ncial
institu
tions
1.38 -
6.93
3,11
6,199
1,
281,1
77
1,18
1,464
65
3,558
-
-
-
-
-
-
-
Inv
estm
ents
2.88 -
12.00
170,2
88,83
5 10
,674,4
88
10,82
8,812
2,
944,1
55
1,37
8,498
87
,666,3
61
17,98
7,185
30
,288,9
33
2,43
3,702
-
6,
086,7
01
Adva
nces
4.00 -
40.00
184,1
61,17
5 12
5,644
,234
17,56
7,979
23
,960,1
33
3,37
1,024
4,
567,3
73
3,36
1,651
2,
391,3
16
925,0
85
1,75
3,343
55
5,884
Ot
her a
ssets
- 6,
471,9
05
-
-
-
-
-
-
-
-
-
6,47
1,905
38
2,421
,721
139,6
79,26
7 29
,578,2
55
27,55
7,846
4,
749,5
22
92,23
3,734
21
,348,8
36
32,68
0,249
3,
358,7
87
1,75
3,343
29
,418,7
29
Liabil
ities
Bills
paya
ble-
3,82
4,278
-
-
-
-
-
-
-
-
-
3,
824,2
78
Borro
wing
s1.0
0 - 6.
20 64
,557,0
43
49,79
8,126
8,
092,5
37
5,20
4,967
14
,289
31,23
4 16
,839
464,3
13
934,7
38
-
-
Depo
sits a
nd ot
her a
ccou
nts0.7
5 - 11
.00 28
8,365
,014
103,9
12,55
4 37
,778,6
47
37,71
0,625
32
,621,4
40
1,94
9,163
85
0,207
70
,674
-
-
73,47
1,704
Su
b-ord
inated
loan
s7.5
7 - 7.
61 4,
998,8
00
-
-
4,99
8,800
-
-
-
-
-
-
-
Lia
bilitie
s aga
inst a
ssets
sub
ject to
finan
ce le
ase
7.71
5,03
2 94
19
1 29
0 59
0 1,
225
636
2,00
6 -
-
-
Ot
her li
abiliti
es -
8,84
8,854
-
-
-
-
-
-
-
-
-
8,
848,8
54
370,5
99,02
1 15
3,710
,774
45,87
1,375
47
,914,6
82
32,63
6,319
1,
981,6
22
867,6
82
536,9
93
934,7
38
-
86,14
4,836
On
-bala
nce s
heet
finan
cial in
strum
ents
11,82
2,700
(1
4,031
,507)
(16,2
93,12
0) (2
0,356
,836)
(27,8
86,79
7) 90
,252,1
12
20,48
1,154
32
,143,2
56
2,42
4,049
1,
753,3
43
(56,6
62,95
4)
Comm
itmen
ts in
respe
ct of
forwa
rd p
urcha
se, c
urren
cy sw
aps,
optio
ns an
d c
ommi
tmen
ts to
exten
t cred
its 30
,348,3
78
4,474
,661
1,55
7,991
21
,879,0
36 88
8,207
75
2,858
53
0,417
26
5,208
-
- -
Comm
itmen
ts in
respe
ct of
forwa
rd sa
le,
curre
ncy s
waps
and o
ption
s (9
,344,1
85)
(4,10
0,495
) (1
,187,3
68)
(58,1
17)
(2,46
4,363
) (7
38,21
7) (5
30,41
7) (2
65,20
8) -
-
-
Off-b
alanc
e she
et ga
p 21
,004,1
93
374,1
66
370,6
23
21,82
0,919
(1
,576,1
56)
14,64
1 -
-
-
-
-
Total
yield
/ inte
rest r
isk se
nsitiv
ity ga
p (1
3,657
,341)
(15,9
22,49
7) 1,
464,0
83
(29,4
62,95
3) 90
,266,7
53
20,48
1,154
32
,143,2
56
2,42
4,049
1,
753,3
43
(56,6
62,95
4)
Cumu
lative
yield
/ inte
rest r
iskse
nsitiv
ity ga
p (1
3,657
,341)
(29,5
79,83
8) (2
8,115
,755)
(57,5
78,70
8) 32
,688,0
45
53,16
9,199
85
,312,4
55
87,73
6,504
89
,489,8
47
For the year ended December 31, 2017
Notes to the Consolidated Financial Statements

267JS Bank Annual Report 2017
2016
Non-
intere
stEff
ectiv
eOv
er 1
Over
3Ov
er 6
Over
1Ov
er 2
Over
3Ov
er 5
beari
ng
yield
Up to
1to
3to
6mo
nths t
oto
2to
3to
5to
10Ab
ove
finan
cial
intere
stTo
talmo
nthmo
nths
month
s1 y
ear
years
years
years
years
10 ye
arsins
trume
nt
rate -
%---
------
------
------
------
------
------
------
------
------
------
------
------
------
------
------
Rup
ees i
n ‘00
0 ----
------
------
------
------
------
------
------
------
------
------
------
------
------
------
-----
On-b
alanc
e she
et fin
ancia
l instr
umen
ts
Asse
ts
Cash
and b
alanc
es w
ithtre
asury
bank
s -
15,50
9,263
1,
385,3
32
-
-
-
-
-
-
-
-
14,12
3,931
Ba
lance
s with
othe
r ban
ks 0
- 6.5
767,7
47
252,1
30
-
-
-
-
-
-
-
-
515,6
17
Lend
ings t
o fina
ncial
institu
tions
0.17 -
6.1
11,33
4,414
10
,654,5
23
522,9
93
156,8
98
-
-
-
-
-
-
-
Inves
tmen
ts - n
et2.9
2 - 12
.00 13
5,038
,901
15,79
6,374
53
,160,2
39
1,20
3,367
8,
311,0
27
10,98
2,102
27
,979,2
49
7,61
4,260
2,
235,8
96
-
7,75
6,387
Ad
vanc
es -
net
0.4 -
39 93
,812,5
06
67,70
2,014
7,
858,8
01
5,19
4,022
1,
794,4
66
2,56
8,462
2,
525,9
85
2,34
0,457
98
0,250
2,
138,4
60
709,5
89
Othe
r ass
ets -
5,44
5,955
-
-
-
-
-
-
-
-
-
5,
445,9
55
261,9
08,78
6 95
,790,3
73
61,54
2,033
6,
554,2
87
10,10
5,493
13
,550,5
64
30,50
5,234
9,
954,7
17
3,21
6,146
2,
138,4
60
28,55
1,479
Lia
bilitie
sBil
ls pa
yable
- 2,
544,0
28
-
-
-
-
-
-
-
-
-
2,54
4,028
Bo
rrowi
ngs
1.8 -
6.00
10,32
0,047
2,
408,6
22
4,19
4,410
2,
910,1
21
10,21
1 20
,422
31,43
7 23
4,580
46
9,716
-
40
,528
Depo
sits a
nd ot
her a
ccou
nts0.1
- 9.1
1 22
5,004
,655
88,22
7,384
31
,651,6
81
33,76
9,494
16
,212,3
83
403,9
22
127,8
44
605,4
24
-
-
54,00
6,523
Su
b-ord
inated
loan
s7.5
3 3,
000,0
00
-
-
3,00
0,000
-
-
-
-
-
-
-
Ot
her li
abiliti
es -
7,11
1,584
-
-
-
-
-
-
-
-
-
7,
111,5
84
247,9
80,31
4 90
,636,0
06
35,84
6,091
39
,679,6
15
16,22
2,594
42
4,344
15
9,281
84
0,004
46
9,716
-
63
,702,6
63
On-b
alanc
e she
et fin
ancia
l instr
umen
ts 13
,928,4
72
5,15
4,367
25
,695,9
42
(33,1
25,32
8) (6
,117,1
01)
13,12
6,220
30
,345,9
53
9,11
4,713
2,
746,4
30
2,13
8,460
(3
5,151
,184)
Comm
itmen
ts in
respe
ct of
forwa
rd pu
rchas
e con
tacts
and c
ommi
tmen
ts to
exten
t cred
its 14
,738,7
29
9,45
7,255
3,
355,3
55
1,02
1,239
38
4,430
31
2,650
20
7,800
-
-
-
-
Comm
itmen
ts in
respe
ct of
forwa
rd ex
chan
ge co
ntrac
ts - s
ale (1
5,879
,540)
(13,9
18,44
5) (9
77,88
9) (2
32,76
8) (2
29,98
8) (3
12,65
0) (2
07,80
0) -
-
-
-
Off-b
alanc
e she
et ga
p (1
,140,8
11)
(4,46
1,190
) 2,
377,4
66
788,4
71
154,4
42
-
-
-
-
-
-
Total
yield
/ inte
rest r
isk se
nsitiv
ity ga
p 69
3,177
28
,073,4
08
(32,3
36,85
7) (5
,962,6
59)
13,12
6,220
30
,345,9
53
9,11
4,713
2,
746,4
30
2,13
8,460
(3
5,151
,184)
Cumu
lative
yield
/ inte
rest r
isk
sens
itivity
gap
693,1
77
28,76
6,585
(3
,570,2
72)
(9,53
2,931
) 3,
593,2
89
33,93
9,242
43
,053,9
55
45,80
0,385
47
,938,8
45
2017
2016
2017
2016
------
- Rup
ees i
n ‘00
0 ----
------
---- R
upee
s in ‘
000 -
------
Reco
ncilia
tion t
o tota
l ass
etsRe
conc
iliatio
n to t
otal li
abilit
ies
Balan
ce as
per b
alanc
e she
et 39
0,953
,876
268,8
25,59
1 Ba
lance
as pe
r bala
nce s
heet
371,2
85,96
2 24
9,063
,197
Less
: Non
finan
cial a
ssets
Less
: Non
finan
cial li
abilit
iesOp
eratin
g fixe
d ass
ets 7,
589,7
02
6,02
1,563
Ot
her li
abiliti
es-
-
Defer
red ta
x ass
ets -
net
-
-
Defer
red ta
x liab
ilities
- ne
t 68
6,941
1,
082,8
85
Othe
r ass
ets 94
2,453
89
5,244
68
6,941
1,
082,8
85
8,53
2,155
6,
916,8
07
370,5
99,02
1 24
7,980
,312
382,4
21,72
1 26
1,908
,784
For the year ended December 31, 2017
Notes to the Consolidated Financial Statements

268 JS Bank Annual Report 2017
44.4
Liquid
ity ris
k
Liquid
ity ris
k is t
he ris
k tha
t the B
ank w
ill not
be ab
le to
raise
fund
s to m
eet it
s com
mitm
ents.
The B
ank’s
Ass
et an
d Liab
ility C
ommi
ttee (
ALCO
) man
ages
the l
iquidi
ty po
sition
on a
conti
nuou
s bas
is.
Bank
’s po
licy t
o liqu
idity
mana
geme
nt is
to ma
intain
adeq
uate
liquid
ity at
all ti
mes a
nd in
all c
urren
cies u
nder
both
norm
al an
d stre
ss co
nditio
ns, to
mee
t our
contr
actua
l and
poten
tial p
ayme
nt ob
ligati
ons
witho
ut inc
urring
addit
ional
and u
nacc
eptab
le co
st to
the bu
sines
s.
Treas
ury is
respo
nsibl
e for
the m
anag
ing liq
uidity
risk u
nder
the gu
idanc
e of A
sset-
Liabil
ity Co
mmitte
e of th
e Ban
k. Th
e Ban
k’s liq
uidity
risk m
anag
emen
t app
roach
start
s at th
e intra
day le
vel (o
perat
ional l
iquidi
ty)
mana
ging t
he da
ily pa
ymen
ts qu
eue a
nd fa
ctorin
g in o
ur ac
cess
to th
e qua
lifying
secu
rities
of St
ate Ba
nk of
Pakis
tan. It
then
cove
rs tac
tical l
iquidi
ty ris
k man
agem
ent d
ealin
g with
the a
cces
s to u
nsec
ured f
undin
g so
urces
and t
he liq
uidity
chara
cteris
tics o
f our
asse
t inve
ntory
(asse
t liqu
idity)
. Fina
lly, th
e stra
tegic
persp
ectiv
e com
prise
s the
matu
rity pr
ofile
of all
asse
ts an
d liab
ilities
on ou
r stat
emen
t of fi
nanc
ial po
sition
.
For m
onito
ring
and
contr
olling
liquid
ity ris
k, the
Ban
k gen
erates
a sc
enari
o se
nsitiv
e matu
rity st
ateme
nt of
finan
cial p
ositio
n, an
d run
contr
olled
mism
atche
s tha
t are
monit
ored
and
discu
ssed
by A
LCO
memb
ers re
gular
ly. Th
e Ban
k prep
ares v
ariou
s typ
es of
repo
rts an
d ana
lysis
for as
sistin
g ALC
O in
taking
nece
ssary
strat
egic
actio
ns fo
r man
aging
liquid
ity ris
k in t
he B
ank.
Thes
e inc
lude l
iquidi
ty rat
ios,
Conc
entra
tion a
nalys
is, G
ap re
ports
, Stre
ss te
sting
, Liqu
idity
Cove
rage r
atio &
Net
Stab
le Fu
nding
Rati
o ana
lysis
etc.
Matur
ity of
asse
ts an
d liab
ilities
- ba
sed o
n con
tractu
al ma
turitie
s of a
ssets
and l
iabilit
ies of
the B
ank
2017
Ove
r 1
Ove
r 3
Ove
r 6
Ove
r 1
Ove
r 2
Ove
r 3
Ove
r 5
Upto
1
to 3
to 6
mon
ths to
to
2 to
3 to
5 to
10
Abo
ve
Total
m
onth
mon
ths
mon
ths
1 ye
ar y
ears
yea
rs y
ears
yea
rs 10
years
---
------
------
------
------
------
------
------
------
------
------
------
------
- Rup
ees i
n ‘00
0 ----
------
------
------
------
------
------
------
------
------
------
------
------
Asse
tsCa
sh an
d bala
nces
with
treas
ury ba
nks
17,33
4,111
17
,334,1
11
-
-
-
-
-
-
-
-
Balan
ces w
ith ot
her b
anks
1,04
9,496
1,
049,4
96
-
-
-
-
-
-
-
-
Lend
ings t
o fina
ncial
insti
tution
s 3,
116,1
99
1,28
1,177
1,
181,4
64
653,5
58
-
-
-
-
-
-
Inves
tmen
ts 17
0,288
,835
10,51
8,903
15
,940,3
09
3,01
8,365
1,
557,6
34
87,51
3,881
18
,432,4
55
30,87
3,586
2,
433,7
02
-Ad
vanc
es 18
4,161
,175
32,62
3,701
27
,637,2
10
32,61
0,366
27
,473,9
05
14,46
0,355
16
,168,7
65
24,28
0,105
6,
102,8
23
2,80
3,945
Op
eratin
g fixe
d ass
ets 7,
589,7
02
71,18
0 42
4,177
18
6,946
37
6,780
66
3,888
51
6,817
85
5,095
1,
236,9
82
3,25
7,837
De
ferred
tax a
ssets
- ne
t -
-
-
-
-
-
-
-
-
-
Ot
her a
ssets
7,41
4,358
5,
005,6
10
10,00
2 33
9,729
30
8,743
52
7,294
44
3,771
74
0,982
38
,227
-
390,9
53,87
6 67
,884,1
78
45,19
3,162
36
,808,9
64
29,71
7,062
10
3,165
,418
35,56
1,808
56
,749,7
68
9,81
1,734
6,
061,7
82
Liabil
ities
Bills
paya
ble
3,82
4,278
3,
824,2
78
-
-
-
-
-
-
-
-
Borro
wing
s 64
,557,0
43
49,79
8,126
8,
092,5
37
5,20
4,967
14
,289
31,23
4 16
,839
464,3
13
934,7
38
-
Depo
sits a
nd ot
her a
ccou
nts 28
8,365
,014
173,4
17,05
4 37
,778,6
47
41,67
7,829
32
,621,4
40
1,94
9,163
85
0,207
70
,674
-
-
Sub-
ordina
ted lo
ans
4,99
8,800
-
-
1,
000
1,00
0 2,
000
2,00
0 4,
001
4,98
8,799
-
Lia
bilitie
s aga
inst a
ssets
subje
ctto
finan
ce le
ase
5,03
2 94
19
1 29
0 59
0 1,
225
636
2,00
6 -
-
De
ferred
tax l
iabiliti
es -
net
686,9
41
4,82
9 2,
117
22,73
8 2,
513
(121
,245)
19,44
4 6,
707
49,85
7 69
9,981
Ot
her li
abiliti
es 8,
848,8
54
5,31
2,891
20
6,421
14
5,426
27
2,466
1,
020,4
64
1,28
0,411
61
0,775
-
-
37
1,285
,962
232,3
57,27
2 46
,079,9
13
47,05
2,250
32
,912,2
98
2,88
2,841
2,
169,5
37
1,15
8,476
5,
973,3
94
699,9
81
Net a
ssets
19,66
7,914
(1
64,47
3,094
) (8
86,75
1) (1
0,243
,286)
(3,19
5,236
) 10
0,282
,577
33,39
2,271
55
,591,2
92
3,83
8,340
5,
361,8
01
Share
capit
al 10
,724,6
43
Disco
unt o
n iss
ue of
share
s (2
,105,4
01)
Prefe
rence
Sha
re 1,
500,0
00
Statu
tory r
eserv
e 1,
540,9
87
Unap
propr
iated
profi
t 5,
463,3
57
Non-
contr
olling
inter
est
1,46
3,454
Su
rplus
on re
valua
tion o
f ass
ets -
net
1,080
,874
19,66
7,914
For the year ended December 31, 2017
Notes to the Consolidated Financial Statements

269JS Bank Annual Report 2017
2016
Ove
r 1
Ove
r 3
Ove
r 6
Ove
r 1
Ove
r 2
Ove
r 3
Ove
r 5
Upto
1
to 3
to 6
mon
ths to
to
2 to
3 to
5 to
10
Abo
ve
Total
m
onth
mon
ths
mon
ths
1 ye
ar y
ears
yea
rs y
ears
yea
rs 10
years
---
------
------
------
------
------
------
------
------
------
------
------
------
- Rup
ees i
n ‘00
0 ----
------
------
------
------
------
------
------
------
------
------
------
------
Asse
tsCa
sh an
d bala
nces
with
treas
ury ba
nks
15,50
9,263
15
,509,2
63
- -
- -
- -
- -
Balan
ces w
ith ot
her b
anks
767,7
47
767,7
47
- -
- -
- -
- -
Lend
ing to
finan
cial in
stitut
ions
11,33
4,414
10
,654,5
23
522,9
93
156,8
98
- -
- -
- -
Inves
tmen
ts 13
5,038
,901
18,67
2,398
56
,557,2
60
1,13
5,734
9,
206,2
56
11,22
7,289
28
,209,4
35
7,79
4,633
2,
235,8
96
-Ad
vanc
es 93
,812,5
06
56,44
3,856
8,
627,6
38
5,57
7,305
3,
889,0
57
5,50
4,828
5,
115,6
87
3,98
0,740
2,
534,9
35
2,13
8,460
Op
eratin
g fixe
d ass
ets 6,
021,5
63
73,64
3 34
0,206
16
4,884
32
5,949
54
5,490
41
5,376
59
1,637
61
4,264
2,
950,1
14
Defer
red ta
x ass
ets -
net
- -
- -
- -
- -
- -
Othe
r ass
ets 6,
341,1
97
5,25
7,433
-
- 30
4,036
27
2,131
38
7,678
96
,310
23,60
9 -
268,8
25,59
1 10
7,378
,863
66,04
8,097
7,
034,8
21
13,72
5,298
17
,549,7
38
34,12
8,176
12
,463,3
20
5,40
8,704
5,
088,5
74
Liabil
ities
Bills
paya
ble
2,54
4,028
2,
544,0
28
- -
- -
- -
- -
Borro
wing
s 10
,320,0
47
2,44
9,151
4,
194,4
09
2,91
0,121
10
,211
20,42
2 31
,437
234,5
80
469,7
16
- De
posit
s and
othe
r acc
ounts
225,0
04,65
5 13
8,048
,758
31,65
1,693
37
,954,6
31
16,21
2,383
40
3,922
12
7,844
60
5,424
-
- Su
b-ord
inated
loan
s 3,
000,0
00
- -
600
600
1,20
0 1,
200
2,40
0 2,
994,0
00
- Lia
bilitie
s aga
inst a
ssets
subje
ctto
finan
ce le
ase
- -
- -
- -
- -
- -
Defer
red ta
x liab
ilities
- ne
t 1,
082,8
85
- -
- -
- 1,
082,8
85
- -
- Ot
her li
abiliti
es 7,
111,5
82
2,22
8,984
3,
022,4
94
31,81
4 10
1,218
42
4,195
94
1,680
26
7,282
93
,915
- 24
9,063
,197
145,2
70,92
1 38
,868,5
96
40,89
7,166
16
,324,4
12
849,7
39
2,18
5,046
1,
109,6
86
3,55
7,631
-
Net a
ssets
19,76
2,394
(3
7,892
,058)
27,17
9,501
(3
3,862
,345)
(2,59
9,114
) 16
,699,9
99
31,94
3,130
11
,353,6
34
1,85
1,073
5,
088,5
74
Share
capit
al 10
,724,6
43
Disco
unt o
n iss
ue of
share
s (2
,105,4
01)
Prefe
rence
share
s 1,
500,0
00
Statu
tory r
eserv
e 1,
334,1
39
Unap
propr
iated
profi
t 3,
973,3
24
Surp
lus on
reva
luatio
n of a
ssets
- ne
t 1,
222,8
20
16,64
9,525
For the year ended December 31, 2017
Notes to the Consolidated Financial Statements

270 JS Bank Annual Report 2017
Mat
urity
of a
sset
s and
liabi
lities
- Ba
sed
on w
orkin
g pr
epar
ed b
y the
Ass
et a
nd L
iabilit
y Com
mitt
ee (A
LCO)
of t
he B
ank
2017
Ove
r 1
Ove
r 3
Ove
r 6
Ove
r 1
Ove
r 2
Ove
r 3
Ove
r 5
Upto
1
to 3
to 6
mon
ths to
to
2 to
3 to
5 to
10
Abo
ve
Total
m
onth
mon
ths
mon
ths
1 ye
ar y
ears
yea
rs y
ears
yea
rs 10
years
---
------
------
------
------
------
------
------
------
------
------
------
------
- Rup
ees i
n ‘00
0 ----
------
------
------
------
------
------
------
------
------
------
------
------
Asse
tsCa
sh an
d bala
nces
with
treas
ury ba
nks
17,33
4,111
17
,334,1
11
- -
- -
- -
- -
Balan
ces w
ith ot
her b
anks
1,04
9,496
1,
049,4
96
- -
- -
- -
- -
Lend
ings t
o fina
ncial
institu
tions
3,11
6,199
1,
281,1
77
1,18
1,464
65
3,558
-
- -
- -
- Inv
estm
ents
170,2
88,83
5 10
,518,9
03
15,94
0,309
3,
018,3
65
1,55
7,634
87
,513,8
81
18,43
2,455
30
,873,5
86
2,43
3,702
-
Adva
nces
184,1
61,17
5 26
,052,6
84
32,53
1,971
32
,302,1
84
32,01
4,489
13
,088,4
75
14,98
7,448
24
,277,1
56
6,10
2,823
2,
803,9
45
Opera
ting fi
xed a
ssets
7,58
9,702
71
,180
424,1
77
186,9
46
376,7
80
663,8
88
516,8
17
855,0
95
1,23
6,982
3,
257,8
37
Defer
red ta
x ass
ets -
net
- -
- -
- -
- -
- -
Othe
r ass
ets 7,
414,3
58
5,00
5,610
10
,002
339,7
29
308,7
43
527,2
94
443,7
71
740,9
82
38,22
7 -
390,9
53,87
6 61
,313,1
61
50,08
7,923
36
,500,7
82
34,25
7,646
10
1,793
,538
34,38
0,491
56
,746,8
19
9,81
1,734
6,
061,7
82
Liabil
ities
Bills
paya
ble
3,82
4,278
3,
824,2
78
- -
- -
- -
- -
Borro
wing
s 64
,557,0
43
49,79
8,126
8,
092,5
37
5,20
4,967
14
,289
31,23
4 16
,839
464,3
13
934,7
38
- De
posit
s and
othe
r acc
ounts
288,3
65,01
4 44
,458,1
33
43,57
9,674
48
,699,1
65
39,64
3,889
12
,176,8
63
13,51
4,535
86
,292,7
55
- -
Sub-
ordina
ted lo
ans
4,99
8,800
-
- 1,
000
1,00
0 2,
000
2,00
0 4,
001
4,98
8,799
-
Liabil
ities a
gains
t ass
ets su
bject
- -
- -
- -
- -
- -
to fin
ance
leas
e 5,
032
94
191
290
590
1,22
5 63
6 2,
006
- -
Defer
red ta
x liab
ilities
- ne
t 68
6,941
4,
829
2,11
7 22
,738
2,51
3 (1
21,24
5) 19
,444
6,70
7 49
,857
699,9
81
Othe
r liab
ilities
8,84
8,854
5,
312,8
91
206,4
21
145,4
26
272,4
66
1,02
0,464
1,
280,4
11
610,7
75
- -
371,2
85,96
2 10
3,398
,351
51,88
0,940
54
,073,5
86
39,93
4,747
13
,110,5
41
14,83
3,865
87
,380,5
57
5,97
3,394
69
9,981
Ne
t ass
ets 19
,667,9
14
(42,0
85,19
0) (1
,793,0
17)
(17,5
72,80
4) (5
,677,1
01)
88,68
2,997
19
,546,6
26
(30,6
33,73
8) 3,
838,3
40
5,36
1,801
Share
capit
al 10
,724,6
43
Disco
unt o
n iss
ue of
share
s (2
,105,4
01)
Prefe
rence
share
1,50
0,000
St
atutor
y res
erve
1,54
0,987
Un
appro
priate
d profi
t 5,
463,3
57
Non-
contr
olling
inter
est
1,46
3,454
Su
rplus
on re
valua
tion o
f ass
ets -
net
1,08
0,874
19
,667,9
14
To id
entif
y the
beh
avio
ural
mat
uritie
s of n
on-c
ontra
ctua
l ass
ets a
nd lia
biliti
es, t
he B
ank
has u
sed
the
follo
wing
met
hodo
logy
:
For d
eterm
ining
the c
ore po
rtion o
f non
contr
actua
l liabil
ities (
non-
volat
ile po
rtion),
the b
ank h
as us
ed th
e ave
rage m
ethod
whe
reby a
verag
e bala
nce m
aintai
ned o
ver p
ast fi
ve ye
ar ha
s bee
n clas
sified
as
core
and h
as be
en pl
aced
in ‘o
ver 3
to 5
years
’ matu
rity bu
cket.
Non
contr
actua
l ass
ets an
d rem
aining
volat
ile po
rtion o
f non
contr
actua
l liabil
ities h
ave b
een s
tratifi
ed in
relev
ant m
aturity
buck
et us
ing
buck
et wi
se pe
rcenta
ges d
eterm
ined b
y usin
g ave
rage v
olatilit
y in r
espe
ctive
perio
d / bu
cket.
Ove
r 1
Ove
r 3
Ove
r 6
Ove
r 1
Ove
r 2
Ove
r 3
Upto
1
to 3
to 6
mon
ths to
to
2 to
3 to
5 m
onth
mon
ths
mon
ths
1 ye
ar y
ears
yea
rs y
ears
3%4%
5%5%
8%10
%
65%
For the year ended December 31, 2017
Notes to the Consolidated Financial Statements

271JS Bank Annual Report 2017
2016
Ove
r 1
Ove
r 3
Ove
r 6
Ove
r 1
Ove
r 2
Ove
r 3
Ove
r 5
Upto
1
to 3
to 6
mon
ths to
to
2 to
3 to
5 to
10
Abo
ve
Total
m
onth
mon
ths
mon
ths
1 ye
ar y
ears
yea
rs y
ears
yea
rs 10
years
---
------
------
------
------
------
------
------
------
------
------
------
------
- Rup
ees i
n ‘00
0 ----
------
------
------
------
------
------
------
------
------
------
------
------
Asse
tsCa
sh an
d bala
nces
with
treas
ury ba
nks
15,50
9,263
15
,509,2
63
- -
- -
- -
- -
Balan
ces w
ith ot
her b
anks
1,95
0,297
1,
950,2
97
- -
- -
- -
- -
Lend
ing to
finan
cial in
stitut
ions
11,33
4,414
10
,654,5
23
522,9
93
156,8
98
- -
- -
- -
Inves
tmen
ts 13
5,038
,901
23,23
0,464
52
,806,3
11
1,13
5,734
8,
399,1
39
11,22
7,289
28
,209,4
35
7,79
4,633
2,
235,8
96
-Ad
vanc
es 93
,812,5
06
17,88
5,620
18
,592,1
26
19,87
4,179
18
,185,9
31
5,50
4,828
5,
115,6
87
3,98
0,740
2,
534,9
35
2,13
8,460
Op
eratin
g fixe
d ass
ets 6,
021,5
63
73,64
3 34
0,206
16
4,884
32
5,949
54
5,490
41
5,376
59
1,637
61
4,264
2,
950,1
14
Defer
red ta
x ass
ets -
net
- -
- -
- -
- -
- -
Othe
r ass
ets 6,
341,1
99
5,25
7,435
-
- 30
4,036
27
2,131
38
7,678
96
,310
23,60
9 -
270,0
08,14
3 74
,561,2
45
72,26
1,636
21
,331,6
95
27,21
5,055
17
,549,7
38
34,12
8,176
12
,463,3
20
5,40
8,704
5,
088,5
74
Liabil
ities
Bills
paya
ble
2,54
4,028
2,
544,0
28
- -
- -
- -
- -
Borro
wing
s 11
,502,5
97
3,63
1,700
4,
194,4
10
2,91
0,121
10
,211
20,42
2 31
,437
234,5
80
469,7
16
- De
posit
s and
othe
r acc
ounts
225,0
04,65
5 38
,354,9
75
37,27
9,275
40
,437,2
31
22,44
7,700
8,
688,9
23
11,93
0,947
65
,865,6
04
- -
Sub-
ordina
ted lo
ans
3,00
0,000
-
- 60
0 60
0 1,
200
1,20
0 2,
400
2,99
4,000
-
Liabil
ities a
gains
t ass
ets su
bject
to fin
ance
leas
e -
- -
- -
- -
- -
- De
ferred
tax l
iabiliti
es -
net
1,08
2,885
-
- -
- -
1,08
2,885
-
- -
Othe
r liab
ilities
7,11
1,584
2,
228,9
84
3,02
2,496
31
,814
101,2
18
424,1
95
941,6
80
267,2
82
93,91
5 -
250,2
45,74
9 46
,759,6
87
44,49
6,181
43
,379,7
66
22,55
9,729
9,
134,7
40
13,98
8,149
66
,369,8
66
3,55
7,631
-
Net a
ssets
19,76
2,394
27
,801,5
58
27,76
5,455
(2
2,048
,071)
4,65
5,326
8,
414,9
98
20,14
0,027
(5
3,906
,546)
1,85
1,073
5,
088,5
74
Share
capit
al 10
,724,6
43
Disco
unt o
n iss
ue of
right
share
s (2
,105,4
01)
Prefe
rence
share
s 1,
500,0
00
Statu
tory r
eserv
e 1,
334,1
38
Unap
propri
ated p
rofit
4,85
8,596
No
n-co
ntroll
ing in
teres
t 1,
434,3
91
Surpl
us on
reva
luatio
n of a
ssets
- ne
t 2,
016,0
27
19,76
2,394
Ove
r 1
Ove
r 3
Ove
r 6
Ove
r 1
Ove
r 2
Ove
r 3
Upto
1
to 3
to 6
mon
ths to
to
2 to
3 to
5 m
onth
mon
ths
mon
ths
1 ye
ar y
ears
yea
rs y
ears
Weig
hted a
verag
e3%
5%6%
6%8%
11%
61%
For the year ended December 31, 2017
Notes to the Consolidated Financial Statements

272 JS Bank Annual Report 2017
44.5 Operational risk
The Bank currently uses Basic Indicator Approach to Operational Risk for regulatory capital calculations. We define the operational risk as the risk of loss resulting from inadequate or failed internal processes, people and system or from external events. With the evolution of Operations Risk Management into a separate distinct discipline, the Bank’s strategy is to further strengthen its risk management system along new industry standards. Accordingly the Bank has set up a separate Operational Risk Management (ORM) Unit. ORM Unit resides within Risk Management Group (RMG). Its responsibility is to implement Operational Risk management tools across the Bank for effective measurement and monitoring of operational risk faced by different areas of the Bank.
Bank’s operational risk management process involves a structured and uniform approach across the Bank. It includes risk identification and assessments, the monitoring of Key Risk Indicators and Risk Control Self-Assessment activities for key operational risks. In order to build a robust Operational Risk Monitoring mechanism, an Operational Risk Management Committee (ORMC) has been constituted to effectively address Operational Risk issues.
The Bank has implemented a comprehensive “Operational Risk Management Framework” which has also been approved by the Board of Directors. The purpose of bank-wide Operational Risk Management Framework is aimed at laying out clearly defined roles and responsibilities of individuals/units across different functions of the bank that are involved in performing various Operational Risk Management tasks. Operational risk is much more pervasive in a financial institution and every operating unit is exposed to operational risk, regardless of whether it is a business or a support function. This Framework has been devised to explain the various building blocks of the Operational Risk Management processes, and their inter-relationships. The framework also captures both qualitative and quantitative guidelines for managing and quantifying operational risks across the bank.
The ORM Unit conducts Operational risk profiling for all major operational areas of the bank and assists various functions of the bank in developing Key Risk Indicators (KRIs) which are monitored against predefined thresholds. Findings from KRIs are used as predictive indicators of potential operational risks.
Operation Risk loss data collection is governed by Bank’s TID Policy which has been developed and implemented to collate operational losses and near misses in a systematic and organized way.
The Bank’s Business Continuity Policy (BCP) includes risk management strategies to mitigate inherent risk and prevent interruption of mission critical services caused by disaster event. The resilience of BCP is tested and rehearsed on an annual basis by the bank.
45. CUSTOMER SATISFACTION AND FAIR TREATMENT
We are committed to providing our customers with the highest level of service quality and satisfaction and have therefore set-up an independent service management function that oversees service quality, phone banking, problem resolution and the fair treatment of customers.
A total of 11,512 complaints were received by the Bank in 2017 and the average time taken to resolve these complaints was 5 days. Our complaint handling policy and grievance redressal mechanism ensures that complaints are resolved in a timely manner and recurrence of complaints is prevented where possible. Customers have the option of registering their complaints at our Branches, phone banking center, the Bank’s website and via email. Complaint management process is kept as transparent as possible through registration, acknowledgement, interim response where applicable, resolution and root cause analysis of recurring complaints. Customers are also given the option of contacting the Banking Mohtasib office in case they are dissatisfied with the response received from the Bank.
For the year ended December 31, 2017
Notes to the Consolidated Financial Statements
273JS Bank Annual Report 2017
To create enhanced visibility of the recourse mechanism available to its customers, the Bank has incorporated awareness messages of its complaint handling function in several customer communications such as account statements, ATM screens, letters and SMS messages. Complete grievance redressal mechanism, contact channels and online feedback forms have been made available through the Bank website, and email broadcasts have been sent to the customers for customer education and awareness.
Fair Treatment of Customers is an integral part of our corporate culture. The Bank has institutionalized a ‘Consumer Protection Framework’. Our priority is to keep customer benefits in mind while designing, selling and managing products and services, without any discrimination. Our focus is to maintain fairness in our customer dealings, clarity in communication, develop a service culture and design an effective grievance handling mechanism. We also focus on financial literacy of our customers, for promoting responsible conduct and informed financial decisions by consumers, through our Consumer Education and Financial Literacy Program.
46. GENERAL
46.1 These consolidated financial statements have been prepared in accordance with the revised forms of annual financial statements of the banks issued by the State Bank of Pakistan through its BSD Circular No. 04 dated February 17, 2006.
46.2 The figures in these consolidated financial statements have been rounded off to the nearest thousand.
47. NON-ADJUSTING EVENT AFTER THE BALANCE SHEET DATE
The Board of Directors have proposed cash preference dividend of 12% (December 31, 2016: 12%) amounting to Rs.180 million (December 31, 2016: Rs.180 million) in their meeting held on March 03, 2018. This appropriation will be approved in the forth coming Annual General Meeting.
48. DATE OF AUTHORISATION FOR ISSUE
These consolidated financial statements were authorized for issue by the Board of Directors of the Bank in their meeting held on March 03, 2018.
Chairman President and Director Director Chief Financial OfficerChief Executive Officer
For the year ended December 31, 2017
Notes to the Consolidated Financial Statements

274 JS Bank Annual Report 2017
As at December 31, 2017As referred to in note 12.2.2 and 13.2.2 to the Unconsolidated and Consolidated financial statements respectively.Details of fixed assets deleted with original cost or book value in excess of Rs.1.00 million or Rs.0.25 million respectively (whichever is less).
Annexure I
Accumulated Written Sale Mode of Buyers' particulars and relationship with Particulars Cost depreciation down value proceeds Gain disposal Bank (if any)
-------------------- Rupees in '000 --------------------Vehicles
Honda Civic 2,096 1,816 279 1,506 1,226 Negotiation Name Noman HasanCNIC 42101-1620434-1Address House No A-908 Block 12 Ancholi Federal B Area Karachi
Honda Civic 1,891 1,828 63 1,191 1,128 Negotiation Name Waqas Nadeem CNIC 34101-2624632-5Address Street No 2 Fazalpura Gujranwala
Honda Civic 2,096 1,851 245 1,424 1,179 Negotiation Name Wali NajamCNIC 42201-7801565-9Address House No Z-102 Block 7/8 B.Y.J.C.H.S Karachi
Honda Civic 2,091 1,882 209 1,600 1,391 Insurance Claim Name EFU General Insurance Limited - related party,Address 1st Floor Kashif Centre Main Shahra-e-faisal Karachi
Honda Civic 1,975 1,975 - 1,345 1,345 Negotiation Name Anisa MajeedCNIC 42201-7344988-4Address House No C-41 Dadu Co-operates Society Near
TV Station karachi
Honda Civic 1,859 1,859 - 978 978 Negotiation Name Nusrat IqbalCNIC 42101-3395059-1Address House No 4-A-11/17 Nazimabad 4 No Karachi
Honda Civic 2,146 858 1,288 1,618 330 Negotiation Name Aslam HasanCNIC 35201-0203797-5Address House No 32-N Street No 1 Phase VI DHA Cantt Lahore
Honda Civic 2,386 1,113 1,273 1,842 569 Negotiation Name Sher AliCNIC 61101-9054255-3Address House No 635 Street No 136 D 12/4 Islamabad
Honda Civic 2,363 71 2,292 2,100 (192) Insurance Claim Name EFU General Insurance Limited - related party,Address 1st Floor Kashif Centre Main Shahra-e-faisal Karachi
Honda Civic 2,396 1,757 639 1,608 969 Negotiation Name Sanam ZaidiCNIC 423019-368234-0Address House No B-135 Block 13D-2 Sehba Akhtar Road
Gulshan E Iqbal KarachiHonda Civic 2,326 2,287 39 1,410 1,371 Negotiation Name Sultan Hasan
CNIC 42101-1044964-1Address House No B-6 North Karachi Sector 11-B Karachi
Honda Civic 1,893 1,893 - 1,119 1,119 Negotiation Name Sultan HasanCNIC 42101-1044964-1Address House No B-6 North Karachi Sector 11-B Karachi
Honda Civic 2,146 1,145 1,002 1,663 661 Negotiation Name Muhammad AltafCNIC 35201-5100624-1Address House No 68-B Railway Colony Walton Lahore
Honda Civic 1,830 1,830 - 1,057 1,057 Negotiation Name Nusrat IqbalCNIC 42101-3395059-1 Address House No 4-A-11/17 Nazimabad Karachi
Honda Civic 4,000 4,000 - 1,596 1,596 Negotiation Name Nusrat IqbalCNIC 42101-3395059-1 Address House No 4-A-11/17 Nazimabad Karachi
Honda Civic 1,893 1,893 - 1,097 1,097 Negotiation Name Nusrat IqbalCNIC 42101-3395059-1 Address House No 4-A-11/17 Nazimabad Karachi
Honda Civic 2,096 1,712 384 1,416 1,032 Negotiation Name Zahid QadriCNIC 42101-1674749-5Address House No R-536-15-A-4 Bafarzon Karachi
Honda Civic 1,893 1,893 - 1,242 1,242 Negotiation Name Zahid QadriCNIC 42101-1674749-5Address House No R-536-15-A-4 Bafarzon Karachi
Toyota Corolla 1,828 701 1,127 1,775 648 Insurance Claim Name EFU General Insurance Limited - related party,Address 1st Floor Kashif Centre Main Shahra-e-faisal Karachi
Toyota Corolla 1,514 1,514 - 1,162 1,162 Negotiation Name Syed AdilCNIC 42101-4759304-9Address House No A-304 Block 12 Gulberg Karachi
Balance c/f. 42,717 33,878 8,839 28,746 19,907

275JS Bank Annual Report 2017
Accumulated Written Sale Mode of Buyers' particulars and relationship with Particulars Cost depreciation down value proceeds Gain disposal Bank (if any)
-------------------- Rupees in '000 --------------------Balance c/f. 42,717 33,878 8,839 28,746 19,907 VehiclesToyota Corolla 1,753 789 964 1,450 486 Insurance Claim Name EFU General Insurance Limited - related party,
Address 1st Floor Kashif Centre Main Shahra-e-faisal KarachiToyota Corolla 2,198 220 1,978 2,150 172 Insurance Claim Name EFU General Insurance Limited - related party,
Address 1st Floor Kashif Centre Main Shahra-e-faisal KarachiToyota Corolla 1,673 1,282 391 1,230 840 Negotiation Name Khurram Khan
CNIC 42101-4153286-9Address House No 25 Block C North Karachi
Toyota Corolla 1,673 1,282 391 1,282 892 Negotiation Name Shayan SohailCNIC 42101-8854313-7Address House No C-51 Block 4 Federal B Area Karachi
Toyota Corolla 1,688 1,153 535 1,261 727 Negotiation Name Muhammad AltafCNIC 35202-5100624-1Address House No 68-B Railway Colony Walton Lahore
Toyota Corolla 1,529 1,529 - 1,198 1,198 Negotiation Name Wasim MirzaCNIC 44204-4438942-7Address House No 292 Mughalpura Sheikhupura
Toyota Corolla 1,683 953 729 1,418 689 Negotiation Name Usman WaheedCNIC 31303-7816470-3Address House No 116 D Gulshan E Iqbal Karachi
Toyota Corolla 2,750 2,750 - 1,464 1,464 Negotiation Name Sohail MansoorCNIC 42301-9957376-9Address House No 33/1 Khayaban e Shamsher Phase V DHA Karachi
Toyota Corolla 1,828 670 1,158 1,700 543 Insurance Claim Name EFU General Insurance Limited - related party,Address 1st Floor Kashif Centre Main Shahra-e-faisal Karachi
Toyota Corolla 1,673 1,617 56 1,184 1,128 Negotiation Name Muhammad UmerCNIC 42301-1532452-5Address Flat No C-15 Maalwala Apartment Nishtar road Ramsuami Karachi
Toyota Corolla 1,673 1,561 112 1,259 1,148 Negotiation Name Numeri Abbar CNIC 42201-4355125-7Address House No A-50 Block 3 Gulistan E Jouhar
Toyota Corolla 1,683 1,122 561 1,342 781 Negotiation Name Khurram ImtiazCNIC 35202-2968031-7Address House No 188-P Model Town Extension Lahore
Toyota Corolla 1,683 1,122 561 1,344 784 Negotiation Name Sajid Hussain CNIC 61101-3168372-1Address House No 99 Street No 3 Amir Humza Road Rawalpindi
Toyota Corolla 1,710 1,482 228 1,307 1,079 Negotiation Name Sajid Hussain CNIC 61101-3168372-1Address House No 99 Street No 3 Amir Humza Road Rawalpindi
Toyota Corolla 1,608 1,608 - 1,278 1,278 Negotiation Name Adnan BasirCNIC 35202-6869315-5Address House No 7-K Begum Road Maznugh Lahore
Toyota Corolla 1,733 1,242 491 1,297 806 Negotiation Name Umair AsadCNIC 35202-5633678-3Address House No 11-A Street No 20 Hota Singh Road Sunset Nagar Lahore
Toyota Corolla 1,608 1,608 - 1,192 1,192 Negotiation Name Qasim ParachaCNIC 35202-8389340-9Address Flat No 25 Shershah Block New Garden Town Lahore
Toyota Corolla 1,608 1,608 - 1,235 1,235 Negotiation Name Saeed RehmanCNIC 42101-3118968-1Address House No 56-A Block D North Nazimabad Karachi
Toyota Corolla 1,864 112 1,752 1,780 28 Insurance Claim Name EFU General Insurance Limited - related party,Address 1st Floor Kashif Centre Main Shahra-e-faisal Karachi
Toyota Corolla 1,683 1,178 505 1,335 830 Negotiation Name ShehzadaCNIC 42301-1085770-1Address House No 2150 Street 6 Gulistan Colony
Madina Masjid Road Liyari KarachiToyota Corolla 1,710 1,539 171 1,159 988 Negotiation Name Atif Sheikh
CNIC 42101-7500950-7Address House No L-97 Center 1-5-0 Rahmaniya Colony North Karachi
Balance c/f. 79,720 60,301 19,419 57,611 38,192
As at December 31, 2017
Annexure I cont.

276 JS Bank Annual Report 2017
Accumulated Written Sale Mode of Buyers' particulars and relationship with Particulars Cost depreciation down value proceeds Gain disposal Bank (if any)
-------------------- Rupees in '000 --------------------
Balance b/f. 79,720 60,301 19,419 57,611 38,192
Vehicles
Toyota Corolla 1,828 792 1,036 1,571 535 Negotiation Name Adnan NaseerCNIC 35202-2757228-5Address House No 2 Madina Market Anarkali Lahore
Toyota Corolla 1,673 1,673 - 1,195 1,195 Negotiation Name Muhammad UmerCNIC 42301-1532452-5Address Flat No C-15 Maalwala Apartment Nishtar road Ramsuami
KarachiToyota Corolla 1,828 792 1,036 1,615 579 Negotiation Name Shahid
CNIC 35200-9413334-9Address House No 206 Street 44 Mughalpura Lahore
Toyota Corolla 1,708 1,309 399 1,356 958 Negotiation Name Numeri Abbar CNIC 42201-4355125-7Address House No A-50 Block 3 Gulistan E Jouhar
Mercedes 4,000 4,000 - 2,266 2,266 Negotiation Name Waqas Younus CNIC 42301-3903629-3Address Flat No 408-D Block 8 Yousuf Grand Square Clifton Karachi
Suzuki Cultus 998 732 266 707 441 Negotiation Name Nusrat IqbalCNIC CNIC:42101-3395059-1 Address House No 4-A-11/17 Nazimabad Karachi
Suzuki Cultus 1,007 671 336 744 408 Negotiation Name Noman HasanCNIC 42101-1620434-1Address House No A-908 Block 12 Ancholi Federal B Area Karachi
Suzuki Cultus 1,039 520 520 783 264 Negotiation Name Shayan SohailCNIC 42101-8854313-7Address House No C-51 Block 4 Federal B Area Karachi
Suzuki Cultus 1,039 485 554 808 254 Negotiation Name Farooq-E-AzamCNIC 35202-6811277-3Address House No 418 Jahanzaib Block Allama Iqbal Town Lahore
Suzuki Cultus 1,099 220 879 1,050 171 Insurance Claim Name EFU General Insurance Limited - related party,Address 1st Floor Kashif Centre Main Shahra-e-faisal Karachi
Suzuki Cultus 1,032 654 378 850 472 Negotiation Name EFU General Insurance Limited - related party,Address 1st Floor Kashif Centre Main Shahra-e-faisal Karachi
Suzuki Cultus 1,007 789 218 706 488 Negotiation Name Noman HasanCNIC 42101-1620434-1Address House No A-908 Block 12 Ancholi Federal B Area Karachi
Suzuki Cultus 1,039 606 433 730 297 Negotiation Name Usman ShahidCNIC 42101-1044964-1Address House No 6-B Sector 11-B North Karachi, Karachi
Suzuki Cultus 1,039 520 520 888 368 Negotiation Name Syed Adil AliCNIC 42101-4759304-9Address House No A-304 Block 12 Gulberg Karachi
Suzuki Cultus 1,002 768 234 689 455 Negotiation Name Muhammad ShahbazCNIC 35202-2558297-1Address House No 654-B Faisal Town Lahore
Suzuki Cultus 1,007 755 252 738 486 Negotiation Name Qasim ParachaCNIC 35202-8389340-9Address Flat No 25 Shershah Block New Garden Town Lahore
Suzuki Cultus 1,039 571 468 798 330 Negotiation Name Saleem AhmedCNIC 42201-4014690-3Address House No L-2290 Metrowel 3, Block 2 Gulzare Hijri Karachi
Suzuki Cultus 1,039 468 572 862 290 Negotiation Name Saleem AhmedCNIC 42201-4014690-3Address House No L-2290 Metrowel 3, Block 2 Gulzare Hijri Karachi
Suzuki Cultus 1,039 641 398 788 390 Negotiation Name Saeed Ur RehmanCNIC 42101-3118968-1Address House No 56-A Block D North Nazimabad Karachi
Suzuki Cultus 1,039 589 450 789 339 Negotiation Name Wasim MirzaCNIC 44204-4438942-7Address House No 292 Mughalpura Sheikhupura
Balance c/f. 106,219 77,852 28,367 77,542 49,175
As at December 31, 2017
Annexure I cont.

277JS Bank Annual Report 2017
Annexure I cont.
Accumulated Written Sale Mode of Buyers' particulars and relationship with Particulars Cost depreciation down value proceeds Gain disposal Bank (if any)
-------------------- Rupees in '000 --------------------
Balance b/f. 106,219 77,852 28,367 77,542 49,175
VehiclesSuzuki Cultus 1,034 603 431 827 396 Negotiation Name Aleem Khan
CNIC 42101-2556537-5Address House No 147-B Block 10 Federal B Area Karachi
Suzuki Cultus 1,007 789 218 704 485 Negotiation Name Sajjid HussainCNIC 61101-3168372-1Address House No 99 Street No 3 Amir Humza Road Rawalpindi
Suzuki Cultus 1,034 483 552 732 180 Negotiation Name Nusrat IqbalCNIC 42101-3395059-1Address House No 4-A-11/17 Nazimabad Karachi
109,294 79,726 29,567 79,805 50,237
Electrical, office and computer equipment
Generator 902 592 310 756 446 Insurance Claim Name EFU General Insurance Limited - related party,Address 1st Floor Kashif Centre Main Shahra-e-faisal Karachi
Generator 902 620 282 701 419 Insurance Claim Name EFU General Insurance Limited - related party,Address 1st Floor Kashif Centre Main Shahra-e-faisal Karachi
Generator 1,025 1,014 11 450 439 Negotiation Name S.M JafferAddress
Generator 901 545 356 65 (291) Negotiation Name AL-Fareed Electronics Address Shop No 14-A Ground Floor Agha Siraj Complex Quetta
Others (note 12.2.3) 44,973 42,640 2,334 26,525 24,191
157,996 125,136 32,860 108,301 75,441
The subsidiary companies
Honda Civic 1,969 861 1,108 1,675 567 Negotiation Name Mr. Omer Bin JavaidCNIC 42201-9928699-1Address D-26/4 Street 9 Block 7 Clifton Karachi
Others (note 12.2.3& 13.2.2) 6,196 5,993 203 351 148
166,161 131,990 34,171 110,327 76,156
Other represent disposal whose original cost or book value is not in excess of Rs.1.0 million or Rs.0.25 million respectively. (note 12.2.2 & 13.2.2)
As at December 31, 2017

278 JS Bank Annual Report 2017
As referred to in note 11.4.3 and 12.6.3 to the Unconsolidated and Consolidated financial statements respectively.
Annexure IIDe
tails
of W
ritte
n-O
ff Lo
ans
for t
he Y
ear E
nded
Dec
embe
r 31,
201
7 fo
r Rs.
0.5
milli
on a
nd a
bove
S. No.
Name
of
Bank
/ D
FI
Full N
ame o
f Bo
rrowe
r / Co
mpan
y Nam
e
Status
of Bo
rrower
(Individ
ual
/ Com
pany
/ Firm)
Name
of D
irecto
r / P
artne
r / Pro
prieto
r
Fathe
r / Hu
sban
d Na
meAd
dress
of Bo
rrowe
rPro
vince
Directo
r Statu
s (No
minee
or Ele
cted o
r Sp
onsor e
tc.)
NIC N
o. of
Borro
wer/D
irecto
rYe
ar of
write
off
Outst
andin
g liab
ilities
Befor
e Adju
stmen
tsAm
ount
Writte
n - O
ff
New
CNIC
Old N
ICPri
ncipa
lAc
crued
Ma
rk up
Othe
rsTo
tal
(13+1
4+15
)Pri
ncipa
lInt
erest
/ Ma
rkup
Othe
rsTo
tal
(17+1
8+19
)
12
34
56
78
910
1112
1314
1516
1718
1920
1JS
Bank
Lim
ited
Wali U
llah Kh
an
Individ
ual
Wali U
llah Kh
an
Muha
mmad
Was
i Ull
ah Kh
an
Suite
No.
401 A
l Fati
ma
Cham
bers
Opp P
aspo
rt Offi
ce Sa
ddar
Khi
Sindh
4220
1-677
8873
-520
17 -
- -
0.09
342,3
27
342,3
27
2JS
Bank
Lim
ited
Raja
Ghula
m Mu
stafa
Individ
ual
Raja
Ghula
m Mu
stafa
Raja
Ghula
m Hia
der
6-D C
omme
rcial
Archit
ects
Engin
eerin
g Hou
sing S
ociet
y La
hore
Globa
l Bus
iness
Co
rporat
ion
Sindh
3720
1-766
8972
-920
17 -
- -
0.83
447,1
21
447,1
22
3JS
Bank
Lim
ited
Asif B
ashir
Ind
ividua
lAs
if Bas
hir
Khalid
Bash
ir7-B
-III Az
iz Ave
nue G
ulberg
V L
ahore
Punja
b35
202-2
6316
07-3
2017
- 11
,683,2
57
11,68
3,257
-
11,68
3,257
11
,683,2
57
4JS
Bank
Lim
ited
Jaha
ngir C
old St
orePa
rtners
hip
Mohs
in Na
veed
Chow
k Gun
jayan
Road
Off
Ring
Road
Mou
za La
kho
Laho
rePu
njab
3520
2-562
7626
-320
17
2,97
2,736
2,
972,7
36
- 2,
972,7
36
2,97
2,736
Gu
lnaz N
avee
d35
202-2
3791
02-2
2017
5JS
Bank
Lim
ited
M Im
ran &
Adna
n En
terpri
ses
Partn
ership
Sajjad
Ahme
dAh
med
11 Su
it 3F C
raze 1
Plaz
a DH
A Kara
chi
Sindh
3120
1-299
8270
-720
17 19
,999,9
94
16,50
4,419
36
,504,4
13
19,99
9,994
16,50
4,419
-
36,50
4,413
Me
hboo
b Qad
irQa
dir31
201-1
2144
10-9
2017
Zaibu
n Nisa
4220
1-739
6458
-020
17
6JS
Bank
Lim
ited
Mohib
Texti
le Mi
lls Lim
ited
Arif S
aigol
Mian
Rafiq
ue Sa
igol
6-FB A
wami
Com
plex N
ew
Garde
n Tow
n Lah
orePu
njab
270-5
9-006
203
2017
44,01
8,477
44
,018,4
77
44,01
8,477
44
,018,4
77
Abid
Saigo
lMi
an Ra
fique
Saigo
l27
0-62-0
0620
120
17As
if Saig
olMi
an Ra
fique
Saigo
l27
0-57-0
0620
220
17M
Shah
zad S
aigol
M Sh
afiq S
aigol
270-8
7-432
238
2017
M Sh
ahid
Saigo
lM
Shafi
q Saig
ol27
0-87-4
3224
020
17M
Shafi
q Saig
olM
Shafi
q Saig
ol27
0-87-4
3223
920
17
7JS
Bank
Lim
ited
Mohib
Expo
rts Li
mited
Arif S
aigol
Mian
Rafiq
ue Sa
igol
6-FB A
wami
Com
plex N
ew
Garde
n Tow
n Lah
orePu
njab
270-5
9-006
203
2017
20,14
0,426
20
,140,4
26
20,14
0,426
20
,140,4
26
Abid
Saigo
lMi
an Ra
fique
Saigo
l27
0-62-0
0620
120
17As
if Saig
olMi
an Ra
fique
Saigo
l27
0-57-0
0620
220
17M
Shah
zad S
aigol
M Sh
afiq S
aigol
270-8
7-432
238
2017
M Sh
ahid
Saigo
lM
Shafi
q Saig
ol27
0-87-4
3224
020
17M
Shafi
q Saig
olM
Shafi
q Saig
ol27
0-87-4
3223
920
17
8JS
Bank
Lim
ited
Pakis
tan Sw
itchg
ear
NANA
Daya
l Sing
h Man
sion T
he
Mall L
ahore
Punja
bNA
NA20
17 66
1,628
66
1,628
66
1,628
-
661,6
28
NANA
NANA
2017
9JS
Bank
Lim
ited
Saif N
adee
m Ka
wasa
kiNA
NASIE
Khala
bat H
aripu
r Haz
araKP
KNA
NA20
17 2,
297,6
67
2,29
7,667
2,
297,6
67
- 2,
297,6
67
10JS
Bank
Lim
ited
Adam
jee In
dustr
ies
Limite
dNA
NAFlo
or PN
SC Bu
ilding
Mtkh
an
Road
Karac
hiSin
dhNA
NA20
17 4,
790,6
29
4,79
0,629
4,
790,6
29
- 4,
790,6
29
11JS
Bank
Lim
ited
Arbor
Acres
Pakis
tanNA
NA4T
h Floo
r Hajr
a Man
sion
Zaibu
nisa S
treet
Karac
hiSin
dhNA
NA20
17 22
,192,9
40
22,19
2,940
22
,192,9
40
- 22
,192,9
40
12JS
Bank
Lim
ited
Rainb
ow En
terpri
ses
NANA
4Th F
loor A
zmat
Manz
il Bo
ulton
Mark
et Ka
rachi
Sindh
NANA
2017
6,20
7,427
6,
207,4
27
6,20
7,427
-
6,20
7,427
13JS
Bank
Lim
ited
Stand
ard In
dustr
ies
Limite
d
Ruba
b Bai
Yahy
a Bai
Oran
ge St
reet L
awren
ce
Road
Karac
hiSin
dh
NANA
2017
2,18
1 2,
181
2,18
1 2,
181
Yahy
a Bai
Not
NANA
2017
Saad
at Ma
hmoo
dMu
hamma
d Mahm
oodNA
NA20
17So
hail M
ahmo
odMu
hamma
d Mahm
oodNA
NA20
17
14JS
Bank
Lim
ited
Stand
ard In
terna
tiona
l Lim
ited
NANA
32-F
Block
VI PE
CHS
Karac
hiSin
dhNA
NA20
17 70
1,248
70
1,248
70
1,248
-
701,2
48
15JS
Bank
Lim
ited
Fatim
a Tex
tile M
ills
Limite
dNA
NASta
te Lif
e Build
ing I.I
Ch
undri
gar R
oad K
arach
iSin
dhNA
NA20
17 1,
692,7
54
1,69
2,754
1,
692,7
54
- 1,
692,7
54
16JS
Bank
Lim
ited
K.I.C
hunn
a - Ka
rachi
Individ
ual
Ki Ch
anna
Iqbal
Ahme
d Ch
anna
H # 4
17 Su
ltana
ad C
olony
Lia
limar
No1 K
arach
iSin
dhNA
502-5
0-070
391
2017
114,9
65
114,9
65
114,9
65
- 11
4,965
17JS
Bank
Lim
ited
Moha
mmad
Shah
id Kh
anInd
ividua
lMo
hamm
ad
Shah
id Kh
anAb
dul G
hafoo
rF #
524 K
orang
i No-4
Ka
rachi
Sindh
NA42
301-3
8685
00-7
2017
22,07
1 22
,071
22,07
1 -
22,07
1
122,8
42,40
6 31
,160,4
12
154,0
02,81
9 12
2,842
,407
31,94
9,860
15
4,792
,267
As at December 31, 2017

279JS Bank Annual Report 2017
Pattern of Shareholding
S.no No Of Sahare holders Shareholdings Total Shares Held
1 628 Shareholding From 1 To 100 8,371 2 627 Shareholding From 101 To 500 254,807 3 610 Shareholding From 501 To 1000 571,856 4 2326 Shareholding From 1001 To 100000 26,819,621 5 84 Shareholding From 100001 To 500000 19,384,398 6 19 Shareholding From 520001 To 1000000 12,964,632 7 1 Shareholding From 1080001 To 1085000 1,083,000 8 2 Shareholding From 1145001 To 1150000 2,300,000 9 1 Shareholding From 1175001 To 1180000 1,176,500
10 2 Shareholding From 1295001 To 1300000 2,600,000 11 1 Shareholding From 1390001 To 1395000 1,394,500 12 1 Shareholding From 1495001 To 1500000 1,500,000 13 1 Shareholding From 1540001 To 1545000 1,545,000 14 1 Shareholding From 1585001 To 1590000 1,588,541 15 1 Shareholding From 1605001 To 1610000 1,608,500 16 1 Shareholding From 1655001 To 1660000 1,655,500 17 1 Shareholding From 1670001 To 1675000 1,671,500 18 1 Shareholding From 1740001 To 1745000 1,741,000 19 2 Shareholding From 1745001 To 1750000 3,500,000 20 1 Shareholding From 1795001 To 1800000 1,800,000 21 1 Shareholding From 1870001 To 1875000 1,872,400 22 1 Shareholding From 1910001 To 1915000 1,912,000 23 1 Shareholding From 2075001 To 2080000 2,076,322 24 1 Shareholding From 2110001 To 2115000 2,111,748 25 1 Shareholding From 2295001 To 2300000 2,300,000 26 1 Shareholding From 2420001 To 2425000 2,422,500 27 1 Shareholding From 2605001 To 2610000 2,609,000 28 2 Shareholding From 2995001 To 3000000 6,000,000 29 1 Shareholding From 3325001 To 3330000 3,328,500 30 1 Shareholding From 4015001 To 4020000 4,020,000 31 1 Shareholding From 4805001 To 4810000 4,807,000 32 1 Shareholding From 4960001 To 4965000 4,963,000 33 1 Shareholding From 5775001 To 5780000 5,780,000 34 1 Shareholding From 8060001 To 8065000 8,063,500 35 1 Shareholding From 8555001 To 8560000 8,558,161 36 1 Shareholding From 9715001 To 9720000 9,720,000 37 1 Shareholding From 9985001 To 9990000 9,986,500 38 1 Shareholding From 10990001 To 10995000 10,994,500 39 1 Shareholding From 11995001 To 12000000 12,000,000 40 1 Shareholding From 13285001 To 13290000 13,288,204 41 1 Shareholding From 19500001 To 19505000 19,504,194 42 1 Shareholding From 27375001 To 27380000 27,380,000 43 1 Shareholding From 30250001 To 30255000 30,251,558 44 1 Shareholding From 38100001 To 38105000 38,102,442 45 1 Shareholding From 755245001 To 755250000 755,245,007
4337 Percentage: 100% 1,072,464,262

280 JS Bank Annual Report 2017
Categories of Shareholders Shares Held Percentage %
Banks, Development Financial institutions, Non-Banking Financial Insitutions. 172,451 0.02
Insurance Companies 19,604,194 1.83
Directors, Chief Executive Officer, and theirSpouse and Minor Children
Mr. Ali Jehangir Siddiqui 500 Mr. Adil Matcheswala 200,000 Mr. Ashraf Nawabi 1 Mr. G.M. Sikander 1 Mr. Kalim-ur-Rahman 1 Mr. Munawar Alam Siddiqui 1 Ms. Nargis Ghaloo 33,001 Mr. Shahab Anwar Khawaja 1 Ms. Safia Munawar 155,000
Sub -Totals: 388,500 0.03
Associated Companies, Undertakingand Related Parties.
Jahangir Siddiqui & Co. Limited 755,245,007 70.42 Modarabas and Mutual Funds 11,209,992 1.05 NIT and ICPInvestment Corp. of Pakistan 972 0.00 Foreign Investors 28,350,666 2.64 Others 148,281,538 13.83 Local - Individuals 109,210,936 10.18
G-Totals 1,072,464,262 100.00
Details of the tansactios carried out by the Directors, Chief Executive Officer, Chief Financial Officer, Company Secretary and their spouse and minor children during the period from January 01, 2017 to December 31, 2017
None of the Directors, CEO, CFO and Company Secretary their spouse and minor children during the year January 1, 2017 to December 31, 2017 carried out transactions in the shares of the bank, except Ms. Nargis Ghaloo - Director who purchased 33,000 shares of the Bank.

281JS Bank Annual Report 2017
Branch Network
Branch Network:
SINDH
Karachi
Shaheen Complex BranchTel: 111 - 572 - 265 021 - 32272569 - 80
Karachi Stock Exchange BranchTel: 021 - 32462851 - 4
S.I.T.E. BranchTel: 021 - 32550080 - 4
Khy-e-Ittehad, DHA Phase II Ext, BranchTel: 021 - 35313811 - 4
Park Towers Clifton BranchTel: 021 - 35832011 - 9
Teen Talwar BranchTel: 021 - 35834127 021 - 35836974
Gulshan-e-Iqbal BranchTel: 021 - 34829055 - 60
Shahrah-e-Faisal BranchTel: 021 - 34373240 - 4
North Nazimabad BranchTel: 021 - 36721010 - 2
Gulistan-e-Jauhar BranchTel: 021 - 34662002 - 5
Safoora Goth BranchTel: 021 - 34661805 - 9
Jheel Park BranchTel: 021 - 34544831 - 5
Nazimabad BranchTel: 021 - 36612325
Korangi Industrial Area BranchTel: 021 - 35055826 021 - 35052773
Zamzama BranchTel: 021 - 35295224 - 5
F.B Area BranchTel: 021 - 36316229
Khy-e-Shahbaz, DHA Phase VI BranchTel: 021 - 35243415 - 9
Gulshan Chowrangi BranchTel: 021 - 34833290 - 3
Dhoraji BranchTel: 021 - 34946280 - 2
Shah Faisal Colony BranchTel: 021 - 34686191 - 4
Islamia College BranchTel: 021 - 34924021 - 4
M.A. Jinnah Road BranchTel: 021 - 32742006 - 8
Lucky Star BranchTel: 021 - 35622431 - 9
Gulshan-e-Hadeed BranchTel: 021 - 34715201 - 3
Cloth Market BranchTel: 021 - 32464042 - 8
Hawks Bay Branch Tel: 021 - 32354060 - 3
Garden West BranchTel: 021 - 32240093 - 7
Timber Market BranchTel: 021 - 32763079
Abul Hasan Isphahani Road BranchTel: 021 - 3469354 - 9
Jodia Bazar BranchTel: 021 - 32435304 -6
New Challi BranchTel: 021 - 3260210 - 3
North Napier BranchTel: 021- 32467791 - 94
Electronic Market BranchTel: 021 - 32700430 - 33
Urdu Bazar BranchTel: 021 - 32603075 - 77
Bahadarabad BranchTel: 021 - 34922802 - 05
Sohrab Goth BranchTel: 021 - 34690612 - 17
North Karachi Industrial Area Branch Tel: 021 - 36962910 - 11
UP Morr BranchTel: 021 - 36948010 - 15
Orangi Town BranchTel: 021 - 36697927 - 30
IBA City Campus BranchTel: 021 - 32294811 - 13
26th Street DHA Phase V Branch Tel: 021 - 35055826
Landhi Branch Tel: 021 - 35046923 - 25
Progressive Centre,Shahrah-e-Faisal BranchTel: 021 - 34324682 - 5
Khy - e- Bokhari l DHA Phase IV BranchTel: 021 - 35340353 - 60
Korangi Road, DHA Phase I BranchTel: 021 - 35803541
Hayderi Market BranchTel: 021 - 36677904
Shershah BranchTel: 021 - 32581013 -17

282 JS Bank Annual Report 2017
Branch Network
Malir Cantt BranchTel: 021 - 34490225 - 27/29
Ocean Mall Branch Tel: 021-3516601 - 02
Regal Chowk Saddar BranchTel: 021 - 35630591 - 99
Marriott Road BranchTel: 021 - 32469609 -11
The Center Saddar BranchTel: 021 - 35165560 - 7
DHA Phase 8 BranchTel: 0345 - 8211949 - 51
Bohara Pir BranchTel: 021 - 32713124 - 7
Khadda Market DHA Phase V BranchTel: 021 - 35242401 - 4
Delhi Colony BranchTel: 021 - 35168645 - 6
Papoosh Nagar BranchTel: 021 - 36700071 - 3
Boat Basin BranchTel: 021 - 35177900 - 07
New Sabzi Mandi BranchTel: 0345 - 8211641 - 43
Clifton Block-2 BranchTel: 021 - 35177909
Chase Shaheed-e-Millat Road BranchTel: 021 - 34370270 - 71
Hyderabad
Saddar BranchTel: 022 - 2730925 - 7
Latifabad BranchTel: 022 - 3817971 - 4
Cloth Market BranchTel: 022 - 26182700 - 13
Qasimabad BranchTel: 022 - 2652191
Citizen Colony BranchTel: 022 - 2100892 - 95
SITE Branch Tel: 022 - 3885192
DHA BranchTel: 022 - 2108078
Anaj Mandi BranchTel: 022 - 2638802 - 3
Latifabad No: 6 BranchTel: 022 - 3411521 - 6
Sanghar
Sanghar BranchTel: 0235 - 800162 - 5
Chak 41 Jamrao BranchTel: 0345 - 8211961 0345 - 8211971
Jamshoro BranchTel: 022 - 3878101 - 4
Mirpurkhas BranchTel: 0233 - 876001 - 4
Kot Ghulam Muhammad BranchTel: 0233 - 866242 - 4
Sukkur
Shaheed Gunj BranchTel: 071 - 5627481 - 2
IBA Campus BranchTel: 071 - 5633826
Military Road BranchTel: 071 - 5630830 - 31
Pano Aqil Branch Tel: 071 - 5690403
Larkana BranchTel: 074 - 4058603 - 5
Khairpur BranchTel: 024 - 3715316 - 8
Maatli Branch BadinTel: 029 - 7841514
Nawabshah BranchTel: 024 - 4330561 - 4
Sultanabad BranchTel: 0233 - 500498
Tando Allahyar BranchTel: 0223 - 892001 - 4
Chambar BranchTel: 0223 - 897033 - 35
Moro BranchTel: 0242 - 413200 - 3
Kunri BranchTel: 0238 - 558163 - 6
Tando Mohammad Khan Branch Tel: 022 - 3340617 - 8
Digri BranchTel: 023 - 3870305 - 7
Sehwan Sharif BranchTel: 025 - 4620305 - 7
Ghotki BranchTel: 072 - 3600484 - 85
Kandhkot Branch KashmoreTel: 072 - 2573048

283JS Bank Annual Report 2017
Branch Network
Shikarpur BranchTel: 072 - 6540374 - 75
Shahdadkot BranchTel: 074 - 4013160
Shahdadpur BranchTel: 0235 - 84317475
Mithi BranchTel: 0232 - 261651
Tando Adam BranchTel: 0235 - 571880 - 81
Mehar BranchTel: 025 - 4730186
Dadu BranchTel: 025 - 471160102
Jacobabad Branch Tel: 0722 - 652677
Badin BranchTel: 0297 - 861201
Tando Jam BranchTel: 022 - 2765612 - 14
Thatta BranchTel: 029 - 8550934
Umerkot BranchTel: 0238 - 570157 - 59
Sheikh Berkiyo Branch Tel: 0335 - 2929824 - 23
Behar Colony Kotri BranchTel: 022 - 3871401 - 03 - 06
Bhiria City BranchTel: 0242 - 432131 - 35
Khipro BranchTel: 0235 - 879073 - 6
Fisheries Branch Karachi
Daharki Branch GhotkiKashmore Branch Kandhkot
Golarchi Branch Badin
BALOCHISTAN
Quetta
Cantt BranchTel: 081 - 2863301
M.A. Jinnah Road BranchTel: 081 - 286 5501 - 4
Zarghoon Road BranchTel: 081 - 2472985
Dera Murad Jamali Branch NairabadTel: 0838 - 710266
Usta Muhammad Branch JafarabadTel: 083 - 8612421/23
Gawadar BranchTel: 086 - 4210246
Dukki BranchTel: 0824 - 666172
Khanozai BranchTel: 082 - 6427207
Muslim Bagh Qilla Saifullah, Zhob
PUNJAB
Lahore
Upper Mall BranchTel: 042 - 111 - 572 - 265
Allama Iqbal Town BranchTel: 042 - 35434253 - 5
Azam Cloth Market BranchTel: 042 - 37671195 - 6
Shadman BranchTel: 042 - 37503701 - 8
College Road Township Branch Tel: 042 - 35117491 - 94
Devine Mega Mall Branch Tel: 042 - 35700081 - 85
Bhagbanpura BranchTel: 042 - 36858873 - 74
Chowburji BranchTel: 042 - 37362981 - 8
Wapda Town BranchTel: 042 - 35211557 - 64
M.M. Alam Road BranchTel: 042 - 35778721 - 30
Model Town BranchTel: 042 - 35915614 - 8
Circular Road BranchTel: 042 -37379325 - 8
Brandreth Road BranchTel: 042 - 37381316 - 9
DHA Phase II BranchTel: 042 - 35707651 - 9
Shah Alam Market BranchTel: 042 - 37375734 - 7
Cavalry BranchTel: 042 - 366 10282 - 4
Raiwind Road BranchTel: 042 - 529 1247 - 8
Urdu Bazar BranchTel: 042 - 37115918
Badami Bagh BranchTel: 042 - 37946853
Bahria Town BranchTel: 042 - 35976212
284 JS Bank Annual Report 2017
Branch Network
Ichra Bazar BranchTel: 042 - 37428406
Shahdara BranchTel: 0423 - 7931903 - 5
Shadbagh BranchTel: 042 - 37604549 - 51
DHA Phase VI BranchTel: 042 - 37180747
Johar Town BranchTel: 042 - 35241084 - 90
Zarar Shaheed Road Branch Tel: 042 - 36639902 - 05
DHA Z – Block BranchTel: 042 - 35692957 - 59
Ferozepur Road Branch Tel: 042 - 35402151 - 3
The Mall BranchTel: 042 - 36285673 - 7
Gulberg BranchTel: 042 - 35771036 - 38
Mughalpura BranchTel: 042 - 36533818 - 822
Gulshan Ravi BranchTel: 042 - 35464541 - 43
New Garden Town BranchTel: 042 - 35940463 - 7
Timber Market Ravi Road BranchTel: 042 - 37721924 - 7
Walton Road BranchTel: 042 - 36677204 - 06
Mcleod RoadTel: 042 - 36311176
Muridke BranchTel: 042 - 37951054 - 7
Gujranwala
G.T. Road BranchTel: 055 - 3257363 055 - 3257365 055 - 3257617
Bank Square BranchTel: 055 - 4234401 - 3
Sheikhupura Road BranchTel: 055 - 4233854 - 57
Kamoki BranchTel: 055 - 6810282 - 83 - 85
Ghakkhar Mandi BranchTel: 055 - 3882556 - 59 055 - 3882561
Wazirabad BranchTel: 055 - 6605841 - 4
Faisalabad
Grain Market BranchTel: 041 - 2633382 - 84
Karkhana Bazar Branch Tel: 041 - 2624501 - 3
Liaquat Road BranchTel: 041 - 241 2263 - 65
Satiana Road BranchTel: 041 - 8556381 - 85
Millat Chowk Gulistan Colony BranchTel: 041 - 8785791 - 5
Ghulam Mohammad Abad BranchTel: 041 - 2692192 - 94
Multan
Abdali Road BranchTel: 061 - 4574496
Vehari Road BranchTel: 061 - 6241101 - 02
Bosan Road BranchTel: 061 - 6223416
Mouza Gajju Hatta BranchTel: 061 - 4396046 - 9
Wapda Town Phase 1 BranchTel: 061 - 6524733 - 38
Sialkot
Cantt BranchTel: 052 - 427 2351- 4
Shahab Pura BranchTel: 052 - 4242681
Nekapura BranchTel: 052 - 3543582 - 4
Daska BranchTel: 052 - 6610461- 4
Ugoki BranchTel: 052 - 3513952
Kasur
Kasur BranchTel: 049 - 276158 - 4
Agrow Kasur BranchTel: 049 - 2771308 - 9

285JS Bank Annual Report 2017
Branch Network
Agrow Allahabad Theeng Morr BranchTel: 049 - 2016310 049 - 2016312
Sheikhupura
Sheikhupura BranchTel: 056 - 3810273 - 6
Agrow Sheikhupura BranchTel: 056 - 3035790
Agrow Warburton BranchTel: 056 - 2794065 - 8
Nankana Sahab BranchTel: 056 - 2877503 - 4
Sahiwal
Sahiwal BranchTel: 040 - 4222733 - 5
Chichawatni BranchTel: 040 - 5481792
Chak No. 89 BranchTel: 040 - 4550409 - 10/11 - 16
Pak Pattan
Pak Pattan BranchTel: 0457- 352591 - 4
Agrow Pak Pattan BranchTel: 0457 - 419629
Qaboola BranchTel: 0457 - 851248 - 51
Dinga BranchTel: 0537 - 401368
Gulyana BranchTel: 0537- 588460 - 64
Kharian Branch Tel: 0537 - 534211
Lala Musa Branch Tel: 0537 - 519656 - 8
Depalpur BranchTel: 044 - 4542246 - 9
Okara BranchTel: 044 - 252872 - 30
Gojra BranchTel: 046 - 3513637
Pirmahal BranchTel: 046 - 3367406 - 7
Toba Tek Singh BranchTel: 046 - 2512052 - 5
Layyah BranchTel: 060 – 6415045
Chah Chand Wala Branch RajanpurTel: 060 - 4567122
Haroonabad BranchTel: 063 - 2250614 - 15
Agrow Chishtian BranchTel: 063 - 2023490
Rahim Yar Khan BranchTel: 068 - 5879511 - 4
Sadiqabad BranchTel: 068 - 5803933 - 38
Mouza Kachi Jamal Branch KhanpurTel: 068 - 5577190 - 195
Narowal Branch Tel: 054 - 2411271 - 73
Jehlum BranchTel: 054 - 4611840 – 3
Dina BranchTel: 054 - 4634273 - 5
Chakwal BranchTel: 054 - 3554317
Rabwa BranchTel: 047 - 6214042 - 5
Jhang BranchTel: 047 - 7652941 - 43
Chiniot Branch Tel: 047 - 6332713 - 14
Hasilpur BranchTel: 062 - 2441305 - 8
Bhawalpur BranchTel: 062 - 2889176 - 78
Gujrat BranchTel: 053 - 3538091 - 4
Kacheri Chowk BranchTel: 053 - 3600583
Khanewal BranchTel: 065 - 2557491 - 3
Mian Chunnoo BranchTel: 065 - 2661282 - 85
Mouza Parhar Sharqi Kot Addu BranchTel: 066 - 2240146 - 49
Muzaffargarh BranchTel: 066 - 2424691 - 2
Vehari BranchTel: 067- 3360715 - 8
Burewala BranchTel: 067 - 3351359
Gagoo Mandi BranchTel: 067 - 3501071 - 76
Sargodha BranchTel: 048 - 3768286 - 90
DG Khan BranchTel: 064 - 2470954

286 JS Bank Annual Report 2017
Branch Network
Jauharabad Branch Tel: 045 - 4723319 - 20 - 22
Hafizabad BranchTel: 0547 - 526407 - 10
Sambrial BranchTel: 0526 - 524105
Bhakkar BranchTel: 0453 - 510407- 409
Arifwala BranchTel: 0457- 835 477 - 81
Jalalpur Jattan BranchTel: 05827 - 404389 - 91
Mandi Bahauddin BranchTel: 0546 - 509452 - 3
Lodhran BranchTel: 0608 - 361892 - 93
Bahawalnagar BranchTel: 063 - 2279434 - 38
Mandi Faizabad BranchTel: 0423 - 7931903 - 5
Gohad Pur Branch Tel: 0524 - 265499 - 98
Rawalpindi
PWD/DHA Ph-2 BranchTel: 051 - 5170584 - 5
Satellite Town BranchTel: 051 - 4842984 - 6
Bank Road BranchTel: 051 - 5120731 - 5
Raja Bazar BranchTel: 051 - 5778560 - 3
Bahria Town BranchTel: 051 - 5731351 - 4
Saidpur Road BranchTel: 051 - 5768049
Peshawar Road BranchTel: 051 - 5492873 - 4
Bahria Town Phase VII BranchTel: 051 - 5154891- 4
Chaklala III / Airport housing Society BranchTel: 051 - 5497012 - 15
Chakri Road BranchTel: 051 - 5129024
Range Road BranchTel: 051- 5128871 051- 5128875
Kurri Road BranchTel: 051 - 4930342 - 43 - 45
Khayaban-e-Sir Syed BranchTel: 051 - 4832091 - 94
Wah Cantt BranchTel: 051 - 4256022
Falcon Complex Branch0311 - 1279501 - 505 - 512
RCCI industrial Estate, Rawat Branch Tel: 0345 - 8210861 -71
Islamabad
Blue Area BranchTel: 051 - 111 - 572 - 265
I - 9 Markaz BranchTel: 051 - 4431296 - 8
F - 8 Markaz BranchTel: 051 - 2818296 - 8
F- 7 Markaz BranchTel: 051 - 2608402 - 5
I - 8 Markaz BranchTel: 051 - 4864523 - 6
F- 10 Markaz BranchTel: 051 - 2112957 - 58
Islamabad Stock Exchange BranchTel: 051 - 2894407 - 10
DHA Phase II Branch Tel: 051 - 4358882
Khanna Pul BranchTel: 051 - 4478006 - 07
G - 11 Markaz BranchTel: 051 - 2830601
E - 11 Markaz BranchTel: 051 - 2304993
G - 15 Markaz BranchTel: 051 - 2160240 - 41
G - 13 Markaz BranchTel: 051 - 2301378 - 9
Tarlai BranchTel: 051 - 2241860-4 - 66
Barakahu BranchTel: 051 - 216503 2 - 7
Taxila BranchTel: 051 - 4535315
Mouza Ghalwan Muzaffargarh
Sunder Industrial Estate Lahore
Talangang Chakwal
Paris Road Sialkot
Valancia Society Lahore
Lalazar Rawalpindi Cantt Rawalpindi
Liaqat Shaeed Road Bhalwal

287JS Bank Annual Report 2017
Branch Network
B-17 Islamabad
Gulberg Green Islamabad
KHYBER PAKHTOONKHWAPeshawar
Cantt BranchTel: 091 - 5279981
University Road BranchTel: 091 - 5711572 - 5
Karkhano Bazar BranchTel: 091 - 5893134 - 7
G.T Road BranchTel: 091 - 2593901 - 4
Dabgari Gardens BranchTel: 091 - 2591422 - 7
Grain Market BranchTel: 091- 2590673 - 8
Shakus BranchTel: 091 - 5602382 - 83 - 85
Topi Branch Tel: 0938 - 272003 - 4
Attock BranchTel: 0572 - 610500
Bafa Branch MansehraTel: 0997- 5110024 - 6
Mansehra BranchTel: 0997 - 301882 - 84
Mardan BranchTel: 0937 - 873445 - 873452
D I Khan BranchTel: 0966 - 733216 -19
Mingora Branch Tel: 0946 - 711740 - 43
Abbottabad BranchTel: 099 - 2331491 - 4
Saleh Khana BranchTel: 0923 - 651113 - 17
Timergara BranchTel: 0945 - 821921
Haripur BranchTel: 0995 - 627370
Bannu BranchTel: 0928 - 6601673
Nowshera BranchTel: 092 - 3612004
Mattanichangan Village Tordher Branch Tel: 093 - 8537567
Chahkdarah Malakand Agency Branch
AZAD JAMMU & KASHMIR (AJK)
Chaksawari BranchTel: 05827 - 454790
Mirpur BranchTel: 05827 - 437281 - 4
Jatlan BranchTel: 05827 - 404388
Dadyal BranchTel: 0586 - 3044668 - 70
Naarr BranchTel: 05826 - 420784 - 85
Muzaffarabad BranchTel: 05822 - 929765 - 7
Kotli BranchTel: 05826 - 448228 -30
Khui Ratta BranchTel: 05826 - 414906 - 7
Shensa Branch Tel: 05826 - 422779 - 422300
Rawalakot BranchTel: 05824 - 445961 - 63
Charroi Branch 05826 - 415474 - 76
Hattian Muzaffarabad Branch Tel: 058 - 22424011 - 14
Seri BranchTel: 058 - 26 – 432731 - 4
Chitral Branch Tel: 0943 - 413027 - 29
Bagh BranchTel: 0346 - 5449449
GILGIT BALTISTAN
Gilgit BranchTel: 0581 - 150615 - 7
Chilas Branch
International Branch
Bahrain BranchTel: 00973 - 17104603


12th Annual General Meeting
The Company Secretary
JS Bank Limited
Shaheen Commercial Complex
Dr. Ziauddin Ahmed Road
P.O. Box 4847 Karachi 74200 Pakistan
I/We ____________________ of _________________ being member(s) of JS Bank Limited holding _______________
ordinary shares as per Register Folio No./CDC /A/c No. _______________ hereby appoint _______________ of
_______________or failing him _______________ of _______________as my / our proxy to attend, act and vote
for me / us and on my / our behalf at the 12th Annual General Meeting of the Bank to be held on March 29, 2018
and / or any adjournment thereof.
As witness my / our hand / seal this ____ day of _______________ 2018 signed by _________________________ in the presence of (name & address)
Witness:
1. Name: ________________________________________
Address ______________________________________
CNIC or ______________________________________
Passport No. __________________________________
Signature _____________________________________
Witness:
2. Name: ________________________________________
Address ______________________________________
CNIC or ______________________________________
Passport No. __________________________________
Signature _____________________________________
Form of Proxy
Signature on Rs. 5/- Revenue Stamp
The signature should agree with the specimen registered with the Bank

Important:
1. A member of the Bank entitled to attend and vote may appoint another member as his / her proxy to attend and vote instead of him / her.
2. The proxy form, duly completed and signed, must be received at the Office of the Bank situated at Shaheen Commercial Complex Dr. Ziauddin Ahmed Road, Karachi 74200 not less than 48 hours before the time of holding the meeting.
3. No person shall act as proxy unless he / she himself is a member of the Bank, except that a corporation may appoint a person who is not a member.
4. If a member appoints more than one proxy and / or more than one instruments of proxy are deposited by a member with the Bank, all such instruments of proxy shall be rendered invalid.
5. Beneficial Owner of the physical shares and the shares registered in the name of Central Depositary Company of Pakistan Ltd (CDC) and / or their proxies are required to produce their original Computerized National Identity Card (CNIC) or Passport for identification purposes at the time of attending meeting. The Form of proxy must be submitted with the Bank within the stipulated time, duly witnessed by two persons whose names, address and CNIC numbers must be mentioned on the form, along with attested copies of CNIC or the Passport of the beneficial owner and the proxy. In case of a corporate entity, the Board of Directors’ Resolution / Power of Attorney along with the specimen signature shall be submitted (unless it has been provided earlier along with the proxy form to the Bank).

6666,,,,ZZZZÃÃÃÃggggxxxx‚:Z¬x !*gZV
ñ~Z÷�eZYZ−+Zgze
Ô0*y 74200 Ô™Z 4847 Zz!*�
&XXXXXXXXXXXXXXXXXXXZZyZzgge�&e~&Z.$�XXXXXXXXXXXXXXXXXXXXXy÷Ôc*~ 2018 ga 29 g][XXXXXXXXXXXXXXXXXXX!*g,‚:Z¬x{ [XXXXXXXXXXXXXXXXXXXc*Zy°x7
(g™@*V&™÷X Proxy ”{@*g6,ZY+$q¢ÔeZzgzz^)
fZg6,& 2018 Z;y)**xZzgí(�W`',ziXXXXXXÔXXXXXXXXX
:{Z**x:XXXXXXXXXXXXXXXXXXXXXXXXXXXXXXXXXXXXXXXXXX X1
XXXXXXXXX :XXXXXXXXXXXXXXXXXXXXXXXXXXXXXXXXXXXXXXXXX :XXXXXXXXXXXXXXXXXXXXXXXXXXXXXXXXXXXXXXXXXX XXXXXXXXXXXXXXXXXXXXXXXXXXXXXXXXX
R,Z,egec*0*g�:XXXXXXXXXXXXXXXXXXXXXX
**x:XXXXXXXXXXXXXXXXXXXXXXXXXXXXXXXXXXXXXXXXXX X2
:XXXXXXXXXXXXXXXXXXXXXXXXXXXXXXXXXXXXXXXXX:XXXXXXXXXXXXXXXXXXXXXXXXXXXXXXXXXXXXXXXXXX
XXXXXXXXXXXXXXXXXXXXXXXXXXXXXXXXXXXXXXXXXX
R,Z,egec*0*g�:XXXXXXXXXXXXXXXXXXXXXX
gzgEZ6, 5
Y�%
**e

ZZZZ^::::z}ZZkq¢ÔeZzgzz^g™X X1
Ô™Z 4847 x÷�ÔeZYZ−+ZgzeÔZz!*� 48 !*‡°{Zzg”{6,ZÃgxZk¬xZZi X2Ô0*y6,wY**eX 74200
Z�gZkq�:ÔZgg�Zg™X X3Z¤/ZqiZZ+g™@*ZzgZqiZZ+Ãgxw÷ZxÃgxcgYX X4
(c*0*g^œ CNIC ‚yZzge~geyZzg&c*ZyZk•z‰ZZR,Z,ege) X5™**X!*‡°{Zzg”{6,ZÃgxg{z‰6,™zZc*YÔ6,zZVÔ**xÔÔR,Z,ege�c*0*g�g`XZkZ{
´Zzg6,ZR,Z,egec*0*g^&”{Ì**¢zg~Xggf$ZZg}g]geWseZ],i
ŒZgZ&0*zgWsZN*g%™zZY)Z¤/6,ZÃgxZ{™zZ(