Embed Size (px)
Citation preview
ANNUAL REPORT
2017
Annual Report 2017
www.ingeniacommunities.com.au
Ingenia Communities Holdings Limited Annual ReportsFOR THE YEAR ENDED 30 JUNE 2017
Contents
Directors’ Report 1Auditor’s Independence Declaration 22Consolidated Statement of Comprehensive Income 23Consolidated Balance Sheet 25Consolidated Cash Flow Statement 26Consolidated Statement of Changes in Equity 27Notes to the Financial Statements 28
1. Summary of significant accounting policies 282. Accounting estimates and judgements 343. Segment information 364. Earnings per security 385. Revenue 396. Finance expense 397. Income tax expense 408. Trade and other receivables 409. Inventories 4110. Investment properties 4111. Assets and liabilities held for sale 4712. Plant and equipment 4713. Intangibles 4714. Deferred tax asset and liabilities 4815. Trade and other payables 4816. Borrowings 4817. Retirement village resident loans 5018. Issued securities 5119. Reserves 5220. Accumulated losses 5221. Commitments 5222. Contingent liabilities 5223. Share-based payment transactions 5324. Capital management 5425. Financial instruments 5426. Fair value measurement 5927. Auditor’s remuneration 6028. Related parties 6029. Company financial information 6130. Subsidiaries 6231. Notes to the cash flow statement 6332. Subsequent events 64
Directors’ Declaration 65Independent Auditor’s Report 66
Securityholder Information 126Investor Relations 128Corporate Directory 129

1Ingenia Communities Holdings Limited
The directors of Ingenia Communities Holdings Limited (“ICH” or the “Company”) present their report together with the Company’s financial report for the year ended 30 June 2017 (the “current year”) and the Independent Auditor’s Report thereon. The Company’s financial report comprises the consolidated financial report of the Company and its controlled entities, including Ingenia Communities Fund (“ICF” or the “Fund”) and Ingenia Communities Management Trust (“ICMT”) (collectively, the “Trusts”). In this report, the Company and the Trusts are referred to collectively as the “Group”.
The shares of the Company are “stapled” with the units of the Trusts and trade on the Australian Securities Exchange (“ASX”) effectively as one security. Ingenia Communities RE Limited (“ICRE” or “Responsible Entity”), a wholly owned subsidiary of the Company is the responsible entity of the Trusts. In this report, the Company and the Trusts are referred to collectively as the Group.
In accordance with Accounting Standard AASB 3 Business Combinations, the stapling of the Company and the Trusts is regarded as a business combination. The Company has been identified as the parent for preparing consolidated financial reports.
DirectorsThe directors of the Company at any time during or since the end of the financial year were:
Non-Executive Directors (“NEDs”)Jim Hazel (Chairman)
Robert Morrison (Deputy Chairman)
Philip Clark AM
Amanda Heyworth
Valerie Lyons (appointed, 1 March 2017)
Norah Barlow ONZM (resigned, 15 November 2016)
Executive DirectorsSimon Owen (Managing Director and Chief
Executive Officer) (“MD” and “CEO”)
Qualifications, Experience and Special Responsibilities
Jim Hazel – Non-Executive ChairmanMr Hazel was appointed to the Board in March 2012. Mr Hazel has had an extensive corporate career in both the banking and retirement sectors. His retirement village operations experience includes being Managing Director of Primelife Corporation
Limited (now part of Lend Lease). Other current listed company directorships include Bendigo and Adelaide Bank Limited and Centrex Metals Limited. He also serves on the Boards of Coopers Brewery Limited and the University of South Australia. Mr Hazel was previously on the board of ImpediMed Limited. Mr Hazel holds a Bachelor of Economics and is a Senior Fellow of the Financial Services Institute of Australasia and a Fellow of the Australian Institute of Company Directors. Mr Hazel is a member of the Investment Committee.
Robert Morrison – Non-Executive Deputy ChairmanMr Morrison was appointed to the Board in February 2013. Mr Morrison brings to the board extensive experience in property investments, property development, portfolio management, capital raising as well as institutional funds management.
During his 21 years at AMP Limited, Mr Morrison’s executive roles included Head of Property for Asia Pacific and Director of Asian Investments. Mr Morrison’s investment experience includes senior portfolio management roles where he managed both listed and unlisted property funds on behalf of institutional investors. Mr Morrison was previously a Non-Executive Director of Mirvac Funds Management Limited, an Executive Director of AMP Capital Limited and a National Director of the Property Council of Australia. He is a founding partner and Executive Director of alternative investments firm, Barwon Investment Partners. Mr Morrison holds a Bachelor of Town and Regional Planning (Hons) and a Master of Commerce. Mr Morrison is a member of the Audit and Risk Committee and is Chair of the Investment Committee.
Philip Clark AM – Non-Executive DirectorMr Clark was appointed to the Board in June 2012. Mr Clark is the Chair of SCA Property Group Limited. He is a member of the J.P. Morgan Advisory Council and also chairs a number of government and private company boards. He was Managing
Partner and Chief Executive Officer of Minter Ellison and worked with that firm from 1995 until June 2005. Prior to joining Minter Ellison, Mr Clark was Director and Head of Corporate with ABN Amro Australia and prior to that he was Managing Partner with Mallesons Stephen Jaques for 16 years. Mr Clark’s qualifications include a Bachelor of Arts, Bachelor of Law and a Masters of Business Administration. Mr Clark is Chair of the Remuneration and Nomination Committee.
Amanda Heyworth – Non-Executive DirectorMs Heyworth is a professional company director and currently serves on the boards of a number of private, university and Government bodies. She previously served as Executive Director of a venture capital fund which specialised in
technology investments. Early in her career, she worked as a Federal Treasury economist and held management roles in the finance and technology sectors.
Ms Heyworth has particular strengths in strategy, managing growth and marketing having worked as a venture capital investor for over a decade and been involved in numerous product launches. She holds a MBA from the Australian Graduate School of Management’s MBA program and has taught strategy and marketing for the AGSM in both Australia and Hong Kong.
Directors’ ReportFOR THE YEAR ENDED 30 JUNE 2017
2 Annual Report 2017
Institute of Australia and a member of the Australian Institute of Superannuation Trustees. Ms Lyons is a member of the Audit and Risk Committee, Investment Committee and Remuneration and Nomination Committee.
Simon Owen – MD and CEOMr Owen joined the Group in November 2009 as the Chief Executive Officer. He initiated the internalisation of management and exit from the ING Group as well as Ingenia’s focus on lifestyle parks. He brings to the Group in-depth sector experience. Mr Owen is
currently a Director of BIG4 Holiday Parks, Australia’s leading holiday parks group representing 180 parks across Australia and is a past member of the Retirement Living Division Council (part of the Property Council of Australia). He is also a past National President of the Retirement Villages Association (now part of the Retirement Living Council), the peak industry advocacy group for the owners, operators, developers and managers of retirement communities in Australia, a role he held for four years. Mr Owen has over 20 years’ experience working in ASX listed groups with roles across finance, funds management, mergers and acquisitions, business development and sales and marketing. Prior to joining Ingenia Communities, Mr Owen was the CEO of Aevum, a formerly listed retirement company. Mr Owen is a qualified accountant (CPA) with a Bachelor of Business (Accounting) and a postgraduate diploma in finance and investment and advanced accounting.
Ms Heyworth has strong finance and accounting credentials. She has been involved in over 40 capital raisings and M&A transactions and holds a BA (Accounting) with a major in finance from the University of South Australia and has post graduate qualifications in accounting and finance. Ms Heyworth is Chair of the Audit and Risk Committee and is a member of the Remuneration and Nomination Committee.
Valerie Lyons – Non-Executive DirectorMs Lyons was appointed to the Board in March 2017. Ms Lyons has over 30 years experience in executive, non-executive and advisory roles across the health, aged care and retirement, and finance and superannuation sectors. Ms Lyons has held CEO and CFO roles in well regarded
seniors and disability service organisations including Uniting AgeWell, Villa Maria and Southern Cross Care (Vic) with prior directorships including Leading Age Services Australia (LASA), Catholic Health Australia (CHA) and Aged and Community Services Australia (ACSA). Ms Lyons is currently a Non-Executive Director of Health Employees Superannuation Trust Australia (HESTA) and registered disability and aged care provider Independence Australia Group. She also serves as a Non-Executive Member of the Audit & Risk Board committee for the Australian Digital Health Agency (ADHA), a government agency with responsibility for all national digital health services and systems. Ms Lyons holds a Bachelor of Business Studies Accounting. Ms Lyons is a Fellow of the Australian Institute of Company Directors, CPA Australia and the Governance
MeetingsThe number of meetings of directors (including meetings of committees of directors) held during the year and the number of meetings attended by each director was as follows:
Board Audit & Risk CommitteeRemuneration &
Nomination CommitteeInvestment Committee
A B A B A B A B
Jim Hazel 14 13 – – – – 4 4
Philip Clark AM 14 13 – – 5 5 – –
Amanda Heyworth 14 14 7 7 5 5 – –
Robert Morrison 14 14 7 7 – – 4 4
Norah Barlow 7 7 3 2 2 2 2 2
Valerie Lyons 3 3 2 2 2 2 2 2
Simon Owen 14 13 – – – – – –
A: Meetings eligible to attend B: Meetings attended
Interests of DirectorsSecurities in the Group held by directors or their associates as at 30 June 2017 were:
Issued stapled securities Rights
Jim Hazel 331,483 –
Amanda Heyworth 122,485 –
Robert Morrison 107,146 –
Philip Clark AM 52,674 –
Valerie Lyons 13,969 –
Simon Owen 1,352,772 365,772
Directors’ ReportFOR THE YEAR ENDED 30 JUNE 2017 | CONTINUED
3Ingenia Communities Holdings Limited
Company Secretaries
Leanne RalphMs Ralph was appointed to the position of Company Secretary in April 2012. Ms Ralph has over 20 years experience in Chief Financial Officer and company secretarial roles for various publicly listed and unlisted entities. Ms Ralph is a member of the Governance Institute of Australia and the Australian Institute of Company Directors. Ms Ralph is the principal of Boardworx Australia Pty Ltd, which supplies bespoke outsourced Company Secretarial services to a number of listed and unlisted companies.
Natalie Kwok (appointed, effective 1 January 2017)Ms Kwok is responsible for the Group’s transactional, legal and tax functions. Ms Kwok joined Ingenia in May 2012 as the Group Tax Manager and moved into the role of General Manager Acquisitions, Legal & Tax. Ms Kwok has over 15 years’ experience in corporate and commercial matters, having worked at PwC, Challenger Financial Services and a commercial law firm. Ms Kwok holds a Bachelor of Law (Honours) and a Bachelor of Commerce, and is a Chartered Accountant and a Solicitor.
Operating and Financial Review
Ingenia Communities Group OverviewThe Group is a leading owner, operator and developer of a diversified portfolio of senior lifestyle and holiday communities across Australia. The Group is in the ASX 300 with a market capitalisation of approximately $536 million. Its real estate assets span key metropolitan and coastal markets, with a carrying value of $693.5 million at 30 June 2017, comprising of 33 lifestyle communities, 31 rental communities and three retirement (deferred management fee) communities.
The Group’s vision is to create Australia’s best lifestyle communities of affordable permanent and tourism rental accommodation, focusing on the seniors demographic. The Board is committed to delivering continued earnings and security price growth to securityholders and providing a supportive community environment to both its permanent and short-term residents.
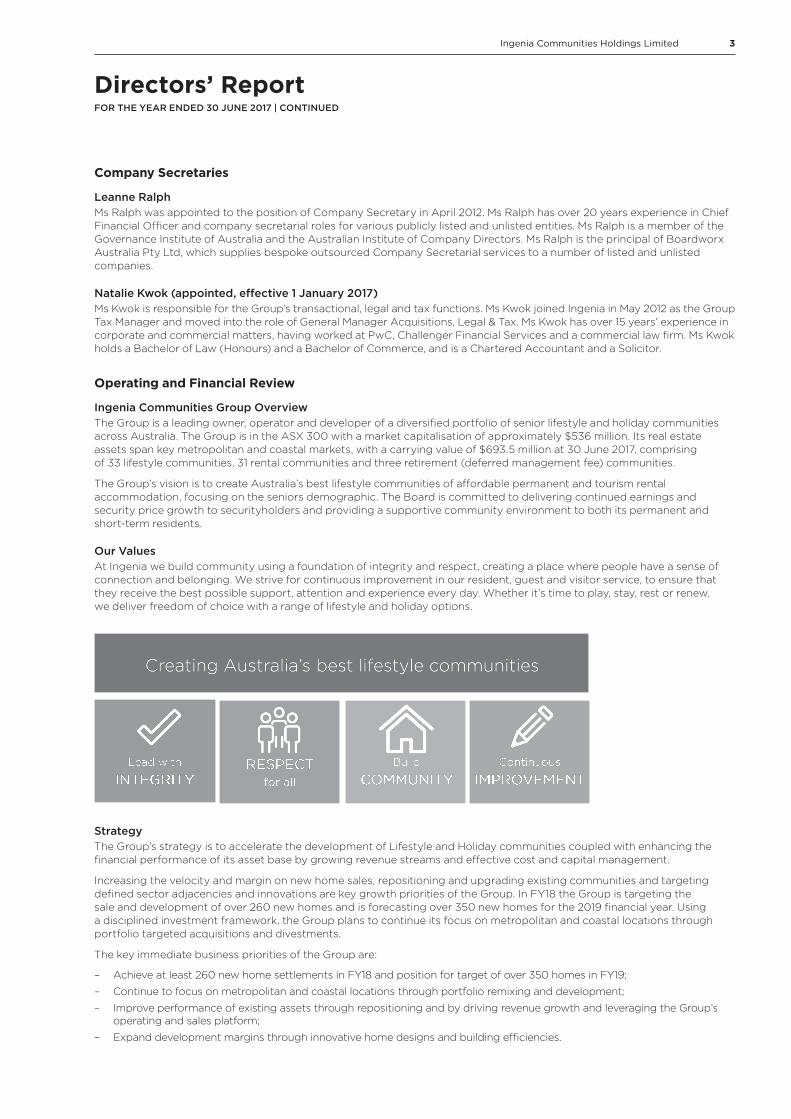
Our ValuesAt Ingenia we build community using a foundation of integrity and respect, creating a place where people have a sense of connection and belonging. We strive for continuous improvement in our resident, guest and visitor service, to ensure that they receive the best possible support, attention and experience every day. Whether it’s time to play, stay, rest or renew, we deliver freedom of choice with a range of lifestyle and holiday options.
StrategyThe Group’s strategy is to accelerate the development of Lifestyle and Holiday communities coupled with enhancing the financial performance of its asset base by growing revenue streams and effective cost and capital management.
Increasing the velocity and margin on new home sales, repositioning and upgrading existing communities and targeting defined sector adjacencies and innovations are key growth priorities of the Group. In FY18 the Group is targeting the sale and development of over 260 new homes and is forecasting over 350 new homes for the 2019 financial year. Using a disciplined investment framework, the Group plans to continue its focus on metropolitan and coastal locations through portfolio targeted acquisitions and divestments.
The key immediate business priorities of the Group are:
– Achieve at least 260 new home settlements in FY18 and position for target of over 350 homes in FY19;
– Continue to focus on metropolitan and coastal locations through portfolio remixing and development;
– Improve performance of existing assets through repositioning and by driving revenue growth and leveraging the Group’s operating and sales platform;
– Expand development margins through innovative home designs and building efficiencies.
Directors’ ReportFOR THE YEAR ENDED 30 JUNE 2017 | CONTINUED
4 Annual Report 2017
FY17 Financial ResultsSignificant investment in Ingenia Lifestyle and Holidays continued during FY17, with a focus on building the Group’s development pipeline and lifestyle and tourism portfolio’s, through eight strategic acquisitions in coastal and metropolitan markets. Management has also remained focused on occupancy and rental growth within the Ingenia Gardens and the Ingenia Lifestyle and Holidays rental assets.
In October 2016 in line with the Group’s asset recycling strategy, five of the eight Settlers’ assets were sold to the Forum Group. The Group retains a 15% share in these assets. The divestment provided cash proceeds of $41 million which were deployed into acquiring lifestyle and holiday communities in key metropolitan and coastal markets during FY17.
FY17 has delivered a statutory profit of $26.4 million, which is up 8.8% on prior year. Underlying Profit from continuing operations was $23.5 million which represents an increase of $3.4 million (16.7%) on the prior year. The underlying result is underpinned by a significantly higher EBIT contribution from the Ingenia Lifestyle and Holidays segment of $28.3 million, up 72% from prior year. The statutory result is further impacted by an uplift in valuations of investment property offset by the impact of the loss on the sale of the Settlers portfolio during the year.
Operating cash flow for the year was $30.3 million, up 43.9% from the prior year, reflecting growth in recurring rental income and new lifestyle home settlements growing by 97.2% to 211.
In May 2017, the Group raised $74 million through a placement and entitlement offer, which was raised to invest in four lifestyle community acquisitions and accelerate development. Prior to 30 June, two of these acquisitions, being Bonny Hills and Durack have settled, with the remaining two acquisitions expected to settle in August 2017. Over the year the Group invested an additional $174.8 million (including transaction costs) into eight newly acquired lifestyle communities.
The Group has today announced a final distribution of 5.1 cents, which brings the full year distribution to 10.2 cents. The dividend reinvestment plan will be available to securityholders and the Board reaffirms its commitment to further growth in securityholder returns.
Key Metrics – Statutory profit was $26.4 million, up 8.8% from FY16
– Underlying Profit was $23.5 million, up 16.7% from FY16
– Full year distributions of 10.2 cents per security, up 9.7% from FY16
– Cash flow was $30.3 million, up 43.9% from FY16
– EBIT was $32.1 million, up 32.6% from FY16
– Statutory profit per security was 14.6 cents, down 1.5 cents from FY16
– Underlying Profit per security was 13.0 cents, down 0.3 cents from FY16
– Net asset value grew by 5 cents per security to $2.50
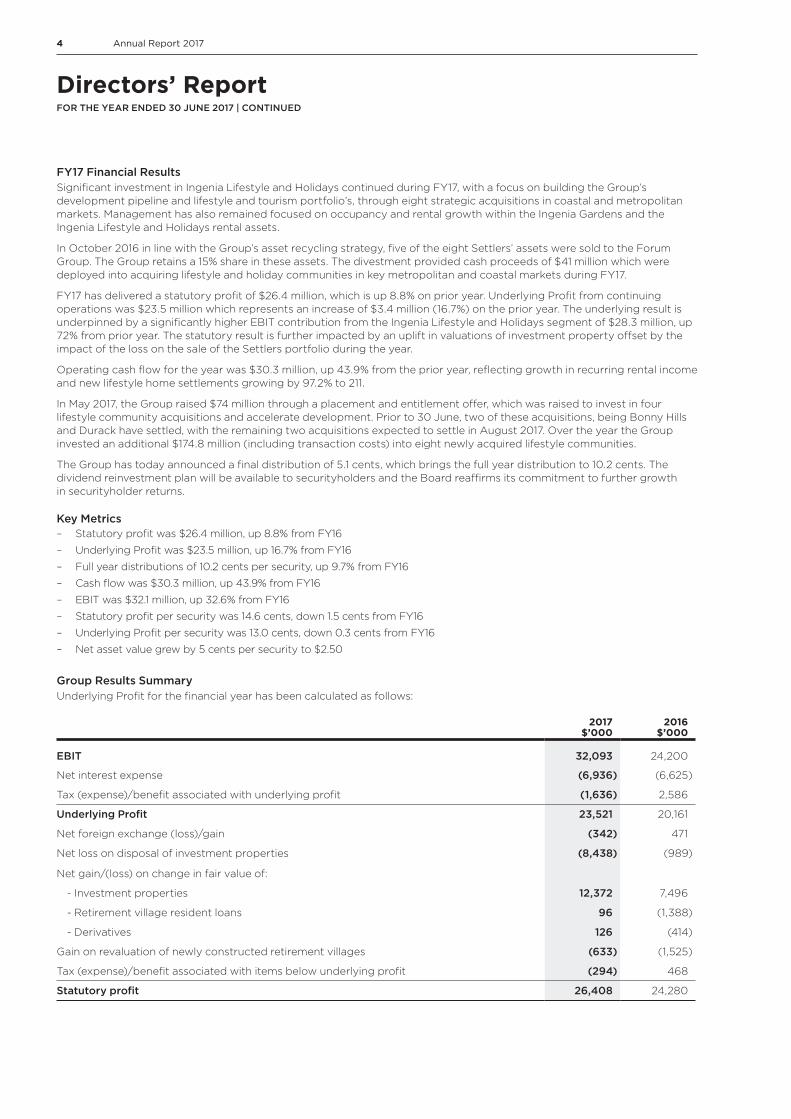
Group Results SummaryUnderlying Profit for the financial year has been calculated as follows:
2017 $’000
2016 $’000
EBIT 32,093 24,200
Net interest expense (6,936) (6,625)
Tax (expense)/benefit associated with underlying profit (1,636) 2,586
Underlying Profit 23,521 20,161
Net foreign exchange (loss)/gain (342) 471
Net loss on disposal of investment properties (8,438) (989)
Net gain/(loss) on change in fair value of:
- Investment properties 12,372 7,496
- Retirement village resident loans 96 (1,388)
- Derivatives 126 (414)
Gain on revaluation of newly constructed retirement villages (633) (1,525)
Tax (expense)/benefit associated with items below underlying profit (294) 468
Statutory profit 26,408 24,280
Directors’ ReportFOR THE YEAR ENDED 30 JUNE 2017 | CONTINUED
5Ingenia Communities Holdings Limited
Underlying Profit is a non-IFRS measure designed to present, in the opinion of the Directors, the results from the on-going operating activities in a way that appropriately reflects underlying performance. Underlying Profit excludes items such as unrealised fair value gains/(losses) and adjustments arising from the effect of revaluing assets/liabilities (such as derivatives and investment properties). These items are required to be included in Statutory Profit in accordance with Australian Accounting Standards.
Segment Performance and Strategic Priorities
Ingenia Lifestyle and Holidays - consolidatedAt 30 June 2017, Ingenia Lifestyle and Holidays comprised 33 lifestyle communities that offer an affordable community experience for seniors and tourism guests. Ingenia Lifestyle and Holidays EBIT grew 72% on FY16 to $28.3 million.
During FY17 the Group continued to expand both its development and rental assets, completing eight acquisitions for $175.0 million (including transaction costs). The carrying value of the Lifestyle and Holidays assets at 30 June 2017 is $514.8 million. A summary of these acquisitions is tabled below:
New South Wales Queensland
Ingenia Holidays Avina (Sydney) Ingenia Holidays Hervey Bay (Fraser Coast)
Ingenia Holidays Ocean Lake (South Coast) Ingenia Holidays Cairns Coconut (Far North QLD)
Latitude One (Mid North Coast) Durack Gardens (Brisbane)
Ingenia Holidays Blueys Beach (Mid North Coast)
Ingenia Holidays Bonny Hills (North Coast)
Subsequent to 30 June, the Group completed the acquisition of Glenwood (NSW North Coast), and signed an unconditional contract for Sheldon Caravan Park (Brisbane), which brings the total number of Lifestyle and Holiday communities to 35.
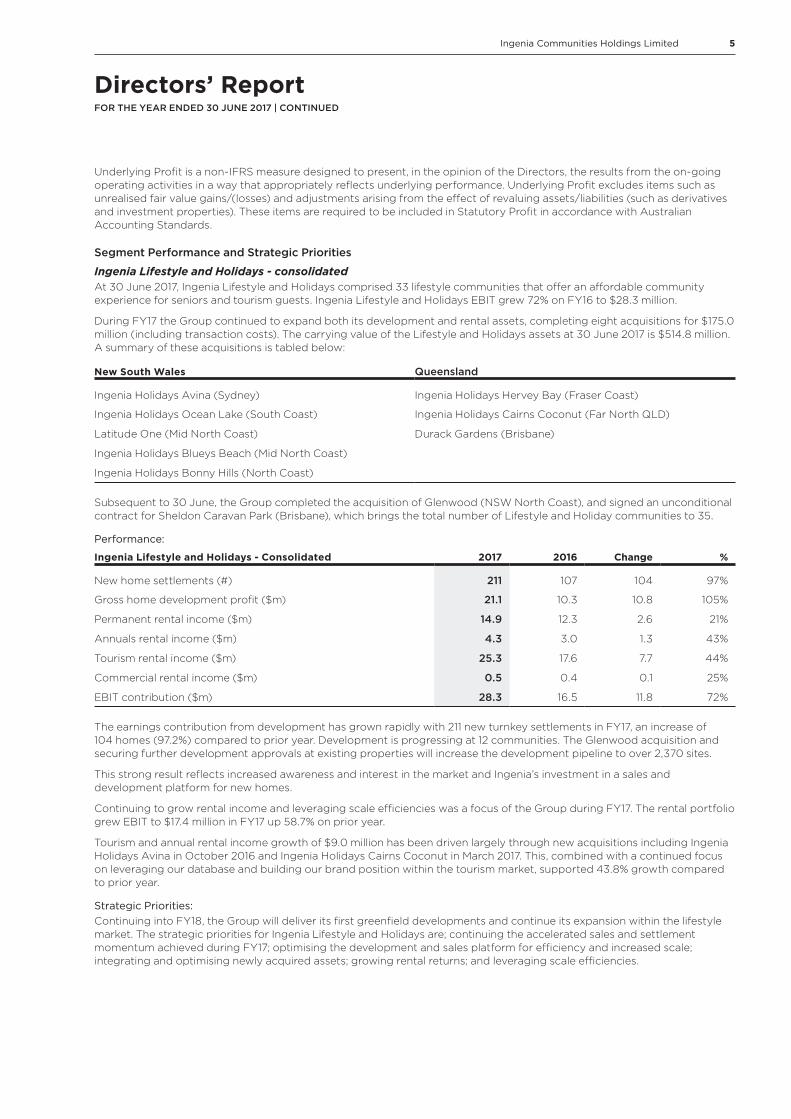
Performance:
Ingenia Lifestyle and Holidays - Consolidated 2017 2016 Change %
New home settlements (#) 211 107 104 97%
Gross home development profit ($m) 21.1 10.3 10.8 105%
Permanent rental income ($m) 14.9 12.3 2.6 21%
Annuals rental income ($m) 4.3 3.0 1.3 43%
Tourism rental income ($m) 25.3 17.6 7.7 44%
Commercial rental income ($m) 0.5 0.4 0.1 25%
EBIT contribution ($m) 28.3 16.5 11.8 72%
The earnings contribution from development has grown rapidly with 211 new turnkey settlements in FY17, an increase of 104 homes (97.2%) compared to prior year. Development is progressing at 12 communities. The Glenwood acquisition and securing further development approvals at existing properties will increase the development pipeline to over 2,370 sites.
This strong result reflects increased awareness and interest in the market and Ingenia’s investment in a sales and development platform for new homes.
Continuing to grow rental income and leveraging scale efficiencies was a focus of the Group during FY17. The rental portfolio grew EBIT to $17.4 million in FY17 up 58.7% on prior year.
Tourism and annual rental income growth of $9.0 million has been driven largely through new acquisitions including Ingenia Holidays Avina in October 2016 and Ingenia Holidays Cairns Coconut in March 2017. This, combined with a continued focus on leveraging our database and building our brand position within the tourism market, supported 43.8% growth compared to prior year.
Strategic Priorities:Continuing into FY18, the Group will deliver its first greenfield developments and continue its expansion within the lifestyle market. The strategic priorities for Ingenia Lifestyle and Holidays are; continuing the accelerated sales and settlement momentum achieved during FY17; optimising the development and sales platform for efficiency and increased scale; integrating and optimising newly acquired assets; growing rental returns; and leveraging scale efficiencies.
Directors’ ReportFOR THE YEAR ENDED 30 JUNE 2017 | CONTINUED
6 Annual Report 2017
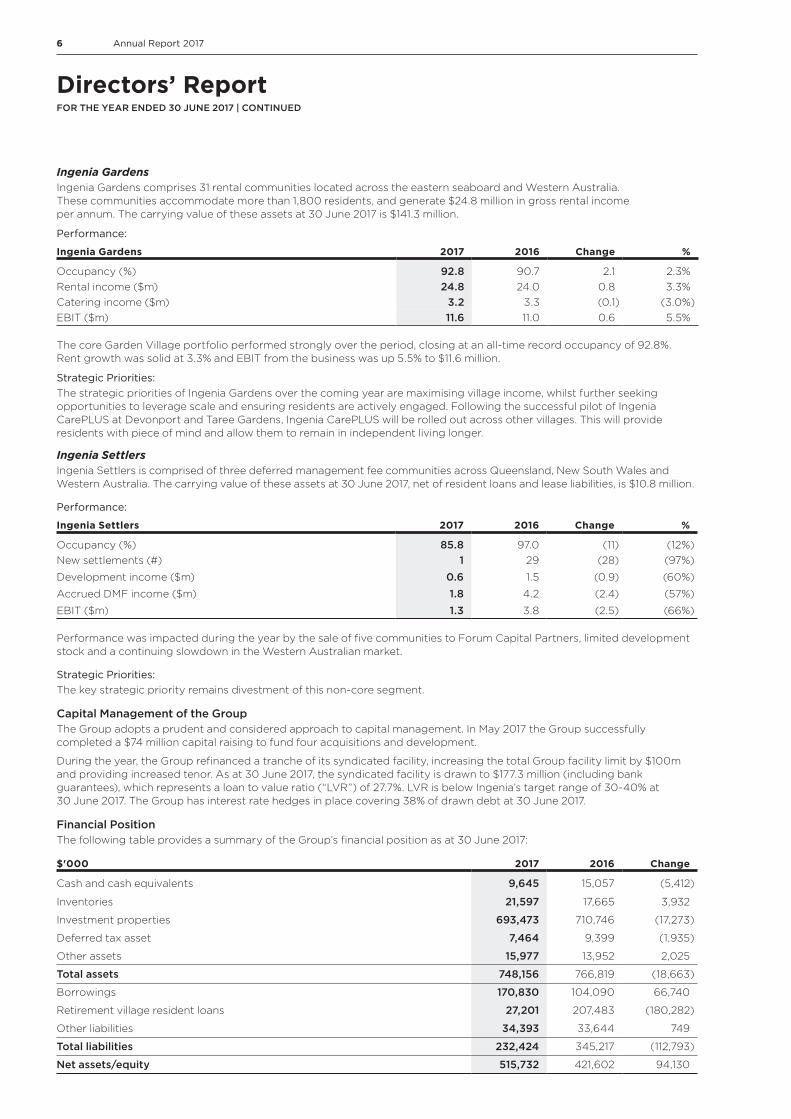
Ingenia GardensIngenia Gardens comprises 31 rental communities located across the eastern seaboard and Western Australia. These communities accommodate more than 1,800 residents, and generate $24.8 million in gross rental income per annum. The carrying value of these assets at 30 June 2017 is $141.3 million.
Performance:
Ingenia Gardens 2017 2016 Change %
Occupancy (%) 92.8 90.7 2.1 2.3%Rental income ($m) 24.8 24.0 0.8 3.3%Catering income ($m) 3.2 3.3 (0.1) (3.0%)EBIT ($m) 11.6 11.0 0.6 5.5%
The core Garden Village portfolio performed strongly over the period, closing at an all-time record occupancy of 92.8%. Rent growth was solid at 3.3% and EBIT from the business was up 5.5% to $11.6 million.
Strategic Priorities:The strategic priorities of Ingenia Gardens over the coming year are maximising village income, whilst further seeking opportunities to leverage scale and ensuring residents are actively engaged. Following the successful pilot of Ingenia CarePLUS at Devonport and Taree Gardens, Ingenia CarePLUS will be rolled out across other villages. This will provide residents with piece of mind and allow them to remain in independent living longer.
Ingenia SettlersIngenia Settlers is comprised of three deferred management fee communities across Queensland, New South Wales and Western Australia. The carrying value of these assets at 30 June 2017, net of resident loans and lease liabilities, is $10.8 million.
Performance:
Ingenia Settlers 2017 2016 Change %
Occupancy (%) 85.8 97.0 (11) (12%)New settlements (#) 1 29 (28) (97%)
Development income ($m) 0.6 1.5 (0.9) (60%)
Accrued DMF income ($m) 1.8 4.2 (2.4) (57%)
EBIT ($m) 1.3 3.8 (2.5) (66%)
Performance was impacted during the year by the sale of five communities to Forum Capital Partners, limited development stock and a continuing slowdown in the Western Australian market.
Strategic Priorities: The key strategic priority remains divestment of this non-core segment.
Capital Management of the GroupThe Group adopts a prudent and considered approach to capital management. In May 2017 the Group successfully completed a $74 million capital raising to fund four acquisitions and development.
During the year, the Group refinanced a tranche of its syndicated facility, increasing the total Group facility limit by $100m and providing increased tenor. As at 30 June 2017, the syndicated facility is drawn to $177.3 million (including bank guarantees), which represents a loan to value ratio (“LVR”) of 27.7%. LVR is below Ingenia’s target range of 30-40% at 30 June 2017. The Group has interest rate hedges in place covering 38% of drawn debt at 30 June 2017.
Financial PositionThe following table provides a summary of the Group’s financial position as at 30 June 2017:
$'000 2017 2016 Change
Cash and cash equivalents 9,645 15,057 (5,412)
Inventories 21,597 17,665 3,932
Investment properties 693,473 710,746 (17,273)
Deferred tax asset 7,464 9,399 (1,935)
Other assets 15,977 13,952 2,025
Total assets 748,156 766,819 (18,663)
Borrowings 170,830 104,090 66,740
Retirement village resident loans 27,201 207,483 (180,282)
Other liabilities 34,393 33,644 749
Total liabilities 232,424 345,217 (112,793)
Net assets/equity 515,732 421,602 94,130
Directors’ ReportFOR THE YEAR ENDED 30 JUNE 2017 | CONTINUED
7Ingenia Communities Holdings Limited
Inventories, up $3.9 million, include 86 newly completed homes, reflecting the Group’s rapidly growing lifestyle community development business.
Investment property book value decreased by $17.3 million from the prior year. This was due to:
– Sale of five Settlers assets which had a gross value in investment property of $230.7 million;
– Acquisition of eight lifestyle communities for $174.8 million (including transaction costs);
– Development expenditure of $29.2 million, and;
– Fair value uplift of $12.6 million.
Borrowings increased by $66.7 million, partly funding the acquisition and development of lifestyle community assets of $174.8 million.
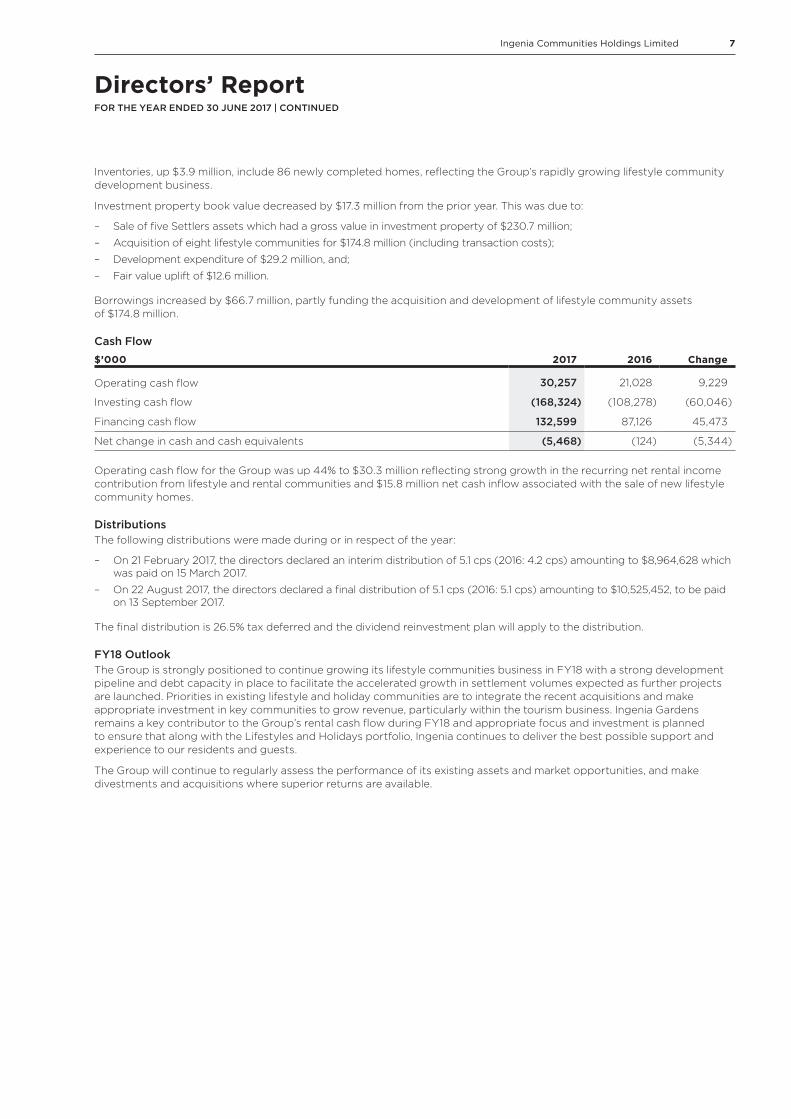
Cash Flow$’000 2017 2016 Change
Operating cash flow 30,257 21,028 9,229
Investing cash flow (168,324) (108,278) (60,046)
Financing cash flow 132,599 87,126 45,473
Net change in cash and cash equivalents (5,468) (124) (5,344)
Operating cash flow for the Group was up 44% to $30.3 million reflecting strong growth in the recurring net rental income contribution from lifestyle and rental communities and $15.8 million net cash inflow associated with the sale of new lifestyle community homes.
DistributionsThe following distributions were made during or in respect of the year:
– On 21 February 2017, the directors declared an interim distribution of 5.1 cps (2016: 4.2 cps) amounting to $8,964,628 which was paid on 15 March 2017.
– On 22 August 2017, the directors declared a final distribution of 5.1 cps (2016: 5.1 cps) amounting to $10,525,452, to be paid on 13 September 2017.
The final distribution is 26.5% tax deferred and the dividend reinvestment plan will apply to the distribution.
FY18 OutlookThe Group is strongly positioned to continue growing its lifestyle communities business in FY18 with a strong development pipeline and debt capacity in place to facilitate the accelerated growth in settlement volumes expected as further projects are launched. Priorities in existing lifestyle and holiday communities are to integrate the recent acquisitions and make appropriate investment in key communities to grow revenue, particularly within the tourism business. Ingenia Gardens remains a key contributor to the Group’s rental cash flow during FY18 and appropriate focus and investment is planned to ensure that along with the Lifestyles and Holidays portfolio, Ingenia continues to deliver the best possible support and experience to our residents and guests.
The Group will continue to regularly assess the performance of its existing assets and market opportunities, and make divestments and acquisitions where superior returns are available.
Directors’ ReportFOR THE YEAR ENDED 30 JUNE 2017 | CONTINUED
8 Annual Report 2017
Significant Changes in the State of AffairsChanges in the state of affairs during the financial year are set out in the various reports in this Financial Report. Refer to Note 10 for Australian investment properties acquired during the year, Note 16 for details of increased debt facility, and Note 18 for issued securities.
Events Susequent to Reporting Date
Final FY17 DistributionOn 22 August 2017, the directors of the Group resolved to declare a final distribution of 5.1cps (2016: 5.1 cps amounting to $10.5 million to be paid at 13 September 2017. The distribution is 26.5% tax deferred and the dividend reinvestment plan will apply to the final distribution.
Acquisition of SheldonOn 31 July 2017, the Group signed an unconditional agreement to purchase Sheldon Caravan Park located in metropolitan Brisbane for $25.0 million.
Acquisition of GlenwoodOn 10 August 2017, the Group completed the acquisition of development approved land located north of Coffs Harbour, on the NSW mid-north coast, for a purchase price of $7.8 million.
Likely DevelopmentsThe Group will continue to pursue strategies aimed at growing its cash earnings, profitability and market share within the seniors rental property and tourism industry during the next financial year, with a continuing focus on the development of lifestyle communities.
Other information about likely developments in the operations of the Group and the expected results of those operations in future financial years is included in the various reports in this Financial Report.
Environmental RegulationsThe Group has policies and procedures in place to ensure that, where operations are subject to any particular and significant environmental regulation under the law of Australia, those obligations are identified and appropriately addressed. The directors have determined that there has not been any material breach of those obligations during the financial year.
Group IndemnitiesThe Group has purchased various insurance policies to cover a range of risks (subject to specified exclusions) for directors, officers and employees of the Group serving in their respective capacities. Key insurance policies include: directors and officers insurance, professional indemnity insurance and management liability insurance.
Indemnification of AuditorTo the extent permitted by law, the Company has agreed to indemnify its auditor, Ernst & Young Australia, as part of the terms of its audit engagement agreement against claims by third parties arising from the audit (for an unspecified amount). No payment has been made to indemnify Ernst & Young during or since the financial year.
Auditor’s Independence DeclarationA copy of the auditor’s independence declaration as required under section 307C of the Corporations Act 2001 is set out on page 22.
Auditor ExtensionOn 16 May 2015 at the recommendation of the Audit & Risk Committee, the directors granted an approval for the extension of the Group’s audit partner for a further one year, when the initial period of five years as permitted under the Corporations Act 2001 expired in June 2015. A further one year extension was granted on 15 October 2015.The Audit & Risk Committee’s recommendation was based on the need to ensure the completion of the audit firm’s succession plan for the audit. In doing so, the Audit & Risk Committee satisfied itself that the extension will maintain the quality of the audit and will not give rise to any conflicts of interest.
Rounding AmountsIngenia Communities Group is an entity of the kind referred to in ASIC Instrument 2016/191, and in accordance with that Class Order, amounts in the financial report and Directors’ report have been rounded to the nearest thousand dollars, unless otherwise stated.
Signed in accordance with a resolution of the Directors of the Responsible Entity.
Jim HazelChairmanSydney, 22 August 2017
Directors’ ReportFOR THE YEAR ENDED 30 JUNE 2017 | CONTINUED
9Ingenia Communities Holdings Limited
Message from the Remuneration and Nomination CommitteeDear Securityholders,
The Board of Ingenia Communities Group (Ingenia) is pleased to present the Remuneration Report for FY17.
IntroductionIngenia undertakes regular reviews of its executive remuneration framework to ensure it is in line with Group strategy, group and individual performance and market relativities. There were only minor changes in the FY17 Key Management Personnel (KMP) remuneration structure.
In relation to the FY18 KMP remuneration structure an additional metric relating to earnings growth will be included in the long-term incentive vesting rules.
Ingenia’s PerformanceThe Board has established a strong nexus between executive remuneration and Ingenia’s performance and its securityholder return.
The Group’s FY17 result, as measured by underlying profit, is strong and significantly increased on the prior year, as supported by the on-target or better sales result achieved in the development business.
A key measure in determining the executives’ remuneration outcomes is Ingenia’s Total Shareholder Return (TSR) relative to that of the ASX 300 Industrials Index. Ingenia’s TSR over the three years ending 30 June 2017 was 6.5% in relation to the TSR of 6.2% for the ASX 300 Industrials Index for the same period.
FY17 STI outcomes for KMP were in line with Ingenia’s strong performance.
The review of NED remuneration is deferred until December 2017.
Ingenia’s Corporate StrategyThe Group’s strategy is highlighted in the FY17 results presentation and Operational and Financial Review section within this Directors’ report, and has not changed substantially from the prior year.
The Board has linked remuneration outcomes to the corporate strategy for medium to long term return on investment. Vesting of deferred STI awards requires year on year earnings growth and vesting of LTI awards occurs on meeting threshold TSR and ROE targets.
ConclusionOverall, Ingenia’s remuneration framework continues to be “fit for purpose”, and remains substantially unchanged from 2016.
Remuneration levels are sufficient to attract and retain key executives, the performance measures focus management on board priorities for creating incremental value, and reward outcomes have varied in line with the Group’s performance.
We recommend Ingenia’s Remuneration Report to investors and seek your support for the resolution to adopt the Remuneration Report at Ingenia’s AGM on Tuesday 14 November 2017.
Phil Marcus Clark AMChair - Remuneration and Nomination Committee
Sydney, 22 August 2017
Directors’ ReportFOR THE YEAR ENDED 30 JUNE 2017 | CONTINUED
10 Annual Report 2017
Remuneration Report (Audited)
IntroductionThe Board presents the Remuneration Report for the Group for the year ended 30 June 2017, which forms part of the Directors’ Report and has been prepared in accordance with section 300A of the Corporations Act 2001 (Cth) (Corporations Act). The data provided in the Remuneration Report was audited as required under section 308(3C) of the Corporations Act.
Remuneration Governance
Remuneration and Nomination Committee (RNC)The Board has an established RNC, which is directly responsible for reviewing and recommending remuneration arrangements for Non-Executive Directors (NEDs), the Managing Director (MD) and Chief Executive Officer (CEO) and senior executives who report directly to the CEO.
The RNC comprises the following NEDs:
– Philip Clark AM (Chair) (appointed, 15 November 2016);
– Amanda Heyworth; and
– Valerie Lyons (appointed, 1 March 2017);
– Norah Barlow ONZM (Chair) (resigned, 15 November 2016);
The RNC provides oversight for general remuneration levels of the Group, ensuring they are set at appropriate levels to access the skills and capabilities the Group needs to operate successfully.
The RNC operates under the delegated authority of the Board for some matters related to remuneration arrangements for both executives and non-executives, and is required to make recommendations to the Board. The RNC also reviews and makes recommendations to the Board on incentive schemes.
The RNC is required to meet regularly throughout the year (a minimum of twice per year), and considers recommendations from internal management and external advisors.
The Board is ultimately responsible for decisions made on recommendations from the RNC. No Director votes on remuneration resolutions that directly impact their remuneration.
External Remunerations AdvisersGuerdon Associates, initially engaged in March 2014, provided independent remuneration advice during FY17 in respect of KMP and reviewed the rules of the Group’s incentive plan. Guerdon Associates have been commissioned by, engaged with, and addressed reports directly to the Chair of the RNC.
The Board is satisfied that the remuneration advice from Guerdon Associates was made free from undue influence of the KMP in respect of whom the advice related, due to there being no engagement with the remuneration advisors outside of the RNC. A declaration of independence from Guerdon Associates was provided to the Board in respect of their engagement and their reports to the RNC.
While remuneration services were received, no remuneration recommendations as defined under Division 1, Part 1.2.98 (1) of the Corporations Act, were made by Guerdon Associates.
Details of KMPKMP for the year ended 30 June 2017 are those persons identified as having direct or indirect authority and responsibility for planning, directing and controlling the activities of the Group, and include any Executive Director or NED of the Group.
KMP of the Group for the year ended 30 June 2017 have been determined by the Board as follows:
Position
NEDs
Jim Hazel Chairman of the Board
Member – Investment Committee
Amanda Heyworth Chair - Audit and Risk Committee
Member - Remuneration and Nomination Committee
Philip Clark AM Chair Remuneration and Nomination Committee (Appointed Chair upon Ms Barlow’s resignation on 15 November 2016. Prior to that Mr Clark was a member of this Committee after previously being Chair)
Robert Morrison Deputy Chairman of the Board
Chair – Investment Committee
Member - Audit and Risk Committee
Directors’ ReportFOR THE YEAR ENDED 30 JUNE 2017 | CONTINUED

11Ingenia Communities Holdings Limited
Position
Norah Barlow ONZM Chair - Remuneration and Nomination Committee
(resigned, 15 November 2016) Member - Audit and Risk Committee
Member – Investment Committee
Valerie Lyons Member – Audit and Risk Committee
(appointed, 1 March 2017) Member – Investment Committee
Member – Remuneration and Nomination Committee
Executive Director
Simon Owen MD and CEO
Other Executive KMP
Tania Betts CFO(1)
Nicole Fisher COO
(1) CFO commenced maternity leave from 1 January 2017, an Acting CFO is currently in the role.
Remuneration of Executive KMP
Remuneration Policy The Group’s Remuneration Policy aims to ensure that remuneration packages properly reflect the person’s duties and responsibilities and that the remuneration is competitive in attracting, retaining and motivating people of suitable quality.
The structure of remuneration, as explained below, is designed to attract suitably qualified candidates, reward the achievement of strategic objectives, and achieve the broader outcome of long-term value creation for securityholders. The remuneration structures take into account a range of factors, including the following:
– Capability, skills and experience;
– Ability to impact achievement of the strategic objectives of the Group;
– Performance of each individual executive KMP;
– The Group’s overall performance;
– Remuneration levels being paid by competitors for similar positions; and
– The need to ensure executive continuity and succession.
Refer below for detail of the mechanisms that link the remuneration outcomes to individual and the Group’s performance.
(1) Above mentioned percentage is for the CEO only. The CFO and COO are split 55% and 30% respectively.
(2) Above mentioned percentage is for the CEO only. The CFO and COO are split 45% and 70% respectively.
Fixed Remuneration
Variable Remuneration
Base Salary + Superannuation
STI Plan
65% Financial performance(1)
35% Non Financial performance(2)70% Relative TSR
30% ROE
Cash Deferred Shares (12 months from issue)
LTI Plan
Rights (3 years from issue)
Directors’ ReportFOR THE YEAR ENDED 30 JUNE 2017 | CONTINUED

12 Annual Report 2017
Link between Remuneration and PerformanceThe Board understands the importance of the relationship between the executive KMP remuneration policy and the Group’s performance. Executive KMP remuneration packages are structured to align remuneration outcomes with the interests of securityholders.
Remuneration component Link to Group performance
Total Fixed Remuneration (TFR) TFR is set with reference to the executive KMP’s role, responsibilities and performance and remuneration levels for similar positions in the market.
Short-Term Incentive (STI) STIs are awarded to executive KMP whose achievements, behaviour and focus meet the Group’s business plan and individual Key Performance Indicators (KPIs) measured over the financial year. Details of the KPIs are explained below
The Board maintains sole discretion over the granting of STIs to employees.
For achievement of STIs in relation to executive KMP, the payment is 50% cash and a 50% deferred equity element linked to earnings growth sustainability.
Deferred STI’s are subject to a malus provision.
Long-Term Incentive (LTI) LTIs are granted to executive KMP to align their focus with the Group’s required Total Shareholder Return (TSR), measured over three financial years, and Return on Equity (ROE) performance measured in the third year following the LTI grant.
The Board maintains sole discretion over the granting of LTIs.
LTI grants are made in equity to ensure alignment with securityholders’ interests.
LTIs are subject to a malus provision.
The table below sets out summary information about the Group’s earnings and movement in securityholder wealth for the five years to 30 June 2017, noting that where applicable, certain amounts have been restated for the security consolidation that occurred in November 2015:
FY17 FY16 FY15 FY14 FY13
EBIT ($’000) 32,093 24,200 18,050 12,144 8,933
Total Underlying Profit ($ '000) 23,521 20,161 17,507 11,568 5,867
Statutory profit/(loss) ($ '000) 26,408 24,280 25,722 11,518 (10,290)
Underlying (Basic) EPS(1) (cents) 13.0 13.4 12.8 10.8 6.8
Statutory (Basic) EPS(1) (cents) 14.6 16.1 18.8 10.8 (12.0)
Net asset value per security ($) 2.50 2.45 2.34 2.13 2.06
Security price at 30th June ($) 2.60 2.87 2.58 3.03 2.07
Distributions (cents) 10.2 9.3 8.1 6.9 6.0
(1) Basic earnings per security is based on the weighted average number of securities on issue during the period.
Directors’ ReportFOR THE YEAR ENDED 30 JUNE 2017 | CONTINUED

13Ingenia Communities Holdings Limited
Mix of Remuneration ComponentsExecutive remuneration packages include a mix of TFR, STIs and LTIs. The Group aims to reward executives with a mix of remuneration commensurate with their position and responsibilities and aligned with market practice.
The Group’s policy is to position remuneration of executive KMP by reference to the 50th percentile range of comparable industry peers and other Australian listed companies of similar size and complexity, whilst also taking into account the individual’s competence and the potential impact of incentives.
The remuneration mix the RNC is aiming to achieve for executives for FY17, expressed as a percentage of total remuneration, is detailed below:
(1) CFO commenced maternity leave on 1 January 2017, an Acting CFO is currently in the role.
Maximum Total Remuneration Available TFR Max STI Max LTIMax
Total REM
Simon Owen (CEO) ($) 682,500 546,000 341,250 1,569,750
Percentage (%) 43 35 22 100
Tania Betts (CFO) ($) 346,286 207,772 69,257 623,315
Percentage (%) 56 33 11 100
Nicole Fisher (COO) ($) 340,673 204,404 68,135 613,212
Percentage (%) 56 33 11 100
Effective, pro rata four days per week ($) 272,538 204,404 68,135 545,077
Percentage (%) 50 37 13 100
Total Fixed Remuneration of Executive KMPTFR is an annual salary, calculated on a total cost basis to include salary-packaged benefits grossed up for FBT, employer superannuation contributions and other non-cash benefits that may be agreed from time to time.
The RNC reviews and makes recommendations to the Board in relation to TFR levels for executive KMP on an annual basis.
The TFR for each of the executives for FY17 and FY16 is:
KMP ($) FY17 TFR (p.a.) FY16 TFR (p.a.) Movement
CEO 682,500 650,000 32,500
CFO 346,286 336,200 10,086
COO(1) 340,673 330,750 9,923
Total 1,369,459 1,316,950 52,509
(1) COO paid on the basis of a four day week, the above remuneration assumes full time employment.
Data ranges for the CEO, CFO and COO FY17 TFR were provided by Guerdon Associates. The RNC used an element of judgement to determine the appropriate positioning within this range. Those recommendations were approved by the Board.
22%
43%
35%
CEO
11%
56%33%
CFO(1) & COO
Fixed Remuneration
STI
LTI
Directors’ ReportFOR THE YEAR ENDED 30 JUNE 2017 | CONTINUED

14 Annual Report 2017
Rights PlanThe current Rights Plan was approved by securityholders at the Annual General Meeting (AGM) held on 12 November 2014.
The Rights Plan provides for the grant of Rights, which upon a determination by the Board that the performance conditions have been met, will result in the issue of stapled securities in the Group for each Right.
The Rights Plan provides for the grant of STI and LTI Rights to both executive KMP and other eligible employees.
Short-Term Incentive Plan (STIP)Under the FY17 Rights Plan, 50% of the maximum STI for the executive KMP will be paid in cash and 50% will be a deferred equity element. The deferred equity component is for a period of 12 months and subject to forfeiture where earnings growth is not sustained. The deferral element is rights to INA stapled securities, plus additional stapled securities equal to the value of distributions during the deferral period on a reinvestment basis.
KMPMaximum STIP (Cash)
Maximum STIP Deferred (Rights)
Total Maximum STIP Available
CEO(1) 40% of TFR 40% of TFR 80% of TFR
$273,000 $273,000 $546,000
CFO 30% of TFR 30% of TFR 60% of TFR
$103,886 $103,886 $207,772
COO(2) 30% of TFR 30% of TFR 60% of TFR
$102,202 $102,202 $204,404
Total $479,088 $479,088 $958,176
(1) Approved by the securityholders at the Annual General Meeting held on 15 November 2016.
(2) COO remuneration above is based on five day week.
The FY17 STI Rights are subject to the following terms and conditions:
– A ‘malus’ provision during the deferral period, which means that some or all of the STIP Rights may be forfeited if:
• the Board determines Ingenia’s earnings growth is not sustainable; or
• any of the circumstances set out in the rules of the Rights Plan occur, such as fraud or dishonesty, a breach of obligations or material misstatement of Ingenia’s financial statements;
– A one-year deferral period and are eligible to vest on, or following 1 October 2018;
– On the vesting date Ingenia will cause the relevant number of Ingenia securities to be issued to the executive in accordance with a prescribed formula;
– No amount is payable by the executive KMP for the issue or transfer of Ingenia securities to the Executive KMP.
The STI award is subject to performance conditions that focus on operating earnings, capital management (for the CEO and CFO only), health and safety (COO only), operational targets, system implementation targets (for the COO and CFO only) and people and reporting assessments. Each assessment area is weighted. These KPIs have been chosen as they aim to focus individuals on meeting the Group’s business plan. The KPIs specific to the executive are outlined below, together with what the Board will consider in determining the achievement of the KPI.
The KPIs are set with ‘threshold’, ‘target’ and ‘stretch’ performance levels, with entitlements calculated on a pro-rata basis between these levels.
The weighting of KPIs for each executive KMP is as follows:
KMP FinancialHealth and
SafetyCapital
Management Operational SystemsPeople and Reporting Total
CEO 40% – 25% 20% – 15% 100%
CFO 40% – 15% 10% 15% 20% 100%
COO 30% 5% – 40% 10% 15% 100%
Directors’ ReportFOR THE YEAR ENDED 30 JUNE 2017 | CONTINUED
15Ingenia Communities Holdings Limited
The key considerations in assessing performance against the KPIs are:
KPI Executive Key Considerations in achievement
Financial CEO, CFO, COO EBIT and underlying profit per security to exceed threshold level.
Health and safety COO Safe work environment culture established across the Group, and lost time injury frequency below benchmark.
Capital management CEO, CFO Non-core asset divestment, capital and debt available on competitive pricing and flexible terms.
Systems CFO, COO Successful implementation of various finance and operational systems.
Operational CEO, CFO, COO Achievement of operational and sales metrics that deliver on business strategy, established for each executive KMP specific for their area of responsibility.
People and reporting CEO, CFO, COO Recruit and retain leading industry talent. High calibre leadership team offering clear succession opportunities. High quality board and statutory reporting, analysis and forecasting. High quality management budgeting, reporting, analysis and forecasting.
For FY17 the Board assessed the performance of the CEO, and the CEO assessed the performance of the CFO and COO, against their respective KPIs. The RNC then recommended and the Board approved STIP awards.
The Board approved the FY17 STIP awards as follows:
KMP Actual STI awarded(1) Actual STI awarded as a % of maximum STI
CEO $505,050 92.5%
CFO(1) $66,487 32.0%
COO(2) $158,413 77.5%
(1) CFO commenced maternity leave on 1 January 2017 and was not awarded STIP whilst on leave.
(2) COO achievement percentage is the STI award divided by the maximum STI.
The CEO’s maximum potential FY17 STIP deferred equity component was approved by securityholders at the AGM held on 15 November 2016. Any FY18 CEO deferred equity component will be subject to securityholder approval at the 2017 AGM to be held on 14 November 2017.
Long-Term Incentives
Long Term Incentive Plan (LTIP)The objective of the Group’s LTIP is to align the ‘at risk’ compensation of executives with long-term securityholder returns whilst also acting as a mechanism to retain key talent.
The FY17 LTIP Rights are subject to the following LTIP Performance Conditions:
– 70% based on Relative Total Shareholder Return (Relative TSR), and
– 30% based on Return on Equity (ROE).
Refer to page 13 for details of maximum LTIP.
Relative TSR Performance ConditionThe Relative TSR hurdle is growth in Ingenia’s TSR relative to growth in the ASX 300 Industrials Index (Index), measured over a three-year period ending on 30 September 2019.
The Index was chosen because the Board considers it transparent and more closely aligned to the Group’s core business operations than alternative peer groups.
Directors’ ReportFOR THE YEAR ENDED 30 JUNE 2017 | CONTINUED
16 Annual Report 2017
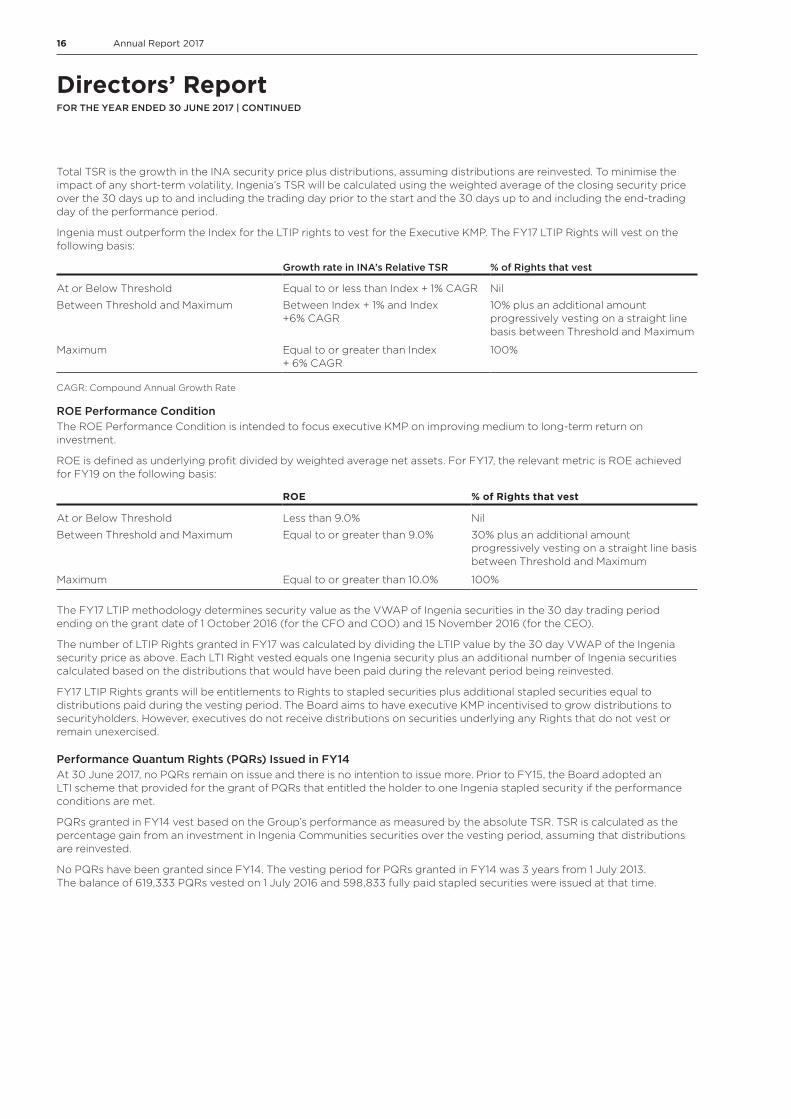
Total TSR is the growth in the INA security price plus distributions, assuming distributions are reinvested. To minimise the impact of any short-term volatility, Ingenia’s TSR will be calculated using the weighted average of the closing security price over the 30 days up to and including the trading day prior to the start and the 30 days up to and including the end-trading day of the performance period.
Ingenia must outperform the Index for the LTIP rights to vest for the Executive KMP. The FY17 LTIP Rights will vest on the following basis:
Growth rate in INA’s Relative TSR % of Rights that vest
At or Below Threshold Equal to or less than Index + 1% CAGR Nil
Between Threshold and Maximum Between Index + 1% and Index +6% CAGR
10% plus an additional amount progressively vesting on a straight line basis between Threshold and Maximum
Maximum Equal to or greater than Index + 6% CAGR
100%
CAGR: Compound Annual Growth Rate
ROE Performance ConditionThe ROE Performance Condition is intended to focus executive KMP on improving medium to long-term return on investment.
ROE is defined as underlying profit divided by weighted average net assets. For FY17, the relevant metric is ROE achieved for FY19 on the following basis:
ROE % of Rights that vest
At or Below Threshold Less than 9.0% Nil
Between Threshold and Maximum Equal to or greater than 9.0% 30% plus an additional amount progressively vesting on a straight line basis between Threshold and Maximum
Maximum Equal to or greater than 10.0% 100%
The FY17 LTIP methodology determines security value as the VWAP of Ingenia securities in the 30 day trading period ending on the grant date of 1 October 2016 (for the CFO and COO) and 15 November 2016 (for the CEO).
The number of LTIP Rights granted in FY17 was calculated by dividing the LTIP value by the 30 day VWAP of the Ingenia security price as above. Each LTI Right vested equals one Ingenia security plus an additional number of Ingenia securities calculated based on the distributions that would have been paid during the relevant period being reinvested.
FY17 LTIP Rights grants will be entitlements to Rights to stapled securities plus additional stapled securities equal to distributions paid during the vesting period. The Board aims to have executive KMP incentivised to grow distributions to securityholders. However, executives do not receive distributions on securities underlying any Rights that do not vest or remain unexercised.
Performance Quantum Rights (PQRs) Issued in FY14At 30 June 2017, no PQRs remain on issue and there is no intention to issue more. Prior to FY15, the Board adopted an LTI scheme that provided for the grant of PQRs that entitled the holder to one Ingenia stapled security if the performance conditions are met.
PQRs granted in FY14 vest based on the Group’s performance as measured by the absolute TSR. TSR is calculated as the percentage gain from an investment in Ingenia Communities securities over the vesting period, assuming that distributions are reinvested.
No PQRs have been granted since FY14. The vesting period for PQRs granted in FY14 was 3 years from 1 July 2013. The balance of 619,333 PQRs vested on 1 July 2016 and 598,833 fully paid stapled securities were issued at that time.
Directors’ ReportFOR THE YEAR ENDED 30 JUNE 2017 | CONTINUED
17Ingenia Communities Holdings Limited
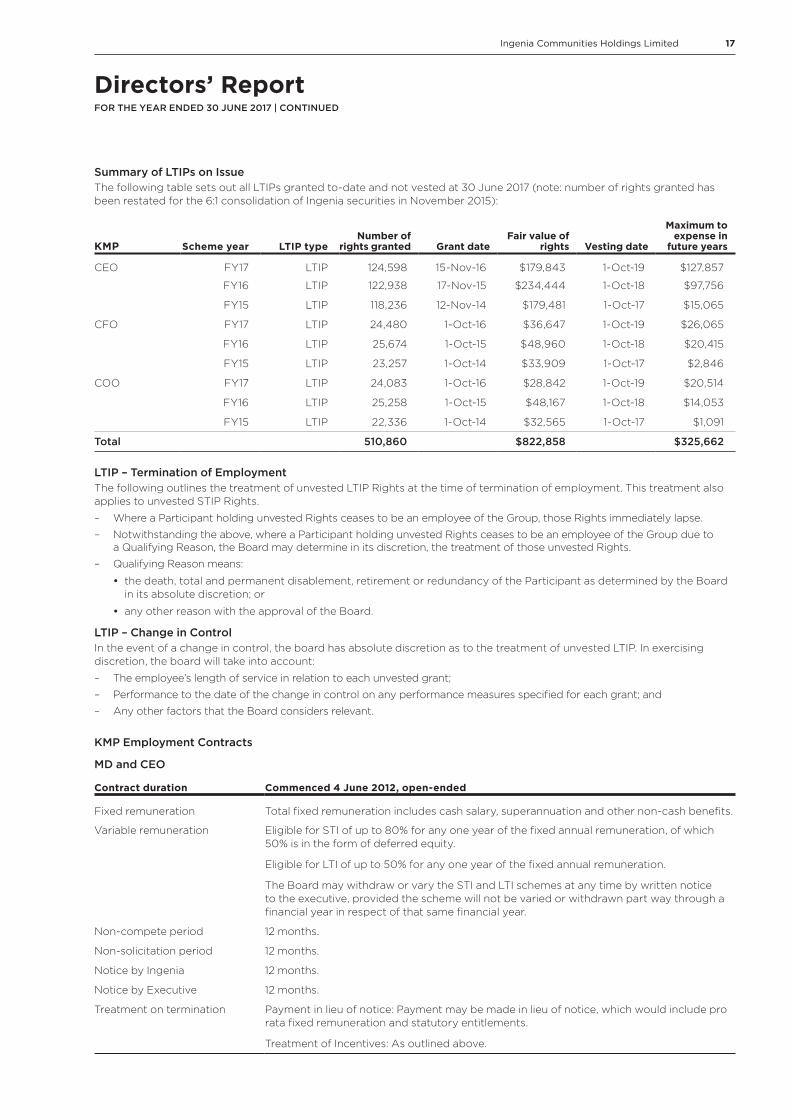
Summary of LTIPs on IssueThe following table sets out all LTIPs granted to-date and not vested at 30 June 2017 (note: number of rights granted has been restated for the 6:1 consolidation of Ingenia securities in November 2015):
KMP Scheme year LTIP typeNumber of
rights granted Grant dateFair value of
rights Vesting date
Maximum to expense in
future years
CEO FY17 LTIP 124,598 15-Nov-16 $179,843 1-Oct-19 $127,857
FY16 LTIP 122,938 17-Nov-15 $234,444 1-Oct-18 $97,756
FY15 LTIP 118,236 12-Nov-14 $179,481 1-Oct-17 $15,065
CFO FY17 LTIP 24,480 1-Oct-16 $36,647 1-Oct-19 $26,065
FY16 LTIP 25,674 1-Oct-15 $48,960 1-Oct-18 $20,415
FY15 LTIP 23,257 1-Oct-14 $33,909 1-Oct-17 $2,846
COO FY17 LTIP 24,083 1-Oct-16 $28,842 1-Oct-19 $20,514
FY16 LTIP 25,258 1-Oct-15 $48,167 1-Oct-18 $14,053
FY15 LTIP 22,336 1-Oct-14 $32,565 1-Oct-17 $1,091
Total 510,860 $822,858 $325,662
LTIP – Termination of EmploymentThe following outlines the treatment of unvested LTIP Rights at the time of termination of employment. This treatment also applies to unvested STIP Rights.
– Where a Participant holding unvested Rights ceases to be an employee of the Group, those Rights immediately lapse.
– Notwithstanding the above, where a Participant holding unvested Rights ceases to be an employee of the Group due to a Qualifying Reason, the Board may determine in its discretion, the treatment of those unvested Rights.
– Qualifying Reason means:
• the death, total and permanent disablement, retirement or redundancy of the Participant as determined by the Board in its absolute discretion; or
• any other reason with the approval of the Board.
LTIP – Change in ControlIn the event of a change in control, the board has absolute discretion as to the treatment of unvested LTIP. In exercising discretion, the board will take into account:
– The employee’s length of service in relation to each unvested grant;
– Performance to the date of the change in control on any performance measures specified for each grant; and
– Any other factors that the Board considers relevant.
KMP Employment Contracts
MD and CEO
Contract duration Commenced 4 June 2012, open-ended
Fixed remuneration Total fixed remuneration includes cash salary, superannuation and other non-cash benefits.
Variable remuneration Eligible for STI of up to 80% for any one year of the fixed annual remuneration, of which 50% is in the form of deferred equity.
Eligible for LTI of up to 50% for any one year of the fixed annual remuneration.
The Board may withdraw or vary the STI and LTI schemes at any time by written notice to the executive, provided the scheme will not be varied or withdrawn part way through a financial year in respect of that same financial year.
Non-compete period 12 months.
Non-solicitation period 12 months.
Notice by Ingenia 12 months.
Notice by Executive 12 months.
Treatment on termination Payment in lieu of notice: Payment may be made in lieu of notice, which would include pro rata fixed remuneration and statutory entitlements.
Treatment of Incentives: As outlined above.
Directors’ ReportFOR THE YEAR ENDED 30 JUNE 2017 | CONTINUED
18 Annual Report 2017
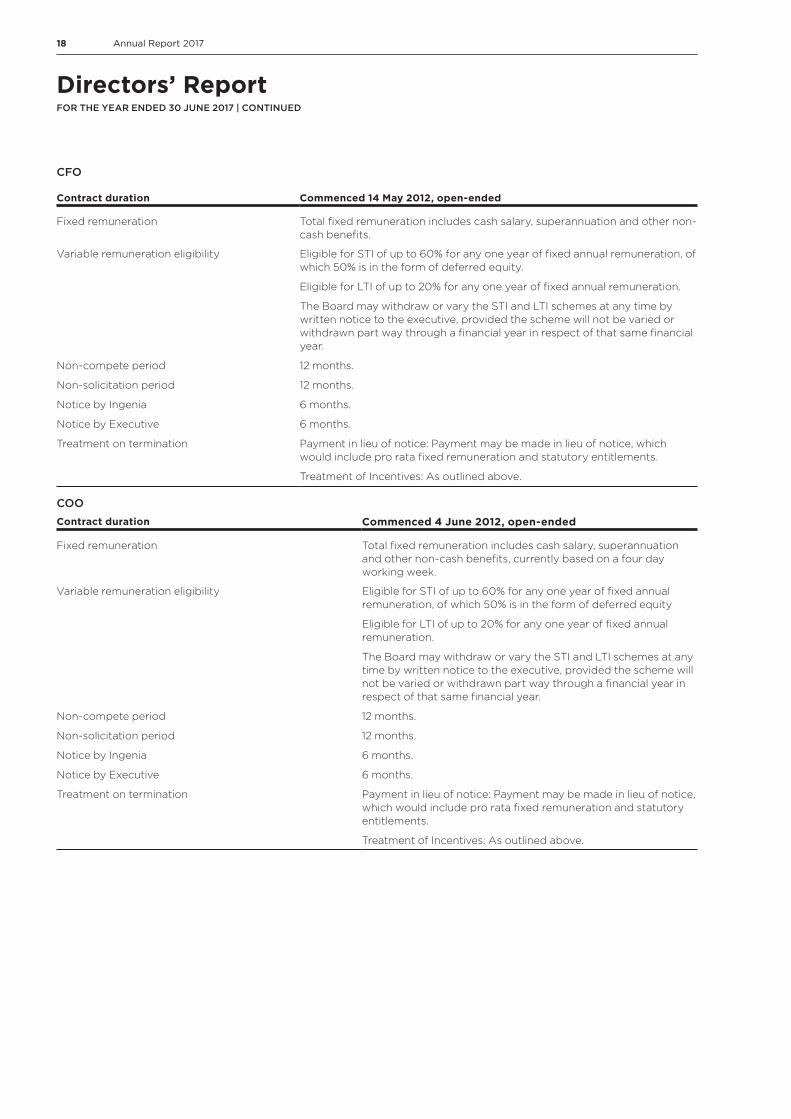
CFO
Contract duration Commenced 14 May 2012, open-ended
Fixed remuneration Total fixed remuneration includes cash salary, superannuation and other non-cash benefits.
Variable remuneration eligibility Eligible for STI of up to 60% for any one year of fixed annual remuneration, of which 50% is in the form of deferred equity.
Eligible for LTI of up to 20% for any one year of fixed annual remuneration.
The Board may withdraw or vary the STI and LTI schemes at any time by written notice to the executive, provided the scheme will not be varied or withdrawn part way through a financial year in respect of that same financial year.
Non-compete period 12 months.
Non-solicitation period 12 months.
Notice by Ingenia 6 months.
Notice by Executive 6 months.
Treatment on termination Payment in lieu of notice: Payment may be made in lieu of notice, which would include pro rata fixed remuneration and statutory entitlements.
Treatment of Incentives: As outlined above.
COOContract duration Commenced 4 June 2012, open-ended
Fixed remuneration Total fixed remuneration includes cash salary, superannuation and other non-cash benefits, currently based on a four day working week.
Variable remuneration eligibility Eligible for STI of up to 60% for any one year of fixed annual remuneration, of which 50% is in the form of deferred equity
Eligible for LTI of up to 20% for any one year of fixed annual remuneration.
The Board may withdraw or vary the STI and LTI schemes at any time by written notice to the executive, provided the scheme will not be varied or withdrawn part way through a financial year in respect of that same financial year.
Non-compete period 12 months.
Non-solicitation period 12 months.
Notice by Ingenia 6 months.
Notice by Executive 6 months.
Treatment on termination Payment in lieu of notice: Payment may be made in lieu of notice, which would include pro rata fixed remuneration and statutory entitlements.
Treatment of Incentives: As outlined above.
Directors’ ReportFOR THE YEAR ENDED 30 JUNE 2017 | CONTINUED

19Ingenia Communities Holdings Limited
Remuneration TablesThe following tables outline the remuneration provided to KMP excluding NEDs for FY16 and FY17.
Short-Term
KMP Financial YearSalary
($)
Super-annuation
Benefits ($)
STI(1) Cash
($)
STI(1) Deferred
Rights ($)
Total short-Term
($)
CEO 2017 662,885 19,615 252,525 252,525 1,187,550
2016 630,696 19,308 208,000 208,000 1,066,004
CFO(2) 2017 235,358 14,712 33,243 33,243 316,556
2016 314,885 19,308 70,098 70,098 474,389
COO(3) 2017 252,923 19,615 79,206 79,206 430,950
2016 245,933 19,308 69,458 69,458 404,157
Total 2017 1,151,166 53,942 355,738 355,738 1,935,056
2016 1,191,514 57,924 347,556 347,556 1,944,550
Performance Related
KMP Financial YearLTI ($)
Total ($)
STI+LTI Percent of
Total (%)
LTI Percent of Total
(%)
CEO 2017 341,250 1,528,800 55 22
2016 385,534 1,451,538 55 27
CFO(2) 2017 69,257 385,813 35 18
2016 93,132 567,521 41 16
COO(3) 2017 54,508 485,458 44 11
2016 89,663 493,820 46 18
Total 2017 465,015 2,400,071 50 19
2016 568,329 2,512,879 50 23
(1) STIs were accrued in the years ended 30 June 2017 and 30 June 2016.
(2) CFO commenced maternity leave on 1 January 2017, an Acting CFO is currently in the role.
(3) The COO’s remuneration noted above is based on a four day week.
Directors’ ReportFOR THE YEAR ENDED 30 JUNE 2017 | CONTINUED
20 Annual Report 2017
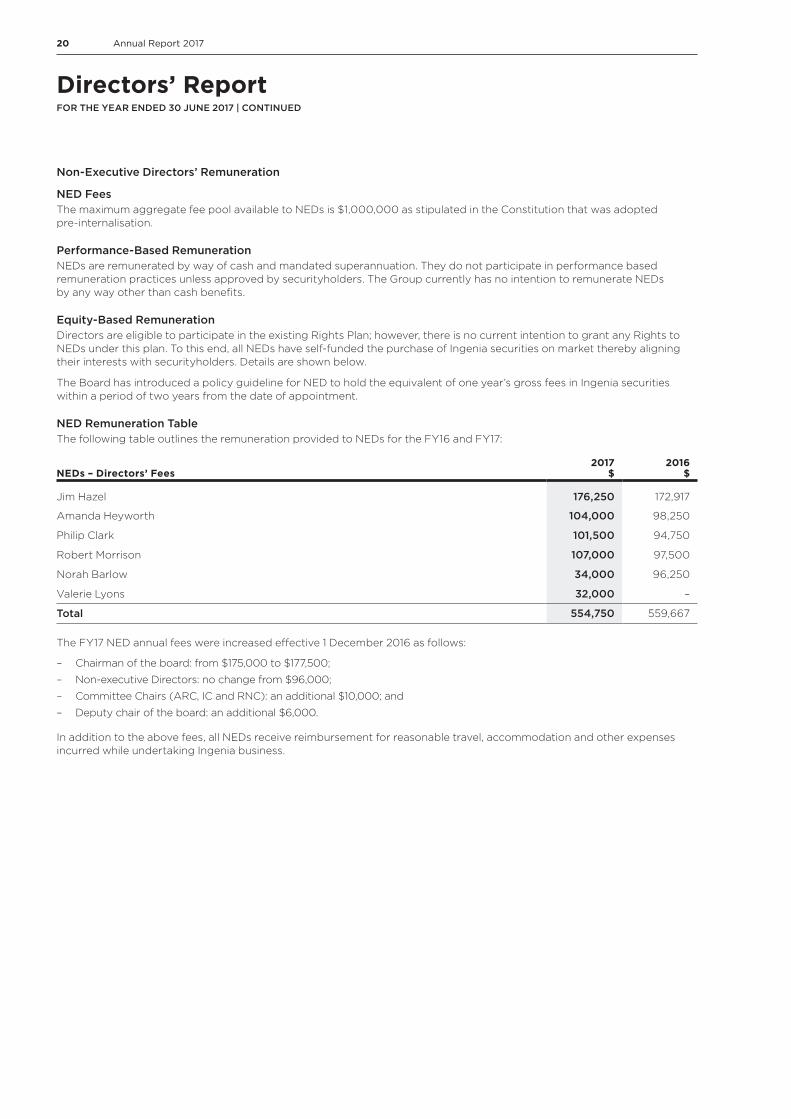
Non-Executive Directors’ Remuneration
NED FeesThe maximum aggregate fee pool available to NEDs is $1,000,000 as stipulated in the Constitution that was adopted pre-internalisation.
Performance-Based RemunerationNEDs are remunerated by way of cash and mandated superannuation. They do not participate in performance based remuneration practices unless approved by securityholders. The Group currently has no intention to remunerate NEDs by any way other than cash benefits.
Equity-Based RemunerationDirectors are eligible to participate in the existing Rights Plan; however, there is no current intention to grant any Rights to NEDs under this plan. To this end, all NEDs have self-funded the purchase of Ingenia securities on market thereby aligning their interests with securityholders. Details are shown below.
The Board has introduced a policy guideline for NED to hold the equivalent of one year’s gross fees in Ingenia securities within a period of two years from the date of appointment.
NED Remuneration TableThe following table outlines the remuneration provided to NEDs for the FY16 and FY17:
NEDs – Directors’ Fees2017
$2016
$
Jim Hazel 176,250 172,917
Amanda Heyworth 104,000 98,250
Philip Clark 101,500 94,750
Robert Morrison 107,000 97,500
Norah Barlow 34,000 96,250
Valerie Lyons 32,000 –
Total 554,750 559,667
The FY17 NED annual fees were increased effective 1 December 2016 as follows:
– Chairman of the board: from $175,000 to $177,500;
– Non-executive Directors: no change from $96,000;
– Committee Chairs (ARC, IC and RNC): an additional $10,000; and
– Deputy chair of the board: an additional $6,000.
In addition to the above fees, all NEDs receive reimbursement for reasonable travel, accommodation and other expenses incurred while undertaking Ingenia business.
Directors’ ReportFOR THE YEAR ENDED 30 JUNE 2017 | CONTINUED
21Ingenia Communities Holdings Limited
Directors’ ReportFOR THE YEAR ENDED 30 JUNE 2017 | CONTINUED
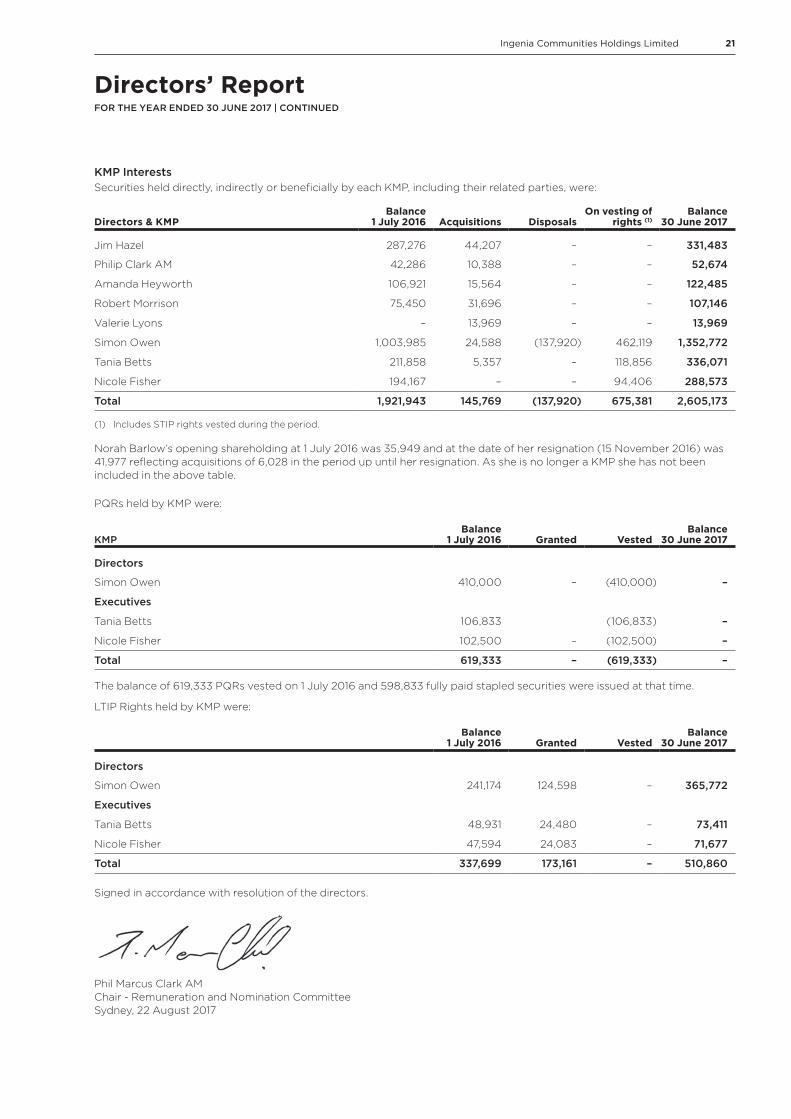
KMP InterestsSecurities held directly, indirectly or beneficially by each KMP, including their related parties, were:
Directors & KMPBalance
1 July 2016 Acquisitions DisposalsOn vesting of
rights (1)Balance
30 June 2017
Jim Hazel 287,276 44,207 – – 331,483
Philip Clark AM 42,286 10,388 – – 52,674
Amanda Heyworth 106,921 15,564 – – 122,485
Robert Morrison 75,450 31,696 – – 107,146
Valerie Lyons – 13,969 – – 13,969
Simon Owen 1,003,985 24,588 (137,920) 462,119 1,352,772
Tania Betts 211,858 5,357 – 118,856 336,071
Nicole Fisher 194,167 – – 94,406 288,573
Total 1,921,943 145,769 (137,920) 675,381 2,605,173
(1) Includes STIP rights vested during the period.
Norah Barlow’s opening shareholding at 1 July 2016 was 35,949 and at the date of her resignation (15 November 2016) was 41,977 reflecting acquisitions of 6,028 in the period up until her resignation. As she is no longer a KMP she has not been included in the above table.
PQRs held by KMP were:
KMPBalance
1 July 2016 Granted VestedBalance
30 June 2017
Directors
Simon Owen 410,000 – (410,000) –
Executives
Tania Betts 106,833 (106,833) –
Nicole Fisher 102,500 – (102,500) –
Total 619,333 – (619,333) –
The balance of 619,333 PQRs vested on 1 July 2016 and 598,833 fully paid stapled securities were issued at that time.
LTIP Rights held by KMP were:
Balance1 July 2016 Granted Vested
Balance30 June 2017
Directors
Simon Owen 241,174 124,598 – 365,772
Executives
Tania Betts 48,931 24,480 – 73,411
Nicole Fisher 47,594 24,083 – 71,677
Total 337,699 173,161 – 510,860
Signed in accordance with resolution of the directors.
Phil Marcus Clark AMChair - Remuneration and Nomination Committee Sydney, 22 August 2017
22 Annual Report 2017
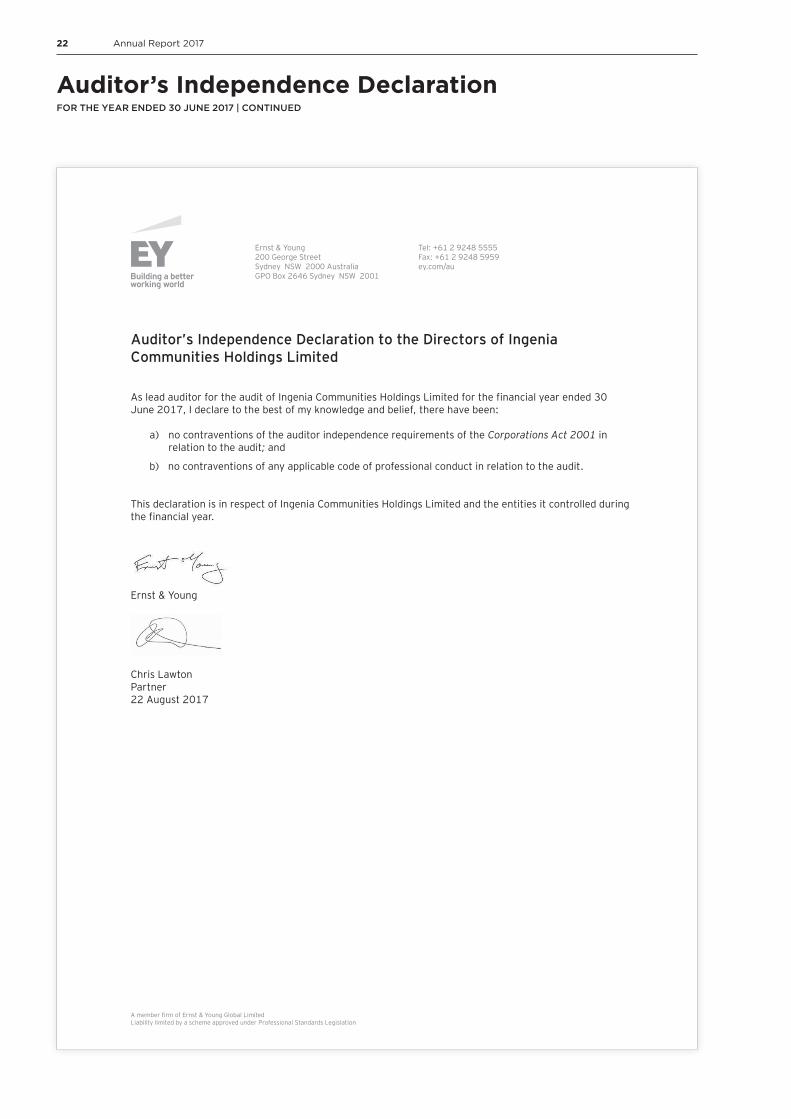
Ernst & Young 200 George Street Sydney NSW 2000 Australia GPO Box 2646 Sydney NSW 2001
Tel: +61 2 9248 5555 Fax: +61 2 9248 5959 ey.com/au
A member firm of Ernst & Young Global Limited Liability limited by a scheme approved under Professional Standards Legislation
Auditor’s Independence Declaration to the Directors of Ingenia Communities Holdings Limited
As lead auditor for the audit of Ingenia Communities Holdings Limited for the financial year ended 30 June 2017, I declare to the best of my knowledge and belief, there have been:
a) no contraventions of the auditor independence requirements of the Corporations Act 2001 inrelation to the audit; and
b) no contraventions of any applicable code of professional conduct in relation to the audit.
This declaration is in respect of Ingenia Communities Holdings Limited and the entities it controlled during the financial year.
Ernst & Young
Chris Lawton Partner 22 August 2017
Auditor’s Independence DeclarationFOR THE YEAR ENDED 30 JUNE 2017 | CONTINUED

23Ingenia Communities Holdings Limited
Note2017
$’0002016
$’000
Revenue
Rental income 5(a) 69,976 57,692
Manufactured home sales 63,752 32,009
Accrued deferred management fee income 17(b) 1,825 4,222
Catering income 3,191 3,258
Service station sales 7,284 6,745
Other property income 5(b) 3,856 3,045
Interest income 25 170
149,909 107,141
Property expenses (24,729) (21,242)
Employee expenses (32,097) (26,153)
Administrative expenses (6,377) (5,129)
Operational, marketing and selling expenses (5,463) (3,555)
Cost of manufactured homes sold (42,699) (21,729)
Service station expenses (6,229) (5,862)
Finance expenses 6 (6,961) (6,795)
Net foreign exchange gain/(loss) (342) 471
Net loss on disposal of investment properties (8,438) (989)
Net gain/(loss) on change in fair value of:
- Investment properties 12,372 7,496
- Derivatives 126 (414)
- Retirement village resident loans 17(b) 96 (1,388)
Depreciation expense 12(b) (455) (360)
Amortisation of intangible assets 13(b) (375) (266)
Profit before income tax 28,338 21,226
Income tax (expense)/benefit 7(a) (1,930) 3,054
Net profit for the period 26,408 24,280
Total comprehensive income for the period net of income tax 26,408 24,280
Profit/(loss) attributable to securityholders of:
- Ingenia Communities Holdings Limited (446) (1,631)
- Ingenia Communities Fund (2,738) 25,855
- Ingenia Communities Management Trust 29,592 56
26,408 24,280
Total comprehensive income/(loss) attributable to securityholders of:
- Ingenia Communities Holdings Limited (446) (1,631)
- Ingenia Communities Fund (2,738) 25,855
- Ingenia Communities Management Trust 29,592 56
26,408 24,280
Consolidated Statement of Comprehensive IncomeFOR THE YEAR ENDED 30 JUNE 2017
24 Annual Report 2017
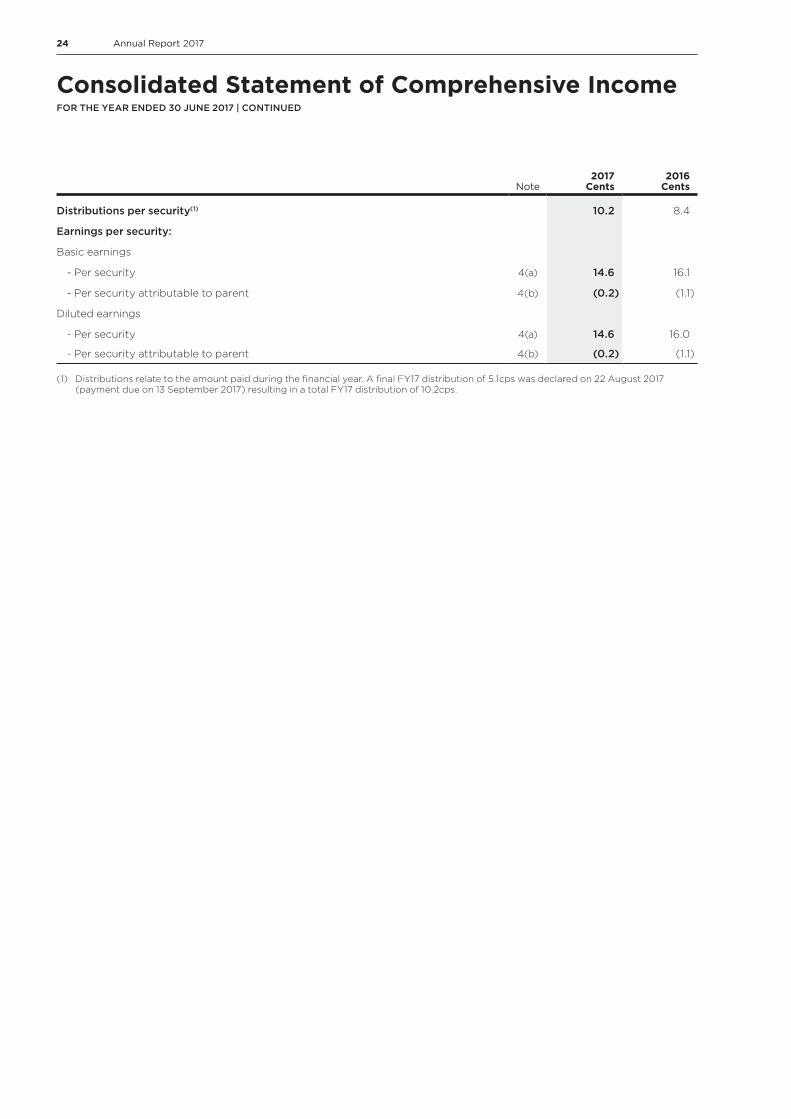
Note2017
Cents2016
Cents
Distributions per security(1) 10.2 8.4
Earnings per security:
Basic earnings
- Per security 4(a) 14.6 16.1
- Per security attributable to parent 4(b) (0.2) (1.1)
Diluted earnings
- Per security 4(a) 14.6 16.0
- Per security attributable to parent 4(b) (0.2) (1.1)
(1) Distributions relate to the amount paid during the financial year. A final FY17 distribution of 5.1cps was declared on 22 August 2017 (payment due on 13 September 2017) resulting in a total FY17 distribution of 10.2cps.
Consolidated Statement of Comprehensive IncomeFOR THE YEAR ENDED 30 JUNE 2017 | CONTINUED
25Ingenia Communities Holdings Limited
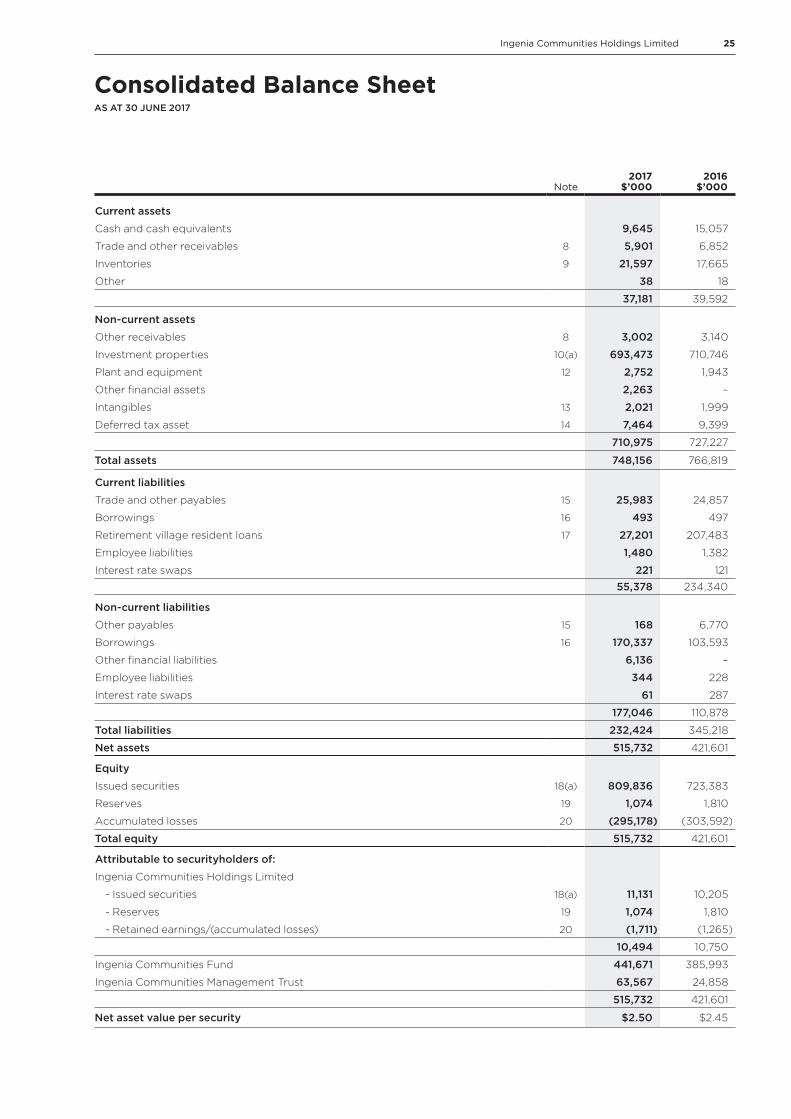
Consolidated Balance SheetAS AT 30 JUNE 2017
Note2017
$’0002016
$’000
Current assets
Cash and cash equivalents 9,645 15,057
Trade and other receivables 8 5,901 6,852
Inventories 9 21,597 17,665
Other 38 18
37,181 39,592
Non-current assets
Other receivables 8 3,002 3,140
Investment properties 10(a) 693,473 710,746
Plant and equipment 12 2,752 1,943
Other financial assets 2,263 –
Intangibles 13 2,021 1,999
Deferred tax asset 14 7,464 9,399
710,975 727,227
Total assets 748,156 766,819
Current liabilities
Trade and other payables 15 25,983 24,857
Borrowings 16 493 497
Retirement village resident loans 17 27,201 207,483
Employee liabilities 1,480 1,382
Interest rate swaps 221 121
55,378 234,340
Non-current liabilities
Other payables 15 168 6,770
Borrowings 16 170,337 103,593
Other financial liabilities 6,136 –
Employee liabilities 344 228
Interest rate swaps 61 287
177,046 110,878
Total liabilities 232,424 345,218
Net assets 515,732 421,601
Equity
Issued securities 18(a) 809,836 723,383
Reserves 19 1,074 1,810
Accumulated losses 20 (295,178) (303,592)
Total equity 515,732 421,601
Attributable to securityholders of:
Ingenia Communities Holdings Limited
- Issued securities 18(a) 11,131 10,205
- Reserves 19 1,074 1,810
- Retained earnings/(accumulated losses) 20 (1,711) (1,265)
10,494 10,750
Ingenia Communities Fund 441,671 385,993
Ingenia Communities Management Trust 63,567 24,858
515,732 421,601
Net asset value per security $2.50 $2.45
26 Annual Report 2017
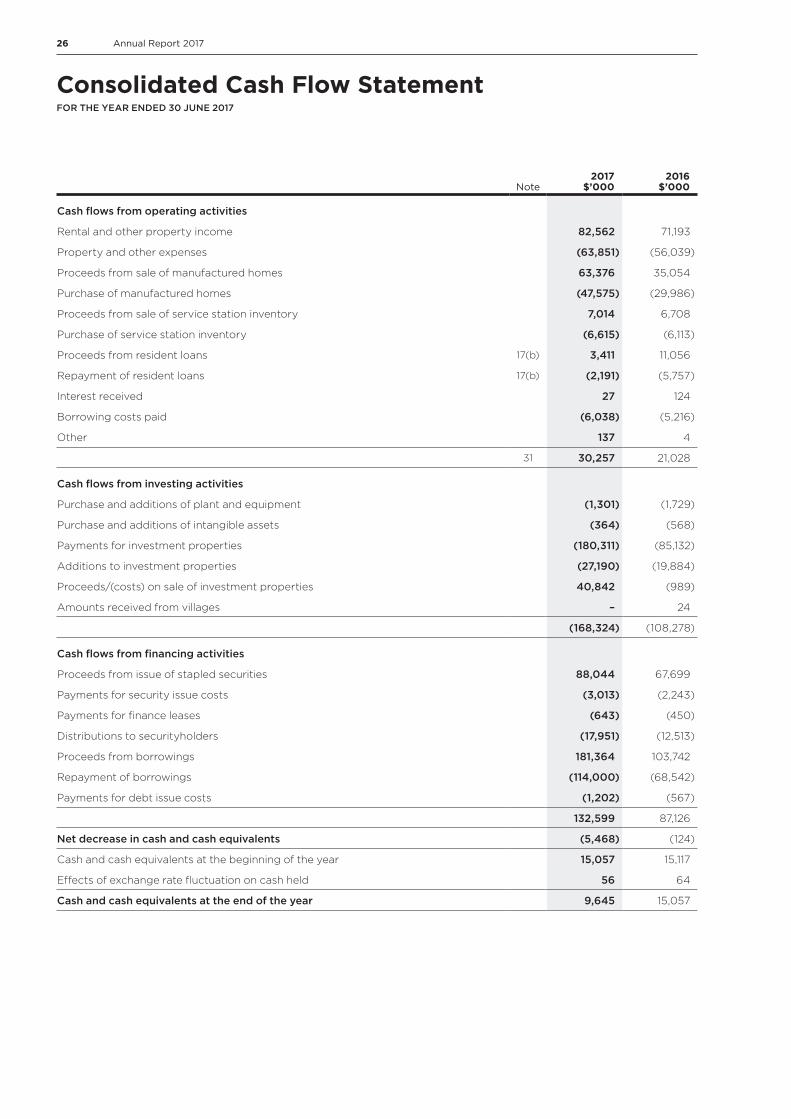
Consolidated Cash Flow StatementFOR THE YEAR ENDED 30 JUNE 2017
Note2017
$’0002016
$’000
Cash flows from operating activities
Rental and other property income 82,562 71,193
Property and other expenses (63,851) (56,039)
Proceeds from sale of manufactured homes 63,376 35,054
Purchase of manufactured homes (47,575) (29,986)
Proceeds from sale of service station inventory 7,014 6,708
Purchase of service station inventory (6,615) (6,113)
Proceeds from resident loans 17(b) 3,411 11,056
Repayment of resident loans 17(b) (2,191) (5,757)
Interest received 27 124
Borrowing costs paid (6,038) (5,216)
Other 137 4
31 30,257 21,028
Cash flows from investing activities
Purchase and additions of plant and equipment (1,301) (1,729)
Purchase and additions of intangible assets (364) (568)
Payments for investment properties (180,311) (85,132)
Additions to investment properties (27,190) (19,884)
Proceeds/(costs) on sale of investment properties 40,842 (989)
Amounts received from villages – 24
(168,324) (108,278)
Cash flows from financing activities
Proceeds from issue of stapled securities 88,044 67,699
Payments for security issue costs (3,013) (2,243)
Payments for finance leases (643) (450)
Distributions to securityholders (17,951) (12,513)
Proceeds from borrowings 181,364 103,742
Repayment of borrowings (114,000) (68,542)
Payments for debt issue costs (1,202) (567)
132,599 87,126
Net decrease in cash and cash equivalents (5,468) (124)
Cash and cash equivalents at the beginning of the year 15,057 15,117
Effects of exchange rate fluctuation on cash held 56 64
Cash and cash equivalents at the end of the year 9,645 15,057

27Ingenia Communities Holdings Limited
Attributable to Securityholders
Ingenia Communities Holdings Limited
ICF & ICMT$’000
Total equity$’000Note
Issued capital$’000
Reserves$’000
Retained earnings
$’000 Total
$’000
Carrying amount at 1 July 2016 10,205 1,810 (1,265) 10,750 410,851 421,601
Net profit/(loss) – – (446) (446) 26,854 26,408
Total comprehensive income for the year – – (446) (446) 26,854 26,408
Transactions with securityholders in their capacity as securityholders:
- Issue of securities 18 915 – – 915 84,171 85,086
- Share-based payment transactions 19 – 631 – 631 – 631
- Payment of distributions to securityholders 20 – – – – (17,994) (17,994)
- Transfer from reserves to issued securities 18,19 11 (1,367) – (1,356) 1,356 –
Carrying amount at 30 June 2017 11,131 1,074 (1,711) 10,494 505,238 515,732
Carrying amount at 1 July 2015 9,231 1,334 366 10,931 332,589 343,520
Net profit/(loss) – – (1,631) (1,631) 25,911 24,280
Total comprehensive income for the year – – (1,631) (1,631) 25,911 24,280
Transactions with securityholders in their capacity as securityholders:
- Issue of securities 18 592 – – 592 64,864 65,456
- Share-based payment transactions 19 – 858 – 858 – 858
- Payment of distributions to securityholders 20 – – – – (12,513) (12,513)
- Transfer from reserves to issued securities 18,19 382 (382) – – – –
Carrying amount at 30 June 2016 10,205 1,810 (1,265) 10,750 410,851 421,601
Consolidated Statement of Changes in EquityFOR THE YEAR ENDED 30 JUNE 2017

28 Annual Report 2017
Notes to the Financial StatementsFOR THE YEAR ENDED 30 JUNE 2017
1. Summary of significant accounting policies
a. The GroupThe financial report of Ingenia Communities Holdings Limited (the “Company”) comprises the consolidated financial report of the Company and its controlled entities, including Ingenia Communities Fund (“ICF” or the “Fund”) and Ingenia Communities Management Trust (“ICMT”) (collectively, the “Trusts”). The shares of the Company are “stapled” with the units of the Trusts and trade on the Australian Securities Exchange (“ASX”) effectively as one security. Ingenia Communities RE Limited (“ICRE”), a wholly owned subsidiary of the Company, is the Responsible Entity of the Trusts. In this report, the Company and the Trusts are referred to collectively as the Group.
The constitutions of the Company and the Trusts require that, for as long as they remain jointly quoted on the ASX, the number of shares in the Company and of units in each trust shall remain equal and those securityholders in the Company and unitholders in each trust shall be identical.
The stapling structure will cease to operate on the first to occur of:
– the Company or either of the Trusts resolving by special resolution in accordance with its constitution to terminate the stapling provisions; or
– the commencement of the winding up of the Company or either of the Trusts.
The financial report as at and for the year ended 30 June 2017 was authorised for issue by the directors on 22 August 2017.
b. Basis of PreparationThe financial report is a general purpose financial report, which has been prepared in accordance with Australian Accounting Standards, Australian Interpretations, other authoritative pronouncements of the Australian Accounting Standards Board (“AASBs”) and the Corporations Act 2001.
The financial report complies with Australian Accounting Standards as issued by the Australian Accounting Standards Board and International Financial Reporting Standards (IFRS) as issued by the International Accounting Standards Board.
As permitted by Instrument 2015/838, issued by the Australian Securities and Investments Commission, the financial statements and accompanying notes of the Group have been presented in the attached combined financial report.
The financial report is presented in Australian dollars and all values are rounded to the nearest thousand dollars ($’000) unless otherwise stated as permitted by Instrument 2016/191.
The financial report is prepared on an historical cost basis, except for investment properties, retirement village resident loans, derivative financial instruments, other financial assets and other financial liabilities, which are measured at fair value.
Where appropriate comparative amounts have been restated to ensure consistency of disclosure throughout the financial report.
At 30 June 2017, the Group recorded a net current asset deficiency of $18,197,000. This deficiency includes retirement village resident loans of $27,201,000. Resident loans obligations of the Group are classified as current liabilities due to the demand feature of these obligations despite the unlikely possibility that the majority of the loans will be settled within the next twelve months. Furthermore, if required, the proceeds from new resident loans could be used by the Group to settle its existing loan obligations should those incumbent residents vacate their units. Accordingly, there are reasonable grounds to believe that the Group will be able to pay its debts as and when they become due and payable; and the financial report of the Group has been prepared on a going concern basis.
c. Adoption of New and Revised Accounting Standards
No new or revised standards and interpretations were issued by the Australian Accounting Standards Board that are relevant to the Group during the period.
d. Principles of ConsolidationThe Group’s consolidated financial statements comprise the Company and its subsidiaries (including the Trusts). Subsidiaries are all those entities (including special purpose entities) over which the Company or the Trusts have the power to govern the financial and operating policies so as to obtain benefits from their activities.
The financial statements of the subsidiaries are prepared for the same reporting period as the parent, using consistent accounting policies. Inter–company balances and transactions including dividends and unrealised gains and losses from intra–group transactions have been eliminated.
Subsidiaries are consolidated from the date on which the parent obtains control. They are de–consolidated from the date that control ceases.
Investments in subsidiaries are carried at cost in the parent’s financial statements.
The Company was incorporated on 24 November 2011. In accordance with Accounting Standard AASB 3 Business Combinations, the stapling of the Company and the Trusts was regarded as a business combination. Under AASB 3, the stapling was accounted for as a reverse acquisition with ICF “acquiring” the Company and the Company subsequently being identified as the ongoing parent for preparing consolidated financial reports. Consequently, the consolidated financial statements are a continuation of the financial statements of the Trusts, and include the results of the Company from the date of incorporation.
e. Business Combinations and GoodwillBusiness combinations are accounted for using the acquisition method. The cost of an acquisition is measured as the aggregate of the consideration transferred, measured at acquisition date fair value and the amount of any non–controlling interest in the acquiree. For each business combination, the Group elects whether it measures the non–controlling interest in the acquiree either at fair value or at the proportionate share of the acquiree’s identifiable net assets. Acquisition costs incurred are expensed and included in other expenses.

29Ingenia Communities Holdings Limited
1. Summary of significant accounting policies (continued)
When the Group acquires a business, it assesses the financial assets and liabilities assumed for appropriate classification and designation in accordance with the contractual terms, economic circumstances and pertinent conditions as at the acquisition date.
If the business combination is achieved in stages, the acquisition date fair value of the acquirer’s previously held equity interest in the acquiree is remeasured to fair value at the acquisition date through profit or loss.
Goodwill is initially measured at cost, being the excess of the aggregate of the consideration transferred and the amount recognised for non–controlling interest over the net identifiable assets acquired and liabilities assumed. If this consideration is lower than the fair value of the net assets of the subsidiary acquired, the difference is recognised in profit or loss.
f. Dividends and DistributionsA liability for any dividend or distribution declared on or before the end of the reporting period is recognised on the balance sheet in the reporting period to which the dividend or distribution pertains.
g. Foreign Currency
Functional and presentation currencies:The presentation currency of the Group, and functional currency of the Company, is the Australian dollar.
Translation of foreign currency transactions:Transactions in foreign currency are initially recorded in the functional currency at the exchange rate prevailing at the date of the transaction. Monetary assets and liabilities denominated in foreign currency are retranslated at the rate of exchange prevailing at the balance date. All differences in the consolidated financial report are taken to the income statement with the exception of differences on foreign currency borrowings designated as a hedge against a net investment in a foreign entity. These are taken directly to equity until the disposal of the net investment at which time they are recognised in the income statement.
A non–monetary item that is measured at fair value in a foreign currency is translated using the exchange rates at the date when the fair value was determined.
h. LeasesFinance leases, which transfer to the Group substantially all the risks and benefits incidental to ownership of the leased item, are capitalised at the inception of the lease at the fair value of the leased asset or, if lower, at the present value of the minimum lease payments. Lease payments are apportioned between the finance charges and reduction of the lease liability to achieve a constant rate of interest on the remaining balance of the liability. Finance charges are recognised as an expense in the income statement.
Finance leases, which transfer away from the Group substantially all the risks and benefits incidental to ownership of the leased item, are recognised at the inception of the lease. A finance lease receivable is recognised on inception at the present value of the
minimum lease receipts. Finance lease receipts are apportioned between the interest income and reduction in the lease receivable to achieve a constant rate of interest on the remaining balance of the receivable. Interest is recognised as income in the income statement.
Leases of investment properties are classified as finance leases under AASB 140 Investment Properties.
Leases where the lessor retains substantially all the risks and benefits of ownership are classified as operating leases. Operating lease payments are recognised as an expense in the income statement on a straight–line basis over the term of the lease.
i. Plant and EquipmentPlant and equipment is stated at cost, net of accumulated depreciation and any accumulated impairment losses. Such cost includes the cost of replacing part of the property, plant and equipment and borrowing costs for long–term construction projects if the recognition criteria are met. When significant parts of property, plant and equipment require replacing at intervals, the Group recognises such parts as individual assets with specific useful lives and depreciates them accordingly. Likewise, when a major inspection is performed, its cost is recognised in the carrying amount of the plant and equipment as a replacement if the recognition criteria are satisfied. All other repair and maintenance costs are recognised in profit or loss as incurred. The present value of the expected cost for the decommissioning of an asset after its use is included in the cost of the respective asset if the recognition criteria for a provision are met.
j. Financial Assets and LiabilitiesCurrent and non–current financial assets and liabilities within the scope of AASB 139 Financial Instruments: Recognition and Measurement are classified as; fair value through profit or loss; loans and receivables; held–to–maturity investments or as available–for–sale. The Group determines the classification of its financial assets and liabilities at initial recognition with the classification depending on the purpose for which the asset or liability was acquired or issued. Financial assets and liabilities are initially recognised at fair value plus directly attributable transaction costs, unless their classification is at fair value through profit or loss. They are subsequently measured at fair value or amortised cost using the effective interest method. Changes in fair value of available–for–sale financial assets are recorded directly in equity. Changes in fair values of any other financial assets and liabilities classified as at fair value through profit or loss are recorded in the income statement.
The fair values of financial instruments that are actively traded in organised financial markets are determined by reference to quoted market bid prices at the close of business on the balance sheet date. For those with no active market, fair values are determined using valuation techniques. Such techniques include: using recent arm’s length market transactions; reference to the current market value of another instrument that is substantially the same; discounted cash flow analysis and option pricing models, making as much use of available and supportable market data as possible and keeping judgemental inputs to a minimum.
Notes to the Financial StatementsFOR THE YEAR ENDED 30 JUNE 2017 | CONTINUED
30 Annual Report 2017
1. Summary of significant accounting policies (continued)
k. Impairment of Non–Financial AssetsAssets other than investment property and financial assets carried at fair value are tested for impairment whenever events or changes in circumstances indicate that the carrying amount may not be recoverable. An impairment loss is recognised for the amount by which the asset’s carrying amount exceeds its recoverable amount. The recoverable amount is the higher of an asset’s fair value less costs to sell and value in use. For the purposes of assessing impairment, assets are grouped at the lowest levels for which there are separately identifiable cash inflows that are largely independent of the cash inflows from other assets or groups of assets. Non–financial assets excluding goodwill which have suffered impairment are reviewed for possible reversal of the impairment at each reporting date.
l. Cash and Cash EquivalentsCash and cash equivalents in the balance sheet and cash flow statements comprise cash at bank and in hand and short term deposits that are readily convertible to known amounts of cash and are subject to an insignificant risk of changes in value.
m. Trade and Other ReceivablesTrade and other receivables are recognised initially at fair value and subsequently measured at amortised cost using the effective interest method, less any provision for impairment. An allowance for impairment is made when there is objective evidence that collection of the full amount is no longer probable.
n. InventoriesThe Group holds inventory in relation to the acquisition and development of manufactured homes and service station fuel and supplies within its Ingenia Lifestyle and Holidays segment.
Inventories are held at the lower of cost and net realisable value.
Costs of inventories comprise all acquisition costs, costs of conversion and other costs incurred in bringing the inventories to their present location and condition. Inventory includes work in progress and raw materials used in the production of manufactured home units.
Net realisable value is determined based on an estimated selling price in the ordinary course of business less estimated costs of completion and the estimated costs necessary to make the sale.
o. Derivative and Financial InstrumentsThe Group uses derivative financial instruments such as interest rate swaps to hedge its risks associated with interest rate fluctuations. Such derivative financial instruments are initially recognised at fair value on the date in which the derivative contract is entered into and are subsequently remeasured to fair value.
p. Investment PropertyLand and buildings have the function of an investment and are regarded as composite assets. In accordance with applicable accounting standards, the buildings, including plant and equipment, are not depreciated.
Investment property includes property under construction, tourism cabins and associated amenities.
Investment properties are measured initially at cost, including transaction costs. Subsequent to initial recognition, investment properties are stated at fair value, which reflects market conditions at the reporting date. Gains or losses arising from changes in the fair values of investment properties are included in the income statement in the period in which they arise, including corresponding tax effect.
Fair value is the price that would be received to sell an asset or paid to transfer a liability in an orderly transaction between market participants at the measurement date in the principal market for the asset or liability, or in its absence, the most advantageous market. In determining the fair value of certain assets, recent market offers have been taken into consideration.
It is the Group’s policy to have all investment properties independently valued at intervals of not more than two years. It is the policy of the Group to review the fair value of each investment property every six months and to cause investment properties to be revalued to fair values whenever their carrying value materially differs to their fair values.
Changes in the fair value of the investment property are recorded in the statement of comprehensive income.
In determining fair values, the Group considers relevant information including the capitalisation of rental streams using market assessed capitalisation rates, expected net cash flows discounted to their present value using market determined risk adjusted discount rates and other available market data such as recent comparable transactions. The assessment of fair value of investment properties does not take into account potential capital gains tax assessable.
q. Intangible AssetsAn intangible asset arising from development expenditure related to software is recognised only when the Group can demonstrate the technical feasibility of completing the intangible asset so that it will be available for use; how the asset will generate future economic benefits; the availability of resources to complete the asset; and the ability to measure reliably the expenditure during its development. Costs capitalised include external direct costs of materials and service, and direct payroll and payroll related costs of employees’ time spent on the project.
Following the initial recognition of expenditure, the asset is carried at cost less any accumulated amortisation and accumulated impairment losses. Amortisation of the asset begins when the development is complete and the asset is available for use. Amortisation is over the period of expected future benefit.
Notes to the Financial StatementsFOR THE YEAR ENDED 30 JUNE 2017 | CONTINUED
31Ingenia Communities Holdings Limited
1. Summary of significant accounting policies (continued)
The Group’s policy applied to capitalised development costs is as follows:
Software and associated development to capitalised development costs (assets in use)
– Useful life: Finite Amortisation method using 7 years on a straight line basis; and
– Impairment test: Amortisation method reviewed at each financial year–end; closing carrying value reviewed annually for indicators of impairment.
Subsequent expenditure on capitalised intangible assets is capitalised only when it increases the future economic benefits embodied in the specific asset to which it relates. All other expenditure is expensed, as incurred. Gains or losses arising from de–recognition of an intangible asset are measured as the difference between the net disposal proceeds and the carrying amount of the asset and are recognised in profit or loss when the asset is de–recognised.
Intangible assets acquired separately, are initially recognised at cost. The cost of intangible assets acquired in a business combination are their fair values as at the date of acquisition. Following initial recognition, intangible assets are carried at cost less any accumulated amortisation and accumulated impairment losses.
r. PayablesTrade and other payables are carried at amortised cost and due to their short–term nature are not discounted. They represent liabilities for goods and services provided to the Group prior to the end of the financial year that are unpaid and are recognised when the Group becomes obliged to make future payments in respect of the purchase of these goods and services.
s. Provisions, Including Employee Benefits
General:Provisions are recognised when the Group has a present obligation (legal or constructive) as a result of a past event, it is probable that an outflow of resources embodying economic benefits will be required to settle the obligation and a reliable estimate can be made of the amount of the obligation. When the Group expects some or all of a provision to be reimbursed, for example, under an insurance contract, the reimbursement is recognised as a separate asset, but only when the reimbursement is virtually certain. The expense relating to a provision is presented in the statement of profit or loss net of any reimbursement.
Wages, salaries, annual leave and sick leave:Liabilities for wages and salaries, including non–monetary benefits and annual leave expected to be settled within twelve months of the reporting date are recognised in respect of employees’ services up to the reporting date. They are measured at the amounts expected to be paid when the liabilities are settled. Expenses for non–accumulating sick leave are recognised when the leave is taken and are measured at the rates paid or payable.
Long service leave:The liability for long service leave is recognised and measured as the present value of expected future payments to be made in respect of services provided by employees up to the reporting date using the projected unit credit method. Consideration is given to expected future wage and salary levels, experience of employee departures, and periods of service. Expected future payments are discounted using market yields at the reporting date on corporate bonds with terms to maturity and currencies that match, as closely as possible, the estimated future cash outflows.
t. Retirement Village Resident LoansThese loans, which are repayable on the departure of the resident, are classified as financial liabilities at fair value through profit and loss with resulting fair value adjustments recognised in the income statement. The fair value of the obligation is measured as the ingoing contribution plus the resident’s share of capital appreciation to reporting date. Although the expected average residency term is more than ten years, these obligations are classified as current liabilities, as required by Accounting Standards, because the Group does not have an unconditional right to defer settlement to more than twelve months after reporting date.
This liability is stated net of accrued deferred management fees at reporting date, because the Group’s contracts with residents require net settlement of those obligations.
Refer to Notes 1(z) and 25(k) for information regarding the valuation of retirement village resident loans.
u. BorrowingsBorrowings are initially recorded at the fair value of the consideration received less directly attributable transaction costs associated with the borrowings. After initial recognition, borrowings are subsequently measured at amortised cost using the effective interest rate method. Under this method fees, costs, discounts and premiums that are yield related are included as part of the carrying amount of the borrowing and amortised over its expected life.
Borrowings are classified as current liabilities unless the Group has an unconditional right to defer settlement to more than twelve months after reporting date.
Borrowing costs are expensed as incurred except where they are directly attributable to the acquisition, construction or production of a qualifying asset. When this is the case, they are capitalised as part of the acquisition cost of that asset.
v. Issued EquityIssued and paid up securities are recognised at the fair value of the consideration received by the Group. Any transaction costs arising on issue of ordinary securities are recognised directly in equity as a reduction of the security proceeds received.
Notes to the Financial StatementsFOR THE YEAR ENDED 30 JUNE 2017 | CONTINUED
32 Annual Report 2017
1. Summary of significant accounting policies (continued)
w. RevenueRevenue from rents, interest and distributions is recognised to the extent that it is probable that the economic benefits will flow to the group and the revenue can be reliably measured. Revenue brought to account but not received at balance date is recognised as a receivable.
Rental income from operating leases is recognised on a straight–line basis over the lease term. Fixed rental increases that do not represent direct compensation for underlying cost increases or capital expenditures are recognised on a straight–line basis until the next market review date. Rent paid in advance is recognised as unearned income.
Deferred management fee income is calculated as the expected fee on a resident’s ingoing loan, allocated pro–rata over the resident’s expected tenure, together with any share of capital appreciation that has occurred at reporting date.
Revenue from the sale of manufactured homes within the Lifestyle and Holidays segment is recognised when the significant risks, rewards of ownership and effective control has been transferred to the buyer.
Service station sales revenue represents the revenue earned from the provision of products to external parties. Sales revenue is only recognised when the significant risks and rewards of ownership of the products including possession are passed to the buyer.
Government incentives are recognised where there is reasonable assurance the incentive will be received, and attached conditions complied with. When the incentive relates to an expense item, it is recognised as income on a systematic basis over the periods that the incentive is intended to compensate.
Interest income is recognised as the interest accrues using the effective interest rate method.
x. Share–based Payment TransactionsCertain senior executives of the Group receive remuneration in the form of share–based payment transactions, whereby employees render services as consideration for equity instruments (equity–settled transactions). The Group does not have any cash–settled share–based payment transactions in the financial year.
The cost of equity–settled transactions is recognised, together with a corresponding increase in reserves in equity, over the period in which the performance and service conditions are fulfilled. The cumulative expense recognised for these transactions at each reporting date until the vesting date reflects the extent to which the vesting period has expired and the Group’s best estimate of the number of equity instruments that will ultimately vest. The income statement expense or credit for a period represents the movement in cumulative expense recognised as at the beginning and end of that period and is recognised in employee expenses.
No expense is recognised for awards that do not ultimately vest, except for equity–settled transactions for which vesting is conditional upon a market or non–vesting condition. These are treated as vesting irrespective of whether or not the market or non–vesting condition is satisfied, provided that all other performance and service conditions are satisfied.
When the terms of an equity–settled transaction are modified, the minimum expense recognised is the expense as if the terms had not been modified, if the original terms of the award are met. An additional expense is recognised for any modification that increases the total fair value of the transaction, or is otherwise beneficial to the employee as measured at the date of modification.
When an equity–settled award is cancelled, it is treated as if it vested on the date of cancellation, and any expense not yet recognised for the award is recognised immediately. This includes any award where non–vesting conditions within the control of either the Group or the employee are not met. However, if a new award is substituted for the cancelled award, and designated as a replacement award on the date that it is granted, the cancelled and new awards are treated as if they were a modification of the original award, as described in the previous paragraph.
The dilutive effect of outstanding rights is reflected as additional share dilution in the computation of diluted earnings per share.
y. Income tax
Current income tax:The Company, ICMT and their subsidiaries are subject to Australian income tax.
Under the current tax legislation, ICF and its subsidiaries are not liable to pay Australian income tax if their taxable income (including any assessable capital gains) is fully distributed to securityholders each year. Tax allowances for building and fixtures depreciation are distributed to securityholders in the form of the tax–deferred component of distributions.
Current tax assets and liabilities for the current period are measured at the amount expected to be recovered from or paid to the taxation authorities, based on the current period’s taxable income. The tax rates and tax laws used to compute the amount are those that are enacted or substantively enacted at the reporting date.
The subsidiaries that previously held the Group’s foreign properties may be subject to corporate income tax and withholding tax in the countries in which they operate. Under current Australian income tax legislation, securityholders may be entitled to receive a foreign tax credit for this withholding tax.
Deferred income tax:Deferred income tax represents tax (including withholding tax) expected to be payable or recoverable by taxable entities on the differences between the tax bases of assets and liabilities and their carrying amounts for financial reporting purposes. Deferred tax assets and liabilities are measured at the tax rates that are expected to apply to the year when the asset is realised through continuing use or the liability is settled, based on tax rates (and tax laws) that have been enacted or substantively enacted at reporting date. Income taxes related to items recognised directly in equity are recognised in equity and not against income.
Notes to the Financial StatementsFOR THE YEAR ENDED 30 JUNE 2017 | CONTINUED
33Ingenia Communities Holdings Limited
1. Summary of significant accounting policies (continued)
Tax consolidation:Each of the Company and ICMT and their respective subsidiaries have formed a tax consolidation group with the Company or ICMT being the head entity. The head entity and the controlled entities in the tax consolidation group continue to account for their own current and deferred tax amounts. Each tax consolidated group has applied a group allocation approach in determining the appropriate amount of current taxes and deferred taxes to allocate to the members therein.
In addition to its own current and deferred tax amounts, the head entity of each tax consolidated group also recognises the current tax liabilities (or assets) and the deferred tax assets arising from unused tax losses and unused tax credits assumed from entities in their respective tax consolidated group.
Assets or liabilities arising under tax funding agreements with the tax consolidated entities are recognised as amounts receivable from or payable to other entities in the Group.
z. Fair Value MeasurementThe Group measures financial instruments, such as derivatives, investment properties, non–financial assets and non–financial liabilities, at fair value at each balance sheet date. Refer to Note 26.
Fair value is the price that would be received to sell an asset or paid to transfer a liability in an orderly transaction between market participants, at the measurement date. The fair value measurement is based on the presumption that the transaction to sell the asset or transfer the liability takes place either:
– In the principal market for the asset or liability; or
– In the absence of a principal market, in the most advantageous market for the asset or liability.
The principal or the most advantageous market must be accessible to the Group.
The fair value of an asset or a liability is measured using the assumptions that market participants would use when pricing the asset or liability, assuming that market participants act in their economic best interest.
A fair value measurement of a non–financial asset takes into account a market participant’s ability to generate economic benefits by using the asset in its highest and best use or by selling it to another market participant that would use the asset in its highest and best use.
The Group uses valuation techniques that are appropriate in the circumstances and for which sufficient data are available to measure fair value, maximising the use of relevant observable inputs and minimising the use of unobservable inputs.
All assets and liabilities for which fair values is measured or disclosed in the financial statements are categorised within the fair value hierarchy, described as follows, based on the lowest level of input that is significant to the fair value measurement as a whole:
– Level 1 – Quoted (unadjusted) market prices in active markets for identical assets or liabilities.
– Level 2 – Valuation techniques for which the lowest level of input that is significant to the fair value measurement is directly or indirectly observable.
– Level 3 – Valuation techniques for which the lowest level input that is significant to the fair value measurement is unobservable.
For assets and liabilities that are recognised in the financial statements on a recurring basis, the Group determines whether transfers have occurred between Levels in the hierarchy by re–assessing categorisation (based on the lowest level input that is significant to the fair value measurement as a whole) at the end of the reporting period.
The Group’s Audit and Risk Committee determines the policies and procedures for both recurring fair value measurement, such as investment properties and resident loans and for non–recurring measurement.
External valuers are involved for valuation of significant assets, such as properties and significant liabilities. Selection criteria include market knowledge, experience and qualifications, reputation, independence and whether professional standards are maintained.
On a six monthly basis, management presents valuation results to the Investment Committee and the Audit and Risk committee once approved. This includes a discussion of the major assumptions used in the valuations.
For the purpose of fair value disclosures, the Group has determined classes of assets and liabilities based on the nature, characteristics and risks of the asset or liability, and the level of the fair value hierarchy, as explained at Note 25.
aa. Goods and Services Tax (GST)Revenue, expenses and assets (with the exception of receivables) are recognised net of the amount of GST to the extent that the GST is recoverable from the taxation authority. Where GST is not recoverable, it is recognised as part of the cost of the acquisition, or as an expense.
Receivables and payables are stated inclusive of GST. The net amount of GST recoverable from or payable to the tax authority is included in the balance sheet as an asset or liability.
Cash flows are included in the cash flow statement on a gross basis. The GST components of cash flows arising from investing and financing activities, which are recoverable from or payable to the tax authorities, are classified as operating cash flows.
bb. Earnings Per Share (EPS)Basic EPS is calculated as net profit attributable to members of the Group, divided by the weighted average number of ordinary securities, adjusted for any bonus element.
Diluted EPS is calculated as net profit attributable to the Group divided by the weighted average number of ordinary securities and dilutive potential ordinary securities, adjusted for any bonus element.
Notes to the Financial StatementsFOR THE YEAR ENDED 30 JUNE 2017 | CONTINUED
34 Annual Report 2017
1. Summary of significant accounting policies (continued)
cc. Pending Accounting StandardsAASB 9 Financial Instruments is applicable to reporting periods beginning on or after 1 January 2018. The Group has not early adopted this standard. This standard provides requirements for the classification, measurement and de–recognition of financial assets and financial liabilities. Changes in the Group’s credit risk, which affect the value of liabilities designated at fair value through profit and loss, can be presented in other comprehensive income. The application of the Standard is not expected to have any material impact on the Group’s financial reporting in future periods.
AASB 15 Revenue from Contracts with Customers is applicable to reporting periods beginning on or after 1 January 2018. The Group has not early adopted this standard. The standard is based on the principle that revenue is recognised when control of a good or service is transferred to a customer. It contains a single model that applies to contracts with customers and two approaches to recognising revenue; at a point in time or over time. The model features a contract–based five–step analysis of transactions, to determine if, how much, and when revenue is recognised.
It applies to all contracts with customers except leases, financial instruments and insurance contracts. It requires reporting entities to provide users of financial statement with more informative and relevant disclosures. The Group has reviewed this standard, and has assessed that it will not have a material impact on its future reporting.
AASB 16 Leases is applicable to reporting periods beginning on or after 1 January 2019. The Group has not early adopted this standard. This standard provides requirements for classification, measurement, and disclosure of all leases with a term of more than 12 months unless the underlying asset is of low value. A lease must now measure right–of–use assets similarly to other non–financial assets and lease liabilities similarly to other financial liabilities. Assets and liabilities arising from a lease are initially measured on a present value basis. The measurement includes non–cancellable lease payments (including inflation–linked payments) and payments made in optional periods, if the lessee is reasonably certain to exercise an option to extend the lease, or not to exercise an option to terminate the lease. The Group is currently the lessee of two non–cancellable operating leases, which will be included under this new standard. These leases relate to the Group’s Sydney and Brisbane offices, which have a future minimum lease payments total of $1,492,000 at 30 June 2017. The Group is also the lessee of four finance leases (relating to the land component of investment properties), which are not expected to be materially impacted by the new standard because they are already substantially treated in the manner prescribed by the new standard.
Other new accounting standards, amendments to accounting standards and interpretations have been published that are not mandatory for the current reporting period and are not expected to have a material impact on the Group’s future financial reporting.
dd. Current Versus Non–current ClassificationThe Group presents assets and liabilities in the balance sheet based on current/non–current classification. An asset is current when it is:
– Expected to be realised or intended to be sold or consumed in the normal operating cycle;
– Held primarily for the purpose of trading;
– Expected to be realised within twelve months after the reporting period; or
– Cash or cash equivalents unless restricted from being exchanged or used to settle a liability for at least twelve months after reporting period.
All other assets are classified as non–current.
A liability is current when:
– It is expected to be settled in the normal operating cycle;
– It is held primarily for the purpose of trading;
– It is due to be settled within twelve months after the reporting period; or
– There is no unconditional right to defer settlement of the liability for at least twelve months after the reporting period.
The Group classifies all other liabilities as non–current.
Deferred tax assets and liabilities are classified as non–current assets and liabilities.
2. Accounting estimates and judgementsThe preparation of financial statements requires the use of certain critical accounting estimates. It also requires the Group to exercise its judgement in the process of applying the Group’s accounting policies. The areas involving a higher degree of judgement or complexity, or areas where assumptions and estimates are significant to the financial statements, are disclosed below.
Estimates and judgements are continually evaluated, and are based on historical experience and other factors, including expectations of future events that are believed to be reasonable under the circumstances.
a. Critical Accounting Estimates and AssumptionsThe Group makes estimates and assumptions concerning the future. The resulting accounting estimates, by definition, will seldom equal the related actual results. The estimates and assumptions that have a significant risk of causing a material adjustment to the carrying amounts of assets and liabilities within the next financial year are discussed below.
Valuation of investment propertyThe Group has investment properties with a carrying amount of $693,473,000 (2016: $710,746,000) (refer Note 10 and Note 11), and retirement village residents’ loans with a carrying amount of $27,201,000 (2016: $207,483,000) (refer Note 17 and Note 11), which together represent the estimated fair value of the Group’s property business.
Notes to the Financial StatementsFOR THE YEAR ENDED 30 JUNE 2017 | CONTINUED

35Ingenia Communities Holdings Limited
2. Accounting estimates and judgements (continued)
These carrying amounts reflect certain assumptions about expected future rentals, rent–free periods, operating costs and appropriate discount and capitalisation rates. The valuation assumptions for deferred management fee villages reflect assumptions relating to average length of stay, unit market values, estimates of capital expenditure, contract terms with residents, discount rates, and projected property growth rates. The valuation assumption for properties to be developed reflect assumptions around sales prices for new homes, sales rates, new rental tariffs, estimates of capital expenditure, discount rates and projected property growth rates.
In forming these assumptions, the Group considered information about current and recent sales activity, current market rents, and discount and capitalisation rates, for properties similar to those owned by the Group, as well as independent valuations of the Group’s property.
Valuation of inventoriesThe Group has inventory in the form of manufactured homes and service station fuel and supplies, which it carries at the lower of cost or net realisable value. Estimates of net realisable value are based on the most reliable evidence available at the time the estimates are made, of the amount the inventories are expected to realise and the estimate of costs to complete. Key assumptions require the use of management judgement, and are continually reviewed.
Fair value of derivativesThe fair value of derivative assets and liabilities is based on assumptions of future events and involves significant estimates. Given the complex nature of these instruments and various assumptions that are used in calculating mark–to–market values, the Group relies on counterparty valuations for derivative values. Counterparty valuations are normally based on mid–market rates and calculated using the main variables including the forward market curve, time and volatility.
Valuation of share–based paymentsValuation of share–based payment transactions is performed using judgements around the fair value of equity instruments on the date at which they are granted. The fair value is determined using a Monte Carlo based simulation method for long–term incentive performance rights and the security price at grant date of short–term incentive rights. Refer to Note 23 for assumptions used in determining the fair value.
Valuation of assets acquired in business combinationsUpon recognising the acquisition, management uses estimations and assumptions of the fair value of assets and liabilities assumed at the date of acquisition, including judgements related to valuation of investment property as discussed above.
Valuation of retirement village resident loansThe fair value of the retirement village resident loans is calculated by reference to the initial loan amount, plus the resident’s share of any capital gains in accordance with their contracts less any deferred management fee income accrued to date by the Group as operator. The key assumption for calculating the capital gain and deferred management fee income components is the value of the dwelling being occupied by the resident. This value is determined by reference to the valuation of investment property, as referred to above.
Calculation of deferred management fee (DMF)DMF is recognised by the Group over the estimated period of time the property will be leased by the resident, and is realised upon exit of the resident. DMF is based on various inputs including the initial price of the property, estimated length of stay of the resident, various contract terms and projected price of property at time of re–leasing.
b. Critical judgment in applying the entity’s accounting principles
There were no judgements, apart from those involving estimations, that management has made in the process of applying the entity’s accounting policies that had a significant effect on the amounts recognised in the financial report.
Notes to the Financial StatementsFOR THE YEAR ENDED 30 JUNE 2017 | CONTINUED

36 Annual Report 2017
3. Segment information
a. Description of SegmentsThe group invests predominantly in rental properties located in Australia with four reportable segments:
– Ingenia Lifestyle and Holidays – comprising long–term and tourism accommodation within lifestyle parks;
– Ingenia Lifestyle Development – comprising the development and sale of manufactured homes;
– Ingenia Gardens – rental villages; and
– Ingenia Settlers – deferred management fee villages.
The Group has identified its operating segments based on the internal reports that are reviewed and used by the chief operating decision maker in assessing performance and determining the allocation of resources. Other parts of the Group are neither an operating segment nor part of an operating segment. Assets that do not belong to an operating segment are described below as “unallocated”.
b. 2017 Lifestyle & Holidays
Operations$’000
Lifestyle Development
$’000
Ingenia Settlers
$’000
Ingenia Gardens
$’000
Corporate/ Unallocated
$’000Total
$’000
i. Segment revenue
External segment revenue 54,971 63,752 3,405 28,389 – 150,517Interest income – – – – 25 25Reclassification of gain on revaluation of newly constructed villages – – (633) – – (633)Total revenue 54,971 63,752 2,772 28,389 25 149,909
ii. Segment Underlying ProfitExternal segment revenue 54,971 63,752 3,405 28,389 – 150,517Interest income – – – – 25 25Property expenses (14,827) (493) (871) (8,023) (515) (24,729)Employee expenses (12,983) (6,453) (928) (7,045) (4,688) (32,097)Administration expenses (2,131) (532) (133) (607) (2,974) (6,377)Operational, marketing and selling expenses (1,145) (2,440) (210) (982) (686) (5,463)Manufactured home cost of sales – (42,699) – – – (42,699)Service station expenses (6,229) – – – – (6,229)Finance expense – – – – (6,961) (6,961)Income tax expense – – – – (1,636) (1,636)Depreciation expense (145) (94) (7) (29) (180) (455)Amortisation of intangibles (105) (160) (21) (89) – (375)Underlying Profit/(loss) 17,406 10,881 1,235 11,614 (17,615) 23,521
Reconciliation of underlying profit to statutory profitNet foreign exchange gain/(loss) – – – – (342) (342)Net gain/(loss) disposal of investment property (870) – (7,568) – – (8,438)Net gain/(loss) on change in fair value of:
- Investment properties 7,838 – (286) 4,820 – 12,372 - Retirement village resident loans – – 96 – – 96 - Derivatives – – – – 126 126Gain on revaluation of newly constructed villages – – (633) – – (633)Income tax expense associated with reconciliation items – – – – (294) (294)
Profit/(loss) per the consolidated statement of comprehensive income 24,374 10,881 (7,156) 16,434 (18,125) 26,408
iii. Segment Assets 526,135 23,310 41,606 133,930 23,175 748,156
Notes to the Financial StatementsFOR THE YEAR ENDED 30 JUNE 2017 | CONTINUED
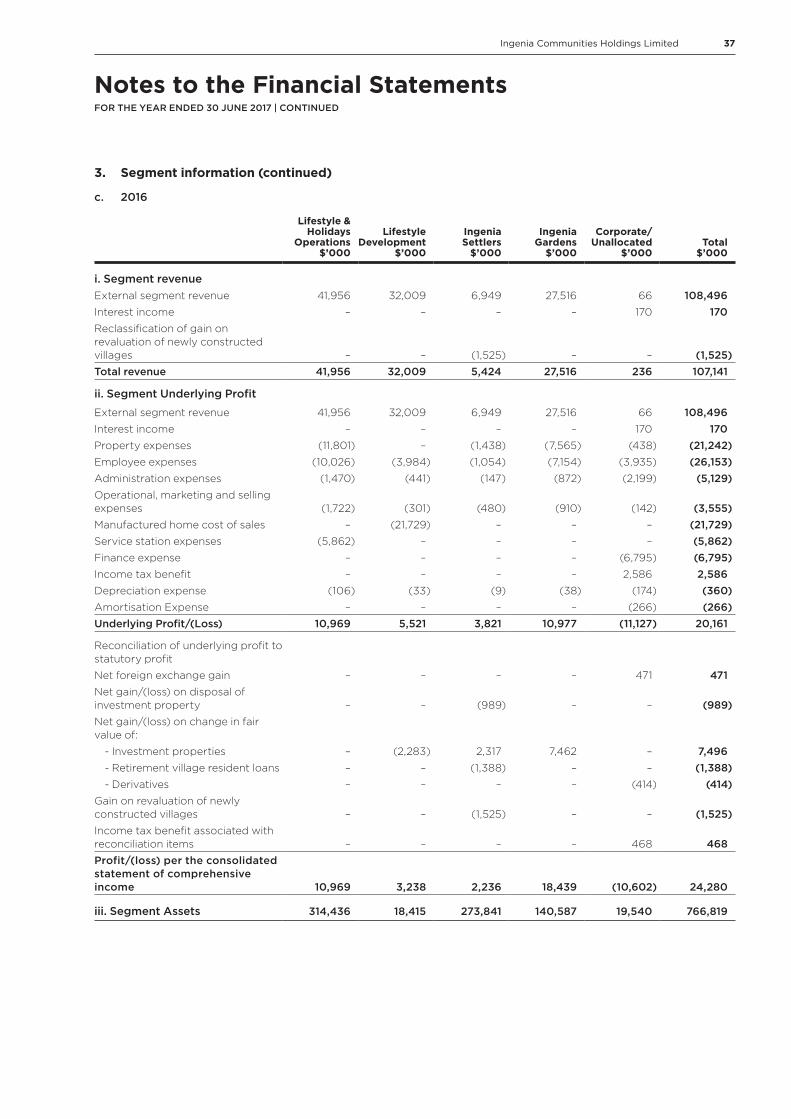
37Ingenia Communities Holdings Limited
3. Segment information (continued)
c. 2016
Lifestyle & Holidays
Operations$’000
Lifestyle Development
$’000
Ingenia Settlers
$’000
Ingenia Gardens
$’000
Corporate/ Unallocated
$’000Total
$’000
i. Segment revenueExternal segment revenue 41,956 32,009 6,949 27,516 66 108,496Interest income – – – – 170 170Reclassification of gain on revaluation of newly constructed villages – – (1,525) – – (1,525)Total revenue 41,956 32,009 5,424 27,516 236 107,141
ii. Segment Underlying Profit
External segment revenue 41,956 32,009 6,949 27,516 66 108,496Interest income – – – – 170 170Property expenses (11,801) – (1,438) (7,565) (438) (21,242)Employee expenses (10,026) (3,984) (1,054) (7,154) (3,935) (26,153)Administration expenses (1,470) (441) (147) (872) (2,199) (5,129)Operational, marketing and selling expenses (1,722) (301) (480) (910) (142) (3,555)Manufactured home cost of sales – (21,729) – – – (21,729)Service station expenses (5,862) – – – – (5,862)Finance expense – – – – (6,795) (6,795)Income tax benefit – – – – 2,586 2,586Depreciation expense (106) (33) (9) (38) (174) (360)Amortisation Expense – – – – (266) (266)Underlying Profit/(Loss) 10,969 5,521 3,821 10,977 (11,127) 20,161
Reconciliation of underlying profit to statutory profit
Net foreign exchange gain – – – – 471 471Net gain/(loss) on disposal of investment property – – (989) – – (989)Net gain/(loss) on change in fair value of:
- Investment properties – (2,283) 2,317 7,462 – 7,496 - Retirement village resident loans – – (1,388) – – (1,388) - Derivatives – – – – (414) (414)Gain on revaluation of newly constructed villages – – (1,525) – – (1,525)Income tax benefit associated with reconciliation items – – – – 468 468Profit/(loss) per the consolidated statement of comprehensive income 10,969 3,238 2,236 18,439 (10,602) 24,280
iii. Segment Assets 314,436 18,415 273,841 140,587 19,540 766,819
Notes to the Financial StatementsFOR THE YEAR ENDED 30 JUNE 2017 | CONTINUED

38 Annual Report 2017
Notes to the Financial StatementsFOR THE YEAR ENDED 30 JUNE 2017 | CONTINUED
4. Earnings per security
2017 2016
a. Per security
Profit attributable to securityholders ($’000) 26,408 24,280
Weighted average number of securities outstanding (thousands):
Issued securities 180,383 150,408
Dilutive securities (thousands):
Performance quantum rights – 620
Long-term incentive rights 486 269
Short-term incentive rights 111 56
Weighted average number of issued and dilutive potential securities outstanding (thousands) 180,980 151,353
Basic earnings per security (cents) 14.6 16.1
Dilutive earnings per security (cents) 14.6 16.0
b. Per security attributable to parent
Profit/(loss) attributable to securityholders ($’000) (446) (1,631)
Weighted average number of securities outstanding (thousands):
Issued securities 180,383 150,408
Dilutive securities (thousands):
Performance quantum rights – 620
Long-term incentive rights 486 269
Short-term incentive rights 111 56
Weighted average number of issued and dilutive potential securities outstanding (thousands) 180,980 151,353
Basic earnings per security (cents) (0.2) (1.1)
Dilutive earnings per security (cents) (0.2) (1.1)

39Ingenia Communities Holdings Limited
5. Revenue
2017$’000
2016$’000
a. Rental Income
Residential rental income – Ingenia Gardens 24,770 23,961
Residential rental income – Settlers 232 462
Residential rental income – Lifestyle and Holidays 14,911 12,311
Annuals rental income – Lifestyle and Holidays 4,348 2,970
Tourism rental income – Lifestyle and Holidays 25,251 17,565
Commercial rental income – Lifestyle and Holidays 464 423
Total rental income 69,976 57,692
b. Other Property Income
Government incentives 267 142
Commissions and administrative fees 335 809
Ancillary lifestyle park income 1,173 644
Utility recoveries 1,281 1,076
Sundry income 800 374
Total other property income 3,856 3,045
6. Finance expense
2017$’000
2016$’000
Debt facility interest paid or payable 6,377 5,636
Deferred consideration interest on acquisitions 169 793
Finance lease interest paid or payable(1) 415 366
Total finance expense 6,961 6,795
(1) Finance leases relate to certain investment properties and are long-term in nature. Refer to Note 16(c) for further detail.
Interest costs of $620,000 have been capitalised into investment properties associated with development assets (2016: $nil).
Notes to the Financial StatementsFOR THE YEAR ENDED 30 JUNE 2017 | CONTINUED

40 Annual Report 2017
Notes to the Financial StatementsFOR THE YEAR ENDED 30 JUNE 2017 | CONTINUED
7. Income tax expense
2017$’000
2016$’000
a. Income tax (expense)/benefit
Current tax benefit 233 –
(Decrease)/Increase in deferred tax asset (2,163) 3,054
Income tax (expense)/benefit (1,930) 3,054
b. Reconciliation between tax expense and pre-tax profit
Profit before income tax 28,338 21,226
Add/(less) amounts not subject to Australian income tax 2,738 (25,855)
31,076 (4,629)
Income tax (expense)/benefit at the Australian tax rate of 30% (9,323) 1,389
Tax effect of amounts which are not deductible/(taxable) in calculating taxable income:
Prior period income tax return true-ups (325) 369
Movements in tax cost base of investment properties(1) 7,615 1,399
Other 103 (103)
Income tax (expense)/benefit (1,930) 3,054
(1) Movement in cost base of investment property impacted by valuation adjustments and resetting of historic cost bases where updated information is available.
c. Tax ConsolidationEffective from 1 July 2011, ICH and its Australian domiciled wholly owned subsidiaries formed a tax consolidation group with ICH being the head entity. Under the tax funding agreement the funding of tax within the tax group is based on taxable income as if that entity was not a member of the tax group.
Effective from 1 July 2012, ICMT and its Australian domiciled owned subsidiaries formed a tax consolidation group with ICMT being the head entity. Under the tax funding agreement the funding of tax within the tax group is based on taxable income as if that entity was not a member of the tax group.
Upon entering into the ICMT tax consolidated group, the tax cost bases for certain assets were reset resulting in income tax benefits being recorded.
8. Trade and other receivables
2017$’000
2016$’000
Current
Trade and other receivables 2,814 2,218
Prepayments 1,912 3,946
Deposits 1,175 688
5,901 6,852
Non-current
Other receivables 3,002 3,140
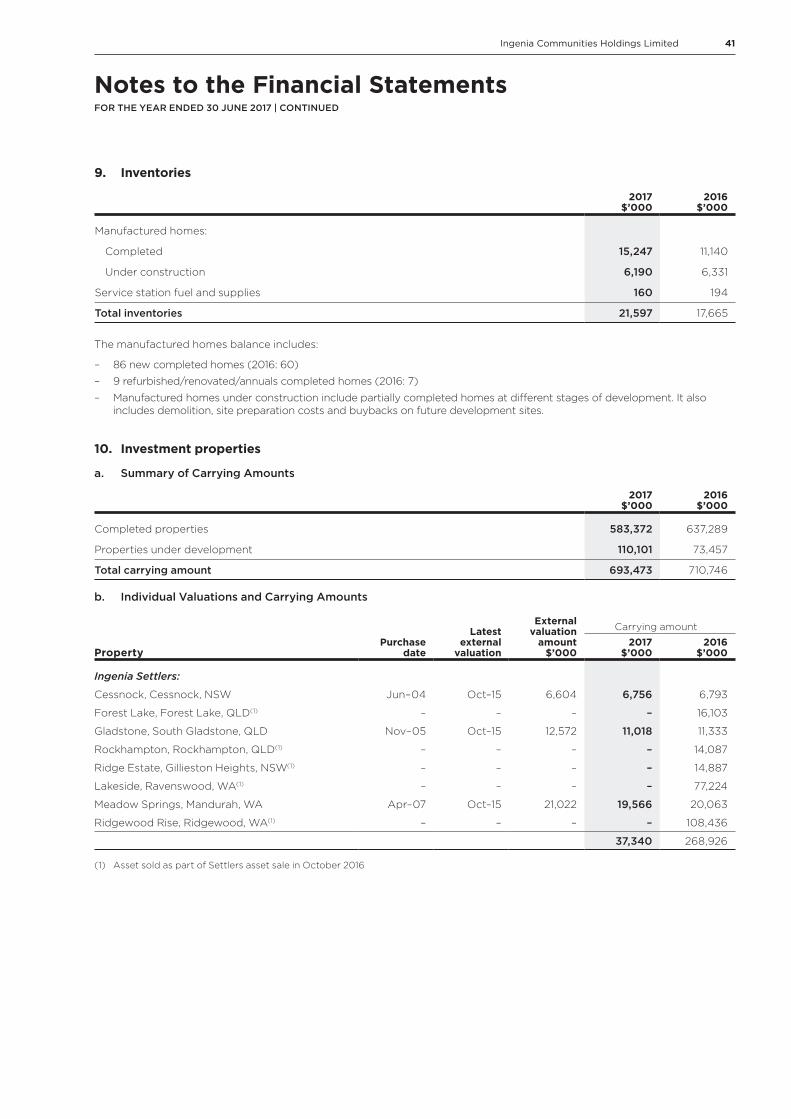
41Ingenia Communities Holdings Limited
9. Inventories
2017$’000
2016$’000
Manufactured homes:
Completed 15,247 11,140
Under construction 6,190 6,331
Service station fuel and supplies 160 194
Total inventories 21,597 17,665
The manufactured homes balance includes:
– 86 new completed homes (2016: 60)
– 9 refurbished/renovated/annuals completed homes (2016: 7)
– Manufactured homes under construction include partially completed homes at different stages of development. It also includes demolition, site preparation costs and buybacks on future development sites.
10. Investment properties
a. Summary of Carrying Amounts
2017$’000
2016$’000
Completed properties 583,372 637,289
Properties under development 110,101 73,457
Total carrying amount 693,473 710,746
b. Individual Valuations and Carrying Amounts
PropertyPurchase
date
Latest external
valuation
External valuation
amount$’000
Carrying amount
2017$’000
2016$’000
Ingenia Settlers:
Cessnock, Cessnock, NSW Jun–04 Oct–15 6,604 6,756 6,793
Forest Lake, Forest Lake, QLD(1) – – – – 16,103
Gladstone, South Gladstone, QLD Nov–05 Oct–15 12,572 11,018 11,333
Rockhampton, Rockhampton, QLD(1) – – – – 14,087
Ridge Estate, Gillieston Heights, NSW(1) – – – – 14,887
Lakeside, Ravenswood, WA(1) – – – – 77,224
Meadow Springs, Mandurah, WA Apr–07 Oct–15 21,022 19,566 20,063
Ridgewood Rise, Ridgewood, WA(1) – – – – 108,436
37,340 268,926
(1) Asset sold as part of Settlers asset sale in October 2016
Notes to the Financial StatementsFOR THE YEAR ENDED 30 JUNE 2017 | CONTINUED

42 Annual Report 2017
Notes to the Financial StatementsFOR THE YEAR ENDED 30 JUNE 2017 | CONTINUED
10. Investment properties (continued)
PropertiesPurchase
date
Latest external
valuation
External valuation
amount$’000
Carrying amount
2017$’000
2016$’000
Ingenia Gardens:
Brooklyn, Brookfield, VIC Jun-04 Dec-16 4,550 4,690 4,220
Carey Park, Bunbury, WA Jun-04 Jun-17 4,400 4,400 4,430
Elphinwood, Launceston, TAS Jun-04 Dec-16 4,100 4,100 3,970
Horsham, Horsham, VIC Jun-04 Jun-17 3,700 3,700 3,960
Jefferis, Bundaberg North, QLD Jun-04 Jun-17 4,550 4,550 4,420
Oxley, Port Macquarie, NSW Jun-04 Dec-16 4,900 4,760 4,360
Townsend, St Albans Park, VIC Jun-04 Jun-17 4,850 4,850 4,310
Yakamia, Yakamia, WA Jun-04 Jun-17 4,500 4,500 4,880
Chatsbury, Goulburn, NSW Jun-04 Dec-16 4,300 4,420 3,680
Claremont, Claremont, TAS Jun-04 Dec-16 4,100 4,260 3,360
Coburns, Brookfield, VIC Jun-04 Dec-16 4,450 4,500 3,940
Devonport, Devonport, TAS Jun-04 Dec-16 1,750 2,160 1,709
Hertford, Sebastopol, VIC Jun-04 Dec-15 3,700 3,840 3,970
Seascape, Erskine, WA Jun-04 Dec-15 4,700 4,980 4,920
Seville Grove, Seville Grove, WA Jun-04 Dec-15 3,900 3,660 3,960
St Albans Park, St Albans Park, VIC Jun-04 Dec-15 4,950 5,680 5,120
Taloumbi, Coffs Harbour, NSW Jun-04 Dec-15 4,900 5,150 5,160
Wheelers, Dubbo, NSW Jun-04 Dec-16 4,900 5,050 5,130
Taree, Taree, NSW Dec-04 Dec-16 3,350 3,940 3,300
Grovedale, Grovedale, VIC Jun-05 Jun-17 5,400 5,400 5,000
Glenorchy, Glenorchy, TAS Jun-05 Dec-15 3,800 4,280 4,110
Marsden, Marsden, QLD Jun-05 Dec-16 9,350 9,560 8,970
Swan View, Swan View, WA Jan-06 Dec-15 7,150 7,610 7,430
Dubbo, Dubbo, NSW Dec-12 Dec-15 3,800 5,170 3,640
Ocean Grove, Mandurah, WA Feb-13 Dec-16 3,850 3,870 3,680
Peel River, Tamworth, NSW Mar-13 Dec-16 4,850 5,270 4,590
Sovereign, Ballarat, VIC Jun-13 Dec-15 3,150 2,540 3,320
Wagga, Wagga Wagga, NSW Jun-13 Dec-15 4,250 3,950 4,350
Bathurst, Bathurst, NSW Jan-14 Dec-16 4,150 4,100 4,340
Launceston, Launceston, TAS Jan-14 Dec-16 3,400 3,350 3,460
Warrnambool, Warrnambool, VIC Jan-14 Dec-16 3,050 3,000 2,880
141,290 134,569
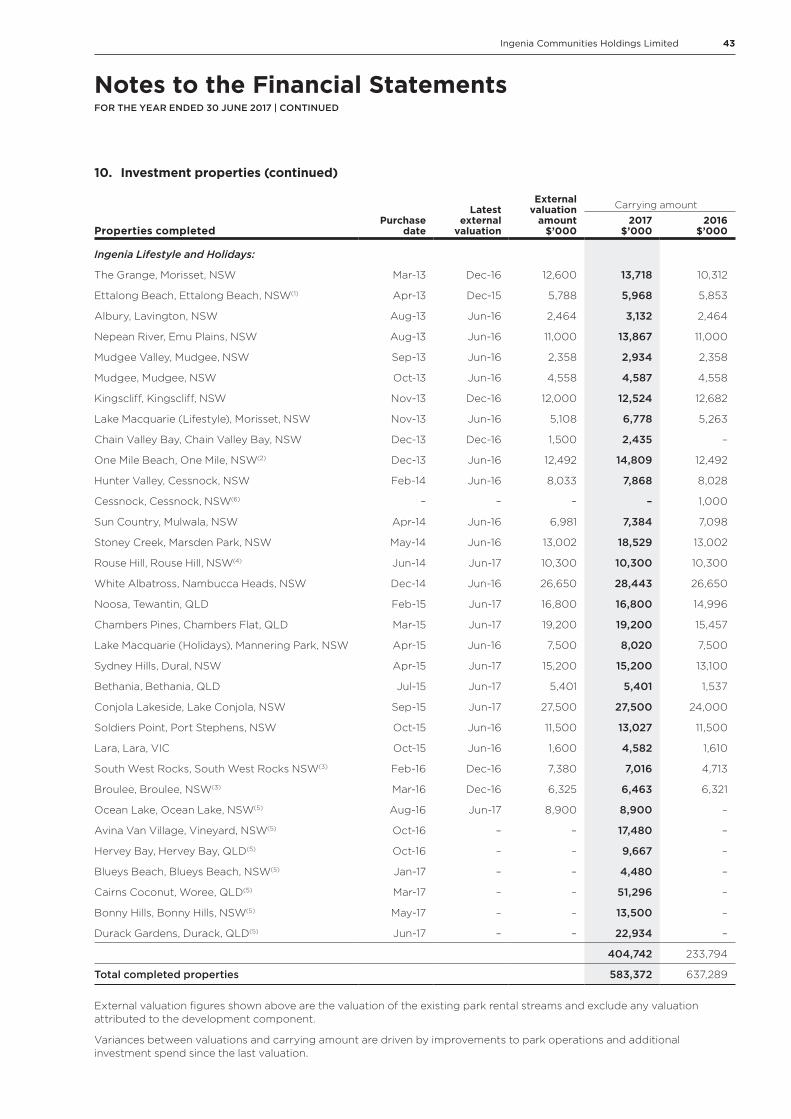
43Ingenia Communities Holdings Limited
10. Investment properties (continued)
Properties completedPurchase
date
Latest external
valuation
External valuation
amount$’000
Carrying amount
2017$’000
2016$’000
Ingenia Lifestyle and Holidays:
The Grange, Morisset, NSW Mar-13 Dec-16 12,600 13,718 10,312
Ettalong Beach, Ettalong Beach, NSW(1) Apr-13 Dec-15 5,788 5,968 5,853
Albury, Lavington, NSW Aug-13 Jun-16 2,464 3,132 2,464
Nepean River, Emu Plains, NSW Aug-13 Jun-16 11,000 13,867 11,000
Mudgee Valley, Mudgee, NSW Sep-13 Jun-16 2,358 2,934 2,358
Mudgee, Mudgee, NSW Oct-13 Jun-16 4,558 4,587 4,558
Kingscliff, Kingscliff, NSW Nov-13 Dec-16 12,000 12,524 12,682
Lake Macquarie (Lifestyle), Morisset, NSW Nov-13 Jun-16 5,108 6,778 5,263
Chain Valley Bay, Chain Valley Bay, NSW Dec-13 Dec-16 1,500 2,435 –
One Mile Beach, One Mile, NSW(2) Dec-13 Jun-16 12,492 14,809 12,492
Hunter Valley, Cessnock, NSW Feb-14 Jun-16 8,033 7,868 8,028
Cessnock, Cessnock, NSW(6) – – – – 1,000
Sun Country, Mulwala, NSW Apr-14 Jun-16 6,981 7,384 7,098
Stoney Creek, Marsden Park, NSW May-14 Jun-16 13,002 18,529 13,002
Rouse Hill, Rouse Hill, NSW(4) Jun-14 Jun-17 10,300 10,300 10,300
White Albatross, Nambucca Heads, NSW Dec-14 Jun-16 26,650 28,443 26,650
Noosa, Tewantin, QLD Feb-15 Jun-17 16,800 16,800 14,996
Chambers Pines, Chambers Flat, QLD Mar-15 Jun-17 19,200 19,200 15,457
Lake Macquarie (Holidays), Mannering Park, NSW Apr-15 Jun-16 7,500 8,020 7,500
Sydney Hills, Dural, NSW Apr-15 Jun-17 15,200 15,200 13,100
Bethania, Bethania, QLD Jul-15 Jun-17 5,401 5,401 1,537
Conjola Lakeside, Lake Conjola, NSW Sep-15 Jun-17 27,500 27,500 24,000
Soldiers Point, Port Stephens, NSW Oct-15 Jun-16 11,500 13,027 11,500
Lara, Lara, VIC Oct-15 Jun-16 1,600 4,582 1,610
South West Rocks, South West Rocks NSW(3) Feb-16 Dec-16 7,380 7,016 4,713
Broulee, Broulee, NSW(3) Mar-16 Dec-16 6,325 6,463 6,321
Ocean Lake, Ocean Lake, NSW(5) Aug-16 Jun-17 8,900 8,900 –
Avina Van Village, Vineyard, NSW(5) Oct-16 – – 17,480 –
Hervey Bay, Hervey Bay, QLD(5) Oct-16 – – 9,667 –
Blueys Beach, Blueys Beach, NSW(5) Jan-17 – – 4,480 –
Cairns Coconut, Woree, QLD(5) Mar-17 – – 51,296 –
Bonny Hills, Bonny Hills, NSW(5) May-17 – – 13,500 –
Durack Gardens, Durack, QLD(5) Jun-17 – – 22,934 –
404,742 233,794
Total completed properties 583,372 637,289
External valuation figures shown above are the valuation of the existing park rental streams and exclude any valuation attributed to the development component.
Variances between valuations and carrying amount are driven by improvements to park operations and additional investment spend since the last valuation.
Notes to the Financial StatementsFOR THE YEAR ENDED 30 JUNE 2017 | CONTINUED

44 Annual Report 2017
Notes to the Financial StatementsFOR THE YEAR ENDED 30 JUNE 2017 | CONTINUED
10. Investment properties (continued)
Carrying amount
Properties to be developedPurchase
date2017
$’0002016
$’000
Ingenia Lifestyle and Holidays:
The Grange, Morisset, NSW Mar-13 1,967 2,516
Albury, Lavington, NSW Aug-13 3,682 3,426
Mudgee Valley, Mudgee, NSW Sep-13 700 2,334
Mudgee, Mudgee, NSW Oct-13 2,203 2,270
Kingscliff, Kingscliff, NSW Nov-13 – 502
Lake Macquarie (Lifestyle), Morisset, NSW Nov-13 – 648
Chain Valley Bay, Chain Valley Bay, NSW Dec-13 2,678 5,334
Hunter Valley, Cessnock, NSW Feb-14 3,395 2,243
Cessnock, Cessnock, NSW(6) Feb-14 – 556
Sun Country, Mulwala, NSW Apr-14 1,904 1,519
Stoney Creek, Marsden Park, NSW May-14 2,560 5,765
Rouse Hill, Rouse Hill, NSW(4) Jun-14 8,224 6,165
Chambers Pines, Chambers Flat, QLD Mar-15 9,590 8,322
Sydney Hills, Dural, NSW Apr-15 160 –
Bethania, Bethania, QLD Jul-15 15,084 11,889
Conjola Lakeside, Lake Conjola, NSW Sep-15 5,000 1,416
Lara, Lara, VIC Oct-15 13,702 13,410
South West Rocks, NSW(3) Feb-16 2,616 5,142
Avina Van Village, Vineyard, NSW(5) Oct-16 17,745 –
Latitude One, Port Stephens, NSW(5)(7) Dec-16 13,805 –
Blueys Beach, Blueys Beach, NSW(5) Jan-17 3,020 –
Durack Gardens, Durack, QLD(5) Jun-17 2,066 –
Properties to be developed 110,101 73,457
Total investment properties 693,473 710,746
(1) Ettalong Beach land component is leased from the Gosford City Council and is recognised as investment property with an associated finance lease.
(2) One Mile Beach land component is leased from the Crown under 40 year and perpetual leases and is recognised as investment property with an associated finance lease.
(3) South West Rocks and Broulee land is leased from the Crown and is recognised as investment property with an associated finance lease.
(4) Rouse Hill has been valued on a highest and best used basis as a medium density residential development.
(5) Held at purchase price plus any subsequent and supportable capital expenditure in accordance with accounting policy.
(6) Cessnock Lifestyle and Holidays was sold in December 2016.
(7) Latitude One is carried at purchase price exclusive of obligations assumed at acquisition which are recorded separately as liabilities.
Investment property that has not been valued by external valuers at reporting date is carried at the Group’s estimate of fair value in accordance with the accounting policy. Properties acquired during the period are carried at purchase price, excluding acquisition costs, plus any subsequent, supportable capital expenditure, which is reflective of the fair value.
Valuations of retirement villages are provided net of retirement village residents’ loans (after deducting any accrued deferred management fees). For presentation in this note, the external valuations shown are stated before deducting this liability to reflect the separate balance sheet presentation. The carrying amounts include the fair value of units completed since the date of the external valuation.
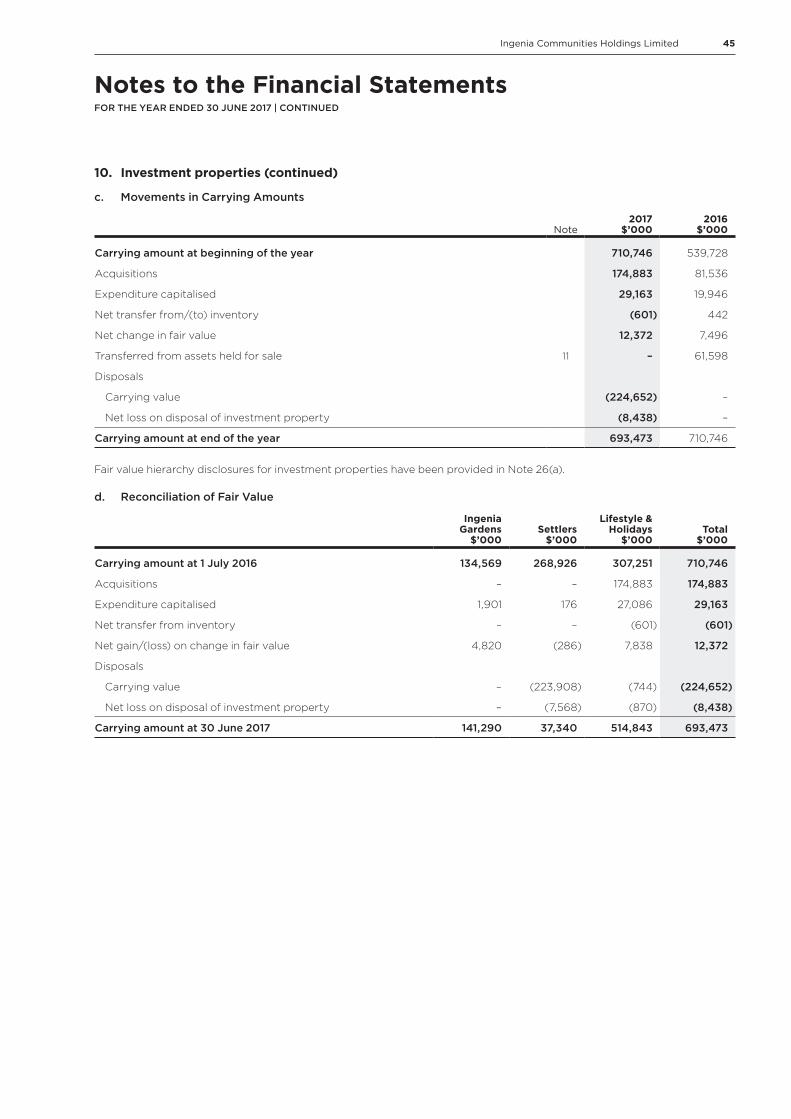
45Ingenia Communities Holdings Limited
10. Investment properties (continued)
c. Movements in Carrying Amounts
Note2017
$’0002016
$’000
Carrying amount at beginning of the year 710,746 539,728
Acquisitions 174,883 81,536
Expenditure capitalised 29,163 19,946
Net transfer from/(to) inventory (601) 442
Net change in fair value 12,372 7,496
Transferred from assets held for sale 11 – 61,598
Disposals
Carrying value (224,652) –
Net loss on disposal of investment property (8,438) –
Carrying amount at end of the year 693,473 710,746
Fair value hierarchy disclosures for investment properties have been provided in Note 26(a).
d. Reconciliation of Fair Value
Ingenia Gardens
$’000Settlers
$’000
Lifestyle & Holidays
$’000Total
$’000
Carrying amount at 1 July 2016 134,569 268,926 307,251 710,746
Acquisitions – – 174,883 174,883
Expenditure capitalised 1,901 176 27,086 29,163
Net transfer from inventory – – (601) (601)
Net gain/(loss) on change in fair value 4,820 (286) 7,838 12,372
Disposals
Carrying value – (223,908) (744) (224,652)
Net loss on disposal of investment property – (7,568) (870) (8,438)
Carrying amount at 30 June 2017 141,290 37,340 514,843 693,473
Notes to the Financial StatementsFOR THE YEAR ENDED 30 JUNE 2017 | CONTINUED
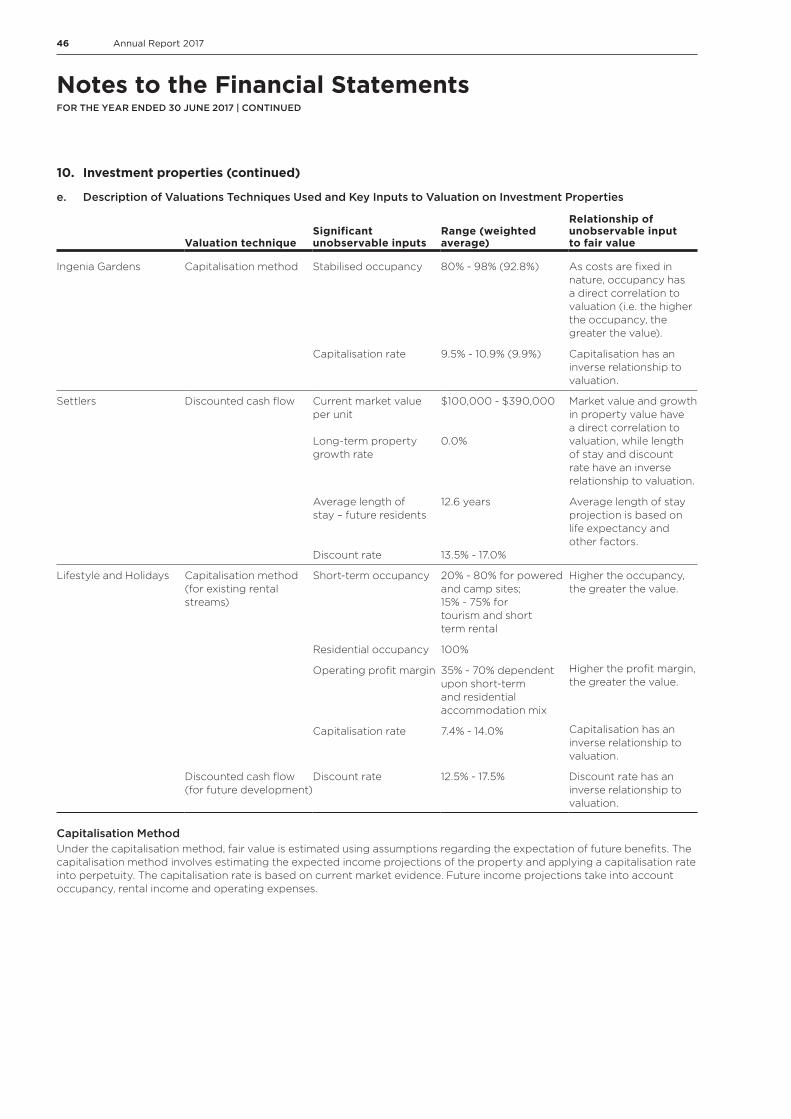
46 Annual Report 2017
Notes to the Financial StatementsFOR THE YEAR ENDED 30 JUNE 2017 | CONTINUED
10. Investment properties (continued)
e. Description of Valuations Techniques Used and Key Inputs to Valuation on Investment Properties
Valuation techniqueSignificant unobservable inputs
Range (weighted average)
Relationship of unobservable input to fair value
Ingenia Gardens Capitalisation method Stabilised occupancy
Capitalisation rate
80% - 98% (92.8%)
9.5% - 10.9% (9.9%)
As costs are fixed in nature, occupancy has a direct correlation to valuation (i.e. the higher the occupancy, the greater the value).
Capitalisation has an inverse relationship to valuation.
Settlers Discounted cash flow Current market value per unit Long-term property growth rate
Average length of stay – future residents Discount rate
$100,000 - $390,000 0.0%
12.6 years 13.5% - 17.0%
Market value and growth in property value have a direct correlation to valuation, while length of stay and discount rate have an inverse relationship to valuation.
Average length of stay projection is based on life expectancy and other factors.
Lifestyle and Holidays Capitalisation method (for existing rental streams)
Short-term occupancy
Residential occupancy
Operating profit margin
Capitalisation rate
20% - 80% for powered and camp sites; 15% - 75% for tourism and short term rental
100%
35% - 70% dependent upon short-term and residential accommodation mix
7.4% - 14.0%
Higher the occupancy, the greater the value. Higher the profit margin, the greater the value.
Capitalisation has an inverse relationship to valuation.
Discounted cash flow (for future development)
Discount rate 12.5% - 17.5% Discount rate has an inverse relationship to valuation.
Capitalisation MethodUnder the capitalisation method, fair value is estimated using assumptions regarding the expectation of future benefits. The capitalisation method involves estimating the expected income projections of the property and applying a capitalisation rate into perpetuity. The capitalisation rate is based on current market evidence. Future income projections take into account occupancy, rental income and operating expenses.
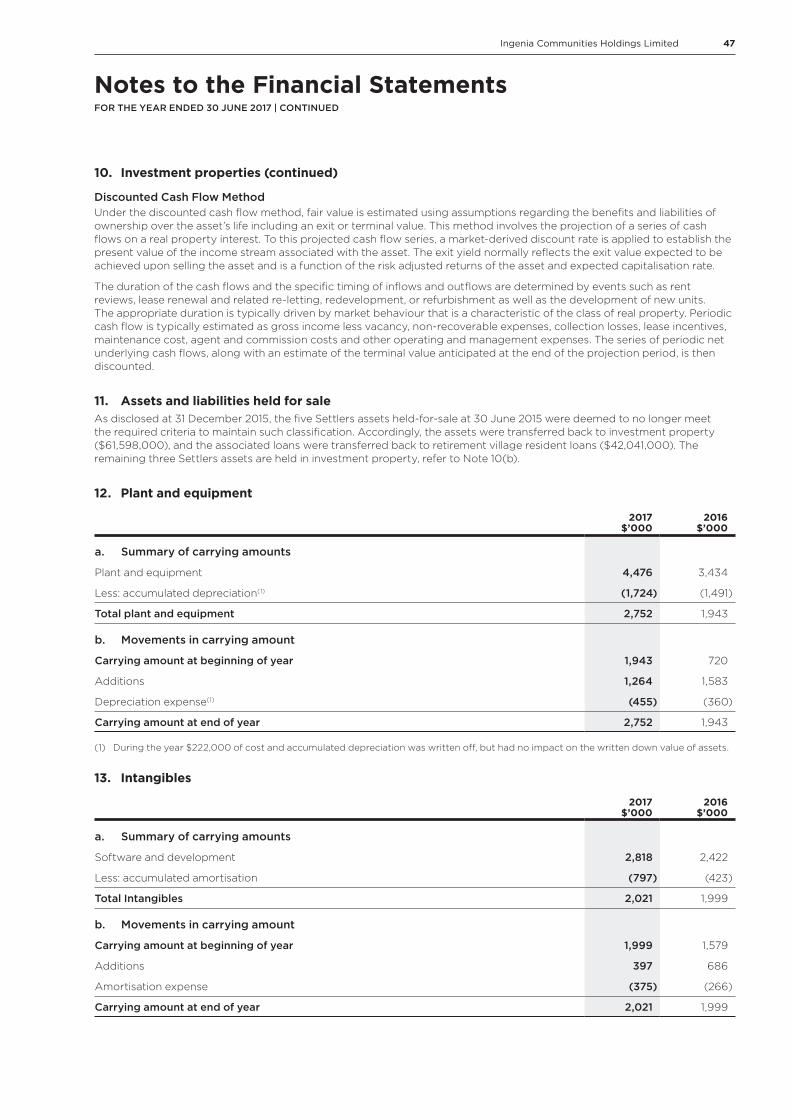
47Ingenia Communities Holdings Limited
10. Investment properties (continued)
Discounted Cash Flow MethodUnder the discounted cash flow method, fair value is estimated using assumptions regarding the benefits and liabilities of ownership over the asset’s life including an exit or terminal value. This method involves the projection of a series of cash flows on a real property interest. To this projected cash flow series, a market-derived discount rate is applied to establish the present value of the income stream associated with the asset. The exit yield normally reflects the exit value expected to be achieved upon selling the asset and is a function of the risk adjusted returns of the asset and expected capitalisation rate.
The duration of the cash flows and the specific timing of inflows and outflows are determined by events such as rent reviews, lease renewal and related re-letting, redevelopment, or refurbishment as well as the development of new units. The appropriate duration is typically driven by market behaviour that is a characteristic of the class of real property. Periodic cash flow is typically estimated as gross income less vacancy, non-recoverable expenses, collection losses, lease incentives, maintenance cost, agent and commission costs and other operating and management expenses. The series of periodic net underlying cash flows, along with an estimate of the terminal value anticipated at the end of the projection period, is then discounted.
11. Assets and liabilities held for saleAs disclosed at 31 December 2015, the five Settlers assets held-for-sale at 30 June 2015 were deemed to no longer meet the required criteria to maintain such classification. Accordingly, the assets were transferred back to investment property ($61,598,000), and the associated loans were transferred back to retirement village resident loans ($42,041,000). The remaining three Settlers assets are held in investment property, refer to Note 10(b).
12. Plant and equipment
2017$’000
2016$’000
a. Summary of carrying amounts
Plant and equipment 4,476 3,434
Less: accumulated depreciation(1) (1,724) (1,491)
Total plant and equipment 2,752 1,943
b. Movements in carrying amount
Carrying amount at beginning of year 1,943 720
Additions 1,264 1,583
Depreciation expense(1) (455) (360)
Carrying amount at end of year 2,752 1,943
(1) During the year $222,000 of cost and accumulated depreciation was written off, but had no impact on the written down value of assets.
13. Intangibles
2017$’000
2016$’000
a. Summary of carrying amounts
Software and development 2,818 2,422
Less: accumulated amortisation (797) (423)
Total Intangibles 2,021 1,999
b. Movements in carrying amount
Carrying amount at beginning of year 1,999 1,579
Additions 397 686
Amortisation expense (375) (266)
Carrying amount at end of year 2,021 1,999
Notes to the Financial StatementsFOR THE YEAR ENDED 30 JUNE 2017 | CONTINUED

48 Annual Report 2017
Notes to the Financial StatementsFOR THE YEAR ENDED 30 JUNE 2017 | CONTINUED
14. Deferred tax asset and liabilities
2017$’000
2016$’000
Deferred tax assets
Tax losses 14,679 20,827
Other 276 1,399
Deferred tax liabilities
DMF receivable (1,011) (8,883)
Investment properties (6,480) (3,944)
Net deferred tax asset 7,464 9,399
Deductible temporary differences and carried forward losses tax effected for which no deferred tax asset has been recognised 7,500 7,500
The availability of carried forward tax losses of $7.5 million to the ICMT tax consolidated group is subject to recoupment rules at the time of recoupment. Further, the rate at which these losses can be utilised is determined by reference to market values at the time of tax consolidation and subsequent events. Accordingly, a portion of these carried forward tax losses may not be available in the future.
The Group offsets tax assets and liabilities, if and only if, it has a legally enforceable right to set off current tax assets and current tax liabilities and the deferred tax assets and deferred tax liabilities relate to income taxes levied by the same tax authority.
15. Trade and other payables
2017$’000
2016$’000
Current
Trade payables and accruals 20,071 11,846
Deposits 4,562 2,841
Other unearned income 1,350 1,670
Deferred acquisition consideration – 8,500
Total current 25,983 24,857
Non-current
Deferred acquisition consideration – 6,770
Other 168 –
Total non-current 168 6,770
16. Borrowings
2017$’000
2016$’000
Current
Finance leases 493 497
Non-current
Bank debt 166,464 99,100
Prepaid borrowing costs (1,735) (1,373)
Finance leases 5,608 5,866
Total non-current 170,337 103,593
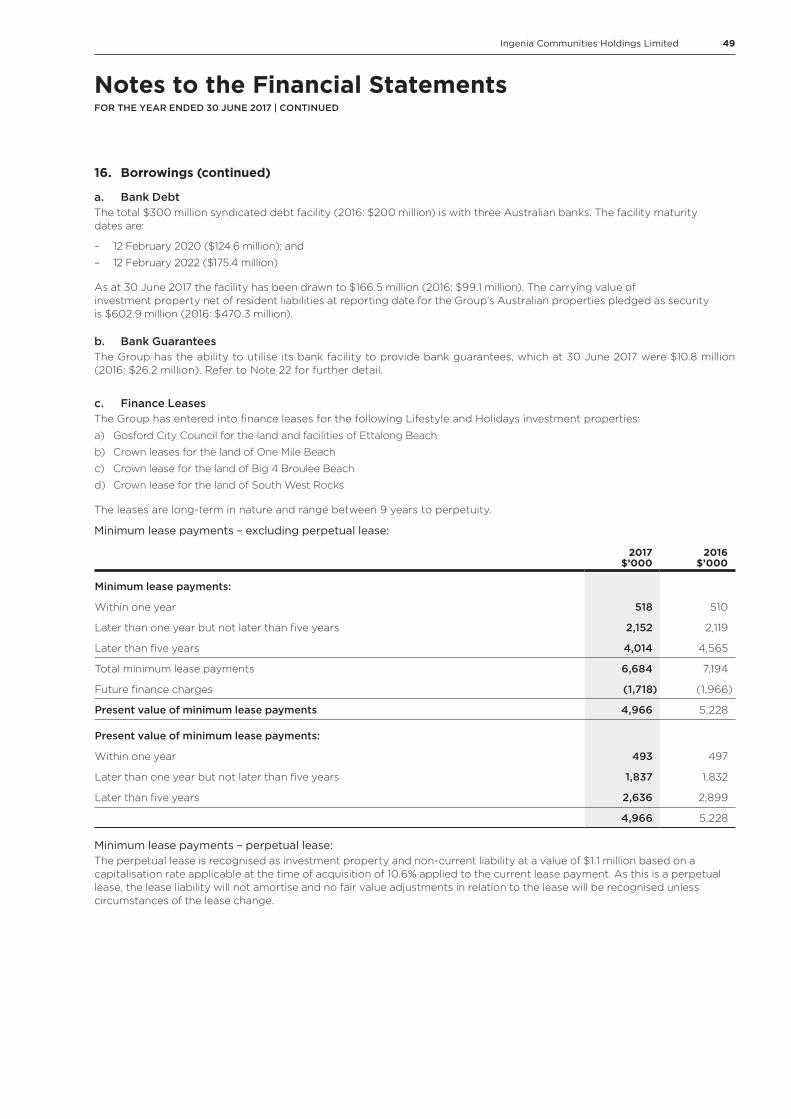
49Ingenia Communities Holdings Limited
16. Borrowings (continued)
a. Bank Debt The total $300 million syndicated debt facility (2016: $200 million) is with three Australian banks. The facility maturity dates are:
– 12 February 2020 ($124.6 million); and
– 12 February 2022 ($175.4 million)
As at 30 June 2017 the facility has been drawn to $166.5 million (2016: $99.1 million). The carrying value of investment property net of resident liabilities at reporting date for the Group’s Australian properties pledged as security is $602.9 million (2016: $470.3 million).
b. Bank GuaranteesThe Group has the ability to utilise its bank facility to provide bank guarantees, which at 30 June 2017 were $10.8 million (2016: $26.2 million). Refer to Note 22 for further detail.
c. Finance LeasesThe Group has entered into finance leases for the following Lifestyle and Holidays investment properties:
a) Gosford City Council for the land and facilities of Ettalong Beach
b) Crown leases for the land of One Mile Beach
c) Crown lease for the land of Big 4 Broulee Beach
d) Crown lease for the land of South West Rocks
The leases are long-term in nature and range between 9 years to perpetuity.
Minimum lease payments – excluding perpetual lease:
2017$’000
2016$’000
Minimum lease payments:
Within one year 518 510
Later than one year but not later than five years 2,152 2,119
Later than five years 4,014 4,565
Total minimum lease payments 6,684 7,194
Future finance charges (1,718) (1,966)
Present value of minimum lease payments 4,966 5,228
Present value of minimum lease payments:
Within one year 493 497
Later than one year but not later than five years 1,837 1,832
Later than five years 2,636 2,899
4,966 5,228
Minimum lease payments – perpetual lease:The perpetual lease is recognised as investment property and non-current liability at a value of $1.1 million based on a capitalisation rate applicable at the time of acquisition of 10.6% applied to the current lease payment. As this is a perpetual lease, the lease liability will not amortise and no fair value adjustments in relation to the lease will be recognised unless circumstances of the lease change.
Notes to the Financial StatementsFOR THE YEAR ENDED 30 JUNE 2017 | CONTINUED

50 Annual Report 2017
17. Retirement village resident loans
Note2017
$’0002016
$’000
a. Summary of Carrying Amounts
Gross resident loans 30,155 240,473
Accrued deferred management fee (2,954) (32,990)
Net resident loans 27,201 207,483
b. Movements in Carrying Amounts
Carrying amount at beginning of year 207,483 161,878
Net gain/(loss) on change in fair value of resident loans (96) 1,388
Accrued deferred management fee income (1,825) (4,222)
Deferred management fee cash collected 465 1,211
Proceeds from resident loans 3,411 11,056
Repayment of resident loans (2,191) (5,757)
Transfer from/(to) liabilities held for sale 11 – 42,041
Disposal of villages (180,283) –
Other 237 (112)
Carrying amount at end of year 27,201 207,483
Fair value hierarchy disclosures for retirement village resident loans have been provided in Note 26.
Notes to the Financial StatementsFOR THE YEAR ENDED 30 JUNE 2017 | CONTINUED

51Ingenia Communities Holdings Limited
18. Issued securities
2017$’000
2016$’000
a. Carrying Values
At beginning of year 723,383 657,544
Issued during the year:
Dividend Reinvestment Plan issues 5,517 3,344
Performance Quantum Rights 1,158 383
Institutional Placement and Rights issue 74,045 64,355
Security Purchase Plan 8,162 –
Short-Term Incentive Plan 238 –
Institutional Placement and Rights issue costs (2,667) (2,243)
At end of year 809,836 723,383
The closing balance is attributable to the securityholders of:
Ingenia Communities Holdings Limited 11,131 10,204
Ingenia Communities Fund 755,570 679,160
Ingenia Communities Management Trust 43,135 34,019
809,836 723,383
2017Thousands
2016Thousands
b. Number of Issued Securities
At beginning of year 172,155 147,118
Issued during the year:
Dividend Reinvestment Plan 2,049 2,968
Performance Quantum Rights 599 640
Security Purchase Plan 3,023 –
Short-Term Incentive Plan 77 –
Institutional Placement and Rights Issue 28,479 21,429
At end of year 206,382 172,155
c. Terms of SecuritiesAll securities are fully paid and rank equally with each other for all purposes. Each security entitles the holder to one vote, in person or by proxy, at a meeting of securityholders.
Notes to the Financial StatementsFOR THE YEAR ENDED 30 JUNE 2017 | CONTINUED
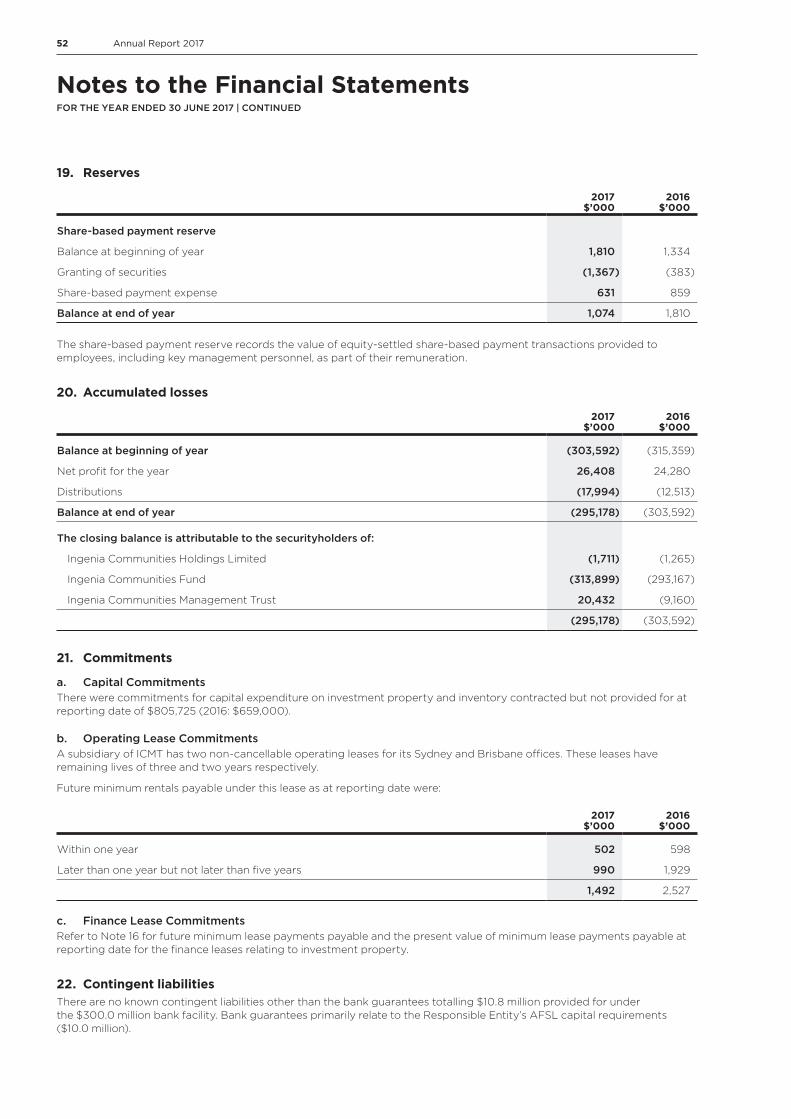
52 Annual Report 2017
19. Reserves
2017$’000
2016$’000
Share-based payment reserve
Balance at beginning of year 1,810 1,334
Granting of securities (1,367) (383)
Share-based payment expense 631 859
Balance at end of year 1,074 1,810
The share-based payment reserve records the value of equity-settled share-based payment transactions provided to employees, including key management personnel, as part of their remuneration.
20. Accumulated losses
2017$’000
2016$’000
Balance at beginning of year (303,592) (315,359)
Net profit for the year 26,408 24,280
Distributions (17,994) (12,513)
Balance at end of year (295,178) (303,592)
The closing balance is attributable to the securityholders of:
Ingenia Communities Holdings Limited (1,711) (1,265)
Ingenia Communities Fund (313,899) (293,167)
Ingenia Communities Management Trust 20,432 (9,160)
(295,178) (303,592)
21. Commitments
a. Capital CommitmentsThere were commitments for capital expenditure on investment property and inventory contracted but not provided for at reporting date of $805,725 (2016: $659,000).
b. Operating Lease CommitmentsA subsidiary of ICMT has two non-cancellable operating leases for its Sydney and Brisbane offices. These leases have remaining lives of three and two years respectively.
Future minimum rentals payable under this lease as at reporting date were:
2017$’000
2016$’000
Within one year 502 598
Later than one year but not later than five years 990 1,929
1,492 2,527
c. Finance Lease CommitmentsRefer to Note 16 for future minimum lease payments payable and the present value of minimum lease payments payable at reporting date for the finance leases relating to investment property.
22. Contingent liabilitiesThere are no known contingent liabilities other than the bank guarantees totalling $10.8 million provided for under the $300.0 million bank facility. Bank guarantees primarily relate to the Responsible Entity’s AFSL capital requirements ($10.0 million).
Notes to the Financial StatementsFOR THE YEAR ENDED 30 JUNE 2017 | CONTINUED
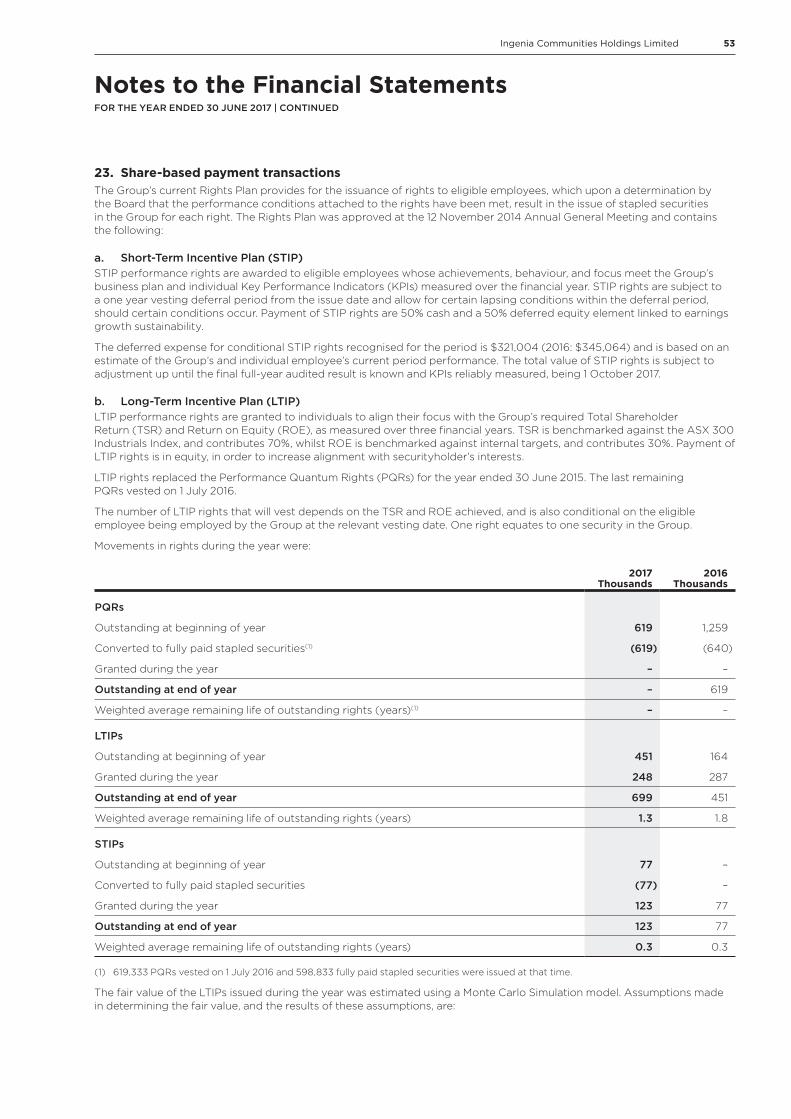
53Ingenia Communities Holdings Limited
23. Share-based payment transactionsThe Group’s current Rights Plan provides for the issuance of rights to eligible employees, which upon a determination by the Board that the performance conditions attached to the rights have been met, result in the issue of stapled securities in the Group for each right. The Rights Plan was approved at the 12 November 2014 Annual General Meeting and contains the following:
a. Short-Term Incentive Plan (STIP) STIP performance rights are awarded to eligible employees whose achievements, behaviour, and focus meet the Group’s business plan and individual Key Performance Indicators (KPIs) measured over the financial year. STIP rights are subject to a one year vesting deferral period from the issue date and allow for certain lapsing conditions within the deferral period, should certain conditions occur. Payment of STIP rights are 50% cash and a 50% deferred equity element linked to earnings growth sustainability.
The deferred expense for conditional STIP rights recognised for the period is $321,004 (2016: $345,064) and is based on an estimate of the Group’s and individual employee’s current period performance. The total value of STIP rights is subject to adjustment up until the final full-year audited result is known and KPIs reliably measured, being 1 October 2017.
b. Long-Term Incentive Plan (LTIP) LTIP performance rights are granted to individuals to align their focus with the Group’s required Total Shareholder Return (TSR) and Return on Equity (ROE), as measured over three financial years. TSR is benchmarked against the ASX 300 Industrials Index, and contributes 70%, whilst ROE is benchmarked against internal targets, and contributes 30%. Payment of LTIP rights is in equity, in order to increase alignment with securityholder’s interests.
LTIP rights replaced the Performance Quantum Rights (PQRs) for the year ended 30 June 2015. The last remaining PQRs vested on 1 July 2016.
The number of LTIP rights that will vest depends on the TSR and ROE achieved, and is also conditional on the eligible employee being employed by the Group at the relevant vesting date. One right equates to one security in the Group.
Movements in rights during the year were:
2017Thousands
2016Thousands
PQRs
Outstanding at beginning of year 619 1,259
Converted to fully paid stapled securities(1) (619) (640)
Granted during the year – –
Outstanding at end of year – 619
Weighted average remaining life of outstanding rights (years)(1) – –
LTIPs
Outstanding at beginning of year 451 164
Granted during the year 248 287
Outstanding at end of year 699 451
Weighted average remaining life of outstanding rights (years) 1.3 1.8
STIPs
Outstanding at beginning of year 77 –
Converted to fully paid stapled securities (77) –
Granted during the year 123 77
Outstanding at end of year 123 77
Weighted average remaining life of outstanding rights (years) 0.3 0.3
(1) 619,333 PQRs vested on 1 July 2016 and 598,833 fully paid stapled securities were issued at that time.
The fair value of the LTIPs issued during the year was estimated using a Monte Carlo Simulation model. Assumptions made in determining the fair value, and the results of these assumptions, are:
Notes to the Financial StatementsFOR THE YEAR ENDED 30 JUNE 2017 | CONTINUED
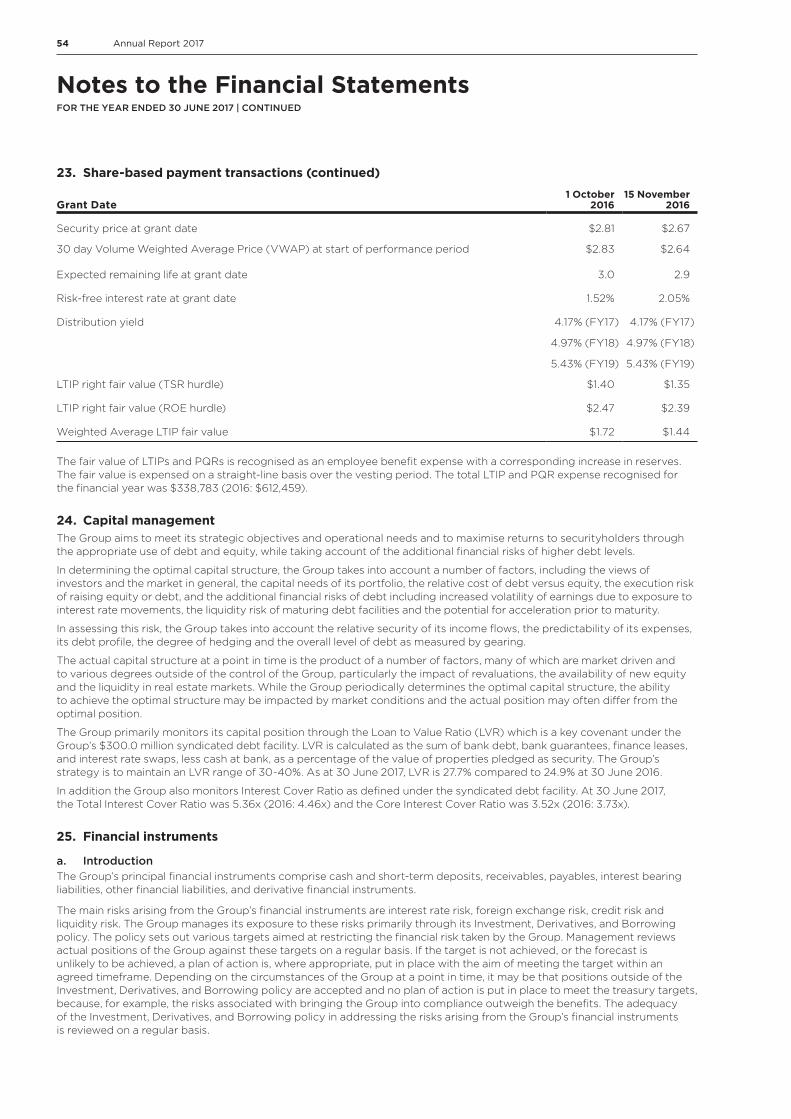
54 Annual Report 2017
Notes to the Financial StatementsFOR THE YEAR ENDED 30 JUNE 2017 | CONTINUED
23. Share-based payment transactions (continued)
Grant Date1 October
201615 November
2016
Security price at grant date $2.81 $2.67
30 day Volume Weighted Average Price (VWAP) at start of performance period $2.83 $2.64
Expected remaining life at grant date 3.0 2.9
Risk-free interest rate at grant date 1.52% 2.05%
Distribution yield 4.17% (FY17)
4.97% (FY18)
5.43% (FY19)
4.17% (FY17)
4.97% (FY18)
5.43% (FY19)
LTIP right fair value (TSR hurdle) $1.40 $1.35
LTIP right fair value (ROE hurdle) $2.47 $2.39
Weighted Average LTIP fair value $1.72 $1.44
The fair value of LTIPs and PQRs is recognised as an employee benefit expense with a corresponding increase in reserves. The fair value is expensed on a straight-line basis over the vesting period. The total LTIP and PQR expense recognised for the financial year was $338,783 (2016: $612,459).
24. Capital managementThe Group aims to meet its strategic objectives and operational needs and to maximise returns to securityholders through the appropriate use of debt and equity, while taking account of the additional financial risks of higher debt levels.
In determining the optimal capital structure, the Group takes into account a number of factors, including the views of investors and the market in general, the capital needs of its portfolio, the relative cost of debt versus equity, the execution risk of raising equity or debt, and the additional financial risks of debt including increased volatility of earnings due to exposure to interest rate movements, the liquidity risk of maturing debt facilities and the potential for acceleration prior to maturity.
In assessing this risk, the Group takes into account the relative security of its income flows, the predictability of its expenses, its debt profile, the degree of hedging and the overall level of debt as measured by gearing.
The actual capital structure at a point in time is the product of a number of factors, many of which are market driven and to various degrees outside of the control of the Group, particularly the impact of revaluations, the availability of new equity and the liquidity in real estate markets. While the Group periodically determines the optimal capital structure, the ability to achieve the optimal structure may be impacted by market conditions and the actual position may often differ from the optimal position.
The Group primarily monitors its capital position through the Loan to Value Ratio (LVR) which is a key covenant under the Group’s $300.0 million syndicated debt facility. LVR is calculated as the sum of bank debt, bank guarantees, finance leases, and interest rate swaps, less cash at bank, as a percentage of the value of properties pledged as security. The Group’s strategy is to maintain an LVR range of 30-40%. As at 30 June 2017, LVR is 27.7% compared to 24.9% at 30 June 2016.
In addition the Group also monitors Interest Cover Ratio as defined under the syndicated debt facility. At 30 June 2017, the Total Interest Cover Ratio was 5.36x (2016: 4.46x) and the Core Interest Cover Ratio was 3.52x (2016: 3.73x).
25. Financial instruments
a. IntroductionThe Group’s principal financial instruments comprise cash and short-term deposits, receivables, payables, interest bearing liabilities, other financial liabilities, and derivative financial instruments.
The main risks arising from the Group’s financial instruments are interest rate risk, foreign exchange risk, credit risk and liquidity risk. The Group manages its exposure to these risks primarily through its Investment, Derivatives, and Borrowing policy. The policy sets out various targets aimed at restricting the financial risk taken by the Group. Management reviews actual positions of the Group against these targets on a regular basis. If the target is not achieved, or the forecast is unlikely to be achieved, a plan of action is, where appropriate, put in place with the aim of meeting the target within an agreed timeframe. Depending on the circumstances of the Group at a point in time, it may be that positions outside of the Investment, Derivatives, and Borrowing policy are accepted and no plan of action is put in place to meet the treasury targets, because, for example, the risks associated with bringing the Group into compliance outweigh the benefits. The adequacy of the Investment, Derivatives, and Borrowing policy in addressing the risks arising from the Group’s financial instruments is reviewed on a regular basis.
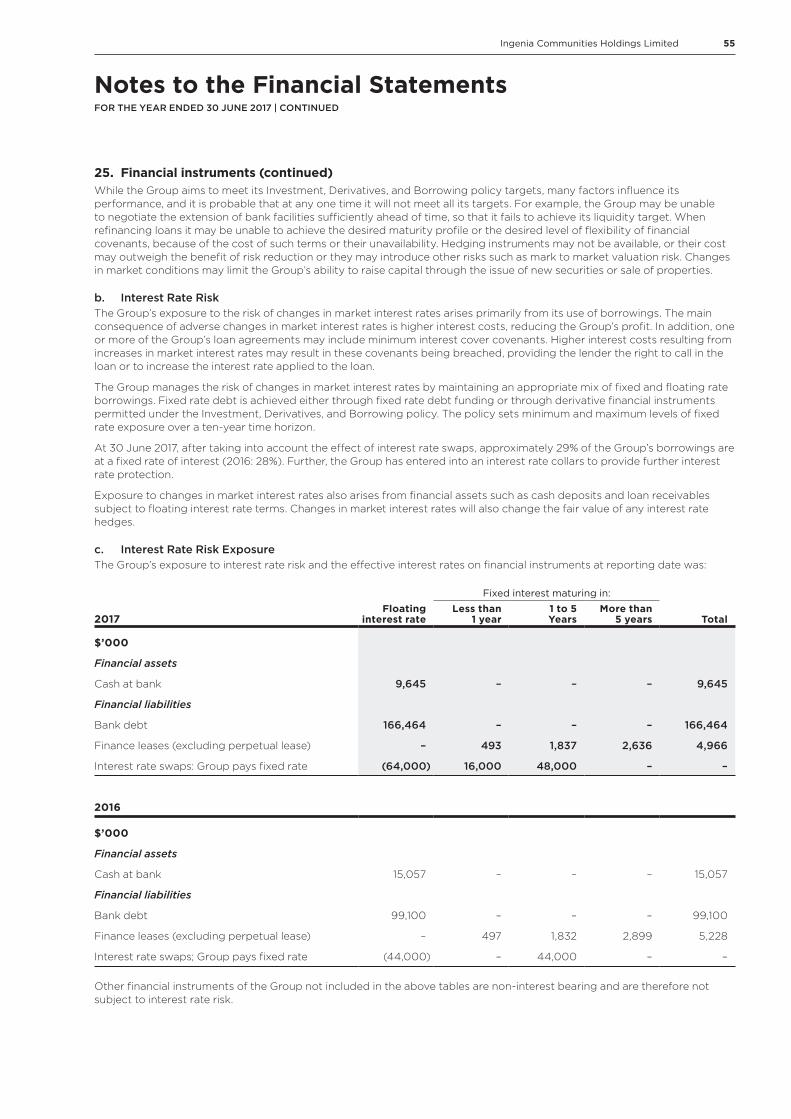
55Ingenia Communities Holdings Limited
25. Financial instruments (continued)While the Group aims to meet its Investment, Derivatives, and Borrowing policy targets, many factors influence its performance, and it is probable that at any one time it will not meet all its targets. For example, the Group may be unable to negotiate the extension of bank facilities sufficiently ahead of time, so that it fails to achieve its liquidity target. When refinancing loans it may be unable to achieve the desired maturity profile or the desired level of flexibility of financial covenants, because of the cost of such terms or their unavailability. Hedging instruments may not be available, or their cost may outweigh the benefit of risk reduction or they may introduce other risks such as mark to market valuation risk. Changes in market conditions may limit the Group’s ability to raise capital through the issue of new securities or sale of properties.
b. Interest Rate RiskThe Group’s exposure to the risk of changes in market interest rates arises primarily from its use of borrowings. The main consequence of adverse changes in market interest rates is higher interest costs, reducing the Group’s profit. In addition, one or more of the Group’s loan agreements may include minimum interest cover covenants. Higher interest costs resulting from increases in market interest rates may result in these covenants being breached, providing the lender the right to call in the loan or to increase the interest rate applied to the loan.
The Group manages the risk of changes in market interest rates by maintaining an appropriate mix of fixed and floating rate borrowings. Fixed rate debt is achieved either through fixed rate debt funding or through derivative financial instruments permitted under the Investment, Derivatives, and Borrowing policy. The policy sets minimum and maximum levels of fixed rate exposure over a ten-year time horizon.
At 30 June 2017, after taking into account the effect of interest rate swaps, approximately 29% of the Group’s borrowings are at a fixed rate of interest (2016: 28%). Further, the Group has entered into an interest rate collars to provide further interest rate protection.
Exposure to changes in market interest rates also arises from financial assets such as cash deposits and loan receivables subject to floating interest rate terms. Changes in market interest rates will also change the fair value of any interest rate hedges.
c. Interest Rate Risk ExposureThe Group’s exposure to interest rate risk and the effective interest rates on financial instruments at reporting date was:
Fixed interest maturing in:
2017Floating
interest rateLess than
1 year1 to 5Years
More than5 years Total
$’000
Financial assets
Cash at bank 9,645 – – – 9,645
Financial liabilities
Bank debt 166,464 – – – 166,464
Finance leases (excluding perpetual lease) – 493 1,837 2,636 4,966
Interest rate swaps: Group pays fixed rate (64,000) 16,000 48,000 – –
2016
$’000
Financial assets
Cash at bank 15,057 – – – 15,057
Financial liabilities
Bank debt 99,100 – – – 99,100
Finance leases (excluding perpetual lease) – 497 1,832 2,899 5,228
Interest rate swaps; Group pays fixed rate (44,000) – 44,000 – –
Other financial instruments of the Group not included in the above tables are non-interest bearing and are therefore not subject to interest rate risk.
Notes to the Financial StatementsFOR THE YEAR ENDED 30 JUNE 2017 | CONTINUED
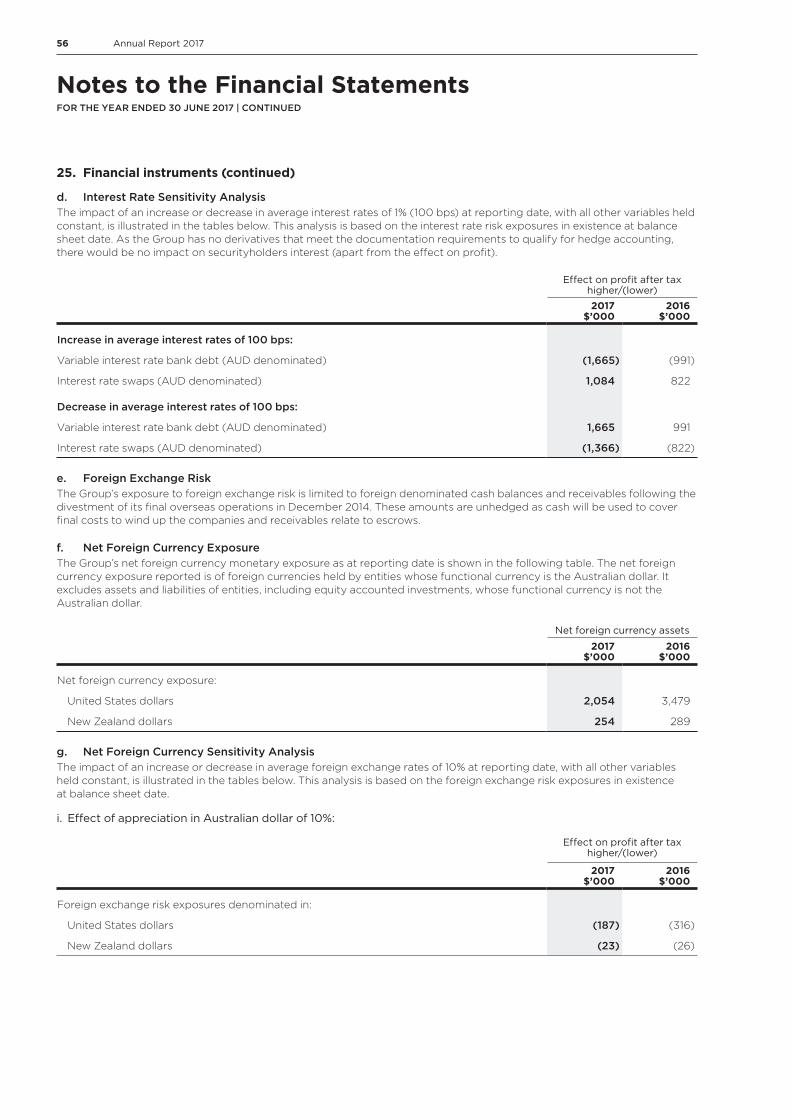
56 Annual Report 2017
Notes to the Financial StatementsFOR THE YEAR ENDED 30 JUNE 2017 | CONTINUED
25. Financial instruments (continued)
d. Interest Rate Sensitivity AnalysisThe impact of an increase or decrease in average interest rates of 1% (100 bps) at reporting date, with all other variables held constant, is illustrated in the tables below. This analysis is based on the interest rate risk exposures in existence at balance sheet date. As the Group has no derivatives that meet the documentation requirements to qualify for hedge accounting, there would be no impact on securityholders interest (apart from the effect on profit).
Effect on profit after tax higher/(lower)
2017$’000
2016$’000
Increase in average interest rates of 100 bps:
Variable interest rate bank debt (AUD denominated) (1,665) (991)
Interest rate swaps (AUD denominated) 1,084 822
Decrease in average interest rates of 100 bps:
Variable interest rate bank debt (AUD denominated) 1,665 991
Interest rate swaps (AUD denominated) (1,366) (822)
e. Foreign Exchange RiskThe Group’s exposure to foreign exchange risk is limited to foreign denominated cash balances and receivables following the divestment of its final overseas operations in December 2014. These amounts are unhedged as cash will be used to cover final costs to wind up the companies and receivables relate to escrows.
f. Net Foreign Currency ExposureThe Group’s net foreign currency monetary exposure as at reporting date is shown in the following table. The net foreign currency exposure reported is of foreign currencies held by entities whose functional currency is the Australian dollar. It excludes assets and liabilities of entities, including equity accounted investments, whose functional currency is not the Australian dollar.
Net foreign currency assets
2017$’000
2016$’000
Net foreign currency exposure:
United States dollars 2,054 3,479
New Zealand dollars 254 289
g. Net Foreign Currency Sensitivity AnalysisThe impact of an increase or decrease in average foreign exchange rates of 10% at reporting date, with all other variables held constant, is illustrated in the tables below. This analysis is based on the foreign exchange risk exposures in existence at balance sheet date.
i. Effect of appreciation in Australian dollar of 10%:
Effect on profit after tax higher/(lower)
2017$’000
2016$’000
Foreign exchange risk exposures denominated in:
United States dollars (187) (316)
New Zealand dollars (23) (26)

57Ingenia Communities Holdings Limited
25. Financial instruments (continued)
ii. Effect of depreciation in Australian dollar of 10%:
Effect on profit after tax higher/(lower)
2017$’000
2016$’000
Foreign exchange risk exposures denominated in:
United States dollars 228 387
New Zealand dollars 28 32
The Group believes that the reporting date risk exposures are representative of the risk exposure inherent in its financial instruments.
h. Credit RiskCredit risk refers to the risk that a counterparty defaults on its contractual obligations resulting in a financial loss to the Group.
The major credit risk for the Group is default by tenants, resulting in a loss of rental income while a replacement tenant is secured and further loss if the rent level agreed with the replacement tenant is below that previously paid by the defaulting tenant.
The Group assesses the credit risk of prospective tenants, the credit risk of in-place tenants when acquiring properties and the credit risk of existing tenants renewing upon expiry of their leases. Factors taken into account when assessing credit risk include the financial strength of the prospective tenant and any form of security, for example a rental bond, to be provided.
The decision to accept the credit risk associated with leasing space to a particular tenant is balanced against the risk of the potential financial loss of not leasing up vacant space.
Rent receivable balances are monitored on an ongoing basis and arrears actively followed up in order to reduce, where possible, the extent of any losses should the tenant subsequently default. The Group believes that its receivables that are neither past due nor impaired do not give rise to any significant credit risk.
Credit risk also arises from deposits placed with financial institutions and derivatives contracts that may have a positive value to the Group. The Group’s Investment, Derivatives, and Borrowing policy sets target limits for credit risk exposure with financial institutions and minimum counterparty credit ratings. Counterparty exposure is measured as the aggregate of all obligations of any single legal entity or economic entity to the Group, after allowing for appropriate set offs which are legally enforceable.
The Group’s maximum exposure to credit risk at reporting date in relation to each class of financial instrument is its carrying amount as reported in the balance sheet.
i. Liquidity RiskThe main objective of liquidity risk management is to reduce the risk that the Group does not have the resources available to meet its financial obligations and working capital and committed capital expenditure requirements. The Group’s Investment, Derivatives, and Borrowing policy sets a target for the level of cash and available undrawn debt facilities to cover future committed capital expenditure in the next year, 75% of forecast net operating cash flow in the next year, six months estimated distributions and 5% of the value of resident loan liabilities.
The Group may also be exposed to contingent liquidity risk under its term loan facilities, where term loan facilities include covenants which if breached give the lender the right to call in the loan, thereby accelerating a cash flow which otherwise was scheduled for the loan maturity. The Group monitors adherence to loan covenants on a regular basis, and the Investment, Derivatives, and Borrowing policy sets targets based on the ability to withstand adverse market movements and remain within loan covenant limits.
In addition, the Group targets the following benchmarks to ensure resilience to breaking covenants on its primary debt facilities:
– 10% reduction in value of assets for LVR covenants; and
– 2% nominal increase in interest rates combined with a 5% fall in income for ICR covenants.
The contractual maturities of the Group’s non-derivative financial liabilities at reporting date are reflected in the following table. It shows the undiscounted contractual cash flows required to discharge the liabilities at market rates.
Although the expected average residency term is more than ten years, retirement village residents’ loans are classified as current liabilities, as required by Accounting Standards, because the Group does not have an unconditional right to defer settlement to more than twelve months after reporting date.
Notes to the Financial StatementsFOR THE YEAR ENDED 30 JUNE 2017 | CONTINUED

58 Annual Report 2017
Notes to the Financial StatementsFOR THE YEAR ENDED 30 JUNE 2017 | CONTINUED
25. Financial instruments (continued)
2017
Less than 1 year $’000
1 to 5 Years $’000
More than 5 years $’000
Total $’000
Trade and other payables 25,983 168 – 26,151
Retirement village residents loans 27,201 – – 27,201
Borrowings 7,435 187,635 – 195,070
Provisions 1,480 344 – 1,824
Finance leases (excluding perpetual lease) 518 2,152 4,014 6,684
Finance lease (perpetual lease)(1) 121 483 – 604
62,738 190,782 4,014 257,534
2016
Trade and other payables 24,857 6,770 – 31,627
Retirement village residents loans 207,483 – – 207,483
Borrowings 4,572 38,153 65,711 108,436
Provisions 1,382 227 – 1,609
Finance leases (excluding perpetual lease) 510 2,119 4,565 7,194
Finance lease (perpetual lease)(1) 121 483 – 604
238,925 47,752 70,276 356,953
(1) For the purpose of the table above, lease payments are included for five years for the perpetual lease. Refer to Note 16(c).
The contractual maturities of the Group’s derivative financial liabilities at reporting date are reflected in the following table. It shows the undiscounted contractual cash flows required to discharge the instruments at market rates.
2017
Less than 1 year $’000
1 to 5 Years $’000
More than 5 years $’000
Total $’000
Liabilities
Derivative liabilities – net settled 221 61 – 282
2016
Liabilities
Derivative liabilities – net settled 121 287 – 408
j. Other Financial Instrument RiskThe Group carries retirement village residents’ loans at fair value with resulting fair value adjustments recognised in the income statement. The fair value of these loans is dependent on market prices for the related retirement village units. The impact of an increase or decrease in these market prices of 10% at reporting date, with all other variables held constant, is shown in the table below. This analysis is based on the retirement village residents’ loans in existence at reporting date.
Effect on profit after tax higher/(lower)
2017$’000
2016$’000
Increase in market prices of investment properties of 10% (3,016) (24,047)
Decrease in market prices of investment properties of 10% 3,016 24,047
These effects are largely offset by corresponding changes in the fair value of the Group’s investment properties. The effect on equity would be the same as the effect on profit.
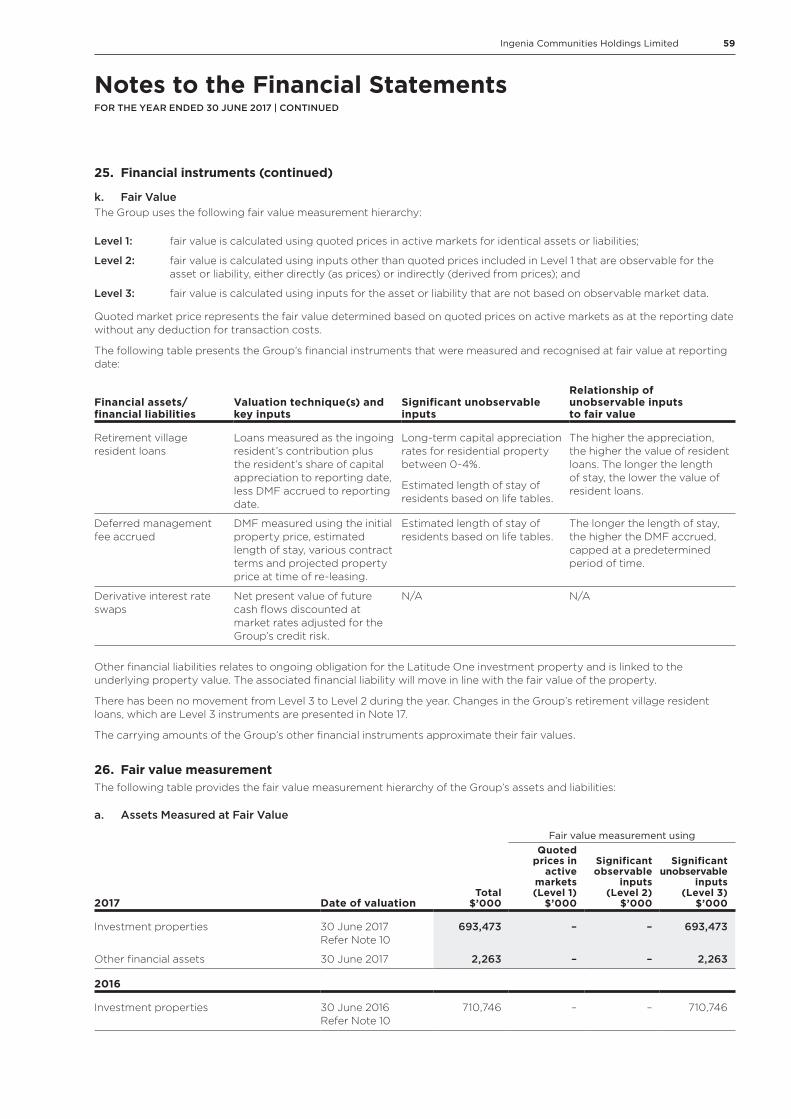
59Ingenia Communities Holdings Limited
25. Financial instruments (continued)
k. Fair ValueThe Group uses the following fair value measurement hierarchy:
Level 1: fair value is calculated using quoted prices in active markets for identical assets or liabilities;
Level 2: fair value is calculated using inputs other than quoted prices included in Level 1 that are observable for the asset or liability, either directly (as prices) or indirectly (derived from prices); and
Level 3: fair value is calculated using inputs for the asset or liability that are not based on observable market data.
Quoted market price represents the fair value determined based on quoted prices on active markets as at the reporting date without any deduction for transaction costs.
The following table presents the Group’s financial instruments that were measured and recognised at fair value at reporting date:
Financial assets/ financial liabilities
Valuation technique(s) and key inputs
Significant unobservable inputs
Relationship of unobservable inputs to fair value
Retirement village resident loans
Loans measured as the ingoing resident’s contribution plus the resident’s share of capital appreciation to reporting date, less DMF accrued to reporting date.
Long-term capital appreciation rates for residential property between 0-4%.
Estimated length of stay of residents based on life tables.
The higher the appreciation, the higher the value of resident loans. The longer the length of stay, the lower the value of resident loans.
Deferred management fee accrued
DMF measured using the initial property price, estimated length of stay, various contract terms and projected property price at time of re-leasing.
Estimated length of stay of residents based on life tables.
The longer the length of stay, the higher the DMF accrued, capped at a predetermined period of time.
Derivative interest rate swaps
Net present value of future cash flows discounted at market rates adjusted for the Group’s credit risk.
N/A N/A
Other financial liabilities relates to ongoing obligation for the Latitude One investment property and is linked to the underlying property value. The associated financial liability will move in line with the fair value of the property.
There has been no movement from Level 3 to Level 2 during the year. Changes in the Group’s retirement village resident loans, which are Level 3 instruments are presented in Note 17.
The carrying amounts of the Group’s other financial instruments approximate their fair values.
26. Fair value measurementThe following table provides the fair value measurement hierarchy of the Group’s assets and liabilities:
a. Assets Measured at Fair Value
Fair value measurement using
2017 Date of valuationTotal
$’000
Quoted prices in
active markets
(Level 1) $’000
Significant observable
inputs (Level 2)
$’000
Significant unobservable
inputs (Level 3)
$’000
Investment properties 30 June 2017 Refer Note 10
693,473 – – 693,473
Other financial assets 30 June 2017 2,263 – – 2,263
2016
Investment properties 30 June 2016 Refer Note 10
710,746 – – 710,746
Notes to the Financial StatementsFOR THE YEAR ENDED 30 JUNE 2017 | CONTINUED
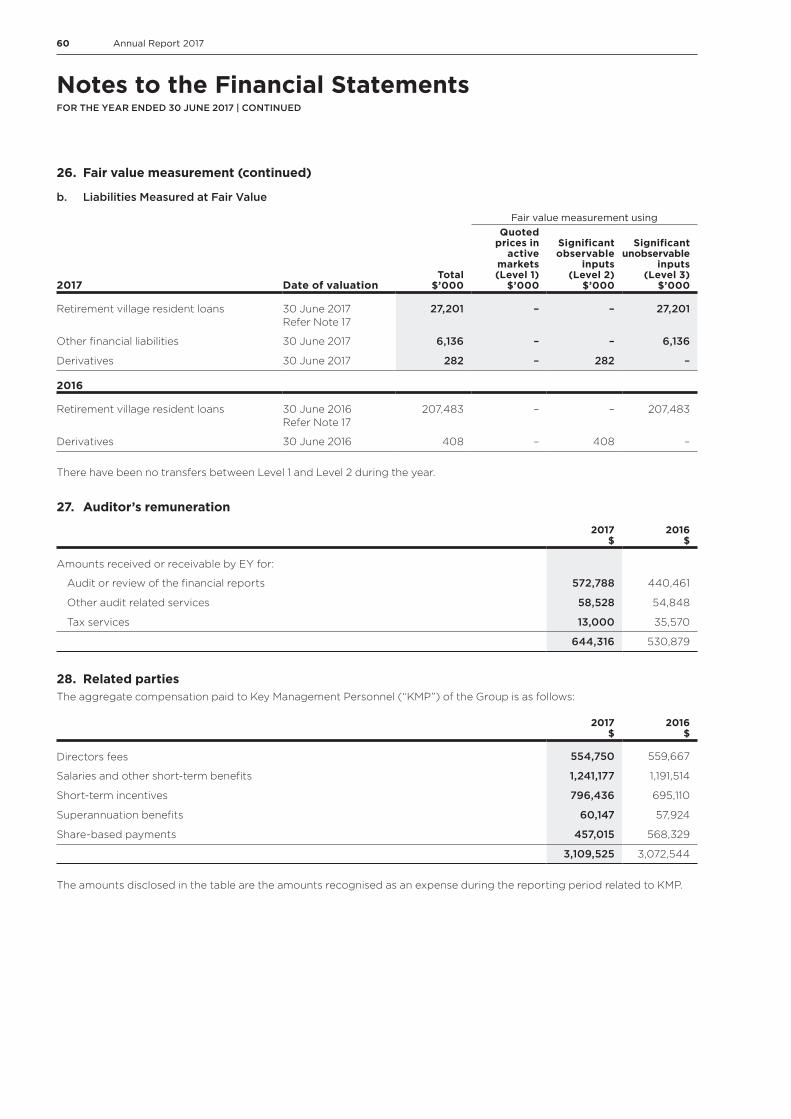
60 Annual Report 2017
Notes to the Financial StatementsFOR THE YEAR ENDED 30 JUNE 2017 | CONTINUED
26. Fair value measurement (continued)
b. Liabilities Measured at Fair Value
Fair value measurement using
2017 Date of valuationTotal
$’000
Quoted prices in
active markets
(Level 1) $’000
Significant observable
inputs (Level 2)
$’000
Significant unobservable
inputs (Level 3)
$’000
Retirement village resident loans 30 June 2017 Refer Note 17
27,201 – – 27,201
Other financial liabilities 30 June 2017 6,136 – – 6,136
Derivatives 30 June 2017 282 – 282 –
2016
Retirement village resident loans 30 June 2016 Refer Note 17
207,483 – – 207,483
Derivatives 30 June 2016 408 – 408 –
There have been no transfers between Level 1 and Level 2 during the year.
27. Auditor’s remuneration
2017$
2016$
Amounts received or receivable by EY for:
Audit or review of the financial reports 572,788 440,461
Other audit related services 58,528 54,848
Tax services 13,000 35,570
644,316 530,879
28. Related partiesThe aggregate compensation paid to Key Management Personnel (“KMP”) of the Group is as follows:
2017$
2016$
Directors fees 554,750 559,667
Salaries and other short-term benefits 1,241,177 1,191,514
Short-term incentives 796,436 695,110
Superannuation benefits 60,147 57,924
Share-based payments 457,015 568,329
3,109,525 3,072,544
The amounts disclosed in the table are the amounts recognised as an expense during the reporting period related to KMP.

61Ingenia Communities Holdings Limited
28. Related parties (continued)The aggregate rights outstanding of the Group held directly by KMP are as follows:
Number outstandingIssue date Right Type Expiry date 2017 2016
FY14 PQR FY17 – 619,333
FY15 STIP FY17 – 76,548
FY15 LTIP FY18 163,829 163,829
FY16 LTIP FY19 173,870 173,870
FY16 STIP FY18 122,850 –
FY17 LTIP FY20 173,161 –
633,710 1,033,580
29. Company financial informationSummary financial information about the Company is:
2017 $’000
2016 $’000
Current assets 106 189
Total assets 11,184 13,419
Current liabilities 690 1,633
Total liabilities 690 2,670
Net assets 10,494 10,750
Securityholders’ equity
Issued securities 11,131 10,205
Reserves 1,074 1,810
Accumulated losses (1,711) (1,265)
Total securityholders’ equity 10,494 10,750
Profit/(loss) from continuing operations (446) (1,631)
Net profit/(loss) attributable to securityholders (446) (1,631)
Total comprehensive income (446) (1,631)
The 2016 comparative information for the Company has been adjusted to realign the recognition of historical transactions within the individual stapled entities. This has resulted in an increase in net assets and equity of the Company as at 30 June 2016 of $9,889,000 and a reduction in net profit for the year ended on that date of $169,000. These adjustments are internal realignments only and do not impact the reported consolidated results of the Stapled Group.
Notes to the Financial StatementsFOR THE YEAR ENDED 30 JUNE 2017 | CONTINUED

62 Annual Report 2017
Notes to the Financial StatementsFOR THE YEAR ENDED 30 JUNE 2017 | CONTINUED
30. SubsidiariesThe consolidated financial statements incorporate the assets, liabilities and results of the following subsidiaries in accordance with the accounting policy described in Note 1(d):
Ownership interestCountry of residence
2017 %
2016 %
Bridge Street Trust Australia 100 100
Browns Plains Road Trust Australia 100 100
Casuarina Road Trust Australia 100 100
Edinburgh Drive Trust Australia 100 100
Garden Villages Management Trust Australia 100 100
INA Community Living Lynbrook Trust Australia 100 100
INA Community Living Subsidiary Trust Australia 100 100
INA Community Living Subsidiary Trust No. 2 Australia – 100
INA Garden Villages Pty Ltd Australia 100 100
INA Kiwi Communities Pty Ltd Australia 100 100
INA Kiwi Communities Subsidiary Trust No. 1 Australia 100 100
INA Management Pty Ltd Australia 100 100
INA Settlers Co Pty Ltd Australia 100 100
INA Sunny Communities Pty Ltd Australia 100 100
INA Sunny Trust Australia 100 100
Ingenia Communities RE Limited Australia 100 100
Jefferis Street Trust Australia 100 100
Lovett Street Trust Australia 100 100
Settlers Operations Trust Australia 100 100
Settlers Subsidiary Trust Australia 100 100
SunnyCove Gladstone Unit Trust Australia 100 100
SunnyCove Rockhampton Unit Trust Australia 100 100
Ridge Estate Trust Australia 100 100
Taylor Street (2) Trust Australia 100 100
INA Subsidiary Trust No. 1 Australia 100 100
INA Subsidiary Trust No. 3 Australia 100 100
INA Operations Pty Ltd Australia 100 100
INA Operations Trust No. 1 Australia 100 100
INA Operations Trust No. 2 Australia 100 100
INA Operations Trust No. 3 Australia 100 100
INA Operations Trust No. 4 (formerly INA Subsidiary Trust No. 2) Australia 100 100
INA Operations Trust No. 6 Australia 100 100
INA Operations Trust No. 7 Australia 100 100
INA Operations Trust No. 8 Australia 100 100
INA Operations Trust No. 9 Australia 100 100
Settlers Company Pty Limited (formerly INA Operations No. 2 Pty Ltd) Australia – 100
Settlers Management Pty Ltd Australia 100 –
INA Latitude One Pty Ltd Australia 100 –
INA Latitude One Development Pty Ltd Australia 100 –
INA Soldiers Point Pty Ltd Australia 100 –
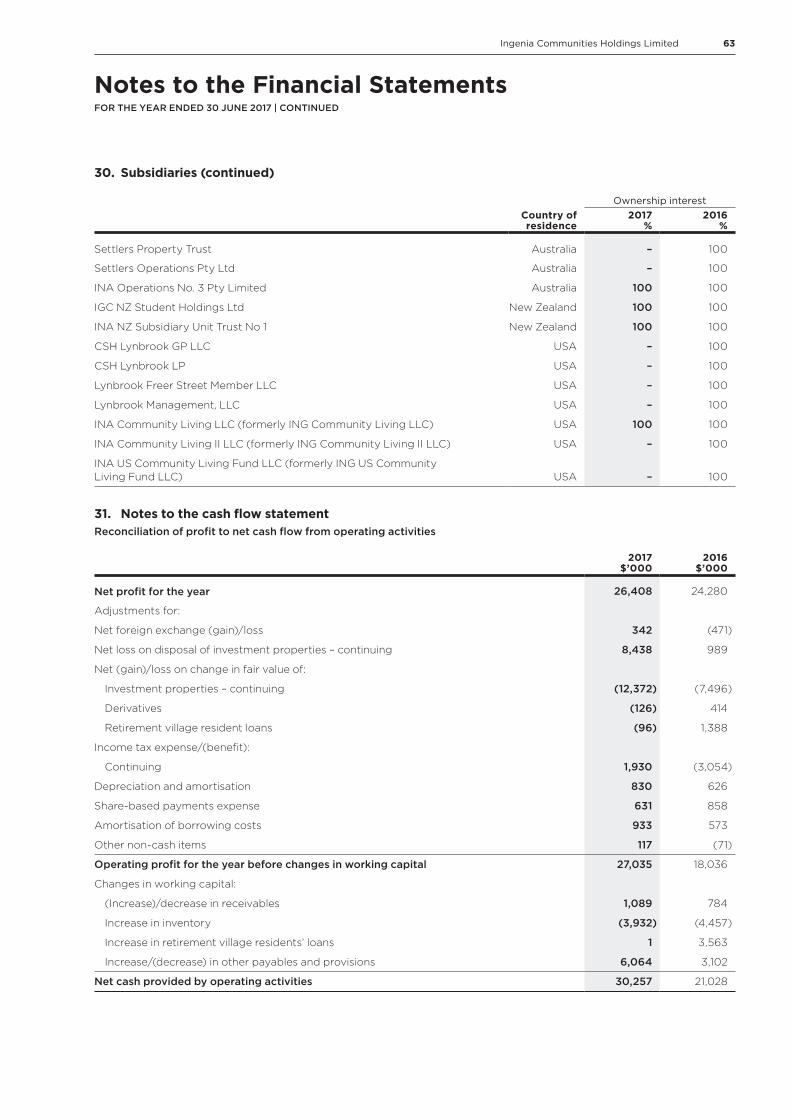
63Ingenia Communities Holdings Limited
Notes to the Financial StatementsFOR THE YEAR ENDED 30 JUNE 2017 | CONTINUED
30. Subsidiaries (continued)
Ownership interestCountry of residence
2017 %
2016 %
Settlers Property Trust Australia – 100
Settlers Operations Pty Ltd Australia – 100
INA Operations No. 3 Pty Limited Australia 100 100
IGC NZ Student Holdings Ltd New Zealand 100 100
INA NZ Subsidiary Unit Trust No 1 New Zealand 100 100
CSH Lynbrook GP LLC USA – 100
CSH Lynbrook LP USA – 100
Lynbrook Freer Street Member LLC USA – 100
Lynbrook Management, LLC USA – 100
INA Community Living LLC (formerly ING Community Living LLC) USA 100 100
INA Community Living II LLC (formerly ING Community Living II LLC) USA – 100
INA US Community Living Fund LLC (formerly ING US Community Living Fund LLC) USA – 100
31. Notes to the cash flow statementReconciliation of profit to net cash flow from operating activities
2017 $’000
2016 $’000
Net profit for the year 26,408 24,280
Adjustments for:
Net foreign exchange (gain)/loss 342 (471)
Net loss on disposal of investment properties – continuing 8,438 989
Net (gain)/loss on change in fair value of:
Investment properties – continuing (12,372) (7,496)
Derivatives (126) 414
Retirement village resident loans (96) 1,388
Income tax expense/(benefit):
Continuing 1,930 (3,054)
Depreciation and amortisation 830 626
Share-based payments expense 631 858
Amortisation of borrowing costs 933 573
Other non-cash items 117 (71)
Operating profit for the year before changes in working capital 27,035 18,036
Changes in working capital:
(Increase)/decrease in receivables 1,089 784
Increase in inventory (3,932) (4,457)
Increase in retirement village residents’ loans 1 3,563
Increase/(decrease) in other payables and provisions 6,064 3,102
Net cash provided by operating activities 30,257 21,028

64 Annual Report 2017
32. Subsequent events
Final FY17 DistributionOn 22 August 2017, the directors of the Group resolved to declare a final distribution of 5.1 cps (2016: 5.1 cps amounting to $10.5 million to be paid at 13 September 2017. The distribution is 26.5% tax deferred and the dividend reinvestment plan will apply to the final distribution.
Acquisition of SheldonOn 31 July 2017, the Group signed an unconditional agreement to purchase Sheldon Caravan Park located in metropolitan Brisbane for $25.0 million.
Acquisition of GlenwoodOn 10 August 2017, the Group completed the acquisition of development approved land located north of Coffs Harbour, on the NSW mid-north coast, for a purchase price of $7.8 million.
Notes to the Financial StatementsFOR THE YEAR ENDED 30 JUNE 2017 | CONTINUED

65Ingenia Communities Holdings Limited
In accordance with a resolution of the directors of Ingenia Communities Holdings Limited, I state that:
1. In the opinion of the directors:
(a) the The financial statements and notes of Ingenia Communities Holdings Limited for the financial year ended 30 June 2017 are in accordance with the Corporations Act 2001, including:
(i) giving a true and fair view of its financial position as at 30 June 2017 and of its performance for the year ended on that date; and
(ii) complying with Accounting Standards (including Australian Accounting Interpretations) and Corporations Regulations 2001; and
(b) there are reasonable grounds to believe that Ingenia Communities Holdings Limited will be able to pay its debts as and when they become due and payable.
2. The financial statements and notes also comply with International Financial Reporting Standards as disclosed in Note 1(b).
3. This declaration has been made after receiving the declarations required to be made to the directors in accordance with section 295A of the Corporations Act 2001.
On behalf of the Board
Jim Hazel Chairman Sydney, 22 August 2017
Directors’ DeclarationFOR THE YEAR ENDED 30 JUNE 2017
66 Annual Report 2017
Independent Auditor’s ReportFOR THE YEAR ENDED 30 JUNE 2017
Ernst & Young200 George StreetSydney NSW 2000 AustraliaGPO Box 2646 Sydney NSW 2001
Tel: +61 2 9248 5555Fax: +61 2 9248 5959ey.com/au
A member firm of Ernst & Young Global LimitedLiability limited by a scheme approved under Professional Standards Legislation
Independent Auditor's Report to the Members of Ingenia Communities Holdings Limited
Report on the Audit of the Financial Report
Opinion
We have audited the financial report of Ingenia Communities Holdings Limited (the Company) and its subsidiaries (collectively the Group), which comprises the consolidated statement of financial position as at 30 June 2017, the consolidated statement of comprehensive income, consolidated statement of changes in equity and consolidated statement of cash flows for the year then ended, notes to the financial statements, including a summary of significant accounting policies, and the directors' declaration.
In our opinion, the accompanying financial report of the Group is in accordance with the Corporations Act 2001, including:
a) giving a true and fair view of the consolidated financial position of the Group as at 30 June 2017 and of its consolidated financial performance for the year ended on that date; and
b) complying with Australian Accounting Standards and the Corporations Regulations 2001.
Basis for Opinion
We conducted our audit in accordance with Australian Auditing Standards. Our responsibilities under those standards are further described in the Auditor’s Responsibilities for the Audit of the Financial Report section of our report. We are independent of the Group in accordance with the auditor independence requirements of the Corporations Act 2001 and the ethical requirements of the Accounting Professional and Ethical Standards Board’s APES 110 Code of Ethics for Professional Accountants (the Code) that are relevant to our audit of the financial report in Australia. We have also fulfilled our other ethical responsibilities in accordance with the Code.
We believe that the audit evidence we have obtained is sufficient and appropriate to provide a basis for our opinion.
Key Audit Matters
Key audit matters are those matters that, in our professional judgment, were of most significance in our audit of the financial report of the current year. These matters were addressed in the context of our audit of the financial report as a whole, and in forming our opinion thereon, but we do not provide a separate opinion on these matters. For each matter below, our description of how our audit addressed the matter is provided in that context.
67Ingenia Communities Holdings Limited
Independent Auditor’s ReportFOR THE YEAR ENDED 30 JUNE 2017 | CONTINUED
A member firm of Ernst & Young Global LimitedLiability limited by a scheme approved under Professional Standards Legislation
2
We have fulfilled the responsibilities described in the Auditor’s Responsibilities for the Audit of the Financial Report section of our report, including in relation to these matters. Accordingly, our audit included the performance of procedures designed to respond to our assessment of the risks of material misstatement of the financial report. The results of our audit procedures, including the procedures performed to address the matters below, provide the basis for our audit opinion on the accompanying financial report. 1. Valuation of Investment Property
Why significant How our audit addressed the key audit matter
Approximately 93% of the Group’s total assets comprise investment properties. These assets are carried at fair value, which is assessed by the directors with reference to either external independent valuations or internal valuations, and is based on market conditions existing at reporting date.
This is considered a key audit matter as valuations contain a number of assumptions which are based on direct market comparisons, or estimates. Minor changes in certain assumptions can lead to significant changes in the valuation.
The Group has three categories of investment properties as disclosed in note 10 to the financial report.
• The Garden Villages portfolio consists of investment properties earning revenue predominantly from longer term rental agreements and the key judgements include capitalisation rates, discount rates, market and contractual rent and forecast occupancy levels.
• The Settlers portfolio consists of investment properties earning revenue predominantly via deferred management fee arrangements and key judgments include assessing discount rates, growth rates in property values and average length of stay of residents.
In obtaining sufficient audit evidence:
• We considered the objectivity, independence and competence of the external valuers and evaluated the suitability of their valuation scope and methodology for the financial report;
• We assessed the Group’s internal valuation methodology and on a sample basis checked the mathematical accuracy of their valuation models. We also assessed the competence of the internal valuer;
• On a sample basis we assessed the property related data used as input for both the external and internal valuations against actual and budgeted property performance; and
• We considered the key inputs and assumptions used in the valuations by comparing this information to external market data, where we involved our real estate valuation specialists.

68 Annual Report 2017
A member firm of Ernst & Young Global LimitedLiability limited by a scheme approved under Professional Standards Legislation
3
• The Lifestyle & Holidays portfolio consists of investment properties earning revenue from a mix of longer term land rental agreements and short-term accommodation rental. In addition the group earns revenue from the sale of manufactured homes to residents of the properties.
The key judgements for the longer term and short-term rental include capitalisation rates, market and contractual rents, forecast short-term and residential occupancy levels, historical transactions and remaining development potential for vacant land. In assessing the development potential, additional key judgments include future new homes sales prices, estimated capital expenditure, discount rates, projected property growth rates and operating profit margins.
2. Deferred tax assets
Why significant How our audit addressed the key audit matter
The Group has recorded net deferred tax assets of $7.5m in the financial report resulting from temporary differences and tax losses carried forward as disclosed in note 14 to the financial report. The Group recognises these deferred tax assets to the extent that it is probable that future taxable profits will allow the deferred tax assets to be recovered. The probability of recovery is impacted by uncertainties regarding the likely timing and level of future taxable profits.
In obtaining sufficient audit evidence:
• We evaluated assumptions and methodologies used by the Group to forecast future taxable profits to determine the likelihood that the losses will be recovered; and
• We checked that information used to forecast future taxable profits was derived from the Group’s business cash flow forecasts that have been subject to internal reviews and were approved by those charged with governance.
Independent Auditor’s ReportFOR THE YEAR ENDED 30 JUNE 2017 | CONTINUED
69Ingenia Communities Holdings Limited
Independent Auditor’s ReportFOR THE YEAR ENDED 30 JUNE 2017 | CONTINUED
A member firm of Ernst & Young Global LimitedLiability limited by a scheme approved under Professional Standards Legislation
4
Information Other than the Financial Report and Auditor’s Report
The directors are responsible for the other information. The other information comprises the information included in the Group’s 2017 Annual Report other than the financial report and our auditor’s report thereon. We obtained the Directors’ Report that is to be included in the Annual Report, prior to the date of this auditor’s report, and we expect to obtain the remaining sections of the Annual Report after the date of this auditor’s report.
Our opinion on the financial report does not cover the other information and we do not and will not express any form of assurance conclusion thereon.
In connection with our audit of the financial report, our responsibility is to read the other information and, in doing so, consider whether the other information is materially inconsistent with the financial report or our knowledge obtained in the audit or otherwise appears to be materially misstated.
If, based on the work we have performed on the other information obtained prior to the date of this auditor’s report, we conclude that there is a material misstatement of this other information, we are required to report that fact. We have nothing to report in this regard.
Responsibilities of the Directors for the Financial Report
The directors of the Company are responsible for the preparation of the financial report that gives a true and fair view in accordance with Australian Accounting Standards and the Corporations Act 2001 and for such internal control as the directors determine is necessary to enable the preparation of the financial report that gives a true and fair view and is free from material misstatement, whether due to fraud or error.
In preparing the financial report, the directors are responsible for assessing the Group’s ability to continue as a going concern, disclosing, as applicable, matters relating to going concern and using the going concern basis of accounting unless the directors either intend to liquidate the Group or to cease operations, or have no realistic alternative but to do so.
Auditor's Responsibilities for the Audit of the Financial Report
Our objectives are to obtain reasonable assurance about whether the financial report as a whole is free from material misstatement, whether due to fraud or error, and to issue an auditor’s report that includes our opinion. Reasonable assurance is a high level of assurance, but is not a guarantee that an audit conducted in accordance with the Australian Auditing Standards will always detect a material misstatement when it exists. Misstatements can arise from fraud or error and are considered material if, individually or in the aggregate, they could reasonably be expected to influence the economic decisions of users taken on the basis of this financial report.
As part of an audit in accordance with the Australian Auditing Standards, we exercise professional judgment and maintain professional scepticism throughout the audit. We also:

70 Annual Report 2017
A member firm of Ernst & Young Global LimitedLiability limited by a scheme approved under Professional Standards Legislation
5
Identify and assess the risks of material misstatement of the financial report, whether due to fraud or error, design and perform audit procedures responsive to those risks, and obtain audit evidence that is sufficient and appropriate to provide a basis for our opinion. The risk of not detecting a material misstatement resulting from fraud is higher than for one resulting from error, as fraud may involve collusion, forgery, intentional omissions, misrepresentations, or the override of internal control.
Obtain an understanding of internal control relevant to the audit in order to design audit
procedures that are appropriate in the circumstances, but not for the purpose of expressing an opinion on the effectiveness of the Group’s internal control.
Evaluate the appropriateness of accounting policies used and the reasonableness of accounting
estimates and related disclosures made by the directors.
Conclude on the appropriateness of the directors’ use of the going concern basis of accounting and, based on the audit evidence obtained, whether a material uncertainty exists related to events or conditions that may cast significant doubt on the Group’s ability to continue as a going concern. If we conclude that a material uncertainty exists, we are required to draw attention in our auditor’s report to the related disclosures in the financial report or, if such disclosures are inadequate, to modify our opinion. Our conclusions are based on the audit evidence obtained up to the date of our auditor’s report. However, future events or conditions may cause the Group to cease to continue as a going concern.
Evaluate the overall presentation, structure and content of the financial report, including the
disclosures, and whether the financial report represents the underlying transactions and events in a manner that achieves fair presentation.
Obtain sufficient appropriate audit evidence regarding the financial information of the entities or
business activities within the Group to express an opinion on the financial report. We are responsible for the direction, supervision and performance of the Group audit. We remain solely responsible for our audit opinion.
We communicate with the directors regarding, among other matters, the planned scope and timing of the audit and significant audit findings, including any significant deficiencies in internal control that we identify during our audit. We also provide the directors with a statement that we have complied with relevant ethical requirements regarding independence, and to communicate with them all relationships and other matters that may reasonably be thought to bear on our independence, and where applicable, related safeguards.
From the matters communicated to the directors, we determine those matters that were of most significance in the audit of the financial report of the current year and are therefore the key audit matters. We describe these matters in our auditor’s report unless law or regulation precludes public disclosure about the matter or when, in extremely rare circumstances, we determine that a matter should not be communicated in our report because the adverse consequences of doing so would reasonably be expected to outweigh the public interest benefits of such communication.
Independent Auditor’s ReportFOR THE YEAR ENDED 30 JUNE 2017 | CONTINUED
71Ingenia Communities Holdings Limited
Independent Auditor’s ReportFOR THE YEAR ENDED 30 JUNE 2017 | CONTINUED
A member firm of Ernst & Young Global LimitedLiability limited by a scheme approved under Professional Standards Legislation
6
Report on the Audit of the Remuneration Report
Opinion on the Remuneration Report
We have audited the Remuneration Report included in pages 10 to 21 of the directors' report for the year ended 30 June 2017.
In our opinion, the Remuneration Report of Ingenia Communities Holdings Limited for the year ended 30 June 2017, complies with section 300A of the Corporations Act 2001.
Responsibilities
The directors of the Company are responsible for the preparation and presentation of the Remuneration Report in accordance with section 300A of the Corporations Act 2001. Our responsibility is to express an opinion on the Remuneration Report, based on our audit conducted in accordance with Australian Auditing Standards.
Ernst & Young
Chris Lawton Partner Sydney 22 August 2017

72 Annual Report 2017
Ingenia Communities Fund & Ingenia Communities Management Trust Annual ReportsFOR THE YEAR ENDED 30 JUNE 2017
Contents
Directors’ Report 73Auditor’s Independence Declaration 76Consolidated Statements of Comprehensive Income 77Consolidated Balance Sheets 79Consolidated Cash Flow Statements 81Statements of Changes in Unitholders’ Interest 82Notes to the Financial Statements 83
1. Summary of significant accounting policies 832. Accounting estimates and judgements 893. Segment information 914. Earnings per unit 955. Income tax expense 956. Trade and other receivables 967. Inventories 978. Investment properties 979. Assets and liabilities held for sale 9810. Plant and equipment 9811. Intangibles 9912. Deferred tax assets and liabilities 9913. Trade and other payables 9914. Borrowings 10015. Retirement village resident loans 10116. Issued units 10217. Accumulated losses and retained earnings 10218. Commitments 10319. Contingencies 10320. Capital management 10321. Financial instruments 10422. Fair value measurement 10923. Auditor’s remuneration 11024. Related parties 11125. Parent financial information 11326. Subsidiaries 11427. Notes to the cash flow statements 11528. Subsequent events 115
Directors’ Declaration 116Independent Auditor’s Report 117
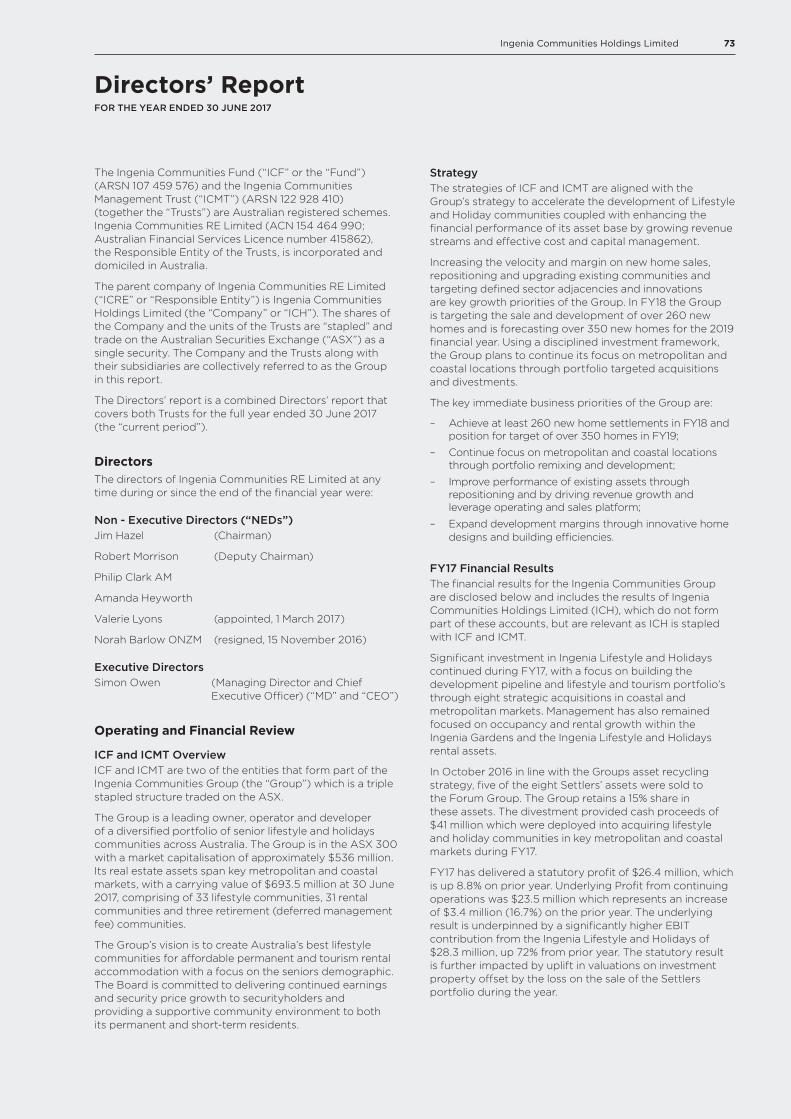
73Ingenia Communities Holdings Limited
The Ingenia Communities Fund (“ICF” or the “Fund”) (ARSN 107 459 576) and the Ingenia Communities Management Trust (“ICMT”) (ARSN 122 928 410) (together the “Trusts”) are Australian registered schemes. Ingenia Communities RE Limited (ACN 154 464 990; Australian Financial Services Licence number 415862), the Responsible Entity of the Trusts, is incorporated and domiciled in Australia.
The parent company of Ingenia Communities RE Limited (“ICRE” or “Responsible Entity”) is Ingenia Communities Holdings Limited (the “Company” or “ICH”). The shares of the Company and the units of the Trusts are “stapled” and trade on the Australian Securities Exchange (“ASX”) as a single security. The Company and the Trusts along with their subsidiaries are collectively referred to as the Group in this report.
The Directors’ report is a combined Directors’ report that covers both Trusts for the full year ended 30 June 2017 (the “current period”).
DirectorsThe directors of Ingenia Communities RE Limited at any time during or since the end of the financial year were:
Non - Executive Directors (“NEDs”)Jim Hazel (Chairman)
Robert Morrison (Deputy Chairman)
Philip Clark AM
Amanda Heyworth
Valerie Lyons (appointed, 1 March 2017)
Norah Barlow ONZM (resigned, 15 November 2016)
Executive DirectorsSimon Owen (Managing Director and Chief
Executive Officer) (“MD” and “CEO”)
Operating and Financial Review
ICF and ICMT OverviewICF and ICMT are two of the entities that form part of the Ingenia Communities Group (the “Group”) which is a triple stapled structure traded on the ASX.
The Group is a leading owner, operator and developer of a diversified portfolio of senior lifestyle and holidays communities across Australia. The Group is in the ASX 300 with a market capitalisation of approximately $536 million. Its real estate assets span key metropolitan and coastal markets, with a carrying value of $693.5 million at 30 June 2017, comprising of 33 lifestyle communities, 31 rental communities and three retirement (deferred management fee) communities.
The Group’s vision is to create Australia’s best lifestyle communities for affordable permanent and tourism rental accommodation with a focus on the seniors demographic. The Board is committed to delivering continued earnings and security price growth to securityholders and providing a supportive community environment to both its permanent and short-term residents.
StrategyThe strategies of ICF and ICMT are aligned with the Group’s strategy to accelerate the development of Lifestyle and Holiday communities coupled with enhancing the financial performance of its asset base by growing revenue streams and effective cost and capital management.
Increasing the velocity and margin on new home sales, repositioning and upgrading existing communities and targeting defined sector adjacencies and innovations are key growth priorities of the Group. In FY18 the Group is targeting the sale and development of over 260 new homes and is forecasting over 350 new homes for the 2019 financial year. Using a disciplined investment framework, the Group plans to continue its focus on metropolitan and coastal locations through portfolio targeted acquisitions and divestments.
The key immediate business priorities of the Group are:
– Achieve at least 260 new home settlements in FY18 and position for target of over 350 homes in FY19;
– Continue focus on metropolitan and coastal locations through portfolio remixing and development;
– Improve performance of existing assets through repositioning and by driving revenue growth and leverage operating and sales platform;
– Expand development margins through innovative home designs and building efficiencies.
FY17 Financial ResultsThe financial results for the Ingenia Communities Group are disclosed below and includes the results of Ingenia Communities Holdings Limited (ICH), which do not form part of these accounts, but are relevant as ICH is stapled with ICF and ICMT.
Significant investment in Ingenia Lifestyle and Holidays continued during FY17, with a focus on building the development pipeline and lifestyle and tourism portfolio’s through eight strategic acquisitions in coastal and metropolitan markets. Management has also remained focused on occupancy and rental growth within the Ingenia Gardens and the Ingenia Lifestyle and Holidays rental assets.
In October 2016 in line with the Groups asset recycling strategy, five of the eight Settlers’ assets were sold to the Forum Group. The Group retains a 15% share in these assets. The divestment provided cash proceeds of $41 million which were deployed into acquiring lifestyle and holiday communities in key metropolitan and coastal markets during FY17.
FY17 has delivered a statutory profit of $26.4 million, which is up 8.8% on prior year. Underlying Profit from continuing operations was $23.5 million which represents an increase of $3.4 million (16.7%) on the prior year. The underlying result is underpinned by a significantly higher EBIT contribution from the Ingenia Lifestyle and Holidays of $28.3 million, up 72% from prior year. The statutory result is further impacted by uplift in valuations on investment property offset by the loss on the sale of the Settlers portfolio during the year.
Directors’ ReportFOR THE YEAR ENDED 30 JUNE 2017
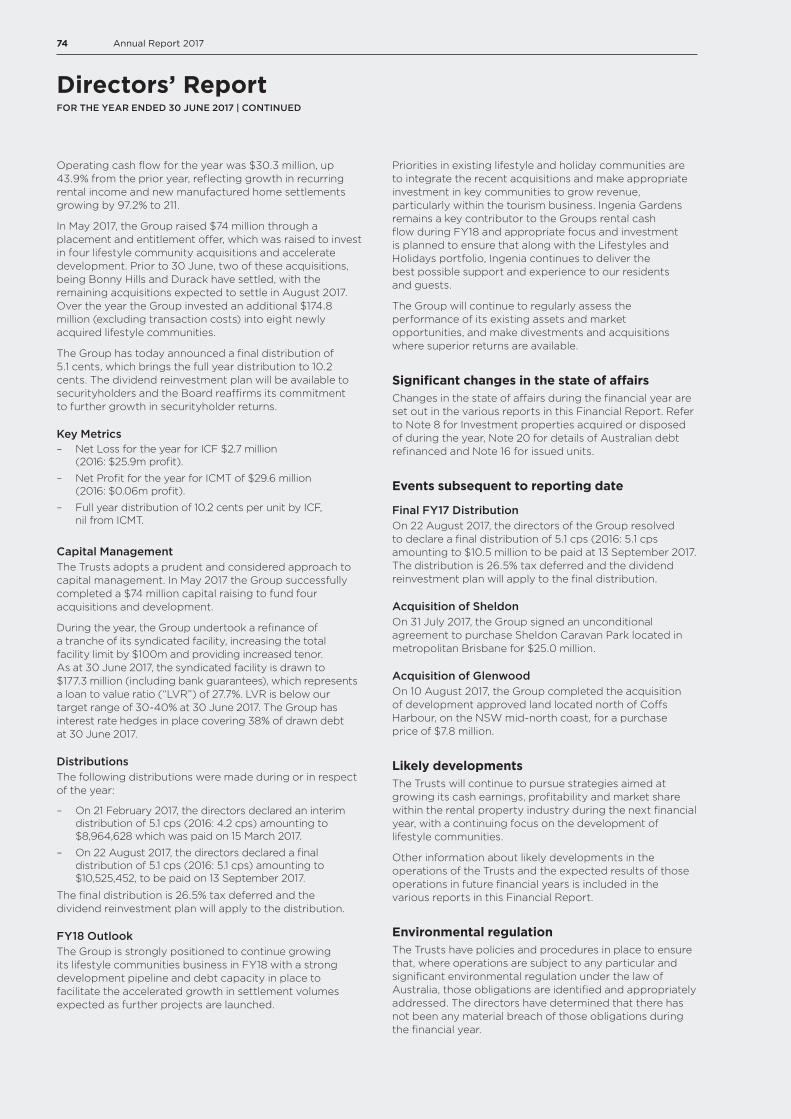
74 Annual Report 2017
Operating cash flow for the year was $30.3 million, up 43.9% from the prior year, reflecting growth in recurring rental income and new manufactured home settlements growing by 97.2% to 211.
In May 2017, the Group raised $74 million through a placement and entitlement offer, which was raised to invest in four lifestyle community acquisitions and accelerate development. Prior to 30 June, two of these acquisitions, being Bonny Hills and Durack have settled, with the remaining acquisitions expected to settle in August 2017. Over the year the Group invested an additional $174.8 million (excluding transaction costs) into eight newly acquired lifestyle communities.
The Group has today announced a final distribution of 5.1 cents, which brings the full year distribution to 10.2 cents. The dividend reinvestment plan will be available to securityholders and the Board reaffirms its commitment to further growth in securityholder returns.
Key Metrics – Net Loss for the year for ICF $2.7 million
(2016: $25.9m profit).
– Net Profit for the year for ICMT of $29.6 million (2016: $0.06m profit).
– Full year distribution of 10.2 cents per unit by ICF, nil from ICMT.
Capital ManagementThe Trusts adopts a prudent and considered approach to capital management. In May 2017 the Group successfully completed a $74 million capital raising to fund four acquisitions and development.
During the year, the Group undertook a refinance of a tranche of its syndicated facility, increasing the total facility limit by $100m and providing increased tenor. As at 30 June 2017, the syndicated facility is drawn to $177.3 million (including bank guarantees), which represents a loan to value ratio (“LVR”) of 27.7%. LVR is below our target range of 30-40% at 30 June 2017. The Group has interest rate hedges in place covering 38% of drawn debt at 30 June 2017.
DistributionsThe following distributions were made during or in respect of the year:
– On 21 February 2017, the directors declared an interim distribution of 5.1 cps (2016: 4.2 cps) amounting to $8,964,628 which was paid on 15 March 2017.
– On 22 August 2017, the directors declared a final distribution of 5.1 cps (2016: 5.1 cps) amounting to $10,525,452, to be paid on 13 September 2017.
The final distribution is 26.5% tax deferred and the dividend reinvestment plan will apply to the distribution.
FY18 OutlookThe Group is strongly positioned to continue growing its lifestyle communities business in FY18 with a strong development pipeline and debt capacity in place to facilitate the accelerated growth in settlement volumes expected as further projects are launched.
Priorities in existing lifestyle and holiday communities are to integrate the recent acquisitions and make appropriate investment in key communities to grow revenue, particularly within the tourism business. Ingenia Gardens remains a key contributor to the Groups rental cash flow during FY18 and appropriate focus and investment is planned to ensure that along with the Lifestyles and Holidays portfolio, Ingenia continues to deliver the best possible support and experience to our residents and guests.
The Group will continue to regularly assess the performance of its existing assets and market opportunities, and make divestments and acquisitions where superior returns are available.
Significant changes in the state of affairsChanges in the state of affairs during the financial year are set out in the various reports in this Financial Report. Refer to Note 8 for Investment properties acquired or disposed of during the year, Note 20 for details of Australian debt refinanced and Note 16 for issued units.
Events subsequent to reporting date
Final FY17 DistributionOn 22 August 2017, the directors of the Group resolved to declare a final distribution of 5.1 cps (2016: 5.1 cps amounting to $10.5 million to be paid at 13 September 2017. The distribution is 26.5% tax deferred and the dividend reinvestment plan will apply to the final distribution.
Acquisition of SheldonOn 31 July 2017, the Group signed an unconditional agreement to purchase Sheldon Caravan Park located in metropolitan Brisbane for $25.0 million.
Acquisition of GlenwoodOn 10 August 2017, the Group completed the acquisition of development approved land located north of Coffs Harbour, on the NSW mid-north coast, for a purchase price of $7.8 million.
Likely developmentsThe Trusts will continue to pursue strategies aimed at growing its cash earnings, profitability and market share within the rental property industry during the next financial year, with a continuing focus on the development of lifestyle communities.
Other information about likely developments in the operations of the Trusts and the expected results of those operations in future financial years is included in the various reports in this Financial Report.
Environmental regulationThe Trusts have policies and procedures in place to ensure that, where operations are subject to any particular and significant environmental regulation under the law of Australia, those obligations are identified and appropriately addressed. The directors have determined that there has not been any material breach of those obligations during the financial year.
Directors’ ReportFOR THE YEAR ENDED 30 JUNE 2017 | CONTINUED

75Ingenia Communities Holdings Limited
Group indemnitiesThe Group has purchased various insurance policies to cover a range of risks (subject to specified exclusions) for directors, officers and employees of the Group serving in their respective capacities. Key insurance policies include: directors and officers insurance, professional indemnity insurance and management liability insurance.
Indemnification of auditorTo the extent permitted by law, the Company has agreed to indemnify its auditor, Ernst & Young Australia, as part of the terms of its audit engagement agreement against claims by third parties arising from the audit (for an unspecified amount). No payment has been made to indemnify Ernst & Young during or since the financial year.
Interests of directors of the responsible entityUnits in each Trust held by directors of the Responsible Entity or associates of the directors as at 30 June 2017 were:
Issued stapled
securities Rights
Jim Hazel 331,483 –
Amanda Heyworth 122,485 –
Robert Morrison 107,146 –
Philip Clark AM 52,674 –
Valerie Lyons 13,969 –
Simon Owen 1,352,772 365,772
Other informationFees paid to the Responsible Entity and its associates, and the number of units in each Trust held by the Responsible Entity and its associates as at the end of the financial year are set out in Note 24 in the financial report.
Auditor’s Independence DeclarationA copy of the auditor’s independence declaration as required under section 307C of the Corporations Act 2001 is set out on page 76.
Auditor extensionOn 16 May 2015 at the recommendation of the Audit & Risk Committee, the directors granted an approval for the extension of the Group’s audit partner for a further one year, when the initial period of five years as permitted under the Corporations Act 2001 expired in June 2015. A further one year extension was granted on 15 October 2015.The Audit & Risk Committee’s recommendation was based on the need to ensure the completion of the audit firm’s succession plan for the audit. In doing so, the Audit & Risk Committee satisfied itself that the extension will maintain the quality of the audit and will not give rise to any conflicts of interest.
Rounding of amountsThe Trusts are of a kind referred to in Instrument 2016/191, issued by the Australian Securities and Investments Commission, relating to the ‘’rounding off’’ of amounts in this report and in the financial report. Amounts in these reports have been rounded off in accordance with that Class Order to the nearest thousand dollars, unless otherwise stated.
Signed in accordance with a resolution of the Directors of the Responsible Entity.
Jim HazelChairmanSydney, 22 August 2017
Directors’ ReportFOR THE YEAR ENDED 30 JUNE 2017 | CONTINUED

76 Annual Report 2017
Auditor’s Independence DeclarationFOR THE YEAR ENDED 30 JUNE 2017
A member firm of Ernst & Young Global Limited Liability limited by a scheme approved under Professional Standards Legislation
Ernst & Young 200 George Street Sydney NSW 2000 Australia GPO Box 2646 Sydney NSW 2001
Tel: +61 2 9248 5555 Fax: +61 2 9248 5959 ey.com/au
Auditor’s Independence Declaration to the Directors of Ingenia Communities RE Limited as Responsible Entity for Ingenia Communities Fund and Ingenia Communities Management Trust As lead auditor for the audit of Ingenia Communities Fund and its controlled entities and Ingenia Communities Management Trust and its controlled entities for the financial year ended 30 June 2017, I declare to the best of my knowledge and belief, there have been:
a) no contraventions of the auditor independence requirements of the Corporations Act 2001 in relation to the audit; and
b) no contraventions of any applicable code of professional conduct in relation to the audit. This declaration is in respect of Ingenia Communities Fund and the entities it controlled during the financial year and Ingenia Communities Management Trust and the entities it controlled during the financial year.
Ernst & Young
Chris Lawton Partner 22 August 2017
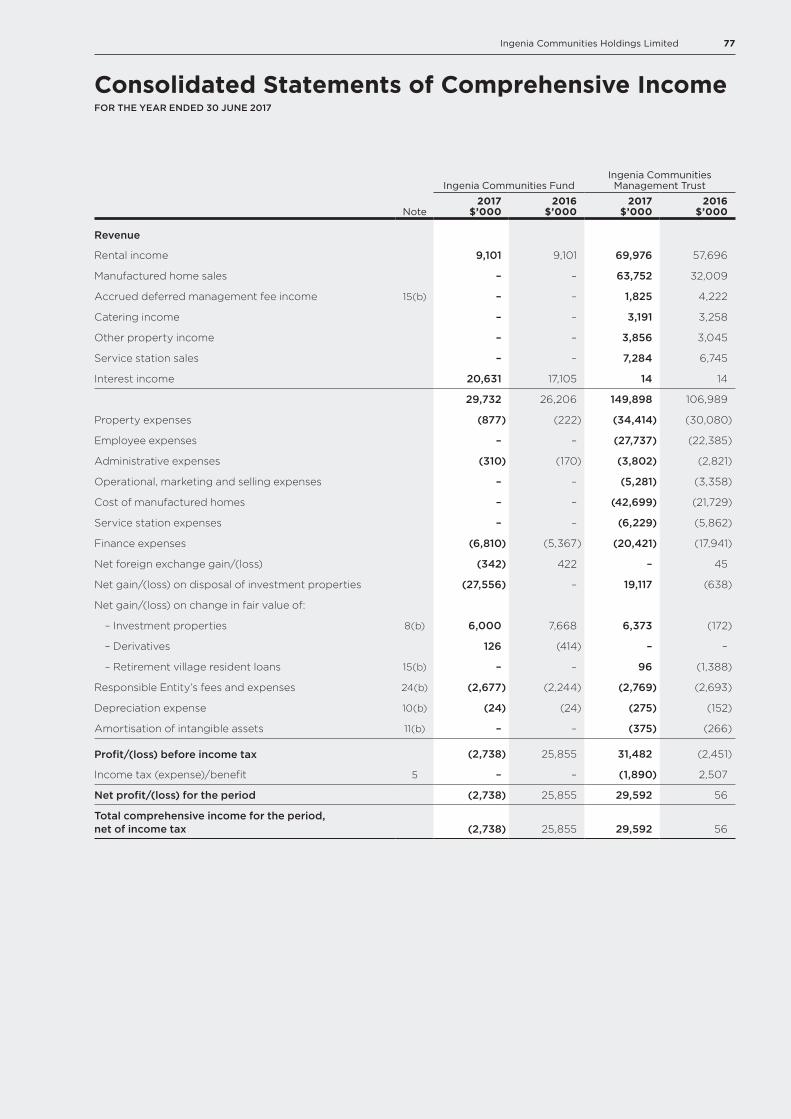
77Ingenia Communities Holdings Limited
Consolidated Statements of Comprehensive IncomeFOR THE YEAR ENDED 30 JUNE 2017
Note
Ingenia Communities FundIngenia CommunitiesManagement Trust
2017$’000
2016$’000
2017$’000
2016$’000
Revenue
Rental income 9,101 9,101 69,976 57,696
Manufactured home sales – – 63,752 32,009
Accrued deferred management fee income 15(b) – – 1,825 4,222
Catering income – – 3,191 3,258
Other property income – – 3,856 3,045
Service station sales – – 7,284 6,745
Interest income 20,631 17,105 14 14
29,732 26,206 149,898 106,989
Property expenses (877) (222) (34,414) (30,080)
Employee expenses – – (27,737) (22,385)
Administrative expenses (310) (170) (3,802) (2,821)
Operational, marketing and selling expenses – – (5,281) (3,358)
Cost of manufactured homes – – (42,699) (21,729)
Service station expenses – – (6,229) (5,862)
Finance expenses (6,810) (5,367) (20,421) (17,941)
Net foreign exchange gain/(loss) (342) 422 – 45
Net gain/(loss) on disposal of investment properties (27,556) – 19,117 (638)
Net gain/(loss) on change in fair value of:
– Investment properties 8(b) 6,000 7,668 6,373 (172)
– Derivatives 126 (414) – –
– Retirement village resident loans 15(b) – – 96 (1,388)
Responsible Entity’s fees and expenses 24(b) (2,677) (2,244) (2,769) (2,693)
Depreciation expense 10(b) (24) (24) (275) (152)
Amortisation of intangible assets 11(b) – – (375) (266)
Profit/(loss) before income tax (2,738) 25,855 31,482 (2,451)
Income tax (expense)/benefit 5 – – (1,890) 2,507
Net profit/(loss) for the period (2,738) 25,855 29,592 56
Total comprehensive income for the period, net of income tax (2,738) 25,855 29,592 56

78 Annual Report 2017
Consolidated Statements of Comprehensive IncomeFOR THE YEAR ENDED 30 JUNE 2017 | CONTINUED
Note
Ingenia Communities FundIngenia CommunitiesManagement Trust
2017$’000
2016$’000
2017$’000
2016$’000
Profit/(loss) attributable to unitholders of:
Ingenia Communities Fund (2,738) 25,855 – –
Ingenia Communities Management Trust – – 29,592 56
(2,738) 25,855 29,592 56
Total comprehensive income attributable to unitholders of:
Ingenia Communities Fund (2,738) 25,855 – –
Ingenia Communities Management Trust – – 29,592 56
(2,738) 25,855 29,592 56
Note2017
Cents2016
Cents2017
Cents2016
Cents
Distributions per unit(1) 10.2 8.4 – –
Earnings per unit(1):
Basic earnings 4 (1.5) 14.6 16.4 –
Diluted earnings 4 (1.5) 14.5 16.4 –
(1) Distributions relate to the amount paid during the financial year. A final FY17 distribution of 5.1 cpu was declared on 22 August (payment due on 13 September 2017) resulting in a total FY17 distribution of 10.2cpu.
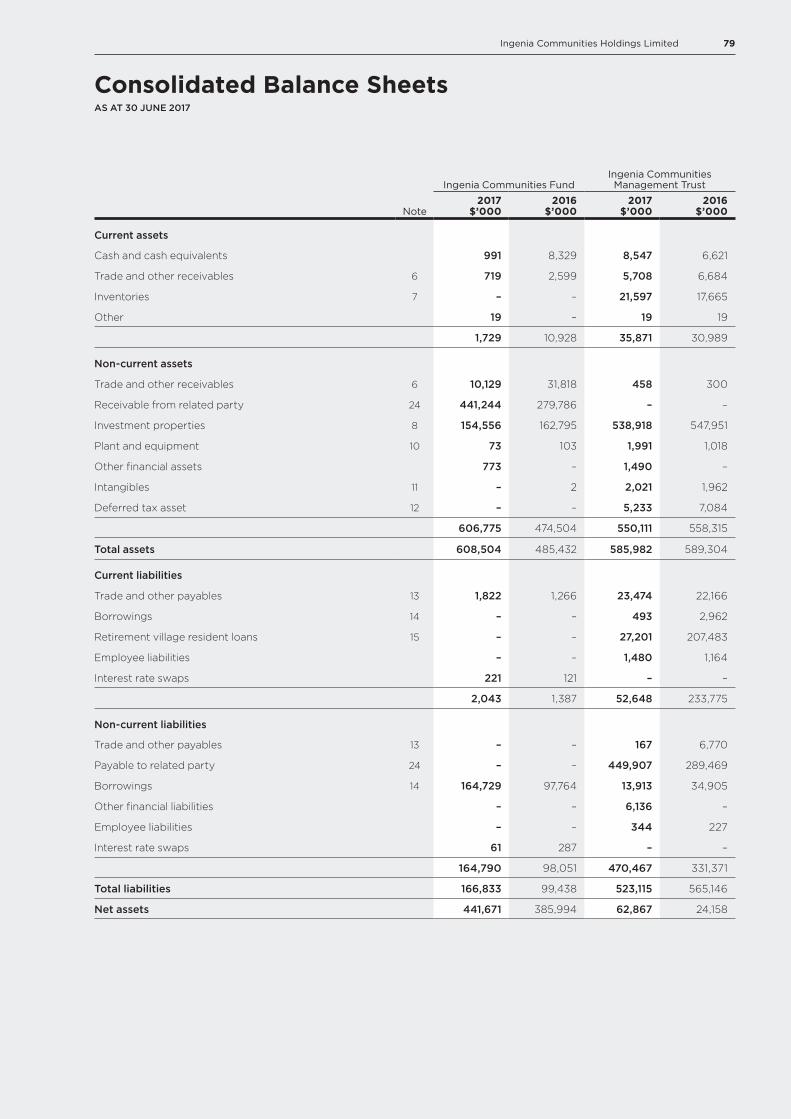
79Ingenia Communities Holdings Limited
Consolidated Balance SheetsAS AT 30 JUNE 2017
Note
Ingenia Communities FundIngenia Communities Management Trust
2017$’000
2016$’000
2017$’000
2016$’000
Current assets
Cash and cash equivalents 991 8,329 8,547 6,621
Trade and other receivables 6 719 2,599 5,708 6,684
Inventories 7 – – 21,597 17,665
Other 19 – 19 19
1,729 10,928 35,871 30,989
Non-current assets
Trade and other receivables 6 10,129 31,818 458 300
Receivable from related party 24 441,244 279,786 – –
Investment properties 8 154,556 162,795 538,918 547,951
Plant and equipment 10 73 103 1,991 1,018
Other financial assets 773 – 1,490 –
Intangibles 11 – 2 2,021 1,962
Deferred tax asset 12 – – 5,233 7,084
606,775 474,504 550,111 558,315
Total assets 608,504 485,432 585,982 589,304
Current liabilities
Trade and other payables 13 1,822 1,266 23,474 22,166
Borrowings 14 – – 493 2,962
Retirement village resident loans 15 – – 27,201 207,483
Employee liabilities – – 1,480 1,164
Interest rate swaps 221 121 – –
2,043 1,387 52,648 233,775
Non-current liabilities
Trade and other payables 13 – – 167 6,770
Payable to related party 24 – – 449,907 289,469
Borrowings 14 164,729 97,764 13,913 34,905
Other financial liabilities – – 6,136 –
Employee liabilities – – 344 227
Interest rate swaps 61 287 – –
164,790 98,051 470,467 331,371
Total liabilities 166,833 99,438 523,115 565,146
Net assets 441,671 385,994 62,867 24,158

80 Annual Report 2017
Note
Ingenia Communities FundIngenia Communities Management Trust
2017$’000
2016$’000
2017$’000
2016$’000
Equity
Issued units 16 755,571 679,161 43,136 34,019
(Accumulated losses)/retained earnings 17 (313,900) (293,167) 20,431 (9,161)
Unitholders’ interest 441,671 385,994 63,567 24,858
Non-controlling interest – – (700) (700)
Total equity 441,671 385,994 62,867 24,158
Attributable to unitholders of:
Ingenia Communities Fund 441,671 385,994 (700) (700)
Ingenia Communities Management Trust – – 63,567 24,858
441,671 385,994 62,867 24,158
Consolidated Balance SheetsAS AT 30 JUNE 2017 | CONTINUED

81Ingenia Communities Holdings Limited
Consolidated Cash Flow StatementsFOR THE YEAR ENDED 30 JUNE 2017
Note
Ingenia Communities FundIngenia Communities Management Trust
2017$’000
2016$’000
2017$’000
2016$’000
Cash flows from operating activities
Rental and other property income – – 82,542 71,147
Property and other expenses (77) (898) (58,523) (48,049)
Proceeds from sale of manufactured homes – – 63,402 35,054
Purchase of manufactured homes – – (47,587) (29,986)
Proceeds from sale of service station inventory – – 7,014 6,708
Purchase of service station inventory – – (6,620) (6,113)
Proceeds from resident loans – – 3,444 11,056
Repayment of resident loans – – (2,190) (5,757)
Interest received 157 104 11 20
Borrowing costs paid (5,803) (4,109) (353) (1,107)
Other – – 137 4
27 (5,723) (4,903) 41,277 32,977
Cash flows from investing activities
Purchase and additions of plant and equipment – (4) (1,259) (835)
Purchase and additions of intangible assets – – (284) (529)
Payments for investment properties – – (180,311) (85,113)
Additions to investment properties (3,829) (1,423) (23,361) (18,475)
Proceeds/(costs) from sale of investment properties – (36) 41,297 (16)
Amounts received from/villages – – – 24
(3,829) (1,463) (163,918) (104,944)
Cash flows from financing activities
Proceeds from the issue units 78,226 61,940 8,937 4,676
Payment of unit issue costs (4,472) (2,064) (299) (150)
Distributions to unitholders (17,952) (12,513) – –
Finance lease payments – – (643) (450)
(Repayment of)/proceeds from related party borrowings (119,879) (76,304) 116,564 68,384
Proceeds from borrowings 181,364 103,742 – –
Repayment of borrowings (114,000) (68,542) – –
Payments for debt issue costs (1,126) (559) – –
2,161 5,700 124,559 72,460
Net (decrease)/increase in cash and cash equivalents (7,391) (666) 1,918 493
Cash and cash equivalents at the beginning of the year 8,329 8,966 6,621 6,094
Effects of exchange rate fluctuation on cash held 53 29 8 34
Cash and cash equivalents at the end of the year 991 8,329 8,547 6,621
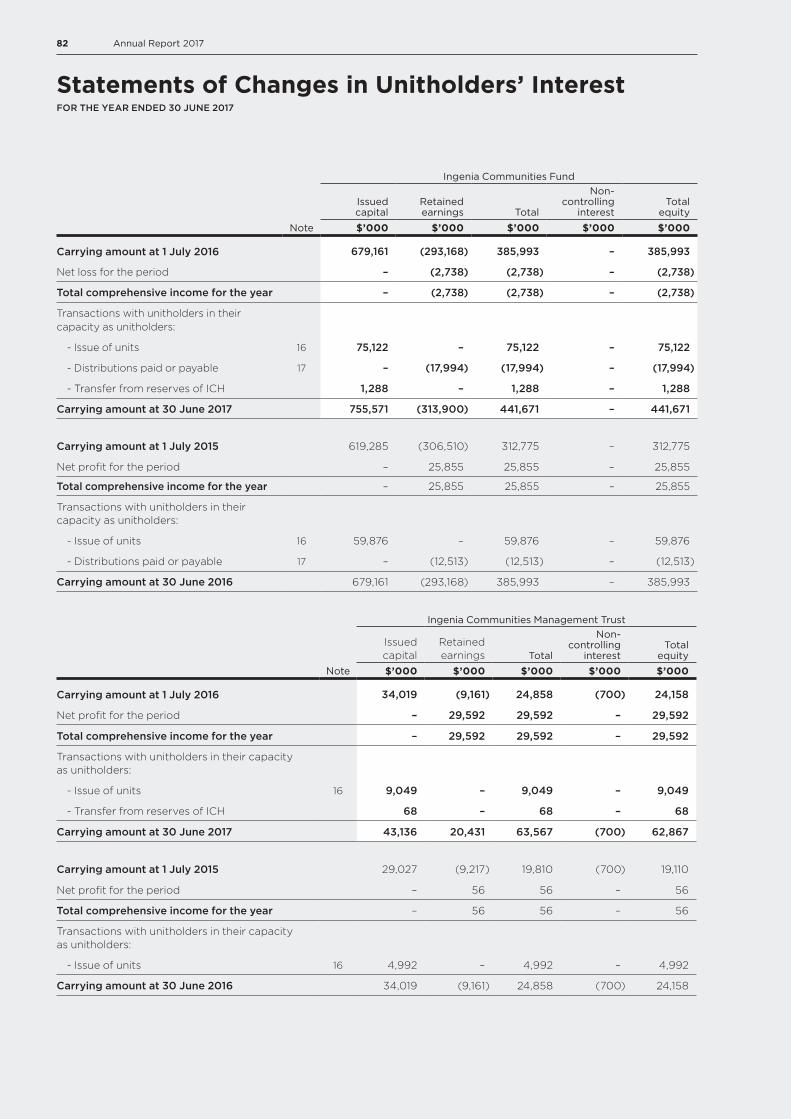
82 Annual Report 2017
Statements of Changes in Unitholders’ InterestFOR THE YEAR ENDED 30 JUNE 2017
Ingenia Communities Fund
Note
Issued capital
Retained earnings
Total
Non-controlling
interestTotal
equity
$’000 $’000 $’000 $’000 $’000
Carrying amount at 1 July 2016 679,161 (293,168) 385,993 – 385,993
Net loss for the period – (2,738) (2,738) – (2,738)
Total comprehensive income for the year – (2,738) (2,738) – (2,738)
Transactions with unitholders in their capacity as unitholders:
- Issue of units 16 75,122 – 75,122 – 75,122
- Distributions paid or payable 17 – (17,994) (17,994) – (17,994)
- Transfer from reserves of ICH 1,288 – 1,288 – 1,288
Carrying amount at 30 June 2017 755,571 (313,900) 441,671 – 441,671
Carrying amount at 1 July 2015 619,285 (306,510) 312,775 – 312,775
Net profit for the period – 25,855 25,855 – 25,855
Total comprehensive income for the year – 25,855 25,855 – 25,855
Transactions with unitholders in their capacity as unitholders:
- Issue of units 16 59,876 – 59,876 – 59,876
- Distributions paid or payable 17 – (12,513) (12,513) – (12,513)
Carrying amount at 30 June 2016 679,161 (293,168) 385,993 – 385,993
Ingenia Communities Management Trust
Note
Issued capital
Retained earnings Total
Non-controlling
interestTotal
equity
$’000 $’000 $’000 $’000 $’000
Carrying amount at 1 July 2016 34,019 (9,161) 24,858 (700) 24,158
Net profit for the period – 29,592 29,592 – 29,592
Total comprehensive income for the year – 29,592 29,592 – 29,592
Transactions with unitholders in their capacity as unitholders:
- Issue of units 16 9,049 – 9,049 – 9,049
- Transfer from reserves of ICH 68 – 68 – 68
Carrying amount at 30 June 2017 43,136 20,431 63,567 (700) 62,867
Carrying amount at 1 July 2015 29,027 (9,217) 19,810 (700) 19,110
Net profit for the period – 56 56 – 56
Total comprehensive income for the year – 56 56 – 56
Transactions with unitholders in their capacity as unitholders:
- Issue of units 16 4,992 – 4,992 – 4,992
Carrying amount at 30 June 2016 34,019 (9,161) 24,858 (700) 24,158
83Ingenia Communities Holdings Limited
Notes to the Financial StatementsFOR THE YEAR ENDED 30 JUNE 2017
1. Summary of significant accounting policies
a. The TrustsThe Ingenia Communities Fund (“ICF” or the “Fund”) (ARSN 107 459 576) and the Ingenia Communities Management Trust (“ICMT”) (ARSN 122 928 410) (together the “Trusts”) are Australian registered schemes. Ingenia Communities RE Limited (ACN 154 464 990; Australian Financial Services Licence number 415862), the Responsible Entity of the Trusts, is incorporated and domiciled in Australia.
The parent company of Ingenia Communities RE Limited is Ingenia Communities Holdings Limited (the “Company”). The shares of the Company and the units of the Trust are “stapled” and trade on the Australian Securities Exchange (“ASX”) as a single security. The Company and the Trust along with their subsidiaries are collectively referred to as the Group in this report.
The stapling structure will cease to operate on the first to occur of:
– the Company or either of the Trusts resolving by special resolution in accordance with its constitution to terminate the stapling provisions; or
– the commencement of the winding up of the Company or either of the Trusts.
The financial report as at and for the year ended 30 June 2017 was authorised for issue by the directors on 22 August 2017.
b. Basis of PreparationThe financial report is a general purpose financial report which has been prepared in accordance with Australian Accounting Standards (“AASB”), Australian Interpretations, other authoritative pronouncements of the Australian Accounting Standards Board (the “Board”) and the Corporations Act 2001.
As permitted by Instrument 2015/838, issued by the Australian Securities and Investments Commission, this financial report is a combined financial report that presents the financial statements and accompanying notes of both ICF and ICMT. The financial statements and accompanying notes of the Trusts have been presented within this financial report.
The financial report complies with Australian Accounting Standards as issued by the Australian Accounting Standards Board and International Financial Reporting Standards (“IFRS”) as issued by the International Accounting Standards Board.
The financial report is presented in Australian dollars and all values are rounded to the nearest thousand dollars ($’000) unless otherwise stated as permitted by Instrument 2016/191.
The financial report is prepared on an historical cost basis, except for investment properties, retirement village residents’ loans and derivative financial instruments, which are measured at fair value.
Where appropriate comparative amounts have been restated to ensure consistency of disclosure throughout the financial report. The 2016 comparative information for the Trusts has been adjusted to realign the recognition of historical transactions within the individual stapled entities. This has resulted in the following:
– For ICF, a reduction in net assets and equity as at 30 June 2016 of $6,186,000 and an increase in net profit for the year ended on that date of $3,874,000.
– For ICMT, a reduction in net assets and equity as at 30 June 2016 of $698,000.
These adjustments are internal realignments only and do not impact the reported consolidated results of the stapled Group.
As at 30 June 2017, ICMT recorded a net current asset deficiency of $16,777,000. This deficiency includes retirement village resident loans of $27,201,000. Resident loan obligations of the Trusts are classified as current liabilities due to the demand feature of these obligations despite the unlikely possibility that the majority of the loans will be settled within the next twelve months. Furthermore, if required, the proceeds from new resident loans could be used by the Trust to settle its existing loan obligations should those incumbent residents vacate their units. Intercompany loan balances of $448,028,000 are payable in the event of default or on termination date, being 30 June 2025 (or such other date as agreed by the parties in writing). Accordingly, there are reasonable grounds to believe that ICMT will be able to pay its debts as and when they become due and payable; and the financial report of ICMT has been prepared on a going concern basis.
c. Adoption of New and Revised Accounting Standards
No new or revised standards and interpretations were issued by the Australian Accounting Standards Board that are relevant to the Group during the period.
d. Principles of ConsolidationICF’s consolidated financial statements comprise the parent and its subsidiaries. ICMT’s consolidated financial statements comprise ICMT and its subsidiaries. Subsidiaries are all those entities (including special purpose entities) whose financial and operating policies a trust has the power to govern, so as to obtain benefits from their activities.
The financial statements of the subsidiaries are prepared for the same reporting period as the parent, using consistent accounting policies. Adjustments are made to bring into line dissimilar accounting policies. Inter-company balances and transactions including unrealised profits have been eliminated.
Subsidiaries are consolidated from the date on which the parent obtains control. They are de-consolidated from the date that control ceases.
Investments in subsidiaries are carried at cost in the parent’s financial statements.

84 Annual Report 2017
1. Summary of significant accounting policies (continued)
e. Business Combinations and GoodwillBusiness combinations are accounted for using the acquisition method. The cost of an acquisition is measured as the aggregate of the consideration transferred, measured at acquisition date fair value and the amount of any non-controlling interest in the acquiree. For each business combination, the Trusts elect whether it measures the non-controlling interest in the acquiree either at fair value or at the proportionate share of the acquiree’s identifiable net assets. Acquisition related costs incurred are expensed and included in other expenses.
When the Trusts acquire a business, they assess the financial assets and liabilities assumed for appropriate classification and designation in accordance with the contractual terms, economic circumstances and pertinent conditions as at the acquisition date.
If the business combination is achieved in stages, the acquisition date fair value of the acquirer’s previously held equity interest in the acquiree is remeasured to fair value at the acquisition date through profit or loss.
Goodwill is initially measured at cost, being the excess of the aggregate of the consideration transferred and the amount recognised for non-controlling interests and any previous interest held over the net identifiable assets acquired and liabilities assumed. If this consideration is lower than the fair value of the net assets of the subsidiary acquired, the difference is recognised in profit or loss.
f. DistributionsA liability for any distribution declared on or before the end of the reporting period is recognised on the balance sheet in the reporting period to which the distribution pertains.
g. Foreign Currency
Functional and presentation currencies:The functional currency and presentation currency of the Trusts and their subsidiaries, other than foreign subsidiaries, is the Australian dollar.
Translation foreign currency transactions:Transactions in foreign currency are initially recorded in the functional currency at the exchange rate prevailing at the date of the transaction. Monetary assets and liabilities denominated in foreign currency are retranslated at the rate of exchange prevailing at the balance date. All differences in the consolidated financial report are taken to the income statement.
A non-monetary item that is measured at fair value in a foreign currency is translated using the exchange rates at the date when the fair value was determined.
h. LeasesFinance leases, which transfer to the Trusts substantially all the risks and benefits incidental to ownership of the leased item, are capitalised at the inception of the lease at the fair value of the leased asset or, if lower, at the present value of the minimum lease payments. Lease payments are apportioned between the finance charges and reduction of the lease liability to achieve a constant rate of interest on the remaining balance of the liability. Finance charges are recognised as an expense in the income statement.
Finance leases, which transfer away from the Trusts substantially all the risks and benefits incidental to ownership of the leased item, are recognised at the inception of the lease. A finance lease receivable is recognised on inception at the present value of the minimum lease receipts. Finance lease receipts are apportioned between the interest income and reduction in the lease receivable to achieve a constant rate of interest on the remaining balance of the receivable. Interest is recognised as income in the income statement.
Leases of properties that are classified as investment properties, are classified as finance leases under AASB 140 Investment Properties.
Leases where the lessor retains substantially all the risks and benefits of ownership are classified as operating leases. Operating lease payments are recognised as an expense in the income statement on a straight-line basis over the term of the lease.
i. Plant and EquipmentPlant and equipment is stated at cost, net of accumulated depreciation and any accumulated impairment losses. Such cost includes the cost of replacing part of the plant and equipment and borrowing costs for long-term construction projects if the recognition criteria are met. When significant parts of property, plant and equipment require replacing at intervals, the Group recognises such parts as individual assets with specific useful lives and depreciates them accordingly. Likewise, when a major inspection is performed, its cost is recognised in the carrying amount of the plant and equipment as a replacement if the recognition criteria are satisfied. All other repair and maintenance costs are recognised in profit or loss as incurred. The present value of the expected cost for the decommissioning of an asset after its use is included in the cost of the respective asset if the recognition criteria for a provision are met.
j. Financial Assets and LiabilitiesCurrent and non-current financial assets and liabilities within the scope of AASB 139 Financial Instruments: Recognition and Measurement are classified as; fair value through profit or loss; loans and receivables; held-to-maturity investments; or as available-for-sale. The Trusts determine the classification of their financial assets and liabilities at initial recognition with the classification depending on the purpose for which the asset or liability was acquired or issued.
Notes to the Financial StatementsFOR THE YEAR ENDED 30 JUNE 2017 | CONTINUED
85Ingenia Communities Holdings Limited
1. Summary of significant accounting policies (continued)
Financial assets and liabilities are initially recognised at fair value, plus directly attributable transaction costs unless their classification is at fair value through profit or loss. They are subsequently measured at fair value or amortised cost using the effective interest method. Changes in fair value of available-for-sale financial assets are recorded directly in equity. Changes in fair values of financial assets and liabilities classified as at fair value through profit or loss are recorded in the income statement.
The fair values of financial instruments that are actively traded in organised financial markets are determined by reference to quoted market bid prices at the close of business on the balance sheet date. For those with no active market, fair values are determined using valuation techniques. Such techniques include: using recent arm’s length market transactions; reference to the current market value of another instrument that is substantially the same; discounted cash flow analysis and option pricing models, making as much use of available and supportable market data as possible and keeping judgemental inputs to a minimum.
k. Impairment of Non-Financial AssetsAssets other than investment property and financial assets carried at fair value are tested for impairment whenever events or changes in circumstances indicate that the carrying amount may not be recoverable. An impairment loss is recognised for the amount by which the asset’s carrying amount exceeds its recoverable amount. The recoverable amount is the higher of an asset’s fair value less costs to sell and value in use. For the purposes of assessing impairment, assets are grouped at the lowest levels for which there are separately identifiable cash inflows that are largely independent of the cash inflows from other assets or groups of assets. Non-financial assets excluding goodwill which have suffered impairment are reviewed for possible reversal of the impairment at each reporting date.
l. Cash and Cash EquivalentsCash and cash equivalents in the balance sheet and cash flow statement comprise cash at bank and in hand and short term deposits that are readily convertible to known amounts of cash and are subject to an insignificant risk of changes in value.
m. Trade and Other ReceivablesTrade and other receivables are recognised initially at fair value and subsequently measured at amortised cost using the effective interest method, less any provision for impairment. An allowance for impairment is made when there is objective evidence that collection of the full amount is no longer probable.
n. Inventories The Trusts hold inventory in relation to the acquisition and development of manufactured homes and service station fuel and supplies within its Lifestyle and Holidays segment.
Inventories are held at the lower of cost and net realisable value.
Costs of inventories comprise all acquisition costs, costs of conversion and other costs incurred in bringing the inventories to their present location and condition. Inventory includes work in progress and raw materials used in the production of manufactured home units.
Net realisable value is determined on the basis of an estimated selling price in the ordinary course of business less estimated costs of completion and the estimated costs necessary to make the sale.
o. Derivative and Financial InstrumentsThe Trusts use derivative financial instruments such as interest rate swaps to hedge its risks associated with interest rate fluctuations. Such derivative financial instruments are initially recognised at fair value on the date in which the derivative contract is entered into and are subsequently remeasured to fair value.
p. Investment PropertyLand and buildings have the function of an investment and are regarded as composite assets. In accordance with applicable accounting standards, the buildings, including plant and equipment, are not depreciated.
Investment property includes property under construction, tourism cabins and associated amenities.
Investment properties are measured initially at cost, including transaction costs. Subsequent to initial recognition, investment properties are stated at fair value, which reflects market conditions at the reporting date. Gains or losses arising from changes in the fair values of investment properties are included in the income statement in the period in which they arise, including corresponding tax effect.
Fair value is the price that would be received to sell an asset or paid to transfer a liability in an orderly transaction between market participants at the measurement date in the principal market for the asset or liability or in its absence, the most advantageous market. In determining the fair value of assets held for sale recent market offers have been taken into consideration.
It is the Trusts’ policy to have all investment properties externally valued at intervals of not more than two years. It is the policy of the responsible trust to review the fair value of each investment property every six months and to cause investment properties to be revalued to fair values whenever their carrying value materially differs to their fair values.
Changes in the fair value of investment property are recorded in the statement of comprehensive income.
In determining fair values, the group considers relevant information including the capitalisation of rental streams using market assessed capitalisation rates, expected net cash flows discounted to their present value using market determined risk adjusted discount rates and other available market data such as recent comparable transactions. The assessment of fair value of investment properties does not take into account potential capital gains tax assessable.
Notes to the Financial StatementsFOR THE YEAR ENDED 30 JUNE 2017 | CONTINUED

86 Annual Report 2017
1. Summary of significant accounting policies (continued)
q. Intangible AssetsAn intangible asset arising from development expenditure related to software is recognised only when the Group can demonstrate the technical feasibility of completing the intangible asset so that it will be available for use, how the asset will generate future economic benefits, the availability of resources to complete the asset and the ability to measure reliably the expenditure during its development. Costs capitalised include external direct costs of materials and service, and direct payroll and payroll related costs of employees’ time spent on the project.
Following the initial recognition of expenditure, the asset is carried at cost less any accumulated amortisation and accumulated impairment losses. Amortisation of the asset begins when the development is complete and the asset is available for use. Amortisation is over the period of expected future benefit.
The Group’s policy applied to capitalised development costs is as follows:
Software and associated development to capitalised development costs (assets in use)
– Useful life: Finite Amortisation method using 7 years on a straight line basis; and
– Impairment test: Amortisation method reviewed at each financial year end; closing carrying value reviewed annually for indicators of impairment.
Subsequent expenditure on capitalised intangible assets is capitalised only when it increases the future economic benefits embodied in the specific asset to which it relates. All other expenditure is expensed as incurred. Gains or losses arising from de-recognition of an intangible asset are measured as the difference between the net disposal proceeds and the carrying amount of the asset and are recognised in profit or loss when the asset is de-recognised.
Intangible assets acquired separately are measured on initial recognition at cost. The cost of intangible assets acquired in a business combination are their fair values as at the date of acquisition. Following initial recognition, intangible assets are carried at cost less any accumulated amortisation and accumulated impairment losses.
r. PayablesTrade and other payables are carried at amortised cost and due to their short-term nature are not discounted. They represent liabilities for goods and services provided to the Trusts prior to the end of the financial year that are unpaid and are recognised when the Trusts become obliged to make future payments in respect of the purchase of these goods and services.
s. Retirement Village Resident LoansThese loans, which are non-interest bearing and repayable on the departure of the resident, are classified as financial liabilities at fair value through profit and loss with resulting fair value adjustments recognised in the income statement. The fair value of the obligation is measured as the ingoing contribution plus the resident’s share of capital appreciation to reporting date. Although the expected average residency term is more than ten years, these obligations are classified as current liabilities, as required by Accounting Standards, because the Trusts do not have an unconditional right to defer settlement to more than twelve months after reporting date.
This liability is stated net of deferred management fee accrued to reporting date, because the Trusts contracts with residents require net settlement of those obligations.
Refer to Notes 15 and 1(z) for information regarding the valuation of retirement village resident loans.
t. BorrowingsBorrowings are initially recorded at the fair value of the consideration received less directly attributable transaction costs associated with the borrowings. After initial recognition, borrowings are subsequently measured at amortised cost using the effective interest rate method. Under this method fees, costs, discounts and premiums that are yield related are included as part of the carrying amount of the borrowing and amortised over its expected life.
Borrowings are classified as current liabilities unless the Trusts do not have an unconditional right to defer settlement to more than twelve months after reporting date.
Borrowing costs are expensed as incurred except where they are directly attributable to the acquisition, construction or production of a qualifying asset. When this is the case, they are capitalised as part of the acquisition cost of that asset.
u. Issued UnitsIssued and paid up units are recognised at the fair value of the consideration received by the Trusts. Any transaction costs arising on issue of ordinary units are recognised directly in unitholders’ interest as a reduction of the units proceeds received.
v. RevenueRevenue from rents, interest and distributions is recognised to the extent that it is probable that the economic benefits will flow to the Group and the revenue can be reliably measured. Revenue brought to account but not received at balance date is recognised as a receivable.
Rental income from operating leases is recognised on a straight-line basis over the lease term. Fixed rental increases that do not represent direct compensation for underlying cost increases or capital expenditures are recognised on a straight-line basis until the next market review date. Rent paid in advance is recognised as unearned income.
Notes to the Financial StatementsFOR THE YEAR ENDED 30 JUNE 2017 | CONTINUED
87Ingenia Communities Holdings Limited
1. Summary of significant accounting policies (continued)
Deferred management fee income is calculated as the expected fee to be earned on a resident’s ingoing loan, allocated pro-rata over the resident’s expected tenure, together with any share of capital appreciation that has occurred at reporting date.
Revenue from the sale of manufactured homes within the Lifestyle Development segment is recognised when the significant risks, rewards of ownership and effective control has been transferred to the buyer.
Service station sales revenue represents the revenue earned from the provision of products to external parties. Sales revenue is only recognised when the significant risks and rewards of ownership of the products including possession are passed to the buyer.
Government incentives are recognised where there is reasonable assurance the incentive will be received and all attached conditions will be complied with. When the incentive relates to an expense item, it is recognised as income on a systematic basis over the periods that the incentive is intended to compensate.
Interest income is recognised as the interest accrues using the effective interest rate method.
w. Provisions, Including for Employees Benefits
General:Provisions are recognised when the Trusts have a present obligation (legal or constructive) as a result of a past event, it is probable that an outflow of resources embodying economic benefits will be required to settle the obligation and a reliable estimate can be made of the amount of the obligation. When the Trusts expect some or all of a provision to be reimbursed, for example, under an insurance contract, the reimbursement is recognised as a separate asset, but only when the reimbursement is virtually certain. The expense relating to a provision is presented in the statement of profit or loss net of any reimbursement.
Wages, salaries, annual leave and sick leave:Liabilities for wages and salaries, including non-monetary benefits and annual leave expected to be settled within twelve months of the reporting date are recognised in respect of employees’ services up to the reporting date. They are measured at the amounts expected to be paid when the liabilities are settled. Expenses for non-accumulating sick leave are recognised when the leave is taken and are measured at the rates paid or payable.
Long service leave:The liability for long service leave is recognised and measured as the present value of expected future payments to be made in respect of services provided by employees up to the reporting date using the projected unit credit method. Consideration is given to expected future wage and salary levels, experience of employee departures, and periods of service. Expected future payments are discounted using market yields at the reporting date on corporate bonds with terms to maturity and currencies that match, as closely as possible, the estimated future cash outflows.
x. Income Tax
Current income tax:Under the current tax legislation, ICF and its subsidiaries are not liable to pay Australian income tax provided that their taxable income (including any assessable capital gains) is fully distributed to unitholders each year. Tax allowances for building and fixtures depreciation are distributed to unitholders in the form of the tax-deferred component of distributions. However, ICMT and its subsidiaries are subject to Australian income tax.
Current tax assets and liabilities for the current period are measured at the amount expected to be recovered from, or paid to, the taxation authorities based on the current period’s taxable income. The tax rates and tax laws used to compute the amount are those that are enacted or substantively enacted at the reporting date.
The subsidiaries that previously held the Trusts’ foreign properties may be subject to corporate income tax and withholding tax in the countries in which they operate. Under current Australian income tax legislation, unitholders may be entitled to receive a foreign tax credit for this withholding tax.
Deferred income tax:Deferred income tax represents tax (including withholding tax) expected to be payable or recoverable by taxable entities on the differences between the tax bases of assets and liabilities and their carrying amounts for financial reporting purposes. Deferred tax assets and liabilities are measured at the tax rates that are expected to apply to the year when the asset is realised through continuing use or the liability is settled, based on tax rates (and tax laws) that have been enacted or substantively enacted at reporting date. Deferred tax assets are recognised for deductible temporary differences only if it is probable that future taxable amounts will be available to utilise those temporary differences. Income taxes related to items recognised directly in equity are recognised in equity and not against income. Critical accounting estimates and judgements are continually evaluated and are based on historical experience and other factors, including expectations of future events that may have a financial impact on the Trust and that are believed to be reasonable under the circumstances.
y. Goods and Services Tax (GST)Revenue, expenses and assets (with the exception of receivables) are recognised net of the amount of GST to the extent that the GST is recoverable from the taxation authority. Where GST is not recoverable, it is recognised as part of the cost of the acquisition, or as an expense.
Receivables and payables are stated inclusive of GST. The net amount of GST recoverable from or payable to the tax authority is included in the balance sheet as an asset or liability.
Cash flows are included in the cash flow statement on a gross basis. The GST components of cash flows arising from investing and financing activities, which are recoverable from or payable to the tax authorities, are classified as operating cash flows.
Notes to the Financial StatementsFOR THE YEAR ENDED 30 JUNE 2017 | CONTINUED
88 Annual Report 2017
1. Summary of significant accounting policies (continued)
z. Fair Value MeasurementThe Trusts measure financial instruments, such as derivatives, investment properties, non-financial assets and non-financial liabilities, at fair value at each balance sheet date. Refer to Note 21.
Fair value is the price that would be received to sell an asset or paid to transfer a liability in an orderly transaction between market participants at the measurement date. The fair value measurement is based on the presumption that the transaction to sell the asset or transfer the liability takes place either:
– In the principal market for the asset or liability; or
– In the absence of a principal market, in the most advantageous market for the asset or liability.
The principal or the most advantageous market must be accessible to the Trusts.
The fair value of an asset or a liability is measured using the assumptions that market participants would use when pricing the asset or liability, assuming that market participants act in their economic best interest.
A fair value measurement of a non-financial asset takes into account a market participant’s ability to generate economic benefits by using the asset in its highest and best use or by selling it to another market participant that would use the asset in its highest and best use.
The Trusts use valuation techniques that are appropriate in the circumstances and for which sufficient data are available to measure fair value, maximising the use of relevant observable inputs and minimising the use of unobservable inputs.
All assets and liabilities for which fair value is measured or disclosed in the financial statements are categorised within the fair value hierarchy, described as follows, based on the lowest level input that is significant to the fair value measurement as a whole:
– Level 1 – Quoted (unadjusted) market prices in active markets for identical assets or liabilities
– Level 2 – Valuation techniques for which the lowest level input that is significant to the fair value measurement is directly or indirectly observable
– Level 3 – Valuation techniques for which the lowest level input that is significant to the fair value measurement is unobservable.
For assets and liabilities that are recognised in the financial statements on a recurring basis, the Trusts determine whether transfers have occurred between Levels in the hierarchy by re-assessing categorisation (based on the lowest level input that is significant to the fair value measurement as a whole) at the end of the reporting period.
The Trusts’ Audit and Risk Committee determines the policies and procedures for both recurring fair value measurement, such as investment properties and resident loans and for non-recurring measurement.
External valuers are involved for valuation of significant assets, such as properties and significant liabilities. Selection criteria include market knowledge, experience and qualifications, reputation, independence and whether professional standards are maintained.
On a six monthly basis management presents valuation results to the Audit and Risk Committee and the Trusts’ auditors. This includes a discussion of the major assumptions used in the valuations.
For the purpose of fair value disclosures, the Trusts have determined classes of assets and liabilities on the basis of the nature, characteristics and risks of the asset or liability and the level of the fair value hierarchy as explained in Note 22.
aa. Pending Accounting StandardsThe trusts have not early adopted the following standards, interpretations, or amendments that have been issued but are not yet effective:
AASB 9 Financial Instruments is applicable to reporting periods beginning on or after 1 January 2018. The Trusts have not early adopted this standard. This standard provides requirements for the classification, measurement and de-recognition of financial assets and financial liabilities. Changes in the Trusts’ credit risk, which affect the value of liabilities designated at fair value through profit and loss, can be presented in other comprehensive income. The application of the Standard is not expected to have any material impact on the Trusts’ financial reporting in future periods.
AASB 15 Revenue from Contracts with Customers is applicable to reporting periods beginning on or after 1 January 2018. The Trusts have not early adopted this standard. The standard is based on the principle that revenue is recognised when control of a good or service is transferred to a customer.
It contains a single model that applies to contracts with customers and two approaches to recognising revenue; at a point in time or over time. The model features a contract-based five-step analysis of transactions to determine whether, how much and when revenue is recognised. It applies to all contracts with customers except leases, financial instruments and insurance contracts. It requires reporting entities to provide users of financial statement with more informative and relevant disclosures. The Group is currently assessing the impact of this standard, however it does not expect it to have a material impact on future reporting.
AASB 16 Leases is applicable to reporting periods beginning on or after 1 January 2019. The Group has not early adopted this standard. This standard provides requirements for classification, measurement, and disclosure of all leases with a term of more than 12 months unless the underlying asset is of low value.
Notes to the Financial StatementsFOR THE YEAR ENDED 30 JUNE 2017 | CONTINUED
89Ingenia Communities Holdings Limited
1. Summary of significant accounting policies (continued)
A lease must now measure right-of-use assets similarly to other non-financial assets and lease liabilities similarly to other financial liabilities. Assets and liabilities arising from a lease are initially measured on a present value basis. The measurement includes non-cancellable lease payments (including inflation-linked payments), and also includes payments to be made in optional periods if the lessee is reasonably certain to exercise an option to extend the lease, or not to exercise an option to terminate the lease. The Group is currently the lessee of two non-cancellable operating leases which would be captured under this new standard. They relate to the Sydney and Brisbane offices with have future minimum lease payments totalling $1,492,000. The Group is also the lessee of four existing finance leases which relate to the land of certain investment properties. The application of the Standard is not expected to have any material impact on these finance leases.
Other new accounting standards, amendments to accounting standards and interpretations have been published that are not mandatory for the current reporting period. These are not expected to have any material impact on the Trusts’ financial reporting in future reporting periods.
bb. Current Versus Non-Current ClassificationThe Trusts present assets and liabilities in the balance sheet based on current/non-current classification. An asset is current when it is:
– Expected to be realised or intended to be sold or consumed in the normal operating cycle
– Held primarily for the purpose of trading
– Expected to be realised within twelve months after the reporting period, or
– Cash or cash equivalents unless restricted from being exchanged or used to settle a liability for at least twelve months after reporting period.
All other assets are classified as non-current.
A liability is current when:
– It is expected to be settled in the normal operating cycle
– It is held primarily for the purpose of trading
– It is due to be settled within twelve months after the reporting period, or
– There is no unconditional right to defer the settlement of the liability for at least twelve months after the reporting period.
The Trusts classify all other liabilities as non-current.
Deferred tax assets and liabilities are classified as non-current assets and liabilities.
2. Accounting estimates and judgementsThe preparation of financial statements requires the use of certain critical accounting estimates. It also requires the Responsible Entity to exercise its judgement in the process of applying the Trusts’ accounting policies. The areas involving a higher degree of judgement or complexity, or areas where assumptions and estimates are significant to the financial statements are disclosed below.
Estimates and judgements are continually evaluated and are based on historical experience and other factors, including expectations of future events that are believed to be reasonable under the circumstances.
a. Critical Accounting Estimates and AssumptionsThe Trusts make estimates and assumptions concerning the future. The resulting accounting estimates, by definition, will seldom equal the related actual results. The estimates and assumptions that have a significant risk of causing a material adjustment to the carrying amounts of assets and liabilities within the next financial year are discussed below.
Valuation of investment propertyThe Trusts have investment properties with a combined carrying amount of $693,473,000 (2016: $710,746,000) (refer Note 8), and combined retirement village residents’ loans of $27,201,000 (2016: $207,483,000) (refer Note 8 and 15) which together represent the estimated fair value of the Trusts interest in retirement villages.
These carrying amounts reflect certain assumptions about expected future rentals, rent-free periods, operating costs and appropriate discount and capitalisation rates. The valuation assumptions for deferred management fee villages reflect assumptions relating to average length of stay, unit market values, estimates of capital expenditure, contract terms with residents, discount rates and projected property growth rates. The valuation assumption for properties to be developed reflect assumptions around sales prices for new homes, sales rates, new rental tariffs, estimates of capital expenditure, discount rates and projected property growth rates.
In forming these assumptions, the Responsible Entity considered information about current and recent sales activity, current market rents, and discount and capitalisation rates, for properties similar to those owned by the Trusts, as well as independent valuations of the Trusts’ property.
Valuation of inventoriesICMT has inventory in the form of manufactured homes and service station fuel and supplies, which it carries at the lower of cost or net realisable value. Estimates of net realisable value are based on the most reliable evidence available at the time the estimates are made, of the amount the inventories are expected to realise and the estimate of costs to complete. Key assumptions require the use of management judgement, and are continually reviewed.
Notes to the Financial StatementsFOR THE YEAR ENDED 30 JUNE 2017 | CONTINUED
90 Annual Report 2017
2. Accounting estimates and judgements (continued)
Fair value of derivativesThe fair value of derivative assets and liabilities is based on assumptions of future events and involves significant estimates. Given the complex nature of these instruments and various assumptions that are used in calculating mark-to-market values, the Trusts rely on counterparty valuations for derivative values. The counterparty valuations are usually based on mid-market rates and calculated using the main variables including the forward market curve, time and volatility.
Valuation of assets acquired in business combinationsUpon recognising the acquisition, management uses estimations and assumptions of the fair value of assets and liabilities assumed at the date of acquisition, including judgements related to valuation of investment property as discussed above.
Valuation of retirement village resident loansThe fair value of the retirement village resident loans is calculated by reference to the initial loan amount plus the resident’s share of any capital gains in accordance with their contracts less any deferred management fee income accrued to date by the operator. The key assumption for calculating the capital gain and deferred management fee income components is the value of the dwelling being occupied by the resident. This value is determined by reference to the valuation of investment property as referred to above.
Calculation of deferred management fee (DMF)Deferred management fees are recognised by the Trusts over the estimated period of time the property will be leased by the resident and the accrued DMF is realised upon exit of the resident. The accrued DMF is based on various inputs including the initial price of the property, estimated length of stay of the resident, various contract terms and projected price of property at time of re-leasing.
b. Critical Judgements in Applying the Entity’s Accounting Policies
There were no judgements, apart from those involving estimations, that management has made in the process of applying the entity’s accounting policies that had a significant effect on the amounts recognised in the financial report.
Notes to the Financial StatementsFOR THE YEAR ENDED 30 JUNE 2017 | CONTINUED
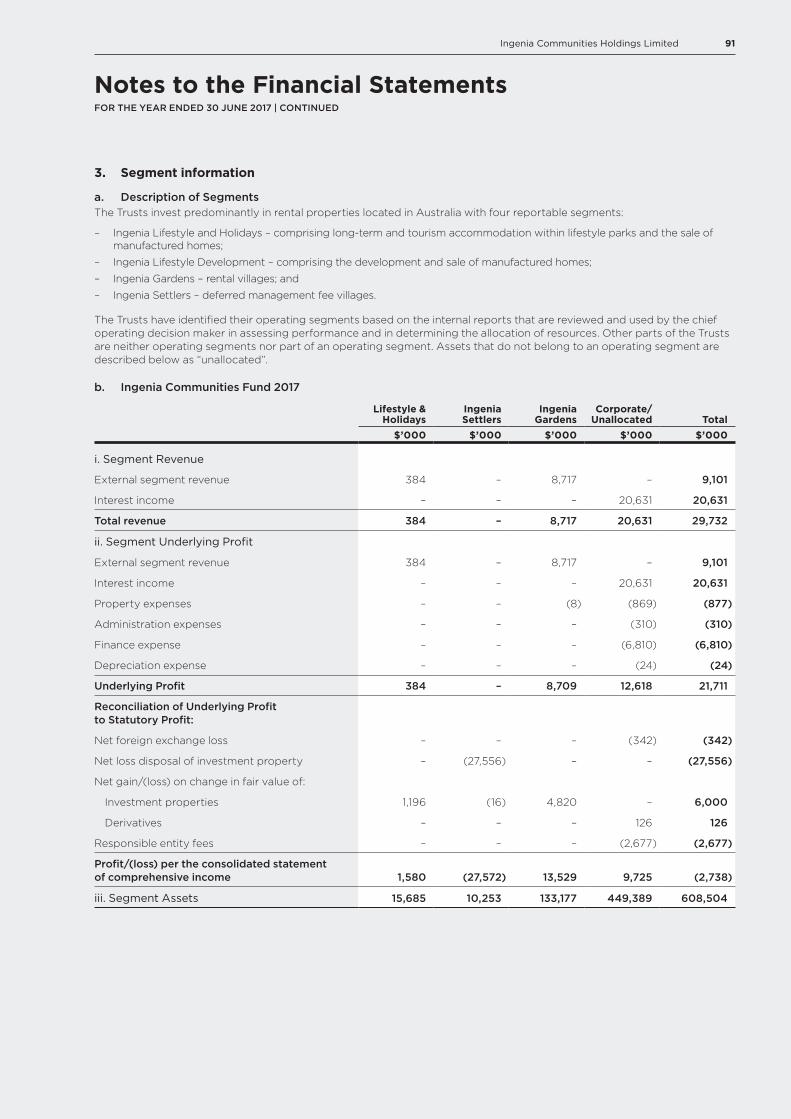
91Ingenia Communities Holdings Limited
3. Segment information
a. Description of SegmentsThe Trusts invest predominantly in rental properties located in Australia with four reportable segments:
– Ingenia Lifestyle and Holidays – comprising long-term and tourism accommodation within lifestyle parks and the sale of manufactured homes;
– Ingenia Lifestyle Development – comprising the development and sale of manufactured homes;
– Ingenia Gardens – rental villages; and
– Ingenia Settlers – deferred management fee villages.
The Trusts have identified their operating segments based on the internal reports that are reviewed and used by the chief operating decision maker in assessing performance and in determining the allocation of resources. Other parts of the Trusts are neither operating segments nor part of an operating segment. Assets that do not belong to an operating segment are described below as “unallocated”.
b. Ingenia Communities Fund 2017
Lifestyle & Holidays
Ingenia Settlers
Ingenia Gardens
Corporate/ Unallocated Total
$’000 $’000 $’000 $’000 $’000
i. Segment Revenue
External segment revenue 384 – 8,717 – 9,101
Interest income – – – 20,631 20,631
Total revenue 384 – 8,717 20,631 29,732
ii. Segment Underlying Profit
External segment revenue 384 – 8,717 – 9,101
Interest income – – – 20,631 20,631
Property expenses – – (8) (869) (877)
Administration expenses – – – (310) (310)
Finance expense – – – (6,810) (6,810)
Depreciation expense – – – (24) (24)
Underlying Profit 384 – 8,709 12,618 21,711
Reconciliation of Underlying Profit to Statutory Profit:
Net foreign exchange loss – – – (342) (342)
Net loss disposal of investment property – (27,556) – – (27,556)
Net gain/(loss) on change in fair value of:
Investment properties 1,196 (16) 4,820 – 6,000
Derivatives – – – 126 126
Responsible entity fees – – – (2,677) (2,677)
Profit/(loss) per the consolidated statement of comprehensive income 1,580 (27,572) 13,529 9,725 (2,738)
iii. Segment Assets 15,685 10,253 133,177 449,389 608,504
Notes to the Financial StatementsFOR THE YEAR ENDED 30 JUNE 2017 | CONTINUED
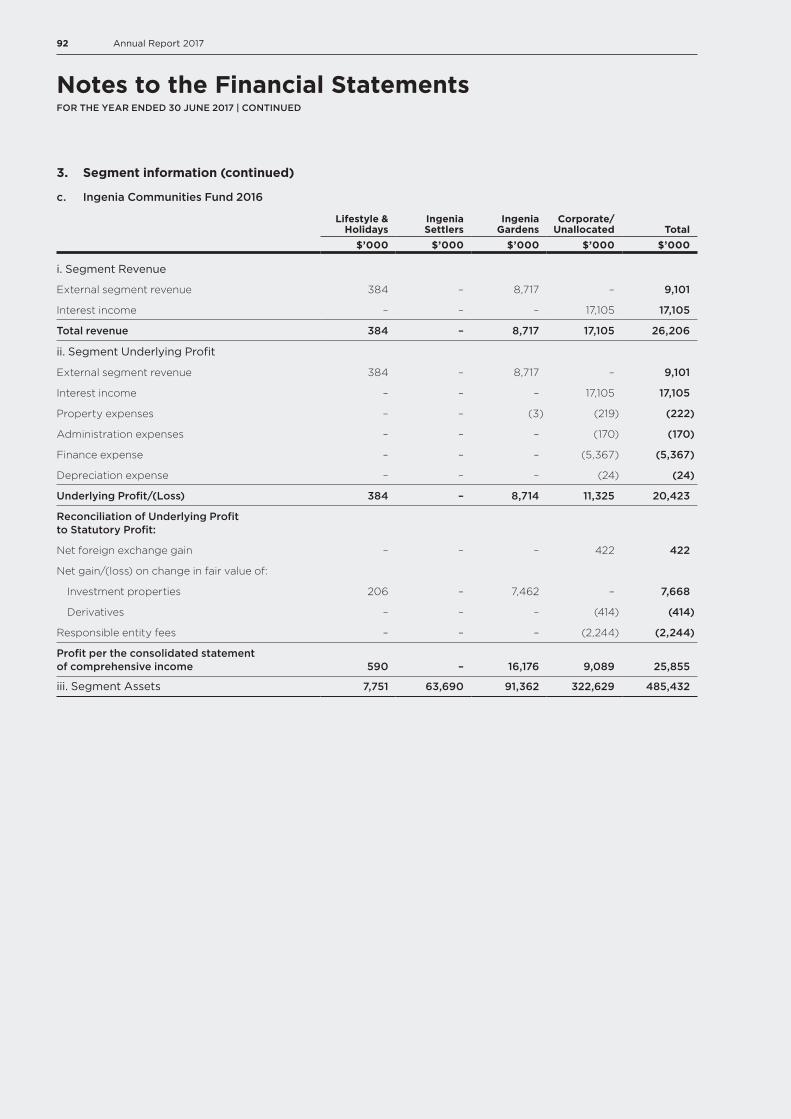
92 Annual Report 2017
3. Segment information (continued)
c. Ingenia Communities Fund 2016
Lifestyle & Holidays
Ingenia Settlers
Ingenia Gardens
Corporate/ Unallocated Total
$’000 $’000 $’000 $’000 $’000
i. Segment Revenue
External segment revenue 384 – 8,717 – 9,101
Interest income – – – 17,105 17,105
Total revenue 384 – 8,717 17,105 26,206
ii. Segment Underlying Profit
External segment revenue 384 – 8,717 – 9,101
Interest income – – – 17,105 17,105
Property expenses – – (3) (219) (222)
Administration expenses – – – (170) (170)
Finance expense – – – (5,367) (5,367)
Depreciation expense – – – (24) (24)
Underlying Profit/(Loss) 384 – 8,714 11,325 20,423
Reconciliation of Underlying Profit to Statutory Profit:
Net foreign exchange gain – – – 422 422
Net gain/(loss) on change in fair value of:
Investment properties 206 – 7,462 – 7,668
Derivatives – – – (414) (414)
Responsible entity fees – – – (2,244) (2,244)
Profit per the consolidated statement of comprehensive income 590 – 16,176 9,089 25,855
iii. Segment Assets 7,751 63,690 91,362 322,629 485,432
Notes to the Financial StatementsFOR THE YEAR ENDED 30 JUNE 2017 | CONTINUED
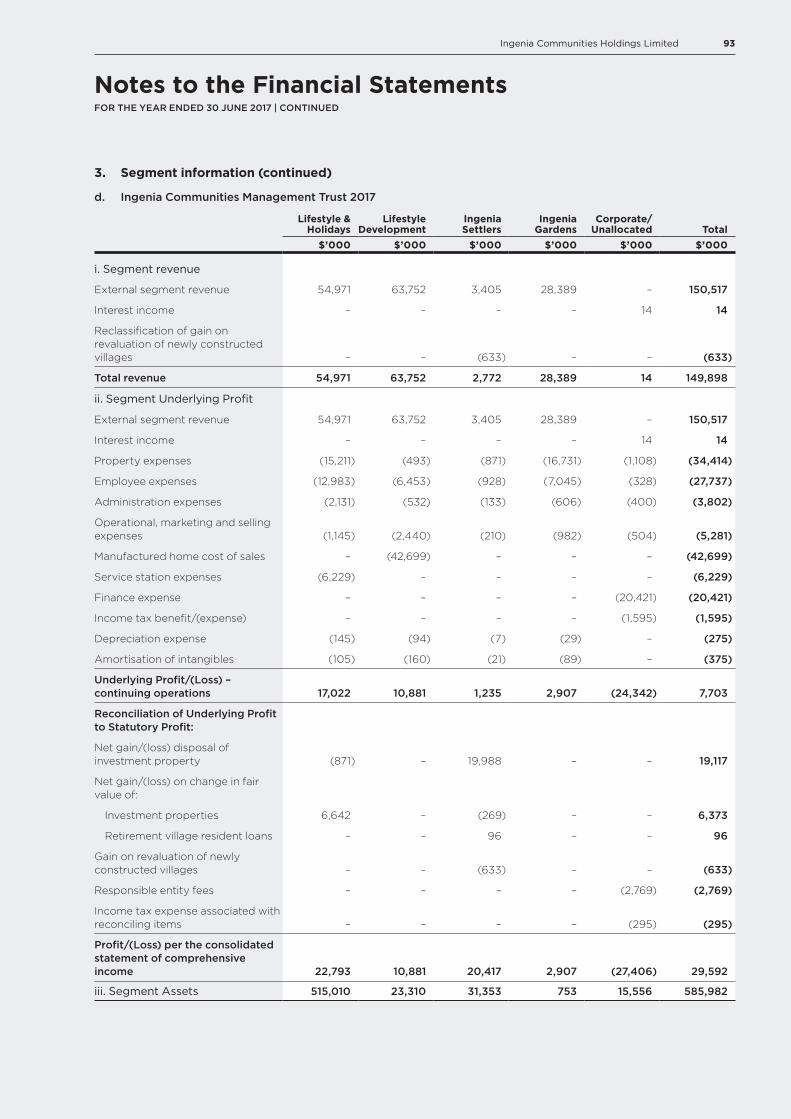
93Ingenia Communities Holdings Limited
3. Segment information (continued)
d. Ingenia Communities Management Trust 2017
Lifestyle & Holidays
Lifestyle Development
Ingenia Settlers
Ingenia Gardens
Corporate/ Unallocated Total
$’000 $’000 $’000 $’000 $’000 $’000
i. Segment revenue
External segment revenue 54,971 63,752 3,405 28,389 – 150,517
Interest income – – – – 14 14
Reclassification of gain on revaluation of newly constructed villages – – (633) – – (633)
Total revenue 54,971 63,752 2,772 28,389 14 149,898
ii. Segment Underlying Profit
External segment revenue 54,971 63,752 3,405 28,389 – 150,517
Interest income – – – – 14 14
Property expenses (15,211) (493) (871) (16,731) (1,108) (34,414)
Employee expenses (12,983) (6,453) (928) (7,045) (328) (27,737)
Administration expenses (2,131) (532) (133) (606) (400) (3,802)
Operational, marketing and selling expenses (1,145) (2,440) (210) (982) (504) (5,281)
Manufactured home cost of sales – (42,699) – – – (42,699)
Service station expenses (6,229) – – – – (6,229)
Finance expense – – – – (20,421) (20,421)
Income tax benefit/(expense) – – – – (1,595) (1,595)
Depreciation expense (145) (94) (7) (29) – (275)
Amortisation of intangibles (105) (160) (21) (89) – (375)
Underlying Profit/(Loss) – continuing operations 17,022 10,881 1,235 2,907 (24,342) 7,703
Reconciliation of Underlying Profit to Statutory Profit:
Net gain/(loss) disposal of investment property (871) – 19,988 – – 19,117
Net gain/(loss) on change in fair value of:
Investment properties 6,642 – (269) – – 6,373
Retirement village resident loans – – 96 – – 96
Gain on revaluation of newly constructed villages – – (633) – – (633)
Responsible entity fees – – – – (2,769) (2,769)
Income tax expense associated with reconciling items – – – – (295) (295)
Profit/(Loss) per the consolidated statement of comprehensive income 22,793 10,881 20,417 2,907 (27,406) 29,592
iii. Segment Assets 515,010 23,310 31,353 753 15,556 585,982
Notes to the Financial StatementsFOR THE YEAR ENDED 30 JUNE 2017 | CONTINUED
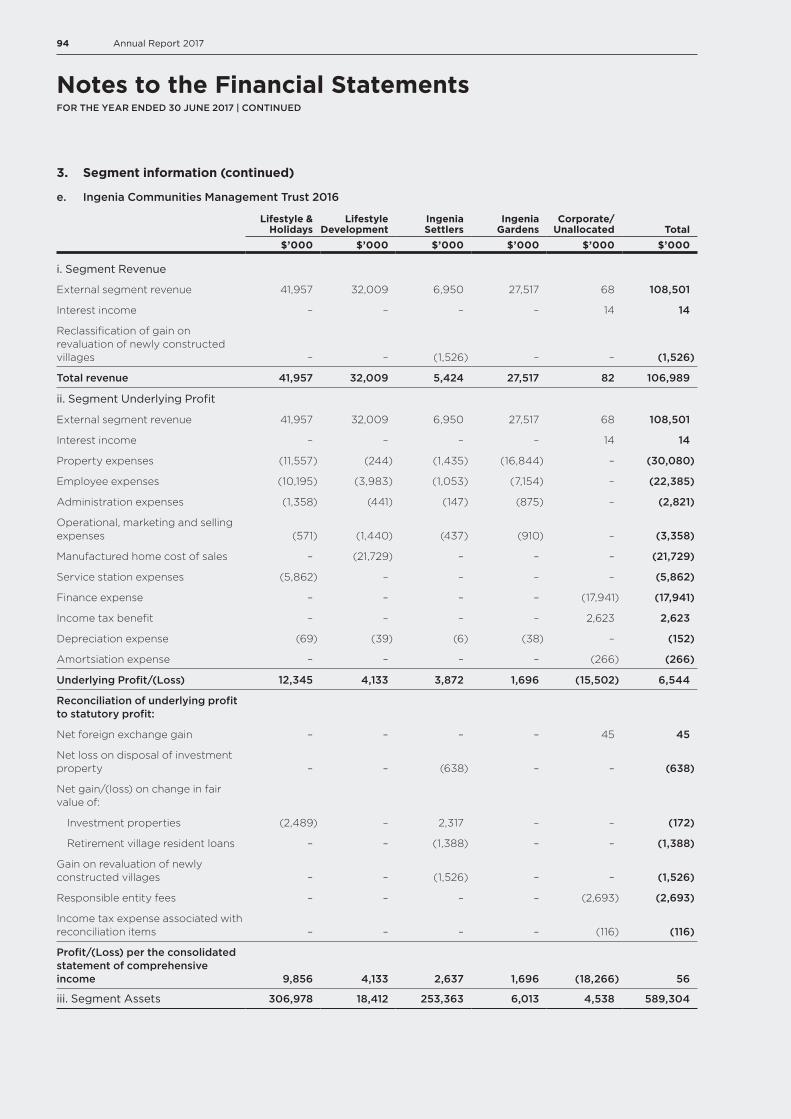
94 Annual Report 2017
3. Segment information (continued)
e. Ingenia Communities Management Trust 2016
Lifestyle & Holidays
Lifestyle Development
Ingenia Settlers
Ingenia Gardens
Corporate/ Unallocated Total
$’000 $’000 $’000 $’000 $’000 $’000
i. Segment Revenue
External segment revenue 41,957 32,009 6,950 27,517 68 108,501
Interest income – – – – 14 14
Reclassification of gain on revaluation of newly constructed villages – – (1,526) – – (1,526)
Total revenue 41,957 32,009 5,424 27,517 82 106,989
ii. Segment Underlying Profit
External segment revenue 41,957 32,009 6,950 27,517 68 108,501
Interest income – – – – 14 14
Property expenses (11,557) (244) (1,435) (16,844) – (30,080)
Employee expenses (10,195) (3,983) (1,053) (7,154) – (22,385)
Administration expenses (1,358) (441) (147) (875) – (2,821)
Operational, marketing and selling expenses (571) (1,440) (437) (910) – (3,358)
Manufactured home cost of sales – (21,729) – – – (21,729)
Service station expenses (5,862) – – – – (5,862)
Finance expense – – – – (17,941) (17,941)
Income tax benefit – – – – 2,623 2,623
Depreciation expense (69) (39) (6) (38) – (152)
Amortsiation expense – – – – (266) (266)
Underlying Profit/(Loss) 12,345 4,133 3,872 1,696 (15,502) 6,544
Reconciliation of underlying profit to statutory profit:
Net foreign exchange gain – – – – 45 45
Net loss on disposal of investment property – – (638) – – (638)
Net gain/(loss) on change in fair value of:
Investment properties (2,489) – 2,317 – – (172)
Retirement village resident loans – – (1,388) – – (1,388)
Gain on revaluation of newly constructed villages – – (1,526) – – (1,526)
Responsible entity fees – – – – (2,693) (2,693)
Income tax expense associated with reconciliation items – – – – (116) (116)
Profit/(Loss) per the consolidated statement of comprehensive income 9,856 4,133 2,637 1,696 (18,266) 56
iii. Segment Assets 306,978 18,412 253,363 6,013 4,538 589,304
Notes to the Financial StatementsFOR THE YEAR ENDED 30 JUNE 2017 | CONTINUED
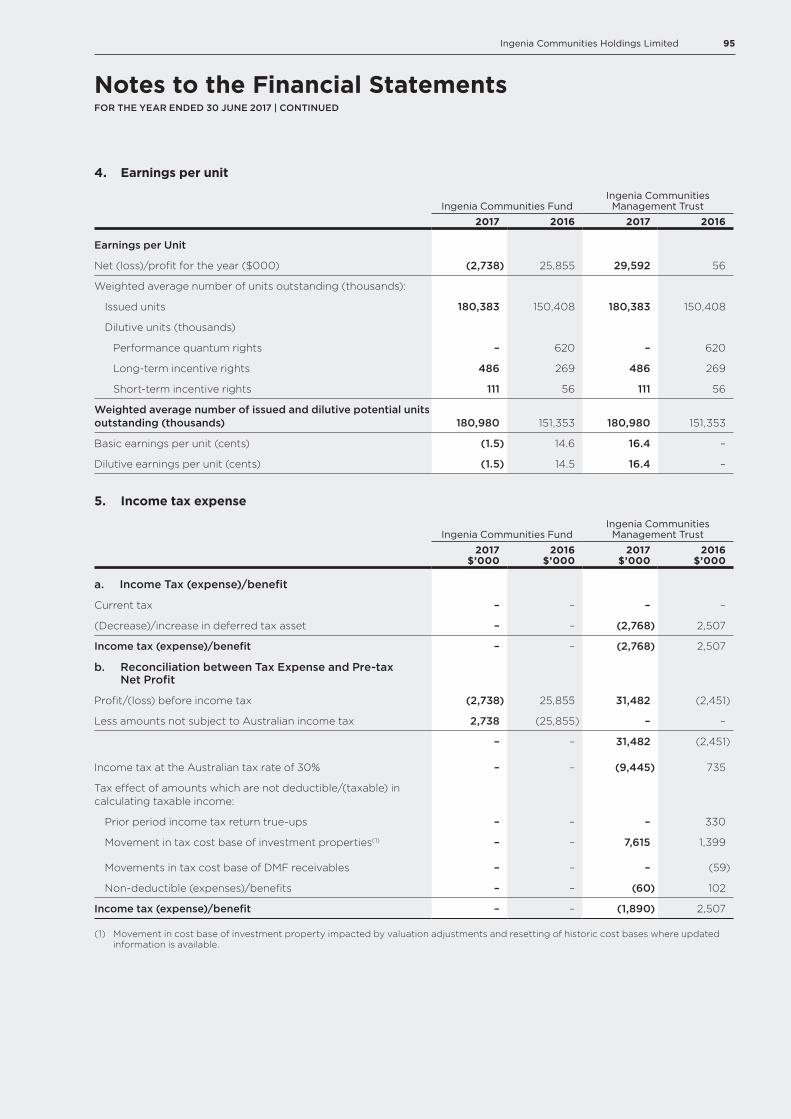
95Ingenia Communities Holdings Limited
4. Earnings per unit
Ingenia Communities FundIngenia Communities Management Trust
2017 2016 2017 2016
Earnings per Unit
Net (loss)/profit for the year ($000) (2,738) 25,855 29,592 56
Weighted average number of units outstanding (thousands):
Issued units 180,383 150,408 180,383 150,408
Dilutive units (thousands)
Performance quantum rights – 620 – 620
Long-term incentive rights 486 269 486 269
Short-term incentive rights 111 56 111 56
Weighted average number of issued and dilutive potential units outstanding (thousands) 180,980 151,353 180,980 151,353
Basic earnings per unit (cents) (1.5) 14.6 16.4 –
Dilutive earnings per unit (cents) (1.5) 14.5 16.4 –
5. Income tax expense
Ingenia Communities FundIngenia Communities Management Trust
2017 $’000
2016 $’000
2017 $’000
2016 $’000
a. Income Tax (expense)/benefit
Current tax – – – –
(Decrease)/increase in deferred tax asset – – (2,768) 2,507
Income tax (expense)/benefit – – (2,768) 2,507
b. Reconciliation between Tax Expense and Pre-tax Net Profit
Profit/(loss) before income tax (2,738) 25,855 31,482 (2,451)
Less amounts not subject to Australian income tax 2,738 (25,855) – –
– – 31,482 (2,451)
Income tax at the Australian tax rate of 30% – – (9,445) 735
Tax effect of amounts which are not deductible/(taxable) in calculating taxable income:
Prior period income tax return true-ups – – – 330
Movement in tax cost base of investment properties(1) – – 7,615 1,399
Movements in tax cost base of DMF receivables – – – (59)
Non-deductible (expenses)/benefits – – (60) 102
Income tax (expense)/benefit – – (1,890) 2,507
(1) Movement in cost base of investment property impacted by valuation adjustments and resetting of historic cost bases where updated information is available.
Notes to the Financial StatementsFOR THE YEAR ENDED 30 JUNE 2017 | CONTINUED
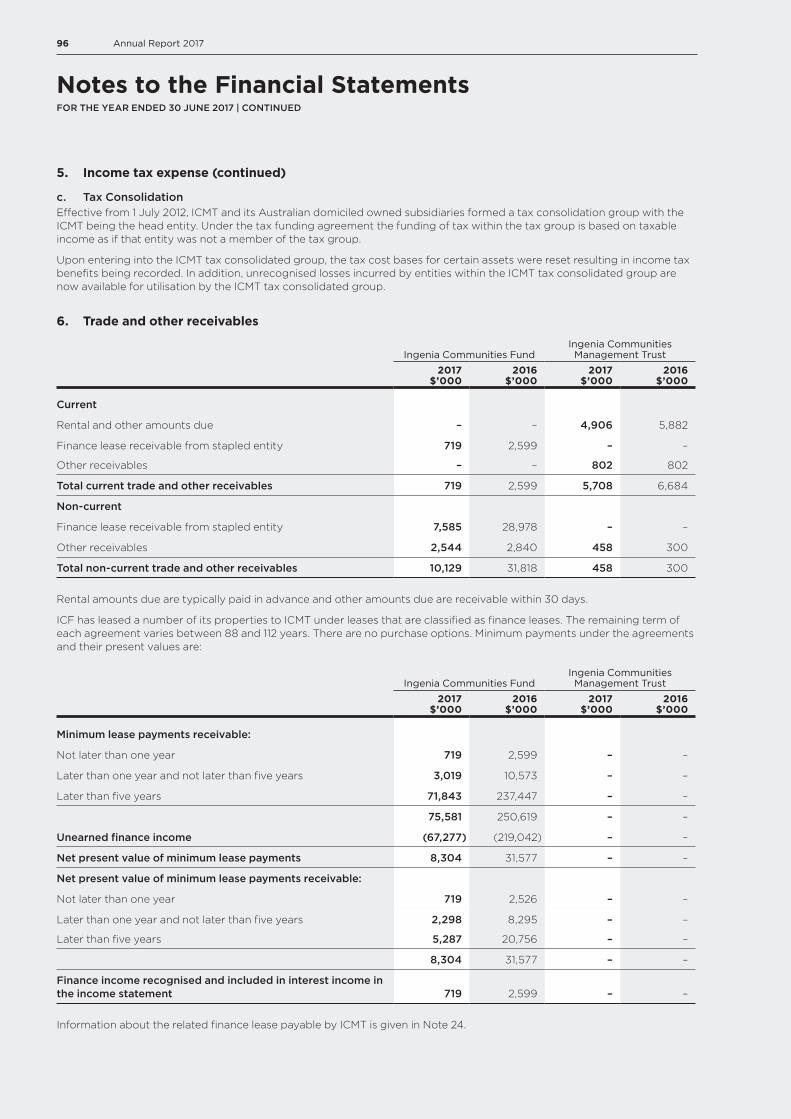
96 Annual Report 2017
5. Income tax expense (continued)
c. Tax ConsolidationEffective from 1 July 2012, ICMT and its Australian domiciled owned subsidiaries formed a tax consolidation group with the ICMT being the head entity. Under the tax funding agreement the funding of tax within the tax group is based on taxable income as if that entity was not a member of the tax group.
Upon entering into the ICMT tax consolidated group, the tax cost bases for certain assets were reset resulting in income tax benefits being recorded. In addition, unrecognised losses incurred by entities within the ICMT tax consolidated group are now available for utilisation by the ICMT tax consolidated group.
6. Trade and other receivables
Ingenia Communities FundIngenia Communities Management Trust
2017 $’000
2016 $’000
2017 $’000
2016 $’000
Current
Rental and other amounts due – – 4,906 5,882
Finance lease receivable from stapled entity 719 2,599 – –
Other receivables – – 802 802
Total current trade and other receivables 719 2,599 5,708 6,684
Non-current
Finance lease receivable from stapled entity 7,585 28,978 – –
Other receivables 2,544 2,840 458 300
Total non-current trade and other receivables 10,129 31,818 458 300
Rental amounts due are typically paid in advance and other amounts due are receivable within 30 days.
ICF has leased a number of its properties to ICMT under leases that are classified as finance leases. The remaining term of each agreement varies between 88 and 112 years. There are no purchase options. Minimum payments under the agreements and their present values are:
Ingenia Communities FundIngenia Communities Management Trust
2017 $’000
2016 $’000
2017 $’000
2016 $’000
Minimum lease payments receivable:
Not later than one year 719 2,599 – –
Later than one year and not later than five years 3,019 10,573 – –
Later than five years 71,843 237,447 – –
75,581 250,619 – –
Unearned finance income (67,277) (219,042) – –
Net present value of minimum lease payments 8,304 31,577 – –
Net present value of minimum lease payments receivable:
Not later than one year 719 2,526 – –
Later than one year and not later than five years 2,298 8,295 – –
Later than five years 5,287 20,756 – –
8,304 31,577 – –
Finance income recognised and included in interest income in the income statement 719 2,599 – –
Information about the related finance lease payable by ICMT is given in Note 24.
Notes to the Financial StatementsFOR THE YEAR ENDED 30 JUNE 2017 | CONTINUED

97Ingenia Communities Holdings Limited
7. Inventories
Ingenia Communities FundIngenia Communities Management Trust
2017 $’000
2016 $’000
2017 $’000
2016 $’000
Carrying values:
Manufactured homes:
Completed – – 15,247 11,140
Under Construction – – 6,190 6,331
Service station fuel and supplies – – 160 194
Total Inventories – – 21,597 17,665
The manufactured homes balance includes:
– 86 new completed homes (2016: 60)
– 9 refurbished/renovated completed homes (2016: 7)
– Manufactured homes under construction include partially completed homes at different stages of development. It also includes demolition, site preparation costs and buybacks on future development sites.
8. Investment properties
a. Summary of Carrying Amounts
Ingenia Communities FundIngenia Communities Management Trust
2017 $’000
2016 $’000
2017 $’000
2016 $’000
Completed properties 154,556 162,795 428,816 474,494
Properties under development – – 110,102 73,457
Total investment properties 154,556 162,795 538,918 547,951
b. Movements in Carrying Amounts
Ingenia Communities FundIngenia Communities Management Trust
2017 $’000
2016 $’000
2017 $’000
2016 $’000
Carrying amount at beginning of period 162,795 153,434 547,951 386,294
Acquisitions – – 174,883 81,536
Expenditure capitalised 3,895 1,451 25,268 19,133
Net transfer from/(to) inventory (268) 242 (333) 200
Transfer of cross staple lease 9,690 – (9,690) –
Net change in fair value 6,000 7,668 6,373 (172)
Transferred from assets held for sale – – – 61,598
Disposals
Carrying Value – – (224,652) –
Net (loss)/gain on disposal of investment property (27,556) – 19,118 (638)
Carrying amount at end of the period 154,556 162,795 538,918 547,951
Notes to the Financial StatementsFOR THE YEAR ENDED 30 JUNE 2017 | CONTINUED
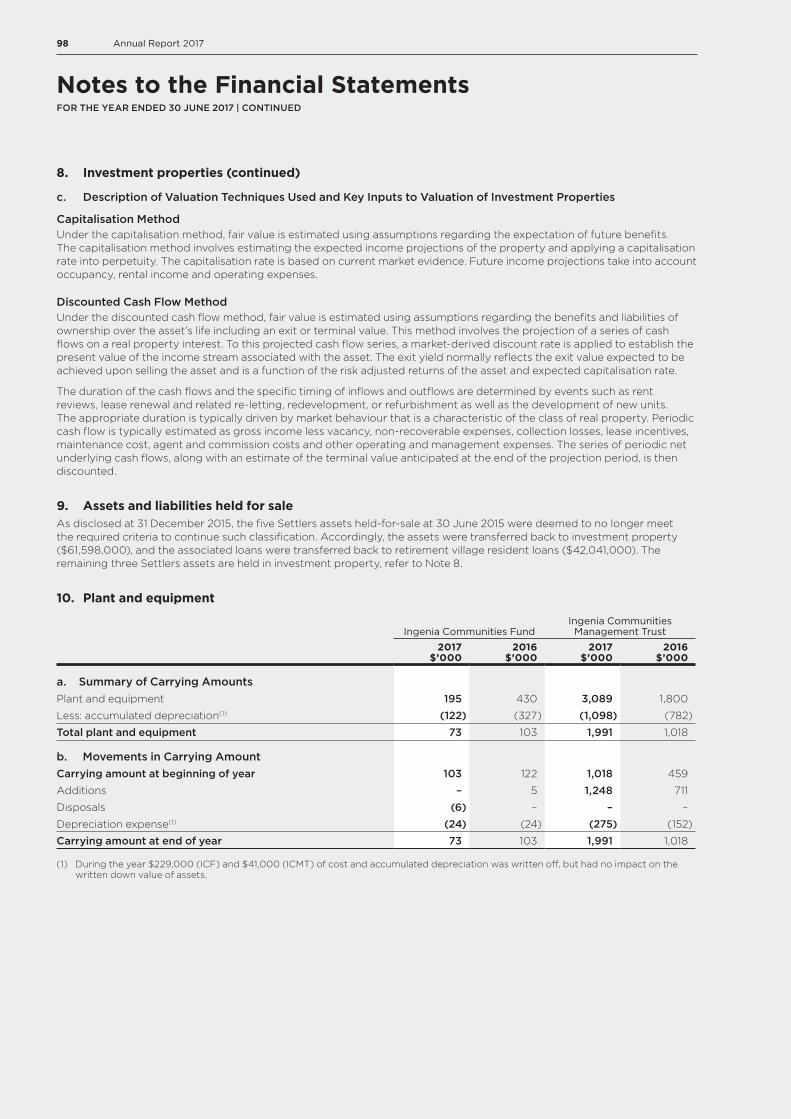
98 Annual Report 2017
8. Investment properties (continued)
c. Description of Valuation Techniques Used and Key Inputs to Valuation of Investment Properties
Capitalisation MethodUnder the capitalisation method, fair value is estimated using assumptions regarding the expectation of future benefits. The capitalisation method involves estimating the expected income projections of the property and applying a capitalisation rate into perpetuity. The capitalisation rate is based on current market evidence. Future income projections take into account occupancy, rental income and operating expenses.
Discounted Cash Flow MethodUnder the discounted cash flow method, fair value is estimated using assumptions regarding the benefits and liabilities of ownership over the asset’s life including an exit or terminal value. This method involves the projection of a series of cash flows on a real property interest. To this projected cash flow series, a market-derived discount rate is applied to establish the present value of the income stream associated with the asset. The exit yield normally reflects the exit value expected to be achieved upon selling the asset and is a function of the risk adjusted returns of the asset and expected capitalisation rate.
The duration of the cash flows and the specific timing of inflows and outflows are determined by events such as rent reviews, lease renewal and related re-letting, redevelopment, or refurbishment as well as the development of new units. The appropriate duration is typically driven by market behaviour that is a characteristic of the class of real property. Periodic cash flow is typically estimated as gross income less vacancy, non-recoverable expenses, collection losses, lease incentives, maintenance cost, agent and commission costs and other operating and management expenses. The series of periodic net underlying cash flows, along with an estimate of the terminal value anticipated at the end of the projection period, is then discounted.
9. Assets and liabilities held for saleAs disclosed at 31 December 2015, the five Settlers assets held-for-sale at 30 June 2015 were deemed to no longer meet the required criteria to continue such classification. Accordingly, the assets were transferred back to investment property ($61,598,000), and the associated loans were transferred back to retirement village resident loans ($42,041,000). The remaining three Settlers assets are held in investment property, refer to Note 8.
10. Plant and equipment
Ingenia Communities FundIngenia Communities Management Trust
2017 $’000
2016 $’000
2017 $’000
2016 $’000
a. Summary of Carrying AmountsPlant and equipment 195 430 3,089 1,800
Less: accumulated depreciation(1) (122) (327) (1,098) (782)
Total plant and equipment 73 103 1,991 1,018
b. Movements in Carrying AmountCarrying amount at beginning of year 103 122 1,018 459
Additions – 5 1,248 711
Disposals (6) – – –
Depreciation expense(1) (24) (24) (275) (152)
Carrying amount at end of year 73 103 1,991 1,018
(1) During the year $229,000 (ICF) and $41,000 (ICMT) of cost and accumulated depreciation was written off, but had no impact on the written down value of assets.
Notes to the Financial StatementsFOR THE YEAR ENDED 30 JUNE 2017 | CONTINUED
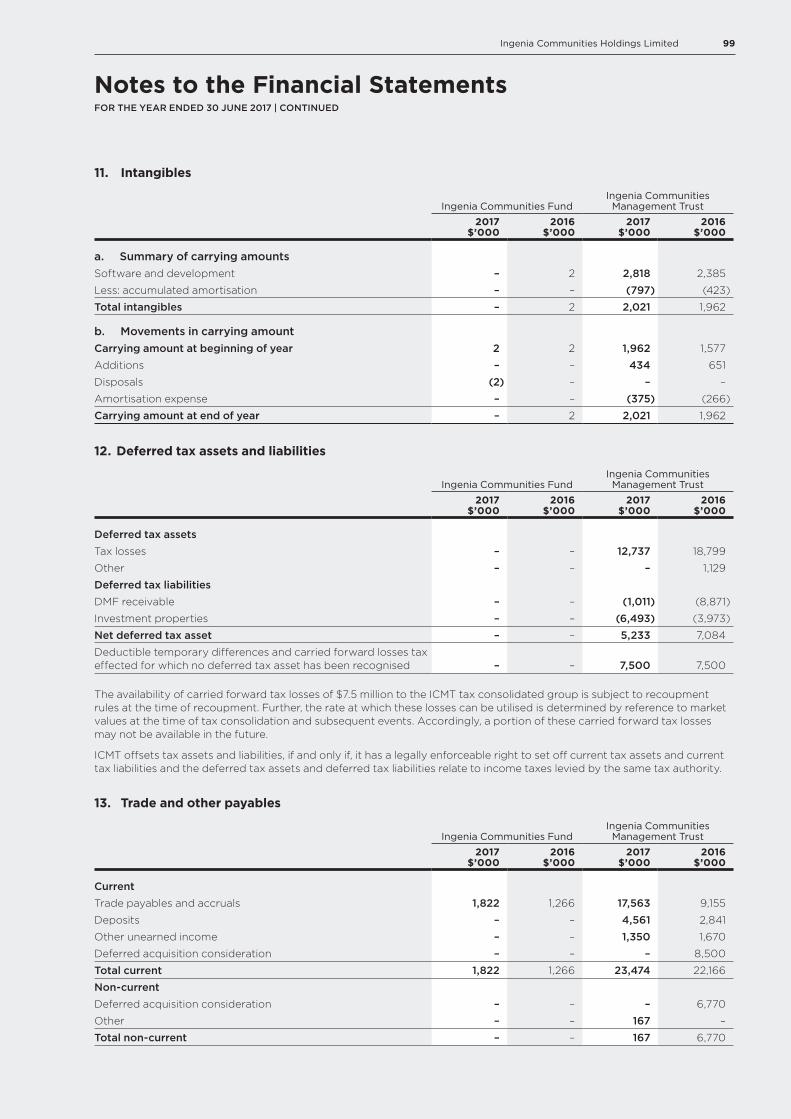
99Ingenia Communities Holdings Limited
11. Intangibles
Ingenia Communities FundIngenia Communities Management Trust
2017 $’000
2016 $’000
2017 $’000
2016 $’000
a. Summary of carrying amountsSoftware and development – 2 2,818 2,385
Less: accumulated amortisation – – (797) (423)
Total intangibles – 2 2,021 1,962
b. Movements in carrying amountCarrying amount at beginning of year 2 2 1,962 1,577
Additions – – 434 651
Disposals (2) – – –
Amortisation expense – – (375) (266)
Carrying amount at end of year – 2 2,021 1,962
12. Deferred tax assets and liabilities
Ingenia Communities FundIngenia Communities Management Trust
2017 $’000
2016 $’000
2017 $’000
2016 $’000
Deferred tax assetsTax losses – – 12,737 18,799
Other – – – 1,129
Deferred tax liabilitiesDMF receivable – – (1,011) (8,871)
Investment properties – – (6,493) (3,973)
Net deferred tax asset – – 5,233 7,084
Deductible temporary differences and carried forward losses tax effected for which no deferred tax asset has been recognised – – 7,500 7,500
The availability of carried forward tax losses of $7.5 million to the ICMT tax consolidated group is subject to recoupment rules at the time of recoupment. Further, the rate at which these losses can be utilised is determined by reference to market values at the time of tax consolidation and subsequent events. Accordingly, a portion of these carried forward tax losses may not be available in the future.
ICMT offsets tax assets and liabilities, if and only if, it has a legally enforceable right to set off current tax assets and current tax liabilities and the deferred tax assets and deferred tax liabilities relate to income taxes levied by the same tax authority.
13. Trade and other payables
Ingenia Communities FundIngenia Communities Management Trust
2017 $’000
2016 $’000
2017 $’000
2016 $’000
CurrentTrade payables and accruals 1,822 1,266 17,563 9,155
Deposits – – 4,561 2,841
Other unearned income – – 1,350 1,670
Deferred acquisition consideration – – – 8,500
Total current 1,822 1,266 23,474 22,166
Non-currentDeferred acquisition consideration – – – 6,770
Other – – 167 –
Total non-current – – 167 6,770
Notes to the Financial StatementsFOR THE YEAR ENDED 30 JUNE 2017 | CONTINUED
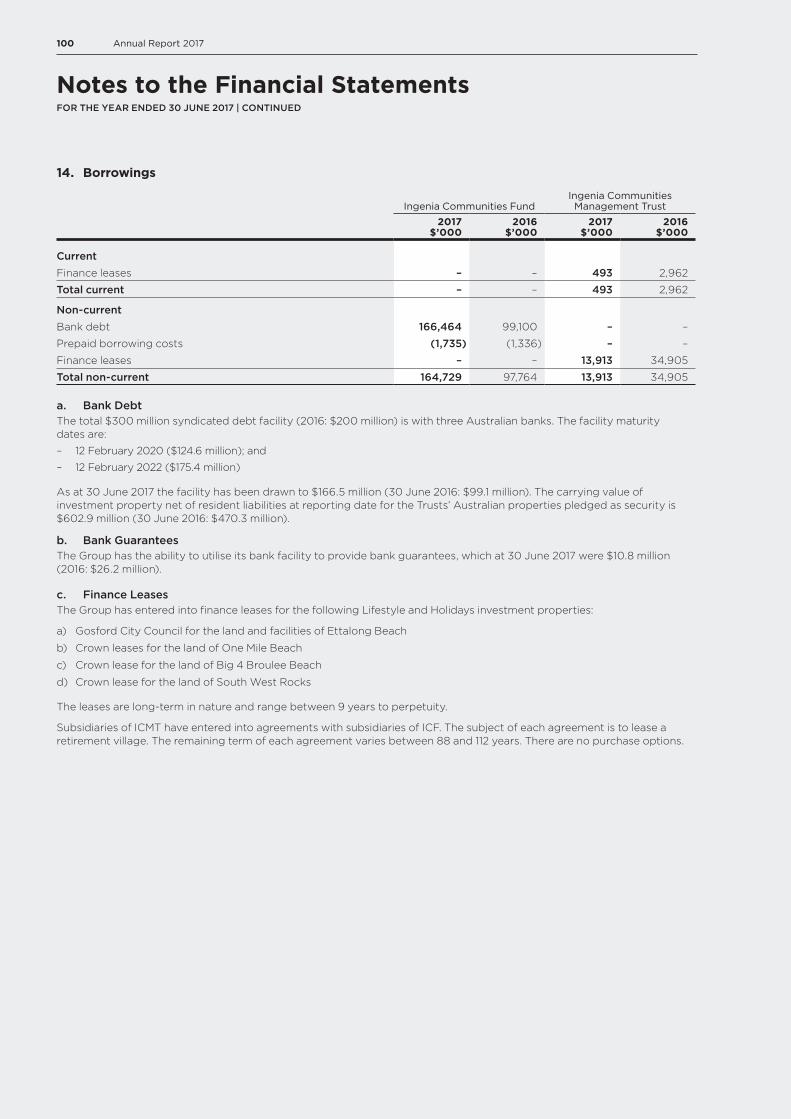
100 Annual Report 2017
Notes to the Financial StatementsFOR THE YEAR ENDED 30 JUNE 2017 | CONTINUED
14. Borrowings
Ingenia Communities FundIngenia Communities Management Trust
2017 $’000
2016 $’000
2017 $’000
2016 $’000
CurrentFinance leases – – 493 2,962
Total current – – 493 2,962
Non-currentBank debt 166,464 99,100 – –
Prepaid borrowing costs (1,735) (1,336) – –
Finance leases – – 13,913 34,905
Total non-current 164,729 97,764 13,913 34,905
a. Bank Debt The total $300 million syndicated debt facility (2016: $200 million) is with three Australian banks. The facility maturity dates are:
– 12 February 2020 ($124.6 million); and
– 12 February 2022 ($175.4 million)
As at 30 June 2017 the facility has been drawn to $166.5 million (30 June 2016: $99.1 million). The carrying value of investment property net of resident liabilities at reporting date for the Trusts’ Australian properties pledged as security is $602.9 million (30 June 2016: $470.3 million).
b. Bank GuaranteesThe Group has the ability to utilise its bank facility to provide bank guarantees, which at 30 June 2017 were $10.8 million (2016: $26.2 million).
c. Finance LeasesThe Group has entered into finance leases for the following Lifestyle and Holidays investment properties:
a) Gosford City Council for the land and facilities of Ettalong Beach
b) Crown leases for the land of One Mile Beach
c) Crown lease for the land of Big 4 Broulee Beach
d) Crown lease for the land of South West Rocks
The leases are long-term in nature and range between 9 years to perpetuity.
Subsidiaries of ICMT have entered into agreements with subsidiaries of ICF. The subject of each agreement is to lease a retirement village. The remaining term of each agreement varies between 88 and 112 years. There are no purchase options.
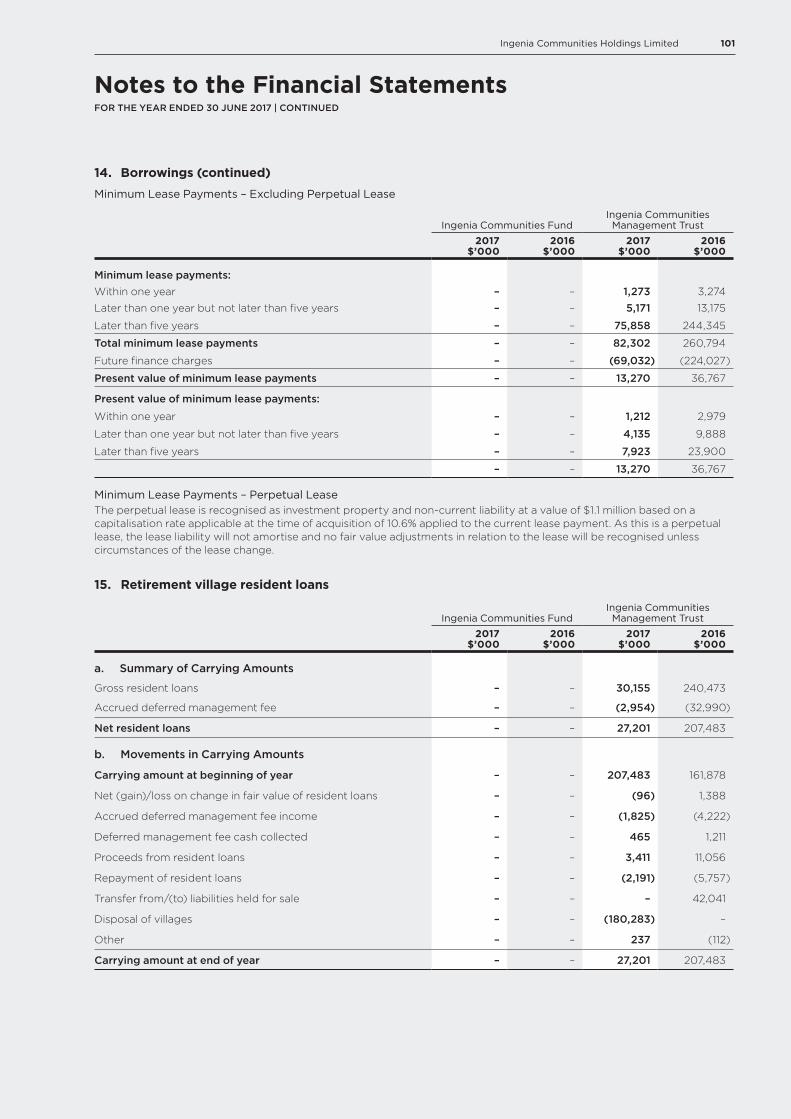
101Ingenia Communities Holdings Limited
14. Borrowings (continued)
Minimum Lease Payments – Excluding Perpetual Lease
Ingenia Communities FundIngenia Communities Management Trust
2017 $’000
2016 $’000
2017 $’000
2016 $’000
Minimum lease payments:Within one year – – 1,273 3,274
Later than one year but not later than five years – – 5,171 13,175
Later than five years – – 75,858 244,345
Total minimum lease payments – – 82,302 260,794
Future finance charges – – (69,032) (224,027)
Present value of minimum lease payments – – 13,270 36,767
Present value of minimum lease payments:
Within one year – – 1,212 2,979
Later than one year but not later than five years – – 4,135 9,888
Later than five years – – 7,923 23,900
– – 13,270 36,767
Minimum Lease Payments – Perpetual LeaseThe perpetual lease is recognised as investment property and non-current liability at a value of $1.1 million based on a capitalisation rate applicable at the time of acquisition of 10.6% applied to the current lease payment. As this is a perpetual lease, the lease liability will not amortise and no fair value adjustments in relation to the lease will be recognised unless circumstances of the lease change.
15. Retirement village resident loans
Ingenia Communities FundIngenia Communities Management Trust
2017 $’000
2016 $’000
2017 $’000
2016 $’000
a. Summary of Carrying Amounts
Gross resident loans – – 30,155 240,473
Accrued deferred management fee – – (2,954) (32,990)
Net resident loans – – 27,201 207,483
b. Movements in Carrying Amounts
Carrying amount at beginning of year – – 207,483 161,878
Net (gain)/loss on change in fair value of resident loans – – (96) 1,388
Accrued deferred management fee income – – (1,825) (4,222)
Deferred management fee cash collected – – 465 1,211
Proceeds from resident loans – – 3,411 11,056
Repayment of resident loans – – (2,191) (5,757)
Transfer from/(to) liabilities held for sale – – – 42,041
Disposal of villages – – (180,283) –
Other – – 237 (112)
Carrying amount at end of year – – 27,201 207,483
Notes to the Financial StatementsFOR THE YEAR ENDED 30 JUNE 2017 | CONTINUED
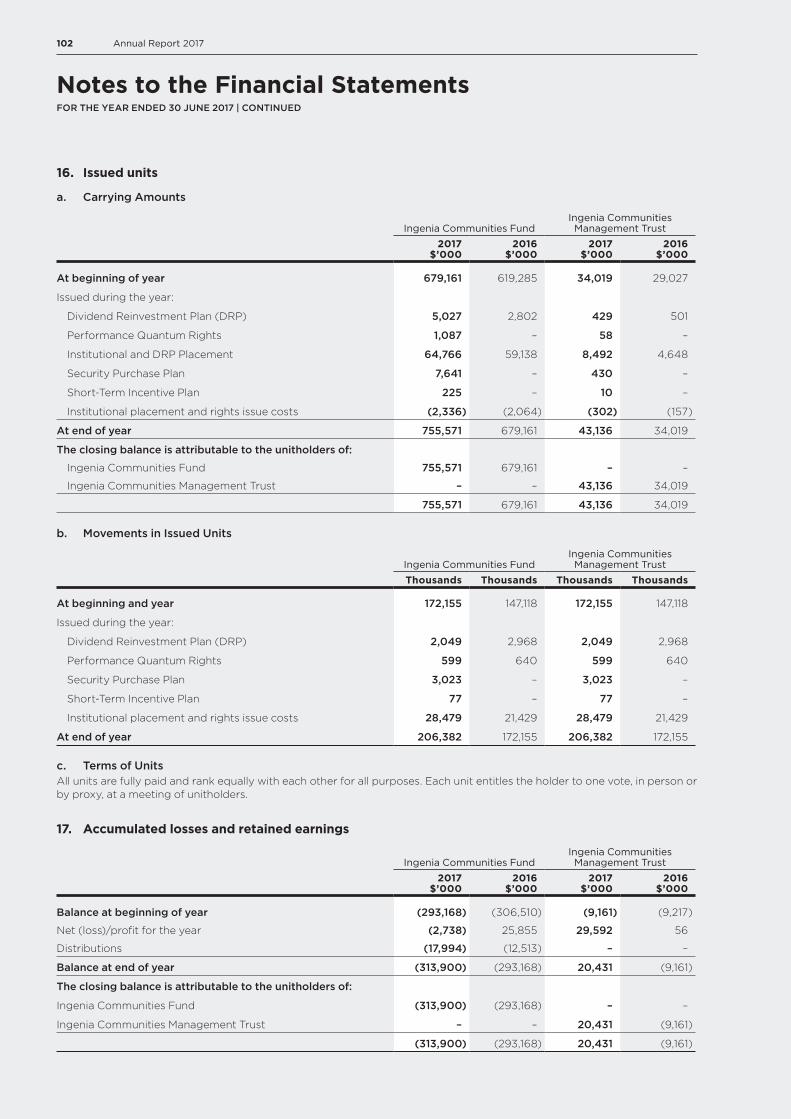
102 Annual Report 2017
Notes to the Financial StatementsFOR THE YEAR ENDED 30 JUNE 2017 | CONTINUED
16. Issued units
a. Carrying Amounts
Ingenia Communities FundIngenia Communities Management Trust
2017 $’000
2016 $’000
2017 $’000
2016 $’000
At beginning of year 679,161 619,285 34,019 29,027
Issued during the year:
Dividend Reinvestment Plan (DRP) 5,027 2,802 429 501
Performance Quantum Rights 1,087 – 58 –
Institutional and DRP Placement 64,766 59,138 8,492 4,648
Security Purchase Plan 7,641 – 430 –
Short-Term Incentive Plan 225 – 10 –
Institutional placement and rights issue costs (2,336) (2,064) (302) (157)
At end of year 755,571 679,161 43,136 34,019
The closing balance is attributable to the unitholders of:
Ingenia Communities Fund 755,571 679,161 – –
Ingenia Communities Management Trust – – 43,136 34,019
755,571 679,161 43,136 34,019
b. Movements in Issued Units
Ingenia Communities FundIngenia Communities Management Trust
Thousands Thousands Thousands Thousands
At beginning and year 172,155 147,118 172,155 147,118
Issued during the year:
Dividend Reinvestment Plan (DRP) 2,049 2,968 2,049 2,968
Performance Quantum Rights 599 640 599 640
Security Purchase Plan 3,023 – 3,023 –
Short-Term Incentive Plan 77 – 77 –
Institutional placement and rights issue costs 28,479 21,429 28,479 21,429
At end of year 206,382 172,155 206,382 172,155
c. Terms of UnitsAll units are fully paid and rank equally with each other for all purposes. Each unit entitles the holder to one vote, in person or by proxy, at a meeting of unitholders.
17. Accumulated losses and retained earnings
Ingenia Communities FundIngenia Communities Management Trust
2017 $’000
2016 $’000
2017 $’000
2016 $’000
Balance at beginning of year (293,168) (306,510) (9,161) (9,217)
Net (loss)/profit for the year (2,738) 25,855 29,592 56
Distributions (17,994) (12,513) – –
Balance at end of year (313,900) (293,168) 20,431 (9,161)
The closing balance is attributable to the unitholders of:
Ingenia Communities Fund (313,900) (293,168) – –
Ingenia Communities Management Trust – – 20,431 (9,161)
(313,900) (293,168) 20,431 (9,161)
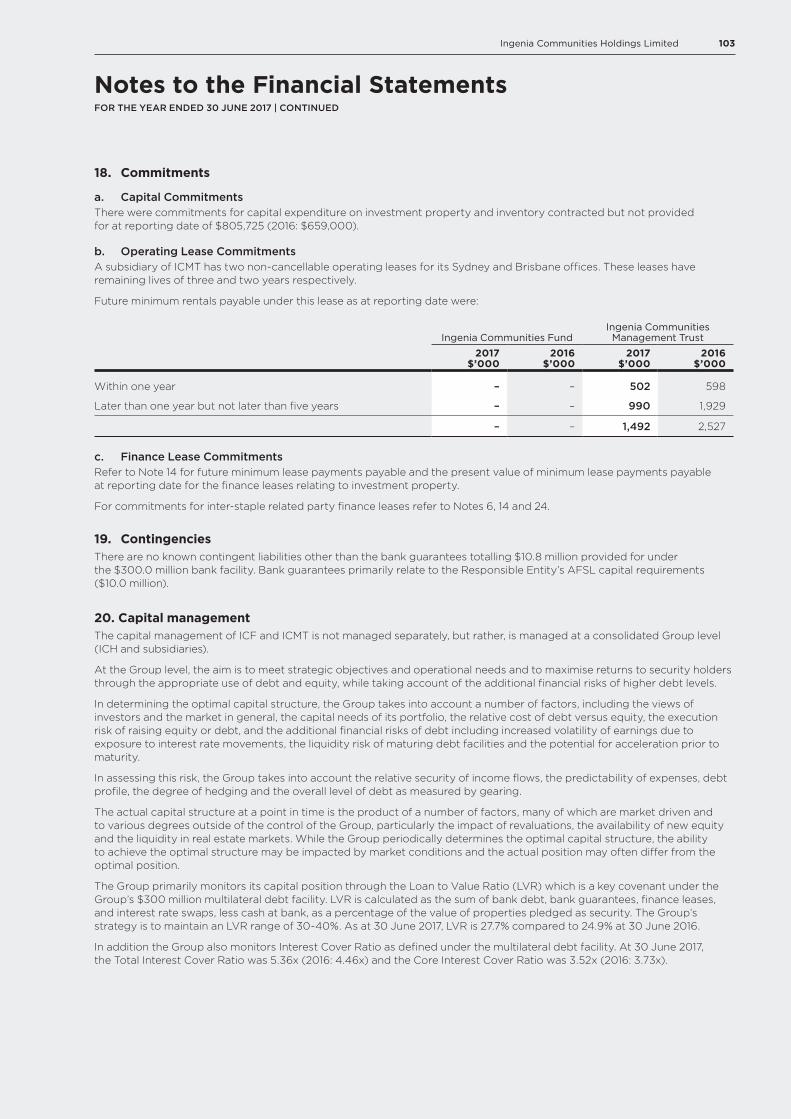
103Ingenia Communities Holdings Limited
18. Commitments
a. Capital CommitmentsThere were commitments for capital expenditure on investment property and inventory contracted but not provided for at reporting date of $805,725 (2016: $659,000).
b. Operating Lease CommitmentsA subsidiary of ICMT has two non-cancellable operating leases for its Sydney and Brisbane offices. These leases have remaining lives of three and two years respectively.
Future minimum rentals payable under this lease as at reporting date were:
Ingenia Communities FundIngenia Communities Management Trust
2017 $’000
2016 $’000
2017 $’000
2016 $’000
Within one year – – 502 598
Later than one year but not later than five years – – 990 1,929
– – 1,492 2,527
c. Finance Lease CommitmentsRefer to Note 14 for future minimum lease payments payable and the present value of minimum lease payments payable at reporting date for the finance leases relating to investment property.
For commitments for inter-staple related party finance leases refer to Notes 6, 14 and 24.
19. ContingenciesThere are no known contingent liabilities other than the bank guarantees totalling $10.8 million provided for under the $300.0 million bank facility. Bank guarantees primarily relate to the Responsible Entity’s AFSL capital requirements ($10.0 million).
20. Capital managementThe capital management of ICF and ICMT is not managed separately, but rather, is managed at a consolidated Group level (ICH and subsidiaries).
At the Group level, the aim is to meet strategic objectives and operational needs and to maximise returns to security holders through the appropriate use of debt and equity, while taking account of the additional financial risks of higher debt levels.
In determining the optimal capital structure, the Group takes into account a number of factors, including the views of investors and the market in general, the capital needs of its portfolio, the relative cost of debt versus equity, the execution risk of raising equity or debt, and the additional financial risks of debt including increased volatility of earnings due to exposure to interest rate movements, the liquidity risk of maturing debt facilities and the potential for acceleration prior to maturity.
In assessing this risk, the Group takes into account the relative security of income flows, the predictability of expenses, debt profile, the degree of hedging and the overall level of debt as measured by gearing.
The actual capital structure at a point in time is the product of a number of factors, many of which are market driven and to various degrees outside of the control of the Group, particularly the impact of revaluations, the availability of new equity and the liquidity in real estate markets. While the Group periodically determines the optimal capital structure, the ability to achieve the optimal structure may be impacted by market conditions and the actual position may often differ from the optimal position.
The Group primarily monitors its capital position through the Loan to Value Ratio (LVR) which is a key covenant under the Group’s $300 million multilateral debt facility. LVR is calculated as the sum of bank debt, bank guarantees, finance leases, and interest rate swaps, less cash at bank, as a percentage of the value of properties pledged as security. The Group’s strategy is to maintain an LVR range of 30-40%. As at 30 June 2017, LVR is 27.7% compared to 24.9% at 30 June 2016.
In addition the Group also monitors Interest Cover Ratio as defined under the multilateral debt facility. At 30 June 2017, the Total Interest Cover Ratio was 5.36x (2016: 4.46x) and the Core Interest Cover Ratio was 3.52x (2016: 3.73x).
Notes to the Financial StatementsFOR THE YEAR ENDED 30 JUNE 2017 | CONTINUED

104 Annual Report 2017
Notes to the Financial StatementsFOR THE YEAR ENDED 30 JUNE 2017 | CONTINUED
21. Financial instruments
a. InstrumentsThe Trusts’ principal financial instruments comprise receivables, payables, interest bearing liabilities, other financial liabilities, cash and short-term deposits and derivative financial instruments.
The main risks arising from the Trusts’ financial instruments are interest rate risk, foreign exchange risk, credit risk and liquidity risk. The Trusts manage the exposure to these risks primarily through the Investments, Derivatives, and Borrowing Policy. The policy sets out various targets aimed at restricting the financial risk taken by the Trusts. Management reviews actual positions of the Trusts against these targets on a regular basis. If the target is not achieved, or the forecast is unlikely to be achieved, a plan of action is, where appropriate, put in place with the aim of meeting the target within an agreed timeframe. Depending on the circumstances of the Trusts at a point in time, it may be that positions outside of the Investments, Derivatives, and Borrowing Policy are accepted and no plan of action is put in place to meet the treasury targets, because, for example, the risks associated with bringing the Trusts into compliance outweigh the benefits. The adequacy of the Investments, Derivatives, and Borrowing Policy in addressing the risks arising from the Trust’s financial instruments is reviewed on a regular basis.
While the Trusts aim to meet the Investments, Derivatives, and Borrowing Policy targets, many factors influence the performance, and it is probable that at any one time, not all targets will be met. For example, the Trusts may be unable to negotiate the extension of bank facilities sufficiently ahead of time, so that they fail to achieve their liquidity target. When refinancing loans they may be unable to achieve the desired maturity profile or the desired level of flexibility of financial covenants, because of the cost of such terms or their unavailability. Hedging instruments may not be available, or their cost may outweigh the benefit of risk reduction or they may introduce other risks such as mark to market valuation risk. Changes in market conditions may limit the Trusts ability to raise capital through the issue of units or sale of properties.
The main risks arising from ICMT’s financial instruments are interest rate risk, foreign exchange risk, credit risk and liquidity risk. These risks are not separately managed. Management of these risks for the ICF may result in consequential changes for ICMT.
b. Interest Rate RiskThe Trusts’ exposure to the risk of changes in market interest rates arises primarily from its use of borrowings. The main consequence of adverse changes in market interest rates is higher interest costs, reducing the Trust’s profit. In addition, one or more of the Trust’s loan agreements may include minimum interest cover covenants. Higher interest costs resulting from increases in market interest rates may result in these covenants being breached, providing the lender the right to call in the loan or to increase the interest rate applied to the loan.
The Trusts manage the risk of changes in market interest rates by maintaining an appropriate mix of fixed and floating rate borrowings. Fixed rate debt is achieved either through fixed rate debt funding or through derivative financial instruments permitted under the Investments, Derivatives, and Borrowing Policy. The policy sets minimum and maximum levels of fixed rate exposure over a ten-year time horizon.
At 30 June 2017 after taking into account the effect of interest rate swaps, approximately 29% of ICF’s borrowings are at a fixed rate of interest (2016: 28%).
Exposure to changes in market interest rates also arises from financial assets such as cash deposits and loan receivables subject to floating interest rate terms. Changes in market interest rates will also change the fair value of any interest rate hedges.
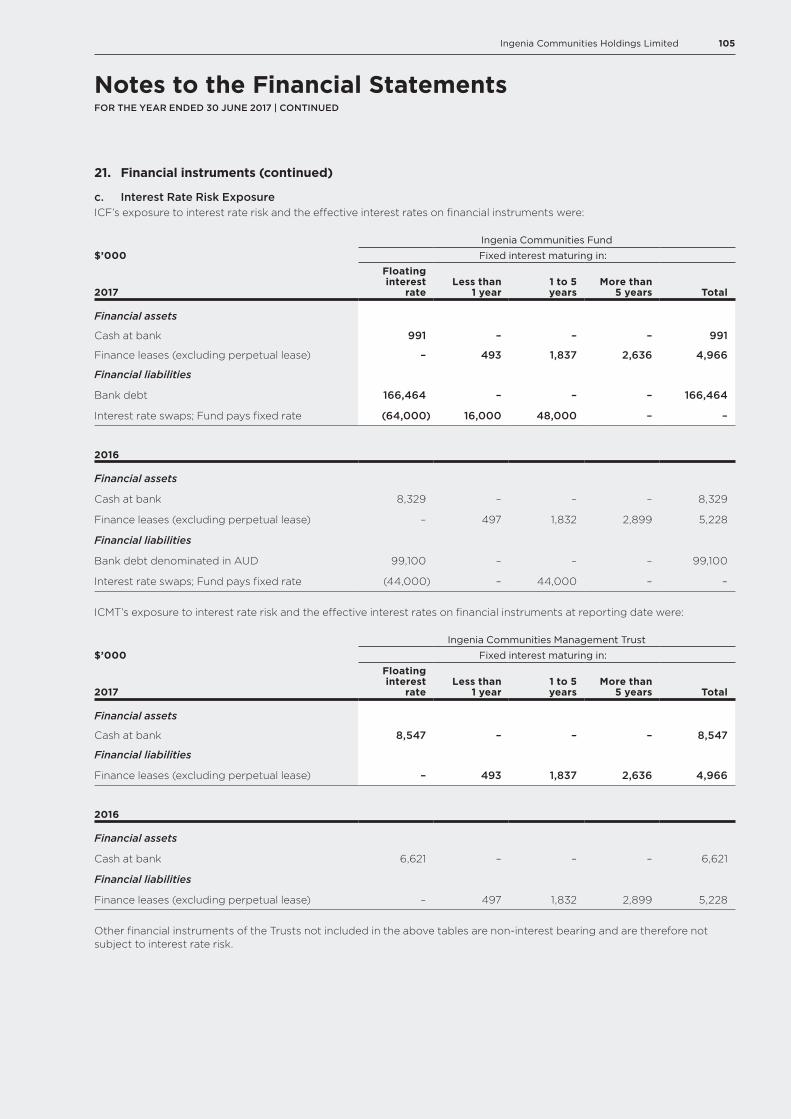
105Ingenia Communities Holdings Limited
21. Financial instruments (continued)
c. Interest Rate Risk ExposureICF’s exposure to interest rate risk and the effective interest rates on financial instruments were:
Ingenia Communities Fund
$’000 Fixed interest maturing in:
2017
Floating interest
rateLess than
1 year1 to 5 years
More than 5 years Total
Financial assets
Cash at bank 991 – – – 991
Finance leases (excluding perpetual lease) – 493 1,837 2,636 4,966
Financial liabilities
Bank debt 166,464 – – – 166,464
Interest rate swaps; Fund pays fixed rate (64,000) 16,000 48,000 – –
2016
Financial assets
Cash at bank 8,329 – – – 8,329
Finance leases (excluding perpetual lease) – 497 1,832 2,899 5,228
Financial liabilities
Bank debt denominated in AUD 99,100 – – – 99,100
Interest rate swaps; Fund pays fixed rate (44,000) – 44,000 – –
ICMT’s exposure to interest rate risk and the effective interest rates on financial instruments at reporting date were:
Ingenia Communities Management Trust
$’000 Fixed interest maturing in:
2017
Floating interest
rateLess than
1 year1 to 5 years
More than 5 years Total
Financial assets
Cash at bank 8,547 – – – 8,547
Financial liabilities
Finance leases (excluding perpetual lease) – 493 1,837 2,636 4,966
2016
Financial assets
Cash at bank 6,621 – – – 6,621
Financial liabilities
Finance leases (excluding perpetual lease) – 497 1,832 2,899 5,228
Other financial instruments of the Trusts not included in the above tables are non-interest bearing and are therefore not subject to interest rate risk.
Notes to the Financial StatementsFOR THE YEAR ENDED 30 JUNE 2017 | CONTINUED
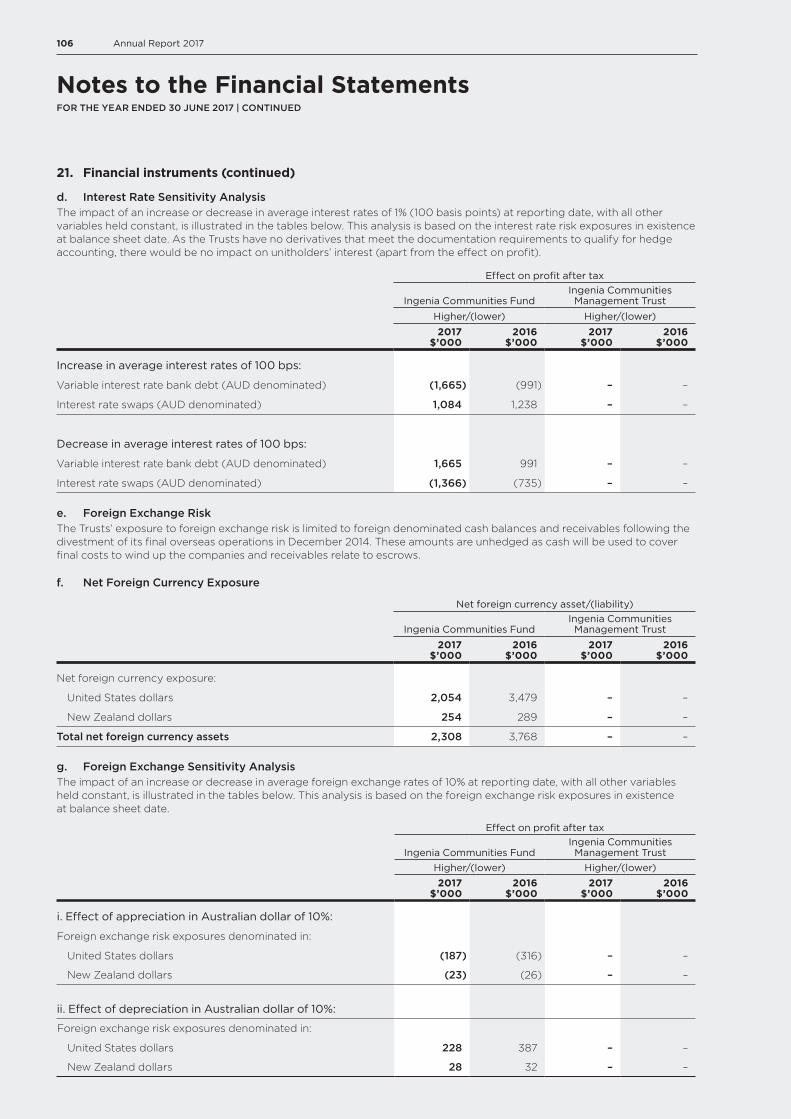
106 Annual Report 2017
Notes to the Financial StatementsFOR THE YEAR ENDED 30 JUNE 2017 | CONTINUED
21. Financial instruments (continued)
d. Interest Rate Sensitivity AnalysisThe impact of an increase or decrease in average interest rates of 1% (100 basis points) at reporting date, with all other variables held constant, is illustrated in the tables below. This analysis is based on the interest rate risk exposures in existence at balance sheet date. As the Trusts have no derivatives that meet the documentation requirements to qualify for hedge accounting, there would be no impact on unitholders’ interest (apart from the effect on profit).
Effect on profit after tax
Ingenia Communities FundIngenia Communities Management Trust
Higher/(lower) Higher/(lower)
2017 $’000
2016 $’000
2017 $’000
2016 $’000
Increase in average interest rates of 100 bps:
Variable interest rate bank debt (AUD denominated) (1,665) (991) – –
Interest rate swaps (AUD denominated) 1,084 1,238 – –
Decrease in average interest rates of 100 bps:
Variable interest rate bank debt (AUD denominated) 1,665 991 – –
Interest rate swaps (AUD denominated) (1,366) (735) – –
e. Foreign Exchange RiskThe Trusts’ exposure to foreign exchange risk is limited to foreign denominated cash balances and receivables following the divestment of its final overseas operations in December 2014. These amounts are unhedged as cash will be used to cover final costs to wind up the companies and receivables relate to escrows.
f. Net Foreign Currency Exposure
Net foreign currency asset/(liability)
Ingenia Communities FundIngenia Communities Management Trust
2017 $’000
2016 $’000
2017 $’000
2016 $’000
Net foreign currency exposure:
United States dollars 2,054 3,479 – –
New Zealand dollars 254 289 – –
Total net foreign currency assets 2,308 3,768 – –
g. Foreign Exchange Sensitivity AnalysisThe impact of an increase or decrease in average foreign exchange rates of 10% at reporting date, with all other variables held constant, is illustrated in the tables below. This analysis is based on the foreign exchange risk exposures in existence at balance sheet date.
Effect on profit after tax
Ingenia Communities FundIngenia Communities Management Trust
Higher/(lower) Higher/(lower)2017
$’0002016
$’0002017
$’0002016
$’000
i. Effect of appreciation in Australian dollar of 10%:
Foreign exchange risk exposures denominated in:
United States dollars (187) (316) – –
New Zealand dollars (23) (26) – –
ii. Effect of depreciation in Australian dollar of 10%:
Foreign exchange risk exposures denominated in:
United States dollars 228 387 – –
New Zealand dollars 28 32 – –
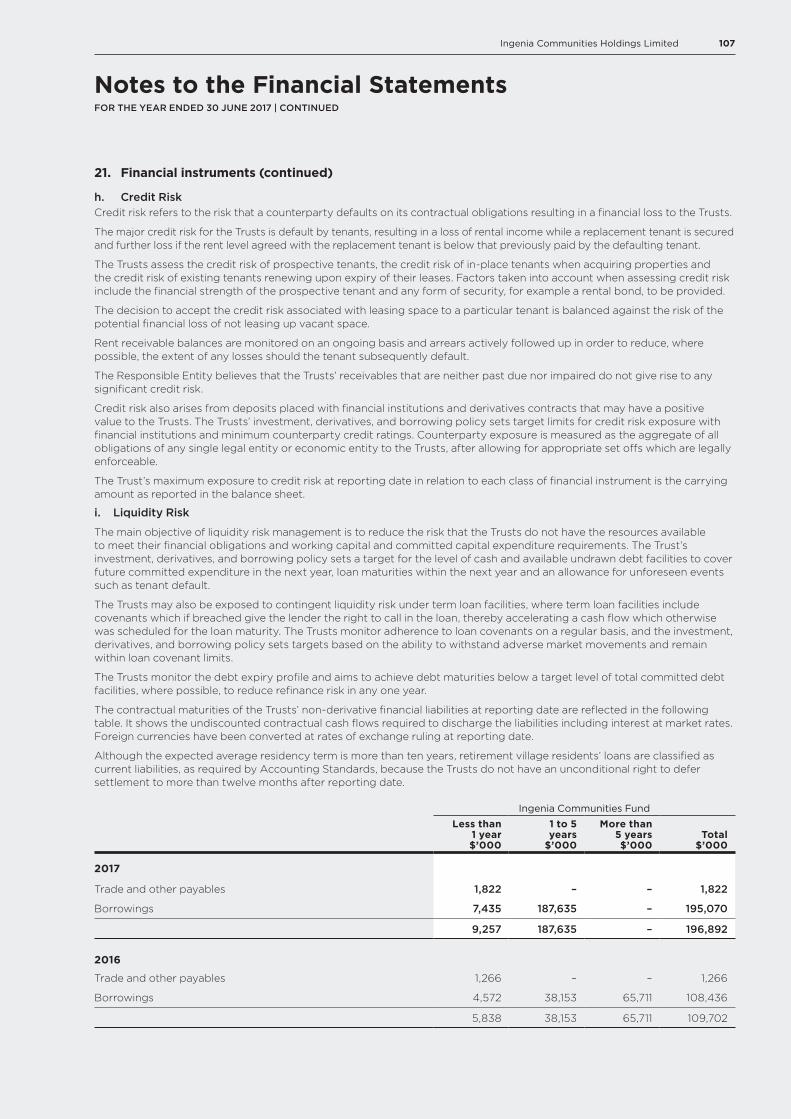
107Ingenia Communities Holdings Limited
21. Financial instruments (continued)
h. Credit RiskCredit risk refers to the risk that a counterparty defaults on its contractual obligations resulting in a financial loss to the Trusts.
The major credit risk for the Trusts is default by tenants, resulting in a loss of rental income while a replacement tenant is secured and further loss if the rent level agreed with the replacement tenant is below that previously paid by the defaulting tenant.
The Trusts assess the credit risk of prospective tenants, the credit risk of in-place tenants when acquiring properties and the credit risk of existing tenants renewing upon expiry of their leases. Factors taken into account when assessing credit risk include the financial strength of the prospective tenant and any form of security, for example a rental bond, to be provided.
The decision to accept the credit risk associated with leasing space to a particular tenant is balanced against the risk of the potential financial loss of not leasing up vacant space.
Rent receivable balances are monitored on an ongoing basis and arrears actively followed up in order to reduce, where possible, the extent of any losses should the tenant subsequently default.
The Responsible Entity believes that the Trusts’ receivables that are neither past due nor impaired do not give rise to any significant credit risk.
Credit risk also arises from deposits placed with financial institutions and derivatives contracts that may have a positive value to the Trusts. The Trusts’ investment, derivatives, and borrowing policy sets target limits for credit risk exposure with financial institutions and minimum counterparty credit ratings. Counterparty exposure is measured as the aggregate of all obligations of any single legal entity or economic entity to the Trusts, after allowing for appropriate set offs which are legally enforceable.
The Trust’s maximum exposure to credit risk at reporting date in relation to each class of financial instrument is the carrying amount as reported in the balance sheet.
i. Liquidity Risk
The main objective of liquidity risk management is to reduce the risk that the Trusts do not have the resources available to meet their financial obligations and working capital and committed capital expenditure requirements. The Trust’s investment, derivatives, and borrowing policy sets a target for the level of cash and available undrawn debt facilities to cover future committed expenditure in the next year, loan maturities within the next year and an allowance for unforeseen events such as tenant default.
The Trusts may also be exposed to contingent liquidity risk under term loan facilities, where term loan facilities include covenants which if breached give the lender the right to call in the loan, thereby accelerating a cash flow which otherwise was scheduled for the loan maturity. The Trusts monitor adherence to loan covenants on a regular basis, and the investment, derivatives, and borrowing policy sets targets based on the ability to withstand adverse market movements and remain within loan covenant limits.
The Trusts monitor the debt expiry profile and aims to achieve debt maturities below a target level of total committed debt facilities, where possible, to reduce refinance risk in any one year.
The contractual maturities of the Trusts’ non-derivative financial liabilities at reporting date are reflected in the following table. It shows the undiscounted contractual cash flows required to discharge the liabilities including interest at market rates. Foreign currencies have been converted at rates of exchange ruling at reporting date.
Although the expected average residency term is more than ten years, retirement village residents’ loans are classified as current liabilities, as required by Accounting Standards, because the Trusts do not have an unconditional right to defer settlement to more than twelve months after reporting date.
Ingenia Communities Fund
Less than 1 year $’000
1 to 5 years
$’000
More than 5 years $’000
Total $’000
2017
Trade and other payables 1,822 – – 1,822
Borrowings 7,435 187,635 – 195,070
9,257 187,635 – 196,892
2016
Trade and other payables 1,266 – – 1,266
Borrowings 4,572 38,153 65,711 108,436
5,838 38,153 65,711 109,702
Notes to the Financial StatementsFOR THE YEAR ENDED 30 JUNE 2017 | CONTINUED
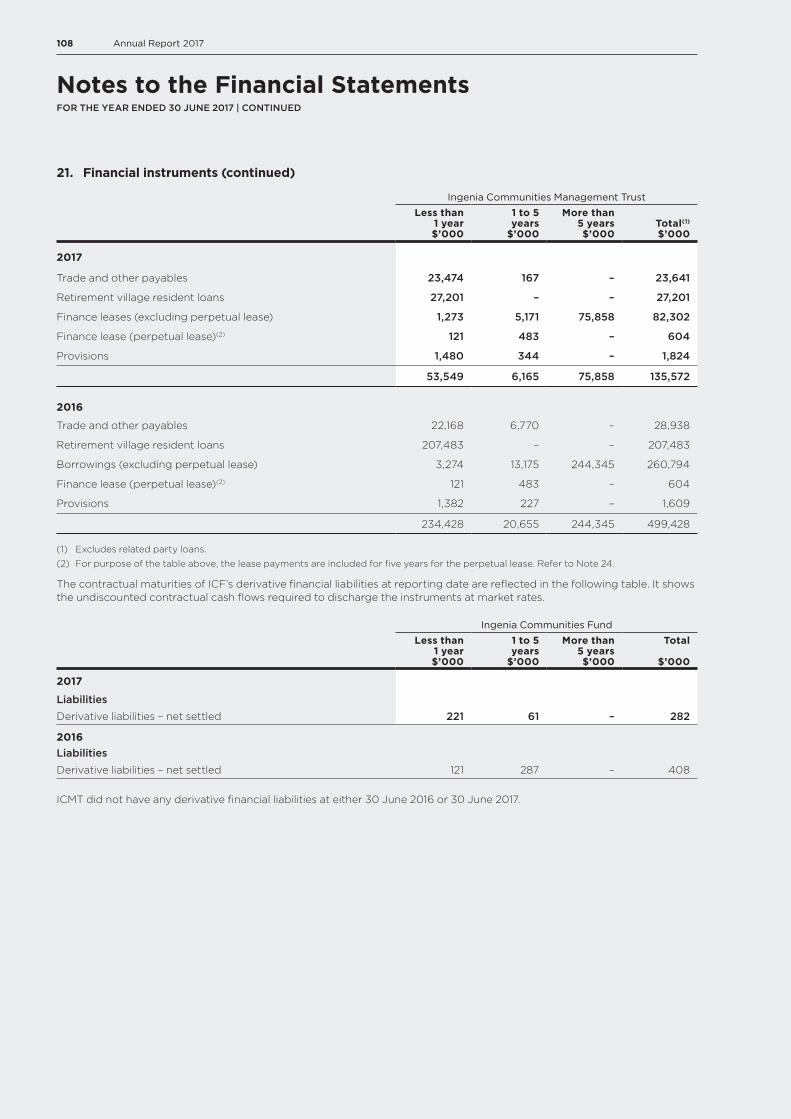
108 Annual Report 2017
Notes to the Financial StatementsFOR THE YEAR ENDED 30 JUNE 2017 | CONTINUED
21. Financial instruments (continued)
Ingenia Communities Management Trust
Less than 1 year $’000
1 to 5 years
$’000
More than 5 years $’000
Total(1) $’000
2017
Trade and other payables 23,474 167 – 23,641
Retirement village resident loans 27,201 – – 27,201
Finance leases (excluding perpetual lease) 1,273 5,171 75,858 82,302
Finance lease (perpetual lease)(2) 121 483 – 604
Provisions 1,480 344 – 1,824
53,549 6,165 75,858 135,572
2016
Trade and other payables 22,168 6,770 – 28,938
Retirement village resident loans 207,483 – – 207,483
Borrowings (excluding perpetual lease) 3,274 13,175 244,345 260,794
Finance lease (perpetual lease)(2) 121 483 – 604
Provisions 1,382 227 – 1,609
234,428 20,655 244,345 499,428
(1) Excludes related party loans.
(2) For purpose of the table above, the lease payments are included for five years for the perpetual lease. Refer to Note 24.
The contractual maturities of ICF’s derivative financial liabilities at reporting date are reflected in the following table. It shows the undiscounted contractual cash flows required to discharge the instruments at market rates.
Ingenia Communities Fund
Less than 1 year $’000
1 to 5 years
$’000
More than 5 years $’000
Total
$’000
2017
LiabilitiesDerivative liabilities – net settled 221 61 – 282
2016LiabilitiesDerivative liabilities – net settled 121 287 – 408
ICMT did not have any derivative financial liabilities at either 30 June 2016 or 30 June 2017.
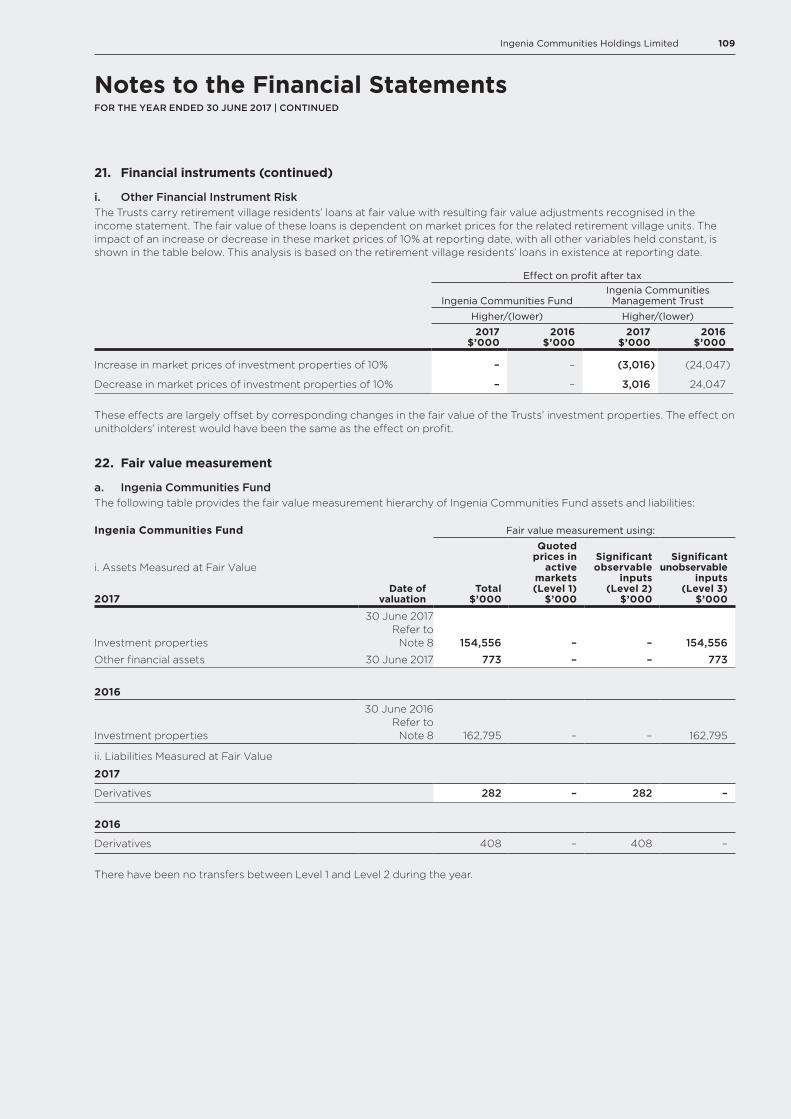
109Ingenia Communities Holdings Limited
Notes to the Financial StatementsFOR THE YEAR ENDED 30 JUNE 2017 | CONTINUED
21. Financial instruments (continued)
i. Other Financial Instrument RiskThe Trusts carry retirement village residents’ loans at fair value with resulting fair value adjustments recognised in the income statement. The fair value of these loans is dependent on market prices for the related retirement village units. The impact of an increase or decrease in these market prices of 10% at reporting date, with all other variables held constant, is shown in the table below. This analysis is based on the retirement village residents’ loans in existence at reporting date.
Effect on profit after tax
Ingenia Communities FundIngenia Communities Management Trust
Higher/(lower) Higher/(lower)
2017 $’000
2016 $’000
2017 $’000
2016 $’000
Increase in market prices of investment properties of 10% – – (3,016) (24,047)
Decrease in market prices of investment properties of 10% – – 3,016 24,047
These effects are largely offset by corresponding changes in the fair value of the Trusts’ investment properties. The effect on unitholders’ interest would have been the same as the effect on profit.
22. Fair value measurement
a. Ingenia Communities FundThe following table provides the fair value measurement hierarchy of Ingenia Communities Fund assets and liabilities:
Ingenia Communities Fund
Date of valuation
Fair value measurement using:
i. Assets Measured at Fair Value
2017
Total$’000
Quoted prices in
active markets
(Level 1) $’000
Significant observable
inputs (Level 2)
$’000
Significant unobservable
inputs (Level 3)
$’000
Investment properties
30 June 2017 Refer to
Note 8 154,556 – – 154,556Other financial assets 30 June 2017 773 – – 773
2016
Investment properties
30 June 2016 Refer to
Note 8 162,795 – – 162,795
ii. Liabilities Measured at Fair Value
2017
Derivatives 282 – 282 –
2016
Derivatives 408 – 408 –
There have been no transfers between Level 1 and Level 2 during the year.
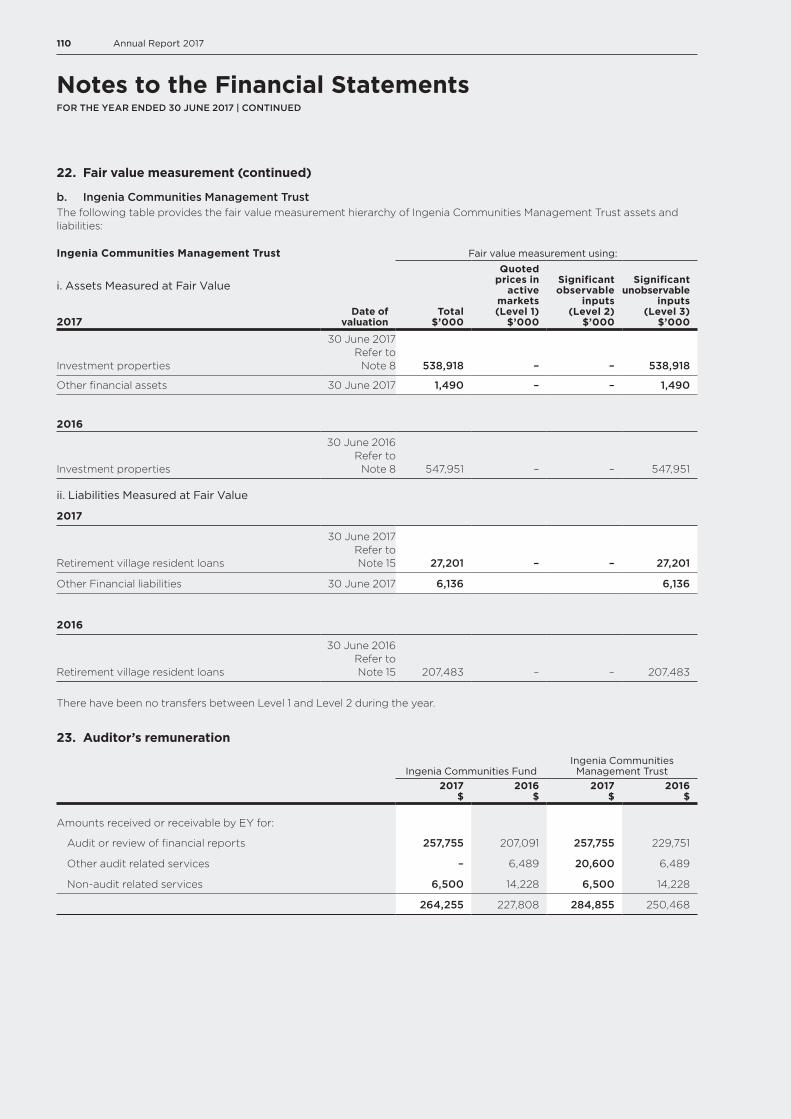
110 Annual Report 2017
Notes to the Financial StatementsFOR THE YEAR ENDED 30 JUNE 2017 | CONTINUED
22. Fair value measurement (continued)
b. Ingenia Communities Management TrustThe following table provides the fair value measurement hierarchy of Ingenia Communities Management Trust assets and liabilities:
Ingenia Communities Management Trust
Date of valuation
Fair value measurement using:
i. Assets Measured at Fair Value 2017
Total$’000
Quoted prices in
active markets
(Level 1)$’000
Significant observable
inputs (Level 2)
$’000
Significant unobservable
inputs (Level 3)
$’000
Investment properties
30 June 2017 Refer to
Note 8 538,918 – – 538,918
Other financial assets 30 June 2017 1,490 – – 1,490
2016
Investment properties
30 June 2016 Refer to
Note 8 547,951 – – 547,951
ii. Liabilities Measured at Fair Value
2017
Retirement village resident loans
30 June 2017 Refer to Note 15 27,201 – – 27,201
Other Financial liabilities 30 June 2017 6,136 6,136
2016
Retirement village resident loans
30 June 2016 Refer to Note 15 207,483 – – 207,483
There have been no transfers between Level 1 and Level 2 during the year.
23. Auditor’s remuneration
Ingenia Communities FundIngenia Communities Management Trust
2017 $
2016 $
2017 $
2016 $
Amounts received or receivable by EY for:
Audit or review of financial reports 257,755 207,091 257,755 229,751
Other audit related services – 6,489 20,600 6,489
Non-audit related services 6,500 14,228 6,500 14,228
264,255 227,808 284,855 250,468
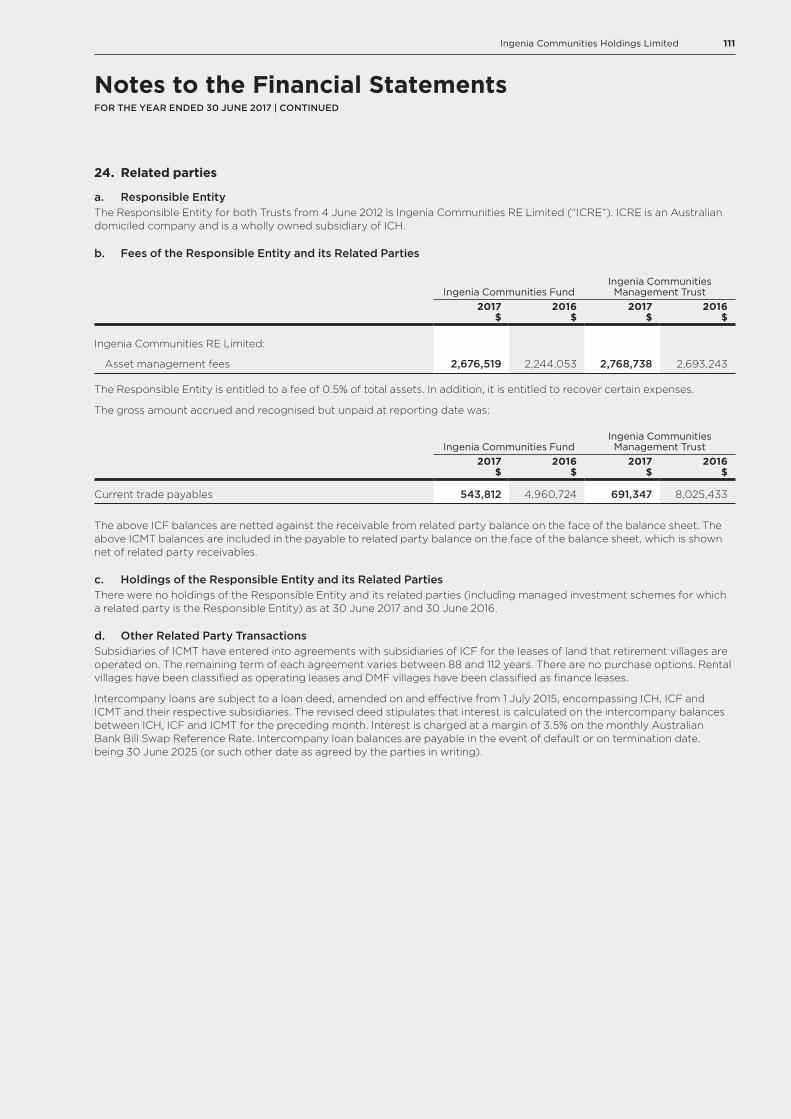
111Ingenia Communities Holdings Limited
24. Related parties
a. Responsible EntityThe Responsible Entity for both Trusts from 4 June 2012 is Ingenia Communities RE Limited (“ICRE”). ICRE is an Australian domiciled company and is a wholly owned subsidiary of ICH.
b. Fees of the Responsible Entity and its Related Parties
Ingenia Communities FundIngenia Communities Management Trust
2017 $
2016 $
2017 $
2016 $
Ingenia Communities RE Limited:
Asset management fees 2,676,519 2,244,053 2,768,738 2,693,243
The Responsible Entity is entitled to a fee of 0.5% of total assets. In addition, it is entitled to recover certain expenses.
The gross amount accrued and recognised but unpaid at reporting date was:
Ingenia Communities FundIngenia Communities Management Trust
2017 $
2016 $
2017 $
2016 $
Current trade payables 543,812 4,960,724 691,347 8,025,433
The above ICF balances are netted against the receivable from related party balance on the face of the balance sheet. The above ICMT balances are included in the payable to related party balance on the face of the balance sheet, which is shown net of related party receivables.
c. Holdings of the Responsible Entity and its Related PartiesThere were no holdings of the Responsible Entity and its related parties (including managed investment schemes for which a related party is the Responsible Entity) as at 30 June 2017 and 30 June 2016.
d. Other Related Party TransactionsSubsidiaries of ICMT have entered into agreements with subsidiaries of ICF for the leases of land that retirement villages are operated on. The remaining term of each agreement varies between 88 and 112 years. There are no purchase options. Rental villages have been classified as operating leases and DMF villages have been classified as finance leases.
Intercompany loans are subject to a loan deed, amended on and effective from 1 July 2015, encompassing ICH, ICF and ICMT and their respective subsidiaries. The revised deed stipulates that interest is calculated on the intercompany balances between ICH, ICF and ICMT for the preceding month. Interest is charged at a margin of 3.5% on the monthly Australian Bank Bill Swap Reference Rate. Intercompany loan balances are payable in the event of default or on termination date, being 30 June 2025 (or such other date as agreed by the parties in writing).
Notes to the Financial StatementsFOR THE YEAR ENDED 30 JUNE 2017 | CONTINUED
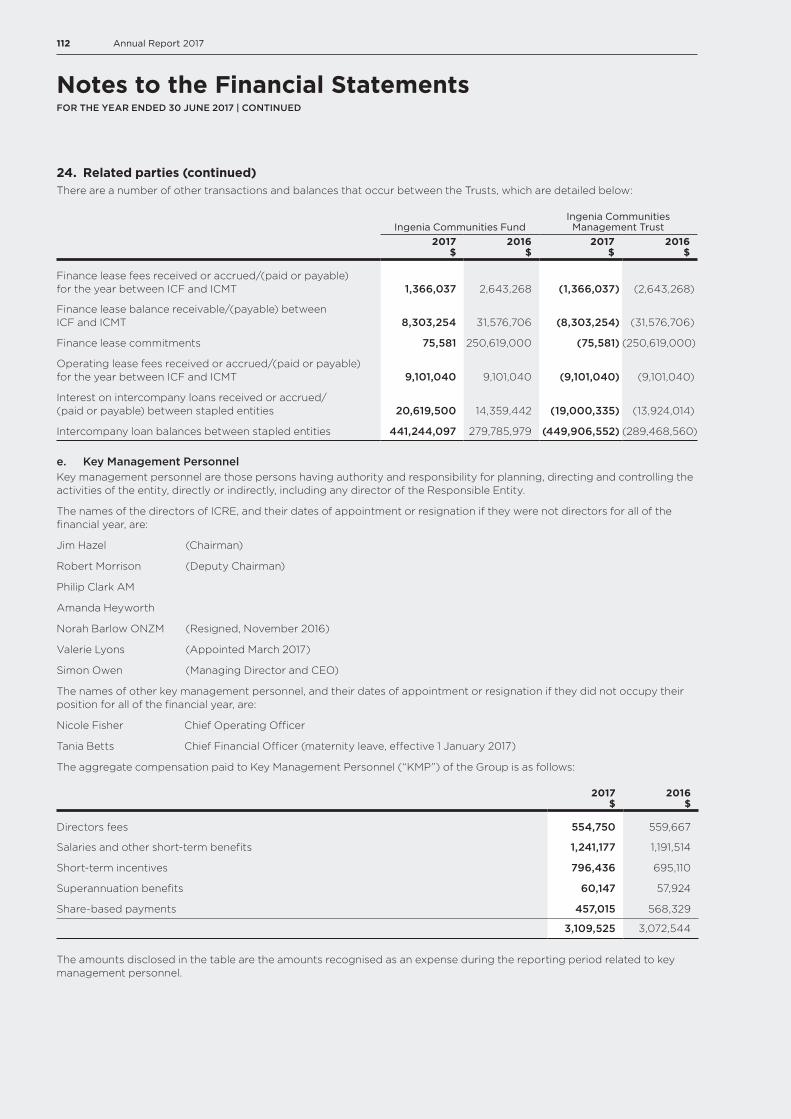
112 Annual Report 2017
Notes to the Financial StatementsFOR THE YEAR ENDED 30 JUNE 2017 | CONTINUED
24. Related parties (continued)There are a number of other transactions and balances that occur between the Trusts, which are detailed below:
Ingenia Communities FundIngenia Communities Management Trust
2017 $
2016 $
2017 $
2016 $
Finance lease fees received or accrued/(paid or payable) for the year between ICF and ICMT 1,366,037 2,643,268 (1,366,037) (2,643,268)
Finance lease balance receivable/(payable) between ICF and ICMT 8,303,254 31,576,706 (8,303,254) (31,576,706)
Finance lease commitments 75,581 250,619,000 (75,581) (250,619,000)
Operating lease fees received or accrued/(paid or payable) for the year between ICF and ICMT 9,101,040 9,101,040 (9,101,040) (9,101,040)
Interest on intercompany loans received or accrued/(paid or payable) between stapled entities 20,619,500 14,359,442 (19,000,335) (13,924,014)
Intercompany loan balances between stapled entities 441,244,097 279,785,979 (449,906,552) (289,468,560)
e. Key Management PersonnelKey management personnel are those persons having authority and responsibility for planning, directing and controlling the activities of the entity, directly or indirectly, including any director of the Responsible Entity.
The names of the directors of ICRE, and their dates of appointment or resignation if they were not directors for all of the financial year, are:
Jim Hazel (Chairman)
Robert Morrison (Deputy Chairman)
Philip Clark AM
Amanda Heyworth
Norah Barlow ONZM (Resigned, November 2016)
Valerie Lyons (Appointed March 2017)
Simon Owen (Managing Director and CEO)
The names of other key management personnel, and their dates of appointment or resignation if they did not occupy their position for all of the financial year, are:
Nicole Fisher Chief Operating Officer
Tania Betts Chief Financial Officer (maternity leave, effective 1 January 2017)
The aggregate compensation paid to Key Management Personnel (“KMP”) of the Group is as follows:
2017 $
2016 $
Directors fees 554,750 559,667
Salaries and other short-term benefits 1,241,177 1,191,514
Short-term incentives 796,436 695,110
Superannuation benefits 60,147 57,924
Share-based payments 457,015 568,329
3,109,525 3,072,544
The amounts disclosed in the table are the amounts recognised as an expense during the reporting period related to key management personnel.
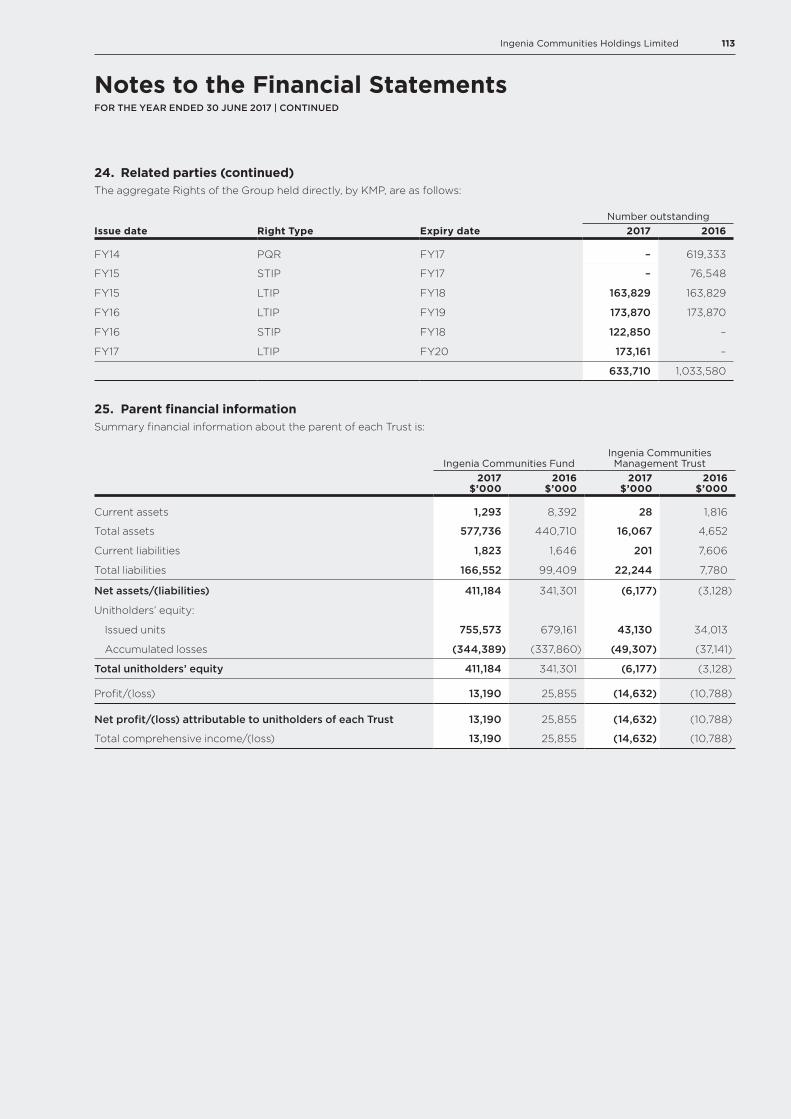
113Ingenia Communities Holdings Limited
24. Related parties (continued)The aggregate Rights of the Group held directly, by KMP, are as follows:
Issue date Right Type Expiry dateNumber outstanding
2017 2016
FY14 PQR FY17 – 619,333
FY15 STIP FY17 – 76,548
FY15 LTIP FY18 163,829 163,829
FY16 LTIP FY19 173,870 173,870
FY16 STIP FY18 122,850 –
FY17 LTIP FY20 173,161 –
633,710 1,033,580
25. Parent financial informationSummary financial information about the parent of each Trust is:
Ingenia Communities FundIngenia Communities Management Trust
2017 $’000
2016 $’000
2017 $’000
2016 $’000
Current assets 1,293 8,392 28 1,816
Total assets 577,736 440,710 16,067 4,652
Current liabilities 1,823 1,646 201 7,606
Total liabilities 166,552 99,409 22,244 7,780
Net assets/(liabilities) 411,184 341,301 (6,177) (3,128)
Unitholders’ equity:
Issued units 755,573 679,161 43,130 34,013
Accumulated losses (344,389) (337,860) (49,307) (37,141)
Total unitholders’ equity 411,184 341,301 (6,177) (3,128)
Profit/(loss) 13,190 25,855 (14,632) (10,788)
Net profit/(loss) attributable to unitholders of each Trust 13,190 25,855 (14,632) (10,788)
Total comprehensive income/(loss) 13,190 25,855 (14,632) (10,788)
Notes to the Financial StatementsFOR THE YEAR ENDED 30 JUNE 2017 | CONTINUED
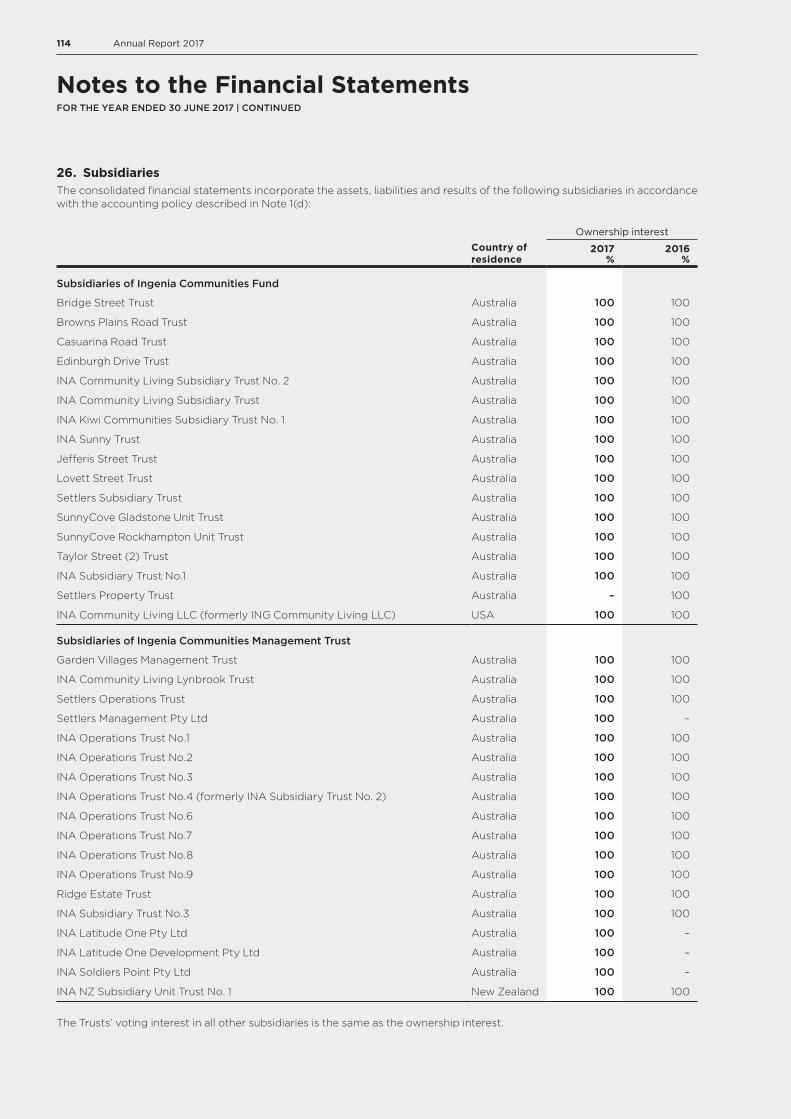
114 Annual Report 2017
Notes to the Financial StatementsFOR THE YEAR ENDED 30 JUNE 2017 | CONTINUED
26. SubsidiariesThe consolidated financial statements incorporate the assets, liabilities and results of the following subsidiaries in accordance with the accounting policy described in Note 1(d):
Ownership interest
Country of residence
2017 %
2016 %
Subsidiaries of Ingenia Communities Fund
Bridge Street Trust Australia 100 100
Browns Plains Road Trust Australia 100 100
Casuarina Road Trust Australia 100 100
Edinburgh Drive Trust Australia 100 100
INA Community Living Subsidiary Trust No. 2 Australia 100 100
INA Community Living Subsidiary Trust Australia 100 100
INA Kiwi Communities Subsidiary Trust No. 1 Australia 100 100
INA Sunny Trust Australia 100 100
Jefferis Street Trust Australia 100 100
Lovett Street Trust Australia 100 100
Settlers Subsidiary Trust Australia 100 100
SunnyCove Gladstone Unit Trust Australia 100 100
SunnyCove Rockhampton Unit Trust Australia 100 100
Taylor Street (2) Trust Australia 100 100
INA Subsidiary Trust No.1 Australia 100 100
Settlers Property Trust Australia – 100
INA Community Living LLC (formerly ING Community Living LLC) USA 100 100
Subsidiaries of Ingenia Communities Management Trust
Garden Villages Management Trust Australia 100 100
INA Community Living Lynbrook Trust Australia 100 100
Settlers Operations Trust Australia 100 100
Settlers Management Pty Ltd Australia 100 –
INA Operations Trust No.1 Australia 100 100
INA Operations Trust No.2 Australia 100 100
INA Operations Trust No.3 Australia 100 100
INA Operations Trust No.4 (formerly INA Subsidiary Trust No. 2) Australia 100 100
INA Operations Trust No.6 Australia 100 100
INA Operations Trust No.7 Australia 100 100
INA Operations Trust No.8 Australia 100 100
INA Operations Trust No.9 Australia 100 100
Ridge Estate Trust Australia 100 100
INA Subsidiary Trust No.3 Australia 100 100
INA Latitude One Pty Ltd Australia 100 –
INA Latitude One Development Pty Ltd Australia 100 –
INA Soldiers Point Pty Ltd Australia 100 –
INA NZ Subsidiary Unit Trust No. 1 New Zealand 100 100
The Trusts’ voting interest in all other subsidiaries is the same as the ownership interest.

115Ingenia Communities Holdings Limited
27. Notes to the cash flow statementsReconciliation of profit to net cash flows from operations:
Ingenia Communities FundIngenia Communities Management Trust
2017 $’000
2016 $’000
2017 $’000
2016 $’000
Net profit for the year (2,738) 25,855 29,592 56
Adjustments for:
Net foreign exchange (gain)/loss 342 (422) – (45)
Net loss on disposal of investment properties 27,556 – 19,117 (638)
Net (gain)/loss on change in fair value of:
Investment properties - continuing (6,000) (7,668) (6,373) 172
Derivatives (126) 414 – –
Retirement village resident loans – – (96) 1,388
Income tax expense/(benefit) – – 1,890 (2,507)
Depreciation and amortisation expense 24 24 650 418
Amortisation of borrowing costs 993 574 – 2
Share based payments expense – – 174 300
Operating profit/(loss) for the year before changes in working capital 20,051 18,777 44,954 (854)
Changes in working capital:
(Increase)/decrease in receivables 315 (320) 818 1,024
(Increase)/decrease in other assets – – (5,276) (4,457)
Increase in retirement village resident loans – – (872) 3,563
Increase/(decrease) in other payables and provisions 67,516 35,628 9,661 4,679
Increase/(decrease) in other payables and provisions related to investing activities (93,605) (58,988) (8,008) 29,022
Net cash provided by operating activities (5,723) (4,903) 41,277 32,977
28. Subsequent events
Final FY17 DistributionOn 22 August 2017, the directors of the Group resolved to declare a final distribution of 5.1 cps (2016: 5.1 cps amounting to $10.5 million to be paid at 13 September 2017. The distribution is 26.5% tax deferred and the dividend reinvestment plan will apply to the final distribution.
Acquisition of SheldonOn 31 July 2017, the Group signed an unconditional agreement to purchase Sheldon Caravan Park located in metropolitan Brisbane for $25.0 million.
Acquisition of GlenwoodOn 10 August 2017, the Group completed the acquisition of development approved land located north of Coffs Harbour, on the NSW mid-north coast, for a purchase price of $7.8 million.
Notes to the Financial StatementsFOR THE YEAR ENDED 30 JUNE 2017 | CONTINUED

116 Annual Report 2017
Directors’ DeclarationFOR THE YEAR ENDED 30 JUNE 2017
1. In the opinion of the directors:
(a) the financial statements and notes of Ingenia Communities Fund and of Ingenia Communities Management Trust are in accordance with the Corporations Act 2001, including:
(i) giving a true and fair view of each Trust’s financial position as at 30 June 2017 and of their performance for the year ended on that date; and
(ii) complying with Accounting Standards and Corporations Regulations 2001; and
(b) there are reasonable grounds to believe that Ingenia Communities Fund and Ingenia Communities Management Trust will be able to pay their debts as and when they become due and payable.
2. The notes to the financial statements include an explicit and unreserved statement of compliance with international financial reporting standards at Note 1(b).
3. This declaration has been made after receiving the declarations required to be made to the Directors in accordance with section 295A of the Corporations Act 2001 for the financial year ended 30 June 2017.
On behalf of the Board
Jim Hazel Chairman Sydney, 22 August 2017
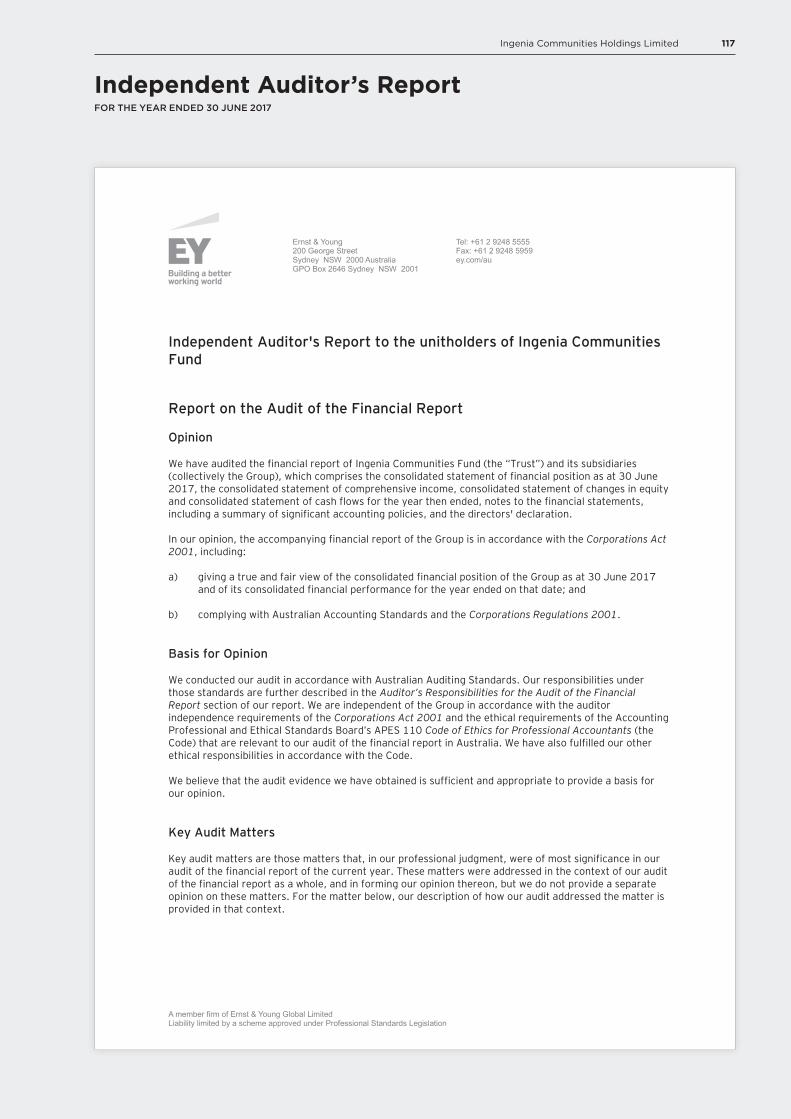
117Ingenia Communities Holdings Limited
Independent Auditor’s ReportFOR THE YEAR ENDED 30 JUNE 2017
Ernst & Young200 George StreetSydney NSW 2000 AustraliaGPO Box 2646 Sydney NSW 2001
Tel: +61 2 9248 5555Fax: +61 2 9248 5959ey.com/au
A member firm of Ernst & Young Global LimitedLiability limited by a scheme approved under Professional Standards Legislation
Independent Auditor's Report to the unitholders of Ingenia Communities Fund
Report on the Audit of the Financial Report
Opinion
We have audited the financial report of Ingenia Communities Fund (the “Trust”) and its subsidiaries (collectively the Group), which comprises the consolidated statement of financial position as at 30 June 2017, the consolidated statement of comprehensive income, consolidated statement of changes in equity and consolidated statement of cash flows for the year then ended, notes to the financial statements, including a summary of significant accounting policies, and the directors' declaration.
In our opinion, the accompanying financial report of the Group is in accordance with the Corporations Act 2001, including:
a) giving a true and fair view of the consolidated financial position of the Group as at 30 June 2017 and of its consolidated financial performance for the year ended on that date; and
b) complying with Australian Accounting Standards and the Corporations Regulations 2001.
Basis for Opinion
We conducted our audit in accordance with Australian Auditing Standards. Our responsibilities under those standards are further described in the Auditor’s Responsibilities for the Audit of the Financial Report section of our report. We are independent of the Group in accordance with the auditor independence requirements of the Corporations Act 2001 and the ethical requirements of the Accounting Professional and Ethical Standards Board’s APES 110 Code of Ethics for Professional Accountants (the Code) that are relevant to our audit of the financial report in Australia. We have also fulfilled our other ethical responsibilities in accordance with the Code.
We believe that the audit evidence we have obtained is sufficient and appropriate to provide a basis for our opinion.
Key Audit Matters
Key audit matters are those matters that, in our professional judgment, were of most significance in our audit of the financial report of the current year. These matters were addressed in the context of our audit of the financial report as a whole, and in forming our opinion thereon, but we do not provide a separate opinion on these matters. For the matter below, our description of how our audit addressed the matter is provided in that context.
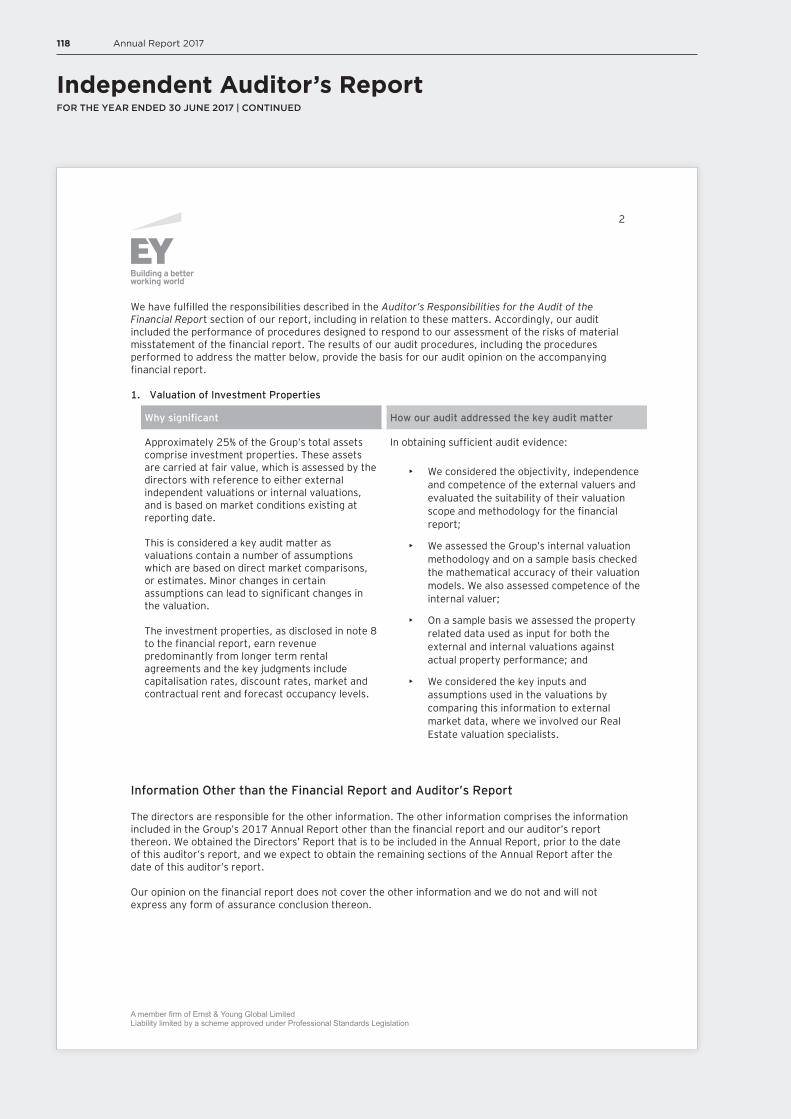
118 Annual Report 2017
Independent Auditor’s ReportFOR THE YEAR ENDED 30 JUNE 2017 | CONTINUED
A member firm of Ernst & Young Global LimitedLiability limited by a scheme approved under Professional Standards Legislation
2
We have fulfilled the responsibilities described in the Auditor’s Responsibilities for the Audit of the Financial Report section of our report, including in relation to these matters. Accordingly, our audit included the performance of procedures designed to respond to our assessment of the risks of material misstatement of the financial report. The results of our audit procedures, including the procedures performed to address the matter below, provide the basis for our audit opinion on the accompanying financial report. 1. Valuation of Investment Properties
Why significant How our audit addressed the key audit matter
Approximately 25% of the Group’s total assets comprise investment properties. These assets are carried at fair value, which is assessed by the directors with reference to either external independent valuations or internal valuations, and is based on market conditions existing at reporting date.
This is considered a key audit matter as valuations contain a number of assumptions which are based on direct market comparisons, or estimates. Minor changes in certain assumptions can lead to significant changes in the valuation.
The investment properties, as disclosed in note 8 to the financial report, earn revenue predominantly from longer term rental agreements and the key judgments include capitalisation rates, discount rates, market and contractual rent and forecast occupancy levels.
In obtaining sufficient audit evidence:
• We considered the objectivity, independence and competence of the external valuers and evaluated the suitability of their valuation scope and methodology for the financial report;
• We assessed the Group’s internal valuation methodology and on a sample basis checked the mathematical accuracy of their valuation models. We also assessed competence of the internal valuer;
• On a sample basis we assessed the property related data used as input for both the external and internal valuations against actual property performance; and
• We considered the key inputs and assumptions used in the valuations by comparing this information to external market data, where we involved our Real Estate valuation specialists.
Information Other than the Financial Report and Auditor’s Report
The directors are responsible for the other information. The other information comprises the information included in the Group’s 2017 Annual Report other than the financial report and our auditor’s report thereon. We obtained the Directors’ Report that is to be included in the Annual Report, prior to the date of this auditor’s report, and we expect to obtain the remaining sections of the Annual Report after the date of this auditor’s report.
Our opinion on the financial report does not cover the other information and we do not and will not express any form of assurance conclusion thereon.

119Ingenia Communities Holdings Limited
Independent Auditor’s ReportFOR THE YEAR ENDED 30 JUNE 2017 | CONTINUED
A member firm of Ernst & Young Global LimitedLiability limited by a scheme approved under Professional Standards Legislation
3
In connection with our audit of the financial report, our responsibility is to read the other information and, in doing so, consider whether the other information is materially inconsistent with the financial report or our knowledge obtained in the audit or otherwise appears to be materially misstated.
If, based on the work we have performed on the other information obtained prior to the date of this auditor’s report, we conclude that there is a material misstatement of this other information, we are required to report that fact. We have nothing to report in this regard.
Responsibilities of the Directors for the Financial Report
The directors of the Company are responsible for the preparation of the financial report that gives a true and fair view in accordance with Australian Accounting Standards and the Corporations Act 2001 and for such internal control as the directors determine is necessary to enable the preparation of the financial report that gives a true and fair view and is free from material misstatement, whether due to fraud or error.
In preparing the financial report, the directors are responsible for assessing the Group’s ability to continue as a going concern, disclosing, as applicable, matters relating to going concern and using the going concern basis of accounting unless the directors either intend to liquidate the Group or to cease operations, or have no realistic alternative but to do so.
Auditor's Responsibilities for the Audit of the Financial Report
Our objectives are to obtain reasonable assurance about whether the financial report as a whole is free from material misstatement, whether due to fraud or error, and to issue an auditor’s report that includes our opinion. Reasonable assurance is a high level of assurance, but is not a guarantee that an audit conducted in accordance with the Australian Auditing Standards will always detect a material misstatement when it exists. Misstatements can arise from fraud or error and are considered material if, individually or in the aggregate, they could reasonably be expected to influence the economic decisions of users taken on the basis of this financial report.
As part of an audit in accordance with the Australian Auditing Standards, we exercise professional judgment and maintain professional scepticism throughout the audit. We also: Identify and assess the risks of material misstatement of the financial report, whether due to fraud
or error, design and perform audit procedures responsive to those risks, and obtain audit evidence that is sufficient and appropriate to provide a basis for our opinion. The risk of not detecting a material misstatement resulting from fraud is higher than for one resulting from error, as fraud may involve collusion, forgery, intentional omissions, misrepresentations, or the override of internal control.
Obtain an understanding of internal control relevant to the audit in order to design audit
procedures that are appropriate in the circumstances, but not for the purpose of expressing an opinion on the effectiveness of the Group’s internal control.
Evaluate the appropriateness of accounting policies used and the reasonableness of accounting
estimates and related disclosures made by the directors.
120 Annual Report 2017
Independent Auditor’s ReportFOR THE YEAR ENDED 30 JUNE 2017 | CONTINUED
A member firm of Ernst & Young Global LimitedLiability limited by a scheme approved under Professional Standards Legislation
4
Conclude on the appropriateness of the directors’ use of the going concern basis of accounting and, based on the audit evidence obtained, whether a material uncertainty exists related to events or conditions that may cast significant doubt on the Group’s ability to continue as a going concern. If we conclude that a material uncertainty exists, we are required to draw attention in our auditor’s report to the related disclosures in the financial report or, if such disclosures are inadequate, to modify our opinion. Our conclusions are based on the audit evidence obtained up to the date of our auditor’s report. However, future events or conditions may cause the Group to cease to continue as a going concern.
Evaluate the overall presentation, structure and content of the financial report, including the
disclosures, and whether the financial report represents the underlying transactions and events in a manner that achieves fair presentation.
Obtain sufficient appropriate audit evidence regarding the financial information of the entities or
business activities within the Group to express an opinion on the financial report. We are responsible for the direction, supervision and performance of the Group audit. We remain solely responsible for our audit opinion.
We communicate with the directors regarding, among other matters, the planned scope and timing of the audit and significant audit findings, including any significant deficiencies in internal control that we identify during our audit. We also provide the directors with a statement that we have complied with relevant ethical requirements regarding independence, and to communicate with them all relationships and other matters that may reasonably be thought to bear on our independence, and where applicable, related safeguards.
From the matters communicated to the directors, we determine those matters that were of most significance in the audit of the financial report of the current year and are therefore the key audit matters. We describe these matters in our auditor’s report unless law or regulation precludes public disclosure about the matter or when, in extremely rare circumstances, we determine that a matter should not be communicated in our report because the adverse consequences of doing so would reasonably be expected to outweigh the public interest benefits of such communication.
Ernst & Young
Chris Lawton Partner Sydney 22 August 2017
121Ingenia Communities Holdings Limited
Independent Auditor’s ReportFOR THE YEAR ENDED 30 JUNE 2017 | CONTINUED
Ernst & Young200 George StreetSydney NSW 2000 AustraliaGPO Box 2646 Sydney NSW 2001
Tel: +61 2 9248 5555Fax: +61 2 9248 5959ey.com/au
A member firm of Ernst & Young Global LimitedLiability limited by a scheme approved under Professional Standards Legislation
Independent Auditor's Report to the unitholders of Ingenia Communities Management Trust
Report on the Audit of the Financial Report
Opinion
We have audited the financial report of Ingenia Communities Management Trust (the “Trust”) and its subsidiaries (collectively the Group), which comprises the consolidated statement of financial position as at 30 June 2017, the consolidated statement of comprehensive income, consolidated statement of changes in equity and consolidated statement of cash flows for the year then ended, notes to the financial statements, including a summary of significant accounting policies, and the directors' declaration.
In our opinion, the accompanying financial report of the Group is in accordance with the Corporations Act 2001, including:
a) giving a true and fair view of the consolidated financial position of the Group as at 30 June 2017 and of its consolidated financial performance for the year ended on that date; and
b) complying with Australian Accounting Standards and the Corporations Regulations 2001.
Basis for Opinion
We conducted our audit in accordance with Australian Auditing Standards. Our responsibilities under those standards are further described in the Auditor’s Responsibilities for the Audit of the Financial Report section of our report. We are independent of the Group in accordance with the auditor independence requirements of the Corporations Act 2001 and the ethical requirements of the Accounting Professional and Ethical Standards Board’s APES 110 Code of Ethics for Professional Accountants (the Code) that are relevant to our audit of the financial report in Australia. We have also fulfilled our other ethical responsibilities in accordance with the Code.
We believe that the audit evidence we have obtained is sufficient and appropriate to provide a basis for our opinion.
Key Audit Matters
Key audit matters are those matters that, in our professional judgment, were of most significance in our audit of the financial report of the current year. These matters were addressed in the context of our audit of the financial report as a whole, and in forming our opinion thereon, but we do not provide a separate opinion on these matters. For each matter below, our description of how our audit addressed the matter is provided in that context. We have fulfilled the responsibilities described in the Auditor’s Responsibilities for the Audit of the Financial Report section of our report, including in relation to these matters. Accordingly, our audit included the performance of procedures designed to respond to our assessment of the risks of material misstatement of the financial report. The results of our audit procedures, including the procedures performed to address the matters below, provide the basis for our audit opinion on the accompanying financial report.
122 Annual Report 2017
Independent Auditor’s ReportFOR THE YEAR ENDED 30 JUNE 2017 | CONTINUED
A member firm of Ernst & Young Global LimitedLiability limited by a scheme approved under Professional Standards Legislation
2
1. Valuation of Investment Property
Why significant How our audit addressed the key audit matter
Approximately 92% of the Group’s total assets comprise investment properties. These assets are carried at fair value, which is assessed by the directors with reference to either external independent valuations or internal valuations, and is based on market conditions existing at reporting date.
This is considered a key audit matter as valuations contain a number of assumptions which are based on direct market comparisons, or estimates. Minor changes in certain assumptions can lead to significant changes in the valuation.
The Group has two categories of investment properties as disclosed in note 8 to the financial report.
• The Group holds a Lifestyle & Holidays portfolio consisting of investment properties earning revenue from a mix of longer term land rental agreements and short-term accommodation rental. In addition the group earns revenue from the sale of manufactured homes to residents of the properties.
The key judgements for the longer term and short-term rental include capitalisation rates, market and contractual rents, forecast short-term and residential occupancy levels, historical transactions and remaining development potential for vacant land. In assessing the development potential additional key judgements include future new homes sales prices, estimated capital expenditure, discount rates, projected property growth rates and operating profit margins.
• The Group holds a Settlers portfolio consisting of investment properties earning revenue predominantly via deferred management fee arrangements and key judgements include assessing discount rates, growth rates in property values and average length of stay of residents.
In obtaining sufficient audit evidence:
• We considered the objectivity, independence and expertise of the external valuers and evaluated the suitability of their valuation scope and methodology for the financial statements;
• We assessed the Group’s internal valuation methodology and on a sample basis checked the mathematical accuracy of their valuation models. We also assessed competence of the internal valuer;
• On a sample basis we assessed the property related data used as input for both the external and internal valuations against actual and budgeted property performance; and
• We considered the key inputs and assumptions used in the valuations by comparing this information to external market data, where we involved our Real Estate valuation specialists.
123Ingenia Communities Holdings Limited
Independent Auditor’s ReportFOR THE YEAR ENDED 30 JUNE 2017 | CONTINUED
A member firm of Ernst & Young Global LimitedLiability limited by a scheme approved under Professional Standards Legislation
3
2. Deferred tax assets
Why significant How our audit addressed the key audit matter
The Group has recorded net deferred tax assets of $5.2m in the financial statements resulting from temporary differences and tax losses carried forward as disclosed in note 12 to the financial statements. The Group recognises these deferred tax assets to the extent that it is probable that future taxable profits will allow the deferred tax assets to be recovered. The probability of recovery is impacted by uncertainties regarding the likely timing and level of future taxable profits.
In obtaining sufficient audit evidence:
• We evaluated assumptions and methodologies used by the Group to forecast future taxable profits to determine the likelihood that the losses will be recovered; and
• We assessed that information used was derived from the Group’s business cash flow forecasts that have been subject to internal reviews and were approved by those charged with governance.
Information Other than the Financial Report and Auditor’s Report
The directors are responsible for the other information. The other information comprises the information included in the Group’s 2017 Annual Report other than the financial report and our auditor’s report thereon. We obtained the Directors’ Report that is to be included in the Annual Report, prior to the date of this auditor’s report, and we expect to obtain the remaining sections of the Annual Report after the date of this auditor’s report.
Our opinion on the financial report does not cover the other information and we do not and will not express any form of assurance conclusion thereon.
In connection with our audit of the financial report, our responsibility is to read the other information and, in doing so, consider whether the other information is materially inconsistent with the financial report or our knowledge obtained in the audit or otherwise appears to be materially misstated.
If, based on the work we have performed on the other information obtained prior to the date of this auditor’s report, we conclude that there is a material misstatement of this other information, we are required to report that fact. We have nothing to report in this regard.
Responsibilities of the Directors for the Financial Report
The directors of the Company are responsible for the preparation of the financial report that gives a true and fair view in accordance with Australian Accounting Standards and the Corporations Act 2001 and for such internal control as the directors determine is necessary to enable the preparation of the financial report that gives a true and fair view and is free from material misstatement, whether due to fraud or error.
In preparing the financial report, the directors are responsible for assessing the Group’s ability to continue as a going concern, disclosing, as applicable, matters relating to going concern and using the going concern basis of accounting unless the directors either intend to liquidate the Group or to cease operations, or have no realistic alternative but to do so.
124 Annual Report 2017
Independent Auditor’s ReportFOR THE YEAR ENDED 30 JUNE 2017 | CONTINUED
A member firm of Ernst & Young Global LimitedLiability limited by a scheme approved under Professional Standards Legislation
4
Auditor's Responsibilities for the Audit of the Financial Report
Our objectives are to obtain reasonable assurance about whether the financial report as a whole is free from material misstatement, whether due to fraud or error, and to issue an auditor’s report that includes our opinion. Reasonable assurance is a high level of assurance, but is not a guarantee that an audit conducted in accordance with the Australian Auditing Standards will always detect a material misstatement when it exists. Misstatements can arise from fraud or error and are considered material if, individually or in the aggregate, they could reasonably be expected to influence the economic decisions of users taken on the basis of this financial report.
As part of an audit in accordance with the Australian Auditing Standards, we exercise professional judgment and maintain professional scepticism throughout the audit. We also: Identify and assess the risks of material misstatement of the financial report, whether due to fraud or error,
design and perform audit procedures responsive to those risks, and obtain audit evidence that is sufficient and appropriate to provide a basis for our opinion. The risk of not detecting a material misstatement resulting from fraud is higher than for one resulting from error, as fraud may involve collusion, forgery, intentional omissions, misrepresentations, or the override of internal control.
Obtain an understanding of internal control relevant to the audit in order to design audit procedures that are
appropriate in the circumstances, but not for the purpose of expressing an opinion on the effectiveness of the Group’s internal control.
Evaluate the appropriateness of accounting policies used and the reasonableness of accounting estimates and
related disclosures made by the directors.
Conclude on the appropriateness of the directors’ use of the going concern basis of accounting and, based on the audit evidence obtained, whether a material uncertainty exists related to events or conditions that may cast significant doubt on the Group’s ability to continue as a going concern. If we conclude that a material uncertainty exists, we are required to draw attention in our auditor’s report to the related disclosures in the financial report or, if such disclosures are inadequate, to modify our opinion. Our conclusions are based on the audit evidence obtained up to the date of our auditor’s report. However, future events or conditions may cause the Group to cease to continue as a going concern.
Evaluate the overall presentation, structure and content of the financial report, including the disclosures, and
whether the financial report represents the underlying transactions and events in a manner that achieves fair presentation.
Obtain sufficient appropriate audit evidence regarding the financial information of the entities or business
activities within the Group to express an opinion on the financial report. We are responsible for the direction, supervision and performance of the Group audit. We remain solely responsible for our audit opinion.
We communicate with the directors regarding, among other matters, the planned scope and timing of the audit and significant audit findings, including any significant deficiencies in internal control that we identify during our audit. We also provide the directors with a statement that we have complied with relevant ethical requirements regarding independence, and to communicate with them all relationships and other matters that may reasonably be thought to bear on our independence, and where applicable, related safeguards.

125Ingenia Communities Holdings Limited
Independent Auditor’s ReportFOR THE YEAR ENDED 30 JUNE 2017 | CONTINUED
A member firm of Ernst & Young Global LimitedLiability limited by a scheme approved under Professional Standards Legislation
5
From the matters communicated to the directors, we determine those matters that were of most significance in the audit of the financial report of the current year and are therefore the key audit matters. We describe these matters in our auditor’s report unless law or regulation precludes public disclosure about the matter or when, in extremely rare circumstances, we determine that a matter should not be communicated in our report because the adverse consequences of doing so would reasonably be expected to outweigh the public interest benefits of such communication.
Ernst & Young
Chris Lawton Partner Sydney 22 August 2017
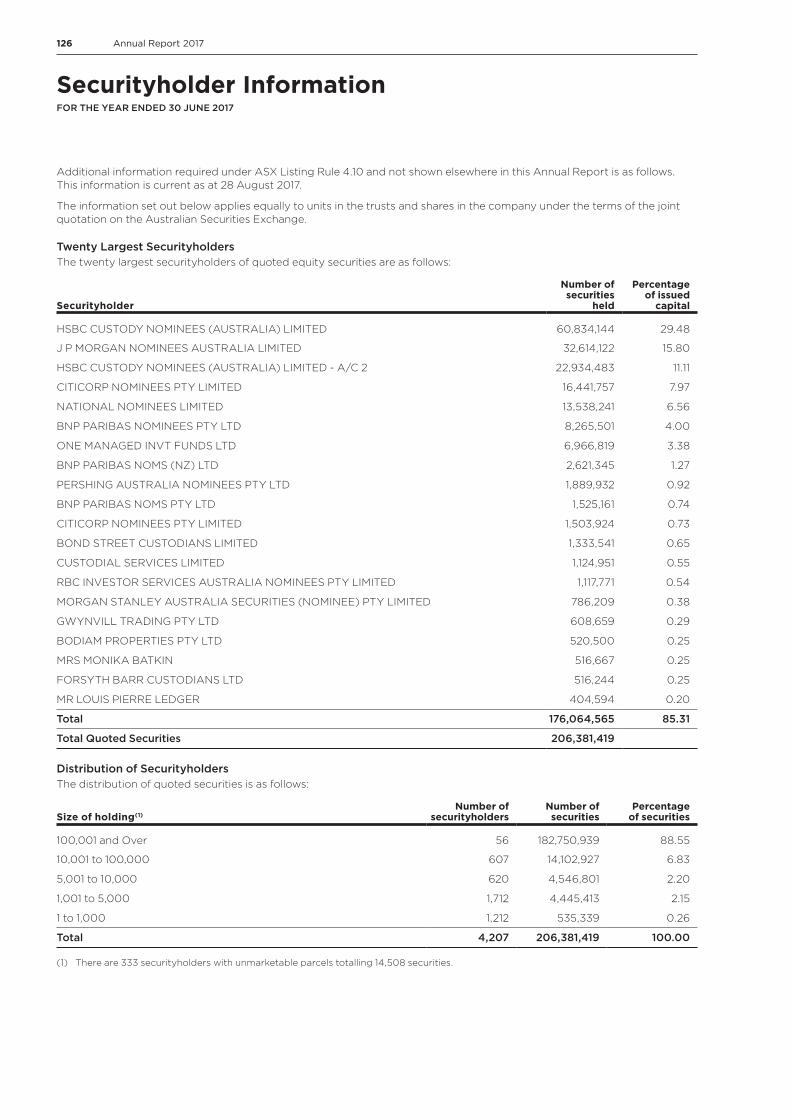
126 Annual Report 2017
Securityholder InformationFOR THE YEAR ENDED 30 JUNE 2017
Additional information required under ASX Listing Rule 4.10 and not shown elsewhere in this Annual Report is as follows. This information is current as at 28 August 2017.
The information set out below applies equally to units in the trusts and shares in the company under the terms of the joint quotation on the Australian Securities Exchange.
Twenty Largest SecurityholdersThe twenty largest securityholders of quoted equity securities are as follows:
Securityholder
Number of securities
held
Percentage of issued
capital
HSBC CUSTODY NOMINEES (AUSTRALIA) LIMITED 60,834,144 29.48
J P MORGAN NOMINEES AUSTRALIA LIMITED 32,614,122 15.80
HSBC CUSTODY NOMINEES (AUSTRALIA) LIMITED - A/C 2 22,934,483 11.11
CITICORP NOMINEES PTY LIMITED 16,441,757 7.97
NATIONAL NOMINEES LIMITED 13,538,241 6.56
BNP PARIBAS NOMINEES PTY LTD 8,265,501 4.00
ONE MANAGED INVT FUNDS LTD 6,966,819 3.38
BNP PARIBAS NOMS (NZ) LTD 2,621,345 1.27
PERSHING AUSTRALIA NOMINEES PTY LTD 1,889,932 0.92
BNP PARIBAS NOMS PTY LTD 1,525,161 0.74
CITICORP NOMINEES PTY LIMITED 1,503,924 0.73
BOND STREET CUSTODIANS LIMITED 1,333,541 0.65
CUSTODIAL SERVICES LIMITED 1,124,951 0.55
RBC INVESTOR SERVICES AUSTRALIA NOMINEES PTY LIMITED 1,117,771 0.54
MORGAN STANLEY AUSTRALIA SECURITIES (NOMINEE) PTY LIMITED 786,209 0.38
GWYNVILL TRADING PTY LTD 608,659 0.29
BODIAM PROPERTIES PTY LTD 520,500 0.25
MRS MONIKA BATKIN 516,667 0.25
FORSYTH BARR CUSTODIANS LTD 516,244 0.25
MR LOUIS PIERRE LEDGER 404,594 0.20
Total 176,064,565 85.31
Total Quoted Securities 206,381,419
Distribution of SecurityholdersThe distribution of quoted securities is as follows:
Size of holding(1) Number of
securityholdersNumber of securities
Percentage of securities
100,001 and Over 56 182,750,939 88.55
10,001 to 100,000 607 14,102,927 6.83
5,001 to 10,000 620 4,546,801 2.20
1,001 to 5,000 1,712 4,445,413 2.15
1 to 1,000 1,212 535,339 0.26
Total 4,207 206,381,419 100.00
(1) There are 333 securityholders with unmarketable parcels totalling 14,508 securities.
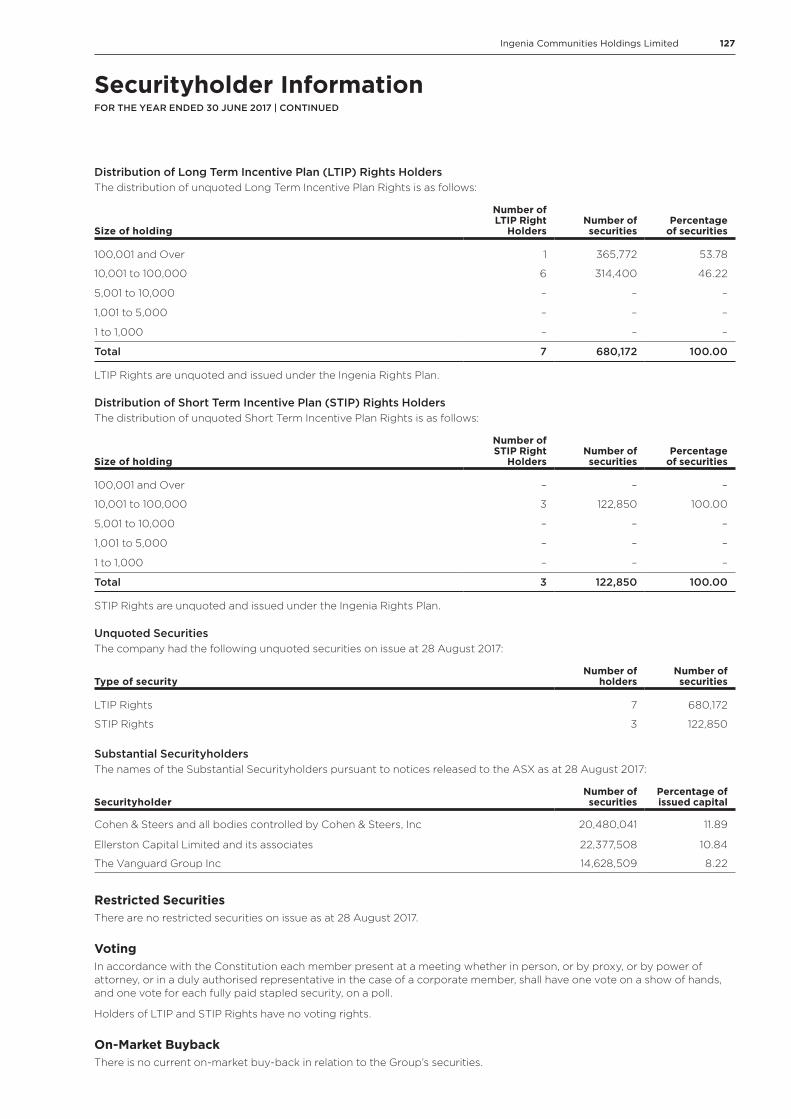
127Ingenia Communities Holdings Limited
Distribution of Long Term Incentive Plan (LTIP) Rights HoldersThe distribution of unquoted Long Term Incentive Plan Rights is as follows:
Size of holding
Number of LTIP Right
HoldersNumber of securities
Percentage of securities
100,001 and Over 1 365,772 53.78
10,001 to 100,000 6 314,400 46.22
5,001 to 10,000 – – –
1,001 to 5,000 – – –
1 to 1,000 – – –
Total 7 680,172 100.00
LTIP Rights are unquoted and issued under the Ingenia Rights Plan.
Distribution of Short Term Incentive Plan (STIP) Rights HoldersThe distribution of unquoted Short Term Incentive Plan Rights is as follows:
Size of holding
Number of STIP Right
HoldersNumber of securities
Percentage of securities
100,001 and Over – – –
10,001 to 100,000 3 122,850 100.00
5,001 to 10,000 – – –
1,001 to 5,000 – – –
1 to 1,000 – – –
Total 3 122,850 100.00
STIP Rights are unquoted and issued under the Ingenia Rights Plan.
Unquoted SecuritiesThe company had the following unquoted securities on issue at 28 August 2017:
Type of securityNumber of
holdersNumber of securities
LTIP Rights 7 680,172
STIP Rights 3 122,850
Substantial SecurityholdersThe names of the Substantial Securityholders pursuant to notices released to the ASX as at 28 August 2017:
Securityholder Number of securities
Percentage of issued capital
Cohen & Steers and all bodies controlled by Cohen & Steers, Inc 20,480,041 11.89
Ellerston Capital Limited and its associates 22,377,508 10.84
The Vanguard Group Inc 14,628,509 8.22
Restricted SecuritiesThere are no restricted securities on issue as at 28 August 2017.
VotingIn accordance with the Constitution each member present at a meeting whether in person, or by proxy, or by power of attorney, or in a duly authorised representative in the case of a corporate member, shall have one vote on a show of hands, and one vote for each fully paid stapled security, on a poll.
Holders of LTIP and STIP Rights have no voting rights.
On-Market BuybackThere is no current on-market buy-back in relation to the Group’s securities.
Securityholder InformationFOR THE YEAR ENDED 30 JUNE 2017 | CONTINUED
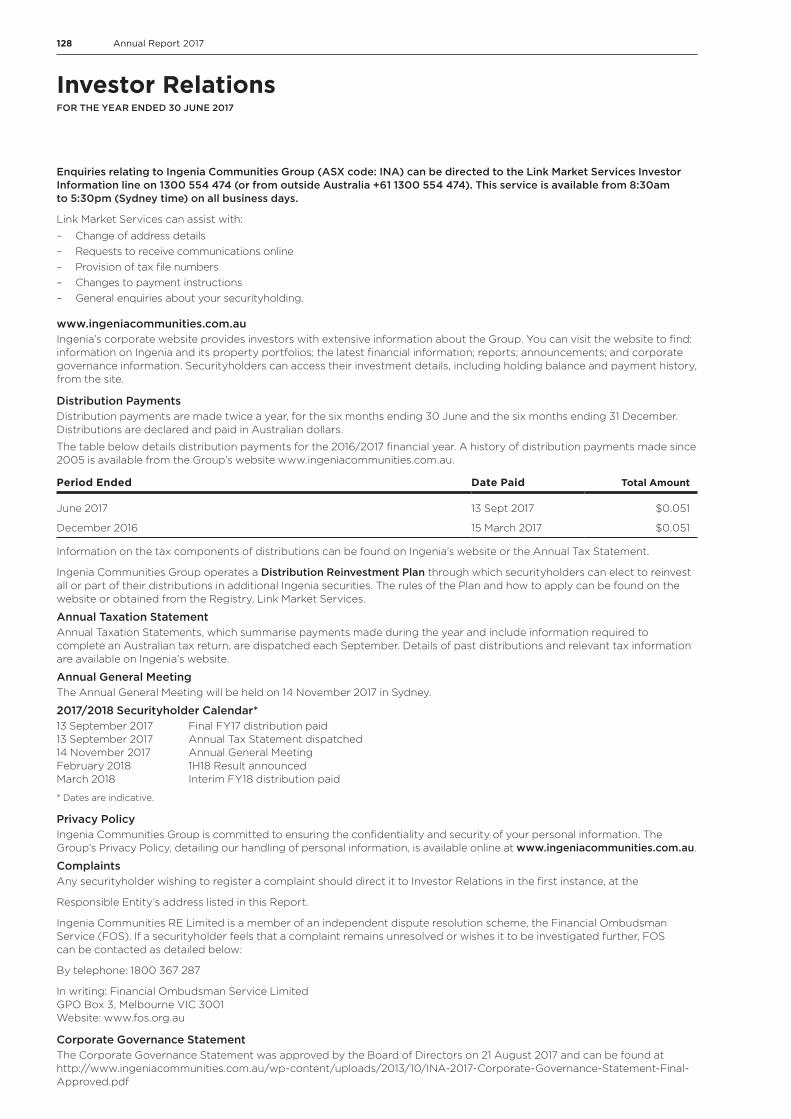
128 Annual Report 2017
Investor RelationsFOR THE YEAR ENDED 30 JUNE 2017
Enquiries relating to Ingenia Communities Group (ASX code: INA) can be directed to the Link Market Services Investor Information line on 1300 554 474 (or from outside Australia +61 1300 554 474). This service is available from 8:30am to 5:30pm (Sydney time) on all business days.
Link Market Services can assist with:
– Change of address details – Requests to receive communications online – Provision of tax file numbers – Changes to payment instructions – General enquiries about your securityholding.
www.ingeniacommunities.com.auIngenia’s corporate website provides investors with extensive information about the Group. You can visit the website to find: information on Ingenia and its property portfolios; the latest financial information; reports; announcements; and corporate governance information. Securityholders can access their investment details, including holding balance and payment history, from the site.
Distribution PaymentsDistribution payments are made twice a year, for the six months ending 30 June and the six months ending 31 December. Distributions are declared and paid in Australian dollars.
The table below details distribution payments for the 2016/2017 financial year. A history of distribution payments made since 2005 is available from the Group’s website www.ingeniacommunities.com.au.
Period Ended Date Paid Total Amount
June 2017 13 Sept 2017 $0.051
December 2016 15 March 2017 $0.051
Information on the tax components of distributions can be found on Ingenia’s website or the Annual Tax Statement.
Ingenia Communities Group operates a Distribution Reinvestment Plan through which securityholders can elect to reinvest all or part of their distributions in additional Ingenia securities. The rules of the Plan and how to apply can be found on the website or obtained from the Registry, Link Market Services.
Annual Taxation StatementAnnual Taxation Statements, which summarise payments made during the year and include information required to complete an Australian tax return, are dispatched each September. Details of past distributions and relevant tax information are available on Ingenia’s website.
Annual General MeetingThe Annual General Meeting will be held on 14 November 2017 in Sydney.
2017/2018 Securityholder Calendar*13 September 2017 Final FY17 distribution paid 13 September 2017 Annual Tax Statement dispatched 14 November 2017 Annual General Meeting February 2018 1H18 Result announced March 2018 Interim FY18 distribution paid
* Dates are indicative.
Privacy PolicyIngenia Communities Group is committed to ensuring the confidentiality and security of your personal information. The Group’s Privacy Policy, detailing our handling of personal information, is available online at www.ingeniacommunities.com.au.
ComplaintsAny securityholder wishing to register a complaint should direct it to Investor Relations in the first instance, at the
Responsible Entity’s address listed in this Report.
Ingenia Communities RE Limited is a member of an independent dispute resolution scheme, the Financial Ombudsman Service (FOS). If a securityholder feels that a complaint remains unresolved or wishes it to be investigated further, FOS can be contacted as detailed below:
By telephone: 1800 367 287
In writing: Financial Ombudsman Service Limited GPO Box 3, Melbourne VIC 3001 Website: www.fos.org.au
Corporate Governance StatementThe Corporate Governance Statement was approved by the Board of Directors on 21 August 2017 and can be found at http://www.ingeniacommunities.com.au/wp-content/uploads/2013/10/INA-2017-Corporate-Governance-Statement-Final-Approved.pdf
129Ingenia Communities Holdings Limited
Corporate DirectoryFOR THE YEAR ENDED 30 JUNE 2017
Ingenia Communities GroupIngenia Communities Holdings Limited ACN 154 444 925
Ingenia Communities Management Trust ARSN 122 928 410
Ingenia Communities Fund ARSN 107 459 576
Responsible EntityIngenia Communities RE Limited ACN 154 464 990 (AFSL 415862)
Registered OfficeLevel 9, 115 Pitt Street Sydney NSW 2000
Telephone: 1300 132 946 Facsimile: +61 2 8263 0500
Email: [email protected] Website: www.ingeniacommunities.com.au
Directors of Ingenia Communities Group (as at 31 August 2017) J Hazel (Chairman) R Morrison (Deputy Chairman) A Heyworth P Clark AM S Owen V Lyons
SecretaryL Ralph N Kwok
Security Registry
Link Market Services LimitedLevel 12, 680 George Street Sydney NSW 2000 Locked Bag A14 Sydney South NSW 1235
Telephone: 1300 554 474 (local call cost) or from outside Australia: +61 1300 554 474 Facsimile: +61 2 9287 0303
Email: [email protected]
Auditors
EY200 George Street Sydney NSW 2000
Stock Exchange QuotationIngenia Communities Group is listed on the Australian Securities Exchange under ASX listing code: INA.
130 Annual Report 2017
DisclaimerThis report was prepared by Ingenia Communities Holdings Limited (ACN 154 444 925) and Ingenia Communities RE Limited (ACN 154 464 990) as responsible entity for Ingenia Communities Fund (ARSN 107 459 576) and Ingenia Communities Management Trust (ARSN 122 928 410) (together Ingenia Communities Group, INA or the Group). Information contained in this report is current as at 30 June 2017. This report is provided for information purposes only and has been prepared without taking account of any particular reader’s financial situation, objectives or needs. Nothing contained in this report constitutes investment, legal, tax or other advice. Accordingly, readers should, before acting on any information in this report, consider its appropriateness, having regard to their objectives, financial situation and needs, and seek the assistance of their financial or other licensed professional adviser before making any investment decision. This report does not constitute an offer, invitation, solicitation or recommendation with respect to the subscription for, purchase or sale of any security, nor does it form the basis of any contract or commitment.


Ingenia Communities Group
Level 9, 115 Pitt Street, Sydney, NSW 2000T. 1300 132 946E. [email protected]. www.ingeniacommunities.com.au