Embed Size (px)
Citation preview
Ingenia Communities Group 2014 Half Year Results Presentation 25 February 2014
ASSEMBLING THE LEADING MANUFACTURED HOMES ESTATE PORTFOLIO
For
per
sona
l use
onl
y
Agenda
p2
Group overview p3
Announced acquisitions p4
Key highlights p5
Key financials p6
Capital management p8
Portfolio update p11
Strategy and development p23
Outlook p27
Appendices p28
For
per
sona
l use
onl
y
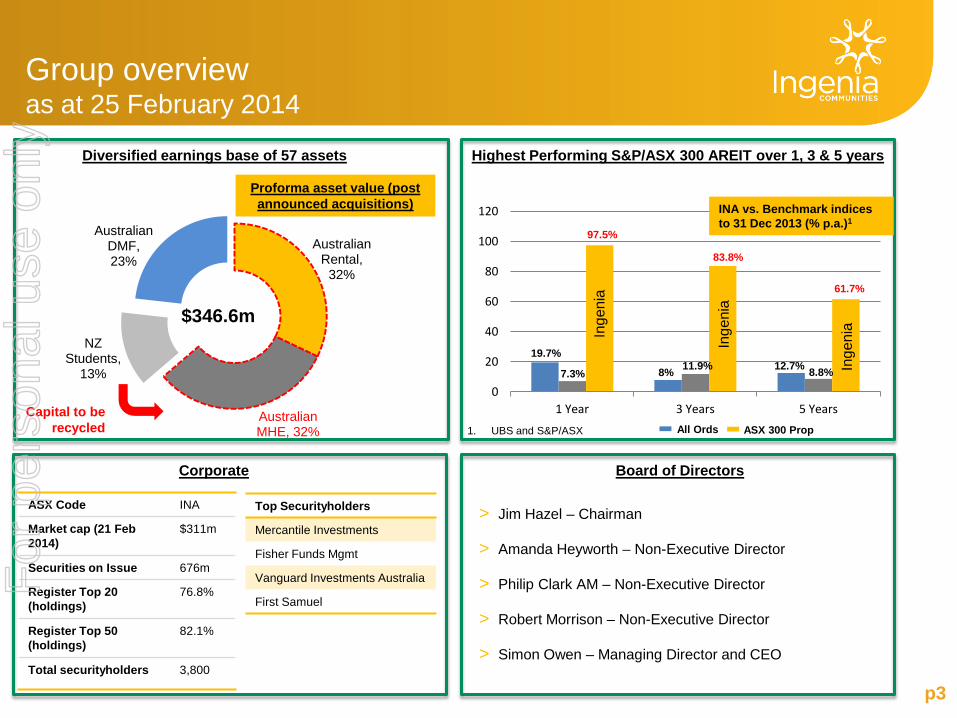
Australian Rental,
32%
Australian MHE, 32%
NZ Students,
13%
Australian DMF, 23%
Highest Performing S&P/ASX 300 AREIT over 1, 3 & 5 years
p3
Group overview as at 25 February 2014
ASX Code INA
Market cap (21 Feb 2014)
$311m
Securities on Issue 676m
Register Top 20 (holdings)
76.8%
Register Top 50 (holdings)
82.1%
Total securityholders 3,800
Top Securityholders
Mercantile Investments
Fisher Funds Mgmt
Vanguard Investments Australia
First Samuel
Corporate
Diversified earnings base of 57 assets
Board of Directors
> Jim Hazel – Chairman
> Amanda Heyworth – Non-Executive Director
> Philip Clark AM – Non-Executive Director
> Robert Morrison – Non-Executive Director
> Simon Owen – Managing Director and CEO
0
20
40
60
80
100
120
1 Year 3 Years 5 Years ASX 300 Prop All Ords
19.7%
7.3%
97.5%
8% 11.9%
83.8%
12.7% 8.8%
61.7%
1. UBS and S&P/ASX
INA vs. Benchmark indices to 31 Dec 2013 (% p.a.)1
Inge
nia
Inge
nia
Inge
nia
Proforma asset value (post announced acquisitions)
$346.6m
Capital to be recycled
For
per
sona
l use
onl
y
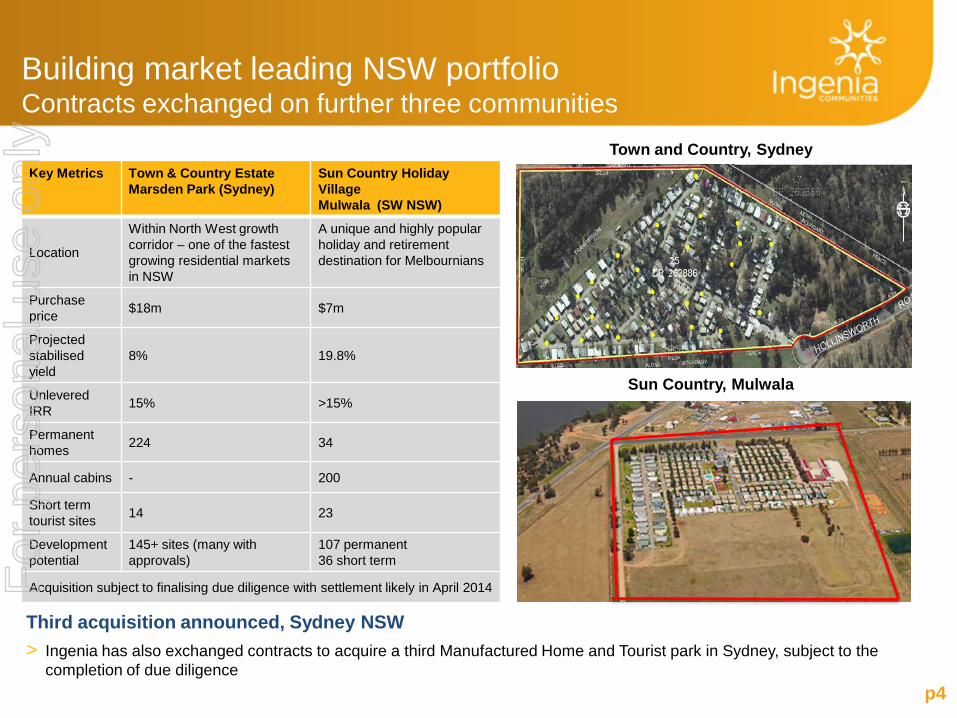
Building market leading NSW portfolio Contracts exchanged on further three communities
Key Metrics Town & Country Estate Marsden Park (Sydney)
Sun Country Holiday Village Mulwala (SW NSW)
Location
Within North West growth corridor – one of the fastest growing residential markets in NSW
A unique and highly popular holiday and retirement destination for Melbournians
Purchase price $18m $7m
Projected stabilised yield
8% 19.8%
Unlevered IRR 15% >15%
Permanent homes 224 34
Annual cabins - 200
Short term tourist sites 14 23
Development potential
145+ sites (many with approvals)
107 permanent 36 short term
Acquisition subject to finalising due diligence with settlement likely in April 2014
Third acquisition announced, Sydney NSW > Ingenia has also exchanged contracts to acquire a third Manufactured Home and Tourist park in Sydney, subject to the
completion of due diligence
Town and Country, Sydney
Sun Country, Mulwala
p4
For
per
sona
l use
onl
y
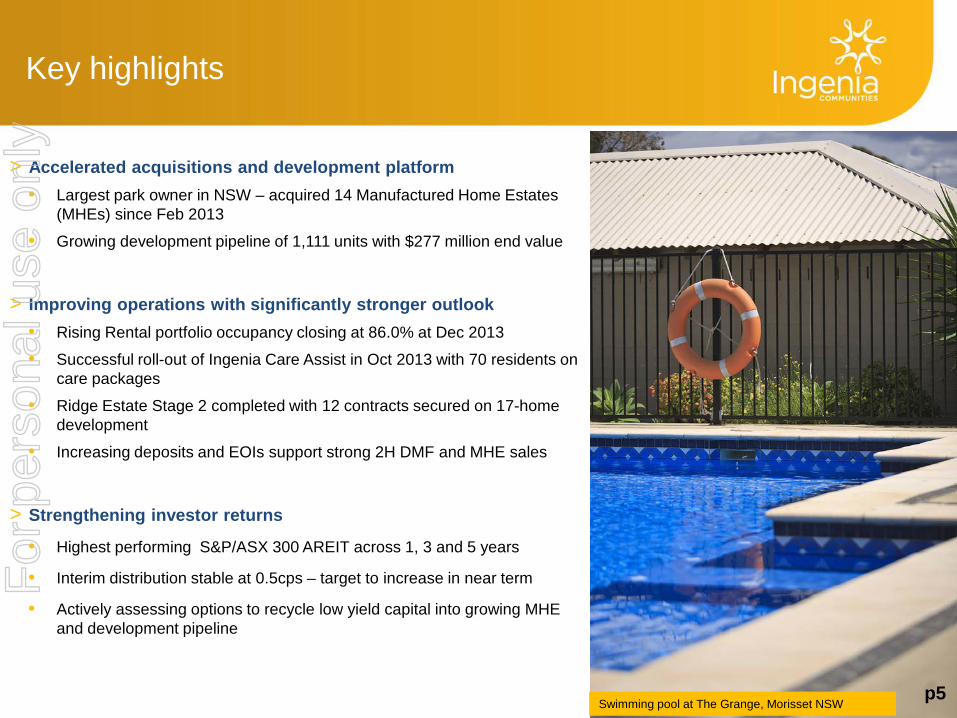
Key highlights
p5
> Accelerated acquisitions and development platform • Largest park owner in NSW – acquired 14 Manufactured Home Estates
(MHEs) since Feb 2013
• Growing development pipeline of 1,111 units with $277 million end value
> Improving operations with significantly stronger outlook • Rising Rental portfolio occupancy closing at 86.0% at Dec 2013
• Successful roll-out of Ingenia Care Assist in Oct 2013 with 70 residents on care packages
• Ridge Estate Stage 2 completed with 12 contracts secured on 17-home development
• Increasing deposits and EOIs support strong 2H DMF and MHE sales
> Strengthening investor returns
• Highest performing S&P/ASX 300 AREIT across 1, 3 and 5 years
• Interim distribution stable at 0.5cps – target to increase in near term
• Actively assessing options to recycle low yield capital into growing MHE and development pipeline
Swimming pool at The Grange, Morisset NSW
For
per
sona
l use
onl
y
p6
Key financials
Outdoor pool at Drifters Village, Kingscliff NSW
For
per
sona
l use
onl
y
Key financials
p7
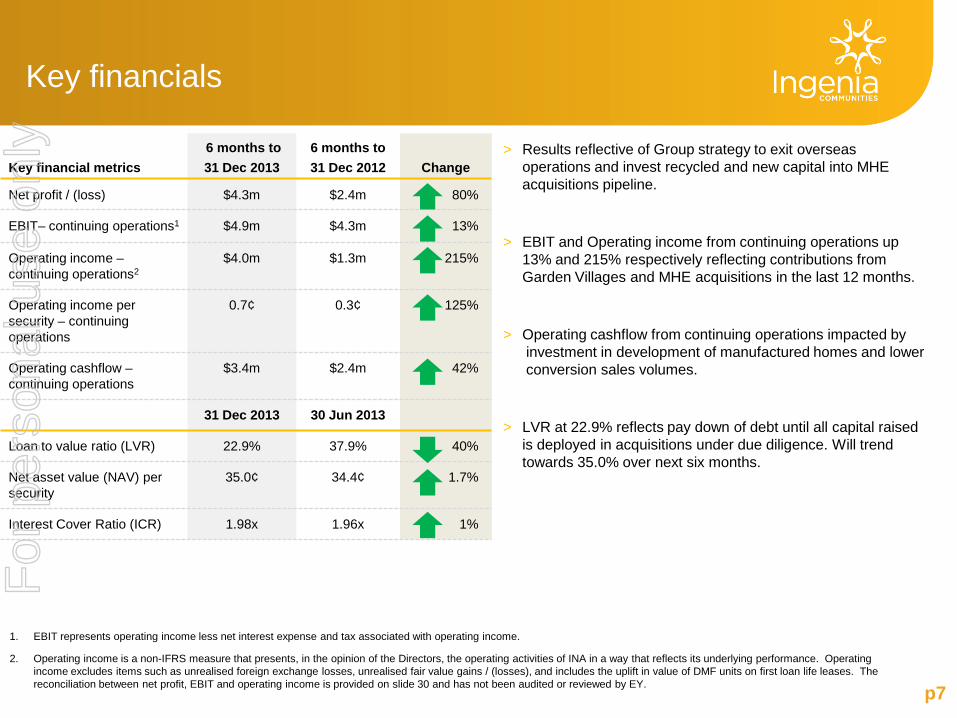
Key financial metrics 6 months to 31 Dec 2013
6 months to 31 Dec 2012 Change
Net profit / (loss) $4.3m $2.4m 80%
EBIT– continuing operations1 $4.9m $4.3m 13%
Operating income – continuing operations2
$4.0m $1.3m 215%
Operating income per security – continuing operations
0.7¢ 0.3¢ 125%
Operating cashflow – continuing operations
$3.4m $2.4m 42%
31 Dec 2013 30 Jun 2013
Loan to value ratio (LVR) 22.9% 37.9% 40%
Net asset value (NAV) per security
35.0¢ 34.4¢ 1.7%
Interest Cover Ratio (ICR) 1.98x 1.96x 1%
1. EBIT represents operating income less net interest expense and tax associated with operating income.
2. Operating income is a non-IFRS measure that presents, in the opinion of the Directors, the operating activities of INA in a way that reflects its underlying performance. Operating income excludes items such as unrealised foreign exchange losses, unrealised fair value gains / (losses), and includes the uplift in value of DMF units on first loan life leases. The reconciliation between net profit, EBIT and operating income is provided on slide 30 and has not been audited or reviewed by EY.
> Results reflective of Group strategy to exit overseas operations and invest recycled and new capital into MHE acquisitions pipeline.
> EBIT and Operating income from continuing operations up 13% and 215% respectively reflecting contributions from Garden Villages and MHE acquisitions in the last 12 months.
> Operating cashflow from continuing operations impacted by investment in development of manufactured homes and lower conversion sales volumes.
> LVR at 22.9% reflects pay down of debt until all capital raised is deployed in acquisitions under due diligence. Will trend towards 35.0% over next six months.
For
per
sona
l use
onl
y
p8
Capital management
Open Day – showcasing Stage 2 development at Ridge Estate Village, Maitland NSW
For
per
sona
l use
onl
y
p9
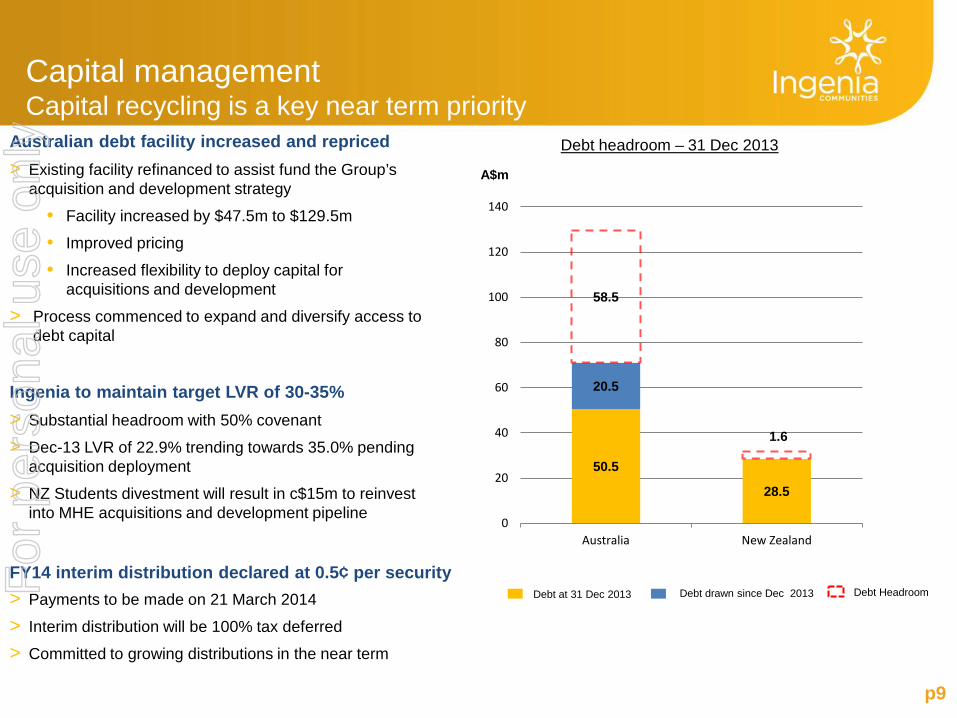
> Substantial headroom with 50% covenant
> Dec-13 LVR of 22.9% trending towards 35.0% pending acquisition deployment
> NZ Students divestment will result in c$15m to reinvest into MHE acquisitions and development pipeline
Debt headroom – 31 Dec 2013 Australian debt facility increased and repriced
> Existing facility refinanced to assist fund the Group’s acquisition and development strategy
• Facility increased by $47.5m to $129.5m
• Improved pricing
• Increased flexibility to deploy capital for acquisitions and development
> Process commenced to expand and diversify access to debt capital
Ingenia to maintain target LVR of 30-35%
FY14 interim distribution declared at 0.5¢ per security > Payments to be made on 21 March 2014
> Interim distribution will be 100% tax deferred
> Committed to growing distributions in the near term
50.5
28.5
20.5
58.5
1.6
0
20
40
60
80
100
120
140
Australia New Zealand
Debt at 31 Dec 2013 Debt Headroom Debt drawn since Dec 2013
A$m
Capital management Capital recycling is a key near term priority
For
per
sona
l use
onl
y
Capital management Steady deployment into immediately accretive acquisitions
p10
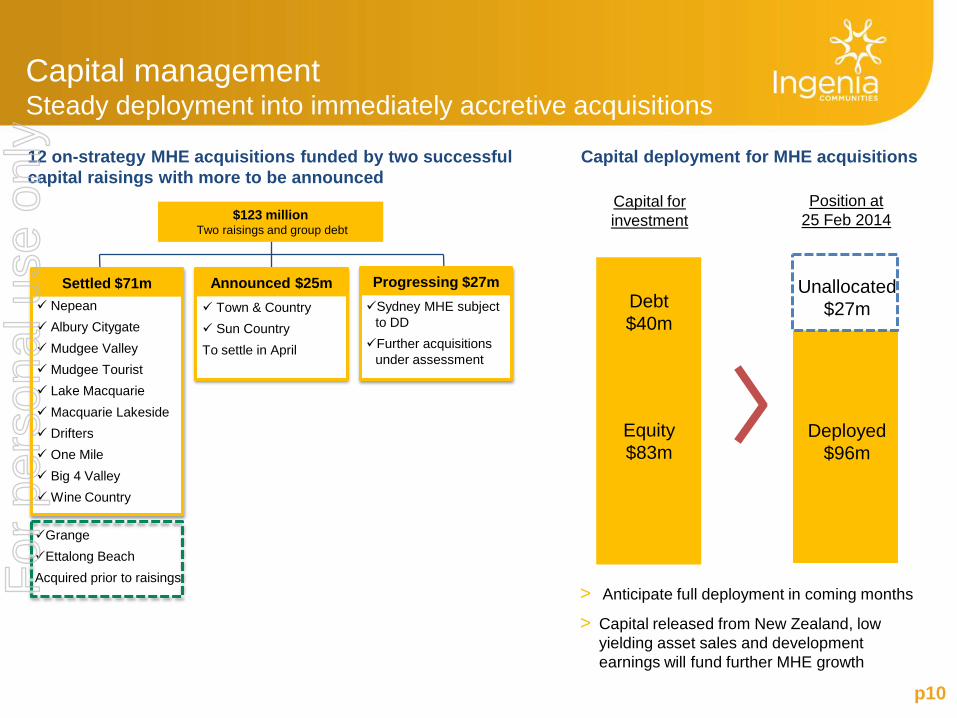
Capital for investment
Position at 25 Feb 2014
Capital deployment for MHE acquisitions
> Anticipate full deployment in coming months
> Capital released from New Zealand, low yielding asset sales and development earnings will fund further MHE growth
Debt $40m
Equity $83m
Unallocated $27m
Deployed $96m
12 on-strategy MHE acquisitions funded by two successful capital raisings with more to be announced
Nepean Albury Citygate Mudgee Valley Mudgee Tourist Lake Macquarie Macquarie Lakeside Drifters One Mile Big 4 Valley Wine Country
Settled $71m Sydney MHE subject
to DD Further acquisitions
under assessment
Progressing $27m Town & Country Sun Country To settle in April
Announced $25m
$123 million Two raisings and group debt
Grange Ettalong Beach Acquired prior to raisings F
or p
erso
nal u
se o
nly
p11
Portfolio update
High quality tourist cabins at Nepean River Holiday Village, Penrith NSW
For
per
sona
l use
onl
y
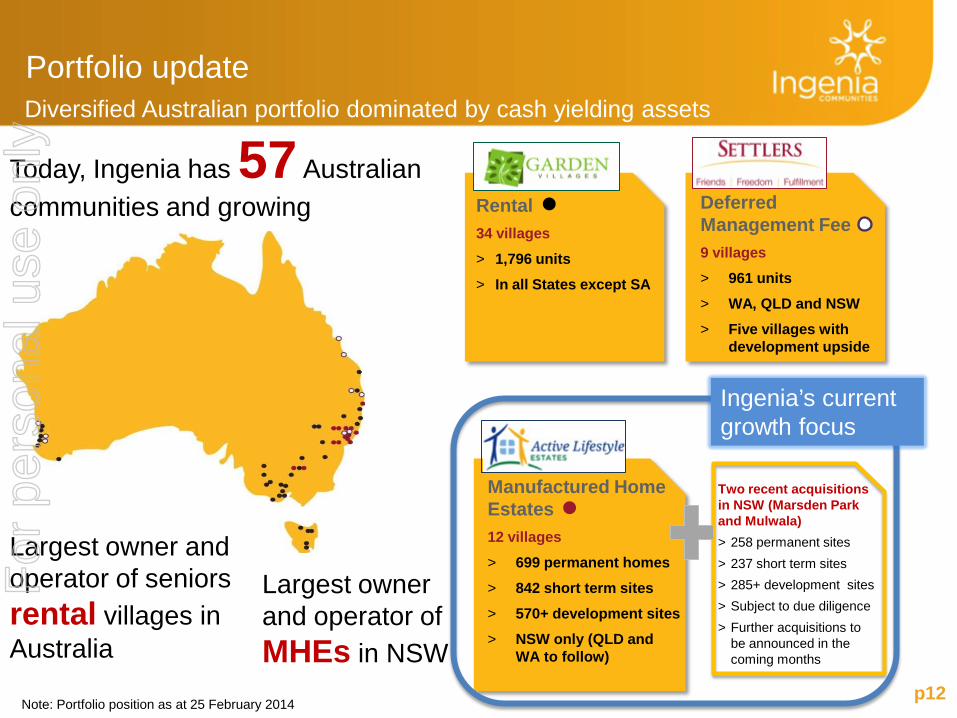
Portfolio update Diversified Australian portfolio dominated by cash yielding assets
p12
Rental 34 villages > 1,796 units > In all States except SA
Deferred Management Fee 9 villages > 961 units > WA, QLD and NSW > Five villages with
development upside
Manufactured Home Estates 12 villages > 699 permanent homes > 842 short term sites > 570+ development sites > NSW only (QLD and
WA to follow)
Two recent acquisitions in NSW (Marsden Park and Mulwala) > 258 permanent sites > 237 short term sites > 285+ development sites > Subject to due diligence > Further acquisitions to
be announced in the coming months
Today, Ingenia has 57 Australian communities and growing
Ingenia’s current growth focus
Note: Portfolio position as at 25 February 2014
Largest owner and operator of seniors rental villages in Australia
Largest owner and operator of MHEs in NSW
For
per
sona
l use
onl
y
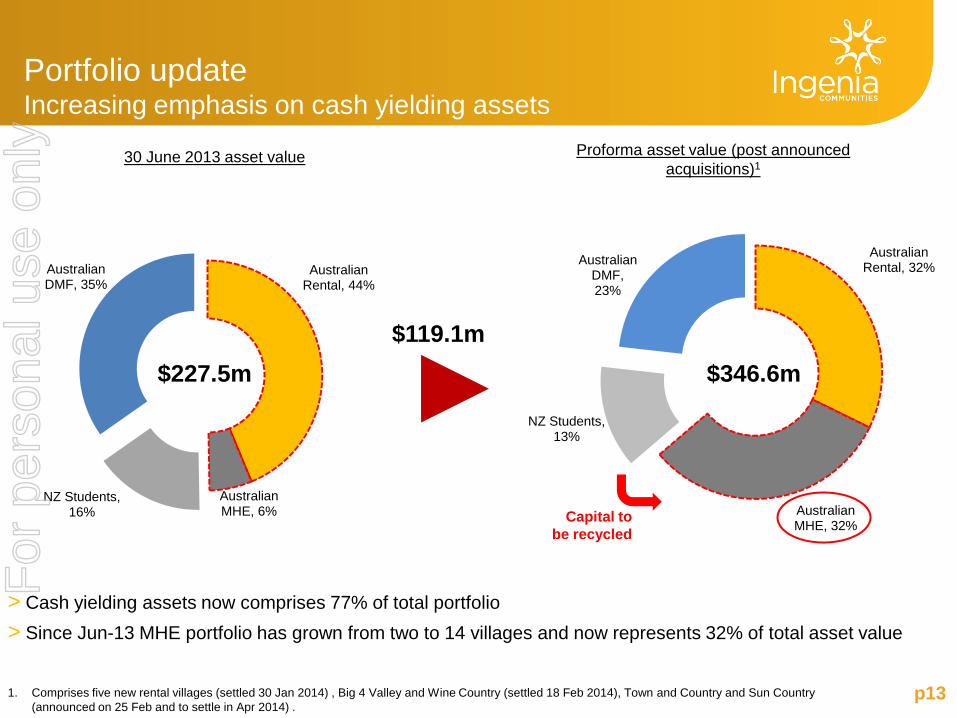
Australian Rental, 32%
Australian MHE, 32%
NZ Students, 13%
Australian DMF, 23%
Australian Rental, 44%
Australian MHE, 6%
NZ Students, 16%
Australian DMF, 35%
Portfolio update Increasing emphasis on cash yielding assets
p13
30 June 2013 asset value
> Cash yielding assets now comprises 77% of total portfolio > Since Jun-13 MHE portfolio has grown from two to 14 villages and now represents 32% of total asset value
1. Comprises five new rental villages (settled 30 Jan 2014) , Big 4 Valley and Wine Country (settled 18 Feb 2014), Town and Country and Sun Country (announced on 25 Feb and to settle in Apr 2014) .
Proforma asset value (post announced acquisitions)1
$119.1m $227.5m $346.6m
►x
Capital to be recycled
For
per
sona
l use
onl
y
p14
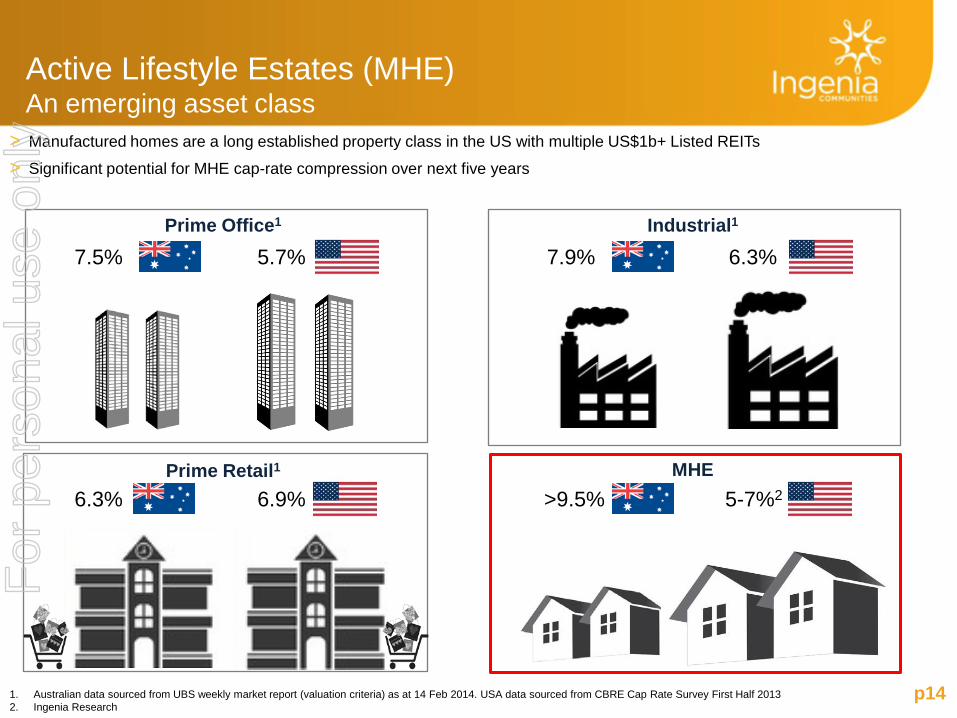
Active Lifestyle Estates (MHE) An emerging asset class
> Manufactured homes are a long established property class in the US with multiple US$1b+ Listed REITs
> Significant potential for MHE cap-rate compression over next five years
Prime Office1 Industrial1
Prime Retail1 MHE
1. Australian data sourced from UBS weekly market report (valuation criteria) as at 14 Feb 2014. USA data sourced from CBRE Cap Rate Survey First Half 2013 2. Ingenia Research
>9.5% 5-7%2
7.9% 6.3%
6.9% 6.3%
7.5% 5.7%
For
per
sona
l use
onl
y
p15
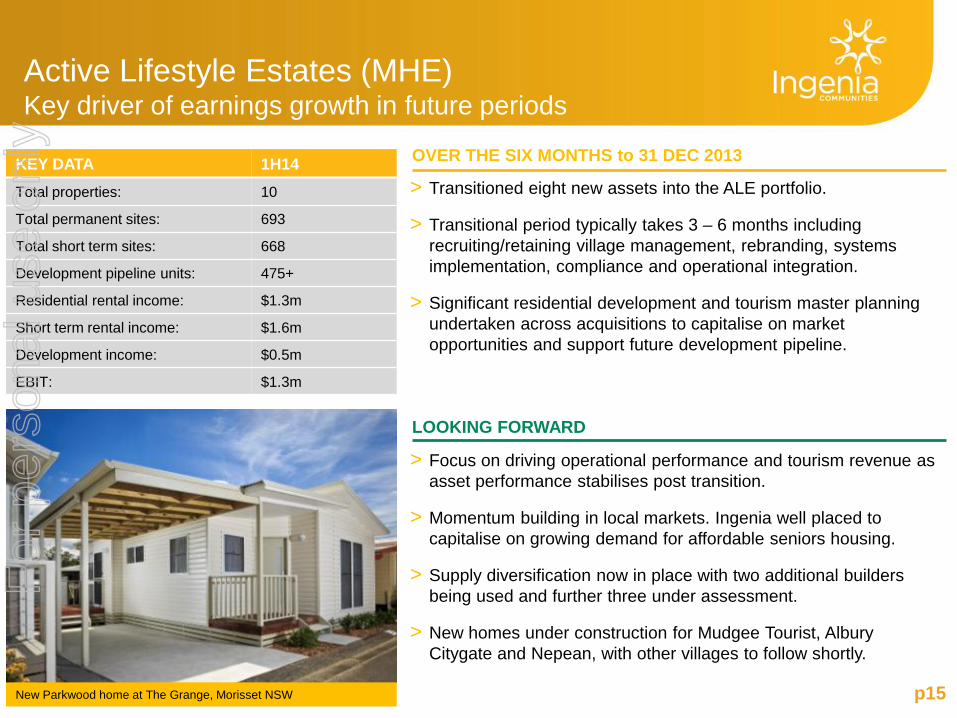
KEY DATA 1H14 Total properties: 10
Total permanent sites: 693
Total short term sites: 668
Development pipeline units: 475+
Residential rental income: $1.3m
Short term rental income: $1.6m
Development income: $0.5m
EBIT: $1.3m
Active Lifestyle Estates (MHE) Key driver of earnings growth in future periods
LOOKING FORWARD
> Focus on driving operational performance and tourism revenue as asset performance stabilises post transition.
> Momentum building in local markets. Ingenia well placed to capitalise on growing demand for affordable seniors housing.
> Supply diversification now in place with two additional builders being used and further three under assessment.
> New homes under construction for Mudgee Tourist, Albury Citygate and Nepean, with other villages to follow shortly.
New Parkwood home at The Grange, Morisset NSW
OVER THE SIX MONTHS to 31 DEC 2013
> Transitioned eight new assets into the ALE portfolio.
> Transitional period typically takes 3 – 6 months including recruiting/retaining village management, rebranding, systems implementation, compliance and operational integration.
> Significant residential development and tourism master planning undertaken across acquisitions to capitalise on market opportunities and support future development pipeline.
For
per
sona
l use
onl
y
p16
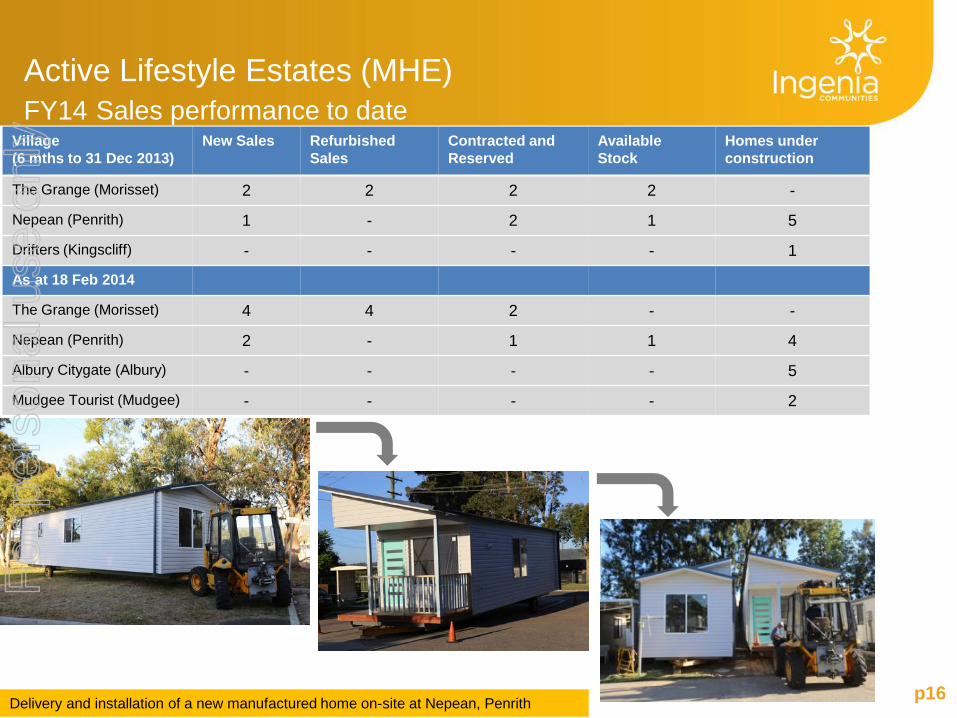
Village (6 mths to 31 Dec 2013)
New Sales Refurbished Sales
Contracted and Reserved
Available Stock
Homes under construction
The Grange (Morisset) 2 2 2 2 -
Nepean (Penrith) 1 - 2 1 5
Drifters (Kingscliff) - - - - 1
As at 18 Feb 2014
The Grange (Morisset) 4 4 2 - -
Nepean (Penrith) 2 - 1 1 4
Albury Citygate (Albury) - - - - 5
Mudgee Tourist (Mudgee) - - - - 2
Active Lifestyle Estates (MHE) FY14 Sales performance to date
Delivery and installation of a new manufactured home on-site at Nepean, Penrith
For
per
sona
l use
onl
y
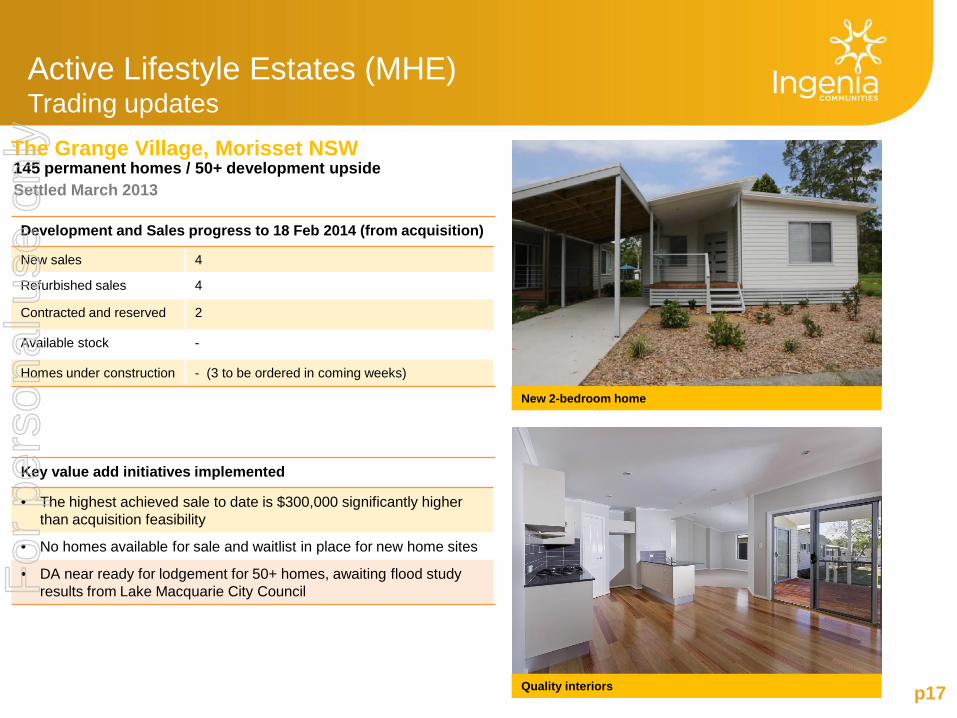
Active Lifestyle Estates (MHE) Trading updates
The Grange Village, Morisset NSW
Development and Sales progress to 18 Feb 2014 (from acquisition)
New sales 4
Refurbished sales 4
Contracted and reserved 2
Available stock -
Homes under construction - (3 to be ordered in coming weeks)
145 permanent homes / 50+ development upside Settled March 2013
Key value add initiatives implemented
• The highest achieved sale to date is $300,000 significantly higher than acquisition feasibility
• No homes available for sale and waitlist in place for new home sites
• DA near ready for lodgement for 50+ homes, awaiting flood study results from Lake Macquarie City Council
p17
New 2-bedroom home
Quality interiors
For
per
sona
l use
onl
y
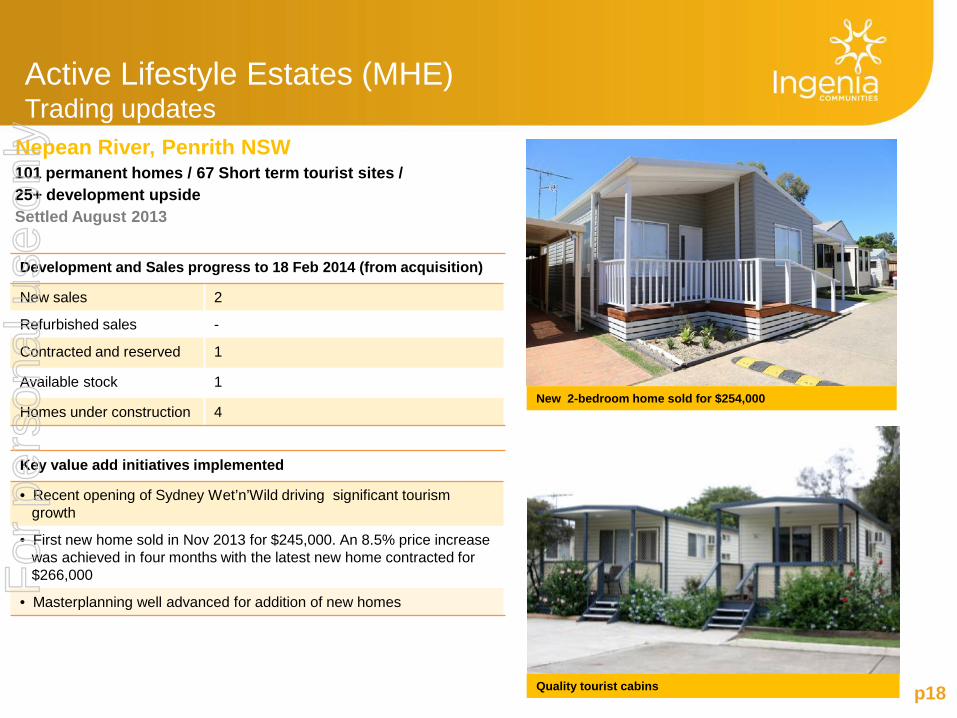
Active Lifestyle Estates (MHE) Trading updates
101 permanent homes / 67 Short term tourist sites / 25+ development upside Settled August 2013
p18
New 2-bedroom home sold for $254,000
Quality tourist cabins
Nepean River, Penrith NSW
Key value add initiatives implemented
• Recent opening of Sydney Wet’n’Wild driving significant tourism growth
• First new home sold in Nov 2013 for $245,000. An 8.5% price increase was achieved in four months with the latest new home contracted for $266,000
• Masterplanning well advanced for addition of new homes
Development and Sales progress to 18 Feb 2014 (from acquisition)
New sales 2
Refurbished sales -
Contracted and reserved 1
Available stock 1
Homes under construction 4
For
per
sona
l use
onl
y
60
65
70
75
80
85
90
95
100
Dec-12 Jun-13 Dec-13 LT target
Garden Villages (Rental) Occupancy growth and acquisitions drive earnings growth
p19
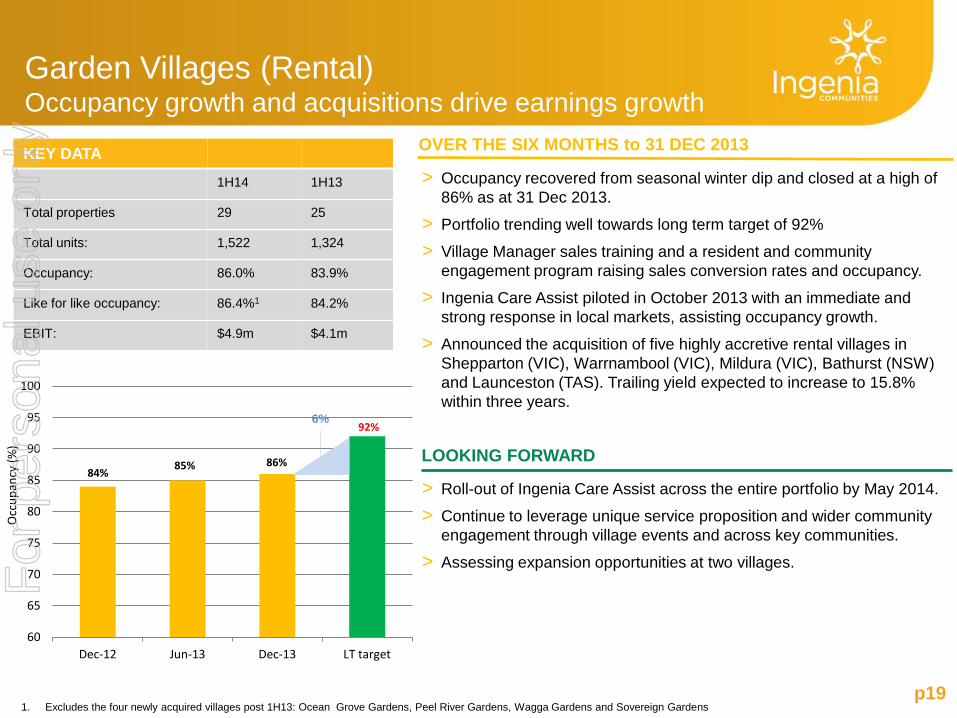
KEY DATA 1H14 1H13
Total properties 29 25
Total units: 1,522 1,324
Occupancy: 86.0% 83.9%
Like for like occupancy: 86.4%1 84.2%
EBIT: $4.9m $4.1m
Occ
upan
cy (%
)
84% 85% 86%
92% 6%
OVER THE SIX MONTHS to 31 DEC 2013
1. Excludes the four newly acquired villages post 1H13: Ocean Grove Gardens, Peel River Gardens, Wagga Gardens and Sovereign Gardens
> Occupancy recovered from seasonal winter dip and closed at a high of 86% as at 31 Dec 2013.
> Portfolio trending well towards long term target of 92%
> Village Manager sales training and a resident and community engagement program raising sales conversion rates and occupancy.
> Ingenia Care Assist piloted in October 2013 with an immediate and strong response in local markets, assisting occupancy growth.
> Announced the acquisition of five highly accretive rental villages in Shepparton (VIC), Warrnambool (VIC), Mildura (VIC), Bathurst (NSW) and Launceston (TAS). Trailing yield expected to increase to 15.8% within three years.
LOOKING FORWARD
> Roll-out of Ingenia Care Assist across the entire portfolio by May 2014.
> Continue to leverage unique service proposition and wider community engagement through village events and across key communities.
> Assessing expansion opportunities at two villages. For
per
sona
l use
onl
y
p20
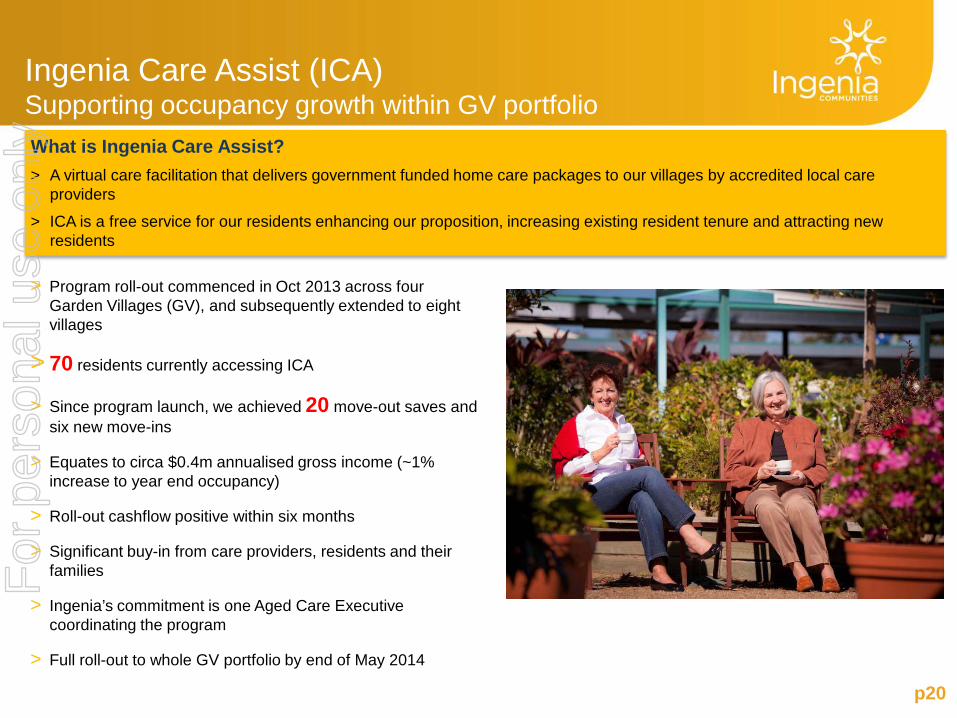
Ingenia Care Assist (ICA) Supporting occupancy growth within GV portfolio What is Ingenia Care Assist? > A virtual care facilitation that delivers government funded home care packages to our villages by accredited local care
providers
> ICA is a free service for our residents enhancing our proposition, increasing existing resident tenure and attracting new residents
> Program roll-out commenced in Oct 2013 across four Garden Villages (GV), and subsequently extended to eight villages
> 70 residents currently accessing ICA
> Since program launch, we achieved 20 move-out saves and six new move-ins
> Equates to circa $0.4m annualised gross income (~1% increase to year end occupancy)
> Roll-out cashflow positive within six months
> Significant buy-in from care providers, residents and their families
> Ingenia’s commitment is one Aged Care Executive coordinating the program
> Full roll-out to whole GV portfolio by end of May 2014
For
per
sona
l use
onl
y
p21
OVER THE SIX MONTHS to 31 DEC 2013
LOOKING FORWARD
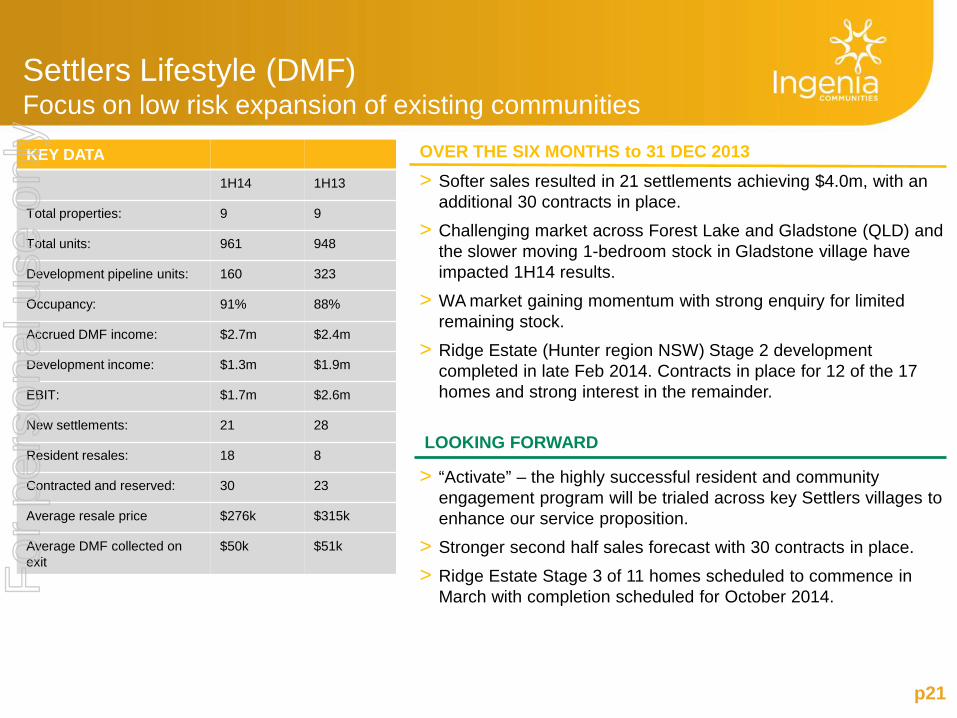
KEY DATA 1H14 1H13
Total properties: 9 9
Total units: 961 948
Development pipeline units: 160 323
Occupancy: 91% 88%
Accrued DMF income: $2.7m $2.4m
Development income: $1.3m $1.9m
EBIT: $1.7m $2.6m
New settlements: 21 28
Resident resales: 18 8
Contracted and reserved: 30 23
Average resale price $276k $315k
Average DMF collected on exit
$50k $51k
Settlers Lifestyle (DMF) Focus on low risk expansion of existing communities
> Softer sales resulted in 21 settlements achieving $4.0m, with an additional 30 contracts in place.
> Challenging market across Forest Lake and Gladstone (QLD) and the slower moving 1-bedroom stock in Gladstone village have impacted 1H14 results.
> WA market gaining momentum with strong enquiry for limited remaining stock.
> Ridge Estate (Hunter region NSW) Stage 2 development completed in late Feb 2014. Contracts in place for 12 of the 17 homes and strong interest in the remainder.
> “Activate” – the highly successful resident and community engagement program will be trialed across key Settlers villages to enhance our service proposition.
> Stronger second half sales forecast with 30 contracts in place.
> Ridge Estate Stage 3 of 11 homes scheduled to commence in March with completion scheduled for October 2014. F
or p
erso
nal u
se o
nly
New Zealand Students portfolio Sale process underway
p22
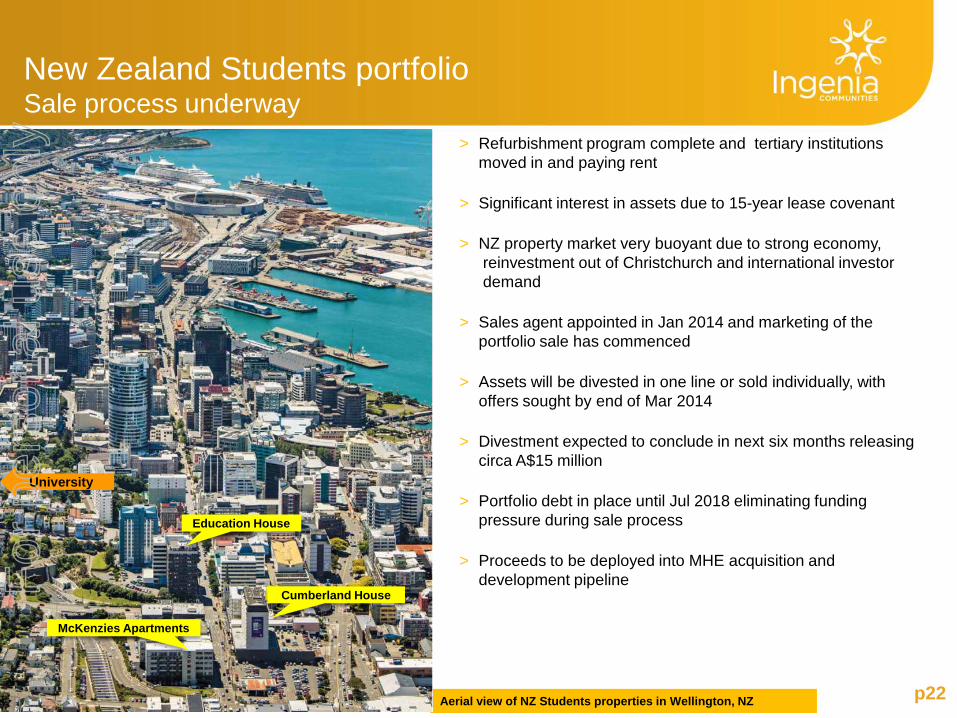
> Refurbishment program complete and tertiary institutions moved in and paying rent
> Significant interest in assets due to 15-year lease covenant
> NZ property market very buoyant due to strong economy, reinvestment out of Christchurch and international investor demand
> Sales agent appointed in Jan 2014 and marketing of the portfolio sale has commenced
> Assets will be divested in one line or sold individually, with offers sought by end of Mar 2014
> Divestment expected to conclude in next six months releasing circa A$15 million
> Portfolio debt in place until Jul 2018 eliminating funding pressure during sale process
> Proceeds to be deployed into MHE acquisition and development pipeline
Note: Portfolio has been classified as discontinued operations Aerial view of NZ Students properties in Wellington, NZ
Cumberland House
McKenzies Apartments
Education House
University
For
per
sona
l use
onl
y
p23
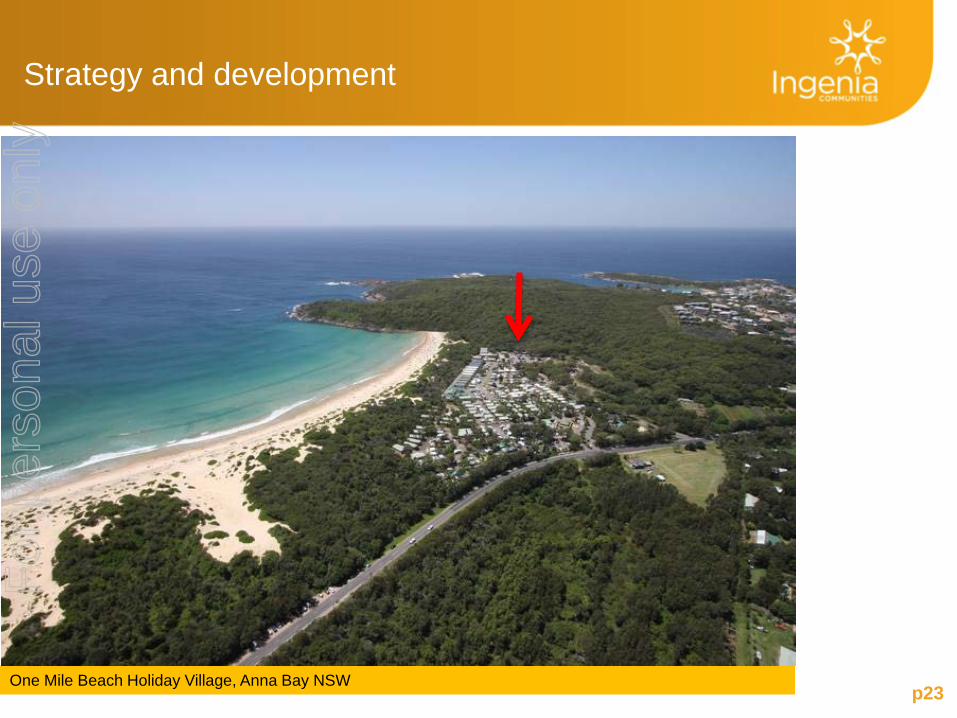
Strategy and development
One Mile Beach Holiday Village, Anna Bay NSW
For
per
sona
l use
onl
y
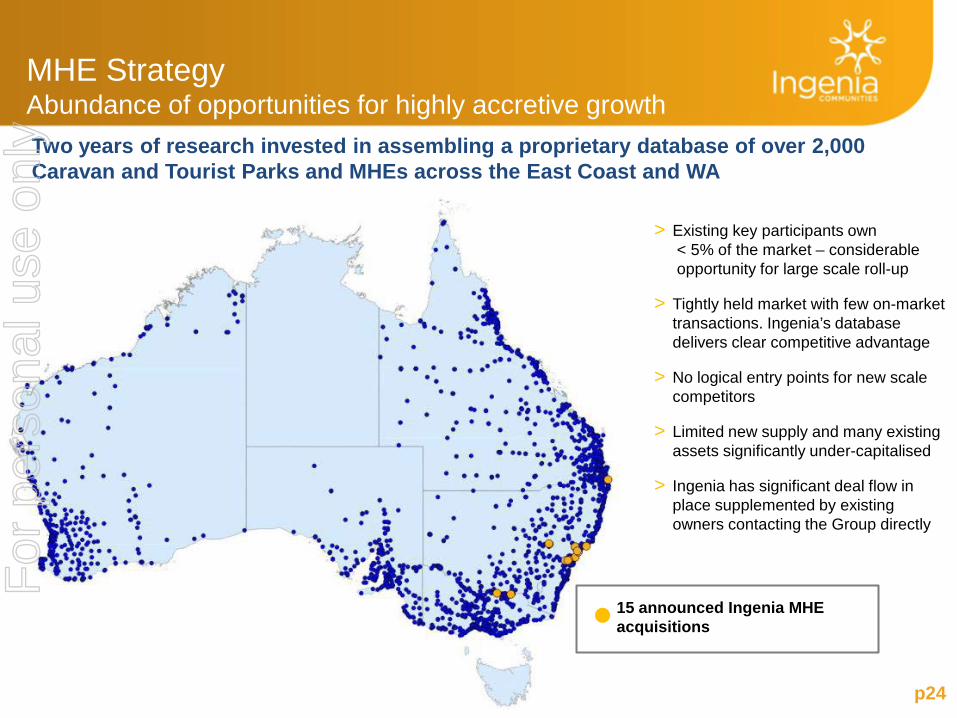
MHE Strategy Abundance of opportunities for highly accretive growth
p24
Two years of research invested in assembling a proprietary database of over 2,000 Caravan and Tourist Parks and MHEs across the East Coast and WA
> Existing key participants own < 5% of the market – considerable opportunity for large scale roll-up
> Tightly held market with few on-market transactions. Ingenia’s database delivers clear competitive advantage
> No logical entry points for new scale competitors
> Limited new supply and many existing assets significantly under-capitalised
> Ingenia has significant deal flow in place supplemented by existing owners contacting the Group directly
15 announced Ingenia MHE acquisitions
For
per
sona
l use
onl
y
p25
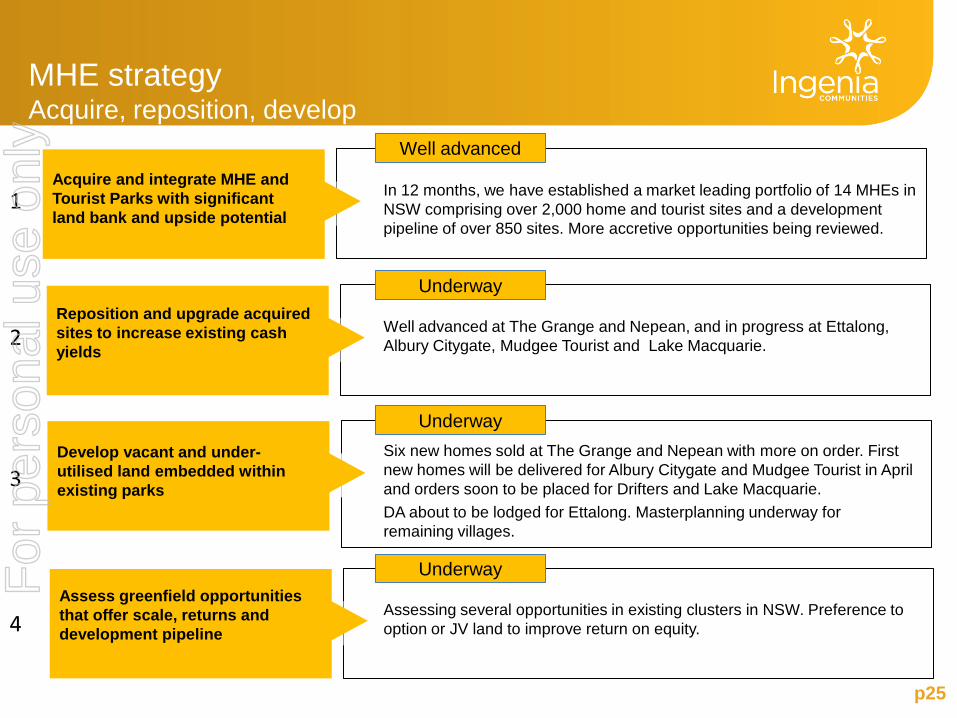
MHE strategy Acquire, reposition, develop
Acquire and integrate MHE and Tourist Parks with significant land bank and upside potential
In 12 months, we have established a market leading portfolio of 14 MHEs in NSW comprising over 2,000 home and tourist sites and a development pipeline of over 850 sites. More accretive opportunities being reviewed.
Well advanced
Well advanced at The Grange and Nepean, and in progress at Ettalong, Albury Citygate, Mudgee Tourist and Lake Macquarie.
Underway
Develop vacant and under-utilised land embedded within existing parks
Six new homes sold at The Grange and Nepean with more on order. First new homes will be delivered for Albury Citygate and Mudgee Tourist in April and orders soon to be placed for Drifters and Lake Macquarie. DA about to be lodged for Ettalong. Masterplanning underway for remaining villages.
Underway
Assess greenfield opportunities that offer scale, returns and development pipeline
Assessing several opportunities in existing clusters in NSW. Preference to option or JV land to improve return on equity.
Underway
Reposition and upgrade acquired sites to increase existing cash yields
1
2
3
4
For
per
sona
l use
onl
y
p26
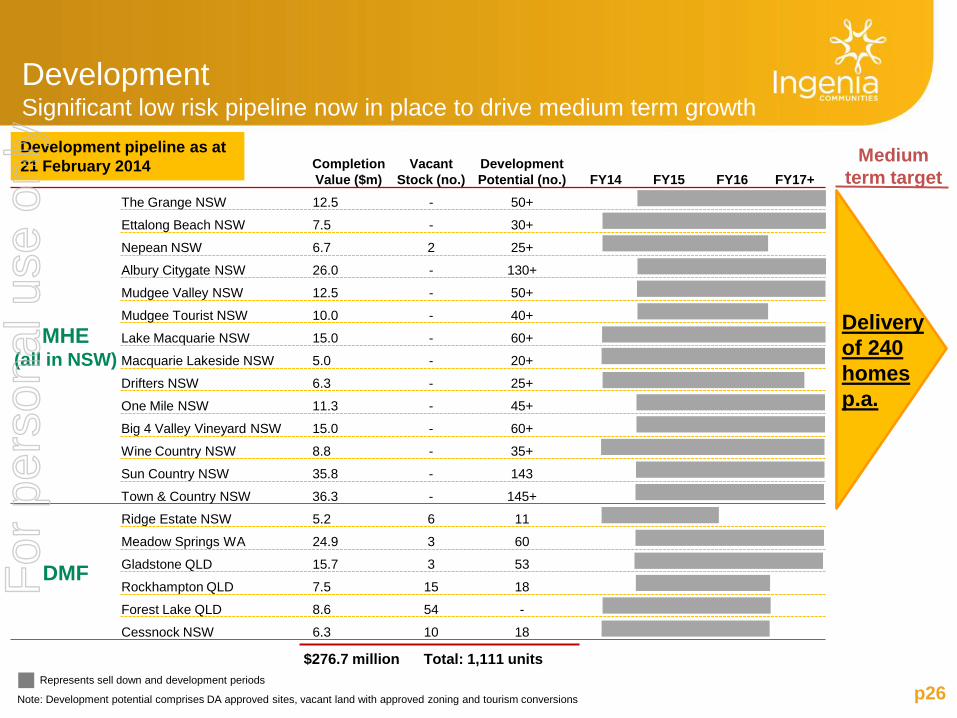
Completion Value ($m)
Vacant Stock (no.)
Development Potential (no.) FY14 FY15 FY16 FY17+
MHE (all in NSW)
The Grange NSW 12.5 - 50+
Ettalong Beach NSW 7.5 - 30+
Nepean NSW 6.7 2 25+
Albury Citygate NSW 26.0 - 130+
Mudgee Valley NSW 12.5 - 50+
Mudgee Tourist NSW 10.0 - 40+
Lake Macquarie NSW 15.0 - 60+
Macquarie Lakeside NSW 5.0 - 20+
Drifters NSW 6.3 - 25+
One Mile NSW 11.3 - 45+
Big 4 Valley Vineyard NSW 15.0 - 60+
Wine Country NSW 8.8 - 35+
Sun Country NSW 35.8 - 143
Town & Country NSW 36.3 - 145+
DMF
Ridge Estate NSW 5.2 6 11
Meadow Springs WA 24.9 3 60
Gladstone QLD 15.7 3 53
Rockhampton QLD 7.5 15 18
Forest Lake QLD 8.6 54 -
Cessnock NSW 6.3 10 18
Development Significant low risk pipeline now in place to drive medium term growth
Medium term target
Note: Development potential comprises DA approved sites, vacant land with approved zoning and tourism conversions
Represents sell down and development periods
Development pipeline as at 21 February 2014
$276.7 million Total: 1,111 units
Delivery of 240 homes p.a.
For
per
sona
l use
onl
y
p27
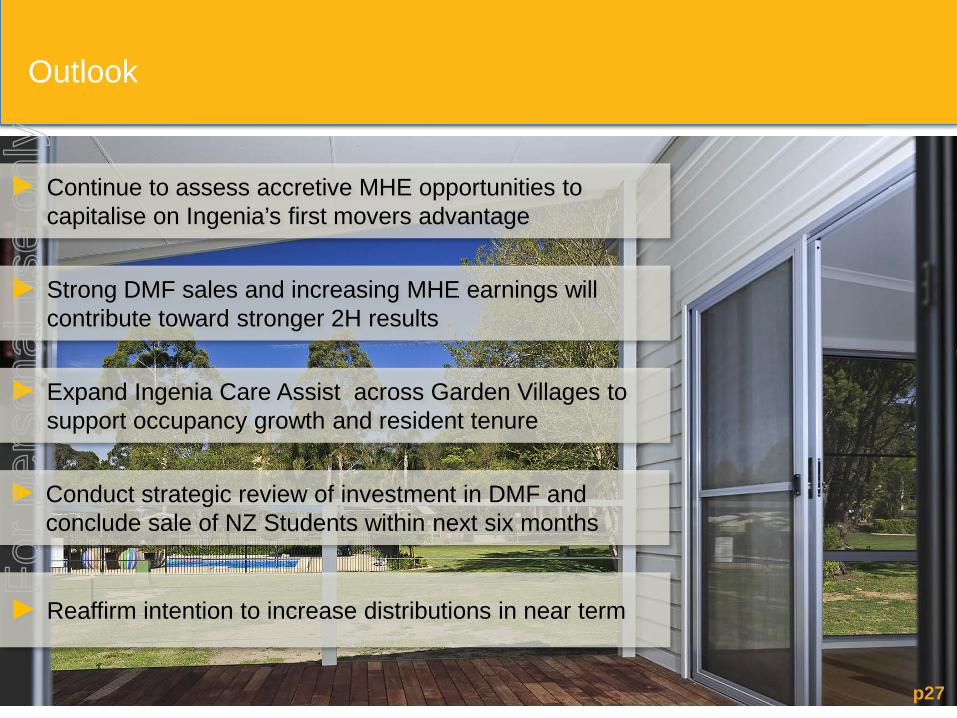
► Continue to assess accretive MHE opportunities to capitalise on Ingenia’s first movers advantage
► Strong DMF sales and increasing MHE earnings will contribute toward stronger 2H results
Outlook
► Expand Ingenia Care Assist across Garden Villages to support occupancy growth and resident tenure
► Reaffirm intention to increase distributions in near term
► Conduct strategic review of investment in DMF and conclude sale of NZ Students within next six months
For
per
sona
l use
onl
y
p28
Appendices
Big 4 Valley Vineyard, Cessnock NSW
For
per
sona
l use
onl
y
p29
Operating income 1H14 (A$m)
1H13 (A$m) Comments
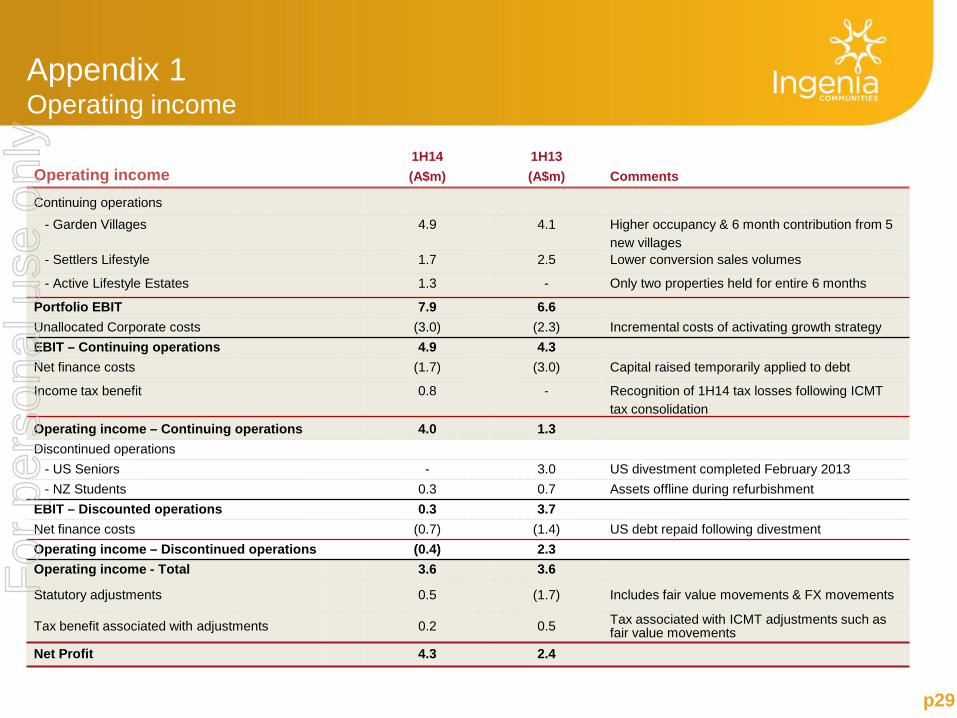
Continuing operations - Garden Villages 4.9 4.1 Higher occupancy & 6 month contribution from 5
new villages - Settlers Lifestyle 1.7 2.5 Lower conversion sales volumes
- Active Lifestyle Estates 1.3 - Only two properties held for entire 6 months
Portfolio EBIT 7.9 6.6 Unallocated Corporate costs (3.0) (2.3) Incremental costs of activating growth strategy EBIT – Continuing operations 4.9 4.3 Net finance costs (1.7) (3.0) Capital raised temporarily applied to debt
Income tax benefit 0.8 - Recognition of 1H14 tax losses following ICMT tax consolidation
Operating income – Continuing operations 4.0 1.3 Discontinued operations
- US Seniors - 3.0 US divestment completed February 2013 - NZ Students 0.3 0.7 Assets offline during refurbishment EBIT – Discounted operations 0.3 3.7 Net finance costs (0.7) (1.4) US debt repaid following divestment Operating income – Discontinued operations (0.4) 2.3 Operating income - Total 3.6 3.6
Statutory adjustments 0.5 (1.7) Includes fair value movements & FX movements
Tax benefit associated with adjustments 0.2 0.5 Tax associated with ICMT adjustments such as fair value movements
Net Profit 4.3 2.4
Appendix 1 Operating income
For
per
sona
l use
onl
y
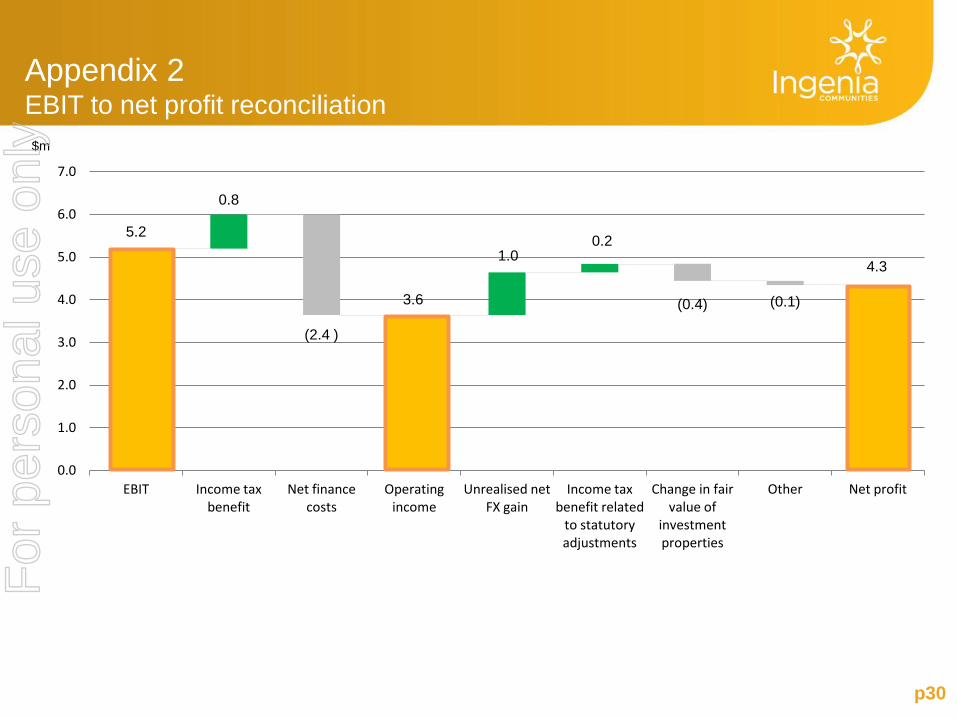
5.2
0.8
(2.4 )
3.6
1.0 0.2
(0.4) (0.1)
4.3
0.0
1.0
2.0
3.0
4.0
5.0
6.0
7.0
EBIT Income tax benefit
Net finance costs
Operating income
Unrealised net FX gain
Income tax benefit related
to statutory adjustments
Change in fair value of
investment properties
Other Net profit
Appendix 2 EBIT to net profit reconciliation
p30
$m
For
per
sona
l use
onl
y
p31
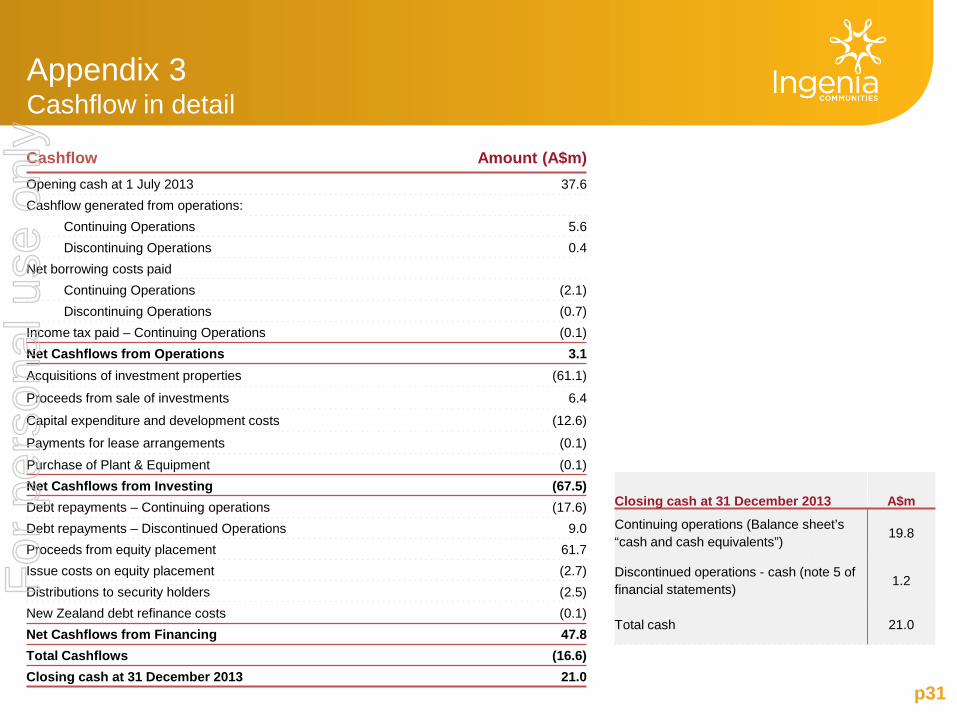
Cashflow Amount (A$m) Opening cash at 1 July 2013 37.6 Cashflow generated from operations:
Continuing Operations 5.6 Discontinuing Operations 0.4
Net borrowing costs paid Continuing Operations (2.1) Discontinuing Operations (0.7)
Income tax paid – Continuing Operations (0.1) Net Cashflows from Operations 3.1 Acquisitions of investment properties (61.1)
Proceeds from sale of investments 6.4
Capital expenditure and development costs (12.6)
Payments for lease arrangements (0.1) Purchase of Plant & Equipment (0.1) Net Cashflows from Investing (67.5) Debt repayments – Continuing operations (17.6) Debt repayments – Discontinued Operations 9.0 Proceeds from equity placement 61.7 Issue costs on equity placement (2.7) Distributions to security holders (2.5) New Zealand debt refinance costs (0.1) Net Cashflows from Financing 47.8 Total Cashflows (16.6) Closing cash at 31 December 2013 21.0
Closing cash at 31 December 2013 A$m
Continuing operations (Balance sheet’s “cash and cash equivalents”) 19.8
Discontinued operations - cash (note 5 of financial statements) 1.2
Total cash 21.0
Appendix 3 Cashflow in detail
For
per
sona
l use
onl
y
p32
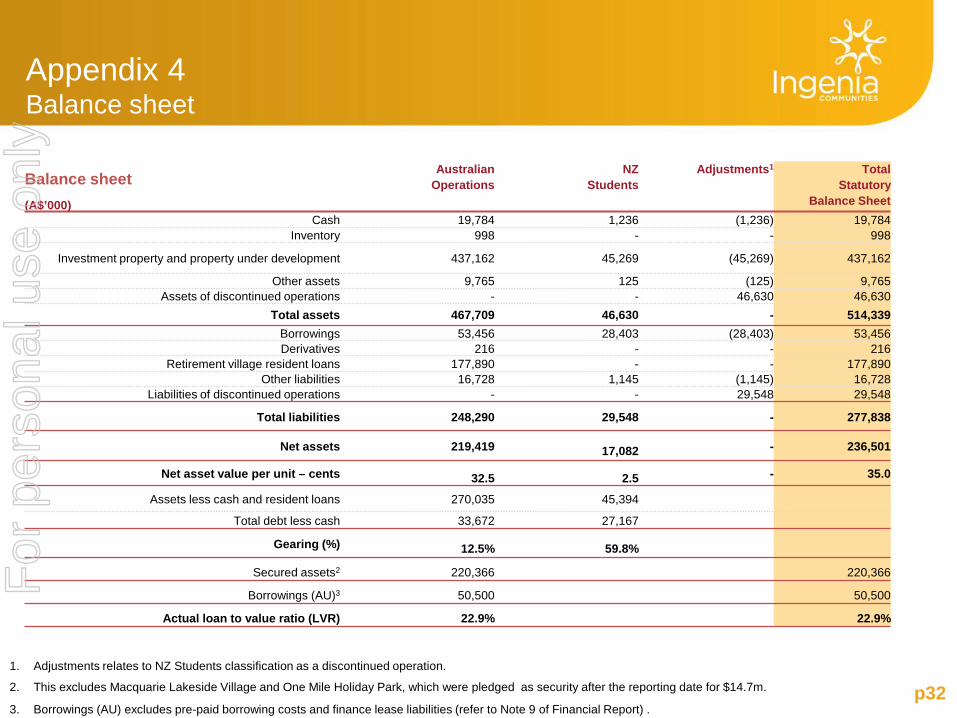
Balance sheet (A$’000)
Australian Operations
NZ Students
Adjustments1 Total Statutory
Balance Sheet
Cash 19,784 1,236 (1,236) 19,784 Inventory 998 - - 998
Investment property and property under development 437,162 45,269 (45,269) 437,162
Other assets 9,765 125 (125) 9,765 Assets of discontinued operations - - 46,630 46,630
Total assets 467,709 46,630 - 514,339 Borrowings 53,456 28,403 (28,403) 53,456 Derivatives 216 - - 216
Retirement village resident loans 177,890 - - 177,890 Other liabilities 16,728 1,145 (1,145) 16,728
Liabilities of discontinued operations - - 29,548 29,548
Total liabilities 248,290 29,548 - 277,838
Net assets 219,419 17,082 - 236,501
Net asset value per unit – cents 32.5 2.5 - 35.0
Assets less cash and resident loans 270,035 45,394
Total debt less cash 33,672 27,167
Gearing (%) 12.5% 59.8%
Secured assets2 220,366 220,366
Borrowings (AU)3 50,500 50,500
Actual loan to value ratio (LVR) 22.9% 22.9%
1. Adjustments relates to NZ Students classification as a discontinued operation.
2. This excludes Macquarie Lakeside Village and One Mile Holiday Park, which were pledged as security after the reporting date for $14.7m.
3. Borrowings (AU) excludes pre-paid borrowing costs and finance lease liabilities (refer to Note 9 of Financial Report) .
Appendix 4 Balance sheet
For
per
sona
l use
onl
y
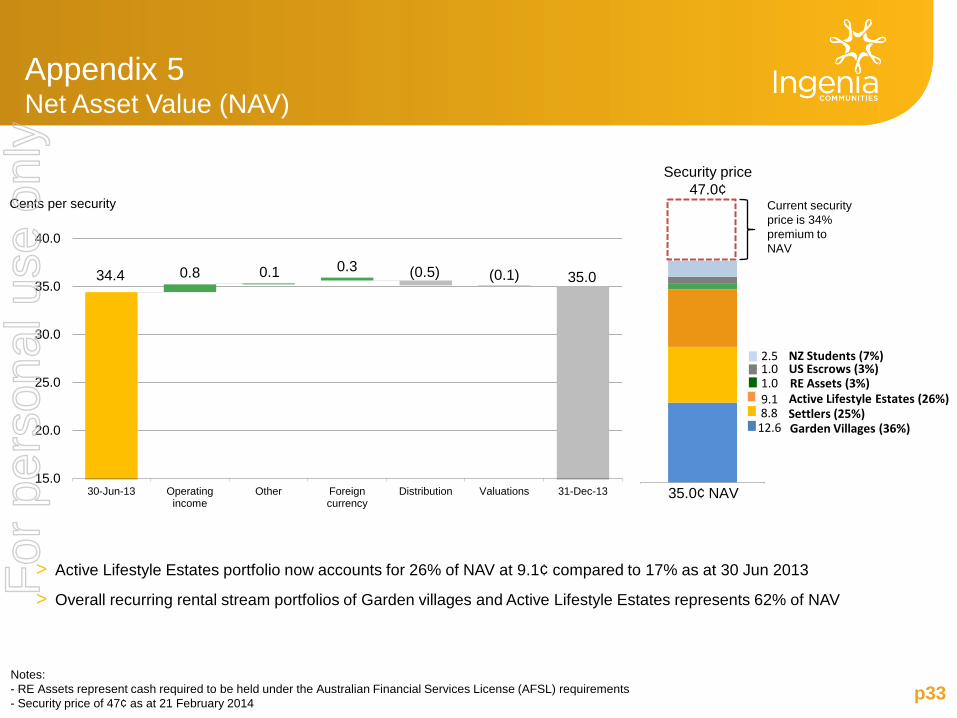
34.4 0.8 0.1 0.3 (0.5) (0.1) 35.0
15.0
20.0
25.0
30.0
35.0
40.0
30-Jun-13 Operating income
Other Foreign currency
Distribution Valuations 31-Dec-13 1/01/1900
Appendix 5 Net Asset Value (NAV)
p33
1.0 9.1
12.6 8.8
RE Assets (3%)
Settlers (25%) Garden Villages (36%)
Active Lifestyle Estates (26%)
Cents per security
Notes: - RE Assets represent cash required to be held under the Australian Financial Services License (AFSL) requirements - Security price of 47¢ as at 21 February 2014
1.0 US Escrows (3%) 2.5 NZ Students (7%)
> Active Lifestyle Estates portfolio now accounts for 26% of NAV at 9.1¢ compared to 17% as at 30 Jun 2013
> Overall recurring rental stream portfolios of Garden villages and Active Lifestyle Estates represents 62% of NAV
Current security price is 34% premium to NAV
Security price 47.0¢
35.0¢ NAV
For
per
sona
l use
onl
y
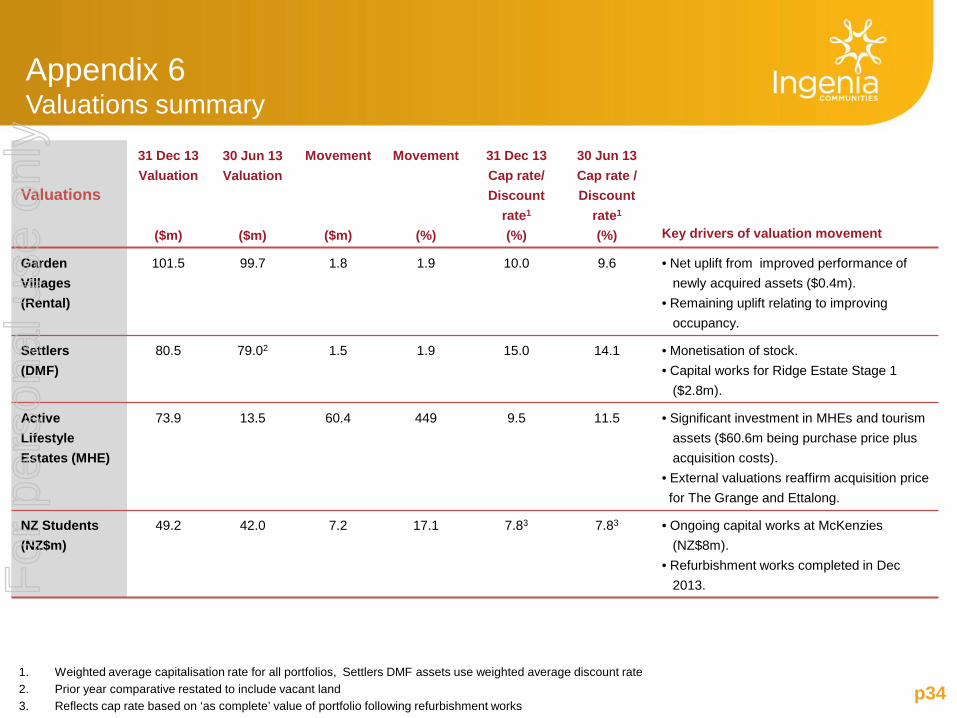
p34 1. Weighted average capitalisation rate for all portfolios, Settlers DMF assets use weighted average discount rate 2. Prior year comparative restated to include vacant land 3. Reflects cap rate based on ‘as complete’ value of portfolio following refurbishment works
Appendix 6 Valuations summary
Valuations
31 Dec 13 Valuation
($m)
30 Jun 13 Valuation
($m)
Movement
($m)
Movement
(%)
31 Dec 13 Cap rate/ Discount
rate1
(%)
30 Jun 13 Cap rate / Discount
rate1
(%)
Key drivers of valuation movement
Garden Villages (Rental)
101.5 99.7 1.8 1.9 10.0 9.6 • Net uplift from improved performance of newly acquired assets ($0.4m). • Remaining uplift relating to improving occupancy.
Settlers (DMF)
80.5 79.02 1.5 1.9 15.0 14.1 • Monetisation of stock. • Capital works for Ridge Estate Stage 1 ($2.8m).
Active Lifestyle Estates (MHE)
73.9 13.5 60.4 449 9.5 11.5 • Significant investment in MHEs and tourism assets ($60.6m being purchase price plus acquisition costs). • External valuations reaffirm acquisition price for The Grange and Ettalong.
NZ Students
(NZ$m) 49.2 42.0 7.2 17.1 7.83 7.83 • Ongoing capital works at McKenzies
(NZ$8m). • Refurbishment works completed in Dec 2013. F
or p
erso
nal u
se o
nly
p35
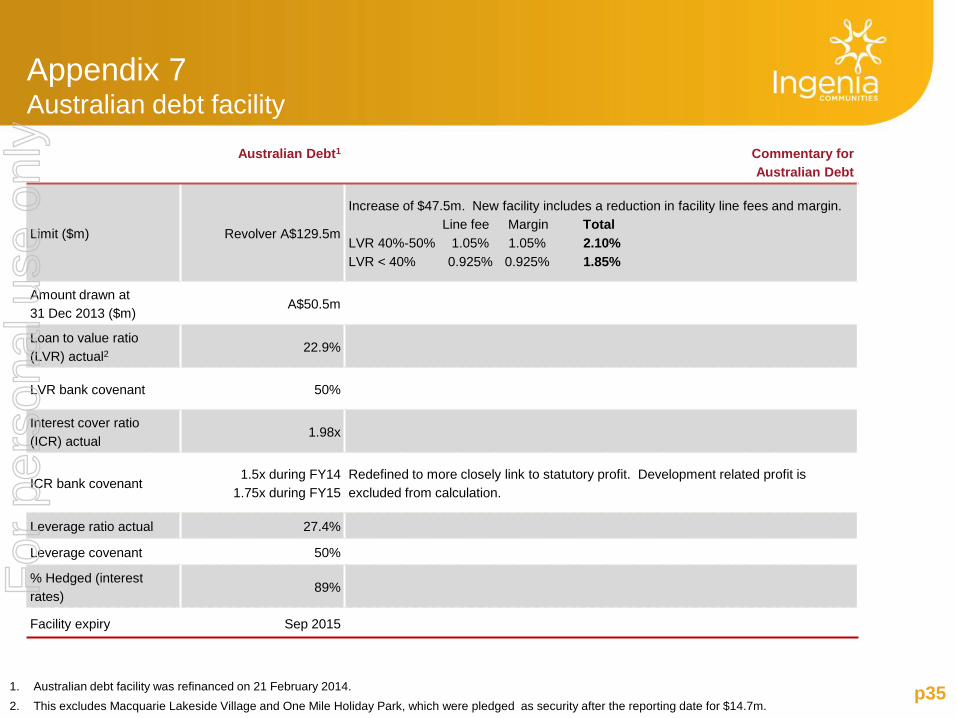
Australian Debt1 Commentary for Australian Debt
Limit ($m) Revolver A$129.5m
Increase of $47.5m. New facility includes a reduction in facility line fees and margin. Line fee Margin Total LVR 40%-50% 1.05% 1.05% 2.10% LVR < 40% 0.925% 0.925% 1.85%
Amount drawn at 31 Dec 2013 ($m)
A$50.5m
Loan to value ratio (LVR) actual2 22.9%
LVR bank covenant 50%
Interest cover ratio (ICR) actual
1.98x
ICR bank covenant 1.5x during FY14
1.75x during FY15 Redefined to more closely link to statutory profit. Development related profit is excluded from calculation.
Leverage ratio actual 27.4%
Leverage covenant 50%
% Hedged (interest rates) 89%
Facility expiry Sep 2015
1. Australian debt facility was refinanced on 21 February 2014. 2. This excludes Macquarie Lakeside Village and One Mile Holiday Park, which were pledged as security after the reporting date for $14.7m.
Appendix 7 Australian debt facility
For
per
sona
l use
onl
y
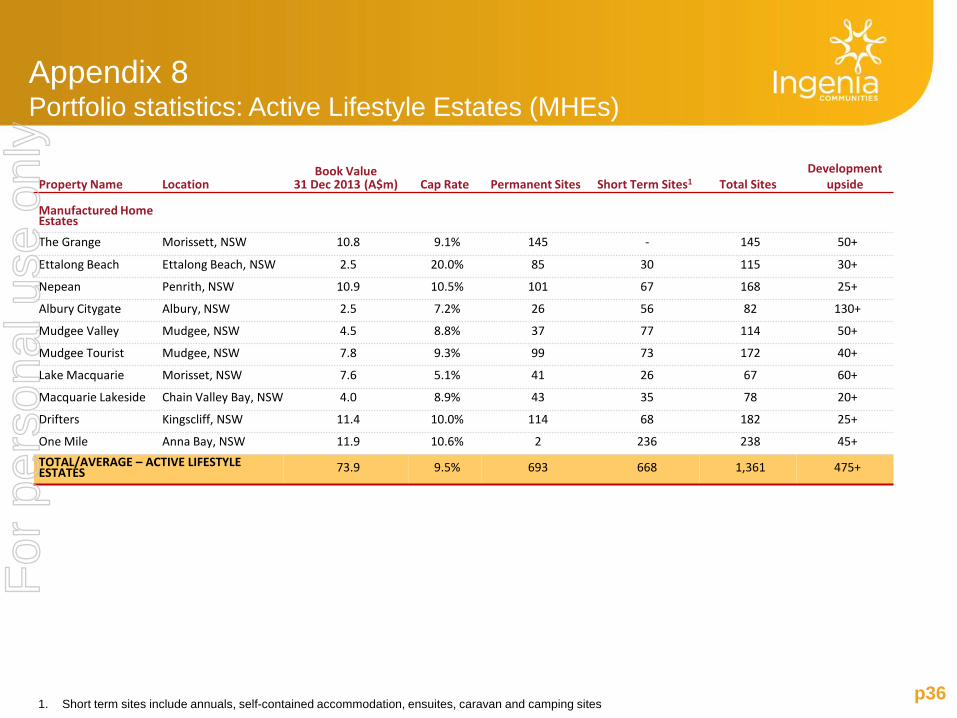
Appendix 8 Portfolio statistics: Active Lifestyle Estates (MHEs)
p36
Property Name Location Book Value
31 Dec 2013 (A$m) Cap Rate Permanent Sites Short Term Sites1 Total Sites Development
upside Manufactured Home Estates
The Grange Morissett, NSW 10.8 9.1% 145 - 145 50+
Ettalong Beach Ettalong Beach, NSW 2.5 20.0% 85 30 115 30+
Nepean Penrith, NSW 10.9 10.5% 101 67 168 25+
Albury Citygate Albury, NSW 2.5 7.2% 26 56 82 130+
Mudgee Valley Mudgee, NSW 4.5 8.8% 37 77 114 50+
Mudgee Tourist Mudgee, NSW 7.8 9.3% 99 73 172 40+
Lake Macquarie Morisset, NSW 7.6 5.1% 41 26 67 60+
Macquarie Lakeside Chain Valley Bay, NSW 4.0 8.9% 43 35 78 20+
Drifters Kingscliff, NSW 11.4 10.0% 114 68 182 25+
One Mile Anna Bay, NSW 11.9 10.6% 2 236 238 45+ TOTAL/AVERAGE – ACTIVE LIFESTYLE ESTATES 73.9 9.5% 693 668 1,361 475+
1. Short term sites include annuals, self-contained accommodation, ensuites, caravan and camping sites
For
per
sona
l use
onl
y
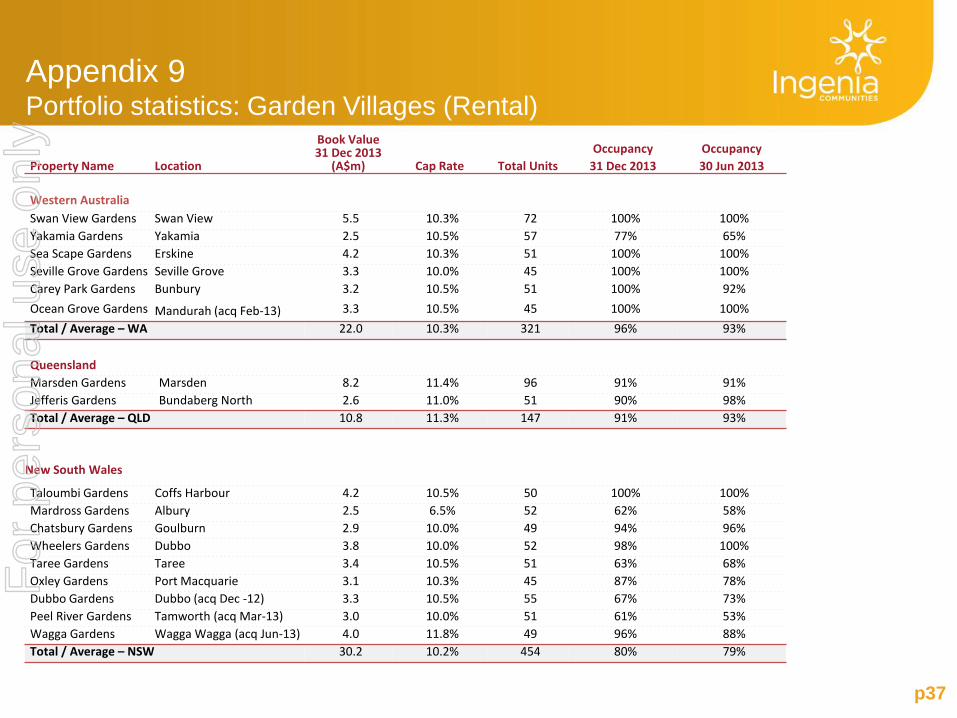
p37
Property Name Location
Book Value 31 Dec 2013
(A$m) Cap Rate Total Units Occupancy
31 Dec 2013 Occupancy 30 Jun 2013
Western Australia Swan View Gardens Swan View 5.5 10.3% 72 100% 100% Yakamia Gardens Yakamia 2.5 10.5% 57 77% 65% Sea Scape Gardens Erskine 4.2 10.3% 51 100% 100% Seville Grove Gardens Seville Grove 3.3 10.0% 45 100% 100% Carey Park Gardens Bunbury 3.2 10.5% 51 100% 92% Ocean Grove Gardens Mandurah (acq Feb-13) 3.3 10.5% 45 100% 100% Total / Average – WA 22.0 10.3% 321 96% 93%
Queensland Marsden Gardens Marsden 8.2 11.4% 96 91% 91% Jefferis Gardens Bundaberg North 2.6 11.0% 51 90% 98% Total / Average – QLD 10.8 11.3% 147 91% 93%
New South Wales
Taloumbi Gardens Coffs Harbour 4.2 10.5% 50 100% 100% Mardross Gardens Albury 2.5 6.5% 52 62% 58% Chatsbury Gardens Goulburn 2.9 10.0% 49 94% 96% Wheelers Gardens Dubbo 3.8 10.0% 52 98% 100% Taree Gardens Taree 3.4 10.5% 51 63% 68% Oxley Gardens Port Macquarie 3.1 10.3% 45 87% 78% Dubbo Gardens Dubbo (acq Dec -12) 3.3 10.5% 55 67% 73% Peel River Gardens Tamworth (acq Mar-13) 3.0 10.0% 51 61% 53% Wagga Gardens Wagga Wagga (acq Jun-13) 4.0 11.8% 49 96% 88% Total / Average – NSW 30.2 10.2% 454 80% 79%
Appendix 9 Portfolio statistics: Garden Villages (Rental)
For
per
sona
l use
onl
y
p38
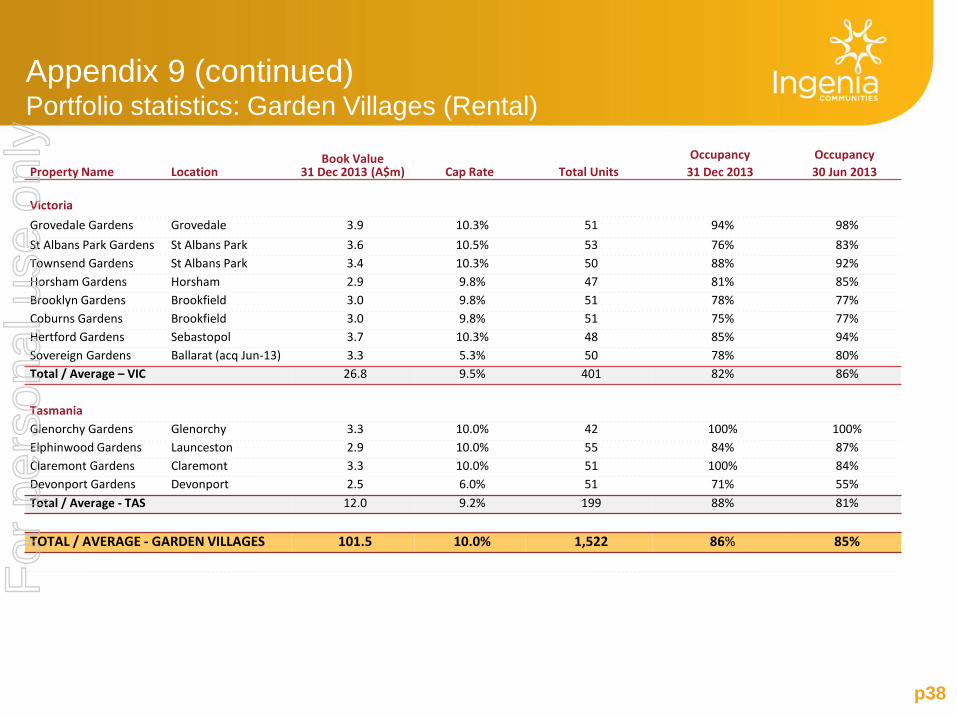
Appendix 9 (continued) Portfolio statistics: Garden Villages (Rental)
Property Name Location Book Value
31 Dec 2013 (A$m) Cap Rate Total Units Occupancy
31 Dec 2013 Occupancy 30 Jun 2013
Victoria Grovedale Gardens Grovedale 3.9 10.3% 51 94% 98% St Albans Park Gardens St Albans Park 3.6 10.5% 53 76% 83% Townsend Gardens St Albans Park 3.4 10.3% 50 88% 92% Horsham Gardens Horsham 2.9 9.8% 47 81% 85% Brooklyn Gardens Brookfield 3.0 9.8% 51 78% 77% Coburns Gardens Brookfield 3.0 9.8% 51 75% 77% Hertford Gardens Sebastopol 3.7 10.3% 48 85% 94% Sovereign Gardens Ballarat (acq Jun-13) 3.3 5.3% 50 78% 80% Total / Average – VIC 26.8 9.5% 401 82% 86%
Tasmania Glenorchy Gardens Glenorchy 3.3 10.0% 42 100% 100% Elphinwood Gardens Launceston 2.9 10.0% 55 84% 87% Claremont Gardens Claremont 3.3 10.0% 51 100% 84% Devonport Gardens Devonport 2.5 6.0% 51 71% 55% Total / Average - TAS 12.0 9.2% 199 88% 81%
TOTAL / AVERAGE - GARDEN VILLAGES 101.5 10.0% 1,522 86% 85%
For
per
sona
l use
onl
y
p39
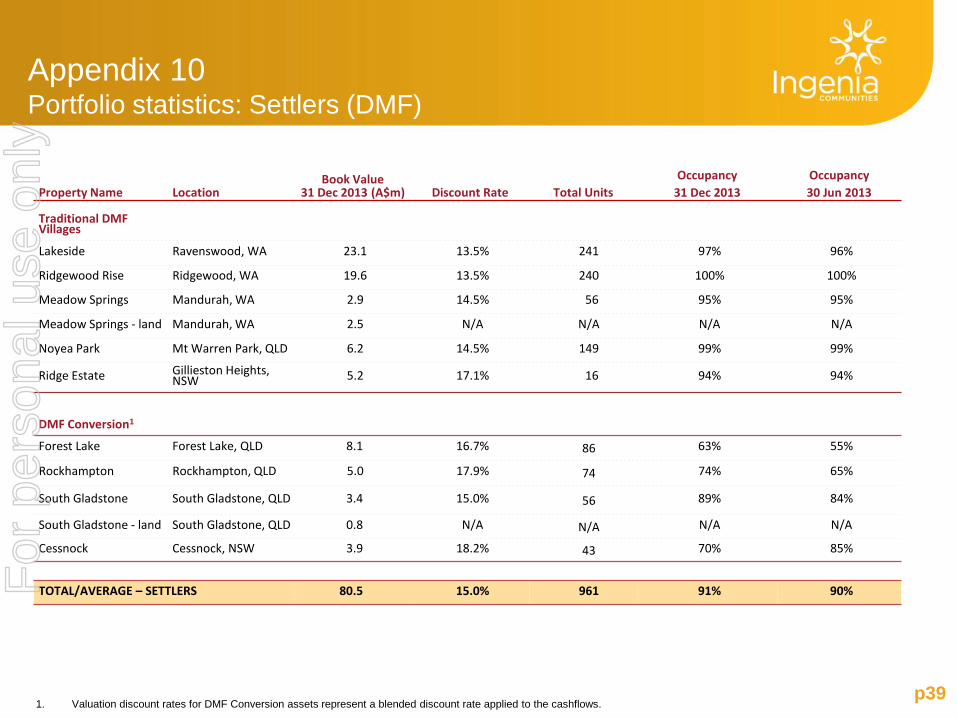
Property Name Location Book Value
31 Dec 2013 (A$m) Discount Rate Total Units Occupancy
31 Dec 2013 Occupancy 30 Jun 2013
Traditional DMF Villages
Lakeside Ravenswood, WA 23.1 13.5% 241 97% 96%
Ridgewood Rise Ridgewood, WA 19.6 13.5% 240 100% 100%
Meadow Springs Mandurah, WA 2.9 14.5% 56 95% 95%
Meadow Springs - land Mandurah, WA 2.5 N/A N/A N/A N/A
Noyea Park Mt Warren Park, QLD 6.2 14.5% 149 99% 99%
Ridge Estate Gillieston Heights, NSW 5.2 17.1% 16 94% 94%
DMF Conversion1
Forest Lake Forest Lake, QLD 8.1 16.7% 86 63% 55%
Rockhampton Rockhampton, QLD 5.0 17.9% 74 74% 65%
South Gladstone South Gladstone, QLD 3.4 15.0% 56 89% 84%
South Gladstone - land South Gladstone, QLD 0.8 N/A N/A N/A N/A
Cessnock Cessnock, NSW 3.9 18.2% 43 70% 85%
TOTAL/AVERAGE – SETTLERS 80.5 15.0% 961 91% 90%
Appendix 10 Portfolio statistics: Settlers (DMF)
1. Valuation discount rates for DMF Conversion assets represent a blended discount rate applied to the cashflows.
For
per
sona
l use
onl
y
p40
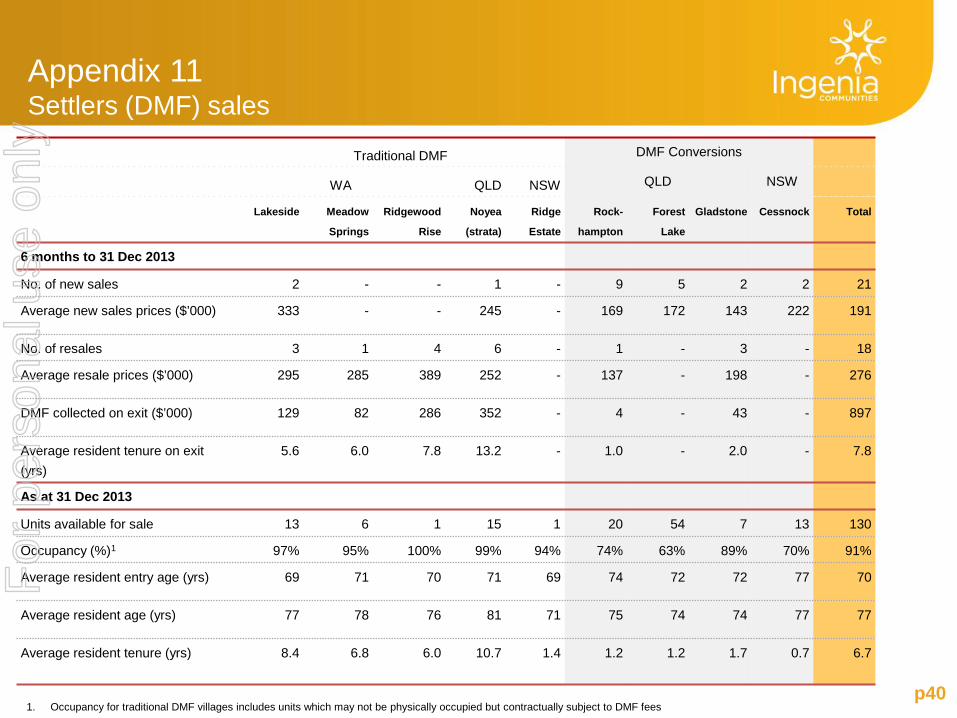
Traditional DMF DMF Conversions
WA QLD NSW QLD NSW
Lakeside Meadow
Springs
Ridgewood
Rise
Noyea
(strata)
Ridge
Estate
Rock-
hampton
Forest
Lake
Gladstone Cessnock Total
6 months to 31 Dec 2013
No. of new sales 2 - - 1 - 9 5 2 2 21
Average new sales prices ($’000) 333 - - 245 - 169 172 143 222 191
No. of resales 3 1 4 6 - 1 - 3 - 18
Average resale prices ($’000) 295 285 389 252 - 137 - 198 - 276
DMF collected on exit ($’000) 129 82 286 352 - 4 - 43 - 897
Average resident tenure on exit (yrs)
5.6 6.0 7.8 13.2 - 1.0 - 2.0 - 7.8
As at 31 Dec 2013
Units available for sale 13 6 1 15 1 20 54 7 13 130
Occupancy (%)1 97% 95% 100% 99% 94% 74% 63% 89% 70% 91%
Average resident entry age (yrs) 69 71 70 71 69 74 72 72 77 70
Average resident age (yrs) 77 78 76 81 71 75 74 74 77 77
Average resident tenure (yrs) 8.4 6.8 6.0 10.7 1.4 1.2 1.2 1.7 0.7 6.7
1. Occupancy for traditional DMF villages includes units which may not be physically occupied but contractually subject to DMF fees
Appendix 11 Settlers (DMF) sales
For
per
sona
l use
onl
y
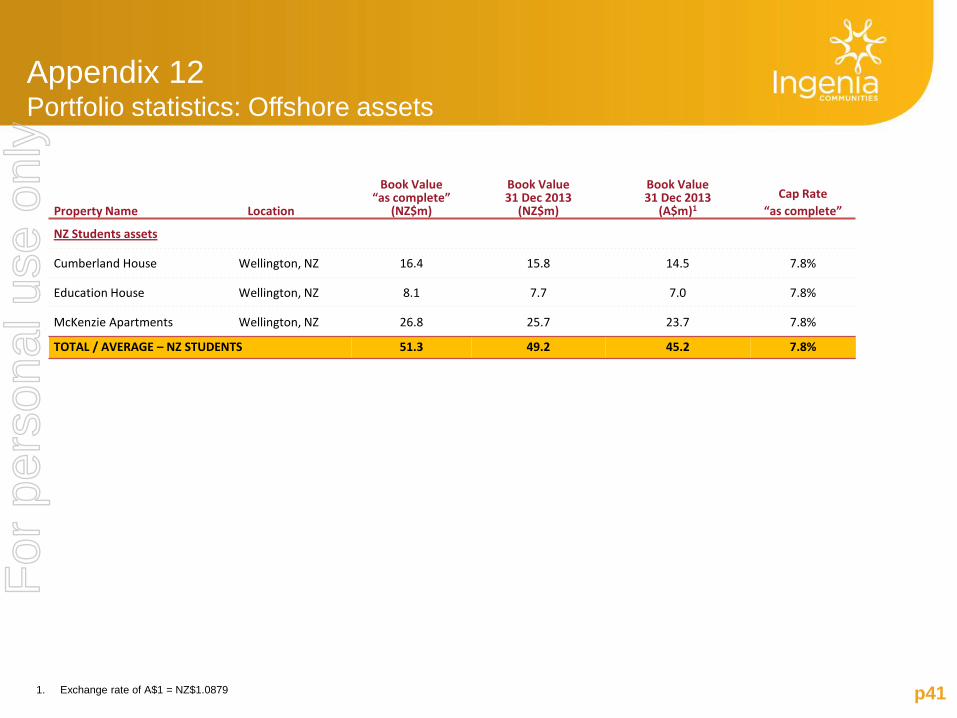
Appendix 12 Portfolio statistics: Offshore assets
p41 1. Exchange rate of A$1 = NZ$1.0879
Property Name
Location
Book Value “as complete”
(NZ$m)
Book Value 31 Dec 2013
(NZ$m)
Book Value 31 Dec 2013
(A$m)1
Cap Rate
“as complete”
NZ Students assets
Cumberland House Wellington, NZ 16.4 15.8 14.5 7.8%
Education House Wellington, NZ 8.1 7.7 7.0 7.8%
McKenzie Apartments Wellington, NZ 26.8 25.7 23.7 7.8%
TOTAL / AVERAGE – NZ STUDENTS 51.3 49.2 45.2 7.8%
For
per
sona
l use
onl
y
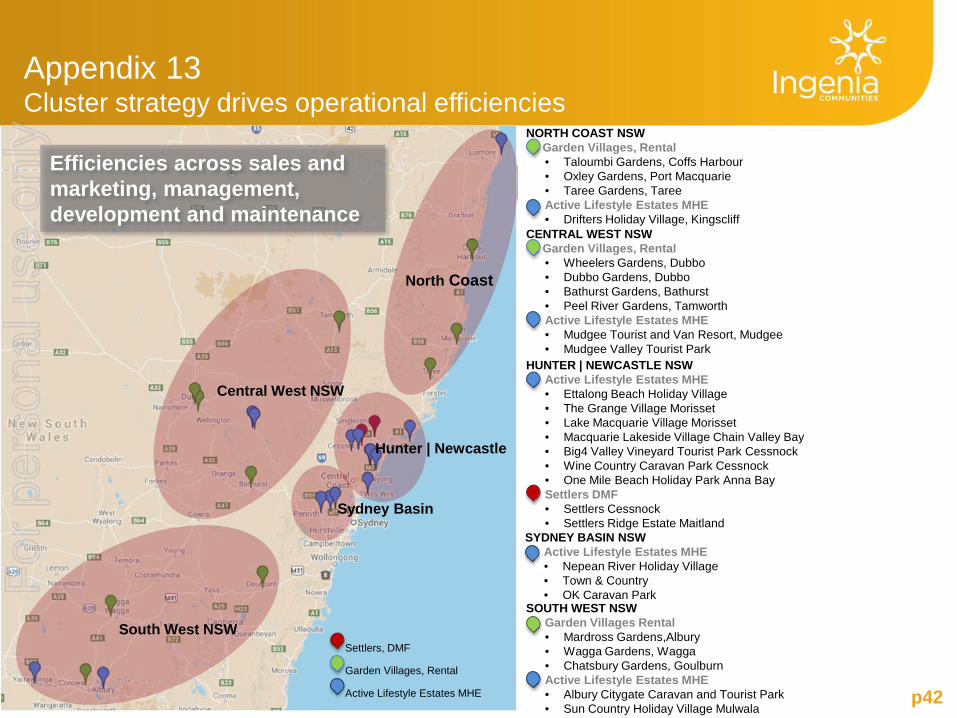
p42 Active Lifestyle Estates MHE
Garden Villages, Rental
Settlers, DMF
NORTH COAST NSW Garden Villages, Rental
• Taloumbi Gardens, Coffs Harbour • Oxley Gardens, Port Macquarie • Taree Gardens, Taree
Active Lifestyle Estates MHE • Drifters Holiday Village, Kingscliff
CENTRAL WEST NSW Garden Villages, Rental
• Wheelers Gardens, Dubbo • Dubbo Gardens, Dubbo • Bathurst Gardens, Bathurst • Peel River Gardens, Tamworth
Active Lifestyle Estates MHE • Mudgee Tourist and Van Resort, Mudgee • Mudgee Valley Tourist Park
HUNTER | NEWCASTLE NSW Active Lifestyle Estates MHE
• Ettalong Beach Holiday Village • The Grange Village Morisset • Lake Macquarie Village Morisset • Macquarie Lakeside Village Chain Valley Bay • Big4 Valley Vineyard Tourist Park Cessnock • Wine Country Caravan Park Cessnock • One Mile Beach Holiday Park Anna Bay Settlers DMF • Settlers Cessnock • Settlers Ridge Estate Maitland
SOUTH WEST NSW • Garden Villages Rental
• Mardross Gardens,Albury • Wagga Gardens, Wagga • Chatsbury Gardens, Goulburn
Active Lifestyle Estates MHE • Albury Citygate Caravan and Tourist Park • Sun Country Holiday Village Mulwala
Efficiencies across sales and marketing, management, development and maintenance
North Coast
Hunter | Newcastle
Sydney Basin
South West NSW
Central West NSW
SYDNEY BASIN NSW Active Lifestyle Estates MHE
• Nepean River Holiday Village • Town & Country • OK Caravan Park
Appendix 13 Cluster strategy drives operational efficiencies
For
per
sona
l use
onl
y
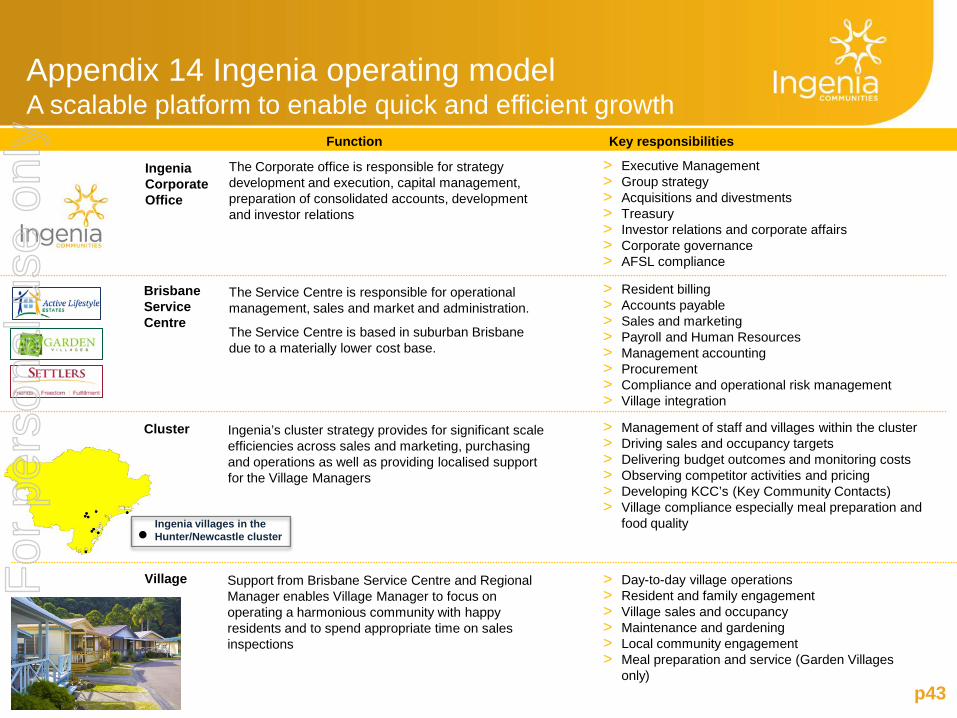
Appendix 14 Ingenia operating model A scalable platform to enable quick and efficient growth
p43
The Corporate office is responsible for strategy development and execution, capital management, preparation of consolidated accounts, development and investor relations
The Service Centre is responsible for operational management, sales and market and administration.
The Service Centre is based in suburban Brisbane due to a materially lower cost base.
Ingenia’s cluster strategy provides for significant scale efficiencies across sales and marketing, purchasing and operations as well as providing localised support for the Village Managers
Support from Brisbane Service Centre and Regional Manager enables Village Manager to focus on operating a harmonious community with happy residents and to spend appropriate time on sales inspections
> Management of staff and villages within the cluster > Driving sales and occupancy targets > Delivering budget outcomes and monitoring costs > Observing competitor activities and pricing > Developing KCC’s (Key Community Contacts) > Village compliance especially meal preparation and
food quality
> Day-to-day village operations > Resident and family engagement > Village sales and occupancy > Maintenance and gardening > Local community engagement > Meal preparation and service (Garden Villages
only)
> Resident billing > Accounts payable > Sales and marketing > Payroll and Human Resources > Management accounting > Procurement > Compliance and operational risk management > Village integration
> Executive Management > Group strategy > Acquisitions and divestments > Treasury > Investor relations and corporate affairs > Corporate governance > AFSL compliance
Function Key responsibilities
Ingenia Corporate Office
Brisbane Service Centre
Cluster
Village
Ingenia villages in the Hunter/Newcastle cluster
For
per
sona
l use
onl
y
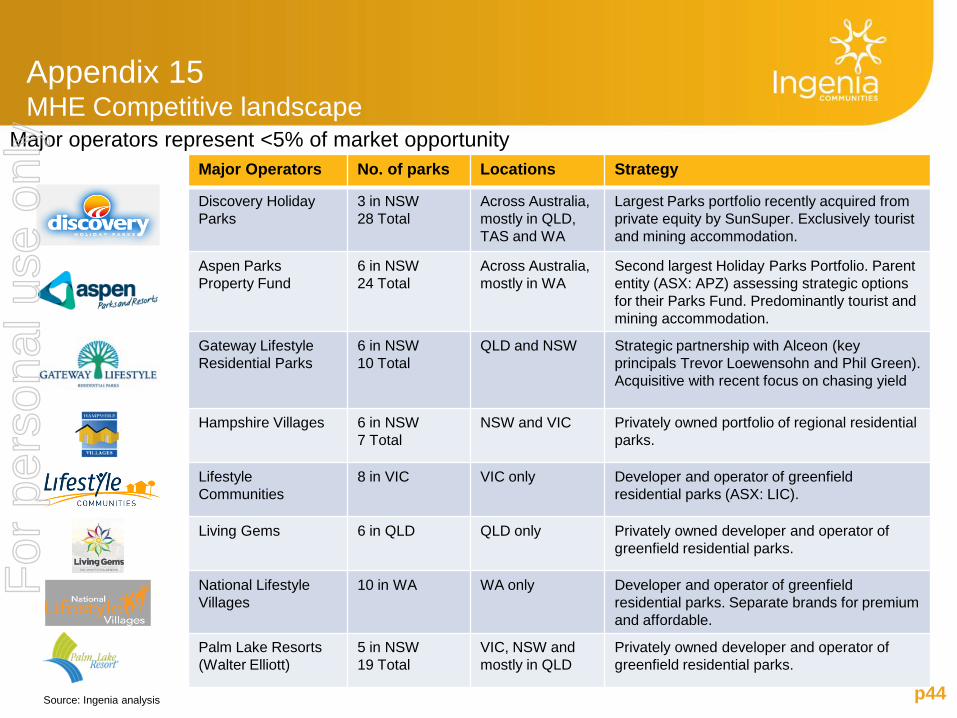
Appendix 15 MHE Competitive landscape
p44
Major Operators No. of parks Locations Strategy
Discovery Holiday Parks
3 in NSW 28 Total
Across Australia, mostly in QLD, TAS and WA
Largest Parks portfolio recently acquired from private equity by SunSuper. Exclusively tourist and mining accommodation.
Aspen Parks Property Fund
6 in NSW 24 Total
Across Australia, mostly in WA
Second largest Holiday Parks Portfolio. Parent entity (ASX: APZ) assessing strategic options for their Parks Fund. Predominantly tourist and mining accommodation.
Gateway Lifestyle Residential Parks
6 in NSW 10 Total
QLD and NSW Strategic partnership with Alceon (key principals Trevor Loewensohn and Phil Green). Acquisitive with recent focus on chasing yield
Hampshire Villages 6 in NSW 7 Total
NSW and VIC Privately owned portfolio of regional residential parks.
Lifestyle Communities
8 in VIC VIC only Developer and operator of greenfield residential parks (ASX: LIC).
Living Gems 6 in QLD QLD only Privately owned developer and operator of greenfield residential parks.
National Lifestyle Villages
10 in WA WA only Developer and operator of greenfield residential parks. Separate brands for premium and affordable.
Palm Lake Resorts (Walter Elliott)
5 in NSW 19 Total
VIC, NSW and mostly in QLD
Privately owned developer and operator of greenfield residential parks.
Source: Ingenia analysis
Major operators represent <5% of market opportunity
For
per
sona
l use
onl
y
Disclaimer
p45
This presentation was prepared by Ingenia Communities Holdings Limited (ACN 154 444 925) and Ingenia Communities RE Limited (ACN 154 565 990) as responsible entity for Ingenia Communities Fund (ARSN 107 459 576) and Ingenia Communities Management Trust (ARSN 122 928 410) (together Ingenia Communities Group , INA or the Group). Information contained in this presentation is current as at 25 February 2014. This presentation is provided for information purposes only and has been prepared without taking account of any particular reader's financial situation, objectives or needs. Nothing contained in this presentation constitutes investment, legal, tax or other advice. Accordingly, readers should, before acting on any information in this presentation, consider its appropriateness, having regard to their objectives, financial situation and needs, and seek the assistance of their financial or other licensed professional adviser before making any investment decision. This presentation does not constitute an offer, invitation, solicitation or recommendation with respect to the subscription for, purchase or sale of any security, nor does it form the basis of any contract or commitment. Except as required by law, no representation or warranty, express or implied, is made as to the fairness, accuracy or completeness of the information, opinions and conclusions, or as to the reasonableness of any assumption, contained in this presentation. By reading this presentation and to the extent permitted by law, the reader releases each entity in the Group and its affiliates, and any of their respective directors, officers, employees, representatives or advisers from any liability (including, without limitation, in respect of direct, indirect or consequential loss or damage or loss or damage arising by negligence) arising in relation to any reader relying on anything contained in or omitted from this presentation. The forward looking statements included in this presentation involve subjective judgment and analysis and are subject to significant uncertainties, risks and contingencies, many of which are outside the control of, and are unknown to, the Group. In particular, they speak only as of the date of these materials, they assume the success of the Group’s business strategies, and they are subject to significant regulatory, business, competitive and economic uncertainties and risks. Actual future events may vary materially from forward looking statements and the assumptions on which those statements are based. Given these uncertainties, readers are cautioned not to place undue reliance on such forward looking statements. The Group, or persons associated with it, may have an interest in the securities mentioned in this presentation, and may earn fees as a result of transactions described in this presentation or transactions in securities in INA. This document is not an offer to sell or a solicitation of an offer to subscribe or purchase or a recommendation of any securities.
For
per
sona
l use
onl
y