Embed Size (px)
Citation preview
ANNUAL REPORT 2017
ii La Trobe University
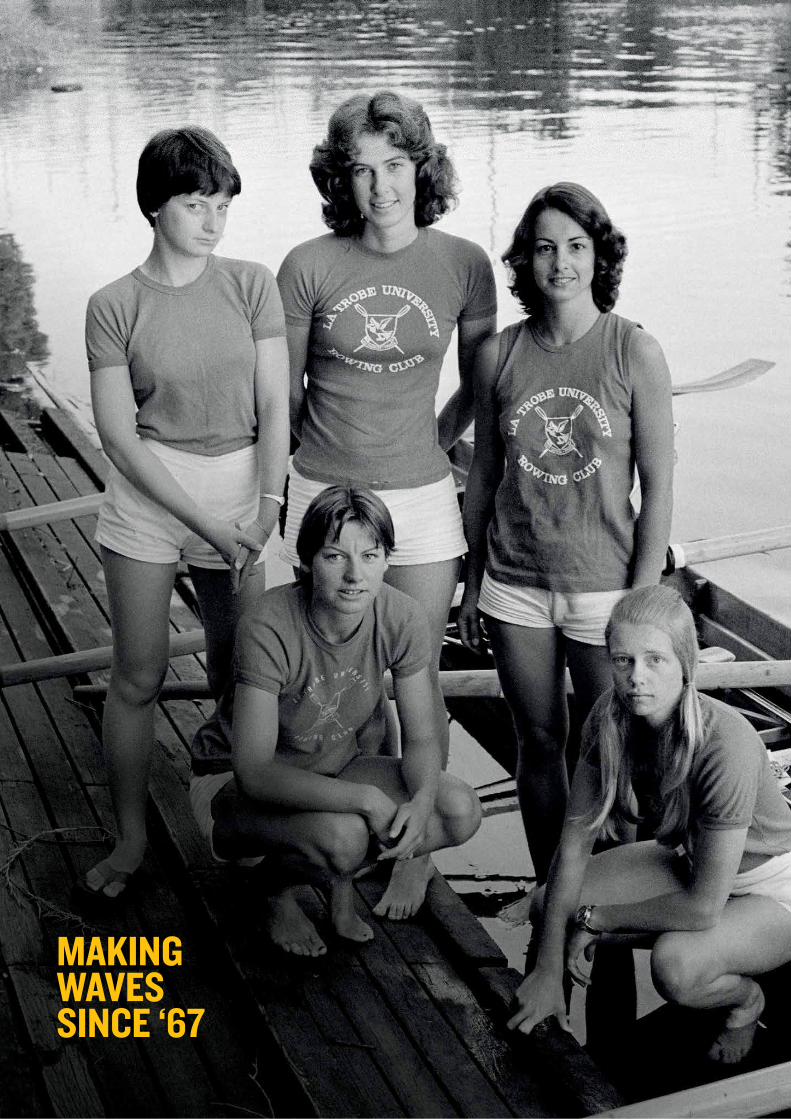
MAKING WAVES SINCE ‘67
Annual Report 2017 1
Contents
2 Letters of transmittal
3 Message from the Chancellor
3 Message from the Vice-Chancellor
4 La Trobe at a glance
5 50 years of La Trobe
6 2017 Year in review
8 Organisational chart
9 University Council Membership
10 Operating framework
10 Governance and accountability
10 Relevant minister
10 Objectives, functions, powers and duties
11 La Trobe’s code of conduct
12 Human resources
13 Key statistics
14 Risk management
14 University’s risk management strategy
14 Risk management office and approach
14 Insurance Office
15 Health and Safety Statement
15 Details of indemnity for members of Council and senior officers
16 Sustainability reporting
19 Risk management statement
20 External reporting obligations
20 Freedom of information
20 Information privacy
20 Whistleblowers, grievances and complaints
20 National competition policy
20 Conformity with the Building Act 1993
21 Protected Disclosure Act 2012
21 Key capital investments
22 La Trobe University consultants 2017
22 Statement on compulsory non-academic fees, subscriptions and charges
22 Compulsory non-academic fees
23 Further Information
24 Financial review
28 University disclosure index table
32 Financial statements
2 La Trobe University
Letters of transmittal
Mailing address
La Trobe University Victoria 3086 Australia
T +61 3 9479 5268 F +61 3 9479 1045 E [email protected]
latrobe.edu.au
OFFICE OF THE CHANCELLOR
MELBOURNE CAMPUSES Bundoora Collins Street CBD Franklin Street CBD
REGIONAL CAMPUSES
ABN 64 804 735 113 CRICOS Provider 00115M
21 March 2018
Minister for Training and Skills 2 Treasury Place East Melbourne VIC 3002
Bendigo Albury-Wondonga Mildura Shepparton
Dear Minister
In accordance with the requirements of regulations under the Financial Management Act 1994, I am pleased to submit for your information and presentation to Parliament the La Trobe University Annual Report for the year ending 31 December 2017.
Yours sincerely
Professor Richard G Larkins AO Chancellor
Annual Report 2017 3
Messages
Chancellor’s message Vice-Chancellor’s message
It was with great pride that I took up the role of Chancellor of La Trobe University in February 2017, 50 years after the first students commenced at this great institution. My formal installation by the Governor of Victoria was at the Bendigo Campus in April. I was particularly pleased that this ceremony occurred at a regional campus of La Trobe. One of the particular strengths of the University is its network of regional campuses with their close interactions with the local communities and industries.
The Council has been superbly led over the last six years by my predecessor, Emeritus Professor Adrienne Clarke AC, who was untiring in her efforts on behalf of the University. All at La Trobe University owe her a great debt and the upward trajectory of the University is very much due to her role together with that of the rest of the Council in supporting the senior leadership of the University and its dedicated staff.
Professor Marilyn Anderson AO also completed her second term on Council as the Ministerial appointee. Marilyn has been a great contributor emphasising the importance of research and demonstrating by her own achievements how important is the role of women in science. We welcomed the appointment of Christine Christian, Adam Furphy, Margaret Burdeu, Michael Gay and Edwina Cornish AO to Council and the elected staff representative Jillian Murray and the elected student representative Kevin Kapeke. Peter McDonald has been reappointed to Council for a further three year term from the end of 2017 and will continue as Chair of the Finance and Resources Committee.
Philip Moors AO, Andrew Eddy and Deborah Radford have all provided great support to me as Deputy Chancellors.
Despite its increased size, the Council has continued to function collegially and effectively. It has overseen the management of the financial and compliance responsibilities of the University, interacted with senior management in the preparation of the new strategic plan, in the development of the new sports park which is the first stage of the redevelopment of the Bundoora Campus, the opening of new city facilities and plans for the regional campuses. The Council has also taken great interest in steps to improve the student experience, research performance, the activities of the Academic Board, the development of the new enterprise agreement and philanthropic fundraising.
The events celebrating the 50th anniversary of the first student intake have been inspirational. This milestone provided a great opportunity for the University community to take pride in what has been achieved and to look ahead to the changing requirements and the challenges and opportunities presented by the digital revolution.
Council has appreciated the positive interactions with the Vice-Chancellor and his leadership team and thank all the staff and students for making La Trobe University an outstanding contributor to knowledge, social justice, the community and the planet.
Professor Richard Larkins AO Chancellor La Trobe University
2017 will be remembered for the way in which La Trobe University’s students, staff, alumni, friends and supporters came together to celebrate the University’s 50th anniversary. Many successful events were held throughout the year, and several new initiatives were launched to coincide with the anniversary, including the establishment of overseas and parliamentary alumni chapters. The University also launched its first ever fundraising campaign, Make the Difference, to raise funds for scholarships, research and infrastructure renewal, and exceptionally generous donors have already contributed very significant amounts to the campaign.
During our milestone year La Trobe University was ranked in the top 400 universities in the world according to the three most prestigious international rankings: the Academic Ranking of World Universities (ARWU), Times Higher Education and QS university rankings. This excellent result reflects not only the hard work of staff across the University over the last several years, but also the foundation built by many La Trobe research and teaching scholars over the last half century.
We made considerable progress towards our goals during 2017, a year in which we grew our industry engagement and partnership activities, and saw the first group of entrepreneurial ideas advance through the La Trobe Accelerator Program. We also launched one of Australia’s leading employability programs, Career Ready, which is helping our students develop the skills needed in the modern workplace, and we developed new teaching programs to prepare students for careers in emerging fields such as cyber security and data analytics.
In 2017 we also performed very well in research funding programs administered by the National Health and Medical Research Council (NHMRC), and were awarded the largest amount ever received by the University from the NHMRC, a testament to our strength in health-related disciplines. We continued to implement our significant capital investment and renewal program across all of our campuses over the last twelve months, and some of the nation’s leading researchers and higher education managers joined La Trobe.
These activities have given the University a solid foundation to continue its renewal as we look to 2018 and beyond. Our vision for the future is set out in the new Strategic Plan that we released this year, which builds on, and reinforces, La Trobe’s historic mission of combining inclusive teaching with excellent research. The Plan responds to the growing challenges facing the university sector arising from digital technologies and new expectations of the role universities should play in generating economic growth in their communities, and aims to ensure that La Trobe flourishes in this era of ceaseless change.
I thank staff for their hard work during the year, and hope that they will share in the successes that come from our shared commitment. The progress we made this year was only possible because of the dedication of our staff, who worked tirelessly to ensure that La Trobe remains relevant to, and is valued by, its communities. We have many significant achievements of which to be proud, and the following pages contain information about many highlights of a very productive year.
Professor John Dewar Vice-Chancellor La Trobe University

4 La Trobe University
La Trobe at a glance
Vision and aspirationSince its foundation in 1964, La Trobe University has sought to be different. We were created to broaden participation in higher education among communities in Melbourne’s north and regional Victoria.
We have joined this mission with that of pursuing world class research that makes a difference to some of the world’s most pressing problems. We are one of Australia’s most successful universities in pursuing these multiple missions. In short, La Trobe is a place where social inclusion and globally recognised excellence come together for the benefit of our students and our communities.
Our valuesOur early reputation as a radical and challenging institution continues to influence the way we enrich the experience of our students and engage with our partners and communities. We were founded half a century ago to broaden participation in higher education in Melbourne’s north and, later, in regional Victoria. We have succeeded for many thousands of students who would otherwise have been excluded from the opportunities provided by a university education. We continue to support access, diversity and inclusivity while undertaking world-class research that aims to address the global forces shaping our world and make a difference to some of the world’s most pressing problems.
This approach is based on our values of:
• inclusiveness, diversity, equity and social justice
• pursuing excellence and sustainability in everything we do
• championing our local communities in Melbourne’s north and regional Victoria
• being willing to innovate and disrupt the traditional way of doing things.
Our missionAdvancing knowledge and learning to shape the future of our students and communities.
Our visionTo promote positive change and address the major issues of our time through being connected, inclusive and excellent.
Our cultural qualities Our strategy development process has clearly articulated the importance of our people – our staff, students and partners – and our culture, which together make us:
Connected Connecting the students and communities we serve to the world outside
Innovative Tackling the big issues of our time to transform the lives of our students and society
Accountable Striving for excellence in everything we do, holding each other to account, and working to the highest standards
Care We care about what we do and why we do it, because we believe in the power of education and research to transform lives and global society
Quick facts• Established in 1964
• First enrolments in 1967: 558
• Student Load (EFTSL) in 2017 (provisional) 29,601 (full time equivalent)
• Staff (full time equivalent) in 2017 (provisional) 3,259.7
• More than 200,000 Alumni
• Campuses in Melbourne (Bundoora) and (CBD), Bendigo, Albury-Wodonga, Mildura, Shepparton and Sydney
• Colleges. Science, Health and Engineering (SHE) and Arts, Social Sciences and Commerce (ASSC)
AcknowledgementLa Trobe University proudly acknowledges the traditional custodians of the lands on which its campuses are located in Victoria.
We recognise that Indigenous Australians have an ongoing connection to the land and the University values their unique contribution both to the University and the wider Australian society.
Annual Report 2017 5
50 years of La Trobe
For five decades La Trobe University has been transforming people and societies – delivering on our goal to embrace excellence and inclusivity.
This year, La Trobe turned 50 and we celebrated the milestone throughout a successful year.
In October, Distinguished Professor Jenny Graves was awarded the prestigious $250,000 Prime Minister’s Prize for Science, the first La Trobe academic to win the award as well as the first female to win in her own right. The geneticist was awarded for five decades of work mapping the genetics of Australian wildlife.
La Trobe continued to improve its world ranking, recording its best ever result in the respected Academic Ranking of World Universities (ARWU). The university is now rated at 301 in the world, a leap of more than 200 places in just two years – to be Australia’s most improved university. The record ARWU result places La Trobe in the top 1.4 per cent of universities globally.
The university also cemented its position in the top 400 of all three major world university rankings. The latest QS ranking has the university at 360 in the world. The 2018 Times Higher Education ranking places it at 392 in the world.
The 2018 Times Higher Education ranking also placed La Trobe’s international outlook at 144 in the world while its innovation and links with industry came in with a ranking of 201.
The Times Higher Education Rankings recognised the breadth of our strengths. Arts and humanities subjects were placed in the top 200 in the world – the top one per cent globally. Life Sciences were ranked in the 176-200 category and Computer science research and teaching was placed in the 251-300 category.
La Trobe’s teaching quality and focus on making graduates career ready was reflected in the latest Shanghai Ranking’s Global Ranking of Academic Subjects. The rankings placed Hospitality and Tourism in the top 75 in the world.
La Trobe is also the largest provider of university education in regional Victoria, with about 6,500 student enrolments at our campuses in Bendigo, Albury-Wodonga, Mildura and Shepparton. Most students stay and work in their communities following graduation.
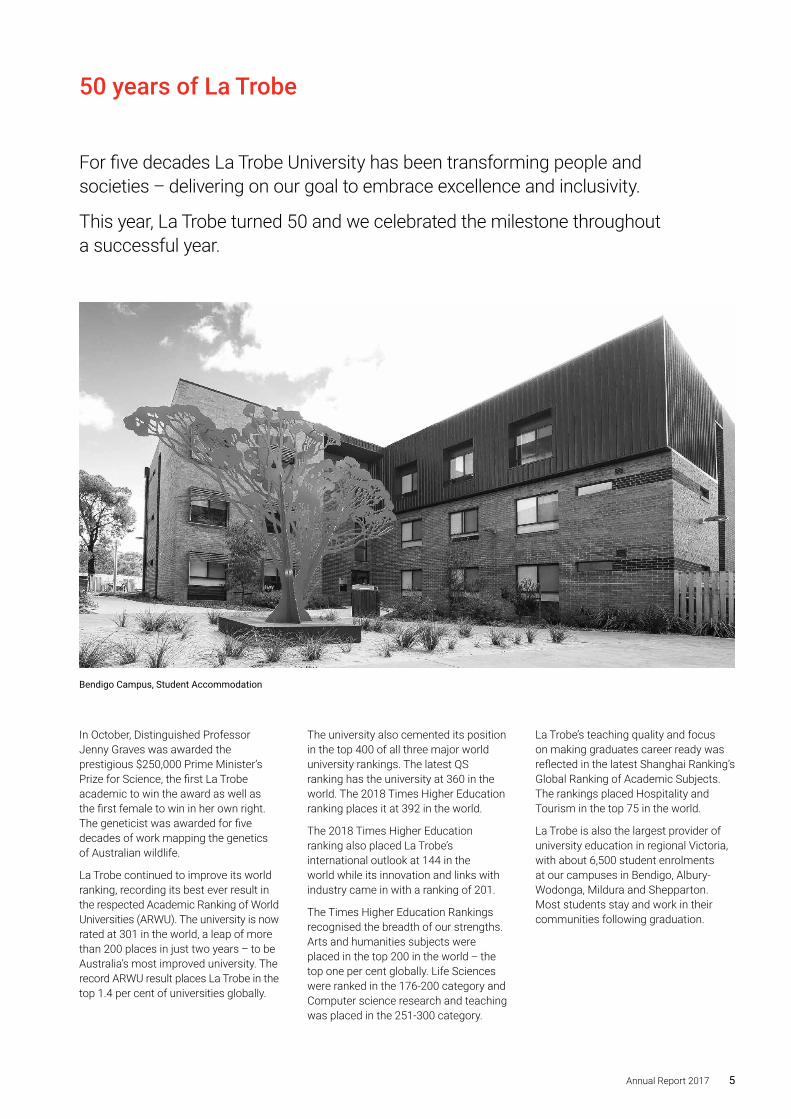
Bendigo Campus, Student Accommodation
6 La Trobe University
2017 Year in review
Outstanding student experience• La Trobe has been active in developing
innovative courses offered in flexible ways to meet student needs. The University is now offering twice as many online courses after the launch of its all new La Trobe Online website.
• Two international students from La Trobe won three major awards at the Victorian Education / Study Melbourne annual awards, which acknowledge and focus on the invaluable contribution international students make to the state, educational institutions and local communities.
• A group of La Trobe students used low cost technology to build a real time bus application for the “Glider’ Bus service at the Bundoora campus, showcasing the University’s commitment to involving students in the future direction of the University.
• The My La Trobe App was launched in 2017 and major improvements were made to the University’s website with vastly improved course information and search capacity.
• The Respect at La Trobe Program was launched to further develop a respectful community culture at La Trobe. The ‘Speak-up’ service was launched to provide coordinated support to students in relation to intimidation, harassment, discrimination, all forms of violence (including sexual and physical assault), and other forms of unacceptable behaviour. Counselling Services waiting times for students to secure an appointment have been improving and are now below the sector average.
Student employability• The 2017 launch of the La Trobe
Career Ready Advantage provides students with a comprehensive and integrated program, including online skills related learning resources that will ensure students can make the most of internships, work experience and volunteering opportunities.
• More than 240 La Trobe students travelled to nine Asian countries for up to three months on placements, exchanges and study-tours under the Australian Government’s New Colombo plan.
• The University in partnership with Cisco, Optus, the specialist science and mathematics centre at Quantum Victoria, the Science Teachers Association of Victoria and Life Journey / Day of STEM launched the inaugural Cyber games for local high school students providing an opportunity to work with industry cyber security software.
• The University’s professional service divisions continued to provide work-place learning and internship opportunities for students from many disciplines including law, IT, human resource management, marketing and communications, and student services.
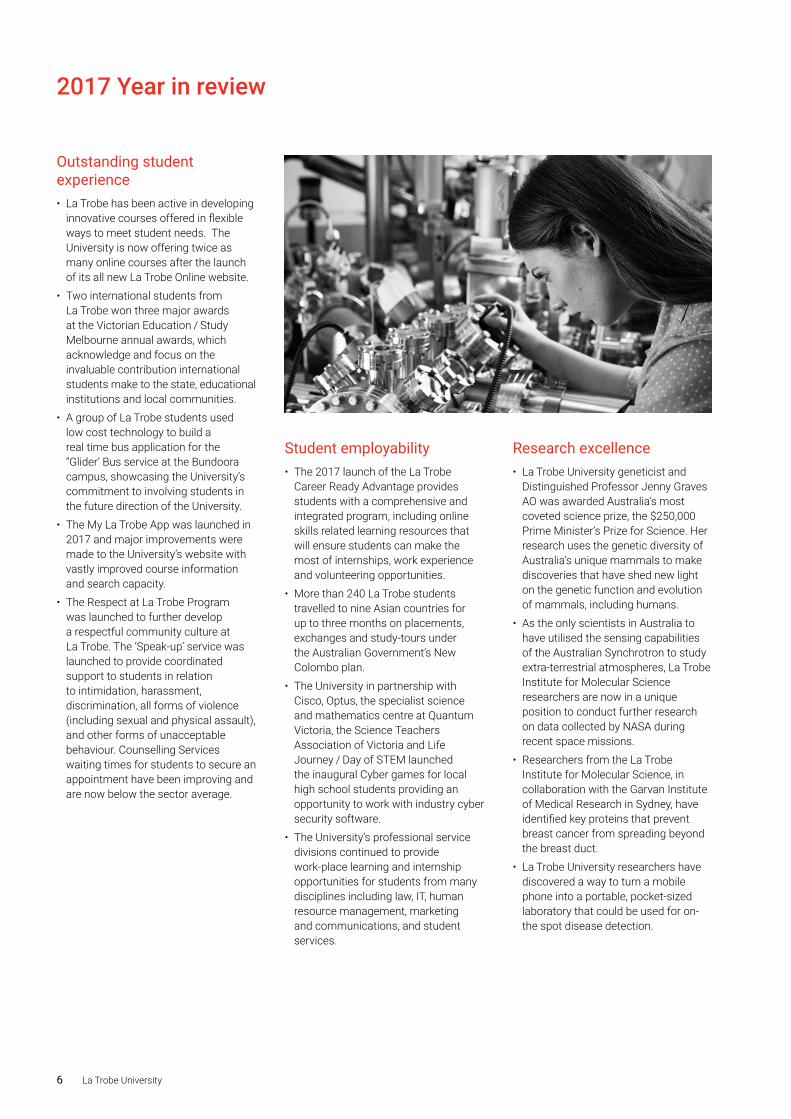
Research excellence• La Trobe University geneticist and
Distinguished Professor Jenny Graves AO was awarded Australia’s most coveted science prize, the $250,000 Prime Minister’s Prize for Science. Her research uses the genetic diversity of Australia’s unique mammals to make discoveries that have shed new light on the genetic function and evolution of mammals, including humans.
• As the only scientists in Australia to have utilised the sensing capabilities of the Australian Synchrotron to study extra-terrestrial atmospheres, La Trobe Institute for Molecular Science researchers are now in a unique position to conduct further research on data collected by NASA during recent space missions.
• Researchers from the La Trobe Institute for Molecular Science, in collaboration with the Garvan Institute of Medical Research in Sydney, have identified key proteins that prevent breast cancer from spreading beyond the breast duct.
• La Trobe University researchers have discovered a way to turn a mobile phone into a portable, pocket-sized laboratory that could be used for on-the spot disease detection.
Annual Report 2017 7
Unrivalled partner of choice• In the first project of its kind in
Victoria, an autonomous shuttle bus is being trialled at the Bundoora campus. Autonobus is a collaboration between VicRoads, founding partner Keolis Downer, La Trobe University, HMI, RACV and ARRB and provides an exciting opportunity to look into the future of transport and how autonomous vehicles can be used to meet passenger demand and complement existing transport options.
• At a time when cybercrime is one of the world’s most critical issues, Optus Business has supported the University’s new Bachelor of Cybersecurity with three scholarships for students.
• The University committed to the establishment of the Bendigo Tech School, in partnership with State Government and a range of Bendigo schools. The Tech School will increase aspirations and achievements of Year 9 to 12 students in STEM subjects. The school will form one floor of the Bendigo Campus’ new engineering building, set for completion in 2018.
• La Trobe University and Ivanhoe Grammar have entered into an Australian first partnership to establish a Year 9 campus on the Bundoora site to provide students with a university-school experience.
• The University and the Australian Ballet have joined forces to examine the athletic capacity of the country’s leading ballet dancers, helping inform prevention and rehabilitation techniques for musculoskeletal injuries.
• La Trobe was again the site for the annual Olivia Newton-John Wellness Walk & Research run with a significant increase in the number of community members participating in the event in Septembe.
• La Trobe University’s partnerships with leading sporting organisations help set it apart as the University of Choice for Sport in Australia. La Trobe Sport facilitates over 50 placements and 10,000 hours of work experience with its four major partners, The AFL Players’ Association, Carlton Football Club, Melbourne City Football Club and Melbourne Rebels.
One university, many opportunities • A new $10 million Sydney Campus
was officially opened in collaboration with ASX listed global education provider Navitas Ltd.
• The University welcomed the call by Deputy Leader of the Nationals Stephanie Ryan, for Shepparton to take the lead on the establishment of a new Murray Darling Medical School.
• Researchers from the Bendigo Campus are investigating the role caffeine and estrogen may one day play in the battle against weight gain.
• La Trobe’s living with Disability Research Centre has recently finalised a pilot study in Bendigo to track the experiences of people with intellectual disabilities who ventured into the community with and without a dog, with findings showing that those with dogs experienced more positive encounters.
• A group of local businesses have partnered with the University to support students studying Agribusiness at the Mildura Campus. Successful recipients of the scholarships will a scholarship for every of their degree and will be guaranteed a work placement opportunity within one of the donor organisations.
• Researchers from La Trobe’s Wodonga-based John Richards Initiative have been awarded Department of Health funding to implement their Virtual Dementia Friendly Rural Community (VERILY) project.The project will run in rural communities in Victoria, New South Wales and South Australia and will involve carers, volunteers and aged care staff recruited from each community.
Operational excellence• The University launched a Women’s
Academic Promotions Support program that directly addresses gender biases that have been identified in data collected as part of the University’s involvement in the Athena Swan accreditation program.
• A strengthened focus on Customer Service has seen the development of a Customer Service Charter, introduction of Student Mystery Shopper Program to identify and implement service improvements, and the wider adoption of the Net Promoter Score as a means of tracking and monitoring progress. Business process mapping and improvement activities were commenced across all service divisions.
• Ask La Trobe Services has been a focus for ongoing development with the introduction of virtual hold technology, expert roving concierge roles and call recording. These and other changes have led to a greater percentage of first-point resolutions and improvements in the connection between Ask La Trobe and academic advisors.
• Major infrastructure change was implemented to University’s firewalls to continue improvement in Cyber Security
• Campus Lighting Project has led to improved lighting around the University’s campuses and investment in a new control room has improved the University’s ability to provide a staff working and learning environment and improve the response to on-campus incidents.
• Enhancements to the MyGrants reporting tool were implemented to provide improved information to researchers managing research grants.
• The Course Management Reform Program commenced to renew the business processes and systems relating to course/subject creation and approval, administration and maintenance, and communication.
• Revised procedures were implemented in scholarship establishment and management, with a new website now promoting donor scholarships.
• Various refurbishments have contributed to improvements for both staff and students including additional teaching spaces.
8 La Trobe University
Organisational chart
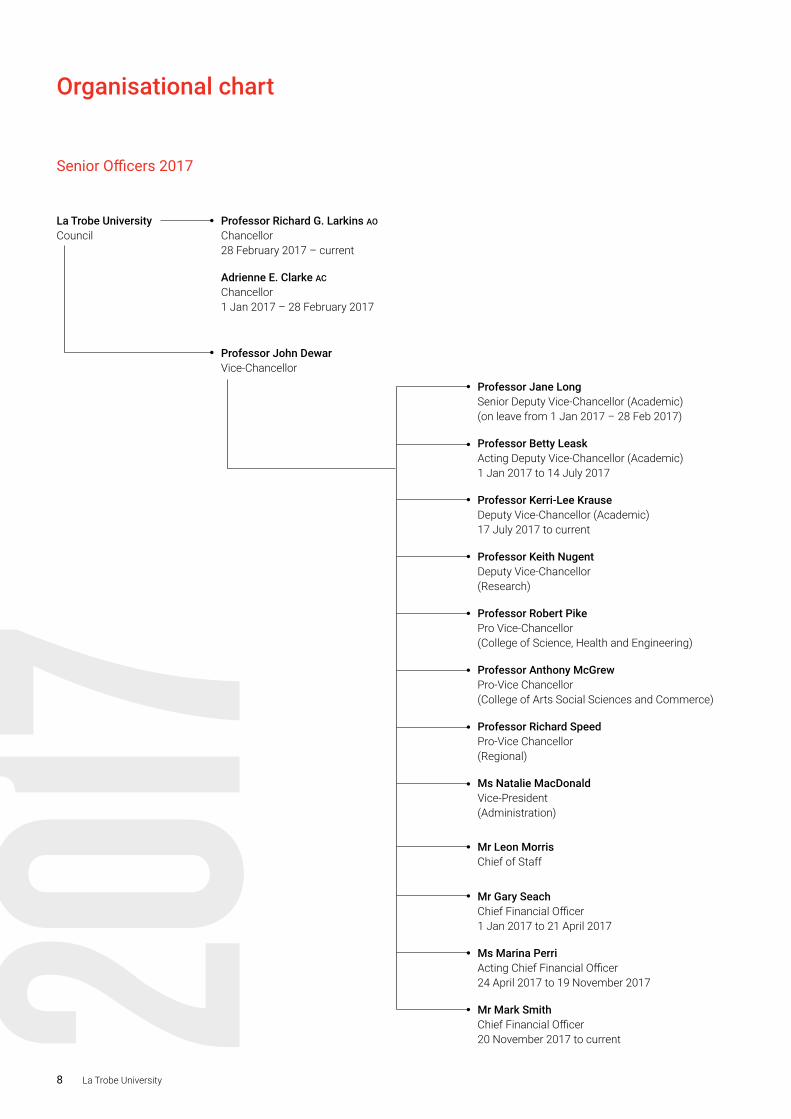
Senior Officers 2017
2017
La Trobe University Council
Adrienne E. Clarke AC Chancellor 1 Jan 2017 – 28 February 2017
Professor Richard G. Larkins AO Chancellor 28 February 2017 – current
Professor John Dewar Vice-Chancellor
Professor Jane Long Senior Deputy Vice-Chancellor (Academic) (on leave from 1 Jan 2017 – 28 Feb 2017)
Professor Betty Leask Acting Deputy Vice-Chancellor (Academic) 1 Jan 2017 to 14 July 2017
Mr Leon Morris Chief of Staff
Professor Robert Pike Pro Vice-Chancellor (College of Science, Health and Engineering)
Professor Anthony McGrew Pro-Vice Chancellor (College of Arts Social Sciences and Commerce)
Professor Richard Speed Pro-Vice Chancellor (Regional)
Professor Kerri-Lee Krause Deputy Vice-Chancellor (Academic) 17 July 2017 to current
Professor Keith Nugent Deputy Vice-Chancellor (Research)
Ms Natalie MacDonald Vice-President (Administration)
Mr Gary Seach Chief Financial Officer 1 Jan 2017 to 21 April 2017
Ms Marina Perri Acting Chief Financial Officer 24 April 2017 to 19 November 2017
Mr Mark Smith Chief Financial Officer 20 November 2017 to current
Annual Report 2017 9
University Council Membership
Professor Richard G Larkins AOChancellor Governor-in-Council appointment (concluded 27/2/2017) LLD Melb (Hon), LLD Monash (Hon), PhD (London), MD Melbourne, MB BS Melbourne, RACP, FRCP, FRCPI, FAMMal, FAMSing
Formerly Vice-Chancellor of Monash University and Dean of the Faculty of Medicine, Dentistry and Health Sciences, University of Melbourne.
Appointed to Council: 14/10/2014 Appointed Chancellor: 28/2/2017 Meetings attended in 2017: ten (10)
Adrienne E Clarke ACChancellor (Part year –term concluded 28/02/2017) BSc(Hons), PhD Melbourne
Distinguished career in education, research and innovation and public service; Laureate Professor, School of Botany (University of Melbourne); Board Member – The Nature Conservancy; Board Member – Victorian Curriculum and Assessment Authority.
Appointed to Council: 24/08/2010 Reappointed: 26/02/2014 Meetings attended in 2017: one (1)
Professor John DewarEx officio (Vice Chancellor) BCL, MA Oxon, PhD Griffith
Commenced as Vice-Chancellor in January 2012.
Meetings attended in 2017: eight (8)
Professor Christine BigbyEx officio (Chair, Academic Board) BA(Hons) MSW, PhD, GAICD
Meetings attended in 2017: nine (9)
Mr Peter McDonaldCouncil appointment BA, MPA, FCPA, GAICD
Director, Northern Health.
Appointed to Council: 10/09/2012 Reappointed: 01/01/2018 Meetings attended in 2017: ten (10)
Mr Adam Furphy Council appointment (part year) BE-Mech RMIT
Managing Director of J. Furphy & Sons and involved in a number of regional community organisations with a focus on tertiary and higher education.
Appointed to Council: 13/02/2017 Meetings attended in 2017: nine (9)
Ms Christine ChristianCouncil appointment (part year) BA Melbourne, Member Australian Institute of Company Directors
Experience in financial services, private equity, investment, credit risk management and digital media and publishing.
Appointed to Council: 13/02/2017 Meetings attended in 2017: seven (7)
Dr Philip Moors AOCouncil appointment BSc (Hons) Australian National University, PhD University of Aberdeen, Scotland
Previous roles include Director and Chief Executive of Royal Botanic Gardens Melbourne.
Appointed to Council: 01/03/2013 Reappointed: 01/01/2016 Meetings attended in 2017: ten (10)
Professor Edwina Cornish AOCouncil appointment (part year) BSc (Hons) Biochemistry, PhD Melbourne
Currently a Director of CSIRO Board, member of the Australian Research Council Advisory Council.
Appointed to Council: 4/07/2017 Meetings attended in 2017: five (5)
Professor Marilyn Anderson AOMinisterial appointment (part year – term concluded 31/3/2017) BSc Hons Melb, PhD in Biochemistry La Trobe
Founding Scientist and Chief Science Office Hexima Ltd, Fellow of the Australian Academy of Science (FAA); Fellow of the Australian Academy of technological Sciences and Engineering (FTSE); Fellow of the Australian Institute of Company Directors.
Appointed to Council: 01/08/2013 Meetings attended in 2017: two (2)
Ms Margaret BurdeuMinisterial appointment (part year) MBA Victoria
Experience in policy and strategy development, advocacy, mutli-agency partnerships and engagement.
Appointed to Council: 4/04/2017 Meetings attended in 2017: six (6)
Mr Andrew EddyGovernor-in-Council appointment BComm Melbourne
Fellow of the Institute of Chartered Accountants in Australia – (FCA)1983, Australian Society of Certified Practicing Accountants – (FCPA) 1986 and Australian Institute of Company Directors – (FAICD).
Appointed to Council: 19/10/2010 Reappointed: 01/01/2016 Appointed Deputy Chancellor: August 2013 Meetings attended in 2017: ten (10)
Ms Deborah RadfordGovernor-in-Council appointment BEc La Trobe
Currently a Director of Bendigo and Adelaide Bank.
Appointed to Council: 14/10/2014 Reappointed: 12/4/2017 Appointed Deputy Chancellor: 1/01/2017 Meetings attended in 2017: ten (10)
Ms Yvonne von Hartel AMGovernor-in-Council appointment B.Arch Melbourne
Substantial experience in architecture, planning and government. Senior Principal at architectural firm peckvonhartel.
Appointed to Council: 14/10/2014 Reappointed: 12/4/2017 Meetings attended in 2017: nine (9)
Commissioner Michael GayGovernor-in-Council appointment (part year) BA La Trobe
Extensive background in Australia industrial relations, currently a commissioner of the Tasmanian Industrial Commission.
Appointed to Council: 2/05/2017 Meetings attended in 2017: six (6)
Mr Kevin KapekeElected Member (Student)
Currently studying a Bachelor degree in Politics, Philosophy and Economics.
Appointed to Council: 12/09/2016 Meetings attended in 2017: seven (7)
Dr Jillian MurrayElected Member (Staff) PhD Law Oxford, MSci Oxford, MA Melb
Appointed to Council: 12/09/2016 Meetings attended in 2017: nine (9)
10 La Trobe University
Operating framework
Governance and accountabilityLa Trobe University was established under the Victorian La Trobe University Act 1964 and was Victoria’s third University when it was officially opened by the Premier of Victoria on the 8 March 1967.
The University continues to operate under the La Trobe University Act 2009 (the Act) which was assented to on 1 December 2009 and came into operation on 1 July 2010.
Section 6 of the Act provides that the University is a body politic and corporate with perpetual succession and that it is capable of doing all acts and suffering all things that a body corporate can do and suffer at law. This includes suing and being sued and acquiring, holding and dealing with real and personal property for the purposes of the Act.
The University is committed to quality and accountability in its operations, ensuring that there are appropriate processes in place to maintain and improve the quality of its research, teaching and learning, and how it engages with the communities it serves.
Relevant ministerThe responsible minister in the Victorian Government during 2017 was Minister for Training and Skills, the Hon. Gayle Tierney.
Objectives, functions, powers and duties
Objectives
The objectives of the University set out in section 5 of the Act are:
(a) to provide and maintain a teaching and learning environment of excellent quality offering higher education at an international standard
(b) to provide vocational education and training, further education and other forms of education determined by the University to support and complement the provision of higher education by the University
(c) to undertake scholarship, pure and applied research, invention, innovation, education and consultancy of international standing and to apply those matters to the advancement of knowledge and to the benefit of the well-being of the Victorian, Australian and international communities
(d) to equip graduates of the University to excel in their chosen careers and to contribute to the life of the community
(e) to serve the Victorian, Australian and international communities and the public interest by:
i) enriching cultural and community life
ii) elevating public awareness of educational, scientific and artistic developments
iii) promoting critical and free enquiry, informed intellectual discourse and public debate within the University and in the wider society
(f) to use its expertise and resources to involve Aboriginal and Torres Straight Islander people of Australia in its teaching and learning, research and advancement of knowledge activities and thereby contribute to:
i) realising Aboriginal and Torres Straight Islander aspirations
ii) the safe guarding of the ancient and rich Aboriginal and Torres Strait Islander cultural heritage
(g) to provide programs and services in a way that reflects principles of equity and social justice
(h) to confer degrees and grant other awards
(i) to utilise or exploit its expertise and resources, whether commercially or otherwise.
Powers and duties
The Act provides the broad framework for the governance and organisation of the University:
(a) Section 8 prescribes the Council as the principal governing body of the University
(b) Sections 9 and 10 set out the key powers and functions of the Council, including the power to confer any degree or grant any diploma or other award to a student of the University
(c) Section 15 sets out the responsibilities of Council members
(d) Section 18 provides that the Council may, by instrument, delegate its powers or functions under the Act to any member or committee of the Council, a member of the staff of the University, the Academic Board or any other entity prescribed in a University Statute
(e) Section 20 provides for the establishment of the Academic Board
(f) Section 26 provides for the appointment of the Vice-Chancellor by the Council
(g) Section 28 gives the Council power to make Statutes and Regulations for or with respect to all matters governing the University
(h) Sections 35 and 38 regulate the acquisition and disposal of property, including land, by the University
(i) Sections 44 to 47 deal with the application and auditing of funds of the University
(j) Sections 48 to 51 regulate the formation and auditing of joint ventures and companies
(k) Sections 52 to 60 deal with the development and application of Ministerial Guidelines for University commercial activities.
Annual Report 2017 11
La Trobe’s Code of ConductThe University, in its policies and actions, must adhere to the highest standards of professional integrity.
We promote critical enquiry and the rational evaluation of evidence, even if turning that critical focus on some of our own actions and practices may cause some discomfort.
We support and where appropriate, lead action to mitigate social harm from environmental degradation, social exclusion, and political and cultural discord.
The purpose of the Code of Conduct is to provide members of La Trobe University with an understanding of the standards required of them in their dealings with both national and international communities.
The Code is applicable to all staff, conjoints, volunteers, University Council members and external members of University committees, who are to uphold the values and comply with the Code in the performance of their duties and in their endeavours. Partners, contractors and visitors are to acknowledge and observe the Code in their dealings with the University.
Trust and respect
Trust is reliance on another person’s integrity, confidentiality and fairness; and demonstrating those principles personally.
We will:
• know when it is appropriate to share information with others inside and outside the University
• be reliable and maintain the integrity, confidentiality and privacy of official University information
• maintain appropriate confidentiality in our dealings with our colleagues
• acknowledge the responsibility of our positions and that we are regarded as having expertise, knowledge and skills in our field and area of work.
Respect is recognising the importance of diversity and difference and promoting a culture that does not tolerate bullying, discrimination or harassment.
We will:
• acknowledge Aboriginal culture and heritage and the traditional custodianship of the lands on which the University is situated
• treat everyone with respect and courtesy, without discrimination or harassment and encourage intellectual freedom
• seek approval and guidance from our colleagues where appropriate
• ensure that our conduct does not harm others
• value difference and diversity and others’ opinions, choices and approaches.
Honesty and fairness
Honesty is being sincere and fair and acting with integrity in day-to-day dealings in the University community and ensuring that actions are clear, transparent and accountable.
We will:
• behave honestly and with integrity in our dealings with our colleagues and community
• comply with any relevant legislative, industrial or administrative requirements
• act with care and diligence in the course of our employment and use University resources in a proper manner
• politely decline personal gifts or benefits unless permissible under University policies or procedures
• show transparency when conflicts of interest arise
• refrain from improper use of privileged information or position.
Fairness is treating others equally regardless of personal differences and making judgements that do not discriminate against individuals.
We will:
• comply with principles of natural justice and procedural fairness when making decisions or when resolving grievances
• be committed to the principle of academic freedom as essential to the proper conduct of teaching, research and scholarship
• recognise not only our rights, but the rights of our colleagues and those in our community.
About the Code
La Trobe University
• provides a workplace that is free from discrimination and recognises and utilises the diversity of its employees
• has the highest ethical standards
• is accountable for its actions
• establishes workplace relations that value communication, consultation, cooperation and input from employees on matters that affect their workplace
• provides a fair, flexible, safe and rewarding workplace
• focuses on achieving results and managing performance
• provides a fair system of review of decisions taken in respect of employees
• encourages staff to exercise their rights to intellectual freedom on matters relevant to areas of specialist knowledge and expertise.
12 La Trobe University
Diversity and InclusionHuman Resources (HR) has continued to work in partnership with areas across the University to lead and deliver key Diversity and Inclusion activities such as the Workplace Gender Equality Agency (WGEA) Employer of Choice for Gender Equality (EOCGE) citation and completing the inaugural Victoria Workplace Equality and Respect pilot project delivered by Our Watch.
HR InitiativesDuring 2017 La Trobe implemented a number of strategic initiatives to support delivery of the University’s strategic plan. HR highlights include:
We reached in principle agreement for a new, modern and simplified Collective Agreement, guaranteeing staff entitlements and conditions whilst supporting the University’s strategic plan.
The Organisational Development team worked with University leaders to produce a Sessional Staff Strategy aimed at attracting, retaining and building capability in this area and to support an outstanding student experience. In 2017 this team also focused on building leadership capability by successfully implementing programs such as Leader Induction, Leadership Foundations (frontline leaders) and development for Heads of Department and Senior Leaders.
Another priority for HR in 2017 was process improvement initiatives in the recruitment, performance management and change procedures, resulting in enhanced service delivery and process efficiencies. Additionally, introduction of a leading-edge Injury Management Service Program for staff provided support for minor injuries sustained in the workplace.
HR implemented the ‘Better Life Wellbeing Program’, reaching 2686 staff. Programs included staff health and wellness classes, mental health education, resilience, stress, Better Neck Back & Shoulders and Manual Handling. The Wellbeing Program was able to offer this beneficial range of initiatives with the collaboration and support of the La Trobe Psychology Clinic, School of Allied Health and La Trobe Sports Centre.
Human resources
Annual Report 2017 13
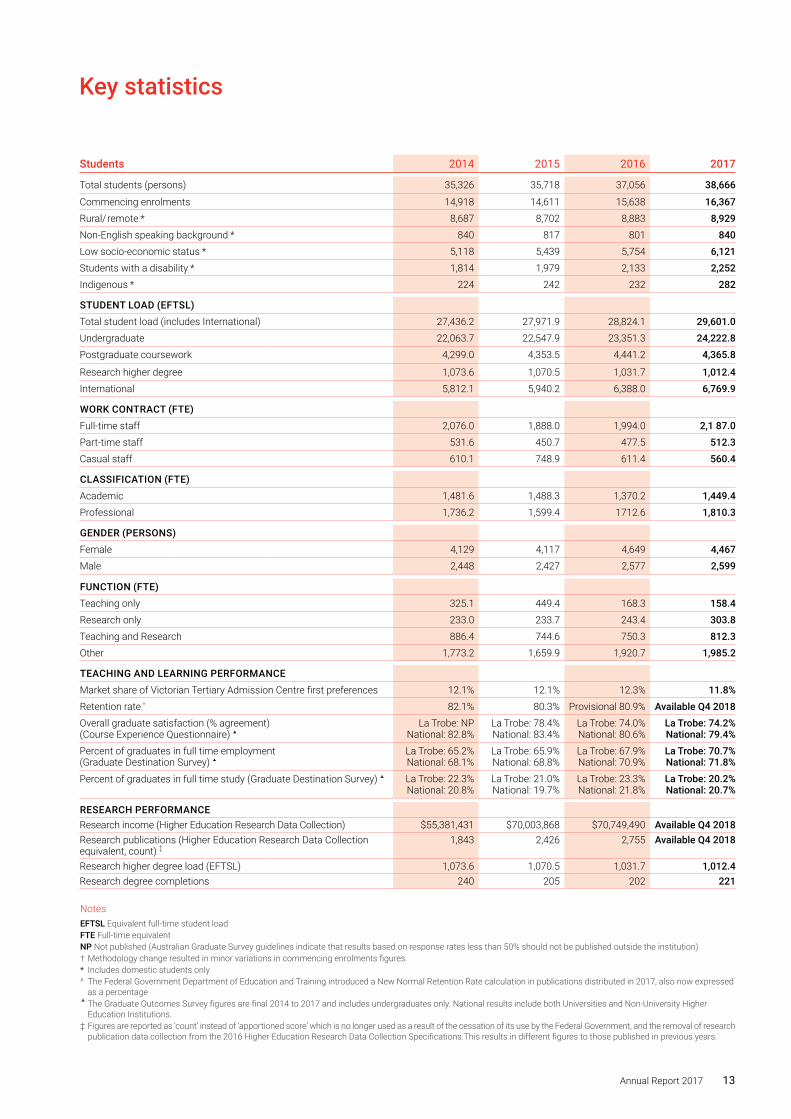
Students 2014 2015 2016 2017
Total students (persons) 35,326 35,718 37,056 38,666
Commencing enrolments 14,918 14,611 15,638 16,367Rural/ remote * 8,687 8,702 8,883 8,929Non-English speaking background * 840 817 801 840Low socio-economic status * 5,118 5,439 5,754 6,121Students with a disability * 1,814 1,979 2,133 2,252Indigenous * 224 242 232 282
STUDENT LOAD (EFTSL)Total student load (includes International) 27,436.2 27,971.9 28,824.1 29,601.0Undergraduate 22,063.7 22,547.9 23,351.3 24,222.8Postgraduate coursework 4,299.0 4,353.5 4,441.2 4,365.8
Research higher degree 1,073.6 1,070.5 1,031.7 1,012.4International 5,812.1 5,940.2 6,388.0 6,769.9
WORK CONTRACT (FTE)Full-time staff 2,076.0 1,888.0 1,994.0 2,1 87.0Part-time staff 531.6 450.7 477.5 512.3Casual staff 610.1 748.9 611.4 560.4
CLASSIFICATION (FTE)Academic 1,481.6 1,488.3 1,370.2 1,449.4Professional 1,736.2 1,599.4 1712.6 1,810.3
GENDER (PERSONS)Female 4,129 4,117 4,649 4,467Male 2,448 2,427 2,577 2,599
FUNCTION (FTE)Teaching only 325.1 449.4 168.3 158.4Research only 233.0 233.7 243.4 303.8Teaching and Research 886.4 744.6 750.3 812.3Other 1,773.2 1,659.9 1,920.7 1,985.2
TEACHING AND LEARNING PERFORMANCEMarket share of Victorian Tertiary Admission Centre first preferences 12.1% 12.1% 12.3% 11.8%Retention rate ^ 82.1% 80.3% Provisional 80.9% Available Q4 2018Overall graduate satisfaction (% agreement) (Course Experience Questionnaire)
La Trobe: NP National: 82.8%
La Trobe: 78.4% National: 83.4%
La Trobe: 74.0% National: 80.6%
La Trobe: 74.2% National: 79.4%
Percent of graduates in full time employment (Graduate Destination Survey)
La Trobe: 65.2% National: 68.1%
La Trobe: 65.9% National: 68.8%
La Trobe: 67.9% National: 70.9%
La Trobe: 70.7% National: 71.8%
Percent of graduates in full time study (Graduate Destination Survey) La Trobe: 22.3% National: 20.8%
La Trobe: 21.0% National: 19.7%
La Trobe: 23.3% National: 21.8%
La Trobe: 20.2% National: 20.7%
RESEARCH PERFORMANCEResearch income (Higher Education Research Data Collection) $55,381,431 $70,003,868 $70,749,490 Available Q4 2018Research publications (Higher Education Research Data Collection equivalent, count) ‡
1,843 2,426 2,755 Available Q4 2018
Research higher degree load (EFTSL) 1,073.6 1,070.5 1,031.7 1,012.4Research degree completions 240 205 202 221
Key statistics
NotesEFTSL Equivalent full-time student loadFTE Full-time equivalentNP Not published (Australian Graduate Survey guidelines indicate that results based on response rates less than 50% should not be published outside the institution)† Methodology change resulted in minor variations in commencing enrolments figures* Includes domestic students only^ The Federal Government Department of Education and Training introduced a New Normal Retention Rate calculation in publications distributed in 2017, also now expressed
as a percentage The Graduate Outcomes Survey figures are final 2014 to 2017 and includes undergraduates only. National results include both Universities and Non-University Higher
Education Institutions.‡ Figures are reported as ‘count’ instead of ‘apportioned score’ which is no longer used as a result of the cessation of its use by the Federal Government, and the removal of research
publication data collection from the 2016 Higher Education Research Data Collection Specifications.This results in different figures to those published in previous years.
14 La Trobe University
Risk management
University’s risk management strategyThe University Council places emphasis on risk management as a key platform of corporate governance and a vital component of effective decision making. The Council’s Corporate Governance, Audit and Risk Committee (CGARC) provides a strong oversight of risk management and compliance activities throughout the University.
Risk management office and approachThe University’s Risk Management Office has responsibility for the delivery of key strategic and operational risk management programs. Risk management is undertaken using a University adapted approach consistent with the Australian and New Zealand Standard (AS/NZS ISO 31000:2009).
Critical incident management and business continuity management is undertaken according to Australian Standard’s
HB 292:2006, the Australian and New Zealand Standard for Business Continuity: management of disruption related risk AS/NZS 5050:2010, and the Australasian Inter-Service Incident Management System.
Identification, assessment and progress on treatment of risk is reported to management and to the Corporate Governance, Audit and Risk Committee at its quarterly meetings.
Insurance OfficeThe insurance office has responsibility for:
• annual review of insurable assets and liabilities
• purchasing of general insurance and other protection covers
• management of self-insurance provisions
• claims management
Key Protections are maintained for ‘Professional Liability’ and for ‘Directors and Officers Liability’.
Annual Report 2017 15
Risk management (cont…)
Health and Safety StatementGeneral Statement
There has been a focus towards active prevention of workplace injury through improved awareness, an increase in reporting of hazards and the delivery of targeted programs to build resilience.
Entity statement
• Number of reported hazards for the year per 100 full time equivalent staff members is 6.0 Number of reported incidents (all categories) for the year per 100 full time equivalent staff members is 13.5
• The number of lost time standard claims for the year per 100 full time equivalent staff members is 0.30
• The average cost per claim for the year (including payments to date and an estimate outstanding claim costs) is $64,188
• There are no reported fatalities
Equivalent data for 2016
• Number of reported hazards for the year per 100 full time equivalent staff members is 4.8
• Number of reported incidents (all categories) for the year per 100 full time equivalent staff members is 13.9
• The number of lost time standard claims for the year per 100 full ti me equivalent staff members is 0.29
• The average cost per claim for the year (including payments to date and an estimate of outstanding claim costs) is $53,525
• There were no reported fatalities
Equivalent data for 2015
• Number of reported hazards for the year per 100 full time equivalent staff members is 2.5
• Number of reported incidents (all categories) for the year per 100 full time equivalent staff members is 13.7
• The number of lost time standard claims for the year per 100 full time equivalent staff members is 0.61
• The average cost per claim for the year (including payments to date and an estimate of outstanding claim costs) is $30,496
• There were no reported fatalities
Indemnity DetailsProfessional Liability
The University maintains Professional Liability cover for its Council Members and senior officers through UniMutual Limited: AFS Licence Number 241142.
The protection period is 1 November 2016 to 31 October 2017 (LTU 17 PL) and 1 November 2017 to 31 October 2018 (LTU 18 PL). The University retains the first $100,000 for each and every claim, with cover limited to $30,000,000 for each and every claim but limited to $120,000,000 in the aggregate for the protection period (the $120,000,000 aggregate is a combined single limit across professional liability, malpractice and general clinical trials). Extension to the standard cover is endorsed for infringement of rights of intellectual property or breach of confidentiality.
Directors and officers liability protection
The University maintains Directors & Officers liability protection for its Council Members and senior officers through Chubb Insurance Company of Australia (AFS Licence Number 239778). Cover has been in place with this provider since 1 November 2011.
The protection period is 31 October 2016 to 31 October 2017 (Policy Number 93306133) and 31 October 2017 to 31 October 2018 (Policy Number 93306133). The University retains the first $10,000 for each and every claim. Cover is limited to $20,000,000 for any one claim and $20,000,000 in the aggregate for the period of cover.
16 La Trobe University
Sustainability reporting
Indicator Unit
Total Data 2017 Calendar
YearTotal Data
2016
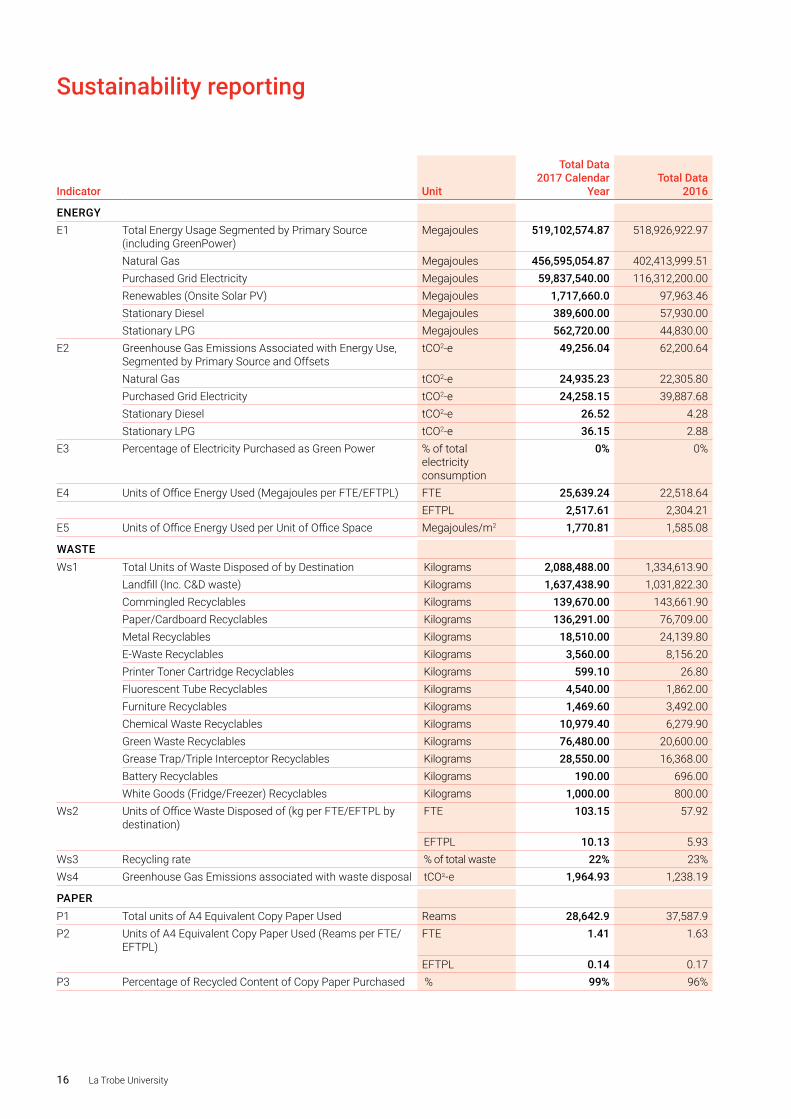
ENERGYE1 Total Energy Usage Segmented by Primary Source
(including GreenPower)Megajoules 519,102,574.87 518,926,922.97
Natural Gas Megajoules 456,595,054.87 402,413,999.51Purchased Grid Electricity Megajoules 59,837,540.00 116,312,200.00Renewables (Onsite Solar PV) Megajoules 1,717,660.0 97,963.46Stationary Diesel Megajoules 389,600.00 57,930.00Stationary LPG Megajoules 562,720.00 44,830.00
E2 Greenhouse Gas Emissions Associated with Energy Use, Segmented by Primary Source and Offsets
tCO2-e 49,256.04 62,200.64
Natural Gas tCO2-e 24,935.23 22,305.80Purchased Grid Electricity tCO2-e 24,258.15 39,887.68Stationary Diesel tCO2-e 26.52 4.28Stationary LPG tCO2-e 36.15 2.88
E3 Percentage of Electricity Purchased as Green Power % of total electricity consumption
0% 0%
E4 Units of Office Energy Used (Megajoules per FTE/EFTPL) FTE 25,639.24 22,518.64EFTPL 2,517.61 2,304.21
E5 Units of Office Energy Used per Unit of Office Space Megajoules/m2 1,770.81 1,585.08
WASTEWs1 Total Units of Waste Disposed of by Destination Kilograms 2,088,488.00 1,334,613.90
Landfill (Inc. C&D waste) Kilograms 1,637,438.90 1,031,822.30Commingled Recyclables Kilograms 139,670.00 143,661.90Paper/Cardboard Recyclables Kilograms 136,291.00 76,709.00Metal Recyclables Kilograms 18,510.00 24,139.80E-Waste Recyclables Kilograms 3,560.00 8,156.20Printer Toner Cartridge Recyclables Kilograms 599.10 26.80Fluorescent Tube Recyclables Kilograms 4,540.00 1,862.00Furniture Recyclables Kilograms 1,469.60 3,492.00Chemical Waste Recyclables Kilograms 10,979.40 6,279.90Green Waste Recyclables Kilograms 76,480.00 20,600.00Grease Trap/Triple Interceptor Recyclables Kilograms 28,550.00 16,368.00Battery Recyclables Kilograms 190.00 696.00White Goods (Fridge/Freezer) Recyclables Kilograms 1,000.00 800.00
Ws2 Units of Office Waste Disposed of (kg per FTE/EFTPL by destination)
FTE 103.15 57.92
EFTPL 10.13 5.93Ws3 Recycling rate % of total waste 22% 23%Ws4 Greenhouse Gas Emissions associated with waste disposal tCO2-e 1,964.93 1,238.19
PAPERP1 Total units of A4 Equivalent Copy Paper Used Reams 28,642.9 37,587.9P2 Units of A4 Equivalent Copy Paper Used (Reams per FTE/
EFTPL)FTE 1.41 1.63
EFTPL 0.14 0.17P3 Percentage of Recycled Content of Copy Paper Purchased % 99% 96%
Annual Report 2017 17
Indicator Unit
Total Data 2017 Calendar
YearTotal Data
2016
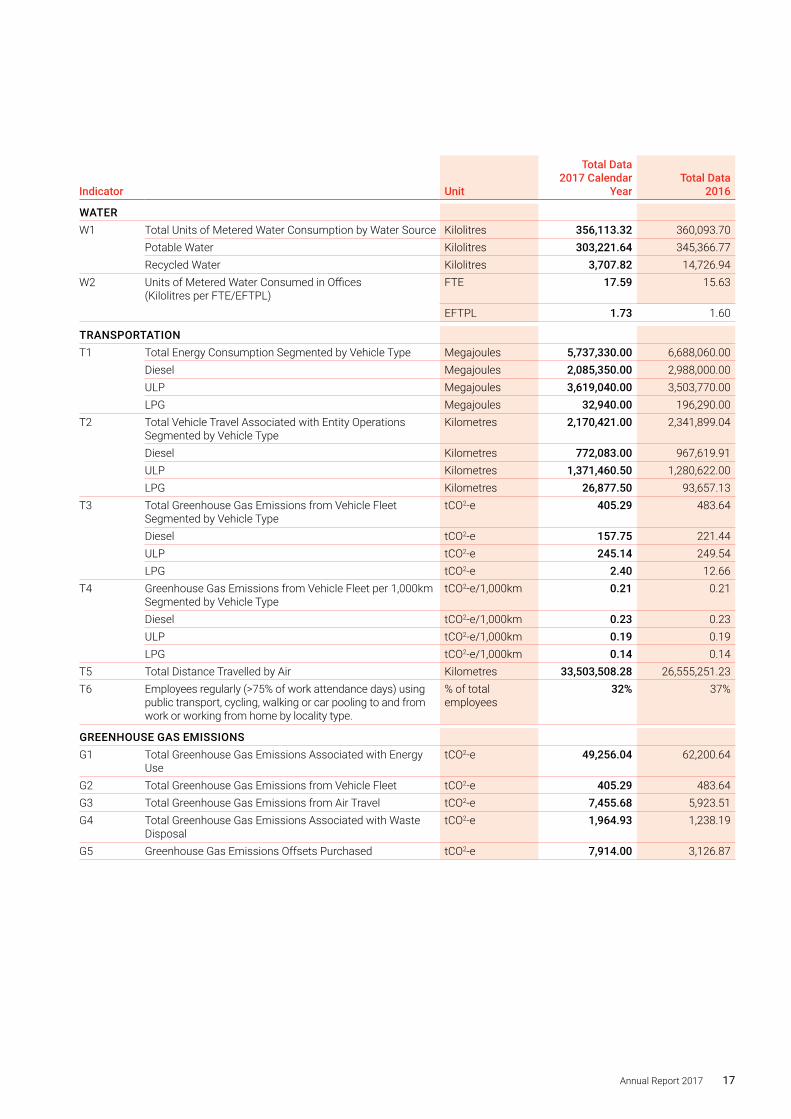
WATERW1 Total Units of Metered Water Consumption by Water Source Kilolitres 356,113.32 360,093.70
Potable Water Kilolitres 303,221.64 345,366.77Recycled Water Kilolitres 3,707.82 14,726.94
W2 Units of Metered Water Consumed in Offices (Kilolitres per FTE/EFTPL)
FTE 17.59 15.63
EFTPL 1.73 1.60
TRANSPORTATIONT1 Total Energy Consumption Segmented by Vehicle Type Megajoules 5,737,330.00 6,688,060.00
Diesel Megajoules 2,085,350.00 2,988,000.00ULP Megajoules 3,619,040.00 3,503,770.00LPG Megajoules 32,940.00 196,290.00
T2 Total Vehicle Travel Associated with Entity Operations Segmented by Vehicle Type
Kilometres 2,170,421.00 2,341,899.04
Diesel Kilometres 772,083.00 967,619.91ULP Kilometres 1,371,460.50 1,280,622.00LPG Kilometres 26,877.50 93,657.13
T3 Total Greenhouse Gas Emissions from Vehicle Fleet Segmented by Vehicle Type
tCO2-e 405.29 483.64
Diesel tCO2-e 157.75 221.44ULP tCO2-e 245.14 249.54LPG tCO2-e 2.40 12.66
T4 Greenhouse Gas Emissions from Vehicle Fleet per 1,000km Segmented by Vehicle Type
tCO2-e/1,000km 0.21 0.21
Diesel tCO2-e/1,000km 0.23 0.23ULP tCO2-e/1,000km 0.19 0.19LPG tCO2-e/1,000km 0.14 0.14
T5 Total Distance Travelled by Air Kilometres 33,503,508.28 26,555,251.23T6 Employees regularly (>75% of work attendance days) using
public transport, cycling, walking or car pooling to and from work or working from home by locality type.
% of total employees
32% 37%
GREENHOUSE GAS EMISSIONSG1 Total Greenhouse Gas Emissions Associated with Energy
UsetCO2-e 49,256.04 62,200.64
G2 Total Greenhouse Gas Emissions from Vehicle Fleet tCO2-e 405.29 483.64G3 Total Greenhouse Gas Emissions from Air Travel tCO2-e 7,455.68 5,923.51G4 Total Greenhouse Gas Emissions Associated with Waste
DisposaltCO2-e 1,964.93 1,238.19
G5 Greenhouse Gas Emissions Offsets Purchased tCO2-e 7,914.00 3,126.87
18 La Trobe University
Sustainability reporting (cont…)
EnergyHaving achieved an 8% reduction in energy usage in 2016, the overall 2017 usage result remains consistent. The mix of energy sources changed within this period with the co-generation plant operating more resulting in more gas and less electricity being used.
Significant investment in solar photovoltaics (PV) on regional campuses has seen the University install 2,820 individual panels, yielding a generating capacity of 705 kW, which is a 1653% increase in renewables. These new systems are generating between 5-33% of individual campus needs.
Feasibility work was also undertaken to determine Solar PV capacity on the Melbourne Campus and this project will progress in 2018, with over 2.5MW to be installed in 2018/19.
There were increases in Stationary Diesel and LPG in 2017 due to specific issues that resulted in emergency generators and a backup chiller being brought online. Although significant in their own right, they do not impact the overall result in a major way.
There have been various energy efficiency initiatives delivered through the year, and these combined with new regional solar have resulted in an improved emissions profile with a 21% reduction overall. The development of an Energy Strategy is underway and will outline future directions in efficiency, renewable technologies and energy security from 2018.
WasteWaste is showing an overall increase of 56% compared to 2016 data. The significant change in results is believed to be attributable to broader service inclusions and improved weighing and data collation through a new cleaning and waste contract which commenced in 2017, rather than being indicative of actual waste generation increases.
Quality of waste data has been an ongoing concern a number of years, as there were known issues with integrity of collection and monitoring methodologies under previous contracts. With better approaches and information now in place the University will review its current waste targets and revise where appropriate.
The recycling rate has remained relatively consistent at 22% vs. 23% for 2016, but still needs to improve significantly to meet the University target of 40%. The role out of centralised waste stations across the main campus will enable better separation of waste which will in turn yield better results.
Organic food collection has been integrated as part of the new service and development of a new Waste Management Strategy will inform further improvements on how various streams are reduced and disposed of.
PaperThe University continues to do well on paper reduction with an overall reduction of 24% and both staff and student usage showing improvements at 1.41kg/FTE in 2017 vs. 1.63 kg/FTE and 0.14kg/EFTPL vs. 0.17kg/EFTPL respectively. These results are attributable to ongoing changing behaviours around on-screen reading and a new printer system rolled out across the University.
The new system has led to a reduced number of printer units and a specific staff login and release program that has resulted in paper reduction as well as savings in energy and ink usage.
The amount of 100% postconsumer recycled content paper purchased and used has increased from 96% to 99% this year.
WaterPotable water usage is down by 12% for 2017 which is a positive indication of more efficient irrigation practices that rely more on automated processes, drawing stormwater from the University’s moat system.
There were however, data issues in relation to recycled water usage in Albury-Wodonga, as it was discovered this year that there were leaks resulting from vandalism in 2016 that skewed the reported water reuse rate. This caused an over representation in last year’s results.
New stormwater metering put in place in 2017 in line with the University’s Melbourne Water licence, is yielding more accurate data on extraction on the Melbourne Campus.
TransportVehicle related impacts have improved as a result of a continuing program to overhaul fleet vehicles on the main campus. This is the result of a combination of approaches including divesting vehicles form the fleet, switching from diesel to petrol models, reducing LPG vehicles and transitioning to car share options for work travel. Based, on these changes there has been an overall improvement of energy usage from vehicle usage of 24%.There has been an 8% reduction in total fleet numbers alongside the use of Go Get cars.
A calculation error, discovered while completing this year’s figures, meant that staff using sustainable modes of travel was misreported as 37% rather than 31% for 2016. When compared to the correct figure, the 2017 figure has remained relatively consistent with 32% travelling by sustainable modes.
Air travel has increased significantly this year, up by 26%. The introduction of a new travel booking system which captures more trips and associated data is likely to be a contributing factor to this result. This will need to be further monitored next year to see if this is the case or if more travel is actually happening.
Greenhouse Gas EmissionsVarious initiatives through 2017 have yielded a marginally improved overall emissions profile, with a reduction of 4% achieved for the year.
OtherLa Trobe was certified to Six Star under the Green Building Council of Australia Green Star Communities rating tool in December, 2016. This result is represents world leadership in master planning and will guide future development of the Melbourne Campus ensuring sustainability is at the core of decisions for the University.
Annual Report 2017 19
Risk management statement
Mailing address
La Trobe University Victoria 3086 Australia
T +61 3 9479 5268 F +61 3 9479 1045
ABN 64 804 735 113 CRICOS Provider 00115M
OFFICE OF THE CHANCELLOR
21 March 2018
Attestation on compliance with the Australian/ New Zealand Risk Management Standard
latrobe.edu.au
MELBOURNE CAMPUSES Bundoora Collins Street CBD Franklin Street CBD
REGIONAL CAMPUSES Bendigo Albury-Wondonga Mildura Shepparton
I, Vanessa Cover certify that the La Trobe University has risk management processes in place consistent with the Australian/New Zealand Risk Management Standard and an internal control system is in place that enables the executive to understand, manage and satisfactorily control risk exposures. The Corporate Governance, Audit and Risk Committee verifies this assurance and that the risk profile of La Trobe University has been critically reviewed within the last 12 months.
Yours sincerely
Vanessa Cover Director Risk Management Office La Trobe University
Professor John Dewar Vice-Chancellor La Trobe University
20 La Trobe University
External reporting obligations
Freedom of informationFreedom of Information Act 1982
The following information is provided in accordance with the requirements of the Freedom of Information Act 1982.
During 2017, the University received 5 applications under the Victorian FOI legislation. Of these applications, 4 were provided in part with edited documents; some information was withheld as it related to internal working documents, business or financial information of business undertakings, was provided to the University in confidence or was personal information that did not pertain to the applicant. No documents existed or were located in the remaining application. This can be found at: latrobe.edu.au/statements/foi
Information privacyPrivacy and Data Protection Act 2014
During 2017, the University received one privacy complaint under the Privacy and Data Protection Act 2014 (Victoria).
Whistleblowers, grievances and complaints Investigation of Complaints
The Ombudsman Statute 2009 empowers the University Ombudsman to conduct mediations and investigate grievances and complaints by staff and students.
The Ombudsman is not subject to the direction of the University Council or the Vice-Chancellor.
Any member of the University may approach the Ombudsman for a matter to be investigated.
The Ombudsman usually receives complaints only after a party or parties have already sought to have the matter dealt with by other parts of the grievance procedures system, at the College level or by the Student Complaints office. The Statute requires parties with a complaint to cooperate with the Ombudsman.
After a complaint has been dealt with by the Ombudsman the parties are notified in writing of the outcome. Non-identifying information on the nature, type, origin and number of the complaints dealt with is contained in the Ombudsman’s Annual Report to the University Council.
During the calendar year 2017, the Ombudsman dealt with 264 complaints from members of the University.’
Further information regarding the student grievance and complaints processes can be found at: latrobe.edu.au/students/complaints
National competition policyThe University’s Research Contracts and Grants Policy and Procedure and La Trobe Consulting Policy and Procedure provide for central University review of all tenders and proposals so that they are adequately costed and that appropriate pricing decisions are made in accordance with competitive neutrality principles.
The University’s Research Contracts and Grants Policy is compliant with the National Competition Policy and the Competitive Neutrality Policy Victoria.
The University’s Competition and Consumer Law compliance program, Policy and Procedural guidelines are available at: latrobe.edu.au/legalservices/competition-consumer-law
Conformity with the Building Act 1993The La Trobe Infrastructure and Operations (I&O) Division is responsible for providing a safe, fit-for-purpose, amenable built and natural environment within which the University community lives and works in pursuit of its teaching, learning and research objectives. The university complied with all provisions of the building act 1993. In 2017, the I&O Division delivered 41 projects that were valued over $50,000 each and included:
• 3 major projects including refurbishment and services upgrades
• 5 capital projects comprising refurbishments and engineering upgrades
• 17 capital maintenance projects comprising of engineering upgrades, building services upgrades
• 16 minor works projects comprising of refurbishments
I&O ensures that all works requiring building approval have permits issued and plans certified. On completion, I&O engages independent registered building surveyors to conduct Final Inspections and issue Certificates of Occupancy.
Works such as engineering infrastructure upgrades, capital building maintenance, equipment replacements, site civil works and landscaping are examples of projects exempt from the 10-year liability cap.
I&O is independently audited by internal and external customers to ensure compliance with legislation obligations.
Mechanisms are in place for continual inspecting, reporting, scheduling, rectifying and maintaining existing buildings.
I&O checks the accreditation and licenses of surveyors, consultants and contractors before engagement and ensures that registration is maintained during the engagement.
Annual Report 2017 21
Key capital investments (I&O)
Project NameTotal
Project Budget $000’s2017
Actual Spend $000s
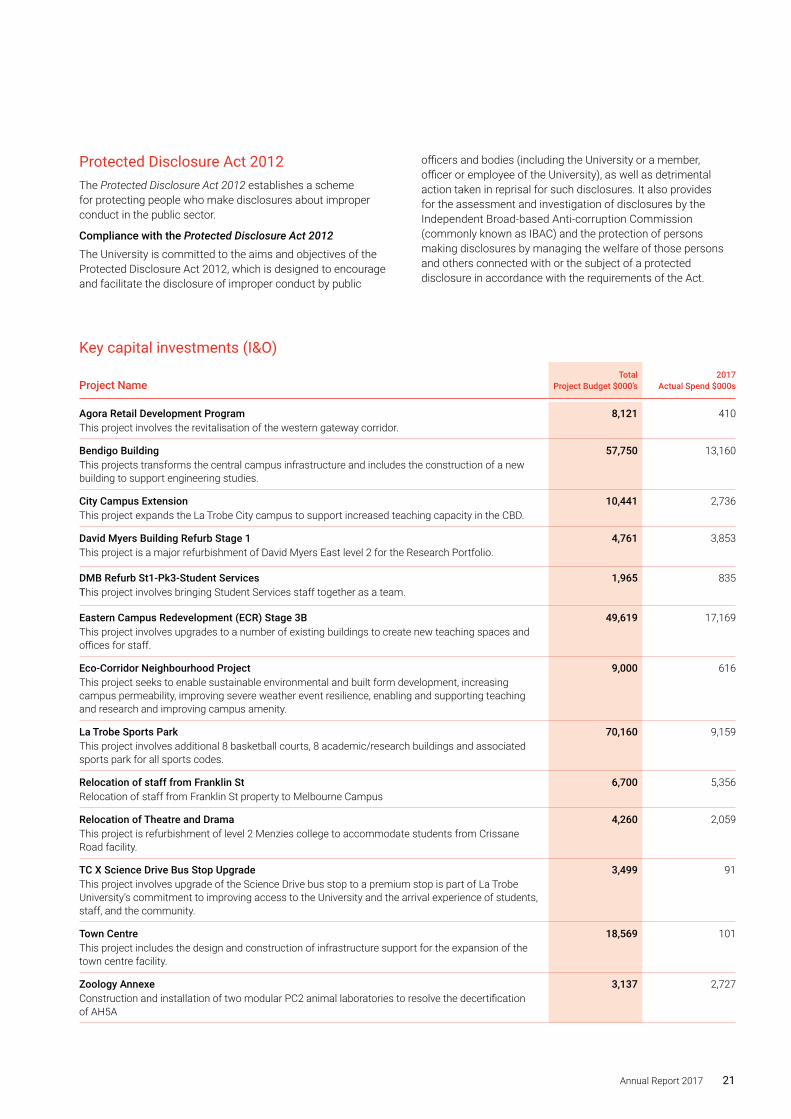
Agora Retail Development Program This project involves the revitalisation of the western gateway corridor.
8,121 410
Bendigo Building This projects transforms the central campus infrastructure and includes the construction of a new building to support engineering studies.
57,750 13,160
City Campus Extension This project expands the La Trobe City campus to support increased teaching capacity in the CBD.
10,441 2,736
David Myers Building Refurb Stage 1 This project is a major refurbishment of David Myers East level 2 for the Research Portfolio.
4,761 3,853
DMB Refurb St1-Pk3-Student Services This project involves bringing Student Services staff together as a team.
1,965 835
Eastern Campus Redevelopment (ECR) Stage 3B This project involves upgrades to a number of existing buildings to create new teaching spaces and offices for staff.
49,619 17,169
Eco-Corridor Neighbourhood Project This project seeks to enable sustainable environmental and built form development, increasing campus permeability, improving severe weather event resilience, enabling and supporting teaching and research and improving campus amenity.
9,000 616
La Trobe Sports Park This project involves additional 8 basketball courts, 8 academic/research buildings and associated sports park for all sports codes.
70,160 9,159
Relocation of staff from Franklin StRelocation of staff from Franklin St property to Melbourne Campus
6,700 5,356
Relocation of Theatre and Drama This project is refurbishment of level 2 Menzies college to accommodate students from Crissane Road facility.
4,260 2,059
TC X Science Drive Bus Stop Upgrade This project involves upgrade of the Science Drive bus stop to a premium stop is part of La Trobe University’s commitment to improving access to the University and the arrival experience of students, staff, and the community.
3,499 91
Town Centre This project includes the design and construction of infrastructure support for the expansion of the town centre facility.
18,569 101
Zoology Annexe Construction and installation of two modular PC2 animal laboratories to resolve the decertification of AH5A
3,137 2,727
Protected Disclosure Act 2012The Protected Disclosure Act 2012 establishes a scheme for protecting people who make disclosures about improper conduct in the public sector.
Compliance with the Protected Disclosure Act 2012
The University is committed to the aims and objectives of the Protected Disclosure Act 2012, which is designed to encourage and facilitate the disclosure of improper conduct by public
officers and bodies (including the University or a member, officer or employee of the University), as well as detrimental action taken in reprisal for such disclosures. It also provides for the assessment and investigation of disclosures by the Independent Broad-based Anti-corruption Commission (commonly known as IBAC) and the protection of persons making disclosures by managing the welfare of those persons and others connected with or the subject of a protected disclosure in accordance with the requirements of the Act.
22 La Trobe University
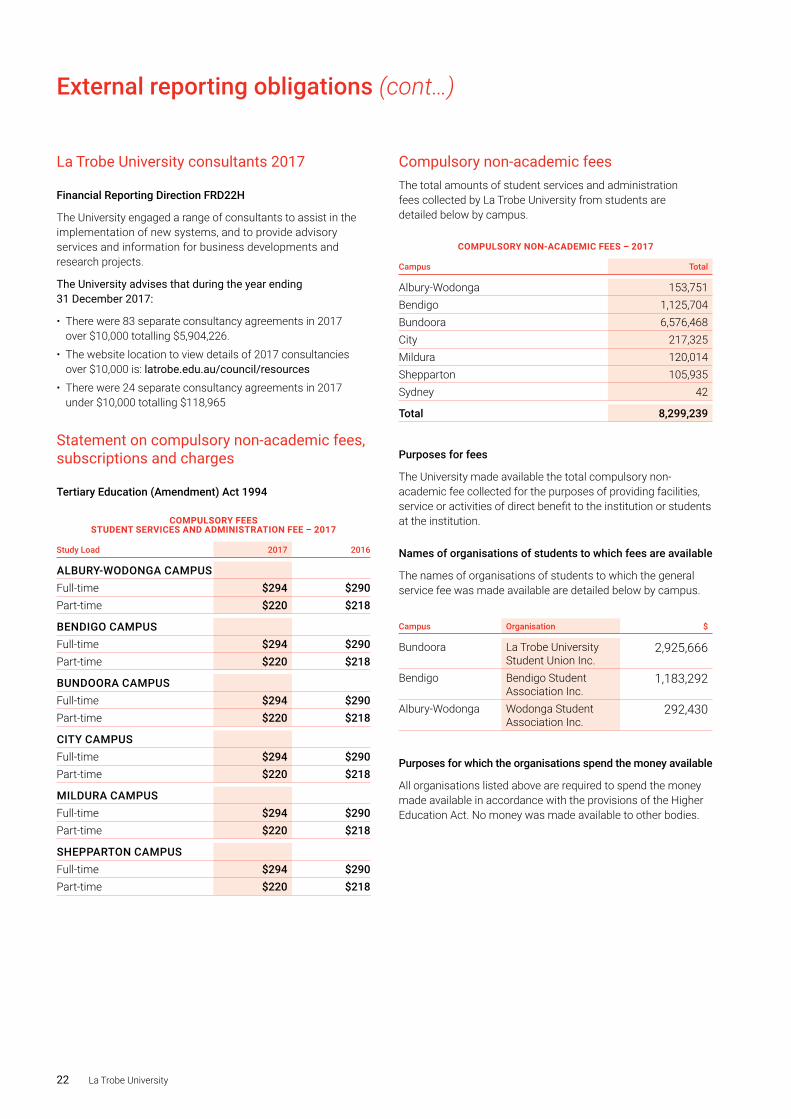
External reporting obligations (cont…)
Compulsory non-academic feesThe total amounts of student services and administration fees collected by La Trobe University from students are detailed below by campus.
COMPULSORY NON-ACADEMIC FEES – 2017
Campus Total
Albury-Wodonga 153,751Bendigo 1,125,704Bundoora 6,576,468City 217,325Mildura 120,014Shepparton 105,935Sydney 42
Total 8,299,239
Purposes for fees
The University made available the total compulsory non-academic fee collected for the purposes of providing facilities, service or activities of direct benefit to the institution or students at the institution.
Names of organisations of students to which fees are available
The names of organisations of students to which the general service fee was made available are detailed below by campus.
Campus Organisation $
Bundoora La Trobe University Student Union Inc.
2,925,666
Bendigo Bendigo Student Association Inc.
1,183,292
Albury-Wodonga Wodonga Student Association Inc.
292,430
Purposes for which the organisations spend the money available
All organisations listed above are required to spend the money made available in accordance with the provisions of the Higher Education Act. No money was made available to other bodies.
La Trobe University consultants 2017
Financial Reporting Direction FRD22H
The University engaged a range of consultants to assist in the implementation of new systems, and to provide advisory services and information for business developments and research projects.
The University advises that during the year ending 31 December 2017:
• There were 83 separate consultancy agreements in 2017 over $10,000 totalling $5,904,226.
• The website location to view details of 2017 consultancies over $10,000 is: latrobe.edu.au/council/resources
• There were 24 separate consultancy agreements in 2017 under $10,000 totalling $118,965
Statement on compulsory non-academic fees, subscriptions and charges
Tertiary Education (Amendment) Act 1994
COMPULSORY FEESSTUDENT SERVICES AND ADMINISTRATION FEE – 2017
Study Load 2017 2016
ALBURY-WODONGA CAMPUSFull-time $294 $290Part-time $220 $218
BENDIGO CAMPUSFull-time $294 $290Part-time $220 $218
BUNDOORA CAMPUSFull-time $294 $290Part-time $220 $218
CITY CAMPUSFull-time $294 $290Part-time $220 $218
MILDURA CAMPUSFull-time $294 $290Part-time $220 $218
SHEPPARTON CAMPUSFull-time $294 $290Part-time $220 $218
Annual Report 2017 23
Further InformationThe University has the following information on request, subject to the provisions of the Freedom of Information Act 1982:
(a) Declarations of pecuniary interests;
(b) Details of shares held by a senior officer as nominee or held beneficially in a statutory authority or subsidiary;
(c) Details of publications produced;
(d) Details of changes in prices, fees, charges, rates and levies charged;
(e) Details of any major external reviews;
(f) Details of major research and development activities;
(g) Details of overseas visits undertaken including a summary of the objectives and outcomes of each visit;
(h) Details of major promotional, public relations and marketing activities undertaken by the entity;
(i) Details of assessments and measures undertaken to improve the occupational health and safety of employees;
(j) A general statement on industrial relations within the entity and details of time lost through industrial accidents and disputes;
(k) A list of major committees sponsored by the entity, the purposes of each committee and the extent to which the purposes have been achieved; and
(l) Details of all consultancies and contractors including:
i) consultants/contractors engaged;
ii) services provided; and
iii) expenditure committed to for each engagement.
Enquiries should be addressed to: [email protected]
24 La Trobe University
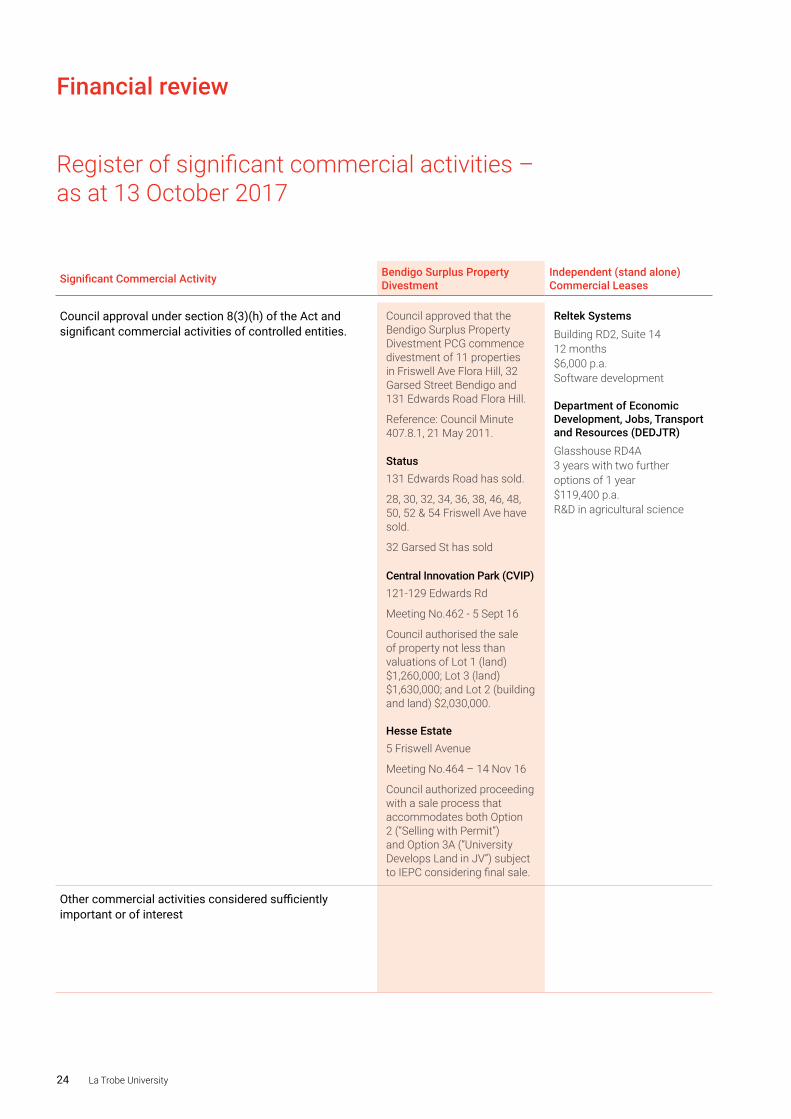
Financial review
Register of significant commercial activities – as at 13 October 2017
Significant Commercial Activity Bendigo Surplus PropertyDivestment
Independent (stand alone) Commercial Leases
Independent (stand alone)Commercial Leases
Independent (stand alone)Commercial Leases
Independent (stand alone)Commercial Leases
Independent (stand alone)Commercial Leases
Council approval under section 8(3)(h) of the Act and significant commercial activities of controlled entities.
Council approved that the Bendigo Surplus Property Divestment PCG commence divestment of 11 properties in Friswell Ave Flora Hill, 32 Garsed Street Bendigo and 131 Edwards Road Flora Hill.
Reference: Council Minute 407.8.1, 21 May 2011.
Status131 Edwards Road has sold.
28, 30, 32, 34, 36, 38, 46, 48, 50, 52 & 54 Friswell Ave have sold.
32 Garsed St has sold
Central Innovation Park (CVIP)121-129 Edwards Rd
Meeting No.462 - 5 Sept 16
Council authorised the sale of property not less than valuations of Lot 1 (land) $1,260,000; Lot 3 (land) $1,630,000; and Lot 2 (building and land) $2,030,000.
Hesse Estate 5 Friswell Avenue
Meeting No.464 – 14 Nov 16
Council authorized proceeding with a sale process that accommodates both Option 2 (“Selling with Permit”) and Option 3A (“University Develops Land in JV”) subject to IEPC considering final sale.
Reltek SystemsBuilding RD2, Suite 14 12 months $6,000 p.a. Software development
Department of Economic Development, Jobs, Transport and Resources (DEDJTR)Glasshouse RD4A 3 years with two further options of 1 year $119,400 p.a. R&D in agricultural science
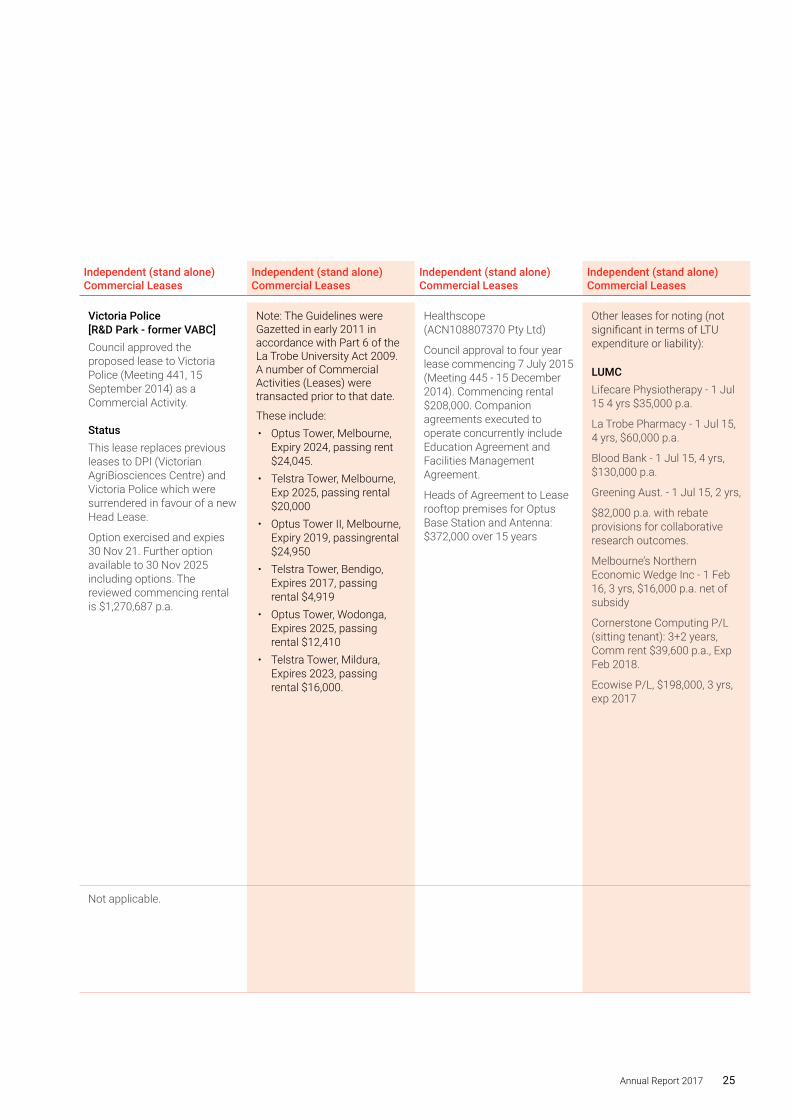
Victoria Police [R&D Park - former VABC]Council approved the proposed lease to Victoria Police (Meeting 441, 15 September 2014) as a Commercial Activity.
StatusThis lease replaces previous leases to DPI (Victorian AgriBiosciences Centre) and Victoria Police which were surrendered in favour of a new Head Lease.
Option exercised and expies 30 Nov 21. Further option available to 30 Nov 2025 including options. The reviewed commencing rental is $1,270,687 p.a.
Note: The Guidelines were Gazetted in early 2011 in accordance with Part 6 of the La Trobe University Act 2009. A number of Commercial Activities (Leases) were transacted prior to that date.
These include:• Optus Tower, Melbourne,
Expiry 2024, passing rent $24,045.
• Telstra Tower, Melbourne, Exp 2025, passing rental $20,000
• Optus Tower II, Melbourne, Expiry 2019, passingrental $24,950
• Telstra Tower, Bendigo, Expires 2017, passing rental $4,919
• Optus Tower, Wodonga, Expires 2025, passing rental $12,410
• Telstra Tower, Mildura, Expires 2023, passing rental $16,000.
Healthscope (ACN108807370 Pty Ltd)
Council approval to four year lease commencing 7 July 2015 (Meeting 445 - 15 December 2014). Commencing rental $208,000. Companion agreements executed to operate concurrently include Education Agreement and Facilities Management Agreement.
Heads of Agreement to Lease rooftop premises for Optus Base Station and Antenna: $372,000 over 15 years
Other leases for noting (not significant in terms of LTU expenditure or liability):
LUMCLifecare Physiotherapy - 1 Jul 15 4 yrs $35,000 p.a.
La Trobe Pharmacy - 1 Jul 15, 4 yrs, $60,000 p.a.
Blood Bank - 1 Jul 15, 4 yrs, $130,000 p.a.
Greening Aust. - 1 Jul 15, 2 yrs,
$82,000 p.a. with rebate provisions for collaborative research outcomes.
Melbourne’s Northern Economic Wedge Inc - 1 Feb 16, 3 yrs, $16,000 p.a. net of subsidy
Cornerstone Computing P/L (sitting tenant): 3+2 years, Comm rent $39,600 p.a., Exp Feb 2018.
Ecowise P/L, $198,000, 3 yrs, exp 2017
Other commercial activities considered sufficiently important or of interest
Not applicable.
Annual Report 2017 25
Significant Commercial Activity Bendigo Surplus PropertyDivestment
Independent (stand alone) Commercial Leases
Independent (stand alone)Commercial Leases
Independent (stand alone)Commercial Leases
Independent (stand alone)Commercial Leases
Independent (stand alone)Commercial Leases
Council approval under section 8(3)(h) of the Act and significant commercial activities of controlled entities.
Council approved that the Bendigo Surplus Property Divestment PCG commence divestment of 11 properties in Friswell Ave Flora Hill, 32 Garsed Street Bendigo and 131 Edwards Road Flora Hill.
Reference: Council Minute 407.8.1, 21 May 2011.
Status131 Edwards Road has sold.
28, 30, 32, 34, 36, 38, 46, 48, 50, 52 & 54 Friswell Ave have sold.
32 Garsed St has sold
Central Innovation Park (CVIP)121-129 Edwards Rd
Meeting No.462 - 5 Sept 16
Council authorised the sale of property not less than valuations of Lot 1 (land) $1,260,000; Lot 3 (land) $1,630,000; and Lot 2 (building and land) $2,030,000.
Hesse Estate 5 Friswell Avenue
Meeting No.464 – 14 Nov 16
Council authorized proceeding with a sale process that accommodates both Option 2 (“Selling with Permit”) and Option 3A (“University Develops Land in JV”) subject to IEPC considering final sale.
Reltek SystemsBuilding RD2, Suite 14 12 months $6,000 p.a. Software development
Department of Economic Development, Jobs, Transport and Resources (DEDJTR)Glasshouse RD4A 3 years with two further options of 1 year $119,400 p.a. R&D in agricultural science
Victoria Police [R&D Park - former VABC]Council approved the proposed lease to Victoria Police (Meeting 441, 15 September 2014) as a Commercial Activity.
StatusThis lease replaces previous leases to DPI (Victorian AgriBiosciences Centre) and Victoria Police which were surrendered in favour of a new Head Lease.
Option exercised and expies 30 Nov 21. Further option available to 30 Nov 2025 including options. The reviewed commencing rental is $1,270,687 p.a.
Note: The Guidelines were Gazetted in early 2011 in accordance with Part 6 of the La Trobe University Act 2009. A number of Commercial Activities (Leases) were transacted prior to that date.
These include:• Optus Tower, Melbourne,
Expiry 2024, passing rent $24,045.
• Telstra Tower, Melbourne, Exp 2025, passing rental $20,000
• Optus Tower II, Melbourne, Expiry 2019, passingrental $24,950
• Telstra Tower, Bendigo, Expires 2017, passing rental $4,919
• Optus Tower, Wodonga, Expires 2025, passing rental $12,410
• Telstra Tower, Mildura, Expires 2023, passing rental $16,000.
Healthscope (ACN108807370 Pty Ltd)
Council approval to four year lease commencing 7 July 2015 (Meeting 445 - 15 December 2014). Commencing rental $208,000. Companion agreements executed to operate concurrently include Education Agreement and Facilities Management Agreement.
Heads of Agreement to Lease rooftop premises for Optus Base Station and Antenna: $372,000 over 15 years
Other leases for noting (not significant in terms of LTU expenditure or liability):
LUMCLifecare Physiotherapy - 1 Jul 15 4 yrs $35,000 p.a.
La Trobe Pharmacy - 1 Jul 15, 4 yrs, $60,000 p.a.
Blood Bank - 1 Jul 15, 4 yrs, $130,000 p.a.
Greening Aust. - 1 Jul 15, 2 yrs,
$82,000 p.a. with rebate provisions for collaborative research outcomes.
Melbourne’s Northern Economic Wedge Inc - 1 Feb 16, 3 yrs, $16,000 p.a. net of subsidy
Cornerstone Computing P/L (sitting tenant): 3+2 years, Comm rent $39,600 p.a., Exp Feb 2018.
Ecowise P/L, $198,000, 3 yrs, exp 2017
Other commercial activities considered sufficiently important or of interest
Not applicable.
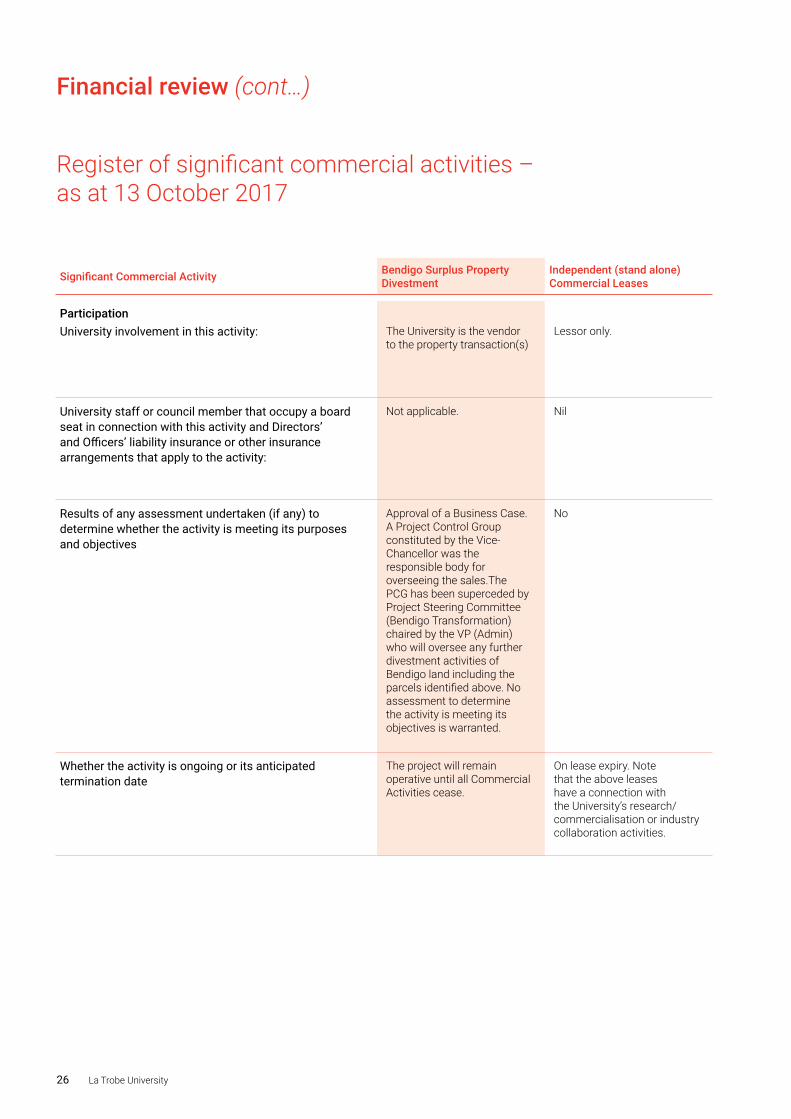
26 La Trobe University
Financial review (cont…)
Register of significant commercial activities – as at 13 October 2017
Significant Commercial Activity Bendigo Surplus PropertyDivestment
Independent (stand alone) Commercial Leases
Independent (stand alone)Commercial Leases
Independent (stand alone)Commercial Leases
Independent (stand alone)Commercial Leases
Independent (stand alone)Commercial Leases
ParticipationUniversity involvement in this activity: The University is the vendor
to the property transaction(s)Lessor only. La Trobe is Lessor.
The University and Forensics have scientific collaboration including a number of supervised post graduates.
Lessor only. Lessor only.
University staff or council member that occupy a board seat in connection with this activity and Directors’ and Officers’ liability insurance or other insurance arrangements that apply to the activity:
Not applicable. Nil Nil Nil Nil Nil
Results of any assessment undertaken (if any) to determine whether the activity is meeting its purposes and objectives
Approval of a Business Case. A Project Control Group constituted by the Vice-Chancellor was the responsible body for overseeing the sales.The PCG has been superceded by Project Steering Committee (Bendigo Transformation) chaired by the VP (Admin) who will oversee any further divestment activities of Bendigo land including the parcels identified above. No assessment to determine the activity is meeting its objectives is warranted.
No This was largely a consolidation exercise of existing leases but rental return was enhanced by increasing net lettable areas and taking up vacancies in building. The rental is subject to annual increments and periodic market reviews.
N/A No No
Whether the activity is ongoing or its anticipated termination date
The project will remain operative until all Commercial Activities cease.
On lease expiry. Note that the above leases have a connection with the University’s research/commercialisation or industry collaboration activities.
The next option is available effective 1 Dec 2021.
Various expiry dates Lease expires 2019. Negotiations in progress for new hospital.
On lease expiry.
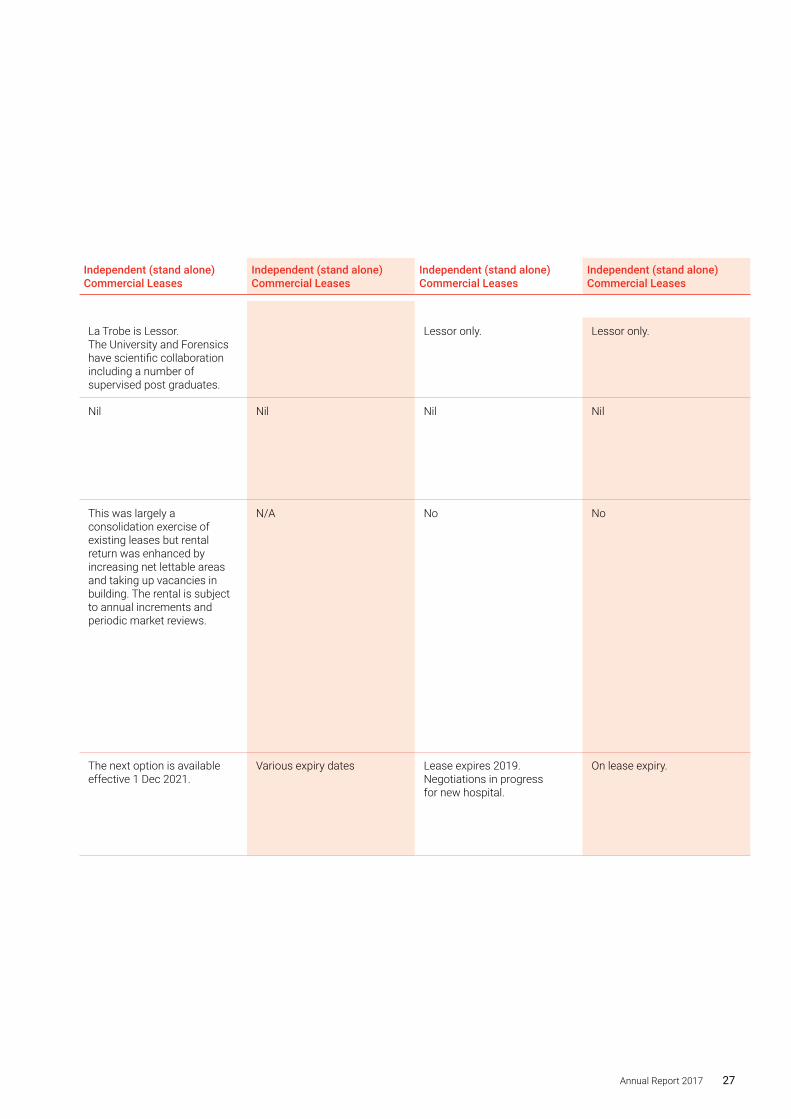
Annual Report 2017 27
Significant Commercial Activity Bendigo Surplus PropertyDivestment
Independent (stand alone) Commercial Leases
Independent (stand alone)Commercial Leases
Independent (stand alone)Commercial Leases
Independent (stand alone)Commercial Leases
Independent (stand alone)Commercial Leases
ParticipationUniversity involvement in this activity: The University is the vendor
to the property transaction(s)Lessor only. La Trobe is Lessor.
The University and Forensics have scientific collaboration including a number of supervised post graduates.
Lessor only. Lessor only.
University staff or council member that occupy a board seat in connection with this activity and Directors’ and Officers’ liability insurance or other insurance arrangements that apply to the activity:
Not applicable. Nil Nil Nil Nil Nil
Results of any assessment undertaken (if any) to determine whether the activity is meeting its purposes and objectives
Approval of a Business Case. A Project Control Group constituted by the Vice-Chancellor was the responsible body for overseeing the sales.The PCG has been superceded by Project Steering Committee (Bendigo Transformation) chaired by the VP (Admin) who will oversee any further divestment activities of Bendigo land including the parcels identified above. No assessment to determine the activity is meeting its objectives is warranted.
No This was largely a consolidation exercise of existing leases but rental return was enhanced by increasing net lettable areas and taking up vacancies in building. The rental is subject to annual increments and periodic market reviews.
N/A No No
Whether the activity is ongoing or its anticipated termination date
The project will remain operative until all Commercial Activities cease.
On lease expiry. Note that the above leases have a connection with the University’s research/commercialisation or industry collaboration activities.
The next option is available effective 1 Dec 2021.
Various expiry dates Lease expires 2019. Negotiations in progress for new hospital.
On lease expiry.
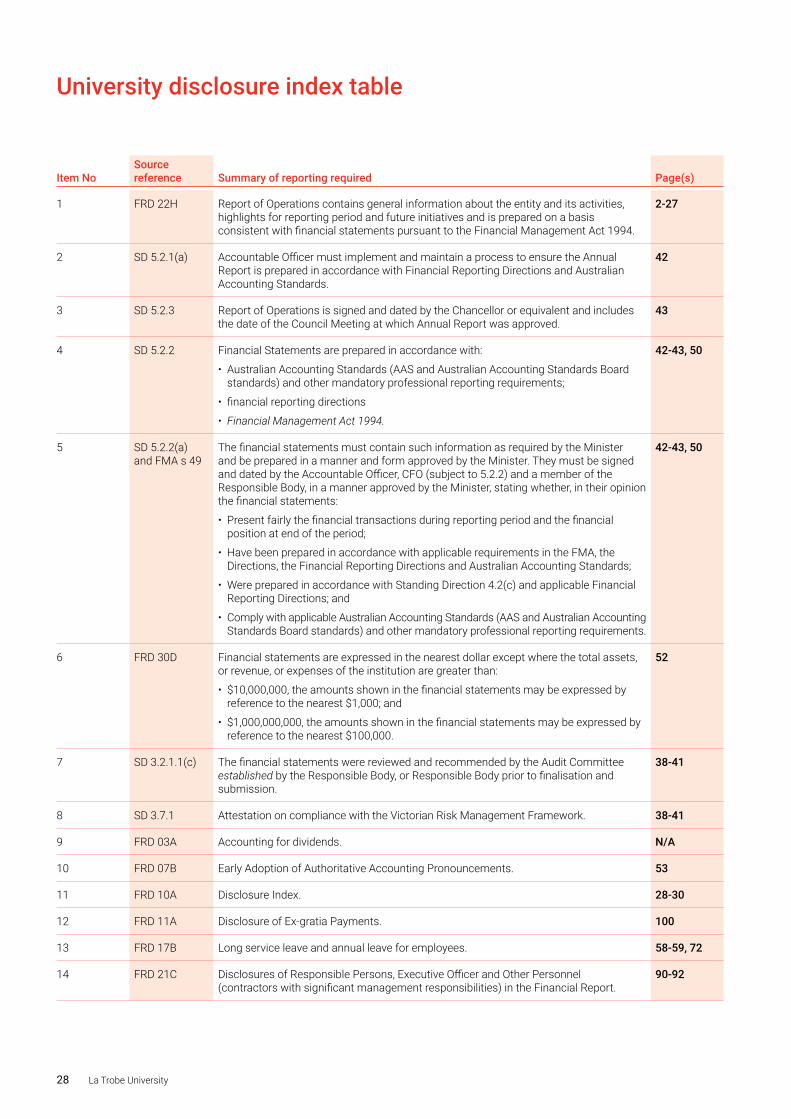
28 La Trobe University
University disclosure index table
Item NoSource reference
Summary of reporting required
Page(s)
1 FRD 22H Report of Operations contains general information about the entity and its activities, highlights for reporting period and future initiatives and is prepared on a basis consistent with financial statements pursuant to the Financial Management Act 1994.
2-27
2 SD 5.2.1(a) Accountable Officer must implement and maintain a process to ensure the Annual Report is prepared in accordance with Financial Reporting Directions and Australian Accounting Standards.
42
3 SD 5.2.3 Report of Operations is signed and dated by the Chancellor or equivalent and includes the date of the Council Meeting at which Annual Report was approved.
43
4 SD 5.2.2 Financial Statements are prepared in accordance with:
• Australian Accounting Standards (AAS and Australian Accounting Standards Board standards) and other mandatory professional reporting requirements;
• financial reporting directions
• Financial Management Act 1994.
42-43, 50
5 SD 5.2.2(a) and FMA s 49
The financial statements must contain such information as required by the Minister and be prepared in a manner and form approved by the Minister. They must be signed and dated by the Accountable Officer, CFO (subject to 5.2.2) and a member of the Responsible Body, in a manner approved by the Minister, stating whether, in their opinion the financial statements:
• Present fairly the financial transactions during reporting period and the financial position at end of the period;
• Have been prepared in accordance with applicable requirements in the FMA, the Directions, the Financial Reporting Directions and Australian Accounting Standards;
• Were prepared in accordance with Standing Direction 4.2(c) and applicable Financial Reporting Directions; and
• Comply with applicable Australian Accounting Standards (AAS and Australian Accounting Standards Board standards) and other mandatory professional reporting requirements.
42-43, 50
6 FRD 30D Financial statements are expressed in the nearest dollar except where the total assets, or revenue, or expenses of the institution are greater than:
• $10,000,000, the amounts shown in the financial statements may be expressed by reference to the nearest $1,000; and
• $1,000,000,000, the amounts shown in the financial statements may be expressed by reference to the nearest $100,000.
52
7 SD 3.2.1.1(c) The financial statements were reviewed and recommended by the Audit Committee established by the Responsible Body, or Responsible Body prior to finalisation and submission.
38-41
8 SD 3.7.1 Attestation on compliance with the Victorian Risk Management Framework. 38-41
9 FRD 03A Accounting for dividends. N/A
10 FRD 07B Early Adoption of Authoritative Accounting Pronouncements. 53
11 FRD 10A Disclosure Index. 28-30
12 FRD 11A Disclosure of Ex-gratia Payments. 100
13 FRD 17B Long service leave and annual leave for employees. 58-59, 72
14 FRD 21C Disclosures of Responsible Persons, Executive Officer and Other Personnel (contractors with significant management responsibilities) in the Financial Report.
90-92
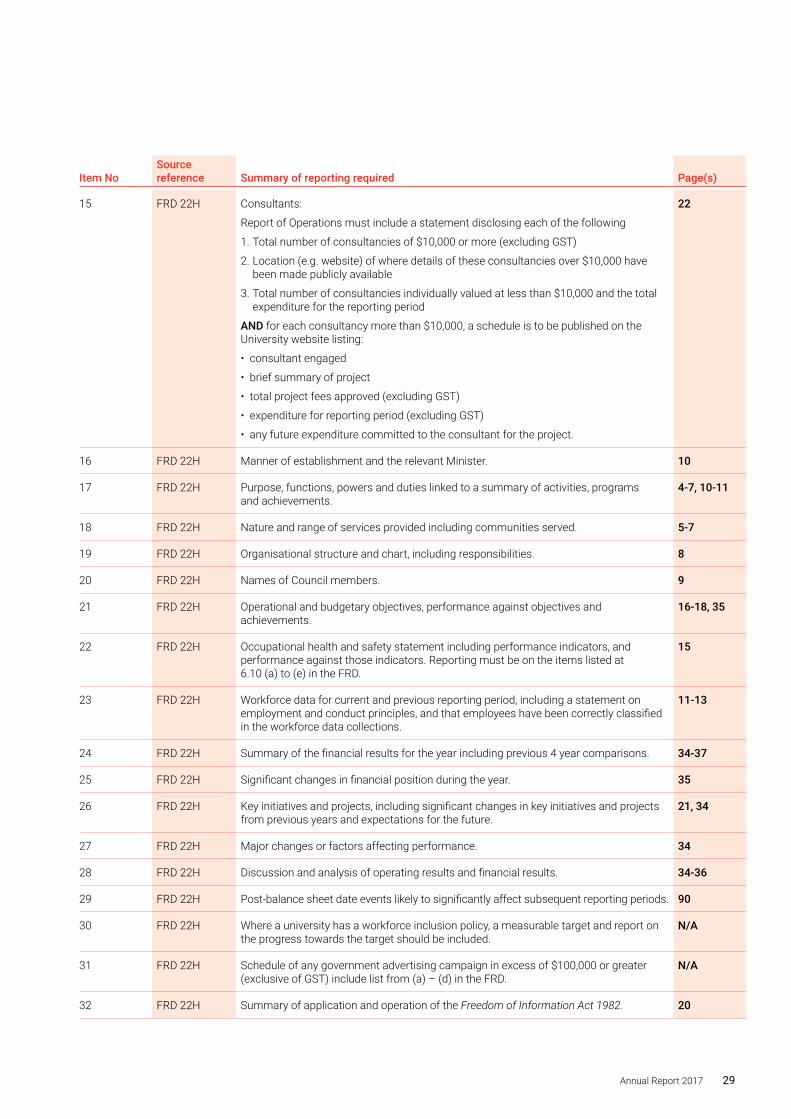
Annual Report 2017 29
Item NoSource reference
Summary of reporting required
Page(s)
15 FRD 22H Consultants:
Report of Operations must include a statement disclosing each of the following
1. Total number of consultancies of $10,000 or more (excluding GST)
2. Location (e.g. website) of where details of these consultancies over $10,000 have been made publicly available
3. Total number of consultancies individually valued at less than $10,000 and the total expenditure for the reporting period
AND for each consultancy more than $10,000, a schedule is to be published on the University website listing:
• consultant engaged
• brief summary of project
• total project fees approved (excluding GST)
• expenditure for reporting period (excluding GST)
• any future expenditure committed to the consultant for the project.
22
16 FRD 22H Manner of establishment and the relevant Minister. 10
17 FRD 22H Purpose, functions, powers and duties linked to a summary of activities, programs and achievements.
4-7, 10-11
18 FRD 22H Nature and range of services provided including communities served. 5-7
19 FRD 22H Organisational structure and chart, including responsibilities. 8
20 FRD 22H Names of Council members. 9
21 FRD 22H Operational and budgetary objectives, performance against objectives and achievements.
16-18, 35
22 FRD 22H Occupational health and safety statement including performance indicators, and performance against those indicators. Reporting must be on the items listed at 6.10 (a) to (e) in the FRD.
15
23 FRD 22H Workforce data for current and previous reporting period, including a statement on employment and conduct principles, and that employees have been correctly classified in the workforce data collections.
11-13
24 FRD 22H Summary of the financial results for the year including previous 4 year comparisons. 34-37
25 FRD 22H Significant changes in financial position during the year. 35
26 FRD 22H Key initiatives and projects, including significant changes in key initiatives and projects from previous years and expectations for the future.
21, 34
27 FRD 22H Major changes or factors affecting performance. 34
28 FRD 22H Discussion and analysis of operating results and financial results. 34-36
29 FRD 22H Post-balance sheet date events likely to significantly affect subsequent reporting periods. 90
30 FRD 22H Where a university has a workforce inclusion policy, a measurable target and report on the progress towards the target should be included.
N/A
31 FRD 22H Schedule of any government advertising campaign in excess of $100,000 or greater (exclusive of GST) include list from (a) – (d) in the FRD.
N/A
32 FRD 22H Summary of application and operation of the Freedom of Information Act 1982. 20
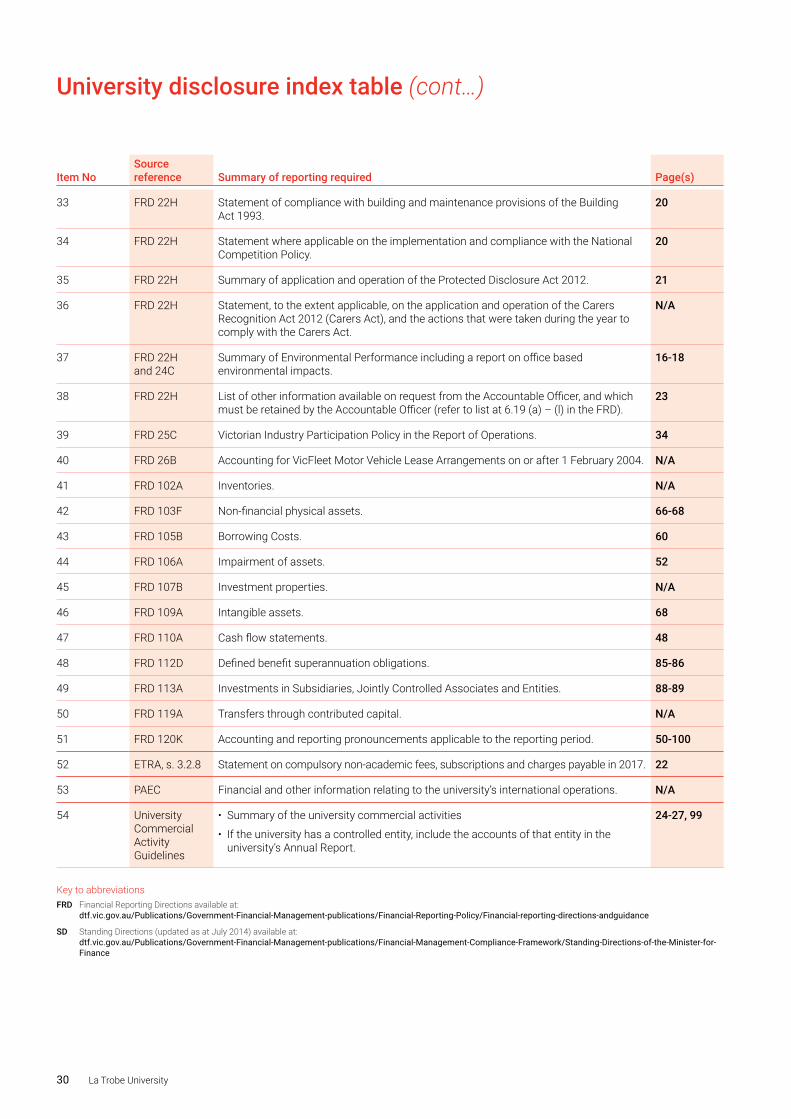
30 La Trobe University
Item NoSource reference
Summary of reporting required
Page(s)
33 FRD 22H Statement of compliance with building and maintenance provisions of the Building Act 1993.
20
34 FRD 22H Statement where applicable on the implementation and compliance with the National Competition Policy.
20
35 FRD 22H Summary of application and operation of the Protected Disclosure Act 2012. 21
36 FRD 22H Statement, to the extent applicable, on the application and operation of the Carers Recognition Act 2012 (Carers Act), and the actions that were taken during the year to comply with the Carers Act.
N/A
37 FRD 22H and 24C
Summary of Environmental Performance including a report on office based environmental impacts.
16-18
38 FRD 22H List of other information available on request from the Accountable Officer, and which must be retained by the Accountable Officer (refer to list at 6.19 (a) – (l) in the FRD).
23
39 FRD 25C Victorian Industry Participation Policy in the Report of Operations. 34
40 FRD 26B Accounting for VicFleet Motor Vehicle Lease Arrangements on or after 1 February 2004. N/A
41 FRD 102A Inventories. N/A
42 FRD 103F Non-financial physical assets. 66-68
43 FRD 105B Borrowing Costs. 60
44 FRD 106A Impairment of assets. 52
45 FRD 107B Investment properties. N/A
46 FRD 109A Intangible assets. 68
47 FRD 110A Cash flow statements. 48
48 FRD 112D Defined benefit superannuation obligations. 85-86
49 FRD 113A Investments in Subsidiaries, Jointly Controlled Associates and Entities. 88-89
50 FRD 119A Transfers through contributed capital. N/A
51 FRD 120K Accounting and reporting pronouncements applicable to the reporting period. 50-100
52 ETRA, s. 3.2.8 Statement on compulsory non-academic fees, subscriptions and charges payable in 2017. 22
53 PAEC Financial and other information relating to the university’s international operations. N/A
54 University Commercial Activity Guidelines
• Summary of the university commercial activities
• If the university has a controlled entity, include the accounts of that entity in the university’s Annual Report.
24-27, 99
Key to abbreviationsFRD Financial Reporting Directions available at:
dtf.vic.gov.au/Publications/Government-Financial-Management-publications/Financial-Reporting-Policy/Financial-reporting-directions-andguidance
SD Standing Directions (updated as at July 2014) available at: dtf.vic.gov.au/Publications/Government-Financial-Management-publications/Financial-Management-Compliance-Framework/Standing-Directions-of-the-Minister-for-Finance
University disclosure index table (cont…)
Annual Report 2017 31
Financial Statements for La Trobe University for the 2017 Reporting Period.
DRAFT
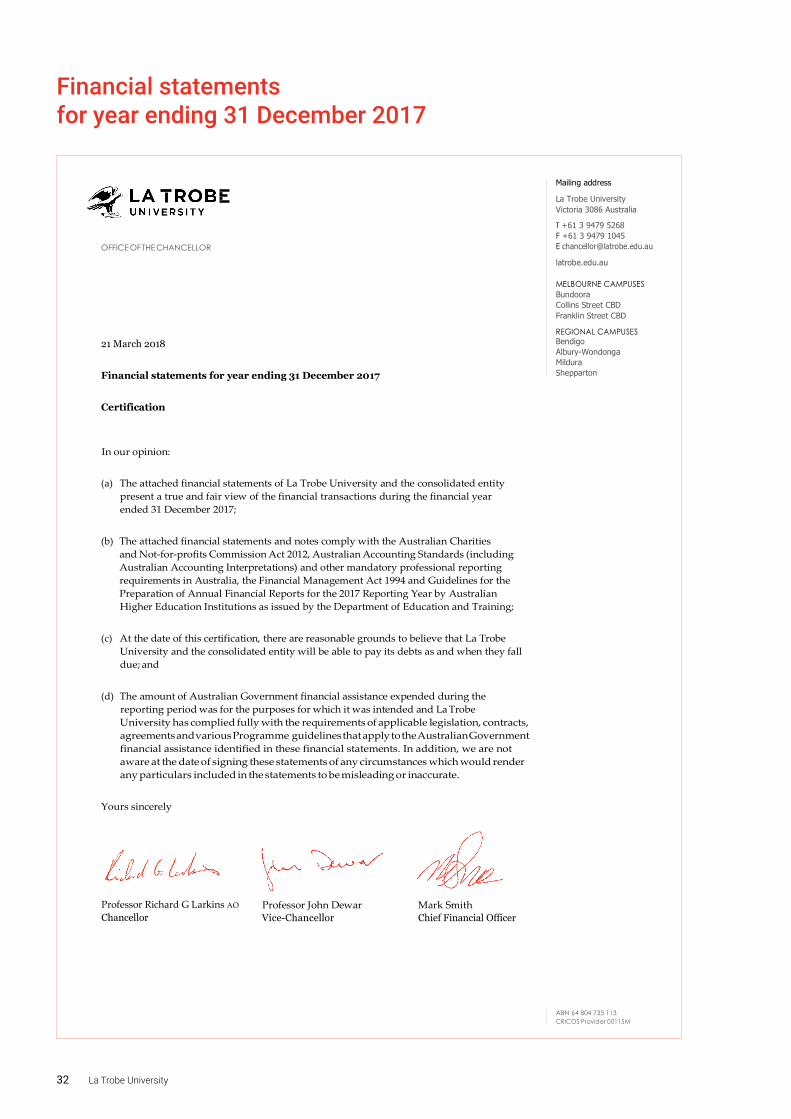
32 La Trobe University
Financial statements for year ending 31 December 2017
Mailing address
La Trobe University Victoria 3086 Australia
T +61 3 9479 5268 F +61 3 9479 1045 E [email protected]
latrobe.edu.au
OFFICE OF THE CHANCELLOR
MELBOURNE CAMPUSES Bundoora Collins Street CBD Franklin Street CBD
REGIONAL CAMPUSES
ABN 64 804 735 113 CRICOS Provider 00115M
21 March 2018
Financial statements for year ending 31 December 2017
Certification
Bendigo Albury-Wondonga Mildura Shepparton
In our opinion:
(a) The attached financial statements of La Trobe University and the consolidated entity
present a true and fair view of the financial transactions during the financial year ended 31 December 2017;
(b) The attached financial statements and notes comply with the Australian Charities
and Not-for-profits Commission Act 2012, Australian Accounting Standards (including Australian Accounting Interpretations) and other mandatory professional reporting requirements in Australia, the Financial Management Act 1994 and Guidelines for the Preparation of Annual Financial Reports for the 2017 Reporting Year by Australian Higher Education Institutions as issued by the Department of Education and Training;
(c) At the date of this certification, there are reasonable grounds to believe that La Trobe
University and the consolidated entity will be able to pay its debts as and when they fall due; and
(d) The amount of Australian Government financial assistance expended during the
reporting period was for the purposes for which it was intended and La Trobe University has complied fully with the requirements of applicable legislation, contracts, agreements and various Programme guidelines that apply to the Australian Government financial assistance identified in these financial statements. In addition, we are not aware at the date of signing these statements of any circumstances which would render any particulars included in the statements to be misleading or inaccurate.
Yours sincerely
Professor Richard G Larkins AO Chancellor
Professor John Dewar Vice-Chancellor
Mark Smith Chief Financial Officer
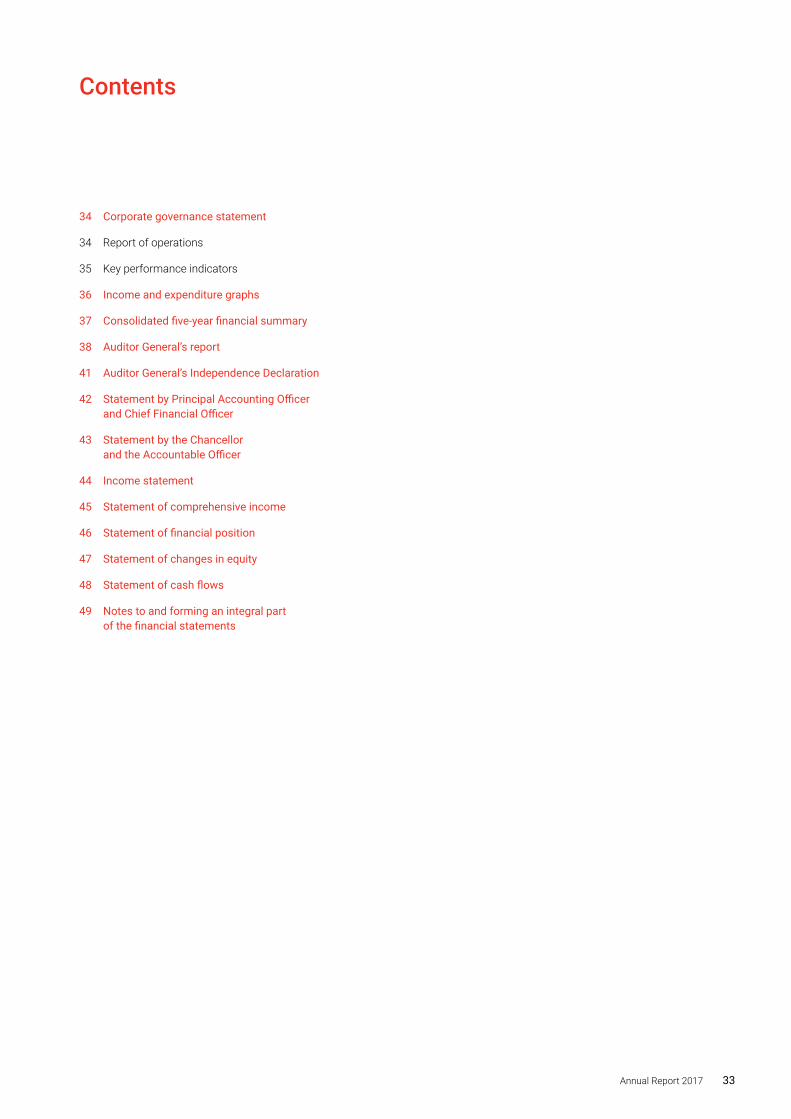
Annual Report 2017 33
34 Corporate governance statement
34 Report of operations
35 Key performance indicators
36 Income and expenditure graphs
37 Consolidated five-year financial summary
38 Auditor General’s report
41 Auditor General’s Independence Declaration
42 Statement by Principal Accounting Officer and Chief Financial Officer
43 Statement by the Chancellor and the Accountable Officer
44 Income statement
45 Statement of comprehensive income
46 Statement of financial position
47 Statement of changes in equity
48 Statement of cash flows
49 Notes to and forming an integral part of the financial statements
Contents
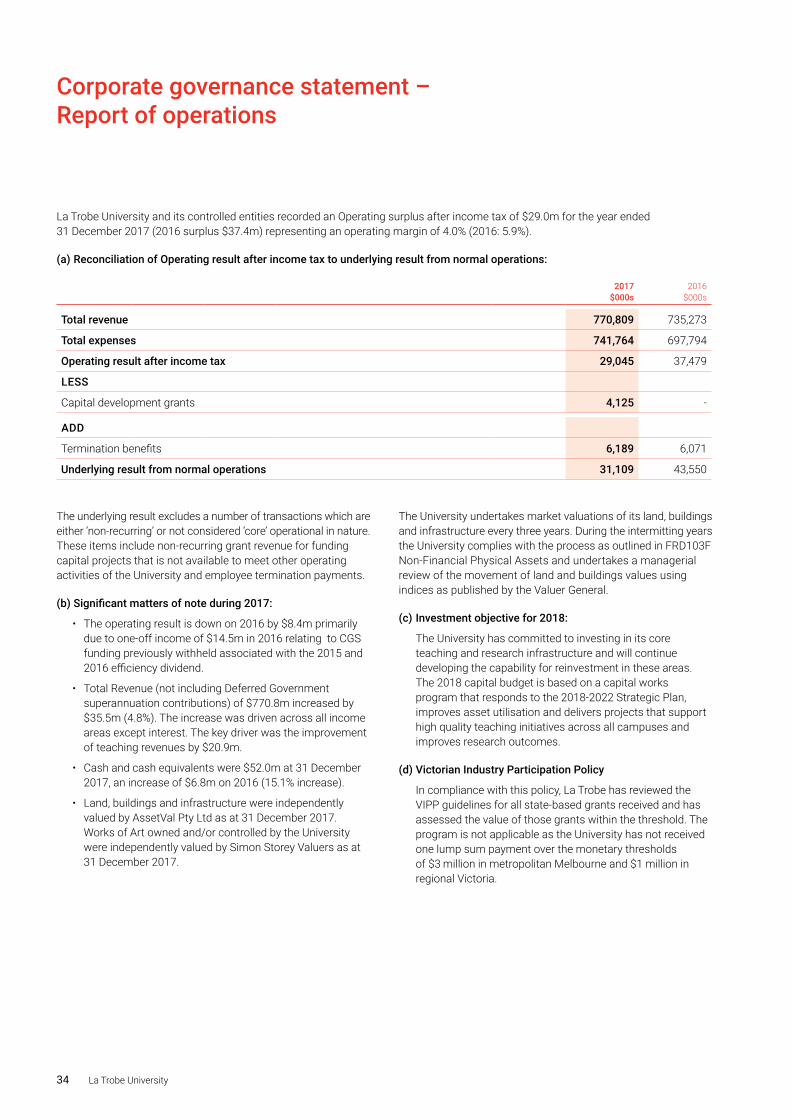
34 La Trobe University
Corporate governance statement –Report of operations
La Trobe University and its controlled entities recorded an Operating surplus after income tax of $29.0m for the year ended 31 December 2017 (2016 surplus $37.4m) representing an operating margin of 4.0% (2016: 5.9%).
(a) Reconciliation of Operating result after income tax to underlying result from normal operations:
2017$000s
2016$000s
Total revenue 770,809 735,273
Total expenses 741,764 697,794
Operating result after income tax 29,045 37,479
LESS
Capital development grants 4,125 -
ADD
Termination benefits 6,189 6,071
Underlying result from normal operations 31,109 43,550
The underlying result excludes a number of transactions which are either ‘non-recurring’ or not considered ‘core’ operational in nature. These items include non-recurring grant revenue for funding capital projects that is not available to meet other operating activities of the University and employee termination payments.
(b) Significant matters of note during 2017:
• The operating result is down on 2016 by $8.4m primarily due to one-off income of $14.5m in 2016 relating to CGS funding previously withheld associated with the 2015 and 2016 efficiency dividend.
• Total Revenue (not including Deferred Government superannuation contributions) of $770.8m increased by $35.5m (4.8%). The increase was driven across all income areas except interest. The key driver was the improvement of teaching revenues by $20.9m.
• Cash and cash equivalents were $52.0m at 31 December 2017, an increase of $6.8m on 2016 (15.1% increase).
• Land, buildings and infrastructure were independently valued by AssetVal Pty Ltd as at 31 December 2017. Works of Art owned and/or controlled by the University were independently valued by Simon Storey Valuers as at 31 December 2017.
The University undertakes market valuations of its land, buildings and infrastructure every three years. During the intermitting years the University complies with the process as outlined in FRD103F Non-Financial Physical Assets and undertakes a managerial review of the movement of land and buildings values using indices as published by the Valuer General.
(c) Investment objective for 2018:
The University has committed to investing in its core teaching and research infrastructure and will continue developing the capability for reinvestment in these areas. The 2018 capital budget is based on a capital works program that responds to the 2018-2022 Strategic Plan, improves asset utilisation and delivers projects that support high quality teaching initiatives across all campuses and improves research outcomes.
(d) Victorian Industry Participation Policy
In compliance with this policy, La Trobe has reviewed the VIPP guidelines for all state-based grants received and has assessed the value of those grants within the threshold. The program is not applicable as the University has not received one lump sum payment over the monetary thresholds of $3 million in metropolitan Melbourne and $1 million in regional Victoria.
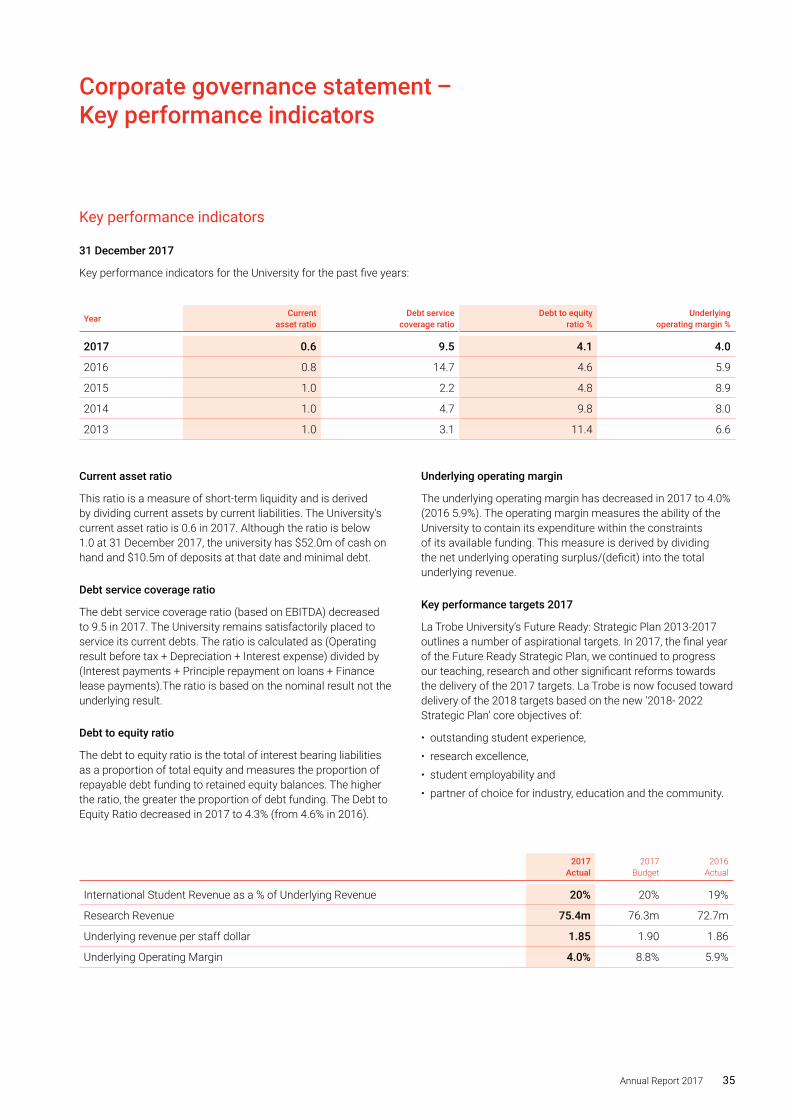
Annual Report 2017 35
Corporate governance statement – Key performance indicators
Key performance indicators
31 December 2017
Key performance indicators for the University for the past five years:
Year Current asset ratio
Debt service coverage ratio
Debt to equity ratio %
Underlying operating margin %
2017 0.6 9.5 4.1 4.0
2016 0.8 14.7 4.6 5.9
2015 1.0 2.2 4.8 8.9
2014 1.0 4.7 9.8 8.0
2013 1.0 3.1 11.4 6.6
Current asset ratio
This ratio is a measure of short-term liquidity and is derived by dividing current assets by current liabilities. The University’s current asset ratio is 0.6 in 2017. Although the ratio is below 1.0 at 31 December 2017, the university has $52.0m of cash on hand and $10.5m of deposits at that date and minimal debt.
Debt service coverage ratio
The debt service coverage ratio (based on EBITDA) decreased to 9.5 in 2017. The University remains satisfactorily placed to service its current debts. The ratio is calculated as (Operating result before tax + Depreciation + Interest expense) divided by (Interest payments + Principle repayment on loans + Finance lease payments).The ratio is based on the nominal result not the underlying result.
Debt to equity ratio
The debt to equity ratio is the total of interest bearing liabilities as a proportion of total equity and measures the proportion of repayable debt funding to retained equity balances. The higher the ratio, the greater the proportion of debt funding. The Debt to Equity Ratio decreased in 2017 to 4.3% (from 4.6% in 2016).
Underlying operating margin
The underlying operating margin has decreased in 2017 to 4.0% (2016 5.9%). The operating margin measures the ability of the University to contain its expenditure within the constraints of its available funding. This measure is derived by dividing the net underlying operating surplus/(deficit) into the total underlying revenue.
Key performance targets 2017
La Trobe University’s Future Ready: Strategic Plan 2013-2017 outlines a number of aspirational targets. In 2017, the final year of the Future Ready Strategic Plan, we continued to progress our teaching, research and other significant reforms towards the delivery of the 2017 targets. La Trobe is now focused toward delivery of the 2018 targets based on the new ‘2018- 2022 Strategic Plan’ core objectives of:
• outstanding student experience,
• research excellence,
• student employability and
• partner of choice for industry, education and the community.
2017Actual
2017Budget
2016Actual
International Student Revenue as a % of Underlying Revenue 20% 20% 19%
Research Revenue 75.4m 76.3m 72.7m
Underlying revenue per staff dollar 1.85 1.90 1.86
Underlying Operating Margin 4.0% 8.8% 5.9%
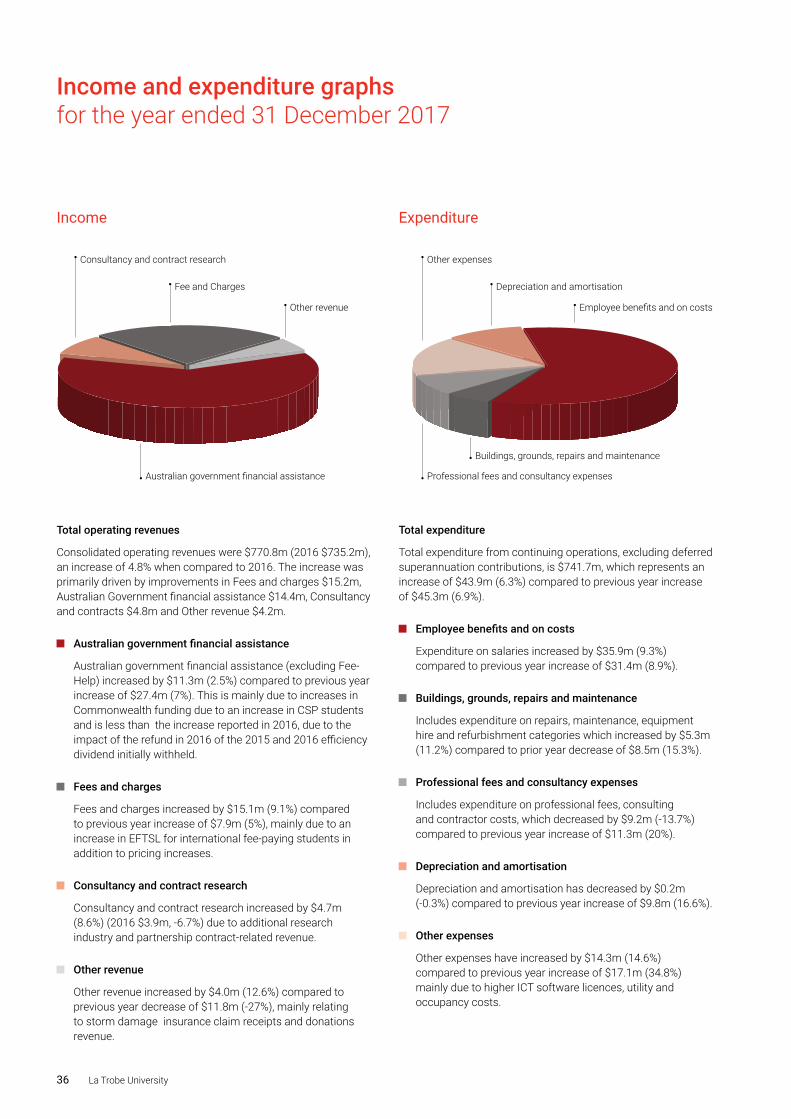
36 La Trobe University
Income and expenditure graphsfor the year ended 31 December 2017
Total operating revenues
Consolidated operating revenues were $770.8m (2016 $735.2m), an increase of 4.8% when compared to 2016. The increase was primarily driven by improvements in Fees and charges $15.2m, Australian Government financial assistance $14.4m, Consultancy and contracts $4.8m and Other revenue $4.2m.
Australian government financial assistance
Australian government financial assistance (excluding Fee-Help) increased by $11.3m (2.5%) compared to previous year increase of $27.4m (7%). This is mainly due to increases in Commonwealth funding due to an increase in CSP students and is less than the increase reported in 2016, due to the impact of the refund in 2016 of the 2015 and 2016 efficiency dividend initially withheld.
Fees and charges
Fees and charges increased by $15.1m (9.1%) compared to previous year increase of $7.9m (5%), mainly due to an increase in EFTSL for international fee-paying students in addition to pricing increases.
Consultancy and contract research
Consultancy and contract research increased by $4.7m (8.6%) (2016 $3.9m, -6.7%) due to additional research industry and partnership contract-related revenue.
Other revenue
Other revenue increased by $4.0m (12.6%) compared to previous year decrease of $11.8m (-27%), mainly relating to storm damage insurance claim receipts and donations revenue.
Total expenditure
Total expenditure from continuing operations, excluding deferred superannuation contributions, is $741.7m, which represents an increase of $43.9m (6.3%) compared to previous year increase of $45.3m (6.9%).
Employee benefits and on costs
Expenditure on salaries increased by $35.9m (9.3%) compared to previous year increase of $31.4m (8.9%).
Buildings, grounds, repairs and maintenance
Includes expenditure on repairs, maintenance, equipment hire and refurbishment categories which increased by $5.3m (11.2%) compared to prior year decrease of $8.5m (15.3%).
Professional fees and consultancy expenses
Includes expenditure on professional fees, consulting and contractor costs, which decreased by $9.2m (-13.7%) compared to previous year increase of $11.3m (20%).
Depreciation and amortisation
Depreciation and amortisation has decreased by $0.2m (-0.3%) compared to previous year increase of $9.8m (16.6%).
Other expenses
Other expenses have increased by $14.3m (14.6%) compared to previous year increase of $17.1m (34.8%) mainly due to higher ICT software licences, utility and occupancy costs.
Income Expenditure
Australian government financial assistance
Fee and Charges
Consultancy and contract research
Other revenue
Income Expenditure
Employee benefits and on costs
Buildings, grounds, repairs and maintenance
Professional fees and consultancy expenses
Other expenses
Depreciation and amortisation
IncomeExpenditure
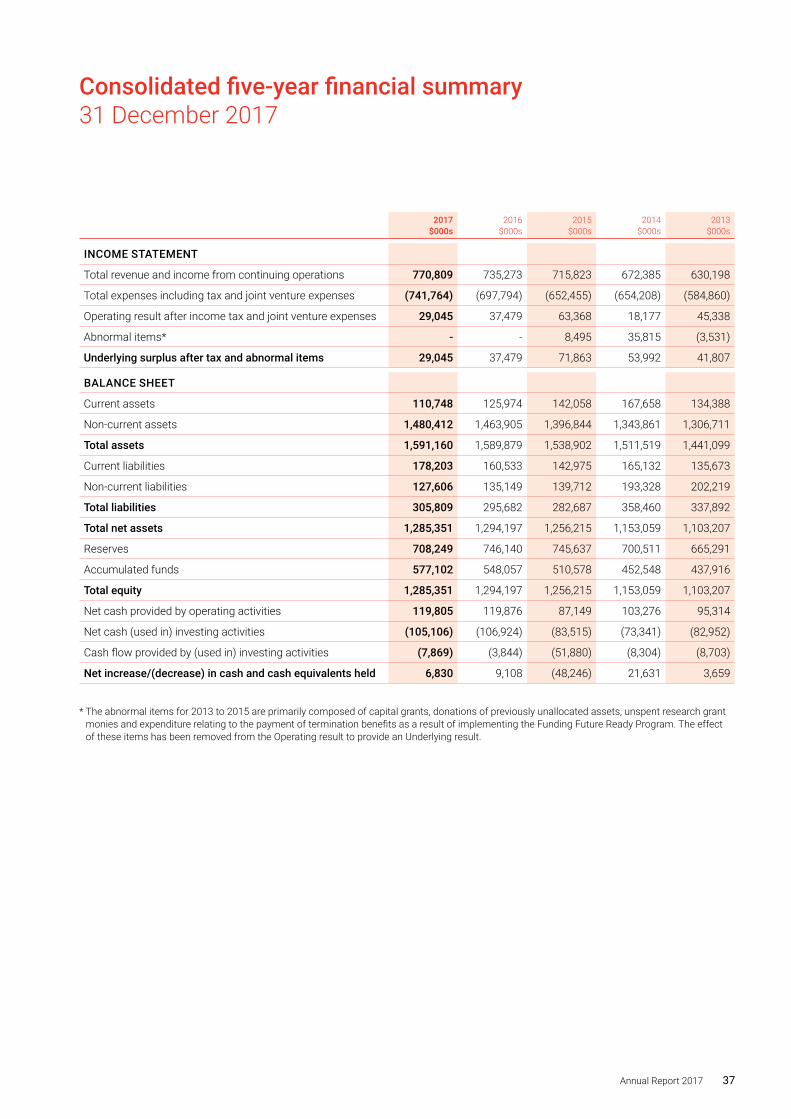
Annual Report 2017 37
Consolidated five-year financial summary31 December 2017
2017$000s
2016$000s
2015$000s
2014$000s
2013$000s
INCOME STATEMENT
Total revenue and income from continuing operations 770,809 735,273 715,823 672,385 630,198
Total expenses including tax and joint venture expenses (741,764) (697,794) (652,455) (654,208) (584,860)
Operating result after income tax and joint venture expenses 29,045 37,479 63,368 18,177 45,338
Abnormal items* - - 8,495 35,815 (3,531)
Underlying surplus after tax and abnormal items 29,045 37,479 71,863 53,992 41,807
BALANCE SHEET
Current assets 110,748 125,974 142,058 167,658 134,388
Non-current assets 1,480,412 1,463,905 1,396,844 1,343,861 1,306,711
Total assets 1,591,160 1,589,879 1,538,902 1,511,519 1,441,099
Current liabilities 178,203 160,533 142,975 165,132 135,673
Non-current liabilities 127,606 135,149 139,712 193,328 202,219
Total liabilities 305,809 295,682 282,687 358,460 337,892
Total net assets 1,285,351 1,294,197 1,256,215 1,153,059 1,103,207
Reserves 708,249 746,140 745,637 700,511 665,291
Accumulated funds 577,102 548,057 510,578 452,548 437,916
Total equity 1,285,351 1,294,197 1,256,215 1,153,059 1,103,207
Net cash provided by operating activities 119,805 119,876 87,149 103,276 95,314
Net cash (used in) investing activities (105,106) (106,924) (83,515) (73,341) (82,952)
Cash flow provided by (used in) investing activities (7,869) (3,844) (51,880) (8,304) (8,703)
Net increase/(decrease) in cash and cash equivalents held 6,830 9,108 (48,246) 21,631 3,659
* The abnormal items for 2013 to 2015 are primarily composed of capital grants, donations of previously unallocated assets, unspent research grant monies and expenditure relating to the payment of termination benefits as a result of implementing the Funding Future Ready Program. The effect of these items has been removed from the Operating result to provide an Underlying result.
38 La Trobe University
Auditor General’s Report to the Council members of La Trobe University
Independent Auditor’s Report To the Council of La Trobe University
Opinion I have audited the consolidated financial report of La Trobe University (the university) and its controlled entities (together the consolidated entity) which comprises the:
consolidated entity statement of financial position as at 31 December 2017 consolidated entity income statement and statement of comprehensive income for
the year then ended consolidated entity statement of changes in equity for the year then ended consolidated entity statement of cash flows for the year then ended notes to the financial statements, including a summary of significant accounting
policies statements by the Principal Accounting Officer, Chief Financial Officer, Chancellor
and Accountable Officer.
In my opinion the financial report is in accordance with the financial reporting requirements of Part 7 of the Financial Management Act 1994 and Division 60 of the Australian Charities and Not-for-profits Commission Act 2012 including:
giving a true and fair view of the financial position of the university and the consolidated entity as at 31 December 2017 and their financial performance and cash flows for the year then ended
complying with Australian Accounting Standards and Division 60 of the Australian Charities and Not-for-profits Commission Regulations 2013.
Basis for Opinion
I have conducted my audit in accordance with the Audit Act 1994 which incorporates the Australian Auditing Standards. My responsibilities under the Act are further described in the Auditor’s Responsibilities for the Audit of the Financial Report section of my report.
My independence is established by the Constitution Act 1975. My staff and I are independent of the university and the consolidated entity in accordance with the auditor independence requirements of the Australian Charities and Not-for-profits Commission Act 2012 and the ethical requirements of the Accounting Professional and Ethical Standards Board’s APES 110 Code of Ethics for Professional Accountants (the Code) that are relevant to my audit of the financial report in Australia. My staff and I have also fulfilled our other ethical responsibilities in accordance with the Code.
I believe that the audit evidence I have obtained is sufficient and appropriate to provide a basis for my opinion.
Annual Report 2017 39
2
Council's responsibilities for the financial report
The Council of the University is responsible for the preparation of a financial report that gives a true and fair view in accordance with Australian Accounting Standards, the Financial Management Act 1994 and the Australian Charities and Not-for-profits Commission Act 2012, and for such internal control as the Council determines is necessary to enable the preparation of a financial report that gives a true and fair view and is free from material misstatement, whether due to fraud or error.
In preparing the financial report, the Council is responsible for assessing the university and the consolidated entity’s ability to continue as a going concern, disclosing, as applicable, matters related to going concern and using the going concern basis of accounting unless it is inappropriate to do so.
Auditor’s responsibilities for the audit of the financial report
As required by the Audit Act 1994, my responsibility is to express an opinion on the financial report based on the audit. My objectives for the audit are to obtain reasonable assurance about whether the financial report as a whole is free from material misstatement, whether due to fraud or error, and to issue an auditor’s report that includes my opinion. Reasonable assurance is a high level of assurance, but is not a guarantee that an audit conducted in accordance with the Australian Auditing Standards will always detect a material misstatement when it exists. Misstatements can arise from fraud or error and are considered material if, individually or in the aggregate, they could reasonably be expected to influence the economic decisions of users taken on the basis of this financial report.
As part of an audit in accordance with the Australian Auditing Standards, I exercise professional judgement and maintain professional scepticism throughout the audit. I also:
identify and assess the risks of material misstatement of the financial report, whether due to fraud or error, design and perform audit procedures responsive to those risks, and obtain audit evidence that is sufficient and appropriate to provide a basis for my opinion. The risk of not detecting a material misstatement resulting from fraud is higher than for one resulting from error, as fraud may involve collusion, forgery, intentional omissions, misrepresentations, or the override of internal control.
obtain an understanding of internal control relevant to the audit in order to design audit procedures that are appropriate in the circumstances, but not for the purpose of expressing an opinion on the effectiveness of the university and the consolidated entity’s internal control
evaluate the appropriateness of accounting policies used and the reasonableness of accounting estimates and related disclosures made by the Council
conclude on the appropriateness of the Council’s use of the going concern basis of accounting and, based on the audit evidence obtained, whether a material uncertainty exists related to events or conditions that may cast significant doubt on the university and the consolidated entity’s ability to continue as a going concern. If I conclude that a material uncertainty exists, I am required to draw attention in my auditor’s report to the related disclosures in the financial report or, if such disclosures are inadequate, to modify my opinion. My conclusions are based on the audit evidence obtained up to the date of my auditor’s report. However, future events or conditions may cause the university and the consolidated entity to cease to continue as a going concern.
40 La Trobe University
Auditor General’s Report to the Council members of La Trobe University (cont…)
3
Auditor’s responsibilities for the audit of the financial report (continued)
evaluate the overall presentation, structure and content of the financial report, including the disclosures, and whether the financial report represents the underlying transactions and events in a manner that achieves fair presentation
obtain sufficient appropriate audit evidence regarding the financial information of the entities and business activities within the university and the consolidated entity to express an opinion on the financial report. I am responsible for the direction, supervision and performance of the audit of the university and the consolidated entity. I remain solely responsible for my audit opinion.
I communicate with the Council regarding, among other matters, the planned scope and timing of the audit and significant audit findings, including any significant deficiencies in internal control that I identify during my audit.
I also provide the Council with a statement that I have complied with relevant ethical requirements regarding independence, and to communicate with them all relationships and other matters that may reasonably be thought to bear on my independence, and where applicable, related safeguards.
MELBOURNE 22 March 2018
Charlotte Jeffries as delegate for the Auditor-General of Victoria
Annual Report 2017 41
Auditor General’s Independence Declaration
Auditor-General’s Independence Declaration
To the Council, La Trobe University
The Auditor-General’s independence is established by the Constitution Act 1975. The Auditor-General, an independent officer of parliament, is not subject to direction by any person about the way in which his powers and responsibilities are to be exercised.
Under the Audit Act 1994, the Auditor-General is the auditor of each public body and for the purposes of conducting an audit has access to all documents and property, and may report to parliament matters which the Auditor-General considers appropriate.
Independence Declaration As auditor for La Trobe University for the year ended 31 December 2017, I declare that, to the best of my knowledge and belief, there have been:
no contraventions of auditor independence requirements of the Australian Charities and Not-for-profits Commission Act 2012 in relation to the audit.
no contraventions of any applicable code of professional conduct in relation to the audit.
MELBOURNE 22 March 2018
Charlotte Jeffries as delegate for the Auditor-General of Victoria

42 La Trobe University
Statement by Principal Accounting Officer and Chief Financial Officer31 December 2017
Mailing address
La Trobe University Victoria 3086 Australia
T +61 3 9479 5268 F +61 3 9479 1045
ABN 64 804 735 113 CRICOS Provider 00115M
OFFICE OF THE CHIEF FINANCIAL OFFICER
21 March 2018
Statement by Principal Accounting Officer and Chief Financial Officer
latrobe.edu.au
MELBOURNE CAMPUSES Bundoora Collins Street CBD Franklin Street CBD
REGIONAL CAMPUSES Bendigo Albury-Wondonga Mildura Shepparton
In my opinion:
(a) The financial report of La Trobe University and its controlled subsidiaries present a true
and fair view of the financial transactions of the University and its controlled subsidiaries during the financial year ended 31 December 2017 and its financial position as at that date;
(b) Australian Government financial assistance received during the financial year ended 31
December 2017 was expended for the purposes for which it was provided;
(c) The University has complied in full with the requirements of various program
guidelines that apply to the Commonwealth financial assistance identified in this financial report.
The financial report has been prepared in accordance with the provision of the Australian Charities and Non-for-profit Commission Act 2012, Australian Accounting Standards (including Australian Accounting Interpretations) and other mandatory professional reporting requirements in Australia, Financial Management Act 1994 and Guidelines for the Preparation of Annual Financial Reports for the 2017 Reporting Year by Australian Higher Education Institutions as issued by the Commonwealth Department of Education and Training. In addition, I am not aware at the date of signing these statements of any circumstances which would render any particulars included in the statements to be misleading or inaccurate and there are reasonable grounds to believe that La Trobe University will be able to pay its debts as and when they fall due.
Mark Smith Chief Financial Officer and Principal Accounting Officer Melbourne
Annual Report 2017 43
Statement by the Chancellor and the Accountable Officer31 December 2017
Mailing address
La Trobe University Victoria 3086 Australia
T +61 3 9479 5268 F +61 3 9479 1045 E [email protected]
latrobe.edu.au
OFFICE OF THE CHANCELLOR
MELBOURNE CAMPUSES Bundoora Collins Street CBD Franklin Street CBD
REGIONAL CAMPUSES
ABN 64 804 735 113 CRICOS Provider 00115M
21 March 2018
Statement by the Chancellor and Accountable Officer
Bendigo Albury-Wondonga Mildura Shepparton
In our opinion:
(a) The financial report of La Trobe University and its controlled subsidiaries present a true
and fair view of the financial transactions of the University and its controlled subsidiaries during the financial year ended 31 December 2017 and its financial position as at that date;
(b) Australian Government financial assistance received during the financial year ended 31
December 2017 was expended for the purposes for which it was provided;
(c) The University has complied in full with the requirements of various program
guidelines that apply to the Commonwealth financial assistance identified in this financial report.
The financial report has been prepared in accordance with the provision of the Australian Charities and Non-for-profit Commission Act 2012, Australian Accounting Standards (including Australian Accounting Interpretations) and other mandatory professional reporting requirements in Australia, Financial Management Act 1994 and Guidelines for the Preparation of Annual Financial Reports for the 2017 Reporting Year by Australian Higher Education Institutions as issued by the Commonwealth Department of Education and Training. In addition, we are not aware at the date of signing this report of any circumstances which would render any particulars included in the report to be misleading or inaccurate, and there are reasonable grounds to believe that La Trobe University will be able to pay its debts as and when they fall due.
The Chancellor and Vice-Chancellor sign this declaration as delegates of, and in accordance with a resolution of, the Council of La Trobe University.
Professor Richard G Larkins AO Chancellor
Professor John Dewar Vice-Chancellor and Accountable Officer
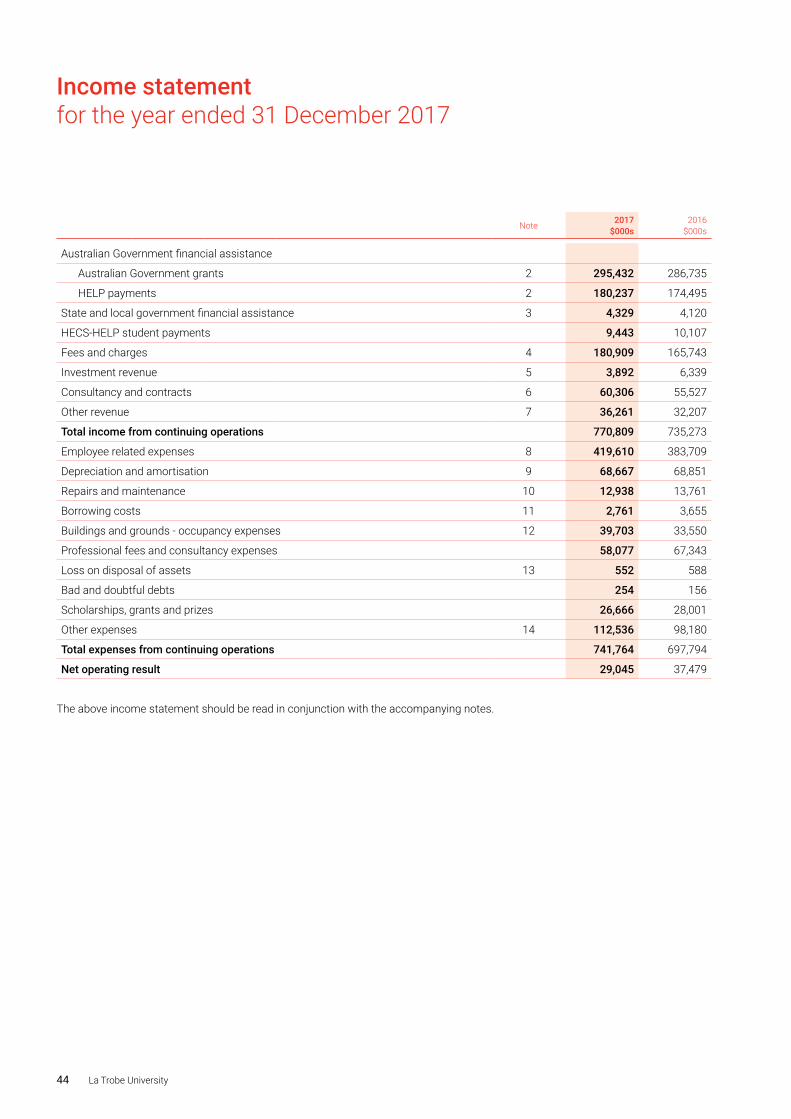
44 La Trobe University
Income statementfor the year ended 31 December 2017
Note 2017$000s
2016$000s
Australian Government financial assistance
Australian Government grants 2 295,432 286,735
HELP payments 2 180,237 174,495
State and local government financial assistance 3 4,329 4,120
HECS-HELP student payments 9,443 10,107
Fees and charges 4 180,909 165,743
Investment revenue 5 3,892 6,339
Consultancy and contracts 6 60,306 55,527
Other revenue 7 36,261 32,207
Total income from continuing operations 770,809 735,273
Employee related expenses 8 419,610 383,709
Depreciation and amortisation 9 68,667 68,851
Repairs and maintenance 10 12,938 13,761
Borrowing costs 11 2,761 3,655
Buildings and grounds - occupancy expenses 12 39,703 33,550
Professional fees and consultancy expenses 58,077 67,343
Loss on disposal of assets 13 552 588
Bad and doubtful debts 254 156
Scholarships, grants and prizes 26,666 28,001
Other expenses 14 112,536 98,180
Total expenses from continuing operations 741,764 697,794
Net operating result 29,045 37,479
The above income statement should be read in conjunction with the accompanying notes.
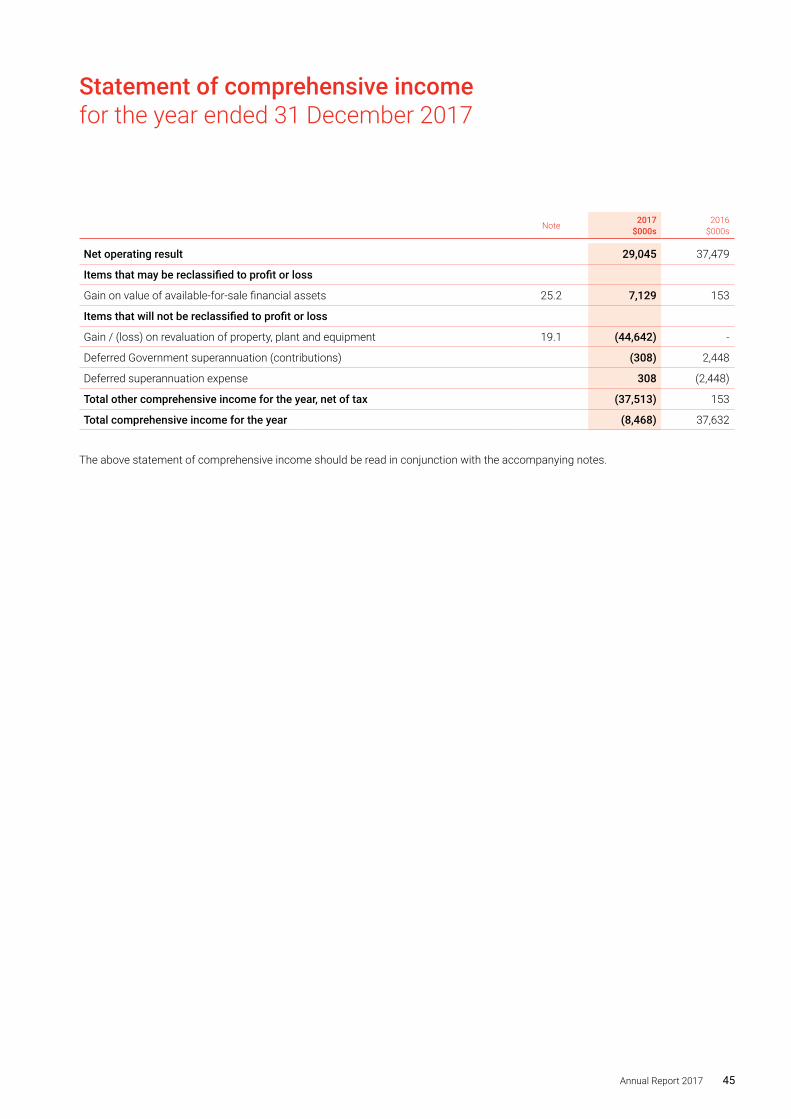
Annual Report 2017 45
Statement of comprehensive incomefor the year ended 31 December 2017
Note 2017$000s
2016$000s
Net operating result 29,045 37,479
Items that may be reclassified to profit or loss
Gain on value of available-for-sale financial assets 25.2 7,129 153
Items that will not be reclassified to profit or loss
Gain / (loss) on revaluation of property, plant and equipment 19.1 (44,642) -
Deferred Government superannuation (contributions) (308) 2,448
Deferred superannuation expense 308 (2,448)
Total other comprehensive income for the year, net of tax (37,513) 153
Total comprehensive income for the year (8,468) 37,632
The above statement of comprehensive income should be read in conjunction with the accompanying notes.
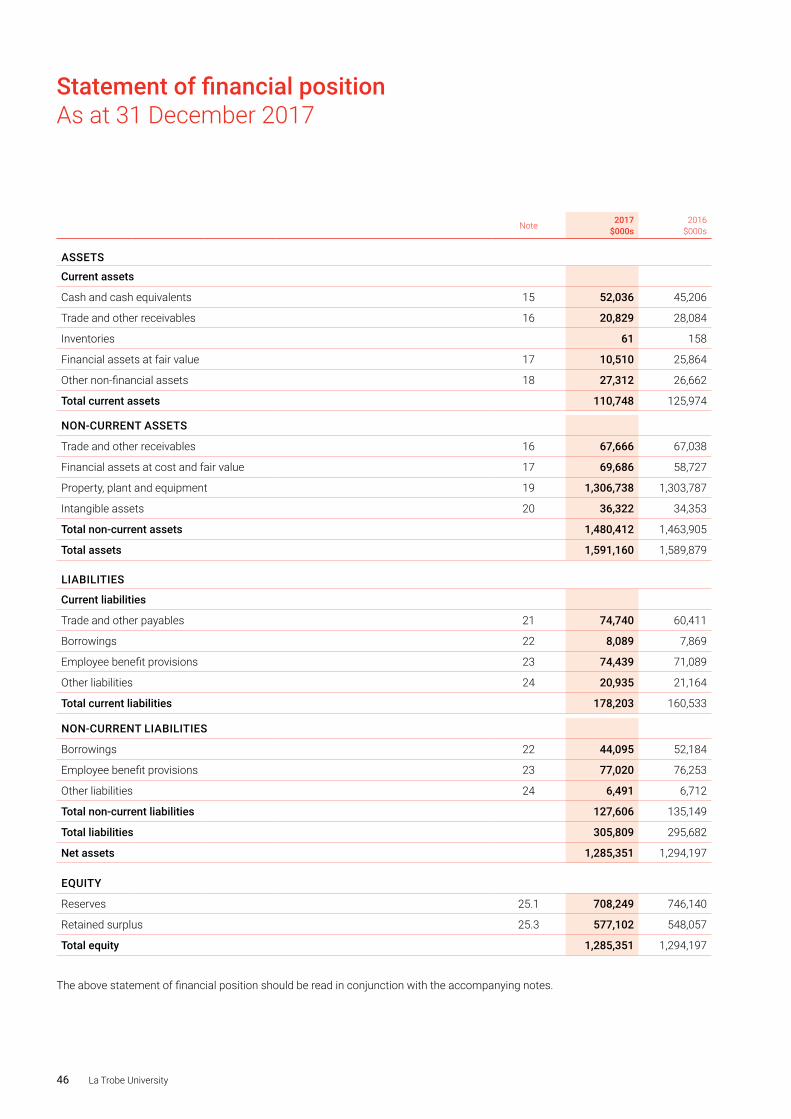
46 La Trobe University
Statement of financial positionAs at 31 December 2017
Note 2017$000s
2016$000s
ASSETS
Current assets
Cash and cash equivalents 15 52,036 45,206
Trade and other receivables 16 20,829 28,084
Inventories 61 158
Financial assets at fair value 17 10,510 25,864
Other non-financial assets 18 27,312 26,662
Total current assets 110,748 125,974
NON-CURRENT ASSETS
Trade and other receivables 16 67,666 67,038
Financial assets at cost and fair value 17 69,686 58,727
Property, plant and equipment 19 1,306,738 1,303,787
Intangible assets 20 36,322 34,353
Total non-current assets 1,480,412 1,463,905
Total assets 1,591,160 1,589,879
LIABILITIES
Current liabilities
Trade and other payables 21 74,740 60,411
Borrowings 22 8,089 7,869
Employee benefit provisions 23 74,439 71,089
Other liabilities 24 20,935 21,164
Total current liabilities 178,203 160,533
NON-CURRENT LIABILITIES
Borrowings 22 44,095 52,184
Employee benefit provisions 23 77,020 76,253
Other liabilities 24 6,491 6,712
Total non-current liabilities 127,606 135,149
Total liabilities 305,809 295,682
Net assets 1,285,351 1,294,197
EQUITY
Reserves 25.1 708,249 746,140
Retained surplus 25.3 577,102 548,057
Total equity 1,285,351 1,294,197
The above statement of financial position should be read in conjunction with the accompanying notes.
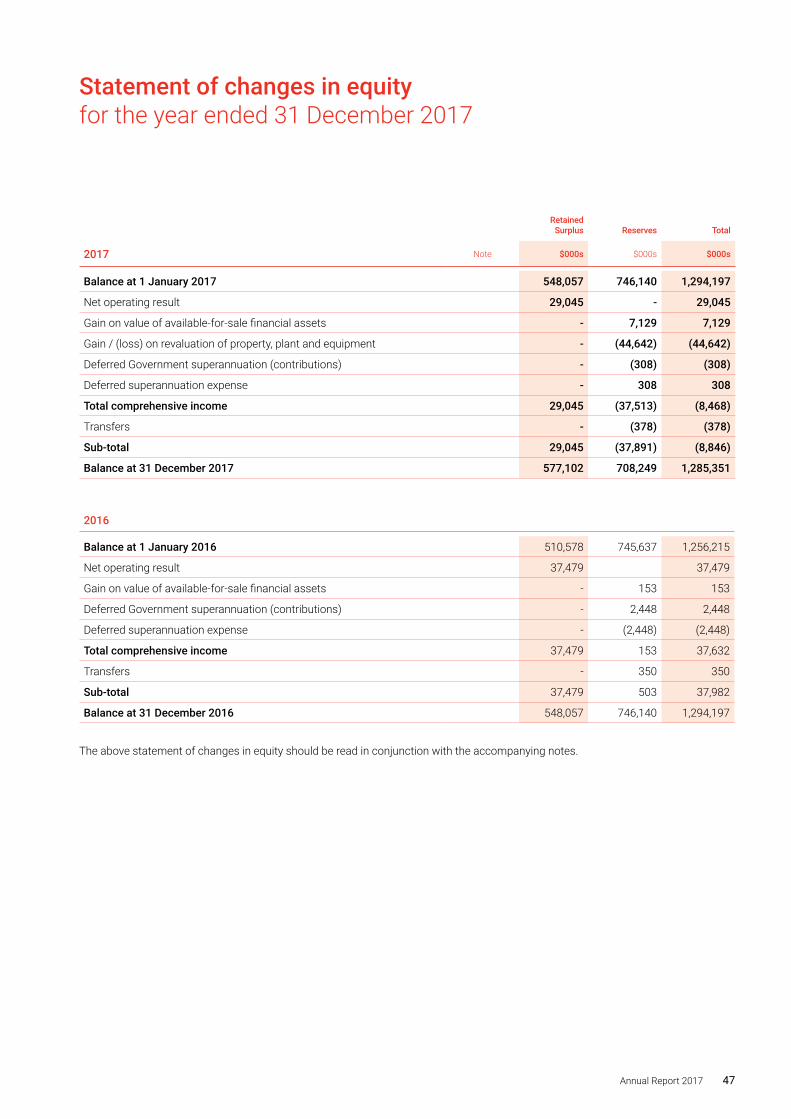
Annual Report 2017 47
Statement of changes in equityfor the year ended 31 December 2017
Retained Surplus Reserves Total
2017 Note $000s $000s $000s
Balance at 1 January 2017 548,057 746,140 1,294,197
Net operating result 29,045 - 29,045
Gain on value of available-for-sale financial assets - 7,129 7,129
Gain / (loss) on revaluation of property, plant and equipment - (44,642) (44,642)
Deferred Government superannuation (contributions) - (308) (308)
Deferred superannuation expense - 308 308
Total comprehensive income 29,045 (37,513) (8,468)
Transfers - (378) (378)
Sub-total 29,045 (37,891) (8,846)
Balance at 31 December 2017 577,102 708,249 1,285,351
2016
Balance at 1 January 2016 510,578 745,637 1,256,215
Net operating result 37,479 37,479
Gain on value of available-for-sale financial assets - 153 153
Deferred Government superannuation (contributions) - 2,448 2,448
Deferred superannuation expense - (2,448) (2,448)
Total comprehensive income 37,479 153 37,632
Transfers - 350 350
Sub-total 37,479 503 37,982
Balance at 31 December 2016 548,057 746,140 1,294,197
The above statement of changes in equity should be read in conjunction with the accompanying notes.
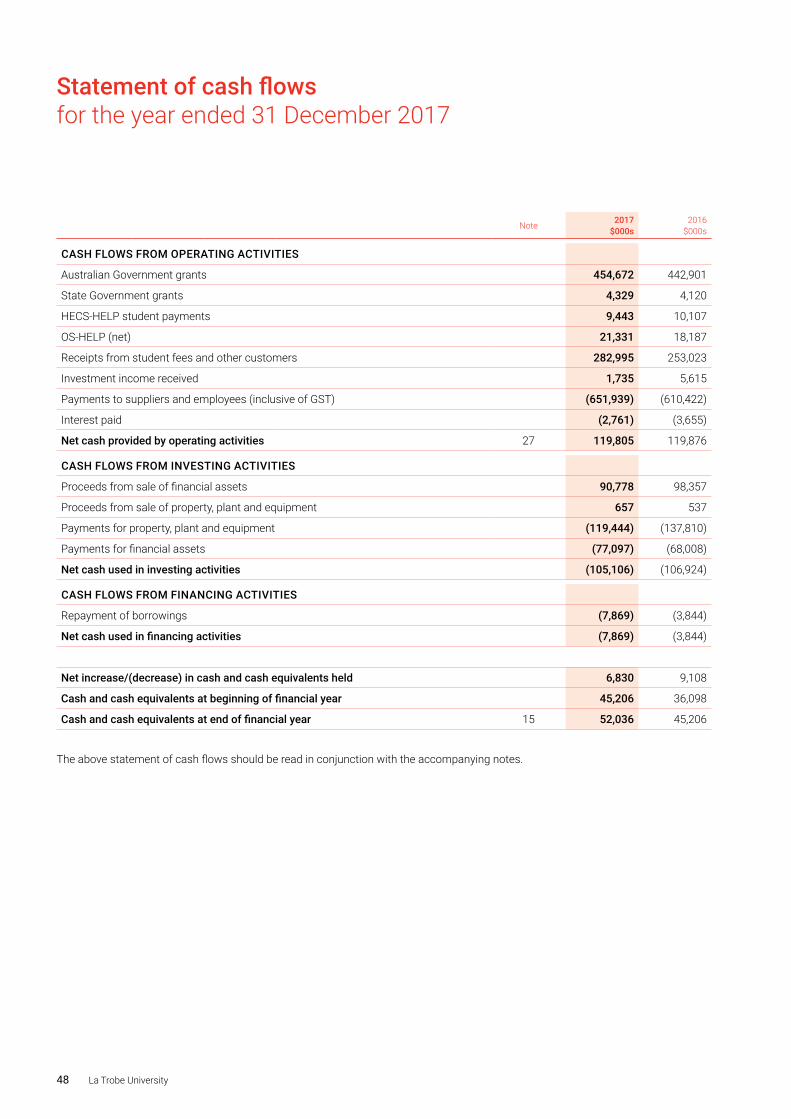
48 La Trobe University
Statement of cash flowsfor the year ended 31 December 2017
Note 2017$000s
2016$000s
CASH FLOWS FROM OPERATING ACTIVITIES
Australian Government grants 454,672 442,901
State Government grants 4,329 4,120
HECS-HELP student payments 9,443 10,107
OS-HELP (net) 21,331 18,187
Receipts from student fees and other customers 282,995 253,023
Investment income received 1,735 5,615
Payments to suppliers and employees (inclusive of GST) (651,939) (610,422)
Interest paid (2,761) (3,655)
Net cash provided by operating activities 27 119,805 119,876
CASH FLOWS FROM INVESTING ACTIVITIES
Proceeds from sale of financial assets 90,778 98,357
Proceeds from sale of property, plant and equipment 657 537
Payments for property, plant and equipment (119,444) (137,810)
Payments for financial assets (77,097) (68,008)
Net cash used in investing activities (105,106) (106,924)
CASH FLOWS FROM FINANCING ACTIVITIES
Repayment of borrowings (7,869) (3,844)
Net cash used in financing activities (7,869) (3,844)
Net increase/(decrease) in cash and cash equivalents held 6,830 9,108
Cash and cash equivalents at beginning of financial year 45,206 36,098
Cash and cash equivalents at end of financial year 15 52,036 45,206
The above statement of cash flows should be read in conjunction with the accompanying notes.
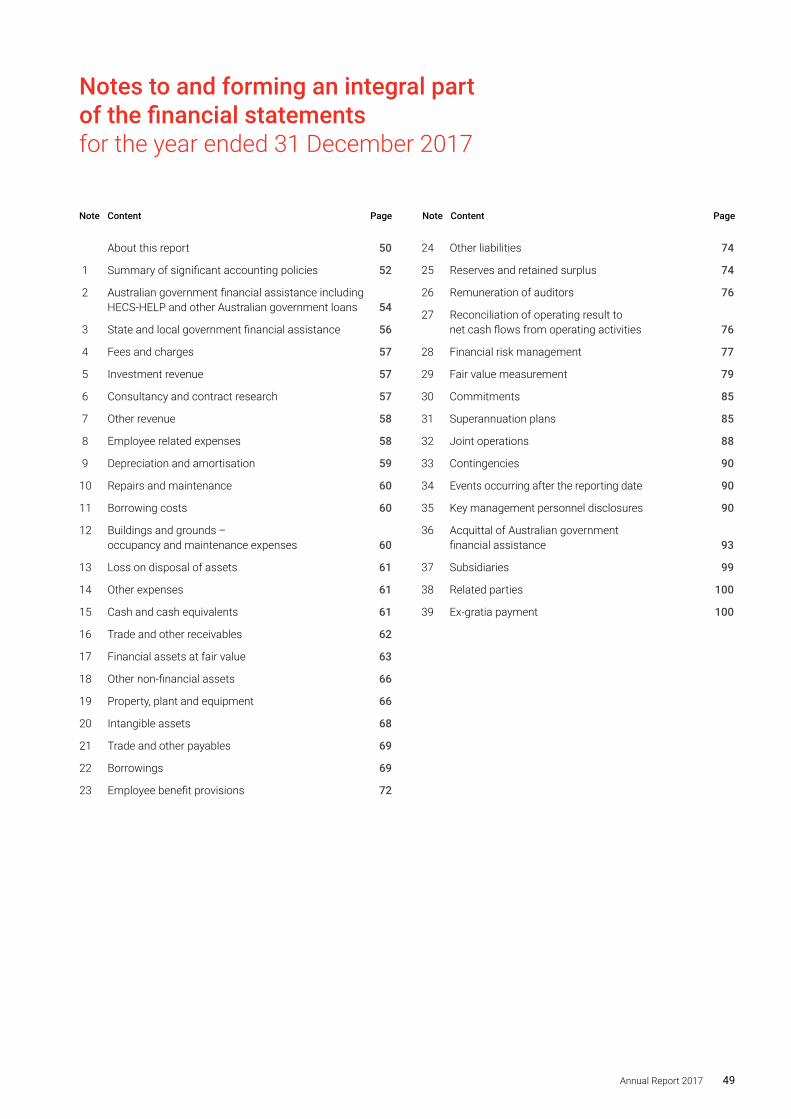
Annual Report 2017 49
Notes to and forming an integral part of the financial statementsfor the year ended 31 December 2017
Note Content Page Note Content Page
About this report 50
1 Summary of significant accounting policies 52
2 Australian government financial assistance including HECS-HELP and other Australian government loans 54
3 State and local government financial assistance 56
4 Fees and charges 57
5 Investment revenue 57
6 Consultancy and contract research 57
7 Other revenue 58
8 Employee related expenses 58
9 Depreciation and amortisation 59
10 Repairs and maintenance 60
11 Borrowing costs 60
12 Buildings and grounds – occupancy and maintenance expenses 60
13 Loss on disposal of assets 61
14 Other expenses 61
15 Cash and cash equivalents 61
16 Trade and other receivables 62
17 Financial assets at fair value 63
18 Other non-financial assets 66
19 Property, plant and equipment 66
20 Intangible assets 68
21 Trade and other payables 69
22 Borrowings 69
23 Employee benefit provisions 72
24 Other liabilities 74
25 Reserves and retained surplus 74
26 Remuneration of auditors 76
27 Reconciliation of operating result to net cash flows from operating activities 76
28 Financial risk management 77
29 Fair value measurement 79
30 Commitments 85
31 Superannuation plans 85
32 Joint operations 88
33 Contingencies 90
34 Events occurring after the reporting date 90
35 Key management personnel disclosures 90
36 Acquittal of Australian government financial assistance 93
37 Subsidiaries 99
38 Related parties 100
39 Ex-gratia payment 100
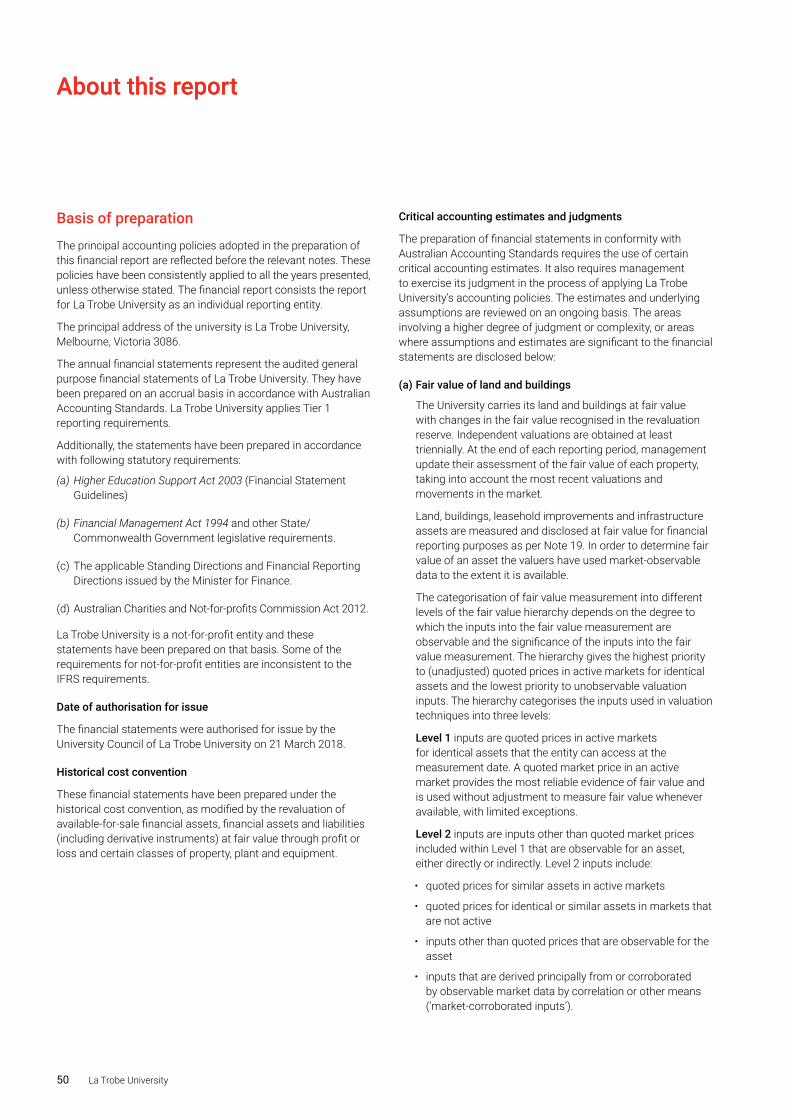
50 La Trobe University
About this reportAbout this report
Basis of preparation
The principal accounting policies adopted in the preparation of this financial report are reflected before the relevant notes. These policies have been consistently applied to all the years presented, unless otherwise stated. The financial report consists the report for La Trobe University as an individual reporting entity.
The principal address of the university is La Trobe University, Melbourne, Victoria 3086.
The annual financial statements represent the audited general purpose financial statements of La Trobe University. They have been prepared on an accrual basis in accordance with Australian Accounting Standards. La Trobe University applies Tier 1 reporting requirements.
Additionally, the statements have been prepared in accordance with following statutory requirements:
(a) Higher Education Support Act 2003 (Financial Statement Guidelines)
(b) Financial Management Act 1994 and other State/Commonwealth Government legislative requirements.
(c) The applicable Standing Directions and Financial Reporting Directions issued by the Minister for Finance.
(d) Australian Charities and Not-for-profits Commission Act 2012.
La Trobe University is a not-for-profit entity and these statements have been prepared on that basis. Some of the requirements for not-for-profit entities are inconsistent to the IFRS requirements.
Date of authorisation for issue
The financial statements were authorised for issue by the University Council of La Trobe University on 21 March 2018.
Historical cost convention
These financial statements have been prepared under the historical cost convention, as modified by the revaluation of available-for-sale financial assets, financial assets and liabilities (including derivative instruments) at fair value through profit or loss and certain classes of property, plant and equipment.
Critical accounting estimates and judgments
The preparation of financial statements in conformity with Australian Accounting Standards requires the use of certain critical accounting estimates. It also requires management to exercise its judgment in the process of applying La Trobe University’s accounting policies. The estimates and underlying assumptions are reviewed on an ongoing basis. The areas involving a higher degree of judgment or complexity, or areas where assumptions and estimates are significant to the financial statements are disclosed below:
(a) Fair value of land and buildings
The University carries its land and buildings at fair value with changes in the fair value recognised in the revaluation reserve. Independent valuations are obtained at least triennially. At the end of each reporting period, management update their assessment of the fair value of each property, taking into account the most recent valuations and movements in the market.
Land, buildings, leasehold improvements and infrastructure assets are measured and disclosed at fair value for financial reporting purposes as per Note 19. In order to determine fair value of an asset the valuers have used market-observable data to the extent it is available.
The categorisation of fair value measurement into different levels of the fair value hierarchy depends on the degree to which the inputs into the fair value measurement are observable and the significance of the inputs into the fair value measurement. The hierarchy gives the highest priority to (unadjusted) quoted prices in active markets for identical assets and the lowest priority to unobservable valuation inputs. The hierarchy categorises the inputs used in valuation techniques into three levels:
Level 1 inputs are quoted prices in active markets for identical assets that the entity can access at the measurement date. A quoted market price in an active market provides the most reliable evidence of fair value and is used without adjustment to measure fair value whenever available, with limited exceptions.
Level 2 inputs are inputs other than quoted market prices included within Level 1 that are observable for an asset, either directly or indirectly. Level 2 inputs include:
• quoted prices for similar assets in active markets
• quoted prices for identical or similar assets in markets that are not active
• inputs other than quoted prices that are observable for the asset
• inputs that are derived principally from or corroborated by observable market data by correlation or other means (‘market-corroborated inputs’).
Annual Report 2017 51
Level 3 inputs are unobservable inputs for the asset or liability. Unobservable inputs are used to measure fair value to the extent that relevant observable inputs are not available, thereby allowing for situations in which there is little, if any, market activity for the asset at the measurement date. The valuers develops unobservable inputs using the best information available in the circumstances, which might include the valuers own data, taking into account all information about market participant assumptions that is reasonably.
(b) Works of art
Works of art are initially carried at cost and revalued subsequently at fair value. Donated or bequeathed works of art assets are carried at fair value and are not depreciated as they do not have a finite useful life. The current use is considered the highest and best use.
An external revaluation process is required every three years but may occur more frequently if material movements in fair value are identified. An independent valuation of the University’s works of art assets was performed by Simon Storey Valuers with a valuation date of 31 December 2017.
Professional judgement was required to establish fair value during the valuation process. This involved taking into account the artist, art work, condition, provenance and market place. In applying professional judgment, the expert valuer had to evaluate their valuations for reasonableness against market and academic research as well as other transactions of artwork. The process included layers based on location and value across entire collection. Previous valuation data was used to assign sample sizes to each stratum. The following boundaries were used to form strata within location; $0 - $5,000, $5,000+ and items in the $5,000+ strata were completely enumerated. This is demonstrated through the relative standard error (RSE) calculated from the process, where RSE was calculated for each category. RSE represents the variability due to sampling and random adjustment.
The overall fair value valuation as at 31st December 2017 was calculated to be $20,260,228 with a relative standard error (RSE) of 1%. There is an approximately 67% chance that a sample valuation estimate will differ by less than one standard error from the valuation estimate if all the assets were valued. There is an approximately 95% chance that a sample valuation estimate will differ by less than two times the standard error from the valuation estimate if all the assets were valued.
(c) Provision for impairment of receivables
The value of the provision for impairment of receivables is estimated by considering the ageing of receivables, communication with the debtors and prior history.
(d) Provisions
As described in the accounting policies, provisions are management’s best estimate of the expenditure required to settle the obligation at the end of the reporting period. These estimates are made taking into account a range of possible outcomes.
52 La Trobe University
Summary of significant accounting policiesfor the year ended 31 December 2017
1. Summary of significant accounting policies
1.1 Impairment of assets
Assets that have an indefinite useful life are not subject to amortisation/depreciation and are tested annually for impairment. Assets that are subject to depreciation or amortisation are reviewed for impairment whenever events or changes in circumstances indicate that the carrying amount may not be recoverable. An impairment loss is recognised for the amount by which the asset’s carrying amount exceeds its recoverable amount. The recoverable amount is the higher of an asset’s fair value less costs to sell and value in use, being written down replacement cost.
1.2 Income tax
The University is exempt from income tax in accordance with the provisions of Section 50 of the Income Tax Assessment Act 1997.
1.3 Goods and services tax (GST)
The University is registered for, and accounts for GST on an accrual basis. Revenues, expenses, assets and liabilities are recognised net of GST amounts, with the exception of receivables and payables, which are inclusive of GST. The net amount of GST receivable from or payable to the Australian Tax Office at balance date is recognised in Statement of financial position as a current asset within Trade and other receivables, or current liabilities within Trade and other payables.
Cash flows are presented on a gross basis. The GST components of cash flows arising from investing or financing activities which are recoverable from, or payable to the taxation authority, are presented as operating cash flows.
1.4 Foreign currency translation
(i) Functional and presentation currency
Items included in the financial statements of each of the University’s entities are measured using the currency of the primary economic environment in which the entity operations (AUD). The consolidated financial statements are presented in Australian dollars, which is La Trobe University’s functional and presentation currency.
(ii) Transactions and balances
Foreign currency transactions are translated into the functional currency using the exchange rates prevailing at the dates of the transactions. Foreign exchange gains and losses resulting from the settlement of such transactions and from the translation at year-end exchange rates of monetary assets and liabilities denominated in foreign currencies are recognised in the income statement.
1.5 Comparative amounts
Where necessary, comparative information has been reclassified to enhance comparability in respect of changes in presentation adopted in the current year.
1.6 Rounding of amounts
The amounts in the financial statements have been rounded to the nearest thousand dollars (000s).
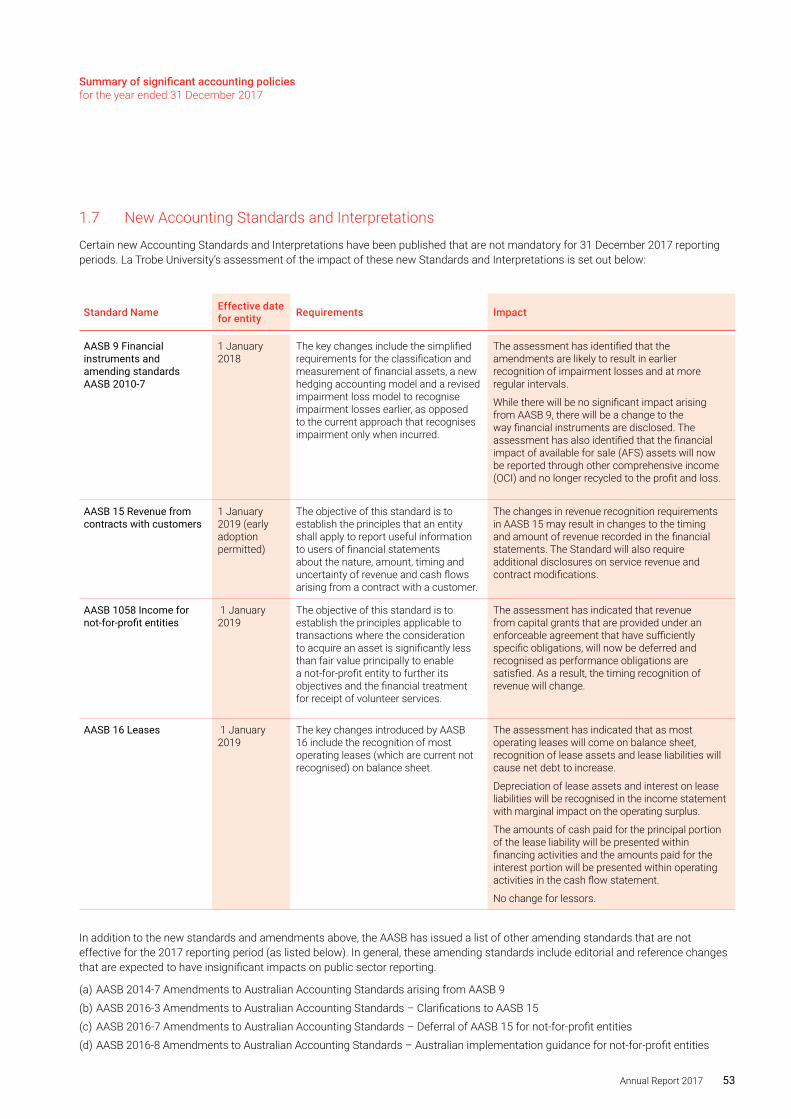
Annual Report 2017 53
Summary of significant accounting policies for the year ended 31 December 2017
1.7 New Accounting Standards and Interpretations
Certain new Accounting Standards and Interpretations have been published that are not mandatory for 31 December 2017 reporting periods. La Trobe University’s assessment of the impact of these new Standards and Interpretations is set out below:
Standard Name Effective date for entity Requirements Impact
AASB 9 Financial instruments and amending standards AASB 2010-7
1 January 2018
The key changes include the simplified requirements for the classification and measurement of financial assets, a new hedging accounting model and a revised impairment loss model to recognise impairment losses earlier, as opposed to the current approach that recognises impairment only when incurred.
The assessment has identified that the amendments are likely to result in earlier recognition of impairment losses and at more regular intervals.
While there will be no significant impact arising from AASB 9, there will be a change to the way financial instruments are disclosed. The assessment has also identified that the financial impact of available for sale (AFS) assets will now be reported through other comprehensive income (OCI) and no longer recycled to the profit and loss.
AASB 15 Revenue from contracts with customers
1 January 2019 (early adoption permitted)
The objective of this standard is to establish the principles that an entity shall apply to report useful information to users of financial statements about the nature, amount, timing and uncertainty of revenue and cash flows arising from a contract with a customer.
The changes in revenue recognition requirements in AASB 15 may result in changes to the timing and amount of revenue recorded in the financial statements. The Standard will also require additional disclosures on service revenue and contract modifications.
AASB 1058 Income for not-for-profit entities
1 January 2019
The objective of this standard is to establish the principles applicable to transactions where the consideration to acquire an asset is significantly less than fair value principally to enable a not-for-profit entity to further its objectives and the financial treatment for receipt of volunteer services.
The assessment has indicated that revenue from capital grants that are provided under an enforceable agreement that have sufficiently specific obligations, will now be deferred and recognised as performance obligations are satisfied. As a result, the timing recognition of revenue will change.
AASB 16 Leases 1 January 2019
The key changes introduced by AASB 16 include the recognition of most operating leases (which are current not recognised) on balance sheet.
The assessment has indicated that as most operating leases will come on balance sheet, recognition of lease assets and lease liabilities will cause net debt to increase.
Depreciation of lease assets and interest on lease liabilities will be recognised in the income statement with marginal impact on the operating surplus.
The amounts of cash paid for the principal portion of the lease liability will be presented within financing activities and the amounts paid for the interest portion will be presented within operating activities in the cash flow statement.
No change for lessors.
In addition to the new standards and amendments above, the AASB has issued a list of other amending standards that are not effective for the 2017 reporting period (as listed below). In general, these amending standards include editorial and reference changes that are expected to have insignificant impacts on public sector reporting.
(a) AASB 2014-7 Amendments to Australian Accounting Standards arising from AASB 9
(b) AASB 2016-3 Amendments to Australian Accounting Standards – Clarifications to AASB 15
(c) AASB 2016-7 Amendments to Australian Accounting Standards – Deferral of AASB 15 for not-for-profit entities
(d) AASB 2016-8 Amendments to Australian Accounting Standards – Australian implementation guidance for not-for-profit entities
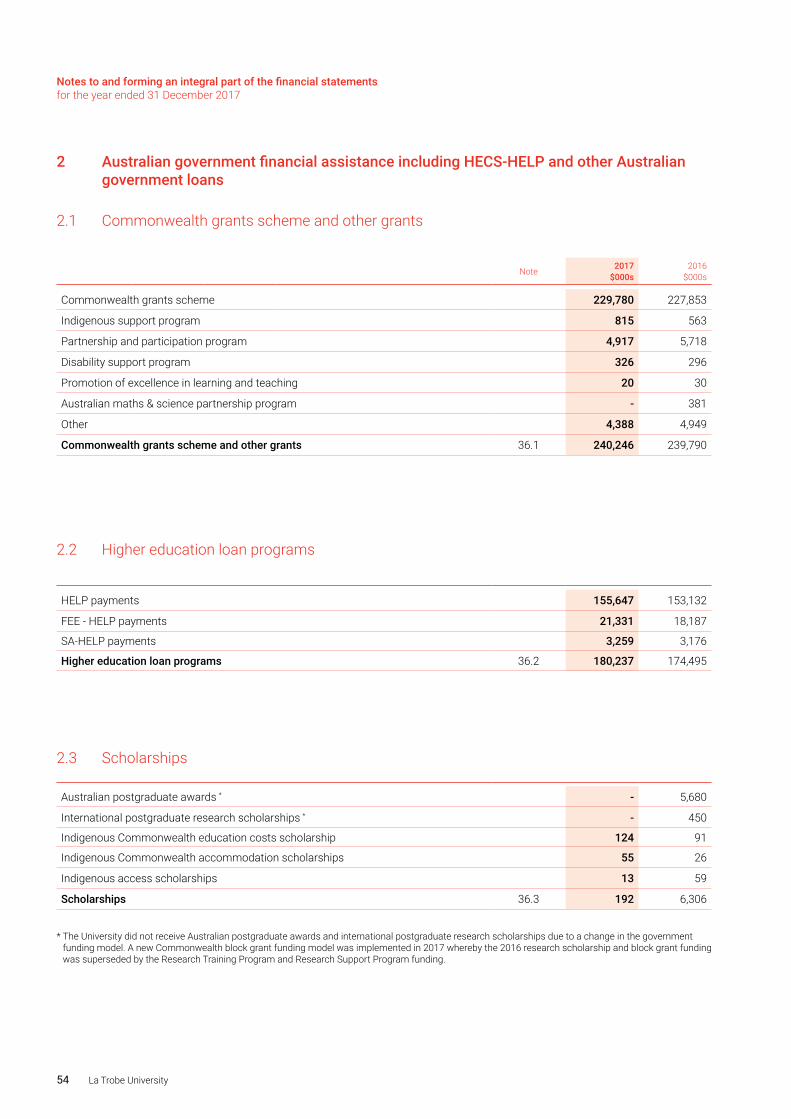
Notes to and forming an integral part of the financial statements for the year ended 31 December 2017
54 La Trobe University
2 Australian government financial assistance including HECS-HELP and other Australian government loans
2.1 Commonwealth grants scheme and other grants
Note 2017$000s
2016$000s
Commonwealth grants scheme 229,780 227,853
Indigenous support program 815 563
Partnership and participation program 4,917 5,718
Disability support program 326 296
Promotion of excellence in learning and teaching 20 30
Australian maths & science partnership program - 381
Other 4,388 4,949
Commonwealth grants scheme and other grants 36.1 240,246 239,790
2.2 Higher education loan programs
HELP payments 155,647 153,132
FEE - HELP payments 21,331 18,187
SA-HELP payments 3,259 3,176
Higher education loan programs 36.2 180,237 174,495
2.3 Scholarships
Australian postgraduate awards * - 5,680
International postgraduate research scholarships * - 450
Indigenous Commonwealth education costs scholarship 124 91
Indigenous Commonwealth accommodation scholarships 55 26
Indigenous access scholarships 13 59
Scholarships 36.3 192 6,306
* The University did not receive Australian postgraduate awards and international postgraduate research scholarships due to a change in the government funding model. A new Commonwealth block grant funding model was implemented in 2017 whereby the 2016 research scholarship and block grant funding was superseded by the Research Training Program and Research Support Program funding.
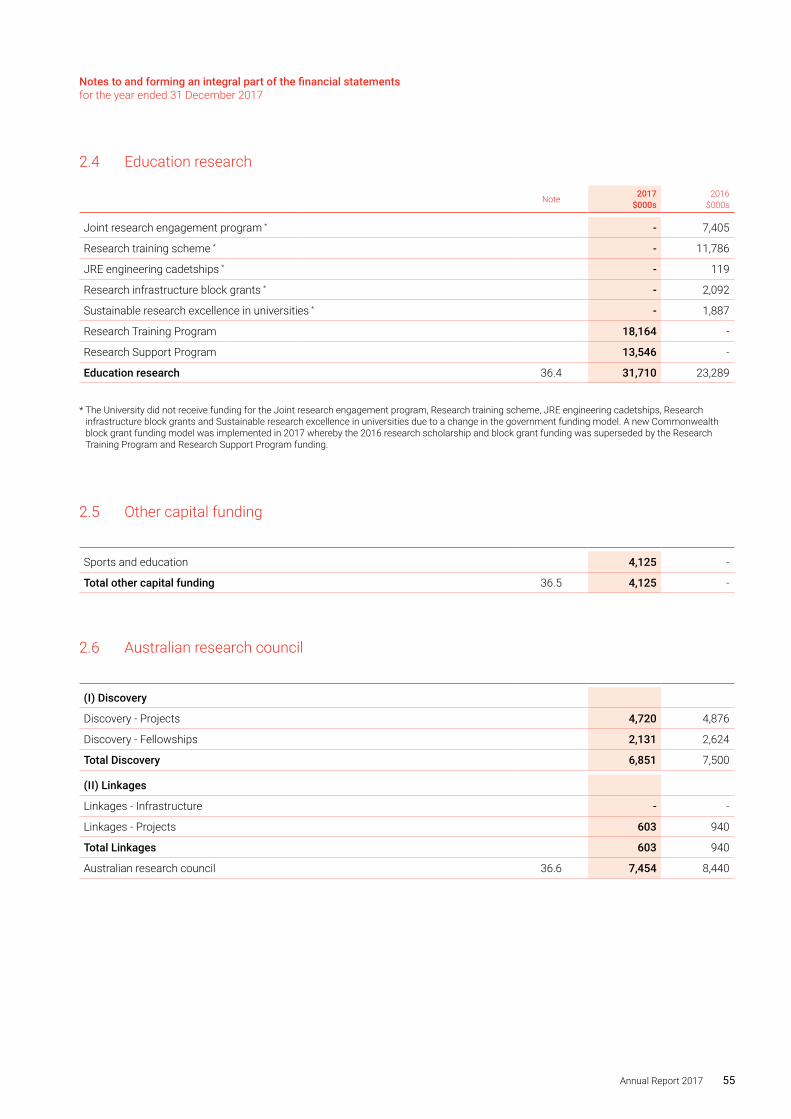
Notes to and forming an integral part of the financial statements for the year ended 31 December 2017
Annual Report 2017 55
2.4 Education research
Note 2017$000s
2016$000s
Joint research engagement program * - 7,405
Research training scheme * - 11,786
JRE engineering cadetships * - 119
Research infrastructure block grants * - 2,092
Sustainable research excellence in universities * - 1,887
Research Training Program 18,164 -
Research Support Program 13,546 -
Education research 36.4 31,710 23,289
* The University did not receive funding for the Joint research engagement program, Research training scheme, JRE engineering cadetships, Research infrastructure block grants and Sustainable research excellence in universities due to a change in the government funding model. A new Commonwealth block grant funding model was implemented in 2017 whereby the 2016 research scholarship and block grant funding was superseded by the Research Training Program and Research Support Program funding.
2.5 Other capital funding
Sports and education 4,125 -
Total other capital funding 36.5 4,125 -
2.6 Australian research council
(I) Discovery
Discovery - Projects 4,720 4,876
Discovery - Fellowships 2,131 2,624
Total Discovery 6,851 7,500
(II) Linkages
Linkages - Infrastructure - -
Linkages - Projects 603 940
Total Linkages 603 940
Australian research council 36.6 7,454 8,440
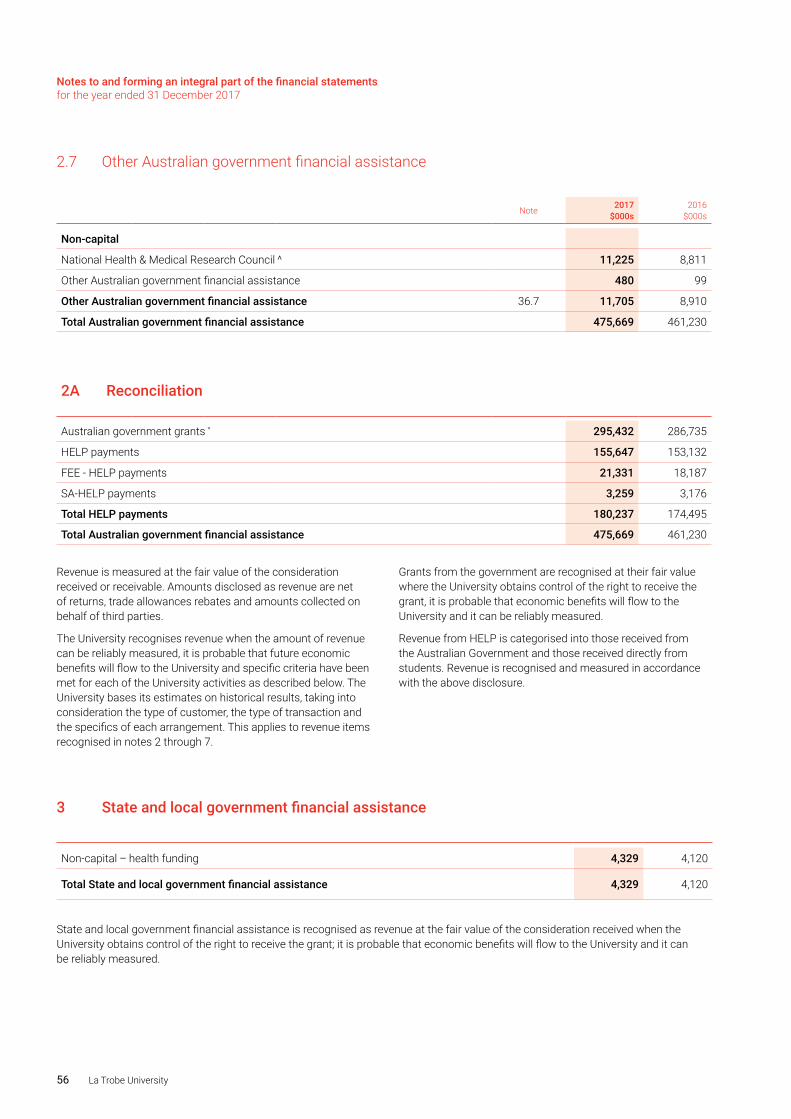
56 La Trobe University
Notes to and forming an integral part of the financial statements for the year ended 31 December 2017
2.7 Other Australian government financial assistance
Note 2017$000s
2016$000s
Non-capital
National Health & Medical Research Council ^ 11,225 8,811
Other Australian government financial assistance 480 99
Other Australian government financial assistance 36.7 11,705 8,910
Total Australian government financial assistance 475,669 461,230
2A Reconciliation
Australian government grants * 295,432 286,735
HELP payments 155,647 153,132
FEE - HELP payments 21,331 18,187
SA-HELP payments 3,259 3,176
Total HELP payments 180,237 174,495
Total Australian government financial assistance 475,669 461,230
Revenue is measured at the fair value of the consideration received or receivable. Amounts disclosed as revenue are net of returns, trade allowances rebates and amounts collected on behalf of third parties.
The University recognises revenue when the amount of revenue can be reliably measured, it is probable that future economic benefits will flow to the University and specific criteria have been met for each of the University activities as described below. The University bases its estimates on historical results, taking into consideration the type of customer, the type of transaction and the specifics of each arrangement. This applies to revenue items recognised in notes 2 through 7.
Grants from the government are recognised at their fair value where the University obtains control of the right to receive the grant, it is probable that economic benefits will flow to the University and it can be reliably measured.
Revenue from HELP is categorised into those received from the Australian Government and those received directly from students. Revenue is recognised and measured in accordance with the above disclosure.
3 State and local government financial assistance
Non-capital – health funding 4,329 4,120
Total State and local government financial assistance 4,329 4,120
State and local government financial assistance is recognised as revenue at the fair value of the consideration received when the University obtains control of the right to receive the grant; it is probable that economic benefits will flow to the University and it can be reliably measured.
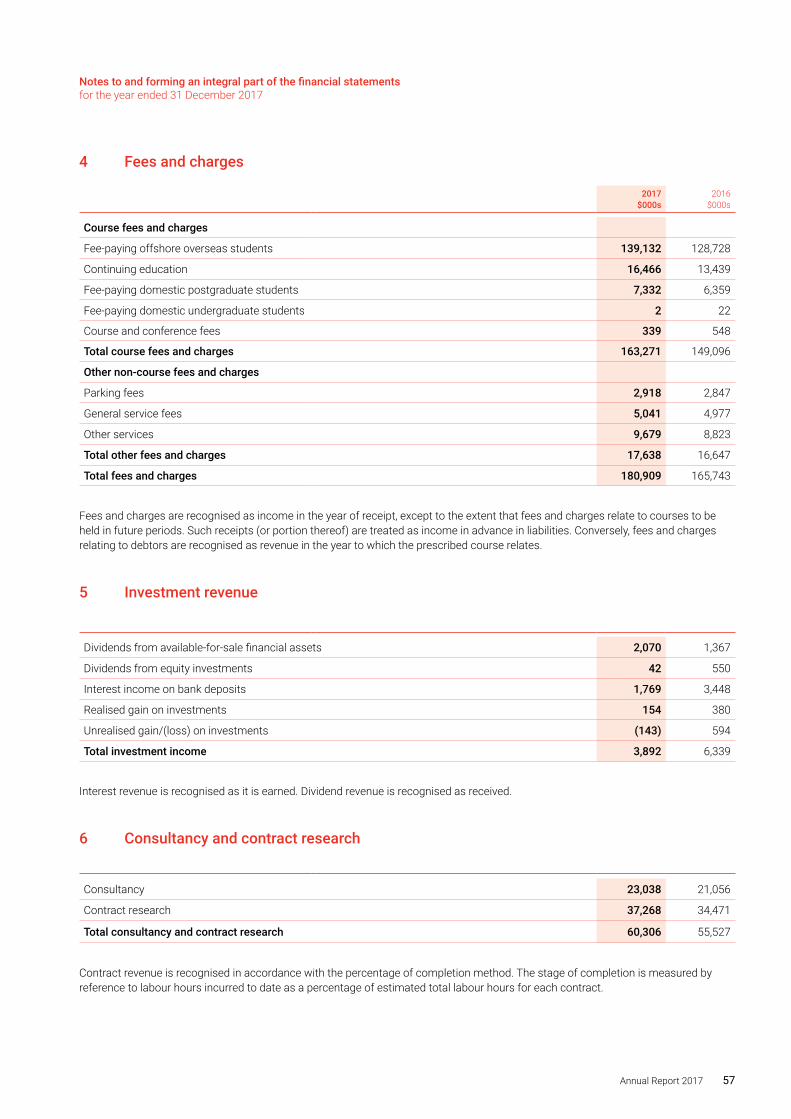
Notes to and forming an integral part of the financial statements for the year ended 31 December 2017
Annual Report 2017 57
4 Fees and charges
2017$000s
2016$000s
Course fees and charges
Fee-paying offshore overseas students 139,132 128,728
Continuing education 16,466 13,439
Fee-paying domestic postgraduate students 7,332 6,359
Fee-paying domestic undergraduate students 2 22
Course and conference fees 339 548
Total course fees and charges 163,271 149,096
Other non-course fees and charges
Parking fees 2,918 2,847
General service fees 5,041 4,977
Other services 9,679 8,823
Total other fees and charges 17,638 16,647
Total fees and charges 180,909 165,743
Fees and charges are recognised as income in the year of receipt, except to the extent that fees and charges relate to courses to be held in future periods. Such receipts (or portion thereof) are treated as income in advance in liabilities. Conversely, fees and charges relating to debtors are recognised as revenue in the year to which the prescribed course relates.
5 Investment revenue
Dividends from available-for-sale financial assets 2,070 1,367
Dividends from equity investments 42 550
Interest income on bank deposits 1,769 3,448
Realised gain on investments 154 380
Unrealised gain/(loss) on investments (143) 594
Total investment income 3,892 6,339
Interest revenue is recognised as it is earned. Dividend revenue is recognised as received.
6 Consultancy and contract research
Consultancy 23,038 21,056
Contract research 37,268 34,471
Total consultancy and contract research 60,306 55,527
Contract revenue is recognised in accordance with the percentage of completion method. The stage of completion is measured by reference to labour hours incurred to date as a percentage of estimated total labour hours for each contract.
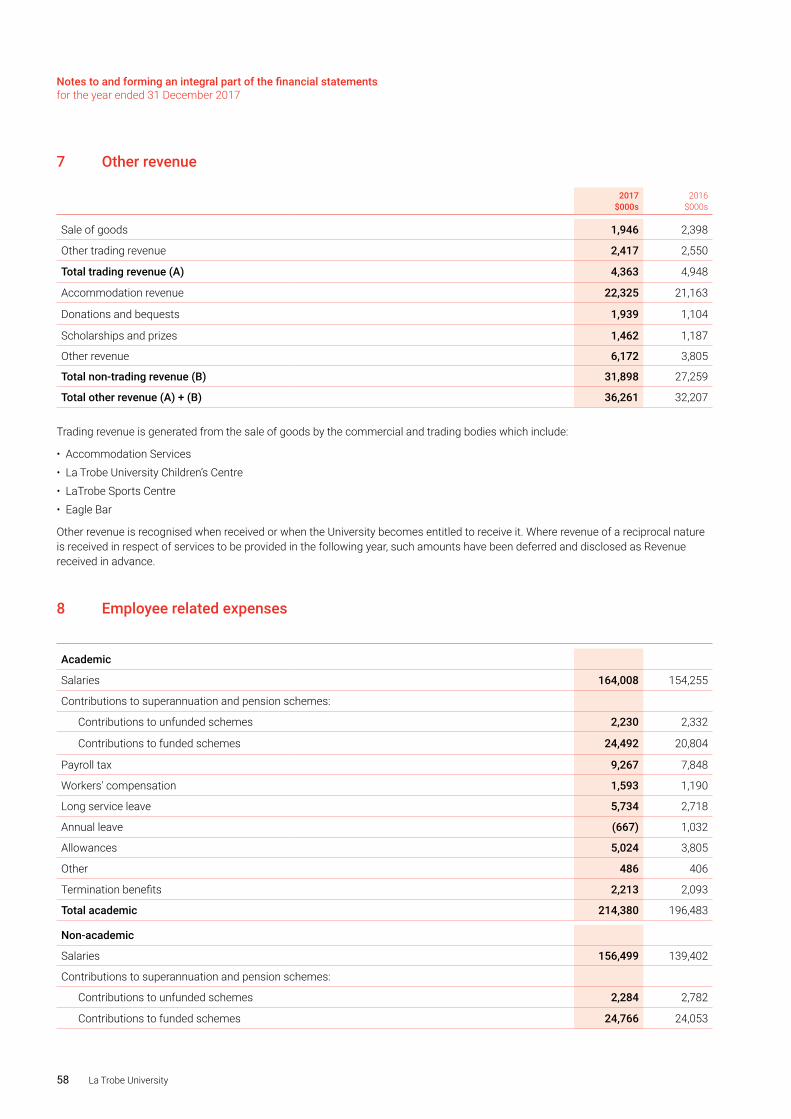
Notes to and forming an integral part of the financial statements for the year ended 31 December 2017
58 La Trobe University
7 Other revenue
2017$000s
2016$000s
Sale of goods 1,946 2,398
Other trading revenue 2,417 2,550
Total trading revenue (A) 4,363 4,948
Accommodation revenue 22,325 21,163
Donations and bequests 1,939 1,104
Scholarships and prizes 1,462 1,187
Other revenue 6,172 3,805
Total non-trading revenue (B) 31,898 27,259
Total other revenue (A) + (B) 36,261 32,207
Trading revenue is generated from the sale of goods by the commercial and trading bodies which include:
• Accommodation Services
• La Trobe University Children’s Centre
• LaTrobe Sports Centre
• Eagle Bar
Other revenue is recognised when received or when the University becomes entitled to receive it. Where revenue of a reciprocal nature is received in respect of services to be provided in the following year, such amounts have been deferred and disclosed as Revenue received in advance.
8 Employee related expenses
Academic
Salaries 164,008 154,255
Contributions to superannuation and pension schemes:
Contributions to unfunded schemes 2,230 2,332
Contributions to funded schemes 24,492 20,804
Payroll tax 9,267 7,848
Workers' compensation 1,593 1,190
Long service leave 5,734 2,718
Annual leave (667) 1,032
Allowances 5,024 3,805
Other 486 406
Termination benefits 2,213 2,093
Total academic 214,380 196,483
Non-academic
Salaries 156,499 139,402
Contributions to superannuation and pension schemes:
Contributions to unfunded schemes 2,284 2,782
Contributions to funded schemes 24,766 24,053
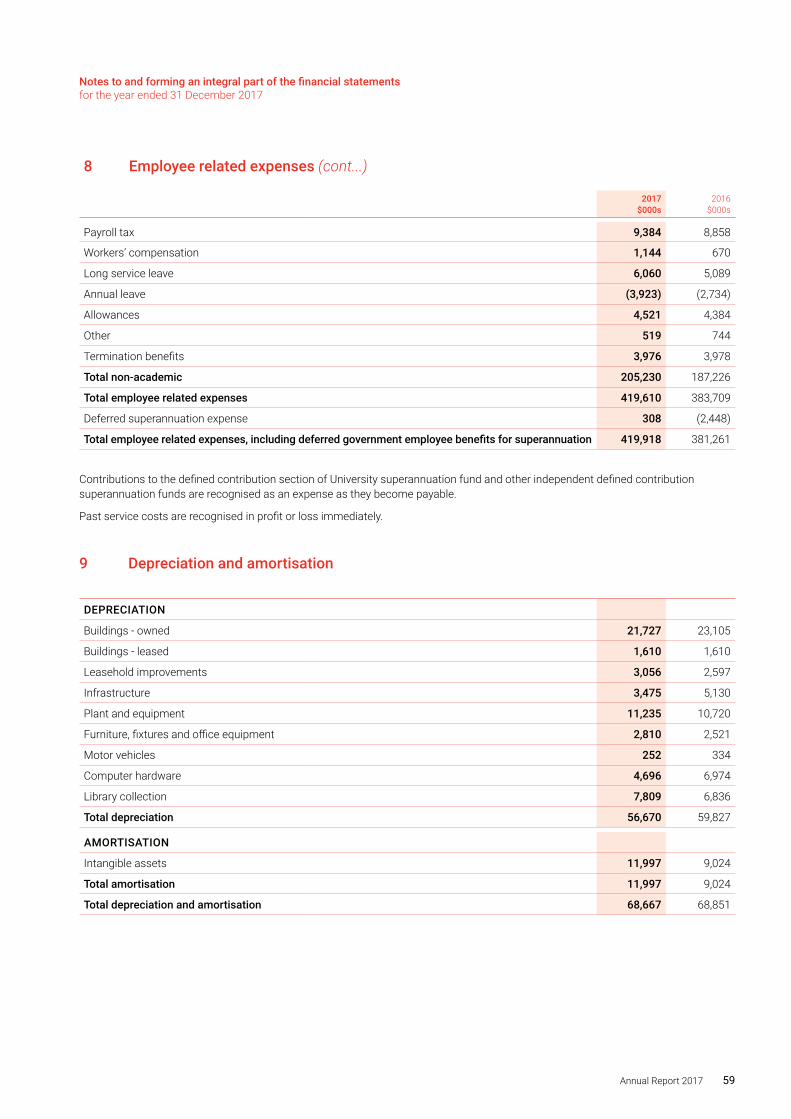
Notes to and forming an integral part of the financial statements for the year ended 31 December 2017
Annual Report 2017 59
8 Employee related expenses (cont...)
2017$000s
2016$000s
Payroll tax 9,384 8,858
Workers’ compensation 1,144 670
Long service leave 6,060 5,089
Annual leave (3,923) (2,734)
Allowances 4,521 4,384
Other 519 744
Termination benefits 3,976 3,978
Total non-academic 205,230 187,226
Total employee related expenses 419,610 383,709
Deferred superannuation expense 308 (2,448)
Total employee related expenses, including deferred government employee benefits for superannuation 419,918 381,261
Contributions to the defined contribution section of University superannuation fund and other independent defined contribution superannuation funds are recognised as an expense as they become payable.
Past service costs are recognised in profit or loss immediately.
9 Depreciation and amortisation
DEPRECIATION
Buildings - owned 21,727 23,105
Buildings - leased 1,610 1,610
Leasehold improvements 3,056 2,597
Infrastructure 3,475 5,130
Plant and equipment 11,235 10,720
Furniture, fixtures and office equipment 2,810 2,521
Motor vehicles 252 334
Computer hardware 4,696 6,974
Library collection 7,809 6,836
Total depreciation 56,670 59,827
AMORTISATION
Intangible assets 11,997 9,024
Total amortisation 11,997 9,024
Total depreciation and amortisation 68,667 68,851
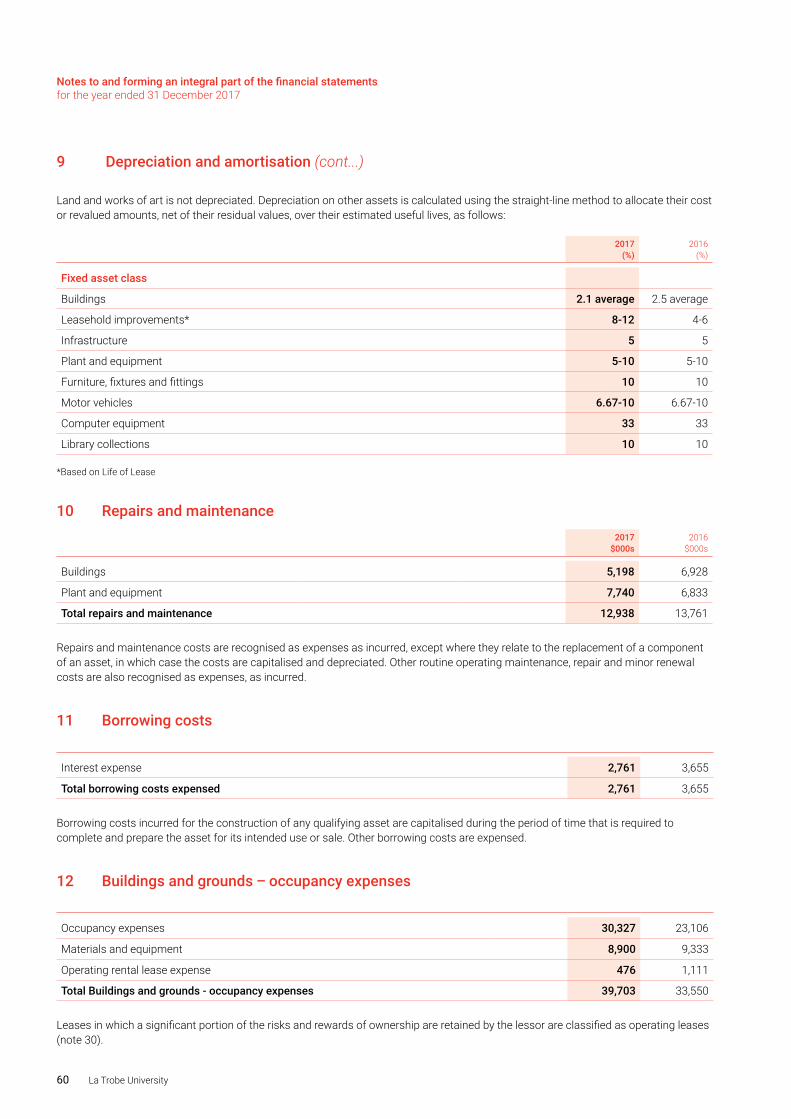
Notes to and forming an integral part of the financial statements for the year ended 31 December 2017
60 La Trobe University
9 Depreciation and amortisation (cont...)
Land and works of art is not depreciated. Depreciation on other assets is calculated using the straight-line method to allocate their cost or revalued amounts, net of their residual values, over their estimated useful lives, as follows:
2017(%)
2016(%)
Fixed asset class
Buildings 2.1 average 2.5 average
Leasehold improvements* 8-12 4-6
Infrastructure 5 5
Plant and equipment 5-10 5-10
Furniture, fixtures and fittings 10 10
Motor vehicles 6.67-10 6.67-10
Computer equipment 33 33
Library collections 10 10
*Based on Life of Lease
10 Repairs and maintenance2017
$000s2016
$000s
Buildings 5,198 6,928
Plant and equipment 7,740 6,833
Total repairs and maintenance 12,938 13,761
Repairs and maintenance costs are recognised as expenses as incurred, except where they relate to the replacement of a component of an asset, in which case the costs are capitalised and depreciated. Other routine operating maintenance, repair and minor renewal costs are also recognised as expenses, as incurred.
11 Borrowing costs
Interest expense 2,761 3,655
Total borrowing costs expensed 2,761 3,655
Borrowing costs incurred for the construction of any qualifying asset are capitalised during the period of time that is required to complete and prepare the asset for its intended use or sale. Other borrowing costs are expensed.
12 Buildings and grounds – occupancy expenses
Occupancy expenses 30,327 23,106
Materials and equipment 8,900 9,333
Operating rental lease expense 476 1,111
Total Buildings and grounds - occupancy expenses 39,703 33,550
Leases in which a significant portion of the risks and rewards of ownership are retained by the lessor are classified as operating leases (note 30).
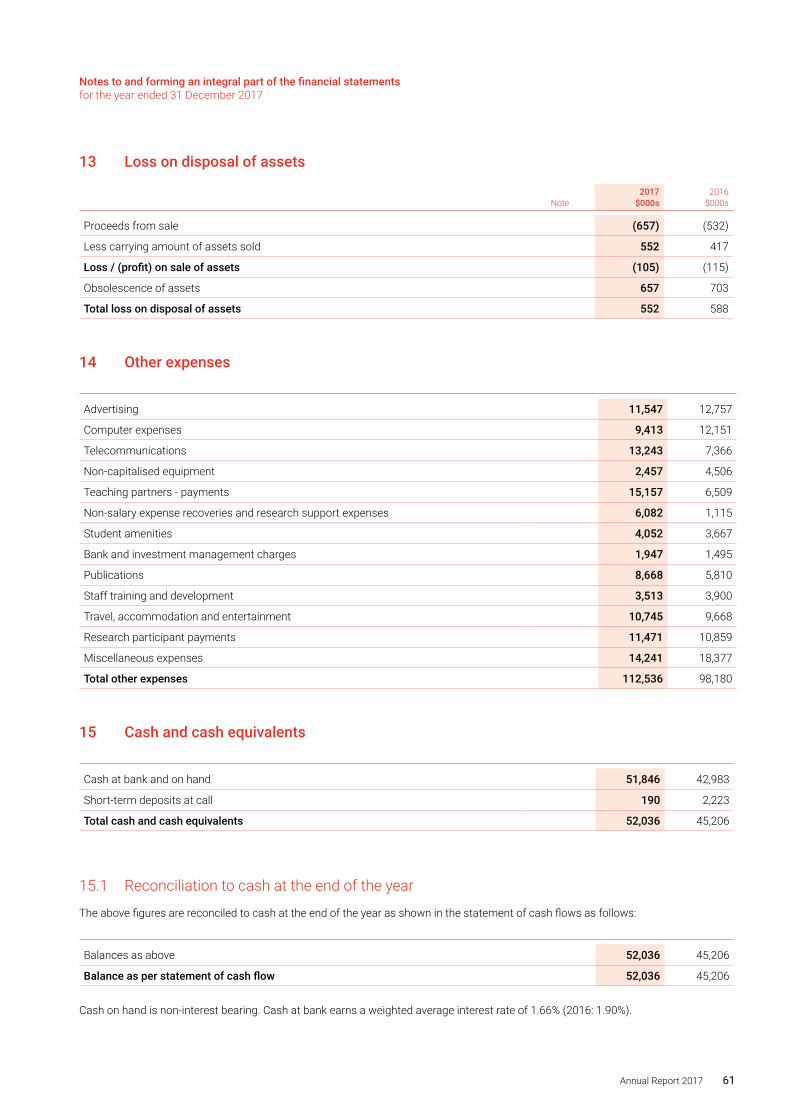
Notes to and forming an integral part of the financial statements for the year ended 31 December 2017
Annual Report 2017 61
13 Loss on disposal of assets
Note2017
$000s2016
$000s
Proceeds from sale (657) (532)
Less carrying amount of assets sold 552 417
Loss / (profit) on sale of assets (105) (115)
Obsolescence of assets 657 703
Total loss on disposal of assets 552 588
14 Other expenses
Advertising 11,547 12,757
Computer expenses 9,413 12,151
Telecommunications 13,243 7,366
Non-capitalised equipment 2,457 4,506
Teaching partners - payments 15,157 6,509
Non-salary expense recoveries and research support expenses 6,082 1,115
Student amenities 4,052 3,667
Bank and investment management charges 1,947 1,495
Publications 8,668 5,810
Staff training and development 3,513 3,900
Travel, accommodation and entertainment 10,745 9,668
Research participant payments 11,471 10,859
Miscellaneous expenses 14,241 18,377
Total other expenses 112,536 98,180
15 Cash and cash equivalents
Cash at bank and on hand 51,846 42,983
Short-term deposits at call 190 2,223
Total cash and cash equivalents 52,036 45,206
15.1 Reconciliation to cash at the end of the year
The above figures are reconciled to cash at the end of the year as shown in the statement of cash flows as follows:
Balances as above 52,036 45,206
Balance as per statement of cash flow 52,036 45,206
Cash on hand is non-interest bearing. Cash at bank earns a weighted average interest rate of 1.66% (2016: 1.90%).
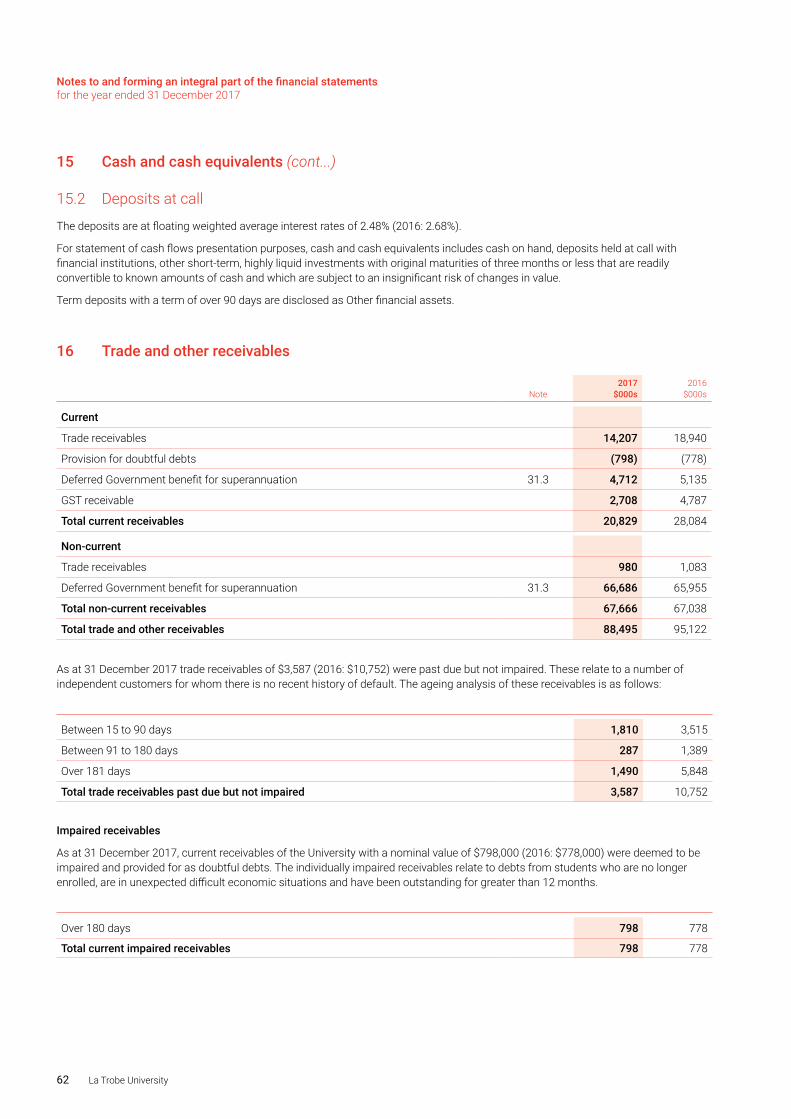
Notes to and forming an integral part of the financial statements for the year ended 31 December 2017
62 La Trobe University
15 Cash and cash equivalents (cont...)
15.2 Deposits at call
The deposits are at floating weighted average interest rates of 2.48% (2016: 2.68%).
For statement of cash flows presentation purposes, cash and cash equivalents includes cash on hand, deposits held at call with financial institutions, other short-term, highly liquid investments with original maturities of three months or less that are readily convertible to known amounts of cash and which are subject to an insignificant risk of changes in value.
Term deposits with a term of over 90 days are disclosed as Other financial assets.
16 Trade and other receivables
Note2017
$000s2016
$000s
Current
Trade receivables 14,207 18,940
Provision for doubtful debts (798) (778)
Deferred Government benefit for superannuation 31.3 4,712 5,135
GST receivable 2,708 4,787
Total current receivables 20,829 28,084
Non-current
Trade receivables 980 1,083
Deferred Government benefit for superannuation 31.3 66,686 65,955
Total non-current receivables 67,666 67,038
Total trade and other receivables 88,495 95,122
As at 31 December 2017 trade receivables of $3,587 (2016: $10,752) were past due but not impaired. These relate to a number of independent customers for whom there is no recent history of default. The ageing analysis of these receivables is as follows:
Between 15 to 90 days 1,810 3,515
Between 91 to 180 days 287 1,389
Over 181 days 1,490 5,848
Total trade receivables past due but not impaired 3,587 10,752
Impaired receivables
As at 31 December 2017, current receivables of the University with a nominal value of $798,000 (2016: $778,000) were deemed to be impaired and provided for as doubtful debts. The individually impaired receivables relate to debts from students who are no longer enrolled, are in unexpected difficult economic situations and have been outstanding for greater than 12 months.
Over 180 days 798 778
Total current impaired receivables 798 778
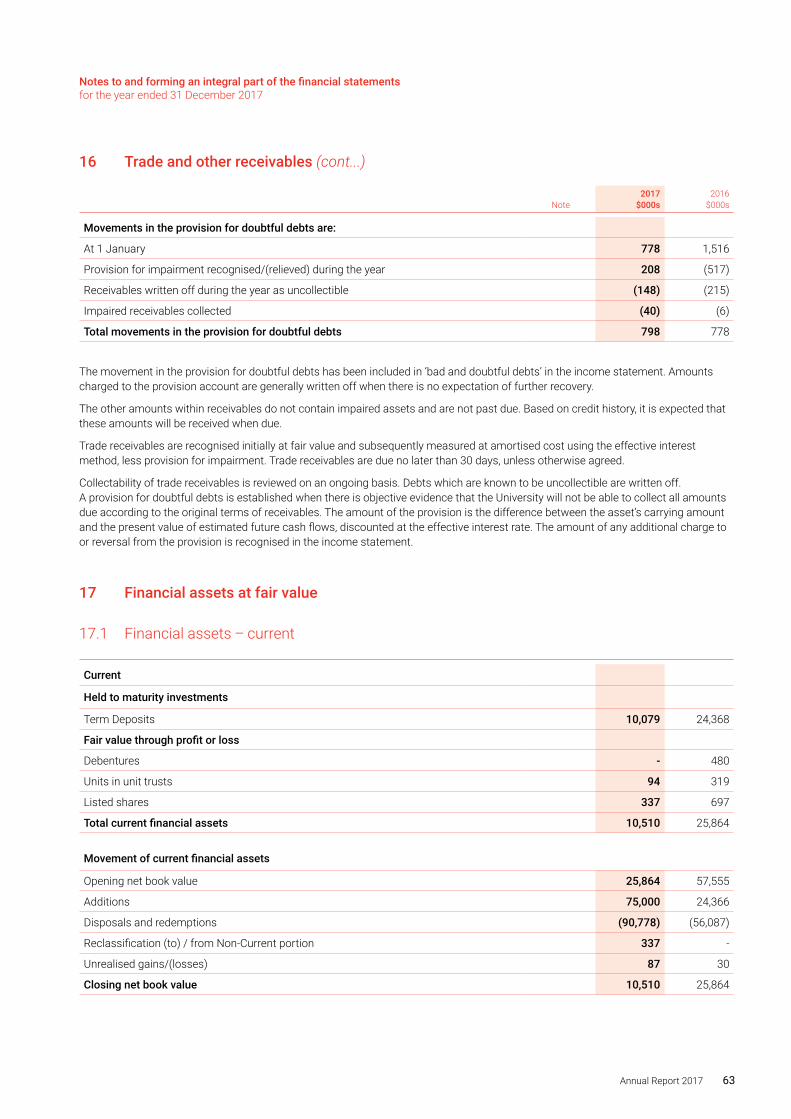
Notes to and forming an integral part of the financial statements for the year ended 31 December 2017
Annual Report 2017 63
16 Trade and other receivables (cont...)
Note2017
$000s2016
$000s
Movements in the provision for doubtful debts are:
At 1 January 778 1,516
Provision for impairment recognised/(relieved) during the year 208 (517)
Receivables written off during the year as uncollectible (148) (215)
Impaired receivables collected (40) (6)
Total movements in the provision for doubtful debts 798 778
The movement in the provision for doubtful debts has been included in ‘bad and doubtful debts’ in the income statement. Amounts charged to the provision account are generally written off when there is no expectation of further recovery.
The other amounts within receivables do not contain impaired assets and are not past due. Based on credit history, it is expected that these amounts will be received when due.
Trade receivables are recognised initially at fair value and subsequently measured at amortised cost using the effective interest method, less provision for impairment. Trade receivables are due no later than 30 days, unless otherwise agreed.
Collectability of trade receivables is reviewed on an ongoing basis. Debts which are known to be uncollectible are written off. A provision for doubtful debts is established when there is objective evidence that the University will not be able to collect all amounts due according to the original terms of receivables. The amount of the provision is the difference between the asset’s carrying amount and the present value of estimated future cash flows, discounted at the effective interest rate. The amount of any additional charge to or reversal from the provision is recognised in the income statement.
17 Financial assets at fair value
17.1 Financial assets – current
Current
Held to maturity investments
Term Deposits 10,079 24,368
Fair value through profit or loss
Debentures - 480
Units in unit trusts 94 319
Listed shares 337 697
Total current financial assets 10,510 25,864
Movement of current financial assets
Opening net book value 25,864 57,555
Additions 75,000 24,366
Disposals and redemptions (90,778) (56,087)
Reclassification (to) / from Non-Current portion 337 -
Unrealised gains/(losses) 87 30
Closing net book value 10,510 25,864
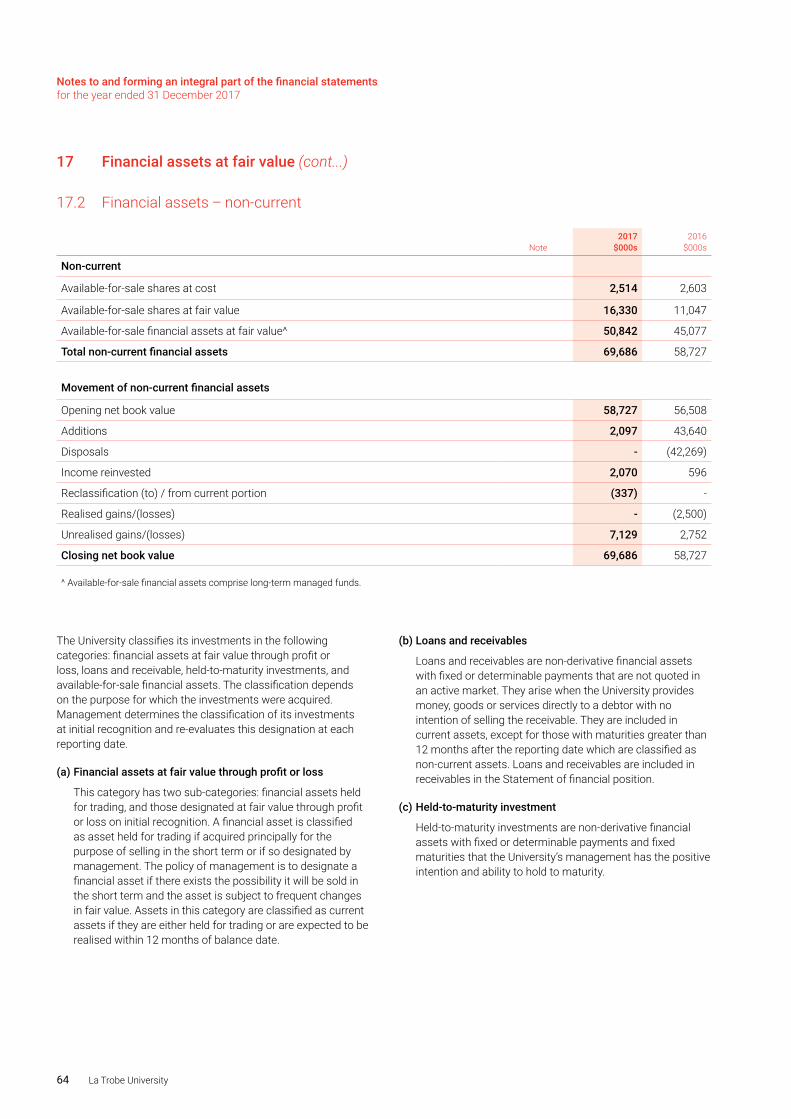
Notes to and forming an integral part of the financial statements for the year ended 31 December 2017
64 La Trobe University
17 Financial assets at fair value (cont...)
17.2 Financial assets – non-current
Note2017
$000s2016
$000s
Non-current
Available-for-sale shares at cost 2,514 2,603
Available-for-sale shares at fair value 16,330 11,047
Available-for-sale financial assets at fair value^ 50,842 45,077
Total non-current financial assets 69,686 58,727
Movement of non-current financial assets
Opening net book value 58,727 56,508
Additions 2,097 43,640
Disposals - (42,269)
Income reinvested 2,070 596
Reclassification (to) / from current portion (337) -
Realised gains/(losses) - (2,500)
Unrealised gains/(losses) 7,129 2,752
Closing net book value 69,686 58,727
^ Available-for-sale financial assets comprise long-term managed funds.
The University classifies its investments in the following categories: financial assets at fair value through profit or loss, loans and receivable, held-to-maturity investments, and available-for-sale financial assets. The classification depends on the purpose for which the investments were acquired. Management determines the classification of its investments at initial recognition and re-evaluates this designation at each reporting date.
(a) Financial assets at fair value through profit or loss
This category has two sub-categories: financial assets held for trading, and those designated at fair value through profit or loss on initial recognition. A financial asset is classified as asset held for trading if acquired principally for the purpose of selling in the short term or if so designated by management. The policy of management is to designate a financial asset if there exists the possibility it will be sold in the short term and the asset is subject to frequent changes in fair value. Assets in this category are classified as current assets if they are either held for trading or are expected to be realised within 12 months of balance date.
(b) Loans and receivables
Loans and receivables are non-derivative financial assets with fixed or determinable payments that are not quoted in an active market. They arise when the University provides money, goods or services directly to a debtor with no intention of selling the receivable. They are included in current assets, except for those with maturities greater than 12 months after the reporting date which are classified as non-current assets. Loans and receivables are included in receivables in the Statement of financial position.
(c) Held-to-maturity investment
Held-to-maturity investments are non-derivative financial assets with fixed or determinable payments and fixed maturities that the University’s management has the positive intention and ability to hold to maturity.
Notes to and forming an integral part of the financial statements for the year ended 31 December 2017
Annual Report 2017 65
(d) Available-for-sale financial assets
Available-for-sale financial assets, comprising principally marketable equity securities, are non-derivatives that are either designated in this category or not classified in any of the other categories. They are included in non-current assets unless management intends to dispose of the investment within 12 months from the reporting date.
Regular purchases and sales of financial assets are recognised on trade-date - the date on which the University commits to purchase or sell the asset. Investments are initially recognised at fair value plus transactions costs for all financial assets not carried at fair value through profit or loss. Financial assets carried at fair value through profit or loss are initially recognised at fair value and transaction costs are expensed in the income statement. Financial assets are derecognised when the right to receive cash flows from the financial assets have expired or have been transferred and the University has transferred substantially all the risks and rewards of ownership.
When securities classified as available-for-sale are sold, the accumulated fair value adjustments recognised in other comprehensive income are included in the income statement as gains and losses from investment securities.
(e) Fair value
The fair values of quoted investments are based on current bid prices. If the market for a financial asset is not active (and for unlisted securities), the University establishes fair value by using valuation techniques. These include reference to the fair values of recent arm’s length transactions, involving the same instruments or other instruments that are substantially the same, discounted cash flow analysis and option pricing models refined to reflect the issuer’s specific circumstances.
(f) Subsequent measurement
Available-for-sale financial assets and financial assets at fair value though profit and loss are subsequently carried at fair value. Loans and receivables and held-to-maturity investments are carried at amortised cost using the effective interest method. Gains or losses arising from changes in the fair value of the ‘financial assets at fair value through profit or loss’ category are included in the income statement within Investment income or other expenses in the period in which they arise.
Changes in the fair value of monetary security denominated in a foreign currency and classified as available-for-sale are analysed between translation differences resulting from changes in amortised cost of the security and other changes in the carrying amount of the security. The translation differences related to changes in the amortised cost are recognised in profit or loss, and other changes in carrying amount are recognised in equity. Changes in the fair value of other monetary and non-monetary securities classified as available-for-sale are recognised in equity.
(g) Impairment
The University assesses at each balance date whether there is objective evidence that a financial asset or group of financial assets is impaired. In the case of equity securities classified as available-for-sale, a significant or prolonged decline in the fair value of a security below its cost is considered in determining whether the security is impaired. If any such evidence exists for available-for-sale financial assets, the cumulative loss - measured as the difference between the acquisition cost and the current fair value, less any impairment loss on that financial asset previously recognised in profit and loss - is removed from equity and recognised in the income statement. Impairment losses recognised in the income statement on equity instruments are not reversed through the income statement.
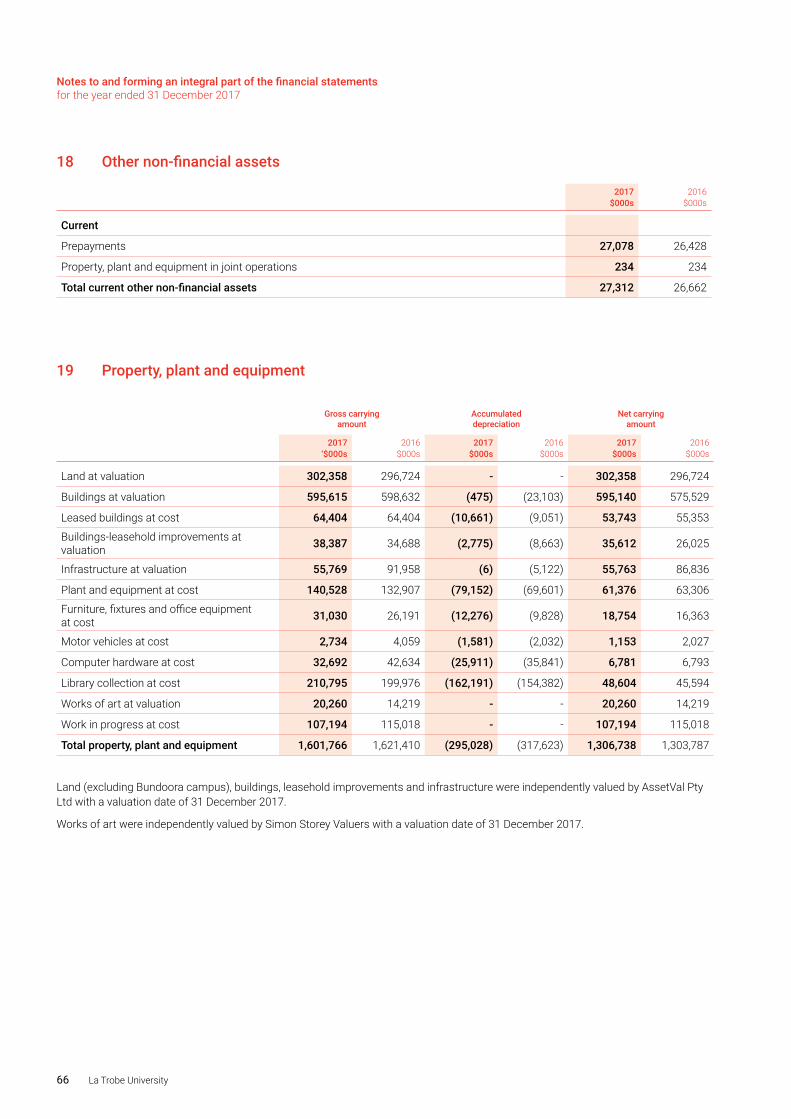
Notes to and forming an integral part of the financial statements for the year ended 31 December 2017
66 La Trobe University
18 Other non-financial assets
2017$000s
2016$000s
Current
Prepayments 27,078 26,428
Property, plant and equipment in joint operations 234 234
Total current other non-financial assets 27,312 26,662
19 Property, plant and equipment
Gross carrying amount
Accumulated depreciation
Net carrying amount
2017 ‘$000s
2016 $000s
2017 $000s
2016 $000s
2017 $000s
2016 $000s
Land at valuation 302,358 296,724 - - 302,358 296,724
Buildings at valuation 595,615 598,632 (475) (23,103) 595,140 575,529
Leased buildings at cost 64,404 64,404 (10,661) (9,051) 53,743 55,353
Buildings-leasehold improvements at valuation 38,387 34,688 (2,775) (8,663) 35,612 26,025
Infrastructure at valuation 55,769 91,958 (6) (5,122) 55,763 86,836
Plant and equipment at cost 140,528 132,907 (79,152) (69,601) 61,376 63,306
Furniture, fixtures and office equipment at cost 31,030 26,191 (12,276) (9,828) 18,754 16,363
Motor vehicles at cost 2,734 4,059 (1,581) (2,032) 1,153 2,027
Computer hardware at cost 32,692 42,634 (25,911) (35,841) 6,781 6,793
Library collection at cost 210,795 199,976 (162,191) (154,382) 48,604 45,594
Works of art at valuation 20,260 14,219 - - 20,260 14,219
Work in progress at cost 107,194 115,018 - - 107,194 115,018
Total property, plant and equipment 1,601,766 1,621,410 (295,028) (317,623) 1,306,738 1,303,787
Land (excluding Bundoora campus), buildings, leasehold improvements and infrastructure were independently valued by AssetVal Pty Ltd with a valuation date of 31 December 2017.
Works of art were independently valued by Simon Storey Valuers with a valuation date of 31 December 2017.
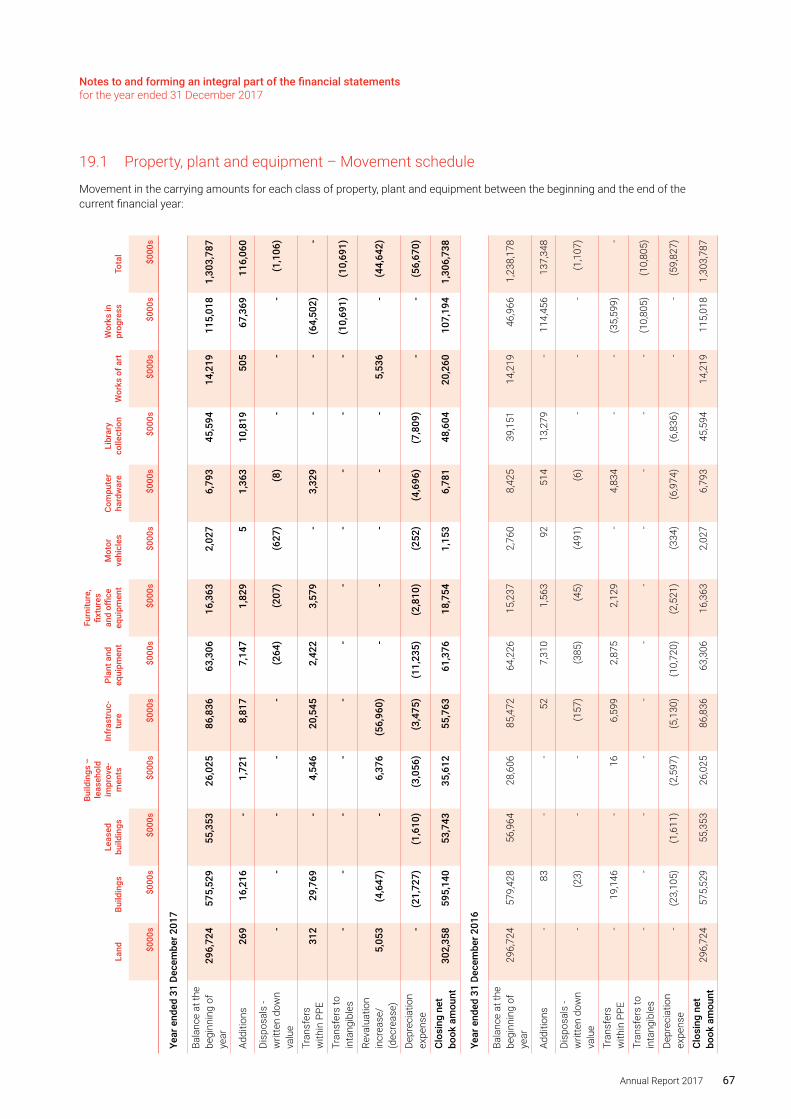
Notes to and forming an integral part of the financial statements for the year ended 31 December 2017
Annual Report 2017 67
19.1 Property, plant and equipment – Movement schedule
Movement in the carrying amounts for each class of property, plant and equipment between the beginning and the end of the current financial year:
Land
Build
ings
Leas
ed
build
ings
Build
ings
–
leas
ehol
d im
prov
e-m
ents
Infr
astr
uc-
ture
Plan
t and
eq
uipm
ent
Furn
iture
, fix
ture
s an
d offi
ce
equi
pmen
tM
otor
ve
hicl
esCo
mpu
ter
hard
war
eLi
brar
y co
llect
ion
Wor
ks o
f art
Wor
ks in
pr
ogre
ssTo
tal
$0
00s
$0
00s
$0
00s
$0
00s
$0
00s
$0
00s
$0
00s
$0
00s
$0
00s
$0
00s
$000
s
$000
s$0
00s
Year
end
ed 3
1 De
cem
ber 2
017
Bala
nce
at th
e be
ginn
ing
of
year
296
,724
5
75,5
29
55,
353
26,
025
86,
836
63,
306
16,
363
2,0
27
6,7
93
45,
594
14,
219
115
,018
1
,303
,787
Addi
tions
269
1
6,21
6 -
1,7
21
8,8
17
7,1
47
1,8
29
5
1,3
63
10,
819
505
6
7,36
9 1
16,0
60
Disp
osal
s -
writ
ten
dow
n va
lue
- -
- -
- (2
64)
(207
) (6
27)
(8)
- -
- (1
,106
)
Tran
sfer
s w
ithin
PPE
312
2
9,76
9 -
4,5
46
20,
545
2,4
22
3,5
79
- 3
,329
-
- (6
4,50
2) -
Tran
sfer
s to
in
tang
ible
s -
- -
- -
- -
- -
- -
(10,
691)
(10,
691)
Reva
luat
ion
incr
ease
/(d
ecre
ase)
5,0
53
(4,6
47)
- 6
,376
(5
6,96
0) -
- -
- -
5,5
36
- (4
4,64
2)
Depr
ecia
tion
expe
nse
- (2
1,72
7) (1
,610
) (3
,056
) (3
,475
) (1
1,23
5) (2
,810
) (2
52)
(4,6
96)
(7,8
09)
- -
(56,
670)
Clos
ing
net
book
am
ount
302
,358
5
95,1
40
53,
743
35,
612
55,
763
61,
376
18,
754
1,1
53
6,7
81
48,
604
20,
260
107
,194
1
,306
,738
Year
end
ed 3
1 De
cem
ber 2
016
Bala
nce
at th
e be
ginn
ing
of
year
296
,724
5
79,4
28
56,
964
28,
606
85,
472
64,
226
15,
237
2,7
60
8,4
25
39,
151
14,
219
46,
966
1,2
38,1
78
Addi
tions
- 8
3 -
- 5
2 7
,310
1
,563
9
2 5
14
13,
279
- 1
14,4
56
137
,348
Disp
osal
s -
writ
ten
dow
n va
lue
- (2
3) -
- (1
57)
(385
) (4
5) (4
91)
(6)
- -
- (1
,107
)
Tran
sfer
s w
ithin
PPE
- 1
9,14
6 -
16
6,5
99
2,8
75
2,1
29
- 4
,834
-
- (3
5,59
9) -
Tran
sfer
s to
in
tang
ible
s -
- -
- -
- -
- -
- -
(10,
805)
(10,
805)
Depr
ecia
tion
expe
nse
- (2
3,10
5) (1
,611
) (2
,597
) (5
,130
) (1
0,72
0) (2
,521
) (3
34)
(6,9
74)
(6,8
36)
- -
(59,
827)
Clos
ing
net
book
am
ount
296
,724
5
75,5
29
55,
353
26,
025
86,
836
63,
306
16,
363
2,0
27
6,7
93
45,
594
14,
219
115
,018
1
,303
,787
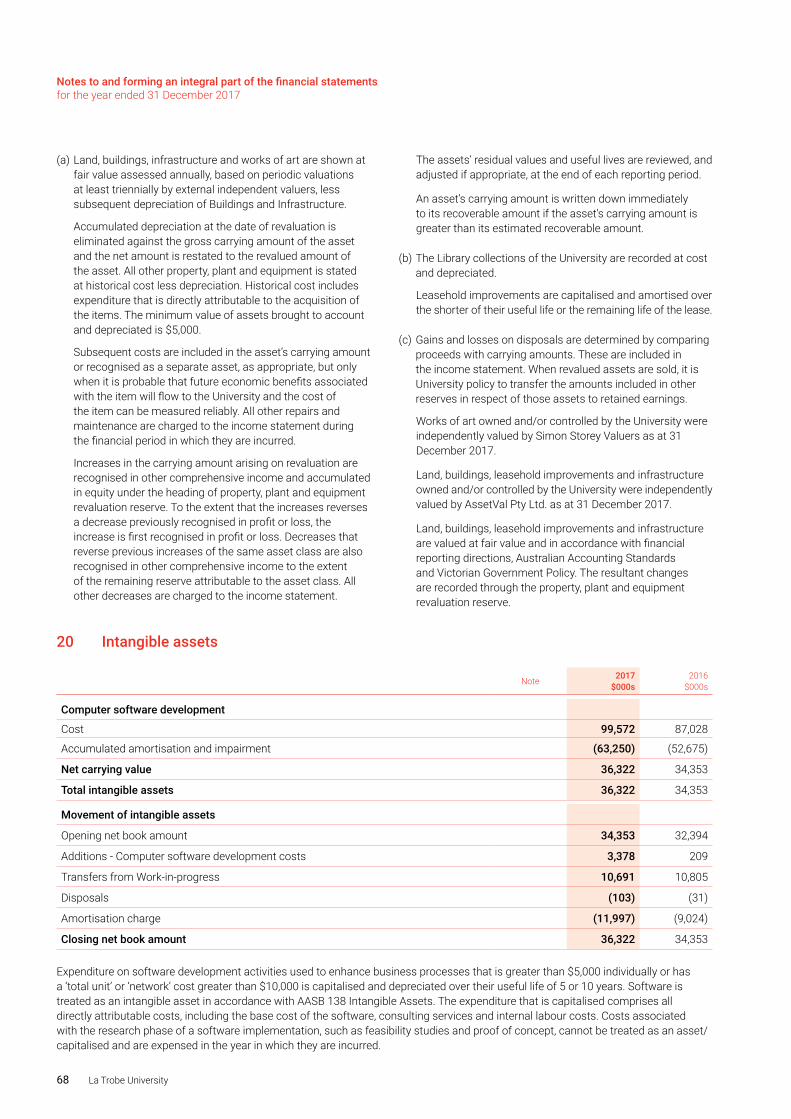
Notes to and forming an integral part of the financial statements for the year ended 31 December 2017
68 La Trobe University
(a) Land, buildings, infrastructure and works of art are shown at fair value assessed annually, based on periodic valuations at least triennially by external independent valuers, less subsequent depreciation of Buildings and Infrastructure.
Accumulated depreciation at the date of revaluation is eliminated against the gross carrying amount of the asset and the net amount is restated to the revalued amount of the asset. All other property, plant and equipment is stated at historical cost less depreciation. Historical cost includes expenditure that is directly attributable to the acquisition of the items. The minimum value of assets brought to account and depreciated is $5,000.
Subsequent costs are included in the asset’s carrying amount or recognised as a separate asset, as appropriate, but only when it is probable that future economic benefits associated with the item will flow to the University and the cost of the item can be measured reliably. All other repairs and maintenance are charged to the income statement during the financial period in which they are incurred.
Increases in the carrying amount arising on revaluation are recognised in other comprehensive income and accumulated in equity under the heading of property, plant and equipment revaluation reserve. To the extent that the increases reverses a decrease previously recognised in profit or loss, the increase is first recognised in profit or loss. Decreases that reverse previous increases of the same asset class are also recognised in other comprehensive income to the extent of the remaining reserve attributable to the asset class. All other decreases are charged to the income statement.
The assets’ residual values and useful lives are reviewed, and adjusted if appropriate, at the end of each reporting period.
An asset’s carrying amount is written down immediately to its recoverable amount if the asset’s carrying amount is greater than its estimated recoverable amount.
(b) The Library collections of the University are recorded at cost and depreciated.
Leasehold improvements are capitalised and amortised over the shorter of their useful life or the remaining life of the lease.
(c) Gains and losses on disposals are determined by comparing proceeds with carrying amounts. These are included in the income statement. When revalued assets are sold, it is University policy to transfer the amounts included in other reserves in respect of those assets to retained earnings.
Works of art owned and/or controlled by the University were independently valued by Simon Storey Valuers as at 31 December 2017.
Land, buildings, leasehold improvements and infrastructure owned and/or controlled by the University were independently valued by AssetVal Pty Ltd. as at 31 December 2017.
Land, buildings, leasehold improvements and infrastructure are valued at fair value and in accordance with financial reporting directions, Australian Accounting Standards and Victorian Government Policy. The resultant changes are recorded through the property, plant and equipment revaluation reserve.
20 Intangible assets
Note 2017$000s
2016$000s
Computer software development
Cost 99,572 87,028
Accumulated amortisation and impairment (63,250) (52,675)
Net carrying value 36,322 34,353
Total intangible assets 36,322 34,353
Movement of intangible assets
Opening net book amount 34,353 32,394
Additions - Computer software development costs 3,378 209
Transfers from Work-in-progress 10,691 10,805
Disposals (103) (31)
Amortisation charge (11,997) (9,024)
Closing net book amount 36,322 34,353
Expenditure on software development activities used to enhance business processes that is greater than $5,000 individually or has a ‘total unit’ or ‘network’ cost greater than $10,000 is capitalised and depreciated over their useful life of 5 or 10 years. Software is treated as an intangible asset in accordance with AASB 138 Intangible Assets. The expenditure that is capitalised comprises all directly attributable costs, including the base cost of the software, consulting services and internal labour costs. Costs associated with the research phase of a software implementation, such as feasibility studies and proof of concept, cannot be treated as an asset/capitalised and are expensed in the year in which they are incurred.
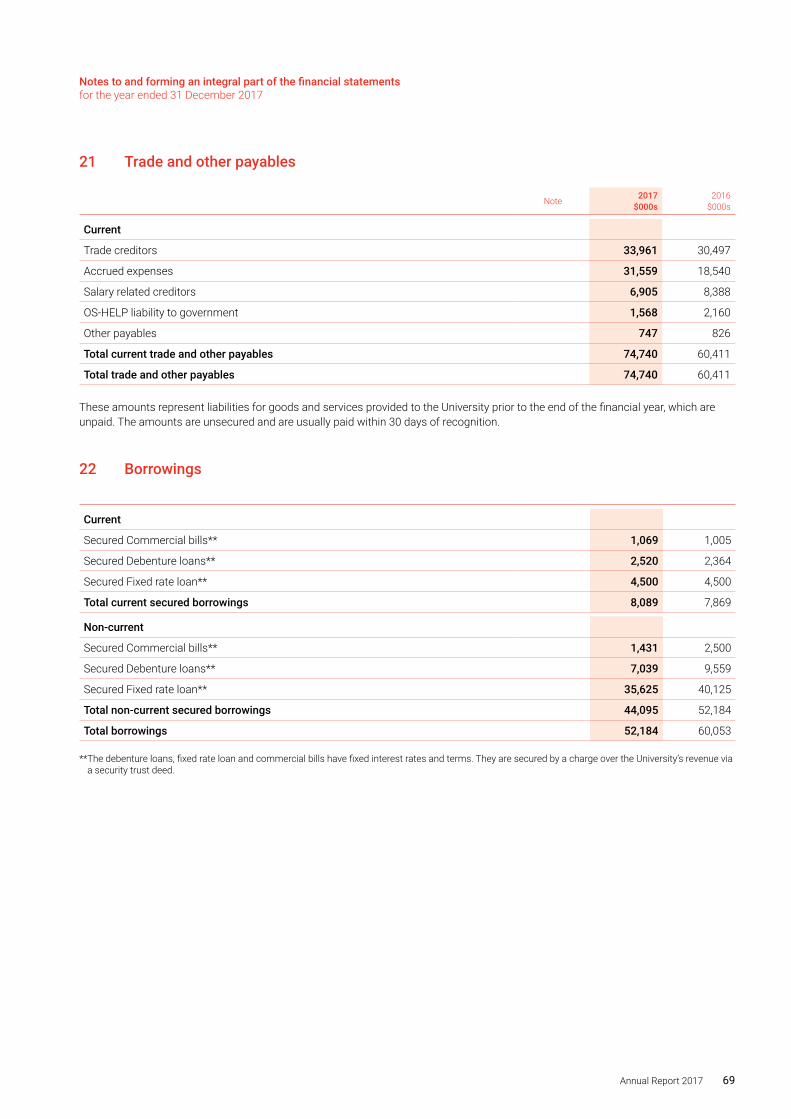
Notes to and forming an integral part of the financial statements for the year ended 31 December 2017
Annual Report 2017 69
21 Trade and other payables
Note 2017$000s
2016$000s
Current
Trade creditors 33,961 30,497
Accrued expenses 31,559 18,540
Salary related creditors 6,905 8,388
OS-HELP liability to government 1,568 2,160
Other payables 747 826
Total current trade and other payables 74,740 60,411
Total trade and other payables 74,740 60,411
These amounts represent liabilities for goods and services provided to the University prior to the end of the financial year, which are unpaid. The amounts are unsecured and are usually paid within 30 days of recognition.
22 Borrowings
Current
Secured Commercial bills** 1,069 1,005
Secured Debenture loans** 2,520 2,364
Secured Fixed rate loan** 4,500 4,500
Total current secured borrowings 8,089 7,869
Non-current
Secured Commercial bills** 1,431 2,500
Secured Debenture loans** 7,039 9,559
Secured Fixed rate loan** 35,625 40,125
Total non-current secured borrowings 44,095 52,184
Total borrowings 52,184 60,053
** The debenture loans, fixed rate loan and commercial bills have fixed interest rates and terms. They are secured by a charge over the University’s revenue via a security trust deed.
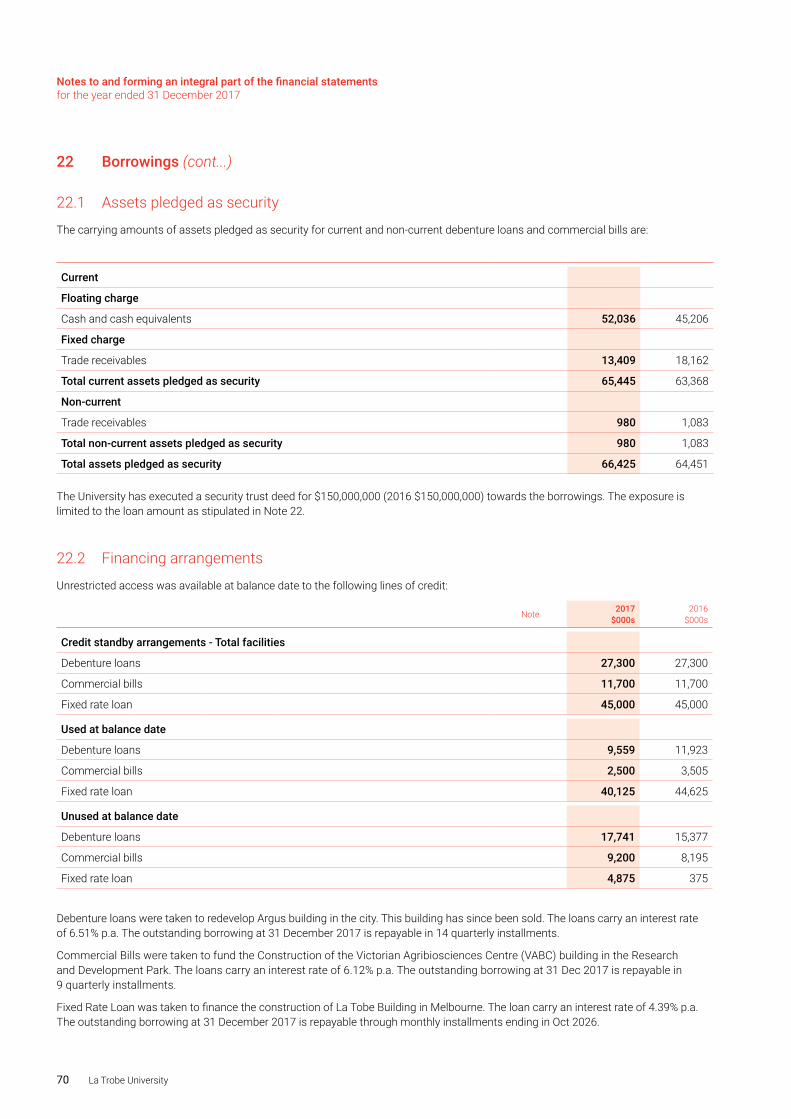
Notes to and forming an integral part of the financial statements for the year ended 31 December 2017
70 La Trobe University
22 Borrowings (cont...)
22.1 Assets pledged as security
The carrying amounts of assets pledged as security for current and non-current debenture loans and commercial bills are:
Current
Floating charge
Cash and cash equivalents 52,036 45,206
Fixed charge
Trade receivables 13,409 18,162
Total current assets pledged as security 65,445 63,368
Non-current
Trade receivables 980 1,083
Total non-current assets pledged as security 980 1,083
Total assets pledged as security 66,425 64,451
The University has executed a security trust deed for $150,000,000 (2016 $150,000,000) towards the borrowings. The exposure is limited to the loan amount as stipulated in Note 22.
22.2 Financing arrangements
Unrestricted access was available at balance date to the following lines of credit:
Note 2017$000s
2016$000s
Credit standby arrangements - Total facilities
Debenture loans 27,300 27,300
Commercial bills 11,700 11,700
Fixed rate loan 45,000 45,000
Used at balance date
Debenture loans 9,559 11,923
Commercial bills 2,500 3,505
Fixed rate loan 40,125 44,625
Unused at balance date
Debenture loans 17,741 15,377
Commercial bills 9,200 8,195
Fixed rate loan 4,875 375
Debenture loans were taken to redevelop Argus building in the city. This building has since been sold. The loans carry an interest rate of 6.51% p.a. The outstanding borrowing at 31 December 2017 is repayable in 14 quarterly installments.
Commercial Bills were taken to fund the Construction of the Victorian Agribiosciences Centre (VABC) building in the Research and Development Park. The loans carry an interest rate of 6.12% p.a. The outstanding borrowing at 31 Dec 2017 is repayable in 9 quarterly installments.
Fixed Rate Loan was taken to finance the construction of La Tobe Building in Melbourne. The loan carry an interest rate of 4.39% p.a. The outstanding borrowing at 31 December 2017 is repayable through monthly installments ending in Oct 2026.
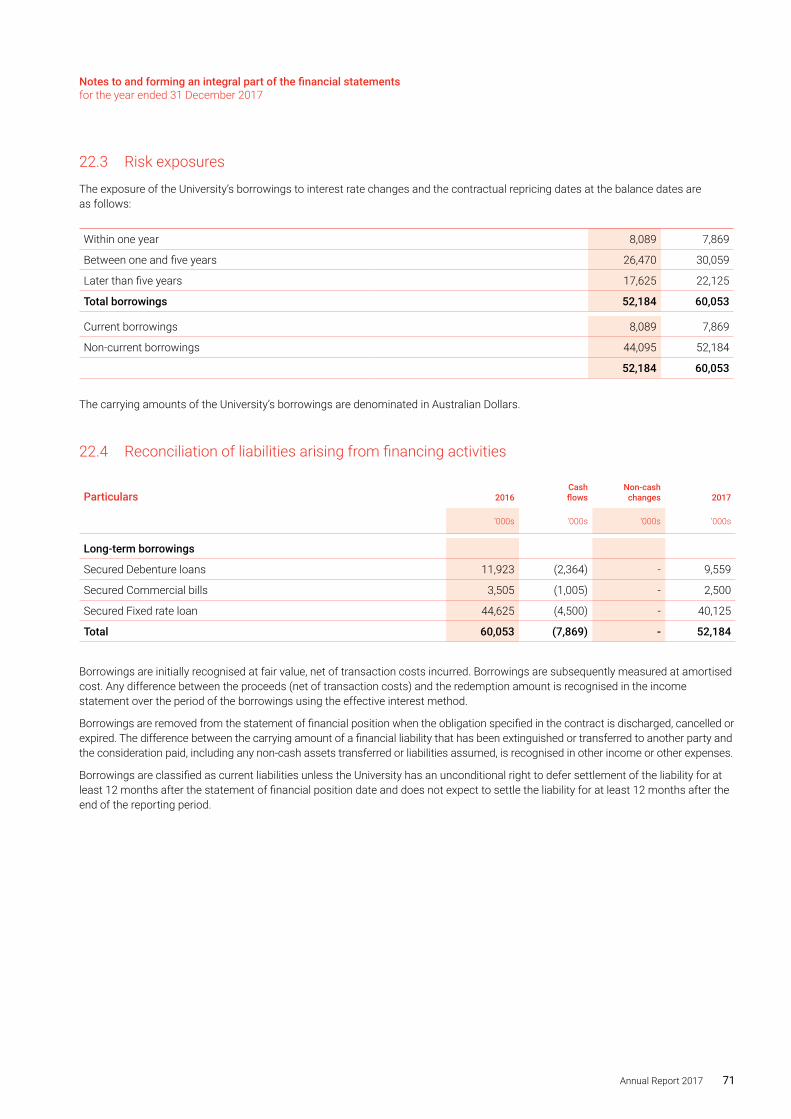
Notes to and forming an integral part of the financial statements for the year ended 31 December 2017
Annual Report 2017 71
22.3 Risk exposures
The exposure of the University’s borrowings to interest rate changes and the contractual repricing dates at the balance dates are as follows:
Within one year 8,089 7,869
Between one and five years 26,470 30,059
Later than five years 17,625 22,125
Total borrowings 52,184 60,053
Current borrowings 8,089 7,869
Non-current borrowings 44,095 52,184
52,184 60,053
The carrying amounts of the University’s borrowings are denominated in Australian Dollars.
22.4 Reconciliation of liabilities arising from financing activities
Particulars 2016Cash flows
Non-cash changes 2017
‘000s ‘000s ‘000s ‘000s
Long-term borrowings
Secured Debenture loans 11,923 (2,364) - 9,559
Secured Commercial bills 3,505 (1,005) - 2,500
Secured Fixed rate loan 44,625 (4,500) - 40,125
Total 60,053 (7,869) - 52,184
Borrowings are initially recognised at fair value, net of transaction costs incurred. Borrowings are subsequently measured at amortised cost. Any difference between the proceeds (net of transaction costs) and the redemption amount is recognised in the income statement over the period of the borrowings using the effective interest method.
Borrowings are removed from the statement of financial position when the obligation specified in the contract is discharged, cancelled or expired. The difference between the carrying amount of a financial liability that has been extinguished or transferred to another party and the consideration paid, including any non-cash assets transferred or liabilities assumed, is recognised in other income or other expenses.
Borrowings are classified as current liabilities unless the University has an unconditional right to defer settlement of the liability for at least 12 months after the statement of financial position date and does not expect to settle the liability for at least 12 months after the end of the reporting period.
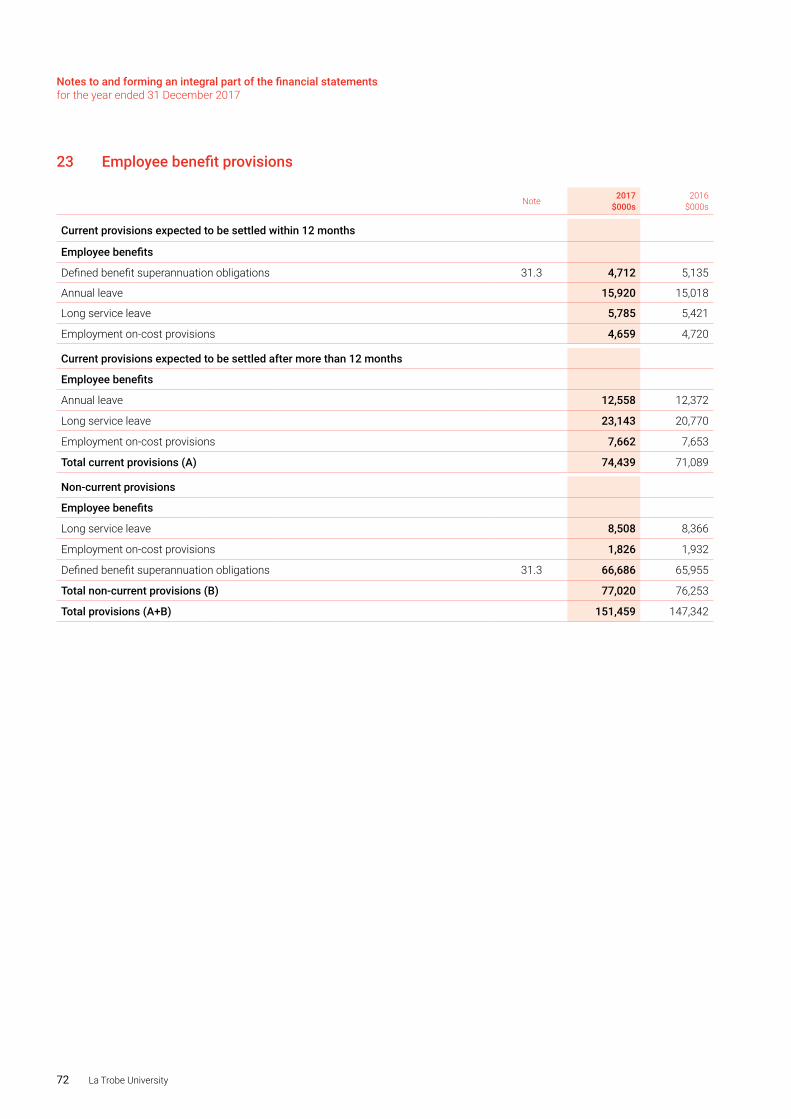
Notes to and forming an integral part of the financial statements for the year ended 31 December 2017
72 La Trobe University
23 Employee benefit provisions
Note 2017$000s
2016$000s
Current provisions expected to be settled within 12 months
Employee benefits
Defined benefit superannuation obligations 31.3 4,712 5,135
Annual leave 15,920 15,018
Long service leave 5,785 5,421
Employment on-cost provisions 4,659 4,720
Current provisions expected to be settled after more than 12 months
Employee benefits
Annual leave 12,558 12,372
Long service leave 23,143 20,770
Employment on-cost provisions 7,662 7,653
Total current provisions (A) 74,439 71,089
Non-current provisions
Employee benefits
Long service leave 8,508 8,366
Employment on-cost provisions 1,826 1,932
Defined benefit superannuation obligations 31.3 66,686 65,955
Total non-current provisions (B) 77,020 76,253
Total provisions (A+B) 151,459 147,342
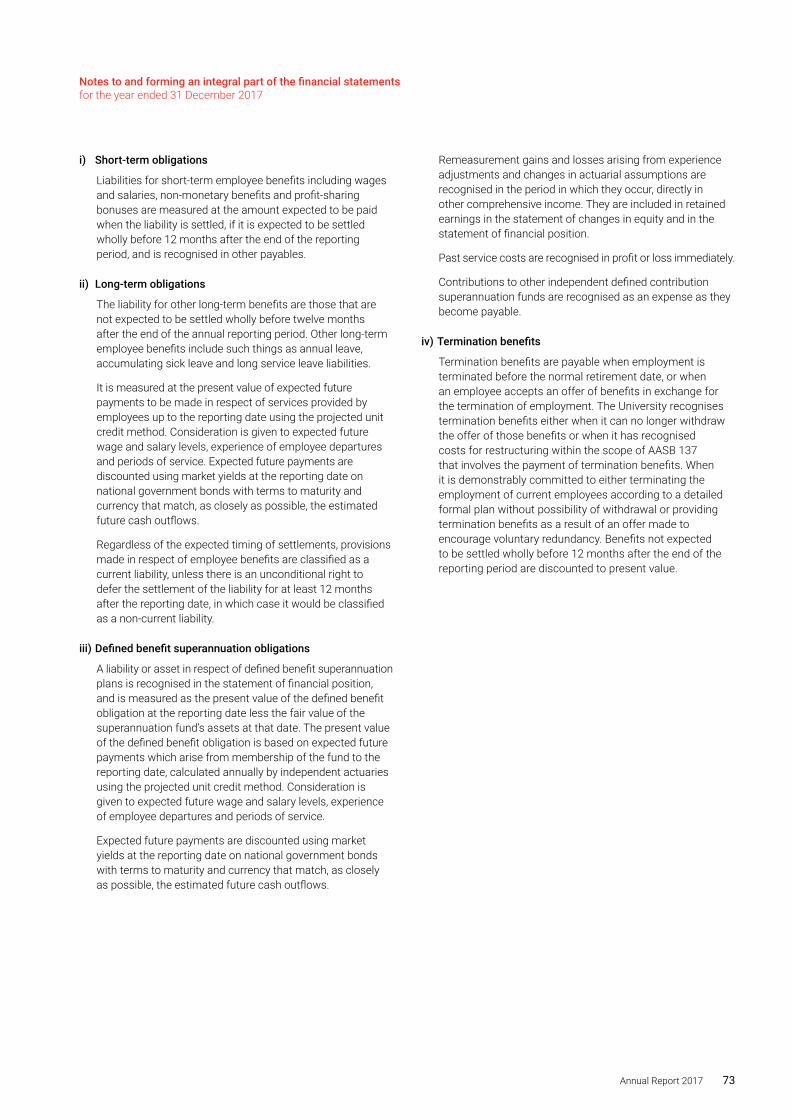
Notes to and forming an integral part of the financial statements for the year ended 31 December 2017
Annual Report 2017 73
i) Short-term obligations
Liabilities for short-term employee benefits including wages and salaries, non-monetary benefits and profit-sharing bonuses are measured at the amount expected to be paid when the liability is settled, if it is expected to be settled wholly before 12 months after the end of the reporting period, and is recognised in other payables.
ii) Long-term obligations
The liability for other long-term benefits are those that are not expected to be settled wholly before twelve months after the end of the annual reporting period. Other long-term employee benefits include such things as annual leave, accumulating sick leave and long service leave liabilities.
It is measured at the present value of expected future payments to be made in respect of services provided by employees up to the reporting date using the projected unit credit method. Consideration is given to expected future wage and salary levels, experience of employee departures and periods of service. Expected future payments are discounted using market yields at the reporting date on national government bonds with terms to maturity and currency that match, as closely as possible, the estimated future cash outflows.
Regardless of the expected timing of settlements, provisions made in respect of employee benefits are classified as a current liability, unless there is an unconditional right to defer the settlement of the liability for at least 12 months after the reporting date, in which case it would be classified as a non-current liability.
iii) Defined benefit superannuation obligations
A liability or asset in respect of defined benefit superannuation plans is recognised in the statement of financial position, and is measured as the present value of the defined benefit obligation at the reporting date less the fair value of the superannuation fund’s assets at that date. The present value of the defined benefit obligation is based on expected future payments which arise from membership of the fund to the reporting date, calculated annually by independent actuaries using the projected unit credit method. Consideration is given to expected future wage and salary levels, experience of employee departures and periods of service.
Expected future payments are discounted using market yields at the reporting date on national government bonds with terms to maturity and currency that match, as closely as possible, the estimated future cash outflows.
Remeasurement gains and losses arising from experience adjustments and changes in actuarial assumptions are recognised in the period in which they occur, directly in other comprehensive income. They are included in retained earnings in the statement of changes in equity and in the statement of financial position.
Past service costs are recognised in profit or loss immediately.
Contributions to other independent defined contribution superannuation funds are recognised as an expense as they become payable.
iv) Termination benefits
Termination benefits are payable when employment is terminated before the normal retirement date, or when an employee accepts an offer of benefits in exchange for the termination of employment. The University recognises termination benefits either when it can no longer withdraw the offer of those benefits or when it has recognised costs for restructuring within the scope of AASB 137 that involves the payment of termination benefits. When it is demonstrably committed to either terminating the employment of current employees according to a detailed formal plan without possibility of withdrawal or providing termination benefits as a result of an offer made to encourage voluntary redundancy. Benefits not expected to be settled wholly before 12 months after the end of the reporting period are discounted to present value.
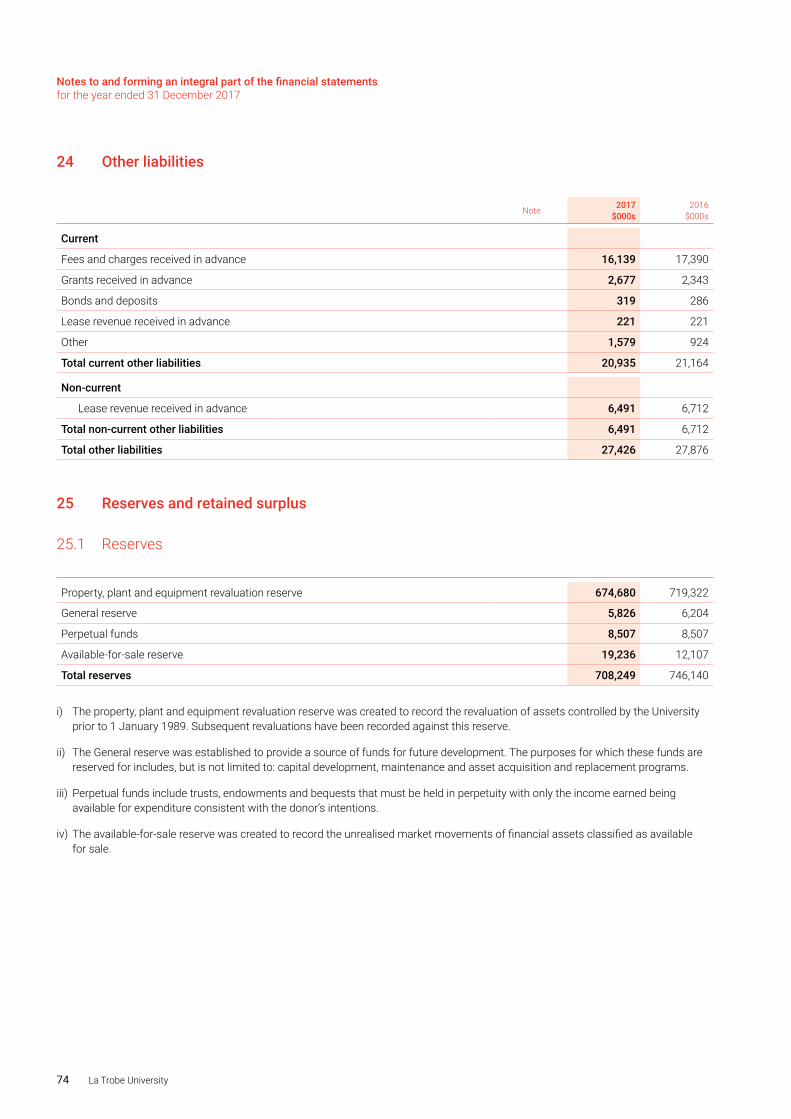
Notes to and forming an integral part of the financial statements for the year ended 31 December 2017
74 La Trobe University
24 Other liabilities
Note 2017$000s
2016$000s
Current
Fees and charges received in advance 16,139 17,390
Grants received in advance 2,677 2,343
Bonds and deposits 319 286
Lease revenue received in advance 221 221
Other 1,579 924
Total current other liabilities 20,935 21,164
Non-current
Lease revenue received in advance 6,491 6,712
Total non-current other liabilities 6,491 6,712
Total other liabilities 27,426 27,876
25 Reserves and retained surplus
25.1 Reserves
Property, plant and equipment revaluation reserve 674,680 719,322
General reserve 5,826 6,204
Perpetual funds 8,507 8,507
Available-for-sale reserve 19,236 12,107
Total reserves 708,249 746,140
i) The property, plant and equipment revaluation reserve was created to record the revaluation of assets controlled by the University prior to 1 January 1989. Subsequent revaluations have been recorded against this reserve.
ii) The General reserve was established to provide a source of funds for future development. The purposes for which these funds are reserved for includes, but is not limited to: capital development, maintenance and asset acquisition and replacement programs.
iii) Perpetual funds include trusts, endowments and bequests that must be held in perpetuity with only the income earned being available for expenditure consistent with the donor’s intentions.
iv) The available-for-sale reserve was created to record the unrealised market movements of financial assets classified as available for sale.
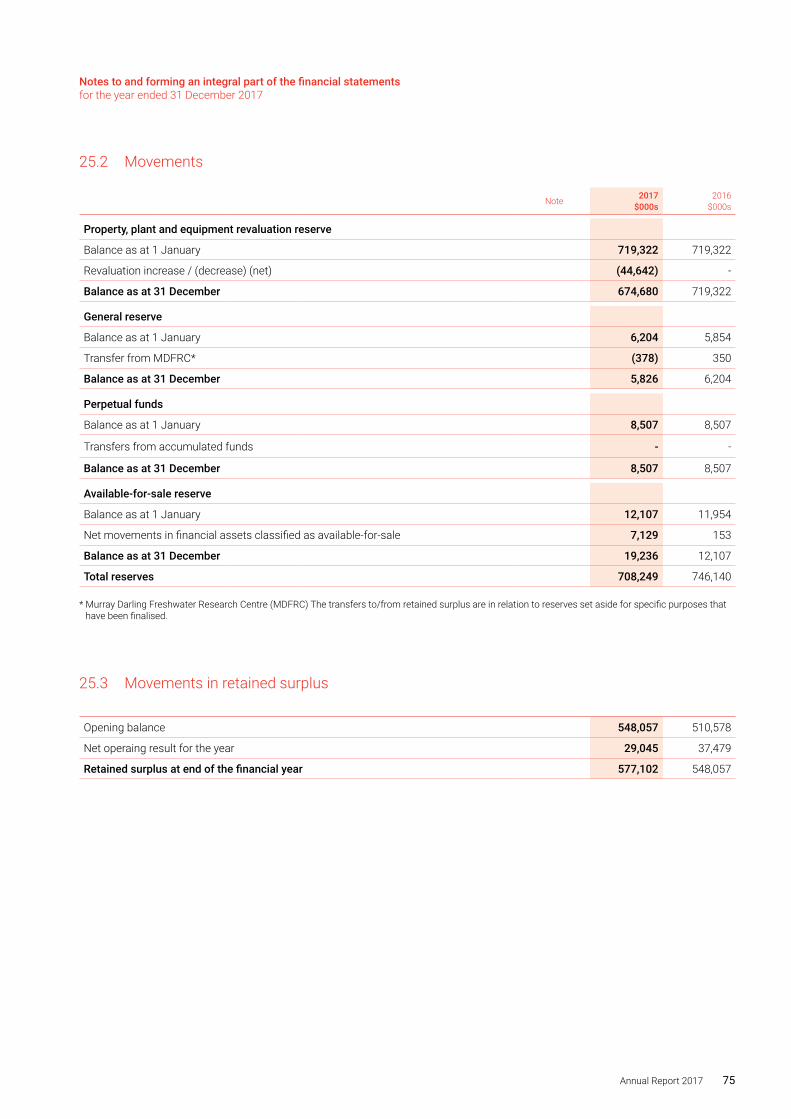
Notes to and forming an integral part of the financial statements for the year ended 31 December 2017
Annual Report 2017 75
25.2 Movements
Note 2017$000s
2016$000s
Property, plant and equipment revaluation reserve
Balance as at 1 January 719,322 719,322
Revaluation increase / (decrease) (net) (44,642) -
Balance as at 31 December 674,680 719,322
General reserve
Balance as at 1 January 6,204 5,854
Transfer from MDFRC* (378) 350
Balance as at 31 December 5,826 6,204
Perpetual funds
Balance as at 1 January 8,507 8,507
Transfers from accumulated funds - -
Balance as at 31 December 8,507 8,507
Available-for-sale reserve
Balance as at 1 January 12,107 11,954
Net movements in financial assets classified as available-for-sale 7,129 153
Balance as at 31 December 19,236 12,107
Total reserves 708,249 746,140
* Murray Darling Freshwater Research Centre (MDFRC) The transfers to/from retained surplus are in relation to reserves set aside for specific purposes that have been finalised.
25.3 Movements in retained surplus
Opening balance 548,057 510,578
Net operaing result for the year 29,045 37,479
Retained surplus at end of the financial year 577,102 548,057
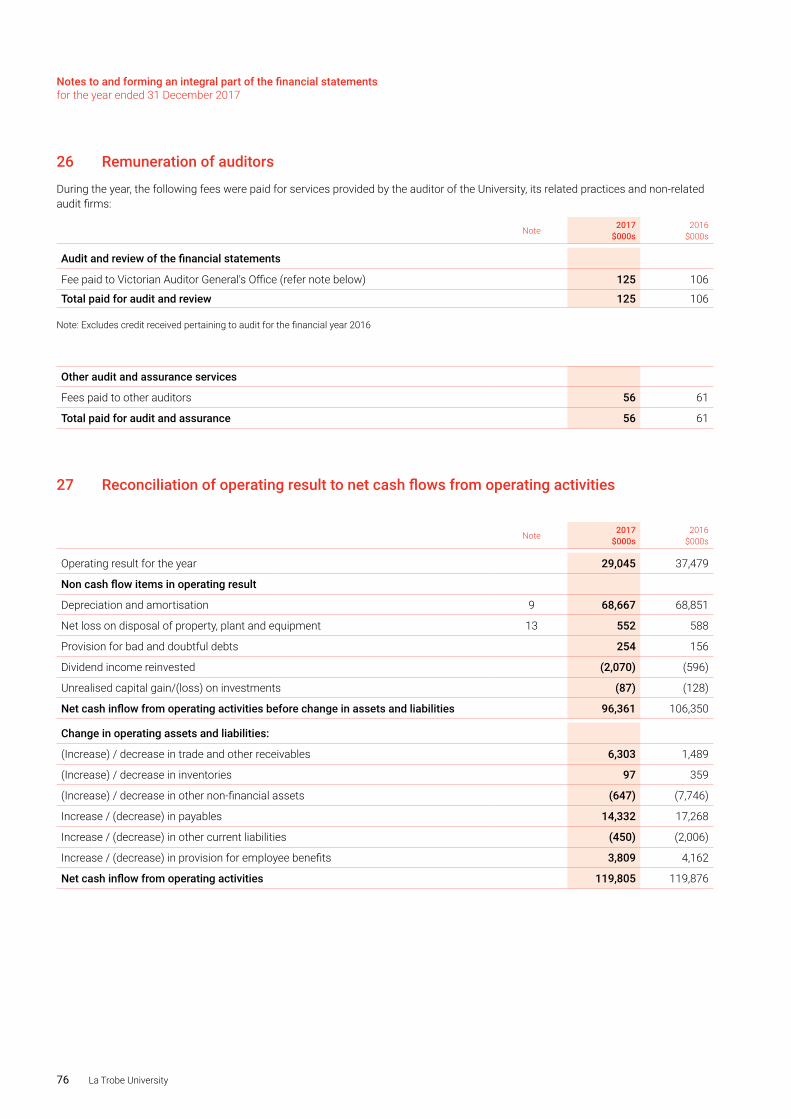
Notes to and forming an integral part of the financial statements for the year ended 31 December 2017
76 La Trobe University
26 Remuneration of auditors
During the year, the following fees were paid for services provided by the auditor of the University, its related practices and non-related audit firms:
Note 2017$000s
2016$000s
Audit and review of the financial statements
Fee paid to Victorian Auditor General's Office (refer note below) 125 106
Total paid for audit and review 125 106
Note: Excludes credit received pertaining to audit for the financial year 2016
Other audit and assurance services
Fees paid to other auditors 56 61
Total paid for audit and assurance 56 61
27 Reconciliation of operating result to net cash flows from operating activities
Note 2017$000s
2016$000s
Operating result for the year 29,045 37,479
Non cash flow items in operating result
Depreciation and amortisation 9 68,667 68,851
Net loss on disposal of property, plant and equipment 13 552 588
Provision for bad and doubtful debts 254 156
Dividend income reinvested (2,070) (596)
Unrealised capital gain/(loss) on investments (87) (128)
Net cash inflow from operating activities before change in assets and liabilities 96,361 106,350
Change in operating assets and liabilities:
(Increase) / decrease in trade and other receivables 6,303 1,489
(Increase) / decrease in inventories 97 359
(Increase) / decrease in other non-financial assets (647) (7,746)
Increase / (decrease) in payables 14,332 17,268
Increase / (decrease) in other current liabilities (450) (2,006)
Increase / (decrease) in provision for employee benefits 3,809 4,162
Net cash inflow from operating activities 119,805 119,876
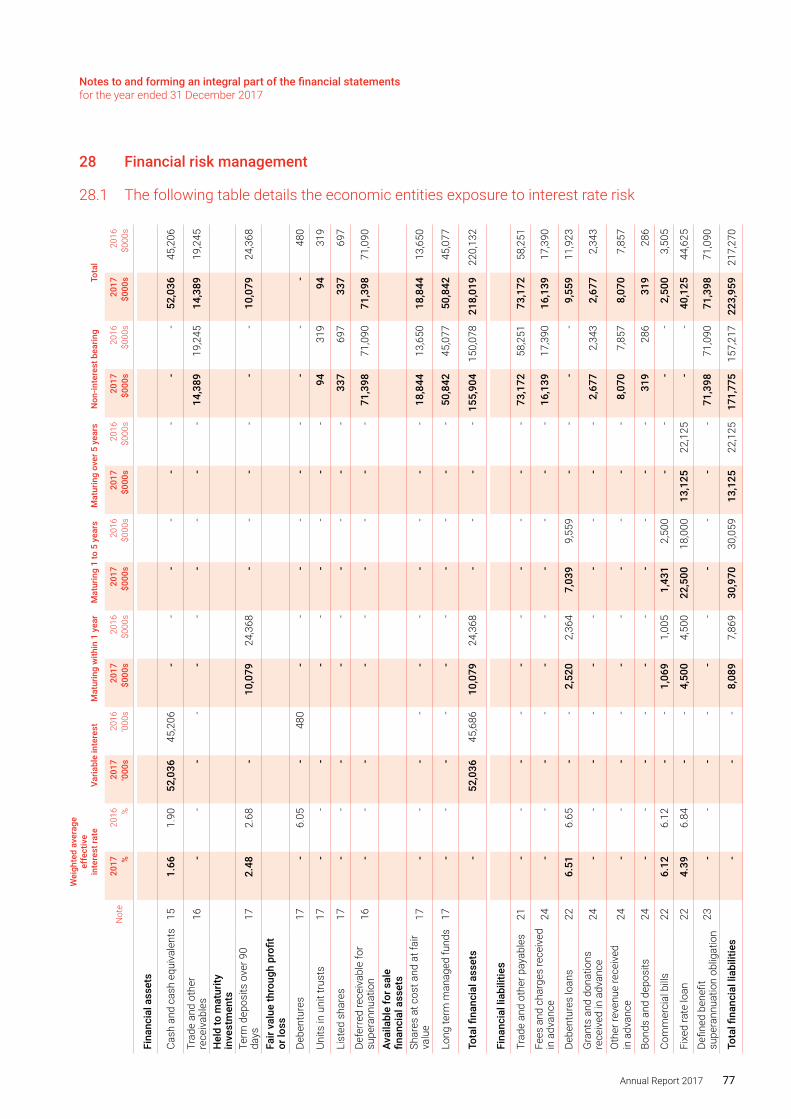
Notes to and forming an integral part of the financial statements for the year ended 31 December 2017
Annual Report 2017 77
Wei
ghte
d av
erag
e ef
fect
ive
in
tere
st ra
teVa
riabl
e in
tere
stM
atur
ing
with
in 1
yea
r
Mat
urin
g 1
to 5
yea
rsM
atur
ing
over
5 y
ears
Non
-inte
rest
bea
ring
Tota
l
Not
e20
17 %20
16 %20
17
‘000
s20
16
‘000
s20
17
$000
s20
16
$000
s20
17
$000
s20
16
$000
s20
17
$000
s20
16
$000
s20
17
$000
s20
16
$000
s20
17
$000
s20
16
$000
s
Fina
ncia
l ass
ets
Cash
and
cas
h eq
uiva
lent
s15
1.6
6 1
.90
52,
036
45,2
06 -
- -
- -
- -
- 5
2,03
6 4
5,20
6
Trad
e an
d ot
her
rece
ivab
les
16 -
- -
- -
- -
- -
- 14
,389
1
9,24
5 14
,389
19,
245
Hel
d to
mat
urity
in
vest
men
tsTe
rm d
epos
its o
ver 9
0 da
ys17
2.4
8 2
.68
- 1
0,07
9 2
4,36
8 -
- -
- -
- 1
0,07
9 2
4,36
8
Fair
valu
e th
roug
h pr
ofit
or lo
ss
Debe
ntur
es17
- 6
.05
- 48
0 -
- -
- -
- -
- -
480
Units
in u
nit t
rust
s17
- -
- -
- -
- -
- 9
4 3
19
94
319
List
ed s
hare
s17
- -
- -
- -
- -
- 3
37
697
3
37
697
Defe
rred
rece
ivab
le fo
r su
pera
nnua
tion
16 -
- -
- -
- -
- -
71,
398
71,
090
71,
398
71,
090
Avai
labl
e fo
r sal
e fin
anci
al a
sset
sSh
ares
at c
ost a
nd a
t fai
r va
lue
17 -
- -
- -
- -
- -
- 1
8,84
4 1
3,65
0 1
8,84
4 1
3,65
0
Long
term
man
aged
fund
s17
- -
- -
- -
- -
- -
50,
842
45,
077
50,
842
45,
077
Tota
l fina
ncia
l ass
ets
- 5
2,03
6 45
,686
10,
079
24,
368
- -
- -
155,
904
150,
078
218,
019
220,
132
Fina
ncia
l lia
bilit
ies
Trad
e an
d ot
her p
ayab
les
21 -
- -
- -
- -
- -
- 7
3,17
2 5
8,25
1 7
3,17
2 5
8,25
1
Fees
and
cha
rges
rece
ived
in
adv
ance
24 -
- -
- -
- -
- -
- 1
6,13
9 1
7,39
0 1
6,13
9 1
7,39
0
Debe
ntur
es lo
ans
22 6
.51
6.6
5 -
- 2
,520
2
,364
7
,039
9,
559
- -
- -
9,5
59
11,
923
Gra
nts
and
dona
tions
re
ceiv
ed in
adv
ance
24 -
- -
- -
- -
- -
- 2
,677
2
,343
2
,677
2
,343
Oth
er re
venu
e re
ceiv
ed
in a
dvan
ce24
- -
- -
- -
- -
- -
8,0
70
7,8
57
8,0
70
7,8
57
Bond
s an
d de
posi
ts24
- -
- -
- -
- -
- -
319
2
86
319
2
86
Com
mer
cial
bill
s22
6.1
2 6
.12
- -
1,0
69
1,00
5 1
,431
2
,500
-
- -
- 2
,500
3
,505
Fixe
d ra
te lo
an22
4.3
9 6
.84
- -
4,5
00
4,5
00
22,
500
18,
000
13,
125
22,
125
- -
40,
125
44,
625
Defin
ed b
enefi
t su
pera
nnua
tion
oblig
atio
n23
- -
- -
- -
- -
- -
71,
398
71,
090
71,
398
71,
090
Tota
l fina
ncia
l lia
bilit
ies
- -
- 8
,089
7
,869
3
0,97
0 3
0,05
9 1
3,12
5 2
2,12
5 1
71,7
75
157,
217
223,
959
217,
270
28 Financial risk management
28.1 The following table details the economic entities exposure to interest rate risk
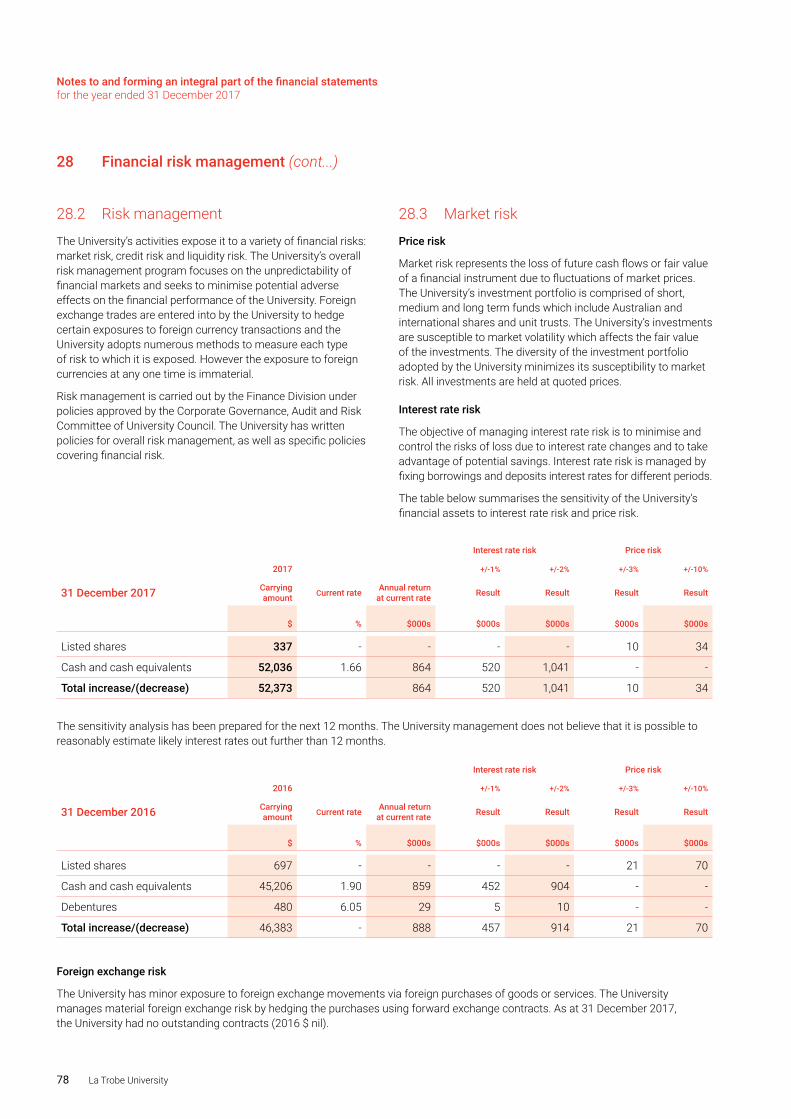
Notes to and forming an integral part of the financial statements for the year ended 31 December 2017
78 La Trobe University
28 Financial risk management (cont...)
28.2 Risk management
The University’s activities expose it to a variety of financial risks: market risk, credit risk and liquidity risk. The University’s overall risk management program focuses on the unpredictability of financial markets and seeks to minimise potential adverse effects on the financial performance of the University. Foreign exchange trades are entered into by the University to hedge certain exposures to foreign currency transactions and the University adopts numerous methods to measure each type of risk to which it is exposed. However the exposure to foreign currencies at any one time is immaterial.
Risk management is carried out by the Finance Division under policies approved by the Corporate Governance, Audit and Risk Committee of University Council. The University has written policies for overall risk management, as well as specific policies covering financial risk.
28.3 Market risk
Price risk
Market risk represents the loss of future cash flows or fair value of a financial instrument due to fluctuations of market prices. The University’s investment portfolio is comprised of short, medium and long term funds which include Australian and international shares and unit trusts. The University’s investments are susceptible to market volatility which affects the fair value of the investments. The diversity of the investment portfolio adopted by the University minimizes its susceptibility to market risk. All investments are held at quoted prices.
Interest rate risk
The objective of managing interest rate risk is to minimise and control the risks of loss due to interest rate changes and to take advantage of potential savings. Interest rate risk is managed by fixing borrowings and deposits interest rates for different periods.
The table below summarises the sensitivity of the University’s financial assets to interest rate risk and price risk.
Interest rate risk Price risk
2017 +/-1% +/-2% +/-3% +/-10%
31 December 2017 Carrying amount Current rate Annual return
at current rate Result Result Result Result
$ % $000s $000s $000s $000s $000s
Listed shares 337 - - - - 10 34
Cash and cash equivalents 52,036 1.66 864 520 1,041 - -
Total increase/(decrease) 52,373 864 520 1,041 10 34
The sensitivity analysis has been prepared for the next 12 months. The University management does not believe that it is possible to reasonably estimate likely interest rates out further than 12 months.
Interest rate risk Price risk
2016 +/-1% +/-2% +/-3% +/-10%
31 December 2016 Carrying amount Current rate Annual return
at current rate Result Result Result Result
$ % $000s $000s $000s $000s $000s
Listed shares 697 - - - - 21 70
Cash and cash equivalents 45,206 1.90 859 452 904 - -
Debentures 480 6.05 29 5 10 - -
Total increase/(decrease) 46,383 - 888 457 914 21 70
Foreign exchange risk
The University has minor exposure to foreign exchange movements via foreign purchases of goods or services. The University manages material foreign exchange risk by hedging the purchases using forward exchange contracts. As at 31 December 2017, the University had no outstanding contracts (2016 $ nil).
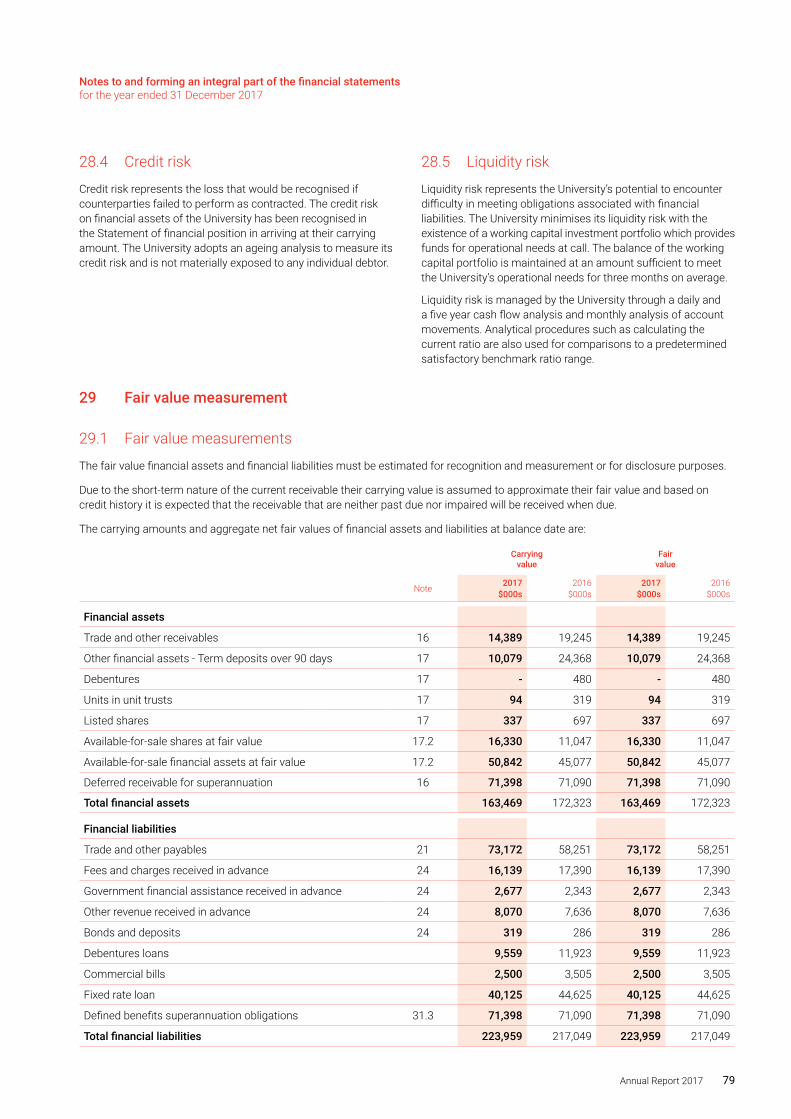
Notes to and forming an integral part of the financial statements for the year ended 31 December 2017
Annual Report 2017 79
28.4 Credit risk
Credit risk represents the loss that would be recognised if counterparties failed to perform as contracted. The credit risk on financial assets of the University has been recognised in the Statement of financial position in arriving at their carrying amount. The University adopts an ageing analysis to measure its credit risk and is not materially exposed to any individual debtor.
28.5 Liquidity risk
Liquidity risk represents the University’s potential to encounter difficulty in meeting obligations associated with financial liabilities. The University minimises its liquidity risk with the existence of a working capital investment portfolio which provides funds for operational needs at call. The balance of the working capital portfolio is maintained at an amount sufficient to meet the University’s operational needs for three months on average.
Liquidity risk is managed by the University through a daily and a five year cash flow analysis and monthly analysis of account movements. Analytical procedures such as calculating the current ratio are also used for comparisons to a predetermined satisfactory benchmark ratio range.
29 Fair value measurement
29.1 Fair value measurements
The fair value financial assets and financial liabilities must be estimated for recognition and measurement or for disclosure purposes.
Due to the short-term nature of the current receivable their carrying value is assumed to approximate their fair value and based on credit history it is expected that the receivable that are neither past due nor impaired will be received when due.
The carrying amounts and aggregate net fair values of financial assets and liabilities at balance date are:
Carrying value
Fair value
Note 2017$000s
2016$000s
2017$000s
2016$000s
Financial assets
Trade and other receivables 16 14,389 19,245 14,389 19,245
Other financial assets - Term deposits over 90 days 17 10,079 24,368 10,079 24,368
Debentures 17 - 480 - 480
Units in unit trusts 17 94 319 94 319
Listed shares 17 337 697 337 697
Available-for-sale shares at fair value 17.2 16,330 11,047 16,330 11,047
Available-for-sale financial assets at fair value 17.2 50,842 45,077 50,842 45,077
Deferred receivable for superannuation 16 71,398 71,090 71,398 71,090
Total financial assets 163,469 172,323 163,469 172,323
Financial liabilities
Trade and other payables 21 73,172 58,251 73,172 58,251
Fees and charges received in advance 24 16,139 17,390 16,139 17,390
Government financial assistance received in advance 24 2,677 2,343 2,677 2,343
Other revenue received in advance 24 8,070 7,636 8,070 7,636
Bonds and deposits 24 319 286 319 286
Debentures loans 9,559 11,923 9,559 11,923
Commercial bills 2,500 3,505 2,500 3,505
Fixed rate loan 40,125 44,625 40,125 44,625
Defined benefits superannuation obligations 31.3 71,398 71,090 71,398 71,090
Total financial liabilities 223,959 217,049 223,959 217,049
Notes to and forming an integral part of the financial statements for the year ended 31 December 2017
80 La Trobe University
29 Fair value measurement (cont...)
The University measures and recognises the following assets and liabilities at fair value on a recurring basis:
• Financial assets at fair value through profit or loss
• Derivative financial instruments
• Available-for-sale financial assets
• Land and buildings
The fair value of assets and liabilities must be measured for recognition and disclosure purposes.
The University classifies fair value measurements using a fair value hierarchy that reflects the significance of the inputs used in making the measurements.
The fair value of assets or liabilities traded in active markets (such as publicly traded derivatives, and trading and available-for-sale securities) is based on quoted market prices for identical assets or liabilities at the reporting date (Level 1). The quoted market price used for assets held by the University is the most representative of fair value in the circumstances within the bid-ask spread.
The fair value of assets or liabilities that are not traded in an active market (for example, over-the-counter-derivatives) is determined using valuation techniques. The University uses a variety of methods and makes assumptions that are based on market conditions existing at each balance date. Quoted market prices or dealer quotes for similar instruments (Level 2) are used for long-term debt instruments held.
Other techniques that are not based on observable market data (Level 3) such as estimated discounted cash flows, are used to determine fair value for the remaining assets and liabilities. The fair value of interest-rate swaps is calculated as the present value of the estimated future cash flows. The fair value of forward exchange contracts is determined using forward exchange market rates at the reporting date.
The level in the fair value hierarchy shall be determined on the basis of the lowest level input that is significant to the fair value measurement in its entirety.
Fair value measurement of non-financial assets takes into account a market participants’ ability to generate economic benefit by using the assets in its highest and best use, or by selling it to another participant that would use the asset in its highest and best use.
The carrying value less impairment provision of trade receivables and payables are assumed to approximate their fair values due to their short-term nature. The fair value of financial liabilities for disclosure purposes is estimated by discounting the future contractual cash flows at the current market interest rate that is available to the University for similar financial instruments.
This applies to fair value items recognised in notes 29.1 through 29.5.
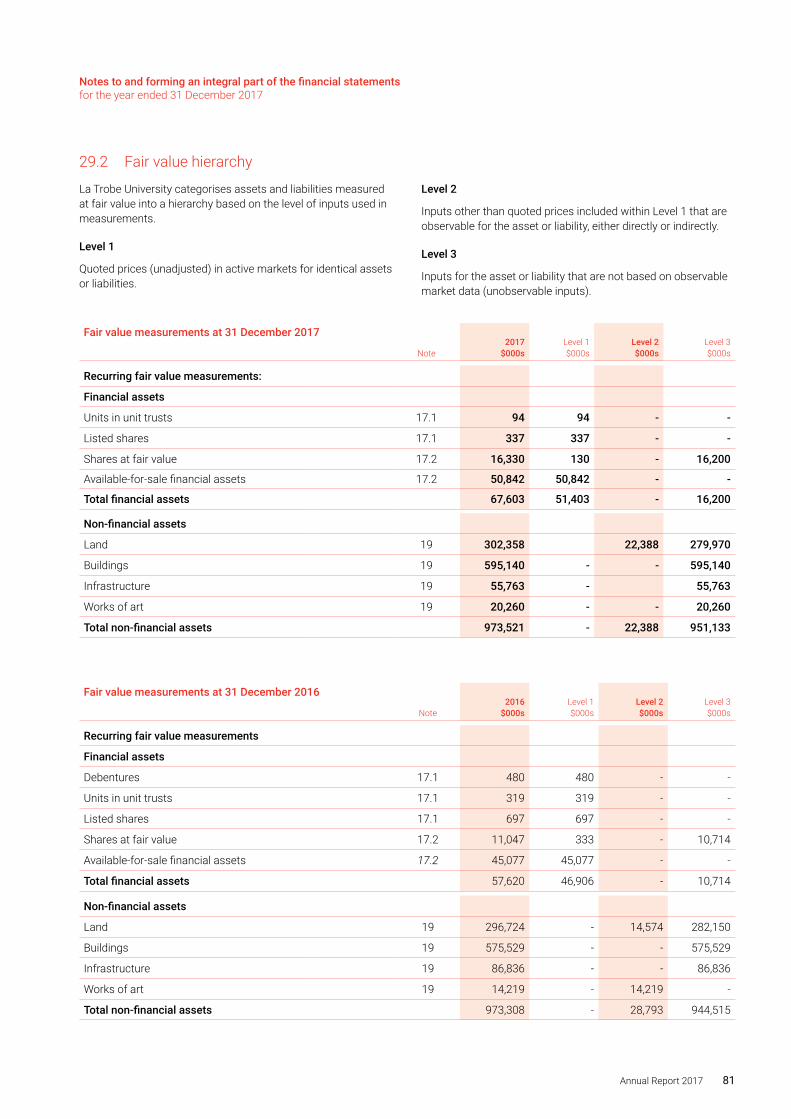
Notes to and forming an integral part of the financial statements for the year ended 31 December 2017
Annual Report 2017 81
29.2 Fair value hierarchy
La Trobe University categorises assets and liabilities measured at fair value into a hierarchy based on the level of inputs used in measurements.
Level 1
Quoted prices (unadjusted) in active markets for identical assets or liabilities.
Level 2
Inputs other than quoted prices included within Level 1 that are observable for the asset or liability, either directly or indirectly.
Level 3
Inputs for the asset or liability that are not based on observable market data (unobservable inputs).
Fair value measurements at 31 December 2017
Note2017
$000sLevel 1$000s
Level 2$000s
Level 3$000s
Recurring fair value measurements:
Financial assets
Units in unit trusts 17.1 94 94 - -
Listed shares 17.1 337 337 - -
Shares at fair value 17.2 16,330 130 - 16,200
Available-for-sale financial assets 17.2 50,842 50,842 - -
Total financial assets 67,603 51,403 - 16,200
Non-financial assets
Land 19 302,358 22,388 279,970
Buildings 19 595,140 - - 595,140
Infrastructure 19 55,763 - 55,763
Works of art 19 20,260 - - 20,260
Total non-financial assets 973,521 - 22,388 951,133
Fair value measurements at 31 December 2016
Note2016
$000sLevel 1$000s
Level 2$000s
Level 3$000s
Recurring fair value measurements
Financial assets
Debentures 17.1 480 480 - -
Units in unit trusts 17.1 319 319 - -
Listed shares 17.1 697 697 - -
Shares at fair value 17.2 11,047 333 - 10,714
Available-for-sale financial assets 17.2 45,077 45,077 - -
Total financial assets 57,620 46,906 - 10,714
Non-financial assets
Land 19 296,724 - 14,574 282,150
Buildings 19 575,529 - - 575,529
Infrastructure 19 86,836 - - 86,836
Works of art 19 14,219 - 14,219 -
Total non-financial assets 973,308 - 28,793 944,515
Notes to and forming an integral part of the financial statements for the year ended 31 December 2017
82 La Trobe University
29 Fair value measurement (cont...)
i) Recognised fair value measurements
Fair value measurements recognised in the Statement of financial position are categorised into the following levels at 31 December 2017. Comparative information for non-financial assets has not been provided as permitted by the transitional provisions of the new standard. There were no transfers between levels 1 and 2 for recurring fair value measurements during the year.
Non-specialised land and works of art
Non-specialised land and works of art are valued using the market approach. Under this valuation method, the assets are compared to recent comparable sales or sales of comparable assets which are considered to have nominal or no added improvement value.
For non-specialised land, an independent valuation was performed by AssetVal Pty Ltd. to determine the fair value using the market approach. Valuation of the assets was determined by analysing comparable sales and allowing for share, size, topography, location and other relevant factors specific to the asset being valued. From the sales analysed, an appropriate rate per square metre has been applied to the subject asset. The effective date of the valuation is 31 December 2017.
For artwork, valuation of the assets is determined by a research of recent records of Australian and international sales, purchases and other forms of acquisition. The collection was valued from catalogue descriptions with reference to published price indicators. The effective date of the valuation was 31 December 2017.
To the extent that non-specialised land and artworks do not contain significant, unobservable adjustments, these assets are classified as Level 2 under the market approach.
Specialised land and specialised buildings
The market approach is also used for specialised land, although is adjusted for the community service obligation (CSO) to reflect the specialised nature of the land being valued.
The CSO adjustment is a reflection of the valuer’s assessment of the impact of restrictions associated with an asset to the extent that is also equally applicable to market participants. This approach is in light of the highest and best use consideration required for fair value measurement, and takes into account the use of the asset that is physically possible, legally permissible, and financially feasible. As adjustments of CSO are considered as significant unobservable inputs, specialised land would be classified as Level 3 assets.
For the University’s majority of specialised buildings, the depreciated replacement cost method is used, adjusting for the associated depreciations. As depreciation adjustments are considered as significant, unobservable inputs in nature, specialised buildings are classified as Level 3 fair value measurements.
An independent valuation of the University’ specialised land and specialised buildings was performed by AssetVal Pty Ltd. The valuation was performed using the market approach adjusted for CSO. The effective date of the valuation is 31 December 2017.
Note: The valuers, AssetVal Pty Ltd. provided the University with a valuation for land assets at Bundoora. Management’s discussion including that with the auditors agreed that the University will obtain a second opinion on these land assets in 2018. As a result, the value of University’s land at Bundoora campus has been kept at existing book value based on the valuation performed at the end of 2015 financial year.
Infrastructure
Infrastructure is valued using the depreciated replacement cost method. This cost generally represents the replacement cost of the building/component after applying depreciation rates on a useful life basis. However the cost may be the reproduction cost rather than the replacement cost if infrastructure assets’ service potential could only be replaced by reproducing them with the same materials.
Where it has not been possible to examine hidden works such as structural frames and floors, the use of reasonable materials and methods of construction have been assumed bearing in mind the age and nature of the building. The estimated cost of reconstruction including structure services and finishes, also factors in any infrastructure classifications as applicable.
An independent valuation of the University’s infrastructure was performed by the AssetVal Pty Ltd. The effective date of the valuation is 31 December 2017.
Investment in Education Australia
The fair value of listed shares was determined by independent valuer ShineWing Australia Pty Ltd. The University owns shares in Education Australia Ltd. IDP Education Ltd jointly owned by listed job search company SEEK and Education Australia, which represents 38 Australian universities. Each of the 38 Universities owns an equivalent amount of shares in Education Australia. IDP Education Ltd listed on the Australian Stock Exchange (ASX) in November 2015 under the ASX code “IEL”. As at 31 December 2017, the ASX share price was $6.15 resulting in a market value of $771,195 million. ShineWing Australia assessed the fair market value of Education Australia as $615,638 million after taking into consideration a 30% discount on the value of Education Australia’s investment in IDP Education Ltd due to escrow arrangement and this equates to a value of $16,200 million (level 3).
IDP Education Ltd shares held by Education Australia are traded in an active market. As such the valuation of these shares has been determined by an appropriately skilled independent third party. The basis of the valuation is to include the cash balance in Education Australia and ASX share price of IDP Education Limited at 31 December 2017 and then a apply a discount due to the shareholder agreement and timing of potential share divestment by the 38 university shareholders.
Notes to and forming an integral part of the financial statements for the year ended 31 December 2017
Annual Report 2017 83
Where the valuation techniques including discounting and other techniques considered appropriate in the circumstance have been employed in pricing or valuing investments, the valuation are inherently subject to estimation uncertainty. Given the inherent subjectivity, the underlying inputs and assumptions are reviewed on an on-going basis to ensure the valuations reflect the best estimates of the economic conditions at reporting date.
(ii) Disclosed fair values
The fair value of assets or liabilities traded in active markets (such as financial assets at fair value through profit or loss – debenture, unit in Unit trust and Listed shares – disclosed in note 17) is based on quoted market prices for identical assets or liabilities at the reporting date (level 1). This is the most representative of fair value in the circumstances.
The carrying value less impairment provision of trade receivables and payables is a reasonable approximation of their fair values due to the short-term nature of trade receivables. The fair value of financial liabilities for disclosure purposes is estimated by discounting the future contractual cash flows at the current market interest rate that is available to the University for similar financial instruments (level 3).
The fair value of non-current borrowings disclosed in note 22 is estimated by discounting the future contractual cash flows at the current market interest rates that are available to the University for similar financial instruments. For the period ending 31 December 2017, the borrowing rates were determined to be between 6% and 7%, depending on the type of borrowing. The fair value of current borrowings approximates the carrying amount, as the impact of discounting is not significant (level 2).
29.3 Valuation techniques used to derive level 2 and level 3 fair values
Recurring fair value measurements
The fair value of financial instruments that are not traded in an active market (for example, over-the-counter derivatives) is determined using valuation techniques. These valuation techniques maximise the use of observable market data where it is available and rely as little as possible on entity specific estimates. If all significant inputs required to fair value an instrument are observable, the instrument is included in level 2.
If one or more of the significant inputs is not based on observable market data, the instrument is included in level 3. This is the case for unlisted equity securities.
The University uses a variety of methods and makes assumptions that are based on market conditions existing at each balance date. Specific valuation techniques used to value financial instruments include:
• The use of quoted market prices or dealer quotes for similar instruments;
• The fair value of interest rate swaps is calculated as the present value of the estimated future cash flows based on observable yield curves;
• The fair value of forward foreign exchange contracts is determined using forward exchange rates at the reporting date;
• Other techniques, such as discounted cash flow analysis, are used to determine fair value for the remaining financial instruments.
Land and buildings are valued independently every three years. At the end of each reporting period, the University updates their assessment of the fair value of each property, taking into account the most recent independent valuations. The University determines the property’s value within a range of reasonable fair value estimates.
The best evidence of fair values is current prices in an active market for similar properties. Where such information is not available, the University considers information from a variety of sources, including:
• current prices in an active market for properties of different nature or recent prices of similar properties in less active markets, adjusted to reflect those differences.
• discounted cash flow projections based on reliable estimates of future cash flows.
• capitalised income projections based on a property’s estimated net market income, and a capitalisation rate derived from an analysis of market evidence.
All resulting fair value estimates for properties are included in level 2. The most significant input into this valuation approach is price per square metre.
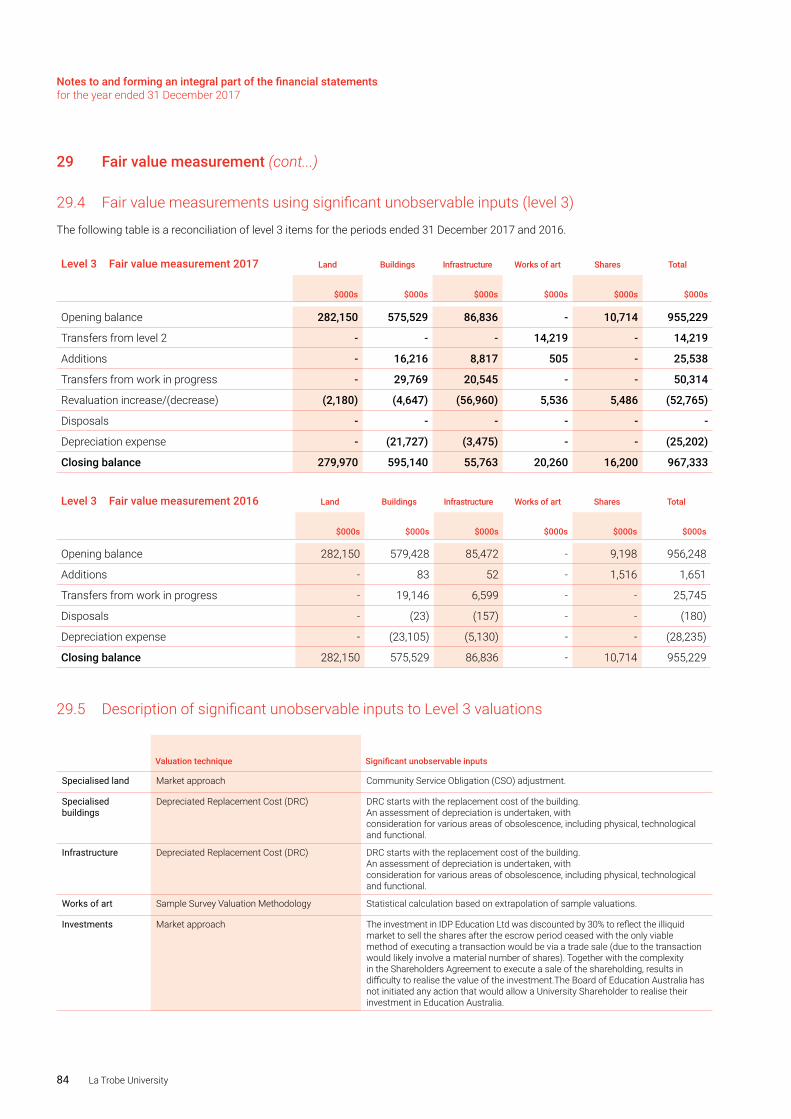
Notes to and forming an integral part of the financial statements for the year ended 31 December 2017
84 La Trobe University
29 Fair value measurement (cont...)
29.4 Fair value measurements using significant unobservable inputs (level 3)
The following table is a reconciliation of level 3 items for the periods ended 31 December 2017 and 2016.
Level 3 Fair value measurement 2017 Land Buildings Infrastructure Works of art Shares Total
$000s
$000s
$000s
$000s $000s $000s
Opening balance 282,150 575,529 86,836 - 10,714 955,229
Transfers from level 2 - - - 14,219 - 14,219
Additions - 16,216 8,817 505 - 25,538
Transfers from work in progress - 29,769 20,545 - - 50,314
Revaluation increase/(decrease) (2,180) (4,647) (56,960) 5,536 5,486 (52,765)
Disposals - - - - - -
Depreciation expense - (21,727) (3,475) - - (25,202)
Closing balance 279,970 595,140 55,763 20,260 16,200 967,333
Level 3 Fair value measurement 2016 Land Buildings Infrastructure Works of art Shares Total
$000s
$000s
$000s
$000s $000s $000s
Opening balance 282,150 579,428 85,472 - 9,198 956,248
Additions - 83 52 - 1,516 1,651
Transfers from work in progress - 19,146 6,599 - - 25,745
Disposals - (23) (157) - - (180)
Depreciation expense - (23,105) (5,130) - - (28,235)
Closing balance 282,150 575,529 86,836 - 10,714 955,229
29.5 Description of significant unobservable inputs to Level 3 valuations
Valuation technique Significant unobservable inputs
Specialised land Market approach Community Service Obligation (CSO) adjustment.
Specialised buildings
Depreciated Replacement Cost (DRC) DRC starts with the replacement cost of the building. An assessment of depreciation is undertaken, with consideration for various areas of obsolescence, including physical, technological and functional.
Infrastructure Depreciated Replacement Cost (DRC) DRC starts with the replacement cost of the building. An assessment of depreciation is undertaken, with consideration for various areas of obsolescence, including physical, technological and functional.
Works of art Sample Survey Valuation Methodology Statistical calculation based on extrapolation of sample valuations.
Investments Market approach The investment in IDP Education Ltd was discounted by 30% to reflect the illiquid market to sell the shares after the escrow period ceased with the only viable method of executing a transaction would be via a trade sale (due to the transaction would likely involve a material number of shares). Together with the complexity in the Shareholders Agreement to execute a sale of the shareholding, results in difficulty to realise the value of the investment.The Board of Education Australia has not initiated any action that would allow a University Shareholder to realise their investment in Education Australia.
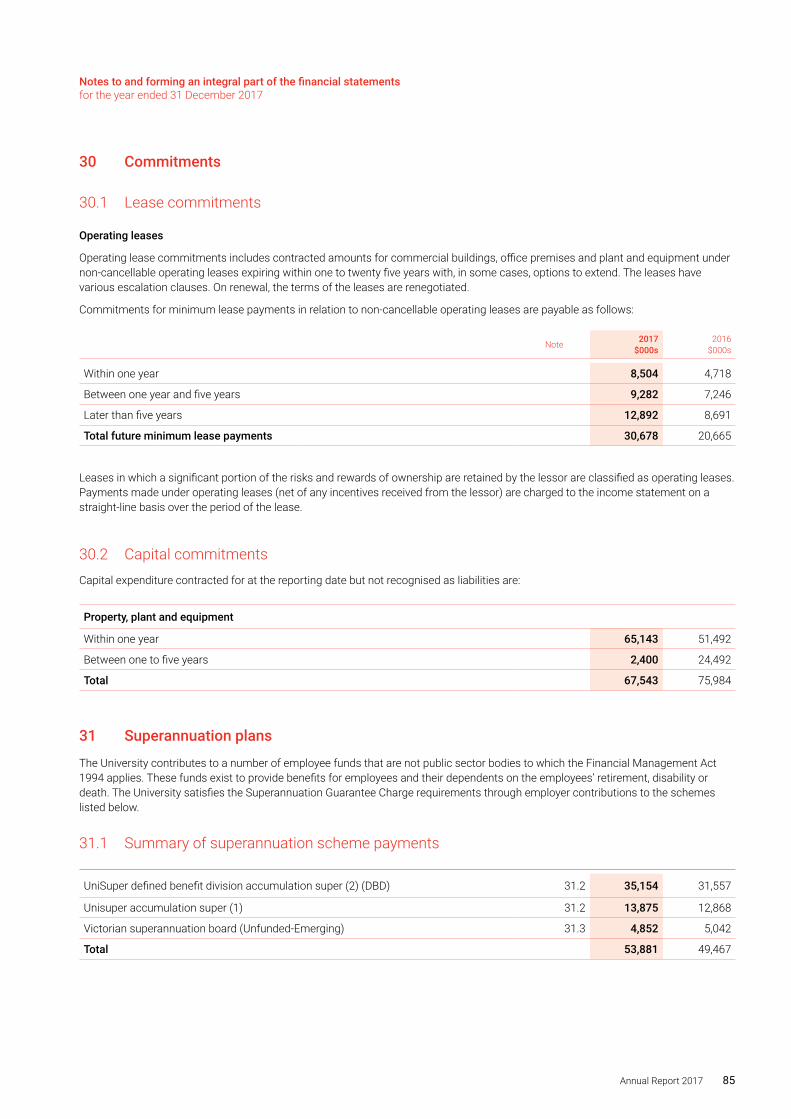
Notes to and forming an integral part of the financial statements for the year ended 31 December 2017
Annual Report 2017 85
30 Commitments
30.1 Lease commitments
Operating leases
Operating lease commitments includes contracted amounts for commercial buildings, office premises and plant and equipment under non-cancellable operating leases expiring within one to twenty five years with, in some cases, options to extend. The leases have various escalation clauses. On renewal, the terms of the leases are renegotiated.
Commitments for minimum lease payments in relation to non-cancellable operating leases are payable as follows:
Note 2017$000s
2016$000s
Within one year 8,504 4,718
Between one year and five years 9,282 7,246
Later than five years 12,892 8,691
Total future minimum lease payments 30,678 20,665
Leases in which a significant portion of the risks and rewards of ownership are retained by the lessor are classified as operating leases. Payments made under operating leases (net of any incentives received from the lessor) are charged to the income statement on a straight-line basis over the period of the lease.
30.2 Capital commitmentsCapital expenditure contracted for at the reporting date but not recognised as liabilities are:
Property, plant and equipment
Within one year 65,143 51,492
Between one to five years 2,400 24,492
Total 67,543 75,984
31 Superannuation plans
The University contributes to a number of employee funds that are not public sector bodies to which the Financial Management Act 1994 applies. These funds exist to provide benefits for employees and their dependents on the employees’ retirement, disability or death. The University satisfies the Superannuation Guarantee Charge requirements through employer contributions to the schemes listed below.
31.1 Summary of superannuation scheme payments
UniSuper defined benefit division accumulation super (2) (DBD) 31.2 35,154 31,557
Unisuper accumulation super (1) 31.2 13,875 12,868
Victorian superannuation board (Unfunded-Emerging) 31.3 4,852 5,042
Total 53,881 49,467
Notes to and forming an integral part of the financial statements for the year ended 31 December 2017
86 La Trobe University
31 Superannuation plans (cont...)
31.2 UniSuper Limited
UniSuper is a multi-employer superannuation fund operated by UniSuper Limited as the Corporate Trustee. It is administered by UniSuper Management Pty Ltd, a wholly owned subsidiary of UniSuper Limited. The operations of UniSuper are regulated by the Superannuation Industry (Supervision) Act 1993.
UniSuper Defined Benefit Division Accumulation Super (2) (DBD)
UniSuper offers eligible members the choice of two schemes known as the Defined benefit plan or Investment choice 58 Notes to and Forming an Integral Part of the Financial Statements for the Year Ended 31 December 2017 Plan where the contribution rate is 21% of member’s salary, of which the member contributes 7% and the University 14%. Employees appointed to positions classified between Higher Education Worker (HEW) levels 1-4 have the option of contributing at half rates (i.e. 3.5% from the employee and 7% from the University).
In 2008, the University adopted the multi-employer provisions of AASB 119 Employee Benefits, which allowed for defined benefit obligations to be reported on a defined contribution basis with some additional information. AASB 119 states that this is an appropriate solution where the employer does not have access to the information required or there is no reliable basis for allocating the benefits, liabilities, assets and costs between employers.
Therefore, the University doesn’t account for any surpluses or shortfalls in the defined benefit fund in its financial statements. As a consequence of changes to clause 34 of the UniSuper Trust Deed in November 2008, UniSuper have advised that both the Defined Benefit Division and Accumulation 2 are defined as multiemployer defined contribution schemes in accordance with AASB 119 Employee Benefits.
Therefore, the University does not have an obligation (legal or constructive) to pay further contributions if the fund does not have sufficient assets to pay all employee benefits under the Trust Deed, and will continue to report on a defined contribution basis.
The employer contribution rate for 2017 is 14% of employee salaries and represents an employer/employee contribution rate of 2:1. These rates are based on the actuarial review completed on 31 December 2017 and comply with the rules governing the Trust Deed. Employer contributions for the year totalled $35,154,245 (2016 $31,556,602). It should be noted that effective 1 July 1995 employees had the option of making the equivalent of their 7% contributions from pre-tax income. Therefore the employer paid $7,730,911 (2016 $7,229,624) additional contributions on behalf of the employee. Outstanding employer contributions as at 31 December 2017 totalled $nil (2016 $nil). There are no loans to fund members.
UniSuper Accumulation Super (1)
UniSuper also offers a cash accumulation productivity scheme known as the Award Plus Plan (APP). University employees have no requirement to contribute to the scheme.
The University contributes the equivalent of 3% of base salary in respect of those employees who were members of the Defined benefit plan or the Investment choice plan.
Casual and non-permanent employees who do not qualify for membership of the DBD will have a minimum contribution 9.5% of their annual salary contributed by the University to the APP prescribed under the Superannuation Guarantee Charge Act 1992.
The employer contribution rate is 3% of employee salaries where the staff member is a member of the DBD. Where UniSuper Accumulation Super (1) is the only scheme the current contribution rate is 9.5%. Employer contributions for the year totalled $13,874,937 (2016 $12,867,776). There were no outstanding employer contributions as at 31 December 2017 (2016 $nil). There are no loans to fund members.
31.3 Victorian Superannuation board
(ESS) (formerly State Government Superannuation Fund). Amounts reported herein relate to unfunded superannuation liabilities as determined by the above mentioned fund.
Employees contribute to this fund on an ongoing basis, but La Trobe University as the employer is only required to contribute to the fund when employees are paid a pension or receive a lump sum payout. Consequently, an unfunded liability has been created. Please note that the Fund is closed to new members.
The State Grants (General Purposes) Act 1994 Section 14 provides for the Commonwealth and the State Governments to meet the costs of the payments from the scheme as they emerge. Consequently the Commonwealth Government has reimbursed La Trobe University for the payments actually made to the fund for the emerging costs since 1988. La Trobe University has every reason to believe that this arrangement will continue until the liability is fully paid.
The Department of Treasury and Finance has determined the ESS unfunded superannuation liability is to be included in the financial statements of all Victorian universities. La Trobe University believes that any disclosure of the unfunded superannuation liability should be matched with the corresponding receivable from the Commonwealth government as detailed above. Accordingly the current policy of the University is to record the liability and the corresponding receivable from the Commonwealth government.
The movements in the liability and the payable of $308,000 during the 2017 year (2016 decrease by $2,448,000) has no financial impact on the operating result. While the Net assets has not altered with these changes, both the Total assets and Total liabilities have increased by $308,000 (2016 decrease by $2,448,000).
During 2017, La Trobe University’s contributions to the Fund totalled $4,851,539 (2016 $5,042,719). There were no outstanding employer contributions as at 31 December 2017 (2016 $nil). There are no loans to fund members.
The policy adopted for calculating employer contributions is based on the advice of the Fund’s trustees.
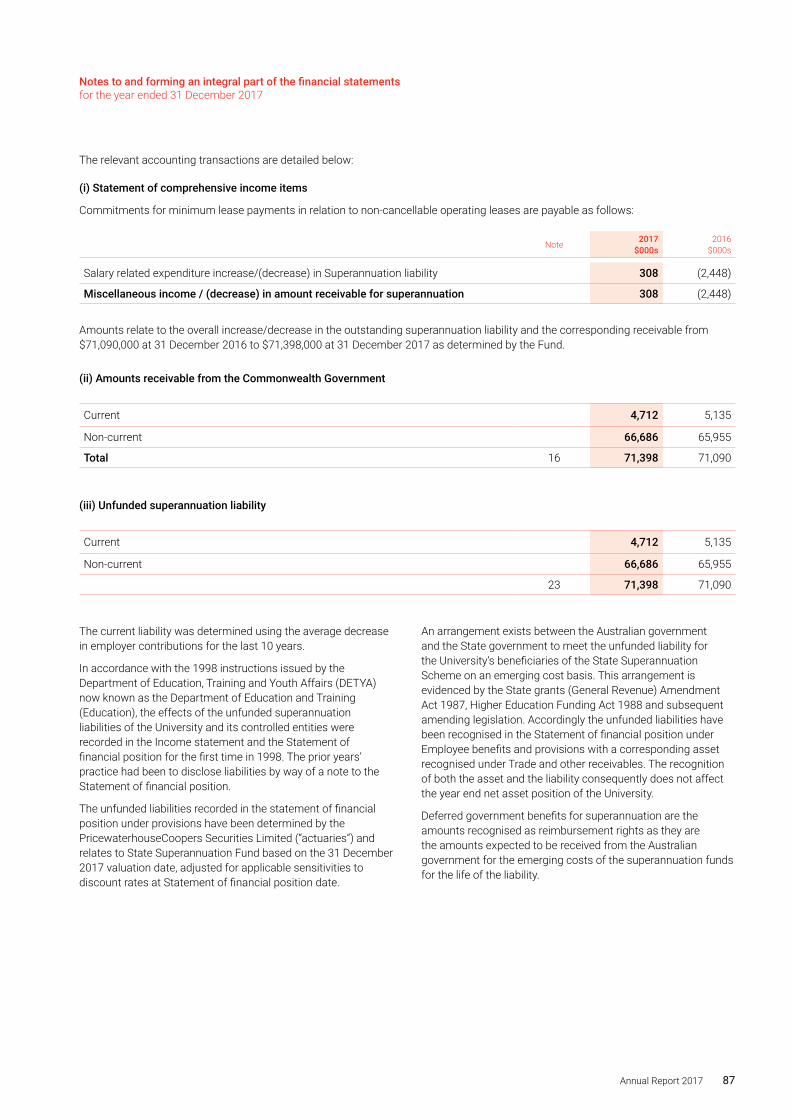
Notes to and forming an integral part of the financial statements for the year ended 31 December 2017
Annual Report 2017 87
The relevant accounting transactions are detailed below:
(i) Statement of comprehensive income items
Commitments for minimum lease payments in relation to non-cancellable operating leases are payable as follows:
Note 2017$000s
2016$000s
Salary related expenditure increase/(decrease) in Superannuation liability 308 (2,448)
Miscellaneous income / (decrease) in amount receivable for superannuation 308 (2,448)
Amounts relate to the overall increase/decrease in the outstanding superannuation liability and the corresponding receivable from $71,090,000 at 31 December 2016 to $71,398,000 at 31 December 2017 as determined by the Fund.
(ii) Amounts receivable from the Commonwealth Government
Current 4,712 5,135
Non-current 66,686 65,955
Total 16 71,398 71,090
(iii) Unfunded superannuation liability
Current 4,712 5,135
Non-current 66,686 65,955
23 71,398 71,090
The current liability was determined using the average decrease in employer contributions for the last 10 years.
In accordance with the 1998 instructions issued by the Department of Education, Training and Youth Affairs (DETYA) now known as the Department of Education and Training (Education), the effects of the unfunded superannuation liabilities of the University and its controlled entities were recorded in the Income statement and the Statement of financial position for the first time in 1998. The prior years’ practice had been to disclose liabilities by way of a note to the Statement of financial position.
The unfunded liabilities recorded in the statement of financial position under provisions have been determined by the PricewaterhouseCoopers Securities Limited (“actuaries”) and relates to State Superannuation Fund based on the 31 December 2017 valuation date, adjusted for applicable sensitivities to discount rates at Statement of financial position date.
An arrangement exists between the Australian government and the State government to meet the unfunded liability for the University’s beneficiaries of the State Superannuation Scheme on an emerging cost basis. This arrangement is evidenced by the State grants (General Revenue) Amendment Act 1987, Higher Education Funding Act 1988 and subsequent amending legislation. Accordingly the unfunded liabilities have been recognised in the Statement of financial position under Employee benefits and provisions with a corresponding asset recognised under Trade and other receivables. The recognition of both the asset and the liability consequently does not affect the year end net asset position of the University.
Deferred government benefits for superannuation are the amounts recognised as reimbursement rights as they are the amounts expected to be received from the Australian government for the emerging costs of the superannuation funds for the life of the liability.

Notes to and forming an integral part of the financial statements for the year ended 31 December 2017
88 La Trobe University
32 Joint operations
32.1 Joint operations and associates
Biosciences Research Centre
On 29th April 2009, the university entered into a joint operation with the State, through the Department of Economic Development, Jobs, Transport and Resources (DEDJTR) formerly known as the Department of Environment and Primary Industries (DEPI) to construct, manage and operate a biosciences research centre (“BRC”) on the Bundoora campus.
The BRC is:
i) jointly owned by La Trobe University and DEPI based on 25% and 75% ownership interest respectively;
ii) used by both parties to undertake joint collaborative research projects as well as their own projects; and
iii) jointly controlled through equal voting rights and equal consent of key decisions.
La Trobe University leases its land upon which the building is located to BRC Co., an incorporated joint venture company to act on behalf of the joint operations. The lease is for 25 years (2012–2037) at a nominal sum of $1 per annum. BRC engaged Plenary Research Pty. Ltd., an independent firm to construct, operate and maintain the BRC for 25 years.
The agreement set out the minimum required payments of the University to contribute $50m (NPV to 1 October 2007) to DEDJTR over the 25 year Project Agreement (which represented the university’s 25% share of the cost to design, construct and operate AgriBio for 25 years). The University accounted for its 25% ownership interest in the building as a leased asset at amortised cost. Amortisation is charged on a straight line basis over the expected lease term of 25 years (incorporating the residual value of the building after the expiration of the 25 years). The University’s 25% share of the lease obligation is accounted for as a lease liability.
The University makes capital and operating contributions to the state through DEDJTR. The capital contributions are used to make repayments on the lease. The operating contributions relate to the University’s share of the operating costs of the BRC facility.
The minimum payments were structured to grow over time (in line with expected growth in research block grant revenue. The payment to be made are the present value of $500k (in 2007 dollars) per quarter for 100 quarters over 25 years, escalating at 8.14%. The contract allowed the University to make additional payments (in part of in full) at any time during the project agreement without any additional cost (with 20 days advance notice). On 14 December 2015, the university exercised its right under this agreement to pay in full its remaining 25% commitment of $57,032,147 ex GST.
The University also receives research grant funding for joint research activity undertaken at the BRC and incurs expenditure on these research grant projects. The joint research revenue and expenditure is included below along with the operating expenditure.
Murray-Darling Freshwater Research Centre
The Murray-Darling Freshwater Research Centre is a joint venture between La Trobe University and CSIRO that focuses on the generation and communication of freshwater ecological knowledge of floodplain ecosystems in the Murray-Darling basin, in particular providing advice and solutions to water managers to optimise their management decisions. The Board of MDFRC decided that from 7 August 2015 La Trobe University would take over the role as Centre agent for the Murray darling freshwater research centre from the previous Centre agent (MDFRC Pty Ltd) on behalf of the joint venture. This was done to achieve efficiencies in delivery of administrative functions, reduce duplication of systems and strengthen governance and accountability of the Centre.
The Centre is:
i) jointly owned by La Trobe University and CSIRO based on 50% and 50% ownership interest respectively effective 1 October 2014;
ii) prior to 1 October 2014 the Centre was jointly owned by La Trobe University, CSIRO and the Murray-darling basin authority – each holding an equal 33.3% ownership interest.
iii) jointly controlled through equal voting rights and equal consent of key decisions.
The Centre’s objective is that the participants add value to each other so that the performance of the centre will be greater than that of each participant performing independently, by generating ecological knowledge that can be incorporated into predictive models of ecosystem response.
The MDFRC board is currently reviewing the JV agreement and continuation of Joint venture within the same capacity.
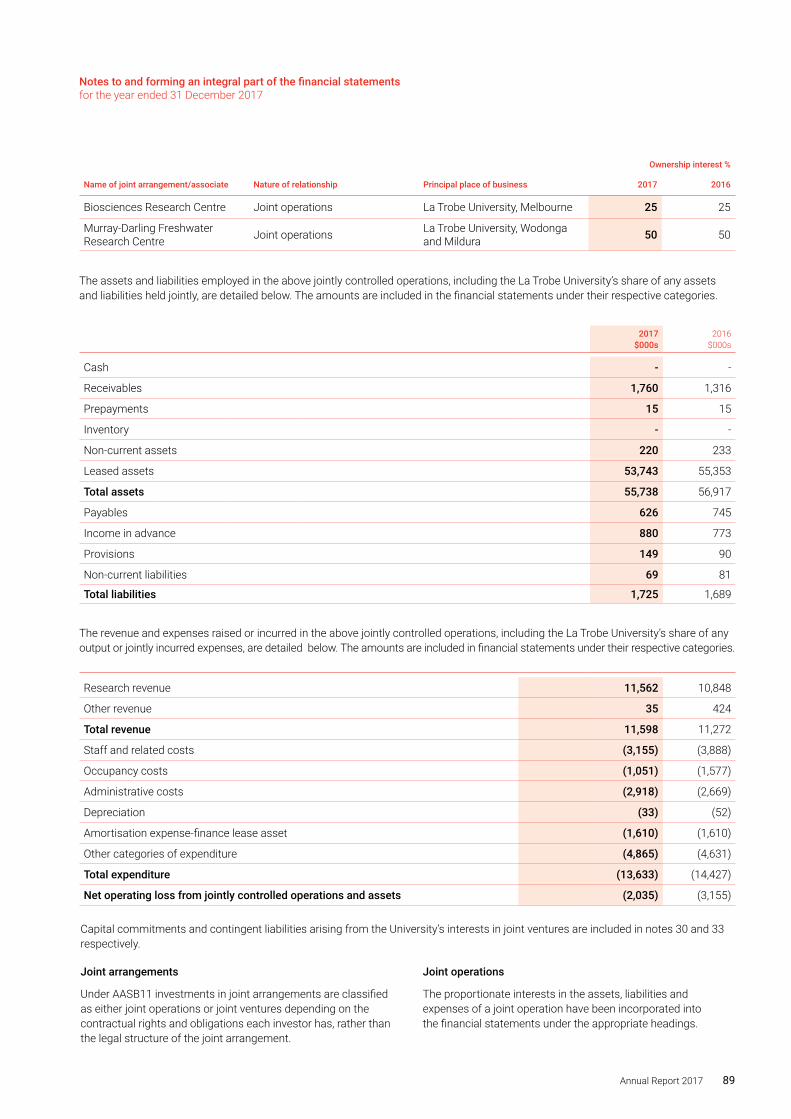
Notes to and forming an integral part of the financial statements for the year ended 31 December 2017
Annual Report 2017 89
Ownership interest %
Name of joint arrangement/associate Nature of relationship Principal place of business 2017 2016
Biosciences Research Centre Joint operations La Trobe University, Melbourne 25 25
Murray-Darling Freshwater Research Centre Joint operations La Trobe University, Wodonga
and Mildura 50 50
The assets and liabilities employed in the above jointly controlled operations, including the La Trobe University’s share of any assets and liabilities held jointly, are detailed below. The amounts are included in the financial statements under their respective categories.
2017$000s
2016$000s
Cash - -
Receivables 1,760 1,316
Prepayments 15 15
Inventory - -
Non-current assets 220 233
Leased assets 53,743 55,353
Total assets 55,738 56,917
Payables 626 745
Income in advance 880 773
Provisions 149 90
Non-current liabilities 69 81
Total liabilities 1,725 1,689
The revenue and expenses raised or incurred in the above jointly controlled operations, including the La Trobe University’s share of any output or jointly incurred expenses, are detailed below. The amounts are included in financial statements under their respective categories.
Research revenue 11,562 10,848
Other revenue 35 424
Total revenue 11,598 11,272
Staff and related costs (3,155) (3,888)
Occupancy costs (1,051) (1,577)
Administrative costs (2,918) (2,669)
Depreciation (33) (52)
Amortisation expense-finance lease asset (1,610) (1,610)
Other categories of expenditure (4,865) (4,631)
Total expenditure (13,633) (14,427)
Net operating loss from jointly controlled operations and assets (2,035) (3,155)
Capital commitments and contingent liabilities arising from the University’s interests in joint ventures are included in notes 30 and 33 respectively.
Joint arrangements
Under AASB11 investments in joint arrangements are classified as either joint operations or joint ventures depending on the contractual rights and obligations each investor has, rather than the legal structure of the joint arrangement.
Joint operations
The proportionate interests in the assets, liabilities and expenses of a joint operation have been incorporated into the financial statements under the appropriate headings.
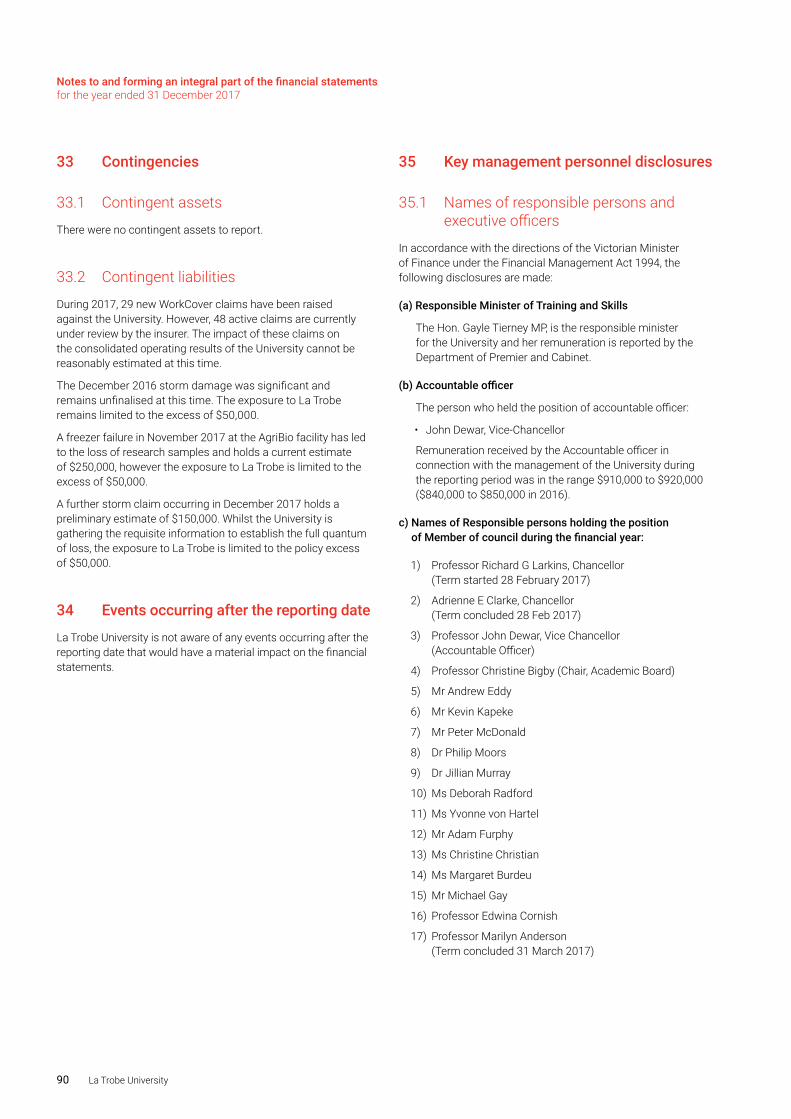
Notes to and forming an integral part of the financial statements for the year ended 31 December 2017
90 La Trobe University
33 Contingencies
33.1 Contingent assets
There were no contingent assets to report.
33.2 Contingent liabilities
During 2017, 29 new WorkCover claims have been raised against the University. However, 48 active claims are currently under review by the insurer. The impact of these claims on the consolidated operating results of the University cannot be reasonably estimated at this time.
The December 2016 storm damage was significant and remains unfinalised at this time. The exposure to La Trobe remains limited to the excess of $50,000.
A freezer failure in November 2017 at the AgriBio facility has led to the loss of research samples and holds a current estimate of $250,000, however the exposure to La Trobe is limited to the excess of $50,000.
A further storm claim occurring in December 2017 holds a preliminary estimate of $150,000. Whilst the University is gathering the requisite information to establish the full quantum of loss, the exposure to La Trobe is limited to the policy excess of $50,000.
34 Events occurring after the reporting date
La Trobe University is not aware of any events occurring after the reporting date that would have a material impact on the financial statements.
35 Key management personnel disclosures
35.1 Names of responsible persons and executive officers
In accordance with the directions of the Victorian Minister of Finance under the Financial Management Act 1994, the following disclosures are made:
(a) Responsible Minister of Training and Skills
The Hon. Gayle Tierney MP, is the responsible minister for the University and her remuneration is reported by the Department of Premier and Cabinet.
(b) Accountable officer
The person who held the position of accountable officer:
• John Dewar, Vice-Chancellor
Remuneration received by the Accountable officer in connection with the management of the University during the reporting period was in the range $910,000 to $920,000 ($840,000 to $850,000 in 2016).
c) Names of Responsible persons holding the position of Member of council during the financial year:
1) Professor Richard G Larkins, Chancellor (Term started 28 February 2017)
2) Adrienne E Clarke, Chancellor (Term concluded 28 Feb 2017)
3) Professor John Dewar, Vice Chancellor (Accountable Officer)
4) Professor Christine Bigby (Chair, Academic Board)
5) Mr Andrew Eddy
6) Mr Kevin Kapeke
7) Mr Peter McDonald
8) Dr Philip Moors
9) Dr Jillian Murray
10) Ms Deborah Radford
11) Ms Yvonne von Hartel
12) Mr Adam Furphy
13) Ms Christine Christian
14) Ms Margaret Burdeu
15) Mr Michael Gay
16) Professor Edwina Cornish
17) Professor Marilyn Anderson (Term concluded 31 March 2017)
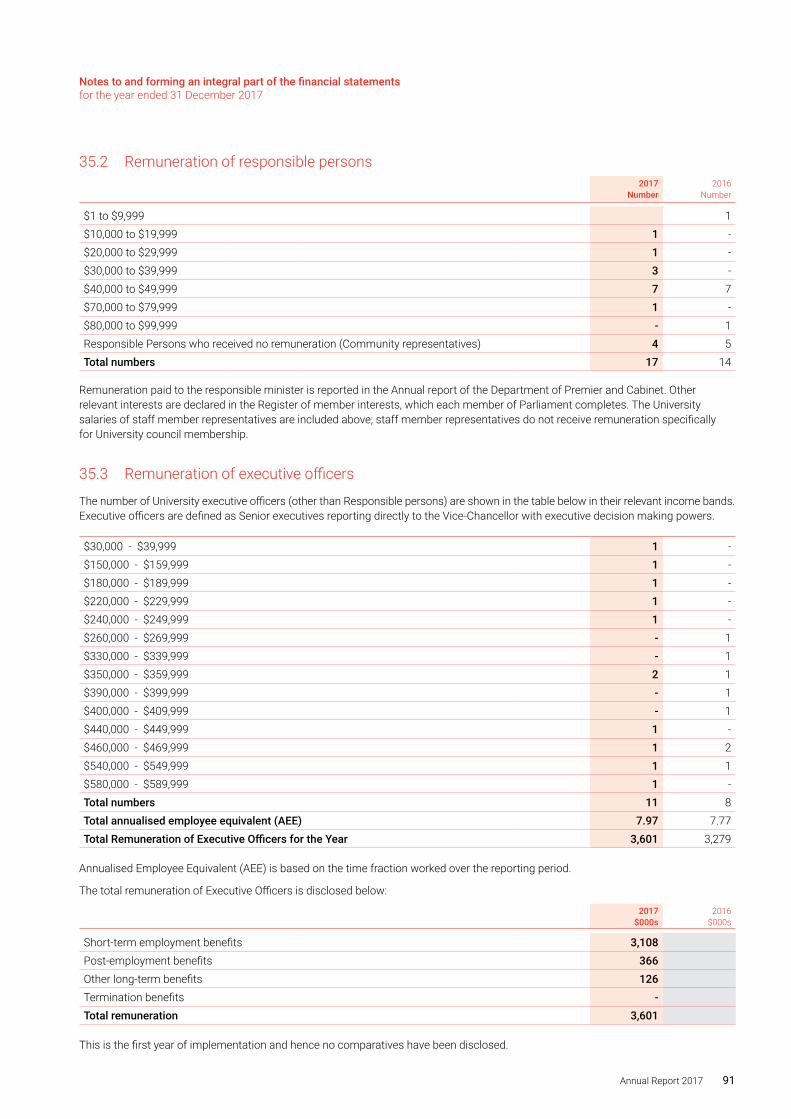
Notes to and forming an integral part of the financial statements for the year ended 31 December 2017
Annual Report 2017 91
35.2 Remuneration of responsible persons2017
Number2016
Number
$1 to $9,999 1$10,000 to $19,999 1 - $20,000 to $29,999 1 - $30,000 to $39,999 3 - $40,000 to $49,999 7 7$70,000 to $79,999 1 - $80,000 to $99,999 - 1Responsible Persons who received no remuneration (Community representatives) 4 5Total numbers 17 14
Remuneration paid to the responsible minister is reported in the Annual report of the Department of Premier and Cabinet. Other relevant interests are declared in the Register of member interests, which each member of Parliament completes. The University salaries of staff member representatives are included above; staff member representatives do not receive remuneration specifically for University council membership.
35.3 Remuneration of executive officers
The number of University executive officers (other than Responsible persons) are shown in the table below in their relevant income bands. Executive officers are defined as Senior executives reporting directly to the Vice-Chancellor with executive decision making powers.
$30,000 - $39,999 1 -$150,000 - $159,999 1 -$180,000 - $189,999 1 -$220,000 - $229,999 1 -$240,000 - $249,999 1 -$260,000 - $269,999 - 1$330,000 - $339,999 - 1$350,000 - $359,999 2 1$390,000 - $399,999 - 1$400,000 - $409,999 - 1$440,000 - $449,999 1 -$460,000 - $469,999 1 2$540,000 - $549,999 1 1$580,000 - $589,999 1 -Total numbers 11 8 Total annualised employee equivalent (AEE) 7.97 7.77 Total Remuneration of Executive Officers for the Year 3,601 3,279
Annualised Employee Equivalent (AEE) is based on the time fraction worked over the reporting period.
The total remuneration of Executive Officers is disclosed below:
2017$000s
2016$000s
Short-term employment benefits 3,108 Post-employment benefits 366 Other long-term benefits 126Termination benefits - Total remuneration 3,601
This is the first year of implementation and hence no comparatives have been disclosed.

Notes to and forming an integral part of the financial statements for the year ended 31 December 2017
92 La Trobe University
35.4 Key management personnel compensation
2017$000s
2016$000s
Short-term employment benefits 1,399
Post-employment benefits 58
Other long-term benefits -
Termination benefits -
Total remuneration 1,457
This is the first year of implementation and hence no comparatives have been disclosed.
35.5 Other related party transactions
A responsible person Adrienne Clarke AC, Chancellor of La Trobe University, was a shareholder of Hexima Limited which has provided contract research to the University. During the year 2017, she is no longer a shareholder of Hexima Limited.
A responsible person Marilyn Anderson, Member of Council (term ended 31 March 2017) was a shareholder, Chief Scientist and Executive Director for Hexima Limited. The aggregate amounts of the research services provided by Hexima Limited, during the period of relationship were:
Total expenses (Exclusive of GST)
2017$
2016$
Hexima Limited - 3,159
A responsible person Peter McDonald, Member of Council, is a Board director of Northern Health, which enters into partnership with La Trobe on an ongoing basis. During the year 2017, Peter McDonald is no longer a Board member in Northern Health. The aggregate amounts in respect of transactions during the period of relationship were:
Total expenses (Exclusive of GST)
2017$
2016$
Northern Health 1,248 1,069
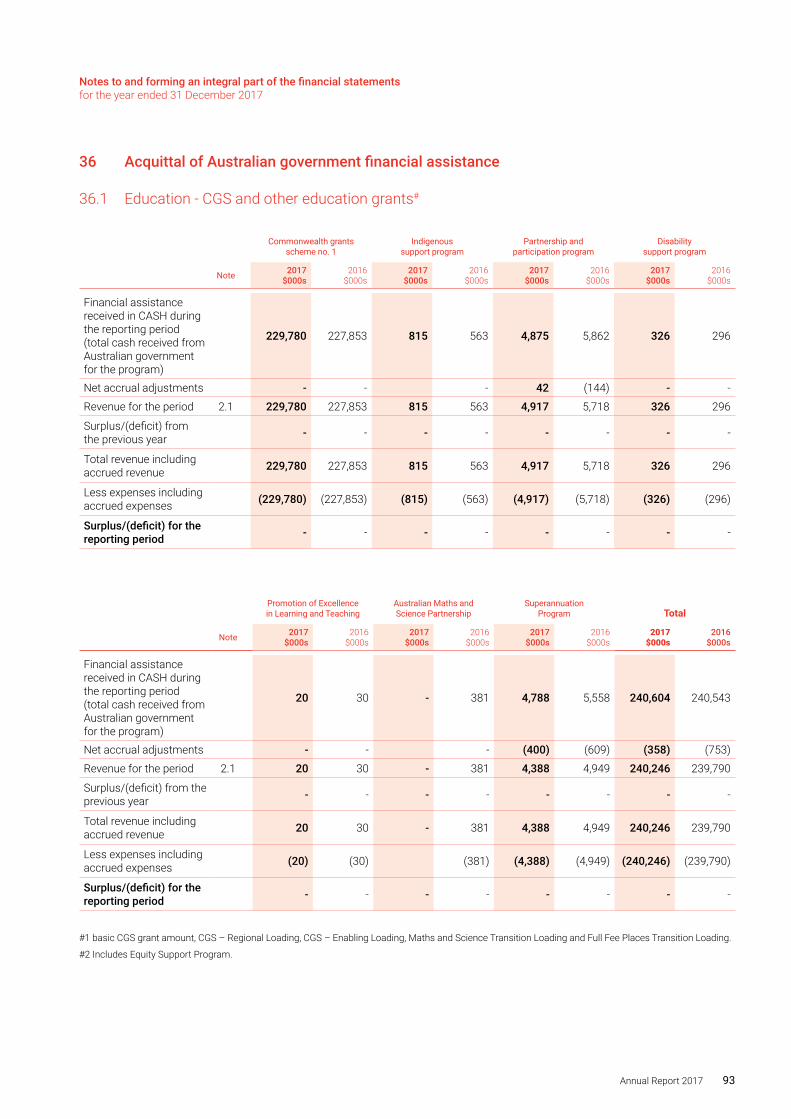
Notes to and forming an integral part of the financial statements for the year ended 31 December 2017
Annual Report 2017 93
36 Acquittal of Australian government financial assistance
36.1 Education - CGS and other education grants#
Commonwealth grants scheme no. 1
Indigenous support program
Partnership and participation program
Disability support program
Note 2017 $000s
2016 $000s
2017 $000s
2016 $000s
2017 $000s
2016 $000s
2017 $000s
2016 $000s
Financial assistance received in CASH during the reporting period (total cash received from Australian government for the program)
229,780 227,853 815 563 4,875 5,862 326 296
Net accrual adjustments - - - 42 (144) - -
Revenue for the period 2.1 229,780 227,853 815 563 4,917 5,718 326 296
Surplus/(deficit) from the previous year - - - - - - - -
Total revenue including accrued revenue 229,780 227,853 815 563 4,917 5,718 326 296
Less expenses including accrued expenses (229,780) (227,853) (815) (563) (4,917) (5,718) (326) (296)
Surplus/(deficit) for the reporting period - - - - - - - -
Promotion of Excellence in Learning and Teaching
Australian Maths and Science Partnership
Superannuation Program Total
Note 2017 $000s
2016 $000s
2017 $000s
2016 $000s
2017 $000s
2016 $000s
2017 $000s
2016 $000s
Financial assistance received in CASH during the reporting period (total cash received from Australian government for the program)
20 30 - 381 4,788 5,558 240,604 240,543
Net accrual adjustments - - - (400) (609) (358) (753)
Revenue for the period 2.1 20 30 - 381 4,388 4,949 240,246 239,790
Surplus/(deficit) from the previous year - - - - - - - -
Total revenue including accrued revenue 20 30 - 381 4,388 4,949 240,246 239,790
Less expenses including accrued expenses (20) (30) (381) (4,388) (4,949) (240,246) (239,790)
Surplus/(deficit) for the reporting period - - - - - - - -
#1 basic CGS grant amount, CGS – Regional Loading, CGS – Enabling Loading, Maths and Science Transition Loading and Full Fee Places Transition Loading.
#2 Includes Equity Support Program.
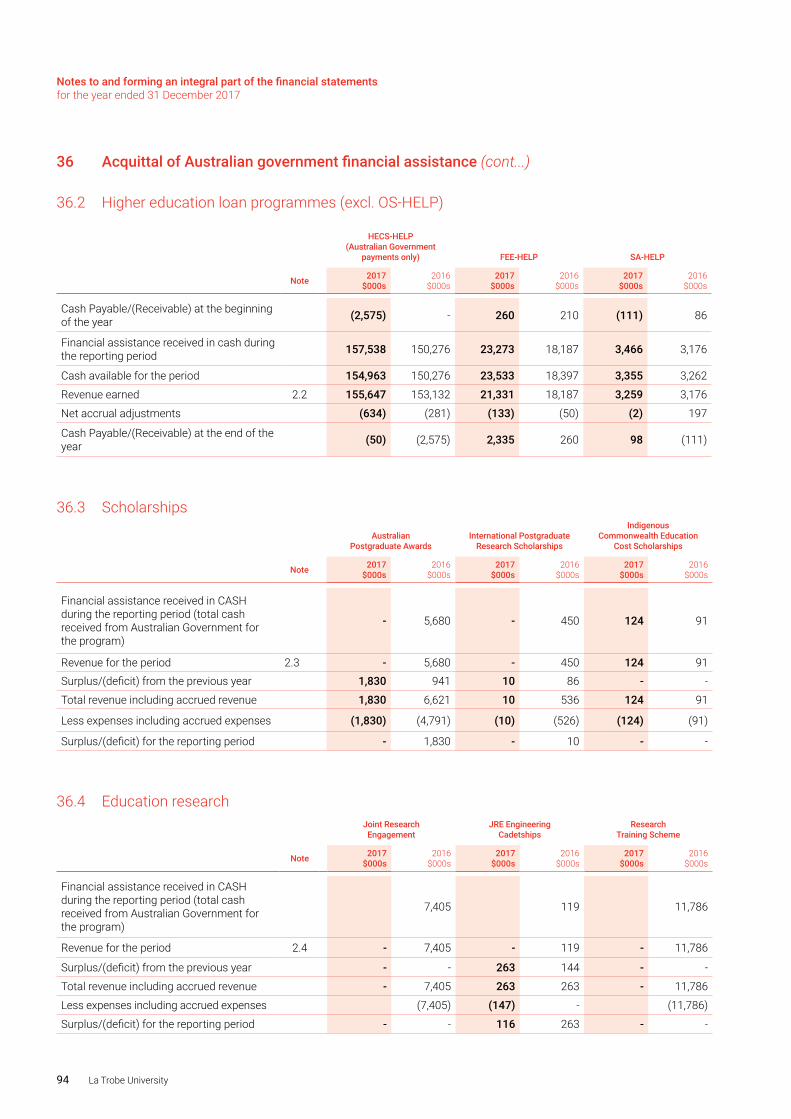
Notes to and forming an integral part of the financial statements for the year ended 31 December 2017
94 La Trobe University
36 Acquittal of Australian government financial assistance (cont...)
36.2 Higher education loan programmes (excl. OS-HELP)
HECS-HELP (Australian Government
payments only) FEE-HELP SA-HELP Total
Note 2017 $000s
2016 $000s
2017 $000s
2016 $000s
2017 $000s
2016 $000s
2017 $000s
2016 $000s
Cash Payable/(Receivable) at the beginning of the year (2,575) - 260 210 (111) 86 (2,426) 296
Financial assistance received in cash during the reporting period 157,538 150,276 23,273 18,187 3,466 3,176 184,277 171,639
Cash available for the period 154,963 150,276 23,533 18,397 3,355 3,262 181,851 171,935
Revenue earned 2.2 155,647 153,132 21,331 18,187 3,259 3,176 180,237 174,495
Net accrual adjustments (634) (281) (133) (50) (2) 197 (769) (134)
Cash Payable/(Receivable) at the end of the year (50) (2,575) 2,335 260 98 (111) 2,383 (2,426)
36.3 Scholarships
Australian Postgraduate Awards
International Postgraduate Research Scholarships
Indigenous Commonwealth Education
Cost ScholarshipsIndigenous Commonwealth
Accommodation scholarshipsIndigenous
Access Scholarship Total
Note 2017 $000s
2016 $000s
2017 $000s
2016 $000s
2017 $000s
2016 $000s
2017 $000s
2016 $000s
2017 $000s
2016 $000s
2017 $000s
2016 $000s
Financial assistance received in CASH during the reporting period (total cash received from Australian Government for the program)
- 5,680 - 450 124 91 55 26 13 59 192 6,306
Revenue for the period 2.3 - 5,680 - 450 124 91 55 26 13 59 192 6,306 Surplus/(deficit) from the previous year 1,830 941 10 86 - - - - - 5 1,840 1,032
Total revenue including accrued revenue 1,830 6,621 10 536 124 91 55 26 13 64 2,032 7,338
Less expenses including accrued expenses (1,830) (4,791) (10) (526) (124) (91) (55) (26) (13) (64) (2,032) (5,498)
Surplus/(deficit) for the reporting period - 1,830 - 10 - - - - - - - 1,840
36.4 Education researchJoint Research
EngagementJRE Engineering
Cadetships Research
Training SchemeResearch Infrastructure
Block GrantsSustainable Research
Excellence in UniversitiesResearch
Training ProgramResearch Support
Program Total
Note 2017 $000s
2016 $000s
2017 $000s
2016 $000s
2017 $000s
2016 $000s
2017 $000s
2016 $000s
2017 $000s
2016 $000s
2017 $000s
2016 $000s
2017 $000s
2016 $000s
2017 $000s
2016 $000s
Financial assistance received in CASH during the reporting period (total cash received from Australian Government for the program)
7,405 119 11,786 2,092 1,887 18,164 - 13,546 - 31,710 23,289
Revenue for the period 2.4 - 7,405 - 119 - 11,786 - 2,092 - 1,887 18,164 - 13,546 - 31,710 23,289
Surplus/(deficit) from the previous year - - 263 144 - - - - - - - - - - 263 144
Total revenue including accrued revenue - 7,405 263 263 - 11,786 - 2,092 - 1,887 18,164 - 13,546 - 31,973 23,433
Less expenses including accrued expenses (7,405) (147) - (11,786) (2,092) (1,887) (17,095) - (13,546) - (30,788) (23,170)
Surplus/(deficit) for the reporting period - - 116 263 - - - - - - 1,069 - - - 1,185 263
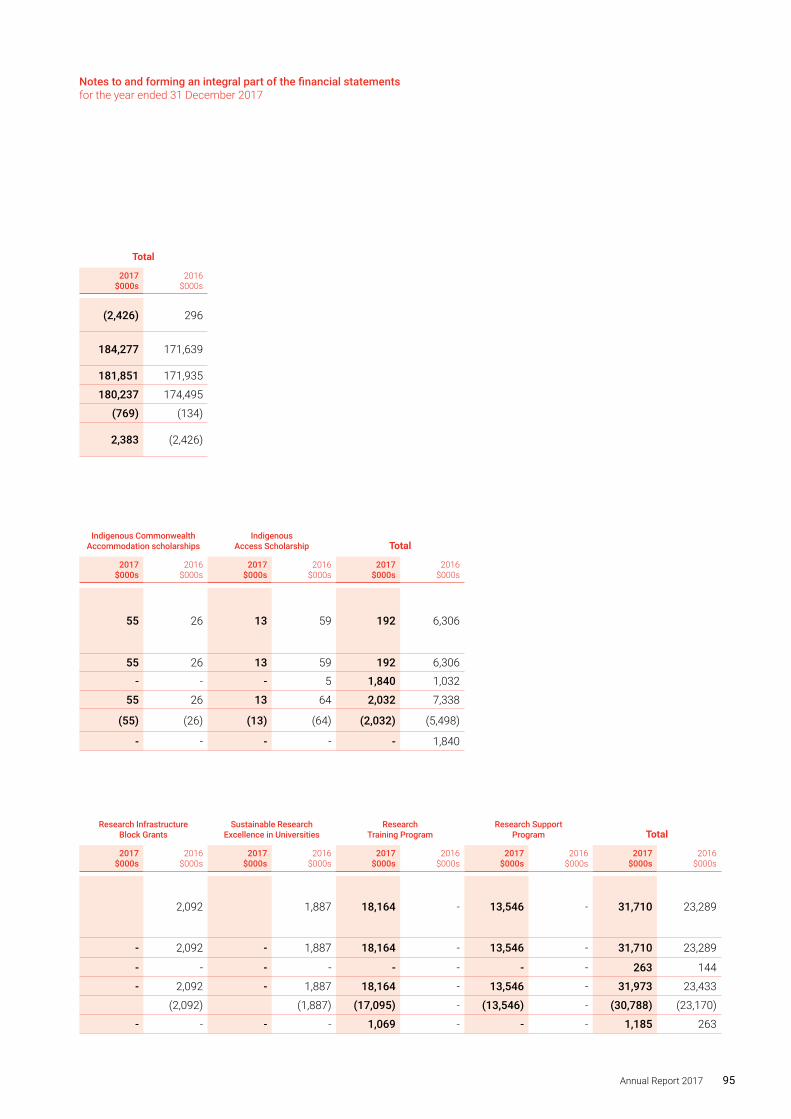
Notes to and forming an integral part of the financial statements for the year ended 31 December 2017
Annual Report 2017 95
36 Acquittal of Australian government financial assistance (cont...)
36.2 Higher education loan programmes (excl. OS-HELP)
HECS-HELP (Australian Government
payments only) FEE-HELP SA-HELP Total
Note 2017 $000s
2016 $000s
2017 $000s
2016 $000s
2017 $000s
2016 $000s
2017 $000s
2016 $000s
Cash Payable/(Receivable) at the beginning of the year (2,575) - 260 210 (111) 86 (2,426) 296
Financial assistance received in cash during the reporting period 157,538 150,276 23,273 18,187 3,466 3,176 184,277 171,639
Cash available for the period 154,963 150,276 23,533 18,397 3,355 3,262 181,851 171,935
Revenue earned 2.2 155,647 153,132 21,331 18,187 3,259 3,176 180,237 174,495
Net accrual adjustments (634) (281) (133) (50) (2) 197 (769) (134)
Cash Payable/(Receivable) at the end of the year (50) (2,575) 2,335 260 98 (111) 2,383 (2,426)
36.3 Scholarships
Australian Postgraduate Awards
International Postgraduate Research Scholarships
Indigenous Commonwealth Education
Cost ScholarshipsIndigenous Commonwealth
Accommodation scholarshipsIndigenous
Access Scholarship Total
Note 2017 $000s
2016 $000s
2017 $000s
2016 $000s
2017 $000s
2016 $000s
2017 $000s
2016 $000s
2017 $000s
2016 $000s
2017 $000s
2016 $000s
Financial assistance received in CASH during the reporting period (total cash received from Australian Government for the program)
- 5,680 - 450 124 91 55 26 13 59 192 6,306
Revenue for the period 2.3 - 5,680 - 450 124 91 55 26 13 59 192 6,306 Surplus/(deficit) from the previous year 1,830 941 10 86 - - - - - 5 1,840 1,032
Total revenue including accrued revenue 1,830 6,621 10 536 124 91 55 26 13 64 2,032 7,338
Less expenses including accrued expenses (1,830) (4,791) (10) (526) (124) (91) (55) (26) (13) (64) (2,032) (5,498)
Surplus/(deficit) for the reporting period - 1,830 - 10 - - - - - - - 1,840
36.4 Education researchJoint Research
EngagementJRE Engineering
Cadetships Research
Training SchemeResearch Infrastructure
Block GrantsSustainable Research
Excellence in UniversitiesResearch
Training ProgramResearch Support
Program Total
Note 2017 $000s
2016 $000s
2017 $000s
2016 $000s
2017 $000s
2016 $000s
2017 $000s
2016 $000s
2017 $000s
2016 $000s
2017 $000s
2016 $000s
2017 $000s
2016 $000s
2017 $000s
2016 $000s
Financial assistance received in CASH during the reporting period (total cash received from Australian Government for the program)
7,405 119 11,786 2,092 1,887 18,164 - 13,546 - 31,710 23,289
Revenue for the period 2.4 - 7,405 - 119 - 11,786 - 2,092 - 1,887 18,164 - 13,546 - 31,710 23,289
Surplus/(deficit) from the previous year - - 263 144 - - - - - - - - - - 263 144
Total revenue including accrued revenue - 7,405 263 263 - 11,786 - 2,092 - 1,887 18,164 - 13,546 - 31,973 23,433
Less expenses including accrued expenses (7,405) (147) - (11,786) (2,092) (1,887) (17,095) - (13,546) - (30,788) (23,170)
Surplus/(deficit) for the reporting period - - 116 263 - - - - - - 1,069 - - - 1,185 263
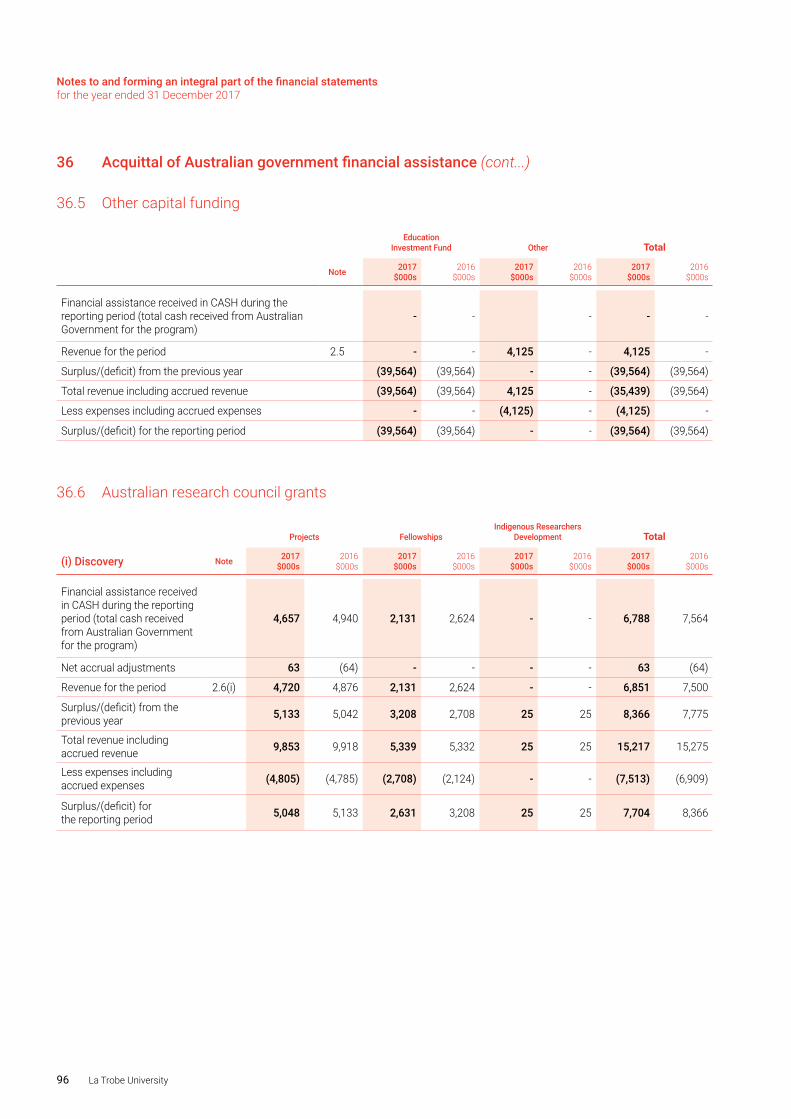
Notes to and forming an integral part of the financial statements for the year ended 31 December 2017
96 La Trobe University
36 Acquittal of Australian government financial assistance (cont...)
36.5 Other capital funding
Education Investment Fund Other Total
Note 2017 $000s
2016 $000s
2017 $000s
2016 $000s
2017 $000s
2016 $000s
Financial assistance received in CASH during the reporting period (total cash received from Australian Government for the program)
- - - - -
Revenue for the period 2.5 - - 4,125 - 4,125 -
Surplus/(deficit) from the previous year (39,564) (39,564) - - (39,564) (39,564)
Total revenue including accrued revenue (39,564) (39,564) 4,125 - (35,439) (39,564)
Less expenses including accrued expenses - - (4,125) - (4,125) -
Surplus/(deficit) for the reporting period (39,564) (39,564) - - (39,564) (39,564)
36.6 Australian research council grants
Projects FellowshipsIndigenous Researchers
Development Total
(i) Discovery Note 2017 $000s
2016 $000s
2017 $000s
2016 $000s
2017 $000s
2016 $000s
2017 $000s
2016 $000s
Financial assistance received in CASH during the reporting period (total cash received from Australian Government for the program)
4,657 4,940 2,131 2,624 - - 6,788 7,564
Net accrual adjustments 63 (64) - - - - 63 (64)
Revenue for the period 2.6(i) 4,720 4,876 2,131 2,624 - - 6,851 7,500
Surplus/(deficit) from the previous year 5,133 5,042 3,208 2,708 25 25 8,366 7,775
Total revenue including accrued revenue 9,853 9,918 5,339 5,332 25 25 15,217 15,275
Less expenses including accrued expenses (4,805) (4,785) (2,708) (2,124) - - (7,513) (6,909)
Surplus/(deficit) for the reporting period 5,048 5,133 2,631 3,208 25 25 7,704 8,366
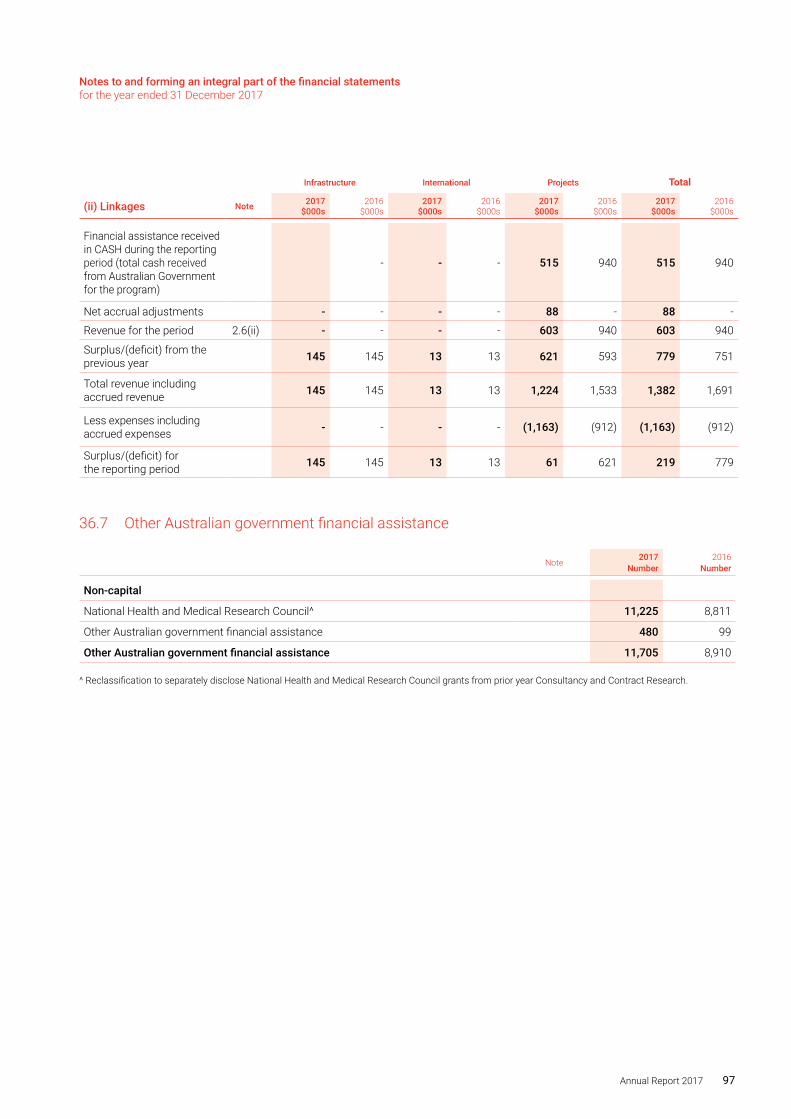
Notes to and forming an integral part of the financial statements for the year ended 31 December 2017
Annual Report 2017 97
Infrastructure International Projects Total
(ii) Linkages Note 2017 $000s
2016 $000s
2017 $000s
2016 $000s
2017 $000s
2016 $000s
2017 $000s
2016 $000s
Financial assistance received in CASH during the reporting period (total cash received from Australian Government for the program)
- - - 515 940 515 940
Net accrual adjustments - - - - 88 - 88 -
Revenue for the period 2.6(ii) - - - - 603 940 603 940
Surplus/(deficit) from the previous year 145 145 13 13 621 593 779 751
Total revenue including accrued revenue 145 145 13 13 1,224 1,533 1,382 1,691
Less expenses including accrued expenses - - - - (1,163) (912) (1,163) (912)
Surplus/(deficit) for the reporting period 145 145 13 13 61 621 219 779
36.7 Other Australian government financial assistance
Note 2017Number
2016Number
Non-capital
National Health and Medical Research Council^ 11,225 8,811
Other Australian government financial assistance 480 99
Other Australian government financial assistance 11,705 8,910
^ Reclassification to separately disclose National Health and Medical Research Council grants from prior year Consultancy and Contract Research.
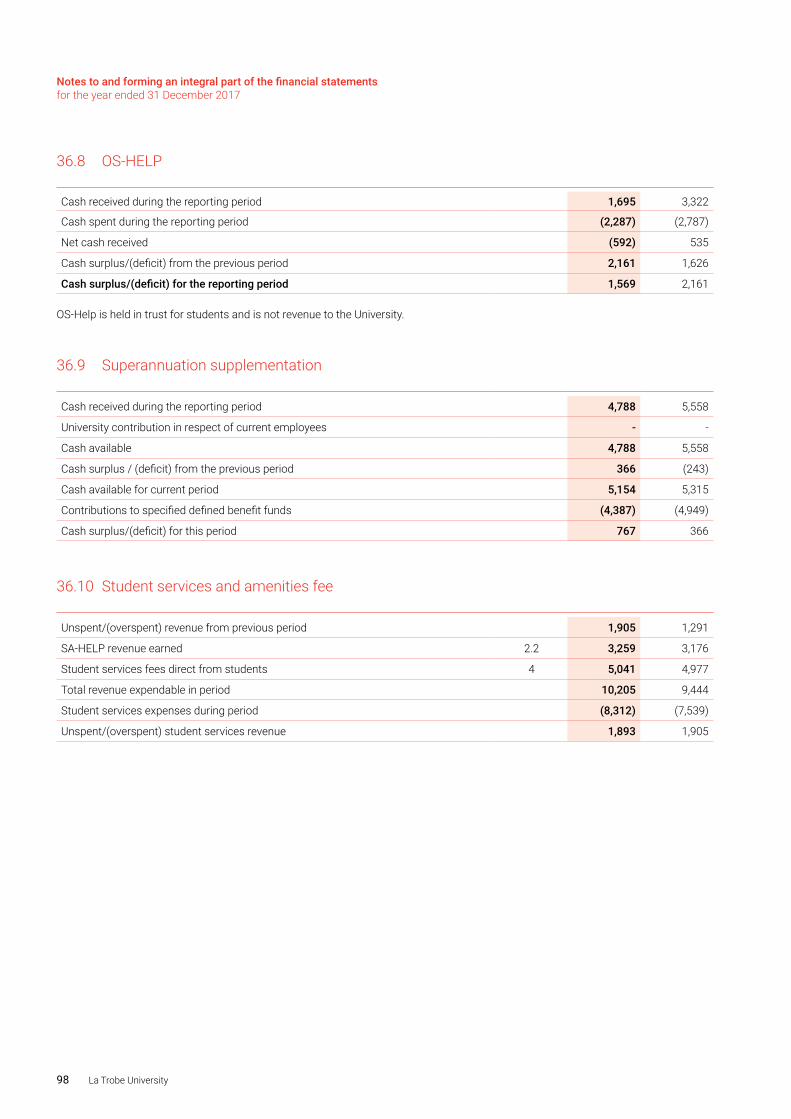
Notes to and forming an integral part of the financial statements for the year ended 31 December 2017
98 La Trobe University
36.8 OS-HELP
Cash received during the reporting period 1,695 3,322
Cash spent during the reporting period (2,287) (2,787)
Net cash received (592) 535
Cash surplus/(deficit) from the previous period 2,161 1,626
Cash surplus/(deficit) for the reporting period 1,569 2,161
OS-Help is held in trust for students and is not revenue to the University.
36.9 Superannuation supplementation
Cash received during the reporting period 4,788 5,558
University contribution in respect of current employees - -
Cash available 4,788 5,558
Cash surplus / (deficit) from the previous period 366 (243)
Cash available for current period 5,154 5,315
Contributions to specified defined benefit funds (4,387) (4,949)
Cash surplus/(deficit) for this period 767 366
36.10 Student services and amenities fee
Unspent/(overspent) revenue from previous period 1,905 1,291
SA-HELP revenue earned 2.2 3,259 3,176
Student services fees direct from students 4 5,041 4,977
Total revenue expendable in period 10,205 9,444
Student services expenses during period (8,312) (7,539)
Unspent/(overspent) student services revenue 1,893 1,905
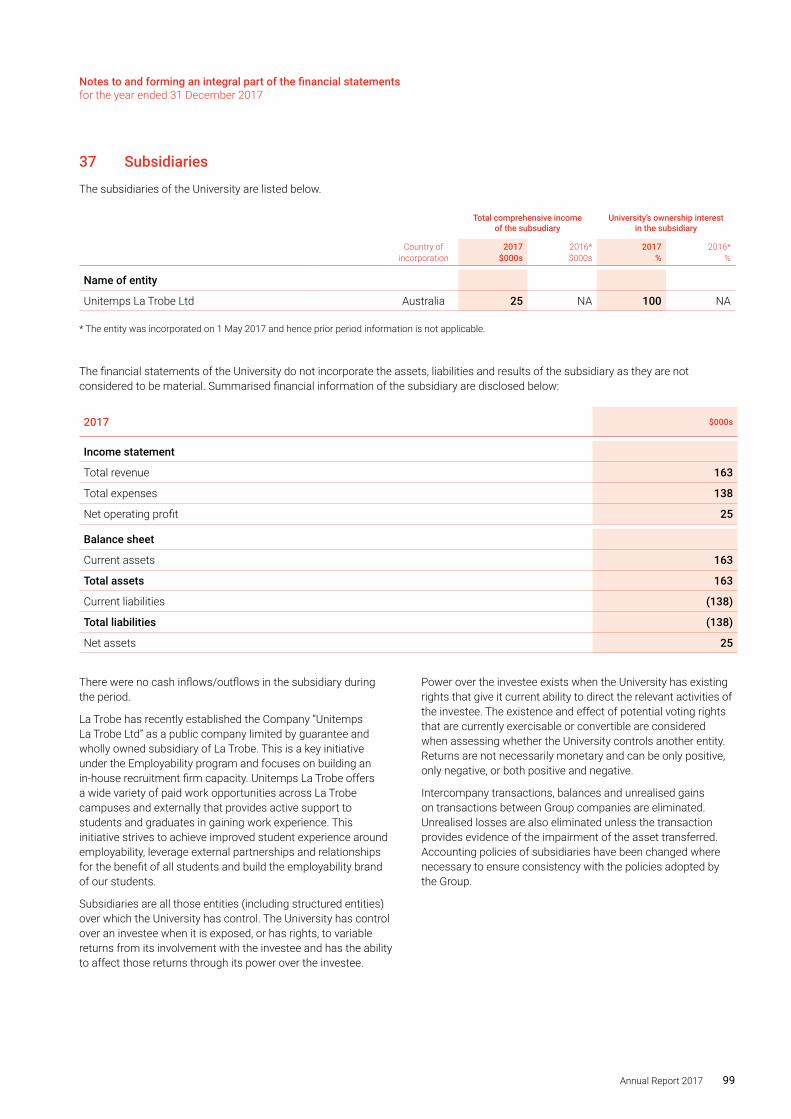
Notes to and forming an integral part of the financial statements for the year ended 31 December 2017
Annual Report 2017 99
37 Subsidiaries
The subsidiaries of the University are listed below.
Total comprehensive income of the subsudiary
University’s ownership interest in the subsidiary
Country of incorporation
2017$000s
2016*$000s
2017%
2016*%
Name of entity
Unitemps La Trobe Ltd Australia 25 NA 100 NA
* The entity was incorporated on 1 May 2017 and hence prior period information is not applicable.
The financial statements of the University do not incorporate the assets, liabilities and results of the subsidiary as they are not considered to be material. Summarised financial information of the subsidiary are disclosed below:
2017 $000s
Income statement
Total revenue 163
Total expenses 138
Net operating profit 25
Balance sheet
Current assets 163
Total assets 163
Current liabilities (138)
Total liabilities (138)
Net assets 25
There were no cash inflows/outflows in the subsidiary during the period.
La Trobe has recently established the Company “Unitemps La Trobe Ltd” as a public company limited by guarantee and wholly owned subsidiary of La Trobe. This is a key initiative under the Employability program and focuses on building an in‐house recruitment firm capacity. Unitemps La Trobe offers a wide variety of paid work opportunities across La Trobe campuses and externally that provides active support to students and graduates in gaining work experience. This initiative strives to achieve improved student experience around employability, leverage external partnerships and relationships for the benefit of all students and build the employability brand of our students.
Subsidiaries are all those entities (including structured entities) over which the University has control. The University has control over an investee when it is exposed, or has rights, to variable returns from its involvement with the investee and has the ability to affect those returns through its power over the investee.
Power over the investee exists when the University has existing rights that give it current ability to direct the relevant activities of the investee. The existence and effect of potential voting rights that are currently exercisable or convertible are considered when assessing whether the University controls another entity. Returns are not necessarily monetary and can be only positive, only negative, or both positive and negative.
Intercompany transactions, balances and unrealised gains on transactions between Group companies are eliminated. Unrealised losses are also eliminated unless the transaction provides evidence of the impairment of the asset transferred. Accounting policies of subsidiaries have been changed where necessary to ensure consistency with the policies adopted by the Group.
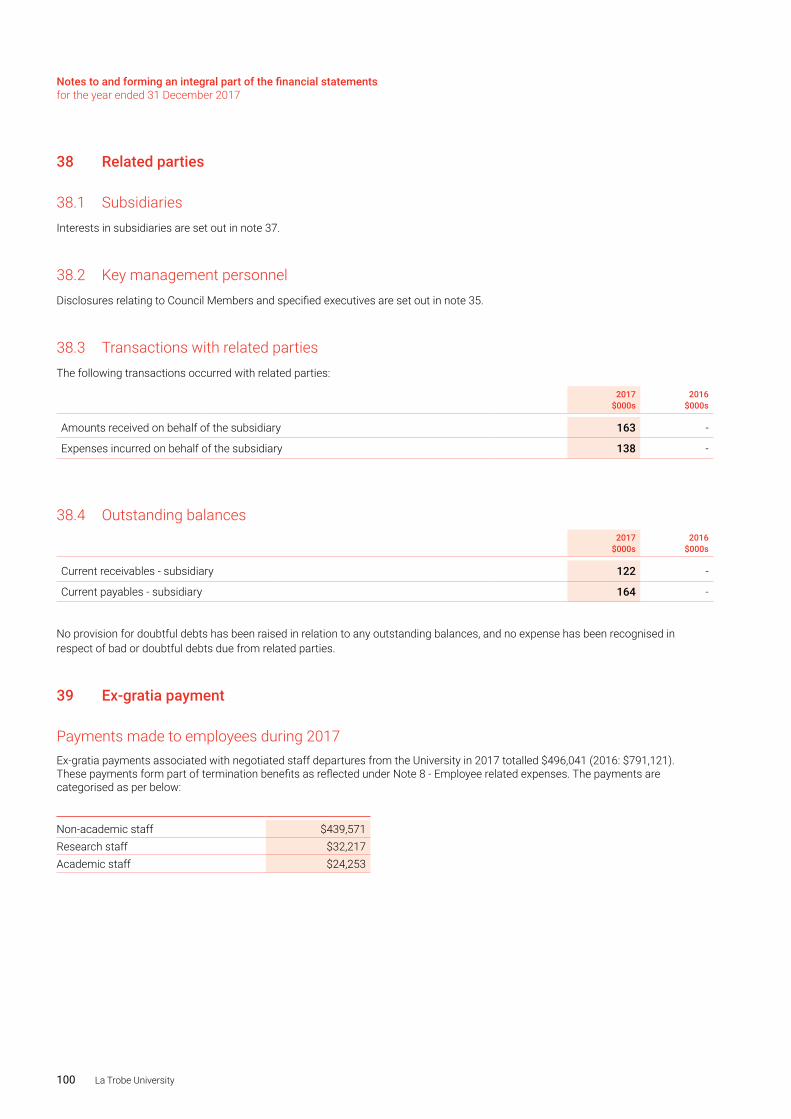
Notes to and forming an integral part of the financial statements for the year ended 31 December 2017
100 La Trobe University
38 Related parties
38.1 SubsidiariesInterests in subsidiaries are set out in note 37.
38.2 Key management personnelDisclosures relating to Council Members and specified executives are set out in note 35.
38.3 Transactions with related partiesThe following transactions occurred with related parties:
2017$000s
2016$000s
Amounts received on behalf of the subsidiary 163 -
Expenses incurred on behalf of the subsidiary 138 -
38.4 Outstanding balances2017
$000s2016
$000s
Current receivables - subsidiary 122 -
Current payables - subsidiary 164 -
No provision for doubtful debts has been raised in relation to any outstanding balances, and no expense has been recognised in respect of bad or doubtful debts due from related parties.
39 Ex-gratia payment
Payments made to employees during 2017 Ex-gratia payments associated with negotiated staff departures from the University in 2017 totalled $496,041 (2016: $791,121). These payments form part of termination benefits as reflected under Note 8 - Employee related expenses. The payments are categorised as per below:
Non-academic staff $439,571Research staff $32,217Academic staff $24,253
Notes to and forming an integral part of the financial statements for the year ended 31 December 2017
Annual Report 2017 101
DRAFTFIRST IN TOUCH SCREEN TECH- NOLOGY
latrobe.edu.au
The Annual Report 2017 is available online at:latrobe.edu.au/council/resources
ContactLa Trobe University Victoria 3086 Australia
General enquiriesT +61 3 9479 1111F +61 3 9478 5814
La Trobe University CRICOS Provider Code Number 00115M
DC34
573
04/1
8