Embed Size (px)
Citation preview

Quality.Innovation.Efficiency.Precision.
Annual Report 2016
WAFERS – HIGH-TECH
IN A GLOBAL NETWORK.
Siltronic Group key figures
2016 2015
Statement of profit or loss
Sales EUR mn 933.4 931.3
Gross profit EUR mn 171.9 162.9
Gross margin % 18.4 17.5
EBITDA EUR mn 146.0 124.0
EBITDA margin % 15.6 13.3
EBIT EUR mn 27.0 2.7
EBIT margin % 2.9 0.3
Financial result EUR mn – 11.1 – 12.2
Income taxes EUR mn – 7.2 – 10.6
Net profit/loss for the period EUR mn 8.7 – 20.1
Earnings per share EUR 0.40 – 0.50
ROCE % 3.7 0.4
Capital expenditure and free cash flow
Capital expenditure in property, plant and equipment, and intangible assets EUR mn – 88.8 – 75.0
Free cash flow EUR mn 19.0 37.4
Dec. 31, 2016 Dec. 31, 2015
Statement of financial position
Total assets EUR mn 1,056.8 1,040.8
Equity EUR mn 425.3 497.3
Equity ratio % 40.2 47.8
Net financial assets EUR mn 175.0 155.9
Employees 3,757 3,894

1
Company profile
Siltronic is one of the world’s leading manufacturers of hyperpure silicon wafers with diameters up to 300mm and partner of many leading semiconductor companies. The Company has a network of state-of-the-art production sites in Europe, Asia and the USA and employs nearly 3,800 people. Silicon wafers are key components of e.g. computers, flat-screens, navigation systems, control systems for the automotive industry and many other applications. Technology leadership and a consistent focus on improving efficiency form the bedrock for increasing the Company’s value going forward.
Content
2 Facts and figures: A brief stroll through the world of Siltronic wafers.
4 Wafers – High-tech in a global network. 6 Quality in Freiberg
10 Innovation in Burghausen
14 Efficiency in Portland
18 Precision in Singapore
22 To our shareholders22 Letter to shareholders
25 Supervisory Board report
29 Siltronic on the stock exchange
31 Report and declaration on corporate governance
38 Combined management report39 Business and economic conditions
44 Business report
46 Financial position and financial performance
55 Siltronic AG
58 Non-financial key performance indicators
68 Risk and opportunity report
80 Outlook
82 Concluding declaration pursuant to
section 312 (3) AktG
83 Remuneration report
87 Disclosures relevant to acquisitions
90 Consolidated financial statements 91 Consolidated statement of profit or loss
92 Consolidated statement of financial position
93 Consolidated statement of cash flows
94 Consolidated statements of
comprehensive income
95 Consolidated statement of changes in equity
96 Notes to the consolidated financial statements
135 Additional information135 Auditor’s report
136 Responsibility statement
137 Further disclosures on offices held
139 Quarterly overview
140 Multi-year overview
141 Glossary
Financial calendar, contact, and imprint
1
1 wafer per secondSiltronic makes one wafer a second.
775 μm
Well on track thanks to the cost roadmap
is the standard thickness of a 300mm wafer.
Identifying areas for improvement and optimizing them accordingly – that is the objective of the cost roadmap, our long-term program to reduce costs. At its core are projects aimed at raising efficiency. New ideas are being discussed all the time and, where possible, are implemented immediately. One of our targets is to continuously reduce the variable costs involved in making a 300-millimeter wafer.
Wafer sizes
< = 100 mm 125 mm 150 mm 200 mm 300 mm
The number of semiconductor circuits that can fit on a single wafer doubles every two years. This increase tightens the specifications for wafer materials by 30 percent each time.
Every two years
Facts and figures: A brief stroll through the world of Siltronic wafers
1953 1962 1990 1998 2004 2006 2014 2015
Siltronic completes a successful IPO
Siltronic acquires a controlling interest in the joint venture in Singapore
The first silicon wafer is developed
Beginning of research and development in the field of hyperpure silicon
The initial expansion of the 300mm pilot production line in Burghausen is brought on stream
First research and development projects for 300mm wafers
Siltronic establishes a joint venture with Samsung in Singapore
Production commences at the production facility for 300mm silicon wafers in Freiberg
The road to success
2 ANNUAL REPORT 2016
FACTS AND FIGURES

100 nm 450 / houris the maximum elevation on the surface of a
wafer from the current generation. If you were to make Germany as flat as one of our wafers, the
highest elevation would be around three meters.
The air in our clean rooms is completely filtered up to 450 times per hour.
SILICON WAFERS
5
POLISHING
4
WIRE CUTTING
3
CRYSTAL GROWING
2
POLYSILICON
1
molten siliconwire
ingot
Wafer production (simplified)approximately 50 to 60 production steps
End markets for semiconductor applications
Source: IHS 2017; ‘Other’ includes network infrastructure, consumer end devices, etc.Source: SEMI SMG 2017
29% Computers – incl. solid state drives
27%Smartphones
25%Other
8%Automotive
11%Industry
7 km 2of silicon was
consumed in 2016 – equivalent to the
land area of Gibraltar.
An average PC needs 30 cm² of silicon.
A car needs 60 cm² of silicon.
A high-end smartphone needs 13 cm² of silicon.
3ANNUAL REPORT 2016
FACTS AND FIGURES
WAFERS – HIGH-TECH
IN A GLOBAL NETWORK.QUALITY.
INNOVATION.EFFICIENCY.PRECISION.
Silicon wafers: The key element of many
everyday products – and of our Company’s success.
4 ANNUAL REPORT 2016
WAFERS – HIGH-TECH IN A GLOBAL NETWORK

Siltronic. As a technology leader with a strong international presence and focus, we supply high-quality silicon wafers to the sophisticated semi- conductor industry all over the world.
Successful for more than 50 years Silicon: a metalloid with a dark grey luster, bearing the chemical symbol Si and atomic number 14 in the periodic table; after oxygen, the second most common element in the Earth’s crust. So much for the plain facts. Yet day in, day out, Siltronic trans-forms this seemingly ‘run-of-the-mill’ element into precious fuel for our modern information-driven society. Made into wafers, silicon is the basis for nearly all semiconductor components and for the global electronics industry. The origins of our business date back to the early 1950s. In 1962, we developed the first silicon wafer for the semiconductor industry.
Well positioned strategically and geographically Since that time, we have established ourselves as one of the leading suppliers in this challenging sector, which rapidly drives progress while never forgiving the slightest error. Accordingly, we pursue a strict zero-defect strategy. And we are well posi-tioned for a profitable future, where we aim to benefit from significant growth drivers in the automotive, industry, commu-nications and solid state drives sectors. Apart from technology leadership, proximity to our customers all over the world is crit-ical in this respect. With our international network of production sites and sales offices, we have positioned ourselves perfectly in strategic and geographic terms.
Munich
Portland SingaporeFreibergBurghausen
USA
France Italy
China
Singapore
South Korea
Japan
Germany Taiwan
5ANNUAL REPORT 2016
WAFERS – HIGH-TECH IN A GLOBAL NETWORK

Hyperpure origin: monocrystals made of silicon are the basis for the ultra-flat wafers.

FREIBERG
Quality. By investing strategically in our locations and technologies, we are ensuring that we will keep our leading position in the future despite tough competition in the semiconductor industry.
From Silicon Saxony to the entire world
Siltronic manufactures silicon wafers for the global market at its Freiberg site in Germany’s high-technology hub in Saxony. In 2016, the Company invested in a new crystal-pulling hall and state-of-the-art crystal pullers for 300mm wafers.
September 22, 2016: Inauguration atmosphere at Siltronic’s plant in Freiberg. Eminent guests from the worlds of politics and business have come to join Siltronic’s management and employ-ees in celebrating the inauguration of the site’s new crystal- pulling hall. This is more than ‘merely’ an investment in the latest technology, as Dr. Christoph von Plotho, CEO of Siltronic AG, makes clear in his welcoming address: ‘Our investment in this new crystal-pulling hall represents a clear commitment to Freiberg and is an important contribution to maintaining and developing our position as preferred supplier to the global semi-conductor industry.’
Investment in Siltronic’s future successReview. 14 months ago, a ground-breaking ceremony was held on this very same spot. In little over a year, a team of specialist engineers and builders erected a 1,500m² building. But for truly world-class performances, you need to look inside the building.
‘We grow monocrystals, or ‘ingots’ in the pulling hall, from which we then produce 300mm wafers designed to meet the latest design rules of chip manufacturers,’ explains plant manager Dr. Christian Heedt.
While this may sound pretty straightforward, the procedure is actually incredibly complex. In very simple terms, a pencil-thin seed crystal is lowered into molten polysilicon, set in rotation, and slowly pulled upward – as a result of which a monocrystal is produced. Once it has grown into a rod weighing more than 350 kilograms, it is polished and sliced and wafers are prepared in accordance with customer requirements. By doping, e.g. with boron or arsenic, the electrical properties of the wafers and their precise qualities are tailored to their intended future functions.
The capital expenditure that has now been made will not help expand production capacities at Freiberg, but should instead enable Siltronic to keep pace with the ever-increasing techno-logical demands of its customers.
Siltronic operates cutting-edge crystal pullers and a production line
for 300mm wafers not far from Dresden, the regional capital
of Saxony. The facility currently has 800 employees.
7ANNUAL REPORT 2016
QUALITY

1 2 3 4 5
Crystal growing in wafer production
1
POLYSILICON IS MELTEDSILICON SEED IS LOW E R ED INTO THE MELT
CRYSTAL GROWING STARTS CRYSTAL GROWING FINISHED PRODUCT
2 3 4 5
Ever faster, smaller, and more powerful:users have high expectations of their products. The process of meeting these expectations starts with manufacturers like Siltronic.
Global megatrends drive manufacturers to new heightsChristian Heedt points to the gray building: ‘The hall extends over three levels with a clean room in the middle. The air in that room is constantly filtered and is 10,000 times purer than fresh mountain air. And we can now control the crystal pulling process even more efficiently from our new production control station.’
‘Efficiency’ is a good word to use here. Alongside megatrends such as mobility, networking, and miniaturization, it is one of the main drivers of Siltronic’s business. Whatever the end product – whether smartphones, tablets, or navigation systems in cars: if it is up to consum-ers, each new generation of devices will ideally be more compact, more powerful, and yet cheaper than their predecessors. In a kind of domino effect, the growing requirements placed on products thus result in increased demands on the components of the semiconductor industry, which in turn expects its suppliers – the wafer manufacturers – to achieve techno-logical breakthroughs at shorter and shorter intervals.
Siltronic’s Freiberg site is no small wonder.
10hectares
8 ANNUAL REPORT 2016
QUALITY

1957 1995 1996 – 1997 2004 2009 2015
Start of semiconductor activities as ‘VEB Spurenmetalle Freiberg’, a state-owned company
The Freiberg plant is integrated into Siltronic while production continues
Wafer production line for small diameters is relocated to Burghausen and employees transferred to other production areas
60 years of semiconductor material production at the Freiberg site
Siltronic takes over the business
Construction of a new 300mm production site containing the most advanced crystal pullers for 300mm monocrystals
300mm crystal-pulling hall is expanded and existing pullers are replaced by state-of-the-art equipment
has been invested in modernizing and expanding the site since 1995.
> 800EUR million
work at the Freiberg site.
800employees
The Freiberg production sitecombines state-of-the-art technology and highly skilled employees.
Zero-defect strategy across the GroupRemaining among the technology leaders in this dynamic and intensely competitive market environment is a permanent challenge. Innovative strength is key, together with highest quality standards that are underpinned by a groupwide zero-defect strategy. Achieving these standards requires ongoing investment in research and development and along the entire production chain. Since the acquisition of ‘Freiberger Elektronikwerkstoffe GmbH’ (as it was formerly known) in 1995, a lot of capital has been invested in modernizing and expanding the site.
Major employer in Saxony’s very own Silicon ValleyIn recent decades, the region between Dresden and Chemnitz has undergone a structural transformation. A large number of businesses from high-tech industries such as semiconductor manufacturing and solar technology have settled in the area. Siltronic found that this location offered excellent conditions and highly skilled employees. Its Freiberg plant now makes a substantial contribution to the Company’s excellent reputation in the sector and thus to its overall success. Today, Siltronic is one of the largest firms and most important employers in Silicon Saxony, the name given to the region in a clear nod to Silicon Valley.
9ANNUAL REPORT 2016
QUALITY

All our sites reap the benefits of our intensive research
and development activities.

Innovation. Constantly making good things that little bit better and even achieving the impossible.With this philosophy we are securing Siltronic’s technological leadership.
A driving force for innovation
Siltronic’s research and development center in Burghausen, East-ern Bavaria, is our innovative hub, where we are constantly working on our future viability and competitiveness. The elec-tronics industry is characterized by extremely short innovation cycles. We have all seen this when it comes to smartphones: two or three years later they are regarded as outdated and no longer competitive. The requirements in regard to wafers are increasing equally rapidly, meaning that a strong research and development (R&D) division is essential in this sector in order to stay techno-logically ahead. Moreover, deploying the maximum degree of innovation can be equated to taking out life insurance for our long-term economic success, in keeping with our vision of always being one generation ahead of our customers’ technol-ogy roadmap.
Developing new products and optimizing our classicsOur R&D activities focus primarily on the development of pro-cesses, products, and metrology. In practice, two general lines of action are pursued. On the one hand, we research innovative approaches to new products and procedures. On the other, we work on continuously improving our existing processes and sys-tems so as to improve the products’ properties, significantly reduce costs, and increase productivity.
A strong market position requires teamworkOur engineering division works very closely with the technology arms of the business – i.e. research, process development, and metrology. As a team, they think on a grand scale, for example with regard to the use of new types of materials, but also con-sider the tiniest of structures in the range of only a few nano-meters. Expertise and premium quality combined with cost efficiency and a swift pace of development are the qualities that are securing, and will continue to secure, our innovative and technological leadership.
Our largest production site is in Burghausen, near Munich,
and has roots that go back more than 50 years. It manufactures
wafers and silicon monocrystals and is also our central R&D hub.
BURGHAUSEN
11ANNUAL REPORT 2016
INNOVATION
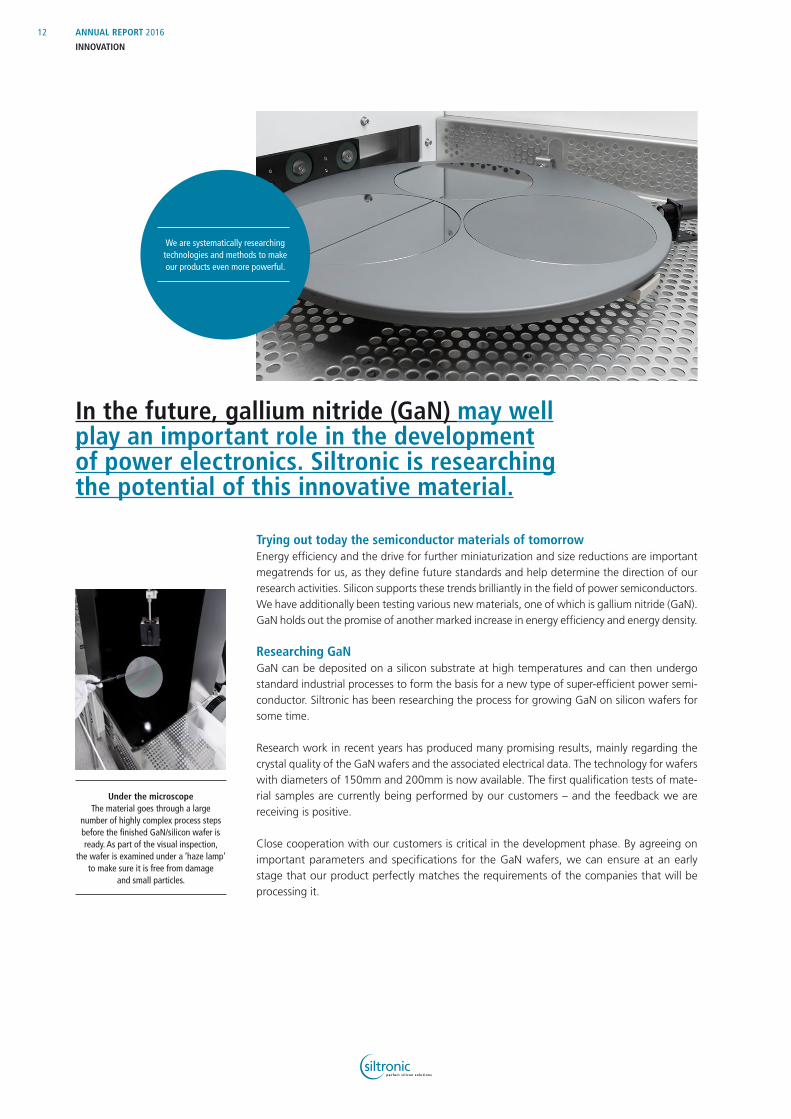
In the future, gallium nitride (GaN) may well play an important role in the development of power electronics. Siltronic is researching the potential of this innovative material.
We are systematically researching technologies and methods to make our products even more powerful.
Trying out today the semiconductor materials of tomorrowEnergy efficiency and the drive for further miniaturization and size reductions are important megatrends for us, as they define future standards and help determine the direction of our research activities. Silicon supports these trends brilliantly in the field of power semiconductors. We have additionally been testing various new materials, one of which is gallium nitride (GaN). GaN holds out the promise of another marked increase in energy efficiency and energy density.
Researching GaN GaN can be deposited on a silicon substrate at high temperatures and can then undergo standard industrial processes to form the basis for a new type of super-efficient power semi-conductor. Siltronic has been researching the process for growing GaN on silicon wafers for some time.
Research work in recent years has produced many promising results, mainly regarding the crystal quality of the GaN wafers and the associated electrical data. The technology for wafers with diameters of 150mm and 200mm is now available. The first qualification tests of mate-rial samples are currently being performed by our customers – and the feedback we are receiving is positive.
Close cooperation with our customers is critical in the development phase. By agreeing on important parameters and specifications for the GaN wafers, we can ensure at an early stage that our product perfectly matches the requirements of the companies that will be processing it.
Under the microscopeThe material goes through a large
number of highly complex process steps before the finished GaN/silicon wafer is ready. As part of the visual inspection,
the wafer is examined under a ‘haze lamp’ to make sure it is free from damage
and small particles.
12 ANNUAL REPORT 2016
INNOVATION
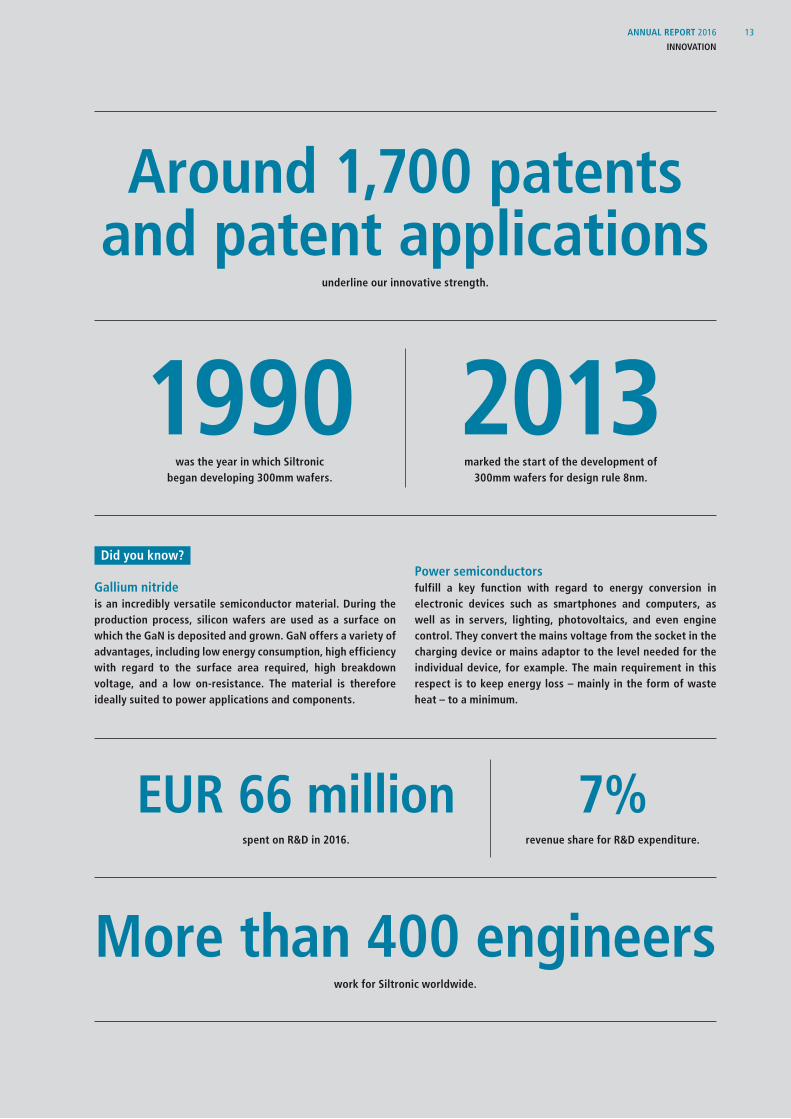
Around 1,700 patents and patent applications
underline our innovative strength.
1990 2013was the year in which Siltronic
began developing 300mm wafers.
Did you know?
Gallium nitrideis an incredibly versatile semiconductor material. During the production process, silicon wafers are used as a surface on which the GaN is deposited and grown. GaN offers a variety of advantages, including low energy consumption, high efficiency with regard to the surface area required, high breakdown voltage, and a low on-resistance. The material is therefore ideally suited to power applications and components.
Power semiconductorsfulfill a key function with regard to energy conversion in electronic devices such as smartphones and computers, as well as in servers, lighting, photovoltaics, and even engine control. They convert the mains voltage from the socket in the charging device or mains adaptor to the level needed for the individual device, for example. The main requirement in this respect is to keep energy loss – mainly in the form of waste heat – to a minimum.
marked the start of the development of 300mm wafers for design rule 8nm.
More than 400 engineerswork for Siltronic worldwide.
7%revenue share for R&D expenditure.
EUR 66 millionspent on R&D in 2016.
ANNUAL REPORT 2016
INNOVATION
13

Our objective is to set the highest standards of quality while using as few resources as possible.

We take safety and environmental protection into account right from the start
In an fiercely contested market, sustainability can provide a real competitive edge. Conserving resources often means saving on costs, too. As a result, our sustainability strategy helps the envi-ronment – while also enhancing the profitability of the Company.
Planning ahead: At Siltronic, this means taking account of fun-damental factors such as health, safety, and the environment in all business processes from the outset. How can production processes and the workplace be made even safer for people and the environment? How do we use resources responsibly? How can we constantly take efficiency to the next level? Questions like these are incorporated into the development of innovative products at just as early a stage as the design of new equipment.
Our measures to protect the environment, in particular, often go beyond what is required by law. This approach ties in with the central idea behind the chemical industry’s Responsible Care® initiative, in which we are participating. We have also signed the United Nations Global Compact and, as a supplier to the electronics industry, have undertaken to comply with the principles of the EICC (Electronic Industry Citizenship Coalition).
Reduce – save – recycle In order to conserve resources, we constantly work on optimiz-ing our manufacturing processes. One way in which we do this is by closing material cycles and putting by-products from else-where back into production. This enables us to avoid waste and reduce consumption.
Our ambition of sustainable production and business is backed by hard numbers. Each of Siltronic’s production sites sets annual savings targets in areas such as emissions, waste, and water consumption. To achieve them, the plants run their own pro-grams that are tailored to the local circumstances. The Siltronic site in Portland, United States, exemplifies the successful action that has been taken to considerably reduce water consumption.
Efficiency. Our endeavors to find the best solution are not restricted to our products and processes. We also set high standards to protect people and the environment.
Built in the US state of Oregon in 1979, this production site was Siltronic’s first outside
Germany. Around 400 employees produce wafers with a diameter
of 200mm.
PORTLAND
15ANNUAL REPORT 2016
EFFICIENCY
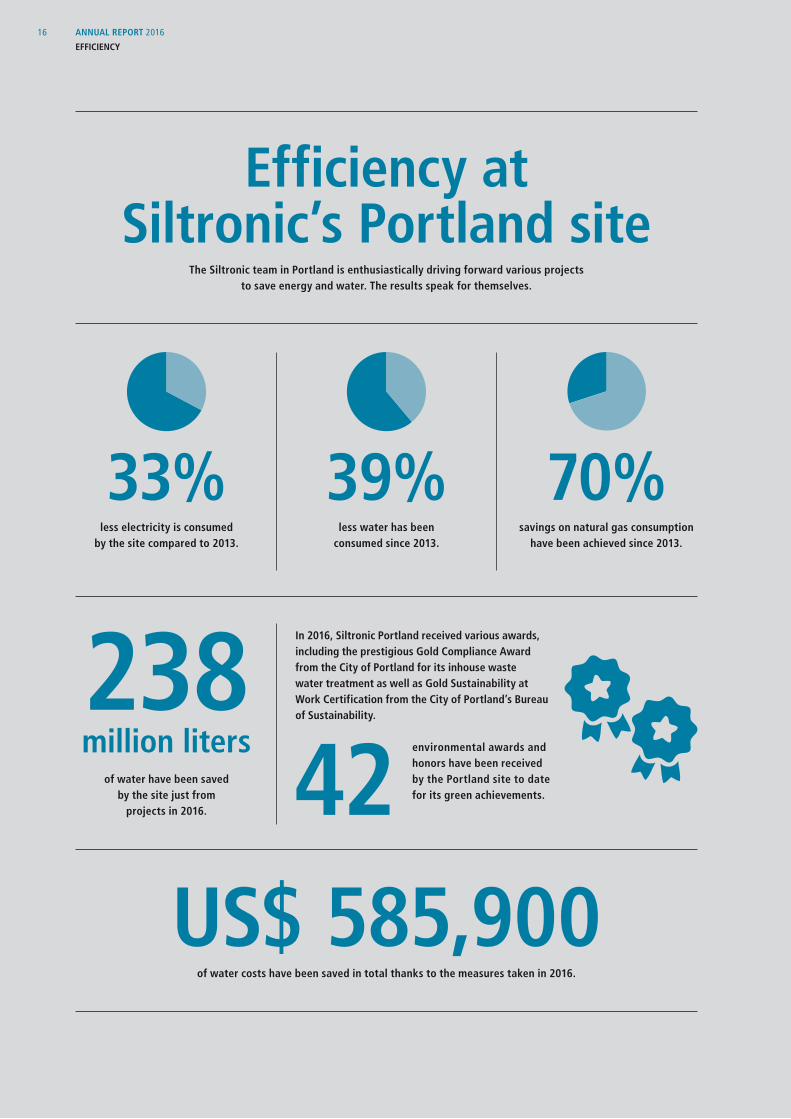
Efficiency at Siltronic’s Portland site
The Siltronic team in Portland is enthusiastically driving forward various projects to save energy and water. The results speak for themselves.
39%33%less water has been
consumed since 2013.
In 2016, Siltronic Portland received various awards, including the prestigious Gold Compliance Award from the City of Portland for its inhouse waste water treatment as well as Gold Sustainability at Work Certification from the City of Portland’s Bureau of Sustainability.
environmental awards and honors have been received by the Portland site to date for its green achievements.
70%less electricity is consumed
by the site compared to 2013.savings on natural gas consumption
have been achieved since 2013.
US$ 585,900of water costs have been saved in total thanks to the measures taken in 2016.
42of water have been saved by the site just from
projects in 2016.
238 million liters
ANNUAL REPORT 2016
EFFICIENCY
16

July
2016Siltronic Portland hosted the
International DI Water Conference (DI = deionized water).
Siltronic’s site in Portland is a trendsetter in the careful use of water, as can be seen from the numerous awards that it has won. How did these efforts come about?John Streicher: ‘Efficiency in production has always been one of Siltronic’s objectives. Protect-ing the environment is important for us and, of course, so is keeping down costs. Careful use of resources means we can achieve both. We have significantly stepped up our endeavors in this regard since 2015. The first question was to ascertain how much water we were actually using, and where. Compiling this information provided us with a long list of opportunities for savings. In 2016, an interdisciplinary team began to drive efforts to reduce water consumption and thus secure substantial cost benefits for the whole site.’
Could you provide a few examples?John Streicher: ‘The focus is on measures to reduce and reuse water in manufacturing. In process engineering, we were able to identify a number of areas in which the use of deionized, i.e. ultrapure, water could be decreased – in some cases significantly. The projects imple-mented include replacing valuable water with reverse osmosis (RO) effluent for use in the HPM fume scrubber, as well as, reductions in the amount of water used for cleaning multi-media filters. Another project is aimed at cutting the amount of waste water put back into the municipal sewers. In 2016, we even won an award from the City of Portland for our inhouse treatment plant.’
And what is happening with regard to efficiency in areas other than water management?John Streicher: ‘We are taking action on all kinds of levels. Thanks to our programs for recy-cling and reducing waste, our recycling rate now stands at over 94 percent. We are also working constantly to lower our electricity and gas consumption. In all of these projects, it is very important that the workforce is fully involved and that we listen to their suggestions for improvement. After all, we can only integrate sustainable business processes into our day-to-day work if everyone feels a sense of responsibility.’
‘ Integrating sustainable business processes into day-to-day work’
John Streicher is a facilities engineer at Siltronic Portland. In 2015, he launched
a project to reduce the site’s water consumption. This has now grown into
a full program of action.
17ANNUAL REPORT 2016
EFFICIENCY
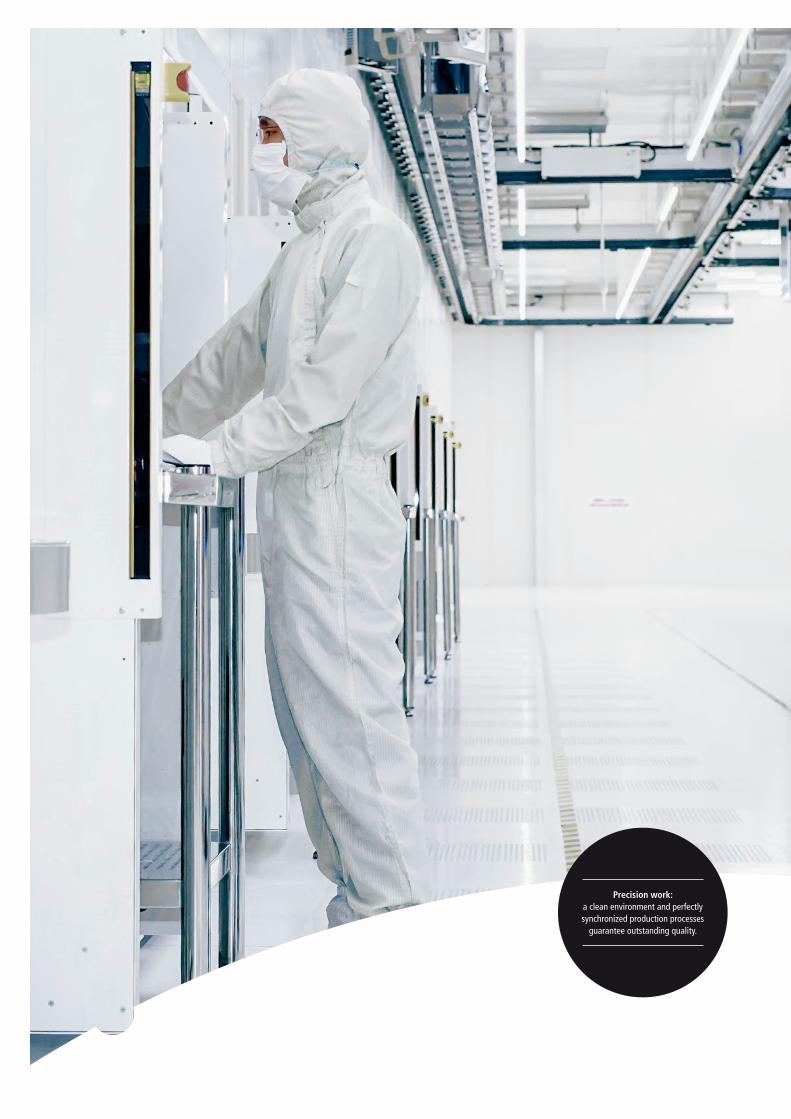
Precision work: a clean environment and perfectly synchronized production processes
guarantee outstanding quality.
Positioned on the spot: automated wafer transport
The majority of our production capacity is located in Singapore. Our sites are among the most modern in the world. To ensure the error rate is as close to zero as possible in the sensitive clean room environment, we use automated ceiling-mounted trans-port systems (OHT systems).
All carrier transports are fully automated using self-driving OHT shuttles. Similar to the gondolas on a cable car, the wafer carriers move around the clean room to take the wafers from one operation point to the next by the shortest route. These OHT shuttles are equiped with a lift mechanism that autonomously picks up the carriers containing the silicon wafers and then places them with pinpoint precision on the load port of the specified equipment. All these logistics processes are controlled by a software system in the background that sends the required transport orders to the shuttles. Automation offers a number of significant advantages compared with manual transport systems.
In this controlled cleanroom environment, it is essential to minimize any vibration. Transporting the wafers using the ceil-ing-mounted OHT system – short for overhead hoist transfer system – minimizes vibration and thus helps to ensure the high quality of our products. There is also less wear and tear on the wafer cassettes, known as FOUPs (front opening unified pods), thus prolonging shelf life. A positive side-effect of the ceiling- mounted system is that it does not take up any floor space. There is no need for FOUP and shuttle storage racks commonly found in manual transport systems. This means that the pro-duction equipment can be arranged much more densely, thus saving on valuable and expensive floor space in the clean room.
Precision. It is important to keep a cool head in the dynamic and fast-moving semiconductor industry. This is because every tiny detail counts in our complex production processes.
Siltronic Singapore is the central point of contact for
our customers in Asia. In our two local production sites, we manufac-
ture 200mm and 300mm wafers from hyperpure silicon for the
semiconductor market.
SINGAPORE
19ANNUAL REPORT 2016
PRECISION

‘ The OHT system works very reliably and enhances lean production. It increases our productivity and frees up space in the clean rooms.’
Direct route to productivity gainsWhen controlled by intelligent software, the FOUP delivery, stocking and removal processes can be designed precisely and efficiently. Unlike manual handling by an operator, the waiting times for loading and unloading the equipment are reduced, the throughput times are short-ened, and machine capacity utilization is increased. This is mainly made possible by intelligent, software-based material dispatching. This means that the wafer carriers arrive at the right equipment in the right sequence and at the right time. The system automatically knows which is the direct route and selects the most suitable shuttle for the transport. Ultimately, this leads to significant productivity gains.
Another important aspect is that the work processes have been optimized in terms of clean-liness and thus product quality: The less human movement there is in a clean room, the fewer particles are generated.
Unlike the wafers that it transports, the system itself is not affected by design rule changes and thus has a longer lifetime. It quickly proved to be a worthwhile investment with benefits in terms of precision, reliability, and efficiency. These positive experiences have already resulted in a similar transport system being installed at the Burghausen site; there are also plans for one in Freiberg.
Mr. Tan Peng, Section Head of Automation & Workshop Engineering
at Siltronic Singapore
Independent OHT systems are used to
transport the wafers.
20 ANNUAL REPORT 2016
PRECISION
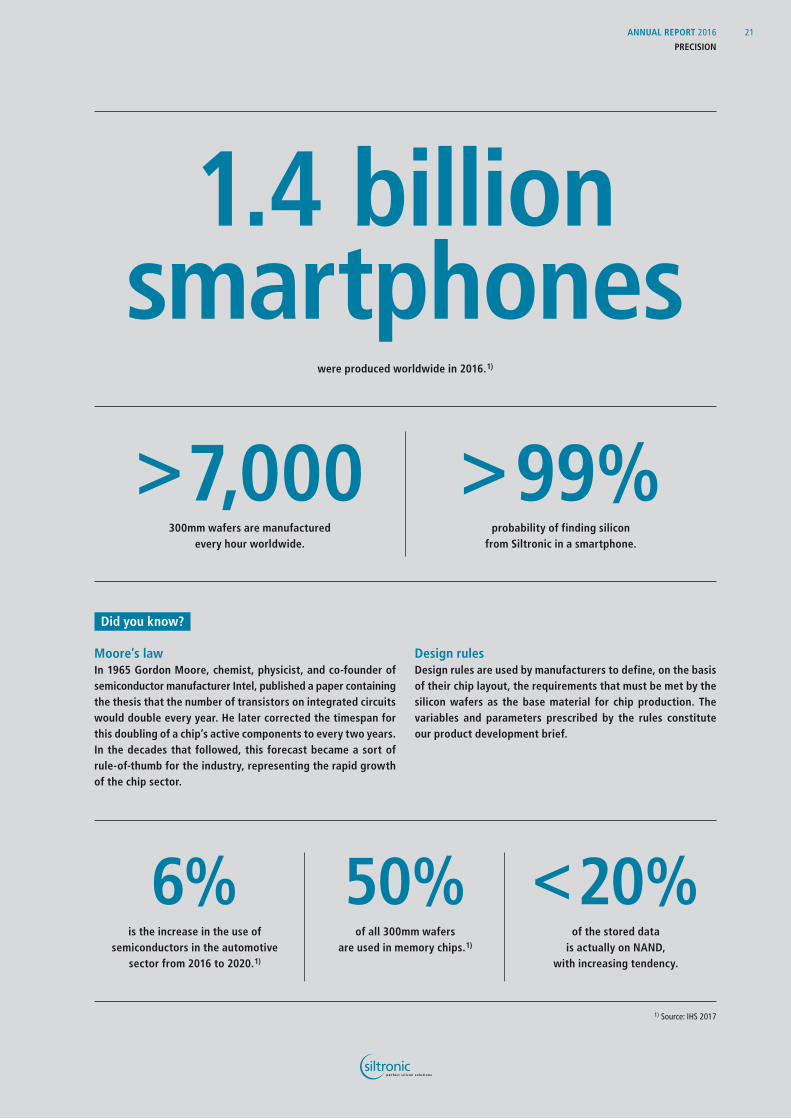
1.4 billion smartphones
were produced worldwide in 2016. 1)
> 7,000 > 99%300mm wafers are manufactured
every hour worldwide.
Did you know?
Moore’s lawIn 1965 Gordon Moore, chemist, physicist, and co-founder of semiconductor manufacturer Intel, published a paper containing the thesis that the number of transistors on integrated circuits would double every year. He later corrected the timespan for this doubling of a chip’s active components to every two years. In the decades that followed, this forecast became a sort of rule-of-thumb for the industry, representing the rapid growth of the chip sector.
Design rulesDesign rules are used by manufacturers to define, on the basis of their chip layout, the requirements that must be met by the silicon wafers as the base material for chip production. The variables and parameters prescribed by the rules constitute our product development brief.
probability of finding silicon from Siltronic in a smartphone.
50%6% < 20%of all 300mm wafers
are used in memory chips. 1)
is the increase in the use of semiconductors in the automotive
sector from 2016 to 2020. 1)
of the stored data is actually on NAND,
with increasing tendency.
1) Source: IHS 2017
21ANNUAL REPORT 2016
PRECISION

Dear shareholders, customers, and business partners,
Last year was a further example of how quickly markets can change. At the beginning of 2016, nobody expected that wafer manufacturers’ capacity for 300mm and 200mm wafers would be fully utilized in the second half of the year due to strong demand for silicon wafers.
As you will remember, our business was impacted by inventory corrections of our customers and a seasonal downturn in the second half of 2015. Moreover, lower demand for wafers was accompanied by a decline in average selling price (ASP). This got 2016 off to a slow start.
However, demand for our wafers started to increase in the first half of the year and we were able to improve our product mix. In the third quarter, we had to turn down several customer orders and reduce our stocks of wafers due to the strong demand. At this point ASP stabilized and, as a result, we started to notify our customers about price increases in 2017.
The wafer manufacturers that succeed are those that ensure their technology keeps pace with latest design rule developments. And this is where Siltronic is at the forefront – true to our mission statement of being ‘one generation ahead’.
The speed of innovation in the semiconductor industry is rapid. Moore’s law, according to which the number of transistors on a computer chip doubles every 18 to 24 months, is still valid. It is essential to use new technologies in order to produce the smallest structures economically and to avoid functional constraints. Our R&D activities and production operations are closely linked to our customers’ processes. Each product is precisely specified and optimally tailored to the needs of individual customers.
For us, this means continuously investing in our capabilities in order to maintain our position as a technology leader in the wafer market. Our aim in investing in new crystal pullers in Freiberg is to make our wafers even better. This replacement investment became necessary in order to meet our customers’ latest design rule requirements. The pullers that we had been using for many years had reached their technological limits as far as producing ingots was concerned.
The automation projects in our production systems are well on track, and higher productivity will further enhance our competitive position.
For Siltronic, 2016 was a successful year. We generated sales of EUR 933.4 million and EBITDA of EUR 146.0 million. The EBITDA margin was 15.6 percent. Adjusted for the expense that arose largely from currency hedging, which is included in other operating income and expense, EBITDA would have risen to EUR 166.9 million and the EBITDA margin would have been 17.9 percent.
Letter to shareholders
22 ANNUAL REPORT 2016
To our shareholders • Letter to shareholders

Dr. Christoph von Plotho,Chief Executive Officer & President
Rainer Irle,Chief Financial Officer & Executive Vice President
23ANNUAL REPORT 2016
To our shareholders • Letter to shareholders
Our equity ratio of 40.2 percent remains strong. At the end of December, net financial assets amounted to EUR 175.0 million and free cash flow came to EUR 19.0 million.
Although muted prospects had a negative impact on Siltronic’s share price at the end of 2015 and beginning of 2016, the positive developments in the semiconductor industry are reflected in the strong upward trend of our share price since August 2016. The feedback by investors in Europe and the United States clearly show that Siltronic is perceived as an attractive stock-market investment.
We will continue to focus on two main tasks also in the future. We want to further optimize our operational business and further extend our technology leadership. In the past, we have proved that we are capable of continuously improving processes and technologies. We see ourselves as best-in-class in this regard. Numerous awards from our customers show that we have an excellent understanding of their needs and requirements.
For 2017, we expect sales of at least EUR 1 billion, based on slight volume growth in silicon wafers and distinct price increases. We will continue to implement our continuous cost-reduction pro-grams. We believe that we are in an excellent position to increase our earnings.
We are confident about the future and hope that you will continue to support us along the way.
Our thanks go to our employees at all sites. Their commitment, team spirit, and hard work contribute to the success of Siltronic every day.
We would also like to thank our customers and business partners – and of course you, our shareholders – for the trust that you have shown us. We look forward to working with you in 2017.
Kind regards,
Dr. Christoph von Plotho Rainer IrlePresident & CEO CFO
24 ANNUAL REPORT 2016
To our shareholders • Letter to shareholders

Dear shareholders,
In 2016, the Supervisory Board fulfilled the obligations placed on it by law, the Articles of Association, and its rules of proce-dure with the greatest degree of care. For this purpose, the Executive Board and Supervisory Board worked trustfully together in the interests of the Company. The Supervisory Board regularly advised the Executive Board on the management of the Company, monitored the Executive Board’s work, and assured itself that the Company is being run lawfully, expedi-ently, and correctly. The Executive Board notified the Supervisory Board and its committees promptly and in detail, both in writing and orally, on the course of business, the Company’s position and strategic development, the risk position, internal audit activ-ities, and compliance matters. The Supervisory Board – or its committees, where appropriate – were involved in all decisions of fundamental significance from an early stage. The Supervisory Board always had the opportunity to critically examine the reports and motions submitted by the Executive Board. Where business deviated from the plans and targets, a detailed expla-nation was always provided. Also outside the regular schedule of Supervisory Board meetings, the Chairman of the Supervisory Board and the Chairman of the Audit Committee remained in close contact with the Executive Board and were kept informed of the current situation and significant business transactions.
Focus of the work of the full Supervisory Board
The Supervisory Board held four ordinary meetings in the report-ing year – two in the first half of the year and two in the second. We also adopted one resolution outside of a meeting. In 2016, every Supervisory Board member participated in all of the Super-visory Board meetings held.
At the Supervisory Board’s accounts review meeting on March 3, 2016 we discussed in great depth – together with the external auditor, who also attended the meeting – the Company’s separate and consolidated financial statements for the year ended December 31, 2015 as well as the associated manage-ment reports and the dependency report and we approved these. The Supervisory Board also used the meeting to set the Executive Board’s variable remuneration for the financial year 2015 based on a recommendation from the Executive Commit-tee and on the targets for variable remuneration for the financial year 2016.
Supervisory Board report
Dr. Tobias Ohler,Chairman of the Supervisory Board, Siltronic AG
25ANNUAL REPORT 2016
To our shareholders • Supervisory Board report

Furthermore, we adopted the Supervisory Board report to the Annual General Meeting and discussed the agenda for the Annual General Meeting on May 12, 2016. The Executive Board reported on the course of business in 2015 and at the start of 2016.
At its meeting on June 16, 2016 the Supervisory Board focused, inter alia, on the business development and examined the reg-ulatory changes brought about by the new EU Market Abuse Regulation, particularly the amended provisions regarding ad-hoc disclosures, directors’ dealings, and the keeping of insider lists.
At the Supervisory Board meeting on September 15, 2016 we discussed the Executive Board’s report on the course of business and the Company’s position. We also looked at the development of the pension obligation that has resulted from persistently low interest rates.
The Executive Board’s report on the course of business and the Siltronic Group’s planning for 2017 and medium-term planning for 2017–2021 were the focus of the Supervisory Board meeting on November 30, 2016. The budget for 2017 presented by the Executive Board, including the financial and capital expenditure planning, was discussed in detail and approved. The Supervisory Board also reviewed the efficiency of its own work during a general and open discussion and ascertained that it does work efficiently. In addition, the Supervisory Board decided to amend its rules of procedure to reflect the wider range of duties incum-bent on the Audit Committee as a result of the EU audit reform. The German Corporate Governance Code and the issuance of a declaration of conformity pursuant to section 161 of the Ger-man Stock Corporation Act (AktG) formed another agenda item. The Executive Board also reports on corporate governance at Siltronic, including on behalf of the Supervisory Board, in the corporate governance report (see / 31).
Supervisory Board committees
The Supervisory Board has established four committees to help it perform its tasks efficiently: an Audit Committee, an Executive Committee, a Nomination Committee and, as is mandatory according to section 27 (3) of the German Codetermination Act (MitbestG), a Conciliation Committee. The Chairman of the Supervisory Board chairs all of the committees except the Audit Committee, which is chaired by Supervisory Board member Bernd Jonas. The committee chairmen regularly and compre-hensively report to the Supervisory Board on the work of the committees. All committee members participated in all the meetings of the committees to which they belong.
The Executive Committee met once in the reporting year. It examined personnel matters relating to the Executive Board, in particular its remuneration.
The Audit Committee held four meetings in 2016. In the pres-ence of the independent auditor, it dealt with the separate and consolidated financial statements as well as the management reports and the dependency report. It also discussed the quar-terly statements and – again in the presence of the independent auditor – the half-year report and its review by the auditor. The Audit Committee recommended to the Supervisory Board that it propose KPMG AG Wirtschaftsprüfungsgesellschaft, Munich, as the independent auditor to the Annual General Meeting in 2016. The Audit Committee engaged the independent auditor for the 2016 financial year, decided on the audit’s focal points, and determined the auditor’s fees. It also monitored the auditor’s independence and qualification, focusing in particular on how non-audit services were treated. Furthermore, the Audit Committee addressed the accounting process, the Company’s risk management system, the effectiveness and findings of the internal audit, and the compliance system, and it regularly received reports about compliance matters.
The Nomination Committee met once in the reporting year in order to prepare a recommendation for the replacement of a Supervisory Board member representing the shareholders at the Annual General Meeting on May 12, 2016.
The Conciliation Committee did not need to be convened in 2016.
26 ANNUAL REPORT 2016
To our shareholders • Supervisory Board report
Audit of the separate and consolidated financial statements
The independent auditor, KPMG AG Wirtschaftsprüfungs-gesellschaft, Munich, audited the 2016 separate annual financial statements of Siltronic AG prepared by the Executive Board and the consolidated financial statements as well as the com-bined management report for both of these (reporting date: December 31, 2016) and issued an unqualified opinion.
The separate financial statements of Siltronic AG and the com-bined management report for the Siltronic Group were prepared in accordance with German statutory accounting principles. The consolidated financial statements were prepared in accordance with International Financial Reporting Standards (IFRS) as adopted by the European Union and additionally in accordance with German statutory requirements, as required by section 315a (1) of the German Commercial Code (HGB).
The financial statements, the combined management report, and the audit reports from the independent auditor were made available to all Supervisory Board members in good time and were discussed and examined in detail, first at the Audit Com-mittee meeting on February 22, 2017 and finally at the Super-visory Board’s accounts review meeting on March 1, 2017, both times in the presence of the independent auditor (represented by Johannes Hanshen and Damir Ratkovic, KPMG). The auditor reported on the main results of the audit and was available to the Audit Committee and full Supervisory Board to answer ques-tions and provide additional information. The independent audi-tor also audited the early-warning system for risk pursuant to section 91 AktG and ascertained that this fulfilled the statutory requirements. No risks to the Company’s survival as a going concern were identified.
The Supervisory Board agrees with the results of the audit of the financial statements. Based on the final outcome of the review by the Audit Committee and our own review, there are no objec-tions to be raised in connection with the separate financial state-ments of Siltronic AG, the consolidated financial statements, the
combined management report, and the audit reports from the independent auditor. We therefore approve the separate finan-cial statements of Siltronic AG prepared by the Executive Board and the consolidated financial statements for the year ended December 31, 2016. The separate financial statements of Siltronic AG have thus been adopted.
The declaration of conformity has been made permanently accessible to the public on the website http://www.siltronic.com/int/en/investor_relations/corporate_governance/declaration/dec-laration.jsp
Dependency report
As of December 31, 2016 Wacker Chemie AG held direct and indirect around 58 percent of the shares in Siltronic AG. No control agreement and/or profit-and-loss transfer agreement exists between the two companies.
The Executive Board of Siltronic AG therefore submitted a report to the Supervisory Board on the Company’s relationships with affiliated companies pursuant to section 312 AktG (dependency report) that covered the whole fiancial year 2016. The depen-dency report was audited by the independent auditor, KPMG AG Wirtschaftsprüfungsgesellschaft, Munich, and given the following auditors’ opinion:
‘Having conducted our audit and assessment in accordance with our duties, we hereby confirm that:
1. the factual statements in the report are accurate;2. the considerations by the company for legal transactions
described in the report were not inappropriately high or dis-advantages have been compensated for;
3. in the activities listed in the report, there is nothing that would give rise to a materially different assessment from that of the Executive Board.’
The audit report was also sent in good time to the members of the Supervisory Board by the independent auditor.
27ANNUAL REPORT 2016
To our shareholders • Supervisory Board report

The dependency report and the related audit report prepared by the auditor were discussed and reviewed for completeness and accuracy, first at the meeting of the Audit Committee on February 22, 2017 and finally at the Supervisory Board’s plenum meeting on March 1, 2017. At that meeting, the Executive Board provided a detailed explanation of the dependency report and was available to answer questions and provide further informa-tion. The auditor, which attended both meetings (represented by Johannes Hanshen and Damir Ratkovic, KPMG), reported on its audit, in particular the focal points of the audit and the main results. The Audit Committee and the full Supervisory Board acknowledged the audit report and the auditors’ opinion, criti-cally examined them, and discussed them with the auditor. The Audit Committee and Supervisory Board were able to satisfy themselves of the correctness and completeness of the depen-dency report, the audit, and the audit report. Nothing was iden-tified that would give rise to concerns about the dependency report or audit report.
The Audit Committee therefore recommended to the Super-visory Board that it approve the results of the audit by the inde-pendent auditor and, as it did not see any reason to raise any objections to the Executive Board’s dependency report, that it issue a corresponding assessment.
The Supervisory Board followed this recommendation and decided that, based on the final outcome of its own review, there were no reservations to be raised regarding the Executive Board’s declaration at the end of the report on relationships with affiliated companies. Furthermore, the Supervisory Board raised no objections to the auditor’s findings and approved the audit report prepared by the auditor.
Changes on the Executive Board and Supervisory Board
There were no changes on the Executive Board during the course of 2016.
In a decision dated January 4, 2016, the courts appointed Angela Wörl, Head of HR/Social Affairs at Wacker Chemie AG, as one of the shareholder representatives on the Supervisory Board to replace Dr. Joachim Rauhut, who had stepped down from the Supervisory Board on December 11, 2015, up to the end of the Annual General Meeting on May 12, 2016. The Annual General Meeting elected Ms. Wörl to the Supervisory Board as a shareholder representative up to the end of the Annual General Meeting at which the formal approval of the actions of the Executive Board and Supervisory Board in 2017 will be decided. The Supervisory Board’s nomination proposed to the Annual General Meeting was based on a corresponding recommendation from the Nomination Committee.
The Supervisory Board would like to thank all employees of Siltronic AG and all Group companies for their hard work and dedication. They have all played their part in a successful year for Siltronic.
Munich, March 1, 2017The Supervisory Board
Dr. Tobias OhlerChairman of the Supervisory Board of Siltronic AG
28 ANNUAL REPORT 2016
To our shareholders • Supervisory Board report

The situation in the stock markets was dominated by concerns about political stability and excess liquidity
The Brexit vote, the election of Donald Trump as the new US president, and the government crisis in Italy preoccupied the equity markets in 2016. Other factors were concerns about the global economy due to weak economic data from China and the fall in the oil price at the beginning of the year. However, the equity markets were largely driven by the major central banks’ excess liquidity. While the Federal Reserve raised the key interest rate slightly, money in Japan and the eurozone remained very cheap. In early December, the European Central Bank extended its billion-euro purchases of government bonds and other securities until the end of 2017.
Siltronic shares perform extremely well
The closing price of Siltronic shares traded on the Xetra platform was EUR 22.59 on December 30, 2015. Negative expectations for the performance of the semiconductor industry caused the value of shares of wafer manufacturers to fall in the first few weeks of 2016. However, more positive sentiment in the semi-conductor market had already brought this downward trend to a halt by the end of the first quarter. The price of our shares was boosted by consistently positive news about the performance of the semiconductor market and by trends toward consolida-tion and the associated company valuations, such as the acqui-sition of SunEdison SEMI by GlobalWafers. The Xetra closing price on December 31, 2016 was EUR 44.03, which represents an increase of 94.9 percent on the 2015 closing price. Based on the Xetra closing price, the Company’s market capitalization was EUR 1.3 billion.
Performance of Siltronic shares vs. indices 2016 (indexed)in %
SILTRONIC TECDAX SOXX Source: FactSet, Deutsche Börse
250
200
150
100
50
0
August November DecemberJuly OctoberJuneMayAprilMarchFebruaryJanuary September
August November DecemberJuly OctoberJuneMayAprilMarchFebruaryJanuary September
Performance of Siltronic shares vs. competitors 2016 (indexed)in %
Siltronic AG Sumco SunEdison SEMI GlobalWafers Source: FactSet
250
200
150
100
50
0
Siltronic on the stock exchange
29ANNUAL REPORT 2016
To our shareholders • Siltronic on the stock exchange
The Philadelphia Semiconductor Sector index was up by 36.6 percent, while the TecDAX lost 1.0 percent compared to 2015.
On a year-on-year basis, the DAX index was up by 6.4 percent and the Dow Jones by 11.8 percent. Both the Nikkei 225 index and the Hang Seng index rose by just 0.4 percent year on year.
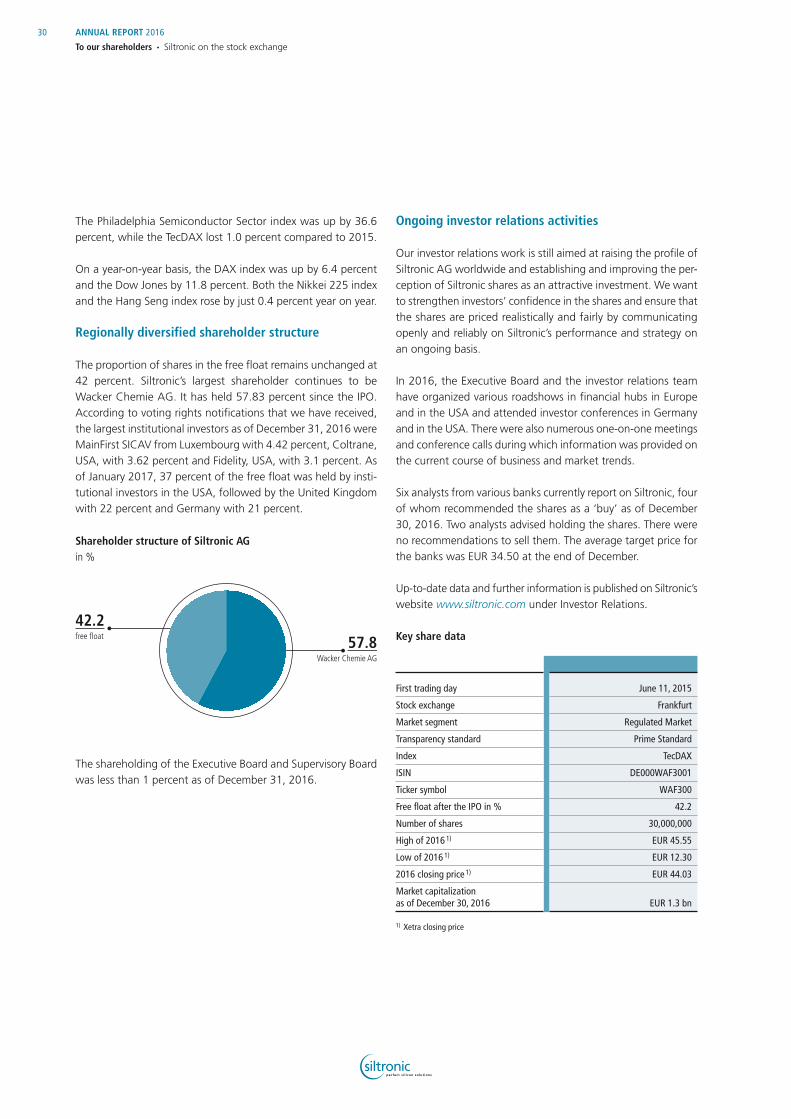
Regionally diversified shareholder structure
The proportion of shares in the free float remains unchanged at 42 percent. Siltronic’s largest shareholder continues to be Wacker Chemie AG. It has held 57.83 percent since the IPO. According to voting rights notifications that we have received, the largest institutional investors as of December 31, 2016 were MainFirst SICAV from Luxembourg with 4.42 percent, Coltrane, USA, with 3.62 percent and Fidelity, USA, with 3.1 percent. As of January 2017, 37 percent of the free float was held by insti-tutional investors in the USA, followed by the United Kingdom with 22 percent and Germany with 21 percent.
The shareholding of the Executive Board and Supervisory Board was less than 1 percent as of December 31, 2016.
Ongoing investor relations activities
Our investor relations work is still aimed at raising the profile of Siltronic AG worldwide and establishing and improving the per-ception of Siltronic shares as an attractive investment. We want to strengthen investors’ confidence in the shares and ensure that the shares are priced realistically and fairly by communicating openly and reliably on Siltronic’s performance and strategy on an ongoing basis.
In 2016, the Executive Board and the investor relations team have organized various roadshows in financial hubs in Europe and in the USA and attended investor conferences in Germany and in the USA. There were also numerous one-on-one meetings and conference calls during which information was provided on the current course of business and market trends.
Six analysts from various banks currently report on Siltronic, four of whom recommended the shares as a ‘buy’ as of December 30, 2016. Two analysts advised holding the shares. There were no recommendations to sell them. The average target price for the banks was EUR 34.50 at the end of December.
Up-to-date data and further information is published on Siltronic’s website www.siltronic.com under Investor Relations.
Key share data
First trading day June 11, 2015
Stock exchange Frankfurt
Market segment Regulated Market
Transparency standard Prime Standard
Index TecDAX
ISIN DE000WAF3001
Ticker symbol WAF300
Free float after the IPO in % 42.2
Number of shares 30,000,000
High of 2016 1) EUR 45.55
Low of 2016 1) EUR 12.30
2016 closing price 1) EUR 44.03
Market capitalization as of December 30, 2016 EUR 1.3 bn
1) Xetra closing price
Shareholder structure of Siltronic AGin %
42.2free fl oat 57.8
Wacker Chemie AG
30 ANNUAL REPORT 2016
To our shareholders • Siltronic on the stock exchange
The sections below constitute the report on corporate gover-nance by the Executive Board – and also on behalf of the Super-visory Board – in accordance with article 3.10 of the German Corporate Governance Code (‘Code’) and section 289a (1) of the German Commercial Code (HGB). It is essential to gain the confidence of our customers, business partners and investors in order to generate long-term growth in enterprise value. A key factor in ensuring this confidence is good corporate governance, that is to say transparent and responsible corporate manage-ment and control.
Declaration on corporate governance in accordance with section 289a HGBDeclaration of conformity by the Executive Board and the Supervisory Board of Siltronic AG in accordance with section 161 AktG
In 2016, the Executive Board and the Supervisory Board devoted a great deal of time and energy to the corporate governance of the Company and the recommendations of the German Corpo-rate Governance Code as amended on May 5, 2015. On Novem-ber 30, 2016, the Executive Board and the Supervisory Board issued the declaration of conformity set out below, which is publicly accessible on a permanent basis on the Company’s web-site (http://www.siltronic.com/int/en/investor_relations/corpo-rate_governance/declaration/declaration.jsp).
The Executive Board and the Supervisory Board of Siltronic AG declare the following with regard to the recommendations of the ‘Commission German Corporate Governance Code’ (the ‘Code’):
1. Future-related Declaration Siltronic AG will comply with the recommendations of the
Code in the version of 5 May 2015, as published in the Fed-eral Gazette on 12 June 2015, subject to the deviations set out and explained below:
a. D&O Insurance Deductible for the Supervisory Board Members (Article 3.8 para. 3 of the Code)
The Code recommends that if the company takes out a D&O insurance policy for the Supervisory Board, a deductible sim-ilar to the deductible for the Executive Board of at least 10% of the loss up to at least the amount of one and a half times the fixed annual compensation shall be agreed upon. The German law and the company’s Articles of Association set clear limits for the Supervisory Board’s capacity to exert
influence on the business activities of a stock corporation. Pur-suant to Section 76 para. 1 of the German Stock Corporation Act, the Executive Board is responsible for independently managing the company. The Supervisory Board determines the main principles of corporate strategy. However, beyond this contribution, the Supervisory Board has limited scope of influence on the implementation of the corporate strategy or on business operations. The same applies to measures to prevent or mitigate harm or damage to the company. Since the Supervisory Board members receive a relatively low fixed compensation when compared to the Executive Board mem-bers’ compensation, which consists of fixed and variable components, we do not deem the agreement of a deductible for members of the Supervisory Board reasonable.
b. Maximum Limits for the Compensation of Executive Board Members (Article 4.2.3 para. 2 sentence 6 of the Code)
Pursuant to the Code, the overall compensation of Executive Board members shall be capped, both overall and for indi-vidual compensation components. The contracts of Executive Board members foresee maximum amounts for fixed and variable compensation components so that the recommen-dation is fulfilled with regard to the major part of the com-pensation. However, it is impossible to define a maximum limit for the compensation component pension benefits due to the specifics of the existing pension plan. The pension plan contributions paid by the company for the Executive Board members are closely correlated with the development of interest rates. When interest rates are low, the company must inevitably provide higher contributions. Owing to the unpre-dictability of the interest rate development, it is impossible to define a maximum amount of pension plan contributions. Consequently, it is not possible to cap the amount of the overall compensation of Executive Board members.
c. Announcement of Proposed Candidates for the Chair of the Supervisory Board to the Shareholders (Article 5.4.3 of the Code)
According to this recommendation, proposed candidates for the Supervisory Board chair shall be announced to the share-holders, even though, as a rule, the Supervisory Board has not yet been appointed. Under German law, the Supervisory Board chair must be elected by and from among the Super-visory Board members. There is no legal requirement to announce the candidates for the chair from among a yet-to-be-appointed group of Supervisory Board members. Further-more, this would result in a de facto predetermination, which is also not provided for under German law. For these reasons, we do not comply with this recommendation.
Report and declaration on corporate governance
31ANNUAL REPORT 2016
To our shareholders • Report and declaration on corporate governance

2. Past-related Declaration Since the last declaration of conformity dated 11 December
2015, Siltronic AG has complied with the recommendations of the Code in the version of 5 May 2015 with the exceptions mentioned and explained above under section 1.
Relevant descriptions of corporate governance practice
The company complies with the legal requirements relating to corporate governance. Siltronic follows, with the exceptions mentioned in the Corporate Governance Declaration, all recom-mendations of the German Corporate Governance Codex.
Compliance is one of the principal management responsibilities of the Executive Board Compliance with legal requirements and internal policies, and ensuring that all related stipulations are observed within the Group, are among the management and oversight responsibil-ities at Siltronic. The Supervisory Board, especially the Audit Committee, regularly addresses compliance issues and reviews the compliance management system.
The compliance management system in the Group is routinely reviewed and refined. This process is the responsibility of Siltronic’s compliance organization. The Company has appointed and trained compliance officers in Germany, the USA, Japan, Singa-pore and Taiwan. These officers hold regular training sessions for employees to provide them with information on relevant statutory provisions and internal policies. The officers act as the point of contact if employees have any questions and can offer advice on compliance issues. Employees may also contact the compliance officers in confidence if they wish to report breaches of internal policy or legal provisions. In 2016, compliance man-agement continued to focus on a number of areas, notably continuous improvement within the compliance organization in relation to information sharing with the international sites and the provision of local training for employees.
Codes of ConductBusinesses need the trust of society if they are to be economically successful. We therefore manage our business responsibly in com-pliance with statutory requirements. Siltronic is a Wacker Group company and is therefore subject to the Wacker’s business prin-ciples of conduct, which are laid down in five corporate codes:
• Code of Conduct, which sets out the basic principles for interaction with business partners and third parties (confi-dentiality, separation of private and business interests, data protection, prevention of money laundering);
• Code of Safety, which defines the safety culture and sets safety regulations for workplaces, plants, products and transport;
• Code of Innovation, which specifies the principles applicable to research and development, partnerships, patents and innovation management;
• Code of Teamwork & Leadership, which lays down the prin-ciples for collaborative teamwork, leadership and management;
• Code of Sustainability, which details the principles for sus-tainable corporate governance.
The codes can be found on Wacker Chemie AG’s website (http://www.wacker.com/cms/en/wacker_group/wacker_facts/policy/policy.jsp). The Codes can be viewed and downloaded by all employees on the Siltronic-Intranet.
Furthermore, Siltronic as a supplier to the electronics industry orients itself towards the Code of Conduct of Electronic Industry Citizenship Coalition (EICC). With this code world’s leading elec-tronic companies want to foster awareness of social and envi-ronmental responsibility around the globe and promote ethical business practices. Further information on the EICC and its Code of Conduct is available on the Internet under http://www.eicco-alition.org.
Moreover, Siltronic implements the ten principles of the United Nations Global Compact initiative, which aims to protect human rights, set social and environmental standards for business oper-ations and combat corruption. Information on the ten principles of the UN Compact is available at www.unglobalcompact.org
Additionally, Siltronic as a company of Wacker Chemie AG Group and as such also participates in the global chemical indus-try’s Responsible Care® initiative (https://www.vci.de/nach-haltigkeit/responsible-care/uebersichtsseite.jsp). Wacker and its Group companies have been committed to this initiative since 1991. The participants in the initiative undertake to strive for continuous improvement in environmental, health, safety and security performance independently and regardless of any stat-utory requirements.
32 ANNUAL REPORT 2016
To our shareholders • Report and declaration on corporate governance

Information on the working methods of the Executive Board and Supervisory Board, and on the composition and working methods of the Supervisory Board’s committees
As required by the German Stock Corporation Act, Siltronic AG has a two-tier governance structure. This structure comprises the Executive Board, which manages the business, and the Supervisory Board, which oversees and advises the executive management. The two bodies are strictly segregated in terms of both membership and their powers.
Executive BoardThe Executive Board currently comprises two members. The Executive Board manages the business of the Company in accor-dance with the law, the Articles of Association and the rules of procedure for the Executive Board. The Executive Board is inde-pendently responsible for managing the Company and rep-resents Siltronic AG in all transactions with third parties. Its actions and decisions are determined by the interests of the Company and are geared toward the objective of a sustained increase in enterprise value. To this end, the Executive Board determines the corporate strategy of the Siltronic Group and then manages and supervises the implementation of this strat-egy by allocating financial and other resources, assigning capac-ity, and by supporting and monitoring the operating units. The Executive Board ensures that the Company complies with stat-utory provisions compliance and that it maintains an appropriate system of risk management and control.
The members of the Executive Board bear joint responsibility for the executive management of the Company, although each individual member of the Executive Board independently man-ages his own assigned areas of responsibility. The Executive Board comes together regularly in meetings convened and led by the CEO. Meetings of the Executive Board must be held to cover matters affecting the wellbeing of the Company. The Exec-utive Board generally approves decisions by simple majority. For as long as the Executive Board only comprises two people, deci-sions can only be made unanimously and the CEO does not have a casting vote.
Close cooperation between Executive Board and Supervisory Board The Executive Board and Supervisory Board work in close collab-oration to ensure that the Company performs successfully over the long term. Their common objective is to achieve sustainable growth in the Company and its value. The Executive Board sub-mits regular, prompt, comprehensive reports to the Supervisory Board covering all matters of strategy, planning, business per-formance, risk position, risk management and compliance rele-vant to the Company. Between meetings, the Chairman of the Supervisory Board remains in contact with the Executive Board, in particular with the CEO, and they discuss key issues. The Executive Board provides the Supervisory Board with explanations if business performance deviates from the plans and targets.
The rules of procedure for the Executive Board of Siltronic AG specify that the consent of the Supervisory Board is required for certain transactions or in certain situations. Matters in which consent is required include the approval of the annual planning (encompassing financial and capital expenditure planning), the acquisition or disposal of equity investments, the commence-ment of a new branch of production or line of business, the discontinuation of an existing branch of production or line of business, and the raising of major long-term loans.
Supervisory Board The Articles of Association specify that the Supervisory Board must comprise twelve members. In accordance with the German Codetermination Act (MitbestG), it has equal numbers of share-holder and employee representatives. The standard period of office for members of the Supervisory Board is five years. They can be re-elected. An overview of the members of the Supervi-sory Board in office during the reporting period and details of other positions that they hold on supervisory boards or similar bodies that are required by law to be formed can be found on / 137. The normal period of office for the current members of the Supervisory Board will expire at the end of the Annual General Meeting in 2018. The Supervisory Board appoints, oversees and advises the Executive Board and is directly involved in decisions of material importance for the Company. Fundamental decisions about the further development of the Company require the approval of the Supervisory Board. The Supervisory Board has set its own rules of procedure, which satisfy the requirements specified in the German Corporate Governance Code.
33ANNUAL REPORT 2016
To our shareholders • Report and declaration on corporate governance

A high degree of independence in the oversight of the Executive Board is already guaranteed by virtue of the two-tier board struc-ture in which the members of the Supervisory Board cannot simultaneously be members of the Executive Board.
If necessary, the Supervisory Board may meet without the pres-ence of the Executive Board.
Committees enhance the efficiency of the Supervisory BoardThe Supervisory Board has created four committees with spe-cialist skills to allow it to carry out its responsibilities in the most efficient manner. Reports on the work of the committees are regularly submitted to full meetings of the Supervisory Board.
Executive Committee
Chairman:Dr. Tobias Ohler
Members:Dr. Hermann GerlingerJohann Hautz
Responsibilities:The Executive Committee prepares HR decisions for the Super-visory Board, in particular those concerning the appointment or removal of members of the Executive Board and the appoint-ment of the CEO. It also deals with the contracts for the mem-bers of the Executive Board and draws up the system of Execu-tive Board remuneration, which the full Supervisory Board then uses as the basis for specifying the remuneration for the Execu-tive Board members.
Nomination Committee
Chairman:Dr. Tobias Ohler
Member:Dr. Hermann Gerlinger
Responsibilities:The Nomination Committee comprises two members. Unless otherwise determined by the Supervisory Board, the members of this committee are those shareholder representatives who are also members of the Executive Committee. The tasks of the Nomination Committee are to identify suitable candidates for potential election to the Supervisory Board, taking into consid-eration the objectives for the composition of the Supervisory
Board, and to prepare the proposals to be submitted by the Supervisory Board to the Annual General Meeting regarding the election of shareholder representatives.
Audit Committee
Chairman:Bernd Jonas
Members:Dr. Tobias Ohler Harald Sikorski
Responsibilities:The Audit Committee carries out the preparation for Supervisory Board decisions on the formal adoption of the annual financial statements and the approval of the consolidated financial state-ments. In addition, it addresses the review of the half-yearly interim consolidated financial statements, discusses the quarterly financial statements and concerns itself with issues related to risk management and compliance. In connection with these tasks, it is responsible for carrying out a preliminary review of the single-entity financial statements, the consolidated financial statements, the management reports for the Group and the parent company and the proposal for the appropriation of profit. In particular, it monitors the financial reporting processes, com-pliance and the effectiveness of the systems for internal control, risk management and internal auditing. It works in close coop-eration with the external auditors. The Audit Committee also prepares the engagement agreement with the external auditors and takes suitable action to monitor the independence of the external auditors and the additional services performed by these auditors. On this basis, it submits a recommendation to the Supervisory Board regarding the auditing firm to be proposed by the Supervisory Board to the Annual General Meeting as the independent auditors. The Chairman of the Audit Committee has a particular expertise and experience in accounting and auditing.
Conciliation Committee
Chairman:Dr. Tobias Ohler
Members:Gebhard FraunhoferJohann HautzAngela Wörl
34 ANNUAL REPORT 2016
To our shareholders • Report and declaration on corporate governance
Responsibilities:The Conciliation Committee established in accordance with sec-tion 27 (3) MitbestG is responsible for the tasks assigned to this committee by law: if a decision regarding the appointment or the withdrawal of the appointment of an Executive Board mem-ber does not have the necessary majority of two thirds of the votes, the Conciliation Committee is then responsible for dis-tributing a proposal.
Targets for the proportion of women in the Executive Board and in management positions below the Executive Board; Specifications of adherence of a minimum gender ratio of the Supervisory Board
There is a target of 0 percent for the proportion of women on the Executive Board of Siltronic AG with an implementation deadline of June 30, 2017. The current situation will therefore remain unchanged. The periods of appointment for the two current members of the Executive Board run until 2018 and 2020 and in the opinion of the Supervisors Board, any expansion of the Executive Board to three or more members would be counterproductive in view of the Company’s efforts to monitor and steadily reduce its costs.
In the case of the first management level below the Executive Board, the target set by the Executive Board is that, by June 30, 2017, three out of a total of 16 heads of division should be women, equating to a ratio of 18.75 percent. The target decided by the Executive Board for the second management level below the Executive Board is that, by June 30, 2017, one out of a total of 34 employees should be a woman, equating a ratio of nearly 3 percent.
In the reporting period, the proportion of women on the Super-visory Board fulfilled legal requirements. Since the appointment of Ms. Angela Wörl by the courts as a shareholder representative on January 4, 2016, four members of the Supervisory Board of Siltronic AG have been women, two on the shareholder side and two on the employee side and eight have been men. The share-holder representatives’ side and the employee representatives’ side have each rejected fulfillment of the gender quota requirement on the basis of the Supervisory Board membership as a whole.
Further information on corporate governance
Objectives for the composition of the Supervisory Board
In 2015 the Supervisory Board decided on the precise objectives for its composition taking into account the German Corporate Governance Code:
1. The Supervisory Board should have an appropriate number of members with international experience, but in any case at least one such member.
2. The rules of procedure for the Supervisory Board already include comprehensive arrangements for preventing and handling conflicts of interest involving members of the Super-visory Board. Furthermore, the Supervisory Board generally strives to prevent conflicts of interest and will also take this objective into account when submitting its proposals to the Annual General Meeting concerning candidates for election to the Supervisory Board.
3. The members of the Supervisory Board should include at least three independent shareholder representatives.
4. Membership of the Supervisory Board should generally be for no more than three full periods of office. The Supervisory Board may deviate from this rule in justified exceptional cases.
The rules of procedure for the Supervisory Board already include an age limit.
The Supervisory Board takes these objectives into consideration when proposing election candidates to the Annual General Meeting.
The composition of the Supervisory Board of Siltronic AG is con-sistent with the adopted objectives and is in compliance with the age limit specified in the rules of procedure for the Super-visory Board.
35ANNUAL REPORT 2016
To our shareholders • Report and declaration on corporate governance
Transparent information for shareholders and the general public
Siltronic aspires to provide information promptly and on an equal basis for all its target audiences, be they shareholders, share-holder representatives, analysts, media or interested members of the public. We regularly publish key dates for the Company in a financial calendar, which can be found on our website. Capital market players are in close contact with our investor relations team. We offer information on current and future busi-ness performance for investors and analysts in conference calls held in conjunction with the publication of each quarterly report. We regularly take part in roadshows and investor conferences. Once a year, we organize an analysts’ meeting. We also publish information in ad-hoc announcements where required to do so by law. To support this requirement, we have created an ad-hoc committee, which includes the two members of the Executive Board, the Head of Legal & Compliance and the Head of Inves-tor Relations & Communications. The team reviews the matters concerned to assess any relevance for ad-hoc announcements. In this way, we ensure that possible insider information is han-dled in compliance with the law. The Company maintains an insider list containing the names of employees who need to have access to insider information as part of their responsibilities.
Key presentations are freely available for inspection on the Com-pany’s website where you will also find all press releases and ad-hoc announcements in German and English, together with the annual report, interim reports and quarterly statements. Further information is available at http://www.siltronic.com.
Annual General Meeting
Shareholders exercise their rights in the Annual General Meet-ing. Amongst others, the Annual General meeting resolves the appropriation of the profit, the discharge of the Executive Board and the Supervisory Board as well as the election of the external auditor. Changes of the articles of associaton and measures with an impact on equity are decided upon by the Annual General Meeting and are implemented by the Executive Board. Further-more, The purpose of the Annual General Meeting is to ensure that all shareholders are informed efficiently and comprehen-
sively about the position of the Company. Even before the Annual General Meeting, shareholders receive key information about the immediately preceding financial year in the annual report. The notice of the Annual General Meeting provides details of the agenda items and explains the eligibility criteria for participation in the meeting. This notice, together with all the reports and documents required under statutory provisions, including the annual report (which contains the consolidated financial statements and the Combined management report among other things) and the separate financial statements of Siltronic AG is also accessible on the website. Following the Annual General Meeting, we publish on the website details of the attendance at the meeting and the results of the voting. Siltronic makes it easy for its shareholders to exercise their rights in person or appoint proxies. The Company makes proxies avail-able to exercise shareholder voting rights in accordance with instructions from the shareholders concerned.
Notification requirements for managers’ transactions
Members of the Siltronic Executive Board and Supervisory Board as well as persons closely associated with them must report the transactions on their own account relating to Siltronic shares or debt instruments, or derivatives or other financial instruments linked there to Siltronic AG and to the German Federal Financial Supervisory Authority (BaFin) according to section 19 of the mar-ket abuse regulation (EU) No. 596/2014. In 2016, there was no notifiable deal reported to Siltronic AG according to section 19 MAR (since July 3, 2016 before according to section 15a Wert-papierhandelsgesetz).
The total of Siltronic shares held by all members of the Executive Board and Supervisory Board does not exceed 1 percent of the shares issued by the Company.
Information on share-based incentive schemes
Of the total annual variable remuneration for the members of the Executive Board, 15 percent is paid in shares of the Com-pany, which the company purchases in the name of the respec-tive Executive Board member. Details are set out in the remuner-ation report on / 83.
36 ANNUAL REPORT 2016
To our shareholders • Report and declaration on corporate governance

Responsible approach to opportunities and risks
Responsible handling of risk by a company is a key element of good corporate governance. Siltronic takes a systematic man-agement approach in which it regularly identifies and monitors the main opportunities and risks for the Company. With this system, it aims to identify risks at an early stage and then mini-mize such risks by means of rigorous risk management. The Executive Board routinely provides the Supervisory Board with information on existing risks and the changes in these risks. The Audit Committee regularly addresses the financial reporting process and the effectiveness of the systems for internal control, risk management and internal auditing. The opportunity and risk management system is continuously refined and adjusted in line with changing circumstances. Further details can be found in the risk and opportunity report on / 68.
Financial reporting and auditing of financial statements
Siltronic’s consolidated financial statements for the year ended December 31, 2016 have been prepared in accordance with the International Financial Reporting Standards (IFRSs), as adopted by the European Union. The annual financial statements of Sil-tronic AG for the year ended December 31, 2016 have been prepared in accordance with the provisions of the German Com-mercial Code. The financial reporting for the 2016 financial year has been audited by KPMG AG Wirtschaftsprüfungsgesellschaft, Munich. In accordance with the recommendations in the Ger-man Corporate Governance Code, the Supervisory Board has agreed with the auditors that the Chairman of the Supervisory Board will be informed without delay of any grounds for exclu-sion or partiality arising during the audit. The auditors also report immediately on any material findings or circumstances that
affect the responsibilities of the Supervisory Board. If, during the audit of financial statements, the auditors identify any factors pointing to a misstatement in the declaration of conformity with the German Corporate Governance Code pursuant to section 161 AktG made by the Executive Board and the Supervisory Board, the auditors will inform the Supervisory Board accordingly and note the finding in the audit report.
D&O insurance
There is a directors’ and officers’ (D&O) insurance covering the activities of the members of the Executive Board and the Super-visory Board. This insurance includes the statutory deductible for the members of the Executive Board. No deductible is applied in the case of the members of the Supervisory Board for the reasons explained in the declaration of conformity.
Conflicts of interest
The members of the Executive Board and Supervisory Board are subject to an obligation to work solely in the interests of the Company. When making decisions, they must not pursue any personal interests or exploit for personal gain any business opportunities available to the Company. The rules of procedure for both the Executive Board and the Supervisory Board specify that any conflicts of interest must be disclosed without delay. If a conflict of interest is material and likely to be present for more than just a short period, the relevant member of the Supervisory Board must step down. All transactions between the Company on the one side and a member of the Executive Board or his family on the other side must be on an arm’s-length basis. Such transactions require the consent of the Supervisory Board if the value of the individual transaction concerned exceeds EUR 5,000.
37ANNUAL REPORT 2016
To our shareholders • Report and declaration on corporate governance

39 Business and economic conditions39 Group structure and business activities
42 Corporate strategy and corporate management
44 Business report44 Macroeconomic situation and industry trends
44 Significant events affecting our business performance
44 Comparison of actual and forecast
business performance
45 Overall statement by the Executive Board on business
performance and the economic position
46 Financial position and financial performance46 Sales and financial performance
50 Assets and liabilities
54 Financial management
55 Siltronic AG
58 Non-financial performance indicators58 Employees
60 Research & development
61 Production and supply chain management
62 Purchasing and supplier management
63 Sales and marketing
64 Corporate social responsibility (CSR)
68 Risk and opportunity report68 Risk strategy and risk policy
68 Risk management system
69 Internal control system in the
consolidated accounting process
70 Material risks
77 Opportunity report
79 The Executive Board’s assessment of aggregate risk
80 Outlook80 Expected macroeconomic and industry trends
80 Siltronic’s future performance
82 Overall statement by the Executive Board
on expected performance
82 Concluding declaration pursuant to section 312 (3) AktG
83 Remuneration report83 Executive Board remuneration system
84 Total remuneration of the members of
the Executive Board for 2016
86 Remuneration for Supervisory Board members
87 Disclosures relevant to acquisitions
Combined management report
38

Group structure and business activities
Leading international supplier of hyperpure silicon wafers
We are a global market and technology leader for hyperpure silicon wafers for the semiconductor industry. We have produc-tion facilities at four locations in Germany, the USA, and Asia, where we manufacture silicon wafers with diameters of up to 300mm. Our customers include the top 20 consumers of silicon wafers in the semiconductor industry, and we maintain usually long-term business relationships with our customers.
Siltronic is known in the market for its long-standing expertise, customer-specific solutions, and global product availability, as well as assured quality and delivery reliability. Our worldwide presence enables us to respond to inquiries from customers within 24 hours. This combination gives rise to our high level of customer satisfaction and is the foundation for the sustained success of our business. Our aim is to supply high-quality wafers with specifications that fulfill our customers’ requirements.
Silicon wafers are the basis for modern microelectronics and nanoelectronics and are therefore a key component of countless everyday objects, such as computers, smartphones, flat screens, and navigation systems.
We strive to be a driving force for innovation in silicon wafers for the semiconductor industry.
Legal structure of the Group
Siltronic has had the legal form of a stock corporation (Aktien-gesellschaft) subject to German law since 1996, although at that time it was called Wacker Siltronic Gesellschaft für Halbleiter-materialien AG. In 2004, the Company was renamed Siltronic AG. It is headquartered in Munich, Germany. The Company has direct or indirect equity investments in five companies.
Management and control
As required by the German Stock Corporation Act (AktG), Siltronic AG has a two-tier governance structure consisting of the Executive Board and Supervisory Board. The Executive Board has two members; its composition did not change in fiscal year 2016. The Supervisory Board consists of twelve members. Infor-mation on the Executive Board and Supervisory Board and how their responsibilities are allocated can be found in the corporate governance report on / 31.
Business and economic conditions
Allocation of responsibilities on the Executive Board
Dr. Christoph von Plotho
• Chief Executive Offi cer & President
• Application Technology• Corporate Development• Engineering• Investor Relations &
Communications• Legal & Compliance• Production• Quality Management &
Sustainability• Sales & Marketing• Site Management,
Burghausen & Freiberg• Supply Chain Management• Technology• Siltronic Japan• Siltronic Singapore
• Chief Financial Offi cer• Labor director• Controlling• Finance & Tax• Human Resources• IT• Procurement• Risk Management & Audit• Siltronic USA
Rainer Irle
39ANNUAL REPORT 2016
Combined management report • Business and economic conditions

Active strategic management holding company, decentralized structure, and proximity to customersThe parent company of the Siltronic Group, Siltronic AG, acts as the Group’s holding company under company law and as its operational holding company. As parent company, Siltronic AG is in charge of the corporate strategy and generic strategic man-agement as well as communications with the Company’s import-ant stakeholders, particularly the capital markets and shareholders. The operational subsidiaries are managed separately from a business perspective. The Siltronic AG Executive Board is repre-sented on the executive boards of the subsidiaries. An extended team of senior group managers at Siltronic AG have their per-formance measured in accordance with agreed targets. Specific targets are defined at groupwide, regional, and operational level and are reviewed on an ongoing basis.
Remuneration of the Executive Board and Supervisory BoardThe Executive Board’s remuneration consists of fixed and variable elements. The main features of the remuneration system for the Executive Board and Supervisory Board are described in the remuneration report on / 83 to / 86 of the combined man-agement report.
Declaration on corporate governanceThe declaration on corporate governance, which is required by section 289a of the German Commercial Code (HGB), is contained in the corporate governance report on / 31 to / 37. It includes information on the work of the Executive Board and Supervisory Board, the declaration of conformity pursuant to section 161 AktG, and details on significant corporate management practices.
The declaration of conformity has been made permanently accessible to the public on the website http://www.siltronic.com/int/en/investor_relations/corporate_governance/declaration/ declaration.jsp.
Important products, business processes, and markets
Our experience, technological expertise, and innovative strength provide added value Silicon is the basis for nearly all semiconductor components and thus essentially underpins the entire global electronics industry. The wafers are used for increasingly small structures, known as design rules, which nowadays are just a few nanometers in size. This makes it possible to manufacture ever more powerful and energy-efficient generations of semiconductor chips. Our silicon wafers, with diameters of up to 300mm, support these devel-opments and form the basis for highly complex semiconductor components, such as high-voltage applications, low-resistivity circuit boards for automotive engineering and telecommunica-tions, and highly integrated microprocessors and memory mod-ules for information processing.
We act as a strategic development partner for our industrial customers, to whom we supply solutions tailored specifically to their requirements. In doing so, we draw on our technical exper-tise and deep understanding of what our customers need. Our four production facilities and nine sales offices in Europe, the USA, and Asia serve customers in more than 40 countries. In 2016, our five largest customers were (in alphabetical order) Infineon Technologies, Micron Technology, Samsung Electronics, SK Hynix and Taiwan Semiconductor Manufacturing Company (TSMC). Our local sales approach enables us to offer high- quality customer service.
Structure of the Siltronic Group
Siltronic AG, Germany
100 %Siltronic Holding International,
Krommenie, Netherlands
100 %Siltronic Singapore Pte. Ltd.,
Singapore
100 % Siltronic Japan Corporation,
Tokyo, Japan
100 %Siltronic Corporation, Portland, Oregon, USA
78 %Siltronic Silicon Wafer Pte. Ltd.,
Singapore (SSW)
40 ANNUAL REPORT 2016
Combined management report • Business and economic conditions

By working closely with our customers, we help them to contin-uously improve and update their products and solutions. We manufacture specified polished and epitaxial wafers in accor-dance with the latest design rules.
Competitive situation
There is a great deal of global competitive pressure in the market for silicon wafers for the semiconductor industry which is char-acterized by a high concentration of wafer suppliers. Market studies show that Siltronic is one of the largest manufacturer of silicon wafers for the semiconductor industry with a market share of approximately 15 percent.
In December 2016, Taiwanese GlobalWafers acquired the US-based SunEdison SEMI. Our main competitors are now the two Japanese manufacturers Shin-Etsu Handotai and SUMCO Corporation plus GlobalWafers from Taiwan and LG Siltron from Korea.
Together, the five largest manufacturers meet roughly 90 per-cent of global demand. Customers are working increasingly closely with manufacturers on the development of new wafers. We expect to be able to benefit even more from this trend in the future due to our excellent access to customers.
Economic and legal influences
We sell our wafers to customers in the semiconductor industry worldwide. This means we are subjected to the cyclical fluctua-tions that are typical for this industry. However, this volatility varies significantly in terms of when it occurs and to what extent. We take account of expected developments in our business planning at an early stage using selected leading indicators, such as commodity prices, customers’ ordering behavior, our capacity utilization, and production and unit sales forecasts for the semi-conductor industry.
Exchange rate volatility caused by trade relationships between currency areas has an operational impact on our sales and earn-ings because we generate around two-thirds of our sales in US dollars but incur the bulk of our costs in euros. We are trying to reduce the currency effect of changes in foreign exchange rates by increasing the production in Singapore which shows correla-tion to the US dollar and pursuing a proactive hedging policy.
Siltronic’s costs are affected by wage and salary increases and by changes in the cost of materials. Our main raw material is polysilicon, most of which we obtain from Wacker Chemie AG on the basis of long-term supply agreements. We use a large number of supplies, e.g. polishes and saw wire, in our manu-facturing processes. As far as possible, we try to procure our materials from multiple suppliers.
We increase our profitability by taking steps within the Com-pany, such as optimizing processes in all functional units. Back in 2010, we launched the cost roadmap, an ongoing cost- reduction program, in order to proactively identify and unlock potential for improvement. All projects aimed at boosting effi-ciency are included in this program. In one of these projects, we are aiming to continuously reduce the variable costs of a 300mm wafer on an annual basis and increase our production capacity by roughly one to two percent each year without the need for new capital expenditure.
End markets for semiconductor applicationsin %
25Other
8Automotive
11Industry
27Smartphones
29Computers – incl. solid state drives
Source: IHS 2017; ‘Other’ includes network infrastructure, consumer end devices, etc.
41ANNUAL REPORT 2016
Combined management report • Business and economic conditions

We prioritize new ideas and monitor the implementation in reg-ular steering committee meetings.
Because we do business worldwide, various legal and tax requirements apply to us that we have to take into account in our operations. These include product liability legislation, employment regulations, foreign trade laws and patent laws.
Risks for our business arising from the economic and legal situ-ation are presented in the risk report on / 68 to / 79.
Corporate strategy and corporate management
Our short- and long-term strategic objective is to expand our business activities in order to strengthen our position as one of the leading manufacturers of semiconductor wafers. To achieve this objective, we want to further develop our technology lead-ership, retain our leading quality position, and continue with our program for operational excellence and cost reductions. We also focus on a high level of profitability and a stable cash flow. There were no major changes to our objectives and strategies com-pared with the previous year.
Megatrends creating a sustained increase in the use of our high-quality hyperpure silicon wafersCustomer requirements in the semiconductor industry are changing all the time, driven primarily by global megatrends such as mobility, connectivity, miniaturization, and cost effi-ciency. Because of the Internet of Things (IoT), for example, the devices that come on to the market will be increasingly intelli-gent, and everyday objects will be fitted with processors, sensors and networking capabilities. The technology will range from app-controlled wearables to smart factories. Continuous improvements to functionality and energy efficiency, for example of smartphones, driver assistance systems in motor vehicles, and industrial automation, are based on semiconductor manufactur-ers constantly enhancing the components needed for these
applications. Typically, these developments mean that raw mate-rials have to meet ever more demanding requirements. For example, smaller design rules for components are only possible if the silicon wafers have the necessary uniformity.
We therefore expect that demand for highly developed wafers will continue to rise. We want to take advantage of these growth opportunities by focusing on innovative solutions that add value, thereby proactively helping to meet our customers’ new requirements.
Synergies from best-in-class production processesWe have many years of experience of manufacturing 300mm wafers and have built state-of-the-art production facilities at our German sites in Freiberg (Saxony) and Burghausen as well as in Singapore that are designed for the volume production of these wafers. Our production facilities in Singapore for 200mm and 300mm wafers are among the biggest and most modern in the world. Standardized processes and largely identical machinery ensure knowledge transfer between our production sites. This enables us to improve processes quickly and easily, to simplify the qualification process by our customers.
Our success factors: a global presence and innovative strength We want to offer solutions with enhanced product capabilities or quality that our customers can use in their current and future applications.
The products required in our target markets are highly sophisti-cated. Examples of applications for silicon wafers are computers, tablets, smartphones, solid-state drives, assistance and control systems in the automotive industry, or wearables. We provide our customers worldwide with specified, high-quality products. Apart from the Czochralski process we use the float zone tech-nology for growing ingots to produce wafers with a diameter of up to 200mm (see the chapter on production on / 62). We continually improve our innovative strength and attach a high priority to research and development (R&D). Our plan is to invest approximately 7 percent of our sales into R&D each year.
42 ANNUAL REPORT 2016
Combined management report • Business and economic conditions

Ongoing optimization of our production processes and cost structuresOur strategic objectives are to improve profitability and strengthen cash flow. We support and steer our efforts to achieve these objectives in a variety of ways. These include cost discipline and continuous improvement of processes in all functions and regions. Our cost roadmap helped us to reduce our costs con-tinuously. We saved around EUR 45 million in 2015 compared to 2014 and around EUR 30 million in 2016 compared to 2015. Our EBITDA has increased despite pressure on prices in the past. On the basis of the plans for improvements that have been identified and initiated, we will continue to focus on achieving the cost benefits arising from this program in the future.
Constant monitoring of selected financial and non-financial key performance indicatorsThe Group’s management team predominantly uses financial key performance indicators (KPIs) to manage Siltronic.
The most important financial KPIs are the EBITDA margin, free cash flow and ROCE (return on capital employed).
A high level of profitability is an important target and metric for the Group’s management team. The measurement basis we use is EBITDA, which enables us to compare ourselves with our competitors. EBITDA is defined as earnings before interest, taxes, and depreciation / amortization including impairment losses and reversals thereof. We use this comparison, along with his-torical trends and planning information, to calculate an EBITDA margin target.
Another important metric is free cash flow. By focusing on this KPI, we are ensuring that Siltronic remains financially solid going forward. Free cash flow shows whether the required investments in property, plant and equipment and intangible assets can be financed from the Company’s own operating activities (cash flow from operating activities). Our goal is to achieve a positive cash flow each year. The main influences on this KPI, besides profit-ability, are effective management of net working capital and the level of capital expenditure. Net working capital is defined as the sum of inventories and trade receivables less trade payables.
ROCE is defined as EBIT (earnings before interest and taxes) divided by capital employed. Capital employed is calculated from non-current assets and working capital, using the average of the respective items at the beginning and end of the reporting period.
Targets for all financial KPIs are set and monitored company- wide. Each month, we measure the discrepancies between the target and actual figures at Group level and in all local com-panies. KPIs are analyzed monthly and quarterly. We also review the detailed business planning on the basis of the available monthly and quarterly results and draw up a specific forecast for business performance.
The abovementioned KPIs are supplemented by additional finan-cial indicators, including particularly sales, capital expenditure and net financial assets.
Non-financial performance indicators mainly refer to human resources, research & development, production and corporate social responsibility, where we use indicators such as productiv-ity, yield and number of accidents at work. We do not use any of these indicators across the board to manage the Company.
43ANNUAL REPORT 2016
Combined management report • Business and economic conditions

Macroeconomic situation and industry trends
According to the International Monetary Fund (IMF), global economic activity in 2016 developed very similar to 2015 with gross domestic product rising by 3.1 percent worldwide (2015: 3.2 percent).
Retained growth in the eurozone economy of 1.7 percent was below 2015 (+2.0 percent). Despite an ongoing favorable oil price development and the expansionary monetary policy of the European Central Bank the whole econonmy was still affected by an unemployment rate which is only slowly decreasing and by the debt crisis in some countries. During 2016, the exchange rate of the Euro against other denominations like the US dollar was comparable to previous year‘s level. Since November, how-ever, the US dollar appreciated distinctly versus the Euro while the Japanese yen depreciated.
The German economy continued to pursue a moderate upward trend in 2016. The German Federal Statistical Office expects growth of 1.9 percent for the year as a whole (2015: 1.7 percent).
The USA grew by 1.6 percent in 2016 which is lower than in 2015 (2.6 percent). However, the USA – as well as Japan – benefit from a low unemployement rate.
Japan’s growth was just 0.9 percent in 2016 (2015: 1.2 percent). In China, gross domestic product increased by 6.7 percent according to the expressed target of a slowly decreasing growth momentum (2015: 6.9 percent).
Measured in terms of the surface area of the wafers sold world-wide, the market for silicon wafers for the semiconductor indus-try grew by 2.9 percent in 2016. Demand in the first quarter of 2016 was significantly lower than in the corresponding period of 2015. However, demand picked up considerably during 2016 and this trend was sustained until the end of the year.
Significant events affecting our business performance
There were no significant events which affected our business performance in 2016.
Comparison of actual and forecast business performance
Business in the first quarter of 2016 was already slightly better than expected and continued to be very encouraging in the second quarter. We were able to improve our product mix, and in the second quarter of 2016 also benefited from an easing in price pressure that had taken hold in the second half of 2015 and continued in the first quarter of 2016. At this point in time we assumed that the demand for silicon wafers would not rise during the second half of the year, but that prices would remain relatively steady. On this basis, we slightly revised our sales fore-cast downward.
Contrary to our forecast at the end of June 2016, demand in silicon wafers rose in the third quarter 2016; our production capacity for 300mm and 200mm wafers was fully utilized in the second half of the year. As predicted, average selling prices stabilized from the third quarter onward, although at a signifi-cantly lower level than in 2015. As a result, the sales forecast was a little more positive than it had been at the end of the second quarter.
The strong Japanese yen had a positive impact on our sales and gross margin. On the other hand, the appreciation of the yen led to higher expenses due to currency hedging which are added up under other operating income and expenses. Therefore, EBITDA was also negatively impacted. Overall, the effect by the yen appreciation was, however, positive. Therefore the EBITDA slightly forecast remained unchanged during the whole of 2016.
We ended 2016 successfully with sales of €933.4 million, which was at the level of the previous year. This was slightly better than our October forecast of a low single-digit percentage fall in sales. The operating EBITDA margin was 15.6 percent, marginally higher than the 2015 figure of 13.3 percent, as anticipated.
As expected in the third quarter, the fluctuations in the value of the Japanese yen led to slightly higher hedging expenses than predicted at the beginning of the year.
Business report
Sources: IMF (World Economic Outlook, January Update, Release January 16th, 2017Statistisches Bundesamt, DIW Berlin (Dezember 2016)SEMI SMG 2017 (Pressemitteilung am 7.2.2017)
44 ANNUAL REPORT 2016
Combined management report • Business report

ROCE was 3.7 percent and thus consistent with the original projection of a low single-digit figure.
Free cash flow was in line with expectations at EUR 19.0 million although we reduced customer prepayment of EUR 20.5 million and made an advance payment to the pension fund of Wacker Chemie VVaG of EUR 11.1 million.
In 2016, we continued to strengthen our technology leadership by investing in our capabilities. In the third quarter, we raised our capital expenditure forecast from around EUR 80 million to a figure between EUR 85 million and EUR 90 million. The actual figure of EUR 88.8 million in 2016 came in at the upper end of our forecasts.
Comparison of actual and forecast business performance
2015 actual
Forecast Annual Report 2015
(March 2016)
Forecast Q1 2016 interim statement
(April 2016)
Forecast Q2 2016 interim report
(July 2016)
Forecast Q3 2016 interim statement
(October 2016) 2016 actual
Sales (EUR mn) 931.3 n/a n/a n/a n/a 933.4
Sales growth in %
10.1
slightly below previous year
in low to mid single-digit
percentage range below previous year
in low to mid single-digit
percentage range below previous year,
bolstered by strong JPY
in low single-digit percentage range
below previous year, bolstered by
strong JPY 0.2
EBITDA margin in % 13.3 slight improvement slight improvement slight improvement slight improvement 15.6
ROCE in %
0.4
in the mid single-digit
percentage range
in the mid single-digit
percentage range
in the low to mid single-digit
percentage range
in the low to mid single-digit
percentage range 3.7
Free cash flow (EUR mn) 37.4
clearly positive, but below the 2015 figure
clearly positive, but below the 2015 figure
clearly positive, but below the 2015 figure
clearly positive, but below the 2015 figure 19.0
Overall statement by the Executive Board on business performance and the economic position
The 2016 financial year slightly exceeded the Executive Board‘s expectations. More than anything else, the high demand for silicon wafers, which had led to full utilization of production capacity in the third and fourth quarters, had not been forecast in the first half of the year. The ASP (average selling price) devel-opment was below our expectations.
Sales amounted to €933.4 million in 2016, which was slightly higher than our forecast. Positive exchange rate effects from the Japanese yen and, in particular, much higher wafer volume sold in the second half of the year to some degree offset the fall in ASP.
Capital expenditure was at the upper end of the forecast because we were able to push ahead rapidly with existing proj-ects such as automation, mainly at the German sites, the new
crystal-pulling hall in Freiberg and the exchange of older crystal pullers versus state-of-the-art pullers. The number of employees continued to decrease as planned. Staff costs were thus within the budgeted figure. R&D expenditure also came in on budget.
Total assets grew slightly year on year. The equity ratio declined to 40.2 percent.
Overall, the Executive Board is satisfied with the performance of the business in 2016. The development of new products in col-laboration with our customers has helped us to confirm our position as a technology leader in the market.
The Executive Board considers Siltronic’s economic position to be stable. This assessment is based on the results in the 2016 consolidated financial statements and separate financial state-ments and takes account of the course of business up to the time of preparing the 2016 combined management report. At the time of preparing this annual report, business performance at the start of 2017 has been in line with the Executive Board’s expectations.
45ANNUAL REPORT 2016
Combined management report • Business report

Sales and financial performance
Sales on previous year level because of higher volumesWe successfully finished 2016 with consolidated sales of EUR 933.4 million, around the same as in preceding year (2015: EUR 931.3 million). Positive FX effects relating to the Janpaese yen and predominantely higher wafer volumes compensated the decline in ASP. Measured in Euro, the ASP in the first three quarters remained stable however below the prior year level. In Q4, ASP increased and was slightly above the ASP of full year 2015.
We generate the bulk of our sales in US dollars and Japanese yen. This means that a weakness of the Euro against the US dollar and the Japanese yen has a positive impact on sales. The average Euro to US dollar exchange rate in 2016 was 1.11 and thus comparable to the prior year. The Euro to Japanese yen exchange rate, however, was on average 11 percent weaker than in 2015 at 134.
The regional breakdown of sales shows that the percentage of sales attributable to the three large regions, Europe, Asia, and the USA, was unchanged compared with 2015. Asia, the largest region, accounted for 67 percent of sales, as it had in the pre-vious year, followed by Europe with 19 percent. In the USA, we generated again 14 percent of sales.
Business at Siltronic is often subject to a certain degree of sea-sonality and is usually characterized by a weak first quarter, stronger second and third quarters, and then a weaker fourth quarter. However, in 2016 the individual quarters did not fully follow this pattern. The first quarter was weak with sales of only EUR 220.6 million followed by better second quarter with sales of EUR 229.6 million The third quarter was strong with sales of EUR 237.0 million, followed by sales of EUR 246.3 million in a very strong fourth quarter.
Sales
In EUR mn Q4 2016 Q4 2015
Change Q1 – Q4 2016
Q1 – Q4 2015
Change
Amount % Amount %
Sales 246.3 215.3 31.0 14.4 933.4 931.3 2.1 0.2
Financial position and financial performance
Sales by regionin %
14USA
19Europe
67Asia
46 ANNUAL REPORT 2016
Combined management report • Financial position and financial performance

Manufacturing costs per wafer area significantly lowerWe were able to reduce the manufacturing costs per wafer area significantly compared to the prior year. This led to a decrease in cost of sales of EUR 6.9 million or 0.9 percent despite the fact that the wafer area sold was higher than in 2015.
The improvement of manufacturing costs per wafer area was mainly driven by higher utilization of our production capacity, successful cost reduction measures and lower depreciation. There was no noticeable influence by foreign exchange rates as around 60 percent of manufacturing costs are incurred in Euro.
Cost of sales
In EUR mn Q4 2016 Q4 2015
Change Q1 – Q4 2016
Q1 – Q4 2015
Change
Amount % Amount %
Cost of sales 192.6 183.6 9.0 4.9 761.5 768.4 – 6.9 – 0.9
Gross profit 53.7 31.7 22.0 69.4 171.9 162.9 9.0 5.5
Gross margin in % 21.8 14.7 18.4 17.5
Gross margin higher than in 2015 due to higher sales and lower manufacturing costs per wafer areaThe gross profit increased by EUR 9.0 million and amounted to EUR 171.9 million. This represents an increase of 5.5 percent. Gross margin increased from 17.5 percent in 2015 to 18.4 per-cent in 2016.
The main reasons for the higher gross margin were the success-ful measures to lower manufacturing costs per wafer area and the increased sales. Although ASP of 2016 decreased in com-parison to prior-year, positive FX effects and higher wafer vol-umes have led to increased sales of EUR 2.1 million in 2016.
Gross margin in 2016 increased quarter on quarter. In Q1 gross margin was 15.3 percent, in Q2 17.1 percent, in Q3 19.1 percent and in Q4 gross margin came to 21.8 percent.
Selling, R&D and general administrative expenses rising slower than salesThe total of marketing and sales expenses, research & develop-ment (R&D) costs, and general administrative expenses increased year-on-year mainly due to tariff increases and higher R&D expenses. Selling expenses, R&D expenses, and administrative expenses as a percentage of sales of 12.9 percent were basically on previous years‘s level (2015: 12.6 percent).
Selling, R&D and administrative expenses have barely changed compared to sales
In EUR mn Q4 2016 Q4 2015
Change Q1 – Q4 2016
Q1 – Q4 2015
Change
Amount % Amount %
Selling expenses 8.4 8.9 – 0.5 – 5.6 33.2 34.9 – 1.7 – 4.9
Research & development expenses (R&D expenses) 16.4 15.9 0.5 3.1 66.4 64.4 2.0 3.1
General administration expenses 4.5 4.3 0.2 4.7 20.6 18.5 2.1 11.4
Total 29.3 29.1 0.2 0.7 120.2 117.8 2.4 2.0
as a percentage of sales 11.9 13.5 12.9 12.6
47ANNUAL REPORT 2016
Combined management report • Financial position and financial performance
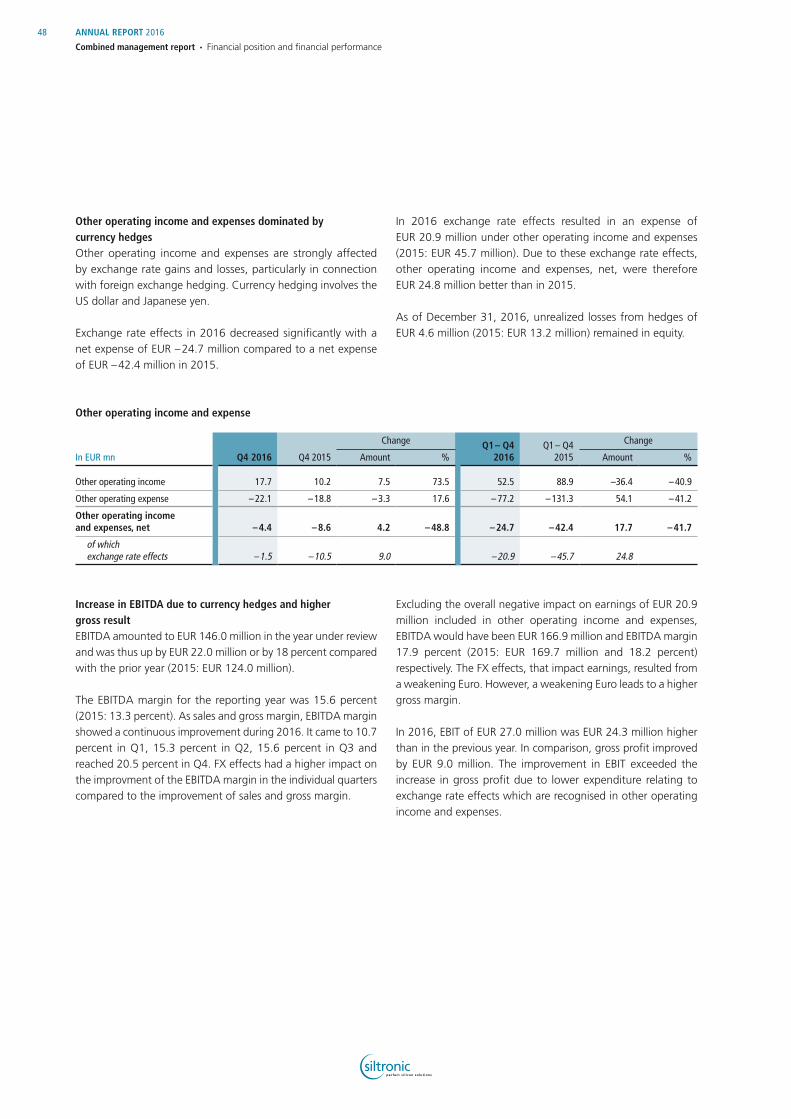
Other operating income and expenses dominated by currency hedges Other operating income and expenses are strongly affected by exchange rate gains and losses, particularly in connection with foreign exchange hedging. Currency hedging involves the US dollar and Japanese yen.
Exchange rate effects in 2016 decreased significantly with a net expense of EUR – 24.7 million compared to a net expense of EUR – 42.4 million in 2015.
In 2016 exchange rate effects resulted in an expense of EUR 20.9 million under other operating income and expenses (2015: EUR 45.7 million). Due to these exchange rate effects, other operating income and expenses, net, were therefore EUR 24.8 million better than in 2015.
As of December 31, 2016, unrealized losses from hedges of EUR 4.6 million (2015: EUR 13.2 million) remained in equity.
Other operating income and expense
In EUR mn Q4 2016 Q4 2015
Change Q1 – Q4 2016
Q1 – Q4 2015
Change
Amount % Amount %
Other operating income 17.7 10.2 7.5 73.5 52.5 88.9 –36.4 – 40.9
Other operating expense – 22.1 – 18.8 – 3.3 17.6 – 77.2 – 131.3 54.1 – 41.2
Other operating income and expenses, net – 4.4 – 8.6 4.2 – 48.8 – 24.7 – 42.4 17.7 – 41.7
of which exchange rate effects – 1.5 – 10.5 9.0 – 20.9 – 45.7 24.8
Increase in EBITDA due to currency hedges and higher gross resultEBITDA amounted to EUR 146.0 million in the year under review and was thus up by EUR 22.0 million or by 18 percent compared with the prior year (2015: EUR 124.0 million).
The EBITDA margin for the reporting year was 15.6 percent (2015: 13.3 percent). As sales and gross margin, EBITDA margin showed a continuous improvement during 2016. It came to 10.7 percent in Q1, 15.3 percent in Q2, 15.6 percent in Q3 and reached 20.5 percent in Q4. FX effects had a higher impact on the improvment of the EBITDA margin in the individual quarters compared to the improvement of sales and gross margin.
Excluding the overall negative impact on earnings of EUR 20.9 million included in other operating income and expenses, EBITDA would have been EUR 166.9 million and EBITDA margin 17.9 percent (2015: EUR 169.7 million and 18.2 percent) respectively. The FX effects, that impact earnings, resulted from a weakening Euro. However, a weakening Euro leads to a higher gross margin.
In 2016, EBIT of EUR 27.0 million was EUR 24.3 million higher than in the previous year. In comparison, gross profit improved by EUR 9.0 million. The improvement in EBIT exceeded the increase in gross profit due to lower expenditure relating to exchange rate effects which are recognised in other operating income and expenses.
48 ANNUAL REPORT 2016
Combined management report • Financial position and financial performance
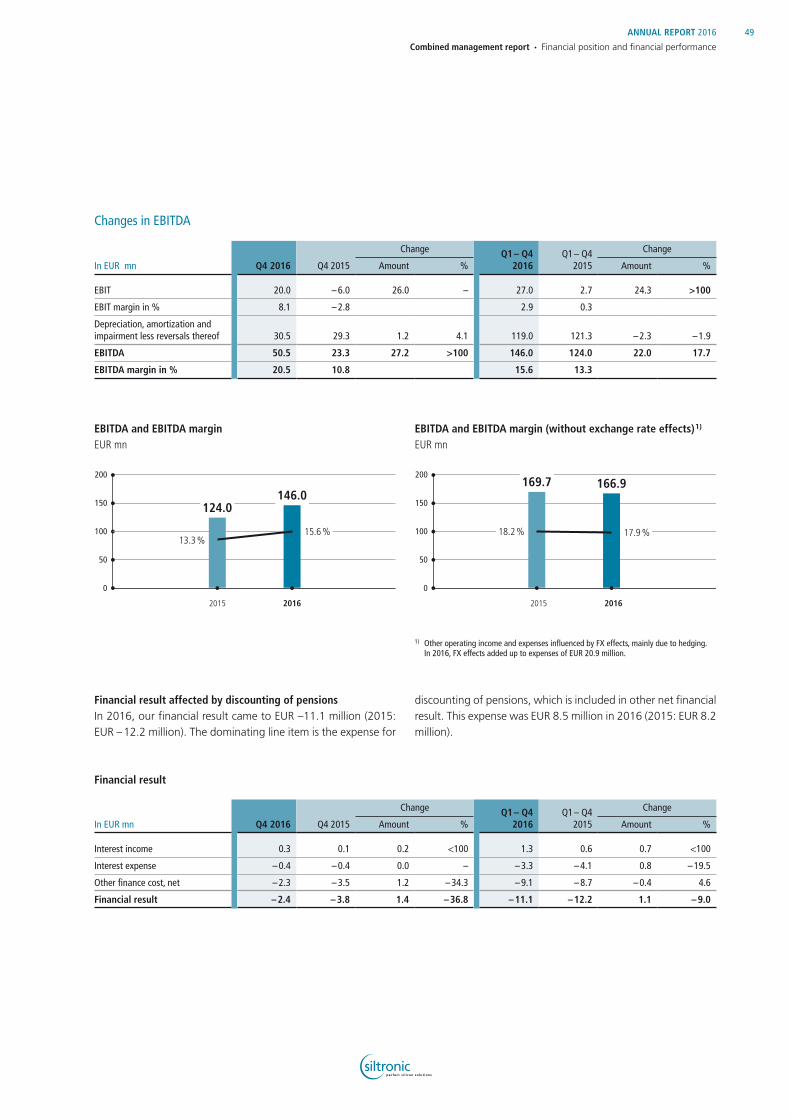
Changes in EBITDA
In EUR mn Q4 2016 Q4 2015
Change Q1 – Q4 2016
Q1 – Q4 2015
Change
Amount % Amount %
EBIT 20.0 – 6.0 26.0 – 27.0 2.7 24.3 >100
EBIT margin in % 8.1 – 2.8 2.9 0.3
Depreciation, amortization and impairment less reversals thereof 30.5 29.3 1.2 4.1 119.0 121.3 – 2.3 – 1.9
EBITDA 50.5 23.3 27.2 >100 146.0 124.0 22.0 17.7
EBITDA margin in % 20.5 10.8 15.6 13.3
Financial result affected by discounting of pensionsIn 2016, our financial result came to EUR –11.1 million (2015: EUR – 12.2 million). The dominating line item is the expense for
discounting of pensions, which is included in other net financial result. This expense was EUR 8.5 million in 2016 (2015: EUR 8.2 million).
Financial result
In EUR mn Q4 2016 Q4 2015
Change Q1 – Q4 2016
Q1 – Q4 2015
Change
Amount % Amount %
Interest income 0.3 0.1 0.2 <100 1.3 0.6 0.7 <100
Interest expense – 0.4 – 0.4 0.0 – – 3.3 – 4.1 0.8 – 19.5
Other finance cost, net – 2.3 – 3.5 1.2 – 34.3 – 9.1 – 8.7 – 0.4 4.6
Financial result – 2.4 – 3.8 1.4 – 36.8 – 11.1 – 12.2 1.1 – 9.0
EBITDA and EBITDA marginEUR mn
EBITDA and EBITDA margin (without exchange rate effects) 1)
EUR mn
200
150
100
50
0
200
150
100
50
0
17.9 %18.2 %
2015
169.7
2016
166.9
2015 2016
1) Other operating income and expenses influenced by FX effects, mainly due to hedging. In 2016, FX effects added up to expenses of EUR 20.9 million.
13.3 %15.6 %
124.0146.0
49ANNUAL REPORT 2016
Combined management report • Financial position and financial performance

Income taxesIncome taxes amounted to EUR 7.2 million in 2016 (2015: EUR 10.6 million). Income tax expenses resulted mainly from current taxes in Singapore for Siltronic Singapore Pte. Ltd. and in the Netherlands for Siltronic Holding International. Income from deferred tax assets of EUR 0.2 million was solely generated in the period under review.
In 2016, the Group tax rate, i.e. the result before taxes compared to income taxes, was 45 percent as potential future tax advan-tages of Siltronic AG are not allowed to be recognized due to a special IFRS rule (refer to Note 03). Therefore the Group tax rate 2015 is not meaningful.
Income tax expense
In EUR mn Q4 2016 Q4 2015
Change Q1 – Q4 2016
Q1 – Q4 2015
Change
Amount % Amount %
Result before income tax 17.6 – 9.8 27.4 – 15.9 – 9.5 25.4 –
Expense (–)/Income (+) of income taxes – 2.1 1.0 – 3,1 – – 7.2 – 10.6 3.4 – 32.1
Tax rate 12 45
Net result for the period strongly improvedOur net result for the period improved from EUR –20.1 million in 2015 to EUR 8.7 million in 2016. Of this is a total EUR 12.0 million for shareholders of Siltronic (2015: EUR – 14,0 million).
Earnings per share improved to EUR 0.40Earnings per share came to EUR 0.40 compared with the earn-ings per share of EUR –0.50 in the previous year.
Assets and liabilities
The total assets of Siltronic AG had increased slightly from EUR 1,040.8 million as of the end of 2015 to EUR 1,056.8 million as of December 31, 2016.
In EUR mn Dec. 31, 2016 Dec. 31, 2015 Change
Intangible assets 26.4 29.7 – 3.3
Property, plant and equipment 519.8 542.9 – 23.1
Other assets 7.9 6.5 1.4
Non-current assets 554.1 579.1 – 25,0
Non-current assets down due to depreciationNon-current assets amounted to EUR 554.1 million as of the end of 2016 and thus made up approximately 52 percent of total assets. They were EUR 25.0 million or 4 percent lower than at the end of the previous year (December 31, 2015: EUR 579.1 million).
This was primarily due to a fall in property, plant and equipment because of depreciation of EUR 118.0 million (December 31, 2015: EUR 121.6 million). Capital expenditure (additions to property, plant and equipment and to non-current intangible assets) totaled EUR 88.8 million (December 31, 2015: EUR 75.0 million) and mainly related to our new crystal pulling hall in Freiberg and the automatization of our production.
50 ANNUAL REPORT 2016
Combined management report • Financial position and financial performance

Capital expenditure mainly serves to meet the needs of our customers, who demand increasingly challenging technical specifications.
As of December 31, 2016, one of the main components of other non-current assets was the goodwill resulting from the step acquisition of SSW. The goodwill amounts to EUR 20.5 million and is not amortized. Another significant asset recognized under this line item is the customer base, which was allocated a value of EUR 4.6 million when the controlling interest was acquired and is amortized using the straight-line method. Furthermore, deferred taxes are recorded with an amount of EUR 6.0 million.
Current assets increased due to clearly positive free cash flow and higher trade receivablesCurrent assets amounted to EUR 502.7 million as of December 31, 2016, representing an increase of EUR 41.0 million com-pared to a year earlier (December 31, 2015: EUR 461.7 million). They thus accounted for roughly 48 percent of total assets (December 31, 2015: 44 percent).
Other current assets included fixed-term deposits amounting to EUR 79.0 million as of December 31, 2016 (December 31, 2015: EUR 40.0 million) and cash and cash equivalents of EUR 136.4 million (December 31, 2015: EUR 154.5 million). The total of fixed-term deposits and cash and cash equivalents therefore increased by EUR 20.9 million.
In EUR mn Dec. 31, 2016 Dec. 31, 2015 Change
Inventories 140.9 142.7 – 1.8
Trade receivables 118.2 100.4 17.8
Fixed-term deposits 79.0 40.0 39.0
Other assets 28.2 24.1 4.1
Cash and cash equivalents 136.4 154.5 – 18.1
Current assets 502.7 461.7 41.0
Increase in working capitalWorking capital (inventories and trade receivables minus trade payables) increased from EUR 171.0 million to EUR 177.5 mil-lion. The increase of EUR 6.5 million was mainly attributable to higher trade receivables as a result of the high sales level in the fourth quarter. Also the Euro to US dollar exchange rate which was 4 percent weaker compared to December 31, 2015 and the 6 percent weaker Japanese yen to the Euro had an influence on the increased trade receivables.
Lower discount rates for pension provisions resulted in lower equityEquity amounted to EUR 425.3 million as of December 31, 2016 (December 31, 2015: EUR 497.3 million). Therefore the equity ratio was 40.2 percent, compared with 47.8 percent as of December 31, 2015.
The negative impact on equity which decreased by EUR 72.0 mil-lion is mainly due to lower discount rates for pension provisions.
Increase in pension provisions due to lower interest rates impacted non-current liabilitiesNon-current liabilities amounted to EUR 479.9 million as of December 31, 2016 (December 31,2015: 396.0) and thus made up approximately 46 percent of total equity and liabilities. The main reason was the increase in pension provisions by EUR 95.7 million which is attributable to lower discount rates in Germany and the USA.
The provisions in Germany were discounted at 1.94 percent at the end of December 2016, whereas the discount rate at the end of December 2015 was 2.75 percent. In the USA the dis-count rate decreased from 4.20 percent at the end of December 2015 to 3.92 percent in 2016.
51ANNUAL REPORT 2016
Combined management report • Financial position and financial performance
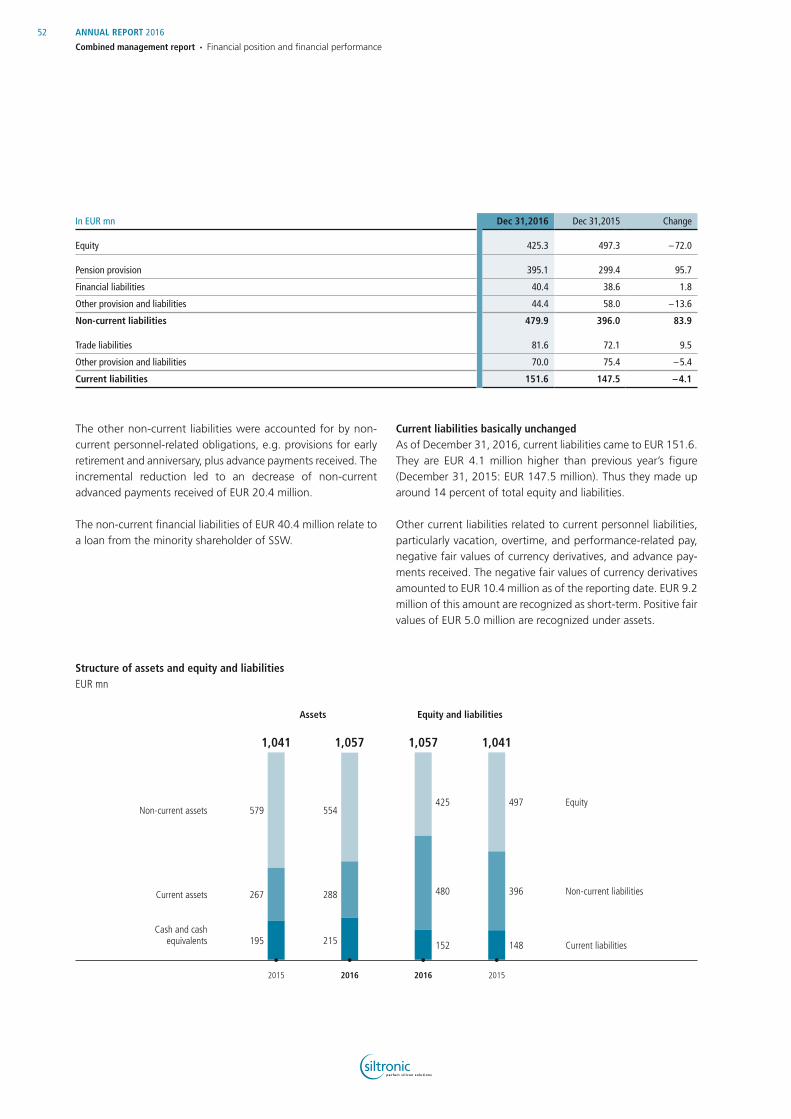
In EUR mn Dec 31,2016 Dec 31,2015 Change
Equity 425.3 497.3 – 72.0
Pension provision 395.1 299.4 95.7
Financial liabilities 40.4 38.6 1.8
Other provision and liabilities 44.4 58.0 – 13.6
Non-current liabilities 479.9 396.0 83.9
Trade liabilities 81.6 72.1 9.5
Other provision and liabilities 70.0 75.4 – 5.4
Current liabilities 151.6 147.5 – 4.1
The other non-current liabilities were accounted for by non- current personnel-related obligations, e.g. provisions for early retirement and anniversary, plus advance payments received. The incremental reduction led to an decrease of non-current advanced payments received of EUR 20.4 million.
The non-current financial liabilities of EUR 40.4 million relate to a loan from the minority shareholder of SSW.
Current liabilities basically unchangedAs of December 31, 2016, current liabilities came to EUR 151.6. They are EUR 4.1 million higher than previous year’s figure (December 31, 2015: EUR 147.5 million). Thus they made up around 14 percent of total equity and liabilities.
Other current liabilities related to current personnel liabilities, particularly vacation, overtime, and performance-related pay, negative fair values of currency derivatives, and advance pay-ments received. The negative fair values of currency derivatives amounted to EUR 10.4 million as of the reporting date. EUR 9.2 million of this amount are recognized as short-term. Positive fair values of EUR 5.0 million are recognized under assets.
1,041 1,0411,057 1,057
425 497554579
480 396288267
152 148215195
Structure of assets and equity and liabilitiesEUR mn
2015
Assets Equity and liabilities
2016 2016 2015
Non-current assetsEquity
Current assets Non-current liabilities
Cash and cash equivalents Current liabilities
52 ANNUAL REPORT 2016
Combined management report • Financial position and financial performance
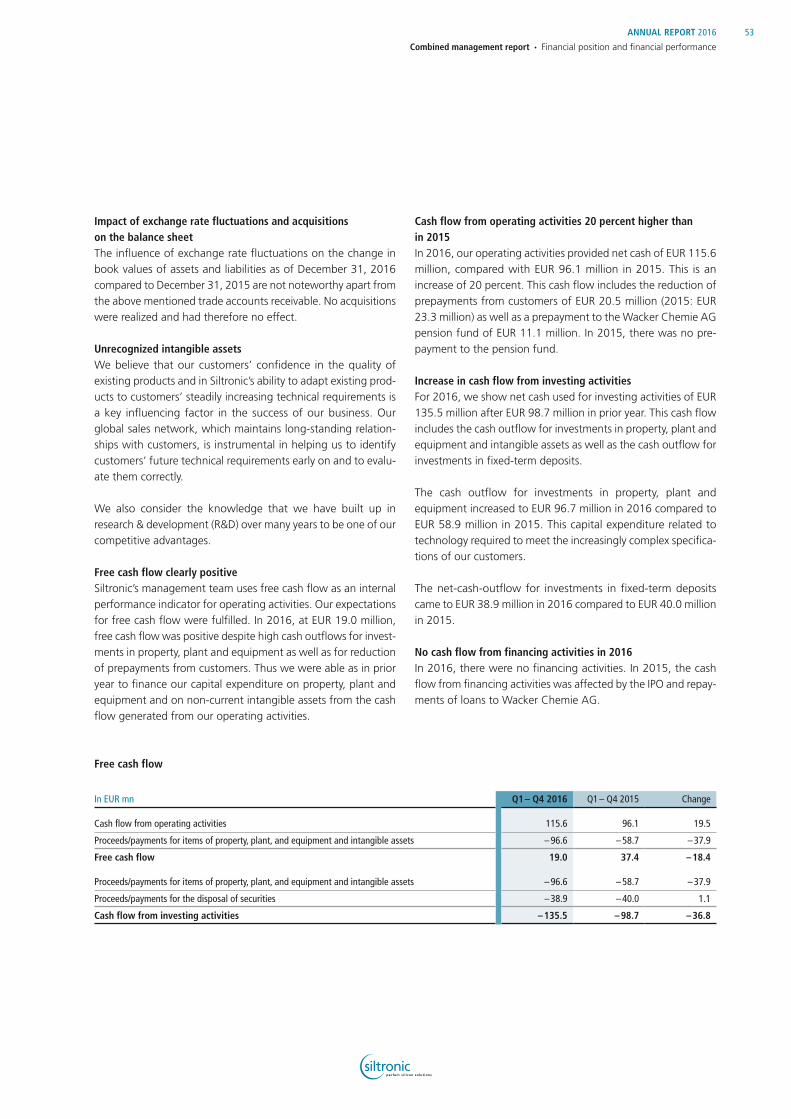
Impact of exchange rate fluctuations and acquisitions on the balance sheetThe influence of exchange rate fluctuations on the change in book values of assets and liabilities as of December 31, 2016 compared to December 31, 2015 are not noteworthy apart from the above mentioned trade accounts receivable. No acquisitions were realized and had therefore no effect.
Unrecognized intangible assetsWe believe that our customers’ confidence in the quality of existing products and in Siltronic’s ability to adapt existing prod-ucts to customers’ steadily increasing technical requirements is a key influencing factor in the success of our business. Our global sales network, which maintains long-standing relation-ships with customers, is instrumental in helping us to identify customers’ future technical requirements early on and to evalu-ate them correctly.
We also consider the knowledge that we have built up in research & development (R&D) over many years to be one of our competitive advantages.
Free cash flow clearly positiveSiltronic’s management team uses free cash flow as an internal performance indicator for operating activities. Our expectations for free cash flow were fulfilled. In 2016, at EUR 19.0 million, free cash flow was positive despite high cash outflows for invest-ments in property, plant and equipment as well as for reduction of prepayments from customers. Thus we were able as in prior year to finance our capital expenditure on property, plant and equipment and on non-current intangible assets from the cash flow generated from our operating activities.
Cash flow from operating activities 20 percent higher than in 2015In 2016, our operating activities provided net cash of EUR 115.6 million, compared with EUR 96.1 million in 2015. This is an increase of 20 percent. This cash flow includes the reduction of prepayments from customers of EUR 20.5 million (2015: EUR 23.3 million) as well as a prepayment to the Wacker Chemie AG pension fund of EUR 11.1 million. In 2015, there was no pre-payment to the pension fund.
Increase in cash flow from investing activitiesFor 2016, we show net cash used for investing activities of EUR 135.5 million after EUR 98.7 million in prior year. This cash flow includes the cash outflow for investments in property, plant and equipment and intangible assets as well as the cash outflow for investments in fixed-term deposits.
The cash outflow for investments in property, plant and equipment increased to EUR 96.7 million in 2016 compared to EUR 58.9 million in 2015. This capital expenditure related to technology required to meet the increasingly complex specifica-tions of our customers.
The net-cash-outflow for investments in fixed-term deposits came to EUR 38.9 million in 2016 compared to EUR 40.0 million in 2015.
No cash flow from financing activities in 2016In 2016, there were no financing activities. In 2015, the cash flow from financing activities was affected by the IPO and repay-ments of loans to Wacker Chemie AG.
Free cash flow
In EUR mn Q1 – Q4 2016 Q1 – Q4 2015 Change
Cash flow from operating activities 115.6 96.1 19.5
Proceeds/payments for items of property, plant, and equipment and intangible assets – 96.6 – 58.7 – 37.9
Free cash flow 19.0 37.4 – 18.4
Proceeds/payments for items of property, plant, and equipment and intangible assets – 96.6 – 58.7 – 37.9
Proceeds/payments for the disposal of securities – 38.9 – 40.0 1.1
Cash flow from investing activities – 135.5 – 98.7 – 36.8
53ANNUAL REPORT 2016
Combined management report • Financial position and financial performance

Financial management
Principles and objectives
The aim of financial management at Siltronic is to optimize cash flows and ensure that currency effects are hedged in accordance with our policy. Derivatives are used exclusively to hedge cash inflows and outflows resulting from receivables and liabilities. As of December 31, 2016, 40 percent of assets were financed from equity and 60 percent from liabilities.
As the Group’s parent company, Siltronic AG is significantly involved in the financing of its subsidiaries. Financing is managed from the perspective of the Group.
Financing instruments not reported on the statement of financial positionSiltronic’s use of sources of financing that are not reported on the statement of financial position is negligible (e.g. non-re-course factoring).
Net financial assets of EUR 175.0 millionBecause of the positive free cash flow of EUR 19.0 million in 2016, Siltronic had net financial assets of EUR 175.0 million as of December 31, 2016 (December 31, 2015: EUR 155.9 million).
The fixed-term deposits have a lifetime until 2017.
The financial liabilities are non-current liabilities based on a granted loan of the minority shareholder of SSW.
Net financial assets
In EUR mn Dec. 31, 2016 Dec. 31, 2015 Change
Financial liabilities – 40.4 – 38.6 – 1.8
Cash and cash equivalents 136.4 154.5 – 18.1
Fixed-term deposits 79.0 40.0 39.0
Net financial assets (+) / net financial debt (–) 175.0 155.9 19.1
ROCE of 3.7 percentROCE for 2016 is based on EBIT of EUR 27.0 million (2015: EUR 2.7 million). In 2015, capital employed came to EUR 743.6 mil-lion. In 2016, it decreased by EUR 19.9 million to EUR 723.7 million primarily because of the reduction in non-current assets. The dominant factor in the improvement in ROCE, which advanced from 0.4 percent to 3.7 percent, was the clear improvement in EBIT.
Liquidity management
Our aim is to pool Group companies’ surplus liquidity and, ensur-ing solvency at all times, to optimally allocate this money within the Group or invest it externally. For this purpose, we use a treasury management system that provides us with an overview of each subsidiary’s cash status at all times.
Summary of financial position
In 2016, we continued to improve our financial position due to a clearly positive free cash flow. The net financial assets of EUR 175.0 million provide a solid basis for our short- and medium-term growth strategy.
Limitation of financial risk
We reduce our financial risk by pursuing a hedging strategy in which we use forward transactions, swaps and options to limit Siltronic’s currency risk. The hedging costs are recognized in accordance with the IFRS rules on hedge accounting.
The core components of our policy for limiting financial risk are the clear definition of process responsibility, multi-level approval processes, and risk assessments.
Analysis of capital expenditure
We mainly invest cash flow from operating activities in existing factories in order to automate and optimize production and to increase yields. In 2016, our largest items of capital expenditure were the new pulling hall at our factory in Freiberg and new crystal pullers in Freiberg and Singapore.
54 ANNUAL REPORT 2016
Combined management report • Financial position and financial performance

In addition to the information on the Siltronic Group, we report on the performance of Siltronic AG. The annual financial state-ments of Siltronic AG are prepared in accordance with the pro-visions of the German Commercial Code (HGB). The complete set of statements is published separately.
As the parent company of the Siltronic Group, Siltronic AG is in charge of generic strategic management as well as allocation of resources, funding, and communications with the capital mar-kets and shareholders.
Siltronic AG is an operating company; it has production facilities in Burghausen and Freiberg, and it also has a site in Taiwan. Wafers and semi-finished goods are manufactured at the pro-duction facilities. The semi-finished goods are sold to subsidiar-ies and the wafers to end customers, provided the latter are located in Europe or Taiwan. In other countries, the wafers are sold through international subsidiaries. In 2015, Siltronic AG had also sold wafers in a number of other Asian countries. These sales are now handled by the subsidiary Siltronic Singapore Pte. Ltd.
Results of operations of Siltronic AG in accordance with the HGB
Change
in EUR mn 2016 2015 Amount in %
Sales 667.5 830.8 – 163.3 – 19.7
Changes in inventories and other own work capitalized – 0.6 – 1.3 0.7 53.8
Total operating output 666.9 829.5 – 162.6 – 19.6
Cost of materials – 305.5 – 449.8 144.3 – 32.1
Staff costs – 209.3 – 212.4 3.1 – 1.5
Depreciation, amortization, and impairment – 49.2 – 51.7 2.5 – 4.8
Other net operating expenses and income – 121.5 – 170.8 49.3 –28.9
EBIT – 18.6 – 55.2 36.6 – 66.3
EBITDA 30.6 – 3.5 34.1 –
Interest income/expense – 3.7 – 16.9 13.2 – 78.1
Result before income taxes – 22.3 – 72.1 49.8 – 69.1
Income taxes – 0.4 – 0.7 0.3 – 42.9
Net loss for the year – 22.7 – 72.8 50.1 – 68.8
Withdrawal from capital reserves 22.7 72.8 – 50.1 – 68.8
Distributable profit 0.0 0.0 0.0 –
The decrease in sales of EUR 163.3 million in 2016 is due to the changes to the sales structure. This also impacted on the regional breakdown of sales, which was as follows: Asia 58 percent (2015: 65 percent), Europe 25 percent (2015: 19 percent), North/South America 15 percent (2015: 14 percent), rest of the world 2 percent (2015: 2 percent).
The change to the sales structure also affected the cost of mate-rials because it no longer includes the purchase of the wafers
that are no longer sold through Siltronic AG. As marketing and sales expenses for these wafers also ceased to apply, the change to the sales structure did not have a negative impact on Siltronic AG’s net loss for the year.
The cost-of-materials ratio, which is the cost of materials in pro-portion to total operating output, was 46 percent in 2016. This ratio improved by 8 percentage points year on year due to the changed sales structure.
Siltronic AG
55ANNUAL REPORT 2016
Combined management report • Siltronic AG
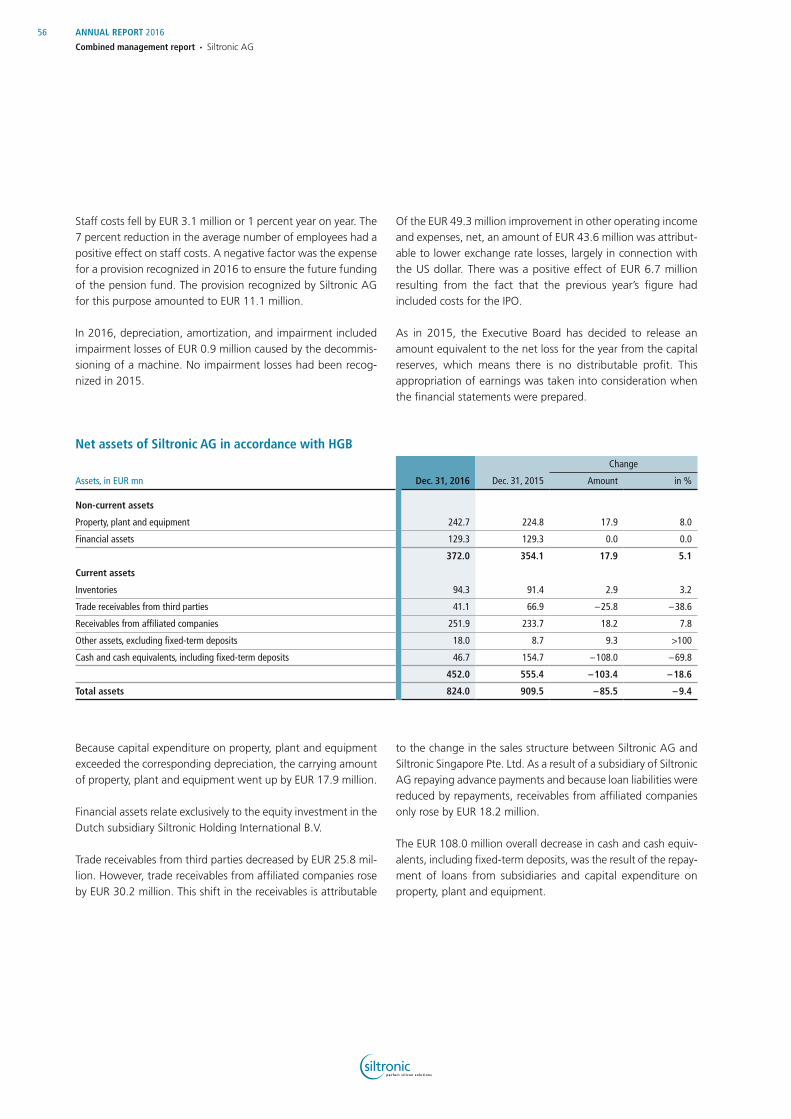
Staff costs fell by EUR 3.1 million or 1 percent year on year. The 7 percent reduction in the average number of employees had a positive effect on staff costs. A negative factor was the expense for a provision recognized in 2016 to ensure the future funding of the pension fund. The provision recognized by Siltronic AG for this purpose amounted to EUR 11.1 million.
In 2016, depreciation, amortization, and impairment included impairment losses of EUR 0.9 million caused by the decommis-sioning of a machine. No impairment losses had been recog-nized in 2015.
Of the EUR 49.3 million improvement in other operating income and expenses, net, an amount of EUR 43.6 million was attribut-able to lower exchange rate losses, largely in connection with the US dollar. There was a positive effect of EUR 6.7 million resulting from the fact that the previous year’s figure had included costs for the IPO.
As in 2015, the Executive Board has decided to release an amount equivalent to the net loss for the year from the capital reserves, which means there is no distributable profit. This appropriation of earnings was taken into consideration when the financial statements were prepared.
Net assets of Siltronic AG in accordance with HGB
Assets, in EUR mn Dec. 31, 2016 Dec. 31, 2015
Change
Amount in %
Non-current assets
Property, plant and equipment 242.7 224.8 17.9 8.0
Financial assets 129.3 129.3 0.0 0.0
372.0 354.1 17.9 5.1
Current assets
Inventories 94.3 91.4 2.9 3.2
Trade receivables from third parties 41.1 66.9 – 25.8 – 38.6
Receivables from affiliated companies 251.9 233.7 18.2 7.8
Other assets, excluding fixed-term deposits 18.0 8.7 9.3 >100
Cash and cash equivalents, including fixed-term deposits 46.7 154.7 – 108.0 – 69.8
452.0 555.4 – 103.4 – 18.6
Total assets 824.0 909.5 – 85.5 – 9.4
Because capital expenditure on property, plant and equipment exceeded the corresponding depreciation, the carrying amount of property, plant and equipment went up by EUR 17.9 million.
Financial assets relate exclusively to the equity investment in the Dutch subsidiary Siltronic Holding International B.V.
Trade receivables from third parties decreased by EUR 25.8 mil-lion. However, trade receivables from affiliated companies rose by EUR 30.2 million. This shift in the receivables is attributable
to the change in the sales structure between Siltronic AG and Siltronic Singapore Pte. Ltd. As a result of a subsidiary of Siltronic AG repaying advance payments and because loan liabilities were reduced by repayments, receivables from affiliated companies only rose by EUR 18.2 million.
The EUR 108.0 million overall decrease in cash and cash equiv-alents, including fixed-term deposits, was the result of the repay-ment of loans from subsidiaries and capital expenditure on property, plant and equipment.
56 ANNUAL REPORT 2016
Combined management report • Siltronic AG

Financial position of Siltronic AG in accordance with HGB
Equity and liabilities, in EUR mn Dec. 31, 2016 Dec. 31, 2015
Change
Amount in %
Equity 503.0 525.7 – 22.7 – 4.3
Provisions
Pension provisions 109.8 109.2 0.6 0.5
Other provisions 92.7 72.3 20.4 28.2
202.5 181.5 21.0 11.6
Liabilities
– Trade payables to third parties 22.5 22.0 0.5 2.3
– To affiliated companies 84.5 160.9 – 76.4 – 47.5
Other liabilities 11.5 19.4 – 7.9 – 40.7
118.5 202.3 – 83.8 – 41.4
Total equity and liabilities 824.0 909.5 – 85.5 – 9.4
As of the reporting date, 61 percent of assets were financed from equity and 39 percent from liabilities. The equity ratio increased by 3 percentage points year on year.
The EUR 20.4 million rise in other provisions is attributable to the provision recognized in 2016 to ensure the security of the future funding of the pension fund and to increased personnel provisions.
Liabilities to affiliated companies dropped by EUR 76.4 million. This is primarily due to Siltronic AG repaying loans to subsidiar-ies in a total amount of EUR 59.8 million.
Net financial assets came to EUR 154.8 million as of December 31, 2016, compared with EUR 207.1 million a year earlier. This equates to a reduction of EUR 52.3 million and relates to free cash flow and cash flow from financing activities.
Siltronic AG’s cash flow from operating activities amounted to EUR 20.6 million in 2016 (2015: EUR 22.5 million). Cash pay-ments for property, plant and equipment and for intangible assets came to EUR 73.3 million, compared with EUR 39.1 mil-lion in 2015. The high volume of cash payments for property, plant and equipment resulted in free cash flow for 2016 of EUR – 52.8 million (2015: EUR –16.6 million).
In the year under review, Siltronic AG repaid loans in an amount of EUR 59.8 million that had been granted to it by subsidiaries.
Siltronic AG funded net disbursements by using its own cash and cash equivalents and by selling fixed-term deposits.
Opportunities and risks
The business performance of Siltronic AG is essentially subject to the same risks and opportunities as that of the Siltronic Group. Siltronic AG generally participates in the risks of its equity investments and subsidiaries in proportion to its shareholding. The valuation of the equity investments is particularly dependent on the risks presented in the risk report. As the parent company of the Siltronic Group, Siltronic AG is part of the groupwide risk management system.
Outlook
The expectations for the business performance of Siltronic AG in 2017 are largely identical to those for the business perfor-mance of the Siltronic Group, which are described in detail in the outlook for the Group.
57ANNUAL REPORT 2016
Combined management report • Siltronic AG
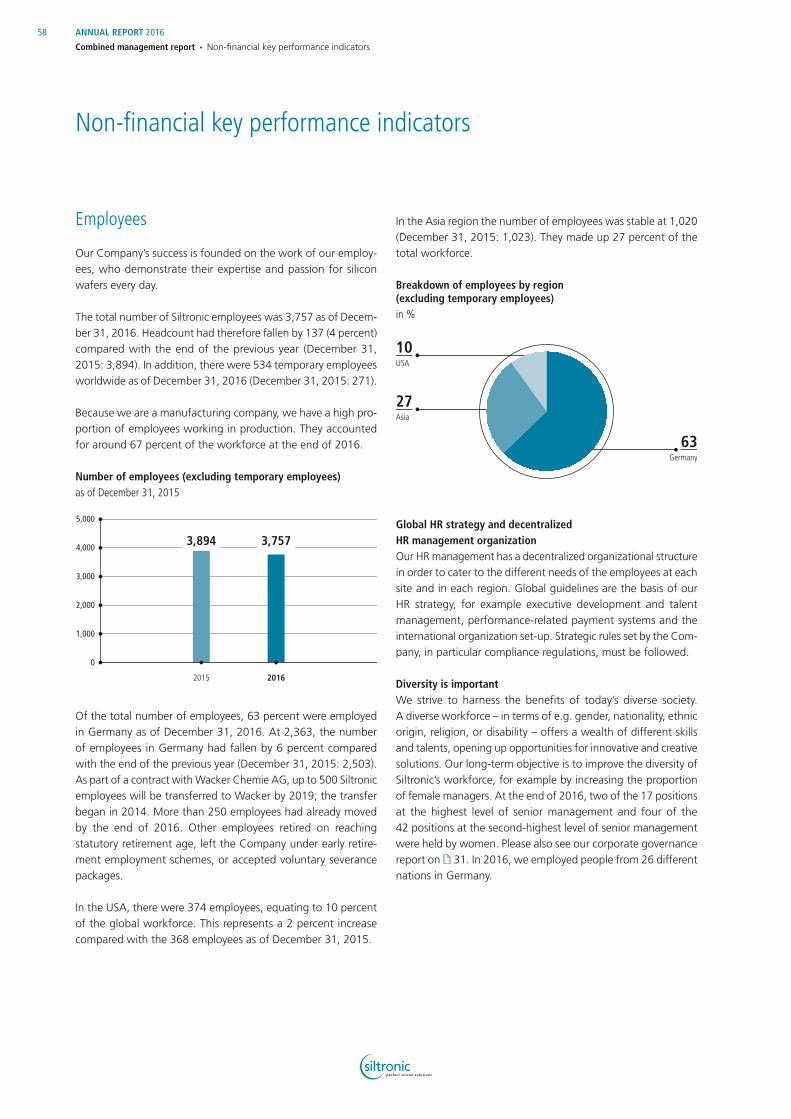
Employees
Our Company’s success is founded on the work of our employ-ees, who demonstrate their expertise and passion for silicon wafers every day.
The total number of Siltronic employees was 3,757 as of Decem-ber 31, 2016. Headcount had therefore fallen by 137 (4 percent) compared with the end of the previous year (December 31, 2015: 3,894). In addition, there were 534 temporary employees worldwide as of December 31, 2016 (December 31, 2015: 271).
Because we are a manufacturing company, we have a high pro-portion of employees working in production. They accounted for around 67 percent of the workforce at the end of 2016.
Of the total number of employees, 63 percent were employed in Germany as of December 31, 2016. At 2,363, the number of employees in Germany had fallen by 6 percent compared with the end of the previous year (December 31, 2015: 2,503). As part of a contract with Wacker Chemie AG, up to 500 Siltronic employees will be transferred to Wacker by 2019; the transfer began in 2014. More than 250 employees had already moved by the end of 2016. Other employees retired on reaching statutory retirement age, left the Company under early retire-ment employment schemes, or accepted voluntary severance packages.
In the USA, there were 374 employees, equating to 10 percent of the global workforce. This represents a 2 percent increase compared with the 368 employees as of December 31, 2015.
In the Asia region the number of employees was stable at 1,020 (December 31, 2015: 1,023). They made up 27 percent of the total workforce.
Global HR strategy and decentralized HR management organizationOur HR management has a decentralized organizational structure in order to cater to the different needs of the employees at each site and in each region. Global guidelines are the basis of our HR strategy, for example executive development and talent management, performance-related payment systems and the international organization set-up. Strategic rules set by the Com-pany, in particular compliance regulations, must be followed.
Diversity is importantWe strive to harness the benefits of today’s diverse society. A diverse workforce – in terms of e.g. gender, nationality, ethnic origin, religion, or disability – offers a wealth of different skills and talents, opening up opportunities for innovative and creative solutions. Our long-term objective is to improve the diversity of Siltronic’s workforce, for example by increasing the proportion of female managers. At the end of 2016, two of the 17 positions at the highest level of senior management and four of the 42 positions at the second-highest level of senior management were held by women. Please also see our corporate governance report on / 31. In 2016, we employed people from 26 different nations in Germany.
Non-financial key performance indicators
Number of employees (excluding temporary employees)as of December 31, 2015
5,000
4,000
3,000
2,000
1,000
0
2015
3,894
2016
3,757
Breakdown of employees by region (excluding temporary employees)in %
27Asia
63Germany
10USA
58 ANNUAL REPORT 2016
Combined management report • Non-financial key performance indicators
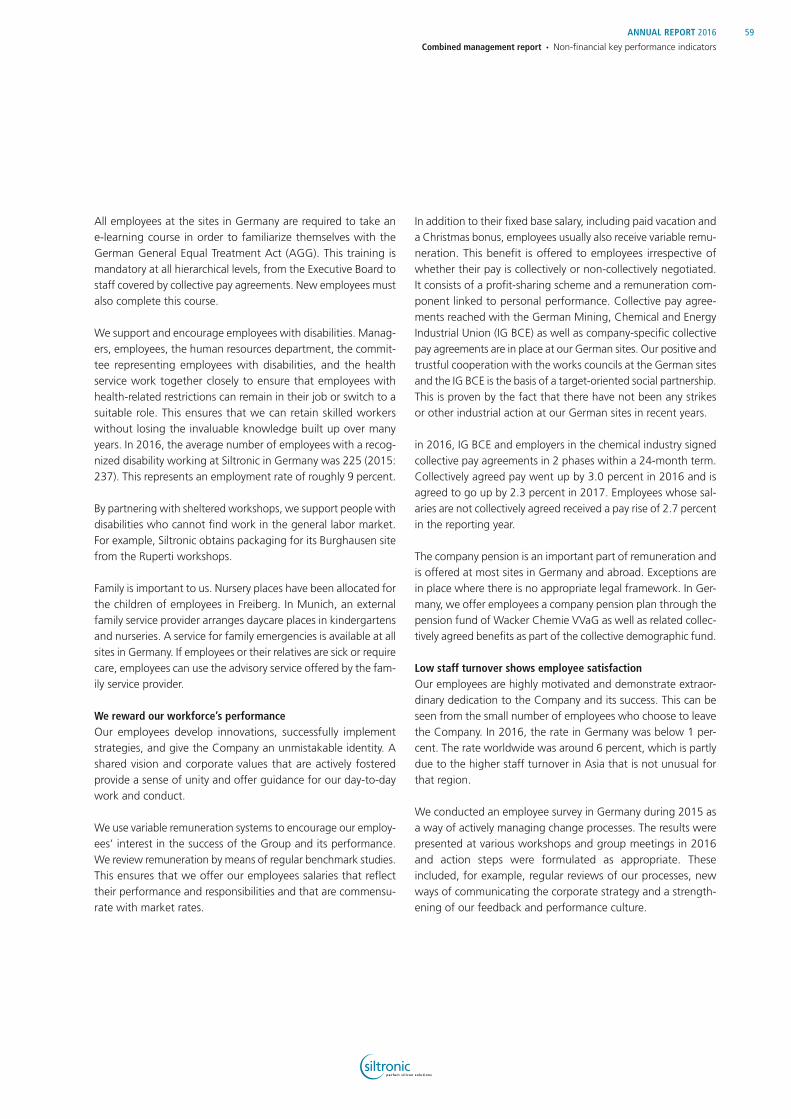
All employees at the sites in Germany are required to take an e-learning course in order to familiarize themselves with the German General Equal Treatment Act (AGG). This training is mandatory at all hierarchical levels, from the Executive Board to staff covered by collective pay agreements. New employees must also complete this course.
We support and encourage employees with disabilities. Manag-ers, employees, the human resources department, the commit-tee representing employees with disabilities, and the health service work together closely to ensure that employees with health-related restrictions can remain in their job or switch to a suitable role. This ensures that we can retain skilled workers without losing the invaluable knowledge built up over many years. In 2016, the average number of employees with a recog-nized disability working at Siltronic in Germany was 225 (2015: 237). This represents an employment rate of roughly 9 percent.
By partnering with sheltered workshops, we support people with disabilities who cannot find work in the general labor market. For example, Siltronic obtains packaging for its Burghausen site from the Ruperti workshops.
Family is important to us. Nursery places have been allocated for the children of employees in Freiberg. In Munich, an external family service provider arranges daycare places in kindergartens and nurseries. A service for family emergencies is available at all sites in Germany. If employees or their relatives are sick or require care, employees can use the advisory service offered by the fam-ily service provider.
We reward our workforce’s performance Our employees develop innovations, successfully implement strategies, and give the Company an unmistakable identity. A shared vision and corporate values that are actively fostered provide a sense of unity and offer guidance for our day-to-day work and conduct.
We use variable remuneration systems to encourage our employ-ees’ interest in the success of the Group and its performance. We review remuneration by means of regular benchmark studies. This ensures that we offer our employees salaries that reflect their performance and responsibilities and that are commensu-rate with market rates.
In addition to their fixed base salary, including paid vacation and a Christmas bonus, employees usually also receive variable remu-neration. This benefit is offered to employees irrespective of whether their pay is collectively or non-collectively negotiated. It consists of a profit-sharing scheme and a remuneration com-ponent linked to personal performance. Collective pay agree-ments reached with the German Mining, Chemical and Energy Industrial Union (IG BCE) as well as company-specific collective pay agreements are in place at our German sites. Our positive and trustful cooperation with the works councils at the German sites and the IG BCE is the basis of a target-oriented social partnership. This is proven by the fact that there have not been any strikes or other industrial action at our German sites in recent years.
in 2016, IG BCE and employers in the chemical industry signed collective pay agreements in 2 phases within a 24-month term. Collectively agreed pay went up by 3.0 percent in 2016 and is agreed to go up by 2.3 percent in 2017. Employees whose sal-aries are not collectively agreed received a pay rise of 2.7 percent in the reporting year.
The company pension is an important part of remuneration and is offered at most sites in Germany and abroad. Exceptions are in place where there is no appropriate legal framework. In Ger-many, we offer employees a company pension plan through the pension fund of Wacker Chemie VVaG as well as related collec-tively agreed benefits as part of the collective demographic fund.
Low staff turnover shows employee satisfactionOur employees are highly motivated and demonstrate extraor-dinary dedication to the Company and its success. This can be seen from the small number of employees who choose to leave the Company. In 2016, the rate in Germany was below 1 per-cent. The rate worldwide was around 6 percent, which is partly due to the higher staff turnover in Asia that is not unusual for that region.
We conducted an employee survey in Germany during 2015 as a way of actively managing change processes. The results were presented at various workshops and group meetings in 2016 and action steps were formulated as appropriate. These included, for example, regular reviews of our processes, new ways of communicating the corporate strategy and a strength-ening of our feedback and performance culture.
59ANNUAL REPORT 2016
Combined management report • Non-financial key performance indicators

High priority given to employee developmentWe launched a talent management process back in 2013 in order to safeguard our long-term success. During the annual talent management cycle, all senior managers and employees whose salaries are not collectively agreed are assessed on the basis of standardized criteria during departmental and then interdepartmental meetings. This provides the basis for the annual staff appraisal interviews, in which employees and their line managers decide on development activities. Our aim in tak-ing this approach is to be able to fill vacancies for high-level positions internally in the medium and long term.
We attach high priority not only to executive development but also to the development of our skilled technical staff and all employees. Employees discuss at least once a year achieved tar-gets, give feedback and determine development activities, if applicable, with their line managers during staff appraisal inter-views. In 2016, our employees in Germany, at all levels, com-pleted around 16,700 e-learning courses (2015: around 14,000); around 2,000 participants attended seminars, continuing pro-fessional development activities, and conferences or received individual tuition (2015: 1,900).
Graduate program for encouraging the next generation of scientistsThe second graduate program initiated in 2015, started in 2016. Our aim is to attract talented science graduates to our Company and give them the opportunity to train for a future managerial role. Besides on-the-job training, the program includes seminars on management topics, communications skills, and teamwork. Participants are supervised by mentors during the 18-month program.
Vocational training helps to secure a long-term supply of skilled workersIn 2016, as a way of responding to the demographic shift, we teamed up with the vocational training center of Wacker Chemie AG to launch a training program for the technical trades.
Health management organization offers employees a range of benefitsTo help us remain innovative and competitive, our employees can access a variety of services through Wacker Chemie’s health management organization. We want to prevent back problems and cardiovascular disease among our employees, strengthen their mental resilience, offer work that is appropriate to their age, and find suitable jobs for employees with health problems.
To this end, the health service has offered check-ups for middle managers aged 45 or older at all German sites since 2012. Besides organ screening, advice on dealing with psychological stress is also available.
Since 2013, Siltronic employees have been taking part in the ‘Fit for your Shift’ program, which is run in cooperation with the German statutory pension insurance scheme. This health pro-gram, which was originally designed for shift workers, shows participants how they can cope better in the long term with the stresses caused by shift work. Because of the Company’s positive experience with the program, it was expanded to other groups of employees working under a lot of stress, including those who do not work shifts.
Research & development
Innovation is key to successThe main driving forces in the semiconductor industry are min-iaturization, cost savings, and efficiency increases. This is expressed in greater processing power and memory capacity and in lower specific electricity consumption, as well as in steadily declining costs per function. Demand for customized wafer solu-tions is also being driven by exceptionally strong growth in spe-cialist applications such as power electronics, sensors, and com-munications electronics. To achieve the goals mentioned above, our customers demand the highest possible technological exper-tise as well as speed in the further development of silicon wafers, which are the most important basic material for the semi-conductor industry.
60 ANNUAL REPORT 2016
Combined management report • Non-financial key performance indicators

Key figures for R&D
2016 2015 2014 2013
R&D expenditure (EUR mn) 66.4 64.4 64.3 58.8
R&D expenditure as a percentage of sales 7.1 6.9 7.6 7.9
R&D grants and subsidies received (EUR mn) 0.6 0.6 0.8 1.6
Intensive development activities are therefore essential in order to keep pace with the rapid rate of development in the semi-conductor market and to maintain our position as a technology leader. Worldwide, we employ more than 400 engineers in pro-cess engineering, metrology, and application engineering. They are based at all of our sites. The Burghausen site is Siltronic’s central development center. Tasks range from product quality assurance and testing and assessment of new technologies and equipment modifications to continuous improvements, line inte-gration, and the qualification of wafers for our customers’ latest technologies.
Intellectual property including around 1,700 registered patents and patent applications in around 300 patent families underpins our great innovative strength and secures our leading techno-logical position in the global market.
Research and development (R&D) expenditure totaled EUR 66.4 million in 2016 (2015: EUR 64.4 million). Grants and subsidies for R&D were not significant in either 2015 or 2016.
Siltronic Inventor AwardWith its Inventor Award, Siltronic regularly honors employees who have come up with technological innovations. In 2016, a team of three employees received the prize in the ‘most import-ant invention’ category. They recognized how to improve prop-erties of wafers. The newly developed pp-epi wafer is harder, has less stress in the crystal lattice and therefore provides a bet-ter overlay performance. The new wafer is already qualified with numerous customers and is proof once again of Siltronic‘s tech-nology leadership.
Strategic collaboration with customers and research institutionsMany of our projects require us to work together closely with our customers on an ongoing basis. We also collaborate with research institutions and universities.
Production and supply chain management
Production
Our production plants are strategically located close to our customers and provide us with good access to highly skilled workers. We make best use of the strengths of our various sites. In Germany we take advantage of the innovation strength of best-in-class scientists and engineers and in Asia of favorable labor costs.
We make silicon crystals using the Czochralski process and turn them into polished wafers. An additional coating known as an epitaxy is added to some of the production volumes.
Siltronic also makes wafers from crystals produced using the float zone technology. These wafers, which are mainly used in power electronics, come with a range of surface properties and have diameters of up to 200mm.
61ANNUAL REPORT 2016
Combined management report • Non-financial key performance indicators
We use standardized processes in all our production sites to deliver our wafers to our customers. We implement process improvements quickly and efficiently by knowledge transfer between our production sites. This enables us to simplify the qualification process by our customers. In addition, we operate our 300mm wafer lines at our German sites in Freiberg and Burghausen as a tightly integrated ‘virtual fab’ with a single cross-site management team.
We optimize our production processes and thus our process capabilities and cost structure on an ongoing basis. Changes are tested, evaluated and implemented by a change management process. A major focus is to secure the quality of our products and the profitability of our lines. State-of-the-art technology is part of our production. This enables us to accommodate our customers’ requirements in a flexible way.
Projects in 2016In 2016, we continued to work on projects that were already started in 2015.
Freiberg, Germany New crystal pullers; Automation of the 300mm wafer line
Burghausen, Germany Automation of the 300mm wafer line
Singapore New crystal pullers
Supply Chain Management
Thanks to our fully integrated logistics processes, we offer added value to our customers in the form of rapid reaction times and a high level of delivery reliability. Our electronically supported supply chain ensures every process – from initial contact to manu-facturing to delivery – is transparent and can be monitored.
We are working continuously to reduce delivery times and optimize our supply chain in terms of costs, speed, and quality. By reusing and recycling, we try to minimize the impact on the environment, particularly with regard to primary packaging for wafers and secondary packaging used for transportation.
Requirements relating to wafer specifications, volumes, and des-tinations for our exports, both to our customers and to Siltronic sites, are subject to constant changes that we analyze regularly and coordinate with our capacities. Global planning of raw materials, semi-finished products, finished wafers, and their shipping to customers takes place in real time using customized systems. We thus offer our customers quality and security of supply.
We use extensive e-business solutions to integrate our external partners into our processes so that we can unlock the full poten-tial of these partnerships. One such solution is a collaboration platform (extranet) that enables us to exchange information with individual partners and thus operate lean and integrated admin-istrative processes.
We primarily use the internationally accepted RosettaNet stan-dard for optimum electronic data interchange with our external partners. In some cases, we also rely on third-party service pro-viders, for example to receive or send EDI formats. We have set up rapid B2B connections to many of our customers, one of the benefits being easier invoicing.
Purchasing and supplier management
We aim to optimize our procurement costs, delivery times, and supplier quality and to quickly harness additional supply poten-tial. Specialist teams manage purchasing processes, such as for the raw materials used in our products, gas and electricity to power our sites around the world, technical materials, and spe-cific services. In 2016, we worked continually on competitively extending our supplier base in procurement markets worldwide. This included identifying and developing new suppliers in our key product areas and gradually ramping them up to supply for full production. We are thus ensuring that we can obtain mate-rials at internationally competitive costs.
62 ANNUAL REPORT 2016
Combined management report • Non-financial key performance indicators
Systematic risk observation is an important tool for Siltronic in the proper assessment of supply relationships. This involves using analyses from rating agencies, our own supplier evalua-tions and, increasingly, direct contact with our partners. Our technical procurement team assessed the risk of 91 and the performance of over 100 suppliers last year.
At EUR 500 million, the volume of procurement orders in 2016 increased year on year (2015: EUR 476 million). Agreed delivery times were complied with by nearly 100 percent of our suppliers. Worldwide, Siltronic placed approximately 56,000 purchase orders. In the area of procurement and logistics, 7 percent of our suppliers account for around 90 percent of our procurement volume.
E-procurement is very important to us. We can look at the entire purchasing process, from sending an inquiry to a supplier to paying the invoice. A key metric is the number of purchase orders created automatically. More than 95,400 different pur-chase order items were requested worldwide in 2016 (2015: around 91,000 items). At our German sites, around 60 percent of the total number for 2016 were created automatically and thereof around 36 percent via eCatalog.
Variation in material price movementsPrice movements relating to our most important materials and raw materials declined again slightly in 2016. We were able to negotiate small reductions on the base prices for specific input materials, however, currency hedging had partly an opposite effect.
Security from long-term agreementsWe have secured our supply of polysilicon for the German sites from Wacker Chemie AG with a long-term supply agreement that runs until 2020. A specific agreement between Wacker and SSW ensures SSW has a stable supply of polysilicon up until 2019. We buy more than 90 percent of our polysilicon of Wacker. On a yearly basis the polysilicon price is renegotiated between Siltronic and Wacker within a determined price range on the basis of the prior year‘s price. As part of our multiple supplier strategy, we can also use alternative sources of supply.
Suppliers play an important role for SiltronicWe highly value direct contact with suppliers and long-term, constructive working relationships. At the same time, it is impor-tant that we are not dependent on individual suppliers. Our supplier management plays a key role. Specialist product group teams with different areas of responsibility manage the Compa-ny’s purchasing processes. These teams tap into new potential in the market and the latest innovations at existing suppliers and then incorporate this expertise into our processes. We can thus safeguard the quality of our products, productivity, and compet-itiveness for the long term.
We have more than 3,400 suppliers worldwide (2015: 3,000). The share of Asian suppliers has increased further. They now account for more than 21 percent.
Our suppliers make a substantial contribution to ensuring that Siltronic can manufacture wafers in the quality required by cus-tomers on the basis of improved processes and a high level of innovation. Also in 2016, four suppliers that went the extra mile in the prior year received the Siltronic Supplier Award 2015 in the categories ‘Excellent Delivery Performance and Business Relationship’ (SGL Carbon), ‘Reliable Product Quality and Supe-rior Customer Orientation’ (ICB GmbH), ‘Excellent Material Per-formance and Global Supply Reliability’ (Shin-Etsu Polymer), and ‘Long-standing Engineering Partnership’ (RENA).
Sales and marketing
We strive for close and long-term collaboration with our cus-tomers. Overall, we supply customers in more than 40 countries. We also run joint development projects with many of our cus-tomers, details of which can be found in the chapter on R&D starting on / 60.
63ANNUAL REPORT 2016
Combined management report • Non-financial key performance indicators
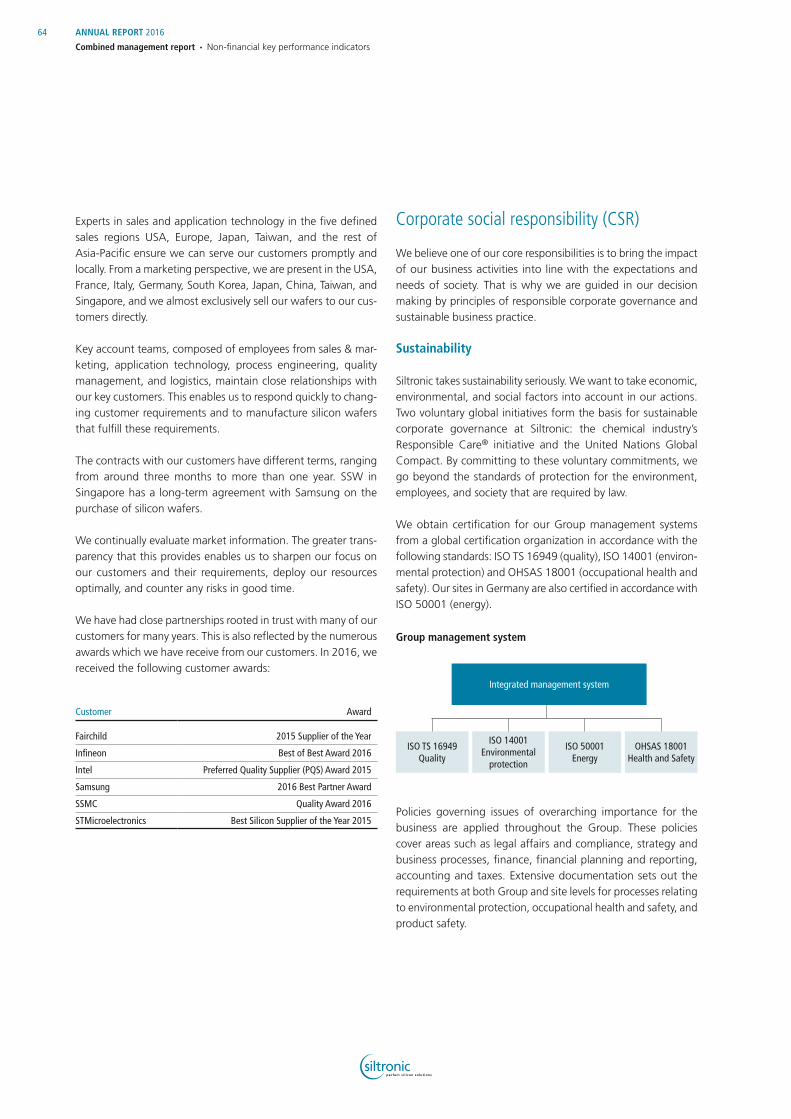
Experts in sales and application technology in the five defined sales regions USA, Europe, Japan, Taiwan, and the rest of Asia-Pacific ensure we can serve our customers promptly and locally. From a marketing perspective, we are present in the USA, France, Italy, Germany, South Korea, Japan, China, Taiwan, and Singapore, and we almost exclusively sell our wafers to our cus-tomers directly.
Key account teams, composed of employees from sales & mar-keting, application technology, process engineering, quality management, and logistics, maintain close relationships with our key customers. This enables us to respond quickly to chang-ing customer requirements and to manufacture silicon wafers that fulfill these requirements.
The contracts with our customers have different terms, ranging from around three months to more than one year. SSW in Singapore has a long-term agreement with Samsung on the purchase of silicon wafers.
We continually evaluate market information. The greater trans-parency that this provides enables us to sharpen our focus on our customers and their requirements, deploy our resources optimally, and counter any risks in good time.
We have had close partnerships rooted in trust with many of our customers for many years. This is also reflected by the numerous awards which we have receive from our customers. In 2016, we received the following customer awards:
Customer Award
Fairchild 2015 Supplier of the Year
Infineon Best of Best Award 2016
Intel Preferred Quality Supplier (PQS) Award 2015
Samsung 2016 Best Partner Award
SSMC Quality Award 2016
STMicroelectronics Best Silicon Supplier of the Year 2015
Corporate social responsibility (CSR)
We believe one of our core responsibilities is to bring the impact of our business activities into line with the expectations and needs of society. That is why we are guided in our decision making by principles of responsible corporate governance and sustainable business practice.
Sustainability
Siltronic takes sustainability seriously. We want to take economic, environmental, and social factors into account in our actions. Two voluntary global initiatives form the basis for sustainable corporate governance at Siltronic: the chemical industry’s Responsible Care® initiative and the United Nations Global Compact. By committing to these voluntary commitments, we go beyond the standards of protection for the environment, employees, and society that are required by law.
We obtain certification for our Group management systems from a global certification organization in accordance with the following standards: ISO TS 16949 (quality), ISO 14001 (environ-mental protection) and OHSAS 18001 (occupational health and safety). Our sites in Germany are also certified in accordance with ISO 50001 (energy).
Policies governing issues of overarching importance for the business are applied throughout the Group. These policies cover areas such as legal affairs and compliance, strategy and business processes, finance, financial planning and reporting, accounting and taxes. Extensive documentation sets out the requirements at both Group and site levels for processes relating to environmental protection, occupational health and safety, and product safety.
Group management system
Integrated management system
ISO TS 16949Quality
ISO 14001Environmental
protection
ISO 50001Energy
OHSAS 18001Health and Safety
64 ANNUAL REPORT 2016
Combined management report • Non-financial key performance indicators
The objectives of our processes are to satisfy customers, ensure we meet our corporate social responsibilities, and safeguard the competitiveness of the Company.
An IT system for sustainability reporting (SPIRIT) is used to cap-ture environmental and energy data, incidents with relevance to the environment or safety, and audits as part of the integrated management system (IMS).
Water
Water is used as drinking water, raw material, and as a solvent or coolant in many technical and chemical processes. Siltronic uses water sparingly and protects natural water resources. We purify our waste water as effectively as possible and recycle the water in our production systems. We make sure that this multi-ple use does not increase our energy consumption or otherwise have a negative impact on the environment.
We continuously streamline the individual process steps and workflows to reduce the volume of raw materials and supplies that we need to use. Despite significant purity requirements, we manage to save water, for example by using recirculated water in processes with lower purity requirements, by ensuring longer bath lifetime, and by recycling reverse osmosis concentrate. We monitor the consumption of ultrapure water in wafer production and achieve a water recycling rate of up to 45 percent.
The town of Freiberg is connected to an extensive network of man-made water channels. The Siltronic facilities make use of surface water as a coolant for the crystal pullers, the water being directed into the plant through one of these water channels. We also process the surface water to create ultrapure water, which can then be used in the manufacture of wafers. Surface water from the Kohlbach man-made water channel is only used to operate the emergency cooling of crystal pullers.
When building the new crystal pulling hall we also invested in a rain storage reservoir with damage prevention at our Freiberg site. In case of need, contaminated wastewater can be separated in a basin made of armored concrete. With this new cutting-edge drainage basin we contribute to further minimizing the risk of contamination of Münzbach and Mulde in case of a damage. Our facility in Portland, in the US state of Oregon, has developed a method for organically breaking down trichloroethylene (TCE) residue in groundwater with the help of microorganisms. This method, which has been approved by the Oregon Department of Environmental Quality (ODEQ), enables us to remove TCE from groundwater almost entirely and thereby achieve drinking water quality. The US Environmental Protection Agency has rec-ognized our biological method for breaking down chlorinated volatile organic compounds (CVOCs), more than 90 percent of which can be removed using this method.
Waste
Our aim is to avoid waste.
Siltronic has developed a slurry recycling method, which is used at all its sites. Slurry is added in the wire-sawing of wafers to ensure clean processing. It consists of a cutting fluid and silicon carbide as cutting material. For recycling purposes, we collect used cutting slurry and then pass it to external recycling com-panies that separate and recover the liquids and solids. The recycling companies recover 85 to 100 percent of the fluid, which is then reused in the production process. The recycling rates for silicon carbide have been up to 75 percent. Any solids that Siltronic cannot make use of again are transferred to other industries and used, for example, in steel smelting as blast fur-nace flux.
Siltronic relies on returnable packaging systems such as the Hybox. We ship 300mm wafers in this type of reusable container, which is designed for transportation of hygienically sensitive products. The volume of Hybox containers is 30 percent lower than that of cardboard packaging. Since the Hybox containers were introduced in 2006, around 74,000 have been shipped. The use of this returnable packaging has enabled us to avoid a total of around 3,700 tonnes of waste between 2006 and 2016.
65ANNUAL REPORT 2016
Combined management report • Non-financial key performance indicators
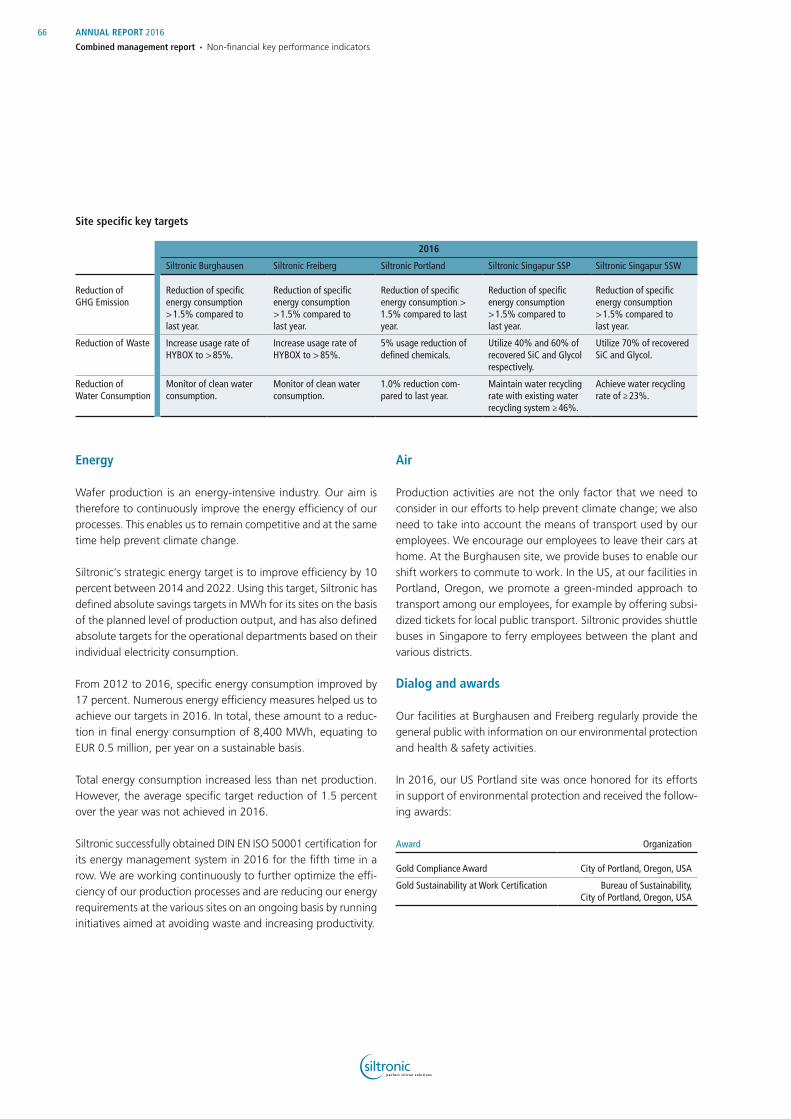
Site specific key targets
2016
Siltronic Burghausen Siltronic Freiberg Siltronic Portland Siltronic Singapur SSP Siltronic Singapur SSW
Reduction of GHG Emission
Reduction of specific energy consumption > 1.5% compared to last year.
Reduction of specific energy consumption > 1.5% compared to last year.
Reduction of specific energy consumption > 1.5% compared to last year.
Reduction of specific energy consumption > 1.5% compared to last year.
Reduction of specific energy consumption > 1.5% compared to last year.
Reduction of Waste
Increase usage rate of HYBOX to > 85%.
Increase usage rate of HYBOX to > 85%.
5% usage reduction of defined chemicals.
Utilize 40% and 60% of recovered SiC and Glycol respectively.
Utilize 70% of recovered SiC and Glycol.
Reduction of Water Consumption
Monitor of clean water consumption.
Monitor of clean water consumption.
1.0% reduction com-pared to last year.
Maintain water recycling rate with existing water recycling system ≥ 46%.
Achieve water recycling rate of ≥ 23%.
Energy
Wafer production is an energy-intensive industry. Our aim is therefore to continuously improve the energy efficiency of our processes. This enables us to remain competitive and at the same time help prevent climate change.
Siltronic‘s strategic energy target is to improve efficiency by 10 percent between 2014 and 2022. Using this target, Siltronic has defined absolute savings targets in MWh for its sites on the basis of the planned level of production output, and has also defined absolute targets for the operational departments based on their individual electricity consumption.
From 2012 to 2016, specific energy consumption improved by 17 percent. Numerous energy efficiency measures helped us to achieve our targets in 2016. In total, these amount to a reduc-tion in final energy consumption of 8,400 MWh, equating to EUR 0.5 million, per year on a sustainable basis.
Total energy consumption increased less than net production. However, the average specific target reduction of 1.5 percent over the year was not achieved in 2016.
Siltronic successfully obtained DIN EN ISO 50001 certification for its energy management system in 2016 for the fifth time in a row. We are working continuously to further optimize the effi-ciency of our production processes and are reducing our energy requirements at the various sites on an ongoing basis by running initiatives aimed at avoiding waste and increasing productivity.
Air
Production activities are not the only factor that we need to consider in our efforts to help prevent climate change; we also need to take into account the means of transport used by our employees. We encourage our employees to leave their cars at home. At the Burghausen site, we provide buses to enable our shift workers to commute to work. In the US, at our facilities in Portland, Oregon, we promote a green-minded approach to transport among our employees, for example by offering subsi-dized tickets for local public transport. Siltronic provides shuttle buses in Singapore to ferry employees between the plant and various districts.
Dialog and awards
Our facilities at Burghausen and Freiberg regularly provide the general public with information on our environmental protection and health & safety activities.
In 2016, our US Portland site was once honored for its efforts in support of environmental protection and received the follow-ing awards:
Award Organization
Gold Compliance Award City of Portland, Oregon, USA
Gold Sustainability at Work Certification Bureau of Sustainability, City of Portland, Oregon, USA
66 ANNUAL REPORT 2016
Combined management report • Non-financial key performance indicators
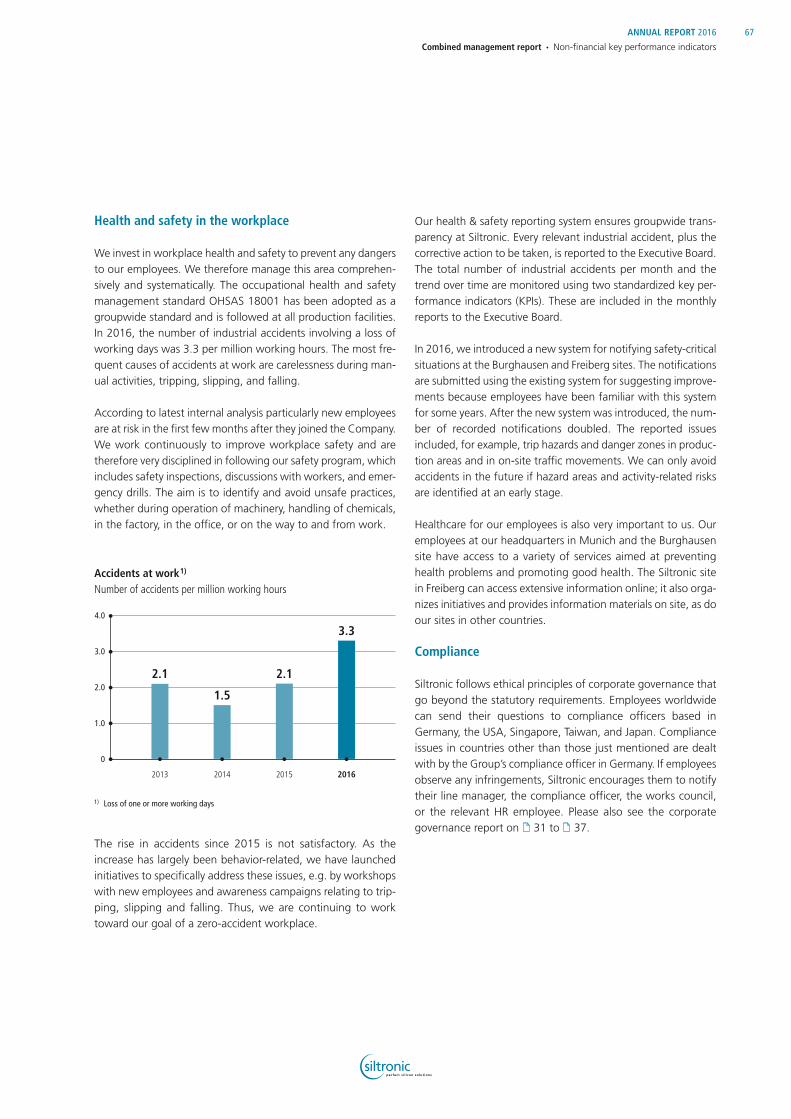
Health and safety in the workplace
We invest in workplace health and safety to prevent any dangers to our employees. We therefore manage this area comprehen-sively and systematically. The occupational health and safety management standard OHSAS 18001 has been adopted as a groupwide standard and is followed at all production facilities. In 2016, the number of industrial accidents involving a loss of working days was 3.3 per million working hours. The most fre-quent causes of accidents at work are carelessness during man-ual activities, tripping, slipping, and falling.
According to latest internal analysis particularly new employees are at risk in the first few months after they joined the Company. We work continuously to improve workplace safety and are therefore very disciplined in following our safety program, which includes safety inspections, discussions with workers, and emer-gency drills. The aim is to identify and avoid unsafe practices, whether during operation of machinery, handling of chemicals, in the factory, in the office, or on the way to and from work.
The rise in accidents since 2015 is not satisfactory. As the increase has largely been behavior-related, we have launched initiatives to specifically address these issues, e.g. by workshops with new employees and awareness campaigns relating to trip-ping, slipping and falling. Thus, we are continuing to work toward our goal of a zero-accident workplace.
Our health & safety reporting system ensures groupwide trans-parency at Siltronic. Every relevant industrial accident, plus the corrective action to be taken, is reported to the Executive Board. The total number of industrial accidents per month and the trend over time are monitored using two standardized key per-formance indicators (KPIs). These are included in the monthly reports to the Executive Board.
In 2016, we introduced a new system for notifying safety-critical situations at the Burghausen and Freiberg sites. The notifications are submitted using the existing system for suggesting improve-ments because employees have been familiar with this system for some years. After the new system was introduced, the num-ber of recorded notifications doubled. The reported issues included, for example, trip hazards and danger zones in produc-tion areas and in on-site traffic movements. We can only avoid accidents in the future if hazard areas and activity-related risks are identified at an early stage.
Healthcare for our employees is also very important to us. Our employees at our headquarters in Munich and the Burghausen site have access to a variety of services aimed at preventing health problems and promoting good health. The Siltronic site in Freiberg can access extensive information online; it also orga-nizes initiatives and provides information materials on site, as do our sites in other countries.
Compliance
Siltronic follows ethical principles of corporate governance that go beyond the statutory requirements. Employees worldwide can send their questions to compliance officers based in Germany, the USA, Singapore, Taiwan, and Japan. Compliance issues in countries other than those just mentioned are dealt with by the Group’s compliance officer in Germany. If employees observe any infringements, Siltronic encourages them to notify their line manager, the compliance officer, the works council, or the relevant HR employee. Please also see the corporate governance report on / 31 to / 37.
Accidents at work 1)
Number of accidents per million working hours
1) Loss of one or more working days
4.0
3.0
2.0
1.0
0
201520142013
2.1
1.5
2.1
2016
3.3
67ANNUAL REPORT 2016
Combined management report • Non-financial key performance indicators

Risk strategy and risk policy
Siltronic is exposed to various risks in connection with its busi-ness activities. That is why we believe effective risk management is an important element of corporate governance for us as a global company. It is also part of our wider process of opportu-nity and risk management aimed at unlocking existing and future potential for success. We define risks as internal and external events that have a negative impact on the achievement of our targets and forecasts. Based on the acceptable aggregate risk, the Executive Board decides which risks we will take in order to seize opportunities available to the Company. Our aim is to detect risks as early as possible, assess them appropriately, and take suitable steps to mitigate or avoid them. The Executive Board regularly reviews and updates the risk strategy, which covers all areas of the Company.
Risk management system
From an organizational perspective, the risk management sys-tem is integrated into the existing decentralized organizational and reporting structure. It is complemented by a multi-stage
process, whose mandatory procedures and criteria for identify-ing, assessing, managing, and reporting risks and for monitoring the system as a whole are defined in a Group manual. The risk management system encompasses all entities. The legally inde-pendent Group companies and the Group functions oversee day-to-day risk management in their own areas. Each month, the designated risk managers are requested to report to head office with regard to risks at their site or in the Group function for which they are responsible. In addition, material risks and risks to the Company’s survival as a going concern must be reported immediately using an ad-hoc reporting process. Corporate Auditing & Risk Management, which reports directly to the Exec-utive Board, is responsible for the processes and systems related to the groupwide early-warning system for risks. This head-office department also coordinates the groupwide recording of all material risks, analyzes the overall situation at Group level, and communicates risks. The Executive Board and the Supervisory Board’s Audit Committee are kept informed about the current risk situation in the Group. There is no formal system for record-ing opportunities within the risk management process. The Executive Board and other senior managers receive monthly reports from the central Financial Planning & Reporting depart-ment on current and expected business performance.
Risk and opportunity report
Risk reporting
Supervisory Board / Audit Committee
Executive Board
Financial planning & reporting process
Regular reporting on topics such as:
• Earnings, rolling forecast, planning• Financial management • Accounts receivable management• Market and competitor analysis• Order situation, etc.
Group functions
Risk management, monitoring, and reporting by the Group functions and sites
Production sites / international subsidiaries
Risk reporting pursuant to the German Control and Transparency of Companies Act (KonTraG)
Corporate Auditing & Risk Management is responsible for the processes and systems relating to risk reporting:
• Recording and systematically evaluation of all material risks across the Group
• Refi ning the risk management system• Ensuring that risk management and the Internal Control System
(IKS) are applied in the Group functions and at the various sites
Reports on the performance and position of the Company
Reporting Ad-hoc risk Monthly risk survey
Risk report (ad-hoc /monthly)
68 ANNUAL REPORT 2016
Combined management report • Risk and opportunity report

The management team then uses this data to discuss, assess, and weigh up the risks and opportunities.
The designated risk managers in our Group functions and at the main sites, along with the Group risk manager, regularly exam-ine processes, procedures, and developments for any risks that might exist. Risks are identified and assessed using standardized risk matrices. We assess the relevant risks for probability of occurrence and the degree of impact on our business activities, financial position, financial performance, and cash flow. We use specific terms to describe the probability that the risks that we have identified will occur. This makes it easier to understand our appraisal of the individual risk areas. The terms indicating the probability of occurrence correspond to the following percent-age ranges:
• Unlikely: less than 25 percent• Possible: 25 percent to 75 percent• Likely: greater than 75 percent.
We also use specific terms to describe what the impact on the Group’s financial position and financial performance would be if the identified risks were to materialize. The terms indicating this impact correspond to the following ranges:
• Low: up to EUR 5 million• Moderate: EUR 5 million up to EUR 25 million• High: more than EUR 25 million
Suitable measures are taken to avoid, reduce the probability of, and lessen the possible financial impact of the risks that are recorded each month or on an ad-hoc basis. These risk contain-ment measures and any relevant early warning indicators are regularly updated and documented centrally, as are the identi-fied residual risks.
The risk management system was checked in 2016 by Group Audit of Wacker Chemie AG.
Internal control system in the consolidated accounting process
The internal control system (IKS) comprises checks that serve to control risk and thus ensure that business activities can proceed properly. These checks are integrated into the operating pro-cesses and incorporate adequate separation of functions, veri-fication by a second person, access and approval procedures, and other steps. The internal control system helps us to achieve the objectives of our business policy by ensuring the correct functioning and efficiency of business processes, compliance with laws and regulations, and the protection of our assets.
With regard to the accounting process, our aim with the internal control system is to apply the accounting rules in the Interna-tional Financial Reporting Standards (IFRS) consistently and to comply with other applicable statutory accounting requirements. This prevents misstatements in the consolidated accounts and in external reporting. The control system is designed so that all transactions are consistently and correctly accounted for at the due time and so that reliable data on the Group’s financial posi-tion and financial performance is always available. To this end, we have drawn up one central interpretation of the IFRS stan-dards and an accounting manual, which is supplemented by more detailed information on important individual issues. Orga-nizational responsibility and the processes for accounting-related tasks are specified in internal written procedures. The Group’s Accounting function monitors compliance with reporting obli-gations centrally. Once approved by the local management team, the reporting packages of the individual companies are posted to a centralized consolidation system. This data is auto-matically validated by the system and checked using reports and analyses, thereby ensuring the integrity of the data and adher-ence to the reporting logic. System-based checks are also built into the consolidation process. Finally, we analyze the Group’s statement of profit or loss and statement of financial position in order to identify trends and anomalies. We keep abreast of changes to financial reporting standards and train the employees who work in this area. For particularly complex aspects of accounting, such as pensions, we bring in external specialists. Our financial systems are protected against misuse by suitable authorization concepts, approval concepts, and access restric-tions. We minimize the risk of data loss and of the failure of accounting-relevant IT systems by performing regular system backups and maintenance.
69ANNUAL REPORT 2016
Combined management report • Risk and opportunity report

We ensure the effectiveness of the checks by monitoring key performance indicators on an ongoing basis as part of the monthly management reporting. Regular reviews and external audits by the independent auditor also take place for each reporting quarter and at the end of the financial year. Each quarter, the management teams of the subsidiaries confirm that all information relevant to the quarterly and annual financial statements has been reported. Internal Audit, acting on behalf of the Executive Board, audits the processes and, in particular, the internal control systems, in the main areas of the Company. In consultation with the Audit Committee, the Executive Board decides on the topics to be audited, following a risk-oriented approach. If necessary, due to a change in circumstances, these topics can be flexibly amended during the year.
The Supervisory Board is also involved in the control system through the Audit Committee. The main aspects monitored by the Audit Committee are the accounting process, the effectiveness of the control system and risk management system, and the audit of the financial statements. It also reviews the documents pertaining to the separate financial statements of Siltronic AG, the consolidated financial statements, and the combined man-agement report relating to these financial statements before discussing them with the Executive Board and the auditor. The auditor assesses the early-warning system for risks during the audit of the annual financial statements.
Material risks
The following summary contains our assessment of the proba-bility of occurrence of the material risks and their possible impact on the Group’s financial position, financial performance, cash flow, and reputation. The statements refer to the period covered by the outlook, i.e. the whole of the 2017 financial year. Risks are assessed on the basis of the net principle, which means that the assessment reflects the management and safeguarding mea-sures that we have taken.
Overall environment
Global economic downturn Our business is heavily dependent on the performance of the global economy. An unexpected slowdown of economic growth, whether globally or in the regions significant to the electronics industry, may mean that our sales do not reach the level we anticipated. Demand for our silicon wafers could decline due to a lack of demand in the market, or we might be forced to lower our prices because of increased competitive pressure. If produc-tion capacity utilization falls, specific manufacturing costs may rise and our earnings would addtionally be adversely affected.
We monitor the economic performance of our main sales mar-kets on an ongoing basis. When economic growth weakens, we make preparations early on in order to flexibly adjust our pro-duction capacities, resources, and inventories in line with cus-tomer demand.
We do not currently see any specific indications that the econo my will perform significantly differently than as described in the outlook. In view of continuing uncertainty amongst others within the European Union and also caused by the possible effect of the presidential election in the USA and by the geo-political situation in the Middle East, and uncertain growth pros-pects in the G20 states, it may be the case that the global econ-omy lags behind current expectations in 2017. We therefore assess the probability of occurrence as possible with a high impact on Siltronic’s earnings performance.
External risk Siltronic is a global company with production facilities in Europe, the USA, and Singapore. Possible natural disasters, political cri-ses, and other disruptions in individual countries or regions in which we operate pose a potential risk for our business and production processes, unit sales of our products, our non-current assets, and thus our financial position and financial perfor-mance.
70 ANNUAL REPORT 2016
Combined management report • Risk and opportunity report

We have drawn up plans and measures for minimizing the impact of external events on the health of our employees and on our business processes. The financial impact of damage to our production facilities caused by natural disasters is partly cov-ered by insurance.
We believe it is unlikely that Siltronic could be severely affected by risks resulting from pandemics, natural disasters, political unrest, or similar incidents. Our production facilities are located in relatively stable and safe regions. Our contingency plans and the global distribution of our production facilities help to miti-gate the impact of local and regional incidents on our business processes. We therefore assume that, even if such incidents were to occur, the impact on the Siltronic Group’s earnings would be moderate.
Industry and market risks
Fierce competition, demand controlled by customers, threat of substitute products, cyclicality of the wafer market The wafer industry is characterized by phases of imbalance between supply and demand resulting from excess production capacities. Such phases regularly have an effect on prices. Fore-casts for unit sales and prices are subject to great uncertainty owing to frequent fluctuations in demand. We may be forced to reduce our unit sales and prices without being able to make any corresponding reduction in our costs. The average selling prices for silicon wafers have generally fallen steadily in recent years because of oversupply and fierce competition. This trend may continue. Our top ten customers account for about two-thirds of our total sales. There has recently been a marked upturn in consolidation activity in the market. Further consoli-dation among our customers could strengthen their control over demand even more and force us to make further price conces-sions. If key customers were to significantly reduce their orders from us, or even terminate them, this may have a considerable impact on our financial position and financial performance.
We lower the risks by increasing flexibility in production and by managing costs rigorously. We adjust our capacities to market conditions and are continuously improving the efficiency of man-ufacturing and business processes in order to reduce the cost base.
We assume that unit sales in 2017 will be higher than in 2016, and our planning and forecasts are based on this scenario. We believe it is possible that unit sales and prices could deviate substantially from our forecast. If unit sales and prices were significantly worse than our current prediction, this would have a high impact on Siltronic’s earnings.
Adaptation of our production facilities to customer requirements and demand Changes in customer demand and/or to the original assumptions about the market might not be reflected in our capital expendi-ture quickly enough or may lead to poor investments. Increased investments lead to greater outflows of funds and, in the future, to higher depreciation charges recognized in profit or loss from operations. Delays to production start-up or capital expenditure projects may mean we are unable to fulfill supply agreements, our sales and earnings may fall, and we could lose market share.
Siltronic takes various steps to counter capital expenditure risk. Capital expenditure projects are only approved on a step-by-step basis. Intensive project planning and control serve to minimize and prevent delays. Capital expenditure risk is also closely linked to changes in customers’ technological requirements. Siltronic counters this risk by closely watching the market and by holding discussions with customers in a systematic manner.
Over the past few years, Siltronic has demonstrated that it can complete capital expenditure projects on schedule, on budget, and in accordance with market conditions. We currently regard the risk of occurrence as unlikely and the impact as low.
71ANNUAL REPORT 2016
Combined management report • Risk and opportunity report

Additional costs from closing production lines or sites Changes to the market and to demand may force us to shut departments, production lines, or sites. This could result in the recognition of impairment losses on non-current assets and closure costs, e.g. severance payments for employees.
We have not yet been able to sell our former production facility in Hikari, Japan. We have written off all carrying amounts for this site and engaged a number of realtors to sell it. There is a risk that we will have to demolish the existing buildings at the Hikari site at our own expense in order to sell the plot of land. We believe we will be able to sell our site in Hikari without having to demolish the buildings.
We have signed an agreement with Wacker Chemie AG under which Wacker Chemie AG has to take on up to 500 of Siltronic AG’s employees, including all associated obligations, at the Burg hausen production facility between 2014 and 2019. The yearly transfer of employees from Siltronic to Wacker Chemie AG has taken place as planned so far. We have not planned any other reductions.
Overall, we rate the risk of an adverse impact as moderate. We consider the probability of occurrence as unlikely.
Product development risk Two of the main characteristics of the semiconductor industry are constant technological progress and ever greater and new demands, and these are also true of our manufacturing pro-cesses. It is possible that we will be unable to respond quickly enough to these changes. We may gauge future market trends incorrectly or customers may not accept our product develop-ments. Our competitors may launch new generations of wafers faster, at lower prices, or with better capabilities. An incorrect assessment of future market trends might have an impact on our position in the market and on our earnings situation. If we are late in developing new products or they do not reflect what the market wants, our sales and earnings will be adversely affected.
We minimize the risks arising from our development work by carrying out certain developments in cooperation with custom-ers. At the same time, we keep a close eye on the market and our competitors, meet with customers and suppliers, and regu-larly attend conferences of significance to our business. Siltronic collaborates with universities and research institutions on its R&D projects in order to incorporate the latest trends into the devel-opment of its technologies and projects. We use systematic project management methods for our development projects. Specific project milestones and clear approval processes help us to detect project risks at an early stage and respond appropri-ately.
Siltronic has long-standing experience in the market and carries out detailed planning that it updates as soon as market trends change. We perceive the risk that we will incorrectly assess mar-ket trends or not respond to them appropriately as possible. If they were to occur in individual application areas, the impact on our financial performance is likely to be moderate.
Procurement market risk
Dependency on individual suppliers Raw materials, energy, other secondary materials, machinery, and spare parts are available from a limited number of suppliers. Complexity and the general pressure on costs will mean increas-ingly close cooperation and mutual dependencies. Quality defects, delays and failures on the part of suppliers, and unex-pected price rises may have a negative impact on production, unit sales, and financial performance, and the necessary certifi-cation for new suppliers can take a long time.
We select our suppliers carefully in order to contain the risk of supplier failures. We define systematic procurement strategies for strategic raw materials and resources each year – and on an ad-hoc basis if required – that include an assessment of procure-ment risk. If procurement risk is considered to be significant, we implement appropriate countermeasures wherever possible, e.g. long-term supply agreements and the establishment of alterna-tive suppliers.
72 ANNUAL REPORT 2016
Combined management report • Risk and opportunity report

Overall, we perceive the risk of supplier failure in respect of the supply of raw materials, other materials, and spare parts to which Siltronic is currently exposed as possible. We regard the potential impact on the Group’s earnings as moderate.
Dependency on related parties We obtain various services and supplies plus a very important raw material for us, polysilicon, from our majority shareholder Wacker Chemie AG. The services and supplies are mainly engi-neering and supply services at the Burghausen site, as well as general Group services such as finance, tax, and IT. If we had to build up capacity for these services ourselves or engage alterna-tive suppliers, it might lead to delays and additional costs. Sup-ply bottlenecks can cause delays in manufacturing and a loss of unit sales.
We have secured the supply services from Wacker Chemie AG on the basis of long-term contracts. Suitable notice periods have been agreed and we obtain polysilicon from Wacker Chemie AG under a long-term agreement.
The price of polysilicon varies depending on economic conditions in the semiconductor industry and on the competitiveness of solar power relative to other forms of electricity generation, taking international trade in photovoltaic systems into consid-eration. A resultant increase in the capacity utilization of poly-silicon production facilities leads to higher polysilicon prices, whereas a rise in overcapacity tends to cause prices to fall.
To minimize failures in the supply of polysilicon, two production facilities of Wacker Chemie AG and other suppliers have been certified. We consider the impact on earnings to be low; the risk of services being terminated is, in our opinion, currently unlikely.
Production risk and product liability risk
Errors can occur during production, storage, and transportation, leading to product defects, personal injury, damage to property, or environmental damage. Our manufacturing process is highly complex and requires state-of-the-art facilities that are continu-ally upgraded in order to meet customers’ high demands in relation to specifications, quality (performance, stability, and continuous improvement), and price. The smallest variances in supplier performance can lead to considerable losses for cus-tomers, along with damages claims, a reduction in orders, and even the termination of customer relationships. In addition, they entail expensive product recalls and recertification processes. The possible resulting harm to our reputation may also adversely affect our future business performance.
We have taken out appropriate insurance for those risks that can be insured. Siltronic places particularly high importance on ensuring high quality standards in order to prevent defects in quality. The Company uses the integrated management system (IMS) along with process control and monitoring systems based on the IMS in order to manage its processes. It defines the pro-cesses and responsibilities and takes account of productivity, quality, adherence to customer specifications, safety, environ-mental protection, and health in equal measure. The IMS is founded not only on statutory requirements but also on national and international standards, such as ISO TS 16949 (quality), ISO 14001 (environment), OHSAS 18001 (health), Responsible Care®, and the Global Compact, which go far beyond the stan-dards required by law. We try to ensure the maximum possible safety at our production facilities by conducting extensive main-tenance checks, regular inspections, and audits. To guarantee the safety of facilities, we carry out wide-ranging safety and risk assessments, from the design stage through to start-up, and identify any necessary improvements. If a damage/loss event occurs, each Siltronic site has emergency response plans in place that govern the cooperation with internal and external emer-gency services and the authorities. To avoid quality risks, we apply Lean Six Sigma methods for prevention, problem-solving, and continuous im prove ment in our production processes.
73ANNUAL REPORT 2016
Combined management report • Risk and opportunity report
There have been no major incidents of loss or damage in recent years. Although it is fundamentally possible for such incidents to occur in connection with production, storage, or transporta-tion of raw materials, products, and waste, we currently believe that the likelihood of a serious loss/damage event is unlikely. However, if such an event did occur, the impact on the Siltronic Group’s earnings could be moderately significant.
Failure to meet efficiency targets and manufacturing cost targets Our budgets are based on expected savings on manufacturing costs and overheads. For example, we are planning various ini-tiatives with which to reduce our use of raw materials and other materials, process costs, and indirect costs (overheads). We have defined the ongoing cost savings for the next few years as part of a cost-cutting program known as the cost roadmap. There is a risk that we will not be able to achieve these cost savings as planned. Firstly, market prices for raw materials and energy fluc-tuate significantly and, secondly, there is a possibility that the initiatives aimed at optimizing manufacturing costs cannot be implemented as planned.
We have already achieved substantial annual cost savings in recent years and are confident that we will continue to do so in the years to come. The cost saving targets were broken down by organizational unit and individually agreed with them. Prog-ress and the degree of target achievement are regularly evalu-ated in our internal monthly cost report, allowing a speedy response to any indications that targets will not be met. We assess the impact of our cost roadmap not being implemented as planned as low and the probability of occurrence as possible.
Legal and regulatory risk
General legal risk Lengthy legal disputes can have a negative impact on our oper-ations, image, and reputation and involve high costs.
In order to counter potential risks that may arise from the many different tax, competition, patent, anti-trust, trade, employ-ment, contractual regulations and laws, Siltronic bases its deci-sions on extensive investigations and legal advice. As a technol-ogy company, Siltronic is particularly reliant on the protection of its intellectual property and thus pursues a patent strategy that supports this. We contain legal risk with legal checks conducted by our Legal department. If required, we call in external legal specialists. Our Intellectual Property department protects and monitors patents, trademarks, and licenses. Before starting research and development projects, we investigate whether existing third-party patents and other rights could hamper us in marketing newly developed products, technologies, and meth-ods. We have compliance programs for limiting the risk of vio-lating legal requirements and laws. The applicable Code of Conduct defines and sets out standards of behavior that are binding for all employees. We raise awareness of such issues in training courses and try to avoid reputational risk.
Owing to the diversity of our business activities in all of the main regions of the world, it is always conceivable that legal risk will occur, for example in the form of legal disputes. At present, we do not have any specific indications of such occurrences that could have a significant impact on our business, but we currently consider the probability of occurrence as possible. We have not currently identified any legal disputes, patent infringements, or other legal risks that could significantly influence our business. If such risks were to occur, their impact on the earnings of the Siltronic Group would be moderate.
Risk relating to environmental laws Siltronic is bound by a range of local environmental protection laws and requirements, primarily in relation to the storage, han-dling, disposal, emission, and registration of hazardous sub-stances. This could expose us to liability for polluting the envi-ronment or could increase our manufacturing costs and, conse-quently, our costs for complying with legal requirements. Changes to environmental laws might generate additional costs at our sites, including those where there is no longer any manu-facturing activity.
74 ANNUAL REPORT 2016
Combined management report • Risk and opportunity report

Siltronic counters this risk by carrying out extensive maintenance routines and regular inspections of its facilities. Siltronic has stated its responsibility regarding health, safety, and the envi-ronment in its mission statement and has communicated prin-ciples and strategies that are binding worldwide. With regard to loss/damage events, it has developed contingency plans that are regularly reviewed and tested and has taken out appropriate insurance cover.
Siltronic Corp., USA is currently a party to administrative pro-ceedings with the Oregon Department of Environmental Quality and the US Environmental Protection Agency in connection with an investigation at a site in Portland and its potential shared responsibility for the contamination of sediment in the Willa-mette river in Portland and Siltronic‘s property. Significant costs for environmental investigations and remediation work have so far been covered by our insurers. Based on Siltronic’s many years of experience with this matter and its communications with the parties involved, particularly the Oregon Department of Environ-mental Quality, the Environmental Protection Agency and the insurance companies, and other property owners in the indus-trial park, the resulting risk is regarded as unlikely. Overall, we consider the probability of occurrence for environmental risk as unlikely and the possible negative impact on the Siltronic Group’s earnings as moderate.
Regulatory riskUnder the German Renewable Energy Sources Act (EEG), there is a limit on the EEG surcharge to be paid by very energy- intensive companies like Siltronic. If we were no longer classified as such because improvements to our energy efficiency meant our electricity use fell below the relevant threshold, we would no longer be able to benefit from the equalization arrangements for energy-intensive companies.
The application to reduce the EEG surcharge in 2017 was pre-sented in 2016 on the basis of prior-year data and was approved at the end of 2016 by the Federal Office of Economics and Export Control. We consider the probability of occurrence as unlikely and the impact on the earnings to be low. The regula-tory risk for subsequent years cannot be assessed at present.
Security of the IT systems; data security
Our IT-supported manufacturing and business processes are exposed to various information security risks. Disruptions, defects, or delays in IT functions and communication systems would therefore have a considerable adverse impact on our financial performance, and reputation.
Siltronic checks its IT constantly and puts a high focus on ensur-ing that the IT-supported manufacturing and business processes can run securely. Our IT security and risk management team has the task of controlling threats in a financially viable manner. The basis is provided by the ISO 27001 standard. Using a risk anal-ysis, we define the requirements for our central systems with regard to the availability, confidentiality, and integrity of data. We have specified these requirements in service level agree-ments (SLAs) with our service providers. We monitor and verify compliance with the SLAs on an ongoing basis.
We have taken appropriate precautions in case of emergencies. Our service provider has set up a global security team that takes organizational and technical measures and runs awareness pro-grams in order to counter problems with the confidentiality, integrity, and availability of data and systems.
There is a general rise in threats to information security. This is particularly true for IT systems used to support business pro-cesses and communications. Disruptions and attacks on IT sys-tems and networks can never be ruled out completely. We regard their probability of occurrence and the resulting risk as unlikely in view of the preventive measures that we have taken. However, if our IT systems suffered a disruption, failure, or attack on a significant scale or for a prolonged period of time, there would be a moderate impact on the Siltronic Group’s earnings.
75ANNUAL REPORT 2016
Combined management report • Risk and opportunity report

HR risk
A lack of committed and qualified specialists and managers can have a negative impact on the Company’s further growth and leading technological position.
We limit HR risk using various HR policies. The two main activi-ties in this area are our talent management process and the associated employee development plans. We also offer a wide range of training and development activities, attractive employee benefits, and performance-based pay. Groupwide succession plans are drawn up for key roles in the Company.
We do not currently see any risk that we will be unable to recruit sufficiently qualified staff. The employee survey that we con-ducted in Germany in 2015 revealed a relatively high level of satisfaction with suggestions for improvement. We believe the overall risk to our personnel requirements is unlikely. If this risk were to materialize, the impact on the Group’s earnings would be low.
Pension risk
In some cases, we are obliged to pay our employees a pension once they retire. The longer life expectancy of beneficiaries, additional obligations resulting from salary and pension increases, and falling discount rates are causing defined benefit liabilities to rise. An increase in defined benefit liabilities, a decrease in plan assets, and possible additions to the pension fund and cover assets will affect the Group’s financial position and financial performance. The bulk of pension entitlements at Siltronic are covered by the pension fund of Wacker Chemie VVaG in Germany and by pension funds in the US. Under IAS 19, actuarial gains and losses and other measurement changes have to be recognized in other comprehensive income immediately and in full. This leads to greater volatility in the level of equity.
The investment portfolio covers a diverse range of asset classes and regions to ensure that the funds earn sufficient interest and to limit investment risk. In order to manage the structure of its assets and liabilities, the pension fund controls and optimizes all of the assets it holds with the aim of achieving the required rate of return while remaining within the specified risk limits. As one of the sponsoring undertakings, Siltronic makes financial con-tributions to the pension fund when required.
Beneficiaries are living for longer and longer, while interest rates in the capital markets have fallen steadily in recent years. In the future, the return on the capital employed is unlikely to be suf-ficient to permanently cover the defined benefit liabilities. We believe that Siltronic will have to make a special payment into the pension fund in Germany in 2017. If this is the case, the impact on the cash flow of the Siltronic Group will be low. However, the probability going forward of our having to make further payments into the pension fund in Germany or the US is possible. More information can be found in note 10 to the consolidated financial statements.
Financial risk
The financial risk to which our operating activities are exposed includes market risk, credit risk, and liquidity risk. Transactions worldwide involving financial instruments and the manage ment of liquidity are carried out centrally by the Corporate Finance & Insurance department.
Credit riskOwing to the use of financial instruments and our large credit balances with banks, we are exposed to the risk of default on the part of financial institutions. We contain our counterparty risk by entering into financial instruments and investments only with investment-grade counterparties and by limiting the indi-vidual transaction volumes and terms to maturity. Due to our rules on counterparty risk, we assume that our risk concentration with respect to default by financial institutions is unlikely. How-ever, if, contrary to expectations, credit risk were to arise due to default by financial institutions, the impact on Siltronic’s earnings would probably be moderate.
76 ANNUAL REPORT 2016
Combined management report • Risk and opportunity report

Consolidation in the semiconductor industry is leading to increasing concentration on customers becoming larger. We use various instruments to reduce the risk of default. Our receivables management team regularly assesses customers’ credit standing. Default risk is contained using defined credit limits and in selected cases bank guarantees. We strive to make our customer base as diversified, balanced, and solid as possible. As in the previous year, there were no significant cases of default in 2015. The probability of occurrence of defaults is, in our view, unlikely. We regard the financial amount of default as low.
Market risk/currency risk Although we generate the bulk of our sales in US dollars and Japanese yen, most of our costs are incurred in EUR and Singa-pore dollars. Exchange rate movements thus affect sales, earn-ings, liquidity, and the measurement of financial assets/liabilities and financial instruments used to hedge currency risk.
We use financial instruments to address and manage the finan-cial requirements and risks that are a necessary part of our oper-ating activities. Hedging is based both on operating activities that have already been posted and on future cash flows. The declining accuracy of forecasts into the future is taken into account with graduated hedge ratios. Having production facili-ties outside the eurozone also helps us to counter currency risk. Translation risk, i.e. measurement risk resulting from the trans-lation of line items in foreign currency on the statement of finan-cial position, is not hedged. An overview of the derivatives in existence as of the reporting date and further information regarding the management of financial risks can be found in the notes to the financial statements under note 16.
From a current perspective, we consider it possible that exchange rate movements will occur in 2017 that deviate substantially from our planning assumptions. If these exchange rate move-ments materialize, they are likely to have a high impact on the Group’s earnings.
Liquidity riskLiquidity risk is managed centrally using rolling liquidity planning and efficient cash management systems. Siltronic counters fund-ing risk by holding liquidity reserves.
Despite higher capital expenditure, Siltronic’s liquidity increased considerably compared with the previous year as a result of the positive cash flow. We regard the risk of occurrence of funding risk and liquidity risk as unlikely. If, contrary to expectations, there were shortages of funding or liquidity, their impact on the Group’s earnings would be low.
Opportunity report
Siltronic can see a variety of opportunities for maintaining its path of successful growth over the next few years. We use var-ious market observation and analysis instruments to identify opportunities at an early stage, for example tools for the con-tinuous structured evaluation of market data, industry data, and competitor data. Close contact with our customers also helps us to assess future opportunities. KPIs (rolling forecasts and reporting of actual figures) enable us to ascertain whether, and to what extent, identified opportunities are fulfilled.
Strategic opportunities of significant importance – such as adjustments to the strategy or possible acquisitions, alliances, and partnerships – are dealt with at Executive Board level as part of the annual strategy development and planning process or, in the case of current matters, during the regular Executive Board meetings. Various scenarios and risk/reward profiles are prepared for these opportunities to provide a basis for decision-making.
77ANNUAL REPORT 2016
Combined management report • Risk and opportunity report

Macroeconomic and industry-specific opportunities
Further increase in incomeSiltronic believes the prospects for increasing income remain good. The region on which we are still concentrating is Asia. Growing prosperity in Asia and the emerging markets of other regions is pushing up demand for higher-quality products in which semiconductors are used. The main focus is on automo-tive and industrial applications as well as smartphones, tablets, and consumer electronics. We want to tap into this growth with innovative products.
As production capacity utilization increases, there is a chance that prices for wafers will rise or at least fall more slowly than they have in the past. Higher prices would be fully reflected in our financial position and financial performance, which means this opportunity is especially important. More favorable exchange rates have a similar effect to price increases. The EUR/US dollar and EUR/Japanese yen exchange rates are crucial to Siltronic. As a rule, silicon wafers are priced in US dollars. The US dollar has appreciated futher in recent months. This trend increases the value of our sales denominated in US dollars, whereas, our mostly Euro-denominated expenses remain unaffected.
Contact with all wafer consumers The customers that buy the products in our portfolio include all of the top 20 consumers of silicon wafers for the semiconductor industry. Growth in demand for silicon wafers for the semicon-ductor industry has been driven by a broad base of applications in recent times. In addition, demand in the smartphone and PC segments developed better than originally expected by the mar-kets. We are anticipating a robust development in demand in the traditional application segments of smartphones, PCs, tab-lets and consumer electronics, while new markets and applica-tion segments in the healthcare, automotive, and industrial sectors are likely to grow disproportionately strongly and thereby lead to rising demand for silicon wafers. Thanks to our broad range of products, we are excellently placed to benefit from these future global trends. Owing to the diversification of our products across a growing number of applications and indus-tries, we anticipate that the semiconductor market will display fewer sudden cyclical fluctuations in demand in the future and will develop into a more stable market.
Strategic and business-performance opportunities
Sound financial positionOur strong financial situation allows us to respond flexibly and quickly to strategic options that open up as a result of develop-ments in the market and the sector. The main areas of capital expenditure are facilities for manufacturing higher-specification wafers and greater automation. In view of current selling prices, there are no plans for significant expansion investment. We are confident of being able to increase our capacity by improving efficiency and eliminating production bottlenecks.
Consolidation of technology leadershipWe firmly believe that we can successfully unlock the further possibilities and opportunities of our industry because we are continually developing new technological solutions for our cus-tomers. The wafers are used for increasingly small structures, known as design rules, which nowadays are just a few nanome-ters in size. For example, we are currently working with our customers on launching the next design rule, commonly referred to as ‘sub 10nm’. We have also already begun developing the subsequent design rule. This will make it possible to manufacture ever more powerful and energy-efficient generations of semi-conductor chips. The use of new materials, such as gallium nitride, is also expected to bring us further opportunities for growth.
Continuous improvement to cost structuresSiltronic has various opportunities for improving cost structures, processes, and productivity. We have identified potential for reducing costs in a number of areas and are already taking steps to harness this potential. These areas include specific costs for auxiliary materials, productivity advances in manufacturing, and the search for new suppliers in order to secure better purchasing terms. Capital expenditure on increased automation of produc-tion is also helping to improve cost structures. Moreover, we are working on making our sites more flexible so that we are better able to respond to changes in the market.
78 ANNUAL REPORT 2016
Combined management report • Risk and opportunity report

The Executive Board’s assessment of overall risk
The Group’s risk profile did not change significantly in the year under review. At the time this report was published, the Execu-tive Board of Siltronic had not identified any individual risks or aggregate risks that could seriously jeopardize the Company’s ability to continue as a going concern.
Risk assessment for 2017
Risk
Probability of occurrence Financial and economic impact
Unlikely Possible LikelyChange from
AR 20151) Low Moderate HighChange from
AR 20151)
Overall environment
Economic downturn • •
External risk • •
Industry and market risk
Competition, demand controlled by customers, threat of substitute products, cyclicality of the wafer market • •
Adaptation of production facilities • •
Additional costs from closures • •
Product development risk • •
Procurement market risk
Dependency on individual companies • •
Dependency on related parties • •
Production risk and product liability risk
Product liability risk and production risk • •
Efficiency targets and manufacturing cost targets • •
Legal and regulatory risk
General legal risk • •
Risk relating to environmental laws • •
Regulatory risk • • â
Security of IT systems and data • •
HR risk • •
Pension risk • á • á
Financial risk
Credit risk financial institutions • • á
Credit risk customers • •
Market risk /currency risk • •
Liquidity risk • •
1) AR: Annual Report unchanged á increased â decreased
79ANNUAL REPORT 2016
Combined management report • Risk and opportunity report

Expected macroeconomic and industry trends
The risks and uncertainties relating to the performance of the global economy continue. The International Monetary Fund (IMF) expects global growth of 3.4 percent in 2017 to be slightly above 2016 (3.1 percent). Thereby the expecations of the IMF for the industrial nations lowered slightly over recent months due to uncertainties relating to new poltiical development. The forecast for emerging markets, however, improved slightly. Over-all, IMF expects a similar development for the large economic industries as in 2016.
The outlook for the eurozone remains at moderate growth of 1.6 percent for 2017.
For Germany, the International Monetary Fund (IMF) is forecast-ing a slightly slowing-down growth of 1.5 percent in 2017 (2016: 1.6 percent). Growth of 2.3 percent is expected for the USA in 2017. The IMF anticipates a steady development in Japan, with a basically unchanged growth of 0.8 percent in 2017 (2016: 0.9 percent) The IMF forecasts grwoth of 6.5 percent for China.
Market research company IHS Markit Technology anticipates that demand for silicon wafers will rise by 4.9 percent, in 2017. The growth is driven by favorable growth forecasts for silicon- based semiconductor units (worldwide sales forecast: +7.4 percent).
Siltronic’s future performance
Siltronic is not planning any significant changes to its corporate objectives or strategy. The short- and long-term focus will remain on increasing our technology leadership, retaining our leading quality position, continuing with our program for operational excellence and cost reductions, and ensuring a high level of profitability and a stable cash flow.
The key financial performance indicators used by the Siltronic Group remain the same as those used in 2016.
These are:• EBITDA margin• ROCE• Free cash flow
From today’s perspective, the most important key financial will develop as follows in 2017.
EBITDA margin will continue to increaseWe expect to be able to improve our EBITDA in 2017. Our EBITDA margin should be at least 20 percent.
The EBITDA margin forecast is based on the following assump-tions, which involve further key financial performance indicators.
Sales of more than EUR 1 billion predicted for 2017From the current perspective (February 2017), the Executive Board of Siltronic anticipates that unit sales of wafers will increase slightly over the year as a whole.
We expect the first quarter of 2017 to be roughly on a par with the very strong fourth quarter of 2016, with the high demand for silicon wafers continuing in the second quarter.
We believe there will be attractive prospects, particularly in solid state drives (SSD) which are based on NAND technology, as well as automotive and industrial applications, and we expect further growth overall.
Outlook
Quellen:IMF (World Economic Outlook, January Update, Release January 16th, 2017)IHS Markit Technology (Semiconductor Silicon Demand Forecast Tool, Q1 – 2017 Update, Release January 13th, 2017)
80 ANNUAL REPORT 2016
Combined management report • Outlook
For 2017, we expect the silicon area to grow in the low single- digit percentage range.
We believe that we will further optimize our product mix in 2017.
At the end of 2016 we had already begun to notify our custom-ers of price increases coming into effect in the first quarter of 2017. Price negotiations so far have been very positive overall and we were able to partly achieve considerable price increases. We expect this trend to continue, at least in the first six months of 2017. However, due to the differing terms of the customer contracts, which range from three months to more than one year, positive effects from the price negotiations are likely to materialize only incrementally in 2017.
Taking into account the above assumptions about volume growth and ASP development, we anticipate that sales for 2017 will be at least EUR 1 billion.
Research and development (R&D) spending will remain at roughly 7 percent of salesTo remain innovative and competitive over the long term, we intend to continue spending around 7 percent of sales in R&D.
Further optimization of cost structuresWe want to continue with our long-standing cost-reduction program, and our plan is to continue reviewing and optimizing our main cost structures on an ongoing basis. For 2017, we expect to realize potential savings of around EUR 20 million to EUR 25 million.
Collectively agreed pay rises and inflation are likely to reduce earnings by approximately EUR 15 million.
Much lower expenses out of currency hedgingExpenses due to currency hedging, which are recognized under other operating income and expense, will be in the range of around EUR 10 million and thus substantially lower than in 2016 (EUR 20.9 million). This is based on the EUR/USD exchange rate averaging out at 1.05 and the EUR/JPY exchange rate at 120 in 2017.
Positive ROCEWe estimate that ROCE in 2017 will be substantially higher than in 2016, approximately at WACC. The projected change in ROCE is influenced not only by the changes in the factors that affect EBITDA but also, by the assumptions described below.
Depreciation, amortization, and impairment on previous year’s levelWe anticipate that depreciation, amortization, and impairment in 2017 will be on the level of 2016. For 2018, we predict a significant decline.
Tax rateThe tax rate will likely be between 20 and 25 percent.
Financial result unchangedThe interest expense is mainly be attributable to the unwinding of the discount on pensions and is likely to be around EUR 10 million.
Capital expenditure slightly above 2016, mainly du to capability requirements and automation projectsDue to a favorable product mix and higher capability require-ments we are planning on capital expenditure of around EUR 100 million in 2017. This also includes capital expenditure for further automation of production sites as well as the ongoing gradual exchange of crystal pullers in Freiberg, Germany.
Positive free cash flow We expect the balance of advance payments received from cus-tomers to decline by approximately EUR 20 million in 2017 with a corresponding adverse impact on cash flow. Despite this effect, we anticipate that free cash flow will be clearly positive in 2017 and by far above the 2016 figure.
Earnings per share will rise significantlyEarnings per share is likely to be significantly higher in 2017.
In view of the economic uncertainty, the actual performance of the Group may vary from that stated in our assumptions, and the difference may be either positive or negative.
81ANNUAL REPORT 2016
Combined management report • Outlook

Overall statement by the Executive Board on expected performance
At the time of preparing the 2016 combined management report, the Executive Board expected Siltronic to continue oper-ating successfully in the market in 2017.
We believe our cost roadmap gives us further opportunities for optimizing costs. Expenses due to currency hedging will also be substantially lower, assuming a Euro/US dollar exchange rate of 1.05 and a Euro/Japanese yen exchange rate of 120. Provided our sales reach at least EUR 1 billion and our EBITDA goes up, we expect a sustainable EBITDA margin of at least 20 percent for 2017.
Forecast for 2017
EBITDA margin at least 20 percent
ROCE substantially higher than in 2016, approximately at WACC
Free cash flow clearly positive, by far above 2016
Sales at least EUR 1bn
R&D unchanged at approximately 7 percent of sales
Cost structures potential savings of around EUR 20 mn to EUR 25 mn
Expenses related to currency hedging around EUR 10 mn
Depreciation, amortization, and impairment on the same level as in 2016
Tax rate between 20 percent and 25 percent
Financial result roughly EUR 10 mn interest expense
Capital expenditure around EUR 100 mn
Earnings per share significantly higher than in 2016
Concluding declaration pursuant to section 312 (3) AktG
Pursuant to section 312 (3) of the German Stock Corporation Act (AktG), the Executive Board of Siltronic AG has produced a dependency report concerning all the Company’s relationships with affiliated entities. This report contains the following decla-ration: ‘We hereby declare that Siltronic AG, for the legal trans-actions and measures listed in the dependency report, received
appropriate consideration in accordance with the circumstances of which we were aware at the time when the legal transactions were concluded or the measures were taken or rejected and that it did not suffer any disadvantages as a result of such measures having been taken or rejected.’
82 ANNUAL REPORT 2016
Combined management report • Outlook
ANNUAL REPORT 2016
Combined management report • Outlook • Concluding declaration

The following remuneration report forms part of the combined management report and the consolidated financial statements, for which an unqualified opinion has been issued.
Executive Board remuneration system
The full Supervisory Board is responsible for determining the individual remuneration of the members of the Executive Board of Siltronic AG on the basis of preparatory work conducted by the Executive Committee.
The main components of the Executive Board remuneration sys-tem are:
Fixed annual salary
The fixed annual salary is paid in equal monthly installments.
Variable salary (success and performance-related bonus)
The amount of the variable bonus, which is paid annually in retrospect, depends on achievement of the standardized targets set by the Supervisory Board for all members of the Executive Board. These targets are based on four KPIs:
• EBITDA margin • Net operating cash flow• Business value contribution • Return on capital employed (ROCE)
The bonus is calculated on the basis of the average of the rate of target achievement for the past financial year and the total rate of target achievement for the two preceding financial years. The theoretical target bonus in the event of 100 percent target achievement in the measurement period is 100 percent of the average gross annual base salary in the final year of the mea-surement period. The bonus for Executive Board members is capped at 200 percent of the average annual base salary in the final year of the measurement period.
The Supervisory Board has the option of increasing or decreasing the calculated theoretical bonus by up to 30 percent in order to take all circumstances and individual performance into account.
The amount of bonus for a particular year is determined by the Company’s Supervisory Board in March of the following year.
Of this bonus, 85 percent is paid with the next fixed salary pay-ment; the remaining 15 percent is paid in the form of Company shares that Siltronic purchases on the stock market in the name of and for the Executive Board member. These shares are subject to a two-year holding period.
In June 2015, Dr. Christoph von Plotho and Mr. Rainer Irle received a special bonus of EUR 120,000 (Dr. Christoph von Plotho) and EUR 84,000 (Mr. Rainer Irle) in recognition of Siltronic AG’s successful IPO. Of these amounts, 50 percent was paid in shares. These shares are also subject to a two-year holding period.
Pension contributions
To provide a basic company pension, the Company and the Executive Board members make a monthly contribution to the pension fund of Wacker Chemie VVaG in accordance with the 1972 general insurance conditions of the pension fund of Wacker Chemie VVaG.
In addition, the Executive Board members acquire entitlements from the Company in accordance with the prevailing version of the company supplementary pension scheme regulations. The pensionable income as defined by the regulations is the agreed fixed annual salary. The benefits provided under this company supplementary pension scheme consist of a retirement pension, early retirement pension, incapacity pension, and surviving dependants’ pension. The pension expense amounts to 12.25 percent of pensionable annual income between 100 per-cent and 150 percent of the applicable annual income limit for the assessment of contributions in the German statutory pension insurance scheme and 15 percent of pensionable annual income above 150 percent of the applicable annual income limit for the assessment of contributions in the German statutory pension insurance scheme. The annual pension benefits are based on the total pension payments made by the Company until the date of the insured event, applying an annuity rate of 18 percent.
In addition, Executive Board members receive from the Company a monthly amount (gross) in the amount of the employer con-tribution to the statutory pension insurance scheme (currently EUR 579.70 gross per month on the basis of the social insurance legislation in force in 2016) to help them build up a private retirement pension.
Remuneration report
83ANNUAL REPORT 2016
Combined management report • Remuneration report

Other material agreements
The Company provides the members of the Executive Board with adequate directors’ and officers’ liability insurance (D&O insur-ance), which has a deductible as required by the German Stock Corporation Act (AktG).
If they leave the Company, the members of the Executive Board are bound by a twelve-month non-compete obligation for which they receive compensation. This non-compete compensation is calculated on the basis of 50 percent of the most recent total annual pay (average for the past three years). Any retirement pension is offset against the non-compete compensation.
The Executive Board service contracts provide for a cap on sev-erance pay that limits any compensation payable in the event of the Executive Board appointment being terminated prematurely without good cause to no more than two years’ total annual remuneration.
Total remuneration of the members of the Executive Board for 2016
The current amount of remuneration for the Executive Board members is shown in the following tables, which are based on the model tables recommended in the German Corporate Gover nance Code.
The following table shows the value of the benefits granted for 2016. The minimum and maximum achievable values are also shown.
Benefits (target values) granted for the reporting year
EUR
Dr. Christoph von PlothoPresident & Chief Executive Officer
Rainer IrleMember of the Executive Board
2016 target
2016 minimum
2016 maximum
2015 target
2016 target
2016 minimum
2016 maximum
2015 target
Fixed remuneration 400,000 400,000 400,000 379,846 280,000 280,000 280,000 258,462
Payment in respect of other accounting periods 1) 0 0 0 12,919 0 0 0 8,021
Fringe benefits 2) 43,139 43,139 43,139 41,244 37,030 37,030 37,030 36,755
Total 443,139 443,139 443,139 434,009 317,030 317,030 317,030 303,238
One-year variable remuneration 3) 0 0 0 79,400 0 0 0 51,900
IPO 0 0 0 120,000 0 0 0 84,000
Multi-year variable remuneration 4) 360,000 156,800 639,600 221,212 252,000 109,760 447,720 154,848
Total 803,139 599,939 1,082,739 854,621 569,030 426,790 764,750 593,986
Pension expenses 5) 58,810 58,810 58,810 59,320 102,910 102,910 102,910 99,899
Total remuneration 861,949 658,749 1,141,549 913,941 671,940 529,700 867,660 693,885
1) This is partial compensation for having waived salary in 2013. Together with the 50 percent payment in 2014 the waived salary of 2013 was fully paid out.2) Fringe benefits largely comprise the use of a company car and social security contributions.3) Pro-rata one-year bonus for the period from January 1 to June 10, 2015 based on the target bonus.4) Pro-rata multi-year remuneration for the period from June 11 to December 31, 2015. ‘Multi-year’ refers to the measurement basis. For 15 percent of the defined gross annual bonus,
the Executive Board members receive Siltronic AG shares with a two-year holding period; the bonus determined using the three-year measurement basis is not affected by subsequent developments once it has been calculated. The minimum and maximum values were calculated on the basis of 100 percent target achievement for 2013 and 2014 and on the basis of a minimum rate of 0 percent and a maximum rate of 200 percent for 2015. The amounts shown for the theoretical minimum and maximum achievable values also reflect the Supervisory Board’s option of increasing or reducing the remuneration at its discretion.
5) Service cost pursuant to IAS 19 arising on entitlements to pensions and other post-retirement benefits.
84 ANNUAL REPORT 2016
Combined management report • Remuneration report

The following table shows the actual remuneration for 2016, comprising fixed remuneration, fringe benefits, variable remu-neration – broken down into one-year and multi-year variable remuneration – and the pension expense.
Actual remuneration for the financial year
EUR
Dr. Christoph von PlothoPresident &
Chief Executive Officer
Rainer IrleMember of the Executive Board
2016 2015 2016 2015
Fixed remuneration 400,000 379,846 280,000 258,462
Payment in respect of other accounting periods 1) 0 12,919 0 8,021
Fringe benefits 2) 43,139 41,244 37,030 36,755
Total 443,139 434,009 317,030 303,238
One-year variable remuneration 3) 0 90,630 0 59,181
IPO 0 120,000 0 84,000
Multi-year variable remuneration 4) 452,400 238,909 316,680 167,236
Total 895,539 883,548 633,710 613,655
Pension expenses 5) 58,810 59,320 102,910 99,899
Total remuneration 954,349 942,868 736,620 713,554
1) This is partial compensation for having waived salary in 2013. Together with the 50 percent payment in 2014 the waived salary of 2013 was fully paid out.2) Fringe benefits include in particular the use of a company car and social security contributions.3) Pro-rata one-year remuneration for the period January 1 to June 10, 2015.4) Pro-rata multi-year remuneration for the period from June 11 to December 31, 2015. ‘Multi-year’ refers to the measurement basis. For 15 percent of the defined gross annual bonus,
the Executive Board members receive Siltronic AG shares with a two-year holding period; the bonus determined using the three-year measurement basis is not affected by subsequent developments once it has been calculated.
5) Service cost pursuant to IAS 19 arising on entitlements to pensions and other post-retirement benefits; this is not part of the allocation in the financial year.
The remuneration paid to former Executive Board members or their surviving dependants amounted to EUR 210,688 in the reporting year (2015: EUR 260,215).
As of December 31, 2016, the defined benefit liability came to EUR 3,536,713 for active Executive Board members (December 31,
2015: EUR 2,686,036) and to EUR 7,402,473 for former Exec-utive Board members or their surviving dependants (December 31, 2015: EUR 6,679,034).
The Executive Board Members do not hold share options, phan-tom stocks or similar instruments.
85ANNUAL REPORT 2016
Combined management report • Remuneration report

Remuneration for Supervisory Board members
The remuneration for the members of the Supervisory Board of Siltronic AG is governed by the Articles of Association of Siltronic AG.
The Articles of Association stipulate fixed annual remuneration for Supervisory Board members of EUR 30,000 (plus VAT).
Due to the additional time and complexity involved in certain functions, the remuneration for the Chairman of the Supervisory Board is multiplied by a factor of 3. A factor of 2 applies for the Deputy Chairman of the Supervisory Board and the chairmen of the committees. The remuneration of committee members is multiplied by a factor of 1.5, with the exception of members of the Conciliation Committee, which has to be formed by law. Membership of this committee does not lead to an increase in annual remuneration. Dual functions and membership of mul-tiple committees are also disregarded, which means that the remuneration of the Supervisory Board chairman and his deputy is not multiplied by any further factors for their committee roles, and Supervisory Board members’ committee memberships are counted only once.
The principle of pro-rata remuneration for Supervisory Board members applies to those joining or stepping down from the Supervisory Board during the year.
Supervisory Board members receive an attendance fee of EUR 2,500 for each physical meeting of the Supervisory Board and its committees that they attend in person. However, the fee is limited to EUR 2,500 per calendar day. Members who attend physical meetings via conference call or video conference or who cast their vote by submitting a written voting form do not receive the attendance fee. If a meeting is only held in the form of a conference call or video conference, the participating members receive a reduced attendance fee of EUR 1,250.
In addition, the Company reimburses Supervisory Board mem-bers for their necessary out-of-pocket expenses, plus applicable VAT, provided they have submitted receipts.
The shareholder representatives on the Supervisory Board who are also Executive Board members or employees at Wacker Chemie AG have waived their remuneration. This waiver only applies for as long as they are employed by Wacker Chemie AG.
The Company provides the members of the Supervisory Board with adequate insurance cover. In particular, the Company takes out directors’ and officers’ liability insurance (D&O insurance) for them.
Supervisory Board remuneration for 2016
The remuneration granted to each member of the Supervisory Board for 2016 can be broken down as follows (excluding any additional VAT paid at 19 percent):
Supervisory Board member
Annual remuneration in EUR
(multiplied by the applicable factor for
special functions)Attendance fee
in EURTotal remuneration
in EUR
Maximilian Baumgartner 30.000,00 10,000.00 40,000.00
Sieglinde Feist 1) – – –
Gebhard Fraunhofer 2) 30.000,00 10,000.00 40,000.00
Dr. Hermann Gerlinger 45.000,00 10,000.00 55,000.00
Karin Gottschalk 2) 30.000,00 10,000.00 40,000.00
Johann Hautz 2) 60.000,00 10,000.00 70,000.00
Bernd Jonas 60.000,00 20,000.00 80,000.00
Gertraud Lauber 2) 30.000,00 10,000.00 40,000.00
Dr. Tobias Ohler 1) – – –
Dr. Franz Richter 30.000,00 10,000.00 40,000.00
Harald Sikorski 2) 45.000,00 20,000.00 65,000.00
Angela Wörl1) – – –
1) Waiver of remuneration as member is both Executive Board member and employee of Wacker Chemie AG.2) These employee representatives on the Supervisory Board and the representatives of the trade unions on the Supervisory Board have declared their willingness
to transfer their compensation to the Hans Boeckler Foundation, in accordance with the guidelines of the Confederation of German Trade Unions (DGB).
86 ANNUAL REPORT 2016
Combined management report • Remuneration report
Composition of subscribed capital (section 289 (4) no. 1 and section 315 (4) no. 1 HGB)The subscribed capital of Siltronic AG amounts to EUR 120 mil-lion and is divided into 30 million no-par-value shares, each with an imputed share of the capital amounting to EUR 4. The shares are registered shares. All the shares are of the same type; each share has the same rights attaching to it and allows one vote at the Annual General Meeting. The Company does not have any treasury shares.
Restrictions on voting rights or the transfer of shares (section 289 (4) no. 2 and section 315 (4) no. 2 HGB)The Executive Board remuneration system specifies that part of the variable remuneration is paid in the form of shares in the Company that the Company purchases in the name of and for the individual Executive Board members. According to their ser-vice contract, Executive Board members are not permitted to sell, pledge, or otherwise dispose of these shares for a lock-up period of two years. Executive Board members still have voting and dividend rights during the lock-up period. For detailed infor-mation about the Executive Board remuneration system, please refer to the remuneration report. We are not aware of any further contractual restrictions on voting rights or the transfer of shares.
The Articles of Association of Siltronic AG do not restrict the transferability of shares. However, there may be restrictions on the shares’ voting rights imposed by the German Stock Corpo-ration Act (e.g. section 136 AktG) or as a consequence of the disclosure requirements pursuant to the German Securities Trad-ing Act (WpHG) being violated. In accordance with section 67 (2) AktG, the parties deemed to be shareholders of Siltronic AG are those parties entered as such in the share register. Pursuant to section 67 (4) AktG, Siltronic AG is entitled to demand infor-mation from the persons entered in the register on whether the shares that are entered as held by them in the register actually belong to them and, if this is not the case, to demand information on who the shares are held for, as required in order to maintain the register. Until this demand is met, the voting rights attaching to the shares are suspended (section 67 (2) sentence 3 AktG).
Shareholdings in the Company that represent more than 10 percent of the voting rights (section 289 (4) no. 3 and section 315 (4) no. 3 HGB)The Company has been notified of the following direct and indirect shareholdings in the Company that represent more than 10 percent of the voting rights:
• Wacker-Chemie Dritte Venture Gesellschaft mit beschränkter Haftung: 49.5 percent (direct)• Wacker Chemie AG: 57.83 percent (of which 8.33 percent direct and 49.5 percent held through Wacker-Chemie Dritte Venture Gesellschaft mit beschränkter Haftung)• Dr. Alexander Wacker Familiengesellschaft mit beschränkter
Haftung: 57.83 percent (held through Wacker Chemie AG and Wacker-Chemie Dritte Venture Gesellschaft mit beschränk-ter Haftung)
Shares with special rights that confer authority to exert control over the Company (section 289 (4) no. 4 and section 315 (4) no. 4 HGB)No shares with special rights that confer authority to exert con-trol over the Company have been issued.
Type of voting right controls in cases where employees hold shares in the Company and do not exercise their control rights directly (section 289 (4) no. 5 and section 315 (4) no. 5 HGB)The employees who hold shares in Siltronic AG exercise their resulting control rights directly in accordance with the statutory provisions and the Articles of Association.
Appointment and removal of members of the Executive Board and amendments to the Articles of Association (section 289 (4) no. 6 and section 315 (4) no. 6 HGB)Pursuant to section 5 of the Articles of Association, the Executive Board of Siltronic AG must consist of a minimum of two persons. In other respects, the Supervisory Board determines the number of Executive Board members. The Supervisory Board appoints one member of the Executive Board as President & Chief Exec-utive Officer. The appointment and removal of members of the Executive Board are governed by section 84 et seq. AktG and section 31 German Codetermination Act (MitbestG).
Disclosures relevant to acquisitions(pursuant to section 289 (4) and section 315 (4) of the German Commercial Code (HGB)) and explanatory report
87ANNUAL REPORT 2016
Combined management report • Disclosures relevant to acquisitions

Changes to the Articles of Association are governed by section 179 et seq. of the German Stock Corporation Act (AktG), which stipulates that all changes to the Articles of Association require a resolution to be adopted by the Annual General Meeting. However, the Supervisory Board is authorized in section 9 (2) of the Articles of Association to make changes that relate solely to the wording. The Supervisory Board is also authorized to amend section 4 (6) of the Articles of Association accordingly after the 2015 Authorized Capital has been utilized or the period for the utilization of the 2015 Authorized Capital has elapsed. Further-more, the Supervisory Board is authorized to amend section 4 (7) of the Articles of Association in accordance with each utili-zation of the 2015 Conditional Capital and after all option and conversion periods have elapsed.
Pursuant to section 179 (2) AktG, resolutions to amend the Articles of Association adopted by the Annual General Meeting require a majority of at least three quarters of the share capital represented during the voting, unless the Articles of Association specify a greater majority. In accordance with article 18 (2) of the Articles of Association, resolutions at the Annual General Meeting are passed by simple majority of the votes cast and by simple majority of the share capital represented in the voting if a majority of the share capital is required, unless the law or the Articles of Association require otherwise. The law requires a greater majority of three quarters of the share capital repre-sented in the voting in several cases, such as when changing the objects of the company (section 179 (2) sentence 2 AktG), cer-tain corporate actions, and the exclusion of shareholders’ pre-emption rights.
Authority of the Executive Board to issue and buy back shares Authorized capital (section 289 (4) no. 7 and section 315 (4) no. 7 HGB)On the basis of a resolution of the Annual General Meeting on June 8, 2015, the Executive Board is authorized, subject to the consent of the Supervisory Board, to increase the Company’s share capital on one or more occasions in the period up to June 7, 2020 by up to a total of EUR 60 million by issuing new reg-istered no-par-value shares for cash or non-cash contributions (2015 Authorized Capital). Shareholders have a pre-emption right, although the Executive Board can exclude this right, sub-ject to the consent of the Supervisory Board, in the cases that are described in more detail in section 4 (6) of the Articles of Association, including, but not limited to:• in order to remove fractional amounts from the pre-emption
right;
• where the issue price of new shares issued for cash during a capital increase is not significantly below the market price of the shares in the Company that are already publicly listed at the time the definitive issue price is set (section 186 (3) sen-tence 4 AktG states that pre-emption rights can be excluded provided the capital increase is no more than 10 percent of the share capital);
• where necessary in order to grant new shares in the Company to holders/beneficial owners of bonds that have been issued or are to be issued by the Company or its subordinate Group companies, when conversion rights or warrants are exercised or to meet conversion obligations, and where necessary to grant holders of conversions rights/warrants or beneficial owners of convertible bonds with conversion obligations a pre-emption right to the same quantity of new shares to which they would have been entitled after exercising their warrants or conversion rights or meeting conversion obliga-tions as shareholders;
• in the event of a capital increase for non-cash contributions; and
• to implement a scrip dividend.
On the basis of a resolution of the Annual General Meeting on June 8, 2015 and subject to the consent of the Supervisory Board, the Executive Board is authorized to issue bearer or reg-istered convertible and/or warrant-linked bonds, profit-sharing rights, and/or income bonds (together: ‘bonds’) in a total amount of up to EUR 750 million on one or more occasions until June 7, 2020 and to grant the holders/beneficial owners of these bonds warrants/conversion rights (including mandatory conver-sion requirements or option obligations) to a maximum of 12.5 million new registered shares that together represent notional share capital of up to EUR 50 million in accordance with the specific terms and conditions of the bonds. The bonds may be issued in return for cash but also for non-cash contributions. If convertible bonds are issued, the holders/beneficial owners of the bonds receive the right to convert them into new shares in the Company in accordance with the specific terms and condi-tions of the bonds. The terms and conditions of the bonds may also specify mandatory conversion on maturity or at an earlier point in time. If warrant-linked bonds are issued, one or more warrants are attached to each bond that entitle or require the holders to buy shares in the Company in accordance with the specific terms and conditions applicable to warrants or that con-tain an issuer’s put option. Shareholders have a pre-emption right to the bonds, but the Executive Board is authorized, subject
88 ANNUAL REPORT 2016
Combined management report • Disclosures relevant to acquisitions

to the consent of the Supervisory Board, to exclude the pre- emption right either wholly or in part in certain cases described in more detail in the resolution adopted by the Annual General Meeting, including but not limited to: • fractional amounts arising from the pre-emption ratio;• where bonds with warrants/conversion rights or with option
obligations/mandatory conversion obligations are issued for cash and are structured such that their issue price is not significantly below their theoretical market value determined according to recognized principles of financial mathematics (section 186 (3) sentence 4 AktG states that pre-emption rights can be excluded provided the capital increase is no more than 10 percent of the share capital);
• where bonds are issued for a non-cash consideration; and• where necessary in order to give the same pre-emption rights
to the holders/beneficial owners of bonds that have previ-ously been issued.
The Executive Board is authorized, subject to the consent of the Supervisory Board and complying with the stipulations of the Annual General Meeting’s resolution, to decide on the further details as regards the issuance and terms of issue of the bonds and their conditions.
To enable the Company to service the aforementioned bonds, the Annual General Meeting of June 8, 2015 conditionally increased the Company’s share capital by up to EUR 50 million through the issue of up to 12.5 million new registered shares (Conditional Capital 2015). The new shares are issued at the conversion or warrant prices to be determined in accordance with the authorization from the Annual General Meeting.
In accordance with the resolution of the Annual General Meet-ing on May 7, 2015, the Executive Board is authorized pursuant to section 71 (1) no. 8 AktG to purchase treasury shares equat-ing to up to a total of 10 percent of the existing share capital at the time the resolution was adopted or at the time the authori-zation is exercised, whichever is the lower. The share capital at the time the resolution was adopted amounted to EUR 100 mil-lion. The authorization is valid until May 6, 2020. At the discre-tion of the Executive Board, the treasury shares may be pur-
chased through the stock exchange, by way of a public purchase offer made to all shareholders, or by way of a public invitation to shareholders to tender their shares. The Annual General Meeting’s authorization sets out different requirements for the individual purchase types, particularly with regard to the pur-chase consideration. The authorization may be exercised on one or more occasions, for the entire amount or for partial amounts. Subject to the consent of the Supervisory Board, the Executive Board is permitted to sell the treasury shares purchased in accor-dance with this authorization on the stock exchange, to make an offer to all shareholders in proportion to their shareholding, or to use these treasury shares for any legally permitted purpose. In particular, they may be sold in return for a non-cash capital consideration (in the context of business combinations, to acquire entities or parts of an entity) or for cash. However, the treasury shares may also be used to satisfy or secure purchase rights or obligations attaching to shares in the Company (in connection with convertible or warrant-linked bonds). The trea-sury shares may also be retired. Shareholders’ subscription rights are disapplied in the aforementioned cases, with the exception of retirement.
Material agreements that are conditional upon a change of control resulting from a takeover bid (section 289 (4) no. 8 and section 315 (4) no. 8 HGB)The framework service agreement with Wacker Chemie AG con-tains a special right of cancellation for goods and services that can no longer be provided for legal or practical reasons (e.g. advice from the Wacker tax department) in the event of a change of control. Siltronic also uses software licenses linked to its membership of the Wacker Group. In addition, some con-tracts with customers contain provisions that entitle the other party to the agreement to terminate the contract prematurely in the event of a change of control.
Compensation agreements in the event of a takeover bid (section 289 (4) no. 9 and section 315 (4) no. 9 HGB)There are no agreements with the Executive Board or employees of the Company that provide for compensation in the event of a takeover bid.
89ANNUAL REPORT 2016
Combined management report • Disclosures relevant to acquisitions
91 Consolidated statement of profit or loss
92 Consolidated statement of financial position
93 Consolidated statement of cash flows
94 Consolidated statements of comprehensive income
95 Consolidated statement of changes in equity
96 Notes to the consolidated financial statements 96 General information to the consolidated financial statements
106 Notes to the statement of profit or loss
109 Notes to the statement of financial position
123 Other disclosures
Consolidated financial statements
90

In EUR mn Note 2016 2015
Sales 01 933.4 931.3
Cost of sales 01 – 761.5 – 768.4
Gross profit 171.9 162.9
Selling expenses – 33.2 – 34.9
Research and development expenses – 66.4 – 64.4
General administration expenses – 20.6 – 18.5
Other operating income 01 52.5 88.9
Other operating expenses 01 – 77.2 – 131.3
Operating result 27.0 2.7
Interest income 02 1.3 0.6
Interest expenses 02 – 3.3 – 4.1
Other finance cost, net 02 – 9.1 – 8.7
Financial result – 11.1 – 12.2
Result before income tax 15.9 – 9.5
Income taxes 03 – 7.2 – 10.6
Net profit/loss for the year 8.7 – 20.1
of which
attributable to Siltronic AG shareholders 12.0 – 14.0
attributable to non-controlling interests – 3.3 – 6.1
Result per common share in EUR (basic /diluted) 15 0.40 – 0.50
Consolidated statement of profit or lossfrom January 1 to December 31, 2016
91ANNUAL REPORT 2016
Consolidated financial statements • Consolidated statement of profit or loss

In EUR mn Note Dec. 31, 2016 Dec. 31, 2015
Intangible assets 04 26.4 29.7
Property, plant and equipment 05 519.8 542.9
Other financial assets 07 1.9 0.2
Income tax receivables 07 – 0.1
Deferred tax assets 03 6.0 6.2
Non-current assets 554.1 579.1
Inventories 06 140.9 142.7
Trade receivables 07 118.2 100.4
Fixed-term deposits 16 79.0 40.0
Other financial assets 07 16.8 15.6
Other non-financial assets 07 11.2 7.3
Income tax receivables 07 0.2 1.2
Cash and cash equivalents 08 136.4 154.5
Current assets 502.7 461.7
Total assets 1,056.8 1,040.8
In EUR million Note Dec. 31, 2016 Dec. 31, 2015
Subscribed capital 120.0 120.0
Capital reserves 974.6 997.3
Retained earnings and net Group result – 455.0 – 489.7
Other equity items – 207.7 – 127.1
Equity attributable to Siltronic AG shareholders 431.9 500.5
Equity attributable to non-controlling interests – 6.6 – 3.2
Equity 09 425.3 497.3
Provision for pensions 10 395.1 299.4
Other provisions 11 36.8 30.4
Deferred tax liabilities 03 2.5 2.6
Financial liabilities 13 40.4 38.6
Other financial liabilities 12 1.2 0.6
Other non-financial liabilities 12 3.9 24.3
Non-current liabilities 479.9 396.0
Other provisions 11 7.8 6.0
Provisions and liabilities for income tax 11/12 6.6 5.4
Trade liabilities 12 81.6 72.1
Other financial liabilities 12 9.8 18.4
Other non-financial liabilities 12 45.8 45.6
Current liabilities 151.6 147.5
Liabilities 631.5 543.5
Total equity and liabilities 1,056.8 1,040.8
Consolidated statement of financial positionas of December 31, 2016
92 ANNUAL REPORT 2016
Consolidated financial statements • Consolidated statement of financial position

In EUR mn Note 2016 2015
Net profit/loss for the year 8.7 – 20.1
Depreciation/amortization of non-current assets, including impairment losses and reversals thereof 119.0 121.3
Other non-cash expenses and income – 4.7 – 23.2
Result from disposal of non-current assets 0.6 0.8
Interest income 2.0 3.5
Interest paid – 2.0 – 2.8
Interest received 1.2 0.6
Tax expense 7.2 10.6
Taxes paid – 4.9 – 6.8
Changes in inventories 3.1 – 3.6
Changes in trade receivables – 13.7 18.6
Changes in other financial and non-financial assets – 11.5 2.8
Changes in deferred taxes 0.2 2.4
Changes in provisions 17.9 23.5
Changes in trade liabilities 12.4 – 5.9
Changes in other financial and non-financial liabilities – 19.9 – 25.6
Cash flow from operating activities 17 115.6 96.1
Payments for capital expenditures (including intangible assets) – 96.7 – 58.9
Proceeds from the disposal of property, plant and equipment 0.1 0.2
Payments for the acquisition of fixed-term deposits – 131.7 – 60.0
Proceeds from fixed-term deposits 92.8 20.0
Cash flow from investing activities 17 – 135.5 – 98.7
Proceeds from the IPO – 143.3
Utilization of funds in (+) or additions to (–) cash pooling of and loans from Wacker Chemie – – 175.5
Cash flow from financing activities – – 32.2
Changes due to exchange-rate fluctuations 1.8 1.9
Changes in cash and cash equivalents 8 – 18.1 – 32.9
at the beginning of the year 154.5 187.4
at the end of the year 136.4 154.5
Consolidated statement of cash flowsfrom January 1 to December 31, 2016
93ANNUAL REPORT 2016
Consolidated financial statements • Consolidated statement of cash flows
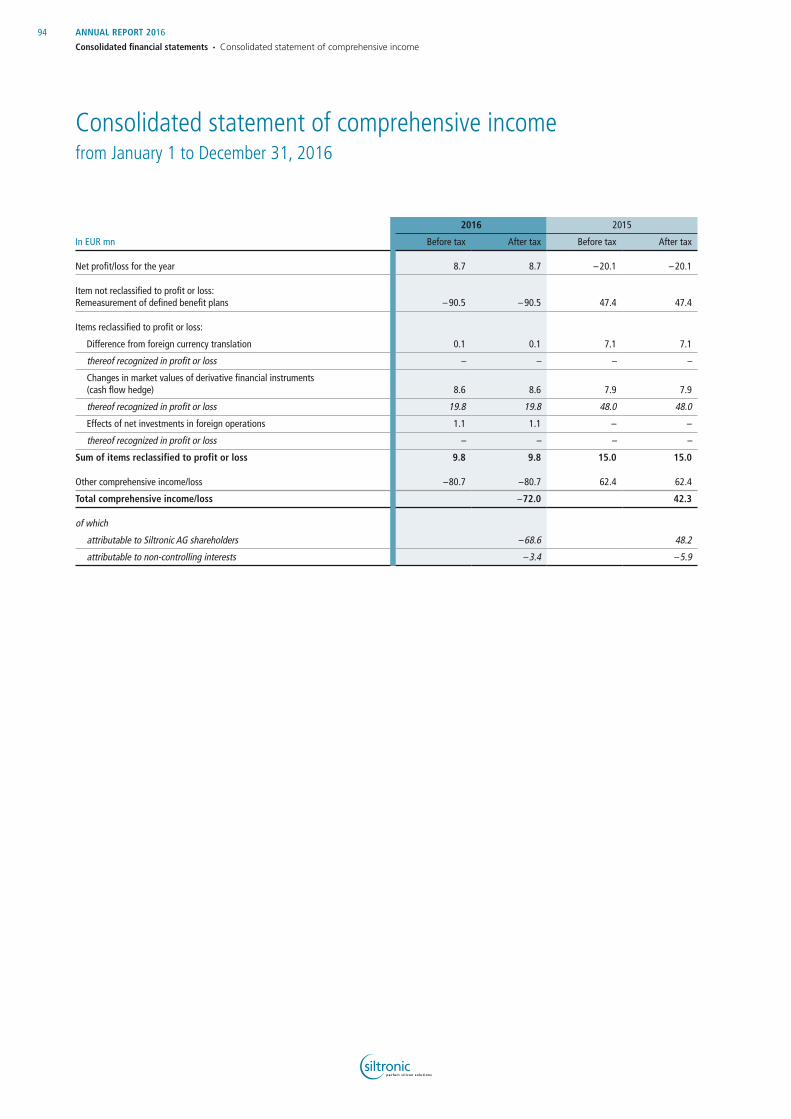
In EUR mn
2016 2015
Before tax After tax Before tax After tax
Net profit/loss for the year 8.7 8.7 – 20.1 – 20.1
Item not reclassified to profit or loss: Remeasurement of defined benefit plans – 90.5 – 90.5 47.4 47.4
Items reclassified to profit or loss:
Difference from foreign currency translation 0.1 0.1 7.1 7.1
thereof recognized in profit or loss – – – –
Changes in market values of derivative financial instruments (cash flow hedge) 8.6 8.6 7.9 7.9
thereof recognized in profit or loss 19.8 19.8 48.0 48.0
Effects of net investments in foreign operations 1.1 1.1 – –
thereof recognized in profit or loss – – – –
Sum of items reclassified to profit or loss 9.8 9.8 15.0 15.0
Other comprehensive income/loss – 80.7 – 80.7 62.4 62.4
Total comprehensive income/loss – 72.0 42.3
of which
attributable to Siltronic AG shareholders – 68.6 48.2
attributable to non-controlling interests – 3.4 – 5.9
Consolidated statement of comprehensive incomefrom January 1 to December 31, 2016
94 ANNUAL REPORT 2016
Consolidated financial statements • Consolidated statement of comprehensive income

In EUR mn Subscribed
capitalCapital
reserves
Difference from
foreign currency
translation
Effects of net
investments in foreign
operations
Changes in market values of
derivative financial
instruments (cash flow
hedge)
Remeasure-ment
of defined benefit
plans
Retained earnings/
net Group result Total
Non- controlling
interestsTotal
equity
Balance as of January 1, 2015 100.0 946.8 – 7.4 – – 21.1 – 160.8 – 548.4 309.1 2.7 311.8
Net loss for the year – – – – – – – 14.0 – 14.0 – 6.1 – 20.1
Other comprehensive income – – 6.9 – 7.9 47.4 – 62.2 0.2 62.4
Total comprehensive income – – 6.9 – 7.9 47.4 – 14.0 48.2 – 5.9 42.3
Capital increase due to IPO 20.0 123.2 – – – – – 143.2 – 143.2
Netting of Siltronic AG’s net loss for the year with capital reserves – – 72.7 – – – – 72.7 0.0 – 0.0
Balance as of December 31, 2015 120.0 997.3 – 0.5 – – 13.2 – 113.4 – 489.7 500.5 – 3.2 497.3
Balance as of January 1, 2016 120.0 997.3 – 0.5 – – 13.2 – 113.4 – 489.7 500.5 – 3.2 497.3
Net profit for the year – – – – – – 12.0 12.0 – 3.3 8.7
Other comprehensive income – – 0.2 1.1 8.6 – 90.5 – – 80.6 – 0.1 – 80.7
Total comprehensive income – – 0.2 1.1 8.6 – 90.5 12.0 – 68.6 – 3.4 – 72.0
Netting of Siltronic AG’s net loss for the year with capital reserves – – 22.7 – – – – 22.7 0.0 – 0.0
Balance as of December 31, 2016 120.0 974.6 – 0.3 1.1 – 4.6 – 203.9 – 455.0 431.9 – 6.6 425.3
Consolidated statement of changes in equityas of December 31, 2016
95ANNUAL REPORT 2016
Consolidated financial statements • Consolidated statement of changes in equity
General information to the consolidated financial statementsNature of operations
Siltronic AG (the ‘Company’), together with its subsidiaries (the ‘Group’) is a producer of semiconductor silicon wafers made from hyperpure silicon whose customers comprise nearly all major semiconductor companies worldwide. Silicon constitutes the base substrate for most semiconductor devices, and silicon wafers are components of everyday electronics including smart-phones, tablets, PCs, flat screens, and sensors. The Group oper-ates wafer facilities one each in Burghausen and in Freiberg, Germany, two wafer facilities in Singapore, and one wafer facil-ity in Portland, Oregon, USA.
Until June 10, 2015, the Company was a wholly-owned subsid-iary of Wacker Chemie AG, with 10 percent of its shares held directly by Wacker Chemie AG and 90 percent by Wacker-Chemie Dritte Venture GmbH, which is a wholly-owned subsidiary of Wacker Chemie AG. On June 11, 2015, Siltronic AG successfully completed its IPO. The Company’s shares are listed in the Prime Standard of the Frankfurt Stock Exchange and are included in the TecDAX. However, Wacker Chemie AG still holds a majority stake in the Company.
Siltronic AG is registered in the commercial register of Munich under number HRB 150884. The headquarter of the company is located at Hanns-Seidel-Platz 4, Munich. Wacker Chemie AG is also headquartered at this address.
Basis of presentation
The consolidated financial statements have been prepared in accordance with the International Financial Reporting Standards (IFRS) and related interpretations issued by the IFRS Interpreta-tions Committee (IFRIC). The consolidated financial statements comply with IFRS as adopted by the EU. The Group has applied all standards and interpretations that were effective as of Decem ber 31, 2016 and endorsed by the EU.
The fiscal year corresponds to the calendar year. Assets and liabilities are reported in the statement of financial position in line with their maturities. The Group classifies assets and liabil-ities as current if it expects to realize or settle them within 12 months. The statement of profit or loss is prepared using the cost of sales method.
The consolidated financial information is presented in euros, which is the Company’s functional currency and the Group’s reporting currency. All amounts are shown in millions of euros (EUR million) unless otherwise stated.
The Executive Board of Siltronic AG approved the consolidated financial statements on February 22, 2017.
The declaration in relation to the German Corporate Governance Code, as prescribed in Section 161 of the German Stock Corpo-ration Act has been issued and was made available to the public on http://www.siltronic.com/int/en/investor_relations/corpo-rate_governance/declaration/declaration.jsp
Financial reporting principles applied for the first time in 2016
Amendments to IAS 1 ‘Disclosure Initiative’ (mandatory application from January 1, 2016): The amendments relate to various disclosure matters. They clarify that disclosures are only necessary if their content is not immaterial. This is also explicitly the case if an IFRS sets out a list of minimum disclosures. Expla-nations relating to the aggregation and disaggregation of items in the statement of financial position and statement of compre-hensive income have also been added. Application of the amendment has resulted in changes to disclosures in the notes to the financial statements.
Improvements to IFRS 2012 – 2014 (mandatory application from January 1, 2016): The changes relate to standards IFRS 5, IFRS 7, IAS 19, and IAS 34. The changes have no material impact on Siltronic’s financial position or financial performance or on the presentation of its financial statements.
Notes to the consolidated financial statements of Siltronic AG and subsidiaries
96 ANNUAL REPORT 2016
Consolidated financial statements • Notes

Other standards that had to be applied for the first time in 2016 did not have any impact on Siltronic’s financial position or finan-cial performance or on the presentation of its financial state-ments. The standards in question were:
• Amendments to IFRS 11 ‘Accounting for Acquisitions of Inter-ests in Joint Operations’
• Amendments to IAS 16 and IAS 38 ‘Clarification of Accept-able Methods of Depreciation and Amortization’
• Amendments to IAS 16 and IAS 41 ‘Agriculture: Bearer Plants’
• Amendments to IAS 19 ‘Defined Benefit Plans: Employee Contributions’
• Amendments to IAS 27 ‘Equity Method in Separate Financial Statements’
• Improvements to IFRS 2010 – 2012• Amendments to IFRS 10, IFRS 12, and IAS 28 ‘Investment
Entities’.
Financial reporting standards and interpretations not yet applied
The application of the following new standards, interpretations, and changes to existing standards is not yet mandatory for the period under review. The Group does not apply any of these earlier than required. The Group continuously evaluates new standards, interpretations, and changes to existing standards to determine their impact on the consolidated financial statements.
Mandatory application from January 1, 2017Amendments to IAS 7 ‘Disclosure Initiative’ (mandatory application from January 1, 2017, not yet endorsed by the EU): These amendments are aimed at improving the information pro-vided about changes in an entity’s debt levels. To comply with the new disclosure requirements, we intend to present a recon-ciliation between the opening and closing balances for liabilities that shows the changes resulting from financing activities.
We do not expect Amendments to IAS 12 ‘Recognition of Deferred Tax Assets for Unrealized Losses’ (mandatory application from January 1, 2017, not yet endorsed by the EU) and Improvements to IFRS 2014 – 2016 (mandatory applica-tion from January 1, 2017, not yet endorsed by the EU) to have any material impact on Siltronic’s financial position or financial performance or on the presentation of its financial statements.
Mandatory application from January 1, 2018IFRS 9 ‘Financial instruments’ (mandatory application from January 1, 2018): IFRS 9, which was published in July 2014, replaces the existing guidance included in IAS 39 ‘Financial Instruments: Recognition and Measurement.‘ IFRS 9 comprises revised guidance for the categorization and classification of financial instruments including a new model covering expected credit default in order to calculate the allowance for financial assets. In addition, the standard has new basic accounting rules for hedging. Siltronic AG is currently evaluating whether to exer-cise the option to carry out hedge accounting in accordance with the rules of IFRS 9 rather than those of IAS 39. It is not yet possible to provide a more detailed statement on the assessment of the effects on the consolidated financial statements of Siltronic AG because the analysis of these effects has not yet been completed. The rules of IFRS 9 will be only for the most recent reporting period and the disclosures will be included in special reconciliation tables in the notes to the financial state-ments, so IFRS 9 will not be applied retrospectively.
IFRS 15 ‘Revenue from Contracts with Customers’ (manda-tory application from January 1, 2018) and Amendments to IFRS 15 ‘Clarifications to IFRS 15’ (mandatory application from January 1, 2018, not yet endorsed by the EU): IFRS 15 ‘Revenue from Contracts with Customers’ provides a comprehensive framework for determining whether, how much, and when rev-enue (sales) has to be recognized. This replaces existing guide-lines for revenue recognition, including IAS 18 ‘Revenue,’ IAS11 ‘Construction Contracts,’ and IFRIC 13 ‘Customer Loyalty Pro-grams’. Siltronic is currently evaluating the effects.
IFRIC 22 ‘Foreign Currency Transactions and Advance Con-sideration’ (mandatory application from January 1, 2018, not yet endorsed by the EU): IFRIC 22 addresses an issue regarding the application of IAS 21 ‘The Effects of Changes in Foreign Exchange Rates’. It clarifies when the exchange rate should be determined for translating transactions that include the receipt or payment of advance consideration in a foreign currency. The date for the purpose of determining the exchange rate for the underlying asset, income, or expense is the date of initial recog-nition of the prepayment asset or deferred income liability. Siltronic is currently analyzing the effects but does not anticipate any material impact on its financial position or financial perfor-mance or on the presentation of its financial statements.
97ANNUAL REPORT 2016
Consolidated financial statements • Notes

We do not expect the following standards, which are to be applied for the first time with effect from January 1, 2018, to have any impact on Siltronic’s financial position or financial per-formance or on the presentation of its financial statements:
• Amendments to IFRS 2 ‘Classification and Measurement of Share-based Payment Transactions’ (not yet endorsed by the EU)
• Amendments to IFRS 4 ‘Applying IFRS 9 with IFRS 4 Insurance Contracts’’ (not yet endorsed by the EU)
• Amendments to IAS 40 ‘Transfers of Investment Property’ (not yet endorsed by the EU)
• Improvements to IFRS 2014–2016 (not yet endorsed by the EU).
Mandatory application from January 1, 2019IFRS 16 ‘Leasing’ (mandatory application from January 1, 2019; not yet endorsed by the EU): In accordance with IFRS 16, a lia-bility has to be recognized for each lease, and a right-of-use-asset for the leased asset has to be recognized at the same time. This asset is depreciated, while the liability is reduced during its term by redemptions and deferred interest. Siltronic has not analyzed the effects of the new standard. We expect that both financial liabilities and intangible assets will increase.
Mandatory application not yet definedAmendments to IFRS 10 and IAS 28 ‘Sale or contribution of assets between an investor and its associate or joint venture’ (not yet endorsed by the EU): The amendments have no impact on the Group’s financial position or financial perfor-mance, or on the presentation of its financial statements.
Scope of consolidation
The consolidated entities as of the reporting date comprised five subsidiaries compared with six subsidiaries the previous year. The lower number was due to the merger of one subsidiary with another. This did not give rise to any changes in the basis of consolidation.
Subsidiaries are defined as companies in which the Company directly or indirectly holds a voting majority or has, in any other way, the power to govern the financial and business policies of an entity in order to benefit from its activities. In assessing con-trol, the Company takes into account potential voting rights that are currently exercisable or convertible. The financial statements of subsidiaries are included in the consolidated financial state-ments from the date when the possibility to control commences until the date that such possibility ceases to exist.
The table below shows the subsidiaries reflected in the scope of consolidation as of December 31 of the respective year. The percentages noted refer to the interest Siltronic has directly or indirectly in the respective companies:
Group holdings
in % Dec. 31, 2016 Dec. 31, 2015
Europe
Siltronic Holding International B.V., Krommenie, The Netherlands 100.0 100.0
North America
Siltronic Corp., Portland, Oregon, USA 100.0 100.0
Asia excluding Japan
Siltronic Singapore Pte. Ltd., Singapore 1) 100.0 100.0
Siltronic Silicon Wafer Pte. Ltd., Singapore 77.7 77.7
Japan
Siltronic Japan Corporation, Tokyo, Japan 100.0 100.0
1) As of January 1, 2016, Siltronic Asia Pte. Ltd., Singapore was merged with Siltronic Singapore Pte. Ltd., Singapore. It was a 100% interest.
Consolidation methods
The consolidated financial statements are based on the separate financial statements of the Company and its consolidated sub-sidiaries for the calendar year.
Intra-group balances and transactions and any related unrealized income and expenses are eliminated.
98 ANNUAL REPORT 2016
Consolidated financial statements • Notes
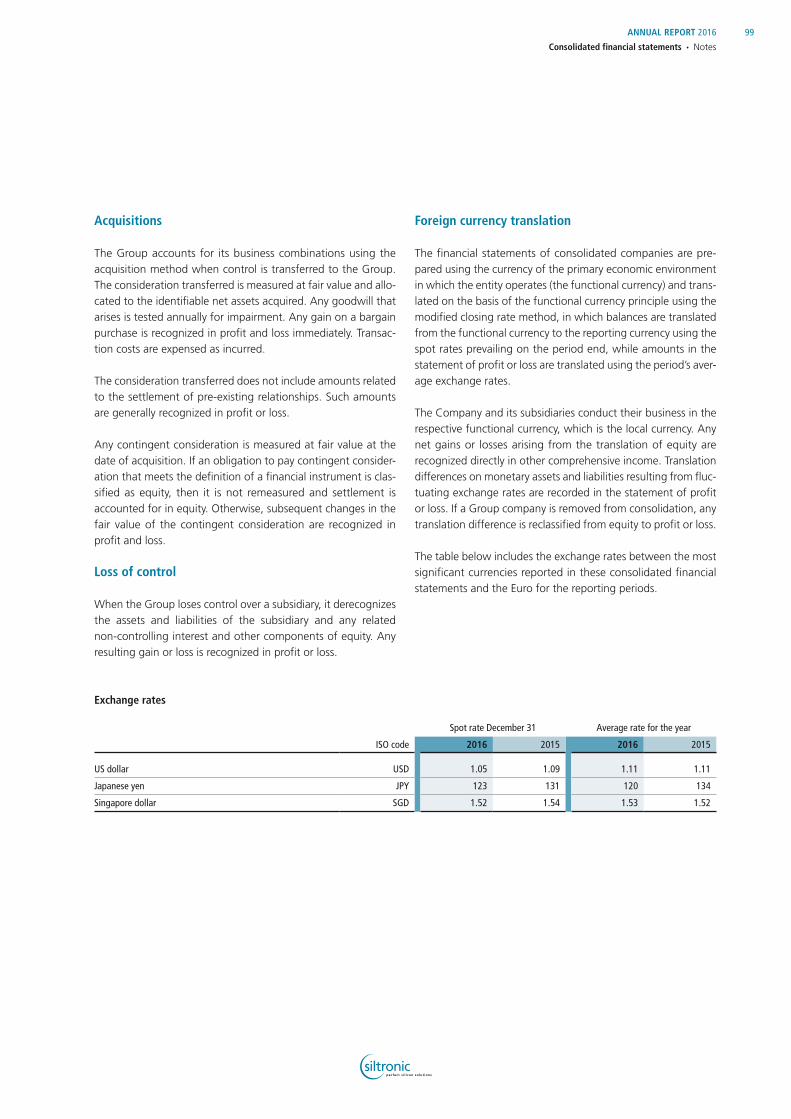
Acquisitions
The Group accounts for its business combinations using the acquisition method when control is transferred to the Group. The consideration transferred is measured at fair value and allo-cated to the identifiable net assets acquired. Any goodwill that arises is tested annually for impairment. Any gain on a bargain purchase is recognized in profit and loss immediately. Transac-tion costs are expensed as incurred.
The consideration transferred does not include amounts related to the settlement of pre-existing relationships. Such amounts are generally recognized in profit or loss.
Any contingent consideration is measured at fair value at the date of acquisition. If an obligation to pay contingent consider-ation that meets the definition of a financial instrument is clas-sified as equity, then it is not remeasured and settlement is accounted for in equity. Otherwise, subsequent changes in the fair value of the contingent consideration are recognized in profit and loss.
Loss of control
When the Group loses control over a subsidiary, it derecognizes the assets and liabilities of the subsidiary and any related non-controlling interest and other components of equity. Any resulting gain or loss is recognized in profit or loss.
Foreign currency translation
The financial statements of consolidated companies are pre-pared using the currency of the primary economic environment in which the entity operates (the functional currency) and trans-lated on the basis of the functional currency principle using the modified closing rate method, in which balances are translated from the functional currency to the reporting currency using the spot rates prevailing on the period end, while amounts in the statement of profit or loss are translated using the period’s aver-age exchange rates.
The Company and its subsidiaries conduct their business in the respective functional currency, which is the local currency. Any net gains or losses arising from the translation of equity are recognized directly in other comprehensive income. Translation differences on monetary assets and liabilities resulting from fluc-tuating exchange rates are recorded in the statement of profit or loss. If a Group company is removed from consolidation, any translation difference is reclassified from equity to profit or loss.
The table below includes the exchange rates between the most significant currencies reported in these consolidated financial statements and the Euro for the reporting periods.
Exchange rates
ISO code
Spot rate December 31 Average rate for the year
2016 2015 2016 2015
US dollar USD 1.05 1.09 1.11 1.11
Japanese yen JPY 123 131 120 134
Singapore dollar SGD 1.52 1.54 1.53 1.52
99ANNUAL REPORT 2016
Consolidated financial statements • Notes
Estimates and assumptions used in preparing the consolidated financial statements
The preparation of the consolidated financial statements in com-pliance with IFRS requires management to make assumptions and estimates that affect the application of accounting policies and the reported amounts of assets, liabilities, income and expenses, and contingencies. These assumptions and estimates impact the carrying amount of assets and liabilities at period end and the amount of income and expenses for the period. The assumptions on which the estimates are based relate primarily to the uniform determination of useful lives throughout the Group, the determination of fair values of financial instruments, the recognition and measurement of provisions, the probability of realizing future tax benefits, and cash flow projections which were used for impairment test and purchase price allocation purposes.
The actual results may differ from these assumptions and esti-mates. Changes in accounting estimates are recognized as soon as they become apparent and affect the net results for the period in which the estimates have changed and in any future periods affected.
Intangible assets and property, plant and equipmentThe expected useful life of intangible assets and of property, plant and equipment, together with their amortization or depre-ciation schedules, is based on past experience, plans, and estimates.
Impairment tests are performed for assets if specific indicators point toward a possible impairment loss or reversal of an impair-ment loss. Goodwill is tested annually for impairment. In the case of an impairment test, an estimate must be made of the recoverable amount of the affected cash-generating unit that corresponds to the higher of the fair value less costs to sell or the value in use. To assess the value in use, the discounted future cash flows of the affected cash-generating unit are to be deter-mined. The estimate of the discounted future cash flows con-tains significant assumptions, in particular relating to future selling prices for and sales volumes of wafers, development of costs and discount rates. Although the Group assumes that the estimates of the relevant expected useful lives and of discounted future cash flows, as well as the assumptions regarding the gen-eral economic conditions and the development of the economic
sectors are reasonable, a change in the assumptions or circum-stances might require a change in the analysis. This could result in additional impairments or reversals of impairment losses in the future.
The carrying amount of intangible assets and property, plant and equipment as of December 31, 2016 amounted to EUR 546.2 million.
Defined benefit obligationsThe accounting of pensions and similar obligations is in accor-dance with actuarial valuations. These valuations are based on statistical and other factors in order to anticipate future events. The factors include the discount rate, expected salary and pen-sion increases, and the mortality rate. If market and economic conditions change, these assumptions could vary considerably from actual developments, consequently leading to major changes in pension and similar obligations as well as the asso-ciated future expenses.
The provision recorded for pension obligations is valued by dis-counting the Group-specific, expected future cash flows. The discount rate is derived from the yield curve of high-grade, fixed interest corporate bonds with maturities matching the pension obligations. The bonds are denominated in the same currency as their underlying pension obligations and have a rating of at least AA from one of the three major rating agencies. This is based on information as of the closing date and on a maturity that approximates the maturity of the pension obligation.
The provision for pensions amounts to EUR 395.1 million as of December 31, 2016.
Deferred tax assetsAt the end of each period, the Group assesses whether the probability of future tax benefits is sufficient to recognize deferred taxes. Among other things, this requires that manage-ment evaluates the tax benefits resulting from currently available tax strategies and future taxable income, as well as taking addi-tional positive and negative factors into account.
Deferred tax assets as of December 31, 2016 amount to EUR 6.0 million.
100 ANNUAL REPORT 2016
Consolidated financial statements • Notes
Accounting policies
The Company and its subsidiaries apply uniform methods for the recognition and valuation of assets, liabilities, income, and expense.
Assets and liabilities of the consolidated financial statements are reported based on their historical cost, with the exception of the items reported at fair value. In particular, derivative financial instruments and plan assets used to cover future pension obli-gations are recorded at fair value.
Other accounting policies have been applied consistently.
Intangible assetsIntangible assets acquired are measured at cost and, if their useful lives can be determined, are amortized on a straight-line basis. The useful life is reviewed annually and, if necessary, revised to correspond to new expectations. Amortization of intangible assets (apart from goodwill) is allocated to the func-tional areas that use the assets. Intangible assets with indefinite useful lives are subject to an annual impairment test. In the year 2014, goodwill was recorded as a result of the step acquisition of SSW.
Internally generated intangible assets are capitalized if it is prob-able that a future economic benefit can be associated with the use of the asset and the costs of the asset can be determined reliably. Such assets are recognized at cost and amortized on a straight-line basis. Their stated useful lives correspond to those of the intangible assets acquired against payment. The capital-ization of development costs does not play a role for the Group because development costs refer to existing products and pro-cesses respectively or because future cash inflows are too uncertain.
Property, plant and equipmentProperty, plant and equipment is capitalized at cost and depre-ciated on a straight-line basis over its expected economic life. The useful life is reviewed annually and, if necessary, revised to correspond to new expectations. In addition to the purchase price, acquisition costs include incidental acquisition costs as well as any obligation incurred for the demolition and removing of the asset from its location. Property, plant and equipment is not revalued on the basis of the provisions in IAS 16. Day-to-day maintenance and repair costs are expensed as incurred. Costs for replacing parts or carrying out major overhauls of property,
plant and equipment are capitalized if future economic benefits are likely to accrue to the Group and if the costs can be mea-sured reliably.
If property, plant and equipment is permanently shut down, sold or given up, the acquisition or production costs are derecog-nized, along with the corresponding accumulated depreciation. Any resulting gain or loss from the sale of an asset is recognized under other operating income or expenses.
Financing costs that were incurred in connection with particular qualifying assets and which can be attributed directly or indi-rectly to them are capitalized as part of acquisition or production costs until the assets are used for the first time. No borrowing costs were capitalized in the periods presented.
Depreciation and amortizationDepreciation and amortization are recognized using the straight-line method and based on the following useful lives:
Useful lives
Years
Intangible assets 3 to 5
Production buildings 20 to 30
Other buildings 10 to 30
Machinery and equipment 6 to 12
Factory and office equipment 3 to 10
If, having been measured in accordance with the above princi-ples, the carrying amounts of intangible assets or items of prop-erty, plant and equipment that were amortized or depreciated are higher than their recoverable amounts as of the reporting date, corresponding impairment losses are recognized as an expense.
The Group reviews regularly the residual value and the useful life of assets.
At the end of every reporting date, the Group checks whether there are triggering events for recognizing (or reversing) impair-ments. An impairment loss is then recognized in the amount by which the carrying amount exceeds the recoverable amount. The recoverable amount is the higher amount of the fair value less costs to sell, and the value in use.
101ANNUAL REPORT 2016
Consolidated financial statements • Notes

Government grantsGovernment grants that relate to the acquisition of an asset reduce acquisition and production costs and are recognized in profit and loss as the asset is depreciated or amortized. Unless otherwise indicated, these grants (investment incentives) are provided by government bodies.
Grants that are compensation for expenses or losses already incurred are recognized as separate assets if the company is of the opinion that all material obligations have been fulfilled and the necessary application form has been or will be submitted. Such grants are recognized as other operating income.
InventoriesInventories are measured at cost using the average cost method. Lower net realizable values or prices are taken into account by means of write-downs to fair value less costs to sell. Cost of sales includes directly attributable costs as well as appropriate por-tions of indirect material and labor costs, administrative expenses, and depreciation. Due to the short-term production processes, financing costs are not included as part of acquisition or production costs. The overhead cost allocations are deter-mined on the basis of a specific capacity utilization.
Write-downs are recognized for inventory risks resulting from obsolescence or reduced usability or to reflect other reductions in the recoverable amount.
Unfinished and finished goods are combined for disclosure pur-poses due to the nature of the wafer production process.
Financial instruments and derivativesA financial instrument is a contract that gives rise to a financial asset at one party and a financial liability or equity instrument at another party. Financial instruments are recognized in the consolidated financial statements at the time that the Group becomes a contracting party to the financial instrument.
In general, financial assets and financial liabilities are not offset. A net amount is presented only if the Group currently has a right to offset the recognized amounts and intends to settle on a net basis.
Financial instruments are measured at fair value on initial recog-nition. The transaction costs directly attributable to the acquisi-tion must be taken into account for all financial assets and lia-bilities not subsequently measured at fair value through profit or loss. The fair values recognized in the statement of financial position generally correspond to the market prices of the finan-cial assets and liabilities. The fair value of financial instruments is equal to the amount the Group would receive or pay if it exchanged or settled the financial instruments. If available, quoted market prices are used for financial instruments. Other-wise, fair values are calculated based on the market conditions prevailing on the valuation date, typically interest rates and exchange rates. The fair value is calculated using mathematical models, typically by discounting future cash flows using the mar-ket interest rate or by applying standard option-pricing models.
The Group’s financial assets comprise cash and cash equivalents, trade receivables, loans granted and other receivables, fixed-term deposits, and primary and derivative financial assets held for trading. Financial assets must generally be settled in cash or for another asset. This includes trade liabilities and derivative financial liabilities. The Group makes no use of its option to measure financial liabilities at fair value through profit or loss.
The manner in which financial assets and liabilities are subse-quently measured depends on whether a financial instrument is held for trading or held-to-maturity, whether such a financial instrument is available for sale, or whether the financial assets concerned are loans and receivables granted by the Company.
Loans and receivables are non-derivative financial assets that are not quoted in an active market. They are measured at amortized cost using the effective interest method. All other primary financial assets, which include equity instruments and debt instruments not held-to-maturity, are classified as available for sale and reported at fair value if their fair value can be determined reliably.
102 ANNUAL REPORT 2016
Consolidated financial statements • Notes

Derivative financial instruments are generally measured at fair value, irrespective of the purpose or intention for which they were concluded. Positive market values are recognized as a receivable and negative market values as a liability.
Changes in the market value of derivatives used to hedge the risk of future cash flows denominated in a foreign currency (cash flow hedges) are recognized in other comprehensive income. The accumulated amount of other comprehensive income of the hedging instrument is not released to the statement of profit or loss until the hedged item is realized. If such a derivative is sold or the hedging relationship is discontinued, the change in its value continues to be reported under other equity items until the underlying transaction occurs. Steps taken to hedge the risk of changes in the market values of recognized assets or liabilities, or to hedge unrecognized fixed contractual obligations, lead to fair value hedges. Changes in fair values are recorded for both the hedged underlying transaction and the derivative financial instruments used for hedging, and are presented in the state-ment of profit or loss.
Derivative financial instruments are used for hedging purposes only to reduce the Group’s exposure to foreign currency exchange rates. The Group does not hedge any net investments in foreign operations.
Contracts concluded in order to receive or deliver non-financial goods for the Group’s own use are not accounted for as deriv-atives, but treated as pending transactions.
For further information see note 16 Financial Instruments.
Receivables and other assets, cash and cash equivalentsTrade receivables and other assets (including tax receivables), with the exception of financial derivatives, are generally recog-nized at cost. Risks are taken into account through appropriate valuation allowances. Allowances for uninsured receivables – or for the deductible in the case of insured receivables – are made
at the latest when legal action is taken. If payment of a receiv-able is no longer expected even though legal action has been taken, the gross receivable is derecognized and any valuation allowances made are reversed. Non-current receivables which are non-interest-bearing or low-interest-bearing are discounted.
Generally, cash and cash equivalents comprise cash in hand, demand deposits, and financial assets that can be converted into cash at any time and are only subject to an insignificant risk of changes in value.
Deferred tax assets and liabilitiesDeferred tax assets and liabilities are recognized for temporary differences between tax bases and carrying amounts. The deferred tax assets include existing loss carryforwards, the real-ization of which is assured with sufficient probability. Deferred taxes are determined on the basis of the tax rates which, under current law, are applicable or anticipated in the individual coun-tries when they are realized. Deferred tax assets and liabilities are offset only to the extent possible under the same tax authority.
The change of deferred tax assets and liabilities is recognized in the statement of profit or loss. In cases where profits or losses are recognized in other comprehensive income, the deferred tax effect is likewise posted under other comprehensive income.
Provision for pensions – defined benefit plansThe Group’s net obligation in respect of defined benefit plans is calculated separately for each plan by estimating the amount of future benefit that employees have earned in the current and prior periods, discounting that amount and deducting the fair value of any plan assets. The calculation of defined benefit obli-gations is performed annually using the projected unit credit method. When the calculation results in a potential asset for the Group, the recognized asset is limited to the present value of economic benefits available in the form of any future refunds from the plan or reductions in future contribution to the plan.
103ANNUAL REPORT 2016
Consolidated financial statements • Notes

Remeasurement of the net defined benefit liability, which com-prises actuarial gains and losses, the return on plan assets (excluding interest income), and the effect of the asset ceiling (if any), are recognized immediately in other comprehensive income. Actuarial gains and losses are arising from the difference between the estimate at the start of the period and actual out-come at the end of the period in relation to mortality rates, pension and salary trends, and discount rates.
The Group determines the net interest expense on the net defined liability for the period by applying the discount rate used to measure the defined benefit obligation at the beginning of the annual period to the net defined benefit liability applicable at that date, taking into account any changes in the net defined benefit liability during the period as a result of contributions and benefit payments. Net interest expense and other expenses to defined benefit plans are recognized in profit and loss.
If the present value of a defined benefit obligation changes due to a plan modification or curtailment, the Group recognizes the effect as past service cost. This is immediately recognized in profit or loss when it occurs. The profits and losses resulting from settlement are also recognized immediately in the statement of profit or loss when settlement takes place. Administrative expenses that are not related to the management of plan assets are likewise recognized in profit or loss when incurred. The expense incurred in funding the pension provisions (service cost) is allocated to the costs of the functional areas concerned. The interest cost is reported under financial result, other finance cost, net.
Provision for pension – defined contribution plansObligations for contributions to defined contribution plans are expensed as the related service is provided. Prepaid contributions are recognized as an asset to the extent that a cash refund or a reduction in future payments is available.
Provisions for early retirement and anniversariesProvisions for early retirement and anniversaries are measured in accordance with actuarial appraisals and belong to other long-term employee benefits. The Group’s net liability is the amount of future benefits that employees have earned in return for their service in the current and prior periods. That benefit is dis-counted to determine its present value. Remeasurements are recognized in profit or loss in the period in which they arise.
Provisions for early retirement are linked to the rendering of future service.
The provisions are recognized on a pro rata basis over the service period during the work phase. The part of the salary that employees forgo during the work phase is secured with plan assets against default. The provision for early retirement rep-resents the Group’s net liability, i.e. after the plan assets have been offset against the total obligation. The additional compen-sation granted is not completely earned until the required work has been rendered in full by the employees.
Other provisionsProvisions are recognized in the statement of financial position for present legal or constructive obligations toward third parties if an outflow of resources to settle these obligations is probable and its amount can be reliably estimated. The amounts recog-nized are based on what will be required to cover the Group’s future payment obligations, identifiable risks and contingencies. As a rule, cost components that are capitalized under inventories are included in the measurement of other provisions. Significant future price increases are taken into account in the measurement.
Non-current provisions are measured at the discounted present value as of the reporting date. The discount rate applied is the current market interest rate for risk-free investments with terms corresponding to the residual term of the obligation to be set-tled. Expected refunds, provided that they are sufficiently certain or legally enforceable, are not offset against provisions. Instead, they are capitalized as separate assets.
104 ANNUAL REPORT 2016
Consolidated financial statements • Notes
Provisions for restructuring costs are recognized if a detailed formal plan for restructuring has been drawn up and conveyed to the affected parties. Termination benefits are expensed at the earlier of when the Group can no longer withdraw the offer of those benefits and when the Group recognizes costs for a restructuring.
Provisions for contingent losses arising from onerous contracts are recognized if the expected benefits to be derived from a contract are lower than the unavoidable costs of meeting the contractual obligations. Provisions for environmental protection are recognized if the future cash outflows for complying with environmental legislation or for cleanup measures are likely, the costs can be estimated with sufficient accuracy and no future acquired benefit can be expected from the measures.
If an amended estimate results in a reversal of a provision, the impact is presented in the same line item of the statement of profit or loss as the original estimate. If the original estimate has been presented in other operating expense the reversal would be presented in other operating income.
LiabilitiesTrade liabilities and other liabilities including tax liabilities are measured at amortized cost using the effective interest method. Financial liabilities are measured at fair value on initial recogni-tion. For all financial liabilities not subsequently measured at fair value through profit or loss, the transaction costs directly attrib-utable to the acquisition are included in the recognized liability.
Sales recognitionSales represent the fair value of the consideration received for the goods and services that were sold within the scope of ordi-nary activities. These are reported without value-added and other taxes incurred in connection with sales and net of dis-counts and price reductions. Sales from products are recognized when the goods have been delivered and the main risks of own-ership have passed to the purchaser. Sales from services are recognized once services are rendered. The Group does not
conduct any business that requires using the percentage-of-com-pletion method for recognizing sales of long-term production contracts.
Cost of salesCost of sales comprise the manufacturing costs for products, the purchase price for trade products, the costs incurred for services rendered to a customer. In addition to directly attribut-able costs such as raw materials and supplies, direct labor and energy costs, cost of sales includes depreciation/amortization, appropriate overhead costs allocated to manufacturing activities, and inventory write-downs. Cost for freight-in and freight-out are part of cost of sales.
Selling expenses, research and development costs, and general administration expensesSelling expenses include costs incurred by the sales organization and the cost of market research, application support on custom-ers’ premises and commission expenses.
Research and development expenses cover costs incurred in the development of products and processes. Research costs in the narrow sense are recognized as expenses when they are incurred, i.e. not capitalized. Development costs are capitalized only if all the prescribed recognition criteria have been met, i.e. the research phase can be separated clearly from the development phase, and the costs incurred can be allocated to the individual project phases without any overlaps. Additionally, there must be sufficient certainty that future cash inflows will be realized.
General administration expenses include the pro rata payroll and material costs of corporate control functions, human resources, and accounting and information technology, unless they have been charged as an internal service to other functional areas.
Timing of recognition of income and expensesOperating expenses are reported as expenses when the service is utilized and interest income is accrued using the effective interest rate.
105ANNUAL REPORT 2016
Consolidated financial statements • Notes

Notes to the statement of profit or loss
01 Sales, cost of sales, other operating income, and other operating expenses
In EUR mn 2016 2015
Sales
Product sales 927.5 923.3
Sales from services and license fees 5.9 8.0
Total 933.4 931.3
Cost of sales – 761.5 – 768.4
thereof inventory valuation allowance and reversal respectively 4.7 6.7
Other operating income
Gains from currency transactions 49.1 82.9
Government grants for research 0.6 0.6
Income from reversal of provisions and liabilities 0.7 2.0
Income from disposal of property, plant and equipment 0.1 0.2
Income from the reversal of impairment losses on property, plant and equipment – 0.5
Income from reversal of valuation allowances for receivables 0.2 0.0
Other 1.8 2.7
Total 52.5 88.9
Other operating expenses
Losses from currency transactions – 70.0 – 128.6
Losses from impairment of property, plant and equipment – 1.0 – 0.1
Losses from disposal of property, plant and equipment – 0.7 – 1.0
Losses from additions to valuation allowances for receivables – 0.1 – 0.1
Losses from onerous contracts – 3.5 0.0
Other – 1.9 – 1.5
Total – 77.2 – 131.3
Losses from onerous contracts result from long-term leases.
Depreciation and amortization expense and personnel expense and cost of salesDepreciation and amortization expense amount to EUR 119.0 million in 2016 (prior year: EUR 121.8 million).
Personnel expenses amount to EUR 278.2 million in 2016 (prior year: EUR 284.2 million), of which EUR 221.9 million was attrib-utable to salaries (prior year: EUR 223.2 million), EUR 37.9 mil-lion to social security (prior year: EUR 39.0 million), and EUR 18.5 million to pensions (prior year: EUR 22.0 million). The cost of sales came to EUR 334.9 million (prior year: EUR 337.5 million).
02 Interest income and expense/ other financial expenses
In EUR mn 2016 2015
Net interest income
Interest income 1.3 0.6
thereof from financial instruments held-to-maturity 0.7 0.2
Interest expense – 3.3 – 4.1
Total – 2.0 – 3.5
Other finance cost, net
Interest cost on provisions – 8.9 – 8.7
Other financial expenses – 0.2 –
Total – 9.1 – 8.7
Other finance cost, netThe interest cost on provisions mainly refers to pensions and includes net interest on the net defined benefit liability.
Other financial expenses result from (real) factoring.
03 Income taxes
Income taxes are calculated on the basis of applicable or anti-cipated tax rates according to the tax laws in the individual countries as of the realization date. These tax rates are generally based on the legal statutes valid or adopted as of the reporting date.
In Germany, prevailing tax rates include a corporate income tax, a solidarity surcharge on corporate income tax, and a trade income tax that varies depending on the municipality in which a company is located.
106 ANNUAL REPORT 2016
Consolidated financial statements • Notes

Tax rates in Germany
In % 2016 2015
Weighted average trade income tax rate in Germany 12.2 12.2
Corporate income tax rate in Germany 15.0 15.0
Solidarity surcharge on corporate income tax in Germany 5.5 5.5
Income tax rate for Siltronic AG in Germany 28.0 28.0
Profits generated by foreign subsidiaries are taxed in the respec-tive countries at the relevant local and national tax rates. The income tax rates for the foreign subsidiaries companies are within a range of 0 percent to 38.7 percent.
Deferred taxes on undistributed profits of subsidiaries are recognized only if distribution is planned. The amount of EUR 170.3 million (prior year: EUR 112.6 million) is available for distribution.
The tax expense reported for the fiscal years 2016 was EUR 7.2 million (prior year: EUR 10.6 million). Applying the German tax rate on the result before tax would result in tax expense of EUR 4.5 million (prior year: tax benefit of EUR 2.6 million). The differences between the expected tax expense and the actual tax expense of EUR 2.7 million (prior year: EUR 13.2 million) were primarily caused by the impairment of deferred tax benefits at Siltronic AG, Siltronic Japan Corp. and Siltronic Corporation and by variances in tax rates.
Income tax comprises current tax income for prior years with an amount of EUR 2.5 million (prior year: current tax expense from prior year of EUR 0.1 million).
Tax expense
In EUR mn 2016 2015
Current taxes, Germany 0.0 – 0.4
Current taxes, foreign – 6.9 – 7.8
Total current taxes – 6.9 – 8.2
Deferred taxes, Germany 0.0 0.0
Deferred taxes, foreign – 0.3 – 2.4
Total deferred taxes – 0.3 – 2.4
Total income taxes – 7.2 – 10.6
Reconciliation of effective tax rate
Result before taxes 15.9 – 9.5
Income tax rate for Siltronic AG in % 28.0 28.0
Expected tax expense (–)/benefit (+) – 4.5 2.6
Variance in tax rate 0.7 – 2.4
Effect of non-deductible expenses – 1.2 – 1.6
Effect of tax-free income 0.8 0.7
Taxes relating to other periods (current earnings) 2.5 – 0.1
Effect due to unrecognized deferred tax assets – 6.0 – 10.0
Other variances 0.5 0.2
Total income taxes – 7.2 – 10.6
Effective tax rate in % 45.3 – 111.7
Deferred tax assets are recognized only if it is assumed that the tax benefits will be realized. The following table shows the allo-cation of deferred taxes to the assets and liabilities:
107ANNUAL REPORT 2016
Consolidated financial statements • Notes
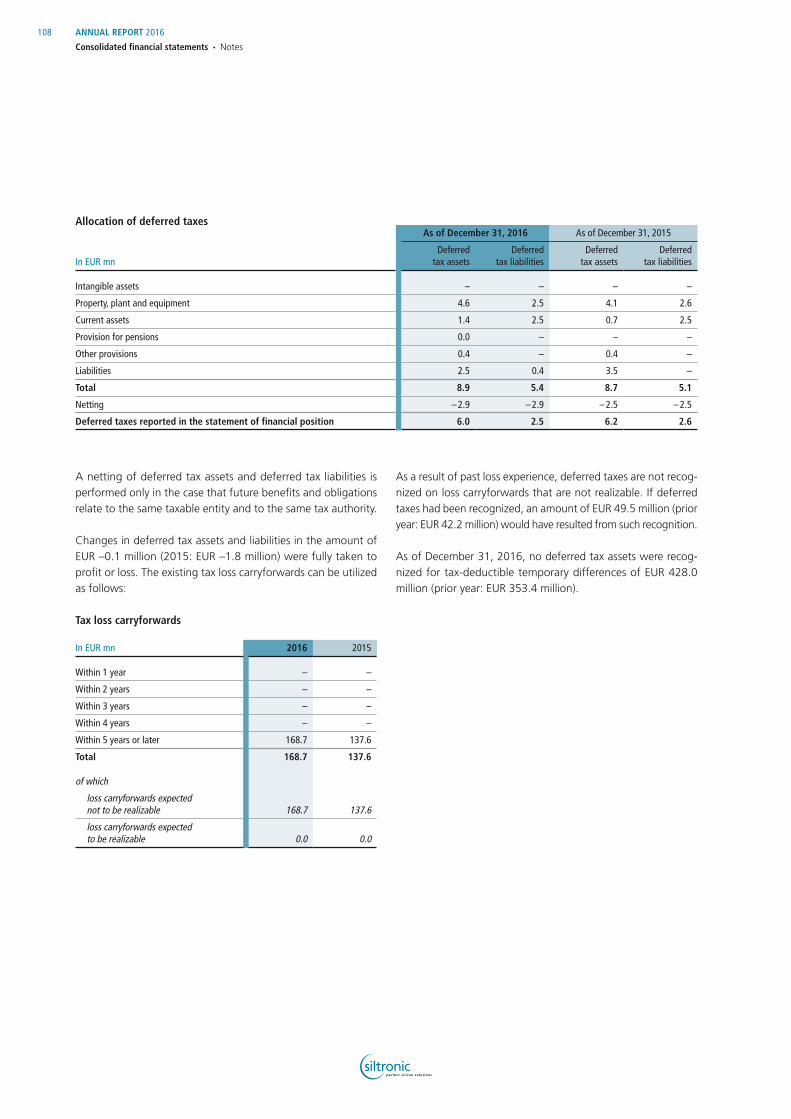
Allocation of deferred taxes
In EUR mn
As of December 31, 2016 As of December 31, 2015
Deferred tax assets
Deferred tax liabilities
Deferred tax assets
Deferred tax liabilities
Intangible assets – – – –
Property, plant and equipment 4.6 2.5 4.1 2.6
Current assets 1.4 2.5 0.7 2.5
Provision for pensions 0.0 – – –
Other provisions 0.4 – 0.4 –
Liabilities 2.5 0.4 3.5 –
Total 8.9 5.4 8.7 5.1
Netting – 2.9 – 2.9 – 2.5 – 2.5
Deferred taxes reported in the statement of financial position 6.0 2.5 6.2 2.6
A netting of deferred tax assets and deferred tax liabilities is performed only in the case that future benefits and obligations relate to the same taxable entity and to the same tax authority.
Changes in deferred tax assets and liabilities in the amount of EUR –0.1 million (2015: EUR –1.8 million) were fully taken to profit or loss. The existing tax loss carryforwards can be utilized as follows:
Tax loss carryforwards
In EUR mn 2016 2015
Within 1 year – –
Within 2 years – –
Within 3 years – –
Within 4 years – –
Within 5 years or later 168.7 137.6
Total 168.7 137.6
of which
loss carryforwards expected not to be realizable 168.7 137.6
loss carryforwards expected to be realizable 0.0 0.0
As a result of past loss experience, deferred taxes are not recog-nized on loss carryforwards that are not realizable. If deferred taxes had been recognized, an amount of EUR 49.5 million (prior year: EUR 42.2 million) would have resulted from such recognition.
As of December 31, 2016, no deferred tax assets were recog-nized for tax-deductible temporary differences of EUR 428.0 million (prior year: EUR 353.4 million).
108 ANNUAL REPORT 2016
Consolidated financial statements • Notes
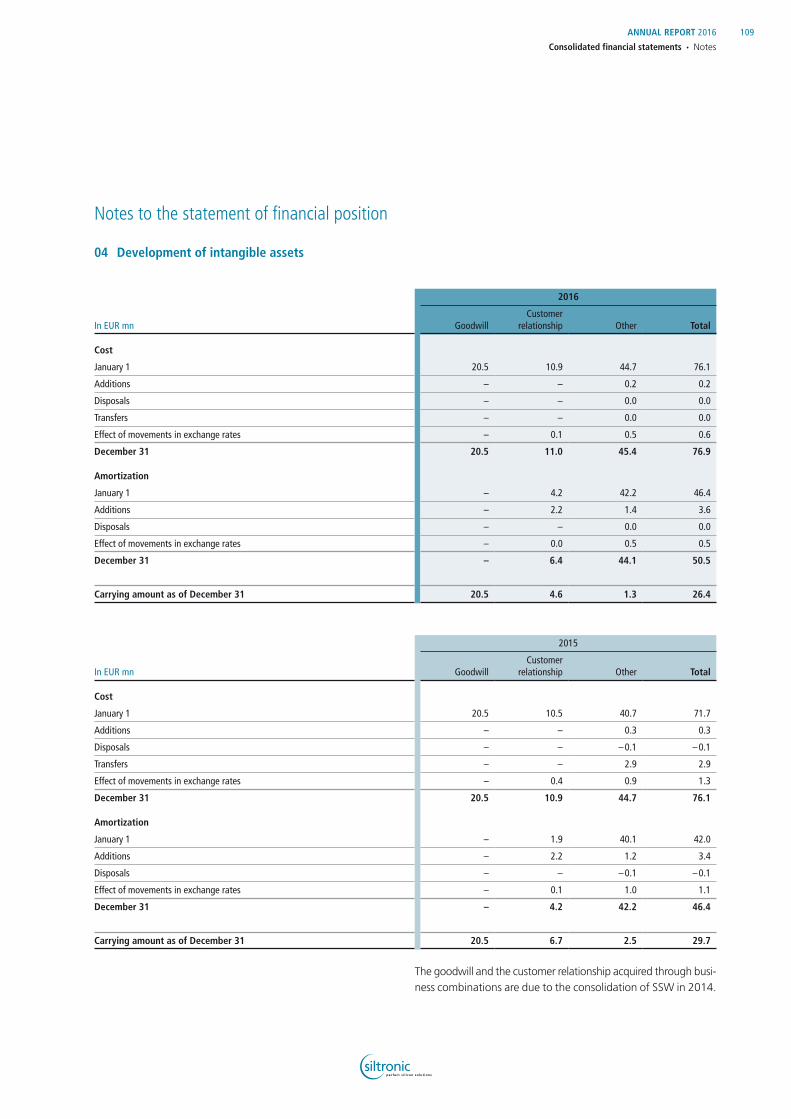
Notes to the statement of financial position
04 Development of intangible assets
In EUR mn
2016
GoodwillCustomer
relationship Other Total
Cost
January 1 20.5 10.9 44.7 76.1
Additions – – 0.2 0.2
Disposals – – 0.0 0.0
Transfers – – 0.0 0.0
Effect of movements in exchange rates – 0.1 0.5 0.6
December 31 20.5 11.0 45.4 76.9
Amortization
January 1 – 4.2 42.2 46.4
Additions – 2.2 1.4 3.6
Disposals – – 0.0 0.0
Effect of movements in exchange rates – 0.0 0.5 0.5
December 31 – 6.4 44.1 50.5
Carrying amount as of December 31 20.5 4.6 1.3 26.4
In EUR mn
2015
GoodwillCustomer
relationship Other Total
Cost
January 1 20.5 10.5 40.7 71.7
Additions – – 0.3 0.3
Disposals – – – 0.1 – 0.1
Transfers – – 2.9 2.9
Effect of movements in exchange rates – 0.4 0.9 1.3
December 31 20.5 10.9 44.7 76.1
Amortization
January 1 – 1.9 40.1 42.0
Additions – 2.2 1.2 3.4
Disposals – – – 0.1 – 0.1
Effect of movements in exchange rates – 0.1 1.0 1.1
December 31 – 4.2 42.2 46.4
Carrying amount as of December 31 20.5 6.7 2.5 29.7
The goodwill and the customer relationship acquired through busi-ness combinations are due to the consolidation of SSW in 2014.
109ANNUAL REPORT 2016
Consolidated financial statements • Notes

The customer relationship is amortized based on management’s expectation of the term of the relationship. The amortization follows the straight-line method over the expected term of the customer relationship. Other intangible assets primarily comprise industrial property rights and similar rights acquired at cost from third parties, e.g. software licenses.
Amortization of intangible assets are included in the cost of sales.
For the purpose of impairment testing, goodwill has been allo-cated to the Group’s Cash Generating Unit (CGU) ‘300 mm’. The recoverable amount of this CGU was based on its value in use, determined by discounting the future cash flows to be gene rated from the continuing use of the CGU. The key assump-tions used for the calculation of the recoverable amount are a long-term EBITDA margin in line with medium-term planning, a remaining useful life of the leading asset of the CGU (parts of buildings designed for the wafer production), and a discount rate of 10.4 percent before tax. The determination of the long-term EBITDA margin and the useful life of the leading asset reflect past experience in relation to similar CGUs. The discount rate was derived from a post-tax measure estimated on the historical industry average weighted-average cost of capital. External information sources in relation to the EBITDA margin of the CGU are only available for some of the EBITDA components.
Medium-term planning is based on the assumption of increasing sales and increasing EBITDA margins. The assumption for the following years until the end of the observation period is that average EBITDA set out in the medium-term planning is achieved and that it remains constant. In order that the CGU achieves the EBITDA according to the medium-term planning, the annual average EBITDA growth to be achieved in the medium-term planning period is 7.5 percent. No growth rate was applied. The recoverable amount exceeds the carrying amount by more than EUR 100 million.
The calculation of the recoverable amount is sensitive to its assumptions as follows:
Long-term EBITDA margin: There is a possibility of lower than forecasted EBITDA margins due to an overcapacity of the world-wide wafer supply industry and due to significant exchange rate fluctuations. A drop in EBITDA margin by an average of 18 percent compared to the forecasted margin would result in impairment.
Discount rate: There is the possibility of higher than forecasted weighted-average cost of capital. A rise in the discount rate by 3.3 percentage points would result in impairment.
110 ANNUAL REPORT 2016
Consolidated financial statements • Notes

05 Development of property, plant and equipment
In EUR mn
2016
Land, buildings and similar rights
Machinery and technical
equipment
Other equipment, factory and
office equipmentAssets under construction Total
Cost
January 1 712.9 2,351.9 130.1 60.3 3,255.2
Additions 11.6 45.2 2.8 29.0 88.6
Disposals 0.0 – 19.7 – 3.6 0.0 – 23.3
Transfers 4.6 39.6 1.7 – 45.9 0.0
Effect of movements in exchange rates 17.0 22.2 0.5 0.3 40.0
December 31 746.1 2,439.2 131.5 43.7 3,360.5
Depreciation and impairment losses
January 1 498.0 2,093.0 121.0 0.3 2,712.3
Additions 12.6 96.8 5.0 – 114.4
Impairment loss 0.1 0.9 0.0 – 1.0
Disposals 0.0 – 18.9 – 3.6 – – 22.5
Transfers – – 0.1 0.1 – 0.0
Effect of movements in exchange rates 14.9 20.0 0.5 – 35.5
December 31 525.6 2,191.8 123.0 0.3 2,840.7
Carrying amount as of December 31 220.5 247.4 8.5 43.4 519.8
In EUR mn
2015
Land, buildings and similar rights
Machinery and technical
equipment
Other equipment, factory and
office equipmentAssets under construction Total
Cost
January 1 677.9 2,285.7 128.7 25.8 3,118.1
Additions 0.2 19.3 2.1 53.1 74.7
Disposals – – 30.8 – 3.5 – 0.7 – 35.0
Transfers 0.1 17.1 1.5 – 18.7 0.0
Effect of movements in exchange rates 34.7 60.6 1.4 0.8 97.5
December 31 712.9 2,351.9 130.2 60.3 3,255.3
Depreciation and impairment losses
January 1 457.6 1,970.5 118.0 0.3 2,546.4
Additions 12.5 100.7 5.1 – 118.3
Reversals of impairment losses – 0.5 – – – – 0.5
Impairment loss 0.1 – – – 0.1
Disposals – – 30.6 – 3.3 – – 33.9
Transfers – – – – –
Effect of movements in exchange rates 28.3 52.4 1.3 – 82.0
December 31 498.0 2,093.0 121.1 0.3 2,712.4
Carrying amount as of December 31 214.9 258.9 9.1 60.0 542.9
111ANNUAL REPORT 2016
Consolidated financial statements • Notes
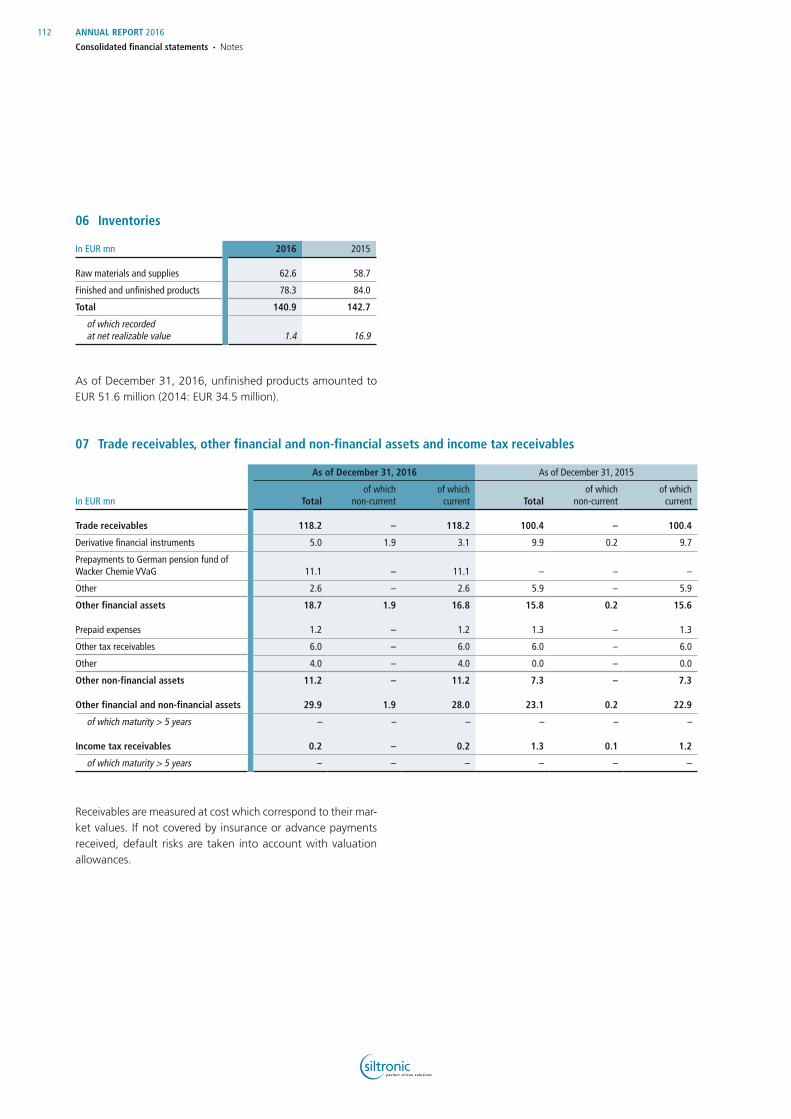
06 Inventories
In EUR mn 2016 2015
Raw materials and supplies 62.6 58.7
Finished and unfinished products 78.3 84.0
Total 140.9 142.7
of which recorded at net realizable value 1.4 16.9
As of December 31, 2016, unfinished products amounted to EUR 51.6 million (2014: EUR 34.5 million).
07 Trade receivables, other financial and non-financial assets and income tax receivables
In EUR mn
As of December 31, 2016 As of December 31, 2015
Totalof which
non-currentof which
current Totalof which
non-currentof which
current
Trade receivables 118.2 – 118.2 100.4 – 100.4
Derivative financial instruments 5.0 1.9 3.1 9.9 0.2 9.7
Prepayments to German pension fund of Wacker Chemie VVaG 11.1 – 11.1 – – –
Other 2.6 – 2.6 5.9 – 5.9
Other financial assets 18.7 1.9 16.8 15.8 0.2 15.6
Prepaid expenses 1.2 – 1.2 1.3 – 1.3
Other tax receivables 6.0 – 6.0 6.0 – 6.0
Other 4.0 – 4.0 0.0 – 0.0
Other non-financial assets 11.2 – 11.2 7.3 – 7.3
Other financial and non-financial assets 29.9 1.9 28.0 23.1 0.2 22.9
of which maturity > 5 years – – – – – –
Income tax receivables 0.2 – 0.2 1.3 0.1 1.2
of which maturity > 5 years – – – – – –
Receivables are measured at cost which correspond to their mar-ket values. If not covered by insurance or advance payments received, default risks are taken into account with valuation allowances.
112 ANNUAL REPORT 2016
Consolidated financial statements • Notes
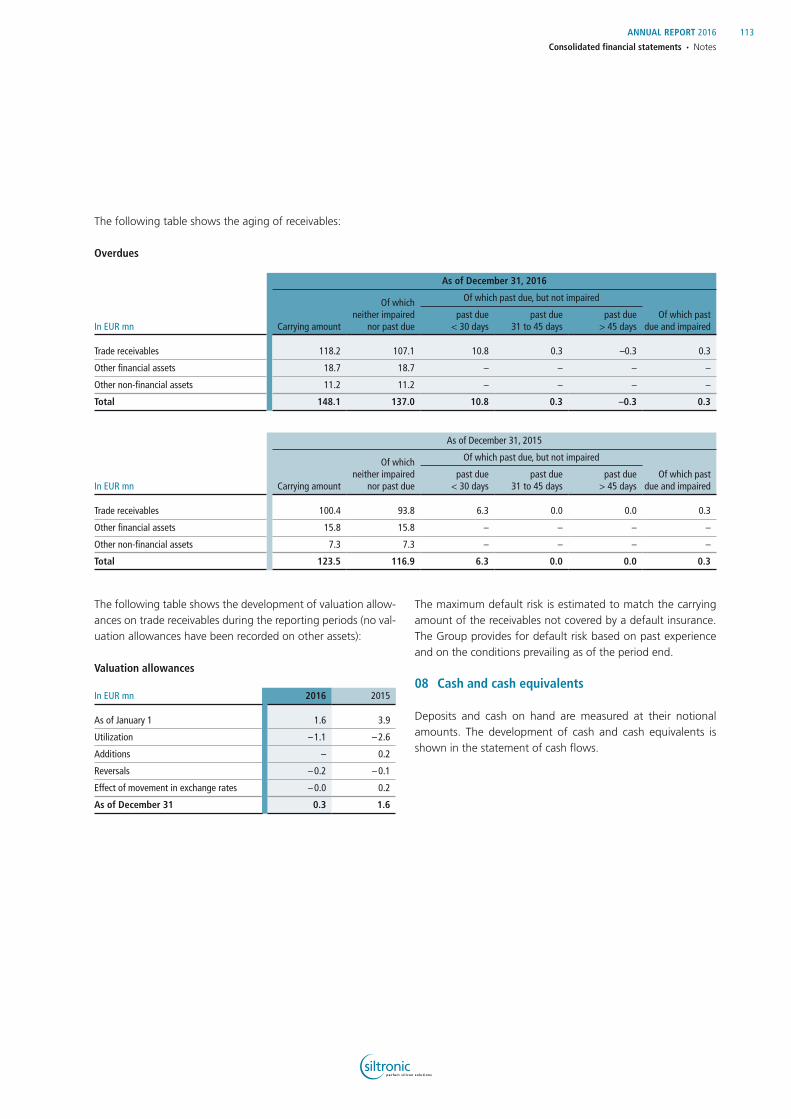
The following table shows the aging of receivables:
Overdues
In EUR mn
As of December 31, 2016
Carrying amount
Of which neither impaired
nor past due
Of which past due, but not impaired
Of which past due and impaired
past due < 30 days
past due 31 to 45 days
past due > 45 days
Trade receivables 118.2 107.1 10.8 0.3 –0.3 0.3
Other financial assets 18.7 18.7 – – – –
Other non-financial assets 11.2 11.2 – – – –
Total 148.1 137.0 10.8 0.3 –0.3 0.3
In EUR mn
As of December 31, 2015
Carrying amount
Of which neither impaired
nor past due
Of which past due, but not impaired
Of which past due and impaired
past due < 30 days
past due 31 to 45 days
past due > 45 days
Trade receivables 100.4 93.8 6.3 0.0 0.0 0.3
Other financial assets 15.8 15.8 – – – –
Other non-financial assets 7.3 7.3 – – – –
Total 123.5 116.9 6.3 0.0 0.0 0.3
The following table shows the development of valuation allow-ances on trade receivables during the reporting periods (no val-uation allowances have been recorded on other assets):
Valuation allowances
In EUR mn 2016 2015
As of January 1 1.6 3.9
Utilization – 1.1 – 2.6
Additions – 0.2
Reversals – 0.2 – 0.1
Effect of movement in exchange rates – 0.0 0.2
As of December 31 0.3 1.6
The maximum default risk is estimated to match the carrying amount of the receivables not covered by a default insurance. The Group provides for default risk based on past experience and on the conditions prevailing as of the period end.
08 Cash and cash equivalents
Deposits and cash on hand are measured at their notional amounts. The development of cash and cash equivalents is shown in the statement of cash flows.
113ANNUAL REPORT 2016
Consolidated financial statements • Notes

09 Equity
The individual items of equity and its development are shown in the consolidated statement of changes in equity.
Subscribed capitalThe subscribed capital of Siltronic AG amounts to EUR 120 mil-lion and is divided into 30 million no-par-value shares, each with an imputed share of the capital amounting to EUR 4. The shares are registered shares. All the shares are of the same type; each share has the same rights attached to it and allows one vote at the Annual General Meeting.
Capital reserveThe capital reserve comprises a premium on the issuance of shares, non-cash capital contributions, and transactions with shareholders. The capital reserve decreased by EUR 22.7 million because of the netting of Siltronic AG’s (HGB) net loss for the year.
Retained earnings and net resultThis item comprises the Group’s cumulative net result of prior periods, net of dividend payouts.
Management of capitalThe capital management of the Siltronic Group pursues the objective of ensuring a going concern on a sustainable basis and of generating an appropriate return for the shareholders. Instru-ments of capital management include, amongst others, dividend payments. In managing its capital, Siltronic AG complies with the legal stipulations on capital maintenance. The Company’s Articles of Association do not stipulate any capital requirements. Special terms for capital are not used.
There is conditional capital and authorized capital: the Compa-ny’s share capital may be increased by issuing up to 12,500,000 new no-par-value registered shares, whereby the share capital may increase by up to EUR 50.0 million (conditional capital). Furthermore, the Executive Board is authorized, subject to the approval of the Supervisory Board, to increase subscribed capital until June 7, 2020, by up to a total amount of EUR 60.0 million through the issue of new no-par value bearer shares on one or more occasions (Authorized Capital).
10 Provision for pensions
There are various post-employment pension plans for Group employees, which depend on the legal, economic and fiscal conditions prevailing in the relevant countries. These pension plans generally take into account employees’ service term and salary levels.
The Group operates both defined contribution and defined ben-efit plans. Defined contribution plans lead to no further obliga-tion for the company beyond paying contributions into special-purpose funds. The Group has both defined contribution and defined benefits plans, which are partly financed through the Pensionskasse der Wacker Chemie VVaG (pension fund) or funds. Pension obligations result from defined benefit plans in the form of entitlements to pension benefits for eligible active and former employees of the Siltronic Group and their surviving dependents. In essence, the various pension plans guarantee employees lifelong pensions based on the average salary (career average plan) during employment at Siltronic, or capital pay-ments.
The Group has the following pension plans:
Plans supplied by pension fundFor employees in Germany, a basic pension is provided through the legally independent pension fund. This is financed by mem-bers’ and company contributions. The promised benefits include retirement, disability, and survivors’ benefits.
The Pension Fund is a small mutual insurance company within the meaning of § 210 of the Insurance Supervision Act (Versi-cherungsaufsichtsgesetz – VAG) and is regulated by § 230 (1) VAG. It is thus subject to the regulations for German insurers and is supervised by the Federal Financial Supervisory Authority (Bundesanstalt für Finanzdienstleistungsaufsicht – BaFin). There are legal minimum financing requirements.
114 ANNUAL REPORT 2016
Consolidated financial statements • Notes

For employees who joined the pension fund up to 2004, the basic pension is subject to a fixed benefit obligation, which must be taken into account when valuing the pension obligations. The pension level is independent of the age of the contribution payment and also irrespective of the asset interest rate achieved. For employees who entered the Company after 2004, new rates apply to the basic pension. The benefits are based on guaran-teed interest rates and the level of benefits depends on the age of the contribution payment. Annual surplus participation may increase future benefits. In addition, employees in Germany can make contributions to the pension fund in respect of the volun-tary supplementary pension scheme PK+. Above all, the contri-butions under the pension scheme regulated by collective agree-ment are paid into the voluntary higher insurance on the basis of collective bargaining agreements on single payments and old-age pensions, and on working life and demography.
In the 2016 fiscal year, the accounting treatment of the tariffs for employees who entered the company after 2004 was changed. Up to the 2015 fiscal year, these tariffs were treated as a defined contribution plan. Due to the continuing low-inter-est environment, these tariffs were reassessed in 2016 as a result of the increased probability of recourse being had to the Com-pany and recognized as a defined benefits obligation. The changeover means that in 2016 the present value of the obli-gation increases by EUR 24.5 million without affecting profit or loss. At the same time, additions of EUR 23.8 million are recog-nized in plan assets without affecting profit or loss. The effects are shown in the table ‘Development of the net liability of defined benefit obligations’ in the lines ‘Gains (–)/losses (+) from plan assets, excluding amounts recognized in interest income’ and ‘Gains (–)/losses (+) from changes in experience-based assumptions’.
Benefits by direct commitments In addition to the pension fund commitments, employees in Germany receive direct commitments in the form of an addi-tional pension. The additional pension insures salary elements above and beyond the pension insurance contribution assess-ment ceiling. For employees who joined the company before the end of 2004, a pension is granted and depends on the average salary earned during the period of employment with the Group (career average plan).
For employees who joined the plan from 2005 onwards, the pension is based on a certain percentage of the salary above the pension insurance contribution assessment ceiling. The resulting capital will bear interest. The benefits may be drawn as a life-long pension or, in the case of commitments from 2005 onwards, as a lump sum. Employees and their surviving depen-dents are eligible to receive benefits. The employees’ entitle-ments are included in the calculation of the pension obligations. This applies both to employees who joined up to 2004 and to employees who joined from 2005 onwards.
‘Deferred Compensation’ plan Non-tariff employees in Germany may contribute part of their salary to an employee-financed commitment plan (‘Deferred Compensation’). This plan enables employees to waive their portions of their future salary claims into pension benefits. Depending on the date of conclusion of the agreement to par-ticipate in the benefit plan (commitment), the pension capital will bear interest at 7 percent (1996–2001), 6 percent (2002–2010) or 5 percent (2011–2013). Plans bearing 7 percent or 6 percent interest may be drawn in the form of either a pension or a lump sum. Plans bearing 5 percent interest are paid out exclusively in lump-sum form. From 2015, senior executives can pay parts of their salary into an employee-financed benefit plan at a variable interest rate. The variable interest rate is dependent on the current yield of domestic five-year bearer bonds and is at least 2.5 percent and at most 5 percent. The pay-out is solely in capital form. Commitments made up to December 31, 2000 are valued at the m/n-tel net present value (in accordance with the Projected Unit Credit method). Commitments made on or after January 1, 2001, are valued at the present value of the acquired expectancy or the acquired capital.
The pension entitlements in Germany are protected against insolvency by the Mutual Pension Assurance Association (Pen-sionssicherungsverein a.G.). The insolvency insurance has an upper limit. There are no legal minimum funding requirements.
115ANNUAL REPORT 2016
Consolidated financial statements • Notes

United StatesVarious pension plans are available for employees of foreign subsidiaries, subject to the statutory provisions applicable in the respective countries. With the exception of the US pension plans, these pension plans are not significant to the Group.
In the United States, defined benefit plans exist for employees of Siltronic Corporation, Portland who have entered the com-pany before end of 2003. Both plans were closed for new entrants after December 31, 2003. Retirement benefits are paid
monthly starting at age 65 and are based on the last average salary paid. Special provisions apply to early retirement at age 55 depending on the employee’s years of service. Post-retire-ment health care and severance benefits are also provided to eligible employees due to the related character. Hires after 2003 only receive defined contribution benefits.
The present value of defined benefit obligations reconcile with the provisions recognized on the statement of financial position as follows:
Net liability of defined benefit obligations
In EUR mn
As of December 31, 2016 As of December 31, 2015
Germany Foreign Total Germany Foreign Total
Present value of the at least partially fund-financed defined benefit obligations 603.3 130.2 733.5 483.1 128.0 611.1
Fair value of plan assets 412.1 88.4 500.5 359.7 90.0 449.7
Funded status 191.2 41.8 233.0 123.4 38.0 161.4
Present value of unfunded defined benefit obligations 154.6 7.5 162.1 131.3 6.7 138.0
Provisions for pensions and similar obligations 345.8 49.3 395.1 254.7 44.7 299.4
116 ANNUAL REPORT 2016
Consolidated financial statements • Notes

Development of the net liability of defined benefit obligations
In EUR mn
2016
Projected benefit plan obligation
Fair value of plan assets Difference
As of January 1 749.1 449.7 299.4
Current service cost 16.9 – 16.9
Interest expense and interest income 22.1 13.6 8.5
Administrative cost paid out of plan assets – – 0.8 0.8
Past service cost 0.4 – 0.4
Effects of settlements1) – 12.7 – 11.8 – 0.9
Remeasurements
Gains (–)/losses (+) from plan assets, excluding amounts recognized in interest income – 38.8 – 38.8
Gains (–)/losses (+) from changes in demographic assumptions – – –
Gains (–)/losses (+) from changes in financial assumptions 114.3 – 114.3
Gains (–)/losses (+) from changes in experience-based assumptions 15.0 – 15.0
Effects of exchange-rate differences 5.9 3.3 2.6
Contributions by
Employer – 17.9 – 17.9
Pension plan beneficiaries 2.5 2.5 –
Pension payments – 15.8 – 12.7 – 3.1
Transfers – 2.1 – – 2.1
As of December 31 895.6 500.5 395.1
1) Relates to the sale of part of the pension obligations for already retired employees by Siltronic Corp., Portland, Oregon, USA, to a third party.
In EUR mn
2015
Projected benefit plan obligation
Fair value of plan assets Difference
As of January 1 761.9 433.8 328.1
Current service cost 19.8 – 19.8
Interest expense and interest income 19.9 11.7 8.2
Administrative cost paid out of plan assets – – 0.7 0.7
Remeasurements
Gains (–)/losses (+) from plan assets, excluding amounts recognized in interest income – – 7.2 7.2
Gains (–)/losses (+) from changes in demographic assumptions – 3.5 – – 3.5
Gains (–)/losses (+) from changes in financial assumptions – 63.6 – – 63.6
Gains (–)/losses (+) from changes in experience-based assumptions 12.1 – 12.1
Effects of exchange-rate differences 14.3 9.4 4.9
Contributions by
Employer – 11.6 – 11.6
Pension plan beneficiaries 2.4 2.4 –
Pension payments – 14.0 – 11.3 – 2.7
Transfers – 0.2 – – 0.2
As of December 31 749.1 449.7 299.4
117ANNUAL REPORT 2016
Consolidated financial statements • Notes
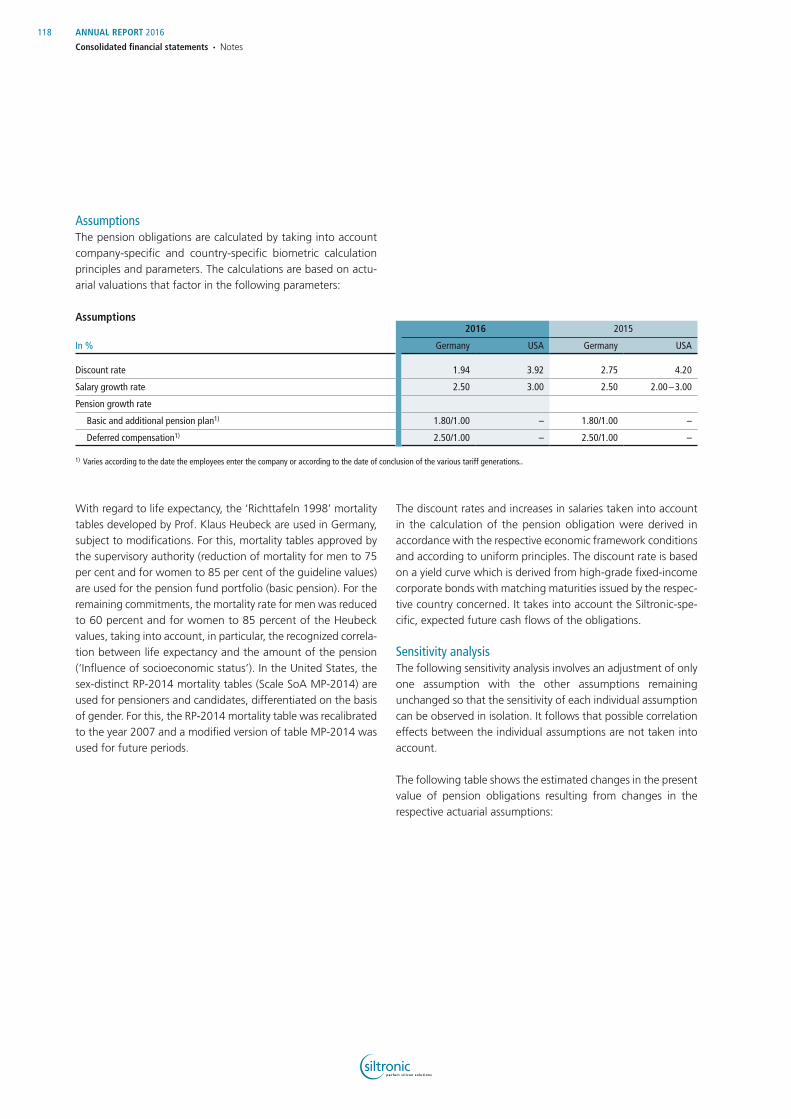
AssumptionsThe pension obligations are calculated by taking into account company-specific and country-specific biometric calculation principles and parameters. The calculations are based on actu-arial valuations that factor in the following parameters:
Assumptions
In %
2016 2015
Germany USA Germany USA
Discount rate 1.94 3.92 2.75 4.20
Salary growth rate 2.50 3.00 2.50 2.00 – 3.00
Pension growth rate
Basic and additional pension plan1) 1.80/1.00 – 1.80/1.00 –
Deferred compensation1) 2.50/1.00 – 2.50/1.00 –
1) Varies according to the date the employees enter the company or according to the date of conclusion of the various tariff generations..
With regard to life expectancy, the ‘Richttafeln 1998’ mortality tables developed by Prof. Klaus Heubeck are used in Germany, subject to modifications. For this, mortality tables approved by the supervisory authority (reduction of mortality for men to 75 per cent and for women to 85 per cent of the guideline values) are used for the pension fund portfolio (basic pension). For the remaining commitments, the mortality rate for men was reduced to 60 percent and for women to 85 percent of the Heubeck values, taking into account, in particular, the recognized correla-tion between life expectancy and the amount of the pension (‘Influence of socioeconomic status’). In the United States, the sex-distinct RP-2014 mortality tables (Scale SoA MP-2014) are used for pensioners and candidates, differentiated on the basis of gender. For this, the RP-2014 mortality table was recalibrated to the year 2007 and a modified version of table MP-2014 was used for future periods.
The discount rates and increases in salaries taken into account in the calculation of the pension obligation were derived in accordance with the respective economic framework conditions and according to uniform principles. The discount rate is based on a yield curve which is derived from high-grade fixed-income corporate bonds with matching maturities issued by the respec-tive country concerned. It takes into account the Siltronic-spe-cific, expected future cash flows of the obligations.
Sensitivity analysisThe following sensitivity analysis involves an adjustment of only one assumption with the other assumptions remaining un changed so that the sensitivity of each individual assumption can be observed in isolation. It follows that possible correlation effects between the individual assumptions are not taken into account.
The following table shows the estimated changes in the present value of pension obligations resulting from changes in the respective actuarial assumptions:
118 ANNUAL REPORT 2016
Consolidated financial statements • Notes

Sensitivity analysis
As of December 31, 2016 As of December 31, 2015
Effect on defined benefit obligation Effect on defined benefit obligation
Defined benefit obligation in EUR mn Change in %
Defined benefit obligation in EUR mn Change in %
Present value of pension obligations as of the reporting date 896 749
Present value of all pension obligations if
the discount rate increases by 0.5% 813 – 9.3 686 – 8.4
the discount rate decreases by 0.5% 990 10.5 821 9.6
salaries increase by 0.5% 904 0.9 757 1.1
salaries decrease by 0.5% 887 – 1.0 742 – 0.9
future pension increases are 0.25% higher 922 2.9 768 2.5
future pension increases are 0.25% lower 871 – 2.8 731 – 2.4
life expectancy increases by one year 926 3.3 772 3.1
Composition of plan assetsIn Germany, the plan assets are comprised of insurance policies issued by the Pension Fund. The Pension Fund invests about half of the assets in equity and equity funds. The other half is invested in bonded loans, real estate, real estate loans and private equity. The remaining part of assets is retained for liquidity purposes.
The investment strategy follows the investment guideline pro-vided by the executive board of the pension fund.
The plan assets of pension funds in the United States are gen-erally invested in equities and funds in accordance with the applicable investment guidelines. The composition of plan assets for the Group is:
Composition of plan assets
In EUR mn
As of December 31, 2016 As of December 31, 2015
Market price quoted in an
active market
No market price quoted in an
active market Total
Market price quoted in an
active market
No market price quoted in an
active market Total
Real estate – 77.0 77.0 – 61.3 61.3
Loans and fixed-income securities 186.2 91.5 277.7 173.2 95.0 268.2
Equities and equity funds 75.6 45.5 121.1 69.4 39.2 108.6
Cash and cash equivalents – 24.7 24.7 – 11.6 11.6
Total plan assets 261.8 238.7 500.5 242.6 207.1 449.7
thereof own-used real estate – 0.5 0.5 – 0.5 0.5
The Group was utilizing EUR 0.5 million of plan assets for its own purposes (prior year: EUR 0.5 million). The assets in ques-tion comprised the real estate used by Siltronic AG for its head-quarters in Munich.
RisksIn addition to the actuarial risks, the risk connected with the defined benefit obligation relates in particular to financial risks connected with plan assets. In Germany, substantial amounts of the defined benefit obligation are covered by plan assets man-aged by the pension fund. The current and future relationship
119ANNUAL REPORT 2016
Consolidated financial statements • Notes

between the asset allocation in its portfolio and our pension obligations are analyzed and projected as part of an annual asset-liability study to determine the long-term return on plan assets. The long-term yield requirement of the pension fund is calculated as a result. Based on this, the pension fund defines a strategic target portfolio. The yield requirement, the company contribution of the sponsoring companies, and the strategic asset allocation are thus reviewed annually and harmonized.
All capital investments are exposed to market price fluctuation risks. These risks may comprise changes in interest rates, equity prices, or exchange rates. The company aims to limit losses to a predefined level by means of what is known as overlay manage-ment. Derivatives are partially used for hedging purposes.
Due to the investment of plan assets in equities and funds, the defined benefits plans in the USA are not only subject to actu-arial risks, but also to market price risks.
Depending on the legal and company statutory provisions, we are under a duty to reduce any shortfall in the pension plans by providing liquid funds.
Risks arise in particular from the life expectancy of the benefi-ciaries, the interest rate guarantee risk and also from salary and pension increases. The interest rate guarantee risk is regularly monitored as part of the risk management process. The deter-mination of the long-term interest rate requirement and the ability to meet it is one of the focus areas of the pension fund. Risks from the interest rate guarantee also apply to the ‘Deferred Compensation’.
Financing of the pension planIn the year 2016 benefits in the amount of EUR 10.6 million (prior year: EUR 9.7 million) were paid into pension plans in Germany, and EUR 5.2 million (prior year: EUR 4.3 million) into pension plans outside of Germany. Employer contributions to plan assets will amount to approximately EUR 12.0 million in the year 2017. The expected term of pension obligations as of December 31, 2016 was 21.3 years (prior year: 19.6 years) in Germany and 16.3 years (prior year: 15.9 years) in the United States.
The following table shows the pensions benefits that the Group expects to pay from 2017 to 2021:
Projected payment periods for pension benefits
In EUR mn 2017 2018 2019 2020 2021
16.9 18.6 21.0 22.5 24.3
Composition of pension expenses by pension plan
In EUR mn 2016 2015
Current service cost due to defined benefit plans 16.9 19.8
Past service cost/effects of settlements/transfers – 0.5 –
Administrative cost paid out of plan assets 0.8 0.7
Net interest expenses due to defined benefit plans 8.5 8.2
Expenses due to defined contribution plans 1.3 1.3
Other pension expenses – 0.2
Contributions to public pension schemes 15.2 15.0
Total retirement benefits 42.2 45.2
11 Other provisions/provisions for income taxes
In EUR mn
As of December 31, 2016 As of December 31, 2015
Totalof which
non-currentof which
current Totalof which
non-currentof which
current
Personnel 39.7 36.6 3.1 33.4 30.3 3.1
Environmental protection 0.9 – 0.9 0.6 – 0.6
Onerous contracts 3.5 – 3.5 – – –
Other 0.5 0.2 0.3 2.4 0.1 2.3
Total 44.6 36.8 7.8 36.4 30.4 6.0
Provision for taxes 6.5 0.0 6.5 5.2 – 5.2
120 ANNUAL REPORT 2016
Consolidated financial statements • Notes

Provision for personnelThe provision for personnel primarily represents obligations for anniversary payments and early retirement. The provisions for early retirement plans will be completely paid out in six years. The outflow takes place on a continuous basis. The Group owns bonds and securities that serve as plan assets for early retirement benefits and have been offset against the obligations resulting from early retirement.
Provisions for environmental protectionProvisions for environmental protection include costs for antici-pated obligations resulting from potential contamination of soil and water at the Group’s facility in Portland, Oregon, United States. The property is under investigation of releases of certain contaminants, including trichloroethylene that was formerly used by the subsidiary in the United States. Furthermore, prior
owners of the property in Portland caused releases of manufac-tured gas plant waste, herbicides, pesticides, and petroleum products, and other hazardous substances. The Group has in-surance coverage that has provided reimbursement for the majority of the defense, investigation, and remediation costs that the Group has incurred to date. Although substantial cov-erage is in place, future defense, investigation, and remediation costs may not be fully reimbursed by the insurance companies.
Provisions for onerous contractsThe provision includes costs for obligations from long-term leases that are not offset by any economic advantage.
The following table shows the development of other provisions for the years 2016 and 2015:
Development of other provisions
In EUR mn Jan. 1, 2016 Utilization Reversal AdditionInterest and
exchange rate Other Dec. 31, 2016
Personnel 33.4 – 13.3 – 19.5 0.4 – 0.3 39.7
Environmental protection 0.6 – 0.5 – 0.8 0.0 – 0.9
Onerous Contracts – – – 3.5 0.0 – 3.5
Other 2.4 – 2.0 – 0.2 0.3 0.0 – 0.5
Total 36.4 – 15.8 – 0.2 24.1 0.4 – 0.3 44.6
Provision for taxesThe provision for taxes comprises amounts for current income tax obligations. This line item comprises all expected obligations from domestic and foreign entities.
The following table shows the development of the provision for income taxes:
Provision for taxes
In EUR mn Jan. 1, 2016 Utilization Reversal AdditionInterest and
exchange rate Dec. 31, 2016
Taxes 5.2 – 5.2 – 6.4 0.1 6.5
121ANNUAL REPORT 2016
Consolidated financial statements • Notes

12 Trade liabilities, other financial and non financial liabilities, and income tax liabilities
In EUR mn
As of December 31, 2016 As of December 31, 2015
Totalof which
non-currentof which
current Totalof which
non-currentof which
current
Trade liabilities 81.6 – 81.6 72.1 – 72.1
Other liabilities
Derivative financial instruments 10.4 1.2 9.2 19.0 0.6 18.4
Other 0.6 – 0.6 – – –
Total 11.0 1.2 9.8 19.0 0.6 18.4
of which > 5 years – – – – – –
Other non-financial liabilities
Other tax liabilities 2.9 – 2.9 3.3 – 3.3
Social security 2.1 – 2.1 0.8 – 0.8
Payroll 1.0 – 1.0 0.7 – 0.7
Profit-sharing and bonuses 10.6 – 10.6 9.9 – 9.9
Other personnel liabilities 6.9 – 6.9 7.3 – 7.3
Prepayments received 26.2 3.9 22.3 46.3 24.3 22.0
Other 0.0 – 0.0 1.6 – 1.6
Total 49.7 3.9 45.8 69.9 24.3 45.6
of which > 5 years – – – – – –
Income tax liabilities 0.1 – 0.1 0.2 – 0.2
Liabilities relating to social security refer in particular to amounts withheld that have not been paid.
The other personnel liabilities include primarily vacation and flextime credits.
Within the scope of long-term supply agreements with customers, the Group has received prepayments for future shipments of wafers. These prepayments will be reduced due to shipments; the amount of the reduction depends on the level of future sales.
The liability from derivative financial instruments represents the negative fair value of these instruments.
13 Financial liabilities
In EUR mn
As of December 31, 2016 As of December 31, 2015
Totalof which
non-currentof which
current Totalof which
non-currentof which
current
Loan from non-controlling interests 40.4 40.4 – 38.6 38.6 –
122 ANNUAL REPORT 2016
Consolidated financial statements • Notes
Non-current financial liabilities include a shareholder loan (from non-controlling interests) in the amount of EUR 40.4 million (including interest) which has an indefinite due date. The non-controlling interests refer to SSW.
No collateral exists for financial liabilities. Financial liabilities are not secured through liens or similar rights.
14 Other financial obligations and contingencies
The Group leases property, equipment, vehicles, and IT equip-ment by way of rental agreements and operating leases. With the exception of the property leases that have terms until the year 2040, the rentals and leases have terms up to five years.
In 2016 and 2015, expenses for lease and rent amounted to EUR 7.1 million and EUR 7.6 million, respectively.
Other financial obligations
In EUR mn Dec. 31, 2016 Dec. 31, 2015
Obligations from rental and operating lease agreements
due within 1 year 3.4 3.3
due between 1 to 5 years 11.3 10.4
due after 5 years and more 45.7 47.7
Total 60.4 61.4
As of December 31, 2016, obligations from purchase commit-ments were EUR 30.6 million (prior year: EUR 48.8 million); the commitments primarily related to property, plant and equipment.
The Group enters into long-term purchase agreements with mi nimum commitments. These minimum purchasing obligations amounted to EUR 45.5 million (prior year: EUR 50.2 million) as of December 31, 2016.
Other disclosures
15 Earnings per share
2016 2015
Net result attributable to Siltronic AG shareholders (in EUR mn) 12.0 – 14.0
Average number of outstanding common shares 30,000,000 27,794,521
Number of common shares outstanding at the end of the year 30,000,000 30,000,000
Earnings per common share (in EUR) (average) 0.40 – 0.50
Dividend payment per common share (in EUR) 0.00 0.00
The average number of common shares results from the fact that, up to and including June 10, 2015 (i.e. the day before the IPO), 25,000,000 shares were outstanding, while 30,000,000 shares were outstanding from the IPO date (June 11, 2015) until year-end.
Siltronic AG’s net loss, which is based on the provisions under German commercial law, was transferred from capital reserves.
16 Financial instruments
The following tables show financial assets and liabilities by measure ment categories and classes for the years ending December 31, 2016 and 2015, respectively. Also presented are liabilities from derivatives for which hedge accounting is used, even though they do not belong to any of the IAS 39 measure-ment categories.
123ANNUAL REPORT 2016
Consolidated financial statements • Notes

The fair value of financial instruments measured at amortized cost is determined based on discounting, taking into account customary market interest rates that are adequate to the specific risk and correspond to the relevant maturity. The carrying amount of current items recognized in the statement of financial position approximate fair value. The categories in accordance with IAS 39 differ between assets and liabilities measured at amortized costs and those measured at fair value as shown in
the table below. These categories are sufficient to reflect the classes in accordance with IFRS 7 which distinguish at minimum financial instruments measured at amortized cost from financial instruments measured at fair value. Those financial instruments which show specific risks are derivative financial instruments only pertaining to foreign currency derivatives, which are pre-sented separately in the table below.
Financial assets and liabilities by measurement categories
In EUR mn
Carrying amount as of Dec. 31, 2016
Measurement according to IAS 39
Fair value as of Dec. 31, 2016Amortized cost
Fair value through profit or loss
Fair value through other
comprehensive income
Trade receivables 118.2 118.2 – – 118.2
Other financial assets 97.7 92.7 1.9 3.1 97.7
Loans and receivables 13.7 – – 13.7
Fixed-term deposits 79.0 – – 79.0
Derivatives for which hedge accounting is not used (assets held for trading) – 1.9 – 1.9
Derivatives for which hedge accounting is used – – 3.1 3.1
Cash and cash equivalents 136.4 136.4 – – 136.4
Total financial assets 352.3 352.3
of which pursuant to IAS 39 measurement categories:
Loans and receivables 347.3 347.3 – – 347.3
Derivatives for which hedge accounting is not used (assets held for trading) 1.9 – 1.9 – 1.9
Derivatives for which hedge accounting is used 3.1 – – 3.1 3.1
Financial liabilities 40.4 40.4 – – 40.4
Recognized at amortized cost 40.4 – – 40.4
Trade liabilities 81.6 81.6 – – 81.6
Recognized at amortized cost 81.6 – – 81.6
Other financial liabilities 11.0 0.6 2.7 7.7 11.0
Recognized at amortized cost 0.6 – – 0.6
Derivatives for which hedge accounting is not used (liabilities held for trading) – 2.7 – 2.7
Derivatives for which hedge accounting is used – – 7.7 7.7
Total financial liabilities 133.0 133.0
of which pursuant to IAS 39 measurement categories:
Financial liabilities recognized at amortized cost 122.6 122.6 – – 122.6
Derivatives for which hedge accounting is not used (assets held for trading) 2.7 – 2.7 – 2.7
Derivatives for which hedge accounting is used 7.7 – – 7.7 7.7
124 ANNUAL REPORT 2016
Consolidated financial statements • Notes

Financial assets and liabilities by measurement categories
In EUR mn
Carrying amount as of Dec. 31, 2015
Measurement according to IAS 39
Fair value as of Dec. 31, 2015Amortized cost
Fair value through profit or loss
Fair value through other
comprehensive income
Trade receivables 100.4 100.4 – – 100.4
Other financial assets 55.7 45.8 9.6 0.3 55.7
Loans and receivables 5.8 – – 5.8
Fixed-term deposits 40.0 – – 40.0
Derivatives for which hedge accounting is not used (assets held for trading) – 9.6 – 9.6
Derivatives for which hedge accounting is used – – 0.3 0.3
Cash and cash equivalents 154.5 154.5 – – 154.5
Total financial assets 310.6 310.6
of which pursuant to IAS 39 measurement categories:
Loans and receivables 300.7 300.7 – – 300.7
Derivatives for which hedge accounting is not used (assets held for trading) 9.6 – 9.6 – 9.6
Derivatives for which hedge accounting is used 0.3 – – 0.3 0.3
Financial Liabilities 38.6 38.6 – – 38.6
Recognized at amortized cost 38.6 – – 38.6
Trade liabilities 72.1 72.1 – – 72.1
Recognized at amortized cost 72.1 – – 72.1
Other financial liabilities 19.0 – 9.1 9.9 19.0
Recognized at amortized cost – – – –
Derivatives for which hedge accounting is not used (liabilities held for trading) – 9.1 – 9.1
Derivatives for which hedge accounting is used – – 9.9 9.9
Total financial liabilities 129.7 129.7
of which pursuant to IAS 39 measurement categories:
Financial liabilities recognized at amortized cost 110.7 110.7 – – 110.7
Derivatives for which hedge accounting is not used (assets held for trading) 9.1 – 9.1 – 9.1
Derivatives for which hedge accounting is used 9.9 – – 9.9 9.9
The loans and receivables reported include trade receivables, fixed-term deposits and other loans, as well as cash and cash equivalents. Cash and cash equivalents in foreign currency are measured at the exchange rate on the reporting date. Their carrying amounts is equal to their fair values.
The carrying amounts of trade liabilities and current other lia-bilities is equal to their fair values. The fair values of financial liabilities constitute the present value of the expected future cash flows. Discounting is carried out on the basis of the interest rates as of the reporting date.
125ANNUAL REPORT 2016
Consolidated financial statements • Notes
The following table shows the net gains and losses from finan-cial instruments by measurement category. The impacts on earn-ings due to derivatives that qualify for cashflow hedge account-ing are not shown in the table because they do not belong to any of the IAS 39 measurement categories.
Net result by measurement category
In EUR mn 2016 2015
Loans and receivables 7.5 7.0
Assets/liabilities classified as at fair value through profit or loss – 3.8 5.5
Financial liabilities recognized at amortized cost – 2.3 – 1.9
Total 1.4 10.6
The net result of the category ‘Loans and receivables’ was pri-marily due to net losses and gains from exchange rate effects, interest income from financial assets, fixed-term deposits and bank balances (net of valuation allowances).
Gains and losses from changes in the fair value of foreign exchange rates which do not meet the requirements of IAS 39 for hedge accounting are recorded in the category ‘fair value through profit or loss.’
The net losses in the category ‘Financial liabilities recognized at amortized cost’ primarily consist of interest expenses on financial liabilities and effects resulting from valuations with different foreign exchange rates.
The interest income from financial assets which are not re cog-nized at fair value through profit or loss amounts to EUR 0.7 million in 2016 (prior year: EUR 0.2 million). This interest income primarily comes from cash and cash equivalents and fixed-term deposits. The interest expenses from financial liabilities which are not recog nized at fair value through profit or loss were EUR 1.3 million in 2016 (prior year: EUR 2.1 million).
The financial assets and liabilities measured at fair value in the statement of financial position were allocated to one of three categories in accordance with the fair value hierarchy described in IFRS 13.
The levels of the hierarchy are as follows:
Level I. Financial instruments measured using quoted prices in active markets (markets showing appropriate liquidity) which are representative to the financial instrument being measured.
Level II. Financial instruments measured using valuation meth-ods based on observable market data, the fair value of which can be determined using similar financial instru-ments traded in active markets or using valuation methods all of whose parameters are observable. These include hedging and non-hedging derivative financial instruments and loans.
Level III. Financial instruments measured using valuation meth-ods not based on observable parameters, the fair value of which cannot be determined using observable mar-ket data and which require application of different valuation methods (typically applied for over-the-counter derivatives and unquoted equity instruments).
The following tables show the categories in the fair value hier-archy to which the financial assets and liabilities measured at fair value in the statement of financial position are allocated.
126 ANNUAL REPORT 2016
Consolidated financial statements • Notes

Fair value hierarchy
In EUR mn
As of December 31, 2016
Level I Level II Level III Total
Financial assets measured at fair value
Fair value through profit or loss
Derivatives for which hedge accounting is not used (assets held for trading) – 1.9 – 1.9
Fair value through other comprehensive income
Derivatives for which hedge accounting is used – 3.1 – 3.1
Total – 5.0 – 5.0
Financial liabilities measured at fair value
Fair value through profit or loss
Derivatives for which hedge accounting is not used (liabilities held for trading) – 2.7 – 2.7
Fair value through other comprehensive income
Derivatives for which hedge accounting is used – 7.7 – 7.7
Total – 10.4 – 10.4
In EUR mn
As of December 31, 2015
Level I Level II Level III Total
Financial assets measured at fair value
Fair value through profit or loss
Derivatives for which hedge accounting is not used (assets held for trading) – 9.6 – 9.6
Fair value through other comprehensive income
Derivatives for which hedge accounting is used – 0.3 – 0.3
Total – 9.9 – 9.9
Financial liabilities measured at fair value
Fair value through profit or loss
Derivatives for which hedge accounting is not used (liabilities held for trading) – 9.1 – 9.1
Fair value through other comprehensive income
Derivatives for which hedge accounting is used – 9.9 – 9.9
Total – 19.0 – 19.0
Market values are calculated using information available on the reporting date and based on counterparties’ quoted prices or via appropriate valuation methods (discounted cash-flow or well- established actuarial methodologies, such as the par method).
Derivative financial instruments are recognized at fair value and are thus subject to a recurring fair value assessment. They are categorized as Level II fair values.
The fair value of a derivative financial instrument is calculated based on market data such as exchange rates or yield curves in accordance with market-specific valuation methods. The calcu-lation of the fair value reflects our and the counterparty’s default risk, using maturity-matching and market-observable CDS values.
As of December 31, 2016 (same as in previous year), financial liabilities measured at amortized cost includes the loan of the non-controlling interests of SSW.
127ANNUAL REPORT 2016
Consolidated financial statements • Notes

Disclosures on derivative financial instrumentsIn cases where the Group hedges against foreign currency risks, it uses derivative financial instruments which comprise currency forward exchange contracts, currency option contracts, and currency foreign exchange swaps. Derivatives are used only if they are offset by scheduled transactions arising from operations (underlying transactions). The scheduled transactions also include expected transactions. The derivatives relate to three areas which are called ‘strategic hedging’ ,‘operational hedging’ and ‘hedging of specific intra-group matters’.
Strategic hedging comprises expected sales transactions in for-eign currency which are not yet invoiced. The time horizon for strategic hedging is between three and a maximum of 21 months. The hedged cash flows influence the statement of profit or loss at the time when sales are realized. The cash inflows are usually recorded one to three months afterwards. Strategic hedging is carried out using currency forward exchange con-tracts and currency option contracts.
Operational hedging relates to recognized trade receivables and trade liabilities and generally covers time horizons of between one and three months. Hedges are executed with currency forward exchange contracts.
Hedging of specific intra-group matters, especially intra-group-loans, are usually covered by currency swap contracts.
Foreign exchange hedging is carried out mainly for the US dollar, Japanese yen and Singapore dollar.
The market values refer to the repurchase values (redemption values) of the financial derivatives and are calculated using rec-ognized actuarial methods.
The derivatives are recognized at their market values, irrespective of their stated purpose. They are reported in the statement of financial position under other assets or other liabilities. Where eligible, cash flow hedge accounting is applied for the strategic hedging of currency exchange risks from future foreign exchange cash flows. In such cases, changes in the market values of for-eign exchange contracts and changes in the intrinsic values of currency options are recognized in other comprehensive income until the underlying transaction takes place, insofar as the hedge is effective. When future transactions are realized, the effects accumulated in other equity items are reversed through profit or loss.
For strategic hedging purposes, staggered hedging ratios of between 30 percent and 50 percent are used in relation to the expected net exposure in US dollars (where applicable, taking into account currencies showing a high correlation with the US dollar). The expected net exposure on US dollar basis for 2017 is approximately 45 percent hedged, with the expected addi-tional net exposure for 2018 amounting to approximately 12 percent hedged.
The accumulated unrealized gains and losses recorded directly in other equity items at December 31, 2016 included unrealized gains and losses from cash flow hedges of EUR – 4.6 million (prior year: EUR – 13.2 million).
Depending on the nature of the underlying transaction, cash flow hedges are posted in the statement of profit or loss under the operating result or, if financial liabilities are being hedged, under financial result.
Nominal values and market values
In EUR mn
As of December 31, 2016 As of December 31, 2015
Nominal values Market values Nominal values Market values
Foreign currency derivatives 593.4 – 5.4 754.4 – 9.2
Market values for derivative financial instruments within hedge accounting – – 4.6 – – 9.6
The foreign exchange derivatives contain forward exchange contracts and currency options with nominal amounts of USD 325.9 million, JPY 22.2 billion, and SGD 70.7 million and
EUR 68.0 million as of December 31, 2016. Derivatives with market values of EUR – 6.1 million are due in 2017 and of EUR 0.6 million due in 2018.
128 ANNUAL REPORT 2016
Consolidated financial statements • Notes
The following table provides information on the netting of finan-cial assets and liabilities in the consolidated statement of finan-cial position. It also shows the financial effects of a possible
setting off of financial instruments from netting agreements, enforceable global netting agreements, or similar agreements.
Netting of financial assets and liabilities
In EUR mn
As of December 31, 2016
I
Gross amounts of recognized
financial assets/liabilities
II Gross amounts
of recognized financial assets/
liabilities set off in the statement of financial position
I – II Net amounts
of financial assets/liabilities presented in the
statement of financial position
Related amounts not set off in the statement of financial position
Net amount
Financial
instrumentsCash collateral
received
Derivatives with a positive market value 5.8 0.9 4.9 4.3 0.0 0.6
Derivatives with a negative market value – 11.2 – 0.9 – 10.3 – 4.3 0.0 – 6.0
In EUR mn
As of December 31, 2015
I
Gross amounts of recognized
financial assets/liabilities
II Gross amounts
of recognized financial assets/
liabilities set off in the statement of financial position
I – II Net amounts
of financial assets/liabilities presented in the
statement of financial position
Related amounts not set off in the statement of financial position
Net amountFinancial
instrumentsCash collateral
received
Derivatives with a positive market value 10.0 0.1 9.9 4.0 – 5.9
Derivatives with a negative market value – 19.1 – 0.1 – 19.0 – 4.0 – – 15.0
In addition to the amounts offset under the provisions on netting pursuant to IAS 32, the table also includes those amounts that may not be netted pursuant to IAS 32.
As a part of strategic hedging of foreign currency cash flows. the Group closes out forward-exchange contracts prior to matu-rity by offsetting transactions. The strategic forward exchange contract and the corresponding offsetting forward exchange
transaction are recognized as a net amount in accordance with IAS 32. In addition, general offsetting agreements, which apply only in cases of insolvency, have been concluded with a number of banks.
The Group has not received any pledged cash security for posi-tive market values of derivatives nor pledged any cash security for negative market values.
129ANNUAL REPORT 2016
Consolidated financial statements • Notes
Management of financial risksThe following disclosures explain the management of the finan-cial risks of the Group. Other parts of these notes include more quantitative information to financial assets and financial liabili-ties or contingencies.
In the normal course of business, the Group is exposed to credit, liquidity, and market risks from financial instruments. The goal of financial risk management is to limit risks from operating business and the resultant financing requirements by using cer-tain derivative and non-derivative hedging instruments.
In terms of assets, liabilities and planned transactions, the Group faces risks resulting from the fluctuation of foreign exchange rates. Changes in interest rates and equity prices do not play a significant role for the Group.
Generally, only those risks which have an impact on the cash flow of the Group are hedged. To mitigate default risks, hedging instruments are only entered with counterparties of high credit rating.
The basic rules of financial management are determined by the Executive Board and monitored by the Supervisory Board of the Group. The Executive Board has the overall responsibility for the implementation and monitoring of the risk management of the Group. Part of this system is the management of financial risks. Among other things, the system for managing financial risks has a guideline defining the usage and the extent of derivative financial instruments and committees supervising the application of the guideline, evaluating the efficiency of the derivative financial instruments entered and defining additional risk limits when necessary.
The Group mitigates financial risks through the risk manage-ment system it has in place. This system is monitored by the Supervisory Board. The fundamental purpose of the risk man-agement system is to identify, analyze, coordinate, monitor, and communicate risks in a timely manner. The Executive Board of the Group receives regular analyses on the extent of those risks. The analyses focus on market risks, in particular on the potential impact of raw-material price risks, foreign currency exchange risks, and interest rate risks on net interest income.
Foreign currency risksForeign currency risks generally result from investments, financ-ing measures, and operating business. The Group hedges for-eign currency risks as far as it can influence the cash flow of the Group. Foreign currencies which do not influence the cash flow of the Group result from the translation of assets and liabilities of foreign subsidiaries into Euro. Such risks are not hedged because they refer to long-term investments.
Since it is very common in the semiconductor industry to trans-act in US dollar and the proceeds for the Group from the sale of products (operating business) significantly exceed the cash-outflows in US dollar (operating business and investments), the Group faces a US dollar foreign exchange risk. The Group also faces foreign exchange risk related to the Japanese yen and the Singapore dollar.
The net exposure for foreign currency, i.e. the amount in the same foreign currencies (or currencies put together because of high correlations) remaining after eliminating cash inflows and cash outflows, is hedged according to the Group policy.
In the finance area, the Group is exposed to currency risks from a loan denominated in foreign currency which exists for the Group’s financing purposes in relation to a minority shareholder. When material, these risks are hedged against currency exchange rates and swaps are used as hedging instruments.
To record market risks, IFRS 7 requires sensitivity analyses which show the results from hypothetical changes of relevant risk vari-ables on profit or loss and on equity. The periodical changes are calculated by applying the hypothetical changes of the risk vari-ables on all existing financial instruments as of the reporting date. The sensitivity analyses regarding foreign currencies have the following presumptions:
The existing primary monetary financial instruments (cash and cash equivalents, fixed-term deposits, receivables, interest bear-ing, and non-interest bearing liabilities) as of the reporting date represent a normal level. In the future, approximately two-thirds of consolidated sales, which is the current level, will be invoiced in US dollar.
130 ANNUAL REPORT 2016
Consolidated financial statements • Notes
Payouts in foreign currency remain on the current level which is dependent on the production level. Thus, the Group is only opposed to foreign currency exchange risks coming from trade receivables not hedged and the change in fair value of existing derivative financial instruments.
If the US dollar had increased or decreased by 10 percent against the Euro as of December 31, 2016, the fair value of the hedging instruments would have been approximately EUR 10.2 million lower or higher. The corresponding change in fair value as of December 31, 2015 would have been approximately EUR 13.0 million lower or EUR 19.2 million higher, respectively. The change would have been recorded in other comprehensive income. If the yen had increased or decreased by 10 percent against the Euro as of December 31, 2016, the fair value of the hedging instruments would have changed by EUR 9.5 million. The cor-responding change in fair value at December 31, 2015 would have been EUR 7.6 million.
Interest rate riskSince the Group had no material interest bearing net liabilities at the reporting date and does not expect to face major net liabilities, interest rate risks are not hedged. Further, due to the fact that the derivatives related to foreign currencies are not subject to significant changes in interest rates, no interest rate risk arises thereof.
Other price risksThe Group does not face any material other market price risks, which generally result from stock market prices.
Credit risk (risk of default)In terms of financial instruments, the Group is exposed to a default risk should a contractual party fail to fulfill its commit-ments. The maximum risk is therefore the amount of the respec-tive financial instrument’s positive fair value. To limit the risk of default, transactions are conducted only within defined limits and with partners of very high credit standing. To make efficient risk management possible, the market risks within the Group are controlled centrally. The conclusion and handling of trans-actions comply with internal guidelines and are subject to mon-itoring procedures that take account of the separation of duties. As for operations, outstanding receivables and default risks are
continually monitored and partly hedged against by means of trade credit insurance. Receivables from major customers are not so high as to represent an extraordinary concentration of risks. The Group has implemented rules to monitor receivables including dunning and stop of shipments. Default risks are accounted for by impairment, taking advance payments received into account.
To minimize the credit risk resulting from all base transactions related to the original financial instruments, collateral (e.g. retention of title) is requested or credit information and refer-ences respectively are obtained or historical data from prior business relationships, especially payment behavior, is used to avoid payment default. The measure depends on the type and amount of transaction. As far as default risk can be recognized for individual financial assets, such risks are covered by specific reserves for bad debt.
In the last three years the expense for default was on average less than 0.2 percent of sales.
Liquidity riskA liquidity risk means that a company may not be able to meet its existing or future financial obligations because of insufficient funds. The Group ensures continuous liquidity and financial flex-ibility by holding enough funds as cash and cash equivalents. Financing through loans plays a minor role.
The liquidity status of the Group is monitored by comparing cash outflows for each of the next three months with the cash pro-ceeds. In addition, actual cash flows are compared to forecasted cash flows to detect unplanned developments early. Moreover, a cash flow forecast on a monthly rolling basis is in place cover-ing the period to the end of the year. This forecast is in accor-dance with the monthly forecasts of statement of profit or loss and statement of financial position which are also covering the period to the end of the year. By these means the Company ensures that it will meet financial liabilities without negatively affecting its reputation.
According to the policy of the Group, guarantees are generally issued only to fully-owned subsidiaries. No guarantees had been issued as of the years ended December 31, 2016 or 2015.
131ANNUAL REPORT 2016
Consolidated financial statements • Notes

Market riskMarket risk describes the risk that the fair value or future cash flows of an original or derivative financial asset will change due to the volatility of the market.
Fixed-term depositsFixed-term deposits are investments held at banks. The terms of the deposits run until 2017.
17 Notes to the Statement of Cash Flows
Before the IPO, the Group was primarily financed by the cash pooling system with Wacker Chemie AG and a loan granted by Wacker Chemie AG. In the course of the IPO, the loan was repaid to Wacker and cash pooling has been performed at Sil-tronic AG level since that date.
Cash and cash equivalents shown in the statement of cash flows comprise cash and bank deposits if the maturity is within three months.
18 Segment reporting
The Group has only one reportable segment, which includes the development, production, and marketing of semiconductor wafers with a wide variety of features satisfying numerous prod-uct specifications to meet customers’ precise technical specifi-cations, which are utilized in the manufacture of semiconductor devices. Based on the fact that in the wafer industry the alloca-tion of resources is derived from a wide variety of specifications, the Group operates only in one segment. The products can dif-fer between diameters, between polished and epitaxial wafer, between different pulling technologies and other features.
The geographical information during the reporting periods was as follows:
Segment information by region
In EUR mn
2016
Germany
Europe excluding Germany United States
China including
Taiwan Korea
Asia excluding
China and Korea
Consoli- dation and
othersSiltronic
Group
External sales by customer location 61.0 109.5 126.2 266.5 193.5 163.5 13.2 933.4
Additions to property, plant and equipment and intangible assets 67.4 – 1.5 – – 19.9 – 88.8
Non-current assets (December 31) 243.7 – 9.6 – – 275.4 17.5 546.2
In EUR mn
2015
Germany
Europe excluding Germany United States
China including
Taiwan Korea
Asia excluding
China and Korea
Consoli- dation and
othersSiltronic
Group
External sales by customer location 56.8 102.7 132.9 278.6 182.4 160.7 17.2 931.3
Additions to property, plant and equipment and intangible assets 49.2 – 2.2 – – 23.6 – 75.0
Non-current assets (December 31) 226.8 – 9.9 – – 319.6 16.3 572.6
In 2016, the Group realized sales with two customers with a share of 16 percent and 13 percent, respectively. In 2015, two customers constituted 15 and 13 percent of consolidated sales.
132 ANNUAL REPORT 2016
Consolidated financial statements • Notes
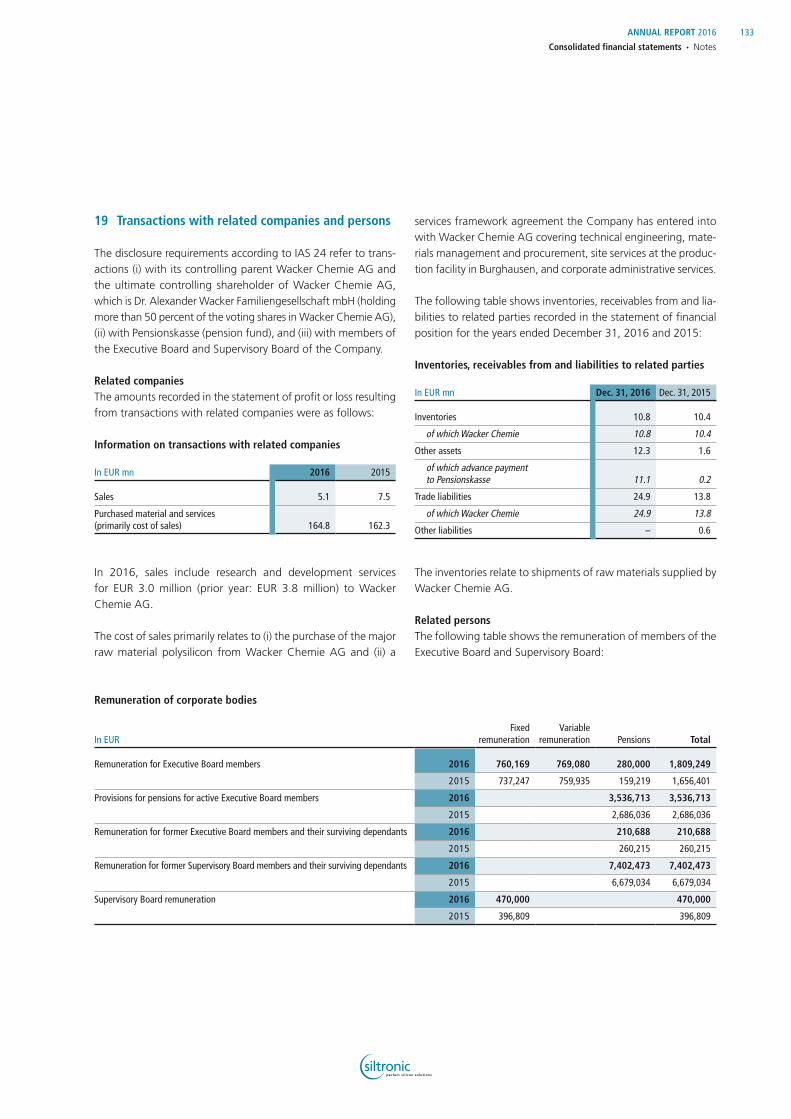
19 Transactions with related companies and persons
The disclosure requirements according to IAS 24 refer to trans-actions (i) with its controlling parent Wacker Chemie AG and the ultimate controlling shareholder of Wacker Chemie AG, which is Dr. Alexander Wacker Familiengesellschaft mbH (holding more than 50 percent of the voting shares in Wacker Chemie AG), (ii) with Pensionskasse (pension fund), and (iii) with members of the Executive Board and Supervisory Board of the Company.
Related companiesThe amounts recorded in the statement of profit or loss resulting from transactions with related companies were as follows:
Information on transactions with related companies
In EUR mn 2016 2015
Sales 5.1 7.5
Purchased material and services (primarily cost of sales) 164.8 162.3
In 2016, sales include research and development services for EUR 3.0 million (prior year: EUR 3.8 million) to Wacker Chemie AG.
The cost of sales primarily relates to (i) the purchase of the major raw material polysilicon from Wacker Chemie AG and (ii) a
services framework agreement the Company has entered into with Wacker Chemie AG covering technical engineering, mate-rials management and procurement, site services at the produc-tion facility in Burghausen, and corporate administrative services.
The following table shows inventories, receivables from and lia-bilities to related parties recorded in the statement of financial position for the years ended December 31, 2016 and 2015:
Inventories, receivables from and liabilities to related parties
In EUR mn Dec. 31, 2016 Dec. 31, 2015
Inventories 10.8 10.4
of which Wacker Chemie 10.8 10.4
Other assets 12.3 1.6
of which advance payment to Pensionskasse 11.1 0.2
Trade liabilities 24.9 13.8
of which Wacker Chemie 24.9 13.8
Other liabilities – 0.6
The inventories relate to shipments of raw materials supplied by Wacker Chemie AG.
Related personsThe following table shows the remuneration of members of the Executive Board and Supervisory Board:
Remuneration of corporate bodies
In EUR Fixed
remunerationVariable
remuneration Pensions Total
Remuneration for Executive Board members 2016 760,169 769,080 280,000 1,809,249
2015 737,247 759,935 159,219 1,656,401
Provisions for pensions for active Executive Board members 2016 3,536,713 3,536,713
2015 2,686,036 2,686,036
Remuneration for former Executive Board members and their surviving dependants 2016 210,688 210,688
2015 260,215 260,215
Remuneration for former Supervisory Board members and their surviving dependants 2016 7,402,473 7,402,473
2015 6,679,034 6,679,034
Supervisory Board remuneration 2016 470,000 470,000
2015 396,809 396,809
133ANNUAL REPORT 2016
Consolidated financial statements • Notes

Remuneration for pensions consists of service costs and interest costs.
Moreover there were no further significant transactions between Siltronic and related parties in the 2016 fiscal year going beyond the existing employment, service, or appointment relationship or the contractual remuneration.
Detailed information on the remuneration of the Executive Board members are included in the remuneration report on / 83. The remuneration report is part of the management report and includes disclosures which are part of the notes under German commercial law.
20 Other information
Siltronic AG prepares consolidated financial statements for the smallest group of companies, while Wacker Chemie AG prepares consolidated financial statements for the largest group of com-panies. Wacker Chemie AG’s consolidated financial statements can be inspected in the electronic Federal Gazette and can be accessed via the Wacker Chemie AG website.
The following table shows the personnel employed on average during the year.
Average number of employees
Number 2016 2015
Non-production staff 1,228 1,252
Production staff 2,583 2,752
Total 3,811 4,004
Costs for auditors are separated into audit and other advisory services. The latter mainly relate to costs for special services. especially provided for the IPO.
Audit fees
In EUR mn 2016 2015
Audit of financial statements 0.4 0.5
Other audit services 0.0 0.1
Total 0.4 0.6
The list of shareholdings in affiliated companies as of December 31, 2016 is as follows (IFRS amounts):
List of shareholdings
2016
Share capital in EUR mn
Net income in EUR mn
Equity share in %
Siltronic Holding International B.V.,Krommenie, The Netherlands 1) 331,173 11,815 100.0
Siltronic Singapore Pte. Ltd., Singapore 2) 171,371 43,418 100.0
Siltronic Silicon Wafer Pte. Ltd., Singapore 2) – 39,510 – 9,778 77.7
Siltronic Corp., Portland (Oregon), USA 2) 11,924 5,110 100.0
Siltronic Japan Corp., Tokyo, Japan 2) – 7,506 – 292 100.0
1) Held directly by Siltronic AG 2) Held indirectly by Siltronic AG
21 Subsequent events
On February 20, 2017, Siltronic AG was informed by the Pen-sionskasse der Wacker Chemie VVaG (pension fund) of a change in the technical business plan of the pension fund. In this con-nection, a special payment of EUR 11.1 million was requested. (Siltronic AG had made a corresponding advance payment before the balance sheet date.)
Munich, February 22, 2017 The Executive Board of Siltronic AG
Dr. Christoph von Plotho Rainer Irle(CEO) (CFO)
134 ANNUAL REPORT 2016
Consolidated financial statements • Notes

Auditor’s report
We have audited the consolidated financial statements prepared by the Siltronic AG, comprising the statement of financial posi-tion, income statement, statement of comprehensive income, statement of changes in equity, statement of cash flows and explanatory notes, together with the report on the position of the Company and the Group for the business year from January 1 to December 31, 2016. The preparation of the consolidated financial statements and the report on the position of the Com-pany and the Group in accordance with IFRSs, as adopted by the EU, and the additional requirements of German commercial law pursuant to § 315a Abs. 1 HGB [Handelsgesetzbuch ‘German Commercial Code’] are the responsibility of the parent company`s management. Our responsibility is to express an opinion on the consolidated financial statements and on the report on the posi-tion of the Company and the Group based on our audit.
We conducted our audit of the consolidated financial statements in accordance with § 317 HGB [Handelsgesetzbuch ‘German Commercial Code’] and German generally accepted standards for the audit of financial statements promulgated by the Institut der Wirtschaftsprüfer [Institute of Public Auditors in Germany] (IDW). Those standards require that we plan and perform the audit such that misstatements materially affecting the presen-tation of the net assets, financial position and results of opera-tions in the consolidated financial statements in accordance with the applicable financial reporting framework and in the report on the position of the Company and the Group are detected with reasonable assurance. Knowledge of the business activities and the economic and legal environment of the Group and
expectations as to possible misstatements are taken into account in the determination of audit procedures. The effectiveness of the accounting-related internal control system and the evidence supporting the disclosures in the consolidated financial state-ments and the report on the position of the Company and the Group are examined primarily on a test basis within the frame-work of the audit. The audit includes assessing the annual finan-cial statements of those entities included in consolidation, the determination of entities to be included in consolidation, the accounting and consolidation principles used and significant estimates made by management, as well as evaluating the over-all presentation of the consolidated financial statements and the report on the position of the Company and the Group. We believe that our audit provides a reasonable basis for our opinion.
Our audit has not led to any reservations.
In our opinion, based on the findings of our audit, the consoli-dated financial statements comply with IFRSs, as adopted by the EU, the additional requirements of German commercial law pursuant to § 315a Abs. 1 HGB (and supplementary provisions of the shareholder agreement/articles of incorporation) and give a true and fair view of the net assets, financial position and results of operations of the Group in accordance with these requirements. The report on the position of the Company and the Group is consistent with the consolidated financial state-ments, complies with the German statutory requirements, and as a whole provides a suitable view of the Group’s position and suitably presents the opportunities and risks of future development.
Munich, February 22, 2017KPMG AG Wirtschaftsprüfungsgesellschaft
Hanshen RatkovicWirtschaftsprüfer Wirtschaftsprüfer(German public auditor) (German public auditor)
Additional information
135ANNUAL REPORT 2016
Additional information • Auditor’s report

Responsibility statement
To the best of our knowledge, and in accordance with the appli-cable reporting principles, the consolidated financial statements give a true and fair view of the assets, liabilities, financial position and profit or loss of the Group, and the management report of the Group includes a fair review of the development and per-formance of the business and the position of the Group, together with a description of the significant opportunities and risks associated with the expected development of the Group.
Munich, February 22, 2017The Executive Board of Siltronic AG
Dr. Christoph von Plotho Rainer Irle(CEO) (CFO)
136 Annual Report 2016
Additional information • Responsibility statement

Further disclosures on offices held
Supervisory Board
Dr. Tobias OhlerChairmanMunichMember of the Executive Board of Wacker Chemie AG
Member of the Supervisory Board– Pensionskasse
Wacker Chemie VVaG
Johann Hautz 1)
Deputy chairman BurghausenChairman of the works council of Siltronic AG, Burghausen site
Maximilian Baumgartner 1)
MarktlHead of Operation Processes, Siltronic AG
Sieglinde FeistGrasbrunnHead of Corporate Development, Wacker Chemie AG
Gebhard Fraunhofer 1)
Simbach am InnChairman of the general works council of Siltronic AG
Dr. Hermann GerlingerAalenMember of the Executive Board of Carl Zeiss AG,Chief Executive Officer of Carl Zeiss SMT GmbH (until December 31, 2016),Advisor to the Executive Board of Carl Zeiss AG (since January 1, 2017)
Karin Gottschalk 1)
Brand-ErbisdorfDeputy chairman of the works council of Siltronic AG, Freiberg site
Bernd JonasEssen Attorney
Gertraud Lauber 1)
Bad Münder Secretary of the Mining, Chemical and Energy Industrial Union (IG BCE), Energy Transition/Sustainability Department
Member of the Advisory Board– Labor and Environmental Foundation
of the IG BCE
Dr. Franz RichterEichenauChief Executive Officer of SÜSS MicroTec AG
Chairman of the Board of Directors– Scint-X AB
Member of the Board of Directors– Meyer Burger Technology AG– COMET Holding AG
Harald Sikorski 1)
Munich District manager at IG BCE, Altötting
Member of the Supervisory Board– Wacker Chemie AG
Angela Wörl(Member since January 4, 2016) Munich Head of HR/Social Affairs, Wacker Chemie AG
Member of the Supervisory Board– Pensionskasse Wacker Chemie VVaG
1) Employee representative
137Annual Report 2016
Additional information • Further disclosures on offices held
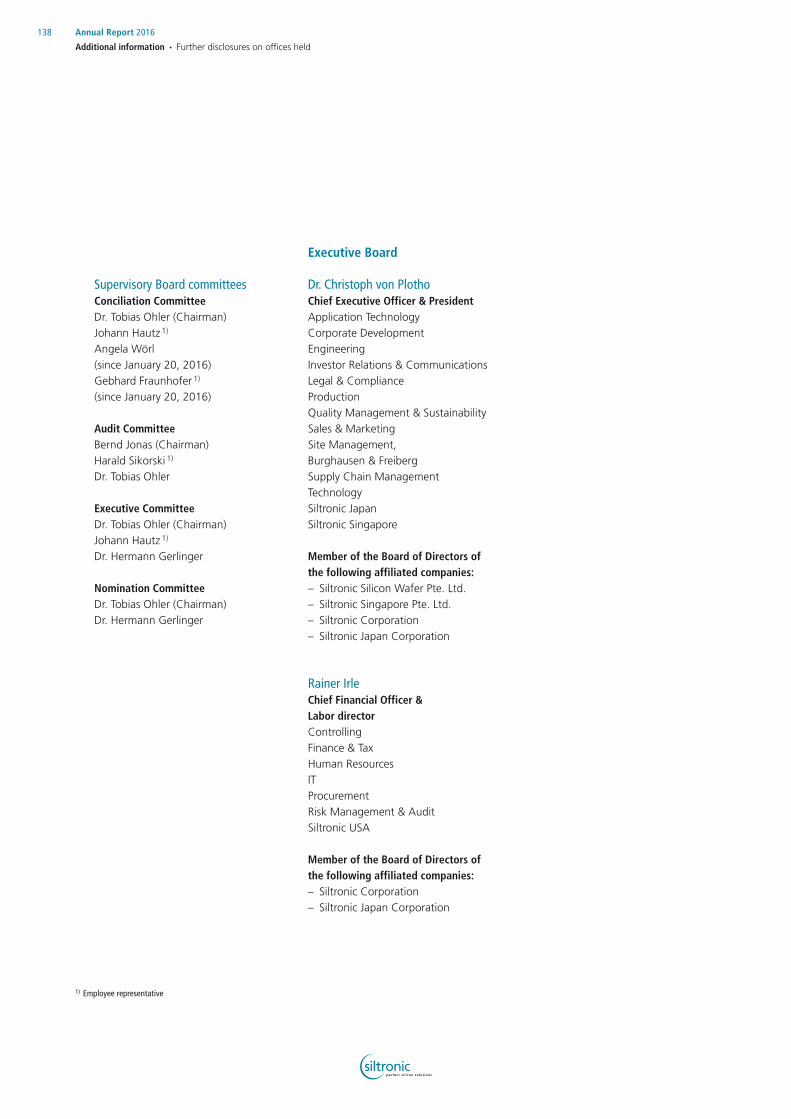
Supervisory Board committeesConciliation CommitteeDr. Tobias Ohler (Chairman) Johann Hautz 1) Angela Wörl (since January 20, 2016) Gebhard Fraunhofer 1) (since January 20, 2016)
Audit CommitteeBernd Jonas (Chairman) Harald Sikorski 1) Dr. Tobias Ohler
Executive Committee Dr. Tobias Ohler (Chairman) Johann Hautz 1) Dr. Hermann Gerlinger
Nomination Committee Dr. Tobias Ohler (Chairman) Dr. Hermann Gerlinger
Executive Board
Dr. Christoph von PlothoChief Executive Officer & PresidentApplication TechnologyCorporate DevelopmentEngineeringInvestor Relations & CommunicationsLegal & ComplianceProductionQuality Management & SustainabilitySales & MarketingSite Management, Burghausen & FreibergSupply Chain ManagementTechnologySiltronic JapanSiltronic Singapore
Member of the Board of Directors of the following affiliated companies:– Siltronic Silicon Wafer Pte. Ltd.– Siltronic Singapore Pte. Ltd.– Siltronic Corporation– Siltronic Japan Corporation
Rainer IrleChief Financial Officer & Labor directorControllingFinance & TaxHuman ResourcesITProcurementRisk Management & AuditSiltronic USA
Member of the Board of Directors of the following affiliated companies:– Siltronic Corporation– Siltronic Japan Corporation
1) Employee representative
138 Annual Report 2016
Additional information • Further disclosures on offices held

Quarterly overview
Q4 2016 Q3 2016 Q2 2016 Q1 2016
Statement of profit or loss
Sales EUR mn 246.3 237.0 229.6 220.6
EBITDA EUR mn 50.5 36.9 35.1 23.6
EBITDA margin % 20.5 15.6 15.3 10.7
EBIT EUR mn 20.0 6.7 6.0 – 5.6
EBIT margin % 8.1 2.8 2.6 – 2.5
Net profit/loss for the period EUR mn 15.5 3.9 0.9 – 11.5
Earnings per share EUR 0.51 0.16 0.07 – 0.34
Capital expenditure and free cash flow
Capital expenditure on property, plant and equipment, and intangible assets EUR mn 23.9 22.1 22.4 20.4
Free cash flow EUR mn 10.0 15.7 0.1 – 6.7
Statement of financial position
Total assets EUR mn 1,056.8 1,031.5 1,037.0 1,030.7
Equity EUR mn 425.3 297.0 323.6 418.2
Equity ratio % 40.2 28.8 31.2 40.5
ROCE % 10.9 3.6 3.2 – 3.0
Net financial assets EUR mn 175.0 165.0 150.9 149.2
139Annual Report 2016
Additional information • Quarterly overview
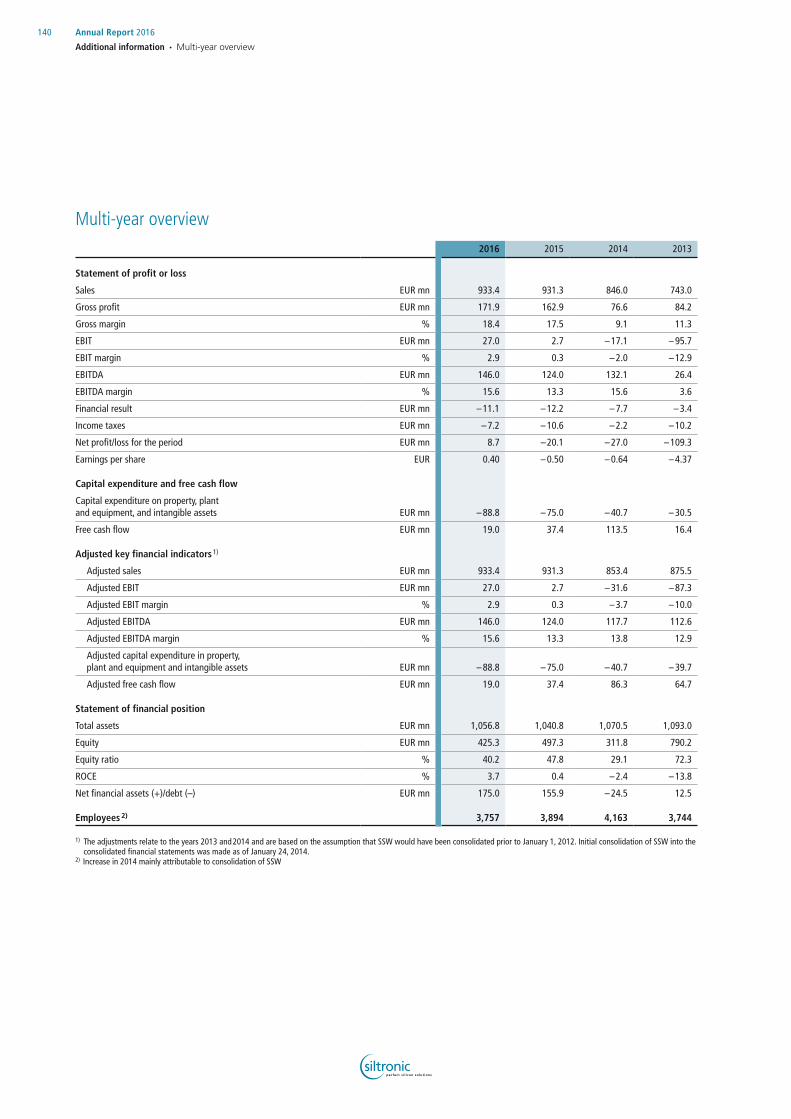
Multi-year overview
2016 2015 2014 2013
Statement of profit or loss
Sales EUR mn 933.4 931.3 846.0 743.0
Gross profit EUR mn 171.9 162.9 76.6 84.2
Gross margin % 18.4 17.5 9.1 11.3
EBIT EUR mn 27.0 2.7 – 17.1 – 95.7
EBIT margin % 2.9 0.3 – 2.0 – 12.9
EBITDA EUR mn 146.0 124.0 132.1 26.4
EBITDA margin % 15.6 13.3 15.6 3.6
Financial result EUR mn – 11.1 – 12.2 – 7.7 – 3.4
Income taxes EUR mn – 7.2 – 10.6 – 2.2 – 10.2
Net profit/loss for the period EUR mn 8.7 – 20.1 – 27.0 – 109.3
Earnings per share EUR 0.40 – 0.50 – 0.64 – 4.37
Capital expenditure and free cash flow
Capital expenditure on property, plant and equipment, and intangible assets EUR mn – 88.8 – 75.0 – 40.7 – 30.5
Free cash flow EUR mn 19.0 37.4 113.5 16.4
Adjusted key financial indicators 1)
Adjusted sales EUR mn 933.4 931.3 853.4 875.5
Adjusted EBIT EUR mn 27.0 2.7 – 31.6 – 87.3
Adjusted EBIT margin % 2.9 0.3 – 3.7 – 10.0
Adjusted EBITDA EUR mn 146.0 124.0 117.7 112.6
Adjusted EBITDA margin % 15.6 13.3 13.8 12.9
Adjusted capital expenditure in property, plant and equipment and intangible assets EUR mn – 88.8 – 75.0 – 40.7 – 39.7
Adjusted free cash flow EUR mn 19.0 37.4 86.3 64.7
Statement of financial position
Total assets EUR mn 1,056.8 1,040.8 1,070.5 1,093.0
Equity EUR mn 425.3 497.3 311.8 790.2
Equity ratio % 40.2 47.8 29.1 72.3
ROCE % 3.7 0.4 – 2.4 – 13.8
Net financial assets (+)/debt (–) EUR mn 175.0 155.9 – 24.5 12.5
Employees 2) 3,757 3,894 4,163 3,744
1) The adjustments relate to the years 2013 and 2014 and are based on the assumption that SSW would have been consolidated prior to January 1, 2012. Initial consolidation of SSW into the consolidated financial statements was made as of January 24, 2014.
2) Increase in 2014 mainly attributable to consolidation of SSW
140 Annual Report 2016
Additional information • Multi-year overview

Glossary
Cash flowA financial metric representing the net amount of cash and cash equivalents flowing into and out of a business during a period. Net cash flow is the sum of cash flow from operating activities (excluding the change in advance payments received) and cash flow from current investing activities (excluding securities but including additions from finance leases).
EBITEarnings before interest and taxes. This standardized metric is used by many companies, making it useful for comparing profit.
EBITDAEarnings before interest, taxes, depreciation and amortization = EBIT + depreciation and amortization.
Equity ratioA company’s equity expressed as a percentage of its total assets. This metric provides an indication of a company’s economic and financial stability.
IFRSInternational Financial Reporting Standards (until 2001: In terna-tional Accounting Standards, IAS). These standards are devel-oped and published by the International Accounting Standards Board (IASB), which is based in London, UK. Under the IAS Reg-ulation, adoption of IFRS has been mandatory for listed compa-nies headquartered in the European Union since 2005.
SemiconductorA substance whose electrical conductivity is much lower than that of a metal but increases rapidly as the temperature rises. Semiconductors can be changed by deliberately introducing impurities in order to adapt them for a particular purpose.
ROCEReturn on capital employed. This metric is calculated from a company’s profit relative to the amount of capital it has used.
PolysiliconHyperpure silicon used to manufacture silicon wafers for the electronics and solar industries. Raw silicon is added to liquid trichlorosilane and extensively distilled before being separated again in a hyperpure form at a temperature of 1,000 degrees Celsius.
SiliconThe second most abundant element on Earth after oxygen. In nature, silicon can only be found in the form of compounds, predominantly silicon dioxide and silicates. Silicon is obtained in an energy-intensive reaction between quartz sand and carbon. It is the most important raw material for the electronics industry.
Silicon waferA round disk with a thickness of approximately 200 to 800μm. Silicon wafers are used by the semiconductor industry to man-ufacture semiconductor components, i.e. integrated circuits and individual components (known as discrete components).
141Annual Report 2016
Additional information • Glossary

Financial calendar
March 14, 2017 Annual Report 2016April 27, 2017 Interim Reporting Q1 2017May 9, 2017 Annual General Meeting, MunichJuly 28, 2017 Interim Report Q2 2017October 26, 2017 Interim Reporting Q3 2017
Contact
Petra Müller Director Investor Relations & CommunicationsPhone +49 89 8564 3133Fax +49 89 8564 [email protected]
Imprint
This annual report is published bySiltronic AGHanns-Seidel-Platz 481737 Munich, GermanyPhone +49 89 8564 3000Fax +49 89 8564 [email protected]
Annual report concept, design and realizationHGB Hamburger Geschäftsberichte GmbH & Co. KG, Hamburg
Note on the Annual ReportThis Annual Report is also available in German. If there are differences between the two, the German version takes priority. The Annual Report is available as a pdf document.
Note on roundingPlease note that slight differences may arise as a result of the use of rounded amounts and percentages.
DisclaimerThis annual report contains forward-looking statements based on assumptions and estimates made by Siltronic’s Executive Board. Although we assume that the expectations in these forward looking statements are realistic, we cannot guarantee they will prove to be correct. The assumptions may harbor risks and uncertainties that may cause the actual figures to differ considerably from the forward-looking statements. Factors that may cause such dis-crepancies include, among other things, changes in the economic and business environment, variations in exchange and interest rates, the introduction of competing products, lack of acceptance for new products or services, and changes in corporate strategy. Siltronic does not plan to update the forward looking statements, nor does it assume the obligation to do so. Due to rounding, it is possible that individual figures in this report and other reports do not exactly add up to the total stated and that percentages shown may not exactly reflect the absolute values to which they refer.

Siltronic AGHanns-Seidel-Platz 481737 Munich, GermanyPhone +49 89 8564 3000Fax +49 89 8564 [email protected]