Embed Size (px)
Citation preview
Annual Report 2016
Key earnings figures (in € mn) 2016 Change2 2015 20143
Total Output1 557.5 -6.0% 593.3 482.6
Revenue 417.0 35.5% 307.8 315.3
EBITDA 49.6 -35.1% 76.5 56.8
EBIT 46.2 -37.3% 73.6 53.5
EBT 40.1 -20.3% 50.3 31.4
Profit for the period 29.4 -21.4% 37.3 28.2
Key assets and financial figures (in € mn)
Total assets 1,233.8 4.1% 1,185.2 1,077.4
Equity 341.5 2.8% 332.0 265.3
Equity ratio 27.7% -0.3 PP 28.0% 24.6%
Net debt 691.2 13.4% 609.7 571.3
Key share data and staff
Number of shares (no., weighted average) 7,472,180 8.2% 6,901,962 6,000,000
Earnings per share (in €, weighted average) 3.9 -20.4% 4.9 3.6
Market capitalisation (in € mn, as of 31.12) 231.6 -15.1% 272.7 142.8
Dividend per share (in €) 1.60 - 1.60 1.25
Staff4 716 4.5% 685 664
Key Performance Indicators
Core markets as a share of the entire portfolio 2016 in % Asset classes as a share of the entire portfolio 2016 in %
39%Austria
35%Office
28%Poland
25%Hotel
11%Other 12%
Other
8%Land bank
22%Germany
20%Residential
1 Total Output corresponds to the revenue of fully consolidated companies and those consolidated under the equity method, as well as sales proceeds from share deals, in proportion to the stake held by UBM.
2 Figures have been rounded off using the compensated summation method. Changes are calculated on the basis of the rounded values.3 Pro-forma, unaudited4 Breakdown: 31.12.2016: Development 309 and Hotel 407; 31.12.2015: Development 354 and Hotel 331
Annual Report 2016
Granary Island, Gdansk
Contents
4 Our second-best year 6 On the way – Executive Committee 8 Highlights 2016
11 About UBM
13 Business model 13 Business fields 14 Sustainability
15 Five reasons to invest
16 Strategy
18 Investor Relations
22 Supervisory Board Report
24 Corporate Governance Report
24 Commitment to the Austrian Code of Corporate Governance
25 The Managing Board 28 The Supervisory Board 32 Criteria for independence 34 Promoting women’s issues 34 Remuneration Report
37 Reference Projects
46 Green Building
49 Group Management Report
49 Economic environment 50 Developments on the property markets 52 Business performance 54 Financial performance indicators 56 Non-financial performance indicators 57 Forecast 58 Risk report 60 Internal control system 61 Internal audit 61 Research and development 62 Disclosure acc. to Art. 243a,
Austrian Commercial Code
65 Consolidated Financial Statements
66 Consolidated Income Statement 67 Statement of Comprehensive Income 68 Consolidated Statement of Financial Position 69 Consolidated Cash Flow Statement 70 Statement of Changes in Group Equity 72 Notes to the Consolidated Financial Statements 131 Shareholdings 139 Auditor’s Report 145 Appropriation of Profits 146 Responsibility Statement
147 Glossary
Acknowledgements

one goal.one team.one company.We are preparing the ground today to be fit tomorrow. Anyone can move forward with a tailwind. Endurance is necessary uphill. We want to be better. Not just better, we want to be at the very top of our game. With a goal that empowers us. With a team that works together. With a company that delivers. We are ready.
4 / UBM Annual Report 2016
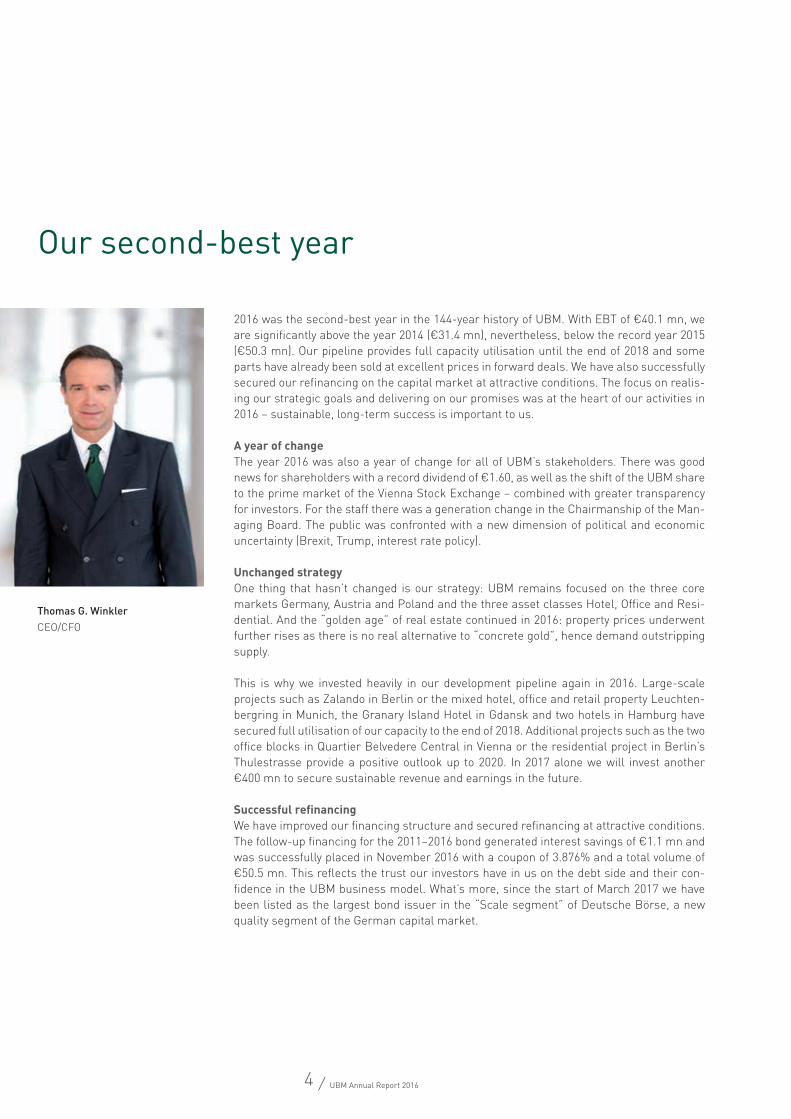
2016 was the second-best year in the 144-year history of UBM. With EBT of €40.1 mn, we are significantly above the year 2014 (€31.4 mn), nevertheless, below the record year 2015 (€50.3 mn). Our pipeline provides full capacity utilisation until the end of 2018 and some parts have already been sold at excellent prices in forward deals. We have also successfully secured our refinancing on the capital market at attractive conditions. The focus on realis-ing our strategic goals and delivering on our promises was at the heart of our activities in 2016 – sustainable, long-term success is important to us.
A year of change The year 2016 was also a year of change for all of UBM’s stakeholders. There was good news for shareholders with a record dividend of €1.60, as well as the shift of the UBM share to the prime market of the Vienna Stock Exchange – combined with greater transparency for investors. For the staff there was a generation change in the Chairmanship of the Man-aging Board. The public was confronted with a new dimension of political and economic uncertainty (Brexit, Trump, interest rate policy).
Unchanged strategyOne thing that hasn’t changed is our strategy: UBM remains focused on the three core markets Germany, Austria and Poland and the three asset classes Hotel, Office and Resi-dential. And the “golden age” of real estate continued in 2016: property prices underwent further rises as there is no real alternative to “concrete gold”, hence demand outstripping supply.
This is why we invested heavily in our development pipeline again in 2016. Large-scale projects such as Zalando in Berlin or the mixed hotel, office and retail property Leuchten-bergring in Munich, the Granary Island Hotel in Gdansk and two hotels in Hamburg have secured full utilisation of our capacity to the end of 2018. Additional projects such as the two office blocks in Quartier Belvedere Central in Vienna or the residential project in Berlin’s Thulestrasse provide a positive outlook up to 2020. In 2017 alone we will invest another €400 mn to secure sustainable revenue and earnings in the future.
Successful refinancingWe have improved our financing structure and secured refinancing at attractive conditions. The follow-up financing for the 2011–2016 bond generated interest savings of €1.1 mn and was successfully placed in November 2016 with a coupon of 3.876% and a total volume of €50.5 mn. This reflects the trust our investors have in us on the debt side and their con-fidence in the UBM business model. What’s more, since the start of March 2017 we have been listed as the largest bond issuer in the “Scale segment” of Deutsche Börse, a new quality segment of the German capital market.
Our second-best year
Thomas G. WinklerCEO/CFO
5 / UBM Annual Report 2016
Foreword by the Chairman of the Managing Board
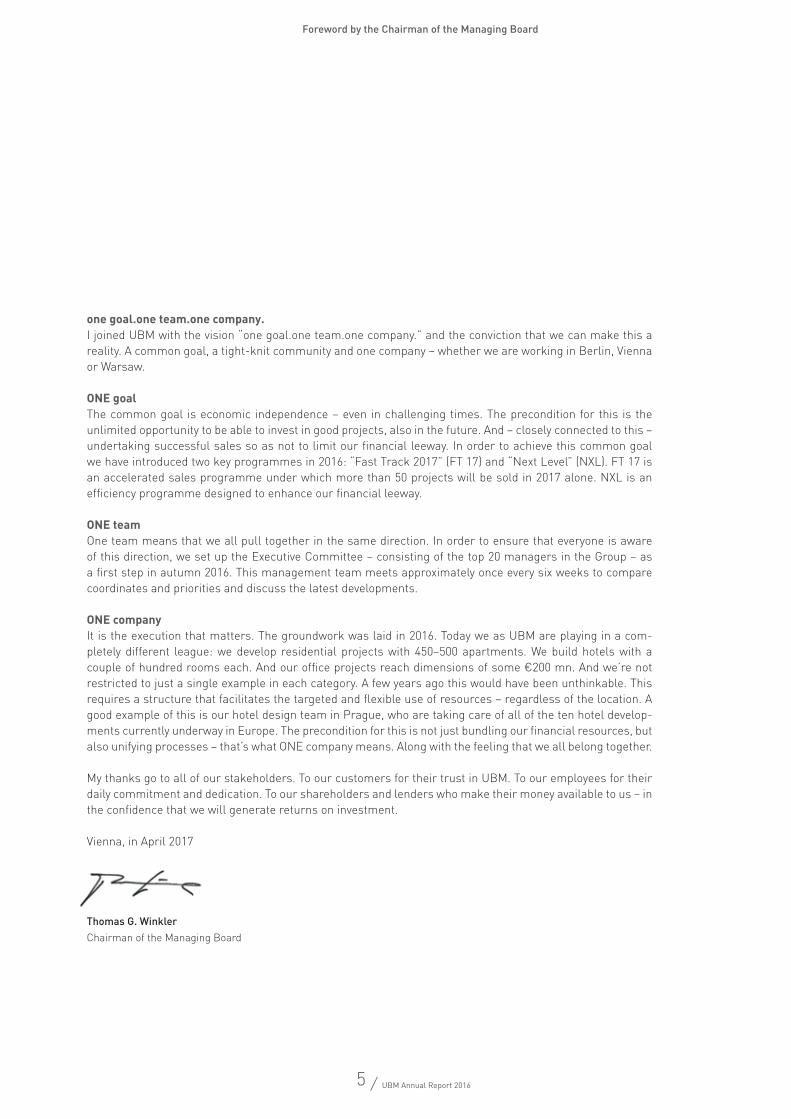
one goal.one team.one company.I joined UBM with the vision “one goal.one team.one company.” and the conviction that we can make this a reality. A common goal, a tight-knit community and one company – whether we are working in Berlin, Vienna or Warsaw.
ONE goalThe common goal is economic independence – even in challenging times. The precondition for this is the unlimited opportunity to be able to invest in good projects, also in the future. And – closely connected to this – undertaking successful sales so as not to limit our financial leeway. In order to achieve this common goal we have introduced two key programmes in 2016: “Fast Track 2017” (FT 17) and “Next Level” (NXL). FT 17 is an accelerated sales programme under which more than 50 projects will be sold in 2017 alone. NXL is an efficiency programme designed to enhance our financial leeway.
ONE teamOne team means that we all pull together in the same direction. In order to ensure that everyone is aware of this direction, we set up the Executive Committee – consisting of the top 20 managers in the Group – as a first step in autumn 2016. This management team meets approximately once every six weeks to compare coordinates and priorities and discuss the latest developments.
ONE companyIt is the execution that matters. The groundwork was laid in 2016. Today we as UBM are playing in a com-pletely different league: we develop residential projects with 450–500 apartments. We build hotels with a couple of hundred rooms each. And our office projects reach dimensions of some €200 mn. And we’re not restricted to just a single example in each category. A few years ago this would have been unthinkable. This requires a structure that facilitates the targeted and flexible use of resources – regardless of the location. A good example of this is our hotel design team in Prague, who are taking care of all of the ten hotel develop-ments currently underway in Europe. The precondition for this is not just bundling our financial resources, but also unifying processes – that’s what ONE company means. Along with the feeling that we all belong together.
My thanks go to all of our stakeholders. To our customers for their trust in UBM. To our employees for their daily commitment and dedication. To our shareholders and lenders who make their money available to us – in the confidence that we will generate returns on investment.
Vienna, in April 2017
Thomas G. Winkler Chairman of the Managing Board
6 / UBM Annual Report 2016
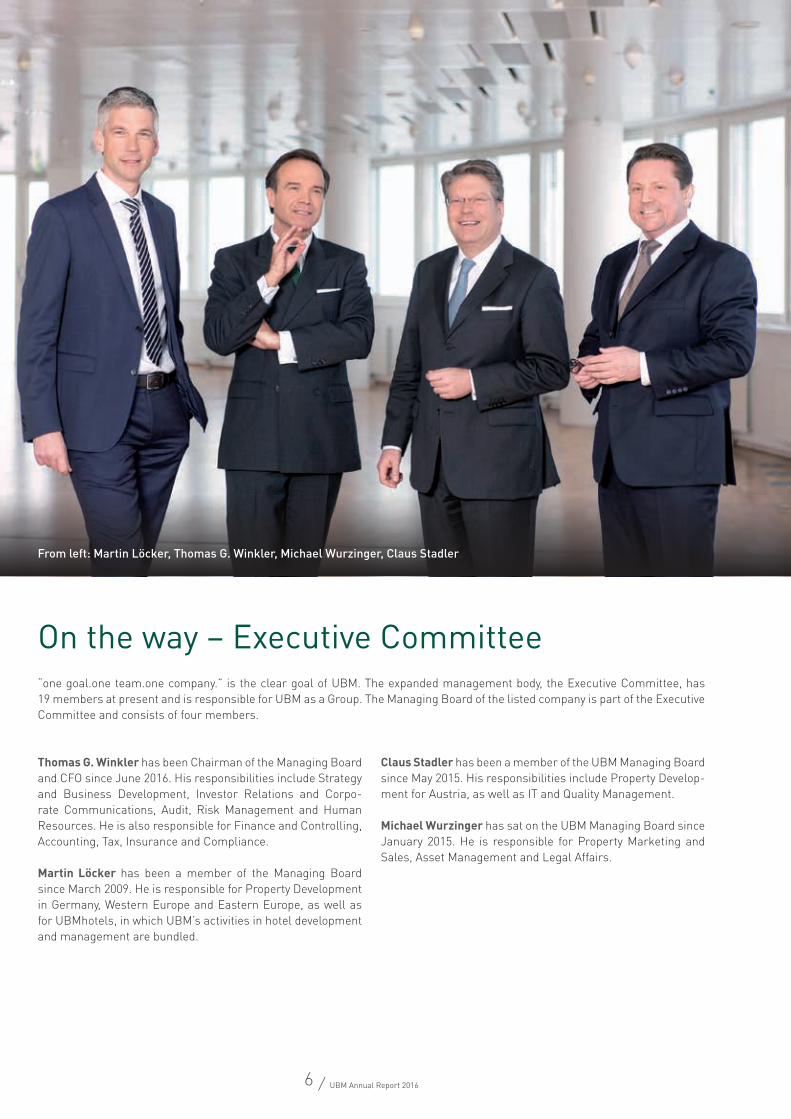
Thomas G. Winkler has been Chairman of the Managing Board and CFO since June 2016. His responsibilities include Strategy and Business Development, Investor Relations and Corpo-rate Communications, Audit, Risk Management and Human Resources. He is also responsible for Finance and Controlling, Accounting, Tax, Insurance and Compliance. Martin Löcker has been a member of the Managing Board since March 2009. He is responsible for Property Development in Germany, Western Europe and Eastern Europe, as well as for UBMhotels, in which UBM’s activities in hotel development and management are bundled.
Claus Stadler has been a member of the UBM Managing Board since May 2015. His responsibilities include Property Develop-ment for Austria, as well as IT and Quality Management. Michael Wurzinger has sat on the UBM Managing Board since January 2015. He is responsible for Property Marketing and Sales, Asset Management and Legal Affairs.
On the way – Executive Committee “one goal.one team.one company.” is the clear goal of UBM. The expanded management body, the Executive Committee, has 19 members at present and is responsible for UBM as a Group. The Managing Board of the listed company is part of the Executive Committee and consists of four members.
From left: Martin Löcker, Thomas G. Winkler, Michael Wurzinger, Claus Stadler
7 / UBM Annual Report 2016
Other members of the Executive Committee
Bertold Wild, Executive Board Münchner Grund
Christian Berger, Executive Board Münchner Grund
Udo Sauter, Executive Board Münchner Grund
Gerald Beck, Executive Board STRAUSS & PARTNER
Ernst Gassner, Executive Board STRAUSS & PARTNER
Peter Obernhuber, Executive Board UBM Polska
Sebastian Vetter, Executive Board UBM Polska
Peter Wöckinger, Executive Board UBM Polska
Jan Zemanek, Executive Board UBM Bohemia
Rolf Hübner, Executive Board UBMhotels
Milena Ioveva, Head of IR & PR UBM
Ralf Mikolasch, Head of Legal UBM
Patric Thate, Head of Finance UBM
Andreas Zangenfeind, Head of Transactions UBM
Erwin Zeller, Head of Controlling UBM
April 2017
On the way – Executive Committee

8 / UBM Annual Report 2016
© f
OTO
@ST
EfA
N-E
ffN
Er.d
E
Highlights 2016
22 August / Move to the prime market
On 22 August 2016 UBM moves to the highest and most liquid seg-ment of the Vienna Stock Exchange – the prime market. With this move UBM agrees to uphold the highest standards of transpar-ency and disclosure criteria. This also increases the tradability and appeal of shares for institutional and international investors.
18 May / UBMhotels founded
UBM founds UBMhotels on 18 May 2016 to strengthen its position as the hotel developer of choice in Europe. The new company not only bundles the competencies for developing hotels, but also for operating them.
24 February / Transaction security through forward sales
UBM and its project partner sell the hotel devel-opment Holiday Inn Gateway Gardens in Frank-furt in a share deal to Hansainvest Hanseatische Investment GmbH. The property was handed over at the end of 2016.
13 July / Forward sale of the DHL logistics hub
UBM, in a 50% partnership with CCG (equity method), developed one of the largest distribution centres for the inter-national express delivery service DHL, on a plot of around 59,000 m² in Cargo Center Graz. The logistics property has already been sold in a forward deal to Palmira Capital.
2 June / New hotel in Gdansk
UBM is building a new four-star hotel in Gdansk that will be completed by the end of 2018. The planning phase has already been
completed. The building will be the city’s most sustainable hotel: the UBM project is setting new standards for Gdansk in terms
of energy efficiency, heat recovery, ecological construction materials and farsightedness.
1 June / Thomas G. Winkler new CEO & CFO
UBM sets the course for the future: Thomas G. Winkler becomes the new Chairman of the Managing Board and Chief Financial Officer. At the same time he acquires 1% of the UBM shares, worth around €2.3 mn. “This invest-ment is my personal long-term commitment to UBM. In line with the motto: don’t claim that you believe in UBM, prove it.”

9 / UBM Annual Report 2016
Highlights 2016
7 September / Groundbreaking for Zalando Headquarters in Berlin
UBM is building a seven-storey office complex on the so-called Anschutz-Areal in Berlin-
Friedrichshain, set for completion by the end of 2018. Zalando will rent a total of 45,600 m² of
office space under a long-term contract.
© H
ENN
2 November / UBM sells QBC 5 hotels for €85 mn
UBM sells the three-star ibis hotel and the four-star Novotel (AccorHotels Group) for €85 mn to Amundi Real Estate.
10 November / UBM sells Doppio Offices for around €20 mn to Union Investment
Closing of the sale of the Vienna office property, Doppio Offices. Property investment manager Union Investment purchases the standing asset. UBM has taken another step towards reducing its standing portfolio.
18 November / Office project QBC 3 sold for around €30 mn to Union Investment
UBM Development AG and S IMMO conclude a forward deal during the development phase for the third lot of QBC – Quartier Belvedere Central – with Union Invest-ment. Completion and handover are planned for the second half of 2017.
15 December / UBM acquires plots for residential construction in Berlin-Pankow
UBM acquires two plots on Thulestrasse in the Pankow district in Berlin, together with a family office as a part-ner. Construction on the 500+ residential units is set to begin in the third quarter of 2017.
© z
OO
M.v
p.AT
24 October 2016 / Executive Committee founded
The new management body consists of the top 20 man-agers of the UBM Group and marks an important step towards achieving the target “one goal.one team.one company.”.
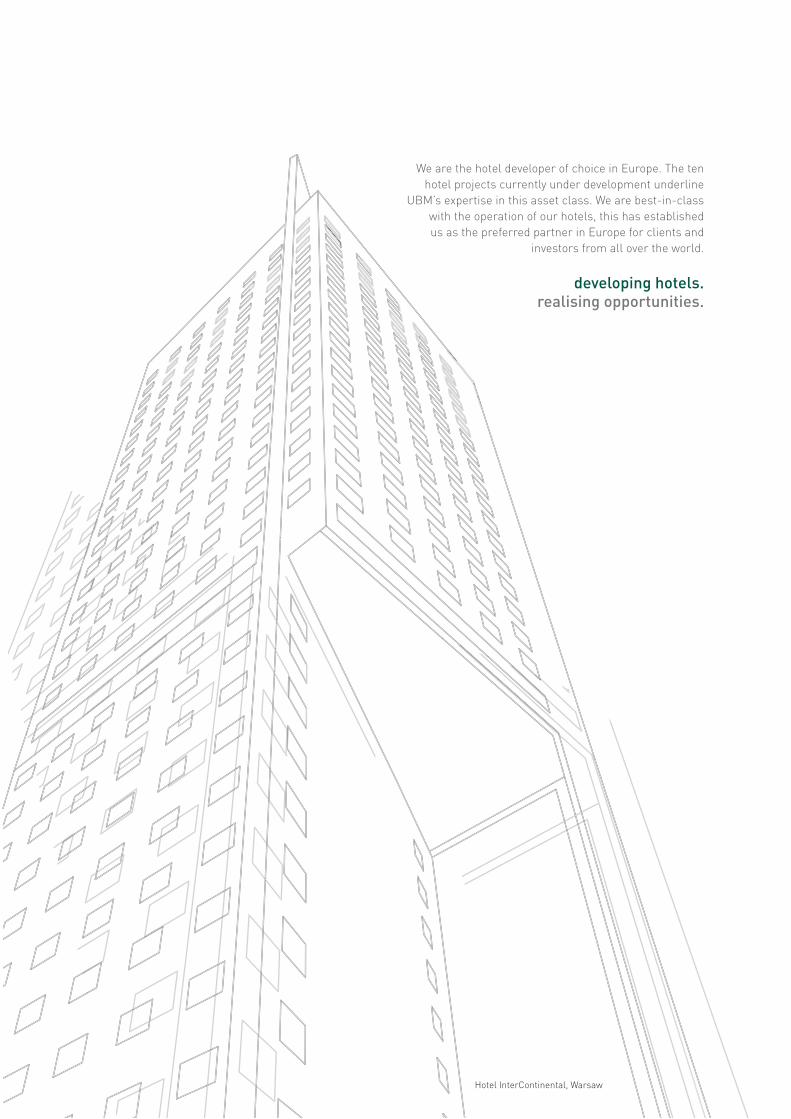
developing hotels.realising opportunities.
We are the hotel developer of choice in Europe. The ten hotel projects currently under development underline
UBM’s expertise in this asset class. We are best-in-class with the operation of our hotels, this has established us as the preferred partner in Europe for clients and
investors from all over the world.
Hotel InterContinental, Warsaw
11 / UBM Annual Report 2016
About UBM
UBM Development AG is a leading European real estate devel-oper. UBM manages individual project developments through-out the entire value chain of a property – from the green-field development through to construction and marketing. In addi-tion, UBM accelerates sales in form of forward deals and sales of standing assets in order to secure a balance between prof-itability and the risk profile.
With a total of 309 development employees (and a further 407 in the hotel sector), UBM is active in the three core markets Germany, Austria and Poland and develops proprietary pro-jects in the three asset classes Hotel, Office and Residential. This enables UBM to offer institutional and private investors unique access to a comprehensive portfolio of first-class developments.
UBM has a project pipeline that guarantees full capacity utili-sation until the end of 2018. Around 430 apartments were sold in Austria and Germany in 2016, of which around 60% were
sold prior to completion. In 2016 around 110,000 m² gross floor space of offices was under development in Austria. In Germany around 32,000 m² and in Poland around 48,000 m² was completed. Furthermore, with over 45 hotels developed for leading international hotel operators, UBM is the hotel developer of choice in Europe. In the reporting year 2016, UBM generated Total Output of €557.5 mn.
In 2015 the free float of UBM increased to over 60%. The change in management at the top of the company in June 2016 set the course for the future. In addition, capital market communication was enhanced, facilitating the move of UBM to the prime market of the Vienna Stock Exchange. The clear commitment to the capital market and to its shareholders was confirmed once again. The company has been listed on the Vienna Stock Exchange since it was founded in 1873.
New focus
2015–2016
February 2015 Downstream merger PIAG – UBM
March 2015 Renamed as UBM Development AG
April 2015 Capital increase
June 2016 Generational change Thomas G. Winkler new CEO/CFO
August 2016 Move to the prime market of the Vienna Stock Exchange
Internationalisation
1992–2010
1992 Czech Republic1993 Poland1999 Germany 2001 France2010 Netherlands
founding
1873
Developing real estate and selling it successfully – this is UBM’s strength. The clear focus on development makes UBM attractive on the stock market, as this is the part of the chain with the greatest value creation. That’s why it’s even more crucial that we explain to our shareholders who we are, what we do and what’s important.
12 / UBM Annual Report 2016
About UBM
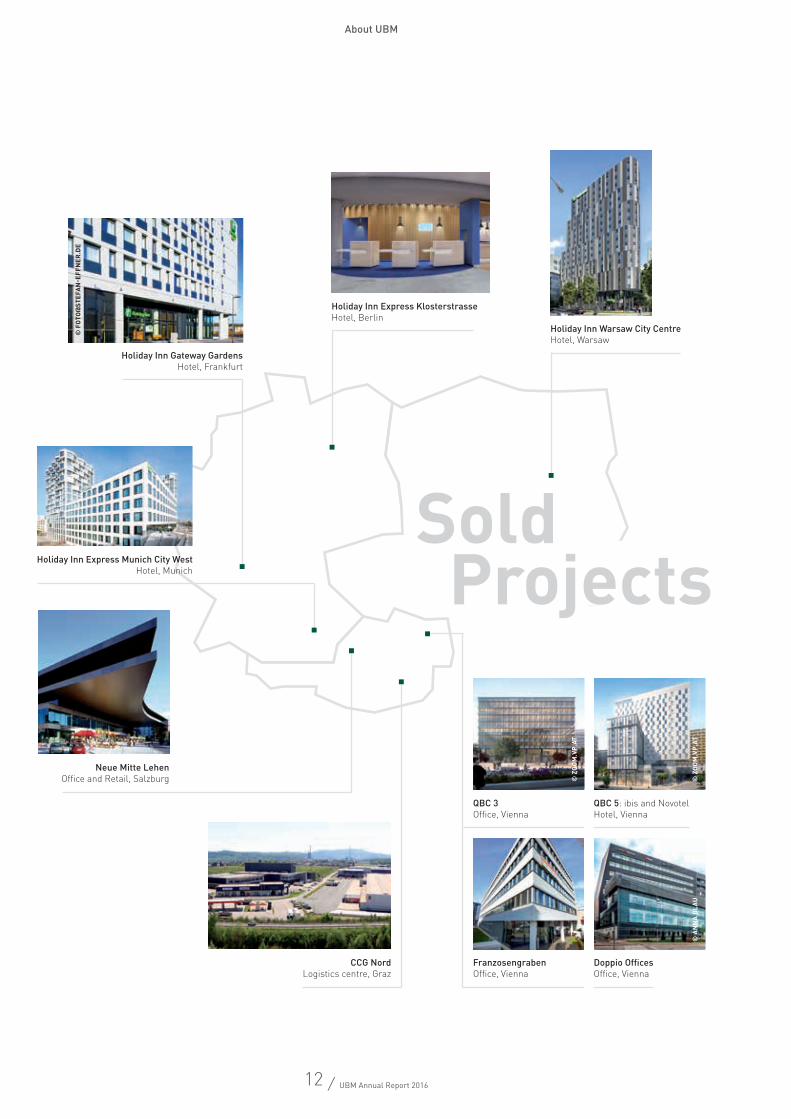
QBC 3 Office, Vienna
FranzosengrabenOffice, Vienna
Holiday Inn Gateway GardensHotel, Frankfurt
CCG NordLogistics centre, Graz
Holiday Inn Express KlosterstrasseHotel, Berlin
Holiday Inn Warsaw City Centre Hotel, Warsaw
Neue Mitte LehenOffice and Retail, Salzburg
Holiday Inn Express Munich City WestHotel, Munich
QBC 5: ibis and NovotelHotel, Vienna
Doppio OfficesOffice, Vienna
Sold projects
© z
OO
M.v
p.AT
© A
NN
A b
LAU
© z
OO
M.v
p.AT
© f
OTO
@ST
EfA
N-E
ffN
Er.d
E
13 / UBM Annual Report 2016
About UBM
Business model
UBM Development is focusing ever more strongly on pure real estate development and thereby covers the most profitable sector of the value chain. Here the company employs a dual focus on countries and asset classes. Development in stable growth markets, many years of technical knowhow and strong local networks additionally secure the high quality of the port-folio that offers sustainable potential for added value.
In the year under review, 2016, the UBM portfolio was divided into standing projects (€536 mn), development projects (€706 mn) and undeveloped plots (€106 mn). As of 31 December 2016 the fair value totalled €1.35 bn. In the third quarter of 2016 UBM began accelerating the sale of projects under development through forward deals and the sale of standing assets. UBM thereby realises its clear strategic goal: the focus on pure prop-erty development and continuity in the dividend policy.
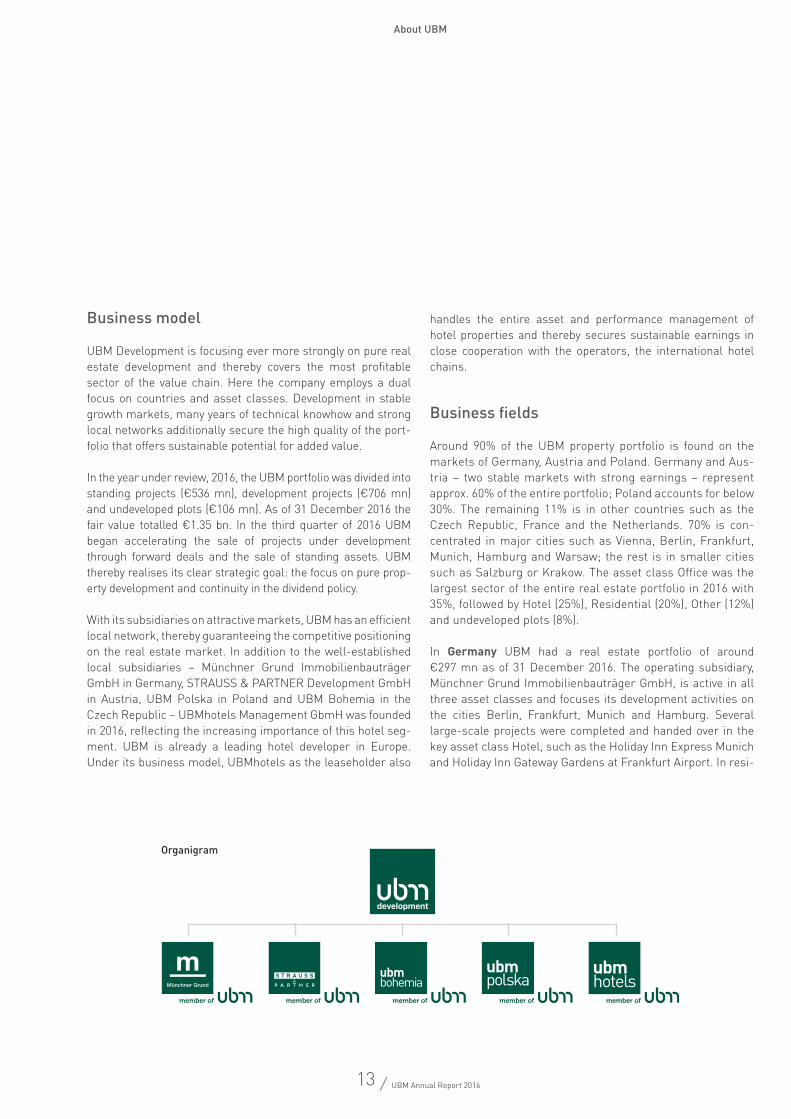
With its subsidiaries on attractive markets, UBM has an efficient local network, thereby guaranteeing the competitive positioning on the real estate market. In addition to the well-established local subsidiaries – Münchner Grund Immobilienbauträger GmbH in Germany, STRAUSS & PARTNER Development GmbH in Austria, UBM Polska in Poland and UBM Bohemia in the Czech Republic – UBMhotels Management GbmH was founded in 2016, reflecting the increasing importance of this hotel seg-ment. UBM is already a leading hotel developer in Europe. Under its business model, UBMhotels as the leaseholder also
handles the entire asset and performance management of hotel properties and thereby secures sustainable earnings in close cooperation with the operators, the international hotel chains.
Business fields
Around 90% of the UBM property portfolio is found on the markets of Germany, Austria and Poland. Germany and Aus-tria – two stable markets with strong earnings – represent approx. 60% of the entire portfolio; Poland accounts for below 30%. The remaining 11% is in other countries such as the Czech Republic, France and the Netherlands. 70% is con-centrated in major cities such as Vienna, Berlin, Frankfurt, Munich, Hamburg and Warsaw; the rest is in smaller cities such as Salzburg or Krakow. The asset class Office was the largest sector of the entire real estate portfolio in 2016 with 35%, followed by Hotel (25%), Residential (20%), Other (12%) and undeveloped plots (8%).
In Germany UBM had a real estate portfolio of around €297 mn as of 31 December 2016. The operating subsidiary, Münchner Grund Immobilienbauträger GmbH, is active in all three asset classes and focuses its development activities on the cities Berlin, Frankfurt, Munich and Hamburg. Several large-scale projects were completed and handed over in the key asset class Hotel, such as the Holiday Inn Express Munich and Holiday Inn Gateway Gardens at Frankfurt Airport. In resi-
Organigram
14 / UBM Annual Report 2016
dential construction the most important development projects at present include Enckestrasse in Berlin and the Kühnehöfe in Hamburg. With the construction of the new headquarters for Zalando in Berlin, UBM is setting another benchmark for first-class project development in the Office asset class in Germany.
At €525 mn, the carrying amount of the Austria portfolio accounted for 39% of the whole UBM portfolio (as of 31 Decem-ber 2016). The increase in the percentage of the Austrian port-folio resulted in particular from fair value gains triggered by the development progress made on projects. UBM operates in Austria via its subsidiary STRAUSS & PARTNER and promotes residential construction with a focus on the provincial capitals of Salzburg, Innsbruck, Graz and Vienna. With “Wohnen am Rosenhügel” and MySky, Austria’s largest residential devel-opment projects are currently underway in Vienna. The most prestigious project of STRAUSS & PARTNER at present is the development of a complete city quarter near Vienna Central Station – Quartier Belvedere Central (QBC).
In poland UBM´s portfolio has a carrying amount of around €374 mn – with a strong focus on the office and hotel sectors. The subsidiary UBM Polska has been operating successfully on the market for almost 25 years and is focused primarily on Warsaw, Krakow and Wroclaw. Poland’s largest business park – the Poleczki Business Park – is currently under development
in Warsaw, while the office buildings Mogilska and Kotlarska are being built in Krakow. The Pegaz Times II office building was completed in Wroclaw in 2016. The hotel development offensive initiated in Poland in 2015 is continuing with a project on Granary Island in Gdansk.
The remaining 11% of the total portfolio value is spread over countries including the Czech Republic, the Netherlands and France. Hotel development in the Netherlands deserves a spe-cial mention here – UBM is about to complete the handover of the Hyatt Regency Amsterdam.
Sustainability
Sustainability is a crucial part of the UBM corporate strat-egy. The long-term value retention and respectful approach to resources are a priority here. At the same time, UBM pays strict attention on every project to high-quality architecture, outstanding construction quality, reliability and excellent func-tionality. This awareness of responsibility is also impressively confirmed by the regular certification of UBM projects includ-ing by DGNB (German Sustainable Building Council) and ÖGNI (the Austrian Society for Sustainable Real Estate) (see also page 46f).
About UBM
15 / UBM Annual Report 2016
12345
Five reasons to invest
UBM has substance and room for manoeuvre
€1.35 bn assets under management (31 December 2016) €0.8 bn investments in the development pipeline (2017 and 2018) €0.2 bn reduction in net debt (from standing assets in 2017)
UBM is the leading hotel developer in Europe
More than 45 hotels already developed (approx. 9,700 rooms) 10 hotels in the development pipeline (approx. 2,500 rooms) 16 hotel operations as leaseholder (approx. 3,600 rooms)
UBM is playing in a different league
Offices with a volume of €200 mn per project Hotels with 500 rooms per project Residential construction with over 450 apartments per project
UBM has focus and expertise
Three core markets (Germany, Austria, Poland) Three asset classes (Hotel, Office, Residential) 144 years of experience (more than 15 years in Germany and Poland)
UBM prioritises the capital market
€1.60 dividend – policy of continuity Prime market of the Vienna Stock Exchange (transparency and tradability) ”Scale segment” of Deutsche Börse in Germany for bonds (credit standing and quality)
16 / UBM Annual Report 2016
Strategy
Dual focus on markets and asset classes
UBM is clearly positioned – the focus is on project develop-ments in the three core markets of Germany, Austria and Poland, as well as on the three asset classes – Hotel, Office and Residential. UBM invests in markets that offer in the medium and long term optimum value added in the balance between profitability and risk profile. The company purchases, devel-ops and sells properties in established locations with potential for value increases and concentrates in particular on large, central cities such as Berlin, Frankfurt, Hamburg, Vienna and Warsaw. The dual approach of a development portfolio which is diversified in terms of both regions and asset classes, while still being focused, guarantees sustainable value creation.
Realising of economies of scale in the three asset classes
The focus on the asset classes Hotel, Office and Residential differs significantly from the prevailing opportunistic approach in the industry. In the hotel sector UBM is the hotel developer of choice in Europe. Alongside hotel development, UBMhotels bundles hotel lease, which generates additional long-term cash flows. The focus is on the three-to-four-star segment in excellent urban locations. In addition, UBM employs a fol-low-your-customer approach. With renowned international hotel chains, the company also realises project developments in selective growth regions outside UBM core markets. In the
office segment UBM primarily undertakes developments in central locations and in business parks at sites with good links to public infrastructure. Project development in the residential sector currently focuses on Germany and Austria. The projects are offered to both owner-occupiers and private investors in the form of freehold flats and to institutional investors in the course of block deals.
A strong local network and in-depth market expertise allow UBM to recognise and realise carefully evaluated market opportunities in a timely manner in order to safeguard the future pipeline. Here the focus is on high-quality, large-volume project developments that promise sustainable and long-term value creation. Longstanding contacts and cooperation with institutional and private market participants and decision-mak-ers create significant competitive advantages as well.
Concentration on high-margin development
In the value chain it is property development that offers the greatest potential for value added. The accelerated sales pro-gramme “Fast Track 17” also aims to substantially decrease UBM’s standing portfolio, which yields a significantly lower return than the development business. By year-end 2017 UBM expects sales of around €600 mn, which should lead to a significant reduction in net debt to €550 mn. In contrast, the investments in the development pipeline of €400 mn will secure future revenues and earnings.
17 / UBM Annual Report 2016
Strategy
Higher deal security and risk mitigation
Real estate continues to benefit from the ongoing economic and political uncertainty. The search for investments as a “safe haven” and the lack of alternative investments has led to ongo-ing high demand for property by private and particularly insti-tutional investors. In forward deals UBM fixes a price today for properties that will only be completed in the future. This leads to greater deal security and mitigates the future market risk. At the same time, the investor can acquire a project for his/her own portfolio at the current price level. Forward sales such as the recent ibis and Novotel hotels and the office buildings in the new city quarter, Quartier Belvedere Central, are perfect examples here.
Efficiency enhancement and streamlining processes
In 2017 UBM promoted the Group-wide efficiency programme “Next Level”. The goal of this programme is sustainably increasing efficiency. The implementation involves measures at every level in order to avoid duplication and to optimise pro-cesses. Operating excellence and streamlined cost structures not only increase financial leeway, but also strengthen the competitive ability of UBM.
Continuity-based dividend policy
With its dividend policy, UBM is committed to continuity and to the company’s strong earnings power that is expected to continue in the future. For the 2016 business year the Manag-ing Board will propose an unchanged high dividend of €1.60 to the Supervisory Board and the AGM – this represents a payout ratio of approx. 41%. With a current dividend yield of around 5%, UBM is thereby among the top dividend-bearing securities on the Vienna Stock Exchange and a leader among its industry peers.
Financing
Real estate development is a capital-intensive business and so financing costs have a significant impact on the earnings of UBM as a Group. UBM draws on both the capital and credit markets to raise debt capital. The follow-up financing of the 2011–2016 bond in 2016 led to a €1.1 mn reduction in future interest payments. In general, real estate projects are financed for their entire planned development period.
18 / UBM Annual Report 2016
Increasing volatility on the stock markets
In 2016 the developments on the capital markets was charac-terised by sharp price fluctuations, although in the end the bal-ance for the year was positive. The pronounced declines in Chi-nese shares and further falls in the oil price led stock markets to experience the weakest start to the year since the 1930s. A slight recovery took hold in the second quarter, buoyed by the easing of the European Central Bank’s fiscal policy and the Federal Reserve’s interest rate policy. However, the expansive policy moves by the central banks were unable to completely quell concerns about growth. Global indices reacted to the sur-prising Brexit vote on 24 June with significant price falls. Good corporate data and positive economic expectations led the markets to stabilise into the third quarter. The unexpected vic-tory of Donald Trump as the 45th President helped the US stock exchanges to a price rally that continued until the end of the year. Just before the end of the year, the Federal Reserve, the American central bank, raised interest rates for the first time since 2008. The US stock exchange index, the DJIA, rose by an impressive 13.4% and recorded another all-time high in 2016.
Ongoing economic and political uncertainty such as the Brexit vote, economic instability in Italy and Spain, and the upcom-ing elections in Germany and France stifled stock exchange growth in Europe. It was only thanks to a year-end rally that the eurozone index, EURO STOXX 50, closed up 0.7% against the close of the previous year. In mid-December the Euro-pean Central Bank gave a noticeable boost to the markets: it announced an extension of the bond-buying programme until year-end 2017. However, it was announced at the same time that the monthly bond buying would be reduced from €80 bn to €60 bn from April 2017. The leading German index, DAX, grew by an impressive 7% in 2016 and closed up for the fifth year in a row. The leading UK index, FTSE, surprised pundits by closing up by a hefty 14% despite Brexit.
In 2016 the Vienna Stock Exchange achieved growth of 9.2%, thereby performing better than many of the European indices. This was also the highest year-end value since 2010. Contrib-uting factors primarily included the positive economic fore-casts for Eastern Europe and an improved backdrop for finan-cial stocks, which have a heavy weighting on the ATX.
Performance of UBM shares also volatile
The UBM shares are listed on the prime market of the Vienna stock exchange and on the Immobilien-ATX (IATX). The price performance of UBM could not escape the volatile stock market environment in 2016. Following a pronounced phase of weakness at the start of the year, it recovered in the sec-ond quarter and the share reached its year-high of €35.4 on 29 April 2016.
The change in the Managing Board in June 2016 led to uncer-tainty among investors in the short term. In the third quarter the UBM share recovered from its year-low, which it reached on 13 July 2016 at €26.6, and underwent a significant rise of 16.2%. The results for the first half of 2016 and the fulfilment of a longstanding promise – UBM’s move to the prime market of the Vienna stock exchange – had a positive impact on the share price. Overall, the share mirrored the Immobilien-ATX from June onwards and lagged behind the general market, as did the industry as a whole. On 30 December 2016, the last trading day of the year, the share closed at a price of €31.0 and was thereby 10.5% below the value at the start of the year. The average trading volumes of the share stood at 4,358. The market capitalisation as of 30 December 2016 was €231.6 mn.
Analysts’ coverage
UBM is currently analysed by four investment firms. Three analysts – Erste Group, Kepler Cheuvreux and SRC – issued buy recommendations, while Baader gave a hold recommen-dation for the UBM share. The consensus of the analysts is a target price of €39.0.
UBM moves to prime market
On 22 August 2016 UBM moved to the prime market, the high-est segment of the Vienna Stock exchange. The UBM share was previously listed in the trading segment standard market continuous. With this move UBM agrees to comply with the Vienna Stock Exchange’s most stringent standards of trans-parency and disclosure criteria. At the same time, a continuous
Investor Relations
19 / UBM Annual Report 2016
Investor Relations
UBM share – Key indicators
2016 2015 2014
Price at 30 Dec in € 31.0 36.5 23.8
Year high in € 35.4 43.8 25.0
Year low in € 26.6 23.0 15.2
Earnings per share in € 3.9 4.9 3.6
Dividend per share in € 1.61 1.6 1.3
Dividend yield in % 5.2 4.4 5.3
Payout ratio in % 41.0 32.6 34.8
Market capitalisation as of 30 Dec in € mn 231.6 272.7 142.8
Price-earnings ratio as of 30 Dec 7.9 7.5 6.6
No. of shares outstanding as of 30 Dec No. 7,472,180 7,472,180 6,000,000
70
80
90
100
110
120
Jan Feb Mar Apr May Jun July Aug Sept Oct Nov Dec
in %
■ UBM share ■ ATX ■ Trading volumes of UBM share
0
2,000
4,000
6,000
8,000
10,000
Average daily tradingvolumes per month
Performance of the UBM share compared to the index and trading volumes in 2016
1 Proposal to Annual General Meeting
20 / UBM Annual Report 2016
Investor Relations
Financial Calendar 2017
Publication 2016 Annual Financial Report, 2016 Annual Report 6.4.2017
Press conference 6.4.2017
Record date for the attendance of the 136th Annual General Meeting, Vienna 13.5.2017
136th Annual General Meeting, EURO PLAZA, Am Euro Platz 2, Building G, 1120 Vienna, 14:00 CET 23.5.2017
Ex-dividend trading on the Vienna Stock Exchange 30.5.2017
Dividend record date 31.5.2017
Publication interim report on the first quarter of 2017 31.5.2017
Dividend payout day for the 2016 business year 1.6.2017
Interest payment UBM bond 2015 9.6.2017
Interest payment UBM bond 2014 10.7.2017
Publication interim report on the first half of 2017 29.8.2017
Publication interim report on the third quarter of 2017 28.11.2017
Interest payment UBM bond 2015 11.12.2017
Shareholder structure in % Regional distribution of free float in %
38.5% Austria
20.5% Northern and
Central Europe
1.3% Poland
1.6% Other
17.1% Germany
21.0% UK
61.2% Free float and Management138.8%
Syndicate
1 including Supervisory Board and Management 11.3%
21 / UBM Annual Report 2016
Investor Relations
price quotation in trading of the shares is guaranteed, thereby enhancing the tradability and appeal of the shares for institu-tional and international investors.
Broad shareholder structure
The share capital of UBM Development AG totalled €22,416,540.0 as of 31 December 2016 and was divided into 7,472,180 shares. The Syndicate (Strauss Group, IGO-Ortner Group) held 38.8% of the shares outstanding. The remaining shares are in free float (61.2%). In February 2016 the larg-est group of investors was from Austria with 38.5%, followed by investors from the UK with 21.0%, Northern and Central Europe (including Switzerland and Scandinavia) with 20.5% and Germany with 17.1%.
Dividend policy: continuity
UBM pursues a dividend policy focused on continuity and earn-ings. The concrete dividend proposal is generally presented in tandem with the publication of the annual financial results. For 2016 UBM proposes a dividend of €1.60 per share. This is at the record level of the previous year and represents a payout ratio of around 41%. On the basis of the closing price of €31.00 as of 30 December 2016, the dividend yield amounts to around 5%. The Managing Board and the Supervisory Board thereby want to ensure that shareholders again in 2016 benefit from the second-best year in the history of UBM.
Successful follow-up financing
In 2016 UBM managed to improve its financing structure and successfully refinanced the 2011–2016 bond due in November in the amount of €50 mn. In the current market environment,
UBM managed to finalize a private placement with Schuld-scheindarlehen and non-listed bearer bonds at significantly more attractive conditions. The issue was predominantly placed with existing institutional investors. The coupon was fixed at 3.876% p.a.; the term was set at five years with redemption upon maturity. The successful follow-up financing will thereby lead to savings on interest payments of €1.1 mn.
Investor relations
The goal of UBM’s investor relations is continuous dialogue and a transparent and timely information policy that allows every shareholder to get a fair picture of the company. The main focus of investor relations activities in 2016 was the contact with existing investors, as well as bringing on board new inves-tors with a long-term focus. The change in the Managing Board and the new head of the investor relations department meant that IR activities were intensified in the second half of the year. Together with investor relations, the management held numerous one-on-one meetings with investors and analysts in Europe’s most important financial centres, including London, Zurich, Vienna, Frankfurt and Munich, and participated in inter-national investment conferences. In addition, UBM reports reg-ularly on its business performance in the course of quarterly telephone conferences for analysts, institutional investors and banks, as well as at the press conferences.
UBM informs comprehensively at www.ubm.at on the latest market trends, key performance indicators, the UBM share, annual and interim results, financial reports, presentations and IR events. In addition, investors can register with [email protected] to receive regular IR updates.
22 / UBM Annual Report 2016
Supervisory Board Report
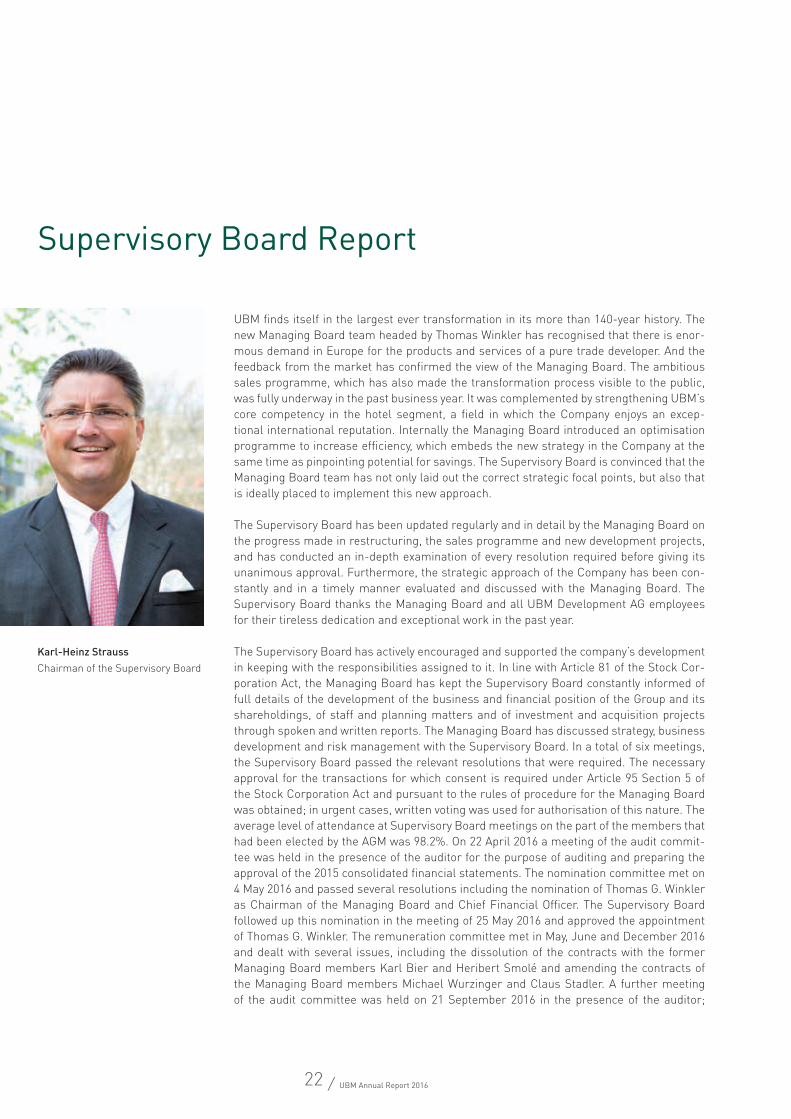
UBM finds itself in the largest ever transformation in its more than 140-year history. The new Managing Board team headed by Thomas Winkler has recognised that there is enor-mous demand in Europe for the products and services of a pure trade developer. And the feedback from the market has confirmed the view of the Managing Board. The ambitious sales programme, which has also made the transformation process visible to the public, was fully underway in the past business year. It was complemented by strengthening UBM’s core competency in the hotel segment, a field in which the Company enjoys an excep-tional international reputation. Internally the Managing Board introduced an optimisation programme to increase efficiency, which embeds the new strategy in the Company at the same time as pinpointing potential for savings. The Supervisory Board is convinced that the Managing Board team has not only laid out the correct strategic focal points, but also that is ideally placed to implement this new approach.
The Supervisory Board has been updated regularly and in detail by the Managing Board on the progress made in restructuring, the sales programme and new development projects, and has conducted an in-depth examination of every resolution required before giving its unanimous approval. Furthermore, the strategic approach of the Company has been con-stantly and in a timely manner evaluated and discussed with the Managing Board. The Supervisory Board thanks the Managing Board and all UBM Development AG employees for their tireless dedication and exceptional work in the past year.
The Supervisory Board has actively encouraged and supported the company’s development in keeping with the responsibilities assigned to it. In line with Article 81 of the Stock Cor-poration Act, the Managing Board has kept the Supervisory Board constantly informed of full details of the development of the business and financial position of the Group and its shareholdings, of staff and planning matters and of investment and acquisition projects through spoken and written reports. The Managing Board has discussed strategy, business development and risk management with the Supervisory Board. In a total of six meetings, the Supervisory Board passed the relevant resolutions that were required. The necessary approval for the transactions for which consent is required under Article 95 Section 5 of the Stock Corporation Act and pursuant to the rules of procedure for the Managing Board was obtained; in urgent cases, written voting was used for authorisation of this nature. The average level of attendance at Supervisory Board meetings on the part of the members that had been elected by the AGM was 98.2%. On 22 April 2016 a meeting of the audit commit-tee was held in the presence of the auditor for the purpose of auditing and preparing the approval of the 2015 consolidated financial statements. The nomination committee met on 4 May 2016 and passed several resolutions including the nomination of Thomas G. Winkler as Chairman of the Managing Board and Chief Financial Officer. The Supervisory Board followed up this nomination in the meeting of 25 May 2016 and approved the appointment of Thomas G. Winkler. The remuneration committee met in May, June and December 2016 and dealt with several issues, including the dissolution of the contracts with the former Managing Board members Karl Bier and Heribert Smolé and amending the contracts of the Managing Board members Michael Wurzinger and Claus Stadler. A further meeting of the audit committee was held on 21 September 2016 in the presence of the auditor;
Karl-Heinz StraussChairman of the Supervisory Board
23 / UBM Annual Report 2016
Supervisory Board Report
the purpose of this meeting was addressing the new challenges and expanded responsibilities for auditors and the audit committee as the result of the amendment to the Audit Act 2016 and the Auditor Supervision Act, as well as to monitor the financial reporting process, evaluate the effectiveness of the internal control system, the internal audit system and risk management within the Group. A meeting of the audit committee was held on 12 December 2016 in accordance with Rule 81a of the Austrian Code of Corporate Governance, in which the monitoring of the audit was discussed. This meeting also gave the audit committee and the (Group) auditor the chance to communicate without the presence of the Managing Board. In another meeting on 12 December 2016, the audit committee addressed the report of the (Group) auditor on the functioning of risk management in accordance with Rule 83 of the Austrian Code of Corporate Governance and the internal audit report, including discussions on the audit plan and the material findings, in accordance with Rule 18 of the Austrian Code of Corporate Governance.
The annual financial statements of UBM Development AG as per 31 December 2016, including the notes to the consolidated financial statements and the management report, and the consolidated financial state-ments that had been prepared as of 31 December 2016 in accordance with International Financial Reporting Standards (IFRS) and the Group management report, were audited by BDO Austria GmbH Wirtschaftsprü-fungs- und Steuerberatungsgesellschaft. The audit, based on the bookkeeping and documentation of the company as well as the explanations and documentation provided by the Managing Board, revealed that the bookkeeping records and the annual financial statements and consolidated accounts complied with the legal requirements and provided no cause for complaint. The Group report and management report accord with the annual and consolidated financial statements. The aforementioned audit company has therefore issued an unqualified audit opinion for the annual and consolidated financial statements.
All of the documents related to financial statements, the Corporate Governance report and the Managing Board’s proposal on the appropriation of net profit and the audit report prepared by the auditor, were dealt with in detail with the auditors on 5 April 2017 in the audit committee and submitted to the Supervisory Board.
The audit committee and the Supervisory Board have approved the annual financial statements as of 31 December 2016 and the Group management report, the Corporate Governance report and the proposal of the Managing Board regarding the appropriation of net profits following intensive discussion and auditing. The annual financial statements as of 31 December 2016 have thus been adopted. The audit committee and the Supervisory Board also approved the consolidated accounts for 2016 that had been prepared in accord-ance with IFRSs and the Group management report. The Supervisory Board agreed with the proposal of the Managing Board regarding the appropriation of earnings.
The Supervisory Board thanks customers and shareholders for the confidence they have placed in UBM and their commitment to the company, as well as the Managing Board and staff for the dedication they have demonstrated over the past year and the constructive collaboration it has enjoyed with them.
Vienna, in April 2017
Karl-Heinz StraussChairman of the Supervisory Board
24 / UBM Annual Report 2016
Corporate Governance Report
Commitment to the Austrian Code of Corporate Governance
UBM Development AG views Corporate Governance as a key concept for responsible and transparent company manage-ment and the comprehensive auditing that accompanies this. The Managing Board and Supervisory Board work closely together in the interests of the company and its staff and are involved in the ongoing evaluation of the development and strategic direction of the UBM Group. Constant dialogue with all relevant interest groups builds trust, also in corporate activities, and provides the basis for sustainable corporate growth in the future. A top priority for UBM is to incorporate and develop standards towards responsible and sustainable corporate management.
In August 2016 the UBM Group made a joint formal declaration by the Managing Board and the Supervisory Board committing itself to observance of the Austrian Code of Corporate Gov-ernance. Pursuant to Article 267b of the Austrian Commer-cial Code, as a listed parent company, UBM must produce a consolidated Corporate Governance report. As the UBM Group does not have any listed subsidiaries, the requisite disclosures cited in Article 243c of the Austrian Commercial Code and information included in the appropriate places of this Corpo-rate Governance report can be limited.
The UBM shares were admitted to the prime market, the pre-mium segment of the Vienna Stock Exchange, on 22 August 2016. Prior to this, the UBM shares were listed in the stand-ard market continuous segment. With the move to the prime market, UBM formally commits to adhere to more stringent criteria regarding the transparency and quality of disclosures.
With reference to the deviations listed below in the Comply or Explain catalogue, UBM is committed to upholding the rules of the Austrian Code of Corporate Governance and sees this as a key precondition for responsible corporate management. The latest version of the Austrian Code of Corporate Govern-ance as laid out by the Austrian Working Group for Corpo-rate Governance is available to the public on the homepage of the Austrian Working Group for Corporate Governance at www.corporate-governance.at.
This Corporate Governance report is published as part of the Annual Report and is available on the Group’s website at www.ubm.at/en/investor-relations/financial-report/ and under Corporate Governance www.ubm.at/en/investor- relations/corporate-governance/.
In accordance with Rule 36 of the Austrian Code of Corporate Governance, for the first time in 2016 the Supervisory Board conducted a self-evaluation in the form of a survey which pri-marily addressed the efficiency of the Supervisory Board, its organisation and its working practices. The findings were then evaluated and discussed in the Supervisory Board.
Comply or Explain catalogue
C rule 18: Until now there has not been a dedicated staff unit for Internal Audit at UBM Development AG. Internal audit duties have been carried out jointly by the Managing Board and the staff units. Work to begin setting up a dedicated staff unit for Internal Audit was initiated in mid-2016. The audit duties were carried out on a case-by-case basis. In 2017 the Internal Audit staff unit will take over all internal audit duties in full.
C rule 27: The remuneration of the Managing Board members consists of fixed and variable components. The variable com-ponents are exclusively related to annual EBT. There are no non-financial criteria that have a significant influence on the variable remuneration. Concerns about objectivity and clear traceability should thereby have been satisfied.
C rule 27a: At present the contracts with the Managing Board members do not contain an express regulation stating that severance payment for premature termination from the Board without cause may not exceed two times the total annual com-pensation and may not amount to more than the remainder of the contractual term. In addition, they do not expressly specify at present that no severance payment shall be made upon premature termination of a Managing Board contract with good cause. The Managing Board contracts do not con-tain any stipulations under which the circumstances of leaving the company and the economic state of the company should be considered upon the premature departure of a Managing
25 / UBM Annual Report 2016
Corporate Governance Report
Board member. The existing Managing Board contracts were concluded at a point in time when adherence to the rules of the Austrian Code of Corporate Governance was not a focal point. Should any new Managing Board contracts be concluded in the future, the Supervisory Board of UBM Development AG will appropriately evaluate the provisions of Rule 27a.
C rule 38: The job profile and the procedure for appoint-ing Managing Board members is defined on a case-by-case basis. When a Managing Board member is to be appointed, the Supervisory Board defines a job profile, whereby particular attention is paid to the candidate’s qualifications, experience and industry knowledge. In the interests of the company, a for-mally defined appointment procedure and a general job pro-file is not used, as this could exclude candidates from being appointed as Managing Board members despite exceptional qualifications and outstanding industry knowledge.
C rule 39: Establishing an emergency committee appears unnecessary in view of the homogenous business activities practised by UBM Development AG as well as the compara-tively low number of Supervisory Board members. The option of circular resolutions may be exercised in urgent cases.
C rule 49: The conclusion of contracts with members of the Supervisory Board in which such members are committed to the performance of a service outside of their activities on the Supervisory Board for the company or a subsidiary for a remuneration not of minor value is subject to approval by the Supervisory Board in line with the law. The company will, how-ever, refrain from publishing these details due to related oper-ational and business confidentiality issues. In any case, the notes to the consolidated financial statements of UBM Devel-opment AG show disclosures on related party transactions, which contain the remuneration for services by companies in which the Supervisory Board members hold a position and/or an interest outside of their activities on the Supervisory Board of UBM Development AG.
C rule 83: A risk assessment by the auditor was not conducted in the year 2016. The reason for this was that the listing in the prime market segment of the Vienna Stock Exchange did not
occur until the second half of the business year. In 2017 the risk assessment will be carried out in full and every measure will be undertaken towards the code-compliant evaluation of the effectiveness of the risk management system, which was previously carried out as part of the internal reporting and reported directly to the Managing Board. In addition, the audit committee and the Supervisory Board will continue as previ-ously to gain an adequate view of the effectiveness of the risk management system through targeted reporting.
The Managing Board
Thomas G. Winkler was born in Salzburg, Austria, in 1963. He completed his law degree at Salzburg University, Austria, in 1985, and graduated as Master of Laws (LL.M.) in 1987 from the University of Cape Town, South Africa. After graduating, he started his career at Erste Österreichische Bank AG (for-merly Girozentrale), from 1990 he was an authorised signa-tory, head of Investor Relations and Corporate Spokesperson at Maculan Holding AG. From 1996 to 1998 he took the post of Vice President, Head of Special Projects at Magna (Europe) Holding AG. From 1998 to 2001 he was Head of Investor Rela-tions at Deutsche Telekom AG in Bonn, before moving to T-Mo-bile International AG & Co. KG, where he was responsible for finance as a member of the Executive Board. In the period 2007 to 2009 Thomas G. Winkler worked in the economic hub of London as a freelance consultant. From 2010 to 2013 he also served as Deputy Chairman of the Supervisory Board of ÖIAG Österreichische Industrieholding AG. Before Thomas G. Win-kler joined UBM Development AG on 1 June 2016, he worked as a Senior Advisory Board Member at Minsait (formerly Indra Business Consulting), Spain, from 2014 and as the Chairman of the Audit Committee and member of the Supervisory Board of Bashneft JSOC, Russia. In accordance with the rules of procedure of the Managing Board, Thomas G. Winkler is the Chairman of the Board and CEO, responsible for fundamen-tal aspects of business policy, Business Development, Inves-tor Relations and Corporate Communications, Internal Audit and Risk Management, as well as for Human Resources. As CFO he is responsible for Finance and Controlling, Accounting, Taxes, Insurance and Compliance.
26 / UBM Annual Report 2016
Corporate Governance Report
Martin Löcker was born in Leoben, Austria, in 1976. He grad-uated in industrial engineering and construction from the Technical University in Graz, Austria, in 2000, before gaining a postgraduate qualification in real estate economics at the European Business School in Munich, Germany, in 2005. He joined the PORR Group and its subsidiary UBM AG in 2001. Here he was responsible for projects in Austria, France and Germany and since 2007 he has held management positions at UBM AG and its subsidiary Münchner Grund. He has been a member of the Managing Board since 1 March 2009. In accord-ance with the rules of procedure of the Managing Board, Martin Löcker is responsible for Real Estate Development (Research & Valuations, Planning & Architecture, Project Management, Project Control) in Germany, Western Europe, Eastern Europe and UBMhotels, in which UBM’s activities in hotel develop-ment and management are bundled.
Claus Stadler was born in Vöcklabruck, Austria, in 1970. In 1997 he graduated in architecture from the Vienna University of Technology, Austria. In 1998 he joined the PORR Group and was responsible for projects in Austria, Germany, Croatia and Romania. From 2005 to 2011 he worked for the Austrian Fed-eral Railways (ÖBB) and from 2008 until 2011 he was the Man-aging Director of ÖBB-Immobilienmanagement GmbH, ÖBB-Werbe center GmbH and other project companies. He became the Managing Director of STRAUSS & PARTNER Development GmbH in 2012. With his appointment to the Managing Board of UBM in 2015, his responsibilities include Property Devel-opment (Research and Valuations, Planning and Architecture, Project Management, Project Control) for Austria as well as IT and Quality Management.
Michael Wurzinger, was born in Salzburg, Austria, in 1971. In 1997 he graduated in business administration from the Univer-sity of Innsbruck, Austria. In 2006 he became a member of the Royal Institution of Chartered Surveyors (RICS). After his stud-ies, he began his career at Constantia Privatbank AG in 1997 and from 2004 he was Head of Property Asset Management
and Project Development for Austria; he joined the Executive Board of the bank in 2006. From 2008 to 2010 he was a mem-ber of the new Executive Board and COO of Immofinanz AG. In 2011 he became the spokesperson for the Executive Board of PORR Solutions Immobilien und Infrasturkturprojekte GmbH (now STRAUSS & PARTNER Development GmbH). In January 2015 he was appointed as a member of the Managing Board of UBM Development AG. He is responsible for Property Market-ing and Sales, Asset Management and Legal Affairs.
Karl bier resigned as Chairman of the Managing Board of UBM with effect from 31 May 2016. He was born in Vienna, Austria, in 1955. He graduated in law from the University of Vienna in 1979. In 1980 he joined IMMORENT, where he was responsible for project development, finance and tax affairs. He then held management positions at several regional com-panies and project companies. Karl Bier was a member of the UBM Managing Board since 1992 and chaired the Board from 1998. In his capacity as the Chairman of the Managing Board he was responsible for Business Guidelines, Business Devel-opment, Investor Relations, Corporate Communication, Group Management, Audit & Risk Management, Internal Audit and Human Resources.
Heribert Smolé resigned as a member of the Managing Board of UBM with effect from 31 May 2016. He was born in Knittel-feld, Austria, in 1955. He joined the PORR Group in 1973 and in 1985 became head of the commercial administration depart-ment for investments. In 1990 he became an authorised joint signatory of UBM AG (part of the PORR Group at that time) and gradually took on the functions of general manager and commercial director at various companies of the PORR Group. In 1996 he became qualified for real estate management and brokerage. Heribert Smolé was a member of the UBM Manag-ing Board since 1997. In accordance with the rules of proce-dure of the Managing Board, he was responsible for the areas of Finance & Controlling, Accounting, Taxes, Insurance and Device Management.
27 / UBM Annual Report 2016
The Managing Board
In accordance with Article 6 of the UBM Articles of Associa-tion, the Managing Board consists of between two and six peo-ple. From 1 January 2016 to 31 May 2016 the Managing Board consisted of five people, since 1 June 2016 it consists of four people. The Supervisory Board can name a member of the Managing Board as Chairman and name members as Deputy Chairmen. The Managing Board passes resolutions by a sim-ple majority of votes cast. If the Supervisory Board appoints a member to chair the Managing Board, he/she has a casting vote in the event of a tie.
The members of the Managing Board are appointed by the Supervisory Board for a maximum term of five years. The renewed appointment or an extension of this period (each for a maximum of five years) is permitted. The Supervisory Board can dismiss a member of the Managing Board before the end of his/her term in office if there is an important reason to do so, for example if there is a serious breach of duty or if the general shareholders meeting passes a vote of no confidence in the Managing Board member.
The Managing Board must conduct its business in line with the specifications of the Austrian Stock Corporation Act, the statutes, other laws and the rules of procedure. The Supervi-sory Board rules on the division of responsibilities in the Man-aging Board in line with maintaining the overall responsibil-ity of the Managing Board as a whole. The Managing Board requires Supervisory Board approval in order to undertake any business dealings specified in the relevant version of Article 95 Section 5 Stock Corporation Act. In as far as legally permitted
by Article 95 Section 5 Stock Corporation Act, the Supervisory Board lays down limits on amounts up to which its approval is not required. Furthermore, the Supervisory Board is entitled to determine types of business which require its approval in addi-tion to the legally stipulated cases (Article 95 Section 5 Stock Corporation Act). The Supervisory Board has issued appropri-ate rules of procedure for the Managing Board. The Managing Board must report regularly to the Supervisory Board on its activities.
The Managing Board members must fulfil their responsibil-ities as their main employment and manage the company’s business with the care of a proper and conscientious manager. They must manage the business in a way which satisfies the interests of the shareholders, the staff members and of the public. The Managing Board members may not take on any other employment without the approval of the Supervisory Board and may not take on an executive function in any com-panies which are not within the consolidated group.
UBM is represented by two Managing Board members, or by one Managing Board member with one authorised signatory. With legal restrictions, UBM can also be represented by two authorised signatories. Any Deputy Managing Board members are considered equal to regular Managing Board members with regard to rights of representation.
The following table shows the Managing Board members, their date of birth, their position, the date of their first appointment, as well as the probable end of their time in office. In 2016 the following people sat on the Managing Board.
Corporate Governance Report
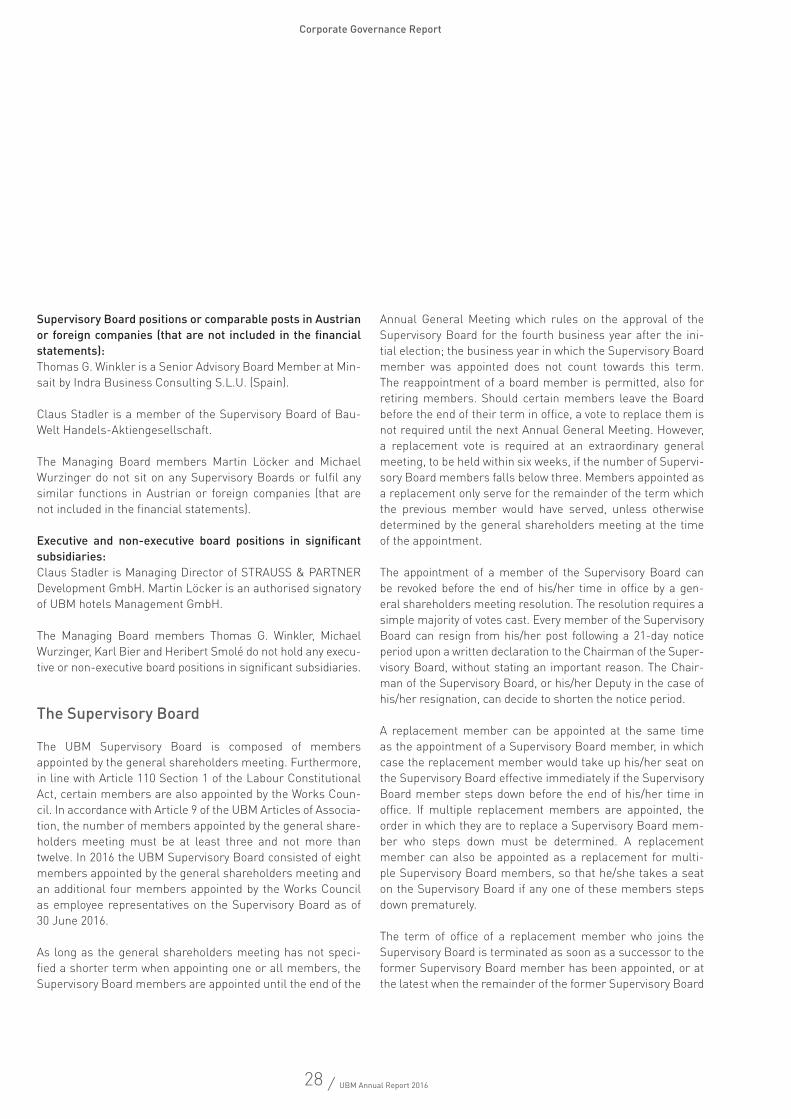
Members of the Managing Board
Name Date of birth Position Member since appointed until
Thomas G. Winkler 24.6.1963 Chairman of the Managing Board 1.6.2016 31.5.2019
Martin Löcker 13.3.1976 Managing Board member 1.3.2009 31.12.2020
Michael Wurzinger 9.4.1971 Managing Board member 15.1.2015 19.2.2018
Claus Stadler 4.7.1970 Managing Board member 29.5.2015 19.2.2018
Karl Bier 3.3.1955 Chairman of the Managing Board 1.8.1992 31.5.2016
Heribert Smolé 16.2.1955 Managing Board member 15.7.1997 31.5.2016
28 / UBM Annual Report 2016
Supervisory Board positions or comparable posts in Austrian or foreign companies (that are not included in the financial statements): Thomas G. Winkler is a Senior Advisory Board Member at Min-sait by Indra Business Consulting S.L.U. (Spain).
Claus Stadler is a member of the Supervisory Board of Bau-Welt Handels-Aktiengesellschaft.
The Managing Board members Martin Löcker and Michael Wurzinger do not sit on any Supervisory Boards or fulfil any similar functions in Austrian or foreign companies (that are not included in the financial statements).
Executive and non-executive board positions in significant subsidiaries: Claus Stadler is Managing Director of STRAUSS & PARTNER Development GmbH. Martin Löcker is an authorised signatory of UBM hotels Management GmbH.
The Managing Board members Thomas G. Winkler, Michael Wurzinger, Karl Bier and Heribert Smolé do not hold any execu-tive or non-executive board positions in significant subsidiaries.
The Supervisory Board
The UBM Supervisory Board is composed of members appointed by the general shareholders meeting. Furthermore, in line with Article 110 Section 1 of the Labour Constitutional Act, certain members are also appointed by the Works Coun-cil. In accordance with Article 9 of the UBM Articles of Associa-tion, the number of members appointed by the general share-holders meeting must be at least three and not more than twelve. In 2016 the UBM Supervisory Board consisted of eight members appointed by the general shareholders meeting and an additional four members appointed by the Works Council as employee representatives on the Supervisory Board as of 30 June 2016.
As long as the general shareholders meeting has not speci-fied a shorter term when appointing one or all members, the Supervisory Board members are appointed until the end of the
Annual General Meeting which rules on the approval of the Supervisory Board for the fourth business year after the ini-tial election; the business year in which the Supervisory Board member was appointed does not count towards this term. The reappointment of a board member is permitted, also for retiring members. Should certain members leave the Board before the end of their term in office, a vote to replace them is not required until the next Annual General Meeting. However, a replacement vote is required at an extraordinary general meeting, to be held within six weeks, if the number of Supervi-sory Board members falls below three. Members appointed as a replacement only serve for the remainder of the term which the previous member would have served, unless otherwise determined by the general shareholders meeting at the time of the appointment.
The appointment of a member of the Supervisory Board can be revoked before the end of his/her time in office by a gen-eral shareholders meeting resolution. The resolution requires a simple majority of votes cast. Every member of the Supervisory Board can resign from his/her post following a 21-day notice period upon a written declaration to the Chairman of the Super-visory Board, without stating an important reason. The Chair-man of the Supervisory Board, or his/her Deputy in the case of his/her resignation, can decide to shorten the notice period.
A replacement member can be appointed at the same time as the appointment of a Supervisory Board member, in which case the replacement member would take up his/her seat on the Supervisory Board effective immediately if the Supervisory Board member steps down before the end of his/her time in office. If multiple replacement members are appointed, the order in which they are to replace a Supervisory Board mem-ber who steps down must be determined. A replacement member can also be appointed as a replacement for multi-ple Supervisory Board members, so that he/she takes a seat on the Supervisory Board if any one of these members steps down prematurely.
The term of office of a replacement member who joins the Supervisory Board is terminated as soon as a successor to the former Supervisory Board member has been appointed, or at the latest when the remainder of the former Supervisory Board
Corporate Governance Report
29 / UBM Annual Report 2016
member’s time in office comes to an end. Should the term of office of a replacement member who joins the Supervisory Board be terminated because a successor to the former Super-visory Board member has been appointed, the replacement member still serves as a replacement for the additional Super-visory Board members he/she has been chosen to represent.
In a meeting held once a year following the Annual General Meeting, the Supervisory Board elects a Chairman and one or more Deputies from among its members. If two Deputies are appointed, then the order in which they are to take up the post shall be determined. The term in office runs until the end of the next Annual General Meeting. If the Chairman or one of the elected Deputies withdraws from his/her post, the Super-visory Board must immediately hold a vote to replace him/her. Should no candidate win a simple majority vote, then a run-off election is held between the people who have received the most votes. Should the runoff election result in a tie, lots shall be drawn to decide the election. If the Chairman or one of the elected Deputies withdraws from his/her post, the Supervisory Board must immediately hold a new election to appoint a suc-cessor. The Chairman and the Deputies can resign their post at any time following a 14-day notice period upon a written decla-ration to the Supervisory Board; this does not require them to step down from the Supervisory Board at the same time.
Every Deputy Chairman has the same rights and responsi-bilities as the Chairman when he/she is standing in for him. This also applies to holding a casting vote in elections and passing resolutions. Should the Chairman and his deputies be prevented from realising their obligations, this obligation passes to the oldest Supervisory Board member (in terms of age) for the duration of the incapacity. Declarations of intent by the Supervisory Board and its committees shall be submitted to the Chairman of the Supervisory Board, or to his Deputy should he/she be incapacitated.
In line with its legal responsibilities and those arising from the Articles of Association, the Supervisory Board produces rules of procedure. Resolutions of the Supervisory Board on its rules of procedure require a simple majority of the members appointed by the general shareholders meeting in addition to the general requirements on resolutions.
The Supervisory Board can form committees made up of its members. Their responsibilities and powers as well as their general rules of procedure are specified by the Supervisory Board. The committees can also take on the authority to make decisions. The committees can be convened long-term or for individual tasks. The employee representatives on the Super-visory Board have the right to nominate members with voting rights to the committees in the ratio specified by Article 110 Section 1 of the Labour Constitutional Act. This does not apply to meetings and votes which relate to relationships between the company and the Managing Board members, except resolutions on the appointment or revocation of a Managing Board member as well as resolutions granting options in company shares.
The Supervisory Board passes resolutions in its regular meet-ings. The Supervisory Board shall hold meetings as often as the interests of the company require, at least once per quar-ter. In 2016 the Supervisory Board held six regular Supervisory Board meetings. The Chairman determines the form of the meeting, the way in which resolutions may be passed outside of meetings and the method of counting votes. The Managing Board members attend all meetings of the Supervisory Board and its committees, as long as the Chairman of the meeting does not determine otherwise.
A Supervisory Board member can nominate another mem-ber in writing to represent him/her at a meeting. A member represented in this way shall not be included in the count determining if the meeting is quorate. The right to chair the meeting cannot be deputised. A Supervisory Board member who is unable to attend a meeting of the Supervisory Board or its committees is entitled to submit his/her written vote on individual agenda items via another member of the respective Board or committee.
The Supervisory Board is quorate when all members of the Supervisory Board have been properly invited to attend and when at least three Supervisory Board members, including one Chairman or Deputy, participate in the resolution. A topic of negotiation which is not on the agenda can only be ruled on by the Supervisory Board if all Supervisory Board members are present or represented and no member participating in the resolution objects.
Corporate Governance Report
30 / UBM Annual Report 2016
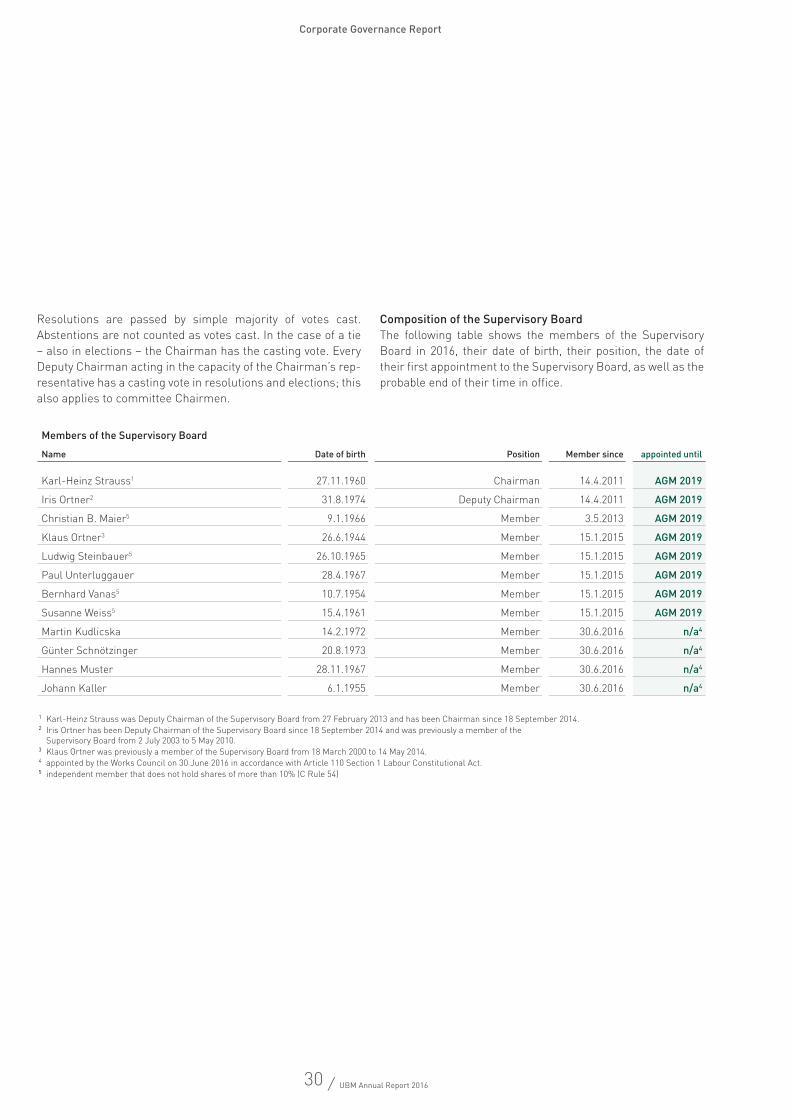
Members of the Supervisory Board
Name Date of birth Position Member since appointed until
Karl-Heinz Strauss1 27.11.1960 Chairman 14.4.2011 AGM 2019
Iris Ortner2 31.8.1974 Deputy Chairman 14.4.2011 AGM 2019
Christian B. Maier5 9.1.1966 Member 3.5.2013 AGM 2019
Klaus Ortner3 26.6.1944 Member 15.1.2015 AGM 2019
Ludwig Steinbauer5 26.10.1965 Member 15.1.2015 AGM 2019
Paul Unterluggauer 28.4.1967 Member 15.1.2015 AGM 2019
Bernhard Vanas5 10.7.1954 Member 15.1.2015 AGM 2019
Susanne Weiss5 15.4.1961 Member 15.1.2015 AGM 2019
Martin Kudlicska 14.2.1972 Member 30.6.2016 n/a4
Günter Schnötzinger 20.8.1973 Member 30.6.2016 n/a4
Hannes Muster 28.11.1967 Member 30.6.2016 n/a4
Johann Kaller 6.1.1955 Member 30.6.2016 n/a4
1 Karl-Heinz Strauss was Deputy Chairman of the Supervisory Board from 27 February 2013 and has been Chairman since 18 September 2014.2 Iris Ortner has been Deputy Chairman of the Supervisory Board since 18 September 2014 and was previously a member of the
Supervisory Board from 2 July 2003 to 5 May 2010.3 Klaus Ortner was previously a member of the Supervisory Board from 18 March 2000 to 14 May 2014. 4 appointed by the Works Council on 30 June 2016 in accordance with Article 110 Section 1 Labour Constitutional Act.5 independent member that does not hold shares of more than 10% (C Rule 54)
Resolutions are passed by simple majority of votes cast. Abstentions are not counted as votes cast. In the case of a tie – also in elections – the Chairman has the casting vote. Every Deputy Chairman acting in the capacity of the Chairman’s rep-resentative has a casting vote in resolutions and elections; this also applies to committee Chairmen.
Composition of the Supervisory Board The following table shows the members of the Supervisory Board in 2016, their date of birth, their position, the date of their first appointment to the Supervisory Board, as well as the probable end of their time in office.
Corporate Governance Report
31 / UBM Annual Report 2016
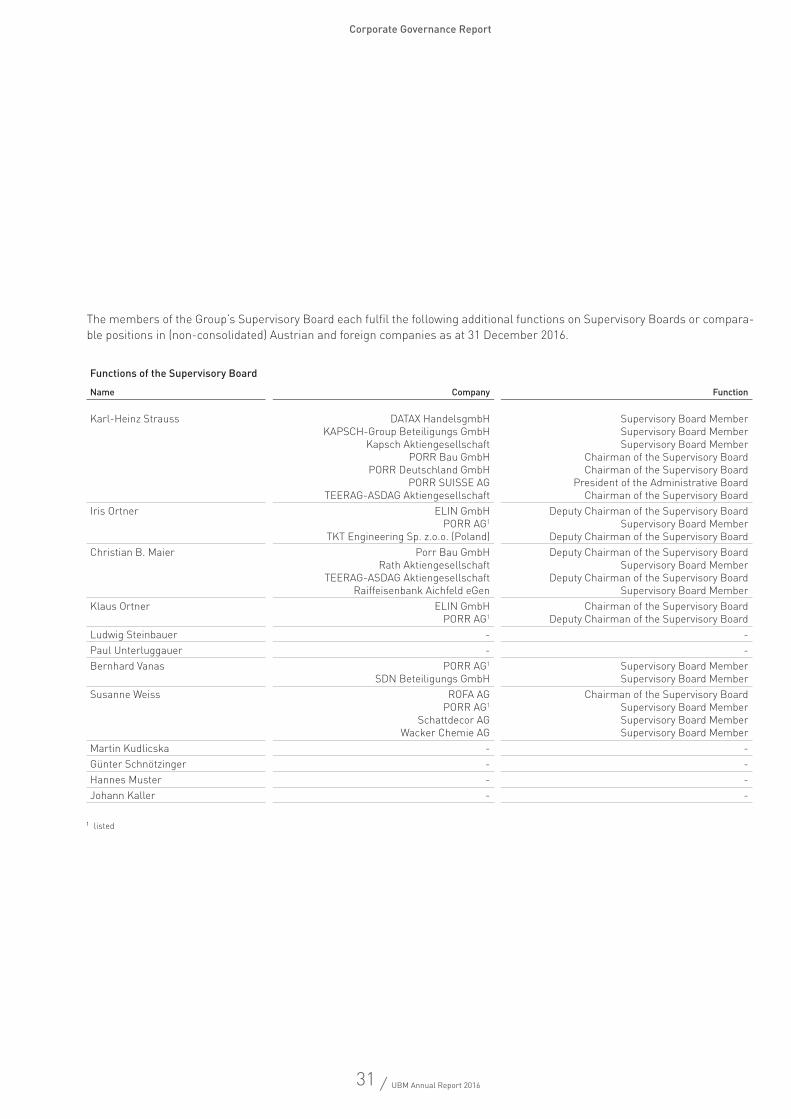
The members of the Group’s Supervisory Board each fulfil the following additional functions on Supervisory Boards or compara-ble positions in (non-consolidated) Austrian and foreign companies as at 31 December 2016.
Corporate Governance Report
Functions of the Supervisory Board
Name Company Function
Karl-Heinz Strauss DATAX HandelsgmbHKAPSCH-Group Beteiligungs GmbH
Kapsch AktiengesellschaftPORR Bau GmbH
PORR Deutschland GmbHPORR SUISSE AG
TEERAG-ASDAG Aktiengesellschaft
Supervisory Board MemberSupervisory Board MemberSupervisory Board Member
Chairman of the Supervisory BoardChairman of the Supervisory Board
President of the Administrative BoardChairman of the Supervisory Board
Iris Ortner ELIN GmbH PORR AG1
TKT Engineering Sp. z.o.o. (Poland)
Deputy Chairman of the Supervisory BoardSupervisory Board Member
Deputy Chairman of the Supervisory BoardChristian B. Maier Porr Bau GmbH
Rath Aktiengesellschaft TEERAG-ASDAG Aktiengesellschaft
Raiffeisenbank Aichfeld eGen
Deputy Chairman of the Supervisory BoardSupervisory Board Member
Deputy Chairman of the Supervisory BoardSupervisory Board Member
Klaus Ortner ELIN GmbH PORR AG1
Chairman of the Supervisory BoardDeputy Chairman of the Supervisory Board
Ludwig Steinbauer - -Paul Unterluggauer - -Bernhard Vanas PORR AG1
SDN Beteiligungs GmbH Supervisory Board MemberSupervisory Board Member
Susanne Weiss ROFA AG PORR AG1
Schattdecor AG Wacker Chemie AG
Chairman of the Supervisory BoardSupervisory Board MemberSupervisory Board MemberSupervisory Board Member
Martin Kudlicska - -Günter Schnötzinger - -Hannes Muster - -Johann Kaller - -
1 listed
32 / UBM Annual Report 2016
Criteria for independence
C Rule 53 of the Austrian Code of Corporate Governance speci-fies that the majority of the members of the Supervisory Board elected by the general shareholders meeting or appointed by shareholders in line with the Articles of Association shall be independent of the company and its Managing Board. A Supervisory Board member shall be considered independent if he/she does not have any business or personal relationship with the company or its Managing Board which constitutes a material conflict of interests and could therefore influence the behaviour of the member.
On this basis, the Supervisory Board of UBM has determined the following criteria for independence, which are available to the public on the UBM website:
a) In the past five years the Supervisory Board member shall not have served on the Managing Board or as a manage-ment-level employee of UBM or one of UBM’s subsidiaries.
b) In the past year the Supervisory Board member shall not maintain or have maintained any business relations with UBM or one of UBM’s subsidiaries to an extent which is significant for the member of the Supervisory Board. This shall also apply to relationships with companies in which a member of the Supervisory Board has a considerable economic interest, although this does not apply to exercis-ing functions in bodies of the Group; knowledge of Group issues and the mere exercising of the activities of a Man-aging Board member or Managing Director by a Supervi-sory Board member do not, as a rule, lead to the affected company being viewed as a “company in which a member of the Supervisory Board has a considerable economic interest” as long as circumstances do not give rise to the assumption that the Supervisory Board member has a direct personal benefit from a business dealing with these companies. The approval of individual transactions by the Supervisory Board pursuant to Rule 48 does not automati-cally mean the person is classified as not independent.
c) In the past three years the Supervisory Board member shall not have been an auditor of the company or been a shareholder or employee of the audit company which audited UBM.
d) The Supervisory Board member shall not serve on the Managing Board of a different company in which a Man-aging Board member of UBM serves on the Supervisory Board.
e) The Supervisory Board member may not remain on the Supervisory Board for more than 15 years. This shall not apply to Supervisory Board members who are sharehold-ers with a direct investment in the company or who repre-sent the interests of such a shareholder.
f) The Supervisory Board member shall not be a close fam-ily member (direct offspring, spouse, life partner, parent, uncle, aunt, sibling, niece, nephew) of a member of the UBM’s Managing Board, or of a person to whom any of the aforementioned they’re not listed as a) to e) this year apply.
In accordance with these criteria, the Supervisory Board mem-bers Karl-Heinz Strauss, Christian B. Maier, Ludwig Stein-bauer, Bernhard Vanas and Susanne Weiss have declared themselves to be independent.
CommitteesThe Articles of Association specify that the Supervisory Board can form committees made up of its members. The following three committees were formed in the 2016 business year for the support and efficient handling of complex issues:
Audit committee: The responsibilities of the audit committee include (i) monitoring the financial reporting process as well as issuing recommendations or suggestions to ensure its relia-bility; (ii) monitoring the effectiveness of the Group-wide inter-nal control system, the internal audit system, where appropri-ate, and the Group’s risk management system; (iii) monitoring the auditing of the individual and consolidated financial state-ments under consideration of the findings and conclusions in the reports published by the Regulatory Authority on Auditors in accordance with Article 4 Section 2 Line 12 of the Super-vision of Auditors Act (APAG); (iv) assessing and monitoring the independence of the chartered auditors, in particular as regards any additional services they may have provided to UBM (Article 5 of EU Regulation Nr. 537/2014 and Article 271a Sec-tion 6 of the Austrian Commercial Code apply); (v) producing the report on the results of the audit to the Supervisory Board and a statement on how the audit has contributed to the relia-
Corporate Governance Report
33 / UBM Annual Report 2016
bility of financial reporting and the role of the audit committee; (vi) assessing the annual financial statements and preparing for their approval, assessing the proposal for appropriation of profits, the Management Report and the Corporate Govern-ance Report, as well as reporting on the audit findings to the Supervisory Board; (vii) assessing the consolidated financial statements and the Group Management Report as well as reporting back to the Supervisory Board of the parent on the audit findings; and (viii) carrying out the process for selecting the auditor under consideration of the appropriateness of his/her fee and preparing the Supervisory Board’s recommenda-tion on the choice of auditor (Article16 of EU Regulation Nr. 537/2014 applies).
The audit committee met three times in the 2016 business year. A meeting of the audit committee was held on 22 April 2016 in the presence of the auditors for the purpose of audit-ing and preparing the approval of the 2015 consolidated finan-cial statements. At the same meeting, the Supervisory Board selected the auditor for the individual and consolidated finan-cial statements as at 31 December 2016. In a meeting on 21 September 2016 the audit committee dealt with the amend-ment to the Audit Act as well as monitoring the financial report-ing process, evaluating the effectiveness of the internal control system, the internal audit system and risk management within the Group. Another meeting of the audit committee was held on 12 December 2016 to determine how the mutual commu-nication between the auditor and the audit committee shall be realised. This meeting also gave the audit committee and the (Group) auditor the chance to communicate without the pres-ence of the Managing Board. In the same meeting the audit committee addressed risk management and the internal audit report on the internal audit plan.
The members of the audit committee are Karl-Heinz Strauss (Chairman), Iris Ortner, Christian B. Maier (financial expert) and Susanne Weiss.
Nomination committee: The nomination committee has the following responsibilities: (i) preparing Managing Board appointments including successor planning: before appointing Managing Board members, the nomination committee shall
define the profile for the Managing Board member taking into account the corporate strategy and state of the company and prepare the decision by the full Supervisory Board; (ii) propos-ing possible candidates to the Supervisory Board when places become available: the nomination committee is involved with planning the allocation of Supervisory Board mandates. The nomination committee shall submit appointment proposals to the entire Supervisory Board, which shall be proposed on the basis of a resolution of the entire Supervisory Board to the general shareholders meeting for their approval. When pro-posing appointments, attention must be paid to the qualifica-tions and personal skills of the Supervisory Board members, as well as the balanced composition of the Supervisory Board in light of the structure and business area of UBM. Further-more, the aspects of diversity in the Supervisory Board with regard to representation of gender, age and internationality shall be considered appropriately. Attention shall be paid to the fact that no-one shall be put forward as a member of the Supervisory Board who has been convicted of a crime which calls his/her professional reliability into question.
In 2016 the nomination committee held one meeting. The change in the Managing Board was discussed in the meeting on 4 May 2016 and Thomas G. Winkler was proposed as the new Chairman of the Managing Board and CFO. A proposal was also made to extend the Managing Board mandate of Martin Löcker. The nomination committee consists of the following Supervisory Board members: Karl-Heinz Strauss (Chairman), Iris Ortner and Susanne Weiss.
remuneration committee: The remuneration committee has the following responsibilities: (i) handling matters related to the remuneration of the Managing Board members and the content of the employment agreements with Managing Board members, particularly specifying the underlying principles of Managing Board member remuneration and determining the criteria for variable remuneration components in line with Rules 27, 27a and 28 of the Austrian Code of Corporate Gov-ernance; (ii) evaluating the remuneration policy for Managing Board members at regular intervals; (iii) approving additional duties of Managing Board members.
Corporate Governance Report
34 / UBM Annual Report 2016
The remuneration committee met twice in 2016. The variable/performance-related remuneration of the Managing Board members was discussed in the meetings on 4 May 2016 and 27 June 2016. The remuneration committee consists of the fol-lowing members: Karl-Heinz Strauss (Chairman), Iris Ortner and Susanne Weiss (remuneration expert).
Promoting women’s issues
UBM is working hard on increasing the number of women in the organisation. Compared to other companies in the real estate sector, UBM measures up positively, with eleven women in management positions as of 31 December 2016 (including Supervisory Board, Managing Directors and authorised signa-tories at UBM Development AG and significant subsidiaries). This represents a significant increase of women in manage-ment positions against the previous year.
As a sustainable corporation, UBM focuses on topics relevant for society, such as equal opportunities in the workplace. In order to ensure that equal opportunities are firmly anchored in the company, the focus of UBM is on finding suitable female candidates when recruiting managers and employees. In 2016 68 new employees were recruited across the Group, of which 30 were women and 38 were men (excluding hotel workers). There are no salary differences between men and women per-forming the same activity and with the same qualifications. Women are specifically addressed in job advertisements. In order to support a balance between professional and family life, the company offers flexible working hours through flexi-time system.
UBM is proactively and sustainably committed to a working envi-ronment free of discrimination and a culture of mutual respect and appreciation among all employees. The company treats its employees equally – regardless of gender, social background, sexual orientation, nationality, religion or age. Any form of dis-crimination or harassment is categorically opposed.
Remuneration Report
Remuneration of the Managing BoardThe remuneration of the UBM Managing Board consists of components which are not related to performance (fixed sal-ary and pension entitlements), those which are performance- related (variable performance bonus), one-off payments and severance for members who have left the Managing Board.
fixed remuneration: The amount of the fixed salary of each Managing Board member is based on the sphere of respon-sibility in accordance with the corporate plan on division of responsibilities. Any additional duties of or by Managing Board members require the approval of the Supervisory Board. The fixed remuneration is paid as non-performance-linked, basic compensation on a monthly basis in the form of a salary. The Managing Board members also receive additional, non-cash fringe benefits (company car, telephone, travel expenses), which are in principle equally available to all Managing Board members.
variable/performance related remuneration: The maximum value of the variable performance bonus for the Chairman of the Managing Board amounts to 2.5% of the EBT shown in the financial statements, up to a maximum of €300,000.00 gross per year. If the earnings meet or exceed the amount defined with the remuneration committee, the Chairman of the Man-aging Board is entitled to the maximum amount of the variable performance bonus. If earnings are below the defined amount, he is entitled to an aliquot share.
The Managing Board member Martin Löcker receives a vari-able performance bonus under the aforementioned scheme, albeit up to a maximum of €200,000.00 gross per year. This regulation was also applied to the former Managing Board member Heribert Smolé. The Managing Board members Claus Stadler and Michael Wurzinger received a varia-ble performance bonus for 2016, respectively amounting to €200,000.00 and €300,000.00 gross, as well as a one-off pay-
Corporate Governance Report
35 / UBM Annual Report 2016
ment of €100,000.00 each. The one-off payment was the result of a delayed conversion of the earlier management contracts into Managing Board member contracts.
pension regulations: Annual payments are made to a pension fund for the Managing Board members. The amount paid in is based on the age of the member. In the business year 2016 provisions were formed in the amount of €458,976.00.
Severance entitlements: Karl Bier received severance pay under the analogous application of the legal severance entitle-ment pursuant to the Austrian Employee Act.
Thomas G. Winkler, Heribert Smolé, Michael Wurzinger, Claus Stadler and Martin Löcker are not entitled to severance pay at the end of their employment.
d&O liability insurance: D&O liability insurance covers the members of the Managing Board, the cost of which is borne by the company.
remuneration policy principles for significant subsidiaries: The remuneration of the Board members of significant sub-sidiaries also consists of components which are not related to performance and those which are performance-related. In addition, they receive non-cash fringe benefits (company car, telephone, travel expenses).
Supervisory Board remunerationIn addition to reimbursement of expenses and an attend-ance fee for every meeting, all Supervisory Board members receive an annual payment for their services. The amount of the attendance fee and the annual payment are determined by a resolution by the general shareholders meeting. The gen-eral shareholders meeting can also rule on a total amount of remuneration for the Supervisory Board and leave the Chair-man of the Supervisory Board to decide how it is distributed.
If members of the Supervisory Board take on special activities in this function and in the interests of the company, extra com-pensation for this can be approved by general shareholders meeting resolution.
Corporate Governance Report
1 The provisions for severance pay and pensions are not included in these figures.2 probable variable gratuities for 2016, payable in 20173 €300,000.00 special bonus and €472,500.00 annual bonus4 €300,000.00 special bonus5 €300,000.00 special bonus and €200,000.00 annual bonus6 since 1 June 20167 €34,900.00 relates to the remainder of a bonus payment for the year 2015.
Managing Board remuneration 2016 (in €)1
Name Salery Variable gratuities²/One-off payment Pension fund/Severance Total
Karl Bier 363,110.36 772,500.003 671,009.76 1,806,620.12
Martin Löcker 227,744.00 500,000.004 9,615.60 737,359.60
Heribert Smolé 249,136.00 500,000.005 18,312.00 767,448.00
Claus Stadler 257,803.14 300,000.00 - 557,803.14
Thomas G. Winkler6 262,500.02 275,000.00 - 537,500.02
Michael Wurzinger 297,728.00 434,900.007 8,720.94 741,348.94
Total 1,658,021.52 2,782,400.00 707,658.30 5,148,079.82
36 / UBM Annual Report 2016
In the interests of the company, Supervisory Board members are covered by an appropriate level of D&O liability insurance, the costs of which are borne by the company.
The resolution of the Annual General Meeting on 25 May 2016 determined the following remuneration for members of the Supervisory Board: the resolution states that the Chairman of the Supervisory Board shall receive fixed remuneration of €25,000.00 per year, the Deputy Chairman of the Supervisory Board shall receive fixed remuneration of €20,000.00 per year and the other members shall receive fixed remuneration of €15,000.00 per year. The attendance fee for meetings was set at €1,000.00 per meeting of the Supervisory Board or one of
its committees. Members of the Supervisory Board who do not reside in Austria receive an additional reimbursement of tax at source settled by the company. The fixed remuneration is due in arrears once a year, within four weeks of the Annual Gen-eral Meeting. The attendance fee for meetings is due within the four weeks following the respective Supervisory Board meeting.
The Supervisory Board members appointed by the Works Council in accordance with Article 110 Section 1 of the Labour Constitutional Act do not receive any additional payment for their work on the Supervisory Board.
Corporate Governance Report
1 Payout within four weeks following the Annual General Meeting 2016
Supervisory Board remuneration 2016 (in €)
Name Fixed remuneration1 Attendance fee for meetings
Karl-Heinz Strauss (Chairman) 25,000.00 6,000.00
Iris Ortner (Deputy Chairman) 20,000.00 6,000.00
Christian B. Maier 15,000.00 6,000.00
Klaus Ortner 15,000.00 6,000.00
Ludwig Steinbauer 15,000.00 6,000.00
Paul Unterluggauer 15,000.00 6,000.00
Bernhard Vanas 15,000.00 6,000.00
Susanne Weiss 15,000.00 5,000.00

37 / UBM Annual Report 2016
Reference Projects
Hotel InterContinental, Warsaw
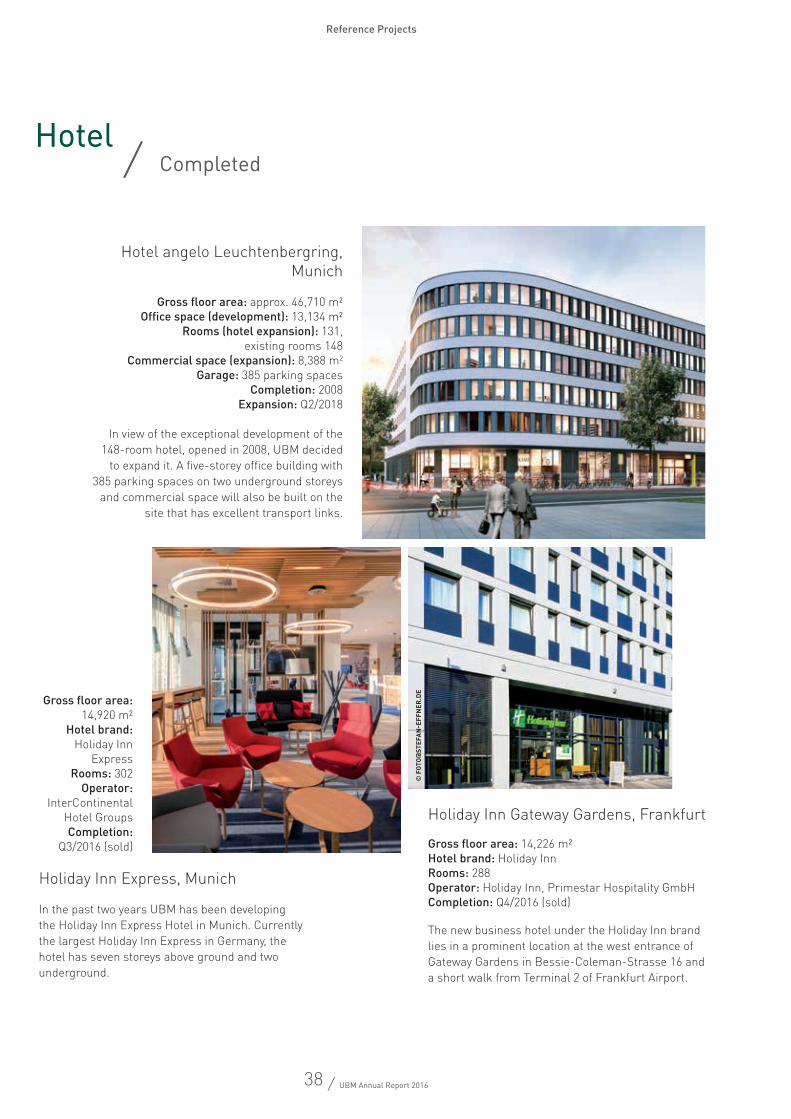
38 / UBM Annual Report 2016
/ FertiggestelltHotel / CompletedHotel
Reference Projects
Holiday Inn Gateway Gardens, Frankfurt
The new business hotel under the Holiday Inn brand lies in a prominent location at the west entrance of Gateway Gardens in Bessie-Coleman-Strasse 16 and a short walk from Terminal 2 of Frankfurt Airport.
Gross floor area: 14,226 m²Hotel brand: Holiday Inn Rooms: 288Operator: Holiday Inn, Primestar Hospitality GmbHCompletion: Q4/2016 (sold)
In view of the exceptional development of the 148-room hotel, opened in 2008, UBM decided
to expand it. A five-storey office building with 385 parking spaces on two underground storeys
and commercial space will also be built on the site that has excellent transport links.
Hotel angelo Leuchtenbergring, Munich
Gross floor area: approx. 46,710 m²Office space (development): 13,134 m²
Rooms (hotel expansion): 131, existing rooms 148
Commercial space (expansion): 8,388 m2
Garage: 385 parking spacesCompletion: 2008
Expansion: Q2/2018
Holiday Inn Express, Munich
In the past two years UBM has been developing the Holiday Inn Express Hotel in Munich. Currently the largest Holiday Inn Express in Germany, the hotel has seven storeys above ground and two underground.
Gross floor area: 14,920 m²
Hotel brand: Holiday Inn
ExpressRooms: 302
Operator: InterContinental
Hotel GroupsCompletion:
Q3/2016 (sold)
© f
OTO
@ST
EfA
N-E
ffN
Er.d
E
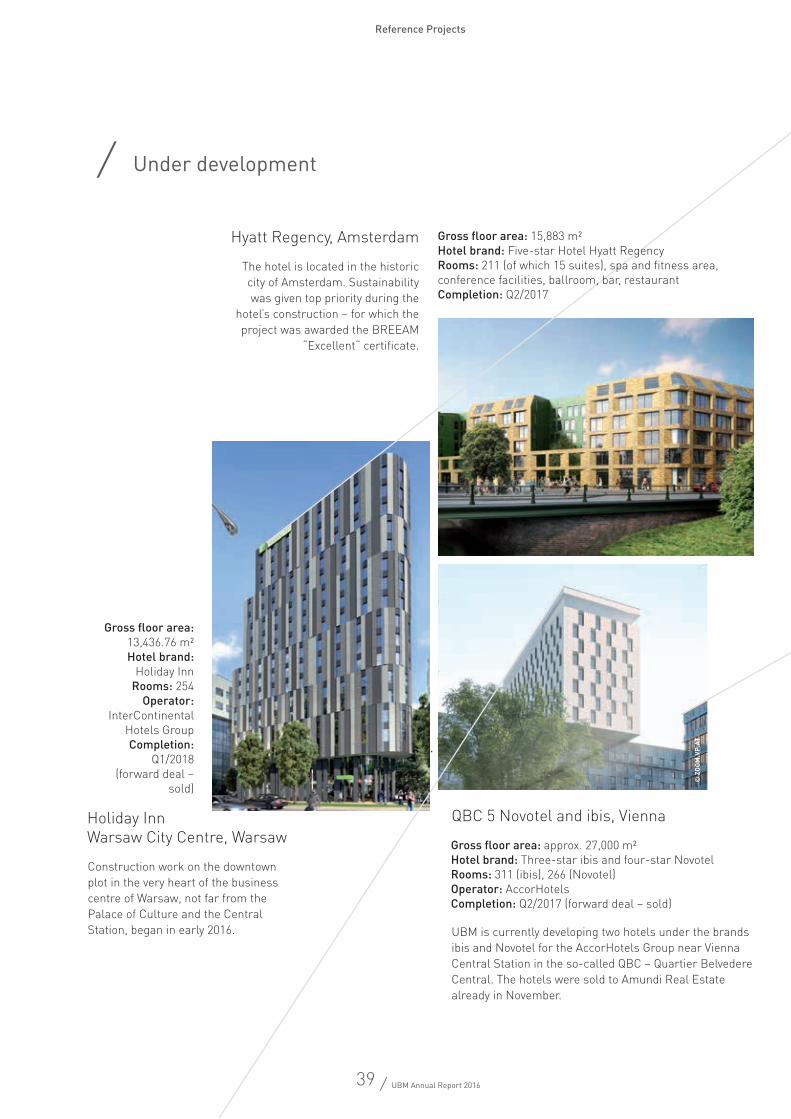
39 / UBM Annual Report 2016
Reference Projects
/ Under development
Hyatt Regency, Amsterdam
Gross floor area: approx. 27,000 m²Hotel brand: Three-star ibis and four-star NovotelRooms: 311 (ibis), 266 (Novotel)Operator: AccorHotelsCompletion: Q2/2017 (forward deal – sold)
QBC 5 Novotel and ibis, Vienna
The hotel is located in the historic city of Amsterdam. Sustainability was given top priority during the
hotel’s construction – for which the project was awarded the BREEAM
“Excellent“ certificate.
Holiday Inn Warsaw City Centre, Warsaw
Construction work on the downtown plot in the very heart of the business centre of Warsaw, not far from the Palace of Culture and the Central Station, began in early 2016.
Gross floor area: 13,436.76 m²Hotel brand:
Holiday InnRooms: 254
Operator: InterContinental
Hotels GroupCompletion:
Q1/2018 (forward deal –
sold)
UBM is currently developing two hotels under the brands ibis and Novotel for the AccorHotels Group near Vienna Central Station in the so-called QBC – Quartier Belvedere Central. The hotels were sold to Amundi Real Estate already in November.
Gross floor area: 15,883 m² Hotel brand: Five-star Hotel Hyatt RegencyRooms: 211 (of which 15 suites), spa and fitness area, conference facilities, ballroom, bar, restaurantCompletion: Q2/2017
© z
OO
M.v
p.AT
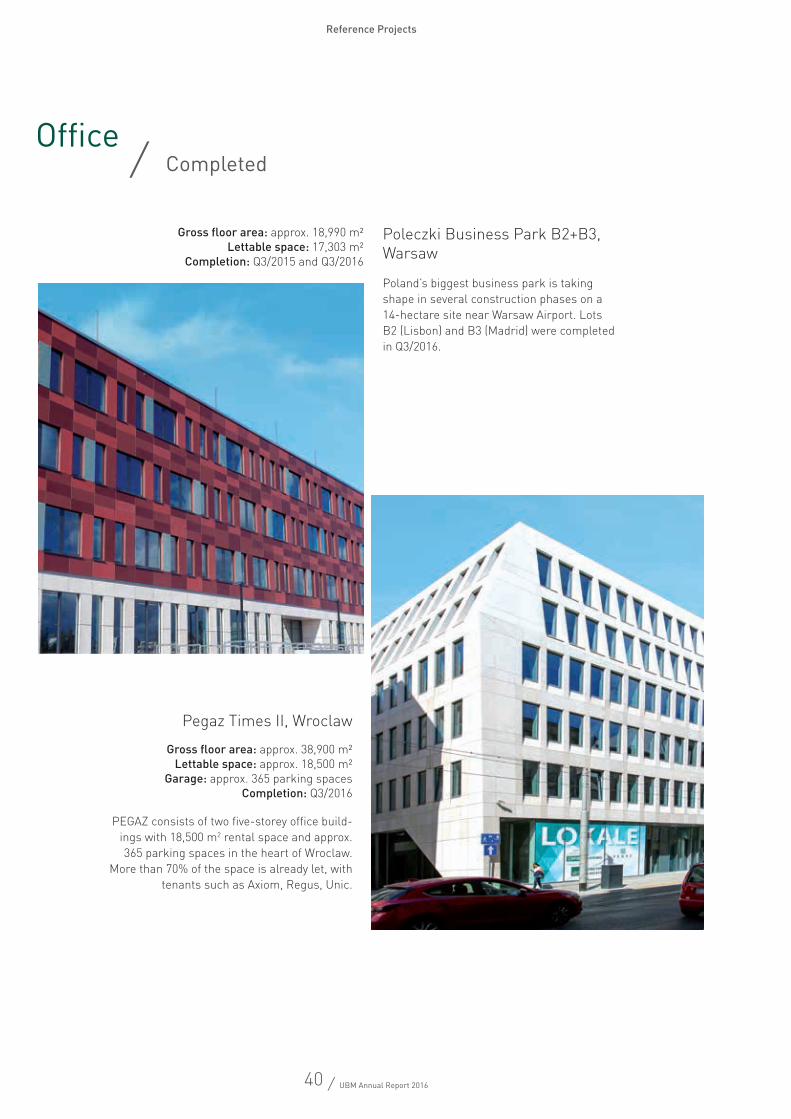
40 / UBM Annual Report 2016
/ CompletedOffice
Pegaz Times II, Wroclaw
Gross floor area: approx. 38,900 m²Lettable space: approx. 18,500 m²
Garage: approx. 365 parking spaces Completion: Q3/2016
Gross floor area: approx. 18,990 m²Lettable space: 17,303 m²
Completion: Q3/2015 and Q3/2016
PEGAZ consists of two five-storey office build-ings with 18,500 m2 rental space and approx. 365 parking spaces in the heart of Wroclaw.
More than 70% of the space is already let, with tenants such as Axiom, Regus, Unic.
Poland’s biggest business park is taking shape in several construction phases on a 14-hectare site near Warsaw Airport. Lots B2 (Lisbon) and B3 (Madrid) were completed in Q3/2016.
Poleczki Business Park B2+B3, Warsaw
Reference Projects
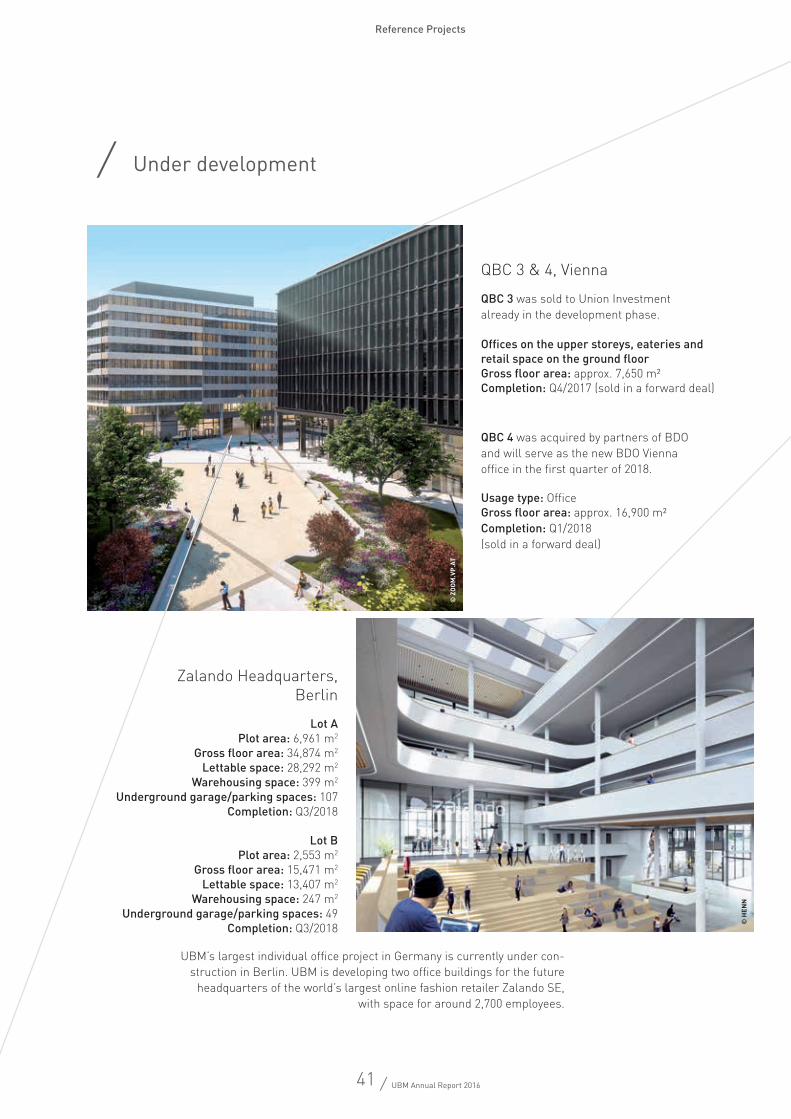
41 / UBM Annual Report 2016
/ Under development
© z
OO
M.v
p.AT
© H
ENN
QBC 3 & 4, Vienna
Lot APlot area: 6,961 m2
Gross floor area: 34,874 m2 Lettable space: 28,292 m2
Warehousing space: 399 m2
Underground garage/parking spaces: 107Completion: Q3/2018
Lot BPlot area: 2,553 m2
Gross floor area: 15,471 m2 Lettable space: 13,407 m2
Warehousing space: 247 m2
Underground garage/parking spaces: 49Completion: Q3/2018
Zalando Headquarters, Berlin
UBM’s largest individual office project in Germany is currently under con-struction in Berlin. UBM is developing two office buildings for the future
headquarters of the world’s largest online fashion retailer Zalando SE, with space for around 2,700 employees.
QBC 3 was sold to Union Investment already in the development phase.
QBC 4 was acquired by partners of BDO and will serve as the new BDO Vienna office in the first quarter of 2018.
Offices on the upper storeys, eateries and retail space on the ground floor Gross floor area: approx. 7,650 m²Completion: Q4/2017 (sold in a forward deal)
Usage type: OfficeGross floor area: approx. 16,900 m²Completion: Q1/2018 (sold in a forward deal)
Reference Projects
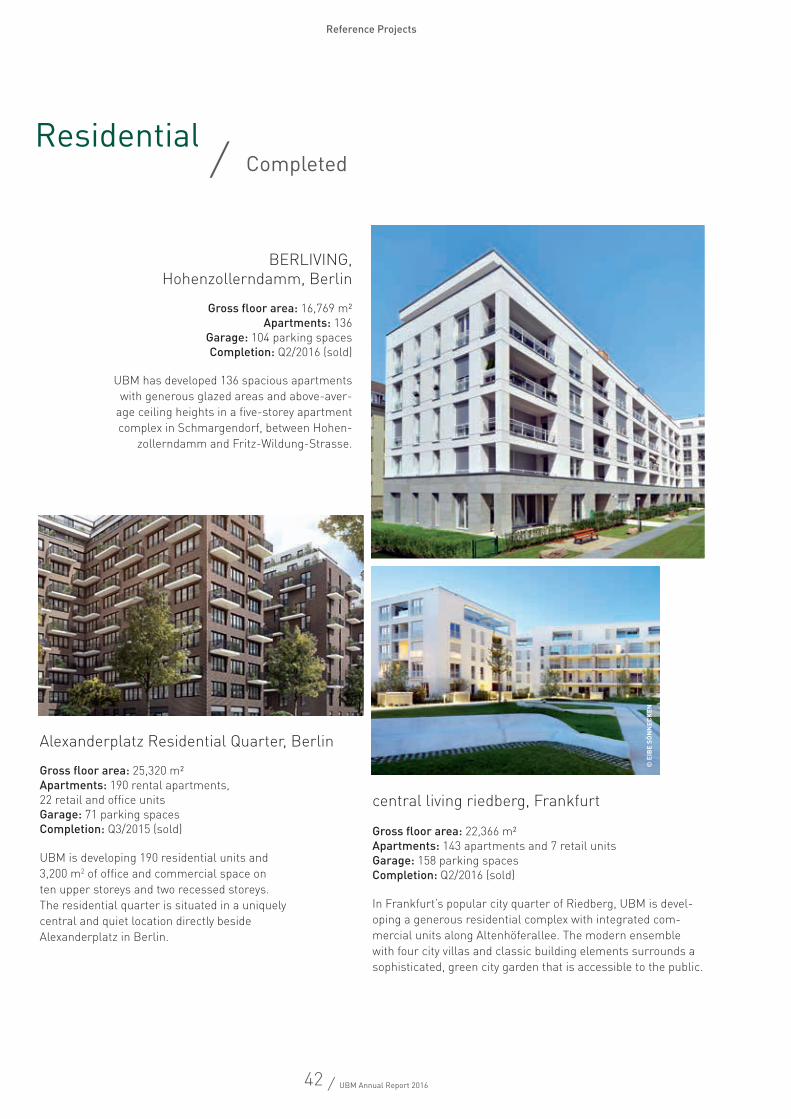
42 / UBM Annual Report 2016
Residential / Completed
In Frankfurt’s popular city quarter of Riedberg, UBM is devel-oping a generous residential complex with integrated com-mercial units along Altenhöferallee. The modern ensemble with four city villas and classic building elements surrounds a sophisticated, green city garden that is accessible to the public.
UBM has developed 136 spacious apartments with generous glazed areas and above-aver-
age ceiling heights in a five-storey apartment complex in Schmargendorf, between Hohen-
zollerndamm and Fritz-Wildung-Strasse.
Gross floor area: 16,769 m²Apartments: 136
Garage: 104 parking spacesCompletion: Q2/2016 (sold)
Gross floor area: 22,366 m²Apartments: 143 apartments and 7 retail units Garage: 158 parking spacesCompletion: Q2/2016 (sold)
UBM is developing 190 residential units and 3,200 m2 of office and commercial space on ten upper storeys and two recessed storeys. The residential quarter is situated in a uniquely central and quiet location directly beside Alexanderplatz in Berlin.
Gross floor area: 25,320 m²Apartments: 190 rental apartments, 22 retail and office unitsGarage: 71 parking spacesCompletion: Q3/2015 (sold)
central living riedberg, Frankfurt
BERLIVING, Hohenzollerndamm, Berlin
Alexanderplatz Residential Quarter, Berlin
© E
IbE
SöN
NEC
KEN
Reference Projects

43 / UBM Annual Report 2016
/ Under development
140 freehold flats and other serviced apartments are being built in lot QBC 6 at the corner Karl-Popper-Strasse/Canettistrasse,
Vienna. The sale of the apartments is already in full swing.
Rosenhügel, Vienna
Living in QBC, Vienna
UBM is developing seven buildings with 205 privately financed freehold flats on a plot of around 16,000 m2 on the site of the former Rosenhügel film studio. Sales are already very successfully underway.
Gross floor area: approx. 31,000 m²Apartments: 205
Garage: 239 parking spaces for cars and 14 for motorcycles
Completion: Q1/2018
Gross floor area: approx. 16,250 m²Apartments: 140
Garage: approx. 30 parking spaces Completion: Q2/2018 ©
zO
OM
.vp.
AT
© f
OO
N
Reference Projects

44 / UBM Annual Report 2016
In planning phase
Kotlarska 11, Krakow
Asset class: OfficePlot area: 6,028 m²Office space: 11,000 m²Completion: Q4/2017
Asset class: HotelGross floor area: 13,700 m²
Hotel brand: Holiday InnRooms: 236
Operator: InterContinental Hotels GroupCompletion: Q4/2018
Granary Island, Gdansk
Asset class: Residential Gross floor area: approx. 7,760 m² No. of apartments: 75 No. of commercial units: 6 Garage: 34 parking spacesCompletion: Q1/2019
NeuHouse (Enckestrasse), Berlin-Kreuzberg
Q4/2017Q4/2018
Q1/2019
Reference Projects
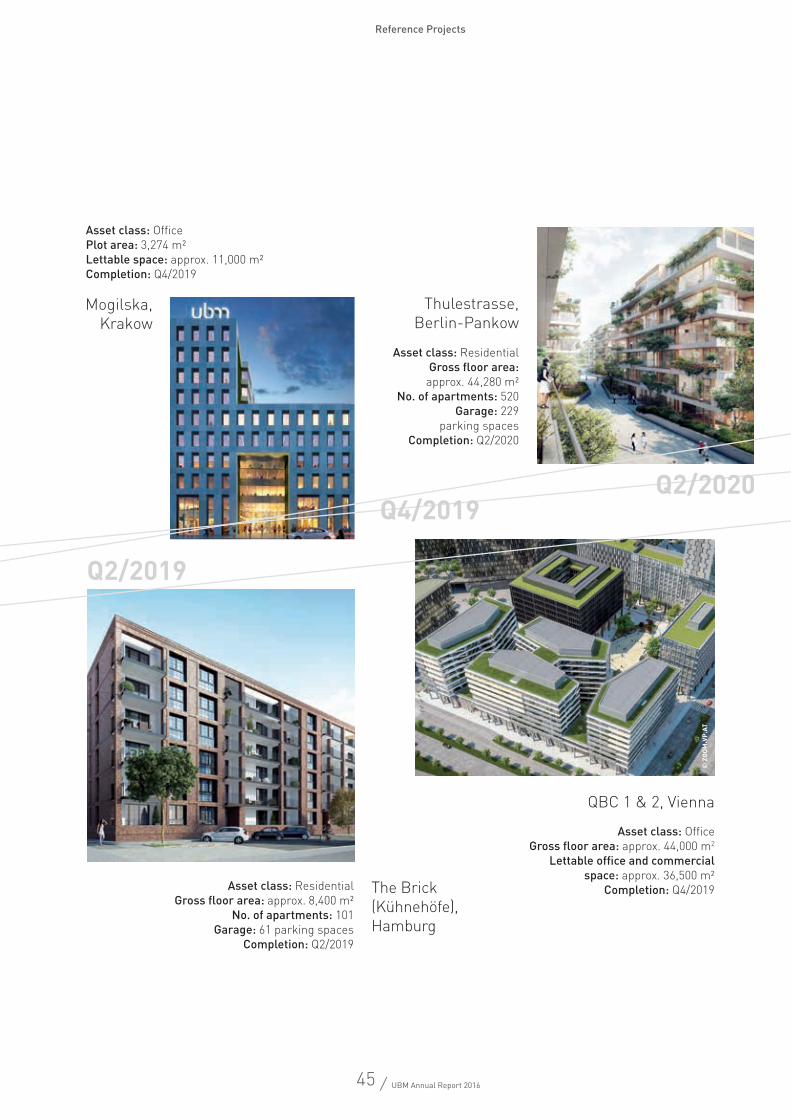
45 / UBM Annual Report 2016
Asset class: OfficePlot area: 3,274 m²Lettable space: approx. 11,000 m²Completion: Q4/2019
Mogilska, Krakow
Asset class: Residential Gross floor area: approx. 44,280 m²
No. of apartments: 520Garage: 229
parking spaces Completion: Q2/2020
Thulestrasse, Berlin-Pankow
QBC 1 & 2, Vienna
Asset class: OfficeGross floor area: approx. 44,000 m2
Lettable office and commercial space: approx. 36,500 m²
Completion: Q4/2019The Brick (Kühnehöfe), Hamburg
Asset class: Residential Gross floor area: approx. 8,400 m²
No. of apartments: 101Garage: 61 parking spaces
Completion: Q2/2019
© z
OO
M.v
p.AT
Q4/2019Q2/2020
Q2/2019
Reference Projects
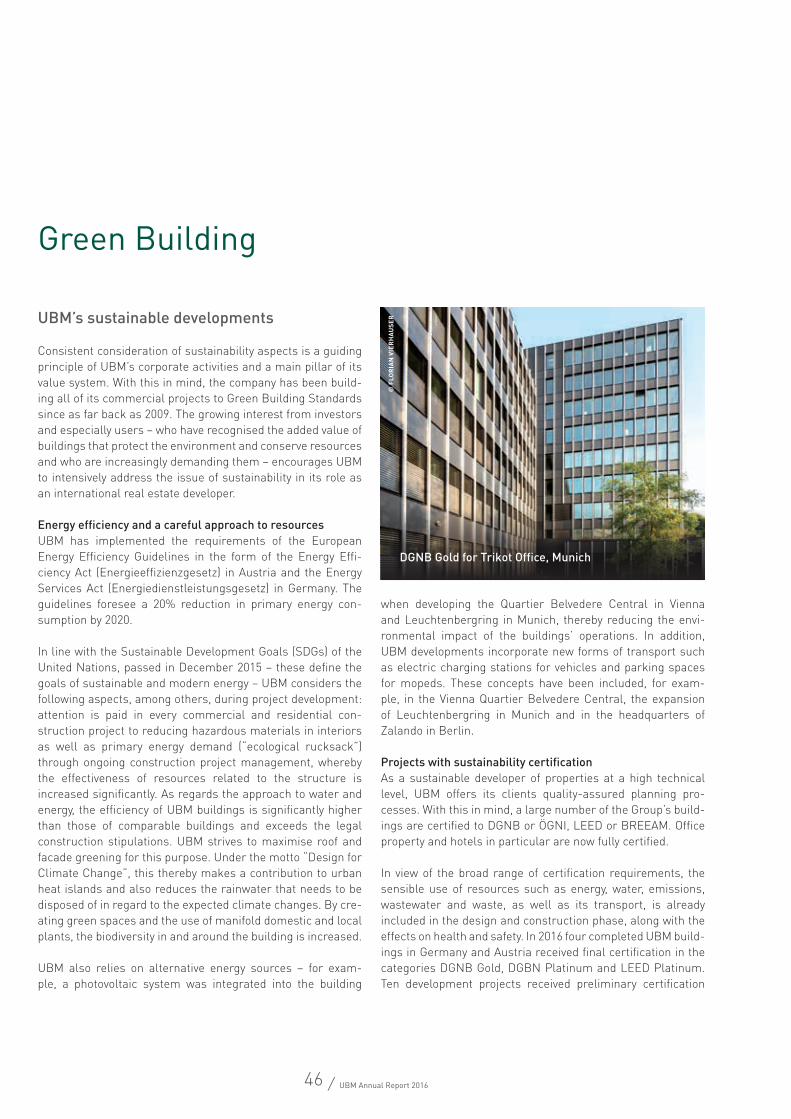
46 / UBM Annual Report 2016
Green Building
UBM’s sustainable developments
Consistent consideration of sustainability aspects is a guiding principle of UBM’s corporate activities and a main pillar of its value system. With this in mind, the company has been build-ing all of its commercial projects to Green Building Standards since as far back as 2009. The growing interest from investors and especially users – who have recognised the added value of buildings that protect the environment and conserve resources and who are increasingly demanding them – encourages UBM to intensively address the issue of sustainability in its role as an international real estate developer.
Energy efficiency and a careful approach to resourcesUBM has implemented the requirements of the European Energy Efficiency Guidelines in the form of the Energy Effi-ciency Act (Energieeffizienzgesetz) in Austria and the Energy Services Act (Energiedienstleistungsgesetz) in Germany. The guidelines foresee a 20% reduction in primary energy con-sumption by 2020.
In line with the Sustainable Development Goals (SDGs) of the United Nations, passed in December 2015 – these define the goals of sustainable and modern energy – UBM considers the following aspects, among others, during project development: attention is paid in every commercial and residential con-struction project to reducing hazardous materials in interiors as well as primary energy demand (“ecological rucksack”) through ongoing construction project management, whereby the effectiveness of resources related to the structure is increased significantly. As regards the approach to water and energy, the efficiency of UBM buildings is significantly higher than those of comparable buildings and exceeds the legal construction stipulations. UBM strives to maximise roof and facade greening for this purpose. Under the motto “Design for Climate Change”, this thereby makes a contribution to urban heat islands and also reduces the rainwater that needs to be disposed of in regard to the expected climate changes. By cre-ating green spaces and the use of manifold domestic and local plants, the biodiversity in and around the building is increased.
UBM also relies on alternative energy sources – for exam-ple, a photovoltaic system was integrated into the building
when developing the Quartier Belvedere Central in Vienna and Leuchtenbergring in Munich, thereby reducing the envi-ronmental impact of the buildings’ operations. In addition, UBM developments incorporate new forms of transport such as electric charging stations for vehicles and parking spaces for mopeds. These concepts have been included, for exam-ple, in the Vienna Quartier Belvedere Central, the expansion of Leuchtenbergring in Munich and in the headquarters of Zalando in Berlin.
Projects with sustainability certificationAs a sustainable developer of properties at a high technical level, UBM offers its clients quality-assured planning pro-cesses. With this in mind, a large number of the Group’s build-ings are certified to DGNB or ÖGNI, LEED or BREEAM. Office property and hotels in particular are now fully certified.
In view of the broad range of certification requirements, the sensible use of resources such as energy, water, emissions, wastewater and waste, as well as its transport, is already included in the design and construction phase, along with the effects on health and safety. In 2016 four completed UBM build-ings in Germany and Austria received final certification in the categories DGNB Gold, DGBN Platinum and LEED Platinum. Ten development projects received preliminary certification
DGNB Gold for Trikot Office, Munich
© f
LOr
IAN
vIE
rH
AU
SEr
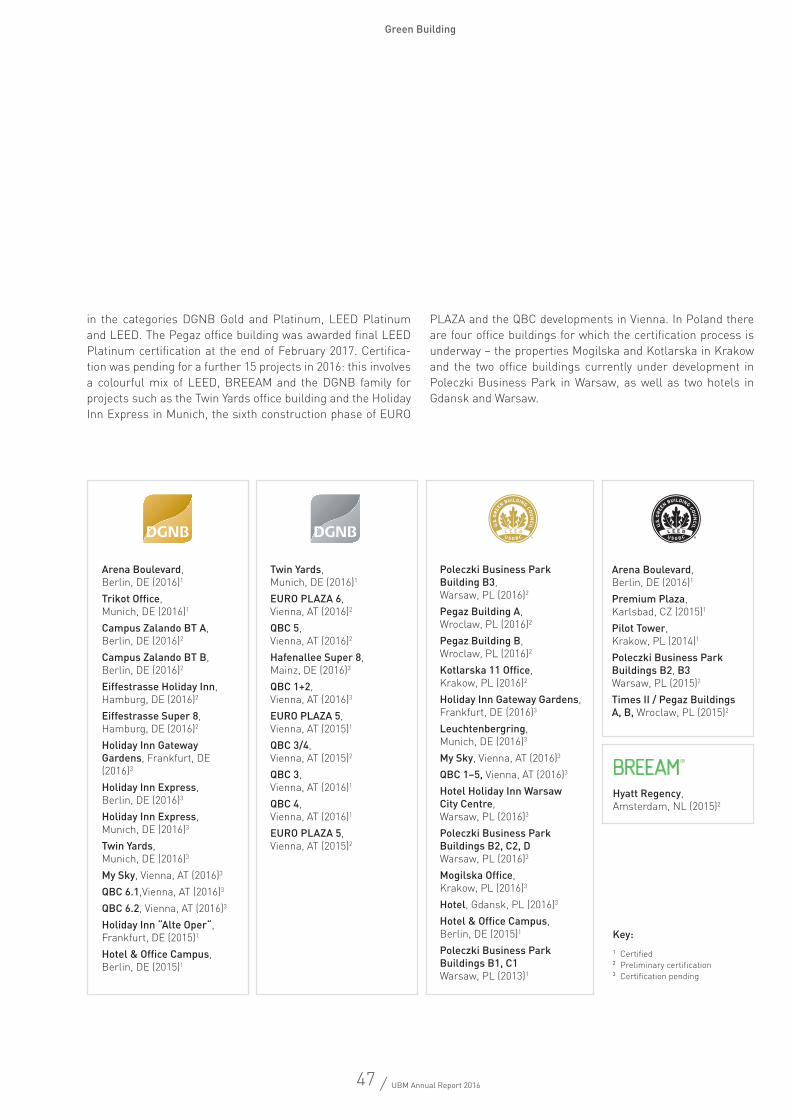
47 / UBM Annual Report 2016
Green Building
in the categories DGNB Gold and Platinum, LEED Platinum and LEED. The Pegaz office building was awarded final LEED Platinum certification at the end of February 2017. Certifica-tion was pending for a further 15 projects in 2016: this involves a colourful mix of LEED, BREEAM and the DGNB family for projects such as the Twin Yards office building and the Holiday Inn Express in Munich, the sixth construction phase of EURO
PLAZA and the QBC developments in Vienna. In Poland there are four office buildings for which the certification process is underway – the properties Mogilska and Kotlarska in Krakow and the two office buildings currently under development in Poleczki Business Park in Warsaw, as well as two hotels in Gdansk and Warsaw.
Arena Boulevard, Berlin, DE (2016)1
Trikot Office, Munich, DE (2016)1
Campus Zalando BT A, Berlin, DE (2016)2
Campus Zalando BT B, Berlin, DE (2016)2
Eiffestrasse Holiday Inn, Hamburg, DE (2016)2
Eiffestrasse Super 8, Hamburg, DE (2016)2
Holiday Inn Gateway Gardens, Frankfurt, DE (2016)3
Holiday Inn Express, Berlin, DE (2016)3
Holiday Inn Express, Munich, DE (2016)3
Twin Yards, Munich, DE (2016)3
My Sky, Vienna, AT (2016)3 QBC 6.1,Vienna, AT (2016)3
QBC 6.2, Vienna, AT (2016)3
Holiday Inn “Alte Oper“, Frankfurt, DE (2015)1
Hotel & Office Campus, Berlin, DE (2015)1
Twin Yards, Munich, DE (2016)1
EURO PLAZA 6, Vienna, AT (2016)2
QBC 5, Vienna, AT (2016)2
Hafenallee Super 8, Mainz, DE (2016)3
QBC 1+2, Vienna, AT (2016)3
EURO PLAZA 5, Vienna, AT (2015)1
QBC 3/4, Vienna, AT (2015)2
QBC 3, Vienna, AT (2016)1
QBC 4, Vienna, AT (2016)1
EURO PLAZA 5, Vienna, AT (2015)2
Poleczki Business Park Building B3, Warsaw, PL (2016)2
Pegaz Building A, Wroclaw, PL (2016)2
Pegaz Building B, Wroclaw, PL (2016)2
Kotlarska 11 Office, Krakow, PL (2016)2
Holiday Inn Gateway Gardens, Frankfurt, DE (2016)3
Leuchtenbergring, Munich, DE (2016)3
My Sky, Vienna, AT (2016)3
QBC 1–5, Vienna, AT (2016)3
Hotel Holiday Inn Warsaw City Centre, Warsaw, PL (2016)3
Poleczki Business Park Buildings B2, C2, D Warsaw, PL (2016)3
Mogilska Office, Krakow, PL (2016)3
Hotel, Gdansk, PL (2016)3
Hotel & Office Campus, Berlin, DE (2015)1
Poleczki Business Park Buildings B1, C1 Warsaw, PL (2013)1
Arena Boulevard, Berlin, DE (2016)1
Premium Plaza, Karlsbad, CZ (2015)1
Pilot Tower, Krakow, PL (2014)1
Poleczki Business Park Buildings B2, B3 Warsaw, PL (2015)2
Times II / Pegaz Buildings A, B, Wroclaw, PL (2015)2
Hyatt Regency, Amsterdam, NL (2015)2
Key:1 Certified 2 Preliminary certification3 Certification pending
Zalando Headquarters, Berlin
We create new working environments for people. The quality of our properties allows us to enhance creativity, productivity and satisfaction, along with
motivation and performance.
developing offices.developing opportunities.
49 / UBM Annual Report 2016
Economic environment
Moderate growth for global economy – eurozone holds steady Increasing political and economic uncertainty characterised another difficult year for the global economy in 2016.1 The restrained, below-average growth was only supported by pri-vate spending and the state of the job markets, which had a positive impact on consumers in the industrial states. In the USA economic growth forecasts2 improved following the presi-dential elections in the fourth quarter and the economy in Asia picked up. Global interest rates remained extremely low. Both the US Federal Reserve (key rate: 0.25%–0.50%) and the Euro-pean Central Bank (0.00%) maintained their expansive mone-tary policy approach. Overall, worldwide GDP growth of 3.1% matched the level of the previous year (3.2%).3
The European economy continued its moderate growth path at a reduced level in 2016.4 The primary factors putting the brakes on growth were political uncertainty, the fragile global economy and, last but not least, the Brexit vote in Great Brit-ain, although this has not yet had an impact on the real econ-omy in Britain. GDP growth was primarily driven by domestic demand.5 Overall, economic growth in the eurozone stood at 1.7%, which was below the previous year’s level of 2.0%.6
UBM core markets remain on trackIn Germany the economic upsurge continued in 2016, with GDP growth of 1.9% in the reporting period. Private consumption once again proved to be a decisive economic pillar, benefiting
as it did from a very good job market situation. In addition there was a sharp increase in investment, particularly for residen-tial buildings. Public spending grew as a result of the refugee influx and this added a further boost to the economy.7
Following the weak growth of the past years – four years in a row of less than 1% - the Austrian economy achieved growth of 1.4% in 2016. Consumption growth accelerated thanks to the increase in available income as a result of the 2015/16 tax reform and because of refugee migration. Investments also picked up.8 Goods manufacturing, construction and the service sector had all improved by year-end and was thereby higher than the long-term average. In the medium term, inflationary pressure remains moderate but higher than in the eurozone, so that growth in real income is set to be lower in Austria.9
The countries in Central and Eastern Europe once again reached the 3% GDP mark and thereby surpassed growth in Western Europe again. In 2016 Poland held onto its position as one of the EU members with the strongest growth, achieving a plus of 2.8%, even though the domestic political situation gave rise to uncertainty about the Polish economy.10 Following on from a record year in 2015, the Czech economy recorded stable growth of 2.4% in the period under review.11
Group Management Report
1 Global Outlook, World Bank, January 20172 WIFO Monthly Report 12/2016, p. 829.3 IMF, http://www.imf.org/external/pubs/ft/weo/2017/update/01/4 ibidem5 OeNB “Investment and consumer spending driving economic upswing”, 12/20166 http://wko.at/statistik/eu/europa-wirtschaftswachstum.pdf7 http://wko.at/statistik/eu/europa-wirtschaftswachstum.pdf8 ibidem; OeNB “Investment and consumer spending driving economic upswing” 12/20169 WIFO Monthly Report, 2016, 89(4), p. 219-22510 http://wko.at/statistik/eu/europa-wirtschaftswachstum.pdf11 ibidem
50 / UBM Annual Report 2016
Group Management Report
Developments on the real estate markets
A strong year-end for Europe1 Investments in commercial property in Europe generated a total volume of €251.1 bn (2015: €277.5 bn). The sentiment on the market was dominated by the Brexit vote and increas-ing economic and political uncertainty. A strong reversal in the trend was felt at the end of the year: the fourth quarter saw the highest quarterly investment volume achieved so far of €86.8 bn – a 5% increase on the fourth quarter of the previous year. The primary investment focus was on office properties (€108.4 bn) and retail properties (€54.0 bn). The interest in property investment was unwaveringly strong, supported by a good economic backdrop, low financing costs and less attrac-tive investment alternatives.2
Germany as number one in EuropeThe German real estate market remained on top form in 2016 – investments in commercial property generated the high-est volumes since the investment boom of 2006/2007. With a strong fourth quarter 2016 (€19.8 bn), investments for the full year 2016 of €52.5 bn almost matched the level of the previ-ous year. This meant that investments exceeded the 50-billion mark for the fourth time since 2006, despite significant price rises and declines in returns. Germany is one of the world’s most popular target markets for real estate, as the market is increasingly in the focus of international investors because it is seen as a safe haven.3
With record revenue from letting, as well as rising rental prices and declining vacancy rates, office property remained the most popular asset class for institutional investors. In the
year under review German office property saw the sharpest increases with €24.8 bn, thereby accounting for 47% of total real estate transactions. Two thirds of office investments were made in the top locations in Germany – Berlin, Düsseldorf, Frankfurt, Hamburg and Munich. This corresponds to a year-on-year increase of 4%.4 Returns in prime locations on the top five office markets averaged 3.6%. Munich reported the lowest returns of 3.2%, followed by Berlin with 3.4% and Frankfurt still at 4.0%.5 Here investors are displaying a slightly higher appetite for risk and a greater focus on second locations in A cities.6
2016 was another strong year on the housing investment mar-ket – particularly for property developers. The volume of for-ward deals surpassed €3 bn for the first time – more than one in four transactions was a project development. This meant that developers were responsible for the most sales with almost €4 bn. The majority of purchases were made by Ger-man special funds with a transaction volume of €2.6 bn. Berlin came out on top (€2.9 bn) for residential transactions, followed by Frankfurt (€790 mn), which established itself as the project development capital.7 Supply is unable to keep pace with the demand caused by the sharp population increase in major cit-ies, despite the increasing number of new builds completed.8 Domestic investors continue to dominate and were responsible for around 70% of residential property transaction volumes.
Austria holds steady in the centreThe high demand for investments on the Austrian real estate market was coupled with scarce supply. In 2016 a total of €2.8 bn was invested in commercial property in Austria. While this did represent a decrease of 29% compared to the record
1 CBRE Market view European Investment Quarterly Q4 20162 CBRE European Investment Market Snapshot Q4 20163 CBRE Germany Investment Market H2 20164 CBRE Market view European Investment Quarterly Q4 20165 CBRE Germany Office Investment Market Q4 20166 JLL Investment Market Overview, Q4 2016 Germany7 JLL Investment Market Overview, Q4 2016 Germany8 CBRE Germany Residential Investment Market Q4 2016
51 / UBM Annual Report 2016
Group Management Report
year 2015, the volume was still 16% higher than the five-year average. This performance was primarily due to the high number of forward deals and the delayed closing of several large-volume transactions.9 Around 60% of the total was gen-erated in Vienna. The asset classes with the highest demand were office and hotel properties with 40% and 26% respec-tively. The transaction volume of hotels reached a record level in 2016 with 28%. In 2007 hotels only accounted for 1% of investments. Hotels have become a popular asset class, a trend that has been seen across the whole of Europe.
The majority of office properties were completed for occupiers; there was a lack of newly built space available. Letting output on the Vienna office market stood at 329,000 m2 in 2016 and was thereby 59% higher than the previous year. As a result, return on office property in prime locations – starting out from a low level – fell to 4.0%; inner-city retail property declined even more sharply and stood at 3.4%.10
The majority of the transactions were carried out by national investors (around 56%), while the share of international inves-tors was lower in 2016 at 44% due to the lack of large-scale transactions.11
Positive CEE performance – Poland boomingOnce again in 2016 the markets in Central and Eastern Europe (CEE) performed very well. Transaction volumes on every core market increased against 2015 – with large investment volumes generated in the office and industry sectors in par-
ticular. With a transaction volume of €4.5 bn, the Polish real estate market12 continued to outperform the region in 2016. The stable economy and the availability of high-quality office properties attracted a growing number of investors – around 97% of the capital invested came from abroad. The number of projects under construction in Warsaw recorded a steady rise, with 850,000 m² under construction at year-end. In addition the production rate of new builds exceeded demand, leading to an increase in vacancy rates for office properties.13 Returns in prime locations in Poland remained under pressure in recent months and reached a record low: top returns in Warsaw stood at 5.35% at year-end; in regional cities such as Wroclaw and Krakow they were at 6.25%.
Growth on the Polish hotel market continues to accelerate – the number of hotels has practically doubled in the past ten years. This strong growth has been caused by the increasing number of tourists and business travellers. The three-star segment therefore is and will remain the strongest hotel cat-egory in Poland.14
The transaction volume in the Czech Republic15 also reached record levels of €3.8 bn. Office property was the dominant sec-tor with 51% of transactions.16 Strong demand by institutional investors led to a further compression of returns in prime locations in the individual sectors. Returns on office property fell to 5.00%; returns on offices in A locations even slipped to 3.75%.17 The asset classes hotel and residential accounted for 8% of the total capital invested in the Czech market.18
9 CBRE Austria Investment Q4 201610 ibidem11 Press Release “37 new retailers in Austria 2016. Investments taking longer. CEE investments at record levels.” 12 CBRE Market View, Poland Investment, H2 201613 CBRE Warsaw Office Q4 201614 Christie & CO Poland Snapshot 07.06.201615 CBRE Czech Republic Property Investment Q4 201616 JLL CEE Investment Pulse H2 201617 CBRE Czech Republic Property Investment Q4 201618 JLL CEE Investment Pulse H2 2016
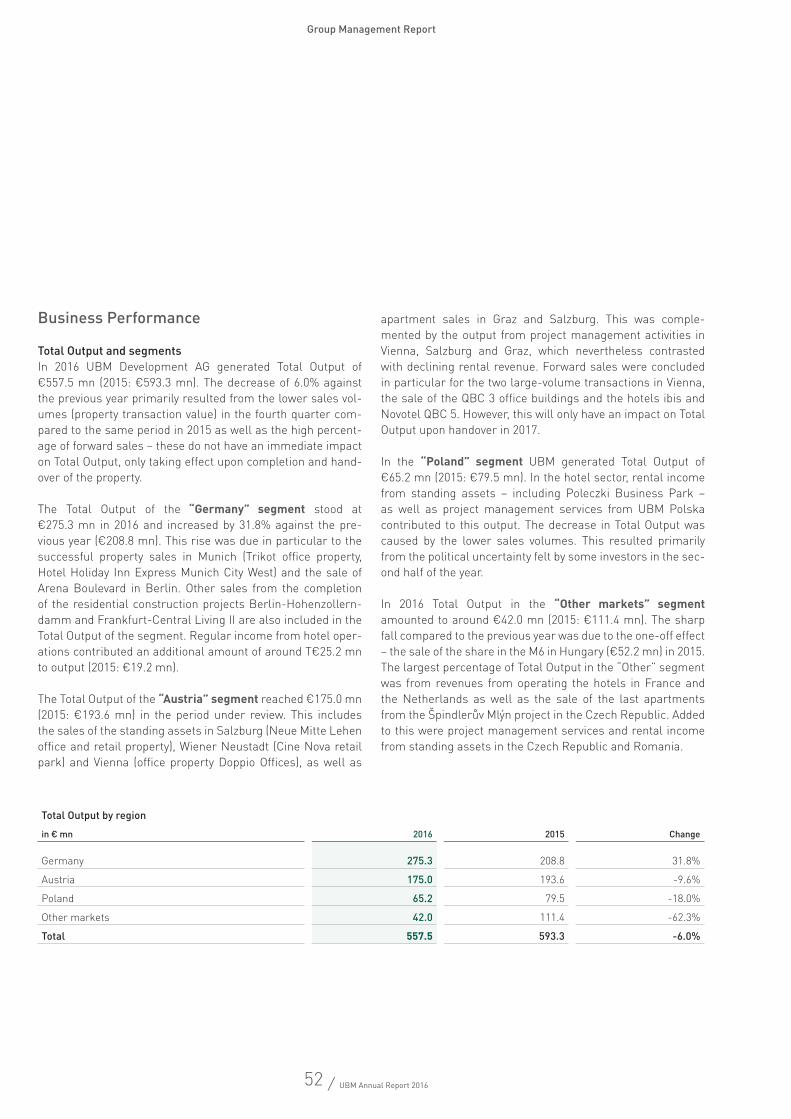
52 / UBM Annual Report 2016
Business Performance
Total Output and segmentsIn 2016 UBM Development AG generated Total Output of €557.5 mn (2015: €593.3 mn). The decrease of 6.0% against the previous year primarily resulted from the lower sales vol-umes (property transaction value) in the fourth quarter com-pared to the same period in 2015 as well as the high percent-age of forward sales – these do not have an immediate impact on Total Output, only taking effect upon completion and hand-over of the property.
The Total Output of the “Germany” segment stood at €275.3 mn in 2016 and increased by 31.8% against the pre-vious year (€208.8 mn). This rise was due in particular to the successful property sales in Munich (Trikot office property, Hotel Holiday Inn Express Munich City West) and the sale of Arena Boulevard in Berlin. Other sales from the completion of the residential construction projects Berlin-Hohenzollern-damm and Frankfurt-Central Living II are also included in the Total Output of the segment. Regular income from hotel oper-ations contributed an additional amount of around T€25.2 mn to output (2015: €19.2 mn).
The Total Output of the “Austria” segment reached €175.0 mn (2015: €193.6 mn) in the period under review. This includes the sales of the standing assets in Salzburg (Neue Mitte Lehen office and retail property), Wiener Neustadt (Cine Nova retail park) and Vienna (office property Doppio Offices), as well as
apartment sales in Graz and Salzburg. This was comple-mented by the output from project management activities in Vienna, Salzburg and Graz, which nevertheless contrasted with declining rental revenue. Forward sales were concluded in particular for the two large-volume transactions in Vienna, the sale of the QBC 3 office buildings and the hotels ibis and Novotel QBC 5. However, this will only have an impact on Total Output upon handover in 2017.
In the “poland” segment UBM generated Total Output of €65.2 mn (2015: €79.5 mn). In the hotel sector, rental income from standing assets – including Poleczki Business Park – as well as project management services from UBM Polska contributed to this output. The decrease in Total Output was caused by the lower sales volumes. This resulted primarily from the political uncertainty felt by some investors in the sec-ond half of the year.
In 2016 Total Output in the “Other markets” segment amounted to around €42.0 mn (2015: €111.4 mn). The sharp fall compared to the previous year was due to the one-off effect – the sale of the share in the M6 in Hungary (€52.2 mn) in 2015. The largest percentage of Total Output in the “Other” segment was from revenues from operating the hotels in France and the Netherlands as well as the sale of the last apartments from the Špindlerův Mlýn project in the Czech Republic. Added to this were project management services and rental income from standing assets in the Czech Republic and Romania.
Total Output by region
in € mn 2016 2015 Change
Germany 275.3 208.8 31.8%
Austria 175.0 193.6 -9.6%
Poland 65.2 79.5 -18.0%
Other markets 42.0 111.4 -62.3%
Total 557.5 593.3 -6.0%
Group Management Report
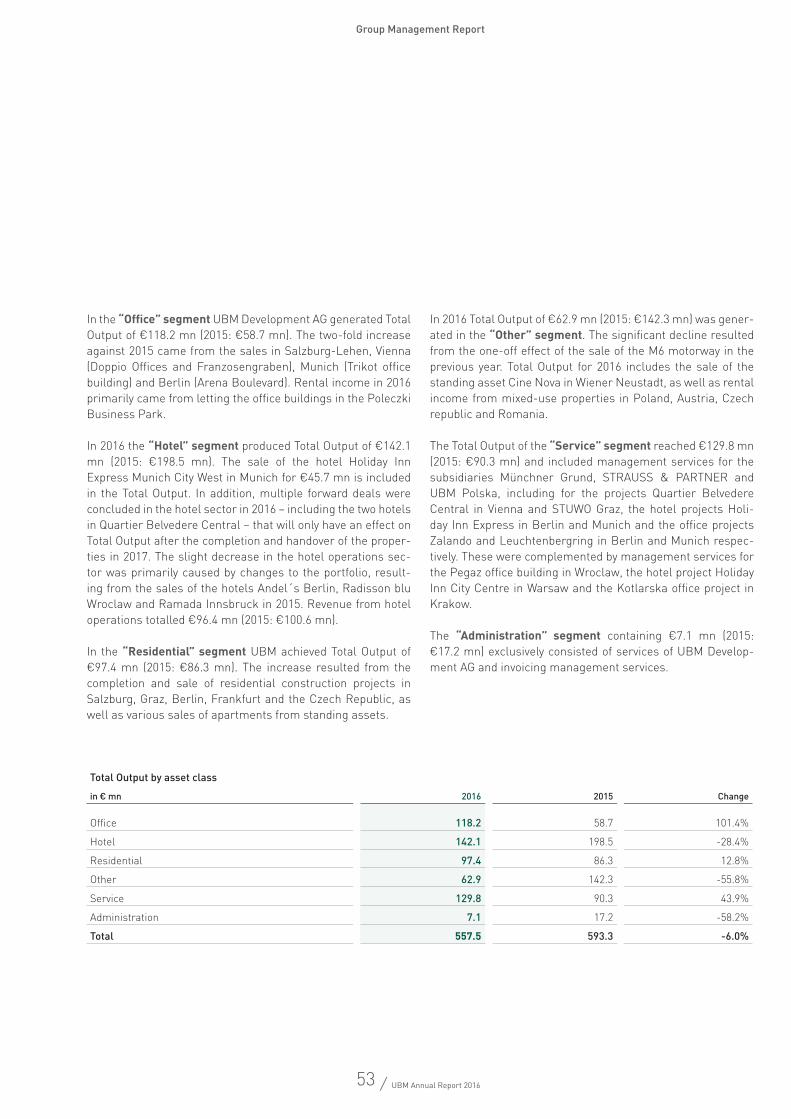
53 / UBM Annual Report 2016
In the “Office” segment UBM Development AG generated Total Output of €118.2 mn (2015: €58.7 mn). The two-fold increase against 2015 came from the sales in Salzburg-Lehen, Vienna (Doppio Offices and Franzosengraben), Munich (Trikot office building) and Berlin (Arena Boulevard). Rental income in 2016 primarily came from letting the office buildings in the Poleczki Business Park.
In 2016 the “Hotel” segment produced Total Output of €142.1 mn (2015: €198.5 mn). The sale of the hotel Holiday Inn Express Munich City West in Munich for €45.7 mn is included in the Total Output. In addition, multiple forward deals were concluded in the hotel sector in 2016 – including the two hotels in Quartier Belvedere Central – that will only have an effect on Total Output after the completion and handover of the proper-ties in 2017. The slight decrease in the hotel operations sec-tor was primarily caused by changes to the portfolio, result-ing from the sales of the hotels Andel´s Berlin, Radisson blu Wroclaw and Ramada Innsbruck in 2015. Revenue from hotel operations totalled €96.4 mn (2015: €100.6 mn).
In the “residential” segment UBM achieved Total Output of €97.4 mn (2015: €86.3 mn). The increase resulted from the completion and sale of residential construction projects in Salzburg, Graz, Berlin, Frankfurt and the Czech Republic, as well as various sales of apartments from standing assets.
In 2016 Total Output of €62.9 mn (2015: €142.3 mn) was gener-ated in the “Other” segment. The significant decline resulted from the one-off effect of the sale of the M6 motorway in the previous year. Total Output for 2016 includes the sale of the standing asset Cine Nova in Wiener Neustadt, as well as rental income from mixed-use properties in Poland, Austria, Czech republic and Romania.
The Total Output of the “Service” segment reached €129.8 mn (2015: €90.3 mn) and included management services for the subsidiaries Münchner Grund, STRAUSS & PARTNER and UBM Polska, including for the projects Quartier Belvedere Central in Vienna and STUWO Graz, the hotel projects Holi-day Inn Express in Berlin and Munich and the office projects Zalando and Leuchtenbergring in Berlin and Munich respec-tively. These were complemented by management services for the Pegaz office building in Wroclaw, the hotel project Holiday Inn City Centre in Warsaw and the Kotlarska office project in Krakow.
The “Administration” segment containing €7.1 mn (2015: €17.2 mn) exclusively consisted of services of UBM Develop-ment AG and invoicing management services.
Total Output by asset class
in € mn 2016 2015 Change
Office 118.2 58.7 101.4%
Hotel 142.1 198.5 -28.4%
Residential 97.4 86.3 12.8%
Other 62.9 142.3 -55.8%
Service 129.8 90.3 43.9%
Administration 7.1 17.2 -58.2%
Total 557.5 593.3 -6.0%
Group Management Report
54 / UBM Annual Report 2016
Financial Indicators
Financial performanceThe core business of the UBM Group involves the pro-ject-based real estate business. Given the IFRS accounting regulations and the fact that projects take multiple years to realise, the revenue reported in the income statement is sub-ject to significant fluctuations as the proceeds are only rec-ognised as revenue once the sale takes effect. If properties are sold as a share deal or projects are developed and sold within companies accounted for under the equity method, these are not recognised in revenue. This has an impact on the informative value and comparability with prior periods. In order to improve the overview and transparency of the busi-ness performance, UBM additionally shows its Total Output. Alongside revenue, this financial indicator includes proceeds from the sale of real estate, rental services, proceeds from hotel operations, settled planning and construction invoices from own building sites, and supplies and management ser-vices to third parties. In addition, the output from companies accounted for under the equity method and from sales as pure share deals is also included. The Total Output is determined in line with the amount of the stake held by UBM. In 2016 Total Output of €557.5 mn was 6.0% lower than the previous year (€593.3 mn). The revenue stated in the consolidated income statement totalled €417.0 mn for the full year and was thereby 35.5% higher than the value at year-end 2015. The increase in revenue resulted from the significant rise against the compa-rable period of sales of fully consolidated projects. In contrast, in the previous year, sales by companies recognised under the equity method made up a disproportionately high share of Total Output. This did not, however, have an impact on the rev-enue shown in the consolidated financial statements.
The share of profit/loss of companies consolidated under the equity method stood at €25.1 mn in 2016, almost matching the figure from the previous year, and included the pro-rata results, as well as gains on the sale of properties.
Gains from fair value adjustments to investment property reached €54.6 mn (previous year: €29.7 mn) and primar-ily resulted from forward deals with fixed sales prices and value adjustments by external expert opinions. Losses from fair value adjustments to investment property amounted to €20.5 mn (previous year: €3.1 mn). The increase against the previous year is primarily due to necessary writedowns on standing assets in Austria. The net gains from positive and negative fair value adjustments stood at €34.1 mn in 2016 (previous year: €26.6 mn).
In the period under review other operating income totalled €7.5 mn (previous year: €8.8 mn) and mainly consisted of exchange gains, other external invoices to third parties and other rents. Other operating expenses rose slightly against the previous year from €48.3 mn to €52.4 mn. These mostly com-prised exchange losses, administrative fees, travel expenses, advertising costs, other third-party services (such as broker-age fees), contributions and charges, and legal and consul-tancy services.
The increase in expenses for materials and other manufactur-ing costs caused by the growth in revenue reflected expenses for building inventory property and investments in standing assets, as well as the book value of disposals from real estate sales. In the year under review these amounted to €300.4 mn compared to €252.7 mn at year-end 2015.
The number of staff members of all companies included in the consolidated financial statements rose to 716 (previous year: 685). 309 staff members (previous year: 354) were employed in real estate development. Staff expense increased from €37.3 mn in the business year 2015 by 18.8% to €44.3 mn. Factors behind the increase in staff expense included the changes in the Managing Board in 2016 and the related one-off effects.
Group Management Report
55 / UBM Annual Report 2016
EBITDA of €49.6 mn was below the previous year’s figure of €76.5. Financial income of €13.1 mn (previous year: €7.4 mn) primarily included interest income on project financing loans to companies accounted for under the equity method and com-panies of minor significance, income from equity interests and earnings from share deals, which led to an increase in the period under review.
Financial expenses fell from €30.8 mn in 2015 to €19.3 mn for the reporting period 2016. This development was caused by the low interest rates and proactive improvement in the financing structure as compared to the previous year, as well as the writ-edowns on other equity interests in 2015.
EBT (earnings before taxes) of €40.1 mn were below the record level of the previous year (€50.3 mn). The tax burden fell from €13.0 mn in the business year 2015 to €10.7 mn in the com-parable period of 2016. The profit for 2016, before deductions for non-controlling interests, stood at €29.4 mn and was thereby €7.9 mn below the comparable period of the previous year. This resulted in earnings per share of €3.90 compared to €4.90 in 2015, whereby the figure is based on the weighted average of the number of shares, which was significantly lower in the previous year. Financial position and cash flowsAt 31 December 2016 the total assets of the UBM Group increased by 4.1% against the previous year to €1,233.8 mn. Property, plant and equipment amounted to €44.5 mn (previ-ous year: €38.7 mn), whereby the increase was due to invest-ment in a hotel in Munich.
Investment property declined as at 31 December 2016 to €496.6 mn (previous year: €553.9 mn). Here a retail park and two office properties were sold. In addition to sales of invest-ment property in 2016, the effect was primarily caused by reclassifications into current assets, as the sale of these prop-erties in the business year 2017 is judged to be highly proba-ble. This item rose in the 2016 statement of financial position
to €157.1 mn (previous year: €1.4 mn). The equity interests in companies accounted for under the equity method decreased slightly to €109.6 mn (previous year: €111.5 mn). This was mainly because of the sale of two Austrian companies.
The increase in project financing to €111.9 mn (previous year: €88.8 mn) came from the capital requirements of companies accounted for under the equity method due to investments.
Other financial assets stood at €5.6 mn (previous year: €5.9 mn) and financial assets amounted to €1.5 mn (previous year: €3.5 mn).
Under current assets, the decrease in inventories was pre-dominantly due to the sale of a hotel in Munich and apartment sales in Germany and Austria. Inventories totalled €185.4 mn (previous year: €215.2 mn).
At 31 December 2016 trade receivables amounted to €38.6 mn (previous year: €43.1 mn).
Other receivables and assets underwent a significant rise due to the VAT rebate that has not yet been received and stood at €18.8 mn (previous year: €9.2 mn).
Cash and cash equivalents decreased from €93.7 mn in the previous year to €42.3 mn. This resulted in an effect that reduced assets/liabilities at the same time as business vol-umes increased; nevertheless, this was overcompensated for by other effects on the balance sheet.
At the end of the reporting period equity stood at €341.5 mn (previous year: €332.0 mn). The earnings for the period led to an increase and contrasted with decreasing factors such as the dividend payout in June of €12.0 mn and the interest pay-ment on the mezzanine and hybrid capital due in the same period in the amount of €4.8 mn. The equity ratio was 27.7% (2015: 28.0%). Return on assets was 4.8% in 2016 (2015: 6.8%). Return on equity stood at 11.7% (2015: 15.1%).
Group Management Report
56 / UBM Annual Report 2016
Cash flow from investing activities amounted to €-114.6 mn (previous year: €-3.1 mn). It represented the increased out-flow of funds from investments in property, plant and equip-ment, as well as investment property and project financing. The key drivers for the increased outflow of funds were invest-ments in property, plant and equipment and investment prop-erty totalling €213.8 mn and investments in project financing of €44.9 mn. This contrasted with inflows from the disposal of investment property and property, plant and equipment of €121.5 mn and inflows from financial assets of €20.2 mn, as well as inflows from project financing of €6.9 mn.
Cash flow from financing activities of €21.4 mn (previous year: €35.6 mn) showed the inflow of funds from a bond issue and the outflow from redeeming a bond. The positive balance from taking out and paying back loans and borrowings resulted in an inflow of €40.3 mn. The outflow of funds from dividend payments and payouts to non-controlling interests totalling €17.5 mn had a contrasting effect.
Non-Financial Performance Indicators
Environmental issuesEnvironmental protection and conserving resources are an important part of the way UBM Development AG approaches and conducts its business. This is why every effort is taken to plan and construct projects and developments in an environ-mentally friendly manner. By consciously using energy-effi-cient building materials and energy-saving planning concepts, the project developments result in sustainable, ecological buildings.
The average staffing levels at 31 December 2016 when all Group companies are included stood at 716 staff members (of which 86 were waged workers). This represents an increase of 4.5% compared to 2015 (685 staff members, of which 53 waged workers).
In total around 81% of UBM employees work abroad. Voca-tional education and training measures for personal and pro-fessional development are offered in the areas of planning and project development, business economics and law, as well as
Bond liabilities (current and non-current) of €321.3 mn at 31 December 2016 remained almost unchanged against the previous year (€321.9 mn) despite the redemption and re -issue of a bond. Financial liabilities (current and non-current) of €412.2 mn rose against the previous year (€381.5 mn) by €30.7 mn, which was once again due to the higher investment activity.
Trade payables increased against the previous year from €55.2 mn by €22.2 mn to €77.4 mn and mostly contained subcontractor payments that had not yet been settled on the reporting date.
Other financial liabilities (current and non-current) declined by €19.5 mn to €36.6 mn (previous year: €56.1 mn). A deci-sive factor here was the reduction in liabilities to companies accounted for under the equity method.
Higher provision requirements for income tax led tax payables to increase from €5.7 mn to €7.5 mn.
At 31 December 2016 net debt totalled €691.2 mn and thereby increased by 13.4% against 31 December 2015. This is primar-ily the direct result of strong investments, particularly in ongo-ing project developments.
Cash flowsCash flow from operating activities of €42.2 mn compared to €14.4 mn in 2015 had a significant impact on the positive liquidity situation.
As decisive factor here was the clearly positive net of the decrease in inventories in the full year 2016 of €29.9 mn. This included the sale of properties recorded as inventories of €97.3 mn, which was significantly higher than the investments in properties recorded as inventories of €44.4 mn. Other inven-tories climbed to €23.0 mn.
Overall, a capital release from working capital of €8.1 mn was achieved. This consisted of an increase in receivables of €3.2 mn, a rise in liabilities (excluding banks) of €34.3 mn and growth in tied-up capital from increasing other inventories to €23.0 mn.
Group Management Report
57 / UBM Annual Report 2016
1 Savills Analysis Outlook Real Estate Market Germany 20172 CBRE Research Real Estate Market Outlook, Europe 2017
language courses and seminars. Here the individual needs of staff as well as the requirements of the market are taken into account. Since UBM is geographically diverse, the person-nel often have to work in international teams; the resultant exchange of expertise is yet another important factor within the context of comprehensive HR development.
Branch officesUBM Development AG has the following branch offices entered in the Commercial Register:Upper Austria branch office Pummererstrasse 17, 4020 LinzTyrol branch office Porr-Strasse 1, 6175 Kematen in TirolStyria branch office Thalerhofstrasse 88, 8141 Unterpremstätten
Outlook
According to the IMF, global economic growth will remain moderate in 2017 at around 3.4%, with a continuing lack of sustainable, positive stimuli. Weaker threshold countries, the sharp fall in the oil price, and the start of the rebound of inter-est rates in the USA bring additional risks.1
In the future the real estate markets in continental Europe will continue to benefit from increasing economic and polit-ical uncertainty, as well as low interest rates. Growth in the eurozone is set to remain weak at 1.6% and no immediate changes are expected in the general interest rate environment in Europe.2
The three core markets of UBM – Germany, Austria and Poland – thereby count as safe havens. Central Europe is seen by CBRE as the winner of the year 2017. Favourable financ-ing conditions and lower returns on alternative investments lead to the expectation that property will be an increasingly sought-after asset class for investors in the future. According
to CBRE, the supply of properties in good locations will remain scarce in 2017, leading to a further compression in yields.
In this environment UBM is not planning any fundamental change of strategy, but will instead concentrate on the most consistent execution of its strategy and delivering on prom-ises made. This also includes minimising future market risks through forward sales, in which prices are already fixed today with buyers for projects that will only be completed in the future. What’s more, UBM is planning a significant reduction in the assets that are not part of the core business.
2017 will see the continued implementation of the accelerated sales programme “Fast Track 2017”. The goal is achieving a reduction in net debt through sales in 2017 of development projects in forward deals and through the sale of standing assets. Net debt should peak by March 2017 at a probable level of around €750 mn. Effects are expected here from invest-ments in ongoing large-scale projects and from recent acqui-sitions – the Viennese “Office Providers” from Sachsenfonds and a Vienna property portfolio from Bank Austria. However, by the end of the year sales totalling around €600 mn should lead to a reduction in net debt of around €550 mn. These proceeds contrast with investments of approximately €400 mn, but will ensure the earnings and revenues of the future.
Furthermore, the efficiency-enhancement programme “Next Level” will have a positive impact on future profitability. The primary goal of the programme is to optimise cost structures and processes to achieve sustainable increases in efficiency.
All of these measures together will help to strengthen UBM in the good times. The main focus here is on a balance between future profitability and the company’s risk profile.
Assuming a positive backdrop for real estate and the imple-mentation of all measures planned for 2017, the Managing Board expects the performance of Total Output and earnings in 2017 to increase compared to 2016.
Group Management Report
58 / UBM Annual Report 2016
Risk Report
FundamentalsAs a result of the business activity of UBM Development AG and its operating subsidiaries and equity interests in multiple European cities and multiple asset classes, the UBM Group is exposed to a range of risks. On the other hand, this diversifica-tion, i.e. conducting activities in various countries and multiple asset classes, also leads to risk management and reduction; this holds true as changes do not usually occur simultaneously and in every region. Furthermore, the opportunity exists to pro-mote individual asset classes over the others and/or increase or decrease the focus on certain countries and markets.
General goals of UBM risk management Safeguarding the assets of the company
(e.g. property, capital, image) Securing the annual results Being able to meet (payment) obligations at any time Fulfilling legal stipulations all of the time
Material risksThe material risks of UBM lie in the nature of the project devel-opment business and result from the company’s value chain. Risks are thereby subdivided into the areas of real estate acquisitions, planning, project calculation and project financ-ing, realisation (construction), operations (letting and leasing) and sales (distribution and sales). General business risks such as macroeconomic and miscellaneous risks also define the risk management.
UBM has been active in project development for many decades and thereby has considerable experience in the early identi-fication, analysis, evaluation, monitoring and control of risks.
Here all material risks are considered that could have a signif-icant impact on the annual results. Risk management system (RMS) measures in 20161. risk identification and analysis: A comprehensive risk catalogue covering the entire UBM value chain was drawn up in order to produce a comprehensive risk profile of the com-pany and thereby highlight potential hazards. All of the individ-ual risks identified were allocated to defined risk categories.
2. risk assessment: Evaluation of individual risks is based on a risk characterisation and on the assessment of the probabil-ity of different scenarios occurring and the possible extent of the damage of incidents that impact on the annual results.
When assessing the possible extent of damage, the impacts of unexpected expenses and/or declines in revenue were evalu-ated against the projected results. Furthermore, the probabil-ity of events occurring were evaluated, whereby an occurrence probability – in five levels from frequent (at least once every two years) to improbable (every 20 years) – was applied. The results were presented in a risk map, which gives a clear over-view of the largest individual risks to UBM.
3. risk management: The results were collated in a report that serves as the basis for subsequent prioritising and con-trolling of risks. The results were reported by the Managing Board to the Supervisory Board.
4. risk monitoring: This structured approach is embedded in the RMS as a continuous process. The risks identified in the RMS are constantly monitored and a risk report is presented by the Managing Board to the Supervisory Board every six months.
Group Management Report
59 / UBM Annual Report 2016
Material risksA number of the individual UBM risks determined have been clustered into seven main risk categories.
1. real estate acquisition risks: In addition to the inherent risks involved in buying real estate, i.e. zoning, third-party rights (neighbours, easements etc.), current status in the Land Registry, length of time until building permit granted, unknown installations, partial hazardous sites (Land Registry), undocu-mented contamination, protective legislation (heritage protec-tion, tree stock, protected areas), more difficult development and/or access, unknown sources, groundwater, emissions etc., risks such as market entry risks, country risks, political risks and competition and market environment risks are taken into consideration.
Knowledge of the region and the respective competitive envi-ronment enjoyed by the individual operating subsidiaries, their knowhow and good networks in the regional market environ-ments, as well as standardised due diligence and acquisition processes help to mitigate these risks.
2. project costing and planning risks: In this phase of a project the risk focus is on purchase and sales prices, rental prices and changes, project financing and interest rates, as well as market viability and third-party usability. Internal and external experts work in a team to develop the necessary fun-damentals that serve as a basis for the decisions of the Man-aging Board. Longstanding experience in every aspect of pro-ject development increases planning security.
3. Construction and quality risks: This is where all of the risks associated with the actual construction of a property are evaluated. Risks of this kind arise from the length and possi-ble delay of the construction period, possible supplier failure, and the quality of execution including the costs for subsequent improvements.
In order to mitigate these risks, UBM relies on experienced project managers to avoid overpriced offers already during
the tender award period and to secure ongoing costs, quality and construction scheduling controls during the construction phase. Regular project reports given to the Managing Board allow deviations between targets and performance to be iden-tified early on and the requisite countermeasures taken swiftly.
4. Operating risks (letting offices or leasing hotels): Oper-ating real estate is also connected with a range of risks, whereby particular risks evaluated include the credit standing of the tenant (creditworthiness, security of rental income), a cluster risk (loss of an important major tenant), vacancy risks, maintenance risks (regular checks, maintenance, servicing, repairs, subsequent technical investments), and building management risks (insufficient processes for debt collection and payment reminders, inadequate invoicing of operating and running costs).
In order to safeguard the value of the property, various spe-cialists from subsidiaries, specialist departments or external expert companies are deployed during the operating phase to continuously generate the planned proceeds on the one hand and sustainably secure the technical quality of the buildings on the other.
5. Sales and distribution risks: Here differentiation is made between the sales risks in the process of home ownership, distribution risks (rental risks for initial letting) and the sales risks when selling complete properties. The main risk in the sales process is the macro factors underlying the valuation methods. These include the expected rental income and the discounting rate applied. The annual results of UBM depend significantly on adjustments to the fair value of property assets. When purchasing real estate, the achievable sales price is directly linked to the realisable market price at the time. This can deviate from the production costs and from the fair value as determined by a valuation expert, thereby deviat-ing from the carrying amount. Further risks in the transaction process include contractual liabilities and guarantees, as well as possible customer warranty claims.
Group Management Report
60 / UBM Annual Report 2016
In this regard UBM analyses the optimal moment to buy in rela-tion to the achievable sales price. Longstanding contact with potential investors and large-scale clients helps with selecting and approaching interested buyers. A dedicated, central trans-action team with the requisite experience and contacts works with experts from the UBM legal department and with external consultants, which should allow UBM to optimise this process. 6. General business risks: These include, in particular, per-sonnel risks (staffing, fluctuation, human error, internal fraud etc.), IT risks (hardware, software, loss of data, hackers, espi-onage etc.), commercial risks (liquidity risk, tax-related risks, financial penalties etc.), as well as legal risks (compliance risks, compensation, general contractual and insurance risks, legislative environment etc.). All of the risks are monitored by the respective specialist department and communicated with-out delay to the Managing Board whenever necessary.
7. Macroeconomic and miscellaneous risks: These risks include economic performance risks (inflation, unemployment, purchasing power etc.), interest rate risks, currency risks and the risk of acts of god (natural disasters, fire, strikes, war, ter-ror). The risks are continuously monitored by the responsible Managing Board members in close cooperation with the staff units. Interest rate and currency exchange risks have been consciously accepted in the past; however, appropriate hedg-ing is not excluded for the future.
Other risksLegal disputes: In January 2015 resolutions were passed for a merger by the general shareholders meetings of PIAG Immobilien AG, as the transferring company, and UBM Real-itätenentwicklung AG, as the acquiring company, in the course of which the existing shareholders of PIAG Immobilien AG would become shareholders of UBM. The conversion ratio was set at 10:3.701098. In accordance with Article 225c Stock Cor-poration Act, shareholders who fulfil certain criteria are enti-tled to submit a request for the legal review of the conversion ratio. Consequently, a total of eleven shareholders submitted requests for the legal review of the conversion ratio in spring
2015. In essence, the shareholders argued that the conversion ratio was inadequate for a range of reasons. UBM disputes this, as the conversion ratio was based on the corporate valua-tions that were applied using comparable methods, principles and approaches. A settlement was reached with all petitioners in this case. Under the terms of the settlement, the conversion ratio remains in place unchanged; no financial compensation was agreed.
The criminal proceedings against former Managing Board members Karl Bier and Heribert Smolé, who stood accused of embezzlement under Article 153 of the Austrian Penal Code as the result of a payment of €600,000 made by the company to a company of Walter Meischberger in 2005, ended in acquittals in the first instance. The verdicts are not legally binding.
The criminal proceedings against Managing Board member Michael Wurzinger on charges of aiding embezzlement under Article 153 of the Austrian Penal Code, as a result of payments made by IMMOFINANZ AG to Ronald Leitgeb in 2006 in relation to a property project in the south of France, ended in a legally binding acquittal in the first instance.
Internal control system
The material goals of the Internal Control System (ICS) within UBM are checking compliance with the business policy and the set goals, safeguarding the assets of the company, ensur-ing the reliability of accounting and reporting, ensuring the effectiveness and efficiency of operating processes, timely risk detection and reliable assessment of potential risks, compli-ance with statutory and legal provisions, and the efficient use of resources and cost-efficiency.
In addition to the internal controls implemented in the core processes of UBM, the company has commercial and techni-cal controlling units, both of which report directly to the Man-aging Board. Commercial controlling monitors current busi-ness developments for variations from the budgeted figures,
Group Management Report
61 / UBM Annual Report 2016
and ensures that the necessary information is passed on to the management for any such deviations. Technical controlling supervises the ongoing implementation of projects in terms of scheduling, construction costs and all processes relevant to technical implementation. Regular reports give the manage-ment a basis for any measures needed to achieve the afore-mentioned goals.
In addition to the legal requirements, UBM has a wide range of rules that serve as tools for employees to use when realising their tasks and also facilitate the efficient set-up of processes and controls. Work instructions, guidelines and templates of this kind promote transparency, simplify communication and documentation, help to make work processes run efficiently and allow controls to be carried out effectively.
UBM has thereby taken the necessary precautions to ensure both legal and internal guidelines are complied with on the one hand, and possible weaknesses in operating and organi-sational processes are quickly recognised and rectified on the other.
In the field of reporting, uniform accounting and valuation reg-ulations ensure that financial reporting is proper and mean-ingful. Clear divisions of functions and control measures such as plausibility tests, regular control activities and invoice approval procedures, along with the dual-control principle, ensure reliable and accurate accounting.
This systematic control management ensures that the accounting processes in the UBM Group are consistent with national and international accounting standards as well as internal guidelines.
As part of the internal control system, the audit committee is responsible for monitoring accounting procedures and for financial reporting on behalf of the Supervisory Board.
Internal audit
The internal audit department has been established with the goal of conducting independent and objective audit and con-sulting services within UBM. Its work is based on the internal audit rules, which legitimise it to the public, and the internal audit handbook, which specifies the tasks, competencies and responsibilities within UBM. In accordance with C Rule 18 of the Austrian Code of Corporate Governance, it reports directly to the Chief Executive Officer (CEO). Internal audit examines corporate processes and the effectiveness of internal con-trols and contributes to improving them. When circumstances require it, internal audit carries out ad hoc audits under the corresponding instructions of the Managing Board.
Furthermore, internal audit serves as an advisor to the Man-aging Board. Its integrated perspective and knowledge of the company should enable it to highlight effective ways of improv-ing the effectiveness, efficiency and profitability of processes. The internal audit department was newly organised in mid-2016, when it began to realise its responsibilities and carry out audits. Its findings have already led to concrete proposals for improvement, some of which have already been implemented. Prior to this, UBM drew on the support of the internal audit department of PORR AG when required.
Research and development
The Group does not conduct any research or development.
Group Management Report
62 / UBM Annual Report 2016
Disclosure acc. to Art. 243a, Austrian Commercial Code as at 31 December 2016
1. Composition of capital As at 31 December 2016 the share capital is composed of 7,472,180 no-par bearer shares, each representing the same amount of the total share capital of €22,416,540. All 7,472,180 shares were in circulation at the end of the reporting period. All shares bear the same legal rights and obligations, and each share carries the right to vote, which may be exercised in accordance with the number of shares held. The share capital of the company is fully paid in. In accordance with Article 5 Section 3 of the Articles of Association and in line with Article 10 Section 2 Stock Corporation Act, the bearer shares must be documented in a global certificate, several if required, and deposited at a collective securities depository in accordance with Article 1 Section 3 of the Securities Deposit Act or at an equivalent foreign institution.
2. Limitations regarding voting rights or the transfer of shares A syndicate agreement is in place between the Strauss Group and the IGO-Ortner Group. The Managing Board has no know-ledge of the content of the syndicate agreement. Resolutions passed by the syndicate oblige the syndicate members to exer-cise their voting rights. There is a reciprocal acquisition right. 3. Direct or indirect shareholdingThe following shareholders hold a direct or indirect interest amounting to at least ten percent of the share capital as at 31 December 2016: Ortner & Strauss Syndicate 38.84% (of which Strauss Group 11.22%, IGO-Ortner Group 27.62%).
4. There are no shares with special control rights at the company.
5. There are no employee stock ownership plans in which the employees do not exercise voting rights directly at UBM Devel-opment AG.
6. Provisions of the composition of the Managing Board and the Supervisory Board and on amending the Articles of Association In accordance with Article 6 Section 1 of the Articles of Asso-ciation, the Managing Board consists of between two and six people. In line with Article 6 Section 2 of the Articles of Asso-ciation, the Supervisory Board can appoint deputies to the Managing Board. In line with Article 6 Section 3 of the Articles of Association, the Supervisory Board can name one member as the Chairman and one member as the Deputy Chairman. Any deputy Managing Board members have the same powers of representation as the regular Managing Board members in line with Article 8 Section 3 of the Articles of Association.
In line with Article 9 Section 1 of the Articles of Association, the Supervisory Board is composed of at least three and not more than twelve members appointed by the general shareholders meeting. In line with Article 9 Section 8 of the Articles of Asso-ciation, a replacement member can be appointed at the same time as the appointment of a Supervisory Board member, in which case the replacement member would take up his seat on the Supervisory Board effective immediately if the Supervisory Board member steps down before the end of his time in office. If multiple replacement members are appointed, the order in which they are to replace a Supervisory Board member who steps down must be determined. A replacement member can also be appointed as a replacement for multiple Supervisory Board members, so that he takes a seat on the Supervisory Board if any one of these members steps down prematurely. The term of office of a replacement member who joins the Supervisory Board is terminated as soon as a successor to the former Supervisory Board member has been appointed, or at the latest when the remainder of the former Supervisory Board member’s time in office comes to an end. Should the term of office of a replacement member who joins the Super-visory Board be terminated because a successor to the former Supervisory Board member has been appointed, the replace-ment member still serves as a replacement for the additional Supervisory Board members he has been chosen to represent. In line with Article 9 Section 2 of the Articles of Association,
Group Management Report
63 / UBM Annual Report 2016
the general shareholders meeting can determine a shorter period in office than legally stipulated for individual Supervi-sory Board members or all of the members it appoints. Should certain members leave the Board before the end of their term in office, in line with Article 9 Section 6 of the Articles of Asso-ciation, a vote to replace them is not required until the next general shareholders meeting. However, a replacement vote is required at an extraordinary general meeting, to be held within six weeks, if the number of Supervisory Board members falls below three. In line with Article 9 Section 4 of the Articles of Association, the appointment of a member of the Supervisory Board can be rescinded before the end of his time in office by general shareholders meeting resolution requiring a simple majority of votes cast.
In accordance with Article 19 Section 1 of the Articles of Asso-ciation, the resolutions of the general meeting of shareholders shall be passed with a simple majority of votes cast and – in cases in which a capital majority is required – with a simple majority of the share capital represented at the vote. From the legal viewpoint of the Managing Board, this resolution has reduced the necessary majority of at least three quarters of the share capital represented in voting as required by the Stock Corporation Act for changes to the Articles of Associa-tion to a simple capital majority.
7. Authority of the members of the Managing Board In accordance with Article 4 Section 4 of the Articles of Associ-ation, as at 31 December 2016, the Managing Board is author-ised to increase the share capital by up to €4,613,460 by 7 May 2019 with the approval of the Supervisory Board by issuing up to 1,537,820 new ordinary no-par bearer shares in exchange for cash and/or contribution in kind, in multiple tranches if so wished, also under application of indirect pre-emptive rights pursuant to Article 153 Section 6 Stock Corporation Act; the Managing Board is also authorised to specify the issue price, issue conditions, the subscription ratio and other details with the approval of the Supervisory Board. The Supervisory Board is entitled to pass resolutions on amending the statutes to allow the Managing Board to make use of this authorisation.
8. Significant agreements In 2011 the company issued a bond (partial debenture) (2011–2016), which was paid back in full on 9 November 2016. In July 2014 a bond (partial debenture) worth €160,000,000.00 (2014–2019) was issued, which was raised by €15,000,000.00 to €175,000,000.00 in December 2014 and by €25,000,000.00 to €200,000,000.00 in February 2015. In December 2015 a bond (partial debenture) with a total nominal value of €75,000,000.00 (2015–2020) was issued. In November 2016 a bearer bond with a total nominal value of €18,500,000.00 (2016–2021) was issued. The bonds involve the following condition: If there is a change of control in the sense of a takeover and this change of control results in a lower credit rating of the issuer, and the issuer is unable to produce proof of its credit standing within 60 days of becoming aware of the change of control, any bond creditor is entitled to call in his/her partial debenture and demand the immediate repayment at nominal value along with any interest accrued until the date of repayment. Furthermore, the company concluded Schuldscheindarlehen agreements with a total nominal value of €32,000,000.00 in November 2016. These Schuldscheindarlehen agreements provide for the right of termination in the case that a change of control event occurs and that this change of control event leads to (i) a sig-nificant impairment of the company’s ability to meet its obli-gations from the respective loan agreement or (ii) a breach of the legally binding regulations of the respective lender. (In this context a change of control means the acquisition of a direct controlling interest in the company pursuant to the Austrian Takeover Act with the legal consequence of a mandatory offer by a natural or legal person who did not hold an interest in the company at the time that the respective loan agreement was concluded.)
There were no other significant agreements under the terms of Article 243a Line 8 of the Commercial Code.
9. Indemnification agreements under the terms of Article 243a Line 9 of the Commercial Code shall not apply.
Group Management Report
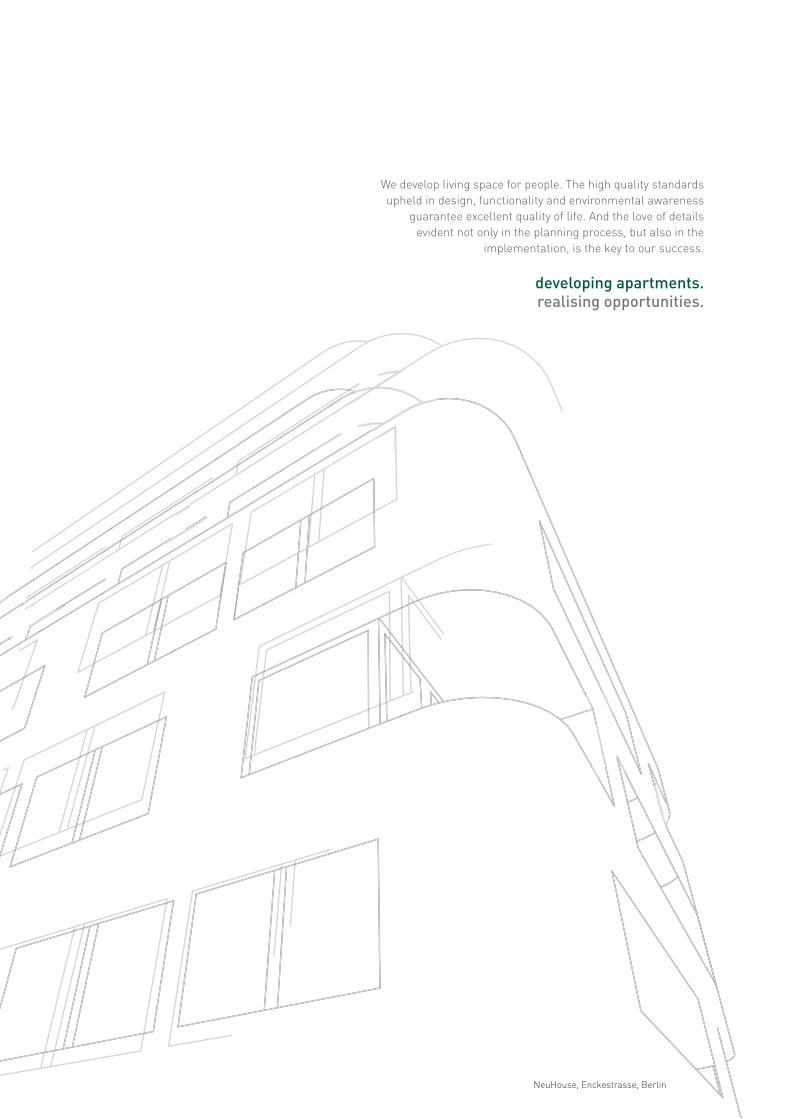
We develop living space for people. The high quality standards upheld in design, functionality and environmental awareness
guarantee excellent quality of life. And the love of details evident not only in the planning process, but also in the
implementation, is the key to our success.
developing apartments.realising opportunities.
NeuHouse, Enckestrasse, Berlin
65 / UBM Annual Report 2016
Consolidated Financial Statements 66 Consolidated Income Statement 67 Statement of Comprehensive Income 68 Consolidated Statement of Financial Position 69 Consolidated Cash Flow Statement 70 Statement of Changes in Group Equity 72 Notes to the Consolidated Financial Statements 131 Shareholdings 139 Auditor’s Report 145 Appropriation of Profits 146 Responsibility Statement
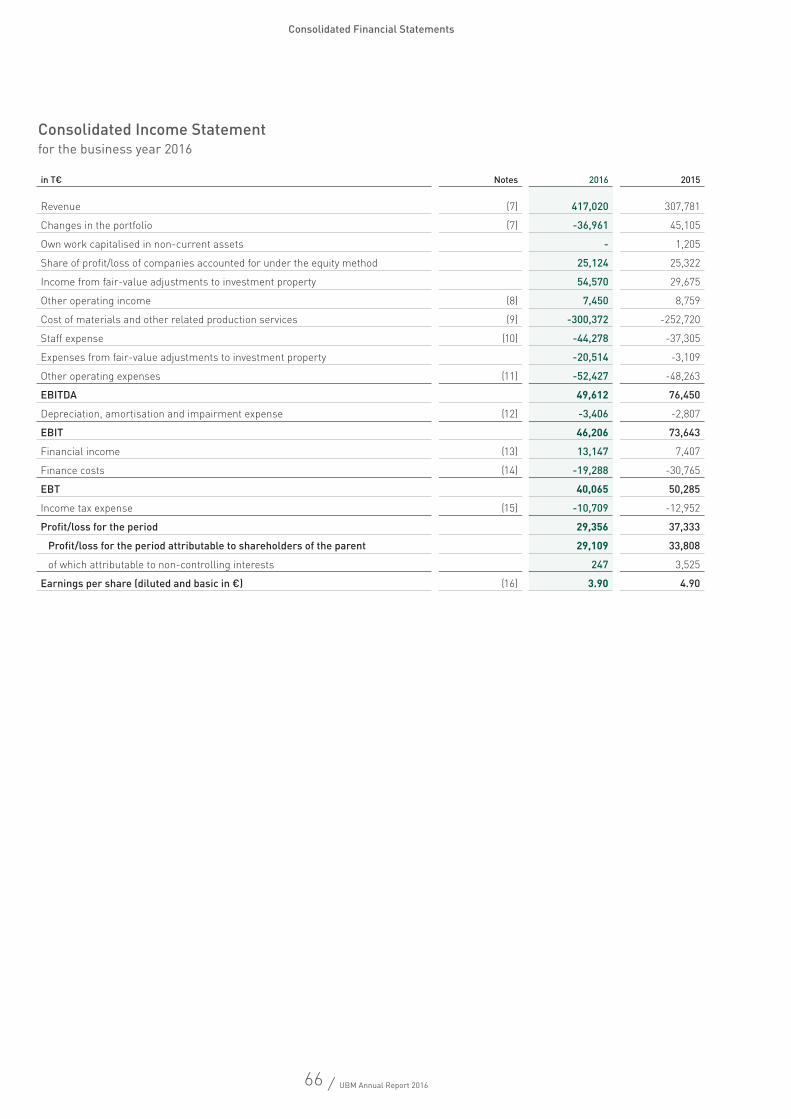
66 / UBM Annual Report 2016
Consolidated Financial Statements
Consolidated Income Statementfor the business year 2016
in T€ Notes 2016 2015
Revenue (7) 417,020 307,781
Changes in the portfolio (7) -36,961 45,105
Own work capitalised in non-current assets - 1,205
Share of profit/loss of companies accounted for under the equity method 25,124 25,322
Income from fair-value adjustments to investment property 54,570 29,675
Other operating income (8) 7,450 8,759
Cost of materials and other related production services (9) -300,372 -252,720
Staff expense (10) -44,278 -37,305
Expenses from fair-value adjustments to investment property -20,514 -3,109
Other operating expenses (11) -52,427 -48,263
EBITDA 49,612 76,450
Depreciation, amortisation and impairment expense (12) -3,406 -2,807
EBIT 46,206 73,643
Financial income (13) 13,147 7,407
Finance costs (14) -19,288 -30,765
EBT 40,065 50,285
Income tax expense (15) -10,709 -12,952
Profit/loss for the period 29,356 37,333
Profit/loss for the period attributable to shareholders of the parent 29,109 33,808
of which attributable to non-controlling interests 247 3,525
Earnings per share (diluted and basic in €) (16) 3.90 4.90
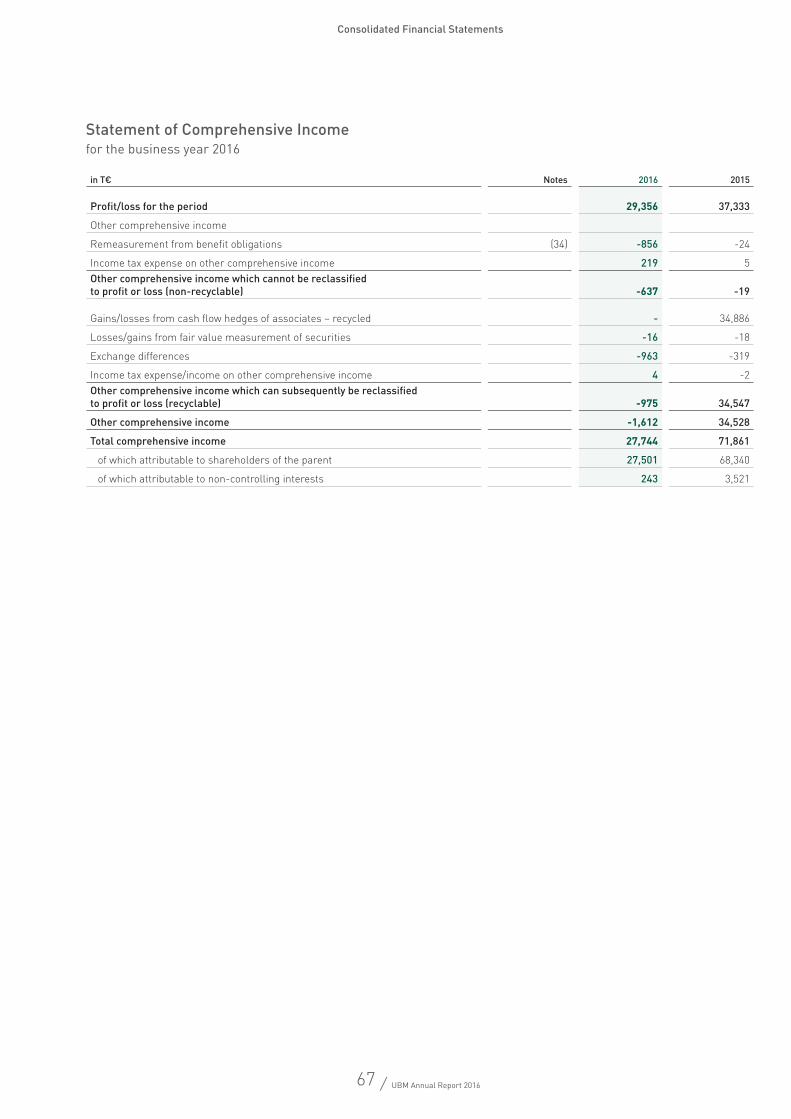
67 / UBM Annual Report 2016
Consolidated Financial Statements
Statement of Comprehensive Incomefor the business year 2016
in T€ Notes 2016 2015
Profit/loss for the period 29,356 37,333
Other comprehensive income
Remeasurement from benefit obligations (34) -856 -24
Income tax expense on other comprehensive income 219 5Other comprehensive income which cannot be reclassified to profit or loss (non-recyclable) -637 -19
Gains/losses from cash flow hedges of associates – recycled - 34,886
Losses/gains from fair value measurement of securities -16 -18
Exchange differences -963 -319
Income tax expense/income on other comprehensive income 4 -2Other comprehensive income which can subsequently be reclassified to profit or loss (recyclable) -975 34,547
Other comprehensive income -1,612 34,528
Total comprehensive income 27,744 71,861
of which attributable to shareholders of the parent 27,501 68,340
of which attributable to non-controlling interests 243 3,521
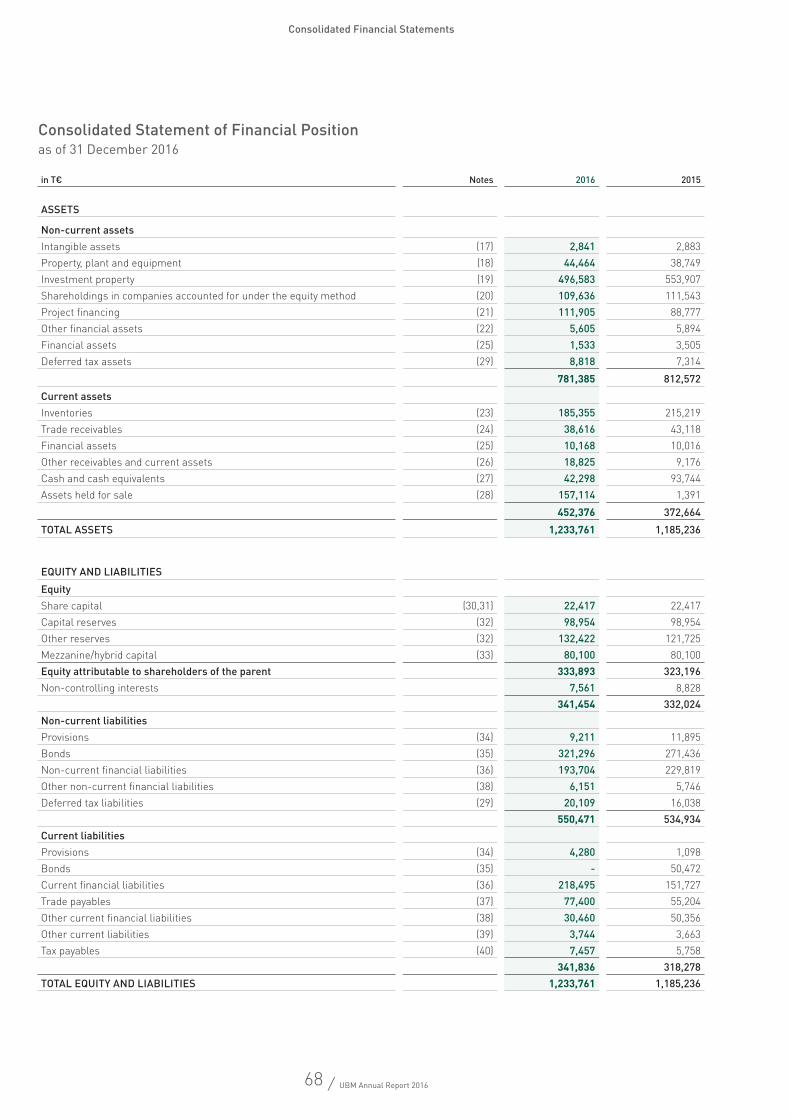
68 / UBM Annual Report 2016
Consolidated Financial Statements
in T€ Notes 2016 2015
ASSETS
Non-current assetsIntangible assets (17) 2,841 2,883Property, plant and equipment (18) 44,464 38,749Investment property (19) 496,583 553,907Shareholdings in companies accounted for under the equity method (20) 109,636 111,543Project financing (21) 111,905 88,777Other financial assets (22) 5,605 5,894Financial assets (25) 1,533 3,505Deferred tax assets (29) 8,818 7,314
781,385 812,572
Current assetsInventories (23) 185,355 215,219Trade receivables (24) 38,616 43,118Financial assets (25) 10,168 10,016Other receivables and current assets (26) 18,825 9,176Cash and cash equivalents (27) 42,298 93,744Assets held for sale (28) 157,114 1,391
452,376 372,664
TOTAL ASSETS 1,233,761 1,185,236
EQUITY AND LIABILITIES
EquityShare capital (30,31) 22,417 22,417Capital reserves (32) 98,954 98,954Other reserves (32) 132,422 121,725Mezzanine/hybrid capital (33) 80,100 80,100 Equity attributable to shareholders of the parent 333,893 323,196Non-controlling interests 7,561 8,828
341,454 332,024Non-current liabilitiesProvisions (34) 9,211 11,895Bonds (35) 321,296 271,436Non-current financial liabilities (36) 193,704 229,819Other non-current financial liabilities (38) 6,151 5,746Deferred tax liabilities (29) 20,109 16,038
550,471 534,934Current liabilitiesProvisions (34) 4,280 1,098Bonds (35) - 50,472Current financial liabilities (36) 218,495 151,727Trade payables (37) 77,400 55,204Other current financial liabilities (38) 30,460 50,356Other current liabilities (39) 3,744 3,663Tax payables (40) 7,457 5,758
341,836 318,278TOTAL EQUITY AND LIABILITIES 1,233,761 1,185,236
Consolidated Statement of Financial Positionas of 31 December 2016
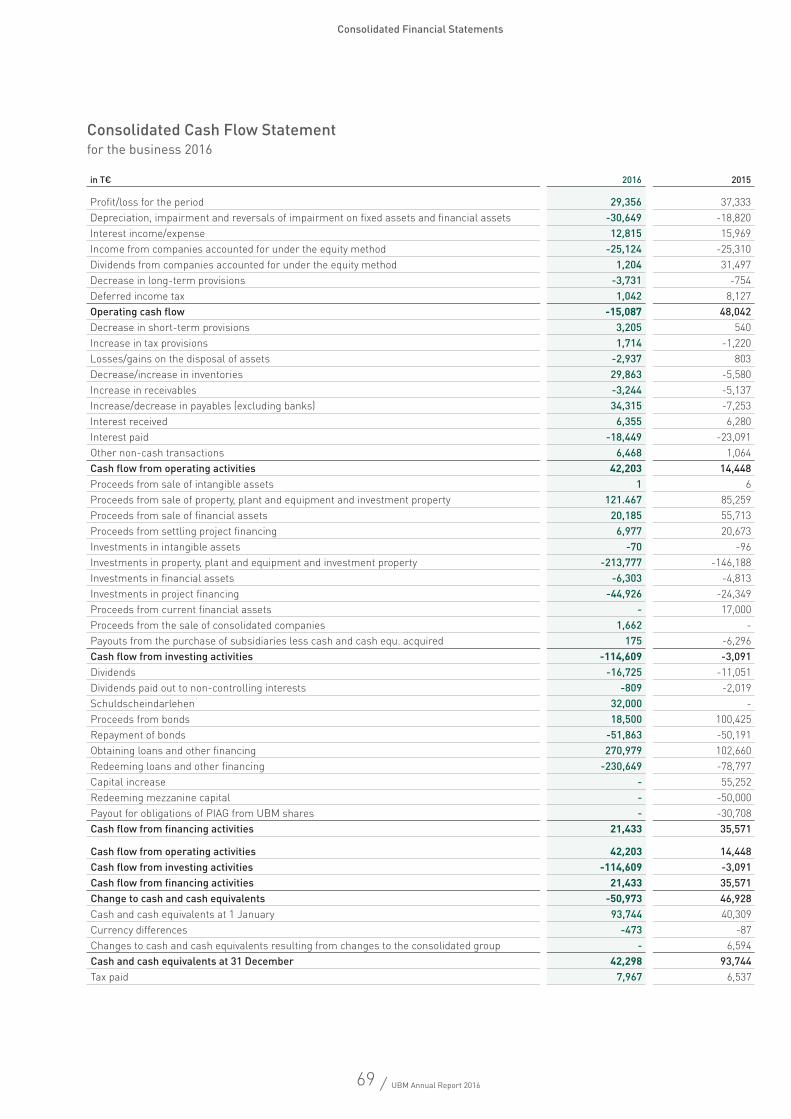
69 / UBM Annual Report 2016
Consolidated Financial Statements
Consolidated Cash Flow Statementfor the business 2016
in T€ 2016 2015
Profit/loss for the period 29,356 37,333Depreciation, impairment and reversals of impairment on fixed assets and financial assets -30,649 -18,820Interest income/expense 12,815 15,969Income from companies accounted for under the equity method -25,124 -25,310Dividends from companies accounted for under the equity method 1,204 31,497Decrease in long-term provisions -3,731 -754Deferred income tax 1,042 8,127Operating cash flow -15,087 48,042Decrease in short-term provisions 3,205 540Increase in tax provisions 1,714 -1,220Losses/gains on the disposal of assets -2,937 803Decrease/increase in inventories 29,863 -5,580Increase in receivables -3,244 -5,137Increase/decrease in payables (excluding banks) 34,315 -7,253Interest received 6,355 6,280Interest paid -18,449 -23,091Other non-cash transactions 6,468 1,064Cash flow from operating activities 42,203 14,448Proceeds from sale of intangible assets 1 6Proceeds from sale of property, plant and equipment and investment property 121.467 85,259Proceeds from sale of financial assets 20,185 55,713Proceeds from settling project financing 6,977 20,673Investments in intangible assets -70 -96Investments in property, plant and equipment and investment property -213,777 -146,188Investments in financial assets -6,303 -4,813Investments in project financing -44,926 -24,349Proceeds from current financial assets - 17,000Proceeds from the sale of consolidated companies 1,662 - Payouts from the purchase of subsidiaries less cash and cash equ. acquired 175 -6,296Cash flow from investing activities -114,609 -3,091Dividends -16,725 -11,051Dividends paid out to non-controlling interests -809 -2,019Schuldscheindarlehen 32,000 - Proceeds from bonds 18,500 100,425Repayment of bonds -51,863 -50,191Obtaining loans and other financing 270,979 102,660Redeeming loans and other financing -230,649 -78,797Capital increase - 55,252Redeeming mezzanine capital - -50,000Payout for obligations of PIAG from UBM shares - -30,708Cash flow from financing activities 21,433 35,571
Cash flow from operating activities 42,203 14,448Cash flow from investing activities -114,609 -3,091Cash flow from financing activities 21,433 35,571Change to cash and cash equivalents -50,973 46,928Cash and cash equivalents at 1 January 93,744 40,309Currency differences -473 -87Changes to cash and cash equivalents resulting from changes to the consolidated group - 6,594Cash and cash equivalents at 31 December 42,298 93,744Tax paid 7,967 6,537
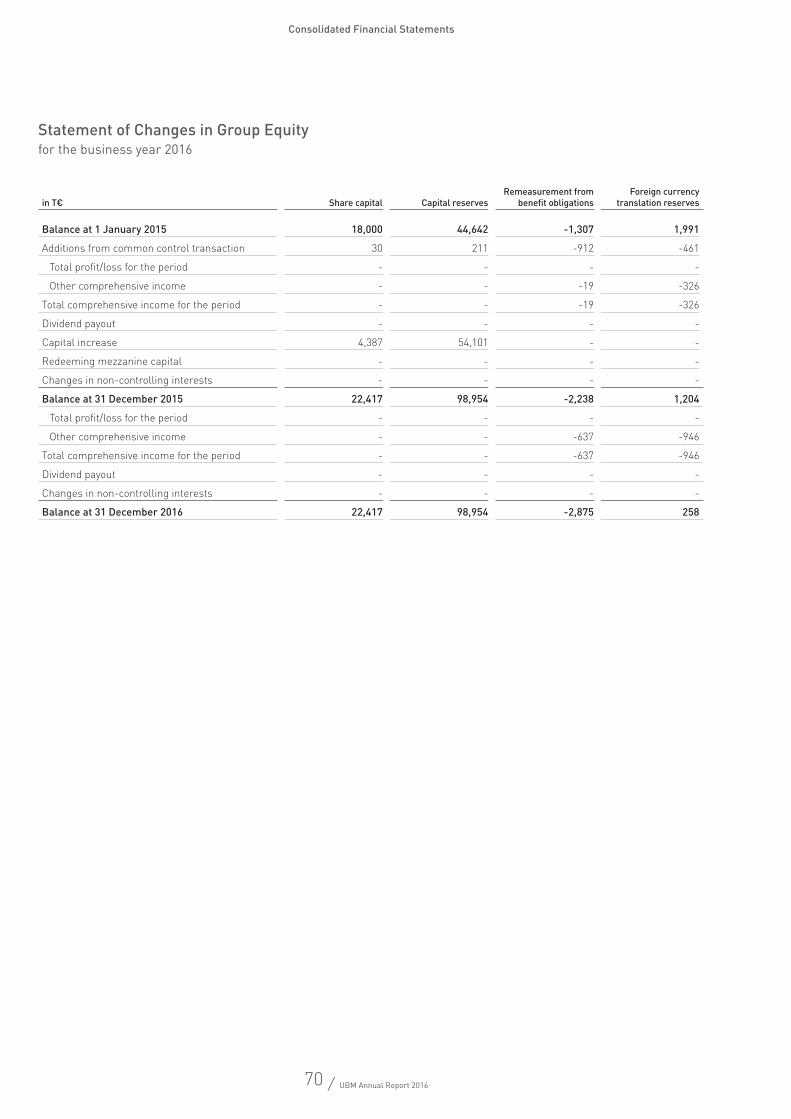
70 / UBM Annual Report 2016
Consolidated Financial Statements
Statement of Changes in Group Equity for the business year 2016
in T€ Share capital Capital reservesRemeasurement from
benefit obligationsForeign currency
translation reserves
Total debt securities available for sale - fair value reserve
Reserve for cash flow hedges Other reserves
Mezzanine/ hybrid capital
Equity attributable to equi-ty holders of the parent
Non-controlling interests Total
Balance at 1 January 2015 18,000 44,642 -1,307 1,991 - - 115,049 - 178,375 2,071 180,446
Additions from common control transaction 30 211 -912 -461 57 -34,886 -9,663 126,729 81,105 3,761 84,866
Total profit/loss for the period - - - - - - 26,898 6,910 33,808 3,525 37,333
Other comprehensive income - - -19 -326 -14 34,886 5 - 34,532 -4 34,528
Total comprehensive income for the period - - -19 -326 -14 34,886 26,903 6,910 68,340 3,521 71,861
Dividend payout - - - - - - -7,512 -3,539 -11,051 -2,019 -13,070
Capital increase 4,387 54,101 - - - - -2,427 - 56,061 - 56,061
Redeeming mezzanine capital - - - - - - - -50,000 -50,000 - -50,000
Changes in non-controlling interests - - - - - - 366 - 366 1,494 1,860
Balance at 31 December 2015 22,417 98,954 -2,238 1,204 43 - 122,716 80,100 323,196 8,828 332,024
Total profit/loss for the period - - - - - - 24,339 4,770 29,109 247 29,356
Other comprehensive income - - -637 -946 -12 - -13 - -1,608 -4 -1,612
Total comprehensive income for the period - - -637 -946 -12 - 24,326 4,770 27,501 243 27,744
Dividend payout - - - - - - -11,955 -4,770 -16,725 -809 -17,534
Changes in non-controlling interests - - - - - - -79 - -79 -701 -780
Balance at 31 December 2016 22,417 98,954 -2,875 258 31 - 135,008 80,100 333,893 7,561 341,454
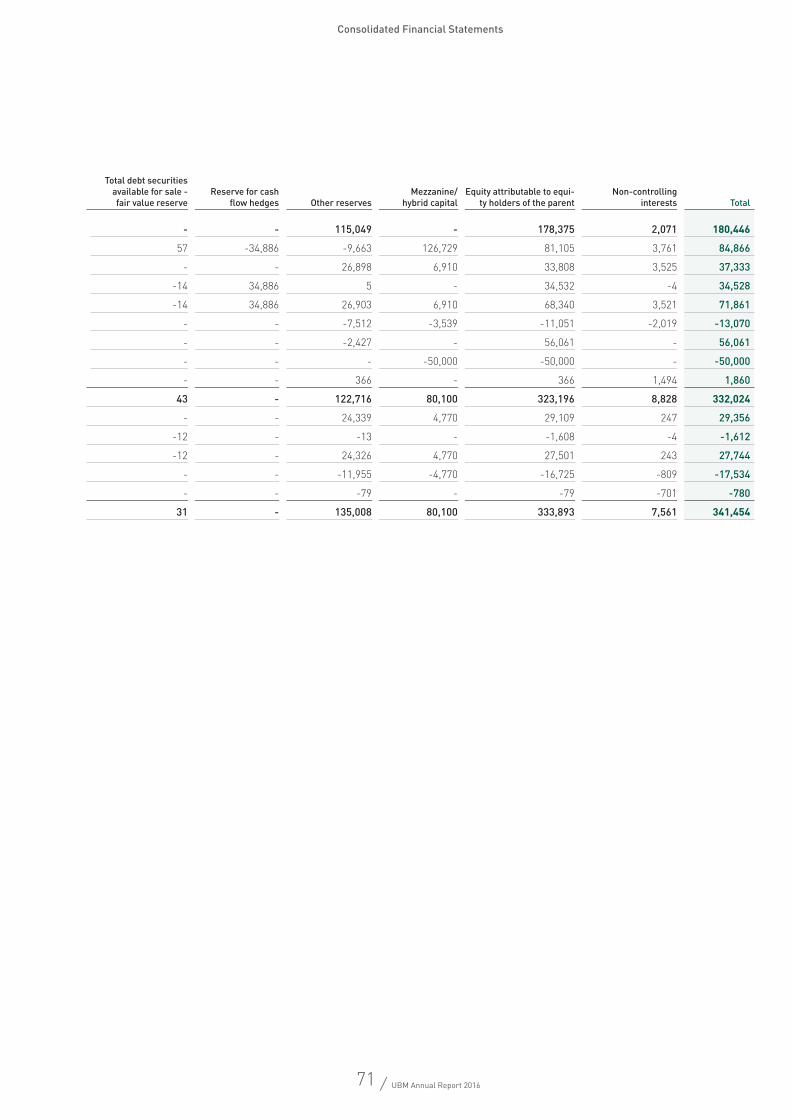
71 / UBM Annual Report 2016
Consolidated Financial Statements
in T€ Share capital Capital reservesRemeasurement from
benefit obligationsForeign currency
translation reserves
Total debt securities available for sale - fair value reserve
Reserve for cash flow hedges Other reserves
Mezzanine/ hybrid capital
Equity attributable to equi-ty holders of the parent
Non-controlling interests Total
Balance at 1 January 2015 18,000 44,642 -1,307 1,991 - - 115,049 - 178,375 2,071 180,446
Additions from common control transaction 30 211 -912 -461 57 -34,886 -9,663 126,729 81,105 3,761 84,866
Total profit/loss for the period - - - - - - 26,898 6,910 33,808 3,525 37,333
Other comprehensive income - - -19 -326 -14 34,886 5 - 34,532 -4 34,528
Total comprehensive income for the period - - -19 -326 -14 34,886 26,903 6,910 68,340 3,521 71,861
Dividend payout - - - - - - -7,512 -3,539 -11,051 -2,019 -13,070
Capital increase 4,387 54,101 - - - - -2,427 - 56,061 - 56,061
Redeeming mezzanine capital - - - - - - - -50,000 -50,000 - -50,000
Changes in non-controlling interests - - - - - - 366 - 366 1,494 1,860
Balance at 31 December 2015 22,417 98,954 -2,238 1,204 43 - 122,716 80,100 323,196 8,828 332,024
Total profit/loss for the period - - - - - - 24,339 4,770 29,109 247 29,356
Other comprehensive income - - -637 -946 -12 - -13 - -1,608 -4 -1,612
Total comprehensive income for the period - - -637 -946 -12 - 24,326 4,770 27,501 243 27,744
Dividend payout - - - - - - -11,955 -4,770 -16,725 -809 -17,534
Changes in non-controlling interests - - - - - - -79 - -79 -701 -780
Balance at 31 December 2016 22,417 98,954 -2,875 258 31 - 135,008 80,100 333,893 7,561 341,454
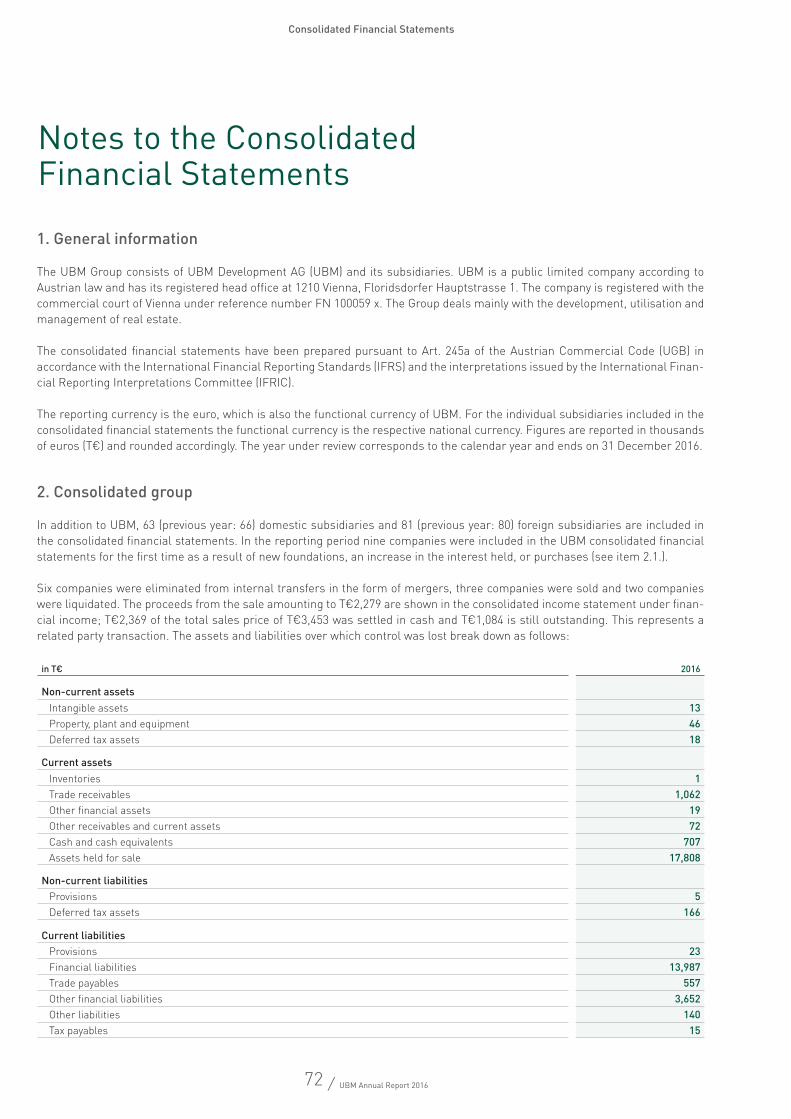
72 / UBM Annual Report 2016
Consolidated Financial Statements
Notes to the Consolidated Financial Statements
1. General information
The UBM Group consists of UBM Development AG (UBM) and its subsidiaries. UBM is a public limited company according to Austrian law and has its registered head office at 1210 Vienna, Floridsdorfer Hauptstrasse 1. The company is registered with the commercial court of Vienna under reference number FN 100059 x. The Group deals mainly with the development, utilisation and management of real estate.
The consolidated financial statements have been prepared pursuant to Art. 245a of the Austrian Commercial Code (UGB) in accordance with the International Financial Reporting Standards (IFRS) and the interpretations issued by the International Finan-cial Reporting Interpretations Committee (IFRIC).
The reporting currency is the euro, which is also the functional currency of UBM. For the individual subsidiaries included in the consolidated financial statements the functional currency is the respective national currency. Figures are reported in thousands of euros (T€) and rounded accordingly. The year under review corresponds to the calendar year and ends on 31 December 2016.
2. Consolidated group
In addition to UBM, 63 (previous year: 66) domestic subsidiaries and 81 (previous year: 80) foreign subsidiaries are included in the consolidated financial statements. In the reporting period nine companies were included in the UBM consolidated financial statements for the first time as a result of new foundations, an increase in the interest held, or purchases (see item 2.1.).
Six companies were eliminated from internal transfers in the form of mergers, three companies were sold and two companies were liquidated. The proceeds from the sale amounting to T€2,279 are shown in the consolidated income statement under finan-cial income; T€2,369 of the total sales price of T€3,453 was settled in cash and T€1,084 is still outstanding. This represents a related party transaction. The assets and liabilities over which control was lost break down as follows:
in T€ 2016
Non-current assetsIntangible assets 13Property, plant and equipment 46Deferred tax assets 18
Current assetsInventories 1Trade receivables 1,062Other financial assets 19Other receivables and current assets 72Cash and cash equivalents 707Assets held for sale 17,808
Non-current liabilitiesProvisions 5Deferred tax assets 166
Current liabilitiesProvisions 23Financial liabilities 13,987Trade payables 557Other financial liabilities 3,652Other liabilities 140Tax payables 15
73 / UBM Annual Report 2016
Consolidated Financial Statements
In addition, 27 (previous year: 26) domestic and 30 (previous year: 30) foreign associates and joint ventures were valued under the equity method.
In the reporting period the stake in three companies was increased insofar as to be included fully in the consolidated group. Five companies were founded; three companies were included for the first time in the UBM consolidated financial statements as a result of acquisitions and four companies were deconsolidated due to sales. For two companies this involved a transaction with a related party; the sales price of T€12,268 was settled in cash.
For twelve subsidiaries UBM does have the majority of voting rights, but the rules in the shareholders agreements state that there is no right of control. These companies are recognised as joint ventures.
2.1. First-time consolidationsIn the 2016 business year the following companies were fully consolidated for the first time (see list of shareholdings for details):
The increases in the interests held in Poleczki Development Spolka z ograniczona odpowiedzialnoscia and Poleczki Lisbon Office Spolka z ograniczona odpowiedzialnoscia relate to the purchase of real estate and the respective financing of this real estate and are not classified as a business combination pursuant to IFRS 3.
Because of purchases Date of initial consolidation
Ligustria 12 Spolka z ograniczona odpowiedzialnoscia 1.1.2016
Because of new foundations Date of initial consolidation
UBM hotels Management GmbH 4.5.2016UBM hotels München GmbH 26.10.2016Poleczki Madrid Office Spólka z ograniczona odpowiedzialnoscia 21.10.2016MGH Potsdam I GmbH & Co. KG 21.12.2016
Because of an increase in the interest held Date of initial consolidation
PBP IT-Services spolka z ograniczona odpowiedzialnoscia 11.1.2016Poleczki Development Spolka z ograniczona odpowiedzialnoscia 11.1.2016Poleczki Lisbon Office Spolka z ograniczona odpowiedzialnoscia 11.1.2016GF Ramba Spolka z ograniczona odpowiedzialnoscia 30.6.2016
74 / UBM Annual Report 2016
Consolidated Financial Statements
T€16 was used to purchase the remaining 50% in GF Ramba Spolka z ograniczona odpowiedzialnoscia. The purchase price was paid in full and was provisionally allocated to the Group’s assets and liabilities as follows:
The initial consolidation contributed T€113 to EBT for the period and T€466 to revenue.
T€38 was used to purchase the remaining 50% in PBP IT-Services spolka z ograniczona odpowiedzialnoscia. The purchase price was paid in full and was provisionally allocated to the Group’s assets and liabilities as follows:
in T€ 2016
Non-current assetsIntangible assets 1 Property, plant and equipment 186Investment property 12,167Deferred tax assets 109
Current assetsTrade receivables 10Other financial assets 196Cash and cash equivalents 130
Non-current liabilitiesDeferred tax payables -708
Current liabilitiesFinancial liabilities -4,283Trade payables -372Other financial liabilities -5,771Other liabilities -10
Fair value of the equity interest already held 1,639Purchase price 16
in T€ 2016
Non-current assetsProperty, plant and equipment 159
Current assetsTrade receivables 10Other receivables and assets 21Cash and cash equivalents 99
Non-current liabilities
Current liabilitiesTrade receivables -71Other financial liabilities -120
Fair value of the equity interest already held 60Purchase price 38
75 / UBM Annual Report 2016
Consolidated Financial Statements
No profit resulted from the valuation of the previously held shares.
The initial consolidation of the company contributed T€17 to earnings before taxes for the period and T€122 to revenue.
3. Consolidation principles
Business combinations are accounted for in accordance with the acquisition method. According to this method, the assets acquired and liabilities assumed as well as contingent liabilities are measured on the acquisition date at their fair values attrib-utable at this date. Where the difference between the acquisition costs and the attributable proportion of net assets valued at fair value shows an excess, this item is shown as goodwill, which is not written off or amortised in regular amounts but is subjected to a test for impairment at least once a year.
All accounts receivable and payable between consolidated companies are eliminated during debt consolidation. Intragroup income and expense is offset within the framework of consolidation of income and expense. Intragroup profits or losses from intragroup deliveries are eliminated if these relate to significant amounts and the relevant assets are still recognised in the con-solidated financial statements.
Shares in net assets of subsidiaries not attributable to UBM are shown separately as part of equity under the item “Non-con-trolling interests”.
4. Accounting and measurement methods
The annual financial statements of all companies included in the consolidated financial statements are prepared according to standard accounting and measurement methods.
Measurement principlesHistoric acquisition costs form the basis for the measurement of intangible assets, property, plant and equipment, inventories, accounts receivable from billed orders and liabilities.
The fair value at the end of the reporting period is the basis for the measurement in respect of securities available for sale, deriv-ative financial instruments and investment property.
Currency translationThe companies included in the consolidated financial statements prepare their annual financial statements in their respective functional currencies, whereby the functional currency is the relevant currency for the commercial activities of the company concerned.
Items in the consolidated statement of financial position are translated at the mean rate of exchange at the end of the reporting period and income statement items are translated at the annual mean rate of exchange for the fiscal year (as an arithmetic mean of all end-of-month quotations). Differences resulting from the currency translation are recognised directly in equity. These translation differences are recognised in the income statement at the date of disposal of the business activities.
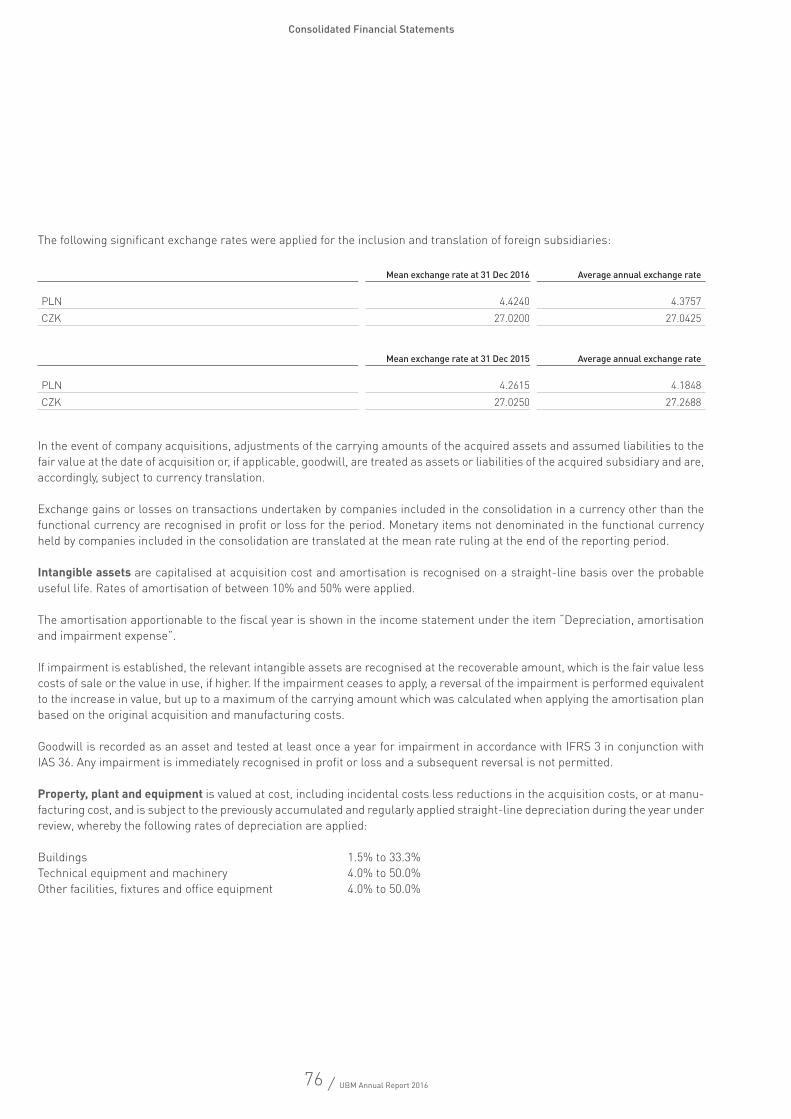
76 / UBM Annual Report 2016
Consolidated Financial Statements
The following significant exchange rates were applied for the inclusion and translation of foreign subsidiaries:
In the event of company acquisitions, adjustments of the carrying amounts of the acquired assets and assumed liabilities to the fair value at the date of acquisition or, if applicable, goodwill, are treated as assets or liabilities of the acquired subsidiary and are, accordingly, subject to currency translation.
Exchange gains or losses on transactions undertaken by companies included in the consolidation in a currency other than the functional currency are recognised in profit or loss for the period. Monetary items not denominated in the functional currency held by companies included in the consolidation are translated at the mean rate ruling at the end of the reporting period.
Intangible assets are capitalised at acquisition cost and amortisation is recognised on a straight-line basis over the probable useful life. Rates of amortisation of between 10% and 50% were applied.
The amortisation apportionable to the fiscal year is shown in the income statement under the item “Depreciation, amortisation and impairment expense”.
If impairment is established, the relevant intangible assets are recognised at the recoverable amount, which is the fair value less costs of sale or the value in use, if higher. If the impairment ceases to apply, a reversal of the impairment is performed equivalent to the increase in value, but up to a maximum of the carrying amount which was calculated when applying the amortisation plan based on the original acquisition and manufacturing costs.
Goodwill is recorded as an asset and tested at least once a year for impairment in accordance with IFRS 3 in conjunction with IAS 36. Any impairment is immediately recognised in profit or loss and a subsequent reversal is not permitted.
property, plant and equipment is valued at cost, including incidental costs less reductions in the acquisition costs, or at manu-facturing cost, and is subject to the previously accumulated and regularly applied straight-line depreciation during the year under review, whereby the following rates of depreciation are applied:
Buildings 1.5% to 33.3%Technical equipment and machinery 4.0% to 50.0%Other facilities, fixtures and office equipment 4.0% to 50.0%
Mean exchange rate at 31 Dec 2016 Average annual exchange rate
PLN 4.4240 4.3757CZK 27.0200 27.0425
Mean exchange rate at 31 Dec 2015 Average annual exchange rate
PLN 4.2615 4.1848CZK 27.0250 27.2688
77 / UBM Annual Report 2016
Consolidated Financial Statements
If impairment is established, the relevant tangible assets are impaired to the recoverable amount, which is the fair value less costs of sale or the value in use, if higher. If the impairment ceases to apply, a reversal of the impairment is performed equiva-lent to the increase in value, but up to a maximum of the carrying amount which was calculated when applying the amortisation plan based on the original acquisition and manufacturing costs. Fundamental rebuilding work is recognised in the statement of financial position, while ongoing maintenance work, repairs and minor rebuilding work are recognised in profit or loss at the time they arose.
Low-value assets were written off in full in the year of purchase, as they are of minor importance for the consolidated financial statements.
Plants under construction, including buildings under construction, which are to be used for operational purposes or whose type of use has not yet been established, are accounted for at acquisition cost or manufacturing cost less impairment.
Borrowing costs for qualifying assets are included in the acquisition or manufacturing cost. Depreciation or impairment of these assets commences upon their completion or attainment of operational status. In the current business year, T€10,005 (previous year: T€13,302) was recognised in interest on property. Please refer to the disclosures in note 36 for the capitalisation rate.
Investment property is real estate that is held for the purpose of obtaining rental income and/or for the purpose of its rise in value. This includes office and commercial premises not used for the Group’s own business purposes, residential buildings and unimproved land. These are recognised at their fair values. Gains or losses from changes in value are reflected in profit or loss for the period in which the change in value occurred. If a fair value cannot be reliably determined, buildings under construction are accounted for at acquisition cost or manufacturing cost, or with the fair value generally determined by the residual value method.
Market value reports by experts are used as the basis for determining the fair value of investment property and/or the fair value is determined using the present value of estimated future cash flows which are expected from the use of the property or have been achieved in similar transactions.
properties held for sale are measured at the lower of acquisition cost, manufacturing cost and net realisable value. Borrowing costs for qualifying assets are included in the acquisition or manufacturing cost.
For properties recognised under current assets where the market value can be determined based on comparable transactions, the market value was determined using the sales comparison approach or the cost approach; this applies to real estate held under current assets that is intended for immediate sale once completed. In accordance with accounting standards, the carrying amount is only aligned with the market value if this is lower. The external appraisers determined the parameters with the local project developers based on the size, age and condition of the buildings and country-specific parameters.
78 / UBM Annual Report 2016
Consolidated Financial Statements
LeasesThe Group as lessor: Where the Group is the lessor, the only lease contracts applicable are operating leases. The rental income from these contracts is recognised in net income on a straight-line basis over the term of the corresponding lease.
The Group as lessee: Leases are classified as finance leases when, according to the lease contract, essentially all the risks and rewards relating to the ownership are transferred to the lessee.
Assets held under finance leases are recorded as Group assets at their fair values or at the present value of the minimum lease payments, if this is lower, at the beginning of the lease. The minimum lease payments are those amounts payable during the non-terminable term of the lease, including a guaranteed residual value. The corresponding liability owed to the lessor is recorded in the statement of financial position as obligations under finance leases. The lease payments are apportioned between interest paid and the reduction of the lease obligation in such a way as to achieve a constant rate of interest on the remaining liability. Interest expense is recognised in the income statement.
Shares in companies accounted for under the equity method are accounted for at acquisition cost, which is apportioned between the pro rata net assets acquired at fair value and, if applicable, goodwill. The carrying amount is increased or decreased annually by the proportionate annual profit or loss, dividends received and other changes to equity. Goodwill is not subject to planned amortisation, rather it is assessed for impairment, as per IAS 36, once a year as well as when circumstances exist that indicate there may be possible impairment. If the recoverable amount differs from the carrying amount, the difference is written off.
project financing is measured at amortised cost. If indicators of impairment are determined, project financing is written down to the present value of the expected cash flows.
The shares in non-consolidated subsidiaries and other shareholdings shown under other financial assets are valued at acqui-sition cost, as it is not possible to determine a reliable fair value. If impairment is established on the financial assets valued at acquisition cost, they are written down to the present value of the expected cash flows.
Construction contracts are recognised according to the percentage of completion of the contract (POC method). The anticipated revenues from the contracts are shown under revenue according to the respective percentage of completion. The percentage of completion, which is the basis for the amount of the contract revenues shown, is, as a rule, determined according to the ratio of the services supplied compared to the estimated total services at the end of the reporting period. Claims are only recognised when it is likely that the customer will accept them and when they can be reliably measured. Where the result of a construction contract cannot be reliably estimated, the amount of the accumulated contract costs alone shall represent the amount recorded for contract revenues. If it is probable that the total contract costs will exceed the total contract revenues, the expected loss is recognised immediately and in full.
The revenues attributable to the services supplied so far according to the percentage of completion method are, to the extent that they exceed the payments on account made by the customer, shown in the statement of financial position under trade receiva-bles. Amounts by which the payments on account received exceed the revenues attributable to the services supplied so far are shown under other liabilities.
receivables are fundamentally recognised at amortised cost. Should there be substantial evidence of default risks, allowances are set up.
79 / UBM Annual Report 2016
Consolidated Financial Statements
deferred tax items are recognised where there are temporary differences between the values of assets and liabilities in the con-solidated financial statements on the one hand and the values for tax purposes on the other hand in the amount of the anticipated future tax expense or tax relief. In addition, a deferred tax asset for future asset advantage resulting from tax loss carryforwards is recognised if there is sufficient certainty of realisation. Temporary differences arising from the first recognition of goodwill constitute exceptions to this comprehensive tax deferral.
The calculation of the deferred tax amount is based on the rate of income tax valid in the country concerned; for Austrian com-panies this is a tax rate of 25%.
The provisions for severance payments, pensions and anniversary bonuses were determined by the projected unit credit method in accordance with IAS 19 and based on the life table AVÖ 2008-P, whereby an actuarial assessment is performed on each reference date. In the valuation of these provisions for Austria and Germany, an interest rate for accounting purposes of 1.65% p.a. (previous year: 2.25%) was applied with salary increases of 2.50% (previous year: 2.50%). When determining provisions for severance payments and anniversary bonuses for Austria, deductions are made for fluctuations based on statistical data within a range of 0.0% to 10.6% (previous year: 1.1% to 14.2%) and for anniversary bonuses in Germany a range of 0.0% to 10.6% (previous year: 0.0% to 25.0%) was applied. For Austrian companies the assumed retirement age is the earliest possible retirement age permitted by law following the 2004 pension reform (corridor pension), taking into account all transitional arrangements; for Ger-man companies the legal retirement age is used. The life table AVÖ 2008-P – Pagler & Pagler is used for calculating provisions in Austria, while for Germany the life table Richttafeln 2005 G by Klaus Heubeck is applied.
Actuarial gains and losses for severance payments and pensions are recognised in full in other comprehensive income, while anniversary bonuses are under profit or loss for the period. Service costs are shown under staff expense. Interest paid is recorded under finance costs.
Other provisions take account of all currently discernible risks and contingent liabilities. They are recognised with the best esti-mate of the expenditure required to settle the present obligation if a reliable estimate exists.
Liabilities are recognised at amortised cost in accordance with the effective interest method.
If the amount to be paid back is lower or higher, this is subjected to appreciation or depreciation in accordance with the effective interest method.
derivative financial instruments are recognised at fair value. Derivatives which involve hedges are treated in line with the requirements for hedge accounting.
revenue is measured at the fair value of the consideration. Discounts and other subsequent reductions in revenue are deducted from this amount. Revenue is recognised on delivery and transfer of ownership. Revenue from construction contracts is recog-nised according to the percentage of completion allocated over the period of the contract.
Interest income and expense is limited under consideration of the respective outstanding sum borrowed and the applicable interest rate.
dividend income from financial investments is recognised when legal title arises.
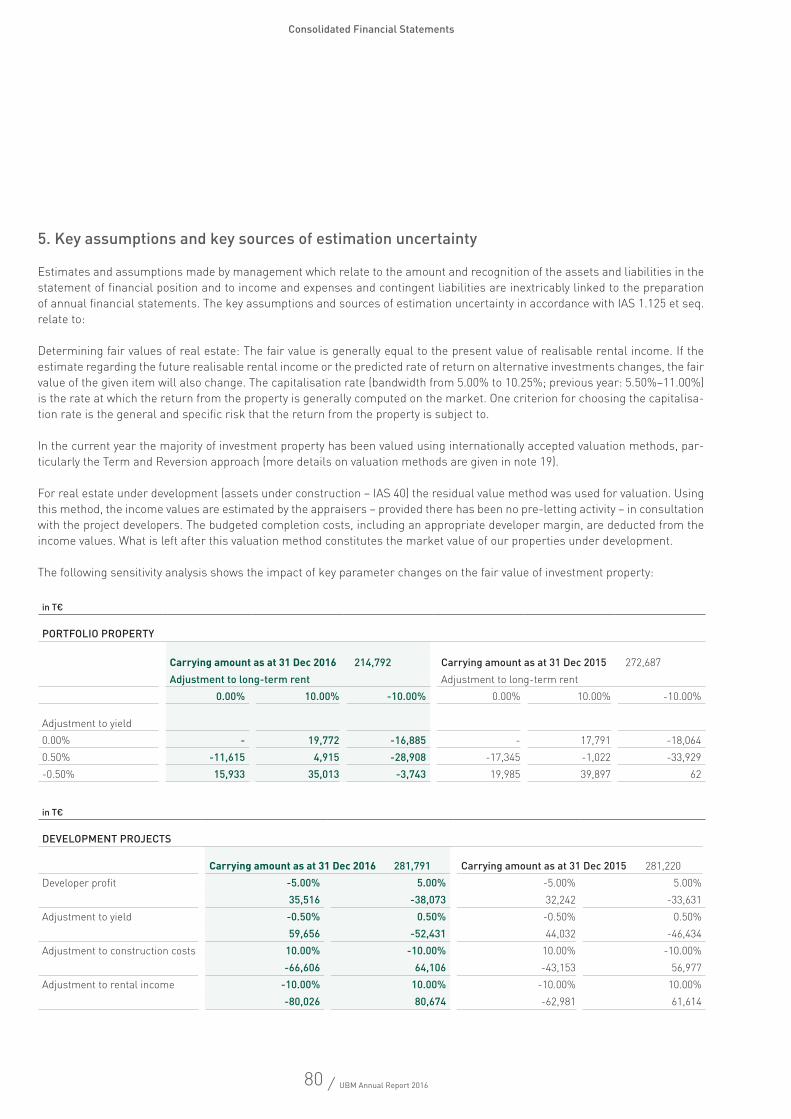
80 / UBM Annual Report 2016
Consolidated Financial Statements
5. Key assumptions and key sources of estimation uncertainty
Estimates and assumptions made by management which relate to the amount and recognition of the assets and liabilities in the statement of financial position and to income and expenses and contingent liabilities are inextricably linked to the preparation of annual financial statements. The key assumptions and sources of estimation uncertainty in accordance with IAS 1.125 et seq. relate to:
Determining fair values of real estate: The fair value is generally equal to the present value of realisable rental income. If the estimate regarding the future realisable rental income or the predicted rate of return on alternative investments changes, the fair value of the given item will also change. The capitalisation rate (bandwidth from 5.00% to 10.25%; previous year: 5.50%–11.00%) is the rate at which the return from the property is generally computed on the market. One criterion for choosing the capitalisa-tion rate is the general and specific risk that the return from the property is subject to.
In the current year the majority of investment property has been valued using internationally accepted valuation methods, par-ticularly the Term and Reversion approach (more details on valuation methods are given in note 19).
For real estate under development (assets under construction – IAS 40) the residual value method was used for valuation. Using this method, the income values are estimated by the appraisers – provided there has been no pre-letting activity – in consultation with the project developers. The budgeted completion costs, including an appropriate developer margin, are deducted from the income values. What is left after this valuation method constitutes the market value of our properties under development.
The following sensitivity analysis shows the impact of key parameter changes on the fair value of investment property:
in T€
PORTFOLIO PROPERTY
Carrying amount as at 31 dec 2016 214,792 Carrying amount as at 31 Dec 2015 272,687Adjustment to long-term rent Adjustment to long-term rent
0.00% 10.00% -10.00% 0.00% 10.00% -10.00%
Adjustment to yield0.00% - 19,772 -16,885 - 17,791 -18,0640.50% -11,615 4,915 -28,908 -17,345 -1,022 -33,929-0.50% 15,933 35,013 -3,743 19,985 39,897 62
in T€
DEVELOPMENT PROJECTS
Carrying amount as at 31 dec 2016 281,791 Carrying amount as at 31 Dec 2015 281,220Developer profit -5.00% 5.00% -5.00% 5.00%
35,516 -38,073 32,242 -33,631Adjustment to yield -0.50% 0.50% -0.50% 0.50%
59,656 -52,431 44,032 -46,434Adjustment to construction costs 10.00% -10.00% 10.00% -10.00%
-66,606 64,106 -43,153 56,977Adjustment to rental income -10.00% 10.00% -10.00% 10.00%
-80,026 80,674 -62,981 61,614
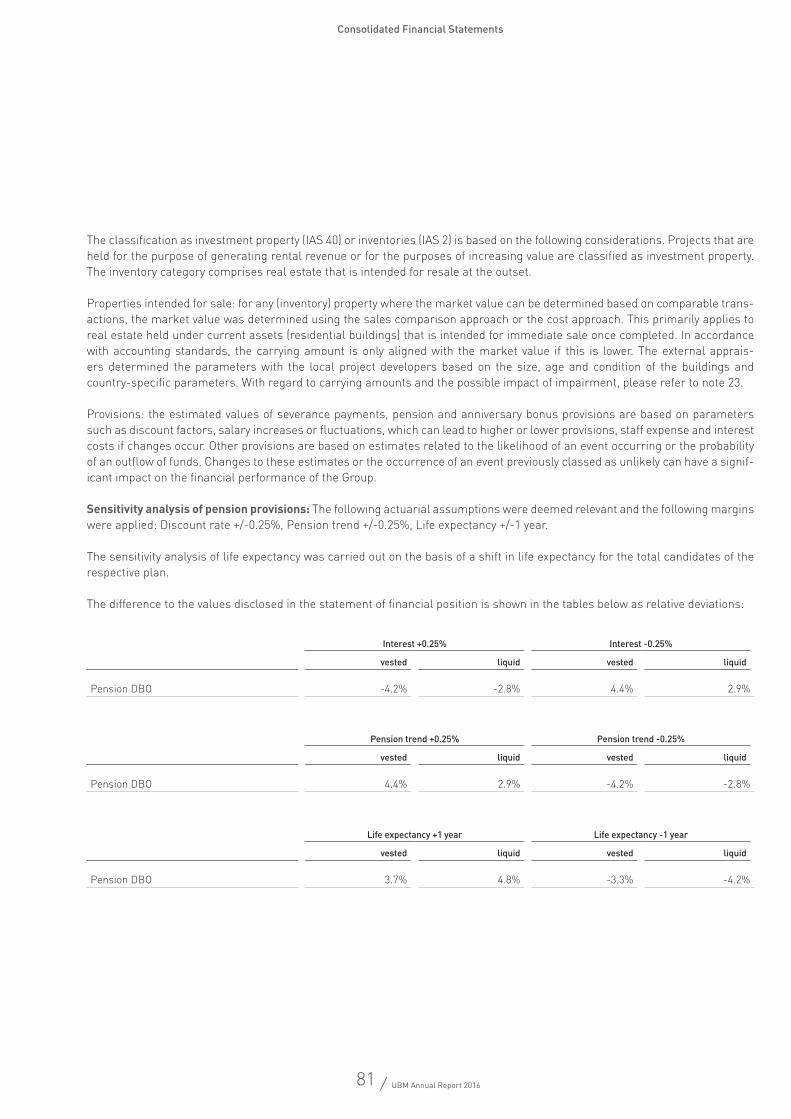
81 / UBM Annual Report 2016
Consolidated Financial Statements
The classification as investment property (IAS 40) or inventories (IAS 2) is based on the following considerations. Projects that are held for the purpose of generating rental revenue or for the purposes of increasing value are classified as investment property. The inventory category comprises real estate that is intended for resale at the outset.
Properties intended for sale: for any (inventory) property where the market value can be determined based on comparable trans-actions, the market value was determined using the sales comparison approach or the cost approach. This primarily applies to real estate held under current assets (residential buildings) that is intended for immediate sale once completed. In accordance with accounting standards, the carrying amount is only aligned with the market value if this is lower. The external apprais-ers determined the parameters with the local project developers based on the size, age and condition of the buildings and country-specific parameters. With regard to carrying amounts and the possible impact of impairment, please refer to note 23.
Provisions: the estimated values of severance payments, pension and anniversary bonus provisions are based on parameters such as discount factors, salary increases or fluctuations, which can lead to higher or lower provisions, staff expense and interest costs if changes occur. Other provisions are based on estimates related to the likelihood of an event occurring or the probability of an outflow of funds. Changes to these estimates or the occurrence of an event previously classed as unlikely can have a signif-icant impact on the financial performance of the Group.
Sensitivity analysis of pension provisions: The following actuarial assumptions were deemed relevant and the following margins were applied: Discount rate +/-0.25%, Pension trend +/-0.25%, Life expectancy +/-1 year.
The sensitivity analysis of life expectancy was carried out on the basis of a shift in life expectancy for the total candidates of the respective plan.
The difference to the values disclosed in the statement of financial position is shown in the tables below as relative deviations:
Interest +0.25% Interest -0.25%
vested liquid vested liquid
Pension DBO -4.2% -2.8% 4.4% 2.9%
Pension trend +0.25% Pension trend -0.25%
vested liquid vested liquid
Pension DBO 4.4% 2.9% -4.2% -2.8%
Life expectancy +1 year Life expectancy -1 year
vested liquid vested liquid
Pension DBO 3.7% 4.8% -3.3% -4.2%
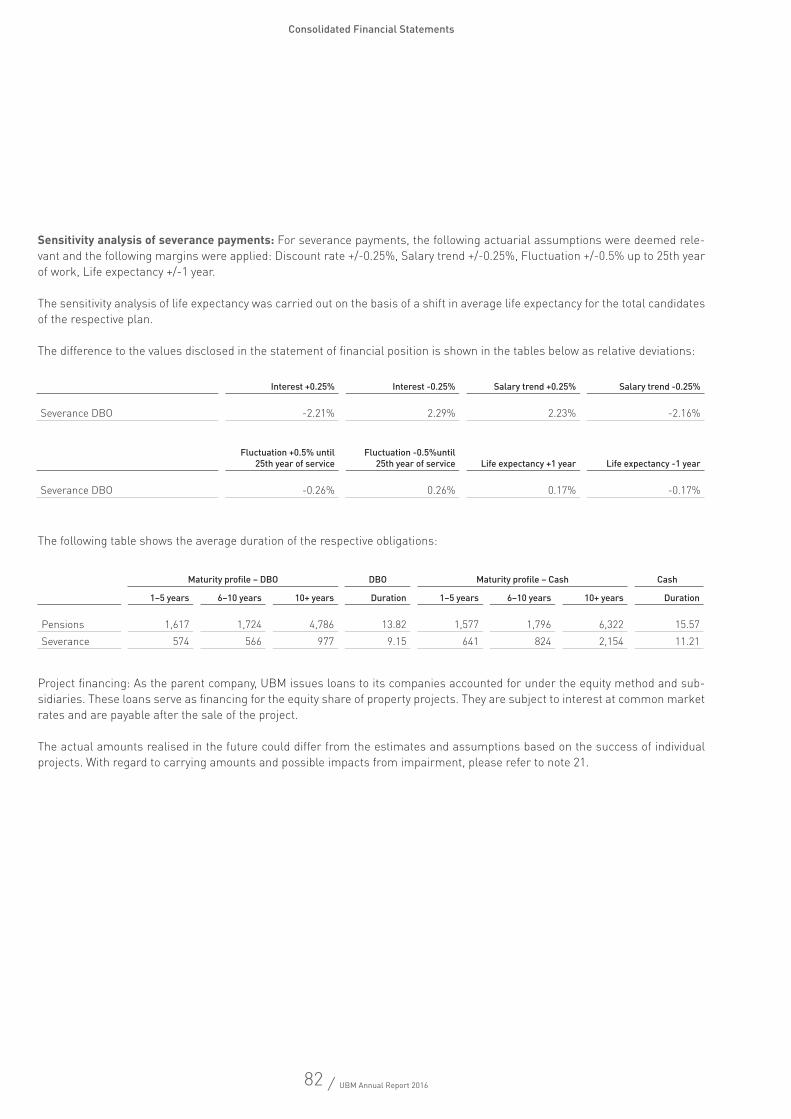
82 / UBM Annual Report 2016
Consolidated Financial Statements
Sensitivity analysis of severance payments: For severance payments, the following actuarial assumptions were deemed rele-vant and the following margins were applied: Discount rate +/-0.25%, Salary trend +/-0.25%, Fluctuation +/-0.5% up to 25th year of work, Life expectancy +/-1 year.
The sensitivity analysis of life expectancy was carried out on the basis of a shift in average life expectancy for the total candidates of the respective plan.
The difference to the values disclosed in the statement of financial position is shown in the tables below as relative deviations:
The following table shows the average duration of the respective obligations:
Project financing: As the parent company, UBM issues loans to its companies accounted for under the equity method and sub-sidiaries. These loans serve as financing for the equity share of property projects. They are subject to interest at common market rates and are payable after the sale of the project.
The actual amounts realised in the future could differ from the estimates and assumptions based on the success of individual projects. With regard to carrying amounts and possible impacts from impairment, please refer to note 21.
Interest +0.25% Interest -0.25% Salary trend +0.25% Salary trend -0.25%
Severance DBO -2.21% 2.29% 2.23% -2.16%
Fluctuation +0.5% until 25th year of service
Fluctuation -0.5%until 25th year of service Life expectancy +1 year Life expectancy -1 year
Severance DBO -0.26% 0.26% 0.17% -0.17%
Maturity profile – DBO DBO Maturity profile – Cash Cash
1–5 years 6–10 years 10+ years Duration 1–5 years 6–10 years 10+ years Duration
Pensions 1,617 1,724 4,786 13.82 1,577 1,796 6,322 15.57Severance 574 566 977 9.15 641 824 2,154 11.21
83 / UBM Annual Report 2016
Consolidated Financial Statements
6. New and amended accounting standards
Standards adopted for the first time in the year under review The first-time application of the standards and interpretations and the amendments to the standards did not have any impact on the consolidated financial statements.
New standards IFRS 14 – Regulatory Deferral AccountsIFRS 14 “Regulatory Deferral Accounts” permits an entity which is a first-time adopter of IFRSs to continue to account, with some limited changes, for regulatory deferral account balances in accordance with its previous GAAP, both on initial adoption of IFRS and in subsequent financial statements. Regulatory deferral account balances, and movements in them, are presented sepa-rately in the statement of financial position and statement of profit or loss and other comprehensive income, and specific disclo-sures are required. IFRS 14 was issued in January 2014 and applies to reporting periods beginning on or after 1 January 2016.
Amendments to standards and interpretationsAmendment to IAS 19 Employee BenefitsThe amendment clarifies how contributions from employees or third parties which are linked to service should be attributed to periods of service and also permits a practical expedient if the amount of the contributions is independent of the number of years of service. The amendment applies to fiscal years beginning on or after 1 February 2015.
Annual Improvements to IFRSs (2010–2012 Cycle)The Annual Improvements to IFRSs 2010–2012 Cycle contains a number of minor amendments to different standards. The amendments apply to fiscal years beginning on or after 1 February 2015. The standards affected by these amendments include: IFRS 2 Share-based Payment; IFRS 3 Business Combinations; IFRS 8 Operating Segments; IFRS 13 Fair Value Measurement; IAS 16 Property, Plant and Equipment; IAS 24 Related Party Disclosures; and IAS 38 Intangible Assets.
Amendments to IFRS 11: Accounting for Acquisitions of Interests in Joint OperationsThe amendments relate to accounting for interests in joint ventures and joint operations. This amendment will involve the inclu-sion of new guidance in IFRS 11 on accounting for acquisitions on interests in joint operations which constitute a business. The amendments apply to fiscal years beginning on or after 1 January 2016.
Amendments to IAS 16 and IAS 38: Clarification of Acceptable Methods of Depreciation and AmortisationThe amendments to IAS 16 “Property, Plant and Equipment” and IAS 38 “Intangible Assets” clarify that a depreciation method that is based on revenue that is generated by an activity that includes the use of an asset is not appropriate because such meth-ods reflect factors other than the pattern of consumption of an asset’s expected future economic benefits. The amendments also specify that a revenue-based amortisation method for determining the future economic benefits of intangible assets is generally inappropriate, whereby this presumption can be overcome under specific limited circumstances. The amendments apply to fiscal years beginning on or after 1 January 2016.
Amendments to IAS 16 and IAS 41: Bearer PlantsThe amendments to IAS 16 “Property, Plant and Equipment” and IAS 41 “Agriculture” relate to the financial reporting for bearer plants. Bearer plants, which are used solely to grow produce, have been brought into the scope of IAS 16. This means that they can be accounted for in the same way as property, plant and equipment. The amendments apply to fiscal years beginning on or after 1 January 2016.
84 / UBM Annual Report 2016
Consolidated Financial Statements
Amendments to IAS 27: Equity Method in Separate Financial StatementsThe minor amendments to IAS 27 “Separate Financial Statements” allow entities to use the equity method as an accounting option for investments in subsidiaries, joint ventures and companies accounted for under the equity method in an entity’s sepa-rate financial statements. The amendments apply to fiscal years beginning on or after 1 January 2016.
Annual Improvements to IFRSs 2012–2014 CycleThe Annual Improvements to IFRSs 2012–2014 Cycle involves a range of small amendments to various standards. Some of the amendments relate to: IFRS 5 “Non-current Assets Held for Sale and Discontinued Operations” – clarifies that no accounting change is required in
cases in which an entity reclassifies an asset from held for sale to held for distribution or vice versa. IFRS 7 “Financial Instruments: Disclosures” – clarifies whether a servicing contract is continuing involvement in a trans-
ferred asset and clarifies offsetting disclosures to the condensed interim financial statements. IAS 19 “Employee Benefits” – the amendments clarify that the corporate bonds used in estimating the discount rate for
post-employment benefits should be denominated in the same currency as the benefits to be paid. IAS 34 “Interim Financial Reporting” – proposes the inclusion of a cross-reference to information disclosed in interim finan-
cial reports.
All of the amendments apply to fiscal years beginning on or after 1 January 2016.
Amendments to IAS 1: Disclosure InitiativeIn December 2014 the IASB issued amendments to IAS 1 Presentation of Financial Statements. The amendments primarily relate to the following points: Clarifying that disclosures in the financial statements are only necessary if their content is not immaterial. Guidance on aggregating and disaggregating items in the statement of financial position and statement of profit or loss and
other comprehensive income. Clarifying how to account for an entity’s share of other comprehensive income of equity-accounted companies accounted for
under the equity method in the statement of comprehensive income. Eliminating the model structure of the financial statements in order to take account of relevance to the specific company.
The amendments apply to reporting periods beginning on or after 1 January 2016.
Amendments to IFRS 10, IFRS 12 and IAS 28: Investment Entities: Applying the Consolidation ExceptionThe IASB issued amendments to IFRS 10 “Consolidated Financial Statements”, IFRS 12 “Disclosure of Interests in Other Enti-ties” and IAS 28 “Investments in Companies accounted for under the equity method and Joint Ventures” with regard to applying the consolidation exception for investment entities. The amendments serve to clarify three issues related to the consolidation exception for investment entities whose subsidiaries are measured at fair value.
The amendments apply to reporting periods beginning on or after 1 January 2016.
The first-time application of the standards and interpretations and the amendments to the standards did not have any impact on the consolidated financial statements.
New accounting standards that have not yet been applied The following standards and interpretations had already been published at the time that these consolidated financial statements were being prepared; they were not mandatory in the current fiscal year and the option to apply them early was not applied.
85 / UBM Annual Report 2016
Consolidated Financial Statements
Standards and interpretations already adopted by the European Union
New standards IFRS 9 – Financial Instruments The IASB published the final version of the standard on 24 July 2014 in the course of completing the various phases of its compre-hensive financial instruments project. This means that IAS 39 Financial Instruments and Recognition can now be fully replaced with the application of IFRS 9. The most recently published version of IFRS 9 replaces all earlier versions of the standard. The amendment applies to reporting periods beginning on or after 1 January 2018. In future the Group will probably use the simplified model pursuant to IFRS 9.5.5.15 et seq. to determine impairment of specific financial instruments. This model provides for the exclusive use of Levels 2 and 3. This means that a risk provision in the amount of the expected loss over the remaining term – lifetime expected loss – will be formed for the financial instrument upon inception. Loans to associates or joint ventures, issued in the course of project development, shall in future be valued pursuant to the 12-month Expected Loss Model or transferred to the Lifetime Expected Loss Model should there be a significant worsening in the credit risk. UBM is currently evaluating the impact of the first-time application.
IFRS 15 – Revenue from Contracts with Customers IFRS 15 specifies how and when an IFRS reporter will recognise revenue as well as requiring such entities to provide users of financial statements with more informative, relevant disclosures. The standard provides a single, principles-based, five-step model to be applied to all contracts with customers. IFRS 15 was issued in May 2014 and applies to reporting periods beginning on or after 1 January 2018. The Group expects only limited impacts on revenue realisation from the first-time application of IFRS 15. In the area of proceeds from rent from IAS 40 Investment Property, it is assumed that there will be no changes regarding the point in time that the revenue is generated. Revenue from utilising real estate is significantly tied to the contractual nature of the transfer and the time of closing. Every contract shall be analysed individually in accordance with the five-step model; neverthe-less, UBM assumes that here there will also not be any significant changes to the current standard. With regard to proceeds from construction contracts, in individual cases it shall be determined whether separable services have been provided. In general, the Group operates as a general contractor, which is why one should expect the ongoing application of the POC method for the majority of projects.
Standards and interpretations not yet adopted by the European Union
New standardsIFRS 16 – LeasesThe standard specifies how to recognise, measure, present and disclose leases. IFRS 16 replaces the previous standard IAS 17 and three interpretations related to leases. The standard provides a single lessee accounting model, requiring lessees to recog-nise assets and liabilities for all leases unless the lease term is 12 months or less or the underlying asset has a low value (option to choose). The standard was published in January 2016 and its application will be obligatory for reporting periods beginning on or after 1 January 2019. The Group is currently evaluating the impact of the standard on the consolidated financial statements.
New interpretationsIFRIC 22: Foreign Currency Transactions and Advance ConsiderationThe goal of this interpretation is to clarify the accounting for transactions that include the receipt or payment of advance consid-eration in a foreign currency. The amendments apply to reporting periods beginning on or after 1 January 2018.
86 / UBM Annual Report 2016
Consolidated Financial Statements
Amendments to standards and interpretationsAmendments to IFRS 10 and IAS 28: Investments in Companies accounted for under the equity method and Joint VenturesThe amendments address an inconsistency between the requirements of IFRS 10 and IAS 28. They clarify how to deal with gains and losses resulting from a transaction between an investor and its associate or joint venture. Gains or losses from downstream transactions involving assets that constitute a business must be recognised in full by the investor. Transactions involving assets which do not constitute a business require only partial recognition of the gain or loss. The application of the amendments has been postponed for an indefinite period. The Group is currently evaluating the impact of the amendments on the consolidated financial statements.
Amendments to IAS 12: Recognition of deferred tax assets for unrealised lossesThe amendments to IAS 12 aim in particular to clarify how to account for deferred tax assets for unrealised losses from assets measured at fair value in order to address diversity in practice. The amendments apply to reporting periods beginning on or after 1 January 2017. The application is not likely to have any impact on the consolidated financial statements.
Amendments to IAS 7: Disclosure Initiative The amendments come with the objective that an entity shall provide disclosures that enable users of financial statements to evaluate changes in liabilities arising from financing activities. The amendments apply to reporting periods beginning on or after 1 January 2017.
Annual Improvements to IFRSs 2014–2016 CycleThe Annual Improvements to IFRSs 2014–2016 Cycle involves a range of small amendments to various standards. Some of the amendments relate to: IFRS 1 First-time Adoption of International Financial Reporting Standards: Deleted the short-term exemptions in paragraphs
E3–E7 of IFRS 1, because they have now served their intended purpose. IFRS 12 Disclosure of Interests in Other Entities: Clarified the scope of the standard by specifying that the disclosure require-
ments in the standard, except for those in paragraphs B10–B16, apply to an entity’s interests listed in paragraph 5 that are classified as held for sale, as held for distribution or as discontinued operations in accordance with IFRS 5 Non-current Assets Held for Sale and Discontinued Operations.
IFRS 28 Investments in Associates and Joint Ventures: Clarified that the election to measure at fair value through profit or loss an investment in an associate or a joint venture that is held by an entity that is a venture capital organisation, or other qualifying entity, is available for each investment in an associate or joint venture on an investment-by-investment basis, upon initial recognition.
Amendments to IFRS 15: Clarification to IFRS 15The amendments address three of the five topics identified (identifying performance obligations, principal versus agent consider-ations, and licensing) and aim to provide some transition relief for modified contracts and completed contracts.
The amendments apply to reporting periods beginning on or after 1 January 2018.
Amendments to IFRS 2: Classification and Measurement of Share-based Payment TransactionsThe amendments address individual questions related to accounting for cash-settled share-based payment transactions. The most important amendment or addition is that IFRS 2 now contains specifications relating to determining the fair value of lia-bilities resulting from share-based payment transactions. The amendments apply to reporting periods beginning on or after 1 January 2018.
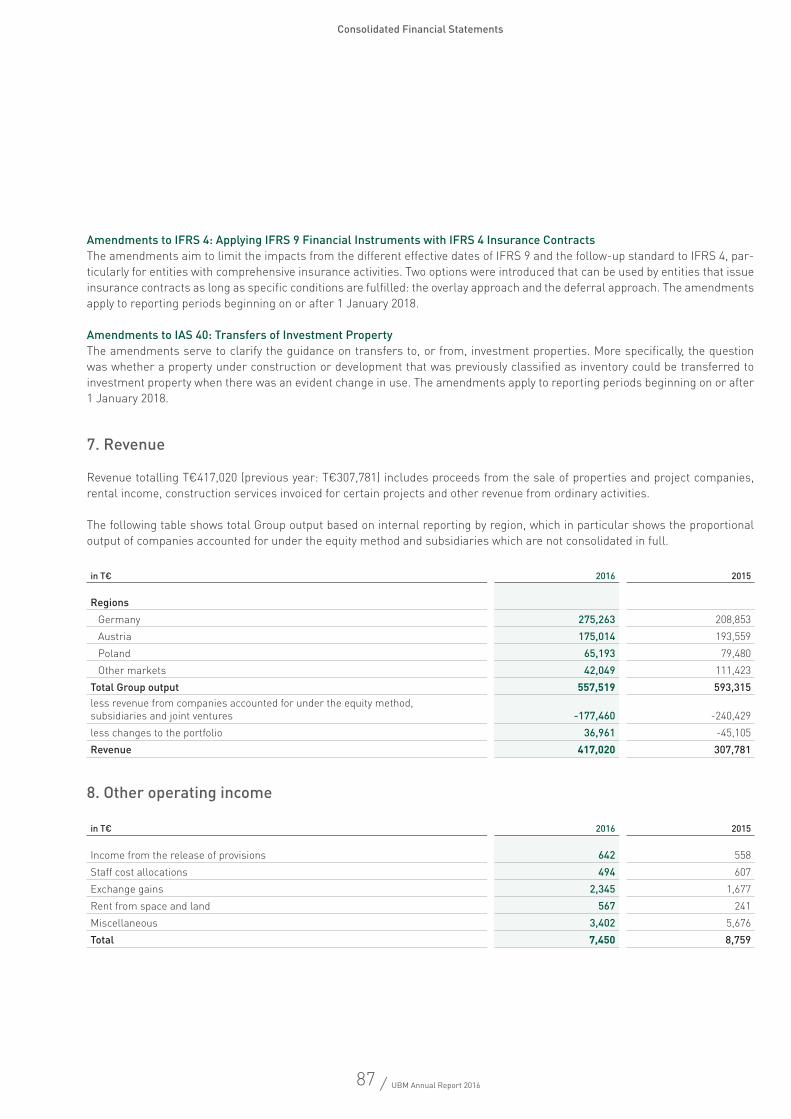
87 / UBM Annual Report 2016
Consolidated Financial Statements
Amendments to IFRS 4: Applying IFRS 9 Financial Instruments with IFRS 4 Insurance Contracts The amendments aim to limit the impacts from the different effective dates of IFRS 9 and the follow-up standard to IFRS 4, par-ticularly for entities with comprehensive insurance activities. Two options were introduced that can be used by entities that issue insurance contracts as long as specific conditions are fulfilled: the overlay approach and the deferral approach. The amendments apply to reporting periods beginning on or after 1 January 2018.
Amendments to IAS 40: Transfers of Investment Property The amendments serve to clarify the guidance on transfers to, or from, investment properties. More specifically, the question was whether a property under construction or development that was previously classified as inventory could be transferred to investment property when there was an evident change in use. The amendments apply to reporting periods beginning on or after 1 January 2018.
7. Revenue
Revenue totalling T€417,020 (previous year: T€307,781) includes proceeds from the sale of properties and project companies, rental income, construction services invoiced for certain projects and other revenue from ordinary activities.
The following table shows total Group output based on internal reporting by region, which in particular shows the proportional output of companies accounted for under the equity method and subsidiaries which are not consolidated in full.
8. Other operating income
in T€ 2016 2015
RegionsGermany 275,263 208,853Austria 175,014 193,559Poland 65,193 79,480Other markets 42,049 111,423
Total Group output 557,519 593,315less revenue from companies accounted for under the equity method, subsidiaries and joint ventures -177,460 -240,429less changes to the portfolio 36,961 -45,105Revenue 417,020 307,781
in T€ 2016 2015
Income from the release of provisions 642 558Staff cost allocations 494 607Exchange gains 2,345 1,677Rent from space and land 567 241Miscellaneous 3,402 5,676Total 7,450 8,759
88 / UBM Annual Report 2016
Consolidated Financial Statements
9. Cost of materials and other related production services
In the business year disposals of carrying amounts from properties sold were recognised in cost of materials, the figures for the previous years have been adjusted correspondingly.
10. Staff expense
Expenditure on severance payments and pensions includes the current service costs and expenditure on defined contribution obligations. The interest expense is shown under the item finance costs.
11. Other operating expenses
The significant other operating expenses break down as follows:
The miscellaneous other operating expenses primarily comprise other third-party services, travel expenses, charges and fees, as well as general administrative costs.
in T€ 2016 2015
Expenditure on raw materials and supplies and for purchased goods -129,623 -42,107Expenditure on purchased services -170,749 -210,613Total -300,372 -252,720
in T€ 2016 2015
Salaries and wages -38,828 -30,801Social welfare expenses -5,005 -6,251Expenditure on severance payments and pensions -445 -253Total -44,278 -37,305
in T€ 2016 2015
Office operations -7,677 -7,155Advertising -1,607 -2,913Legal and consultancy services -9,450 -10,625Depreciation/impairment on current real estate assets -5,547 -5,105Exchange losses -8,513 -1,295Taxes, contributions and charges -3,137 -3,975Bank charges -1,775 -2,912Miscellaneous -14,721 -14,283Total -52,427 -48,263
89 / UBM Annual Report 2016
Consolidated Financial Statements
12. Depreciation, amortisation and impairment expense
Amortisation of T€78 (previous year: T€67) was applied to intangible assets and depreciation of T€3,329 (previous year: T€2,740) to property, plant and equipment.
13. Financial income
14. Finance costs
15. Income tax
Income tax is the taxes on income and earnings paid or owed in the individual countries, the tax allocation for other shareholders of a non-consolidated shareholding in accordance with Article 9 Austrian Corporate Tax Act and deferred taxes.
The calculation is based on tax rates that will be applicable pursuant to the prevailing tax laws or according to tax laws whose entry into force is essentially finalised, at the probable date of realisation.
in T€ 2016 2015
Income from shareholdings 4,069 659of which from affiliates 4,068 305
Interest and similar income 6,385 6,330of which from project financing for companies accounted for under the equity method and subsidiaries 4,894 3,624of which from affiliates 44 365
Income from the disposal of/reversal of impairment of current financial assets 2,693 418of which from affiliates - -
Total 13,147 7,407
in T€ 2016 2015
Interest and similar expenditure relating to bonds -13,336 -11,225Interest and similar expenditure relating to other financial liabilities -2,921 -4,444Other interest and similar expenses -2,943 -6,630Expenditure relating to shareholdings - -
of which from companies accounted for under the equity method - -of which from affiliates - -
Expenditure from other financial assets -88 -8,466of which impairment and amortisation - -4,939
Total -19,288 -30,765
90 / UBM Annual Report 2016
Consolidated Financial Statements
The tax expense resulting from the application of the Austrian Corporation Tax rate of 25% can be reconciled to the actual expense as follows:
In addition to the tax expense recognised in the consolidated income statement, the tax effect of expenses and income set off to other comprehensive income was also recognised in other comprehensive income. The income recognised in other comprehen-sive income amounted to T€223 (previous year: T€3) and related to the tax effect of the remeasurement from benefit obligations.
16. Earnings per share
Earnings per share are calculated by dividing the proportion of the annual profit relating to the shareholders of the parent by the weighted average number of shares issued. Basic earnings per share correspond to diluted earnings per share.
in T€ 2016 2015
Profit before income tax 40,065 50,285Theoretical tax expense (+)/income (-) 10,016 12,571Differences in rates of taxation 2,940 317Tax effect of non-deductible expenditure and tax-exempt income -5,442 -9,194Income/expenditure from companies accounted for under the equity method -3,529 2,013Changes in deferred tax assets not applied in relation to loss carryforwards 5,569 8,356Effect of changes in tax rates -141 103Tax losses (-)/income (+) related to other periods -1,110 -1,603Other differences 2,406 389Taxes on income and earnings 10,709 12,952
2016 2015
Proportion of annual surplus relating to shareholders of the parent (in T€) 29,109 33,808Weighted average number of shares issued 7,472,180 6,901,962Earnings per share (in €) 3.90 4.90
in T€ 2016 2015
Actual tax expense 9,667 5,306Deferred tax expense/income 1,042 7,646Tax expense (+)/income (-) 10,709 12,952
91 / UBM Annual Report 2016
Consolidated Financial Statements
17. Intangible assets
The only acquired intangible assets shown are those with a limited useful life. The details under accounting and measurement methods explain the useful lives and methods of amortisation, depreciation and impairment.
Scheduled depreciation is shown in the income statement under “Depreciation, amortisation and impairment expense”.
The impairment test involves comparing the total of the carrying amounts of the assets of the cash-generating unit to which goodwill was allocated with the recoverable amount of the same assets. For the UBM Group the cash-generating unit is the sep-arate consolidated company. The goodwill is allocated to the cash-generating unit of Münchner Grund Immobilien Bauträger AG.
in T€Concessions, licences
and similar rights Goodwill Total
Acquisition and manufacturing costsBalance at 1 Jan 2015 355 3,861 4,216Additions from common control transaction 438 - 438Additions 96 - 96Disposals -164 - -164Reclassifications 6 - 6Currency adjustments 2 - 2Balance at 31 Dec 2015 733 3,861 4,594
Changes through corporate acquisitions 6 - 6Additions/disposals through changes to the consolidated group -117 -21 -138Additions 70 - 70Disposals -83 - -83Reclassifications - - -Currency adjustments -4 - -4Balance at 31 Dec 2016 605 3,840 4,445
Accumulated amortisation and impairmentBalance at 1 Jan 2015 289 1,182 1,471Additions from common control transaction 329 - 329Additions 67 - 67Disposals -158 - -158Reclassifications - - -Currency adjustments 2 - 2Appreciation - - -Balance at 31 Dec 2015 529 1,182 1,711
Changes through corporate acquisitions 5 - 5Additions/disposals through changes to the consolidated group -104 - -104Additions 78 - 78Disposals -82 - -82Reclassifications - - -Currency adjustments -4 - -4Appreciation - - -Balance at 31 Dec 2016 422 1,182 1,604
Carrying amounts – balance at 31 Dec 2015 204 2,679 2,883Carrying amounts – balance at 31 Dec 2016 183 2,658 2,841
92 / UBM Annual Report 2016
Consolidated Financial Statements
The recoverable amount of the cash-generating unit corresponds to the value in use. The cash flows were derived from budgets for the year 2016 and the following four years (detailed planning period) with a growth rate of 1% (previous year: 1%) approved by the Managing Board and current as at the time of the implementation of the impairment tests. These forecasts are based on past experience and on expectations on future market development. Discounting was applied on the basis of specific capital costs of 6.64% (previous year: 7.68%), based on a perpetual annuity. A 1% change in the specific capital costs would not yield any change in valuation.
18. Property, plant and equipment
in T€
Land, land rights and buildings including buildings
on leasehold land
Technical equipment and
machinery
Other facilities, fixtures and office
equipment
Payments on account and assets under construction Total
Acquisition and manufacturing costsBalance at 1 Jan 2015 28,679 1,894 11,111 45 41,729Additions from common control transaction 4,648 725 3,599 - 8,972Changes through corporate acquisitions - 1,330 774 - 2,104Additions 14,084 196 3,355 163 17,798Disposals - -1,646 -2,532 -7 -4,185Reclassifications -14,253 5 -1,162 136 -15,274Currency adjustments 8 6 21 -5 30Balance at 31 Dec 2015 33,166 2,510 15,166 332 51,174
Changes through corporate acquisitions - 575 46 - 621Additions/disposals through changes to the consolidated group - -62 -324 - -386Additions - 222 862 1,491 2,575Disposals -272 -10 -674 - -956Reclassifications 5,598 667 -10 -657 5,598Currency adjustments 1 -51 -127 -21 -198Balance at 31 Dec 2016 38,493 3,851 14,939 1,145 58,428
Accumulated depreciation and impairmentBalance at 1 Jan 2015 594 1,363 6,840 0 8,797Additions from common control transaction 638 707 2,988 - 4,333Changes through corporate acquisitions - 374 342 - 716Additions 999 127 1,614 - 2,740Disposals - -1,489 -2,364 - -3,853Reclassifications -328 - -33 - -361Currency adjustments 1 17 35 - 53Appreciation - - - - -Balance at 31 Dec 2015 1,904 1,099 9,422 0 12,425
Changes through corporate acquisitions - 230 46 - 276Additions/disposals through changes to the consolidated group - -59 -281 - -340Additions 730 951 1,648 - 3,329Disposals -272 -10 -333 - -615Reclassifications - -680 -338 - -1,018Currency adjustments - -23 -69 -1 -93Appreciation - - - - -Balance at 31 Dec 2016 2,362 1,508 10,095 -1 13,964
Carrying amounts – balance at 31 Dec 2015 31,262 1,411 5,744 332 38,749Carrying amounts – balance at 31 Dec 2016 36,131 2,343 4,844 1,146 44,464
93 / UBM Annual Report 2016
Consolidated Financial Statements
Any impairment recognised in profit or loss is shown together with scheduled depreciation under “Depreciation, amortisation and impairment expense“ and any reversals of impairment recognised in profit or loss on assets subject to prior impairment are shown in the income statement under “Other operating income”. The carrying amount of property, plant and equipment pledged as collateral as of the reporting date amounts to T€35,867 (previous year: T€31,400). Property, plant and equipment with a car-rying amount of T€35,867 (previous year: T€31,400) is subject to restrictions on disposal.
The carrying amounts of property, plant and equipment held under finance leasing agreements amounted to T€2,184 (previous year: T€2,312). These are balanced by corresponding liabilities represented by the present value of the minimum lease payments of T€1,016 (previous year: T€1,097).
Operating leasesThe Group essentially leases cars and individual items of real estate under operating leases, in most cases pre-agreed extension options are not exercised. The average term of car leasing agreements is five years and the term of real estate leasing agree-ments is up to seven years.
19. Investment property
The carrying amounts of investment property correspond to the fair value and break down as follows:
in T€ 2016 2015
Due with 1 year 2,353 3,099Due within 1 to 5 years 10,323 14,647Due after 5 years - -
in T€
Carrying amountsBalance at 1 Jan 2015 229,869Additions from common control transaction 193,212Changes through corporate acquisitions 24,632Additions 128,479Disposals -18,327Reclassifications IFRS 5 -27,973Reclassifications -2,306Currency adjustments -245Appreciation 26,566Balance at 31 Dec 2015 553,907
Changes through corporate acquisitions 12,167Additions 211,203Disposals -118,791Reclassifications IFRS 5 -184,319Reclassifications -6,616Currency adjustments -5,024Appreciation 34,056Balance at 31 Dec 2016 496,583
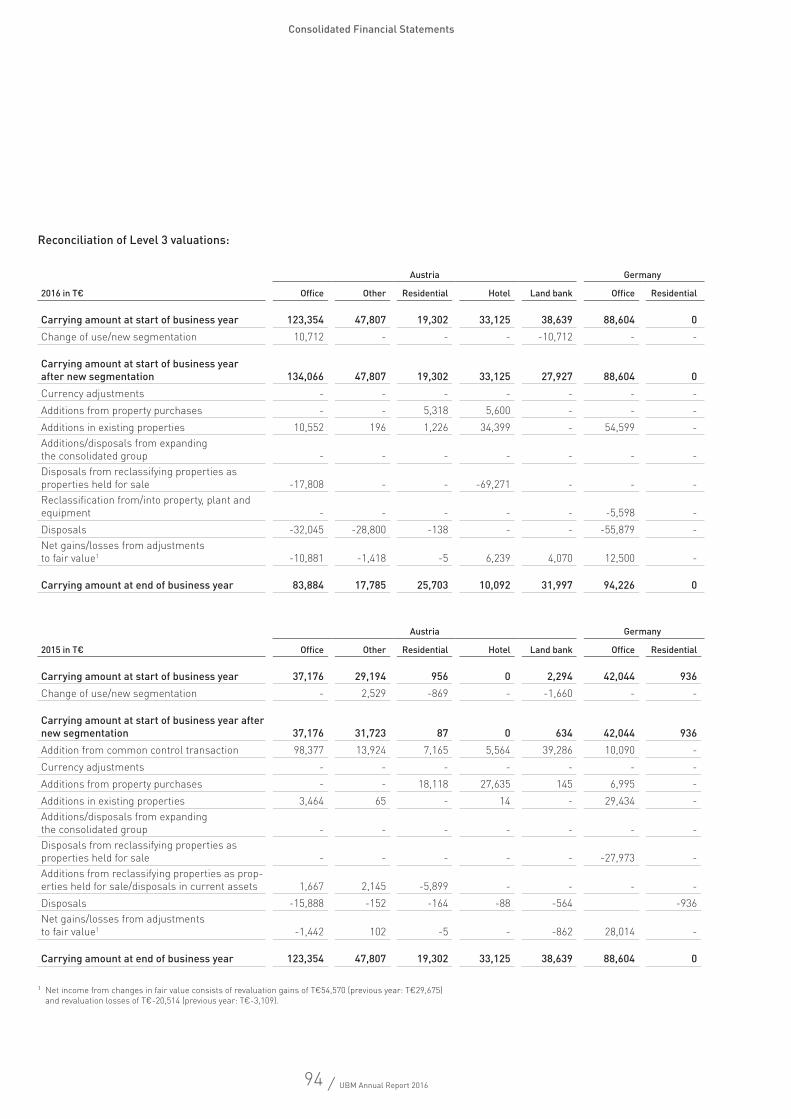
94 / UBM Annual Report 2016
Consolidated Financial Statements
Reconciliation of Level 3 valuations:
1 Net income from changes in fair value consists of revaluation gains of T€54,570 (previous year: T€29,675) and revaluation losses of T€-20,514 (previous year: T€-3,109).
Austria Germany Germany Poland Other markets
2016 in T€ Office Other Residential Hotel Land bank Office Residential Hotel Land bank Office Other Hotel Land bank Office Other Residential Land bank Total
Carrying amount at start of business year 123,354 47,807 19,302 33,125 38,639 88,604 0 917 9,534 58,510 64,419 8,825 0 19,051 26,879 525 14,416 553,907Change of use/new segmentation 10,712 - - - -10,712 - - - - - - - - - - - - 0
Carrying amount at start of business year after new segmentation 134,066 47,807 19,302 33,125 27,927 88,604 0 917 9,534 58,510 64,419 8,825 0 19,051 26,879 525 14,416 553,907Currency adjustments - - - - - - - - - -3,259 -1,318 -420 - -2 -56 5 26 -5,024Additions from property purchases - - 5,318 5,600 - - - 250 14,074 50,827 - 3,108 - - - - - 79,177Additions in existing properties 10,552 196 1,226 34,399 - 54,599 - 635 1,126 23,025 - 5,653 - 202 91 - 322 132,026Additions/disposals from expanding the consolidated group - - - - - - - - - 12,167 - - - - - - - 12,167Disposals from reclassifying properties as properties held for sale -17,808 - - -69,271 - - - - -23,500 -73,740 - - - - - - - -184,319Reclassification from/into property, plant and equipment - - - - - -5,598 - - - - -1,018 - - - - - - -6,616Disposals -32,045 -28,800 -138 - - -55,879 - - - -188 - - - -851 - - -890 -118,791Net gains/losses from adjustments to fair value1 -10,881 -1,418 -5 6,239 4,070 12,500 - - 18,763 8,708 -2,830 - - -1,090 - - - 34,056
Carrying amount at end of business year 83,884 17,785 25,703 10,092 31,997 94,226 0 1,802 19,997 76,050 59,253 17,166 0 17,310 26,914 530 13,874 496,583
Austria Germany Germany Poland Other markets
2015 in T€ Office Other Residential Hotel Land bank Office Residential Hotel Land bank Office Other Hotel Land bank Office Other Residential Land bank Total
Carrying amount at start of business year 37,176 29,194 956 0 2,294 42,044 936 0 1,568 0 0 0 0 35,918 73,642 0 6,141 229,869Change of use/new segmentation - 2,529 -869 - -1,660 - - - - 35,088 63,642 - - -35,088 -63,427 - -215 0
Carrying amount at start of business year after new segmentation 37,176 31,723 87 0 634 42,044 936 0 1,568 35,088 63,642 0 0 830 10,215 0 5,926 229,869Addition from common control transaction 98,377 13,924 7,165 5,564 39,286 10,090 - - - - - - - 10,129 - 523 8,154 193,212Currency adjustments - - - - - - - - - -422 -2 -162 - 281 -54 2 112 -245Additions from property purchases - - 18,118 27,635 145 6,995 - 917 8,466 8,623 783 8,699 - - 495 - - 80,876Additions in existing properties 3,464 65 - 14 - 29,434 - - - 14,388 - - - 3 - - 235 47,603Additions/disposals from expanding the consolidated group - - - - - - - - - - - - - 8,170 16,462 - - 24,632Disposals from reclassifying properties as properties held for sale - - - - - -27,973 - - - - - - - - - - - -27,973Additions from reclassifying properties as prop-erties held for sale/disposals in current assets 1,667 2,145 -5,899 - - - - - - - - - - - -219 - - -2,306Disposals -15,888 -152 -164 -88 -564 -936 - -500 - -4 - - - -20 - -11 -18,327Net gains/losses from adjustments to fair value1 -1,442 102 -5 - -862 28,014 - - - 833 - 288 - -362 - - - 26,566
Carrying amount at end of business year 123,354 47,807 19,302 33,125 38,639 88,604 0 917 9,534 58,510 64,419 8,825 0 19,051 26,879 525 14,416 553,907
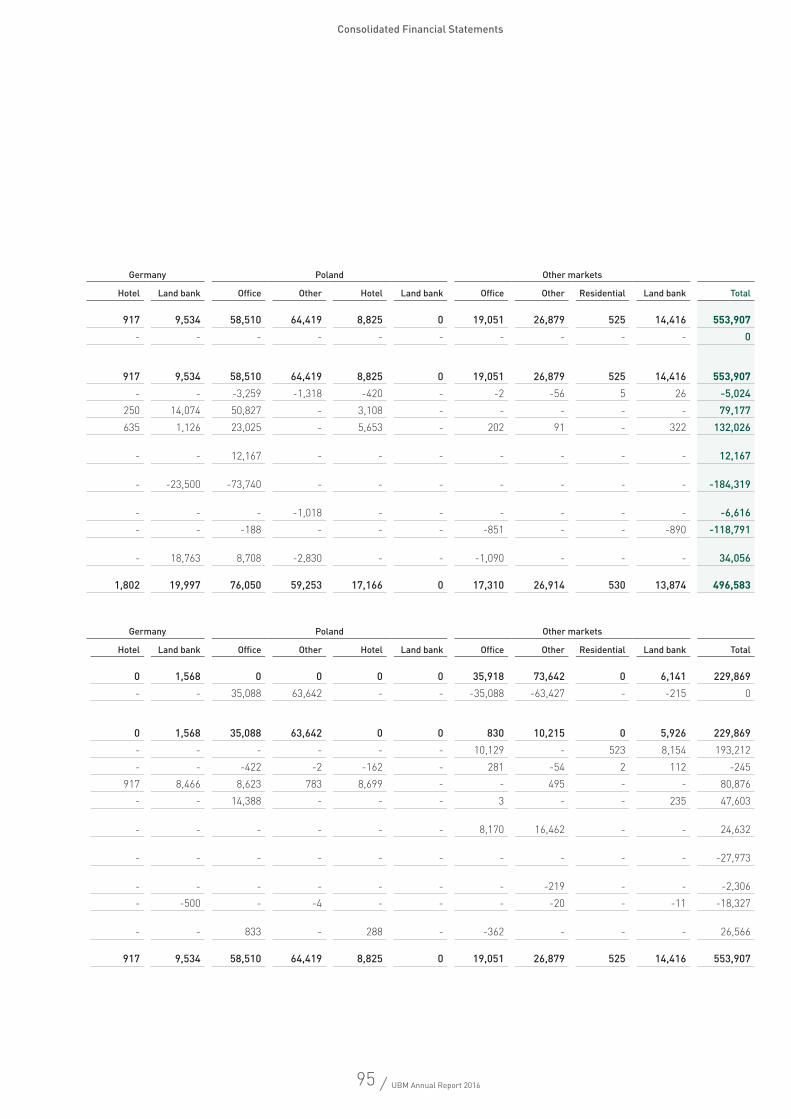
95 / UBM Annual Report 2016
Consolidated Financial Statements
Austria Germany Germany Poland Other markets
2016 in T€ Office Other Residential Hotel Land bank Office Residential Hotel Land bank Office Other Hotel Land bank Office Other Residential Land bank Total
Carrying amount at start of business year 123,354 47,807 19,302 33,125 38,639 88,604 0 917 9,534 58,510 64,419 8,825 0 19,051 26,879 525 14,416 553,907Change of use/new segmentation 10,712 - - - -10,712 - - - - - - - - - - - - 0
Carrying amount at start of business year after new segmentation 134,066 47,807 19,302 33,125 27,927 88,604 0 917 9,534 58,510 64,419 8,825 0 19,051 26,879 525 14,416 553,907Currency adjustments - - - - - - - - - -3,259 -1,318 -420 - -2 -56 5 26 -5,024Additions from property purchases - - 5,318 5,600 - - - 250 14,074 50,827 - 3,108 - - - - - 79,177Additions in existing properties 10,552 196 1,226 34,399 - 54,599 - 635 1,126 23,025 - 5,653 - 202 91 - 322 132,026Additions/disposals from expanding the consolidated group - - - - - - - - - 12,167 - - - - - - - 12,167Disposals from reclassifying properties as properties held for sale -17,808 - - -69,271 - - - - -23,500 -73,740 - - - - - - - -184,319Reclassification from/into property, plant and equipment - - - - - -5,598 - - - - -1,018 - - - - - - -6,616Disposals -32,045 -28,800 -138 - - -55,879 - - - -188 - - - -851 - - -890 -118,791Net gains/losses from adjustments to fair value1 -10,881 -1,418 -5 6,239 4,070 12,500 - - 18,763 8,708 -2,830 - - -1,090 - - - 34,056
Carrying amount at end of business year 83,884 17,785 25,703 10,092 31,997 94,226 0 1,802 19,997 76,050 59,253 17,166 0 17,310 26,914 530 13,874 496,583
Austria Germany Germany Poland Other markets
2015 in T€ Office Other Residential Hotel Land bank Office Residential Hotel Land bank Office Other Hotel Land bank Office Other Residential Land bank Total
Carrying amount at start of business year 37,176 29,194 956 0 2,294 42,044 936 0 1,568 0 0 0 0 35,918 73,642 0 6,141 229,869Change of use/new segmentation - 2,529 -869 - -1,660 - - - - 35,088 63,642 - - -35,088 -63,427 - -215 0
Carrying amount at start of business year after new segmentation 37,176 31,723 87 0 634 42,044 936 0 1,568 35,088 63,642 0 0 830 10,215 0 5,926 229,869Addition from common control transaction 98,377 13,924 7,165 5,564 39,286 10,090 - - - - - - - 10,129 - 523 8,154 193,212Currency adjustments - - - - - - - - - -422 -2 -162 - 281 -54 2 112 -245Additions from property purchases - - 18,118 27,635 145 6,995 - 917 8,466 8,623 783 8,699 - - 495 - - 80,876Additions in existing properties 3,464 65 - 14 - 29,434 - - - 14,388 - - - 3 - - 235 47,603Additions/disposals from expanding the consolidated group - - - - - - - - - - - - - 8,170 16,462 - - 24,632Disposals from reclassifying properties as properties held for sale - - - - - -27,973 - - - - - - - - - - - -27,973Additions from reclassifying properties as prop-erties held for sale/disposals in current assets 1,667 2,145 -5,899 - - - - - - - - - - - -219 - - -2,306Disposals -15,888 -152 -164 -88 -564 -936 - -500 - -4 - - - -20 - -11 -18,327Net gains/losses from adjustments to fair value1 -1,442 102 -5 - -862 28,014 - - - 833 - 288 - -362 - - - 26,566
Carrying amount at end of business year 123,354 47,807 19,302 33,125 38,639 88,604 0 917 9,534 58,510 64,419 8,825 0 19,051 26,879 525 14,416 553,907
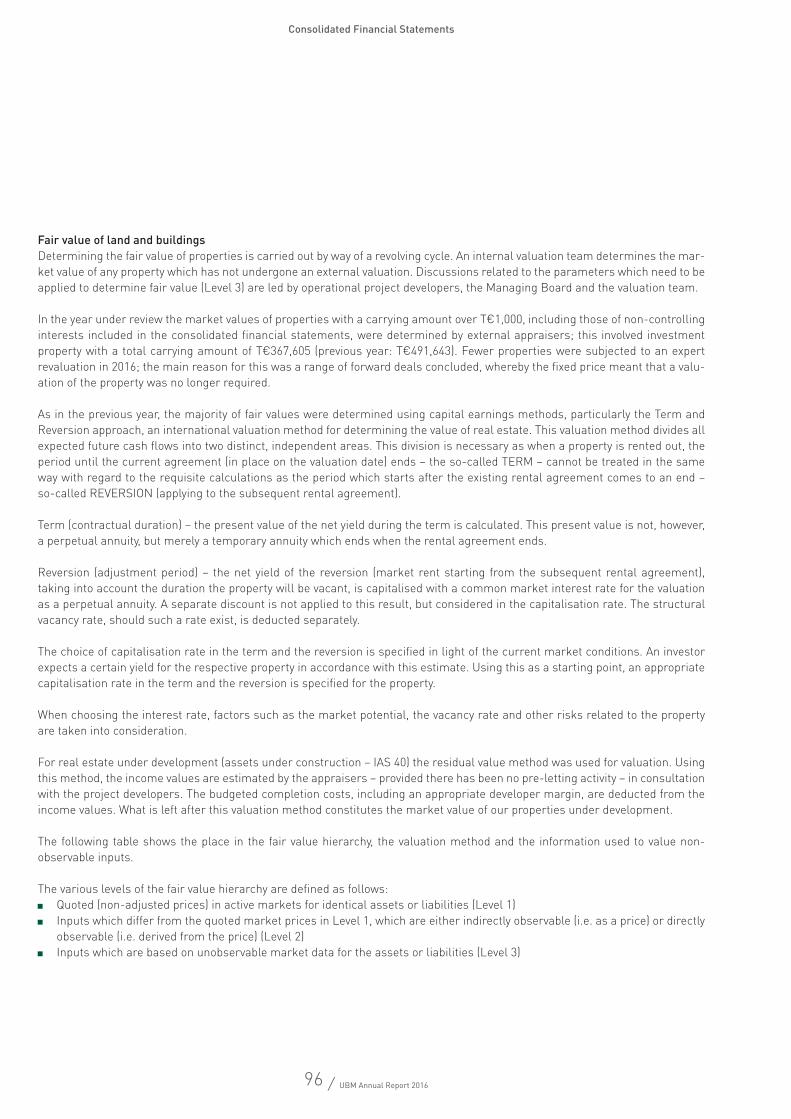
96 / UBM Annual Report 2016
Consolidated Financial Statements
Fair value of land and buildingsDetermining the fair value of properties is carried out by way of a revolving cycle. An internal valuation team determines the mar-ket value of any property which has not undergone an external valuation. Discussions related to the parameters which need to be applied to determine fair value (Level 3) are led by operational project developers, the Managing Board and the valuation team.
In the year under review the market values of properties with a carrying amount over T€1,000, including those of non-controlling interests included in the consolidated financial statements, were determined by external appraisers; this involved investment property with a total carrying amount of T€367,605 (previous year: T€491,643). Fewer properties were subjected to an expert revaluation in 2016; the main reason for this was a range of forward deals concluded, whereby the fixed price meant that a valu-ation of the property was no longer required.
As in the previous year, the majority of fair values were determined using capital earnings methods, particularly the Term and Reversion approach, an international valuation method for determining the value of real estate. This valuation method divides all expected future cash flows into two distinct, independent areas. This division is necessary as when a property is rented out, the period until the current agreement (in place on the valuation date) ends – the so-called TERM – cannot be treated in the same way with regard to the requisite calculations as the period which starts after the existing rental agreement comes to an end – so-called REVERSION (applying to the subsequent rental agreement).
Term (contractual duration) – the present value of the net yield during the term is calculated. This present value is not, however, a perpetual annuity, but merely a temporary annuity which ends when the rental agreement ends.
Reversion (adjustment period) – the net yield of the reversion (market rent starting from the subsequent rental agreement), taking into account the duration the property will be vacant, is capitalised with a common market interest rate for the valuation as a perpetual annuity. A separate discount is not applied to this result, but considered in the capitalisation rate. The structural vacancy rate, should such a rate exist, is deducted separately.
The choice of capitalisation rate in the term and the reversion is specified in light of the current market conditions. An investor expects a certain yield for the respective property in accordance with this estimate. Using this as a starting point, an appropriate capitalisation rate in the term and the reversion is specified for the property.
When choosing the interest rate, factors such as the market potential, the vacancy rate and other risks related to the property are taken into consideration.
For real estate under development (assets under construction – IAS 40) the residual value method was used for valuation. Using this method, the income values are estimated by the appraisers – provided there has been no pre-letting activity – in consultation with the project developers. The budgeted completion costs, including an appropriate developer margin, are deducted from the income values. What is left after this valuation method constitutes the market value of our properties under development.
The following table shows the place in the fair value hierarchy, the valuation method and the information used to value non- observable inputs.
The various levels of the fair value hierarchy are defined as follows: Quoted (non-adjusted prices) in active markets for identical assets or liabilities (Level 1) Inputs which differ from the quoted market prices in Level 1, which are either indirectly observable (i.e. as a price) or directly
observable (i.e. derived from the price) (Level 2) Inputs which are based on unobservable market data for the assets or liabilities (Level 3)
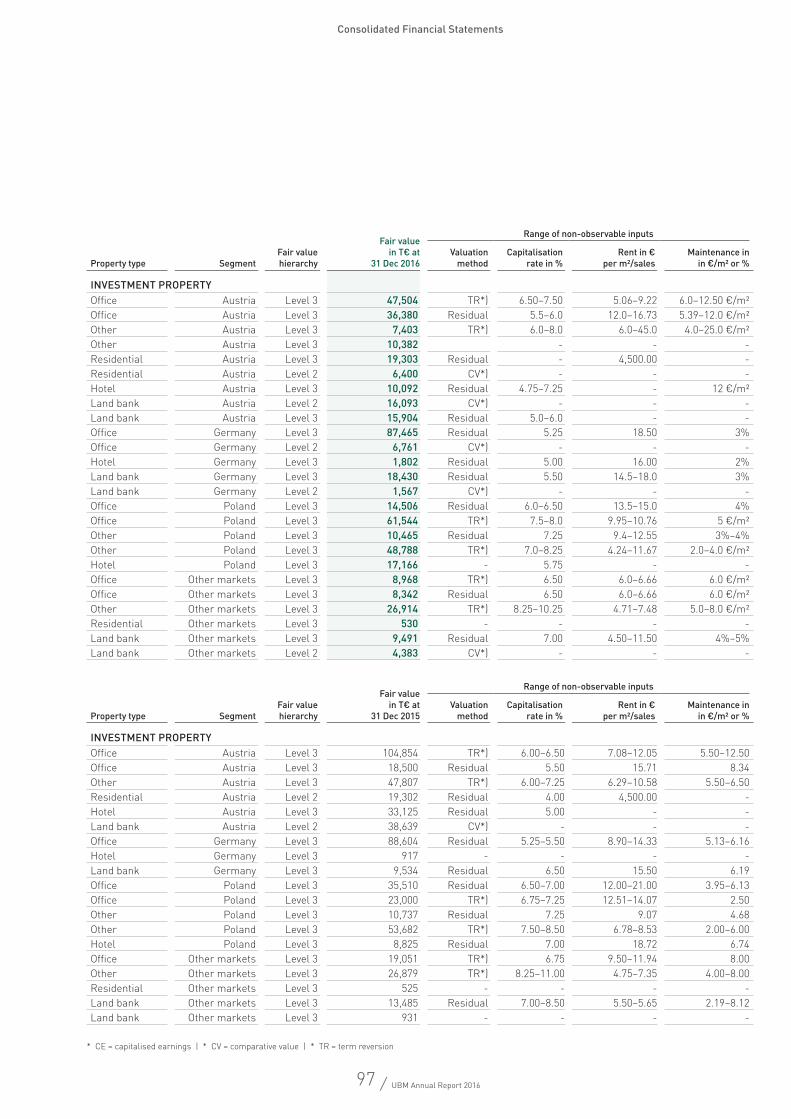
97 / UBM Annual Report 2016
Consolidated Financial Statements
* CE = capitalised earnings | * CV = comparative value | * TR = term reversion
Fair value in T€ at
31 Dec 2016
Range of non-observable inputs
Property type SegmentFair value hierarchy
Valuation method
Capitalisation rate in %
Rent in € per m²/sales
Maintenance inin €/m² or %
INVESTMENT PROPERTYOffice Austria Level 3 47,504 TR*) 6.50–7.50 5.06–9.22 6.0–12.50 €/m²Office Austria Level 3 36,380 Residual 5.5–6.0 12.0–16.73 5.39–12.0 €/m²Other Austria Level 3 7,403 TR*) 6.0–8.0 6.0–45.0 4.0–25.0 €/m²Other Austria Level 3 10,382 - - -Residential Austria Level 3 19,303 Residual - 4,500.00 -Residential Austria Level 2 6,400 CV*) - - -Hotel Austria Level 3 10,092 Residual 4.75–7.25 - 12 €/m²Land bank Austria Level 2 16,093 CV*) - - -Land bank Austria Level 3 15,904 Residual 5.0–6.0 - -Office Germany Level 3 87,465 Residual 5.25 18.50 3%Office Germany Level 2 6,761 CV*) - - -Hotel Germany Level 3 1,802 Residual 5.00 16.00 2%Land bank Germany Level 3 18,430 Residual 5.50 14.5–18.0 3%Land bank Germany Level 2 1,567 CV*) - - -Office Poland Level 3 14,506 Residual 6.0–6.50 13.5–15.0 4%Office Poland Level 3 61,544 TR*) 7.5–8.0 9.95–10.76 5 €/m²Other Poland Level 3 10,465 Residual 7.25 9.4–12.55 3%–4%Other Poland Level 3 48,788 TR*) 7.0–8.25 4.24–11.67 2.0–4.0 €/m²Hotel Poland Level 3 17,166 - 5.75 - -Office Other markets Level 3 8,968 TR*) 6.50 6.0–6.66 6.0 €/m²Office Other markets Level 3 8,342 Residual 6.50 6.0–6.66 6.0 €/m²Other Other markets Level 3 26,914 TR*) 8.25–10.25 4.71–7.48 5.0–8.0 €/m²Residential Other markets Level 3 530 - - - -Land bank Other markets Level 3 9,491 Residual 7.00 4.50–11.50 4%–5%Land bank Other markets Level 2 4,383 CV*) - - -
Fair value in T€ at
31 Dec 2015
Range of non-observable inputs
Property type SegmentFair value hierarchy
Valuation method
Capitalisation rate in %
Rent in € per m²/sales
Maintenance inin €/m² or %
INVESTMENT PROPERTYOffice Austria Level 3 104,854 TR*) 6.00–6.50 7.08–12.05 5.50–12.50Office Austria Level 3 18,500 Residual 5.50 15.71 8.34Other Austria Level 3 47,807 TR*) 6.00–7.25 6.29–10.58 5.50–6.50Residential Austria Level 2 19,302 Residual 4.00 4,500.00 -Hotel Austria Level 3 33,125 Residual 5.00 - -Land bank Austria Level 2 38,639 CV*) - - -Office Germany Level 3 88,604 Residual 5.25–5.50 8.90–14.33 5.13–6.16Hotel Germany Level 3 917 - - - -Land bank Germany Level 3 9,534 Residual 6.50 15.50 6.19Office Poland Level 3 35,510 Residual 6.50–7.00 12.00–21.00 3.95–6.13Office Poland Level 3 23,000 TR*) 6.75–7.25 12.51–14.07 2.50Other Poland Level 3 10,737 Residual 7.25 9.07 4.68Other Poland Level 3 53,682 TR*) 7.50–8.50 6.78–8.53 2.00–6.00Hotel Poland Level 3 8,825 Residual 7.00 18.72 6.74Office Other markets Level 3 19,051 TR*) 6.75 9.50–11.94 8.00Other Other markets Level 3 26,879 TR*) 8.25–11.00 4.75–7.35 4.00–8.00Residential Other markets Level 3 525 - - - -Land bank Other markets Level 3 13,485 Residual 7.00–8.50 5.50–5.65 2.19–8.12Land bank Other markets Level 3 931 - - - -
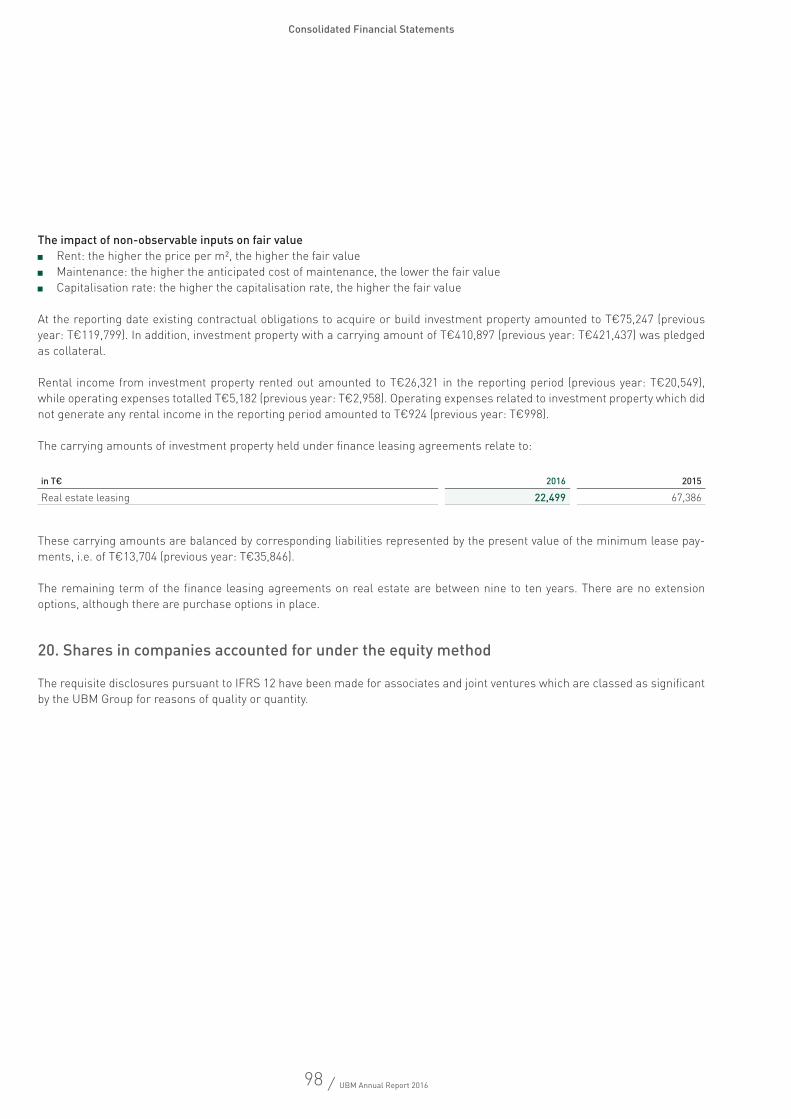
98 / UBM Annual Report 2016
Consolidated Financial Statements
The impact of non-observable inputs on fair value Rent: the higher the price per m², the higher the fair value Maintenance: the higher the anticipated cost of maintenance, the lower the fair value Capitalisation rate: the higher the capitalisation rate, the higher the fair value
At the reporting date existing contractual obligations to acquire or build investment property amounted to T€75,247 (previous year: T€119,799). In addition, investment property with a carrying amount of T€410,897 (previous year: T€421,437) was pledged as collateral.
Rental income from investment property rented out amounted to T€26,321 in the reporting period (previous year: T€20,549), while operating expenses totalled T€5,182 (previous year: T€2,958). Operating expenses related to investment property which did not generate any rental income in the reporting period amounted to T€924 (previous year: T€998).
The carrying amounts of investment property held under finance leasing agreements relate to:
These carrying amounts are balanced by corresponding liabilities represented by the present value of the minimum lease pay-ments, i.e. of T€13,704 (previous year: T€35,846).
The remaining term of the finance leasing agreements on real estate are between nine to ten years. There are no extension options, although there are purchase options in place.
20. Shares in companies accounted for under the equity method
The requisite disclosures pursuant to IFRS 12 have been made for associates and joint ventures which are classed as significant by the UBM Group for reasons of quality or quantity.
in T€ 2016 2015
Real estate leasing 22,499 67,386
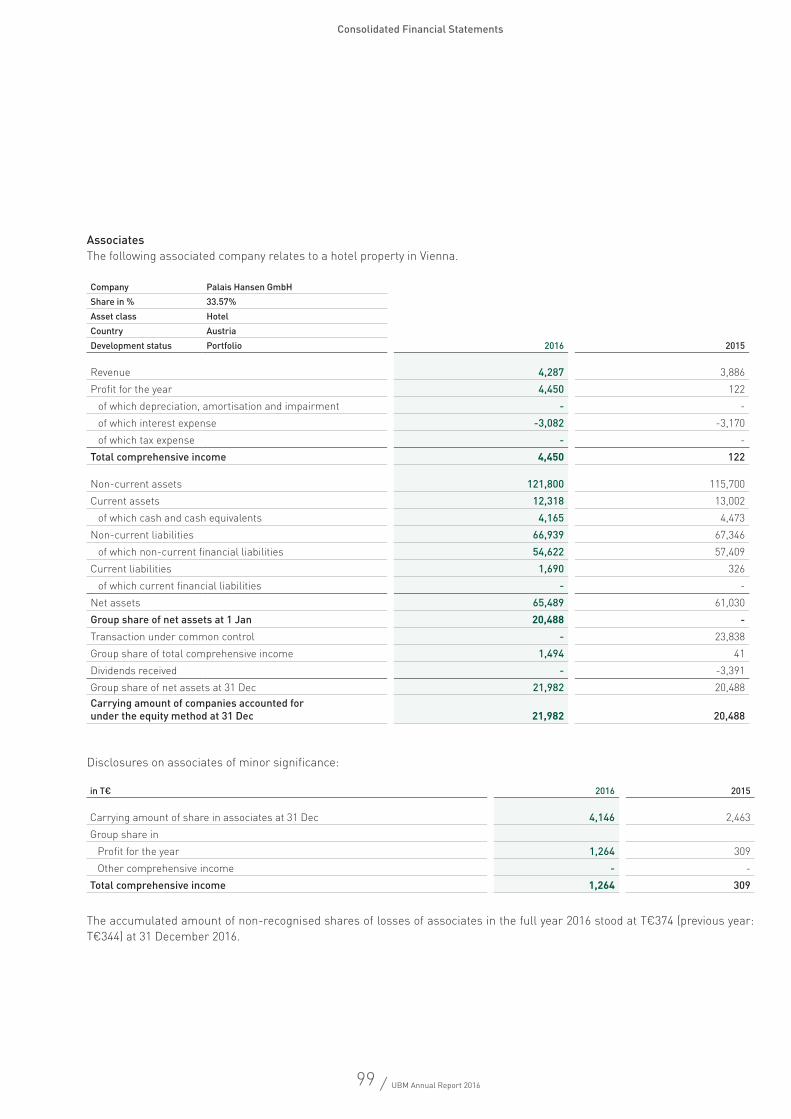
99 / UBM Annual Report 2016
Consolidated Financial Statements
AssociatesThe following associated company relates to a hotel property in Vienna.
Disclosures on associates of minor significance:
The accumulated amount of non-recognised shares of losses of associates in the full year 2016 stood at T€374 (previous year: T€344) at 31 December 2016.
in T€ 2016 2015
Carrying amount of share in associates at 31 Dec 4,146 2,463Group share in
Profit for the year 1,264 309Other comprehensive income - -
Total comprehensive income 1,264 309
Company Palais Hansen GmbHShare in % 33.57%Asset class HotelCountry AustriaDevelopment status Portfolio 2016 2015
Revenue 4,287 3,886Profit for the year 4,450 122
of which depreciation, amortisation and impairment - -of which interest expense -3,082 -3,170of which tax expense - -
Total comprehensive income 4,450 122
Non-current assets 121,800 115,700Current assets 12,318 13,002
of which cash and cash equivalents 4,165 4,473Non-current liabilities 66,939 67,346
of which non-current financial liabilities 54,622 57,409Current liabilities 1,690 326
of which current financial liabilities - -Net assets 65,489 61,030Group share of net assets at 1 Jan 20,488 -Transaction under common control - 23,838Group share of total comprehensive income 1,494 41Dividends received - -3,391Group share of net assets at 31 Dec 21,982 20,488Carrying amount of companies accounted for under the equity method at 31 Dec 21,982 20,488
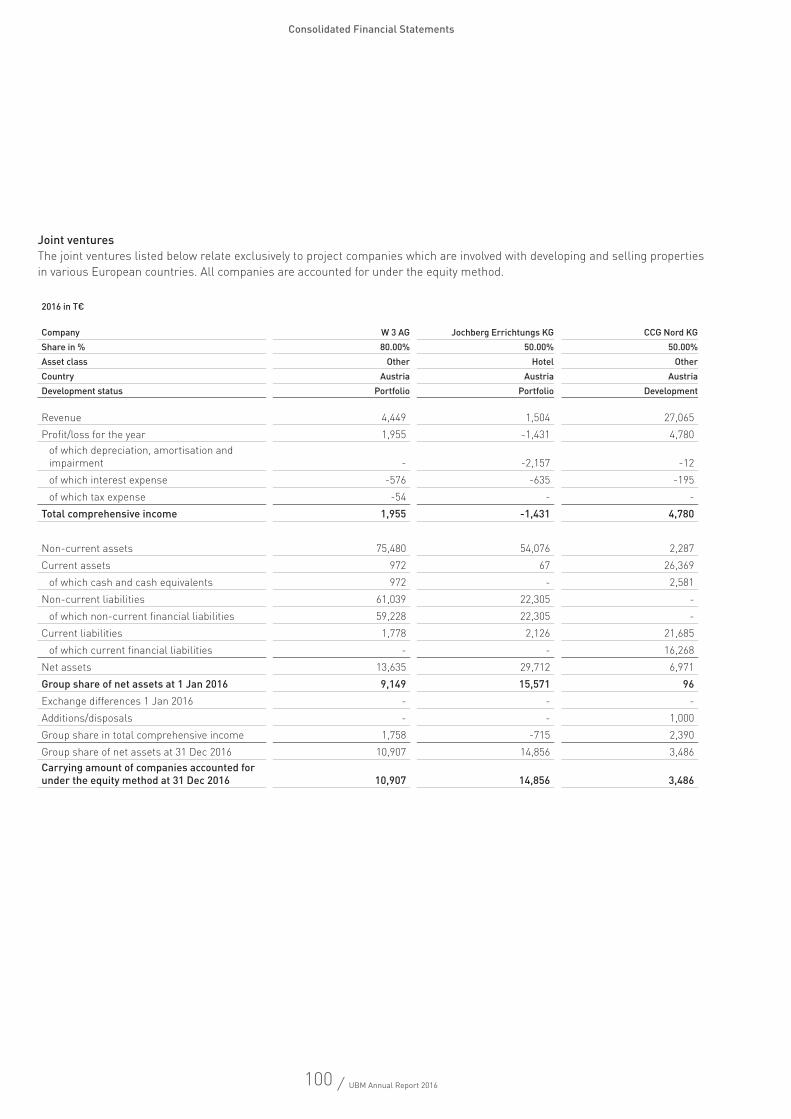
100 / UBM Annual Report 2016
Consolidated Financial Statements
Joint venturesThe joint ventures listed below relate exclusively to project companies which are involved with developing and selling properties in various European countries. All companies are accounted for under the equity method.
2016 in T€
Company W 3 AG Jochberg Errichtungs KG CCG Nord KG QBC Gamma KG Anders Wohnen GmbH German Hotel Invest I KG Lanzarota Sienna Hotel SKA Emma Hotel CVShare in % 80.00% 50.00% 50.00% 65.00% 47.00% 44.18% 50.00% 47.62%Asset class Other Hotel Other Office Residential Hotel Hotel HotelCountry Austria Austria Austria Austria Germany Germany Poland NetherlandsDevelopment status Portfolio Portfolio Development Development Development Development Portfolio Development
Revenue 4,449 1,504 27,065 - 660 31 22,642 -Profit/loss for the year 1,955 -1,431 4,780 2,357 -1,185 5,543 -36 -
of which depreciation, amortisation and impairment - -2,157 -12 - - - -462 -of which interest expense -576 -635 -195 - -234 -705 - -of which tax expense -54 - - - - -2,690 - -
Total comprehensive income 1,955 -1,431 4,780 2,357 -1,185 5,543 -36 -
Non-current assets 75,480 54,076 2,287 12,294 41,844 43,718 12,012 102,500Current assets 972 67 26,369 244 6,160 7,251 6,278 4,139
of which cash and cash equivalents 972 - 2,581 100 500 265 4,116 3,385Non-current liabilities 61,039 22,305 - 7,740 18,553 32,498 1,210 56,430
of which non-current financial liabilities 59,228 22,305 - 7,740 18,553 32,498 1,210 56,430Current liabilities 1,778 2,126 21,685 804 385 10,225 1,822 23,287
of which current financial liabilities - - 16,268 - - - - -Net assets 13,635 29,712 6,971 3,994 29,066 8,246 15,258 26,922Group share of net assets at 1 Jan 2016 9,149 15,571 96 1,069 9,157 1 6,241 -Exchange differences 1 Jan 2016 - - - - - - -218 -Additions/disposals - - 1,000 - - - - -Group share in total comprehensive income 1,758 -715 2,390 1,527 -557 2,447 1,606 12,820Group share of net assets at 31 Dec 2016 10,907 14,856 3,486 2,596 8,600 2,448 7,629 12,820Carrying amount of companies accounted for under the equity method at 31 Dec 2016 10,907 14,856 3,486 2,596 8,600 2,448 7,629 12,820
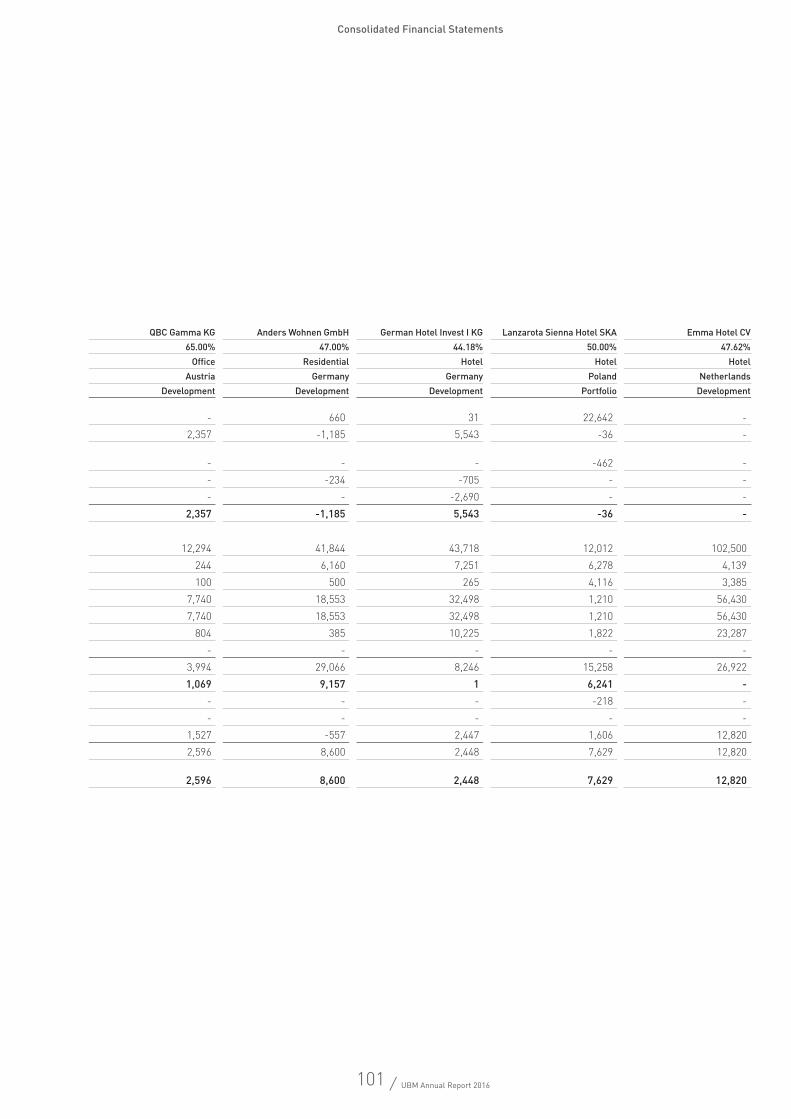
101 / UBM Annual Report 2016
Consolidated Financial Statements
2016 in T€
Company W 3 AG Jochberg Errichtungs KG CCG Nord KG QBC Gamma KG Anders Wohnen GmbH German Hotel Invest I KG Lanzarota Sienna Hotel SKA Emma Hotel CVShare in % 80.00% 50.00% 50.00% 65.00% 47.00% 44.18% 50.00% 47.62%Asset class Other Hotel Other Office Residential Hotel Hotel HotelCountry Austria Austria Austria Austria Germany Germany Poland NetherlandsDevelopment status Portfolio Portfolio Development Development Development Development Portfolio Development
Revenue 4,449 1,504 27,065 - 660 31 22,642 -Profit/loss for the year 1,955 -1,431 4,780 2,357 -1,185 5,543 -36 -
of which depreciation, amortisation and impairment - -2,157 -12 - - - -462 -of which interest expense -576 -635 -195 - -234 -705 - -of which tax expense -54 - - - - -2,690 - -
Total comprehensive income 1,955 -1,431 4,780 2,357 -1,185 5,543 -36 -
Non-current assets 75,480 54,076 2,287 12,294 41,844 43,718 12,012 102,500Current assets 972 67 26,369 244 6,160 7,251 6,278 4,139
of which cash and cash equivalents 972 - 2,581 100 500 265 4,116 3,385Non-current liabilities 61,039 22,305 - 7,740 18,553 32,498 1,210 56,430
of which non-current financial liabilities 59,228 22,305 - 7,740 18,553 32,498 1,210 56,430Current liabilities 1,778 2,126 21,685 804 385 10,225 1,822 23,287
of which current financial liabilities - - 16,268 - - - - -Net assets 13,635 29,712 6,971 3,994 29,066 8,246 15,258 26,922Group share of net assets at 1 Jan 2016 9,149 15,571 96 1,069 9,157 1 6,241 -Exchange differences 1 Jan 2016 - - - - - - -218 -Additions/disposals - - 1,000 - - - - -Group share in total comprehensive income 1,758 -715 2,390 1,527 -557 2,447 1,606 12,820Group share of net assets at 31 Dec 2016 10,907 14,856 3,486 2,596 8,600 2,448 7,629 12,820Carrying amount of companies accounted for under the equity method at 31 Dec 2016 10,907 14,856 3,486 2,596 8,600 2,448 7,629 12,820
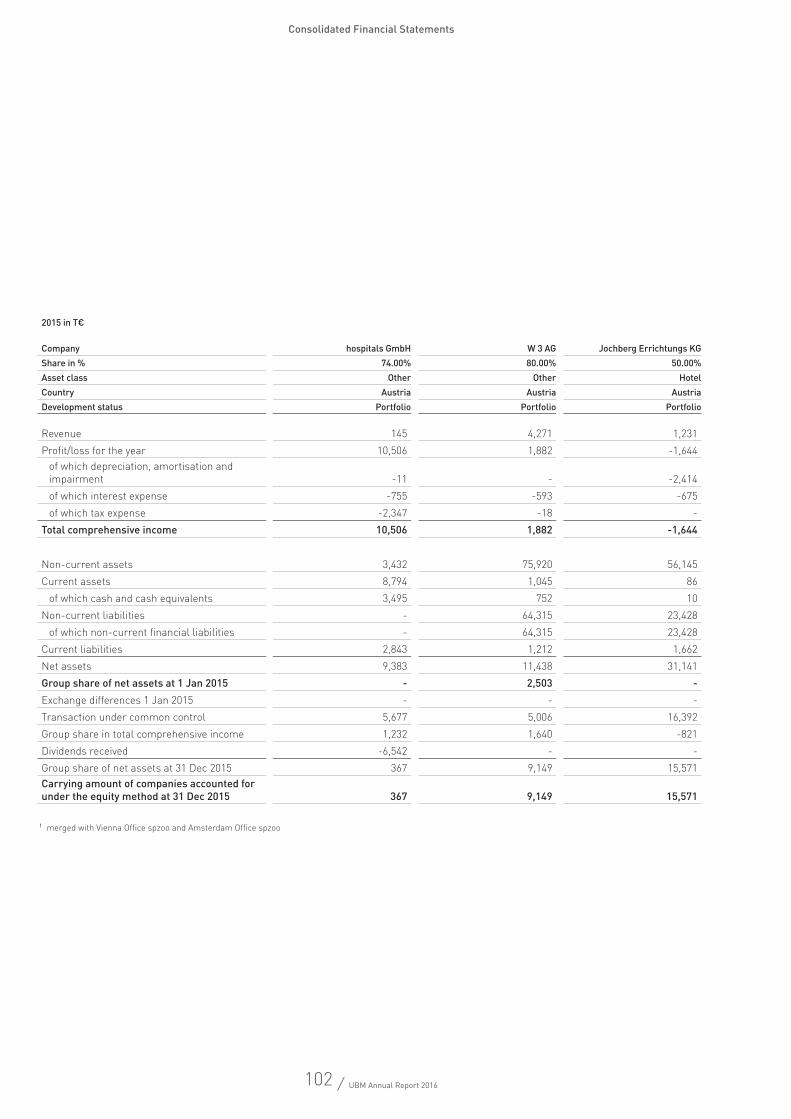
102 / UBM Annual Report 2016
Consolidated Financial Statements
1 merged with Vienna Office spzoo and Amsterdam Office spzoo
2015 in T€
Company hospitals GmbH W 3 AG Jochberg Errichtungs KG "hospitals" GmbH BLV Pasing GmbHUBX 1 Objekt Berlin GmbH
Polecki Business park spzoo1 Sienna Hotel SKA Top Office Munich GmbH
Share in % 74.00% 80.00% 50.00% 65.34% 47.00% 50.00% 50.00% 50.00% 47.00%Asset class Other Other Hotel Other Residential Hotel Other Hotel OtherCountry Austria Austria Austria Austria Germany Germany Poland Poland GermanyDevelopment status Portfolio Portfolio Portfolio Portfolio Development Portfolio Portfolio
Revenue 145 4,271 1,231 854 750 34,551 232 21,646 56,418Profit/loss for the year 10,506 1,882 -1,644 3,838 1,876 18,318 800 94 5,718
of which depreciation, amortisation and impairment -11 - -2,414 -4 - -2,197 - -867 -of which interest expense -755 -593 -675 -96 -203 -2,538 -36 - -of which tax expense -2,347 -18 - -30 -323 - -24 - -
Total comprehensive income 10,506 1,882 -1,644 3,838 1,876 18,318 800 94 5,718
Non-current assets 3,432 75,920 56,145 14,835 38,092 - - 9,866 -Current assets 8,794 1,045 86 676 6,268 32,790 29,918 5,187 15,928
of which cash and cash equivalents 3,495 752 10 78 923 1,033 628 4,446 5,837Non-current liabilities - 64,315 23,428 4,675 23,487 - - 1,468 -
of which non-current financial liabilities - 64,315 23,428 3,352 15,857 - - 1,468 -Current liabilities 2,843 1,212 1,662 48 1,364 2,766 48 1,103 9,786Net assets 9,383 11,438 31,141 10,788 19,509 30,024 29,870 12,482 6,142Group share of net assets at 1 Jan 2015 - 2,503 - - 8,287 5,850 14,535 6,194 -Exchange differences 1 Jan 2015 - - - - - - 2 - -Transaction under common control 5,677 5,006 16,392 4,540 - - - - 200Group share in total comprehensive income 1,232 1,640 -821 2,508 870 9,162 400 47 2,687Dividends received -6,542 - - - - -14,975 - - -Group share of net assets at 31 Dec 2015 367 9,149 15,571 7,048 9,157 37 14,937 6,241 2,887Carrying amount of companies accounted for under the equity method at 31 Dec 2015 367 9,149 15,571 7,048 9,157 37 14,937 6,241 2,887
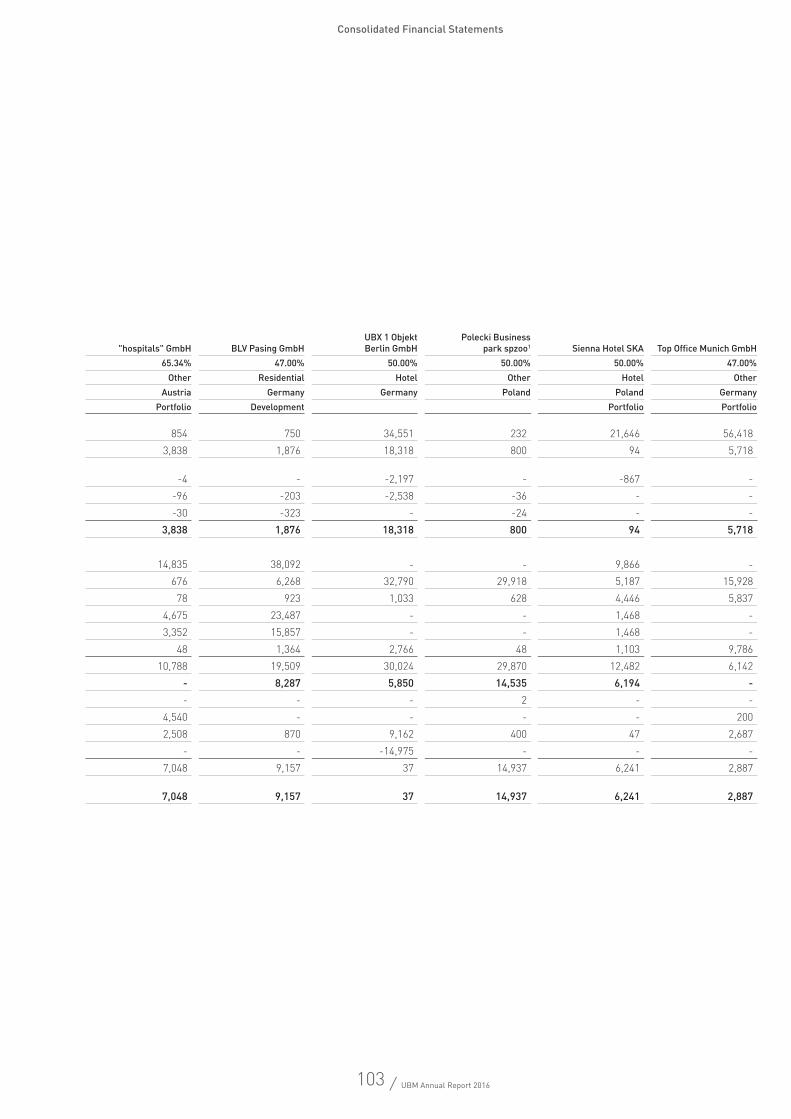
103 / UBM Annual Report 2016
Consolidated Financial Statements
2015 in T€
Company hospitals GmbH W 3 AG Jochberg Errichtungs KG "hospitals" GmbH BLV Pasing GmbHUBX 1 Objekt Berlin GmbH
Polecki Business park spzoo1 Sienna Hotel SKA Top Office Munich GmbH
Share in % 74.00% 80.00% 50.00% 65.34% 47.00% 50.00% 50.00% 50.00% 47.00%Asset class Other Other Hotel Other Residential Hotel Other Hotel OtherCountry Austria Austria Austria Austria Germany Germany Poland Poland GermanyDevelopment status Portfolio Portfolio Portfolio Portfolio Development Portfolio Portfolio
Revenue 145 4,271 1,231 854 750 34,551 232 21,646 56,418Profit/loss for the year 10,506 1,882 -1,644 3,838 1,876 18,318 800 94 5,718
of which depreciation, amortisation and impairment -11 - -2,414 -4 - -2,197 - -867 -of which interest expense -755 -593 -675 -96 -203 -2,538 -36 - -of which tax expense -2,347 -18 - -30 -323 - -24 - -
Total comprehensive income 10,506 1,882 -1,644 3,838 1,876 18,318 800 94 5,718
Non-current assets 3,432 75,920 56,145 14,835 38,092 - - 9,866 -Current assets 8,794 1,045 86 676 6,268 32,790 29,918 5,187 15,928
of which cash and cash equivalents 3,495 752 10 78 923 1,033 628 4,446 5,837Non-current liabilities - 64,315 23,428 4,675 23,487 - - 1,468 -
of which non-current financial liabilities - 64,315 23,428 3,352 15,857 - - 1,468 -Current liabilities 2,843 1,212 1,662 48 1,364 2,766 48 1,103 9,786Net assets 9,383 11,438 31,141 10,788 19,509 30,024 29,870 12,482 6,142Group share of net assets at 1 Jan 2015 - 2,503 - - 8,287 5,850 14,535 6,194 -Exchange differences 1 Jan 2015 - - - - - - 2 - -Transaction under common control 5,677 5,006 16,392 4,540 - - - - 200Group share in total comprehensive income 1,232 1,640 -821 2,508 870 9,162 400 47 2,687Dividends received -6,542 - - - - -14,975 - - -Group share of net assets at 31 Dec 2015 367 9,149 15,571 7,048 9,157 37 14,937 6,241 2,887Carrying amount of companies accounted for under the equity method at 31 Dec 2015 367 9,149 15,571 7,048 9,157 37 14,937 6,241 2,887
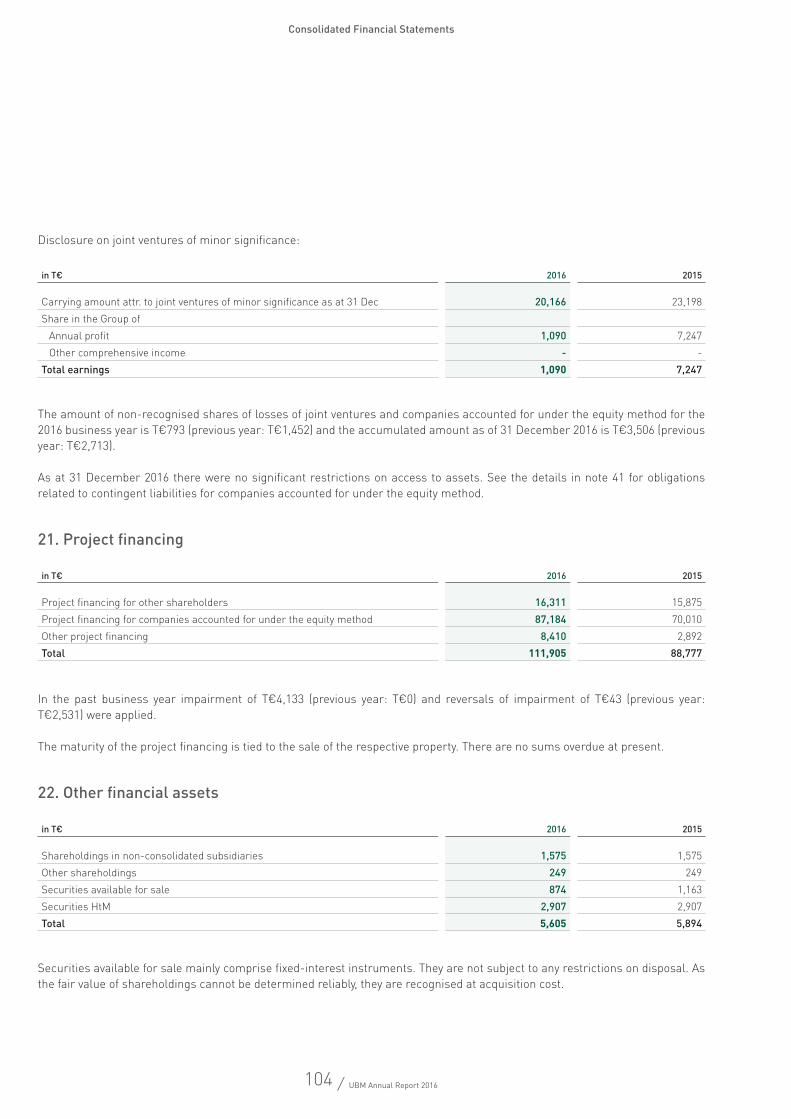
104 / UBM Annual Report 2016
Consolidated Financial Statements
Disclosure on joint ventures of minor significance:
The amount of non-recognised shares of losses of joint ventures and companies accounted for under the equity method for the 2016 business year is T€793 (previous year: T€1,452) and the accumulated amount as of 31 December 2016 is T€3,506 (previous year: T€2,713).
As at 31 December 2016 there were no significant restrictions on access to assets. See the details in note 41 for obligations related to contingent liabilities for companies accounted for under the equity method.
21. Project financing
In the past business year impairment of T€4,133 (previous year: T€0) and reversals of impairment of T€43 (previous year: T€2,531) were applied.
The maturity of the project financing is tied to the sale of the respective property. There are no sums overdue at present.
22. Other financial assets
Securities available for sale mainly comprise fixed-interest instruments. They are not subject to any restrictions on disposal. As the fair value of shareholdings cannot be determined reliably, they are recognised at acquisition cost.
in T€ 2016 2015
Carrying amount attr. to joint ventures of minor significance as at 31 Dec 20,166 23,198Share in the Group of
Annual profit 1,090 7,247Other comprehensive income - -
Total earnings 1,090 7,247
in T€ 2016 2015
Project financing for other shareholders 16,311 15,875Project financing for companies accounted for under the equity method 87,184 70,010Other project financing 8,410 2,892Total 111,905 88,777
in T€ 2016 2015
Shareholdings in non-consolidated subsidiaries 1,575 1,575Other shareholdings 249 249Securities available for sale 874 1,163Securities HtM 2,907 2,907Total 5,605 5,894
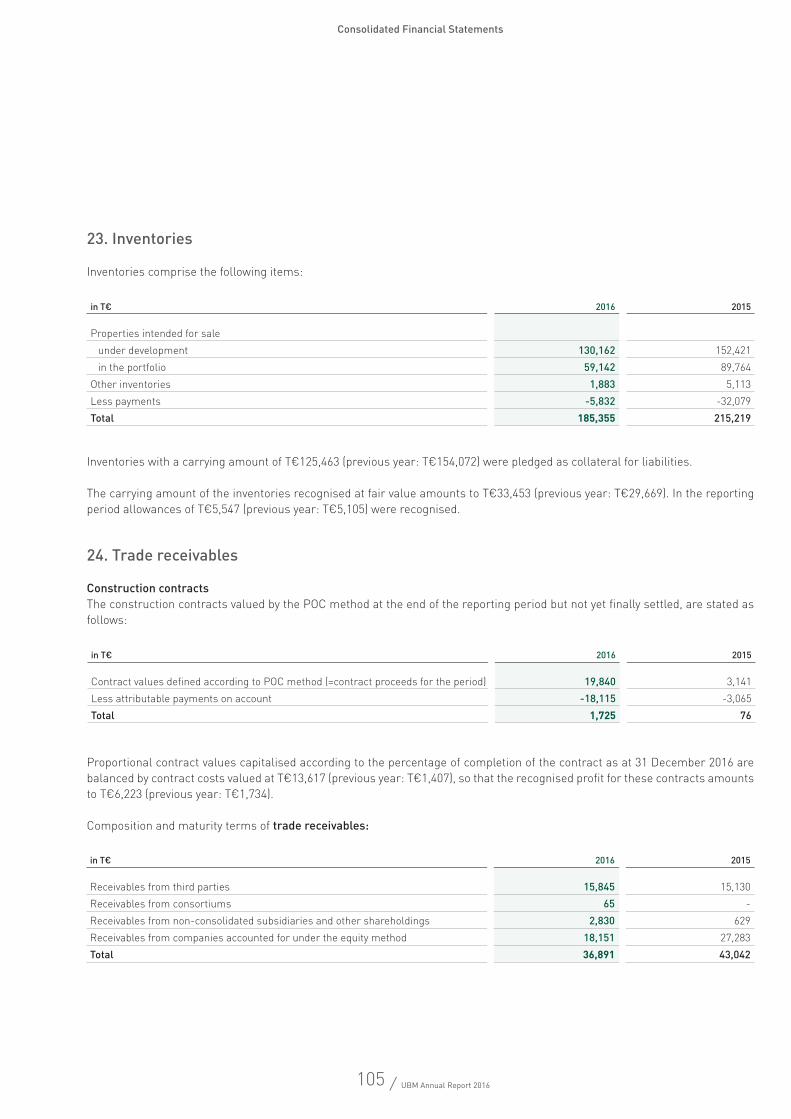
105 / UBM Annual Report 2016
Consolidated Financial Statements
23. Inventories
Inventories comprise the following items:
Inventories with a carrying amount of T€125,463 (previous year: T€154,072) were pledged as collateral for liabilities.
The carrying amount of the inventories recognised at fair value amounts to T€33,453 (previous year: T€29,669). In the reporting period allowances of T€5,547 (previous year: T€5,105) were recognised.
24. Trade receivables
Construction contractsThe construction contracts valued by the POC method at the end of the reporting period but not yet finally settled, are stated as follows:
Proportional contract values capitalised according to the percentage of completion of the contract as at 31 December 2016 are balanced by contract costs valued at T€13,617 (previous year: T€1,407), so that the recognised profit for these contracts amounts to T€6,223 (previous year: T€1,734).
Composition and maturity terms of trade receivables:
in T€ 2016 2015
Properties intended for sale under development 130,162 152,421in the portfolio 59,142 89,764
Other inventories 1,883 5,113Less payments -5,832 -32,079Total 185,355 215,219
in T€ 2016 2015
Contract values defined according to POC method (=contract proceeds for the period) 19,840 3,141Less attributable payments on account -18,115 -3,065Total 1,725 76
in T€ 2016 2015
Receivables from third parties 15,845 15,130Receivables from consortiums 65 -Receivables from non-consolidated subsidiaries and other shareholdings 2,830 629Receivables from companies accounted for under the equity method 18,151 27,283Total 36,891 43,042
106 / UBM Annual Report 2016
Consolidated Financial Statements
Receivables from third parties totalling T€6,935 (previous year: T€5,785) were not yet overdue and T€8,910 (previous year: T€9,345) were due for less than a year. All other receivables from non-consolidated subsidiaries, other shareholdings and com-panies accounted for under the equity method are not yet due.
Ageing structure of receivables from third parties:
25. Financial assets
Other financial assets primarily include receivables from insurance and from managing property, other advances from the pre-vious year and a cash deposit.
26. Other receivables and assets
Of which overdue at closing date in the following time periods
in T€Carrying amount
at 31 Dec 2016Of which not
overdue at closing dateLess than 30
daysBetween 30 and 60 days
Between 60 and 180 days
Between 180 and 360 days
More than 360 days
Receivables from third parties 15,845 6,935 2,628 1,321 2,133 2,828 -
Of which overdue at closing date in the following time periods
in T€Carrying amount
at 31 Dec 2015Of which not
overdue at closing dateLess than 30
daysBetween 30 and 60 days
Between 60 and 180 days
Between 180 and 360 days
More than 360 days
Receivables from third parties 15,130 5,785 3,980 246 2,003 3,116 -
in T€ 2016 Remaining term > 1 year 2015 Remaining term > 1 year
Other 11,701 1,533 13,521 3,505Total 11,701 1,533 13,521 3,505
in T€ 2016 Remaining term > 1 year 2015 Remaining term > 1 year
Tax assets 18,822 - 9,174 -Other 3 - 2 -Total 18,825 - 9,176 -
107 / UBM Annual Report 2016
Consolidated Financial Statements
27. Cash and cash equivalents
The cash and cash equivalents include cash at banks amounting to T€41,297 (previous year: T€92,237) and cash in hand of T€1,001 (previous year: T€1,507). UBM used the freed-up cash to settle debts. This resulted in an effect that reduced assets/liabilities at the same time as business volumes increased; nevertheless, this was overcompensated for by other effects on the balance sheet.
28. Non-current assets held for sale
The non-current assets held for sale relate to two office properties in Poland, one hotel property in Austria and an undeveloped plot in Germany, whose sale is considered highly probable and have therefore been reclassified out of investment property. The non-current assets held for sale are recognised at fair value, which corresponds to the purchase price agreed. The significant increase in this item compared to 2015 is mainly due to forward sales agreed in 2016, including the two hotels in QBC 5 in Vienna (ibis and Novotel) and the Pilot Tower office building in Krakow.
29. Deferred tax assets
Temporary differences between the valuations in the IFRS consolidated financial statements and the respective valuations for tax purposes impacted as follows on the tax deferments shown in the statement of financial position:
Deferred tax assets from loss carryforwards are recognised to the extent that these can probably be offset against future taxable profits. The balance of the non-recognised tax assets for loss carryforwards amounted to T€27,056 (previous year: T€21,778) as of 31 December 2016, of which T€911 (previous year: T€1,346) were foreign losses in Austria. The recognised deferred tax assets for loss carryforwards primarily relate to Austrian pre-consolidation losses. Of this, T€22,396 is vested, the remaining T€4,660 is non-vested within five to nine years.
2016 2015
in T€ Assets Liabilities Assets Liabilities
Investment property, other valuation differences 5,648 21,574 6,466 25,217Property plant and equipment 10 6,106 659 4,071Financial assets and liabilities 9,501 6,384 17,174 8,102POC method - 1,676 346 501Provisions 6,835 45 3,086 107Tax loss carryforwards 2,657 - 1,687 -Other 42 199 55 199Offsetting -15,875 -15,875 -22,159 -22,159
Deferred taxes 8,818 20,109 7,314 16,038Net deferred taxes - 11,291 - 8,724
108 / UBM Annual Report 2016
Consolidated Financial Statements
30. Share capital
The share capital of €22,416,540 (previous year: €22,416,540) is divided into 7,472,180 (previous year: 7,472,180) ordinary, no-par bearer shares. The amount of share capital attributed to any single bearer share is €3 (previous year: €3).
Every ordinary share has an equal right to participate in profits, including liquidation profits, and is entitled to one vote at the Annual General Meeting.
31. Authorised capital
Subject to approval being granted by the Supervisory Board, the Managing Board is authorised until 7 May 2019 to increase the share capital by up to €4,613,460 by issuing up to 1,537,820 new ordinary no-par bearer shares in exchange for cash and/or contribution in kind, in multiple tranches if so wished, also under application of indirect pre-emptive rights pursuant to Art. 153 Sec. 6 Austrian Stock Corporation Act; the Managing Board is also authorised to specify the issue price, issue conditions, the subscription ratio and other details with the approval of the Supervisory Board. The Supervisory Board is entitled to pass resolu-tions on amending the statutes to allow the Managing Board to make use of this authorisation.
Furthermore, the Managing Board is permitted, with the approval of the Supervisory Board, to acquire treasury shares in the Company up to the legally permitted level of 10% of share capital, including treasury shares already bought back for a 30-month period beginning on the date the resolution was passed (20 May 2015).
32. Reserves
The capital reserves result from the capital increases, adjustments and statute-barred dividend claims arising from previous years. The capital reserves include an amount of T€98,954 (previous year: T€98,954), which is restricted. It may only be released to compensate for an accumulated loss which would otherwise be shown in the annual financial statements of UBM, to the extent that free reserves are not available to cover this.
The other reserves comprise the reserves from revaluation of the annual financial statements of subsidiaries in foreign cur-rencies (foreign currency translation reserves), the reserves for remeasurement from benefit obligations, retained earnings of UBM AG including the statutory reserve and the untaxed reserves after deducting deferred tax items, retained profits from subsidiaries since their acquisition and the effects of adjusting the annual financial statements of companies included in the consolidated financial statements to the accounting and measurement methods used in the consolidated financial statements.
Share capital Number €
Ordinary bearer shares 7,472,180 22,416,540
109 / UBM Annual Report 2016
Consolidated Financial Statements
Net earnings for the year amounting to T€11,997 (previous year: T€11,976) are available for distribution to shareholders in UBM. In addition, the unrestricted retained earnings of UBM, which come to T€25,871 (previous year: T€18,087) as at 31 December 2016 may be released and distributed to the shareholders of UBM in subsequent periods.
In the year under review dividends from the 2015 net profit totalling €11,955,488 were paid to the shareholders of UBM, amount-ing to €1.60 per share once again. The Managing Board proposes the distribution of dividends from the 2016 net profit of €1.60 per share, thereby totalling €11,955,488.
Equity interests which are not held by UBM or a Group company are shown under the item “Non-controlling interests”.
33. Mezzanine and hybrid capital
The merger of PIAG as the transferring company and UBM as the absorbing company led to the transfer of mezzanine capital totalling €100 mn and hybrid capital totalling €25.3 mn, issued by PIAG in November 2014, to UBM AG by way of legal succession. Both the mezzanine capital and the hybrid capital are fundamentally subject to ongoing interest. €50.0 mn of the mezzanine capital was paid back in December 2015.
UBM is only obliged to pay interest on the mezzanine capital and hybrid capital if it resolves to pay a dividend to shareholders from the annual surplus. UBM is not obliged to pay the due interest for one year in the absence of a profit payout, and if the issuer utilises their right not to pay, then this unpaid interest is kept in arrears which must be paid as soon as the shareholders of UBM decide to pay out a dividend from the annual surplus.
In the case of dismissal by UBM of the mezzanine or hybrid capital, the mezzanine or hybrid capital becomes due to the holders, in addition to the valid interest accrued by this date and outstanding interest. The hybrid capital can only be paid back if, prior to the payback, a process is carried out in accordance with Art. 178 Stock Exchange Act in the amount of the planned equity payback in the course of a capital increase in accordance with Art. 149 et seq. Stock Exchange Act, or if a capital adjustment is carried out.
As payments, interest and capital redemption are only compulsory when the conditions are activated, where their activation can be authorised or prevented by UBM, and the Group therefore has the option of avoiding payment on the mezzanine and hybrid capital permanently, this mezzanine and hybrid capital is categorised as equity instruments. Interest which is paid, less any tax effect such as profit payouts, is to be recorded directly in equity as a deduction.
Both the mezzanine capital and the hybrid capital were held by PORR AG.
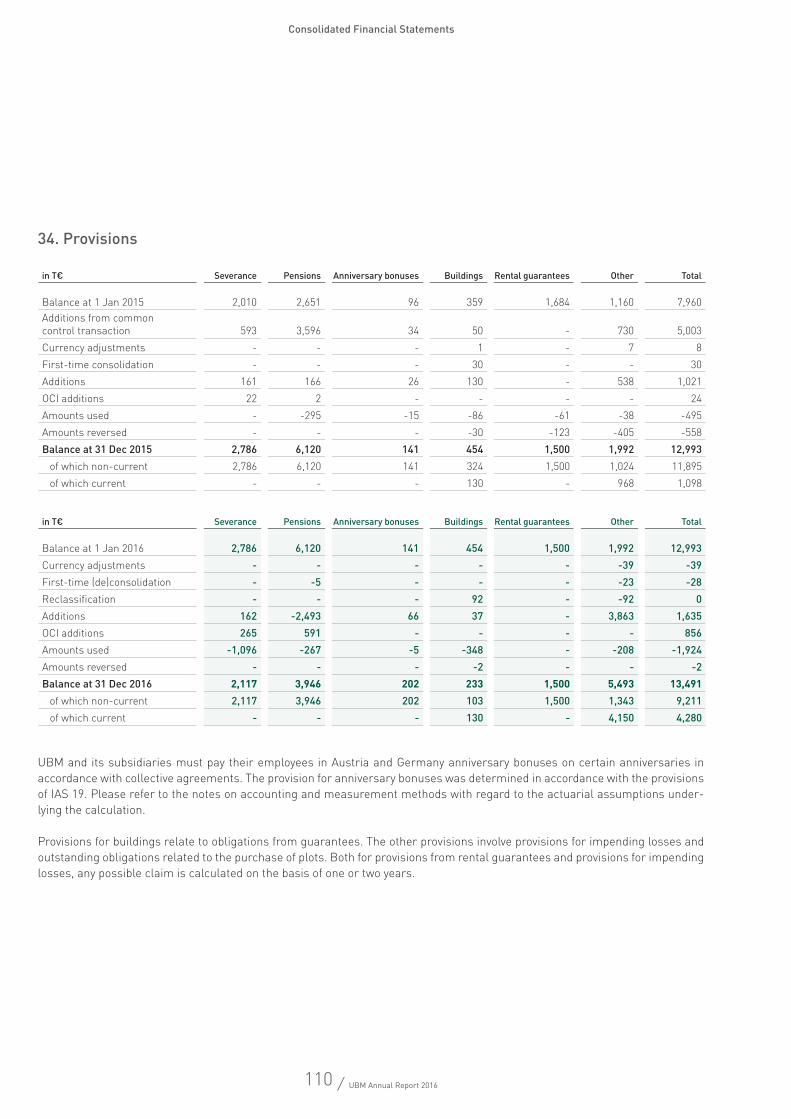
110 / UBM Annual Report 2016
Consolidated Financial Statements
34. Provisions
UBM and its subsidiaries must pay their employees in Austria and Germany anniversary bonuses on certain anniversaries in accordance with collective agreements. The provision for anniversary bonuses was determined in accordance with the provisions of IAS 19. Please refer to the notes on accounting and measurement methods with regard to the actuarial assumptions under-lying the calculation.
Provisions for buildings relate to obligations from guarantees. The other provisions involve provisions for impending losses and outstanding obligations related to the purchase of plots. Both for provisions from rental guarantees and provisions for impending losses, any possible claim is calculated on the basis of one or two years.
in T€ Severance Pensions Anniversary bonuses Buildings Rental guarantees Other Total
Balance at 1 Jan 2015 2,010 2,651 96 359 1,684 1,160 7,960Additions from common control transaction 593 3,596 34 50 - 730 5,003Currency adjustments - - - 1 - 7 8First-time consolidation - - - 30 - - 30Additions 161 166 26 130 - 538 1,021OCI additions 22 2 - - - - 24Amounts used - -295 -15 -86 -61 -38 -495Amounts reversed - - - -30 -123 -405 -558Balance at 31 Dec 2015 2,786 6,120 141 454 1,500 1,992 12,993
of which non-current 2,786 6,120 141 324 1,500 1,024 11,895of which current - - - 130 - 968 1,098
in T€ Severance Pensions Anniversary bonuses Buildings Rental guarantees Other Total
Balance at 1 Jan 2016 2,786 6,120 141 454 1,500 1,992 12,993Currency adjustments - - - - - -39 -39First-time (de)consolidation - -5 - - - -23 -28Reclassification - - - 92 - -92 0Additions 162 -2,493 66 37 - 3,863 1,635OCI additions 265 591 - - - - 856Amounts used -1,096 -267 -5 -348 - -208 -1,924Amounts reversed - - - -2 - - -2Balance at 31 Dec 2016 2,117 3,946 202 233 1,500 5,493 13,491
of which non-current 2,117 3,946 202 103 1,500 1,343 9,211of which current - - - 130 - 4,150 4,280
111 / UBM Annual Report 2016
Consolidated Financial Statements
Pension plans
defined benefit plans Provisions for severance pay were created for employees (on wages and salaries) who have claims to severance payments pursu-ant to the Employee Act, the Wage Earners’ Severance Pay Act or works agreements. Employees whose employment is subject to Austrian law, if the relevant employment began prior to 1 January 2003 and has been ongoing for a specific period, have a claim to severance pay where the employment is terminated upon the employee reaching the statutory age of retirement. The amount of the severance pay depends on the amount of the pay at the time of termination and of the length of employment. These employee claims should therefore be treated as claims under defined benefit pension plans, in which case plan assets do not exist.
Changes within provisions for severance pay were as follows:
Please refer to the notes on the accounting and measurement methods with regard to the actuarial assumptions underlying the calculation. For the following business year a current service cost of T€89 and an interest expense of T€33 are planned.
The pension commitments in the UBM Group only relate to former members of the Managing Board. As a rule, these pension commitments are defined individual benefit commitments. The amount of the pension claim depends on the number of years’ service in each case.
in T€ 2016 2015
Present value of severance obligations (DBO) at 1 Jan 2,786 2,010Additions from common control transaction - 593Current service cost 104 105Interest expense 58 56Severance payments 1,096 -Actuarial profits/losses 265 22
of which demographic profits/losses 15 -of which financial profits/losses 112 -19of which profits/losses from experience-based adjustments 138 42
Present value of severance obligations (DBO) at 31 Dec 2,117 2,786
in T€ 2016 2015
Current service cost (entitlements) 104 105Interest expense 58 56Severance costs (recognised in profit and loss for the period) 162 161Severance costs (recognised in comprehensive profit and loss for the period) 265 22
112 / UBM Annual Report 2016
Consolidated Financial Statements
Pension provisions:
Pension obligations transferred to provisions:
Changes within provisions for pensions were as follows:
The obligations from the direct pension benefits are partly covered by insurance contracts concluded with WIENER STÄDTISCHE VERSICHERUNG AG Vienna Insurance Group. In order to secure the pension rights of the employees insured from the corporate pension benefits, the rights from the insurance agreements are pledged in favour of the employees insured. The pension plan reinsurance is held in an independent department of the cover pool for life insurance as laid down in Article 20 Section 2 Line 1 in connection with Article 78 of the Insurance Supervision Law.
Receivables from pension plan reinsurance amounting to T€4,188 (previous year: T€1,343) represent plan assets pursuant to IAS 19 and were offset against the present value of pension provisions.
in T€ 2016 2015
Present value of obligations covered by plan assets 8,134 7,463Fair value of the plan assets -4,188 -1,343Net value of the obligations covered by plan assets 3,946 6,120Carrying amount of provisions at 31 Dec 3,946 6,120
in T€ 2016 2015
Present value of pension obligations (DBO) at 1 Jan 7,463 3,888Additions from common control transaction - 3,596Transfers -5 -Current service cost 106 101Interest expense 165 165Pension payments -267 -295Actuarial profits/losses 672 8
of which demographic profits/losses - -of which financial profits/losses 622 -5of which profits/losses from experience-based adjustments 50 13
Present value of pension obligations (DBO) at 31 Dec 8,134 7,463
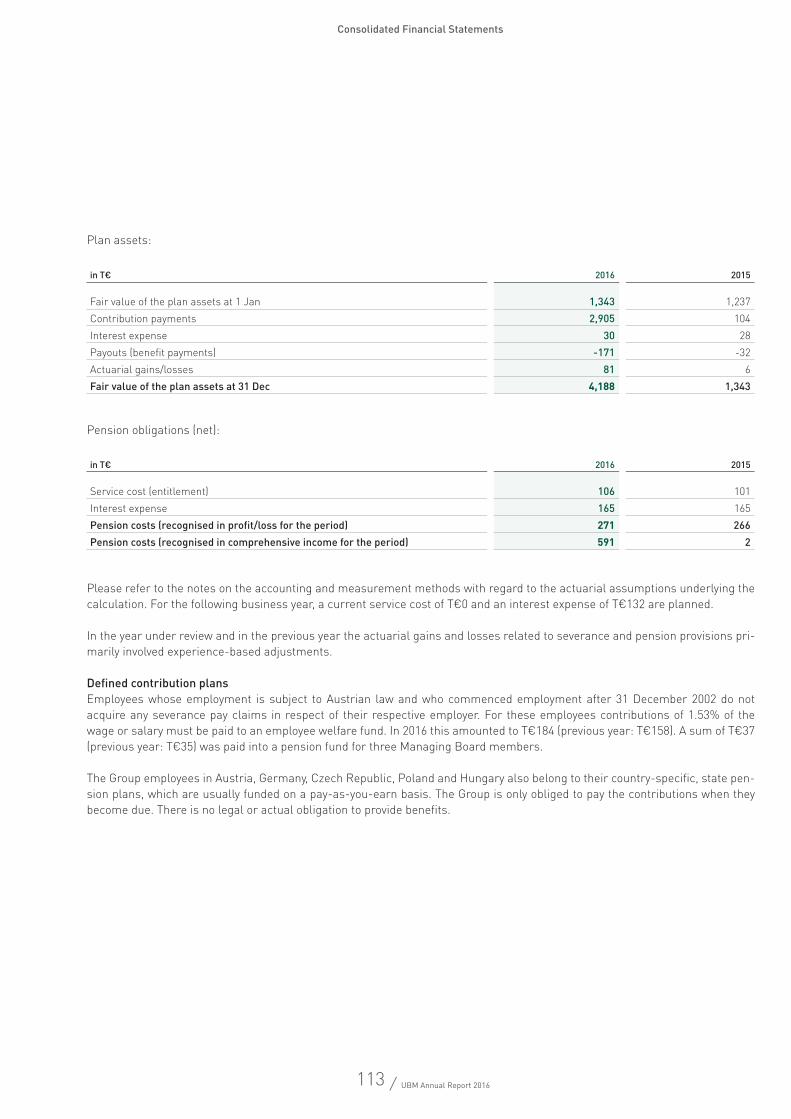
113 / UBM Annual Report 2016
Consolidated Financial Statements
Plan assets:
Pension obligations (net):
Please refer to the notes on the accounting and measurement methods with regard to the actuarial assumptions underlying the calculation. For the following business year, a current service cost of T€0 and an interest expense of T€132 are planned.
In the year under review and in the previous year the actuarial gains and losses related to severance and pension provisions pri-marily involved experience-based adjustments.
Defined contribution plans Employees whose employment is subject to Austrian law and who commenced employment after 31 December 2002 do not acquire any severance pay claims in respect of their respective employer. For these employees contributions of 1.53% of the wage or salary must be paid to an employee welfare fund. In 2016 this amounted to T€184 (previous year: T€158). A sum of T€37 (previous year: T€35) was paid into a pension fund for three Managing Board members.
The Group employees in Austria, Germany, Czech Republic, Poland and Hungary also belong to their country-specific, state pen-sion plans, which are usually funded on a pay-as-you-earn basis. The Group is only obliged to pay the contributions when they become due. There is no legal or actual obligation to provide benefits.
in T€ 2016 2015
Fair value of the plan assets at 1 Jan 1,343 1,237Contribution payments 2,905 104Interest expense 30 28Payouts (benefit payments) -171 -32Actuarial gains/losses 81 6Fair value of the plan assets at 31 Dec 4,188 1,343
in T€ 2016 2015
Service cost (entitlement) 106 101Interest expense 165 165Pension costs (recognised in profit/loss for the period) 271 266Pension costs (recognised in comprehensive income for the period) 591 2
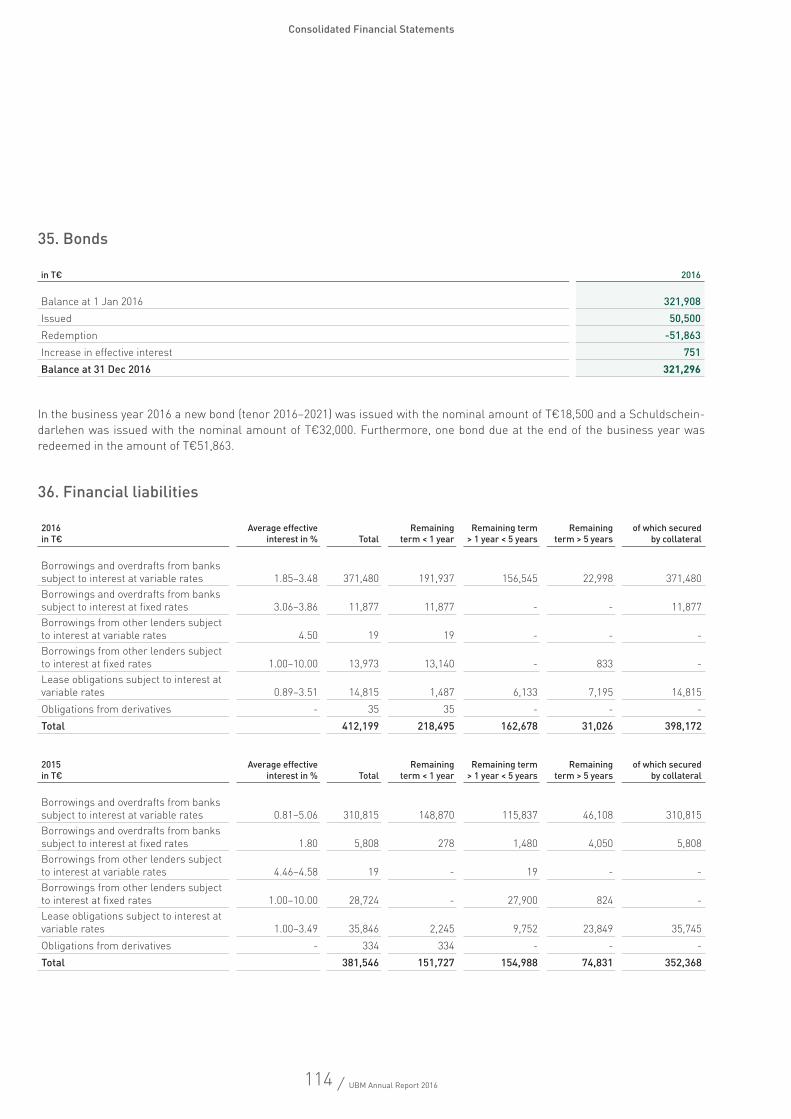
114 / UBM Annual Report 2016
Consolidated Financial Statements
35. Bonds
In the business year 2016 a new bond (tenor 2016–2021) was issued with the nominal amount of T€18,500 and a Schuldschein-darlehen was issued with the nominal amount of T€32,000. Furthermore, one bond due at the end of the business year was redeemed in the amount of T€51,863.
36. Financial liabilities
in T€ 2016
Balance at 1 Jan 2016 321,908Issued 50,500Redemption -51,863Increase in effective interest 751Balance at 31 Dec 2016 321,296
2016in T€
Average effective interest in % Total
Remaining term < 1 year
Remaining term > 1 year < 5 years
Remaining term > 5 years
of which secured by collateral
Borrowings and overdrafts from banks subject to interest at variable rates 1.85–3.48 371,480 191,937 156,545 22,998 371,480Borrowings and overdrafts from banks subject to interest at fixed rates 3.06–3.86 11,877 11,877 - - 11,877Borrowings from other lenders subject to interest at variable rates 4.50 19 19 - - -Borrowings from other lenders subject to interest at fixed rates 1.00–10.00 13,973 13,140 - 833 -Lease obligations subject to interest at variable rates 0.89–3.51 14,815 1,487 6,133 7,195 14,815Obligations from derivatives - 35 35 - - -Total 412,199 218,495 162,678 31,026 398,172
2015in T€
Average effective interest in % Total
Remaining term < 1 year
Remaining term > 1 year < 5 years
Remaining term > 5 years
of which secured by collateral
Borrowings and overdrafts from banks subject to interest at variable rates 0.81–5.06 310,815 148,870 115,837 46,108 310,815Borrowings and overdrafts from banks subject to interest at fixed rates 1.80 5,808 278 1,480 4,050 5,808Borrowings from other lenders subject to interest at variable rates 4.46–4.58 19 - 19 - -Borrowings from other lenders subject to interest at fixed rates 1.00–10.00 28,724 - 27,900 824 -Lease obligations subject to interest at variable rates 1.00–3.49 35,846 2,245 9,752 23,849 35,745Obligations from derivatives - 334 334 - - -Total 381,546 151,727 154,988 74,831 352,368
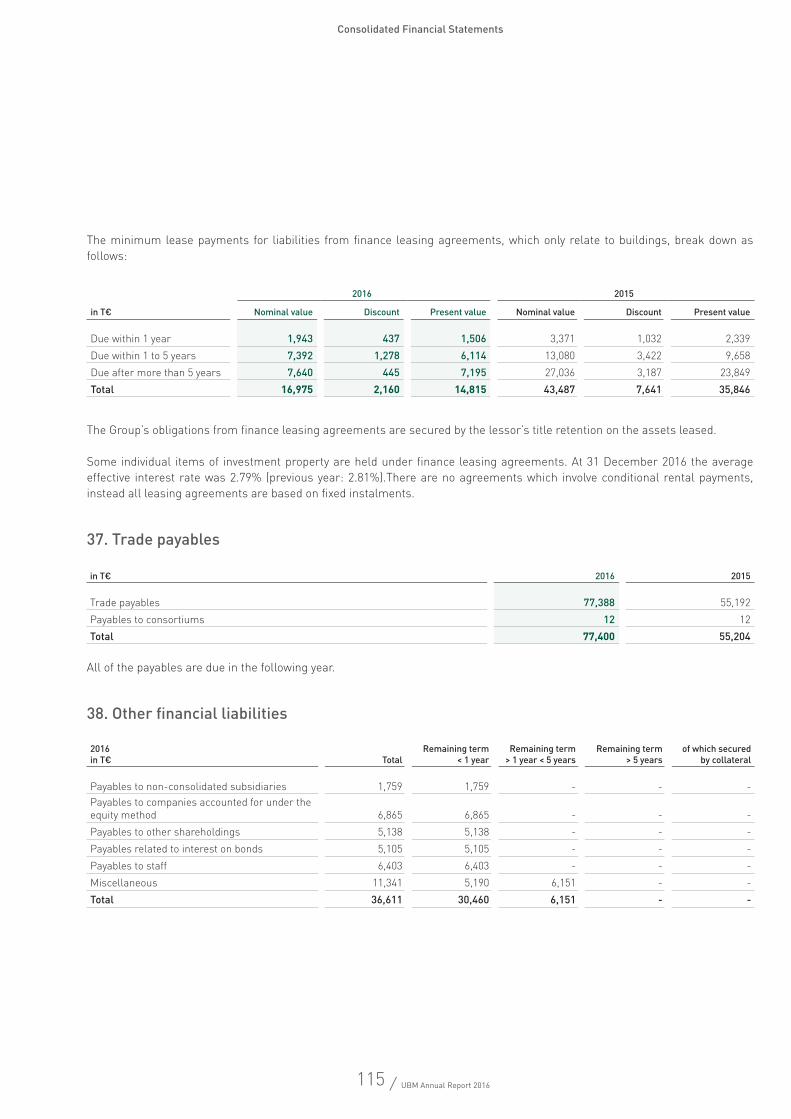
115 / UBM Annual Report 2016
Consolidated Financial Statements
The minimum lease payments for liabilities from finance leasing agreements, which only relate to buildings, break down as follows:
The Group’s obligations from finance leasing agreements are secured by the lessor’s title retention on the assets leased.
Some individual items of investment property are held under finance leasing agreements. At 31 December 2016 the average effective interest rate was 2.79% (previous year: 2.81%).There are no agreements which involve conditional rental payments, instead all leasing agreements are based on fixed instalments.
37. Trade payables
All of the payables are due in the following year.
38. Other financial liabilities
2016 2015
in T€ Nominal value Discount Present value Nominal value Discount Present value
Due within 1 year 1,943 437 1,506 3,371 1,032 2,339Due within 1 to 5 years 7,392 1,278 6,114 13,080 3,422 9,658Due after more than 5 years 7,640 445 7,195 27,036 3,187 23,849Total 16,975 2,160 14,815 43,487 7,641 35,846
in T€ 2016 2015
Trade payables 77,388 55,192Payables to consortiums 12 12Total 77,400 55,204
2016in T€ Total
Remaining term < 1 year
Remaining term > 1 year < 5 years
Remaining term > 5 years
of which secured by collateral
Payables to non-consolidated subsidiaries 1,759 1,759 - - -Payables to companies accounted for under the equity method 6,865 6,865 - - -Payables to other shareholdings 5,138 5,138 - - -Payables related to interest on bonds 5,105 5,105 - - -Payables to staff 6,403 6,403 - - -Miscellaneous 11,341 5,190 6,151 - -Total 36,611 30,460 6,151 - -
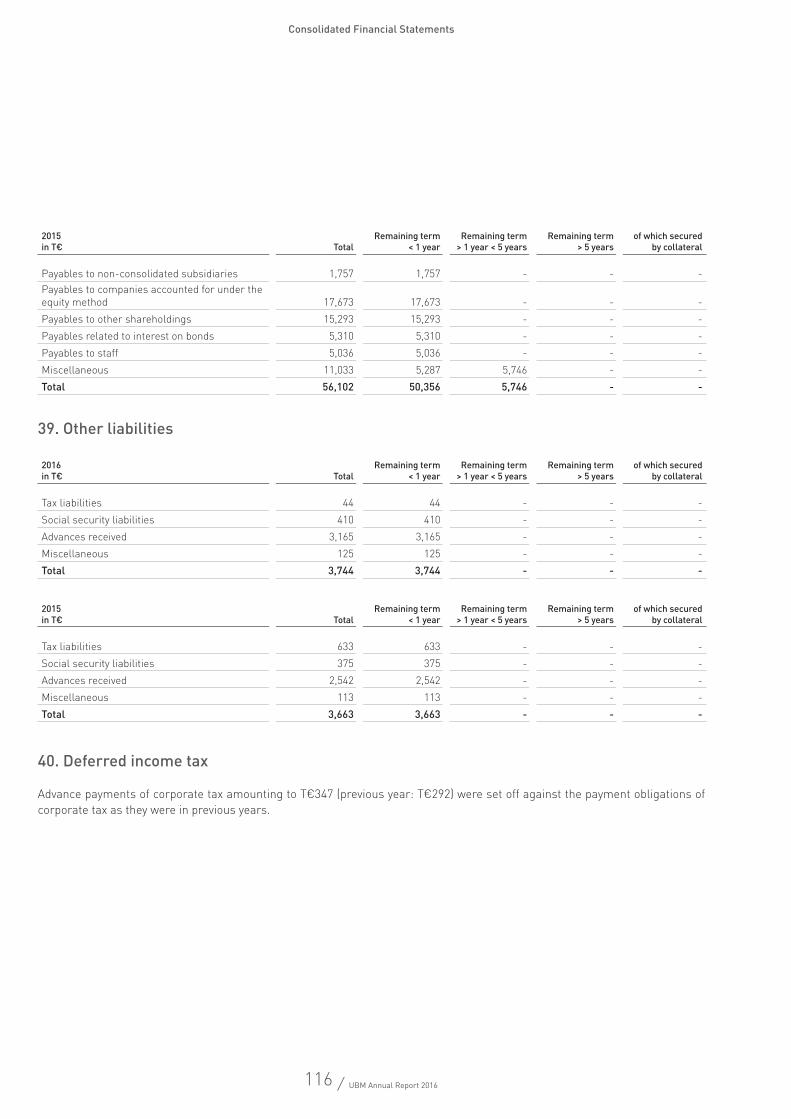
116 / UBM Annual Report 2016
Consolidated Financial Statements
39. Other liabilities
40. Deferred income tax
Advance payments of corporate tax amounting to T€347 (previous year: T€292) were set off against the payment obligations of corporate tax as they were in previous years.
2016in T€ Total
Remaining term < 1 year
Remaining term > 1 year < 5 years
Remaining term > 5 years
of which secured by collateral
Tax liabilities 44 44 - - -Social security liabilities 410 410 - - -Advances received 3,165 3,165 - - -Miscellaneous 125 125 - - -Total 3,744 3,744 - - -
2015in T€ Total
Remaining term < 1 year
Remaining term > 1 year < 5 years
Remaining term > 5 years
of which secured by collateral
Tax liabilities 633 633 - - -Social security liabilities 375 375 - - -Advances received 2,542 2,542 - - -Miscellaneous 113 113 - - -Total 3,663 3,663 - - -
2015in T€ Total
Remaining term < 1 year
Remaining term > 1 year < 5 years
Remaining term > 5 years
of which secured by collateral
Payables to non-consolidated subsidiaries 1,757 1,757 - - -Payables to companies accounted for under the equity method 17,673 17,673 - - -Payables to other shareholdings 15,293 15,293 - - -Payables related to interest on bonds 5,310 5,310 - - -Payables to staff 5,036 5,036 - - -Miscellaneous 11,033 5,287 5,746 - -Total 56,102 50,356 5,746 - -
117 / UBM Annual Report 2016
Consolidated Financial Statements
41. Contingent liabilities and guarantees
Guarantees comprise credit guarantees and guarantee declarations amounting to T€177,503 (previous year: T€133,931). Con-tingent liabilities for companies accounted for under the equity method amounted to T€159,368 (previous year: T€111,031). An availment of these liabilities is improbable.
Securities pledgedIn the course of project financing, it is common that individual Group companies pledge securities for loans and borrowings. As a rule, the financing applies individually at the level of the project. Every company must take responsibility for the ongoing servicing of the debt. There are a range of securities available to the lender for hedging loans and borrowings, which can be drawn on if the claims need to be settled. The securities pledged can involve the following collateral:
Mortgage-backed securities on property Pledging shares in the project company Pledging rent receivables
The conditions, type and scope of the securities are agreed individually (for each project company) and are tied to the project volume and the amount and duration of the loans and borrowings.
With regard to securities for investment property, please refer to note 19 and for inventories to note 23.
42. Notes on segment reporting
Segment reporting is based on geographical regions in accordance with the internal organisational structure of the UBM Group. The individual development companies within a segment are pooled into groups for the purposes of segment reporting. These groups each constitute a business area of the UBM Group. During the transfer of segment assets and liabilities, internal receiv-ables and liabilities are eliminated for the purposes of debt consolidation.
Internal reporting is based on IFRS figures and adjusted for intragroup sales as standard. High revenues are generated through the sale of real estate projects in the course of UBM’s business activities; however, this does not mean the Group is dependent on individual clients.
118 / UBM Annual Report 2016
Consolidated Financial Statements
Germany Austria Poland Other markets Reconciliation Group
in T€ 2016 2015 2016 2015 2016 2015 2016 2015 2016 2015 2016 2015
Total OutputAdministration - - 7,154 17,150 - - - - 7,154 17,150Hotel 70,914 79,264 11,798 29,486 29,159 47,763 30,184 42,023 142,055 198,536Office 72,105 28,311 32,518 21,541 12,509 7,948 1,034 880 118,166 58,680Other 5,448 16,322 50,241 66,577 2,960 3,107 4,303 56,300 62,952 142,306Residential 71,626 73,202 21,518 7,789 707 600 3,510 4,745 97,361 86,336Service 55,170 11,754 51,785 51,016 19,858 20,062 3,018 7,475 129,831 90,307Total Output 275,263 208,853 175,014 193,559 65,193 79,480 42,049 111,423 557,519 593,315Less revenue from associates and companies of minor significance and from performance companies -72,640 -57,521 -61,301 -92,102 -28,739 -19,002 -14,780 -71,804 -177,460 -240,429Change in inventories 57,273 -16,711 -20,294 -25,554 - -2,856 -18 16 36,961 -45,105Revenue 259,896 134,621 93,419 75,903 36,454 57,622 27,251 39,635 417,020 307,781
Administration - - 1,065 16,606 - - - - 1,065 16,606Hotel 12,915 5,457 7,429 433 -1,149 1,525 12,987 115 32,182 7,530Office 4,076 28,429 -10,479 -2,039 3,674 2,522 -1,755 -1,057 -4,484 27,855Other 12,292 1,401 -4,070 -5,445 -4,643 452 292 5,171 3,871 1,579Residential 8,819 5,258 212 489 -7,148 -4,758 -5,335 -2,116 -3,452 -1,127Service 2,796 -418 4,975 -8,084 1,160 1,213 1,952 5,131 10,883 -2,158Total EBT 40,898 40,127 -868 1,960 -8,106 954 8,141 7,244 40,065 50,285
including: Earnings from associates 1,984 13,038 11,514 4,384 1,229 4,464 10,397 3,436 25,124 25,322Depreciation, amortisation and impairment -888 -865 -604 -933 -1,241 -484 -673 -525 -3,406 -2,807Interest income 846 665 5,488 5,626 50 40 1 -1 6,385 6,330Interest expense -1,466 -1,048 -14,031 -20,856 -2,458 23 -1,245 -418 -19,200 -22,299
Segment assets at 31 Dec 356,554 333,496 1,364,175 1,294,474 343,902 219,456 151,726 145,385 -982,596 -807,575 1,233,761 1,185,236of which including intangible assets, property, plant and equipment and investment property 148,645 126,843 177,312 270,373 155,682 133,992 62,249 64,330 543,888 595,538of which including associates 13,531 12,406 68,267 64,655 12,706 28,779 15,132 5,703 109,636 111,543
Segment liabilities at 31 Dec 281,394 273,632 805,705 764,610 311,092 219,146 97,883 108,064 -603,767 -512,240 892,307 853,212Investments in non-current assets and investment property 70,899 45,921 57,722 66,148 83,835 33,520 1,418 785 213,874 146,374Staff 254 175 138 125 226 273 98 112 716 685
119 / UBM Annual Report 2016
Consolidated Financial Statements
Germany Austria Poland Other markets Reconciliation Group
in T€ 2016 2015 2016 2015 2016 2015 2016 2015 2016 2015 2016 2015
Total OutputAdministration - - 7,154 17,150 - - - - 7,154 17,150Hotel 70,914 79,264 11,798 29,486 29,159 47,763 30,184 42,023 142,055 198,536Office 72,105 28,311 32,518 21,541 12,509 7,948 1,034 880 118,166 58,680Other 5,448 16,322 50,241 66,577 2,960 3,107 4,303 56,300 62,952 142,306Residential 71,626 73,202 21,518 7,789 707 600 3,510 4,745 97,361 86,336Service 55,170 11,754 51,785 51,016 19,858 20,062 3,018 7,475 129,831 90,307Total Output 275,263 208,853 175,014 193,559 65,193 79,480 42,049 111,423 557,519 593,315Less revenue from associates and companies of minor significance and from performance companies -72,640 -57,521 -61,301 -92,102 -28,739 -19,002 -14,780 -71,804 -177,460 -240,429Change in inventories 57,273 -16,711 -20,294 -25,554 - -2,856 -18 16 36,961 -45,105Revenue 259,896 134,621 93,419 75,903 36,454 57,622 27,251 39,635 417,020 307,781
Administration - - 1,065 16,606 - - - - 1,065 16,606Hotel 12,915 5,457 7,429 433 -1,149 1,525 12,987 115 32,182 7,530Office 4,076 28,429 -10,479 -2,039 3,674 2,522 -1,755 -1,057 -4,484 27,855Other 12,292 1,401 -4,070 -5,445 -4,643 452 292 5,171 3,871 1,579Residential 8,819 5,258 212 489 -7,148 -4,758 -5,335 -2,116 -3,452 -1,127Service 2,796 -418 4,975 -8,084 1,160 1,213 1,952 5,131 10,883 -2,158Total EBT 40,898 40,127 -868 1,960 -8,106 954 8,141 7,244 40,065 50,285
including: Earnings from associates 1,984 13,038 11,514 4,384 1,229 4,464 10,397 3,436 25,124 25,322Depreciation, amortisation and impairment -888 -865 -604 -933 -1,241 -484 -673 -525 -3,406 -2,807Interest income 846 665 5,488 5,626 50 40 1 -1 6,385 6,330Interest expense -1,466 -1,048 -14,031 -20,856 -2,458 23 -1,245 -418 -19,200 -22,299
Segment assets at 31 Dec 356,554 333,496 1,364,175 1,294,474 343,902 219,456 151,726 145,385 -982,596 -807,575 1,233,761 1,185,236of which including intangible assets, property, plant and equipment and investment property 148,645 126,843 177,312 270,373 155,682 133,992 62,249 64,330 543,888 595,538of which including associates 13,531 12,406 68,267 64,655 12,706 28,779 15,132 5,703 109,636 111,543
Segment liabilities at 31 Dec 281,394 273,632 805,705 764,610 311,092 219,146 97,883 108,064 -603,767 -512,240 892,307 853,212Investments in non-current assets and investment property 70,899 45,921 57,722 66,148 83,835 33,520 1,418 785 213,874 146,374Staff 254 175 138 125 226 273 98 112 716 685
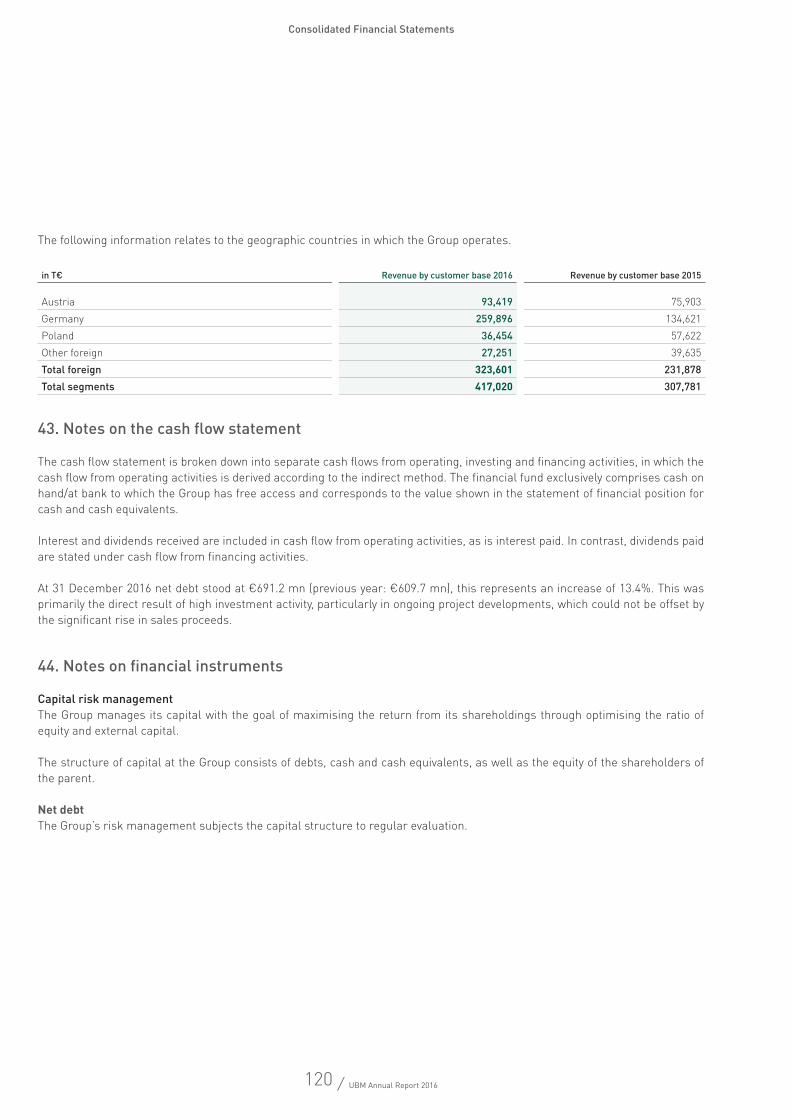
120 / UBM Annual Report 2016
Consolidated Financial Statements
The following information relates to the geographic countries in which the Group operates.
43. Notes on the cash flow statement
The cash flow statement is broken down into separate cash flows from operating, investing and financing activities, in which the cash flow from operating activities is derived according to the indirect method. The financial fund exclusively comprises cash on hand/at bank to which the Group has free access and corresponds to the value shown in the statement of financial position for cash and cash equivalents.
Interest and dividends received are included in cash flow from operating activities, as is interest paid. In contrast, dividends paid are stated under cash flow from financing activities.
At 31 December 2016 net debt stood at €691.2 mn (previous year: €609.7 mn), this represents an increase of 13.4%. This was primarily the direct result of high investment activity, particularly in ongoing project developments, which could not be offset by the significant rise in sales proceeds.
44. Notes on financial instruments
Capital risk managementThe Group manages its capital with the goal of maximising the return from its shareholdings through optimising the ratio of equity and external capital.
The structure of capital at the Group consists of debts, cash and cash equivalents, as well as the equity of the shareholders of the parent.
Net debtThe Group’s risk management subjects the capital structure to regular evaluation.
in T€ Revenue by customer base 2016 Revenue by customer base 2015
Austria 93,419 75,903Germany 259,896 134,621Poland 36,454 57,622Other foreign 27,251 39,635Total foreign 323,601 231,878Total segments 417,020 307,781
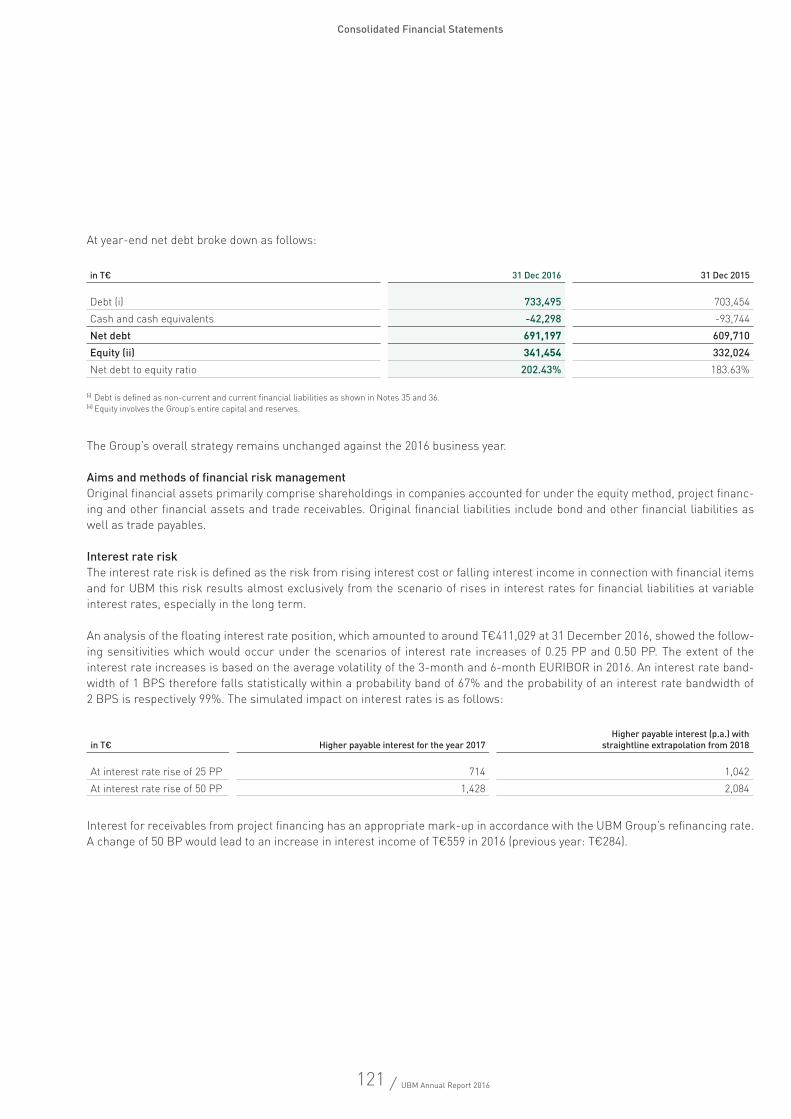
121 / UBM Annual Report 2016
Consolidated Financial Statements
At year-end net debt broke down as follows:
(i) Debt is defined as non-current and current financial liabilities as shown in Notes 35 and 36.(ii) Equity involves the Group’s entire capital and reserves.
The Group’s overall strategy remains unchanged against the 2016 business year.
Aims and methods of financial risk managementOriginal financial assets primarily comprise shareholdings in companies accounted for under the equity method, project financ-ing and other financial assets and trade receivables. Original financial liabilities include bond and other financial liabilities as well as trade payables.
Interest rate riskThe interest rate risk is defined as the risk from rising interest cost or falling interest income in connection with financial items and for UBM this risk results almost exclusively from the scenario of rises in interest rates for financial liabilities at variable interest rates, especially in the long term.
An analysis of the floating interest rate position, which amounted to around T€411,029 at 31 December 2016, showed the follow-ing sensitivities which would occur under the scenarios of interest rate increases of 0.25 PP and 0.50 PP. The extent of the interest rate increases is based on the average volatility of the 3-month and 6-month EURIBOR in 2016. An interest rate band-width of 1 BPS therefore falls statistically within a probability band of 67% and the probability of an interest rate bandwidth of 2 BPS is respectively 99%. The simulated impact on interest rates is as follows:
Interest for receivables from project financing has an appropriate mark-up in accordance with the UBM Group’s refinancing rate. A change of 50 BP would lead to an increase in interest income of T€559 in 2016 (previous year: T€284).
in T€ 31 Dec 2016 31 Dec 2015
Debt (i) 733,495 703,454Cash and cash equivalents -42,298 -93,744Net debt 691,197 609,710Equity (ii) 341,454 332,024Net debt to equity ratio 202.43% 183.63%
in T€ Higher payable interest for the year 2017Higher payable interest (p.a.) with
straightline extrapolation from 2018
At interest rate rise of 25 PP 714 1,042At interest rate rise of 50 PP 1,428 2,084

122 / UBM Annual Report 2016
Consolidated Financial Statements
Credit risk Credit risk describes the threat of losses caused by the default of a business partner no longer capable of meeting its contractual payment obligations. This comprises default and country risks as well as the credit standing of borrowers being downgraded. The credit risk for the real estate business comprises rental obligations. The default of a tenant and the resultant loss of rental pay-ments reduce the present value of the real estate project. This risk is taken into account at project level through expert opinions.
The risk related to receivables from customers can be classified as marginal, owing to the broad dispersion and ongoing creditworthiness checks, with regard to project financing please refer to table 44 of accumulated depreciation for project financing.
The risk of default in the case of other original financial instruments stated under assets in the statement of financial position is also regarded as low because all contracting parties are financial institutions and other debtors with prime credit standing. The carrying amount of the financial assets represents the maximum risk of default. Where risks of default are recognised in relation to financial assets, account is taken of these risks by performing allowances for impairment. There was no need for allowances of this type.
Foreign exchange riskThe interest and currency risks are evaluated regularly by risk management. Market analyses and projections from renowned financial service providers are analysed and regular reports are made to management.
The foreign exchange risk is treated within the UBM Group as transaction-oriented and results from financing in connection with property development.
As of 31 December 2016, currency risks, which result from intragroup financing transactions and/or from loan financing for pro-ject companies, were subject to a simulation, in order to be able to estimate possible risks from changes to foreign exchange rates:
1 VAR = Value At Risk at a one-sided 99% confidence interval, this corresponds to a standard deviation of 2.3 over a time period of ten days. Correlations between currency pairs remain unconsidered.
The simulated maximum loss at a probability of 99% and over a time period of ten days is currently a maximum of €9.21 mn.
Hedging currency risks The UBM Group had concluded forward exchange contracts of T€626 (previous year: T€14,735) at 31 December 2016 which all involved €/PLN forward sales. Around T€429 (previous year: T€10,090) are used as hedges for loans financed in euros and the remainder of T€197 (previous year: T€4,645) for hedging intragroup financing.
FX position in T€ Local currency FX position in local currency in thousand VAR1 in T€
-25,439 CZK 687,380 545-19,044 HRK 143,968 140
-30 HUF 9,295 1-240,518 PLN 1,061 8,318
-17,048 RON 77,379 202
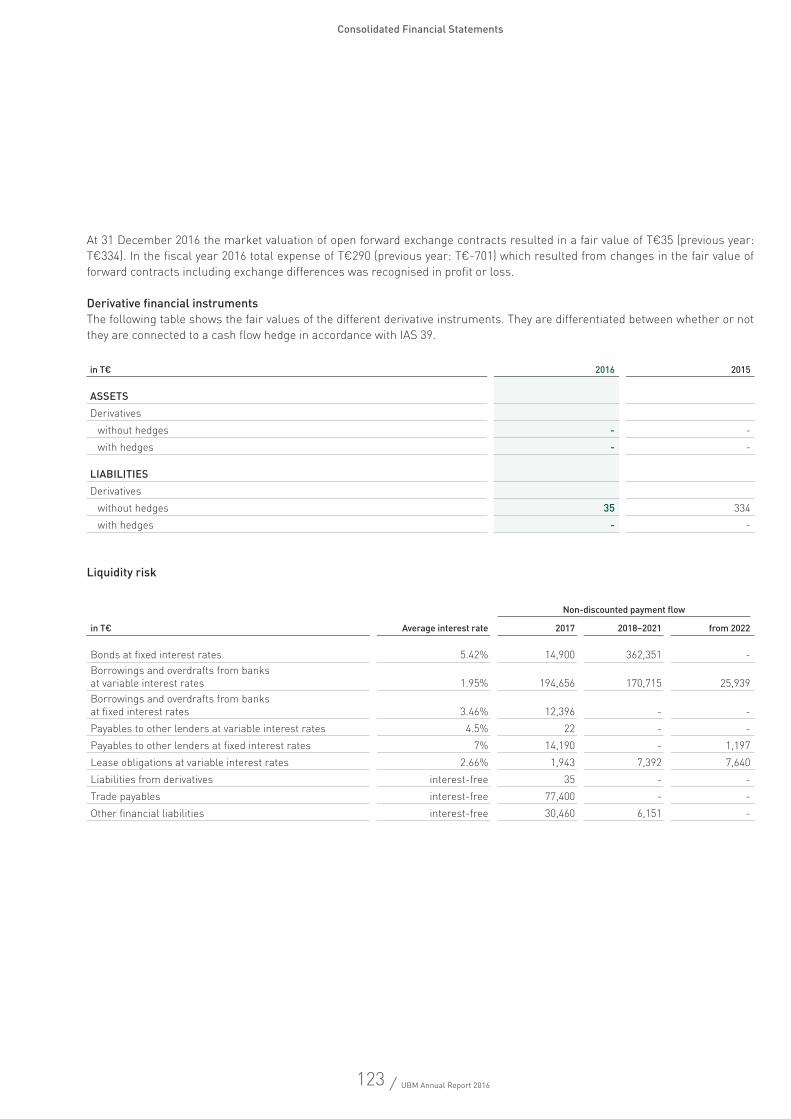
123 / UBM Annual Report 2016
Consolidated Financial Statements
At 31 December 2016 the market valuation of open forward exchange contracts resulted in a fair value of T€35 (previous year: T€334). In the fiscal year 2016 total expense of T€290 (previous year: T€-701) which resulted from changes in the fair value of forward contracts including exchange differences was recognised in profit or loss.
Derivative financial instruments The following table shows the fair values of the different derivative instruments. They are differentiated between whether or not they are connected to a cash flow hedge in accordance with IAS 39.
Liquidity risk
in T€ 2016 2015
ASSETSDerivatives
without hedges - -with hedges - -
LIABILITIESDerivatives
without hedges 35 334with hedges - -
Non-discounted payment flow
in T€ Average interest rate 2017 2018–2021 from 2022
Bonds at fixed interest rates 5.42% 14,900 362,351 -Borrowings and overdrafts from banks at variable interest rates 1.95% 194,656 170,715 25,939Borrowings and overdrafts from banks at fixed interest rates 3.46% 12,396 - -Payables to other lenders at variable interest rates 4.5% 22 - -Payables to other lenders at fixed interest rates 7% 14,190 - 1,197Lease obligations at variable interest rates 2.66% 1,943 7,392 7,640Liabilities from derivatives interest-free 35 - -Trade payables interest-free 77,400 - -Other financial liabilities interest-free 30,460 6,151 -
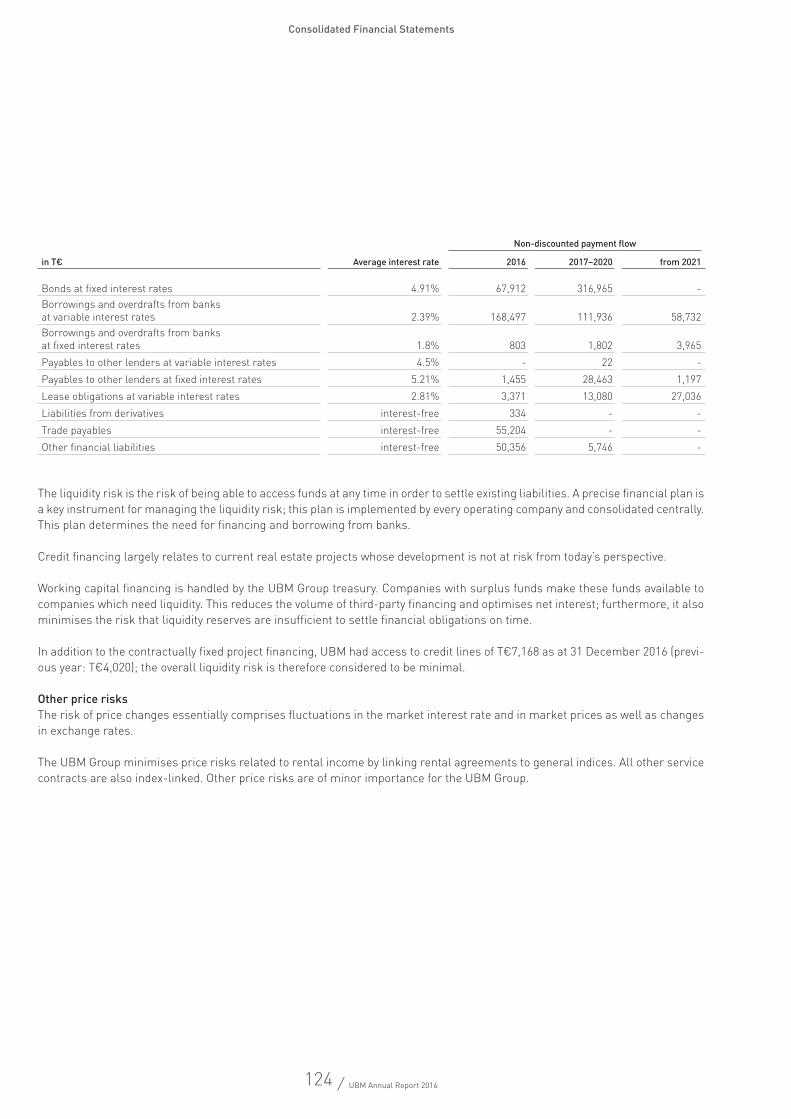
124 / UBM Annual Report 2016
Consolidated Financial Statements
Non-discounted payment flow
in T€ Average interest rate 2016 2017–2020 from 2021
Bonds at fixed interest rates 4.91% 67,912 316,965 -Borrowings and overdrafts from banks at variable interest rates 2.39% 168,497 111,936 58,732Borrowings and overdrafts from banks at fixed interest rates 1.8% 803 1,802 3,965Payables to other lenders at variable interest rates 4.5% - 22 -Payables to other lenders at fixed interest rates 5.21% 1,455 28,463 1,197Lease obligations at variable interest rates 2.81% 3,371 13,080 27,036Liabilities from derivatives interest-free 334 - -Trade payables interest-free 55,204 - -Other financial liabilities interest-free 50,356 5,746 -
The liquidity risk is the risk of being able to access funds at any time in order to settle existing liabilities. A precise financial plan is a key instrument for managing the liquidity risk; this plan is implemented by every operating company and consolidated centrally. This plan determines the need for financing and borrowing from banks.
Credit financing largely relates to current real estate projects whose development is not at risk from today’s perspective.
Working capital financing is handled by the UBM Group treasury. Companies with surplus funds make these funds available to companies which need liquidity. This reduces the volume of third-party financing and optimises net interest; furthermore, it also minimises the risk that liquidity reserves are insufficient to settle financial obligations on time.
In addition to the contractually fixed project financing, UBM had access to credit lines of T€7,168 as at 31 December 2016 (previ-ous year: T€4,020); the overall liquidity risk is therefore considered to be minimal.
Other price risksThe risk of price changes essentially comprises fluctuations in the market interest rate and in market prices as well as changes in exchange rates.
The UBM Group minimises price risks related to rental income by linking rental agreements to general indices. All other service contracts are also index-linked. Other price risks are of minor importance for the UBM Group.
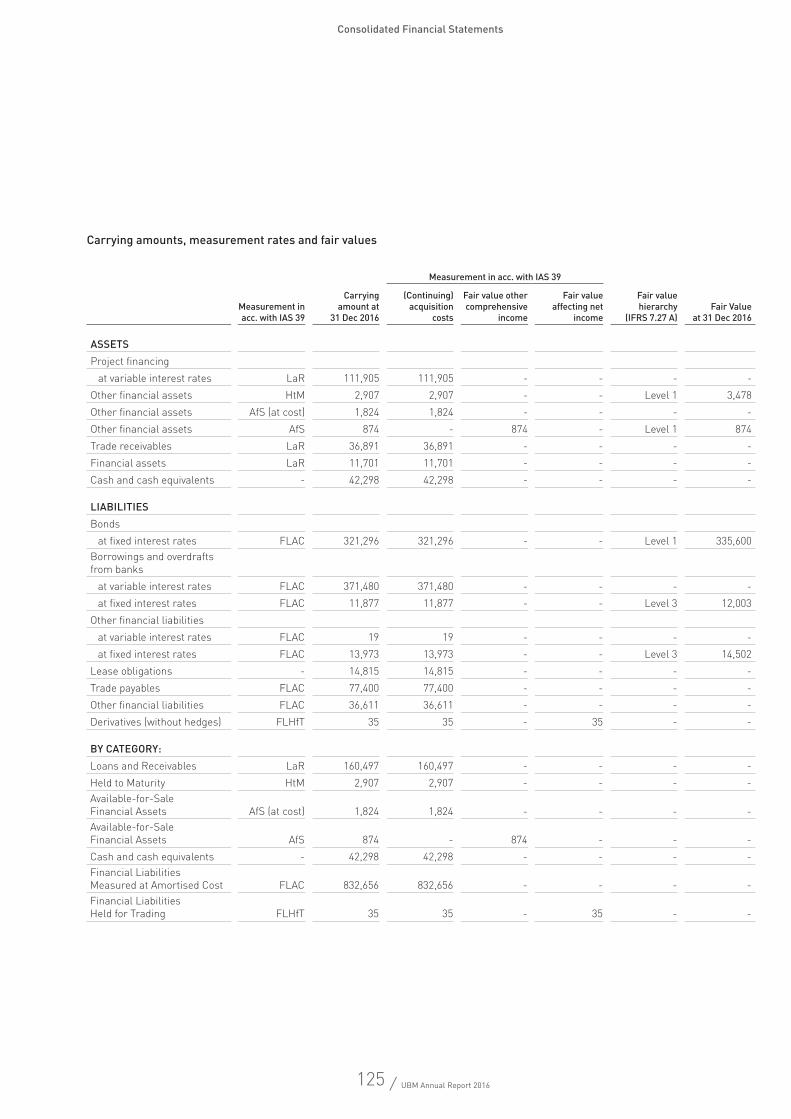
125 / UBM Annual Report 2016
Consolidated Financial Statements
Carrying amounts, measurement rates and fair values
Measurement in acc. with IAS 39
Measurement in acc. with IAS 39
Carrying amount at
31 Dec 2016
(Continuing) acquisition
costs
Fair value other comprehensive
income
Fair value affecting net
income
Fair value hierarchy
(IFRS 7.27 A)Fair Value
at 31 Dec 2016
ASSETS Project financing
at variable interest rates LaR 111,905 111,905 - - - -Other financial assets HtM 2,907 2,907 - - Level 1 3,478Other financial assets AfS (at cost) 1,824 1,824 - - - -Other financial assets AfS 874 - 874 - Level 1 874Trade receivables LaR 36,891 36,891 - - - -Financial assets LaR 11,701 11,701 - - - -Cash and cash equivalents - 42,298 42,298 - - - -
LIABILITIESBonds
at fixed interest rates FLAC 321,296 321,296 - - Level 1 335,600Borrowings and overdrafts from banks
at variable interest rates FLAC 371,480 371,480 - - - -at fixed interest rates FLAC 11,877 11,877 - - Level 3 12,003
Other financial liabilitiesat variable interest rates FLAC 19 19 - - - -at fixed interest rates FLAC 13,973 13,973 - - Level 3 14,502
Lease obligations - 14,815 14,815 - - - -Trade payables FLAC 77,400 77,400 - - - -Other financial liabilities FLAC 36,611 36,611 - - - -Derivatives (without hedges) FLHfT 35 35 - 35 - -
BY CATEGORY:Loans and Receivables LaR 160,497 160,497 - - - -Held to Maturity HtM 2,907 2,907 - - - -Available-for-Sale Financial Assets AfS (at cost) 1,824 1,824 - - - -Available-for-Sale Financial Assets AfS 874 - 874 - - -Cash and cash equivalents - 42,298 42,298 - - - -Financial Liabilities Measured at Amortised Cost FLAC 832,656 832,656 - - - -Financial Liabilities Held for Trading FLHfT 35 35 - 35 - -
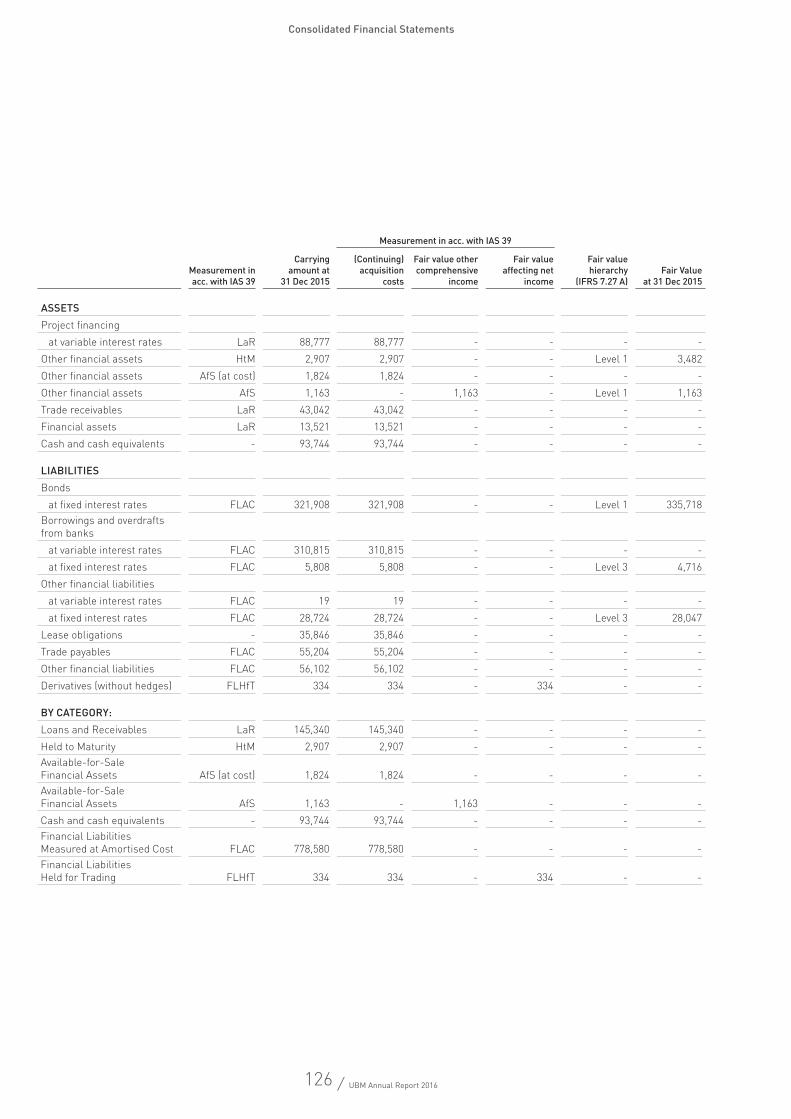
126 / UBM Annual Report 2016
Consolidated Financial Statements
Measurement in acc. with IAS 39
Measurement in acc. with IAS 39
Carrying amount at
31 Dec 2015
(Continuing) acquisition
costs
Fair value other comprehensive
income
Fair value affecting net
income
Fair value hierarchy
(IFRS 7.27 A)Fair Value
at 31 Dec 2015
ASSETS Project financing
at variable interest rates LaR 88,777 88,777 - - - -Other financial assets HtM 2,907 2,907 - - Level 1 3,482Other financial assets AfS (at cost) 1,824 1,824 - - - -Other financial assets AfS 1,163 - 1,163 - Level 1 1,163Trade receivables LaR 43,042 43,042 - - - -Financial assets LaR 13,521 13,521 - - - -Cash and cash equivalents - 93,744 93,744 - - - -
LIABILITIESBonds
at fixed interest rates FLAC 321,908 321,908 - - Level 1 335,718Borrowings and overdrafts from banks
at variable interest rates FLAC 310,815 310,815 - - - -at fixed interest rates FLAC 5,808 5,808 - - Level 3 4,716
Other financial liabilitiesat variable interest rates FLAC 19 19 - - - -at fixed interest rates FLAC 28,724 28,724 - - Level 3 28,047
Lease obligations - 35,846 35,846 - - - -Trade payables FLAC 55,204 55,204 - - - -Other financial liabilities FLAC 56,102 56,102 - - - -Derivatives (without hedges) FLHfT 334 334 - 334 - -
BY CATEGORY:Loans and Receivables LaR 145,340 145,340 - - - -Held to Maturity HtM 2,907 2,907 - - - -Available-for-Sale Financial Assets AfS (at cost) 1,824 1,824 - - - -Available-for-Sale Financial Assets AfS 1,163 - 1,163 - - -Cash and cash equivalents - 93,744 93,744 - - - -Financial Liabilities Measured at Amortised Cost FLAC 778,580 778,580 - - - -Financial Liabilities Held for Trading FLHfT 334 334 - 334 - -
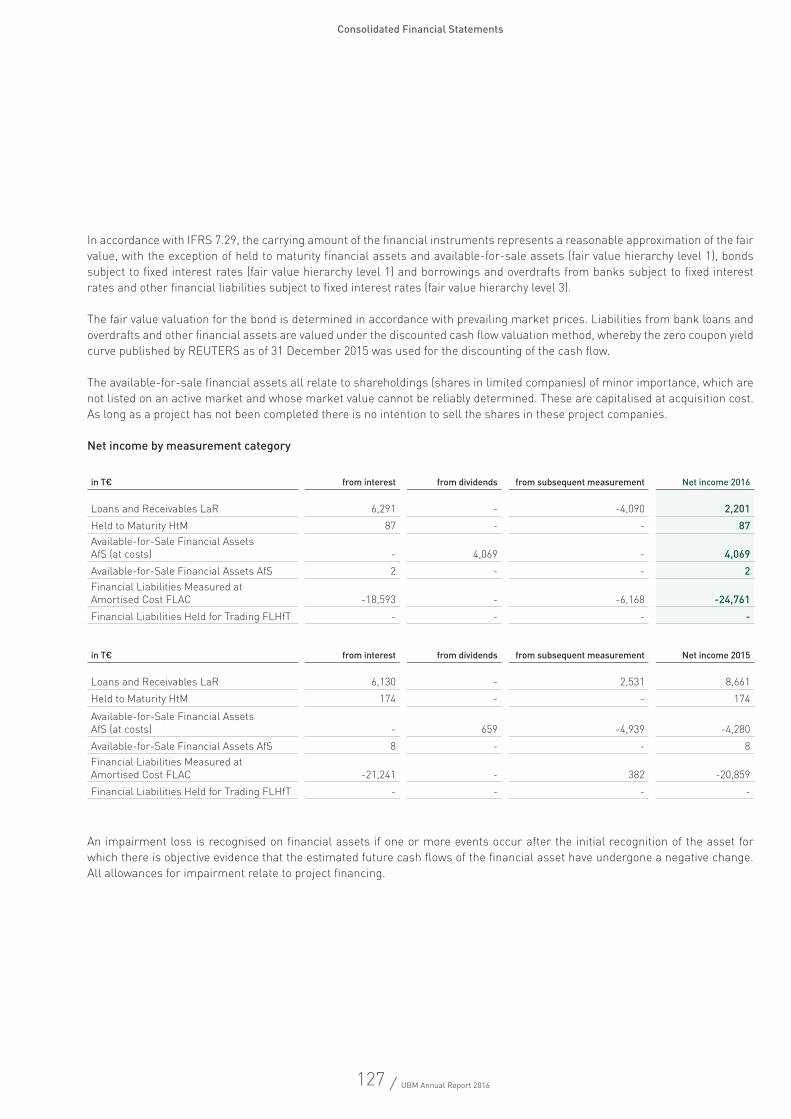
127 / UBM Annual Report 2016
Consolidated Financial Statements
In accordance with IFRS 7.29, the carrying amount of the financial instruments represents a reasonable approximation of the fair value, with the exception of held to maturity financial assets and available-for-sale assets (fair value hierarchy level 1), bonds subject to fixed interest rates (fair value hierarchy level 1) and borrowings and overdrafts from banks subject to fixed interest rates and other financial liabilities subject to fixed interest rates (fair value hierarchy level 3).
The fair value valuation for the bond is determined in accordance with prevailing market prices. Liabilities from bank loans and overdrafts and other financial assets are valued under the discounted cash flow valuation method, whereby the zero coupon yield curve published by REUTERS as of 31 December 2015 was used for the discounting of the cash flow.
The available-for-sale financial assets all relate to shareholdings (shares in limited companies) of minor importance, which are not listed on an active market and whose market value cannot be reliably determined. These are capitalised at acquisition cost. As long as a project has not been completed there is no intention to sell the shares in these project companies.
Net income by measurement category
An impairment loss is recognised on financial assets if one or more events occur after the initial recognition of the asset for which there is objective evidence that the estimated future cash flows of the financial asset have undergone a negative change. All allowances for impairment relate to project financing.
in T€ from interest from dividends from subsequent measurement Net income 2016
Loans and Receivables LaR 6,291 - -4,090 2,201Held to Maturity HtM 87 - - 87Available-for-Sale Financial Assets AfS (at costs) - 4,069 - 4,069Available-for-Sale Financial Assets AfS 2 - - 2Financial Liabilities Measured at Amortised Cost FLAC -18,593 - -6,168 -24,761Financial Liabilities Held for Trading FLHfT - - - -
in T€ from interest from dividends from subsequent measurement Net income 2015
Loans and Receivables LaR 6,130 - 2,531 8,661Held to Maturity HtM 174 - - 174
Available-for-Sale Financial Assets AfS (at costs) - 659 -4,939 -4,280Available-for-Sale Financial Assets AfS 8 - - 8Financial Liabilities Measured at Amortised Cost FLAC -21,241 - 382 -20,859Financial Liabilities Held for Trading FLHfT - - - -
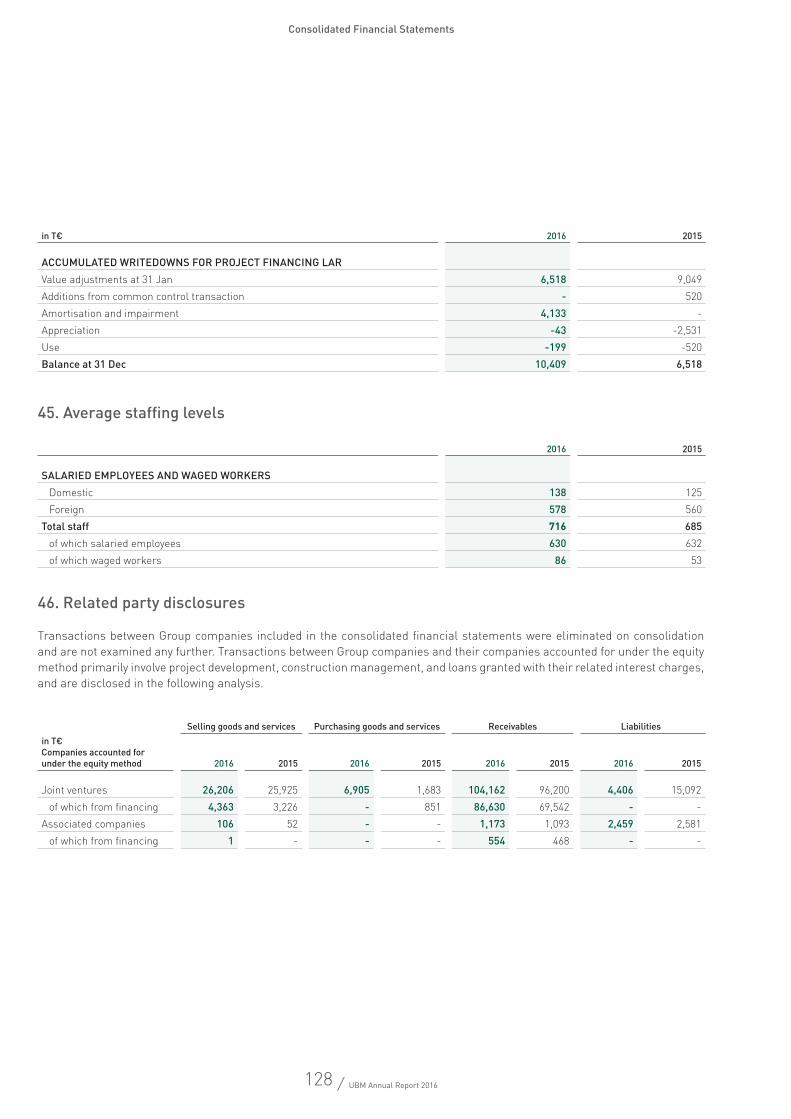
128 / UBM Annual Report 2016
Consolidated Financial Statements
45. Average staffing levels
46. Related party disclosures
Transactions between Group companies included in the consolidated financial statements were eliminated on consolidation and are not examined any further. Transactions between Group companies and their companies accounted for under the equity method primarily involve project development, construction management, and loans granted with their related interest charges, and are disclosed in the following analysis.
2016 2015
SALARIED EMPLOYEES AND WAGED WORKERSDomestic 138 125Foreign 578 560
Total staff 716 685of which salaried employees 630 632of which waged workers 86 53
Selling goods and services Purchasing goods and services Receivables Liabilities in T€ Companies accounted for under the equity method 2016 2015 2016 2015 2016 2015 2016 2015
Joint ventures 26,206 25,925 6,905 1,683 104,162 96,200 4,406 15,092of which from financing 4,363 3,226 - 851 86,630 69,542 - -
Associated companies 106 52 - - 1,173 1,093 2,459 2,581of which from financing 1 - - - 554 468 - -
in T€ 2016 2015
ACCUMULATED WRITEDOWNS FOR PROJECT FINANCING LARValue adjustments at 31 Jan 6,518 9,049Additions from common control transaction - 520Amortisation and impairment 4,133 -Appreciation -43 -2,531Use -199 -520Balance at 31 Dec 10,409 6,518
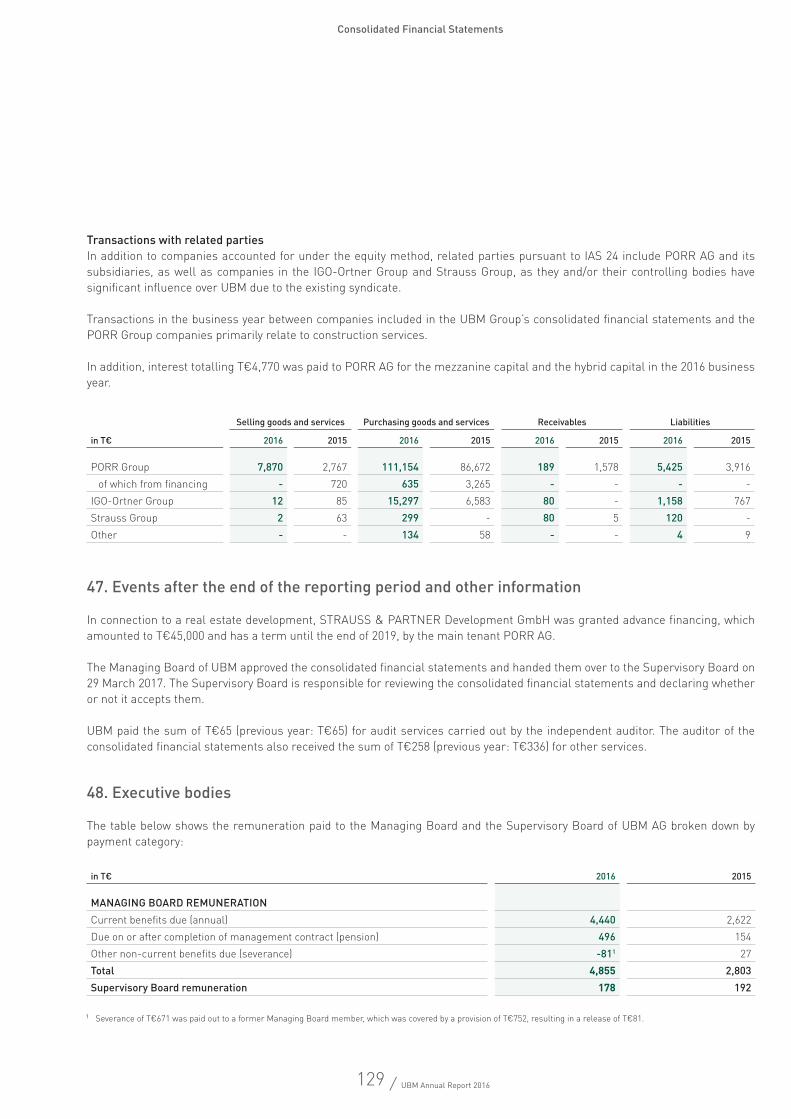
129 / UBM Annual Report 2016
Consolidated Financial Statements
Transactions with related partiesIn addition to companies accounted for under the equity method, related parties pursuant to IAS 24 include PORR AG and its subsidiaries, as well as companies in the IGO-Ortner Group and Strauss Group, as they and/or their controlling bodies have significant influence over UBM due to the existing syndicate.
Transactions in the business year between companies included in the UBM Group’s consolidated financial statements and the PORR Group companies primarily relate to construction services.
In addition, interest totalling T€4,770 was paid to PORR AG for the mezzanine capital and the hybrid capital in the 2016 business year.
47. Events after the end of the reporting period and other information
In connection to a real estate development, STRAUSS & PARTNER Development GmbH was granted advance financing, which amounted to T€45,000 and has a term until the end of 2019, by the main tenant PORR AG.
The Managing Board of UBM approved the consolidated financial statements and handed them over to the Supervisory Board on 29 March 2017. The Supervisory Board is responsible for reviewing the consolidated financial statements and declaring whether or not it accepts them.
UBM paid the sum of T€65 (previous year: T€65) for audit services carried out by the independent auditor. The auditor of the consolidated financial statements also received the sum of T€258 (previous year: T€336) for other services.
48. Executive bodies
The table below shows the remuneration paid to the Managing Board and the Supervisory Board of UBM AG broken down by payment category:
Selling goods and services Purchasing goods and services Receivables Liabilities
in T€ 2016 2015 2016 2015 2016 2015 2016 2015
PORR Group 7,870 2,767 111,154 86,672 189 1,578 5,425 3,916of which from financing - 720 635 3,265 - - - -
IGO-Ortner Group 12 85 15,297 6,583 80 - 1,158 767Strauss Group 2 63 299 - 80 5 120 -Other - - 134 58 - - 4 9
in T€ 2016 2015
MANAGING BOARD REMUNERATIONCurrent benefits due (annual) 4,440 2,622Due on or after completion of management contract (pension) 496 154Other non-current benefits due (severance) -811 27Total 4,855 2,803Supervisory Board remuneration 178 192
1 Severance of T€671 was paid out to a former Managing Board member, which was covered by a provision of T€752, resulting in a release of T€81.
130 / UBM Annual Report 2016
Consolidated Financial Statements
Thomas G. Winkler Chairman
Martin Löcker Michael WurzingerClaus Stadler
Vienna, 29 March 2017The Managing Board
Managing Board members: Thomas G. Winkler, Chairman (from 1 June 2016)Martin Löcker Michael Wurzinger Claus StadlerKarl Bier, Chairman (until 31 May 2016)Heribert Smolé (until 31 May 2016)
Members of the Supervisory Board:Karl-Heinz Strauss, ChairmanIris Ortner, Deputy ChairmanChristian B. Maier Klaus OrtnerLudwig Steinbauer Paul UnterluggauerBernhard Vanas Susanne Weiss
Johann Kaller (from 30 June 2016)Martin Kudlicska (from 30 June 2016)Hannes Muster (from 30 June 2016)Günter Schnötzinger (from 30 June 2016)
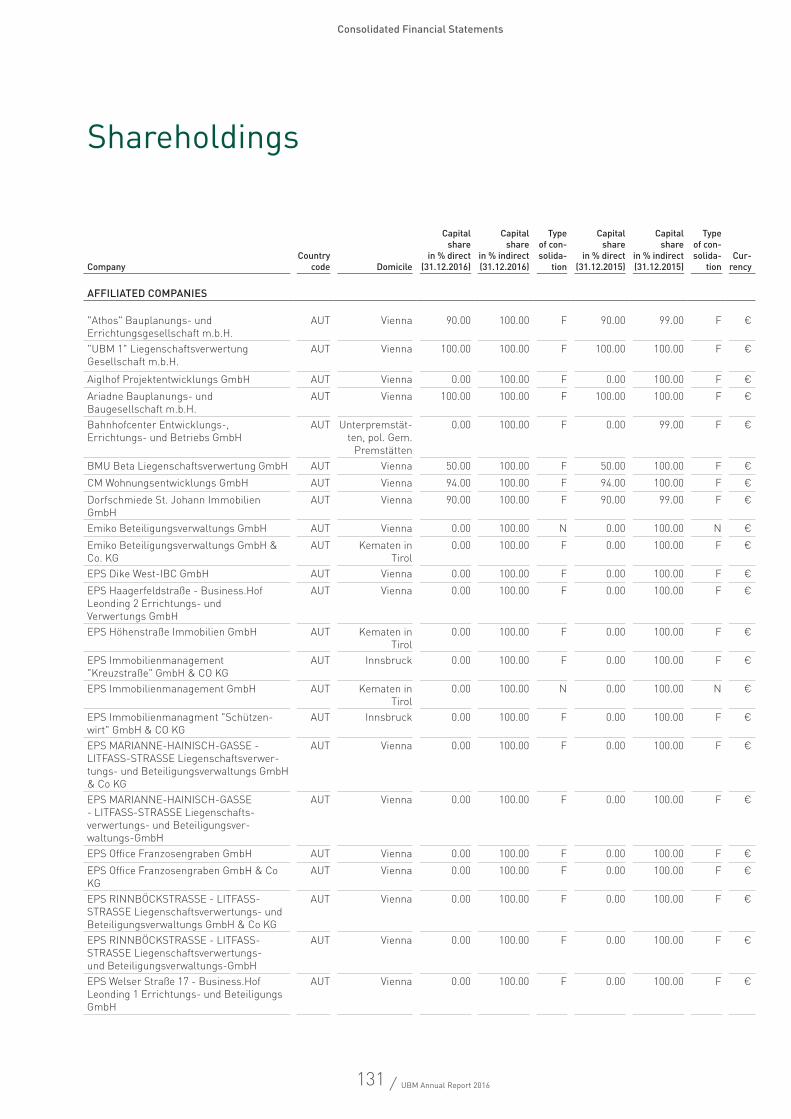
131 / UBM Annual Report 2016
Consolidated Financial Statements
Shareholdings
CompanyCountry
code Domicile
Capital share
in % direct (31.12.2016)
Capital share
in % indirect (31.12.2016)
Typeof con-solida-
tion
Capital share
in % direct (31.12.2015)
Capital share
in % indirect (31.12.2015)
Typeof con-solida-
tionCur-
rency
AFFILIATED COMPANIES
"Athos" Bauplanungs- und Errichtungsgesellschaft m.b.H.
AUT Vienna 90.00 100.00 F 90.00 99.00 F €
"UBM 1" Liegenschaftsverwertung Gesellschaft m.b.H.
AUT Vienna 100.00 100.00 F 100.00 100.00 F €
Aiglhof Projektentwicklungs GmbH AUT Vienna 0.00 100.00 F 0.00 100.00 F €Ariadne Bauplanungs- und Baugesellschaft m.b.H.
AUT Vienna 100.00 100.00 F 100.00 100.00 F €
Bahnhofcenter Entwicklungs-, Errichtungs- und Betriebs GmbH
AUT Unterpremstät-ten, pol. Gem.
Premstätten
0.00 100.00 F 0.00 99.00 F €
BMU Beta Liegenschaftsverwertung GmbH AUT Vienna 50.00 100.00 F 50.00 100.00 F €CM Wohnungsentwicklungs GmbH AUT Vienna 94.00 100.00 F 94.00 100.00 F €Dorfschmiede St. Johann Immobilien GmbH
AUT Vienna 90.00 100.00 F 90.00 99.00 F €
Emiko Beteiligungsverwaltungs GmbH AUT Vienna 0.00 100.00 N 0.00 100.00 N €Emiko Beteiligungsverwaltungs GmbH & Co. KG
AUT Kematen in Tirol
0.00 100.00 F 0.00 100.00 F €
EPS Dike West-IBC GmbH AUT Vienna 0.00 100.00 F 0.00 100.00 F €EPS Haagerfeldstraße - Business.Hof Leonding 2 Errichtungs- und Verwertungs GmbH
AUT Vienna 0.00 100.00 F 0.00 100.00 F €
EPS Höhenstraße Immobilien GmbH AUT Kematen in Tirol
0.00 100.00 F 0.00 100.00 F €
EPS Immobilienmanagement "Kreuzstraße" GmbH & CO KG
AUT Innsbruck 0.00 100.00 F 0.00 100.00 F €
EPS Immobilienmanagement GmbH AUT Kematen in Tirol
0.00 100.00 N 0.00 100.00 N €
EPS Immobilienmanagment "Schützen-wirt" GmbH & CO KG
AUT Innsbruck 0.00 100.00 F 0.00 100.00 F €
EPS MARIANNE-HAINISCH-GASSE - LITFASS-STRASSE Liegenschaftsverwer-tungs- und Beteiligungsverwaltungs GmbH & Co KG
AUT Vienna 0.00 100.00 F 0.00 100.00 F €
EPS MARIANNE-HAINISCH-GASSE - LITFASS-STRASSE Liegenschafts-verwertungs- und Beteiligungsver-waltungs-GmbH
AUT Vienna 0.00 100.00 F 0.00 100.00 F €
EPS Office Franzosengraben GmbH AUT Vienna 0.00 100.00 F 0.00 100.00 F €EPS Office Franzosengraben GmbH & Co KG
AUT Vienna 0.00 100.00 F 0.00 100.00 F €
EPS RINNBÖCKSTRASSE - LITFASS- STRASSE Liegenschaftsverwertungs- und Beteiligungsverwaltungs GmbH & Co KG
AUT Vienna 0.00 100.00 F 0.00 100.00 F €
EPS RINNBÖCKSTRASSE - LITFASS- STRASSE Liegenschaftsverwertungs- und Beteiligungsverwaltungs-GmbH
AUT Vienna 0.00 100.00 F 0.00 100.00 F €
EPS Welser Straße 17 - Business.Hof Leonding 1 Errichtungs- und Beteiligungs GmbH
AUT Vienna 0.00 100.00 F 0.00 100.00 F €
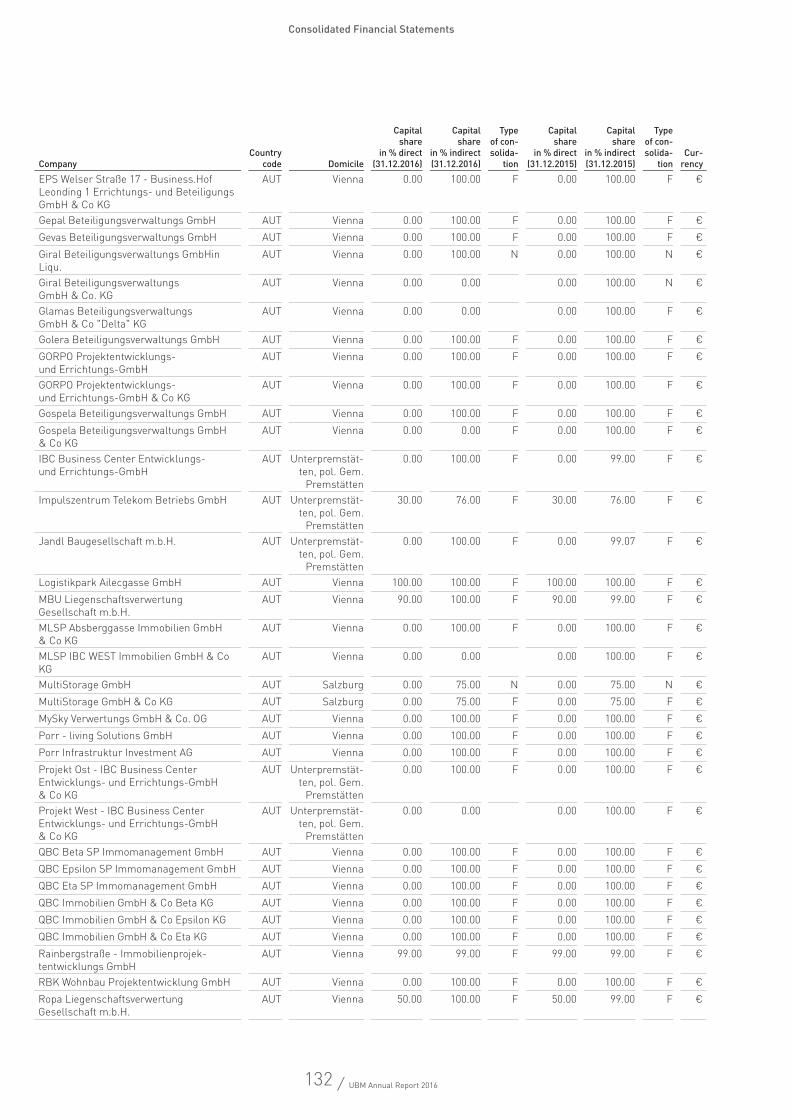
132 / UBM Annual Report 2016
Consolidated Financial Statements
EPS Welser Straße 17 - Business.Hof Leonding 1 Errichtungs- und Beteiligungs GmbH & Co KG
AUT Vienna 0.00 100.00 F 0.00 100.00 F €
Gepal Beteiligungsverwaltungs GmbH AUT Vienna 0.00 100.00 F 0.00 100.00 F €Gevas Beteiligungsverwaltungs GmbH AUT Vienna 0.00 100.00 F 0.00 100.00 F €Giral Beteiligungsverwaltungs GmbHin Liqu.
AUT Vienna 0.00 100.00 N 0.00 100.00 N €
Giral Beteiligungsverwaltungs GmbH & Co. KG
AUT Vienna 0.00 0.00 0.00 100.00 N €
Glamas Beteiligungsverwaltungs GmbH & Co "Delta" KG
AUT Vienna 0.00 0.00 0.00 100.00 F €
Golera Beteiligungsverwaltungs GmbH AUT Vienna 0.00 100.00 F 0.00 100.00 F €GORPO Projektentwicklungs- und Errichtungs-GmbH
AUT Vienna 0.00 100.00 F 0.00 100.00 F €
GORPO Projektentwicklungs- und Errichtungs-GmbH & Co KG
AUT Vienna 0.00 100.00 F 0.00 100.00 F €
Gospela Beteiligungsverwaltungs GmbH AUT Vienna 0.00 100.00 F 0.00 100.00 F €Gospela Beteiligungsverwaltungs GmbH & Co KG
AUT Vienna 0.00 0.00 F 0.00 100.00 F €
IBC Business Center Entwicklungs- und Errichtungs-GmbH
AUT Unterpremstät-ten, pol. Gem.
Premstätten
0.00 100.00 F 0.00 99.00 F €
Impulszentrum Telekom Betriebs GmbH AUT Unterpremstät-ten, pol. Gem.
Premstätten
30.00 76.00 F 30.00 76.00 F €
Jandl Baugesellschaft m.b.H. AUT Unterpremstät-ten, pol. Gem.
Premstätten
0.00 100.00 F 0.00 99.07 F €
Logistikpark Ailecgasse GmbH AUT Vienna 100.00 100.00 F 100.00 100.00 F €MBU Liegenschaftsverwertung Gesellschaft m.b.H.
AUT Vienna 90.00 100.00 F 90.00 99.00 F €
MLSP Absberggasse Immobilien GmbH & Co KG
AUT Vienna 0.00 100.00 F 0.00 100.00 F €
MLSP IBC WEST Immobilien GmbH & Co KG
AUT Vienna 0.00 0.00 0.00 100.00 F €
MultiStorage GmbH AUT Salzburg 0.00 75.00 N 0.00 75.00 N €MultiStorage GmbH & Co KG AUT Salzburg 0.00 75.00 F 0.00 75.00 F €MySky Verwertungs GmbH & Co. OG AUT Vienna 0.00 100.00 F 0.00 100.00 F €Porr - living Solutions GmbH AUT Vienna 0.00 100.00 F 0.00 100.00 F €Porr Infrastruktur Investment AG AUT Vienna 0.00 100.00 F 0.00 100.00 F €Projekt Ost - IBC Business Center Entwicklungs- und Errichtungs-GmbH & Co KG
AUT Unterpremstät-ten, pol. Gem.
Premstätten
0.00 100.00 F 0.00 100.00 F €
Projekt West - IBC Business Center Entwicklungs- und Errichtungs-GmbH & Co KG
AUT Unterpremstät-ten, pol. Gem.
Premstätten
0.00 0.00 0.00 100.00 F €
QBC Beta SP Immomanagement GmbH AUT Vienna 0.00 100.00 F 0.00 100.00 F €QBC Epsilon SP Immomanagement GmbH AUT Vienna 0.00 100.00 F 0.00 100.00 F €QBC Eta SP Immomanagement GmbH AUT Vienna 0.00 100.00 F 0.00 100.00 F €QBC Immobilien GmbH & Co Beta KG AUT Vienna 0.00 100.00 F 0.00 100.00 F €QBC Immobilien GmbH & Co Epsilon KG AUT Vienna 0.00 100.00 F 0.00 100.00 F €QBC Immobilien GmbH & Co Eta KG AUT Vienna 0.00 100.00 F 0.00 100.00 F €Rainbergstraße - Immobilienprojek-tentwicklungs GmbH
AUT Vienna 99.00 99.00 F 99.00 99.00 F €
RBK Wohnbau Projektentwicklung GmbH AUT Vienna 0.00 100.00 F 0.00 100.00 F €Ropa Liegenschaftsverwertung Gesellschaft m.b.H.
AUT Vienna 50.00 100.00 F 50.00 99.00 F €
CompanyCountry
code Domicile
Capital share
in % direct (31.12.2016)
Capital share
in % indirect (31.12.2016)
Typeof con-solida-
tion
Capital share
in % direct (31.12.2015)
Capital share
in % indirect (31.12.2015)
Typeof con-solida-
tionCur-
rency
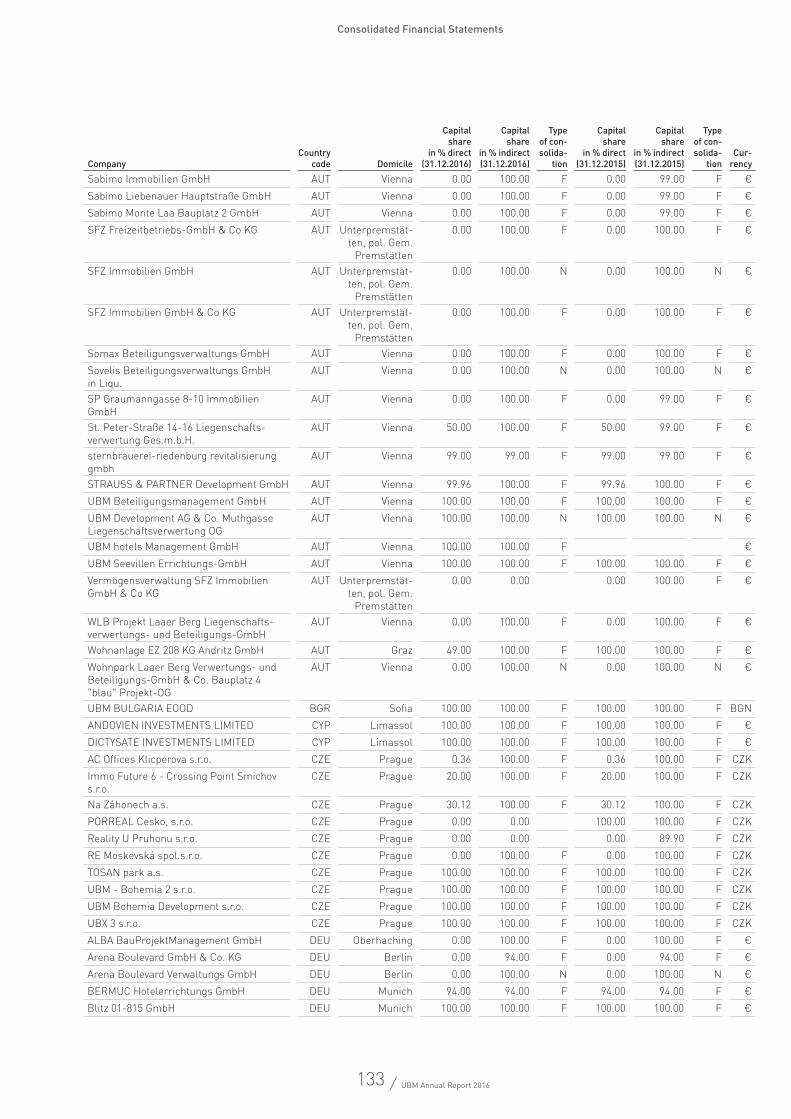
133 / UBM Annual Report 2016
Consolidated Financial Statements
Sabimo Immobilien GmbH AUT Vienna 0.00 100.00 F 0.00 99.00 F €Sabimo Liebenauer Hauptstraße GmbH AUT Vienna 0.00 100.00 F 0.00 99.00 F €Sabimo Monte Laa Bauplatz 2 GmbH AUT Vienna 0.00 100.00 F 0.00 99.00 F €SFZ Freizeitbetriebs-GmbH & Co KG AUT Unterpremstät-
ten, pol. Gem. Premstätten
0.00 100.00 F 0.00 100.00 F €
SFZ Immobilien GmbH AUT Unterpremstät-ten, pol. Gem.
Premstätten
0.00 100.00 N 0.00 100.00 N €
SFZ Immobilien GmbH & Co KG AUT Unterpremstät-ten, pol. Gem.
Premstätten
0.00 100.00 F 0.00 100.00 F €
Somax Beteiligungsverwaltungs GmbH AUT Vienna 0.00 100.00 F 0.00 100.00 F €Sovelis Beteiligungsverwaltungs GmbH in Liqu.
AUT Vienna 0.00 100.00 N 0.00 100.00 N €
SP Graumanngasse 8-10 Immobilien GmbH
AUT Vienna 0.00 100.00 F 0.00 99.00 F €
St. Peter-Straße 14-16 Liegenschafts-verwertung Ges.m.b.H.
AUT Vienna 50.00 100.00 F 50.00 99.00 F €
sternbrauerei-riedenburg revitalisierung gmbh
AUT Vienna 99.00 99.00 F 99.00 99.00 F €
STRAUSS & PARTNER Development GmbH AUT Vienna 99.96 100.00 F 99.96 100.00 F €UBM Beteiligungsmanagement GmbH AUT Vienna 100.00 100.00 F 100.00 100.00 F €UBM Development AG & Co. Muthgasse Liegenschaftsverwertung OG
AUT Vienna 100.00 100.00 N 100.00 100.00 N €
UBM hotels Management GmbH AUT Vienna 100.00 100.00 F €UBM Seevillen Errichtungs-GmbH AUT Vienna 100.00 100.00 F 100.00 100.00 F €Vermögensverwaltung SFZ Immobilien GmbH & Co KG
AUT Unterpremstät-ten, pol. Gem.
Premstätten
0.00 0.00 0.00 100.00 F €
WLB Projekt Laaer Berg Liegenschafts-verwertungs- und Beteiligungs-GmbH
AUT Vienna 0.00 100.00 F 0.00 100.00 F €
Wohnanlage EZ 208 KG Andritz GmbH AUT Graz 49.00 100.00 F 100.00 100.00 F €Wohnpark Laaer Berg Verwertungs- und Beteiligungs-GmbH & Co. Bauplatz 4 "blau" Projekt-OG
AUT Vienna 0.00 100.00 N 0.00 100.00 N €
UBM BULGARIA EOOD BGR Sofia 100.00 100.00 F 100.00 100.00 F BGNANDOVIEN INVESTMENTS LIMITED CYP Limassol 100.00 100.00 F 100.00 100.00 F €DICTYSATE INVESTMENTS LIMITED CYP Limassol 100.00 100.00 F 100.00 100.00 F €AC Offices Klicperova s.r.o. CZE Prague 0.36 100.00 F 0.36 100.00 F CZKImmo Future 6 - Crossing Point Smichov s.r.o.
CZE Prague 20.00 100.00 F 20.00 100.00 F CZK
Na Záhonech a.s. CZE Prague 30.12 100.00 F 30.12 100.00 F CZKPORREAL Cesko, s.r.o. CZE Prague 0.00 0.00 100.00 100.00 F CZKReality U Pruhonu s.r.o. CZE Prague 0.00 0.00 0.00 89.90 F CZKRE Moskevská spol.s.r.o. CZE Prague 0.00 100.00 F 0.00 100.00 F CZKTOSAN park a.s. CZE Prague 100.00 100.00 F 100.00 100.00 F CZKUBM - Bohemia 2 s.r.o. CZE Prague 100.00 100.00 F 100.00 100.00 F CZKUBM Bohemia Development s.r.o. CZE Prague 100.00 100.00 F 100.00 100.00 F CZKUBX 3 s.r.o. CZE Prague 100.00 100.00 F 100.00 100.00 F CZKALBA BauProjektManagement GmbH DEU Oberhaching 0.00 100.00 F 0.00 100.00 F €Arena Boulevard GmbH & Co. KG DEU Berlin 0.00 94.00 F 0.00 94.00 F €Arena Boulevard Verwaltungs GmbH DEU Berlin 0.00 100.00 N 0.00 100.00 N €BERMUC Hotelerrichtungs GmbH DEU Munich 94.00 94.00 F 94.00 94.00 F €Blitz 01-815 GmbH DEU Munich 100.00 100.00 F 100.00 100.00 F €
CompanyCountry
code Domicile
Capital share
in % direct (31.12.2016)
Capital share
in % indirect (31.12.2016)
Typeof con-solida-
tion
Capital share
in % direct (31.12.2015)
Capital share
in % indirect (31.12.2015)
Typeof con-solida-
tionCur-
rency
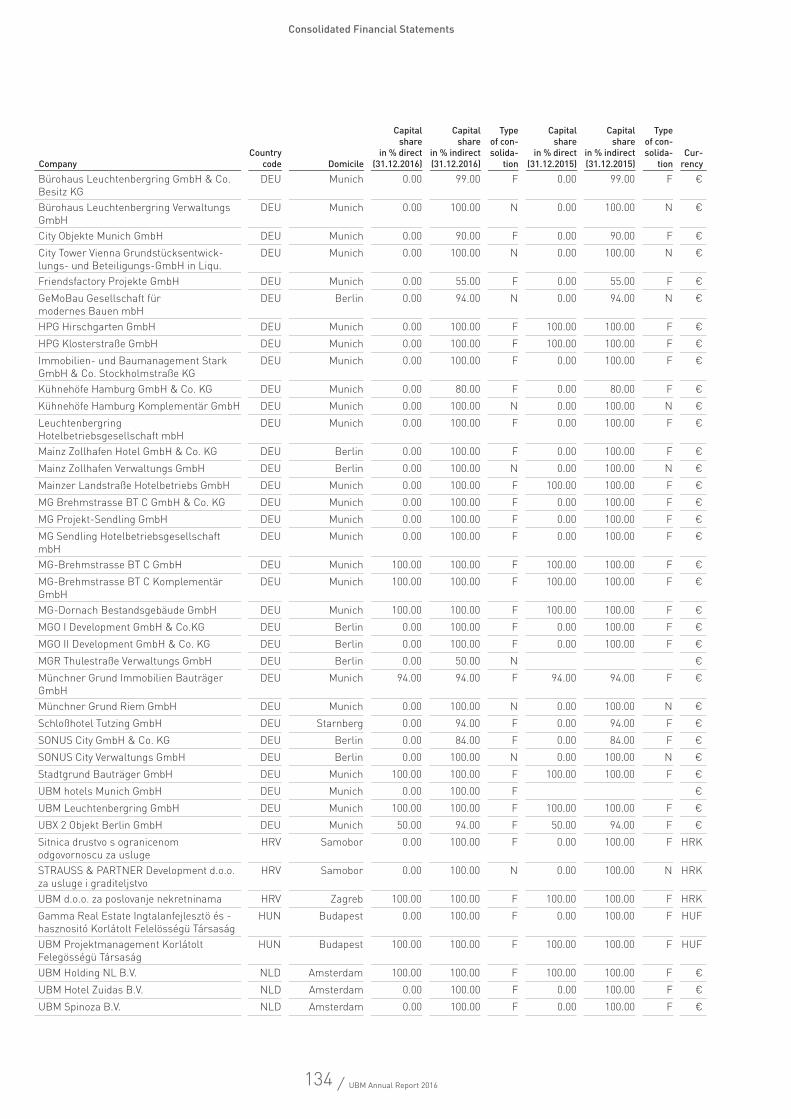
134 / UBM Annual Report 2016
Consolidated Financial Statements
Bürohaus Leuchtenbergring GmbH & Co. Besitz KG
DEU Munich 0.00 99.00 F 0.00 99.00 F €
Bürohaus Leuchtenbergring Verwaltungs GmbH
DEU Munich 0.00 100.00 N 0.00 100.00 N €
City Objekte Munich GmbH DEU Munich 0.00 90.00 F 0.00 90.00 F €City Tower Vienna Grundstücksentwick-lungs- und Beteiligungs-GmbH in Liqu.
DEU Munich 0.00 100.00 N 0.00 100.00 N €
Friendsfactory Projekte GmbH DEU Munich 0.00 55.00 F 0.00 55.00 F €GeMoBau Gesellschaft für modernes Bauen mbH
DEU Berlin 0.00 94.00 N 0.00 94.00 N €
HPG Hirschgarten GmbH DEU Munich 0.00 100.00 F 100.00 100.00 F €HPG Klosterstraße GmbH DEU Munich 0.00 100.00 F 100.00 100.00 F €Immobilien- und Baumanagement Stark GmbH & Co. Stockholmstraße KG
DEU Munich 0.00 100.00 F 0.00 100.00 F €
Kühnehöfe Hamburg GmbH & Co. KG DEU Munich 0.00 80.00 F 0.00 80.00 F €Kühnehöfe Hamburg Komplementär GmbH DEU Munich 0.00 100.00 N 0.00 100.00 N €Leuchtenbergring Hotelbetriebsgesellschaft mbH
DEU Munich 0.00 100.00 F 0.00 100.00 F €
Mainz Zollhafen Hotel GmbH & Co. KG DEU Berlin 0.00 100.00 F 0.00 100.00 F €Mainz Zollhafen Verwaltungs GmbH DEU Berlin 0.00 100.00 N 0.00 100.00 N €Mainzer Landstraße Hotelbetriebs GmbH DEU Munich 0.00 100.00 F 100.00 100.00 F €MG Brehmstrasse BT C GmbH & Co. KG DEU Munich 0.00 100.00 F 0.00 100.00 F €MG Projekt-Sendling GmbH DEU Munich 0.00 100.00 F 0.00 100.00 F €MG Sendling Hotelbetriebsgesellschaft mbH
DEU Munich 0.00 100.00 F 0.00 100.00 F €
MG-Brehmstrasse BT C GmbH DEU Munich 100.00 100.00 F 100.00 100.00 F €MG-Brehmstrasse BT C Komplementär GmbH
DEU Munich 100.00 100.00 F 100.00 100.00 F €
MG-Dornach Bestandsgebäude GmbH DEU Munich 100.00 100.00 F 100.00 100.00 F €MGO I Development GmbH & Co.KG DEU Berlin 0.00 100.00 F 0.00 100.00 F €MGO II Development GmbH & Co. KG DEU Berlin 0.00 100.00 F 0.00 100.00 F €MGR Thulestraße Verwaltungs GmbH DEU Berlin 0.00 50.00 N €Münchner Grund Immobilien Bauträger GmbH
DEU Munich 94.00 94.00 F 94.00 94.00 F €
Münchner Grund Riem GmbH DEU Munich 0.00 100.00 N 0.00 100.00 N €Schloßhotel Tutzing GmbH DEU Starnberg 0.00 94.00 F 0.00 94.00 F €SONUS City GmbH & Co. KG DEU Berlin 0.00 84.00 F 0.00 84.00 F €SONUS City Verwaltungs GmbH DEU Berlin 0.00 100.00 N 0.00 100.00 N €Stadtgrund Bauträger GmbH DEU Munich 100.00 100.00 F 100.00 100.00 F €UBM hotels Munich GmbH DEU Munich 0.00 100.00 F €UBM Leuchtenbergring GmbH DEU Munich 100.00 100.00 F 100.00 100.00 F €UBX 2 Objekt Berlin GmbH DEU Munich 50.00 94.00 F 50.00 94.00 F €Sitnica drustvo s ogranicenom odgovornoscu za usluge
HRV Samobor 0.00 100.00 F 0.00 100.00 F HRK
STRAUSS & PARTNER Development d.o.o. za usluge i graditeljstvo
HRV Samobor 0.00 100.00 N 0.00 100.00 N HRK
UBM d.o.o. za poslovanje nekretninama HRV Zagreb 100.00 100.00 F 100.00 100.00 F HRKGamma Real Estate Ingtalanfejlesztö és - hasznositó Korlátolt Felelösségü Társaság
HUN Budapest 0.00 100.00 F 0.00 100.00 F HUF
UBM Projektmanagement Korlátolt Felegösségü Társaság
HUN Budapest 100.00 100.00 F 100.00 100.00 F HUF
UBM Holding NL B.V. NLD Amsterdam 100.00 100.00 F 100.00 100.00 F €UBM Hotel Zuidas B.V. NLD Amsterdam 0.00 100.00 F 0.00 100.00 F €UBM Spinoza B.V. NLD Amsterdam 0.00 100.00 F 0.00 100.00 F €
CompanyCountry
code Domicile
Capital share
in % direct (31.12.2016)
Capital share
in % indirect (31.12.2016)
Typeof con-solida-
tion
Capital share
in % direct (31.12.2015)
Capital share
in % indirect (31.12.2015)
Typeof con-solida-
tionCur-
rency
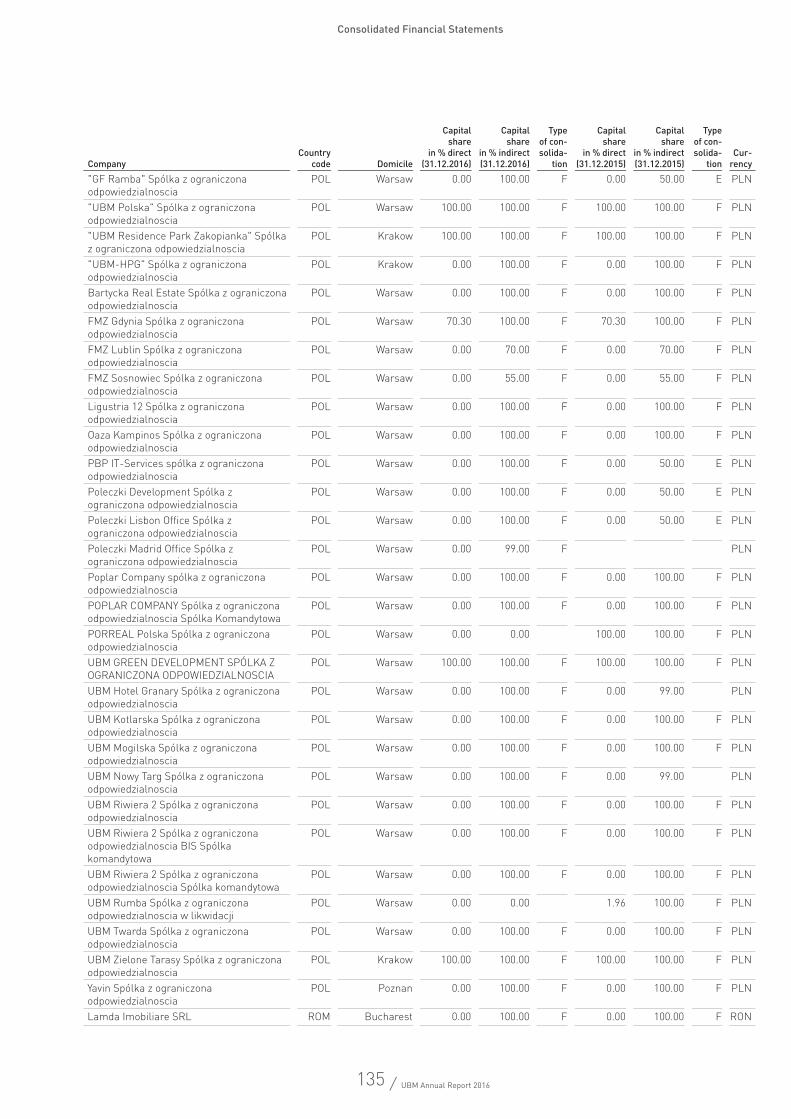
135 / UBM Annual Report 2016
Consolidated Financial Statements
"GF Ramba" Spólka z ograniczona odpowiedzialnoscia
POL Warsaw 0.00 100.00 F 0.00 50.00 E PLN
"UBM Polska" Spólka z ograniczona odpowiedzialnoscia
POL Warsaw 100.00 100.00 F 100.00 100.00 F PLN
"UBM Residence Park Zakopianka" Spólka z ograniczona odpowiedzialnoscia
POL Krakow 100.00 100.00 F 100.00 100.00 F PLN
"UBM-HPG" Spólka z ograniczona odpowiedzialnoscia
POL Krakow 0.00 100.00 F 0.00 100.00 F PLN
Bartycka Real Estate Spólka z ograniczona odpowiedzialnoscia
POL Warsaw 0.00 100.00 F 0.00 100.00 F PLN
FMZ Gdynia Spólka z ograniczona odpowiedzialnoscia
POL Warsaw 70.30 100.00 F 70.30 100.00 F PLN
FMZ Lublin Spólka z ograniczona odpowiedzialnoscia
POL Warsaw 0.00 70.00 F 0.00 70.00 F PLN
FMZ Sosnowiec Spólka z ograniczona odpowiedzialnoscia
POL Warsaw 0.00 55.00 F 0.00 55.00 F PLN
Ligustria 12 Spólka z ograniczona odpowiedzialnoscia
POL Warsaw 0.00 100.00 F 0.00 100.00 F PLN
Oaza Kampinos Spólka z ograniczona odpowiedzialnoscia
POL Warsaw 0.00 100.00 F 0.00 100.00 F PLN
PBP IT-Services spólka z ograniczona odpowiedzialnoscia
POL Warsaw 0.00 100.00 F 0.00 50.00 E PLN
Poleczki Development Spólka z ograniczona odpowiedzialnoscia
POL Warsaw 0.00 100.00 F 0.00 50.00 E PLN
Poleczki Lisbon Office Spólka z ograniczona odpowiedzialnoscia
POL Warsaw 0.00 100.00 F 0.00 50.00 E PLN
Poleczki Madrid Office Spólka z ograniczona odpowiedzialnoscia
POL Warsaw 0.00 99.00 F PLN
Poplar Company spólka z ograniczona odpowiedzialnoscia
POL Warsaw 0.00 100.00 F 0.00 100.00 F PLN
POPLAR COMPANY Spólka z ograniczona odpowiedzialnoscia Spólka Komandytowa
POL Warsaw 0.00 100.00 F 0.00 100.00 F PLN
PORREAL Polska Spólka z ograniczona odpowiedzialnoscia
POL Warsaw 0.00 0.00 100.00 100.00 F PLN
UBM GREEN DEVELOPMENT SPÓLKA Z OGRANICZONA ODPOWIEDZIALNOSCIA
POL Warsaw 100.00 100.00 F 100.00 100.00 F PLN
UBM Hotel Granary Spólka z ograniczona odpowiedzialnoscia
POL Warsaw 0.00 100.00 F 0.00 99.00 PLN
UBM Kotlarska Spólka z ograniczona odpowiedzialnoscia
POL Warsaw 0.00 100.00 F 0.00 100.00 F PLN
UBM Mogilska Spólka z ograniczona odpowiedzialnoscia
POL Warsaw 0.00 100.00 F 0.00 100.00 F PLN
UBM Nowy Targ Spólka z ograniczona odpowiedzialnoscia
POL Warsaw 0.00 100.00 F 0.00 99.00 PLN
UBM Riwiera 2 Spólka z ograniczona odpowiedzialnoscia
POL Warsaw 0.00 100.00 F 0.00 100.00 F PLN
UBM Riwiera 2 Spólka z ograniczona odpowiedzialnoscia BIS Spólka komandytowa
POL Warsaw 0.00 100.00 F 0.00 100.00 F PLN
UBM Riwiera 2 Spólka z ograniczona odpowiedzialnoscia Spólka komandytowa
POL Warsaw 0.00 100.00 F 0.00 100.00 F PLN
UBM Rumba Spólka z ograniczona odpowiedzialnoscia w likwidacji
POL Warsaw 0.00 0.00 1.96 100.00 F PLN
UBM Twarda Spólka z ograniczona odpowiedzialnoscia
POL Warsaw 0.00 100.00 F 0.00 100.00 F PLN
UBM Zielone Tarasy Spólka z ograniczona odpowiedzialnoscia
POL Krakow 100.00 100.00 F 100.00 100.00 F PLN
Yavin Spólka z ograniczona odpowiedzialnoscia
POL Poznan 0.00 100.00 F 0.00 100.00 F PLN
Lamda Imobiliare SRL ROM Bucharest 0.00 100.00 F 0.00 100.00 F RON
CompanyCountry
code Domicile
Capital share
in % direct (31.12.2016)
Capital share
in % indirect (31.12.2016)
Typeof con-solida-
tion
Capital share
in % direct (31.12.2015)
Capital share
in % indirect (31.12.2015)
Typeof con-solida-
tionCur-
rency
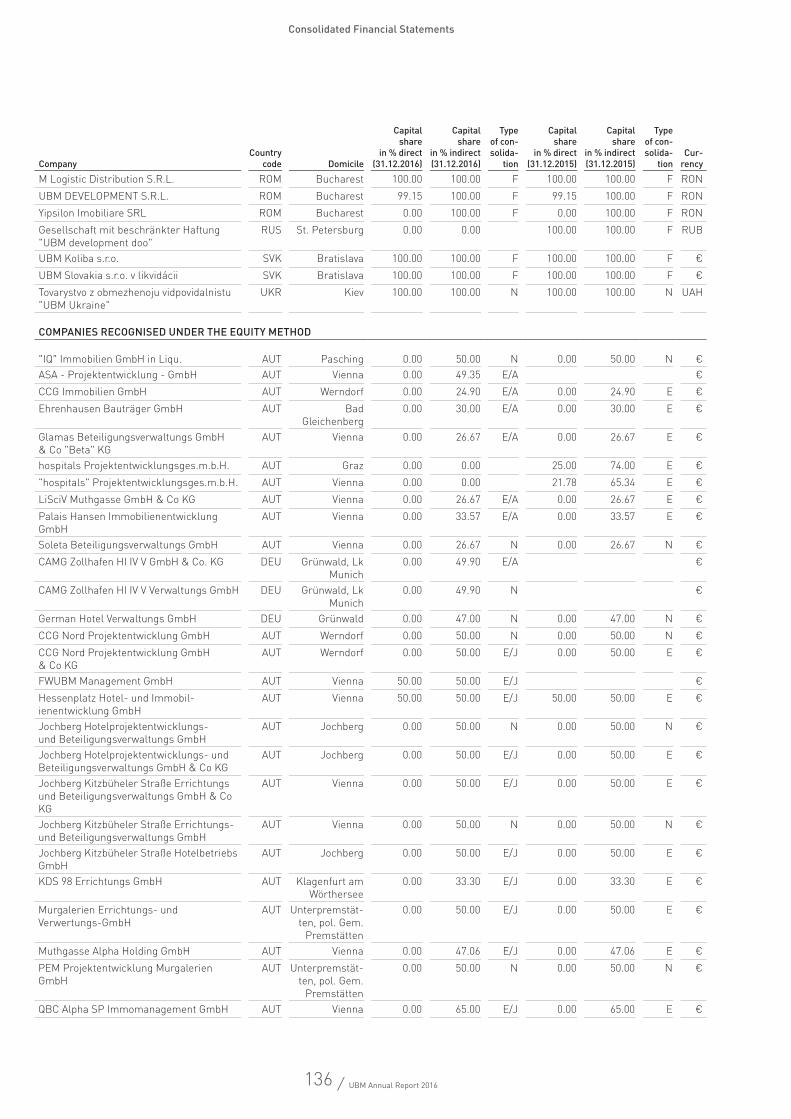
136 / UBM Annual Report 2016
Consolidated Financial Statements
M Logistic Distribution S.R.L. ROM Bucharest 100.00 100.00 F 100.00 100.00 F RONUBM DEVELOPMENT S.R.L. ROM Bucharest 99.15 100.00 F 99.15 100.00 F RONYipsilon Imobiliare SRL ROM Bucharest 0.00 100.00 F 0.00 100.00 F RONGesellschaft mit beschränkter Haftung "UBM development doo"
RUS St. Petersburg 0.00 0.00 100.00 100.00 F RUB
UBM Koliba s.r.o. SVK Bratislava 100.00 100.00 F 100.00 100.00 F €UBM Slovakia s.r.o. v likvidácii SVK Bratislava 100.00 100.00 F 100.00 100.00 F €Tovarystvo z obmezhenoju vidpovidalnistu "UBM Ukraine"
UKR Kiev 100.00 100.00 N 100.00 100.00 N UAH
COMPANIES RECOGNISED UNDER THE EQUITY METHOD
"IQ" Immobilien GmbH in Liqu. AUT Pasching 0.00 50.00 N 0.00 50.00 N €ASA - Projektentwicklung - GmbH AUT Vienna 0.00 49.35 E/A €CCG Immobilien GmbH AUT Werndorf 0.00 24.90 E/A 0.00 24.90 E €Ehrenhausen Bauträger GmbH AUT Bad
Gleichenberg0.00 30.00 E/A 0.00 30.00 E €
Glamas Beteiligungsverwaltungs GmbH & Co "Beta" KG
AUT Vienna 0.00 26.67 E/A 0.00 26.67 E €
hospitals Projektentwicklungsges.m.b.H. AUT Graz 0.00 0.00 25.00 74.00 E €"hospitals" Projektentwicklungsges.m.b.H. AUT Vienna 0.00 0.00 21.78 65.34 E €LiSciV Muthgasse GmbH & Co KG AUT Vienna 0.00 26.67 E/A 0.00 26.67 E €Palais Hansen Immobilienentwicklung GmbH
AUT Vienna 0.00 33.57 E/A 0.00 33.57 E €
Soleta Beteiligungsverwaltungs GmbH AUT Vienna 0.00 26.67 N 0.00 26.67 N €CAMG Zollhafen HI IV V GmbH & Co. KG DEU Grünwald, Lk
Munich0.00 49.90 E/A €
CAMG Zollhafen HI IV V Verwaltungs GmbH DEU Grünwald, Lk Munich
0.00 49.90 N €
German Hotel Verwaltungs GmbH DEU Grünwald 0.00 47.00 N 0.00 47.00 N €CCG Nord Projektentwicklung GmbH AUT Werndorf 0.00 50.00 N 0.00 50.00 N €CCG Nord Projektentwicklung GmbH & Co KG
AUT Werndorf 0.00 50.00 E/J 0.00 50.00 E €
FWUBM Management GmbH AUT Vienna 50.00 50.00 E/J €Hessenplatz Hotel- und Immobil-ienentwicklung GmbH
AUT Vienna 50.00 50.00 E/J 50.00 50.00 E €
Jochberg Hotelprojektentwicklungs- und Beteiligungsverwaltungs GmbH
AUT Jochberg 0.00 50.00 N 0.00 50.00 N €
Jochberg Hotelprojektentwicklungs- und Beteiligungsverwaltungs GmbH & Co KG
AUT Jochberg 0.00 50.00 E/J 0.00 50.00 E €
Jochberg Kitzbüheler Straße Errichtungs und Beteiligungsverwaltungs GmbH & Co KG
AUT Vienna 0.00 50.00 E/J 0.00 50.00 E €
Jochberg Kitzbüheler Straße Errichtungs- und Beteiligungsverwaltungs GmbH
AUT Vienna 0.00 50.00 N 0.00 50.00 N €
Jochberg Kitzbüheler Straße Hotelbetriebs GmbH
AUT Jochberg 0.00 50.00 E/J 0.00 50.00 E €
KDS 98 Errichtungs GmbH AUT Klagenfurt am Wörthersee
0.00 33.30 E/J 0.00 33.30 E €
Murgalerien Errichtungs- und Verwertungs-GmbH
AUT Unterpremstät-ten, pol. Gem.
Premstätten
0.00 50.00 E/J 0.00 50.00 E €
Muthgasse Alpha Holding GmbH AUT Vienna 0.00 47.06 E/J 0.00 47.06 E €PEM Projektentwicklung Murgalerien GmbH
AUT Unterpremstät-ten, pol. Gem.
Premstätten
0.00 50.00 N 0.00 50.00 N €
QBC Alpha SP Immomanagement GmbH AUT Vienna 0.00 65.00 E/J 0.00 65.00 E €
CompanyCountry
code Domicile
Capital share
in % direct (31.12.2016)
Capital share
in % indirect (31.12.2016)
Typeof con-solida-
tion
Capital share
in % direct (31.12.2015)
Capital share
in % indirect (31.12.2015)
Typeof con-solida-
tionCur-
rency
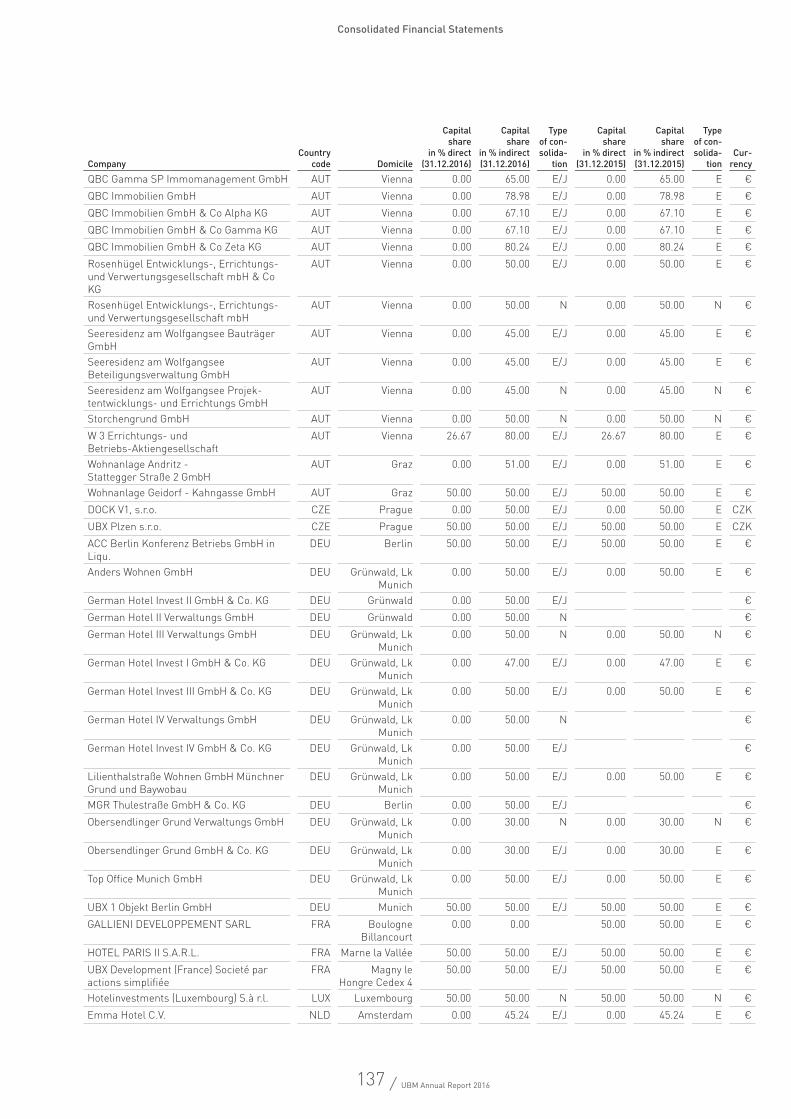
137 / UBM Annual Report 2016
Consolidated Financial Statements
QBC Gamma SP Immomanagement GmbH AUT Vienna 0.00 65.00 E/J 0.00 65.00 E €QBC Immobilien GmbH AUT Vienna 0.00 78.98 E/J 0.00 78.98 E €QBC Immobilien GmbH & Co Alpha KG AUT Vienna 0.00 67.10 E/J 0.00 67.10 E €QBC Immobilien GmbH & Co Gamma KG AUT Vienna 0.00 67.10 E/J 0.00 67.10 E €QBC Immobilien GmbH & Co Zeta KG AUT Vienna 0.00 80.24 E/J 0.00 80.24 E €Rosenhügel Entwicklungs-, Errichtungs- und Verwertungsgesellschaft mbH & Co KG
AUT Vienna 0.00 50.00 E/J 0.00 50.00 E €
Rosenhügel Entwicklungs-, Errichtungs- und Verwertungsgesellschaft mbH
AUT Vienna 0.00 50.00 N 0.00 50.00 N €
Seeresidenz am Wolfgangsee Bauträger GmbH
AUT Vienna 0.00 45.00 E/J 0.00 45.00 E €
Seeresidenz am Wolfgangsee Beteiligungsverwaltung GmbH
AUT Vienna 0.00 45.00 E/J 0.00 45.00 E €
Seeresidenz am Wolfgangsee Projek-tentwicklungs- und Errichtungs GmbH
AUT Vienna 0.00 45.00 N 0.00 45.00 N €
Storchengrund GmbH AUT Vienna 0.00 50.00 N 0.00 50.00 N €W 3 Errichtungs- und Betriebs-Aktiengesellschaft
AUT Vienna 26.67 80.00 E/J 26.67 80.00 E €
Wohnanlage Andritz - Stattegger Straße 2 GmbH
AUT Graz 0.00 51.00 E/J 0.00 51.00 E €
Wohnanlage Geidorf - Kahngasse GmbH AUT Graz 50.00 50.00 E/J 50.00 50.00 E €DOCK V1, s.r.o. CZE Prague 0.00 50.00 E/J 0.00 50.00 E CZKUBX Plzen s.r.o. CZE Prague 50.00 50.00 E/J 50.00 50.00 E CZKACC Berlin Konferenz Betriebs GmbH in Liqu.
DEU Berlin 50.00 50.00 E/J 50.00 50.00 E €
Anders Wohnen GmbH DEU Grünwald, Lk Munich
0.00 50.00 E/J 0.00 50.00 E €
German Hotel Invest II GmbH & Co. KG DEU Grünwald 0.00 50.00 E/J €German Hotel II Verwaltungs GmbH DEU Grünwald 0.00 50.00 N €German Hotel III Verwaltungs GmbH DEU Grünwald, Lk
Munich0.00 50.00 N 0.00 50.00 N €
German Hotel Invest I GmbH & Co. KG DEU Grünwald, Lk Munich
0.00 47.00 E/J 0.00 47.00 E €
German Hotel Invest III GmbH & Co. KG DEU Grünwald, Lk Munich
0.00 50.00 E/J 0.00 50.00 E €
German Hotel IV Verwaltungs GmbH DEU Grünwald, Lk Munich
0.00 50.00 N €
German Hotel Invest IV GmbH & Co. KG DEU Grünwald, Lk Munich
0.00 50.00 E/J €
Lilienthalstraße Wohnen GmbH Münchner Grund und Baywobau
DEU Grünwald, Lk Munich
0.00 50.00 E/J 0.00 50.00 E €
MGR Thulestraße GmbH & Co. KG DEU Berlin 0.00 50.00 E/J €Obersendlinger Grund Verwaltungs GmbH DEU Grünwald, Lk
Munich0.00 30.00 N 0.00 30.00 N €
Obersendlinger Grund GmbH & Co. KG DEU Grünwald, Lk Munich
0.00 30.00 E/J 0.00 30.00 E €
Top Office Munich GmbH DEU Grünwald, Lk Munich
0.00 50.00 E/J 0.00 50.00 E €
UBX 1 Objekt Berlin GmbH DEU Munich 50.00 50.00 E/J 50.00 50.00 E €GALLIENI DEVELOPPEMENT SARL FRA Boulogne
Billancourt0.00 0.00 50.00 50.00 E €
HOTEL PARIS II S.A.R.L. FRA Marne la Vallée 50.00 50.00 E/J 50.00 50.00 E €UBX Development (France) Societé par actions simplifiée
FRA Magny le Hongre Cedex 4
50.00 50.00 E/J 50.00 50.00 E €
Hotelinvestments (Luxembourg) S.à r.l. LUX Luxembourg 50.00 50.00 N 50.00 50.00 N €Emma Hotel C.V. NLD Amsterdam 0.00 45.24 E/J 0.00 45.24 E €
CompanyCountry
code Domicile
Capital share
in % direct (31.12.2016)
Capital share
in % indirect (31.12.2016)
Typeof con-solida-
tion
Capital share
in % direct (31.12.2015)
Capital share
in % indirect (31.12.2015)
Typeof con-solida-
tionCur-
rency
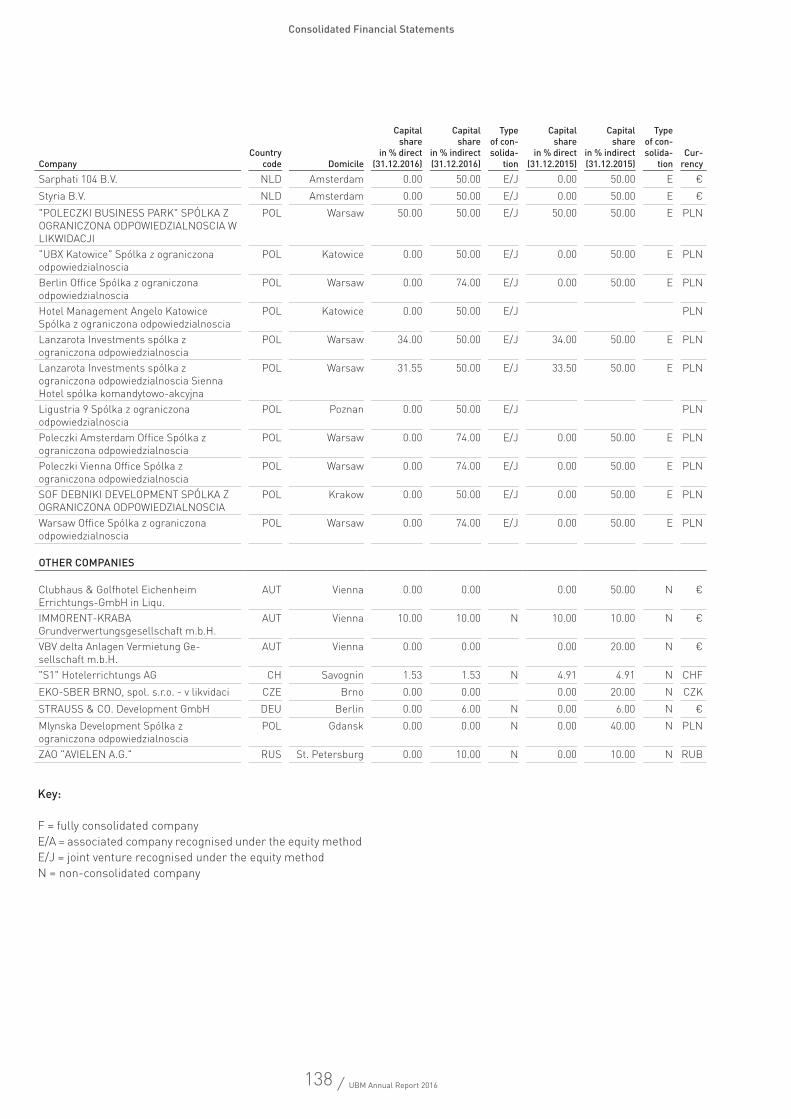
138 / UBM Annual Report 2016
Consolidated Financial Statements
Key:
F = fully consolidated companyE/A = associated company recognised under the equity methodE/J = joint venture recognised under the equity methodN = non-consolidated company
Sarphati 104 B.V. NLD Amsterdam 0.00 50.00 E/J 0.00 50.00 E €Styria B.V. NLD Amsterdam 0.00 50.00 E/J 0.00 50.00 E €"POLECZKI BUSINESS PARK" SPÓLKA Z OGRANICZONA ODPOWIEDZIALNOSCIA W LIKWIDACJI
POL Warsaw 50.00 50.00 E/J 50.00 50.00 E PLN
"UBX Katowice" Spólka z ograniczona odpowiedzialnoscia
POL Katowice 0.00 50.00 E/J 0.00 50.00 E PLN
Berlin Office Spólka z ograniczona odpowiedzialnoscia
POL Warsaw 0.00 74.00 E/J 0.00 50.00 E PLN
Hotel Management Angelo Katowice Spólka z ograniczona odpowiedzialnoscia
POL Katowice 0.00 50.00 E/J PLN
Lanzarota Investments spólka z ograniczona odpowiedzialnoscia
POL Warsaw 34.00 50.00 E/J 34.00 50.00 E PLN
Lanzarota Investments spólka z ograniczona odpowiedzialnoscia Sienna Hotel spólka komandytowo-akcyjna
POL Warsaw 31.55 50.00 E/J 33.50 50.00 E PLN
Ligustria 9 Spólka z ograniczona odpowiedzialnoscia
POL Poznan 0.00 50.00 E/J PLN
Poleczki Amsterdam Office Spólka z ograniczona odpowiedzialnoscia
POL Warsaw 0.00 74.00 E/J 0.00 50.00 E PLN
Poleczki Vienna Office Spólka z ograniczona odpowiedzialnoscia
POL Warsaw 0.00 74.00 E/J 0.00 50.00 E PLN
SOF DEBNIKI DEVELOPMENT SPÓLKA Z OGRANICZONA ODPOWIEDZIALNOSCIA
POL Krakow 0.00 50.00 E/J 0.00 50.00 E PLN
Warsaw Office Spólka z ograniczona odpowiedzialnoscia
POL Warsaw 0.00 74.00 E/J 0.00 50.00 E PLN
OTHER COMPANIES
Clubhaus & Golfhotel Eichenheim Errichtungs-GmbH in Liqu.
AUT Vienna 0.00 0.00 0.00 50.00 N €
IMMORENT-KRABA Grundverwertungsgesellschaft m.b.H.
AUT Vienna 10.00 10.00 N 10.00 10.00 N €
VBV delta Anlagen Vermietung Ge-sellschaft m.b.H.
AUT Vienna 0.00 0.00 0.00 20.00 N €
"S1" Hotelerrichtungs AG CH Savognin 1.53 1.53 N 4.91 4.91 N CHFEKO-SBER BRNO, spol. s.r.o. - v likvidaci CZE Brno 0.00 0.00 0.00 20.00 N CZKSTRAUSS & CO. Development GmbH DEU Berlin 0.00 6.00 N 0.00 6.00 N €Mlynska Development Spólka z ograniczona odpowiedzialnoscia
POL Gdansk 0.00 0.00 N 0.00 40.00 N PLN
ZAO "AVIELEN A.G." RUS St. Petersburg 0.00 10.00 N 0.00 10.00 N RUB
CompanyCountry
code Domicile
Capital share
in % direct (31.12.2016)
Capital share
in % indirect (31.12.2016)
Typeof con-solida-
tion
Capital share
in % direct (31.12.2015)
Capital share
in % indirect (31.12.2015)
Typeof con-solida-
tionCur-
rency
139 / UBM Annual Report 2016
Consolidated Financial Statements
Auditor’s Report
Report on the Consolidated Financial Statements
AUDIT OPINIONWe have audited the consolidated financial statements of UBM Development AG, Vienna, and of its subsidiaries (the Group) comprising the consolidated statement of financial position as of 31 December 2016, the consolidated income statement, the consolidated statement of comprehensive income, the consolidated statement of changes in Group equity and the consolidated cash flow statement for the fiscal year then ended and the notes to the consolidated financial statements.
Based on our audit the accompanying consolidated financial statements were prepared in accordance with the legal regulations and present fairly, in all material respects, the assets and the financial position of the Group as of 31 December 2016 and its financial performance for the year then ended in accordance with International Financial Reporting Standards (IFRS) as adopted by the EU, and in accordance with Austrian Generally Accepted Accounting Principles, particularly § 245a UGB.
BASIS FOR OPINIONWe conducted our audit in accordance with Austrian Standards on Auditing. Those standards require that we comply with Interna-tional Standards on Auditing. Our responsibilities under those regulations and standards are further described in the “Auditor’s Responsibilities for the Audit of the Financial Statements” section of our report. We are independent of the Company in accord-ance with the Austrian General Accepted Accounting Principles and professional requirements and in accordance with IESBA Code of Ethics. We have fulfilled our other ethical responsibilities in accordance with these requirements. We believe that the audit evidence we have obtained is sufficient and appropriate to provide a basis for our opinion.
KEY AUDIT MATTERSKey audit matters are those matters that, in our professional judgment, were of most significance in our audit of the consolidated financial statements of the fiscal year. These matters were addressed in the context of our audit of the consolidated financial statements as a whole, and in forming our opinion thereon, and we do not provide a separate opinion on these matters.
The following describes the key audit matters which in our view are the most significant:1. Valuation of real estate assets2. Valuation of shareholdings in companies accounted for under the equity method and project financing
1. vALUATION Of rEAL ESTATE ASSETS
Situation and reference to further informationThe majority of assets of the group is invested in real estate in the balance sheet items PPE, investment property, inventories and non-current assets held for sale. These balance sheet items total a real estate value amounting to approximately €873 mn, which sums up to 71% of the balance sheet total. The valuations mostly depend on the fair value of the real estate on the reporting date. For investment property and assets held for sale in accordance with IFRS 5 the fair value model according to IAS 40 is used, whereas other assets in accordance with IAS 2 and IAS 16 use the fair value as a comparative amount for necessary adjustments of carrying amounts.
140 / UBM Annual Report 2016
Consolidated Financial Statements
Due to the lack of available prices in active markets the fair value is determined by using valuation methods, particularly the Term and Reversion approach. For real estate under development in general the residual value method is used. The result of valuation depends to a large degree on estimations of material inputs that affect the value such as interest rates, expected rent and capital flows as well as completion costs and developer profits.
The risk for the consolidated financial statements is primarily the estimation of future cash flows and interest rates which are influenced by future market and economic developments. The valuation of real estate assets and the resulting gains and losses in the income statement are therefore subject to uncertainty.
Our audit responseThe fair value is determined primarily by external appraisers, and partly also by internal valuations. As of 31 December 2016, real estate classified as investment property, inventory and PPE with a total carrying amount of €481 mn was valued by external appraisers. Concerning the appropriateness of the fair value for assets held for sale with a total carrying amount of €157 mn transaction and negotiation documents were also available.
Investment properties are generally determined by external appraisers when a minimum threshold is exceeded, whereas real estate classified as inventory and PPE are externally valuated when there are indicators for impairment. In the course of the audit, we have assessed the appropriateness of the criteria and critically evaluated the selection of external valuation.
We chose our sample of tested valuations based on quantitative and qualitative criteria, in which we especially paid attention to real estate with material appreciation or depreciation of the fair value. For these properties we performed detailed audit proce-dures. Other material qualitative criteria were the geographic location and the asset class of the property as well as properties with specific risk and uncertainty factors.
Real estate disposals and the resulting gains and losses were compared to the respective purchase contracts and values accord-ing to the latest financial statements. Moreover, purchase contracts containing earn-out clauses or similar were subject to a critical assessment.
The existing negotiation and transaction documents were reviewed for the properties qualifying as disposals in accordance with IFRS 5. The status and expectations of the further sales steps were discussed with the management, and management’s posi-tions were collected and critically assessed.
For our sample of tested valuations, our real estate experts performed the following audit procedures:
Evaluation of the objectivity, independence and expertise of the external appraisers.
Evaluation of the used valuation method and assessment whether it is in accordance with internationally accepted stand-ards. For the residual value method of projects under development, we paid particular attention to the applicability of the material assumptions regarding expected development costs and expected real estate utilisation and whether these could be assessed with sufficient certainty and plausibility.
Critical assessment of the discount rates and their change over time. The discount rates and yields were compared to trans-actions and valuations of similar asset classes and locations. Within the observed bandwidths, it was assessed whether changes in discount rates were justified due to market conditions or property-specific characteristics and whether they were consistently applied.
Our real estate experts tested the plausibility of other material inputs such as rental income, occupancy rates and repair and maintenance costs by comparing them to similar market and experience rates. In addition, the data used was reconciled to underlying data of specific properties, such as, for example, the current lease status or lease payments, this was performed on a sampling basis. In the case of real estate in development, the expected construction costs used in the appraisals were compared to construction costs until completion of comparable objects. The developer profit used for the valuation was assessed through comparison with similar properties.
141 / UBM Annual Report 2016
Consolidated Financial Statements
In addition, the expectations, changes and conspicuities with respect to material inputs and the performance of individ-ual properties were discussed with the management and the internal valuation team. These discussions were held both in advance of the assessment and after the assessment results were obtained. We challenged the valuations based on compa-rable transactions and knowledge of the market. Particular attention was paid to changes that differed from our preliminary expectations.
Reference to further informationInformation on accounting and measurement methods for real estate assets can be found in chapter 4 (accounting and measure-ment methods) of the notes to the consolidated financial statements. Chapter 5 (key assumptions and key sources of estimation uncertainty) contains information on substantial estimation uncertainty. Furthermore, concerning investments properties and inventories the chapter refers to chapters 19 and 23 of the notes to the consolidated financial statements. Chapter 19 (investment property) contains a breakdown and movement schedule of investment property divided into asset classes as well as a table with significant inputs for the fair value determination. The section on inventories (23) includes information on carrying amounts of real estate carried at fair value and impairments. Performed appreciations and depreciations are reported in the income state-ment or in chapter 11 (other operating expenses) of the notes to the consolidated financial statements.
2. vALUATION Of SHArEHOLdINGS IN COMpANIES ACCOUNTEd fOr UNdEr THE EQUITY METHOd ANd prOJECT fINANCING
Situation and reference to further informationApart from real estate property in fully consolidated Group companies, the book values of shareholdings in companies accounted for under the equity method and therein bound project financing in associated companies and joint ventures form a major part of the Group assets. In total these assets account for about €197 mn as of 31 December 2016, which amounts to 16% of total assets.
These are mainly Austrian and foreign real estate project entities which use the provided funding by UBM for real estate acqui-sition and investment purposes. The measurement and recoverability of shares in companies accounted for under the equity method and project financing are mainly based on the fair value of real estate held by the project entities. Investment property held by companies accounted for under the equity method have to be recorded at fair value and the gains and losses thereof are carried forward in the Group share. Whereas for other real estate classes and project financing, the fair value is used as a com-parative amount for the evaluation of the recoverability of the carrying amount.
In the process of preparing consolidated financial statements, the fair value of the properties held in the joint ventures and associated companies is determined. The fair value is determined primarily by means of the discounted cash flow model, in particular through the Term and Reversion method. In general, the residual value method is applied for real estate development. The results of the valuations are highly dependent on the estimation of the main inputs influencing the value of interest such as interest rates, expected rental and capital flows, construction costs up to completion and developer profits.
The risk for the consolidated financial statements is primarily the estimation of the future cash flows and interest rates which are influenced by future market and economic developments. The valuation of shareholdings in companies accounted for under the equity method and project financing and the resulting gains and losses in the income statement are therefore subject to uncertainty.
Our audit responseThe fair value of the real estate held in joint ventures and associated companies is determined in the same manner as the val-uation of the real estate that is directly held by the group. It is therefore primarily carried out by assigning external appraisers, whereby external valuations are generally carried out when a certain threshold is exceeded or if there are indications for an impairment. In the course of the audit, we examined the appropriateness of the criteria and the actual selection of the external appraisals.
142 / UBM Annual Report 2016
Consolidated Financial Statements
Similar to the audit procedures performed on real estate held directly by the group, we selected a sample for the review of the valuations. This sample was selected based on quantitative and qualitative criteria. For this sample, our real estate appraisal specialists carried out auditing procedures similar to the auditing procedures for real estate held directly by the Group.
In addition, we have tested whether the gains and losses resulting from the fair value movement of investment properties were accurately accounted for in the equity of the joint ventures and associated companies. Also, we have tested the evaluation of the net equity of the project companies and the resulting impairment and reversal of impair-ment of shareholdings and project financing by comparison with the carrying amounts. Thereby, the recoverability of shareholdings and project financing have been evaluated and reviewed together per project company.
Reference to further informationChapter 4 (accounting and measurement methods) of the notes to the consolidated financial statements provides information on the accounting and measurement methods for shareholdings in companies accounted for under the equity method and project financing. In chapter 20 (shares in companies accounted for under the equity method) the carrying values and the comprehensive income originating from associated companies and joint ventures is disclosed as well as further information about the financial position, financial performance and cash flows of the significant entities. Chapters 21 and 44 contain information regarding the carrying values, impairment and their development of project financing.
RESPONSIBILITIES OF MANAGEMENT AND OF THE SUPERVISORY BOARD FOR THE CONSOLIDATED FINANCIAL STATEMENTSManagement is responsible for the preparation of the consolidated financial statements in accordance with International Finan-cial Reporting Standards (IFRS) as adopted by the EU, and in accordance with Austrian Generally Accepted Accounting Prin-ciples, particularly § 245a UGB, for them to present a true and fair view of the assets, the financial position and the financial performance of the Group and for such internal controls as management determines are necessary to enable the preparation of consolidated financial statements that are free from material misstatement, whether due to fraud or error.
In preparing the consolidated financial statements, management is responsible for assessing the Group’s ability to continue as a going concern, disclosing, as applicable, matters related to going concern and using the going concern basis of accounting unless management either intends to liquidate the Group or to cease operations, or has no realistic alternative but to do so.
The Audit Committee is responsible for overseeing the Group’s financial reporting process.
AUDITOR’S RESPONSIBILITIES FOR THE AUDIT OF THE CONSOLIDATED FINANCIAL STATEMENTSOur objectives are to obtain reasonable assurance about whether the consolidated financial statements as a whole are free from material misstatement, whether due to fraud or error, and to issue an auditor’s report that includes our opinion. Reasonable assurance is a high level of assurance, but is not a guarantee that an audit conducted in accordance with in accordance with Austrian Standards on Auditing will always detect a material misstatement when it exists. Misstatements can arise from fraud or error and are considered material if, individually or in the aggregate, they could reasonably be expected to influence the economic decisions of users taken on the basis of these consolidated financial statements.
As part of an audit in accordance with Austrian Standards on Auditing, which require the application of ISA, we exercise profes-sional judgment and maintain professional scepticism throughout the audit.
We also:
Identify and assess the risks of material misstatement of the consolidated financial statements, whether due to fraud or error, design and perform audit procedures responsive to those risks, and obtain audit evidence that is sufficient and appropriate to provide a basis for our opinion. The risk of not detecting a material misstatement resulting from fraud is higher than for one resulting from error, as fraud may involve collusion, forgery, intentional omissions, misrepresentations, or the override of internal control.
143 / UBM Annual Report 2016
Consolidated Financial Statements
Obtain an understanding of internal control relevant to the audit in order to design audit procedures that are appropriate in the circumstances, but not for the purpose of expressing an opinion on the effectiveness of the Group’s internal control.
Evaluate the appropriateness of accounting policies used and the reasonableness of accounting estimates and related disclo-sures made by management.
Conclude on the appropriateness of management’s use of the going concern basis of accounting and, based on the audit evidence obtained, whether a material uncertainty exists related to events or conditions that may cast significant doubt on the Group’s ability to continue as a going concern. If we conclude that a material uncertainty exists, we are required to draw attention in our auditor’s report to the related disclosures in the consolidated financial statements or, if such disclosures are inadequate, to modify our opinion. Our conclusions are based on the audit evidence obtained up to the date of our auditor’s report. However, future events or conditions may cause the Group to cease to continue as a going concern.
Evaluate the overall presentation, structure and content of the consolidated financial statements, including the disclosures, and whether the consolidated financial statements represent the underlying transactions and events in a manner that achieves fair presentation.
Obtain sufficient appropriate audit evidence regarding the financial information of the entities or business activities within the Group to express an opinion on the consolidated financial statements. We are responsible for the direction, supervision and performance of the group audit. We remain solely responsible for our audit opinion.
We communicate with the Audit Committee regarding, among other matters, the planned scope and timing of the audit and sig-nificant audit findings, including any significant deficiencies in internal control that we identify during our audit.
We also provide the Audit Committee with a statement that we have complied with relevant ethical requirements regarding inde-pendence, and to communicate with them all relationships and other matters that may reasonably be thought to bear on our independence, and where applicable, related safeguards.
From the matters communicated with the Audit Committee, we determine those matters that were of most significance in the audit of the consolidated financial statements of the current period and are therefore the key audit matters. We describe these matters in our auditor’s report unless law or regulation precludes public disclosure about the matter or when, in extremely rare circumstances, we determine that a matter should not be communicated in our report because the adverse consequences of doing so would reasonably be expected to outweigh the public interest benefits of such communication.
REPORT ON OTHER LEGAL AND REGULATORY REQUIREMENTS COMMENTS ON THE MANAGEMENT REPORT FOR THE GROUP
Pursuant to Austrian Generally Accepted Accounting Principles, the Group management report is to be audited as to whether it is consistent with the consolidated financial statements and as to whether it was prepared in accordance with the applicable legal regulations.
Management is responsible for the preparation of the Group’s management report in accordance with Austrian Generally Accepted Accounting Principles and other legal or regulatory requirements.
We conducted our audit in accordance with Austrian Standards on Auditing for the audit of the Group’s management report.
144 / UBM Annual Report 2016
Consolidated Financial Statements
OpinionIn our opinion, the management report for the group was prepared in accordance with the valid legal requirements, contains information in accordance with § 243a UGB and is consistent with the consolidated financial statements.
StatementBased on the findings during the audit of the consolidated financial statements and due to the thus obtained understanding con-cerning the Group and its circumstances no material misstatements in the Group’s management report came to our attention.
OTHEr INfOrMATIONSManagement is responsible for the other information. The other information comprises the information included in the annual report, but does not include the consolidated financial statements, the Group’s management report and the auditor’s report thereon.
Our opinion on the consolidated financial statements does not cover the other information and we do not express any form of assurance conclusion thereon.
In connection with our audit of the consolidated financial statements, our responsibility is to read the other information and, in doing so, to consider whether the other information is materially inconsistent with the consolidated financial statements or our knowledge obtained in the audit, or otherwise appears to be materially misstated. If, based on the work we have performed, we conclude that there is a material misstatement of this other information, we are required to report that fact. We have nothing to report in this regard. rESpONSIbLE AUSTrIAN CErTIfIEd pUbLIC ACCOUNTANTThe engagement partner on the audit resulting in this independent auditor’s report is Mr. Klemens Eiter, Certified Public Accountant.
Vienna, 30 March 2017
BDO Austria GmbHWirtschaftsprüfungs- und Steuerberatungsgesellschaft
This report is a translation of the original report in German, which is solely valid.
Klemens EiterCertified Public Accountant
Gerhard FremgenCertified Public Accountant
145 / UBM Annual Report 2016
Consolidated Financial Statements
Appropriation of Profits
UBM Development AG ended the 2016 fiscal year with a retained profit of €11,997,061.51. The Managing Board proposes a dividend of €1.60 per share, which with 7,472,180 shares totals a payout of €11,955,488.00, with the remainder of the profits totalling €41,573.51 to be carried forward to new account.
Upon approval by the Annual General Meeting on this proposal for the appropriation of profits, the payout of a dividend of €1.60 per share shall ensue from 1 July 2017 through the custodian bank, subject to tax law regulations. The main paying agent is Erste Group Bank AG.
Vienna, 29 March 2017The Managing Board
Thomas G. WinklerChairman
Martin Löcker Michael WurzingerClaus Stadler
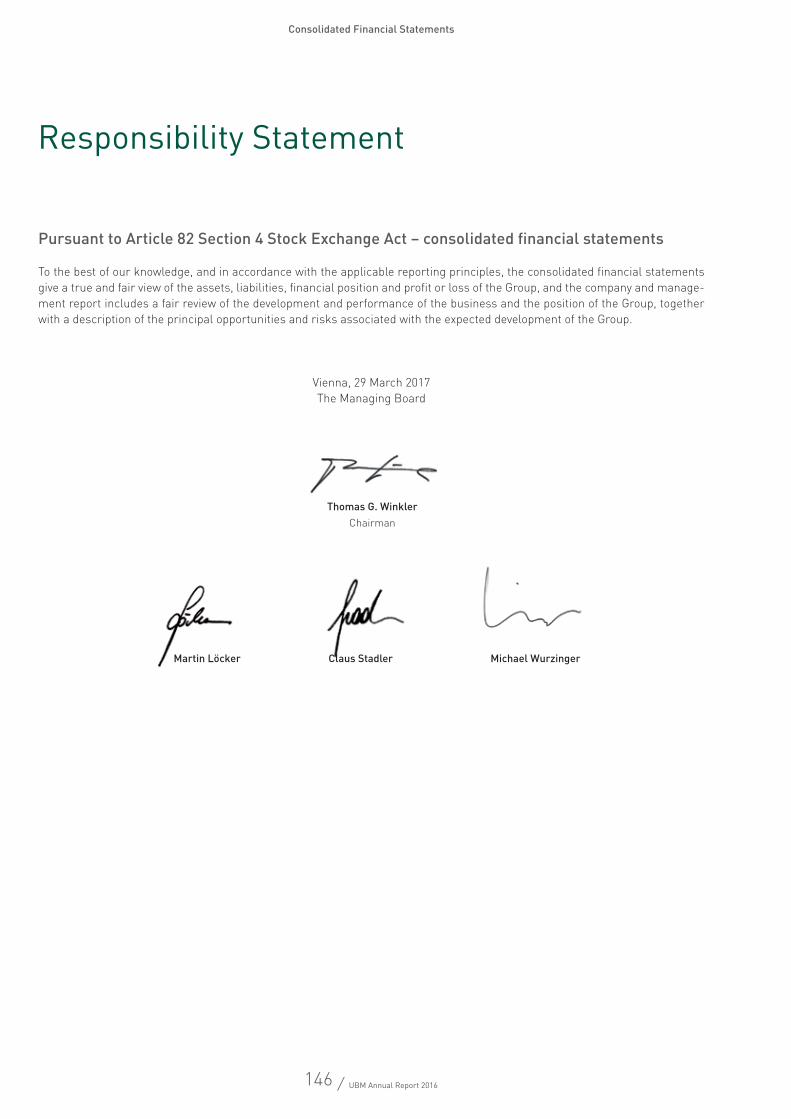
146 / UBM Annual Report 2016
Consolidated Financial Statements
Responsibility Statement
Pursuant to Article 82 Section 4 Stock Exchange Act – consolidated financial statements
To the best of our knowledge, and in accordance with the applicable reporting principles, the consolidated financial statements give a true and fair view of the assets, liabilities, financial position and profit or loss of the Group, and the company and manage-ment report includes a fair review of the development and performance of the business and the position of the Group, together with a description of the principal opportunities and risks associated with the expected development of the Group.
Vienna, 29 March 2017The Managing Board
Thomas G. Winkler Chairman
Martin Löcker Michael WurzingerClaus Stadler
147 / UBM Annual Report 2016
Glossary
ATX Austrian Traded Index, leading index of Vienna Stock Exchange
Dividend yield Dividends per share in relation to the share price
EBIT Earnings Before Interest and Taxes
EBITDA Earnings Before Interest, Taxes, Depreciation and Amortization
EBT Earnings Before Taxes
Equity ratio Equity recognised as of the reporting date in relation to total assets
EURO STOXX 50 Stock index that consists of the 50 largest listed companies in the eurozone
IAS International Accounting Standards
IATXImmobilien Austrian Traded Index; real estate index that contains the most important real estate companies listed on the Vienna Stock Exchange
IFRS International Financial Reporting Standards
Impairment test
In accordance with IAS 36 an evaluation of asset values shall be carried out by means of a regular test, which will establish any reduction in values of the asset and which may lead, if required, to the recording of corresponding adjustments.
Market capitalisation Share price multiplied by the number of shares in issue
Net debt Non-current and current bonds plus non-current and current financial liabilities minus cash and cash equivalents
P/E ratio Price-earnings ratio, the share price in relation to earnings per share
Profit for the period EBT after income taxes
Return on Assets (ROA) EBT plus interest on borrowings in relation to total capital
Return on Equity (ROE) EBT in relation to equity
Sales proceeds The share of revenue/Total Output generated by the sale of property projects
Total Output
Total Output corresponds to the revenue of fully consolidated companies and those consolidated under the equity method, as well as sales proceeds from share deals, in proportion to the stake held by UBM.
Contact
Investor Relations & Corporate CommunicationsMilena IovevaTel: +43 (0) 50 [email protected], [email protected]
Acknowledgements
Media Proprietor and PublisherUBM Development AGFloridsdorfer Hauptstrasse 11210 Vienna, AustriaTel: +43 (0) 50 626-2600www.ubm.at, www.ubm.eu
Concept, Design and EditingUBM Development AG, Investor Relations & Corporate Communicationsbe.public Corporate & Financial Communications GmbHHeiligenstädter Strasse 50 1190 Vienna, Austriawww.bepublic.at
IllustrationsFritz Dorfner
Proofreadingbe.public Corporate & Financial Communications GmbHGabriele Migdalek
TranslationGalina Collet, Collet Ltd.
ImagesMartina Draper (Managing Board photos)STRAUSS & PARTNER Development GmbH© ZOOM VP.AT (QBC photos)© Henn (Zalando)
PrintingPaul Gerin GmbH & Co KG, Gerinstrasse 1–3, 2120 Wolkersdorf, Austria
DisclaimerThis Annual Report also contains statements relating to the future which are based on estimates and assumptions made, to the best of their current knowledge, by managerial staff.
Future-related statements may be identified as such by expressions such as “anticipated”, “target” or similar constructions. Forecasts con-cerning the future development of the company take the form of estimates based on information available at 31 December 2016. Actual results may differ from forecast values where the assumptions on which these are based should prove incorrect or risks should develop in unforesee-able ways.
Every care has been taken in the compilation of this Annual Report as of 31 December 2016 to ensure the accuracy and completeness of infor-mation in all sections. However, round-off, typesetting and printing errors cannot be completely ruled out.
This report is a translation into English of the 2016 Annual Report published in the German language and is provided solely for the convenience of English-speaking users. In the event of a discrepancy or translation error, the German-language version prevails.