Embed Size (px)
Citation preview
1
2016 Annual Report to the School Community
School Name: Warrandyte High School
School Number: 8437
Stephen Parkin
Name of School Principal:
Lyn Dyason
Name of School Council President:
26 April 2017
Date of Endorsement:
Warrandyte High School
2
About Our School
School Context
Warrandyte High School has built and maintained a strong reputation for excellence in academic and creative achievement. Through a holistic environment where every student is valued and supported to achieve their personal best, the School encourages students to grow as individuals and participants in the wider community. The School is a learning community that strives for excellence in the delivery of its programs and recognises the strong link between self-efficacy and learning, placing great emphasis on the development of a Growth Mindset which embraces academic challenge and understands that academic growth is only achieved through hard work. Our teachers work in professional learning teams to develop and implement relevant and innovative programs which facilitate the best possible outcomes for our students.
Our four whole school theories of action are: Prioritise High Expectations & Authentic Relationships Emphasise Inquiry Focused Teaching Adopt Consistent Teaching Protocols Adopt Consistent Learning Protocols
Our six theories of action for teachers are: Harness Learning Intentions, Narrative & Pace Set Challenging Learning Tasks Frame Higher Order Questions Connect Feedback to Data Commit to Assessment for Learning Implement Cooperative Groups
The school was founded in 1978 and is situated in a green wedge, 20 km from the Melbourne CBD. The School facilities are set in tiered bushland creating a calming, safe and supportive atmosphere. The school values of excellence, integrity and respect are proudly displayed on large banners, visible from the main arterial entrance. English, Mathematics, Science and Humanities Immersion programs in Years 7 and 8 and the Taking the Challenge program in Year 9 extend the broad range of core and elective subjects offered. Year 10 students are given access to all our VCE/VET subjects providing opportunities for breadth, extension and acceleration. In 2016 over 90% of our Year 10 students took one or more VCE/VET subjects. VET programs are offered on-site and through a local cluster arrangement. The School’s visual and performing arts and digital media programs are acknowledged for their excellence and innovation. There is an extensive year level camps program which include an adventure camp, Melbourne City Experience, and a tour to Central Australia and Kakadu, as well as camps offered across year levels. The latter include the Great Victorian Bike Ride, World Challenge, Italy Tour and China Tour featuring a visit to our Sister School. Student leadership opportunities include; School Captains, Sport, Music and Production Captains, Class Captains and Student Representative Council. In 2016 Warrandyte High School had an enrolment of 469 students with 33.9 equivalent full-time Teaching staff, 2 Principal class and 12.5 equivalent full-time Education Support staff.
Framework for Improving Student Outcomes (FISO)
Improvement initiative: Building Leadership Teams Key improvement strategies-
Develop and Implement a school leadership structure aligned to the School Strategic Plan: o Implement a best fit distributive leadership model o Introduce combined learning teams o Build knowledge and capability to lead change to enhance school climate and professional
learning culture o Develop the capabilities of leading teachers to strengthen their expertise though proven coaching
and feedback methods
Progress achieved-
Combined learning teams implemented with a focus on pedagogy and curriculum development
Leading Teachers roles redefined to focus on school climate and professional learning culture
School Improvement Team created to drive improvement initiatives Provision of coaching to Leading Teachers by principal class members
Warrandyte High School
3
Improvement Initiative: Building Practice Excellence: Key improvement strategies-
Develop and implement an instructional model which: o Prioritises high expectations and authentic relationships o Adopts consistent teaching protocols and consistent learning protocols o Emphasises inquiry focussed teaching
Embed whole school literacy and numeracy strategies Progress achieved:
Professional learning teams dedicating one to two hours per week on development of instructional model
Completed peer observation cycles of inquiry indicating changes in classroom practice reflecting key improvement strategies
Student participation in the observation of teachers and the provision of feedback to teachers through a student/teacher designed survey
Whole school agreement on the WHS ‘direct instruction’ model
Documentation of the WHS ‘direct instruction’ model and evidence of its implementation in classrooms
Literacy and Numeracy resources purchased and professional development programs undertaken
Achievement
When compared to schools with similar student profiles, Warrandyte High School students are achieving similar results as measured by VCE median scores across all subjects. Student achievement in English and Mathematics as measured by AusVELS Teacher judgments indicated that the percentage of students in Years 7 to 10 working at or above expected standards is higher than the State Median and Similar to schools with similar intake characteristics. Year 9 NAPLAN indicates our students are achieving above the State Median in both Literacy and Numeracy. When compared to schools with similar intake characteristics our Year 9 NAPLAN Literacy results are Similar and the Numeracy results are Lower. NAPLAN Relative Growth from Year 7 to Year 9 indicates improvement in Grammar and Punctuation with a 5% reduction in low growth and a 5% increase in high growth from 2015. Both Reading and Writing showed 6% improvement in high growth but no corresponding reduction in low growth. Spelling indicated a 12% increase in low growth and no change in high growth from the previous year. Numeracy indicated a 14% reduction in low growth, however the low growth figure is still too large and the high growth figure dropped by 12%. Literacy and Numeracy will continue to be a key priority in 2017. All PSD students have made good progress in relation to their Individual Learning Plans.
Curriculum Framework implemented in 2016 (please mark the relevant box with an X by double clicking in the box)
Victorian Early Years Learning and Development Framework
X
AusVELS
Victorian Curriculum
A Combination of these
Engagement
The school emphasises the strong link between regular attendance and successful learning. All absences are followed up quickly through a strong Sub-School structure. The average number of days absent per full-time equivalent student at Warrandyte High School is significantly less than the State median. This very good result indicates that our students enjoy being at school and reflects our close tracking of student absence and our high quality communication with parents. A focus on a safe environment through an agreed code of conduct means that students feel supported and secure at school. Student retention from Year 7 to Year 10 slipped just below the State median. A target of the school’s Strategic Plan is to further improve the transitions between year levels and increase the opportunities for student voice.
Wellbeing
Warrandyte High School
4
The core of the school’s wellbeing program is Restorative Practice and the establishment of a safe and supportive learning environment. The program is overseen by the Sub-School Teams and the Wellbeing Leader. At each year level dedicated programs are presented to students which address their specific social and personal needs. These include both internally run programs and programs provided by outside agencies such as the YMCA. There has also been a concerted effort to increase student voice through enhancing the role of the Student Leadership Team and the Class Captains who support the work of the Student Representative Council. The 2016 Student Attitudes to School survey data indicated a small overall increase in the Connectedness to School and in the Student Perceptions of Safety measures. However, neither of these were consistent across all year levels.
For more detailed information regarding our school please visit our website at http://www.warrandytehigh.vic.edu.au/
Warrandyte High School
5
Performance Summary
The Government School Performance Summary provides an overview of how this school is contributing to the objectives of the Education State and how it compares to other Victorian government schools.
All schools work in partnership with their school community to improve outcomes for children and young people. Sharing this information with parents and the wider school community will help to deliver community engagement in student learning in the school, which is a state-wide priority of the Framework for Improving Student Outcomes.
Accessible data tables are available for all schools separately – please refer to 'AR_Appendix_Data_Tables' which can be found on the School Performance Reporting website.
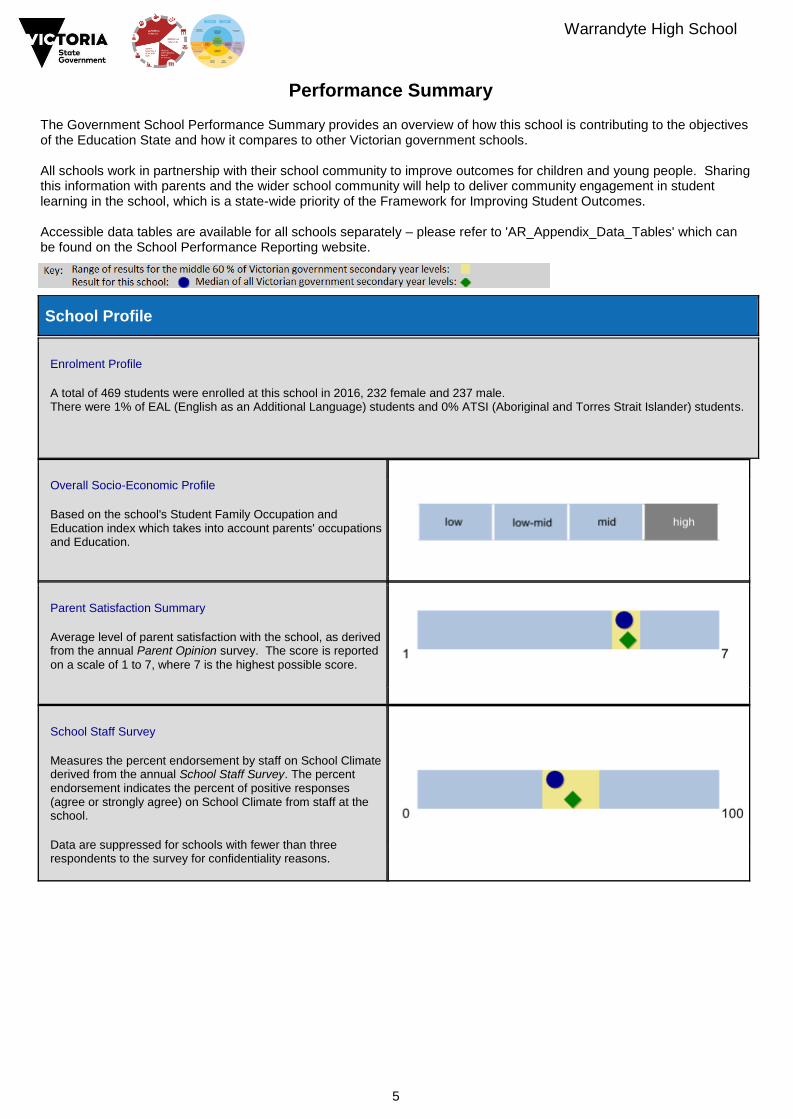
School Profile
Enrolment Profile A total of 469 students were enrolled at this school in 2016, 232 female and 237 male. There were 1% of EAL (English as an Additional Language) students and 0% ATSI (Aboriginal and Torres Strait Islander) students.
Overall Socio-Economic Profile Based on the school's Student Family Occupation and Education index which takes into account parents' occupations and Education.
Parent Satisfaction Summary Average level of parent satisfaction with the school, as derived from the annual Parent Opinion survey. The score is reported
on a scale of 1 to 7, where 7 is the highest possible score.
School Staff Survey Measures the percent endorsement by staff on School Climate derived from the annual School Staff Survey. The percent endorsement indicates the percent of positive responses (agree or strongly agree) on School Climate from staff at the school. Data are suppressed for schools with fewer than three respondents to the survey for confidentiality reasons.
Warrandyte High School
6
Performance Summary
Achievement
Student Outcomes
School Comparison
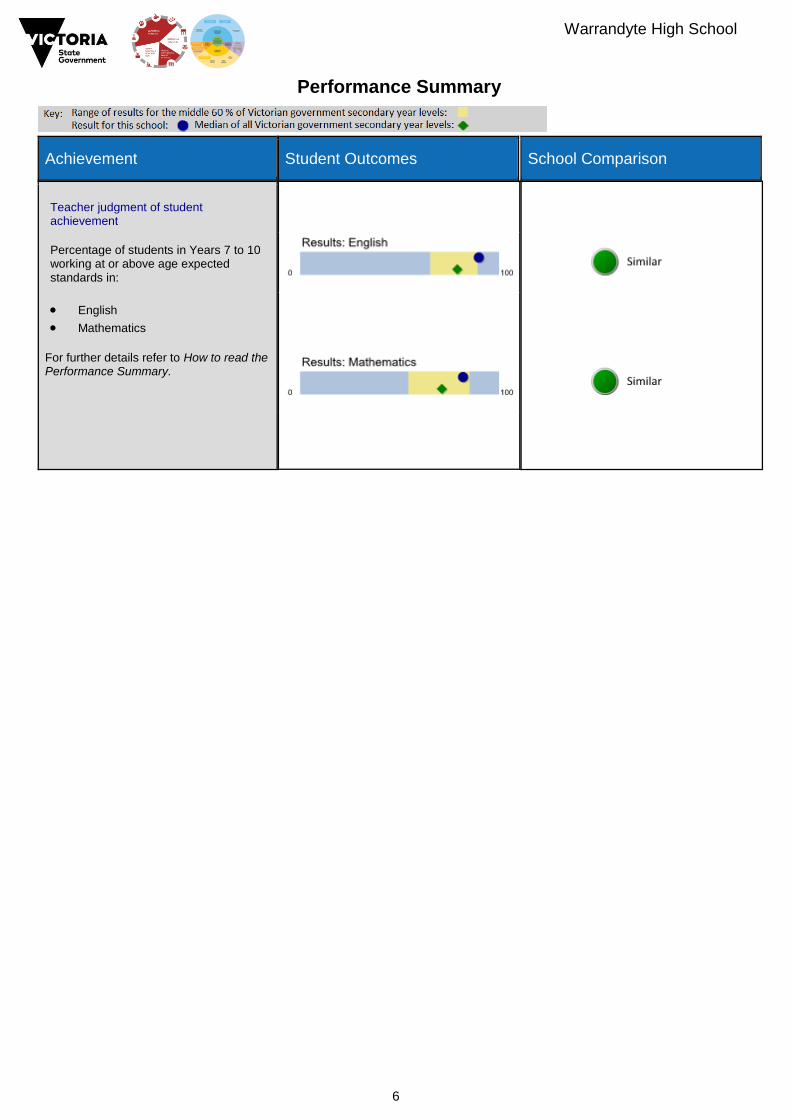
Teacher judgment of student achievement Percentage of students in Years 7 to 10 working at or above age expected standards in:
English
Mathematics
For further details refer to How to read the Performance Summary.
Warrandyte High School
7
Performance Summary
Achievement
Student Outcomes
School Comparison
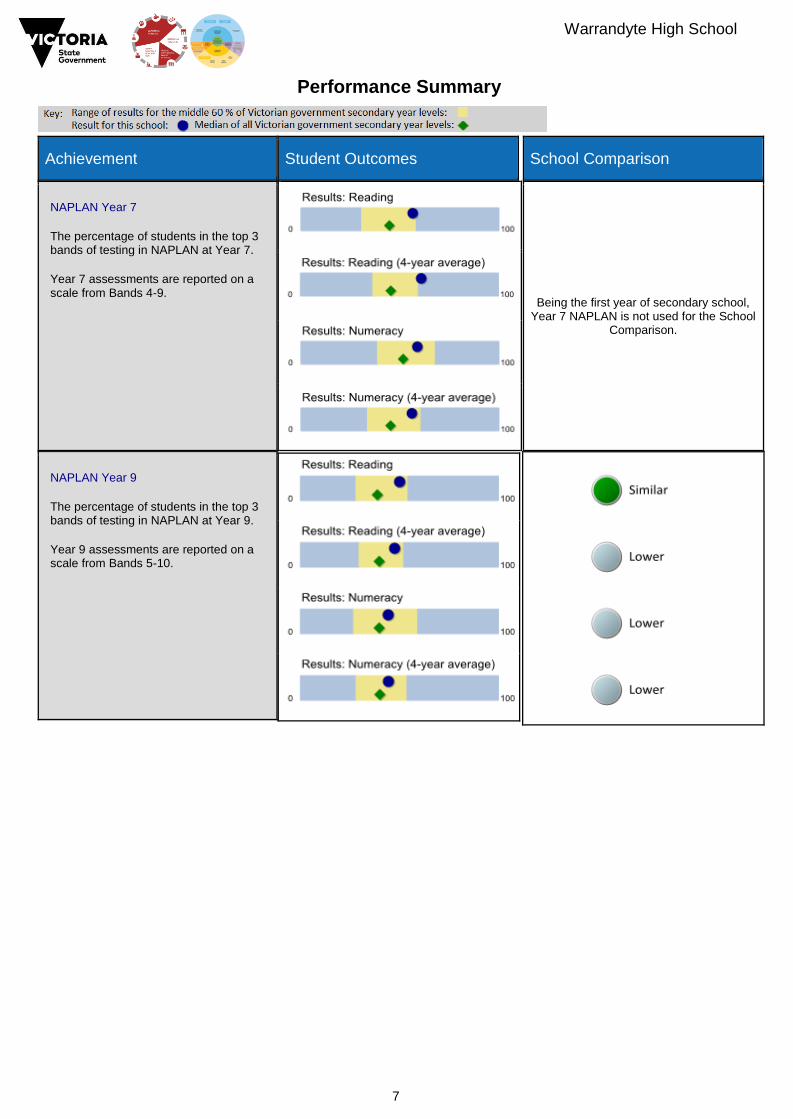
NAPLAN Year 7 The percentage of students in the top 3 bands of testing in NAPLAN at Year 7. Year 7 assessments are reported on a scale from Bands 4-9.
Being the first year of secondary school, Year 7 NAPLAN is not used for the School
Comparison.
NAPLAN Year 9 The percentage of students in the top 3 bands of testing in NAPLAN at Year 9. Year 9 assessments are reported on a scale from Bands 5-10.
Warrandyte High School
8
Performance Summary
Achievement
Student Outcomes
School Comparison
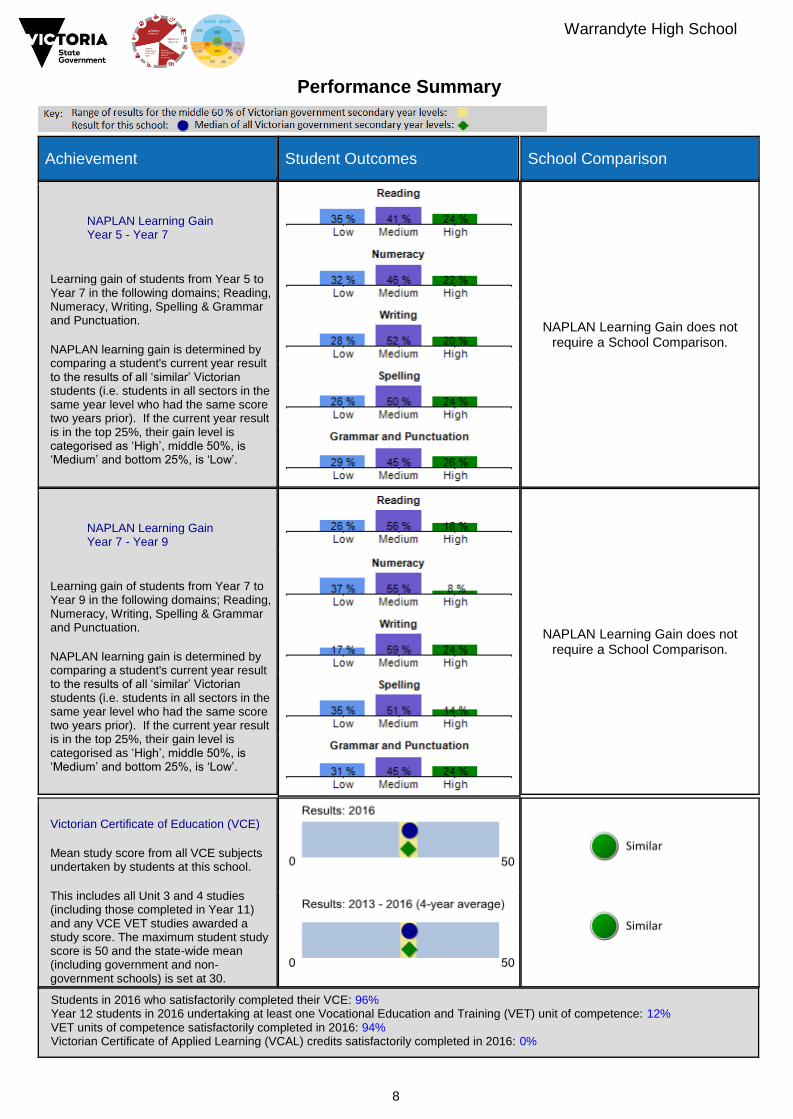
NAPLAN Learning Gain Year 5 - Year 7
Learning gain of students from Year 5 to Year 7 in the following domains; Reading, Numeracy, Writing, Spelling & Grammar and Punctuation. NAPLAN learning gain is determined by comparing a student's current year result to the results of all ‘similar’ Victorian students (i.e. students in all sectors in the same year level who had the same score two years prior). If the current year result is in the top 25%, their gain level is categorised as ‘High’, middle 50%, is ‘Medium’ and bottom 25%, is ‘Low’.
NAPLAN Learning Gain does not require a School Comparison.
NAPLAN Learning Gain Year 7 - Year 9
Learning gain of students from Year 7 to Year 9 in the following domains; Reading, Numeracy, Writing, Spelling & Grammar and Punctuation. NAPLAN learning gain is determined by comparing a student's current year result to the results of all ‘similar’ Victorian students (i.e. students in all sectors in the same year level who had the same score two years prior). If the current year result is in the top 25%, their gain level is categorised as ‘High’, middle 50%, is ‘Medium’ and bottom 25%, is ‘Low’.
NAPLAN Learning Gain does not require a School Comparison.
Victorian Certificate of Education (VCE) Mean study score from all VCE subjects undertaken by students at this school. This includes all Unit 3 and 4 studies (including those completed in Year 11) and any VCE VET studies awarded a study score. The maximum student study score is 50 and the state-wide mean (including government and non-government schools) is set at 30.
Students in 2016 who satisfactorily completed their VCE: 96% Year 12 students in 2016 undertaking at least one Vocational Education and Training (VET) unit of competence: 12% VET units of competence satisfactorily completed in 2016: 94% Victorian Certificate of Applied Learning (VCAL) credits satisfactorily completed in 2016: 0%
Warrandyte High School
9
Performance Summary
Engagement
Student Outcomes
School Comparison
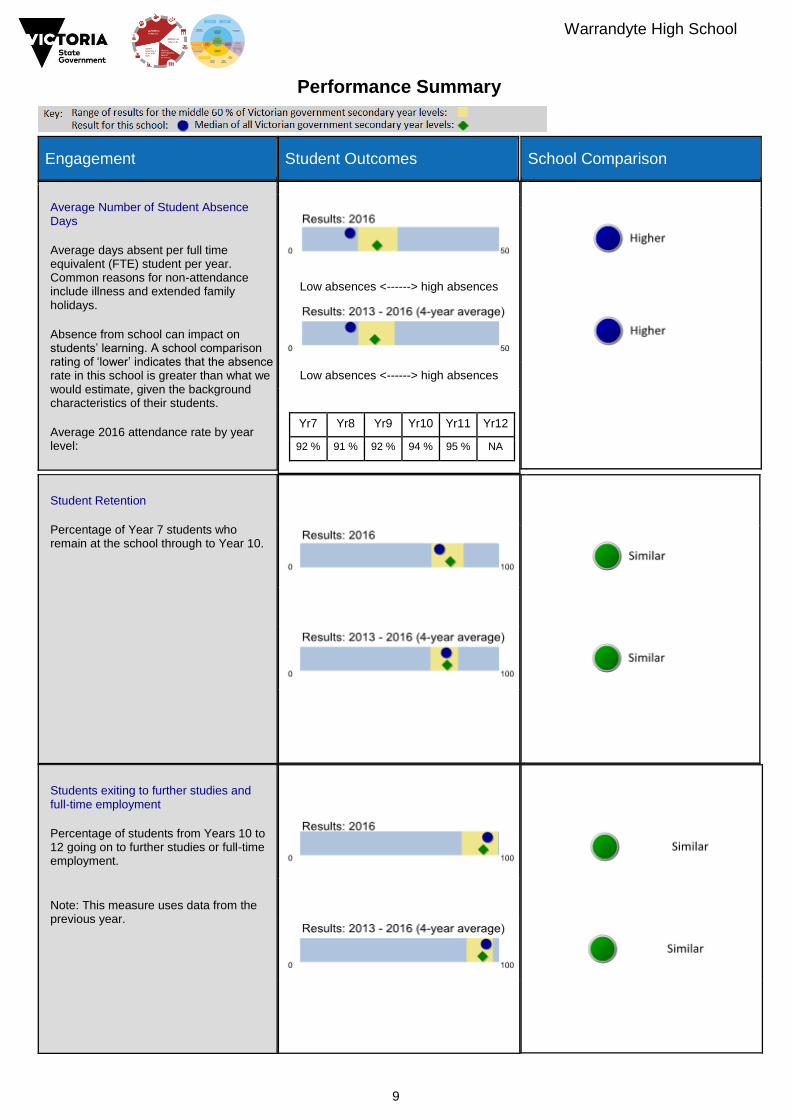
Average Number of Student Absence Days Average days absent per full time equivalent (FTE) student per year. Common reasons for non-attendance include illness and extended family holidays. Absence from school can impact on students’ learning. A school comparison rating of ‘lower’ indicates that the absence rate in this school is greater than what we would estimate, given the background characteristics of their students. Average 2016 attendance rate by year level:
Low absences <------> high absences
Low absences <------> high absences
Yr7
Yr8
Yr9
Yr10
Yr11
Yr12
92 %
91 %
92 %
94 %
95 %
NA
Student Retention Percentage of Year 7 students who remain at the school through to Year 10.
Students exiting to further studies and full-time employment Percentage of students from Years 10 to 12 going on to further studies or full-time employment.
Note: This measure uses data from the previous year.
Warrandyte High School
10
Performance Summary
Wellbeing
Student Outcomes
School Comparison
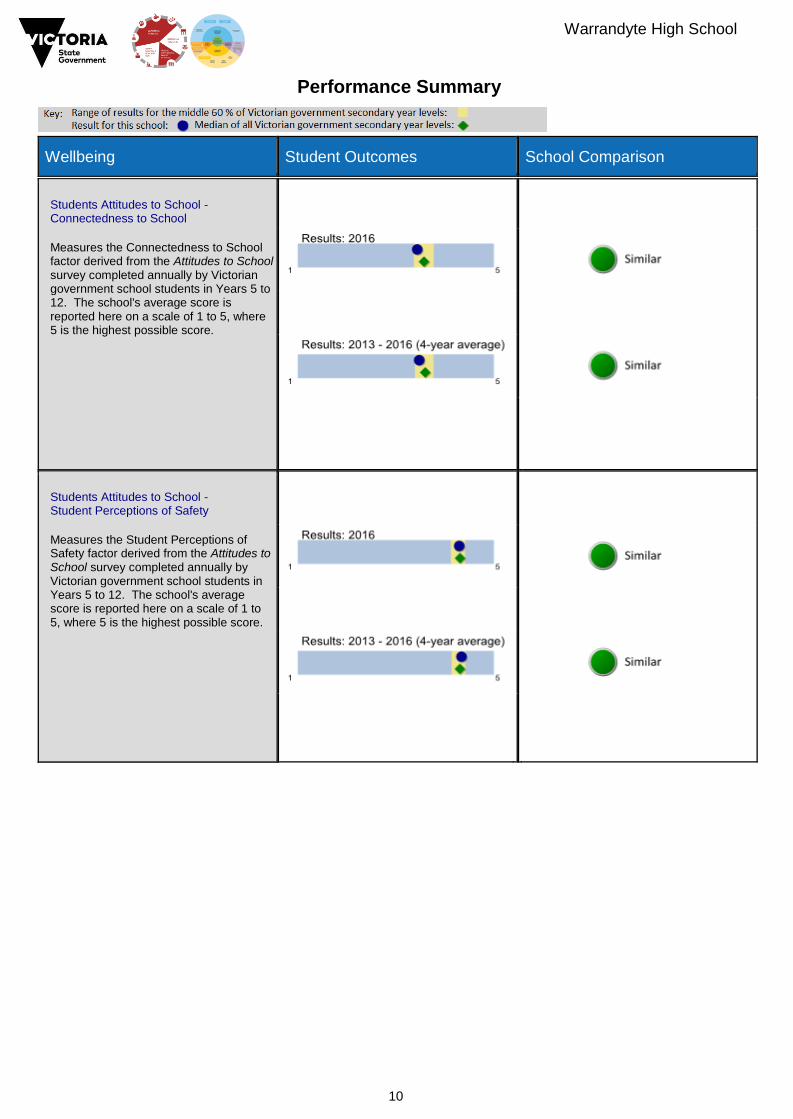
Students Attitudes to School - Connectedness to School Measures the Connectedness to School factor derived from the Attitudes to School survey completed annually by Victorian government school students in Years 5 to 12. The school's average score is reported here on a scale of 1 to 5, where 5 is the highest possible score.
Students Attitudes to School - Student Perceptions of Safety Measures the Student Perceptions of Safety factor derived from the Attitudes to School survey completed annually by Victorian government school students in Years 5 to 12. The school's average score is reported here on a scale of 1 to 5, where 5 is the highest possible score.
Warrandyte High School
11
How to read the Performance Summary
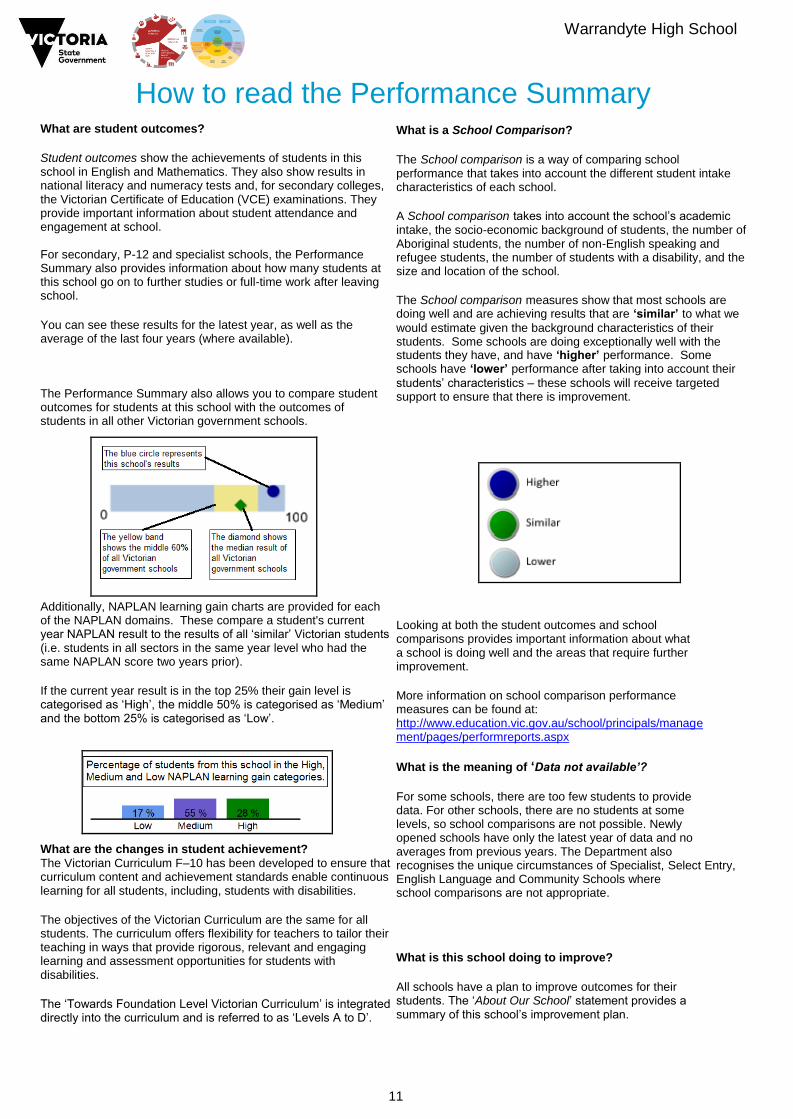
What are student outcomes? Student outcomes show the achievements of students in this school in English and Mathematics. They also show results in national literacy and numeracy tests and, for secondary colleges, the Victorian Certificate of Education (VCE) examinations. They provide important information about student attendance and engagement at school. For secondary, P-12 and specialist schools, the Performance Summary also provides information about how many students at this school go on to further studies or full-time work after leaving school. You can see these results for the latest year, as well as the average of the last four years (where available).
What is a School Comparison?
The School comparison is a way of comparing school performance that takes into account the different student intake characteristics of each school. A School comparison takes into account the school’s academic intake, the socio-economic background of students, the number of Aboriginal students, the number of non-English speaking and refugee students, the number of students with a disability, and the size and location of the school. The School comparison measures show that most schools are doing well and are achieving results that are ‘similar’ to what we
would estimate given the background characteristics of their students. Some schools are doing exceptionally well with the students they have, and have ‘higher’ performance. Some schools have ‘lower’ performance after taking into account their
students’ characteristics – these schools will receive targeted support to ensure that there is improvement.
Looking at both the student outcomes and school comparisons provides important information about what a school is doing well and the areas that require further improvement. More information on school comparison performance measures can be found at: http://www.education.vic.gov.au/school/principals/manage ment/pages/performreports.aspx
What is the meaning of ‘Data not available’?
For some schools, there are too few students to provide data. For other schools, there are no students at some levels, so school comparisons are not possible. Newly opened schools have only the latest year of data and no averages from previous years. The Department also recognises the unique circumstances of Specialist, Select Entry, English Language and Community Schools where school comparisons are not appropriate.
What is this school doing to improve?
All schools have a plan to improve outcomes for their students. The ‘About Our School’ statement provides a summary of this school’s improvement plan.
The Performance Summary also allows you to compare student outcomes for students at this school with the outcomes of students in all other Victorian government schools.
Additionally, NAPLAN learning gain charts are provided for each of the NAPLAN domains. These compare a student's current year NAPLAN result to the results of all ‘similar’ Victorian students (i.e. students in all sectors in the same year level who had the same NAPLAN score two years prior). If the current year result is in the top 25% their gain level is categorised as ‘High’, the middle 50% is categorised as ‘Medium’ and the bottom 25% is categorised as ‘Low’.
What are the changes in student achievement? The Victorian Curriculum F–10 has been developed to ensure that curriculum content and achievement standards enable continuous learning for all students, including, students with disabilities. The objectives of the Victorian Curriculum are the same for all students. The curriculum offers flexibility for teachers to tailor their teaching in ways that provide rigorous, relevant and engaging learning and assessment opportunities for students with disabilities. The ‘Towards Foundation Level Victorian Curriculum’ is integrated directly into the curriculum and is referred to as ‘Levels A to D’.
Warrandyte High School
12
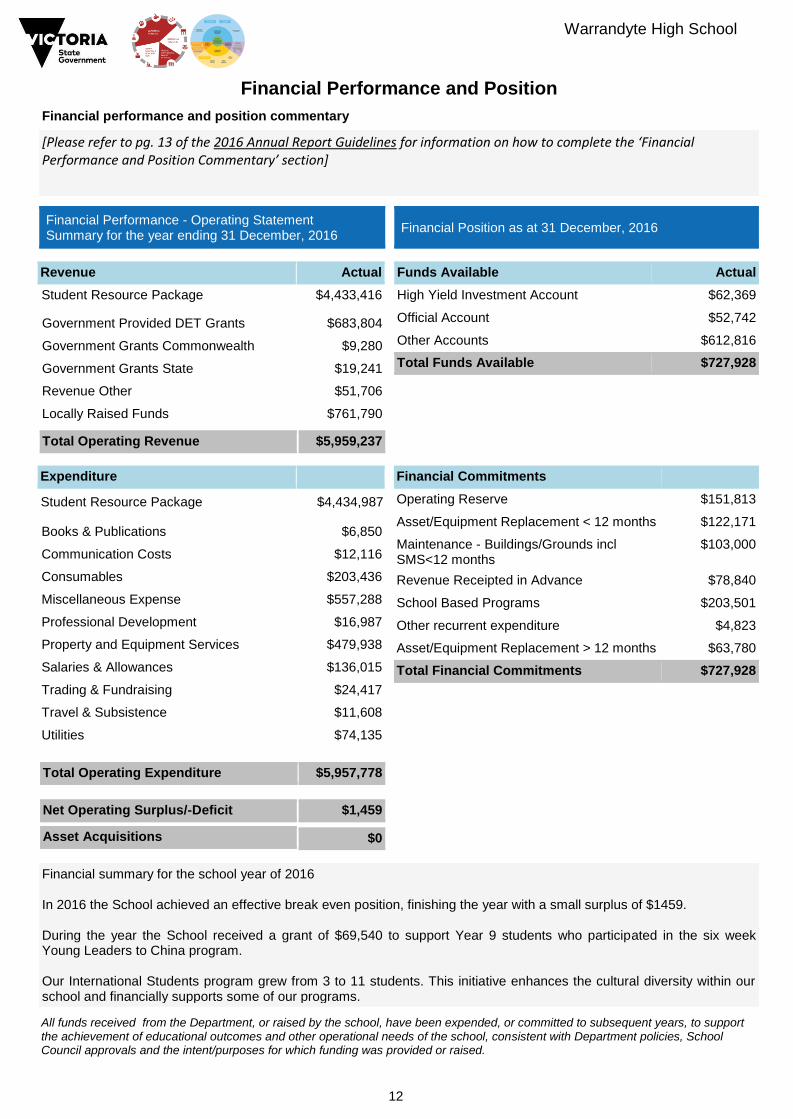
Financial Performance and Position
Financial performance and position commentary
[Please refer to pg. 13 of the 2016 Annual Report Guidelines for information on how to complete the ‘Financial Performance and Position Commentary’ section]
Financial Performance - Operating Statement Summary for the year ending 31 December, 2016
Financial Position as at 31 December, 2016
Revenue
Actual
Funds Available Actual
High Yield Investment Account $62,369
Official Account $52,742
Other Accounts $612,816
Total Funds Available $727,928
Student Resource Package
$4,433,416
Government Provided DET Grants $683,804
Government Grants Commonwealth $9,280
Government Grants State $19,241
Revenue Other $51,706
Locally Raised Funds $761,790
Total Operating Revenue
$5,959,237
Expenditure
Financial Commitments
Operating Reserve $151,813
Asset/Equipment Replacement < 12 months $122,171
Maintenance - Buildings/Grounds incl SMS<12 months
$103,000
Revenue Receipted in Advance $78,840
School Based Programs $203,501
Other recurrent expenditure $4,823
Asset/Equipment Replacement > 12 months $63,780
Total Financial Commitments $727,928
Student Resource Package
$4,434,987
Books & Publications $6,850
Communication Costs $12,116
Consumables $203,436
Miscellaneous Expense $557,288
Professional Development $16,987
Property and Equipment Services $479,938
Salaries & Allowances $136,015
Trading & Fundraising $24,417
Travel & Subsistence $11,608
Utilities $74,135
Total Operating Expenditure
$5,957,778
Net Operating Surplus/-Deficit
$1,459
Asset Acquisitions
$0
Financial summary for the school year of 2016 In 2016 the School achieved an effective break even position, finishing the year with a small surplus of $1459. During the year the School received a grant of $69,540 to support Year 9 students who participated in the six week Young Leaders to China program. Our International Students program grew from 3 to 11 students. This initiative enhances the cultural diversity within our school and financially supports some of our programs.
All funds received from the Department, or raised by the school, have been expended, or committed to subsequent years, to support the achievement of educational outcomes and other operational needs of the school, consistent with Department policies, School Council approvals and the intent/purposes for which funding was provided or raised.