Embed Size (px)
Citation preview
A N N U A L R E P O R T 2 0 1 6
CONTENTS
123579
1113162327313233353637
Corporate DirectoryFive Year Financial SummaryChairman’s StatementBoard of DirectorsChief Executive Officer’s ReviewFinancial ReviewOperations’ ReviewMarketing and Sales ReviewSustainability ReportDirectors’ StatementIndependent Auditor’s ReportConsolidated Income StatementConsolidated Statement of Comprehensive IncomeBalance SheetsConsolidated Statement of Changes in EquityConsolidated Statement of Cash FlowsNotes to the Financial Statements
Page
SAKARI RESOURCES LIMITED ANNUAL REPORT 20161
CORPORATE DIRECTORY
DirectorsMr Surong Bulakul ChairmanMs Rosaya Teinwan Chief Executive OfficerMr Wirat Uanarumit (w.e.f. 28 Oct 2016) Non-Executive DirectorMr Thanakorn Poolthavee Independent DirectorMr Han Eng Juan Independent DirectorMs Julie Therese Hall Independent Director
Audit, Risk & Compliance CommitteeMr Han Eng Juan ChairmanMr Thanakorn Poolthavee Member
Remuneration Committee and Nomination CommitteeMr Wirat Uanarumit ChairmanMs Julie Therese Hall Member
Company Secretaries Seow Han Chiang Winston Lee Sock Wei
Registered and Head Office 391B Orchard Road Ngee Ann City Tower B 17-01 Singapore 238874 Tel (65) 6499 4100 Fax (65) 6327 4222
Share Register Boardroom Corporate & Advisory Services Pte. Ltd. 50 Raffles Place #32-01 Singapore Land Tower, Singapore 048623
Independent Auditors PricewaterhouseCoopers LLP. 8 Cross Street PWC Building Singapore 048424
Audit Partner: Graham Lee
Website www.sakariresources.com
SAKARI RESOURCES LIMITED ANNUAL REPORT 20162
FIVE YEAR SUMMARY
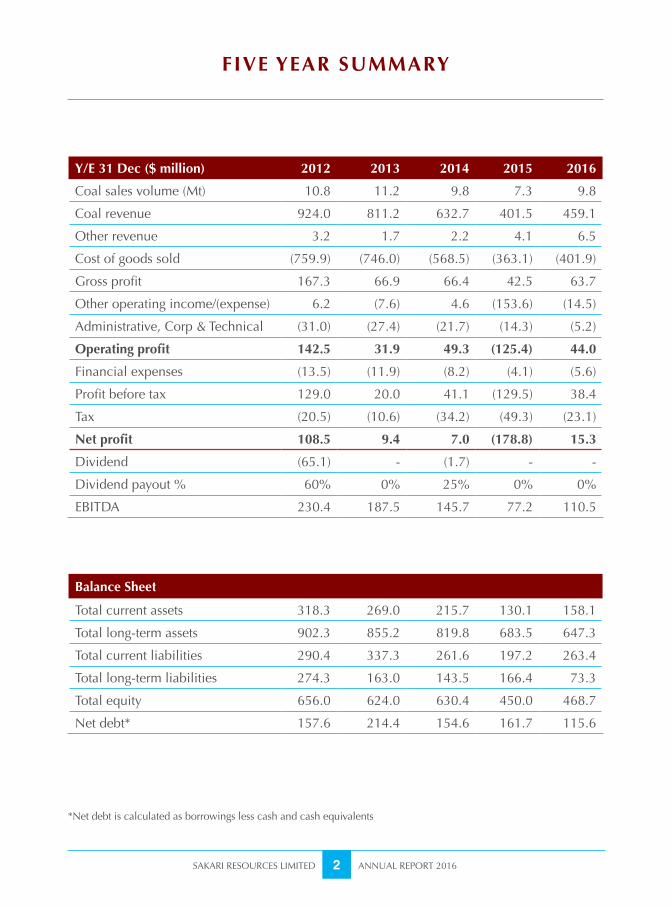
Y/E 31 Dec ($ million) 2012 2013 2014 2015 2016
Coal sales volume (Mt) 10.8 11.2 9.8 7.3 9.8
Coal revenue 924.0 811.2 632.7 401.5 459.1
Other revenue 3.2 1.7 2.2 4.1 6.5
Cost of goods sold (759.9) (746.0) (568.5) (363.1) (401.9)
Gross profit 167.3 66.9 66.4 42.5 63.7
Other operating income/(expense) 6.2 (7.6) 4.6 (153.6) (14.5)
Administrative, Corp & Technical (31.0) (27.4) (21.7) (14.3) (5.2)
Operating profit 142.5 31.9 49.3 (125.4) 44.0
Financial expenses (13.5) (11.9) (8.2) (4.1) (5.6)
Profit before tax 129.0 20.0 41.1 (129.5) 38.4
Tax (20.5) (10.6) (34.2) (49.3) (23.1)
Net profit 108.5 9.4 7.0 (178.8) 15.3
Dividend (65.1) - (1.7) - -
Dividend payout % 60% 0% 25% 0% 0%
EBITDA 230.4 187.5 145.7 77.2 110.5
Balance Sheet
Total current assets 318.3 269.0 215.7 130.1 158.1
Total long-term assets 902.3 855.2 819.8 683.5 647.3
Total current liabilities 290.4 337.3 261.6 197.2 263.4
Total long-term liabilities 274.3 163.0 143.5 166.4 73.3
Total equity 656.0 624.0 630.4 450.0 468.7
Net debt* 157.6 214.4 154.6 161.7 115.6
*Net debt is calculated as borrowings less cash and cash equivalents
SAKARI RESOURCES LIMITED ANNUAL REPORT 20163
Dear Shareholders
2016 saw a watershed in the seaborne thermal coal market. The pressure on thermal coal prices that has persisted over the past few years has started to ease, despite the volatile movement of coal prices throughout the year. I am pleased to report that in 2016, Sakari has turned around and achieved higher operational and financial results. I would like to thank Sakari Management for taking many positive and immediate actions in response to the challenges that we faced.
Sakari in 2016
2016 marked as one of the most challenging years for Sakari. There were many prompt actions carried out throughout the year with an aim to regaining Sakari’s profitability, including renegotiation of mining rates with our mining contractor, reorganization of Sakari management team to streamline functions and optimize resources as well as rationalization of overhead costs at both corporate and site levels. Additionally, Sakari has strengthened its tax team which has been proactive in dealing with prior-year tax issues in Indonesia and sorting out complex tax issues. The overall results from our actions and efforts were very satisfactory. As a result, Sakari ended 2016 with a stronger position financially and operationally than at the begining of the year. The Group’s EBITDA margin increased from 19% in 2015 to 24% in 2016 and the Group’s net profit turned positive
CHAIRMAN’S STATEMENT
at $15.3 million (2015: -$178.8 million). Sakari was able to make loan repayments as planned and we still have substantial unused lines for our operations. This is a very satisfactory outcome in the face of considerable challenges. We will be keeping a strong focus on cost reduction and revenue optimization in all areas of the business and thus laying a robust groundwork for Sakari to continue striving for excellence in 2017.
Shareholder Developments
Your Board remains fully aware of shareholders’ concerns on the lack of liquidity for their shares and we have raised the concerns at the highest levels in PTT. Sakari and PTT are working together toward an exit solution for all affected shareholders. We appreciate your patience and we look forward to a satisfactory outcome.
Directorate
On November 30, 2016, Mr. Pitipan Tepartimargorn who was appointed to the Board since May 2014 stood down from the Board of Sakari and Mr. Wirat Uanarumit from PTT joined as a Non-Executive Director on October 28, 2016. Mr Wirat is a finance professional and has over 10 years of experience as Chief Financial Officer within PTT Group. Please join me in welcoming Mr. Wirat to the Board and in thanking Mr. Pitipan for his invaluable contributions and service to the company.
SAKARI RESOURCES LIMITED ANNUAL REPORT 20164
Outlook and Conclusion
We believe that thermal coal will retain its position as base source for power generation in long term. A significant portion of the world population still lacks access to electricity. Thermal coal, as one of the most reliable sources of energy and one of the lowest cost options, certainly remains a primary choice for power generation, especially in developing countries. Nevertheless, whilst we hold our strong belief in the promising future of coal business, we are adopting a cautious outlook for our 2017 strategies given the rapid change of events towards the end of 2016. We will constantly review and carefully assess both opportunities and challenges along the way.
Once again, I would like to thank the many public officers and communities that we deal with in Indonesia and elsewhere for their diligent approach to overcoming the issues that arise in the course of Sakari’s daily business. I also would like to offer my sincere appreciation to my fellow directors, the entire management team and staff of Sakari for the support and commitment they have demonstrated over the past year and the continuous improvement that has clearly been achieved throughout the Group.
Mr Surong BulakulChairman
CHAIRMAN’S STATEMENT (cont’d)
SAKARI RESOURCES LIMITED ANNUAL REPORT 20165
Surong BulakulChairman
Mr Surong was appointed to the Board of Sakari in February 2013, became Acting CEO in September 2013 and Chairman in June 2014. He holds a BSc in Industrial Engineering and Operations Research, a Master of Engineering in Operations Research and an MBA from Cornell University, USA. He joined PTT Group in 1973 where he had held senior management positions including Chief Operating Officer Infrastructure, PTT Public Company Limited. In addition to being Chairman of Sakari, he is also the Chairman of Global Power Synergy Company Limited, PTT Power Group’s flagship, and a Director of the Provincial Electricity Authority of Thailand.
Rosaya TeinwanActing Chief Executive Officer
Ms Rosaya Teinwan, who was appointed to the Board and the position of Acting CEO on 1 December 2015, has been employed by PTT Group since 1991. She holds a BSc in Electrical Engineering, a Master of Business Administration and specializes in organizational development and planning. Ms Rosaya has been involved in the upstream and downstream business of PTT Group for many years, her last appointment being Executive Vice President of PTT and the acting President of PTT Green Energy Pte Ltd.
BOARD OF DIRECTORS
Han Eng JuanIndependent
Mr Han who holds a Bachelor of Accountancy (Hon)(NUS) is a qualified accountant. He is a Director of the Singapore Deposit Insurance Corporation Limited, and is a member of the finance commission of the Singapore Red Cross Society having previously served as its Council Member and Chairman of the Audit Committe. Mr Han has been awarded the Public Administration Medal (Silver) for service in the public sector and the Public Service Medal for community work. In the public sector, Mr Han has held senior positions in the Board of Commissioners of Currency Singapore and the Monetary Authority of Singapore. His last position in the private sector was as Senior Managing Director and Singapore Country Head of Dexia Banque Internationale à Luxembourg.
Julie Therese HallIndependent
Ms Hall is a qualified geologist and also holds several diplomas in corporate directorship and financial planning. She is a Senior Fellow of the Corporate Directors Association, a member of the Australian Institute of Directors and a Senior Fellow of the Financial Securities Institute. Ms Hall has almost 30 years’ experience in mining projects in Australia and Asia, including 13 years at BHP Ltd. She is an Executive Director of Far East Energy Corporate Pty Limited and its subsidiaries, and a Director of Pegnel Resources Pty Limited, a private resources consultancy company.
SAKARI RESOURCES LIMITED ANNUAL REPORT 20166
BOARD OF DIRECTORS (cont’d)
Wirat UanarumitNon-Executive
Mr Wirat holds a Bachelor Degree in Electrical Engineering from Chulalongkorn University and an MBA from Pennsylvania State University, USA. He has just recently moved from the position of Chief Financial Officer (CFO) to Chief Operating Officer - Upstream Petroleum and Gas Business Group (COOU) at PTT Public Company Limited. He had had over 10 years of experience as CFO within PTT Group, including Thai Oil Public Company Limited and IRPC Public Company Limited during 2005-2012. He started his career with Shell Company of Thailand in 1988. With his engineering training and business background, he worked in various capacities, including his last position as Refinery Project Business Manager of Rayong Refinery. Prior to joining Shell Company, Mr Wirat held several executive positions in the finance sector over a span of 15 years at Nomura Securities and ABN AMRO Bank N. V. Mr Wirat was appointed as a director of Sakari in October 2016.
Thanakorn Poolthavee Independent
Mr Thanakorn holds a B. Eng. in Mining from Chulalongkorn University, Thailand. He has extensive experience in the energy industry in a career that has included his holding the position of Deputy Governor, Fuel for The Electricity Generating Authority of Thailand (EGAT). He was formerly a Director of EGAT International Co. Ltd and Ratchaburi Electricity Generating Holding PLC. Mr Thanakorn was appointed to Sakari’s Board in May 2014.
SAKARI RESOURCES LIMITED ANNUAL REPORT 20167
CHIEF EXECUTIVE OFFICER’S REVIEW
Dear Shareholders
Year 2016 was a turnaround year for seaborne thermal coal market. The coal market sentiment remained weak in the first half of 2016, reflecting coal overcapacity and weak demand. Later in the year, the coal over-supply situation in the global market had subsided, mainly owing to the measures from China’s government aimed at reducing domestic production by limiting the number of working days for coal miners. The decline in China’s domestic production has led to higher coal imports to China which triggered a major rally in coal market prices, particularly during October and November.
Sakari Management has been carefully monitoring such external factors that might affect our business and keeping our operations and marketing plans under constant review in order to be responsive to the changing environment. The outcomes in the face of volatile conditions are satisfactory and have proved the potential that lies within Sakari Group.
Operations
In 2016, Jembayan Mine produced 7.1 Mt of coal (2015: 6.0 Mt), representing nearly 80% of our Group’s total production. The increase in Jembayan production was in line with sales commitments in response to the increase in coal price in late 2016.
Sebuku Mine produced 1.8 Mt of coal in 2016 (2015: 1.9 Mt). We have been closely
monitoring and constantly reviewing the production plans of Sebuku by focusing on optimizing the value of the mine. During the coal market downturn, we decided to temporarily cease the coal washing operations to maximize the overall profit as we have been successful in marketing Sebuku’s unwashed coal to customers.
Overall, I am very satisfied that the Group’s average cash cost was reduced by $9.1/t or 20% on year-on-year basis. The reduction in production cost was mainly attributable to past and on-going cost improvement initiatives across the value chain. This was an excellent achievement by the whole team including the much appreciated strong support from our mine’s contractor.
Marketing
Sakari’s weighted average selling price (ASP) in 2016 was $46.3/t (2015: $54.4/t). The lower ASP was mainly due to our plan to focus on fixed price transactions to protect margins under the weak market sentiment continuing from 2015. Total coal sales at 9.8 Mt exceeded our coal production as we took advantage of the opportunity in the market to buy third party coal mainly for coal blending to optimize Sakari’s revenue. Once again, the Group earned net despatch on its coal deliveries in 2016, affirming the excellent working relationship and strong co-operation between our marketing team and the mine sites.
SAKARI RESOURCES LIMITED ANNUAL REPORT 20168
Financial Performance
In 2016, Sakari’s turnover hit $465.6 million (2015: $405.6 million) reflecting primarily the higher coal sales volume. With tight cost control measures being implemented throughout the year, profit at all levels improved significantly. EBITDA in 2016 was $110.5 million (2015: $77.2 million) and net profit after tax was $15.3 million (2015: -$178.8 million, including a non-cash impairment charge of $149.3 million).
During the year, we reduced our borrowings from $195 million to $150 million. It is a testament to the strength of our financial performance and balance sheet.
Organization Development
Our decisions in late 2015 to make significant staff cuts in our Head Office in Singapore and in the site administration offices in order to streamline work functions and optimize resources have resulted in the Group’s corporate and technical support costs being significantly reduced to $5.2 million from $14.3 million in 2015. In 2017, we will continue to develop Jakarta office as our Head Office in Indonesia with centralization of key functions to enhance operational efficiency and alignment.
CHIEF EXECUTIVE OFFICER’S REVIEW (cont’d)
Sustainability
Sakari’s Sustainability Report for 2016 is included in this Annual Report.
Outlook
Despite the recent rally in the coal prices, there is uncertainty as to whether the current price level and stability will continue in 2017. This is largely dependent on China’s policies on domestic coal production which will significantly affect coal supplies in the seaborne thermal coal market. This unclear situation will have a major impact on coal price and, inevitably, Sakari’s earnings.
Sakari Management is committed to striving hard to ensure that Sakari remains competitive through continuous implementation of cost reduction initiatives throughout the group as well as revenue optimization to maximise margins. We have also begun a process of reviewing all the Group’s strategies and key processes and we will continue to explore ways and opportunities in which we can improve returns for shareholders in the future.
Rosaya Teinwan Chief Executive Officer
SAKARI RESOURCES LIMITED ANNUAL REPORT 20169
FINANCIAL REVIEW
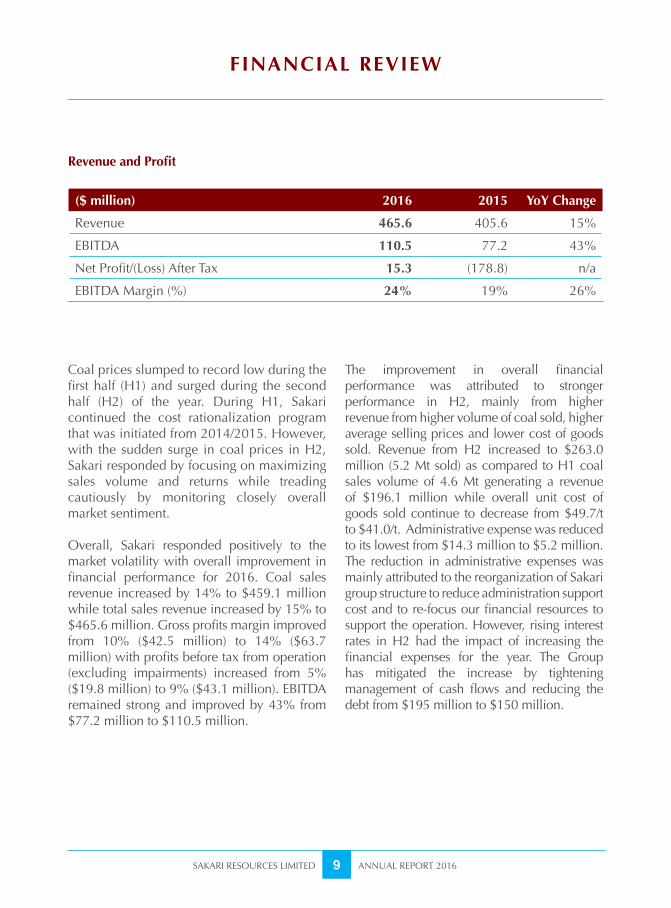
Coal prices slumped to record low during the first half (H1) and surged during the second half (H2) of the year. During H1, Sakari continued the cost rationalization program that was initiated from 2014/2015. However, with the sudden surge in coal prices in H2, Sakari responded by focusing on maximizing sales volume and returns while treading cautiously by monitoring closely overall market sentiment.
Overall, Sakari responded positively to the market volatility with overall improvement in financial performance for 2016. Coal sales revenue increased by 14% to $459.1 million while total sales revenue increased by 15% to $465.6 million. Gross profits margin improved from 10% ($42.5 million) to 14% ($63.7 million) with profits before tax from operation (excluding impairments) increased from 5% ($19.8 million) to 9% ($43.1 million). EBITDA remained strong and improved by 43% from $77.2 million to $110.5 million.
The improvement in overall financial performance was attributed to stronger performance in H2, mainly from higher revenue from higher volume of coal sold, higher average selling prices and lower cost of goods sold. Revenue from H2 increased to $263.0 million (5.2 Mt sold) as compared to H1 coal sales volume of 4.6 Mt generating a revenue of $196.1 million while overall unit cost of goods sold continue to decrease from $49.7/t to $41.0/t. Administrative expense was reduced to its lowest from $14.3 million to $5.2 million. The reduction in administrative expenses was mainly attributed to the reorganization of Sakari group structure to reduce administration support cost and to re-focus our financial resources to support the operation. However, rising interest rates in H2 had the impact of increasing the financial expenses for the year. The Group has mitigated the increase by tightening management of cash flows and reducing the debt from $195 million to $150 million.
($ million) 2016 2015 YoY Change
Revenue 465.6 405.6 15%
EBITDA 110.5 77.2 43%
Net Profit/(Loss) After Tax 15.3 (178.8) n/a
EBITDA Margin (%) 24% 19% 26%
Revenue and Profit
SAKARI RESOURCES LIMITED ANNUAL REPORT 201610
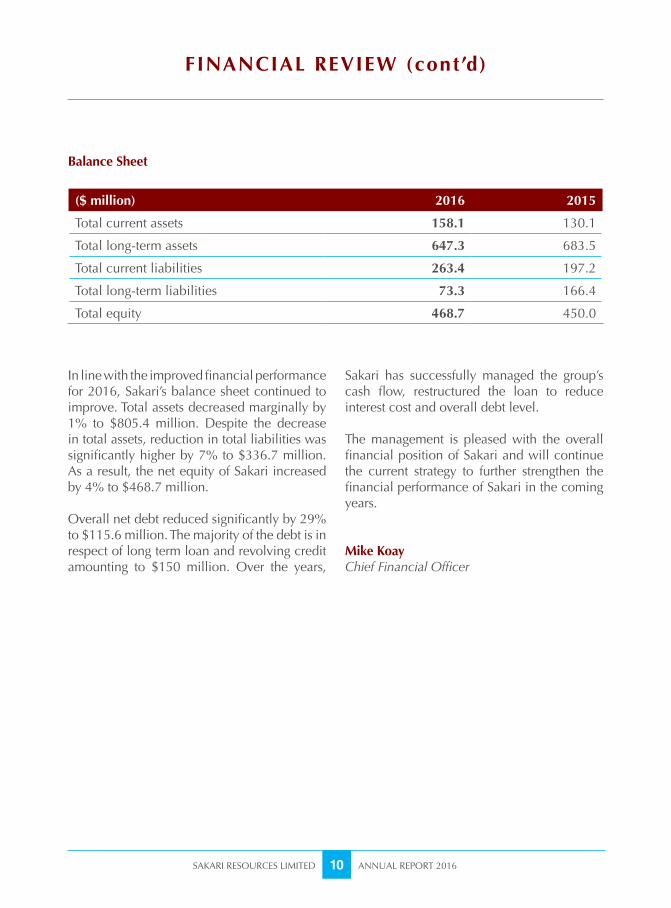
In line with the improved financial performance for 2016, Sakari’s balance sheet continued to improve. Total assets decreased marginally by 1% to $805.4 million. Despite the decrease in total assets, reduction in total liabilities was significantly higher by 7% to $336.7 million. As a result, the net equity of Sakari increased by 4% to $468.7 million.
Overall net debt reduced significantly by 29% to $115.6 million. The majority of the debt is in respect of long term loan and revolving credit amounting to $150 million. Over the years,
Sakari has successfully managed the group’s cash flow, restructured the loan to reduce interest cost and overall debt level.
The management is pleased with the overall financial position of Sakari and will continue the current strategy to further strengthen the financial performance of Sakari in the coming years.
Mike Koay Chief Financial Officer
($ million) 2016 2015
Total current assets 158.1 130.1
Total long-term assets 647.3 683.5
Total current liabilities 263.4 197.2
Total long-term liabilities 73.3 166.4
Total equity 468.7 450.0
Balance Sheet
FINANCIAL REVIEW (cont’d)
SAKARI RESOURCES LIMITED ANNUAL REPORT 201611
OPERATIONS’ REVIEW
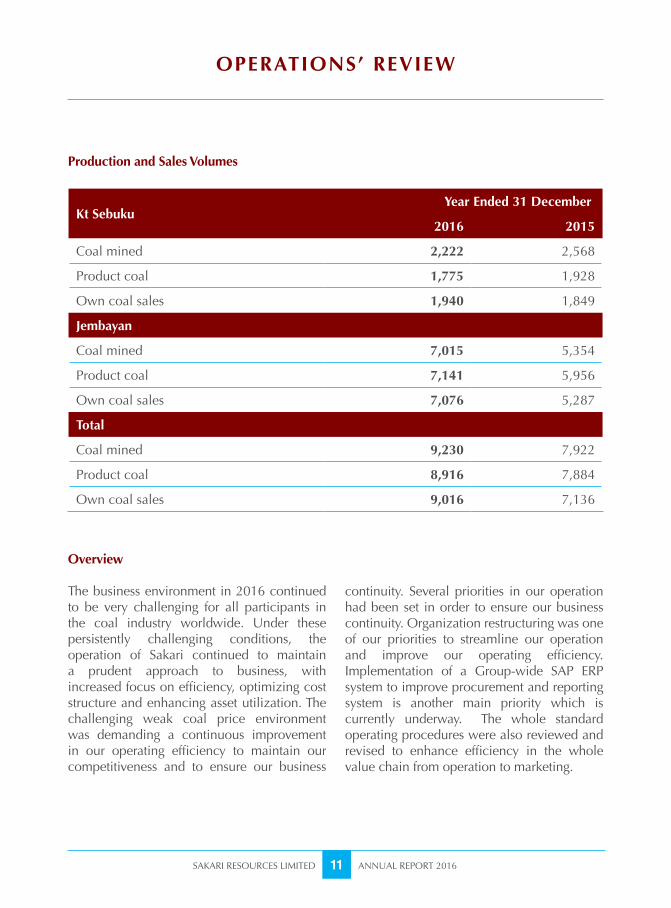
Kt Sebuku Year Ended 31 December
2016 2015
Coal mined 2,222 2,568
Product coal 1,775 1,928
Own coal sales 1,940 1,849
Jembayan
Coal mined 7,015 5,354
Product coal 7,141 5,956
Own coal sales 7,076 5,287
Total
Coal mined 9,230 7,922
Product coal 8,916 7,884
Own coal sales 9,016 7,136
Production and Sales Volumes
Overview
The business environment in 2016 continued to be very challenging for all participants in the coal industry worldwide. Under these persistently challenging conditions, the operation of Sakari continued to maintain a prudent approach to business, with increased focus on efficiency, optimizing cost structure and enhancing asset utilization. The challenging weak coal price environment was demanding a continuous improvement in our operating efficiency to maintain our competitiveness and to ensure our business
continuity. Several priorities in our operation had been set in order to ensure our business continuity. Organization restructuring was one of our priorities to streamline our operation and improve our operating efficiency. Implementation of a Group-wide SAP ERP system to improve procurement and reporting system is another main priority which is currently underway. The whole standard operating procedures were also reviewed and revised to enhance efficiency in the whole value chain from operation to marketing.
SAKARI RESOURCES LIMITED ANNUAL REPORT 201612
Jembayan
Production volume at Jembayan increased from 6.0 Mt in 2015 to 7.1 Mt in 2016, corresponding to the improvement in coal price in later half of the year. Cash costs in 2016 was reduced by $10.4/t or 24%. The reduction in production cost was achieved by shorter overburden distance, lower strip ratio and lower fuel price. Looking ahead there is no doubt that the prompt implementation of cost reduction measures and continuous efforts to improve performance have strengthened and increased competitiveness of Jembayan’s production platform for the year ahead.
Sebuku
Sebuku faces new operational challenges including change of coal quality with higher sulphur and higher ash content when mining moves further north and lower yield from the washing process. Sakari responded to such challenges by pursuing different operational and marketing strategies. We decided to
temporarily cease the washing operations and introduce Sebuku’s unwashed coal to customers in order to optimize profit outcomes. For this reason, the focus in 2016 remained on maintaining the overall efficiency. Sebuku coal production in 2016 was lower than that of 2015 by 8%, while cash costs were reduced by $4.7/t or 10% from 2015.
Quality Security Safety Health Environment (QSSHE)
Quality, Security, Safety, Health and Environment (QSSHE) compliance was closely monitored and carried out across the Group. For more information and other Sustainable business initiatives, please see our Sustainability Report later in this Annual Report.
Visit Coothongkul Chief Operating Officer
OPERATIONS’ REVIEW (cont’d)
SAKARI RESOURCES LIMITED ANNUAL REPORT 201613
MARKETING AND SALES REVIEW
$110.00
$80.00
$100.00
$70.00
$50.00
$90.00
$60.00
$40.00
Jan-1
4M
ar-14
May
-14
Jul-1
4Se
p-14
Nov-1
4Jan
-15
Mar-
15M
ay-1
5Ju
l-15
Sep-
15Nov
-15
Jan-1
6M
ar-16
May
-16
Jul-1
6Se
p-16
Nov-1
6Jan
-17
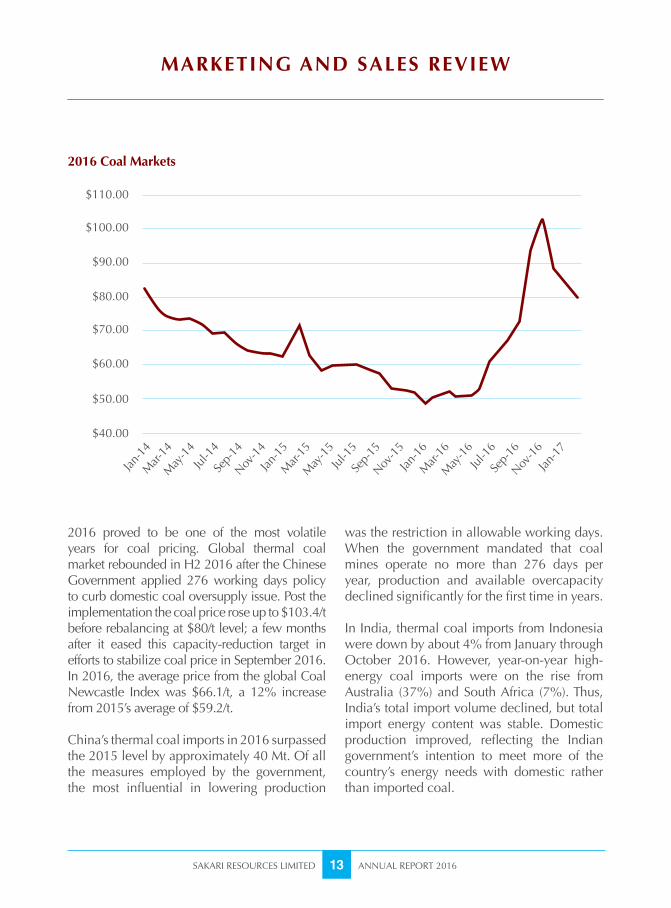
2016 Coal Markets
2016 proved to be one of the most volatile years for coal pricing. Global thermal coal market rebounded in H2 2016 after the Chinese Government applied 276 working days policy to curb domestic coal oversupply issue. Post the implementation the coal price rose up to $103.4/t before rebalancing at $80/t level; a few months after it eased this capacity-reduction target in efforts to stabilize coal price in September 2016. In 2016, the average price from the global Coal Newcastle Index was $66.1/t, a 12% increase from 2015’s average of $59.2/t.
China’s thermal coal imports in 2016 surpassed the 2015 level by approximately 40 Mt. Of all the measures employed by the government, the most influential in lowering production
was the restriction in allowable working days. When the government mandated that coal mines operate no more than 276 days per year, production and available overcapacity declined significantly for the first time in years.
In India, thermal coal imports from Indonesia were down by about 4% from January through October 2016. However, year-on-year high-energy coal imports were on the rise from Australia (37%) and South Africa (7%). Thus, India’s total import volume declined, but total import energy content was stable. Domestic production improved, reflecting the Indian government’s intention to meet more of the country’s energy needs with domestic rather than imported coal.
SAKARI RESOURCES LIMITED ANNUAL REPORT 201614
Demand from Europe declined due to switching from coal to gas; however there was increasing demand in South East Asia especially in Vietnam, the Philippines and Malaysia which added up to approximately 12 Mt. Overall seaborne demand increased by 7 Mt as compared to 2015.
On the supply side, from January through June, markets were defined by low prices. This price pressure was translated into mining cost reduction efforts. Generally, mining costs were lowered by between 5% and 10%. The potential for greater cost reduction was limited by fuel price increases and a slower rate of local currency devaluation against the US dollar. However, Indonesian producers derived less benefit from their depreciating currency than their competitors in other countries.
Market conditions improved in H2 2016 with the advent of higher prices. Export volumes picked up as the price arbitrage in China favoured seaborne coal. However, producers responded to increased prices more cautiously than in previous years based on the possibility that higher prices might be short-lived. Furthermore, producers’ abilities to increase production were limited by more modest capital budgets.
Tiger Energy’s Performance
The Group’s ASP in 2016 was $46.3/t, which includes contributions from trading and derivative transactions. Comparing to 2015, despite higher global coal price, our ASP was lower due to two main reasons which were the fixed price sales contracts and the change in product specification.
Firstly, approximately 40% of 2016 coal sales were on term basis, of which the prices were agreed during an earlier part of the year when the global coal price was around $50/t level. Some of the buyers had also exercised positive volumes option which had further minimized available volumes being placed into the spot markets.
Secondly, due to reduced washing yield from Sebuku operations, we decided to stop washing coal and introduced the unwashed coal product into the markets. The unwashed coal has a reduced heat value and higher ash content, therefore ASPs were lower compared to the washed product; however the revenue was higher due to increased saleable volumes. Moreover, we were successful in placing the unwashed coal into both the China and India Markets. Going forward, we will continue to explore opportunities to expand into the South East Asia markets as the potential in these markets appears promising.
MARKETING AND SALES REVIEW (cont’d)
SAKARI RESOURCES LIMITED ANNUAL REPORT 201615
MARKETING AND SALES REVIEW (cont’d)
Coal trading/blending business is still on-going in order to optimize our product quality and specification. We also maximize the Group profitability by enhancing sales of by-product coal from Sebuku washing plant. The total sales of coal from third party mines and new products amounted to 0.85 Mt in 2016; increased from 0.34 Mt in 2015.
Shipping and logistics team continued to deliver a good outcome on managing shipment scheduling. For another year, Sakari Group achieved a net despatch from two operations.
During the difficult period, Tiger Energy Trading as well as Sakari had been maintaining our reputation as a reliable supplier and has built strong trust and potential to becoming a term supply partner with main power plants
in Asia region. In 2016, we successfully diversified into USA and introduced Jembayan coal to Japanese utilities. The marketing efforts include a continuous development of long term contracts into both exporting and domestic market.
Tiger Energy Trading continues to focus on adding value to stakeholders ranging from delivering the highest quality level of service for its customers to developing new products and new markets for Sakari Group.
Rosaya Teinwan PresidentTiger Energy Trading Pte Ltd
SAKARI RESOURCES LIMITED ANNUAL REPORT 201616
SUSTAINABILITY
Overview
Sakari aspires to conduct business in line with the principles of sustainable development through providing leadership, building trust and creating a sustainable future for the society and the environment in which it operates through innovation, excellence and transparency. We encourage stakeholders to actively share information with us to provide feedback on any issue affecting our relationships. This Sustainability Report covers the period 1 January 2016 to 31 December 2016.
Community
Sakari is integrally involved with, and sees itself as part of, the local communities in the area of our mines who are key stakeholders in Sakari’s operations. An objective of our work with communities is to offer development opportunities, education and training so that they may be more self-sufficient after mining in their area (with its consequential benefits) has finished. We recognize the rights of community members and treat them with respect and equality. Each of our mines has a Community Development Department, whose purpose is to ensure that we implement our Community Social Responsibility (CSR) programmes to achieve the goal of enriching the lives of local community members who are affected by, or interact with, our operations. To ensure engagement with communities is effective, social mapping programmes have been undertaken at both Jembayan and Sebuku in prior years: the data obtained has greatly assisted us to identify areas where our sustainability efforts may best be applied. Regular meetings are held with community members, village leaders and local politicians to discuss current and potential programmes. During 2016 Sakari staff also participated in local government strategic planning sessions to ensure our efforts are synchronized with those of local government bodies. Below is a summary of the major initiatives that Sakari supported during 2016:
1. Infant mortality and maternal health: We build on prior years’ work to reduce infant mortality and improve maternal health. Sakari regularly donated food supplements to infants and pregnant mothers in our local communities.
2. Farming and Livestock Farming: We continued to devote resources to the Integrated Farming System (IFS) programmes that we have promoted and we have increased the self-sufficiency of many local community members. The farms are starting to generate modest amounts of regular income.
SAKARI RESOURCES LIMITED ANNUAL REPORT 201617
SUSTAINABILITY (cont’d)
Jembayan continuously cooperated with the Department of Agriculture and Animal Husbandry at both provincial and district level in developing agriculture and livestock programs. Mined land area of 100 hectares has been developed and provided as forage area. Currently there are 70 cows under management by farmer groups, Jadi Makmur Bersama, whose members consist of employees and communities. In 2016, more than 1,000 goats have been distributed to the communities in Mulawarman. Mulawarman has been proclaimed as Kampung Ternak, which is expected to be a superior area for goat farming.
In 2016, Jembayan provided 10 hectares of land used for cultivation of “Doyo”, a local crop of East Kalimantan to support and promote local wisdom. Jembayan has started Paddy Field Programme since 2015 and currently there are 52.5 hectares of rice paddy fields located in Separi and Segihan village. This program has attracted community’s interest to engage in agriculture, especially food crops.
Similarly, Sebuku participated in a local government’s project, Project Cetak Sawah, to create new rice paddy fields in Sekapung village. Currently, there are 65 hectares of rice paddy created under this project, some of which use Sebuku’s mined-out land that we have finished rehabilitation. The harvest yield at Mandin was satisfactory at an average yield of 4.5 tons per hectare.
3. Education: In 2016 we provided training for school children to become computer-literate and donated several computers to increase the availability of the programme. We provided many books to local libraries and encouraged reading. We also awarded several scholarships to various higher educational institutions for outstanding achievers. We also undertook several projects to build new schools and facilitate repairs to existing schools.
4. Health awareness: We again promoted health awareness in many villages by having regional doctors providing health screening and training on general health and hygiene. Sakari also donated and helped improve infrastructure such as roads, bridges, sewers and drains in an effort to improve the living conditions in villages around our mine sites. As blood is needed to save lives in times of emergencies and to sustain the lives of those with medical conditions, in 2016, we collaborated with the Indonesian Red Cross Society to carry out quarterly blood donation drive around mine site.
5. Disaster relief assistance: Sakari staff provided general ad-hoc disaster relief assistance to victims of fires and floods on a wider basis than just those living near our mines. This ranged from giving blood to donating food, small household items and care packages.
SAKARI RESOURCES LIMITED ANNUAL REPORT 201618
SUSTAINABILITY (cont’d)
6. Social activities and community bonding: We participate in social activities and promote community bonding by sponsoring local community cultural, religious, sporting and educational activities. In this programme, Sakari contributes food and household items and our staff volunteer to assist the community organizers who host these events. Another way we support this goal is by building community halls for general use by villagers.
7. Youth and sport: Jembayan donated sport equipment such as balls, nets and other means to sport groups at village level. Jembayan also sponsored events organised by the provincial and district government, such as football tournament of Governor of East Kalimantan.
Consumer
We have considered our coal products carefully and concluded that nothing we sell is inherently dangerous to customers in the form in which it is sold. It is organically and chemically stable and can be handled, stored and stockpiled safely with low risk to the environment and people, given that normal industry safety standards are followed. Sakari discloses specifications for its products in a clear and transparent manner. Independent analysis of the products prior to sale ensures that customers are certain about quality and that a fair price is achieved for each sale. Any discrepancies between quoted and actual specifications are openly resolved with customers. Many of Sakari’s customers request multi-year contracts so that they can enjoy stable supplies and a long-term relationship with Sakari. These long-term relationships evidence the value we place on consumer service, support and responsibility when making sales.
Environment
Minimizing the effect our operations have on the environment is another of the Sakari’s sustainability focuses. Our goal is to reduce the impact of our footprint on the local flora and fauna so as to preserve the ecosystem and protect biodiversity in areas under our care. Ensuring that our environmental impact is minimal will contribute to the long-term livelihoods of local communities who rely on a well-balanced environment for their day to day living. We ensure that we are achieving our goals through diligent monitoring of air and water quality and look to the future targets through ongoing environmental impact assessments. Both mines are regularly visited by staff from the Department of Mines and Energy and other state and local government agencies that undertake environmental audits and reviews. The results of the 2016 audits and reviews were positive, with only minor items raised, most of which have been rectified at the date of this report.
SAKARI RESOURCES LIMITED ANNUAL REPORT 201619
SUSTAINABILITY (cont’d)
Independent audits of Environmental Management Systems at Jembayan site by an independent third party consultant, Environment Resource Management (ERM) Indonesia are conducted every 2 years. The overall audit results in 2016 were satisfactory. Minor matters arising from the audit are in the process of being rectified and will be revisited by ERM Indonesia during 2017 audit. In collaboration with ERM Indonesia, Jembayan conducted a preliminary energy audit on the total amount of energy we consumed and saved during the last 3 years. This energy audit is mandatory for all companies that consume energy more than 6,000 toe (ton of equivalent) of fuel. The next energy audit will be conducted in 2017. In 2016, we have achieved 100% of target to re-vegetate land area of 134 hectares in total. This brings the total rehabilitated area over Jembayan’s life of mine to 999 hectares as at December 2016. According to carbon stock calculation, these areas can reduce 16,075 tons of carbon and provide 38,601 tons of biomass. During the year, Sebuku focused on rehabilitation of MBRS outpit mudcell, KM and central pit of BCS area. We continued to spread topsoil and plant seedlings to ensure the return of native vegetation. Total area of 29 hectares has been re-vegetated. This brings total rehabilitated areas over Sebuku’s life of mine to 721 hectares as at December 2016.
In 2016, Sebuku conducted a revision of Feasibility Study and Environmental Impact Assessment regarding changing of Dungun River Diversion. Presentation to and approval from the authority are scheduled by early 2017. This is our effort to proactively manage and minimize the impact on area being prepared for future mining at Sebuku.
Awards and Certifications
In 2016, Jembayan again received the Gold Provincial PROPER Award for the environmental excellence. This is the third time Jembayan has received this prestigious award. This award recognizes outstanding performance in hazardous waste recycling and management, implementation of Environmental Impact Assessments, compliance with all relevant environmental regulations and permits, and the effectiveness of corporate social responsibility (CSR) programmes. This represents and reflects our consistent efforts and commitments in pursuing environmental excellence.
The Mine Environment Management Award which was organized by Ministry of Energy and Natural Resources was postponed in 2016 period and will be conducted by early 2017. The award represents the culmination of several years of concerted efforts of striving for environmental excellence, evidencing our enduring commitment to nurture the environment in which Sakari’s businesses operate.
SAKARI RESOURCES LIMITED ANNUAL REPORT 201620
In 2016, Sebuku retained the level of Blue National PROPER Award from Environmental and Forestry Ministry, whilst the assessment of Mine Environment Management Award 2016 period was postponed by government for the period and will be conducted by early 2017. Both mines remained certified under ISO 14001:2004 Environmental Management Systems throughout the year. The year 2016 was the third period of the 3-year cycle for Jembayan in applying ISO 14001:2004. Recertification of ISO 14001 for Jembayan was completed in 2016 and it will be effective until 2018. There was no major finding in the recertification audit. Recertification audit of ISO 14001 for Sebuku will be conducted by early 2017.
Fair Operating Practices
Fair Operating Practices (FOP) relates to Sakari applying ethical practices in dealings with all other entities. FOP consists of five key areas; anti-corruption, responsible political involvement, fair competition, promoting social responsibility and respect for property rights. FOP is a core area that Sakari monitors at the corporate level and reports upon annually. Sakari has a long history of conducting its operations in accordance with principles of FOP and during 2014 we operated all business units with the ethics and transparency expected by our Corporate Code of Conduct. Each year, all staff are required to confirm they have read the code and agree to comply with its terms. A central contracts register has been established to assist in confirming that Sakari has complied with FOP in the negotiation of key contracts.
Human Rights
Sakari has a solid reputation for upholding international human rights’ principles. Supporting Sakari’s adherence to these principles are our Corporate Code of Conduct, our Whistleblower Policy, policies for equal opportunity of employment, training procedures, our Occupational Health and Safety Policy, anti-discrimination procedures, local community procedures, purchasing procedures, marketing procedures and our Legal and Anti-Corruption Policy.
A statement on human rights has been adopted by senior management and staff has been made aware of this statement. Ongoing business operations with communities, suppliers and customers have not revealed any indication of possible breaches of the commitment to human rights. Should Sakari become aware that a breach may have occurred, Sakari would immediately review the matter and determine appropriate remedial action.
SUSTAINABILITY (cont’d)
SAKARI RESOURCES LIMITED ANNUAL REPORT 201621
SUSTAINABILITY (cont’d)
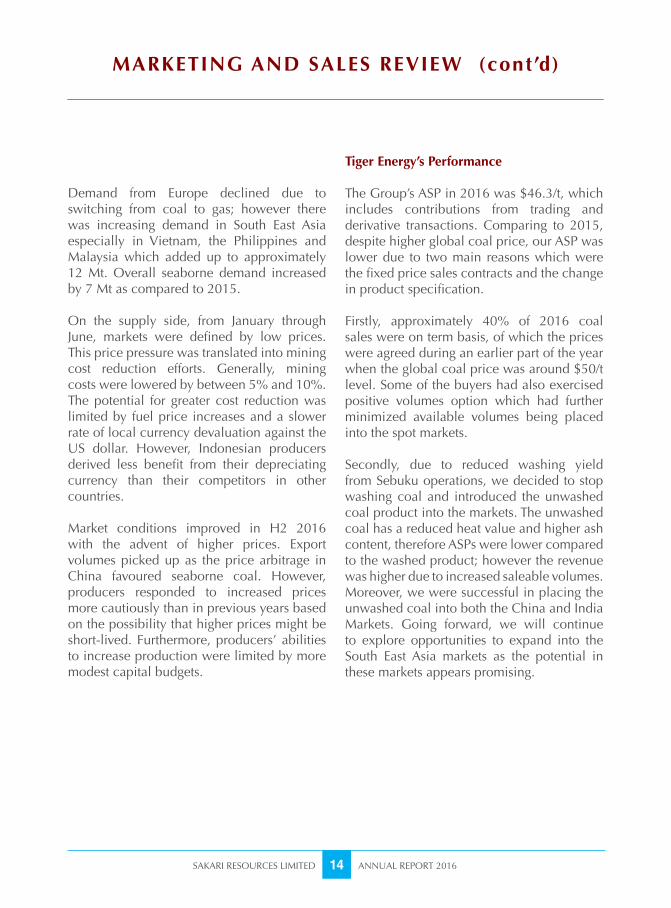
0.6 0.6
0.3 0.3
0.5 0.5
0.2 0.2
0 0
0.4 0.4
0.1
Nil Nil Nil
0.1
Sebuku Mine Jembayan Mine
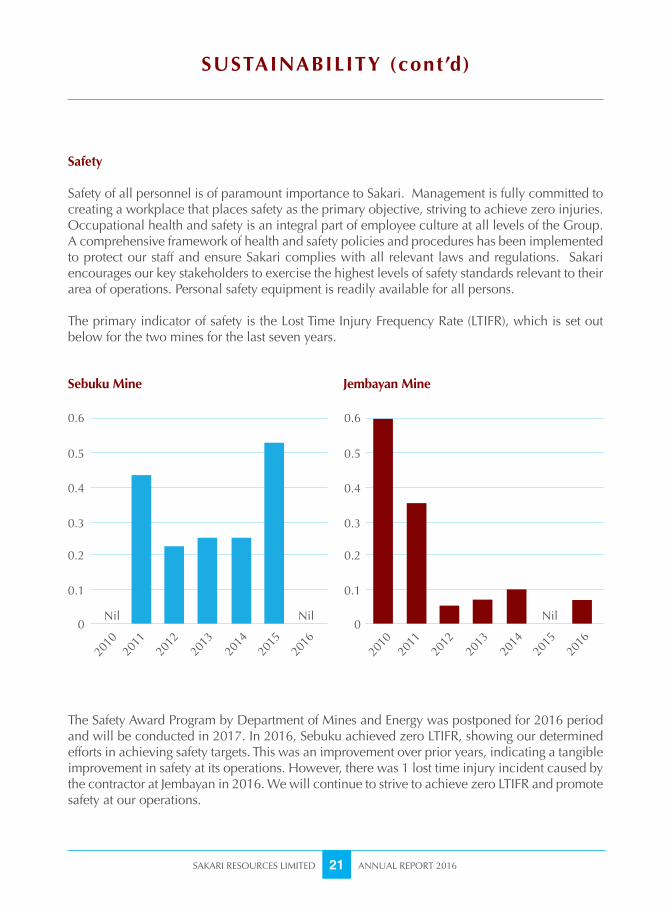
The Safety Award Program by Department of Mines and Energy was postponed for 2016 period and will be conducted in 2017. In 2016, Sebuku achieved zero LTIFR, showing our determined efforts in achieving safety targets. This was an improvement over prior years, indicating a tangible improvement in safety at its operations. However, there was 1 lost time injury incident caused by the contractor at Jembayan in 2016. We will continue to strive to achieve zero LTIFR and promote safety at our operations.
Safety
Safety of all personnel is of paramount importance to Sakari. Management is fully committed to creating a workplace that places safety as the primary objective, striving to achieve zero injuries. Occupational health and safety is an integral part of employee culture at all levels of the Group. A comprehensive framework of health and safety policies and procedures has been implemented to protect our staff and ensure Sakari complies with all relevant laws and regulations. Sakari encourages our key stakeholders to exercise the highest levels of safety standards relevant to their area of operations. Personal safety equipment is readily available for all persons.
The primary indicator of safety is the Lost Time Injury Frequency Rate (LTIFR), which is set out below for the two mines for the last seven years.
2010
2010
2011
2011
2012
2012
2013
2013
2014
2014
2015
2015
2016
2016
SAKARI RESOURCES LIMITED ANNUAL REPORT 201622
FINANCIAL CONTENTS
2327313233353637
Directors’ StatementIndependent Auditor’s ReportConsolidated Income StatementConsolidated Statement of Comprehensive IncomeBalance SheetsConsolidated Statement of Changes in EquityConsolidated Statement of Cash FlowsNotes to the Financial Statements
Page
SAKARI RESOURCES LIMITED ANNUAL REPORT 201623
DIRECTORS’ STATEMENTFor the fi nancial year ended 31 December 2016
The directors present their statement to the members together with the audited fi nancial statements of Sakari Resources Limited and its subsidiaries (the “Group”) for the fi nancial year ended 31 December 2016 and the balance sheet of Sakari Resources Limited (the “Company”) as at 31 December 2016.
In the opinion of the directors,
(a) the balance sheet of the Company and the consolidated fi nancial statements of the Group as set out on pages 31 to 112 are drawn up so as to give a true and fair view of the fi nancial position of the Company and of the Group as at 31 December 2016 and the fi nancial performance, changes in equity and cash fl ows of the Group for the fi nancial year covered by the consolidated fi nancial statements; and
(b) at the date of this statement, there are reasonable grounds to believe that the Company will be able to pay its debts as and when they fall due.
Directors
The directors of the Company in offi ce at the date of this statement are as follows:
Mr Surong Bulakul Non-executive Chairman Mr Han Eng Juan Independent DirectorMs Julie Therese Hall Independent Director Mr Thanakorn Poolthavee Independent Director Ms Rosaya Teinwan Chief Executive Offi cer/Executive Director Mr Wirat Uanarumit Non-executive Director (appointed on 28 October 2016)
Arrangements to enable directors to acquire shares or debentures
Neither at the end of nor at any time during the fi nancial year was the Company a party to any arrangement whose object was to enable the directors of the Company to acquire benefi ts by means of the acquisition of shares in, or debentures of, the Company or any other body corporate.
DIRECTORS’ STATEMENT
SAKARI RESOURCES LIMITED ANNUAL REPORT 201624
For the fi nancial year ended 31 December 2016
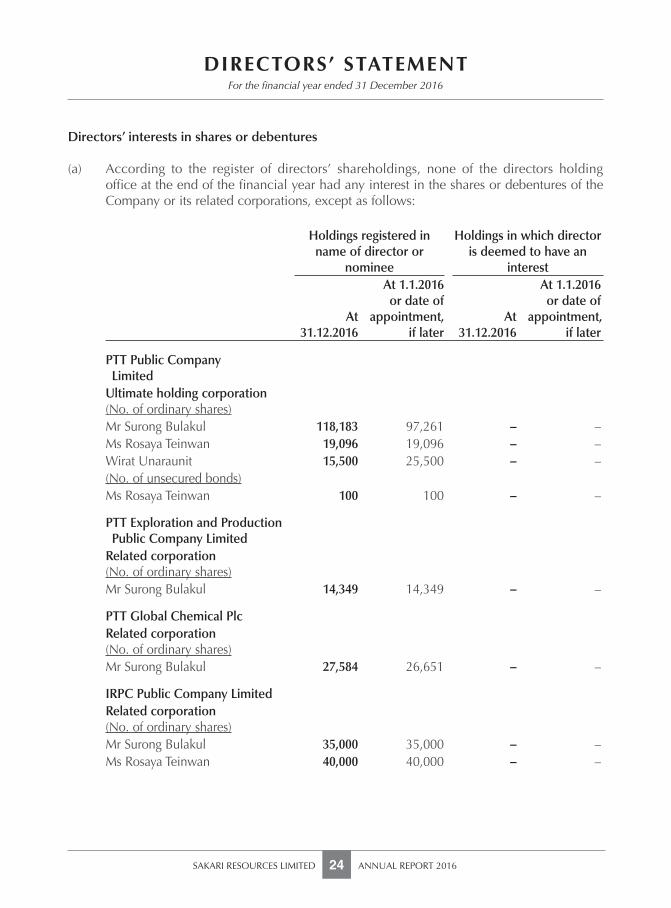
Directors’ interests in shares or debentures
(a) According to the register of directors’ shareholdings, none of the directors holding offi ce at the end of the fi nancial year had any interest in the shares or debentures of the Company or its related corporations, except as follows:
Holdings registered in name of director or
nominee
Holdings in which director is deemed to have an
interest
At31.12.2016
At 1.1.2016 or date of
appointment, if later
At31.12.2016
At 1.1.2016 or date of
appointment, if later
PTT Public Company LimitedUltimate holding corporation(No. of ordinary shares)Mr Surong Bulakul 118,183 97,261 – –Ms Rosaya Teinwan 19,096 19,096 – –Wirat Unaraunit 15,500 25,500 – –(No. of unsecured bonds)Ms Rosaya Teinwan 100 100 – –
PTT Exploration and Production Public Company LimitedRelated corporation(No. of ordinary shares)Mr Surong Bulakul 14,349 14,349 – –
PTT Global Chemical PlcRelated corporation(No. of ordinary shares)Mr Surong Bulakul 27,584 26,651 – –
IRPC Public Company LimitedRelated corporation(No. of ordinary shares)Mr Surong Bulakul 35,000 35,000 – –Ms Rosaya Teinwan 40,000 40,000 – –
SAKARI RESOURCES LIMITED ANNUAL REPORT 201625
DIRECTORS’ STATEMENTFor the fi nancial year ended 31 December 2016
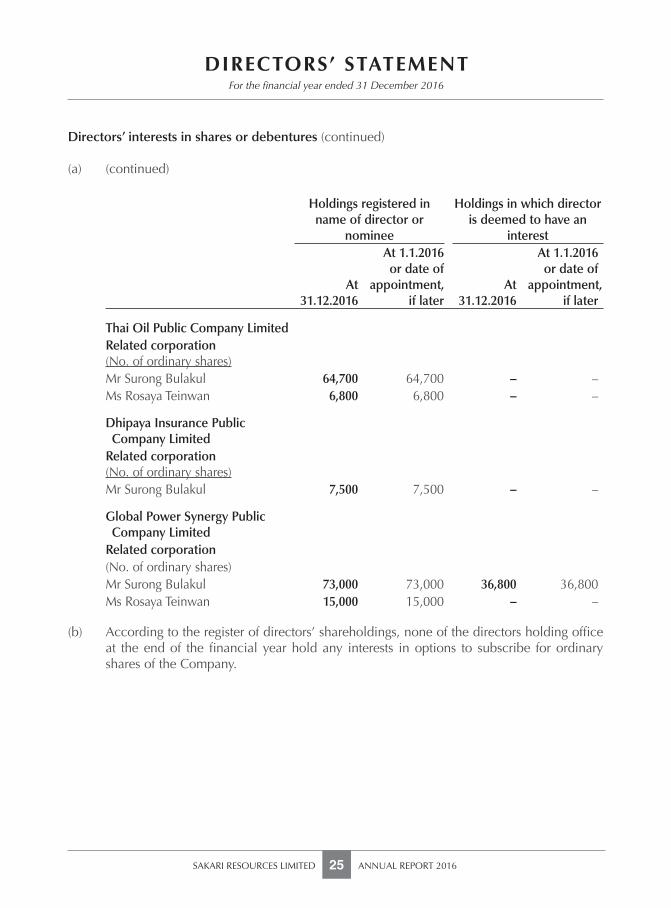
Directors’ interests in shares or debentures (continued)
(a) (continued)
Holdings registered in name of director or
nominee
Holdings in which director is deemed to have an
interest
At31.12.2016
At 1.1.2016 or date of
appointment, if later
At31.12.2016
At 1.1.2016 or date of
appointment, if later
Thai Oil Public Company LimitedRelated corporation(No. of ordinary shares)Mr Surong Bulakul 64,700 64,700 – –Ms Rosaya Teinwan 6,800 6,800 – –
Dhipaya Insurance Public Company LimitedRelated corporation(No. of ordinary shares)Mr Surong Bulakul 7,500 7,500 – –
Global Power Synergy Public Company LimitedRelated corporation(No. of ordinary shares)Mr Surong Bulakul 73,000 73,000 36,800 36,800Ms Rosaya Teinwan 15,000 15,000 – –
(b) According to the register of directors’ shareholdings, none of the directors holding offi ce at the end of the fi nancial year hold any interests in options to subscribe for ordinary shares of the Company.
DIRECTORS’ STATEMENT
SAKARI RESOURCES LIMITED ANNUAL REPORT 201626
For the fi nancial year ended 31 December 2016
Share options
There were no options granted during the period by the Company to any person to take up unissued shares in the Company. No options have been granted during the fi nancial year ended 31 December 2016 to subscribe for unissued shares of the Company.
There were no unissued shares of the Company under option at the end of the fi nancial year.
Independent Auditor
The independent auditor, PricewaterhouseCoopers LLP, has expressed its willingness to accept re-appointment.
On behalf of the directors
Rosaya TeinwanDirector
Surong Bulakul Director
20 February 2017
SAKARI RESOURCES LIMITED ANNUAL REPORT 201627
INDEPENDENT AUDITOR’S REPORTTO THE MEMBERS OF SAKARI RESOURCES LIMITED
Report on the Audit of the Financial Statements
Our opinion
In our opinion, the accompanying consolidated fi nancial statements of Sakari Resources Limited (the “Company”) and its subsidiaries (the “Group”) and the statement of fi nancial position of the Company are properly drawn up in accordance with the provisions of the Companies Act, Chapter 50 (“the Act”) and Financial Reporting Standards in Singapore (“FRSs”) so as to give a true and fair view of the consolidated fi nancial position of the Group and the fi nancial position of the Company as at 31 December 2016 and of the consolidated fi nancial performance, consolidated changes in equity and consolidated cash fl ows of the Group for the fi nancial year ended on that date.
What we have audited
The fi nancial statements of the Company and the Group comprise:
the balance sheets of the Group and the Company as at 31 December 2016; the consolidated income statement for the year then ended; the consolidated statement of comprehensive income for the year then ended; the consolidated statement of changes in equity for the year then ended; the consolidated statement of cash fl ows of the Group for the year then ended; and the notes to the fi nancial statements, including a summary of signifi cant accounting
policies.
Basis for Opinion
We conducted our audit in accordance with Singapore Standards on Auditing (“SSAs”). Our responsibilities under those standards are further described in the Auditor’s Responsibilities for the Audit of the Financial Statements section of our report.
We believe that the audit evidence we have obtained is suffi cient and appropriate to provide a basis for our opinion.
Independence
We are independent of the Group in accordance with the Accounting and Corporate Regulatory Authority (“ACRA”) Code of Professional Conduct and Ethics for Public Accountants and Accounting Entities (“ACRA Code”) together with the ethical requirements that are relevant to our audit of the fi nancial statements in Singapore, and we have fulfi lled our other ethical responsibilities in accordance with these requirements and the ACRA Code.
INDEPENDENT AUDITOR’S REPORT
SAKARI RESOURCES LIMITED ANNUAL REPORT 201628
TO THE MEMBERS OF SAKARI RESOURCES LIMITED
Other Information
Management is responsible for the other information. The other information refers to the “Directors’ Statement” included in pages 23 to 26 of the annual report but does not include the fi nancial statements and our auditor’s report thereon, which we obtained prior to the date of this auditor’s report, and the remaining sections of the annual report which are expected to be made available to us after that date.
Our opinion on the fi nancial statements does not cover the other information and we do not and will not express any form of assurance conclusion thereon.
In connection with our audit of the fi nancial statements, our responsibility is to read the other information identifi ed above and, in doing so, consider whether the other information is materially inconsistent with the fi nancial statements or our knowledge obtained in the audit, or otherwise appears to be materially misstated.
If, based on the work we have performed on the other information that we obtained prior to the date of this auditor’s report, we conclude that there is a material misstatement of this other information, we are required to report that fact. We have nothing to report in this regard.
When we read the remaining sections of the annual report, if we conclude that there is a material misstatement therein, we are required to communicate the matter to those charged with governance and take appropriate actions in accordance with SSAs.
Responsibilities of Management and Directors for the Financial Statements
Management is responsible for the preparation of fi nancial statements that give a true and fair view in accordance with the provisions of the Act and FRSs, and for devising and maintaining a system of internal accounting controls suffi cient to provide a reasonable assurance that assets are safeguarded against loss from unauthorised use or disposition; and transactions are properly authorised and that they are recorded as necessary to permit the preparation of true and fair fi nancial statements and to maintain accountability of assets.
In preparing the fi nancial statements, management is responsible for assessing the Group’s ability to continue as a going concern, disclosing, as applicable, matters related to going concern and using the going concern basis of accounting unless management either intends to liquidate the Group or to cease operations, or has no realistic alternative but to do so.
The directors’ responsibilities include overseeing the Group’s fi nancial reporting process.
SAKARI RESOURCES LIMITED ANNUAL REPORT 201629
INDEPENDENT AUDITOR’S REPORTTO THE MEMBERS OF SAKARI RESOURCES LIMITED
Auditor’s Responsibilities for the Audit of the Financial Statements
Our objectives are to obtain reasonable assurance about whether the fi nancial statements as a whole are free from material misstatement, whether due to fraud or error, and to issue an auditor’s report that includes our opinion. Reasonable assurance is a high level of assurance, but is not a guarantee that an audit conducted in accordance with SSAs will always detect a material misstatement when it exists. Misstatements can arise from fraud or error and are considered material if, individually or in the aggregate, they could reasonably be expected to infl uence the economic decisions of users taken on the basis of these fi nancial statements.
As part of an audit in accordance with SSAs, we exercise professional judgement and maintain professional scepticism throughout the audit. We also:
Identify and assess the risks of material misstatement of the fi nancial statements, whether due to fraud or error, design and perform audit procedures responsive to those risks, and obtain audit evidence that is suffi cient and appropriate to provide a basis for our opinion. The risk of not detecting a material misstatement resulting from fraud is higher than for one resulting from error, as fraud may involve collusion, forgery, intentional omissions, misrepresentations, or the override of internal control.
Obtain an understanding of internal control relevant to the audit in order to design audit procedures that are appropriate in the circumstances, but not for the purpose of expressing an opinion on the effectiveness of the Group’s internal control.
Evaluate the appropriateness of accounting policies used and the reasonableness of accounting estimates and related disclosures made by management.
Conclude on the appropriateness of management’s use of the going concern basis of accounting and, based on the audit evidence obtained, whether a material uncertainty exists related to events or conditions that may cast signifi cant doubt on the Group’s ability to continue as a going concern. If we conclude that a material uncertainty exists, we are required to draw attention in our auditor’s report to the related disclosures in the fi nancial statements or, if such disclosures are inadequate, to modify our opinion. Our conclusions are based on the audit evidence obtained up to the date of our auditor’s report. However, future events or conditions may cause the Group to cease to continue as a going concern.
Evaluate the overall presentation, structure and content of the fi nancial statements, including the disclosures, and whether the fi nancial statements represent the underlying transactions and events in a manner that achieves fair presentation.
Obtain sufficient appropriate audit evidence regarding the financial information of the entities or business activities within the Group to express an opinion on the consolidated fi nancial statements. We are responsible for the direction, supervision and performance of the group audit. We remain solely responsible for our audit opinion.
We communicate with the directors regarding, among other matters, the planned scope and timing of the audit and signifi cant audit fi ndings, including any signifi cant defi ciencies in internal control that we identify during our audit.
INDEPENDENT AUDITOR’S REPORT
SAKARI RESOURCES LIMITED ANNUAL REPORT 201630
TO THE MEMBERS OF SAKARI RESOURCES LIMITED
Report on Other Legal and Regulatory Requirements
In our opinion, the accounting and other records required by the Act to be kept by the Company and by those subsidiary corporations incorporated in Singapore of which we are the auditors have been properly kept in accordance with the provisions of the Act.
PricewaterhouseCoopers LLPPublic Accountants and Chartered AccountantsSingapore, 20 February 2017
SAKARI RESOURCES LIMITED ANNUAL REPORT 201631
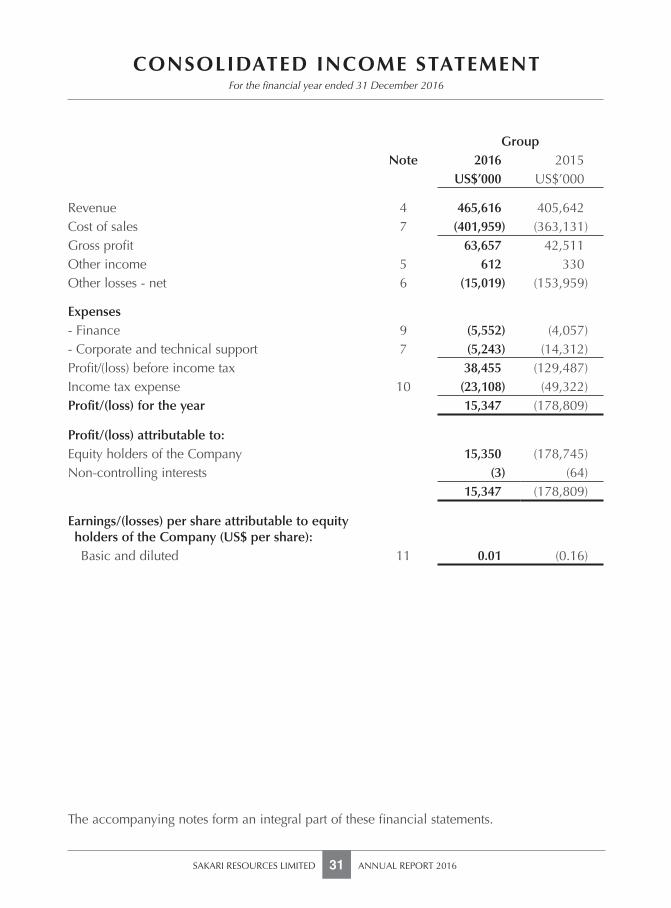
CONSOLIDATED INCOME STATEMENTFor the fi nancial year ended 31 December 2016
The accompanying notes form an integral part of these fi nancial statements.
GroupNote 2016 2015
US$’000 US$’000
Revenue 4 465,616 405,642Cost of sales 7 (401,959) (363,131)Gross profi t 63,657 42,511Other income 5 612 330Other losses - net 6 (15,019) (153,959)
Expenses- Finance 9 (5,552) (4,057)- Corporate and technical support 7 (5,243) (14,312)Profi t/(loss) before income tax 38,455 (129,487)Income tax expense 10 (23,108) (49,322)Profi t/(loss) for the year 15,347 (178,809)
Profi t/(loss) attributable to:Equity holders of the Company 15,350 (178,745)Non-controlling interests (3) (64)
15,347 (178,809)
Earnings/(losses) per share attributable to equity holders of the Company (US$ per share): Basic and diluted 11 0.01 (0.16)
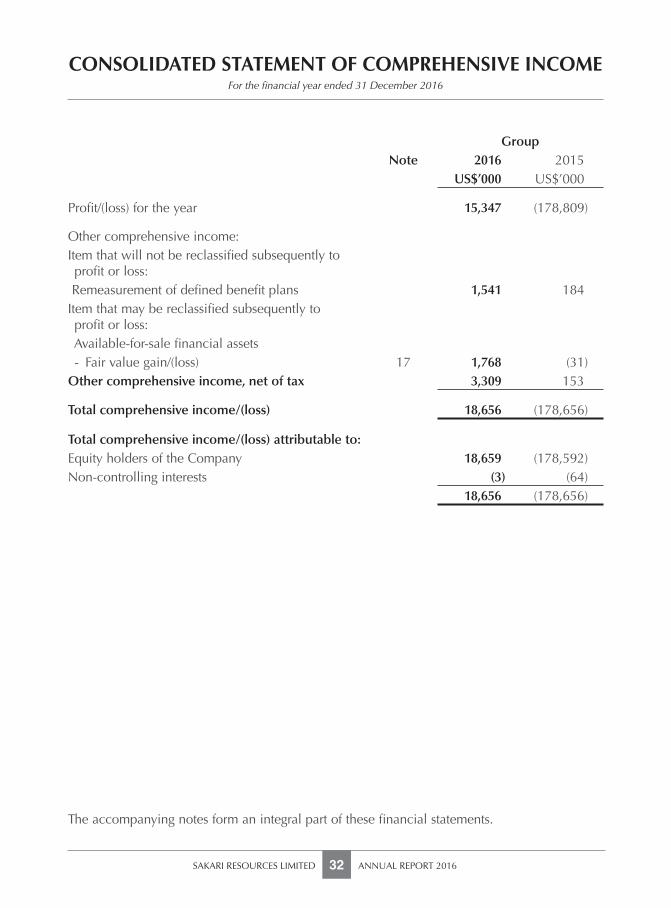
CONSOLIDATED STATEMENT OF COMPREHENSIVE INCOME
SAKARI RESOURCES LIMITED ANNUAL REPORT 201632
For the fi nancial year ended 31 December 2016
The accompanying notes form an integral part of these fi nancial statements.
GroupNote 2016 2015
US$’000 US$’000
Profi t/(loss) for the year 15,347 (178,809)
Other comprehensive income:Item that will not be reclassifi ed subsequently to profi t or loss: Remeasurement of defi ned benefi t plans 1,541 184Item that may be reclassifi ed subsequently to profi t or loss: Available-for-sale fi nancial assets - Fair value gain/(loss) 17 1,768 (31)Other comprehensive income, net of tax 3,309 153
Total comprehensive income/(loss) 18,656 (178,656)
Total comprehensive income/(loss) attributable to:Equity holders of the Company 18,659 (178,592)Non-controlling interests (3) (64)
18,656 (178,656)
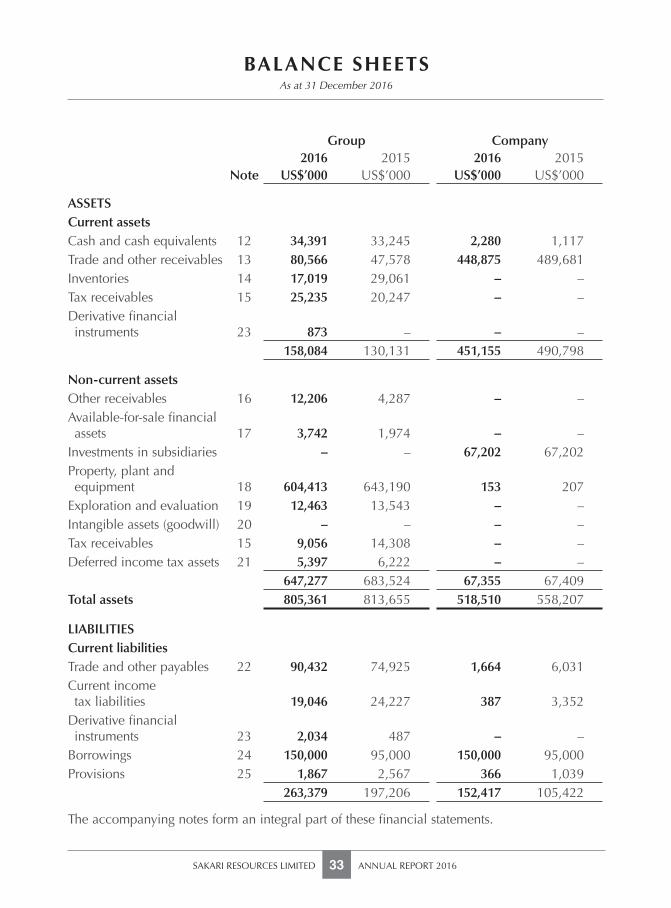
SAKARI RESOURCES LIMITED ANNUAL REPORT 201633
BALANCE SHEETSAs at 31 December 2016
The accompanying notes form an integral part of these fi nancial statements.
Group Company2016 2015 2016 2015
Note US$’000 US$’000 US$’000 US$’000
ASSETSCurrent assetsCash and cash equivalents 12 34,391 33,245 2,280 1,117Trade and other receivables 13 80,566 47,578 448,875 489,681Inventories 14 17,019 29,061 – –Tax receivables 15 25,235 20,247 – –Derivative fi nancial instruments 23 873 – – –
158,084 130,131 451,155 490,798
Non-current assetsOther receivables 16 12,206 4,287 – –Available-for-sale fi nancial assets 17 3,742 1,974 – –Investments in subsidiaries – – 67,202 67,202Property, plant and equipment 18 604,413 643,190 153 207Exploration and evaluation 19 12,463 13,543 – –Intangible assets (goodwill) 20 – – – –Tax receivables 15 9,056 14,308 – –Deferred income tax assets 21 5,397 6,222 – –
647,277 683,524 67,355 67,409Total assets 805,361 813,655 518,510 558,207
LIABILITIESCurrent liabilitiesTrade and other payables 22 90,432 74,925 1,664 6,031Current income tax liabilities 19,046 24,227 387 3,352Derivative fi nancial instruments 23 2,034 487 – –Borrowings 24 150,000 95,000 150,000 95,000Provisions 25 1,867 2,567 366 1,039
263,379 197,206 152,417 105,422
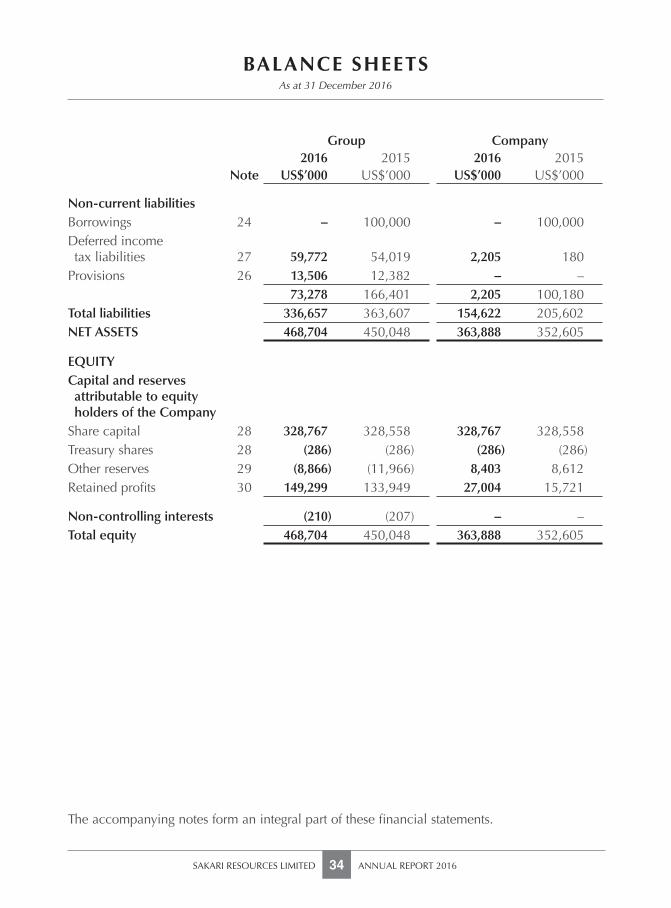
BALANCE SHEETS
SAKARI RESOURCES LIMITED ANNUAL REPORT 201634
As at 31 December 2016
The accompanying notes form an integral part of these fi nancial statements.
Group Company2016 2015 2016 2015
Note US$’000 US$’000 US$’000 US$’000
Non-current liabilitiesBorrowings 24 – 100,000 – 100,000Deferred income tax liabilities 27 59,772 54,019 2,205 180Provisions 26 13,506 12,382 – –
73,278 166,401 2,205 100,180Total liabilities 336,657 363,607 154,622 205,602NET ASSETS 468,704 450,048 363,888 352,605
EQUITY Capital and reserves attributable to equity holders of the CompanyShare capital 28 328,767 328,558 328,767 328,558Treasury shares 28 (286) (286) (286) (286)Other reserves 29 (8,866) (11,966) 8,403 8,612Retained profi ts 30 149,299 133,949 27,004 15,721
Non-controlling interests (210) (207) – –Total equity 468,704 450,048 363,888 352,605
SAKARI RESOURCES LIMITED ANNUAL REPORT 201635
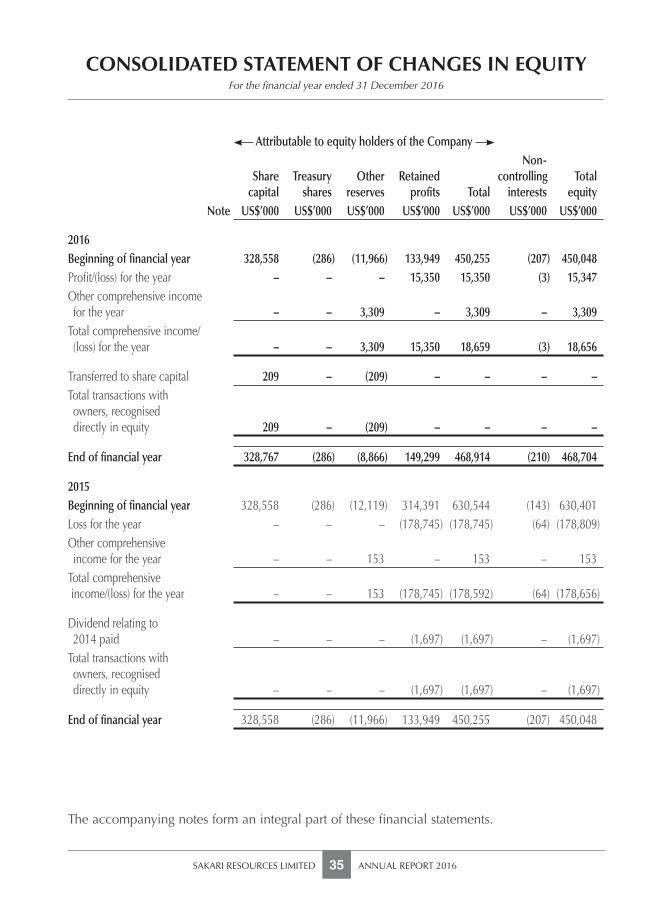
CONSOLIDATED STATEMENT OF CHANGES IN EQUITYFor the fi nancial year ended 31 December 2016
The accompanying notes form an integral part of these fi nancial statements.
Attributable to equity holders of the Company
Sharecapital
Treasuryshares
Otherreserves
Retained profi ts Total
Non-controlling
interestsTotal
equityNote US$’000 US$’000 US$’000 US$’000 US$’000 US$’000 US$’000
2016Beginning of fi nancial year 328,558 (286) (11,966) 133,949 450,255 (207) 450,048Profi t/(loss) for the year – – – 15,350 15,350 (3) 15,347Other comprehensive income for the year – – 3,309 – 3,309 – 3,309Total comprehensive income/ (loss) for the year – – 3,309 15,350 18,659 (3) 18,656
Transferred to share capital 209 – (209) – – – –Total transactions with owners, recognised directly in equity 209 – (209) – – – –
End of fi nancial year 328,767 (286) (8,866) 149,299 468,914 (210) 468,704
2015Beginning of fi nancial year 328,558 (286) (12,119) 314,391 630,544 (143) 630,401Loss for the year – – – (178,745) (178,745) (64) (178,809)Other comprehensive income for the year – – 153 – 153 – 153Total comprehensive income/(loss) for the year – – 153 (178,745) (178,592) (64) (178,656)
Dividend relating to 2014 paid – – – (1,697) (1,697) – (1,697)Total transactions with owners, recognised directly in equity – – – (1,697) (1,697) – (1,697)
End of fi nancial year 328,558 (286) (11,966) 133,949 450,255 (207) 450,048
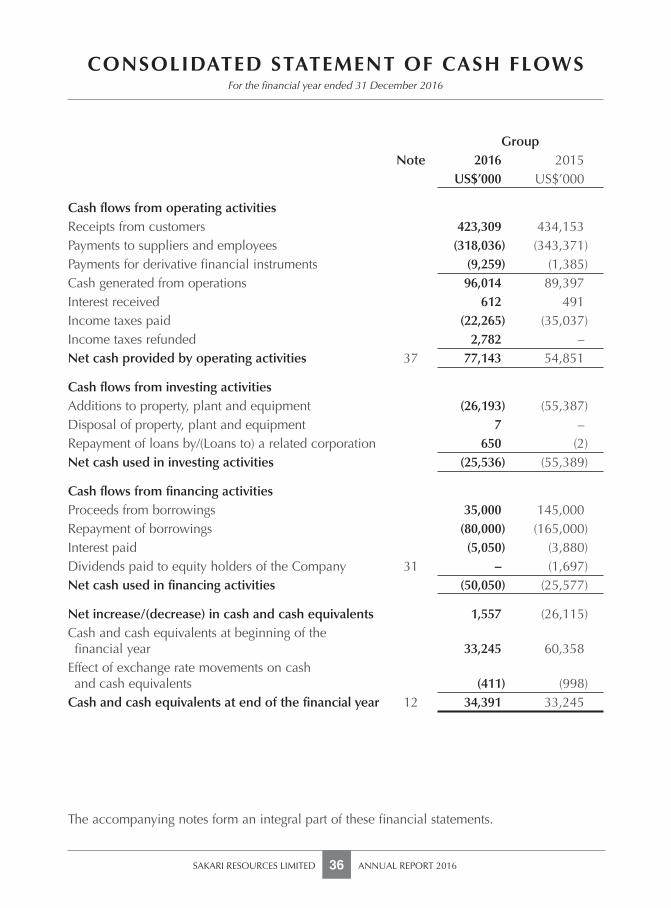
CONSOLIDATED STATEMENT OF CASH FLOWS
SAKARI RESOURCES LIMITED ANNUAL REPORT 201636
For the fi nancial year ended 31 December 2016
The accompanying notes form an integral part of these fi nancial statements.
GroupNote 2016 2015
US$’000 US$’000
Cash fl ows from operating activitiesReceipts from customers 423,309 434,153Payments to suppliers and employees (318,036) (343,371)Payments for derivative fi nancial instruments (9,259) (1,385)Cash generated from operations 96,014 89,397Interest received 612 491Income taxes paid (22,265) (35,037)Income taxes refunded 2,782 –Net cash provided by operating activities 37 77,143 54,851
Cash fl ows from investing activitiesAdditions to property, plant and equipment (26,193) (55,387)Disposal of property, plant and equipment 7 –Repayment of loans by/(Loans to) a related corporation 650 (2)Net cash used in investing activities (25,536) (55,389)
Cash fl ows from fi nancing activitiesProceeds from borrowings 35,000 145,000Repayment of borrowings (80,000) (165,000)Interest paid (5,050) (3,880)Dividends paid to equity holders of the Company 31 – (1,697)Net cash used in fi nancing activities (50,050) (25,577)
Net increase/(decrease) in cash and cash equivalents 1,557 (26,115)Cash and cash equivalents at beginning of the fi nancial year 33,245 60,358Effect of exchange rate movements on cash and cash equivalents (411) (998)Cash and cash equivalents at end of the fi nancial year 12 34,391 33,245
SAKARI RESOURCES LIMITED ANNUAL REPORT 201637
NOTES TO THE FINANCIAL STATEMENTSFor the fi nancial year ended 31 December 2016
These notes form an integral part of and should be read in conjunction with the accompanying fi nancial statements.
1. General information
The Company is incorporated and domiciled in Singapore. The address of its registered offi ce is 391B Orchard Road, Ngee Ann City, Tower B #17-01, Singapore 238874. Sakari Resources Limited and its subsidiaries together are referred to in these fi nancial statements as the Group.
The principal activity of the Company is that of investment holding. The Group is principally engaged in the exploration for and mining and marketing of coal.
The Company’s immediate parent company is PTT Mining Ltd, a company incorporated in Hong Kong. The Company’s ultimate parent company is PTT Public Company Limited, a company incorporated in Thailand. The address of PTT Public Company Limited is 555 Vibhavadi Rangsit Road, Chatuchak, Bangkok 10900, Thailand.
2. Summary of signifi cant accounting policies
(a) Basis of preparation
These fi nancial statements have been prepared in accordance with Singapore Financial Reporting Standards (“FRS”) under the historical cost convention, except as disclosed in the accounting policies below.
The preparation of financial statements in conformity with FRS requires management to exercise its judgement in the process of applying the Group’s accounting policies. It also requires the use of certain critical accounting estimates and assumptions. The areas involving a higher degree of judgement or complexity, or areas where assumptions and estimates are signifi cant to the fi nancial statements are disclosed in Note 3.
Interpretations and amendments to published standards effective in 2016
On 1 January 2016, the Group adopted the new or amended FRS and Interpretations of FRS (“INT FRS”) that are mandatory for application for the fi nancial year. Changes to the Group’s accounting policies have been made as required, in accordance with the transitional provisions in the respective FRS and INT FRS.
NOTES TO THE FINANCIAL STATEMENTS
SAKARI RESOURCES LIMITED ANNUAL REPORT 201638
For the fi nancial year ended 31 December 2016
2. Summary of signifi cant accounting policies (continued)
(a) Basis of preparation (continued)
The adoption of these new or amended FRS and INT FRS did not result in substantial changes to the accounting policies of the Group and the Company and had no material effect on the amounts reported for the current or prior fi nancial years.
(b) Group accounting
(i) Subsidiaries
Consolidation
Subsidiaries are all entities (including structured entities) over which the Group has control. The Group controls an entity when the Group is exposed to, or has rights to, variable returns from its involvement with the entity and has the ability to affect those returns through its power over the entity. Subsidiaries are fully consolidated from the date on which control is transferred to the Group. They are de-consolidated from the date on that control ceases.
In preparing the consolidated fi nancial statements, transactions, balances
and unrealised gains on transactions between group entities are eliminated. Unrealised losses are also eliminated unless the transaction provides evidence of an impairment indicator of the asset transferred. Accounting policies of subsidiaries have been changed where necessary to ensure consistency with the policies adopted by the Group.
Non-controlling interests comprise the portion of a subsidiary’s net results of operations and its net assets, which is attributable to the interests that are not owned directly or indirectly by the equity holders of the Company. They are shown separately in the consolidated income statement, consolidated statement of comprehensive income, statement of changes in equity, and balance sheet. Total comprehensive income is attributed to the non-controlling interests based on their respective interests in a subsidiary, even if this results in the non-controlling interests having a defi cit balance.
SAKARI RESOURCES LIMITED ANNUAL REPORT 201639
NOTES TO THE FINANCIAL STATEMENTSFor the fi nancial year ended 31 December 2016
2. Summary of signifi cant accounting policies (continued)
(b) Group accounting (continued)
(i) Subsidiaries (continued)
Acquisitions
The acquisition method of accounting is used to account for business combinations entered into by the Group.
The consideration transferred for the acquisition of a subsidiary or business comprises the fair value of the assets transferred, the liabilities incurred and the equity interests issued by the Group. The consideration transferred also includes any contingent consideration arrangement and any pre-existing equity interest in the subsidiary measured at their fair values at the acquisition date.
Acquisition-related costs are expensed as incurred.
Identifiable assets acquired and liabilities and contingent liabilities assumed in a business combination are, with limited exceptions, measured initially at their fair values at the acquisition date.
On an acquisition-by-acquisition basis, the Group recognises any non-controlling interest in the acquiree at the date of acquisition either at fair value or at the non-controlling interest’s proportionate share of the acquiree’s identifi able net assets.
The excess of (a) the consideration transferred, the amount of any noncontrolling interest in the acquiree and the acquisition-date fair value of any previous equity interest in the acquiree over the (b) fair value of the identifi able assets acquired net of the fair values of the liabilities and any contingent liabilities assumed, is recorded as goodwill. Please refer to the paragraph “Intangible assets” for the subsequent accounting policy on goodwill.
NOTES TO THE FINANCIAL STATEMENTS
SAKARI RESOURCES LIMITED ANNUAL REPORT 201640
For the fi nancial year ended 31 December 2016
2. Summary of signifi cant accounting policies (continued)
(b) Group accounting (continued)
(i) Subsidiaries (continued)
Disposals When a change in the Group’s ownership interest in a subsidiary results
in a loss of control over the subsidiary, the assets and liabilities of the subsidiary including any goodwill are derecognised. Amounts previously recognised in other comprehensive income in respect of that entity are also reclassifi ed to profi t or loss or transferred directly to retained profi ts if required by a specifi c Standard.
Any retained equity interest in the entity is remeasured at fair value. The difference between the carrying amount of the retained interest at the date when control is lost and its fair value is recognised in profi t or loss.
Please refer to the paragraph “Investment in subsidiaries” for the accounting policy on investments in subsidiaries in the separate fi nancial statements of the Company.
(ii) Transactions with non-controlling interests
Changes in the Group’s ownership interest in a subsidiary that do not result in a loss of control over the subsidiary are accounted for as transactions with equity owners of the Company. Any difference between the change in the carrying amounts of the non-controlling interest and the fair value of the consideration paid or received is recognised within equity attributable to the equity holders of the Company.
(c) Foreign currency translation
(i) Functional and presentation currency
Items included in the fi nancial statements of each entity in the Group are measured using the currency of the primary economic environment in which the entity operates (“functional currency”). The fi nancial statements are presented in United States Dollars, which is the functional currency of the Company.
SAKARI RESOURCES LIMITED ANNUAL REPORT 201641
NOTES TO THE FINANCIAL STATEMENTSFor the fi nancial year ended 31 December 2016
2. Summary of signifi cant accounting policies (continued)
(c) Foreign currency translation (continued) (ii) Transactions and balances
Transactions in a currency other than the functional currency (“foreign currency”) are translated into the functional currency using the exchange rates at the dates of the transactions. Currency translation differences resulting from the settlement of such transactions and from the translation of monetary assets and liabilities denominated in foreign currencies at the closing rates at the balance date are recognised in profi t or loss.
Foreign exchange gains and losses impacting profi t or loss are presented in the income statement within other losses – net.
Non-monetary items that are measured at fair value in foreign currencies are translated using the exchange rates at the date when the fair value was determined. Translation differences on assets and liabilities carried at fair value are reported as part of the fair value gain or loss. For example, translation differences on non-monetary assets and liabilities such as equities held at fair value through profi t or loss are recognised in profi t or loss as part of the fair value gain or loss and translation differences on non-monetary assets such as equities classifi ed as available-for-sale fi nancial assets are recognised in other comprehensive income.
(iii) Translation of Group entities’ fi nancial statements
The results and fi nancial position of all the Group entities (none of which has the currency of a hyperinfl ationary economy) that have a functional currency different from the presentation currency are translated into the presentation currency as follows:
(i) Assets and liabilities are translated at the closing exchange rates at the reporting date;
(ii) Income and expenses are translated at average exchange rates (unless the average is not a reasonable approximation of the cumulative effect of the rates prevailing on the transaction dates, in which case income and expenses are translated using the exchange rates at the dates of the transactions); and
NOTES TO THE FINANCIAL STATEMENTS
SAKARI RESOURCES LIMITED ANNUAL REPORT 201642
For the fi nancial year ended 31 December 2016
2. Summary of signifi cant accounting policies (continued)
(c) Foreign currency translation (continued)
(iii) Translation of Group entities’ fi nancial statements (continued)
(iii) All resulting currency translation differences are recognised in other comprehensive income and accumulated in the currency translation reserve. These currency translation differences are reclassifi ed to profi t or loss on disposal or partial disposal of the entity giving rise to such reserve.
Goodwill and fair value adjustments arising on the acquisition of foreign operations are treated as assets and liabilities of the foreign operations and translated at the closing rates at the reporting date.
(d) Revenue recognition
Revenue comprise the fair value of the consideration received or receivable for the sale of goods and rendering of services in the ordinary course of the Group’s activities. Revenue are presented, net of value added tax, rebates, discounts and after eliminating sales within the Group.
The Group recognises revenue when the amount of revenue and related cost can be reliably measured, it is probable that the collectability of the related receivables is reasonably assured and when the specifi c criteria for each of the Group’s activities are met as follows:
(i) Sale of goods – Coal
Revenue from these sales are recognised when a Group entity has delivered the products to locations specifi ed by its customers and the customers have accepted the products in accordance with the sales contract and the collectability of the related receivable is reasonably assured.
(ii) Provisional pricing
Revenue from the sale of coal where the coal is provisionally priced pending a renegotiation of the sales contract is initially recognised at the invoiced provisional price. Subsequently, a best estimate based on the fi nal benchmark price adjustment using an appropriate benchmark calculation is made. The difference between the carrying amount of the revenue recognised for the sale and the estimated price adjustment is recognised in revenue. This adjustment will continue until the contract price is negotiated.
SAKARI RESOURCES LIMITED ANNUAL REPORT 201643
NOTES TO THE FINANCIAL STATEMENTSFor the fi nancial year ended 31 December 2016
2. Summary of signifi cant accounting policies (continued)
(d) Revenue recognition (continued)
(iii) Rendering of services
Revenue from logistic services is recognised over the period in which the services are rendered, by reference to completion of the specifi c transaction assessed on the basis of the actual service provided as a proportion of the total services to be performed.
(iv) Interest income
Interest income is recognised using the effective interest method.
(v) Dividend income
Dividends are recognised when the right to receive payment is established.
(e) Income taxes
Current income tax for current and prior periods is recognised at the amount expected to be paid to or recovered from the tax authorities, using the tax rates and tax laws that have been enacted or substantively enacted by the balance sheet date.
Deferred income tax is recognised for all temporary differences arising between the tax bases of assets and liabilities and their carrying amounts in the fi nancial statements except when the deferred income tax arises from the initial recognition of goodwill or an asset or liability in a transaction that is not a business combination and affects neither accounting nor taxable profi t or loss at the time of the transaction.
A deferred income tax liability is recognised on temporary differences arising on investments in subsidiaries, except where the Group is able to control the timing of the reversal of the temporary difference and it is probable that the temporary difference will not reverse in the foreseeable future.
A deferred income tax asset is recognised to the extent that it is probable that
future taxable profi t will be available against which the deductible temporary differences and tax losses can be utilised.

NOTES TO THE FINANCIAL STATEMENTS
SAKARI RESOURCES LIMITED ANNUAL REPORT 201644
For the fi nancial year ended 31 December 2016
2. Summary of signifi cant accounting policies (continued)
(e) Income taxes (continued)
Deferred income tax is measured:
(i) at the tax rates that are expected to apply when the related deferred income tax asset is realised or the deferred income tax liability is settled, based on tax rates and tax laws that have been enacted or substantively enacted by the balance sheet date; and
(ii) based on the tax consequence that will follow from the manner in which the Group expects, at the balance sheet date, to recover or settle the carrying amounts of its assets and liabilities.
Current and deferred income taxes are recognised as income or expenses in profi t or loss, except to the extent that the tax arises from a business combination or a transaction which is recognised directly in equity. Deferred tax arising from a business combination is adjusted against goodwill on acquisition.
The Group accounts for investment tax credits (for example, productivity and innovative credit) similar to accounting for other tax credits where deferred tax asset is recognised for unused tax credits to the extent that it is probable that future taxable profi t will be available against which the unused tax credit can be utilised.
(f) Leases
The Group leases offi ce space, residential properties and offi ce equipment under operating leases from non-related parties. Leases of offi ce space, residential properties and offi ce equipment where substantially all the risks and rewards incidental to ownership are retained by the lessors are classifi ed as operating leases. Payments made under operating leases (net of any incentives received from the lessors) are recognised in profi t or loss on a straight line basis over the period of the lease.
Contingent rents are recognised as an expense in profi t or loss when incurred.
(g) Investments in subsidiaries
Investments in subsidiaries are carried at cost less accumulated impairment losses in the Company’s balance sheet. On disposal of such investments, the difference between disposal proceeds and the carrying amounts of the investments are recognised in profi t or loss.
SAKARI RESOURCES LIMITED ANNUAL REPORT 201645
NOTES TO THE FINANCIAL STATEMENTSFor the fi nancial year ended 31 December 2016
2. Summary of signifi cant accounting policies (continued)
(h) Cash and cash equivalents
For the purpose of presentation in the consolidated statement of cash fl ows, cash and cash equivalents include cash on hand, deposits with fi nancial institutions which are subject to an insignifi cant risk of change in value, and bank overdrafts. Bank overdrafts are presented as current borrowings on the balance sheet. For cash subjected to restriction, assessment is made on the economic substance of the restriction and whether they meet the defi nition of cash and cash equivalents.
(i) Trade receivables
Trade receivables are recognised initially at fair value and subsequently measured at amortised cost using the effective interest method, less provision for impairment. Trade receivables are generally due for settlement within 30 days. They are presented as current assets unless collection is not expected for more than 12 months after the reporting date.
Collectability of trade receivables is reviewed on an ongoing basis. Debts which are known to be uncollectible are written off by reducing the carrying amount directly. An allowance account (provision for impairment of trade receivables) is used when there is objective evidence that the Group will not be able to collect all amounts due according to the original terms of the receivables. Signifi cant fi nancial diffi culties of the debtor, probability that the debtor will enter bankruptcy or fi nancial reorganisation, and default or delinquency in payments are considered indicators that the trade receivable is impaired. The amount of the impairment allowance is the difference between the asset’s carrying amount and the present value of estimated future cash fl ows, discounted at the original effective interest rate. Cash fl ows relating to short-term receivables are not discounted if the effect of discounting is immaterial.
The amount of the impairment loss is recognised in cost of sales. When a trade receivable for which an impairment allowance had been recognised becomes uncollectible in a subsequent period, it is written off against the allowance account. Subsequent recoveries of amounts previously written off are credited against other losses - net in profi t or loss.
NOTES TO THE FINANCIAL STATEMENTS
SAKARI RESOURCES LIMITED ANNUAL REPORT 201646
For the fi nancial year ended 31 December 2016
2. Summary of signifi cant accounting policies (continued)
(j) Inventories
Run of mine coal and fi nished product coal is valued at the lower of cost and net realisable value. The cost of coal inventories is determined using the weighted average cost method. Costs includes direct material, overburden removal, mining, processing, labour incurred in the extraction process and an appropriate proportion of variable and fi xed overhead costs directly related to mining activities. Net realisable value is the estimated selling price in the ordinary course of business, less the estimated costs of completion and applicable variable selling expenses.
Inventories are classifi ed as follows:
(i) Run of mine: This is material extracted through the mining process.
(ii) Finished product coal: These are products that have passed through all stages of the production process.
(iii) Consumables: These are goods or supplies to be either directly or indirectly consumed in the production process.
(k) Financial assets
Classifi cation
The Group classifi es its fi nancial assets in the following categories: fi nancial assets at fair value through profit or loss (including derivative financial instruments), loans and receivables and available-for-sale fi nancial assets. The classifi cation depends on the nature of the asset and the purpose for which the assets were acquired. Management determines the classifi cation of its fi nancial assets at initial recognition.
(i) Financial assets at fair value though profi t or loss
This category has two sub-categories: fi nancial assets held for trading, and those designated at fair value through profi t or loss at inception. A fi nancial asset is classifi ed as held for trading if it is acquired principally for the purpose of selling in the short term. Financial assets designated as at fair value through profi t or loss at inception are those that are managed and their performances are evaluated on a fair value basis, in accordance with a documented Group investment strategy. Derivatives are also categorised as held for trading unless they are designated as hedges. Assets in this category are presented as current assets if they are either held for trading or are expected to be realised within 12 months after the balance sheet date.
SAKARI RESOURCES LIMITED ANNUAL REPORT 201647
NOTES TO THE FINANCIAL STATEMENTSFor the fi nancial year ended 31 December 2016
2. Summary of signifi cant accounting policies (continued)
(k) Financial assets (continued)
(ii) Loans and receivables
Loans and receivables are non-derivative fi nancial assets with fi xed or determinable payments that are not quoted in an active market. They are included in current assets, except for those expected to be realized later than 12 months after the balance sheet date which are classifi ed as non-current assets. Loans and receivables are presented as “trade and other receivables” (note 13), “other receivables” (note 16) and “cash and cash equivalents” (note 12) on the balance sheet.
(iii) Available-for-sale fi nancial assets
Available-for-sale financial assets are non-derivatives that are either designated in this category or not classifi ed in any of the other categories. They are presented as non-current assets unless the investment matures or management intends to dispose of the assets within 12 months after the balance sheet date.
Recognition and derecognition
Regular way purchases and sales of fi nancial assets are recognised on the trade date the date on which the Group commits to purchase or sell the asset.
Financial assets are derecognised when the rights to receive cash fl ows from the fi nancial assets have expired or have been transferred and the Group has transferred substantially all risks and rewards of ownership. On disposal of a fi nancial asset, the difference between the carrying amount and the sale proceeds is recognised in profi t or loss. Any amount previously recognised in other comprehensive income relating to that asset is reclassifi ed to profi t or loss.
Initial measurement
Financial assets are initially recognised at fair value plus transaction costs except for fi nancial assets at fair value through profi t or loss, which are recognised at fair value. Transaction costs of fi nancial assets carried at fair value through profi t or loss are recognised immediately as expenses.
NOTES TO THE FINANCIAL STATEMENTS
SAKARI RESOURCES LIMITED ANNUAL REPORT 201648
For the fi nancial year ended 31 December 2016
2. Summary of signifi cant accounting policies (continued)
(k) Financial assets (continued)
Subsequent measurement
Available-for-sale fi nancial assets and fi nancial assets at fair value through profi t or loss are subsequently carried at fair value. Loans and receivables are subsequently carried at amortised cost using the effective interest method.
Changes in the fair values of fi nancial assets at fair value through profi t or loss including the effects of currency translation, interest and dividends, are recognised in profi t or loss when the changes arise.
Interest and dividend income on available-for-sale fi nancial assets are recognised separately in income. Changes in the fair values of available-for-sale debt securities (i.e. monetary items) denominated in foreign currencies are analysed into currency translation differences on the amortised cost of the securities and other changes; the currency translation differences are recognised in profi t or loss and the other changes are recognised in other comprehensive income and accumulated in the fair value reserve. Changes in the fair values of available-for-sale equity securities (i.e. non-monetary items) are recognised in other comprehensive income and accumulated in the fair value reserve, together with the related currency translation differences.
Impairment
The Group assesses at the end of each balance sheet date whether there is objective evidence that a fi nancial asset or group of fi nancial assets is impaired and recognises an allowance for impairment when such evidence exists.
(i) Loans and receivables
Signifi cant fi nancial diffi culties of the debtor, probability that the debtor will enter bankruptcy and default or signifi cant delay in payments are objective evidence that these fi nancial assets are impaired.
The carrying amount of these assets is reduced through the use of an impairment allowance account which is calculated as the difference between the carrying amount and the present value of estimated future cash fl ows, discounted at the original effective interest rate. When the asset becomes uncollectible, it is written off against the allowance account. Subsequent recoveries of amounts previously written off are recognised against the same line item in profi t or loss.
SAKARI RESOURCES LIMITED ANNUAL REPORT 201649
NOTES TO THE FINANCIAL STATEMENTSFor the fi nancial year ended 31 December 2016
2. Summary of signifi cant accounting policies (continued)
(k) Financial assets (continued)
Impairment (continued)
(i) Loans and receivables (continued)
The impairment allowance is reduced through profit or loss in a subsequent period when the amount of impairment loss decreases and the related decrease can be objectively measured. The carrying amount of the asset previously impaired is increased to the extent that the new carrying amount does not exceed the amortised cost had no impairment been recognised in prior periods.
(ii) Available-for-sale fi nancial assets
In addition to the objective evidence of impairment described above, a signifi cant or prolonged decline in the fair value of an equity security below its cost is considered as an indicator that the available-for-sale fi nancial asset is impaired.
If there is objective evidence of impairment, the cumulative loss that had been recognised in other comprehensive income is reclassifi ed from equity to profi t or loss. The amount of cumulative loss that is reclassifi ed is measured as the difference between the acquisition cost (net of any principal repayment and amortisation) and current fair value, less any impairment loss on that fi nancial asset previously recognised in profi t or loss. The impairment losses recognised as an expense for an equity security are not reversed through profi t or loss in subsequent period.
(l) Offsetting of fi nancial instruments
Financial assets and liabilities are offset and the net amount reported in the balance sheet when there is a legally enforceable right to offset and there is an intention to settle on a net basis or realise the asset and settle the liability simultaneously.
NOTES TO THE FINANCIAL STATEMENTS
SAKARI RESOURCES LIMITED ANNUAL REPORT 201650
For the fi nancial year ended 31 December 2016
2. Summary of signifi cant accounting policies (continued)
(m) Derivative fi nancial instruments and hedging activities
A derivative fi nancial instrument is initially recognised at fair value on the date the derivative contract is entered into and are subsequently carried at its fair value. The method of recognising the resulting gain or loss depends on whether the derivative is designated as a hedging instrument, and if so, the nature of the item being hedged. The Group designates certain derivatives as either:
- hedges of the fair value of recognised assets or liabilities or a fi rm commitment (fair value hedges)
- hedges of a particular risk associated with the cash fl ows of recognised assets and liabilities and highly probable forecast transactions (cash fl ow hedges), or
- hedges of a net investment in a foreign operation (net investment hedges).
Fair value changes on derivatives that are not designated or do not qualify for hedge accounting are recognised in profi t or loss when the changes arise.
The carrying amount of a derivative designated as a hedge is presented as a non-current asset or liability if the remaining expected life of the hedged item is more than 12 months, and as a current asset or liability if the remaining expected life of the hedged item is less than 12 months. The fair value of the trading derivative is presented as a current asset or liability.
(n) Property, plant and equipment
(i) Measurement
All items of property, plant and equipment are initially recognised at cost and subsequently carried at cost less accumulated depreciation and accumulated impairment losses.
(ii) Components of cost
The cost of an item of property, plant and equipment initially recognised includes its purchase price and any cost that is directly attributable to bringing the asset to the location and condition necessary for it to be capable of operating in the manner intended by management, as well as the estimated future costs of dismantling and removing the asset. Cost also includes borrowing costs that are directly attributable to the acquisition, construction or production of a qualifying asset.
SAKARI RESOURCES LIMITED ANNUAL REPORT 201651
NOTES TO THE FINANCIAL STATEMENTSFor the fi nancial year ended 31 December 2016
2. Summary of signifi cant accounting policies (continued)
(n) Property, plant and equipment (continued)
(iii) Mining properties Development expenditure incurred by the Group is accumulated
separately for each area of interest in which economically recoverable resources have been identifi ed. Such expenditure comprises costs directly attributable to the construction of a mine and the related infrastructure and exclude physical assets, which are recorded in property, plant and equipment.
Once a development decision has been taken, the carrying amount of the exploration and evaluation assets relating to the area of interest is transferred to “mines under development” within mining properties and aggregated with the subsequent development expenditure.
A “mine under development” is reclassifi ed to “mines in production” within mining properties at the end of the commissioning phase, when the mine is capable of operating in the manner intended by management.
Mining properties comprise:
Capitalised exploration and evaluation assets for properties now in production
Development expenditure (including pre-production stripping)
Acquisition costs and mineral rights acquired
Production stripping (as described below in “deferred stripping costs”)
No amortisation is recognised in respect of development properties until they are reclassifi ed as “mines in production”.
When further development expenditure is incurred in respect of a mining property after the commencement of production, such expenditure is carried forward as part of the “mines in production” asset when it is probable that additional future economic benefi ts associated with the expenditure will fl ow to the Group. Otherwise, such expenditure is classifi ed as a cost of production.
NOTES TO THE FINANCIAL STATEMENTS
SAKARI RESOURCES LIMITED ANNUAL REPORT 201652
For the fi nancial year ended 31 December 2016
2. Summary of signifi cant accounting policies (continued)
(n) Property, plant and equipment (continued)
(iii) Mining properties (continued)
“Mines in production” are amortised using the units-of-production method, with separate calculations being made for each area of interest. The units-of-production basis results in an amortisation charge proportional to the depletion of proved and probable reserves.
Identifi able mining properties acquired in a business combination are recognised as assets at their fair value. Development expenses incurred subsequent to the acquisition of the mining properties are accounted for in accordance with the policy outlined above.
These assets are tested for impairment in accordance with the policy in Note 2(q).
Deferred stripping costs
Overburden and other mine waste materials are often removed during the initial development of a mine site in order to access the mineral deposit. This activity is referred to as development stripping. The directly attributable costs are capitalised under mining properties. Capitalisation of development stripping costs ceases at the time that saleable material begins to be extracted from the mine and these costs are depreciated over the life of the mine using the units-of-production method.
Production stripping commences from the point saleable materials are being extracted from the mine. Stripping costs incurred during the production phase might benefi t current period production and improve access to ore bodies in future periods. Where benefi ts are realised in the form of inventory produced in the current period, these costs are accounted for as part of the cost of producing inventory. Where a benefi t of improved access exists, the costs are recognised as part of mine properties when the following criteria are met:
(a) it is probable that the future economic benefi t (improved access to the ore body) associated with the stripping activity will fl ow to the entity;
SAKARI RESOURCES LIMITED ANNUAL REPORT 201653
NOTES TO THE FINANCIAL STATEMENTSFor the fi nancial year ended 31 December 2016
2. Summary of signifi cant accounting policies (continued)
(n) Property, plant and equipment (continued)
(iii) Mining properties (continued)
Deferred stripping costs (continued)
(b) the Group can identify the component of the ore body for which access has been improved; and
(c) the costs relating to the stripping activity associated with that component can be measured reliably.
In identifying the components of the ore body, mining operations personnel will analyse the Group’s mine plans. Generally a component will be subset of the total ore body and a mine may have several components, for example, certain quantities of coal within separate mining pits.
The stripping activity asset is initially measured at cost, which is the accumulation of costs directly incurred to perform the stripping activity that improves access to the identifi ed component of ore, plus an allocation of directly attributable overhead costs. This is accounted for as an addition to an existing asset, which the Group has determined to be “Mining Properties”.
When the costs of stripping to improve access to an ore body are not clearly distinguishable from the costs of producing current inventories, i.e., there is a mixture of waste and ore being removed, the stripping costs are allocated based on a relevant measure of production. This production measure is calculated for the identifi ed component of the ore body. The Group uses the expected volume of waste extracted compared with the actual volume for a given volume of ore production.
The stripping activity asset is subsequently amortised using the units of production method over the life of the identifi ed component of the ore body for which access has been improved. Economically recoverable reserves, which comprise proven and probable reserves, are used to determine the expected useful life of the identifi ed component of the ore body. The stripping activity asset is then carried at cost less depreciation and impairment losses, if any.
NOTES TO THE FINANCIAL STATEMENTS
SAKARI RESOURCES LIMITED ANNUAL REPORT 201654
For the fi nancial year ended 31 December 2016
2. Summary of signifi cant accounting policies (continued)
(n) Property, plant and equipment (continued)
(iv) Depreciation of plant, property and equipment
The depreciable amount of items of property, plant and equipment are depreciated over their useful lives, or over the remaining life of the mine if shorter. Depreciation commences when an asset is available for use. The major categories of property, plant and equipment are depreciated either on a units-of-production and/or straight-line basis as follows:
Units-of-production basis
For mining properties and land rights and certain mining equipment, the economic benefi ts from the asset are consumed in a pattern which is linked to the production level. Except as noted below, such assets are depreciated on a units-of-production basis.
Straight line basis
Assets which have a physical life shorter than the related mine or whose usage is not directly related to production levels, are depreciated on a straight line basis as follows:
Buildings 20 years Plant and equipment 3 – 15 years Capital work in progress Not depreciated
Residual values and useful lives are reviewed, and adjusted if appropriate, at each balance sheet date. Changes to the estimated residual values or useful lives are accounted for prospectively. In applying the units-of- production method, depreciation/amortisation is normally calculated using the quantity of material extracted from the mine in the period as a percentage of the total quantity of material to be extracted in current and future periods based on proved and probable reserves. Non-reserve material may be included in depreciation/amortisation calculations where there is a high degree of confi dence in its economic extraction. Reserves/resources and life of mine estimates are reviewed on an annual basis and depreciation calculations are adjusted accordingly where necessary.
SAKARI RESOURCES LIMITED ANNUAL REPORT 201655
NOTES TO THE FINANCIAL STATEMENTSFor the fi nancial year ended 31 December 2016
2. Summary of signifi cant accounting policies (continued)
(n) Property, plant and equipment (continued)
(v) Subsequent expenditure
Subsequent expenditure relating to property, plant and equipment that has already been recognised is added to the carrying amount of the asset only when it is probable that future economic benefi ts associated with the item will fl ow to the Group and the cost of the item can be measured reliably. All other repair and maintenance expenses are recognised in profi t or loss when incurred.
(vi) Disposal
On disposal of an item of property, plant and equipment, the difference between the disposal proceeds and its carrying amount is recognised in profi t or loss within “other losses – net”.
(o) Exploration and evaluation expenditure
Exploration and evaluation activity involves the search for mineral resources, the determination of technical feasibility and the assessment of the commercial viability of an identifi ed resource. Costs incurred before the Group has obtained the legal rights to explore an area are recognised in the income statement. Exploration and evaluation expenditure are capitalised in respect of each area of interest for which the rights to tenure are current and where:
(i) The exploration and evaluation expenditures are expected to be recouped through successful development and exploitation of the area of interest; or alternatively, by its sale; or
(ii) Exploration and evaluation activities in the area of interest have not reached a stage which permits a reasonable assessment of the existence (or otherwise) of economically recoverable reserves, and active and significant operations in, or in relation to, the areas of interest are continuing.
NOTES TO THE FINANCIAL STATEMENTS
SAKARI RESOURCES LIMITED ANNUAL REPORT 201656
For the fi nancial year ended 31 December 2016
2. Summary of signifi cant accounting policies (continued)
(o) Exploration and evaluation expenditure (continued)
Exploration and evaluation expenditure comprises costs that are directly attributable to: acquisition of rights to explore, researching and analysing existing exploration data, gathering exploration data through topographical, geochemical and geophysical studies, exploratory drilling, trenching and sampling, determining and examining the volume and grade of the resource, examining and testing extraction and treatment methods, surveying transportation and infrastructure requirements, compiling pre-feasibility and feasibility studies and/or gaining access to areas of interest including occupancy and relocation compensation.
General and administration costs are allocated to, and included in, the cost of an exploration and evaluation asset only to the extent that those costs can be related directly to operational activities in the area of interest to which the exploration and evaluation asset relates. In all other cases, these costs are expensed as incurred.
Exploration and evaluation assets are transferred to mining properties, a component of property, plant and equipment, when the technical feasibility and commercial viability of extracting the mineral resource are demonstrable and sanctioned by the Board.
Capitalised exploration and evaluation expenditure is written off where the above conditions are no longer satisfi ed.
Exploration and evaluation assets are assessed for impairment when facts and circumstances suggest that the carrying amount of an exploration and evaluation asset may exceed its recoverable amount. Where a potential impairment is indicated, assessment is performed for each area of interest in conjunction with the group of operating assets (representing a cash generating unit) to which the exploration and evaluation asset is attributable. To the extent that capitalised exploration and evaluation expenditure is not expected to be recovered it is charged to the income statement.
Cash fl ows associated with exploration and evaluation expenditure are classifi ed as investing activities in the consolidated statement of cash fl ows.
SAKARI RESOURCES LIMITED ANNUAL REPORT 201657
NOTES TO THE FINANCIAL STATEMENTSFor the fi nancial year ended 31 December 2016
2. Summary of signifi cant accounting policies (continued)
(p) Intangible assets
Goodwill on acquisitions of subsidiaries and businesses, represents the excess of (i) the sum of the consideration transferred, the amount of any non-controlling interest in the acquiree and the acquisition-date fair value of any previous equity interest in the acquiree over (ii) the fair value of the identifi able net assets acquired. Goodwill on subsidiaries is recognised separately as intangible assets and carried at cost less accumulated impairment losses.
Gains and losses on the disposal of subsidiaries include the carrying amount of goodwill relating to the entity sold.
(q) Impairment of non-fi nancial assets
(i) Goodwill
Goodwill recognised separately as an intangible asset is tested for impairment annually and whenever there is indication that the goodwill may be impaired.
For the purpose of impairment testing of goodwill, goodwill is allocated to each of the Group’s cash-generating-units (“CGU”) expected to benefi t from synergies arising from the business combination.
An impairment loss is recognised when the carrying amount of a CGU, including the goodwill, exceeds the recoverable amount of the CGU. The recoverable amount of a CGU is the higher of the CGU’s fair value less cost to sell and value-in-use.
The total impairment loss of a CGU is allocated fi rst to reduce the carrying amount of goodwill allocated to the CGU and then to the other assets of the CGU pro-rata on the basis of the carrying amount of each asset in the CGU.
An impairment loss on goodwill is recognised as an expense and is not reversed in a subsequent period.
NOTES TO THE FINANCIAL STATEMENTS
SAKARI RESOURCES LIMITED ANNUAL REPORT 201658
For the fi nancial year ended 31 December 2016
2. Summary of signifi cant accounting policies (continued)
(q) Impairment of non-fi nancial assets (continued)
(ii) Property, plant and equipment Investment in subsidiaries
Property, plant and equipment and investments in subsidiaries are tested for impairment whenever there is any objective evidence or indication that these assets may be impaired.
For the purpose of impairment testing, the recoverable amount (i.e. the higher of the fair value less cost to sell and the value-in-use) is determined on an individual asset basis unless the asset does not generate cash infl ows that are largely independent of those from other assets. If this is the case, the recoverable amount is determined for the CGU to which the asset belongs.
If the recoverable amount of the asset (or CGU) is estimated to be less than its carrying amount, the carrying amount of the asset (or CGU) is reduced to its recoverable amount.
The difference between the carrying amount and the recoverable amount is recognised as an impairment loss in profi t and loss.
An impairment loss for an asset other than goodwill is reversed only if, there has been a change in the estimates used to determine the asset’s recoverable amount since the last impairment loss was recognised. The carrying amount of this asset is increased to its revised recoverable amount, provided that this amount does not exceed the carrying amount that would have been determined (net of any accumulated amortisation or depreciation) had no impairment loss been recognised for the asset in prior years.
A reversal of impairment loss for an asset other than goodwill is recognised in profi t or loss, unless the asset is carried at revalued amount, in which case, such reversal is treated as a revaluation increase. However, to the extent that an impairment loss on the same revalued asset was previously recognised as an expense, a reversal of that impairment is also recognised in profi t or loss.
SAKARI RESOURCES LIMITED ANNUAL REPORT 201659
NOTES TO THE FINANCIAL STATEMENTSFor the fi nancial year ended 31 December 2016
2. Summary of signifi cant accounting policies (continued)
(r) Trade and other payables
Trade and other payables represent liabilities for goods and services provided to the Group prior to the end of fi nancial year which are unpaid. They are classifi ed as current liabilities if payment is due within one year or less (or in the normal operating cycle of the business if longer). Otherwise, they are presented as non-current liabilities.
Trade and other payables are initially recognised at fair value, and subsequently carried at amortised cost using the effective interest method.
(s) Borrowings
Borrowings are initially recognised at fair value (net of transaction costs) and subsequently carried at amortised cost. Any difference between the proceeds (net of transaction costs) and the redemption value is recognised in profi t or loss over the period of the borrowings using the effective interest method.
Borrowings are presented as current liabilities unless the Group has an unconditional right to defer settlement for at least 12 months after the balance sheet date in which case they are presented as non-current liabilities.
(t) Borrowing costs
Borrowing costs are recognised in profi t or loss using the effective interest method except for those costs that are directly attributable to the construction or development of property, plant and equipment. This includes those costs on borrowings acquired specifi cally for the construction or development of property, plant and equipment, as well as those in relation to general borrowings used to fi nance the construction or development of property, plant and equipment.
(u) Provisions
Provisions are recognised when the Group has a present legal or constructive obligation as a result of past events, it is more likely than not that an outfl ow of resources will be required to settle the obligation and the amount has been reliably estimated. Provisions are not recognised for future operating losses.
NOTES TO THE FINANCIAL STATEMENTS
SAKARI RESOURCES LIMITED ANNUAL REPORT 201660
For the fi nancial year ended 31 December 2016
2. Summary of signifi cant accounting policies (continued)
(u) Provisions (continued)
Other provisions are measured at the present value of the expenditure expected to be required to settle the obligation using a pre-tax discount rate that refl ects the current market assessment of the time value of money and the risks specifi c to the obligation. The increase in the provision due to the passage of time is recognised in the statement of comprehensive income as fi nance expense.
Changes in the estimated timing or amount of the expenditure or discount rate are recognised in profi t or loss when the changes arise.
Provision for rehabilitation and dismantling
The Group has present obligations to dismantle, remove, restore and rehabilitate certain items of property, plant and equipment and mining pits. The Group recognises the estimated costs of dismantlement, removal or restoration of items of property, plant and equipment arising from the acquisition or use of assets. The provisions are estimated based on the best estimate of the expenditure required to settle or transfer the obligation, taking into consideration the time value of money.
The estimated costs are measured at the present value of the expenditure expected to be required to settle the obligation using the pre-tax discount rate that refl ects the current market assessment of the time value of money and the risks specifi c to the obligation. The increase in the provision due to the passage of time is recognised in the income statement under fi nance expenses. Changes in the estimated timing or amount of the expenditure or discount rate are accounted for as a change in the corresponding capitalised cost of the related assets, in which case the capitalised cost is reduced to nil and the remaining adjustment is recognised in profi t or loss.
(v) Employee compensation
Employee benefi ts are recognised as an expense, unless the cost qualifi es to be capitalised as an asset.
(i) Wages and salaries
Liabilities for wages and salaries expected to be settled within 12 months of the reporting date are recognised under Trade and other payables in respect of employees’ services up to the reporting date and are measured at the amounts expected to be paid when the liabilities are settled.
SAKARI RESOURCES LIMITED ANNUAL REPORT 201661
NOTES TO THE FINANCIAL STATEMENTSFor the fi nancial year ended 31 December 2016
2. Summary of signifi cant accounting policies (continued)
(v) Employee compensation (continued)
(ii) Other long-term employee benefi t obligations
The liability for long service leave and annual leave which is not expected to be settled within 12 months after the end of the period in which the employees render the related service is recognised in the provision for employee benefi ts and measured as the present value of expected future payments to be made in respect of services provided by employees up to the end of the reporting period using the projected unit credit method. Consideration is given to expected future wage and salary levels, experience of employee departures and periods of service. Expected future payments are discounted using market yields at the end of the reporting period on national government bonds with terms to maturity and currency that match, as closely as possible, the estimated future cash outfl ows.
(iii) Termination benefi ts
Termination benefits are those benefits which are payable when employment is terminated before the normal retirement date, or whenever an employee accepts voluntary redundancy in exchange for these benefi ts. The Group recognises termination benefi ts at the earlier of the following dates: (a) when the Group can no longer withdraw the offer of those benefi ts; and (b) when the Group recognises costs for a restructuring that is within the scope of FRS 37 and involves the payment of termination benefi ts. In the case of an offer made to encourage voluntary redundancy, the termination benefi ts are measured based on the number of employees expected to accept the offer. Benefi ts falling due more than 12 months after the end of the reporting period are discounted to their present value.
(iv) Defi ned contribution plans
Defi ned contribution plans are post-employment benefi t plans under which the Group pays fi xed contributions into separate entities such as the Central Provident Fund on a mandatory, contractual or voluntary basis. The Group has no further payment obligations once the contributions have been paid.
NOTES TO THE FINANCIAL STATEMENTS
SAKARI RESOURCES LIMITED ANNUAL REPORT 201662
For the fi nancial year ended 31 December 2016
2. Summary of signifi cant accounting policies (continued)
(v) Employee compensation (continued) (v) Defi ned benefi t plans
Defi ned benefi t plans are post-employment benefi t pension plans other than defi ned contribution plans, which the Group pays to an employee on termination of employment, whether the termination is voluntary or not. These benefi ts are mandatory under certain jurisdictions the Group operates within.
The liability recognised in the balance sheet in respect of a defi ned benefi t pension plan is the present value of the defi ned benefi t obligation at the reporting date less the fair value of plan assets, together with adjustments for unrecognised past-service costs. The defi ned benefi t obligation is calculated annually by independent actuaries using the projected unit credit method. The present value of the defi ned benefi t obligation is determined by discounting the estimated future cash outfl ows using interest rates of government bonds (considering there is no deep market for high-quality corporate bonds) that are denominated in the currency in which the benefi ts will be paid, and have tenures approximating to that of the related post-employment benefi t obligations.
Actuarial gains and losses arising from changes in actuarial assumptions are charged or credited to equity in other comprehensive income in the period when they arise.
Past service costs are recognised immediately in profi t or loss.
(vi) Share-based compensation
The Group operated equity-settled share-based compensation plans. Share-based payment benefits were provided to employees via the Executive Share Acquisition Plan (“ExSAP”) and Employee Share Option Plan (“ESOP”).
SAKARI RESOURCES LIMITED ANNUAL REPORT 201663
NOTES TO THE FINANCIAL STATEMENTSFor the fi nancial year ended 31 December 2016
2. Summary of signifi cant accounting policies (continued)
(v) Employee compensation (continued)
(vi) Share-based compensation (continued)
The fair value of the employee services received in exchange for the grant of options under the ESOP was recognised as an expense with a corresponding increase in the share-based payment reserve over the vesting period. The total amount to be recognised over the vesting period is determined by reference to the fair value of the options granted on the date of the grant. Non-market vesting conditions were included in the estimation of the number of shares under options that are expected to become exercisable on the vesting date. At each balance sheet date, the Group revised its estimates of the number of shares under option that are expected to become exercisable on the vesting date and recognised the impact of the revision of the estimates in profi t or loss, with a corresponding adjustment to the share-based payment reserve over the remaining vesting period.
Upon the exercise of options, the proceeds received (net of transaction costs) and the balance previously recognised in the share-based payment reserve relating to those options was transferred to the share capital account.
Share-based compensation benefi ts were also provided to employees via
the ExSAP by allowing participants to purchase shares in the Company at a price approved by the Board by way of a Company provided interest free loan. The subscription price of an award under ExSAP was the last traded share price of the Company on the Singapore Exchange before the date of grant of the award, rounded to nearest whole cent. A holding lock was placed over the shares in the Company until the loan is repaid in full. The fair value of the employee services received in exchange for the grant of shares under the ExSAP was recognised as an expense with a corresponding increase in the share-based payment reserve. When the loan under the ExSAP was fully repaid, the proceeds received (net of transaction costs) and the related balance previously recognised in the sharebased payment reserve were credited to the share capital account when the ordinary shares were paid up.
NOTES TO THE FINANCIAL STATEMENTS
SAKARI RESOURCES LIMITED ANNUAL REPORT 201664
For the fi nancial year ended 31 December 2016
2. Summary of signifi cant accounting policies (continued)
(v) Employee compensation (continued)
(vi) Share-based compensation (continued)
At the annual general meeting of the Company held on 9 May 2014, the shareholders of the Company approved the termination of the ExSAP in respect of further issues of ExSAP shares and the Company shall continue to administer any outstanding ExSAP shares. Options under the ESOP Scheme which have not been exercised or surrendered for cancellation by the Company shall lapse and become null and void. As at 31 December 2016, all share options have been cancelled by the Group.
(vii) Profi t-sharing and bonus plans
The Group recognises a liability and an expense for bonuses and profi t-sharing based on a formula that takes into consideration the profit attributable to the company’s shareholders after certain adjustments. The Group recognises a provision where contractually obliged or where there is a past practice that has created a constructive obligation.
(w) Share capital and treasury shares
Ordinary shares are classifi ed as equity. Incremental costs directly attributable to the issuance of new ordinary shares are deducted against the share capital account.
When any entity within the Group purchases the Company’s ordinary shares (“treasury shares”), the carrying amount which includes the consideration paid and any directly attributable transaction cost is presented as a component within equity attributable to the Company’s equity holders, until they are cancelled, sold or reissued.
When treasury shares are subsequently cancelled, the cost of treasury shares
are deducted against the share capital account if the shares are purchased out of capital of the Company, or against the retained profi ts of the Company if the shares are purchased out of earnings of the Company.
When treasury shares are subsequently sold or reissued pursuant to an employee share option scheme, the cost of treasury shares is reversed from the treasury share account and the realised gain or loss on sale or reissue, net of any directly attributable incremental transaction costs and related income tax, is recognised in the capital reserve.
SAKARI RESOURCES LIMITED ANNUAL REPORT 201665
NOTES TO THE FINANCIAL STATEMENTSFor the fi nancial year ended 31 December 2016
2. Summary of signifi cant accounting policies (continued)
(x) Dividends to the Company’s shareholders
Dividends to the Company’s shareholders are recognised when the dividends are approved for payment.
(y) Earnings per share
(i) Basic earnings per share
Basic earnings per share is calculated by dividing the net profi t after income tax attributable to equity holders of the Company, by the weighted average number of ordinary shares outstanding during the fi nancial year.
(ii) Diluted earnings per share For the purpose of calculating diluted earnings per share, profi t attributable
to equity holders of the Company and the weighted average number of ordinary shares outstanding are adjusted for the effects of dilutive potential ordinary shares.
3. Critical accounting estimates, assumptions and judgements
Estimates, assumptions and judgements are continually evaluated and are based on historical experience and other factors, including expectation of future events that are believed to be reasonable under the circumstances.
(i) Estimation for the provision for rehabilitation and dismantling
Provisions for rehabilitation and dismantling of property, plant and equipment and mining pits are estimated taking into consideration facts and circumstances of the Group’s mining properties available at the balance sheet date. These estimates are based on the expenditure required to transfer or settle the obligation for rehabilitation and dismantling, taking into consideration the time value of money. Cost estimates can vary in response to many factors including changes to the relevant legal or local/national government ownership requirements, the Group’s environmental policies, the emergence of new restoration techniques, the timing of the expenditures and the effects of infl ation. Experience gained at other mine or production sites is also a signifi cant consideration. Cost estimates are updated throughout the life of the operation.

NOTES TO THE FINANCIAL STATEMENTS
SAKARI RESOURCES LIMITED ANNUAL REPORT 201666
For the fi nancial year ended 31 December 2016
3. Critical accounting estimates, assumptions and judgements (continued) (i) Estimation for the provision for rehabilitation and dismantling (continued)
The expected timing of expenditure included in cost estimates can also change, for example in response to changes in ore reserves, production rates, operating license or economic conditions. Cash fl ows are discounted if this has a material effect. The selection of appropriate sources on which to base calculation of the risk free discount rate used for this purpose also requires judgement.
Changes in these estimates and assumptions may impact the carrying value of the provision for rehabilitation and dismantling of property, plant and equipment and mining pits. The provision recognised is reviewed at each reporting date and updated based on the facts and circumstances available at that time.
(ii) Estimated impairment of non-fi nancial assets
Property, plant and equipment, exploration and evaluation and investment in subsidiaries, are tested for impairment whenever there is any objective evidence or indication that these assets may be impaired. The recoverable amounts of assets and where applicable, cash generating units, are determined based on value-in-use calculations which require the use of estimates.
The determination of fair value and value-in-use requires management to make estimates and assumptions about expected production and sales volumes, commodity prices (considering current and historical prices, price trends and related factors), reserves, operating costs, closure and rehabilitation costs and future capital expenditure. These estimates and assumptions are subject to risk and uncertainty; hence there is a possibility that changes in circumstances will alter these projections, which may impact the recoverable amount of the assets. In such circumstances, some or all of the carrying value of the assets may be further impaired or the impairment charge reduced with the impact recorded in profi t or loss. Management expects that any reasonable change in the key assumptions on which the recoverable amount is based would not cause the carrying amount of non-fi nancial assets to exceed its recoverable amount.
SAKARI RESOURCES LIMITED ANNUAL REPORT 201667
NOTES TO THE FINANCIAL STATEMENTSFor the fi nancial year ended 31 December 2016
3. Critical accounting estimates, assumptions and judgements (continued) (iii) Uncertain tax positions
The Group is subject to income taxes in Singapore and Indonesia. The Group operates in these jurisdictions where legislative applications can give rise to uncertain tax positions. Management believe that the current tax positions taken by the Group are appropriate and supportable by expert advice where relevant. In determining the income tax liabilities, management is required to estimate the amount of capital allowances and the deductibility of certain expenses (“uncertain tax positions”) at each jurisdiction. Where the fi nal tax outcome of these matters is different from the amounts that were initially recognised, such differences will impact the income tax and deferred tax provisions in the year in which such determination is made. Details of the uncertain tax positions are disclosed in note 10.
Deferred tax assets, including those arising from unrecouped tax losses, capital
allowances and temporary differences, are recognised only where it is considered more likely than not that they will be recovered, which is dependent on the generation of suffi cient future taxable profi ts. Assumptions about the generation of future taxable profi ts depend on management’s estimates of future cash fl ows. These depend on estimates of future production, sales volumes or sales of service, commodity prices, reserves, operating costs, restoration and reclamation costs, capital expenditure, dividends and other capital management transactions.
(iv) Determination of coal reserves
Judgement is required in determining the Group’s coal reserves taking into account various assumptions regarding mining costs and the sale price of the particular resource concerned. The Group’s economically recoverable coal reserves are sensitive to the cost and revenue assumptions used due to the geological structure of the deposits, which means that, all other factors remaining the same, higher cost assumptions or lower price assumptions will result in lower estimated reserves, and lower cost assumptions or higher price assumptions will result in higher estimated reserves. The Group bases all assumptions on geological reports and uses only measured reserves.
Additional geological data is gathered during the course of mining operations and this, in conjunction with the various assumptions used, could result in a change in estimated coal reserves from period to period. Changes in estimated coal reserves could affect the Group’s fi nancial results in a numbers of ways, including the rate of depreciation and amortisation of plant, property and equipment as well as the carrying value of certain mine assets due to change in estimates of mine life and future discounted cash fl ows.
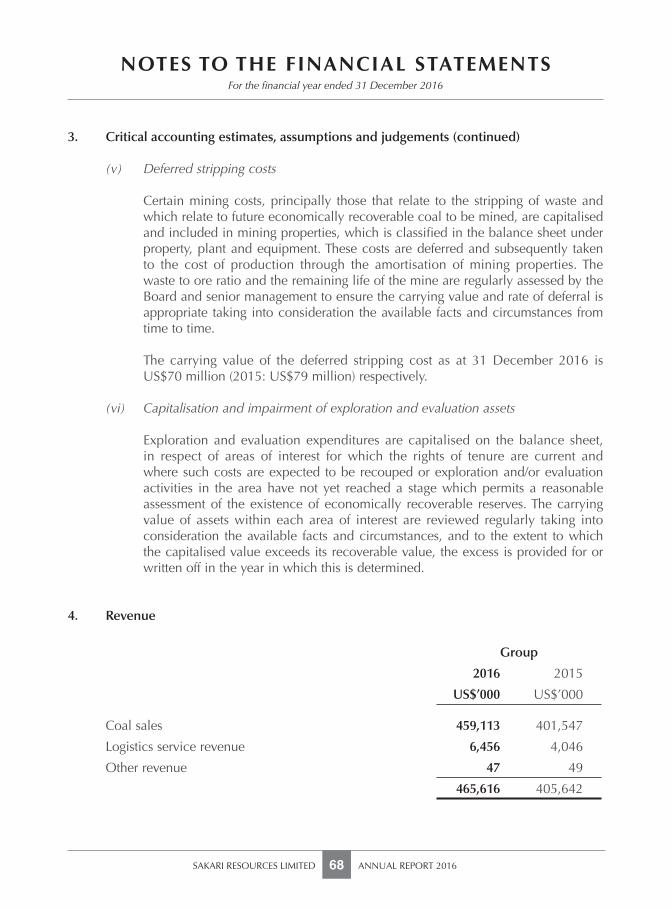
NOTES TO THE FINANCIAL STATEMENTS
SAKARI RESOURCES LIMITED ANNUAL REPORT 201668
For the fi nancial year ended 31 December 2016
3. Critical accounting estimates, assumptions and judgements (continued) (v) Deferred stripping costs
Certain mining costs, principally those that relate to the stripping of waste and which relate to future economically recoverable coal to be mined, are capitalised and included in mining properties, which is classifi ed in the balance sheet under property, plant and equipment. These costs are deferred and subsequently taken to the cost of production through the amortisation of mining properties. The waste to ore ratio and the remaining life of the mine are regularly assessed by the Board and senior management to ensure the carrying value and rate of deferral is appropriate taking into consideration the available facts and circumstances from time to time.
The carrying value of the deferred stripping cost as at 31 December 2016 is US$70 million (2015: US$79 million) respectively.
(vi) Capitalisation and impairment of exploration and evaluation assets
Exploration and evaluation expenditures are capitalised on the balance sheet, in respect of areas of interest for which the rights of tenure are current and where such costs are expected to be recouped or exploration and/or evaluation activities in the area have not yet reached a stage which permits a reasonable assessment of the existence of economically recoverable reserves. The carrying value of assets within each area of interest are reviewed regularly taking into consideration the available facts and circumstances, and to the extent to which the capitalised value exceeds its recoverable value, the excess is provided for or written off in the year in which this is determined.
4. Revenue
Group
2016 2015
US$’000 US$’000
Coal sales 459,113 401,547
Logistics service revenue 6,456 4,046
Other revenue 47 49
465,616 405,642
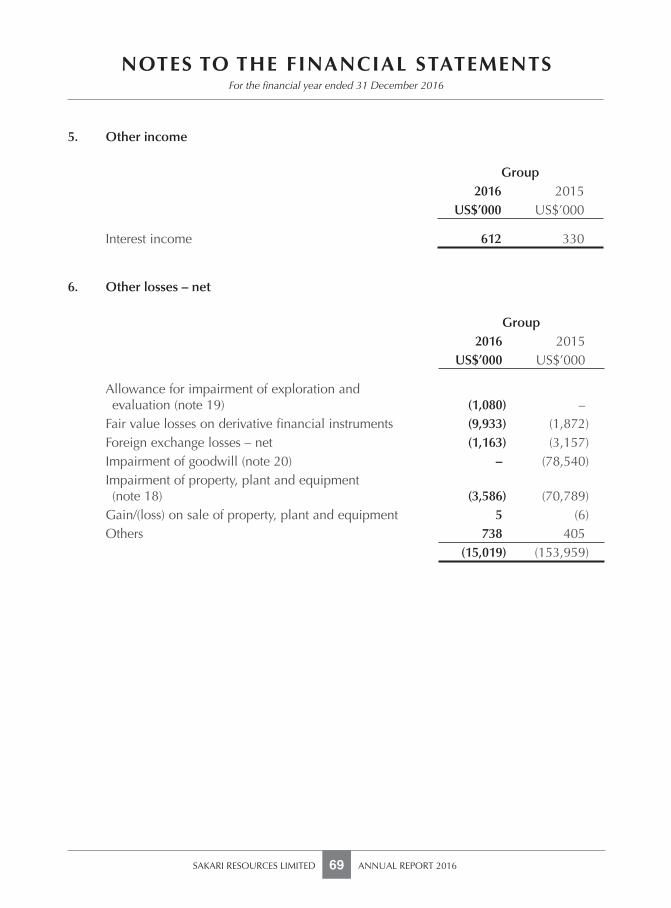
SAKARI RESOURCES LIMITED ANNUAL REPORT 201669
NOTES TO THE FINANCIAL STATEMENTSFor the fi nancial year ended 31 December 2016
5. Other income
Group2016 2015
US$’000 US$’000
Interest income 612 330
6. Other losses – net
Group2016 2015
US$’000 US$’000
Allowance for impairment of exploration and evaluation (note 19) (1,080) –Fair value losses on derivative fi nancial instruments (9,933) (1,872)Foreign exchange losses – net (1,163) (3,157)Impairment of goodwill (note 20) – (78,540)Impairment of property, plant and equipment (note 18) (3,586) (70,789)Gain/(loss) on sale of property, plant and equipment 5 (6)Others 738 405
(15,019) (153,959)
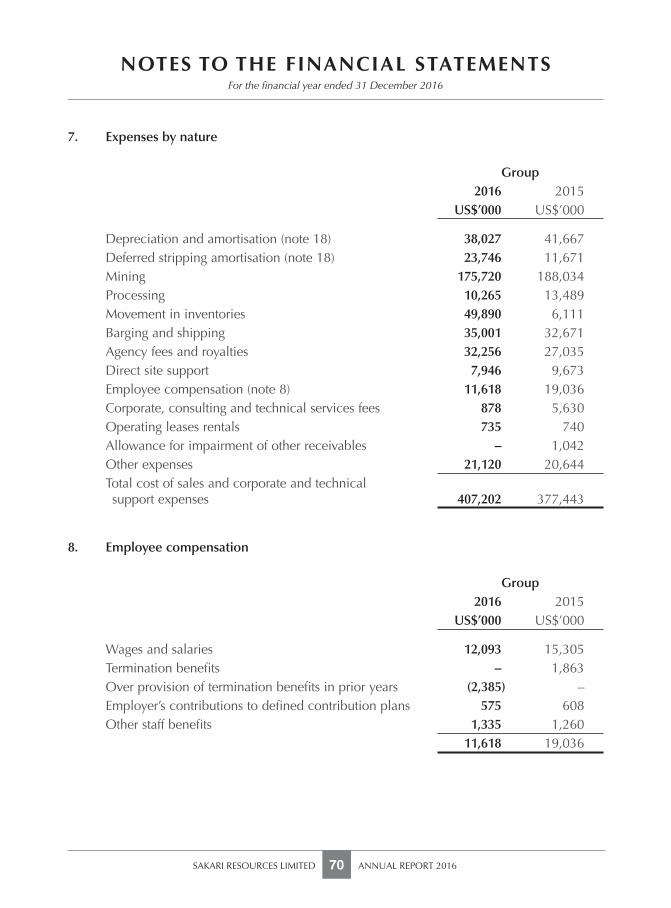
NOTES TO THE FINANCIAL STATEMENTS
SAKARI RESOURCES LIMITED ANNUAL REPORT 201670
For the fi nancial year ended 31 December 2016
7. Expenses by nature
Group2016 2015
US$’000 US$’000
Depreciation and amortisation (note 18) 38,027 41,667Deferred stripping amortisation (note 18) 23,746 11,671Mining 175,720 188,034Processing 10,265 13,489Movement in inventories 49,890 6,111Barging and shipping 35,001 32,671Agency fees and royalties 32,256 27,035Direct site support 7,946 9,673Employee compensation (note 8) 11,618 19,036Corporate, consulting and technical services fees 878 5,630Operating leases rentals 735 740Allowance for impairment of other receivables – 1,042Other expenses 21,120 20,644Total cost of sales and corporate and technical support expenses 407,202 377,443
8. Employee compensation
Group2016 2015
US$’000 US$’000
Wages and salaries 12,093 15,305Termination benefi ts – 1,863Over provision of termination benefi ts in prior years (2,385) –Employer’s contributions to defi ned contribution plans 575 608Other staff benefi ts 1,335 1,260
11,618 19,036
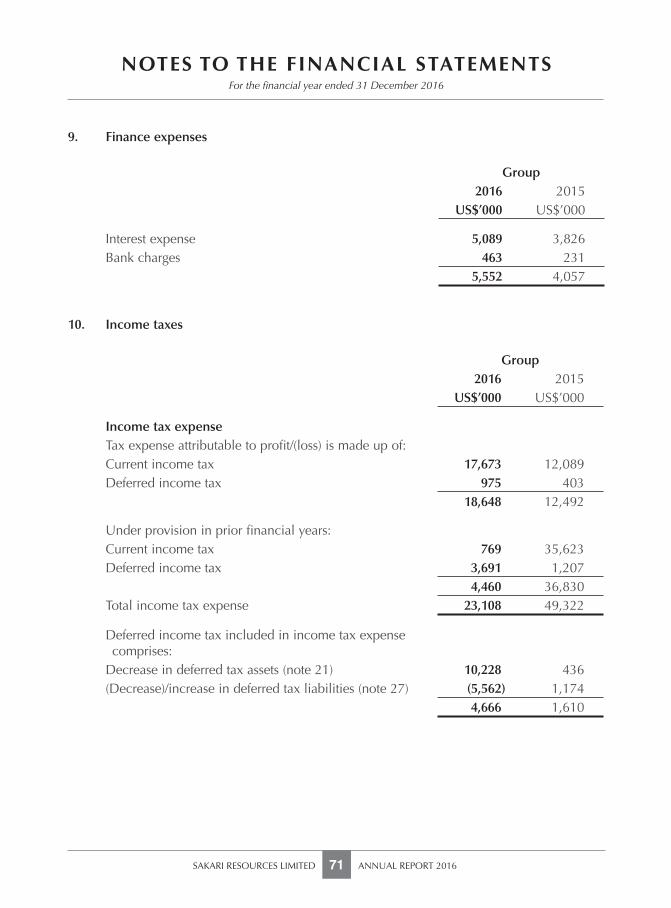
SAKARI RESOURCES LIMITED ANNUAL REPORT 201671
NOTES TO THE FINANCIAL STATEMENTSFor the fi nancial year ended 31 December 2016
9. Finance expenses
Group2016 2015
US$’000 US$’000
Interest expense 5,089 3,826Bank charges 463 231
5,552 4,057
10. Income taxes
Group2016 2015
US$’000 US$’000
Income tax expenseTax expense attributable to profi t/(loss) is made up of:Current income tax 17,673 12,089Deferred income tax 975 403
18,648 12,492
Under provision in prior fi nancial years:Current income tax 769 35,623Deferred income tax 3,691 1,207
4,460 36,830Total income tax expense 23,108 49,322
Deferred income tax included in income tax expense comprises:Decrease in deferred tax assets (note 21) 10,228 436(Decrease)/increase in deferred tax liabilities (note 27) (5,562) 1,174
4,666 1,610
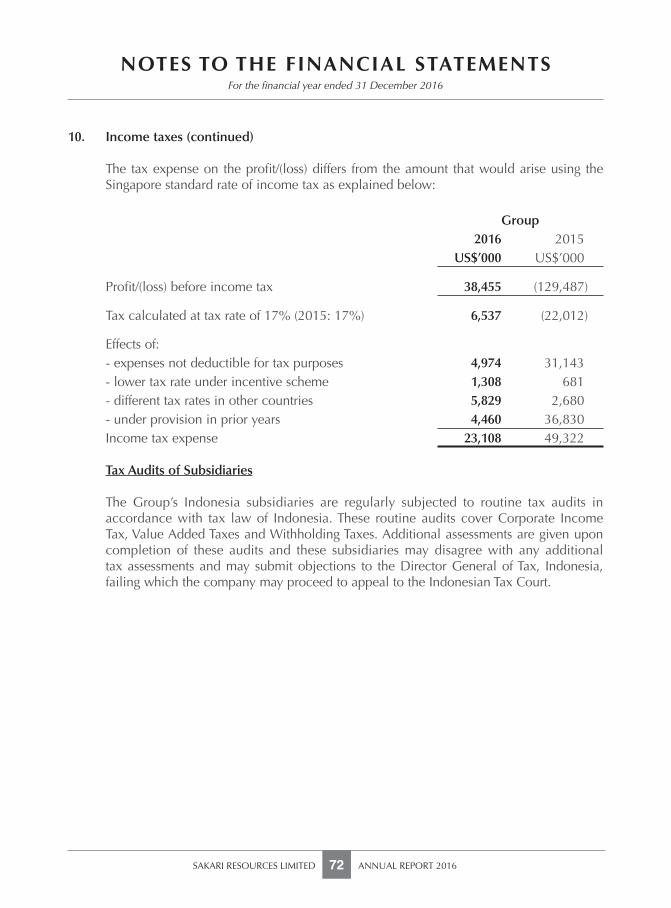
NOTES TO THE FINANCIAL STATEMENTS
SAKARI RESOURCES LIMITED ANNUAL REPORT 201672
For the fi nancial year ended 31 December 2016
10. Income taxes (continued)
The tax expense on the profi t/(loss) differs from the amount that would arise using the Singapore standard rate of income tax as explained below:
Group2016 2015
US$’000 US$’000
Profi t/(loss) before income tax 38,455 (129,487)
Tax calculated at tax rate of 17% (2015: 17%) 6,537 (22,012)
Effects of:- expenses not deductible for tax purposes 4,974 31,143- lower tax rate under incentive scheme 1,308 681- different tax rates in other countries 5,829 2,680- under provision in prior years 4,460 36,830Income tax expense 23,108 49,322
Tax Audits of Subsidiaries The Group’s Indonesia subsidiaries are regularly subjected to routine tax audits in
accordance with tax law of Indonesia. These routine audits cover Corporate Income Tax, Value Added Taxes and Withholding Taxes. Additional assessments are given upon completion of these audits and these subsidiaries may disagree with any additional tax assessments and may submit objections to the Director General of Tax, Indonesia, failing which the company may proceed to appeal to the Indonesian Tax Court.
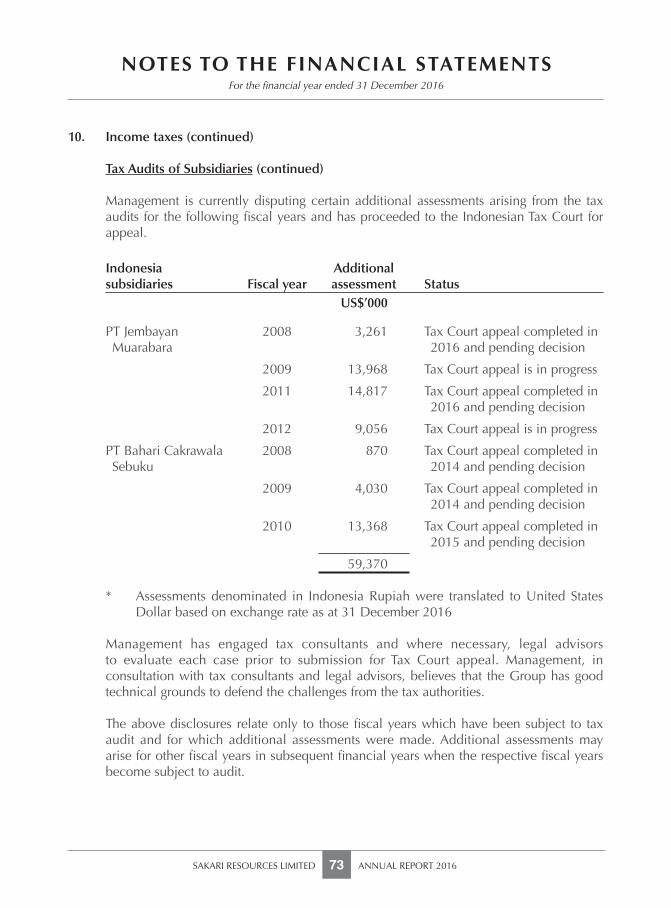
SAKARI RESOURCES LIMITED ANNUAL REPORT 201673
NOTES TO THE FINANCIAL STATEMENTSFor the fi nancial year ended 31 December 2016
10. Income taxes (continued)
Tax Audits of Subsidiaries (continued) Management is currently disputing certain additional assessments arising from the tax
audits for the following fi scal years and has proceeded to the Indonesian Tax Court for appeal.
Indonesia subsidiaries Fiscal year
Additional assessment Status
US$’000
PT Jembayan Muarabara
2008 3,261 Tax Court appeal completed in 2016 and pending decision
2009 13,968 Tax Court appeal is in progress
2011 14,817 Tax Court appeal completed in 2016 and pending decision
2012 9,056 Tax Court appeal is in progress
PT Bahari Cakrawala Sebuku
2008 870 Tax Court appeal completed in 2014 and pending decision
2009 4,030 Tax Court appeal completed in 2014 and pending decision
2010 13,368 Tax Court appeal completed in 2015 and pending decision
59,370
* Assessments denominated in Indonesia Rupiah were translated to United States Dollar based on exchange rate as at 31 December 2016
Management has engaged tax consultants and where necessary, legal advisors to evaluate each case prior to submission for Tax Court appeal. Management, in consultation with tax consultants and legal advisors, believes that the Group has good technical grounds to defend the challenges from the tax authorities.
The above disclosures relate only to those fi scal years which have been subject to tax audit and for which additional assessments were made. Additional assessments may arise for other fi scal years in subsequent fi nancial years when the respective fi scal years become subject to audit.
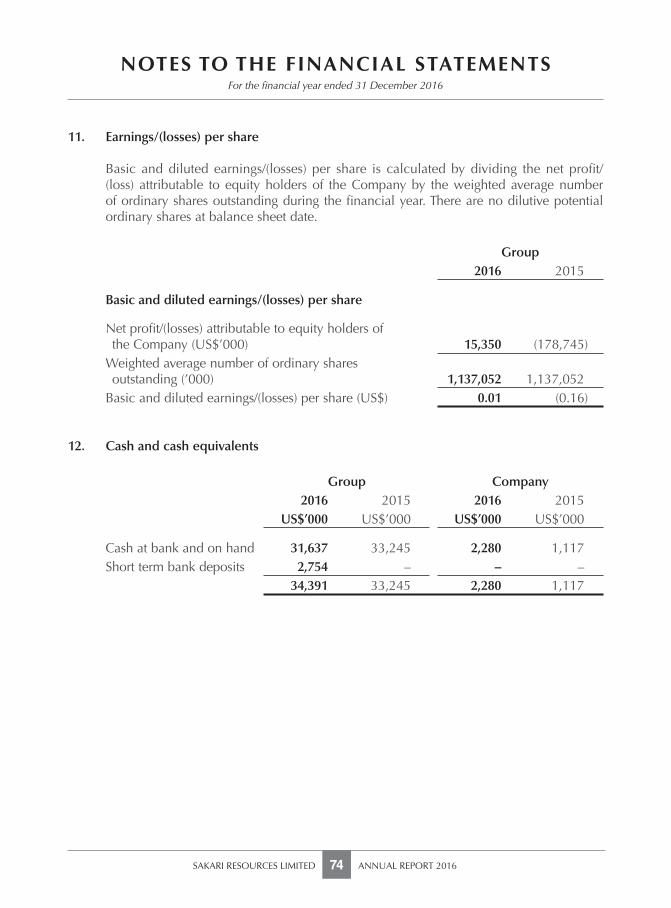
NOTES TO THE FINANCIAL STATEMENTS
SAKARI RESOURCES LIMITED ANNUAL REPORT 201674
For the fi nancial year ended 31 December 2016
11. Earnings/(losses) per share
Basic and diluted earnings/(losses) per share is calculated by dividing the net profi t/(loss) attributable to equity holders of the Company by the weighted average number of ordinary shares outstanding during the fi nancial year. There are no dilutive potential ordinary shares at balance sheet date.
Group2016 2015
Basic and diluted earnings/(losses) per share
Net profi t/(losses) attributable to equity holders of the Company (US$’000) 15,350 (178,745)Weighted average number of ordinary shares outstanding (’000) 1,137,052 1,137,052Basic and diluted earnings/(losses) per share (US$) 0.01 (0.16)
12. Cash and cash equivalents
Group Company2016 2015 2016 2015
US$’000 US$’000 US$’000 US$’000
Cash at bank and on hand 31,637 33,245 2,280 1,117Short term bank deposits 2,754 – – –
34,391 33,245 2,280 1,117
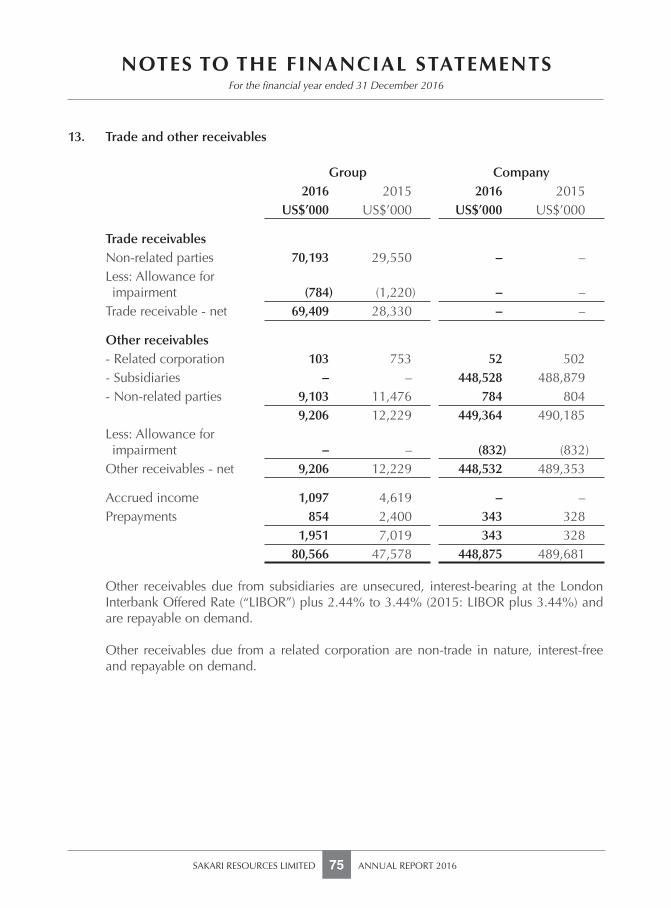
SAKARI RESOURCES LIMITED ANNUAL REPORT 201675
NOTES TO THE FINANCIAL STATEMENTSFor the fi nancial year ended 31 December 2016
13. Trade and other receivables
Group Company2016 2015 2016 2015
US$’000 US$’000 US$’000 US$’000
Trade receivablesNon-related parties 70,193 29,550 – –Less: Allowance for impairment (784) (1,220) – –Trade receivable - net 69,409 28,330 – –
Other receivables- Related corporation 103 753 52 502- Subsidiaries – – 448,528 488,879- Non-related parties 9,103 11,476 784 804
9,206 12,229 449,364 490,185Less: Allowance for impairment – – (832) (832)Other receivables - net 9,206 12,229 448,532 489,353
Accrued income 1,097 4,619 – –Prepayments 854 2,400 343 328
1,951 7,019 343 32880,566 47,578 448,875 489,681
Other receivables due from subsidiaries are unsecured, interest-bearing at the London
Interbank Offered Rate (“LIBOR”) plus 2.44% to 3.44% (2015: LIBOR plus 3.44%) and are repayable on demand.
Other receivables due from a related corporation are non-trade in nature, interest-free and repayable on demand.
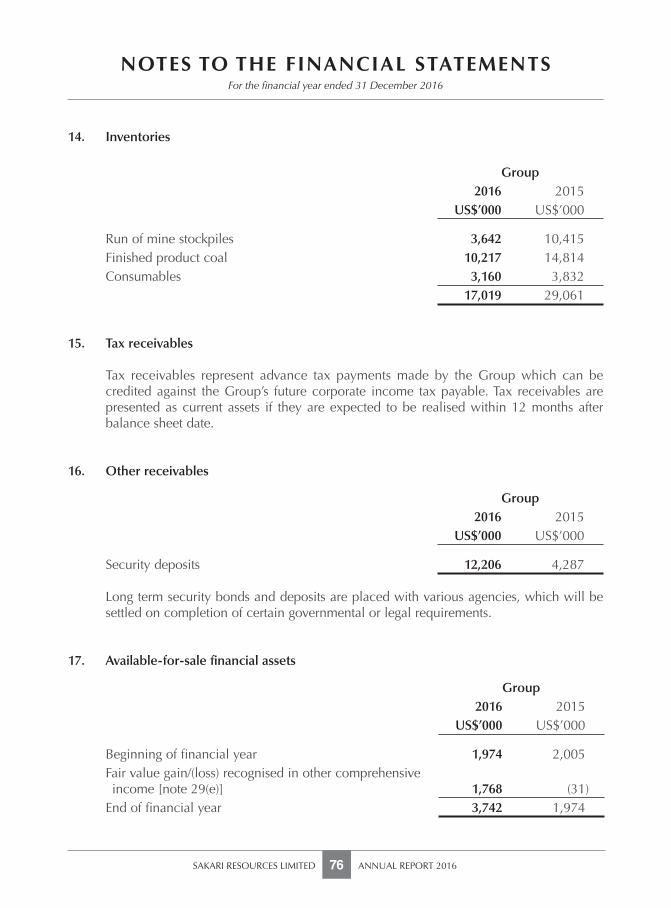
NOTES TO THE FINANCIAL STATEMENTS
SAKARI RESOURCES LIMITED ANNUAL REPORT 201676
For the fi nancial year ended 31 December 2016
14. Inventories
Group2016 2015
US$’000 US$’000
Run of mine stockpiles 3,642 10,415Finished product coal 10,217 14,814Consumables 3,160 3,832
17,019 29,061
15. Tax receivables
Tax receivables represent advance tax payments made by the Group which can be credited against the Group’s future corporate income tax payable. Tax receivables are presented as current assets if they are expected to be realised within 12 months after balance sheet date.
16. Other receivables
Group2016 2015
US$’000 US$’000
Security deposits 12,206 4,287 Long term security bonds and deposits are placed with various agencies, which will be
settled on completion of certain governmental or legal requirements.
17. Available-for-sale fi nancial assets
Group2016 2015
US$’000 US$’000
Beginning of fi nancial year 1,974 2,005Fair value gain/(loss) recognised in other comprehensive income [note 29(e)] 1,768 (31)End of fi nancial year 3,742 1,974
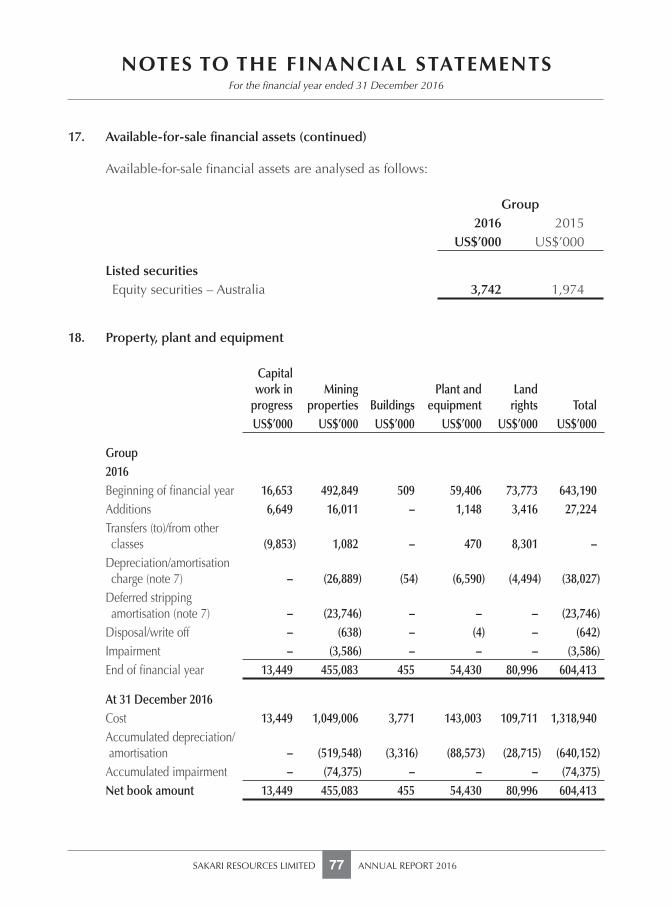
SAKARI RESOURCES LIMITED ANNUAL REPORT 201677
NOTES TO THE FINANCIAL STATEMENTSFor the fi nancial year ended 31 December 2016
17. Available-for-sale fi nancial assets (continued)
Available-for-sale fi nancial assets are analysed as follows:
Group2016 2015
US$’000 US$’000
Listed securities Equity securities – Australia 3,742 1,974
18. Property, plant and equipment
Capital work in
progressMining
properties BuildingsPlant and
equipmentLand
rights TotalUS$’000 US$’000 US$’000 US$’000 US$’000 US$’000
Group2016Beginning of fi nancial year 16,653 492,849 509 59,406 73,773 643,190Additions 6,649 16,011 – 1,148 3,416 27,224Transfers (to)/from other classes (9,853) 1,082 – 470 8,301 –Depreciation/amortisation charge (note 7) – (26,889) (54) (6,590) (4,494) (38,027)Deferred stripping amortisation (note 7) – (23,746) – – – (23,746)Disposal/write off – (638) – (4) – (642)Impairment – (3,586) – – – (3,586)End of fi nancial year 13,449 455,083 455 54,430 80,996 604,413
At 31 December 2016Cost 13,449 1,049,006 3,771 143,003 109,711 1,318,940Accumulated depreciation/ amortisation – (519,548) (3,316) (88,573) (28,715) (640,152)Accumulated impairment – (74,375) – – – (74,375)Net book amount 13,449 455,083 455 54,430 80,996 604,413
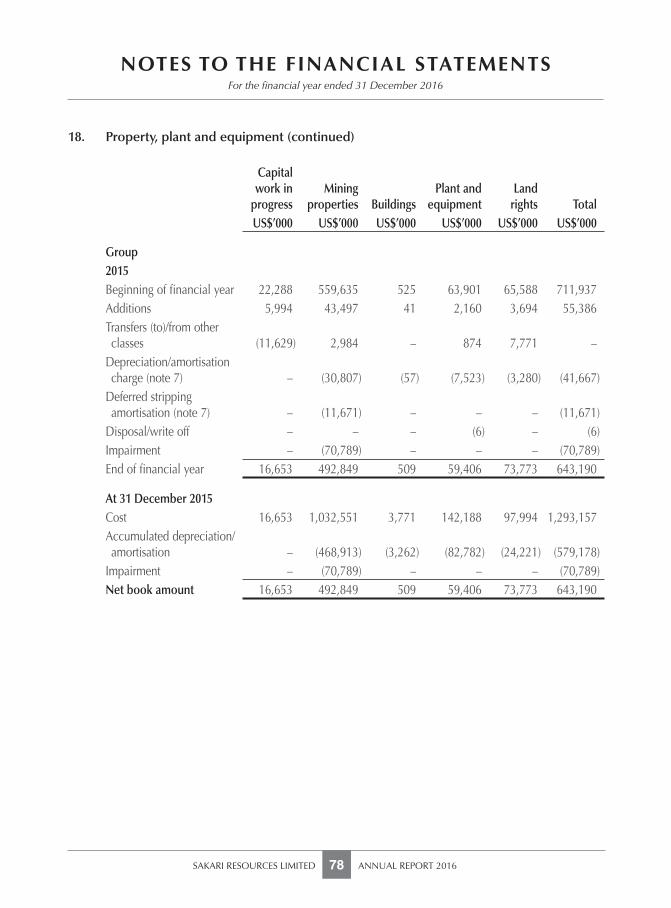
NOTES TO THE FINANCIAL STATEMENTS
SAKARI RESOURCES LIMITED ANNUAL REPORT 201678
For the fi nancial year ended 31 December 2016
18. Property, plant and equipment (continued)
Capital work in
progressMining
properties BuildingsPlant and
equipmentLand
rights TotalUS$’000 US$’000 US$’000 US$’000 US$’000 US$’000
Group2015Beginning of fi nancial year 22,288 559,635 525 63,901 65,588 711,937Additions 5,994 43,497 41 2,160 3,694 55,386Transfers (to)/from other classes (11,629) 2,984 – 874 7,771 –Depreciation/amortisation charge (note 7) – (30,807) (57) (7,523) (3,280) (41,667)Deferred stripping amortisation (note 7) – (11,671) – – – (11,671)Disposal/write off – – – (6) – (6)Impairment – (70,789) – – – (70,789)End of fi nancial year 16,653 492,849 509 59,406 73,773 643,190
At 31 December 2015Cost 16,653 1,032,551 3,771 142,188 97,994 1,293,157Accumulated depreciation/ amortisation – (468,913) (3,262) (82,782) (24,221) (579,178)Impairment – (70,789) – – – (70,789)Net book amount 16,653 492,849 509 59,406 73,773 643,190
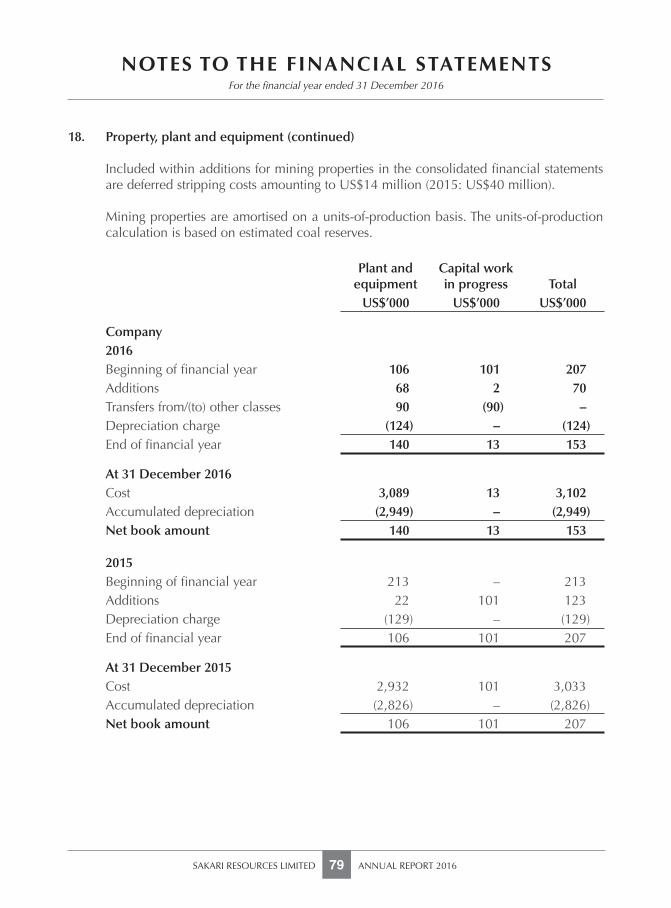
SAKARI RESOURCES LIMITED ANNUAL REPORT 201679
NOTES TO THE FINANCIAL STATEMENTSFor the fi nancial year ended 31 December 2016
18. Property, plant and equipment (continued)
Included within additions for mining properties in the consolidated fi nancial statements are deferred stripping costs amounting to US$14 million (2015: US$40 million).
Mining properties are amortised on a units-of-production basis. The units-of-production calculation is based on estimated coal reserves.
Plant and equipment
Capital workin progress Total
US$’000 US$’000 US$’000
Company2016Beginning of fi nancial year 106 101 207Additions 68 2 70Transfers from/(to) other classes 90 (90) –Depreciation charge (124) – (124)End of fi nancial year 140 13 153
At 31 December 2016Cost 3,089 13 3,102Accumulated depreciation (2,949) – (2,949)Net book amount 140 13 153
2015Beginning of fi nancial year 213 – 213Additions 22 101 123Depreciation charge (129) – (129)End of fi nancial year 106 101 207
At 31 December 2015Cost 2,932 101 3,033Accumulated depreciation (2,826) – (2,826)Net book amount 106 101 207
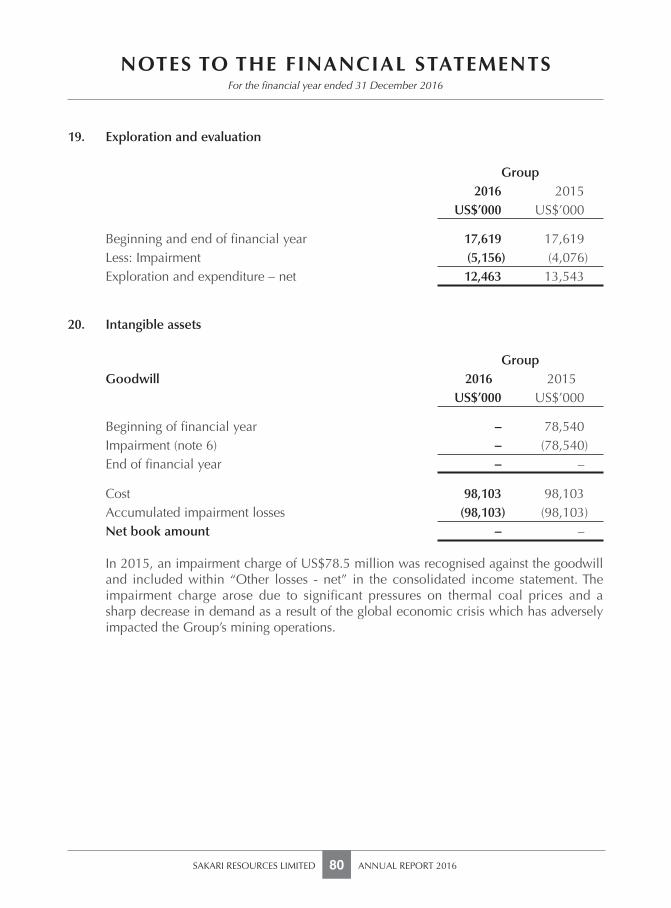
NOTES TO THE FINANCIAL STATEMENTS
SAKARI RESOURCES LIMITED ANNUAL REPORT 201680
For the fi nancial year ended 31 December 2016
19. Exploration and evaluation
Group2016 2015
US$’000 US$’000
Beginning and end of fi nancial year 17,619 17,619Less: Impairment (5,156) (4,076)Exploration and expenditure – net 12,463 13,543
20. Intangible assets
GroupGoodwill 2016 2015
US$’000 US$’000
Beginning of fi nancial year – 78,540Impairment (note 6) – (78,540)End of fi nancial year – –
Cost 98,103 98,103Accumulated impairment losses (98,103) (98,103)Net book amount – –
In 2015, an impairment charge of US$78.5 million was recognised against the goodwill and included within “Other losses - net” in the consolidated income statement. The impairment charge arose due to signifi cant pressures on thermal coal prices and a sharp decrease in demand as a result of the global economic crisis which has adversely impacted the Group’s mining operations.
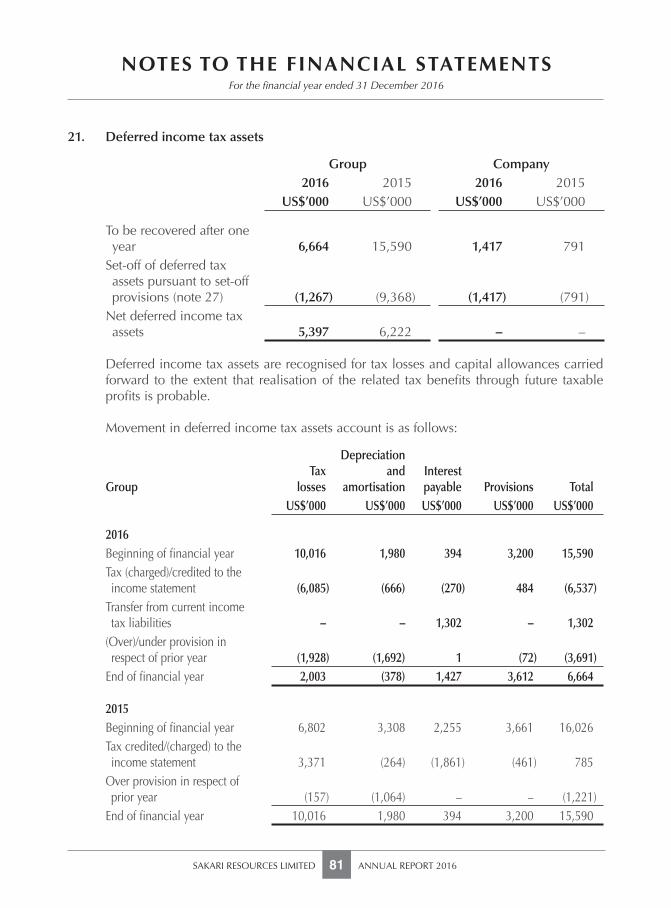
SAKARI RESOURCES LIMITED ANNUAL REPORT 201681
NOTES TO THE FINANCIAL STATEMENTSFor the fi nancial year ended 31 December 2016
21. Deferred income tax assets
Group Company2016 2015 2016 2015
US$’000 US$’000 US$’000 US$’000
To be recovered after one year 6,664 15,590 1,417 791Set-off of deferred tax assets pursuant to set-off provisions (note 27) (1,267) (9,368) (1,417) (791)Net deferred income tax assets 5,397 6,222 – –
Deferred income tax assets are recognised for tax losses and capital allowances carried
forward to the extent that realisation of the related tax benefi ts through future taxable profi ts is probable.
Movement in deferred income tax assets account is as follows:
GroupTax
losses
Depreciation and
amortisationInterestpayable Provisions Total
US$’000 US$’000 US$’000 US$’000 US$’000
2016Beginning of fi nancial year 10,016 1,980 394 3,200 15,590Tax (charged)/credited to the income statement (6,085) (666) (270) 484 (6,537)Transfer from current income tax liabilities – – 1,302 – 1,302(Over)/under provision in respect of prior year (1,928) (1,692) 1 (72) (3,691)End of fi nancial year 2,003 (378) 1,427 3,612 6,664
2015Beginning of fi nancial year 6,802 3,308 2,255 3,661 16,026Tax credited/(charged) to the income statement 3,371 (264) (1,861) (461) 785Over provision in respect of prior year (157) (1,064) – – (1,221)End of fi nancial year 10,016 1,980 394 3,200 15,590
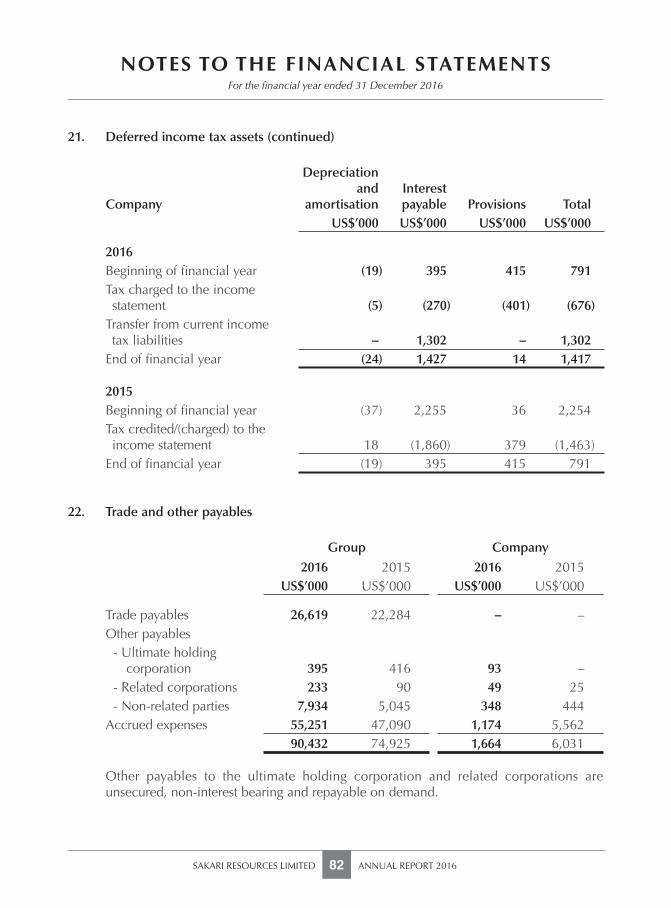
NOTES TO THE FINANCIAL STATEMENTS
SAKARI RESOURCES LIMITED ANNUAL REPORT 201682
For the fi nancial year ended 31 December 2016
21. Deferred income tax assets (continued)
Company
Depreciation and
amortisationInterestpayable Provisions Total
US$’000 US$’000 US$’000 US$’000
2016Beginning of fi nancial year (19) 395 415 791Tax charged to the income statement (5) (270) (401) (676)Transfer from current income tax liabilities – 1,302 – 1,302End of fi nancial year (24) 1,427 14 1,417
2015Beginning of fi nancial year (37) 2,255 36 2,254Tax credited/(charged) to the income statement 18 (1,860) 379 (1,463)End of fi nancial year (19) 395 415 791
22. Trade and other payables
Group Company
2016 2015 2016 2015US$’000 US$’000 US$’000 US$’000
Trade payables 26,619 22,284 – –Other payables
- Ultimate holding corporation 395 416 93 –- Related corporations 233 90 49 25- Non-related parties 7,934 5,045 348 444
Accrued expenses 55,251 47,090 1,174 5,56290,432 74,925 1,664 6,031
Other payables to the ultimate holding corporation and related corporations are
unsecured, non-interest bearing and repayable on demand.
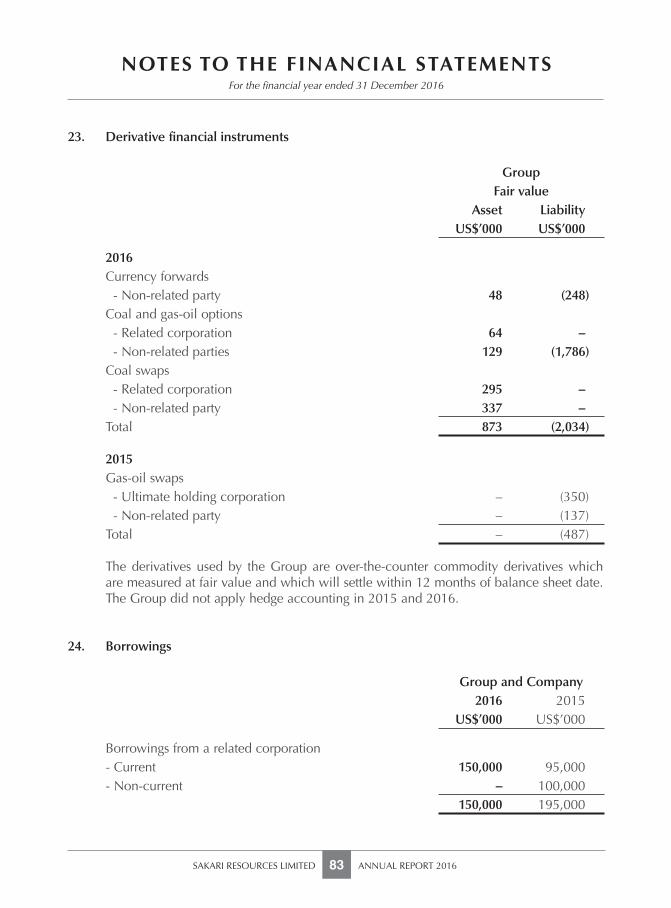
SAKARI RESOURCES LIMITED ANNUAL REPORT 201683
NOTES TO THE FINANCIAL STATEMENTSFor the fi nancial year ended 31 December 2016
23. Derivative fi nancial instruments
GroupFair value
Asset LiabilityUS$’000 US$’000
2016Currency forwards
- Non-related party 48 (248)Coal and gas-oil options
- Related corporation 64 –- Non-related parties 129 (1,786)
Coal swaps- Related corporation 295 –- Non-related party 337 –
Total 873 (2,034)
2015Gas-oil swaps
- Ultimate holding corporation – (350)- Non-related party – (137)
Total – (487)
The derivatives used by the Group are over-the-counter commodity derivatives which are measured at fair value and which will settle within 12 months of balance sheet date. The Group did not apply hedge accounting in 2015 and 2016.
24. Borrowings
Group and Company2016 2015
US$’000 US$’000
Borrowings from a related corporation- Current 150,000 95,000- Non-current – 100,000
150,000 195,000
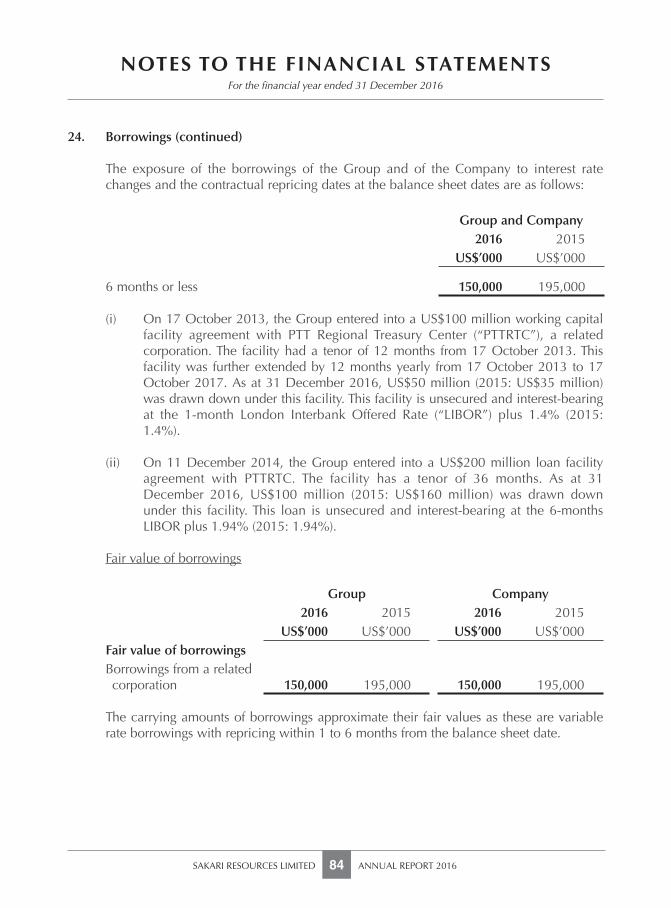
NOTES TO THE FINANCIAL STATEMENTS
SAKARI RESOURCES LIMITED ANNUAL REPORT 201684
For the fi nancial year ended 31 December 2016
24. Borrowings (continued)
The exposure of the borrowings of the Group and of the Company to interest rate changes and the contractual repricing dates at the balance sheet dates are as follows:
Group and Company2016 2015
US$’000 US$’000
6 months or less 150,000 195,000
(i) On 17 October 2013, the Group entered into a US$100 million working capital facility agreement with PTT Regional Treasury Center (“PTTRTC”), a related corporation. The facility had a tenor of 12 months from 17 October 2013. This facility was further extended by 12 months yearly from 17 October 2013 to 17 October 2017. As at 31 December 2016, US$50 million (2015: US$35 million) was drawn down under this facility. This facility is unsecured and interest-bearing at the 1-month London Interbank Offered Rate (“LIBOR”) plus 1.4% (2015: 1.4%).
(ii) On 11 December 2014, the Group entered into a US$200 million loan facility agreement with PTTRTC. The facility has a tenor of 36 months. As at 31 December 2016, US$100 million (2015: US$160 million) was drawn down under this facility. This loan is unsecured and interest-bearing at the 6-months LIBOR plus 1.94% (2015: 1.94%).
Fair value of borrowings
Group Company2016 2015 2016 2015
US$’000 US$’000 US$’000 US$’000Fair value of borrowingsBorrowings from a related corporation 150,000 195,000 150,000 195,000
The carrying amounts of borrowings approximate their fair values as these are variable rate borrowings with repricing within 1 to 6 months from the balance sheet date.
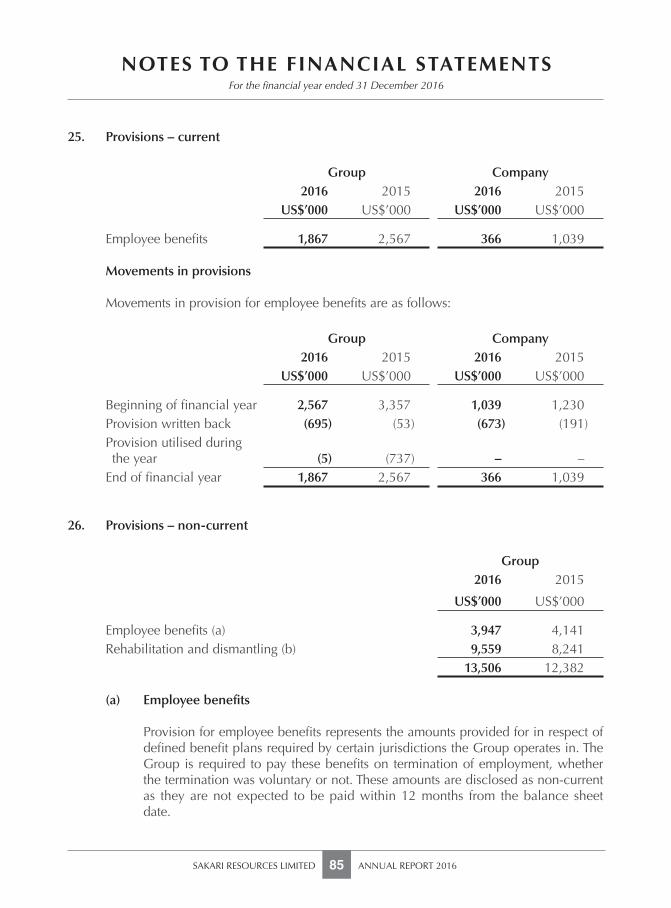
SAKARI RESOURCES LIMITED ANNUAL REPORT 201685
NOTES TO THE FINANCIAL STATEMENTSFor the fi nancial year ended 31 December 2016
25. Provisions – current
Group Company2016 2015 2016 2015
US$’000 US$’000 US$’000 US$’000
Employee benefi ts 1,867 2,567 366 1,039 Movements in provisions
Movements in provision for employee benefi ts are as follows:
Group Company2016 2015 2016 2015
US$’000 US$’000 US$’000 US$’000
Beginning of fi nancial year 2,567 3,357 1,039 1,230Provision written back (695) (53) (673) (191)Provision utilised during the year (5) (737) – –End of fi nancial year 1,867 2,567 366 1,039
26. Provisions – non-current
Group2016 2015
US$’000 US$’000
Employee benefi ts (a) 3,947 4,141Rehabilitation and dismantling (b) 9,559 8,241
13,506 12,382 (a) Employee benefi ts
Provision for employee benefi ts represents the amounts provided for in respect of defi ned benefi t plans required by certain jurisdictions the Group operates in. The Group is required to pay these benefi ts on termination of employment, whether the termination was voluntary or not. These amounts are disclosed as non-current as they are not expected to be paid within 12 months from the balance sheet date.
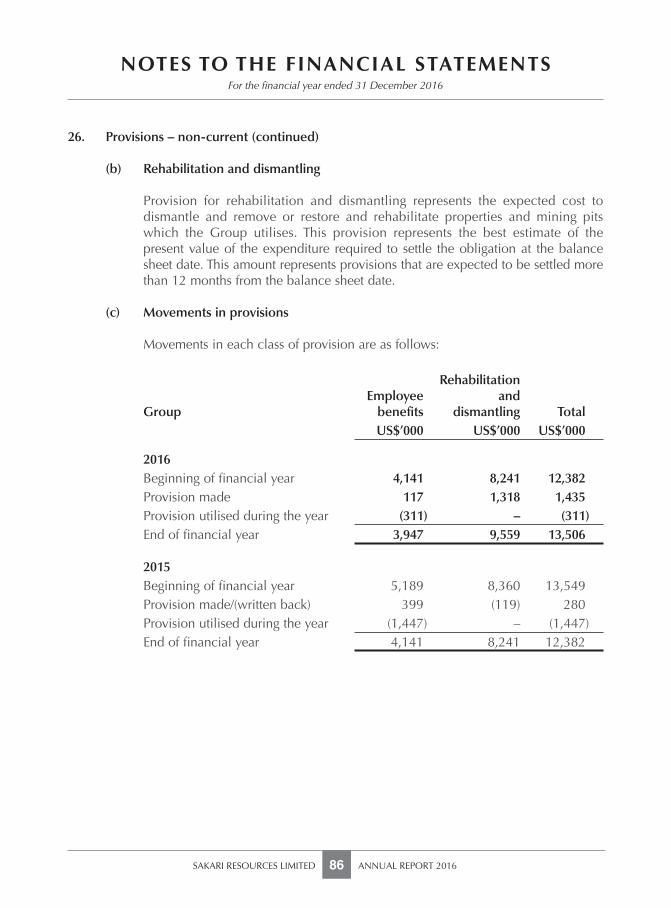
NOTES TO THE FINANCIAL STATEMENTS
SAKARI RESOURCES LIMITED ANNUAL REPORT 201686
For the fi nancial year ended 31 December 2016
26. Provisions – non-current (continued)
(b) Rehabilitation and dismantling
Provision for rehabilitation and dismantling represents the expected cost to dismantle and remove or restore and rehabilitate properties and mining pits which the Group utilises. This provision represents the best estimate of the present value of the expenditure required to settle the obligation at the balance sheet date. This amount represents provisions that are expected to be settled more than 12 months from the balance sheet date.
(c) Movements in provisions
Movements in each class of provision are as follows:
GroupEmployee
benefi ts
Rehabilitation and
dismantling TotalUS$’000 US$’000 US$’000
2016Beginning of fi nancial year 4,141 8,241 12,382Provision made 117 1,318 1,435Provision utilised during the year (311) – (311)End of fi nancial year 3,947 9,559 13,506
2015Beginning of fi nancial year 5,189 8,360 13,549Provision made/(written back) 399 (119) 280Provision utilised during the year (1,447) – (1,447)End of fi nancial year 4,141 8,241 12,382
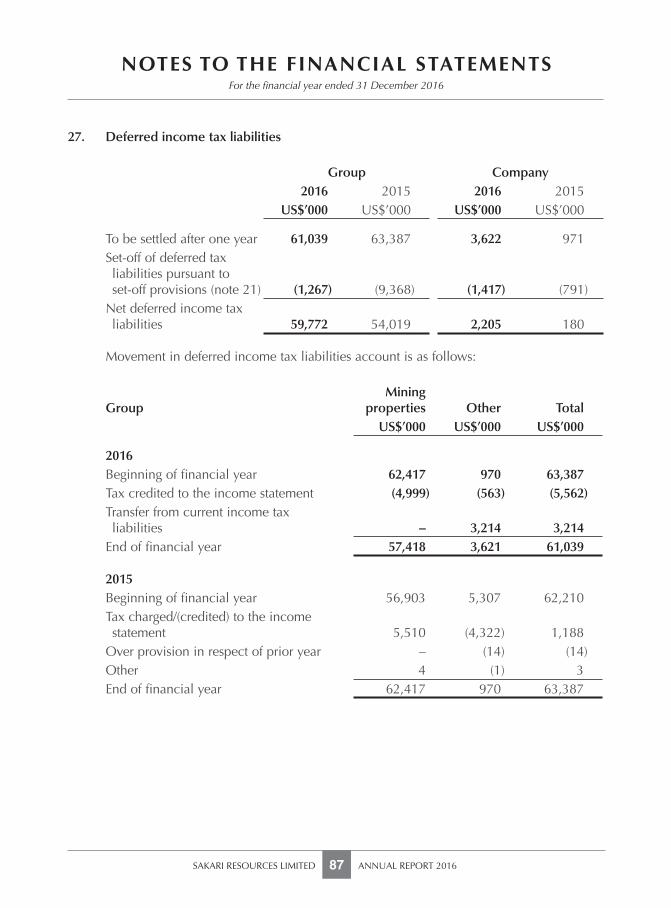
SAKARI RESOURCES LIMITED ANNUAL REPORT 201687
NOTES TO THE FINANCIAL STATEMENTSFor the fi nancial year ended 31 December 2016
27. Deferred income tax liabilities
Group Company2016 2015 2016 2015
US$’000 US$’000 US$’000 US$’000
To be settled after one year 61,039 63,387 3,622 971Set-off of deferred tax liabilities pursuant to set-off provisions (note 21) (1,267) (9,368) (1,417) (791)Net deferred income tax liabilities 59,772 54,019 2,205 180
Movement in deferred income tax liabilities account is as follows:
GroupMining
properties Other TotalUS$’000 US$’000 US$’000
2016Beginning of fi nancial year 62,417 970 63,387Tax credited to the income statement (4,999) (563) (5,562)Transfer from current income tax liabilities – 3,214 3,214End of fi nancial year 57,418 3,621 61,039
2015Beginning of fi nancial year 56,903 5,307 62,210Tax charged/(credited) to the income statement 5,510 (4,322) 1,188Over provision in respect of prior year – (14) (14)Other 4 (1) 3End of fi nancial year 62,417 970 63,387
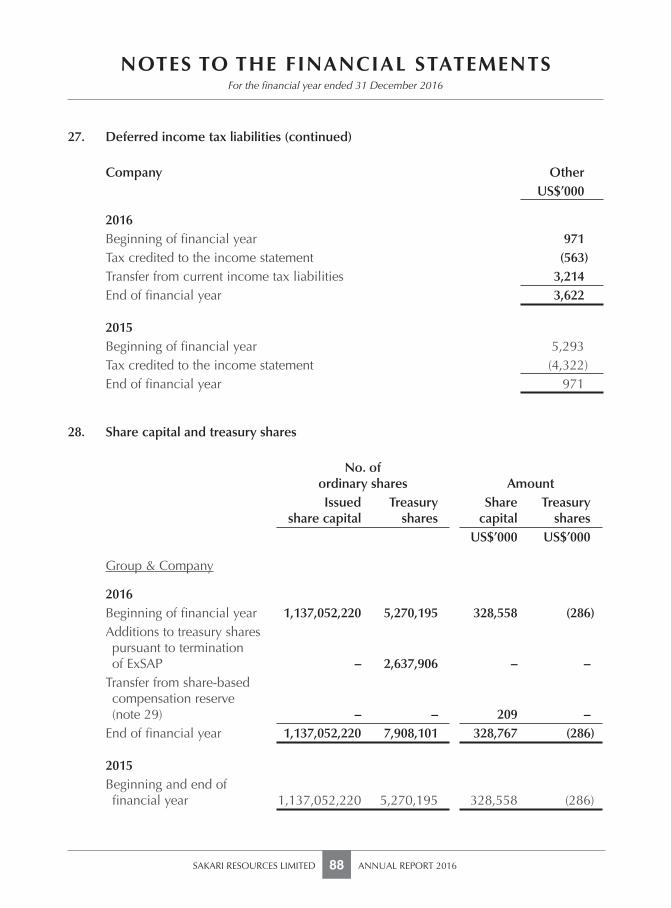
NOTES TO THE FINANCIAL STATEMENTS
SAKARI RESOURCES LIMITED ANNUAL REPORT 201688
For the fi nancial year ended 31 December 2016
27. Deferred income tax liabilities (continued)
Company OtherUS$’000
2016Beginning of fi nancial year 971Tax credited to the income statement (563)Transfer from current income tax liabilities 3,214End of fi nancial year 3,622
2015Beginning of fi nancial year 5,293Tax credited to the income statement (4,322)End of fi nancial year 971
28. Share capital and treasury shares
No. ofordinary shares AmountIssued
share capitalTreasury
sharesShare
capital Treasury
sharesUS$’000 US$’000
Group & Company
2016Beginning of fi nancial year 1,137,052,220 5,270,195 328,558 (286)Additions to treasury shares pursuant to termination of ExSAP – 2,637,906 – –Transfer from share-based compensation reserve (note 29) – – 209 –End of fi nancial year 1,137,052,220 7,908,101 328,767 (286)
2015Beginning and end of fi nancial year 1,137,052,220 5,270,195 328,558 (286)
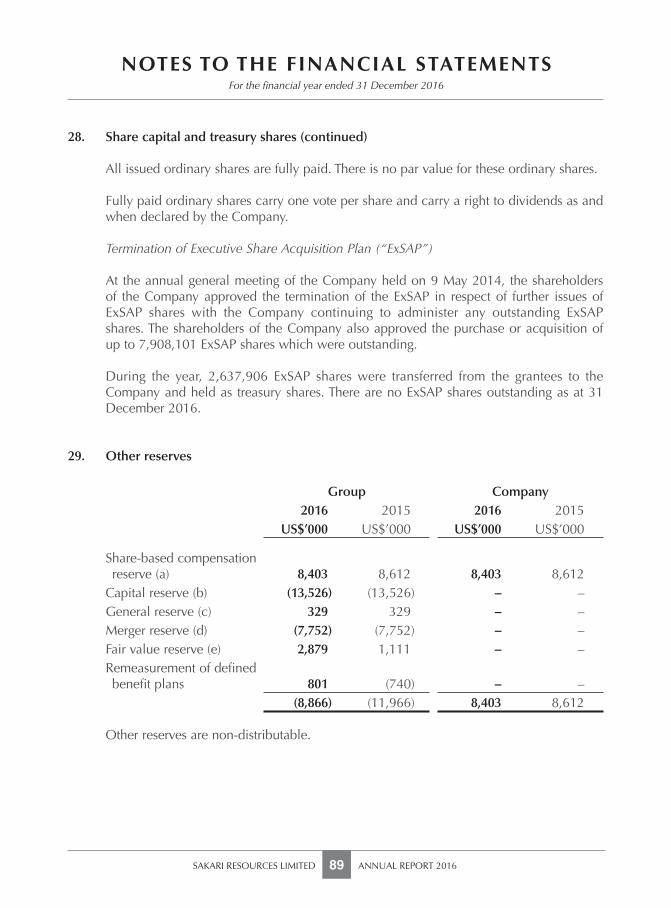
SAKARI RESOURCES LIMITED ANNUAL REPORT 201689
NOTES TO THE FINANCIAL STATEMENTSFor the fi nancial year ended 31 December 2016
28. Share capital and treasury shares (continued)
All issued ordinary shares are fully paid. There is no par value for these ordinary shares.
Fully paid ordinary shares carry one vote per share and carry a right to dividends as and when declared by the Company.
Termination of Executive Share Acquisition Plan (“ExSAP”)
At the annual general meeting of the Company held on 9 May 2014, the shareholders of the Company approved the termination of the ExSAP in respect of further issues of ExSAP shares with the Company continuing to administer any outstanding ExSAP shares. The shareholders of the Company also approved the purchase or acquisition of up to 7,908,101 ExSAP shares which were outstanding.
During the year, 2,637,906 ExSAP shares were transferred from the grantees to the Company and held as treasury shares. There are no ExSAP shares outstanding as at 31 December 2016.
29. Other reserves
Group Company2016 2015 2016 2015
US$’000 US$’000 US$’000 US$’000
Share-based compensation reserve (a) 8,403 8,612 8,403 8,612Capital reserve (b) (13,526) (13,526) – –General reserve (c) 329 329 – –Merger reserve (d) (7,752) (7,752) – –Fair value reserve (e) 2,879 1,111 – –Remeasurement of defi ned benefi t plans 801 (740) – –
(8,866) (11,966) 8,403 8,612 Other reserves are non-distributable.
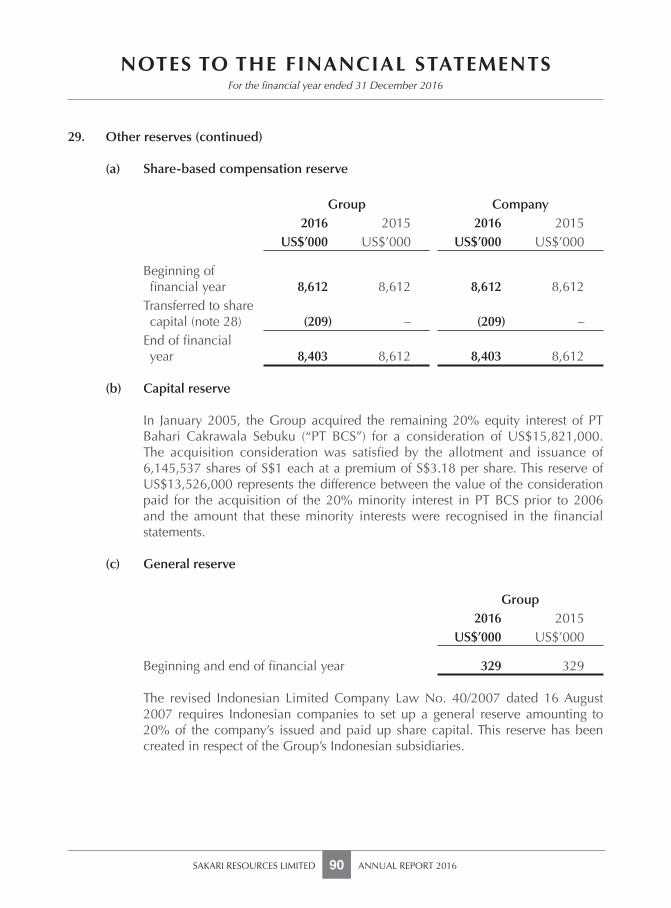
NOTES TO THE FINANCIAL STATEMENTS
SAKARI RESOURCES LIMITED ANNUAL REPORT 201690
For the fi nancial year ended 31 December 2016
29. Other reserves (continued)
(a) Share-based compensation reserve
Group Company2016 2015 2016 2015
US$’000 US$’000 US$’000 US$’000
Beginning of fi nancial year 8,612 8,612 8,612 8,612Transferred to share capital (note 28) (209) – (209) –End of fi nancial year 8,403 8,612 8,403 8,612
(b) Capital reserve
In January 2005, the Group acquired the remaining 20% equity interest of PT Bahari Cakrawala Sebuku (“PT BCS”) for a consideration of US$15,821,000. The acquisition consideration was satisfi ed by the allotment and issuance of 6,145,537 shares of S$1 each at a premium of S$3.18 per share. This reserve of US$13,526,000 represents the difference between the value of the consideration paid for the acquisition of the 20% minority interest in PT BCS prior to 2006 and the amount that these minority interests were recognised in the fi nancial statements.
(c) General reserve
Group2016 2015
US$’000 US$’000
Beginning and end of fi nancial year 329 329 The revised Indonesian Limited Company Law No. 40/2007 dated 16 August
2007 requires Indonesian companies to set up a general reserve amounting to 20% of the company’s issued and paid up share capital. This reserve has been created in respect of the Group’s Indonesian subsidiaries.
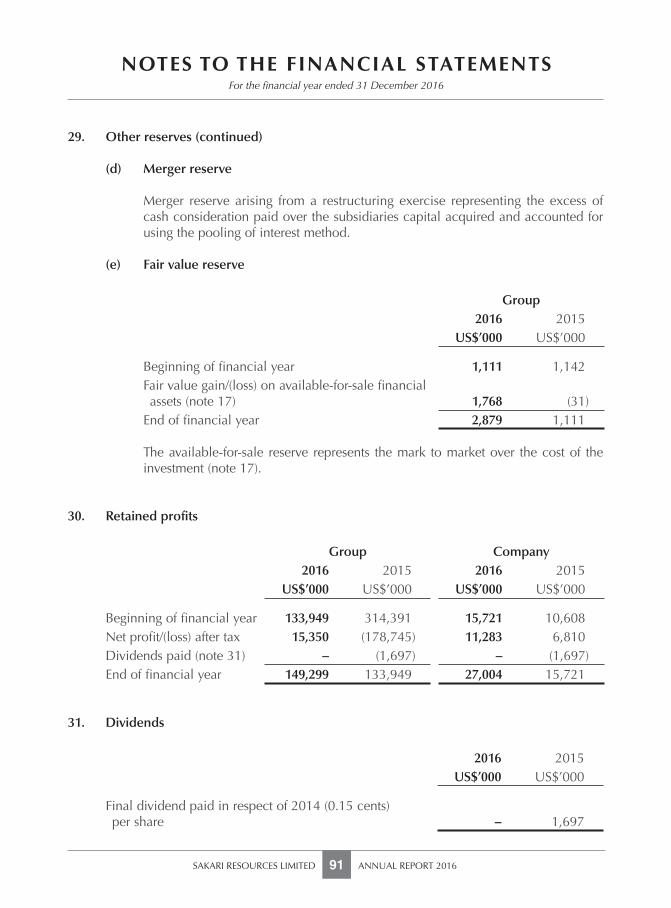
SAKARI RESOURCES LIMITED ANNUAL REPORT 201691
NOTES TO THE FINANCIAL STATEMENTSFor the fi nancial year ended 31 December 2016
29. Other reserves (continued)
(d) Merger reserve
Merger reserve arising from a restructuring exercise representing the excess of cash consideration paid over the subsidiaries capital acquired and accounted for using the pooling of interest method.
(e) Fair value reserve
Group2016 2015
US$’000 US$’000
Beginning of fi nancial year 1,111 1,142Fair value gain/(loss) on available-for-sale fi nancial assets (note 17) 1,768 (31)End of fi nancial year 2,879 1,111
The available-for-sale reserve represents the mark to market over the cost of the
investment (note 17).
30. Retained profi ts
Group Company2016 2015 2016 2015
US$’000 US$’000 US$’000 US$’000
Beginning of fi nancial year 133,949 314,391 15,721 10,608Net profi t/(loss) after tax 15,350 (178,745) 11,283 6,810Dividends paid (note 31) – (1,697) – (1,697)End of fi nancial year 149,299 133,949 27,004 15,721
31. Dividends
2016 2015US$’000 US$’000
Final dividend paid in respect of 2014 (0.15 cents) per share – 1,697
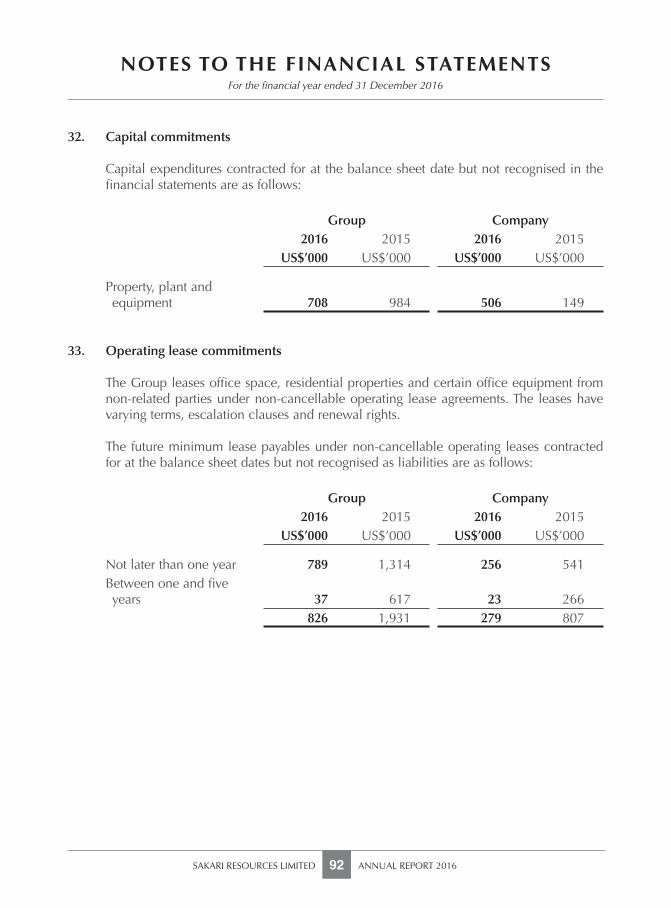
NOTES TO THE FINANCIAL STATEMENTS
SAKARI RESOURCES LIMITED ANNUAL REPORT 201692
For the fi nancial year ended 31 December 2016
32. Capital commitments
Capital expenditures contracted for at the balance sheet date but not recognised in the fi nancial statements are as follows:
Group Company2016 2015 2016 2015
US$’000 US$’000 US$’000 US$’000
Property, plant and equipment 708 984 506 149
33. Operating lease commitments
The Group leases offi ce space, residential properties and certain offi ce equipment from non-related parties under non-cancellable operating lease agreements. The leases have varying terms, escalation clauses and renewal rights.
The future minimum lease payables under non-cancellable operating leases contracted for at the balance sheet dates but not recognised as liabilities are as follows:
Group Company2016 2015 2016 2015
US$’000 US$’000 US$’000 US$’000
Not later than one year 789 1,314 256 541Between one and fi ve years 37 617 23 266
826 1,931 279 807
SAKARI RESOURCES LIMITED ANNUAL REPORT 201693
NOTES TO THE FINANCIAL STATEMENTSFor the fi nancial year ended 31 December 2016
34. Financial risk management
Financial risk factors
The Group’s activities are exposed to market risk (including currency risk, price risk and interest rate risk), credit risk and liquidity risk. The Group’s overall risk management strategy seeks to minimise any adverse effects from the unpredictability of fi nancial and commodity markets on the Group’s fi nancial performance. The Group uses fi nancial instruments such as over-the-counter commodity swaps to hedge certain market risk exposures.
Management establishes the detailed policies such as authority levels, oversight responsibilities, risk identifi cation and measurement, exposure limits and hedging strategies and presented these policies to the Board of Directors for approval.
Financial risk management is carried out by a central treasury department, trading department and reporting department and these teams evaluate and hedge fi nancial risks in co-operation with the Group’s operating units. Regular reports are also submitted to management and the Board of the Directors.
(a) Market risk
(i) Currency risk
The Group operates in Singapore and Indonesia. Entities in the Group regularly transact in their respective functional currency, which is the United States dollar (“USD”). Currency risk arises when transactions are denominated in foreign currencies such as the Singapore dollar (“SGD”), Australian dollar (“AUD”) and Indonesia rupiah (“IDR”).
The Group uses fi nancial instruments such as forward exchange contracts to mitigate the currency risks.
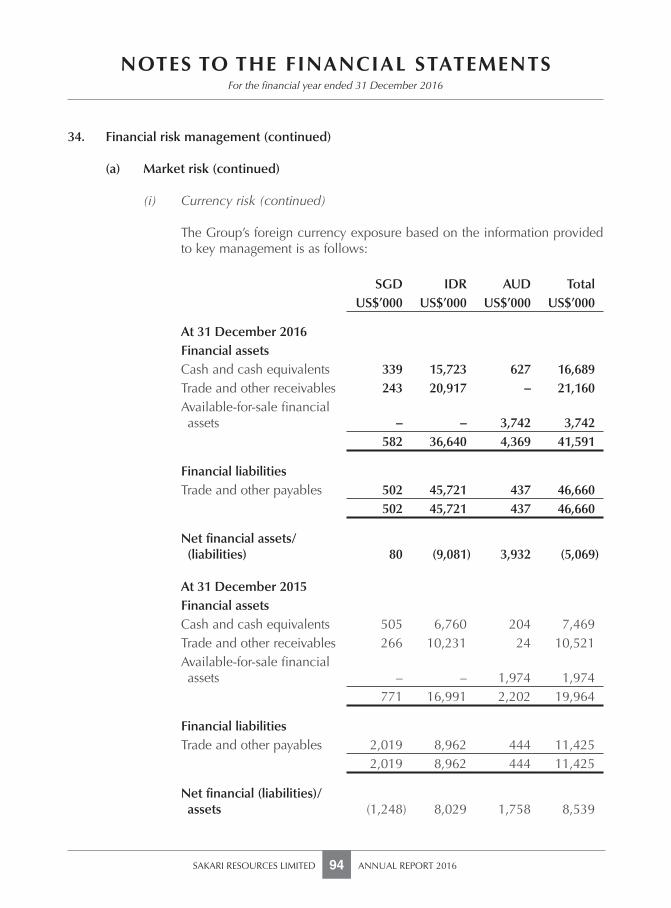
NOTES TO THE FINANCIAL STATEMENTS
SAKARI RESOURCES LIMITED ANNUAL REPORT 201694
For the fi nancial year ended 31 December 2016
34. Financial risk management (continued)
(a) Market risk (continued)
(i) Currency risk (continued)
The Group’s foreign currency exposure based on the information provided to key management is as follows:
SGD IDR AUD TotalUS$’000 US$’000 US$’000 US$’000
At 31 December 2016Financial assetsCash and cash equivalents 339 15,723 627 16,689Trade and other receivables 243 20,917 – 21,160Available-for-sale fi nancial assets – – 3,742 3,742
582 36,640 4,369 41,591
Financial liabilitiesTrade and other payables 502 45,721 437 46,660
502 45,721 437 46,660
Net fi nancial assets/ (liabilities) 80 (9,081) 3,932 (5,069)
At 31 December 2015Financial assetsCash and cash equivalents 505 6,760 204 7,469Trade and other receivables 266 10,231 24 10,521Available-for-sale fi nancial assets – – 1,974 1,974
771 16,991 2,202 19,964
Financial liabilitiesTrade and other payables 2,019 8,962 444 11,425
2,019 8,962 444 11,425
Net fi nancial (liabilities)/ assets (1,248) 8,029 1,758 8,539
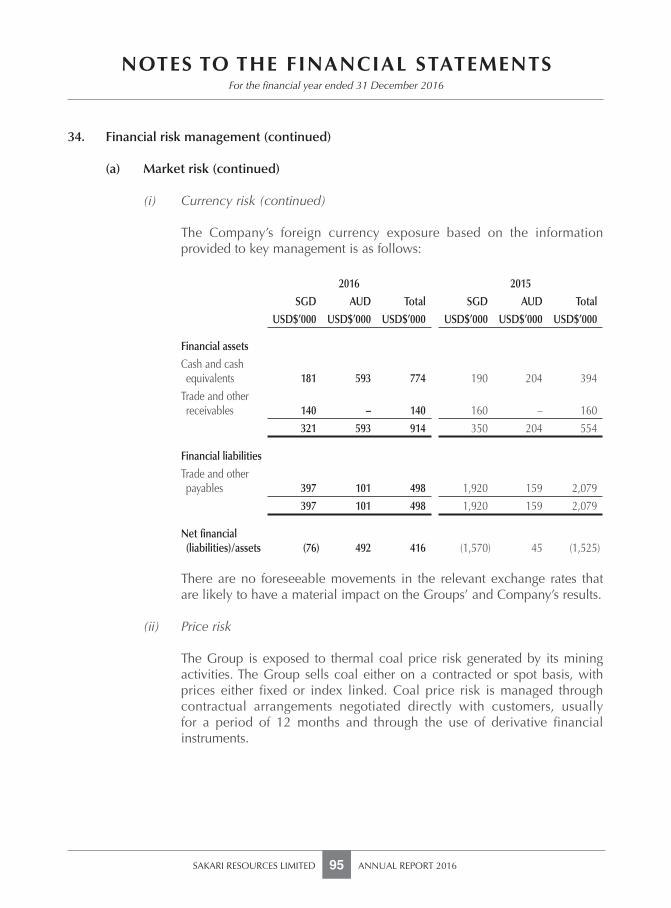
SAKARI RESOURCES LIMITED ANNUAL REPORT 201695
NOTES TO THE FINANCIAL STATEMENTSFor the fi nancial year ended 31 December 2016
34. Financial risk management (continued)
(a) Market risk (continued)
(i) Currency risk (continued)
The Company’s foreign currency exposure based on the information provided to key management is as follows:
2016 2015
SGD AUD Total SGD AUD Total
USD$’000 USD$’000 USD$’000 USD$’000 USD$’000 USD$’000
Financial assets
Cash and cash equivalents 181 593 774 190 204 394
Trade and other receivables 140 – 140 160 – 160
321 593 914 350 204 554
Financial liabilities
Trade and other payables 397 101 498 1,920 159 2,079
397 101 498 1,920 159 2,079
Net fi nancial (liabilities)/assets (76) 492 416 (1,570) 45 (1,525)
There are no foreseeable movements in the relevant exchange rates that are likely to have a material impact on the Groups’ and Company’s results.
(ii) Price risk
The Group is exposed to thermal coal price risk generated by its mining activities. The Group sells coal either on a contracted or spot basis, with prices either fi xed or index linked. Coal price risk is managed through contractual arrangements negotiated directly with customers, usually for a period of 12 months and through the use of derivative fi nancial instruments.
NOTES TO THE FINANCIAL STATEMENTS
SAKARI RESOURCES LIMITED ANNUAL REPORT 201696
For the fi nancial year ended 31 December 2016
34. Financial risk management (continued)
(a) Market risk (continued)
(ii) Price risk (continued)
Fuel is a major component of the Group’s operating costs. The Group’s exposure to changes in fuel prices is ultimately based on reference to a USD Mean of Platts Singapore (“MOPS”) Gas Oil assessment price. This benchmark reference is used to determine diesel fuel prices in Indonesia, which are primarily passed through to the Group by mine contractors through rise and fall adjustment clauses. Historically, as sources of energy generation, there is a positive correlation between coal and oil prices, and this has served as a natural hedge to the Group’s exposure to changing fuel prices.
The Group uses derivative fi nancial instruments in the form of gas-oil swaps to hedge adverse movements in coal prices received by customers and gas-oil prices paid as part of the Group’s mining costs. These instruments are over-the-counter derivative contracts referenced to indices and therefore underlying commodity prices of coal and gas-oil. If the referenced price had increased/decreased by 10% (2015: 10%) with all other variables including tax rate being held constant, the profi t/(loss) after tax would have been lower/ higher by US$1,500,240 (2015: US$173,495).
The Group has an equity investment which is classifi ed as available-for-sale on the balance sheet that is exposed to equity securities price risk. If the price for the equity security listed on the Australian Securities Exchange had changed by 10% (2015: 10%) with all other variables including tax rate being held constant, the other comprehensive income would have been lower/ higher by US$374,200 (2015: US$197,400).
(iii) Cash fl ow and fair value interest rate risks Cash fl ow interest rate risk is the risk that the future cash fl ows of a
fi nancial instrument will fl uctuate because of changes in market interest rates. Fair value interest rate risk is the risk that the fair value of a fi nancial instrument will fl uctuate due to changes in market interest rates. As the Group has no signifi cant interest bearing assets, the Group’s income is substantially independent of changes in market interest rates.
SAKARI RESOURCES LIMITED ANNUAL REPORT 201697
NOTES TO THE FINANCIAL STATEMENTSFor the fi nancial year ended 31 December 2016
34. Financial risk management (continued)
(a) Market risk (continued)
(iii) Cash fl ow and fair value interest rate risks (continued) The Group’s main interest rate risk arises from borrowings. Borrowings
issued at variable rates expose the Group to cash fl ow interest rate risk.
The Group’s borrowings are at variable rates and are denominated in USD. If the interest rates had increased/decreased by 0.50% (2015: 0.50%) with all other variables including tax rate being held constant, the profi t/(loss) after tax would have been lower/higher by US$945,000 (2015: higher/lower by US$912,000) as a result of higher/lower interest expense on these borrowings.
(b) Credit risk
Credit risk refers to the risk that counterparty will default on its contractual obligations resulting in fi nancial loss to the Group. Credit risk is managed on a group basis. Credit risk arises from cash and cash equivalents, and deposits with banks and fi nancial institutions and derivative fi nancial instruments, as well as credit exposures to trade customers, including outstanding receivables and contracted sales. The Group only deals with banks and fi nancial institutions of good repute and standing. For trade customers, the corporate team assesses and monitors the credit quality of each trade customer, taking into account their fi nancial position, past experience and other relevant factors.
Credit exposure to an individual counterparty is restricted by the corporate team management based on ongoing credit evaluation. Counterparty payment profi les are monitored by management. Generally, the Group only enters into contracts with large counterparties (such as power utilities). Counterparty and payment risk is also managed through the use of letters of credit or telegraphic transfers payable within 30 days from a vessel’s bill of lading date.
The Group has a broad customer base with many sales secured by letters of credit. The majority of the Group’s customers belong to the power generation sector across various countries which represent some concentration of risk within this market.
The maximum exposure to credit risk for each class of fi nancial instrument is the carrying amount of that class of fi nancial assets presented on the balance sheet.
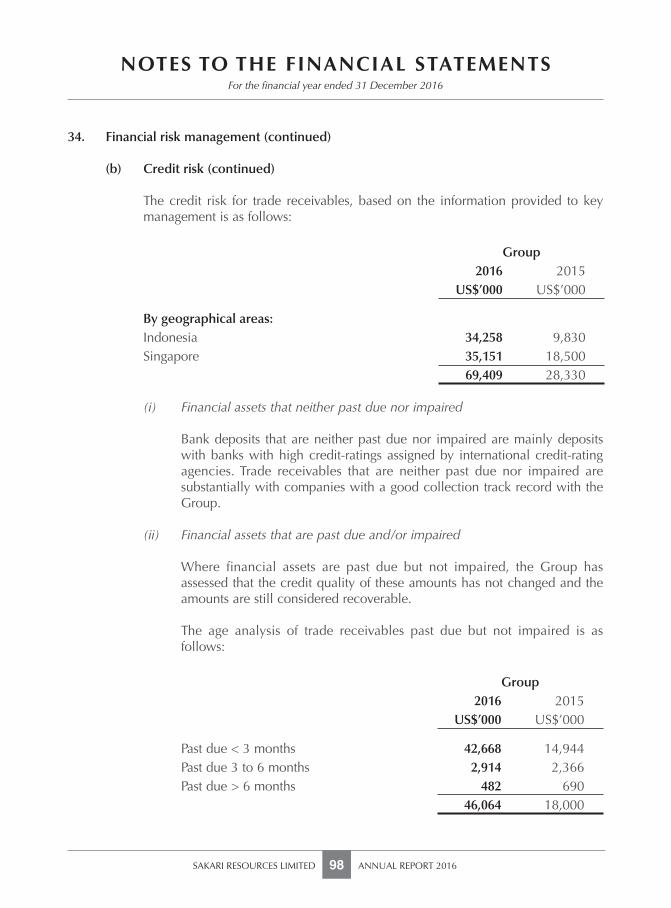
NOTES TO THE FINANCIAL STATEMENTS
SAKARI RESOURCES LIMITED ANNUAL REPORT 201698
For the fi nancial year ended 31 December 2016
34. Financial risk management (continued)
(b) Credit risk (continued) The credit risk for trade receivables, based on the information provided to key
management is as follows:
Group2016 2015
US$’000 US$’000
By geographical areas:Indonesia 34,258 9,830Singapore 35,151 18,500 69,409 28,330
(i) Financial assets that neither past due nor impaired
Bank deposits that are neither past due nor impaired are mainly deposits with banks with high credit-ratings assigned by international credit-rating agencies. Trade receivables that are neither past due nor impaired are substantially with companies with a good collection track record with the Group.
(ii) Financial assets that are past due and/or impaired
Where fi nancial assets are past due but not impaired, the Group has assessed that the credit quality of these amounts has not changed and the amounts are still considered recoverable.
The age analysis of trade receivables past due but not impaired is as
follows:
Group2016 2015
US$’000 US$’000
Past due < 3 months 42,668 14,944Past due 3 to 6 months 2,914 2,366Past due > 6 months 482 690
46,064 18,000
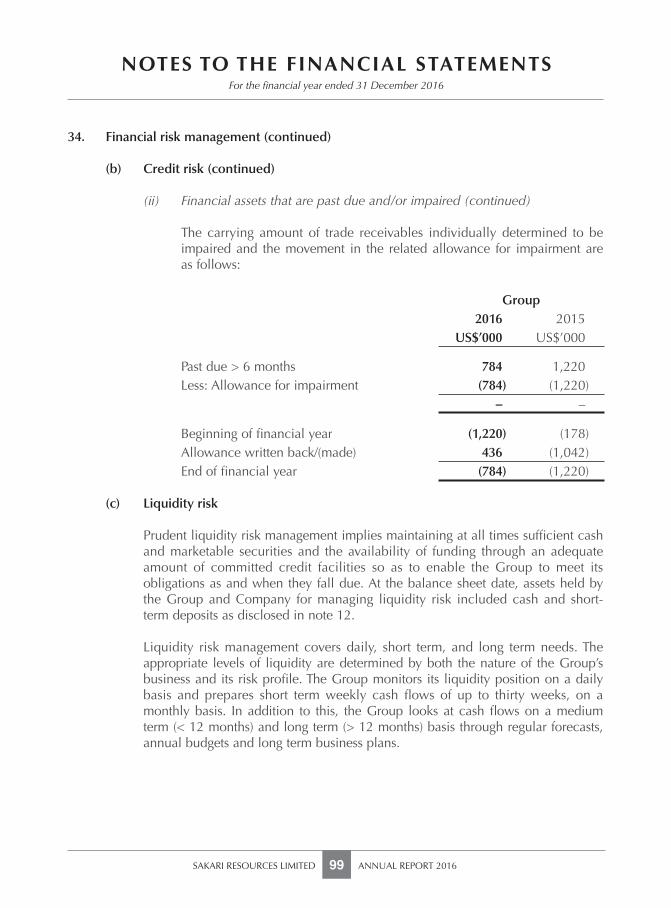
SAKARI RESOURCES LIMITED ANNUAL REPORT 201699
NOTES TO THE FINANCIAL STATEMENTSFor the fi nancial year ended 31 December 2016
34. Financial risk management (continued)
(b) Credit risk (continued)
(ii) Financial assets that are past due and/or impaired (continued)
The carrying amount of trade receivables individually determined to be impaired and the movement in the related allowance for impairment are as follows:
Group2016 2015
US$’000 US$’000
Past due > 6 months 784 1,220Less: Allowance for impairment (784) (1,220)
– –
Beginning of fi nancial year (1,220) (178)Allowance written back/(made) 436 (1,042)End of fi nancial year (784) (1,220)
(c) Liquidity risk
Prudent liquidity risk management implies maintaining at all times suffi cient cash and marketable securities and the availability of funding through an adequate amount of committed credit facilities so as to enable the Group to meet its obligations as and when they fall due. At the balance sheet date, assets held by the Group and Company for managing liquidity risk included cash and short-term deposits as disclosed in note 12.
Liquidity risk management covers daily, short term, and long term needs. The appropriate levels of liquidity are determined by both the nature of the Group’s business and its risk profi le. The Group monitors its liquidity position on a daily basis and prepares short term weekly cash fl ows of up to thirty weeks, on a monthly basis. In addition to this, the Group looks at cash fl ows on a medium term (< 12 months) and long term (> 12 months) basis through regular forecasts, annual budgets and long term business plans.
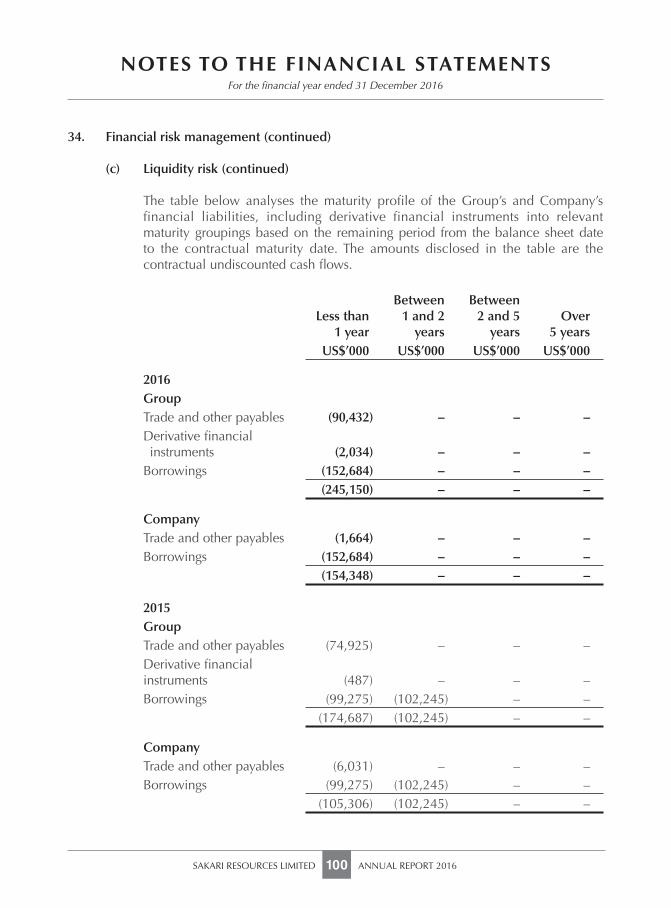
NOTES TO THE FINANCIAL STATEMENTS
SAKARI RESOURCES LIMITED ANNUAL REPORT 2016100
For the fi nancial year ended 31 December 2016
34. Financial risk management (continued)
(c) Liquidity risk (continued)
The table below analyses the maturity profi le of the Group’s and Company’s financial liabilities, including derivative financial instruments into relevant maturity groupings based on the remaining period from the balance sheet date to the contractual maturity date. The amounts disclosed in the table are the contractual undiscounted cash fl ows.
Less than 1 year
Between 1 and 2
years
Between 2 and 5
yearsOver
5 yearsUS$’000 US$’000 US$’000 US$’000
2016GroupTrade and other payables (90,432) – – –Derivative fi nancial instruments (2,034) – – –Borrowings (152,684) – – –
(245,150) – – –
CompanyTrade and other payables (1,664) – – –Borrowings (152,684) – – –
(154,348) – – –
2015GroupTrade and other payables (74,925) – – –Derivative fi nancial instruments (487) – – –Borrowings (99,275) (102,245) – –
(174,687) (102,245) – –
CompanyTrade and other payables (6,031) – – –Borrowings (99,275) (102,245) – –
(105,306) (102,245) – –
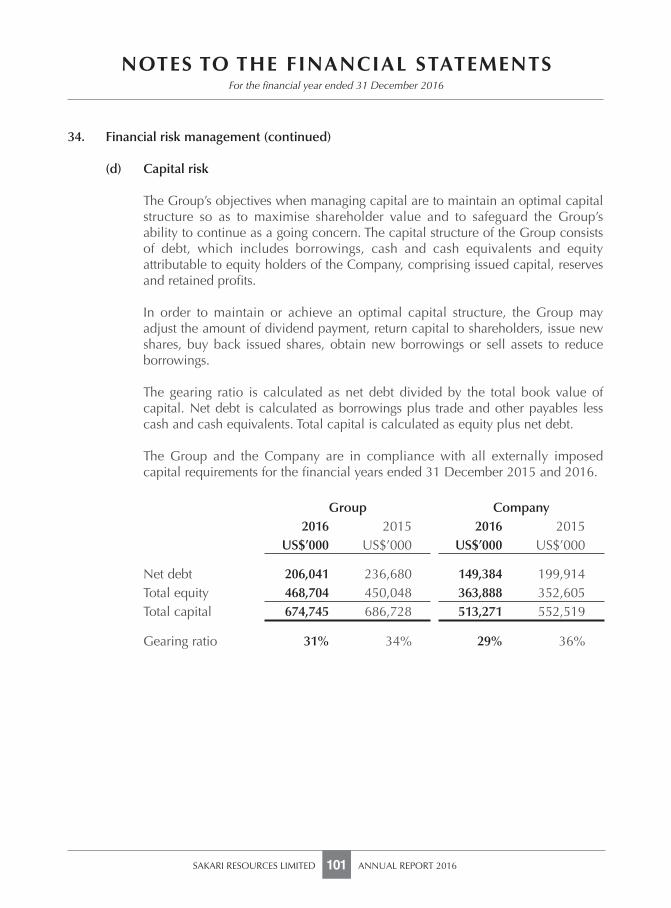
SAKARI RESOURCES LIMITED ANNUAL REPORT 2016101
NOTES TO THE FINANCIAL STATEMENTSFor the fi nancial year ended 31 December 2016
34. Financial risk management (continued)
(d) Capital risk
The Group’s objectives when managing capital are to maintain an optimal capital structure so as to maximise shareholder value and to safeguard the Group’s ability to continue as a going concern. The capital structure of the Group consists of debt, which includes borrowings, cash and cash equivalents and equity attributable to equity holders of the Company, comprising issued capital, reserves and retained profi ts.
In order to maintain or achieve an optimal capital structure, the Group may adjust the amount of dividend payment, return capital to shareholders, issue new shares, buy back issued shares, obtain new borrowings or sell assets to reduce borrowings.
The gearing ratio is calculated as net debt divided by the total book value of capital. Net debt is calculated as borrowings plus trade and other payables less cash and cash equivalents. Total capital is calculated as equity plus net debt.
The Group and the Company are in compliance with all externally imposed capital requirements for the fi nancial years ended 31 December 2015 and 2016.
Group Company2016 2015 2016 2015
US$’000 US$’000 US$’000 US$’000
Net debt 206,041 236,680 149,384 199,914Total equity 468,704 450,048 363,888 352,605Total capital 674,745 686,728 513,271 552,519
Gearing ratio 31% 34% 29% 36%
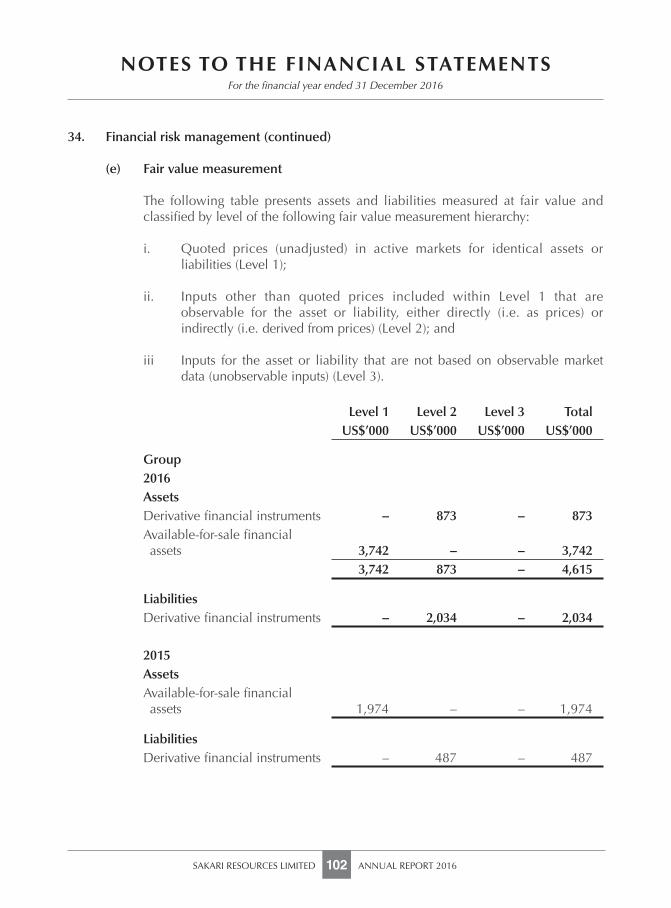
NOTES TO THE FINANCIAL STATEMENTS
SAKARI RESOURCES LIMITED ANNUAL REPORT 2016102
For the fi nancial year ended 31 December 2016
34. Financial risk management (continued)
(e) Fair value measurement
The following table presents assets and liabilities measured at fair value and classifi ed by level of the following fair value measurement hierarchy:
i. Quoted prices (unadjusted) in active markets for identical assets or liabilities (Level 1);
ii. Inputs other than quoted prices included within Level 1 that are observable for the asset or liability, either directly (i.e. as prices) or indirectly (i.e. derived from prices) (Level 2); and
iii Inputs for the asset or liability that are not based on observable market data (unobservable inputs) (Level 3).
Level 1 Level 2 Level 3 TotalUS$’000 US$’000 US$’000 US$’000
Group2016AssetsDerivative fi nancial instruments – 873 – 873Available-for-sale fi nancial assets 3,742 – – 3,742
3,742 873 – 4,615
LiabilitiesDerivative fi nancial instruments – 2,034 – 2,034
2015AssetsAvailable-for-sale fi nancial assets 1,974 – – 1,974
LiabilitiesDerivative fi nancial instruments – 487 – 487
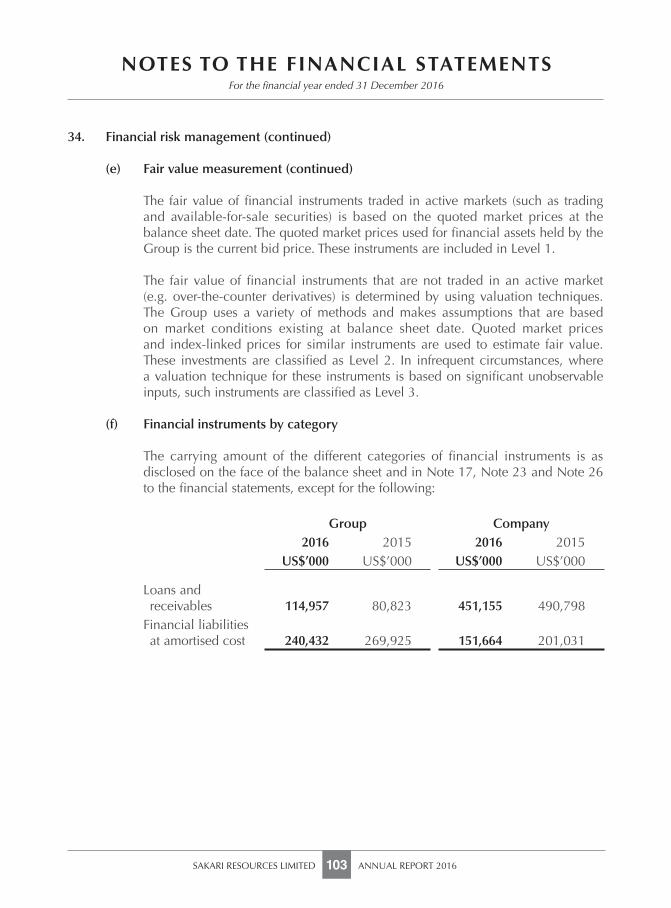
SAKARI RESOURCES LIMITED ANNUAL REPORT 2016103
NOTES TO THE FINANCIAL STATEMENTSFor the fi nancial year ended 31 December 2016
34. Financial risk management (continued)
(e) Fair value measurement (continued)
The fair value of fi nancial instruments traded in active markets (such as trading and available-for-sale securities) is based on the quoted market prices at the balance sheet date. The quoted market prices used for fi nancial assets held by the Group is the current bid price. These instruments are included in Level 1.
The fair value of fi nancial instruments that are not traded in an active market (e.g. over-the-counter derivatives) is determined by using valuation techniques. The Group uses a variety of methods and makes assumptions that are based on market conditions existing at balance sheet date. Quoted market prices and index-linked prices for similar instruments are used to estimate fair value. These investments are classifi ed as Level 2. In infrequent circumstances, where a valuation technique for these instruments is based on signifi cant unobservable inputs, such instruments are classifi ed as Level 3.
(f) Financial instruments by category
The carrying amount of the different categories of fi nancial instruments is as disclosed on the face of the balance sheet and in Note 17, Note 23 and Note 26 to the fi nancial statements, except for the following:
Group Company2016 2015 2016 2015
US$’000 US$’000 US$’000 US$’000
Loans and receivables 114,957 80,823 451,155 490,798Financial liabilities at amortised cost 240,432 269,925 151,664 201,031
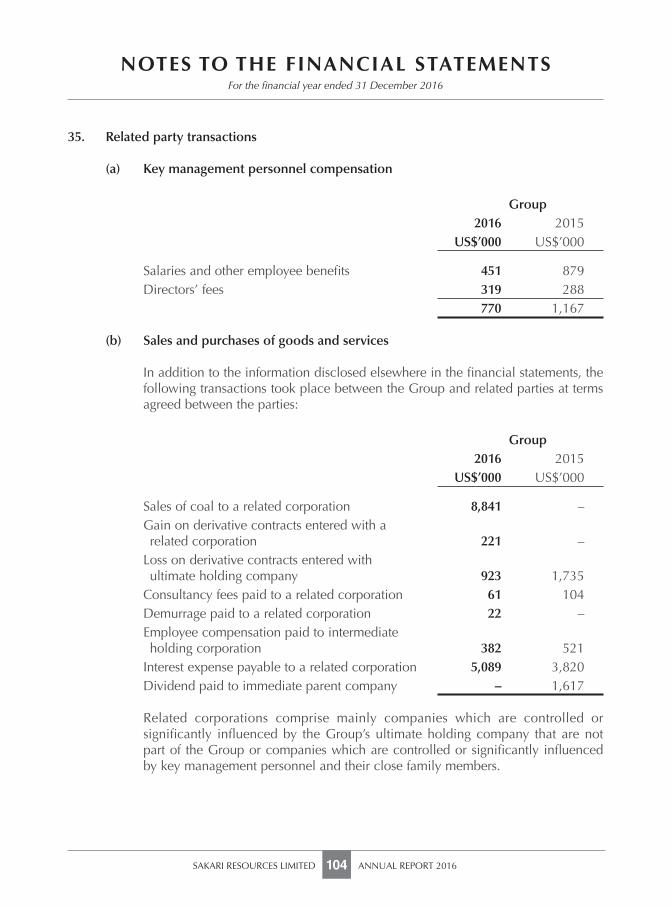
NOTES TO THE FINANCIAL STATEMENTS
SAKARI RESOURCES LIMITED ANNUAL REPORT 2016104
For the fi nancial year ended 31 December 2016
35. Related party transactions
(a) Key management personnel compensation
Group2016 2015
US$’000 US$’000
Salaries and other employee benefi ts 451 879Directors’ fees 319 288
770 1,167
(b) Sales and purchases of goods and services
In addition to the information disclosed elsewhere in the fi nancial statements, the following transactions took place between the Group and related parties at terms agreed between the parties:
Group2016 2015
US$’000 US$’000
Sales of coal to a related corporation 8,841 –Gain on derivative contracts entered with a related corporation 221 –Loss on derivative contracts entered with ultimate holding company 923 1,735Consultancy fees paid to a related corporation 61 104Demurrage paid to a related corporation 22 –Employee compensation paid to intermediate holding corporation 382 521Interest expense payable to a related corporation 5,089 3,820Dividend paid to immediate parent company – 1,617
Related corporations comprise mainly companies which are controlled or signifi cantly infl uenced by the Group’s ultimate holding company that are not part of the Group or companies which are controlled or signifi cantly infl uenced by key management personnel and their close family members.
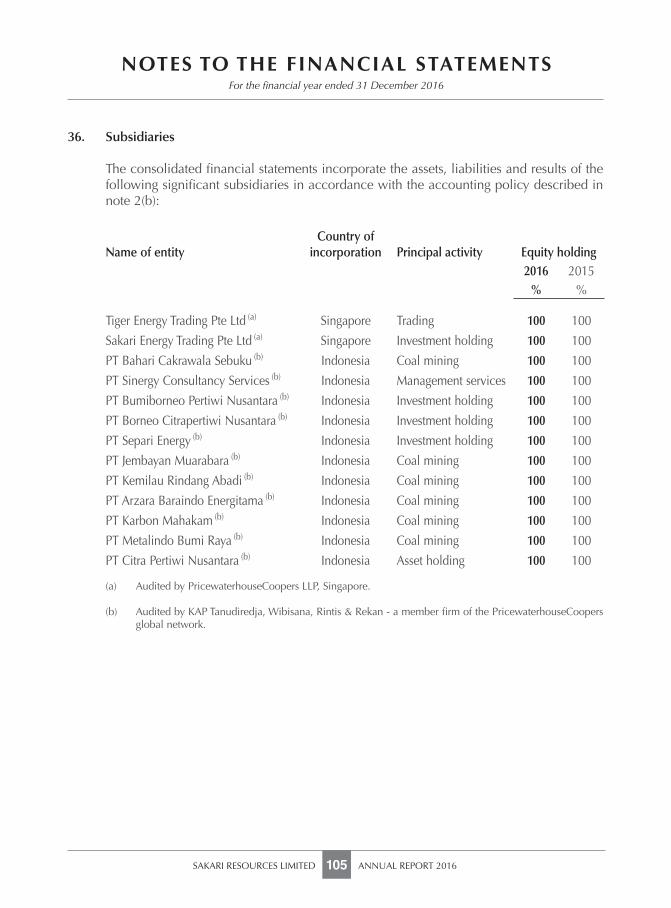
SAKARI RESOURCES LIMITED ANNUAL REPORT 2016105
NOTES TO THE FINANCIAL STATEMENTSFor the fi nancial year ended 31 December 2016
36. Subsidiaries
The consolidated fi nancial statements incorporate the assets, liabilities and results of the following signifi cant subsidiaries in accordance with the accounting policy described in note 2(b):
Name of entityCountry of
incorporation Principal activity Equity holding2016 2015
% %
Tiger Energy Trading Pte Ltd (a) Singapore Trading 100 100
Sakari Energy Trading Pte Ltd (a) Singapore Investment holding 100 100
PT Bahari Cakrawala Sebuku (b) Indonesia Coal mining 100 100
PT Sinergy Consultancy Services (b) Indonesia Management services 100 100
PT Bumiborneo Pertiwi Nusantara (b) Indonesia Investment holding 100 100
PT Borneo Citrapertiwi Nusantara (b) Indonesia Investment holding 100 100
PT Separi Energy (b) Indonesia Investment holding 100 100
PT Jembayan Muarabara (b) Indonesia Coal mining 100 100
PT Kemilau Rindang Abadi (b) Indonesia Coal mining 100 100
PT Arzara Baraindo Energitama (b) Indonesia Coal mining 100 100
PT Karbon Mahakam (b) Indonesia Coal mining 100 100
PT Metalindo Bumi Raya (b) Indonesia Coal mining 100 100
PT Citra Pertiwi Nusantara (b) Indonesia Asset holding 100 100
(a) Audited by PricewaterhouseCoopers LLP, Singapore.
(b) Audited by KAP Tanudiredja, Wibisana, Rintis & Rekan - a member fi rm of the PricewaterhouseCoopers global network.
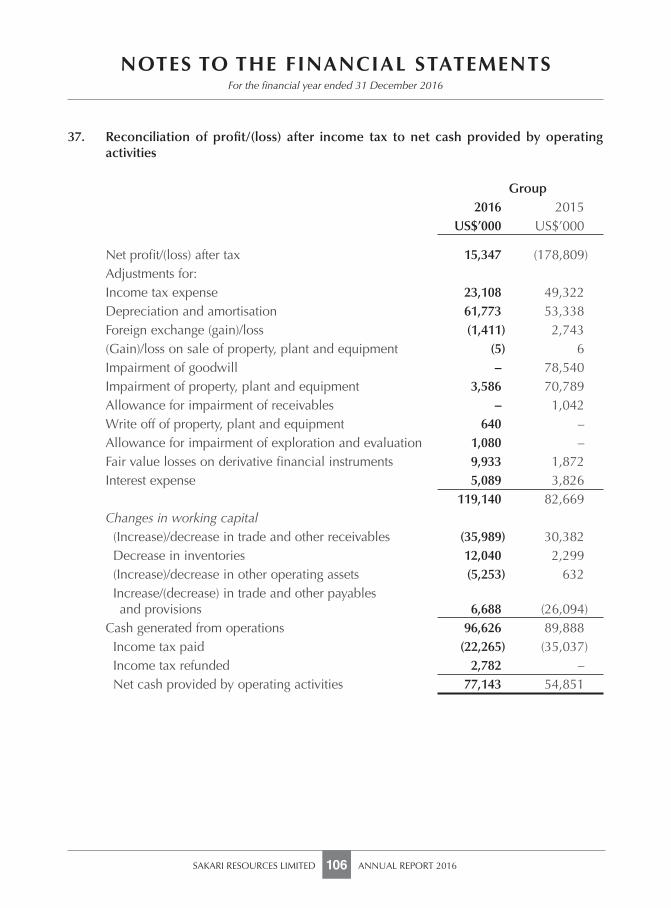
NOTES TO THE FINANCIAL STATEMENTS
SAKARI RESOURCES LIMITED ANNUAL REPORT 2016106
For the fi nancial year ended 31 December 2016
37. Reconciliation of profi t/(loss) after income tax to net cash provided by operating activities
Group2016 2015
US$’000 US$’000
Net profi t/(loss) after tax 15,347 (178,809)Adjustments for:Income tax expense 23,108 49,322Depreciation and amortisation 61,773 53,338Foreign exchange (gain)/loss (1,411) 2,743(Gain)/loss on sale of property, plant and equipment (5) 6Impairment of goodwill – 78,540Impairment of property, plant and equipment 3,586 70,789Allowance for impairment of receivables – 1,042Write off of property, plant and equipment 640 –Allowance for impairment of exploration and evaluation 1,080 –Fair value losses on derivative fi nancial instruments 9,933 1,872Interest expense 5,089 3,826
119,140 82,669Changes in working capital
(Increase)/decrease in trade and other receivables (35,989) 30,382Decrease in inventories 12,040 2,299(Increase)/decrease in other operating assets (5,253) 632Increase/(decrease) in trade and other payables and provisions 6,688 (26,094)
Cash generated from operations 96,626 89,888Income tax paid (22,265) (35,037)Income tax refunded 2,782 –Net cash provided by operating activities 77,143 54,851
SAKARI RESOURCES LIMITED ANNUAL REPORT 2016107
NOTES TO THE FINANCIAL STATEMENTSFor the fi nancial year ended 31 December 2016
38. Signifi cant laws and regulations that may have an impact on the Group
(a) Government Regulation No.78/2010
On 20 December 2010, the Government of Indonesia released Government Regulation No. 78/2010 (“GR No. 78”) that deals with reclamation and post-mining activities for both IUP-Exploration and IUP-Production Operation holders.
IUP-Production Operation holders, among other requirements, must prepare (1) a 5-year reclamation plan; (2) a post-mining plan; (3) provide a reclamation guarantee which may be in the form of a joint account or time deposit placed at a state-owned bank, a bank guarantee, or an accounting provision (if eligible); and (4) provide a post-mine guarantee in the form of a time deposit at a state-owned bank.
On 28 February 2014, the Minister of Energy and Mineral Resources (“MEMR”) released Ministerial Regulation No. 7/2014 as implementing regulation on reclamation and post-mining activities for mineral and coal mining companies which further regulates the aspect of reclamation plan, consideration of future value from the post-mining costs and accounting reserve determination.
The requirement to provide reclamation and post-mine guarantees does not release the IUP holder from the requirement to perform reclamation and post-mine activities. As at 31 December 2016, the Group has deposited US$11,707,213 to the government for reclamation and mine closure bond.
(b) Ministerial Regulation No. 28/2009 On 30 September 2009, the MEMR issued Ministerial Regulation No. 28/2009
which, among others, sets strict criteria for mining companies to be able to assign its ‘Affi liates’ or ‘Subsidiaries’ as their mining contractor and requires the directorate general’s approval on behalf of the minister.
The regulation provides exceptions only when no other capable mining service companies operate in the area.
Management believes that this regulation has no signifi cant impact to the Group’s operation.
NOTES TO THE FINANCIAL STATEMENTS
SAKARI RESOURCES LIMITED ANNUAL REPORT 2016108
For the fi nancial year ended 31 December 2016
38. Signifi cant laws and regulations that may have an impact on the Group (continued)
(c) Ministerial Regulation No. 34/2009
In December 2009, the MEMR issued Ministerial Regulation No. 34/2009, which provides a legal framework to require mining companies to sell a portion of their output to domestic customers (“Domestic Market Obligation” or “DMO”).
The Group is not exposed to DMO shortage penalty in 2016.
(d) Ministerial Regulation No. 17/2010
On 23 September 2010, the MEMR issued Ministerial Regulation No. 17/2010 outlining the mechanism for determining the Indonesian Minerals and Coal Benchmark Price (“IMCBP”) and which requires the sale of coal to be conducted with reference to the IMCBP.
On 24 March 2011, the DGMC issued regulation No. 515.K/32/DJB/2011 outlining the formula mechanism of Coal Benchmark Price for spot and term sales contracts.
On 26 August 2011, the DGMC issued Regulation No. 999.K/30/DJB/2011 on the Procedure for Determining the Adjustment Coal Benchmark Price. On 21 March 2013, this regulation was amended by the Director General Regulation No. 644.K/30/DJB/2013.
Management believes that the Group have complied with the requirements of the above regulations.
(e) Government Regulation No. 24/2012
Government Regulation (“GR”) No. 24/2012 which amends GR No. 23/2010 was signed by the President of the Republic of Indonesia on February 21, 2012. GR No. 24/2012 requires a gradual divestment scheme applicable for IUP and IUPK holders, such that in the tenth year from their production commissioning at least 51% of their shares shall be owned by Indonesian participant(s).
SAKARI RESOURCES LIMITED ANNUAL REPORT 2016109
NOTES TO THE FINANCIAL STATEMENTSFor the fi nancial year ended 31 December 2016
38. Signifi cant laws and regulations that may have an impact on the Group (continued)
(e) Government Regulation No. 24/2012 (continued)
On 13 September 2013, the MEMR issued Ministerial Regulation No. 27/2013 on the Procedures and Determination of Divestment Price as well as Changes in Capital Investment in Mineral and Coal Mining Businesses. Based on this regulation, the provision which governs the changes in capital investment consists of (a) changes in investment and fi nancing sources, (b) changes in company status from foreign investment to domestic investment or vice versa, (c) changes in Article of Association, (d) changes in the Board of Directors and Commissioners and (e) changes in shareholders composition.
On 14 October 2014, GR No. 77/2014 was issued which sets out progressive divestment requirements for mining companies owning different types of mining permits.
As at 31 December 2016, Management does not believe that the Group is impacted by this regulation.
39. New or revised accounting standards and interpretations
Below are the mandatory standards, amendments and interpretations to existing standards that have been published, and are relevant for the Group’s accounting periods beginning on or after 1 January 2017 or later periods and which the Group has not early adopted:
(a) FRS 115 Revenue from contracts with customers (effective for annual periods beginning on or after 1 January 2018)
This is the converged standard on revenue recognition. It replaces FRS 11 Construction contracts, FRS 18 Revenue, and related interpretations. Revenue is recognised when a customer obtains control of a good or service. A customer obtains control when it has the ability to direct the use of and obtain the benefi ts from the good or service. The core principle of FRS 115 is that an entity recognises revenue to depict the transfer of promised goods or services to
NOTES TO THE FINANCIAL STATEMENTS
SAKARI RESOURCES LIMITED ANNUAL REPORT 2016110
For the fi nancial year ended 31 December 2016
39. New or revised accounting standards and interpretations (continued)
(a) FRS 115 Revenue from contracts with customers (effective for annual periods beginning on or after 1 January 2018) (continued)
customers in an amount that refl ects the consideration to which the entity expects to be entitled in exchange for those goods or services. An entity recognises revenue in accordance with that core principle by applying the following steps:
- Step 1: Identify the contract(s) with a customer - Step 2: Identify the performance obligations in the contract - Step 3: Determine the transaction price - Step 4: Allocate the transaction price to the performanceobligations in
the contract - Step 5: Recognise revenue when (or as) the entity satisfi es a performance
obligation
FRS 115 also includes a cohesive set of disclosure requirements that will result in an entity providing users of fi nancial statements with comprehensive information about the nature, amount, timing and uncertainty of revenue and cash fl ows arising from the entity’s contracts with customers.
At this stage, the Group is not able to estimate the impact of the new rules on the Group’s fi nancial statements. The Group will make more detailed assessment of the impact over the next twelve months.
(b) FRS 109 Financial instruments (effective for annual periods beginning on or after 1 January 2018)
The complete version of FRS 109 replaces most of the guidance in FRS 39.
FRS 109 retains the mixed measurement model and establishes three primary measurement categories for fi nancial assets: amortised cost, fair value through Other Comprehensive Income (OCI) and fair value through Profi t or Loss. The basis of classifi cation depends on the entity’s business model and the contractual cash fl ow characteristics of the fi nancial asset. Investments in equity instruments are required to be measured at fair value through profit or loss with the irrevocable option at inception to present changes in fair value in OCI.
SAKARI RESOURCES LIMITED ANNUAL REPORT 2016111
NOTES TO THE FINANCIAL STATEMENTSFor the fi nancial year ended 31 December 2016
39. New or revised accounting standards and interpretations (continued)
(b) FRS 109 Financial instruments (effective for annual periods beginning on or after 1 January 2018) (continued)
While the Group has yet to undertake a detailed assessment of the classifi cation and measurement of fi nancial assets, the investment in equity securities currently classifi ed as available-for-sale (AFS) fi nancial assets would appear to satisfy the conditions for classifi cation as at fair value through OCI and hence there will be no change to the accounting for these assets.
The other fi nancial assets held by the Group include:
equity instruments currently classifi ed as AFS for which fair value through OCI election is available;
equity investments currently measured at fair value through profi t or loss which would likely to continue to be measured on the same basis under FRS 109; and
debt instruments classifi ed as held-to-maturity or loans and receivables and measured at amortised cost appear to meet the conditions for classifi cation at amortised cost under FRS 109.
Accordingly, the Group does not expect the new guidance to have a signifi cant impact on the classifi cation of its fi nancial assets.
For fi nancial liabilities there were no changes to classifi cation and measurement except for the recognition of changes in own credit risk in OCI, for liabilities designed at fair value through profi t or loss. There will be no impact on the Group’s accounting for fi nancial liabilities as the Group does not have any such liabilities.
FRS 109 relaxes the requirements for hedge effectiveness by replacing the bright
line hedge effectiveness tests. It requires an economic relationship between the hedged item and hedging instrument and for the ‘hedged ratio’ to be the same as the one management actually use for risk management purposes. The Group does not expect a signifi cant impact on the fi nancial statements as it does not apply hedge accounting.
NOTES TO THE FINANCIAL STATEMENTS
SAKARI RESOURCES LIMITED ANNUAL REPORT 2016112
For the fi nancial year ended 31 December 2016
39. New or revised accounting standards and interpretations (continued)
(b) FRS 109 Financial instruments (effective for annual periods beginning on or after 1 January 2018) (continued)
There is now a new expected credit losses model that replaces the incurred loss impairment model used in FRS 39. It applies to fi nancial assets classifi ed at amortised cost, debt instruments measured at fair value through OCI, contract assets under FRS 115 Revenue from contracts with customers, lease receivables, loan commitments and certain fi nancial guarantee contracts. While the Group has not yet undertaken a detailed assessment of how its impairment provisions would be affected by the new model, it may result in an earlier recognition of credit losses.
The new standard also introduces expanded disclosure requirements and changes in presentation. These are expected to change the nature and extent of the Group’s disclosures about its fi nancial instruments particularly in the year of the adoption of the new standard.
(c) FRS 116 Leases (effective for annual periods beginning on or after 1 January 2019)
FRS 116 will result in almost all leases being recognised on the balance sheet, as the distinction between operating and fi nance leases is removed. Under the new standard, an asset (the right to use the leased item) and a fi nancial liability to pay rentals are recognised. The only exceptions are short-term and low-value leases. The accounting for lessors will not change signifi cantly.
The standard will affect primarily the accounting for the Group’s operating leases. As at the reporting date, the Group has non-cancellable operating lease commitments of US$826,000 (Note 33). However, the Group has yet to determine to what extent these commitments will result in the recognition of an asset and a liability for future payments and how this will affect the Group’s profi t and classifi cation of cash fl ows.
Some of the commitments may be covered by the exception for short-term and low-value leases and some commitments may relate to arrangements that will not qualify as leases under FRS 116.
40. Authorisation of fi nancial statements
These fi nancial statements were authorised for issue in accordance with a resolution of the Board of Directors of Sakari Resources Limited on 20 February 2017.
SAKARI RESOURCES LIMITED ANNUAL REPORT 2016113
NOTICE OF ANNUAL GENERAL MEETING
SAKARI RESOURCES LIMITED(Company Registration Number: 199504024R)
(Incorporated in the Republic of Singapore)
NOTICE OF ANNUAL GENERAL MEETING
NOTICE IS HEREBY GIVEN that the Annual General Meeting of SAKARI RESOURCES LIMITED (“the Company”) will be held at the Marie I and II, York Hotel, 21 Mount Elizabeth, Singapore 228516 on Monday, 19 June 2017 at 14:00 for the following purposes:
AS ORDINARY BUSINESS
To consider and, if thought fi t, to pass the following resolutions as Ordinary Resolutions, with or without any modifi cations:
1. To receive and adopt the Directors’ Statement and the Audited Financial Statements of the Company for the year ended 31 December 2016 together with the Auditors’ Report thereon. (Resolution 1)
2. To re-elect the following Directors retiring pursuant to Articles 94 and 100 of the Company’s Constitution:
Mr Surong Bulakul [Retiring under Article 94] (Resolution 2)
Mr Thanakorn Poolthavee [Retiring under Article 94] (Resolution 3)
Mr Wirat Uanarumit [Retiring under Article 100] (Resolution 4)
Mr Thanakorn Poolthavee will, upon re-election as a Director of the Company, remain as a member of the Audit, Risk & Compliance Committee.
Mr Wirat Uanarumit will upon re-election as a Director of the Company, remain as Chairman of the Remuneration and Nomination Committee.
3. To approve the payment of directors’ fees of up to S$501,000 payable by the Company for the year ending 31 December 2017. (Resolution 5)
4. To re-appoint PriceWaterhouseCoopers LLP as the Company’s Auditors to hold offi ce until the conclusion of the next Annual General Meeting and to authorise the Directors to fi x their remuneration. (Resolution 6)
NOTICE OF ANNUAL GENERAL MEETING
SAKARI RESOURCES LIMITED ANNUAL REPORT 2016114
5. To transact any other ordinary business which may properly be transacted at an Annual General Meeting.
By Order of the Board
Seow Han Chiang WinstonCompany SecretarySingapore1 June 2017
Notes:
1. A Member entitled to attend and vote at the Annual General Meeting (the “Meeting”) is entitled to appoint one (1) or two (2) proxies to attend and vote in his/her stead. A proxy need not be a Member of the Company.
2. The instrument appointing a proxy must be deposited at the Registered Offi ce of the Company at 391B Orchard Road, Ngee Ann City Tower B #17-01, Singapore 238874 not less than 48 hours before the time appointed for holding the Meeting.
SAKARI RESOURCES LIMITED ANNUAL REPORT 2016115
GLOSSARY
The following defi nitions apply throughout this Annual Report:
“ASP” Average selling price
“Board” The Board of Directors of Sakari
“CEO” Chief Executive Offi cer
“Sakari”, “Company” Sakari Resources Limited
“Group” Sakari and its subsidiaries
“ha” Hectares
“Mt” Millions of metric tonnes
“pa” per year
“PTT” PTT Public Company Limited Ltd, Sakari’s ultimate holding company
“t” One metric tonne
“Kt” Thousands of metric tonnes
“$”, “US$” United States dollars
“CY” Calendar year
391B Orchard Road #17-01Ngee Ann City Tower B Singapore 238874
Tel : +65 6499 4100www.sakariresources.com