Embed Size (px)
Citation preview

Annual Report 2016

Introduction We Are HEINEKEN 01
Report of the Executive BoardChief Executive’s Statement 02
Strong performance and progress 04
Key figures 05
Our impact on society: From Barley to Bar 06
Executive Team 08
Our business priorities 09
Win in premium led by Heineken® 10
Shape the cider category 11
Lead by cool marketing and innovation 12
Be commercially assertive 13
Drive end2end productivity 14
Brewing a Better World 15
Regional Review 16
Africa, Middle East and Eastern Europe 17
Americas 18
Asia Pacific 19
Europe 20
Risk Management 21
Financial Review 28
Corporate Governance Statement 33
Report of the Supervisory BoardTo the Shareholders 46
Remuneration Report 50
Financial StatementsConsolidated Income Statement 59
Consolidated Statement of Comprehensive Income 60
Consolidated Statement of Financial Position 61
Consolidated Statement of Cash Flows 62
Consolidated Statement of Changes in Equity 64
Notes to the Consolidated Financial Statements 66
Heineken N.V. Balance Sheet 124
Heineken N.V. Income Statement 125
Notes to the Heineken N.V. Financial Statements 126
Sustainability ReviewBrewing a Better World: our sustainability performance 135
Protecting water resources 136
Reducing CO2 emissions 138
Sourcing sustainably 140
Advocating responsible consumption 141
Promoting health and safety 143
Growing with communities 144
Reporting basis and criteria non-financial indicators 146
List of operating companies for non-financial indicators 151
Other InformationAppropriation of Profit 153
Independent Auditor’s Report 154
Deloitte Assurance Report 158
Shareholder Information 160
Bondholder Information 164
Historical Summary 165
Glossary 167
Reference Information 169
Disclaimer 170
Heineken N.V. Annual Report 2016 Introduction
Report of the Executive Board
Report of the Supervisory Board
Financial Statements
Sustainability Review
Other Information
Inside this year’s report
Further information online at: theHEINEKENcompany.com– Download the Annual Report
– Find out about HEINEKEN’s history
– Explore our countries and brands
– Read more about our sustainability journey
Follow us on Twitter for news and updates: @HEINEKENCorp

We build true human connections and break down barriers, because we believe great moments of shared experiences are the best in life.We are inspired by consumers to brew the best beers and extend that same passion to all of our brands, products and activities.We are proud of our family history and Dutch heritage and derive from them our entrepreneurial spirit that takes us to every corner of the world.We are brand builders. The Heineken® brand defines and unites us while our many local, regional and global brands make our portfolio diverse and unique.People are at the heart of our company. We see our strength in trust, diversity and progress.We stand by our values: passion for quality, enjoyment of life, respect for people and for the planet.We always advocate for responsible consumption. We are committed to our communities and strive to consistently improve the impact we make on the planet.We work with our customers and partners to grow together and seek to win with integrity and fairness.And we are convinced that by staying true to these commitments, we create value for our shareholders.We Are HEINEKEN.
01 Heineken N.V. Annual Report 2016 Introduction
Report of the Executive Board
Report of the Supervisory Board
Financial Statements
Sustainability Review
Other Information
We Are HEINEKEN
2016 was another strong year for HEINEKEN despite a tough economic environment, significant currency fluctuations and geopolitical instability. Organic revenue grew by 4.8% with revenue per hectolitre up 2.2%. In addition, our operating profit (beia) grew by 9.9%, Diluted Earnings Per Share (beia) increased by 2.9% to EUR 3.68, and we delivered a margin expansion of more than 50 basis points.
We benefited from our unique diversified footprint. Whereas our Africa, Middle East and Eastern Europe region was negatively affected by adverse economic circumstances, Europe, Asia and the Americas performed well, with Vietnam and Mexico particularly strong.
The Heineken® brand grew 3.7%, with positive volume performance across all regions. Innovations under the brand include the new ‘wild lager’ beers H41 and H71, which were launched in selected markets in Europe. In addition to our UEFA Champions League, Rugby and James Bond sponsorships, we announced a five-year partnership with Formula 1® in May. The partnership allows us to connect with more consumers, particularly in high growth markets, and to build a bold responsible marketing campaign. In the next five years, we will commit EUR 200 million and our best marketing brains to reinforce our ‘When You Drive, Never Drink’ message with campaigns in markets around the world.
Our International Brands portfolio outperformed overall portfolio growth. Amstel, which now sells in more than 100 markets, reached 11.5 million hectolitres and is a challenger in its segment. Tecate and Tiger delivered stellar growth. Tiger reached the 10 million hectolitre milestone much earlier than anticipated and expanded sales to a total of almost 60 markets. Both Tecate and Tiger are connecting with consumers through the positions they are taking on things that matter to these brands and consumers alike.
In the last two years, our Cider portfolio has grown from 25 markets to now being enjoyed in a total of 41. In 2016, the UK, the home of ciders, also grew. Overall, our consolidated cider volume grew to 4.8 million hectolitres. The growth of cider has been fuelled in particular by Strongbow Apple Ciders, our flagship brand, but is also supported by the growth of our other cider brands, including our newest, Orchard Thieves, and the continuous ingredient and flavour innovations of the portfolio.
We see a lot of potential for our low- and no-alcohol portfolio, which in 2016 reached a consolidated volume of 12.3 million hectolitres. The portfolio continues to develop with new innovations that expand consumer choice. We are learning a lot from brands like Amstel, Fayrouz, Bintang and Cruzcampo and in markets like Nigeria, Indonesia and Spain where this part of the business is thriving. In 2016, Radler extended beyond European markets into Mongolia, Egypt and Chile and Radler 0.0% launched in five markets. We see a lot of opportunity for growth and are very excited to launch Heineken 0.0 in 2017.
In 2016, HEINEKEN continued to invest in key developing markets. We added capacity in Ethiopia and Cambodia. We opened a brewery in Shanghai, acquired a brewery in Vietnam, and we are building a new brewery in Mexico.
Chief Executive’s Statement
02 Heineken N.V. Annual Report 2016 Introduction
Report of the Executive Board
Report of the Supervisory Board
Financial Statements
Sustainability Review
Other Information

In addition, we continued to optimise costs, leverage our size, and improve the efficiency of our Financial Shared Services and Global Procurement. Our operations improved productivity despite increasing complexity brought about by an enlarged product offering and increased personalisation requirements from retailers.
Efficiency and productivity targets are tightly linked to our Brewing a Better World strategy. In 2016, we decreased our water consumption to 3.6 hl/hl from 3.7 hl/hl in the previous year. These savings would be equivalent to more than 1,000 Olympic-sized swimming pools of water. Our CO2 emissions in production decreased to 6.5 kg CO2-eq/hl, down from 6.7 kg CO2-eq/hl in 2015. This reduction is similar to the emissions saved by installing nearly 300,000 solar panels.
We are on track with most of our 2020 Brewing a Better World commitments and during 2017 we will define our 2030 ambitions in line with the UN Sustainable Development Goals (SDGs) and COP21. In the last seven years, since we kicked off Brewing a Better World, our CO2 emissions have decreased 5%, despite our business volume growing by 52%. But this is not enough. As a result of the Paris Agreements of COP21, we will redouble our efforts in emission reduction.
Preparing for the future requires above all great leaders that can do more than drive excellent financial performance. In 2016, 150 of our most senior leaders attended a week-long residential course at Harvard Business School. We are rolling out a renewed guide of Leadership Expectations and a new Inclusion and Diversity Platform will help us to better leverage our global talent pool. HEINEKEN is a very inclusive company and we see diversity as a richness. Five nationalities are represented in our Supervisory Board, seven in our Executive Team and 53 in our senior leader community. We now aim to increase our focus on gender diversity. Our values guide how we work and conduct our business and we support the principles of the OECD guidelines.
This is the first year we have produced a joint annual and sustainability report. We feel strongly that our aim is to run the business sustainably throughout our operations. Disclosing the progress of Brewing a Better World together with our financial results is the right thing to do going forward.
In 2017, economic conditions are expected to remain volatile and we have assumed a negative impact from currency comparable to 2016. We expect further organic revenue and profit growth. Excluding major unforeseen macroeconomic and political developments as well as the impact of proposed acquisitions in Brazil and in the UK, we expect continued margin expansion in 2017 in line with the medium term margin guidance of a year-on-year improvement in operating profit (beia) margin of around 40bps. Capital expenditure related to property, plant and equipment should be slightly below EUR 2 billion.
I end this letter by expressing my gratitude to our customers, partners and stakeholders. I especially want to thank our employees for their dedication and effort, they are the backbone of these results. I am looking forward to working with all of you in 2017.
Jean-François van BoxmeerChairman of the Executive Board/CEO
Amsterdam, 14 February 2017
03 Heineken N.V. Annual Report 2016 Introduction
Report of the Executive Board
Report of the Supervisory Board
Financial Statements
Sustainability Review
Other Information

We’re making good progress and are on track to reach the majority of our 2020 commitments. Brewing a Better World is one of our six key business priorities. It focuses on six areas where we can make the biggest difference and inspires our brands to align their brand purpose with environmental and social issues. One example is Tecate, which is raising awareness of domestic violence.
We’re making good progress in all of our six focus areas, putting us on track to reach the majority of our commitments for 2020. This gives us the strength and determination to try harder. We are currently looking beyond 2020 as we raise our ambitions for the future, in line with the Paris Agreement on climate change (COP21), the UN Sustainable Development Goals and our conversations with stakeholders. We will announce these ambitions in the course of 2017.
135 Heineken N.V. Annual Report 2016 Introduction
Report of the Executive Board
Report of the Supervisory Board
Financial Statements
Sustainability Review
Other Information
Growing with communities
Protecting water resources
Reducing CO2 emissions
Sourcing sustainably
Advocating responsible
consumption
Promoting health and safety
Sustainability Review
Brewing a Better World: our sustainability performance
Visit our website to explore our Brewing a Better World governance, material issues, stakeholder engagement and performance – along with case studies from our businesses around the world. From March 2017, you’ll be able to explore additional non-financial indicators and GRI-4 tables.
Our strategy focuses on six areas

Water is a shared resource and essential for everyone on this planet. Without water, HEINEKEN wouldn’t exist – beer is 95% water. We use water throughout our supply chain, from growing crops to our finished products. As global demand for water continues to rise, we take our responsibility to minimising our water footprint.
Protecting water resources
Our 2020 commitment
– Reduce water consumption in our breweries to 3.5 hl/hl.1
– Reduce water consumption in our breweries to 3.3 hl/hl in water-stressed areas.
Our 2018 milestone
– Reduce water consumption in our breweries to 3.6 hl/hl.
Our progress in 2016
On track
– We decreased average water consumption in our breweries worldwide to 3.6 hl/hl in 2016, reaching our 2018 milestone.
– We decreased average water consumption in our breweries in water-stressed areas to 3.3 hl/hl, reaching our 2020 commitment faster than planned (2015: 3.6 hl/hl, 2014: 3.8 hl/hl).
– We’ve already achieved our 3.5 hl/hl 2020 target in more than 63% of our total production volume.
– At a number of sites, water consumption is still too high. 33 sites still use above 5 hl/hl, representing 7% of our volume.
Looking ahead
Our next step will be to promote water recycling in our production processes in water-stressed areas. We’ve developed a new Governance Standard that will help our breweries upgrade their treated wastewater to drinking water quality, enabling it to be reused in a range of non-product applications. We plan to implement this technology in our breweries in Mexico and Indonesia in 2017.
Reduce water consumption in our breweries
Water consumption Hl/hl beer + cider + soft drinks + water
3.6 hl/hl
2009
2010
2011
2012
2013
2014
3.7
3.6
4.8
4.5
4.3
4.2
4.1
3.9
2008 5.0
2015
2016
3.3 hl/hlaverage water consumption in our breweries in water-stressed areas
1,011Olympic-sized pools – the equivalent of water we saved in 2016 compared to 2015
€13.5msaved through water efficiency since 2009
28%decrease in water consumption (hl/hl) compared with 2008
1 Baseline 2008.
For more on our water stewardship approach and progress, see our website
136 Heineken N.V. Annual Report 2016 Introduction
Report of the Executive Board
Report of the Supervisory Board
Financial Statements
Sustainability Review
Other Information
Sustainability Review (continued)
Our 2020 commitment
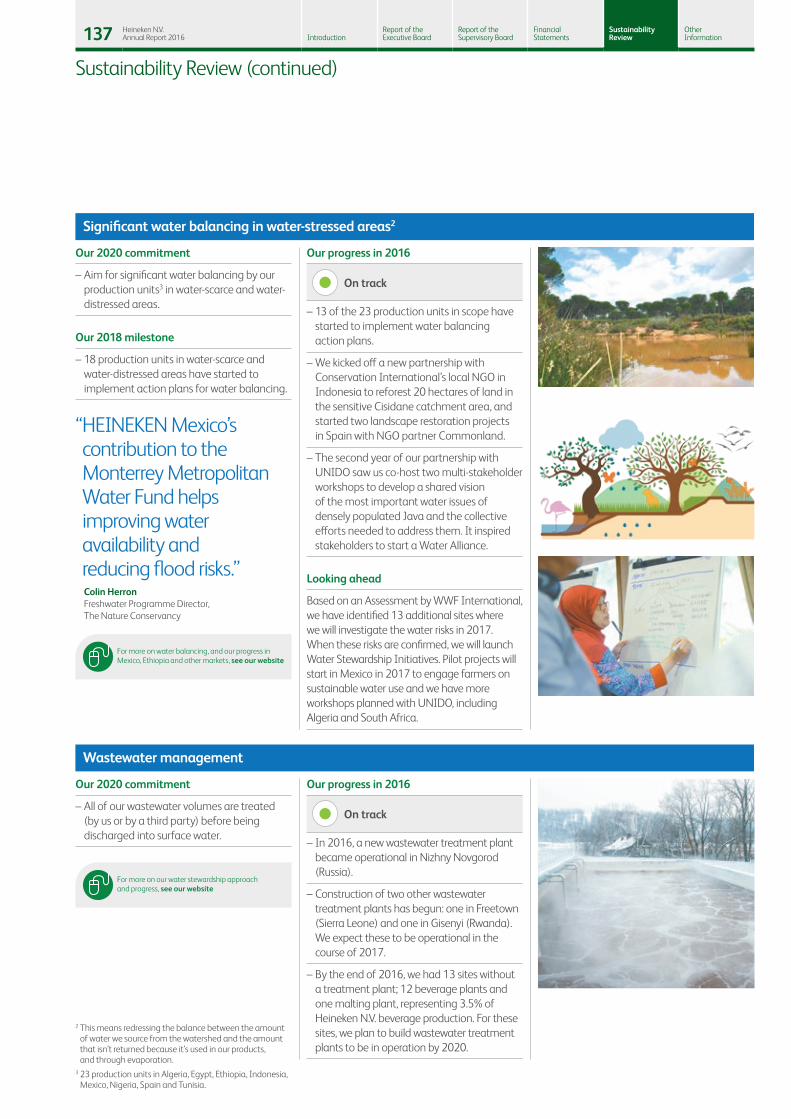
– Aim for significant water balancing by our production units3 in water-scarce and water-distressed areas.
Our 2018 milestone
– 18 production units in water-scarce and water-distressed areas have started to implement action plans for water balancing.
Our progress in 2016
On track
– 13 of the 23 production units in scope have started to implement water balancing action plans.
– We kicked off a new partnership with Conservation International’s local NGO in Indonesia to reforest 20 hectares of land in the sensitive Cisidane catchment area, and started two landscape restoration projects in Spain with NGO partner Commonland.
– The second year of our partnership with UNIDO saw us co-host two multi-stakeholder workshops to develop a shared vision of the most important water issues of densely populated Java and the collective efforts needed to address them. It inspired stakeholders to start a Water Alliance.
Looking ahead
Based on an Assessment by WWF International, we have identified 13 additional sites where we will investigate the water risks in 2017. When these risks are confirmed, we will launch Water Stewardship Initiatives. Pilot projects will start in Mexico in 2017 to engage farmers on sustainable water use and we have more workshops planned with UNIDO, including Algeria and South Africa.
Our 2020 commitment
– All of our wastewater volumes are treated (by us or by a third party) before being discharged into surface water.
Our progress in 2016
On track
– In 2016, a new wastewater treatment plant became operational in Nizhny Novgorod (Russia).
– Construction of two other wastewater treatment plants has begun: one in Freetown (Sierra Leone) and one in Gisenyi (Rwanda). We expect these to be operational in the course of 2017.
– By the end of 2016, we had 13 sites without a treatment plant; 12 beverage plants and one malting plant, representing 3.5% of Heineken N.V. beverage production. For these sites, we plan to build wastewater treatment plants to be in operation by 2020.
Significant water balancing in water-stressed areas2
Wastewater management
2 This means redressing the balance between the amount of water we source from the watershed and the amount that isn’t returned because it’s used in our products, and through evaporation.
3 23 production units in Algeria, Egypt, Ethiopia, Indonesia, Mexico, Nigeria, Spain and Tunisia.
“ HEINEKEN Mexico’s contribution to the Monterrey Metropolitan Water Fund helps improving water availability and reducing flood risks.”
Colin Herron Freshwater Programme Director, The Nature Conservancy
For more on water balancing, and our progress in Mexico, Ethiopia and other markets, see our website
For more on our water stewardship approach and progress, see our website
137 Heineken N.V. Annual Report 2016 Introduction
Report of the Executive Board
Report of the Supervisory Board
Financial Statements
Sustainability Review
Other Information
Sustainability Review (continued)
Our 2020 commitment
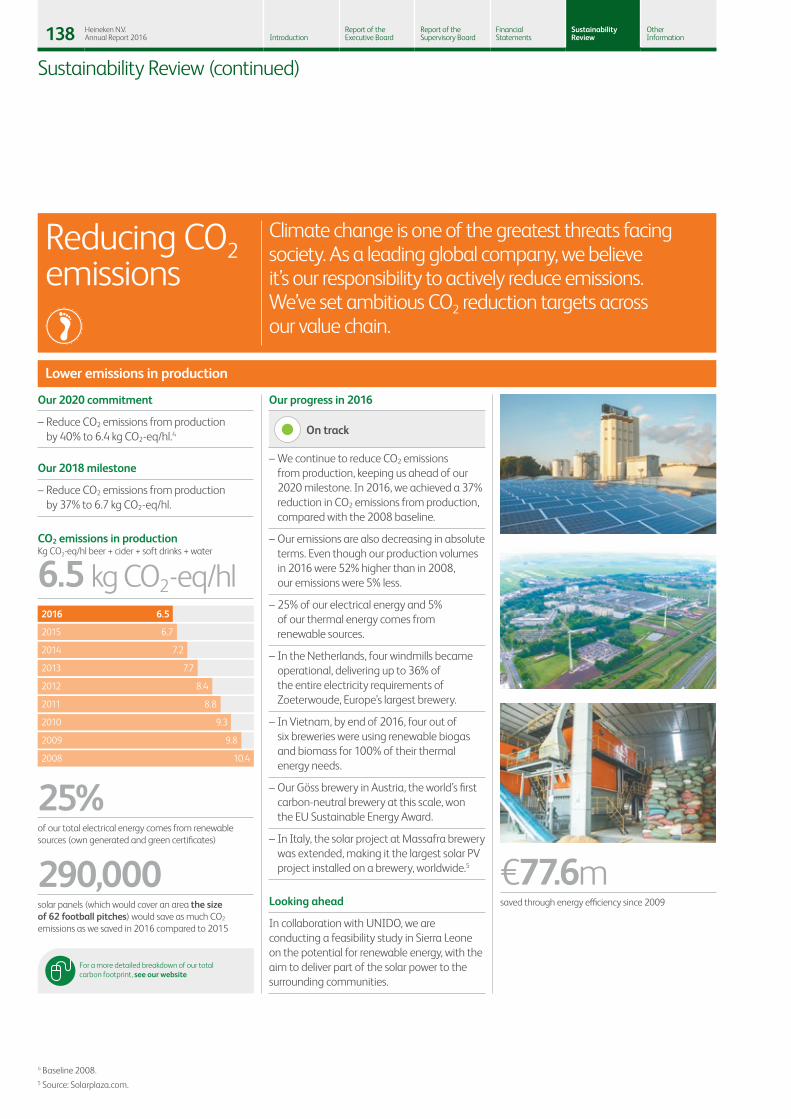
– Reduce CO2 emissions from production by 40% to 6.4 kg CO2-eq/hl.4
Our 2018 milestone
– Reduce CO2 emissions from production by 37% to 6.7 kg CO2-eq/hl.
Our progress in 2016
On track
– We continue to reduce CO2 emissions from production, keeping us ahead of our 2020 milestone. In 2016, we achieved a 37% reduction in CO2 emissions from production, compared with the 2008 baseline.
– Our emissions are also decreasing in absolute terms. Even though our production volumes in 2016 were 52% higher than in 2008, our emissions were 5% less.
– 25% of our electrical energy and 5% of our thermal energy comes from renewable sources.
– In the Netherlands, four windmills became operational, delivering up to 36% of the entire electricity requirements of Zoeterwoude, Europe’s largest brewery.
– In Vietnam, by end of 2016, four out of six breweries were using renewable biogas and biomass for 100% of their thermal energy needs.
– Our Göss brewery in Austria, the world’s first carbon-neutral brewery at this scale, won the EU Sustainable Energy Award.
– In Italy, the solar project at Massafra brewery was extended, making it the largest solar PV project installed on a brewery, worldwide.5
Looking ahead
In collaboration with UNIDO, we are conducting a feasibility study in Sierra Leone on the potential for renewable energy, with the aim to deliver part of the solar power to the surrounding communities.
Climate change is one of the greatest threats facing society. As a leading global company, we believe it’s our responsibility to actively reduce emissions. We’ve set ambitious CO2 reduction targets across our value chain.
Reducing CO2 emissions
Lower emissions in production
4 Baseline 2008. 5 Source: Solarplaza.com.
CO2 emissions in production Kg CO2-eq/hl beer + cider + soft drinks + water
6.5 kg CO2-eq/hl
2009
2010
2011
2012
2013
2014
6.7
6.5
9.8
9.3
8.8
8.4
7.7
7.2
2008 10.4
2015
2016
290,000solar panels (which would cover an area the size of 62 football pitches) would save as much CO2 emissions as we saved in 2016 compared to 2015
25%of our total electrical energy comes from renewable sources (own generated and green certificates)
€77.6msaved through energy efficiency since 2009
For a more detailed breakdown of our total carbon footprint, see our website
138 Heineken N.V. Annual Report 2016 Introduction
Report of the Executive Board
Report of the Supervisory Board
Financial Statements
Sustainability Review
Other Information
Sustainability Review (continued)

Our 2020 commitment
– Reduce the CO2 emissions from distribution by 20%6 in Europe and the Americas.
Our 2018 milestone
– Reduce the CO2 emissions from distribution by 16% in Europe and 0% in the Americas.
Our progress in 2016 7
Europe: On track
Americas: not available
– Emissions in Europe (including Russia and Belarus) went down 3.8% from 2015 and 13.2% compared to baseline year, putting us on track to meet our commitment for the region. Poland, Netherlands and Serbia have already achieved the 2020 commitment of 20% reduction.
– USA and Brazil are showing progress compared to last year, but the results for Mexico needed more time for validation. Given Mexico’s significant impact on the regional (Americas) and global number we will disclose final results by end of March in the sustainability section of the Company website.
Looking ahead
Our new brewery in Chihuahua, northern Mexico, is due to be operational in late 2017 which will make a positive contribution to further emission reduction in distribution. This is because we will become less dependent on transporting products from our breweries in the south to meet demand in the north.
Our 2020 commitment
– Reduce the CO2 emissions of our fridges by 50%.8
Our 2018 milestone
– 100% green fridges purchased.
– Reduce the CO2 emissions of our fridges by 47%.
Our progress in 2016
On track
– Almost 100% of our 125,059 new fridges in 2016 had one or more green features: use of hydrocarbon refrigerant, LED illumination, an energy management system and energy-efficient fans.
– CO2 emissions per fridge were almost 46% less than in 2010, putting us on track to reach our 2020 commitment.
Reduced emissions from distribution in Europe and the Americas
Lower emissions in our fridges
6 Baseline 2010/2011, scope is Europe and Americas, 24 of our largest operations: Belgium, Bulgaria, France, Ireland, Italy, Netherlands, Portugal, Spain, Switzerland, UK, Austria, Belarus, Croatia, Czech Republic, Greece, Hungary, Poland, Romania, Russia, Serbia, Slovakia, Brazil, Mexico, USA. Outbound transport under HEINEKEN control. Excluding Slovenia as this operation has not started its Logistic Programme in 2016.
7 At the time of publication, this indicator was not assured; however, final externally assured data will be published on the HEINEKEN website by the end of March 2017. 8 Baseline 2010.
For more information on how we reduce CO2 emissions across our value chain and how we move towards circular business models, see our website
We are exploring opportunities to shift towards sustainable bio-fuel for road freight and ocean freight in a number of countries.
139 Heineken N.V. Annual Report 2016 Introduction
Report of the Executive Board
Report of the Supervisory Board
Financial Statements
Sustainability Review
Other Information
Sustainability Review (continued)

Our 2020 commitment
– Deliver 60% of agricultural raw materials in Africa via local sourcing within the continent.
Our 2018 milestone
– 56%11 of agricultural raw materials used in Africa to be locally sourced12 from within the continent.
Our progress in 2016
More to do
– We sourced an estimated 49% of the agricultural raw materials we used in Africa and the Middle East locally in 2016, showing we still have work to do to meet our 2020 commitment.
– The total percentage remained on the same level as in 2015 due to the consolidation of South Africa into our reporting for the first time.
– Excluding this new market we increased local sourcing to 53% on a like-for-like basis with 2015.
– We’re now sourcing in 13 operating companies across 27 different value chains, including five Public-Private Partnerships.
Looking ahead
To achieve 60% local sourcing in Africa in 2020, we need to continue to encourage and support partners to invest in new processing capacity in several markets.
Source agricultural raw materials locally in Africa and Middle East
9 In scope are barley, hops, apples, sugar beet, sugar cane, rice, sorghum, wheat and maize.10 Including Joint Ventures that fall under our global purchase organisations. At the time of
publication, this indicator was not assured; however, final externally assured data will be published on the HEINEKEN website by the end of March 2017.
11 Based upon volume (in tons).12 With local sourcing we refer to sourcing within the region of Africa and Middle East.
“ HEINEKEN clearly understands that linking local farmers to markets is key to sustainability and economic development.”
Niels Hanssens Deputy Executive Director, European Cooperative for Rural Development (EUCORD)
Our local sourcing projects provide work to an estimated 150,000 farmer households. With an average of seven family members* per household, our potential impact is much higher.
* Source: World Bank.
Responsible sourcing of raw materials has never been more important. We want to guarantee a long-term, sustainable supply of raw materials and operate in a way that improves quality of life for local people. Working with our suppliers is key.
Sourcing sustainably
Our 2020 commitment
– Aim for at least 50% of our main raw materials9 to come from sustainable sources.
Our 2018 milestone
– Aim for at least 25% of our main raw materials to come from sustainable sources.
Our progress in 2016
On track
– In 2016, 17% of our main raw materials came from sustainable sources.10
– For the first time, we looked across all our main raw materials, meaning sugar beet, sugar cane, rice, sorghum, wheat and maize were included in our reporting, alongside barley, hops and apples.
Source agricultural raw materials from sustainable sources
For more on our Sustainable Agriculture approach and 2016 progress, see our website
For more on our Local Sourcing programme and progress in 2016, see our website
140 Heineken N.V. Annual Report 2016 Introduction
Report of the Executive Board
Report of the Supervisory Board
Financial Statements
Sustainability Review
Other Information
Sustainability Review (continued)

Our 2020 commitment
– Ongoing compliance with our Supplier Code Procedure.
Our 2018 milestone
– 95% compliance with four-step Supplier Code Procedure.
Our progress in 2016
More to do
– The estimated average level of compliance with our four-step Supplier Code Procedure across the 70 operating companies in scope, is 78%. See page 146 ‘Reporting basis and criteria non-financial indicators’ for more information on the supplier procedure and how we calculate this percentage.
– We stopped working with 25 suppliers because they were unwilling to sign our Supplier Code (9), refused to subscribe to Ecovadis (15) or refused to undergo a site audit (1).
Looking ahead
HEINEKEN’s Supplier Code provides guidelines for how we expect our suppliers to act in the areas of Integrity and Business Conduct, Human Rights, and the Environment. In 2016, we asked NGO Forum for the Future to review our Supplier Code and related governance procedures. We’re now considering the outcomes as we look to strengthen our Supplier Code and Supplier Risk Analysis.
Compliance with our Supplier Code Procedure
HEINEKEN products are enjoyed in moderation by hundreds of millions of people around the world. We believe it’s our responsibility to encourage people to drink responsibly. Our 2020 commitments are aimed at encouraging responsible attitudes and reducing the harmful use of alcohol. We continue to innovate in the low- and no-alcohol category.
Advocating responsible consumption
Our 2020 commitment
– Make responsible consumption aspirational through Heineken®.
Our 2018 milestone
– Invest a minimum of 10% of our media spend13 for Heineken® in supporting our dedicated responsible consumption campaign in at least 50% of our market volume.14
Our progress in 2016
On track
– Our 14 markets in scope, representing more than 50% of the Heineken® brand global volume, invested more than 10% of media spend in dedicated responsible consumption campaigns.
– In January 2016, we launched our third campaign: ‘Moderate Drinkers Wanted’.
– In September, we launched our new global Formula 1® partnership with the campaign ‘When You Drive, Never Drink’. In the Netherlands it won the STIVA Award for best and most responsible alcohol commercial.
Looking ahead
From 2017 onwards, we are raising our ambition. We will dedicate 10% of media spend in every single market where we sell Heineken® to responsible drinking campaigns.
Make responsible consumption aspirational
13 Investments dedicated to responsible consumption messaging with regards to Heineken® brand communication. This includes the ‘Dance More Drink Slow’ and ‘Moderate Drinkers Wanted’ campaign, ‘When You Drive, Never Drink’ Formula 1® campaign, UEFA® Champions League specific responsible consumption boarding and other specific activations at festivals and events.
14 Market scope, covering in total at least 50% of Heineken® global volume. We focus our efforts on the larger markets where we can make the biggest impact.
For more on our Supplier Code Procedure, see our website
141 Heineken N.V. Annual Report 2016 Introduction
Report of the Executive Board
Report of the Supervisory Board
Financial Statements
Sustainability Review
Other Information
Sustainability Review (continued)

15 Imported low volume non-European brands are not in scope.
Our 2018 milestone
– Deliver global industry commitments by end of 2017 and report in 2018, taking actions in five key areas: under-age drinking, marketing codes of practice, consumer information and product innovation, drinking and driving, retailer support.
Our progress in 2016
On track
– A collective report on the progress on these commitments was published in July 2016 and assured by KPMG.
– A progress report for 2016 will be published by IARD mid 2017.
– By end of 2016, low- and no-alcohol options made up 6% of our total global volume.
Looking ahead
We continue the expansion of our low- and no-alcohol portfolio. In 2017, we will launch a 0.0 version of our flagship brand Heineken®.
Our 2016 milestone – Provide ingredients and nutrition information on pack for all our beer brands in the EU, ahead of industry.
– Include a link on the packaging referring to a website, where consumers can obtain further information on fat, sugars, protein and salt.
Our progress in 2016
Partly achieved
– By the end of 2016, labels have been changed for 47% of brands in scope15.
– For 37% of brands, these labels also display a link to a website.
– Delivering this commitment isn’t straightforward due to the complexity of the operation. We aim to achieve it before the end of 2017, still ahead of the industry but avoiding unnecessary waste by first using existing stock.
Deliver global industry commitments
Ingredients and nutrition information on labels
Our 2020 commitment
– Every market in scope has and reports publicly on a measurable partnership aimed at addressing alcohol abuse.
Our 2018 milestone
– Operating companies representing 90% of sales volume report publicly on a measurable partnership aimed at addressing alcohol abuse.
Our progress in 2016
More to do
– 51 operating companies across 50 markets have a partnership in place to address alcohol-related harm.
– Of these, 69% have met our partnership criteria, representing 81% of the consolidated beer volume.
Building partnerships to address alcohol abuse
For more information on our responsible consumption approach, see our website
See the case study section of our website for examples of our partnerships
142 Heineken N.V. Annual Report 2016 Introduction
Report of the Executive Board
Report of the Supervisory Board
Financial Statements
Sustainability Review
Other Information
Sustainability Review (continued)
Our 2020 commitment
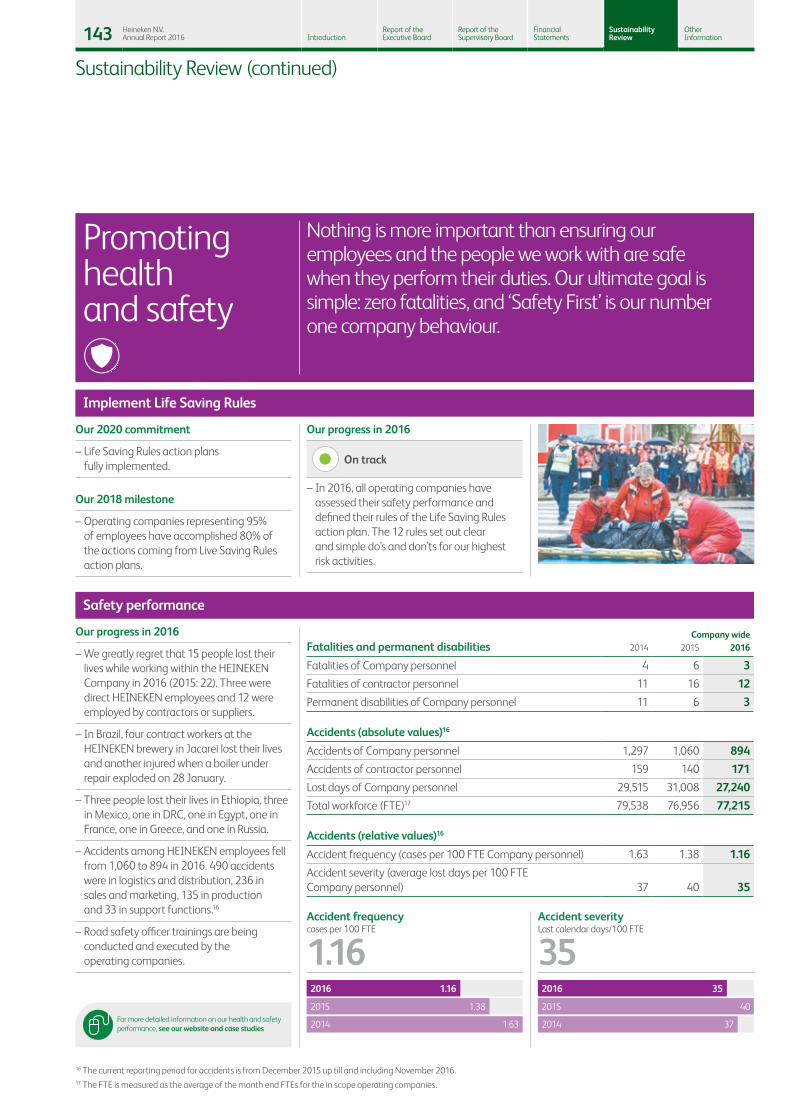
– Life Saving Rules action plans fully implemented.
Our 2018 milestone
– Operating companies representing 95% of employees have accomplished 80% of the actions coming from Live Saving Rules action plans.
Our progress in 2016
On track
– In 2016, all operating companies have assessed their safety performance and defined their rules of the Life Saving Rules action plan. The 12 rules set out clear and simple do’s and don’ts for our highest risk activities.
Nothing is more important than ensuring our employees and the people we work with are safe when they perform their duties. Our ultimate goal is simple: zero fatalities, and ‘Safety First’ is our number one company behaviour.
Promoting health and safety
Implement Life Saving Rules
Safety performance
Our progress in 2016
– We greatly regret that 15 people lost their lives while working within the HEINEKEN Company in 2016 (2015: 22). Three were direct HEINEKEN employees and 12 were employed by contractors or suppliers.
– In Brazil, four contract workers at the HEINEKEN brewery in Jacarei lost their lives and another injured when a boiler under repair exploded on 28 January.
– Three people lost their lives in Ethiopia, three in Mexico, one in DRC, one in Egypt, one in France, one in Greece, and one in Russia.
– Accidents among HEINEKEN employees fell from 1,060 to 894 in 2016. 490 accidents were in logistics and distribution, 236 in sales and marketing, 135 in production and 33 in support functions.16
– Road safety officer trainings are being conducted and executed by the operating companies.
Company wideFatalities and permanent disabilities 2014 2015 2016
Fatalities of Company personnel 4 6 3Fatalities of contractor personnel 11 16 12Permanent disabilities of Company personnel 11 6 3
Accidents (absolute values)16
Accidents of Company personnel 1,297 1,060 894Accidents of contractor personnel 159 140 171Lost days of Company personnel 29,515 31,008 27,240Total workforce (FTE)17 79,538 76,956 77,215
Accidents (relative values)16
Accident frequency (cases per 100 FTE Company personnel) 1.63 1.38 1.16Accident severity (average lost days per 100 FTE Company personnel) 37 40 35
Accident frequency cases per 100 FTE
1.162015
2016
1.38
1.16
2014 1.63
Accident severity Last calendar days/100 FTE
3540
35
37
2015
2016
2014
16 The current reporting period for accidents is from December 2015 up till and including November 2016.17 The FTE is measured as the average of the month end FTEs for the in scope operating companies.
For more detailed information on our health and safety performance, see our website and case studies
143 Heineken N.V. Annual Report 2016 Introduction
Report of the Executive Board
Report of the Supervisory Board
Financial Statements
Sustainability Review
Other Information
Sustainability Review (continued)
18 The effective income tax rate (beia) is different from the reported (IFRS) effective tax rate, which was 29.7% in 2016 (see page 90 of this 2016 Annual Report).
Investing in our communities
Direct contributions
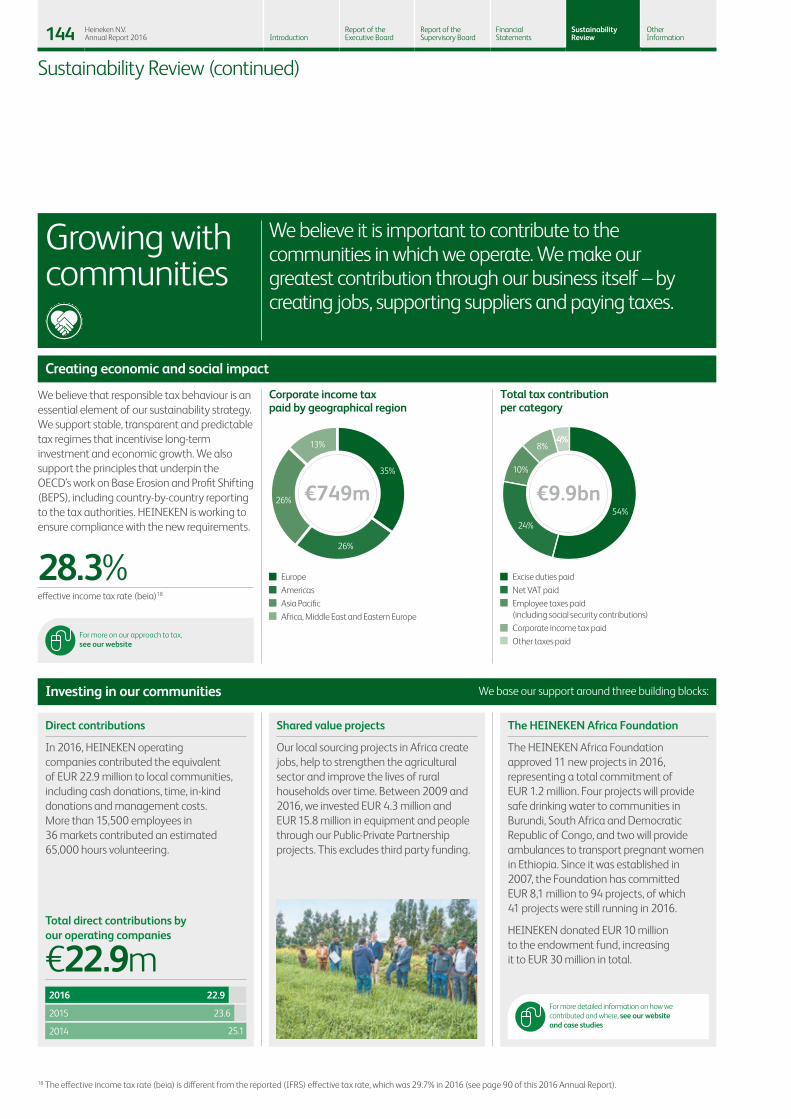
In 2016, HEINEKEN operating companies contributed the equivalent of EUR 22.9 million to local communities, including cash donations, time, in-kind donations and management costs. More than 15,500 employees in 36 markets contributed an estimated 65,000 hours volunteering.
Shared value projects
Our local sourcing projects in Africa create jobs, help to strengthen the agricultural sector and improve the lives of rural households over time. Between 2009 and 2016, we invested EUR 4.3 million and EUR 15.8 million in equipment and people through our Public-Private Partnership projects. This excludes third party funding.
The HEINEKEN Africa Foundation
The HEINEKEN Africa Foundation approved 11 new projects in 2016, representing a total commitment of EUR 1.2 million. Four projects will provide safe drinking water to communities in Burundi, South Africa and Democratic Republic of Congo, and two will provide ambulances to transport pregnant women in Ethiopia. Since it was established in 2007, the Foundation has committed EUR 8,1 million to 94 projects, of which 41 projects were still running in 2016.
HEINEKEN donated EUR 10 million to the endowment fund, increasing it to EUR 30 million in total.
Total direct contributions by our operating companies
¤22.9m
2014
2015
2016 22.9
23.6
25.1
We believe it is important to contribute to the communities in which we operate. We make our greatest contribution through our business itself – by creating jobs, supporting suppliers and paying taxes.
Growing with communities
We believe that responsible tax behaviour is an essential element of our sustainability strategy. We support stable, transparent and predictable tax regimes that incentivise long-term investment and economic growth. We also support the principles that underpin the OECD’s work on Base Erosion and Profit Shifting (BEPS), including country-by-country reporting to the tax authorities. HEINEKEN is working to ensure compliance with the new requirements.
Creating economic and social impact
EuropeAmericasAsia PacificAfrica, Middle East and Eastern Europe
35%
26%
26%
13%
Corporate income taxpaid by geographical region
€749m
Excise duties paidNet VAT paidEmployee taxes paid(including social security contributions)Corporate income tax paidOther taxes paid
54%24%
10%
8%4%
Total tax contributionper category
€9.9bn
28.3%effective income tax rate (beia)18
We base our support around three building blocks:
For more on our approach to tax, see our website
For more detailed information on how we contributed and where, see our website and case studies
144 Heineken N.V. Annual Report 2016 Introduction
Report of the Executive Board
Report of the Supervisory Board
Financial Statements
Sustainability Review
Other Information
Sustainability Review (continued)

We value a passion for quality, enjoyment of life, and respect for people and for our planet. Our values represent what we stand for as a corporate citizen, a business partner and an employer. They are part of our company culture, and our Code of Business Conduct, Supplier & Marketing Codes.
Values and behaviours
Code of Business Conduct – As of 2016 year end, more than 50,000 employees had completed our Code of Business Conduct training, either online or in classroom sessions.
– At the end of 2016, module one and module two of our anti-bribery e-learning training programme were completed more than 11,000 times. Module three will be launched in 2017.
Speak Up – We received 380 grievance reports through Speak Up in 2016, up from 330 in 2015. Reports related to fraud (36%), misconduct or inappropriate behaviour (33%), discrimination and harassment (7%), and other issues (24%).
– 64% of reports were substantiated and corrective and preventative actions taken where relevant and possible. Actions included process and control improvements, reimbursement of financial loss and disciplinary measures.
– On 14 December 2015, former employees of Bralima in Bukavu, DRC filed a complaint with the Dutch National Contact Point (NCP) with regard to an alleged violation of the OECD Guidelines for Multinational Enterprises. We accepted the NCP’s offer to enter into a mediation process and welcome the opportunity to understand the issues raised by the complainants that occurred in 2003.
Employee engagementIn 2016, 86% of our employees participated in HEINEKEN’s Employee Engagement Survey. The Employee Engagement Index score, which assesses the motivation, commitment and willingness of our employees to apply discretionary effort, rose by 1% to 78%. This is 7% above the externally benchmarked norm and marks us out as a high-performing organisation in relation to engagement.
DiversityWe want to make sure there are equal opportunities for all. Cultural diversity remains our strong point. In 2016, we had 53 different nationalities amongst our senior managers. However, we need to do more to increase our gender diversity. In 2017, we are rolling out a renewed guide of Leadership Expectations and a new Inclusion and Diversity Platform to help us better leverage our global talent pool. Growing a talent pipeline to build a diverse organisation will take time.
Representation by gender in % (2016) Male Female
Supervisory Board 73 27Executive Board 50 50Executive Team 80 20Senior Management 83 17
Employees’ and Human Rights – With the expert support of Shift, we are developing a Human Rights Due Diligence process based on the UN Guiding Principles on Business and Human Rights. To better understand the Human Rights related challenges in our operations and supply chain, we conducted a global gap analysis and initiated Human Rights workshops in Mexico, Myanmar and Nigeria. Based on the insights, we will develop a Human Rights action plan and guidance for our operating companies in 2017.
– We participated in the 2016 pilot study of the Corporate Human Rights Benchmark. This benchmark ranks the top 500 globally listed companies on their human rights policy, process and performance.
– We started co-operating with the African Studies Centre Leiden (Leiden University) to have a closer look at the opportunities and challenges of doing business in Africa, more specifically in conflict zones and in markets operating in difficult conditions.
Looking ahead
We are increasing our dialogue with NGOs, investors, government ministries and other stakeholders.
For more on our Business Code of Conduct and Employees’ and Human Rights approach, see our website
145 Heineken N.V. Annual Report 2016 Introduction
Report of the Executive Board
Report of the Supervisory Board
Financial Statements
Sustainability Review
Other Information
Sustainability Review (continued)

As we integrate Brewing a Better World in the way we manage our business, it appears only logical to gradually move towards Integrated Reporting. For the 2015 Annual Report, we made a first step by disclosing a selection of non-financial indicators (KPIs). For this year’s report, we further integrate the most important non-financial KPIs and no longer publish a separate Sustainability Report. The remaining non-financial KPIs will be disclosed at the end of March 2016, in the sustainability section of our Company Website. This includes more detailed information on the actions we took in 2016, case studies, an overview of data and the G4-reference table. Operating companies in scopeThe non-financial indicators in this report cover the performance of all our consolidated operating companies from 1 January 2016 up to and including 31 December 2016, unless stated otherwise. A different reporting period is applied to those indicators where the current reporting cycle does not allow for reporting within the timelines required for the Annual Report. In this year’s review, in a number of indicators, we include the following businesses for the first time: Desnoes & Geddes in Jamaica, Heineken Malaysia Berhad, Pivovarna Lasko Union in Slovenia, APB Alliance Brewery in Myanmar and Heineken South Africa.
The term ‘production unit’ means breweries, cider plants, soft drink plants, malteries, water plants and combinations of these, at which malt, beer, cider, soft drinks and water are produced. Two packaging material plants are also in the scope of production units, covering the manufacture of bottles and crates. Other plants have been included too, such as a winery, distillery and ice production facilities.
Indicators in scopeThe content of the report is based on the material aspects for both our Company and our stakeholders and is directly linked to the Brewing a Better World strategy, our six focus areas and our 2020 commitments. We have selected the non-financial KPIs that are most material, based on the following criteria:
– The KPI is a Brewing a Better World commitment
– The KPI is a new target we publicly disclosed in our 2015 report
– The KPI is not related to a target but part of one of the Brewing a Better World focus areas and seen as important by our stakeholders
– The combination of KPIs should give a balanced – high level – overview of our progress in 2016.
Scope and materiality of indicators are approved on an annual basis by the Disclosure Committee, and may be adjusted once a year with effect as of the following year.
Reporting systemsThe main systems used for collection, validation and analysis of reported data:
– Safety data is reported quarterly via a global system named ARISO (Accident Reporting & Investigation Software system)
– The collection and validation of environmental data have been integrated in Business Comparison System (BCS). Production units submit environmental data on a monthly basis in BCS
– The Green Gauge reporting system allows us to monitor and report quarterly progress against 12 key areas, related to our commitments
– Other reporting systems include the Contract Lifecycle System (CLM) and the EcoVadis Platform for Supplier Code and performance information, and Ethics Point for ‘Speak Up’ data
– The Annual Sustainability Survey is the source of information for all other data that is not covered by the previously mentioned data sources.
146 Heineken N.V. Annual Report 2016 Introduction
Report of the Executive Board
Report of the Supervisory Board
Financial Statements
Sustainability Review
Other Information
Reporting basis and criteria non-financial indicators

Reliability and accuracy of dataProcesses have been established for collection, review and validation of the non-financial data included the reporting, both at local operating company and global level. Subject matter experts are involved at various levels to validate and challenge the data and process.
HEINEKEN is continuing to work on formulating and applying uniform definitions and instructions for reporting purposes, in order to improve the accuracy and comparability of data. Where possible, standard calculations are being built into our systems to minimise errors. Despite the continuous strengthening of our data collection processes and the fact that our operating companies and data owners have reported to the best of their knowledge, in good faith and in accordance with agreed procedures, it is not possible to ascertain 100% completeness of data contained in our report. Our operating companies are at differing maturity levels with regards to implementing the various data collection processes. Where we have any concerns, however, it is highlighted in the report.
HEINEKEN Global Audit is involved in monitoring KPI reporting processes. A yearly risk assessment is performed on all KPIs to determine the year-end audit approach. For this purpose, Global Audit is tracking the methods for measurement and consolidation, and the developments in terms of newly acquired operating companies or implementation of systems.
Apart from the annual review of the full reporting process, including monitoring the quality of control procedures at various levels, the data ownership, the clarity of definition sets, and instructions to the operating companies, Global Audit is involved on a local level to perform data validation audits for a selection of indicators. For 2016, this included the environmental indicators, supplier code, tax and local sourcing. Global Audit also checked all text statements in this report, based on materiality.
Deloitte provides limited assurance on the selected indicators as described in detail in the Assurance report of the independent auditor.
DefinitionsWe gather data in accordance with guidelines and definitions based on the Global Reporting Initiative (GRI 4.0) Guidelines, unless stated otherwise. Overall, we aim to align with international standards, and if not available we work with industry partners such as the Beverage Industry and Environmental Roundtable (BIER), to develop common practices. For some measures in responsible consumption we track the implementation in accordance to industry agreements (for example, labels on our packaging).
The most important indicators and definitions are listed below:
Water indicators
Specific water consumption Hectolitre water intake per hectolitre volume produced of beer, cider, soft drinks and water. Water intake minus water exported to third parties
Total water withdrawal19 The total volume of water withdrawn from the following sources: – Surface water, including water from wetlands, rivers, lakes, and oceans – Ground water – Rainwater collected directly and stored by the organisation – Municipal water supplies or other water utilities
Wastewater quantity19 All wastewater coming from the brewery (m3)Wastewater treated19 The volume of wastewater treated expressed in m3
Effluent organic load to surface water (kg COD)19
This indicator relates to the pollution load of the effluent going to surface water from our breweries. This excludes the wastewater which is treated by third parties. COD stands for Chemical Oxygen Demand, which is a measure for the pollution of water with organic material
Waste water treatment plant Plant removing contaminants from the brewery’s wastewater and producing environmentally safe treated wastewater, before releasing it into the environment
Water stress Refers to the ability, or lack thereof, to meet human and ecological demand for water. Compared to scarcity, ‘water stress’ is a more inclusive and broader concept. It considers several physical aspects related to water resources, including water scarcity, but also water quality, environmental flows, and the accessibility of water
Water balancing Redressing the balance in water-stressed areas between the amount of water we source from the watershed and the amount that isn’t returned because it’s used in our products, and through evaporation
Water balancing projects Projects that aim to conserve or restore water quantity, quality or biodiversity in the local watershed; and/or improve access to clean water for the local communities
19 This specific indicator will be disclosed by end of March 2017 in the sustainability section of the Company website.
147 Heineken N.V. Annual Report 2016 Introduction
Report of the Executive Board
Report of the Supervisory Board
Financial Statements
Sustainability Review
Other Information
Reporting basis and criteria non-financial indicators (continued)

Energy and CO2 indicators
Thermal energy consumption19 In absolute terms: consumption of thermal energy in MJIn relative terms: consumption or thermal energy per unit produced in MJ/hl beer, cider, soft, drinks and water
Electricity consumption19 In absolute terms: consumption of electrical energy in kWhIn relative terms: consumption of electrical energy per unit produced in kWh/hl beer, cider, soft drinks and water
Specific total energy consumption19
Equals thermal energy consumption plus 3.6 times the electricity consumption per unit produced
% of electrical energy coming from renewable sources
Quantity of renewable electrical energy use (kWh) divided by total electrical energy use (kWh). Sources can be: – Own renewable production = all electricity generated from renewable resources on-site (wind, solar, biogas) – Imported electricity under green certificates = all electricity streams for which certified green electricity is purchased
% of thermal energy coming from renewable sources
Quantity of renewable thermal energy use (MJ) divided by total thermal energy use (MJ). Sources are: biomass, biogas, solar thermal and imported heat (with 100% renewable % and 0 g CO2/MJ)
CO2 emissions in production (Scope 1 and 2, GHG Protocol)
This indicator includes CO2-eq emissions caused by: – direct emissions from combustion of fuels – indirect emissions from imported heat and electricity – emissions from refrigerant losses
CO2 emissions in distribution (Scope 3, GHG protocol)
This indicator refers to CO2-eq emissions from outbound distribution of finished goods and returns of empty packaging material. It includes domestic and export transport by road, rail and sea. Excluded is inbound transport
CO2 emissions from fridges Scope 3, GHG protocol)
This indicator refers to CO2-eq emissions as a result of the electricity used by beverage fridges (branded and non-branded) delivered to HEINEKEN warehouses in the reporting year
Green fridges A green fridge has one or more of the following green features: use of hydrocarbon refrigerant, LED illumination, an energy management system and energy-efficient fans
Waste destination per % and absolute value19
Destination of residual products from the brewing process: either recycled into feed, material loops, compost or energy, or – when not recycled – incinerated or sent to landfill
Sustainable sourcing indicators
Sustainable agriculture We follow the definition of the Sustainable Agriculture Initiative (SAI): The efficient production of safe, high quality agricultural products, in a way that protects and improves the natural environment, the social and economic conditions of farmers, their employees and local communities, and safeguards the health and welfare of all farmed species
% of our main agricultural raw materials from sustainable sources
Contracted sustainable volumes (tonnes)/Total contracted volumes (tonnes).Sustainable volume = any agricultural product in scope of the Sustainable Agriculture programme, that has been:1. cultivated in accordance with an approved Code of Practice and 2. has been allocated to HEINEKEN by our supplier, in accordance with the mass balance approachVolumes contracted in 2016 for delivery in 2017 are reported in the 2016 Annual Report
% of agricultural raw materials locally sourced in Africa
Quantity (in tons) of agricultural ‘extract’ producing raw materials (plus hops) that are cultivated in the Africa and Middle East region and that are used in the production of beers, soft drinks, cider, wine and spirits at our own production facilities in that region
Estimated number of smallholder farms involved and total number of beneficiaries
Calculation based on the total quantity of agricultural raw materials purchased (tons), divided by the average farm size (hectares) and the average yield per crop produced (tons per hectare). This gives the estimated number of smallholder farms involved, which is multiplied by 7 (average family size in Africa) to give an estimation of the total number of beneficiaries
– Average farm size (hectares) and average yield per hectare from project estimates – Average family size in Sub Saharan Africa from World Bank estimates
Number of different local sourcing initiatives
HEINEKEN operating companies sourcing any agricultural raw material within the AME Region. Each value chain is counted individually
HEINEKEN Supplier Code The HEINEKEN Supplier Code, applicable to all our suppliers, provides clear guidelines for how we expect them to act in the areas of Integrity and Business Conduct, Human Rights, and the Environment
19 This specific indicator will be disclosed by end of March 2017 in the sustainability section of the Company website.
148 Heineken N.V. Annual Report 2016 Introduction
Report of the Executive Board
Report of the Supervisory Board
Financial Statements
Sustainability Review
Other Information
Reporting basis and criteria non-financial indicators (continued)

Sustainable sourcing indicators (continued)
Supplier Code four-step procedure
1. The Supplier Code is signed by the suppliers in the first step2. For all suppliers a risk analysis is performed in step two3. Supplier with a high risk profile are invited to join the EcoVadis sustainability monitoring platform in step three4. In step four site audits are conducted for suppliers showing limited performance in the previous step
% compliance with four-step Supplier Code Procedure
This KPI measures the average performance over the four steps of our Supplier Code Procedure, per operating company, and then taking the average of all operating companies in scope
Number of contract terminations Number of suppliers with which any commercial relationship ended, because: a) they were unwilling to sign our supplier codeb) or refused to subscribe to EcoVadisc) or refused to undergo a site audit
Responsible consumption indicators
% of media spend for Heineken® in supporting dedicated responsible consumption campaign in at least 50% of our market volume
All expenses incurred for placing and broadcasting Heineken® brand dedicated responsible consumption advertisements in various paid media and other specific responsible consumption campaign activities, across selected operating companies totalling at least 50% of global Heineken® volumes, amounting to 10% of their actual Heineken® media spend
Number of operating companies have and report publicly on a measurable partnership aimed at addressing alcohol abuse
Working closely with third parties like local governments, NGOs and specialists, these partnerships address alcohol-related harm on issues like underage drinking, drinking and driving or excessive drinking. In scope are all HEINEKEN markets, with the exemption of Islamic countries, export markets, markets where we have a Joint Venture, and one minimal-volume market (Laos) for who allocating resource is unrealistic. South Africa will be included as of 2017.
Low- and no-alcohol All beer, cider, hop and/or malt based drinks with an ABV of 3.5% or less. This does not include soft drinksLow- and no-alcohol as % of our global volume
Total low- and no-alcohol volume/Total consolidated beer and cider volume
Ingredients and nutrition information on pack for all our beer brands in the EU
This involves beer brands produced and sold by HEINEKEN operating companies in the European Union. Commitment is only applicable to consumer-facing products (bottles, cans). We committed to include ingredients and energy values (kcal) per 100ml, plus a link on the packaging referring to a website where consumers can obtain further information on fat, sugars, protein and salt
Health & safety indicators
Number of HEINEKEN operating companies having approved plans in place for Life Saving Rules actions
Our ‘Safety First’ approach is focused on improving safety across the whole company. The 12 rules set out clear and simple ‘do’s and don’ts’ for our highest-risk activities. All operating companies are required to assess their safety performance and close any gaps through action plans
Fatal accidents All work-related fatal accidents of permanent, fixed-term or temporary personnel (own staff and contractor personnel)
Accidents An accident which resulted in permanent disability or which requires hospitalisation for more than 24 hours or resulting in more than 1 lost day
Lost days Lost days are counted from the first day after the case until the day the person returns to normal duties at work. All calendar days are counted
Accident frequency Number of accidents resulting in absence from work per 100 FTE. This is an indicator of the state of health and safety at the workplace
Accident severity Number of days lost from work as a result of disabling injuries per 100 FTE
149 Heineken N.V. Annual Report 2016 Introduction
Report of the Executive Board
Report of the Supervisory Board
Financial Statements
Sustainability Review
Other Information
Reporting basis and criteria non-financial indicators (continued)

Economic and social impact indicators
Total tax contribution The tax payments made by the fully consolidated Heineken companies during the calendar year. The total tax contribution includes a limited degree of estimation
Corporate income tax paid Cash flows arising from taxes on income, reported by the fully consolidated Heineken companiesEffective income tax rate Income tax expense expressed as a percentage of the profit before income tax, adjusted for share of profit
of associates and joint ventures and impairments thereof (net of income tax)Beia Before exceptional items and amortisation of acquisition-related intangible assetsTotal direct contributions Donations as a voluntary engagement with charitable organisations that extends beyond our core business
activities, to help address a range of wider issues in the communities where we do business
Values and behaviours indicators
Speak up policy(number of reports + breakdown)
The number of Speak Up reports is the total number of reports received via our Speak Up channels in which reporters raised a concern in regard to a (possible) breach of the HEINEKEN Code of Business Conduct. A break-down per topic is presented to give insight into the main topics of said Speak Up reports
Training Code of Business Conduct (number of employees)
The Code of Business Conduct training is a training that has to be completed by all HEINEKEN employees. It is expected to be completed as part of the induction for new joiners. Thereafter it is expected to be completed regularly (preferably on an annual basis). The training is facilitated by an e-learning, which can be completed online, as well as during a classroom session for those employees without access to their own workstation.A training completion is counted if (i) an employee has completed the e-learning (this is automatically registered in a database), or (ii) if an employee has attended a classroom training and signed off an attendance form
Training anti-bribery (number of employees)
The anti-bribery training is mandatory for a selected audience (those above a certain job grade and those considered to be risk groups). A training completion is counted if an employee has completed the e-learning
150 Heineken N.V. Annual Report 2016 Introduction
Report of the Executive Board
Report of the Supervisory Board
Financial Statements
Sustainability Review
Other Information
Reporting basis and criteria non-financial indicators (continued)

List of operating companies in scope for non-financial indicators20
Region Country Operating Company/Business Unit
Africa, Middle East & Eastern Europe Algeria TangoBelarus Heineken BreweriesBurundi BrarudiDemocratic Republic of Congo BralimaEgypt Al Ahram Beverages CompanyEthiopia Heineken BreweriesEthiopia Harar BreweryEthiopia Bedele BreweryLa Réunion Brasseries de BourbonLebanon AlmazaNigeria Nigerian BreweriesRussia Heineken BreweriesRwanda BralirwaSierra Leone Sierra Leone BrewerySouth Africa Heineken South AfricaTunisia Nouvelle de Brasserie ‘Sonobra’
Americas Bahamas Commonwealth BreweryBrazil Cervejarias Kaiser BrasilHaiti Brasserie Nationale d’HaitiJamaica Desnoes & GeddesMexico Cuauhtémoc MoctezumaPanama Cervecerias Barú-PanamaSt. Lucia Windward & Leeward BrewerySurinam Surinaamse BrouwerijUSA Heineken USAExport Other export markets
Asia Pacific Cambodia Cambodia BreweryChina Heineken (Shanghai)China Heineken Brewery GuangzhouChina Heineken Brewery HainanHong Kong Heineken Hong KongIndonesia PT Multi Bintang IndonesiaJapan Heineken JapanKorea Heineken KoreaLaos Lao Asia Pacific BreweriesMalaysia Heineken Malaysia BerhadMongolia MCS Asia Pacific BreweryMyanmar APB Alliance BreweryNew Caledonia Grande Brasserie de Nouvelle CaledonieNew Zealand DB BreweriesPapua New Guinea South Pacific BrewerySingapore Heineken Asia PacificSingapore Asia Pacific Breweries (Singapore)Singapore Heineken Asia Pacific Export
20 Scope can vary per non-financial indicator. When not all operating companies are in scope, this is being indicated in the specific section.
151 Heineken N.V. Annual Report 2016 Introduction
Report of the Executive Board
Report of the Supervisory Board
Financial Statements
Sustainability Review
Other Information
Reporting basis

152 Heineken N.V. Annual Report 2016 Introduction
Report of the Executive Board
Report of the Supervisory Board
Financial Statements
Sustainability Review
Other Information
Reporting basis (continued)
List of operating companies in scope for non-financial indicators (continued)20
Region Country Operating Company/Business Unit
Asia Pacific (continued) Solomon Islands Solomon BreweriesSri Lanka Asia Pacific Brewery (Lanka)Taiwan Heineken TaiwanVietnam Heineken Hanoi BreweryVietnam Heineken Vietnam Brewery
Europe Austria Brau Union ÖsterreichBelgium Brouwerijen Alken-MaesBulgaria ZagorkaCroatia Heineken HrvatskaCzech Republic Heineken Ceská RepublikaFrance Heineken FranceGreece Athenian BreweryHungary Heineken HungariaIreland Heineken IrelandItaly Heineken ItaliaNetherlands Heineken Nederland (including Vrumona)Poland Grupa ŻywiecPortugal Sociedade Central de Cervejas e BebidasRomania Heineken RomaniaSerbia Heineken SerbiaSlovakia Heineken SlovenskoSlovenia Pivovarna Lasko UnionSpain Heineken EspañaSwitzerland Heineken SwitzerlandUK Heineken UK
Global Various Head Office, Regional Offices including export offices and Global Duty Free, HEINEKEN Financial Shared Services centre (Kraków, Poland)
20 Scope can vary per non-financial indicator. When not all operating companies are in scope, this is being indicated in the specific section.

Annual Report 2016


![Case Heineken[1]](https://img.pdfslide.us/doc/110x75/547edaa1b37959892b8b562d/case-heineken1.jpg)