Embed Size (px)
Citation preview
1
ANNUAL REPORT
2016
AUSTRALIA’S MOST EXPERIENCED MAGNETITE PRODUCER
GRANGE RESOURCES LIMITED
Board of Directors Michelle Li Non-executive Chairperson
Yan Jia Non-executive Deputy Chairperson
Daniel Tenardi Non-executive Director
Liming Huang Non-executive Director
Honglin Zhao Chief Executive Officer and Executive Director
COMPANY SECRETARY Piers Lewis
REGISTERED OFFICE Grange Resources Limited ABN 80 009 132 405
34a Alexander Street, BURNIE, TAS 7320
Telephone: + 61 (3) 6430 0222; Facsimile: + 61 (3) 6432 3390
SHARE REGISTRY Advance Share Registry Services Limited
110 Stirling Highway
Nedlands, WA 6009
AUDITORS PricewaterhouseCoopers
Freshwater Place
2 Southbank Boulevard, SOUTHBANK, VIC 3006
STOCK EXCHANGE Grange Resources Limited is listed on the ASX Limited
(ASX Code: GRR) and the ‘OTC’ Markets in Berlin, Munich,
Stuttgart and Frankfurt in Germany (Code: WKN. 917447)
WEBSITE www.grangeresources.com.au
Contents About Grange ......................................................................... 1
2016 Overview ........................................................................ 2
2017 Priorities ......................................................................... 3
About the Grange Business ................................................... 4
Chairperson’s & Chief Executive Officer’s Review ................. 5
Operating and Financial Review ............................................ 8
Corporate Governance Statement ....................................... 19
Directors’ Report ................................................................... 21
Auditor’s Independence Declaration .................................... 31
Financial Statements .......................................................32-61
Tenement Schedule .............................................................. 66
ASX Additional Information ................................................... 67
List of Significant ASX Announcements ............................... 68
Grange Resources Limited » 2016 Annual Report
ABOUT GRANGE
OUR BUSINESS Grange Resources Limited (Grange or the Company), ASX Code: GRR, is Australia’s most experienced magnetite producer with over 49 years of mining and production from its Savage River mine and has a projected mine life beyond 2030.
Grange’s operations consist principally of owning and operating the Savage River integrated iron ore mining and pellet production business located in the north-west region of Tasmania. The Savage River magnetite iron ore mine is a long life mining asset. At Port Latta, on the north-west coast of Tasmania, Grange owns a downstream pellet plant and port facility producing over 2 million tonnes of premium quality iron ore pellets annually, with plans to increase annual production. Grange has a combination of spot and contracted sales arrangements in place to deliver its pellets to customers throughout the Asia Pacific region.
In addition, Grange is a majority joint venture partner in a major magnetite development project at Southdown, near Albany in Western Australia. The Southdown magnetite project, once developed, is expected to have the capacity to supply over four times the amount of iron ore produced at Savage River, at an annual production rate of 10 million tonnes of premium magnetite concentrate. The Company is continuing its search for an equity partner for a strategic share of the Company’s interest in the project.
OUR VISION We will produce high quality steel making raw materials economically and effectively. Our operations will be efficient, flexible, and stakeholder focused.
OUR VALUES At Grange we ALL will...
• Work safely
• Lead and act with fairness, integrity, trust and respect
• Be responsible and accountable for our actions
• Utilise our resources efficiently and effectively
• Engage with stakeholders and proactively manage our impact on their environment
• Work together openly and transparently
• Promote an environment in which our people can develop and prosper
1
2016 Annual Report « Grange Resources Limited
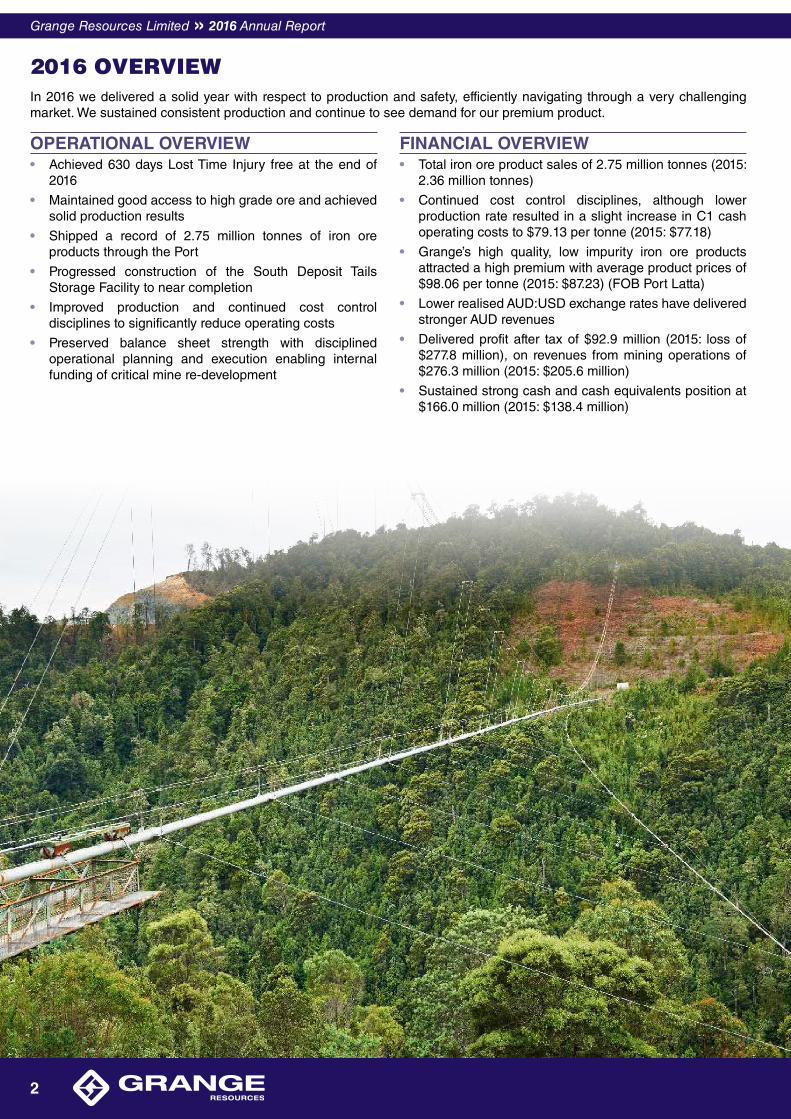
2016 OVERVIEWIn 2016 we delivered a solid year with respect to production and safety, efficiently navigating through a very challenging market. We sustained consistent production and continue to see demand for our premium product.
OPERATIONAL OVERVIEW • Achieved 630 days Lost Time Injury free at the end of
2016
• Maintained good access to high grade ore and achieved solid production results
• Shipped a record of 2.75 million tonnes of iron ore products through the Port
• Progressed construction of the South Deposit Tails Storage Facility to near completion
• Improved production and continued cost control disciplines to significantly reduce operating costs
• Preserved balance sheet strength with disciplined operational planning and execution enabling internal funding of critical mine re-development
FINANCIAL OVERVIEW • Total iron ore product sales of 2.75 million tonnes (2015:
2.36 million tonnes)
• Continued cost control disciplines, although lower production rate resulted in a slight increase in C1 cash operating costs to $79.13 per tonne (2015: $77.18)
• Grange’s high quality, low impurity iron ore products attracted a high premium with average product prices of $98.06 per tonne (2015: $87.23) (FOB Port Latta)
• Lower realised AUD:USD exchange rates have delivered stronger AUD revenues
• Delivered profit after tax of $92.9 million (2015: loss of $277.8 million), on revenues from mining operations of $276.3 million (2015: $205.6 million)
• Sustained strong cash and cash equivalents position at $166.0 million (2015: $138.4 million)
Grange Resources Limited » 2016 Annual Report
2
2017 PRIORITIESGrange is Australia’s proven, safe, reliable, long life producer of premium quality Haematite pellets. Grange is committed to the local community of North West Tasmania and makes a significant contribution to the state economy.
2017 PRIORITIES • Maintain cost control disciplines and increase efficiencies
• Ensure the qualities of our premium product are realised
• Deliver into committed sales off-take agreements
• Formulate a valid alternate development model and seek to secure equity partners for a strategic share of the Company’s interest in the Southdown project
• Continue investment in mine development – continue cutbacks in North Pit and deliver high grade ore from the main pit early in the year
• Continue to develop and implement ‘real time’ operational scheduling and management processes to improve daily productivity
• Pursue opportunities to add value to our product such as producing a fluxed pellet
• Continue to invest in process infrastructure through disciplined capital management programmes
• Complete the installation of the second Autogenous Mill Shell at the Savage River Concentrator
• Prepare the South Deposit Tailings Storage Facility for operation
• Maintain and develop Mine-to-Market quality management processes
• Continue to develop the plan for Pit Rim Crushing and Conveyor System to improve mining efficiency
• Seek additional investment opportunities to deliver shareholder value
3
2016 Annual Report « Grange Resources Limited
ABOUT THE GRANGE BUSINESS
MAGNETITE Magnetite is a naturally occurring mineral commonly refined into an iron ore concentrate and used for steel production. Iron ore makes up about five per cent of the Earth’s crust and most commonly occurs in the form of haematite or magnetite. Most of the magnetite mined now is used as an ore of iron. Iron liberated from magnetite ore is usually used to make concentrate for pellet feed or pellets which are used to make steel.
The Australian iron ore industry has traditionally been based on the mining, production and export of haematite ores, also referred to as ‘Direct Shipping Ore’ (DSO). Approximately 96 per cent of Australian iron ore production comes from DSO. While magnetite is an emerging industry in Australia, globally it accounts for approximately 50 per cent of iron ore production.
Smelting magnetite to iron involves agglomeration or ‘clumping together’ of the magnetite concentrate, and thermal treatment to produce iron ore pellets.
The pellets can be used directly in a blast furnace or at direct reduction iron-making plants.
Magnetite concentrate has internal thermal energy meaning less energy is required, compared to haematite, in the pelletising process which in turn results in less carbon dioxide emissions. The blast furnace chemically reduces iron oxide into liquid iron called ‘hot metal’. The iron ore and reducing agents (coke, coal and limestone) are combined. Pre-heated air is blown at the bottom of the combination for up to eight hours. The final product is a liquid which is drained, and eventually refined to produce steel.
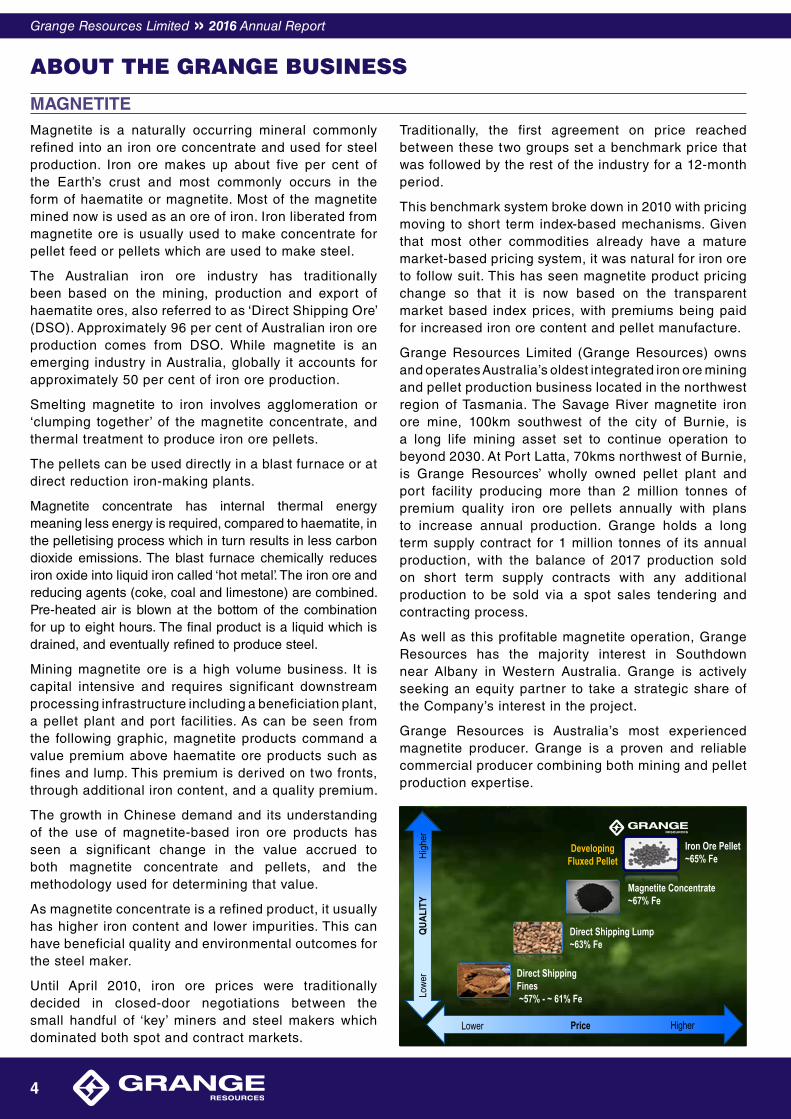
Mining magnetite ore is a high volume business. It is capital intensive and requires significant downstream processing infrastructure including a beneficiation plant, a pellet plant and port facilities. As can be seen from the following graphic, magnetite products command a value premium above haematite ore products such as fines and lump. This premium is derived on two fronts, through additional iron content, and a quality premium.
The growth in Chinese demand and its understanding of the use of magnetite-based iron ore products has seen a significant change in the value accrued to both magnetite concentrate and pellets, and the methodology used for determining that value.
As magnetite concentrate is a refined product, it usually has higher iron content and lower impurities. This can have beneficial quality and environmental outcomes for the steel maker.
Until April 2010, iron ore prices were traditionally decided in closed-door negotiations between the small handful of ‘key’ miners and steel makers which dominated both spot and contract markets.
Traditionally, the first agreement on price reached between these two groups set a benchmark price that was followed by the rest of the industry for a 12-month period.
This benchmark system broke down in 2010 with pricing moving to short term index-based mechanisms. Given that most other commodities already have a mature market-based pricing system, it was natural for iron ore to follow suit. This has seen magnetite product pricing change so that it is now based on the transparent market based index prices, with premiums being paid for increased iron ore content and pellet manufacture.
Grange Resources Limited (Grange Resources) owns and operates Australia’s oldest integrated iron ore mining and pellet production business located in the northwest region of Tasmania. The Savage River magnetite iron ore mine, 100km southwest of the city of Burnie, is a long life mining asset set to continue operation to beyond 2030. At Port Latta, 70kms northwest of Burnie, is Grange Resources’ wholly owned pellet plant and port facility producing more than 2 million tonnes of premium quality iron ore pellets annually with plans to increase annual production. Grange holds a long term supply contract for 1 million tonnes of its annual production, with the balance of 2017 production sold on short term supply contracts with any additional production to be sold via a spot sales tendering and contracting process.
As well as this profitable magnetite operation, Grange Resources has the majority interest in Southdown near Albany in Western Australia. Grange is actively seeking an equity partner to take a strategic share of the Company’s interest in the project.
Grange Resources is Australia’s most experienced magnetite producer. Grange is a proven and reliable commercial producer combining both mining and pellet production expertise.
May 2016 Slide 1
QUAL
ITY
High
erLo
wer Direct Shipping
Fines~57% - ~ 61% Fe
Magnetite Concentrate ~67% Fe
Direct Shipping Lump ~63% Fe
Iron Ore Pellet~65% Fe
Price HigherLower
1.4 Products from Tasmanian Operations
Developing Fluxed Pellet
Grange Resources Limited » 2016 Annual Report
4
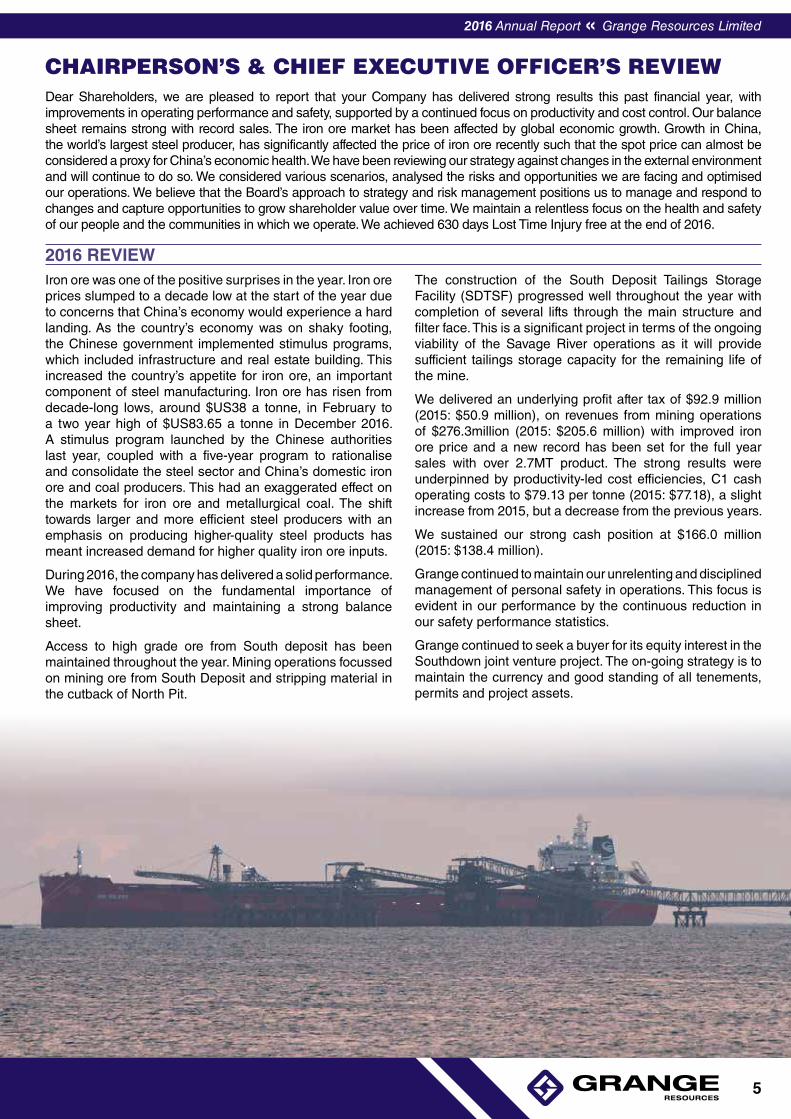
CHAIRPERSON’S & CHIEF EXECUTIVE OFFICER’S REVIEWDear Shareholders, we are pleased to report that your Company has delivered strong results this past financial year, with improvements in operating performance and safety, supported by a continued focus on productivity and cost control. Our balance sheet remains strong with record sales. The iron ore market has been affected by global economic growth. Growth in China, the world’s largest steel producer, has significantly affected the price of iron ore recently such that the spot price can almost be considered a proxy for China’s economic health. We have been reviewing our strategy against changes in the external environment and will continue to do so. We considered various scenarios, analysed the risks and opportunities we are facing and optimised our operations. We believe that the Board’s approach to strategy and risk management positions us to manage and respond to changes and capture opportunities to grow shareholder value over time. We maintain a relentless focus on the health and safety of our people and the communities in which we operate. We achieved 630 days Lost Time Injury free at the end of 2016.
2016 REVIEW Iron ore was one of the positive surprises in the year. Iron ore prices slumped to a decade low at the start of the year due to concerns that China’s economy would experience a hard landing. As the country’s economy was on shaky footing, the Chinese government implemented stimulus programs, which included infrastructure and real estate building. This increased the country’s appetite for iron ore, an important component of steel manufacturing. Iron ore has risen from decade-long lows, around $US38 a tonne, in February to a two year high of $US83.65 a tonne in December 2016. A stimulus program launched by the Chinese authorities last year, coupled with a five-year program to rationalise and consolidate the steel sector and China’s domestic iron ore and coal producers. This had an exaggerated effect on the markets for iron ore and metallurgical coal. The shift towards larger and more efficient steel producers with an emphasis on producing higher-quality steel products has meant increased demand for higher quality iron ore inputs.
During 2016, the company has delivered a solid performance. We have focused on the fundamental importance of improving productivity and maintaining a strong balance sheet.
Access to high grade ore from South deposit has been maintained throughout the year. Mining operations focussed on mining ore from South Deposit and stripping material in the cutback of North Pit.
The construction of the South Deposit Tailings Storage Facility (SDTSF) progressed well throughout the year with completion of several lifts through the main structure and filter face. This is a significant project in terms of the ongoing viability of the Savage River operations as it will provide sufficient tailings storage capacity for the remaining life of the mine.
We delivered an underlying profit after tax of $92.9 million (2015: $50.9 million), on revenues from mining operations of $276.3million (2015: $205.6 million) with improved iron ore price and a new record has been set for the full year sales with over 2.7MT product. The strong results were underpinned by productivity-led cost efficiencies, C1 cash operating costs to $79.13 per tonne (2015: $77.18), a slight increase from 2015, but a decrease from the previous years.
We sustained our strong cash position at $166.0 million (2015: $138.4 million).
Grange continued to maintain our unrelenting and disciplined management of personal safety in operations. This focus is evident in our performance by the continuous reduction in our safety performance statistics.
Grange continued to seek a buyer for its equity interest in the Southdown joint venture project. The on-going strategy is to maintain the currency and good standing of all tenements, permits and project assets.
5
2016 Annual Report « Grange Resources Limited
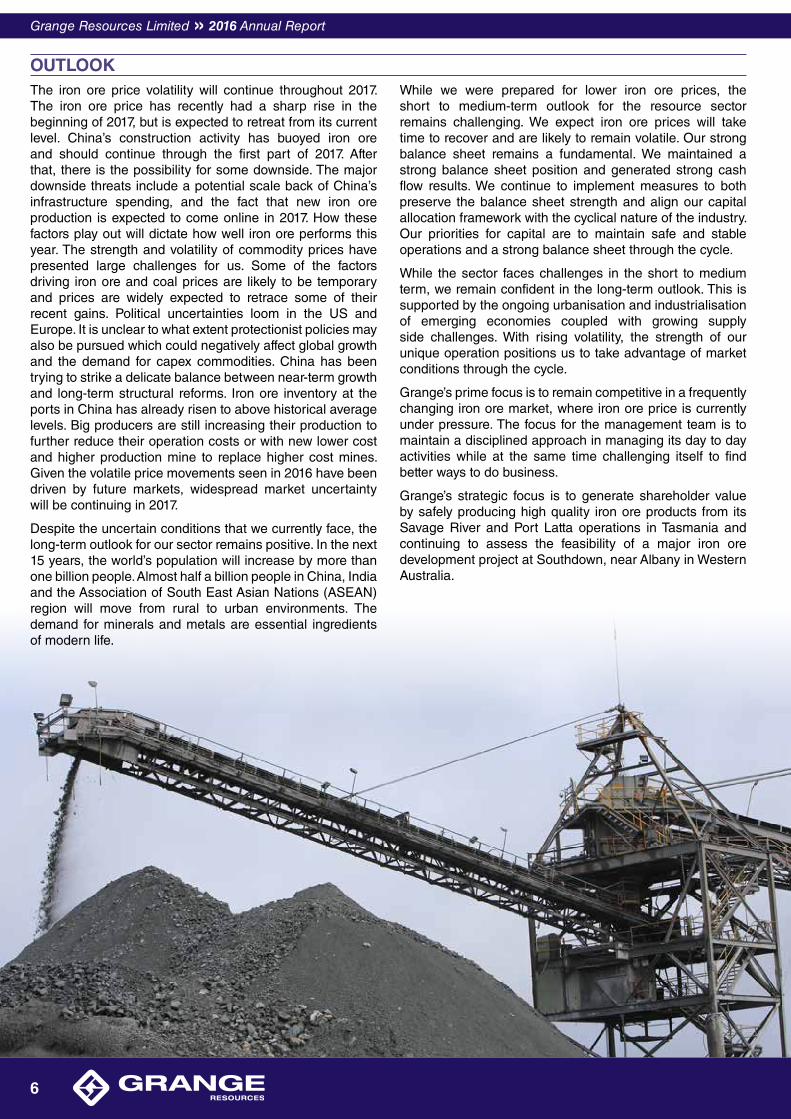
OUTLOOK The iron ore price volatility will continue throughout 2017. The iron ore price has recently had a sharp rise in the beginning of 2017, but is expected to retreat from its current level. China’s construction activity has buoyed iron ore and should continue through the first part of 2017. After that, there is the possibility for some downside. The major downside threats include a potential scale back of China’s infrastructure spending, and the fact that new iron ore production is expected to come online in 2017. How these factors play out will dictate how well iron ore performs this year. The strength and volatility of commodity prices have presented large challenges for us. Some of the factors driving iron ore and coal prices are likely to be temporary and prices are widely expected to retrace some of their recent gains. Political uncertainties loom in the US and Europe. It is unclear to what extent protectionist policies may also be pursued which could negatively affect global growth and the demand for capex commodities. China has been trying to strike a delicate balance between near-term growth and long-term structural reforms. Iron ore inventory at the ports in China has already risen to above historical average levels. Big producers are still increasing their production to further reduce their operation costs or with new lower cost and higher production mine to replace higher cost mines. Given the volatile price movements seen in 2016 have been driven by future markets, widespread market uncertainty will be continuing in 2017.
Despite the uncertain conditions that we currently face, the long-term outlook for our sector remains positive. In the next 15 years, the world’s population will increase by more than one billion people. Almost half a billion people in China, India and the Association of South East Asian Nations (ASEAN) region will move from rural to urban environments. The demand for minerals and metals are essential ingredients of modern life.
While we were prepared for lower iron ore prices, the short to medium-term outlook for the resource sector remains challenging. We expect iron ore prices will take time to recover and are likely to remain volatile. Our strong balance sheet remains a fundamental. We maintained a strong balance sheet position and generated strong cash flow results. We continue to implement measures to both preserve the balance sheet strength and align our capital allocation framework with the cyclical nature of the industry. Our priorities for capital are to maintain safe and stable operations and a strong balance sheet through the cycle.
While the sector faces challenges in the short to medium term, we remain confident in the long-term outlook. This is supported by the ongoing urbanisation and industrialisation of emerging economies coupled with growing supply side challenges. With rising volatility, the strength of our unique operation positions us to take advantage of market conditions through the cycle.
Grange’s prime focus is to remain competitive in a frequently changing iron ore market, where iron ore price is currently under pressure. The focus for the management team is to maintain a disciplined approach in managing its day to day activities while at the same time challenging itself to find better ways to do business.
Grange’s strategic focus is to generate shareholder value by safely producing high quality iron ore products from its Savage River and Port Latta operations in Tasmania and continuing to assess the feasibility of a major iron ore development project at Southdown, near Albany in Western Australia.
Grange Resources Limited » 2016 Annual Report
6
The Group’s current strategic priorities include:
SAVAGE RIVER AND PORT LATTA OPERATIONS • Securing majority of sales through off take agreements
• Broadening our customer base for the longer term to take advantage of market opportunities and to diversify geographic customer risk
• Maintaining access to high grade ore by continuing to invest in mine development
• Continuing to invest in process infrastructure
• Optimising the Life of Mine Plan together with cost reduction strategies
• Fluxed pellet project ongoing and continued communication with interested customers
• Continuing focus on improving productivity and implementing cost control projects
SOUTHDOWN PROJECT • Ensuring that all tenements, permits and project assets
remain in good standing
• Secure Commonwealth EPBC approval for the minesite, slurry pipeline, port facilities and desalination infrastructure
• Maintaining the currency of all the elements of the definitive feasibility study
• Continuing review and identifying the potential for alternative development models
• Continuing the search for new equity partners to take a strategic share of the Company’s interest in the Project
The Board and the management team have a positive outlook for the pellet market and are proactively exploring opportunities for innovation, improvement and productivity growth. The on-going development of the iron ore market and the issues in China of increasing restrictions on environmental noncompliance provide a unique opportunity for Grange. We are very confident of our competitiveness to supply a sustained high quality, low impurity iron ore pellet product. We strive to deliver value to our loyal employees and shareholders.
THANK YOU On behalf of Grange’s Board, we would like to thank all of our employees for their dedication and hard work over the past year. We are proud of our excellent culture, capability and resilience to best place us for a prosperous future. And to our shareholders, thank you for your continued support.
Michelle Li Honglin Zhao
Chairperson Chief Executive Officer
7
2016 Annual Report « Grange Resources Limited
OPERATING AND FINANCIAL REVIEW
KEY HIGHLIGHTS • Achieved a Lost Time Injury free of 630 days in year of 2016
• Delivered profit after tax of $92.9 million (2015: loss of $277.8 million), on revenues from mining operations of $276.3 million (2015: $205.6 million)
• A new record has been set for the full year sales with over 2.7MT product sold
• Grange’s high quality, low impurity iron ore products attracted a high premium with average product prices of $98.06 per tonne (2015: $87.23) (FOB Port Latta)
• Total iron ore product sales of 2.75 million tonnes (2015: 2.36 million tonnes)
• Lower realised AUD:USD exchange rates have delivered stronger AUD revenues
• Continued focus on selling cargoes to targeted customers and balancing opportunities in the spot market
• Continued mine redevelopment in North Pit and production in South Deposit using the waste in the construction of the South Deposit Tails Storage Facility (SDTSF)
• Continued cost control disciplines, although lower production rate resulted in a slight increase in C1 cash operating costs to $79.13 per tonne (2015: $77.18)
• Sustained strong cash and cash equivalents position at $166.0 million (2015: $138.4 million)
• Construction of the South Deposit Tailings Storage Facility (SDTSF) continued on plan and near completion
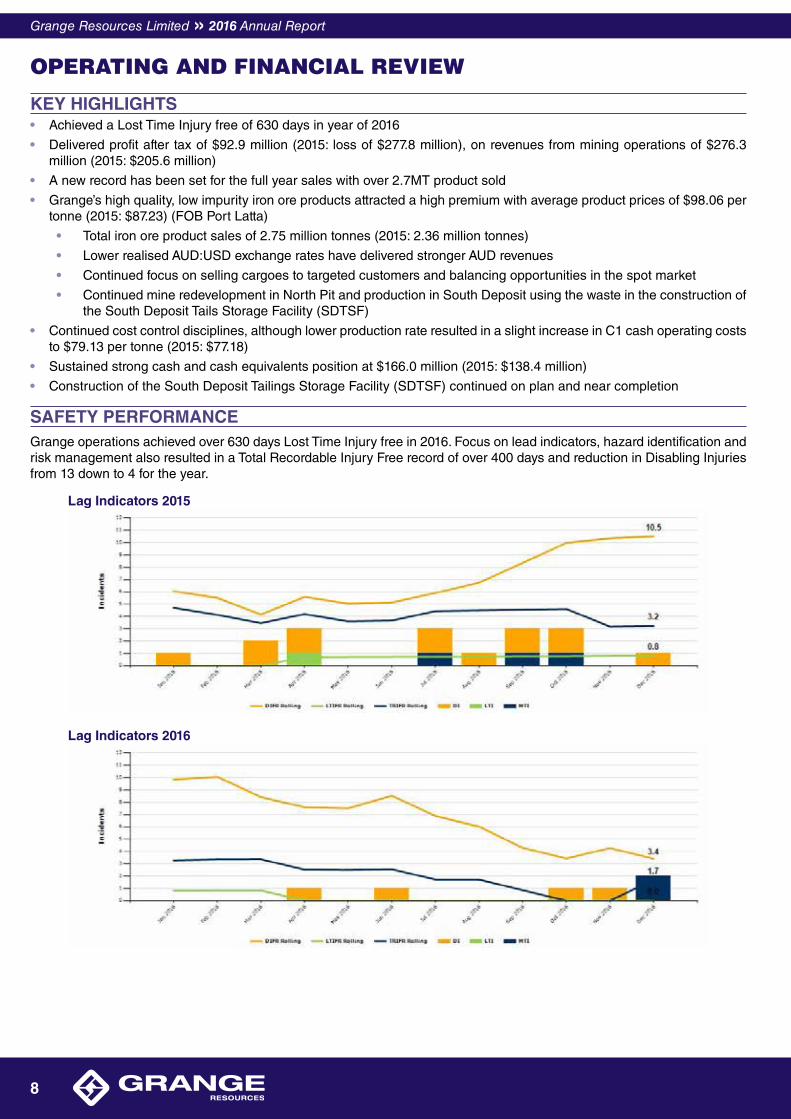
SAFETY PERFORMANCE Grange operations achieved over 630 days Lost Time Injury free in 2016. Focus on lead indicators, hazard identification and risk management also resulted in a Total Recordable Injury Free record of over 400 days and reduction in Disabling Injuries from 13 down to 4 for the year.
Lag Indicators 2015
Lag Indicators 2016
Grange Resources Limited » 2016 Annual Report
8
FULL YEAR RESULT Grange recorded a statutory profit after tax of $92.9 million for the year ended 31 December 2016 (2015: loss $277.8 million).
Key revenue metrics for the year ended 31 December 2016 and the preceding 2015 year were as follows:
2016 2015
Iron Ore Pellet Sales (dmt) 2,637,607 2,249,405
Iron Ore Concentrate Sales (dmt) 118 162
Iron Ore Chip Sales (dmt) 112,378 107,090
Total Iron Ore Product Sales (dmt) 2,750,103 2,356,657
Average Realised Product Price
(US$/t FOB Port Latta) 72.94 66.23
Average Realised Exchange Rate
(AUD:USD) 0.7438 0.7593
Average Realised Product Price
(A$/t FOB Port Latta) 98.06 87.23
Total sales for the year ended 31 December 2016 were 2.75 million tonnes of high quality, low impurity iron ore products (2015: 2.36 million tonnes) and reflects sustained production from maintaining access to high grade ore.
The average iron ore product price received during the year was $98.06 per tonne of product sold (FOB Port Latta) (2015: $87.23 per tonne). The upward movement was consistent with the increase in benchmark 62% Fe iron ore prices (CFR China) which was driven by stimulus policies following a slowing growth of the Chinese economy in late 2015 and structural reform in the Chinese steel industry that resulted in greater demand for higher grade iron ore.
Please refer to Note 4 of the Financial Report for segment information for sales to different geographical markets. The sales from long term off take agreements with Jiangsu Shagang International Trade Co. Ltd represents 39.6% of total sales for 2016 (2015: 42.5%)
Key operating metrics for the year ended 31 December 2016 and the preceding 2015 year were as follows:
2016 2015
Total BCM Mined 9,514,884 15,299,080
Total Ore BCM 1,218,363 1,708,356
Concentrate Produced (t) 2,397,318 2,606,233
Weight Recovery (%) 41.6 46.1
Pellets Produced (t) 2,378,486 2,528,235
Pellet Stockpile (t) 171,140 430,261
‘C1’ Operating Cost
(A$/t Product Produced)(1) $79.13 77.18(1) Note: ‘C1’ costs are the cash costs associated with producing iron ore products without allowance for mine development, deferred stripping and
stockpile movements, and also excludes royalties, sustaining capital, depreciation and amortisation costs.
Mining operations focussed on mining ore from South Deposit and stripping material in the cutback of North Pit. Blending of ore from South Deposit with High Grade (HG) ore stockpiled from North Pit supported high processing rates and quality production.
The construction of the South Deposit Tailings Storage Facility (SDTSF) progressed well throughout the year with completion of several lifts through the main structure and filter face. This is a significant project in terms of the ongoing viability of the Savage River operations as it will provide sufficient tailings storage capacity for the remaining life of the mine. This facility will also provide the ability for treatment of the legacy environmental issues arising from previous operations at Savage River.
The change out of the second of the 48 year old Ball Mill Motors, and replacement of the original 12.5/15MVA Concentrator Transformers was completed to de-risk some key elements of the production process, improve our productivity, and increase our efficiency.
Expenditure on exploration and evaluation activities during the year was $1.4 million (2015: $1.7 million) and has been charged to the income statement.
9
2016 Annual Report « Grange Resources Limited
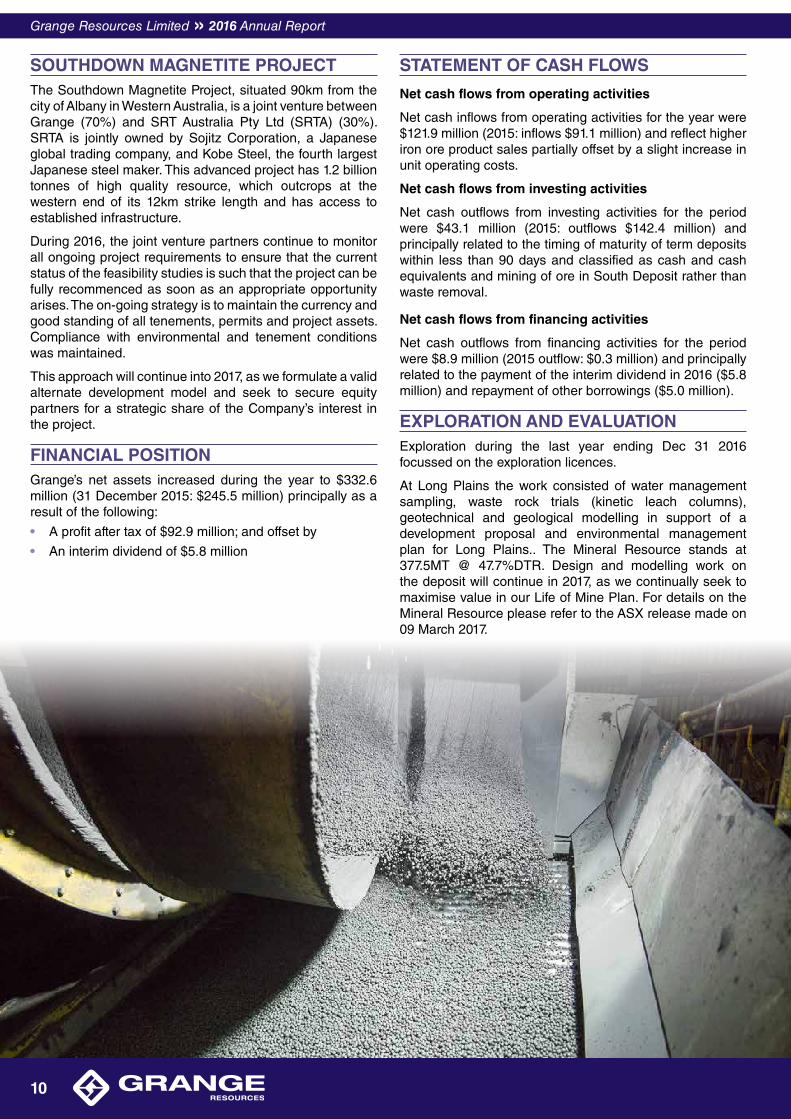
SOUTHDOWN MAGNETITE PROJECT The Southdown Magnetite Project, situated 90km from the city of Albany in Western Australia, is a joint venture between Grange (70%) and SRT Australia Pty Ltd (SRTA) (30%). SRTA is jointly owned by Sojitz Corporation, a Japanese global trading company, and Kobe Steel, the fourth largest Japanese steel maker. This advanced project has 1.2 billion tonnes of high quality resource, which outcrops at the western end of its 12km strike length and has access to established infrastructure.
During 2016, the joint venture partners continue to monitor all ongoing project requirements to ensure that the current status of the feasibility studies is such that the project can be fully recommenced as soon as an appropriate opportunity arises. The on-going strategy is to maintain the currency and good standing of all tenements, permits and project assets. Compliance with environmental and tenement conditions was maintained.
This approach will continue into 2017, as we formulate a valid alternate development model and seek to secure equity partners for a strategic share of the Company’s interest in the project.
FINANCIAL POSITION Grange’s net assets increased during the year to $332.6 million (31 December 2015: $245.5 million) principally as a result of the following:
• A profit after tax of $92.9 million; and offset by
• An interim dividend of $5.8 million
STATEMENT OF CASH FLOWS
Net cash flows from operating activities
Net cash inflows from operating activities for the year were $121.9 million (2015: inflows $91.1 million) and reflect higher iron ore product sales partially offset by a slight increase in unit operating costs.
Net cash flows from investing activities
Net cash outflows from investing activities for the period were $43.1 million (2015: outflows $142.4 million) and principally related to the timing of maturity of term deposits within less than 90 days and classified as cash and cash equivalents and mining of ore in South Deposit rather than waste removal.
Net cash flows from financing activities
Net cash outflows from financing activities for the period were $8.9 million (2015 outflow: $0.3 million) and principally related to the payment of the interim dividend in 2016 ($5.8 million) and repayment of other borrowings ($5.0 million).
EXPLORATION AND EVALUATION Exploration during the last year ending Dec 31 2016 focussed on the exploration licences.
At Long Plains the work consisted of water management sampling, waste rock trials (kinetic leach columns), geotechnical and geological modelling in support of a development proposal and environmental management plan for Long Plains.. The Mineral Resource stands at 377.5MT @ 47.7%DTR. Design and modelling work on the deposit will continue in 2017, as we continually seek to maximise value in our Life of Mine Plan. For details on the Mineral Resource please refer to the ASX release made on 09 March 2017.
Grange Resources Limited » 2016 Annual Report
10
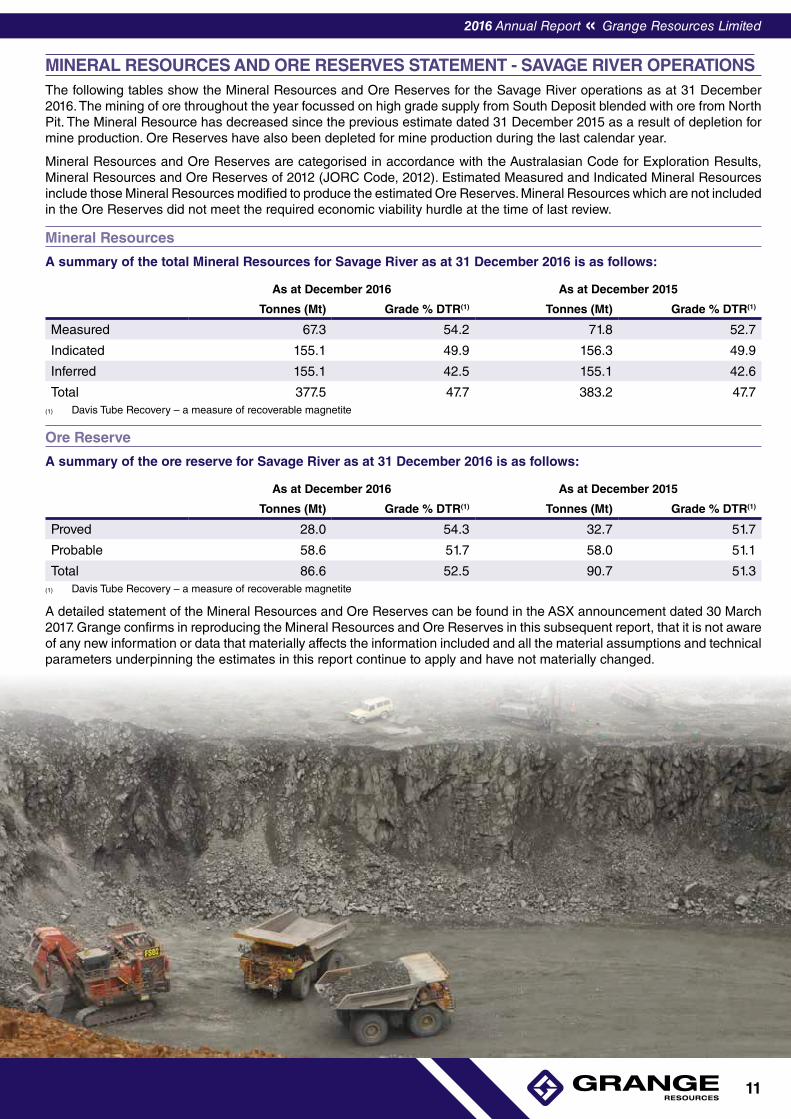
MINERAL RESOURCES AND ORE RESERVES STATEMENT - SAVAGE RIVER OPERATIONS The following tables show the Mineral Resources and Ore Reserves for the Savage River operations as at 31 December 2016. The mining of ore throughout the year focussed on high grade supply from South Deposit blended with ore from North Pit. The Mineral Resource has decreased since the previous estimate dated 31 December 2015 as a result of depletion for mine production. Ore Reserves have also been depleted for mine production during the last calendar year.
Mineral Resources and Ore Reserves are categorised in accordance with the Australasian Code for Exploration Results, Mineral Resources and Ore Reserves of 2012 (JORC Code, 2012). Estimated Measured and Indicated Mineral Resources include those Mineral Resources modified to produce the estimated Ore Reserves. Mineral Resources which are not included in the Ore Reserves did not meet the required economic viability hurdle at the time of last review.
Mineral Resources
A summary of the total Mineral Resources for Savage River as at 31 December 2016 is as follows:
As at December 2016 As at December 2015
Tonnes (Mt) Grade % DTR(1) Tonnes (Mt) Grade % DTR(1)
Measured 67.3 54.2 71.8 52.7
Indicated 155.1 49.9 156.3 49.9
Inferred 155.1 42.5 155.1 42.6
Total 377.5 47.7 383.2 47.7(1) Davis Tube Recovery – a measure of recoverable magnetite
Ore Reserve
A summary of the ore reserve for Savage River as at 31 December 2016 is as follows:
As at December 2016 As at December 2015
Tonnes (Mt) Grade % DTR(1) Tonnes (Mt) Grade % DTR(1)
Proved 28.0 54.3 32.7 51.7
Probable 58.6 51.7 58.0 51.1
Total 86.6 52.5 90.7 51.3(1) Davis Tube Recovery – a measure of recoverable magnetite
A detailed statement of the Mineral Resources and Ore Reserves can be found in the ASX announcement dated 30 March 2017. Grange confirms in reproducing the Mineral Resources and Ore Reserves in this subsequent report, that it is not aware of any new information or data that materially affects the information included and all the material assumptions and technical parameters underpinning the estimates in this report continue to apply and have not materially changed.
11
2016 Annual Report « Grange Resources Limited
HEALTH AND SAFETY
Overview
Grange believe that responsible occupational Health and Safety (OHS) and sound environmental and social responsibility (ESR) practices are integral to an efficient and successful company. Grange’s OHS & ESR Management Systems have been integrated to form the ‘Safety and Environment Management System’ (SEMS) which supports OHS & ESR policies and defines the required standards to which any Grange facility must operate.
SEMS is an integral part of the Grange Management System (GMS), it is well supported by a management plan for sixteen (16) of the major hazards identified in our industry. Of the 16 Major Hazard Standards 4 are deemed to be Principal Mining Hazards as outlined Tasmanian Mining Legislation. The implementation and effective management of SEMS enables compliance with legislation, reduction of risk, increased efficiencies and provides the framework for continuous improvement. SEMS is aligned to ISO 14001 Environmental & OHSAS 18001 Quality Management Systems and is applicable to any existing and future national or international operation.
Mission Statement
Our mission is to drive a continuous improvement culture involving all managers, supervisors, employees and contractors. We strive to eliminate injury and minimise loss, create positive environmental outcomes and to add value to the communities in which we operate. This will be achieved through effective management systems, positive management, integrated risk management practices, risk aware culture, demonstrable leadership, maintaining standards, monitoring performance and looking after our people.
Safety Performance
The Company is committed to providing a safe place of work and safe systems of work for all its workers at every site. We take this commitment seriously and expect those working for us to share the same level of commitment. We want our workers to return home as fit as when they left home each and every day. The effectiveness of our systems and safety management in general is well demonstrated by the considerable measurable improvements in all safety lag indicators. Improvements in our lag indicators has been reinforced by a regime of measureable lead indicators to help reduce risk exposures.
In addition, Grange is committed to ensuring compliance with legislative requirements for each area of its operations including meeting or exceeding requirements within:
• Federal & State Work Health & Safety Legislation;
• Anti-Discrimination Legislation;
• Fair Work Australia Legislation;
• Rehabilitation & Workers Compensation Legislation;
• Environmental Legislation;
• Codes of Practice nominated in all Federal and State Legislation;
• Adopting accepted industry standards in areas where legislation is deficient;
• Mining specific, OH&S and Environmental Legislation as required; and
• Environmental licence conditions for existing and new operations.
Established systems are in place to ensure legislative requirements are tracked, monitored and corrective actions implemented for any instances of non-compliance.
During 2016 we focused on reducing costs without reducing services.
• Initiatives for ERT in-house training saved considerable costs from external training providers.
• Taking up the challenges required to obtain Federal and State government training funds reduced the outlay for training in leadership and continuous improvement.
• Utilising a redundant truck tray has provided a practical safety option to deploy while working under high walls and a low cost.
• Participating in the Insurance Underwriters safety audit has provided initiatives to help reduce insurance costs.
Grange recognises the importance of our contractors’ safety management systems being aligned with WorkSafe Tasmania and mine safety regulations as well as being on par with our own safety standards. To this end we have incorporated and communicated new OHS & ESR requirements for contractors into our SEMS.
During 2016 enhancing Safety Preventative Maintenance (PM) work orders in lead indicators, dedicated Area Inspections covering all areas on site, formalising Task Observations for management and key personnel as Lead Indicator Key Performance Indicators (KPI’s) and tracking these has helped reduce risk exposures across all areas. This was particularly evident through our resulting reduction in disabling injuries from the previous year.
Grange Resources Limited » 2016 Annual Report
12
Sharing and Learning
Grange adopts a philosophy of continuous learning and sharing of safety experiences. In addition to its highly successful on-line induction programs, Grange Resources conducts an extensive range of on-site safety training activities including energy isolations, site driving and pit driving permits, simulation training for new operators, fire warden and extinguisher training as well as refreshers on occupational first aid and road accident rescue entrapment release.
During the year Grange continued to work closely and openly with the Office of the Chief inspector of Mines (OCIM), inviting them to participate in regular inspections, audits and organising forums sponsored by Grange for improving OHS in operating mines. These forums also have a positive impact on other Tasmanian operations including connected industries. Grange represent Tasmanian Mines on a Mines Legislation Steering Committee that is reviewing and enhancing the current Tasmanian Mining Supplementary Safety Act and Regulations.
Principal Hazard Management Plans and subordinate standards and procedures were also revised and compiled to ensure full compliance with the new legislative requirements. These Plans were presented to the Office of the Chief inspector of Mines (OCIM) and assessed as being the benchmark for the mining industry.
In addition to training delivered at the operational level, the company rolled out a number of site-wide health and safety programs aimed at improving our employee’s wellbeing, including cancer awareness, heart safety awareness and mental health awareness.
The Company has a fully functional and qualified emergency response team (‘ERT’) providing expert first aid and first response care to our sites and others in need including road accidents in the Savage River and Port Latta areas. During the year a combined Savage River and Port Latta team competed in and won the Tasmanian Mines Emergency Rescue Committee (TMERC) Emergency Rescue Competition for 2016 in a very competitive and close run event.
Commitment to Social Responsibility
Grange continued with its commitment to social responsibility engaging with our stakeholders and communities to help us understand and respond to their interests and concerns. In addition to regular dialogue with neighbours and communities close to our operations, the Company continues to host and support the education sector through tours, school curriculum information, industry links, a graduate program as well as work opportunities at its operations.
Grange is actively involved in the community in which we operate and regularly support local events throughout the region.
In 2016 our management and workers have again rolled up their sleeves and participated in 2016 Business Clean Up Australia Day, covering the long and winding 38 km road between Waratah and the Savage River Township, collecting roadside litter and rubbish to enhance our environment, an effort noted by our local newspaper.
Grange staff actively participated in the local school’s student development programs including mock interviews, conducting site visits and the ‘careers on wheels’ program.
13
2016 Annual Report « Grange Resources Limited
ENVIRONMENTAL
Legislative Approval
Grange obtained environmental and planning approval in 1996 and 1997 allowing it to operate under the Tasmanian Land Use Planning and Approvals Act 1993 (LUPA), the Tasmanian Environmental Management and Pollution Control Act 1994 (EMPCA), the Tasmanian Goldamere Pty Ltd (Agreement) Act 1996 (Goldamere Act) and the Tasmanian Mineral Resources Development Act 1995. This approval covers an expected mine and processing life using open-cut mining at Savage River, gangue removal and concentrating at Savage River and pelletising at Port Latta. During 2014 Grange received relevant approvals for the South Deposit Tailings Storage Facility.
Goldamere Act
The Goldamere Act overrides all other Tasmanian legislation with respect to Grange’s operations. The Goldamere Act limits Grange’s liability for remediation of contamination, under Tasmanian law, to damage caused by Grange’s operations, and indemnifies Grange for certain environmental liabilities arising from past operations. Where pollution is caused or might be caused by previous operations and that pollution may be impacting on Grange’s operations or discharges, Grange is indemnified against that pollution. Grange is required to operate to Best Practice Environmental Management (BPEM).
Planning Approvals
Grange obtained planning approval subject to a series of environmental permit conditions on 29 January 1997. Planning approval was issued by the Waratah Wynyard Council for Savage River and by the Circular Head Council for Port Latta. The approvals were conditional on the provision of an Environmental Management Plan (EMP) incorporating a Rehabilitation Plan (ERP) prior to the commencement of operations. Various other studies were also required. Grange received planning approvals from the Waratah Wynyard Council for the South Deposit Tailings Storage Facility (SDTSF) during 2014, construction commenced in July 2014 and is expected to be completed in 2017.
The SDTSF has progressed to the point when Grange Resources can now apply to use the facility for tailings storage.
Environmental Management Plans
The EMP incorporating the ERP and study results were approved by the (then) Department of Environment Parks, Heritage and the Arts and operations commenced in October 1997. The latest revision of the approval documents occurred on 6 October 2000 when Environmental Protection Notices (EPN) 248/2 and 302/2 were issued to replace the environmental permit conditions for Savage River and Port Latta respectively.
Approvals are required from the Department of Primary Industries, Parks, Water and the Environment (DPIPWE) and relevant Councils for major infrastructure developments and operational expansions and changes. These approvals
are in the form of approved EMP’s and or amendments and reflect changing operational circumstances, an increasing knowledge base and include approvals designed to extend operations, amend management plans and provide for changes to waste rock dumping plans and any proposed treatment facilities. Such amendments are enacted by the issue of EPN’s or Permit Conditions Environmental (PCE)’s.
An amendment to the EMP was approved for an extension of mine and pelletising operations in early 2007 to approve the Mine Life Extension Plan.
EMP and ERP reviews were submitted in December 2013 with the next revision under review for submission in 2017. The revised EMPs reflect BPEM and current mine planning and focus on closure requirements and rehabilitation. The development of significant new projects such as a new pit will require additional planning approval and at a minimum an EMP amendment approval followed by issuance of an EPN from the EPA.
Goldamere Agreement
The Goldamere Agreement (which forms part of the Goldamere Act) provides a framework for Grange to repay the Tasmanian Government for the purchase of the mine through remediation works. A significant variation to the Goldamere Agreement was signed on the 19 December 2014 which extends the Agreement until 24 December 2034. This variation also removed a significant number of redundant conditions. The amended Goldamere Agreement provides a framework for Grange to co-manage the Savage River Rehabilitation Project (SRRP) and carry out contracted works in lieu of paying the purchase price of the operation to the Government. The agreement also allows Grange to integrate its rehabilitation obligations with those of the State under the SRRP.
Savage River Rehabilitation Project (‘SRRP’)
Grange representatives meet with representatives from DPIPWE on a regular basis to develop and implement remediation works at Savage River. Grange has contracted with the SRRP for works including construction, management and development of waste rock dump covers, acid pipelines and other remediation projects. The SRRP objective is to capture and treat 65% of the site’s copper load to remove the possibility of an acutely toxic aquatic environment. The scope of works to meet this objective has been completed and costed to feasibility level.
A strategic plan outlining the works required to achieve the objective and repay Grange’s purchase price debt has been approved by the Tasmanian Environmental Protection Authority and is being implemented by the SRRP Committee. This plan was updated in 2012 to reflect the long term risks and Grange’s latest mining plan.
Grange Resources Limited » 2016 Annual Report
14
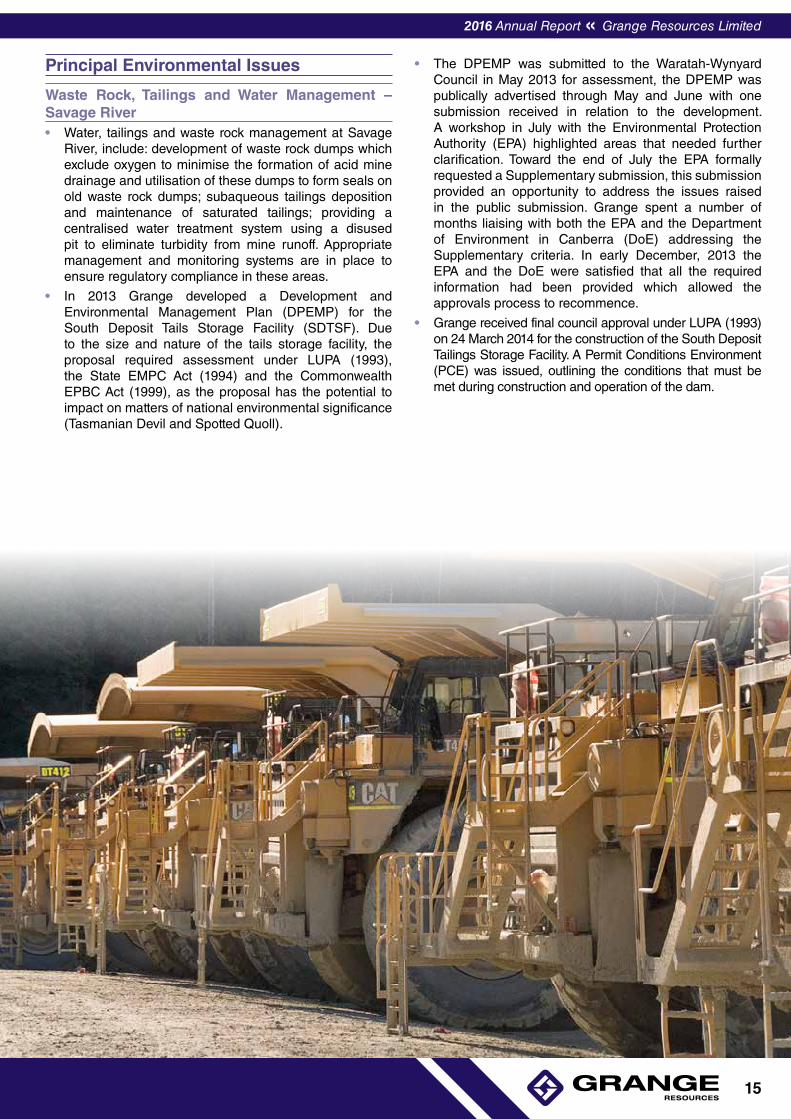
Principal Environmental Issues
Waste Rock, Tailings and Water Management – Savage River • Water, tailings and waste rock management at Savage
River, include: development of waste rock dumps which exclude oxygen to minimise the formation of acid mine drainage and utilisation of these dumps to form seals on old waste rock dumps; subaqueous tailings deposition and maintenance of saturated tailings; providing a centralised water treatment system using a disused pit to eliminate turbidity from mine runoff. Appropriate management and monitoring systems are in place to ensure regulatory compliance in these areas.
• In 2013 Grange developed a Development and Environmental Management Plan (DPEMP) for the South Deposit Tails Storage Facility (SDTSF). Due to the size and nature of the tails storage facility, the proposal required assessment under LUPA (1993), the State EMPC Act (1994) and the Commonwealth EPBC Act (1999), as the proposal has the potential to impact on matters of national environmental significance (Tasmanian Devil and Spotted Quoll).
• The DPEMP was submitted to the Waratah-Wynyard Council in May 2013 for assessment, the DPEMP was publically advertised through May and June with one submission received in relation to the development. A workshop in July with the Environmental Protection Authority (EPA) highlighted areas that needed further clarification. Toward the end of July the EPA formally requested a Supplementary submission, this submission provided an opportunity to address the issues raised in the public submission. Grange spent a number of months liaising with both the EPA and the Department of Environment in Canberra (DoE) addressing the Supplementary criteria. In early December, 2013 the EPA and the DoE were satisfied that all the required information had been provided which allowed the approvals process to recommence.
• Grange received final council approval under LUPA (1993) on 24 March 2014 for the construction of the South Deposit Tailings Storage Facility. A Permit Conditions Environment (PCE) was issued, outlining the conditions that must be met during construction and operation of the dam.
15
2016 Annual Report « Grange Resources Limited
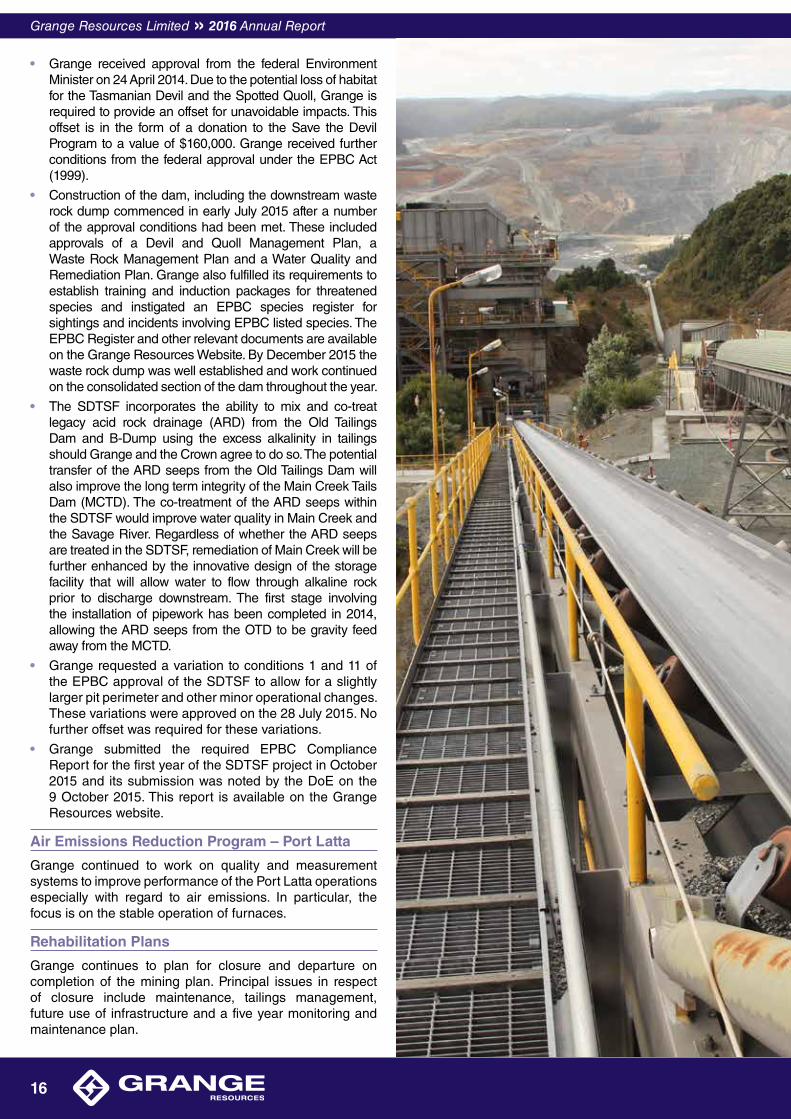
• Grange received approval from the federal Environment Minister on 24 April 2014. Due to the potential loss of habitat for the Tasmanian Devil and the Spotted Quoll, Grange is required to provide an offset for unavoidable impacts. This offset is in the form of a donation to the Save the Devil Program to a value of $160,000. Grange received further conditions from the federal approval under the EPBC Act (1999).
• Construction of the dam, including the downstream waste rock dump commenced in early July 2015 after a number of the approval conditions had been met. These included approvals of a Devil and Quoll Management Plan, a Waste Rock Management Plan and a Water Quality and Remediation Plan. Grange also fulfilled its requirements to establish training and induction packages for threatened species and instigated an EPBC species register for sightings and incidents involving EPBC listed species. The EPBC Register and other relevant documents are available on the Grange Resources Website. By December 2015 the waste rock dump was well established and work continued on the consolidated section of the dam throughout the year.
• The SDTSF incorporates the ability to mix and co-treat legacy acid rock drainage (ARD) from the Old Tailings Dam and B-Dump using the excess alkalinity in tailings should Grange and the Crown agree to do so. The potential transfer of the ARD seeps from the Old Tailings Dam will also improve the long term integrity of the Main Creek Tails Dam (MCTD). The co-treatment of the ARD seeps within the SDTSF would improve water quality in Main Creek and the Savage River. Regardless of whether the ARD seeps are treated in the SDTSF, remediation of Main Creek will be further enhanced by the innovative design of the storage facility that will allow water to flow through alkaline rock prior to discharge downstream. The first stage involving the installation of pipework has been completed in 2014, allowing the ARD seeps from the OTD to be gravity feed away from the MCTD.
• Grange requested a variation to conditions 1 and 11 of the EPBC approval of the SDTSF to allow for a slightly larger pit perimeter and other minor operational changes. These variations were approved on the 28 July 2015. No further offset was required for these variations.
• Grange submitted the required EPBC Compliance Report for the first year of the SDTSF project in October 2015 and its submission was noted by the DoE on the 9 October 2015. This report is available on the Grange Resources website.
Air Emissions Reduction Program – Port Latta
Grange continued to work on quality and measurement systems to improve performance of the Port Latta operations especially with regard to air emissions. In particular, the focus is on the stable operation of furnaces.
Rehabilitation Plans
Grange continues to plan for closure and departure on completion of the mining plan. Principal issues in respect of closure include maintenance, tailings management, future use of infrastructure and a five year monitoring and maintenance plan.
Grange Resources Limited » 2016 Annual Report
16
SOUTHDOWN MAGNETITE PROJECT The Southdown Project ultimately aims to export 10 million tonnes per year of premium magnetite concentrate to Asian steel markets. The Southdown Joint Venture (SDJV) is a joint venture between Grange Resources Limited (70%) and SRT Australia Pty Ltd (SRTA) (30%). SRTA is jointly owned by Sojitz Corporation, a Japanese global trading company, and Kobe Steel, one of Japan’s largest steel producers.
2016 Project Overview • The Project continued on reduced expenditure while
Grange seeks an equity partner for a strategic share in the Project
• Existing tenure and approvals have been maintained
• Project security has been enhanced by continuing to build land tenure and access, including progressing negotiations with the State and landowners for access to key infrastructure areas.
• Progressed studies relating to project engineering and further environmental permitting, including:
• Progression of the commonwealth environmental approval for mine, desalination and pipelines.
• Groundwater exploration which identified deep water-bearing palaeo channels and commenced modelling to assess potential to contribute to construction water supply.
• Ongoing hydrogeological baseline studies.
Grange announced to the market on 29 November 2012 that it would significantly reduce expenditure on its 70% share of the Southdown Magnetite Project. Following this announcement the Project’s team size and scope of work was reduced.
Challenging global economic conditions have resulted in the search for an equity partner continuing throughout the year. The reduced Project team has continued to work toward securing environmental approvals, and to build land tenure and access through negotiations with land holders and government agencies to enhance the ability of the Project to rapidly mobilise in the future.
During 2016, market conditions for securing project investment funding did not improve. The joint venture partners continue to monitor all ongoing project requirements to ensure that the current status of the feasibility studies is such that the project can be fully recommenced as soon as an appropriate opportunity arises. The on-going strategy is to maintain the currency and good standing of all tenements, permits and project assets. This approach will be continued into 2017, and at least until Grange is able to secure an equity partner for a strategic share of the Company’s interest in the project or until a valid alternate development model can be successfully formulated.
2017 Project Priorities • Continue to develop alternate development models which
may see the Southdown Project move into construction and operation
• Continue search for new equity partner to take a strategic share of the Company’s interest in the Project
• Maintain reduced expenditure for 2017 to approximately $700K (Grange share)
• Maintain all tenements, permits and project assets in good order
• Progress environmental approvals and permits
• Grange has the in house skills, systems, capability and discipline to deliver Southdown’s potential when the time is right
Project Overview
Geology
The Southdown magnetite deposit is a long, thin, near-surface, continuous ore body. It extends over 12 kilometres, with depths varying from 50 metres in the west to 480 metres in the east. The deposit has been drilled and evaluated since its initial discovery in 1983, including an extensive program of resource drilling during 2011 for the feasibility study.
Conventional Mining
Targeted concentrate production rates require a material movement in the mine of up to 132 Mt per annum by conventional drill, blast, load and haul mining methods. The final proposed pit is six kilometres long, one kilometre wide and about 370 metres deep. The mining operation will draw heavily on Grange’s existing capability as Australia’s most experienced commercial producer of magnetite concentrate, to assist with start-up and ongoing operations.
Ore Crushing and Concentration
The project plan envisages Southdown ore being processed to increase the iron content from around 25% to 69%. Extensive metallurgical test work including pilot plant trials have been conducted since 2004.
The process includes crushing, grinding, classification and magnetic separation. The concentrate is further upgraded using hydro separation to remove fine silica, and flotation to remove sulphur impurities.
Transporting the Concentrate Slurry 110 km to the Port
Final magnetite concentrate will be thickened and transported through a 110 km pipeline to the Port of Albany, where it will be filtered and stored for loading onto cape size ships. A second pipeline will return the filtered water back to the mine site so it can be used again in the process. Both pipelines will be buried.
Increasing Albany’s Port Capacity
Subject to a decision to proceed, a concentrate export facility would be built on 7 hectares of reclaimed land at Albany Port, immediately east of the existing wood chip terminal site. The plan incorporates a filtration plant, storage shed, new berth and ship loading facility. Deepening and widening a 9.5 kilometre approach channel will enable 200,000 tonne cape size ships to use the port. Whilst minimal dust generation is expected because of the high moisture content of the concentrate, the shed will be fully enclosed, under negative pressure and fitted with dust extraction equipment.
17
2016 Annual Report « Grange Resources Limited
The development would more than treble Albany’s current port capacity from approximately 4 Mt per annum to 14 Mt per annum. The design has been developed in close consultation with the Southern Ports Authority, Port of Albany (formerly Albany Port Authority) and in line with the Public Environmental Review approved in November 2010.
A new source of water and power supply
The plan also envisages that a seawater desalination plant would be constructed 25 km from the mine to supply the plant with 11 GL per annum of water. Power for the mine site would be provided by a new 278 kilometre 330kv transmission line from Muja to Southdown, to be built by Western Power.
Operations Planning
The Southdown operation will be modelled on Grange’s existing Savage River operation in Tasmania operating on a 24/7 basis for 365 days per year.
Construction Planning & Schedule
Subject to a decision to proceed, the project will engage an experienced construction management company to coordinate a series of fixed price contracts to minimise risk and the number of interfaces. The Southdown Joint Venture continues to work alongside the community, including traditional owners of the land, to ensure a safe and environmentally responsible project.
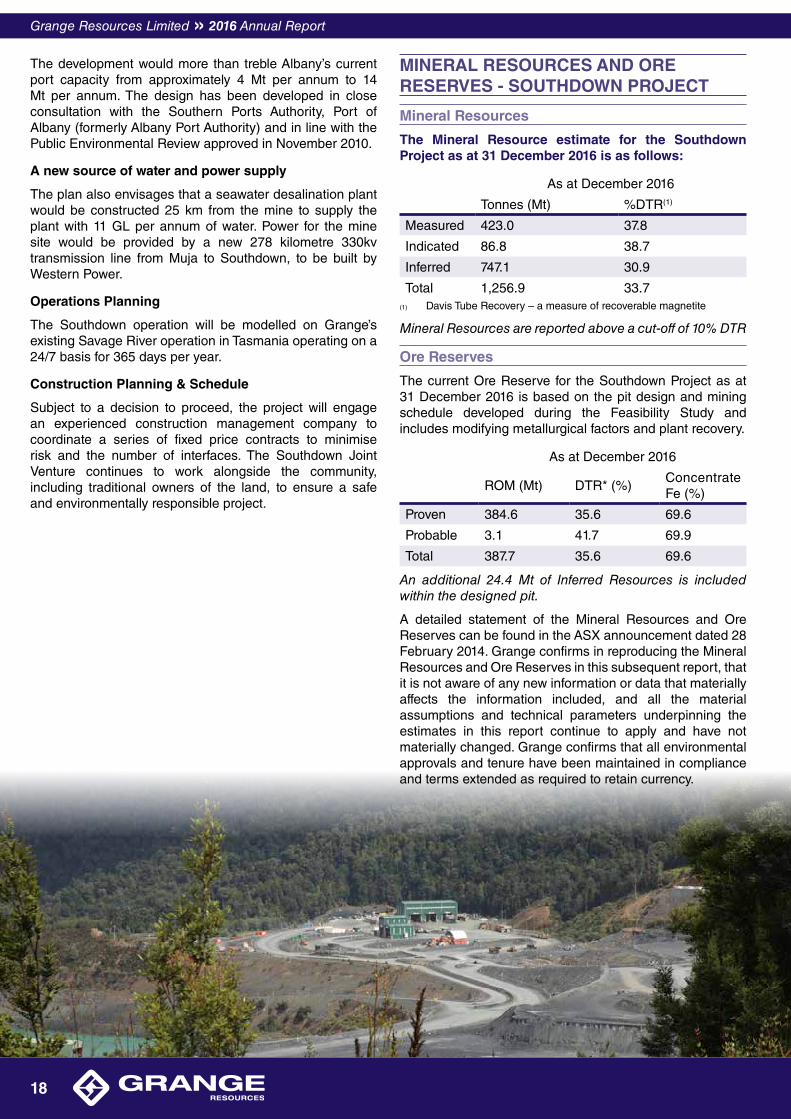
MINERAL RESOURCES AND ORE RESERVES - SOUTHDOWN PROJECT
Mineral Resources
The Mineral Resource estimate for the Southdown Project as at 31 December 2016 is as follows:
As at December 2016
Tonnes (Mt) %DTR(1)
Measured 423.0 37.8
Indicated 86.8 38.7
Inferred 747.1 30.9
Total 1,256.9 33.7(1) Davis Tube Recovery – a measure of recoverable magnetite
Mineral Resources are reported above a cut-off of 10% DTR
Ore Reserves
The current Ore Reserve for the Southdown Project as at 31 December 2016 is based on the pit design and mining schedule developed during the Feasibility Study and includes modifying metallurgical factors and plant recovery.
As at December 2016
ROM (Mt) DTR* (%)Concentrate Fe (%)
Proven 384.6 35.6 69.6
Probable 3.1 41.7 69.9
Total 387.7 35.6 69.6
An additional 24.4 Mt of Inferred Resources is included within the designed pit.
A detailed statement of the Mineral Resources and Ore Reserves can be found in the ASX announcement dated 28 February 2014. Grange confirms in reproducing the Mineral Resources and Ore Reserves in this subsequent report, that it is not aware of any new information or data that materially affects the information included, and all the material assumptions and technical parameters underpinning the estimates in this report continue to apply and have not materially changed. Grange confirms that all environmental approvals and tenure have been maintained in compliance and terms extended as required to retain currency.
Grange Resources Limited » 2016 Annual Report
18
CORPORATE GOVERNANCE STATEMENTGrange is committed to creating and building sustainable value for shareholders and protecting stakeholder interests. The Company recognises that high standards of corporate governance are essential to achieving that objective.
The Board has the responsibility for ensuring Grange is properly managed so as to protect and enhance shareholders’ interests in a manner that is consistent with the Company’s responsibility to meet its obligations to all stakeholders. For this reason, the Board is committed to applying appropriate standards of corporate governance across the organisation.
As part of its commitment to enhancing its corporate governance, and as a listed company, the Board has adopted relevant practices which are consistent with the Australian Securities Exchange (‘ASX’) Corporate Governance Principles.
Details of the Company’s corporate governance practices are included in the Corporate Governance Statement and Appendix 4G which have been announced on the ASX and can be located on our Company’s website www.grangeresources.com.au in the Corporate Governance and Policies section in the About us area. This facilitates transparency about Grange’s corporate governance practices and assists shareholders and other stakeholders make informed judgments.
Grange considers that its governance practices comply with the majority of the ASX Best Practice Recommendations.
ASX Best Practice Recommendations
The following table lists the departures from the ASX Best Practice Recommendations applicable to the Company as at the date of its financial year end, being 31 December 2016. Where the Company considers that it is divergent from these recommendations, or that it is not practical to comply, there is an explanation of the Company’s reasons set out following the table.
‘Recommendation’ Ref (‘Principle No’ Ref followed by Recommendation Ref)
Departure Explanation
7.3(b) A separate internal audit function has not been formed.
An Internal Audit function has not been established as per recommendation 7.3(a), The Board monitors the need for an internal audit function having regard to the size, geographic location and complexity of the Company’s operations.
The Company’s Management periodically undertakes an internal review of financial systems and processes and where systems are considered to require improvement these systems are developed. The Board also considers external reviews of specific areas and monitors the implementation of system improvements.
19
2016 Annual Report « Grange Resources Limited
Grange Resources LimitedABN 80 009 132 405
and Controlled Entities
A USTRALIA’S MOST EXPERIENCED MAGNETITE PRODUCER
FINANCIAL REPORTFor the Year Ended 31 December 2016
ContentsDirectors’ Report 21
Auditor’s Independence Declaration 31
Financial Statements
Statement of Comprehensive Income 32
Statement of Financial Position 33
Statement of Changes in Equity 34
Statement of Cashflow 35
Notes to the Financial Statements 36
Directors’ Declaration 60
Independent Auditor’s Report 61
These financial statements are the consolidated financial statements of the consolidated entity consisting of Grange Resources Limited and its subsidiaries. The financial statements are presented in Australian currency.
Grange Resources Limited is a company limited by shares, incorporated and domiciled in Australia. Its registered office and principal place of business is:
34A Alexander StreetBurnie Tasmania 7320
A description of the nature of the consolidated entity’s operations and its principal activities is included in the Directors’ Report on pages 2 to 19, which is not part of these financial statements.
All press releases, financial reports and other information are available on our website:
www.grangeresources.com.au
Grange Resources Limited » 2016 Annual Report
20
DIRECTORS’ REPORTThe Directors present their report on the consolidated entity (the ‘Group’) consisting of Grange Resources Limited (‘Grange’ or ‘the Company’) and the entities it controlled at the end of, or during, the year ended 31 December 2016.
Directors The following persons were directors of the Company during the whole year and up to the date of this report:
Michelle Li PhD, GAICD
Chairperson
Non-executive Chairperson, Member of the Audit and Risk Committee, Member of the Remuneration and Nomination Committee
Dr Li was appointed as non-executive Chairperson on 29 October 2013. Dr Li is a mineral processing engineer and metallurgist with over 20 years’ experience in the Australian mining sector. Dr Li’s experience includes senior roles at CITIC Pacific, Rio Tinto and Iluka Resources, as well as a senior project role on the Grange Resources Southdown project.
Dr Li has a PhD from the University of Queensland and is currently a non-executive Director of Ardiden Limited and was previously a non-executive Director of Orion Metals Limited and Sherwin Iron Limited.
Honglin ZhaoExecutive Director, Chief Executive Officer
Executive Director, Chief Executive Officer
Mr Zhao is a former Director of Shagang International (Australia) Pty Ltd, former Director and General Manager of Shagang (Australia) Pty Ltd, and former Director of Jiangsu Shagang Group, ultimate shareholder of Shagang International Holdings Limited and China’s largest private steel company.
Mr Zhao has over 40 years’ experience in the industry and was previously the Commander of Project Development Headquarters with Shagang. Mr Zhao has extensive project management and implementation experience and expertise.
Daniel TenardiNon-Executive Director
Non-executive Director and Chairperson of the Remuneration and Nomination Committee and member of Audit and Risk Committee.
Mr Tenardi is an experienced mining executive with over 40 years’ experience in the resources industry across a range of commodities including iron ore, gold, bauxite, and copper. He has a wealth of knowledge in managing bulk ore operations and has extensive international networks.
Mr Tenardi was the former CEO of Ngarda Civil & Mining and has also held senior executive and operational roles at CITIC Pacific, Alcoa, Roche Mining and Rio Tinto. He was the Managing Director of Bauxite Resources, and is a non-executive Director of Australia Minerals & Mining Group Ltd.Yan Jia GAICD
Deputy Non-Executive Chairperson
Deputy Non-executive Chairperson and Member of the Remuneration and Nomination Committee
Ms Jia is currently the Director of the Administration Department with the Jiangsu Shagang International Trade Co Ltd, a subsidiary of Jiangsu Shagang Group, China’s largest private steel company. Ms Jia has over ten years’ experience of managerial, human resources, intellectual property and commercial experience in the steel industry and bulk raw material transaction sector.
Liming Huang JD, LLM, EMBA
Non-Executive Director
Non-executive Director and Chairperson of the Audit and Risk Committee
Mr Huang is a corporate and commercial lawyer with 12 years legal experience. He is currently special counsel with Corrs Chambers Westgarth Lawyers. Mr Huang has been extensively involved in a number of iron ore, gold and other resource corporate transactions between Australia and China and provides legal advice to local and international investors and businesses on mergers and acquisitions, joint venture, equity capital market and corporate governance. In addition, Mr Huang is an associate member of CPA Australia.
Mr Huang is the Vice President of Australia China Business Council Victoria Branch.
21
2016 Annual Report « Grange Resources Limited
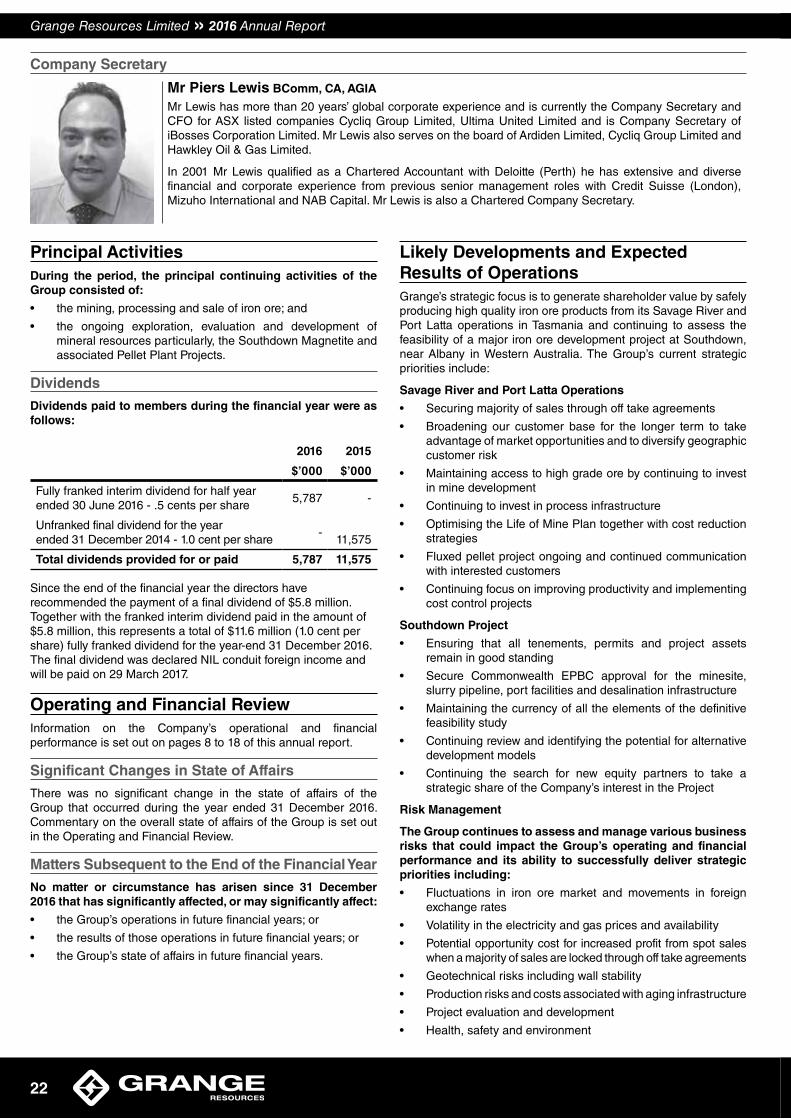
Company Secretary
Mr Piers Lewis BComm, CA, AGIA
Mr Lewis has more than 20 years’ global corporate experience and is currently the Company Secretary and CFO for ASX listed companies Cycliq Group Limited, Ultima United Limited and is Company Secretary of iBosses Corporation Limited. Mr Lewis also serves on the board of Ardiden Limited, Cycliq Group Limited and Hawkley Oil & Gas Limited.
In 2001 Mr Lewis qualified as a Chartered Accountant with Deloitte (Perth) he has extensive and diverse financial and corporate experience from previous senior management roles with Credit Suisse (London), Mizuho International and NAB Capital. Mr Lewis is also a Chartered Company Secretary.
Principal Activities During the period, the principal continuing activities of the Group consisted of:
• the mining, processing and sale of iron ore; and
• the ongoing exploration, evaluation and development of mineral resources particularly, the Southdown Magnetite and associated Pellet Plant Projects.
Dividends
Dividends paid to members during the financial year were as follows:
2016 2015
$’000 $’000
Fully franked interim dividend for half year ended 30 June 2016 - .5 cents per share
5,787 -
Unfranked final dividend for the year ended 31 December 2014 - 1.0 cent per share
-
11,575
Total dividends provided for or paid 5,787 11,575
Since the end of the financial year the directors have recommended the payment of a final dividend of $5.8 million. Together with the franked interim dividend paid in the amount of $5.8 million, this represents a total of $11.6 million (1.0 cent per share) fully franked dividend for the year-end 31 December 2016. The final dividend was declared NIL conduit foreign income and will be paid on 29 March 2017.
Operating and Financial Review Information on the Company’s operational and financial performance is set out on pages 8 to 18 of this annual report.
Significant Changes in State of Affairs
There was no significant change in the state of affairs of the Group that occurred during the year ended 31 December 2016. Commentary on the overall state of affairs of the Group is set out in the Operating and Financial Review.
Matters Subsequent to the End of the Financial Year
No matter or circumstance has arisen since 31 December 2016 that has significantly affected, or may significantly affect:
• the Group’s operations in future financial years; or
• the results of those operations in future financial years; or
• the Group’s state of affairs in future financial years.
Likely Developments and Expected Results of Operations Grange’s strategic focus is to generate shareholder value by safely producing high quality iron ore products from its Savage River and Port Latta operations in Tasmania and continuing to assess the feasibility of a major iron ore development project at Southdown, near Albany in Western Australia. The Group’s current strategic priorities include:
Savage River and Port Latta Operations
• Securing majority of sales through off take agreements
• Broadening our customer base for the longer term to take advantage of market opportunities and to diversify geographic customer risk
• Maintaining access to high grade ore by continuing to invest in mine development
• Continuing to invest in process infrastructure
• Optimising the Life of Mine Plan together with cost reduction strategies
• Fluxed pellet project ongoing and continued communication with interested customers
• Continuing focus on improving productivity and implementing cost control projects
Southdown Project
• Ensuring that all tenements, permits and project assets remain in good standing
• Secure Commonwealth EPBC approval for the minesite, slurry pipeline, port facilities and desalination infrastructure
• Maintaining the currency of all the elements of the definitive feasibility study
• Continuing review and identifying the potential for alternative development models
• Continuing the search for new equity partners to take a strategic share of the Company’s interest in the Project
Risk Management
The Group continues to assess and manage various business risks that could impact the Group’s operating and financial performance and its ability to successfully deliver strategic priorities including:
• Fluctuations in iron ore market and movements in foreign exchange rates
• Volatility in the electricity and gas prices and availability
• Potential opportunity cost for increased profit from spot sales when a majority of sales are locked through off take agreements
• Geotechnical risks including wall stability
• Production risks and costs associated with aging infrastructure
• Project evaluation and development
• Health, safety and environment
Grange Resources Limited » 2016 Annual Report
22
Risk mitigation strategies include the following:
• Close monitoring of the fluctuations in iron ore prices and demands from different markets
• Flexible strategy to determine the volume to be secured through off-take agreements
• Intense program of geotechnical wall monitoring, modelling and redesign work to mitigate potential stability issues
• Continue disciplined and rigorous review process regarding budget development and cost control to ensure investment directed to highest priority areas while reducing overall operating costs
• A well developed tool kit to ensure projects are adequately planned and peer reviewed prior to commitment and execution
• Outstanding safety record is supported by comprehensive safety system that enables management to develop a resilient safety culture and ensure our stewardship over the environment
Environmental Regulation The mining and exploration tenements held by the Group contain environmental requirements and conditions that the Group must comply with in the course of normal operations. These conditions and regulations cover the management of the storage of hazardous materials and rehabilitation of mine sites.
The Group is subject to significant environmental legislation and regulation in respect of its mining, processing and exploration activities as set out below:
Savage River and Port Latta Operations
The Group obtained approvals to operate in 1996 and 1997 under the Land Use Planning and Approvals Act (LUPA) and the Environmental Management and Pollution Control Act (EMPCA) as well as the Goldamere Act and Mineral Resources Development Act. The land use permit conditions for Savage River and Port Latta are contained in Environmental Protection Notices 248/2 and 302/2 respectively. The currently approved Environmental Management Plans were submitted for Savage River and Port Latta on 21 December 2010. The extension of the project’s life was approved by the Department of Tourism, Arts and the Environment on 12 March 2007 and together with the Goldamere Act and the Environmental Protection Notices, is the basis for the management of all environmental aspects of the mining leases. The Group has been relieved of any environmental obligation in relation to contamination, pollutants or pollution caused by operations prior to the date of the Goldamere Agreement (December 1996).
During the financial year there were no breaches of licence conditions.
Southdown Joint Venture
The Southdown Joint Venture has not been responsible for any activities which would cause a breach of environmental legislation.
Mount Windsor Joint Venture
The Group is a junior partner (30%) in the Mt Windsor project in North Queensland which is now being rehabilitated for future lease relinquishment. An ongoing Transitional Environment Program has been entered into voluntarily to identify and remediate various sources of pollution on site. A comprehensive plan has been developed and instigated to manage the leases with relinquishment expected in 2045.
During the financial year there were no breaches of licence conditions.
National Greenhouse and Energy Reporting Act 2007
The National Greenhouse and Energy Reporting Act 2007 requires the Group to report its annual greenhouse gas emissions and energy use by 31 October each year. The Group has implemented systems and processes for the collection and calculation of the data required and has submitted its annual reports to the Greenhouse and Energy Data Officer by 31 October each year.
Clean Energy Act 2011 and the Clean Energy Legislation (Carbon Tax Repeal) Act 2014
The Group has complied with its obligations under the Clean Energy Act, the Clean Energy Legislation (Carbon Tax Repeal) Act and related legislation by completing True-up requirements with regard to assistance received through the Jobs and Competitiveness Program for the emissions-intensive trade-exposed activities of Production of Iron Ore Pellets and Production of Magnetite Concentrate in the moderately emissions-intensive category.
Meetings of Directors The numbers of meetings of the Company’s Board of Directors and of each Board Committee held during the year ended 31 December 2016, and the numbers of meetings attended by each Director were:
NameDirectors’ meetings
Meetings of Committees
Audit Remuneration
A B A B A B
M Li 8 8 8 8 3 3
Y Jia 8 8 - - 3 3
D Tenardi 7 8 7 8 3 3
L Huang 8 8 8 8 - -
H Zhao 8 8 - - - -
A = Number of meetings attended
B = Number of meetings held during the time the Director held office or was a member of the committee during the year ended 31 December 2016
Interests in the Shares, Rights and Options of the Company The relevant interest of each Director in the share capital and options of the Company as at the date of this report is:
DirectorNumber of Fully Paid
Ordinary Shares Rights OptionsBeneficial Non-Beneficial
M Li 13,507 - - -
Y Jia(1) - - - -
D Tenardi - - - -
L Huang - - - -
H Zhao(2) - - - -
(1) Y Jia is an employee of Jiangsu Shagang International Trade Co. Ltd which is a subsidiary of the Jiangsu Shagang Group, ultimate shareholder of Shagang International Holdings Limited. Shagang International Holdings Limited and its affiliates hold 554,762,656 ordinary fully paid shares in the Company as at the date of this report.
(2) H Zhao is a former Director on the Board of the Jiangsu Shagang Group, ultimate shareholder of Shagang International Holdings Limited. Shagang International Holdings Limited and its affiliates hold 554,762,656 ordinary fully paid shares in the Company as at the date of this report.
23
2016 Annual Report « Grange Resources Limited
Remuneration Report This remuneration report sets out remuneration information for Non-executive Directors, Executive Directors and other key management personnel of the Group and the company.
i) Key management personnel disclosed in this report
Non-executive directors
Michelle Li
Yan Jia
Daniel Tenardi
Liming Huang
Executive directors Position
Honglin Zhao Executive Director
Chief Executive Officer
Other key management personnel
Position
Bessie ZhangChief Financial Officer (until 7
March 2016)
Steven PhanChief Financial Officer (from
11 April 2016)
Ben Maynard General Manager Operations
ii) Remuneration governanceThe Board has an established Remuneration and Nomination Committee to assist in overseeing the development of policies and practices which enable the Company to attract and retain capable Directors and employees, reward employees fairly and responsibly and meet the Board’s oversight responsibilities in relation to corporate governance practices.
The Remuneration and Nomination Committee is composed of Mr Daniel Tenardi (Committee Chairperson), Ms Yan Jia (Non-Executive Deputy Chairperson) and Dr Michelle Li (Chairperson).
The responsibilities and functions for the Remuneration and Nomination Committee include reviewing and making recommendations on the following:
• Equity based executive and employee incentive plans;
• Recruitment, retention, succession planning, performance measurement and termination policies and procedures for Non-executive Directors, Executive Directors and Key Management Personnel;
• The remuneration of the Chief Executive Officer; Chief Financial Officer; and General Manager Operations;
• Periodically assessing the skills required by the Board;
• Recommend processes to evaluate the performance of the Board, its Committees and individual Directors; and
• Reviewing governance arrangements pertaining to remuneration matters.
The Charter is reviewed annually and remuneration strategies are reviewed regularly.
The Company did not receive any specific feedback at the annual general meeting or throughout the year on its remuneration practices.
iii) Executive remuneration philosophy and framework
It is the Company’s objective to provide maximum stakeholder benefit from the retention of a small high quality executive team by remunerating Executive Directors and executives fairly and appropriately with reference to relevant market conditions. To assist in achieving this objective, the Board attempts to link the nature and amount of executives’ emoluments to the Company’s performance. The remuneration framework aims to ensure that remuneration practices are:
• acceptable to shareholders, transparent and easily understood;
• competitive and reasonable, enabling the company to attract and retain key talents who share the same values with Grange Resources; and
• aligned to the Company’s strategic and business objectives and the creation of shareholder value.
Using external remuneration sector comparative data, the Group has structured an executive remuneration framework that is market competitive and complementary to the reward strategy of the organisation. The framework is reviewed regularly along with the remuneration strategy review. The Board decided it was not necessary to use the services of independent remuneration consultants during the year ended 31 December 2016.
The framework provides a mix of fixed and variable pay, and a blend of short and long term incentives detailed as follows:
Fixed Remuneration
Fixed remuneration is reviewed annually by the Remuneration and Nomination Committee. The process consists of a review of Group and individual performance, relevant comparative remuneration externally and internally and, where appropriate, external advice on policies and practices.
Executives are given the opportunity to receive their fixed (primary) remuneration in a variety of forms including cash and fringe benefits. It is intended that the manner of payment chosen is optimal for the recipient without creating any undue cost for the Group.
There are no guaranteed fixed pay increases included in any executives’ contracts.
Variable Remuneration – Short Term Incentive (‘STI’)
The objective of the STI is to link the achievement of the Company’s annual operational targets (usually reflected in the approved budgets) and an individual’s personal targets with the remuneration received by selected executive directors and senior employees responsible for meeting those targets. Payments are made as a cash incentive payable after the financial statements have been audited and released to the Australian Securities Exchange (‘ASX’). 50% of the STI relates to the achievement of company performance goals and 50% relates to the attainment of agreed personal performance goals.
Grange Resources Limited » 2016 Annual Report
24
Variable Remuneration - Long Term Incentive (‘LTI’)
a) Deferred Cash
The Board determined that it was appropriate to simplify the Company LTI plan and introduce a 2 year deferred cash incentive scheme with immediate effect from 1 January 2014.
The objective of this deferred cash scheme is to reward selected executive directors and senior employees with a cash payment which is linked to the Company satisfying financial performance hurdles and subject to ongoing employment with Grange. The deferred cash component is determined by measuring the Company’s:
• sales volumes (weighting 33.33%) of iron ore products (pellets, chips and concentrate)
• normalised EPS result (weighting 33.33%) (excluding abnormal items), and
• generation of additional free cash flow (mainly operating and investing cash flows) over Budget (weighting 33.33%) (excluding capital management initiatives i.e. inflows from debt funding and outflows from dividends to shareholders).
The deferred cash component is determined based on the Company’s performance for the year ended 31 December, with 50% payable on 31 December the following year, and the balance payable on or about the following 31 December (i.e. 2 years after the relevant calculation date). Payment of deferred cash is subject to continuing employment with Grange at the scheduled date of the payment.
b) Rights to Grange Shares
The objective for the issue of Rights under the LTI program was replaced with Deferred Cash from 1 January 2014 as discussed above. The Company did not issue any Rights to employees in the 12 months ended 31 December 2016.
iv) Relationship between remuneration and Grange Resources performanceThe table below shows key performance indicators of Company performance over the past five years.
2012 2013 2014 2015 2016
Revenue from mining operations $ million 331.3 281.1 297.2 205.6 276.3
Net profit (loss) after tax $ million 59.1 21.8 (110.2) (277.8) 92.90
Basic earnings per share Cents 5.12 1.89 (9.52) (24.00) 8.03
Dividends paid and declared $ million 23.1 34.7 11.6 - 11.6
Share price (last trade day of financial year) Cents 35.0 26.0 10.5 9.0 14.0
v) Non-executive director remuneration policyFees and payments to Non-executive Directors reflect the responsibilities and demands made on them. Non-executive Directors’ fees and payments are reviewed periodically by the Board. The Board also considers comparative market data and if required the advice of independent remuneration consultants to ensure Non-executive Directors’ fees and payments are appropriate and in line with the market. The Chairperson’s fees are determined independently to the fees of Non-executive Directors based on comparative roles in the external market.
The current remuneration was last reviewed with effect from 1 November 2014. The Chairperson’s remuneration is inclusive of committee fees while other Non-executive Directors who chair a Committee receive additional yearly fees. The Deputy Chairperson is also entitled to receive an additional yearly fee.
Non-executive Directors’ fees are determined within an aggregate Directors’ fee pool limit, which is periodically reviewed for adequacy. Any increase to the aggregate Directors’ fee pool is submitted to shareholders for approval. The maximum currently stands at $800,000 per annum and was approved by shareholders at the Annual General Meeting on 26 November 2010. Non-executive Directors do not receive performance-based pay.
The following annual fees (inclusive of superannuation) have applied:
From 1 November2014
Board of Directors
Chairperson(1) $157,500
Deputy Chairperson $89,250
Non-executive Director $78,750
Audit and Risk Committee
Chairperson $15,750
Committee Member $10,500
Remuneration and Nomination Committee
Chairperson $15,750
Committee Member $7,500
(1) The Chairperson is not paid any additional amounts for Committee membership.
25
2016 Annual Report « Grange Resources Limited
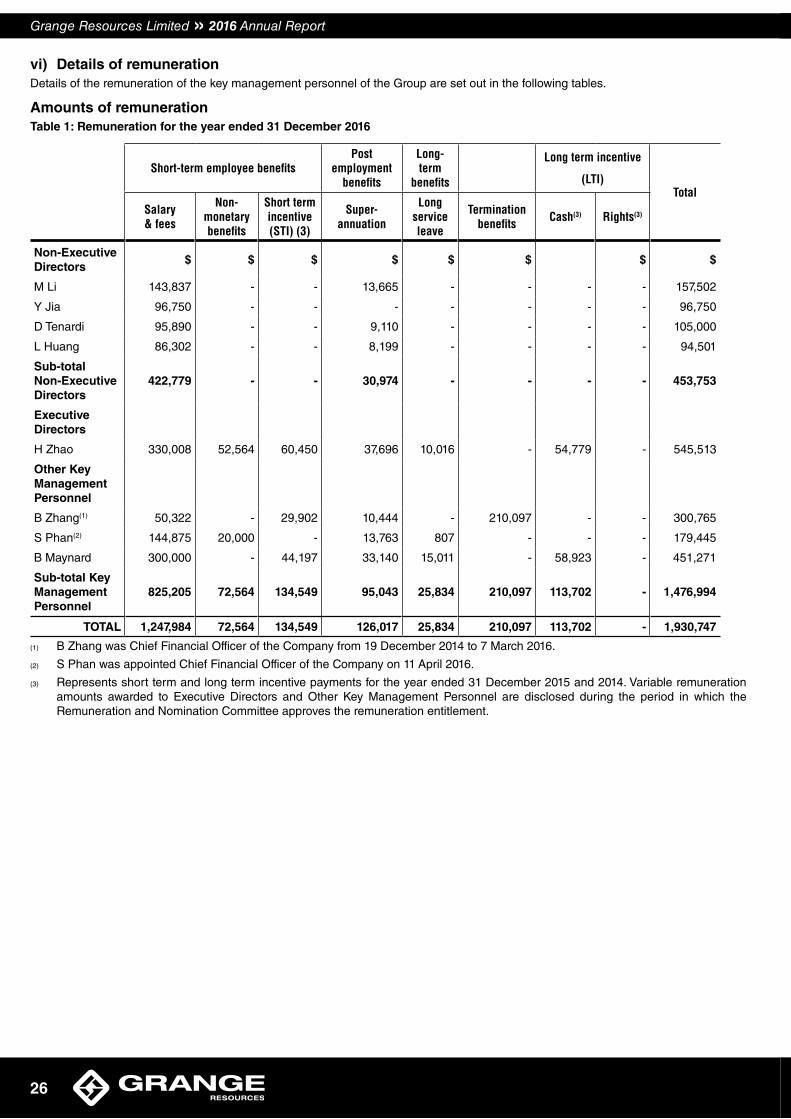
vi) Details of remuneration Details of the remuneration of the key management personnel of the Group are set out in the following tables.
Amounts of remunerationTable 1: Remuneration for the year ended 31 December 2016
Short-term employee bene� tsPost
employment bene� ts
Long-term
bene� ts
Long term incentive
(LTI)Total
Salary & fees
Non-monetary bene� ts
Short term incentive (STI) (3)
Super-annuation
Long service leave
Termination bene� ts Cash(3) Rights(3)
Non-Executive Directors
$ $ $ $ $ $ $ $
M Li 143,837 - - 13,665 - - - - 157,502
Y Jia 96,750 - - - - - - - 96,750
D Tenardi 95,890 - - 9,110 - - - - 105,000
L Huang 86,302 - - 8,199 - - - - 94,501
Sub-total Non-Executive Directors
422,779 - - 30,974 - - - - 453,753
Executive Directors
H Zhao 330,008 52,564 60,450 37,696 10,016 - 54,779 - 545,513
Other Key Management Personnel
B Zhang(1) 50,322 - 29,902 10,444 - 210,097 - - 300,765
S Phan(2) 144,875 20,000 - 13,763 807 - - - 179,445
B Maynard 300,000 - 44,197 33,140 15,011 - 58,923 - 451,271
Sub-total Key Management Personnel
825,205 72,564 134,549 95,043 25,834 210,097 113,702 - 1,476,994
TOTAL 1,247,984 72,564 134,549 126,017 25,834 210,097 113,702 - 1,930,747
(1) B Zhang was Chief Financial Officer of the Company from 19 December 2014 to 7 March 2016.
(2) S Phan was appointed Chief Financial Officer of the Company on 11 April 2016.
(3) Represents short term and long term incentive payments for the year ended 31 December 2015 and 2014. Variable remuneration amounts awarded to Executive Directors and Other Key Management Personnel are disclosed during the period in which the Remuneration and Nomination Committee approves the remuneration entitlement.
Grange Resources Limited » 2016 Annual Report
26
Table 2: Remuneration for the year ended 31 December 2015
Short-term employee bene� tsPost
employment bene� ts
Long-term
bene� ts
Long term incentive (LTI) Total
Salary & fees
Non-monetary bene� ts
Short term incentive (STI) (3)
Super-annuation
Long service leave
Termination bene� ts Cash(3) Rights(3)
Non-Executive Directors
$ $ $ $ $ $ $ $
M Li 143,837 - - 13,665 - - - - 157,502
Y Jia 96,751 - - - - - - - 96,751
C Ko(1) 32,813 - - - - - - - 32,813
D Tenardi 86,302 - - 8,199 - - - - 94,501
L Huang 86,302 - - 8,199 - - - - 94,501
Sub-total Non-Executive Directors
446,005 - - 30,063 - - - - 476,068
Executive Directors
H Zhao(2) 302,358 72,353 20,321 30,655 19,585 - 23,590 - 468,862
Other Key Management Personnel
B Zhang(4) 250,005 - - 23,751 1,349 - 4,422 - 279,527
B Maynard 300,004 - 28,146 31,174 29,132 - 25,335 (15,552) 398,239
Sub-total Key Management Personnel
852,367 72,353 48,467 85,580 50,066 - 53,347 (15,552) 1,146,628
TOTAL 1,298,372 72,353 48,467 115,643 50,066 - 53,347 (15,552) 1,622,696
(1) C Ko was Non-Executive Director of the Company until 12 May 2015.
(2) H Zhao was appointed Chief Executive Officer of the Company from 6 March 2015.
(3) Represents short term and long term incentive payments for the year ended 31 December 2014 and 2013. Variable remuneration amounts awarded to Executive Directors and Other Key Management Personnel are disclosed during the period in which the Remuneration and Nomination Committee approves the remuneration entitlement.
(4) B Zhang was Chief Financial Officer of the Company from 19 December 2014 to 7 March 2016.
Table 3: Relative proportions linked to performance
The relative proportions of remuneration that are linked to performance and those that are fixed are as follows:
NameFixed Remuneration At Risk - STI At Risk - LTI
Dec-16 Dec-15 Dec-16 Dec-15 Dec-16 Dec-15
Executive Directors
H Zhao 77% 77% 14% 14% 9% 9%
- - -
Other Key Management Personnel
B Zhang(1) - 86% - 7% - 7%
S Phan(2) 84% - 8% - 8% -
B Maynard 80% 80% 12% 12% 8% 8%
(1) B Zhang was Chief Financial Officer of the Company from 19 December 2014 to 7 March 2016.
(2) S Phan was appointed Chief Financial Officer of the Company from 11 April 2016.
27
2016 Annual Report « Grange Resources Limited
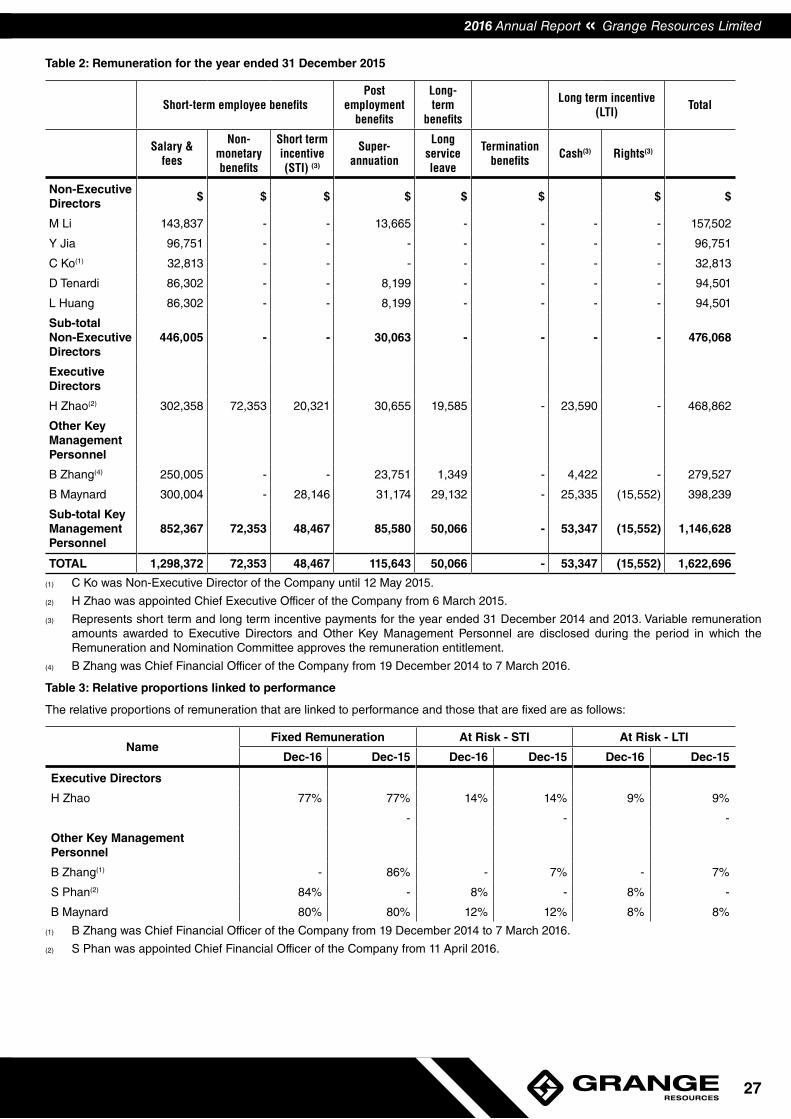
vi) Details of remuneration Details of the remuneration of the key management personnel of the Group are set out in the following tables.
Amounts of remunerationTable 1: Remuneration for the year ended 31 December 2016
Short-term employee bene� tsPost
employment bene� ts
Long-term
bene� ts
Long term incentive
(LTI)Total
Salary & fees
Non-monetary bene� ts
Short term incentive (STI) (3)
Super-annuation
Long service leave
Termination bene� ts Cash(3) Rights(3)
Non-Executive Directors
$ $ $ $ $ $ $ $
M Li 143,837 - - 13,665 - - - - 157,502
Y Jia 96,750 - - - - - - - 96,750
D Tenardi 95,890 - - 9,110 - - - - 105,000
L Huang 86,302 - - 8,199 - - - - 94,501
Sub-total Non-Executive Directors
422,779 - - 30,974 - - - - 453,753
Executive Directors
H Zhao 330,008 52,564 60,450 37,696 10,016 - 54,779 - 545,513
Other Key Management Personnel
B Zhang(1) 50,322 - 29,902 10,444 - 210,097 - - 300,765
S Phan(2) 144,875 20,000 - 13,763 807 - - - 179,445
B Maynard 300,000 - 44,197 33,140 15,011 - 58,923 - 451,271
Sub-total Key Management Personnel
825,205 72,564 134,549 95,043 25,834 210,097 113,702 - 1,476,994
TOTAL 1,247,984 72,564 134,549 126,017 25,834 210,097 113,702 - 1,930,747
(1) B Zhang was Chief Financial Officer of the Company from 19 December 2014 to 7 March 2016.
(2) S Phan was appointed Chief Financial Officer of the Company on 11 April 2016.
(3) Represents short term and long term incentive payments for the year ended 31 December 2015 and 2014. Variable remuneration amounts awarded to Executive Directors and Other Key Management Personnel are disclosed during the period in which the Remuneration and Nomination Committee approves the remuneration entitlement.
Grange Resources Limited » 2016 Annual Report
26
Table 2: Remuneration for the year ended 31 December 2015
Short-term employee bene� tsPost
employment bene� ts
Long-term
bene� ts
Long term incentive (LTI) Total
Salary & fees
Non-monetary bene� ts
Short term incentive (STI) (3)
Super-annuation
Long service leave
Termination bene� ts Cash(3) Rights(3)
Non-Executive Directors
$ $ $ $ $ $ $ $
M Li 143,837 - - 13,665 - - - - 157,502
Y Jia 96,751 - - - - - - - 96,751
C Ko(1) 32,813 - - - - - - - 32,813
D Tenardi 86,302 - - 8,199 - - - - 94,501
L Huang 86,302 - - 8,199 - - - - 94,501
Sub-total Non-Executive Directors
446,005 - - 30,063 - - - - 476,068
Executive Directors
H Zhao(2) 302,358 72,353 20,321 30,655 19,585 - 23,590 - 468,862
Other Key Management Personnel
B Zhang(4) 250,005 - - 23,751 1,349 - 4,422 - 279,527
B Maynard 300,004 - 28,146 31,174 29,132 - 25,335 (15,552) 398,239
Sub-total Key Management Personnel
852,367 72,353 48,467 85,580 50,066 - 53,347 (15,552) 1,146,628
TOTAL 1,298,372 72,353 48,467 115,643 50,066 - 53,347 (15,552) 1,622,696
(1) C Ko was Non-Executive Director of the Company until 12 May 2015.
(2) H Zhao was appointed Chief Executive Officer of the Company from 6 March 2015.
(3) Represents short term and long term incentive payments for the year ended 31 December 2014 and 2013. Variable remuneration amounts awarded to Executive Directors and Other Key Management Personnel are disclosed during the period in which the Remuneration and Nomination Committee approves the remuneration entitlement.
(4) B Zhang was Chief Financial Officer of the Company from 19 December 2014 to 7 March 2016.
Table 3: Relative proportions linked to performance
The relative proportions of remuneration that are linked to performance and those that are fixed are as follows:
NameFixed Remuneration At Risk - STI At Risk - LTI
Dec-16 Dec-15 Dec-16 Dec-15 Dec-16 Dec-15
Executive Directors
H Zhao 77% 77% 14% 14% 9% 9%
- - -
Other Key Management Personnel
B Zhang(1) - 86% - 7% - 7%
S Phan(2) 84% - 8% - 8% -
B Maynard 80% 80% 12% 12% 8% 8%
(1) B Zhang was Chief Financial Officer of the Company from 19 December 2014 to 7 March 2016.
(2) S Phan was appointed Chief Financial Officer of the Company from 11 April 2016.
27
2016 Annual Report « Grange Resources Limited
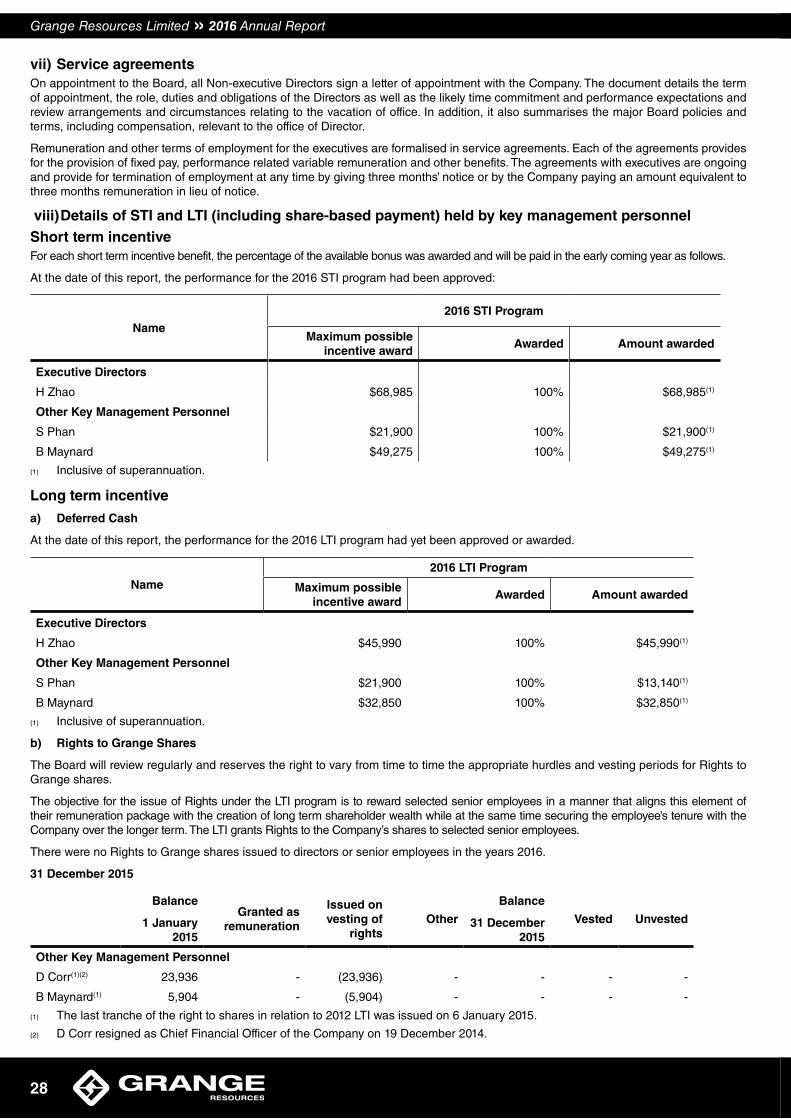
vii) Service agreementsOn appointment to the Board, all Non-executive Directors sign a letter of appointment with the Company. The document details the term of appointment, the role, duties and obligations of the Directors as well as the likely time commitment and performance expectations and review arrangements and circumstances relating to the vacation of office. In addition, it also summarises the major Board policies and terms, including compensation, relevant to the office of Director.
Remuneration and other terms of employment for the executives are formalised in service agreements. Each of the agreements provides for the provision of fixed pay, performance related variable remuneration and other benefits. The agreements with executives are ongoing and provide for termination of employment at any time by giving three months’ notice or by the Company paying an amount equivalent to three months remuneration in lieu of notice.
viii) Details of STI and LTI (including share-based payment) held by key management personnelShort term incentiveFor each short term incentive benefit, the percentage of the available bonus was awarded and will be paid in the early coming year as follows.
At the date of this report, the performance for the 2016 STI program had been approved:
Name2016 STI Program
Maximum possible incentive award
Awarded Amount awarded
Executive Directors
H Zhao $68,985 100% $68,985(1)
Other Key Management Personnel
S Phan $21,900 100% $21,900(1)
B Maynard $49,275 100% $49,275(1)
(1) Inclusive of superannuation.
Long term incentive
a) Deferred Cash
At the date of this report, the performance for the 2016 LTI program had yet been approved or awarded.
Name2016 LTI Program
Maximum possible incentive award
Awarded Amount awarded
Executive Directors
H Zhao $45,990 100% $45,990(1)
Other Key Management Personnel
S Phan $21,900 100% $13,140(1)
B Maynard $32,850 100% $32,850(1)
(1) Inclusive of superannuation.
b) Rights to Grange Shares
The Board will review regularly and reserves the right to vary from time to time the appropriate hurdles and vesting periods for Rights to Grange shares.
The objective for the issue of Rights under the LTI program is to reward selected senior employees in a manner that aligns this element of their remuneration package with the creation of long term shareholder wealth while at the same time securing the employee’s tenure with the Company over the longer term. The LTI grants Rights to the Company’s shares to selected senior employees.
There were no Rights to Grange shares issued to directors or senior employees in the years 2016.
31 December 2015
Balance
1 January 2015
Granted as remuneration
Issued on vesting of
rightsOther
Balance
31 December 2015
Vested Unvested
Other Key Management Personnel
D Corr(1)(2) 23,936 - (23,936) - - - -
B Maynard(1) 5,904 - (5,904) - - - -
(1) The last tranche of the right to shares in relation to 2012 LTI was issued on 6 January 2015.
(2) D Corr resigned as Chief Financial Officer of the Company on 19 December 2014.
Grange Resources Limited » 2016 Annual Report
28
Share holdings
The number of shares in the Company held during the period by each Director of Grange Resources Limited and other key management personnel of the Group, including their personally related parties, are set out below:
31 December 2016
Balance
1 January 2016
On vesting of rights
On market purchases
On market disposals
OtherBalance
31 December 2016
Directors of Grange Resources Limited
M Li 13,507 - - - - 13,507
Other Key Management Personnel
B Maynard 68,121 - - - - 68,121
31 December 2015
Balance
1 January 2015
On vesting of rights
On market purchases
On market disposals
OtherBalance
31 December 2015
Directors of Grange Resources Limited
M Li 13,507 - - - - 13,507
Other Key Management Personnel
B Maynard 62,217 5,904 - - - 68,121
ix) Loans to key management personnelThere were no loans to key management personnel during the year (December 2015: Nil).
x) Other transactions with key management personnel
A director, Mr Honglin Zhao, is a former director of Jiangsu Shagang Group (Shagang) to which sales of iron ore products are made under long-term off-take agreements. As at 27 February 2017, Shagang holds 47.93% (29 February 2016: 47.68%) of the issued ordinary shares of Grange. Each transaction between Shagang and Grange must be either approved by non-associated Grange shareholders, or approved by the Grange independent directors.
A director, Ms Yan Jia, is an employee of Shagang International Trade Co. Ltd., which is a wholly owned subsidiary of Jiangsu Shagang Group (Shagang) to which sales of iron ore products are made under long-term off-take agreements. As at 27 February 2017, Shagang holds 47.93% (29 February 2016: 47.68%) of the issued ordinary shares of Grange. Each transaction between Shagang and Grange must be either approved by non-associated Grange shareholders, or approved by the Grange independent directors.
Aggregate amounts of each of the above types of other transactions with key management personnel of Grange:
2016 2015
$ $
Sales of iron ore products
Pellets 105,507,651 85,678,147
Chips - 1,732,487
105,507,651 87,410,634
The following balances are outstanding at the end of the reporting period in relation to the above transactions:
2016 2015
$ $
Trade receivables (sales of iron ore products)
Pellets 5,130,461 (723,723)
Chips - (123,835)
Others (46,463) (75,346)
5,083,999 (922,904)
Insurance of OfficersDuring the financial period, the Company has paid premiums in respect of Directors’ and Officers’ Liability Insurance and Company Reimbursement policies, which cover all Directors and Officers of the Group to the extent permitted under the Corporations Act 2001. The policy conditions preclude the Group from any detailed disclosures.
Indemnity of AuditorsThe Company has entered into an agreement to indemnify its auditor, PricewaterhouseCoopers, against any claims or liabilities (including legal costs) asserted by third parties arising out of their services as auditor of the Company, where the liabilities arise as a direct result of the Company’s breach of its obligations to the Auditors, unless prohibited by the Corporations Act 2001.
29
2016 Annual Report « Grange Resources Limited
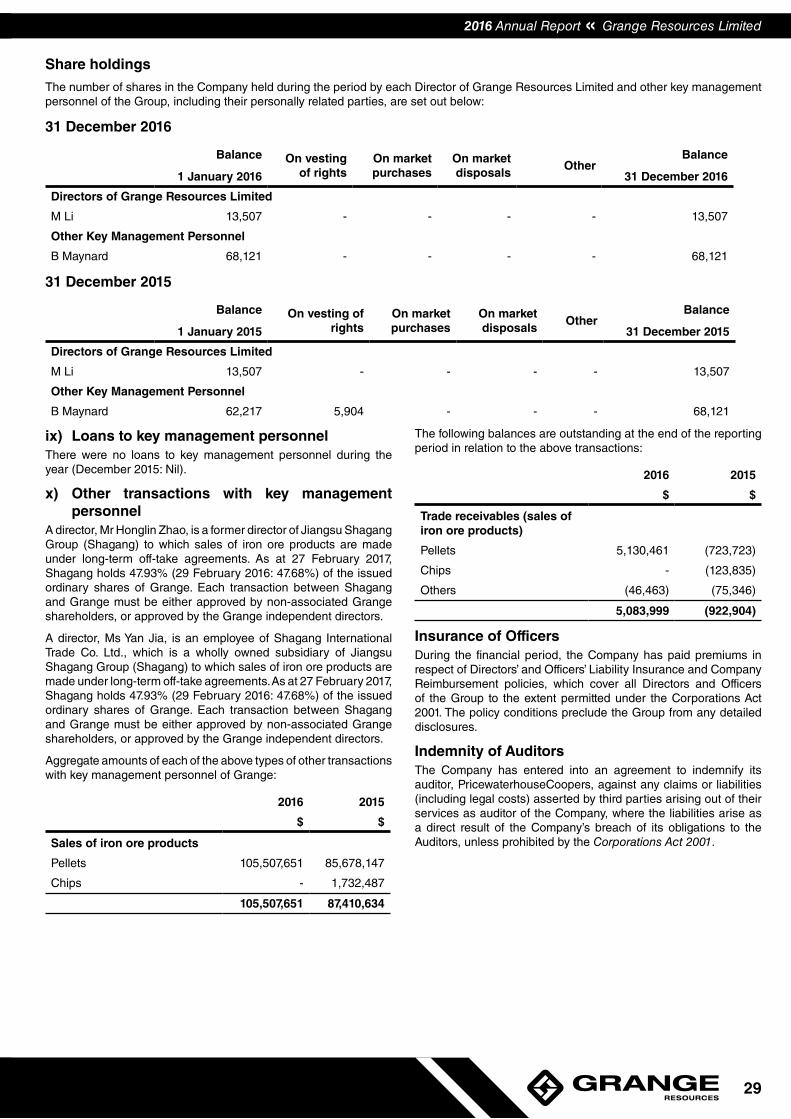
vii) Service agreementsOn appointment to the Board, all Non-executive Directors sign a letter of appointment with the Company. The document details the term of appointment, the role, duties and obligations of the Directors as well as the likely time commitment and performance expectations and review arrangements and circumstances relating to the vacation of office. In addition, it also summarises the major Board policies and terms, including compensation, relevant to the office of Director.
Remuneration and other terms of employment for the executives are formalised in service agreements. Each of the agreements provides for the provision of fixed pay, performance related variable remuneration and other benefits. The agreements with executives are ongoing and provide for termination of employment at any time by giving three months’ notice or by the Company paying an amount equivalent to three months remuneration in lieu of notice.
viii) Details of STI and LTI (including share-based payment) held by key management personnelShort term incentiveFor each short term incentive benefit, the percentage of the available bonus was awarded and will be paid in the early coming year as follows.
At the date of this report, the performance for the 2016 STI program had been approved:
Name2016 STI Program
Maximum possible incentive award
Awarded Amount awarded
Executive Directors
H Zhao $68,985 100% $68,985(1)
Other Key Management Personnel
S Phan $21,900 100% $21,900(1)
B Maynard $49,275 100% $49,275(1)
(1) Inclusive of superannuation.
Long term incentive
a) Deferred Cash
At the date of this report, the performance for the 2016 LTI program had yet been approved or awarded.
Name2016 LTI Program
Maximum possible incentive award
Awarded Amount awarded
Executive Directors
H Zhao $45,990 100% $45,990(1)
Other Key Management Personnel
S Phan $21,900 100% $13,140(1)
B Maynard $32,850 100% $32,850(1)
(1) Inclusive of superannuation.
b) Rights to Grange Shares
The Board will review regularly and reserves the right to vary from time to time the appropriate hurdles and vesting periods for Rights to Grange shares.
The objective for the issue of Rights under the LTI program is to reward selected senior employees in a manner that aligns this element of their remuneration package with the creation of long term shareholder wealth while at the same time securing the employee’s tenure with the Company over the longer term. The LTI grants Rights to the Company’s shares to selected senior employees.
There were no Rights to Grange shares issued to directors or senior employees in the years 2016.
31 December 2015
Balance
1 January 2015
Granted as remuneration
Issued on vesting of
rightsOther
Balance
31 December 2015
Vested Unvested
Other Key Management Personnel
D Corr(1)(2) 23,936 - (23,936) - - - -
B Maynard(1) 5,904 - (5,904) - - - -
(1) The last tranche of the right to shares in relation to 2012 LTI was issued on 6 January 2015.
(2) D Corr resigned as Chief Financial Officer of the Company on 19 December 2014.
Grange Resources Limited » 2016 Annual Report
28
Share holdings
The number of shares in the Company held during the period by each Director of Grange Resources Limited and other key management personnel of the Group, including their personally related parties, are set out below:
31 December 2016
Balance
1 January 2016
On vesting of rights
On market purchases
On market disposals
OtherBalance
31 December 2016
Directors of Grange Resources Limited
M Li 13,507 - - - - 13,507
Other Key Management Personnel
B Maynard 68,121 - - - - 68,121
31 December 2015
Balance
1 January 2015
On vesting of rights
On market purchases
On market disposals
OtherBalance
31 December 2015
Directors of Grange Resources Limited
M Li 13,507 - - - - 13,507
Other Key Management Personnel
B Maynard 62,217 5,904 - - - 68,121
ix) Loans to key management personnelThere were no loans to key management personnel during the year (December 2015: Nil).
x) Other transactions with key management personnel
A director, Mr Honglin Zhao, is a former director of Jiangsu Shagang Group (Shagang) to which sales of iron ore products are made under long-term off-take agreements. As at 27 February 2017, Shagang holds 47.93% (29 February 2016: 47.68%) of the issued ordinary shares of Grange. Each transaction between Shagang and Grange must be either approved by non-associated Grange shareholders, or approved by the Grange independent directors.
A director, Ms Yan Jia, is an employee of Shagang International Trade Co. Ltd., which is a wholly owned subsidiary of Jiangsu Shagang Group (Shagang) to which sales of iron ore products are made under long-term off-take agreements. As at 27 February 2017, Shagang holds 47.93% (29 February 2016: 47.68%) of the issued ordinary shares of Grange. Each transaction between Shagang and Grange must be either approved by non-associated Grange shareholders, or approved by the Grange independent directors.
Aggregate amounts of each of the above types of other transactions with key management personnel of Grange:
2016 2015
$ $
Sales of iron ore products
Pellets 105,507,651 85,678,147
Chips - 1,732,487
105,507,651 87,410,634
The following balances are outstanding at the end of the reporting period in relation to the above transactions:
2016 2015
$ $
Trade receivables (sales of iron ore products)
Pellets 5,130,461 (723,723)
Chips - (123,835)
Others (46,463) (75,346)
5,083,999 (922,904)
Insurance of OfficersDuring the financial period, the Company has paid premiums in respect of Directors’ and Officers’ Liability Insurance and Company Reimbursement policies, which cover all Directors and Officers of the Group to the extent permitted under the Corporations Act 2001. The policy conditions preclude the Group from any detailed disclosures.
Indemnity of AuditorsThe Company has entered into an agreement to indemnify its auditor, PricewaterhouseCoopers, against any claims or liabilities (including legal costs) asserted by third parties arising out of their services as auditor of the Company, where the liabilities arise as a direct result of the Company’s breach of its obligations to the Auditors, unless prohibited by the Corporations Act 2001.
29
2016 Annual Report « Grange Resources Limited
Audit and Non-audit Services
Details of the amounts paid or payable to the auditor for audit and non-audit services provided during the year are set out below.
The Board of Directors has considered the position and, in accordance with advice received from the Company’s Audit and Risk Committee, is satisfied that the provision of non-audit services is compatible with the general standard of independence for auditors imposed by the Corporations Act 2001. The Directors are satisfied that the provision of non-audit services by the auditor, as set out below, did not compromise the auditor independence requirements of the Corporations Act 2001 for the following reasons:
• all non-audit services have been reviewed by the Audit and Risk Committee to ensure they do not impact the impartiality and objectivity of the auditor; and
• none of the services undermine the general principles relating to auditor independence as set out in APES 110 Code of Ethics for Professional Accountants.
During the year the following fees were paid or payable for services provided by the auditor of the parent entity, its related practices and non-related audit firms:
2016 2015
$’000 $’000
a) PwC - AustraliaAudit and review of financial reports
235 389
Audit fees associated with additional work for 31 December 2015 audit accrued and paid for in 2016
- 143
Other assurance services 16 11
Other advisory services 37 -
Total remuneration of PwC - Australia
288 543
b) Related practices of PwC - AustraliaAudit and review of financial reports
24 19
Taxation compliance 1 4
Total remuneration of related practices of PwC - Australia
25 23
It is the Group’s policy to employ PricewaterhouseCoopers on assignments additional to their statutory audit duties where PricewaterhouseCoopers’s expertise and experience with the Group are important. These assignments are principally tax consulting and advice or where PricewaterhouseCoopers is awarded assignments on a competitive basis. It is the Group’s policy to seek competitive tenders on all major consulting assignments. Group policy also requires the Chairperson of the Audit and Risk Committee to approve all individual assignments performed by PricewaterhouseCoopers with total fees greater than $10,000.
Auditor’s independence declarationA copy of the auditor’s independence declaration as required under section 307C of the Corporations Act 2001 is set out on page 21.
Rounding of amountsThe Company is of a kind referred to in ASIC Legislative Instrument 2016/19, issued by the Australian Securities and Investments Commission, relating to the ‘rounding off’ of amounts in the Directors’ Report. Amounts in the Directors’ Report have been rounded off in accordance with the instrument to the nearest thousand dollars, or in certain cases, to the nearest dollar.
AuditorPwC continues in office in accordance with section 327 of the Corporations Act 2001.
The report is made in accordance with a resolution of Directors.
Michelle Li
Chairperson of the Board of Directors
Perth, Western Australia27 February 2017
Grange Resources Limited » 2016 Annual Report
30
AUDITOR’S INDEPENDENCE DECLARATION
PricewaterhouseCoopers, ABN 52 780 433 7572 Riverside Quay, SOUTHBANK VIC 3006, GPO Box 1331, MELBOURNE VIC 3001T: 61 3 8603 1000, F: 61 3 8603 1999, www.pwc.com.au
Liability limited by a scheme approved under Professional Standards Legislation.
21
Auditor’s Independence Declaration
As lead auditor for the audit of Grange Resources Limited for the year ended 31 December 2016, Ideclare that to the best of my knowledge and belief, there have been:
(a) no contraventions of the auditor independence requirements of the Corporations Act 2001 inrelation to the audit; and
(b) no contraventions of any applicable code of professional conduct in relation to the audit.
This declaration is in respect of Grange Resources Limited and the entities it controlled during theperiod.
John O'Donoghue MelbournePartnerPricewaterhouseCoopers
27 February 2017
31
2016 Annual Report « Grange Resources Limited
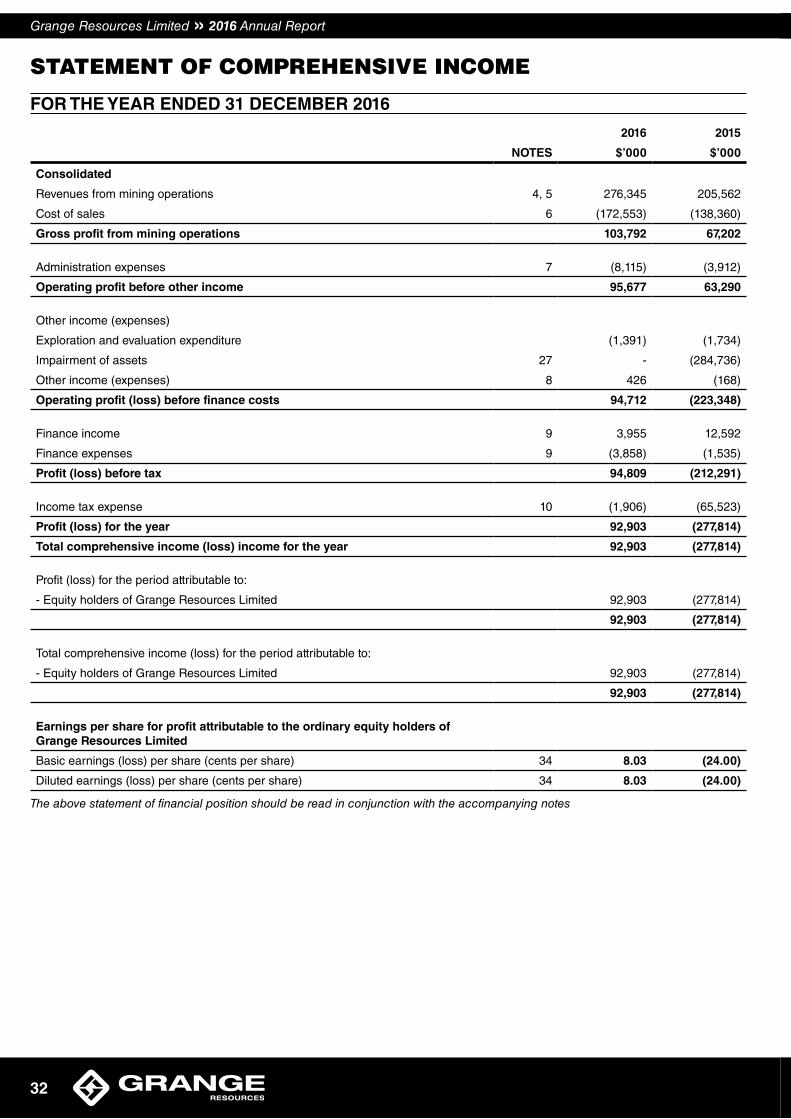
STATEMENT OF COMPREHENSIVE INCOME
FOR THE YEAR ENDED 31 DECEMBER 2016
NOTES
2016 2015
$’000 $’000
Consolidated
Revenues from mining operations 4, 5 276,345 205,562
Cost of sales 6 (172,553) (138,360)
Gross profit from mining operations 103,792 67,202
Administration expenses 7 (8,115) (3,912)
Operating profit before other income 95,677 63,290
Other income (expenses)
Exploration and evaluation expenditure (1,391) (1,734)
Impairment of assets 27 - (284,736)
Other income (expenses) 8 426 (168)
Operating profit (loss) before finance costs 94,712 (223,348)
Finance income 9 3,955 12,592
Finance expenses 9 (3,858) (1,535)
Profit (loss) before tax 94,809 (212,291)
Income tax expense 10 (1,906) (65,523)
Profit (loss) for the year 92,903 (277,814)
Total comprehensive income (loss) income for the year 92,903 (277,814)
Profit (loss) for the period attributable to:
- Equity holders of Grange Resources Limited 92,903 (277,814)
92,903 (277,814)
Total comprehensive income (loss) for the period attributable to:
- Equity holders of Grange Resources Limited 92,903 (277,814)
92,903 (277,814)
Earnings per share for profit attributable to the ordinary equity holders of Grange Resources Limited
Basic earnings (loss) per share (cents per share) 34 8.03 (24.00)
Diluted earnings (loss) per share (cents per share) 34 8.03 (24.00)
The above statement of financial position should be read in conjunction with the accompanying notes
Grange Resources Limited » 2016 Annual Report
32
STATEMENT OF FINANCIAL POSITION
AS AT 31 DECEMBER 2016
NOTES 31 December 2016 31 December 2015
Consolidated $’000 $’000
ASSETS
Current Assets
Cash and cash equivalents 11 165,958 94,698
Term deposits 11 - 43,732
Trade and other receivables 12 31,288 9,913
Inventories 13 35,541 79,124
Other financial assets 2 19 2,055
Total current assets 232,806 229,522
Non-current assets
Receivables 14 7,864 7,848
Property, plant and equipment 15 120,259 83,066
Mine properties and development 16 59,330 16,554
Deferred tax assets 17 8,697 4,304
Total non-current assets 196,150 111,772
Total assets 428,956 341,294
LIABILITIES
Current liabilities
Trade and other payables 18 17,827 16,072
Borrowings 19 6,530 4,990
Current tax liability - 4,119
Provisions 20 11,828 12,309
Total current liabilities 36,185 37,490
Non-current liabilities
Borrowings 21 2,724 7,393
Provisions 22 57,394 50,874
Total non-current liabilities 60,118 58,267
Total liabilities 96,303 95,757
Net assets 332,653 245,537
EQUITY
Contributed equity 23 331,513 331,513
Retained profits 25 1,140 (85,976)
Capital and reserves attributable to owners of Grange Resources Limited
332,653 245,537
Total equity 332,653 245,537
The above statement of financial position should be read in conjunction with the accompanying notes
33
2016 Annual Report « Grange Resources Limited
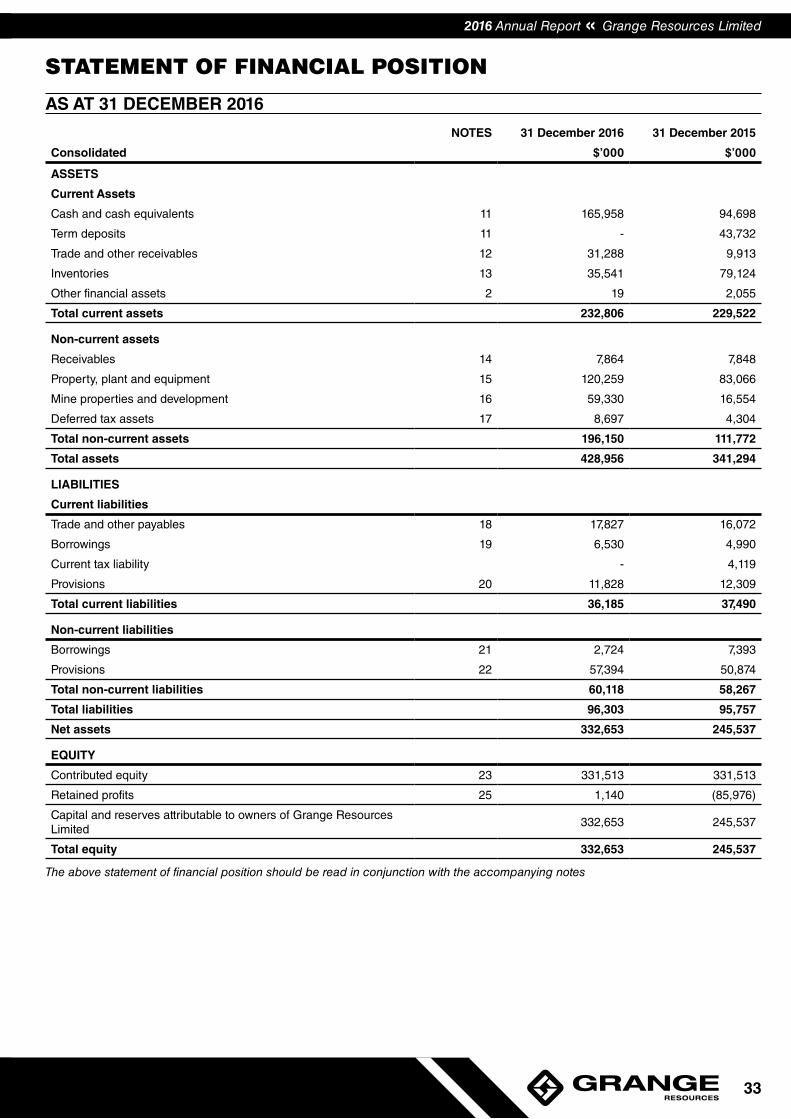
STATEMENT OF COMPREHENSIVE INCOME
FOR THE YEAR ENDED 31 DECEMBER 2016
NOTES
2016 2015
$’000 $’000
Consolidated
Revenues from mining operations 4, 5 276,345 205,562
Cost of sales 6 (172,553) (138,360)
Gross profit from mining operations 103,792 67,202
Administration expenses 7 (8,115) (3,912)
Operating profit before other income 95,677 63,290
Other income (expenses)
Exploration and evaluation expenditure (1,391) (1,734)
Impairment of assets 27 - (284,736)
Other income (expenses) 8 426 (168)
Operating profit (loss) before finance costs 94,712 (223,348)
Finance income 9 3,955 12,592
Finance expenses 9 (3,858) (1,535)
Profit (loss) before tax 94,809 (212,291)
Income tax expense 10 (1,906) (65,523)
Profit (loss) for the year 92,903 (277,814)
Total comprehensive income (loss) income for the year 92,903 (277,814)
Profit (loss) for the period attributable to:
- Equity holders of Grange Resources Limited 92,903 (277,814)
92,903 (277,814)
Total comprehensive income (loss) for the period attributable to:
- Equity holders of Grange Resources Limited 92,903 (277,814)
92,903 (277,814)
Earnings per share for profit attributable to the ordinary equity holders of Grange Resources Limited
Basic earnings (loss) per share (cents per share) 34 8.03 (24.00)
Diluted earnings (loss) per share (cents per share) 34 8.03 (24.00)
The above statement of financial position should be read in conjunction with the accompanying notes
Grange Resources Limited » 2016 Annual Report
32
STATEMENT OF FINANCIAL POSITION
AS AT 31 DECEMBER 2016
NOTES 31 December 2016 31 December 2015
Consolidated $’000 $’000
ASSETS
Current Assets
Cash and cash equivalents 11 165,958 94,698
Term deposits 11 - 43,732
Trade and other receivables 12 31,288 9,913
Inventories 13 35,541 79,124
Other financial assets 2 19 2,055
Total current assets 232,806 229,522
Non-current assets
Receivables 14 7,864 7,848
Property, plant and equipment 15 120,259 83,066
Mine properties and development 16 59,330 16,554
Deferred tax assets 17 8,697 4,304
Total non-current assets 196,150 111,772
Total assets 428,956 341,294
LIABILITIES
Current liabilities
Trade and other payables 18 17,827 16,072
Borrowings 19 6,530 4,990
Current tax liability - 4,119
Provisions 20 11,828 12,309
Total current liabilities 36,185 37,490
Non-current liabilities
Borrowings 21 2,724 7,393
Provisions 22 57,394 50,874
Total non-current liabilities 60,118 58,267
Total liabilities 96,303 95,757
Net assets 332,653 245,537
EQUITY
Contributed equity 23 331,513 331,513
Retained profits 25 1,140 (85,976)
Capital and reserves attributable to owners of Grange Resources Limited
332,653 245,537
Total equity 332,653 245,537
The above statement of financial position should be read in conjunction with the accompanying notes
33
2016 Annual Report « Grange Resources Limited
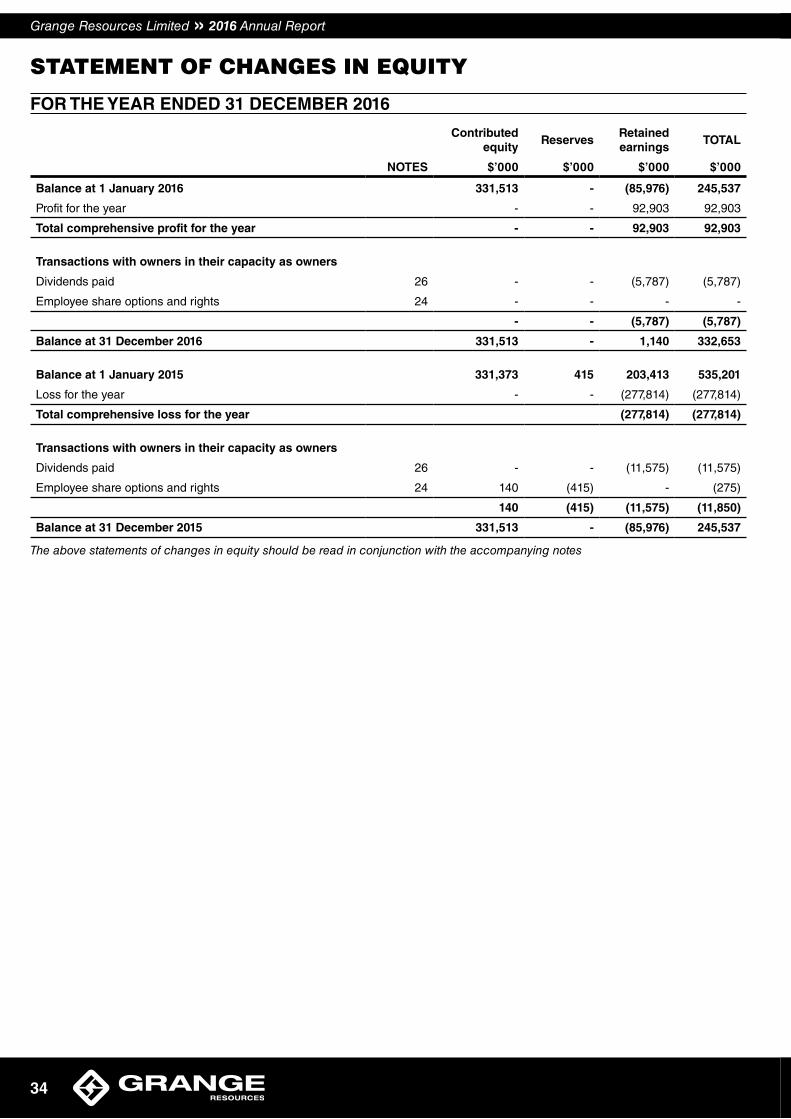
STATEMENT OF CHANGES IN EQUITY
FOR THE YEAR ENDED 31 DECEMBER 2016
Contributed equity
ReservesRetained earnings
TOTAL
NOTES $’000 $’000 $’000 $’000
Balance at 1 January 2016 331,513 - (85,976) 245,537
Profit for the year - - 92,903 92,903
Total comprehensive profit for the year - - 92,903 92,903
Transactions with owners in their capacity as owners
Dividends paid 26 - - (5,787) (5,787)
Employee share options and rights 24 - - - -
- - (5,787) (5,787)
Balance at 31 December 2016 331,513 - 1,140 332,653
Balance at 1 January 2015 331,373 415 203,413 535,201
Loss for the year - - (277,814) (277,814)
Total comprehensive loss for the year (277,814) (277,814)
Transactions with owners in their capacity as owners
Dividends paid 26 - - (11,575) (11,575)
Employee share options and rights 24 140 (415) - (275)
140 (415) (11,575) (11,850)
Balance at 31 December 2015 331,513 - (85,976) 245,537
The above statements of changes in equity should be read in conjunction with the accompanying notes
Grange Resources Limited » 2016 Annual Report
34
STATEMENT OF CASHFLOW
FOR THE YEAR ENDED 31 DECEMBER 2016
2016 2015
Consolidated NOTES $’000 $’000
Cash flows from operating activities
Receipts from customers (inclusive of goods and services tax) 255,524 216,107
Payments to suppliers and employees (inclusive of goods and services tax) (124,691) (119,200)
130,833 96,907
Proceeds from insurance claim 345 -
Interest received 2,791 2,947
Interest paid (738) (101)
Income taxes paid (11,292) (8,633)
Net cash inflow from operating activities 33 121,939 91,120
Cash flows from investing activities
Proceeds from sale of property, plant and equipment 15 -
Payments for property, plant and equipment 15 (40,667) (54,744)
Payments for mine properties and development 16 (46,300) (58,930)
(Payments) proceeds for term deposits 43,862 (28,732)
Net cash outflow from investing activities (43,090) (142,406)
Cash flows from financing activities
Repayment of borrowings (4,962) (2,425)
Proceeds from borrowings 2,154 14,008
Dividends paid to shareholders (5,787) (11,575)
Finance lease payments (329) (332)
Net cash outflow from financing activities (8,924) (324)
Net increase (decrease) in cash and cash equivalents 69,925 (51,610)
Cash and cash equivalents at beginning of the year 94,698 138,650
Net foreign exchange differences 1,335 7,658
Cash and cash equivalents at end of the year 11 165,958 94,698
The above statement of cash flows should be read in conjunction with accompanying notes.
35
2016 Annual Report « Grange Resources Limited
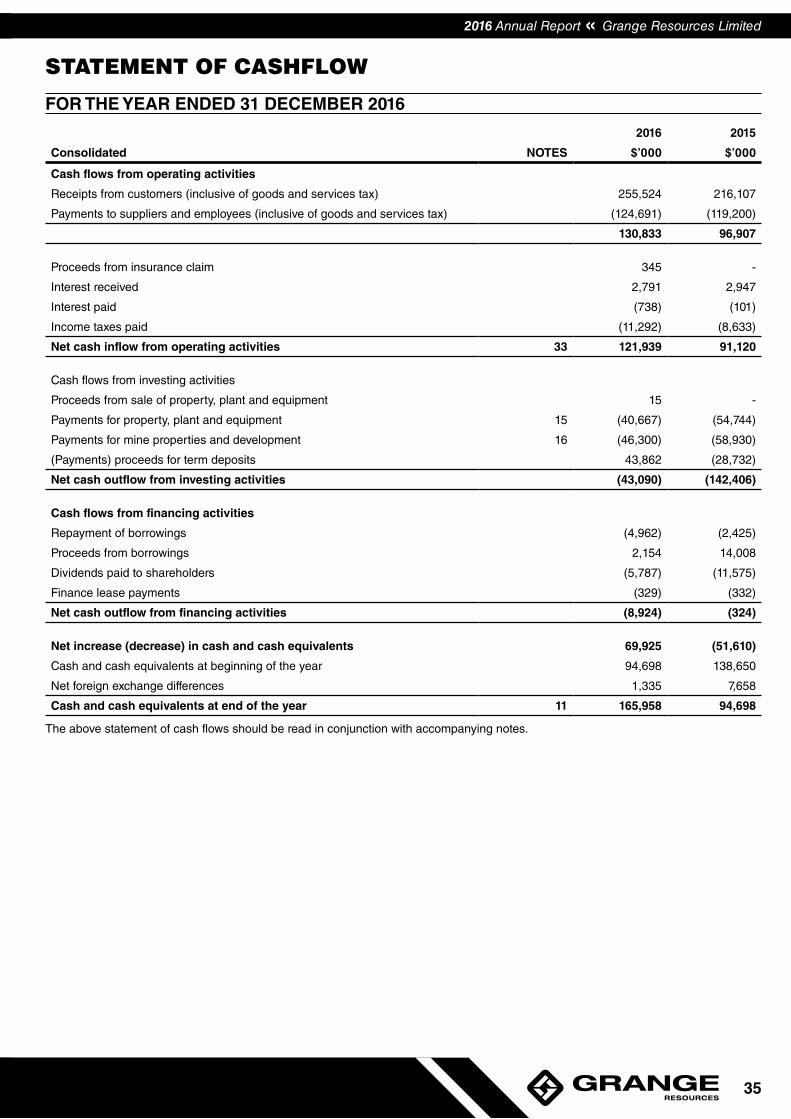
STATEMENT OF CHANGES IN EQUITY
FOR THE YEAR ENDED 31 DECEMBER 2016
Contributed equity
ReservesRetained earnings
TOTAL
NOTES $’000 $’000 $’000 $’000
Balance at 1 January 2016 331,513 - (85,976) 245,537
Profit for the year - - 92,903 92,903
Total comprehensive profit for the year - - 92,903 92,903
Transactions with owners in their capacity as owners
Dividends paid 26 - - (5,787) (5,787)
Employee share options and rights 24 - - - -
- - (5,787) (5,787)
Balance at 31 December 2016 331,513 - 1,140 332,653
Balance at 1 January 2015 331,373 415 203,413 535,201
Loss for the year - - (277,814) (277,814)
Total comprehensive loss for the year (277,814) (277,814)
Transactions with owners in their capacity as owners
Dividends paid 26 - - (11,575) (11,575)
Employee share options and rights 24 140 (415) - (275)
140 (415) (11,575) (11,850)
Balance at 31 December 2015 331,513 - (85,976) 245,537
The above statements of changes in equity should be read in conjunction with the accompanying notes
Grange Resources Limited » 2016 Annual Report
34
STATEMENT OF CASHFLOW
FOR THE YEAR ENDED 31 DECEMBER 2016
2016 2015
Consolidated NOTES $’000 $’000
Cash flows from operating activities
Receipts from customers (inclusive of goods and services tax) 255,524 216,107
Payments to suppliers and employees (inclusive of goods and services tax) (124,691) (119,200)
130,833 96,907
Proceeds from insurance claim 345 -
Interest received 2,791 2,947
Interest paid (738) (101)
Income taxes paid (11,292) (8,633)
Net cash inflow from operating activities 33 121,939 91,120
Cash flows from investing activities
Proceeds from sale of property, plant and equipment 15 -
Payments for property, plant and equipment 15 (40,667) (54,744)
Payments for mine properties and development 16 (46,300) (58,930)
(Payments) proceeds for term deposits 43,862 (28,732)
Net cash outflow from investing activities (43,090) (142,406)
Cash flows from financing activities
Repayment of borrowings (4,962) (2,425)
Proceeds from borrowings 2,154 14,008
Dividends paid to shareholders (5,787) (11,575)
Finance lease payments (329) (332)
Net cash outflow from financing activities (8,924) (324)
Net increase (decrease) in cash and cash equivalents 69,925 (51,610)
Cash and cash equivalents at beginning of the year 94,698 138,650
Net foreign exchange differences 1,335 7,658
Cash and cash equivalents at end of the year 11 165,958 94,698
The above statement of cash flows should be read in conjunction with accompanying notes.
35
2016 Annual Report « Grange Resources Limited
NOTES TO THE FINANCIAL STATEMENTSNOTE 1. SUMMARY OF SIGNIFICANT
ACCOUNTING POLICIESThe principal accounting policies adopted in the preparation of the consolidated financial statements are set out below. These policies have been consistently applied for all the periods presented, unless otherwise stated.
The financial statements are for the consolidated entity consisting of Grange Resources Limited and its subsidiaries.
a) Basis of preparationThis general purpose financial report has been prepared in accordance with Australian Accounting Standards and Interpretations issued by the Australian Accounting Standards Board and the Corporations Act 2001.
Compliance with IFRS
The consolidated financial statements of the Grange Resources Limited group also comply with International Financial Reporting Standards (IFRS) as issued by the International Accounting Standards Board (IASB).
Historical cost convention
These financial statements have been prepared under the historical costs convention, except for certain assets which, as noted, are at fair value.
Critical accounting estimates
The preparation of financial statements requires the use of certain critical accounting estimates. It also requires management to exercise its judgement in the process of applying the Group’s accounting policies. The areas involving a higher degree of judgement or complexity, or areas where assumptions and estimates are significant to the financial statements, are disclosed in Note 3.
b) Principles of consolidationi) SubsidiariesThe consolidated financial statements incorporate the assets and liabilities of all subsidiaries of Grange Resources Limited as at 31 December 2016 and the results of all subsidiaries for the year then ended. Grange Resources Limited and its subsidiaries together are referred to in this financial report as the Group or the consolidated entity.
Subsidiaries are those entities over which the Group has control. The Group controls an entity when the Group is exposed to, or has rights to, variable returns from its involvement with the entity and has the ability to affect those returns through its power to direct the activities of the entity.
Subsidiaries are fully consolidated from the date on which control is transferred to the Group. They are de-consolidated from the date that control ceases. Details of subsidiaries are set out in Note 31.
The acquisition method of accounting is used to account for business combinations by the Group (refer to note 1(e)).
Intercompany transactions, balances and unrealised gains on transactions between Group companies are eliminated. Unrealised losses are also eliminated unless the transaction provides evidence of the impairment of the asset transferred. Accounting policies of subsidiaries have been changed where necessary to ensure consistency with the policies adopted by the Group.
ii) Joint arrangements
Joint operations
The Group recognises its direct right to the assets, liabilities, revenues and expenses of joint operations and its share of any jointly held or incurred assets, liabilities, revenues and expenses. These have been incorporated in the financial statements under the appropriate headings. Details of the joint operations are set out in Note 32.
c) Segment reportingOperating segments are reported in a manner consistent with the internal reporting provided to the chief operating decision maker. The chief operating decision maker, who is responsible for allocating resources and assessing performance of the operating segments, has been identified as the Chief Executive Officer.
Refer to Note 4 for further information on segment descriptions
d) Foreign currency translationi) Functional and presentation currencyItems included in the financial statements of each of the Group’s entities are measured using the currency of the primary economic environment in which the entity operates (‘the functional currency’). The consolidated financial statements are presented in Australian dollars, which is Grange Resources Limited’s functional and presentation currency.
ii) Transactions and balancesAll foreign currency transactions during the financial period are translated into the functional currency using the exchange rate prevailing at the dates of the transactions. Foreign exchange gains and losses resulting from the settlement of such transactions and from the translation at period end exchange rates of monetary assets and liabilities denominated in foreign currencies are recognised in the profit and loss, except when they are deferred in equity as qualifying cash flow hedges and qualifying net investment hedges or are attributable to part of the net investment in a foreign operation.
Non-monetary items that are measured in terms of historical cost in foreign currency are translated using the exchange rate as at the date of the initial transaction. Non-monetary items measured at fair value in a foreign currency are translated using the exchange rates at the date when the fair value was determined.
iii) Group companiesThe results and financial position of all the Group entities (none of which has the currency of a hyperinflationary economy) that have a functional currency different from the presentation currency are translated into the presentation currency as follows:
• assets and liabilities for each balance sheet presented are translated at the closing rate at the date of that balance sheet,
• income and expenses for each income statement are translated at average exchange rates (unless this is not a reasonable approximation of the cumulative effect of the rates prevailing on the transaction dates, in which case income and expenses are translated at the dates of the transactions), and
• all resulting exchange differences are recognised in other comprehensive income.
Grange Resources Limited » 2016 Annual Report
36
• On consolidation, exchange differences arising from the translation of any net investment in foreign entities, and of borrowings and other financial instruments designated as hedges of such investments, are recognised in other comprehensive income. When a foreign operation is sold or any borrowings forming part of the net investment are repaid, a proportionate share of such exchange differences are reclassified to the income statement, as part of the gain or loss on sale where applicable. Goodwill and fair value adjustments arising on the acquisition of a foreign entity are treated as assets and liabilities of the foreign entities and translated at the closing rate.
e) Business combinationsThe acquisition method of accounting is used to account for all business combinations, regardless of whether equity instruments or other assets are acquired. The consideration transferred for the acquisition of a subsidiary comprises the
• fair values of the assets transferred
• liabilities incurred to the former owners of the acquired business
• equity interests issued by the Group
• fair value of any asset or liability resulting from a contingent consideration arrangement, and
• fair value of any pre-existing equity interest in the subsidiary.
Identifiable assets acquired and liabilities and contingent liabilities assumed in a business combination are, with limited exceptions, measured initially at their fair values at the acquisition date. The Group recognises any non-controlling interest in the acquired entity on an acquisition-by-acquisition basis either at fair value or at the non-controlling interest’s proportionate share of the acquired entity’s net identifiable assets. Acquisition-related costs are expensed as incurred.
The excess of the
• consideration transferred,
• amount of any non-controlling interest in the acquired entity, and
• acquisition-date fair value of any previous equity interest in the acquired entity
over the fair value of the net identifiable assets acquired is recorded as goodwill. If those amounts are less than the fair value of the net identifiable assets of the subsidiary acquired, the difference is recognised directly in profit or loss as a bargain purchase. Where settlement of any part of cash consideration is deferred, the amounts payable in the future are discounted to their present value as at the date of exchange. The discount rate used is the entity’s incremental borrowing rate, being the rate at which a similar borrowing could be obtained from an independent financier under comparable terms and conditions.
Contingent consideration is classified either as equity or a financial liability. Amounts classified as a financial liability are subsequently remeasured to fair value with changes in fair value recognised in profit or loss.
If the business combination is achieved in stages, the acquisition date carrying value of the acquirer’s previously held equity interest in the acquire is remeasured to fair value at the acquisition date. Any gains or losses arising from such remeasurement are recognised in profit or loss.
f) Revenue recognitionRevenue is recognised and measured at the fair value of the consideration received or receivable. The Group recognises revenue when the amount of revenue can be reliably measured, it is probable that the economic benefits will flow to the Group and specific criteria have been met for each of the Group’s activities described below. Amounts disclosed as revenue are net of agency commissions and amounts collected on behalf of third parties.
Revenue is recognised for the major business transactions as follows:
Sales of iron ore
Revenues from the sales of iron ore are recognised when the significant risks and rewards of ownership of the goods have passed to the customer and the amount of revenue can be measured reliably. Risks and rewards are considered passed to the buyer at the time when title passes to the customer.
The majority of the Group’s sales arrangements specify that title passes when the product is transferred to the vessel on which the product will be shipped. Revenues are generally recognised on the bill of lading date. Sales arrangements allow for an adjustment to the sales price based on a survey of the goods by the customer (an assay for mineral content). Accordingly, sales revenue is initially recognised on a provisional basis using the most recently determined estimate of the product specifications and subsequently adjusted, if necessary, based on a survey of the goods by the customer.
Interest revenue
Interest revenue is recognised on a time proportion basis using the effective interest method.
g) Government GrantsGovernment grants are recognised at their fair value when there is reasonable assurance that the grant will be received and all attaching conditions will be complied with.
When the grant relates to an expense item, it is recognised as income over the periods necessary to match the grant on a systematic basis to the costs that it is intended to compensate.
When the grant relates to an asset, the fair value is credited to a deferred income account and is released to the income statement over the expected useful life of the relevant asset by equal annual instalments.
h) LeasesLeases are classified as either operating or finance leases at the inception of the leases based on the economic substance of their agreement so as to reflect the risks and rewards incidental to ownership.
Finance leases, which are those leases that transfer substantially all of the risks and rewards incidental to ownership of the leased item to the Group, are capitalised at the present value of the minimum lease payments and disclosed as property, plant and equipment. A lease liability of equal value is also recognised. Each lease payment is allocated between the liability and financing costs. The finance cost is charged to the income statement over the lease period so as to produce a constant periodic rate of interest on the remaining balance of the liability over the period. The property, plant and equipment acquired under a finance lease is depreciated over the asset’s useful life or over the shorter of the asset’s useful life and the lease term if there is no reasonable certainty that the Group will obtain ownership at the end of the lease term.
Operating leases are those leases that do not transfer a significant portion of the risks and rewards of ownership to the Group as lessee. Payments made under operating leases are charged to the income statement on a straight-line basis over the period of the lease.
37
2016 Annual Report « Grange Resources Limited
i) Cash and cash equivalentsCash and cash equivalents comprise cash on hand, deposits held at call with financial institutions, other short-term, highly liquid investments with original maturities of three months or less that are readily convertible to amounts of cash and which are subject to an insignificant risk of changes in value. Bank overdrafts are shown within borrowings in current liabilities on the balance sheet.
j) Trade and other receivablesTrade receivables are recognised and carried at the original invoice amount less provision for impairment. Trade receivables are generally due for settlement within 14 days.
Collectability of trade receivables are reviewed on an ongoing basis. Debts which are known to be uncollectable are written off by reducing the amount directly. An allowance account (provision for impairment of trade receivables) is used when there is objective evidence that the Group will not be able to collect all amounts due according to the original terms of the receivables. The amount of the impairment loss is recognised in the income statement within other expenses. When a trade receivable for which an impairment allowance had been recognised becomes uncollectable in a subsequent period, it is written off against the allowance account. Subsequent recoveries of amounts previously written off are credited against other expenses in the income statement.
k) InventoriesRaw materials and stores, ore stockpiles, work in progress and finished goods are stated at the lower of cost and net realisable value. Cost is determined primarily on the basis of weighted average costs and comprises of the cost of direct materials and the costs of production which include:
• labour costs, materials and contractor expenses which are directly attributable to the extraction and processing of ore;
• depreciation of property, plant and equipment used in the extraction and processing of ore; and
• production overheads directly attributable to the extraction and processing of ore.
Stockpiles represent ore that has been extracted and is available for further processing. If there is significant uncertainty as to when the stockpiled ore will be processed it is expensed as incurred. Where the future processing of the ore can be predicted with confidence because it exceeds the mine’s cut-off grade, it is valued at the lower of cost and net realisable value. Work in progress inventory includes partly processed material. Quantities are assessed primarily through surveys and assays.
Net realisable value is the estimated selling price in the ordinary course of business less the estimated costs of completion and the estimated costs necessary to make the sale.
l) Income taxThe income tax expense or benefit for the period is the tax payable on the current period’s taxable income based on the applicable income tax rate for each jurisdiction adjusted by changes in deferred tax assets and liabilities attributable to temporary differences and to unused tax losses.
The current income tax charge is calculated on the basis of the tax laws enacted or substantively enacted at the end of the reporting period in the countries where the Group’s subsidiaries operate and generate taxable income. Management periodically evaluates positions taken in tax returns with respect to situations in which applicable tax regulation is subject to interpretation. It establishes provisions where appropriate on the basis of amounts expected to be paid to the tax authorities.
Deferred income tax is provided in full, using the liability method, on temporary differences arising between the tax bases of assets and liabilities and their carrying amounts in the consolidated financial statements. However, deferred tax liabilities are not recognised if they arise from the initial recognition of goodwill. Deferred income tax is also not accounted for if it arises from initial recognition of an asset or liability in a transaction other than a business combination that at the time of the transaction affects neither accounting nor taxable profit or loss. Deferred income tax is determined using tax rates (and laws) that have been enacted or substantially enacted by the end of the reporting period and are expected to apply when the related deferred income tax asset is realised or the deferred income tax liability is settled.
Deferred tax assets are recognised for deductible temporary differences and unused tax losses, only if it is probable that future taxable amounts will be available to utilise those temporary differences and losses.
Deferred tax liabilities and assets are not recognised for temporary differences between the carrying amount and the tax bases of investments in foreign operations where the Group is able to control the timing of the reversal of the temporary differences and it is probable that the differences will not reverse in the foreseeable future.
Deferred tax assets and liabilities are offset when there is a legally enforceable right to offset current tax assets and liabilities and when the deferred tax balances relate to the same taxation authority. Current tax assets and tax liabilities are offset where the entity has a legally enforceable right to offset and intends either to settle on a net basis, or to realise the asset and settle the liability simultaneously.
Grange Resources Limited and its wholly-owned Australian controlled entities have implemented the tax consolidation legislation. As a consequence, Grange Resources Limited and its subsidiaries are taxed as a single entity and the deferred tax assets and liabilities of the Group are set off in the consolidated financial statements.
m) Goods and Services Tax (GST)Revenues, expenses and assets are recognised net of the amount of GST except:
• when GST incurred on a purchase of goods and services is not recoverable from the taxation authority, in which case the GST is recognised as part of the cost of acquisition of the asset or as part of the expense item as applicable; and
• receivables and payables, which are stated with the amount of GST included.
The net amount of GST recoverable from, or payable to, the taxation authority is included as part of receivables or payables in the balance sheet.
Cash flows are included in the Statement of Cash Flows on a gross basis and the GST component of cash flows arising from investing and financing activities, which is recoverable from, or payable to, the taxation authority, are presented as operating cash flows.
Commitments and contingencies are presented net of the amount of GST recoverable from, or payable to, the taxation authority.
Grange Resources Limited » 2016 Annual Report
38
n) Property, plant and equipmentLand and buildings and plant and equipment are measured at cost less, where applicable, any accumulated depreciation, amortisation or impairment in value. Cost includes expenditure that is directly attributable to the acquisition of the item. In the event that all or part of the purchase consideration is deferred, cost is determined by discounting the amounts payable in the future to their present value as at the date of acquisition.
Subsequent costs are included in the asset’s carrying amount or recognised as a separate asset, as appropriate, only when it is probable that future economic benefits associated with the item will flow to the Group and the cost of the item can be measured reliably. The carrying amount of any component accounted for as a separate asset is derecognised when replaced. All other repairs and maintenance are charged to the income statement during the reporting period in which they are incurred.
Land is not depreciated. Assets under construction are measured at cost and are not depreciated until they are ready and available for use. Depreciation on assets is calculated using either a straight-line or diminishing value method to allocate the cost, net of their residual values, over the estimated useful lives or the life of the mine, whichever is shorter. Leasehold improvements and certain leased plant and equipment are depreciated over the shorter lease term.
Other non-mine plant and equipment typically has the following estimated useful lives:
Buildings 10 years
Plant and Equipment 4 to 8 years
Computer Equipment 3 to 5 years
The assets residual values, useful lives and amortisation methods are reviewed and adjusted if appropriate, at each financial period end.
An item of property, plant and equipment is derecognised upon disposal or when no further economic benefits are expected from its use or disposal.
Any gain or loss arising on derecognition of the asset (calculated as the difference between the net disposal proceeds and the carrying amount of the asset) is included in the income statement in the period the asset is derecognised.
The carrying value of property, plant and equipment is assessed annually for impairment in accordance with Note 1(r).
o) Exploration and evaluationExploration and evaluation expenditure comprises costs which are directly attributable to:
• research and analysing exploration data
• conducting geological studies, exploratory drilling and sampling
• examining and testing extraction and treatment methods
• compiling pre-feasibility and definitive feasibility studies
Exploration and evaluation expenditure also includes the costs incurred in acquiring rights, the entry premiums paid to gain access to areas of interest and amounts payable to third parties to acquire interests in existing projects.
Exploration and evaluation expenditure is charged against profit and loss as incurred; except for expenditure incurred after a decision to proceed to development is made, in which case the expenditure is capitalised as an asset.
p) Mine properties and developmentMine properties and development represent the accumulation of all exploration, evaluation and development expenditure incurred by, not on behalf of, the entity in relation to areas of interest in which mining of a mineral resource has commenced.
Where further development expenditure is incurred in respect of a production property after the commencement of production, such expenditure is carried forward as part of the cost of that production property only when substantial future economic benefits arise, otherwise such expenditure is classified as part of the cost of production.
Costs on production properties in which the Group has an interest are amortised over the life of the area of interest to which such costs relate on the production output basis. Changes to the life of the area of interest are accounted for prospectively.
The carrying value of each mine property and development are assessed annually for impairment in accordance with Note 1(r).
q) Deferred stripping costsStripping (i.e. overburden and other waste removal) costs incurred in the production phase of a surface mine are capitalised to the extent that they improve access to an identified component of the ore body and are subsequently amortised on a systematic basis over the expected useful life of the identified component of the ore body. Capitalised stripping costs are disclosed as a component of Mine Properties and Development.
Components of an ore body are determined with reference to life of mine plans and take account of factors such as the geographical separation of mining locations and/or the economic status of mine development decisions.
Capitalised stripping costs are initially measured at cost and represent an accumulation of costs directly incurred in performing the stripping activity that improves access to the identified component of the ore body, plus an allocation of directly attributable overhead costs. The amount of stripping costs deferred is based on a relevant production measure which uses a ratio obtained by dividing the tonnage of waste mined by the quantity of ore mined for an identified component of the ore body. Stripping costs incurred in the period for an identified component of the ore body are deferred to the extent that the current period ratio exceeds the expected ratio for the life of the identified component of the ore body. Such deferred costs are then charged against the income statement on a systematic units of production basis over the expected useful life of an identified component of the ore body.
Changes to the life of mine plan, identified components of an ore body, stripping ratios, units of production and expected useful life are accounted for prospectively.
Deferred stripping costs form part of the total investment in a cash generating unit, which is reviewed for impairment if events or changes in circumstances indicate that the carrying value may not be recoverable.
39
2016 Annual Report « Grange Resources Limited
r) Impairment of assetsAt each reporting date, the Group assesses whether there is any indication that an asset, including capitalised development expenditure, may be impaired. Where an indicator of impairment exists, the Group makes a formal estimate of the recoverable amount. Where the carrying amount of an asset exceeds its recoverable amount the asset is considered impaired and is written down to its recoverable amount. Impairment losses are recognised in the income statement.
Recoverable amount is the greater of fair value less costs of disposal and value in use. For the purposes of assessing impairment, assets are grouped at the lowest levels for which there are separately identifiable cash inflows which are largely independent of the cash inflows from other assets or groups of assets (cash generating units).
Where there is no binding sale agreement or active market, fair value less costs of disposal is based on the best information available to reflect the amount the Group could receive for the cash generating unit in an arm’s length transaction. In assessing fair value, the estimated future cash flows are discounted to their present value using a post-tax discount rate that reflects current market assessments of the time value of money and the risks specific to the asset.
An assessment is also made at each reporting date as to whether there is any indication that previously recognised impairment losses may no longer exist or may have decreased. If such indication exists, the recoverable amount is estimated. A previously recognised impairment loss is reversed only if there has been a change in the estimates used to determine the asset’s recoverable amount since the last impairment loss was recognised. If that is the case the carrying amount of the asset is increased to its recoverable amount. That increased amount cannot exceed the pre-impairment value, adjusted for any depreciation that would have been recognised on the asset had the initial impairment loss not occurred. Such reversal is recognised in profit or loss.
After such a reversal the depreciation charge is adjusted in future periods to allocate the asset’s revised carrying amount, less any residual value, on a systematic basis over its remaining useful life.
s) Investments and other financial assetsClassification
The Group classifies its financial assets in the following categories: financial assets at fair value through profit and loss, loans and receivables, held-to-maturity financial assets and available-for-sale financial assets. The classification depends on the purpose for which the investments were acquired. Management determines the classification of its investments at initial recognition, and in the case of assets classified as held-to-maturity, re-evaluates this designation at each reporting date.
Loans and receivables
Loans and receivables are non-derivative financial assets with fixed or determinable payments that are not quoted in an active market. Due to the short-term nature of the current receivables, their carrying amount is assumed to be the same as their fair value. For the majority of the non-current receivables, the fair values are also not significantly different to their carrying amounts. The fair values were calculated based on cash flows discounted using a current lending rate. They are classified as level 3 fair values in the fair value hierarchy due to the inclusion of unobservable inputs including counterparty credit risk.
Interest and dividends
Interest and dividends are classified as expenses or as distributions of profit consistent with the balance sheet classification of the related debt or equity instruments or component parts of compound instruments.
Term deposits
Term deposits held with financial institutions with maturities of more than three months are presented separately on the statement of financial position. Term deposits with a maturity date of more than 12 months after the reporting date are classified as non-current.
t) DerivativesDerivatives are initially recognised at fair value on the date a derivative contract is entered into and are subsequently remeasured to their fair value at the end of each reporting period. The accounting for subsequent changes in fair value depends on whether the derivative is designated as a hedging instrument, and if so, the nature of the item being hedged. Changes in the fair value of any derivative instrument that does not qualify for hedge accounting are recognised immediately in profit or loss and are included in other income or other expenses.
The full fair value of a hedging derivative is classified as a non-current asset or liability when the remaining maturity of the hedged item is more than 12 months; it is classified as a current asset or liability when the remaining maturity of the hedged item is less than 12 months.
u) Non-current assets held for saleNon-current assets (and disposal groups) classified as held for sale are measured at the lower of carrying amount and fair value less costs to sell.
Non-current assets and disposal groups are classified as held for sale if their carrying amount will be recovered through a sale transaction rather than through continuing use. This condition is regarded as met only when the sale is highly probable and the asset (or disposal group) is available for immediate sale in its present condition. The sale of the asset (or disposal group) is expected to be completed within one year from the date of classification.
An impairment loss is recognised for any initial or subsequent write-down of the asset to fair value less costs to sell. A gain is recognised for any subsequent increases in fair value less costs to sell of an asset, but not in excess of any cumulative impairment loss previously recognised. A gain or loss not previously recognised by the date of the sale of the non-current asset is recognised at the date of derecognition.
Non-current assets are not depreciated or amortised while they are classified as held for sale. Interest and other expenses attributable to the liabilities of a disposal group classified as held for sale continue to be recognised.
Non-current assets classified as held for sale and the assets of a disposal group classified as held for sale are presented separately from the other assets in the balance sheet. The liabilities of a disposal group are held for sale are presented separately from other liabilities in the balance sheet.
Grange Resources Limited » 2016 Annual Report
40
v) Ore reservesThe Company estimates its mineral resources and ore reserves based on information compiled by Competent Persons as defined in accordance with the Australasian Code for Reporting of Exploration Results, Mineral Resources and Ore Reserves of December 2012 (the JORC 2012 code). Reserves, and certain mineral resources determined in this way, are used in the calculation of depreciation, amortisation and impairment charges, the assessment of life of mine stripping ratios and for forecasting the timing of the payment of close down and restoration costs.
In assessing the life of a mine for accounting purposes, mineral resources are only taken into account where there is a high degree of confidence of economic extraction.
w) Trade and other payablesTrade payables and other payables are carried at amortised cost and represent liabilities for goods and services provided to the Group prior to the end of the financial period that are unpaid. Trade payables and other payables arise when the Group becomes obliged to make future payments in respect of the purchase of these goods and services. The amounts are unsecured and are usually paid within 30 days of recognition.
x) BorrowingsAll borrowings are initially recognised at the fair value of the consideration received, less transaction costs. After initial recognition, borrowings are subsequently measured at amortised cost. Fees paid on the establishment of loan facilities are recognised as transaction costs of the loan to the extent that it is probable that some or all of the facility will be drawn down. In this case the fee is deferred until the draw down occurs. To the extent there is no evidence that it is probable that some or all of the facility will be drawn down, the fee is capitalised as a prepayment for liquidity services and amortised over the period of the facility to which it relates.
Borrowings are removed from the balance sheet when the obligation specified in the contract is discharged, cancelled or expired. Borrowings are classified as current liabilities unless the Group has an unconditional right to defer settlement of the liability for at least 12 months after the reporting date.
Borrowing costs
Borrowing costs incurred for the construction of any qualifying asset are capitalised during the period of time that is required to complete and prepare the asset for its intended use or sale. Other borrowing costs are expensed.
y) ProvisionsProvisions are recognised when the Group has a present obligation, it is probable that there will be a future sacrifice of economic benefits and a reliable estimate can be made of the amount of the obligation.
When the Group expects some or all of a provision to be recovered from a third party, for example under an insurance contract, the receivable is recognised as a separate asset but only when the reimbursement is virtually certain and it can be measured reliably. The expense relating to any provision is presented in the income statement net of any reimbursement.
If the effect of the time value of money is material, provisions are discounted using a pre-tax rate that reflects the current market assessment of the time value of money. Where this is the case, its carrying amount is the present value of these estimated future cash flows. When discounting is used, the increase in the provision due to the passage of time is recognised as a finance cost.
Decommissioning and restoration
Decommissioning and restoration provisions include the dismantling and demolition of infrastructure and the removal of residual materials and remediation of disturbed areas. The provision is recognised in the accounting period when the obligation arising from the related disturbance occurs, whether this occurs during the mine development or during the production phase, based on the net present value of estimated future costs. The costs are estimated on the basis of a closure plan. The cost estimates are calculated annually during the life of the operation to reflect known developments and are subject to formal review at regular intervals.
The amortisation or ‘unwinding’ of the discount applied in establishing the net present value of provisions is charged to the income statement in each accounting period. The amortisation of the discount is shown as a financing cost, rather than as an operating cost. Other movements in the provisions for close down and restoration costs, including those resulting from new disturbance, updated cost estimates, changes to the lives of operations and revisions to discount rates are capitalised within mine properties and development, to the extent that any amount of deduction does not exceed the carrying amount of the asset. Any deduction in excess of the carrying amount is recognised in the income statement immediately. If an adjustment results in an addition to the cost of the related asset, consideration will be given to whether an indication of impairment exists and the impairment policy will apply. These costs are then depreciated over the life of the area of interest to which they relate.
Onerous contracts
An onerous contract is considered to exist where the Company has a contract under which the unavoidable cost of meeting the contractual obligations exceed the economic benefits estimated to be received. Present obligations arising under onerous contracts are recognised as a provision to the extent that the present obligation exceeds the economic benefits estimated to be received.
Restructuring
A provision for restructuring is recognised when the Company has developed a detailed formal plan for the restructuring and has raised a valid expectation in those affected that it will carry out the restructuring by:
• starting to implement the plan; or
• announcing its main features to those affected by it.
z) Employee entitlementsWages, salaries and sick leave
Liabilities for wages and salaries, including non-monetary benefits and accumulating sick leave expected to be settled within 12 months of the reporting date are recognised in other payables in respect of employees’ services up to the reporting date and are measured at the amounts expected to be paid when the liabilities are settled.
Annual leave
Liabilities for annual leave expected to be settled within 12 months of the reporting date are recognised in the provision for employee benefits in respect of employees’ services up to the reporting date and are measured at the amounts expected to be paid when the liabilities are settled.
41
2016 Annual Report « Grange Resources Limited
Long service leave
The liability for long service leave is recognised in the provision for employee benefits and measured as the present value of expected future payments to be made in respect of services provided by employees up to the reporting date using the projected unit credit method.
Consideration is given to expected future wage and salary levels, experience of employee departures and periods of service. Expected future payments are discounted using market yields at the reporting date on corporate bonds with terms to maturity and currency that match, as closely as possible, the estimated future cash outflows.
Defined contribution superannuation funds
Contributions to defined contribution funds are recognised as an expense in the income statement as they become payable.
Share-based payment transactions
Share based compensation benefits are provided to Directors and eligible employees under various plans. Information relating to the plans operated by the Company is set out in Note 35.
The fair value of rights granted under the plans is recognised as an employee benefit expense with a corresponding increase in equity. The fair value is measured at the grant date and recognised over the period during which the Director or eligible employee become unconditionally entitled to the rights.
The fair value of rights is determined with reference to the fair value of rights issued, which includes the volume weighted average price of the Company’s shares.
Non-market vesting conditions are included in the assumptions about the number of rights that are expected to be exercisable. At each reporting date, the entity revises its estimate of the number of rights that are expected to vest or become exercisable. The employee benefit expense recognised each period takes into account the most recent estimate. The impact of the revision to original estimates, if any, is recognised in the income statement with a corresponding adjustment to equity.
Where an equity-settled award is modified, as a minimum an expense is recognised as if the terms had not been modified. In addition, an expense is recognised for any increase in the value of the transaction as a result of the modifications, as measured at the date of modification.
Where an equity-settled award is cancelled, it is treated as if it had vested on the date of cancellation, and any expense not yet recognised for the award is recognised immediately. However, if a new award is substituted for the cancelled award, and designated as a replacement award on the date that it is granted, the cancelled and new award are treated as if they were a modification of the original award, as described in the previous paragraph.
aa) Contributed equityOrdinary share capital is recognised at the fair value of the consideration received by the Company.
Any transaction costs arising on the issue of ordinary shares are recognised directly in equity as a reduction, net of tax, of the share proceeds received.
ab) DividendsProvision is made for the amount of any dividend declared, being appropriately authorised and no longer at the discretion of the entity, on or before the end of the financial period but not distributed at balance date.
ac) Earnings per share (EPS)i) Basic earnings per shareBasic earnings per share is calculated by dividing:
• the profit attributable to equity holders of the Company, excluding any costs of servicing equity other than ordinary shares;
• by the weighted average number of ordinary shares outstanding during the financial year, adjusted for bonus elements in ordinary shares issued during the period and excluding treasury shares.
ii) Diluted earnings per shareDiluted earnings per share adjusts the figures used in the determination of basic earnings per share to take into account:
• the after income tax effect of interest and other financing costs associated with dilutive potential ordinary shares; and
• the weighted average number of additional ordinary shares that would have been outstanding assuming the conversion of all dilutive potential ordinary shares.
ad) Parent entity financial informationThe financial information for the parent entity, Grange Resources Limited, disclosed in Note 36 has been prepared on the same basis as the consolidated financial statements, except as set out below.
Investments in subsidiaries, associates and joint venture entities
Investments in subsidiaries and joint venture entities are accounted for at cost in the financial statements of Grange Resources Limited. Dividends received from associates are recognised in the parent entity’s profit or loss, rather than being deducted from the carrying amount of these investments.
Financial guarantees
Where the parent entity has provided financial guarantees in relation to loans and payables of subsidiaries for no compensation, the fair values of these guarantees are accounted for as contributions and recognised as part of the cost of the investment.
ae) Rounding of amountsThe Group is of a kind referred to in ASIC Legislative Instrument 2016/191 Class, issued by the Australian Securities and Investments Commission, relating to the ‘rounding off’ of amounts in the financial report. Amounts in the financial report have been rounded off in accordance with the instrument to the nearest thousand dollars, or in certain cases, the nearest dollar.
Grange Resources Limited » 2016 Annual Report
42
af) New accounting standards and interpretations Certain new accounting standards and interpretations have been published that are not mandatory for 31 December 2016 reporting periods. The Group’s assessment of the impact of these new standards and interpretations is set out below.
i) AASB 2016-1 Amendments to Australian Accounting Standards – Recognition of Deferred Tax Assets for Unrealised Losses (effective from 1 January 2017)
AASB 2016-1- Amendment to AASB 112 Income Taxes merely clarifies the requirements on recognition of deferred tax assets for unrealised losses on debt instruments measured at fair value and therefore does not affect the Group’s amendment to AASB 112. The Group intends to apply the standard from 1 January 2017.
ii) AASB 2016-2 Amendments to Australian Accounting Standards – Disclosure Initiative: Amendments to AASB 107 (effective from 1 January 2017)
AASB 2016-2 Amendments to Australian Accounting Standards – Disclosure Initiative: Amendments to AASB 107 requires entities preparing financial statements in accordance with Tier 1 reporting requirements to provide disclosures that enable users of financial statements to assess changes in liabilities arising from financing activities, including both changes arising from cash flows and non-cash changes. The Group intends to apply the standard from 1 January 2017. Application of this standard will not have significant impact on the Group.
iii) AASB 9 Financial Instruments, AASB 2009-11 Amendments to Australian Accounting Standards arising from AASB 9 and AASB 2010-7 Amendments to Australian Accounting Standards arising from AASB 9 (December 2010) and AASB 2012-6 Amendments to Australian Accounting Standards – Mandatory Effective Date of AASB 9 and Transition Disclosures (effective from 1 January 2018)
AASB 9 Financial Instruments addresses the classification, measurement and derecognition of financial assets and financial liabilities. The standard is not applicable until 1 January 2018 but is available for early adoption. The Group intends to apply the standard from 1 January 2018. Application of this standard will not have a significant impact on the Group.
iv) AASB 15 Revenue from Contracts with Customers – Mandatory Effective Date of AASB 15 (effective from 1 January 2018)
AASB 15 introduces a new framework for accounting for revenue and will replace AASB 118 Revenue, AASB 111 Construction Contracts and IFRIC 13 Customer Loyalty Programs. AASB 15 establishes principals for reporting the nature, amount, timing and uncertainty of revenue and cash flows arising from an entity’s contract with customers. The new standard is based on the principle that revenue is recognised when control of a good or services transfers to customer, therefore the notion of control replaces the existing notion of risks and rewards.
The Group is currently assessing the effects of applying new standards on its financial statements and has identified the key area likely to be impacted is freight revenue. AASB 15 requires the individual components of revenue to be recognised separately and freight revenue is likely to be deferred until the product is delivered rather than when the product is shipped. No other areas are expected to be significantly impacted.
The new standard also introduces expanded disclosure requirements and changes in presentation. These are expected to change the nature and extent of the Group’s disclosure about its revenue from contracts with customers and associated assets and, particularly in the year of the adoption of the new standard.
v) IFRS 16 Leases (effective from 1 January 2019)IFRS 16 Leases will replace the current guidance in IAS 17 and require all operating leases to be recognised on the balance sheet. The Group intends to apply the standard from 1 January 2019. Application of this standard will not have an impact to the Group’s financial statements. The Group does not have operating leases.
vi) Amendments to IFRS 2 Share-based Payment (effective from 1 January 2018)
The amendments to IFRS 2 Share-based Payment provide requirements on the accounting for the classification and measurement of certain types of share-based payment transactions. The Group is still assessing the impact of the new amendments on the Group’s financial statements. The Group intends to apply the standard from January 1, 2018.
The Group has applied the following standards and amendments for the first time for their annual reporting period commencing 1 January 2016:
• AASB 2015-1 Amendments to Australian Accounting Standards – Annual Improvements to Australian Accounting Standards 2012-2014 Cycle.
• AASB 2015-2 Amendments to Australian Accounting Standards – Disclosure Initiative: Amendments to AASB101.
The adoption of these amendments did not have any impact on the current period or any prior period and is not likely to affect future periods.
43
2016 Annual Report « Grange Resources Limited
NOTE 2. FINANCIAL RISK MANAGEMENTThe Group’s activities expose it to a variety of financial risks: market risk (including currency risk, interest rate risk and price risk), credit risk and liquidity risk. The Group’s overall risk management program focuses on the unpredictability of financial markets and seeks to minimise potential adverse effects on the financial performance of the Group. The Group has used derivative financial instruments such as foreign exchange contracts and forward commodity contracts to manage certain risk exposures. Derivatives are exclusively used for hedging purposes, i.e. not as trading or other speculative instruments. The Group uses different methods to measure different types of risks to which it is exposed. These methods include sensitivity analysis in the case of interest rate, foreign exchange and commodity price risks and aging analysis for credit risk.
Risk management is carried out by the management team following guidance received from the Audit and Risk Committee.
The Group holds the following financial instruments:
2016 2015
$’000 $’000
Financial Assets
Cash and cash equivalents 165,958 94,698
Term deposits - 43,732
Trade and other receivables 37,287 15,874
Derivative financial instruments 19 2,055
203,264 156,359
Financial Liabilities
Trade and other payables 17,827 16,072
Borrowings 9,254 12,383
27,081 28,455
a) Market Riski) Foreign exchange riskThe Group operates internationally and is exposed to foreign exchange risk arising from various currency exposures, primarily with respect to the US dollar.
Foreign exchange risk arises from commercial transactions, given that the Group’s sales revenues are denominated in US dollars and the majority of its operating costs are denominated in Australian dollars, and recognised assets and liabilities denominated in a currency that is not the entity’s functional currency. The risk is measured using sensitivity analysis and cash flow forecasting.
The Group entered into a few short-term AUD vs USD Dual Currency Investments during the year but there was no open currency hedges as at 31 December 2016 (2015: nil)
The Group’s exposure to US dollar denominated foreign currency risk at the reporting date, expressed in Australian dollars, was as follows:
2016 2015
$’000 $’000
Cash and cash equivalents 66,503 32,487
Term Deposits - 34,218
Trade and other receivables 25,789 4,020
Trade and other payables (201) (1,247)
Net US dollar surplus 92,091 69,478
Group sensitivity
Based on the financial instruments held at 31 December 2016, had the Australian dollar weakened/strengthened by 10% against the US dollar with all other variables held constant, the Group’s post tax profit for the financial period would have been $5.9 million higher / $7.2 million lower (2015: $4.4 million higher / $5.4 million lower), mainly as a result of foreign exchange gains/losses on US dollar denominated cash and cash equivalents, term deposits and receivables as detailed in the above table.
ii) Price riskThe Group is exposed to commodity price risk. During prior years, the Group agreed with its customers to price its iron ore pellets at index based market prices. At this time, the Group does not manage its iron ore price risk with financial instruments.
Going forward, the Group may consider using financial instruments to manage commodity price risk given exposures to market prices arising from the adoption of index based market pricing mechanisms.
iii) Cash flow and fair value interest rate riskThe Group’s main interest rate risk arises from cash and cash equivalents and term deposits.
As at the reporting date, the Group has no variable rate borrowings outstanding. Borrowings issued at variable rates expose the Group to cash flow interest rate risk. Borrowings issued at fixed rates expose the Group to fair value interest rate risk if the borrowings are carried at fair value. The Group’s fixed rate borrowings are carried at amortised cost. As they are fixed rate borrowings, they are not subject to interest rate risk as defined by AASB 7, Financial Instruments: Disclosures.
The Group analyses its interest rate exposure on a dynamic basis. Various scenarios are simulated taking into consideration refinancing, renewal of existing positions, alternative financing and hedging.
Based on these scenarios, the Group calculates the impact on profit and loss of a defined interest rate shift. No financial instruments are used to manage interest rate risk.
Group sensitivity
The Group’s fixed rate borrowings are carried at amortised cost. As they are fixed rate borrowings, they are not subject to interest rate risk and are excluded from the interest rate sensitivity analysis.
At 31 December 2016, if interest rates had increased by 50 basis points (bps) or decreased by 50 basis points from the period end rates with all other variables held constant, post tax profit for the period would have been $0.3 million higher / $0.3 million lower (2015 changes of 50 bps / 50 bps: $0.6 million higher / $0.6 million lower).
b) Credit RiskCredit risk is managed on a Group basis. Credit risk arises from cash and cash equivalents and deposits with banks and financial institutions, as well as credit exposures to customers, including outstanding receivables and committed transactions.
The Group is exposed to a concentration of risk with sales of iron ore being made to a limited number of customers. The maximum exposure to credit risk at the reporting date is limited to the carrying value of trade receivables, cash and cash equivalents and deposits with banks and financial institutions.
As at 31 December 2016, there were no trade receivables (2015 nil) that are past due. The other classes within trade and other receivables do not contain impaired assets and are not past due.
Grange Resources Limited » 2016 Annual Report
44
c) Liquidity RiskPrudent liquidity risk management implies maintaining sufficient cash and marketable securities, the availability of funding through an adequate amount of committed credit facilities and the ability to close out market positions. The Group manages liquidity risk by continuously monitoring forecast and actual cash flows and matching the maturity profiles of financial assets and liabilities.
Maturities of financial liabilities
The table below analyses the Group’s financial liabilities into relevant maturity groupings based on the remaining period as at the reporting date to the contractual maturity date. The amounts disclosed in the table are the contractual undiscounted cash flows.
2016 - ConsolidatedLess than 6 months
6-12 months
Between 1 and 2
years
Between 2 and 5
years
Over 5 years
Total contract
-ual cash flows
Carrying amount
liabilities
$’000 $’000 $’000 $’000 $’000 $’000 $’000
Non-derivatives
Trade and other payables 17,827 - - - - 17,827 17,827
Fixed rate borrowings 4,320 2,406 2,755 - - 9,481 9,254
Total non-derivatives 22,147 2,406 2,755 - - 27,308 27,081
2015 - ConsolidatedLess than 6 months
6-12 months
Between 1 and 2
years
Between 2 and 5
years
Over 5 years
Total contract
-ual cash flows
Carrying amount
liabilities
$’000 $’000 $’000 $’000 $’000 $’000 $’000
Non-derivatives
Trade and other payables 16,072 - - - - 16,072 16,072
Fixed rate borrowings 2,819 2,728 4,959 2,773 - 13,279 12,383
Total non-derivatives 18,891 2,728 4,959 2,773 - 29,351 28,455
d) Capital Risk ManagementWhen managing capital, the Group’s objective is to safeguard the ability to continue as a going concern so that the Group continues to provide returns for shareholders and benefits for other stakeholders, and to maintain an optimal capital structure to reduce the cost of capital.
Management is constantly reviewing and adjusting, where necessary, the capital structure. This involves the use of corporate forecasting models which enable analysis of the Group’s financial position including cash flow forecasts to determine future capital management requirements. To ensure sufficient funding, a range of assumptions are modeled.
e) DerivativesDerivatives are only used for economic hedging purposes and not as speculative investments. The Group has the following derivative financial instruments:
2016 2015
$’000 $’000
Dual Currency Investment (394) -
Electricity Fixed Forward - 3,035
Diesel Commodity Swap 413 (980)
Derivative financial instruments
19 2,055
f) Classification of derivativesDerivatives are classified as held for trading and accounted for at fair value through profit or loss. They are presented as current assets or liabilities if they are expected to be settled within 12 months after the end of the reporting period.
g) Recognised fair value measurementsThis section explains the judgements and estimates made in determining the fair values of the financial instruments that are recognised and measured at fair value in the financial statements. To provide an indication about the reliability of the inputs used in determining fair value, the Group has classified its financial instruments into the three levels prescribed under the accounting standards. As at 31 December 2016, all the derivative financial instruments disclosed above are classified as fair value measurements level 2.
Level 2: The fair value of financial instruments that are not traded in an active market (for example, over-the-counter derivatives) is determined using valuation techniques which maximise the use of observable market data and rely as little as possible on entity-specific estimates. If all significant inputs required to fair value an instrument are observable, the instrument is included in level 2.
Specific valuation techniques used to value the derivative financial instruments mainly include determining the fair value of forward contracts using forward rates at the balance sheet date provided by the dealers.
45
2016 Annual Report « Grange Resources Limited
NOTE 3. CRITICAL ACCOUNTING ESTIMATES AND JUDGEMENTS
Estimates and judgements are continually evaluated and are based on historical experience and other factors, including expectations of future events that may have a financial impact on the entity and that are believed to be reasonable under the circumstances.
The Group makes estimates and assumptions concerning the future. The resulting accounting estimates will, by definition, seldom equal the related actual results. The estimates and assumptions that have a significant risk of causing a material adjustment to the carrying amounts of assets and liabilities within the next financial year are discussed below.
a) Net realisable value of inventoriesThe Group reviews the carrying value of its inventories at each reporting date to ensure that the cost does not exceed net realisable value. Estimates of net realisable value include a number of assumptions, including commodity price expectations, foreign exchange rates and costs to complete inventories to a saleable product. As at 31 December 2016 the net realisable value exceeded cost for all significant inventory balances.
b) Impairment of property, plant and equipment and mine properties and developmentWhere there is an indication of a possible impairment, a formal estimate of the recoverable amount of each Cash Generating Unit (CGU) is made, which is deemed to be the higher of a cash generating unit’s fair value less costs of disposal and its value in use.
Details in relation to the Group’s impairment assessment are disclosed at Note 27.
c) Stripping costs in the production phase of a surface mine (Interpretation 20)The application of Interpretation 20 requires management judgement in determining whether a surface mine is in the production phase and whether the benefits of production stripping activities will be realised in the form of inventory produced through improved access to ore.
Judgement is also applied in identifying the component of the ore body and the manner in which stripping costs are capitalised and amortised. There are a number of uncertainties inherent in identifying components of the ore body and the inputs to the relevant production methods for capitalising and amortising stripping costs and these assumptions may change significantly when new information becomes available. Such changes could impact on capitalisation and amortisation rates for capitalised stripping costs and deferred stripping asset values.
d) Determination of mineral resources and ore reservesMineral resources and ore reserves are based on information compiled by a Competent Person as defined in accordance with the Australasian Code for Reporting of Exploration Results, Mineral Resources and Ore Reserves (the JORC 2012 code). There are numerous uncertainties inherent in estimating ore reserves and assumptions that are valid at the time of estimation may change significantly when new information becomes available. Changes in forecast prices of commodities, exchange rates, production costs or recovery rates may change the economic status of ore reserves and may, ultimately, result in the reserves being restated. Such changes in reserves could impact on depreciation and amortisation rates, asset carrying values and provisions for rehabilitation.
e) TaxationThe Group’s accounting policy for taxation requires management judgment in relation to the application of income tax legislation. There are many transactions and calculations undertaken during the ordinary course of business where the ultimate tax determination is uncertain. The Group recognises liabilities for tax, and if appropriate taxation investigation or audit issues, based on whether tax will be due and payable. Where the taxation outcome of such matters is different from the amount initially recorded, such difference will impact the current and deferred tax positions in the period in which the assessment is made.
The Group merged its multiple tax consolidated groups on 6 January 2011 which has impacted the carrying amount of deferred tax assets and deferred tax liabilities recognised on the balance sheet. Management has used judgment in the application of income tax legislation on accounting for this tax consolidation. These judgments are based on management’s interpretation of the income tax legislation applicable at the time of the consolidation.
In addition, certain deferred tax assets for deductible temporary differences have been recognised. In recognising these deferred tax assets assumptions have been made regarding the Group’s ability to generate future taxable profits. Utilization of the tax losses also depends on the ability of the tax consolidated entities to satisfy certain tests at the time the losses are recouped. There is an inherent risk and uncertainty in applying these judgments and a possibility that changes in legislation or forecasts will impact upon the carrying amount of deferred tax assets and deferred tax liabilities recognised on the balance sheet.
f) Provision for decommissioning and restoration costsDecommissioning and restoration costs are a normal consequence of mining, and the majority of this expenditure is incurred at the end of a mine’s life. In determining an appropriate level of provision, consideration is given to the expected future costs to be incurred, the timing of these expected future costs (largely dependent on the life of the mine), and the estimated future level of inflation.
The ultimate cost of decommissioning and restoration is uncertain and costs can vary in response to many factors including changes to the relevant legal requirements, changes to mine plan, and the emergence of new restoration techniques or experience at other mine sites. The expected timing of expenditure can also change, for example in response to changes in reserves or to production rates.
Certain rehabilitation activities are undertaken as part of the mining operations included in the life of mine plan. Should the life of mine plan be amended in the future to exclude these activities, the provision for rehabilitation would increase correspondingly.
Changes to any of the estimates could result in significant changes to the level of provisioning required, which would in turn impact future financial results. These estimates are reviewed annually and adjusted where necessary to ensure that the most up to date data is used.
g) Share-based payment transactionsThe Group measures the cost of equity-settled transactions with employees by reference to the fair value of the equity instruments at the date at which they are granted. The fair value for shares issued is determined by the volume weighted average trading price over a specified number of days.
h) Revenue recognition - Provisional pricingAs at 31 December 2016 the Group did not recognise any revenue from the sale of iron ore products which requires quantity and quality verification by the customer (31 December 2015: nil).
Grange Resources Limited » 2016 Annual Report
46
NOTE 4. SEGMENT INFORMATION
a) Description of segmentsOperating segments are determined based on the reports reviewed by the Chief Executive Officer, who is the Group’s chief operating decision maker in terms of allocating resources and assessing performance.
The Group has one reportable segment, being the exploration, evaluation and development of mineral resources and iron ore mining operations. The Chief Executive Officer allocates resources and assesses performance, in terms of revenues earned, expenses incurred and assets employed, on a consolidated basis in a manner consistent with that of the measurement and presentation in the financial statements.
Exploration, evaluation and development projects (including the Southdown project) are not deemed reportable operating segments at this time as the financial performance of these operations is not separately included in the reports provided to the Chief Executive Officer. These projects may become segments in the future.
The following table presents revenues from sales of iron ore based on the geographical location of the port of discharge.
Segment revenues from sales to external customers
2016 2015
$’000 $’000
Australia 29,483 17,627
China 195,445 144,462
Japan 30,493 254
Korea 20,924 43,214
Malaysia - 5
TOTAL 276,345 205,562
Segment assets and capital are allocated based on where the assets are located. The consolidated assets of the Group were predominately located in Australia as at 31 December 2016 and 31 December 2015. The total costs incurred during the current and comparative periods to acquire segment assets were also predominately incurred in Australia.
NOTE 5. REVENUE
2016 2015
From mining operations $’000 $’000
Sales of iron ore products 276,345 205,562
276,345 205,562
NOTE 6. COST OF SALES
2016 2015
$’000 $’000
Mining costs 94,073 111,680
Production costs 103,494 88,770
Government royalties 9,876 2,580
Depreciation and amortisation expense
3,455 8,474
Property, Plant and Equipment
- Amounts capitalised during the year
(35,136) (32,752)
Mine properties and development
- Amounts capitalised during the year
- -
- Amortisation expense 3,436 29,622
Deferred stripping
- Amounts capitalised during the year
(46,300) (57,201)
- Amortisation expense 838 14,307
Changes in inventories 39,352 (23,410)
Foreign exchange gain (535) (3,710)
172,553 138,360
Depreciation and amortisation
Land and buildings 171 439
Plant and equipment 3,215 7,665
Computer equipment 69 370
3,455 8,474
Profit before income tax includes the following specific expenses
Employee benefits expense 55,118 59,097
Defined contribution superannuation expense
4,916 5,289
NOTE 7. ADMINISTRATIVE EXPENSES
2016 2015
$’000 $’000
Provision for rehabilitation - Interest in joint operation
4,754 1,244
Salaries 2,062 1,471
Consultancy fees 915 927
Other 384 270
8,115 3,912
47
2016 Annual Report « Grange Resources Limited
NOTE 8. OTHER INCOME (EXPENSES)
2016 2015
$’000 $’000
Net loss on the disposal of property, plant and equipment
11 (16)
Rent income 50 52
Insurance claim 345 -
Other income (expenses) 20 (204)
426 (168)
NOTE 9. FINANCE INCOME (EXPENSES)
2016 2015
$’000 $’000
Finance Income
Interest income received or receivable
2,620 2,878
Gain on financial instruments - 2,055
Exchange gains on foreign currency deposits / borrowings (net)
1,335 7,659
3,955 12,592
Interest charges paid or payable
(705) (541)
Finance lease interest charges paid or payable
(42) (40)
Loss on financial instruments (2,035) -
Provisions: unwinding of discount
- Decommissioning and restoration (Note 22)
(1,076) (954)
(3,858) (1,535)
NOTE 10. INCOME TAX BENEFIT (EXPENSE)
a) Income tax expense (benefit)2016 2015
$’000 $’000
Current tax 6,299 2,269
Deferred tax (4,393) (63,254)
1,906 65,523
Deferred income tax included in income tax expense (benefit) comprises:
(Increase) decrease in deferred tax assets
(4,393) 66,585
Decrease in deferred tax liabilities
- (3,331)
(4,393) 63,254
b) Numerical reconciliation of income tax (benefit) / expense to prima facie tax payable
Profit (loss) from continuing operations before income tax (benefit) / expense
94,809 (212,291)
Tax expense (credit) at the Australian tax rate of 30% (2015: 30%)
28,443 (63,687)
Tax effect of amounts which are not deductible (taxable) in calculating taxable income:
Share based payments expense
- (83)
Sundry items (227) (123)
28,216 (63,893)
Movement in previously unrealised deferred tax assets
(22,105) -
Movement in deferred tax assets recognised
(5,553) -
Deferred tax assets not recognised
- 68,011
De-recognition of previously recognised deferred tax assets
- 63,254
Adjustments to tax of prior period
1,348 (1,849)
Income tax expense 1,906 65,523
c) Taxation Losses2016 2015
$’000 $’000
Unused taxation losses for which no deferred tax asset has been recognised
54,104 54,104
Potential tax benefit @ 30% 16,231 16,231
All unused taxation losses were incurred by Australian entities that are part of the tax consolidated group. The tax losses as disclosed above have not been recognised as they are not presently available for use. Their availability is subject to the satisfaction of the same business test under Australia’s tax loss integrity rules.
d) Unrecognised temporary differences
Temporary difference for which deferred tax assets not recognised
349,073 437,550
Unrecognised deferred tax assets relating to the above temporary differences
104,722 131,265
Grange Resources Limited » 2016 Annual Report
48
NOTE 11. CASH AND CASH EQUIVALENTS
2016 2015
$’000 $’000
Cash at bank and in hand 101,177 49,698
Short-term deposits 64,781 45,000
165,958 94,698
Cash at bank and in hand as per statement of cash flows
165,958 94,698
Add:
Term deposits - 43,732
165,958 138,430
Total cash is held in trading accounts or term deposits with major financial institutions under normal terms and conditions appropriate to the operation of the accounts. These deposits earn interest at rates set by these institutions. As at 31 December 2016 the weighted average interest rate on the Australian dollar accounts was 2.85% (31 December 2015: 2.87%) and the weighted average interest rate on the United States dollar accounts was 2.46% (31 December 2015: 0.64%).
a) Risk exposureThe Group’s exposure to interest rate risk is discussed in Note 2. The maximum exposure to credit risk at the reporting date is the carrying amount of each class of cash and cash equivalents mentioned above.
NOTE 12. TRADE AND OTHER RECEIVABLES
2016 2015
$’000 $’000
Trade receivables 26,102 4,234
Security deposits(1) 271 402
Other receivables 2,175 3,391
Prepayments 1,865 1,886
Income tax refund 875 -
31,288 9,913
(1) Security deposits comprises of restricted deposits that are used for monetary backing for performance guarantees.
a) Impaired trade receivablesInformation regarding the impairment of trade and other receivables is provided in Note 2. As at 31 December 2016, there were no trade receivables (2015 nil) that are past due.
b) Foreign exchange and interest rate riskInformation about the Group’s exposure to foreign currency risk and interest rate risk in relation to trade and other receivables is provided in Note 2.
c) Fair value and credit riskDue to the short-term nature of these receivables, their carrying amount is assumed to approximate their fair value. The maximum exposure to credit risk at the end of the reporting period is the carrying amount of each class of receivables mentioned above. Refer to Note 2 for more information on the credit quality of the Group’s trade and other receivables.
NOTE 13. INVENTORIES
2016 2015
$’000 $’000
Stores and spares 20,500 24,740
Ore stockpiles 2,536 21,209
Work in progress 2,434 7,141
Finished goods (at lower of cost and net realisable value)
10,071 26,034
35,541 79,124
Inventories are valued at the lower of weighted average cost and estimated net realisable value. An expense of $39.35 million in 2016 and a credit of $23.41 million in 2015 were recognised for the movements in finished goods inventories (note 6).
NOTE 14. RECEIVABLES
2016 2015
$’000 $’000
Security deposits(1) 7,864 7,848
7,864 7,848
(1) Non-current security deposits comprise of restricted deposits that are used for monetary backing for performance guarantees.
a) Risk exposureInformation about the Group’s exposure to credit risk, foreign exchange and interest rate risk is provided in Note 2. The maximum exposure to credit risk at the reporting date is the carrying amount of each class of receivables mentioned above.
49
2016 Annual Report « Grange Resources Limited
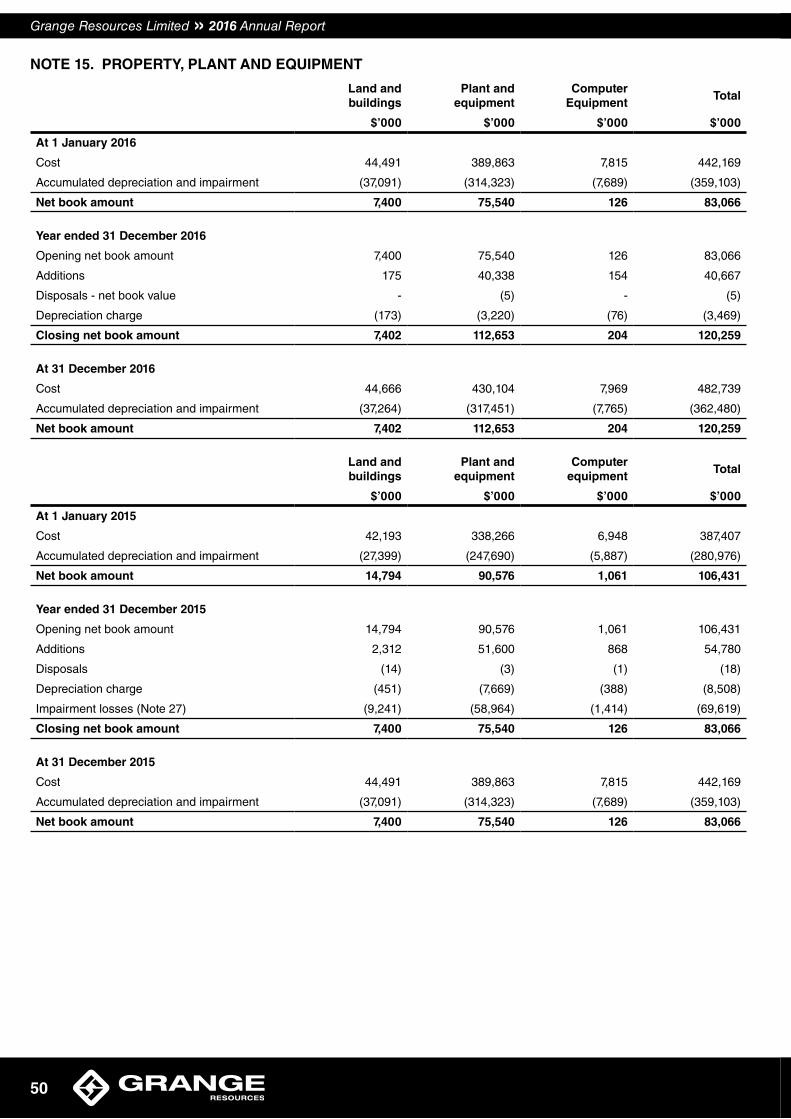
NOTE 15. PROPERTY, PLANT AND EQUIPMENT
Land and buildings
Plant and equipment
Computer Equipment
Total
$’000 $’000 $’000 $’000
At 1 January 2016
Cost 44,491 389,863 7,815 442,169
Accumulated depreciation and impairment (37,091) (314,323) (7,689) (359,103)
Net book amount 7,400 75,540 126 83,066
Year ended 31 December 2016
Opening net book amount 7,400 75,540 126 83,066
Additions 175 40,338 154 40,667
Disposals - net book value - (5) - (5)
Depreciation charge (173) (3,220) (76) (3,469)
Closing net book amount 7,402 112,653 204 120,259
At 31 December 2016
Cost 44,666 430,104 7,969 482,739
Accumulated depreciation and impairment (37,264) (317,451) (7,765) (362,480)
Net book amount 7,402 112,653 204 120,259
Land and buildings
Plant and equipment
Computer equipment
Total
$’000 $’000 $’000 $’000
At 1 January 2015
Cost 42,193 338,266 6,948 387,407
Accumulated depreciation and impairment (27,399) (247,690) (5,887) (280,976)
Net book amount 14,794 90,576 1,061 106,431
Year ended 31 December 2015
Opening net book amount 14,794 90,576 1,061 106,431
Additions 2,312 51,600 868 54,780
Disposals (14) (3) (1) (18)
Depreciation charge (451) (7,669) (388) (8,508)
Impairment losses (Note 27) (9,241) (58,964) (1,414) (69,619)
Closing net book amount 7,400 75,540 126 83,066
At 31 December 2015
Cost 44,491 389,863 7,815 442,169
Accumulated depreciation and impairment (37,091) (314,323) (7,689) (359,103)
Net book amount 7,400 75,540 126 83,066
Grange Resources Limited » 2016 Annual Report
50
a) Assets under constructionThe carrying amounts of the assets disclosed above includes expenditure of $98.14 million (2015: $69.0 million) recognised in relation to property, plant and equipment which is in the course of construction.
b) Leased assetsPlant and equipment includes the following amounts where the Group is a lessee under a finance lease. The lessor is secured over the leased assets.
2016 2015
$’000 $’000
Cost 999 999
Accumulated depreciation and impairment (989) (984)
Net book amount 10 15
NOTE 16. MINE PROPERTIES AND DEVELOPMENT
2016 2015
$’000 $’000
Mine properties and development (at cost) 468,140 466,846
Accumulated amortisation and impairment (465,716) (461,736)
Net book amount 2,424 5,110
Deferred stripping costs (net book amount) 56,906 11,444
Total mine properties and development 59,330 16,554
Movements in mine properties and development are set out below:
Mine properties and development
Opening net book amount 5,110 115,283
Current year expenditure capitalised - -
Change in rehabilitation estimate 750 3,170
Amortisation expense (3,436) (29,622)
Impairment losses (Refer Note 27) - (83,721)
Closing net book amount 2,424 5,110
Deferred stripping costs
Opening net book amount 11,444 99,947
Current year expenditure capitalised 46,300 57,201
Amortisation expense (838) (14,307)
Impairment losses (Refer Note 27) - (131,397)
Closing net book amount 56,906 11,444
NOTE 17. DEFERRED TAX ASSETS
2016 2015
$’000 $’000
The balance comprises temporary differences attributable to:
Property, plant and equipment 3,398 2,206
Mine properties and development 3,883 1,571
Trade and other payables 4 1
Employee benefits 359 133
Decommissioning and restoration 1,053 393
Total deferred tax assets 8,697 4,304
51
2016 Annual Report « Grange Resources Limited
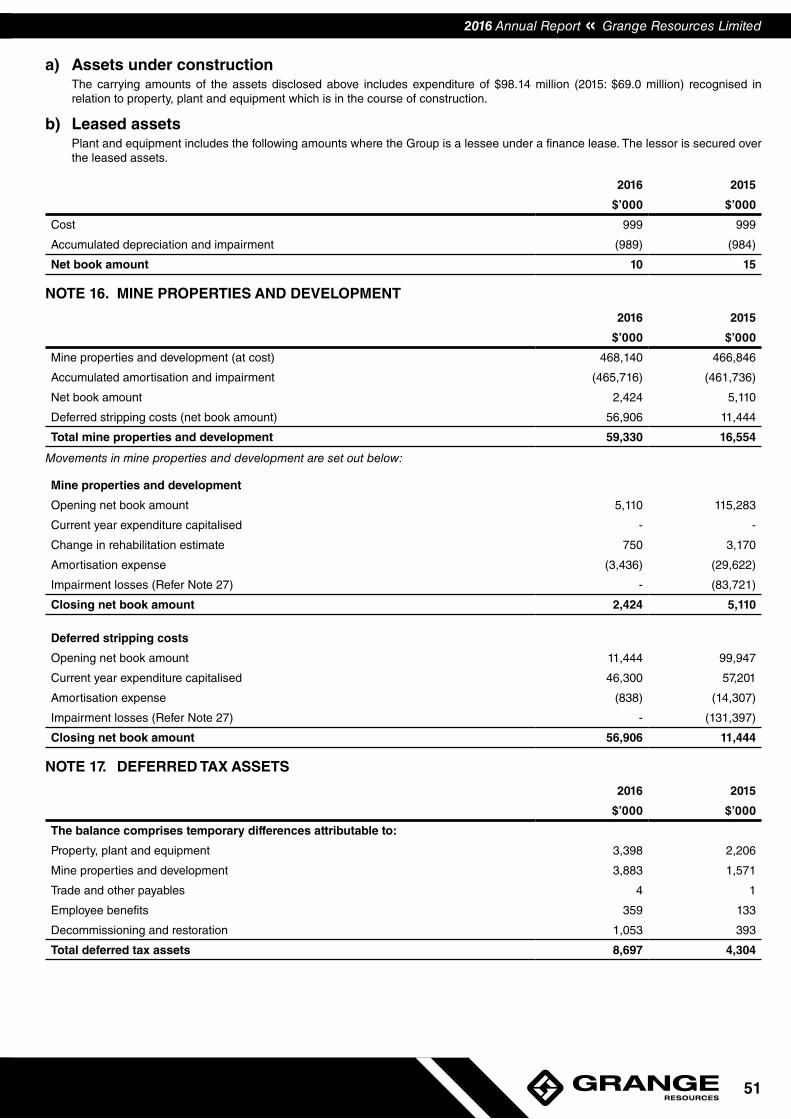
NOTE 15. PROPERTY, PLANT AND EQUIPMENT
Land and buildings
Plant and equipment
Computer Equipment
Total
$’000 $’000 $’000 $’000
At 1 January 2016
Cost 44,491 389,863 7,815 442,169
Accumulated depreciation and impairment (37,091) (314,323) (7,689) (359,103)
Net book amount 7,400 75,540 126 83,066
Year ended 31 December 2016
Opening net book amount 7,400 75,540 126 83,066
Additions 175 40,338 154 40,667
Disposals - net book value - (5) - (5)
Depreciation charge (173) (3,220) (76) (3,469)
Closing net book amount 7,402 112,653 204 120,259
At 31 December 2016
Cost 44,666 430,104 7,969 482,739
Accumulated depreciation and impairment (37,264) (317,451) (7,765) (362,480)
Net book amount 7,402 112,653 204 120,259
Land and buildings
Plant and equipment
Computer equipment
Total
$’000 $’000 $’000 $’000
At 1 January 2015
Cost 42,193 338,266 6,948 387,407
Accumulated depreciation and impairment (27,399) (247,690) (5,887) (280,976)
Net book amount 14,794 90,576 1,061 106,431
Year ended 31 December 2015
Opening net book amount 14,794 90,576 1,061 106,431
Additions 2,312 51,600 868 54,780
Disposals (14) (3) (1) (18)
Depreciation charge (451) (7,669) (388) (8,508)
Impairment losses (Note 27) (9,241) (58,964) (1,414) (69,619)
Closing net book amount 7,400 75,540 126 83,066
At 31 December 2015
Cost 44,491 389,863 7,815 442,169
Accumulated depreciation and impairment (37,091) (314,323) (7,689) (359,103)
Net book amount 7,400 75,540 126 83,066
Grange Resources Limited » 2016 Annual Report
50
a) Assets under constructionThe carrying amounts of the assets disclosed above includes expenditure of $98.14 million (2015: $69.0 million) recognised in relation to property, plant and equipment which is in the course of construction.
b) Leased assetsPlant and equipment includes the following amounts where the Group is a lessee under a finance lease. The lessor is secured over the leased assets.
2016 2015
$’000 $’000
Cost 999 999
Accumulated depreciation and impairment (989) (984)
Net book amount 10 15
NOTE 16. MINE PROPERTIES AND DEVELOPMENT
2016 2015
$’000 $’000
Mine properties and development (at cost) 468,140 466,846
Accumulated amortisation and impairment (465,716) (461,736)
Net book amount 2,424 5,110
Deferred stripping costs (net book amount) 56,906 11,444
Total mine properties and development 59,330 16,554
Movements in mine properties and development are set out below:
Mine properties and development
Opening net book amount 5,110 115,283
Current year expenditure capitalised - -
Change in rehabilitation estimate 750 3,170
Amortisation expense (3,436) (29,622)
Impairment losses (Refer Note 27) - (83,721)
Closing net book amount 2,424 5,110
Deferred stripping costs
Opening net book amount 11,444 99,947
Current year expenditure capitalised 46,300 57,201
Amortisation expense (838) (14,307)
Impairment losses (Refer Note 27) - (131,397)
Closing net book amount 56,906 11,444
NOTE 17. DEFERRED TAX ASSETS
2016 2015
$’000 $’000
The balance comprises temporary differences attributable to:
Property, plant and equipment 3,398 2,206
Mine properties and development 3,883 1,571
Trade and other payables 4 1
Employee benefits 359 133
Decommissioning and restoration 1,053 393
Total deferred tax assets 8,697 4,304
51
2016 Annual Report « Grange Resources Limited
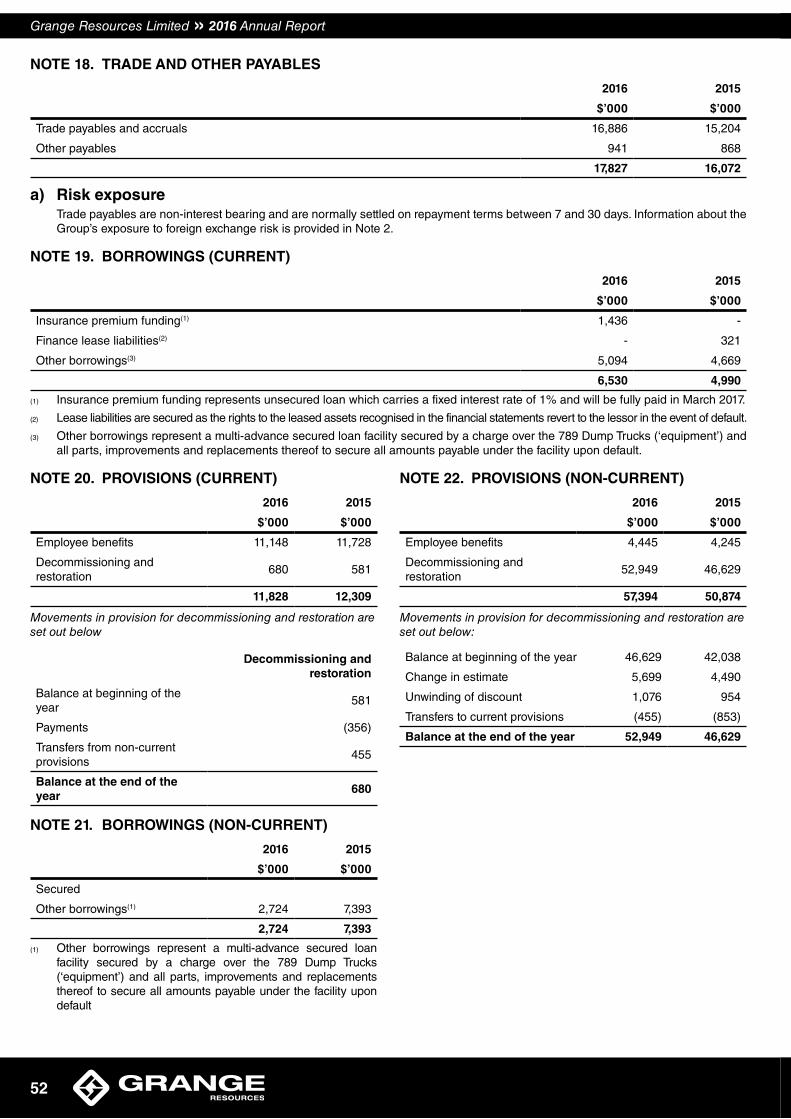
NOTE 18. TRADE AND OTHER PAYABLES
2016 2015
$’000 $’000
Trade payables and accruals 16,886 15,204
Other payables 941 868
17,827 16,072
a) Risk exposureTrade payables are non-interest bearing and are normally settled on repayment terms between 7 and 30 days. Information about the Group’s exposure to foreign exchange risk is provided in Note 2.
NOTE 19. BORROWINGS (CURRENT)
2016 2015
$’000 $’000
Insurance premium funding(1) 1,436 -
Finance lease liabilities(2) - 321
Other borrowings(3) 5,094 4,669
6,530 4,990
(1) Insurance premium funding represents unsecured loan which carries a fixed interest rate of 1% and will be fully paid in March 2017.
(2) Lease liabilities are secured as the rights to the leased assets recognised in the financial statements revert to the lessor in the event of default.
(3) Other borrowings represent a multi-advance secured loan facility secured by a charge over the 789 Dump Trucks (‘equipment’) and all parts, improvements and replacements thereof to secure all amounts payable under the facility upon default.
NOTE 20. PROVISIONS (CURRENT)
2016 2015
$’000 $’000
Employee benefits 11,148 11,728
Decommissioning and restoration
680 581
11,828 12,309
Movements in provision for decommissioning and restoration are set out below
Decommissioning and restoration
Balance at beginning of the year
581
Payments (356)
Transfers from non-current provisions
455
Balance at the end of the year
680
NOTE 21. BORROWINGS (NON-CURRENT)
2016 2015
$’000 $’000
Secured
Other borrowings(1) 2,724 7,393
2,724 7,393
(1) Other borrowings represent a multi-advance secured loan facility secured by a charge over the 789 Dump Trucks (‘equipment’) and all parts, improvements and replacements thereof to secure all amounts payable under the facility upon default
NOTE 22. PROVISIONS (NON-CURRENT)
2016 2015
$’000 $’000
Employee benefits 4,445 4,245
Decommissioning and restoration
52,949 46,629
57,394 50,874
Movements in provision for decommissioning and restoration are set out below:
Balance at beginning of the year 46,629 42,038
Change in estimate 5,699 4,490
Unwinding of discount 1,076 954
Transfers to current provisions (455) (853)
Balance at the end of the year 52,949 46,629
Grange Resources Limited » 2016 Annual Report
52
NOTE 23. CONTRIBUTED EQUITY
2016 2015 2016 2015
Shares Shares $’000 $’000
Shares 1,157,338,698 1,157,338,698 331,513 331,513
1,157,338,698 1,157,338,698 331,513 331,513
(a) Movements in ordinary share capital Number of shares $’000
1 January 2015 - Opening Balance 1,157,097,869 331,373
Issue of shares under long term incentive plan 240,829 140
Closing balance at 31 December 2015 1,157,338,698 331,513
Issue of shares under long term incentive plan - -
Closing balance at 31 December 2016 1,157,338,698 331,513
a) Ordinary sharesOrdinary shares entitle the holder to participate in dividends and the proceeds of winding up of the Company in proportion to the number of and amounts paid on the shares held. Ordinary shares entitle their holder to one vote per share, either in person or by proxy, at a meeting of the Company. Ordinary shares have no par value and the Company does not have a limited amount of authorised share capital.
b) Share options and rightsThe Company has share based payment schemes under which rights for the Company’s shares have been granted to certain executives and eligible employees (refer to Note 34).
NOTE 24. RESERVES
2016 2015
$’000 $’000
a) Movements in share-based payments reservesBalance at beginning of the year
- 415
Share based payments expense
- -
Issue of shares to employees - (140)
Rights forfeited (275)
Balance at the end of the year - -
b) Nature and purpose of share-based payment reserveThe share based payments reserve is used to recognise the fair value of equity benefits issued by the Company.
NOTE 25. RETAINED PROFITS
2016 2015
$’000 $’000
Retained profits (loss)
Movements in retained profits were as follows:
Balance at the beginning of the year
(85,976) 203,413
Profit (loss) for the year 92,903 (277,814)
Dividends paid (5,787) (11,575)
Balance at the end of the year 1,140 (85,976)
53
2016 Annual Report « Grange Resources Limited
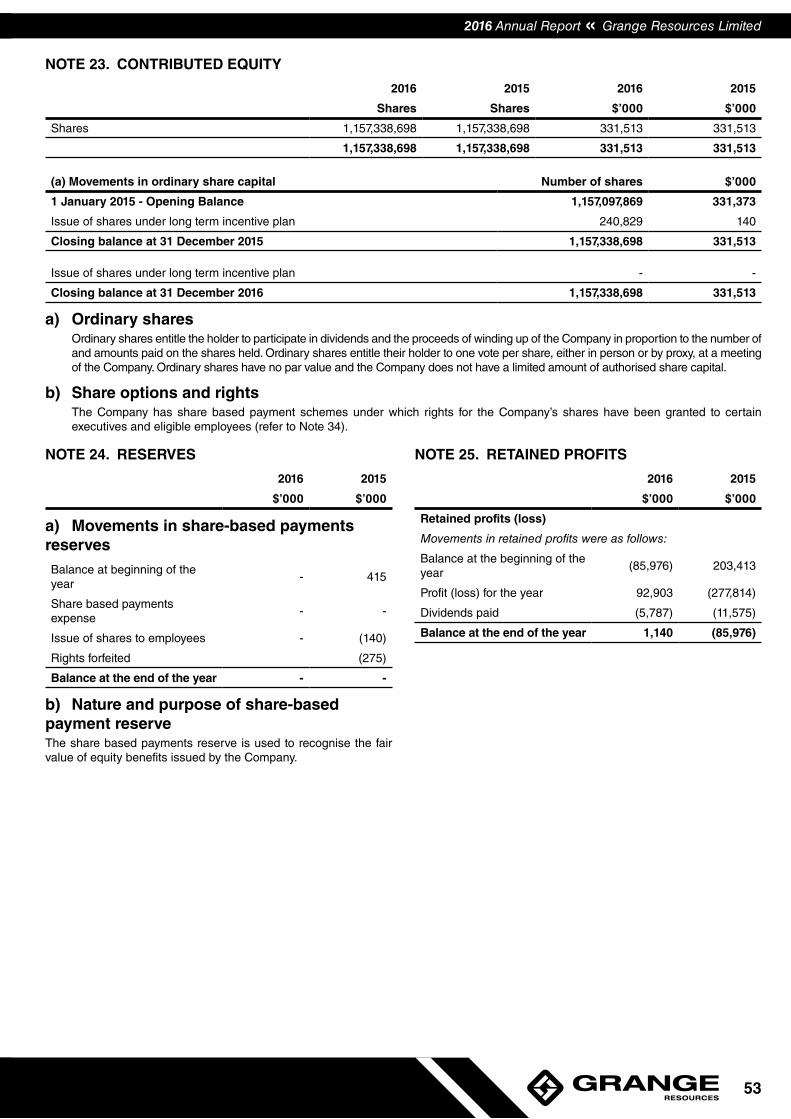
NOTE 18. TRADE AND OTHER PAYABLES
2016 2015
$’000 $’000
Trade payables and accruals 16,886 15,204
Other payables 941 868
17,827 16,072
a) Risk exposureTrade payables are non-interest bearing and are normally settled on repayment terms between 7 and 30 days. Information about the Group’s exposure to foreign exchange risk is provided in Note 2.
NOTE 19. BORROWINGS (CURRENT)
2016 2015
$’000 $’000
Insurance premium funding(1) 1,436 -
Finance lease liabilities(2) - 321
Other borrowings(3) 5,094 4,669
6,530 4,990
(1) Insurance premium funding represents unsecured loan which carries a fixed interest rate of 1% and will be fully paid in March 2017.
(2) Lease liabilities are secured as the rights to the leased assets recognised in the financial statements revert to the lessor in the event of default.
(3) Other borrowings represent a multi-advance secured loan facility secured by a charge over the 789 Dump Trucks (‘equipment’) and all parts, improvements and replacements thereof to secure all amounts payable under the facility upon default.
NOTE 20. PROVISIONS (CURRENT)
2016 2015
$’000 $’000
Employee benefits 11,148 11,728
Decommissioning and restoration
680 581
11,828 12,309
Movements in provision for decommissioning and restoration are set out below
Decommissioning and restoration
Balance at beginning of the year
581
Payments (356)
Transfers from non-current provisions
455
Balance at the end of the year
680
NOTE 21. BORROWINGS (NON-CURRENT)
2016 2015
$’000 $’000
Secured
Other borrowings(1) 2,724 7,393
2,724 7,393
(1) Other borrowings represent a multi-advance secured loan facility secured by a charge over the 789 Dump Trucks (‘equipment’) and all parts, improvements and replacements thereof to secure all amounts payable under the facility upon default
NOTE 22. PROVISIONS (NON-CURRENT)
2016 2015
$’000 $’000
Employee benefits 4,445 4,245
Decommissioning and restoration
52,949 46,629
57,394 50,874
Movements in provision for decommissioning and restoration are set out below:
Balance at beginning of the year 46,629 42,038
Change in estimate 5,699 4,490
Unwinding of discount 1,076 954
Transfers to current provisions (455) (853)
Balance at the end of the year 52,949 46,629
Grange Resources Limited » 2016 Annual Report
52
NOTE 23. CONTRIBUTED EQUITY
2016 2015 2016 2015
Shares Shares $’000 $’000
Shares 1,157,338,698 1,157,338,698 331,513 331,513
1,157,338,698 1,157,338,698 331,513 331,513
(a) Movements in ordinary share capital Number of shares $’000
1 January 2015 - Opening Balance 1,157,097,869 331,373
Issue of shares under long term incentive plan 240,829 140
Closing balance at 31 December 2015 1,157,338,698 331,513
Issue of shares under long term incentive plan - -
Closing balance at 31 December 2016 1,157,338,698 331,513
a) Ordinary sharesOrdinary shares entitle the holder to participate in dividends and the proceeds of winding up of the Company in proportion to the number of and amounts paid on the shares held. Ordinary shares entitle their holder to one vote per share, either in person or by proxy, at a meeting of the Company. Ordinary shares have no par value and the Company does not have a limited amount of authorised share capital.
b) Share options and rightsThe Company has share based payment schemes under which rights for the Company’s shares have been granted to certain executives and eligible employees (refer to Note 34).
NOTE 24. RESERVES
2016 2015
$’000 $’000
a) Movements in share-based payments reservesBalance at beginning of the year
- 415
Share based payments expense
- -
Issue of shares to employees - (140)
Rights forfeited (275)
Balance at the end of the year - -
b) Nature and purpose of share-based payment reserveThe share based payments reserve is used to recognise the fair value of equity benefits issued by the Company.
NOTE 25. RETAINED PROFITS
2016 2015
$’000 $’000
Retained profits (loss)
Movements in retained profits were as follows:
Balance at the beginning of the year
(85,976) 203,413
Profit (loss) for the year 92,903 (277,814)
Dividends paid (5,787) (11,575)
Balance at the end of the year 1,140 (85,976)
53
2016 Annual Report « Grange Resources Limited
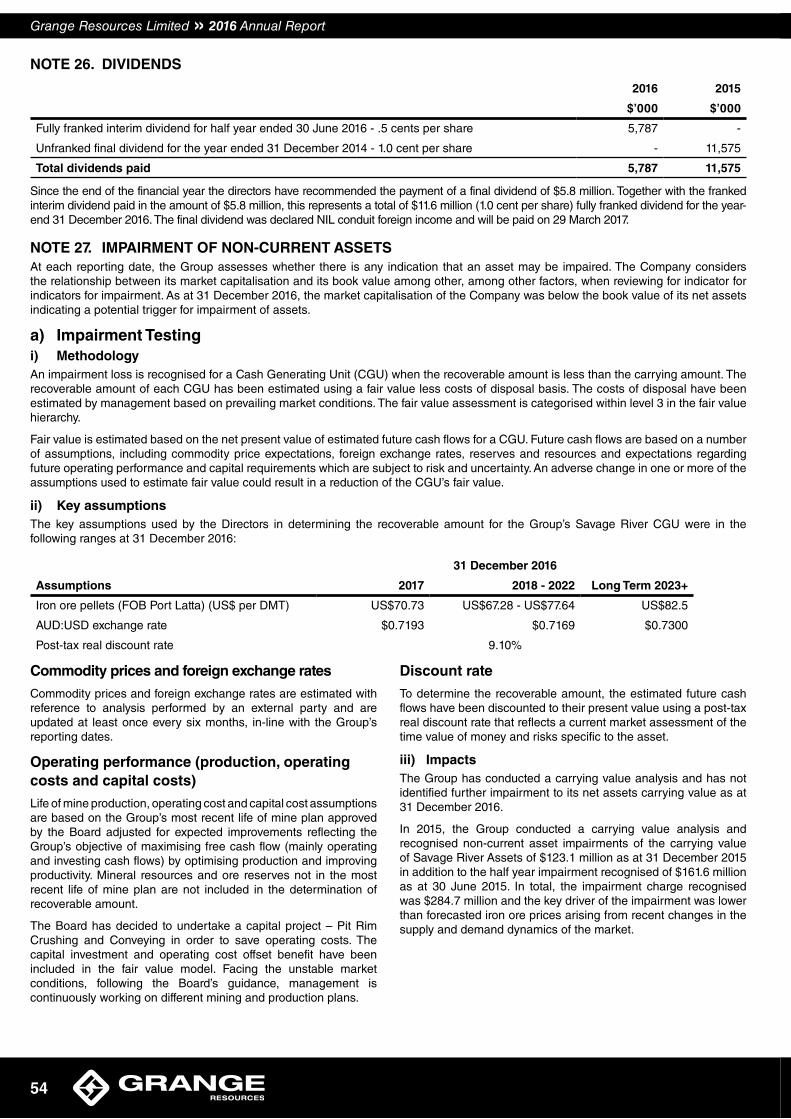
NOTE 26. DIVIDENDS
2016 2015
$’000 $’000
Fully franked interim dividend for half year ended 30 June 2016 - .5 cents per share 5,787 -
Unfranked final dividend for the year ended 31 December 2014 - 1.0 cent per share - 11,575
Total dividends paid 5,787 11,575
Since the end of the financial year the directors have recommended the payment of a final dividend of $5.8 million. Together with the franked interim dividend paid in the amount of $5.8 million, this represents a total of $11.6 million (1.0 cent per share) fully franked dividend for the year-end 31 December 2016. The final dividend was declared NIL conduit foreign income and will be paid on 29 March 2017.
NOTE 27. IMPAIRMENT OF NON-CURRENT ASSETSAt each reporting date, the Group assesses whether there is any indication that an asset may be impaired. The Company considers the relationship between its market capitalisation and its book value among other, among other factors, when reviewing for indicator for indicators for impairment. As at 31 December 2016, the market capitalisation of the Company was below the book value of its net assets indicating a potential trigger for impairment of assets.
a) Impairment Testingi) MethodologyAn impairment loss is recognised for a Cash Generating Unit (CGU) when the recoverable amount is less than the carrying amount. The recoverable amount of each CGU has been estimated using a fair value less costs of disposal basis. The costs of disposal have been estimated by management based on prevailing market conditions. The fair value assessment is categorised within level 3 in the fair value hierarchy.
Fair value is estimated based on the net present value of estimated future cash flows for a CGU. Future cash flows are based on a number of assumptions, including commodity price expectations, foreign exchange rates, reserves and resources and expectations regarding future operating performance and capital requirements which are subject to risk and uncertainty. An adverse change in one or more of the assumptions used to estimate fair value could result in a reduction of the CGU’s fair value.
ii) Key assumptionsThe key assumptions used by the Directors in determining the recoverable amount for the Group’s Savage River CGU were in the following ranges at 31 December 2016:
Assumptions
31 December 2016
2017 2018 - 2022 Long Term 2023+
Iron ore pellets (FOB Port Latta) (US$ per DMT) US$70.73 US$67.28 - US$77.64 US$82.5
AUD:USD exchange rate $0.7193 $0.7169 $0.7300
Post-tax real discount rate 9.10%
Commodity prices and foreign exchange rates
Commodity prices and foreign exchange rates are estimated with reference to analysis performed by an external party and are updated at least once every six months, in-line with the Group’s reporting dates.
Operating performance (production, operating costs and capital costs)
Life of mine production, operating cost and capital cost assumptions are based on the Group’s most recent life of mine plan approved by the Board adjusted for expected improvements reflecting the Group’s objective of maximising free cash flow (mainly operating and investing cash flows) by optimising production and improving productivity. Mineral resources and ore reserves not in the most recent life of mine plan are not included in the determination of recoverable amount.
The Board has decided to undertake a capital project – Pit Rim Crushing and Conveying in order to save operating costs. The capital investment and operating cost offset benefit have been included in the fair value model. Facing the unstable market conditions, following the Board’s guidance, management is continuously working on different mining and production plans.
Discount rate
To determine the recoverable amount, the estimated future cash flows have been discounted to their present value using a post-tax real discount rate that reflects a current market assessment of the time value of money and risks specific to the asset.
iii) ImpactsThe Group has conducted a carrying value analysis and has not identified further impairment to its net assets carrying value as at 31 December 2016.
In 2015, the Group conducted a carrying value analysis and recognised non-current asset impairments of the carrying value of Savage River Assets of $123.1 million as at 31 December 2015 in addition to the half year impairment recognised of $161.6 million as at 30 June 2015. In total, the impairment charge recognised was $284.7 million and the key driver of the impairment was lower than forecasted iron ore prices arising from recent changes in the supply and demand dynamics of the market.
Grange Resources Limited » 2016 Annual Report
54
iv) Sensitivity analysisIt is estimated that changes in the following key assumptions would have the following approximate impact on the fair value of the Savage River CGU as at 31 December 2016:
Decrease in fair value resulting from:
US$1 per dmt decrease in iron ore pellet prices (FOB Port Latta)
$19.28 million
$0.01 increase in the AUD:USD exchange rate $23.15 million
1% increase in estimated operating costs $13.44 million
25 bps increase in the discount rate $5.46 million
Reasonably possible changes in circumstances may affect these key assumptions and therefore the fair value. In reality, a change in any one of the aforementioned assumptions (including operating performance) would usually be accompanied by a change in another assumption which may have an off-setting impact. Action is usually taken to respond to adverse changes in assumptions to mitigate the impact of any such change. If the carrying amount is assessed to be impaired, the impairment charge is recognised in profit or loss.
NOTE 28. REMUNERATION OF AUDITORSDuring the period the following fees were paid or payable for services provided by the auditor of the parent entity, its related practices and non-related audit firms.
2016 2015
$’000 $’000
a) PwC - AustraliaAudit and review of financial reports
235 389
Audit fees associated with additional work for 31 December 2015 audit accrued and paid for in 2016
- 143
Other assurance services 16 11
Other advisory services 37 -
Total remuneration of PwC - Australia
288 543
b) Related practices of PwC - AustraliaAudit and review of financial reports
24 19
Taxation compliance 1 4
Total remuneration of related practices of PwC - Australia
25 23
NOTE 29. COMMITMENTS AND CONTINGENCIES
a) Tenement expenditure commitmentsIn order to maintain the mining and exploration tenements in which the Group is involved, the Group is committed to meet conditions under which the tenements were granted. If the Group continues to hold those tenements, the minimum expenditure requirements (including interests in joint venture arrangements) will be approximately:
2016 2015
$’000 $’000
Within one year 924 970
After one year but not more than five years
3,817 4,717
4,741 5,687
b) Operating and capital expenditure commitmentsIn order to maintain and continue mining and pellet processing operations in Tasmania there are a number of commitments and ongoing orders to various contractors or suppliers going forward, these will be approximately:
2016 2015
$’000 $’000
Within one year 29,638 29,996
After one year but not more than five years
351 7,648
29,989 37,644
c) Finance lease expenditure commitmentsThe finance lease commitments comprise the leasing of light vehicles and heavy mining equipment. Commitments for minimum lease payments in relation to the Group’s finance leases are payable as follows:
2016 2015
$’000 $’000
Within one year 5,361 5,549
After one year but not more than five years
2,769 7,722
8,130 13,271
Future finance charges (312) (888)
Recognised as liability 7,818 12,383
55
2016 Annual Report « Grange Resources Limited
d) Bank GuaranteesBank guarantees have been provided on the Group’s behalf to secure, on demand by the Minister for Mines and Energy for the State of Queensland, any sum to a maximum aggregate amount of $2,012,963 (2015: $2,012,963), in relation to the rehabilitation of the Highway Reward project.
A Bank guarantee has been provided by Grange Resources (Tasmania) Pty Ltd, held by the Tasmanian Government, as required under Environmental Management and Pollution Control Act 1994 (EMPCA) for the amount of $3,071,180 (2015: $3,034,956). This amount is to guarantee the rehabilitation responsibilities under the mining lease at Savage River.
A Bank guarantee has been provided by Grange Resources (Tasmania) Pty Ltd, held by the National Australia Bank, as required under the Goldamere Agreement and applicable Deeds of Variation, for the amount of $2,800,000 (2015: $2,800,000). This amount is a guarantee against the purchase price outstanding with the Tasmanian government as specified in the Goldamere Agreement.
No material losses are anticipated in respect to the above bank guarantees and the rehabilitation provisions include these amounts.
e) Contingent Assets and LiabilitiesThe Group did not have any contingent assets or liabilities at the Balance Sheet Date.
NOTE 30. RELATED PARTY TRANSACTIONS
a) Ultimate ParentGrange Resources Limited (Grange) is the ultimate Australian parent company.
b) SubsidiariesInterests in subsidiaries are set out in Note 31.
c) Key management personnel compensation 2016 2015
$ $
Short-term employee benefits 1,455,097 1,419,192
Post-employment benefits 126,017 115,643
Long-term benefits 25,834 50,066
Termination benefits 210,097 -
Long-term incentives 113,702 37,795
1,930,747 1,622,696
Detailed remuneration disclosures are provided in the remuneration report on pages 10 to 19.
d) Transactions with related partiesDuring the year the following transactions occurred with related parties:
2016 2015
$ $
Sales of iron ore products
Pellets 105,507,651 85,678,147
Chips - 1,732,487
105,507,651 87,410,634
(1) Sales of iron ore products to Jiangsu Shagang International Trade Co. Ltd, a wholly owned subsidiary of Jiangsu Shagang Group, under long-term off-take agreements.
During the year 1,087,446 dry metric tonnes of iron ore products were sold to Shagang in accordance with the terms of the long term off-take agreements (2015: 1,007,845 dry metric tonnes)
e) Outstanding balances arising from transactions with related partiesThe following balances are outstanding at the end of the reporting period in relation to transactions with related parties:
2016 2015
$ $
Trade receivables (sales of iron ore products)
Pellets 5,130,461 (723,723)
Chips - (123,835)
Others (46,463) (75,346)
5,083,999 (922,904)
Amounts outstanding under the long term off-take agreement with Shagang are unsecured whereas amounts outstanding in respect of spot sales are secured against an irrecoverable letter of credit. All outstanding balances will be settled in cash. The credit balance of the receivables represent the final price adjustments due to the quotation periods and final discharge port results.
There is no allowance to account for impaired receivables in relation to any outstanding balances with related parties, and no expense has been recognised during the year in respect of impaired receivables due from related parties (2015: Nil).
Long term off-take agreement
Grange Resources (Tasmania) Pty Ltd (Grange Tasmania) is party to a long term off-take agreements (Pellets) with Jiangsu Shagang International Trade Co. Ltd (Shagang), a wholly owned subsidiary of Jiangsu Shagang Group Co. Ltd, who, as at 27 February 2017, holds 47.93% (29 February 2016: 47.68%) of the issued ordinary shares of Grange.
Pellets
The key terms of the agreement with Shagang, as advised to the ASX on 19 November 2012, are as follows:
• The sale of 1 million dry metric tonnes of iron ore pellets per annum until 2022.
• The price for the iron ore pellets will be the fair market value as agreed by the parties having regard to:
• seaborne iron ore supply and demand conditions;
• available published price benchmarks for iron ore; and
• product quality differentials and potential freight costs.
Grange Resources Limited » 2016 Annual Report
56
Chips
The Chips long term off-take agreement was terminated on 17 September 2015 in order to achieve a better margin by selling chips to the local market as approved by the independent directors.
The key terms of the agreement with Shagang, were as follows:
• The sale of 90 thousand dry metric tonnes of iron ore chips per annum until 2022.
• The price for the iron ore chips will be the fair market value as agreed by the parties having regard to:
• seaborne iron ore supply and demand conditions;
• available published price benchmarks for iron ore; and
• product quality differentials and potential freight costs.
As set out in the Grange Notice of Meeting dated 5 November 2008, each transaction between Shagang and Grange (including the off-take arrangements) must be either approved by non-associated Grange shareholders, or approved by the Grange independent directors.
Agency agreements with related parties
Grange sold some product on the spot market through sales agency agreements with sales agents who were related parties of Grange. Any appointment of a related party sales agent was non-exclusive and negotiated and appointed by Grange directors and management independent of the related parties, acting in the best interests of all Grange shareholders. The related party sales had nil commission.
NOTE 31. SUBSIDIARIESThe consolidated financial statements incorporate the assets, liabilities and results of the following subsidiaries in accordance with the accounting policy described in Note 1.
Percentage of equity interest held by the Group
2016 2015
Name % %
Ever Green Resources Co., Limited(1) 100 100
Grange Tasmania Holdings Pty Ltd
100 100
Beviron Pty Ltd 100 100
Grange Resources (Tasmania) Pty Ltd
100 100
Grange Capital Pty Ltd 100 100
Grange Administrative Services Pty Ltd
100 100
Barrack Mines Pty Ltd 100 100
Bamine Pty Ltd 100 100
BML Holdings Pty Ltd 100 100
Horseshoe Gold Mine Pty Ltd 100 100
Grange Resources (Southdown) Pty Ltd
100 100
Southdown Project Management Company Pty Ltd
100 100
Grange Developments Sdn Bhd (2) 100 100
(1) Ever Green Resources Co., Limited is incorporated in Hong Kong, and registered as a foreign company under the Corporations Act 2001.
(2) Grange Developments Sdn Bhd is incorporated in Malaysia.
NOTE 32. INTEREST IN JOINT OPERATIONS
% Interest % Interest
Name of Joint Operation 2016 2015
Southdown Magnetite and Associated Pellet Project(s) – Iron Ore
70.00 70.00
Reward - Copper / Gold 31.15 31.15
Highway – Copper 30.00 30.00
Reward Deeps / Conviction - Copper
30.00 30.00
Mt Windsor Exploration - Gold / Base Metals
30.00 30.00
Durack / Wembley – Exploration Gold
15.00 15.00
The joint operations are not separate legal entities. They are contractual arrangements between the participants for the sharing of costs and output and do not in themselves generate revenue and profit.
Southdown Magnetite and Associated Pellet Project(s) is a joint venture between Grange Resources Limited and SRT Australia Pty Ltd. The joint venture proposes to mine and export premium iron ore pellets and concentrates. The principal place of business of the joint venture is at 34a Alexander Street, Burnie, Tasmania, 7320.
Mt Windsor Exploration is a joint venture between BML Holdings Pty Limited, a subsidiary of Grange Resources Limited, and Thalanga Copper Mines Pty Ltd. The joint venture was engaged in ore mining and is now being rehabilitated for future lease relinquishment. The principal place of business of the joint venture is at 1 Penghana Road, Queenstown, Tasmania, 7326.
57
2016 Annual Report « Grange Resources Limited
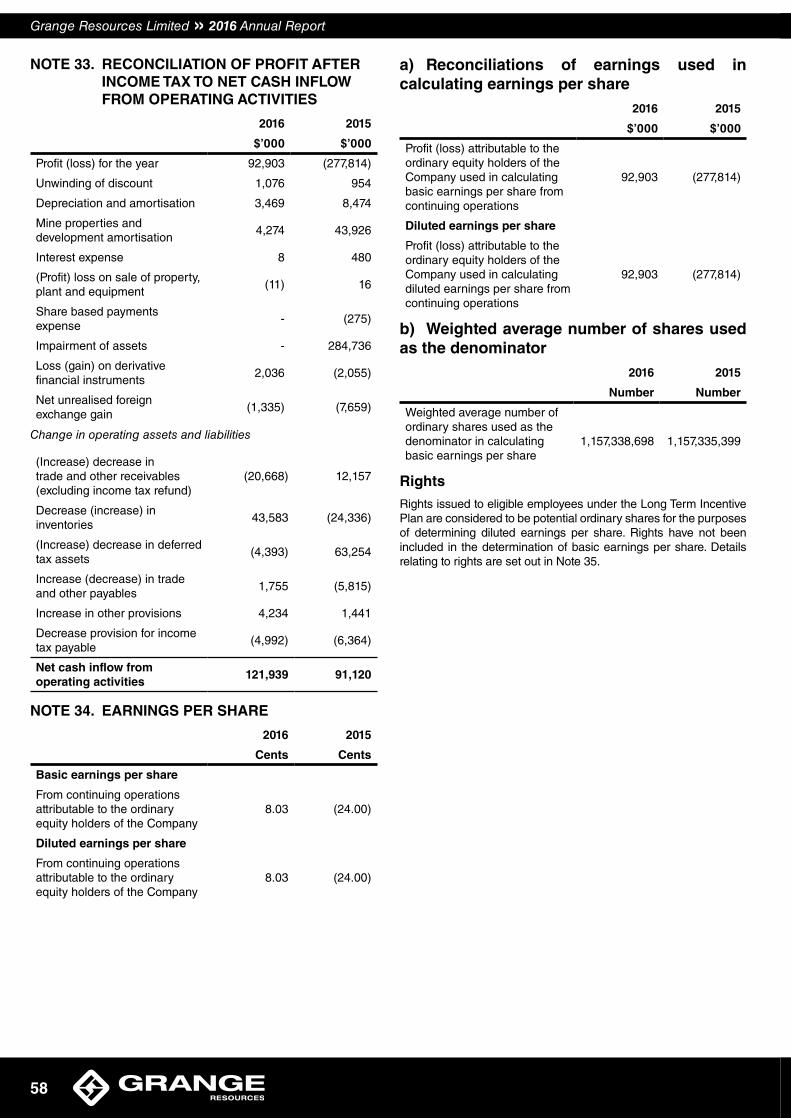
NOTE 33. RECONCILIATION OF PROFIT AFTER INCOME TAX TO NET CASH INFLOW FROM OPERATING ACTIVITIES
2016 2015
$’000 $’000
Profit (loss) for the year 92,903 (277,814)
Unwinding of discount 1,076 954
Depreciation and amortisation 3,469 8,474
Mine properties and development amortisation
4,274 43,926
Interest expense 8 480
(Profit) loss on sale of property, plant and equipment
(11) 16
Share based payments expense
- (275)
Impairment of assets - 284,736
Loss (gain) on derivative financial instruments
2,036 (2,055)
Net unrealised foreign exchange gain
(1,335) (7,659)
Change in operating assets and liabilities
(Increase) decrease in trade and other receivables (excluding income tax refund)
(20,668) 12,157
Decrease (increase) in inventories
43,583 (24,336)
(Increase) decrease in deferred tax assets
(4,393) 63,254
Increase (decrease) in trade and other payables
1,755 (5,815)
Increase in other provisions 4,234 1,441
Decrease provision for income tax payable
(4,992) (6,364)
Net cash inflow from operating activities
121,939 91,120
NOTE 34. EARNINGS PER SHARE
2016 2015
Cents Cents
Basic earnings per share
From continuing operations attributable to the ordinary equity holders of the Company
8.03 (24.00)
Diluted earnings per share
From continuing operations attributable to the ordinary equity holders of the Company
8.03 (24.00)
a) Reconciliations of earnings used in calculating earnings per share
2016 2015
$’000 $’000
Profit (loss) attributable to the ordinary equity holders of the Company used in calculating basic earnings per share from continuing operations
92,903 (277,814)
Diluted earnings per share
Profit (loss) attributable to the ordinary equity holders of the Company used in calculating diluted earnings per share from continuing operations
92,903 (277,814)
b) Weighted average number of shares used as the denominator
2016 2015
Number Number
Weighted average number of ordinary shares used as the denominator in calculating basic earnings per share
1,157,338,698
1,157,335,399
Rights
Rights issued to eligible employees under the Long Term Incentive Plan are considered to be potential ordinary shares for the purposes of determining diluted earnings per share. Rights have not been included in the determination of basic earnings per share. Details relating to rights are set out in Note 35.
Grange Resources Limited » 2016 Annual Report
58
NOTE 35. SHARE BASED PAYMENTS
a) Expenses arising from share-based payment transactionsTotal expenses arising from share-based payment transactions recognised during the period as part of employee benefit expense were as follows:
2016 2015
$’000 $’000
Rights issued to eligible employees under the LTIP
- -
Rights forfeited (275)
- (275)
The types of share-based payments are described below.
b) Types of share-based paymentsi) Rights to Grange SharesThe Board will review regularly and reserves the right to vary from time to time the appropriate hurdles and vesting periods for Rights to Grange shares.
The objective for the issue of Rights under the LTI program is to reward selected senior employees in a manner that aligns this element of their remuneration package with the creation of long term shareholder wealth while at the same time securing the employee’s tenure with the Company over the longer term. The LTI grants Rights to the Company’s shares to selected senior employees.
31 December 2013 Award
In December 2012, the Board determined that the LTI program move to a three year performance period with immediate effect from 1 January 2013 and that Total Shareholder Return (‘TSR’) be used as the performance hurdle for the Plan.
Total Shareholder Return is a common measure of value creation for shareholders. It is calculated as the difference in the share price between the beginning and end of the period, divided by the share price at the start of the period. The Board has determined that the performance hurdle for the rights be the attainment of a Total Shareholder Return of 5% per annum compounded over the three year period from 1 January 2013 to 31 December 2015.
The rights to shares for 2013 award is forfeited as a result of the attainment failure.
31 December 2012 Award
For the year ending 31 December 2012, 50% of the LTI for an employee related to Company performance goals and 50% related to personal performance goals. Rights were allocated using a share price that was based on the volume weighted average price of the Company’s shares.
Rights awarded for performance leading up to and inclusive of 31 December 2012 vested in three equal tranches over 24 months, completing on 1 January 2015. The last tranche of shares was issued on 6 January 2015.
For the 31 December 2012 Award, the share price was based on the volume weighted average price of the Company’s shares for the first two months of the Award performance period (i.e. the volume weighted average price of the Company’s shares from 1 January 2012 to 29 February 2012).
No expense was recognised during the year ended 31 December 2016.
The table below summaries rights issued to eligible employees:
31 December 2016
Performance Period
Balance
1 January 2015
Granted as remuneration
Issued on vesting of
rights
Rights forfeited
Balance
31 December 2015
Vested Unvested
- - - - - - - -
31 December 2015
Performance Period
Balance
1 January 2015
Granted as remuneration
Issued on vesting of
rights
Rights forfeited
Balance
31 December 2015
Vested Unvested
31 December 2012 240,829 - (240,829) - - - -
31 December 2013(1) 614,029 - - (614,029) - - -
Total 854,858 - (240,829) (614,029) - - -
(1) From 1 January 2013, the LTI program adopted a Total Shareholder Return performance hurdle and moved to a three year performance period. Rights awarded to eligible employees will be disclosed in the period in which the Remuneration and Nomination Committee approves the variable remuneration entitlement following the end of the three year performance period
59
2016 Annual Report « Grange Resources Limited
NOTE 36. PARENT ENTITY FINANCIAL INFORMATION
a) Summary financial informationThe individual financial statements for the parent entity show the following aggregate amounts:
2016 2015
$’000 $’000
Balance Sheet
Current assets 6,984 11,013
Total assets 270,850 280,974
Current liabilities 2,547 3,335
Total liabilities 32,994 33,961
Shareholders’ equity
Contributed equity 392,475 392,475
Reserves
- Share-based payments 31,191 31,191
Retained (Losses) (185,810) (176,653)
Total equity 237,856 247,013
Profit for the year 5,951 17,974
Total comprehensive income for the year
5,951 17,974
b) Contingent liabilities of the parent entityOther contingent liabilities
Pursuant to the terms of an agreement dated 21 November 2003, under which the Company purchased certain tenements comprising the Southdown project, the Company is required to make a further payment of $1,000,000 to MedAire, Inc upon commencement of commercial mining operations from those tenements.
NOTE 37. EVENTS OCCURRING AFTER THE REPORTING PERIOD
No matter or circumstance has arisen since 31 December 2016 that has significantly affected, or may significantly affect:
• the Group’s operations in future financial years; or
• the results of those operations in future financial years; or
• the Group’s state of affairs in future financial years.
DIRECTORS’ DECLARATIONIn the Directors’ opinion:
a) the financial statements and notes set out on pages 28 to 74 are in accordance with the Corporations Act 2001, including:
i) complying with Accounting Standards, the Corporations Regulations 2001 and other mandatory professional reporting requirements, and
ii) giving true and fair view of the consolidated entity’s financial position as at 31 December 2016 and of its performance for the financial year ended on that date, and
b) there are reasonable grounds to believe that the Company will be able to pay its debts as and when they become due and payable, andNote 1(a) confirms that the financial statements also comply with International Financial Reporting Standards as issued by the International Accounting Standards Board.
The Directors have been given the declarations of the Chief Executive Officer and Chief Financial Officer required by section 295A of the Corporations Act 2001.
This declaration is made in accordance with a resolution of the Directors.
Michelle Li
Chairperson of the Board of Directors
Perth, Western Australia27 February 2017
Grange Resources Limited » 2016 Annual Report
60
INDEPENDENT AUDITOR’S REPORT
To the members of Grange Resources Limited
Independent auditor’s report To the shareholders of Grange Resources Limited
Report on the audit of the financial report Our opinion In our opinion:
The accompanying financial report of Grange Resources Limited (the Company) and its controlled entities (together the Group) is in accordance with the Corporations Act 2001, including:
a) giving a true and fair view of the Group’s financial position as at 31 December 2016 and of its financial performance for the year then ended
b) complying with Australian Accounting Standards and the Corporations Regulations 2001.
What we have audited The Group’s financial report comprises:
• the consolidated statement of financial position as at 31 December 2016
• the consolidated statement of comprehensive income for the year then ended
• the consolidated statement of changes in equity for the year then ended
• the consolidated statement of cash flows for the year then ended
• the notes to the consolidated financial statements, which include a summary of significant accounting policies
• the directors’ declaration
Basis for opinion We conducted our audit in accordance with Australian Auditing Standards. Our responsibilities under those standards are further described in the Auditor’s responsibilities for the audit of the financial report section of our report.
We believe that the audit evidence we have obtained is sufficient and appropriate to provide a basis for our opinion.
Independence
We are independent of the Group in accordance with the auditor independence requirements of the Corporations Act 2001 and the ethical requirements of the Accounting Professional and Ethical Standards Board’s APES 110 Code of Ethics for Professional Accountants (the Code) that are relevant to our audit of the financial report in Australia. We have also fulfilled our other ethical responsibilities in accordance with the Code.
PricewaterhouseCoopers, ABN 52 780 433 757 2 Riverside Quay, SOUTHBANK VIC 3006, GPO Box 1331 MELBOURNE VIC 3001 T: +61 3 8603 1000, F: +61 3 8603 1999, www.pwc.com.au
Liability limited by a scheme approved under Professional Standards Legislation.
76
61
2016 Annual Report « Grange Resources Limited
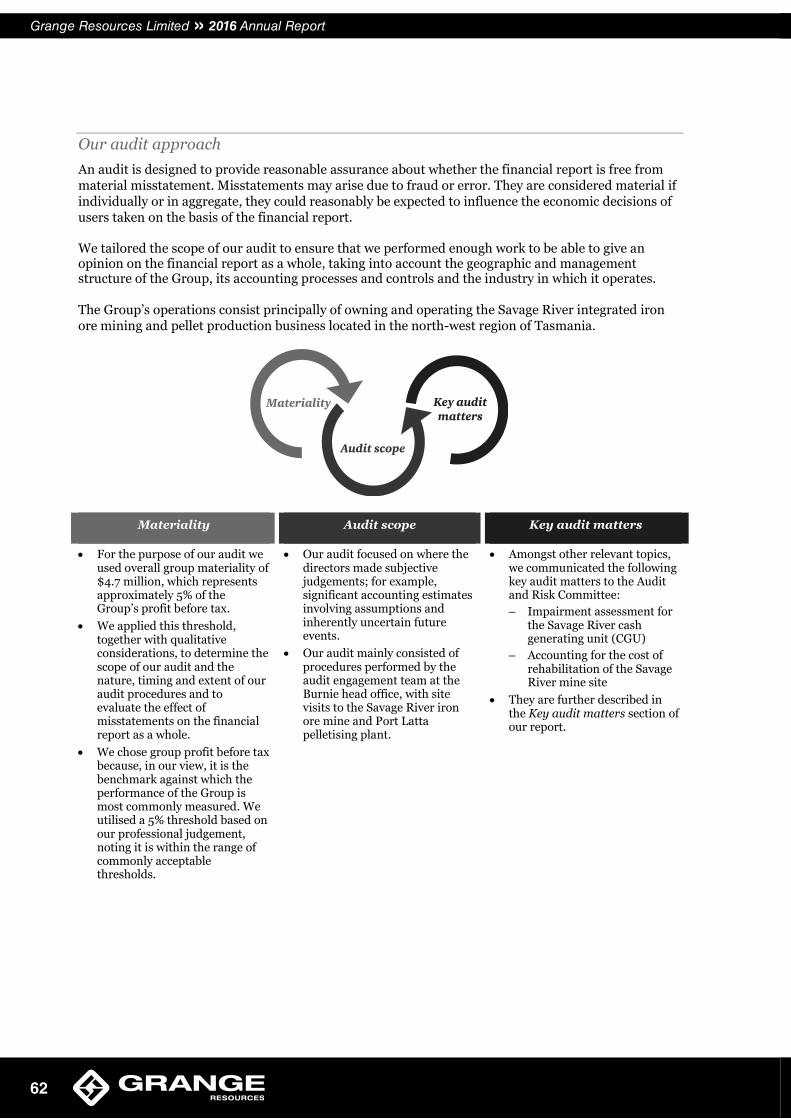
Our audit approach An audit is designed to provide reasonable assurance about whether the financial report is free from material misstatement. Misstatements may arise due to fraud or error. They are considered material if individually or in aggregate, they could reasonably be expected to influence the economic decisions of users taken on the basis of the financial report.
We tailored the scope of our audit to ensure that we performed enough work to be able to give an opinion on the financial report as a whole, taking into account the geographic and management structure of the Group, its accounting processes and controls and the industry in which it operates.
The Group’s operations consist principally of owning and operating the Savage River integrated iron ore mining and pellet production business located in the north-west region of Tasmania.
Materiality Audit scope Key audit matters
• For the purpose of our audit we used overall group materiality of $4.7 million, which represents approximately 5% of the Group’s profit before tax.
• We applied this threshold, together with qualitative considerations, to determine the scope of our audit and the nature, timing and extent of our audit procedures and to evaluate the effect of misstatements on the financial report as a whole.
• We chose group profit before tax because, in our view, it is the benchmark against which the performance of the Group is most commonly measured. We utilised a 5% threshold based on our professional judgement, noting it is within the range of commonly acceptable thresholds.
• Our audit focused on where the directors made subjective judgements; for example, significant accounting estimates involving assumptions and inherently uncertain future events.
• Our audit mainly consisted of procedures performed by the audit engagement team at the Burnie head office, with site visits to the Savage River iron ore mine and Port Latta pelletising plant.
• Amongst other relevant topics, we communicated the following key audit matters to the Audit and Risk Committee:– Impairment assessment for
the Savage River cash generating unit (CGU)
– Accounting for the cost of rehabilitation of the Savage River mine site
• They are further described in the Key audit matters section of our report.
77
Grange Resources Limited » 2016 Annual Report
62
Key audit matters Key audit matters are those matters that, in our professional judgement, were of most significance in our audit of the financial report for the current period. The key audit matters were addressed in the context of our audit of the financial report as a whole, and in forming our opinion thereon, and we do not provide a separate opinion on these matters. Further, any commentary on the outcomes of a particular audit procedure is made in that context.
Key audit matter How our audit addressed the key audit matter
Impairment assessment for the Savage River cash generating unit (CGU) (Refer to note 26)
The impairment assessment of the Savage River CGU, which consists of the mine and pelletising plant, was a key audit matter given the significance of the carrying value of $187.0 million to the balance sheet as at 31 December 2016 (including the offsetting rehabilitation liability of $53.6 million). There were also a number of factors requiring judgement which increased the risk of an impairment arising including:
● Ongoing volatility and commercial risk associated with the pellet (final product) price and in the AUD/USD exchange rate
● Estimation uncertainty associated with forecast operating and capital expenditure for the period to 2033 (Life of Mine).
For 31 December 2016, the Group prepared a discounted cashflow model (the model) to determine the recoverable amount of the Savage River CGU balance, which requires a number of assumptions as described in Note 26.
We evaluated the cash flow forecasts in the model and developed our understanding of the process by which they were prepared. We satisfied ourselves that the operating and capital expenditure forecasts were consistent with the latest Board approved Life of Mine plan (to 2033) and budget.
In order to assess the Group’s ability to make reliable forecasts, we compared current year (2016) actual results with the figures included in the prior year forecasts (2015).
We also assessed: ● The long term pellet price and AUD/USD
exchange rate in the forecasts by comparing them to economic and industry forecasts;
● The projected cost savings in future years which rely on future capital projects;
● The discount rate used in the impairment model by assessing the cost of capital for the Group, including involving PwC valuations experts, and comparing it to market data and industry research.
Accounting for the cost of rehabilitation (Refer to note 19 and 21) ($53.6 million)
The main component of the provision is for the Group’s obligation to rehabilitate the Savage River and Port Latta sites for the disturbance caused by its operations. The rehabilitation provision also includes an obligation under the Tasmanian Goldamere Pty Ltd Act 1996 to repay the Tasmanian Government for part of the purchase of the mine through expenditure on remediation.
The net present value of the cost of rehabilitation is recorded as a provision of $52.9 million (non-current) and $0.7 million (current), for a total of $53.6 million. Given the significance of this balance
We obtained the Group’s calculation of the rehabilitation obligation (the model). We checked the timing of the cash flows in the model for consistency with the current Life of Mine plan and any communications with the Tasmanian Government.
We checked that the discount rate used for consistency with that generally used in the industry to discount liabilities of this type.
Where external and internal experts were used by the Group to estimate remediation costs, we assessed our
78
63
2016 Annual Report « Grange Resources Limited
Key audit matter How our audit addressed the key audit matterand the complexities and uncertainties outlined below, our examination of the provision for rehabilitation was a key audit matter.
Calculating the final rehabilitation obligation is challenging and requires significant estimation and judgement by the Group, given some of the uncertainties over methods of rehabilitation, costs and timing. The calculation of the provision requires significant input from specialists and experts, both from within and external to the Group.
ability to rely on their estimates for the purposes of our audit.
We compared the Group’s assumptions on rehabilitation costs to other similar costs in the business.
Other information The directors are responsible for the other information. The other information included in the Group’s annual report for the year ended 31 December 2016 comprises the directors’ report, operating and financial review and corporate governance statement but does not include the financial report and our auditor’s report thereon, which we obtained prior to the date of this auditor’s report. The other information also includes About Grange, 2016 Overview, 2017 Priorities, About the Grange Business, Chairperson’s and Chief Executive Officer’s Review, Tenement Schedule, ASX Additional Information, List of Significant ASX Announcements, which are expected to be made available to us after that date.
Our opinion on the financial report does not cover the other information and we do not and will not express an opinion or any form of assurance conclusion thereon.
In connection with our audit of the financial report, our responsibility is to read the other information identified above and, in doing so, consider whether the other information is materially inconsistent with the financial report or our knowledge obtained in the audit, or otherwise appears to be materially misstated.
If, based on the work we have performed on the other information that we obtained prior to the date of this auditor’s report, we conclude that there is a material misstatement of this other information, we are required to report that fact. We have nothing to report in this regard.
When we read the other information not yet received as identified above, if we conclude that there is a material misstatement therein, we are required to communicate the matter to the directors and use our professional judgement to determine the appropriate action to take.
Responsibilities of the directors for the financial report The directors of the Company are responsible for the preparation of the financial report that gives a true and fair view in accordance with Australian Accounting Standards and the Corporations Act 2001 and for such internal control as the directors determine is necessary to enable the preparation of the financial report that gives a true and fair view and is free from material misstatement, whether due to fraud or error.
In preparing the financial report, the directors are responsible for assessing the ability of the Group to continue as a going concern, disclosing, as applicable, matters related to going concern and using the
79
Grange Resources Limited » 2016 Annual Report
64
going concern basis of accounting unless the directors either intend to liquidate the Group or to cease operations, or have no realistic alternative but to do so.
Auditor’s responsibilities for the audit of the financial reportOur objectives are to obtain reasonable assurance about whether the financial report as a whole is free from material misstatement, whether due to fraud or error, and to issue an auditor’s report that includes our opinion. Reasonable assurance is a high level of assurance, but is not a guarantee that an audit conducted in accordance with the Australian Auditing Standards will always detect a material misstatement when it exists. Misstatements can arise from fraud or error and are considered material if, individually or in the aggregate, they could reasonably be expected to influence the economic decisions of users taken on the basis of the financial report.
A further description of our responsibilities for the audit of the financial report is located at the Auditing and Assurance Standards Board website at: http://www.auasb.gov.au/auditors_files/ar1.pdf. This description forms part of our auditor’s report.
Report on the remuneration reportOur opinion on the remuneration reportWe have audited the remuneration report included in pages 10 to 18 of the directors’ report for the year ended 31 December 2016.
In our opinion, the remuneration report of Grange Resources Limited for the year ended 31 December 2016 complies with section 300A of the Corporations Act 2001.
Responsibilities The directors of the Company are responsible for the preparation and presentation of the remuneration report in accordance with section 300A of the Corporations Act 2001. Our responsibility is to express an opinion on the remuneration report, based on our audit conducted in accordance with Australian Auditing Standards.
PricewaterhouseCoopers
John O'DonoghuePartner
Melbourne27 February 2017
80
65
2016 Annual Report « Grange Resources Limited
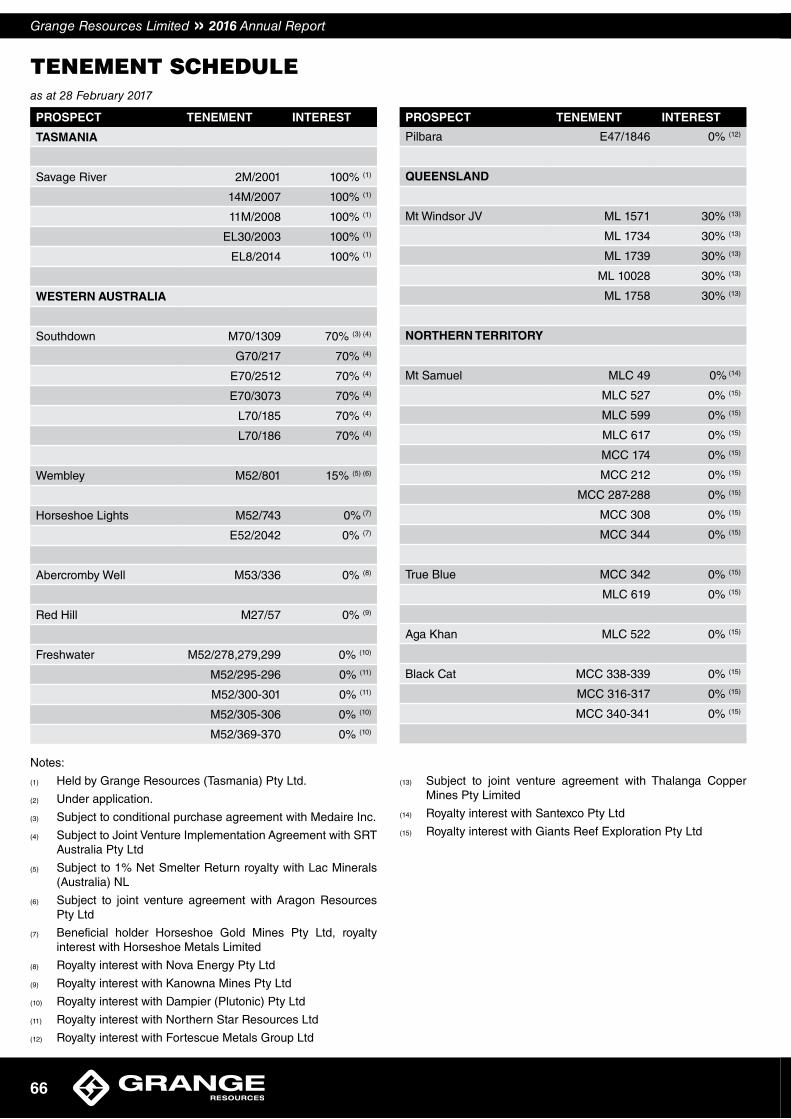
TENEMENT SCHEDULEas at 28 February 2017
PROSPECT TENEMENT INTEREST
TASMANIA
Savage River 2M/2001 100% (1)
14M/2007 100% (1)
11M/2008 100% (1)
EL30/2003 100% (1)
EL8/2014 100% (1)
WESTERN AUSTRALIA
Southdown M70/1309 70% (3) (4)
G70/217 70% (4)
E70/2512 70% (4)
E70/3073 70% (4)
L70/185 70% (4)
L70/186 70% (4)
Wembley M52/801 15% (5) (6)
Horseshoe Lights M52/743 0% (7)
E52/2042 0% (7)
Abercromby Well M53/336 0% (8)
Red Hill M27/57 0% (9)
Freshwater M52/278,279,299 0% (10)
M52/295-296 0% (11)
M52/300-301 0% (11)
M52/305-306 0% (10)
M52/369-370 0% (10)
PROSPECT TENEMENT INTEREST
Pilbara E47/1846 0% (12)
QUEENSLAND
Mt Windsor JV ML 1571 30% (13)
ML 1734 30% (13)
ML 1739 30% (13)
ML 10028 30% (13)
ML 1758 30% (13)
NORTHERN TERRITORY
Mt Samuel MLC 49 0% (14)
MLC 527 0% (15)
MLC 599 0% (15)
MLC 617 0% (15)
MCC 174 0% (15)
MCC 212 0% (15)
MCC 287-288 0% (15)
MCC 308 0% (15)
MCC 344 0% (15)
True Blue MCC 342 0% (15)
MLC 619 0% (15)
Aga Khan MLC 522 0% (15)
Black Cat MCC 338-339 0% (15)
MCC 316-317 0% (15)
MCC 340-341 0% (15)
Notes:
(1) Held by Grange Resources (Tasmania) Pty Ltd.
(2) Under application.
(3) Subject to conditional purchase agreement with Medaire Inc.
(4) Subject to Joint Venture Implementation Agreement with SRT Australia Pty Ltd
(5) Subject to 1% Net Smelter Return royalty with Lac Minerals (Australia) NL
(6) Subject to joint venture agreement with Aragon Resources Pty Ltd
(7) Beneficial holder Horseshoe Gold Mines Pty Ltd, royalty interest with Horseshoe Metals Limited
(8) Royalty interest with Nova Energy Pty Ltd
(9) Royalty interest with Kanowna Mines Pty Ltd
(10) Royalty interest with Dampier (Plutonic) Pty Ltd
(11) Royalty interest with Northern Star Resources Ltd
(12) Royalty interest with Fortescue Metals Group Ltd
(13) Subject to joint venture agreement with Thalanga Copper Mines Pty Limited
(14) Royalty interest with Santexco Pty Ltd
(15) Royalty interest with Giants Reef Exploration Pty Ltd
Grange Resources Limited » 2016 Annual Report
66
ASX ADDITIONAL INFORMATIONAdditional information required by the Australian Securities Exchange Limited and not shown elsewhere in this report is as follows.
The shareholder information set out below was applicable as at 8 February 2017 except where otherwise indicated.
ORDINARY SHARES
Twenty Largest Shareholders as at 8 February 2017
The twenty largest holders of ordinary fully paid shares are listed below:
Rank Name Number % of units
1 Shagang Group 541,206,533 46.8%
2 Pacific International Co 95,154,884 8.2%
3 Realindex Investments 43,060,260 3.7%
4 RGL Holdings Co 39,947,342 3.5%
5 Bank Julius Baer 33,173,377 2.9%
6 Dimensional Fund Advisors 20,306,442 1.8%
7 Schroder Investment Mgmt 20,204,252 1.7%
8 ABM AMRO Bank 17,436,383 1.5%
9 Mr Andreas Hadjipanayis 12,000,000 1.0%
10 Rabobank Nederland 11,602,908 1.0%
11 Theodoor Gilissen Bankiers 10,866,626 0.9%
12 Mr & Mrs Timothy B Kleemann
10,613,704 0.9%
13 UBS 8,759,785 0.8%
14 BinckBank 8,348,753 0.7%
15 Mr Adam Garrigan 7,500,000 0.6%
16 Mirabaud & Cie Banquiers Prives
6,580,834 0.6%
17 IFM Investors 6,450,055 0.6%
18 LSV Asset Mgmt 5,742,700 0.5%
19 Mr & Mrs Lionel RD Moore 5,030,000 0.4%
20 Mr Ray Hislop 3,881,548 0.3%
Totals: Top 20 holders of ORDINARY FULLY PAID SHARES (TOTAL)
907,866,386 78.4%
Distribution of Equity Securities
Analysis of number of shareholders by size and holding
Spreadsof
holdings
Number of holders
Numberof
units
% of total issued capital
1 - 1,000 459 222,668 0.02%
1,001 - 5,000 1,057 3,141,720 0.27%
5,001 - 10,000 700 5,781,019 0.50%
10,001 - 100,000 1,506 53,806,911 4.65%
100,001 - 999,999,999,999
351 1,094,386,380 94.56%
Total 4,073 1,157,338,698 100%
The number of shareholders holding less than a marketable parcel of Ordinary Shares as at 8 February 2017 was 1,643.
Voting Rights
All shares carry one vote per share without restriction.
Substantial Shareholders
An extract of the Company’s Register of Substantial Shareholders as at 8 February 2017 is set out below:
Name
Number of fully paid
sharesVoting power
Shagang Group
Pacific International Co636,361,417 55%
Securities Subject to Voluntary Escrow
The following securities are subject to voluntary escrow:
Class of SecurityNumber of Securities
Escrowperiod ends
Fully Paid Ordinary Shares
Nil Not applicable
67
2016 Annual Report « Grange Resources Limited
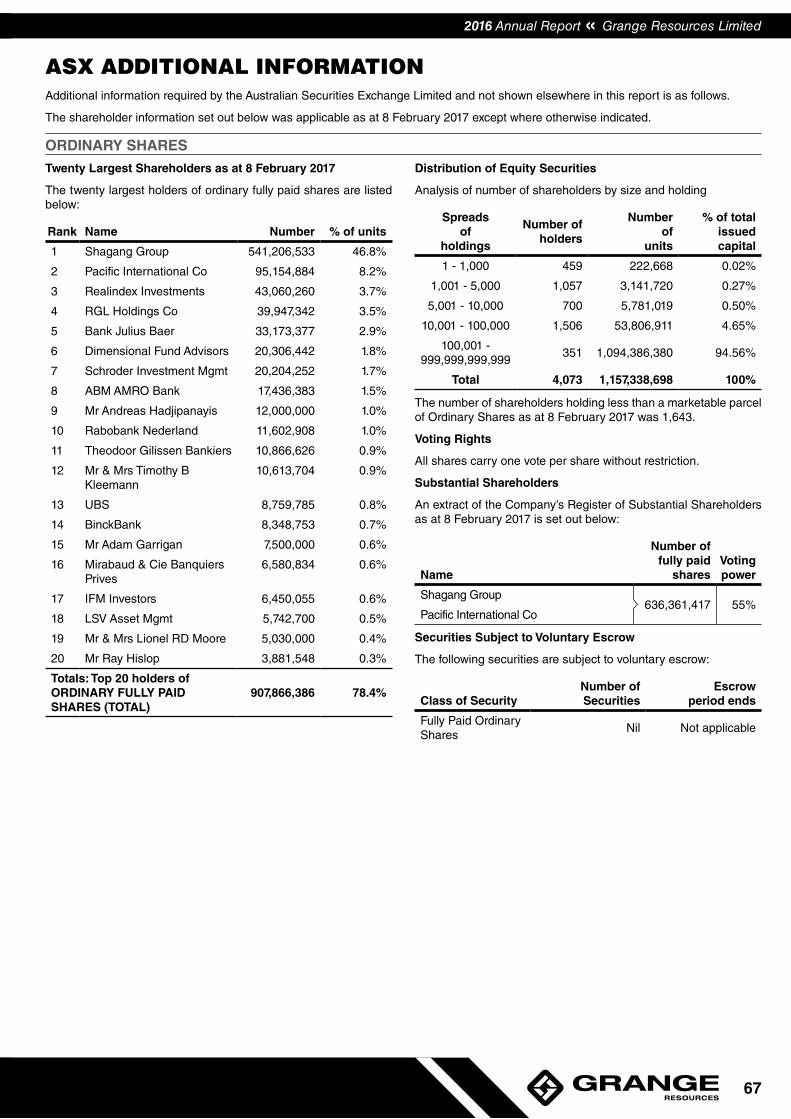
TENEMENT SCHEDULEas at 28 February 2017
PROSPECT TENEMENT INTEREST
TASMANIA
Savage River 2M/2001 100% (1)
14M/2007 100% (1)
11M/2008 100% (1)
EL30/2003 100% (1)
EL8/2014 100% (1)
WESTERN AUSTRALIA
Southdown M70/1309 70% (3) (4)
G70/217 70% (4)
E70/2512 70% (4)
E70/3073 70% (4)
L70/185 70% (4)
L70/186 70% (4)
Wembley M52/801 15% (5) (6)
Horseshoe Lights M52/743 0% (7)
E52/2042 0% (7)
Abercromby Well M53/336 0% (8)
Red Hill M27/57 0% (9)
Freshwater M52/278,279,299 0% (10)
M52/295-296 0% (11)
M52/300-301 0% (11)
M52/305-306 0% (10)
M52/369-370 0% (10)
PROSPECT TENEMENT INTEREST
Pilbara E47/1846 0% (12)
QUEENSLAND
Mt Windsor JV ML 1571 30% (13)
ML 1734 30% (13)
ML 1739 30% (13)
ML 10028 30% (13)
ML 1758 30% (13)
NORTHERN TERRITORY
Mt Samuel MLC 49 0% (14)
MLC 527 0% (15)
MLC 599 0% (15)
MLC 617 0% (15)
MCC 174 0% (15)
MCC 212 0% (15)
MCC 287-288 0% (15)
MCC 308 0% (15)
MCC 344 0% (15)
True Blue MCC 342 0% (15)
MLC 619 0% (15)
Aga Khan MLC 522 0% (15)
Black Cat MCC 338-339 0% (15)
MCC 316-317 0% (15)
MCC 340-341 0% (15)
Notes:
(1) Held by Grange Resources (Tasmania) Pty Ltd.
(2) Under application.
(3) Subject to conditional purchase agreement with Medaire Inc.
(4) Subject to Joint Venture Implementation Agreement with SRT Australia Pty Ltd
(5) Subject to 1% Net Smelter Return royalty with Lac Minerals (Australia) NL
(6) Subject to joint venture agreement with Aragon Resources Pty Ltd
(7) Beneficial holder Horseshoe Gold Mines Pty Ltd, royalty interest with Horseshoe Metals Limited
(8) Royalty interest with Nova Energy Pty Ltd
(9) Royalty interest with Kanowna Mines Pty Ltd
(10) Royalty interest with Dampier (Plutonic) Pty Ltd
(11) Royalty interest with Northern Star Resources Ltd
(12) Royalty interest with Fortescue Metals Group Ltd
(13) Subject to joint venture agreement with Thalanga Copper Mines Pty Limited
(14) Royalty interest with Santexco Pty Ltd
(15) Royalty interest with Giants Reef Exploration Pty Ltd
Grange Resources Limited » 2016 Annual Report
66
ASX ADDITIONAL INFORMATIONAdditional information required by the Australian Securities Exchange Limited and not shown elsewhere in this report is as follows.
The shareholder information set out below was applicable as at 8 February 2017 except where otherwise indicated.
ORDINARY SHARES
Twenty Largest Shareholders as at 8 February 2017
The twenty largest holders of ordinary fully paid shares are listed below:
Rank Name Number % of units
1 Shagang Group 541,206,533 46.8%
2 Pacific International Co 95,154,884 8.2%
3 Realindex Investments 43,060,260 3.7%
4 RGL Holdings Co 39,947,342 3.5%
5 Bank Julius Baer 33,173,377 2.9%
6 Dimensional Fund Advisors 20,306,442 1.8%
7 Schroder Investment Mgmt 20,204,252 1.7%
8 ABM AMRO Bank 17,436,383 1.5%
9 Mr Andreas Hadjipanayis 12,000,000 1.0%
10 Rabobank Nederland 11,602,908 1.0%
11 Theodoor Gilissen Bankiers 10,866,626 0.9%
12 Mr & Mrs Timothy B Kleemann
10,613,704 0.9%
13 UBS 8,759,785 0.8%
14 BinckBank 8,348,753 0.7%
15 Mr Adam Garrigan 7,500,000 0.6%
16 Mirabaud & Cie Banquiers Prives
6,580,834 0.6%
17 IFM Investors 6,450,055 0.6%
18 LSV Asset Mgmt 5,742,700 0.5%
19 Mr & Mrs Lionel RD Moore 5,030,000 0.4%
20 Mr Ray Hislop 3,881,548 0.3%
Totals: Top 20 holders of ORDINARY FULLY PAID SHARES (TOTAL)
907,866,386 78.4%
Distribution of Equity Securities
Analysis of number of shareholders by size and holding
Spreadsof
holdings
Number of holders
Numberof
units
% of total issued capital
1 - 1,000 459 222,668 0.02%
1,001 - 5,000 1,057 3,141,720 0.27%
5,001 - 10,000 700 5,781,019 0.50%
10,001 - 100,000 1,506 53,806,911 4.65%
100,001 - 999,999,999,999
351 1,094,386,380 94.56%
Total 4,073 1,157,338,698 100%
The number of shareholders holding less than a marketable parcel of Ordinary Shares as at 8 February 2017 was 1,643.
Voting Rights
All shares carry one vote per share without restriction.
Substantial Shareholders
An extract of the Company’s Register of Substantial Shareholders as at 8 February 2017 is set out below:
Name
Number of fully paid
sharesVoting power
Shagang Group
Pacific International Co636,361,417 55%
Securities Subject to Voluntary Escrow
The following securities are subject to voluntary escrow:
Class of SecurityNumber of Securities
Escrowperiod ends
Fully Paid Ordinary Shares
Nil Not applicable
67
2016 Annual Report « Grange Resources Limited
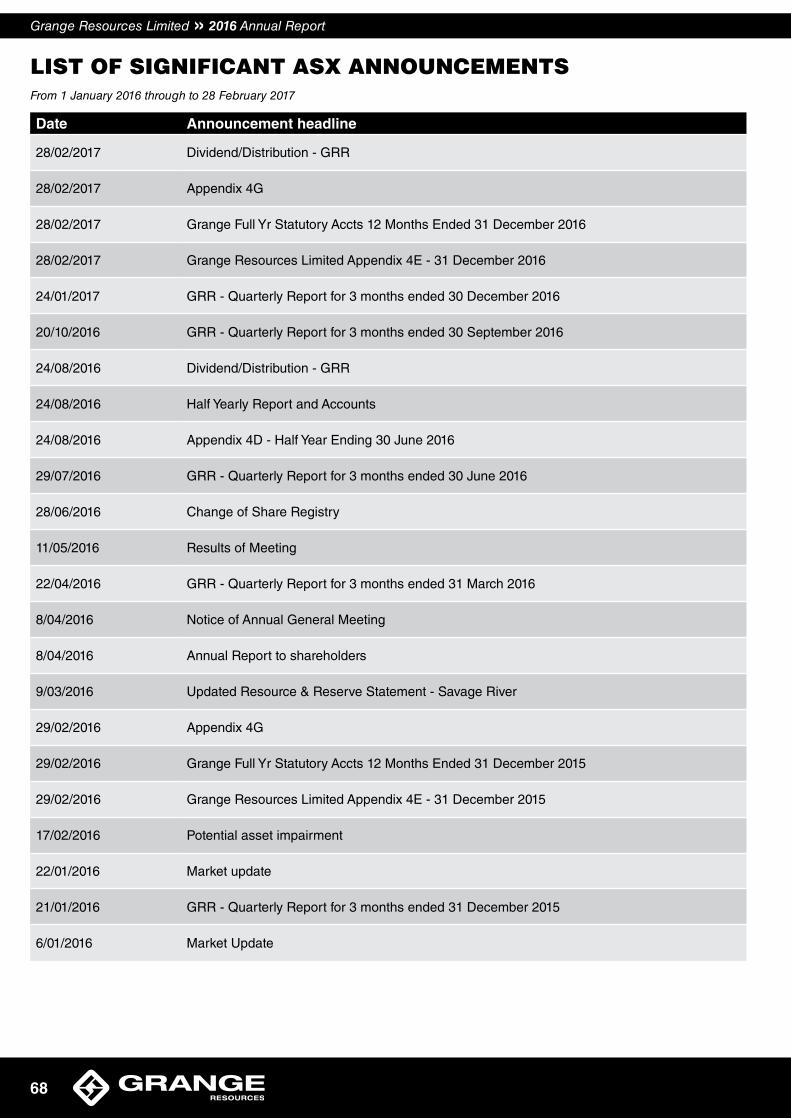
LIST OF SIGNIFICANT ASX ANNOUNCEMENTSFrom 1 January 2016 through to 28 February 2017
Date Announcement headline
28/02/2017 Dividend/Distribution - GRR
28/02/2017 Appendix 4G
28/02/2017 Grange Full Yr Statutory Accts 12 Months Ended 31 December 2016
28/02/2017 Grange Resources Limited Appendix 4E - 31 December 2016
24/01/2017 GRR - Quarterly Report for 3 months ended 30 December 2016
20/10/2016 GRR - Quarterly Report for 3 months ended 30 September 2016
24/08/2016 Dividend/Distribution - GRR
24/08/2016 Half Yearly Report and Accounts
24/08/2016 Appendix 4D - Half Year Ending 30 June 2016
29/07/2016 GRR - Quarterly Report for 3 months ended 30 June 2016
28/06/2016 Change of Share Registry
11/05/2016 Results of Meeting
22/04/2016 GRR - Quarterly Report for 3 months ended 31 March 2016
8/04/2016 Notice of Annual General Meeting
8/04/2016 Annual Report to shareholders
9/03/2016 Updated Resource & Reserve Statement - Savage River
29/02/2016 Appendix 4G
29/02/2016 Grange Full Yr Statutory Accts 12 Months Ended 31 December 2015
29/02/2016 Grange Resources Limited Appendix 4E - 31 December 2015
17/02/2016 Potential asset impairment
22/01/2016 Market update
21/01/2016 GRR - Quarterly Report for 3 months ended 31 December 2015
6/01/2016 Market Update
Grange Resources Limited » 2016 Annual Report
68
AUSTRALIA’S MOST EXPERIENCED MAGNETITE PRODUCER
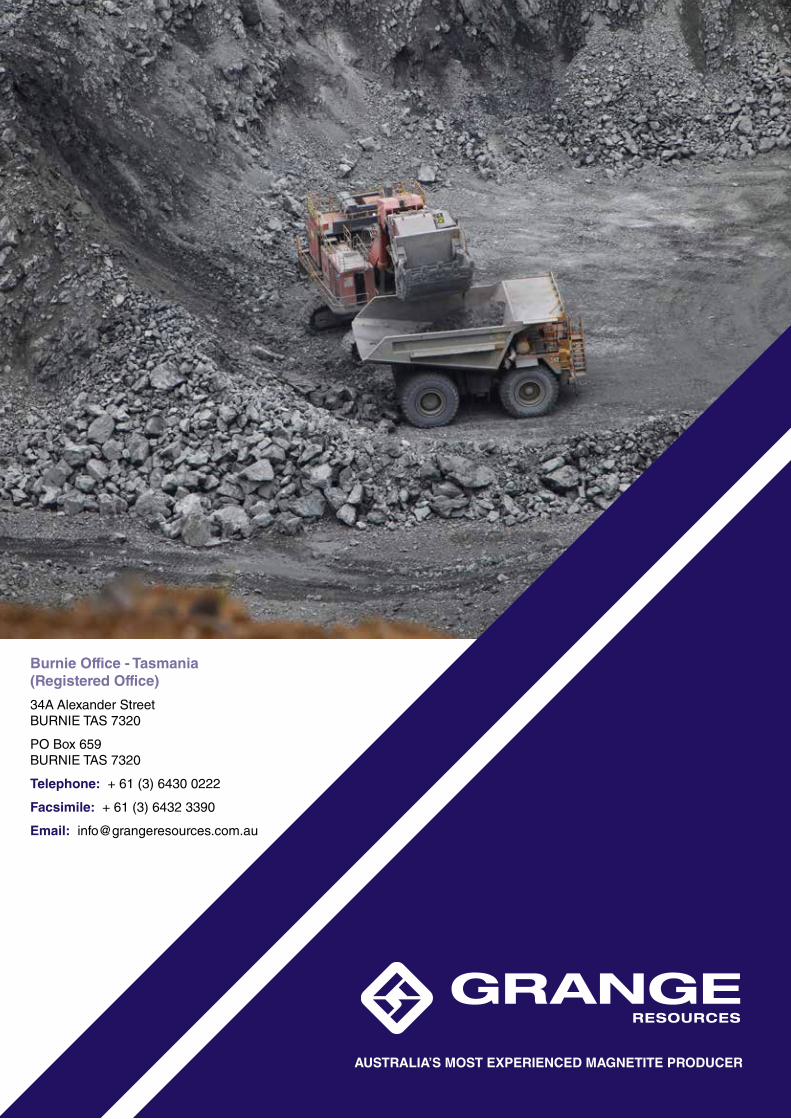
AUSTRALIA’S MOST EXPERIENCED MAGNETITE PRODUCER
Burnie Office - Tasmania (Registered Office)
34A Alexander Street BURNIE TAS 7320
PO Box 659 BURNIE TAS 7320
Telephone: + 61 (3) 6430 0222
Facsimile: + 61 (3) 6432 3390
Email: [email protected]