Embed Size (px)
Citation preview

JOB
#: H
AR
P-1
46
35
If y
ou
hav
e q
ues
tio
ns
con
cern
ing
th
is f
ile, p
leas
e co
nta
ct o
ur
Pro
du
ctio
n M
anag
er im
med
iate
ly a
t 80
8.53
9.34
87
CLI
ENT:
Haw
aiia
n A
irlin
esC
OLO
R: 4
CD
ATE
: Feb
ruar
y 20
17
TITL
E: A
nn
ual
Rep
ort
C
ove
r 20
16
BLE
ED: 0
.25”
TRIM
: 16.
5”w
x 1
0.75
”hFO
LDS
TO: 8
.25”
w x
10.
75”h
OU
TSID
E C
OV
ER
A N N U A L R E P O R T
H AWA I I A N H O L D I N G S, I N C.
2016
Kū Mākou
The traditional lehua blossom and
‘ohe kapala elements of our
new uniform design represent
Hawai‘i wherever we fly. The design
process was a collaborative effort
between our staff and the legendary
Sig Zane, and resulted in a theme of
Together We Stand.
HARP-14635_AnnualReportCover2016_R1.indd 1 3/7/17 4:07 PM
JOB
#: H
AR
P-1
46
35
If y
ou
hav
e q
ues
tio
ns
con
cern
ing
th
is f
ile, p
leas
e co
nta
ct o
ur
Pro
du
ctio
n M
anag
er im
med
iate
ly a
t 80
8.53
9.34
87
CLI
ENT:
Haw
aiia
n A
irlin
esC
OLO
R: 4
CD
ATE
: Feb
ruar
y 20
17
TITL
E: A
nn
ual
Rep
ort
C
ove
r 20
16
BLE
ED: 0
.25”
TRIM
: 16.
5”w
x 1
0.75
”hFO
LDS
TO: 8
.25”
w x
10.
75”h
INSI
DE
CO
VER
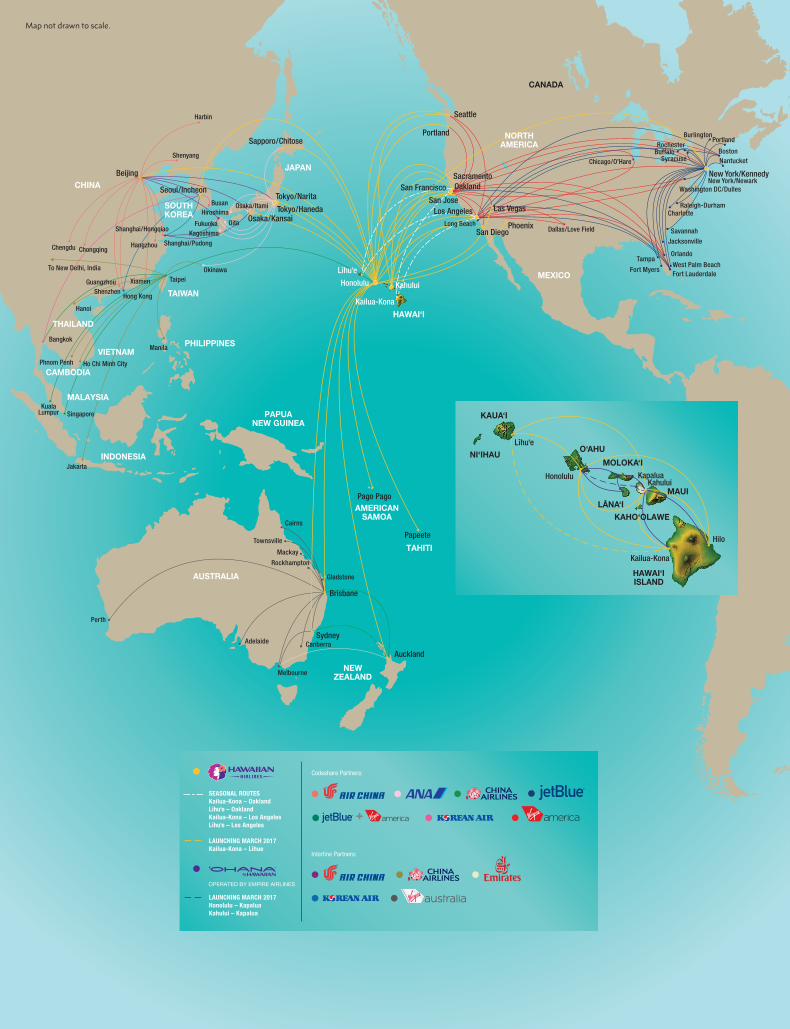
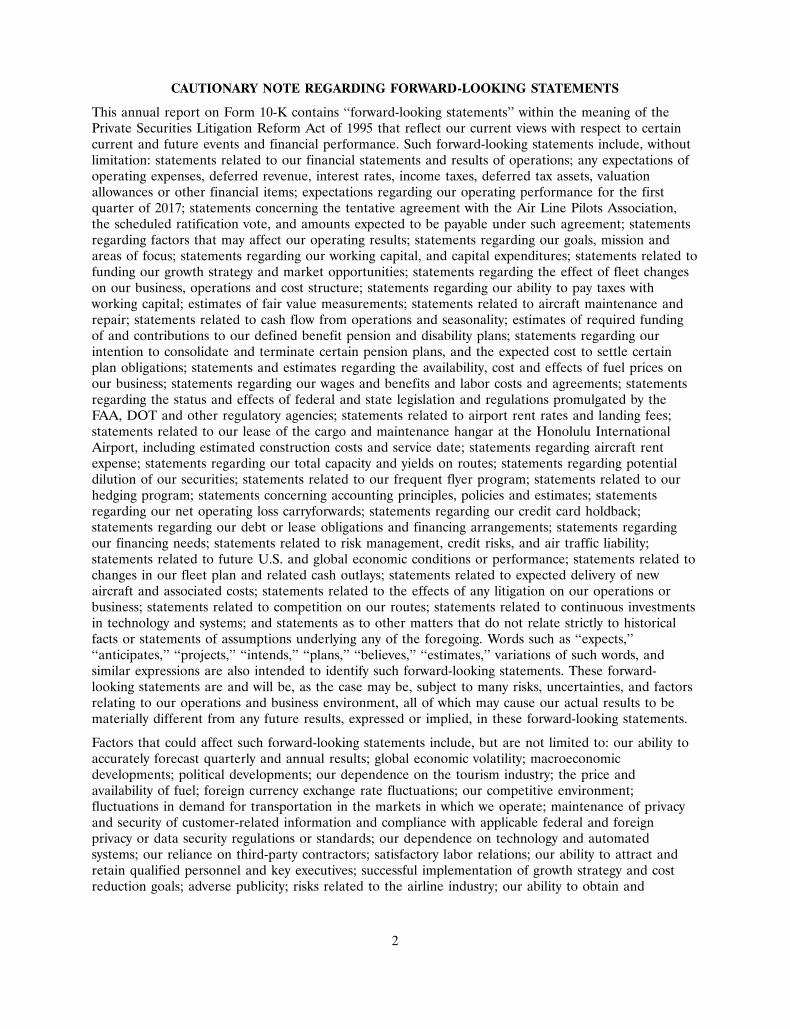
Interline Partners:
Codeshare Partners:
SEASONAL ROUTESKailua-Kona – OaklandLı̄hu‘e – Oakland Kailua-Kona – Los AngelesLı̄hu‘e – Los Angeles
LAUNCHING MARCH 2017Kailua-Kona – Lı̄hue
LAUNCHING MARCH 2017Honolulu – KapaluaKahului – Kapalua
OPERATED BY EMPIRE AIRLINES
New York/Kennedy
Raleigh-Durham
New York/Newark
Charlotte
Savannah
Jacksonville
Lı̄hu‘e
KualaLumpur Singapore
Manila
Jakarta
SOUTHKOREA
PHILIPPINESVIETNAM
MALAYSIA
CAMBODIA
THAILAND
CHINA
AUSTRALIA
INDONESIA
PAPUANEW GUINEA
NEWZEALAND
AMERICANSAMOA
TAHITI
JAPAN
NORTHAMERICA
MEXICO
HAWAI‘I
CANADA
TAIWAN
Tokyo/Haneda
Tokyo/Narita
Osaka/Kansai Fukuoka
Pago Pago
Papeete
Seoul/Incheon
Taipei
Sapporo/Chitose
Sydney
Brisbane
Auckland
San FranciscoSacramento
Portland
Phoenix
Oakland
Las Vegas
Seattle
San Jose
Kahului
Okinawa
Kagoshima
Beijing
Shanghai/Pudong
Hong Kong
Busan Osaka/Itami
Oita
Hiroshima
Bangkok
Hanoi
Ho Chi Minh CityPhnom Penh
Perth
Canberra
Gladstone
Rockhampton
Townsville
Mackay
Adelaide
Melbourne
Cairns
Dallas/Love Field
Chicago/O’Hare
PortlandBurlington
Boston
Orlando
West Palm BeachFort Lauderdale
Tampa
Fort Myers
Washington DC/Dulles
RochesterBuffalo
Syracuse
Honolulu
Kailua-Kona
KAUA‘I
O‘AHU
MAUI
HAWAI‘IISLAND
MOLOKA‘I
LANA‘I
NI‘IHAU
KAHO‘OLAWE
Kahului
Kailua-Kona
Hilo
Lıhu‘e
Honolulu
Shanghai/Hongqiao
Hangzhou
Xiamen
Chengdu Chongqing
GuangzhouShenzhen
Shenyang
Harbin
To New Delhi, India
Nantucket
Los AngelesLong Beach
San Diego
Kapalua
Map not drawn to scale.
B O A R D O F D I R E C T O R S
Lawrence S. HershfieldChairman of the Board Hawaiian Holdings, Inc. and Hawaiian Airlines, Inc.
Chief Executive Officer Ranch Capital, LLC
Mark B. DunkerleyPresident and Chief Executive Officer Hawaiian Holdings, Inc. and Hawaiian Airlines, Inc.
Donald J. CartyFormer Chairman and Chief Executive Officer AMR Corp. and American Airlines
Former Vice Chairman Dell, Inc.
Earl E. FryFormer Chief Financial Officer and Executive Vice President Services and Support Informatica Corp.
Joseph Guerrieri, Jr.Principal Guerrieri, Clayman, Bartos, Parcelli & Roma, P.C.
Randall L. JensonPresident Ranch Capital, LLC
President and Chief Financial Officer Berkadia
Crystal K. RosePartner Bays Lung Rose & Holma
William S. SwelbarResearch Engineer Massachusetts Institute of Technology
Duane E. WoerthFormer U.S. Ambassador International Civil Aviation Organization
Richard N. ZwernWorldwide Director-Executive Development WPP
C O R P O R AT E O F F I C E R S
Mark B. DunkerleyPresident and Chief Executive Officer Hawaiian Holdings, Inc. and Hawaiian Airlines, Inc.
Aaron J. AlterCorporate Secretary Hawaiian Holdings, Inc.
Executive Vice President Chief Legal Officer and Corporate Secretary Hawaiian Airlines, Inc.
Shannon L. OkinakaExecutive Vice President Chief Financial Officer and Treasurer Hawaiian Holdings, Inc.
Executive Vice President Chief Financial Officer Hawaiian Airlines, Inc.
Ronald R. Anderson-LehmanExecutive Vice President and Chief Administrative Officer Hawaiian Airlines, Inc.
Peter R. IngramExecutive Vice President and Chief Commercial Officer Hawaiian Airlines, Inc.
Jonathan D. SnookExecutive Vice President and Chief Operating Officer Hawaiian Airlines, Inc.
Ann R. BotticelliSenior Vice President Corporate Communications and Public Affairs Hawaiian Airlines, Inc.
Barbara D. FalveySenior Vice President Human Resources Hawaiian Airlines, Inc.
Avi A. MannisSenior Vice President Marketing Hawaiian Airlines, Inc.
Theo PanagiotouliasSenior Vice President Global Sales and Alliances Hawaiian Airlines, Inc.
Karen A. BerryVice President Labor and Employee Relations Hawaiian Airlines, Inc.
Jeffrey K. HelfrickVice President Customer Services Hawaiian Airlines, Inc.
K. Sayle HirashimaVice President Controller Hawaiian Airlines, Inc.
John E. Jacobi IIIVice President Information Technology Hawaiian Airlines, Inc.
James W. LandersVice President Maintenance and Engineering Hawaiian Airlines, Inc.
Brent A. OverbeekVice President Network Planning and Revenue Management Hawaiian Airlines, Inc.
Kenneth E. RewickVice President Flight Operations Hawaiian Airlines, Inc.
John F. Schaefer, Jr.Vice President Treasurer Hawaiian Airlines, Inc.
Robin A. SparlingVice President Inflight Services Hawaiian Airlines, Inc.
Edward T. StraussVice President Cargo Hawaiian Airlines, Inc.
Noel P. VillamilVice President Financial Planning and Analysis Hawaiian Airlines, Inc.
C O R P O R AT E I N F O R M AT I O N
HEADQUARTERS Hawaiian Airlines, Inc.3375 Koapaka Street, Suite G350 Honolulu, Hawai‘i 96819 Telephone: (808) 835-3700 Facsimile: (808) 835-3690
MAILING ADDRESSP. O. Box 30008 Honolulu, Hawai‘i 96820
INTERNET ADDRESSHawaiianAirlines.com
INVESTOR [email protected]
STOCK TRANSFER AGENT AND REGISTRARAmerican Stock Transfer & Trust Company 6201 15th Avenue Brooklyn, New York 11219 Telephone: (800) 937-5449 [email protected]
STOCK EXCHANGE LISTINGSymbol – HA NASDAQ Stock Market, LLC New York, New York
INDEPENDENT AUDITORSErnst & Young, LLP Honolulu, Hawai‘i
CORPORATE COUNSELWilson Sonsini Goodrich & Rosati, P.C. Palo Alto, California
A N N U A L M E E T I N GThe 2017 Annual Meeting of Stockholders of Hawaiian Holdings, Inc. will be held on Wednesday, May 10, 2017 at 8:00 a.m.
Hilton Hawaiian Village Waikiki Beach Resort Kalia Executive Conference Center Hibiscus Suite 2005 Kalia Road Honolulu, Hawai‘i 96815
HARP-14635_AnnualReportCover2016_R1.indd 2 3/7/17 4:07 PM
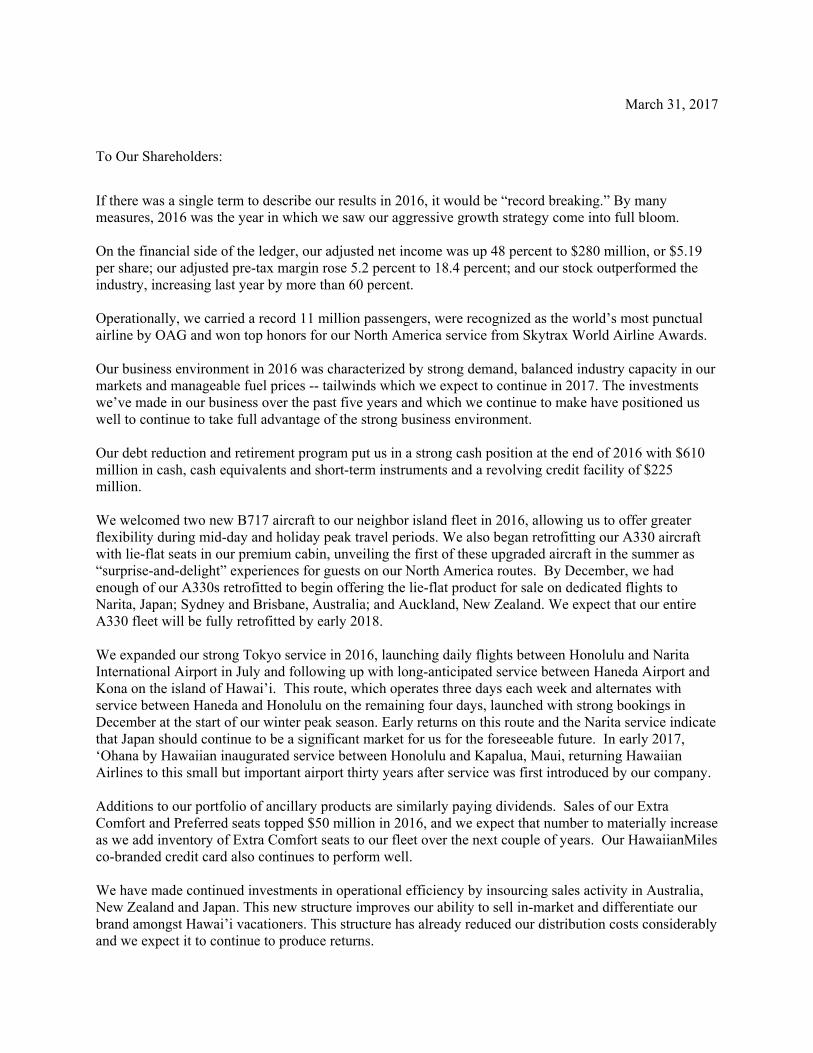
March 31, 2017
To Our Shareholders:
If there was a single term to describe our results in 2016, it would be “record breaking.” By many measures, 2016 was the year in which we saw our aggressive growth strategy come into full bloom. On the financial side of the ledger, our adjusted net income was up 48 percent to $280 million, or $5.19 per share; our adjusted pre-tax margin rose 5.2 percent to 18.4 percent; and our stock outperformed the industry, increasing last year by more than 60 percent. Operationally, we carried a record 11 million passengers, were recognized as the world’s most punctual airline by OAG and won top honors for our North America service from Skytrax World Airline Awards. Our business environment in 2016 was characterized by strong demand, balanced industry capacity in our markets and manageable fuel prices -- tailwinds which we expect to continue in 2017. The investments we’ve made in our business over the past five years and which we continue to make have positioned us well to continue to take full advantage of the strong business environment. Our debt reduction and retirement program put us in a strong cash position at the end of 2016 with $610 million in cash, cash equivalents and short-term instruments and a revolving credit facility of $225 million. We welcomed two new B717 aircraft to our neighbor island fleet in 2016, allowing us to offer greater flexibility during mid-day and holiday peak travel periods. We also began retrofitting our A330 aircraft with lie-flat seats in our premium cabin, unveiling the first of these upgraded aircraft in the summer as “surprise-and-delight” experiences for guests on our North America routes. By December, we had enough of our A330s retrofitted to begin offering the lie-flat product for sale on dedicated flights to Narita, Japan; Sydney and Brisbane, Australia; and Auckland, New Zealand. We expect that our entire A330 fleet will be fully retrofitted by early 2018. We expanded our strong Tokyo service in 2016, launching daily flights between Honolulu and Narita International Airport in July and following up with long-anticipated service between Haneda Airport and Kona on the island of Hawai’i. This route, which operates three days each week and alternates with service between Haneda and Honolulu on the remaining four days, launched with strong bookings in December at the start of our winter peak season. Early returns on this route and the Narita service indicate that Japan should continue to be a significant market for us for the foreseeable future. In early 2017, ‘Ohana by Hawaiian inaugurated service between Honolulu and Kapalua, Maui, returning Hawaiian Airlines to this small but important airport thirty years after service was first introduced by our company. Additions to our portfolio of ancillary products are similarly paying dividends. Sales of our Extra Comfort and Preferred seats topped $50 million in 2016, and we expect that number to materially increase as we add inventory of Extra Comfort seats to our fleet over the next couple of years. Our HawaiianMiles co-branded credit card also continues to perform well. We have made continued investments in operational efficiency by insourcing sales activity in Australia, New Zealand and Japan. This new structure improves our ability to sell in-market and differentiate our brand amongst Hawai’i vacationers. This structure has already reduced our distribution costs considerably and we expect it to continue to produce returns.
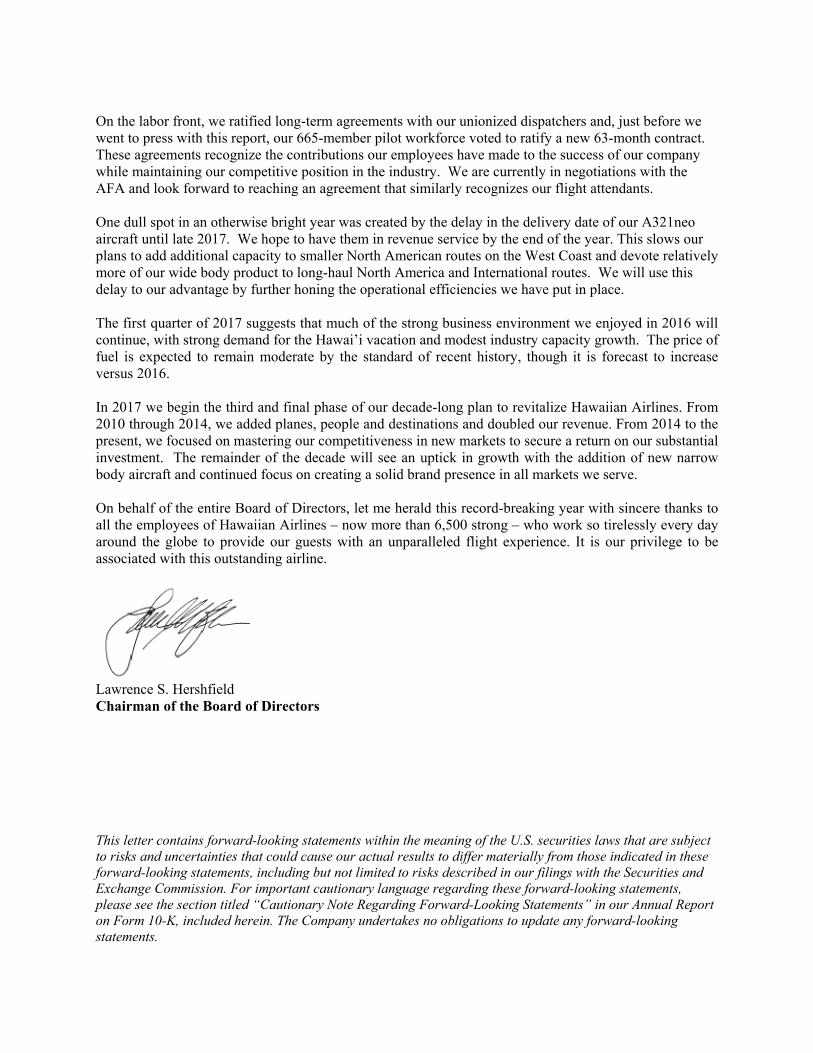
On the labor front, we ratified long-term agreements with our unionized dispatchers and, just before we went to press with this report, our 665-member pilot workforce voted to ratify a new 63-month contract. These agreements recognize the contributions our employees have made to the success of our company while maintaining our competitive position in the industry. We are currently in negotiations with the AFA and look forward to reaching an agreement that similarly recognizes our flight attendants. One dull spot in an otherwise bright year was created by the delay in the delivery date of our A321neo aircraft until late 2017. We hope to have them in revenue service by the end of the year. This slows our plans to add additional capacity to smaller North American routes on the West Coast and devote relatively more of our wide body product to long-haul North America and International routes. We will use this delay to our advantage by further honing the operational efficiencies we have put in place. The first quarter of 2017 suggests that much of the strong business environment we enjoyed in 2016 will continue, with strong demand for the Hawai’i vacation and modest industry capacity growth. The price of fuel is expected to remain moderate by the standard of recent history, though it is forecast to increase versus 2016. In 2017 we begin the third and final phase of our decade-long plan to revitalize Hawaiian Airlines. From 2010 through 2014, we added planes, people and destinations and doubled our revenue. From 2014 to the present, we focused on mastering our competitiveness in new markets to secure a return on our substantial investment. The remainder of the decade will see an uptick in growth with the addition of new narrow body aircraft and continued focus on creating a solid brand presence in all markets we serve. On behalf of the entire Board of Directors, let me herald this record-breaking year with sincere thanks to all the employees of Hawaiian Airlines – now more than 6,500 strong – who work so tirelessly every day around the globe to provide our guests with an unparalleled flight experience. It is our privilege to be associated with this outstanding airline.
Lawrence S. Hershfield Chairman of the Board of Directors This letter contains forward-looking statements within the meaning of the U.S. securities laws that are subject to risks and uncertainties that could cause our actual results to differ materially from those indicated in these forward-looking statements, including but not limited to risks described in our filings with the Securities and Exchange Commission. For important cautionary language regarding these forward-looking statements, please see the section titled “Cautionary Note Regarding Forward-Looking Statements” in our Annual Report on Form 10-K, included herein. The Company undertakes no obligations to update any forward-looking statements.

THE FOLLOWING PAGES CONTAIN THE ANNUAL REPORT ON FORM 10-K OF HAWAIIAN HOLDINGS, INC. AS FILED WITH THE
SECURITIES AND EXCHANGE COMMISSION

[This Page Intentionally Left Blank]
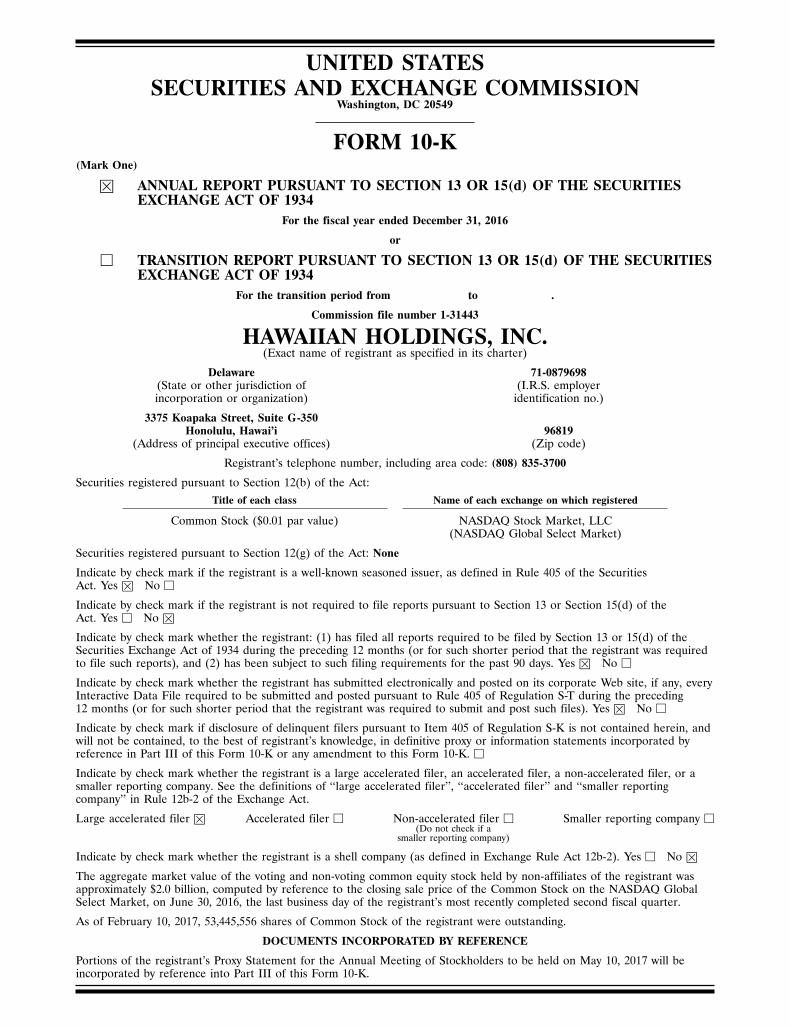
UNITED STATESSECURITIES AND EXCHANGE COMMISSION
Washington, DC 20549
FORM 10-K(Mark One)
� ANNUAL REPORT PURSUANT TO SECTION 13 OR 15(d) OF THE SECURITIESEXCHANGE ACT OF 1934
For the fiscal year ended December 31, 2016
or
� TRANSITION REPORT PURSUANT TO SECTION 13 OR 15(d) OF THE SECURITIESEXCHANGE ACT OF 1934
For the transition period from to .
Commission file number 1-31443
HAWAIIAN HOLDINGS, INC.(Exact name of registrant as specified in its charter)
Delaware 71-0879698(State or other jurisdiction of (I.R.S. employerincorporation or organization) identification no.)
3375 Koapaka Street, Suite G-350Honolulu, Hawai’i 96819
(Address of principal executive offices) (Zip code)
Registrant’s telephone number, including area code: (808) 835-3700
Securities registered pursuant to Section 12(b) of the Act:Title of each class Name of each exchange on which registered
Common Stock ($0.01 par value) NASDAQ Stock Market, LLC(NASDAQ Global Select Market)
Securities registered pursuant to Section 12(g) of the Act: None
Indicate by check mark if the registrant is a well-known seasoned issuer, as defined in Rule 405 of the SecuritiesAct. Yes � No �
Indicate by check mark if the registrant is not required to file reports pursuant to Section 13 or Section 15(d) of theAct. Yes � No �
Indicate by check mark whether the registrant: (1) has filed all reports required to be filed by Section 13 or 15(d) of theSecurities Exchange Act of 1934 during the preceding 12 months (or for such shorter period that the registrant was requiredto file such reports), and (2) has been subject to such filing requirements for the past 90 days. Yes � No �
Indicate by check mark whether the registrant has submitted electronically and posted on its corporate Web site, if any, everyInteractive Data File required to be submitted and posted pursuant to Rule 405 of Regulation S-T during the preceding12 months (or for such shorter period that the registrant was required to submit and post such files). Yes � No �
Indicate by check mark if disclosure of delinquent filers pursuant to Item 405 of Regulation S-K is not contained herein, andwill not be contained, to the best of registrant’s knowledge, in definitive proxy or information statements incorporated byreference in Part III of this Form 10-K or any amendment to this Form 10-K. �
Indicate by check mark whether the registrant is a large accelerated filer, an accelerated filer, a non-accelerated filer, or asmaller reporting company. See the definitions of ‘‘large accelerated filer’’, ‘‘accelerated filer’’ and ‘‘smaller reportingcompany’’ in Rule 12b-2 of the Exchange Act.
Large accelerated filer � Accelerated filer � Non-accelerated filer � Smaller reporting company �(Do not check if a
smaller reporting company)
Indicate by check mark whether the registrant is a shell company (as defined in Exchange Rule Act 12b-2). Yes � No �
The aggregate market value of the voting and non-voting common equity stock held by non-affiliates of the registrant wasapproximately $2.0 billion, computed by reference to the closing sale price of the Common Stock on the NASDAQ GlobalSelect Market, on June 30, 2016, the last business day of the registrant’s most recently completed second fiscal quarter.
As of February 10, 2017, 53,445,556 shares of Common Stock of the registrant were outstanding.
DOCUMENTS INCORPORATED BY REFERENCE
Portions of the registrant’s Proxy Statement for the Annual Meeting of Stockholders to be held on May 10, 2017 will beincorporated by reference into Part III of this Form 10-K.

[This Page Intentionally Left Blank]
TABLE OF CONTENTS
Page
PART I . . . . . . . . . . . . . . . . . . . . . . . . . . . . . . . . . . . . . . . . . . . . . . . . . . . . . . . . . . . . . . . . . . 4ITEM 1. BUSINESS . . . . . . . . . . . . . . . . . . . . . . . . . . . . . . . . . . . . . . . . . . . . . . . . . . . 4ITEM 1A. RISK FACTORS . . . . . . . . . . . . . . . . . . . . . . . . . . . . . . . . . . . . . . . . . . . . . . . 11ITEM 1B. UNRESOLVED STAFF COMMENTS . . . . . . . . . . . . . . . . . . . . . . . . . . . . . . . 24ITEM 2. PROPERTIES . . . . . . . . . . . . . . . . . . . . . . . . . . . . . . . . . . . . . . . . . . . . . . . . 25ITEM 3. LEGAL PROCEEDINGS . . . . . . . . . . . . . . . . . . . . . . . . . . . . . . . . . . . . . . . . 27ITEM 4. MINE SAFETY DISCLOSURES . . . . . . . . . . . . . . . . . . . . . . . . . . . . . . . . . . 27
PART II . . . . . . . . . . . . . . . . . . . . . . . . . . . . . . . . . . . . . . . . . . . . . . . . . . . . . . . . . . . . . . . . . 28ITEM 5. MARKET FOR REGISTRANT’S COMMON EQUITY, RELATED
STOCKHOLDER MATTERS AND ISSUER PURCHASES OF EQUITYSECURITIES . . . . . . . . . . . . . . . . . . . . . . . . . . . . . . . . . . . . . . . . . . . . . . . 28
ITEM 6. SELECTED FINANCIAL DATA . . . . . . . . . . . . . . . . . . . . . . . . . . . . . . . . . . . 30ITEM 7. MANAGEMENT’S DISCUSSION AND ANALYSIS OF FINANCIAL
CONDITION AND RESULTS OF OPERATIONS . . . . . . . . . . . . . . . . . . . . 31ITEM 7A. QUANTITATIVE AND QUALITATIVE DISCLOSURES ABOUT MARKET
RISK . . . . . . . . . . . . . . . . . . . . . . . . . . . . . . . . . . . . . . . . . . . . . . . . . . . . . 48ITEM 8. FINANCIAL STATEMENTS AND SUPPLEMENTARY DATA . . . . . . . . . . . . 50ITEM 9. CHANGES IN AND DISAGREEMENTS WITH ACCOUNTANTS ON
ACCOUNTING AND FINANCIAL DISCLOSURE . . . . . . . . . . . . . . . . . . . 106ITEM 9A. CONTROLS AND PROCEDURES . . . . . . . . . . . . . . . . . . . . . . . . . . . . . . . . 106ITEM 9B. OTHER INFORMATION . . . . . . . . . . . . . . . . . . . . . . . . . . . . . . . . . . . . . . . . 109
PART III . . . . . . . . . . . . . . . . . . . . . . . . . . . . . . . . . . . . . . . . . . . . . . . . . . . . . . . . . . . . . . . . 109ITEM 10. DIRECTORS, EXECUTIVE OFFICERS AND CORPORATE
GOVERNANCE . . . . . . . . . . . . . . . . . . . . . . . . . . . . . . . . . . . . . . . . . . . . . 109ITEM 11. EXECUTIVE COMPENSATION . . . . . . . . . . . . . . . . . . . . . . . . . . . . . . . . . . 109ITEM 12. SECURITY OWNERSHIP OF CERTAIN BENEFICIAL OWNERS AND
MANAGEMENT AND RELATED STOCKHOLDER MATTERS . . . . . . . . 109ITEM 13. CERTAIN RELATIONSHIPS AND RELATED TRANSACTIONS, AND
DIRECTOR INDEPENDENCE . . . . . . . . . . . . . . . . . . . . . . . . . . . . . . . . . 109ITEM 14. PRINCIPAL ACCOUNTANT FEES AND SERVICES . . . . . . . . . . . . . . . . . . . 109
PART IV . . . . . . . . . . . . . . . . . . . . . . . . . . . . . . . . . . . . . . . . . . . . . . . . . . . . . . . . . . . . . . . . 109ITEM 15. EXHIBITS, FINANCIAL STATEMENT SCHEDULES . . . . . . . . . . . . . . . . . . 109SIGNATURES . . . . . . . . . . . . . . . . . . . . . . . . . . . . . . . . . . . . . . . . . . . . . . . . . . . . . . . . . . 118
1
CAUTIONARY NOTE REGARDING FORWARD-LOOKING STATEMENTS
This annual report on Form 10-K contains ‘‘forward-looking statements’’ within the meaning of thePrivate Securities Litigation Reform Act of 1995 that reflect our current views with respect to certaincurrent and future events and financial performance. Such forward-looking statements include, withoutlimitation: statements related to our financial statements and results of operations; any expectations ofoperating expenses, deferred revenue, interest rates, income taxes, deferred tax assets, valuationallowances or other financial items; expectations regarding our operating performance for the firstquarter of 2017; statements concerning the tentative agreement with the Air Line Pilots Association,the scheduled ratification vote, and amounts expected to be payable under such agreement; statementsregarding factors that may affect our operating results; statements regarding our goals, mission andareas of focus; statements regarding our working capital, and capital expenditures; statements related tofunding our growth strategy and market opportunities; statements regarding the effect of fleet changeson our business, operations and cost structure; statements regarding our ability to pay taxes withworking capital; estimates of fair value measurements; statements related to aircraft maintenance andrepair; statements related to cash flow from operations and seasonality; estimates of required fundingof and contributions to our defined benefit pension and disability plans; statements regarding ourintention to consolidate and terminate certain pension plans, and the expected cost to settle certainplan obligations; statements and estimates regarding the availability, cost and effects of fuel prices onour business; statements regarding our wages and benefits and labor costs and agreements; statementsregarding the status and effects of federal and state legislation and regulations promulgated by theFAA, DOT and other regulatory agencies; statements related to airport rent rates and landing fees;statements related to our lease of the cargo and maintenance hangar at the Honolulu InternationalAirport, including estimated construction costs and service date; statements regarding aircraft rentexpense; statements regarding our total capacity and yields on routes; statements regarding potentialdilution of our securities; statements related to our frequent flyer program; statements related to ourhedging program; statements concerning accounting principles, policies and estimates; statementsregarding our net operating loss carryforwards; statements regarding our credit card holdback;statements regarding our debt or lease obligations and financing arrangements; statements regardingour financing needs; statements related to risk management, credit risks, and air traffic liability;statements related to future U.S. and global economic conditions or performance; statements related tochanges in our fleet plan and related cash outlays; statements related to expected delivery of newaircraft and associated costs; statements related to the effects of any litigation on our operations orbusiness; statements related to competition on our routes; statements related to continuous investmentsin technology and systems; and statements as to other matters that do not relate strictly to historicalfacts or statements of assumptions underlying any of the foregoing. Words such as ‘‘expects,’’‘‘anticipates,’’ ‘‘projects,’’ ‘‘intends,’’ ‘‘plans,’’ ‘‘believes,’’ ‘‘estimates,’’ variations of such words, andsimilar expressions are also intended to identify such forward-looking statements. These forward-looking statements are and will be, as the case may be, subject to many risks, uncertainties, and factorsrelating to our operations and business environment, all of which may cause our actual results to bematerially different from any future results, expressed or implied, in these forward-looking statements.
Factors that could affect such forward-looking statements include, but are not limited to: our ability toaccurately forecast quarterly and annual results; global economic volatility; macroeconomicdevelopments; political developments; our dependence on the tourism industry; the price andavailability of fuel; foreign currency exchange rate fluctuations; our competitive environment;fluctuations in demand for transportation in the markets in which we operate; maintenance of privacyand security of customer-related information and compliance with applicable federal and foreignprivacy or data security regulations or standards; our dependence on technology and automatedsystems; our reliance on third-party contractors; satisfactory labor relations; our ability to attract andretain qualified personnel and key executives; successful implementation of growth strategy and costreduction goals; adverse publicity; risks related to the airline industry; our ability to obtain and
2
maintain adequate facilities and infrastructure; seasonal and cyclical volatility; the effect of applicablestate, federal and foreign laws and regulations; increases in insurance costs or reductions in coverage;the limited number of suppliers for aircraft, aircraft engines and parts; our existing aircraft purchaseagreements; delays in aircraft deliveries or other loss of fleet capacity; fluctuations in our share price;and our financial liquidity. The risks, uncertainties, and assumptions referred to above that could causeour results to differ materially from the results expressed or implied by such forward-looking statementsinclude those discussed under the heading ‘‘Risk Factors’’ in Item 1A in this Annual Report onForm 10-K and the risks, uncertainties and assumptions discussed from time to time in our other publicfilings and public announcements. All forward-looking statements included in this document are basedon information available to us as of the date hereof. We undertake no obligation to publicly update orrevise any forward-looking statements to reflect events or circumstances that may arise after the datehereof.
3
PART I
ITEM 1. BUSINESS.
Overview
Hawaiian Holdings, Inc. (the Company, Holdings, we, us, and our) is a holding company incorporatedin the State of Delaware. The Company’s primary asset is our sole ownership of all issued andoutstanding shares of common stock of Hawaiian Airlines, Inc. (Hawaiian). Hawaiian was originallyincorporated in January 1929 under the laws of the Territory of Hawai’i and became our indirectwholly-owned subsidiary pursuant to a corporate restructuring that was consummated in August 2002.Hawaiian became a Delaware corporation and the Company’s direct wholly-owned subsidiaryconcurrent with its reorganization and reacquisition by the Company in June 2005.
Our Business
We are engaged in the scheduled air transportation of passengers and cargo amongst the HawaiianIslands (the Neighbor Island routes), between the Hawaiian Islands and certain cities in the UnitedStates (the North America routes), and between the Hawaiian Islands and the South Pacific, Australia,New Zealand and Asia (the International routes), collectively referred to as our Scheduled Operations.We offer non-stop service to Hawai’i from more U.S. gateway cities (11) than any other airline, andalso provide approximately 160 daily flights between the Hawaiian Islands. In addition, we operatevarious charter flights.
We are the longest serving airline as well as the largest airline headquartered in the State of Hawai’i,and the 10th largest domestic airline in the United States based on revenue passenger miles (RPMs)reported by the Research and Innovative Technology Administration Bureau of Transportation Servicesas of October 2016, the latest data available.
At December 31, 2016, our fleet consisted of 20 Boeing 717-200 aircraft for the Neighbor Island routes,eight Boeing 767-300 aircraft, and 23 Airbus A330-200 aircraft for the North America, International,and charter routes. We also own three ATR42 aircraft for the ‘‘Ohana by Hawaiian’’ Neighbor Islandservice.
Our goal is to be the number one destination carrier serving Hawai’i. We are devoted to the travelneeds of the residents of and visitors to Hawai’i and offer a unique travel experience. We are stronglyrooted in the culture and people of Hawai’i and seek to provide quality service to our customers thatexemplifies the spirit of Aloha.
Outlook
Our mission every year is to grow a profitable airline with a passion for excellence, our customers, ourpeople and the spirit of Hawai’i. In 2017, we will continue to focus on strengthening our competitiveposition in the markets that we serve primarily by continuing to mature the routes we launched overthe past several years, improving our sales distribution channels, maintaining a disciplined approach incontrolling our costs, and growing our offering of value-added products and services.
Flight Operations
Our flight operations are based in Honolulu, Hawai’i. At December 31, 2016, we operated218 scheduled flights with:
• Daily service on our North America routes between the State of Hawai’i and Los Angeles,Oakland, Sacramento, San Diego, San Francisco, and San Jose, California; Las Vegas, Nevada;Phoenix, Arizona; Portland, Oregon; and Seattle, Washington; and scheduled service between theState of Hawai’i and New York City, New York.
4
• Daily service on our Neighbor Island routes among the six major islands of the State of Hawai’i.
• Daily service on our International routes between the State of Hawai’i and Sydney, Australia;and Tokyo and Osaka, Japan and scheduled service between the State of Hawai’i and Pago Pago,American Samoa; Papeete, Tahiti; Brisbane, Australia; Auckland, New Zealand; Sapporo, Japan;Seoul, South Korea; and Beijing, China.
• Various ad hoc charters.
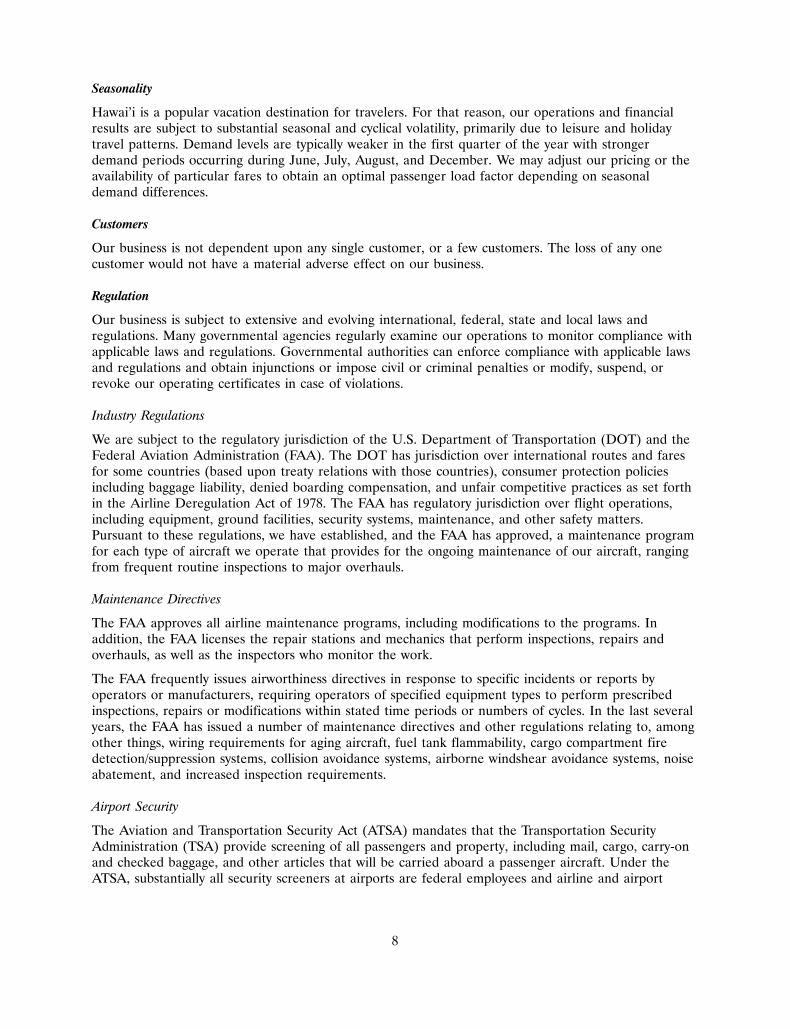
Fuel
Our operations and financial results are significantly affected by the availability and price of jet fuel.The following table sets forth statistics about our aircraft fuel consumption and cost.
Gallons Total cost, Average cost Percent ofYear consumed including taxes per gallon operating expenses
(in thousands)
2016 . . . . . . . . . . . . . . . . . . 244,118 $344,322 $1.41 16.8%2015 . . . . . . . . . . . . . . . . . . 234,183 $417,728 $1.78 22.1%2014 . . . . . . . . . . . . . . . . . . 230,199 $678,253 $2.95 32.8%
As illustrated by the table above, fuel costs constitute a significant portion of our operating expenses.We purchase aircraft fuel at prevailing market prices, and seek to manage economic risks associatedwith fluctuations in aircraft fuel prices by entering into derivative financial instruments such as heatingoil swaps and crude oil call options.
Aircraft Maintenance
Our aircraft maintenance programs consist of a series of phased or continuous checks for each aircrafttype. These checks are performed at specified intervals measured by calendar months, time flown, bythe number of takeoffs and landings, or cycles operated. In addition, we perform inspections, repairs,and modifications of our aircraft in response to Federal Aviation Administration (FAA) directives. Weperform checks ranging from ‘‘walk around’’ inspections before each flight’s departure to majoroverhauls of the airframes which can take several weeks to complete. Aircraft engines are subject tophased maintenance programs designed to detect and remedy potential problems before they occur.The service lives of certain airframe and engine parts and components, which are time or cyclecontrolled, are replaced or refurbished prior to the expiration of their time or cycle limits. We havecontracts with third parties to provide certain maintenance on our aircraft and aircraft engines.
Marketing and Ticket Distribution
We utilize various distribution channels including our website www.hawaiianairlines.com, primarily forour North America and Neighbor Island routes, and travel agencies and wholesale distributors for ourInternational routes.
Our website is available in English, Japanese, Korean, and Chinese and offers our customersinformation on our flight schedules, information on our HawaiianMiles frequent flyer program, theability to book reservations on our flights or connecting flights with any of our code-share partners, thestatus of our flights as well as the ability to purchase hotels, cars and vacation packages. We alsodistribute our fares through online travel agencies.
Frequent Flyer Program
The HawaiianMiles frequent flyer program was initiated in 1983 to encourage and develop customerloyalty. HawaiianMiles allows passengers to earn mileage credits by flying with us and our partner
5
carriers. In addition, members earn mileage credits for patronage with our other program partners,including credit card issuers, hotels, car rental firms, and general merchants pursuant to our exchangepartnership agreements. We also sell mileage credits to other companies participating in the program.
HawaiianMiles members have a choice of various awards based on accumulated mileage credits, withmost of the awards being redeemed for free air travel on Hawaiian.
HawaiianMiles accounts with no activity (frequent flyer miles earned or redeemed) for 18 monthsautomatically expire. The number of free travel awards used for travel on Hawaiian was approximately585,000 in 2016. The amount of free travel awards as a percentage of total revenue passengers wasapproximately 5% in 2016. We believe displacement of revenue passengers is minimal due to our abilityto manage frequent flyer seat inventory, and the relatively low ratio of free award usage to totalrevenue passengers.
Code-Share and Other Alliances
We have marketing alliances with other airlines that provide reciprocal frequent flyer mileage accrualand redemption privileges and code-shares on certain flights (one carrier placing its name and flightnumbers, or code, on flights operated by the other carrier). These programs enhance our revenueopportunities by:
• increasing value to our customers by providing easier access to more travel destinations andbetter mileage accrual/redemption opportunities;
• gaining access to more connecting traffic from other airlines; and
• providing members of our alliance partners’ frequent flyer programs an opportunity to travel onour system while earning mileage credit in the alliance partners’ programs.
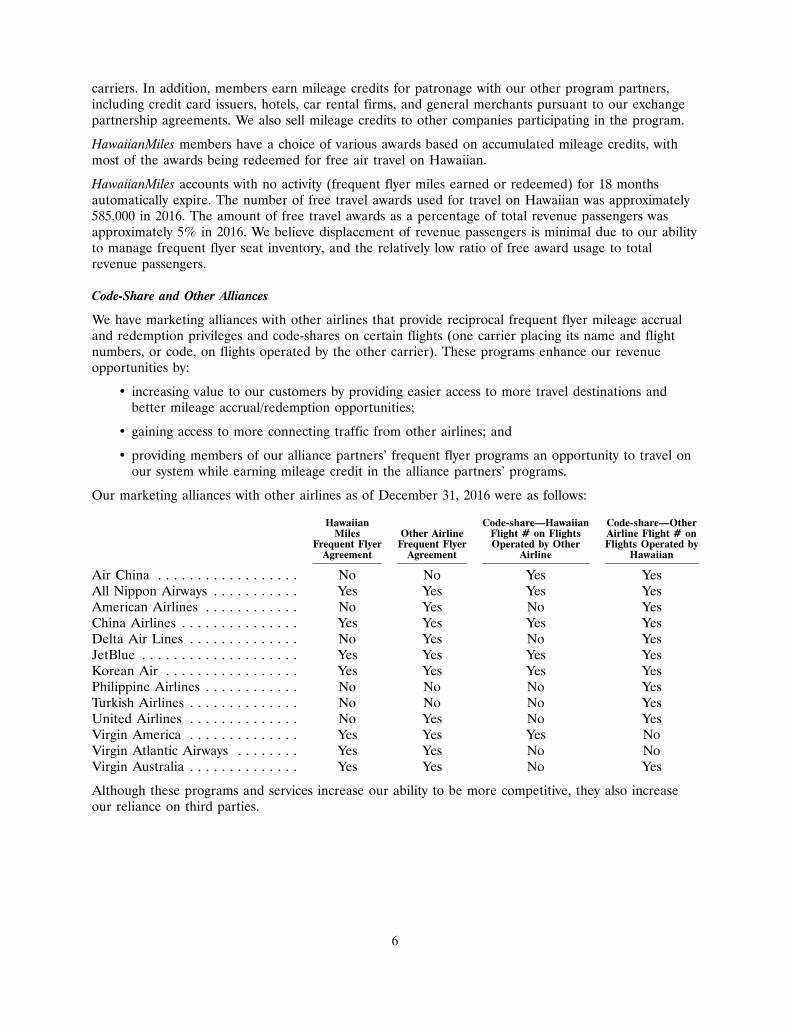
Our marketing alliances with other airlines as of December 31, 2016 were as follows:
Hawaiian Code-share—Hawaiian Code-share—OtherMiles Other Airline Flight # on Flights Airline Flight # on
Frequent Flyer Frequent Flyer Operated by Other Flights Operated byAgreement Agreement Airline Hawaiian
Air China . . . . . . . . . . . . . . . . . . No No Yes YesAll Nippon Airways . . . . . . . . . . . Yes Yes Yes YesAmerican Airlines . . . . . . . . . . . . No Yes No YesChina Airlines . . . . . . . . . . . . . . . Yes Yes Yes YesDelta Air Lines . . . . . . . . . . . . . . No Yes No YesJetBlue . . . . . . . . . . . . . . . . . . . . Yes Yes Yes YesKorean Air . . . . . . . . . . . . . . . . . Yes Yes Yes YesPhilippine Airlines . . . . . . . . . . . . No No No YesTurkish Airlines . . . . . . . . . . . . . . No No No YesUnited Airlines . . . . . . . . . . . . . . No Yes No YesVirgin America . . . . . . . . . . . . . . Yes Yes Yes NoVirgin Atlantic Airways . . . . . . . . Yes Yes No NoVirgin Australia . . . . . . . . . . . . . . Yes Yes No Yes
Although these programs and services increase our ability to be more competitive, they also increaseour reliance on third parties.
6
Competition
The airline industry is extremely competitive. We believe that the principal competitive factors in theairline industry are:
• Price;
• Flight frequency and schedule;
• On-time performance and reliability;
• Name recognition;
• Marketing affiliations;
• Frequent flyer benefits;
• Customer service;
• Aircraft type; and
• In-flight services.
Domestic—We face multiple competitors on our North America routes including major network carrierssuch as Alaska (ALK), American Airlines (AA), United Airlines (UA), and Delta Airlines (DL).Various charter companies also provide non scheduled service to Hawai’i, mostly under public charterarrangements. Our Neighbor Island competitors consist of regional carriers, which include Island Air,Mokulele Airlines, and a number of other ‘‘air taxi’’ companies.
International—Currently, we are the only provider of direct service between Honolulu and each ofSapporo, Japan; Pago Pago, American Samoa; and Papeete, Tahiti. However, we face multiplecompetitors from both domestic and foreign carriers on our other international routes.
Employees
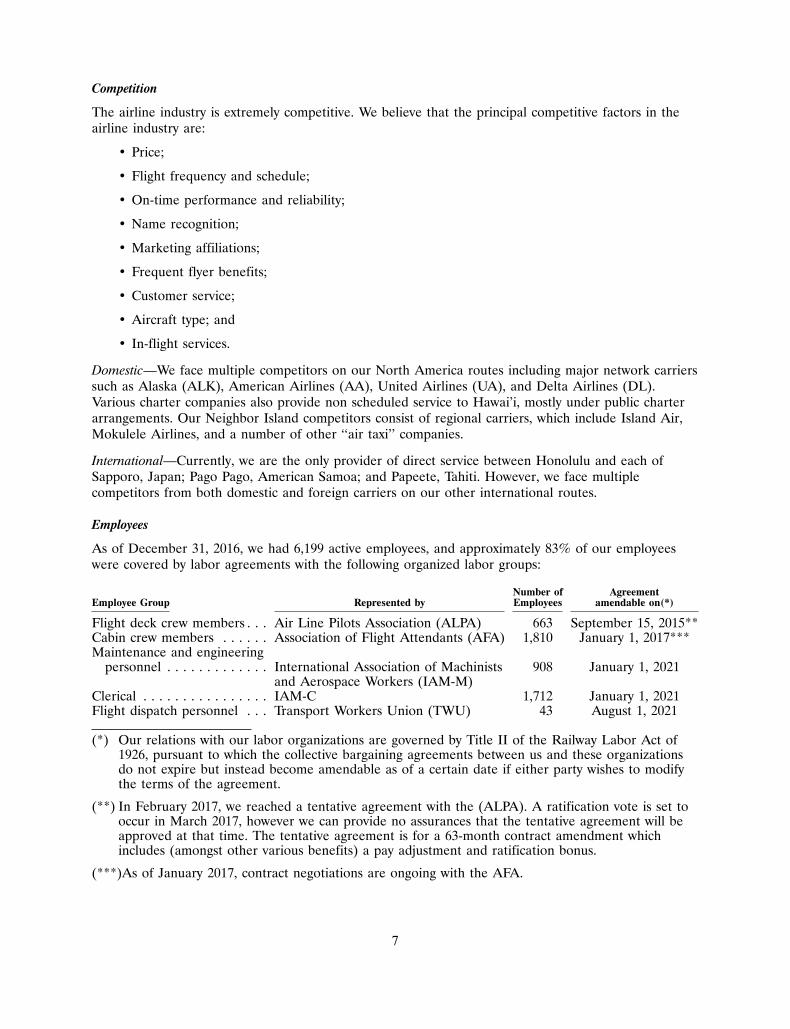
As of December 31, 2016, we had 6,199 active employees, and approximately 83% of our employeeswere covered by labor agreements with the following organized labor groups:
Number of AgreementEmployee Group Represented by Employees amendable on(*)
Flight deck crew members . . . Air Line Pilots Association (ALPA) 663 September 15, 2015**Cabin crew members . . . . . . Association of Flight Attendants (AFA) 1,810 January 1, 2017***Maintenance and engineering
personnel . . . . . . . . . . . . . International Association of Machinists 908 January 1, 2021and Aerospace Workers (IAM-M)
Clerical . . . . . . . . . . . . . . . . IAM-C 1,712 January 1, 2021Flight dispatch personnel . . . Transport Workers Union (TWU) 43 August 1, 2021
(*) Our relations with our labor organizations are governed by Title II of the Railway Labor Act of1926, pursuant to which the collective bargaining agreements between us and these organizationsdo not expire but instead become amendable as of a certain date if either party wishes to modifythe terms of the agreement.
(**) In February 2017, we reached a tentative agreement with the (ALPA). A ratification vote is set tooccur in March 2017, however we can provide no assurances that the tentative agreement will beapproved at that time. The tentative agreement is for a 63-month contract amendment whichincludes (amongst other various benefits) a pay adjustment and ratification bonus.
(***)As of January 2017, contract negotiations are ongoing with the AFA.
7
Seasonality
Hawai’i is a popular vacation destination for travelers. For that reason, our operations and financialresults are subject to substantial seasonal and cyclical volatility, primarily due to leisure and holidaytravel patterns. Demand levels are typically weaker in the first quarter of the year with strongerdemand periods occurring during June, July, August, and December. We may adjust our pricing or theavailability of particular fares to obtain an optimal passenger load factor depending on seasonaldemand differences.
Customers
Our business is not dependent upon any single customer, or a few customers. The loss of any onecustomer would not have a material adverse effect on our business.
Regulation
Our business is subject to extensive and evolving international, federal, state and local laws andregulations. Many governmental agencies regularly examine our operations to monitor compliance withapplicable laws and regulations. Governmental authorities can enforce compliance with applicable lawsand regulations and obtain injunctions or impose civil or criminal penalties or modify, suspend, orrevoke our operating certificates in case of violations.
Industry Regulations
We are subject to the regulatory jurisdiction of the U.S. Department of Transportation (DOT) and theFederal Aviation Administration (FAA). The DOT has jurisdiction over international routes and faresfor some countries (based upon treaty relations with those countries), consumer protection policiesincluding baggage liability, denied boarding compensation, and unfair competitive practices as set forthin the Airline Deregulation Act of 1978. The FAA has regulatory jurisdiction over flight operations,including equipment, ground facilities, security systems, maintenance, and other safety matters.Pursuant to these regulations, we have established, and the FAA has approved, a maintenance programfor each type of aircraft we operate that provides for the ongoing maintenance of our aircraft, rangingfrom frequent routine inspections to major overhauls.
Maintenance Directives
The FAA approves all airline maintenance programs, including modifications to the programs. Inaddition, the FAA licenses the repair stations and mechanics that perform inspections, repairs andoverhauls, as well as the inspectors who monitor the work.
The FAA frequently issues airworthiness directives in response to specific incidents or reports byoperators or manufacturers, requiring operators of specified equipment types to perform prescribedinspections, repairs or modifications within stated time periods or numbers of cycles. In the last severalyears, the FAA has issued a number of maintenance directives and other regulations relating to, amongother things, wiring requirements for aging aircraft, fuel tank flammability, cargo compartment firedetection/suppression systems, collision avoidance systems, airborne windshear avoidance systems, noiseabatement, and increased inspection requirements.
Airport Security
The Aviation and Transportation Security Act (ATSA) mandates that the Transportation SecurityAdministration (TSA) provide screening of all passengers and property, including mail, cargo, carry-onand checked baggage, and other articles that will be carried aboard a passenger aircraft. Under theATSA, substantially all security screeners at airports are federal employees and airline and airport
8
security is overseen and performed by federal employees, including security managers, law enforcementofficers, and Federal Air Marshals. The ATSA also provides for increased security on flight decks ofaircraft and requires Federal Air Marshals to be present on certain flights, improved airport perimeteraccess security, airline crew security training, enhanced security screening of passengers, baggage, cargo,mail, employees and vendors, enhanced training and qualifications of security screening personnel,provision of passenger data to U.S. Customs and Border Protection and enhanced background checks.
The TSA also has the authority to impose additional fees on the air carriers, if necessary, to coveradditional federal aviation security costs.
Environmental and Employee Safety and Health
We are subject to various laws and regulations concerning environmental matters and employee safetyand health in the U.S. and other countries in which we do business. Many aspects of airlines’operations are subject to increasingly stringent federal, state, local, and foreign laws protecting theenvironment. U.S. federal laws that have a particular impact on us include the Airport Noise andCapacity Act of 1990, the Clean Air Act, the Resource Conservation and Recovery Act, the CleanWater Act, the Safe Drinking Water Act, and the Comprehensive Environmental Response,Compensation, and Liability Act. Certain of our operations are also subject to the oversight of theOccupational Safety and Health Administration (OSHA) concerning employee safety and healthmatters. The U.S. Environmental Protection Agency (EPA), OSHA, and other federal agencies havebeen authorized to promulgate regulations that affect our operations. In addition to these federalactivities, states have been delegated certain authority under the aforementioned federal statutes. Manystate and local governments have adopted environmental and employee safety and health laws andregulations, some of which are similar to or stricter than federal requirements, such as California.
The EPA is authorized to regulate aircraft emissions and has historically implemented emissions controlstandards previously adopted by the International Civil Aviation Organization. Our aircraft comply withthe existing EPA standards as applicable by engine design date.
We seek to minimize the impact of carbon emissions from our operations through reductions in ourfuel consumption and other efforts. We have reduced the fuel needs of our aircraft fleet through theretirement and replacement of certain elements of our fleet with newer, more fuel efficient aircraft. Inaddition, we have implemented fuel saving procedures in our flight and ground support operations thatfurther reduce carbon emissions. In 2012, we earned the first-ever aviation based carbon creditsthrough the reduction of carbon dioxide emissions with the use of an eco-friendly engine washingtechnology. We are also supporting initiatives to develop alternative fuels and efforts to modernize theair traffic control system in the U.S. as part of our efforts to reduce our emissions and minimize ourimpact on the environment.
Noise Abatement
Under the Airport Noise and Capacity Act, the DOT allows local airport authorities to implementprocedures designed to abate special noise problems, provided such procedures do not unreasonablyinterfere with interstate and foreign commerce, or the national transportation system. Certain airports,including the major airports at Los Angeles, San Diego, San Francisco, and San Jose, California,Sydney, Australia, and Tokyo, Japan, have established airport restrictions to limit noise, includingrestrictions on aircraft types to be used and limits on the number of hourly or daily operations or thetime of such operations. Local authorities at other airports could consider adopting similar noiserestrictions. In some instances, these restrictions have caused curtailments in services or increases inoperating costs, and such restrictions could limit our ability to expand our operations.
9
Civil Reserve Air Fleet Program
The U.S. Department of Defense regulates the Civil Reserve Air Fleet (CRAF) and governmentcharters. We have elected to participate in the CRAF program by agreeing to make aircraft available tothe federal government for use by the U.S. military under certain stages of readiness related to nationalemergencies. The program is a standby arrangement that allows the U.S. Department of Defense U.S.Transportation Command to call on as many as 12 contractually committed Hawaiian aircraft and crewsto supplement military airlift capabilities. None of our aircraft are presently mobilized under thisprogram.
Other Regulations
The State of Hawai’i is uniquely dependent upon air transportation. The Hawai’i state legislature hasenacted legislation that reflects and attempts to address its concerns. For example, House Bill 2250HD1, Act 1 of the 2008 Special Session, establishes a statutory scheme for the regulation of Hawai’ineighbor island air carriers, provided that federal legislation is enacted to permit its implementation.The U.S. Congress has yet to enact legislation that would allow this proposed legislation to go intoeffect.
Additionally, several aspects of airline operations are subject to regulation or oversight by federalagencies other than the FAA and the DOT. Federal antitrust laws are enforced by the U.S. Departmentof Justice. The U.S. Postal Service has jurisdiction over certain aspects of the transportation of mailand related services provided by our cargo services. Labor relations in the air transportation industryare generally regulated under the Railway Labor Act. We and other airlines certificated prior toOctober 24, 1978 are also subject to preferential hiring rights granted by the Airline Deregulation Actto certain airline employees who have been furloughed or terminated (other than for cause). TheFederal Communications Commission issues licenses and regulates the use of all communicationsfrequencies assigned to us and other airlines. There is increased focus on consumer protection both onthe federal and state level. We cannot always accurately predict the cost of such requirements on ouroperations.
Additional laws and regulations are proposed from time to time, which could significantly increase thecost of airline operations by imposing additional requirements or restrictions. U.S. law restricts theownership of U.S. airlines to corporations where no more than 25% of the voting stock may be held bynon-U.S. citizens and the airline must be under the actual control of U.S. citizens. The President andtwo thirds of the Board of Directors and other managing officers must also be U.S. citizens.Regulations also have been considered from time to time that would prohibit or restrict the ownershipand/or transfer of airline routes or takeoff and landing slots and authorizations. Also, the award ofinternational routes to U.S. carriers (and their retention) is regulated by treaties and relatedagreements between the U.S. and foreign governments, which are amended from time to time. Wecannot predict what laws and regulations will be adopted or what changes to international airtransportation treaties will be adopted, if any, or how we will be affected by those changes.
Business Segment Data
We operate in a single industry segment. All required financial segment information can be found inour consolidated financial statements.
Information about Geographic Revenue and Foreign Operations
Information concerning revenues by geographic area is set forth in Note 15 to our consolidatedfinancial statements.
10
Available Information
General information about us, including the charters for the committees of our Board of Directors canbe found at https://www.hawaiianairlines.com. Our annual reports on Form 10-K, quarterly reports onForm 10-Q, and current reports on Form 8-K, as well as any amendments and exhibits to those reportsthat we file with the Securities and Exchange Commission (SEC) are available free of charge throughour website. The SEC maintains an internet site that contains reports, proxy and informationstatements, and other information regarding issuers that file electronically with the SEC, which can befound at http://www.sec.gov.
We also use the investor relations section of our websitehttps://newsroom.hawaiianairlines.com/investor-relations and our website(https://www.hawaiianairlines.com), as a means of disclosing material information and for complying withour disclosure obligations under Regulation FD.
Information on our website is not incorporated into this Annual Report on Form 10-K or our othersecurities filings and is not a part of such filings.
ITEM 1A. RISK FACTORS.
In addition to the risks identified elsewhere in this report, the following risk factors apply to ourbusiness, results of operations, and financial conditions.
ECONOMIC RISKS
Our business is affected by global economic volatility.
Our business and results of operations are significantly impacted by general world-wide economicconditions. Demand for discretionary purchases including air travel and vacations to Hawai’i remainsunpredictable. Deterioration in demand resulting from economic uncertainty or another recession mayresult in a reduction in our passenger traffic and/or increased competitive pressure on fares in themarkets we serve, which would negatively impact our results of operations and financial condition. Wecannot assure that we would be able to offset such revenue reductions by reducing our costs.
Our business is highly dependent on tourism to, from, and amongst the Hawaiian Islands and our financialresults could suffer if there is a downturn in tourism levels.
Our principal base of operations is in Hawai’i and our revenue is linked primarily to the number oftravelers (mainly tourists) to, from and amongst the Hawaiian Islands. Hawai’i tourism levels areaffected by the political and economic climate in Hawai’i’s main tourism markets, the availability ofhotel accommodations, the popularity of Hawai’i as a tourist destination relative to other vacationdestinations, and other global factors, including natural disasters, safety and security. From time totime, various events and industry specific problems such as labor strikes have had a negative impact ontourism in Hawai’i. The occurrence of natural disasters, such as earthquakes and tsunamis, in Hawai’ior other parts of the world could also have a material adverse effect on Hawai’i tourism. In addition,the potential or actual occurrence of terrorist attacks, wars, and the threat of other negative worldevents have had, and may in the future have, a material adverse effect on Hawai’i tourism. A decline inthe level of Hawai’i passenger traffic could have a material adverse effect on our results of operationsand financial condition.
Our business is highly dependent on the price and availability of fuel.
Our results and operations are heavily impacted by the price and availability of jet fuel. While we havebenefited recently from lower fuel costs, fuel costs began to increase in the latter half of 2016 and wecannot assure that fuel costs will not increase further in the future. The cost and availability of jet fuel
11
remains volatile and is subject to political, economic, and market factors that are generally outside ofour control. Prices may be affected by many factors including, without limitation, the impact of politicalinstability, crude oil production and refining capacity, unexpected changes in the availability ofpetroleum products due to disruptions to distribution systems or refineries, unpredicted increases indemand due to weather or the pace of global economic growth, inventory reserve levels of crude oiland other petroleum products, the relative fluctuation between the U.S. dollar and other majorcurrencies, and the actions of speculators in commodity markets. Because of the effects of these factorson the price and availability of jet fuel, the cost and future availability of fuel cannot be predicted withany degree of certainty. Also, due to the competitive nature of the airline industry, there can be noassurance that we will be able to increase our fares or other fees to sufficiently offset any increase infuel prices.
We enter into derivative agreements to protect against the volatility of fuel costs. There is no assurancethat such agreements will protect us during unfavorable market conditions or that our counterpartieswill be able to perform under these hedge arrangements. Also, if fuel prices fall significantly below thelevels in existence at the time we enter into our hedging contracts, we may be required to post asignificant amount of cash collateral, which could have an impact on the level of our unrestricted cashand cash equivalents and adversely affect our liquidity.
Also, see Item 7A, Quantitative and Qualitative Disclosures About Market Risk, for further informationregarding our exposure to the price of fuel.
Our business is exposed to foreign currency exchange rate fluctuations.
Our business is expanding internationally with an increasing percentage of our passenger revenuegenerated from our International routes. The fluctuation of the U.S. dollar relative to foreigncurrencies can significantly affect our results of operations and financial condition. To manage theeffects of fluctuating exchange rates, we periodically enter into foreign currency forward contracts.There is no assurance that such agreements will protect us against foreign currency exchange ratefluctuations during unfavorable market conditions or that our counterparties will be able to performunder these hedge arrangements.
COMPETITIVE ENVIRONMENT RISKS
We operate in an extremely competitive environment.
The airline industry is characterized by low profit margins, high fixed costs, and significant pricecompetition. We compete with other airlines on all of our Domestic and International routes. Thecommencement of, or increase in, service on our routes by existing or new carriers could negativelyimpact our operating results. Many of our competitors on our North America and International routesare larger and have greater financial resources and brand recognition than we do. Aggressive marketingtactics or a prolonged fare war initiated by one or more of these competitors could adversely affect ourfinancial resources and our ability to compete in these markets. Since airline markets have few naturalbarriers to entry, we also face the threat of new entrants in all of our markets.
Furthermore, large network carriers have significantly reduced their costs and adjusted their routes tocompete with low-cost carriers (LCC) in their existing markets by diverting resources to long-haulmarkets such as Hawai’i, where LCC competition has been less severe. Additional capacity to Hawai’i,whether from network carriers or LCCs, could decrease our share of the markets in which we operate,could cause a decline in our yields, or both, which could have a material adverse effect on our resultsof operations and financial condition.
12
Airline bankruptcy restructuring, strategic combinations or industry consolidation could have an impact onour competitive environment.
Many of our competitors have dramatically reduced operating costs through a combination ofbankruptcy restructuring, industry consolidation, and vendor and labor negotiations to increase marketstrength. Several domestic airlines were able to reduce labor costs, restructure debt and leaseagreements, and implement other financial improvements through the bankruptcy process. In addition,certain of our competitors have merged (for example, the Alaska Airlines acquisition of Virgin Americain December 2016) to create larger and more financially formidable airlines.
Through consolidation, carriers have the opportunity to achieve cost reductions by eliminatingredundancy in their networks and operating structures. With reduced costs, these competitors are morecapable of operating profitably in an environment of reduced fares and may, as a result, increaseservice in our primary markets or reduce fares to attract additional customers. Because airlinecustomers are price sensitive, we cannot ensure that we will be able to attract a sufficient number ofcustomers at sufficiently high fare levels to generate profitability, or that we will be able to reduce ouroperating costs sufficiently to remain competitive with other airlines.
The concentration of our business in Hawai’i, and between Hawai’i and the U.S. mainland, provides littlediversification of our revenue.
During 2016, approximately 74% of our passenger revenue was generated from air transportationbetween the Hawaiian Islands and the U.S. mainland and amongst the Hawaiian Islands. Many of ourcompetitors, particularly major network carriers with whom we compete on our North America routes,enjoy greater geographical diversification of their revenue. A reduction in the level of demand fortravel within Hawai’i, or to Hawai’i from the U.S. mainland, or an increase in the level of industrycapacity on these routes, may reduce the revenue we are able to generate and adversely affect ourfinancial results. As these routes account for a significantly higher proportion of our revenue than theydo for many of our competitors, such a reduction would have a relatively greater adverse effect on ourfinancial results.
Our business is affected by the competitive advantages held by network carriers in the North America market.
During 2016, approximately 54% of our passenger revenue was generated from our North Americaroutes. The majority of competition on our North America routes is from network carriers such asALK, AA, DL, and UA, all of whom have a number of competitive advantages. Primarily, networkcarriers generate passenger traffic from and throughout the U.S. mainland, which enable them toattract higher customer traffic levels as compared to us.
In contrast, we lack a comparable direct network to feed passengers to our North America flights andare therefore more reliant on passenger demand in the specific cities we serve. We also rely on ourcode-share partner agreements (with jetBlue (JBLU), AA, etc.) to provide customers access to andfrom North America destinations currently unserved by us. Most network carriers operate from hubs,which can provide a built-in market of passengers depending on the economic strength of the hub cityand the size of the customer group that frequent the airline. Our Honolulu and Maui hubs do notoriginate a large proportion of North American travel, nor do they have the population or potentialcustomer franchise of a larger city to provide us with a built-in market. Passengers in the NorthAmerica market, for the most part, do not originate in Honolulu, but on the U.S. mainland, makingHonolulu primarily a destination rather than an origin of passenger traffic.
Our Neighbor Island routes are affected by increased capacity provided by our competitors.
During 2016, approximately 24% of our passenger revenue was generated from our Neighbor Islandroutes. Although we enjoy a strong competitive position on our Neighbor Island routes, our
13
competitors have increased capacity to Hawai’i either by introducing new routes or increasing thefrequency of existing routes from North America to the Neighbor Islands. This additional capacityprovided by our competitors has the effect of decreasing our share of traffic on our Neighbor Islandroutes, which could have a material adverse effect on our results of operations and financial condition.
Our International routes are affected by competition from domestic and foreign carriers.
During 2016, approximately 22% of our passenger revenue was generated from our Internationalroutes. Our competitors on these routes include both domestic and foreign carriers. Both domestic andforeign competitors have a number of competitive advantages that may enable them to attract highercustomer traffic levels as compared to us.
Many of our domestic competitors have joined airline alliances, which provide customers access to eachparticipating airline’s international network, allowing for convenience and connectivity to theirdestinations. These alliances formed by our domestic competitors have increased in recent years. Insome instances our domestic competitors have been granted antitrust exemptions to form joint venturearrangements in certain geographies, further deepening their cooperation on certain routes. Wecurrently do not participate in any world-wide airline alliances or joint ventures, which may negativelyimpact our market share and operations as capacity provided by our competitors increase. To mitigatethis risk, we rely on code-share agreements with partner airlines to provide customers access tointernational destinations currently unserved by us.
Many of our foreign competitors are network carriers that benefit from network feed to supportInternational routes on which we compete. In contrast, we lack a comparable direct network to feedpassengers to our International flights, and are therefore more reliant on passenger demand in thespecific destinations that we serve. Most network carriers operate from hubs, which can provide abuilt-in home base market of passengers. Passengers on our International routes, for the most part, donot originate in Hawai’i, but rather internationally, in these foreign carriers’ home bases. We also relyon our code-share agreements and our relationships with travel agencies and wholesale distributors toprovide customers access to and from International destinations currently unserved by us.
INFORMATION TECHNOLOGY AND THIRD-PARTY RISKS
If we do not maintain the privacy and security of customer-related information or fail to comply withapplicable U.S. and foreign privacy or data security regulations or security standards imposed by ourcommercial partners, our reputation could be damaged, we could incur substantial additional costs, and wecould become subject to litigation or regulatory penalties.
We receive, retain, and transmit personal information about our customers and we are subject toincreasing legislative, regulatory and customer focus on privacy and data security. A number of ourcommercial partners, including credit card companies, have imposed data security standards that we areobligated to meet and these standards continue to evolve. We will continue our efforts to meet newand increasing privacy and security standards; however, it is possible that such new standards may provedifficult to meet, require us to expend additional resources, and result in the Company being unable toprocess credit card transactions if determined to be non-compliant. Additionally, any compromise ofour technology systems could result in the loss, disclosure, misappropriation of or access to ourcustomers’, employees’ or business partners’ information. Any such loss, disclosure, misappropriation oraccess could result in legal claims or proceedings, liability or regulatory penalties under laws protectingthe privacy of personal information. Any significant data breach or our failure to comply withapplicable U.S. and foreign privacy or data security regulations or security standards imposed by ourcommercial partners may adversely affect our reputation, business, results of operations and financialcondition, and may require that we expend significant additional resources related to the security ofinformation systems.
14
We are increasingly dependent on technology and automated systems to operate our business.
We depend heavily on technology and automated systems to effectively operate our business. Thesesystems include flight operations systems, communications systems, airport systems, reservationssystems, management and accounting systems, commercial websites, including www.hawaiianairlines.com,and other systems, all of which must be able to accommodate high traffic volumes, maintain secureinformation and provide accurate flight information, as well as process critical financial relatedtransactions. Any substantial or repeated failures of these systems could negatively affect our customerservice, compromise the security of customer information, result in the loss of important data, loss ofrevenue and increased costs, and generally harm our business. Like other companies, our systems maybe vulnerable to disruptions due to events beyond our control, including natural disasters, powerdisruptions, software or equipment failures, terrorist attacks, cybersecurity threats, computer viruses andhackers. There can be no assurance that the measures we have taken to reduce the adverse effects ofcertain potential failures or disruptions are adequate to prevent or remedy disruptions of our systems.In addition, we will need to continuously make significant investments in technology to periodicallyupgrade and replace existing systems. If we are unable to make these investments or fail to successfullyimplement, upgrade or replace our systems, our business could be adversely impacted.
We are highly reliant on third-party contractors to provide certain facilities and services for our operations,and termination of our third-party agreements could have a potentially adverse effect on our financial results.
We have historically relied on outside vendors for a variety of services and functions critical to ourbusiness, including aircraft maintenance and parts, code-sharing, reservations, computer servicesincluding hosting and software maintenance, accounting, frequent flyer programs, passenger processing,ground facilities, baggage and cargo handling, personnel training, and the distribution and sale ofairline seats. As part of our cost-control efforts, our reliance on outside vendors has increased and maycontinue to do so in the future.
The failure of any of our third-party service providers to adequately perform their service obligations,or other interruptions of services may reduce our revenues, increase expenses, and/or prevent us fromoperating our flights and providing other services to our customers. Our business and financialperformance would be materially harmed if our customers believe that our services are unreliable orunsatisfactory.
LABOR RELATIONS AND RELATED COSTS RISKS
We are dependent on satisfactory labor relations.
Labor costs are a significant component of airline expenses and can substantially impact an airline’sresults of operations. A significant portion of our workforce is represented by labor unions. We maymake strategic and operational decisions that require the consent of one or more of these labor unions,and these labor unions could demand additional wages, benefits or other consideration in return fortheir consent.
In addition, we have entered into collective bargaining agreements with our pilots, mechanical groupemployees, clerical group employees, flight attendants, and dispatchers. We cannot ensure that futureagreements with our employees’ labor unions will be on terms in line with our expectations orcomparable to agreements entered into by our competitors, and any future agreements may increaseour labor costs or otherwise adversely affect our business. We are currently in labor negotiations withour flight attendants union, AFA, whose contract became amendable January 1, 2017. If we are unableto reach an agreement with any unionized work group, we may be subject to future work interruptionsand/or stoppages, which may hamper or halt operations. In addition, the threat of future workinterruptions and/or stoppages may cause a decline in our passenger traffic, negatively impacting ourresults of operations and financial condition. In February 2017, we reached a tentative agreement with
15
the Air Line Pilots Association (ALPA), covering our pilots. A ratification vote is set to occur in March2017, however we can provide no assurances that the tentative agreement will be approved at that time(see Note 11 to the Notes to Consolidated Financial Statements for additional information).
Our operations may be adversely affected if we are unable to attract and retain qualified personnel and keyexecutives, including our Chief Executive Officer.
We are dependent on the knowledge and expertise of our key executives, particularly Mark B.Dunkerley, our Chief Executive Officer. Attracting and retaining such personnel in the airline industryis highly competitive. We cannot be certain that we will be able to retain our Chief Executive Officer orother key executives or attract other qualified personnel in the future. Any inability to retain our keyexecutives, or attract and retain additional qualified executives, could have a negative impact on ouroperations.
In addition, as we continue to expand our operations through the acquisition of new aircraft andintroduction of service to new markets, it may be challenging to attract a sufficient number of qualifiedpersonnel including pilots, mechanics and other skilled labor. As we compete with other carriers forqualified personnel, we also face the challenge of attracting individuals who embrace ourteam-oriented, friendly and customer-driven corporate culture. Our inability to attract and retainqualified personnel who embrace our corporate culture could have a negative impact on our reputationand overall operations.
A higher than normal number of pilot retirements could adversely affect us.
We currently have a large number of pilots eligible for retirement. Among other things, the extensionof pilot careers facilitated by the FAA’s 2007 modification of the mandatory retirement age from age 60to age 65 has now been fully implemented, resulting in large numbers of pilots in the industryapproaching the revised mandatory retirement age. If pilot retirements were to exceed normal levels inthe future, and we are not able to replace these pilots in a timely fashion, it may adversely affect ouroperations.
STRATEGY AND BRAND RISKS
Our failure to successfully implement our route and network strategy could harm our business.
Our route and network strategy (how we determine to deploy our fleet) includes initiatives to increaserevenue, decrease costs, mature our network, and improve our distribution sales channels. It is criticalthat we execute upon our planned strategy in order for our business to attain economies of scale and tosustain or improve our results of operations. If we are unable to utilize and fill increased capacityprovided by additional aircraft entering our fleet, hire and retain skilled personnel, or secure therequired equipment and facilities in a cost-effective manner, we may be unable to successfully developand grow our new and existing markets, which may adversely affect our business and operations.
We continue to strive toward aggressive cost-containment goals which are an important part of ourbusiness strategy to offer the best value to passengers through competitive fares while maintainingacceptable profit margins and return on capital. We believe a lower cost structure will better position usto fund our strategy and take advantage of market opportunities. If we are unable to adequatelycontain our non-fuel unit costs, our financial results may suffer.
16
Our reputation and financial results could be harmed in the event of adverse publicity, including the event ofan aircraft accident or incident.
Our customer base is broad and our business activities have significant prominence, particularly inHawai’i and other destinations we serve. Consequently, negative publicity resulting from real orperceived shortcomings in our customer service, employee relations, business conduct, or other eventsaffecting our operations could negatively affect the public image of our company and the willingness ofcustomers to purchase services from us, which could affect our financial results.
Additionally, we are exposed to potential losses that may be incurred in the event of an aircraftaccident or incident. Any such accident or incident involving our aircraft or an aircraft operated by oneof our code-share partners could involve not only the repair or replacement of a damaged aircraft andits consequential temporary or permanent loss of revenue, but also significant potential claims ofinjured passengers and others. We are required by the U.S. Department of Transportation (DOT) tocarry liability insurance, and although we currently maintain liability insurance in amounts consistentwith the industry, we cannot be assured that our insurance coverage will adequately cover us from allclaims and we may be forced to bear substantial losses incurred with an accident. In addition, anyaircraft accident or incident could cause a public perception that we are less safe or reliable than otherairlines, which would harm our business.
AIRLINE INDUSTRY, REGULATION AND RELATED COSTS RISKS
The airline industry has substantial operating leverage and is affected by many conditions that are beyond itscontrol, which could harm our financial condition and results of operations.
The airline industry has historically operated on low gross profit margins. Due to the substantial fixedcosts associated with operating an airline, there is a disproportionate relationship between the cost ofoperating each flight and the number of passengers carried. However, the revenue generated from aparticular flight is directly related to the number of passengers carried and the respective average faresapplied. Accordingly, a decrease in the number of passengers carried would cause a correspondingdecrease in revenue (if not offset by higher fares), and it may result in a disproportionately greaterdecrease in profits. Therefore, any general reduction in airline passenger traffic as a result of any of thefollowing or other factors, which are largely outside of our control, could harm our business, financialcondition, and results of operations:
• decline in general economic conditions;
• continued threat of terrorist attacks and conflicts overseas;
• actual or threatened war and political instability;
• increased security measures or breaches in security;
• adverse weather and natural disasters;
• changes in consumer preferences, perceptions, or spending patterns;
• increased costs related to security and safety measures;
• increased fares as a result of increases in fuel costs;
• outbreaks of contagious diseases or fear of contagion; and
• congestion at airports and actual or potential disruptions in the air traffic control system.
Our results of operations may be volatile due to the conditions identified above. We cannot ensure thatour financial resources will be sufficient to absorb the effects of any of these unexpected factors shouldthey occur.
17
Our financial results and operations may be negatively affected by the State of Hawai’i’s airportmodernization plan.
The State of Hawai’i has begun to implement a modernization plan encompassing the airports we servewithin the State. Our landing fees and airport rent rates have increased to fund the modernizationprogram. Additionally, we expect the costs for our Neighbor Island operations to increase more thanthe costs related to our North America and International operations due to phased adjustments of theairport’s funding mechanism. Therefore, costs related to the modernization program will have a greaterimpact on our operations as compared to our competitors, who do not have significant Neighbor Islandoperations. We can offer no assurance that we will be successful in offsetting these cost increasesthrough other cost reductions or increases in our revenue and, therefore, can offer no assurance thatour future financial results will not be negatively affected by them.
Our operations may be disrupted if we are unable to obtain and maintain adequate facilities andinfrastructure at airports within the State of Hawai’i.
We must be able to maintain and/or obtain adequate gates, maintenance capacity, office space,operations areas, and ticketing facilities at the airports within the State of Hawai’i to be able to operateour existing and proposed flight schedules. Failure to maintain such facilities and infrastructure mayadversely impact our operations and financial performance.
Our business is subject to substantial seasonal and cyclical volatility.
Our results of operations reflect the impact of seasonal volatility primarily due to passenger leisure andholiday travel patterns. As Hawai’i is a popular vacation destination, demand from North America, ourlargest source of visitors, is typically stronger during June, July, August and December and considerablyweaker at other times of the year. Because of fluctuations in our results from seasonality, operatingresults for a historical period are not necessarily indicative of operating results for a future period andoperating results for an interim period are not necessarily indicative of operating results for an entireyear.
Terrorist attacks or international hostilities, or the fear of terrorist attacks or hostilities, even if not madedirectly on the airline industry, could negatively affect us and the airline industry.
Terrorist attacks, even if not made directly on the airline industry, or the fear of such attacks, hostilitiesor act of war, could adversely affect the airline industry, including us, and could result in a significantdecrease in demand for air travel, increased security costs, increased insurance costs coveringwar-related risks, and increased flight operational loss due to cancellations and delays. Any futureterrorist attacks or the implementation of additional security-related fees could have a material adverseeffect on our business, financial condition and results of operations, and on the airline industry ingeneral.
The airline industry is subject to extensive government regulation, new regulations, and taxes which couldhave an adverse effect on our financial condition and results of operations.
Airlines are subject to extensive regulatory requirements that result in significant costs. New, andmodifications to existing, laws, regulations, taxes and airport rates, and charges imposed by domesticand foreign governments have been proposed from time to time that could significantly increase thecost of airline operations, restrict operations or reduce revenue. The FAA from time to time issuesdirectives and other regulations relating to the maintenance and operation of aircraft that requiresignificant expenditures. Some FAA requirements cover, among other things, retirement of olderaircraft, security measures, collision avoidance systems, airborne windshear avoidance systems, noiseabatement and other environmental concerns, commuter aircraft safety and increased inspections, and
18
maintenance procedures to be conducted on older aircraft. A failure to be in compliance, or amodification, suspension or revocation of any of our DOT/FAA authorizations or certificates, wouldhave a material adverse impact on our operations.
We cannot predict the impact that laws or regulations may have on our operations, nor can we ensurethat laws or regulations enacted in the future will not adversely affect our business. Further, we cannotguarantee that we will be able to obtain or maintain necessary governmental approvals. Once obtained,operating permits are subject to modification and revocation by the issuing agencies. Compliance withthese and any future regulatory requirements could require us to incur significant capital and operatingexpenditures.
In addition to extensive government regulations, the airline industry is dependent on certain servicesprovided by government agencies (DOT, FAA, CBP, TSA, etc.). Furthermore, because of significantlyhigher security and other costs incurred by airports since September 11, 2001, many airports havesignificantly increased their rates and charges to airlines, including us, and may do so again in thefuture.
The airline industry is required to comply with various environmental laws and regulations, which couldinhibit our ability to operate and could also have an adverse effect on our results of operations.
Many aspects of airlines’ operations are subject to increasingly stringent federal, state, local, andforeign laws protecting the environment. U.S. federal laws that have a particular impact on us includethe Airport Noise and Capacity Act of 1990, the Clean Air Act, the Resource Conservation andRecovery Act, the Clean Water Act, the Safe Drinking Water Act, the Comprehensive EnvironmentalResponse Act and the Compensation and Liability Act. Compliance with these and other environmentallaws and regulations can require significant expenditures, and violations can lead to significant finesand penalties. Governments globally are increasingly focusing on the environmental impact caused bythe consumption of fossil fuels and as a result have proposed or enacted legislation which may increasethe cost of providing airline service or restrict its provision. We expect the focus on environmentalmatters to increase.
Concern about climate change and greenhouse gases may result in additional regulation of aircraftemissions in the U.S. and abroad. In addition, other legislative or regulatory action to regulategreenhouse gas emissions is possible. At this time, we cannot predict whether any such legislation orregulation would apportion costs between one or more jurisdictions in which we operate flights. We aremonitoring and evaluating the potential impact of such legislative and regulatory developments.
In addition to direct costs, such regulation may have a greater effect on the airline industry throughincreases in fuel costs. The impact to us and our industry from such actions is likely to be adverse andcould be significant, particularly if regulators were to conclude that emissions from commercial aircraftcause significant harm to the atmosphere or have a greater impact on climate change than otherindustries.
Our operations may be adversely affected by our expansion into non-U.S. jurisdictions and the related lawsand regulations to which we are subject.
The expansion of our operations into non-U.S. jurisdictions has expanded the scope of the laws andregulations to which we are subject, both domestically and internationally. Compliance with the lawsand regulations of foreign jurisdictions and the restrictions on operations that these laws, regulations orother government actions may impose could significantly increase the cost of airline operations orreduce revenue. For example, a number of our destinations in Asia have been revising their privacy andconsumer laws and regulations. Failure to comply with these evolving laws or regulations could result insignificant penalties, criminal charges, costs to defend in a foreign jurisdiction, restrictions onoperations and reputational damage. In addition, we operate flights on international routes regulated
19
by treaties and related agreements between the U.S. and foreign governments, which are subject tochange as they may be amended from time to time. Modifications of these arrangements could result inan inability to obtain or retain take-off or landing slots for our routes, route authorization andnecessary facilities. Any limitations, additions or modifications to government treaties, agreements,regulations, laws or policies related to our international routes could have a material adverse impact onour financial position and results of operations.
We may be party to litigation or regulatory action in the normal course of business or otherwise, which couldhave an adverse effect on our operations and financial results.
From time to time, we are a party to or otherwise involved in legal or regulatory proceedings, claims,government inspections, investigations or other legal matters, both domestically and in foreignjurisdictions. Resolving or defending legal matters can take months or years. The duration of suchmatters can be unpredictable with many variables that we do not control including adverse party orgovernment responses. Litigation and regulatory proceedings are subject to significant uncertainty andmay be expensive, time-consuming and disruptive to our operations. In addition, an adverse resolutionof a lawsuit, regulatory matter, investigation or other proceeding could have a material adverse effecton our financial condition and results of operations. We may be required to change or restrict ouroperations or be subject to injunctive relief, significant compensatory damages, punitive damages,penalties, fines or disgorgement of profits, none of which may be covered by insurance. We may haveto pay out settlements that also may not be covered by insurance. There can be no assurance that anyof these payments or actions will not be material. In addition, publicity of ongoing legal and regulatorymatters may adversely affect our reputation.
Our insurance costs are susceptible to significant increases and further increases in insurance costs orreductions in coverage could have an adverse effect on our financial results.
We carry types and amounts of insurance customary in the airline industry, including coverage forgeneral liability, passenger liability, property damage, aircraft loss or damage, baggage and cargoliability, and workers’ compensation. We are required by the DOT to carry liability insurance on eachof our aircraft. We currently maintain commercial airline insurance with a major group of independentinsurers that regularly participate in world aviation insurance markets, including public liabilityinsurance and coverage for losses resulting from the physical destruction or damage to our aircraft.However, there can be no assurance that the amount of such coverage will not change or that we willnot bear substantial losses from accidents or damage to, or loss of, aircraft or other property due toother factors such as natural disasters. We could incur substantial claims resulting from an accident ordamage to, or loss of, aircraft or other property due to other factors such as natural disasters in excessof related insurance coverage that could have a material adverse effect on our results of operations andfinancial condition.
FLEET AND FLEET-RELATED RISKS
We are dependent on a limited number of suppliers for aircraft, aircraft engines and parts.
We are dependent on a limited number of suppliers (e.g. Airbus, Boeing, Rolls Royce, etc.) for aircraft,aircraft engines, and aircraft-related items. As a result, we are vulnerable to any problems associatedwith the supply of those aircraft and parts which could result in increased parts and maintenance costsin future years.
20
Our agreements to purchase Airbus A330-200, Airbus A321neo aircraft, and A330-800neo aircraft representsignificant future financial commitments and operating costs.
As of December 31, 2016, we had the following firm order commitments and purchase rights foraircraft:
Firm PurchaseAircraft Type Orders Rights Expected Delivery Dates
A330-200 aircraft . . . . . . . . . . . . . . . . . 1 — In 2017A321neo aircraft . . . . . . . . . . . . . . . . . . 16 9 Between 2017 and 2020A330-800neo aircraft . . . . . . . . . . . . . . 6 6 Between 2019 and 2021
We have made substantial pre-delivery payments for Airbus aircraft under existing purchase agreementsand are required to continue these pre-delivery payments as well as make payments for the balance ofthe purchase price through delivery of each aircraft. These commitments substantially increase ourfuture capital spending requirements and may require us to increase our level of debt in future years.There can be no assurance that we will be able to obtain such financing on favorable terms, or at all.
Delays in scheduled aircraft deliveries or other loss of fleet capacity may adversely impact our operations andfinancial results.
The success of our business depends on, among other things, the ability to effectively operate a certainnumber and type of aircraft. As noted above, we have contractual commitments to purchase andintegrate additional Airbus aircraft into our fleet. If for any reason we are unable to secure deliveriesof the Airbus aircraft on the contractually scheduled delivery dates and successfully introduce theseaircraft into our fleet, then our business, operations, and financial performance could be negativelyimpacted. For example, we have been notified of anticipated delays of three months for the initial threeA321neo deliveries, which were initially scheduled to be delivered in the third quarter of 2017. Delaysin scheduled aircraft deliveries or our failure to integrate newly purchased Airbus aircraft into our fleetas planned may require us to utilize our existing fleet longer than expected. Such extensions mayrequire us to operate existing aircraft beyond the point at which it is economically optimal to retirethem, resulting in increased maintenance costs.
We may never realize the full value of our long-lived assets, resulting in impairment and other related chargesthat may negatively impact our financial position and results of operations.
Economic and intrinsic triggers, which include extreme fuel price volatility, an uncertain economic andcredit environment, unfavorable trends in historical or forecasted results of operations and cash flows,as well as other uncertainties, may cause us to record material impairments of our long-lived assets. Forexample, in the fourth quarter of 2016, based on fleet plan changes, we recorded a $49.4 millionnon-cash impairment charge relating to the planned early retirement of our owned fleet ofBoeing 767-300 aircraft, engines, and related assets. We could be subject to similar impairment chargesin the future that could have an adverse effect on our financial position and results of operations infuture periods.
COMMON STOCK RISKS
Our share price is subject to fluctuations and stockholders could have difficulty trading shares.
The market price of our stock is influenced by many factors, many of which are outside of our control,and include the following:
• operating results and financial condition;
• changes in the competitive environment in which we operate;
21
• fuel price volatility including the availability of fuel;
• announcements concerning our competitors including bankruptcy filings, mergers, restructuringsor acquisitions by other airlines;
• increases or changes in government regulation;
• general and industry specific market conditions;
• changes in financial estimates or recommendations by securities analysts; and
• sales of our common stock or other actions by investors with significant shareholdings.
In recent years the stock market has experienced volatile price and volume fluctuations that often havebeen unrelated to the operating performance of individual companies. These market fluctuations, aswell as general economic conditions, may affect the price of our common stock.
In the past, securities class action litigation has often been instituted against a company followingperiods of volatility in the company’s stock price. This type of litigation, if filed against us, could resultin substantial costs and divert our management’s attention and resources. In addition, the future sale ofa substantial number of shares of common stock by us or by our existing stockholders may have anadverse impact on the market price of our common stock. There can be no assurance that the tradingprice of our common stock will remain at or near its current level.
Certain provisions of our certificate of incorporation and bylaws may delay or prevent a change of control,which could materially adversely affect the price of our common stock.
Our certificate of incorporation and bylaws contain provisions that may make it difficult to remove ourBoard of Directors and management, and may discourage or delay a change of control, which couldmaterially and adversely affect the price of our common stock. These provisions include, among others:
• the ability of our Board of Directors to issue, without further action by the stockholders, seriesof undesignated preferred stock, or rights to acquire preferred stock, that could dilute theinterest of, or impair the voting power of, holders of our common stock or could also be used asa method of discouraging, delaying or preventing a change of control;
• advance notice procedures for stockholder proposals to be considered at stockholders’ meetingsand for nominations of candidates for election to our Board of Directors;
• the ability of our Board of Directors to fill vacancies on the board;
• a prohibition against stockholders taking action by written consent;
• a prohibition against stockholders calling special meetings of stockholders; and
• super-majority voting requirements to modify or amend specified provisions of our certificate ofincorporation.
Our certificate of incorporation includes a provision limiting voting and ownership by non-U.S. citizens andour bylaws include a provision specifying an exclusive forum for stockholder disputes.
To comply with restrictions imposed by federal law on foreign ownership of U.S. airlines, our certificateof incorporation restricts voting of shares of our common stock by non-U.S. citizens. Our certificate ofincorporation provides that the failure of non-U.S. citizens to register their shares on a separate stockrecord, which we refer to as the ‘‘foreign stock record,’’ would result in a suspension of their votingrights in the event that the aggregate foreign ownership of the outstanding common stock exceeds theforeign ownership restrictions imposed by federal law.
22
Our certificate of incorporation further provides that no shares of our common stock will be registeredon the foreign stock record if the amount so registered would exceed the foreign ownership restrictionsimposed by federal law. If it is determined that the amount registered in the foreign stock recordexceeds the foreign ownership restrictions imposed by federal law, shares will be removed from theforeign stock record in reverse chronological order based on the date of registration therein, until thenumber of shares registered therein does not exceed the foreign ownership restrictions imposed byfederal law. As of December 31, 2016, we believe we were in compliance with the foreign ownershiprules.
Our bylaws provide that, unless we consent in writing to an alternative forum, the Court of Chancery ofthe State of Delaware or, if such court lacks jurisdiction, any other state or federal court located in theState of Delaware will be the sole and exclusive forum for (i) any derivative action or proceedingbrought on behalf of us; (ii) any action asserting a claim of breach of a fiduciary duty owed by any ofour current or former directors, officers or other employees to us or our stockholders; (iii) any actionasserting a claim against us or any of our directors, officers or other employees arising pursuant to anyprovision of the Delaware General Corporation Law or our certificate of incorporation or bylaws laws(as each may be amended or restated from time to time); or (iv) any action asserting a claim against usor any of our directors, officers or other employees governed by the internal affairs doctrine.Accordingly, stockholders may be limited in your ability to pursue legal actions, in all cases subject tothe court’s having personal jurisdiction over the indispensable parties named as defendants.Accordingly, stockholders may be limited in their ability to pursue legal actions.
LIQUIDITY RISKS
See Item 7, Management’s Discussion and Analysis of Financial Condition and Results of Operations, forfurther information regarding our liquidity.
Our financial liquidity could be adversely affected by credit market conditions.
Our business requires access to capital markets to finance equipment purchases, including aircraft, andto provide liquidity in seasonal or cyclical periods of weaker revenue generation. In particular, we willface specific funding requirements with respect to our obligation under purchase agreements withAirbus to acquire new aircraft. We may finance these upcoming aircraft deliveries; however, theunpredictability of global credit market conditions may adversely affect the availability of financing ormay result in unfavorable terms and conditions. We can offer no assurance that the financing we needwill be available when required or that the economic terms on which it is available will not adverselyaffect our financial condition. If we cannot obtain financing or we cannot obtain financing oncommercially reasonable terms, our business and financial condition will be adversely affected.
Our debt could adversely affect our liquidity and financial condition, and include covenants that imposerestrictions on our financial and business operations.
As of December 31, 2016, we had $482 million in outstanding debt. Our debt and related covenantscould:
• require us to dedicate a substantial portion of our cash flow from operations to payments on ourdebt, thereby reducing the availability of our cash flow for other operational purposes;
• limit our flexibility in planning for, or reacting to, changes in our business and the industry inwhich we operate;
• limit, along with the financial and other restrictive covenants in the agreements governing ourdebt, our ability to borrow additional funds;
23
• place us at a competitive disadvantage compared to other less leveraged competitors andcompetitors with debt agreements on more favorable terms than us; and
• adversely affect our ability to secure additional financing in the future on acceptable terms or atall, which would impact our ability to fund our working capital, capital expenditures, acquisitionsor other general purpose needs.
These agreements require us to meet certain covenants. If we breach any of these covenants we couldbe in a default under these facilities, which could cause our outstanding obligations under thesefacilities to accelerate and become due and payable immediately, and could also cause us to defaultunder our other debt or lease obligations and lead to an acceleration of the obligations related to suchother debt or lease obligations. The existence of such a default could also preclude us from borrowingfunds under our credit facilities.
Our ability to comply with the provisions of financing agreements can be affected by events beyond ourcontrol and a default under any such financing agreements if not cured or waived, could have amaterial adverse effect on us. In the event our debt is accelerated, we may not have sufficient liquidityto repay these obligations or to refinance our debt obligations, resulting in a material adverse effect onour financial condition.
We are required to maintain reserves under our credit card processing agreements which could adversely affectour financial and business operations.
Under our bank-issued credit card processing agreements, certain proceeds from advance ticket sales isheld back to serve as collateral to cover any possible chargebacks or other disputed charges that mayoccur. These holdbacks totaled $5.0 million as of December 31, 2016. In the event of a materialadverse change in our business, the holdback could incrementally increase to an amount up to 100% ofthe applicable credit card activity for all unflown flights, which would also cause an increase in the levelof restricted cash. If we are unable to obtain a waiver, or otherwise mitigate the increase in restrictedcash, it could adversely affect our liquidity and also cause a covenant violation under other debt orlease obligations and have a material adverse effect on our financial condition.
Our obligations for funding our defined benefit pension plans are significant and are affected by factorsbeyond our control.
We sponsor two defined benefit pension plans, as well as a separate plan to administer pilots’ disabilitybenefits. Currently, our minimum funding obligation for our pension plans is subject to temporaryfavorable rules that are scheduled to expire at the end of 2017. As of December 31, 2016, the unfundedpension and disability obligation related to these plans was $174 million. The timing and amount offunding requirements depend upon a number of factors, including labor negotiations and changes topension plan benefits as well as factors outside our control, such as the number and demographicprofile of qualified retiring employees, asset returns, interest rates and changes in pension laws. Thesefactors, along with the impact of results that can vary significantly from estimates, may significantlyimpact our funding requirements and have an adverse effect on our financial condition.
ITEM 1B. UNRESOLVED STAFF COMMENTS.
None.
24
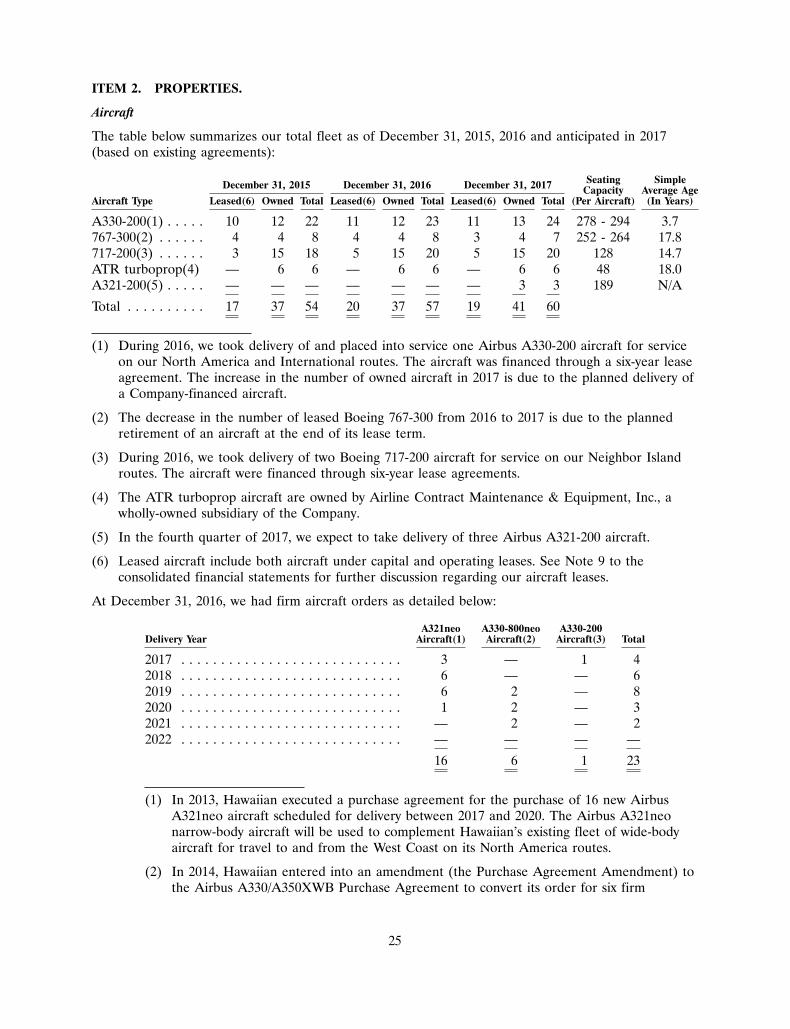
ITEM 2. PROPERTIES.
Aircraft
The table below summarizes our total fleet as of December 31, 2015, 2016 and anticipated in 2017(based on existing agreements):
Seating SimpleDecember 31, 2015 December 31, 2016 December 31, 2017 Capacity Average AgeAircraft Type Leased(6) Owned Total Leased(6) Owned Total Leased(6) Owned Total (Per Aircraft) (In Years)
A330-200(1) . . . . . 10 12 22 11 12 23 11 13 24 278 - 294 3.7767-300(2) . . . . . . 4 4 8 4 4 8 3 4 7 252 - 264 17.8717-200(3) . . . . . . 3 15 18 5 15 20 5 15 20 128 14.7ATR turboprop(4) — 6 6 — 6 6 — 6 6 48 18.0A321-200(5) . . . . . — — — — — — — 3 3 189 N/A
Total . . . . . . . . . . 17 37 54 20 37 57 19 41 60
(1) During 2016, we took delivery of and placed into service one Airbus A330-200 aircraft for serviceon our North America and International routes. The aircraft was financed through a six-year leaseagreement. The increase in the number of owned aircraft in 2017 is due to the planned delivery ofa Company-financed aircraft.
(2) The decrease in the number of leased Boeing 767-300 from 2016 to 2017 is due to the plannedretirement of an aircraft at the end of its lease term.
(3) During 2016, we took delivery of two Boeing 717-200 aircraft for service on our Neighbor Islandroutes. The aircraft were financed through six-year lease agreements.
(4) The ATR turboprop aircraft are owned by Airline Contract Maintenance & Equipment, Inc., awholly-owned subsidiary of the Company.
(5) In the fourth quarter of 2017, we expect to take delivery of three Airbus A321-200 aircraft.
(6) Leased aircraft include both aircraft under capital and operating leases. See Note 9 to theconsolidated financial statements for further discussion regarding our aircraft leases.
At December 31, 2016, we had firm aircraft orders as detailed below:
A321neo A330-800neo A330-200Delivery Year Aircraft(1) Aircraft(2) Aircraft(3) Total
2017 . . . . . . . . . . . . . . . . . . . . . . . . . . . . 3 — 1 42018 . . . . . . . . . . . . . . . . . . . . . . . . . . . . 6 — — 62019 . . . . . . . . . . . . . . . . . . . . . . . . . . . . 6 2 — 82020 . . . . . . . . . . . . . . . . . . . . . . . . . . . . 1 2 — 32021 . . . . . . . . . . . . . . . . . . . . . . . . . . . . — 2 — 22022 . . . . . . . . . . . . . . . . . . . . . . . . . . . . — — — —
16 6 1 23
(1) In 2013, Hawaiian executed a purchase agreement for the purchase of 16 new AirbusA321neo aircraft scheduled for delivery between 2017 and 2020. The Airbus A321neonarrow-body aircraft will be used to complement Hawaiian’s existing fleet of wide-bodyaircraft for travel to and from the West Coast on its North America routes.
(2) In 2014, Hawaiian entered into an amendment (the Purchase Agreement Amendment) tothe Airbus A330/A350XWB Purchase Agreement to convert its order for six firm
25
A350XWB-800 aircraft with an additional six purchase rights into an order for six firmA330-800neo aircraft with an additional six purchase rights. The Purchase AgreementAmendment provides for delivery, subject to certain flexibility rights, of six AirbusA330-800neo aircraft starting in 2019. These fuel efficient, long-range aircraft willcomplement our existing fleet of wide-body, twin aisle aircraft used for long-haul flying onour North America and International routes.
(3) In 2016, Hawaiian executed a purchase agreement for the purchase of one new AirbusA330-200 aircraft scheduled for delivery in the fourth quarter of 2017.
Hawaiian has purchase rights for an additional nine A321neo aircraft and six A330-800neo aircraft andcan utilize these rights subject to production availability. See Note 9 to the consolidated financialstatements for additional information regarding our aircraft lease agreements.
Ground Facilities
Our principal terminal facilities, cargo facilities and hangar and maintenance facilities are located at theHonolulu International Airport (HNL). The majority of the facilities at HNL are leased on amonth-to-month basis. We are also charged for the use of terminal facilities at the four major NeighborIsland airports owned by the State of Hawai’i. Some terminal facilities, including gates and holdingrooms, are considered by the State of Hawai’i to be common areas and thus are not exclusivelycontrolled by us. We also utilize other State of Hawai’i facilities, including station managers’ offices,Premier Club lounges, and operations support space.
26
The table below sets forth the airport locations we utilize pursuant to various agreements as ofDecember 31, 2016:
Name of Airport Location
Phoenix Sky Harbor International Airport . . . . . . . . . . . . . . . . . . . . . Phoenix ArizonaLos Angeles International Airport . . . . . . . . . . . . . . . . . . . . . . . . . . . Los Angeles CaliforniaOakland International Airport . . . . . . . . . . . . . . . . . . . . . . . . . . . . . . Oakland CaliforniaSacramento International Airport . . . . . . . . . . . . . . . . . . . . . . . . . . . Sacramento CaliforniaSan Diego International Airport . . . . . . . . . . . . . . . . . . . . . . . . . . . . San Diego CaliforniaSan Francisco International Airport . . . . . . . . . . . . . . . . . . . . . . . . . . San Francisco CaliforniaNorman Y. Mineta San Jose International Airport . . . . . . . . . . . . . . . San Jose CaliforniaHilo International Airport . . . . . . . . . . . . . . . . . . . . . . . . . . . . . . . . . Hilo Hawai’iHonolulu International Airport . . . . . . . . . . . . . . . . . . . . . . . . . . . . . Honolulu Hawai’iKahului Airport . . . . . . . . . . . . . . . . . . . . . . . . . . . . . . . . . . . . . . . . Kahului Hawai’iKapalua Airport . . . . . . . . . . . . . . . . . . . . . . . . . . . . . . . . . . . . . . . . Lahaina Hawai’iKona International Airport . . . . . . . . . . . . . . . . . . . . . . . . . . . . . . . . Kona Hawai’iLana’i Airport . . . . . . . . . . . . . . . . . . . . . . . . . . . . . . . . . . . . . . . . . Lana’i Hawai’iLihu’e Airport . . . . . . . . . . . . . . . . . . . . . . . . . . . . . . . . . . . . . . . . . Lihu’e Hawai’iMoloka’i Airport . . . . . . . . . . . . . . . . . . . . . . . . . . . . . . . . . . . . . . . Moloka’i Hawai’iMcCarran International Airport . . . . . . . . . . . . . . . . . . . . . . . . . . . . Las Vegas NevadaJohn F. Kennedy International Airport . . . . . . . . . . . . . . . . . . . . . . . New York New YorkPortland International Airport . . . . . . . . . . . . . . . . . . . . . . . . . . . . . . Portland OregonSeattle-Tacoma International Airport . . . . . . . . . . . . . . . . . . . . . . . . . Seattle WashingtonPago Pago International Airport . . . . . . . . . . . . . . . . . . . . . . . . . . . . Pago Pago American SamoaBrisbane International Airport . . . . . . . . . . . . . . . . . . . . . . . . . . . . . Brisbane AustraliaSydney International Airport . . . . . . . . . . . . . . . . . . . . . . . . . . . . . . . Sydney AustraliaBeijing Capital International Airport . . . . . . . . . . . . . . . . . . . . . . . . . Beijing ChinaHaneda International Airport . . . . . . . . . . . . . . . . . . . . . . . . . . . . . . Tokyo JapanKansai International Airport . . . . . . . . . . . . . . . . . . . . . . . . . . . . . . . Osaka JapanNarita International Airport . . . . . . . . . . . . . . . . . . . . . . . . . . . . . . . Tokyo JapanNew Chitose International Airport . . . . . . . . . . . . . . . . . . . . . . . . . . Sapporo JapanAuckland Airport . . . . . . . . . . . . . . . . . . . . . . . . . . . . . . . . . . . . . . . Auckland New ZealandIncheon International Airport . . . . . . . . . . . . . . . . . . . . . . . . . . . . . . Seoul South KoreaFaa’a International Airport . . . . . . . . . . . . . . . . . . . . . . . . . . . . . . . . Papeete Tahiti
Our corporate headquarters are located in leased premises adjacent to the Honolulu InternationalAirport.
ITEM 3. LEGAL PROCEEDINGS.
We are subject to legal proceedings arising in the normal course of our operations. We do notanticipate that the disposition of any currently pending proceeding will have a material effect on ouroperations, business or financial condition.
ITEM 4. MINE SAFETY DISCLOSURES.
Not applicable.
27
PART II
ITEM 5. MARKET FOR REGISTRANT’S COMMON EQUITY, RELATED STOCKHOLDERMATTERS AND ISSUER PURCHASES OF EQUITY SECURITIES.
Our common stock is traded on the NASDAQ Stock Market, LLC (NASDAQ) under the symbol‘‘HA.’’ The following table sets forth the range of high and low sales prices of our common stock asreported on the NASDAQ for the periods indicated.
High Low
2016Fourth Quarter . . . . . . . . . . . . . . . . . . . . . . . . . . . . . . . . . . . . $60.90 $44.28Third Quarter . . . . . . . . . . . . . . . . . . . . . . . . . . . . . . . . . . . . . 49.87 37.40Second Quarter . . . . . . . . . . . . . . . . . . . . . . . . . . . . . . . . . . . . 50.95 34.69First Quarter . . . . . . . . . . . . . . . . . . . . . . . . . . . . . . . . . . . . . . 48.14 28.40
2015Fourth Quarter . . . . . . . . . . . . . . . . . . . . . . . . . . . . . . . . . . . . $40.13 $23.77Third Quarter . . . . . . . . . . . . . . . . . . . . . . . . . . . . . . . . . . . . . 26.00 19.87Second Quarter . . . . . . . . . . . . . . . . . . . . . . . . . . . . . . . . . . . . 26.10 20.75First Quarter . . . . . . . . . . . . . . . . . . . . . . . . . . . . . . . . . . . . . . 27.66 18.01
Holders
There were 844 stockholders of record of our common stock as of February 10, 2017, which does notreflect those shares held beneficially or those shares held in ‘‘street’’ name.
Dividends and Other Restrictions
We paid no dividends in 2016 or 2015. We do not anticipate paying periodic cash dividends on ourcommon stock for the foreseeable future. See ‘‘Management’s Discussion and Analysis of FinancialCondition and Results of Operations—Liquidity and Capital Resources.’’
United States law prohibits non-U.S. citizens from owning more than 25% of the voting interest of aU.S. air carrier or controlling a U.S. air carrier. Our certificate of incorporation prohibits theownership or control of more than 25% (to be increased or decreased from time to time, as permittedunder the laws of the U.S.) of our issued and outstanding voting capital stock by persons who are not‘‘citizens of the U.S.’’ As of December 31, 2016, we believe we are in compliance with the law as itrelates to voting stock held by non-U.S. citizens.
Purchases of Equity Securities by the Issuer and Affiliated Purchasers
On April 23, 2015, we announced that our Board of Directors approved a stock repurchase programunder which we may purchase up to $100 million of our outstanding common stock over a two-yearperiod ending on April 24, 2017 through the open market, established plans or privately negotiatedtransactions in accordance with applicable securities laws, rules and regulations. The stock repurchaseprogram is subject to modification or termination at any time. We did not repurchase any shares of ourcommon stock during the three months ended December 31, 2016. As of December 31, 2016, theCompany has$46.0 million remaining to spend under the stock repurchase program.
28
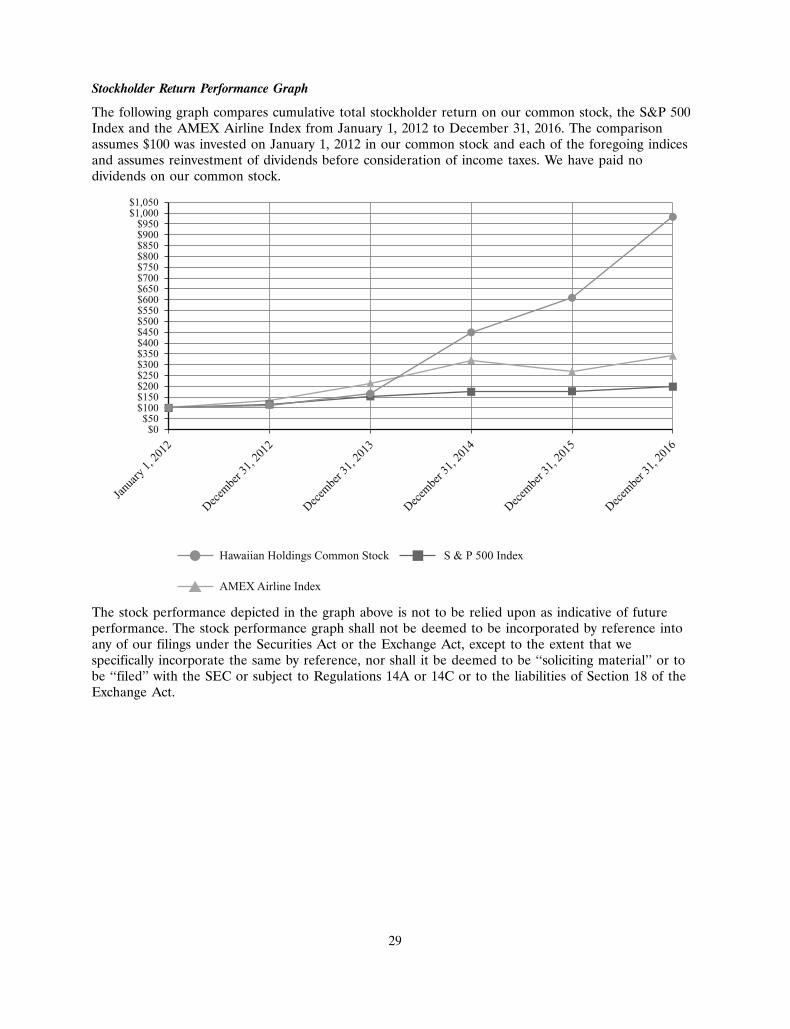
24FEB201707190447
Stockholder Return Performance Graph
The following graph compares cumulative total stockholder return on our common stock, the S&P 500Index and the AMEX Airline Index from January 1, 2012 to December 31, 2016. The comparisonassumes $100 was invested on January 1, 2012 in our common stock and each of the foregoing indicesand assumes reinvestment of dividends before consideration of income taxes. We have paid nodividends on our common stock.
$1,050$1,000
$950$900$850$800$750$700$650$600$550$500$450$400$350$300$250$200$150$100$50$0
Hawaiian Holdings Common Stock
AMEX Airline Index
S & P 500 Index
Janu
ary 1
, 201
2
Decem
ber 3
1, 20
12
Decem
ber 3
1, 20
13
Decem
ber 3
1, 20
14
Decem
ber 3
1, 20
15
Decem
ber 3
1, 20
16
The stock performance depicted in the graph above is not to be relied upon as indicative of futureperformance. The stock performance graph shall not be deemed to be incorporated by reference intoany of our filings under the Securities Act or the Exchange Act, except to the extent that wespecifically incorporate the same by reference, nor shall it be deemed to be ‘‘soliciting material’’ or tobe ‘‘filed’’ with the SEC or subject to Regulations 14A or 14C or to the liabilities of Section 18 of theExchange Act.
29
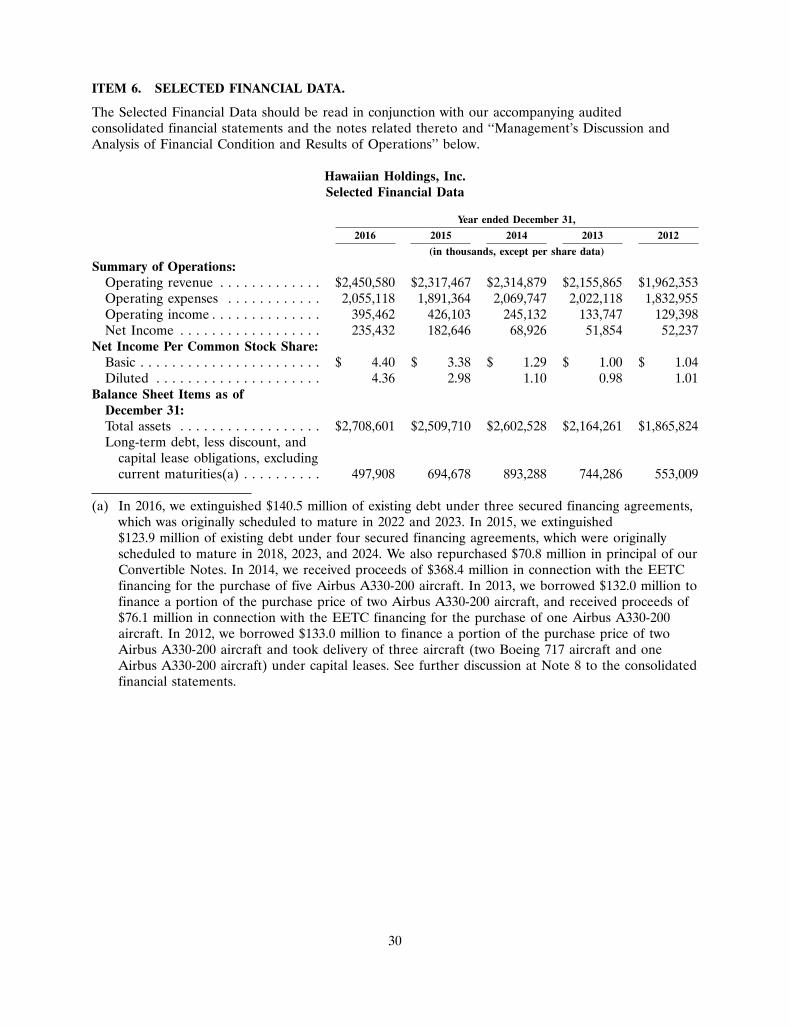
ITEM 6. SELECTED FINANCIAL DATA.
The Selected Financial Data should be read in conjunction with our accompanying auditedconsolidated financial statements and the notes related thereto and ‘‘Management’s Discussion andAnalysis of Financial Condition and Results of Operations’’ below.
Hawaiian Holdings, Inc.Selected Financial Data
Year ended December 31,
2016 2015 2014 2013 2012
(in thousands, except per share data)
Summary of Operations:Operating revenue . . . . . . . . . . . . . $2,450,580 $2,317,467 $2,314,879 $2,155,865 $1,962,353Operating expenses . . . . . . . . . . . . 2,055,118 1,891,364 2,069,747 2,022,118 1,832,955Operating income . . . . . . . . . . . . . . 395,462 426,103 245,132 133,747 129,398Net Income . . . . . . . . . . . . . . . . . . 235,432 182,646 68,926 51,854 52,237
Net Income Per Common Stock Share:Basic . . . . . . . . . . . . . . . . . . . . . . . $ 4.40 $ 3.38 $ 1.29 $ 1.00 $ 1.04Diluted . . . . . . . . . . . . . . . . . . . . . 4.36 2.98 1.10 0.98 1.01
Balance Sheet Items as ofDecember 31:Total assets . . . . . . . . . . . . . . . . . . $2,708,601 $2,509,710 $2,602,528 $2,164,261 $1,865,824Long-term debt, less discount, and
capital lease obligations, excludingcurrent maturities(a) . . . . . . . . . . 497,908 694,678 893,288 744,286 553,009
(a) In 2016, we extinguished $140.5 million of existing debt under three secured financing agreements,which was originally scheduled to mature in 2022 and 2023. In 2015, we extinguished$123.9 million of existing debt under four secured financing agreements, which were originallyscheduled to mature in 2018, 2023, and 2024. We also repurchased $70.8 million in principal of ourConvertible Notes. In 2014, we received proceeds of $368.4 million in connection with the EETCfinancing for the purchase of five Airbus A330-200 aircraft. In 2013, we borrowed $132.0 million tofinance a portion of the purchase price of two Airbus A330-200 aircraft, and received proceeds of$76.1 million in connection with the EETC financing for the purchase of one Airbus A330-200aircraft. In 2012, we borrowed $133.0 million to finance a portion of the purchase price of twoAirbus A330-200 aircraft and took delivery of three aircraft (two Boeing 717 aircraft and oneAirbus A330-200 aircraft) under capital leases. See further discussion at Note 8 to the consolidatedfinancial statements.
30
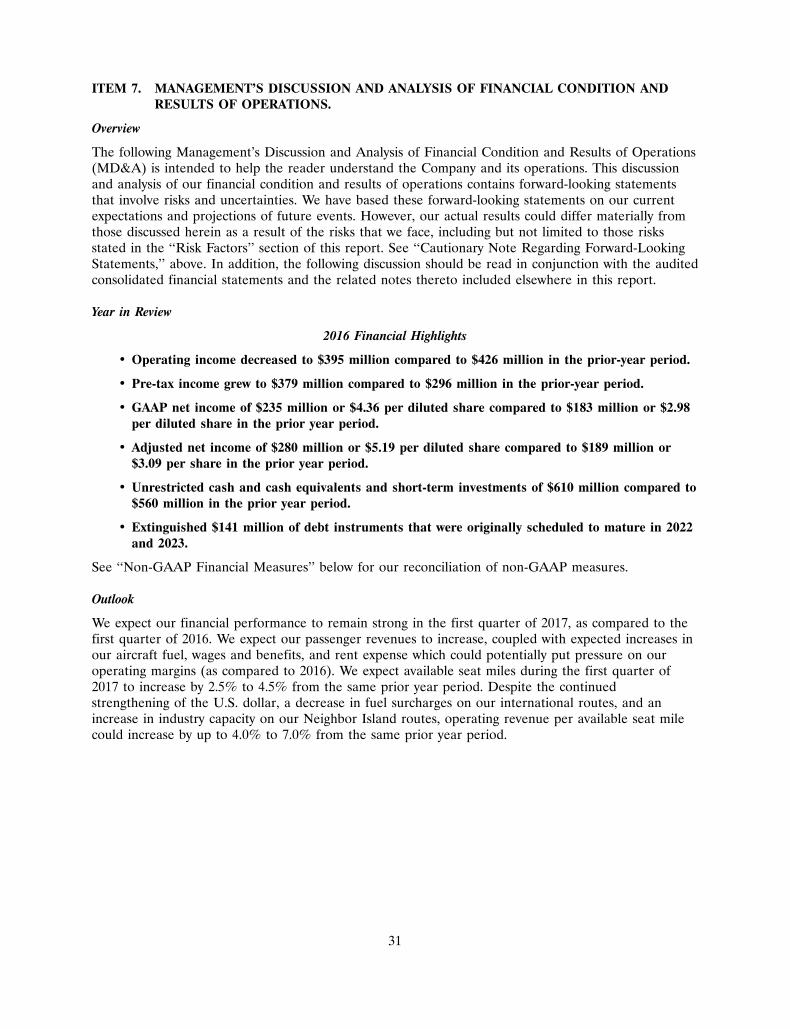
ITEM 7. MANAGEMENT’S DISCUSSION AND ANALYSIS OF FINANCIAL CONDITION ANDRESULTS OF OPERATIONS.
Overview
The following Management’s Discussion and Analysis of Financial Condition and Results of Operations(MD&A) is intended to help the reader understand the Company and its operations. This discussionand analysis of our financial condition and results of operations contains forward-looking statementsthat involve risks and uncertainties. We have based these forward-looking statements on our currentexpectations and projections of future events. However, our actual results could differ materially fromthose discussed herein as a result of the risks that we face, including but not limited to those risksstated in the ‘‘Risk Factors’’ section of this report. See ‘‘Cautionary Note Regarding Forward-LookingStatements,’’ above. In addition, the following discussion should be read in conjunction with the auditedconsolidated financial statements and the related notes thereto included elsewhere in this report.
Year in Review
2016 Financial Highlights
• Operating income decreased to $395 million compared to $426 million in the prior-year period.
• Pre-tax income grew to $379 million compared to $296 million in the prior-year period.
• GAAP net income of $235 million or $4.36 per diluted share compared to $183 million or $2.98per diluted share in the prior year period.
• Adjusted net income of $280 million or $5.19 per diluted share compared to $189 million or$3.09 per share in the prior year period.
• Unrestricted cash and cash equivalents and short-term investments of $610 million compared to$560 million in the prior year period.
• Extinguished $141 million of debt instruments that were originally scheduled to mature in 2022and 2023.
See ‘‘Non-GAAP Financial Measures’’ below for our reconciliation of non-GAAP measures.
Outlook
We expect our financial performance to remain strong in the first quarter of 2017, as compared to thefirst quarter of 2016. We expect our passenger revenues to increase, coupled with expected increases inour aircraft fuel, wages and benefits, and rent expense which could potentially put pressure on ouroperating margins (as compared to 2016). We expect available seat miles during the first quarter of2017 to increase by 2.5% to 4.5% from the same prior year period. Despite the continuedstrengthening of the U.S. dollar, a decrease in fuel surcharges on our international routes, and anincrease in industry capacity on our Neighbor Island routes, operating revenue per available seat milecould increase by up to 4.0% to 7.0% from the same prior year period.
31
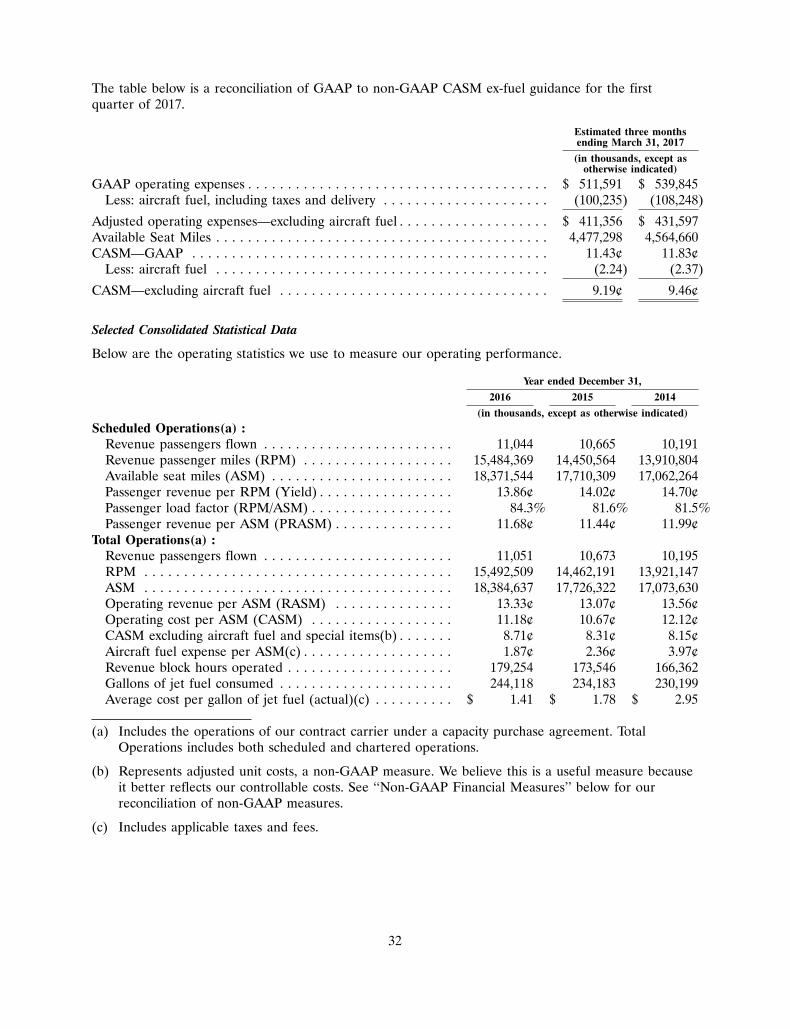
The table below is a reconciliation of GAAP to non-GAAP CASM ex-fuel guidance for the firstquarter of 2017.
Estimated three monthsending March 31, 2017
(in thousands, except asotherwise indicated)
GAAP operating expenses . . . . . . . . . . . . . . . . . . . . . . . . . . . . . . . . . . . . . . $ 511,591 $ 539,845Less: aircraft fuel, including taxes and delivery . . . . . . . . . . . . . . . . . . . . . (100,235) (108,248)
Adjusted operating expenses—excluding aircraft fuel . . . . . . . . . . . . . . . . . . . $ 411,356 $ 431,597Available Seat Miles . . . . . . . . . . . . . . . . . . . . . . . . . . . . . . . . . . . . . . . . . . 4,477,298 4,564,660CASM—GAAP . . . . . . . . . . . . . . . . . . . . . . . . . . . . . . . . . . . . . . . . . . . . . 11.43¢ 11.83¢
Less: aircraft fuel . . . . . . . . . . . . . . . . . . . . . . . . . . . . . . . . . . . . . . . . . . (2.24) (2.37)
CASM—excluding aircraft fuel . . . . . . . . . . . . . . . . . . . . . . . . . . . . . . . . . . 9.19¢ 9.46¢
Selected Consolidated Statistical Data
Below are the operating statistics we use to measure our operating performance.
Year ended December 31,
2016 2015 2014
(in thousands, except as otherwise indicated)
Scheduled Operations(a) :Revenue passengers flown . . . . . . . . . . . . . . . . . . . . . . . . 11,044 10,665 10,191Revenue passenger miles (RPM) . . . . . . . . . . . . . . . . . . . 15,484,369 14,450,564 13,910,804Available seat miles (ASM) . . . . . . . . . . . . . . . . . . . . . . . 18,371,544 17,710,309 17,062,264Passenger revenue per RPM (Yield) . . . . . . . . . . . . . . . . . 13.86¢ 14.02¢ 14.70¢Passenger load factor (RPM/ASM) . . . . . . . . . . . . . . . . . . 84.3% 81.6% 81.5%Passenger revenue per ASM (PRASM) . . . . . . . . . . . . . . . 11.68¢ 11.44¢ 11.99¢
Total Operations(a) :Revenue passengers flown . . . . . . . . . . . . . . . . . . . . . . . . 11,051 10,673 10,195RPM . . . . . . . . . . . . . . . . . . . . . . . . . . . . . . . . . . . . . . . 15,492,509 14,462,191 13,921,147ASM . . . . . . . . . . . . . . . . . . . . . . . . . . . . . . . . . . . . . . . 18,384,637 17,726,322 17,073,630Operating revenue per ASM (RASM) . . . . . . . . . . . . . . . 13.33¢ 13.07¢ 13.56¢Operating cost per ASM (CASM) . . . . . . . . . . . . . . . . . . 11.18¢ 10.67¢ 12.12¢CASM excluding aircraft fuel and special items(b) . . . . . . . 8.71¢ 8.31¢ 8.15¢Aircraft fuel expense per ASM(c) . . . . . . . . . . . . . . . . . . . 1.87¢ 2.36¢ 3.97¢Revenue block hours operated . . . . . . . . . . . . . . . . . . . . . 179,254 173,546 166,362Gallons of jet fuel consumed . . . . . . . . . . . . . . . . . . . . . . 244,118 234,183 230,199Average cost per gallon of jet fuel (actual)(c) . . . . . . . . . . $ 1.41 $ 1.78 $ 2.95
(a) Includes the operations of our contract carrier under a capacity purchase agreement. TotalOperations includes both scheduled and chartered operations.
(b) Represents adjusted unit costs, a non-GAAP measure. We believe this is a useful measure becauseit better reflects our controllable costs. See ‘‘Non-GAAP Financial Measures’’ below for ourreconciliation of non-GAAP measures.
(c) Includes applicable taxes and fees.
32
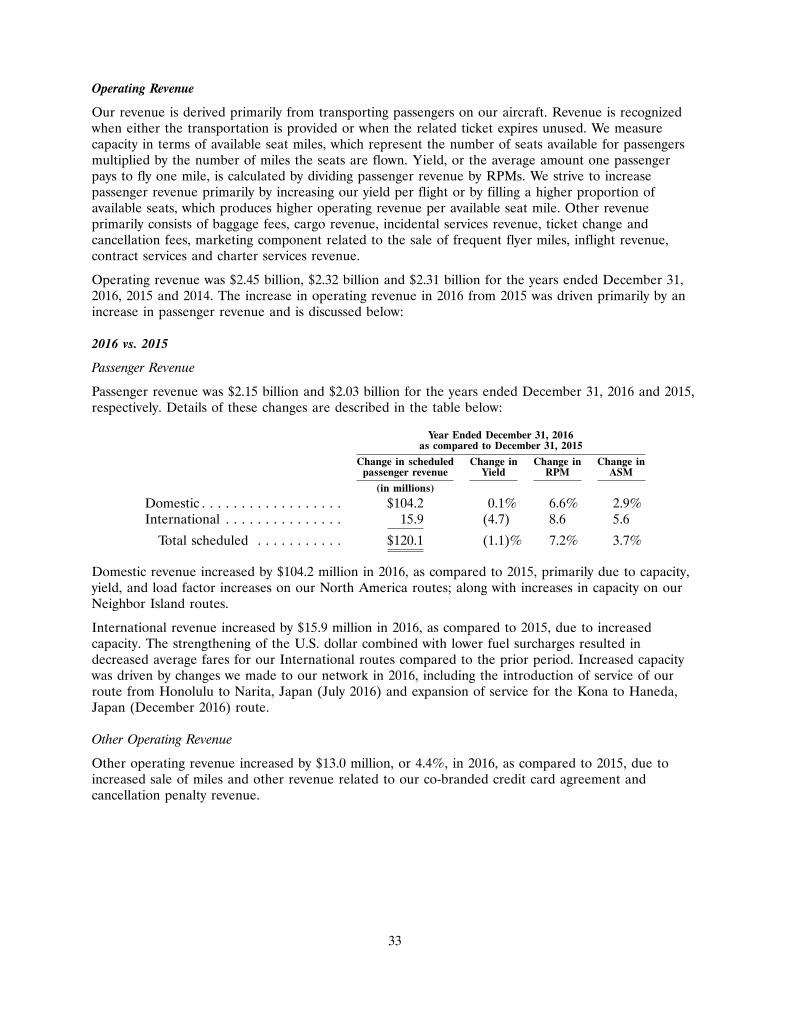
Operating Revenue
Our revenue is derived primarily from transporting passengers on our aircraft. Revenue is recognizedwhen either the transportation is provided or when the related ticket expires unused. We measurecapacity in terms of available seat miles, which represent the number of seats available for passengersmultiplied by the number of miles the seats are flown. Yield, or the average amount one passengerpays to fly one mile, is calculated by dividing passenger revenue by RPMs. We strive to increasepassenger revenue primarily by increasing our yield per flight or by filling a higher proportion ofavailable seats, which produces higher operating revenue per available seat mile. Other revenueprimarily consists of baggage fees, cargo revenue, incidental services revenue, ticket change andcancellation fees, marketing component related to the sale of frequent flyer miles, inflight revenue,contract services and charter services revenue.
Operating revenue was $2.45 billion, $2.32 billion and $2.31 billion for the years ended December 31,2016, 2015 and 2014. The increase in operating revenue in 2016 from 2015 was driven primarily by anincrease in passenger revenue and is discussed below:
2016 vs. 2015
Passenger Revenue
Passenger revenue was $2.15 billion and $2.03 billion for the years ended December 31, 2016 and 2015,respectively. Details of these changes are described in the table below:
Year Ended December 31, 2016as compared to December 31, 2015
Change in scheduled Change in Change in Change inpassenger revenue Yield RPM ASM
(in millions)
Domestic . . . . . . . . . . . . . . . . . . $104.2 0.1% 6.6% 2.9%International . . . . . . . . . . . . . . . 15.9 (4.7) 8.6 5.6
Total scheduled . . . . . . . . . . . $120.1 (1.1)% 7.2% 3.7%
Domestic revenue increased by $104.2 million in 2016, as compared to 2015, primarily due to capacity,yield, and load factor increases on our North America routes; along with increases in capacity on ourNeighbor Island routes.
International revenue increased by $15.9 million in 2016, as compared to 2015, due to increasedcapacity. The strengthening of the U.S. dollar combined with lower fuel surcharges resulted indecreased average fares for our International routes compared to the prior period. Increased capacitywas driven by changes we made to our network in 2016, including the introduction of service of ourroute from Honolulu to Narita, Japan (July 2016) and expansion of service for the Kona to Haneda,Japan (December 2016) route.
Other Operating Revenue
Other operating revenue increased by $13.0 million, or 4.4%, in 2016, as compared to 2015, due toincreased sale of miles and other revenue related to our co-branded credit card agreement andcancellation penalty revenue.
33
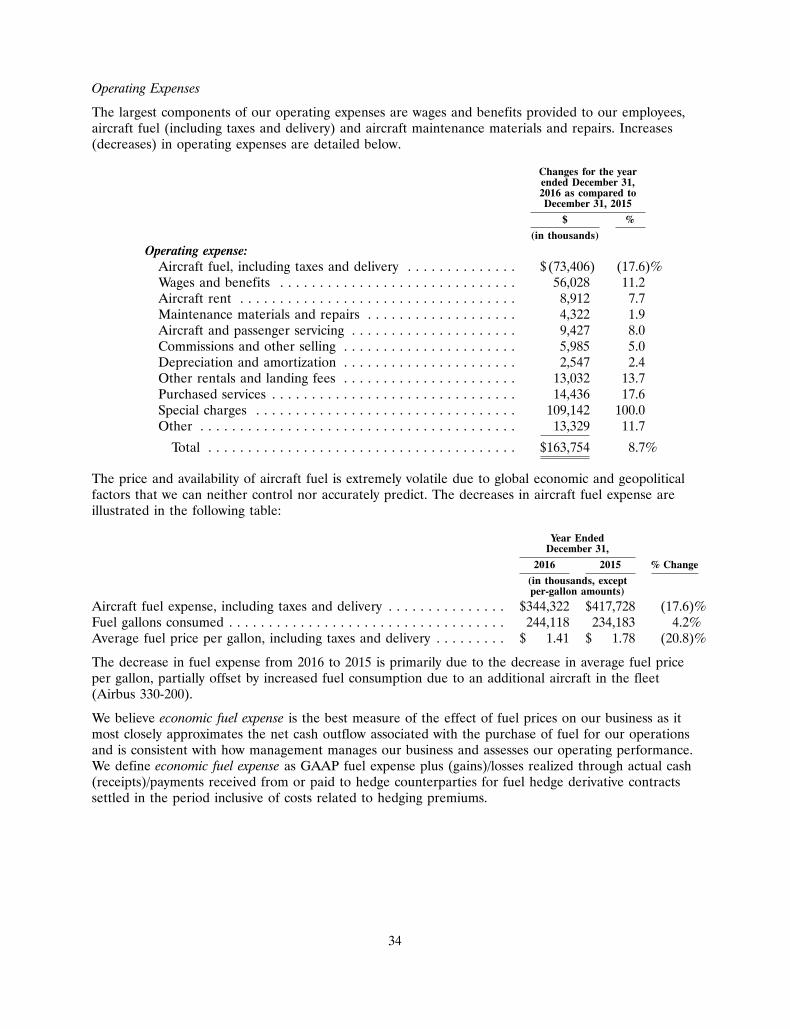
Operating Expenses
The largest components of our operating expenses are wages and benefits provided to our employees,aircraft fuel (including taxes and delivery) and aircraft maintenance materials and repairs. Increases(decreases) in operating expenses are detailed below.
Changes for the yearended December 31,2016 as compared toDecember 31, 2015
$ %
(in thousands)
Operating expense:Aircraft fuel, including taxes and delivery . . . . . . . . . . . . . . $ (73,406) (17.6)%Wages and benefits . . . . . . . . . . . . . . . . . . . . . . . . . . . . . . 56,028 11.2Aircraft rent . . . . . . . . . . . . . . . . . . . . . . . . . . . . . . . . . . . 8,912 7.7Maintenance materials and repairs . . . . . . . . . . . . . . . . . . . 4,322 1.9Aircraft and passenger servicing . . . . . . . . . . . . . . . . . . . . . 9,427 8.0Commissions and other selling . . . . . . . . . . . . . . . . . . . . . . 5,985 5.0Depreciation and amortization . . . . . . . . . . . . . . . . . . . . . . 2,547 2.4Other rentals and landing fees . . . . . . . . . . . . . . . . . . . . . . 13,032 13.7Purchased services . . . . . . . . . . . . . . . . . . . . . . . . . . . . . . . 14,436 17.6Special charges . . . . . . . . . . . . . . . . . . . . . . . . . . . . . . . . . 109,142 100.0Other . . . . . . . . . . . . . . . . . . . . . . . . . . . . . . . . . . . . . . . . 13,329 11.7
Total . . . . . . . . . . . . . . . . . . . . . . . . . . . . . . . . . . . . . . . $163,754 8.7%
The price and availability of aircraft fuel is extremely volatile due to global economic and geopoliticalfactors that we can neither control nor accurately predict. The decreases in aircraft fuel expense areillustrated in the following table:
Year EndedDecember 31,
2016 2015 % Change
(in thousands, exceptper-gallon amounts)
Aircraft fuel expense, including taxes and delivery . . . . . . . . . . . . . . . $344,322 $417,728 (17.6)%Fuel gallons consumed . . . . . . . . . . . . . . . . . . . . . . . . . . . . . . . . . . . 244,118 234,183 4.2%Average fuel price per gallon, including taxes and delivery . . . . . . . . . $ 1.41 $ 1.78 (20.8)%
The decrease in fuel expense from 2016 to 2015 is primarily due to the decrease in average fuel priceper gallon, partially offset by increased fuel consumption due to an additional aircraft in the fleet(Airbus 330-200).
We believe economic fuel expense is the best measure of the effect of fuel prices on our business as itmost closely approximates the net cash outflow associated with the purchase of fuel for our operationsand is consistent with how management manages our business and assesses our operating performance.We define economic fuel expense as GAAP fuel expense plus (gains)/losses realized through actual cash(receipts)/payments received from or paid to hedge counterparties for fuel hedge derivative contractssettled in the period inclusive of costs related to hedging premiums.
34
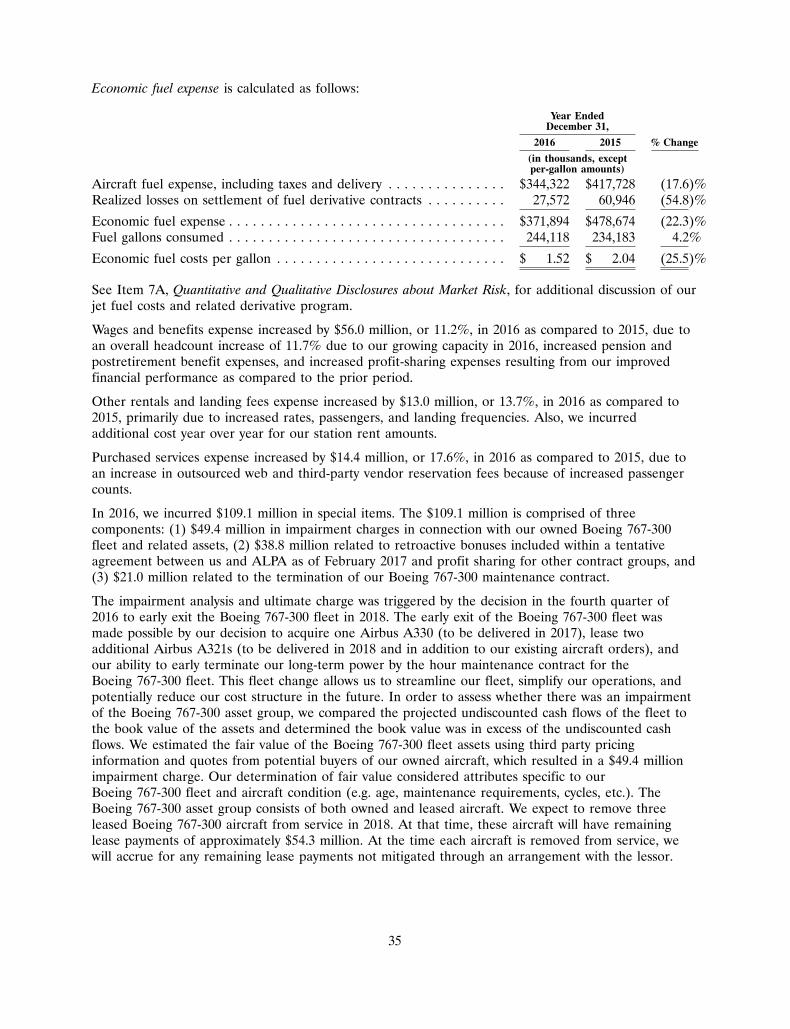
Economic fuel expense is calculated as follows:
Year EndedDecember 31,
2016 2015 % Change
(in thousands, exceptper-gallon amounts)
Aircraft fuel expense, including taxes and delivery . . . . . . . . . . . . . . . $344,322 $417,728 (17.6)%Realized losses on settlement of fuel derivative contracts . . . . . . . . . . 27,572 60,946 (54.8)%
Economic fuel expense . . . . . . . . . . . . . . . . . . . . . . . . . . . . . . . . . . . $371,894 $478,674 (22.3)%Fuel gallons consumed . . . . . . . . . . . . . . . . . . . . . . . . . . . . . . . . . . . 244,118 234,183 4.2%
Economic fuel costs per gallon . . . . . . . . . . . . . . . . . . . . . . . . . . . . . $ 1.52 $ 2.04 (25.5)%
See Item 7A, Quantitative and Qualitative Disclosures about Market Risk, for additional discussion of ourjet fuel costs and related derivative program.
Wages and benefits expense increased by $56.0 million, or 11.2%, in 2016 as compared to 2015, due toan overall headcount increase of 11.7% due to our growing capacity in 2016, increased pension andpostretirement benefit expenses, and increased profit-sharing expenses resulting from our improvedfinancial performance as compared to the prior period.
Other rentals and landing fees expense increased by $13.0 million, or 13.7%, in 2016 as compared to2015, primarily due to increased rates, passengers, and landing frequencies. Also, we incurredadditional cost year over year for our station rent amounts.
Purchased services expense increased by $14.4 million, or 17.6%, in 2016 as compared to 2015, due toan increase in outsourced web and third-party vendor reservation fees because of increased passengercounts.
In 2016, we incurred $109.1 million in special items. The $109.1 million is comprised of threecomponents: (1) $49.4 million in impairment charges in connection with our owned Boeing 767-300fleet and related assets, (2) $38.8 million related to retroactive bonuses included within a tentativeagreement between us and ALPA as of February 2017 and profit sharing for other contract groups, and(3) $21.0 million related to the termination of our Boeing 767-300 maintenance contract.
The impairment analysis and ultimate charge was triggered by the decision in the fourth quarter of2016 to early exit the Boeing 767-300 fleet in 2018. The early exit of the Boeing 767-300 fleet wasmade possible by our decision to acquire one Airbus A330 (to be delivered in 2017), lease twoadditional Airbus A321s (to be delivered in 2018 and in addition to our existing aircraft orders), andour ability to early terminate our long-term power by the hour maintenance contract for theBoeing 767-300 fleet. This fleet change allows us to streamline our fleet, simplify our operations, andpotentially reduce our cost structure in the future. In order to assess whether there was an impairmentof the Boeing 767-300 asset group, we compared the projected undiscounted cash flows of the fleet tothe book value of the assets and determined the book value was in excess of the undiscounted cashflows. We estimated the fair value of the Boeing 767-300 fleet assets using third party pricinginformation and quotes from potential buyers of our owned aircraft, which resulted in a $49.4 millionimpairment charge. Our determination of fair value considered attributes specific to ourBoeing 767-300 fleet and aircraft condition (e.g. age, maintenance requirements, cycles, etc.). TheBoeing 767-300 asset group consists of both owned and leased aircraft. We expect to remove threeleased Boeing 767-300 aircraft from service in 2018. At that time, these aircraft will have remaininglease payments of approximately $54.3 million. At the time each aircraft is removed from service, wewill accrue for any remaining lease payments not mitigated through an arrangement with the lessor.
35
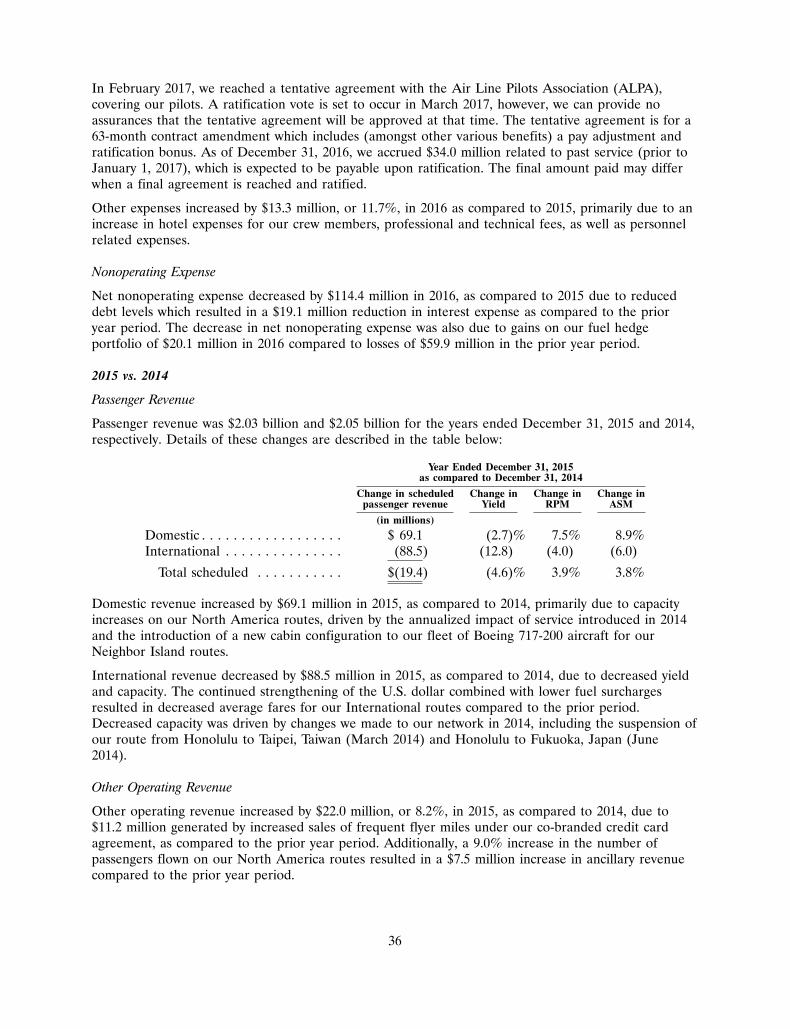
In February 2017, we reached a tentative agreement with the Air Line Pilots Association (ALPA),covering our pilots. A ratification vote is set to occur in March 2017, however, we can provide noassurances that the tentative agreement will be approved at that time. The tentative agreement is for a63-month contract amendment which includes (amongst other various benefits) a pay adjustment andratification bonus. As of December 31, 2016, we accrued $34.0 million related to past service (prior toJanuary 1, 2017), which is expected to be payable upon ratification. The final amount paid may differwhen a final agreement is reached and ratified.
Other expenses increased by $13.3 million, or 11.7%, in 2016 as compared to 2015, primarily due to anincrease in hotel expenses for our crew members, professional and technical fees, as well as personnelrelated expenses.
Nonoperating Expense
Net nonoperating expense decreased by $114.4 million in 2016, as compared to 2015 due to reduceddebt levels which resulted in a $19.1 million reduction in interest expense as compared to the prioryear period. The decrease in net nonoperating expense was also due to gains on our fuel hedgeportfolio of $20.1 million in 2016 compared to losses of $59.9 million in the prior year period.
2015 vs. 2014
Passenger Revenue
Passenger revenue was $2.03 billion and $2.05 billion for the years ended December 31, 2015 and 2014,respectively. Details of these changes are described in the table below:
Year Ended December 31, 2015as compared to December 31, 2014
Change in scheduled Change in Change in Change inpassenger revenue Yield RPM ASM
(in millions)
Domestic . . . . . . . . . . . . . . . . . . $ 69.1 (2.7)% 7.5% 8.9%International . . . . . . . . . . . . . . . (88.5) (12.8) (4.0) (6.0)
Total scheduled . . . . . . . . . . . $(19.4) (4.6)% 3.9% 3.8%
Domestic revenue increased by $69.1 million in 2015, as compared to 2014, primarily due to capacityincreases on our North America routes, driven by the annualized impact of service introduced in 2014and the introduction of a new cabin configuration to our fleet of Boeing 717-200 aircraft for ourNeighbor Island routes.
International revenue decreased by $88.5 million in 2015, as compared to 2014, due to decreased yieldand capacity. The continued strengthening of the U.S. dollar combined with lower fuel surchargesresulted in decreased average fares for our International routes compared to the prior period.Decreased capacity was driven by changes we made to our network in 2014, including the suspension ofour route from Honolulu to Taipei, Taiwan (March 2014) and Honolulu to Fukuoka, Japan (June2014).
Other Operating Revenue
Other operating revenue increased by $22.0 million, or 8.2%, in 2015, as compared to 2014, due to$11.2 million generated by increased sales of frequent flyer miles under our co-branded credit cardagreement, as compared to the prior year period. Additionally, a 9.0% increase in the number ofpassengers flown on our North America routes resulted in a $7.5 million increase in ancillary revenuecompared to the prior year period.
36
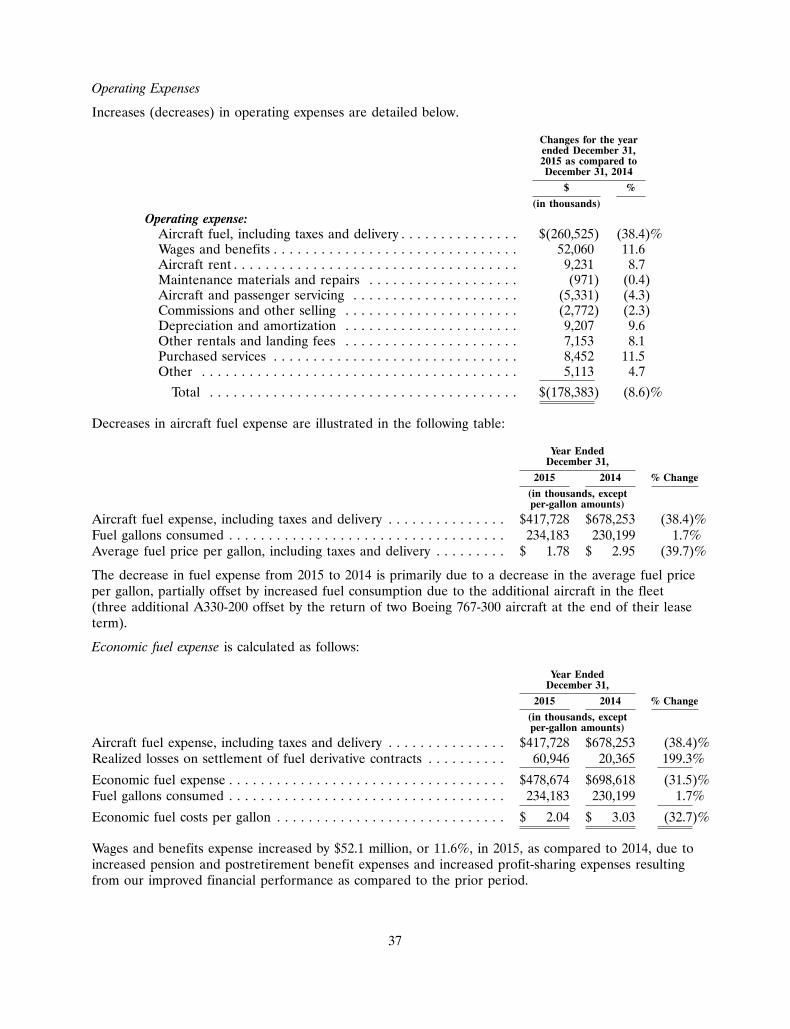
Operating Expenses
Increases (decreases) in operating expenses are detailed below.
Changes for the yearended December 31,2015 as compared toDecember 31, 2014
$ %
(in thousands)
Operating expense:Aircraft fuel, including taxes and delivery . . . . . . . . . . . . . . . $(260,525) (38.4)%Wages and benefits . . . . . . . . . . . . . . . . . . . . . . . . . . . . . . . 52,060 11.6Aircraft rent . . . . . . . . . . . . . . . . . . . . . . . . . . . . . . . . . . . . 9,231 8.7Maintenance materials and repairs . . . . . . . . . . . . . . . . . . . (971) (0.4)Aircraft and passenger servicing . . . . . . . . . . . . . . . . . . . . . (5,331) (4.3)Commissions and other selling . . . . . . . . . . . . . . . . . . . . . . (2,772) (2.3)Depreciation and amortization . . . . . . . . . . . . . . . . . . . . . . 9,207 9.6Other rentals and landing fees . . . . . . . . . . . . . . . . . . . . . . 7,153 8.1Purchased services . . . . . . . . . . . . . . . . . . . . . . . . . . . . . . . 8,452 11.5Other . . . . . . . . . . . . . . . . . . . . . . . . . . . . . . . . . . . . . . . . 5,113 4.7
Total . . . . . . . . . . . . . . . . . . . . . . . . . . . . . . . . . . . . . . . $(178,383) (8.6)%
Decreases in aircraft fuel expense are illustrated in the following table:
Year EndedDecember 31,
2015 2014 % Change
(in thousands, exceptper-gallon amounts)
Aircraft fuel expense, including taxes and delivery . . . . . . . . . . . . . . . $417,728 $678,253 (38.4)%Fuel gallons consumed . . . . . . . . . . . . . . . . . . . . . . . . . . . . . . . . . . . 234,183 230,199 1.7%Average fuel price per gallon, including taxes and delivery . . . . . . . . . $ 1.78 $ 2.95 (39.7)%
The decrease in fuel expense from 2015 to 2014 is primarily due to a decrease in the average fuel priceper gallon, partially offset by increased fuel consumption due to the additional aircraft in the fleet(three additional A330-200 offset by the return of two Boeing 767-300 aircraft at the end of their leaseterm).
Economic fuel expense is calculated as follows:
Year EndedDecember 31,
2015 2014 % Change
(in thousands, exceptper-gallon amounts)
Aircraft fuel expense, including taxes and delivery . . . . . . . . . . . . . . . $417,728 $678,253 (38.4)%Realized losses on settlement of fuel derivative contracts . . . . . . . . . . 60,946 20,365 199.3%
Economic fuel expense . . . . . . . . . . . . . . . . . . . . . . . . . . . . . . . . . . . $478,674 $698,618 (31.5)%Fuel gallons consumed . . . . . . . . . . . . . . . . . . . . . . . . . . . . . . . . . . . 234,183 230,199 1.7%
Economic fuel costs per gallon . . . . . . . . . . . . . . . . . . . . . . . . . . . . . $ 2.04 $ 3.03 (32.7)%
Wages and benefits expense increased by $52.1 million, or 11.6%, in 2015, as compared to 2014, due toincreased pension and postretirement benefit expenses and increased profit-sharing expenses resultingfrom our improved financial performance as compared to the prior period.
37
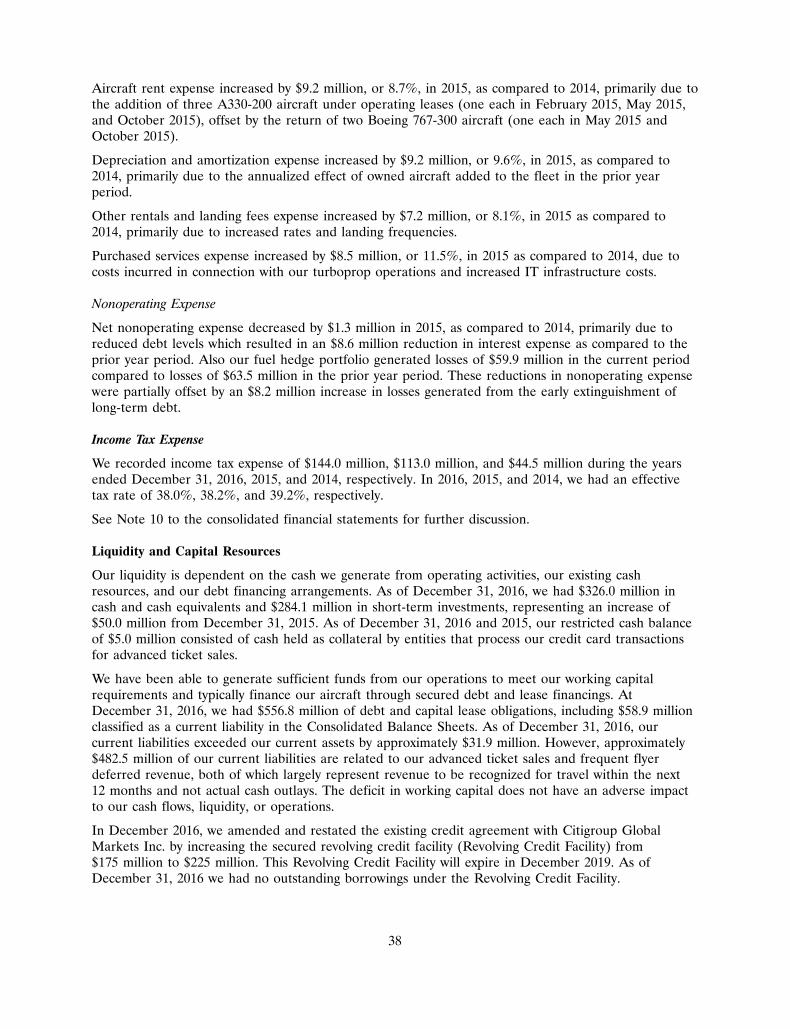
Aircraft rent expense increased by $9.2 million, or 8.7%, in 2015, as compared to 2014, primarily due tothe addition of three A330-200 aircraft under operating leases (one each in February 2015, May 2015,and October 2015), offset by the return of two Boeing 767-300 aircraft (one each in May 2015 andOctober 2015).
Depreciation and amortization expense increased by $9.2 million, or 9.6%, in 2015, as compared to2014, primarily due to the annualized effect of owned aircraft added to the fleet in the prior yearperiod.
Other rentals and landing fees expense increased by $7.2 million, or 8.1%, in 2015 as compared to2014, primarily due to increased rates and landing frequencies.
Purchased services expense increased by $8.5 million, or 11.5%, in 2015 as compared to 2014, due tocosts incurred in connection with our turboprop operations and increased IT infrastructure costs.
Nonoperating Expense
Net nonoperating expense decreased by $1.3 million in 2015, as compared to 2014, primarily due toreduced debt levels which resulted in an $8.6 million reduction in interest expense as compared to theprior year period. Also our fuel hedge portfolio generated losses of $59.9 million in the current periodcompared to losses of $63.5 million in the prior year period. These reductions in nonoperating expensewere partially offset by an $8.2 million increase in losses generated from the early extinguishment oflong-term debt.
Income Tax Expense
We recorded income tax expense of $144.0 million, $113.0 million, and $44.5 million during the yearsended December 31, 2016, 2015, and 2014, respectively. In 2016, 2015, and 2014, we had an effectivetax rate of 38.0%, 38.2%, and 39.2%, respectively.
See Note 10 to the consolidated financial statements for further discussion.
Liquidity and Capital Resources
Our liquidity is dependent on the cash we generate from operating activities, our existing cashresources, and our debt financing arrangements. As of December 31, 2016, we had $326.0 million incash and cash equivalents and $284.1 million in short-term investments, representing an increase of$50.0 million from December 31, 2015. As of December 31, 2016 and 2015, our restricted cash balanceof $5.0 million consisted of cash held as collateral by entities that process our credit card transactionsfor advanced ticket sales.
We have been able to generate sufficient funds from our operations to meet our working capitalrequirements and typically finance our aircraft through secured debt and lease financings. AtDecember 31, 2016, we had $556.8 million of debt and capital lease obligations, including $58.9 millionclassified as a current liability in the Consolidated Balance Sheets. As of December 31, 2016, ourcurrent liabilities exceeded our current assets by approximately $31.9 million. However, approximately$482.5 million of our current liabilities are related to our advanced ticket sales and frequent flyerdeferred revenue, both of which largely represent revenue to be recognized for travel within the next12 months and not actual cash outlays. The deficit in working capital does not have an adverse impactto our cash flows, liquidity, or operations.
In December 2016, we amended and restated the existing credit agreement with Citigroup GlobalMarkets Inc. by increasing the secured revolving credit facility (Revolving Credit Facility) from$175 million to $225 million. This Revolving Credit Facility will expire in December 2019. As ofDecember 31, 2016 we had no outstanding borrowings under the Revolving Credit Facility.
38
Cash Flows
Net cash provided by operating activities was $417.4 million, $476.0 million, and $300.4 million in 2016,2015, and 2014, respectively. The decrease in 2016 was primarily due to: (1) a $66.1 million decrease inour deferred income tax expense as a result of becoming a cash taxpayer, (2) a $46.7 million netdecrease in the change to unrealized gains/losses on our fuel derivative contracts, and (3) a$42.7 million net increase in pension and postretirement benefit contributions, partially offset by (4) anincrease of $52.8 million in net income and (5) a $49.4 million increase relating to the impairment ofour Boeing 767-300 assets. The increase in 2015 was primarily due to the increased net income beforedeferred income tax expense, which does not impact our cash flows because our net operating losscarryforwards were used to satisfy this income tax obligation.
Net cash used in investing activities was $154.1 million, $35.3 million, and $686.8 million for 2016, 2015,and 2014, respectively. The increase in net cash used in 2016 was primarily due to a $69.9 milliondecrease in cash received compared to 2015, for purchase assignment and leaseback transactions, andengine credit payments received from the manufacturer. There was also an increase of $60.0 million incash payments for property and equipment, including pre-delivery deposits for our Airbus A330-200and Airbus A321neo fleet. The decrease in 2015 was due to acquisition of fewer aircraft during theyear, which resulted in a $323.4 million reduction in capital expenditures. We also received$101.7 million from the purchase assignment and leaseback of three Airbus A330-200 aircraft duringthe year, and reduced our net purchases of investments by $240.2 million in 2015.
Net cash used in financing activities was $218.8 million and $423.3 million for 2016 and 2015,respectively, and net cash provided by financing activities was $227.1 million for 2014. The decrease incash used in 2016 was due to the lack of repurchases and payments for settlements of our convertiblenotes in 2016. The increase in cash used in financing activities in 2015 was due to the lack of long-termborrowings during the year, the early repayment of long-term debt, and the repurchase of convertiblenotes and common stock. This was partially offset by the net settlement of the convertible note calloptions and warrants.
Covenants under our Financing Arrangements
Under our bank-issued credit card processing agreements, certain proceeds from advance ticket salesmay be held back to serve as collateral to cover any possible chargebacks or other disputed chargesthat may occur. These holdbacks, which are included in restricted cash in our Consolidated BalanceSheets totaled $5.0 million as of December 31, 2016 and 2015.
In the event of a material adverse change in the business, the holdback could increase to an amount upto 100% of the applicable credit card activity for all unflown tickets, which would also result in anincrease in the required level of restricted cash. If we are unable to obtain a waiver of, or otherwisemitigate the increase in the restriction of cash, it could have a material adverse impact on ouroperations.
Pension and Other Postretirement Benefit Plan Funding
As of December 31, 2016, the excess of the projected benefit obligations over the fair value of planassets was approximately $359.3 million. We contributed $57.8 million, $20.4 million, and $8.9 million toour defined benefit pension plans and disability plan during 2016, 2015, and 2014, respectively. Futurefunding requirements for our defined benefit and other postretirement plans are dependent upon manyfactors such as interest rates, funded status, applicable regulatory requirements, and the level andtiming of asset returns. In 2017, we expect to contribute approximately $50.0 million to our definedbenefit pension plans and disability plan.
39
In 2016, the Hawaiian Airlines, Inc. Pension Plan for Salaried Employees (Salaried Plan) wasconsolidated into the Hawaiian Airlines, Inc. Pension Plan for Employees Represented by theInternational Association of Machinists (IAM), which established the Hawaiian Airlines, Inc.Salaried & IAM Merged Pension Plan (the Merged Plan). At that time, the net liabilities of theSalaried Plan were transferred to the Merged Plan. The benefits under the Merged Plan have remainedconsistent with the prior plan documents. We, as plan sponsor, have submitted an application to theDepartment of Labor to settle the Merged Plan and expect to receive a response in 2017, at whichtime we intend to terminate the Merged Plan (if the application is approved by the Department ofLabor). In 2017, we expect to spend approximately $17 million to $22 million to settle the planobligations. As of December 31, 2016, there was no significant effect to the operation of the plans.
Off-Balance Sheet Arrangements
An off-balance sheet arrangement is any transaction, agreement or other contractual arrangementinvolving an unconsolidated entity under which a company has (i) made guarantees, (ii) retained acontingent interest in transferred assets, (iii) an obligation under derivative instruments classified asequity or (iv) any obligation arising out of a material variable interest in an unconsolidated entity thatprovides financing, liquidity, market risk or credit risk support to the company, or that engages inleasing, hedging or research and development arrangements with the company. We have noarrangements of the types described in the first three categories that we believe may have a current orfuture material effect on our financial condition, liquidity or results of operations. We do haveobligations arising out of variable interests in unconsolidated entities related to certain aircraft leases.To the extent our leases and related guarantees are with a separate legal entity other than agovernmental entity, we are not the primary beneficiary because the lease terms are consistent withmarket terms at the inception of the lease, and the lease does not include a residual value guarantee,fixed price purchase option, or similar feature.
Contractual Obligations
Our estimated contractual obligations as of December 31, 2016 are summarized in the following table:
Less than More thanContractual Obligations Total 1 Year 1 - 3 Years 3 - 5 Years 5 Years
(in thousands)
Debt and capital lease obligations(1) . . . . $ 703,585 $ 89,730 $ 192,341 $119,008 $ 302,506Operating leases—aircraft and related
equipment(2) . . . . . . . . . . . . . . . . . . . 741,329 120,766 235,889 162,447 222,227Operating leases—non-aircraft . . . . . . . . . 139,170 5,223 13,624 13,065 107,258Purchase commitments—capital(3) . . . . . . 1,565,362 240,884 888,912 386,582 48,984Other commitments(4) . . . . . . . . . . . . . . 703,894 79,098 121,636 112,290 390,870Projected employee benefit
contributions(5) . . . . . . . . . . . . . . . . . . 75,050 50,000 25,050 — —
Total contractual obligations . . . . . . . . . $3,928,390 $585,701 $1,477,452 $793,392 $1,071,845
(1) Amounts reflect capital lease obligations for one Airbus A330-200 aircraft, two Boeing 717-200aircraft, one Airbus A330 flight simulator, and aircraft and IT related equipment.
(2) Amounts reflect leases for ten Airbus A330-200 aircraft, four Boeing 767-300 aircraft, threeBoeing 717-200 aircraft, three turboprop aircraft and aircraft-related equipment as ofDecember 31, 2016.
(3) Amounts include our firm commitments for aircraft and aircraft related equipment.
40
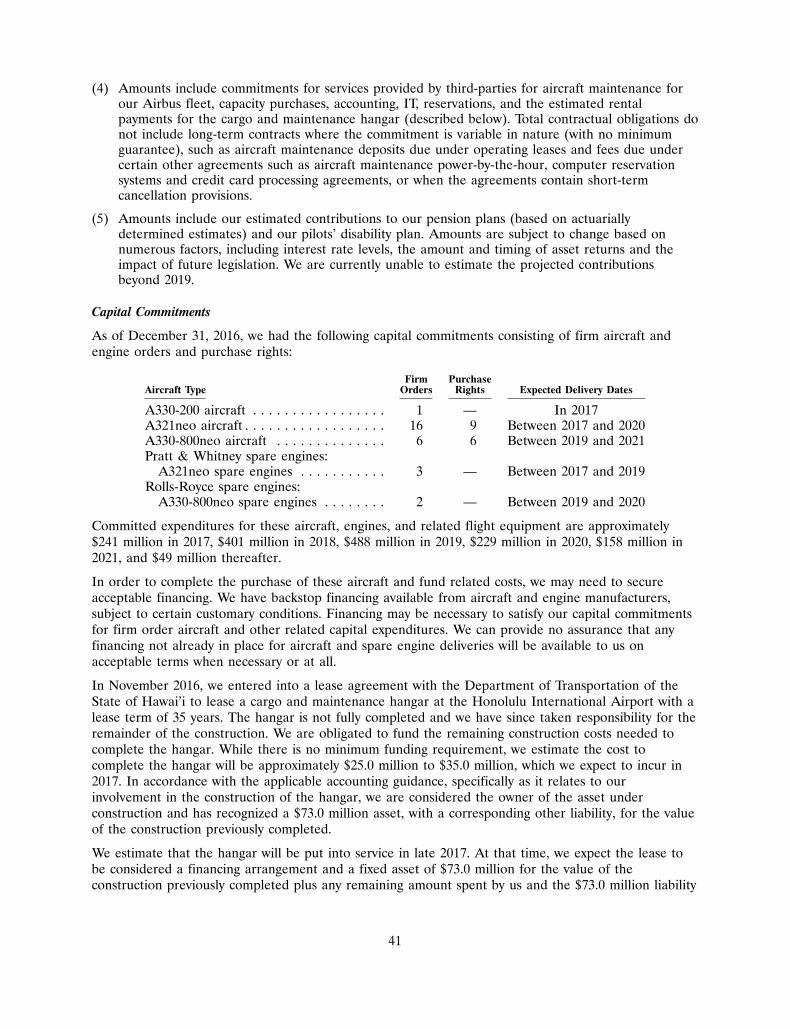
(4) Amounts include commitments for services provided by third-parties for aircraft maintenance forour Airbus fleet, capacity purchases, accounting, IT, reservations, and the estimated rentalpayments for the cargo and maintenance hangar (described below). Total contractual obligations donot include long-term contracts where the commitment is variable in nature (with no minimumguarantee), such as aircraft maintenance deposits due under operating leases and fees due undercertain other agreements such as aircraft maintenance power-by-the-hour, computer reservationsystems and credit card processing agreements, or when the agreements contain short-termcancellation provisions.
(5) Amounts include our estimated contributions to our pension plans (based on actuariallydetermined estimates) and our pilots’ disability plan. Amounts are subject to change based onnumerous factors, including interest rate levels, the amount and timing of asset returns and theimpact of future legislation. We are currently unable to estimate the projected contributionsbeyond 2019.
Capital Commitments
As of December 31, 2016, we had the following capital commitments consisting of firm aircraft andengine orders and purchase rights:
Firm PurchaseAircraft Type Orders Rights Expected Delivery Dates
A330-200 aircraft . . . . . . . . . . . . . . . . . 1 — In 2017A321neo aircraft . . . . . . . . . . . . . . . . . . 16 9 Between 2017 and 2020A330-800neo aircraft . . . . . . . . . . . . . . 6 6 Between 2019 and 2021Pratt & Whitney spare engines:
A321neo spare engines . . . . . . . . . . . 3 — Between 2017 and 2019Rolls-Royce spare engines:
A330-800neo spare engines . . . . . . . . 2 — Between 2019 and 2020
Committed expenditures for these aircraft, engines, and related flight equipment are approximately$241 million in 2017, $401 million in 2018, $488 million in 2019, $229 million in 2020, $158 million in2021, and $49 million thereafter.
In order to complete the purchase of these aircraft and fund related costs, we may need to secureacceptable financing. We have backstop financing available from aircraft and engine manufacturers,subject to certain customary conditions. Financing may be necessary to satisfy our capital commitmentsfor firm order aircraft and other related capital expenditures. We can provide no assurance that anyfinancing not already in place for aircraft and spare engine deliveries will be available to us onacceptable terms when necessary or at all.
In November 2016, we entered into a lease agreement with the Department of Transportation of theState of Hawai’i to lease a cargo and maintenance hangar at the Honolulu International Airport with alease term of 35 years. The hangar is not fully completed and we have since taken responsibility for theremainder of the construction. We are obligated to fund the remaining construction costs needed tocomplete the hangar. While there is no minimum funding requirement, we estimate the cost tocomplete the hangar will be approximately $25.0 million to $35.0 million, which we expect to incur in2017. In accordance with the applicable accounting guidance, specifically as it relates to ourinvolvement in the construction of the hangar, we are considered the owner of the asset underconstruction and has recognized a $73.0 million asset, with a corresponding other liability, for the valueof the construction previously completed.
We estimate that the hangar will be put into service in late 2017. At that time, we expect the lease tobe considered a financing arrangement and a fixed asset of $73.0 million for the value of theconstruction previously completed plus any remaining amount spent by us and the $73.0 million liability
41
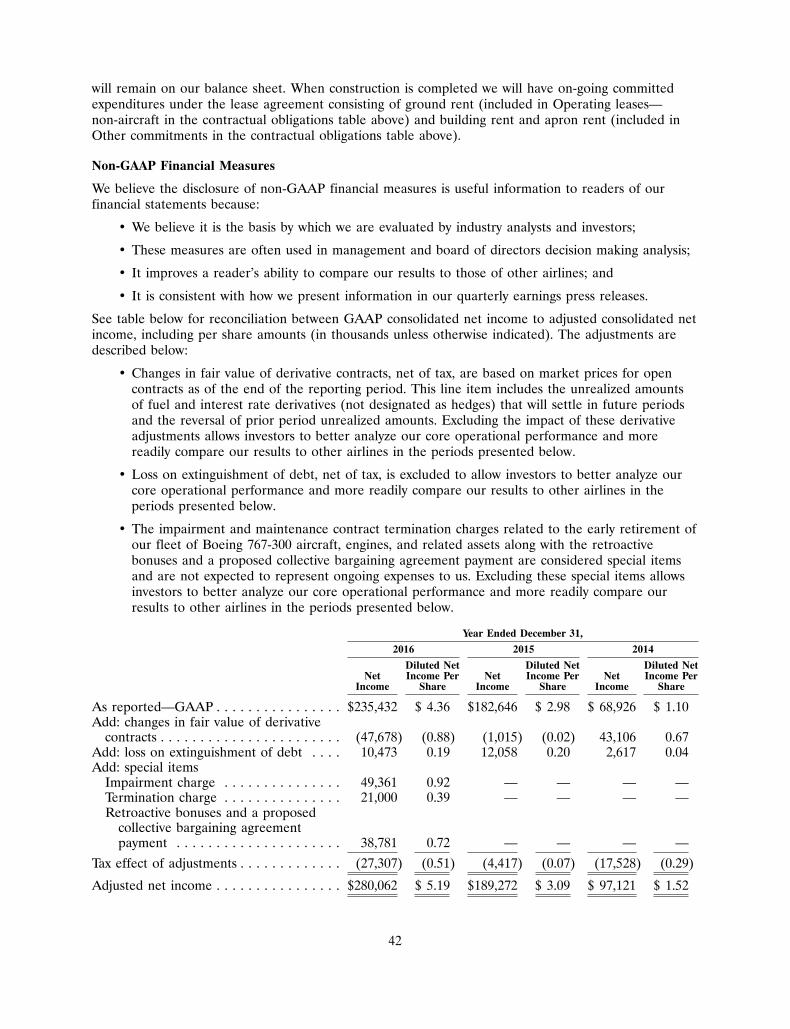
will remain on our balance sheet. When construction is completed we will have on-going committedexpenditures under the lease agreement consisting of ground rent (included in Operating leases—non-aircraft in the contractual obligations table above) and building rent and apron rent (included inOther commitments in the contractual obligations table above).
Non-GAAP Financial Measures
We believe the disclosure of non-GAAP financial measures is useful information to readers of ourfinancial statements because:
• We believe it is the basis by which we are evaluated by industry analysts and investors;
• These measures are often used in management and board of directors decision making analysis;
• It improves a reader’s ability to compare our results to those of other airlines; and
• It is consistent with how we present information in our quarterly earnings press releases.
See table below for reconciliation between GAAP consolidated net income to adjusted consolidated netincome, including per share amounts (in thousands unless otherwise indicated). The adjustments aredescribed below:
• Changes in fair value of derivative contracts, net of tax, are based on market prices for opencontracts as of the end of the reporting period. This line item includes the unrealized amountsof fuel and interest rate derivatives (not designated as hedges) that will settle in future periodsand the reversal of prior period unrealized amounts. Excluding the impact of these derivativeadjustments allows investors to better analyze our core operational performance and morereadily compare our results to other airlines in the periods presented below.
• Loss on extinguishment of debt, net of tax, is excluded to allow investors to better analyze ourcore operational performance and more readily compare our results to other airlines in theperiods presented below.
• The impairment and maintenance contract termination charges related to the early retirement ofour fleet of Boeing 767-300 aircraft, engines, and related assets along with the retroactivebonuses and a proposed collective bargaining agreement payment are considered special itemsand are not expected to represent ongoing expenses to us. Excluding these special items allowsinvestors to better analyze our core operational performance and more readily compare ourresults to other airlines in the periods presented below.
Year Ended December 31,
2016 2015 2014
Diluted Net Diluted Net Diluted NetNet Income Per Net Income Per Net Income Per
Income Share Income Share Income Share
As reported—GAAP . . . . . . . . . . . . . . . . $235,432 $ 4.36 $182,646 $ 2.98 $ 68,926 $ 1.10Add: changes in fair value of derivative
contracts . . . . . . . . . . . . . . . . . . . . . . . (47,678) (0.88) (1,015) (0.02) 43,106 0.67Add: loss on extinguishment of debt . . . . 10,473 0.19 12,058 0.20 2,617 0.04Add: special items
Impairment charge . . . . . . . . . . . . . . . 49,361 0.92 — — — —Termination charge . . . . . . . . . . . . . . . 21,000 0.39 — — — —Retroactive bonuses and a proposed
collective bargaining agreementpayment . . . . . . . . . . . . . . . . . . . . . 38,781 0.72 — — — —
Tax effect of adjustments . . . . . . . . . . . . . (27,307) (0.51) (4,417) (0.07) (17,528) (0.29)
Adjusted net income . . . . . . . . . . . . . . . . $280,062 $ 5.19 $189,272 $ 3.09 $ 97,121 $ 1.52
42
Operating Costs per Available Seat Mile (CASM)
Listed in the table below is our fuel costs per ASM and non-GAAP unit costs, excluding fuel. Theseamounts are included in CASM, but for internal purposes we consistently use cost metrics that excludefuel and non-recurring items (if applicable) to measure and monitor its costs.
CASM and CASM, excluding fuel, are summarized in the table below:
Year Ended December 31,
2016 2015 2014
GAAP operating expenses . . . . . . . . . . . . . . . . . . . . . . . . . . $ 2,055,118 $ 1,891,364 $ 2,069,747Less: aircraft fuel, including taxes and delivery . . . . . . . . . (344,322) (417,728) (678,253)Less: special items
Impairment charge . . . . . . . . . . . . . . . . . . . . . . . . . . . . (49,361) — —Termination charge . . . . . . . . . . . . . . . . . . . . . . . . . . . (21,000) — —Bonuses and a proposed collective bargaining agreement
payment . . . . . . . . . . . . . . . . . . . . . . . . . . . . . . . . . . (38,781) — —
Adjusted operating expenses—excluding aircraft fuel andspecial items . . . . . . . . . . . . . . . . . . . . . . . . . . . . . . . . . . $ 1,601,654 $ 1,473,636 $ 1,391,494
Available Seat Miles . . . . . . . . . . . . . . . . . . . . . . . . . . . . . . 18,384,637 17,726,322 17,073,630
CASM—GAAP . . . . . . . . . . . . . . . . . . . . . . . . . . . . . . . . . 11.18¢ 10.67¢ 12.12¢Less: aircraft fuel . . . . . . . . . . . . . . . . . . . . . . . . . . . . . . (1.87) (2.36) (3.97)
Less: special itemsImpairment charge . . . . . . . . . . . . . . . . . . . . . . . . . . . . (0.28) — —Termination charge . . . . . . . . . . . . . . . . . . . . . . . . . . . (0.11) — —Bonuses and a proposed collective bargaining agreement
payment . . . . . . . . . . . . . . . . . . . . . . . . . . . . . . . . . . (0.21) — —
CASM—excluding aircraft fuel and special items . . . . . . . . . 8.71¢ 8.31¢ 8.15¢
Critical Accounting Policies and Estimates
The discussion and analysis of our financial condition and results of operations are based uponfinancial statements that have been prepared in accordance with U.S. generally accepted accountingprinciples. The preparation of these financial statements requires management to make estimates andjudgments that affect the reported amount of assets and liabilities, revenue and expenses, and relateddisclosure of contingent assets and liabilities as of the date of the financial statements. Actual resultscould differ from those estimates.
Critical accounting policies and estimates are defined as those accounting policies and accountingestimates that are reflective of significant judgments and uncertainties, and that potentially result inmaterially different results under different assumptions and conditions. Our most critical accountingpolicies and estimates are described below. See the summary of significant accounting policies includedin Note 1 to the consolidated financial statements for additional discussion of the application of theseestimates and other accounting policies.
Frequent Flyer Accounting
HawaiianMiles, Hawaiian’s frequent flyer travel award program, provides a variety of awards toprogram members based on accumulated mileage. We utilize the incremental cost method ofaccounting for free travel awards earned by passengers issued from the HawaiianMiles program throughflight activity. This method utilizes a number of estimates including the incremental cost per mile and
43
breakage. We record a liability for the estimated incremental cost of providing travel awards that areexpected to be redeemed on Hawaiian or the contractual rate of expected redemption on other airlines.We estimate the incremental cost of travel awards based on periodic studies of actual costs and applythese cost estimates to all issued miles, less an appropriate breakage factor for estimated miles that willnot be redeemed. Incremental costs include the cost of fuel, meals and beverages, insurance andcertain other passenger traffic-related costs, but does not include any costs for aircraft ownership andmaintenance. The breakage factor is estimated based on an analysis of historical expirations.
We also sell mileage credits to companies participating in our frequent flyer program. These sales areaccounted for as multiple-element arrangements, with one element representing the transportation thatwill ultimately be provided when the mileage credits are redeemed and the other elements consisting ofmarketing related activities that we conduct with the participating company.
In 2013, Hawaiian entered into a co-branded credit card agreement, which provides for the sale offrequent flyer miles to Barclays Bank Delaware (Barclays) which began in 2014. The agreement was anew multiple element arrangement subject to Accounting Standards Update 2009-13, MultipleDeliverable Revenue Arrangements—A consensus of the FASB Emerging Issues Task Force(ASU 2009-13), which was effective for new and materially modified revenue arrangements entered intoby us after January 1, 2011. ASU 2009-13 requires the allocation of the overall consideration receivedto each deliverable using the estimated selling price. The objective of using estimated selling pricebased methodology is to determine the price at which we would transact a sale if the product or servicewere sold on a stand-alone basis.
The following four deliverables or elements were identified in the agreement: (i) travel miles; (ii) useof the Hawaiian brand and access to member lists; (iii) advertising elements; and (iv) other airlinebenefits including checked baggage services and travel discounts. We determined the relative fair valueof each element by estimating the selling prices of the deliverables by considering discounted cash flowsusing multiple inputs and assumptions, including: (1) the expected number of miles to be awarded andredeemed; (2) the estimated weighted average equivalent ticket value, adjusted by a fulfillmentdiscount; (3) the estimated total annual cardholder spend; (4) an estimated royalty rate for theHawaiian portfolio; and (5) the expected use of each of the airline benefits. The overall considerationreceived is allocated to the deliverables based on their relative selling prices. The transportationelement is deferred and recognized as passenger revenue over the period when the transportation isexpected to be provided (23 months). The other elements are generally recognized as other revenuewhen earned.
Under the programs of certain participating companies, credits are accumulated in accounts maintainedby the participating company, then transferred into a member’s HawaiianMiles account for immediateredemption of free travel awards. For those transactions, revenue is recognized over the period duringwhich the mileage is projected to be used for travel (four months).
On an annual basis, we review the deferral period and deferral rate for mileage credits sold toparticipating companies (except for miles sold under our co-branded credit card agreement), as well asthe breakage rate assumption for free travel awards earned in connection with the purchase ofpassenger tickets. The cost components of the incremental cost assumption are reviewed on a quarterlybasis.
Pension and Other Postretirement and Postemployment Benefits
The calculation of pension and other postretirement and postemployment benefit expenses and itscorresponding liabilities require the use of significant assumptions, including the assumed discount rate,the expected long-term rate of return on plan assets, expected mortality rates of the plan participants,and the expected health care cost trend rate. Changes in these assumptions will impact the expense and
44
liability amounts, and future actual experience may differ from these assumptions. The significantassumptions as of December 31, 2016 are as follows:
Pension:Discount rate to determine projected benefit obligation . . . . . . . . . . . . . . . 4.19%Expected return on plan assets . . . . . . . . . . . . . . . . . . . . . . . . . . . . . . . . . 6.69%+
Postretirement:Discount rate to determine projected benefit obligation . . . . . . . . . . . . . . . 4.29%Expected return on plan assets . . . . . . . . . . . . . . . . . . . . . . . . . . . . . . . . . N/AExpected health care cost trend rate:
Initial . . . . . . . . . . . . . . . . . . . . . . . . . . . . . . . . . . . . . . . . . . . . . . . . . . 7.75%Ultimate . . . . . . . . . . . . . . . . . . . . . . . . . . . . . . . . . . . . . . . . . . . . . . . . 4.75%Years to reach ultimate trend rate . . . . . . . . . . . . . . . . . . . . . . . . . . . . . 6
Disability:Discount rate to determine projected benefit obligation . . . . . . . . . . . . . . . 4.24%Expected return on plan assets . . . . . . . . . . . . . . . . . . . . . . . . . . . . . . . . . 5.37%+
N/A Not Applicable
+ Expected return on plan assets used to determine the net periodic benefit expense for2017 is 6.34% for the pension plans and 4.60% for the disability plan.
The expected long-term rate of return assumption is developed by evaluating input from the trusteemanaging the plans’ assets, including the trustee’s review of asset class return expectations by severalconsultants and economists, as well as long-term inflation assumptions. Our expected long-term rate ofreturn on plan assets is based on a target allocation of assets, which is based on our goal of earning thehighest rate of return while maintaining risk at acceptable levels. The Retirement Plan for Pilots ofHawaiian Airlines, Inc. and the Pilot’s Voluntary Employee Beneficiary Association Disability andSurvivor’s Benefit Plan strive to have assets sufficiently diversified so that adverse or unexpected resultsfrom any one security class will not have an unduly detrimental impact on the entire portfolio. TheMerged pension plan strives to have its assets align with the potential liability as of the expectedsettlement date. We believe that our long-term asset allocation on average will approximate thetargeted allocation. We periodically review our actual asset allocation and rebalance the pension plan’sinvestments to our targeted allocation when considered appropriate. Pension expense increases as theexpected rate of return on plan assets decreases. Lowering the expected long-term rate of return willhave the following effects on our estimated 2017 pension and disability benefit expense:
100 Basis PointDecrease
(in millions)
Increase in estimated 2017 pension expense . . . . . . . . . . . . . . . . . . . . $3.1Increase in estimated 2017 disability benefit expense . . . . . . . . . . . . . 0.2
We determine the appropriate discount rate for each of our plans based on current rates on highquality corporate bonds that would generate the cash flow necessary to pay plan benefits when due.
45
The pension and other postretirement benefit liabilities and future expense both increase as thediscount rate is reduced. Lowering the discount rate would have the following effects:
100 Basis PointDecrease
(in millions)
Increase in pension obligation as of December 31, 2016 . . . . . . . . . . . $57.9Increase in other postretirement benefit obligation as of
December 31, 2016 . . . . . . . . . . . . . . . . . . . . . . . . . . . . . . . . . . . . 44.1Increase in estimated 2017 pension expense . . . . . . . . . . . . . . . . . . . . 2.9Increase in estimated 2017 other postretirement benefit expense . . . . . 6.2
The health care cost trend rate is based upon an evaluation of our historical trends and experiencetaking into account current and expected market conditions. Changes in the assumed health care costtrend rate would have the following annual effects:
100 Basis PointIncrease
(in millions)
Increase in other postretirement benefit obligation as ofDecember 31, 2016 . . . . . . . . . . . . . . . . . . . . . . . . . . . . . . . . . . . . $39.1
Increase in estimated 2017 other postretirement benefit expense . . . . . 7.7
100 Basis PointDecrease
(in millions)
Decrease in other postretirement benefit obligation as ofDecember 31, 2016 . . . . . . . . . . . . . . . . . . . . . . . . . . . . . . . . . . . . $30.4
Decrease in estimated 2017 other postretirement benefit expense . . . . 4.3
Aircraft Maintenance and Repair Costs
On a quarterly basis we complete a forecast of maintenance costs for the next scheduled event onapplicable leased aircraft and compare these estimates to our forecasted nonrefundable deposits toidentify costs not expected to be recoverable. Any costs not expected to be recoverable are consideredto be not substantially and contractually related to maintenance of the leased asset. Therefore, webifurcate and expense the proportionate share that is estimated to not be recoverable from existing andfuture nonrefundable deposits. In determining whether it is probable that maintenance deposits will beused to fund the cost of the maintenance events, we conduct the following analysis:
• We evaluate the aircraft’s condition, including the airframe, the engines, the auxiliary power unitand the landing gear.
• We then project future usage of the aircraft during the term of the lease based on our businessand fleet plan.
• We estimate the cost of performing the next scheduled maintenance event. These estimates arebased on the experience of our maintenance personnel and available industry data, includinghistorical fleet operating statistic reports published by the aircraft and engine manufacturers.
• We compare the forecasted maintenance deposits to be paid at the time of the next scheduledmaintenance event to the estimated cost of the next scheduled maintenance event. Those costsnot expected to be recoverable are considered to be not substantially and contractually relatedto maintenance of the leased asset.
• We prospectively account for any changes in estimates.
46
Our assessment of the recoverability of our maintenance deposits is subject to change in the event thatkey estimates and assumptions change over time. Those key estimates and assumptions include ourfleet plan and the projected total cost and, to a lesser extent, anticipated timing of the majormaintenance activities covered by the maintenance reserves.
Based on historical trends and future projections, including those published by the manufacturers ofour aircraft and engines, we believe it is unlikely that future maintenance costs for our aircraft willdecline to such an extent that the maintenance deposits currently recorded on our ConsolidatedBalance Sheets would not be used to fund the cost of future maintenance events and, therefore, not berecoverable.
Impairment of Long-Lived Assets and Finite-lived Intangible Assets
Long-lived assets used in operations, consisting principally of property and equipment and finite-livedintangible assets, are tested for impairment when events or changes in circumstances indicate, inmanagement’s judgment, that the assets might be impaired and the undiscounted cash flows estimatedto be generated by those assets are less than their carrying amount. When testing for impairmentmanagement considers market trends, the expected useful lives of the assets, changes in economicconditions, recent transactions involving sales of similar assets and, if necessary, estimates of futureundiscounted cash flows. To determine whether impairment exists for aircraft used in operations, assetsare grouped at the fleet-type level (the lowest level for which there are identifiable cash flows) andfuture cash flows are estimated based on projections of capacity, passenger mile yield, fuel costs, laborcosts and other relevant factors. If, at any time, management determines the net carrying value of anasset is not recoverable, the amount is reduced to its fair value during the period in which suchdetermination is made. Any changes in the estimated useful lives of these assets will be accounted forprospectively.
The impairment analysis and ultimate charge was triggered by the decision in the fourth quarter of2016 to exit the Boeing 767-300 fleet in 2018. The early exit of the Boeing 767-300 fleet was madepossible by our decision to acquire one Airbus A330 (to be delivered in 2017), lease two additionalAirbus A321s (to be delivered in 2018 and in addition to our existing aircraft orders), and our ability toearly terminate our long-term power by the hour maintenance contract for the Boeing 767-300 fleet.This fleet change allows us to streamline our fleet, simplify our operations, and potentially reduce ourcost structure in the future. In order to assess whether there was an impairment of the Boeing 767-300asset group, we compared the projected undiscounted cash flows of the fleet to the book value of theassets and determined the book value was in excess of the undiscounted cash flows. We estimated thefair value of the Boeing 767-300 fleet assets using third party pricing information and quotes frompotential buyers of our owned aircraft, which resulted in a $49.4 million impairment charge. Ourdetermination of fair value considered attributes specific to our Boeing 767-300 fleet and aircraftcondition (e.g. age, maintenance requirements, cycles, etc.). The Boeing 767-300 asset group consists ofboth owned and leased aircraft. We expect to remove three leased Boeing 767-300 aircraft from servicein 2018. At that time, these aircraft will have remaining lease payments of approximately $54.3 million.At the time each aircraft is removed from service we will accrue for any remaining lease payments notmitigated through an arrangement with the lessor.
47
ITEM 7A. QUANTITATIVE AND QUALITATIVE DISCLOSURES ABOUT MARKET RISK.
We are subject to certain market risks, including commodity price risk (i.e. jet fuel prices) and foreigncurrency risk. We have market-sensitive instruments in the form of financial derivatives used to offsetHawaiian’s exposure to jet fuel price increases, and financial hedge instruments used to hedgeHawaiian’s exposure to foreign currency exchange risk. The adverse effects of potential changes inthese market risks are discussed below.
The sensitivity analyses presented do not consider the effects that such adverse changes may have onoverall economic activity nor do they consider additional actions we might undertake to mitigate ourexposure to such changes. Actual results may differ.
Aircraft Fuel Costs
Aircraft fuel costs constitute a significant portion of our operating expense. Fuel costs represented 17%of our operating expenses for the year ended December 31, 2016. Approximately 70% of our fuel isbased on Singapore jet fuel prices and 30% is based on U.S. West Coast jet fuel prices. Based ongallons expected to be consumed in 2017, for every one cent increase in the cost of a gallon of jet fuel,our fuel expense would increase by approximately $2.5 million, excluding the results of our fuel hedgeprogram.
We periodically enter into derivative financial instruments to manage our exposure to changes in theprice of jet fuel. During 2016, our fuel hedge portfolio primarily consisted of heating oil swaps andcrude oil call options. Swaps provide for a settlement in our favor in the event the prices exceed apredetermined contractual level and are unfavorable in the event prices fall below a predeterminedcontractual level. With call options, we are hedged against spikes in crude oil prices, and during aperiod of decline in crude oil prices we only forfeit cash previously paid for hedge premiums.
As of December 31, 2016, we hedged approximately 50% of our projected fuel requirements for 2017with heating oil swaps and crude oil call options. As of December 31, 2016, the fair value of these fuelderivative agreements reflected a net asset of $15.1 million that is recorded in other accrued liabilitiesin the Consolidated Balance Sheets.
We expect to continue our program of offsetting some of our exposure to future changes in the priceof jet fuel with a combination of fixed forward pricing contracts, swaps, puts and other option-basedstructures.
We do not hold or issue derivative financial instruments for trading purposes.
Interest Rates
Our results of operations are affected by fluctuations in interest rates due to our interest incomeearned on our cash deposits. Our variable-rate debt agreements include the Revolving Credit Facilityand secured loan agreements, the terms of which are discussed in Note 8 to our consolidated financialstatements.
Changes in market interest rates have a direct and corresponding effect on our pre-tax earnings andcash flows associated with our interest-bearing cash accounts. Based on the balances of our cash andcash equivalents, restricted cash, and short-term investments as of December 31, 2016, a change ininterest rates is unlikely to have a material impact on our results of operations.
At December 31, 2016, we had $570.6 million of fixed-rate debt including aircraft capital leaseobligations, facility agreements for aircraft purchases, and the outstanding equipment notes related tothe EETC financing. Market risk for fixed-rate long-term debt is estimated as the potential increase infair value resulting from a hypothetical 10% decrease in market rates, and amounted to approximately$9.6 million as of December 31, 2016.
48
Foreign Currency
We generate revenues and incur expenses in foreign currencies. Changes in foreign currency exchangerates impact our results of operations through changes in the dollar value of foreign currency-denominated operating revenues and expenses. Our most significant foreign currency exposures are theJapanese Yen and Australian Dollar. Based on expected 2017 revenues and expenses denominated inJapanese Yen and Australian Dollars, a 10% strengthening in value of the U.S. dollar, relative to theJapanese Yen and Australian Dollar, would result in a decrease in operating income of approximately$27.5 million and $17.1 million, respectively, which excludes the offset of the hedges discussed below.This potential impact to the results of our operation is driven by the inherent nature of ourinternational operations, which requires us to accept a large volume of sales transactions denominatedin foreign currencies while few expense transactions are settled in foreign currencies. This disparity isthe primary factor in our exposure to foreign currency exchange rates.
As of December 31, 2016, the fair value of our foreign currency forwards reflected a net asset of$8.9 million that is recorded in prepaid expenses and other, and $2.6 million recorded in long-termprepayments and other reflected in the Consolidated Balance Sheets.
49
ITEM 8. FINANCIAL STATEMENTS AND SUPPLEMENTARY DATA.
INDEX TO FINANCIAL STATEMENTS
Page
Hawaiian Holdings, Inc.Report of Independent Registered Public Accounting Firm . . . . . . . . . . . . . . . . . . . . . . . . . . . . 51Consolidated Statements of Operations for the years ended December 31, 2016, 2015 and 2014 . . 52Consolidated Statements of Comprehensive Income for the years ended December 31, 2016,
2015 and 2014 . . . . . . . . . . . . . . . . . . . . . . . . . . . . . . . . . . . . . . . . . . . . . . . . . . . . . . . . . . . 53Consolidated Balance Sheets as of December 31, 2016 and 2015 . . . . . . . . . . . . . . . . . . . . . . . . 54Consolidated Statements of Shareholders’ Equity for the years ended December 31, 2016, 2015
and 2014 . . . . . . . . . . . . . . . . . . . . . . . . . . . . . . . . . . . . . . . . . . . . . . . . . . . . . . . . . . . . . . . 55Consolidated Statements of Cash Flows for the years ended December 31, 2016, 2015 and 2014 . 56Notes to Consolidated Financial Statements . . . . . . . . . . . . . . . . . . . . . . . . . . . . . . . . . . . . . . . 57
50
REPORT OF INDEPENDENT REGISTERED PUBLIC ACCOUNTING FIRM
The Board of Directors and Shareholders of Hawaiian Holdings, Inc.
We have audited the accompanying consolidated balance sheets of Hawaiian Holdings, Inc. as ofDecember 31, 2016 and 2015, and the related consolidated statements of operations, comprehensiveincome (loss), shareholders’ equity, and cash flows for each of the three years in the period endedDecember 31, 2016. Our audits also included the financial statement schedule listed in the Index atItem 15(a). These financial statements and schedule are the responsibility of the Company’smanagement. Our responsibility is to express an opinion on these financial statements and schedulebased on our audits.
We conducted our audits in accordance with the standards of the Public Company AccountingOversight Board (United States). Those standards require that we plan and perform the audit to obtainreasonable assurance about whether the financial statements are free of material misstatement. Anaudit includes examining, on a test basis, evidence supporting the amounts and disclosures in thefinancial statements. An audit also includes assessing the accounting principles used and significantestimates made by management, as well as evaluating the overall financial statement presentation. Webelieve that our audits provide a reasonable basis for our opinion.
In our opinion, the financial statements referred to above present fairly, in all material respects, theconsolidated financial position of Hawaiian Holdings, Inc. at December 31, 2016 and 2015, and theconsolidated results of its operations and its cash flows for each of the three years in the period endedDecember 31, 2016, in conformity with U.S. generally accepted accounting principles. Also, in ouropinion, the related financial statement schedule, when considered in relation to the basic financialstatements taken as a whole, presents fairly in all material respects the information set forth therein.
We also have audited, in accordance with the standards of the Public Company Accounting OversightBoard (United States), Hawaiian Holdings, Inc.’s internal control over financial reporting as ofDecember 31, 2016, based on criteria established in Internal Control—Integrated Framework issued bythe Committee of Sponsoring Organizations of the Treadway Commission (2013 framework) and ourreport dated February 16, 2017, expressed an unqualified opinion thereon.
/s/ ERNST & YOUNG LLP
Honolulu, Hawai’iFebruary 16, 2017
51
Hawaiian Holdings, Inc.
Consolidated Statements of Operations
For the Years ended December 31, 2016, 2015 and 2014
2016 2015 2014
(in thousands, except per share data)
Operating Revenue:Passenger . . . . . . . . . . . . . . . . . . . . . . . . . . . . . . . . . . . . . . . $2,145,742 $2,025,610 $2,045,052Other . . . . . . . . . . . . . . . . . . . . . . . . . . . . . . . . . . . . . . . . . 304,838 291,857 269,827
Total . . . . . . . . . . . . . . . . . . . . . . . . . . . . . . . . . . . . . . . . 2,450,580 2,317,467 2,314,879
Operating Expenses:Wages and benefits . . . . . . . . . . . . . . . . . . . . . . . . . . . . . . . . 555,534 499,506 447,446Aircraft fuel, including taxes and delivery . . . . . . . . . . . . . . . . 344,322 417,728 678,253Aircraft rent . . . . . . . . . . . . . . . . . . . . . . . . . . . . . . . . . . . . 124,565 115,653 106,422Maintenance materials and repairs . . . . . . . . . . . . . . . . . . . . 228,970 224,648 225,619Aircraft and passenger servicing . . . . . . . . . . . . . . . . . . . . . . 126,876 117,449 122,780Commissions and other selling . . . . . . . . . . . . . . . . . . . . . . . 125,731 119,746 122,518Depreciation and amortization . . . . . . . . . . . . . . . . . . . . . . . 108,128 105,581 96,374Other rentals and landing fees . . . . . . . . . . . . . . . . . . . . . . . 108,087 95,055 87,902Purchased services . . . . . . . . . . . . . . . . . . . . . . . . . . . . . . . . 96,274 81,838 73,386Special items . . . . . . . . . . . . . . . . . . . . . . . . . . . . . . . . . . . . 109,142 — —Other . . . . . . . . . . . . . . . . . . . . . . . . . . . . . . . . . . . . . . . . . 127,489 114,160 109,047
Total . . . . . . . . . . . . . . . . . . . . . . . . . . . . . . . . . . . . . . . . 2,055,118 1,891,364 2,069,747
Operating Income . . . . . . . . . . . . . . . . . . . . . . . . . . . . . . . . . . 395,462 426,103 245,132
Nonoperating Income (Expense):Interest expense and amortization of debt discounts and
issuance costs . . . . . . . . . . . . . . . . . . . . . . . . . . . . . . . . . . (36,612) (55,678) (64,240)Interest income . . . . . . . . . . . . . . . . . . . . . . . . . . . . . . . . . . 4,007 2,811 1,684Capitalized interest . . . . . . . . . . . . . . . . . . . . . . . . . . . . . . . . 2,651 3,261 8,024Gains (losses) on fuel derivatives . . . . . . . . . . . . . . . . . . . . . . 20,106 (59,931) (63,471)Loss on extinguishment of debt . . . . . . . . . . . . . . . . . . . . . . . (10,473) (12,058) (3,885)Other, net . . . . . . . . . . . . . . . . . . . . . . . . . . . . . . . . . . . . . . 4,323 (8,820) (9,797)
Total . . . . . . . . . . . . . . . . . . . . . . . . . . . . . . . . . . . . . . . . (15,998) (130,415) (131,685)
Income Before Income Taxes . . . . . . . . . . . . . . . . . . . . . . . . . . 379,464 295,688 113,447Income tax expense . . . . . . . . . . . . . . . . . . . . . . . . . . . . . . . 144,032 113,042 44,521
Net Income . . . . . . . . . . . . . . . . . . . . . . . . . . . . . . . . . . . . . . . $ 235,432 $ 182,646 $ 68,926
Net Income Per Common Stock Share:Basic . . . . . . . . . . . . . . . . . . . . . . . . . . . . . . . . . . . . . . . . . . $ 4.40 $ 3.38 $ 1.29
Diluted . . . . . . . . . . . . . . . . . . . . . . . . . . . . . . . . . . . . . . . . $ 4.36 $ 2.98 $ 1.10
Weighted Average Number of Common Stock SharesOutstanding:Basic . . . . . . . . . . . . . . . . . . . . . . . . . . . . . . . . . . . . . . . . . . 53,502 54,031 53,591
Diluted . . . . . . . . . . . . . . . . . . . . . . . . . . . . . . . . . . . . . . . . 53,958 61,256 62,822
See accompanying Notes to Consolidated Financial Statements.
52
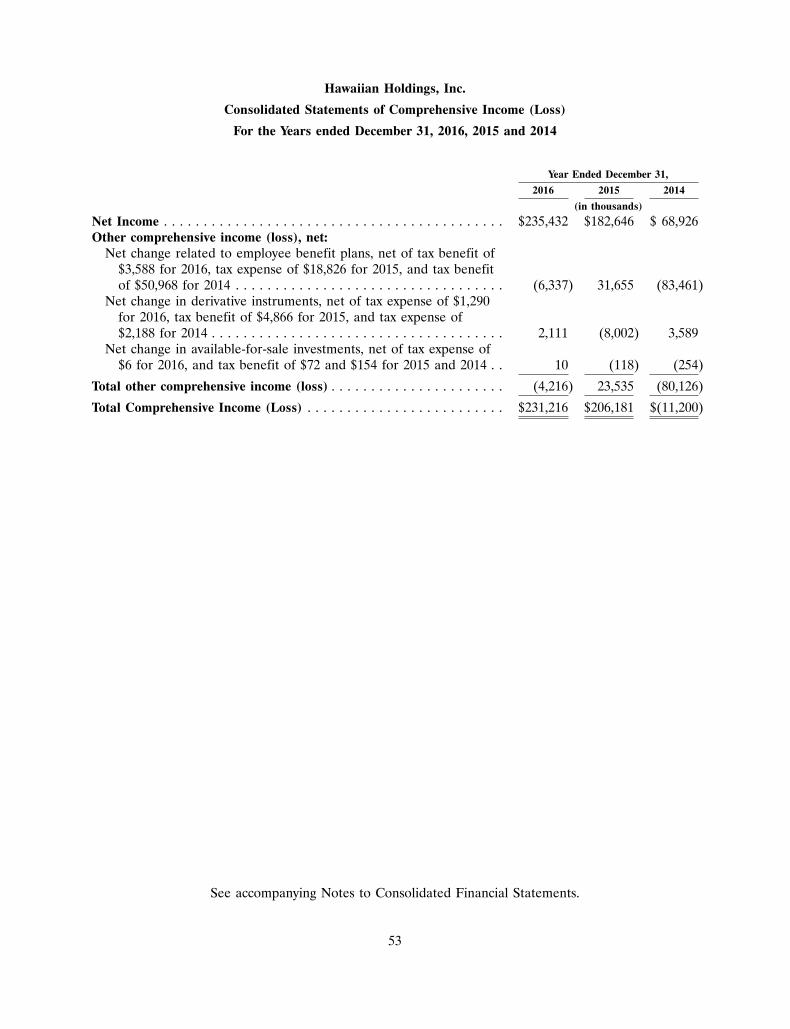
Hawaiian Holdings, Inc.
Consolidated Statements of Comprehensive Income (Loss)
For the Years ended December 31, 2016, 2015 and 2014
Year Ended December 31,
2016 2015 2014
(in thousands)
Net Income . . . . . . . . . . . . . . . . . . . . . . . . . . . . . . . . . . . . . . . . . . . $235,432 $182,646 $ 68,926Other comprehensive income (loss), net:
Net change related to employee benefit plans, net of tax benefit of$3,588 for 2016, tax expense of $18,826 for 2015, and tax benefitof $50,968 for 2014 . . . . . . . . . . . . . . . . . . . . . . . . . . . . . . . . . . (6,337) 31,655 (83,461)
Net change in derivative instruments, net of tax expense of $1,290for 2016, tax benefit of $4,866 for 2015, and tax expense of$2,188 for 2014 . . . . . . . . . . . . . . . . . . . . . . . . . . . . . . . . . . . . . 2,111 (8,002) 3,589
Net change in available-for-sale investments, net of tax expense of$6 for 2016, and tax benefit of $72 and $154 for 2015 and 2014 . . 10 (118) (254)
Total other comprehensive income (loss) . . . . . . . . . . . . . . . . . . . . . . (4,216) 23,535 (80,126)
Total Comprehensive Income (Loss) . . . . . . . . . . . . . . . . . . . . . . . . . $231,216 $206,181 $(11,200)
See accompanying Notes to Consolidated Financial Statements.
53
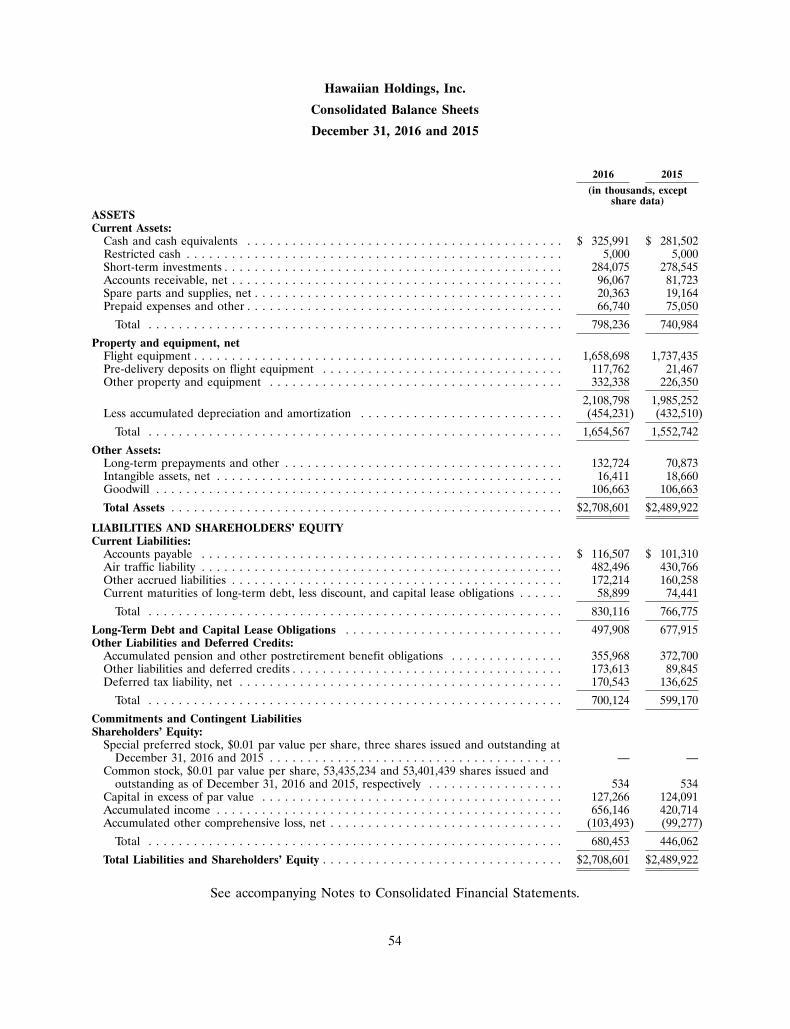
Hawaiian Holdings, Inc.
Consolidated Balance Sheets
December 31, 2016 and 2015
2016 2015
(in thousands, exceptshare data)
ASSETSCurrent Assets:
Cash and cash equivalents . . . . . . . . . . . . . . . . . . . . . . . . . . . . . . . . . . . . . . . . . . $ 325,991 $ 281,502Restricted cash . . . . . . . . . . . . . . . . . . . . . . . . . . . . . . . . . . . . . . . . . . . . . . . . . . 5,000 5,000Short-term investments . . . . . . . . . . . . . . . . . . . . . . . . . . . . . . . . . . . . . . . . . . . . . 284,075 278,545Accounts receivable, net . . . . . . . . . . . . . . . . . . . . . . . . . . . . . . . . . . . . . . . . . . . . 96,067 81,723Spare parts and supplies, net . . . . . . . . . . . . . . . . . . . . . . . . . . . . . . . . . . . . . . . . . 20,363 19,164Prepaid expenses and other . . . . . . . . . . . . . . . . . . . . . . . . . . . . . . . . . . . . . . . . . . 66,740 75,050
Total . . . . . . . . . . . . . . . . . . . . . . . . . . . . . . . . . . . . . . . . . . . . . . . . . . . . . . . 798,236 740,984
Property and equipment, netFlight equipment . . . . . . . . . . . . . . . . . . . . . . . . . . . . . . . . . . . . . . . . . . . . . . . . . 1,658,698 1,737,435Pre-delivery deposits on flight equipment . . . . . . . . . . . . . . . . . . . . . . . . . . . . . . . . 117,762 21,467Other property and equipment . . . . . . . . . . . . . . . . . . . . . . . . . . . . . . . . . . . . . . . 332,338 226,350
2,108,798 1,985,252Less accumulated depreciation and amortization . . . . . . . . . . . . . . . . . . . . . . . . . . . (454,231) (432,510)
Total . . . . . . . . . . . . . . . . . . . . . . . . . . . . . . . . . . . . . . . . . . . . . . . . . . . . . . . 1,654,567 1,552,742
Other Assets:Long-term prepayments and other . . . . . . . . . . . . . . . . . . . . . . . . . . . . . . . . . . . . . 132,724 70,873Intangible assets, net . . . . . . . . . . . . . . . . . . . . . . . . . . . . . . . . . . . . . . . . . . . . . . 16,411 18,660Goodwill . . . . . . . . . . . . . . . . . . . . . . . . . . . . . . . . . . . . . . . . . . . . . . . . . . . . . . 106,663 106,663
Total Assets . . . . . . . . . . . . . . . . . . . . . . . . . . . . . . . . . . . . . . . . . . . . . . . . . . . . $2,708,601 $2,489,922
LIABILITIES AND SHAREHOLDERS’ EQUITYCurrent Liabilities:
Accounts payable . . . . . . . . . . . . . . . . . . . . . . . . . . . . . . . . . . . . . . . . . . . . . . . . $ 116,507 $ 101,310Air traffic liability . . . . . . . . . . . . . . . . . . . . . . . . . . . . . . . . . . . . . . . . . . . . . . . . 482,496 430,766Other accrued liabilities . . . . . . . . . . . . . . . . . . . . . . . . . . . . . . . . . . . . . . . . . . . . 172,214 160,258Current maturities of long-term debt, less discount, and capital lease obligations . . . . . . 58,899 74,441
Total . . . . . . . . . . . . . . . . . . . . . . . . . . . . . . . . . . . . . . . . . . . . . . . . . . . . . . . 830,116 766,775
Long-Term Debt and Capital Lease Obligations . . . . . . . . . . . . . . . . . . . . . . . . . . . . . 497,908 677,915Other Liabilities and Deferred Credits:
Accumulated pension and other postretirement benefit obligations . . . . . . . . . . . . . . . 355,968 372,700Other liabilities and deferred credits . . . . . . . . . . . . . . . . . . . . . . . . . . . . . . . . . . . . 173,613 89,845Deferred tax liability, net . . . . . . . . . . . . . . . . . . . . . . . . . . . . . . . . . . . . . . . . . . . 170,543 136,625
Total . . . . . . . . . . . . . . . . . . . . . . . . . . . . . . . . . . . . . . . . . . . . . . . . . . . . . . . 700,124 599,170
Commitments and Contingent LiabilitiesShareholders’ Equity:
Special preferred stock, $0.01 par value per share, three shares issued and outstanding atDecember 31, 2016 and 2015 . . . . . . . . . . . . . . . . . . . . . . . . . . . . . . . . . . . . . . . — —
Common stock, $0.01 par value per share, 53,435,234 and 53,401,439 shares issued andoutstanding as of December 31, 2016 and 2015, respectively . . . . . . . . . . . . . . . . . . 534 534
Capital in excess of par value . . . . . . . . . . . . . . . . . . . . . . . . . . . . . . . . . . . . . . . . 127,266 124,091Accumulated income . . . . . . . . . . . . . . . . . . . . . . . . . . . . . . . . . . . . . . . . . . . . . . 656,146 420,714Accumulated other comprehensive loss, net . . . . . . . . . . . . . . . . . . . . . . . . . . . . . . . (103,493) (99,277)
Total . . . . . . . . . . . . . . . . . . . . . . . . . . . . . . . . . . . . . . . . . . . . . . . . . . . . . . . 680,453 446,062
Total Liabilities and Shareholders’ Equity . . . . . . . . . . . . . . . . . . . . . . . . . . . . . . . . $2,708,601 $2,489,922
See accompanying Notes to Consolidated Financial Statements.
54
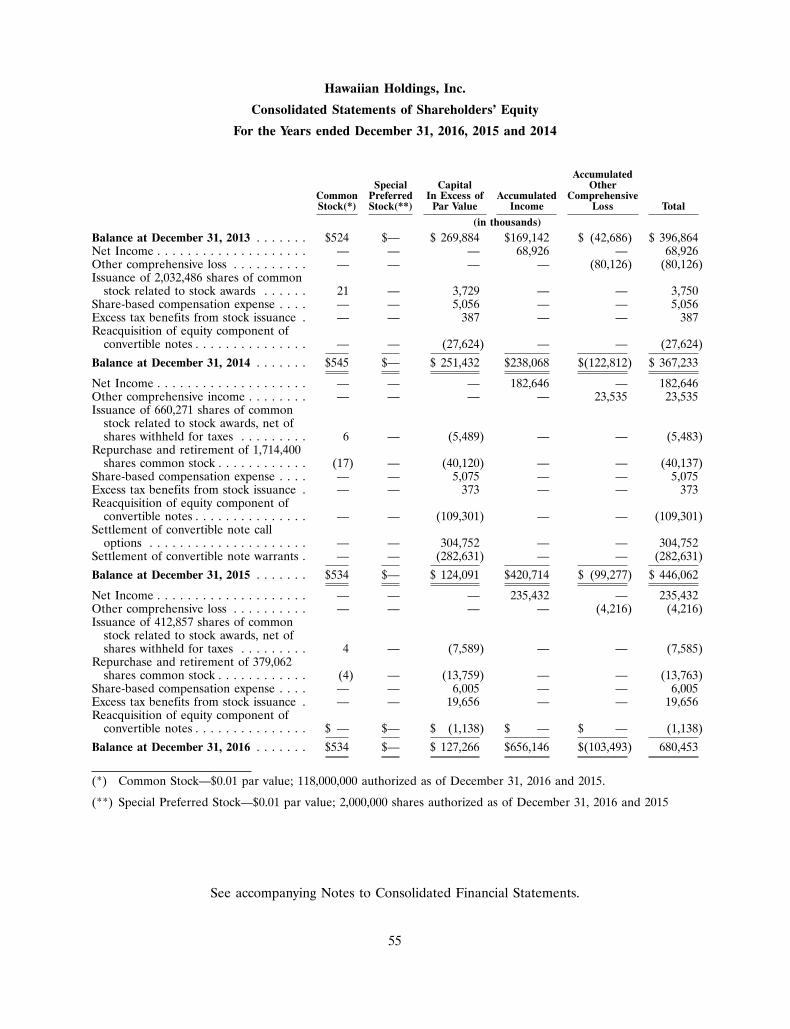
Hawaiian Holdings, Inc.
Consolidated Statements of Shareholders’ Equity
For the Years ended December 31, 2016, 2015 and 2014
AccumulatedSpecial Capital Other
Common Preferred In Excess of Accumulated ComprehensiveStock(*) Stock(**) Par Value Income Loss Total
(in thousands)
Balance at December 31, 2013 . . . . . . . $524 $— $ 269,884 $169,142 $ (42,686) $ 396,864Net Income . . . . . . . . . . . . . . . . . . . . — — — 68,926 — 68,926Other comprehensive loss . . . . . . . . . . — — — — (80,126) (80,126)Issuance of 2,032,486 shares of common
stock related to stock awards . . . . . . 21 — 3,729 — — 3,750Share-based compensation expense . . . . — — 5,056 — — 5,056Excess tax benefits from stock issuance . — — 387 — — 387Reacquisition of equity component of
convertible notes . . . . . . . . . . . . . . . — — (27,624) — — (27,624)
Balance at December 31, 2014 . . . . . . . $545 $— $ 251,432 $238,068 $(122,812) $ 367,233
Net Income . . . . . . . . . . . . . . . . . . . . — — — 182,646 — 182,646Other comprehensive income . . . . . . . . — — — — 23,535 23,535Issuance of 660,271 shares of common
stock related to stock awards, net ofshares withheld for taxes . . . . . . . . . 6 — (5,489) — — (5,483)
Repurchase and retirement of 1,714,400shares common stock . . . . . . . . . . . . (17) — (40,120) — — (40,137)
Share-based compensation expense . . . . — — 5,075 — — 5,075Excess tax benefits from stock issuance . — — 373 — — 373Reacquisition of equity component of
convertible notes . . . . . . . . . . . . . . . — — (109,301) — — (109,301)Settlement of convertible note call
options . . . . . . . . . . . . . . . . . . . . . — — 304,752 — — 304,752Settlement of convertible note warrants . — — (282,631) — — (282,631)
Balance at December 31, 2015 . . . . . . . $534 $— $ 124,091 $420,714 $ (99,277) $ 446,062
Net Income . . . . . . . . . . . . . . . . . . . . — — — 235,432 — 235,432Other comprehensive loss . . . . . . . . . . — — — — (4,216) (4,216)Issuance of 412,857 shares of common
stock related to stock awards, net ofshares withheld for taxes . . . . . . . . . 4 — (7,589) — — (7,585)
Repurchase and retirement of 379,062shares common stock . . . . . . . . . . . . (4) — (13,759) — — (13,763)
Share-based compensation expense . . . . — — 6,005 — — 6,005Excess tax benefits from stock issuance . — — 19,656 — — 19,656Reacquisition of equity component of
convertible notes . . . . . . . . . . . . . . . $ — $— $ (1,138) $ — $ — (1,138)
Balance at December 31, 2016 . . . . . . . $534 $— $ 127,266 $656,146 $(103,493) 680,453
(*) Common Stock—$0.01 par value; 118,000,000 authorized as of December 31, 2016 and 2015.
(**) Special Preferred Stock—$0.01 par value; 2,000,000 shares authorized as of December 31, 2016 and 2015
See accompanying Notes to Consolidated Financial Statements.
55
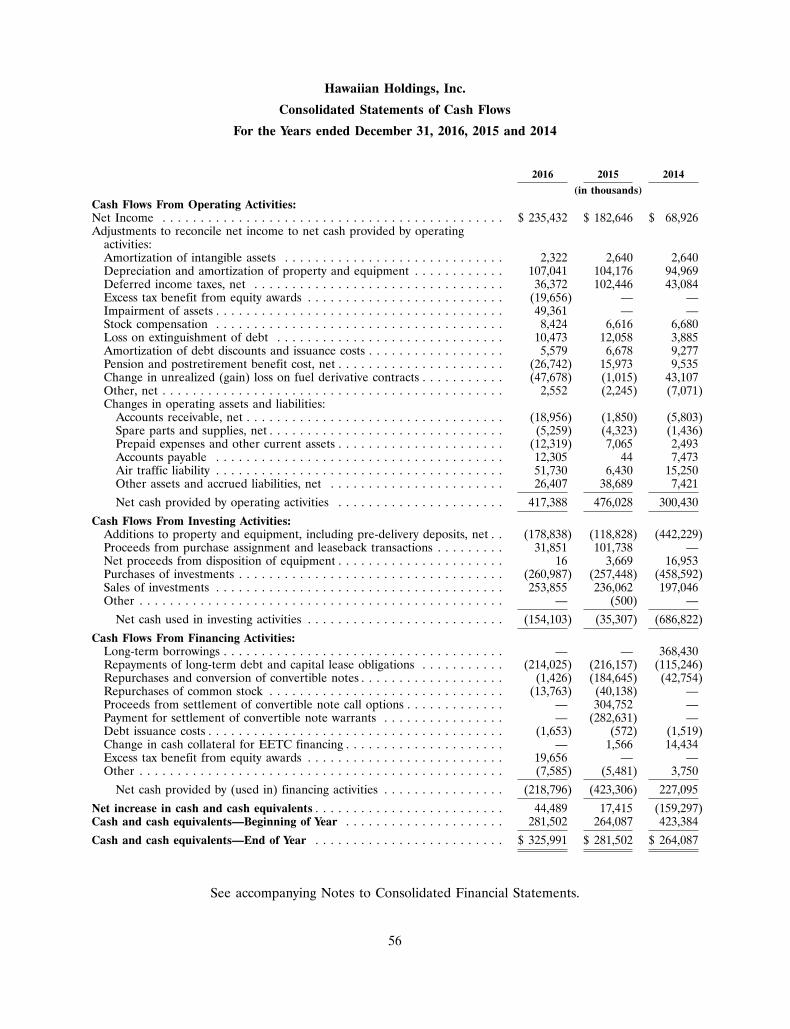
Hawaiian Holdings, Inc.
Consolidated Statements of Cash Flows
For the Years ended December 31, 2016, 2015 and 2014
2016 2015 2014
(in thousands)Cash Flows From Operating Activities:Net Income . . . . . . . . . . . . . . . . . . . . . . . . . . . . . . . . . . . . . . . . . . . . . $ 235,432 $ 182,646 $ 68,926Adjustments to reconcile net income to net cash provided by operating
activities:Amortization of intangible assets . . . . . . . . . . . . . . . . . . . . . . . . . . . . . 2,322 2,640 2,640Depreciation and amortization of property and equipment . . . . . . . . . . . . 107,041 104,176 94,969Deferred income taxes, net . . . . . . . . . . . . . . . . . . . . . . . . . . . . . . . . . 36,372 102,446 43,084Excess tax benefit from equity awards . . . . . . . . . . . . . . . . . . . . . . . . . . (19,656) — —Impairment of assets . . . . . . . . . . . . . . . . . . . . . . . . . . . . . . . . . . . . . . 49,361 — —Stock compensation . . . . . . . . . . . . . . . . . . . . . . . . . . . . . . . . . . . . . . 8,424 6,616 6,680Loss on extinguishment of debt . . . . . . . . . . . . . . . . . . . . . . . . . . . . . . 10,473 12,058 3,885Amortization of debt discounts and issuance costs . . . . . . . . . . . . . . . . . . 5,579 6,678 9,277Pension and postretirement benefit cost, net . . . . . . . . . . . . . . . . . . . . . . (26,742) 15,973 9,535Change in unrealized (gain) loss on fuel derivative contracts . . . . . . . . . . . (47,678) (1,015) 43,107Other, net . . . . . . . . . . . . . . . . . . . . . . . . . . . . . . . . . . . . . . . . . . . . . 2,552 (2,245) (7,071)Changes in operating assets and liabilities:
Accounts receivable, net . . . . . . . . . . . . . . . . . . . . . . . . . . . . . . . . . . (18,956) (1,850) (5,803)Spare parts and supplies, net . . . . . . . . . . . . . . . . . . . . . . . . . . . . . . . (5,259) (4,323) (1,436)Prepaid expenses and other current assets . . . . . . . . . . . . . . . . . . . . . . (12,319) 7,065 2,493Accounts payable . . . . . . . . . . . . . . . . . . . . . . . . . . . . . . . . . . . . . . 12,305 44 7,473Air traffic liability . . . . . . . . . . . . . . . . . . . . . . . . . . . . . . . . . . . . . . 51,730 6,430 15,250Other assets and accrued liabilities, net . . . . . . . . . . . . . . . . . . . . . . . 26,407 38,689 7,421
Net cash provided by operating activities . . . . . . . . . . . . . . . . . . . . . . 417,388 476,028 300,430
Cash Flows From Investing Activities:Additions to property and equipment, including pre-delivery deposits, net . . (178,838) (118,828) (442,229)Proceeds from purchase assignment and leaseback transactions . . . . . . . . . 31,851 101,738 —Net proceeds from disposition of equipment . . . . . . . . . . . . . . . . . . . . . . 16 3,669 16,953Purchases of investments . . . . . . . . . . . . . . . . . . . . . . . . . . . . . . . . . . . (260,987) (257,448) (458,592)Sales of investments . . . . . . . . . . . . . . . . . . . . . . . . . . . . . . . . . . . . . . 253,855 236,062 197,046Other . . . . . . . . . . . . . . . . . . . . . . . . . . . . . . . . . . . . . . . . . . . . . . . . — (500) —
Net cash used in investing activities . . . . . . . . . . . . . . . . . . . . . . . . . . (154,103) (35,307) (686,822)
Cash Flows From Financing Activities:Long-term borrowings . . . . . . . . . . . . . . . . . . . . . . . . . . . . . . . . . . . . . — — 368,430Repayments of long-term debt and capital lease obligations . . . . . . . . . . . (214,025) (216,157) (115,246)Repurchases and conversion of convertible notes . . . . . . . . . . . . . . . . . . . (1,426) (184,645) (42,754)Repurchases of common stock . . . . . . . . . . . . . . . . . . . . . . . . . . . . . . . (13,763) (40,138) —Proceeds from settlement of convertible note call options . . . . . . . . . . . . . — 304,752 —Payment for settlement of convertible note warrants . . . . . . . . . . . . . . . . — (282,631) —Debt issuance costs . . . . . . . . . . . . . . . . . . . . . . . . . . . . . . . . . . . . . . . (1,653) (572) (1,519)Change in cash collateral for EETC financing . . . . . . . . . . . . . . . . . . . . . — 1,566 14,434Excess tax benefit from equity awards . . . . . . . . . . . . . . . . . . . . . . . . . . 19,656 — —Other . . . . . . . . . . . . . . . . . . . . . . . . . . . . . . . . . . . . . . . . . . . . . . . . (7,585) (5,481) 3,750
Net cash provided by (used in) financing activities . . . . . . . . . . . . . . . . (218,796) (423,306) 227,095
Net increase in cash and cash equivalents . . . . . . . . . . . . . . . . . . . . . . . . . 44,489 17,415 (159,297)Cash and cash equivalents—Beginning of Year . . . . . . . . . . . . . . . . . . . . . 281,502 264,087 423,384
Cash and cash equivalents—End of Year . . . . . . . . . . . . . . . . . . . . . . . . . $ 325,991 $ 281,502 $ 264,087
See accompanying Notes to Consolidated Financial Statements.
56
Hawaiian Holdings, Inc.
Notes to Consolidated Financial Statements
1. Summary of Significant Accounting Policies
Basis of Presentation
Hawaiian Holdings, Inc. (the Company, Holdings, we, us and our) and its direct wholly-ownedsubsidiary, Hawaiian Airlines, Inc. (Hawaiian), are incorporated in the State of Delaware. TheCompany’s primary asset is its sole ownership of all issued and outstanding shares of common stock ofHawaiian.
The consolidated financial statements include the accounts of the Company and its wholly-ownedsubsidiaries, including its principal subsidiary, Hawaiian, through which the Company conductssubstantially all of its operations. All significant inter-company balances and transactions have beeneliminated upon consolidation.
Certain prior period amounts were reclassified to conform to the current period presentation. None ofthese reclassifications had a material effect on the consolidated financial statements.
Cash Equivalents
Cash equivalents consist of short-term, highly liquid investments with an original maturity of threemonths or less at the date of purchase.
Restricted Cash
Restricted cash consists of cash held as collateral by institutions that process our credit cardtransactions for advanced ticket sales.
Spare Parts and Supplies
Spare parts and supplies are valued at average cost, and primarily consist of expendable parts for flightequipment and other supplies. An allowance for obsolescence of expendable parts is provided over theestimated useful lives of the related aircraft and engines for spare parts expected to be on hand at thedate the aircraft are retired from service. These allowances are based on management’s estimates andare subject to change.
Property, Equipment and Depreciation
Property and equipment are stated at cost and depreciated on a straight-line basis to their estimatedresidual values over the asset’s estimated useful life. Depreciation begins when the asset is placed intoservice. Aircraft and related parts begin depreciating on the aircraft’s first revenue flight.
57
Hawaiian Holdings, Inc.
Notes to Consolidated Financial Statements (Continued)
1. Summary of Significant Accounting Policies (Continued)
Estimated useful lives and residual values of property and equipment are as follows:
Boeing 717-200 aircraft and engines . . . . . . . . . . . 7 - 11 years, 7 - 34% residual valueBoeing 767-300 aircraft and engines(1) . . . . . . . . . 1 - 2 years, 85% residual value(1)Airbus A330-200 aircraft and engines . . . . . . . . . . 25 years, 10% residual valueATR turboprop aircraft and engines . . . . . . . . . . 10 years, 15% residual valueAircraft under capital leases . . . . . . . . . . . . . . . . 8 - 12 years, no residual valueFlight simulator under capital lease . . . . . . . . . . . 10 years, no residual valueMajor rotable parts . . . . . . . . . . . . . . . . . . . . . . . Average lease term or useful life for related
aircraft, 10% - 15% residual valueImprovements to leased flight equipment . . . . . . . Shorter of lease term or useful lifeFacility leasehold improvements . . . . . . . . . . . . . . Shorter of lease term, including assumed lease
renewals when renewal is economically compelledat key airports, or useful life
Furniture, fixtures and other equipment . . . . . . . . 3 - 7 years, no residual valueCapitalized software . . . . . . . . . . . . . . . . . . . . . . 3 - 7 years, no residual value
(1) In 2016, the Company made a determination to early retire its Boeing 767-300 fleet by the end of2018. Useful lives and residual values have been adjusted accordingly to reflect this decision andmatch the retirement dates of the aircraft. See Note 11 for further discussion.
Additions and modifications that significantly enhance the operating performance and/or extend theuseful lives of property and equipment are capitalized and depreciated over the lesser of the remaininguseful life of the asset or the remaining lease term, as applicable. Expenditures that do not improve orextend asset lives are charged to expense as incurred. Pre-delivery deposits are capitalized when paid.
Aircraft under capital leases are recorded at an amount equal to the present value of minimum leasepayments utilizing the Company’s incremental borrowing rate at lease inception and amortized on astraight-line basis over the lesser of the remaining useful life of the aircraft or the lease term. Theamortization is recorded in depreciation and amortization expense on the Consolidated Statement ofOperations. Accumulated amortization of aircraft and other capital leases was $56.1 million and$43.4 million as of December 31, 2016 and 2015, respectively.
The Company capitalizes certain costs related to the acquisition and development of computer softwareand amortizes these costs using the straight-line method over the estimated useful life of the software.The net book value of computer software, which is included in Other property and equipment on theconsolidated balance sheets, was $31.0 million and $31.7 million at December 31, 2016 and 2015,respectively. The value of construction in progress, which is included in other property and equipmenton the consolidated balance sheets, was $157.8 million and $35.7 million as of December 31, 2016 and2015, respectively. Amortization expense related to computer software was $9.7 million, $6.3 millionand $5.5 million for the years ended December 31, 2016, 2015, and 2014 respectively.
Aircraft Maintenance and Repair Costs
Maintenance and repair costs for owned and leased flight equipment, including the overhaul of aircraftcomponents, are charged to operating expenses as incurred. Engine overhaul costs covered bypower-by-the-hour arrangements are paid and expensed as incurred or expensed on a straight-line basis
58
Hawaiian Holdings, Inc.
Notes to Consolidated Financial Statements (Continued)
1. Summary of Significant Accounting Policies (Continued)
and are based on the amount of hours flown per contract. Under the terms of these power-by-the-houragreements, the Company pays a set dollar amount per engine hour flown on a monthly basis and thethird-party vendor assumes the obligation to repair the engines at no additional cost, subject to certainspecified exclusions.
Additionally, although the Company’s aircraft lease agreements specifically provide that it is responsiblefor maintenance of the leased aircraft, the Company pays maintenance reserves to the aircraft lessorsthat are applied toward the cost of future maintenance events. These reserves are calculated based on aperformance measure, such as flight hours, and are available for reimbursement to the Company uponthe completion of the maintenance of the leased aircraft. However, reimbursements are limited to theavailable reserves associated with the specific maintenance activity for which the Company requestsreimbursement.
Under certain aircraft lease agreements, the lessor is entitled to retain excess amounts on deposit atthe expiration of the lease, if any; whereas at the expiration of certain other existing aircraft leaseagreements any such excess amounts are returned to the Company, provided that it has fulfilled all ofits obligations under the lease agreements. The maintenance reserves paid under the lease agreementsdo not transfer either the obligation to maintain the aircraft or the cost risk associated with themaintenance activities to the aircraft lessor. In addition, the Company maintains the right to select anythird-party maintenance provider.
Maintenance reserve payments that are expected to be recovered from lessors are recorded as depositsin the Consolidated Balance Sheets as an asset until it is less than probable that any portion of thedeposit is recoverable. In addition, payments of maintenance reserves that are not substantially andcontractually related to the maintenance of the leased assets are expensed as incurred. Any costs thatare substantially and contractually unrelated to the maintenance of the leased asset are considered tobe unrecoverable. In order to properly account for the costs that are related to the maintenance of theleased asset, the Company bifurcates its maintenance reserves into two groups and expenses theproportionate share that is expected to be unrecoverable.
Goodwill and Indefinite-lived Intangible Assets
Goodwill and intangible assets with indefinite lives are not amortized, but are tested for impairment atleast annually using a three-step process in accordance with Accounting Standard Codification (ASC)Intangibles—Goodwill and Other (ASC 350).
In the event that the Company determines that the values of goodwill or indefinite-lived intangibleassets have become impaired, the Company will incur an accounting charge during the period in whichsuch determination is made.
Impairment of Long-Lived Assets and Finite-lived Intangible Assets
Long-lived assets used in operations, consisting principally of property and equipment and finite-livedintangible assets, are tested for impairment when events or changes in circumstances indicate, inmanagement’s judgment, that the assets might be impaired and the undiscounted cash flows estimatedto be generated by those assets are less than their carrying amount. When testing for impairmentmanagement considers market trends, the expected useful lives of the assets, changes in economicconditions, recent transactions involving sales of similar assets and, if necessary, estimates of future
59
Hawaiian Holdings, Inc.
Notes to Consolidated Financial Statements (Continued)
1. Summary of Significant Accounting Policies (Continued)
undiscounted cash flows. To determine whether impairment exists for aircraft used in operations, assetsare grouped at the fleet-type level (the lowest level for which there are identifiable cash flows) andfuture cash flows are estimated based on projections of capacity, passenger mile yield, fuel costs, laborcosts and other relevant factors. If, at any time, management determines the net carrying value of anasset is not recoverable, the amount is reduced to its fair value during the period in which suchdetermination is made. Any changes in the estimated useful lives of these assets will be accounted forprospectively. In 2016, it was determined that the Boeing 767-300 fleet and related assets wereimpaired. A $49.4 million impairment charge was recorded, see Note 11 for further details.
Operating Leases
The Company leases aircraft, engines, airport terminal facilities, office space, and other equipmentunder operating leases. Some of these lease agreements include escalation clauses and renewal options.For scheduled rent escalation clauses during the lease terms or for rental payments commencing at adate other than the date of initial occupancy, the Company records minimum rental expenses on astraight-line basis over the terms of the leases in the Consolidated Statements of Operations. Whenlease renewals are considered to be reasonably assured, the rental payments that will be due during therenewal periods are included in the determination of rent expense over the life of the lease. Rentalexpense for operating leases totaled $193.0 million, $174.9 million, and $160.7 million for the yearsended December 31, 2016, 2015 and 2014, respectively.
Leased Aircraft Return Costs
Costs associated with the return of leased aircraft are accrued when it is probable that a payment willbe made and that amount is reasonably estimable. Any accrual is based on the time remaining on thelease, planned aircraft usage, and the provisions included in the lease agreement, although the actualamount due to any lessor upon return will not be known with certainty until lease termination.
Revenue Recognition
Passenger revenue is recognized either when the transportation is provided or when tickets expireunused. The value of passenger tickets for future travel is included as air traffic liability.
Various taxes and fees assessed on the sale of tickets to end customers are collected by the Company asan agent and remitted to taxing authorities. These taxes and fees have been presented on a net basis inthe accompanying Consolidated Statements of Operations and recorded as a liability until remitted tothe appropriate taxing authority.
Other operating revenue includes checked baggage revenue, cargo revenue, ticket change andcancellation fees, charter revenue, ground handling fees, commissions and fees earned under certainjoint marketing agreements with other companies, inflight revenue, and other incidental sales.
Ticket change and cancellation fees are recognized at the time the fees are assessed. All other revenueis recognized as revenue when the related goods and services are provided.
Frequent Flyer Program
HawaiianMiles, Hawaiian’s frequent flyer travel award program provides a variety of awards to programmembers based on accumulated mileage. The Company utilizes the incremental cost method of
60
Hawaiian Holdings, Inc.
Notes to Consolidated Financial Statements (Continued)
1. Summary of Significant Accounting Policies (Continued)
accounting for free travel awards earned by passengers issued from the HawaiianMiles program throughflight activity. The Company records a liability for the estimated incremental cost of providing travelawards that are expected to be redeemed on Hawaiian or the contractual rate of expected redemptionon other airlines. The Company estimates the incremental cost of travel awards based on periodicstudies of actual costs and applies these cost estimates to all issued miles, less an appropriate breakagefactor for estimated miles that will not be redeemed. Incremental cost includes the costs of fuel, mealsand beverages, insurance and certain other passenger traffic-related costs, but does not include anycosts for aircraft ownership and maintenance. The breakage factor is estimated based on an analysis ofhistorical expirations.
The Company also sells mileage credits to companies participating in our frequent flyer program. Thesesales are accounted for as multiple-element arrangements, with one element representing the travel thatwill ultimately be provided when the mileage credits are redeemed and the other consisting ofmarketing related activities that we conduct with the participating company.
In 2013, Hawaiian entered into a co-branded credit card agreement, which provides for the sale offrequent flyer miles to Barclays Bank Delaware (Barclays) which began in 2014. The agreement was anew multiple element arrangement subject to Accounting Standards Update 2009-13, MultipleDeliverable Revenue Arrangements—A consensus of the FASB Emerging Issues Task Force(ASU 2009-13), which was effective for new and materially modified revenue arrangements entered intoby the Company after January 1, 2011. ASU 2009-13 requires the allocation of the overall considerationreceived to each deliverable using the estimated selling price. The objective of using estimated sellingprice based methodology is to determine the price at which the Company would transact a sale if theproduct or service were sold on a stand-alone basis.
The following four deliverables or elements were identified in the agreement: (i) travel miles; (ii) useof the Hawaiian brand and access to member lists; (iii) advertising elements; and (iv) other airlinebenefits including checked baggage services and travel discounts. The Company determined the relativefair value of each element by estimating the selling prices of the deliverables by considering discountedcash flows using multiple inputs and assumptions, including: (1) the expected number of miles to beawarded and redeemed; (2) the estimated weighted average equivalent ticket value, adjusted by afulfillment discount; (3) the estimated total annual cardholder spend; (4) an estimated royalty rate forthe Hawaiian portfolio; and (5) the expected use of each of the airline benefits. The overallconsideration received is allocated to the deliverables based on their relative selling prices. Thetransportation element is deferred and recognized as passenger revenue over the period when thetransportation is expected to be provided (23 months). The other elements will generally be recognizedas other revenue when earned.
61
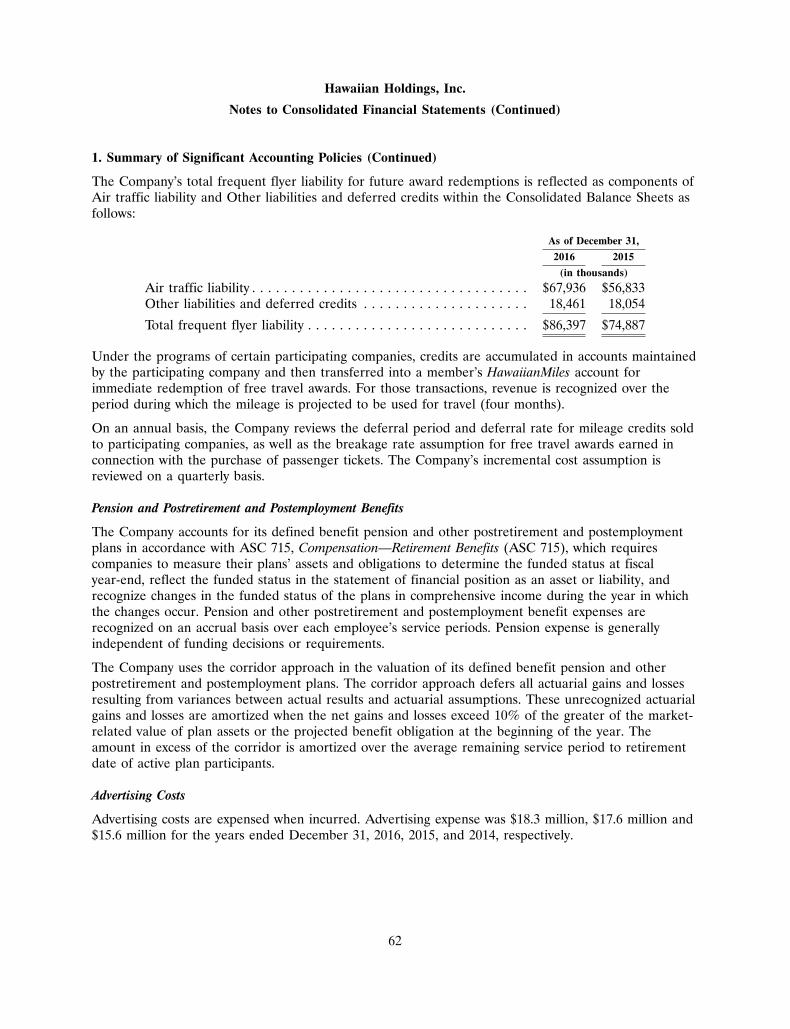
Hawaiian Holdings, Inc.
Notes to Consolidated Financial Statements (Continued)
1. Summary of Significant Accounting Policies (Continued)
The Company’s total frequent flyer liability for future award redemptions is reflected as components ofAir traffic liability and Other liabilities and deferred credits within the Consolidated Balance Sheets asfollows:
As of December 31,
2016 2015
(in thousands)
Air traffic liability . . . . . . . . . . . . . . . . . . . . . . . . . . . . . . . . . . . $67,936 $56,833Other liabilities and deferred credits . . . . . . . . . . . . . . . . . . . . . 18,461 18,054
Total frequent flyer liability . . . . . . . . . . . . . . . . . . . . . . . . . . . . $86,397 $74,887
Under the programs of certain participating companies, credits are accumulated in accounts maintainedby the participating company and then transferred into a member’s HawaiianMiles account forimmediate redemption of free travel awards. For those transactions, revenue is recognized over theperiod during which the mileage is projected to be used for travel (four months).
On an annual basis, the Company reviews the deferral period and deferral rate for mileage credits soldto participating companies, as well as the breakage rate assumption for free travel awards earned inconnection with the purchase of passenger tickets. The Company’s incremental cost assumption isreviewed on a quarterly basis.
Pension and Postretirement and Postemployment Benefits
The Company accounts for its defined benefit pension and other postretirement and postemploymentplans in accordance with ASC 715, Compensation—Retirement Benefits (ASC 715), which requirescompanies to measure their plans’ assets and obligations to determine the funded status at fiscalyear-end, reflect the funded status in the statement of financial position as an asset or liability, andrecognize changes in the funded status of the plans in comprehensive income during the year in whichthe changes occur. Pension and other postretirement and postemployment benefit expenses arerecognized on an accrual basis over each employee’s service periods. Pension expense is generallyindependent of funding decisions or requirements.
The Company uses the corridor approach in the valuation of its defined benefit pension and otherpostretirement and postemployment plans. The corridor approach defers all actuarial gains and lossesresulting from variances between actual results and actuarial assumptions. These unrecognized actuarialgains and losses are amortized when the net gains and losses exceed 10% of the greater of the market-related value of plan assets or the projected benefit obligation at the beginning of the year. Theamount in excess of the corridor is amortized over the average remaining service period to retirementdate of active plan participants.
Advertising Costs
Advertising costs are expensed when incurred. Advertising expense was $18.3 million, $17.6 million and$15.6 million for the years ended December 31, 2016, 2015, and 2014, respectively.
62
Hawaiian Holdings, Inc.
Notes to Consolidated Financial Statements (Continued)
1. Summary of Significant Accounting Policies (Continued)
Capitalized Interest
Interest is capitalized upon the payment of predelivery deposits for aircraft and engines, and isdepreciated over the estimated useful life of the asset from service inception date.
Stock Compensation Plans
The Company has a stock compensation plan for it and its subsidiaries’ officers, consultants andnon-employee directors. The Company accounts for stock compensation awards under ASC 718,Compensation—Stock Compensation, which requires companies to measure the cost of employeeservices received in exchange for an award of equity instruments based on the fair value of such awardson the dates they are granted. The fair value of the awards are estimated using the following:(1) option-pricing models for grants of stock options or (2) fair value at the measurement date (usuallythe grant date) for awards of stock subject to time and / or performance-based vesting. The resultantcost is recognized as compensation expense over the period of time during which an employee isrequired to provide services to the Company (the service period) in exchange for the award, the serviceperiod generally being the vesting period of the award.
Financial Derivative Instruments
The Company uses derivatives to manage risks associated with certain assets and liabilities arising fromthe potential adverse impact of fluctuations in global aircraft fuel prices, interest rates and foreigncurrency exchange rates.
The following table summarizes the accounting treatment of the Company’s derivative contracts:
Classification of UnrealizedClassification of Gains (Losses)Accounting RealizedDerivative Type Designation Gains and Losses Effective Portion Ineffective Portion
Interest ratecontracts . . . . . Designated as Interest expense AOCI Nonoperating
cash flow hedges and amortization income (expense)of debt discountsand issuance costs
Foreign currencyexchangecontracts . . . . . Designated as Passenger revenue AOCI Nonoperating
cash flow hedges income (expense)
Fuel hedgecontracts . . . . . Not designated as Gains (losses) on Change in fair value is recorded in
hedges fuel derivatives nonoperating income (expense)
Foreign currencyexchangecontracts . . . . . Not designated as Nonoperating Change in fair value is recorded in
hedges income (expense), nonoperating income (expense)Other
63
Hawaiian Holdings, Inc.
Notes to Consolidated Financial Statements (Continued)
1. Summary of Significant Accounting Policies (Continued)
If the Company terminates a derivative designated for hedge accounting under ASC 815, prior to itscontractual settlement date, then the cumulative gain or loss recognized in AOCI at the terminationdate remains in AOCI until the forecasted transaction occurs. In a situation where it becomes probablethat a hedged forecasted transaction will not occur, any gains and/or losses that have been recorded toAOCI would be required to be immediately reclassified into earnings. All cash flows associated withpurchasing and settling derivatives are classified as operating cash flows in the Consolidated Statementsof Cash Flows.
Use of Estimates in the Preparation of Financial Statements
The preparation of financial statements in conformity with U.S. generally accepted accountingprinciples requires management to make estimates and assumptions that affect the amounts reported inthe financial statements and accompanying notes. Actual results could differ significantly from thoseestimates.
Recently Adopted Accounting Pronouncements
In April 2015, the FASB issued Accounting Standards Update 2015-03, Simplifying the Presentation ofDebt Issuance Costs (ASU 2015-03), requiring an entity to present its debt issuance costs on thebalance sheet as a deduction from the carrying amount of the related debt liability instead of adeferred charge. It is effective for annual reporting periods beginning after December 15, 2015. Theimpact of ASU 2015-03 on the Company’s consolidated balance sheet as of December 31, 2015included a reclassification of unamortized debt issuance costs of $23.9 million from long-termprepayments and other to long-term debt.
Recently Issued Accounting Pronouncements
In November 2016, the Financial Accounting Standards Board (FASB) issued Accounting StandardsUpdate 2016-18, Statement of Cash Flows (Topic 230), Restricted Cash, requiring restricted cash andrestricted cash equivalents to be included with cash and cash equivalents on the statement of cash flowswhen reconciling the beginning-of-period and end-of-period total amounts shown on the statement ofcash flows. The guidance is effective for interim and annual periods beginning after December 15,2017, with early adoption permitted. The adoption of this guidance is not expected to have a materialimpact on the Company’s consolidated financial statements.
In August 2016, the FASB issued ASU 2016-15, Statement of Cash Flows (Topic 230), Classification ofCertain Cash Receipts and Cash Payments. The new standard clarifies how certain cash receipts andcash payments are presented and classified in the statement of cash flows. The guidance is effective forinterim and annual periods beginning after December 15, 2017, with early adoption permitted. Theadoption of this guidance is not expected to have a material impact on the Company’s consolidatedfinancial statements.
In March 2016, the FASB issued ASU 2016-09, Improvements to Employee Share-Based PaymentAccounting (ASU 2016-09), requiring all income tax effects of awards to be recognized in the incomestatement when the awards vest or are settled. ASU 2016-09 will also allow an employer to withholdmore shares for tax withholding purposes without triggering liability accounting and to make a policyelection to account for forfeitures as they occur. ASU 2016-09 is effective for annual reporting periods
64
Hawaiian Holdings, Inc.
Notes to Consolidated Financial Statements (Continued)
1. Summary of Significant Accounting Policies (Continued)
beginning after December 15, 2016. The Company does not expect the adoption of ASU 2016-09 tohave a material impact on its consolidated financial statements.
In February 2016, the FASB issued ASU 2016-02, Leases (ASU 2016-02), requiring a lessee torecognize in the statement of financial position a liability to make lease payments and a right-of-useasset representing its right to use the underlying asset for the lease term. ASU 2016-02 is effective forannual reporting periods beginning after December 15, 2018. ASU 2016-02 requires entities to use amodified retrospective approach for leases that exist or are entered into after the beginning of theearliest comparative period in the financial statements. Full retrospective application is prohibited. TheCompany is currently evaluating the effect that the provisions of ASU 2016-02 will have on itsconsolidated financial statements and related disclosures. The Company has determined that the newstandard, once effective will have a significant effect on both its fixed asset and lease liability balances.
In May 2014, the FASB issued ASU 2014-09, Revenue from Contracts with Customers (ASU 2014-09),requiring an entity to recognize the amount of revenue to which it expects to be entitled for thetransfer of promised goods or services to customers. ASU 2014-09 will replace most existing revenuerecognition guidance in GAAP when it becomes effective. In July 2015, the FASB voted to defer theamendments in ASU 2014-09 by one year to December 15, 2017. The terms of ASU 2014-09 areeffective for fiscal years, and interim periods within those fiscal years, beginning after the revisedeffective date, and allow for either full retrospective or modified retrospective adoption.
The Company is currently evaluating the overall effect that the provisions of ASU 2014-09 will have onits consolidated financial statements and related disclosures. The Company has determined that thenew standard, once effective, will affect frequent flyer, ticket breakage, and airline ticket change feeaccounting. The standard will preclude the Company from applying the incremental cost method ofaccounting for free travel awards earned by passengers issued from the HawaiianMiles program throughflight activity. The Company will instead be required to allocate consideration received between theticket and miles earned by passengers and defer the value of the miles until redemption, resulting in asignificant increase to deferred revenue liability on the balance sheet. Passenger revenue is currentlyrecognized for unflown tickets when tickets expire unused. Under the new standard, the Companyexpects to estimate tickets that will expire unused and recognize revenue at the ticketed flight date.Fees for changing itineraries are currently recognized when received. The Company expects to deferthe recognition of these fees until the related transportation is provided. Amounts currently classified inother revenue (e.g. bag and other ancillary fees) will be reclassified to passenger revenue. Thesechanges could have a significant impact on the Company’s financial statements. As of the date of thisreport, the Company intends to adopt the new revenue standard as of January 1, 2018 via thefull-retrospective option.
65
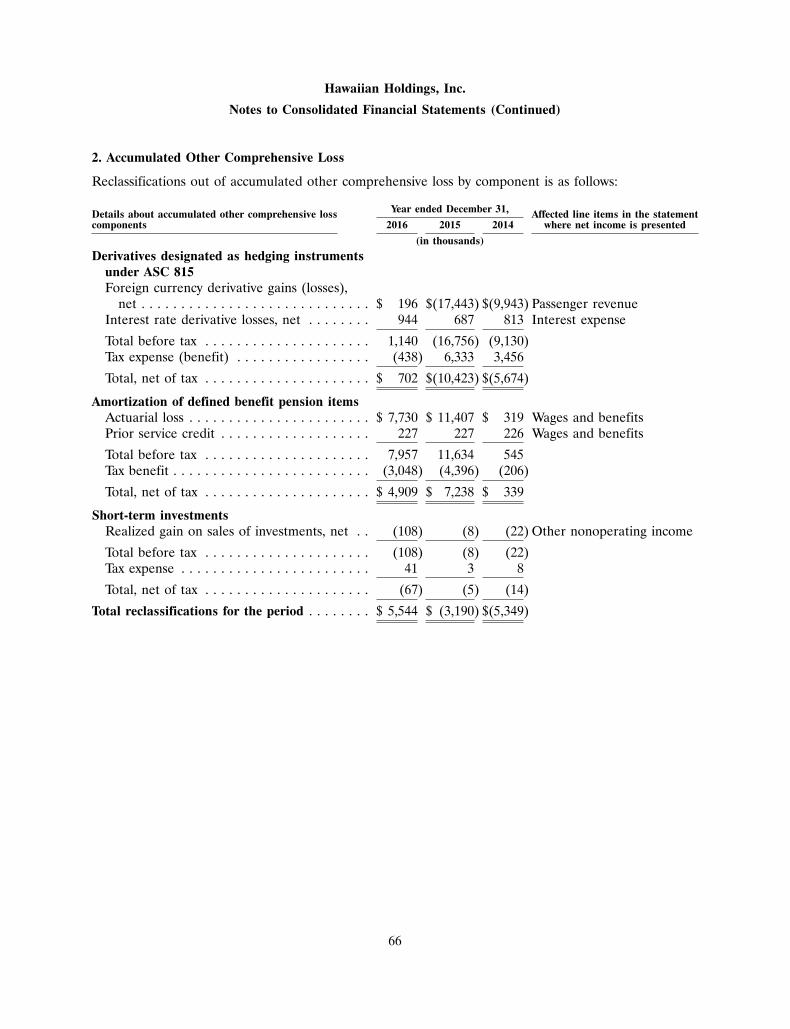
Hawaiian Holdings, Inc.
Notes to Consolidated Financial Statements (Continued)
2. Accumulated Other Comprehensive Loss
Reclassifications out of accumulated other comprehensive loss by component is as follows:
Year ended December 31,Details about accumulated other comprehensive loss Affected line items in the statementcomponents 2016 2015 2014 where net income is presented
(in thousands)
Derivatives designated as hedging instrumentsunder ASC 815Foreign currency derivative gains (losses),
net . . . . . . . . . . . . . . . . . . . . . . . . . . . . . $ 196 $(17,443) $(9,943) Passenger revenueInterest rate derivative losses, net . . . . . . . . 944 687 813 Interest expense
Total before tax . . . . . . . . . . . . . . . . . . . . . 1,140 (16,756) (9,130)Tax expense (benefit) . . . . . . . . . . . . . . . . . (438) 6,333 3,456
Total, net of tax . . . . . . . . . . . . . . . . . . . . . $ 702 $(10,423) $(5,674)
Amortization of defined benefit pension itemsActuarial loss . . . . . . . . . . . . . . . . . . . . . . . $ 7,730 $ 11,407 $ 319 Wages and benefitsPrior service credit . . . . . . . . . . . . . . . . . . . 227 227 226 Wages and benefits
Total before tax . . . . . . . . . . . . . . . . . . . . . 7,957 11,634 545Tax benefit . . . . . . . . . . . . . . . . . . . . . . . . . (3,048) (4,396) (206)
Total, net of tax . . . . . . . . . . . . . . . . . . . . . $ 4,909 $ 7,238 $ 339
Short-term investmentsRealized gain on sales of investments, net . . (108) (8) (22) Other nonoperating income
Total before tax . . . . . . . . . . . . . . . . . . . . . (108) (8) (22)Tax expense . . . . . . . . . . . . . . . . . . . . . . . . 41 3 8
Total, net of tax . . . . . . . . . . . . . . . . . . . . . (67) (5) (14)
Total reclassifications for the period . . . . . . . . $ 5,544 $ (3,190) $(5,349)
66
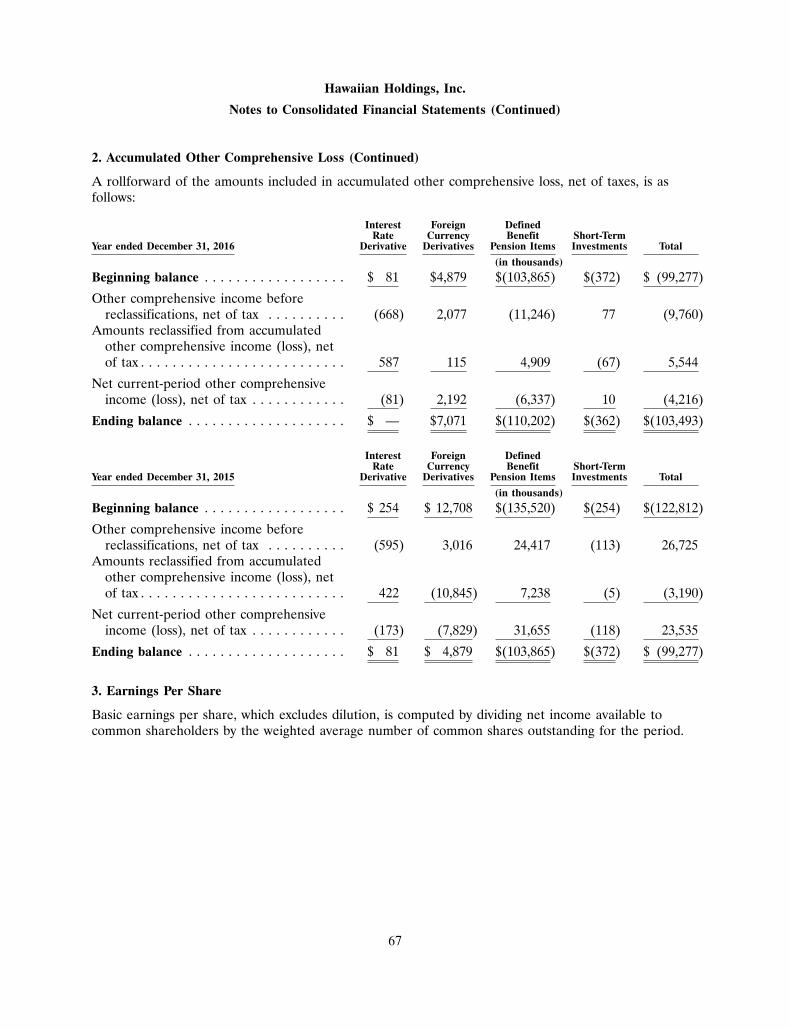
Hawaiian Holdings, Inc.
Notes to Consolidated Financial Statements (Continued)
2. Accumulated Other Comprehensive Loss (Continued)
A rollforward of the amounts included in accumulated other comprehensive loss, net of taxes, is asfollows:
Interest Foreign DefinedRate Currency Benefit Short-Term
Year ended December 31, 2016 Derivative Derivatives Pension Items Investments Total
(in thousands)
Beginning balance . . . . . . . . . . . . . . . . . . $ 81 $4,879 $(103,865) $(372) $ (99,277)
Other comprehensive income beforereclassifications, net of tax . . . . . . . . . . (668) 2,077 (11,246) 77 (9,760)
Amounts reclassified from accumulatedother comprehensive income (loss), netof tax . . . . . . . . . . . . . . . . . . . . . . . . . . 587 115 4,909 (67) 5,544
Net current-period other comprehensiveincome (loss), net of tax . . . . . . . . . . . . (81) 2,192 (6,337) 10 (4,216)
Ending balance . . . . . . . . . . . . . . . . . . . . $ — $7,071 $(110,202) $(362) $(103,493)
Interest Foreign DefinedRate Currency Benefit Short-Term
Year ended December 31, 2015 Derivative Derivatives Pension Items Investments Total
(in thousands)
Beginning balance . . . . . . . . . . . . . . . . . . $ 254 $ 12,708 $(135,520) $(254) $(122,812)
Other comprehensive income beforereclassifications, net of tax . . . . . . . . . . (595) 3,016 24,417 (113) 26,725
Amounts reclassified from accumulatedother comprehensive income (loss), netof tax . . . . . . . . . . . . . . . . . . . . . . . . . . 422 (10,845) 7,238 (5) (3,190)
Net current-period other comprehensiveincome (loss), net of tax . . . . . . . . . . . . (173) (7,829) 31,655 (118) 23,535
Ending balance . . . . . . . . . . . . . . . . . . . . $ 81 $ 4,879 $(103,865) $(372) $ (99,277)
3. Earnings Per Share
Basic earnings per share, which excludes dilution, is computed by dividing net income available tocommon shareholders by the weighted average number of common shares outstanding for the period.
67
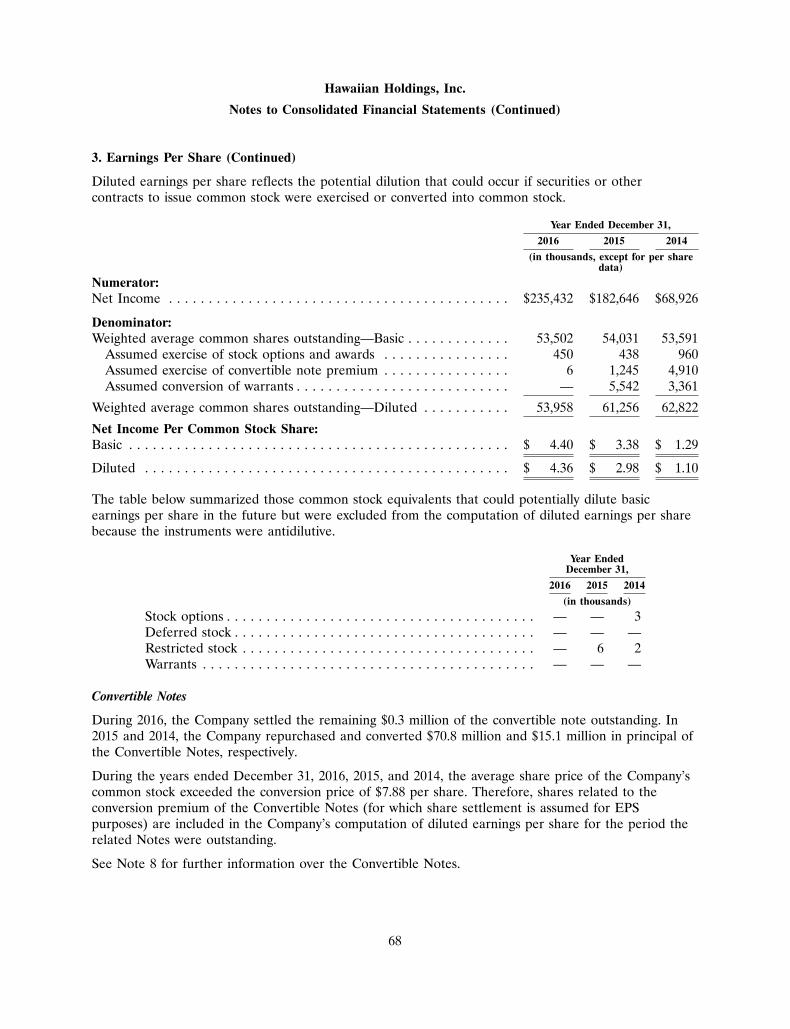
Hawaiian Holdings, Inc.
Notes to Consolidated Financial Statements (Continued)
3. Earnings Per Share (Continued)
Diluted earnings per share reflects the potential dilution that could occur if securities or othercontracts to issue common stock were exercised or converted into common stock.
Year Ended December 31,
2016 2015 2014
(in thousands, except for per sharedata)
Numerator:Net Income . . . . . . . . . . . . . . . . . . . . . . . . . . . . . . . . . . . . . . . . . . . $235,432 $182,646 $68,926
Denominator:Weighted average common shares outstanding—Basic . . . . . . . . . . . . . 53,502 54,031 53,591
Assumed exercise of stock options and awards . . . . . . . . . . . . . . . . 450 438 960Assumed exercise of convertible note premium . . . . . . . . . . . . . . . . 6 1,245 4,910Assumed conversion of warrants . . . . . . . . . . . . . . . . . . . . . . . . . . . — 5,542 3,361
Weighted average common shares outstanding—Diluted . . . . . . . . . . . 53,958 61,256 62,822
Net Income Per Common Stock Share:Basic . . . . . . . . . . . . . . . . . . . . . . . . . . . . . . . . . . . . . . . . . . . . . . . . $ 4.40 $ 3.38 $ 1.29
Diluted . . . . . . . . . . . . . . . . . . . . . . . . . . . . . . . . . . . . . . . . . . . . . . $ 4.36 $ 2.98 $ 1.10
The table below summarized those common stock equivalents that could potentially dilute basicearnings per share in the future but were excluded from the computation of diluted earnings per sharebecause the instruments were antidilutive.
Year EndedDecember 31,
2016 2015 2014
(in thousands)
Stock options . . . . . . . . . . . . . . . . . . . . . . . . . . . . . . . . . . . . . . . — — 3Deferred stock . . . . . . . . . . . . . . . . . . . . . . . . . . . . . . . . . . . . . . — — —Restricted stock . . . . . . . . . . . . . . . . . . . . . . . . . . . . . . . . . . . . . — 6 2Warrants . . . . . . . . . . . . . . . . . . . . . . . . . . . . . . . . . . . . . . . . . . — — —
Convertible Notes
During 2016, the Company settled the remaining $0.3 million of the convertible note outstanding. In2015 and 2014, the Company repurchased and converted $70.8 million and $15.1 million in principal ofthe Convertible Notes, respectively.
During the years ended December 31, 2016, 2015, and 2014, the average share price of the Company’scommon stock exceeded the conversion price of $7.88 per share. Therefore, shares related to theconversion premium of the Convertible Notes (for which share settlement is assumed for EPSpurposes) are included in the Company’s computation of diluted earnings per share for the period therelated Notes were outstanding.
See Note 8 for further information over the Convertible Notes.
68
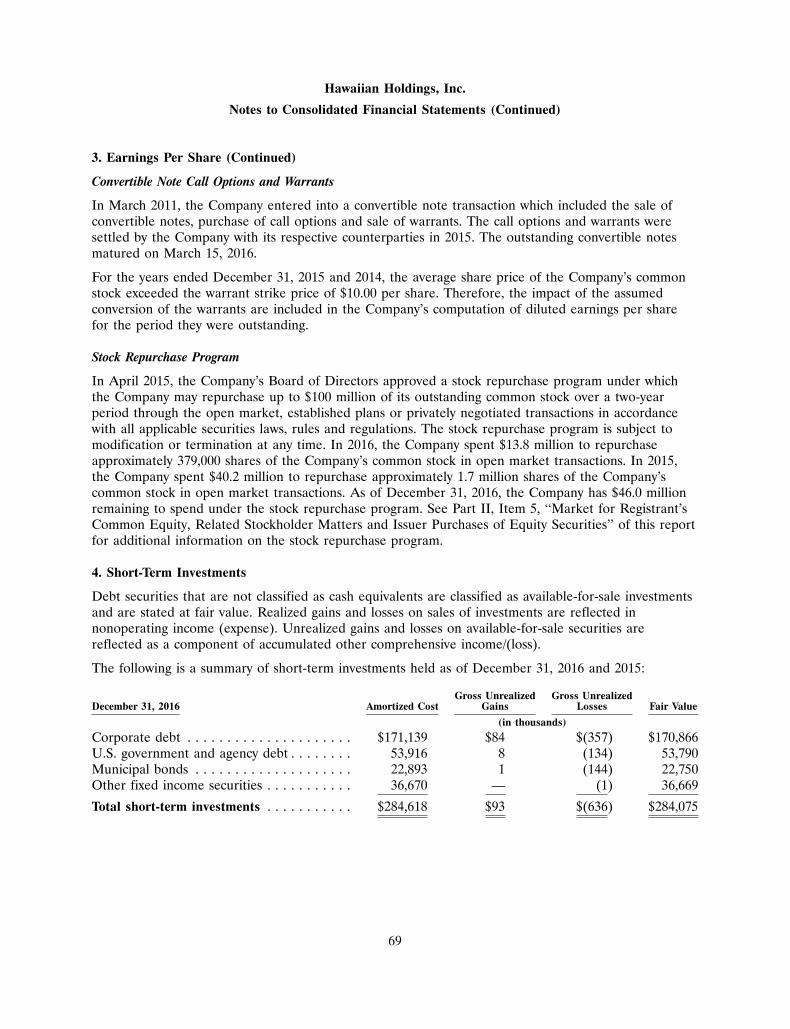
Hawaiian Holdings, Inc.
Notes to Consolidated Financial Statements (Continued)
3. Earnings Per Share (Continued)
Convertible Note Call Options and Warrants
In March 2011, the Company entered into a convertible note transaction which included the sale ofconvertible notes, purchase of call options and sale of warrants. The call options and warrants weresettled by the Company with its respective counterparties in 2015. The outstanding convertible notesmatured on March 15, 2016.
For the years ended December 31, 2015 and 2014, the average share price of the Company’s commonstock exceeded the warrant strike price of $10.00 per share. Therefore, the impact of the assumedconversion of the warrants are included in the Company’s computation of diluted earnings per sharefor the period they were outstanding.
Stock Repurchase Program
In April 2015, the Company’s Board of Directors approved a stock repurchase program under whichthe Company may repurchase up to $100 million of its outstanding common stock over a two-yearperiod through the open market, established plans or privately negotiated transactions in accordancewith all applicable securities laws, rules and regulations. The stock repurchase program is subject tomodification or termination at any time. In 2016, the Company spent $13.8 million to repurchaseapproximately 379,000 shares of the Company’s common stock in open market transactions. In 2015,the Company spent $40.2 million to repurchase approximately 1.7 million shares of the Company’scommon stock in open market transactions. As of December 31, 2016, the Company has $46.0 millionremaining to spend under the stock repurchase program. See Part II, Item 5, ‘‘Market for Registrant’sCommon Equity, Related Stockholder Matters and Issuer Purchases of Equity Securities’’ of this reportfor additional information on the stock repurchase program.
4. Short-Term Investments
Debt securities that are not classified as cash equivalents are classified as available-for-sale investmentsand are stated at fair value. Realized gains and losses on sales of investments are reflected innonoperating income (expense). Unrealized gains and losses on available-for-sale securities arereflected as a component of accumulated other comprehensive income/(loss).
The following is a summary of short-term investments held as of December 31, 2016 and 2015:
Gross Unrealized Gross UnrealizedDecember 31, 2016 Amortized Cost Gains Losses Fair Value
(in thousands)
Corporate debt . . . . . . . . . . . . . . . . . . . . . $171,139 $84 $(357) $170,866U.S. government and agency debt . . . . . . . . 53,916 8 (134) 53,790Municipal bonds . . . . . . . . . . . . . . . . . . . . 22,893 1 (144) 22,750Other fixed income securities . . . . . . . . . . . 36,670 — (1) 36,669
Total short-term investments . . . . . . . . . . . $284,618 $93 $(636) $284,075
69
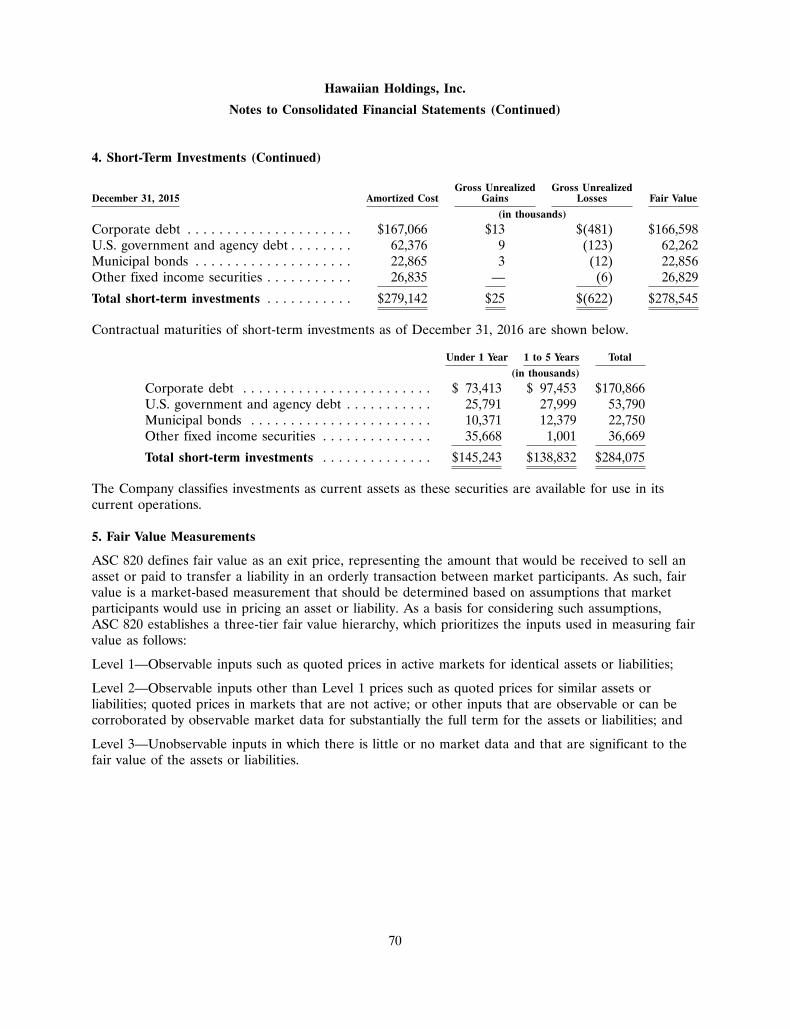
Hawaiian Holdings, Inc.
Notes to Consolidated Financial Statements (Continued)
4. Short-Term Investments (Continued)
Gross Unrealized Gross UnrealizedDecember 31, 2015 Amortized Cost Gains Losses Fair Value
(in thousands)
Corporate debt . . . . . . . . . . . . . . . . . . . . . $167,066 $13 $(481) $166,598U.S. government and agency debt . . . . . . . . 62,376 9 (123) 62,262Municipal bonds . . . . . . . . . . . . . . . . . . . . 22,865 3 (12) 22,856Other fixed income securities . . . . . . . . . . . 26,835 — (6) 26,829
Total short-term investments . . . . . . . . . . . $279,142 $25 $(622) $278,545
Contractual maturities of short-term investments as of December 31, 2016 are shown below.
Under 1 Year 1 to 5 Years Total
(in thousands)
Corporate debt . . . . . . . . . . . . . . . . . . . . . . . . $ 73,413 $ 97,453 $170,866U.S. government and agency debt . . . . . . . . . . . 25,791 27,999 53,790Municipal bonds . . . . . . . . . . . . . . . . . . . . . . . 10,371 12,379 22,750Other fixed income securities . . . . . . . . . . . . . . 35,668 1,001 36,669
Total short-term investments . . . . . . . . . . . . . . $145,243 $138,832 $284,075
The Company classifies investments as current assets as these securities are available for use in itscurrent operations.
5. Fair Value Measurements
ASC 820 defines fair value as an exit price, representing the amount that would be received to sell anasset or paid to transfer a liability in an orderly transaction between market participants. As such, fairvalue is a market-based measurement that should be determined based on assumptions that marketparticipants would use in pricing an asset or liability. As a basis for considering such assumptions,ASC 820 establishes a three-tier fair value hierarchy, which prioritizes the inputs used in measuring fairvalue as follows:
Level 1—Observable inputs such as quoted prices in active markets for identical assets or liabilities;
Level 2—Observable inputs other than Level 1 prices such as quoted prices for similar assets orliabilities; quoted prices in markets that are not active; or other inputs that are observable or can becorroborated by observable market data for substantially the full term for the assets or liabilities; and
Level 3—Unobservable inputs in which there is little or no market data and that are significant to thefair value of the assets or liabilities.
70
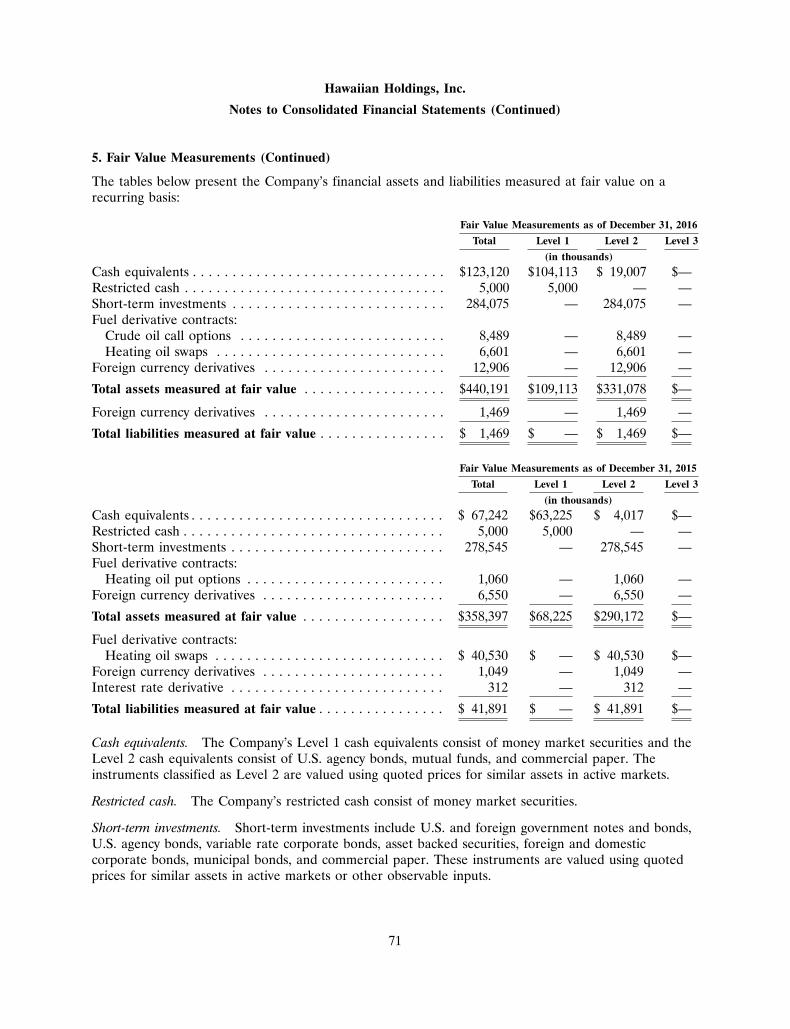
Hawaiian Holdings, Inc.
Notes to Consolidated Financial Statements (Continued)
5. Fair Value Measurements (Continued)
The tables below present the Company’s financial assets and liabilities measured at fair value on arecurring basis:
Fair Value Measurements as of December 31, 2016
Total Level 1 Level 2 Level 3
(in thousands)
Cash equivalents . . . . . . . . . . . . . . . . . . . . . . . . . . . . . . . . $123,120 $104,113 $ 19,007 $—Restricted cash . . . . . . . . . . . . . . . . . . . . . . . . . . . . . . . . . 5,000 5,000 — —Short-term investments . . . . . . . . . . . . . . . . . . . . . . . . . . . 284,075 — 284,075 —Fuel derivative contracts:
Crude oil call options . . . . . . . . . . . . . . . . . . . . . . . . . . 8,489 — 8,489 —Heating oil swaps . . . . . . . . . . . . . . . . . . . . . . . . . . . . . 6,601 — 6,601 —
Foreign currency derivatives . . . . . . . . . . . . . . . . . . . . . . . 12,906 — 12,906 —
Total assets measured at fair value . . . . . . . . . . . . . . . . . . $440,191 $109,113 $331,078 $—
Foreign currency derivatives . . . . . . . . . . . . . . . . . . . . . . . 1,469 — 1,469 —
Total liabilities measured at fair value . . . . . . . . . . . . . . . . $ 1,469 $ — $ 1,469 $—
Fair Value Measurements as of December 31, 2015
Total Level 1 Level 2 Level 3
(in thousands)
Cash equivalents . . . . . . . . . . . . . . . . . . . . . . . . . . . . . . . . $ 67,242 $63,225 $ 4,017 $—Restricted cash . . . . . . . . . . . . . . . . . . . . . . . . . . . . . . . . . 5,000 5,000 — —Short-term investments . . . . . . . . . . . . . . . . . . . . . . . . . . . 278,545 — 278,545 —Fuel derivative contracts:
Heating oil put options . . . . . . . . . . . . . . . . . . . . . . . . . 1,060 — 1,060 —Foreign currency derivatives . . . . . . . . . . . . . . . . . . . . . . . 6,550 — 6,550 —
Total assets measured at fair value . . . . . . . . . . . . . . . . . . $358,397 $68,225 $290,172 $—
Fuel derivative contracts:Heating oil swaps . . . . . . . . . . . . . . . . . . . . . . . . . . . . . $ 40,530 $ — $ 40,530 $—
Foreign currency derivatives . . . . . . . . . . . . . . . . . . . . . . . 1,049 — 1,049 —Interest rate derivative . . . . . . . . . . . . . . . . . . . . . . . . . . . 312 — 312 —
Total liabilities measured at fair value . . . . . . . . . . . . . . . . $ 41,891 $ — $ 41,891 $—
Cash equivalents. The Company’s Level 1 cash equivalents consist of money market securities and theLevel 2 cash equivalents consist of U.S. agency bonds, mutual funds, and commercial paper. Theinstruments classified as Level 2 are valued using quoted prices for similar assets in active markets.
Restricted cash. The Company’s restricted cash consist of money market securities.
Short-term investments. Short-term investments include U.S. and foreign government notes and bonds,U.S. agency bonds, variable rate corporate bonds, asset backed securities, foreign and domesticcorporate bonds, municipal bonds, and commercial paper. These instruments are valued using quotedprices for similar assets in active markets or other observable inputs.
71
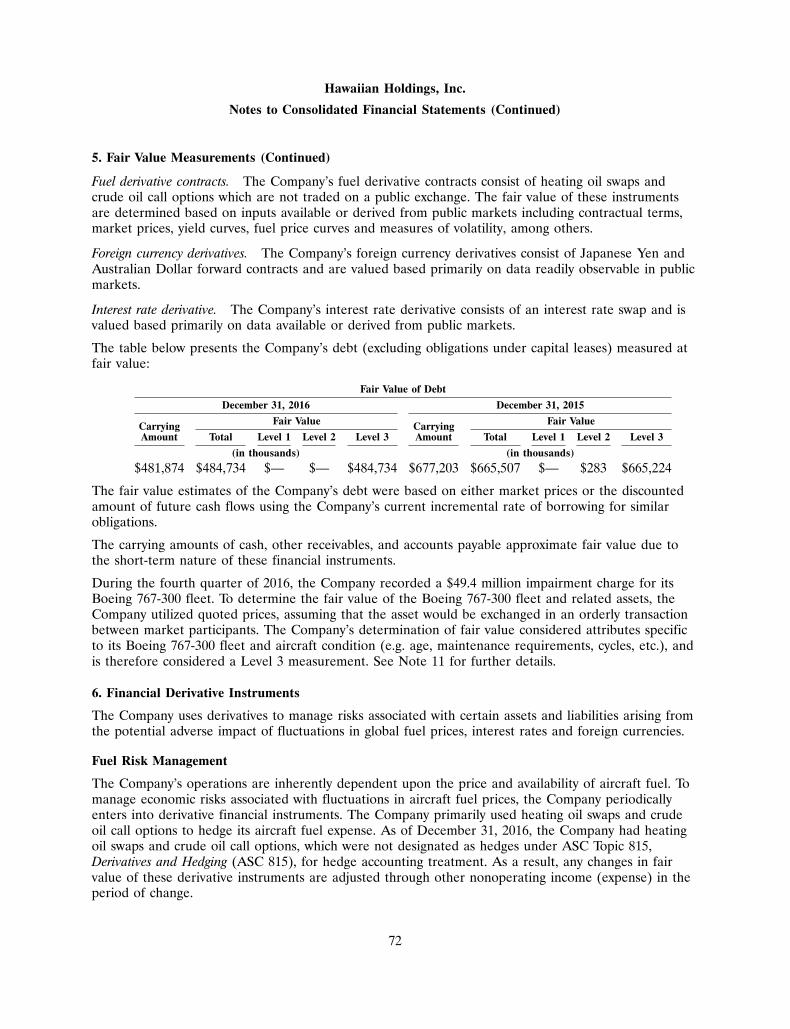
Hawaiian Holdings, Inc.
Notes to Consolidated Financial Statements (Continued)
5. Fair Value Measurements (Continued)
Fuel derivative contracts. The Company’s fuel derivative contracts consist of heating oil swaps andcrude oil call options which are not traded on a public exchange. The fair value of these instrumentsare determined based on inputs available or derived from public markets including contractual terms,market prices, yield curves, fuel price curves and measures of volatility, among others.
Foreign currency derivatives. The Company’s foreign currency derivatives consist of Japanese Yen andAustralian Dollar forward contracts and are valued based primarily on data readily observable in publicmarkets.
Interest rate derivative. The Company’s interest rate derivative consists of an interest rate swap and isvalued based primarily on data available or derived from public markets.
The table below presents the Company’s debt (excluding obligations under capital leases) measured atfair value:
Fair Value of Debt
December 31, 2016 December 31, 2015
Fair Value Fair ValueCarrying CarryingAmount Total Level 1 Level 2 Level 3 Amount Total Level 1 Level 2 Level 3
(in thousands) (in thousands)
$481,874 $484,734 $— $— $484,734 $677,203 $665,507 $— $283 $665,224
The fair value estimates of the Company’s debt were based on either market prices or the discountedamount of future cash flows using the Company’s current incremental rate of borrowing for similarobligations.
The carrying amounts of cash, other receivables, and accounts payable approximate fair value due tothe short-term nature of these financial instruments.
During the fourth quarter of 2016, the Company recorded a $49.4 million impairment charge for itsBoeing 767-300 fleet. To determine the fair value of the Boeing 767-300 fleet and related assets, theCompany utilized quoted prices, assuming that the asset would be exchanged in an orderly transactionbetween market participants. The Company’s determination of fair value considered attributes specificto its Boeing 767-300 fleet and aircraft condition (e.g. age, maintenance requirements, cycles, etc.), andis therefore considered a Level 3 measurement. See Note 11 for further details.
6. Financial Derivative Instruments
The Company uses derivatives to manage risks associated with certain assets and liabilities arising fromthe potential adverse impact of fluctuations in global fuel prices, interest rates and foreign currencies.
Fuel Risk Management
The Company’s operations are inherently dependent upon the price and availability of aircraft fuel. Tomanage economic risks associated with fluctuations in aircraft fuel prices, the Company periodicallyenters into derivative financial instruments. The Company primarily used heating oil swaps and crudeoil call options to hedge its aircraft fuel expense. As of December 31, 2016, the Company had heatingoil swaps and crude oil call options, which were not designated as hedges under ASC Topic 815,Derivatives and Hedging (ASC 815), for hedge accounting treatment. As a result, any changes in fairvalue of these derivative instruments are adjusted through other nonoperating income (expense) in theperiod of change.
72
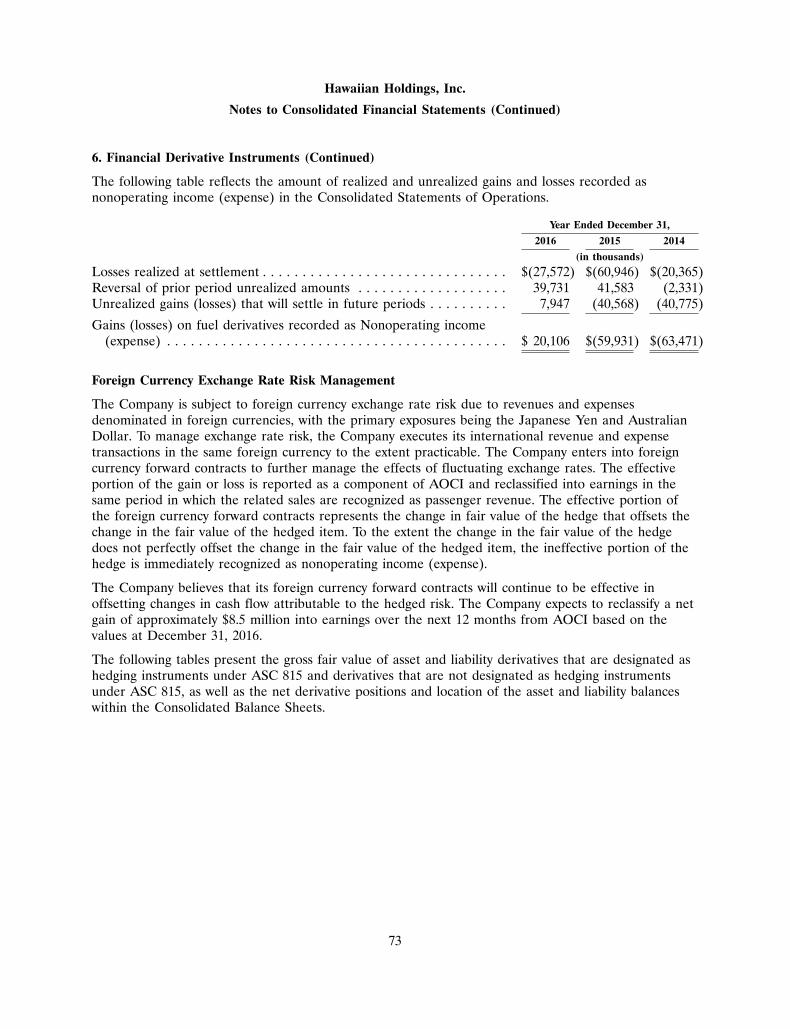
Hawaiian Holdings, Inc.
Notes to Consolidated Financial Statements (Continued)
6. Financial Derivative Instruments (Continued)
The following table reflects the amount of realized and unrealized gains and losses recorded asnonoperating income (expense) in the Consolidated Statements of Operations.
Year Ended December 31,
2016 2015 2014
(in thousands)
Losses realized at settlement . . . . . . . . . . . . . . . . . . . . . . . . . . . . . . . $(27,572) $(60,946) $(20,365)Reversal of prior period unrealized amounts . . . . . . . . . . . . . . . . . . . 39,731 41,583 (2,331)Unrealized gains (losses) that will settle in future periods . . . . . . . . . . 7,947 (40,568) (40,775)
Gains (losses) on fuel derivatives recorded as Nonoperating income(expense) . . . . . . . . . . . . . . . . . . . . . . . . . . . . . . . . . . . . . . . . . . . $ 20,106 $(59,931) $(63,471)
Foreign Currency Exchange Rate Risk Management
The Company is subject to foreign currency exchange rate risk due to revenues and expensesdenominated in foreign currencies, with the primary exposures being the Japanese Yen and AustralianDollar. To manage exchange rate risk, the Company executes its international revenue and expensetransactions in the same foreign currency to the extent practicable. The Company enters into foreigncurrency forward contracts to further manage the effects of fluctuating exchange rates. The effectiveportion of the gain or loss is reported as a component of AOCI and reclassified into earnings in thesame period in which the related sales are recognized as passenger revenue. The effective portion ofthe foreign currency forward contracts represents the change in fair value of the hedge that offsets thechange in the fair value of the hedged item. To the extent the change in the fair value of the hedgedoes not perfectly offset the change in the fair value of the hedged item, the ineffective portion of thehedge is immediately recognized as nonoperating income (expense).
The Company believes that its foreign currency forward contracts will continue to be effective inoffsetting changes in cash flow attributable to the hedged risk. The Company expects to reclassify a netgain of approximately $8.5 million into earnings over the next 12 months from AOCI based on thevalues at December 31, 2016.
The following tables present the gross fair value of asset and liability derivatives that are designated ashedging instruments under ASC 815 and derivatives that are not designated as hedging instrumentsunder ASC 815, as well as the net derivative positions and location of the asset and liability balanceswithin the Consolidated Balance Sheets.
73
Hawaiian Holdings, Inc.
Notes to Consolidated Financial Statements (Continued)
6. Financial Derivative Instruments (Continued)
Derivative positions as of December 31, 2016
Final Gross fair Gross fair NetMaturity value of value of derivative
Balance Sheet Location Notional Amount Date assets (liabilities) position
(in thousands) (in thousands)Derivatives designated as hedgesForeign currency derivatives . . Prepaid expenses and 16,121,5000 Japanese Yen December 2017 9,803 (1,349) 8,454
other 41,917 Australian DollarsLong-term prepayments 4,371,900 Japanese Yen December 2018 2,632 (59) 2,573and other 8,434 Australian Dollars
Derivatives not designated ashedges
Foreign currency derivatives . . Prepaid expenses and 879,050 Japanese Yen March 2017 471 (61) 410other 5,802 Australian Dollars
Fuel derivative contracts . . . . Prepaid expenses and 17,850 gallons December 2017 15,090 — 15,090other
Derivative positions as of December 31, 2015
Final Gross fair Gross fair NetMaturity value of value of derivative
Balance Sheet Location Notional Amount Date assets (liabilities) position
(in thousands) (in thousands)Derivatives designated as hedgesInterest rate derivative . . . . . . Other accrued liabilities $51,000 U.S. dollars April 2023 $ — $ (70) $ (70)
Other liabilities anddeferred credits(1) — (242) (242)
Foreign currency derivatives . . . Prepaid expenses and 7,594,750 Japanese Yen December 2016 6,461 (525) 5,936other 44,917 Australian DollarsOther liabilities and 5,437,400 Japanese Yen December 2017 78 (493) (415)deferred credits 8,730 Australian Dollars
Derivatives not designated ashedges
Foreign currency derivatives . . . Prepaid expenses and 2,762,000 Japanese Yen August 2016 11 — 11other 3,303 Australian DollarsOther liabilities and 2,845 Australian Dollars March 2017 — (31) (31)deferred credits
Fuel derivative contracts . . . . . Other accrued liabilities 84,067 gallons December 2016 1,060 (40,530) (39,470)
(1) Represents the noncurrent portion of the $51 million interest rate derivative with final maturity in April 2023.
The following table reflects the impact of cash flow hedges designated for hedge accounting treatmentand their location within the Consolidated Statements of Comprehensive Income.
Gain recognized innonoperating
(Gain) Loss recognized in (Gain) Loss reclassified (income) expenseAOCI on derivatives from AOCI into income (ineffective portion)
(effective portion) (effective portion) Year endedYear ended December 31, Year ended December 31, December 31,
2016 2015 2014 2016 2015 2014 2016 2015 2014
(in thousands)Foreign currency derivatives . . . . . . . . . $(3,350) $(4,854) $(17,295) $196 $(17,443) $(9,943) $— $— $—Interest rate derivatives . . . . . . . . . . . . 923 182 1,249 944 687 813 — — —
74
Hawaiian Holdings, Inc.
Notes to Consolidated Financial Statements (Continued)
6. Financial Derivative Instruments (Continued)
Risk and Collateral
The financial derivative instruments expose the Company to possible credit loss in the event thecounterparties to the agreements fail to meet their obligations. To manage such credit risks, theCompany (1) selects its counterparties based on past experience and credit ratings, (2) limits itsexposure to any single counterparty, and (3) periodically monitors the market position and credit ratingof each counterparty. Credit risk is deemed to have a minimal impact on the fair value of thederivative instruments as cash collateral would be provided to or by the counterparties based on thecurrent market exposure of the derivative.
The Company’s agreements with its counterparties also require the posting of cash collateral in theevent the aggregate value of the Company’s positions exceeds certain exposure thresholds. Theaggregate fair value of the Company’s derivative instruments that contain credit-risk related contingentfeatures that are in a net asset position was $26.5 million and a net liability position of $39.5 million asof December 31, 2016 and December 31, 2015, respectively.
ASC 815 requires a reporting entity to elect a policy of whether to offset rights to reclaim cashcollateral or obligations to return cash collateral against derivative assets and liabilities executed withthe same counterparty under a master netting agreement, or present such amounts on a gross basis.The Company’s accounting policy is to present its derivative assets and liabilities on a net basis,including any collateral posted with the counterparty. The Company had no collateral posted with itscounterparties as of December 31, 2016 and December 31, 2015.
The Company is also subject to market risk in the event these financial instruments become lessvaluable in the market. However, changes in the fair value of the derivative instruments will generallyoffset the change in the fair value of the hedged item, limiting the Company’s overall exposure.
7. Intangible Assets
The following tables summarize the gross carrying values of intangible assets less accumulatedamortization, and the useful lives assigned to each asset.
As of December 31, 2016 ApproximateGross carrying Accumulated Net book useful life
value amortization value (years)
(in thousands)
Favorable aircraft maintenance contracts . . . . . . . . . $ 8,740 $ (7,132) $ 1,608 14(*)Hawaiian Airlines trade name . . . . . . . . . . . . . . . . . 13,000 — 13,000 IndefiniteOperating certificates . . . . . . . . . . . . . . . . . . . . . . . 3,660 (3,475) 185 12Other . . . . . . . . . . . . . . . . . . . . . . . . . . . . . . . . . . . 1,888 (270) 1,618 3
Total intangible assets . . . . . . . . . . . . . . . . . . . . . $27,288 $(10,877) $16,411
75
Hawaiian Holdings, Inc.
Notes to Consolidated Financial Statements (Continued)
7. Intangible Assets (Continued)
As of December 31, 2015 ApproximateGross carrying Accumulated Net book useful life
value amortization value (years)
(in thousands)
Favorable aircraft maintenance contracts . . . . . . . . . $18,200 $(13,541) $ 4,659 14(*)Frequent flyer program—customer relations . . . . . . . 12,200 (11,684) 516 11Hawaiian Airlines trade name . . . . . . . . . . . . . . . . . 13,000 — 13,000 IndefiniteOperating certificates . . . . . . . . . . . . . . . . . . . . . . . 3,660 (3,175) 485 12
Total intangible assets . . . . . . . . . . . . . . . . . . . . . $47,060 $(28,400) $18,660
(*) Weighted average is based on the gross carrying values and estimated useful lives as of June 2,2005 (the date Hawaiian emerged from bankruptcy).
Amortization expense related to the above intangible assets was $2.3 million, $2.6 million, and$2.6 million for the years ended December 31, 2016, 2015, and 2014, respectively. Amortization of thefavorable aircraft maintenance contracts are included in maintenance materials and repairs in theaccompanying Consolidated Statements of Operations. The estimated future amortization expense as ofDecember 31, 2016 for the intangible assets subject to amortization is as follows (in thousands):
2017 . . . . . . . . . . . . . . . . . . . . . . . . . . . . . . . . . . . . . . . . . . . . . . . . . . . . . $1,7232018 . . . . . . . . . . . . . . . . . . . . . . . . . . . . . . . . . . . . . . . . . . . . . . . . . . . . . 1,0392019 . . . . . . . . . . . . . . . . . . . . . . . . . . . . . . . . . . . . . . . . . . . . . . . . . . . . . 649
$3,411
76
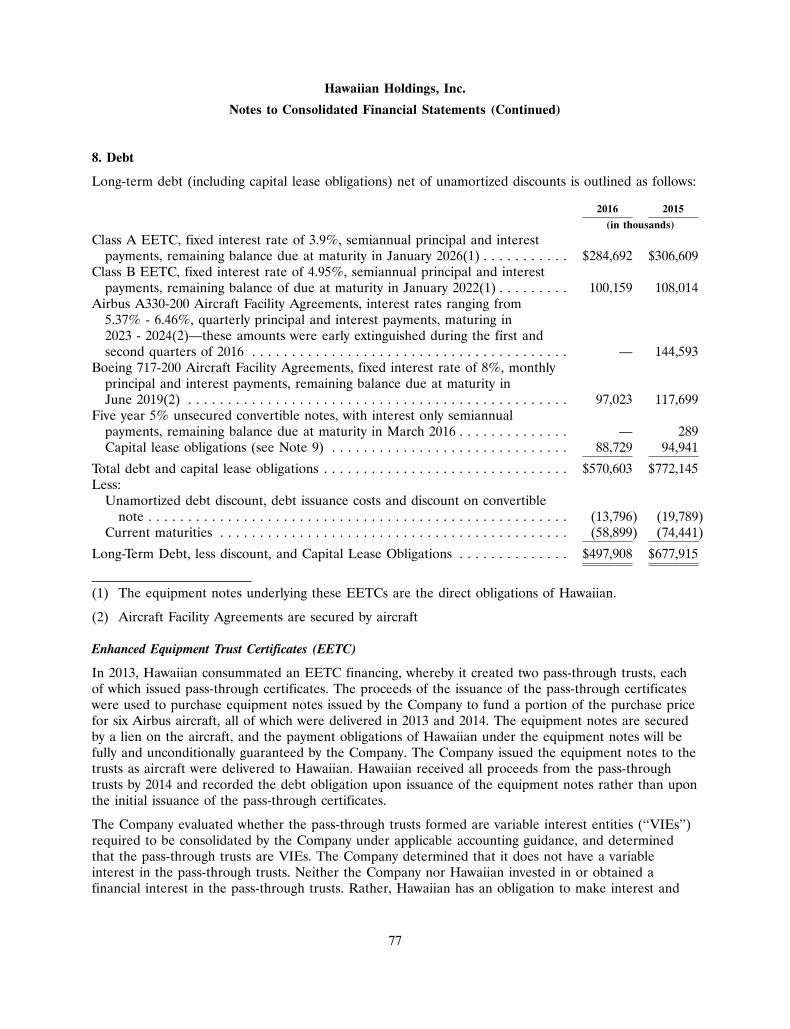
Hawaiian Holdings, Inc.
Notes to Consolidated Financial Statements (Continued)
8. Debt
Long-term debt (including capital lease obligations) net of unamortized discounts is outlined as follows:
2016 2015
(in thousands)
Class A EETC, fixed interest rate of 3.9%, semiannual principal and interestpayments, remaining balance due at maturity in January 2026(1) . . . . . . . . . . . $284,692 $306,609
Class B EETC, fixed interest rate of 4.95%, semiannual principal and interestpayments, remaining balance of due at maturity in January 2022(1) . . . . . . . . . 100,159 108,014
Airbus A330-200 Aircraft Facility Agreements, interest rates ranging from5.37% - 6.46%, quarterly principal and interest payments, maturing in2023 - 2024(2)—these amounts were early extinguished during the first andsecond quarters of 2016 . . . . . . . . . . . . . . . . . . . . . . . . . . . . . . . . . . . . . . . . — 144,593
Boeing 717-200 Aircraft Facility Agreements, fixed interest rate of 8%, monthlyprincipal and interest payments, remaining balance due at maturity inJune 2019(2) . . . . . . . . . . . . . . . . . . . . . . . . . . . . . . . . . . . . . . . . . . . . . . . . 97,023 117,699
Five year 5% unsecured convertible notes, with interest only semiannualpayments, remaining balance due at maturity in March 2016 . . . . . . . . . . . . . . — 289Capital lease obligations (see Note 9) . . . . . . . . . . . . . . . . . . . . . . . . . . . . . . 88,729 94,941
Total debt and capital lease obligations . . . . . . . . . . . . . . . . . . . . . . . . . . . . . . . $570,603 $772,145Less:
Unamortized debt discount, debt issuance costs and discount on convertiblenote . . . . . . . . . . . . . . . . . . . . . . . . . . . . . . . . . . . . . . . . . . . . . . . . . . . . . (13,796) (19,789)
Current maturities . . . . . . . . . . . . . . . . . . . . . . . . . . . . . . . . . . . . . . . . . . . . (58,899) (74,441)
Long-Term Debt, less discount, and Capital Lease Obligations . . . . . . . . . . . . . . $497,908 $677,915
(1) The equipment notes underlying these EETCs are the direct obligations of Hawaiian.
(2) Aircraft Facility Agreements are secured by aircraft
Enhanced Equipment Trust Certificates (EETC)
In 2013, Hawaiian consummated an EETC financing, whereby it created two pass-through trusts, eachof which issued pass-through certificates. The proceeds of the issuance of the pass-through certificateswere used to purchase equipment notes issued by the Company to fund a portion of the purchase pricefor six Airbus aircraft, all of which were delivered in 2013 and 2014. The equipment notes are securedby a lien on the aircraft, and the payment obligations of Hawaiian under the equipment notes will befully and unconditionally guaranteed by the Company. The Company issued the equipment notes to thetrusts as aircraft were delivered to Hawaiian. Hawaiian received all proceeds from the pass-throughtrusts by 2014 and recorded the debt obligation upon issuance of the equipment notes rather than uponthe initial issuance of the pass-through certificates.
The Company evaluated whether the pass-through trusts formed are variable interest entities (‘‘VIEs’’)required to be consolidated by the Company under applicable accounting guidance, and determinedthat the pass-through trusts are VIEs. The Company determined that it does not have a variableinterest in the pass-through trusts. Neither the Company nor Hawaiian invested in or obtained afinancial interest in the pass-through trusts. Rather, Hawaiian has an obligation to make interest and
77
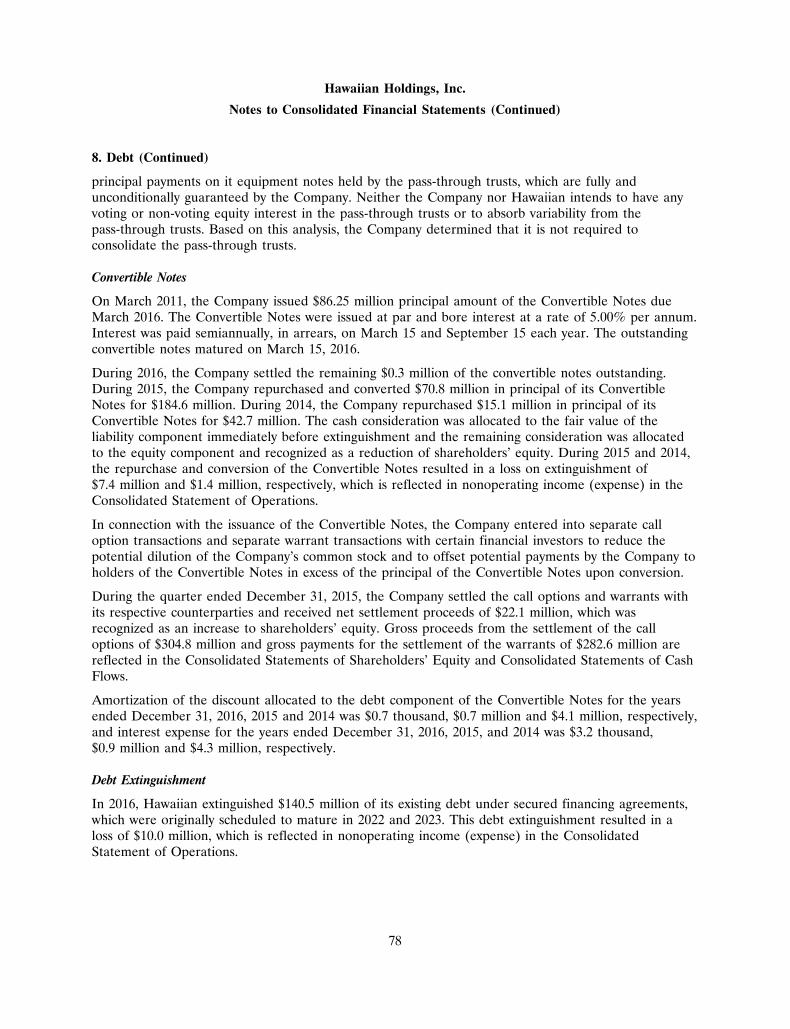
Hawaiian Holdings, Inc.
Notes to Consolidated Financial Statements (Continued)
8. Debt (Continued)
principal payments on it equipment notes held by the pass-through trusts, which are fully andunconditionally guaranteed by the Company. Neither the Company nor Hawaiian intends to have anyvoting or non-voting equity interest in the pass-through trusts or to absorb variability from thepass-through trusts. Based on this analysis, the Company determined that it is not required toconsolidate the pass-through trusts.
Convertible Notes
On March 2011, the Company issued $86.25 million principal amount of the Convertible Notes dueMarch 2016. The Convertible Notes were issued at par and bore interest at a rate of 5.00% per annum.Interest was paid semiannually, in arrears, on March 15 and September 15 each year. The outstandingconvertible notes matured on March 15, 2016.
During 2016, the Company settled the remaining $0.3 million of the convertible notes outstanding.During 2015, the Company repurchased and converted $70.8 million in principal of its ConvertibleNotes for $184.6 million. During 2014, the Company repurchased $15.1 million in principal of itsConvertible Notes for $42.7 million. The cash consideration was allocated to the fair value of theliability component immediately before extinguishment and the remaining consideration was allocatedto the equity component and recognized as a reduction of shareholders’ equity. During 2015 and 2014,the repurchase and conversion of the Convertible Notes resulted in a loss on extinguishment of$7.4 million and $1.4 million, respectively, which is reflected in nonoperating income (expense) in theConsolidated Statement of Operations.
In connection with the issuance of the Convertible Notes, the Company entered into separate calloption transactions and separate warrant transactions with certain financial investors to reduce thepotential dilution of the Company’s common stock and to offset potential payments by the Company toholders of the Convertible Notes in excess of the principal of the Convertible Notes upon conversion.
During the quarter ended December 31, 2015, the Company settled the call options and warrants withits respective counterparties and received net settlement proceeds of $22.1 million, which wasrecognized as an increase to shareholders’ equity. Gross proceeds from the settlement of the calloptions of $304.8 million and gross payments for the settlement of the warrants of $282.6 million arereflected in the Consolidated Statements of Shareholders’ Equity and Consolidated Statements of CashFlows.
Amortization of the discount allocated to the debt component of the Convertible Notes for the yearsended December 31, 2016, 2015 and 2014 was $0.7 thousand, $0.7 million and $4.1 million, respectively,and interest expense for the years ended December 31, 2016, 2015, and 2014 was $3.2 thousand,$0.9 million and $4.3 million, respectively.
Debt Extinguishment
In 2016, Hawaiian extinguished $140.5 million of its existing debt under secured financing agreements,which were originally scheduled to mature in 2022 and 2023. This debt extinguishment resulted in aloss of $10.0 million, which is reflected in nonoperating income (expense) in the ConsolidatedStatement of Operations.
78
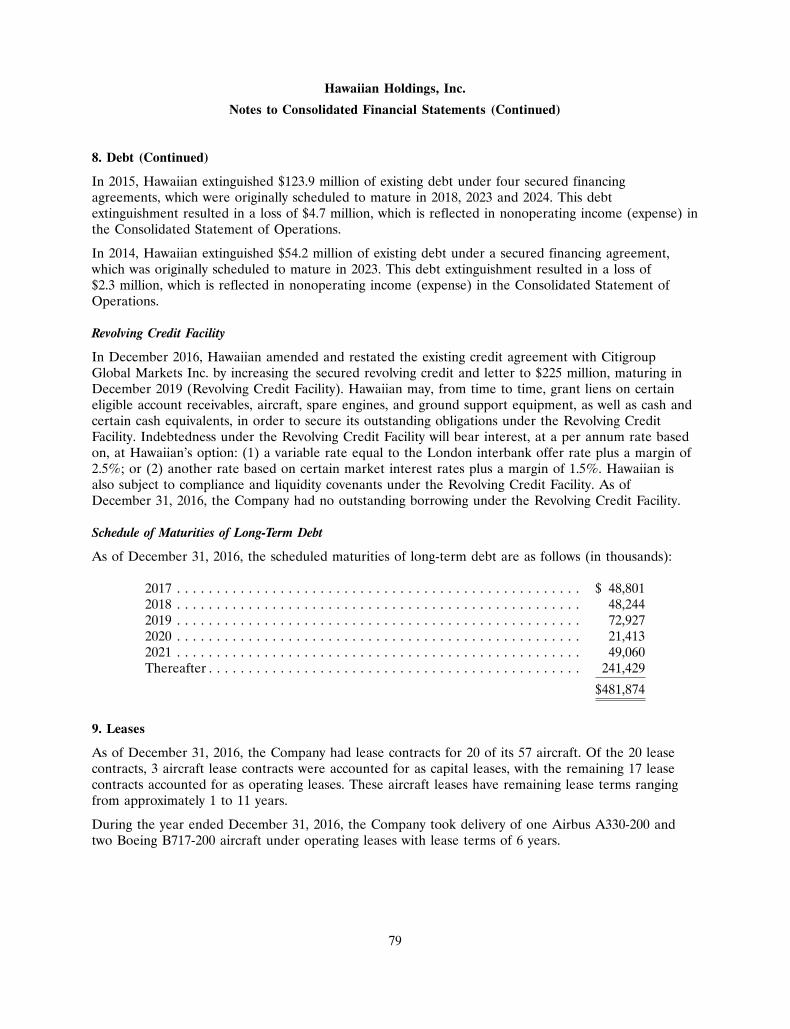
Hawaiian Holdings, Inc.
Notes to Consolidated Financial Statements (Continued)
8. Debt (Continued)
In 2015, Hawaiian extinguished $123.9 million of existing debt under four secured financingagreements, which were originally scheduled to mature in 2018, 2023 and 2024. This debtextinguishment resulted in a loss of $4.7 million, which is reflected in nonoperating income (expense) inthe Consolidated Statement of Operations.
In 2014, Hawaiian extinguished $54.2 million of existing debt under a secured financing agreement,which was originally scheduled to mature in 2023. This debt extinguishment resulted in a loss of$2.3 million, which is reflected in nonoperating income (expense) in the Consolidated Statement ofOperations.
Revolving Credit Facility
In December 2016, Hawaiian amended and restated the existing credit agreement with CitigroupGlobal Markets Inc. by increasing the secured revolving credit and letter to $225 million, maturing inDecember 2019 (Revolving Credit Facility). Hawaiian may, from time to time, grant liens on certaineligible account receivables, aircraft, spare engines, and ground support equipment, as well as cash andcertain cash equivalents, in order to secure its outstanding obligations under the Revolving CreditFacility. Indebtedness under the Revolving Credit Facility will bear interest, at a per annum rate basedon, at Hawaiian’s option: (1) a variable rate equal to the London interbank offer rate plus a margin of2.5%; or (2) another rate based on certain market interest rates plus a margin of 1.5%. Hawaiian isalso subject to compliance and liquidity covenants under the Revolving Credit Facility. As ofDecember 31, 2016, the Company had no outstanding borrowing under the Revolving Credit Facility.
Schedule of Maturities of Long-Term Debt
As of December 31, 2016, the scheduled maturities of long-term debt are as follows (in thousands):
2017 . . . . . . . . . . . . . . . . . . . . . . . . . . . . . . . . . . . . . . . . . . . . . . . . . . . $ 48,8012018 . . . . . . . . . . . . . . . . . . . . . . . . . . . . . . . . . . . . . . . . . . . . . . . . . . . 48,2442019 . . . . . . . . . . . . . . . . . . . . . . . . . . . . . . . . . . . . . . . . . . . . . . . . . . . 72,9272020 . . . . . . . . . . . . . . . . . . . . . . . . . . . . . . . . . . . . . . . . . . . . . . . . . . . 21,4132021 . . . . . . . . . . . . . . . . . . . . . . . . . . . . . . . . . . . . . . . . . . . . . . . . . . . 49,060Thereafter . . . . . . . . . . . . . . . . . . . . . . . . . . . . . . . . . . . . . . . . . . . . . . . 241,429
$481,874
9. Leases
As of December 31, 2016, the Company had lease contracts for 20 of its 57 aircraft. Of the 20 leasecontracts, 3 aircraft lease contracts were accounted for as capital leases, with the remaining 17 leasecontracts accounted for as operating leases. These aircraft leases have remaining lease terms rangingfrom approximately 1 to 11 years.
During the year ended December 31, 2016, the Company took delivery of one Airbus A330-200 andtwo Boeing B717-200 aircraft under operating leases with lease terms of 6 years.
79
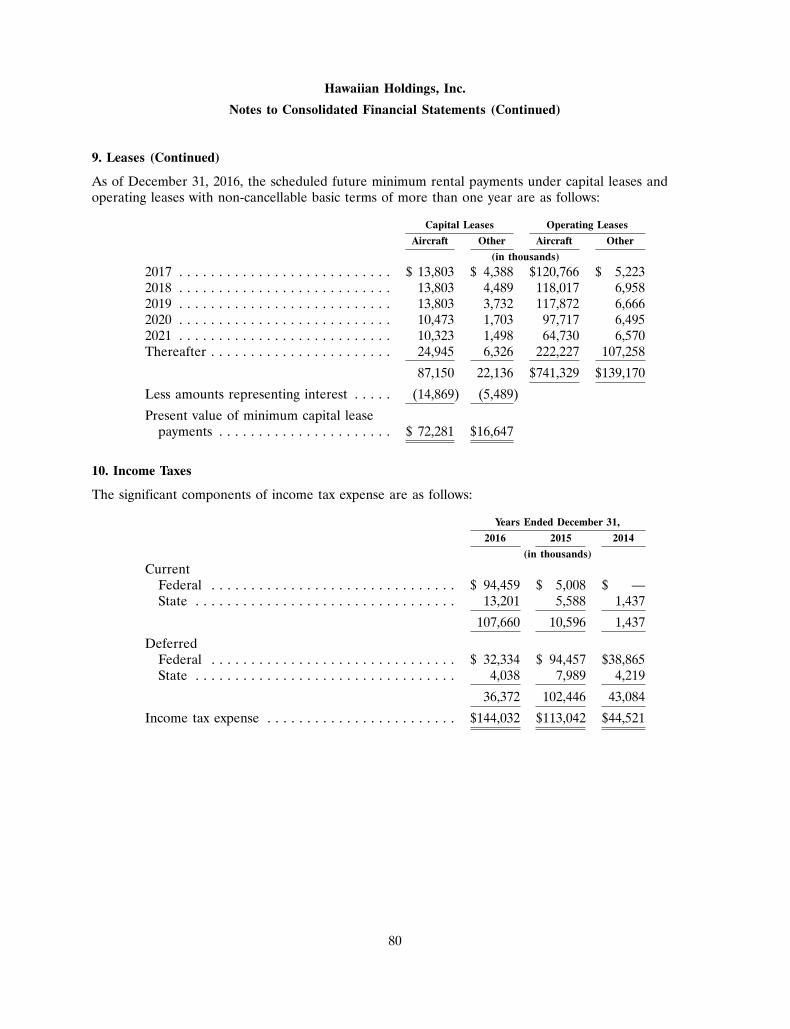
Hawaiian Holdings, Inc.
Notes to Consolidated Financial Statements (Continued)
9. Leases (Continued)
As of December 31, 2016, the scheduled future minimum rental payments under capital leases andoperating leases with non-cancellable basic terms of more than one year are as follows:
Capital Leases Operating Leases
Aircraft Other Aircraft Other
(in thousands)
2017 . . . . . . . . . . . . . . . . . . . . . . . . . . . $ 13,803 $ 4,388 $120,766 $ 5,2232018 . . . . . . . . . . . . . . . . . . . . . . . . . . . 13,803 4,489 118,017 6,9582019 . . . . . . . . . . . . . . . . . . . . . . . . . . . 13,803 3,732 117,872 6,6662020 . . . . . . . . . . . . . . . . . . . . . . . . . . . 10,473 1,703 97,717 6,4952021 . . . . . . . . . . . . . . . . . . . . . . . . . . . 10,323 1,498 64,730 6,570Thereafter . . . . . . . . . . . . . . . . . . . . . . . 24,945 6,326 222,227 107,258
87,150 22,136 $741,329 $139,170
Less amounts representing interest . . . . . (14,869) (5,489)
Present value of minimum capital leasepayments . . . . . . . . . . . . . . . . . . . . . . $ 72,281 $16,647
10. Income Taxes
The significant components of income tax expense are as follows:
Years Ended December 31,
2016 2015 2014
(in thousands)
CurrentFederal . . . . . . . . . . . . . . . . . . . . . . . . . . . . . . . $ 94,459 $ 5,008 $ —State . . . . . . . . . . . . . . . . . . . . . . . . . . . . . . . . . 13,201 5,588 1,437
107,660 10,596 1,437
DeferredFederal . . . . . . . . . . . . . . . . . . . . . . . . . . . . . . . $ 32,334 $ 94,457 $38,865State . . . . . . . . . . . . . . . . . . . . . . . . . . . . . . . . . 4,038 7,989 4,219
36,372 102,446 43,084
Income tax expense . . . . . . . . . . . . . . . . . . . . . . . . $144,032 $113,042 $44,521
80
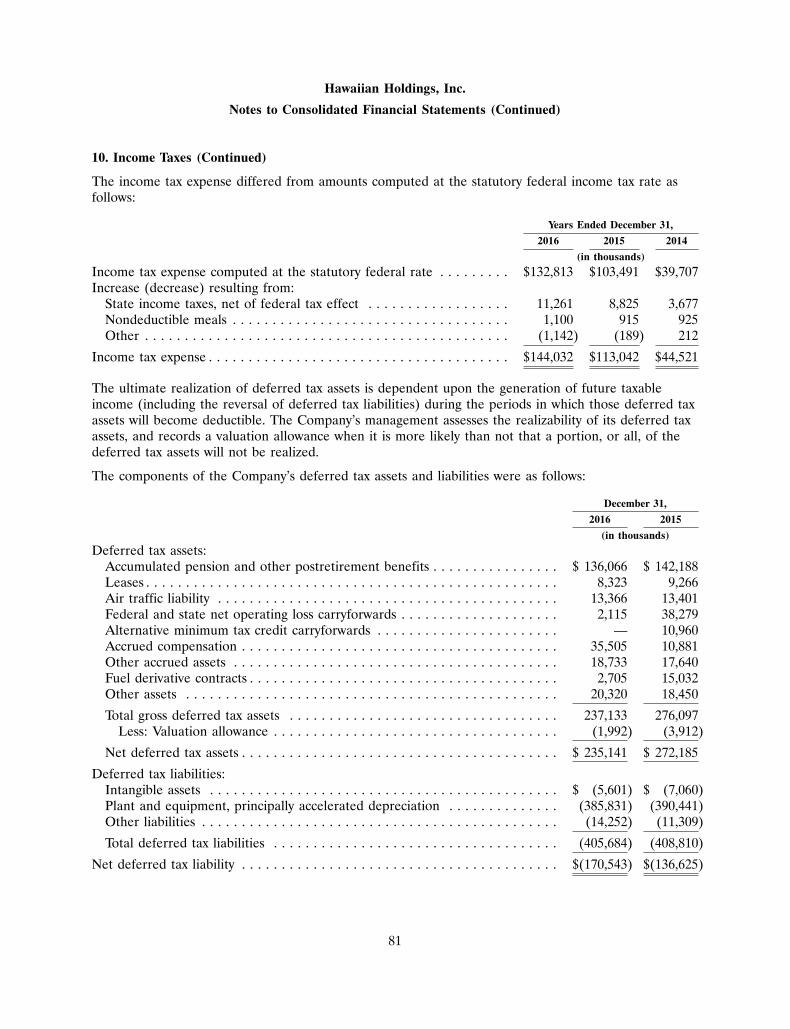
Hawaiian Holdings, Inc.
Notes to Consolidated Financial Statements (Continued)
10. Income Taxes (Continued)
The income tax expense differed from amounts computed at the statutory federal income tax rate asfollows:
Years Ended December 31,
2016 2015 2014
(in thousands)
Income tax expense computed at the statutory federal rate . . . . . . . . . $132,813 $103,491 $39,707Increase (decrease) resulting from:
State income taxes, net of federal tax effect . . . . . . . . . . . . . . . . . . 11,261 8,825 3,677Nondeductible meals . . . . . . . . . . . . . . . . . . . . . . . . . . . . . . . . . . . 1,100 915 925Other . . . . . . . . . . . . . . . . . . . . . . . . . . . . . . . . . . . . . . . . . . . . . . (1,142) (189) 212
Income tax expense . . . . . . . . . . . . . . . . . . . . . . . . . . . . . . . . . . . . . . $144,032 $113,042 $44,521
The ultimate realization of deferred tax assets is dependent upon the generation of future taxableincome (including the reversal of deferred tax liabilities) during the periods in which those deferred taxassets will become deductible. The Company’s management assesses the realizability of its deferred taxassets, and records a valuation allowance when it is more likely than not that a portion, or all, of thedeferred tax assets will not be realized.
The components of the Company’s deferred tax assets and liabilities were as follows:
December 31,
2016 2015
(in thousands)
Deferred tax assets:Accumulated pension and other postretirement benefits . . . . . . . . . . . . . . . . $ 136,066 $ 142,188Leases . . . . . . . . . . . . . . . . . . . . . . . . . . . . . . . . . . . . . . . . . . . . . . . . . . . . 8,323 9,266Air traffic liability . . . . . . . . . . . . . . . . . . . . . . . . . . . . . . . . . . . . . . . . . . . 13,366 13,401Federal and state net operating loss carryforwards . . . . . . . . . . . . . . . . . . . . 2,115 38,279Alternative minimum tax credit carryforwards . . . . . . . . . . . . . . . . . . . . . . . — 10,960Accrued compensation . . . . . . . . . . . . . . . . . . . . . . . . . . . . . . . . . . . . . . . . 35,505 10,881Other accrued assets . . . . . . . . . . . . . . . . . . . . . . . . . . . . . . . . . . . . . . . . . 18,733 17,640Fuel derivative contracts . . . . . . . . . . . . . . . . . . . . . . . . . . . . . . . . . . . . . . . 2,705 15,032Other assets . . . . . . . . . . . . . . . . . . . . . . . . . . . . . . . . . . . . . . . . . . . . . . . 20,320 18,450
Total gross deferred tax assets . . . . . . . . . . . . . . . . . . . . . . . . . . . . . . . . . . 237,133 276,097Less: Valuation allowance . . . . . . . . . . . . . . . . . . . . . . . . . . . . . . . . . . . . (1,992) (3,912)
Net deferred tax assets . . . . . . . . . . . . . . . . . . . . . . . . . . . . . . . . . . . . . . . . $ 235,141 $ 272,185
Deferred tax liabilities:Intangible assets . . . . . . . . . . . . . . . . . . . . . . . . . . . . . . . . . . . . . . . . . . . . $ (5,601) $ (7,060)Plant and equipment, principally accelerated depreciation . . . . . . . . . . . . . . (385,831) (390,441)Other liabilities . . . . . . . . . . . . . . . . . . . . . . . . . . . . . . . . . . . . . . . . . . . . . (14,252) (11,309)
Total deferred tax liabilities . . . . . . . . . . . . . . . . . . . . . . . . . . . . . . . . . . . . (405,684) (408,810)
Net deferred tax liability . . . . . . . . . . . . . . . . . . . . . . . . . . . . . . . . . . . . . . . . $(170,543) $(136,625)
81
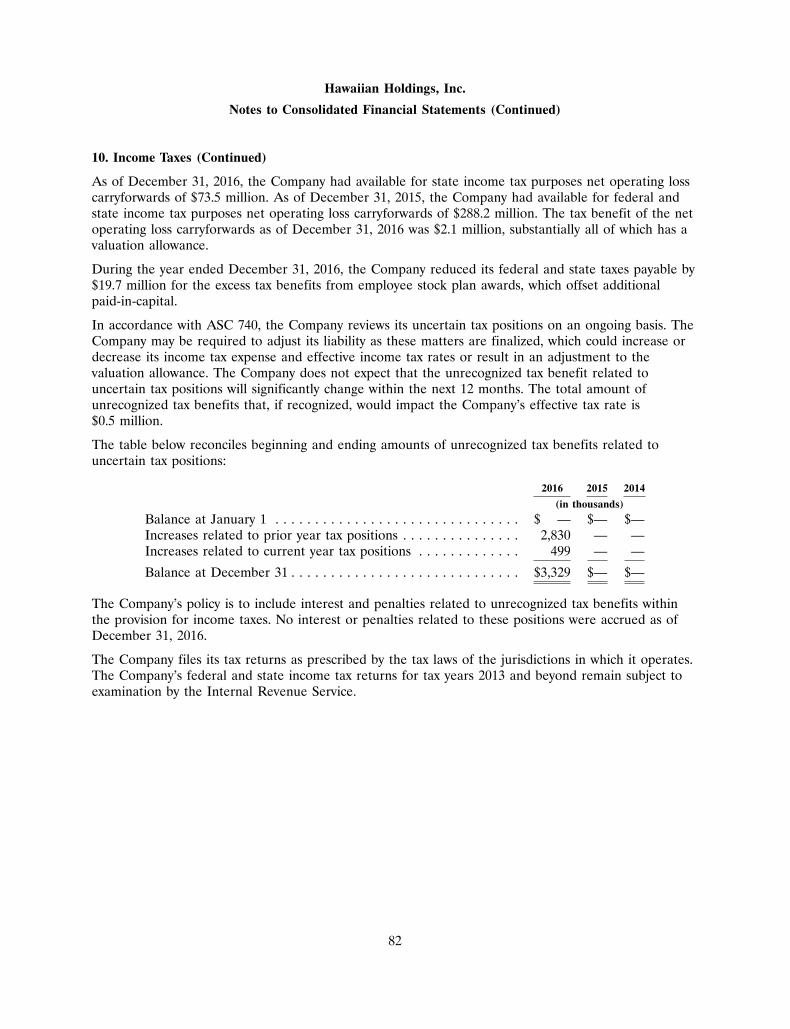
Hawaiian Holdings, Inc.
Notes to Consolidated Financial Statements (Continued)
10. Income Taxes (Continued)
As of December 31, 2016, the Company had available for state income tax purposes net operating losscarryforwards of $73.5 million. As of December 31, 2015, the Company had available for federal andstate income tax purposes net operating loss carryforwards of $288.2 million. The tax benefit of the netoperating loss carryforwards as of December 31, 2016 was $2.1 million, substantially all of which has avaluation allowance.
During the year ended December 31, 2016, the Company reduced its federal and state taxes payable by$19.7 million for the excess tax benefits from employee stock plan awards, which offset additionalpaid-in-capital.
In accordance with ASC 740, the Company reviews its uncertain tax positions on an ongoing basis. TheCompany may be required to adjust its liability as these matters are finalized, which could increase ordecrease its income tax expense and effective income tax rates or result in an adjustment to thevaluation allowance. The Company does not expect that the unrecognized tax benefit related touncertain tax positions will significantly change within the next 12 months. The total amount ofunrecognized tax benefits that, if recognized, would impact the Company’s effective tax rate is$0.5 million.
The table below reconciles beginning and ending amounts of unrecognized tax benefits related touncertain tax positions:
2016 2015 2014
(in thousands)
Balance at January 1 . . . . . . . . . . . . . . . . . . . . . . . . . . . . . . . $ — $— $—Increases related to prior year tax positions . . . . . . . . . . . . . . . 2,830 — —Increases related to current year tax positions . . . . . . . . . . . . . 499 — —
Balance at December 31 . . . . . . . . . . . . . . . . . . . . . . . . . . . . . $3,329 $— $—
The Company’s policy is to include interest and penalties related to unrecognized tax benefits withinthe provision for income taxes. No interest or penalties related to these positions were accrued as ofDecember 31, 2016.
The Company files its tax returns as prescribed by the tax laws of the jurisdictions in which it operates.The Company’s federal and state income tax returns for tax years 2013 and beyond remain subject toexamination by the Internal Revenue Service.
82
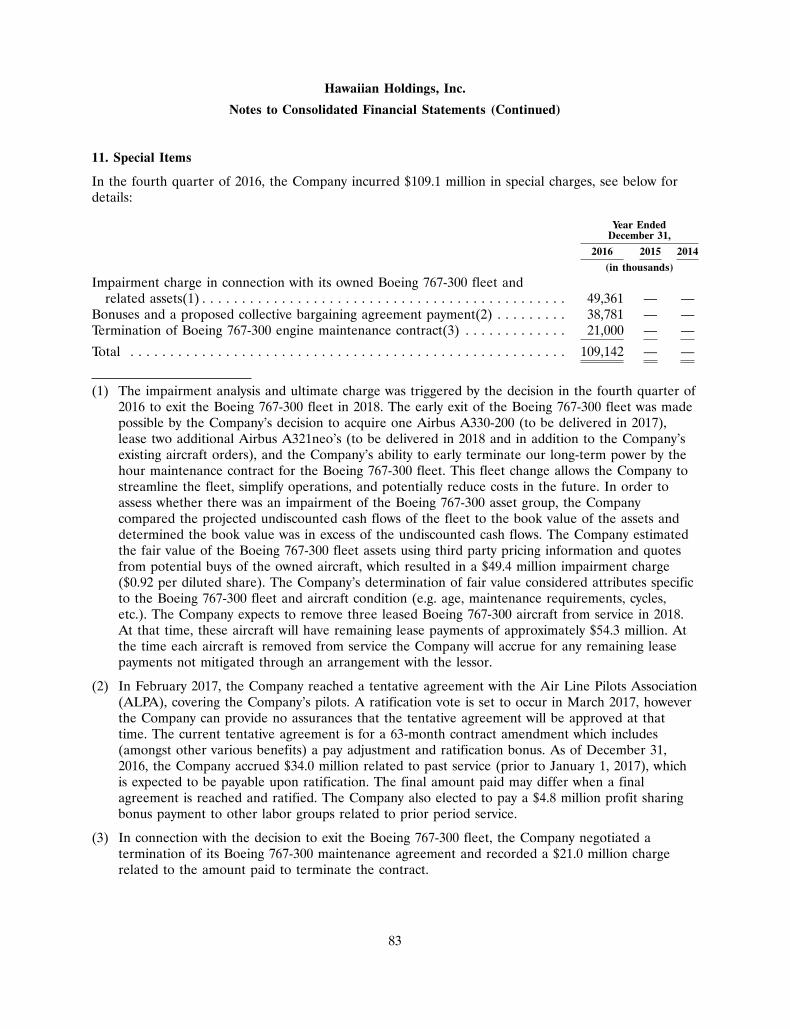
Hawaiian Holdings, Inc.
Notes to Consolidated Financial Statements (Continued)
11. Special Items
In the fourth quarter of 2016, the Company incurred $109.1 million in special charges, see below fordetails:
Year EndedDecember 31,
2016 2015 2014
(in thousands)
Impairment charge in connection with its owned Boeing 767-300 fleet andrelated assets(1) . . . . . . . . . . . . . . . . . . . . . . . . . . . . . . . . . . . . . . . . . . . . . . 49,361 — —
Bonuses and a proposed collective bargaining agreement payment(2) . . . . . . . . . 38,781 — —Termination of Boeing 767-300 engine maintenance contract(3) . . . . . . . . . . . . . 21,000 — —
Total . . . . . . . . . . . . . . . . . . . . . . . . . . . . . . . . . . . . . . . . . . . . . . . . . . . . . . . 109,142 — —
(1) The impairment analysis and ultimate charge was triggered by the decision in the fourth quarter of2016 to exit the Boeing 767-300 fleet in 2018. The early exit of the Boeing 767-300 fleet was madepossible by the Company’s decision to acquire one Airbus A330-200 (to be delivered in 2017),lease two additional Airbus A321neo’s (to be delivered in 2018 and in addition to the Company’sexisting aircraft orders), and the Company’s ability to early terminate our long-term power by thehour maintenance contract for the Boeing 767-300 fleet. This fleet change allows the Company tostreamline the fleet, simplify operations, and potentially reduce costs in the future. In order toassess whether there was an impairment of the Boeing 767-300 asset group, the Companycompared the projected undiscounted cash flows of the fleet to the book value of the assets anddetermined the book value was in excess of the undiscounted cash flows. The Company estimatedthe fair value of the Boeing 767-300 fleet assets using third party pricing information and quotesfrom potential buys of the owned aircraft, which resulted in a $49.4 million impairment charge($0.92 per diluted share). The Company’s determination of fair value considered attributes specificto the Boeing 767-300 fleet and aircraft condition (e.g. age, maintenance requirements, cycles,etc.). The Company expects to remove three leased Boeing 767-300 aircraft from service in 2018.At that time, these aircraft will have remaining lease payments of approximately $54.3 million. Atthe time each aircraft is removed from service the Company will accrue for any remaining leasepayments not mitigated through an arrangement with the lessor.
(2) In February 2017, the Company reached a tentative agreement with the Air Line Pilots Association(ALPA), covering the Company’s pilots. A ratification vote is set to occur in March 2017, howeverthe Company can provide no assurances that the tentative agreement will be approved at thattime. The current tentative agreement is for a 63-month contract amendment which includes(amongst other various benefits) a pay adjustment and ratification bonus. As of December 31,2016, the Company accrued $34.0 million related to past service (prior to January 1, 2017), whichis expected to be payable upon ratification. The final amount paid may differ when a finalagreement is reached and ratified. The Company also elected to pay a $4.8 million profit sharingbonus payment to other labor groups related to prior period service.
(3) In connection with the decision to exit the Boeing 767-300 fleet, the Company negotiated atermination of its Boeing 767-300 maintenance agreement and recorded a $21.0 million chargerelated to the amount paid to terminate the contract.
83
Hawaiian Holdings, Inc.
Notes to Consolidated Financial Statements (Continued)
12. Employee Benefit Plans
Defined Benefit Plans
Hawaiian sponsors various defined benefit pension plans covering the Air Line Pilots Association(ALPA), International Association of Machinists and Aerospace Workers (AFL-CIO) (IAM) and otherpersonnel (salaried, Transport Workers Union, Network Engineering Group). The plans for the IAMand other employees were frozen in September 1993. Effective January 1, 2008, benefit accruals forpilots under age 50 as of July 1, 2005 were frozen (with the exception of certain pilots who were bothage 50 and older and participants of the plan on July 1, 2005) and Hawaiian began makingcontributions to an alternate defined contribution retirement program for its pilots. All of the pilots’accrued benefits under their defined benefit plan at the date of the freeze were preserved. In addition,Hawaiian sponsors four unfunded defined benefit postretirement medical and life insurance plans and aseparate plan to administer the pilots’ disability benefits.
In 2016, the Hawaiian Airlines, Inc. Pension Plan for Salaried Employees (Salaried Plan) wasconsolidated into the Hawaiian Airlines, Inc. Pension Plan for Employees Represented by theInternational Association of Machinists (IAM), which established the Hawaiian Airlines, Inc.Salaried & IAM Merged Pension Plan (the Merged Plan). At that time, the net liabilities of theSalaried Plan were transferred to the Merged Plan. The benefits under the Merged Plan have remainedconsistent with the prior plan documents. The Company (plan sponsor) has submitted an application tothe Department of Labor to settle the Merged Plan and expects to receive a response in 2017, at whichtime the Company intends to terminate the Merged Plan (if the application is approved by theDepartment of Labor). In 2017, the Company expects to spend approximately $17.0 million to$22.0 million to settle the plan obligations. As of December 31, 2016 there was no significant effect tothe operation of the plans.
84
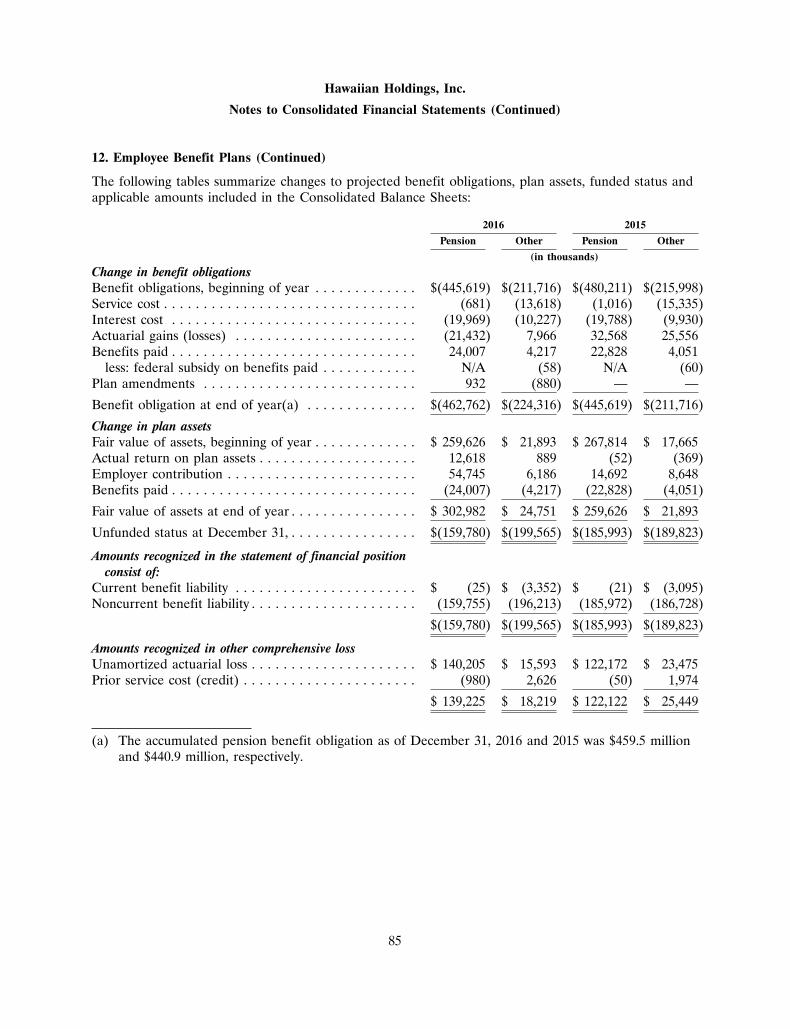
Hawaiian Holdings, Inc.
Notes to Consolidated Financial Statements (Continued)
12. Employee Benefit Plans (Continued)
The following tables summarize changes to projected benefit obligations, plan assets, funded status andapplicable amounts included in the Consolidated Balance Sheets:
2016 2015
Pension Other Pension Other
(in thousands)
Change in benefit obligationsBenefit obligations, beginning of year . . . . . . . . . . . . . $(445,619) $(211,716) $(480,211) $(215,998)Service cost . . . . . . . . . . . . . . . . . . . . . . . . . . . . . . . . (681) (13,618) (1,016) (15,335)Interest cost . . . . . . . . . . . . . . . . . . . . . . . . . . . . . . . (19,969) (10,227) (19,788) (9,930)Actuarial gains (losses) . . . . . . . . . . . . . . . . . . . . . . . (21,432) 7,966 32,568 25,556Benefits paid . . . . . . . . . . . . . . . . . . . . . . . . . . . . . . . 24,007 4,217 22,828 4,051
less: federal subsidy on benefits paid . . . . . . . . . . . . N/A (58) N/A (60)Plan amendments . . . . . . . . . . . . . . . . . . . . . . . . . . . 932 (880) — —
Benefit obligation at end of year(a) . . . . . . . . . . . . . . $(462,762) $(224,316) $(445,619) $(211,716)
Change in plan assetsFair value of assets, beginning of year . . . . . . . . . . . . . $ 259,626 $ 21,893 $ 267,814 $ 17,665Actual return on plan assets . . . . . . . . . . . . . . . . . . . . 12,618 889 (52) (369)Employer contribution . . . . . . . . . . . . . . . . . . . . . . . . 54,745 6,186 14,692 8,648Benefits paid . . . . . . . . . . . . . . . . . . . . . . . . . . . . . . . (24,007) (4,217) (22,828) (4,051)
Fair value of assets at end of year . . . . . . . . . . . . . . . . $ 302,982 $ 24,751 $ 259,626 $ 21,893
Unfunded status at December 31, . . . . . . . . . . . . . . . . $(159,780) $(199,565) $(185,993) $(189,823)
Amounts recognized in the statement of financial positionconsist of:
Current benefit liability . . . . . . . . . . . . . . . . . . . . . . . $ (25) $ (3,352) $ (21) $ (3,095)Noncurrent benefit liability . . . . . . . . . . . . . . . . . . . . . (159,755) (196,213) (185,972) (186,728)
$(159,780) $(199,565) $(185,993) $(189,823)
Amounts recognized in other comprehensive lossUnamortized actuarial loss . . . . . . . . . . . . . . . . . . . . . $ 140,205 $ 15,593 $ 122,172 $ 23,475Prior service cost (credit) . . . . . . . . . . . . . . . . . . . . . . (980) 2,626 (50) 1,974
$ 139,225 $ 18,219 $ 122,122 $ 25,449
(a) The accumulated pension benefit obligation as of December 31, 2016 and 2015 was $459.5 millionand $440.9 million, respectively.
85
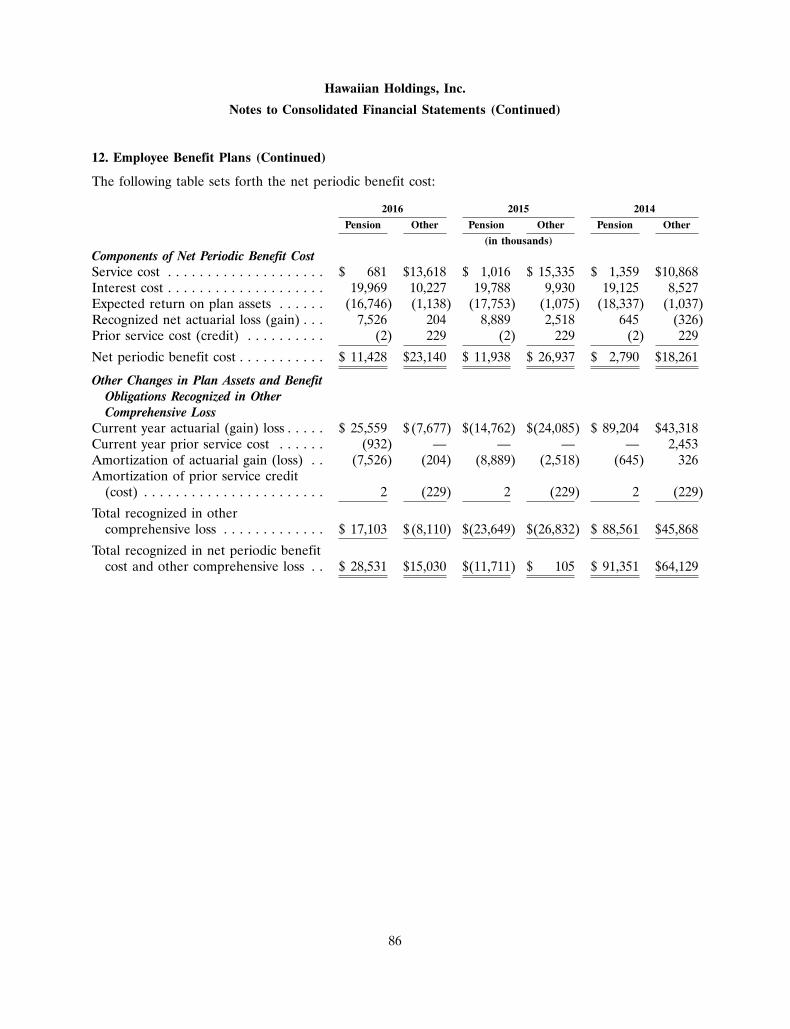
Hawaiian Holdings, Inc.
Notes to Consolidated Financial Statements (Continued)
12. Employee Benefit Plans (Continued)
The following table sets forth the net periodic benefit cost:
2016 2015 2014
Pension Other Pension Other Pension Other
(in thousands)
Components of Net Periodic Benefit CostService cost . . . . . . . . . . . . . . . . . . . . $ 681 $13,618 $ 1,016 $ 15,335 $ 1,359 $10,868Interest cost . . . . . . . . . . . . . . . . . . . . 19,969 10,227 19,788 9,930 19,125 8,527Expected return on plan assets . . . . . . (16,746) (1,138) (17,753) (1,075) (18,337) (1,037)Recognized net actuarial loss (gain) . . . 7,526 204 8,889 2,518 645 (326)Prior service cost (credit) . . . . . . . . . . (2) 229 (2) 229 (2) 229
Net periodic benefit cost . . . . . . . . . . . $ 11,428 $23,140 $ 11,938 $ 26,937 $ 2,790 $18,261
Other Changes in Plan Assets and BenefitObligations Recognized in OtherComprehensive Loss
Current year actuarial (gain) loss . . . . . $ 25,559 $(7,677) $(14,762) $(24,085) $ 89,204 $43,318Current year prior service cost . . . . . . (932) — — — — 2,453Amortization of actuarial gain (loss) . . (7,526) (204) (8,889) (2,518) (645) 326Amortization of prior service credit
(cost) . . . . . . . . . . . . . . . . . . . . . . . 2 (229) 2 (229) 2 (229)
Total recognized in othercomprehensive loss . . . . . . . . . . . . . $ 17,103 $(8,110) $(23,649) $(26,832) $ 88,561 $45,868
Total recognized in net periodic benefitcost and other comprehensive loss . . $ 28,531 $15,030 $(11,711) $ 105 $ 91,351 $64,129
86
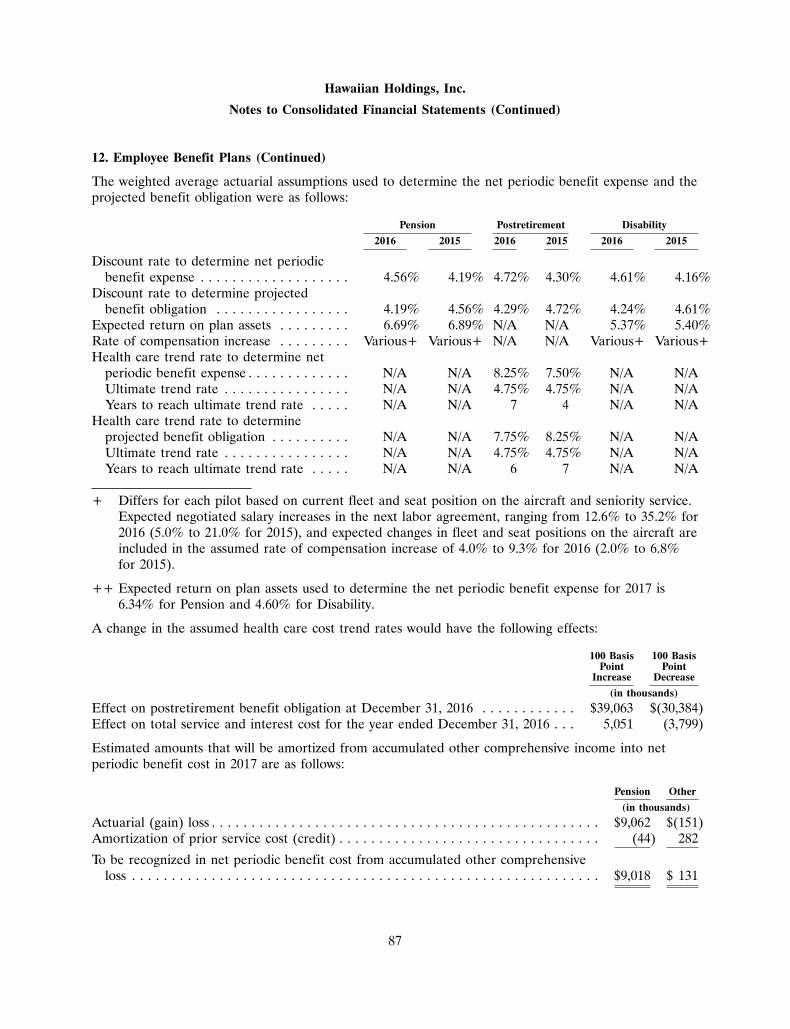
Hawaiian Holdings, Inc.
Notes to Consolidated Financial Statements (Continued)
12. Employee Benefit Plans (Continued)
The weighted average actuarial assumptions used to determine the net periodic benefit expense and theprojected benefit obligation were as follows:
Pension Postretirement Disability
2016 2015 2016 2015 2016 2015
Discount rate to determine net periodicbenefit expense . . . . . . . . . . . . . . . . . . . 4.56% 4.19% 4.72% 4.30% 4.61% 4.16%
Discount rate to determine projectedbenefit obligation . . . . . . . . . . . . . . . . . 4.19% 4.56% 4.29% 4.72% 4.24% 4.61%
Expected return on plan assets . . . . . . . . . 6.69% 6.89% N/A N/A 5.37% 5.40%Rate of compensation increase . . . . . . . . . Various+ Various+ N/A N/A Various+ Various+Health care trend rate to determine net
periodic benefit expense . . . . . . . . . . . . . N/A N/A 8.25% 7.50% N/A N/AUltimate trend rate . . . . . . . . . . . . . . . . N/A N/A 4.75% 4.75% N/A N/AYears to reach ultimate trend rate . . . . . N/A N/A 7 4 N/A N/A
Health care trend rate to determineprojected benefit obligation . . . . . . . . . . N/A N/A 7.75% 8.25% N/A N/AUltimate trend rate . . . . . . . . . . . . . . . . N/A N/A 4.75% 4.75% N/A N/AYears to reach ultimate trend rate . . . . . N/A N/A 6 7 N/A N/A
+ Differs for each pilot based on current fleet and seat position on the aircraft and seniority service.Expected negotiated salary increases in the next labor agreement, ranging from 12.6% to 35.2% for2016 (5.0% to 21.0% for 2015), and expected changes in fleet and seat positions on the aircraft areincluded in the assumed rate of compensation increase of 4.0% to 9.3% for 2016 (2.0% to 6.8%for 2015).
++ Expected return on plan assets used to determine the net periodic benefit expense for 2017 is6.34% for Pension and 4.60% for Disability.
A change in the assumed health care cost trend rates would have the following effects:
100 Basis 100 BasisPoint Point
Increase Decrease
(in thousands)
Effect on postretirement benefit obligation at December 31, 2016 . . . . . . . . . . . . $39,063 $(30,384)Effect on total service and interest cost for the year ended December 31, 2016 . . . 5,051 (3,799)
Estimated amounts that will be amortized from accumulated other comprehensive income into netperiodic benefit cost in 2017 are as follows:
Pension Other
(in thousands)
Actuarial (gain) loss . . . . . . . . . . . . . . . . . . . . . . . . . . . . . . . . . . . . . . . . . . . . . . . . . $9,062 $(151)Amortization of prior service cost (credit) . . . . . . . . . . . . . . . . . . . . . . . . . . . . . . . . . (44) 282
To be recognized in net periodic benefit cost from accumulated other comprehensiveloss . . . . . . . . . . . . . . . . . . . . . . . . . . . . . . . . . . . . . . . . . . . . . . . . . . . . . . . . . . . $9,018 $ 131
87
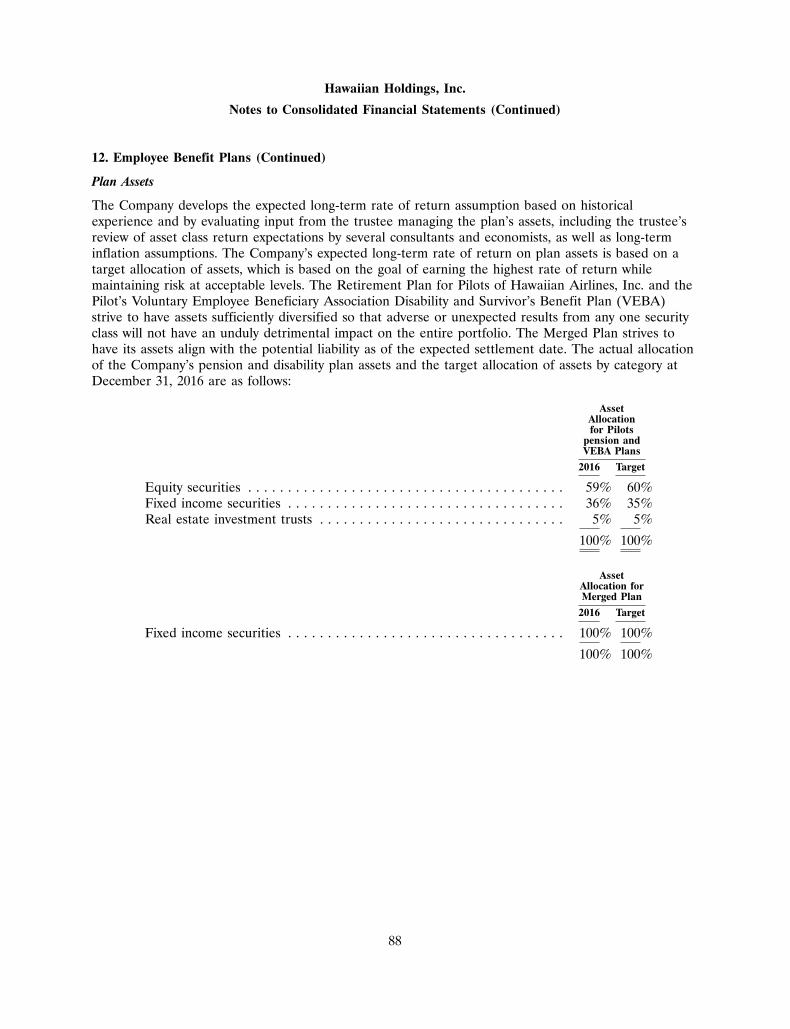
Hawaiian Holdings, Inc.
Notes to Consolidated Financial Statements (Continued)
12. Employee Benefit Plans (Continued)
Plan Assets
The Company develops the expected long-term rate of return assumption based on historicalexperience and by evaluating input from the trustee managing the plan’s assets, including the trustee’sreview of asset class return expectations by several consultants and economists, as well as long-terminflation assumptions. The Company’s expected long-term rate of return on plan assets is based on atarget allocation of assets, which is based on the goal of earning the highest rate of return whilemaintaining risk at acceptable levels. The Retirement Plan for Pilots of Hawaiian Airlines, Inc. and thePilot’s Voluntary Employee Beneficiary Association Disability and Survivor’s Benefit Plan (VEBA)strive to have assets sufficiently diversified so that adverse or unexpected results from any one securityclass will not have an unduly detrimental impact on the entire portfolio. The Merged Plan strives tohave its assets align with the potential liability as of the expected settlement date. The actual allocationof the Company’s pension and disability plan assets and the target allocation of assets by category atDecember 31, 2016 are as follows:
AssetAllocationfor Pilots
pension andVEBA Plans
2016 Target
Equity securities . . . . . . . . . . . . . . . . . . . . . . . . . . . . . . . . . . . . . . . . 59% 60%Fixed income securities . . . . . . . . . . . . . . . . . . . . . . . . . . . . . . . . . . . 36% 35%Real estate investment trusts . . . . . . . . . . . . . . . . . . . . . . . . . . . . . . . 5% 5%
100% 100%
AssetAllocation forMerged Plan
2016 Target
Fixed income securities . . . . . . . . . . . . . . . . . . . . . . . . . . . . . . . . . . . 100% 100%
100% 100%
88
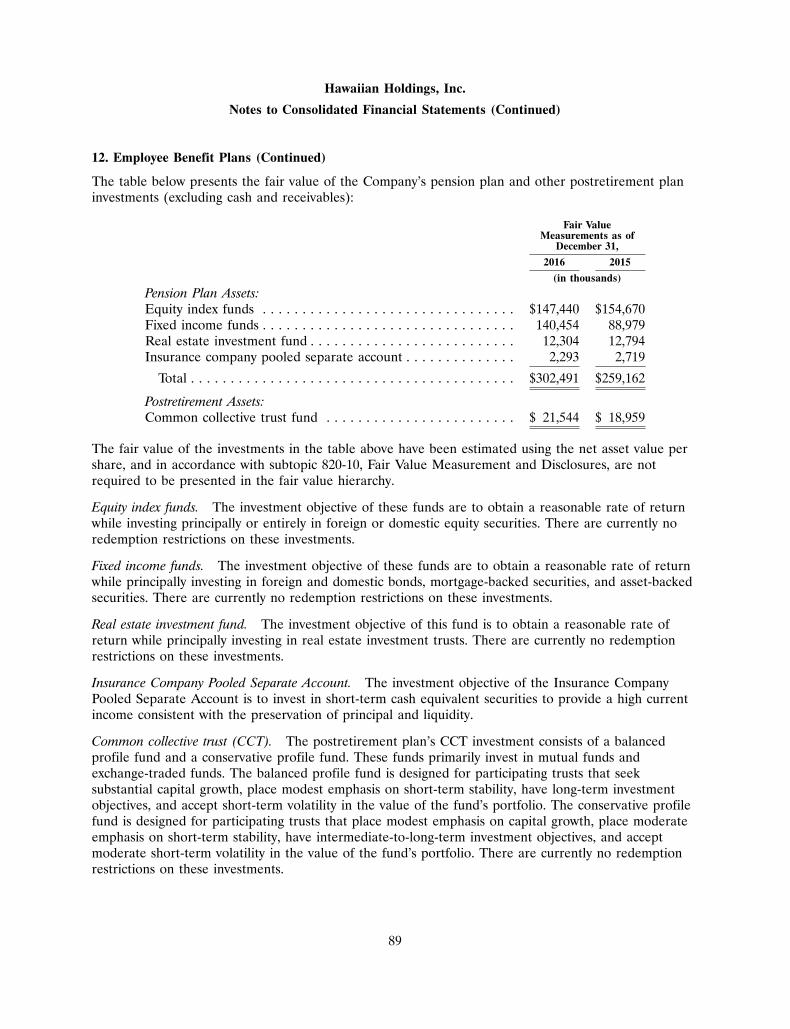
Hawaiian Holdings, Inc.
Notes to Consolidated Financial Statements (Continued)
12. Employee Benefit Plans (Continued)
The table below presents the fair value of the Company’s pension plan and other postretirement planinvestments (excluding cash and receivables):
Fair ValueMeasurements as of
December 31,
2016 2015
(in thousands)
Pension Plan Assets:Equity index funds . . . . . . . . . . . . . . . . . . . . . . . . . . . . . . . . $147,440 $154,670Fixed income funds . . . . . . . . . . . . . . . . . . . . . . . . . . . . . . . . 140,454 88,979Real estate investment fund . . . . . . . . . . . . . . . . . . . . . . . . . . 12,304 12,794Insurance company pooled separate account . . . . . . . . . . . . . . 2,293 2,719
Total . . . . . . . . . . . . . . . . . . . . . . . . . . . . . . . . . . . . . . . . . $302,491 $259,162
Postretirement Assets:Common collective trust fund . . . . . . . . . . . . . . . . . . . . . . . . $ 21,544 $ 18,959
The fair value of the investments in the table above have been estimated using the net asset value pershare, and in accordance with subtopic 820-10, Fair Value Measurement and Disclosures, are notrequired to be presented in the fair value hierarchy.
Equity index funds. The investment objective of these funds are to obtain a reasonable rate of returnwhile investing principally or entirely in foreign or domestic equity securities. There are currently noredemption restrictions on these investments.
Fixed income funds. The investment objective of these funds are to obtain a reasonable rate of returnwhile principally investing in foreign and domestic bonds, mortgage-backed securities, and asset-backedsecurities. There are currently no redemption restrictions on these investments.
Real estate investment fund. The investment objective of this fund is to obtain a reasonable rate ofreturn while principally investing in real estate investment trusts. There are currently no redemptionrestrictions on these investments.
Insurance Company Pooled Separate Account. The investment objective of the Insurance CompanyPooled Separate Account is to invest in short-term cash equivalent securities to provide a high currentincome consistent with the preservation of principal and liquidity.
Common collective trust (CCT). The postretirement plan’s CCT investment consists of a balancedprofile fund and a conservative profile fund. These funds primarily invest in mutual funds andexchange-traded funds. The balanced profile fund is designed for participating trusts that seeksubstantial capital growth, place modest emphasis on short-term stability, have long-term investmentobjectives, and accept short-term volatility in the value of the fund’s portfolio. The conservative profilefund is designed for participating trusts that place modest emphasis on capital growth, place moderateemphasis on short-term stability, have intermediate-to-long-term investment objectives, and acceptmoderate short-term volatility in the value of the fund’s portfolio. There are currently no redemptionrestrictions on these investments.
89
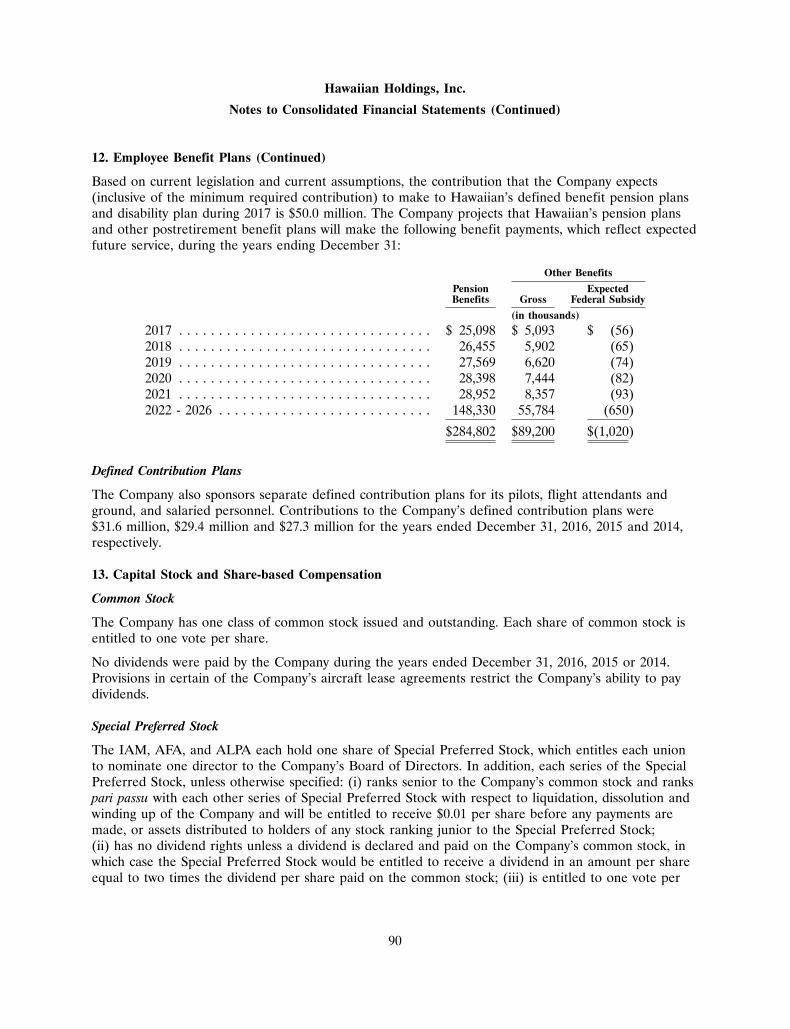
Hawaiian Holdings, Inc.
Notes to Consolidated Financial Statements (Continued)
12. Employee Benefit Plans (Continued)
Based on current legislation and current assumptions, the contribution that the Company expects(inclusive of the minimum required contribution) to make to Hawaiian’s defined benefit pension plansand disability plan during 2017 is $50.0 million. The Company projects that Hawaiian’s pension plansand other postretirement benefit plans will make the following benefit payments, which reflect expectedfuture service, during the years ending December 31:
Other Benefits
Pension ExpectedBenefits Gross Federal Subsidy
(in thousands)
2017 . . . . . . . . . . . . . . . . . . . . . . . . . . . . . . . . $ 25,098 $ 5,093 $ (56)2018 . . . . . . . . . . . . . . . . . . . . . . . . . . . . . . . . 26,455 5,902 (65)2019 . . . . . . . . . . . . . . . . . . . . . . . . . . . . . . . . 27,569 6,620 (74)2020 . . . . . . . . . . . . . . . . . . . . . . . . . . . . . . . . 28,398 7,444 (82)2021 . . . . . . . . . . . . . . . . . . . . . . . . . . . . . . . . 28,952 8,357 (93)2022 - 2026 . . . . . . . . . . . . . . . . . . . . . . . . . . . 148,330 55,784 (650)
$284,802 $89,200 $(1,020)
Defined Contribution Plans
The Company also sponsors separate defined contribution plans for its pilots, flight attendants andground, and salaried personnel. Contributions to the Company’s defined contribution plans were$31.6 million, $29.4 million and $27.3 million for the years ended December 31, 2016, 2015 and 2014,respectively.
13. Capital Stock and Share-based Compensation
Common Stock
The Company has one class of common stock issued and outstanding. Each share of common stock isentitled to one vote per share.
No dividends were paid by the Company during the years ended December 31, 2016, 2015 or 2014.Provisions in certain of the Company’s aircraft lease agreements restrict the Company’s ability to paydividends.
Special Preferred Stock
The IAM, AFA, and ALPA each hold one share of Special Preferred Stock, which entitles each unionto nominate one director to the Company’s Board of Directors. In addition, each series of the SpecialPreferred Stock, unless otherwise specified: (i) ranks senior to the Company’s common stock and rankspari passu with each other series of Special Preferred Stock with respect to liquidation, dissolution andwinding up of the Company and will be entitled to receive $0.01 per share before any payments aremade, or assets distributed to holders of any stock ranking junior to the Special Preferred Stock;(ii) has no dividend rights unless a dividend is declared and paid on the Company’s common stock, inwhich case the Special Preferred Stock would be entitled to receive a dividend in an amount per shareequal to two times the dividend per share paid on the common stock; (iii) is entitled to one vote per
90
Hawaiian Holdings, Inc.
Notes to Consolidated Financial Statements (Continued)
13. Capital Stock and Share-based Compensation (Continued)
share of such series and votes with the common stock as a single class on all matters submitted toholders of the Company’s common stock; and (iv) automatically converts into the Company’s commonstock on a 1:1 basis, at such time as such shares are transferred or such holders are no longer entitledto nominate a representative to the Company’s Board of Directors pursuant to their respectivecollective bargaining agreements.
Share-Based Compensation
Total share-based compensation expense recognized by the Company under ASC 718 was $8.4 million,$6.6 million and $6.7 million for the years ended December 31, 2016, 2015 and 2014, respectively. As ofDecember 31, 2016, $5.7 million of share-based compensation expense related to unvested stockoptions and other stock awards (inclusive of $0.3 million for stock options and other stock awardsgranted to non-employee directors) is attributable to future performance and has not yet beenrecognized. The related expense will be recognized over a weighted average period of approximately0.8 years.
Stock Options
The aggregate intrinsic value of stock options outstanding as of December 31, 2016 and 2015 was$1.0 million and $3.1 million, respectively. The aggregate intrinsic value of stock options exercisable asof December 31, 2016 and 2015 was $0.9 million and $3.0 million, respectively. The intrinsic value ofstock options exercised during the years ended December 31, 2016, 2015 and 2014 was $2.6 million,$5.9 million and $15.9 million, respectively.
Performance-Based Stock Awards
During 2016, the Company granted performance-based stock awards covering 117,849 shares ofcommon stock (the Target Award) with a maximum payout of 196,180 shares of common stock (theMaximum Award) to employees pursuant to the Company’s 2015 Stock Incentive Plan. These awardsvest over a period of one or three years. The Company valued the performance-based stock awardsusing grant date fair values equal to the Company’s share price on the measurement date.
91
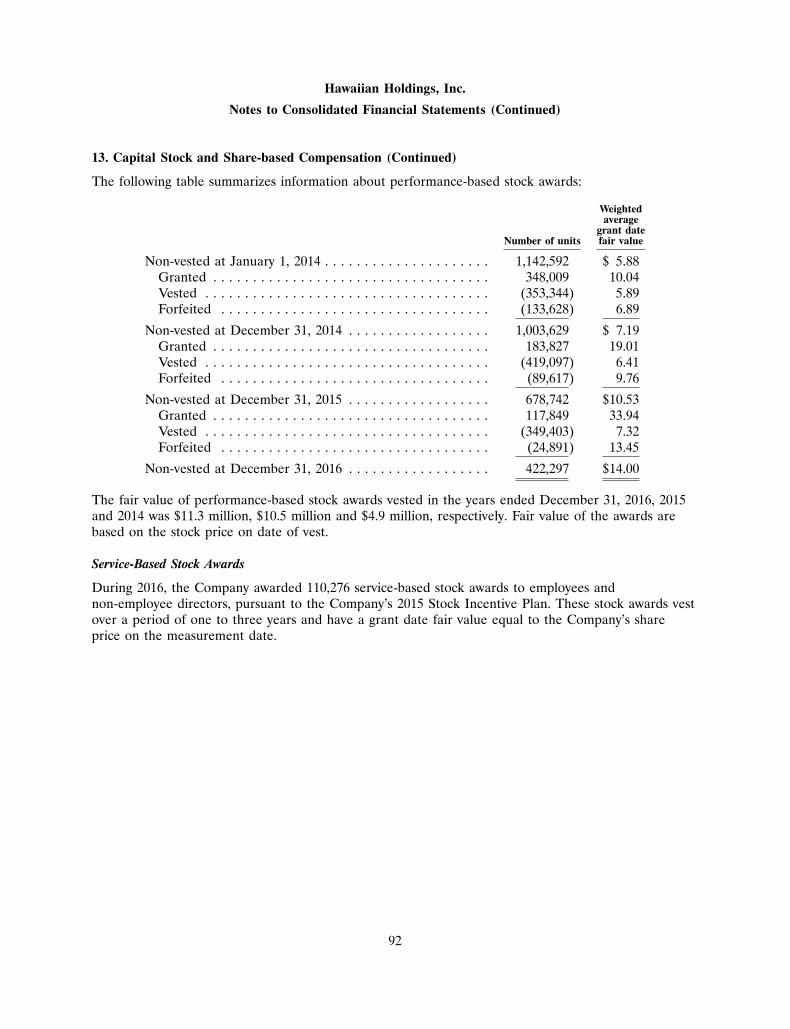
Hawaiian Holdings, Inc.
Notes to Consolidated Financial Statements (Continued)
13. Capital Stock and Share-based Compensation (Continued)
The following table summarizes information about performance-based stock awards:
Weightedaverage
grant dateNumber of units fair value
Non-vested at January 1, 2014 . . . . . . . . . . . . . . . . . . . . . 1,142,592 $ 5.88Granted . . . . . . . . . . . . . . . . . . . . . . . . . . . . . . . . . . . 348,009 10.04Vested . . . . . . . . . . . . . . . . . . . . . . . . . . . . . . . . . . . . (353,344) 5.89Forfeited . . . . . . . . . . . . . . . . . . . . . . . . . . . . . . . . . . (133,628) 6.89
Non-vested at December 31, 2014 . . . . . . . . . . . . . . . . . . 1,003,629 $ 7.19Granted . . . . . . . . . . . . . . . . . . . . . . . . . . . . . . . . . . . 183,827 19.01Vested . . . . . . . . . . . . . . . . . . . . . . . . . . . . . . . . . . . . (419,097) 6.41Forfeited . . . . . . . . . . . . . . . . . . . . . . . . . . . . . . . . . . (89,617) 9.76
Non-vested at December 31, 2015 . . . . . . . . . . . . . . . . . . 678,742 $10.53Granted . . . . . . . . . . . . . . . . . . . . . . . . . . . . . . . . . . . 117,849 33.94Vested . . . . . . . . . . . . . . . . . . . . . . . . . . . . . . . . . . . . (349,403) 7.32Forfeited . . . . . . . . . . . . . . . . . . . . . . . . . . . . . . . . . . (24,891) 13.45
Non-vested at December 31, 2016 . . . . . . . . . . . . . . . . . . 422,297 $14.00
The fair value of performance-based stock awards vested in the years ended December 31, 2016, 2015and 2014 was $11.3 million, $10.5 million and $4.9 million, respectively. Fair value of the awards arebased on the stock price on date of vest.
Service-Based Stock Awards
During 2016, the Company awarded 110,276 service-based stock awards to employees andnon-employee directors, pursuant to the Company’s 2015 Stock Incentive Plan. These stock awards vestover a period of one to three years and have a grant date fair value equal to the Company’s shareprice on the measurement date.
92
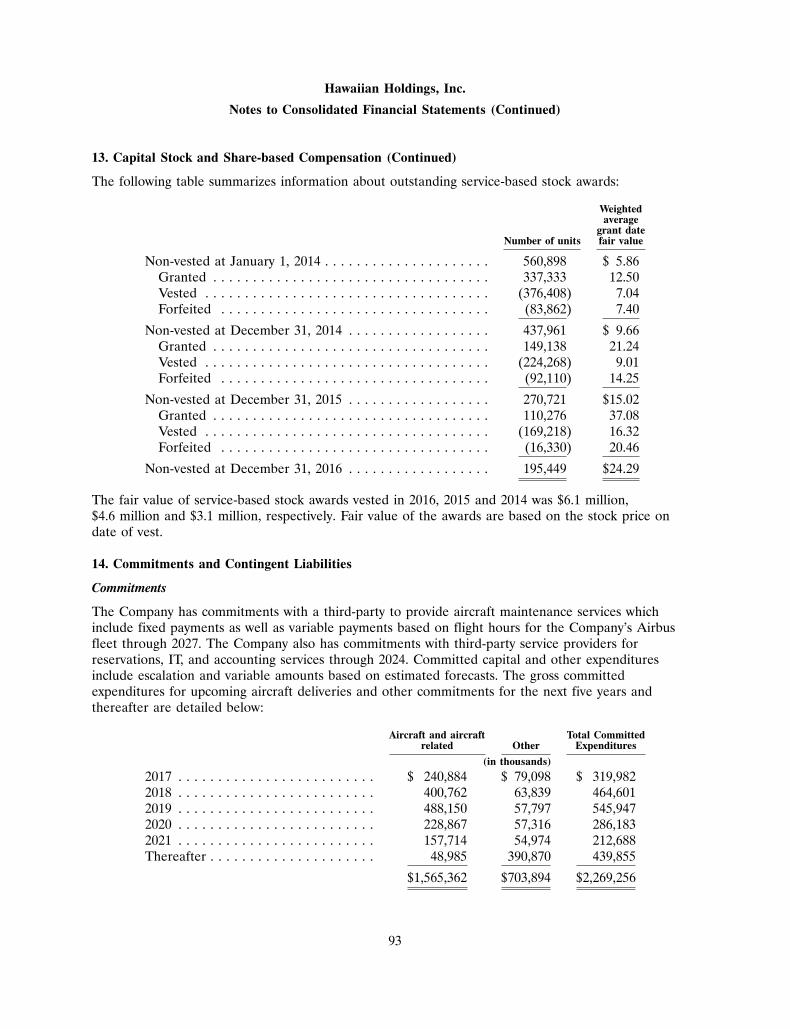
Hawaiian Holdings, Inc.
Notes to Consolidated Financial Statements (Continued)
13. Capital Stock and Share-based Compensation (Continued)
The following table summarizes information about outstanding service-based stock awards:
Weightedaverage
grant dateNumber of units fair value
Non-vested at January 1, 2014 . . . . . . . . . . . . . . . . . . . . . 560,898 $ 5.86Granted . . . . . . . . . . . . . . . . . . . . . . . . . . . . . . . . . . . 337,333 12.50Vested . . . . . . . . . . . . . . . . . . . . . . . . . . . . . . . . . . . . (376,408) 7.04Forfeited . . . . . . . . . . . . . . . . . . . . . . . . . . . . . . . . . . (83,862) 7.40
Non-vested at December 31, 2014 . . . . . . . . . . . . . . . . . . 437,961 $ 9.66Granted . . . . . . . . . . . . . . . . . . . . . . . . . . . . . . . . . . . 149,138 21.24Vested . . . . . . . . . . . . . . . . . . . . . . . . . . . . . . . . . . . . (224,268) 9.01Forfeited . . . . . . . . . . . . . . . . . . . . . . . . . . . . . . . . . . (92,110) 14.25
Non-vested at December 31, 2015 . . . . . . . . . . . . . . . . . . 270,721 $15.02Granted . . . . . . . . . . . . . . . . . . . . . . . . . . . . . . . . . . . 110,276 37.08Vested . . . . . . . . . . . . . . . . . . . . . . . . . . . . . . . . . . . . (169,218) 16.32Forfeited . . . . . . . . . . . . . . . . . . . . . . . . . . . . . . . . . . (16,330) 20.46
Non-vested at December 31, 2016 . . . . . . . . . . . . . . . . . . 195,449 $24.29
The fair value of service-based stock awards vested in 2016, 2015 and 2014 was $6.1 million,$4.6 million and $3.1 million, respectively. Fair value of the awards are based on the stock price ondate of vest.
14. Commitments and Contingent Liabilities
Commitments
The Company has commitments with a third-party to provide aircraft maintenance services whichinclude fixed payments as well as variable payments based on flight hours for the Company’s Airbusfleet through 2027. The Company also has commitments with third-party service providers forreservations, IT, and accounting services through 2024. Committed capital and other expendituresinclude escalation and variable amounts based on estimated forecasts. The gross committedexpenditures for upcoming aircraft deliveries and other commitments for the next five years andthereafter are detailed below:
Aircraft and aircraft Total Committedrelated Other Expenditures
(in thousands)
2017 . . . . . . . . . . . . . . . . . . . . . . . . . $ 240,884 $ 79,098 $ 319,9822018 . . . . . . . . . . . . . . . . . . . . . . . . . 400,762 63,839 464,6012019 . . . . . . . . . . . . . . . . . . . . . . . . . 488,150 57,797 545,9472020 . . . . . . . . . . . . . . . . . . . . . . . . . 228,867 57,316 286,1832021 . . . . . . . . . . . . . . . . . . . . . . . . . 157,714 54,974 212,688Thereafter . . . . . . . . . . . . . . . . . . . . . 48,985 390,870 439,855
$1,565,362 $703,894 $2,269,256
93
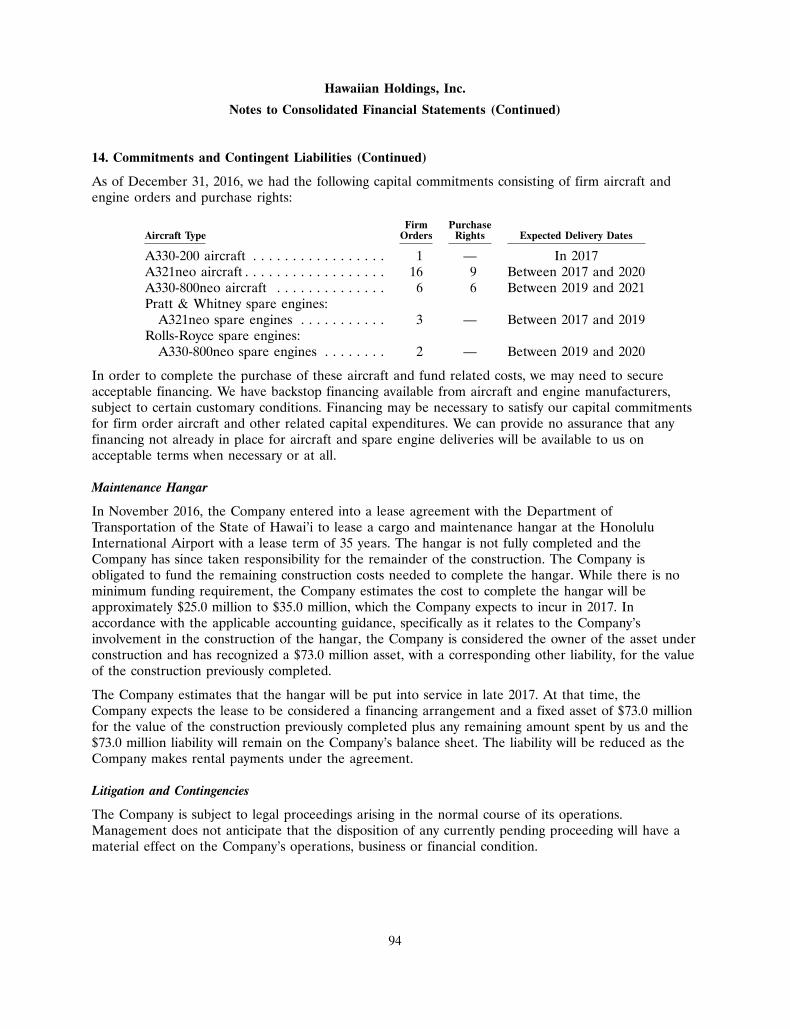
Hawaiian Holdings, Inc.
Notes to Consolidated Financial Statements (Continued)
14. Commitments and Contingent Liabilities (Continued)
As of December 31, 2016, we had the following capital commitments consisting of firm aircraft andengine orders and purchase rights:
Firm PurchaseAircraft Type Orders Rights Expected Delivery Dates
A330-200 aircraft . . . . . . . . . . . . . . . . . 1 — In 2017A321neo aircraft . . . . . . . . . . . . . . . . . . 16 9 Between 2017 and 2020A330-800neo aircraft . . . . . . . . . . . . . . 6 6 Between 2019 and 2021Pratt & Whitney spare engines:
A321neo spare engines . . . . . . . . . . . 3 — Between 2017 and 2019Rolls-Royce spare engines:
A330-800neo spare engines . . . . . . . . 2 — Between 2019 and 2020
In order to complete the purchase of these aircraft and fund related costs, we may need to secureacceptable financing. We have backstop financing available from aircraft and engine manufacturers,subject to certain customary conditions. Financing may be necessary to satisfy our capital commitmentsfor firm order aircraft and other related capital expenditures. We can provide no assurance that anyfinancing not already in place for aircraft and spare engine deliveries will be available to us onacceptable terms when necessary or at all.
Maintenance Hangar
In November 2016, the Company entered into a lease agreement with the Department ofTransportation of the State of Hawai’i to lease a cargo and maintenance hangar at the HonoluluInternational Airport with a lease term of 35 years. The hangar is not fully completed and theCompany has since taken responsibility for the remainder of the construction. The Company isobligated to fund the remaining construction costs needed to complete the hangar. While there is nominimum funding requirement, the Company estimates the cost to complete the hangar will beapproximately $25.0 million to $35.0 million, which the Company expects to incur in 2017. Inaccordance with the applicable accounting guidance, specifically as it relates to the Company’sinvolvement in the construction of the hangar, the Company is considered the owner of the asset underconstruction and has recognized a $73.0 million asset, with a corresponding other liability, for the valueof the construction previously completed.
The Company estimates that the hangar will be put into service in late 2017. At that time, theCompany expects the lease to be considered a financing arrangement and a fixed asset of $73.0 millionfor the value of the construction previously completed plus any remaining amount spent by us and the$73.0 million liability will remain on the Company’s balance sheet. The liability will be reduced as theCompany makes rental payments under the agreement.
Litigation and Contingencies
The Company is subject to legal proceedings arising in the normal course of its operations.Management does not anticipate that the disposition of any currently pending proceeding will have amaterial effect on the Company’s operations, business or financial condition.
94
Hawaiian Holdings, Inc.
Notes to Consolidated Financial Statements (Continued)
14. Commitments and Contingent Liabilities (Continued)
General Guarantees and Indemnifications
In the normal course of business, the Company enters into numerous aircraft financing and real estateleasing arrangements that have various guarantees included in the contract. It is common in such leasetransactions for the lessee to agree to indemnify the lessor and other related third-parties for tortliabilities that arise out of or relate to the lessee’s use of the leased aircraft or occupancy of the leasedpremises. In some cases, this indemnity extends to related liabilities arising from the negligence of theindemnified parties, but usually excludes any liabilities caused by their gross negligence or willfulmisconduct. Additionally, the lessee typically indemnifies such parties for any environmental liabilitythat arises out of or relates to its use of the real estate leased premises. The Company believes that itis insured (subject to deductibles) for most tort liabilities and related indemnities described above withrespect to the aircraft and real estate that it leases. The Company cannot estimate the potentialamount of future payments, if any, under the foregoing indemnities and agreements.
Credit Card Holdback
Under the Company’s bank-issued credit card processing agreements, certain proceeds from advanceticket sales may be held back to serve as collateral to cover any possible chargebacks or other disputedcharges that may occur. These holdbacks, which are included in restricted cash in the Company’sConsolidated Balance Sheets, totaled $5.0 million at December 31, 2016 and 2015.
In the event of a material adverse change in the business, the holdback could increase to an amount upto 100% of the applicable credit card air traffic liability, which would also cause an increase in the levelof restricted cash.
Labor Negotiations
As of December 31, 2016, approximately 83% of employees were represented by unions. Additionally,the collective bargaining agreement for the Association of Flight Attendants (AFA), which represents29% of employees became amendable on January 1, 2017, the Company is currently in negotiationswith the AFA. Also, the Company has reached tentative agreement with the ALPA as their collectivebargaining agreement became amendable on September 15, 2015 (See Note 11 for further discussion).The Company can provide no assurance that a successful or timely resolution of these labornegotiations will be achieved.
15. Geographic Information
The Company’s primary operations are that of its wholly-owned subsidiary, Hawaiian. Principally alloperations of Hawaiian either originate and/or end in the State of Hawai’i. The management of suchoperations is based on a system-wide approach due to the interdependence of Hawaiian’s routestructure in its various markets. As Hawaiian offers only one significant line of business (i.e., airtransportation), management has concluded that it has only one segment.
95
Hawaiian Holdings, Inc.
Notes to Consolidated Financial Statements (Continued)
15. Geographic Information (Continued)
The Company’s operating revenues by geographic region (as defined by the Department ofTransportation, DOT) are summarized below:
Year Ended December 31,
2016 2015 2014
(in thousands)
Domestic . . . . . . . . . . . . . . . . . . . . . . . . . . . $1,906,840 $1,775,355 $1,683,487Pacific . . . . . . . . . . . . . . . . . . . . . . . . . . . . . 543,740 542,112 631,392
Total operating revenue . . . . . . . . . . . . . . . . . $2,450,580 $2,317,467 $2,314,879
Hawaiian attributes operating revenue by geographic region based upon the origin and destination ofeach flight segment. Hawaiian’s tangible assets consist primarily of flight equipment, which are mobileacross geographic markets, and, therefore, have not been allocated to specific geographic regions.
16. Supplemental Cash Flow Information
Supplemental disclosures of cash flow information and non-cash investing and financing activities wereas follows:
Year Ended December 31,
2016 2015 2014
(in thousands)
Cash payments for interest (net of amounts capitalized) . . . . . . . . . . . . . $29,751 $45,519 $42,242Cash payments (refunds) for income taxes . . . . . . . . . . . . . . . . . . . . . . . 92,934 4,664 (1,882)Investing and Financing Activities Not Affecting Cash:Property and equipment acquired through a capital lease . . . . . . . . . . . . 6,092 2,791 —Maintenance Hangar project (see Note 14 for further discussion) . . . . . . . 72,996 — —
17. Condensed Consolidating Financial Information
The following condensed consolidating financial information is presented in accordance withRegulation S-X paragraph 210.3-10 because, in connection with the issuance by two pass-through trustsformed by Hawaiian (which is also referred to in this Note 17 as Subsidiary Issuer / Guarantor) ofpass-through certificates, as discussed in Note 8, the Company (which is also referred to in this Note 17as Parent Issuer / Guarantor), is fully and unconditionally guaranteeing the payment obligations ofHawaiian, which is a 100% owned subsidiary of the Company, under equipment notes to be issued byHawaiian to purchase new aircraft.
96
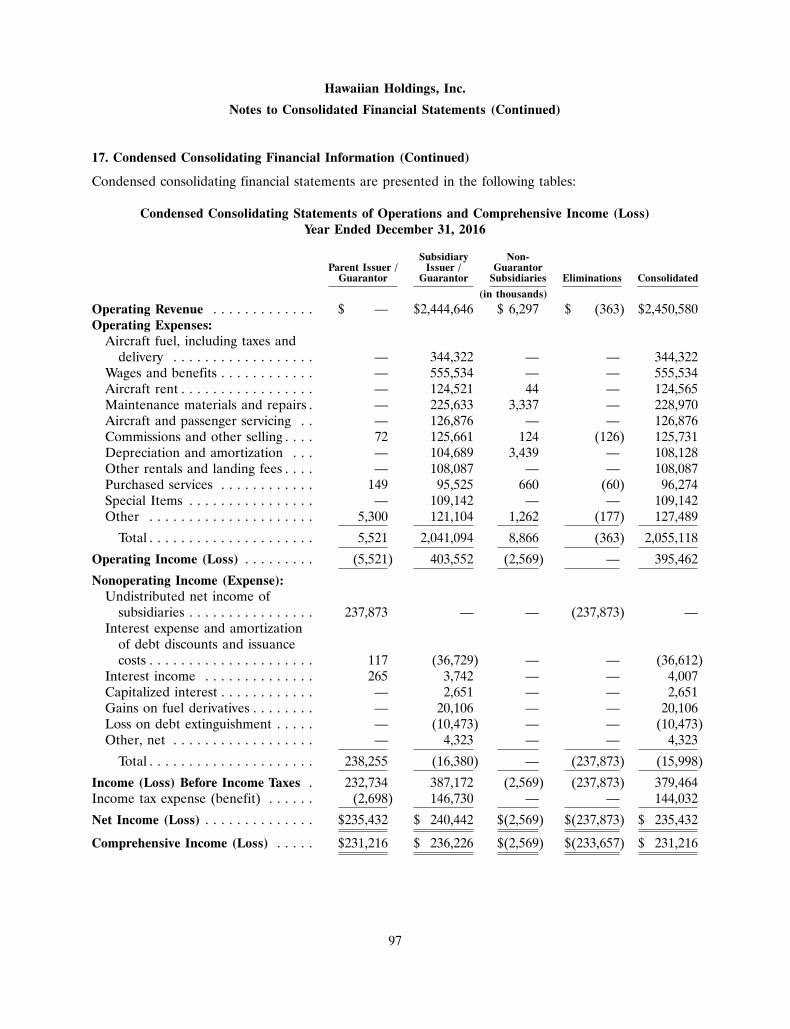
Hawaiian Holdings, Inc.
Notes to Consolidated Financial Statements (Continued)
17. Condensed Consolidating Financial Information (Continued)
Condensed consolidating financial statements are presented in the following tables:
Condensed Consolidating Statements of Operations and Comprehensive Income (Loss)Year Ended December 31, 2016
Subsidiary Non-Parent Issuer / Issuer / Guarantor
Guarantor Guarantor Subsidiaries Eliminations Consolidated
(in thousands)
Operating Revenue . . . . . . . . . . . . . $ — $2,444,646 $ 6,297 $ (363) $2,450,580Operating Expenses:
Aircraft fuel, including taxes anddelivery . . . . . . . . . . . . . . . . . . — 344,322 — — 344,322
Wages and benefits . . . . . . . . . . . . — 555,534 — — 555,534Aircraft rent . . . . . . . . . . . . . . . . . — 124,521 44 — 124,565Maintenance materials and repairs . — 225,633 3,337 — 228,970Aircraft and passenger servicing . . — 126,876 — — 126,876Commissions and other selling . . . . 72 125,661 124 (126) 125,731Depreciation and amortization . . . — 104,689 3,439 — 108,128Other rentals and landing fees . . . . — 108,087 — — 108,087Purchased services . . . . . . . . . . . . 149 95,525 660 (60) 96,274Special Items . . . . . . . . . . . . . . . . — 109,142 — — 109,142Other . . . . . . . . . . . . . . . . . . . . . 5,300 121,104 1,262 (177) 127,489
Total . . . . . . . . . . . . . . . . . . . . . 5,521 2,041,094 8,866 (363) 2,055,118
Operating Income (Loss) . . . . . . . . . (5,521) 403,552 (2,569) — 395,462
Nonoperating Income (Expense):Undistributed net income of
subsidiaries . . . . . . . . . . . . . . . . 237,873 — — (237,873) —Interest expense and amortization
of debt discounts and issuancecosts . . . . . . . . . . . . . . . . . . . . . 117 (36,729) — — (36,612)
Interest income . . . . . . . . . . . . . . 265 3,742 — — 4,007Capitalized interest . . . . . . . . . . . . — 2,651 — — 2,651Gains on fuel derivatives . . . . . . . . — 20,106 — — 20,106Loss on debt extinguishment . . . . . — (10,473) — — (10,473)Other, net . . . . . . . . . . . . . . . . . . — 4,323 — — 4,323
Total . . . . . . . . . . . . . . . . . . . . . 238,255 (16,380) — (237,873) (15,998)
Income (Loss) Before Income Taxes . 232,734 387,172 (2,569) (237,873) 379,464Income tax expense (benefit) . . . . . . (2,698) 146,730 — — 144,032
Net Income (Loss) . . . . . . . . . . . . . . $235,432 $ 240,442 $(2,569) $(237,873) $ 235,432
Comprehensive Income (Loss) . . . . . $231,216 $ 236,226 $(2,569) $(233,657) $ 231,216
97
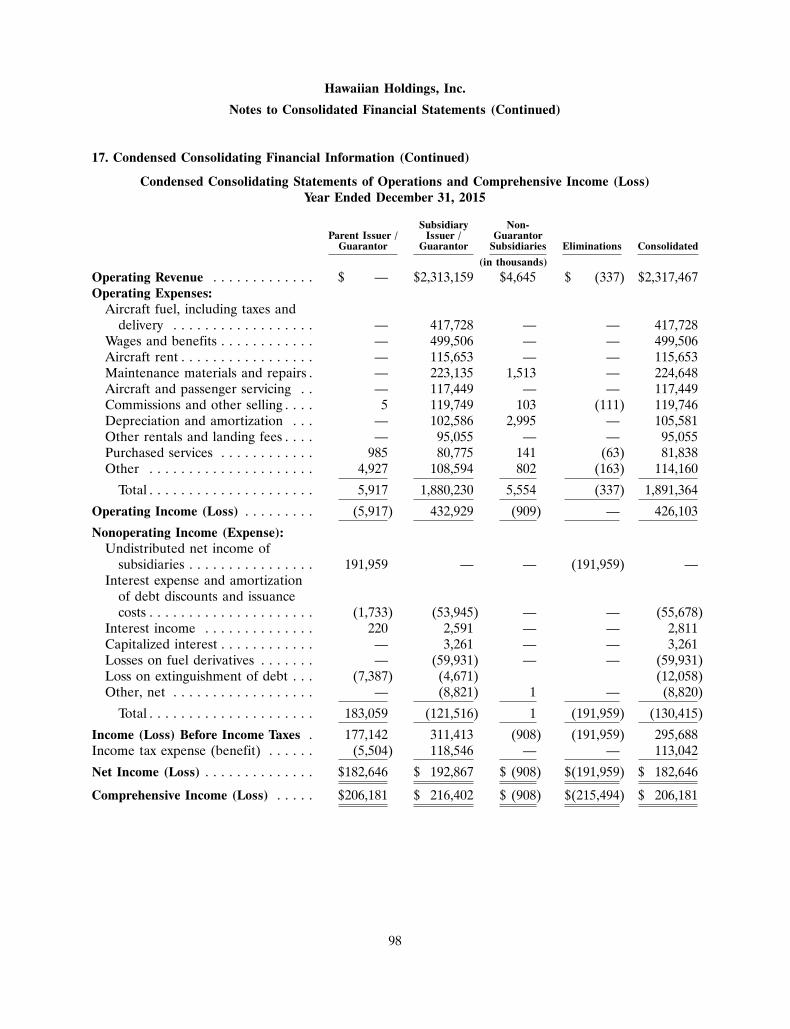
Hawaiian Holdings, Inc.
Notes to Consolidated Financial Statements (Continued)
17. Condensed Consolidating Financial Information (Continued)
Condensed Consolidating Statements of Operations and Comprehensive Income (Loss)Year Ended December 31, 2015
Subsidiary Non-Parent Issuer / Issuer / Guarantor
Guarantor Guarantor Subsidiaries Eliminations Consolidated
(in thousands)
Operating Revenue . . . . . . . . . . . . . $ — $2,313,159 $4,645 $ (337) $2,317,467Operating Expenses:
Aircraft fuel, including taxes anddelivery . . . . . . . . . . . . . . . . . . — 417,728 — — 417,728
Wages and benefits . . . . . . . . . . . . — 499,506 — — 499,506Aircraft rent . . . . . . . . . . . . . . . . . — 115,653 — — 115,653Maintenance materials and repairs . — 223,135 1,513 — 224,648Aircraft and passenger servicing . . — 117,449 — — 117,449Commissions and other selling . . . . 5 119,749 103 (111) 119,746Depreciation and amortization . . . — 102,586 2,995 — 105,581Other rentals and landing fees . . . . — 95,055 — — 95,055Purchased services . . . . . . . . . . . . 985 80,775 141 (63) 81,838Other . . . . . . . . . . . . . . . . . . . . . 4,927 108,594 802 (163) 114,160
Total . . . . . . . . . . . . . . . . . . . . . 5,917 1,880,230 5,554 (337) 1,891,364
Operating Income (Loss) . . . . . . . . . (5,917) 432,929 (909) — 426,103
Nonoperating Income (Expense):Undistributed net income of
subsidiaries . . . . . . . . . . . . . . . . 191,959 — — (191,959) —Interest expense and amortization
of debt discounts and issuancecosts . . . . . . . . . . . . . . . . . . . . . (1,733) (53,945) — — (55,678)
Interest income . . . . . . . . . . . . . . 220 2,591 — — 2,811Capitalized interest . . . . . . . . . . . . — 3,261 — — 3,261Losses on fuel derivatives . . . . . . . — (59,931) — — (59,931)Loss on extinguishment of debt . . . (7,387) (4,671) (12,058)Other, net . . . . . . . . . . . . . . . . . . — (8,821) 1 — (8,820)
Total . . . . . . . . . . . . . . . . . . . . . 183,059 (121,516) 1 (191,959) (130,415)
Income (Loss) Before Income Taxes . 177,142 311,413 (908) (191,959) 295,688Income tax expense (benefit) . . . . . . (5,504) 118,546 — — 113,042
Net Income (Loss) . . . . . . . . . . . . . . $182,646 $ 192,867 $ (908) $(191,959) $ 182,646
Comprehensive Income (Loss) . . . . . $206,181 $ 216,402 $ (908) $(215,494) $ 206,181
98
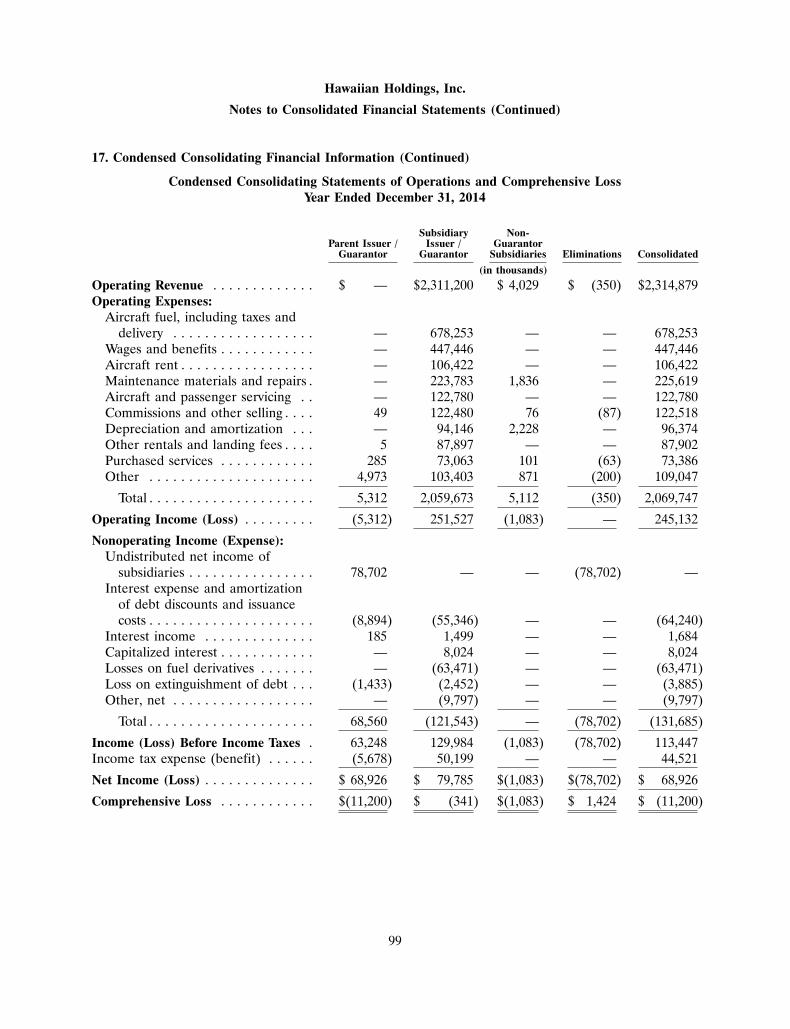
Hawaiian Holdings, Inc.
Notes to Consolidated Financial Statements (Continued)
17. Condensed Consolidating Financial Information (Continued)
Condensed Consolidating Statements of Operations and Comprehensive LossYear Ended December 31, 2014
Subsidiary Non-Parent Issuer / Issuer / Guarantor
Guarantor Guarantor Subsidiaries Eliminations Consolidated
(in thousands)
Operating Revenue . . . . . . . . . . . . . $ — $2,311,200 $ 4,029 $ (350) $2,314,879Operating Expenses:
Aircraft fuel, including taxes anddelivery . . . . . . . . . . . . . . . . . . — 678,253 — — 678,253
Wages and benefits . . . . . . . . . . . . — 447,446 — — 447,446Aircraft rent . . . . . . . . . . . . . . . . . — 106,422 — — 106,422Maintenance materials and repairs . — 223,783 1,836 — 225,619Aircraft and passenger servicing . . — 122,780 — — 122,780Commissions and other selling . . . . 49 122,480 76 (87) 122,518Depreciation and amortization . . . — 94,146 2,228 — 96,374Other rentals and landing fees . . . . 5 87,897 — — 87,902Purchased services . . . . . . . . . . . . 285 73,063 101 (63) 73,386Other . . . . . . . . . . . . . . . . . . . . . 4,973 103,403 871 (200) 109,047
Total . . . . . . . . . . . . . . . . . . . . . 5,312 2,059,673 5,112 (350) 2,069,747
Operating Income (Loss) . . . . . . . . . (5,312) 251,527 (1,083) — 245,132
Nonoperating Income (Expense):Undistributed net income of
subsidiaries . . . . . . . . . . . . . . . . 78,702 — — (78,702) —Interest expense and amortization
of debt discounts and issuancecosts . . . . . . . . . . . . . . . . . . . . . (8,894) (55,346) — — (64,240)
Interest income . . . . . . . . . . . . . . 185 1,499 — — 1,684Capitalized interest . . . . . . . . . . . . — 8,024 — — 8,024Losses on fuel derivatives . . . . . . . — (63,471) — — (63,471)Loss on extinguishment of debt . . . (1,433) (2,452) — — (3,885)Other, net . . . . . . . . . . . . . . . . . . — (9,797) — — (9,797)
Total . . . . . . . . . . . . . . . . . . . . . 68,560 (121,543) — (78,702) (131,685)
Income (Loss) Before Income Taxes . 63,248 129,984 (1,083) (78,702) 113,447Income tax expense (benefit) . . . . . . (5,678) 50,199 — — 44,521
Net Income (Loss) . . . . . . . . . . . . . . $ 68,926 $ 79,785 $(1,083) $(78,702) $ 68,926
Comprehensive Loss . . . . . . . . . . . . $(11,200) $ (341) $(1,083) $ 1,424 $ (11,200)
99
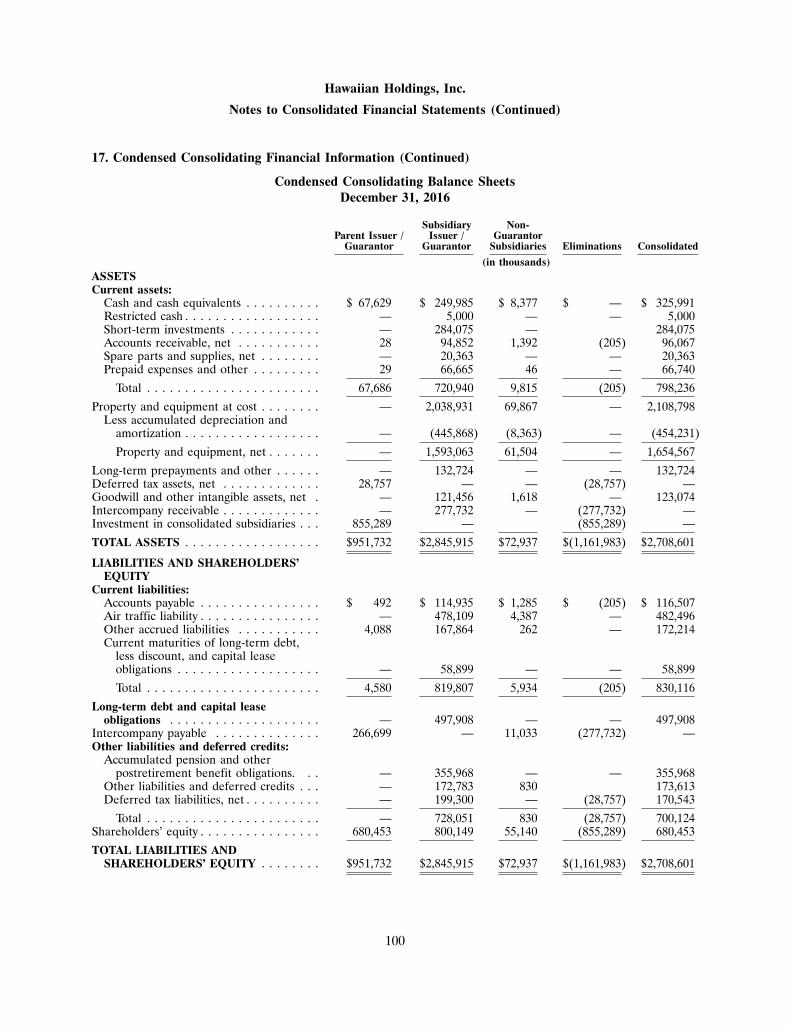
Hawaiian Holdings, Inc.
Notes to Consolidated Financial Statements (Continued)
17. Condensed Consolidating Financial Information (Continued)
Condensed Consolidating Balance SheetsDecember 31, 2016
Subsidiary Non-Parent Issuer / Issuer / Guarantor
Guarantor Guarantor Subsidiaries Eliminations Consolidated
(in thousands)ASSETSCurrent assets:
Cash and cash equivalents . . . . . . . . . . $ 67,629 $ 249,985 $ 8,377 $ — $ 325,991Restricted cash . . . . . . . . . . . . . . . . . . — 5,000 — — 5,000Short-term investments . . . . . . . . . . . . — 284,075 — 284,075Accounts receivable, net . . . . . . . . . . . 28 94,852 1,392 (205) 96,067Spare parts and supplies, net . . . . . . . . — 20,363 — — 20,363Prepaid expenses and other . . . . . . . . . 29 66,665 46 — 66,740
Total . . . . . . . . . . . . . . . . . . . . . . . 67,686 720,940 9,815 (205) 798,236
Property and equipment at cost . . . . . . . . — 2,038,931 69,867 — 2,108,798Less accumulated depreciation and
amortization . . . . . . . . . . . . . . . . . . — (445,868) (8,363) — (454,231)
Property and equipment, net . . . . . . . — 1,593,063 61,504 — 1,654,567
Long-term prepayments and other . . . . . . — 132,724 — — 132,724Deferred tax assets, net . . . . . . . . . . . . . 28,757 — — (28,757) —Goodwill and other intangible assets, net . — 121,456 1,618 — 123,074Intercompany receivable . . . . . . . . . . . . . — 277,732 — (277,732) —Investment in consolidated subsidiaries . . . 855,289 — (855,289) —
TOTAL ASSETS . . . . . . . . . . . . . . . . . . $951,732 $2,845,915 $72,937 $(1,161,983) $2,708,601
LIABILITIES AND SHAREHOLDERS’EQUITY
Current liabilities:Accounts payable . . . . . . . . . . . . . . . . $ 492 $ 114,935 $ 1,285 $ (205) $ 116,507Air traffic liability . . . . . . . . . . . . . . . . — 478,109 4,387 — 482,496Other accrued liabilities . . . . . . . . . . . 4,088 167,864 262 — 172,214Current maturities of long-term debt,
less discount, and capital leaseobligations . . . . . . . . . . . . . . . . . . . — 58,899 — — 58,899
Total . . . . . . . . . . . . . . . . . . . . . . . 4,580 819,807 5,934 (205) 830,116
Long-term debt and capital leaseobligations . . . . . . . . . . . . . . . . . . . . — 497,908 — — 497,908
Intercompany payable . . . . . . . . . . . . . . 266,699 — 11,033 (277,732) —Other liabilities and deferred credits:
Accumulated pension and otherpostretirement benefit obligations. . . — 355,968 — — 355,968
Other liabilities and deferred credits . . . — 172,783 830 173,613Deferred tax liabilities, net . . . . . . . . . . — 199,300 — (28,757) 170,543
Total . . . . . . . . . . . . . . . . . . . . . . . — 728,051 830 (28,757) 700,124Shareholders’ equity . . . . . . . . . . . . . . . . 680,453 800,149 55,140 (855,289) 680,453
TOTAL LIABILITIES ANDSHAREHOLDERS’ EQUITY . . . . . . . . $951,732 $2,845,915 $72,937 $(1,161,983) $2,708,601
100
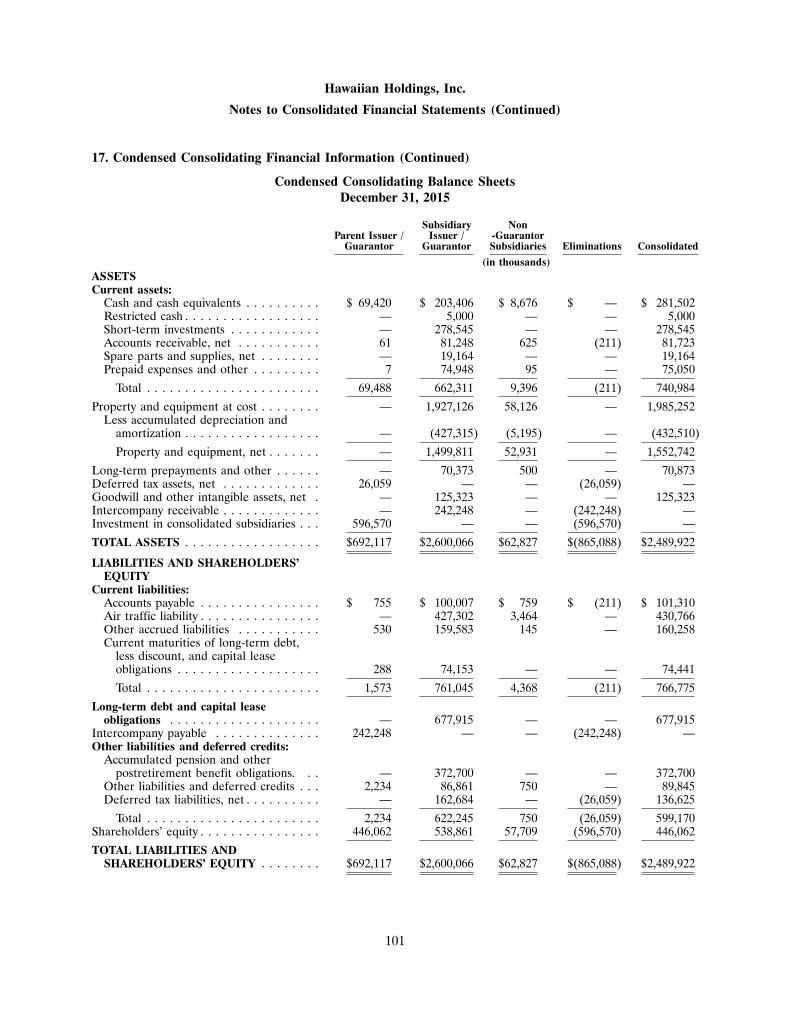
Hawaiian Holdings, Inc.
Notes to Consolidated Financial Statements (Continued)
17. Condensed Consolidating Financial Information (Continued)
Condensed Consolidating Balance SheetsDecember 31, 2015
Subsidiary NonParent Issuer / Issuer / -Guarantor
Guarantor Guarantor Subsidiaries Eliminations Consolidated
(in thousands)ASSETSCurrent assets:
Cash and cash equivalents . . . . . . . . . . $ 69,420 $ 203,406 $ 8,676 $ — $ 281,502Restricted cash . . . . . . . . . . . . . . . . . . — 5,000 — — 5,000Short-term investments . . . . . . . . . . . . — 278,545 — — 278,545Accounts receivable, net . . . . . . . . . . . 61 81,248 625 (211) 81,723Spare parts and supplies, net . . . . . . . . — 19,164 — — 19,164Prepaid expenses and other . . . . . . . . . 7 74,948 95 — 75,050
Total . . . . . . . . . . . . . . . . . . . . . . . 69,488 662,311 9,396 (211) 740,984
Property and equipment at cost . . . . . . . . — 1,927,126 58,126 — 1,985,252Less accumulated depreciation and
amortization . . . . . . . . . . . . . . . . . . — (427,315) (5,195) — (432,510)
Property and equipment, net . . . . . . . — 1,499,811 52,931 — 1,552,742
Long-term prepayments and other . . . . . . — 70,373 500 — 70,873Deferred tax assets, net . . . . . . . . . . . . . 26,059 — — (26,059) —Goodwill and other intangible assets, net . — 125,323 — — 125,323Intercompany receivable . . . . . . . . . . . . . — 242,248 — (242,248) —Investment in consolidated subsidiaries . . . 596,570 — — (596,570) —
TOTAL ASSETS . . . . . . . . . . . . . . . . . . $692,117 $2,600,066 $62,827 $(865,088) $2,489,922
LIABILITIES AND SHAREHOLDERS’EQUITY
Current liabilities:Accounts payable . . . . . . . . . . . . . . . . $ 755 $ 100,007 $ 759 $ (211) $ 101,310Air traffic liability . . . . . . . . . . . . . . . . — 427,302 3,464 — 430,766Other accrued liabilities . . . . . . . . . . . 530 159,583 145 — 160,258Current maturities of long-term debt,
less discount, and capital leaseobligations . . . . . . . . . . . . . . . . . . . 288 74,153 — — 74,441
Total . . . . . . . . . . . . . . . . . . . . . . . 1,573 761,045 4,368 (211) 766,775
Long-term debt and capital leaseobligations . . . . . . . . . . . . . . . . . . . . — 677,915 — — 677,915
Intercompany payable . . . . . . . . . . . . . . 242,248 — — (242,248) —Other liabilities and deferred credits:
Accumulated pension and otherpostretirement benefit obligations. . . — 372,700 — — 372,700
Other liabilities and deferred credits . . . 2,234 86,861 750 — 89,845Deferred tax liabilities, net . . . . . . . . . . — 162,684 — (26,059) 136,625
Total . . . . . . . . . . . . . . . . . . . . . . . 2,234 622,245 750 (26,059) 599,170Shareholders’ equity . . . . . . . . . . . . . . . . 446,062 538,861 57,709 (596,570) 446,062
TOTAL LIABILITIES ANDSHAREHOLDERS’ EQUITY . . . . . . . . $692,117 $2,600,066 $62,827 $(865,088) $2,489,922
101
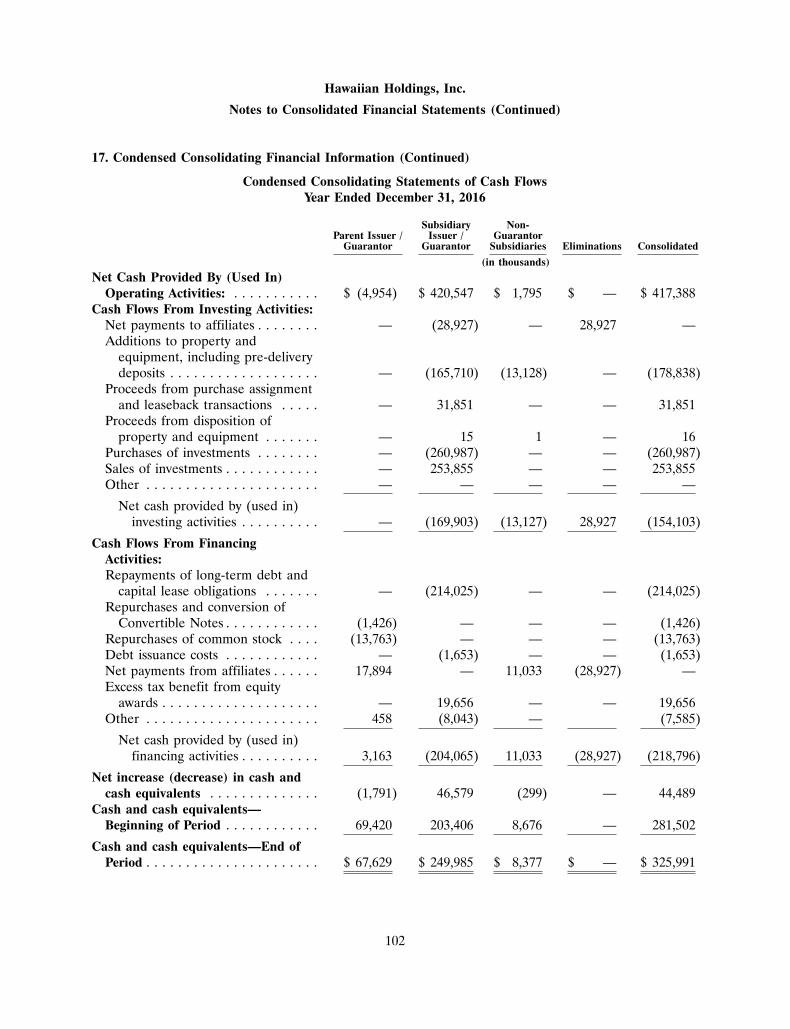
Hawaiian Holdings, Inc.
Notes to Consolidated Financial Statements (Continued)
17. Condensed Consolidating Financial Information (Continued)
Condensed Consolidating Statements of Cash FlowsYear Ended December 31, 2016
Subsidiary Non-Parent Issuer / Issuer / Guarantor
Guarantor Guarantor Subsidiaries Eliminations Consolidated
(in thousands)
Net Cash Provided By (Used In)Operating Activities: . . . . . . . . . . . $ (4,954) $ 420,547 $ 1,795 $ — $ 417,388
Cash Flows From Investing Activities:Net payments to affiliates . . . . . . . . — (28,927) — 28,927 —Additions to property and
equipment, including pre-deliverydeposits . . . . . . . . . . . . . . . . . . . — (165,710) (13,128) — (178,838)
Proceeds from purchase assignmentand leaseback transactions . . . . . — 31,851 — — 31,851
Proceeds from disposition ofproperty and equipment . . . . . . . — 15 1 — 16
Purchases of investments . . . . . . . . — (260,987) — — (260,987)Sales of investments . . . . . . . . . . . . — 253,855 — — 253,855Other . . . . . . . . . . . . . . . . . . . . . . — — — — —
Net cash provided by (used in)investing activities . . . . . . . . . . — (169,903) (13,127) 28,927 (154,103)
Cash Flows From FinancingActivities:Repayments of long-term debt and
capital lease obligations . . . . . . . — (214,025) — — (214,025)Repurchases and conversion of
Convertible Notes . . . . . . . . . . . . (1,426) — — — (1,426)Repurchases of common stock . . . . (13,763) — — — (13,763)Debt issuance costs . . . . . . . . . . . . — (1,653) — — (1,653)Net payments from affiliates . . . . . . 17,894 — 11,033 (28,927) —Excess tax benefit from equity
awards . . . . . . . . . . . . . . . . . . . . — 19,656 — — 19,656Other . . . . . . . . . . . . . . . . . . . . . . 458 (8,043) — (7,585)
Net cash provided by (used in)financing activities . . . . . . . . . . 3,163 (204,065) 11,033 (28,927) (218,796)
Net increase (decrease) in cash andcash equivalents . . . . . . . . . . . . . . (1,791) 46,579 (299) — 44,489
Cash and cash equivalents—Beginning of Period . . . . . . . . . . . . 69,420 203,406 8,676 — 281,502
Cash and cash equivalents—End ofPeriod . . . . . . . . . . . . . . . . . . . . . . $ 67,629 $ 249,985 $ 8,377 $ — $ 325,991
102
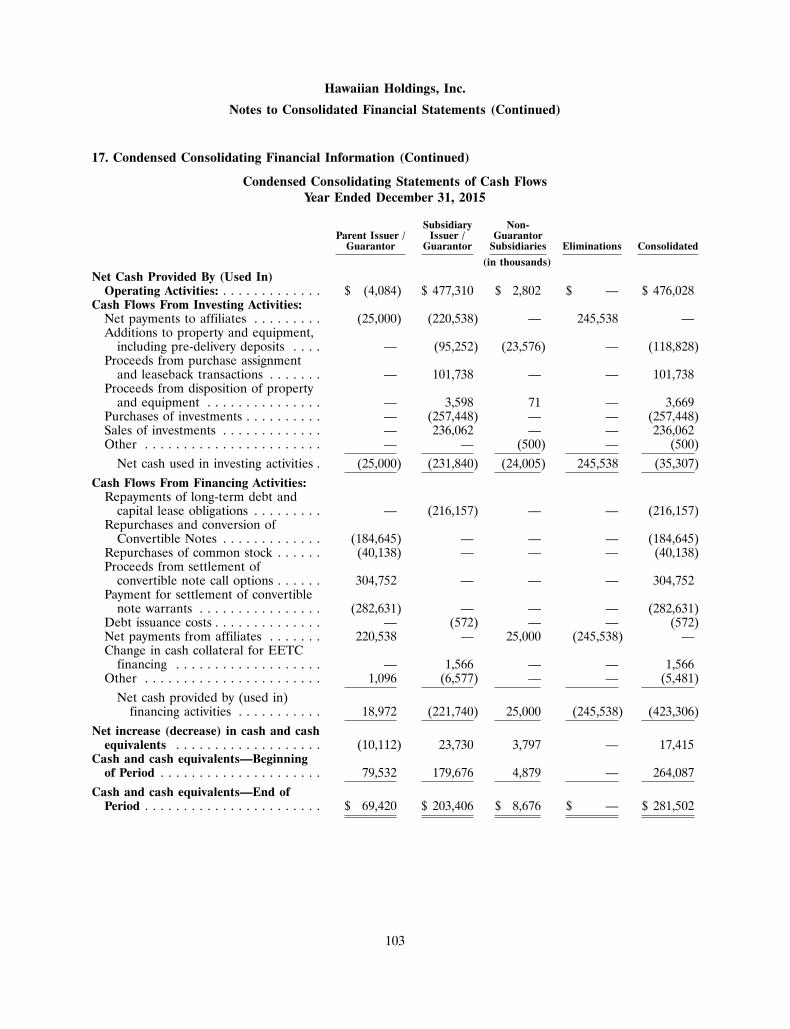
Hawaiian Holdings, Inc.
Notes to Consolidated Financial Statements (Continued)
17. Condensed Consolidating Financial Information (Continued)
Condensed Consolidating Statements of Cash FlowsYear Ended December 31, 2015
Subsidiary Non-Parent Issuer / Issuer / Guarantor
Guarantor Guarantor Subsidiaries Eliminations Consolidated
(in thousands)Net Cash Provided By (Used In)
Operating Activities: . . . . . . . . . . . . . $ (4,084) $ 477,310 $ 2,802 $ — $ 476,028Cash Flows From Investing Activities:
Net payments to affiliates . . . . . . . . . (25,000) (220,538) — 245,538 —Additions to property and equipment,
including pre-delivery deposits . . . . — (95,252) (23,576) — (118,828)Proceeds from purchase assignment
and leaseback transactions . . . . . . . — 101,738 — — 101,738Proceeds from disposition of property
and equipment . . . . . . . . . . . . . . . — 3,598 71 — 3,669Purchases of investments . . . . . . . . . . — (257,448) — — (257,448)Sales of investments . . . . . . . . . . . . . — 236,062 — — 236,062Other . . . . . . . . . . . . . . . . . . . . . . . — — (500) — (500)
Net cash used in investing activities . (25,000) (231,840) (24,005) 245,538 (35,307)
Cash Flows From Financing Activities:Repayments of long-term debt and
capital lease obligations . . . . . . . . . — (216,157) — — (216,157)Repurchases and conversion of
Convertible Notes . . . . . . . . . . . . . (184,645) — — — (184,645)Repurchases of common stock . . . . . . (40,138) — — — (40,138)Proceeds from settlement of
convertible note call options . . . . . . 304,752 — — — 304,752Payment for settlement of convertible
note warrants . . . . . . . . . . . . . . . . (282,631) — — — (282,631)Debt issuance costs . . . . . . . . . . . . . . — (572) — — (572)Net payments from affiliates . . . . . . . 220,538 — 25,000 (245,538) —Change in cash collateral for EETC
financing . . . . . . . . . . . . . . . . . . . — 1,566 — — 1,566Other . . . . . . . . . . . . . . . . . . . . . . . 1,096 (6,577) — — (5,481)
Net cash provided by (used in)financing activities . . . . . . . . . . . 18,972 (221,740) 25,000 (245,538) (423,306)
Net increase (decrease) in cash and cashequivalents . . . . . . . . . . . . . . . . . . . (10,112) 23,730 3,797 — 17,415
Cash and cash equivalents—Beginningof Period . . . . . . . . . . . . . . . . . . . . . 79,532 179,676 4,879 — 264,087
Cash and cash equivalents—End ofPeriod . . . . . . . . . . . . . . . . . . . . . . . $ 69,420 $ 203,406 $ 8,676 $ — $ 281,502
103
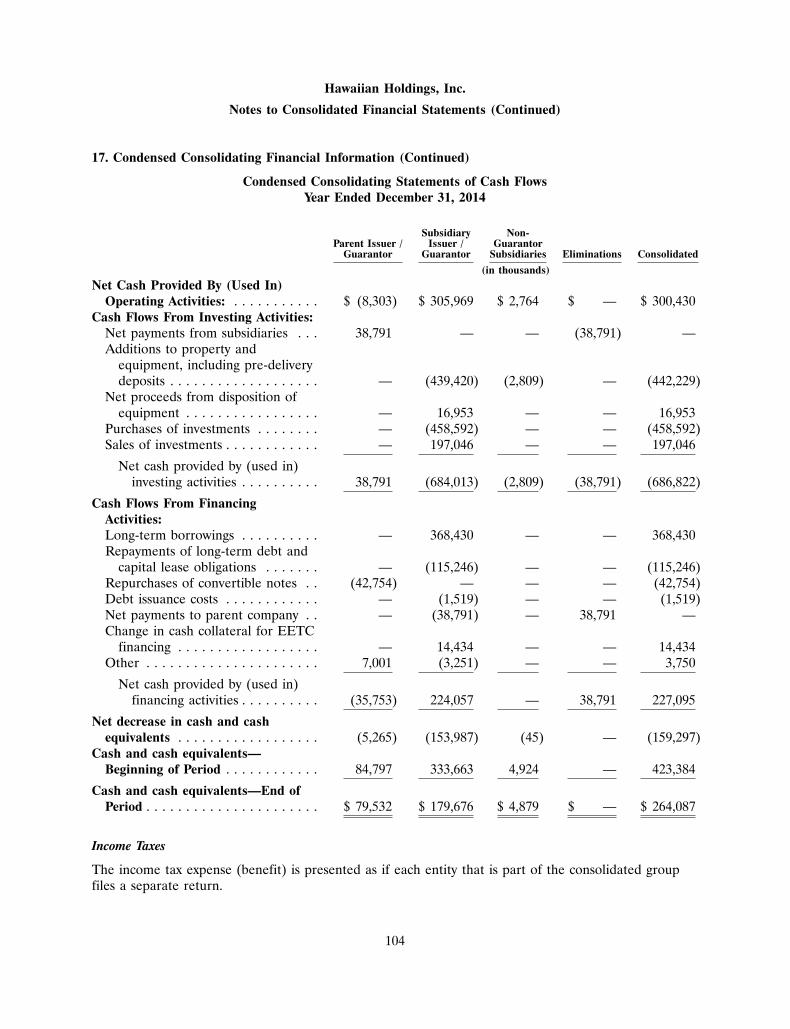
Hawaiian Holdings, Inc.
Notes to Consolidated Financial Statements (Continued)
17. Condensed Consolidating Financial Information (Continued)
Condensed Consolidating Statements of Cash FlowsYear Ended December 31, 2014
Subsidiary Non-Parent Issuer / Issuer / Guarantor
Guarantor Guarantor Subsidiaries Eliminations Consolidated
(in thousands)
Net Cash Provided By (Used In)Operating Activities: . . . . . . . . . . . $ (8,303) $ 305,969 $ 2,764 $ — $ 300,430
Cash Flows From Investing Activities:Net payments from subsidiaries . . . 38,791 — — (38,791) —Additions to property and
equipment, including pre-deliverydeposits . . . . . . . . . . . . . . . . . . . — (439,420) (2,809) — (442,229)
Net proceeds from disposition ofequipment . . . . . . . . . . . . . . . . . — 16,953 — — 16,953
Purchases of investments . . . . . . . . — (458,592) — — (458,592)Sales of investments . . . . . . . . . . . . — 197,046 — — 197,046
Net cash provided by (used in)investing activities . . . . . . . . . . 38,791 (684,013) (2,809) (38,791) (686,822)
Cash Flows From FinancingActivities:Long-term borrowings . . . . . . . . . . — 368,430 — — 368,430Repayments of long-term debt and
capital lease obligations . . . . . . . — (115,246) — — (115,246)Repurchases of convertible notes . . (42,754) — — — (42,754)Debt issuance costs . . . . . . . . . . . . — (1,519) — — (1,519)Net payments to parent company . . — (38,791) — 38,791 —Change in cash collateral for EETC
financing . . . . . . . . . . . . . . . . . . — 14,434 — — 14,434Other . . . . . . . . . . . . . . . . . . . . . . 7,001 (3,251) — — 3,750
Net cash provided by (used in)financing activities . . . . . . . . . . (35,753) 224,057 — 38,791 227,095
Net decrease in cash and cashequivalents . . . . . . . . . . . . . . . . . . (5,265) (153,987) (45) — (159,297)
Cash and cash equivalents—Beginning of Period . . . . . . . . . . . . 84,797 333,663 4,924 — 423,384
Cash and cash equivalents—End ofPeriod . . . . . . . . . . . . . . . . . . . . . . $ 79,532 $ 179,676 $ 4,879 $ — $ 264,087
Income Taxes
The income tax expense (benefit) is presented as if each entity that is part of the consolidated groupfiles a separate return.
104
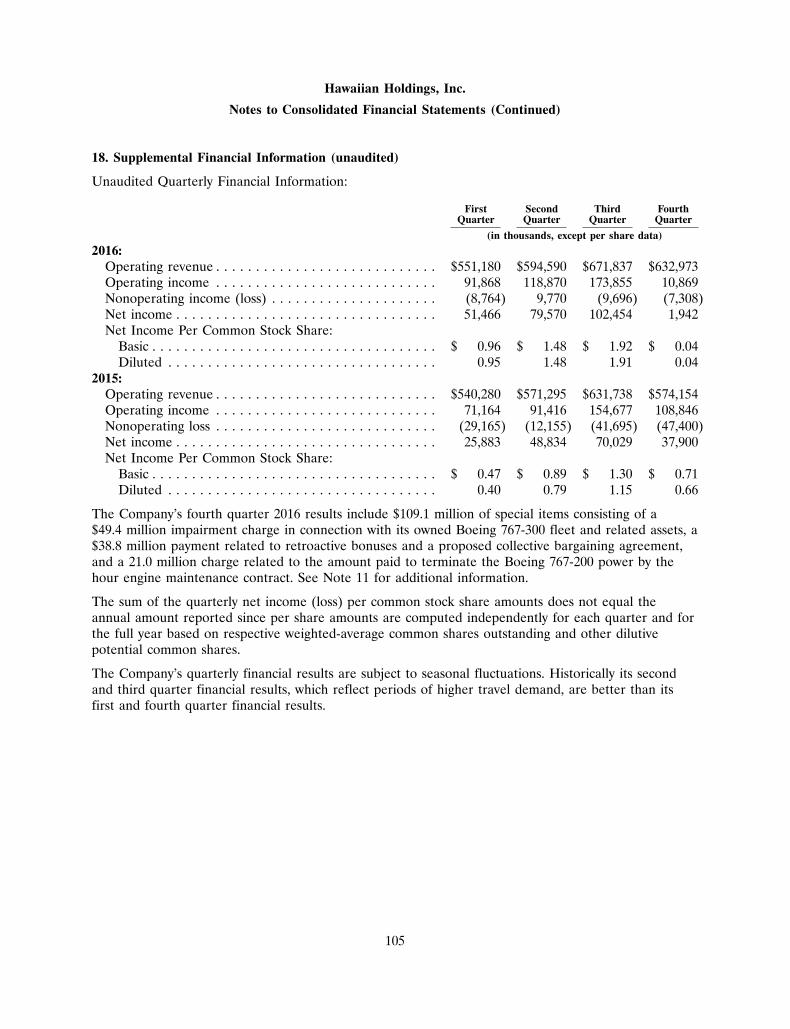
Hawaiian Holdings, Inc.
Notes to Consolidated Financial Statements (Continued)
18. Supplemental Financial Information (unaudited)
Unaudited Quarterly Financial Information:
First Second Third FourthQuarter Quarter Quarter Quarter
(in thousands, except per share data)
2016:Operating revenue . . . . . . . . . . . . . . . . . . . . . . . . . . . . $551,180 $594,590 $671,837 $632,973Operating income . . . . . . . . . . . . . . . . . . . . . . . . . . . . 91,868 118,870 173,855 10,869Nonoperating income (loss) . . . . . . . . . . . . . . . . . . . . . (8,764) 9,770 (9,696) (7,308)Net income . . . . . . . . . . . . . . . . . . . . . . . . . . . . . . . . . 51,466 79,570 102,454 1,942Net Income Per Common Stock Share:
Basic . . . . . . . . . . . . . . . . . . . . . . . . . . . . . . . . . . . . $ 0.96 $ 1.48 $ 1.92 $ 0.04Diluted . . . . . . . . . . . . . . . . . . . . . . . . . . . . . . . . . . 0.95 1.48 1.91 0.04
2015:Operating revenue . . . . . . . . . . . . . . . . . . . . . . . . . . . . $540,280 $571,295 $631,738 $574,154Operating income . . . . . . . . . . . . . . . . . . . . . . . . . . . . 71,164 91,416 154,677 108,846Nonoperating loss . . . . . . . . . . . . . . . . . . . . . . . . . . . . (29,165) (12,155) (41,695) (47,400)Net income . . . . . . . . . . . . . . . . . . . . . . . . . . . . . . . . . 25,883 48,834 70,029 37,900Net Income Per Common Stock Share:
Basic . . . . . . . . . . . . . . . . . . . . . . . . . . . . . . . . . . . . $ 0.47 $ 0.89 $ 1.30 $ 0.71Diluted . . . . . . . . . . . . . . . . . . . . . . . . . . . . . . . . . . 0.40 0.79 1.15 0.66
The Company’s fourth quarter 2016 results include $109.1 million of special items consisting of a$49.4 million impairment charge in connection with its owned Boeing 767-300 fleet and related assets, a$38.8 million payment related to retroactive bonuses and a proposed collective bargaining agreement,and a 21.0 million charge related to the amount paid to terminate the Boeing 767-200 power by thehour engine maintenance contract. See Note 11 for additional information.
The sum of the quarterly net income (loss) per common stock share amounts does not equal theannual amount reported since per share amounts are computed independently for each quarter and forthe full year based on respective weighted-average common shares outstanding and other dilutivepotential common shares.
The Company’s quarterly financial results are subject to seasonal fluctuations. Historically its secondand third quarter financial results, which reflect periods of higher travel demand, are better than itsfirst and fourth quarter financial results.
105
ITEM 9. CHANGES IN AND DISAGREEMENTS WITH ACCOUNTANTS ON ACCOUNTING ANDFINANCIAL DISCLOSURE.
None.
ITEM 9A. CONTROLS AND PROCEDURES.
Management’s Evaluation of Disclosure Controls and Procedures
Our management, including our Chief Executive Officer (CEO) and Chief Financial Officer (CFO),performed an evaluation of our disclosure controls and procedures (as defined in Rules 13a-15(e) and15d-15(e) under the Exchange Act). Based on that evaluation, our management, including our CEOand CFO, concluded that our disclosure controls and procedures were effective as of December 31,2016, and provide reasonable assurance that the information required to be disclosed by the Companyin reports it files under the Securities Exchange Act of 1934, as amended (the Exchange Act), isrecorded, processed, summarized and reported within the time periods specified in the rules and formsof the SEC, and is accumulated and communicated to our management, including our CEO and CFO,to allow timely decisions regarding required disclosure.
Management’s Report on Internal Control over Financial Reporting
Our management is responsible for establishing and maintaining effective internal control over financialreporting as defined in Rules 13a-15(f) and 15d-15(f) under the Exchange Act. Our internal controlover financial reporting is designed to provide reasonable assurance regarding the reliability of financialreporting and the preparation of financial statements for external purposes in accordance with U.S.generally accepted accounting principles.
Under the supervision and with the participation of our management, including our CEO and CFO, anassessment of the effectiveness of our internal control over financial reporting as of December 31, 2016was conducted. In making this assessment, management used the criteria set forth by the Committee ofSponsoring Organizations of the Treadway Commission (COSO) in Internal Control—IntegratedFramework (2013 framework). Based on their assessment, we concluded that, as of December 31, 2016,the Company’s internal control over financial reporting was effective to provide reasonable assuranceregarding the reliability of financial reporting and the preparation of financial statements for externalpurposes in accordance with U.S. generally accepted accounting principles. We reviewed the results ofmanagement’s assessment with the Audit Committee of our Board of Directors.
The effectiveness of our internal control over financial reporting as of December 31, 2016, has beenaudited by Ernst & Young LLP, the independent registered public accounting firm who also has auditedour consolidated financial statements included in this Annual Report on Form 10-K. Ernst & Young’sreport on our internal control over financial reporting appears below.
Changes in Internal Control over Financial Reporting
There were no changes in our internal control over financial reporting during the quarter endedDecember 31, 2016 that materially affected, or are reasonably likely to materially affect, our internalcontrol over financial reporting.
Inherent Limitations on Effectiveness of Controls
Our management, including our CEO and CFO, does not expect that our disclosure controls or ourinternal control over financial reporting will prevent or detect all error and all fraud. A control system,no matter how well designed and operated, can provide only reasonable, not absolute, assurance thatthe control system’s objectives will be met. The design of a control system must reflect the fact thatthere are resource constraints, and the benefits of controls must be considered relative to their costs.
106
Further, because of the inherent limitations in all control systems, no evaluation of controls can provideabsolute assurance that misstatements due to error or fraud will not occur or that all control issues andinstances of fraud, if any, have been detected. These inherent limitations include the realities thatjudgments in decision-making can be faulty and that breakdowns can occur because of simple error ormistake. Controls can also be circumvented by the individual acts of some persons, by collusion of twoor more people, or by management override of the controls. The design of any system of controls isbased in part on certain assumptions about the likelihood of future events, and there can be noassurance that any design will succeed in achieving its stated goals under all potential future conditions.Projections of any evaluation of controls effectiveness to future periods are subject to risks. Over time,controls may become inadequate because of changes in conditions or deterioration in the degree ofcompliance with policies or procedures.
107
Report of Independent Registered Public Accounting Firm
The Board of Directors and Stockholders of Hawaiian Holdings, Inc.
We have audited Hawaiian Holdings, Inc.’s internal control over financial reporting as of December 31,2016, based on criteria established in Internal Control—Integrated Framework issued by the Committeeof Sponsoring Organizations of the Treadway Commission (2013 framework) (the COSO criteria).Hawaiian Holdings, Inc.’s management is responsible for maintaining effective internal control overfinancial reporting, and for its assessment of the effectiveness of internal control over financialreporting included in the accompanying Management’s Report on Internal Control over FinancialReporting. Our responsibility is to express an opinion on the company’s internal control over financialreporting based on our audit.
We conducted our audit in accordance with the standards of the Public Company Accounting OversightBoard (United States). Those standards require that we plan and perform the audit to obtainreasonable assurance about whether effective internal control over financial reporting was maintainedin all material respects. Our audit included obtaining an understanding of internal control overfinancial reporting, assessing the risk that a material weakness exists, testing and evaluating the designand operating effectiveness of internal control based on the assessed risk, and performing such otherprocedures as we considered necessary in the circumstances. We believe that our audit provides areasonable basis for our opinion.
A company’s internal control over financial reporting is a process designed to provide reasonableassurance regarding the reliability of financial reporting and the preparation of financial statements forexternal purposes in accordance with generally accepted accounting principles. A company’s internalcontrol over financial reporting includes those policies and procedures that (1) pertain to themaintenance of records that, in reasonable detail, accurately and fairly reflect the transactions anddispositions of the assets of the company; (2) provide reasonable assurance that transactions arerecorded as necessary to permit preparation of financial statements in accordance with generallyaccepted accounting principles, and that receipts and expenditures of the company are being made onlyin accordance with authorizations of management and directors of the company; and (3) providereasonable assurance regarding prevention or timely detection of unauthorized acquisition, use ordisposition of the company’s assets that could have a material effect on the financial statements.
Because of its inherent limitations, internal control over financial reporting may not prevent or detectmisstatements. Also, projections of any evaluation of effectiveness to future periods are subject to therisk that controls may become inadequate because of changes in conditions, or that the degree ofcompliance with the policies or procedures may deteriorate.
In our opinion, Hawaiian Holdings, Inc. maintained, in all material respects, effective internal controlover financial reporting as of December 31, 2016, based on the COSO criteria.
We also have audited, in accordance with the standards of the Public Company Accounting OversightBoard (United States), the consolidated balance sheets of Hawaiian Holdings, Inc. as of December 31,2016 and 2015 and the related consolidated statements of operations, comprehensive income,shareholders’ equity, and cash flows for each of the three years in the period ended December 31, 2016of Hawaiian Holdings, Inc. and our report dated February 16, 2017 expressed an unqualified opinionthereon.
/s/ ERNST & YOUNG LLP
Honolulu, Hawai’iFebruary 16, 2017
108
ITEM 9B. OTHER INFORMATION.
None.
PART III
ITEM 10. DIRECTORS, EXECUTIVE OFFICERS AND CORPORATE GOVERNANCE.
The information required by this item is incorporated herein by reference from our definitive proxystatement relating to our 2017 Annual Meeting of Stockholders.
ITEM 11. EXECUTIVE COMPENSATION.
The information required by this item is incorporated herein by reference from our definitive proxystatement relating to our 2017 Annual Meeting of Stockholders.
ITEM 12. SECURITY OWNERSHIP OF CERTAIN BENEFICIAL OWNERS AND MANAGEMENTAND RELATED STOCKHOLDER MATTERS.
The information required by this item is incorporated herein by reference from our definitive proxystatement relating to our 2017 Annual Meeting of Stockholders.
ITEM 13. CERTAIN RELATIONSHIPS AND RELATED TRANSACTIONS, AND DIRECTORINDEPENDENCE.
The information required by this item is incorporated herein by reference from our definitive proxystatement relating to our 2017 Annual Meeting of Stockholders.
ITEM 14. PRINCIPAL ACCOUNTANT FEES AND SERVICES.
The information required by this item is incorporated herein by reference from our definitive proxystatement relating to our 2017 Annual Meeting of Stockholders.
PART IV
ITEM 15. EXHIBITS, FINANCIAL STATEMENT SCHEDULES.
(a) Financial Statements and Financial Statement Schedules:
(1) Financial Statements of Hawaiian Holdings, Inc.
i. Report of Ernst & Young LLP, Independent Registered Public Accounting Firm.
ii. Consolidated Statements of Operations for the Years ended December 31, 2016, 2015 and2014.
iii. Consolidated Statements of Comprehensive Income, December 31, 2016, 2015 and 2014.
iv. Consolidated Balance Sheets, December 31, 2016 and 2015.
v. Consolidated Statements of Shareholders’ Equity Years ended December 31, 2016, 2015and 2014.
vi. Consolidated Statements of Cash Flows for the Years ended December 31, 2016, 2015and 2014.
vii. Notes to Consolidated Financial Statements.
109
(2) Schedule of Valuation and Qualifying Accounts of Hawaiian Holdings, Inc.
The information required by Schedule I, ‘‘Condensed Financial Information of Registrant’’ has beenprovided in Note 16 to the consolidated financial statements. All other schedules have been omittedbecause they are not required.
(b) Exhibits:
3.1 Amended and Restated Certificate of Incorporation of Hawaiian Holdings, Inc. (filed asExhibit 3.1 to the Form S-1, File No. 333-129503, filed by Hawaiian Holdings, Inc. onNovember 7, 2005).*
3.2 Amended and Restated By-Laws of Hawaiian Holdings, Inc. (filed as Exhibit 3.2 to theForm 8-K filed by Hawaiian Holdings, Inc. on May 24, 2016).*
10.1 Form of Hawaiian Holdings, Inc. Stock Option Agreement for certain employees andexecutive officers (filed as Exhibit 10.14 to the Form 10-K filed by Hawaiian Holdings, Inc.on February 25, 2009).*+
10.2 Form of Hawaiian Holdings, Inc. Restricted Stock Agreement for certain employees andexecutive officers (filed as Exhibit 10.15 to the Form 10-K filed by Hawaiian Holdings, Inc.on February 25, 2009).*+
10.3 Form of Hawaiian Holdings, Inc. Restricted Stock Unit Award Agreement for certainemployees and executive officers (filed as Exhibit 10.15.2 to the Form 10-K filed byHawaiian Holdings, Inc. on February 11, 2011).*+
10.4 Form of Hawaiian Holdings, Inc. Performance-Based Restricted Stock Unit AwardAgreement for certain employees and executive officers (filed as Exhibit 10.15.3 to theForm 10-K filed by Hawaiian Holdings, Inc. on February 11, 2011).*+
10.5 Form of Hawaiian Holdings, Inc. Deferred Stock Unit Agreement for certain employeesand executive officers (filed as Exhibit 10.16 to the Form 10-K filed by HawaiianHoldings, Inc. on February 25, 2009).*+
10.6 Form of Hawaiian Holdings, Inc. Award Agreement for directors (filed as Exhibit 10.17 tothe Form 10-K filed by Hawaiian Holdings, Inc. on February 25, 2009).*+
10.7 Hawaiian Holdings, Inc. 2005 Stock Incentive Plan (incorporated by reference to theRegistrant’s Definitive Proxy Statement on Schedule 14A as filed with the Commission onMarch 26, 2010, File No. 001-31443).*+
10.8 Hawaiian Holdings, Inc. 2006 Management Incentive Plan (filed as Exhibit 10.1 to theForm 8-K filed by Hawaiian Holdings, Inc. on June 6, 2006).*+
10.9 Hawaiian Holdings, Inc. 2016 Management Incentive Plan.+
10.10 Hawaiian Holdings, Inc. Outside Director Compensation Policy.+
10.11 Type A Restricted Stock Unit Award Agreement, dated as of February 7, 2013, by andbetween Mark B. Dunkerley and Hawaiian Holdings, Inc. (filed as Exhibit 10.2 toform 10-Q filed by Hawaiian Holdings, Inc. on April 25, 2013).*+
10.12 Type B Restricted Stock Unit Award Agreement, dated as of February 7, 2013, by andbetween Mark B. Dunkerley and Hawaiian Holdings, Inc. (filed as Exhibit 10.3 toform 10-Q filed by Hawaiian Holdings, Inc. on April 25, 2013).*+
110
10.13 Hawaiian Holdings, Inc. 2015 Stock Incentive Plan (filed as Exhibit 10.1 to the Form 8-Kfiled by Hawaiian Holdings, Inc. on May 12, 2015).*+
10.14 Form of Hawaiian Holdings, Inc. Restricted Stock Unit Agreement (filed as Exhibit 10.2 tothe Form 8-K filed by Hawaiian Holdings, Inc. on May 28, 2015).*+
10.15 Form of Hawaiian Holdings, Inc. Performance Restricted Stock Unit Agreement (filed asExhibit 10.3 to the Form 8-K filed by Hawaiian Holdings, Inc. on May 28, 2015).*+
10.16 Form of Hawaiian Holdings, Inc. Stock Option Agreement (filed as Exhibit 10.4 to theForm 8-K filed by Hawaiian Holdings, Inc. on May 28, 2015).*+
10.17 Amended and Restated Mark B. Dunkerley Employment Agreement, dated as ofDecember 24, 2016, by and between Mark B. Dunkerley and each of HawaiianHoldings, Inc. and its wholly-owned subsidiary Hawaiian Airlines, Inc.+
10.18 Employment Agreement, dated as of November 18, 2005, between Hawaiian Airlines, Inc.and Peter R. Ingram (filed as Exhibit 10.24 to the Form 10-K filed by HawaiianHoldings, Inc. on March 23, 2006).*+
10.18.1 First Amendment to Employment Agreement, dated as of November 2008, by and betweenPeter R. Ingram and Hawaiian Airlines, Inc. (filed as Exhibit 10.23 to the Form 10-K filedby Hawaiian Holdings, Inc. on February 26, 2009).*+
10.18.2 Second Amendment to Employment Agreement, dated as of April 6, 2009, by and betweenPeter R. Ingram and Hawaiian Airlines, Inc. (filed as Exhibit 10.1 to the Form 10-Q filedby Hawaiian Holdings, Inc. on April 30, 2009).*+
10.19 Employment Agreement, dated as of July 11, 2005, between Hawaiian Airlines, Inc. andBarbara Falvey (filed as Exhibit 10.1 to the Form 10-Q filed by Hawaiian Holdings, Inc. onMay 9, 2007).*+
10.19.1 First Amendment to Employment Agreement, dated as of April 6, 2009, between HawaiianAirlines, Inc. and Barbara Falvey (filed as Exhibit 10.2 to the Form 10-Q filed by HawaiianHoldings, Inc. on April 30, 2009).*+
10.20 Form of Hawaiian Holdings, Inc. Indemnification Agreement for directors and executiveofficers.+
10.21 Form of Change in Control and Severance Agreement for executive officers.+
10.22 Airbus A330/A350XWB Purchase Agreement, dated as of January 31, 2008, betweenAirbus S.A.S. and Hawaiian Airlines, Inc. (filed as Exhibit 10.52 to the Form 10-K filed byHawaiian Holdings, Inc. on March 3, 2008 in redacted form since confidential treatment hasbeen granted for certain provisions thereof pursuant to Rule 24b-2 of the SecuritiesExchange Act of 1934, as amended).*‡
10.22.1 Amendment No. 1 to the Airbus A330/A350XWB Purchase Agreement dated as ofJanuary 31, 2008 between Airbus S.A.S. and Hawaiian Airlines, Inc. (filed as Exhibit 10.1 tothe Form 10-Q filed by Hawaiian Holdings, Inc. on August 6, 2008 in redacted form sinceconfidential treatment has been granted for certain provisions thereof pursuant toRule 24b-2 of the Securities Exchange Act of 1934, as amended).*‡
10.22.2 Amendment No. 2 to the Airbus A330/A350XWB Purchase Agreement dated as ofJanuary 31, 2008 between Airbus S.A.S. and Hawaiian Airlines, Inc. (filed as Exhibit 10.2 tothe Form 10-Q filed by Hawaiian Holdings, Inc. on April 27, 2010).*
111
10.22.3 Amendment No. 3 to the Airbus A330/A350XWB Purchase Agreement dated as ofJanuary 31, 2008 between Airbus S.A.S. and Hawaiian Airlines, Inc. (filed as Exhibit 10.3 tothe Form 10-Q filed by Hawaiian Holdings, Inc. on April 27, 2010 in redacted form sinceconfidential treatment has been granted for certain provisions thereof pursuant toRule 24b-2 of the Securities Exchange Act of 1934, as amended).*‡
10.22.4 Amendment No. 4 to the Airbus A330/A350XWB Purchase Agreement dated as ofJanuary 31, 2008 between Airbus S.A.S. and Hawaiian Airlines, Inc. (filed as Exhibit 10.44.3to the Form 10-K filed by Hawaiian Holdings, Inc. on February 11, 2011 in redacted formsince confidential treatment has been granted for certain provisions thereof pursuant toRule 24b-2 of the Securities Exchange Act of 1934, as amended).*‡
10.22.5 Amendment No. 5 to the Airbus A330/A350XWB Purchase Agreement dated as ofJanuary 31, 2008 between Airbus S.A.S. and Hawaiian Airlines, Inc. (filed as Exhibit 10.44.4to the Form 10-K filed by Hawaiian Holdings, Inc. on February 11, 2011 in redacted formsince confidential treatment has been granted for certain provisions thereof pursuant toRule 24b-2 of the Securities Exchange Act of 1934, as amended).*‡
10.22.6 Amendment No. 6 to the Airbus A330/A350XWB Purchase Agreement dated as ofJanuary 31, 2008 between Airbus S.A.S. and Hawaiian Airlines, Inc. (filed as Exhibit 10.44.5to the Form 10-K filed by Hawaiian Holdings, Inc. on February 9, 2012 in redacted formsince confidential treatment has been granted for certain provisions thereof pursuant toRule 24b-2 of the Securities Exchange Act of 1934, as amended).*‡
10.22.7 Amendment No. 7 to the Airbus A330/A350XWB Purchase Agreement dated as ofJanuary 31, 2008 between Airbus S.A.S. and Hawaiian Airlines, Inc. (filed as Exhibit 10.2 tothe Form 10-Q filed by Hawaiian Holdings, Inc. on July 26, 2012 in redacted form sinceconfidential treatment has been granted for certain provisions thereof pursuant toRule 24b-2 of the Securities Exchange Act of 1934, as amended).*‡
10.22.8 Amendment No. 8 to the Airbus A330/A350XWB Purchase Agreement dated as ofJanuary 31, 2008 between Airbus S.A.S. and Hawaiian Airlines, Inc. (filed as Exhibit 10.36.8to the Form 10-K filed by Hawaiian Holdings, Inc. on February 9, 2015 in redacted formsince confidential treatment has been granted for certain provisions thereof pursuant toRule 24b-2 of the Securities Exchange Act of 1934, as amended).*‡
10.22.9 Amendment No. 9 to the Airbus A330/A350XWB Purchase Agreement dated as ofJanuary 31, 2008 between Airbus S.A.S. and Hawaiian Airlines, Inc. (filed as Exhibit 10.36.9to the Form 10-K filed by Hawaiian Holdings, Inc. on February 9, 2015 in redacted formsince confidential treatment has been granted for certain provisions thereof pursuant toRule 24b-2 of the Securities Exchange Act of 1934, as amended).*‡
10.22.10 Amended and Restated Letter Agreement No. 3 to the Airbus A330/A350XWB PurchaseAgreement dated as of January 31, 2008 between Airbus S.A.S. and Hawaiian Airlines, Inc.(filed as Exhibit 10.44.5 to the Form 10-K filed by Hawaiian Holdings, Inc. on February 11,2011 in redacted form since confidential treatment has been granted for certain provisionsthereof pursuant to Rule 24b-2 of the Securities Exchange Act of 1934, as amended).*‡
10.23 Purchase Agreement, dated as of June 27, 2011, by and among Wells Fargo BankNorthwest, National Association, solely as owner trustee of trusts beneficially owned byBCC Equipment Leasing Corporation and MDFC Spring Company, and HawaiianAirlines, Inc. (filed as Exhibit 10.2 to the Form 10-Q filed by Hawaiian Holdings, Inc. onJuly 27, 2011 in redacted form since confidential treatment has been granted for certainprovisions thereof pursuant to Rule 24b-2 of the Securities Exchange Act of 1934, asamended).*‡
112
10.24 Facility Agreement [Hawaiian 717-200 [55001]], dated as of June 27, 2011 by and betweenHawaiian Airlines, Inc. and Boeing Capital Loan Corporation (filed as Exhibit 10.3 to theForm 10-Q/A filed by Hawaiian Holdings, Inc. on December 14, 2011 in redacted formsince confidential treatment has been granted for certain provisions thereof pursuant toRule 24b-2 of the Securities Exchange Act of 1934, as amended). Hawaiian Airlines, Inc.also entered into Facility Agreement [Hawaiian 717-200 [55002]], dated as of June 27, 2011;Facility Agreement [Hawaiian 717-200 [55118]], dated as of June 27, 2011; FacilityAgreement [Hawaiian 717-200 [55121]], dated as of June 27, 2011; Facility Agreement[Hawaiian 717-200 [55122]], dated as of June 27, 2011; Facility Agreement[Hawaiian 717-200 [55123]], dated as of June 27, 2011; Facility Agreement[Hawaiian 717-200 [55124]], dated as of June 27, 2011; Facility Agreement[Hawaiian 717-200 [55125]], dated as of June 27, 2011; Facility Agreement[Hawaiian 717-200 [55126]], dated as of June 27, 2011; Facility Agreement[Hawaiian 717-200 [55128]], dated as of June 27, 2011; Facility Agreement[Hawaiian 717-200 [55129]], dated as of June 27, 2011; Facility Agreement[Hawaiian 717-200 [55130]], dated as of June 27, 2011; Facility Agreement[Hawaiian 717-200 [55131]], dated as of June 27, 2011; Facility Agreement[Hawaiian 717-200 [55132]], dated as of June 27, 2011; and Facility Agreement[Hawaiian 717-200 [55151]], dated as of June 27, 2011, which facility agreements aresubstantially identical to Facility Agreement 55001, and pursuant to Regulation S-KItem 601, Instruction 2, these facility agreements were not filed.*‡
10.25 Lease Agreement 491HA, dated as of June 28, 2011, by and between Wells Fargo BankNorthwest, National Association, a national banking association organized under the laws ofthe United States of America, not in its individual capacity, but solely as owner trustee of atrust beneficially owned by BCC Equipment Leasing Corporation, and HawaiianAirlines, Inc. (filed as Exhibit 10.5 to Form 10-Q/A filed by Hawaiian Holdings, Inc. onDecember 14, 2011 in redacted form since confidential treatment has been granted forcertain provisions thereof pursuant to Rule 24b-2 of the Securities Exchange Act of 1934, asamended). Hawaiian Airlines, Inc. also entered into Lease Agreement 492HA, dated as ofJune 28, 2011; and Lease Agreement 493HA, dated as of June 28, 2011, which leaseagreements are substantially identical to Lease Agreement 491HA, and pursuant toRegulation S-K Item 601, Instruction 2, these lease agreements were not filed.*‡
10.26 Contract Services Agreement, dated as of June 29, 2011, by and between HawaiianAirlines, Inc. and Airline Contract Maintenance and Equipment, Inc. (filed as Exhibit 10.7to the Form 10-Q filed by Hawaiian Holdings, Inc. on July 27, 2011 in redacted form sinceconfidential treatment has been granted for certain provisions thereof pursuant toRule 24b-2 of the Securities Exchange Act of 1934, as amended).*‡
10.27 Airbus A320 Family Purchase Agreement, dated as of March 18, 2013, betweenAirbus S.A.S. and Hawaiian Airlines, Inc. (filed as Exhibit 10.1 to Form 10-Q/A filed byHawaiian Holdings, Inc. on October 17, 2013 in redacted form since confidential treatmenthas been granted for certain provisions thereof pursuant to Rule 24b-2 of the SecuritiesExchange Act of 1934, as amended).*‡
10.27.1 Amendment #1 to Airbus A320 Family Purchase Agreement, dated as of March 18, 2013,between Airbus S.A.S. and Hawaiian Airlines, Inc. (filed as Exhibit 10.62.1 to theForm 10-K filed by Hawaiian Holdings, Inc. on February 9, 2015).*
113
10.27.2 Amendment #2 to Airbus A320 Family Purchase Agreement, dated as of March 18, 2013,between Airbus S.A.S. and Hawaiian Airlines, Inc. (filed as Exhibit 10.62.2 to theForm 10-K filed by Hawaiian Holdings, Inc. on February 9, 2015 in redacted form sinceconfidential treatment has been granted for certain provisions thereof pursuant toRule 24b-2 of the Securities Exchange Act of 1934, as amended).*‡
10.28 Pass Through Trust Agreement, dated May 29, 2013, between Hawaiian Airlines, Inc. andWilmington Trust, National Association, as trustee (filed as Exhibit 4.1to the Form 8-K filedby Hawaiian Holdings, Inc. on May 31, 2013).*
10.29 Trust Supplement No. 2013-1A-O, dated as of May 29, 2013, between Wilmington Trust,National Association, as Trustee, and Hawaiian Airlines, Inc. to Pass Through TrustAgreement, dated as of May 29, 2013 (filed as Exhibit 4.2 to the Form 8-K filed byHawaiian Holdings, Inc. on May 31, 2013).*
10.30 Trust Supplement No. 2013-1A-S, dated as of May 29, 2013, between Wilmington Trust,National Association, as Trustee, and Hawaiian Airlines, Inc. to Pass Through TrustAgreement, dated as of May 29, 2013 (filed as Exhibit 4.3 to the Form 8-K filed byHawaiian Holdings, Inc. on May 31, 2013).*
10.31 Trust Supplement No. 2013-1B-O, dated as of May 29, 2013, between Wilmington Trust,National Association, as Trustee, and Hawaiian Airlines, Inc. to Pass Through TrustAgreement, dated as of May 29, 2013 (filed as Exhibit 4.4 to the Form 8-K filed byHawaiian Holdings, Inc. on May 31, 2013).*
10.32 Trust Supplement No. 2013-1B-S, dated as of May 29, 2013, between Wilmington Trust,National Association, as Trustee, and Hawaiian Airlines, Inc. to Pass Through TrustAgreement, dated as of May 29, 2013 (filed as Exhibit 4.5 to the Form 8-K filed byHawaiian Holdings, Inc. on May 31, 2013).*
10.33 Revolving Credit Agreement (2013-1A), dated as of May 29, 2013, between WilmingtonTrust, National Association, as subordination agent, as agent and trustee, and as borrower,and Natixis S.A., acting via its New York Branch, as liquidity provider (filed as Exhibit 4.6to the Form 8-K filed by Hawaiian Holdings, Inc. on May 31, 2013).*
10.34 Revolving Credit Agreement (2013-1B), dated as of May 29, 2013, between WilmingtonTrust, National Association, as subordination agent, as agent and trustee, and as borrower,and Natixis S.A., acting via its New York Branch, as liquidity provider (filed as Exhibit 4.7to the Form 8-K filed by Hawaiian Holdings, Inc. on May 31, 2013).*
10.35 Intercreditor Agreement, dated as of May 29, 2013, among Wilmington Trust, NationalAssociation, as trustee, Natixis S.A., acting via its New York Branch, as liquidity provider,and Wilmington Trust, National Association, as subordination agent and trustee (filed asExhibit 4.8 to the Form 8-K filed by Hawaiian Holdings, Inc. on May 31, 2013).*
10.36 Deposit Agreement (Class A), dated as of May 29, 2013, between Wells Fargo BankNorthwest, National Association, as escrow agent, and Natixis S.A., acting via its New YorkBranch, as depositary (filed as Exhibit 4.9 to the Form 8-K filed by Hawaiian Holdings, Inc.on May 31, 2013).*
10.37 Deposit Agreement (Class B), dated as of May 29, 2013, between Wells Fargo BankNorthwest, National Association, as escrow agent, and Natixis S.A., acting via its New YorkBranch, as depositary (filed as Exhibit 4.10 to the Form 8-K filed by HawaiianHoldings, Inc. on May 31, 2013).*
114
10.38 Escrow and Paying Agent Agreement (Class A), dated as of May 29, 2013, among WellsFargo Bank Northwest, National Association, as escrow agent, Citigroup GlobalMarkets Inc., Goldman, Sachs & Co. and Morgan Stanley & Co. LLC, for themselves andon behalf of the several Underwriters of the Certificates, Wilmington Trust, NationalAssociation, as trustee, and Wilmington Trust, National Association, as paying agent (filedas Exhibit 4.11 to the Form 8-K filed by Hawaiian Holdings, Inc. on May 31, 2013).*
10.39 Escrow and Paying Agent Agreement (Class B), dated as of May 29, 2013, among WellsFargo Bank Northwest, National Association, as escrow agent, Citigroup GlobalMarkets Inc., Goldman, Sachs & Co. and Morgan Stanley & Co. LLC, for themselves andon behalf of the several Underwriters of the Certificates, Wilmington Trust, NationalAssociation, as trustee, and Wilmington Trust, National Association, as paying agent (filedas Exhibit 4.12 to the Form 8-K filed by Hawaiian Holdings, Inc. on May 31, 2013).*
10.40 Note Purchase Agreement, dated as of May 29, 2013, among Hawaiian Airlines, Inc.,Wilmington Trust, National Association, as trustee, Wilmington Trust, National Association,as subordination agent, Wells Fargo Bank Northwest, National Association, as escrow agent,and Wilmington Trust, National Association, as paying agent (filed as the Exhibit 4.13 tothe Form 8-K filed by Hawaiian Holdings, Inc. on May 31, 2013).*
10.41 Form of Participation Agreement (Participation Agreement between Hawaiian Airlines, Inc.and Wilmington Trust, National Association, as mortgagee, subordination agent and trustee)(Exhibit B to Note Purchase Agreement) (filed as Exhibit 4.14 to the Form 8-K filed byHawaiian Holdings, Inc. on May 31, 2013).*
10.42 Form of Indenture (Trust Indenture and Mortgage between Hawaiian Airlines, Inc. andWilmington Trust, National Association, as mortgagee and securities intermediary)(Exhibit C to Note Purchase Agreement) (filed Exhibit 4.15 to the Form 8-K filed byHawaiian Holdings, Inc. on May 31, 2013).*
10.43 Form of Hawaiian Airlines Pass Through Certificate, Series 2013-1A-O (filed as Exhibit 4.16to the Form 8-K filed by Hawaiian Holdings, Inc. on May 31, 2013).*
10.44 Form of Hawaiian Airlines Pass Through Certificate, Series 2013-1B-O (filed as Exhibit 4.17to the Form 8-K filed by Hawaiian Holdings, Inc. on May 31, 2013).*
10.45 Lease Agreement, dated as of November 15, 2016 between Hawaiian Airlines, Inc. and theDepartment of Transportation of the State of Hawai’i.
12 Computation of ratio of earnings to fixed charges for the years ended December 31, 2016,2015, 2014, 2013, and 2012.
21.1 List of Subsidiaries of Hawaiian Holdings, Inc.
23.1 Consent of Ernst & Young LLP.
31.1 Rule 13a-14(a) Certification of Chief Executive Officer.
31.2 Rule 13a-14(a) Certification of Chief Financial Officer.
32.1 Certification of Chief Executive Officer pursuant to 18 U.S.C. Section 1350, as adoptedpursuant to Section 906 of the Sarbanes-Oxley Act of 2002.
32.2 Certification of Chief Financial Officer pursuant to 18 U.S.C. Section 1350, as adoptedpursuant to Section 906 of the Sarbanes-Oxley Act of 2002.
101.INS XBRL Instance Document.
101.SCH XBRL Taxonomy Extension Schema Document
115
101.CAL XBRL Taxonomy Extension Valuation Linkbase Document.
101.DEF XBRL Taxonomy Extension Definition Linkbase Document.
101.LAB XBRL Taxonomy Extension Label Linkbase Document.
101.PRE XBRL Taxonomy Extension Presentation Linkbase Document.
+ These exhibits relate to management contracts or compensatory plans or arrangements.
* Previously filed; incorporated herein by reference.
‡ Confidential treatment has been requested for a portion of this exhibit.
116
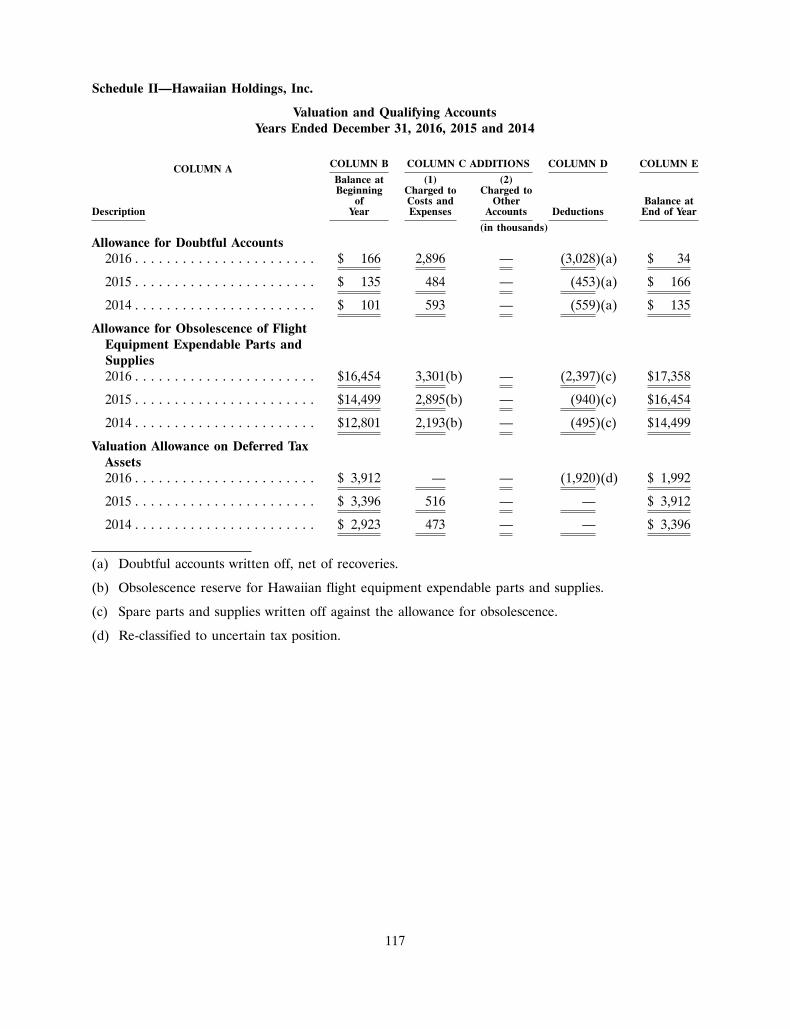
Schedule II—Hawaiian Holdings, Inc.
Valuation and Qualifying AccountsYears Ended December 31, 2016, 2015 and 2014
COLUMN B COLUMN C ADDITIONS COLUMN D COLUMN ECOLUMN ABalance at (1) (2)Beginning Charged to Charged to
of Costs and Other Balance atDescription Year Expenses Accounts Deductions End of Year
(in thousands)
Allowance for Doubtful Accounts2016 . . . . . . . . . . . . . . . . . . . . . . . $ 166 2,896 — (3,028)(a) $ 34
2015 . . . . . . . . . . . . . . . . . . . . . . . $ 135 484 — (453)(a) $ 166
2014 . . . . . . . . . . . . . . . . . . . . . . . $ 101 593 — (559)(a) $ 135
Allowance for Obsolescence of FlightEquipment Expendable Parts andSupplies2016 . . . . . . . . . . . . . . . . . . . . . . . $16,454 3,301(b) — (2,397)(c) $17,358
2015 . . . . . . . . . . . . . . . . . . . . . . . $14,499 2,895(b) — (940)(c) $16,454
2014 . . . . . . . . . . . . . . . . . . . . . . . $12,801 2,193(b) — (495)(c) $14,499
Valuation Allowance on Deferred TaxAssets2016 . . . . . . . . . . . . . . . . . . . . . . . $ 3,912 — — (1,920)(d) $ 1,992
2015 . . . . . . . . . . . . . . . . . . . . . . . $ 3,396 516 — — $ 3,912
2014 . . . . . . . . . . . . . . . . . . . . . . . $ 2,923 473 — — $ 3,396
(a) Doubtful accounts written off, net of recoveries.
(b) Obsolescence reserve for Hawaiian flight equipment expendable parts and supplies.
(c) Spare parts and supplies written off against the allowance for obsolescence.
(d) Re-classified to uncertain tax position.
117
SIGNATURES
Pursuant to the requirements of Section 13 or 15(d) of the Securities Exchange Act of 1934, asamended, the Registrant has duly caused this report to be signed on its behalf by the undersigned,thereunto duly authorized.
HAWAIIAN HOLDINGS, INC.
February 16, 2017 By /s/ SHANNON L. OKINAKA
Shannon L. OkinakaExecutive Vice President, Chief Financial Officer
and Treasurer (Principal Financial andAccounting Officer)
Pursuant to the requirements of the Securities Exchange Act of 1934, as amended, this report has beensigned below by the following persons on behalf of the Registrant and in the capacities indicated onFebruary 16, 2017.
Signature Title
/s/ MARK B. DUNKERLEY President and Chief Executive Officer, andDirector (Principal Executive Officer)Mark B. Dunkerley
Executive Vice President, Chief Financial Officer/s/ SHANNON L. OKINAKAand Treasurer (Principal Financial and Accounting
Shannon L. Okinaka Officer)
/s/ LAWRENCE S. HERSHFIELDChair of the Board of Directors
Lawrence S. Hershfield
/s/ DONALD J. CARTYDirector
Donald J. Carty
/s/ EARL E. FRYDirector
Earl E. Fry
/s/ JOSEPH GUERRIERI, JR.Director
Joseph Guerrieri, Jr.
/s/ RANDALL L. JENSONDirector
Randall L. Jenson
118
Signature Title
/s/ CRYSTAL K. ROSEDirector
Crystal K. Rose
/s/ WILLIAM S. SWELBARDirector
William S. Swelbar
/s/ DUANE E. WOERTHDirector
Duane E. Woerth
/s/ RICHARD N. ZWERNDirector
Richard N. Zwern
119

[This Page Intentionally Left Blank]

[This Page Intentionally Left Blank]

[This Page Intentionally Left Blank]
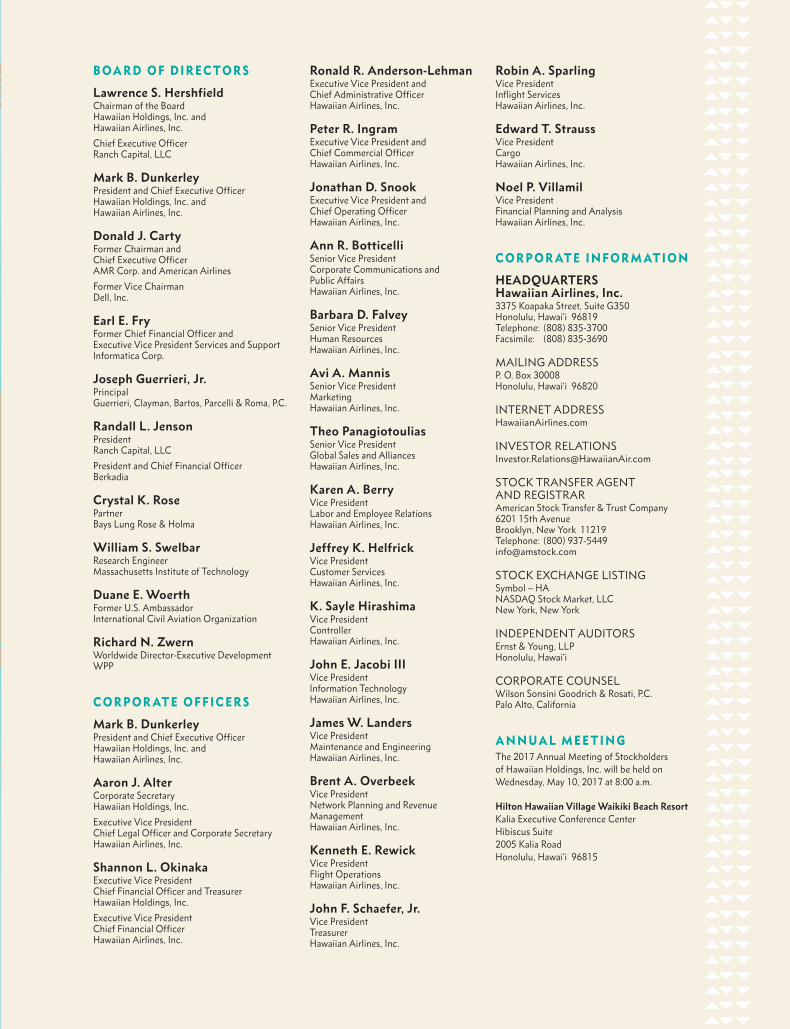
JOB
#: H
AR
P-1
46
35
If y
ou
hav
e q
ues
tio
ns
con
cern
ing
th
is f
ile, p
leas
e co
nta
ct o
ur
Pro
du
ctio
n M
anag
er im
med
iate
ly a
t 80
8.53
9.34
87
CLI
ENT:
Haw
aiia
n A
irlin
esC
OLO
R: 4
CD
ATE
: Feb
ruar
y 20
17
TITL
E: A
nn
ual
Rep
ort
C
ove
r 20
16
BLE
ED: 0
.25”
TRIM
: 16.
5”w
x 1
0.75
”hFO
LDS
TO: 8
.25”
w x
10.
75”h
INSI
DE
CO
VER
Interline Partners:
Codeshare Partners:
SEASONAL ROUTESKailua-Kona – OaklandLı̄hu‘e – Oakland Kailua-Kona – Los AngelesLı̄hu‘e – Los Angeles
LAUNCHING MARCH 2017Kailua-Kona – Lı̄hue
LAUNCHING MARCH 2017Honolulu – KapaluaKahului – Kapalua
OPERATED BY EMPIRE AIRLINES
New York/Kennedy
Raleigh-Durham
New York/Newark
Charlotte
Savannah
Jacksonville
Lı̄hu‘e
KualaLumpur Singapore
Manila
Jakarta
SOUTHKOREA
PHILIPPINESVIETNAM
MALAYSIA
CAMBODIA
THAILAND
CHINA
AUSTRALIA
INDONESIA
PAPUANEW GUINEA
NEWZEALAND
AMERICANSAMOA
TAHITI
JAPAN
NORTHAMERICA
MEXICO
HAWAI‘I
CANADA
TAIWAN
Tokyo/Haneda
Tokyo/Narita
Osaka/Kansai Fukuoka
Pago Pago
Papeete
Seoul/Incheon
Taipei
Sapporo/Chitose
Sydney
Brisbane
Auckland
San FranciscoSacramento
Portland
Phoenix
Oakland
Las Vegas
Seattle
San Jose
Kahului
Okinawa
Kagoshima
Beijing
Shanghai/Pudong
Hong Kong
Busan Osaka/Itami
Oita
Hiroshima
Bangkok
Hanoi
Ho Chi Minh CityPhnom Penh
Perth
Canberra
Gladstone
Rockhampton
Townsville
Mackay
Adelaide
Melbourne
Cairns
Dallas/Love Field
Chicago/O’Hare
PortlandBurlington
Boston
Orlando
West Palm BeachFort Lauderdale
Tampa
Fort Myers
Washington DC/Dulles
RochesterBuffalo
Syracuse
Honolulu
Kailua-Kona
KAUA‘I
O‘AHU
MAUI
HAWAI‘IISLAND
MOLOKA‘I
LANA‘I
NI‘IHAU
KAHO‘OLAWE
Kahului
Kailua-Kona
Hilo
Lıhu‘e
Honolulu
Shanghai/Hongqiao
Hangzhou
Xiamen
Chengdu Chongqing
GuangzhouShenzhen
Shenyang
Harbin
To New Delhi, India
Nantucket
Los AngelesLong Beach
San Diego
Kapalua
Map not drawn to scale.
B O A R D O F D I R E C T O R S
Lawrence S. HershfieldChairman of the Board Hawaiian Holdings, Inc. and Hawaiian Airlines, Inc.
Chief Executive Officer Ranch Capital, LLC
Mark B. DunkerleyPresident and Chief Executive Officer Hawaiian Holdings, Inc. and Hawaiian Airlines, Inc.
Donald J. CartyFormer Chairman and Chief Executive Officer AMR Corp. and American Airlines
Former Vice Chairman Dell, Inc.
Earl E. FryFormer Chief Financial Officer and Executive Vice President Services and Support Informatica Corp.
Joseph Guerrieri, Jr.Principal Guerrieri, Clayman, Bartos, Parcelli & Roma, P.C.
Randall L. JensonPresident Ranch Capital, LLC
President and Chief Financial Officer Berkadia
Crystal K. RosePartner Bays Lung Rose & Holma
William S. SwelbarResearch Engineer Massachusetts Institute of Technology
Duane E. WoerthFormer U.S. Ambassador International Civil Aviation Organization
Richard N. ZwernWorldwide Director-Executive Development WPP
C O R P O R AT E O F F I C E R S
Mark B. DunkerleyPresident and Chief Executive Officer Hawaiian Holdings, Inc. and Hawaiian Airlines, Inc.
Aaron J. AlterCorporate Secretary Hawaiian Holdings, Inc.
Executive Vice President Chief Legal Officer and Corporate Secretary Hawaiian Airlines, Inc.
Shannon L. OkinakaExecutive Vice President Chief Financial Officer and Treasurer Hawaiian Holdings, Inc.
Executive Vice President Chief Financial Officer Hawaiian Airlines, Inc.
Ronald R. Anderson-LehmanExecutive Vice President and Chief Administrative Officer Hawaiian Airlines, Inc.
Peter R. IngramExecutive Vice President and Chief Commercial Officer Hawaiian Airlines, Inc.
Jonathan D. SnookExecutive Vice President and Chief Operating Officer Hawaiian Airlines, Inc.
Ann R. BotticelliSenior Vice President Corporate Communications and Public Affairs Hawaiian Airlines, Inc.
Barbara D. FalveySenior Vice President Human Resources Hawaiian Airlines, Inc.
Avi A. MannisSenior Vice President Marketing Hawaiian Airlines, Inc.
Theo PanagiotouliasSenior Vice President Global Sales and Alliances Hawaiian Airlines, Inc.
Karen A. BerryVice President Labor and Employee Relations Hawaiian Airlines, Inc.
Jeffrey K. HelfrickVice President Customer Services Hawaiian Airlines, Inc.
K. Sayle HirashimaVice President Controller Hawaiian Airlines, Inc.
John E. Jacobi IIIVice President Information Technology Hawaiian Airlines, Inc.
James W. LandersVice President Maintenance and Engineering Hawaiian Airlines, Inc.
Brent A. OverbeekVice President Network Planning and Revenue Management Hawaiian Airlines, Inc.
Kenneth E. RewickVice President Flight Operations Hawaiian Airlines, Inc.
John F. Schaefer, Jr.Vice President Treasurer Hawaiian Airlines, Inc.
Robin A. SparlingVice President Inflight Services Hawaiian Airlines, Inc.
Edward T. StraussVice President Cargo Hawaiian Airlines, Inc.
Noel P. VillamilVice President Financial Planning and Analysis Hawaiian Airlines, Inc.
C O R P O R AT E I N F O R M AT I O N
HEADQUARTERS Hawaiian Airlines, Inc.3375 Koapaka Street, Suite G350 Honolulu, Hawai‘i 96819 Telephone: (808) 835-3700 Facsimile: (808) 835-3690
MAILING ADDRESSP. O. Box 30008 Honolulu, Hawai‘i 96820
INTERNET ADDRESSHawaiianAirlines.com
INVESTOR [email protected]
STOCK TRANSFER AGENT AND REGISTRARAmerican Stock Transfer & Trust Company 6201 15th Avenue Brooklyn, New York 11219 Telephone: (800) 937-5449 [email protected]
STOCK EXCHANGE LISTINGSymbol – HA NASDAQ Stock Market, LLC New York, New York
INDEPENDENT AUDITORSErnst & Young, LLP Honolulu, Hawai‘i
CORPORATE COUNSELWilson Sonsini Goodrich & Rosati, P.C. Palo Alto, California
A N N U A L M E E T I N GThe 2017 Annual Meeting of Stockholders of Hawaiian Holdings, Inc. will be held on Wednesday, May 10, 2017 at 8:00 a.m.
Hilton Hawaiian Village Waikiki Beach Resort Kalia Executive Conference Center Hibiscus Suite 2005 Kalia Road Honolulu, Hawai‘i 96815
HARP-14635_AnnualReportCover2016_R1.indd 2 3/7/17 4:07 PM

JOB
#: H
AR
P-1
46
35
If y
ou
hav
e q
ues
tio
ns
con
cern
ing
th
is f
ile, p
leas
e co
nta
ct o
ur
Pro
du
ctio
n M
anag
er im
med
iate
ly a
t 80
8.53
9.34
87
CLI
ENT:
Haw
aiia
n A
irlin
esC
OLO
R: 4
CD
ATE
: Feb
ruar
y 20
17
TITL
E: A
nn
ual
Rep
ort
C
ove
r 20
16
BLE
ED: 0
.25”
TRIM
: 16.
5”w
x 1
0.75
”hFO
LDS
TO: 8
.25”
w x
10.
75”h
OU
TSID
E C
OV
ER
A N N U A L R E P O R T
H AWA I I A N H O L D I N G S, I N C.
2016
Kū Mākou
The traditional lehua blossom and
‘ohe kapala elements of our
new uniform design represent
Hawai‘i wherever we fly. The design
process was a collaborative effort
between our staff and the legendary
Sig Zane, and resulted in a theme of
Together We Stand.
HARP-14635_AnnualReportCover2016_R1.indd 1 3/7/17 4:07 PM