Embed Size (px)
Citation preview
Queen’s Student Managed Fund
Annual Report 2015/16

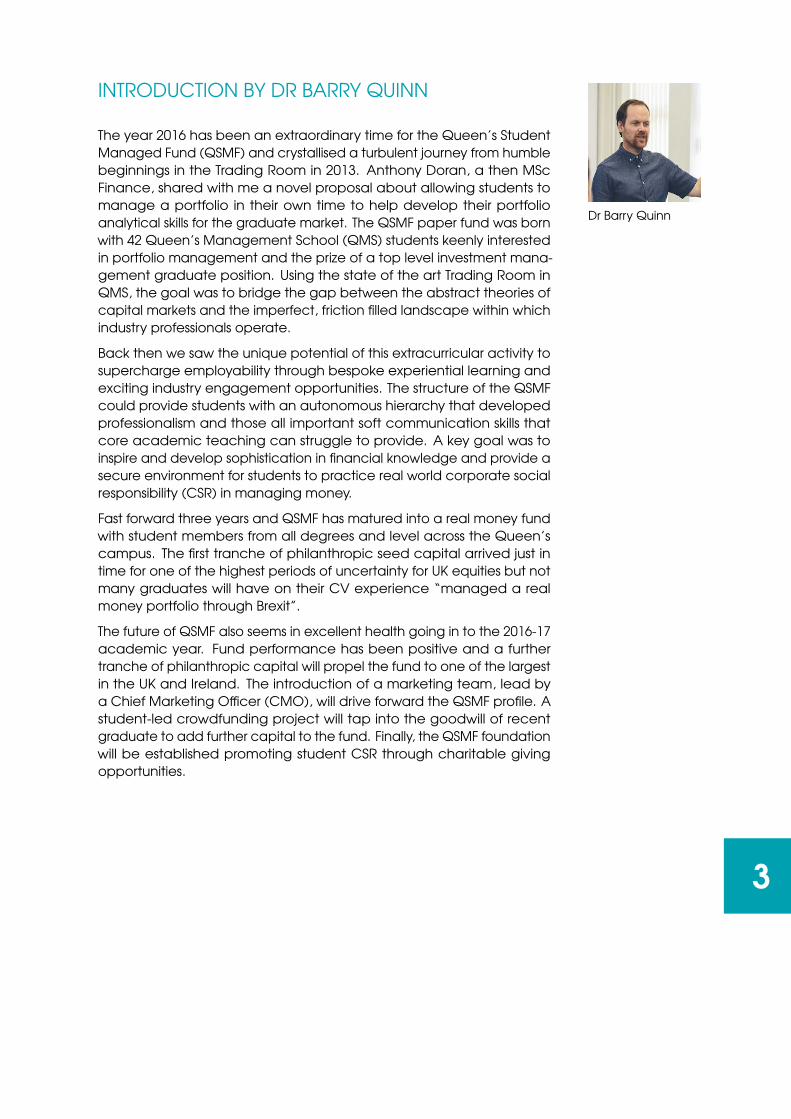
INTRODUCTION BY DR BARRY QUINN
The year 2016 has been an extraordinary time for the Queen’s Student
Managed Fund (QSMF) and crystallised a turbulent journey from humble
beginnings in the Trading Room in 2013. Anthony Doran, a then MSc
Finance, shared with me a novel proposal about allowing students to
manage a portfolio in their own time to help develop their portfolio
analytical skills for the graduate market. The QSMF paper fund was born
with 42 Queen’s Management School (QMS) students keenly interested
in portfolio management and the prize of a top level investment mana-
gement graduate position. Using the state of the art Trading Room in
QMS, the goal was to bridge the gap between the abstract theories of
capital markets and the imperfect, friction filled landscape within which
industry professionals operate.
Back then we saw the unique potential of this extracurricular activity to
supercharge employability through bespoke experiential learning and
exciting industry engagement opportunities. The structure of the QSMF
could provide students with an autonomous hierarchy that developed
professionalism and those all important soft communication skills that
core academic teaching can struggle to provide. A key goal was to
inspire and develop sophistication in financial knowledge and provide a
secure environment for students to practice real world corporate social
responsibility (CSR) in managing money.
Fast forward three years and QSMF has matured into a real money fund
with student members from all degrees and level across the Queen’s
campus. The first tranche of philanthropic seed capital arrived just in
time for one of the highest periods of uncertainty for UK equities but not
many graduates will have on their CV experience “managed a real
money portfolio through Brexit”.
The future of QSMF also seems in excellent health going in to the 2016-17
academic year. Fund performance has been positive and a further
tranche of philanthropic capital will propel the fund to one of the largest
in the UK and Ireland. The introduction of a marketing team, lead by
a Chief Marketing Officer (CMO), will drive forward the QSMF profile. A
student-led crowdfunding project will tap into the goodwill of recent
graduate to add further capital to the fund. Finally, the QSMF foundation
will be established promoting student CSR through charitable giving
opportunities.
Dr Barry Quinn
3
TO PROGRESS AND LEADINVEST IN THE FUTURE
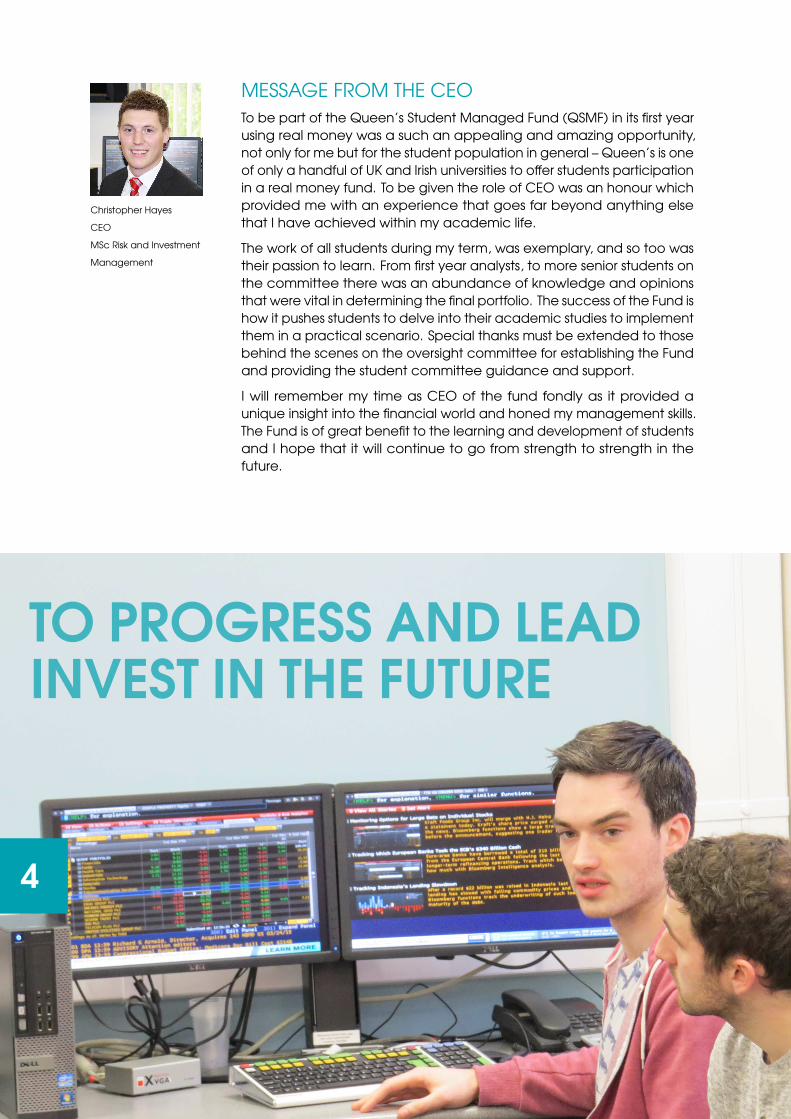
MESSAGE FROM THE CEO
To be part of the Queen’s Student Managed Fund (QSMF) in its first year
using real money was a such an appealing and amazing opportunity,
not only for me but for the student population in general – Queen’s is one
of only a handful of UK and Irish universities to offer students participation
in a real money fund. To be given the role of CEO was an honour which
provided me with an experience that goes far beyond anything else
that I have achieved within my academic life.
The work of all students during my term, was exemplary, and so too was
their passion to learn. From first year analysts, to more senior students on
the committee there was an abundance of knowledge and opinions
that were vital in determining the final portfolio. The success of the Fund is
how it pushes students to delve into their academic studies to implement
them in a practical scenario. Special thanks must be extended to those
behind the scenes on the oversight committee for establishing the Fund
and providing the student committee guidance and support.
I will remember my time as CEO of the fund fondly as it provided a
unique insight into the financial world and honed my management skills.
The Fund is of great benefit to the learning and development of students
and I hope that it will continue to go from strength to strength in the
future.
Christopher Hayes
CEO
MSc Risk and Investment
Management
4
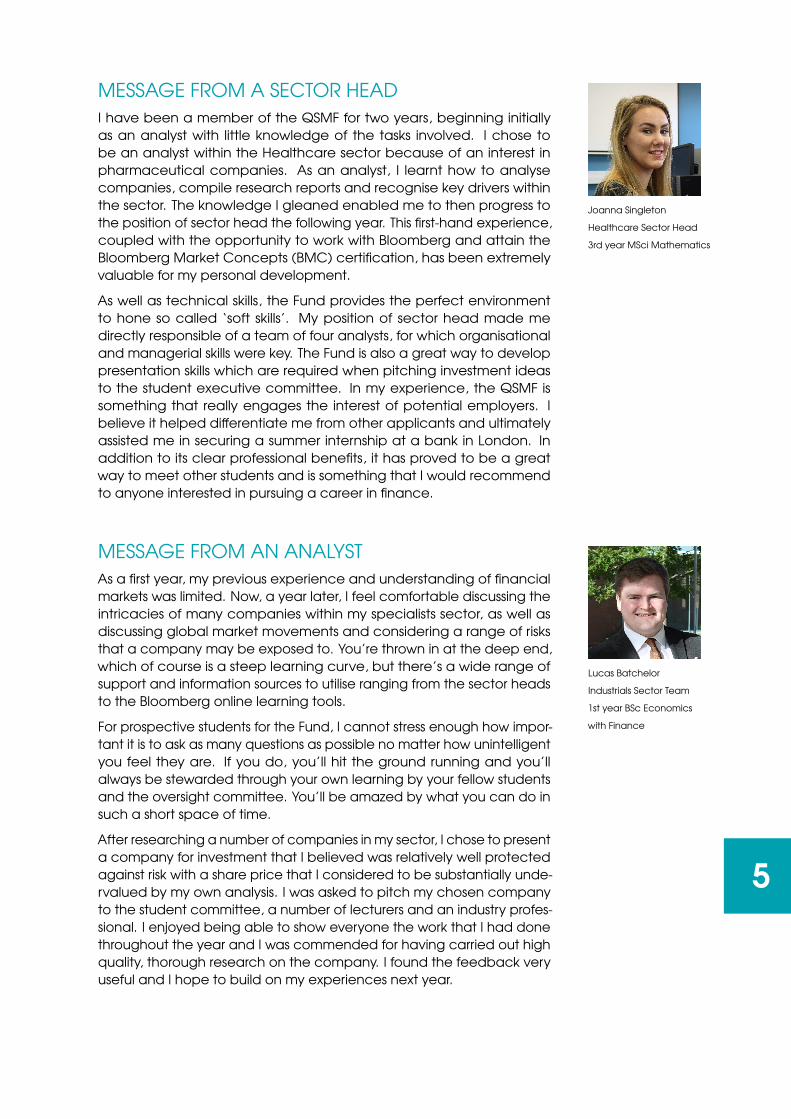
MESSAGE FROM A SECTOR HEAD
I have been a member of the QSMF for two years, beginning initially
as an analyst with little knowledge of the tasks involved. I chose to
be an analyst within the Healthcare sector because of an interest in
pharmaceutical companies. As an analyst, I learnt how to analyse
companies, compile research reports and recognise key drivers within
the sector. The knowledge I gleaned enabled me to then progress to
the position of sector head the following year. This first-hand experience,
coupled with the opportunity to work with Bloomberg and attain the
Bloomberg Market Concepts (BMC) certification, has been extremely
valuable for my personal development.
As well as technical skills, the Fund provides the perfect environment
to hone so called ‘soft skills’. My position of sector head made me
directly responsible of a team of four analysts, for which organisational
and managerial skills were key. The Fund is also a great way to develop
presentation skills which are required when pitching investment ideas
to the student executive committee. In my experience, the QSMF is
something that really engages the interest of potential employers. I
believe it helped differentiate me from other applicants and ultimately
assisted me in securing a summer internship at a bank in London. In
addition to its clear professional benefits, it has proved to be a great
way to meet other students and is something that I would recommend
to anyone interested in pursuing a career in finance.
MESSAGE FROM AN ANALYST
As a first year, my previous experience and understanding of financial
markets was limited. Now, a year later, I feel comfortable discussing the
intricacies of many companies within my specialists sector, as well as
discussing global market movements and considering a range of risks
that a company may be exposed to. You’re thrown in at the deep end,
which of course is a steep learning curve, but there’s a wide range of
support and information sources to utilise ranging from the sector heads
to the Bloomberg online learning tools.
For prospective students for the Fund, I cannot stress enough how impor-
tant it is to ask as many questions as possible no matter how unintelligent
you feel they are. If you do, you’ll hit the ground running and you’ll
always be stewarded through your own learning by your fellow students
and the oversight committee. You’ll be amazed by what you can do in
such a short space of time.
After researching a number of companies in my sector, I chose to present
a company for investment that I believed was relatively well protected
against risk with a share price that I considered to be substantially unde-
rvalued by my own analysis. I was asked to pitch my chosen company
to the student committee, a number of lecturers and an industry profes-
sional. I enjoyed being able to show everyone the work that I had done
throughout the year and I was commended for having carried out high
quality, thorough research on the company. I found the feedback very
useful and I hope to build on my experiences next year.
Joanna Singleton
Healthcare Sector Head
3rd year MSci Mathematics
Lucas Batchelor
Industrials Sector Team
1st year BSc Economics
with Finance
5
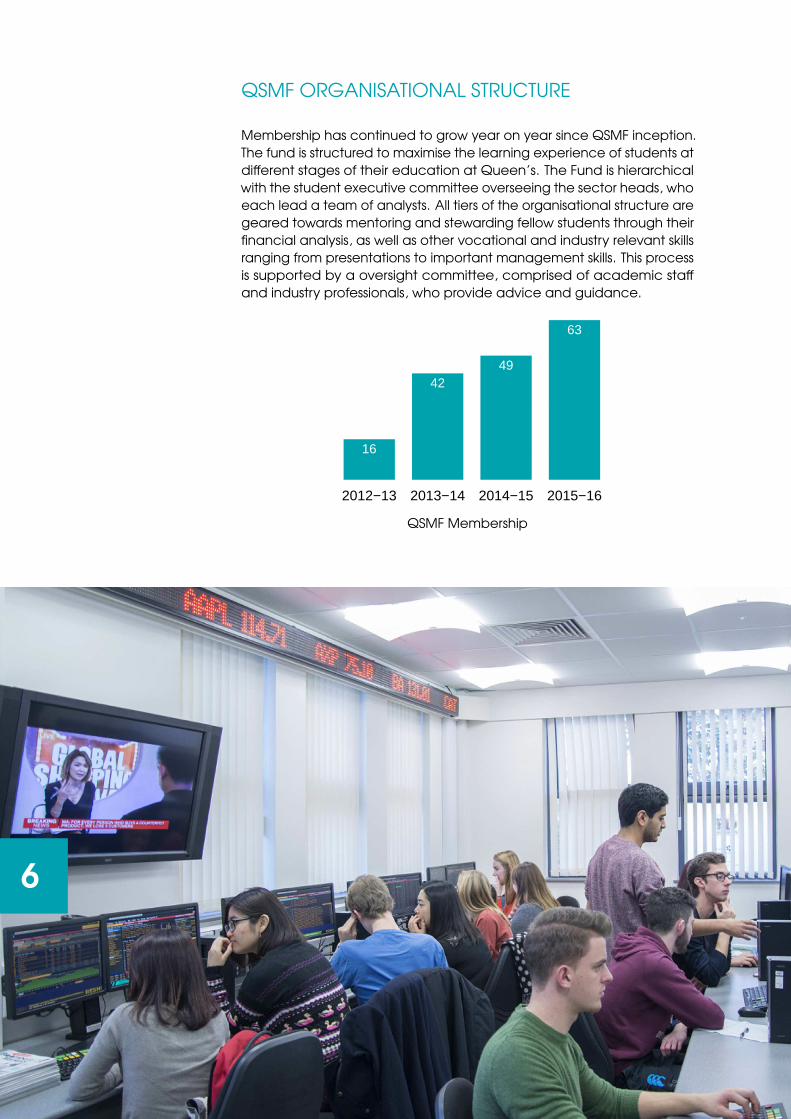
QSMF ORGANISATIONAL STRUCTURE
Membership has continued to grow year on year since QSMF inception.
The fund is structured to maximise the learning experience of students at
different stages of their education at Queen’s. The Fund is hierarchical
with the student executive committee overseeing the sector heads, who
each lead a team of analysts. All tiers of the organisational structure are
geared towards mentoring and stewarding fellow students through their
financial analysis, as well as other vocational and industry relevant skills
ranging from presentations to important management skills. This process
is supported by a oversight committee, comprised of academic staff
and industry professionals, who provide advice and guidance.
16
4249
63
2012−13 2013−14 2014−15 2015−16
QSMF Membership
.
6
FUND GOALS
The Fund aims to secure long term, sustainable returns through prudent
stock selection. Analysts seek to identify relatively undervalued stocks
with long term growth strategies, supported by strong fundamentals to
achieve active returns.
CHANGES TO THE FUND
The main change to the fund this year is that it is now a real money
fund. After securing £10,000 from our donors, we have added a new
dynamic to the fund making it more engaging and industry-relevant for
our students. The fund this year has solely invested in UK equities (FTSE
350), although our options for asset allocation may broaden over the
coming years. The real money aspect meant students had to consider
carefully the timing of their initial investment and how this would affect
their capital in a time of high market volatility. Students experienced
increased pressure as they exercised their fiduciary responsibility. We also
introduced the Bloomberg Market Concepts (BMC) qualification as a
requirement and part of a channel for students to secure ‘Degree Plus’.
These developments and focus on student’s vocational development
was rewarded by a Queen’s teaching award for “Excellence in teaching
in a team” to the fund’s oversight committee.
“In today’s competitive market, academic know-
ledge is rarely sufficient to achieve one’s full po-
tential. Student learning needs to complemented
with authentic experience, practical application
and commercial awareness. The real money QSMF
provides these opportunities which is why I’m deli-
ghted to support it.
”Dr Gary Kennedy
QUB Alumni and QSMF Donor
.
7
INVESTMENT PROCESS
The Fund meet every Wednesday afternoon in the Trading Room. Sector
teams each have a one hour slot, and the times allocated to each
sector change each week to ensure students who have regular commit-
ments have the opportunity to use the Bloomberg terminals to source
data for their analysis. Depending on the number of companies in a
sector and a sector head’s own organisation style, sector teams either
analyse all the companies in their sector or, especially if there are many
companies, those deemed to most fit in with investment objectives.
An important aspect of the Fund is to exercise corporate social respon-
sibility. In practice analysts must perform due diligence and consider
the ethical aspects of potential investments. After the companies to
be analysed are selected, sectors spend the following weeks applying
the fundamental analysis skills they have learnt from their degree, from
stewardship from the sector heads and oversight committee and with
the different learning resources provided on how to value companies. By
the middle of the term, sectors are expected to finalise on companies
they would like to make a recommendation on, and each analyst is
expected to write one report recommending either a ‘Buy’, ‘Sell’ or
‘Hold’. Each analyst must produce a five page analyst report, of industry
standard, on the company detailing:
• An overview of the company including a business overview and
key highlights.
• An investment summary highlighting the pros and cons substantia-
ting the recommendation.
• Industry overview and competitive positioning explaining why the
company would represent a positive return relative to its peers.
• Financial analysis providing substantiated valuations with all as-
sumptions to be scrutinised.
• Investment risks, specifically how they tie in with our investment
horizon and prudent stock selection.
• Corporate governance and social responsibility to ensure that the
company meets our ethical standards for investing.
The analyst reports are submitted at the end of week 10 of 12 in the
semester. The sector heads then discuss with their analysts which two
companies they would like to pitch for inclusion in the Fund and analysts
decide whether to put themselves forward to pitch the companies
themselves. There is a five day window for the student committee to
read, mark and research further all of the analyst reports. Analysts are
encouraged to seek further feedback and recommendations on their
reports from the student committee.
.
8
INVESTMENT STYLE
As this was the first ‘real money’ year of the Fund, our stock selection was
influenced by the EU referendum vote as well as the broader economic
environment. Our final stock selection was completed early April, where
a vote to remain seemed a foregone conclusion but our defensive inve-
stment style meant we still decided to be underweight financials and
diversified across real estate, insurance, banks and financial services.
We also considered how to hedge against a potential out vote by cho-
osing a number of counter cyclical companies such as Randgold whose
stock price is highly correlated with the price of gold. We also sought
to invest in companies with a high proportion of their revenues being
made in foreign currencies such as Diageo and Unilever in anticipation
of a devalued GBP and the stability that comes with their respective
staples. We continued to be overweight technology as our key, long
term growth sector. Companies such as Glencore and Paysafe were
relatively undervalued, and so we invested in these companies to help
secure an active return for the Fund – considering both of these compa-
nies to be cheaper than their sector peers.
PITCHING EVENTS
The pitching event involves a 10 minute presentation on the analyst
report followed by ten minutes of robust questioning by the student com-
mittee who will have researched the company in preparation. Students
have the opportunity to have their pitches filmed to identify and im-
prove upon their presentations skills. At the pitching event, the oversight
committee and an industry professional are present to offer their own
feedback on the presentation and the stock recommendation.
The student committee, after the pitching event, decide upon which
companies to include in the Fund in line with an outlined investment
strategy of achieving consistent long term, positive returns by optimally
managing downside risk. In the Fund’s 2015-16 year for example, a
key tenet was to buy high dividend paying stocks that can evidence
substantial dividend cover, even in times of turmoil. When the companies
and their weightings have been chosen by the committee, it is fed back
to the members where the choices can be challenged.
The compilation of the Fund was ultimately presented to a room of
seasoned industry professionals at QSMF’s launch at Davy’s Belfast office
who provided valuable feedback on the companies chosen. A team
of 10 QSMF representatives, ranging from the student committee to
analysts, presented the stock recommendations to over 30 experienced
professionals within the asset management industry with challenges and
debate encouraged.
.
9
PORTFOLIO ANALYSIS
OVERVIEW OF SECTOR COMPOSITION
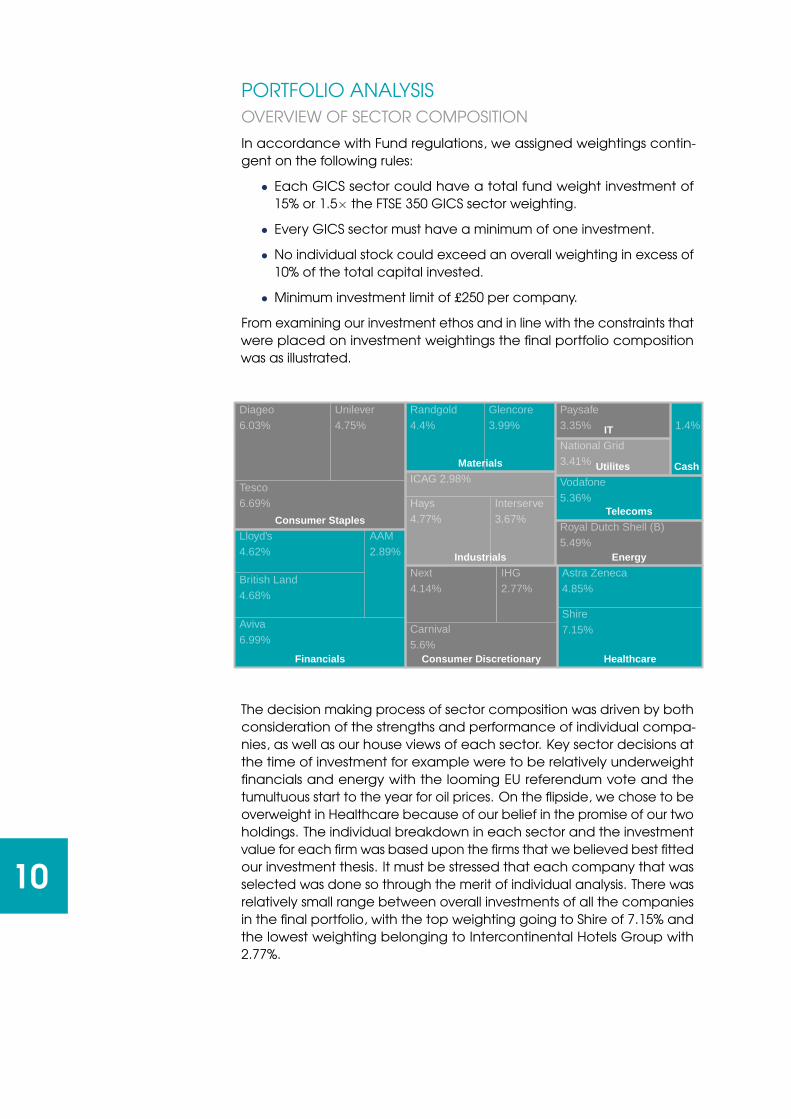
In accordance with Fund regulations, we assigned weightings contin-
gent on the following rules:
• Each GICS sector could have a total fund weight investment of
15% or 1.5× the FTSE 350 GICS sector weighting.
• Every GICS sector must have a minimum of one investment.
• No individual stock could exceed an overall weighting in excess of
10% of the total capital invested.
• Minimum investment limit of £250 per company.
From examining our investment ethos and in line with the constraints that
were placed on investment weightings the final portfolio composition
was as illustrated.
Cash
Consumer Discretionary
Consumer Staples
Energy
Financials Healthcare
Industrials
IT
Materials
Telecoms
Utilites
1.4%
AAM2.89%
Astra Zeneca4.85%
Aviva6.99%
British Land4.68%
Carnival5.6%
Diageo6.03%
Glencore3.99%
Hays4.77%
ICAG 2.98%
IHG2.77%
Interserve3.67%
Lloyd's4.62%
National Grid3.41%
Next4.14%
Paysafe3.35%
Randgold4.4%
Royal Dutch Shell (B)5.49%
Shire7.15%
Tesco6.69%
Unilever4.75%
Vodafone5.36%
The decision making process of sector composition was driven by both
consideration of the strengths and performance of individual compa-
nies, as well as our house views of each sector. Key sector decisions at
the time of investment for example were to be relatively underweight
financials and energy with the looming EU referendum vote and the
tumultuous start to the year for oil prices. On the flipside, we chose to be
overweight in Healthcare because of our belief in the promise of our two
holdings. The individual breakdown in each sector and the investment
value for each firm was based upon the firms that we believed best fitted
our investment thesis. It must be stressed that each company that was
selected was done so through the merit of individual analysis. There was
relatively small range between overall investments of all the companies
in the final portfolio, with the top weighting going to Shire of 7.15% and
the lowest weighting belonging to Intercontinental Hotels Group with
2.77%.
.
10
95
100
105
110
May Jun Jul Aug Sep
FTSE 350 SMF
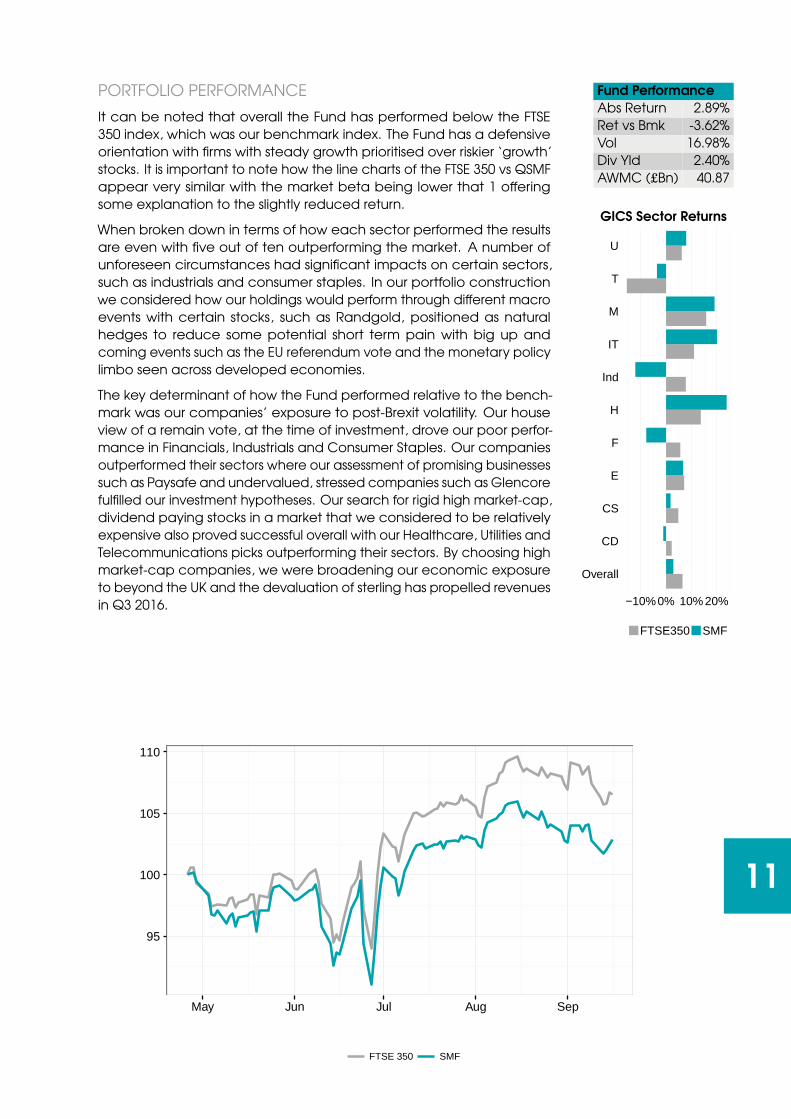
PORTFOLIO PERFORMANCE
It can be noted that overall the Fund has performed below the FTSE
350 index, which was our benchmark index. The Fund has a defensive
orientation with firms with steady growth prioritised over riskier ‘growth’
stocks. It is important to note how the line charts of the FTSE 350 vs QSMF
appear very similar with the market beta being lower that 1 offering
some explanation to the slightly reduced return.
When broken down in terms of how each sector performed the results
are even with five out of ten outperforming the market. A number of
unforeseen circumstances had significant impacts on certain sectors,
such as industrials and consumer staples. In our portfolio construction
we considered how our holdings would perform through different macro
events with certain stocks, such as Randgold, positioned as natural
hedges to reduce some potential short term pain with big up and
coming events such as the EU referendum vote and the monetary policy
limbo seen across developed economies.
The key determinant of how the Fund performed relative to the bench-
mark was our companies’ exposure to post-Brexit volatility. Our house
view of a remain vote, at the time of investment, drove our poor perfor-
mance in Financials, Industrials and Consumer Staples. Our companies
outperformed their sectors where our assessment of promising businesses
such as Paysafe and undervalued, stressed companies such as Glencore
fulfilled our investment hypotheses. Our search for rigid high market-cap,
dividend paying stocks in a market that we considered to be relatively
expensive also proved successful overall with our Healthcare, Utilities and
Telecommunications picks outperforming their sectors. By choosing high
market-cap companies, we were broadening our economic exposure
to beyond the UK and the devaluation of sterling has propelled revenues
in Q3 2016.
Fund Performance
Abs Return 2.89%
Ret vs Bmk -3.62%
Vol 16.98%
Div Yld 2.40%
AWMC (£Bn) 40.87
GICS Sector Returns
Overall
CD
CS
E
F
H
Ind
IT
M
T
U
−10%0% 10% 20%
FTSE350 SMF
11
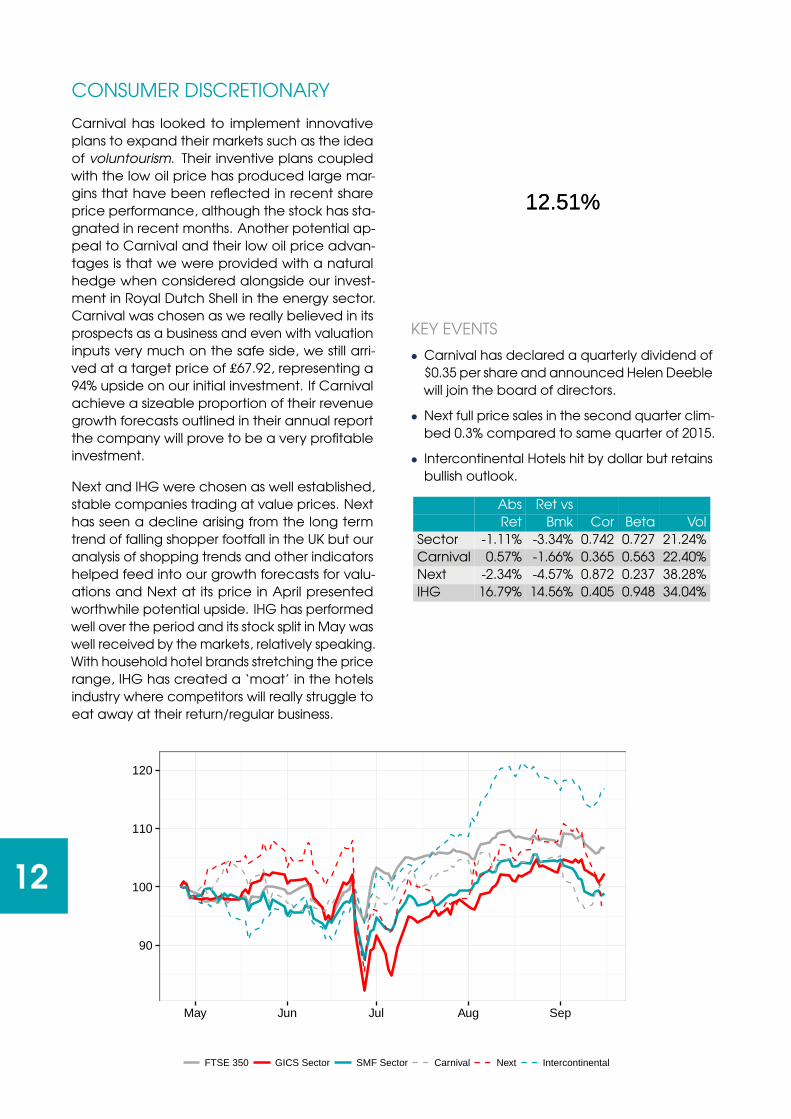
CONSUMER DISCRETIONARY
Carnival has looked to implement innovative
plans to expand their markets such as the idea
of voluntourism. Their inventive plans coupled
with the low oil price has produced large mar-
gins that have been reflected in recent share
price performance, although the stock has sta-
gnated in recent months. Another potential ap-
peal to Carnival and their low oil price advan-
tages is that we were provided with a natural
hedge when considered alongside our invest-
ment in Royal Dutch Shell in the energy sector.
Carnival was chosen as we really believed in its
prospects as a business and even with valuation
inputs very much on the safe side, we still arri-
ved at a target price of £67.92, representing a
94% upside on our initial investment. If Carnival
achieve a sizeable proportion of their revenue
growth forecasts outlined in their annual report
the company will prove to be a very profitable
investment.
Next and IHG were chosen as well established,
stable companies trading at value prices. Next
has seen a decline arising from the long term
trend of falling shopper footfall in the UK but our
analysis of shopping trends and other indicators
helped feed into our growth forecasts for valu-
ations and Next at its price in April presented
worthwhile potential upside. IHG has performed
well over the period and its stock split in May was
well received by the markets, relatively speaking.
With household hotel brands stretching the price
range, IHG has created a ‘moat’ in the hotels
industry where competitors will really struggle to
eat away at their return/regular business.
12.51%12.51%
KEY EVENTS
• Carnival has declared a quarterly dividend of
$0.35 per share and announced Helen Deeble
will join the board of directors.
• Next full price sales in the second quarter clim-
bed 0.3% compared to same quarter of 2015.
• Intercontinental Hotels hit by dollar but retains
bullish outlook.
Abs Ret vs
Ret Bmk Cor Beta Vol
Sector -1.11% -3.34% 0.742 0.727 21.24%
Carnival 0.57% -1.66% 0.365 0.563 22.40%
Next -2.34% -4.57% 0.872 0.237 38.28%
IHG 16.79% 14.56% 0.405 0.948 34.04%
90
100
110
120
May Jun Jul Aug Sep
FTSE 350 GICS Sector SMF Sector Carnival Next Intercontinental
12
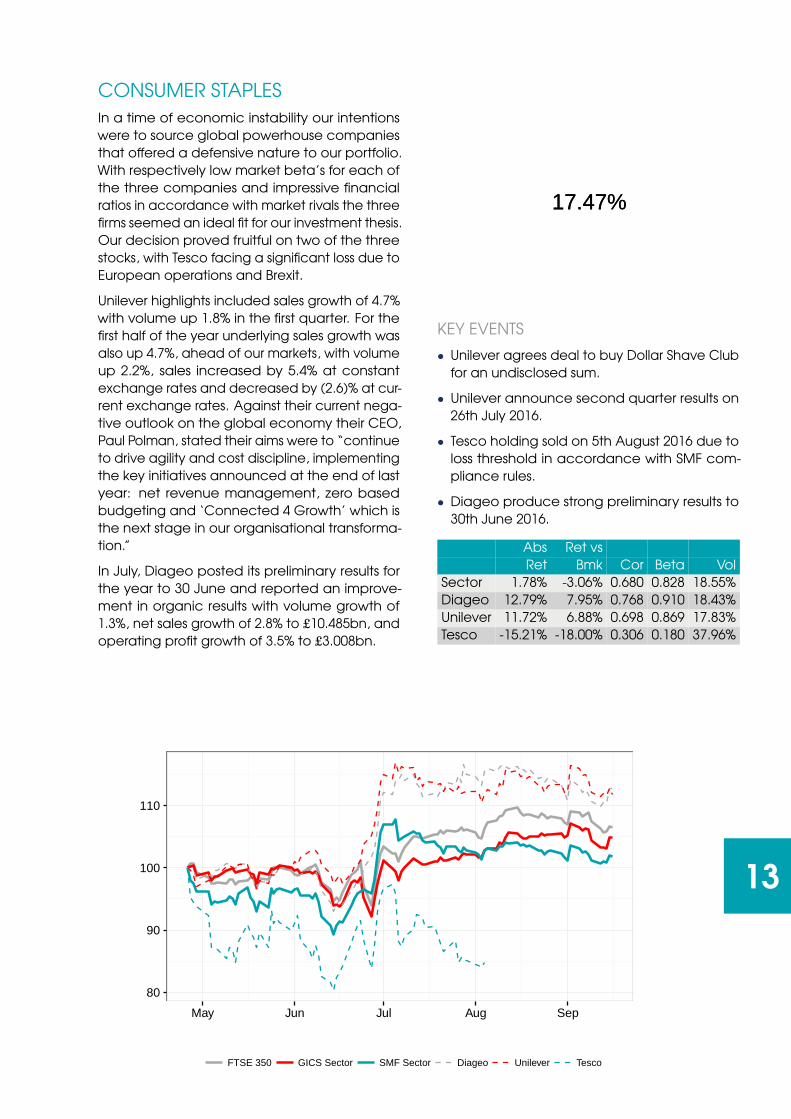
CONSUMER STAPLES
In a time of economic instability our intentions
were to source global powerhouse companies
that offered a defensive nature to our portfolio.
With respectively low market beta’s for each of
the three companies and impressive financial
ratios in accordance with market rivals the three
firms seemed an ideal fit for our investment thesis.
Our decision proved fruitful on two of the three
stocks, with Tesco facing a significant loss due to
European operations and Brexit.
Unilever highlights included sales growth of 4.7%
with volume up 1.8% in the first quarter. For the
first half of the year underlying sales growth was
also up 4.7%, ahead of our markets, with volume
up 2.2%, sales increased by 5.4% at constant
exchange rates and decreased by (2.6)% at cur-
rent exchange rates. Against their current nega-
tive outlook on the global economy their CEO,
Paul Polman, stated their aims were to “continue
to drive agility and cost discipline, implementing
the key initiatives announced at the end of last
year: net revenue management, zero based
budgeting and ‘Connected 4 Growth’ which is
the next stage in our organisational transforma-
tion.”
In July, Diageo posted its preliminary results for
the year to 30 June and reported an improve-
ment in organic results with volume growth of
1.3%, net sales growth of 2.8% to £10.485bn, and
operating profit growth of 3.5% to £3.008bn.
17.47%17.47%
KEY EVENTS
• Unilever agrees deal to buy Dollar Shave Club
for an undisclosed sum.
• Unilever announce second quarter results on
26th July 2016.
• Tesco holding sold on 5th August 2016 due to
loss threshold in accordance with SMF com-
pliance rules.
• Diageo produce strong preliminary results to
30th June 2016.
Abs Ret vs
Ret Bmk Cor Beta Vol
Sector 1.78% -3.06% 0.680 0.828 18.55%
Diageo 12.79% 7.95% 0.768 0.910 18.43%
Unilever 11.72% 6.88% 0.698 0.869 17.83%
Tesco -15.21% -18.00% 0.306 0.180 37.96%
80
90
100
110
May Jun Jul Aug Sep
FTSE 350 GICS Sector SMF Sector Diageo Unilever Tesco
13
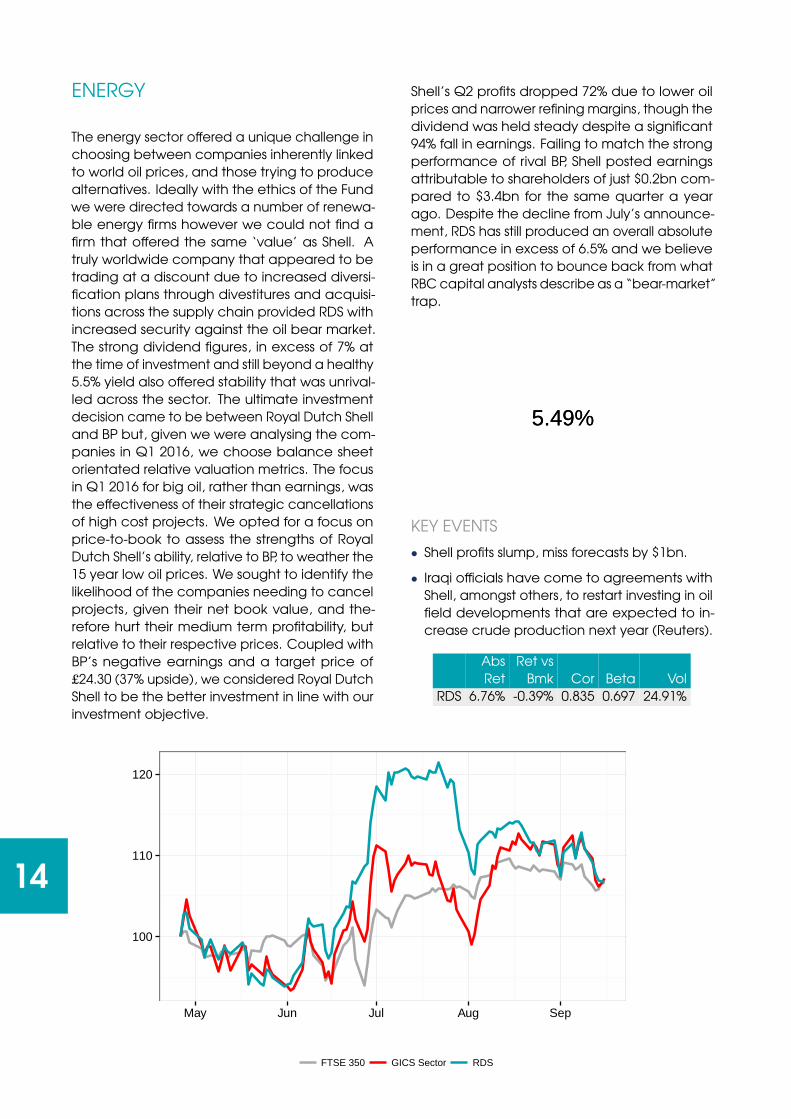
ENERGY
The energy sector offered a unique challenge in
choosing between companies inherently linked
to world oil prices, and those trying to produce
alternatives. Ideally with the ethics of the Fund
we were directed towards a number of renewa-
ble energy firms however we could not find a
firm that offered the same ‘value’ as Shell. A
truly worldwide company that appeared to be
trading at a discount due to increased diversi-
fication plans through divestitures and acquisi-
tions across the supply chain provided RDS with
increased security against the oil bear market.
The strong dividend figures, in excess of 7% at
the time of investment and still beyond a healthy
5.5% yield also offered stability that was unrival-
led across the sector. The ultimate investment
decision came to be between Royal Dutch Shell
and BP but, given we were analysing the com-
panies in Q1 2016, we choose balance sheet
orientated relative valuation metrics. The focus
in Q1 2016 for big oil, rather than earnings, was
the effectiveness of their strategic cancellations
of high cost projects. We opted for a focus on
price-to-book to assess the strengths of Royal
Dutch Shell’s ability, relative to BP, to weather the
15 year low oil prices. We sought to identify the
likelihood of the companies needing to cancel
projects, given their net book value, and the-
refore hurt their medium term profitability, but
relative to their respective prices. Coupled with
BP’s negative earnings and a target price of
£24.30 (37% upside), we considered Royal Dutch
Shell to be the better investment in line with our
investment objective.
Shell’s Q2 profits dropped 72% due to lower oil
prices and narrower refining margins, though the
dividend was held steady despite a significant
94% fall in earnings. Failing to match the strong
performance of rival BP, Shell posted earnings
attributable to shareholders of just $0.2bn com-
pared to $3.4bn for the same quarter a year
ago. Despite the decline from July’s announce-
ment, RDS has still produced an overall absolute
performance in excess of 6.5% and we believe
is in a great position to bounce back from what
RBC capital analysts describe as a “bear-market”
trap.
5.49%5.49%
KEY EVENTS
• Shell profits slump, miss forecasts by $1bn.
• Iraqi officials have come to agreements with
Shell, amongst others, to restart investing in oil
field developments that are expected to in-
crease crude production next year (Reuters).
Abs Ret vs
Ret Bmk Cor Beta Vol
RDS 6.76% -0.39% 0.835 0.697 24.91%
100
110
120
May Jun Jul Aug Sep
FTSE 350 GICS Sector RDS
14
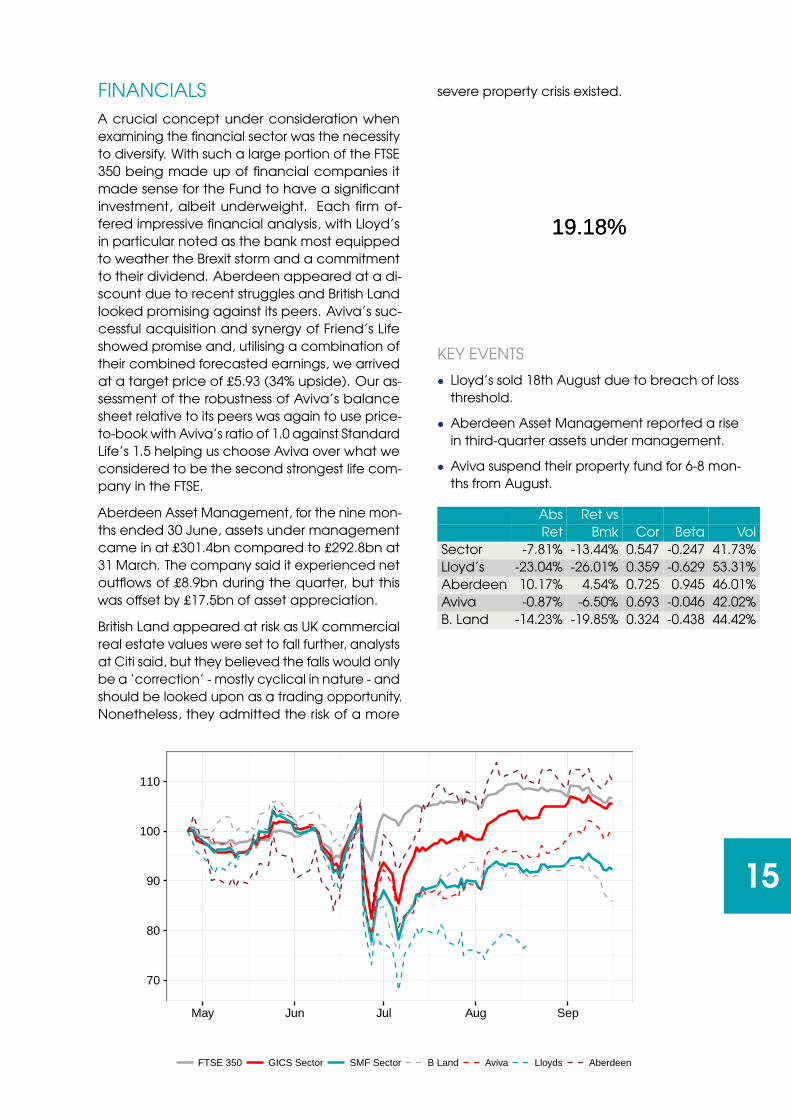
FINANCIALS
A crucial concept under consideration when
examining the financial sector was the necessity
to diversify. With such a large portion of the FTSE
350 being made up of financial companies it
made sense for the Fund to have a significant
investment, albeit underweight. Each firm of-
fered impressive financial analysis, with Lloyd’s
in particular noted as the bank most equipped
to weather the Brexit storm and a commitment
to their dividend. Aberdeen appeared at a di-
scount due to recent struggles and British Land
looked promising against its peers. Aviva’s suc-
cessful acquisition and synergy of Friend’s Life
showed promise and, utilising a combination of
their combined forecasted earnings, we arrived
at a target price of £5.93 (34% upside). Our as-
sessment of the robustness of Aviva’s balance
sheet relative to its peers was again to use price-
to-book with Aviva’s ratio of 1.0 against Standard
Life’s 1.5 helping us choose Aviva over what we
considered to be the second strongest life com-
pany in the FTSE.
Aberdeen Asset Management, for the nine mon-
ths ended 30 June, assets under management
came in at £301.4bn compared to £292.8bn at
31 March. The company said it experienced net
outflows of £8.9bn during the quarter, but this
was offset by £17.5bn of asset appreciation.
British Land appeared at risk as UK commercial
real estate values were set to fall further, analysts
at Citi said, but they believed the falls would only
be a ‘correction’ - mostly cyclical in nature - and
should be looked upon as a trading opportunity.
Nonetheless, they admitted the risk of a more
severe property crisis existed.
19.18%19.18%
KEY EVENTS
• Lloyd’s sold 18th August due to breach of loss
threshold.
• Aberdeen Asset Management reported a rise
in third-quarter assets under management.
• Aviva suspend their property fund for 6-8 mon-
ths from August.
Abs Ret vs
Ret Bmk Cor Beta Vol
Sector -7.81% -13.44% 0.547 -0.247 41.73%
Lloyd’s -23.04% -26.01% 0.359 -0.629 53.31%
Aberdeen 10.17% 4.54% 0.725 0.945 46.01%
Aviva -0.87% -6.50% 0.693 -0.046 42.02%
B. Land -14.23% -19.85% 0.324 -0.438 44.42%
70
80
90
100
110
May Jun Jul Aug Sep
FTSE 350 GICS Sector SMF Sector B Land Aviva Lloyds Aberdeen
15
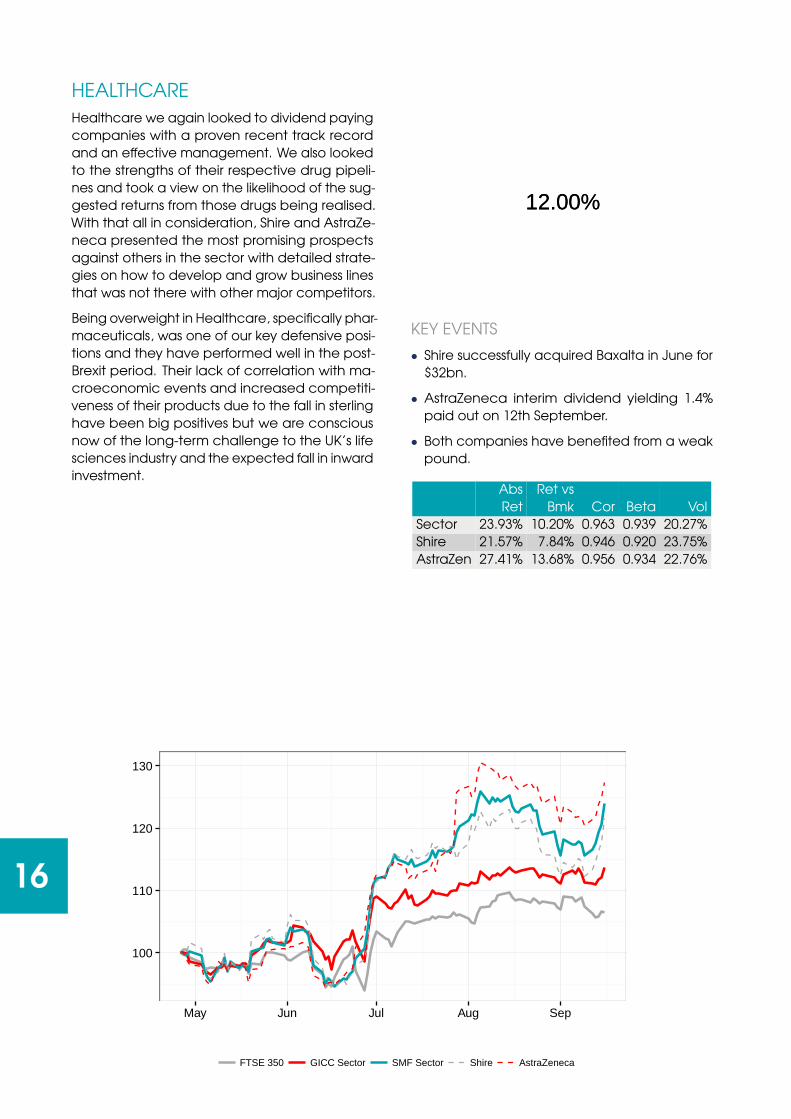
HEALTHCARE
Healthcare we again looked to dividend paying
companies with a proven recent track record
and an effective management. We also looked
to the strengths of their respective drug pipeli-
nes and took a view on the likelihood of the sug-
gested returns from those drugs being realised.
With that all in consideration, Shire and AstraZe-
neca presented the most promising prospects
against others in the sector with detailed strate-
gies on how to develop and grow business lines
that was not there with other major competitors.
Being overweight in Healthcare, specifically phar-
maceuticals, was one of our key defensive posi-
tions and they have performed well in the post-
Brexit period. Their lack of correlation with ma-
croeconomic events and increased competiti-
veness of their products due to the fall in sterling
have been big positives but we are conscious
now of the long-term challenge to the UK’s life
sciences industry and the expected fall in inward
investment.
12.00%12.00%
KEY EVENTS
• Shire successfully acquired Baxalta in June for
$32bn.
• AstraZeneca interim dividend yielding 1.4%
paid out on 12th September.
• Both companies have benefited from a weak
pound.
Abs Ret vs
Ret Bmk Cor Beta Vol
Sector 23.93% 10.20% 0.963 0.939 20.27%
Shire 21.57% 7.84% 0.946 0.920 23.75%
AstraZen 27.41% 13.68% 0.956 0.934 22.76%
100
110
120
130
May Jun Jul Aug Sep
FTSE 350 GICC Sector SMF Sector Shire AstraZeneca
16
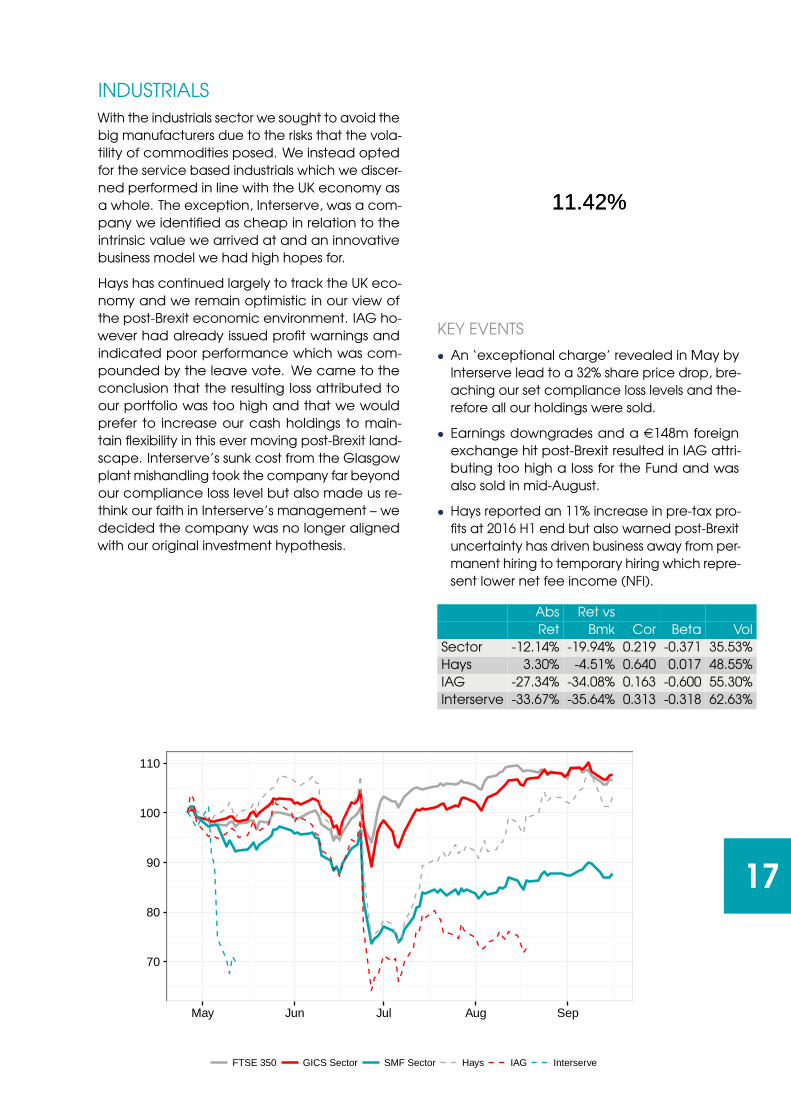
INDUSTRIALS
With the industrials sector we sought to avoid the
big manufacturers due to the risks that the vola-
tility of commodities posed. We instead opted
for the service based industrials which we discer-
ned performed in line with the UK economy as
a whole. The exception, Interserve, was a com-
pany we identified as cheap in relation to the
intrinsic value we arrived at and an innovative
business model we had high hopes for.
Hays has continued largely to track the UK eco-
nomy and we remain optimistic in our view of
the post-Brexit economic environment. IAG ho-
wever had already issued profit warnings and
indicated poor performance which was com-
pounded by the leave vote. We came to the
conclusion that the resulting loss attributed to
our portfolio was too high and that we would
prefer to increase our cash holdings to main-
tain flexibility in this ever moving post-Brexit land-
scape. Interserve’s sunk cost from the Glasgow
plant mishandling took the company far beyond
our compliance loss level but also made us re-
think our faith in Interserve’s management – we
decided the company was no longer aligned
with our original investment hypothesis.
11.42%11.42%
KEY EVENTS
• An ‘exceptional charge’ revealed in May by
Interserve lead to a 32% share price drop, bre-
aching our set compliance loss levels and the-
refore all our holdings were sold.
• Earnings downgrades and a e148m foreign
exchange hit post-Brexit resulted in IAG attri-
buting too high a loss for the Fund and was
also sold in mid-August.
• Hays reported an 11% increase in pre-tax pro-
fits at 2016 H1 end but also warned post-Brexit
uncertainty has driven business away from per-
manent hiring to temporary hiring which repre-
sent lower net fee income (NFI).
Abs Ret vs
Ret Bmk Cor Beta Vol
Sector -12.14% -19.94% 0.219 -0.371 35.53%
Hays 3.30% -4.51% 0.640 0.017 48.55%
IAG -27.34% -34.08% 0.163 -0.600 55.30%
Interserve -33.67% -35.64% 0.313 -0.318 62.63%
70
80
90
100
110
May Jun Jul Aug Sep
FTSE 350 GICS Sector SMF Sector Hays IAG Interserve
17
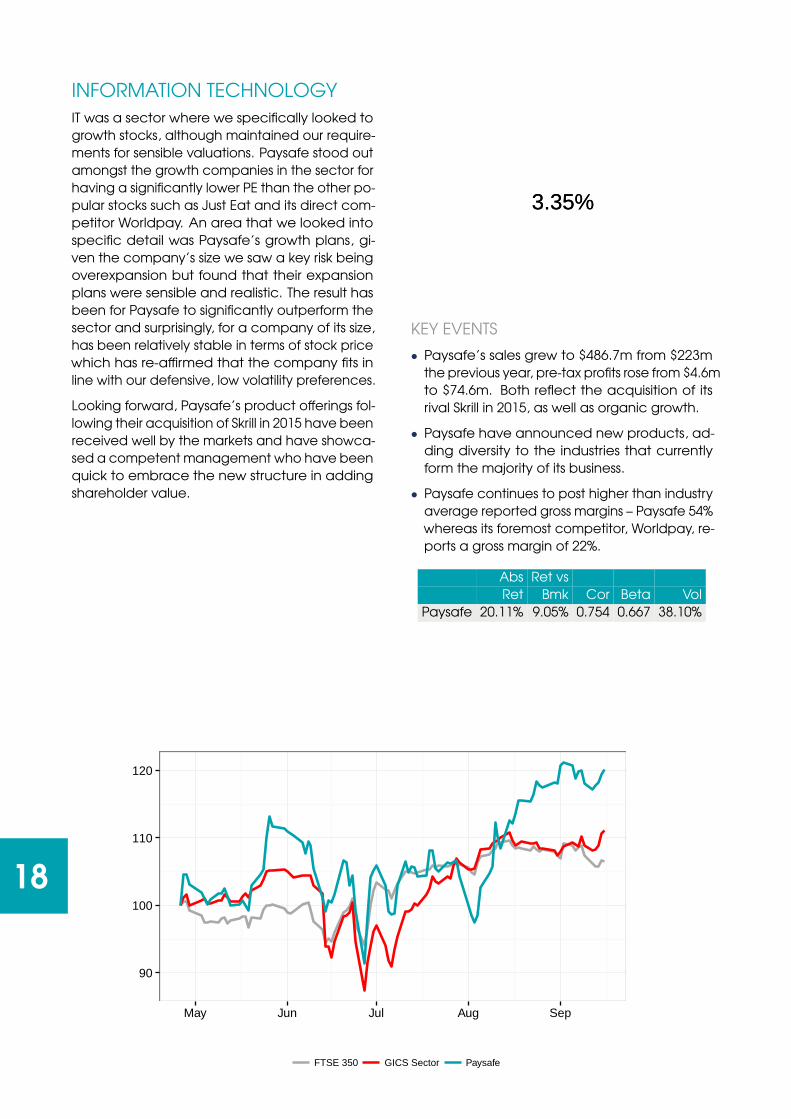
INFORMATION TECHNOLOGY
IT was a sector where we specifically looked to
growth stocks, although maintained our require-
ments for sensible valuations. Paysafe stood out
amongst the growth companies in the sector for
having a significantly lower PE than the other po-
pular stocks such as Just Eat and its direct com-
petitor Worldpay. An area that we looked into
specific detail was Paysafe’s growth plans, gi-
ven the company’s size we saw a key risk being
overexpansion but found that their expansion
plans were sensible and realistic. The result has
been for Paysafe to significantly outperform the
sector and surprisingly, for a company of its size,
has been relatively stable in terms of stock price
which has re-affirmed that the company fits in
line with our defensive, low volatility preferences.
Looking forward, Paysafe’s product offerings fol-
lowing their acquisition of Skrill in 2015 have been
received well by the markets and have showca-
sed a competent management who have been
quick to embrace the new structure in adding
shareholder value.
3.35%3.35%
KEY EVENTS
• Paysafe’s sales grew to $486.7m from $223m
the previous year, pre-tax profits rose from $4.6m
to $74.6m. Both reflect the acquisition of its
rival Skrill in 2015, as well as organic growth.
• Paysafe have announced new products, ad-
ding diversity to the industries that currently
form the majority of its business.
• Paysafe continues to post higher than industry
average reported gross margins – Paysafe 54%
whereas its foremost competitor, Worldpay, re-
ports a gross margin of 22%.
Abs Ret vs
Ret Bmk Cor Beta Vol
Paysafe 20.11% 9.05% 0.754 0.667 38.10%
90
100
110
120
May Jun Jul Aug Sep
FTSE 350 GICS Sector Paysafe
18
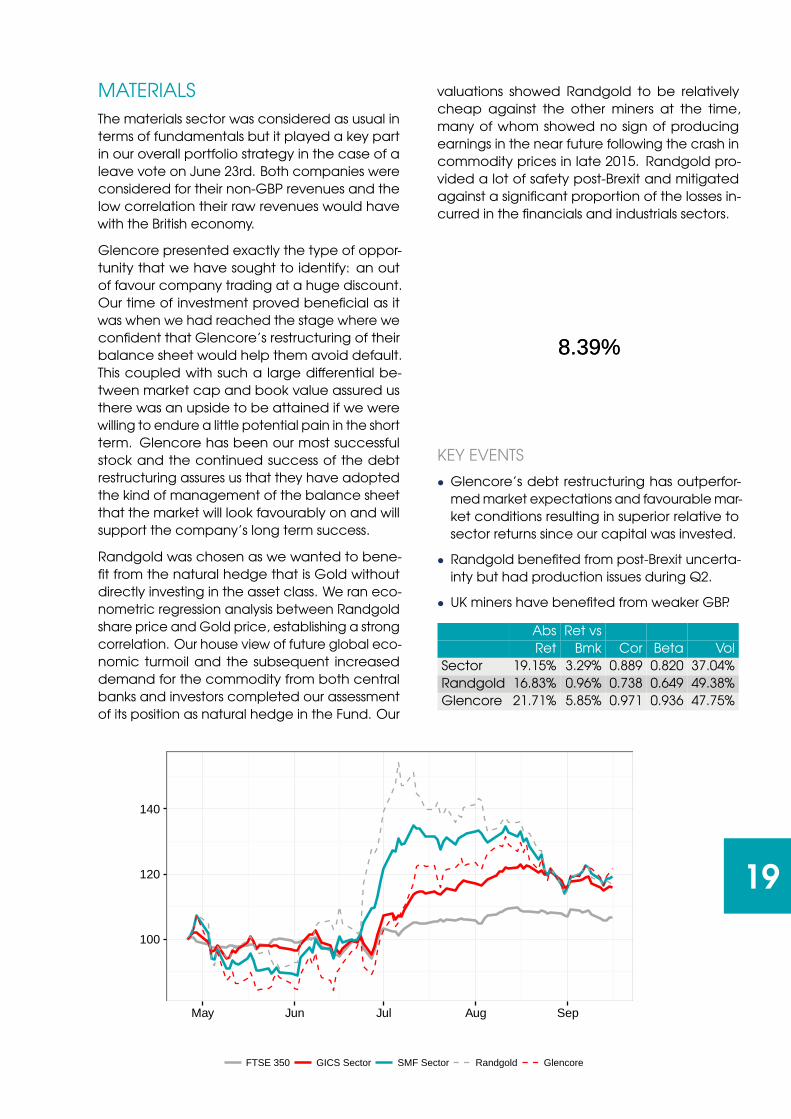
MATERIALS
The materials sector was considered as usual in
terms of fundamentals but it played a key part
in our overall portfolio strategy in the case of a
leave vote on June 23rd. Both companies were
considered for their non-GBP revenues and the
low correlation their raw revenues would have
with the British economy.
Glencore presented exactly the type of oppor-
tunity that we have sought to identify: an out
of favour company trading at a huge discount.
Our time of investment proved beneficial as it
was when we had reached the stage where we
confident that Glencore’s restructuring of their
balance sheet would help them avoid default.
This coupled with such a large differential be-
tween market cap and book value assured us
there was an upside to be attained if we were
willing to endure a little potential pain in the short
term. Glencore has been our most successful
stock and the continued success of the debt
restructuring assures us that they have adopted
the kind of management of the balance sheet
that the market will look favourably on and will
support the company’s long term success.
Randgold was chosen as we wanted to bene-
fit from the natural hedge that is Gold without
directly investing in the asset class. We ran eco-
nometric regression analysis between Randgold
share price and Gold price, establishing a strong
correlation. Our house view of future global eco-
nomic turmoil and the subsequent increased
demand for the commodity from both central
banks and investors completed our assessment
of its position as natural hedge in the Fund. Our
valuations showed Randgold to be relatively
cheap against the other miners at the time,
many of whom showed no sign of producing
earnings in the near future following the crash in
commodity prices in late 2015. Randgold pro-
vided a lot of safety post-Brexit and mitigated
against a significant proportion of the losses in-
curred in the financials and industrials sectors.
8.39%8.39%
KEY EVENTS
• Glencore’s debt restructuring has outperfor-
med market expectations and favourable mar-
ket conditions resulting in superior relative to
sector returns since our capital was invested.
• Randgold benefited from post-Brexit uncerta-
inty but had production issues during Q2.
• UK miners have benefited from weaker GBP.
Abs Ret vs
Ret Bmk Cor Beta Vol
Sector 19.15% 3.29% 0.889 0.820 37.04%
Randgold 16.83% 0.96% 0.738 0.649 49.38%
Glencore 21.71% 5.85% 0.971 0.936 47.75%
100
120
140
May Jun Jul Aug Sep
FTSE 350 GICS Sector SMF Sector Randgold Glencore
19
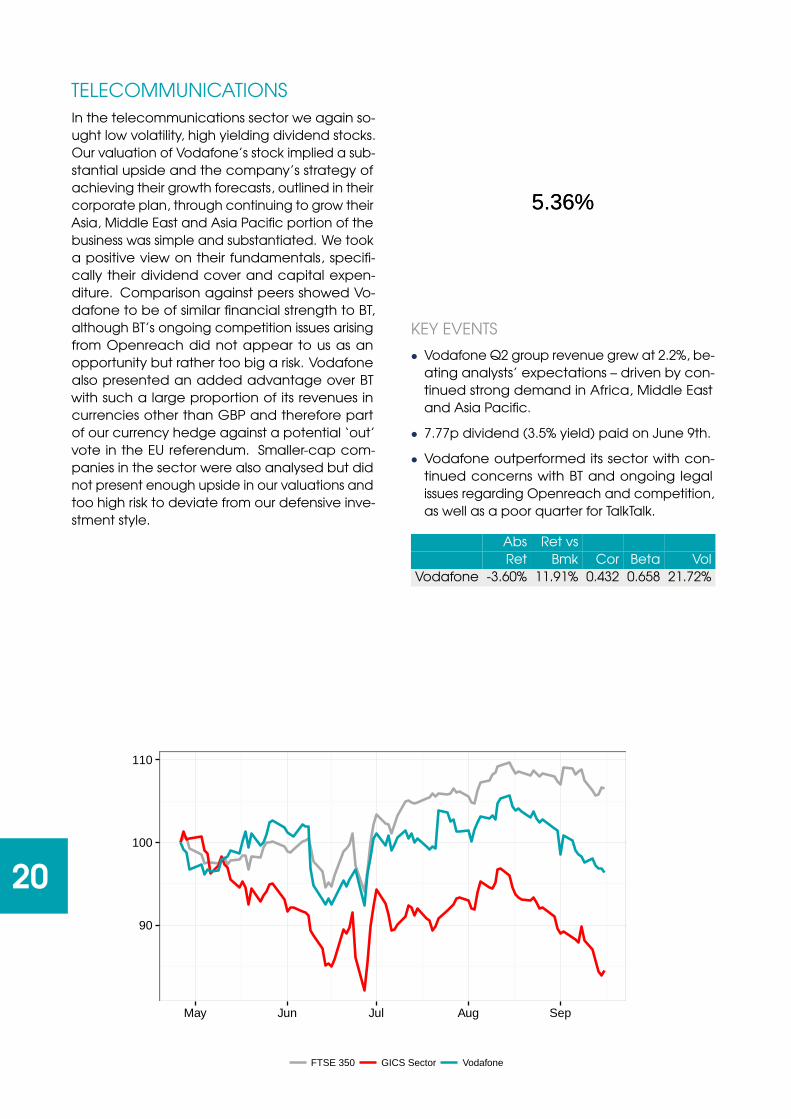
TELECOMMUNICATIONS
In the telecommunications sector we again so-
ught low volatility, high yielding dividend stocks.
Our valuation of Vodafone’s stock implied a sub-
stantial upside and the company’s strategy of
achieving their growth forecasts, outlined in their
corporate plan, through continuing to grow their
Asia, Middle East and Asia Pacific portion of the
business was simple and substantiated. We took
a positive view on their fundamentals, specifi-
cally their dividend cover and capital expen-
diture. Comparison against peers showed Vo-
dafone to be of similar financial strength to BT,
although BT’s ongoing competition issues arising
from Openreach did not appear to us as an
opportunity but rather too big a risk. Vodafone
also presented an added advantage over BT
with such a large proportion of its revenues in
currencies other than GBP and therefore part
of our currency hedge against a potential ‘out’
vote in the EU referendum. Smaller-cap com-
panies in the sector were also analysed but did
not present enough upside in our valuations and
too high risk to deviate from our defensive inve-
stment style.
5.36%5.36%
KEY EVENTS
• Vodafone Q2 group revenue grew at 2.2%, be-
ating analysts’ expectations – driven by con-
tinued strong demand in Africa, Middle East
and Asia Pacific.
• 7.77p dividend (3.5% yield) paid on June 9th.
• Vodafone outperformed its sector with con-
tinued concerns with BT and ongoing legal
issues regarding Openreach and competition,
as well as a poor quarter for TalkTalk.
Abs Ret vs
Ret Bmk Cor Beta Vol
Vodafone -3.60% 11.91% 0.432 0.658 21.72%
90
100
110
May Jun Jul Aug Sep
FTSE 350 GICS Sector Vodafone
20
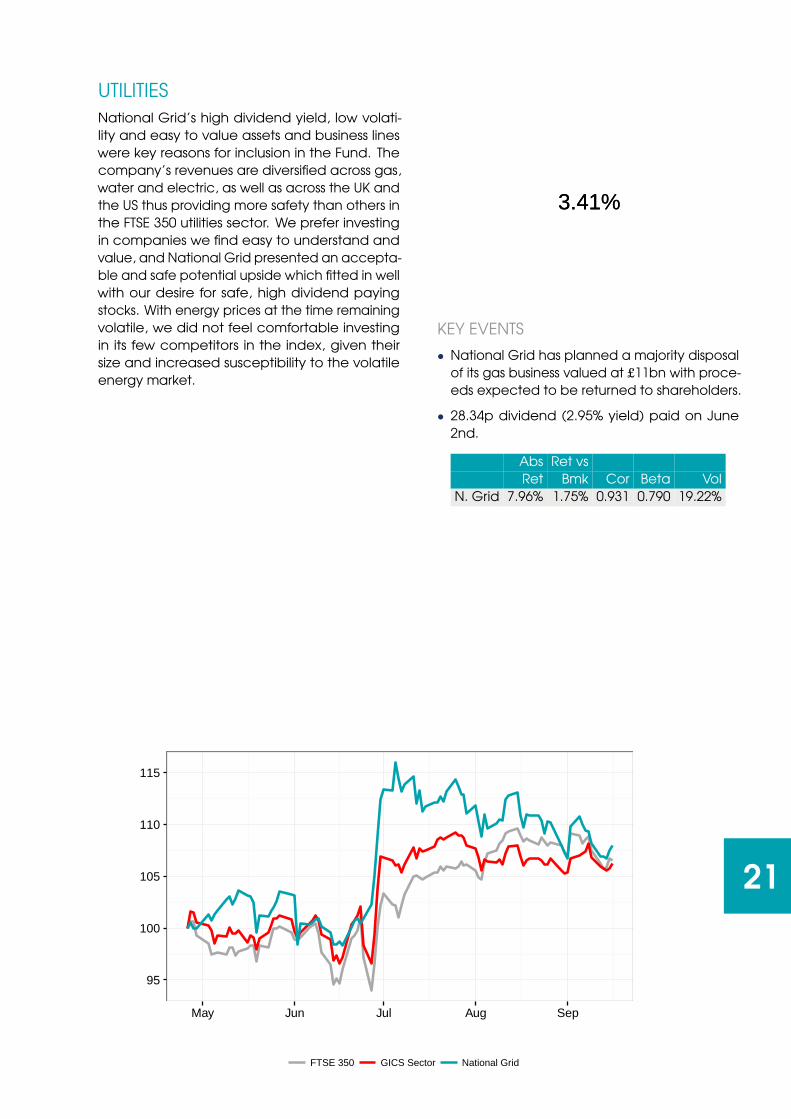
UTILITIES
National Grid’s high dividend yield, low volati-
lity and easy to value assets and business lines
were key reasons for inclusion in the Fund. The
company’s revenues are diversified across gas,
water and electric, as well as across the UK and
the US thus providing more safety than others in
the FTSE 350 utilities sector. We prefer investing
in companies we find easy to understand and
value, and National Grid presented an accepta-
ble and safe potential upside which fitted in well
with our desire for safe, high dividend paying
stocks. With energy prices at the time remaining
volatile, we did not feel comfortable investing
in its few competitors in the index, given their
size and increased susceptibility to the volatile
energy market.
3.41%3.41%
KEY EVENTS
• National Grid has planned a majority disposal
of its gas business valued at £11bn with proce-
eds expected to be returned to shareholders.
• 28.34p dividend (2.95% yield) paid on June
2nd.
Abs Ret vs
Ret Bmk Cor Beta Vol
N. Grid 7.96% 1.75% 0.931 0.790 19.22%
95
100
105
110
115
May Jun Jul Aug Sep
FTSE 350 GICS Sector National Grid
21
BEYOND THE FUND
As part of a drive from Queen’s staff and students alike to expand the
Fund, extend its reach and continue to teach industry relevant skills, as
with any industry we have to raise philanthropic capital. Part of the Fund
therefore includes a crowdfunding project where students of different
levels in the Fund have come together to create a crowdfunding video
for prospective investors. QSMF is also planning to launch a mail and
phone campaign seeking financial support from Queen’s alumni. In line
with the ethos of the Fund, as it grows and becomes established, QSMF
aims to donate a portion of future profits to a student-focused charity
such as the Student Union’s hardship fund.
The Fund is focused primarily with the student learning experience. Stu-
dent members of the Fund regularly hear from guest speakers giving
students a special insight into industry norms, how to secure roles in
the speaker’s line of work and provide students an opportunity to start
building their own professional network.
Other initiatives are run throughout the year such as budget specials
where students monitor the markets through the autumn and spring
budgets to see how policies impact company share prices.
.
22
CONNECT
@QUBSMF
http://go.qub.ac.uk/qubsmf
Queen’s Student Managed Fund
ACKNOWLEDGEMENTS
QSMF would like to express their gratitude to all those who have supported the fund in various
ways through its development and launch. Invaluable support has provided from within Queen’s
from the Management School, Student’s Union, and Alumni Relations Office. In particular we
wish to thank the individuals and corporate donors, many of whom wish to remain anonymous,
whose generous donations have turned the long-planned, real-money fund into a reality.
DISCLAIMER
The material in this presentation has been prepared by students of Queen’s Student Managed
Fund (QSMF) and provides background information on QSMF activities. The Fund is operated
on the basis of philanthropic donations and has an educational focus. Information contained
within should not be considered as advice or a recommendation to investors. Past performance
is not a reliable indication of future performance.

Queen’s Management School
Riddel Hall, 185 Stranmillis Road, Belfast, Northern Ireland, UK, BT9 5EE
T +44 (0)28 9097 4200 E [email protected] W www.qub.ac.uk/mgt