Embed Size (px)
Citation preview

of the Certified Breast Cancer Centres (BCCs)
Annual Report 2015
Audit year 2014 / indicator year 2013

Annual Report BCCs 2015 (audit year 2014 / indicator year 2013)
Content
2
Introduction
Status of the certification system: Breast Cancer Centres 2015
General information
Tumour documentation systems used in Breast Cancer Centres
Basic data
Analysis of Indicators
Indicator Nr. 1: Postoperative case presentation
Indicator Nr. 2: Pretreatment case presentation
Indicator Nr. 3: Case discussion of local recurrence/metastases
Indicator Nr. 4.1: Recommended RT after BCT in cases of inv. BreCa
Indicator Nr. 4.2: Completed RT after BCT in cases of inv. Br-Ca (based on year previous to index year)
Indicator Nr. 5.1: Recommended RT after BCT in cases of DCIS
Indicator Nr. 5.2: Completed radiotherapy after BCT in cases of DCIS (based on year previous to index year)
Indicator Nr. 6.1: Recommended RT after a mastectomy in cases of inv. Br-Ca
Indicator Nr. 6.2: Completed radiotherapy after a mastectomy in cases of inv. breast cancer (in relation to the previous index year)
Indicator Nr. 7.1: Recommended chemotherapy in cases of steroid receptor negative diagnostic finding
Indicator Nr. 7.2: Completed chemotherapies in cases of steroid receptive negative diagnostic finding (based on year previous to ind. year)
Indicator Nr. 8.1: Recommended chemotherapy in cases of receptor positive and nodal positive diagnostic finding
Indicator Nr. 8.2: Completed chemotherapy in cases of receptor positive and nodal positive diagnostic finding (based on year previous to ind. year)
Indicator Nr. 9.1: Recommended endocrine therapy in cases of steroid receptor positive diagnostic finding
Indicator Nr. 9.2: Initiated endocrine therapy in cases of steroid receptive positive diagnostic finding4 (in relation to the previous index year)
Indicator Nr. 10.1: Recommended trastuzumab therapy over one year in cases of HER-2 positive diagnostic finding
Indicator Nr. 10.2: Completed trastuzumab therapy over 1 year in cases of HER2 positive diagnostic finding
Indicator Nr. 11: Endocrine therapy in cases of metastases
Indicator Nr. 12: Psycho-oncologic care (>30 min)
Indicator Nr. 13: Social-service counseling
Indicator Nr. 14: Participation in research study
Indicator Nr. 15: Pre-therapeutic histological confirmation
Indicator Nr. 16: Primary cases Br-Ca
Indicator Nr. 17: BCT in cases of pT1 primary cases
Indicator Nr. 18: Mastectomies primary cases
Indicator Nr. 19: DCIS in initial procedure primary cases (pTIS)
Indicator Nr. 20: LN dissection in cases of DCIS
Indicator Nr. 21: Determination of the nodal status in cases of inv. Br-Ca
Indicator Nr. 22: SLNE only in cases of pN0
Indicator Nr. 23: Intraoperative specimen radio-/sonography
Indicator Nr. 24: Revision operations primary cases
Indicator Nr. 25: Postoperative wound infection primary cases
Indicator Nr. 26: Breast reconstruction
Indicator Nr. 27: Specification of the resection margin and safety margin
Indicator Nr. 28: Report to the cancer registry
Imprint
3
3
4
7
8
10
10
11
12
13
14
15
16
17
18
19
20
21
22
23
24
25
26
27
28
29
30
31
32
33
34
35
36
37
38
39
40
41
42
43
44
45
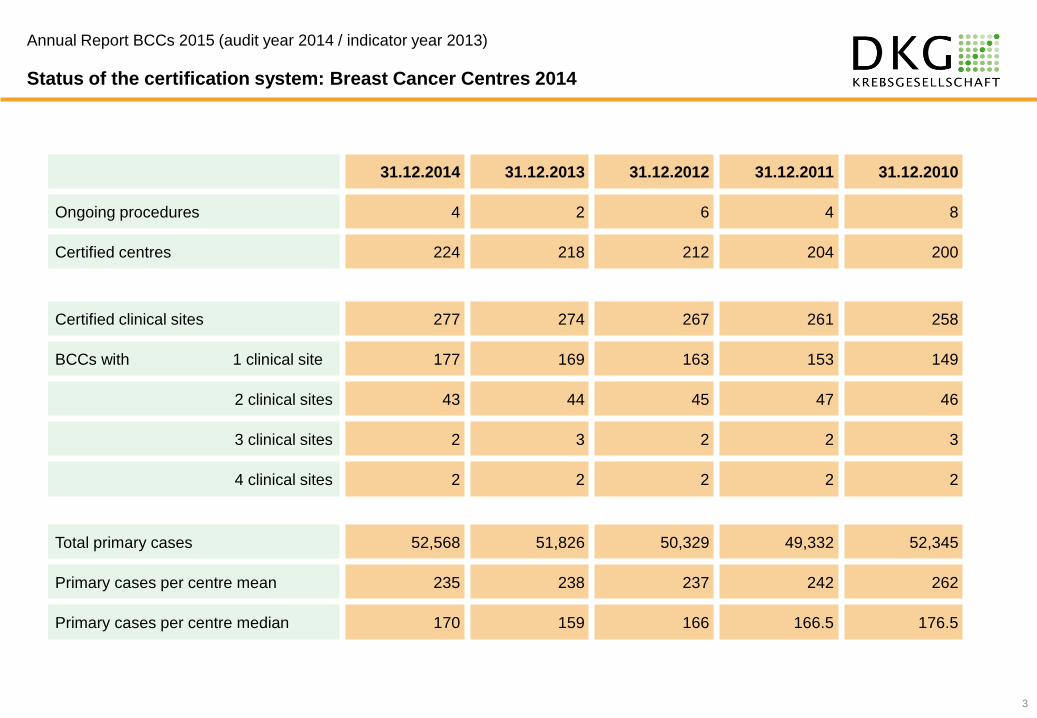
Status of the certification system: Breast Cancer Centres 2014
3
31.12.2014 31.12.2013 31.12.2012 31.12.2011 31.12.2010
Ongoing procedures 4 2 6 4 8
Certified centres 224 218 212 204 200
Certified clinical sites 277 274 267 261 258
BCCs with 1 clinical site 177 169 163 153 149
2 clinical sites 43 44 45 47 46
3 clinical sites 2 3 2 2 3
4 clinical sites 2 2 2 2 2
Total primary cases 52,568 51,826 50,329 49,332 52,345
Primary cases per centre mean 235 238 237 242 262
Primary cases per centre median 170 159 166 166.5 176.5
Annual Report BCCs 2015 (audit year 2014 / indicator year 2013)

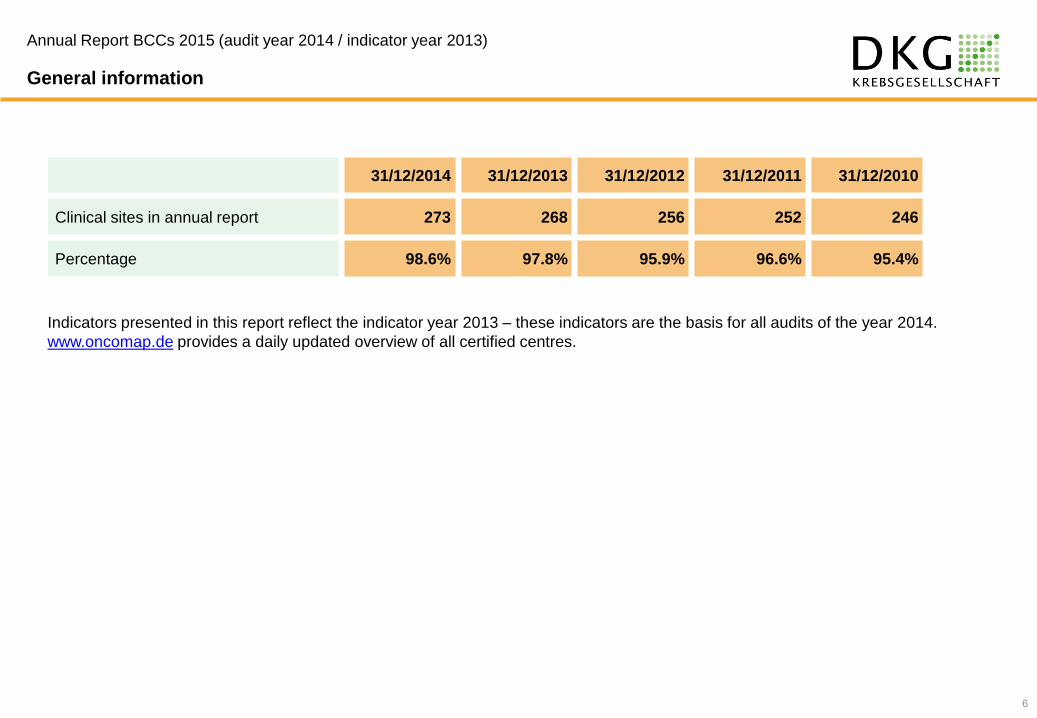
General information
4
Basic data / indicator:
The definition of the numerator, population (=denominator), and target value is
taken from the data sheet form, a part of the Catalogue of Requirements.
Ranges are indicated for numerator, population, and rate.
Chart:
The x-axis indicates the number of centres, the y-axis indicates the value in percent.
Median and target value are indicated by green lines.
Annual Report BCCs 2015 (audit year 2014 / indicator year 2013)

Cohorts development:
The development of the cohorts 2009, 2010, 2011, 2012, and 2013 is graphically
represented with boxplots.
Boxplot:
A boxplot consits of a box with median, whiskers and outliers. 50% of the centres
constitute the box, 90% box and whiskers, dots present the outliers.
General information
5
Annual Report BCCs 2015 (audit year 2014 / indicator year 2013)
General information
6
31/12/2014 31/12/2013 31/12/2012 31/12/2011 31/12/2010
Clinical sites in annual report 273 268 256 252 246
Percentage 98.6% 97.8% 95.9% 96.6% 95.4%
Indicators presented in this report reflect the indicator year 2013 – these indicators are the basis for all audits of the year 2014.
www.oncomap.de provides a daily updated overview of all certified centres.
Annual Report BCCs 2015 (audit year 2014 / indicator year 2013)

Tumour documentation systems used in Breast Cancer Centres
Legende:
Andere/ “others“ System is used in less than 4 centres
7
Annual Report BCCs 2015 (audit year 2014 / indicator year 2013)
8
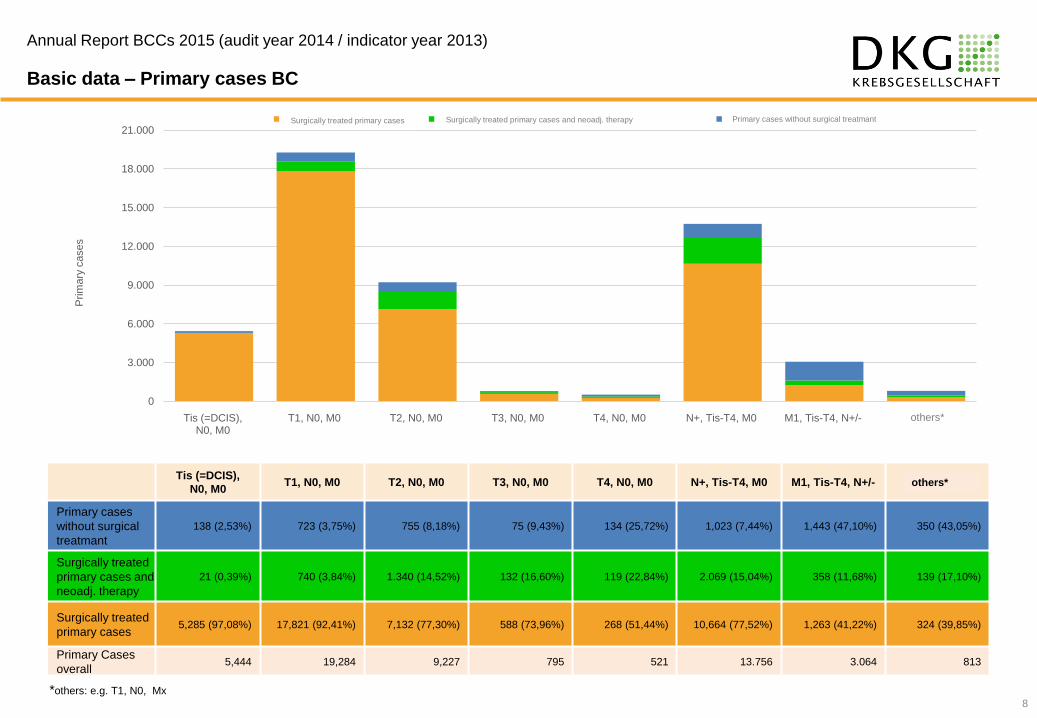
Basic data – Primary cases BC
Tis (=DCIS),
N0, M0 T1, N0, M0 T2, N0, M0 T3, N0, M0 T4, N0, M0 N+, Tis-T4, M0 M1, Tis-T4, N+/-
nicht
zuzuordnen*
Primary cases
without surgical
treatmant
138 (2,53%) 723 (3,75%) 755 (8,18%) 75 (9,43%) 134 (25,72%) 1,023 (7,44%) 1,443 (47,10%) 350 (43,05%)
Surgically treated
primary cases and
neoadj. therapy
21 (0,39%) 740 (3,84%) 1.340 (14,52%) 132 (16,60%) 119 (22,84%) 2.069 (15,04%) 358 (11,68%) 139 (17,10%)
Surgically treated
primary cases 5,285 (97,08%) 17,821 (92,41%) 7,132 (77,30%) 588 (73,96%) 268 (51,44%) 10,664 (77,52%) 1,263 (41,22%) 324 (39,85%)
Primary Cases
overall 5,444 19,284 9,227 795 521 13.756 3.064 813
0
3.000
6.000
9.000
12.000
15.000
18.000
21.000
Tis (=DCIS),N0, M0
T1, N0, M0 T2, N0, M0 T3, N0, M0 T4, N0, M0 N+, Tis-T4, M0 M1, Tis-T4, N+/- nicht zuzuordnen
Prim
ary
cases
Primärfälle operiert Primärfälle operiert mit neoadjuvanter Therapie Primärfälle nicht operiert
*others: e.g. T1, N0, Mx
others*
others*
Primary cases without surgical treatmant Surgically treated primary cases and neoadj. therapy Surgically treated primary cases
Annual Report BCCs 2015 (audit year 2014 / indicator year 2013)

9
Basic data – Distribution of surgically treated primary cases
0
3.000
6.000
9.000
12.000
15.000
18.000
Tis (=DCIS),N0, M0
T1, N0, M0 T2, N0, M0 T3, N0, M0 T4, N0, M0 N+, Tis-T4, M0 M1, Tis-T4, M0 nicht zuzuordnen
Prim
ary
cases
BET Mastektomien
Tis (=DCIS),
N0, M0 T1, N0, M0 T2, N0, M0 T3, N0, M0 T4, N0, M0 N+, Tis-T4, M0 M1, Tis-T4, N+/- others*
Mastectomy 1,197 (22,56%) 2,765 (14,90%) 2,607 (30,77%) 530 (73,61%) 294 (75,97%) 5,624 (44,17%) 1,063 (65,58%) 151 (32,61%)
BCT 4,109 (77,44%) 15,796 (85,10%) 5,865 (69,23%) 190 (26,39%) 93 (24,03%) 7,109 (55,83%) 558 (34,42%) 312 (67,39%)
Primary Cases 5,306 18,561 8,472 720 387 12,733 1,621 463
*others e.g. T1, N0, Mx
Mastectomies BCT
others*
others*
Annual Report BCCs 2015 (audit year 2014 / indicator year 2013)

1. Postoperative case presentation
10
Clinical sites with
evaluable data
Clinical sites meeting
the target
Number % Number %
273 100% 273 100%
Definition of indicator
All clinical sites 2013
Median Range
Numerator All surgically treated primary
cases presented in the
tumour conference
154* 38 - 786
Population Surgically treated primary
cases (for definition of a
primary case see 5.2.1)
156* 39 - 793
Rate Target ≥ 95% 100% 95.00% - 100% (133/140) - (552/552)
Comment:
2009 2010 2011 2012 2013
Max 100% 100% 100% 100% 100%
95th percentile 100% 100% 100% 100% 100%
75th percentile 100% 100% 100% 100% 100%
Median 99.32% 100% 100% 100% 100%
25th percentile 96.88% 98.31% 98.72% 98.93% 98.69%
5th percentile 91.19% 95.66% 96.10% 96.67% 96.77%
Min 73.39% 87.34% 87.56% 93.40% 95.00%
Annual Report BCCs 2015 (audit year 2014 / indicator year 2013)
clinical sites

2. Pretreatment case presentation
11
Clinical sites with
evaluable data
Clinical sites meeting
the target
Number % Number %
273 100% ----- -----
Definition of indicator
All clinical sites 2013
Median Range
Numerator Number of primary cases
presented in the pre-therapeutic
tumour board
89 3 - 682
Population Primary cases 172 44 - 839
Rate Currently no target value 61.60% 3.18% - 100% (5/157) - (644/644)
Comment:
Proportion of pretherapeutic case discussions increasing over time. Centres with low presentation rates mainly present patients with neoadjuvant therapy. However, more and more centres are discussing all primary case patients pre- and post-operatively.
2009 2010 2011 2012 2013
Max ----- 100% 100% 100% 100%
95th percentile ----- 100% 100% 100% 99.77%
75th percentile ----- 87.67% 91.98% 93.41% 93.63%
Median ----- 37.70% 46.67% 58.26% 61.60%
25th percentile ----- 13.81% 19.63% 22.19% 25.97%
5th percentile ----- 4.17% 7.39% 7.39% 7.26%
Min ----- 0.00% 0.00% 0.85% 3.18%
Annual Report BCCs 2015 (audit year 2014 / indicator year 2013)
clinical sites

3. Case discussion of local recurrence/metastases
12
Clinical sites with
evaluable data
Clinical sites meeting
the target
Number % Number %
273 100% ----- -----
Definition of indicator
All clinical sites 2013
Median Range
Number Number of cases with local
recurrence/newly diagnosed
metastases presented in the TB
19 0 - 185
Currently no target value
Comment:
Indicator from 2015 no longer given just as a number but also as a proportion (ratio of presented patients with local recurrence/newly diagnosed metastases to population = numerator).
2009 2010 2011 2012 2013
Max ----- 217.00 416.00 206.00 185.00
95th percentile ----- 104.80 98.35 95.50 89.00
75th percentile ----- 40.50 45.00 37.00 41.00
Median ----- 20.00 20.50 18.00 19.00
25th percentile ----- 10.00 11.00 10.00 11.00
5th percentile ----- 3.00 3.00 4.00 4.00
Min ----- 0.00 0.00 0.00 0.00
Annual Report BCCs 2015 (audit year 2014 / indicator year 2013)
clinical sites

4.1. Recommended RT after breast conserving therapy in cases of inv. BC
13
Clinical sites with
evaluable data
Clinical sites meeting
the target
Number % Number %
273 100% 261 95,60%
Definition of indicator
All clinical sites 2013
Median Range
Numerator Primary cases with inv.
breast cancer and breast
conserving therapy, in
which a radiotherapy was
recommended
94 20 - 515
Population Primary cases with
invasive breast cancer with
BCT
96 20 - 525
Rate Target ≥ 95% 98.59% 90.38% - 100% (94/104) - (285/285)
Comment:
The reasons given by centres which do not meet the target are advanced age, existing multi-morbidities with/or distant metastasization of patient.
2009 2010 2011 2012 2013
Max ----- 100% 100% 100% 100%
95th percentile ----- 100% 100% 100% 100%
75th percentile ----- 100% 99.22% 99.08% 100%
Median ----- 98.00% 98.15% 97.75% 98.59%
25th percentile ----- 96.25% 96.28% 96.20% 97.18%
5th percentile ----- 92.37% 93.51% 93.58% 95.25%
Min ----- 87.50% 88.10% 87.50% 90.38%
Annual Report BCCs 2015 (audit year 2014 / indicator year 2013)
clinical sites

4.2. Completed RT after breast conserving therapy in cases of inv. BC
(based on year previous to index year)
14
Clinical sites with
evaluable data
Clinical sites meeting
the target
Number % Number %
192 70.33% 144 75.0%
Definition of indicator
All clinical sites 2013
Median Range
Numerator Primary cases with inv.
breast cancer and BCT, for
which radiotherapy was
recommended and
performed
89,5 18 - 322
Population Numerator for indicator no.
4.1 for the year previous to
index year
93 19 - 332
Rate Target ≥ 95% 97.28% 29.08% - 100% (41/141) - (194/194)
Comment:
The centre with the lowest value had a documentation problem. The reason given by the centres for the non-conduct of radiation therapy is patient refusal. Information is optional. Indicator is a quality indicator of the Guideline
2009 2010 2011 2012 2013
Max ----- 100% 100% 100% 100%
95th percentile ----- 100% 100% 100% 100%
75th percentile ----- 98.65% 98.98% 100% 98.93%
Median ----- 96.89% 97.10% 97.70% 97.28%
25th percentile ----- 94.98% 95.24% 95.27% 94.99%
5th percentile ----- 90.21% 89.86% 88.54% 86.90%
Min ----- 80.54% 74.47% 71.42% 29.08%
Annual Report BCCs 2015 (audit year 2014 / indicator year 2013)
clinical sites

5.1. Recommended RT after breast conserving therapy in cases of DCIS
15
Clinical sites with
evaluable data
Clinical sites meeting
the target
Number % Number %
273 100% 197 72.16%
Definition of indicator
All clinical sites 2013
Median Range
Numerator Primary cases with DCIS and
BCT for which radiotherapy
was recommended
13 0 - 65
Population Primary cases with DCIS und
BCT 13 1 - 68
Rate Target ≥ 95% 100% 0.00% - 100% (0/1) - (37/37)
Comment:
The centre with the lowest recommendation proportion had 1 patient with DCIS and BCT, who was not recommended radiation because of her age. Reasons for the non-conduct of radiation in the case of DCIS: small tumour, low grading and low-risk tumour.
2009 2010 2011 2012 2013
Max ----- 100% 100% 100% 100%
95th percentile ----- 100% 100% 100% 100%
75th percentile ----- 100% 100% 100% 100%
Median ----- 100% 100% 100% 100%
25th percentile ----- 92.31% 91.11% 94.11% 93.75%
5th percentile ----- 66.67% 74.50% 72.96% 79.30%
Min ----- 45.00% 33.33% 20.00% 0.00%
Annual Report BCCs 2015 (audit year 2014 / indicator year 2013)
clinical sites

5.2. Completed radiotherapy after breast conserving therapy in cases of DCIS
(based on year previous to index year)
16
Clinical sites with
evaluable data
Clinical sites meeting
the target
Number % Number %
192 70.33% 132 68.75%
Definition of indicator
All clinical sites 2013
Median Range
Numerator Primary cases with DCIS and
BCT that were treated with
radiotherapy
11 1 - 220
Population Numerator for indicator no. 5.1
for the year previous to index
year
11,5 1 - 241
Rate Target ≥ 95% 100% 26.67% - 100% (4/15) - (95/95)
Comment
Most of the recommended therapies were conducted. Non-conduct results above all from patient refusal. The centre with the lowest rate is the same centre that had the lowest value for indicator 4.2 as well. Documentation problems were given as the reason. Information is optional.
2009 2010 2011 2012 2013
Max ----- 100% 100% 100% 100%
95th percentile ----- 100% 100% 100% 100%
75th percentile ----- 100% 100% 100% 100%
Median ----- 100% 100% 100% 100%
25th percentile ----- 88.89% 93.33% 94.44% 92.72%
5th percentile ----- 66.67% 69.27% 75.42% 75.42%
Min ----- 45.45% 21.43% 0.00% 26.67%
Annual Report BCCs 2015 (audit year 2014 / indicator year 2013)
clinical sites

6.1. Recommended RT after a mastectomy in cases of inv. Br-Ca
17
Clinical sites with
evaluable data
Clinical sites meeting
the target
Number % Number %
273 100% 141 51.65%
Definition of indicator
All clinical sites 2013
Median Range
Numerator Primary cases with invasive
breast cancer and mastectomy,
for which radiotherapy was
recommended
13 1 - 60
Population Primary cases with invasive
breast cancer und mastectomy
and indication for radiotherapy
of the chest wall (T3/4-Tm,
R1/R2 resection with no
possibility of repeated resection
or pN +> 3 LN)
14 1 - 63
Rate Target ≥ 95% 95.00% 45.45% - 100% (5/11) - (52/52)
Comment
The reasons for not recommending therapy are advanced age of patients, existing distant metastasization and multi-morbidities.
2009 2010 2011 2012 2013
Max ----- 100% 100% 100% 100%
95th percentile ----- 100% 100% 100% 100%
75th percentile ----- 100% 100% 100% 100%
Median ----- 95.60% 95.55% 95.23% 95.00%
25th percentile ----- 87.50% 86.59% 85.71% 86.67%
5th percentile ----- 66.67% 70.24% 67.39% 70.00%
Min ----- 23.08% 0.00% 37.50% 45.45%
Annual Report BCCs 2015 (audit year 2014 / indicator year 2013)
clinical sites
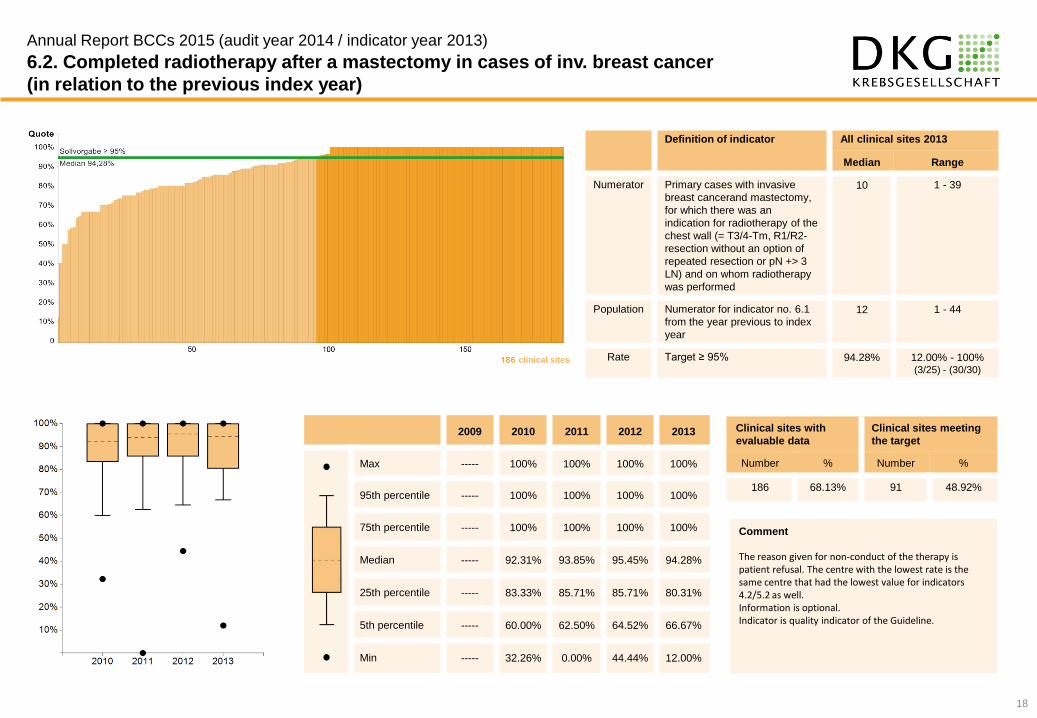
6.2. Completed radiotherapy after a mastectomy in cases of inv. breast cancer
(in relation to the previous index year)
18
Clinical sites with
evaluable data
Clinical sites meeting
the target
Number % Number %
186 68.13% 91 48.92%
Definition of indicator
All clinical sites 2013
Median Range
Numerator Primary cases with invasive
breast cancerand mastectomy,
for which there was an
indication for radiotherapy of the
chest wall (= T3/4-Tm, R1/R2-
resection without an option of
repeated resection or pN +> 3
LN) and on whom radiotherapy
was performed
10 1 - 39
Population Numerator for indicator no. 6.1
from the year previous to index
year
12 1 - 44
Rate Target ≥ 95% 94.28% 12.00% - 100% (3/25) - (30/30)
Comment
The reason given for non-conduct of the therapy is patient refusal. The centre with the lowest rate is the same centre that had the lowest value for indicators 4.2/5.2 as well. Information is optional. Indicator is quality indicator of the Guideline.
2009 2010 2011 2012 2013
Max ----- 100% 100% 100% 100%
95th percentile ----- 100% 100% 100% 100%
75th percentile ----- 100% 100% 100% 100%
Median ----- 92.31% 93.85% 95.45% 94.28%
25th percentile ----- 83.33% 85.71% 85.71% 80.31%
5th percentile ----- 60.00% 62.50% 64.52% 66.67%
Min ----- 32.26% 0.00% 44.44% 12.00%
Annual Report BCCs 2015 (audit year 2014 / indicator year 2013)
clinical sites

7.1. Recommended chemotherapy in cases of steroid receptor negative diagnostic finding
19
Clinical sites with
evaluable data
Clinical sites meeting
the target
Number % Number %
273 100% 235 86.08%
Definition of indicator
All clinical sites 2013
Median Range
Numerator All steroid receptor neg. primary
cases with invasive breast
cancer, for which chemotherapy
was recommended
18 1 - 84
Population Primary cases with invasive
breast cancer with steroid
receptor negative diagnostic
finding
21 1 - 96
Rate Target ≥ 80% 88.24% 28.57% - 100% (2/7) - (36/36)
Comment Some centres did not include patients with neoadjuvant therapy in the numerator. The reasons given for non-recommendation: multi-morbidity, pT1a, patients’ age. The centre with the lowest value has a small population (7 patients).
2009 2010 2011 2012 2013
Max ----- 100% 100% 100% 100%
95th percentile ----- 100% 100% 100% 100%
75th percentile ----- 92.77% 94.74% 95.00% 93.33%
Median ----- 86.24% 90.00% 89.53% 88.24%
25th percentile ----- 80.00% 83.33% 83.33% 82.61%
5th percentile ----- 66.67% 69.89% 73.14% 72.53%
Min ----- 25.00% 41.94% 45.45% 28.57%
Annual Report BCCs 2015 (audit year 2014 / indicator year 2013)
clinical sites

7.2. Completed chemotherapies in cases of steroid receptive negative diagnostic finding (based on year previous to index year)
20
Clinical sites with
evaluable data
Clinical sites meeting
the target
Number % Number %
193 70.70% 117 60.62%
Definition of indicator
All clinical sites 2013
Median Range
Numer
ator
All steroid receptor negative
primary cases with invasive breast
cancer, to whom chemotherapy
was administered
16 1 - 68
Populat
ion
Numerator for indicator Nr. 7.1 from
the year previous to index year
18 1 - 76
Rate Target ≥ 95% 96.67% 50.00% - 100% (1/2) - (43/43)
Comment
The reason given for the non-conduct of the recommended therapies is patient refusal. Information is optional. Indicator is quality indicator of the Guideline.
2009 2010 2011 2012 2013
Max ----- 100% 100% 100% 100%
95th percentile ----- 100% 100% 100% 100%
75th percentile ----- 100% 100% 100% 100%
Median ----- 94.74% 96.55% 99.32% 96.67%
25th percentile ----- 86.67% 90.00% 91.57% 90.48%
5th percentile ----- 71.43% 76.95% 72.77% 73.00%
Min ----- 42.86% 33.33% 19.40% 50.00%
Annual Report BCCs 2015 (audit year 2014 / indicator year 2013)
clinical sites

8.1. Recommended chemotherapy in cases of receptor positive and
nodal positive diagnostic finding
21
Clinical sites with
evaluable data
Clinical sites meeting
the target
Number % Number %
273 100% 243 89.01%
Definition of indicator
All clinical sites 2013
Median Range
Numerator All receptor positive and nodal
positive primary cases with
invasive breast cancer in which
a chemotherapy was
recommended
28 2 - 120
Population Primary cases with invasive
breast cancerwith receptor
positive and nodal positive
diagnostic finding
37 2 - 191
Rate Target ≥ 60% 72.22% 25.00% - 100% (6/24) - (76/76)
Comment
Recommendations for the conduct of chemotherapy in the case of a receptor pos. and nodal pos. finding decrease over time. The reasons given are: patients’ age, comorbidities, neoadjuvant therapies not included in the numerators, luminal A-like patients, micrometastases.
2009 2010 2011 2012 2013
Max ----- 100% 100% 100% 100%
95th percentile ----- 100% 100% 96.37% 92.50%
75th percentile ----- 86.36% 85.84% 83.06% 79.49%
Median ----- 77.27% 76.06% 75.00% 72.22%
25th percentile ----- 70.00% 66.67% 66.66% 64.15%
5th percentile ----- 56.43% 55.09% 52.74% 50.59%
Min ----- 33.33% 30.30% 37.50% 25.00%
Annual Report BCCs 2015 (audit year 2014 / indicator year 2013)
clinical sites

8.2. Completed chemotherapy in cases of receptor positive and nodal positive
diagnostic finding (based on year previous to index year)
22
Clinical sites with
evaluable data
Clinical sites meeting
the target
Number % Number %
191 69.96% 89 46.60%
Definition of indicator
All clinical sites 2013
Median Range
Numer
ator
All receptor positive and nodal
positive primary cases with invasive
breast cancerthat were treated with
chemotherapy
24 1 - 85
Populat
ion
Numerator for indicator no. 8.1 from
the year previous to index year
27 4 - 112
Rate Target ≥ 95% 94,44% 25,00% - 100% (1/4) - (53/53)
Comment
See also reasons 8.1. When the recommended therapy is not conducted, this mainly reflects the patient’s wish. Information is optional. Indicator is quality indicator of the Guideline.
2009 2010 2011 2012 2013
Max ----- 100% 100% 100% 100%
95th percentile ----- 100% 100% 100% 100%
75th percentile ----- 100% 100% 100% 100%
Median ----- 93.75% 95.56% 96.15% 94.44%
25th percentile ----- 86.05% 88.00% 88.88% 87.23%
5th percentile ----- 65.22% 69.62% 73.68% 63.53%
Min ----- 37.50% 53.57% 18.65% 25.00%
Annual Report BCCs 2015 (audit year 2014 / indicator year 2013)
clinical sites

9.1. Recommended endocrine therapy in cases of steroid receptor positive
diagnostic finding
23
Clinical sites with
evaluable data
Clinical sites meeting
the target
Number % Number %
273 100% 273 100%
Definition of indicator
All clinical sites 2013
Median Range
Numerator All steroid receptor positive
primary cases in which an
endocrine therapy was
recommended
124 28 - 618
Population Primary cases with
invasive breast cancer with
steroid receptor positive
diagnostic finding
128 32 - 666
Rate Target ≥ 80% 96.40% 80.53% - 100% (91/113) - (292/292)
Comment
2009 2010 2011 2012 2013
Max ----- 100% 100% 100% 100%
95th percentile ----- 100% 100% 100% 100%
75th percentile ----- 98.76% 98.70% 98.60% 98.15%
Median ----- 9669% 96.77% 96.27% 96.40%
25th percentile ----- 93.60% 93.22% 93.33% 93.62%
5th percentile ----- 86.41% 87.72% 87.64% 86.88%
Min ----- 71.17% 65.54% 80.27% 80.53%
Annual Report BCCs 2015 (audit year 2014 / indicator year 2013)
clinical sites

9.2. Initiated endocrine therapy in cases of steroid receptive positive diagnostic finding
(in relation to the previous index year)
24
Clinical sites with
evaluable data
Clinical sites meeting
the target
Number % Number %
186 68.13% 118 63.44%
Definition of indicator
All clinical sites 2013
Median Range
Numerator All steroid receptor positive
primary cases that have been
treated with endocrine therapy
107.5 2 - 380
Population Numerator for indicator no. 9.1
from the year previous to index
year
123 21 - 432
Rate Target ≥ 95% 96.36% 0.94% - 100% (2/213) - (223/223)
Comment
Centres with low values state that they do not receive any feedback from their colleagues in general practice about the conduct of the recommended therapy. Indicator is optional. Indicator is quality indicator of the Guideline.
2009 2010 2011 2012 2013
Max ----- 100% 100% 100% 100%
95th percentile ----- 100% 100% 100% 100%
75th percentile ----- 99.28% 98.91% 98.71% 98.63%
Median ----- 96.85% 97.19% 96.00% 96.36%
25th percentile ----- 92.78% 93.41% 90.53% 90.03%
5th percentile ----- 61.23% 66.46% 61.13% 45.69%
Min ----- 0.00% 0.88% 9.80% 0.94%
Annual Report BCCs 2015 (audit year 2014 / indicator year 2013)
clinical sites

10.1. Recommended Trastuzumab therapy over one year
in cases of HER-2 positive diagnostic finding
25
Clinical sites with
evaluable data
Clinical sites meeting
the target
Number % Number %
273 100% 128 46.89%
Definition of indicator
All clinical sites 2013
Median Range
Numerator All HER2 pos. primary cases, for
which a trastuzumab therapy
was recommended for over 1
year
18 2 - 82
Population Primary cases with HER2 pos.
diagnostic finding 19 3 - 93
Rate Target ≥ 95% 93.33% 42.86% - 100% (3/7) - (60/60)
Comment
The reasons given by centres with a low recommendation proportion are small tumours (pT1mic), existing comorbidities or advanced age of patients.
2009 2010 2011 2012 2013
Max ----- 100% 100% 100% 100%
95th percentile ----- 100% 100% 100% 100%
75th percentile ----- 93.65% 94.74% 100% 100%
Median ----- 83.33% 85.71% 93.75% 93.33%
25th percentile ----- 72.41% 73.05% 87.50% 86.21%
5th percentile ----- 50.00% 49.86% 70.87% 68.63%
Min ----- 18.52% 31.25% 40.00% 42.86%
Annual Report BCCs 2015 (audit year 2014 / indicator year 2013)
clinical sites

10.2 Completed trastuzumab therapy over 1 year in cases of HER2 positive diagnostic finding
26
Clinical sites with
evaluable data
Clinical sites meeting
the target
Number % Number %
188 68.86% 94 50.0%
Definition of indicator
All clinical sites 2013
Median Range
Numerator All HER2 pos. primary cases
that have been treated with a
trastuzumab therapy for over 1
year
15 0 - 236
Population Numerator for indicator no. 10.1
from the year previous to index
year
16 2 - 242
Rate Target ≥ 95% 94.87% 0.00% - 100% (0/8) - (46/46)
Comment
The reasons given by centres with a low proportion are: therapy refusal by patients, ongoing therapies and death of patients. Indicator is optional. Indicator is quality indicator of the Guideline.
2009 2010 2011 2012 2013
Max ----- 100% 100% 100% 100%
95th percentile ----- 100% 100% 100% 100%
75th percentile ----- 100% 100% 100% 100%
Median ----- 93.94% 97.41% 96.66% 94.87%
25th percentile ----- 84.58% 88.89% 88.88% 86.20%
5th percentile ----- 57.39% 66.15% 62.81% 50.00%
Min ----- 38.10% 0.00% 0.00% 0.00%
Annual Report BCCs 2015 (audit year 2014 / indicator year 2013)
clinical sites

11. Endocrine therapy in cases of metastases
27
Clinical sites with
evaluable data
Clinical sites meeting
the target
Number % Number %
272 99.63% 85 31.25%
Definition of indicator
All clinical sites 2013
Median Range
Numerator Patients for whom an endocrine
therapy was begun as a first-line
therapy in metastasised stage
6 0 - 57
Population All patients with steroid receptor
positive invasive breast cancer
and initial diagnosis of
metastases
9 1 - 59
Rate Target ≥ 95% 80.00% 0.00% - 100% (0/3) - (21/21)
Comment
When endocrine therapy was not begun as a first-line therapy, the reasons given by the centres are that rapid remission was necessary for these patients (e.g. radiation in the case of bone metastasization or extensive local findings) or that the patients died prior to commencement of therapy. Indicator is quality indicator of the Guideline.
2009 2010 2011 2012 2013
Max ----- ----- ----- 100% 100%
95th percentile ----- ----- ----- 100% 100%
75th percentile ----- ----- ----- 100% 100%
Median ----- ----- ----- 82.08% 80.00%
25th percentile ----- ----- ----- 60.63% 58.33%
5th percentile ----- ----- ----- 18.36% 29.36%
Min ----- ----- ----- 0.00% 0.00%
Annual Report BCCs 2015 (audit year 2014 / indicator year 2013)
clinical sites

12. Psycho-oncologic care (>30 min)
28
Clinical sites with
evaluable data
Clinical sites meeting
the target
Number % Number %
273 100% ----- -----
Definition of indicator
All clinical sites 2013
Median Range
Numerator Number of primary patients,
who received psycho-
oncological care (length of
consultation > 30 Min.)
103 5 - 525
Population Primary cases
168 43 - 812
Rate To be defined 70.07% 5.11% - 100% (12/235) - (143/143)
Comment
Centres with a low proportion of conducted consultations >30 min state that the psycho-oncological resources were insufficient, the consultations were not adequately documented or there was no further need. The centre with the lowest presentation rate also has the lowest presentation proportion in the Gynaecological Cancer Centre: the auditor formulated one deviation. In the case of centres with a 100% presentation proportion, the contact (=i.e. not the consultation >30 min) is also included in the numerator. The auditors undergo corresponding training.
2009 2010 2011 2012 2013
Max 100% 100% 100% 100% 100%
95th percentile 98.63% 96.36% 96.96% 95.73% 94.60%
75th percentile 83.81% 82.86% 83.75% 83.23% 85.60%
Median 66.74% 65.56% 65.99% 69.02% 70.07%
25th percentile 40.64% 40.64% 41.50% 43.88% 45.74%
5th percentile 13.24% 14.96% 12.55% 17.02% 17.57%
Min 0.90% 0.00% 0.00% 5.22% 5.11%
Annual Report BCCs 2015 (audit year 2014 / indicator year 2013)
clinical sites

13. Social-service counseling
29
Clinical sites with
evaluable data
Clinical sites meeting
the target
Number % Number %
273 100% ----- -----
Definition of indicator
All clinical sites 2013
Median Range
Numerator Number of primary patients, who
received social services
counselling
136 0 - 782
Population Primary cases
168 43 - 812
Rate Currently no target value
88.33% 0.00% - 100%
(0/175) - (236/236)
Comment
The 5 centres with the lowest counselling proportions are in Austria, Switzerland and Italy. The tasks of social work there are mainly assumed by institutions outside the clinic. In the case of low presentation proportions the auditors frequently mention limited HR resources.
2009 2010 2011 2012 2013
Max 100% 100% 100% 100% 100%
95th percentile 100% 100% 100% 100% 99.34%
75th percentile 96.01% 96.64% 96.95% 94.35% 94.76%
Median 89.54% 91.55% 92.19% 87.87% 88.33%
25th percentile 77.10% 78.73% 83.16% 80.16% 79.14%
5th percentile 26.28% 48.14% 43.91% 44.71% 42.97%
Min 1.71% 0.00% 0.00% 0.00% 0.00%
Annual Report BCCs 2015 (audit year 2014 / indicator year 2013)
clinical sites
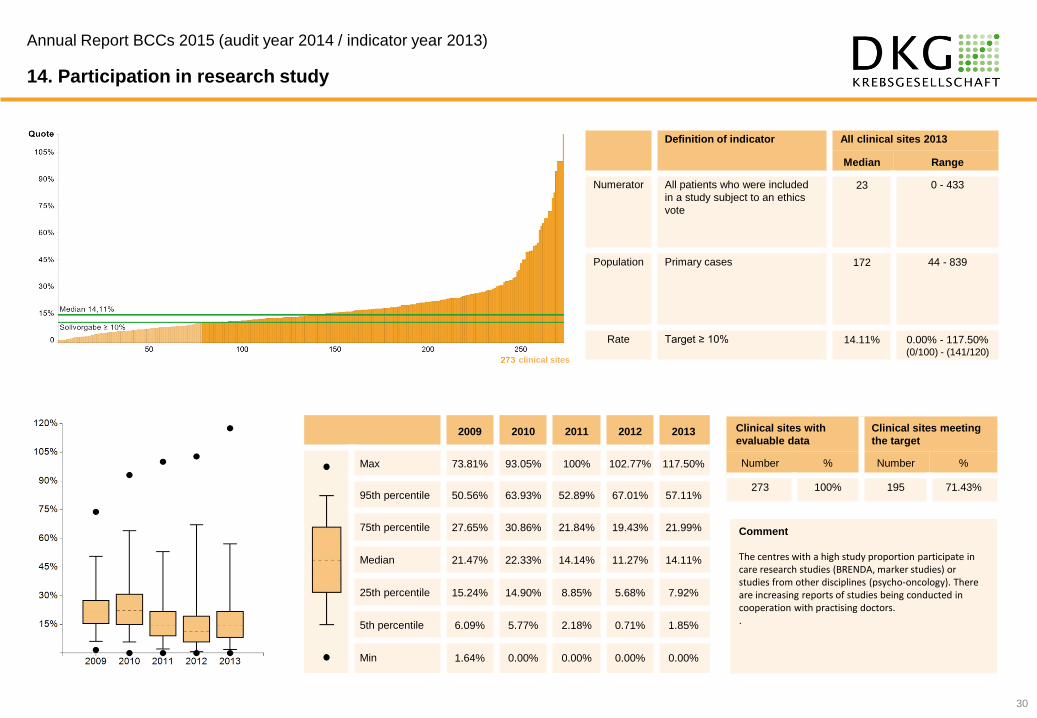
14. Participation in research study
30
Clinical sites with
evaluable data
Clinical sites meeting
the target
Number % Number %
273 100% 195 71.43%
Definition of indicator
All clinical sites 2013
Median Range
Numerator All patients who were included
in a study subject to an ethics
vote
23 0 - 433
Population Primary cases
172 44 - 839
Rate Target ≥ 10% 14.11% 0.00% - 117.50% (0/100) - (141/120)
Comment
The centres with a high study proportion participate in care research studies (BRENDA, marker studies) or studies from other disciplines (psycho-oncology). There are increasing reports of studies being conducted in cooperation with practising doctors. .
2009 2010 2011 2012 2013
Max 73.81% 93.05% 100% 102.77% 117.50%
95th percentile 50.56% 63.93% 52.89% 67.01% 57.11%
75th percentile 27.65% 30.86% 21.84% 19.43% 21.99%
Median 21.47% 22.33% 14.14% 11.27% 14.11%
25th percentile 15.24% 14.90% 8.85% 5.68% 7.92%
5th percentile 6.09% 5.77% 2.18% 0.71% 1.85%
Min 1.64% 0.00% 0.00% 0.00% 0.00%
Annual Report BCCs 2015 (audit year 2014 / indicator year 2013)
clinical sites

15. Pre-therapeutic histological confirmation
31
Clinical sites with
evaluable data
Clinical sites meeting
the target
Number % Number %
273 100% 261 95.60%
Definition of indicator
All clinical sites 2013
Median Range
Numerator Patients with pretherapeutic
histological diagnosis
confirmation by means of a
punch or vacuum biopsy
154 37 - 802
Population Patients with initial procedure
and histology of invasive breast
cancer or DCIS as primary
disease
158 39 - 837
Rate Target ≥ 90% 97.37% 72.97% - 100% (54/74) - (399/399)
Comment
The reasons given by centres for not meeting the target are: micro-calcifications, patients of an advanced age, Marcumar therapy, patients with condition after benign/unclear punch biopsy, hence PE. Auditors formulated corresponding information/deviations. Indicator is quality indicator of the Guideline.
2009 2010 2011 2012 2013
Max 100% 100% 100% 100% 100%
95th percentile 100% 100% 100% 100% 100%
75th percentile 99.19% 99.19% 98.96% 99.13% 99.06%
Median 97.56% 97.37% 97.47% 97.46% 97.37%
25th percentile 95.55% 93.09% 94.36% 95.04% 94.70%
5th percentile 92.11% 86.51% 88.09% 90.79% 90.19%
Min 42.05% 77.14% 75.00% 78.26% 72.97%
Annual Report BCCs 2015 (audit year 2014 / indicator year 2013)
clinical sites

16. Primary cases BC
32
Clinical sites with
evaluable data
Clinical sites meeting
the target
Number % Number %
273 100% 240 87.91%
Definition of indicator
All clinical sites 2013
Median Range
Number Primary cases 172 44 - 839
Target ≥ 100
Comment All centres which do not meet the target of 100 primary cases/year are cooperative sites. From 2015 they must show evidence of at least 50 primary cases for the follow-up audits, too.
2009 2010 2011 2012 2013
Max 597.00 566.00 691.00 642.00 839.00
95th percentile 408.75 377.95 361.00 365.15 383.00
75th percentile 244.75 225.75 230.00 221.25 224.00
Median 176.50 166.50 166.00 170.50 172.00
25th percentile 122.75 121.00 124.50 123.75 128.00
5th percentile 75.00 79.10 76.75 69.70 77.60
Min 37.00 53.00 50.00 36.00 44.00
Annual Report BCCs 2015 (audit year 2014 / indicator year 2013)
clinical sites
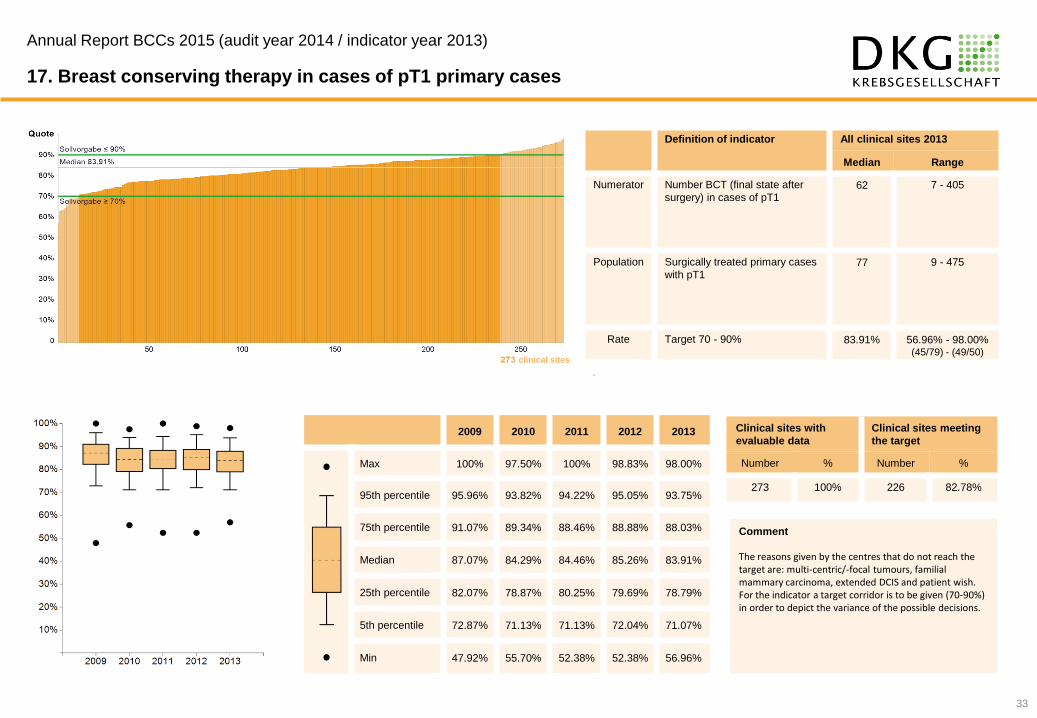
17. Breast conserving therapy in cases of pT1 primary cases
33
Clinical sites with
evaluable data
Clinical sites meeting
the target
Number % Number %
273 100% 226 82.78%
Definition of indicator
All clinical sites 2013
Median Range
Numerator Number BCT (final state after
surgery) in cases of pT1
62 7 - 405
Population Surgically treated primary cases
with pT1 77 9 - 475
Rate Target 70 - 90% 83.91% 56.96% - 98.00% (45/79) - (49/50)
.
Comment
The reasons given by the centres that do not reach the target are: multi-centric/-focal tumours, familial mammary carcinoma, extended DCIS and patient wish. For the indicator a target corridor is to be given (70-90%) in order to depict the variance of the possible decisions.
2009 2010 2011 2012 2013
Max 100% 97.50% 100% 98.83% 98.00%
95th percentile 95.96% 93.82% 94.22% 95.05% 93.75%
75th percentile 91.07% 89.34% 88.46% 88.88% 88.03%
Median 87.07% 84.29% 84.46% 85.26% 83.91%
25th percentile 82.07% 78.87% 80.25% 79.69% 78.79%
5th percentile 72.87% 71.13% 71.13% 72.04% 71.07%
Min 47.92% 55.70% 52.38% 52.38% 56.96%
Annual Report BCCs 2015 (audit year 2014 / indicator year 2013)
clinical sites

18. Mastectomies primary cases
34
Clinical sites with
evaluable data
Clinical sites meeting
the target
Number % Number %
273 100% ----- -----
Definition of indicator
All clinical sites 2013
Median Range
Numerator Number of mastectomies (final
state after surgery) 43 9 - 263
Population Surgically treated primary cases
156 39 - 793
Rate Currently no target value
29.41% 9.52% - 55.79%
(20/210) - (53/95)
Comment
The reasons given for high mastectomy rates are patient wish, T3/T4 tumours, multi-centric mammary carcinoma and increased incidence of familial mammary carcinomas.
2009 2010 2011 2012 2013
Max 51.37% 61.90% 62.20% 58.53% 55.79%
95th percentile 33.30% 40.88% 41.85% 40.37% 41.85%
75th percentile 25.68% 33.09% 32.91% 34.07% 34.15%
Median 21.61% 28.49% 28.83% 28.57% 29.41%
25th percentile 18.18% 23.10% 23.65% 23.37% 24.41%
5th percentile 12.08% 17.81% 17.21% 16.33% 18.21%
Min 7.69% 9.98% 11.74% 10.27% 9.52%
Annual Report BCCs 2015 (audit year 2014 / indicator year 2013)
clinical sites

19. DCIS in initial procedure primary cases (pTIS)
35
Clinical sites with
evaluable data
Clinical sites meeting
the target
Number % Number %
273 100% ----- -----
Definition of indicator
All clinical sites 2013
Median Range
Numerator Number pTi’s 17 0 - 87
Population Surgically treated primary cases
156 39 - 793
Rate Currently no target value
11.11% 0.00% - 24.67%
(0/69) - (37/150)
Comment
Indicator is deleted from 2015 as it is recorded in future in the basic data.
2009 2010 2011 2012 2013
Max 23.86% 23.48% 19.90% 28.09% 24.67%
95th percentile 17.38% 16.45% 15.86% 16.66% 17.97%
75th percentile 12.99% 13.04% 12.84% 12.38% 13.75%
Median 10.50% 10.39% 10.14% 10.14% 11.1%
25th percentile 7.96% 8.14% 8.17% 7.89% 8.85%
5th percentile 5.26% 5.69% 4.62% 4.76% 5.94%
Min 1.10% 3.70% 1.96% 1.75% 0.00%
Annual Report BCCs 2015 (audit year 2014 / indicator year 2013)
clinical sites

20. LN dissection in cases of DCIS
36
Clinical sites with
evaluable data
Clinical sites meeting
the target
Number % Number %
273 100% 181 66.30%
Definition of indicator
All clinical sites 2013
Median Range
Numerator Patients with axillary lymph
node dissection 0 0 - 17
Population Patients with a primary
diagnosis of DCIS and
completed surgical
13 1 - 68
Rate Target ≤ 5% 0.00% 0.00% - 100% (0/1) - (12/12)
Comment
Centres with frequent LN dissection mostly have a small population with a high impact on the proportion when the patient undergoes LN dissection. Reasons for LN dissection in DCIS: large DCIS, in particular invasive mammary carcinoma, G3. LN dissection is almost only done as SLNE. Indicator is quality indicator of the Guideline.
2009 2010 2011 2012 2013
Max ----- ----- ----- 100% 100%
95th percentile ----- ----- ----- 40.00% 33.33%
75th percentile ----- ----- ----- 15.50% 10.00%
Median ----- ----- ----- 0.00% 0.00%
25th percentile ----- ----- ----- 0.00% 0.00%
5th percentile ----- ----- ----- 0.00% 0.00%
Min ----- ----- ----- 0.00% 0.00%
Annual Report BCCs 2015 (audit year 2014 / indicator year 2013)
clinical sites

21. Determination of the nodal status in cases of inv. Br-Ca
37
Clinical sites with
evaluable data
Clinical sites meeting
the target
Number % Number %
273 100% 234 85,71%
Definition of indicator
All clinical sites 2013
Median Range
Numerator Number of primary cases with
inv. breast cancer for which
the nodal status was
determined
132 33 - 678
Population Surgically treated primary
cases With invasive breast
cancer
136 33 - 699
Rate Target ≥ 95% 97.83% 87.16% - 100% (95/109) - (335/335)
Comment
If nodal status was not determined, the reasons given are: primary palliative situation, general condition and patient’s age.
2009 2010 2011 2012 2013
Max 100% 100% 100% 100% 100%
95th percentile 100% 100% 100% 100% 100%
75th percentile 98.73% 99.07% 99.08% 99.30% 99.33%
Median 96.93% 97.78% 97.76% 97.70% 97.83%
25th percentile 95.05% 96.03% 95.94% 95.65% 96.00%
5th percentile 88.35% 92.11% 92.37% 92.66% 92.83%
Min 80.14% 75.31% 85.34% 78.81% 87.16%
Annual Report BCCs 2015 (audit year 2014 / indicator year 2013)
clinical sites

22. SLNE only in cases of pN0 (GL QI)
38
Clinical sites with
evaluable data
Clinical sites meeting
the target
Number % Number %
273 100% 266 97.44%
Definition of indicator
All clinical sites 2013
Median Range
Numerator Patients with a sentinel node
biopsy only 74 2 - 362
Population Patients with invasive breast
cancer as a primary disease and
negative pN staging without
preoperative tumour-specific
therapy
81 2 - 380
Rate Target ≥ 80% 93.75% 54.22% - 100% (45/83) - (222/222)
Comment
The centres which not only performed a sole sentinel LNE stated that intraoperatively other lymph nodes were suspect which were then dissected or that intraoperatively the preoperatively marked lymph nodes were not detectable. Indicator is quality indicator of the Guideline.
2009 2010 2011 2012 2013
Max 100% 100% 100% 100% 100%
95th percentile 100% 100% 100% 100% 100%
75th percentile 95.29% 97.85% 99.21% 98.45% 97.62%
Median 90.72% 93.30% 95.45% 95.20% 93.75%
25th percentile 84.10% 87.19% 90.43% 90.14% 88.52%
5th percentile 71.48% 77.47% 78.00% 82.29% 81.17%
Min 28.57% 51.35% 57.45% 62.50% 54.22%
Annual Report BCCs 2015 (audit year 2014 / indicator year 2013)
clinical sites
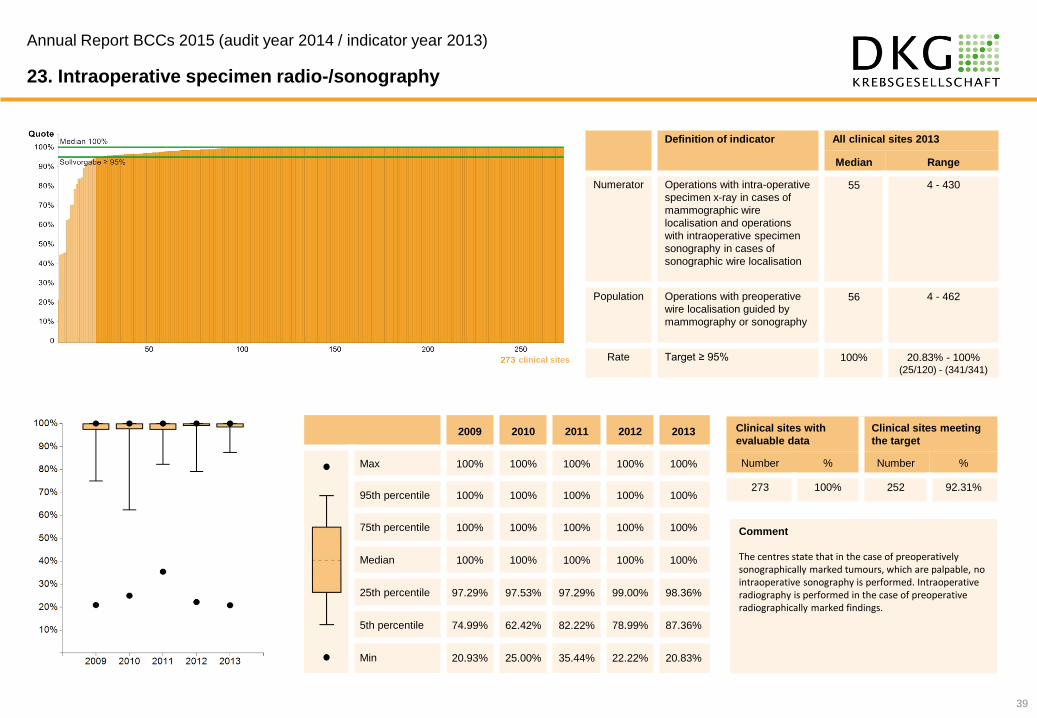
23. Intraoperative specimen radio-/sonography
39
Clinical sites with
evaluable data
Clinical sites meeting
the target
Number % Number %
273 100% 252 92.31%
Definition of indicator
All clinical sites 2013
Median Range
Numerator Operations with intra-operative
specimen x-ray in cases of
mammographic wire
localisation and operations
with intraoperative specimen
sonography in cases of
sonographic wire localisation
55 4 - 430
Population Operations with preoperative
wire localisation guided by
mammography or sonography
56 4 - 462
Rate Target ≥ 95% 100% 20.83% - 100% (25/120) - (341/341)
Comment
The centres state that in the case of preoperatively sonographically marked tumours, which are palpable, no intraoperative sonography is performed. Intraoperative radiography is performed in the case of preoperative radiographically marked findings.
2009 2010 2011 2012 2013
Max 100% 100% 100% 100% 100%
95th percentile 100% 100% 100% 100% 100%
75th percentile 100% 100% 100% 100% 100%
Median 100% 100% 100% 100% 100%
25th percentile 97.29% 97.53% 97.29% 99.00% 98.36%
5th percentile 74.99% 62.42% 82.22% 78.99% 87.36%
Min 20.93% 25.00% 35.44% 22.22% 20.83%
Annual Report BCCs 2015 (audit year 2014 / indicator year 2013)
clinical sites

24. Revision operations primary cases
40
Clinical sites with
evaluable data
Clinical sites meeting
the target
Number % Number %
273 100% 240 87.91%
Definition of indicator
All clinical sites 2013
Median Range
Numerator Revision surgery due to
postoperative complications
(only surgically treated primary
cases)
4 0 - 44
Population Surgically treated primary cases
156 39 - 793
Rate Target ≤ 5% 2.70% 0.00% - 10.98% (0/53) - (9/82)
Comment
The reasons given for a high rate of revision operations are mainly haematomas and lymphocoeles. The centres with a high rate discussed their cases with the auditors or in quality circles.
2009 2010 2011 2012 2013
Max 10.28% 11.31% 14.53% 14.73% 10.98%
95th percentile 5.78% 6.63% 7.42% 6.80% 6.28%
75th percentile 3.38% 4.04% 4.25% 4.24% 4.40%
Median 2.21% 2.63% 2.78% 3.07% 2.70%
25th percentile 1.19% 1.40% 1.43% 1.60% 1.57%
5th percentile 0.00% 0.00% 0.00% 0.34% 0.50%
Min 0.00% 0.00% 0.00% 0.00% 0.00%
Annual Report BCCs 2015 (audit year 2014 / indicator year 2013)
clinical sites

25. Postoperative wound infection primary cases
41
Clinical sites with
evaluable data
Clinical sites meeting
the target
Number % Number %
273 100% 267 97,80%
Definition of indicator
All clinical sites 2013
Median Range
Numerator Number of postoperative wound
infections after operations on
primary cases
2 0 - 14
Population Surgically treated primary cases
156 39 - 793
Rate Target ≤ 5% 1,45% 0.00% - 7.23% (0/45) - (6/83)
Comment
Indicator deleted from 2015 as in senology there is no suitable score for the valid recording of wound infection.
2009 2010 2011 2012 2013
Max 8.93% 7.14% 8.54% 11.57% 7.23%
95th percentile 4.43% 4.86% 4.49% 4.57% 4.53%
75th percentile 2.23% 2.53% 2.75% 2.75% 2.59%
Median 1.31% 1.44% 1.32% 1.41% 1.45%
25th percentile 0.74% 0.71% 0.67% 0.71% 0.68%
5th percentile 0.00% 0.00% 0.00% 0.00% 0.00%
Min 0.00% 0.00% 0.00% 0.00% 0.00%
Annual Report BCCs 2015 (audit year 2014 / indicator year 2013)
clinical sites

26. Breast reconstruction
42
Clinical sites with
evaluable data
Clinical sites meeting
the target
Number % Number %
273 100% ----- -----
Definition of indicator
All clinical sites 2013
Median Range
Number Number of breast reconstructions
(5-883.- ff , 5-885.-ff, 5-886.1-2, 5-
876.1-3, 5-889.2-5, 5-905.0a)
16 1 - 530
Currently no target value
Comment Centres with few reconstructions state that they cannot record the number of reconstructions because these data are collected by plastic surgery. Furthermore, sec. reconstructions are often not recorded. The indicator will, therefore, be adjusted from 2015 onwards and the number of operated primary cases from the indicator for the previous year will then be included in the numerator. The evaluations show that own tissue reconstructions are mainly performed in cooperation with plastic surgeons and that the proportion of reconstructions increases as cooperation with plastic surgery grows.
2009 2010 2011 2012 2013
Max 401.00 723.00 800.00 470.00 530.00
95th percentile 158.00 191.00 149.80 116.30 116.80
75th percentile 63.00 71.00 66.00 35.25 34.00
Median 27.00 30.00 31.00 15.00 16.00
25th percentile 11.00 12.50 1.,00 6.00 8.00
5th percentile 2.00 2.10 5.00 1.00 3.00
Min 0.00 0.00 0.00 0.00 1.00
Annual Report BCCs 2015 (audit year 2014 / indicator year 2013)
clinical sites

27. Specification of the resection margin and safety margin
43
Clinical sites with
evaluable data
Clinical sites meeting
the target
Number % Number %
273 100% 267 97,80%
Definition of indicator
All clinical sites 2013
Median Range
Numerator The resection margin and safety
margin specified by the
pathologist
153 39 - 772
Population Surgically treated primary cases
156 39 - 793
Rate Target ≥ 95% 99.50% 82.42% - 100% (75/91) - (395/395)
Comment
The reasons given for not meeting the target are pT0 results and complete tumour resection during biopsy.
2009 2010 2011 2012 2013
Max 100% 100% 100% 100% 100%
95th percentile 100% 100% 100% 100% 100%
75th percentile 100% 100% 100% 100% 100%
Median 100% 100% 99.74% 99.92% 99.50%
25th percentile 99.33% 98.37% 98.06% 98.44% 97.89%
5th percentile 96.33% 95.69% 95.36% 95.98% 95.65%
Min 79.63% 85.53% 90.76% 90.17% 82.42%
Annual Report BCCs 2015 (audit year 2014 / indicator year 2013)
clinical sites

28. Report to the cancer registry
44
Clinical sites with
evaluable data
Clinical sites meeting
the target
Number % Number %
273 100% 249 91.21%
Definition of indicator
All clinical sites 2013
Median Range
Numerator Patients reported to a hospital
and/or epidemiological cancer
registry
167 0 - 839
Population All patients with histologically
confirmed primary disease of
invasive breast cancerand/or
DCIS
172 44 - 839
Rate Target ≥ 95% 100% 0.00% - 100% (0/105) - (839/839)
Comment
2009 2010 2011 2012 2013
Max ----- ----- ----- 100% 100%
95th percentile ----- ----- ----- 100% 100%
75th percentile ----- ----- ----- 100% 100%
Median ----- ----- ----- 100% 100%
25th percentile ----- ----- ----- 97.07% 98.24%
5th percentile ----- ----- ----- 62.08% 82.22%
Min ----- ----- ----- 0.00% 0.00%
Annual Report BCCs 2015 (audit year 2014 / indicator year 2013)
clinical sites

45

Imprint Publisher and responsability regarding content:
Deutsche Krebsgesellschaft (DKG)
Kuno-Fischer-Straße 8
14057 Berlin, Germany
Tel: +49 (030) 322 93 29 0
Fax: +49 (030) 322 93 29 66
Vereinsregister Amtsgericht Charlottenburg,
Vereinsregister-Nr.: VR 27661 B
in cooperation with:
OnkoZert, Neu-Ulm
www.onkozert.de
Version e-A4-en; 21.07.2016
Autoren Deutsche Krebsgesellschaft e.V.
Deutsche Gesellschaft für Senologie e.V.
Certification Commission Breast Cancer Centers
Rolf Kreienberg, Speaker Certification Commission
Simone Wesselmann, Deutsche Krebsgesellschaft e.V.
Christoph Kowalski, Deutsche Krebsgesellschaft e.V.
Diethelm Wallwiener, University Hospital Tübingen
Sara Yvonne Brucker, University Hospital Tübingen
Julia Ferencz, OnkoZert GmbH
DOI: 10.13140/RG.2.1.3477.5768
ISBN: 978-3-946714-40-8