Embed Size (px)
Citation preview
Data Extraction, Visualization and Processing
Minor Project Presentation
Santosh Ghimire – 066 BCT 533Subit Raj Pokharel – 066 BCT 538Sudip Kafle – 066 BCT 539
2
Data Extraction
Visualization
Processing
3
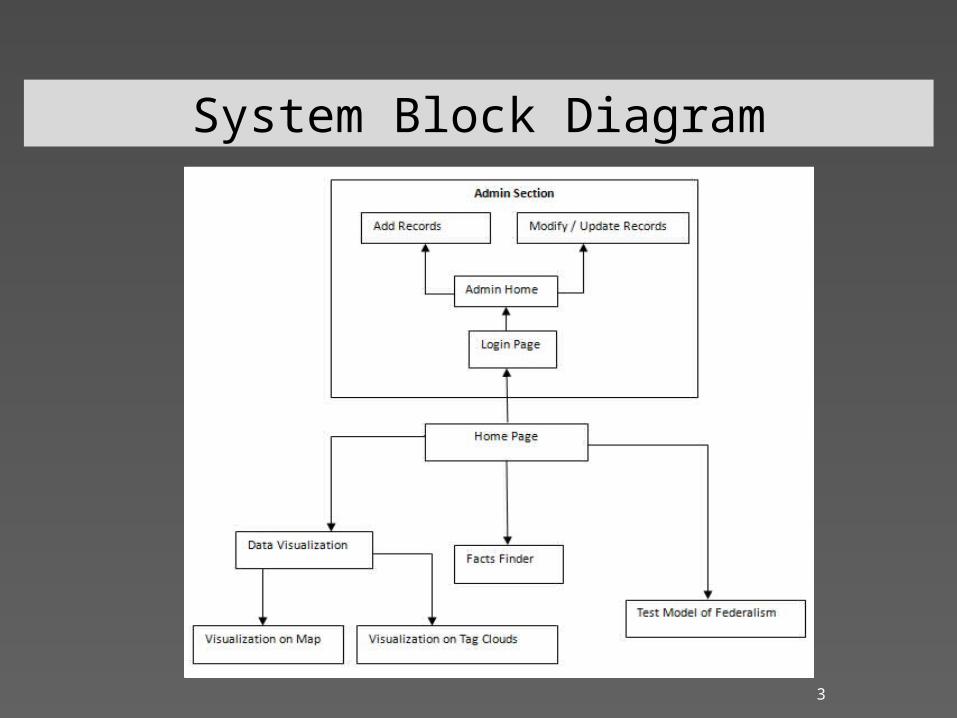
System Block Diagram

Data Extraction
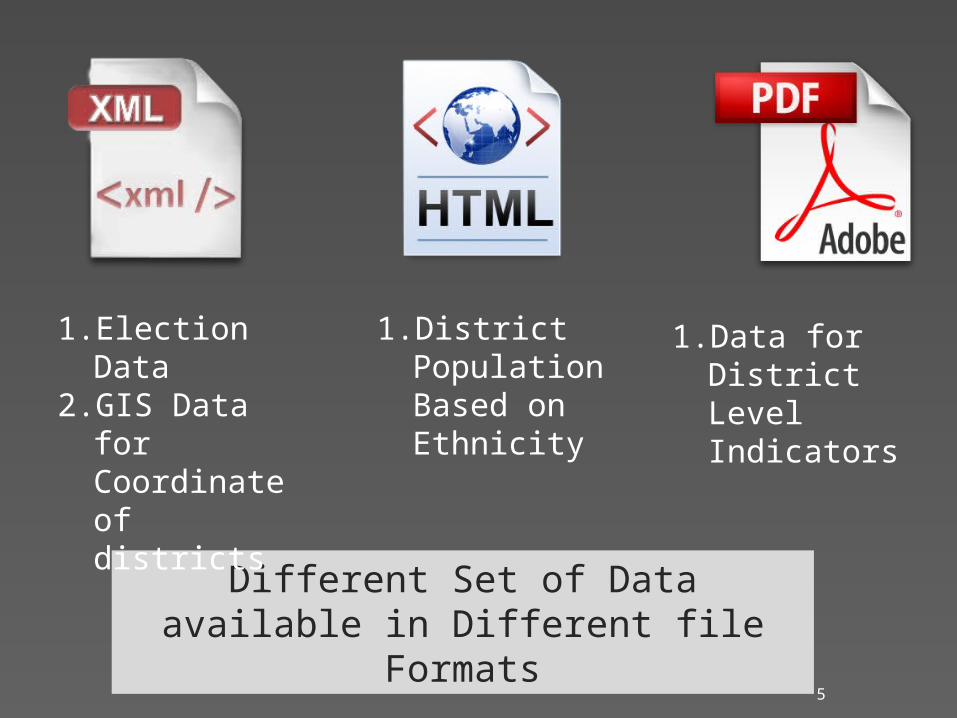
Different Set of Data available in Different file Formats
1. District Population Based on Ethnicity
1. Election Data2. GIS Data for
Coordinate of districts
1. Data for District Level Indicators
Database
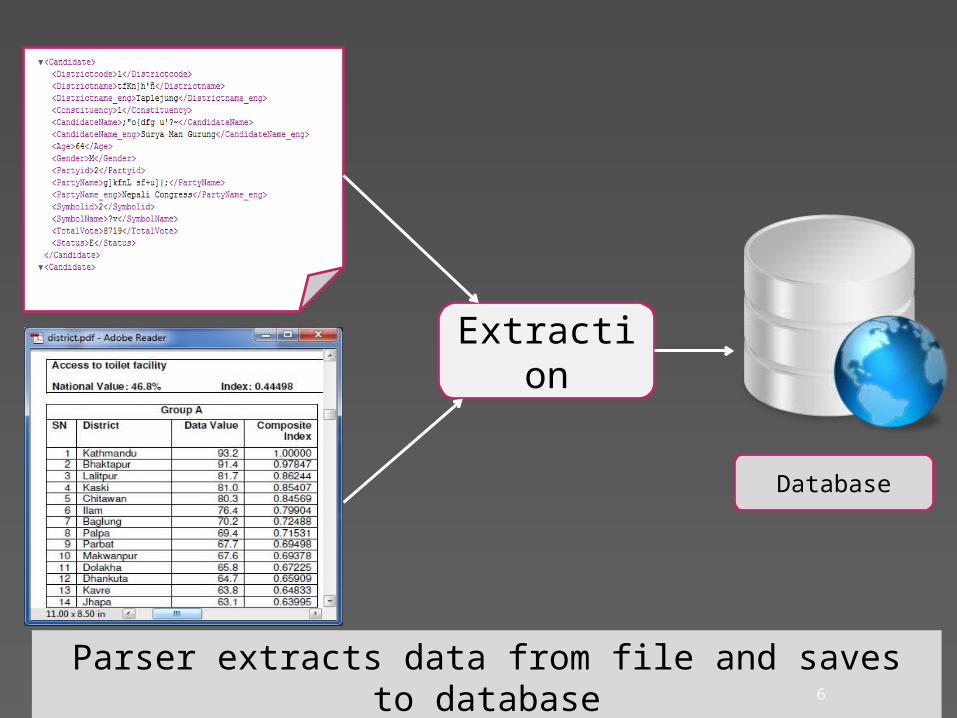
Extraction
Parser extracts data from file and saves to database
7
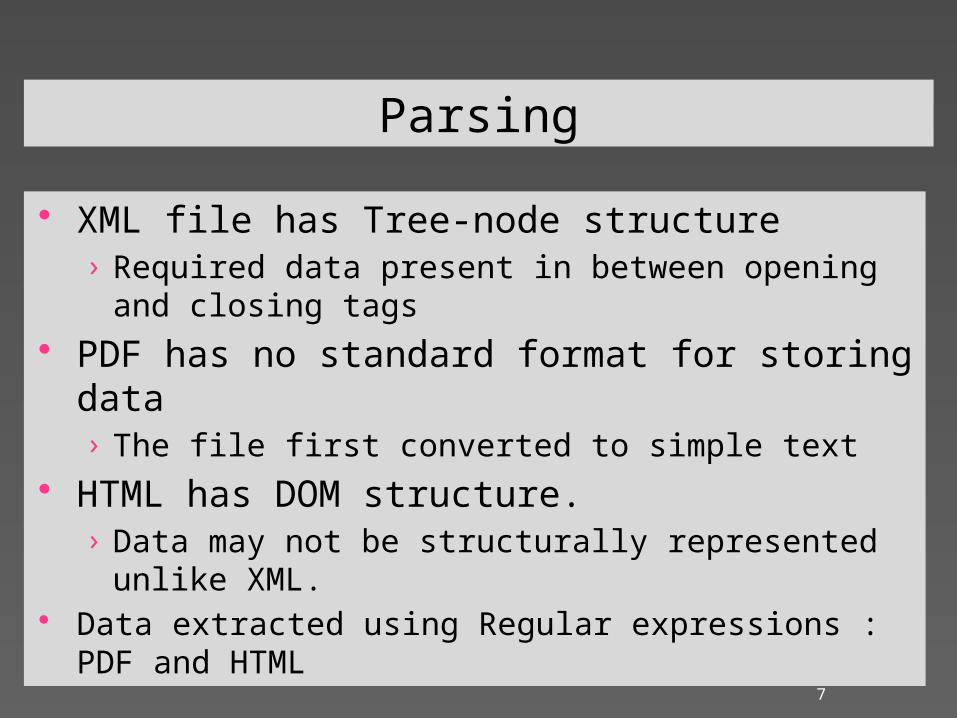
Parsing
XML file has Tree-node structure› Required data present in between opening and
closing tags PDF has no standard format for storing
data› The file first converted to simple text
HTML has DOM structure.› Data may not be structurally represented
unlike XML. Data extracted using Regular expressions : PDF
and HTML
8
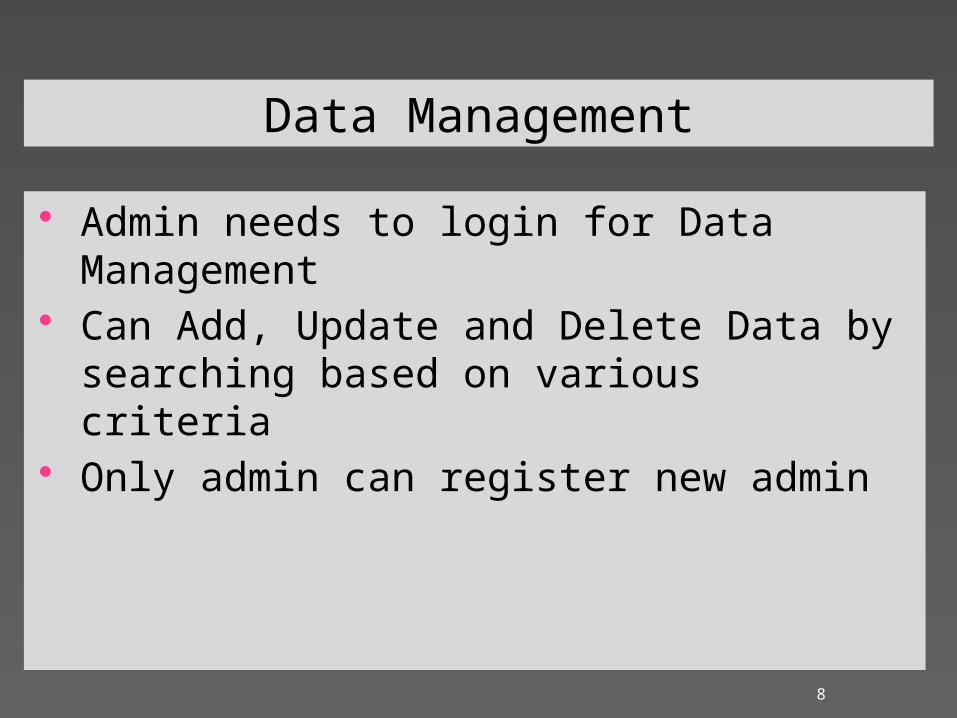
Data Management
Admin needs to login for Data Management
Can Add, Update and Delete Data by searching based on various criteria
Only admin can register new admin
Data Visualization
10
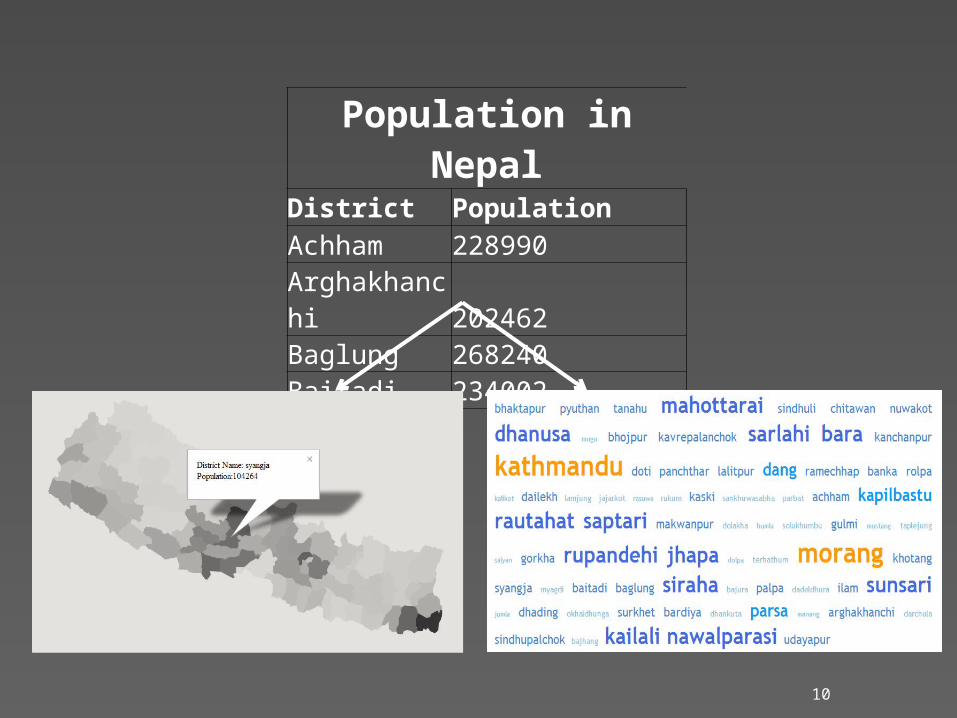
Population in NepalDistrict Population
Achham 228990Arghakhanchi202462Baglung 268240Baitadi 234002
11
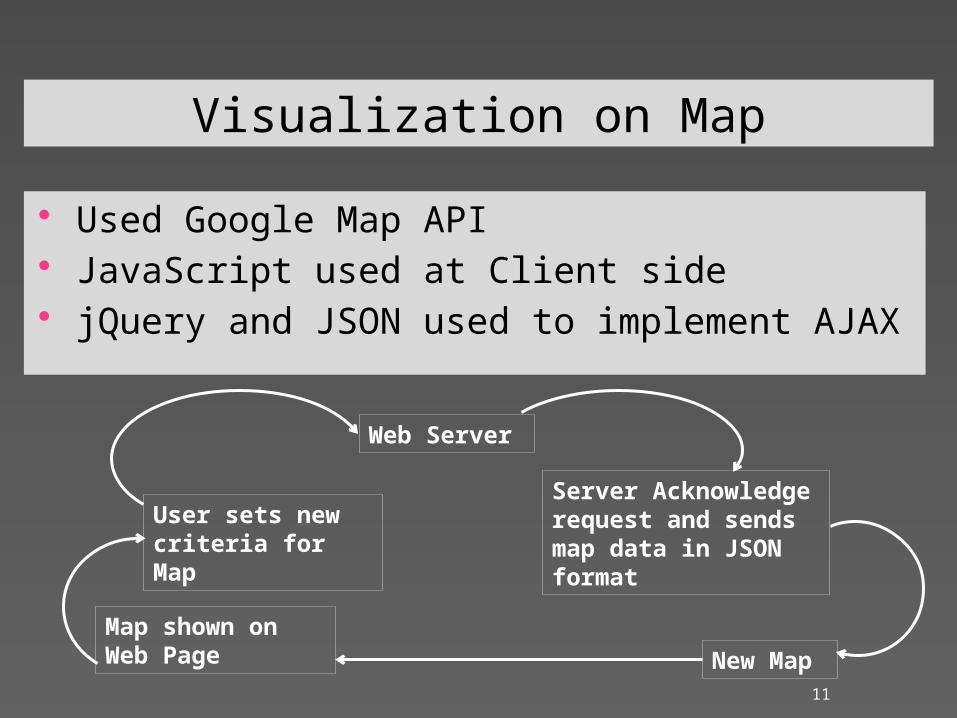
Visualization on Map
Used Google Map API JavaScript used at Client side jQuery and JSON used to implement AJAX
Map shown on Web Page
Web Server
User sets new criteria for Map
Server Acknowledge request and sends map data in JSON format
New Map
12
Visualization with Tag Cloud
Shows overview of scattering of data. One dimension represented by Text
displayed (e.g. Name of district) Other dimension by weight(Font size and
Color) of Text › Implemented using CSS.
Weight of Tags statistically calculated based on population.

Data Processing
14
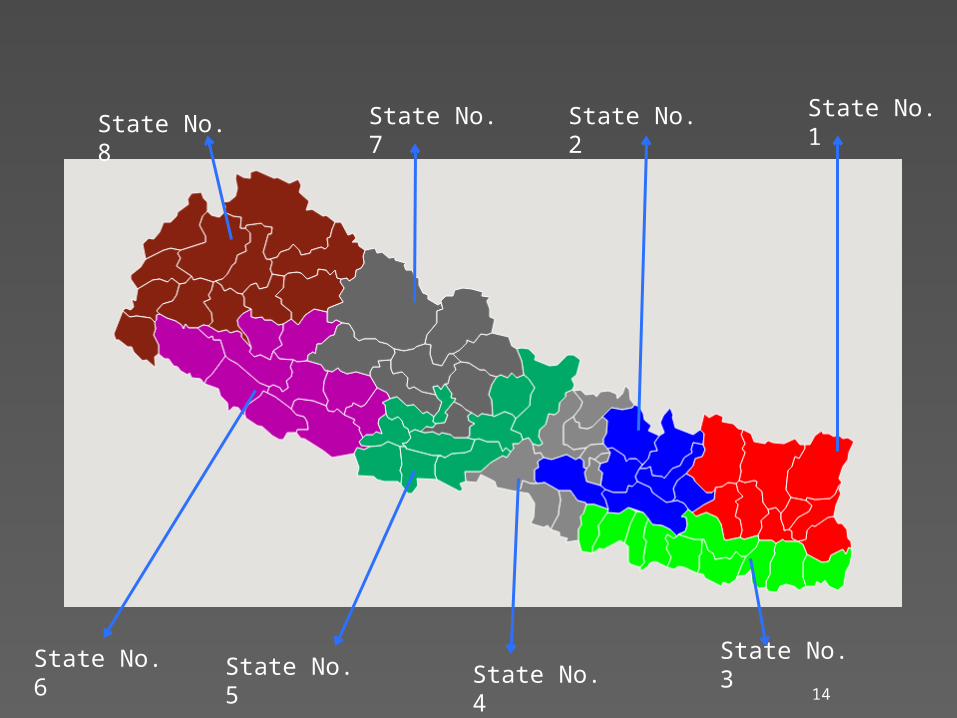
State No. 1State No. 2
State No. 3State No. 5 State No. 4
State No. 6
State No. 7State No. 8
15
Analyzing Feasibility of Federal States
Districts can be selected to form new state.
Aggregate data for each state obtained from database. › Data can be
Top Caste, Top Parties in election, development index
Coefficient of Variation used to see if it is feasible
16
Facts Finder
Informative facts extracted from raw data in Database
User allowed to choose from multiple criteria
Nested SQL queries used
17
Methodology
Programming Languages› C# with ASP .Net, JavaScript, jQuery
MS-SQL Server 2008 as Database Engine
Web Technologies› JSON, AJAX
Google Map API
18
Project Management
Each phase divided into small chunks.› Assigned to team members.
Online Repository created on BitBucket.org› Using Mercurial based TortoiseHg› Works synchronized among each member
Weekly discussion with Senior Developer at YIPL Nepal.