Embed Size (px)
Citation preview
Annual Report 2015

Management report 1
Table of contents
Management Report
Company overview ____________________________________________________________________________________________ 2
Business overview _____________________________________________________________________________________________ 3
Disclosures about market risks ___________________________________________________________________________________ 29
Group operational structure _____________________________________________________________________________________ 32
Key transactions and events in 2015 _______________________________________________________________________________ 35
Recent developments __________________________________________________________________________________________ 35
Corporate governance _________________________________________________________________________________________ 36
> Luxembourg takeover law disclosure_____________________________________________________________________________ 61
Additional information __________________________________________________________________________________________ 62
Chief executive officer and chief financial officer’s responsibility statement _______________________________________________ 65
Consolidated financial statements for the year ended December 31, 2015 ________________________________________________ 66
Consolidated statements of operations ____________________________________________________________________________ 67
Consolidated statements of other comprehensive income ____________________________________________________________ 68
Consolidated statements of financial position _______________________________________________________________________ 69
Consolidated statements of changes in equity _______________________________________________________________________ 70
Consolidated statements of cash flows _____________________________________________________________________________ 71
Notes to the consolidated financial statements ______________________________________________________________________ 72
Report of the réviseur d’entreprises agréé – consolidated financial statements ____________________________________________ 161
Financial statements of ArcelorMittal parent company for the year ended December 31, 2015 ________________________________ 162
Management Report ___________________________________________________________________________________________ 163
Chief executive officer and chief financial officer’s responsibility statement _______________________________________________ 164
Statements of financial position __________________________________________________________________________________ 165
Statements of operations ________________________________________________________________________________________ 166
Statements of other comprehensive income ________________________________________________________________________ 166
Statements of changes in equity __________________________________________________________________________________ 167
Statements of cash flows ________________________________________________________________________________________ 168
Notes to the financial statements _________________________________________________________________________________ 169
Report of the réviseur d’entreprises agréé – financial statements of ArcelorMittal parent company _____________________________ 205
Risks related to the global economy and the steel industry ____________________________________________________________ 207
Mining ______________________________________________________________________________________________________ 219
2 Management report
Company Overview
History and development of the Company
ArcelorMittal is the world’s leading integrated steel and mining company. Since the creation of ArcelorMittal in 2006 (through the combination of Mittal Steel and Arcelor) and continuing through 2008, ArcelorMittal pursued a disciplined growth strategy, with transactions in Argentina, Australia, Austria, Brazil, Canada, Costa Rica, China, Estonia, France, Germany, Italy, Mexico, Poland, Russia, Slovakia, South Africa, Sweden, Turkey, the United Kingdom, Uruguay, United Arab Emirates, the United States and Venezuela. Beginning in the latter part of 2008, ArcelorMittal largely suspended mergers and acquisitions activity in light of the deteriorating economic and market environment, and sharply curtailed its investment activities, with the exception of the acquisition (along with a partner) of Baffinland in 2011.
Since September 2011, ArcelorMittal has been undergoing a deleveraging process to reduce its indebtedness including numerous divestments of non-core assets (see note 2.3 to the consolidated financial statements for the divestments made in 2014 and 2015). Despite ArcelorMittal’s overall strategy of deleveraging, the Company completed an acquisition through a 50/50 joint venture partnership of Calvert in 2014.
ArcelorMittal’s success is built on its core values of sustainability, quality and leadership and the entrepreneurial boldness that has empowered its emergence as the first truly global steel and mining company. Acknowledging that a combination of structural issues and macroeconomic conditions will continue to challenge returns in its sector, the Company has adapted its footprint to the new demand realities, redoubled its efforts to control costs and repositioned its operations to outperform its competitors. ArcelorMittal’s research and development capability is strong and includes several major research centers as well as strong academic partnerships with universities and
other scientific bodies.
Against this backdrop, ArcelorMittal’s strategy is to leverage four distinctive attributes that will enable it to capture leading positions in the most attractive areas of the steel industry’s value chain, from mining at one end to distribution and first-stage processing at the other: global scale and scope; unmatched technical capabilities; a diverse portfolio of steel and related businesses, one of which is mining; and financial capabilities.
Geography: ArcelorMittal is the largest steel producer in the Americas, Africa and Europe and is the fifth largest steel producer in the CIS region. ArcelorMittal has steel-making operations in 19 countries on four continents, including 54 integrated and mini-mill steel-making facilities. As of December 31, 2015, ArcelorMittal had approximately 209,000 employees.
ArcelorMittal’s steel-making operations have a high degree of geographic diversification. Approximately 37% of its crude steel is produced in the Americas, approximately 47% is produced in Europe and approximately 15% is produced in other countries, such as Kazakhstan, South Africa and Ukraine. In addition, ArcelorMittal’s sales of steel products are spread over both developed and developing markets, which have different consumption characteristics. ArcelorMittal’s mining operations, present in North and South America, Africa, Europe and the CIS region, are integrated with its global steel-making facilities and are important producers of iron ore and coal in their own right.
Products: ArcelorMittal produces a broad range of high-quality finished and semi-finished steel products (“semis”). Specifically, ArcelorMittal produces flat steel products, including sheet and plate, and long steel products, including bars, rods and structural shapes. In addition, ArcelorMittal produces pipes and tubes for various applications. ArcelorMittal sells its steel products primarily in local markets and through its centralized marketing
organization to a diverse range of customers in approximately 160 countries including the automotive, appliance, engineering, construction and machinery industries. The Company also produces various types of mining products including iron ore lump, fines, concentrate and sinter feed, as well as coking, PCI and thermal coal.
As a global steel producer, the Company is able to meet the needs of different markets. Steel consumption and product requirements clearly differ between developed markets and developing markets. Steel consumption in developed economies is weighted towards flat products and a higher value-added mix, while developing markets utilize a higher proportion of long products and commodity grades. To meet these diverse needs, the Company maintains a high degree of product diversification and seeks opportunities to increase the proportion of higher value-added products in its product mix.
Automotive focus: ArcelorMittal has a leading market share in its core markets in the automotive steel business and is a leader in the fast-growing advanced high strength steels segment. ArcelorMittal is the first steel company in the world to embed its own engineers within an automotive customer to provide engineering support. The Company begins working with original equipment manufacturers (“OEMs”) as early as five years before a vehicle reaches the showroom, to provide generic steel solutions, co-engineering and help with the industrialization of the project. In June 2013, ArcelorMittal launched an innovative ultra-lightweight steel car door, which is less expensive than an aluminum door. In addition, further solutions developed for the pick-up trucks market offer weight savings benefits.
Mining Value Chain: ArcelorMittal has a significant portfolio of raw material and mining assets, as well as certain strategic long-term contracts with external suppliers. In 2015 (assuming full shipments of iron ore at ArcelorMittal Mines Canada, Serra Azul, Andrade, Liberia
and full shipments at Peña Colorada for own use), approximately 62% of ArcelorMittal’s iron-ore requirements and approximately 15% of its PCI and coal requirements were supplied from its own mines or pursuant to strategic contracts at many of its operating units. The Company currently has iron ore mining activities in Brazil, Bosnia, Canada, Kazakhstan, Liberia, Mexico, Ukraine and the United States. The Company currently has coal mining activities in Kazakhstan and the United States. ArcelorMittal also has made strategic investments in order to secure access to other raw materials including manganese and ferro alloys.
In addition, ArcelorMittal produces substantial amounts of direct reduced iron, or DRI, which is a scrap substitute used in its mini-mill facilities to supplement external metallics purchases. ArcelorMittal is also a significant producer of coke, which is produced from metallurgical coal and is a critical raw material for steel-making, satisfying 86% of its coke needs through its own production facilities. ArcelorMittal’s facilities have good access to shipping facilities, including through ArcelorMittal’s own 17 deep-water port facilities and linked railway sidings.
ArcelorMittal has its own downstream steel distribution business, primarily run through its Europe segment. It also provides value-added and customized steel solutions through additional processing activities to meet specific customer requirements.

Management report 3
Cautionary Statement Regarding Forward-Looking Statements
This annual report may contain forward-looking statements based on estimates and assumptions. Forward-looking statements include, among other things, statements concerning the business, future financial condition, results of operations and prospects of ArcelorMittal, including its subsidiaries. These statements usually contain the words “believes”, “plans”, “expects”, “anticipates”, “intends”, “estimates” or other similar expressions. For each of these statements, you should be aware that forward-looking statements involve known and unknown risks and uncertainties. Although it is believed that the expectations reflected in these forward-looking statements are reasonable, there is no assurance that the actual results or developments anticipated will be realized or, even if realized, that they will have the expected effects on the business, financial condition, results of operations or prospects of ArcelorMittal.
These forward-looking statements speak only as of the date on which the statements were made, and no obligation has been undertaken to publicly update or revise any forward-looking statements made in this annual report or elsewhere as a result of new information, future events or otherwise, except as required by applicable laws and regulations. A detailed discussion of principal risks and uncertainties which may cause actual results and events to differ materially from such forward-looking statements is included in the section titled “Risk factors”. The Company undertakes no obligation to update or revise publicly any forward-looking statements whether because of new information, future events, or otherwise, except as required by securities and other applicable laws.
Corporate and other information
ArcelorMittal is a public limited liability company (société anonyme) that was incorporated for an unlimited period under the laws of the Grand Duchy of Luxembourg on June 8, 2001. ArcelorMittal is registered at the R.C.S. Luxembourg under number B 82.454.
The mailing address and telephone number of ArcelorMittal’s registered office are:
ArcelorMittal24-26, Boulevard d’AvranchesL-1160 LuxembourgGrand-Duchy of LuxembourgTelephone: +352 4792-3746
ArcelorMittal’s agent for U.S. federal securities law purposes is:
ArcelorMittal USA LLC1 South Dearborn Street, 19th floorChicago, Illinois 60603United States of AmericaTelephone: + 1 312 899-3985
ArcelorMittal shares are listed and traded (through a single order book as from January 14, 2009) on the Euronext European markets (Paris and Amsterdam) (symbol “MT”), are admitted to trading on the Luxembourg Stock Exchange’s regulated market and listed on the Official List of the Luxembourg Stock Exchange (symbol “MT”) and are listed and traded on the Spanish Stock Exchanges (symbol “MTS”). ArcelorMittal shares are also listed and traded on the NYSE (symbol “MT”).
Internet site
ArcelorMittal maintains an Internet site at www.arcelormittal.com. Information contained in or otherwise accessible through this Internet site is not a part of this annual report. All references in this annual report to this Internet site are inactive textual references to this URL and are for information only.
Business overview
The following discussion and analysis should be read in conjunction with ArcelorMittal’s consolidated financial statements and related notes for the year ended December 31, 2015 included in this annual report.
Key factors affecting results of operations
ArcelorMittal’s sales are predominantly derived from the sale of flat steel products, long steel products, and tubular products, as well as of iron ore and coal. Prices of steel products, iron ore and coal, in general, are sensitive to changes in worldwide and regional demand, which, in turn, are affected by worldwide and country-specific economic conditions and available production capacity.
The steel industry, and the iron ore and coal mining industries, which provide its principal raw materials, have historically been highly cyclical. They are significantly affected by general economic conditions, as well as by worldwide production capacity and fluctuations in international steel trade and tariffs. In particular, this is due to the cyclical nature of the automotive, construction, machinery and equipment and transportation industries that are the principal consumers of steel. After a period of continuous growth between 2004 and 2008, the sharp fall in demand resulting from the global economic crisis demonstrated the steel market’s vulnerability to volatility and sharp corrections.
The North American and European markets together account for over 60% of ArcelorMittal’s deliveries in 2014 and 2015 and, consequently, any weakness in these markets can have a significant impact on ArcelorMittal’s results. The onset of the eurozone crisis caused underlying European steel demand to weaken in 2012 and, coupled with significant destocking, apparent steel
demand fell by over 10%. Since then, deliveries have increased in each of the past three years, but in 2015 were still lower than 2011 levels and remained close to 25% below 2007 levels. Underlying steel demand in North America has increased in each of the past five years, but apparent demand has been negatively impacted by inventory movements, particularly during 2014 when inventories rose significantly on the back of a rapid increase in imports and were up almost 40% over 2013. This led to stockists purchasing over six million fewer tonnes in 2015, as compared to 2014, as they sought to reduce inventory levels as steel prices declined. Although underlying steel demand continued to rise (remaining strong in the Company’s core markets, U.S. and Europe) in 2015, apparent demand declined significantly, negatively impacting the Company’s deliveries and profitability. The significant declines in steel demand in Brazil and the CIS over the past two years have reduced their share of the Company’s deliveries to under 10% contributing to the overall decrease in deliveries.
Demand dynamics in China have also substantially affected the global steel business. After growing strongly since 2000, Chinese steel demand has started to decline as a result of weaker real estate sector construction and machinery production. This decline in domestic demand has led to a surge in Chinese steel exports, which increased by over 30 million tonnes from 2013 to 2014, and then by an additional 18 million tonnes from 2014 to 2015. This increase in Chinese exports is greater than the growth in world ex-China steel demand over the past two years, and has had the effect of curtailing domestic production in countries outside of China over the period. While the majority of these exports are directed to Asia, an increasing proportion is being directed toward ArcelorMittal’s core markets and Europe, in particular. While not a sustainable long-term strategy, Chinese exports in 2015
4 Management report
were increasingly being sold at prices apparently below cost (China Iron and Steel Association (“CISA”) reports large and medium-sized CISA mills losing RMB 53 billion ($8.6 billion) from January through November 2015), negatively impacting prices and therefore margins in many regions.Unlike many commodities, steel is not completely fungible due to wide differences in shape, chemical composition, quality, specifications and application, all of which affect sales prices. Accordingly, there is still limited exchange trading and uniform pricing of steel, whereas there is increasing trading of steel raw materials, particularly iron ore. Commodity spot prices can vary, which causes sale prices from exports to fluctuate as a function of the worldwide balance of supply and demand at the time sales are made. ArcelorMittal’s sales are made on the basis of shorter-term purchase orders as well as some longer-term contracts to certain industrial customers, particularly in the automotive industry. Steel price surcharges are often implemented on steel sold pursuant to long-term contracts in order to recover increases in input costs. However, spot market steel, iron ore and coal prices and short-term contracts are more driven by market conditions.
One of the principal factors affecting the Company’s operating profitability is the relationship between raw material prices and steel selling prices. Profitability depends in part on the extent to which steel selling prices exceed raw material prices, and, in particular, the extent to which changes in raw material prices are passed through to customers in steel selling prices. Complicating factors include the extent of the time lag between (a) the raw material price change and the steel selling price change and (b) the date of the raw material purchase and of the actual sale of the steel product in which the raw material was used (average cost basis). In recent periods, steel selling prices have tended to react quickly to changes in raw material prices,
due in part to the tendency of distributors to increase purchases of steel products early in a rising cycle of raw material prices and to hold back from purchasing as raw material prices decline. With respect to (b), as average cost basis is used to determine the cost of the raw materials incorporated, inventories must first be worked through before a decrease in raw material prices translates into decreased operating costs. In some of ArcelorMittal’s segments, in particular Europe and NAFTA, there are several months between raw material purchases and sales of steel products incorporating those materials. Although this lag has been reduced recently by changes to the timing of pricing adjustments in iron ore contracts, it cannot be eliminated and exposes these segments’ margins to changes in steel selling prices in the interim (known as a “price-cost squeeze”). In addition, decreases in steel prices may outstrip decreases in raw material costs in absolute terms, as has occurred numerous times over the past few years.
Given this overall dynamic, the Company’s operating profitability has been particularly sensitive to fluctuations in raw material prices, which have become more volatile since the iron ore industry moved away from annual benchmark pricing to quarterly pricing in 2010. Iron ore prices were relatively stable in 2013, averaging $135/t, but fell sharply in 2014, reaching lows of $68/t in December 2014 and averaging under $100 for the first time since 2009. Volatility on steel margins aside, the results of the Company’s mining segment are also directly impacted by iron ore prices, which were weaker again in 2015, ending the year at $40/t and averaging only $55.5/t. This means, among other things, that if iron ore prices were to remain around current levels ($40/t) due to continued strong growth of supply or any further significant decline of Chinese steel production, this would continue to have a negative impact on ArcelorMittal’s revenues and profitability.
Economic environment1
Global GDP growth fell short of expectations in 2015, slowing marginally, to 2.5% year-on-year, from 2.7% in 2014 (2.5% in 2013) as deceleration in key emerging and developing economies overshadowed a modest recovery in major developed countries in 2015. This deceleration was accompanied by further declines in commodity prices, subdued global trade, bouts of financial market volatility, and weakening capital flows.
Domestic demand in the United States was supported by robust consumption and investment, with the exception of the oil sector. U.S. GDP growth in 2015 is estimated at 2.5%, the highest annual rate in the post-2008 crisis period. Solid labor market conditions and low oil prices continue to support a consumption-led recovery, with automotive sales growing by over 5% year-on-year in 2015 to a record of 17.4 million. Nominal construction spending increased by around 10% year-on-year in 2015, with strong growth in both residential and non-residential construction. The weakness in net exports is the result of the strong dollar and softness in external demand, particularly from large emerging markets. Despite headline inflation of around zero in the second half of 2015, the Federal Reserve began increasing interest rates in December due to the strength of labor markets. Fiscal policy has eased to a broadly growth-neutral stance in 2015, after having been a headwind in previous years.
European Union (EU) GDP growth picked up in 2015 to around 1.8%, as domestic demand strengthened and eurozone exports were supported by euro depreciation. Low oil prices and improving financing conditions are supporting consumer spending and investment. Indeed, EU automotive sales grew by 9% year-on-year in 2015 to 13.7 million,
1 GDP and industrial production data and estimates sourced from IHS Global Insight January 15, 2016.
their highest level since 2009. Moderating fiscal consolidation and healing labor markets are also underpinning domestic demand, although conditions vary across countries. Activity firmed in Spain, but France and Italy are still lagging, whereas growth slowed in the United Kingdom but remained stronger than the eurozone average. Peripheral economies saw little contagion from another Greek crisis, which led to a third bailout program and promises of further reforms. Credit conditions have improved, supported by the European Central Bank’s (“ECB”) quantitative easing program. With headline inflation close to zero in 2015, deflation concerns have receded but have not disappeared, prompting the ECB to ease monetary policy further in December 2015.
Sectoral rebalancing in China became more pronounced in 2015 with GDP growth slowing in 2015 to an estimated 6.9%, down from 7.3% in 2014. In line with rebalancing efforts, the deceleration in activity during 2015 has been most visible in heavy industry and real estate sectors with considerable overcapacity and, in the case of heavy industry, a high presence of state-owned enterprises. Weaker manufacturing growth and declining construction activity has significantly impacted import demand, which contracted in the first half of 2015. The service sector has seen its share of employment increasing in recent years, and accounted for the majority of new urban jobs created in 2015. The fiscal deficit widened to a six-year high of 2.3 percent of GDP in 2015, reflecting accelerated infrastructure investment by the central government to support growth in the second half of the year. The People’s Bank of China introduced a change in the calculation of the renminbi reference rate on August 10, 2015, leading to an almost 3% depreciation against the US$. Otherwise, the renminbi was stable throughout most of 2015, but weakened further towards the end of the year.
Management report 5
Brazil and Russia have taken a turn for the worse as a result of global and domestic headwinds, and the weakness in oil and other commodity prices, with both countries experiencing deepening contractions, above-target inflation, and deteriorating public finances. In South Africa, chronic power supply bottlenecks are a major factor behind weak growth. In contrast to other major developing countries, growth in India remained robust, buoyed by strong investor sentiment and the positive effect on real incomes of the recent fall in oil prices.
Global industrial production (“IP”) growth slowed to 1.5% year-on-year as IP in Organization for Economic Co-operation and Development (“OECD”) countries eased to just 0.9% year-on-year in 2015, after growing by 2.3% in 2014, whereas IP growth in non-OECD countries slowed to 2.3% in 2015 from 3.8% in 2014.
Global apparent steel consumption (“ASC”) is estimated to have fallen by 2.2% year-on-year. This was mainly due to the slowdown in China, where consumption fell by 4.5% in 2015, the second consecutive year of decline. However, Chinese demand estimates are subject to change, due to significant revisions to steel production estimates to account for under-reported output by Chinese mills. Elsewhere, world-ex-China ASC fell by just 0.3%, as significant declines in CIS (-8%), NAFTA (-7%) and Latin America (-7%) were offset by growth in other regions, particularly EU28 (+3%), Asia ex-China (+5%) and Africa & Middle East (+4%).
Steel production2
After declining sharply during 2009 to 1.2 billion tonnes, world crude steel production grew robustly each year to 1.6 billion tonnes in 2013, driven by strong Chinese growth. Global production 2 Global production data is for all 66 countries for which production data is collected by the World steel, accounting for around 99% of global steel production.
continued to rise in 2014, up 3.2% to 1.65 billion tonnes due again to the rising output in China. Chinese production is estimated to have increased from 775 million tonnes in 2013 to about 813 million tonnes in 2014 (+5.0% year-on-year), whereas world ex-China growth also increased only 1.5% year-on-year to 839 million tonnes. World crude steel production fell in 2015, for the first time since 2009, as steel consumption in developed and key emerging markets declined. Amid depressed demand conditions, the availability of low priced imports, particularly from CIS, in which domestic demand also declined, forced many producers across the world to curtail output.
Between 2009 and 2014, global production increased by around 35%, rising by approximately 0.5 billion tonnes to 1.67 billion tonnes in 2014, of which China alone accounted for around 60% of the growth. While global steel consumption also increased following the 2009 financial crisis, the slowdown in China in 2014 and 2015 exposed the excess capacity issues faced by the steel industry as Chinese producers increased export volumes to compensate for falling domestic demand. Indeed, Chinese exports soared by 72% over the past two years, rising to a record 112 million tonnes in 2015.
Global steel production is estimated to have fallen by 2.8% to 1.62 billion tonnes in 2015 (-1.8% year-on-year over the first half of the year and -3.6% year-on-year over the second half of the year). Production in the second half of 2015 was weaker and reflected worsening global demand conditions over the period and increased destocking as prices fell. China, which accounted for 49.5% of steel production in 2015 (49.3% in 2014), saw a decline in output of 2.3% as tighter steel margins rendered some mills unprofitable and producers were unable to offset the decline in domestic demand with increased exports. Apart from China, almost all major steel producing regions also recorded a decline in production
in 2015. EU28 steel output decreased by 1.8% to around 166.2 million tonnes even though consumption recorded positive growth; the incremental demand was in fact satisfied by imports. North American steel production fell by 8.5% in 2015 mainly due to a decline in U.S. output, which tumbled by 10.5% as stockholders and end-users sought to correct inventories which had grown in 2014 when total steel imports rose by almost 40%. In the CIS, output also fell (-4.3% in 2015 year-on-year) as a recession lowered domestic demand and overwhelmed increased international competitiveness from weaker domestic currencies. South America also saw a 2.5% decline in production as Brazilian steel demand faltered by around 15% due to economic issues facing the country. In Asia, production decreased by 2.3%, mainly due to slower growth in China and a 5% decline in Japanese output. In India, however, production increased by 2.6% and elsewhere, Australia/New Zealand also recorded a 4.6% rise in production.
Steel prices3
Steel prices for Flat products in Europe remained relatively stable in euro terms during the first quarter of 2015 against 2014 fourth quarter averages, despite continuous erosion of raw material costs. A balanced market, low interest rates and steady demand for durables, coupled with the weak euro, helped improve the steel market in the first quarter of 2015. In Northern Europe the price for hot rolled coil (“HRC”) improved slightly from January to March, to an average of €405-413 ($458-467) per tonne (/t) for the first quarter of 2015. Prices saw a similar trend in Southern Europe, with spot HRC improving to €395-404 ($446-456)/t, while a weaker euro impacted the realization of this improvement in USD terms both in Northern and Southern Europe by roughly -$50 quarter on quarter. Economic conditions remained good in Europe during the second quarter 3 Source: Steel Business Briefing (SBB)
of 2015, with strong bookings in industry and auto. Despite this, steel prices saw consistent weakening on a monthly basis from April to June, due mainly to pressure from imports. Spot HRC averaged at €398-405 ($440-448)/t in Northern Europe and at €385-393 ($425-435)/t in Southern Europe. Aggressive domestic offers at the beginning of the third quarter, coupled with low-priced imports from Turkey, Russia and China, kept prices in Europe under pressure, and HRC spot saw a drop of approximately €27/$27 quarter on quarter, in Northern Europe, to €372-378 ($414-420)/t and €37/$38/t, in Southern Europe, to €348-357 ($387-397)/t. Eurozone consumer confidence dropped to a nine-month low in October, while the gap in the offer price for steel in northern vs. southern Europe continued to feed expectations for price declines. HRC spot further weakened during the fourth quarter to €325-335 ($357-368)/t in Northern Europe and to €293-304 ($322-333)/t in Southern Europe.
In the United States, 2015 started with a positive economic outlook, supported by consumer confidence in February at its highest since 2007, despite negative sentiment in the oil & gas sector. The steel market was nevertheless challenging, due to high inventories and buyer caution in placing orders. A strong USD continued to encourage imports during the first quarter of 2015, with South Korea, Japan, Germany and Australia quickly taking over volumes upon the termination of an export suspension agreement with Russia in December 2014. Domestic prices declined, especially during February and March, following declines in Scrap #1 Busheling, which fell from $369 per gross tonne (“/GT”) in January to $255/GT in March. Spot HRC prices during the first quarter of 2015 dropped from a $631/t average in January to $531/t in March, for a quarterly average of $578/t. The second quarter had a weak start, with declining scrap prices rolling over into April and HRC bottoming at
6 Management report
$491-503/t, before strengthening of underlying demand aided prices to firm to a $502-510/t level in May. Scrap #1 Busheling gained $30 from April to June to an average of $266/GT for the second quarter of 2015, supporting HRC price improvement to $507-514/t in June, for a quarterly average of $500-509/t. Despite the consumer confidence index increasing by +10.5 points from July to 101.5 in August, and steel consumption being sustained by strong sales in auto (17.7 million units SAAR in August), prices started weakening again during the third quarter, as U.S. prices re-aligned to those globally and scrap prices failed to provide cost support. Spot HRC price fell to $485-497/t by September, for a quarterly average of $499-510/t. Demand for both scrap and finished steel during the fourth quarter remained weak due to destocking and Scrap #1 Busheling fell to $167-180/GT, pushing HRC spot price down approximately $70 quarter on quarter, to an average of 421-438/t.
In China, 2015 began with increased uncertainty due to the change in export rebate policy as of January 1, 2015 (discouraging exports and adding more pressure on the domestic market), and the government’s efforts to implement anti-pollution regulation, impacting producer costs and possible cuts to capacity. Despite the Central Bank’s 0.5% cut to the reserve requirement ratio to boost growth, steel market activity remained depressed in the first quarter of 2015 and remained weak into the second quarter, due to declining real estate demand. Production, however, was sustained by exports, which surged from March onward. Domestic prices continued their accelerated decline, with spot HRC down to $357-362/t VAT excluded, during the first quarter (from $415-419/t in the fourth quarter of 2014), and further to $326-330/t VAT excluded, in the second quarter. Market sentiment remained weak during the third quarter, with prices declining month by month, to an HRC average of $268-269/t level, VAT
excluded. Demand continued to shrink in the fourth quarter, as the cold season approached and HRC domestic prices saw a drop in their quarterly average to $250-252/t level, VAT excluded.
Long products saw resilient demand in Europe in January and February 2015, and a slight increase in scrap price gave support for improvement on commodity pricing, despite pressure from Russia and Ukraine in Eastern Europe. Buyers became more hesitant towards the end of the first quarter as scrap price weakened and expectations built for a price decline. Medium section prices, however, saw progressive, albeit limited, improvement from January to March 2015 (+€7/t), with a quarterly average at €512-522 ($577-589)/t. Rebar prices, on the other hand, were impacted to a greater degree by scrap fluctuation, and declined by €10 during the quarter, to an average range of €413-422 ($466-476)/t. The European Central Bank’s lending survey at the beginning of the second quarter sustained a take-off for construction investments, thus demand continued solid during the April-June period. In addition, with scrap picking up, further price gains were achieved in euro terms both for medium sections at €521-530 ($576-585)/t and rebar prices at €418-426 ($462-470)/t. Price trends reversed starting in the third quarter, as pressure on scrap from the international markets resulted in E3 scrap prices dropping, impacting commodity offers. Medium section prices declined to €511-520 ($568-578)/t and rebar to €405-413 ($450-458)/t. The situation continued into the fourth quarter, when further scrap deterioration pushed medium sections down approximately €36/$48 versus the third quarter, to a range of €474-486 ($519-532)/t, and rebar prices were down by approximately €38/$49, ranging around €366-374 ($401-410)/t.
In 2015, scrap prices globally re-aligned following a year of anomalously high levels. Prices of scrap HMS 1&2 of USA origin
imported into Turkey dropped substantially during the first two months of 2015 from $311/t CFR in January to $248/t CFR in February. This was followed by an unexpected price improvement starting in March, on the back of tight supply, to a peak of $286/t in May (average range of $274-279/t during the second quarter of 2015). Export prices for Turkish rebar fluctuated alongside scrap dropping from $493/t FOB in January to $436/t FOB in March ($455-461/t average range in the first quarter), and reversing to a peak of $454/t FOB in May (second quarter average range of $441-446/t FOB). The spread of Turkey FOB rebar prices over scrap declined by approximately $20/t during the period, partly compensated by the Turkish lira’s depreciation. Turkish imported scrap saw significant price declines during the third and the fourth quarters, as raw material costs continued to deteriorate and international price pressure increased. Scrap HMS 1&2 fell to as low as $204/t CFR Turkey by September and $180/t CFR Turkey in October, followed by slight improvement towards the end of 2015 (to $188 avg. in December). Lack of support from scrap, as well as weaker billet prices (due to severe Chinese competition), coupled with weak demand, impacted rebar prices, which dropped during the third quarter to an average of $383-392/t FOB Turkey, and further to $331-337/t FOB, during the fourth quarter.
Current and anticipated trends in steel production and prices
Steel output declined in major steel producing regions in 2015 reflecting falling global steel consumption, as well as the availability of cheaper imports from mainly China and the CIS. Chinese production declined by around 2% compared to a fall in domestic consumption of around 4.5%, while exports continued to increase substantially to a record 112 million tonnes in 2015, up 18 million tonnes year-on-year. The combination of softening global
demand and excess Chinese capacity had a negative impact on production in many regions. With the exception of Europe, apparent consumption in developed markets fell in 2015, particularly in United States where the inventory overhang resulted in an almost 10% fall in apparent demand. Steel production in the USA fell by 10.5% in 2015 as imports remained elevated relative to historical levels, particularly for flat and long products, despite an overall fall of 6.5% year-on-year. ArcelorMittal expects continued growth in underlying real steel demand in the United States in 2016 and, due to the level of destocking last year, considers that apparent steel demand and domestic steel production will be likely to rebound. In Europe, ArcelorMittal expects the gradual recovery in the steel consuming sectors to continue, albeit more slowly than in 2015, while steel production is only likely to be up slightly year-on-year in 2016, provided that trade actions are taken to protect domestic producers from unfairly priced imports. ArcelorMittal forecasts that global steel demand will remain stable in 2016, at best rising by less than 1% in 2016, following a 2.2% fall in 2015 triggered by weakening developing markets and destocking in some developed economies. While ArcelorMittal expects continued weakness in Brazil and Russia, the magnitude of their declines is expected to be lower than those of 2015. China too is expected to see demand levels fall slightly, likely to be in the -1% range assuming the real estate market begins to improve in the second half of 2016. Weaker emerging market currencies are expected to continue to support export opportunities, due to international price competitiveness, thereby supporting steel production in these countries. In China, the increasing threat of countervailing and anti-dumping measures against Chinese origin material by several countries, as well as domestic environmental compliance issues are likely to keep steel production growth

Management report 7
muted, particularly as global steel demand remains subdued in the first half of 2016. Should competitively priced Chinese exports continue to rise, however, production growth in export destinations will likely be negatively affected.
Despite the weakness of steel prices, steel spreads (the difference between raw material costs and finished steel prices) have actually begun to pick up so far in the first quarter of 2016 from the depressed levels seen at the turn of the year. Ultimately, steel prices will depend on the strength of underlying raw material prices, which are a function of both the demand and supply of each commodity.
Raw materials
The primary raw material inputs for a steelmaker are iron ore, solid fuels, metallics (e.g., scrap), alloys, electricity, natural gas and base metals. ArcelorMittal is exposed to price volatility in each of these raw materials with respect to its purchases in the spot market and under its long-term supply contracts. In the longer term, demand for raw materials is expected to continue to correlate closely with the steel market, with prices fluctuating according to supply and demand dynamics. Since most of the minerals used in the steel-making process are finite resources, they may also rise in response to any perceived scarcity of remaining accessible supplies, combined with the evolution of the pipeline of new exploration projects to replace depleted resources.
The spot markets for iron ore and coking coal have been in a downward price trend since the first half of 2014. In 2015, this trend gained momentum with a slower growth rate in China, recession in developing economies such as Brazil and Russia, and continued robust seaborne supply from major miners. Since the beginning of 2014, the iron ore and coking coal prices decreased by 61% and 37% respectively (Platts Q1-2014
vs. Q4-2015).As for pricing mechanisms, since 2012, quarterly and monthly pricing systems have been the main type of contract pricing mechanisms, but spot purchases also appear to have gained a greater share of pricing mechanisms as steelmakers have developed strategies to benefit from increasing spot market liquidity and volatility. In 2015, the trend for using shorter-term pricing cycles continued, with the spot market remaining liquid and driven by Chinese demand.
Iron ore
In the first quarter of 2013, iron ore prices increased dramatically reaching $160 per tonne in late February as a result of restocking in China before the New Year holiday and a seasonally weaker supply due to weather-related disruptions in production in Brazil and Australia. The average price for the first quarter of 2013 was $148 per tonne. In the second quarter of 2013, iron ore prices declined significantly as a result of stock cuts stemming from uncertainties about the Chinese market outlook, reaching a low of $110 per tonne in May and averaging $126 per tonne for the quarter. In the third quarter of 2013, iron ore spot prices recovered, averaging $132 per tonne for the quarter, as a result of strong crude steel production rates in China and significant restocking at Chinese steel mills through the end of August. Despite a strong seaborne supply coming on-stream from the third quarter of 2013 onwards, the spot price remained above $130 per tonne. In the fourth quarter of 2013, the iron ore market stabilized within a range of $130 to $140 per tonne with no clear price direction as the increasing supply availability was matched with a higher demand on the winter season restock.
In the first half of 2014, iron ore spot prices declined by 31% from $134.50 per tonne on January 1, 2014 to $93.25 per tonne on June 30, 2014. This downward price trend was due mainly to increasing
supply in the seaborne market and financial weakness in the Chinese steel sector. Credit market tightness combined with stretched cash flows at Chinese mills resulted in a strong destocking trend at Chinese mills from the beginning of the year through the end of the second quarter. Rising iron ore import inventory at Chinese ports was reflective of stronger seaborne supply while real iron ore demand in the Chinese off-shore market remained relatively stable.
The downward trend continued and reached $66-69 per tonne in late December 2014 on continued structural iron ore oversupply and persistent strains in the credit market in China. The average spot price for the fourth quarter was $74 per tonne, or 18% lower than the previous quarter at $90 per tonne. As of end of January 2015, iron ore spot prices were trading in the range of $62-69 per tonne (January 15-30, 2015, CFR China, Platts index, 62% Fe).
The downward trend of iron ore prices persisted through 2015, with quarterly averages spot prices of $62.40 per tonne in the first quarter of 2015, $58.45 per tonne in the second quarter, $54.90 per tonne in the third quarter and $46.65 per tonne in the fourth quarter (CFR China, Platts index, 62% Fe). This downward trend has been supported by continued structural oversupply, resilience of high cost mines (in China and seaborne), lower mining costs at major supply regions (supported by currency depreciation, e. g. in Australia and Brazil), lower fuel and freight costs as well as bearish sentiment about Chinese steel demand. In this context of oversupply, the Samarco tailings ponds dam collapsed in November 2015 resulting in a halt of operations (a 30 million tonne pellet capacity producer); however, it did not affect the plummeting iron ore price trend, which continued decreasing through the end of 2015.
Coking coal
Due to a continued strong supply and weak demand outlook, the spot coking coal market remained weak in 2013. Better-than-average supply conditions during the Australian wet season in early 2013 contributed to a decrease in hard coking coal prices in the first half of 2013, with premium coking coal spot prices reaching a low of $130 per tonne (FOB Australia) by the end of the second quarter. Spurred by Chinese demand, spot hard coking coal prices began to increase at the beginning of the third quarter of 2013, peaking at $152 per tonne in mid-September. However, despite high imports of coking coal to China, the seaborne coking coal market remained weak until the end of 2013, largely as a result of relatively weak ex-China seaborne demand, an improved supply base from Australia and strong domestic production in China. The premium coking coal spot price was $131 per tonne on December 31, 2013. In 2013, contract prices followed the volatile spot price trend over the year, with the quarterly contract price for hard coking coal progressing from $165 per tonne in the first quarter to $172 per tonne in the second quarter, then to $145 per tonne in the third quarter and $152 per tonne in the fourth quarter.
Due to the combined effects of strong Australian coking coal production performance, the mild wet season in Australia and weaker seaborne demand from China, the coking coal spot market and quarterly contracts settlements have been on a downward trend in 2014 and 2015. Moreover, in the same period there was an increase of seaborne supply from new regions, notably Russia and Mozambique, as well as productivity improvement and cost reductions at major producers also supported by depreciated local currencies and lower diesel prices. This downward trend prevailed despite some supply closures, e.g. major seaborne suppliers of coking coal from Australia, the United States, and

8 Management report
Canada announced the closure of their least cost efficient mines in order to adjust to weaker seaborne demand and to remain cost competitive. These supply closures seem to be more than offset by lower Chinese imports, throughout 2014-2015. Chinese coking coal imports continued their decline (a decrease of 21% year-on-year in 2014 and a decrease of 21% for January to November 2015 vs. January to November 2014, Tex Report January 5, 2016), while an increased share of imports from Australia at the expense of other seaborne suppliers, mainly from the U.S. bearish market price forecasts, combined with successive loss-making quarters partially originated from high debt service obligations (following past acquisitions), have forced several U.S. coal producers, to file chapter 11 bankruptcy in 2015 in order to restructure their finances and operations.
The first half of 2015 experienced sharp spot price and contract reference price reductions, with a widening gap in the second quarter between both references (spot indexes and quarterly contract settlement), as quarterly contract references settled at $117 per tonne (FOB Australia) and $109.50 per tonne for the first and second quarters of 2015, respectively. Spot prices for such quarters averaged $104 per tonne and $87 per tonne, respectively. In the third quarter of 2015, premium coking coal spot prices reached a low of $79 per tonne (FOB Australia) while contract settlement for the same quarter was at $93 per tonne (FOB Australia). Contract settlement further reduced in the fourth quarter of 2015, where contract prices settled at $89 per tonne (FOB Australia), while spot prices were trading in the range of $72-77 per tonne (December 1 through 31, 2015, FOB Australia HCC Peak Downs Platts index).
ArcelorMittal has continued to leverage its full supply chain and diversified supply portfolio in terms of the origin of sources to mitigate risks of regional
supply disruptions. Additionally, ArcelorMittal further diversified its coking coal supply portfolio by adding new sources from emerging mines, e.g. from Mozambique and Russia.
Scrap
Scrap prices decreased throughout 2014. In Europe, the average price of scrap in 2014 was €262 per tonne (Eurofer Index for Demolition Scrap), which was 6.1% lower than in 2013 when the average price was €279.10 per tonne. The published value of the index on February 5, 2015 was €239 per tonne. Similarly, in NAFTA the average price of scrap in 2014 was $338.50 per tonne (HMS 1&2 FOB East Coast), which was 4.7% lower than in 2013 when the average price was $355.30 per tonne. The published value of this Index on February 5, 2015 was $250.60 per tonne. During the course of 2014, scrap prices decreased by 20.2% compared to 2013 (from $393 to $313.50 per tonne: MB HMS 1&2 80:20 CFR Turkey, North European origin). The published value of this Index on February 5, 2015 was $242.20 per tonne. In 2014 as compared to 2013, the drop in the Metal Bulletin Index HMS 1&2 80:20 CFR Turkey, North European origin was 5.5% on average, consistent with the 6.1% in local European Eurofer E3 prices.
Scrap imports towards Turkey remained constant with a decrease of 0.28% in 2014 as compared to 2013. This was, to some extent, a consequence of Turkey’s capacity to source iron ore based materials in order to control scrap prices. Imports of billets were sourced from CIS beginning in the second half of 2014. The second and third importers are South Korea (< 1/3 the amount Turkey imports) and Italy. China takes 10th place and decreased its imports of scrap by 41.4% in 2014 as compared to 2013, mainly due to preference for iron ore in this context, plus the use of internal scrap (no exports recorded in 2013 or 2014). Regarding exports of scrap, the United States continued to take
the lead but with a continuous downtrend to 15.5MT in 2014 as compared to 18.5MT in 2013 as a result of better economic activity, which is to say, strong demand, plus a favorable €/$ exchange rate discouraging traditional exports to Turkey.
In Europe, after some volatility in the first quarter of 2014 (average price of €269 per tonne) the Eurofer E3 index remained very stable in the second and third quarters, around €270 per tonne. However, there was a decrease in the fourth quarter of 2014, to €243.67 per tonne on average due to alternative sourcing from Turkey. The lowest price was reached in November at €237 per tonne. In NAFTA, the HMS 1&2 FOB index reacted consistently with Europe, with prices in 2014 at $345 per tonne in the first quarter, $355 per tonne in the second quarter, $357 per tonne in the third quarter and a final decrease to $297.80 per tonne in the fourth quarter. Beginning in the third quarter of 2014, the U.S. dollar strengthened significantly against the euro, which improved the attractiveness of scrap exports from the eurozone region relative to NAFTA.
Scrap prices decreased throughout 2015. In Europe, the average price of scrap in 2015 was €208.9 per tonne (Eurofer Index for Demolition Scrap), which was 20.3% lower than in 2014. In NAFTA, the average price of scrap in 2015 was $218 per tonne (HMS 1 Domestic MidWest), which was 40% lower than in 2014 when the average price was $364 per tonne. Comparing 2015 to 2014, average international scrap prices decreased by 33.5% from $352 to $234 per tonne (MB HMS 1&2 80:20 CFR Turkey, North European origin). Similarly for NAFTA, the average price of scrap in 2015 was $224.4 per tonne (HMS 1&2 FOB East Coast) which was 33.7% lower than in 2014 when the average price was $338.5 per tonne.
Turkish scrap import volumes were 14.5 million tonnes in the first 11 months of 2015, representing a decrease of 18.4% compared
to same period in 2014. This was mainly a consequence of Turkey’s capacity to source iron ore based materials which drove scrap prices down. Turkish billets imports from China increased 1.33 million tonnes. Turkey remains the main scrap buying country in the international market and approximately 65% of its steel production is based on the EAF process. Turkey’s crude steel production decreased by 8% in the first 11 months of 2015 as compared to the first 11 months of 2014, with a decrease of 14.6% in the EAF process and an increase of 7.5% in the blast furnace process.
The high scrap prices have made the EAF process less profitable as compared to the iron ore based processes. Production cuts in the EAF base processes took place in 2015 reducing scrap demand.
Ferro alloys and base metals
Ferro alloys4
The underlying price driver for manganese alloys is the price of manganese ore which was at the level of $3.11 per dry metric tonne unit (“dmtu”) (for 44% lump ore) on Cost, Insurance and Freight (“CIF”) China for 2015, representing a decrease of 31.80% from $4.56 per dmtu in 2014 ($5.33 per dmtu for 2013) mainly due to poor demand and oversupply of manganese ore in 2015.
The 2015 prices of high carbon ferro manganese decreased compared to the prior year by 15.8% from $1,119 to $942 per tonne. Prices of silicon manganese decreased compared to the prior year by 17.43% from $1,222 to $1,009 per tonne ($1,174 per tonne for 2013). Prices for medium carbon ferro manganese decreased in 2015 compared to the prior year by 13.11% from $1,686 to $1,465 per tonne ($1,644 per tonne for 2013).
4 Prices for high grade manganese ore are typically quoted for ore with 44% manganese content.

Management report 9
Base metals5
Base metals used by ArcelorMittal are zinc, tin and aluminum for coating, aluminum for deoxidization of liquid steel and nickel for producing stainless or special steels. ArcelorMittal partially hedges its exposure to its base metal inputs in accordance with its risk management policies.The average price of zinc for 2015 was $1,928 per tonne, representing a decrease of 11% as compared to the 2014 average of $2,164 per tonne (the 2013 average was $1,909 per tonne). The low for 2015 was $1,461 per tonne on December 17, 2015 and high was $2,405 per tonne on May 6, 2015. The global zinc metal market was in a surplus of 213,000 tonnes in the first 10 months of 2015 (production vs. usage). Stocks registered at the London Metal Exchange (“LME”) warehouses stood at 464,400 tonnes as of December 31, 2015, representing a decrease of 33% compared to December 31, 2014 when stocks registered stood at 691,600 tonnes (933,475 tonnes in 2013), reflecting the change in LME warehousing rules in response to a surfeit in stocks and decreased contango.
The average price of tin for 2015 was $16,070 per tonne, representing an decrease of 27% compared to the 2014 average of $21,893 per tonne (the 2013 average was $22,304).
The average price of aluminum for 2015 was $1,661 per tonne, representing an decrease of 11% compared to the 2014 average of $1,867 per tonne (the 2013 average was $1,845).
The average price of nickel for 2015 was $11,834 per tonne, representing an decrease of 30% compared to the 2014 average of $16,867 per tonne (the 2013 average was $15,003).
5 Prices included in this section are based on the London Metal Exchange (LME) cash price.
Energy market
Electricity
In most of the countries where ArcelorMittal operates, electricity prices have moved in line with other commodities. In North America, the continuous pressure on oil brought the natural gas price down approximately 15% while forward prices in the PJM electricity market for the calendar year 2016 have seen a reduction of approximately 9% (from $44/MWh down to $40/MWh) compared to November 2015. The mild winter, strong pipeline flows from Russia/Norway to Europe and comfortable storage capacity has decreased the premium built into electricity prices. Brent oil prices are currently in the range of $30/bbl to $35/bbl ($36.70/bbl at the end of December 2015) and the general commodity bearish mood brought the electricity price below €30/MWh at the end of 2015 in most of the western countries, representing a drop between €5~8/MWh or a ~20% price reduction since November 2015. Prices continued to decline in January 2016.
Overall production capacity in Europe is comfortable in the short term but increasing environmental constraints and low market prices are pushing utilities to close recent gas plants and the oldest coal power plants. The electricity price crash that occurred at the end of 2015 and beginning of January 2016 may accelerate decisions for mothballing unprofitable units. This market price driven cut is inconsistent with the need of more flexible power generation required to cope with increasingly intermittent renewables capacity and is therefore fueling “capacity market” debates and other market mechanisms that could be needed to guarantee the required investments ensuring security of supply.
In the absence of increasing demand, the only positive signal in the short term, apart from strong climate deviations, would likely be from policy decisions
on capacity markets. On the CO2 markets where the market stability reserve is intended to rebalance the existing long term market, the results of the COP 21 meeting in December 2015 did not succeed in boosting prices, and was in fact followed by a price decrease from €8.5/MWh to below €6.5/MWh (~25% reduction).
Natural gas
Natural gas is priced regionally. European prices were historically linked with petroleum prices but continuous spot market development and increasing liquidity are now prevailing in almost all countries except in poorly integrated markets (e.g., Spain, Portugal) or markets in transition from a tariff based system (e.g., Poland). With increasing liquid natural gas (“LNG”) flows in Spain, definitive movement towards a more liquid and integrated market could be experienced by 2017.
This trend is reducing the correlation and sensibility of the Western European market to oil price volatility. As an example, the gas auction of Gazprom in September 2015 was based on market prices and not oil indexation, as market prices were considered better indicators. North American natural gas prices trade independently of oil prices and are set by spot and future contracts, traded on the NYMEX exchange or over-the-counter. Elsewhere, prices are set on an oil derivative or bilateral basis, depending on local market conditions. International oil prices are dominated by global supply and demand conditions and are also influenced by geopolitical factors.
In 2015 and 2014, the LNG market continued to grow in Asia, although at a slower pace than in 2013. Excess supply is developing in that market as new liquefaction capacities are coming on stream or ramping up from Australia, Papuasia and Malaysia. This increase is not being absorbed due to the economic slowdown and is allowing for higher shipments
to Europe (compounded by the fact that Japanese nuclear power plants have slowly initiated the ramp-up in generating power). The expected high number of LNG shipments in Europe has pushed the whole forward curve down and has fully erased the bullish market effect of the lack of flexibility that was lost in 2015 when the production of Groningen, a giant natural gas field located in the Netherlands, was reduced due to repeated earthquakes.
Increasing supply (due to, among other things, North America shale oil and a lack of OPEC discipline) and lower demand than expected (due to, among other things, a decrease in the Chinese economy) pushed oil prices down, which resulted in: i) Asian oil indexed LNG prices (JKM) dropping (from $18 down to $7.50/MM British thermal unit (“BTU”) during 2015 and down to $6/MMbtu for spot LNG cargos mid-January 2015), closing the arbitrage window between Europe and Asia (no strong window is expected in the medium term), and ii) European LNG no longer being re-routed to Asia, resulting in increased supply in a continuously depressed market and pushing gas prices down year-on-year from $10.50/MMBtu in 2013 and $7.8/MMBtu in 2014 to $6/MMbtu in 2015, with downward pressure continuing in 2016. Prices are expected to be around $4/MMBtu for February 2016 onwards.
The premium related to the risk of gas flow disruption between Ukraine and Russia has disappeared with the agreement between Russia and Ukraine already on the table. In addition, Ukraine launched a successful tender to buy natural gas from a national joint-stock company Naftogaz Ukrainy in Europe on the western border of Ukraine using the three-year revolving loan of $300 million issued by the European Bank for reconstruction and development.
In 2015 in the United States, unconventional gas production
10 Management report
proved more than robust despite low oil prices and the continuous drop in gas market prices. A record buildup of gas in storage has materialized during the 2015/2016 winter with a surplus of approximately 15% compared to the 5 year average (decreasing the risk premium for winter months). The situation may change due to the pressure on gas and oil prices that will put pressure on some production areas in 2016. As a result, steam coal continues to be challenged as a fuel to produce power. Gas power plants are taking the lead and increasing their market share in the production mix which could trigger volatility in the summer period if there are heat waves. Projects to build liquefaction facilities for export to Europe or Asia continue to be developed, with production expected to start in early 2016 and potentially pushing U.S. gas prices up to keep up with the new export demand. In this context, natural gas prices in North American markets continued to increase from 2012 lows, averaging in 2014 at around $4.20 per MMBtu, up from $3.70 per MMBtu in 2013. Since the end of the 2014-2015winter, gas prices have been dropping. With storage recovery and high market confidence in the ability to meet demand, prices began to decrease in the fourth quarter of 2014 to $3/MMBtu and continued to decline in 2015, with prices below $2.5/MMBtu for 2016. LNG exports and an increase of Mexico’s cross-border infrastructure could play a role in increasing the gas price for 2016 onwards.
Ocean freight6
The shipping market generally exceeded expectations in the first half of 2014, in a period which is usually known to endure seasonal restrictions, due to strength seen in Australian exports. Total iron ore imports by China were up 19% year on year, as iron ore prices dropped. However, coal and other sectors such as grain did not see
6 Sources: Baltic Daily Index, Clarksons Shipping Intelligence Network, LBH, Fearnleys, RS Platou.
as much growth and especially as congestion eased, the result was improved vessel turnaround and increased efficiency in ports. Rates were expected to recover in the second half of 2014 as a result of increased Brazilian shipments, however, the recovery never materialized and Chinese demand waned. As a result, rates primarily remained at low levels throughout the second half of 2014, with only small periods of temporary strength. The Baltic Dry Index (“BDI”) averaged 1,105 points, an 8% decrease as compared to 2013. Chinese demand for both iron ore and coal was weaker than expected and even government measures did not allow sustained recovery in 2014. Although Australian exports did well in the first half of 2014, they suffered in the second half of the year as a direct result of the slowdown in Chinese demand. Meanwhile, bunker fuel prices fell in 2014, especially in the second half of the year and this aided in keeping freight rates low. Capesize rates averaged at $13,800 per day ($14,842 per day in 2014 based on revised BDI methodology), a 5% decrease as compared to 2013. The smaller vessels saw less significant growth as the sector faced some resistance as a result of the Indonesian ban on bauxite and nickel ore exports, delayed South American grain exports and a weaker coal trade. Panamax rates averaged at $7,718 per day in 2014, a 19% decrease compared to 2013.
Ocean freight market rates for dry cargo remained low for the majority of 2015, primarily due to a fall in coal and iron ore imports and the fall in oil prices. Chinese coal imports fell 30% year-on-year while average fuel price (reference price recorded for Rotterdam, Netherlands) decreased 51% in 2015 ($260 per million tonne) compared to 2014 ($531 per million tonne). There has been a flood of new build deliveries, but at the same time bulker demolition has also surged which has helped to curb a small portion of the oversupply and thereby slow expected net fleet growth.
The BDI averaged 718 points in 2015, representing a 35% decrease compared 2014. The Capesize sector averaged $8,127 per day in 2015 ($14,842 per day in 2014 based on revised BDI methodology). The Panamax sector averaged $5,561 per day in 2015 ($7,718 per day in 2014). Impact of Exchange Rate Movements
After having reached a yearly low during the first half of 2013 against most currencies in the jurisdictions where ArcelorMittal operates, the U.S. dollar strengthened significantly during the second part of 2013.
During 2014, mainly two different periods and market conditions were seen. Aside from the Ukrainian Hryvnia and the Kazakhstani tenge devaluations against the U.S. dollar, in the beginning of 2014, there was a low volatility period where the €/$ exchange rate remained within the range of 1.35 - 1.40 and emerging countries started their recovery with evidence of adjustments. However, at the end of the second quarter of 2014, geopolitical conflicts, monetary policy divergence, very low oil prices as well as strong demand for the U.S. dollar started to have a negative impact on a number of currencies, especially in jurisdictions where ArcelorMittal operates.
In 2015, the currency landscape was reshaped. Supported by a robust labor market and resilient growth figures, the strength of the U.S. dollar was confirmed in December 2015 by the first rate increase by the Federal Reserve after a seven year period of a “zero interest rate policy.” The situation in the U.S. contrasted strongly with the eurozone, where the European Central Bank’s (the “ECB”) quantitative easing program increased in intensity throughout the year. This, alongside disappointing data on production activity and inflation, put pressure on the euro, which started the year at 1.21 and ended the year
at 1.09 against the U.S. dollar. The Chinese slowdown hit commodity prices and commodity exporters by extension, contributing to a move of the Canadian dollar and the Mexican peso in 2015 from 1.16 to 1.38 and from 14.80 to 17.20, respectively, against the U.S. dollar. The situation in Brazil, which entered into recession and witnessed unprecedented corruption scandals, and Russia, where geopolitical issues persisted, only further deteriorated by the fall of commodities: during the year the Brazilian real went from 2.55 to 4.25 and the Russian ruble from 58.05 to 73.05 against the U.S. dollar. In August 2015, Kazakhstan switched to a free float and allowed its currency to devalue 86% from 183 to 341 against the U.S. dollar in order to keep its market share vis-à-vis Russia, its main business partner. Currency developments have been similar in South Africa where a combination of weak commodity prices and tense political circumstances pushed the South African rand against the U.S. dollar to 15.55 at the end of 2015 from 11.60 at the beginning of the year.
Because a substantial portion of ArcelorMittal’s assets, liabilities, sales and earnings are denominated in currencies other than the U.S. dollar (its reporting currency), ArcelorMittal has exposure to fluctuations in the values of these currencies relative to the U.S. dollar. These currency fluctuations, especially the fluctuation of the U.S. dollar relative to the euro, as well as fluctuations in the currencies of the other countries in which ArcelorMittal has significant operations and sales, can have a material impact on its results of operations. In order to minimize its currency exposure, ArcelorMittal enters into hedging transactions to lock-in a set exchange rate, as per its risk management policies.

Management report 11
Trade and Import Competition
Europe7
Import competition in the EU28 steel market peaked in 2007 – when demand was above productive capacity - with import penetration of 18.6% before fluctuating down to 12.0% by 2012, due to recovering global demand post the 2008/09 global recession.
Imports penetration into Europe has continued to trend upwards since 2012 as global steel markets started to slow down and the effects of excess Chinese steel capacity became more apparent. In 2013, despite a slight decline in steel demand, imports rose, particularly from China, Russia and Turkey, to total approximately 18.4 million tonnes, and the penetration ratio increased to 13.1%.
During 2014, finished steel imports increased by 19.9% year-on-year to around 22.0 million tonnes with growth mainly from shipments originating from CIS and China. Though finished steel demand also strengthened, growth was slower than imports at approximately 5% year-on-year. As a result, the import penetration rate for 2014 rose to 15.1%.
In 2015, strengthening industrial activity in Europe led to a 2% rise in underlying steel demand. However, the slowdown in global steel consumption coupled with excess capacity in China resulted in increased shipments to Europe as domestic prices remained relatively attractive. Third country imports into Europe have increased by approximately 22% last year, much faster than apparent consumption growth, leading to the penetration ratio to pick-up to 17.5% in 2015. Between 2012 and 2015, finished steel imports are estimated to have increased by approximately 10 million tonnes, of this incremental volume 40% originated from China
7 Source: Eurostat trade data to November 2015, estimates for December 2015.
while 25% were shipped from the Commonwealth of Independent States (CIS). This rapid increase in shipments from China meant the share of Chinese origin imports into Europe has risen from 20% in 2012 to an estimated 27% in 2015. The CIS remains the largest exporter to Europe with an estimated 29% share in 2015 though the share has declined marginally from 31% in 2012. Other traditional importers into Europe such as developed Asia and Turkey have seen their market share squeezed by the growing influence of China and to a lesser extent the CIS.
United States8
Steel import penetration peaked in 2015 at 29.3% but both apparent consumption and finished imports declined by 9.5% and 6.9% respectively as 2014 import volumes remained the highest on record since 2006.
Imports rose significantly in 2014, up 35.9% year-on-year to 30.6 million tonnes, compared to a 3.9% decline in 2013. In the same year, penetration increased to 28.4% from 23.2% in 2013 despite an 11.8% increase in apparent steel demand as overall steel imports were up 37.9%, buoyed by a strong rise in semis volumes, up 44.6% year-on-year.
Despite the decline in imports in 2015, volumes actually remained relatively elevated compared to historical levels, particularly for flat and long products. In fact, long product imports increased by around 4% in 2015 (+23% in 2014) while flat products declined by just 6.4% (+60% in 2014). Semis and tubes both declined significantly in 2015 to levels consistent with historical averages. As a result, total finished steel imports dropped by just 6.9% to 28.5 million tonnes in 2015 following a 35.9% rise to 30.6 million tonnes in 2014 while overall steel imports were down to 35.3 million tonnes (down 12.3% year-on-year) in 2015 8 Source: U.S. Department of Commerce, customs census data up to November 2015 and estimates for December 2015.
from 40.2 million tonnes (+37.9% year-on-year) in 2014. Almost three quarters of US imports originate from other NAFTA countries (Canada and Mexico), developed Asia, Brazil and EU28 and they have maintained a steady share of imports even though volumes have trended upwards. Of the remaining countries, only Turkey has increased its share from 4% to 8 % in 2015 while China’s share of US imports has remained steady at around just 5% to 6% of total volumes. However, trade measures against Russia have seen the CIS share drop from 11% in 2014 to 6% in 2015.
Consolidation in the steel and mining industries
Given the current economic uncertainties in the developed economies, combined with a slowdown in emerging markets, consolidation transactions decreased significantly in terms of number and value in the past three years and this trend is expected to continue in 2016, unless and until prices stabilize and supply and demand balance out in the context of worldwide structural overcapacity.
While developed markets continued to present fewer opportunities for consolidation, steel industry consolidation also began to slow down substantially in China in 2012 and continued through 2015. Despite being a key initiative of the five-year plan issued in March 2011, the concentration process of the steel industry was expected to reduce overcapacity, rationalize steel production based on obsolete technology, improve energy efficiency, achieve environmental targets and strengthen the bargaining position of Chinese steel companies in price negotiations for iron ore which has not been very effective. In 2015, China dropped its target objective for the top ten Chinese steel producers to account for 60% of national production and for at least two producers to reach 100 million tonne capacity in the next few years. A new industry consolidation plan published by China aims to simplify approval procedures and
facilitate acquisition financing for firms in sectors like steel.
Going forward, any further consolidation should foster the ability of the steel industry to maintain more consistent performance through industry cycles by achieving greater efficiencies and economies of scale, and should lead to improved bargaining power relative to customers and, crucially, suppliers, which tend to have higher levels of consolidation. Given the difficult iron ore price environment, it is quite possible that consolidation in this part of the value chain may occur in the future. The last evidence of major consolidation among mining companies was the completion of the merger between Xstrata and Glencore on May 2, 2013.
Key indicators
The following discussion and analysis should be read in conjunction with ArcelorMittal’s consolidated financial statements included in this annual report.
ArcelorMittal reports its operations in five reportable segments: NAFTA, Brazil, Europe, ACIS and Mining. The key performance indicators that ArcelorMittal’s management uses to analyze operations are sales, average steel selling prices, steel shipments, iron ore and coal production and operating income. Management’s analysis of liquidity and capital resources is driven by operating cash flows.

12 Management report
Sales for the year ended December 31,1 Operating income for the year ended December 31,2
Segment2015
(in $ millions)2014
(in $ millions)2013
(in $ millions)2015
(in $ millions)2014
(in $ millions)2013
(in $ millions)NAFTA 17,293 21,162 19,645 (705) 386 630 Brazil 8,503 10,037 10,148 628 1,388 1,204 Europe 31,893 39,552 40,507 171 737 (985)ACIS 6,128 8,268 8,419 (624) 95 (457)Mining 3,387 4,970 5,766 (3,522) 565 1,176 Others and eliminations (3,626) (4,707) (5,045) (109) (137) (371)Total 63,578 79,282 79,440 (4,161) 3,034 1,197 1 Amounts are prior to inter-segment eliminations (except for total) and sales include non-steel sales.2 Other and eliminations to segment operating income reflects certain adjustments made to operating income of the segments to reflect corporate costs, income from non-steel operations (e.g. energy, logistics and shipping services) and the elimination of stock margins between segments. See table below.
Years ended December 31, 2015, 2014 and 2013
Sales, operating income, crude steel production, steel shipments, average steel selling prices and mining production
The following tables provide a summary of ArcelorMittal’s performance by reportable segment for the year ended December 31, 2015, 2014 and 2013:
Adjustments to segment operating income and other Year ended December 31,
2015 (in $ millions)
2014 (in $ millions)
2013 (in $ millions)
Corporate and shared services 1 (10) (132) (207)Financial activities (20) (16) (12)Shipping and logistics (84) (30) (29)Intragroup stock margin eliminations 2 31 109 (73)Depreciation and impairment (26) (68) (50)Total adjustments to segment operating income and other (109) (137) (371)1 Includes primarily staff and other holding costs and results from shared service activities. In 2015, Corporate and shared services includes the sale of corporate assets. 2 In 2015 and 2014, as compared to 2013, margins decreased as a result of low iron ore prices leading to a reduction in intragroup-margin eliminations.

Management report 13
Sales
ArcelorMittal had sales of $63.6 billion for the year ended December 31, 2015, representing a 19.8% decrease from sales of $79.3 billion for the year ended December 31, 2014, primarily due to lower average steel selling prices which were down 19.7%, lower seaborne iron ore reference prices which were down 43% and lower steel shipments which decreased by 0.6%, partially offset by higher market priced iron ore shipments which were up by 1.4%. In the first half of 2015, sales of $34.0 billion represented a 16.1% decrease from sales of $40.5 billion in the first half of 2014, primarily due to 18% lower average steel selling prices and 46% lower seaborne iron ore prices, partially offset by a 3% increase in steel shipments and a 2% increase in marketable iron ore shipments. In the second half of 2015, sales of $29.6 billion represented a 24.0% decrease as compared to sales of $38.8 billion in the second half of 2014, primarily driven by a drop in average steel prices of 21.6% and a decrease of 4.4% in steel shipments.
ArcelorMittal had sales of $79.3 billion for the year ended December 31, 2014, representing a marginal decrease from sales of $79.4 billion for the year ended December 31, 2013, primarily due to lower average steel selling prices (which were down 3%) and lower seaborne iron ore reference prices (which were down 28.4%) despite higher steel shipments (which were up 3%) and marketable iron ore shipments (which were up 13.2%). In the first half of 2014, sales of $40.5 billion represented a 1.5% increase from sales of $39.9 billion in the first half of 2013, primarily due to an increase in steel shipments, partially offset by a decrease in average steel selling prices. In the second half of 2014, sales of $38.8 billion represented a marginal decrease from sales of $39.5 billion in the second half of 2013 primarily driven by a drop in average steel prices of 4%, partially offset by an increase in steel shipments of 4%.
Cost of sales
Cost of sales consists primarily of purchases of raw materials necessary for steel-making (iron ore, coke and coking coal, scrap and alloys), electricity, repair and maintenance costs, as well as direct labor costs, depreciation and impairment. Cost of sales for the year ended December 31, 2015 was $65.2 billion as compared to $73.3 billion for the year ended December 31, 2014. Cost of sales for the year ended December 31, 2015 was negatively affected by an increase in impairment on tangible and intangible assets for $4.8 billion partially offset by a decrease in depreciation and foreign exchange impacts due to the appreciation of the U.S. dollar against the major currencies. Selling, general and administrative expenses (“SG&A”) were $2.5 billion for the year ended December 31, 2015 compared to $3.0 billion for the year ended December 31, 2014. SG&A increased as a percentage of sales to 4.0% of sales for the year ended December 31, 2015 as compared to 3.7% for 2014 as described below.
Cost of sales for the year ended December 31, 2014 was $73.3 billion as compared to $75.2 billion for the year ended December 31, 2013. Cost of sales for the year ended December 31, 2014 was positively affected by a decrease in depreciation following a change in the useful lives of certain property plant and equipment as described earlier and a decline in raw material prices. Cost of sales for the year ended December 31, 2013 was negatively affected by impairment losses of $0.4 billion and restructuring charges for $0.6 billion. SG&A remained stable at $3.0 billion for the year ended December 31, 2014 and 2013. SG&A remained relatively stable compared to sales as it represented 3.7% of sales for the year ended December 31, 2014 as compared to 3.8% for the year ended December 31, 2013.
Operating income or loss
ArcelorMittal’s operating loss for the year ended December 31, 2015 was $4.2 billion as compared with operating income of $3.0 billion for the year ended December 31, 2014. Operating loss in 2015 was negatively affected by impairment charges of $4.8 billion including $0.9 billion with respect to the Mining segment goodwill and $3.9 billion related to tangible and intangible assets, of which $2.5 billion was in respect of iron ore mining operations at ArcelorMittal Liberia ($1.4 billion), Las Truchas in Mexico ($0.2 billion), ArcelorMittal Serra Azul in Brazil ($0.2 billion) and coal mining operations at ArcelorMittal Princeton in the United States ($0.7 billion) mainly due to a downward revision of cash flow projections relating to the expected persistence of a lower iron ore and coking coal price outlook. Management performed its quarterly analysis of impairment indicators in the context of high volatility in the raw material prices during 2015 and concluded that impairment indicators existed in the fourth quarter of 2015 as a result of the expected persistence of lower long term prices and strategic decisions. ArcelorMittal also recorded impairment charges of $0.3 billion, $0.3 billion and $0.2 billion with respect to the Saldanha plant in ArcelorMittal South Africa (ACIS) as a result of its revised competitive outlook, Indiana Harbor East and West in the United States (NAFTA) in connection with the deployment of asset optimization programs and the currently idled ArcelorMittal Point Lisas facility in Trinidad and Tobago (Brazil segment), respectively. In addition, the Company recorded impairment charges of $0.2 billion with respect to the intended sale of the Long Carbon facilities in the United States ( ArcelorMittal La Place, Steelton and Vinton) and $0.4 billion primarily in connection with the idling for an indefinite time of the ArcelorMittal Sestao plant in Spain (Europe segment). Operating loss in 2015 also included negative impacts
due to inventory related losses of $1.3 billion following the rapid decline of international steel prices and litigation costs of $0.1 billion in South Africa. See note 5 to the consolidated financial statements for the critical accounting policies and uses of judgments and estimates related to the impairment of tangible and intangible assets, including goodwill.
Operating income was $1.2 billion for the first nine months of 2015 as compared to $2.5 billion for the same period in 2014, while the operating loss in the fourth quarter of 2015 was $5.3 billion as compared to operating income of $0.6 billion for the same period in 2014. The fourth quarter of 2015 was impacted by all of the impairments and charges mentioned above and $0.8 billion of inventory related losses (with $0.5 billion of inventory related losses being recorded in the third quarter of 2015).
ArcelorMittal’s operating income for the year ended December 31, 2014 was $3.0 billion, as compared with an operating income of $1.2 billion for the year ended December 31, 2013. Operating income in 2014 was negatively impacted by a $90 million charge following the settlement of antitrust litigation in the United States and a $76 million charge for onerous supply contract provisions primarily for tin coated products at Weirton in the United States (NAFTA) offset in part by a $79 million gain on the disposal of the Kuzbass coal mines (Mining). Operating income for the year ended December 31, 2014 was positively affected by a decrease in depreciation (from $4.7 billion for the year ended December 31, 2013 to $3.9 billion for the year ended December 31, 2014) as a result of a change in useful lives of plant and equipment. The Company performed a review of the useful lives of its assets and determined its maintenance and operating practices enabled a change in the useful lives of plant and equipment. As a result, certain of the Company’s existing

14 Management report
assets have been and will be used longer than previously anticipated and therefore, the estimated useful lives of certain plant and equipment were lengthened prospectively. In addition, operating income for the year ended December 31, 2014 was negatively affected by impairment charges of $264 million, of which $114 million primarily related to the idling of the steel shop and rolling facilities of the Indiana Harbor Long carbon operations in the United States (NAFTA), $63 million relating to the impairment of the Volcan iron ore mine in Mexico (Mining) due to a short residual life of the mine and $57 million related to the idling of mill C in Rodange, Luxembourg (Europe segment).
Operating income was $2.5 billion for the first nine months of 2014, which was a 108% increase from $1.2 billion for the first nine months of 2013, while the operating income in the fourth quarter of 2014 was $569 million and represented a significant improvement over the operating loss recorded in the fourth quarter of 2013 for $36 million. The fourth quarter of 2014 was impacted by all of the gains and charges mentioned above except for the $90 million charge following the settlement of antitrust litigation in the United States which was recognized in the second quarter of 2014. The fourth quarter of 2013 was negatively affected by impairment losses
and restructuring charges of $0.7 billion. Operating income for the year ended December 31, 2013 included impairment losses of $444 million. These impairment losses included a charge of $181 million related to the Thabazimbi mine in ArcelorMittal South Africa (ACIS) following the transfer of the future operating and financial risks of the asset to Kumba as a result of the iron ore supply agreement signed with Sishen on November 5, 2013. ArcelorMittal also recognized impairment charges of $101 million and $61 million for the costs associated with the discontinued iron ore projects in Senegal and Mauritania (Mining), respectively. The Company recorded an impairment loss of $55 million in connection with the long-term idling of the ArcelorMittal Tallinn galvanizing line in Estonia (Europe segment) and reversed an impairment loss of $52 million at the Liège site of ArcelorMittal Belgium (Europe segment) following the restart of the hot dip galvanizing line HDG5. ArcelorMittal also recognized an impairment charge of $24 million relating to the closure of the organic coating and tin plate lines at the Florange site of ArcelorMittal Atlantique et Lorraine in France (Europe segment). Additionally, in connection with the agreed sale of certain steel cord assets in the United States, Europe and Asia (Europe segment) to the joint venture partner Kiswire Ltd., ArcelorMittal recorded an
impairment charge of $41 million with respect to the subsidiaries included in this transaction.
Operating income for the year ended December 31, 2013 was positively affected by a non-cash gain of $92 million corresponding to the final recycling of income relating to unwinding of hedges on raw material purchases (Europe) and a $47 million fair valuation gain relating to DJ Galvanizing in Canada (NAFTA), a joint operation in which the Company acquired the remaining 50% interest held by the other joint operator. Operating income for the year ended December 31, 2013 was negatively affected by restructuring charges totaling $552 million primarily related to costs incurred for the long-term idling of the Florange liquid phase in ArcelorMittal Atlantique et Lorraine (including voluntary separation scheme costs, site rehabilitation and safeguarding costs and take or pay obligations) and to social and environmental costs as a result of the agreed industrial and social plan for the finishing facilities at the Liège site of ArcelorMittal Belgium.
Shipments and average steel selling price
ArcelorMittal had steel shipments of 84.6 million tonnes for the year ended December 31, 2015, decreased by 0.6% as compared to steel shipments of 85.1 million tonnes for the year
ended December 31, 2014. Steel shipments increased 3% in the first half of 2015 as compared to the first half of 2014, but then decreased 4.4% in the second half of 2015 as compared to the second half of 2014, primarily due to lower volumes in NAFTA.
Average steel selling price decreased by 19.7% for the year ended December 31, 2015 as compared to the year ended December 31, 2014. Average steel selling price in the first half of 2015 decreased by 18% as compared to the first half of 2014 and decreased by 21.6% in the second half of 2015 as compared to the second half of 2014.
ArcelorMittal had steel shipments of 85.1 million tonnes for the year ended December 31, 2014, representing an increase of 3% from steel shipments of 82.6 million tonnes for the year ended December 31, 2013.
Average steel selling price for the year ended December 31, 2014 decreased 3% compared to the year ended December 31, 2013, following weakness in raw material prices. Average steel selling price in the first half of 2014 decreased by 2% from the same period in 2013, while average steel selling price in the second half of the year was down 4% from the same period in 2013.
NAFTAPerformance for the year ended December 31,
(in millions of USD unless otherwise shown) 2015 2014 2013
Sales 17,293 21,162 19,645Depreciation 616 706 767Impairments 526 114 -Operating income / (loss) (705) 386 630
Crude steel production (thousand tonnes) 22,795 25,036 24,914Steel shipments (thousand tonnes) 21,306 23,074 22,500
Average steel selling price (USD/tonne) 732 843 829

Management report 15
Sales
Sales in the NAFTA segment were $17.3 billion for the year ended December 31, 2015, representing a decrease of 18.3% as compared to December 31, 2014. Sales decreased primarily as a result of the decrease in average steel selling prices by 13.2% and a decrease in steel shipments by 7.7%, both of which were primarily driven by lower domestic prices impacted by weak demand and import pressures. Sales in the first half of 2015 were $9.3 billion, a 10% decrease as compared to the same period in 2014, mainly due to a 10% decrease in average steel selling prices and a 3% decrease in steel shipments. In the second half of the year, sales were $8.0 billion, a decrease of 26.3% compared to the same period in 2014, primarily driven by a 16.3% decrease in average steel selling prices and 12.6% decrease in steel shipments.
Sales in the NAFTA segment were $21.2 billion for the year ended December 31, 2014 representing an increase of 8% as compared to $19.6 billion for the year ended December 31, 2013. Sales increased primarily due to a 2% increase in average steel selling prices and a 3% increase in steel shipments. Sales in the first half of 2014 were $10.4 billion, up 7% from the same period in 2013 primarily driven by a 4% increase in steel shipments and 1% increase in average steel selling prices. In the second half of the year sales were $10.8 billion, up 8% from the same period in 2013, a 1.5% increase in shipments and a 2% increase in average steel selling prices.
Operating income or loss
Operating loss for the NAFTA segment was $705 million for the year ended December 31, 2015 as compared to an operating income of $386 million for the year ended December 31, 2014. Operating loss included impairment charges of $526 million of which $231 million related to the intended sale of the Long carbon facilities in the United States (ArcelorMittal Laplace, Steelton and Vinton) and $276
million with respect to the Indiana Harbor East and West facilities (United States) in connection with deployment of the asset optimization programs. It was also negatively affected by inventory related losses amounting to $0.5 billion following the rapid decline of steel prices. Operating loss for the segment amounted to $52 million for the six months ended June 30, 2015 as compared with operating income of $77 million for the same period of 2014. Operating loss for the first half of 2015 was negatively affected by a $69 million provision for inventory related losses in the US and an impairment of $19 million relating to the closure of the Georgetown facility in the U.S. as well as lower volumes and lower average selling prices as compared to the same period of 2014. Operating loss for the second half of 2015 was $653 million which was negatively affected by the impairments and inventory related losses described above as compared to operating income in the second half of 2014. Operating performance in the second half of 2015 was also affected by negative price-cost squeeze.
Operating income for the NAFTA segment amounted to $386 million for the year ended December 31, 2014, compared to operating income of $630 million for the year ended December 31, 2013. Operating income for the segment amounted to $309 million for the second half of the year, compared to $77 million in the first half. Operating income in the first half of 2014 was negatively affected by a $90 million charge following the settlement of antitrust litigation in the United States and higher input costs resulting from the severe winter weather conditions as well as costs related to planned and unplanned maintenance downtime. Operating income in the second half of 2014 benefited from lower input costs and decreased maintenance expenses, particularly in the fourth quarter, but was negatively impacted by a $76 million charge for onerous supply contract provisions, primarily for tin coated products at Weirton, in the United States and
impairment charges of $114 million in the United States primarily related to the idling of the steel shop and rolling facilities of Indiana Harbor Long carbon operations.
Operating income for the year ended December 31, 2013 was negatively affected by lower shipments in the first half of the year following labor issues at Burns Harbor and operational incidents at Indiana Harbor East and West during the second quarter. Operating income was positively affected by a $47 million fair valuation gain relating to DJ Galvanizing in Canada, a joint operation in which the Company acquired the remaining 50% interest held by the other joint operator, lower average steel selling prices in the third quarter of 2013 and positively affected by 5% higher volumes in the second half of the year compared to the first half.
Crude steel production, steel shipments and average steel selling price
Crude steel production in the NAFTA segment decreased 9% for the year ended December 31, 2015 as compared to the year ended December 31, 2014 to align with weaker demand. Crude steel production remained relatively flat at 25 million tonnes for the year ended December 31, 2014 and for the year ended December 31, 2013.
Total steel shipments decreased 7.7% for the year ended December 31, 2015 as compared to the year ended December 31, 2014. Shipments were 11.1 million tonnes in the first half of 2015, a decrease of 3% from the same period in 2014, while shipments in the second half of the year were 10.2 million tonnes, a decrease of 12.6% from the same period in 2014. Steel shipments for the first half of 2015 were negatively affected by increased imports. Steel shipments for the second half of 2015 were negatively affected by a decrease in flat product shipments (mainly Mexico and U.S.) and a decrease in long product shipment volumes due to the closure of
Georgetown and Indiana Harbor Bar in the first half of 2015.
Total steel shipments were 23.1 million tonnes for the year ended December 31, 2014, representing a 3% increase compared to the year ended December 31, 2013. Shipments were 11.4 million tonnes in the first half of 2014, up 4% from the same period in 2013, while shipments in the second half of the year were 11.7 million tonnes, up 1.5% from the same period in 2013. Steel shipments for the first half of 2013 were negatively affected by labor issues at Burns Harbor and operational incidents at Indiana Harbor East and West, for which reductions in inventory and supplies from other NAFTA units partially mitigated the market impact. The increase in the second half of 2014 reflected improved demand.
Average steel selling price decreased 13.2% for the year ended December 31, 2015 as compared to the year ended December 31, 2014. Average steel selling price in the first half of 2015 decreased 10% from the same period in 2014 primarily due to lower domestic prices impacted by falling raw material prices and import pressures. Average steel selling price in the second half of the year decreased by 16.3% as compared to the same period in 2014, although average steel selling prices in the fourth quarter of 2015 decreased by 14.3% compared to the same period of 2014.
Average steel selling price increased 2% for the year ended December 31, 2014 as compared to the year ended December 31, 2013. Average steel selling price in the first half of 2014 increased 1% from the same period in 2013, as well as average steel selling price in the second half of the year which was higher by 2%, as compared to the same period in 2013, although average steel selling price in the fourth quarter of 2014 was relatively flat as compared to the fourth quarter of 2013.

16 Management report
Sales
In the Brazil segment, sales were $8.5 billion for the year ended December 31, 2015 which represented a 15.3% decrease as compared to the year ended December 31, 2014 primarily due to lower average steel selling prices, impacted by foreign exchange rates and low international steel pricing for both flat and long products offset in part by higher steel shipments. Sales in the first half of 2015 were $4.3 billion, down 10% from the same period in 2014 primarily due to lower average selling prices partially offset by higher steel shipments following the restart of Blast Furnace #3 at Tubarão in July 2014, while sales in the second half of the year were $4.2 billion, down 19.7% from the same period in 2014 primarily due to lower average selling prices (28.2%), partially offset by an increase in shipments (4.5%) and an increase in sales from the Company’s Venezuelan operations.
In the Brazil segment, sales were $10.0 billion for the year ended December 31, 2014 which represented a 1% decrease as compared to the year ended December 31, 2013. Sales in the first half of 2014 were $4.8 billion, down 6% from the same period in 2013, while sales in the second half of the year were $5.2 billion, up 4% from the same period in 2013.
Operating income or loss
Operating income for the Brazil segment for the year ended December 31, 2015 was $628
million, a decrease of 54.7% as compared to the year ended December 31, 2014. The decrease was primarily due to a 25.4% decrease in average steel selling prices, write-downs of $91 million primarily related to inventories in the third and fourth quarters of 2015 following the rapid decline of steel prices and an impairment of $176 million relating to the currently idled ArcelorMittal Point Lisas (Trinidad and Tobago) facility, partially offset by a 11.2% increase in steel shipments. Operating income for the first half of 2015 decreased 4.4% to $566 million as compared with the first half of 2014 primarily due to lower average steel selling prices offset in part by higher steel shipments following the restart of Blast Furnace #3 at Tubarão and the improvement in the Company’s tubular operations. Operating income for the second half of 2015 was $63 million, a 92.1% decrease compared to the second half of 2014 due to the decrease in average steel selling prices (28.2%) and the impairment and write-down described above, partially offset by a 4.5% increase in shipments. Operating income for the Brazil segment for the year ended December 31, 2014 was $1.4 billion compared to $1.2 billion for the year ended December 31, 2013. The increase was primarily due to higher steel shipment volumes as described below, lower costs and lower depreciation, which was $457 million for 2014 as compared to $691 million for 2013, mainly due to the change in asset lives of certain plant and
equipment. Operating income for the segment amounted to $0.8 billion for the second half of 2014, compared to operating income of $0.6 billion in the first half of 2014. Operating income for the first half of 2014 was negatively affected by lower shipments and lower average steel selling prices as compared to the same period in 2013. Operating income for the second half of 2014 was positively affected by the additional slab volumes as described below.
Crude steel production, steel shipments and average steel selling price
Crude steel production increased by 10.3% to 11.6 million tonnes for the year ended December 31, 2015 as compared to the year ended December 31, 2014 as a result of the restart of Blast Furnace #3 at Tubarão. Crude steel production increased by 21% to 5.8 million tonnes for the first half of 2015 as compared to 4.8 million tonnes for the first half of 2014 as a result of the restart of the Tubarão furnace in July 2014, while crude steel production increased by 1.3% for the second half of 2015 as compared to the second half of 2014. Similarly, crude steel production increased by 5% to 10.5 million tonnes for the year ended December 31, 2014 as compared with 10.0 million tonnes for the year ended December 31, 2013.
Total steel shipments reached 11.5 million tonnes for the year ended December 31, 2015, which was an 11.2% increase from steel shipments for the year ended
December 31, 2014. Shipments were 5.5 million tonnes in the first half of 2015, which was up 19.5% compared to the same period in 2014, primarily driven by increased slab exports from Brazil. Shipments in the second half of the year were up by 4.5% as compared to the second half of 2014, primarily due to higher exports of slab shipments from Brazil, although shipments were down in the fourth quarter of 2015, due to a continued slowdown in demand.
Total steel shipments reached 10.4 million tonnes for the year ended December 31, 2014, which was a 6% increase from steel shipments for the year ended December 31, 2013. Shipments were 4.6 million tonnes in the first half of 2014, which was down 5% compared to the same period in 2013, primarily due to operational issues in the hot strip mill in Tubarão, while shipments in the second half of the year were up by 17% as compared to the second half of 2013, primarily due to higher exports of slab shipments from Brazil after blast furnace No. 3 was restarted at Tubarão.
Average steel selling price decreased 25.4% for the year ended December 31, 2015 as compared to the year ended December 31, 2014 primarily driven by a weaker Brazilian real, weaker product mix due to increased slab exports and a decline in international prices. Average steel selling price in the first half of 2015 was down 23% from the same period in 2014, primarily driven by a weaker Brazilian real, weaker product mix
BrazilPerformance for the year ended December 31,
(in millions of USD unless otherwise shown) 2015 2014 2013
Sales 8,503 10,037 10,148Depreciation 336 457 691Impairments 176 - -Operating income / (loss) 628 1,388 1,204
Crude steel production (thousand tonnes) 11,612 10,524 9,987Steel shipments (thousand tonnes) 11,540 10,376 9,797
Average steel selling price (USD/tonne) 647 867 940

Management report 17
due to increased slab exports post the restart of Blast Furnace #3 at Tubarão described above and a decline in international prices. The average steel selling price in the second half of the year was down 28.2% from the same period in 2014 due to the mix impact
described above.Average steel selling price decreased 8% for the year ended December 31, 2014 as compared to the year ended December 31, 2013 primarily due to a mix impact (higher slab shipments) following the restart of blast furnace No. 3 at
Tubarão. Average steel selling price in the first half of 2014 was down 3% from the same period in 2013, driven by a decrease in global steel prices, currency devaluation in Brazil, Argentina and Venezuela. The average steel selling price in the second half of the year was
down 12% from the same period in 2013 due to the mix impact described above.
Sales
Sales in the Europe segment were $31.9 billion for the year ended December 31, 2015, representing a decrease of 19.4% as compared to the year ended December 31, 2014 primarily due to lower average steel selling prices partially offset by higher shipments. Local average steel selling prices declined, partially reflecting lower raw material costs. Sales in the first half of 2015 decreased 18% to $17.1 billion as compared to the first half of 2014 primarily due to a 22% decrease in average steel selling prices which were negatively impacted by the USD appreciation against the Euro, partially offset by an increase in steel shipments by 7%. In the second half of the year sales were $14.7 billion, a decrease of 21.2% compared to the same period in 2014 primarily due to lower average steel selling prices and a marginal decrease in steel shipments described below.Sales in the Europe segment were $39.6 billion for the year ended December 31, 2014, representing a decrease of 2% as compared to $40.5 billion for the year ended December 31, 2013. The decrease was primarily due to a 4% decrease in average steel selling price while steel shipments increased by 4%. Sales in the first half of 2014 were
$20.8 billion, remaining relatively flat compared to the same period in 2013, and in the second half of the year sales were $18.8 billion, a decrease of 5% compared to the same period in 2013. The decrease was primarily related to lower average steel selling prices.
Operating income or loss
Operating income for the Europe segment for the year ended December 31, 2015 decreased to $171 million, a 76.8% decrease as compared to the year ended December 31, 2014. Operating loss for the segment was $533 million for the second half of the year, compared to operating income of $704 million for the first half of the year. Operating income was negatively impacted by (i) an impairment charge of $398 million primarily relating to the indefinite idling of the Sestao facility in Spain and the write down of carrying values for certain ArcelorMittal Downstream Solutions operations as a result of the classification as held for sale and (ii) write-downs of inventories for $0.6 billion in the second half of 2015 following the rapid decline in steel prices, partially offset by improved market conditions and realized benefits of cost optimization efforts as well as increased shipments and the effects of the USD appreciation
against the euro.Operating income for the Europe segment for the year ended December 31, 2014 significantly increased to $0.7 billion compared to operating loss of $1.0 billion for the year ended December 31, 2013. Operating income for the segment was $0.3 billion for the second half of the year, compared to operating income of $0.4 billion for the first half of the year. Despite the continuous difficult economic environment in Europe reflected in lower average steel selling prices mainly due to lower raw material prices, shipments increased by 4% in 2014 as a result of improved domestic demand. Operating income for the year ended December 31, 2014 was positively affected by improved market conditions, lower costs and benefits of cost optimization efforts. Operating income for the year ended December 31, 2014 included impairment charges of $57 million related to the idling of mill C in Rodange, Luxembourg. In addition, operating income was positively impacted by a decrease in depreciation which was $1.5 billion and $2.0 billion for the years ended December 31, 2014 and December 31, 2013, respectively, mainly due to the change in useful lives of certain plant and equipment.Europe’s operating loss for the
year ended December 31, 2013 included restructuring costs amounting to $517 million, including $137 million of costs incurred for the long-term idling of the Florange liquid phase in ArcelorMittal Atlantique et Lorraine (including voluntary separation scheme costs, site rehabilitation / safeguarding costs and take or pay obligations) and $354 million (including social and environmental costs) as a result of the agreed industrial and social plan for the finishing facilities at the Liège site of ArcelorMittal Belgium. These charges were partially offset by a reversal of provisions of $38 million in France and Spain following the revision of certain assumptions. Europe’s operating loss was reduced by a non-cash gain of $92 million corresponding to the final recycling of income relating to unwinding of hedges on raw material purchases.
Europe’s operating loss for the year ended December 31, 2013 also included impairment charges of $86 million, of which $55 million was in connection with the long-term idling of the ArcelorMittal Tallinn galvanizing line in Estonia, largely offset by the reversal of an impairment loss of $52 million at the Liège site of ArcelorMittal Belgium following the restart of
EuropePerformance for the year ended December 31,
(in millions of USD unless otherwise shown) 2015 2014 2013
Sales 31,893 39,552 40,507Depreciation 1,192 1,510 2,003Impairments 398 57 86Operating income / (loss) 171 737 (985)
Crude steel production (thousand tonnes) 43,853 43,419 41,923Steel shipments (thousand tonnes) 40,676 39,639 38,269
Average steel selling price (USD/tonne) 609 773 804
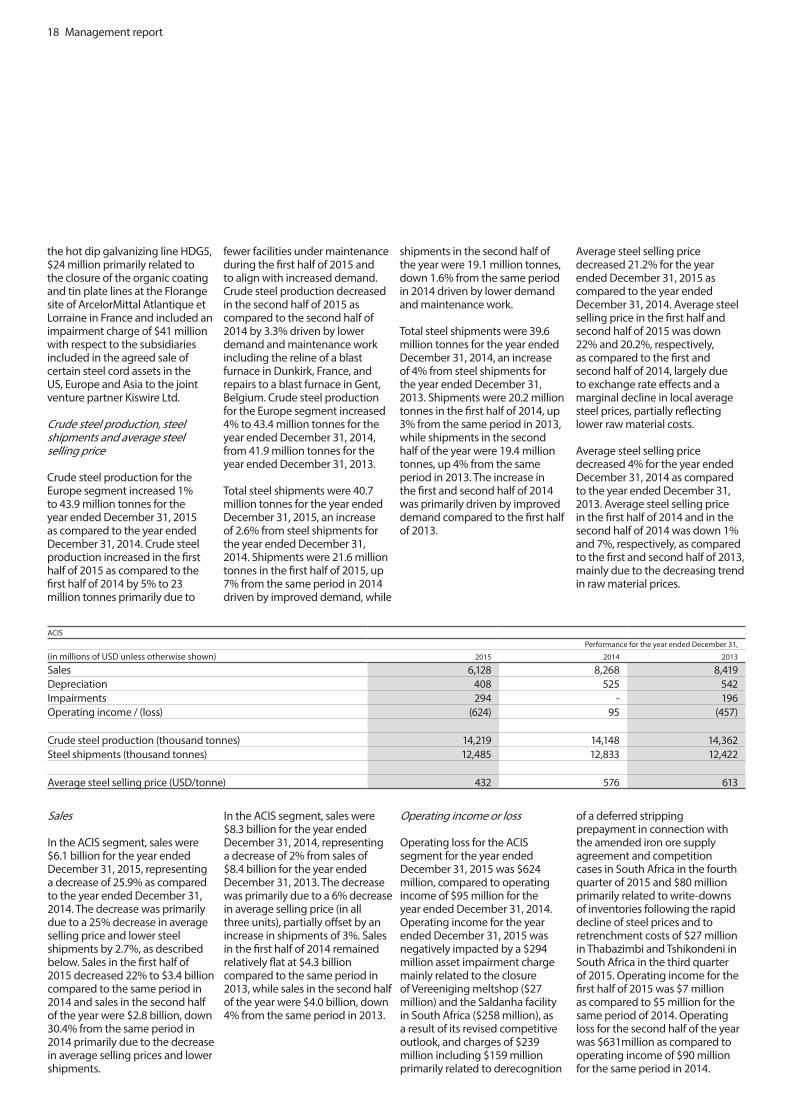
18 Management report
the hot dip galvanizing line HDG5, $24 million primarily related to the closure of the organic coating and tin plate lines at the Florange site of ArcelorMittal Atlantique et Lorraine in France and included an impairment charge of $41 million with respect to the subsidiaries included in the agreed sale of certain steel cord assets in the US, Europe and Asia to the joint venture partner Kiswire Ltd.
Crude steel production, steel shipments and average steel selling price
Crude steel production for the Europe segment increased 1% to 43.9 million tonnes for the year ended December 31, 2015 as compared to the year ended December 31, 2014. Crude steel production increased in the first half of 2015 as compared to the first half of 2014 by 5% to 23 million tonnes primarily due to
fewer facilities under maintenance during the first half of 2015 and to align with increased demand. Crude steel production decreased in the second half of 2015 as compared to the second half of 2014 by 3.3% driven by lower demand and maintenance work including the reline of a blast furnace in Dunkirk, France, and repairs to a blast furnace in Gent, Belgium. Crude steel production for the Europe segment increased 4% to 43.4 million tonnes for the year ended December 31, 2014, from 41.9 million tonnes for the year ended December 31, 2013.
Total steel shipments were 40.7 million tonnes for the year ended December 31, 2015, an increase of 2.6% from steel shipments for the year ended December 31, 2014. Shipments were 21.6 million tonnes in the first half of 2015, up 7% from the same period in 2014 driven by improved demand, while
shipments in the second half of the year were 19.1 million tonnes, down 1.6% from the same period in 2014 driven by lower demand and maintenance work.
Total steel shipments were 39.6 million tonnes for the year ended December 31, 2014, an increase of 4% from steel shipments for the year ended December 31, 2013. Shipments were 20.2 million tonnes in the first half of 2014, up 3% from the same period in 2013, while shipments in the second half of the year were 19.4 million tonnes, up 4% from the same period in 2013. The increase in the first and second half of 2014 was primarily driven by improved demand compared to the first half of 2013.
Average steel selling price decreased 21.2% for the year ended December 31, 2015 as compared to the year ended December 31, 2014. Average steel selling price in the first half and second half of 2015 was down 22% and 20.2%, respectively, as compared to the first and second half of 2014, largely due to exchange rate effects and a marginal decline in local average steel prices, partially reflecting lower raw material costs.
Average steel selling price decreased 4% for the year ended December 31, 2014 as compared to the year ended December 31, 2013. Average steel selling price in the first half of 2014 and in the second half of 2014 was down 1% and 7%, respectively, as compared to the first and second half of 2013, mainly due to the decreasing trend in raw material prices.
ACISPerformance for the year ended December 31,
(in millions of USD unless otherwise shown) 2015 2014 2013
Sales 6,128 8,268 8,419Depreciation 408 525 542Impairments 294 - 196Operating income / (loss) (624) 95 (457)
Crude steel production (thousand tonnes) 14,219 14,148 14,362Steel shipments (thousand tonnes) 12,485 12,833 12,422
Average steel selling price (USD/tonne) 432 576 613
Sales
In the ACIS segment, sales were $6.1 billion for the year ended December 31, 2015, representing a decrease of 25.9% as compared to the year ended December 31, 2014. The decrease was primarily due to a 25% decrease in average selling price and lower steel shipments by 2.7%, as described below. Sales in the first half of 2015 decreased 22% to $3.4 billion compared to the same period in 2014 and sales in the second half of the year were $2.8 billion, down 30.4% from the same period in 2014 primarily due to the decrease in average selling prices and lower shipments.
In the ACIS segment, sales were $8.3 billion for the year ended December 31, 2014, representing a decrease of 2% from sales of $8.4 billion for the year ended December 31, 2013. The decrease was primarily due to a 6% decrease in average selling price (in all three units), partially offset by an increase in shipments of 3%. Sales in the first half of 2014 remained relatively flat at $4.3 billion compared to the same period in 2013, while sales in the second half of the year were $4.0 billion, down 4% from the same period in 2013.
Operating income or loss
Operating loss for the ACIS segment for the year ended December 31, 2015 was $624 million, compared to operating income of $95 million for the year ended December 31, 2014. Operating income for the year ended December 31, 2015 was negatively impacted by a $294 million asset impairment charge mainly related to the closure of Vereeniging meltshop ($27 million) and the Saldanha facility in South Africa ($258 million), as a result of its revised competitive outlook, and charges of $239 million including $159 million primarily related to derecognition
of a deferred stripping prepayment in connection with the amended iron ore supply agreement and competition cases in South Africa in the fourth quarter of 2015 and $80 million primarily related to write-downs of inventories following the rapid decline of steel prices and to retrenchment costs of $27 million in Thabazimbi and Tshikondeni in South Africa in the third quarter of 2015. Operating income for the first half of 2015 was $7 million as compared to $5 million for the same period of 2014. Operating loss for the second half of the year was $631million as compared to operating income of $90 million for the same period in 2014.

Management report 19
Operating income was negatively impacted by the decrease in average steel selling prices and lower shipments for both the first and second half of 2015 (as well as the impairments and write-downs in the second half of 2015) as compared to the same period of 2014, partially offset by lower costs in all three units (Ukraine, Kazakhstan and South Africa) due to currency devaluation.
Operating income for the ACIS segment for the year ended December 31, 2014 was $95 million, compared to operating loss of $457 million for the year ended December 31, 2013. The improved results reflected improved operations and lower costs primarily in the CIS, offset in part by lower average steel selling prices. Operating income for the segment amounted to $90 million for the second half of the year, compared to operating income of $5 million in the first half. Operating income was positively impacted by improved market conditions resulting in increased shipments and the realized benefits of cost optimization efforts, offset slightly by lower average steel selling prices.
Operating loss for the year ended 2013 included a charge of $181 million related to the Thabazimbi mine in ArcelorMittal South Africa following the transfer of the operating and financial risks of the asset to Kumba as a result of the
iron ore supply agreement signed with Sishen on November 5, 2013.
Crude steel production, steel shipments and average steel selling price
Crude steel production for the ACIS segment remained fairly flat at 14.2 million tonnes for the year ended December 31, 2015 as compared to 2014. Production was lower in Ukraine due to planned repairs of Blast Furnace #9, partially offset by higher production in South Africa following the Newcastle reline completion. Crude steel production for the first half of 2015 increased 4% to 7.3 million tonnes as compared to 7.0 million tonnes for the first half of 2014 primarily driven by the Newcastle reline completion, while crude steel production for the second half of 2015 decreased 3.0% as compared to the second half of 2014, mainly due to planned repair of Blast Furnace #9 in Ukraine. Crude steel production for the ACIS segment decreased 2% to 14.1 million tonnes for the year ended December 31, 2014, from 14.4 million tonnes for the year ended December 31, 2013.
Total steel shipments reached 12.5 million tonnes for the year ended December 31, 2015, a decrease of 2.7% compared to the year ended December 31, 2014. Steel shipments were 6.2 million tonnes in the first half of 2015, down 4%
from the same period in 2014. Steel shipments for the first half of 2015 were negatively affected by lower volumes in South Africa and a weaker CIS market. Steel shipments for the second half of 2015 decreased 1% compared to the second half of 2014 due to lower steel shipments in Ukraine impacted by lower production and a weaker South Africa market in 2015, partially offset by lower volume in 2014 due to the Newcastle reline.
Total steel shipments reached 12.8 million tonnes for the year ended December 31, 2014, an increase of 3% from steel shipments for the year ended December 31, 2013. Steel shipments were 6.5 million tonnes in the first half of 2014, up 5% from the same period in 2013. Steel shipments for the first half of 2014 were positively impacted by improved shipments in Kazakhstan with stable operations, while steel shipments for the first half of 2013 were negatively affected by lower volumes in South Africa, caused by fire disruption at the Vanderbijlpark site, and Kazakhstan. In the second half of 2014, steel shipments were 6.3 million tonnes and represented a 2% increase compared to the same period in 2013, primarily as a result of higher shipments from CIS countries.
Average steel selling price decreased 25% for the year ended December 31, 2015 as compared
to the year ended December 31, 2014. This decrease was mainly related to lower average steel selling prices in all three units (Ukraine, Kazakhstan and South Africa). Average steel selling price in the first half of 2015 decreased 18% from the same period in 2014, primarily due to lower global steel prices and weak demand in both CIS and South Africa. Average steel selling price in the second half of 2015 decreased 32.4% from the same period in 2014 due to lower average steel selling prices in all three units, impacted by lower global steel prices and weak demand in both CIS and South Africa.
Average steel selling price decreased 6% for the year ended December 31, 2014 as compared to the year ended December 31, 2013. This decrease was mainly related to lower average steel selling prices in all three units. Average steel selling price in the first half of 2014 was down 7% from the same period in 2013, primarily due to lower international prices driven by lower raw material prices, and partially due to currency devaluation, as well as the second half of the year when average steel selling prices were down 5% compared to the same period in 2013.
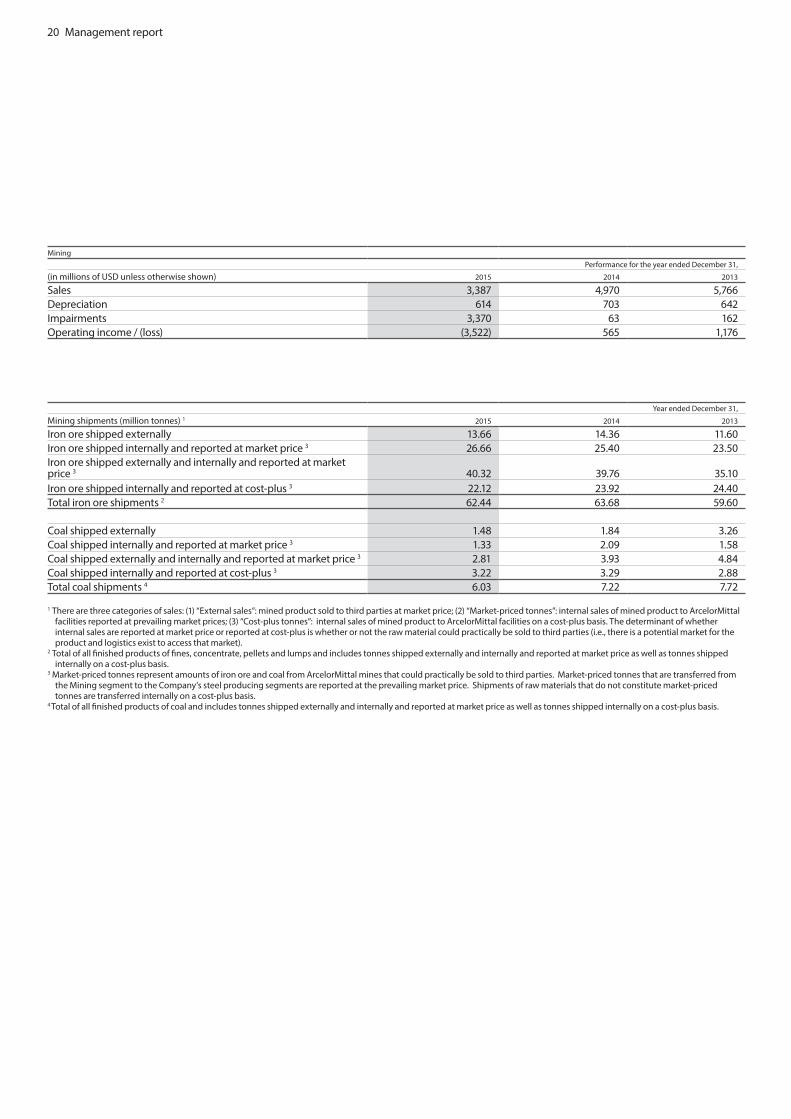
20 Management report
Year ended December 31,
Mining shipments (million tonnes) 1 2015 2014 2013
Iron ore shipped externally 13.66 14.36 11.60Iron ore shipped internally and reported at market price 3 26.66 25.40 23.50Iron ore shipped externally and internally and reported at market price 3 40.32 39.76 35.10Iron ore shipped internally and reported at cost-plus 3 22.12 23.92 24.40Total iron ore shipments 2 62.44 63.68 59.60
Coal shipped externally 1.48 1.84 3.26Coal shipped internally and reported at market price 3 1.33 2.09 1.58Coal shipped externally and internally and reported at market price 3 2.81 3.93 4.84Coal shipped internally and reported at cost-plus 3 3.22 3.29 2.88Total coal shipments 4 6.03 7.22 7.72
1 There are three categories of sales: (1) “External sales”: mined product sold to third parties at market price; (2) “Market-priced tonnes”: internal sales of mined product to ArcelorMittal facilities reported at prevailing market prices; (3) “Cost-plus tonnes”: internal sales of mined product to ArcelorMittal facilities on a cost-plus basis. The determinant of whether internal sales are reported at market price or reported at cost-plus is whether or not the raw material could practically be sold to third parties (i.e., there is a potential market for the product and logistics exist to access that market).
2 Total of all finished products of fines, concentrate, pellets and lumps and includes tonnes shipped externally and internally and reported at market price as well as tonnes shipped internally on a cost-plus basis.
3 Market-priced tonnes represent amounts of iron ore and coal from ArcelorMittal mines that could practically be sold to third parties. Market-priced tonnes that are transferred from the Mining segment to the Company’s steel producing segments are reported at the prevailing market price. Shipments of raw materials that do not constitute market-priced tonnes are transferred internally on a cost-plus basis.
4 Total of all finished products of coal and includes tonnes shipped externally and internally and reported at market price as well as tonnes shipped internally on a cost-plus basis.
MiningPerformance for the year ended December 31,
(in millions of USD unless otherwise shown) 2015 2014 2013
Sales 3,387 4,970 5,766Depreciation 614 703 642Impairments 3,370 63 162Operating income / (loss) (3,522) 565 1,176

Management report 21
Year ended December 31,Iron ore production (million metric tonnes) 1 Type Product 2015 2014 2013
Own mines
America 2 Open pit
Concentrate, lump, fines and
pellets 39.0 37.3 32.5South America Open pit Lump and fines 3.5 4.5 3.9
Europe Open pitConcentrate and
lump 2.1 2.1 2.1
AfricaOpen pit /
Underground Fines 4.3 5.5 4.8
Asia, CIS & OtherOpen pit /
Underground
Concentrate, lump, fines and
sinter feed 13.9 14.5 15.0Total own iron ore production 62.8 63.9 58.4Strategic long-term contracts - iron oreNorth America 3 Open pit Pellets 6.6 8.2 7.0Africa 4 Open pit Lump and fines 4.3 4.9 4.7Total strategic long.term contracts - iron ore 10.9 13.1 11.7Total 73.7 77.0 70.11 Total of all finished production of fines, concentrate, pellets and lumps.2 Includes own mines and share of production from Hibbing (United States, 62.30%) and Peña (Mexico, 50%).3 Consists of a long-term supply contract with Cleveland Cliffs for purchases made at a previously set price, adjusted for changes in certain steel prices and inflation factors.4 Includes purchases under an interim strategic agreement with Sishen Iron Ore Company (Proprietary) Limited (“SIOC”) which was extended on December 13, 2012 and became
effective on January 1, 2013, pursuant to which SIOC supplied a maximum annual volume of 4.8 million tonnes of iron ore at a weighted average price of $65 per tonne. On November 5, 2013, ArcelorMittal and SIOC entered into an agreement establishing long-term pricing arrangements for the supply of iron ore by SIOC to ArcelorMittal. Pursuant to the terms of the agreement, which became effective on January 1, 2014, ArcelorMittal may purchase from SIOC up to 6.25 million tonnes iron ore per year, complying with agreed specifications and lump-fine ratios. The price of iron ore sold to ArcelorMittal by SIOC is determined by reference to the cost (including capital costs) associated with the production of iron ore from the DMS Plant at the Sishen mine plus a margin of 20%, subject to a ceiling price equal to the Sishen Export Parity Price at the mine gate. While all prices are referenced to Sishen mine costs (plus 20%) from 2016, the parties agreed to a different price for certain pre-determined quantities of iron ore for the first two years of the 2014 Agreement. On November 6, 2015, ArcelorMittal announced that an agreement had been reached with SIOC to amend the pricing mechanism terms of the current iron ore supply agreement from a cost-based price to an Export Parity Price (“EPP”) with effect from October 1, 2015. The EPP will be calculated on the basis of the Platts 62% Fe CFR China Fines Index (the “Index price”) and, at certain price levels, ArcelorMittal will receive a discounted price. In addition, under the amended agreement, ArcelorMittal South Africa will no longer contribute toward stripping costs. Accordingly at December 31, 2015, the “deferred stripping pre-payment asset” was derecognized. As a result of this amendment, the contract will no longer be considered as a strategic contract in 2016.
Year ended December 31,Coal production (million metric tonnes) 2015 2014 2013
Own minesNorth America 1.57 2.04 2.62Asia,CIS & Other 4.58 4.98 5.43Total own coal productions 6.15 7.02 8.05Strategic long.term contracts - coalNorth America 1 0.14 0.37 0.37Africa 2 - 0.31 0.42Total strategic long.term contracts - coal 0.14 0.68 0.79
Total 6.29 7.70 8.841 Includes strategic agreement - prices on a fixed price basis.2 Includes long-term lease - prices on a cost-plus basis.
22 Management report
Sales
In the Mining segment, sales were $3.4 billion for the year ended December 31, 2015, representing a decrease of 31.8% as compared to the year ended December 31, 2014. The decrease was primarily due to lower seaborne iron ore market prices which were down 43% (average year-on-year). Sales in the first half of 2015 were $1.7 billion, a decrease of 35% compared to the same period in 2014, while sales in the second half of 2015 were $1.7 billion, down 28.6% from the same period in 2014.
Sales to external customers were $0.8 billion for the year ended December 31, 2015, representing a decrease of 38% compared to the year ended December 31, 2014. Iron ore shipments to external customers decreased 5% from 14.4 million tonnes in 2014 to 13.7 million tonnes in 2015, while coal shipments to external customers decreased by 20% from 1.84 million tonnes to 1.48 million tonnes. The decrease in the volume of external sales for iron ore was primarily due to lower external shipments from Brazil and Liberia partially offset by the Company’s Canadian operations. In the second half of 2015, iron ore shipments to external customers were nearly in line with the first half. The decrease in coal shipments to external customers was primarily due the scope change as a result of the disposal of the Company’s Russian coal operations and lower external sales from Kazakhstan. With respect to prices, for example, the average reference iron ore price was $55.50 per tonne in 2015, $96.7 per tonne in 2014 and $135.2 per tonne in 2013 (CFR China 62% Fe, Platts Index) and the average reference price for hard coking coal decreased to $88.00 per tonne in 2015, from $114.44 per tonne in 2014 and $148.12 per tonne in 2013 (FOB Australia HCC Peak Downs, Platts Index). The decrease in the average reference iron ore price accelerated in the second half of 2015, with prices down 38% compared to the second half of 2014, and down 46% in the first half of 2015 compared to the first half of 2014. It should be
noted, however, that there may not be a direct correlation between reference prices and actual selling prices in various regions at a given time.
In the Mining segment, sales were $5.0 billion for the year ended December 31, 2014, representing a decrease of 14% from sales of $5.8 billion for the year ended December 31, 2013. The decrease was primarily due to lower seaborne iron ore market prices which were down 28% (average year-on-year), partially offset by higher marketable iron ore shipments due to higher shipments from the Company’s Canadian operations following the successful commissioning and ramp-up of the expanded concentrator. Sales in the first half of 2014 were $2.64 billion, up 3.5% from the same period in 2013, while sales in the second half of the year were $2.33 billion, down 28% from the same period in 2013.
Sales to external customers were $1.3 billion for the year ended December 31, 2014, representing a decrease of 20% from $1.7 billion for the year ended December 31, 2013. Iron ore shipments to external customers increased 24% from 11.6 million tonnes in 2013 to 14.4 million tonnes in 2014, while coal shipments to external customers decreased by 44% from 3.26 million tonnes to 1.84 million tonnes. The increase in the volume of external sales for iron ore was primarily due to higher shipments from the Company’s Canadian operations. In the second half of 2014, iron ore shipments to external customers were 14% higher than in the first half primarily as a result of higher shipments from the Company’s Canadian operations. The increase in volume of sales to external customers for iron ore was more than offset by the substantial decrease in the market price of iron ore and coal. The decrease in coal shipments to external customers was primarily due to very difficult geological conditions that limited underground extraction in the Company’s Russian coal operations and lower external sales from Kazakhstan due to a change in mix between internal and external
sales. With respect to prices, for example, the average reference iron ore price was $96.7 per tonne in 2014 as compared to $135.2 per tonne in 2013 (CFR China 62% Fe, Platts Index) and the average reference price for hard coking coal decreased to $114.44 per tonne in 2014 as compared to $148.12 per tonne in 2013 (FOB Australia HCC Peak Downs, Platts Index). The decrease in the average reference iron ore price accelerated in the second half of 2014, with prices down 38% compared to the second half of 2013, while prices were only down 19% in the first half of 2014 compared to the first half of 2013. It should be noted, however, that there may not be a direct correlation between reference prices and actual selling prices in various regions at a given time.
Operating income or loss
Operating loss for the Mining segment for the year ended December 31, 2015 was $3.5 billion, compared to operating income of $0.6 billion for the year ended December 31, 2014. Operating loss in 2015 was negatively impacted by the decrease in seaborne iron ore and coking coal market prices noted above and included impairment charges of $3.4 billion, including $854 million with respect to the Mining segment goodwill and $2.5 billion related to tangible and intangible assets in respect of iron ore mining operations at ArcelorMittal Liberia ($1,426 million), Las Truchas in Mexico ($220 million), ArcelorMittal Serra Azul in Brazil ($176 million) and coal mining operations at ArcelorMittal Princeton in the United States ($684 million). These impairments were mainly due to the downward revision of cash flow projections relating to the expected persistence of a lower raw material price outlook. In addition to such impairment charges, operating performance in 2015 compared to 2014 reflected lower seaborne iron ore market prices, offset in part by operating cost improvement.
Iron ore marketable volume for the year ended December 31,
2015 was 40.3 million tonnes, an increase of 1.4% compared to the year ended December 31, 2014. Coal marketable volume for the year ended December 31, 2015 was lower at 2.8 million tonnes, a decrease of 28.5% compared to the year ended December 31, 2014.
Operating income for the Mining segment for the year ended December 31, 2014 was $0.6 billion, compared to operating income of $1.2 billion for the year ended December 31, 2013. Operating income for the year ended December 31, 2014 was positively impacted by a $79 million gain on disposal of Kuzbass coal mines in Russia and by higher marketable iron ore shipments, offset by negative impacts for the decrease in seaborne iron ore market prices noted above and an impairment charge of $63 million relating to the Volcan iron ore mine in Mexico due to a short residual life of the mine. Iron ore marketable volume for the year ended December 31, 2014 was 39.8 million tonnes, compared to 35.1 million tonnes for the year ended December 31, 2013. Coal marketable volume for the year ended December 31, 2014 was lower at 3.9 million tonnes, compared to 4.8 million tonnes for the year ended December 31, 2013. Operating income for the segment amounted to $0.1 billion for the second half of 2014, compared to $0.5 billion in the first half of 2014. Operating income for the second half of 2014 was negatively affected by the decrease in iron ore reference prices to $82.4 per tonne in the second half, as compared to $111.5 per tonne in the first half of the year and the above-mentioned impairment charges.
Production
ArcelorMittal had own iron ore production of 62.8 million tonnes for the year ended December 31, 2015, a decrease of 1.7% compared to the year ended December 31, 2014. The decrease in iron ore production was primarily due to lower production in Kazakhstan, Brazil, Mexico and Liberia offset by increases due to higher production at the

Management report 23
Company’s Canadian operations.ArcelorMittal had own coking coal production of 6.1 million tonnes for the year ended December 31, 2015, a decrease of 12.4% compared to the year ended December 31, 2014. The decrease in coal production was primarily due to lower production at both U.S. and Kazakhstan operations as well as the disposal of the Kuzbass coal mines in Russia during the fourth quarter of 2014.ArcelorMittal had own iron ore production of 63.9 million tonnes for the year ended December 31, 2014, an increase of 9.4%, as compared to 58.4 million tonnes for the year ended December 31, 2013. The increase in iron ore production was driven primarily by Canada as a result of the ramp up post expansion project.ArcelorMittal had own coking coal production of 7.0 million tonnes for the year ended December 31, 2014, a decrease of 13.6%, as compared to 8.1 million tonnes for the year ended December 31, 2013. The decrease in coal production was primarily due to very difficult geological conditions that limited underground extraction in the Company’s Russian coal operations and lower production in the Company’s USA coal operations (Princeton).
Income or loss from investments in associates, joint ventures and other investments
ArcelorMittal recorded a loss of $502 million from investments in associates, joint ventures and other investments for the year ended December 31, 2015, as compared with a loss of $172 million for the year ended December 31, 2014. The loss for the year ended December 31, 2015 included an impairment charge of $283 million related to the Company’s 50% interest in the joint venture Kalagadi Manganese (Propriety) Ltd engaged in the development of the Kalagadi manganese ore deposits in South Africa as a result of a downward revision of cash flow projections following an expected persistence of lower manganese prices. It also
included an impairment charge of $138 million with respect to the Company’s Indian investee, of which $69 million on the carrying value of the investment and $69 million on related loans, respectively, as a result of a downward revision of cash flow projections and a $101 million impairment charge related to the decrease in market value of the Company’s 12.08% interest in Erdemir (Turkey). These losses were partially offset by income generated from the share swap agreement with respect to Gerdau, Brazil entered into on July 14, 2015, as part of which ArcelorMittal received preferred shares of Gerdau and cash consideration of $28 million in exchange for unlisted Gerdau shares, resulting in a gain of $55 million.
ArcelorMittal recorded a loss of $172 million from investments in associates, joint ventures and other investments for the year ended December 31, 2014, as compared with a loss of $442 million for the year ended December 31, 2013. The loss for the year ended December 31, 2014 was primarily due to a $621 million impairment charge relating to China Oriental following a revision of business assumptions in the context of continuing growth slowdown in China, an impairment charge of $56 million relating to Erdemir and a loss of $14 million related to the disposal of Hunan Valin shares (comprising a net loss of $76 million related to the exercise of the third put option on February 8, 2014 and the resulting discontinuation of equity method accounting, partly offset by a net gain of $62 million with respect to the fourth and last put option exercised on August 6, 2014). These losses were partially offset by a $193 million gain on the sale of ArcelorMittal’s 50% ownership in Gallatin, improved performance of European investees and the share of profits in Calvert’s operations.
The loss for the year ended December 31, 2013 included impairment charges for a total amount of $422 million, of
which $200 million related to the Company’s 47% stake in the associate China Oriental. In addition, the Company recorded an impairment charge of $111 million relating to the Company’s 50% interest in the associate Kiswire ArcelorMittal Ltd in the framework of the agreed sale of certain steel cord assets to the joint venture partner Kiswire Ltd. (with another impairment charge recorded in cost of sales in the Europe segment as described above). The loss for the year ended December 31, 2013 also included an impairment charge of $111 million relating to the associate Coal of Africa as a result of lower profitability and decline in market value. The loss for the year ended December 31, 2013 included a charge of $57 million following the disposal of a 6.66% interest in Erdemir shares by way of a single accelerated bookbuilt offering to institutional investors. In addition, the loss for the year ended December 31, 2013 included a $56 million expense for contingent consideration with respect to the Gonvarri Brasil acquisition made in 2008 partly offset by a gain of $45 million, with respect to the sale of a 10% interest in Hunan Valin Steel Tube and Wire Co. Ltd. (“Hunan Valin”) following the exercise of the first and second put options.
Financing costs-net
Net financing costs include net interest expense, revaluation of financial instruments, net foreign exchange income/expense (i.e., the net effects of transactions in a foreign currency other than the functional currency of a subsidiary) and other net financing costs (which mainly include bank fees, accretion of defined benefit obligations and other long-term liabilities). Net financing costs were lower for the year ended December 31, 2015, at $2.9 billion, a 15.5% decrease compared to the year ended December 31, 2014. Net financing costs were higher for the year ended December 31, 2014, at $3.4 billion, as compared with $3.1 billion for the year ended
December 31, 2013.
Net interest expense (interest expense less interest income) was $1.3 billion for the year ended December 31, 2015, a decrease of 13% compared to the year ended December 31, 2014 due to lower average cost resulting from debt repaid and raised during the year, despite the increased interest costs following the ratings downgrades that occurred during 2015.
Net interest expense was $1.5 billion for the year ended December 31, 2014 as compared to $1.8 billion for the year ended December 31, 2013. Interest expense was slightly lower for the year ended December 31, 2014 at $1.6 billion, compared to interest expense of $1.9 billion for the year ended December 31, 2013, primarily due to the positive effect of lower debt following the repayment of convertible bonds in April and May and bonds in October 2014 and lower cost of debt. Interest income for the year ended December 31, 2014 amounted to $0.1 billion, compared to $0.1 billion for the year ended December 31, 2013.
Foreign exchange losses increased to $0.7 billion for the year ended December 31, 2015, an increase of 12.4% compared to $0.6 billion the year ended December 31, 2014, primarily due to an appreciation of the USD against the euro. This foreign exchange loss primarily relates to the impact of the USD appreciation of an additional 10% against the euro (12% appreciation for the year ended December 31, 2014), a 32% appreciation against the Brazilian real (12% appreciation for the year ended December 31, 2014) and a 46% devaluation of the Kazakhstani tenge.
Other net financing costs (including expenses related to True Sale of Receivables, bank fees, interest on pensions and fair value adjustments of convertible bonds and derivative instruments) were $0.9 billion for the year ended December 31, 2015, as compared to $1.3 billion for the year ended December 31, 2014, and included

24 Management report
an expense of $79 million relating to the extension of the mandatory convertible bond. The reduction in the loss was mainly due to the change in the accretion of defined benefit obligations and other long term liabilities for $0.2 billion.
Foreign exchange losses increased to $620 million for the year ended December 31, 2014, as compared to $248 million for the year ended December 31, 2013, primarily due to an appreciation of the USD against the euro. This foreign exchange loss primarily relates to the impact of the USD appreciation on euro-denominated deferred tax assets. In addition, other net financing costs (including expenses related to True Sale of Receivables, bank fees, interest on pensions and fair value adjustments of convertible bonds and derivative instruments) were $1.3 billion for the year ended December 31, 2014, as compared to $1.1 billion for the year ended December 31, 2013,
and included expenses related to the termination of the Senegal greenfield project, gains and losses on convertible bonds and hedging instruments that matured during the period as well as a $161 million charge related to the federal tax amnesty plan in Brazil with respect to the settlement of the Siderbras case.
Income tax expense (benefit)
ArcelorMittal recorded a consolidated income tax expense of $0.9 billion for the year ended December 31, 2015, as compared to $0.5 billion for the year ended December 31, 2014, due to impairments of deferred tax assets stemming from lower future taxable results forecasts in some jurisdictions. For additional information related to ArcelorMittal’s income taxes, see note 9 to ArcelorMittal’s consolidated financial statements.ArcelorMittal recorded a consolidated income tax expense
of $0.5 billion for the year ended December 31, 2014, as compared to $0.2 billion for the year ended December 31, 2013, primarily due to improved results in certain jurisdictions. Income tax expense for the year ended December 31, 2013 included the settlement of two tax amnesty programs in Brazil.
ArcelorMittal’s consolidated income tax expense (benefit) is affected by the income tax laws and regulations in effect in the various countries in which it operates and the pre-tax results of its subsidiaries in each of these countries, which can vary from year to year. ArcelorMittal operates in certain jurisdictions, mainly in Eastern Europe and Asia, which have a structurally lower corporate income tax rate than the statutory tax rate as in effect in Luxembourg (29.22%), as well as in jurisdictions, mainly in Western Europe and the Americas, which have a structurally higher corporate income tax rate.
The statutory income tax expense (benefit) and the statutory income tax rates of the countries that most significantly resulted in the tax expense (benefit) at statutory rate for each of the years ended December 31, 2015, 2014 and 2013 are as set forth below:
2015 2014 2013Statutory income tax Statutory income tax rate Statutory income tax Statutory income tax rate Statutory income tax Statutory income tax rate
United States (863) 35.00% (352) 35.00% (120) 35.00%Argentina 50 35.00% 59 35.00% 52 35.00%France (32) 34.43% 18 34.43% (224) 34.43%Brazil (48) 34.00% 141 34.00% 94 34.00%Belgium 64 33.99% (10) 33.99% (208) 33.99%Germany (43) 30.30% (82) 30.30% (138) 30.30%Spain (146) 25.00% (78) 25.00% (218) 30.00%Luxembourg (613) 29.22% (228) 29.22% 203 29.22%Mexico (55) 30.00% 9 30.00% (93) 30.00%South Africa (199) 28.00% (23) 28.00% (57) 28.00%Canada 247 26.90% 298 26.90% 240 26.90%Algeria - 23.00% - 25.00% (26) 25.00%Russia (1) 20.00% (18) 20.00% (14) 20.00%Kazakhstan (48) 20.00% (4) 20.00% (24) 20.00%Czech Republic 9 19.00% 38 19.00% (7) 19.00%Poland 23 19.00% 25 19.00% (8) 19.00%Romania (10) 16.00% (12) 16.00% (29) 16.00%Ukraine 11 18.00% 23 18.00% (32) 16.00%Trinidad & Tobago (83) 25.00% (11) 25.00% (11) 25.00%Liberia (388) 25.00% (30) 25.00% (14) 25.00%United Kingdom 17 20.00% 55 20.00% 17 20.00%Others (38) 35 26Total (2,146) (147) (591)
Note: The statutory tax rates are the (future) rates enacted or substantively enacted by the end of the respective period.
Management report 25
Non-controlling interests
Net loss attributable to non-controlling interests was $477 million for the year ended December 31, 2015, as compared with net income attributable to non-controlling interests of $112 million for the year ended December 31, 2014. Net loss attributable to non-controlling interests for 2015 was primarily related to losses generated by ArcelorMittal South Africa and Liberia resulting from the impairments of the assets described above.
Net income attributable to non-controlling interests was $112 million for the year ended December 31, 2014, as compared with net loss attributable to non-controlling interests of $30 million for the year ended December 31, 2013. Net income attributable to non-controlling interests increased in 2014 primarily as a result of income attributable to non-controlling interests in ArcelorMittal Mines Canada and Belgo Bekaert Arames, partially offset by losses generated in ArcelorMittal South Africa, which were however significantly lower than in 2013.
Net loss attributable to equity holders of the parent
ArcelorMittal’s net loss attributable to equity holders of the parent for the year ended December 31, 2015 amounted to $7.9 billion compared to net loss attributable to equity holders of $1.1 billion for the year ended December 31, 2014 and $2.5 billion for the year ended December 31, 2013, for the reasons discussed above.
Liquidity and capital resources
ArcelorMittal’s principal sources of liquidity are cash generated from its operations and its credit facilities at the corporate level.
Because ArcelorMittal is a holding company, it is dependent upon the earnings and cash flows of, and dividends and distributions from, its operating subsidiaries to
pay expenses and meet its debt service obligations. Significant cash or cash equivalent balances may be held from time to time at the Company’s international operating subsidiaries, including in particular those in France, where the Company maintains a cash management system under which most of its cash and cash equivalents are centralized, and in Argentina, Brazil, Canada, Morocco, South Africa, Ukraine, USA, and Venezuela. Some of these operating subsidiaries have debt outstanding or are subject to acquisition agreements that impose restrictions on such operating subsidiaries’ ability to pay dividends, but such restrictions are not significant in the context of ArcelorMittal’s overall liquidity. Repatriation of funds from operating subsidiaries may also be affected by tax and foreign exchange policies in place from time to time in the various countries where the Company operates, though none of these policies is currently significant in the context of ArcelorMittal’s overall liquidity.
In management’s opinion, ArcelorMittal’s credit facilities are adequate for its present requirements.
As of December 31, 2015, ArcelorMittal’s cash and cash equivalents, including restricted cash, amounted to $4.1 billion as compared to $4.0 billion as of December 31, 2014. In addition, ArcelorMittal had available borrowing capacity of $6.0 billion under its $6.0 billion revolving credit facility as of December 31, 2015 and 2014.
As of December 31, 2015, ArcelorMittal’s total debt, which includes long-term debt and short-term debt, was $19.8 billion, compared to $19.8 billion (excluding $0.1 billion debt classified as held for sale) as of December 31, 2014.
Net debt (defined as long-term debt plus short-term debt, less cash and cash equivalents and restricted cash) was $15.7 billion as
of December 31, 2015, essentially stable compared to $15.8 billion at December 31, 2014. Most of the external debt is borrowed by the parent company on an unsecured basis and bears interest at varying levels based on a combination of fixed and variable interest rates. Gearing (defined as net debt divided by total equity) at December 31, 2015 was 57% as compared to 35% at December 31, 2014. The Company expects gearing to decrease in 2016 as a result of the planned capital increase and the sale of 35% of its stake in Gestamp, each announced on February 5, 2016, see Recent developments.
The margin applicable to ArcelorMittal’s principal credit facilities ($6 billion revolving credit facility and certain other credit facilities) and the coupons on certain of its outstanding bonds are subject to adjustment in the event of a change in its long-term credit ratings. In a context of low steel prices and challenging industry conditions, on February 3, 2015, Standard & Poor’s further downgraded ArcelorMittal’s credit rating and, on December 18, 2015, it placed ArcelorMittal on negative outlook. On November 12, 2015, Moody’s further downgraded ArcelorMittal and placed it on negative outlook. On November 16, 2015, while Fitch affirmed its credit rating of ArcelorMittal, it lowered its outlook to negative. The margin under ArcelorMittal’s principal credit facilities and certain of its outstanding bonds is subject to adjustment in the event of a change in its long-term credit ratings, and the February 2015 downgrade resulted in an increase in interest paid of $28 million in 2015. The November 2015 downgrade will similarly result in increased interest expense.
ArcelorMittal’s $6 billion revolving credit facility, which incorporates a first tranche of $2.5 billion maturing on April 30, 2018, and a second tranche of $3.5 billion maturing on April 30, 2020, contains restrictive covenants. Among other things, these covenants limit encumbrances
on the assets of ArcelorMittal and its subsidiaries, the ability of ArcelorMittal’s subsidiaries to incur debt and the ability of ArcelorMittal and its subsidiaries to dispose of assets in certain circumstances. The agreement also requires compliance with a financial covenant, as summarized below.
The Company must ensure that the ratio of “Consolidated Total Net Borrowings” (consolidated total borrowings less consolidated cash and cash equivalents) to “Consolidated EBITDA” (the consolidated net pre-taxation profits of the ArcelorMittal group for a Measurement Period, subject to certain adjustments as set out in the facility) does not, at the end of each “Measurement Period” (each period of 12 months ending on the last day of a financial half-year or a financial year of the Company), exceed a certain ratio, referred to by the Company as the “Leverage ratio”. ArcelorMittal’s principle credit facilities set this ratio to 4.25 to 1, whereas one facility has a ratio of 4.0 to 1. As of December 31, 2015, the Company was in compliance with both ratios.
Non-compliance with the covenants in the Company’s borrowing agreements would entitle the lenders under such facilities to accelerate the Company’s repayment obligations. The Company was in compliance with the financial covenants in the agreements related to all of its borrowings as of December 31, 2015 and December 31, 2014.
As of December 31, 2015, ArcelorMittal had guaranteed approximately $0.2 billion of debt of its operating subsidiaries. ArcelorMittal’s debt facilities have provisions whereby the acceleration of the debt of another borrower within the ArcelorMittal group could, under certain circumstances, lead to acceleration under such facilities.

26 Management report
The average debt maturity of the Company was 6.2 years as of December 31, 2015, as compared to 6.3 years as of December 31, 2014.
Further information regarding ArcelorMittal’s outstanding long-term indebtedness as of December 31, 2015, including the breakdown between fixed rate and variable rate debt, is set forth in note 6 to the consolidated financial statements. Further information regarding ArcelorMittal’s use of financial instruments for hedging purposes is set forth in note 6 to the consolidated financial statements.
Financings
The principal financings of ArcelorMittal and its subsidiaries are summarized below by category. Further information regarding ArcelorMittal’s short-term and long-term indebtedness is provided in note 6 to the consolidated financial statements.
Principal credit facilities
On April 30, 2015, ArcelorMittal signed a $6 billion revolving credit facility which incorporates a first
tranche of $2.5 billion maturing on April 30, 2018 and a second tranche of $3.5 billion maturing on April 30, 2020. The facility may be used for general corporate purposes and replaces the $2.4 billion revolving credit facility agreement dated May 6, 2010 and the $3.6 billion revolving credit facility agreement dated March 18, 2011. As of December 31, 2015, the $6 billion revolving credit facility remains fully available.
On September 30, 2010, ArcelorMittal entered into the $500 million revolving multi-currency letter of credit facility (the “Letter of Credit Facility”). The Letter of Credit Facility is used by the Company and its subsidiaries for the issuance of letters of credit and other instruments and matures on September 30, 2016. The terms of the letters of credit and other instruments contain certain restrictions as to duration. The Letter of Credit Facility was amended on October 26, 2012 to reduce its amount to $450 million. On September 30, 2014, the Company refinanced its Letter of Credit Facility by entering into a $350 million revolving multi-currency letter of credit facility.
2015 capital markets transactions
On October 22, 2015, the Company redeemed its $500 million 3.75% Unsecured notes due March 1, 2016, prior to their scheduled maturity for a total amount of $511 million, including premium and accrued interest.
On July 3, 2015, ArcelorMittal completed the offering of CHF 225 million 2.5% Notes due July 3, 2020, issued under the Company’s Euro Medium Term Notes Programme. The proceeds of the issuance were used to repay or prepay existing indebtedness.
On July 2, 2015, the Company redeemed its $1 billion 3.75% Unsecured Notes due August 5, 2015, prior to their scheduled maturity for a total amount of $1,022 million, including premium and accrued interest.
On June 1, 2015, ArcelorMittal completed the offering of $500 million 5.125% Notes due June 1, 2020, and $500 million 6.125% Notes due June 1, 2025, issued under the Company’s automatic shelf registration statement filed with the U.S. Securities and Exchange Commission (including
a prospectus). The proceeds of the issuance were used to repay existing indebtedness, in particular the early redemption of bonds maturing in August 2015.
On April 9, 2015, ArcelorMittal completed the offering of €400 million Floating Rate Notes due April 9, 2018, and €500 million 3.00% Notes due April 9, 2021, issued under the Company’s Euro Medium Term Notes Programme. The proceeds of the issuance were used for general corporate purposes.
On March 20, 2015, ArcelorMittal increased the size of its wholesale Euro Medium Term Notes Programme to €6 billion.
On January 14, 2015, ArcelorMittal completed the offering of €750 million 3.125% Notes due January 14, 2022. The Notes were issued under ArcelorMittal’s €3 billion wholesale Euro Medium Term Notes Programme.
Mandatory convertible bond
On November 23, 2015, the Company announced the extension of the conversion date for the $1 billion privately placed
The following table summarizes the repayment schedule of ArcelorMittal’s outstanding indebtedness, which includes short-term and long-term debt, as of December 31, 2015
Repayment Amounts per Year (in billions of $)Type of Indebtedness as of December 31, 2015 2016 2017 2018 2019 2020 >2020 Total
Bonds 1.1 2.5 2.5 2.3 2.4 6.9 17.7Long-term revolving credit lines - - - - - - -- $2.5 billion tranche of $6 billion revolving credit facility - - - - - - -- $3.5 billion tranche of $6 billion revolving credit facility - - - - - - -Commercial paper1 0.1 - - - - - 0.1Other loans 1.1 0.2 0.1 0.2 0.1 0.3 2.0Total Gross Debt 2.3 2.7 2.6 2.5 2.5 7.2 19.8
1 Commercial paper is expected to continue to be rolled over in the normal course of business.
The following table summarizes the amount of credit available as of December 31, 2015, under ArcelorMittal’s $6 billion revolving credit facility:
Credit lines available Facility Amount Drawn Available
$2.5 billion tranche of $6 billion revolving credit facility $2.5 - $ 2.5$3.5 billion tranche of $6 billion revolving credit facility $3.5 - $ 3.5 Total committed lines $6.0 - $ 6.0
Management report 27
mandatory convertible bond (the “MCB”) issued on December 28, 2009 by one of its wholly-owned Luxembourg subsidiaries. This amendment to the MCB, which is mandatorily convertible into preferred shares of such subsidiary, was executed on November 20, 2015. The mandatory conversion date of the bond has been extended to January 31, 2018. The other main features of the MCB remain unchanged. The bond was privately placed with a Luxembourg affiliate of Credit Agricole Corporate and Investment Bank and is not listed. In connection with the extension of the conversion date of the MCB, ArcelorMittal also extended the maturities of the equity-linked notes in which the proceeds of the MCB issuances are invested.
Other loans and facilities
During the six months ended June 30, 2014, ArcelorMittal entered into certain short-term committed bilateral credit facilities. The facilities were extended in 2015. As of December 31, 2015, the facilities, totalling approximately $0.8 billion, remain fully available.
On June 10, 2014, ArcelorMittal entered into an agreement for financing with a financial institution for $1.0 billion. The financial institution had the right to request early repayment once per year beginning in February 2015 until the final maturity on April 20, 2017. On February 13, 2015, the Company elected to make an early repayment of such financing. True sale of receivables (“TSR”) programs
The Company has established a number of programs for sales without recourse of trade accounts receivable to various financial institutions (referred to as True Sale of Receivables (“TSR”)) for an aggregate amount of $5,254 million as of December 31, 2015. This amount represents the maximum amount of unpaid receivables that may be sold and outstanding at any given time.
Of this amount, the Company has utilized $4,580 million and $5,015 million, as of December 31, 2015 and 2014, respectively. Through the TSR programs, certain operating subsidiaries of ArcelorMittal surrender the control, risks and benefits associated with the accounts receivable sold; therefore, the amount of receivables sold is recorded as a sale of financial assets and the balances are removed from the consolidated statements of financial position at the moment of sale. The total amount of receivables sold under TSR programs and derecognized in accordance with IAS 39 for the years ended 2015, 2014 and 2013 was $33.1 billion, $37.8 billion and $35.4 billion, respectively (with amounts of receivables sold converted to U.S. dollars at the monthly average exchange rate). Expenses incurred under the TSR programs (reflecting the discount granted to the acquirers of the accounts receivable) recognized in the consolidated statements of operations for the years ended December 31, 2015, 2014 and 2013 were $116 million, $150 million and $172 million, respectively.
Earnings distribution
In light of the downturn in global economic conditions that commenced in September 2008, ArcelorMittal’s Board of Directors recommended on February 10, 2009 a reduction of the annual dividend in 2009 to $0.75 per share (with quarterly dividend payments of $0.1875) from $1.50 per share previously. The dividend policy was approved by the annual general meeting of shareholders on May 12, 2009, and was also maintained in 2010, 2011 and 2012. In view of the continued challenging global economic conditions affecting the Company’s business in 2013 and its priority to deleverage, ArcelorMittal’s Board of Directors recommended on May 7, 2013 a further reduction of the annual dividend to $0.20 per share from $0.75 per share in 2012. The
recommendation was approved by the annual general meeting of shareholders on May 8, 2013, and the dividend was paid in full on July 15, 2013.
On February 7, 2014, ArcelorMittal’s Board of Directors announced a gross dividend payment of $0.20 per share. The dividend was approved by the shareholders at the annual general meeting of shareholders held on May 8, 2014, and the dividend was paid in full on July 15, 2014.
On February 13, 2015, ArcelorMittal’s Board of Directors announced a gross dividend payment of $0.20 per share. The dividend was approved by the shareholders at the annual general meeting of shareholders held on May 5, 2015, and the dividend was paid in full on June 15, 2015.
On November 6, 2015, ArcelorMittal’s Board of Directors proposed the suspension of the dividend for the financial year 2015. This proposal is subject to shareholder approval at the annual general meeting to be held on May 4, 2016. The Company has indicated that a dividend will not be proposed until its leverage has further improved from what it will be following the proposed $3.0 billion rights offering and sale of Gestamp.
ArcelorMittal held 8,581,090 shares in treasury as of December 31, 2015, as compared to 11,018,413 shares as of December 31, 2014. As of December 31, 2015, the number of shares held by the Company in treasury represented approximately 0.52% of the Company’s total issued share capital.
Pension/OPEB liabilities
The defined benefit liabilities for employee benefits decreased by $0.8 billion, from $9.9 billion as of December 31, 2014 to $9.1 billion as of December 31, 2015. The main effects for ArcelorMittal are related to the appreciation of the U.S. Dollar against the major currencies (mainly EUR and CAD) and the
change in financial assumptions such as the increase of discount rates used to calculate the pension, other post-employment benefits (“OPEB”) and early retirement obligations. For additional information with respect to the Company’s pension plan and OPEB liabilities, including a breakdown by region and by type of plan, see note 7.2 to the consolidated financial statements

28 Management report
Net cash provided by operating activities
For the year ended December 31, 2015, net cash provided by operating activities decreased to $2.2 billion, as compared with $3.9 billion for the year ended December 31, 2014, mainly due to lower operating working capital release. As a result of stable operating working capital with rotation days remaining fairly constant at 50 for the year ended December 31, 2015 and 51 for the year ended December 31, 2014, net cash provided by operating activities for the year ended December 31, 2015 included a marginal increase of $31 million in working capital (consisting of inventories plus trade accounts receivable less trade accounts payable), including a $0.3 billion decrease in accounts receivable and $0.9 billion decrease in inventories, partially offset by a decrease in trade payables of $1.3 billion.
For the year ended December 31, 2014, net cash provided by operating activities decreased to $3.9 billion, as compared with $4.3 billion for the year ended December 31, 2013, mainly because of lower operating working capital release. The net cash provided by operating activities for the year ended December 31, 2014 was positively affected by a $0.4 billion decrease in working capital (consisting of inventories plus trade accounts receivable less trade accounts payable), including a $0.5 billion decrease in accounts receivable which was partially offset by a $0.1 billion increase in inventories. The decrease in accounts receivable was primarily related to a lower
average number of rotation days (18 days as compared to 22 days) combined with lower sales and steel selling prices.
Net cash used in investing activities
Net cash used in investing activities was $2.2 billion for the year ended December 31, 2015 as compared to $3.1 billion for the year ended December 31, 2014. This decrease is mainly related to a decrease in capital expenditures which amounted to $2.7 billion for the year ended December 31, 2015 as compared to $3.7 billion for the year ended December 31, 2014. Net inflows from other investing activities amounted to $0.5 billion including an inflow of $0.2 billion for the sale of tangible assets (including the Liberté building), $0.1 billion from the exercise of the fourth put option on Hunan Valin shares and $0.1 billion for cash collateral received. In 2015, capital expenditure of $2.7 billion included $2.2 billion related to non-growth projects (including health and safety investments) and $0.5 billion dedicated to growth projects mainly in Mining. ArcelorMittal’s major capital expenditures in the year ended December 31, 2015 included the following major projects: wire rod production expansion in Monlevade; the construction of a heavy gauge galvanizing line to optimize galvanizing operations in ArcelorMittal Dofasco rebar; the meltshop expansion in Juiz de Fora; the HRM extension and HDG increase at ArcelorMittal Krawkow; construction of a new rolling mill in Acindar and the expansion project in Liberia. See “Capital expenditure projects” for a summary of the Liberia projects.
Net cash used in investing activities was $3.1 billion for the year ended December 31, 2014 as compared to $2.9 billion for the year ended December 31, 2013. This increase is mainly related to capital expenditure which amounted to $3.7 billion for the year ended December 31, 2014 as compared to $3.5 billion for the year ended December 31, 2013. Capital expenditures in 2014 were mainly related to blast furnace relining in South Africa, Ukraine, Kazakhstan and the US. Net inflows from other investing activities amounted to $0.6 billion, including an inflow of $0.6 billion relating to various disposals ($144 million from the sale of the Company’s 78% stake in ATIC, preliminary proceeds of $39 million for the sale of the steel cord business, $49 million relating to the sale of Circuit Foil and $389 million related to proceeds from the sale of the Company’s 50% interest in Gallatin) and $133 million of proceeds from the exercise of the second and third put option in Hunan Valin shares (cash proceeds from the fourth put option were received in the first quarter of 2015). In addition, net inflows from other investing included an outflow of $258 million relating to the acquisition of a 50% interest in Calvert. In 2014, capital expenditure of $3.7 billion included $2.8 billion related to maintenance (including health and safety investments) and $0.9 billion dedicated to growth projects mainly in Mining. ArcelorMittal’s major capital expenditures in the year ended December 31, 2014 included the following major projects: Liberia greenfield mining project; capacity expansion in finished products, wire rod production
expansion in Monlevade; rebar and meltshop expansion in Juiz de Fora; construction of a new rolling mill in Acindar and construction of a heavy gauge galvanizing line to optimize galvanizing operations in ArcelorMittal Dofasco. In 2013, capital expenditure of $3.5 billion included $2.4 billion related to maintenance (including health and safety investments) and $1.1 billion dedicated to growth projects mainly in mining.
In 2016, capital expenditure is expected to be approximately $2.4 billion.
Net cash (used in) provided by financing activities
Net cash provided by financing activities was $0.4 billion for the year ended December 31, 2015, as compared to net cash used in financing activities of $2.8 billion in 2014. The decrease in cash used in financing activities was primarily due to $3.8 billion in proceeds from the issuance of short and long-term debt partly offset by payments of $3.0 billion for short and long-term debt. Proceeds included receipts from the issuance of debenture loans amounting to $2.6 billion, including $2.1 billion related to the issuance of Notes under the Company’s Euro Medium Term Notes Programme (€750 million 3.125% Notes due January 14, 2022, €400 million Floating Rate Notes due April 9, 2018, €500 million 3.00% Notes due April 9, 2021 and CHF 225 million 2.5% Notes due July 3, 2020) and $1 billion in proceeds from the issuance of $500 million 5.125% Notes due June 1, 2020 and $500 million 6.125% Notes due June 1, 2025. Payments mainly include the
Summary of Cash Flow For the year endend December 31,(in $ millions) 2015 2014 2013
Net cash provided by operating activities 2,151 3,870 4,296 Net cash used in investing activities (2,170) (3,077) (2,877)Net cash (used in) provided by financing activities 395 (2,750) 241
Sources and Uses of Cash
Years ended December 31, 2015, 2014 and 2013
The following table presents a summary of cash flow of ArcelorMittal:

Management report 29
repayment of a $1.0 billion loan with a financial institution and the redemption of the Company’s $1 billion 3.75% Unsecured Notes due August 5, 2015, and its $500 million 3.75% notes due March 1, 2016, prior to their scheduled maturity.
Dividends paid during the year ended December 31, 2015 were $0.4 billion, including $331 million paid to ArcelorMittal shareholders and $85 million paid to non-controlling shareholders in subsidiaries.
Net cash used in financing activities was $2.8 billion for the year ended December 31, 2014, as compared to net cash provided by financing activities of $0.2 billion in 2013. The increase in cash used in financing activities was primarily due to payments of $6.5 billion including a €360 million bond repayment, a $136 million bond repayment, €1.25 billion for the 7.25% convertible bonds due April 1, 2014, $800 million for the 5.00% convertible bonds due May 15, 2014, redeemed subordinated perpetual capital securities for $657 million and $1.25 billion for the early redemption of the 9% Notes due February 15, 2015 and the 3.75% Notes due February 25, 2015. These payments were partly offset by the receipts of $4.3 billion, including $1.0 billion financing, proceeds from the issuance of €750 million 3.00% Notes due March 25, 2019, $805 million from the issuance of €600 million 2.875% Notes due July 6, 2020 under the Company’s €3 billion wholesale Euro Medium Term Notes Programme and proceeds from a new 3-year $300 million financing provided by EDC (Export Development Canada).
Dividends paid during the year ended December 31, 2014 were $0.5 billion, including $328 million paid to ArcelorMittal shareholders, $22 million paid to holders of subordinated perpetual capital securities and $108 million paid to non-controlling shareholders in subsidiaries. Dividends paid in the year ended December 31, 2013 were $0.4 billion.
Equity
Equity attributable to the equity holders of the parent decreased to $25.3 billion at December 31, 2015, as compared to $42.1 billion at December 31, 2014, primarily due to a $8.2 billion decrease in the foreign exchange translation reserve as a result of the depreciation of most currencies against the U.S. dollar, $0.1 billion of recognized actuarial losses, a $0.3 billion decrease in the revaluation reserve on derivative instruments and available-for-sale securities, the net loss attributable to the equity holders of the parent of $7.9 billion and dividend payments of $0.3 billion. See note 10 to ArcelorMittal’s consolidated financial statements for the year ended December 31, 2015.
Equity attributable to the equity holders of the parent decreased to $42.1 billion at December 31, 2014, as compared to $49.8 billion at December 31, 2013, primarily due to a $4.7 billion decrease in the foreign exchange translation reserve as a result of the depreciation of most currencies against the U.S. dollar, $1.4 billion of recognized actuarial losses, the redemption of subordinated perpetual capital securities for $0.7 billion, the net loss attributable to the equity holders of the parent of $1.1 billion and dividend payments of $0.3 billion.
Research and Development, Patents and Licenses
Costs relating to research and development, patents and licenses were not significant as a percentage of sales. Research and development costs expensed (and included in selling, general and administration expenses) in 2013, 2014 and 2015 amounted to $270 million, $259 million and $227 million, respectively.
Trend Information
All of the statements in this “Trend Information” section are subject to and qualified by the information set forth under the “Cautionary Statement Regarding Forward-
Looking Statements”. See also “Key factors affecting results of operations”.
Outlook
According to ArcelorMittal’s estimates, global ASC declined by 2.2% in 2015 as compared to 2014. ArcelorMittal expects stabilization in 2016. By region: Driven by a significant destock, ASC in the U.S. declined by 9.6% in 2015. However, underlying demand continues to expand and due to the expected absence of a further destock in 2016, ArcelorMittal expects ASC in the US to grow by +3% to 4% above 2015 levels, despite an expected further decline in Oil Country Tubular Goods demand. ArcelorMittal expects the pick-up in underlying European demand to continue but apparent demand is expected to be modest at +0% to +1% in 2016 (versus growth of 3.4% in 2015) as the high level of imports in the fourth quarter of 2015 have raised inventory levels particularly in Southern Europe. Despite declining 15.6% in 2015, Brazil ASC is expected to decline further, albeit slower at -6% to -7% in 2016 as the economy remains mired in recession. With the ongoing recession in Russia impacted by weak oil prices, CIS demand is expected to decline -5% to -6% (versus a decline of 8.0% in 2015). In China, we expect ongoing weakness in the real estate sector to have a negative impact, and expect steel demand decline of around -1% (from -4.3% decline in 2015).
Despite an expected difficult start to 2016, due to order book and the time lag required for lower raw material costs to positively impact cost of sales, a combination of Company actions and known developments is expected to support operating performance in the full-year 2016, at prevailing raw material costs and spot steel spreads.
The Company also targets a reduction of its cash requirements in 2016 in excess of $1 billion as compared to 2015, through lower capital expenditures (full-
year 2016 capital expenditure is expected to be approximately $2.4 billion as compared to $2.7 billion in full-year 2015), lower interest expenses (full-year 2016 net interest expenses are expected to be lower at approximately $1.1 billion as compared to $1.3 billion in full-year 2015, due to net debt reductions and lower cash payments for interest following the maturity of the Mandatorily Convertible Notes in January 2016); no dividend in respect of the 2015 financial year; and lower cash payments in respect of taxes.
These actions and developments are intended to enable the Company to reduce net debt and maintain strong liquidity.
Disclosures about market risks
ArcelorMittal is exposed to a number of different market risks arising from its normal business activities. Market risk is the possibility that changes in raw materials prices, foreign currency exchange rates, interest rates, base metal prices (zinc, nickel, aluminum and tin) and energy prices (oil, natural gas and power) will adversely affect the value of ArcelorMittal’s financial assets, liabilities or expected future cash flows.
The fair value information presented below is based on the information available to management as of the date of the consolidated statements of financial position. Although ArcelorMittal is not aware of any factors that would significantly affect the estimated fair value amounts, such amounts have not been comprehensively revalued for purposes of this annual report since that date, and therefore, the current estimates of fair value may differ significantly from the amounts presented below. The estimated fair values of certain financial instruments have been determined using available market information or other valuation methodologies that require considerable judgment in interpreting market data and developing estimates.

30 Management report
See note 6 to ArcelorMittal’s consolidated financial statements for quantitative information about risks relating to financial instruments, including financial instruments entered into pursuant to the Company’s risk management policies.
Risk management
ArcelorMittal has implemented strict policies and procedures to manage and monitor financial market risks. Organizationally, supervisory functions are separated from operational functions, with proper segregation of duties. Financial market activities are overseen by the CFO, the Corporate Finance and Tax Committee and the GMB.
All financial market risks are managed in accordance with the Treasury and Financial Risk Management Policy. These risks are managed centrally through Group Treasury by a group specializing in foreign exchange, interest rate, commodity, internal and external funding and cash and liquidity management.
All financial market hedges are governed by ArcelorMittal’s Treasury and Financial Risk Management Policy, which includes a delegated authority and approval framework, sets the boundaries for all hedge activities and dictates the required approvals for all Treasury activities. Hedging activity and limits are monitored on an ongoing basis. ArcelorMittal enters into
transactions with numerous counterparties, mainly banks and financial institutions, as well as brokers, major energy producers and consumers.
As part of its financial risk management activities, ArcelorMittal uses derivative instruments to manage its exposure to changes in interest rates, foreign exchange rates and commodities prices. These instruments are principally interest rate, currency and commodity swaps, spots and forwards. ArcelorMittal may also use futures and options contracts.
Counterparty risk
ArcelorMittal has established detailed counterparty limits to mitigate the risk of default by its counterparties. The limits restrict the exposure ArcelorMittal may have to any single counterparty. Counterparty limits are calculated taking into account a range of factors that govern the approval of all counterparties. The factors include an assessment of the counterparty’s financial soundness and its ratings by the major rating agencies, which must be of a high quality. Counterparty limits are monitored on a periodic basis.
All counterparties and their respective limits require the prior approval of the Corporate Finance and Tax Committee. Standard agreements, such as those published by the International Swaps and Derivatives Association, Inc. (ISDA) are negotiated
with all ArcelorMittal trading counterparties.
Currency exposure
ArcelorMittal seeks to manage each of its entities’ exposure to its operating currency. For currency exposure generated by activities, the conversion and hedging of revenues and costs in foreign currencies is typically performed using currency transactions on the spot market and forward market. For some of its business segments, ArcelorMittal hedges future cash flows.
Because a substantial portion of ArcelorMittal’s assets, liabilities, sales and earnings are denominated in currencies other than the U.S. dollar (its reporting currency), ArcelorMittal has exposure to fluctuations in the values of these currencies relative to the U.S. dollar. These currency fluctuations, especially the fluctuation of the value of the U.S. dollar relative to the euro, the Canadian dollar, Brazilian real, South African rand, Kazakh tenge and Ukrainian hryvnia, as well as fluctuations in the currencies of the other countries in which ArcelorMittal has significant operations and/or sales, could have a material impact on its results of operations.
ArcelorMittal faces transaction risk, where its businesses generate sales in one currency but incur costs relating to that revenue in a different currency. For example, ArcelorMittal’s non-U.S. subsidiaries may purchase raw materials, including iron ore and coking coal, in U.S. dollars, but may sell finished steel products in other currencies. Consequently, an appreciation of the U.S. dollar will increase the cost of raw materials, thereby negatively impacting the Company’s operating margins, unless the Company is able to pass along the higher cost in the form of higher selling prices.
ArcelorMittal faces translation risk, which arises when ArcelorMittal translates the financial statements of its subsidiaries, denominated in currencies other than the U.S. dollar for inclusion in ArcelorMittal’s consolidated financial statements.
The tables below illustrate the impact of an appreciation and a depreciation of the U.S. dollar of 10% against the euro, on the conversion of the net debt of ArcelorMittal into U.S. dollars as of December 31, 2015 and December 31, 2014. The impact on net debt denominated in a currency different than the euro, is computed based on historical data of how such currency would move against the U.S. dollar when the U.S. dollar appreciates/depreciates 10% against the euro. A positive sign means an increase in the net debt.
CurrencyImpact on net debt translation of a 10% appreciation of the
U.S. dollar against the euroImpact on net debt translation of a 10% depreciation of the U.S.
dollar against the euro
In 2015in $ equivalent
(in millions)in $ equivalent
(in millions)
Brazilian real (13) 17Canadian dollar 16 (18)Euro (420) 420Swiss Franc (8) 8Ukrainian hryvnia 9 (13)South African rand 1 (1)Other 8 (8)
Management report 31
Derivative instruments
ArcelorMittal uses derivative instruments to manage its exposure to movements in interest rates, foreign exchange rates and commodity prices. Changes in the fair value of derivative instruments are recognized in the consolidated statements of operations or in equity according to nature and effectiveness of the hedge.
Derivatives used are non-exchange-traded derivatives such as over-the-counter swaps, options and forward contracts.
For the Company’s tabular presentation of information related to its market risk sensitive instruments, please see note 6 to the consolidated financial statements.
Interest rate sensitivity
Cash balances, which are primarily composed of euros and U.S. dollars, are managed according to the short term (up to one year) guidelines established by senior management on the basis of a daily interest rate benchmark, primarily through short-term currency swaps, without modifying the currency exposure.
Interest rate risk on debt
ArcelorMittal’s policy consists of incurring debt at fixed and floating interest rates, primarily in U.S. dollars and euros according to general corporate needs. Interest rate and currency swaps are utilized to manage the currency and/or interest rate exposure of the debt. For the Company’s tabular presentation of the fair values of its short and long term debt, please see note 6 to the consolidated financial statements.
Commodity price risk
ArcelorMittal utilizes a number of exchange-traded commodities in the steel-making process. In certain instances, ArcelorMittal is the leading consumer worldwide of certain commodities. In some businesses and in certain situations, ArcelorMittal is able to pass this exposure on to its customers. The residual exposures are managed as appropriate.
Financial instruments related to commodities (base metals, energy, freight and emission rights) are utilized to manage ArcelorMittal’s exposure to price fluctuations.
Hedges in the form of swaps and options are utilized to manage the exposure to commodity price fluctuations.
For the Company’s tabular presentation of information related to its market risk sensitive instruments, please see note 6 to the consolidated financial statements.
In respect of non-exchange traded commodities, ArcelorMittal is exposed to volatility in the prices of raw materials such as iron ore (which is generally correlated with steel prices with a time lag) and coking coal. This exposure is almost entirely managed through long-term contracts, however some hedging of iron ore exposures is made through derivative contracts. For a more detailed discussion of ArcelorMittal’s iron ore and coking coal purchases, see “Raw materials”.
CurrencyImpact on net debt translation of a 10% appreciation of the
U.S. dollar against the euroImpact on net debt translation of a 10% depreciation of the
U.S. dollar against the euro
In 2014
in $ equivalent(in millions)
in $ equivalent(in millions)
Brazilian real (20) 24 Euro (341) 341Ukrainian hryvnia 10 (17)Other 15 (18)
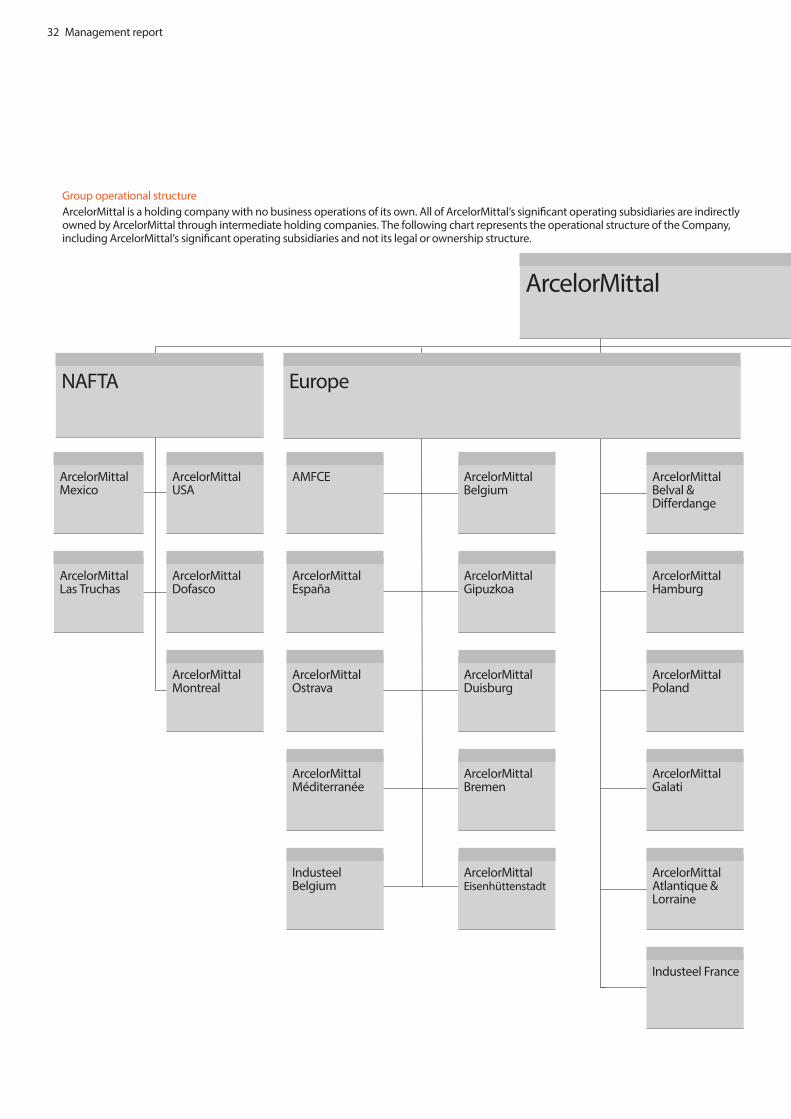
32 Management report
ArcelorMittal Mexico
ArcelorMittal Las Truchas
ArcelorMittal USA
ArcelorMittal Dofasco
ArcelorMittal Montreal
AMFCE
ArcelorMittal España
ArcelorMittal Ostrava
ArcelorMittal Méditerranée
Industeel Belgium
ArcelorMittal Belgium
ArcelorMittal Gipuzkoa
ArcelorMittal Duisburg
ArcelorMittal Bremen
ArcelorMittal Eisenhüttenstadt
ArcelorMittal Belval & Differdange
ArcelorMittal Hamburg
ArcelorMittal Poland
ArcelorMittal Galati
ArcelorMittal Atlantique & Lorraine
Industeel France
Europe
ArcelorMittal is a holding company with no business operations of its own. All of ArcelorMittal’s significant operating subsidiaries are indirectly owned by ArcelorMittal through intermediate holding companies. The following chart represents the operational structure of the Company, including ArcelorMittal’s significant operating subsidiaries and not its legal or ownership structure.
NAFTA
Group operational structure
ArcelorMittal

Management report 33
ArcelorMittal
ArcelorMittal Brazil
Acindar
ACISBrazil
ArcelorMittal South Africa
ArcelorMittal Temirtau
ArcelorMittal Mines Canada
ArcelorMittal Termitau
ArcelorMittal Kryvyi Rih
ArcelorMittal International Luxembourg
ArcelorMittal Kryvyi Rih
ArcelorMittal Liberia
Mining

34 Management report
The following table identifies each significant operating subsidiary of ArcelorMittal, including the country of incorporation. Please refer to note 2.2.1 of the consolidated financial statements for the ownership percentages of these subsidiaries. Unless otherwise stated, the subsidiaries as listed have share capital consisting solely of ordinary shares, which are held directly or indirectly by the Company and the proportion of ownership interests held equals to the voting rights held by the Company.
Name of Subsidiary Abbreviation CountryNAFTA ArcelorMittal Dofasco Inc.1 ArcelorMittal Dofasco CanadaArcelorMittal Mexico S.A. de C.V. ArcelorMittal Mexico MexicoArcelorMittal USA LLC ArcelorMittal USA USAArcelorMittal Las Truchas, S.A. de C.V. ArcelorMittal Las Truchas MexicoArcelorMittal Montreal Inc2 ArcelorMittal Montreal Canada Brazil and neighboring countries (“Brazil”) ArcelorMittal Brasil S.A. ArcelorMittal Brasil BrazilAcindar Industria Argentina de Aceros S.A. Acindar Argentina Europe ArcelorMittal Atlantique et Lorraine S.A.S. ArcelorMittal Atlantique & Lorraine FranceArcelorMittal Belgium N.V. ArcelorMittal Belgium BelgiumArcelorMittal España S.A. ArcelorMittal España SpainArcelorMittal Flat Carbon Europe S.A. AMFCE LuxembourgArcelorMittal Galati S.A. ArcelorMittal Galati RomaniaArcelorMittal Poland S.A. ArcelorMittal Poland PolandIndusteel Belgium S.A. Industeel Belgium BelgiumIndusteel France S.A. Industeel France FranceArcelorMittal Eisenhüttenstadt GmbH ArcelorMittal Eisenhüttenstadt GermanyArcelorMittal Bremen GmbH ArcelorMittal Bremen GermanyArcelorMittal Méditerranée S.A.S. ArcelorMittal Méditerranée FranceArcelorMittal Belval & Differdange S.A. ArcelorMittal Belval & Differdange LuxembourgArcelorMittal Hamburg GmbH ArcelorMittal Hamburg GermanyArcelorMittal Gipúzkoa S.L. ArcelorMittal Gipúzkoa SpainArcelorMittal Ostrava a.s. ArcelorMittal Ostrava Czech RepublicArcelorMittal Duisburg GmbH ArcelorMittal Duisburg Germany Africa and Commonwealth of Independent States (“ACIS”) ArcelorMittal South Africa Ltd. ArcelorMittal South Africa South AfricaJSC ArcelorMittal Temirtau ArcelorMittal Temirtau KazakhstanPJSC ArcelorMittal Kryvyi Rih ArcelorMittal Kryvyi Rih UkraineArcelorMittal International Luxembourg S.A. ArcelorMittal International Luxembourg Luxembourg
Mining ArcelorMittal Mines Canada Inc. ArcelorMittal Mines Canada CanadaArcelormittal Liberia Ltd Arcelormittal Liberia LiberiaJSC ArcelorMittal Temirtau ArcelorMittal Temirtau KazakhstanPJSC ArcelorMittal Kryvyi Rih ArcelorMittal Kryvyi Rih Ukraine
1 As of January 1, 2016, the business formerly carried on by ArcelorMittal Dofasco Inc. is now carried on by ArcelorMittal Dofasco G.P. 2 As of January 1, 2016, the business formerly carried on by ArcelorMittal Montreal Inc. is now carried on by ArcelorMittal Long Products Canada G.P.

Management report 35
Key transactions and events in 2015
ArcelorMittal’s principal investments, acquisitions and disposals, and other key events that occurred during the year ended December 31, 2015 are summarized below.
• During 2015, ArcelorMittal completed several financing transactions. Please refer to “—Liquidity and capital resources—Financings” for a summary of the transactions.
• During 2015, ArcelorMittal completed several divestment and other investment transactions. Please refer to notes 2.3 and 2.5 to the consolidated financial statements within this report for a summary of the transactions.
• On December 16, 2015, ArcelorMittal announced a new organizational structure for the Americas and group finance. The Group Management Board (“GMB”), which was established to ensure a smooth integration following the creation of ArcelorMittal, was replaced with a more flexible structure effective January 1, 2016. The CEO office, comprised of the CEO and CFO, will work directly with a team of seven executive officers, who collectively encompass the key regions and corporate functions of ArcelorMittal. In addition, the Company announced that Lou Schorsch, senior executive vice president, member of the GMB and CEO of ArcelorMittal Americas will retire from the Company, effective end of February 2016. Please refer to “—Corporate governance” for a discussion of the new management structure resulting from this announcement.
The seven executive officers include:
• Davinder Chugh, Senior executive vice president, CEO of Africa and the CIS
• Brian Aranha, Executive vice president, Head of strategy, CTO,
R&D, CCM and global automotive• Jim Baske, Executive vice
president, CEO ArcelorMittal NAFTA Flat Rolled
•Henri Blaffart, Executive vice president, Group head of HR and corporate services
• Jefferson de Paula, Executive vice president, CEO of ArcelorMittal South America Long
• Geert van Poelvoorde, Executive vice president, CEO of ArcelorMittal Europe Flat
• Simon Wandke, Executive vice president, CEO of ArcelorMittal Mining
• On October 7, 2015, ArcelorMittal announced it reached an outline agreement for restructuring the shareholding of ArcelorMittal Algeria, ArcelorMittal Pipes and Tubes Algeria and ArcelorMittal Tebessa. As part of the restructuring, ArcelorMittal will transfer its minority shareholding in both ArcelorMittal Algeria and ArcelorMittal Tebessa as well as its majority shareholding in ArcelorMittal Pipes & Tubes Algeria to the state-owned Algerian company IMETAL. ArcelorMittal will continue its technical support for the implementation of the El Hadjar Complex development plan.
• On July 10, 2015, ArcelorMittal announced that Simon Wandke was nominated Executive Vice President of ArcelorMittal and promoted to Chief Executive Officer of ArcelorMittal Mining, with immediate effect. Simon replaced Bill Scotting, who left the Company to pursue other opportunities.
• On May 22, 2015, ArcelorMittal and the Steel Authority of India Limited (“SAIL”), India’s leading steel company, signed a Memorandum of Understanding to set up an automotive steel manufacturing facility under a joint venture arrangement in India. This was the first step toward creating the proposed joint venture which will construct a state-of-the-art cold rolling mill and other downstream finishing facilities in India that will offer technologically advanced
steel products to India’s rapidly growing automotive sector.
Recent developments
• On February 9, 2016, ArcelorMittal published a convening notice for an extraordinary general meeting of shareholders to be held on Thursday, March 10, 2016 in order to approve certain matters in connection with the Company’s announced intention to increase its capital through a rights issue with shareholders benefiting from non-statutory preferential subscription rights on terms to be determined by the Company based on market practice and conditions. Among other things, the proposals to be voted include a reduction in the par value per share to €0.10 and an increase in the authorized share capital to €3,199,585,721.30.
• On February 5, 2016, ArcelorMittal announced a proposed capital increase of approximately $3 billion subject to shareholder approval by way of a rights issue structured as non-statutory preferential subscription rights for ArcelorMittal shareholders. The Mittal family has committed to take up its pro-rata entitlement corresponding to approximately $1.1 billion. ArcelorMittal has entered into a standby underwriting commitment with three banks acting as joint global coordinators, pursuant to which the latter undertook to underwrite the capital increase for the remaining amount, subject to customary conditions. As the subscription price will be denominated in euros, the capital increase amount will correspond to the euro equivalent of $3 billion upon the rights offering launch. The actual amount of the capital increase in USD will depend on the exchange rate at closing.
• On February 1, 2016, ArcelorMittal completed the sale of its 35% stake in Gestamp Automoción (“Gestamp”) to the majority shareholder, the Riberas family, for total cash consideration of €875 million. The transaction
is unconditional and payment is expected to be made to ArcelorMittal within six months. In addition to the cash consideration, ArcelorMittal will receive a payment of €10 million for the 2015 dividend. ArcelorMittal will continue its supply relationship with Gestamp through its 35% shareholding in Gonvarri Steel Industries, a sister company of Gestamp. ArcelorMittal sells coils to Gonvarri Steel Industries for processing before they pass to Gestamp and other customers. Further, ArcelorMittal will continue to have a board presence in Gestamp, collaborate in automotive R&D and remain its major steel supplier. In 2015, Gestamp contributed $57 million to income (loss) from investments in associates, joint ventures and other investments and paid a dividend of $15 million.
• On January 15, 2016, ArcelorMittal South Africa completed a rights offering fully underwritten by ArcelorMittal. The total cash proceeds amounted to R4.5 billion. ArcelorMittal subscribed to the capital increase through repayment of an outstanding intragroup loan of R3.2 billion and an additional cash injection of approximately R460 million. The intragroup loan is being repaid in two tranches; the first has been repaid and the second is expected to be paid in 2016. As a result of the rights issue, ArcelorMittal’s shareholding in ArcelorMittal South Africa increased from 52% to 71%.
• On January 13, 2016, ArcelorMittal announced the issuance of 137,967,116 new ordinary shares of the Company upon conversion of the 88,182,131 outstanding 6% Mandatorily Convertible Subordinated Notes due January 15, 2016. Following this issuance, the share capital of the Company is €7,453,441,006.98 represented by 1,803,359,338 shares
36 Management report
Corporate governance
The “Corporate Governance” section of our Annual Report 2015 contains a full overview of our corporate governance practices.
Directors and senior management
Board of DirectorsArcelorMittal places a strong emphasis on corporate governance. ArcelorMittal has eight independent directors on its 12 member Board of Directors. The Board’s Audit & Risk Committee and Appointments,
Remuneration and Corporate Governance Committee (“ARCG Committee”) are each comprised exclusively of independent directors.
The annual general meeting of shareholders on May 5, 2015 acknowledged the expiration of the terms of office of Mr. Narayanan Vaghul, Mr. Wilbur Ross and Mr. Tye Burt.
At the same meeting, the shareholders re-elected Mr. Narayanan Vaghul, Mr. Wilbur Ross and Mr. Tye Burt for a new term of three years each. The shareholders also elected Mrs. Karyn Ovelmen for a three-year term.
The Board of Directors is composed of 12 directors, of which 11 are non-executive directors and eight are independent directors. The Board of Directors comprises only one executive director, Mr. Lakshmi N. Mittal, the Chairman and Chief Executive Officer of ArcelorMittal.
Mr. Lewis B. Kaden is the Lead Independent Director. In the most recent assessment of the Company’s leadership structure, the ARCG Committee reviewed the key duties and responsibilities of the Company’s Chairman and Chief Executive Officer and its Lead Independent Director as follows:
Chairman Lead Independent Director* Chairs the Board of Directors and shareholders’ meetings * Provides independent leadership to the Board of Directors
* Works with the Lead Independent Director to set agenda for the Board of Directors and review schedule of the meetings * Presides at executive sessions of independent directors
* Serves as a public face of the Board of Directors and of the Company * Advises the Chairman of any decisions reached and suggestions made at the executive sessions, as appropriate
* Serves as a resource for the Board of Directors * Coordinates the activities of the other independent directors
* Guides discussions at the Board of Directors meetings and encourages directors to express their positions
* Oversees Board of Directors' governance processes, including succession planning and other governance-related matters
* Communicates significant business developments and time-sensitive matters to the Board of Directors * Liaison between the Chairman and the other independent directors
* Is responsible for managing day-to-day business and affairs of the Company * Calls meetings of the independent directors when necessary and appropriate
* Interacts with the Group Management Board (the “GMB”) of the Company and frequently meets stakeholders and provide feedback to the Board of Directors
* Leads the Board of Directors’ self-evaluation process and such other duties as are assigned from time to time by the Board of Directors
No member of the Board of Directors, including the executive director, has entered into any service contract with ArcelorMittal or any of its subsidiaries providing for benefits upon the end of his or her service on the Board of Directors. All non-executive Directors of the Company signed an Appointment Letter with the Company, which confirms the conditions of their appointment including compliance with a non-compete provision, the 10 Principles of Corporate Governance of the Luxembourg Stock Exchange and the Company’s Code of Business Conduct.
Name Age4 Date of joining the Board5 End of Term Position within ArcelorMittal
Lakshmi N. Mittal 65 May 1997 May 2017Chairman of the Board of Directors
and Chief Executive OfficerLewis B. Kaden 1 2 3 73 April 2005 May 2017 Lead Independent DirectorVanisha Mittal Bhatia 35 December 2004 May 2016 DirectorNarayanan Vaghul1 3 79 July 1997 May 2018 DirectorWilbur L. Ross1 3 78 April 2005 May 2018 DirectorJeannot Krecké 65 January 2010 May 2016 DirectorAntoine Spillmann 2 3 52 October 2006 May 2017 DirectorSuzanne P. Nimocks2 3 56 January 2011 May 2016 DirectorBruno Lafont1 3 59 May 2011 May 2017 DirectorTye Burt 2 3 58 May 2012 May 2018 DirectorMichel Wurth 61 May 2014 May 2017 DirectorKaryn Ovelmen 1 3 52 May 2015 May 2018 Director
1 Member of the Audit & Risk Committee.2 Member of the Appointments, Remuneration and Corporate Governance Committee.3 Non-executive and independent director.4 Age as of December 31, 2015.5 Date of joining the Board of ArcelorMittal or, if prior to 2006, its predecessor Mittal Steel Company NV.
The members of the Board of Directors are set out below:

Management report 37
Henk Scheffer is the Company Secretary and, accordingly, acts as secretary of the Board of Directors.
Lakshmi N Mittal, 65, is the Chairman and Chief Executive Officer of ArcelorMittal. Mr. Mittal started his career in steel in 1976 by founding Ispat Indo, a company that is still held privately by the Mittal family. He founded Mittal Steel Company (formerly the LNM Group) in 1989 and guided its strategic development, culminating in the merger in 2006 with Arcelor, to form the world’s largest steelmaker. He is widely recognized for the leading role he has played in restructuring the steel industry towards a more consolidated and globalized model. Mr. Mittal is an active philanthropist and a member of various boards and trusts, including chairman of the board of Aperam and the boards of Goldman Sachs and Airbus N.V (previously EADS NV). He is a member of the Foreign Investment Council in Kazakhstan, the World Economic Forum’s International Business Council and the World Steel Association’s Executive Committee. He also sits on the Board of Trustees of Cleveland Clinic in the United States. Mr. Mittal began his career working in his family’s steelmaking business in India, and has over 35 years of experience working in steel and related industries. In addition to spearheading the steel industry’s consolidation, he championed the development of integrated mini-mills and the use of Direct Reduced Iron (DRI) as a scrap substitute for steelmaking. Following the merger of Ispat International and LNM Holdings to form Mittal Steel in December 2004, with the simultaneous acquisition of International Steel Group, he led the formation of the world’s steel producer at the time. In 2006, he orchestrated Mittal Steel and Arcelor’s merger to form ArcelorMittal. Mr. Mittal then led a successful integration of two large entities to firmly establish ArcelorMittal as one of the foremost industrial companies in the world. The company continues to be the largest and
most global steel manufacturer. More recently, Mr. Mittal has been leading ArcelorMittal’s expansion of its mining business through significant brownfield and greenfield growth. In 1996, Mr. Mittal was awarded ‘Steelmaker of the Year’ by New Steel in the United States and in 1998 the ‘Willy Korf Steel Vision Award’ by World Steel Dynamics for outstanding vision, entrepreneurship, leadership and success in global steel development. He was named Fortune magazine’s ‘European Businessman of the Year 2004’. Mr. Mittal was awarded ‘Business Person of 2006’ by the Sunday Times, ‘International Newsmaker of the Year 2006’ by Time Magazine and ‘Person of the Year 2006’ by the Financial Times for his outstanding business achievements. In January 2007, Mr. Mittal was presented with a Fellowship from King’s College London, the college’s highest award. He also received in 2007 the Dwight D. Eisenhower Global Leadership Award, the Grand Cross of Civil Merit from Spain and was named AIST Steelmaker of the year. In January 2008, Mr. Mittal was awarded the Padma Vibhushan, India’s second highest civilian honor, by the President of India. In September 2008, Mr. Mittal was chosen for the third ‘Forbes Lifetime Achievement Award’, which honors heroes of entrepreneurial capitalism and free enterprise. In October 2010, he was awarded World Steel Association’s medal in recognition of his services to the Association as its Chairman and also for his contribution to the sustainable development of the global steel industry. In January 2013, Mr. Mittal was awarded with a Doctor Honoris Causa by the AGH University of Science and Technology in Krakow, Poland. Mr. Mittal was born in Sadulpur in Rajasthan, India on June 15, 1950. He graduated from St. Xavier’s College in Kolkata, India where he received a Bachelor of Commerce degree. Mr. Mittal is married to Usha Mittal. They have a son, Aditya Mittal, and a daughter, Vanisha Mittal Bhatia. Mr. Mittal is a citizen of India.
Lewis B. Kaden, 73, Lead Independent Director of ArcelorMittal, member of the Audit & Risk Committee and chairman of the Appointments, Remuneration and Corporate Governance Committee. He has approximately 40 years of experience in corporate governance, financial services, dispute resolution and economic policy. He is currently Senior Adviser of TGG Group, the John Harvey Gregory Lecturer on World Organization at Harvard University. Mr. Kaden was Vice Chairman of Citigroup between 2005 and 2013. Prior to that, he was a partner of the law firm Davis Polk & Wardwell, and served as Counsel to the Governor of New Jersey, as a Professor of Law at Columbia University and as director of Columbia University’s Center for Law and Economic Studies. He has served as a director of Bethlehem Steel Corporation for ten years and is currently Chairman of the Board of Trustees of the Markle Foundation and Vice Chairman of the Board of Trustees of Asia Society. He is a member of the Council on Foreign Relations and of the Trilateral Commission being a moderator of the Business-Labor Dialogue. He is a Senior Fellow of the Moussavar - Rahmani Center on Business and Government at the Harvard Kennedy School of Government and Senior Fellow of the Program on Corporate Governance and the Center on the Legal Profession at Harvard Law School. Mr. Kaden is a citizen of the United States of America.
Vanisha Mittal Bhatia, 35, is a non-independent Director of ArcelorMittal. She was appointed as a member of the LNM Holdings Board of Directors in June 2004. Ms. Vanisha Mittal Bhatia was appointed to Mittal Steel’s Board of Directors in December 2004, where she worked on the Procurement department. She joined Aperam in April 2011 and is the Chief Strategy Officer. She has a Bachelor of Sciences from the European Business School. She is also the daughter of Mr. Lakshmi N. Mittal. Mrs. Mittal Bhatia is a citizen of India.
Narayanan Vaghul, 79, is non-executive and independent Director of ArcelorMittal as well as the chairman of the Audit & Risk Committee. He has over 50 years of experience in the financial sector and was the Chairman of ICICI Bank Limited between 2002 and April 2009. Previously, he served as the Chairman of the Industrial Credit and Investment Corporation of India, a long-term credit development bank for 17 years and, prior to that, served as Chairman of the Bank of India and Executive Director of the Central Bank of India. He also served for brief periods as Consultant to the World Bank, the International Finance Corporation and the Asian Development Bank. Mr. Vaghul was also a visiting Professor at the Stern Business School at New York University and a Board member of Mahindra & Mahindra. Mr. Vaghul is Chairman of the Indian Institute of Finance Management & Research and is also a Board member of Wipro, Piramal Healthcare Limited and Apollo Hospitals. He was chosen as a Businessman of the Year in 1992 by Business India. He also received a Lifetime Achievement Award from the Economic Times. In 2009, he was awarded the Padma Bhushan, India’s third highest civilian honor. Mr. Vaghul is a citizen of India.
Wilbur L. Ross, Jr., 78, is a non-executive and independent Director of ArcelorMittal and a member of the Audit & Risk Committee. He is also the Chairman of WL Ross Holding Corporation which is listed on NASDAQ. He is Vice Chairman of the Bank of Cyprus which is listed on the Cyprus and Athens Stock Exchanges and is a Director of Sun Bancorp (an “Over the Counter” - OTC entity), and of Exco, which is listed on the New York Stock Exchange. Mr. Ross has a number of non-profit affiliations. He is on the Board of the Yale School of Management and the Harvard Business School Dean’s Advisory Board. Mr. Ross is Chairman of the Japan Society and of the Economic Studies Council of the Brookings Institution, of which he is also a Trustee. He is the President

38 Management report
of the American Friends of the Magritte Museum and a member of the International Council of the Musée des Arts Décoratifs. He also is a Trustee of the Palm Beach Retirement Funds, the Palm Beach Preservation Foundation and the Palm Beach Civic Association. Mr. Ross is a citizen of the United States of America.
Jeannot Krecké, 65, is a non-executive and non-independent Director of ArcelorMittal. He started his university studies at the Université Libre de Bruxelles (ULB) in Belgium in 1969, from where he obtained a degree in physical and sports education. He decided in 1983 to change professional direction. His interests led him to retrain in economics, accounting and taxation. He enrolled in various courses, in particular in the United States. Following the legislative elections of June 13, 2004, Mr. Krecké was appointed Minister of the Economy and Foreign Trade of Luxembourg on July 13, 2004. Upon the return of the coalition government formed by the Christian Social Party (CSV) and the Luxembourg Socialist Workers’ Party (LSAP) as a result of the legislative elections of June 7, 2009, Mr. Krecké retained the portfolio of Minister of the Economy and Foreign Trade on July 23, 2009. As of July 2004, Mr. Krecké represented the Luxembourg government at the Council of Ministers of the EU in the Internal Market and Industry sections of its Competitiveness configuration as well as in the Economic and Financial Affairs Council and in the Energy section of its Transport, Telecommunications and Energy configuration. He was also a member of the Eurogroup from July 2004 to June 2009. On February 1, 2012, Mr. Krecké retired from government and decided to end his active political career in order to pursue a range of different projects. Mr. Krecké is currently the CEO of Key International Strategy Services. He is a member of the boards of JSFC Sistema, of East West United Bank, of China Construction Bank Europe, of Calzedonia Finanziara S.A., Jan De
Nul S.A. and Novenergia Holding Company S.A. Mr. Krecké is a citizen of Luxembourg.
Antoine Spillmann, 52, is a non-executive and independent Director of ArcelorMittal and a member of the Appointments, Remuneration and Corporate Governance Committee. He is the CEO and executive partner at the firm Bruellan Wealth Management; one of Switzerland’s leading independent asset management companies based in Geneva, Switzerland. He spends most of his time defending the rights of shareholders and investors in quoted companies in Switzerland. He served for 5 years as vice-president of the Swiss association of asset managers. Mr. Spillmann is also a non-independent board member of Bondpartners SA (“BPL”), Lechanche SA. BPL is a Swiss financial services company founded in 1972, authorized under the law to trade securities and controlled by the Swiss Financial Market Supervisory Authority (FINMA). BPL is also a member of the Swiss Bankers Association, member of the International Capital Market Association and associated member of the Swiss Stock Exchange. Leclanché is a 100 year old Swiss company that develops and produces energy storage systems using large-format lithium-ion-cells. The firm is quoted on the SIX Stock Exchange. Mr. Spillmann studied in Switzerland and London, receiving diplomas from the London Business School in Investment Management and Corporate Finance. Mr. Spillmann is a citizen of Switzerland.
Suzanne P. Nimocks, 56, is a non-executive and independent Director of ArcelorMittal and a member of the Appointments, Remuneration and Corporate Governance Committee. She was previously a director (senior partner) with McKinsey & Company, a global management consulting firm, from June 1999 to March 2010, and was with the firm in various other capacities beginning in 1989, including as a leader in the
firm’s Global Petroleum Practice, Electric Power & Natural Gas Practice, Organization Practice, and Risk Management Practice. Ms. Nimocks chaired the Environmental Committee of the Greater Houston Partnership, the primary advocate of Houston’s business community, until December 31, 2010. She holds a Bachelor of Arts in Economics from Tufts University and a Masters in Business Administration from the Harvard Graduate School of Business. Ms. Nimocks is currently a Board Member for Encana Corporation, Rowan Companies Plc, and Owens Corning, all listed companies. Encana is a major natural gas exploration and production company, Rowan Companies provides drilling services for the oil and gas industry and Owens Corning is a manufacturer of building products. In the non-profit sector, she chairs the board of directors of the Houston Zoo and serves as a Trustee of the Texas Children’s Hospital. Mrs. Nimocks is a citizen of the United States of America.
Bruno Lafont, 59, is a non-executive and independent Director of ArcelorMittal and a member of the Audit & Risk Committee. He began his career at Lafarge in 1983 and has held numerous positions in finance and international operations with the same company. In 1995, Mr. Lafont was appointed Group Executive Vice President, Finance, and thereafter Executive Vice President of the Gypsum Division in 1998. Mr. Lafont joined Lafarge’s General Management as Chief Operating Officer between May 2003 and December 2005. Chief Executive Officer in January 2006, Bruno Lafont was appointed Chairman and Chief Executive Officer in May 2007. In July 2015, Bruno Lafont was appointed co-Chairman of the Board of Directors of LafargeHolcim and Honorary Chairman of Lafarge. Mr. Lafont presently chairs the Energy & Climate Change Working Group of the ERT (European Roundtable of Industrialists) and the Sustainable Development Commission of the MEDEF
(Mouvement des Entreprises de France), the French Employers Association. He is a member of the Executive Committee of the World Business Council for Sustainable Development (WBCSD) and a Board member of the AFEP (French large companies association). He is also a Special Adviser to the Mayor of Chongqing (China) and a Board Member of EDF. Born in 1956, Mr. Lafont is a graduate from the Hautes Etudes Commerciales business school (HEC 1977, Paris) and the Ecole Nationale d’Administration (ENA 1982, Paris). Mr. Lafont is a citizen of France.
Tye Burt, 58, is a non-executive and independent Director of ArcelorMittal and a member of the Appointments, Remuneration and Corporate Governance Committee. He was appointed President and Chief Executive Officer of Kinross Gold Corporation in March 2005. He held this position until August 1, 2012. Kinross is listed on the New York Stock Exchange and the Toronto Stock Exchange. Mr. Burt was also a member of the board of directors of Kinross. Mr. Burt has broad experience in the global mining industry, specializing in corporate finance, business strategy and mergers and acquisitions. Prior to joining Kinross, he held the position of Vice Chairman and Executive Director of Corporate Development at Barrick Gold Corporation. He was President of the Cartesian Capital Group from 2000 to 2002; Chairman of Deutsche Bank Canada and Deutsche Bank Securities Canada; Global Managing Director of Global Metals and Mining for Deutsche Bank AG from 1997 to 2000; and Managing Director and Co-Head of the Global Mining Group at BMO Nesbitt Burns from 1995 to 1997, holding various other positions at BMO Nesbitt Burns from 1986 to 1995. Mr. Burt is the Chairman of Urthecast Corp., a small Canadian TSX-listed company in the aerospace technology business. The Company is focused on the business of streaming color images of the Earth from the International Space Station. He is also the

Management report 39
Chair and Principal at Carbon Arc Capital Investments Corp. and the Life Sciences Research Campaign Chair of the University of Guelph’s Better Planet Project. Mr. Burt is a member of the Duke of Edinburgh’s Award Charter for Business Board of Governors. He is a graduate of Osgoode Hall Law School, a member of the Law Society of Upper Canada, and he holds a Bachelor of Arts degree from the University of Guelph. Mr. Burt is a citizen of Canada.
Michel Wurth, 61, is a non-independent Director of ArcelorMittal. He joined Arbed in 1979 and held a variety of functions before joining the Arbed Group Management Board and becoming its chief financial officer in 1996. The merger of Aceralia, Arbed and Usinor, leading to the creation of Arcelor in 2002, led to Mr. Wurth’s appointment as senior executive vice president and CFO of Arcelor. He became a member of ArcelorMittal’s Group Management Board in 2006, responsible for Flat Carbon Europe, Global R&D, Distribution Solutions and Long Carbon Worldwide, respectively. Michel Wurth retired from the GMB in April 2014 and was elected to ArcelorMittal’s board of directors in May 2014. He holds a Law degree from the University of Grenoble,
France, and a degree in Political Science from the Institut d’Études Politiques de Grenoble as well as a Master’s of Economics from the London School of Economics, UK. Michel Wurth is also doctor of laws honoris causa of the Sacred Heart University, Luxembourg. Michel Wurth has served as Chairman of the Luxembourg Chamber of Commerce since 2004. He is also non-executive Chairman of Paul Wurth S.A. and of BIP Investment Partners and non-executive Director of BGL BNP Paribas S.A., of SMS Group and of Brasserie Nationale. Paul Wurth S.A. is controlled by SMS Group, a leading equipment and engineering supplier for the steel and non-ferrous metal producing industry. BIP Investment Partners is a Luxembourg based company, mainly invested in private equity, BGL BNP Paribas is a Luxembourg bank, majority owned BNP of France and Brasserie Nationale is a privately owned brewery based in Luxembourg. Mr. Wurth is a citizen of Luxembourg.
Karyn Ovelmen, 52, is a non-executive and an independent Director of ArcelorMittal and a member of the Audit & Risk Committee. She is the Executive Vice President and Chief Financial Officer of Flowserve, a leading provider of flow control products
and services for the global infrastructure market, a position that she has held since June 2015. Most recently she also served as Chief Financial Officer and Executive Vice President of LyondellBasell Industries NV from 2011 to May 2015, as Executive Vice President and Chief Financial Officer of Petroplus Holdings AG from May 2006 to September 2010 and as Executive Vice President and Chief Financial Officer of Argus Services Corporation from 2005 to 2006. Prior to that, she was Vice President of External Reporting and Investor Relations for Premcor Refining Group Inc. She also spent 12 years with PricewaterhouseCoopers, primarily serving energy industry accounts. Mrs. Ovelmen holds a Bachelor of Arts degree from the University of Connecticut, USA, and is a Certified Public Accountant (“CPA”) of AICPA. Mrs. Ovelmen is a citizen of the United States of America.
Senior management
On December 16, 2015, ArcelorMittal announced that Mr. Lou Schorsch will retire from the Company, effective end of February 2016.
The Company also announced that it would take the opportunity to simplify its management structure
in-line with the ongoing drive to promote a performance-driven culture, empowering the segments to deliver optimum business results. As a result the GMB, which was established to ensure a smooth integration following the creation of ArcelorMittal, was replaced, effective January 1, 2016, with a more flexible structure. The CEO office - comprising the CEO, Mr. Lakshmi N. Mittal and the CFO, Mr. Aditya Mittal will be defined as ArcelorMittal’s senior management in 2016, in replacement of the GMB.
As of December 31, 2015, ArcelorMittal’s senior executive management was comprised of the members of the Group Management Board (“GMB”). The GMB had responsibility for, and its remuneration was tied to, the day-to-day management of the business of ArcelorMittal on a global basis. The GMB was defined as ArcelorMittal’s senior management.
Name Age1 Position
Lakshmi N. Mittal 65Chairman and Chief Executive Officer of ArcelorMittal with additional responsibility for Mining
Davinder Chugh 59Chief Executive Officer of ArcelorMittal Africa and CIS, responsible for Algeria, Kazakhstan, South Africa and Ukraine
Aditya Mittal 39Chief Financial Officer of ArcelorMittal, Investor Relations, and Chief Executive Officer of ArcelorMittal Europe
Lou Schorsch 66
Chief Executive Officer of ArcelorMittal Americas, with additional responsibility for corporate activities (Strategy, Technology, R&D, Global Automotive and Commercial co-ordination)
1 Age as of December 31, 2015.
40 Management report
Lakshmi N. Mittal(See “Board of Directors”).
Davinder Chugh, 59, is CEO of ArcelorMittal Africa and CIS, member of the GMB responsible for Kazakhstan, South Africa and Ukraine. He has over three decades of experience in the steel industry in general management, materials purchasing, marketing, logistics, warehousing and shipping. Mr. Chugh was previously a Senior Executive Vice President of ArcelorMittal responsible for Shared Services since 2013. Before becoming a Senior Executive Vice President of ArcelorMittal, he served as the CEO of Mittal Steel South Africa until 2006. Mr. Chugh worked in South Africa from 2002 following the acquisition of Mittal Steel South Africa (ISCOR) and was involved in the turnaround and consolidation of the South African operations of ArcelorMittal. He also served as Director of Commercial and Marketing at Mittal Steel South Africa. Mr. Chugh was Vice President of Purchasing in Mittal Steel Europe until 2002, where he consolidated procurement and logistics across plants in Europe. Between 1995, when he joined Mittal Steel and 1999, he worked as general manager (purchasing) of Hamburg Steel Works and as general manager (purchasing) of Mittal Steel Germany. Prior to joining Mittal Steel, he held senior positions at the Steel Authority India Limited in New Delhi, India. He holds bachelor’s degrees of B.Sc. (Physics Honors), an LLB and an MBA. Mr. Chugh is a citizen of India and as of November 2013 Mr. Chugh became a citizen of United Kingdom.
Aditya Mittal, 39, Prior to the merger to create ArcelorMittal, Mr. Aditya Mittal held the position of President and Chief Financial Officer of Mittal Steel Company from October 2004 to 2006. He joined Mittal Steel in January 1997 and has held various finance and management roles within the company. In 1999, he was appointed Head of Mergers and Acquisitions for Mittal Steel. In this role, he led the company’s acquisition strategy, resulting
in Mittal Steel’s expansion into Central Europe, Africa and the United States. Besides M&A responsibilities, Aditya Mittal was involved in post-integration, turnaround and improvement strategies. As Chief Financial Officer of Mittal Steel, he also initiated and led Mittal Steel’s offer for Arcelor to create the first 100 million tonnes plus steel company. In 2008, Mr. Aditya Mittal was awarded ‘European Business Leader of the Future’ by CNBC Europe. In 2011, he was also ranked 4th in the ‘40 under 40’ list of Fortune magazine. He is a Young Global Leader of the World Economic Forum, a Board member at the Wharton School and a Board member at Iconiq Capital. Aditya Mittal holds a Bachelor’s degree of Science in Economics with concentrations in Strategic Management and Corporate Finance from the Wharton School in Pennsylvania, United States. Mr. Aditya Mittal is the son of Mr. Lakshmi N. Mittal. Mr. Aditya Mittal is a citizen of India.
Lou Schorsch, 66, was elected to the GMB in May 2011. Prior to this appointment he had been President and Chief Executive Officer of Flat Carbon Americas, a position established with the 2006 merger of Arcelor and Mittal Steel, as well as a member of the ArcelorMittal Management Committee. He had previously led the American operations of the Mittal Group, Mittal Steel USA (2005-2006) and Ispat Inland (2003-2005). Prior to joining Ispat Inland, Dr. Schorsch had spent most of his career as a partner in McKinsey & Co and was co-leader of that firm’s Metals Practice. He joined McKinsey’s Brussels Office in 1985 and also worked in that firm’s Pittsburgh and Chicago offices. While at McKinsey his work focused on the steel sector and involved client service with leading steel firms in the Americas, Europe and Asia. He left McKinsey in 2000 to become CEO of GSX, an internet steel exchange founded by Cargill, Samsung, Duferco, and Arbed. He is the author of numerous articles related to the steel sector, was the co-author of
the 1983 book “Steel: Upheaval in a Basic Industry”, and has appeared as a steel expert on NBC and PBS television channels in the United States. Prior to joining McKinsey Dr. Schorsch was an analyst at the Congressional Budget Office in Washington, D.C. and a millwright at the USS South Chicago Works in the late 1970s, when he develop his initial interest in the steel sector. He holds a doctorate in Economics from American University and a bachelor’s degree from Georgetown University, both in Washington, D.C. Mr. Schorsch is a citizen of the United States of America.
Board practices/corporate governance
This section describes the corporate governance practices of ArcelorMittal for the year ended December 31, 2015.
Board of Directors and GMB
ArcelorMittal is governed by a Board of Directors and managed by the GMB. As described above, as of January 1, 2016, the GMB was replaced by the CEO office - comprising the CEO, Mr. Lakshmi N. Mittal and the CFO, Mr. Aditya Mittal – working directly with a team of seven executive officers, who together encompass the key regions and corporate functions. This simplified management structure is in-line with the ongoing drive to promote a performance-driven culture, empowering the segments to deliver optimum business results based on clear accountability. A number of corporate governance provisions in the Articles of Association of ArcelorMittal reflect provisions of the Memorandum of Understanding signed on June 25, 2006 (prior to Mittal Steel’s merger with Arcelor), amended in April 2008 and which mostly expired on August 1, 2009. For more information about the Memorandum of Understanding, see “Memorandum of Understanding”.ArcelorMittal fully complies with the 10 Principles of Corporate
Governance of the Luxembourg Stock Exchange. This is explained in more detail in “Other Corporate Governance practices” below. ArcelorMittal also complies with the New York Stock Exchange Listed Company Manual as applicable to foreign private issuers.
Board of Directors
Composition
The Board of Directors is in charge of the overall governance and direction of ArcelorMittal. It is responsible for the performance of all acts of administration necessary or useful in furtherance of the corporate purpose of ArcelorMittal, except for matters reserved by Luxembourg law or the Articles of Association to the general meeting of shareholders. The Articles of Association provide that the Board of Directors is composed of a minimum of three and a maximum of 18 members, all of whom, except the Chief Executive Officer, must be non-executive directors. None of the members of the Board of Directors, except for the Chief Executive Officer, may hold an executive position or executive mandate within ArcelorMittal or any entity controlled by ArcelorMittal.
The Articles of Association provide that directors are elected and removed by the general meeting of shareholders by a simple majority of votes cast. Other than as set out in the Company’s Articles of Association, no shareholder has any specific right to nominate, elect or remove directors. Directors are elected by the general meeting of shareholders for three-year terms. In the event that a vacancy arises on the Board of Directors for any reason, the remaining members of the Board of Directors may by a simple majority elect a new director to temporarily fulfill the duties attaching to the vacant post until the next general meeting of the shareholders.

Management report 41
In 2015, the Board of Directors proposed Mrs. Karyn Ovelmen to serve as a member of the ArcelorMittal Board of Directors, which was approved at the ArcelorMittal annual general shareholders’ meeting held on May 5, 2015.
The Board of Directors is comprised of 12 members, of which 11 are non-executive directors and one is an executive director. The Chief Executive Officer of ArcelorMittal is the sole executive director.
Mr. Lakshmi N. Mittal was elected Chairman of the Board of Directors on May 13, 2008. Mr. Mittal is also ArcelorMittal’s Chief Executive Officer. Mr. Mittal was re-elected to the Board of Directors for a three-year term by the annual general meeting of shareholders on May 8, 2014.
Eight of the 12 members of the Board of Directors are independent. The non-independent directors are Mr. Lakshmi N. Mittal, Ms. Vanisha Mittal Bhatia, Mr. Jeannot Krecké and Mr. Michel Wurth. A director is considered “independent” if:
(a) he or she is independent within the meaning of the New York Stock Exchange Listed Company Manual, as applicable to foreign private issuers,
(b) he or she is unaffiliated with any shareholder owning or controlling more than two percent of the total issued share capital of ArcelorMittal, and
(c) the Board of Directors makes an affirmative determination to this effect.
For these purposes, a person is deemed affiliated to a shareholder if he or she is an executive officer, a director who also is an employee, a general partner, a managing member or a controlling shareholder of such shareholder. The 10 Principles of Governance of the Luxembourg Stock Exchange, which constitute ArcelorMittal’s domestic corporate governance
code, require ArcelorMittal to define the independence criteria that apply to its directors, which are described in article 8.1 of its Articles of Association.
Specific characteristics of the director role
The Company’s Articles of Association do not require directors to be shareholders of the Company. The Board of Directors nevertheless adopted a share ownership policy on October 30, 2012, considering that it is in the best interests of all shareholders for all non-executive directors to acquire and hold a minimum number of ArcelorMittal ordinary shares in order to better align their long-term interests with those of ArcelorMittal’s shareholders. The Board of Directors believes that this share ownership policy will result in a meaningful holding of ArcelorMittal shares by each non-executive director, while at the same time taking into account the fact that the share ownership requirement should not be excessive in order not to unnecessarily limit the pool of available candidates for appointment to the Board of Directors. Directly or indirectly, and as sole or joint beneficiary owner (e.g., with a spouse or minor children), within five years of the earlier of October 30, 2012 or the relevant person’s election to the Board of Directors, the Lead Independent Director should own a minimum of 15,000 ordinary shares and each other non-executive director should own a minimum of 10,000 ordinary shares. Each director will hold the shares acquired on the basis of this policy for so long as he or she serves on the Board of Directors. Directors purchasing shares in compliance with this policy must comply with the ArcelorMittal Insider Dealing Regulations and, in particular, and refrain from trading during any restricted period, including any such period that may apply immediately after the Director’s departure from the Board of Directors for any reason.
On October 30, 2012, the Board of Directors also adopted a policy that places limitations on the terms of independent directors as well as the number of directorships Directors may hold in order to align the Company’s corporate governance practices with best practices in this area. The policy provides that an independent director may not serve on the Board of Directors for more than 12 consecutive years, although the Board of Directors may, by way of exception to this rule, make an affirmative determination, on a case-by-case basis, that he or she may continue to serve beyond the 12 years rule if the Board of Directors considers it to be in the best interest of the Company based on the contribution of the Director involved and the balance between the knowledge, skills, experience and need for renewal of the Board.
As membership of the Board of Directors represents a significant time commitment, the policy requires both executive and non-executive directors to devote sufficient time to the discharge of their duties as a director of ArcelorMittal. Directors are therefore required to consult with the Chairman and the Lead Independent Director before accepting any additional commitment that could conflict with or impact the time they can devote to their role as a Director of ArcelorMittal. Furthermore, a non-executive director may not serve on the boards of directors of more than four publicly listed companies in addition to the ArcelorMittal Board of Directors. However, a non-executive Director’s service on the board of directors of any subsidiary or affiliate of ArcelorMittal or of any non-publically listed company is not taken into account for purposes of complying with the foregoing limitation. Directors have a time period of three years from October 30, 2012 before the limit of five directorships of public companies will be applied.
Although non-executive directors of ArcelorMittal who change their
principal occupation or business association are not necessarily required to leave the Board of Directors, the policy requires each non-executive director, in such circumstances, promptly to inform the Board of Directors of the action he or she is contemplating. Should the Board of Directors determine that the contemplated action would generate a conflict of interests, such non-executive director would be asked to tender his or her resignation to the chairman of the Board of Directors, who would decide to accept the resignation or not.
None of the members of the Board of Directors, including the executive director, have entered into service contracts with ArcelorMittal or any of its subsidiaries that provide for any form of remuneration or for benefits upon the termination of their term. All non-executive Directors of the Company signed the Company’s Appointment Letter, which confirms the conditions of their appointment by the General Meeting of the Shareholders including compliance with certain non-compete provisions, the 10 Principles of Corporate Governance of the Luxembourg Stock Exchange and the Company’s Code of Business Conduct.
All members of the Board of Directors are required to sign the Company’s Code of Business Conduct upon first joining the Board of Directors and confirm their adherence thereto on an annual basis thereafter.
The remuneration of the members of the Board of Directors is determined on a yearly basis by the annual general meeting of shareholders.
Share transactions by management
In compliance with laws prohibiting insider dealing, the Board of Directors of ArcelorMittal has adopted insider dealing regulations,

42 Management report
which apply throughout the ArcelorMittal group. These regulations are designed to ensure that insider information is treated appropriately within the Company and avoid insider dealing and market manipulation. Any breach of the rules set out in this procedure may lead to criminal or civil charges against the individuals involved, as well as disciplinary action by the Company.
Shareholding requirement for non-executive directors
In consideration of corporate governance trends indicating that a reasonable amount of share ownership helps better align the interests of the directors with those of all shareholders, the Board of Directors adopted on October 30, 2012 share ownership guidelines for non-executive Directors. The directors are required to own 10,000 shares and the Lead Independent Director is required to own 15,000 shares, both within five years of the earlier of (i) the effective date of the share ownership guidelines, i.e. October 30, 2012, or (ii) the date of the appointment of a Director if appointed after October 30, 2012.
Operation
General
The Board of Directors and the Board committees may engage the services of external experts or advisers as well as take all actions necessary or useful to implement the Company’s corporate purpose. The Board of Directors (including its three committees) has its own budget, which covers functioning costs such as external consultants, continuing education activities for Directors and travel expenses.
Meetings
The Board of Directors meets when convened by the Chairman of the Board or any two members of the Board of Directors. The Board of Directors holds physical meetings at least on a quarterly basis as five regular meetings are scheduled per
year. The Board of Directors holds additional meetings if and when circumstances require, in person or by teleconference and can take decisions by written circulation, provided that all members of the Board of Directors agree.
The Board of Directors held seven meetings in 2015. The average attendance rate of the directors at the Board of Directors’ meetings was 99%.
In order for a meeting of the Board of Directors to be validly held, a majority of the Directors must be present or represented, including at least a majority of the independent Directors. In the absence of the Chairman, the Board of Directors will appoint by majority vote a chairman for the meeting in question. The Chairman may decide not to participate in a Board of Directors’ meeting, provided he has given a proxy to one of the Directors who will be present at the meeting. For any meeting of the Board of Directors, a Director may designate another Director to represent him or her and vote in his or her name, provided that the director so designated may not represent more than one of his or her colleagues at any time.
Each Director has one vote and none of the Directors, including the Chairman, has a casting vote. Decisions of the Board of Directors are made by a majority of the directors present and represented at a validly constituted meeting, except for the decisions of the Board of Directors relating to the issue of any financial instruments carrying or potentially carrying a right to equity pursuant to the authorization conferred by article 5.5. of the Articles of Association, which shall be taken by a majority of two-thirds of the directors present or represented at a validly constituted meeting.
Lead Independent Director
In April 2008, the Board of Directors created the role of Lead Independent Director. His or her function is highlighted above.
Mr. Lewis B. Kaden was elected by the Board of Directors as ArcelorMittal’s first Lead Independent Director in April 2008 and remains Lead Independent Director, having been re-elected as a director for a three-year term on May 8, 2014.
The agenda of each meeting of the Board of Directors is decided jointly by the Chairman of the Board of Directors and the Lead Independent Director.
Separate meetings of independent directors
The independent members of the Board of Directors may schedule meetings outside the presence of non-independent Directors. Five meetings of the independent Directors outside the presence of management and non-independent Directors were held in 2015.
Annual self-evaluation
The Board of Directors decided in 2008 to start conducting an annual self-evaluation of its functioning in order to identify potential areas for improvement. The first self-evaluation process was carried out in early 2009. The self-evaluation process includes structured interviews between the Lead Independent Director and each director and covers the overall performance of the Board of Directors, its relations with senior management, the performance of individual directors, and the performance of the committees. The process is supported by the Company Secretary under the supervision of the Chairman and the Lead Independent Director. The findings of the self-evaluation process are examined by the ARCG Committee and presented with recommendations from the ARCG Committee to the Board of Directors for adoption and implementation. Suggestions for improvement of the Board of Directors’ process based on the prior year’s performance and functioning are implemented during the following year.
The 2015 Board of Directors’ self-evaluation is in progress.
The Board of Directors believes that its members have the appropriate range of skills, knowledge and experience, as well as the degree of diversity, necessary to enable it to effectively govern the business. Board of Directors composition is reviewed on a regular basis and additional skills and experience are actively searched for in line with the expected development of ArcelorMittal’s business as and when appropriate.
Required skills, experience and other personal characteristics
Diverse skills, backgrounds, knowledge, experience, geographic location, nationalities and gender are required in order to effectively govern a global business the size of the Company’s operations. The Board of Directors and its committees are therefore required to ensure that the Board has the right balance of skills, experience, independence and knowledge necessary to perform its role in accordance with the highest standards of governance.
The Company’s directors must demonstrate unquestioned honesty and integrity, preparedness to question, challenge and critique constructively, and a willingness to understand and commit to the highest standards of governance. They must be committed to the collective decision-making process of the Board of Directors and must be able to debate issues openly and constructively, and question or challenge the opinions of others. Directors must also commit themselves to remain actively involved in Board decisions and apply strategic thought to matters at issue. They must be clear communicators and good listeners who actively contribute to the Board in a collegial manner. Each director must also ensure that no decision or action is taken that places his or her interests in front of the interests of the business. Each director has an obligation to

Management report 43
protect and advance the interests of the Company and must refrain from any conduct that would harm it.
In order to govern effectively, non-executive directors must have a clear understanding of the Company’s strategy, and a thorough knowledge of the ArcelorMittal group and the industries in which it operates. Non-executive directors must be sufficiently familiar with the Company’s core business to effectively contribute to the development of strategy and monitor performance.
With specific regard to the non-executive directors of the Company, the composition of the group of non-executive directors should be such that the combination of experience, knowledge and independence of its members allows the Board to fulfill its obligations towards the Company and other stakeholders in the best possible manner.
The ARCG Committee ensures that the Board of Directors is comprised of high-caliber individuals whose background, skills, experience and personal characteristics enhance the overall profile of the Board and meets its needs and diversity aspirations by nominating high quality candidates for election to the Board by the general meeting of shareholders.
Board profile
The key skills and experience of the directors, and the extent to which they are represented on the Board of Directors and its committees, are set out below. In summary, the non-executive directors contribute:
• international and operational experience;
• understanding of the industry sectors in which ArcelorMittal operates;
• knowledge of world capital markets and being a company listed in several jurisdictions; and
• an understanding of the health, safety, environmental, political and community challenges that ArcelorMittal faces.
Each director is required to adhere to the values set out in, and sign, the ArcelorMittal Code of Business Conduct.
Renewal
The Board of Directors plans for its own succession, with the assistance of the ARCG Committee. In doing this, the Board of Directors:
• considers the skills, backgrounds, knowledge, experience and diversity of geographic location, nationality and gender necessary to allow it to meet the corporate purpose;
• assesses the skills, backgrounds, knowledge, experience and diversity currently represented;
• identifies any inadequate representation of those attributes and agrees the process necessary to ensure a candidate is selected who brings them to the Board of Directors; and
• reviews how Board performance might be enhanced, both at an individual Director level and for the Board as a whole.
The Board believes that orderly succession and renewal is achieved through careful planning and by continuously reviewing the composition of the Board.
When considering new appointments to the Board, the ARCG Committee oversees the preparation of a position specification that is provided to an independent recruitment firm retained to conduct a global search, taking into account, among other factors, geographic location, nationality and gender. In addition to the specific skills, knowledge and experience required of the candidate, the specification contains the criteria set out in the ArcelorMittal Board profile.
Diversity
In line with the worldwide effort to increase gender diversity on the boards of directors of listed and unlisted companies, the Board met its goal of increasing the number of women on the Board to at least three by the end of 2015 with the election of Mrs. Karyn Ovelmen in May 2015, based upon a Board of Directors size of 12 members. The ArcelorMittal Board’s diversity not only relates to gender, but also to the region, background and industry of its members.
Director induction, training and development
The Board considers that the development of the directors’ knowledge of the Company, the steel-making and mining industries, and the markets in which the Company operates is an ongoing process. To further bolster the skills and knowledge of directors, the Company set up a continuous development program in 2009.
Upon his or her election, each new non-executive director undertakes an induction program specifically tailored to his or her needs and includes ArcelorMittal’s long-term vision centered on the concept of “Safe Sustainable Steel”. The Board’s development activities include the provision of regular updates to directors on each of the Company’s products and markets. Non-executive directors may also participate in training programs designed to maximize the effectiveness of the directors throughout their tenure and link in with their individual performance evaluations. The training and development program may cover not only matters of a business nature, but also matters falling into the environmental, social and governance area.
Structured opportunities are provided to build knowledge through initiatives such as visits to plants and mine sites and business briefings provided at Board meetings. Non-executive
directors also build their Company and industry knowledge through the involvement of the GMB and other senior employees in Board meetings. Business briefings, site visits and development sessions underpin and support the Board’s work in monitoring and overseeing progress towards the corporate purpose of creating long-term shareholder value through the development of the ArcelorMittal business in steel and mining. The Company therefore continuously builds directors’ knowledge to ensure that the Board remains up-to-date with developments within the Company’s segments, as well as developments in the markets in which the Company operates.
During the year, non-executive directors participated in the following activities:
• comprehensive business briefings intended to provide each director with a deeper understanding of the Company’s activities, environment, key issues and strategy of the Company’s segments. These briefings are provided to the Board of Directors by senior executives, including GMB members. The briefings provided during the course of 2015 covered health and safety processes, HR, legal, marketing, steel-making, strategy, mining and R&D. Certain business briefings were combined with site visits and thus took place on-site and, in other cases, they took place at Board meetings;
• briefing meetings with Company executives in charge of specific business segments or markets;
• site visits to plants and R&D centers; and
• development sessions on specific topics of relevance, such as health and safety, commodity markets, HR, investor relations, accounting, the world economy, changes in corporate governance standards, directors’ duties and shareholder feedback.
44 Management report
The ARCG Committee oversees director training and development. This approach allows induction and learning opportunities to be tailored to the directors’ committee memberships, as well as the Board of Director’s specific areas of focus. In addition, this approach ensures a coordinated process in relation to succession planning, Board renewal, training, development and committee composition, all of which are relevant to the ARCG Committee’s role in securing the supply of talent to the Board.
Board of Directors committees
The Board of Directors has two committees:
• the Audit & Risk Committee, and
• the Appointments, Remuneration and Corporate Governance Committee.
Audit & Risk Committee
In 2015 the Board decided to combine the Audit Committee with the Risk Management Committee in order to provide their members with a more holistic view of ArcelorMittal’s current governance, risks and control systems.
The primary function of the Audit & Risk Committee is to assist the Board in fulfilling its oversight responsibilities by reviewing:
a. the integrity of the financial reports and other financial information provided by the company to any governmental body or the public;
b. the Company’s compliance with legal and regulatory requirements;
c. the registered public accounting firm’s (Independent Auditor) qualifications and independence;
d. the Company’s system of internal control regarding finance, accounting, legal compliance, ethics and risk management that management and the Board have established;
e. the Company’s auditing,
accounting and financial reporting processes generally;
f. the identification and management of risks to which the ArcelorMittal group is exposed.
The Audit & Risk Committee must be composed solely of independent members of the Board of Directors. The members are appointed by the Board of Directors each year after the annual general meeting of shareholders. The Audit & Risk Committee comprises four to five members, all of whom must be independent under the company’s corporate governance guidelines, the New York Stock Exchange (NYSE) standards and the 10 Principles of Corporate Governance of the Luxembourg Stock Exchange. The Audit & Risk Committee makes decisions by a simple majority with no member having a casting vote.
At least one member must qualify as an Audit & Risk Committee “financial expert” as defined by the SEC and determined by the Board.
At least one member must qualify as an Audit & Risk Committee “risk management expert” having experience in identifying, assessing, and managing risk exposures of large, complex companies.
The Audit & Risk Committee currently consists of five members: Mr. Narayanan Vaghul (Chairman), Mr. Wilbur L. Ross, Mr. Lewis Kaden, Mr. Bruno Lafont and Mrs. Karyn Ovelmen, each of whom is an independent director according to the NYSE standards and the 10 Principles of Corporate Governance of the Luxembourg Stock Exchange. The Chairman of the Audit & Risk Committee is Mr. Vaghul. According to its charter, the Audit & Risk Committee is required to meet at least four times a year. During 2015, the Audit & Risk Committee met four times. The Audit & Risk Committee performs its annual self-evaluation. Its 2015 self-evaluation is in progress.
The charter of the Audit & Risk Committee is available from ArcelorMittal upon request.
Appointments, Remuneration and Corporate Governance Committee
The ARCG Committee has been comprised of four directors, each of whom is independent under the New York Stock Exchange standards and the 10 Principles of Corporate Governance of the Luxembourg Stock Exchange.
The members are appointed by the Board of Directors each year after the annual general meeting of shareholders. The ARCG Committee makes decisions by a simple majority with no member having a casting vote.
The Board of Directors has established the ARCG Committee to:
• determine, on its behalf and on behalf of the shareholders within agreed terms of reference, ArcelorMittal’s compensation framework, including short and long term incentives for the Chief Executive Officer, the Chief Financial Officer and the members of the Management Committee;
• review and approve succession and contingency plans for key managerial positions at the level of the Management Committee;
• consider any candidate for appointment or reappointment to the Board of Directors at the request of the Board of Directors and provide advice and recommendations to it regarding the same;
• evaluate the functioning of the Board of Directors and monitor the Board of Directors’ self-evaluation process;
• assess the roles of the Chairman and CEO and deliberate on the merits of the Board’s leadership structure to ensure that the most efficient and appropriate structure is in place; and
• develop, monitor and review corporate governance principles and corporate responsibility policies applicable to
ArcelorMittal, as well as their application in practice.
The ARCG Committee’s principal criteria in determining the compensation of executives is to encourage and reward performance that will lead to long-term enhancement of shareholder value. The ARCG Committee may seek the advice of outside experts.
The four members of the ARCG Committee are Mr. Lewis B. Kaden, Mrs. Suzanne P. Nimocks, Mr. Antoine Spillmann and Mr. Tye Burt, each of whom is independent in accordance with the NYSE standards and the 10 Principles of Corporate Governance of the Luxembourg Stock Exchange. The Chairman of the ARCG Committee is Mr. Kaden.
The ARCG Committee is required to meet at least twice a year. During 2015, this committee met eight times.
The ARCG Committee performs its annual self-evaluation. Its 2015 self-evaluation is in progress.
The charter of the ARCG Committee is available from ArcelorMittal upon request.
Succession management
Succession management at ArcelorMittal is a systematic, structured process for identifying and preparing employees with potential to fill key organizational positions, should the position become vacant. This process applies to all ArcelorMittal key positions up to and including the GMB. Succession management aims to ensure the continued effective performance of the organization by providing for the availability of experienced and capable employees who are prepared to assume these roles as they become available. For each position, candidates are identified based on performance, potential and an assessment of leadership capabilities and their “years to readiness”. Development needs linked to the succession plans are discussed, after which “Personal

Management report 45
Development Plans” are put in place, to accelerate development and prepare candidates. Regular reviews of succession plans are conducted at different levels of the organization to ensure that they are accurate and up to date, leading to at least once yearly a formal review by the GMB, of all key positions. Succession management is a necessary process to reduce risk of vacant positions or skill gap transitions, create a pipeline of future leaders, ensure smooth business continuity and improve employee motivation and engagement. This process has been in place for several years and reinforced, widened and made more systematic in all regions of the organization. The responsibility to review and approve succession plans and contingency plans at the highest level rests with the Board’s ARCG Committee.
Other corporate governance practices
ArcelorMittal is committed to adhere to best practices in terms of corporate governance in its dealings with shareholders and aims to ensure good corporate governance by applying rules on transparency, quality of reporting and the balance of powers. ArcelorMittal continually monitors U.S., EU and Luxembourg legal requirements and best practices in order to make adjustments to its corporate governance controls and procedures when necessary, as evidenced by the new policies adopted by the Board of Directors in 2012.
ArcelorMittal complies with the 10 Principles of Corporate Governance of the Luxembourg Stock Exchange in all respects. However, in respect of Recommendation 1.3 under the Principles, which advocates separating the roles of chairman of the board and the head of the executive management body, the Company has made a different choice. This is permitted, however, as, unlike the 10 Principles themselves with which ArcelorMittal must comply, the Recommendations are subject to
a more flexible “comply or explain” standard.
The nomination of the same person to both positions was approved by the shareholders (with the Significant Shareholder abstaining). Since that date, the rationale for combining the positions of Chief Executive Officer and Chairman of the Board of Directors has become even more compelling. The Board of Directors is of the opinion that Mr. Mittal’s strategic vision for the steel industry in general and for ArcelorMittal in particular in his role as CEO is a key asset to the Company, while the fact that he is fully aligned with the interests of the Company’s shareholders means that he is uniquely positioned to lead the Board of Directors in his role as Chairman. The combination of these roles was revisited at the Annual General Meeting of Shareholders of the Company held in May 2014, when Mr. Lakshmi N. Mittal was reelected to the Board of Directors for another three year term by a strong majority.
Ethics and conflicts of interest
Ethics and conflicts of interest are governed by ArcelorMittal’s Code of Business Conduct, which establishes the standards for ethical behavior that are to be followed by all employees and directors of ArcelorMittal in the exercise of their duties. Each employee of ArcelorMittal is required to sign and acknowledge the Code of Conduct upon joining the Company. This also applies to the members of the Board of Directors of ArcelorMittal, who signed the Company’s Appointment Letter in which they acknowledged their duties and obligations. Any new member of the Board of Directors must sign and acknowledge the Code of Conduct upon appointment.
Employees must always act in the best interests of ArcelorMittal and must avoid any situation in which their personal interests conflict, or could conflict, with their obligations to ArcelorMittal.
Employees are prohibited from acquiring any financial or other interest in any business or participate in any activity that could deprive ArcelorMittal of the time or the attention needed to devote to the performance of their duties. Any behavior that deviates from the Code of Business Conduct is to be reported to the employee’s supervisor, a member of the management, the head of the legal department or the head of the internal assurance department.
Code of Business Conduct training is offered throughout ArcelorMittal on a regular basis in the form of face-to-face trainings, webinars and online trainings. Employees are periodically trained about the Code of Business Conduct in each location where ArcelorMittal has operations. The Code of Business Conduct is available in the “Corporate Governance—Code of Business Conduct” section of ArcelorMittal’s website at www.arcelormittal.com.
In addition to the Code of Business Conduct, ArcelorMittal has developed a Human Rights Policy and a number of other compliance policies in more specific areas, such as anti-trust, anti-corruption, economic sanctions and insider dealing. In all these areas, specifically targeted groups of employees are required to undergo specialized compliance training. Furthermore, ArcelorMittal’s compliance program also includes a quarterly compliance certification process covering all business segments and entailing reporting to the Audit & Risk Committee.
Process for Handling Complaints on Accounting Matters
As part of the procedures of the Board of Directors for handling complaints or concerns about accounting, internal controls and auditing issues, ArcelorMittal’s Anti-Fraud Policy and Code of Business Conduct encourage all employees to bring such issues to the Audit & Risk Committee’s attention on a confidential
basis. In accordance with ArcelorMittal’s Anti-Fraud and Whistleblower Policy, concerns with regard to possible fraud or irregularities in accounting, auditing or banking matters or bribery within ArcelorMittal or any of its subsidiaries or other controlled entities may also be communicated through the “Corporate Governance Whistleblower” section of the ArcelorMittal website at www.arcelormittal.com, where ArcelorMittal’s Anti-Fraud Policy and Code of Business Conduct are also available in each of the main working languages used within the Group. In recent years ArcelorMittal has implemented local whistleblowing facilities, as needed.
During 2015, there were 175 complaints received relating to alleged fraud, which were referred to and duly reviewed by the Company’s Internal Assurance Department. Following review by the Audit & Risk Committee, none of these complaints was found to be significant.
Internal assurance
ArcelorMittal has an Internal Assurance function that, through its Head of Internal Assurance, reports to the Audit & Risk Committee. The function is staffed by full-time professional staff located within each of the principal operating subsidiaries and at the corporate level. Recommendations and matters relating to internal control and processes are made by the Internal Assurance function and their implementation is regularly reviewed by the Audit & Risk Committee.
Independent auditors
The appointment and determination of fees of the independent auditors is the direct responsibility of the Audit & Risk Committee. The Audit & Risk Committee is further responsible for obtaining, at least once each year, a written statement from the independent auditors that their independence has not
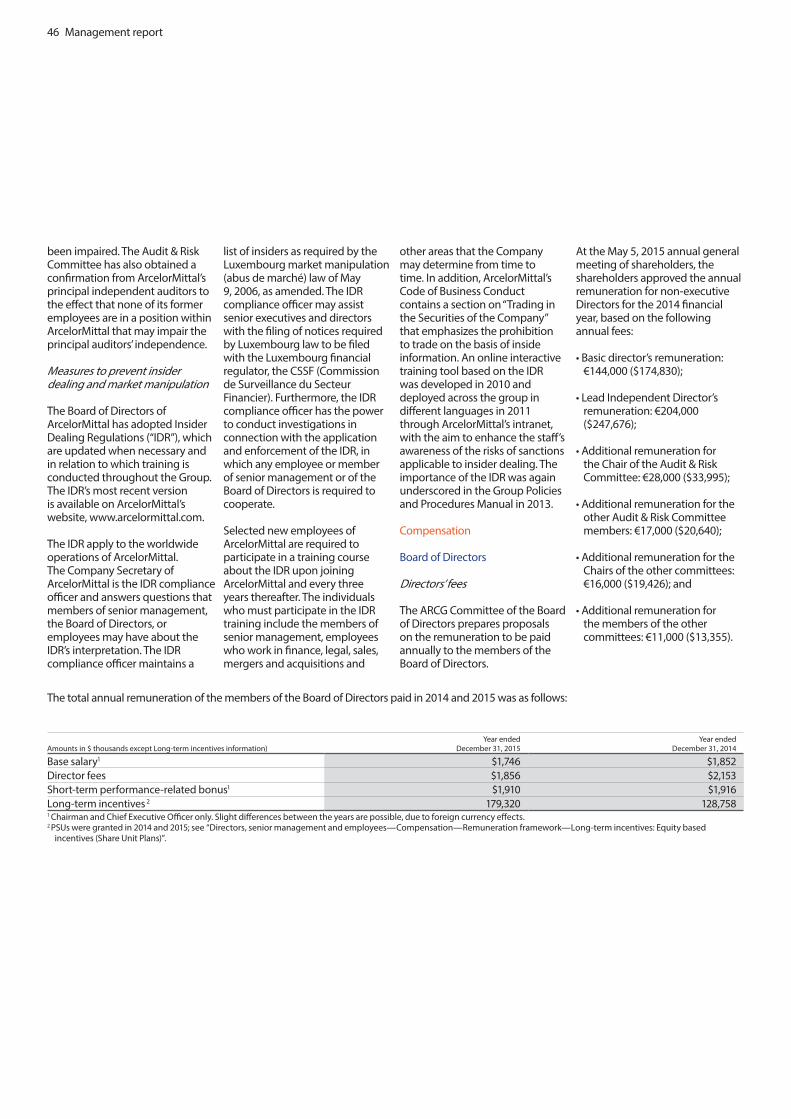
46 Management report
been impaired. The Audit & Risk Committee has also obtained a confirmation from ArcelorMittal’s principal independent auditors to the effect that none of its former employees are in a position within ArcelorMittal that may impair the principal auditors’ independence.
Measures to prevent insider dealing and market manipulation
The Board of Directors of ArcelorMittal has adopted Insider Dealing Regulations (“IDR”), which are updated when necessary and in relation to which training is conducted throughout the Group. The IDR’s most recent version is available on ArcelorMittal’s website, www.arcelormittal.com.
The IDR apply to the worldwide operations of ArcelorMittal. The Company Secretary of ArcelorMittal is the IDR compliance officer and answers questions that members of senior management, the Board of Directors, or employees may have about the IDR’s interpretation. The IDR compliance officer maintains a
list of insiders as required by the Luxembourg market manipulation (abus de marché) law of May 9, 2006, as amended. The IDR compliance officer may assist senior executives and directors with the filing of notices required by Luxembourg law to be filed with the Luxembourg financial regulator, the CSSF (Commission de Surveillance du Secteur Financier). Furthermore, the IDR compliance officer has the power to conduct investigations in connection with the application and enforcement of the IDR, in which any employee or member of senior management or of the Board of Directors is required to cooperate.
Selected new employees of ArcelorMittal are required to participate in a training course about the IDR upon joining ArcelorMittal and every three years thereafter. The individuals who must participate in the IDR training include the members of senior management, employees who work in finance, legal, sales, mergers and acquisitions and
other areas that the Company may determine from time to time. In addition, ArcelorMittal’s Code of Business Conduct contains a section on “Trading in the Securities of the Company” that emphasizes the prohibition to trade on the basis of inside information. An online interactive training tool based on the IDR was developed in 2010 and deployed across the group in different languages in 2011 through ArcelorMittal’s intranet, with the aim to enhance the staff’s awareness of the risks of sanctions applicable to insider dealing. The importance of the IDR was again underscored in the Group Policies and Procedures Manual in 2013.
Compensation
Board of Directors
Directors’ fees
The ARCG Committee of the Board of Directors prepares proposals on the remuneration to be paid annually to the members of the Board of Directors.
At the May 5, 2015 annual general meeting of shareholders, the shareholders approved the annual remuneration for non-executive Directors for the 2014 financial year, based on the following annual fees:
• Basic director’s remuneration: €144,000 ($174,830);
• Lead Independent Director’s remuneration: €204,000 ($247,676);
• Additional remuneration for the Chair of the Audit & Risk Committee: €28,000 ($33,995);
• Additional remuneration for the other Audit & Risk Committee members: €17,000 ($20,640);
• Additional remuneration for the Chairs of the other committees: €16,000 ($19,426); and
• Additional remuneration for the members of the other committees: €11,000 ($13,355).
The total annual remuneration of the members of the Board of Directors paid in 2014 and 2015 was as follows:
Amounts in $ thousands except Long-term incentives information)Year ended
December 31, 2015Year ended
December 31, 2014
Base salary1 $1,746 $1,852 Director fees $1,856 $2,153 Short-term performance-related bonus1 $1,910 $1,916 Long-term incentives 2 179,320 128,758 1 Chairman and Chief Executive Officer only. Slight differences between the years are possible, due to foreign currency effects.2 PSUs were granted in 2014 and 2015; see “Directors, senior management and employees—Compensation—Remuneration framework—Long-term incentives: Equity based
incentives (Share Unit Plans)”.

Management report 47
As of December 31, 2015, ArcelorMittal did not have any loans or advances outstanding to members of its Board of Directors and ArcelorMittal had not given
any guarantees in favor of any member of its Board of Directors.
None of the members of the Board of Directors, including
the Chairman and Chief Executive Officer, benefit from an ArcelorMittal pension plan.The policy of the Company is not to grant any share-based
remuneration to members of the Board of Directors who are not executives of the Company
(Amounts in $ thousands except share information) 20151 20141
2015Short-term Performance
Related
2014Short-term Performance
Related
2015Long-term
Number of PSUs
2014Long-term
Number of PSUs
Lakshmi N. Mittal $1,746 $1,852 $1,910 $1,916 179,320 128,758 Vanisha Mittal Bhatia 160 185 — — — —Narayanan Vaghul 204 235 — — — —Suzanne P. Nimocks 184 213 — — — —Wilbur L. Ross, Jr. 180 207 — — — —Lewis B. Kaden 244 281 — — — —Bruno Lafont 180 207 — — — —Tye Burt 173 199 — — — —Antoine Spillmann 198 228 — — — —HRH Prince Guillaume de Luxembourg - 199 — — — —Jeannot Krecké 173 199 — — — —Michel Wurth 160 — — — — —Total $3,602 $4,005 $1,910 $1,916 179,320 128,758 1 Remuneration for non-executive Directors with respect to 2014 (paid after shareholder approval at the annual general meeting held on May 5, 2015) is included in the 2014 column.
Remuneration for non-executive Directors with respect to 2015 (subject to shareholder approval at the annual general meeting to be held on May 4, 2016) will be paid in 2016 and is included in the 2015 column. Slight differences between the years are possible, due to foreign currency effects.
The annual remuneration paid for 2014 and 2015 to the current and former members of the Board of Directors for services in all capacities was as follows:
Options granted in 2010
Options granted in 2009
Options granted in 2008
Options granted in 2007
Options granted in 2006 Options Total
Weighted Average Exercise Price of Options
Lakshmi N. Mittal 56,500 60,000 60,000 60,000 60,000 336,500 $46.04Exercise price1 $30.66 $36.38 $78.44 $61.09 $32.07 — $46.04Term (in years) 10 10 10 10 10 — —Expiration date Aug. 3, 2020 Aug. 4, 2019 Aug. 5, 2018 Aug. 2, 2017 Sep. 1, 2016 — —1 Due to the spin-off of January 25, 2011, the strike price of outstanding options was reduced by 5% in line with the spin-off ratio. The table above reflects this adjustment.
The following tables provide a summary of the options and the exercise price of options, Restricted Share Units (“RSUs”) and Performance Share Units (“PSUs”) granted to the Chairman and Chief Executive Officer, who is the sole executive director on the Board of Directors, as of December 31, 2015.
PSUs granted in 2015 PSUs granted in 2014 PSUs granted in 2013
Lakshmi N. Mittal 179,320 128,758 150,576Term (in years) 3 3 3Vesting date 1 June 30, 2018 June 27, 2017 June 28, 20161 See “Directors, senior management and employees—Compensation—Remuneration framework—Long-term incentives: Equity
based incentives (Share Unit Plans)”, for vesting conditions.
The PSU’s granted in 2012 have not given right to receive ArcelorMittal shares at the end of the vesting period (March 2015) as the performance conditions set at the date of the grant have not been met.

48 Management report
Remuneration of senior management
The total remuneration paid in 2015 to members of ArcelorMittal’s senior management listed in “Corporate governance” (including Mr. Lakshmi N. Mittal in his capacity as Chief Executive Officer) was $5.4 million in base salary and other benefits paid in cash (such as health, life insurance, lunch
allowances, financial services, gasoline and car allowance) and $4.9 million in short-term performance-related variable remuneration consisting of a bonus linked to the Company’s 2014 results.
During 2015, approximately $ 300,000 was accrued by ArcelorMittal to provide pension benefits to senior management (other than Mr. Mittal).
No loans or advances to ArcelorMittal’s senior management were made during 2015, and no such loans or advances were outstanding as of December 31, 2015.
The following table shows the remuneration received by the Chief Executive Officer and the GMB members as determined by the ARCG Committee in relation to 2015 and 2014, including all remuneration components.
Chief Executive Officer Other GMB Members (Amounts in $ thousands except for Long-term incentives) 2015 2014 2015 20145
Base salary1 1,746 1,852 3,497 7,023 Retirement benefits - - 305 837 Other benefits2 40 41 101 178 Short-term incentives3 1,910 1,916 2,948 6,402 Long-term incentives - fair value in $ thousands4 1,530 2,169 2,431 12,038
- number of share units 179,320 128,758 284,985 714,618 1 Base salary for the Chief Executive Officer has been increased by 2% in April 2015. Base salaries for GMB members have been increased by 2.3% in average in April 2015. Slight
differences between the years are possible, due to foreign currency effects.2 Other benefits comprise benefits paid in cash such as health insurance and other insurances, lunch allowances, financial services, gasoline and car allowances. 3 Short-term incentives are entirely performance-based and are fully paid in cash. The short-term incentive for a given year relates to the Company’s results in the previous year.
previous year.4 Fair value determined at the grant date is recorded as an expense using the straight line method over the vesting period and adjusted for the effect of non-market based vesting
conditions. The remuneration expenses recognized for the RSUs/PSUs granted to the Chief Executive Officer and other GMB members was $6.9 million and $7 million for the years ended December 31, 2014 and 2015, respectively.
5 Mr. Michel Wurth is included until his retirement in April 2014.
The Company allocated 2014 remuneration according to the following timeline:
12/20156/2015March/April 20151/20151/2014
3 years
PSUs allocationSTI payout 2014performance-relatedBase salary review
Short term incentiveperformance measurement starts
Long term incentives
Short term incentives (cash)
Base salary andbenefits
Performance measured
Performance measured

Management report 49
SOX 304 and clawback policy
Under Section 304 of the Sarbanes-Oxley Act, the SEC may seek to recover remuneration from the Chief Executive Officer and Chief Financial Officer of the Company in the event that it is required to restate accounting information due to any material misstatement thereof or as a result of misconduct in respect of a financial reporting requirement under the U.S. securities laws (the “SOX Clawback”).
Under the SOX Clawback, the Chief Executive Officer and the Chief Financial Officer may have to reimburse ArcelorMittal for any bonus or other incentive- or equity-based remuneration received during the 12-month period following the first public issuance or filing with the SEC (whichever occurs first) of the relevant filing, and any profits realized from the sale of ArcelorMittal securities during that 12-month period.
The Board of Directors, through its ARCG Committee, decided in 2012 to adopt its own clawback policy (the “Clawback Policy”) that applies to the members of the GMB and to the Executive Vice President of Finance, of ArcelorMittal.
The Clawback Policy comprises cash bonuses and any other incentive-based or equity-based remuneration, as well as profits from the sale of the Company’s securities received during the 12-month period following the first public issuance or filing with the SEC (whichever first occurs) of the filing that contained the material misstatement of accounting information.
For purposes of determining whether the Clawback Policy should be applied, the Board of Directors will evaluate the circumstances giving rise to the restatement (in particular, whether there was any fraud or misconduct), determine when any such misconduct occurred and determine the amount of remuneration that should be
recovered by the Company. In the event that the Board of Directors determines that remuneration should be recovered, it may take appropriate action on behalf of the Company, including, but not limited to, demanding repayment or cancellation of cash bonuses, incentive-based or equity-based remuneration or any gains realized as the result of options being exercised or awarded or long-term incentives vesting. The Board may also choose to reduce future remuneration as a means of recovery.
2015 Remuneration policy
Board oversight
The Board is responsible for ensuring that the Group’s remuneration arrangements are equitable and aligned with the long-term interests of the Company and its shareholders. It is therefore critical that the Board of Directors remain independent of management when making decisions affecting remuneration of the Chief Executive Officer and his direct reports.
To this end, the Board of Directors has established the ARCG Committee to assist it in making decisions affecting employee remuneration. All members of the ARCG Committee are required to be independent under the Company’s corporate governance guidelines, the NYSE standards and the 10 Principles of Corporate Governance of the Luxembourg Stock Exchange.
The members are appointed by the Board of Directors each year after the annual general meeting of shareholders. The members have relevant expertise or experience relating to the purposes of the ARCG Committee. The ARCG Committee makes decisions by a simple majority with no member having a casting vote.
The ARCG Committee is chaired by Mr. Lewis Kaden, Lead Independent Director.
Appointments, remuneration and corporate governance committee
The primary function of the ARCG Committee is to assist the Board of Directors, among others with respect to the following:
• review and approve corporate goals and objectives relevant to the GMB and other members of executive management as deemed appropriate by the committee regarding their remuneration, and assess performance against goals and objectives;
• make recommendations to the Board with respect to incentive remuneration plans and equity-based plans;
• identify candidates qualified to serve as members of the Board and the GMB;
• recommend candidates to the Board for appointment by the general meeting of shareholders or for appointment by the Board to fulfill interim Board vacancies;
• develop, monitor and review corporate governance principles applicable to the Company;
• facilitate the evaluation of the Board;
• review the succession planning and the executive development of the GMB members;
• submit proposals to the Board on the remuneration of GMB members, and on the appointment of new directors and GMB members;
• make recommendations to the Board of Directors in respect of the Company’s framework of remuneration for the members of the GMB and such other members of the executive management as designated by the committee. In making such recommendations, the committee may take into account factors that it deems necessary. This may include a member’s total cost of
employment (factoring in equity/long term incentives, any perquisites and benefits in kind and pension contributions).
The ARCG Committee met 8 times in 2015. Its members comprise Mr. Lewis Kaden (Chairman), Mr. Antoine Spillmann, Ms. Suzanne Nimocks and Mr. Tye Burt. Regular invitees include Mr. Lakshmi N. Mittal (Chief Executive Officer and Chairman) and Mr. Henri Blaffart (Head of Group Human Resources and Corporate Services). Mr. Henk Scheffer (Company Secretary) acts as secretary. The relevant persons are not present when their remuneration is discussed by the ARCG Committee. The ARCG Committee Chairman presents its decisions and findings to the Board of Directors after each ARCG Committee meeting.
2015 Remuneration strategy
Scope
ArcelorMittal’s remuneration philosophy and framework apply to the following group of senior management:
• the Chief Executive Officer; and
• the other members of the GMB.
The remuneration philosophy and governing principles also apply, with certain limitations, to a wider group of employees including Executive Vice Presidents, Vice Presidents, General Managers and Managers.
Remuneration philosophy
ArcelorMittal’s remuneration philosophy for its senior managers is based on the following principles:
• provide total remuneration competitive with executive remuneration levels of a peer group composed of a selection of industrial companies of a similar size and scope;
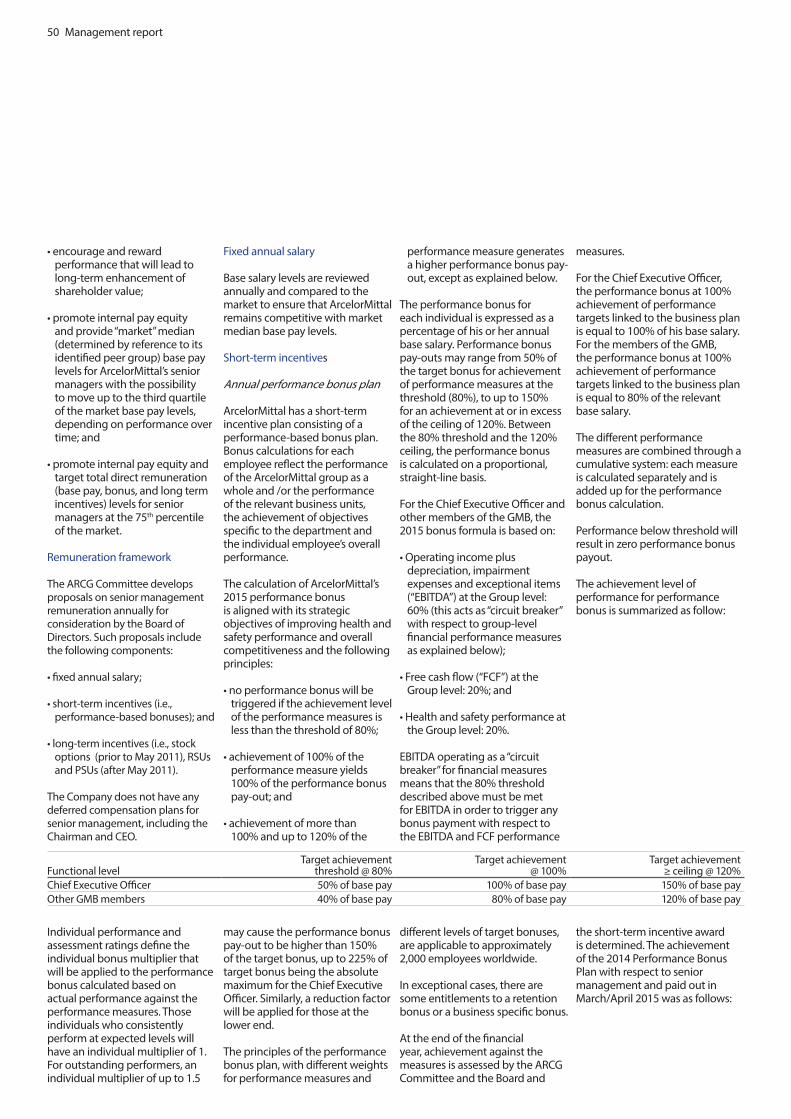
50 Management report
• encourage and reward performance that will lead to long-term enhancement of shareholder value;
• promote internal pay equity and provide “market” median (determined by reference to its identified peer group) base pay levels for ArcelorMittal’s senior managers with the possibility to move up to the third quartile of the market base pay levels, depending on performance over time; and
• promote internal pay equity and target total direct remuneration (base pay, bonus, and long term incentives) levels for senior managers at the 75th percentile of the market.
Remuneration framework
The ARCG Committee develops proposals on senior management remuneration annually for consideration by the Board of Directors. Such proposals include the following components:
• fixed annual salary;
• short-term incentives (i.e., performance-based bonuses); and
• long-term incentives (i.e., stock options (prior to May 2011), RSUs and PSUs (after May 2011).
The Company does not have any deferred compensation plans for senior management, including the Chairman and CEO.
Fixed annual salary
Base salary levels are reviewed annually and compared to the market to ensure that ArcelorMittal remains competitive with market median base pay levels.
Short-term incentives
Annual performance bonus plan
ArcelorMittal has a short-term incentive plan consisting of a performance-based bonus plan. Bonus calculations for each employee reflect the performance of the ArcelorMittal group as a whole and /or the performance of the relevant business units, the achievement of objectives specific to the department and the individual employee’s overall performance.
The calculation of ArcelorMittal’s 2015 performance bonus is aligned with its strategic objectives of improving health and safety performance and overall competitiveness and the following principles:
• no performance bonus will be triggered if the achievement level of the performance measures is less than the threshold of 80%;
• achievement of 100% of the performance measure yields 100% of the performance bonus pay-out; and
• achievement of more than 100% and up to 120% of the
performance measure generates a higher performance bonus pay-out, except as explained below.
The performance bonus for each individual is expressed as a percentage of his or her annual base salary. Performance bonus pay-outs may range from 50% of the target bonus for achievement of performance measures at the threshold (80%), to up to 150% for an achievement at or in excess of the ceiling of 120%. Between the 80% threshold and the 120% ceiling, the performance bonus is calculated on a proportional, straight-line basis.
For the Chief Executive Officer and other members of the GMB, the 2015 bonus formula is based on:
• Operating income plus depreciation, impairment expenses and exceptional items (“EBITDA”) at the Group level: 60% (this acts as “circuit breaker” with respect to group-level financial performance measures as explained below);
• Free cash flow (“FCF”) at the Group level: 20%; and
• Health and safety performance at the Group level: 20%.
EBITDA operating as a “circuit breaker” for financial measures means that the 80% threshold described above must be met for EBITDA in order to trigger any bonus payment with respect to the EBITDA and FCF performance
measures.
For the Chief Executive Officer, the performance bonus at 100% achievement of performance targets linked to the business plan is equal to 100% of his base salary. For the members of the GMB, the performance bonus at 100% achievement of performance targets linked to the business plan is equal to 80% of the relevant base salary.
The different performance measures are combined through a cumulative system: each measure is calculated separately and is added up for the performance bonus calculation.
Performance below threshold will result in zero performance bonus payout.
The achievement level of performance for performance bonus is summarized as follow:
Functional levelTarget achievement
threshold @ 80%Target achievement
@ 100%Target achievement
≥ ceiling @ 120%Chief Executive Officer 50% of base pay 100% of base pay 150% of base pay Other GMB members 40% of base pay 80% of base pay 120% of base pay
Individual performance and assessment ratings define the individual bonus multiplier that will be applied to the performance bonus calculated based on actual performance against the performance measures. Those individuals who consistently perform at expected levels will have an individual multiplier of 1. For outstanding performers, an individual multiplier of up to 1.5
may cause the performance bonus pay-out to be higher than 150% of the target bonus, up to 225% of target bonus being the absolute maximum for the Chief Executive Officer. Similarly, a reduction factor will be applied for those at the lower end.
The principles of the performance bonus plan, with different weights for performance measures and
different levels of target bonuses, are applicable to approximately 2,000 employees worldwide.
In exceptional cases, there are some entitlements to a retention bonus or a business specific bonus.
At the end of the financial year, achievement against the measures is assessed by the ARCG Committee and the Board and
the short-term incentive award is determined. The achievement of the 2014 Performance Bonus Plan with respect to senior management and paid out in March/April 2015 was as follows:

Management report 51
Other benefits
In addition to the remuneration described above, other benefits may be provided to senior management and, in certain cases, other employees. These other benefits can include insurance, housing (in cases of international transfers), car allowances and tax assistance.
Long-term incentives: equity-based incentives (share unit plans)
On May 10, 2011, the annual general meeting of shareholders approved the ArcelorMittal Equity Incentive Plan, a new equity-based incentive plan that replaced the Global Stock Option Plan. The ArcelorMittal Equity Incentive Plan is intended to align the interests of the Company’s shareholders and eligible employees by allowing them to participate in the success of the Company. The ArcelorMittal Equity Incentive Plan provides for the grant of RSUs and PSUs to eligible Company employees and is designed to incentivize employees, improve the Company’s long-term performance and retain key employees. On May 8, 2013, the annual general meeting of shareholders approved the GMB PSU Plan, which provides for the grant of PSUs to GMB members. Until the introduction of the GMB PSU Plan in 2013, GMB members were eligible to receive RSUs and PSUs under the ArcelorMittal Equity Incentive Plan.
The maximum number of RSUs and PSUs available for grant during any given year is subject to the prior approval of the Company’s shareholders at the annual general meeting. The annual shareholders’ meeting on May 5, 2015 approved the maximum to be granted until the next annual shareholders’ meeting. For the period from
the May 2015 annual general shareholders’ meeting to the May 2016 annual general shareholders’ meeting, a maximum of 5,000,000 RSUs and PSUs may be allocated to eligible employees under the ArcelorMittal Equity Incentive Plan and the GMB PSU Plan combined.
ArcelorMittal equity incentive plan
RSUs. RSUs granted under the ArcelorMittal Equity Incentive Plan are designed to provide a retention incentive to eligible employees. RSUs are subject to “cliff vesting” after three years, with 100% of the grant vesting on the third anniversary of the grant contingent upon the continued active employment of the eligible employee within the Group. RSUs are an integral part of the Company’s remuneration framework. Between 500 and 700 of the Group’s most senior managers are eligible for RSUs.
We refer to note 7.3 to the consolidated financial statements for amounts of RSUs granted.
PSUs. The grant of PSUs under the ArcelorMittal Equity Incentive Plan aims to serve as an effective performance-enhancing scheme based on the employee’s contribution to the eligible achievement of the Company’s strategy. Awards in connection with PSUs are subject to the fulfillment of cumulative performance criteria over a three-year period from the date of the PSU grant. The employees eligible to receive PSUs are a sub-set of the group of employees eligible to receive RSUs. The target group for PSU grants initially included the Chief Executive Officer and the other GMB members. However, from 2013 onwards, the Chief Executive Officer and other GMB members receive PSU grants under the GMB PSU Plan instead of the
ArcelorMittal Equity Incentive Plan (see “GMB PSU Plan”).
We refer to note 7.3 to the consolidated financial statements for amounts of PSUs granted.
PSUs vest three years after their date of grant subject to the eligible employee’s continued employment with the Company and the fulfillment of targets related to the following performance measures: return on capital employed (ROCE) and a strategic measure which was total cost of employment (in U.S. dollars per tonne) for the steel business (TCOE) and the mining volume plan and ROCE for the Mining segment until the 2013 grant. As from 2014, most of the Steel Business Units have kept only ROCE as a performance measure and the Mining segment continued with ROCE and mining volume plan. In case the level of achievement of performance is below threshold, there is no vesting, and the rights are automatically forfeited.
GMB PSU plan
The GMB PSU Plan is designed to enhance the long-term performance of the Company and align the members of the GMB to the Company’s objectives. The GMB PSU Plan complements ArcelorMittal’s existing program of annual performance-related bonuses which is the Company’s reward system for short-term performance and achievements. The main objective of the GMB PSU Plan is to be an effective performance-enhancing scheme for GMB members based on the achievement of ArcelorMittal’s strategy aimed at creating a measurable long-term shareholder value.
The members of the GMB including the Chief Executive Officer will be eligible for PSU grants. The GMB PSU Plan provides for cliff vesting on the third year anniversary of the grant date, under the condition that the relevant GMB member continues to be actively employed by the ArcelorMittal group on that date. If the GMB member is retired on that date or in case of an early retirement by mutual consent, the relevant GMB member will not automatically forfeit PSUs and pro rata vesting will be considered at the end of the vesting period at the sole discretion of the Appointments, Remuneration & Corporate Governance Committee of the Board of Directors. Awards under the GMB PSU Plan are subject to the fulfillment of cumulative performance criteria over a three-year period from the date of the PSU grant. The value of the grant at grant date will equal one year of base salary for the Chief Executive Officer and 80% of base salary for other GMB members. Each PSU may give the right to up to two shares of the Company, and each PSU from the 2014 grant may convey the right to up to one and a half shares.
We refer to note 7.3 to the consolidated financial statements for amounts of GMB PSUs granted.
Two sets of performance criteria must be met for vesting of the PSUs. 50% of the criteria is based on the Total Shareholder Return (TSR) defined as the share price at the end of period minus the share price at start of period plus any dividend paid divided by the share price at the start of the period. “Start of period” and “end of period” will be defined by the ARCG Committee of the Board of Directors. This will then be compared with a peer group of companies and the S&P 500
2014 Measures
% Weighting for Chief Executive Officer and GMB
members AssessmentEBITDA 60% Incentive attributable to this metric as the assessment was slightly above targetFCF 20% Incentive attributable to this metric as the assessment was at the ceilingHealth and Safety 20% Incentive attributable to this metric as the assessment was below threshold

52 Management report
index, each counting for half of the weighting. No vesting will take place for performance below 80% of the median compared to the peer group or below 80% of the S&P 500 index measured over three years.
• For 25% of PSUs, performance is compared to the peer group. The percentage of PSUs vesting will be 50% for achieving 80% of the median TSR, 100% for achieving the median TSR and 150% for achieving 120% of the median TSR.
• For 25% of PSUs, performance is compared to the S&P 500 index. The percentage of PSUs vesting will be 50% for achieving performance equal to 80% of the index, 100% for achieving a performance equal to the index and 150% for achieving a performance equal to index plus an outperformance of 2%.
The other 50% of the criteria to be met to trigger vesting of the PSUs is based on the development of Earnings Per Share (EPS), defined as the amount of earnings per share outstanding compared to a peer group of companies. The percentage of PSUs vesting will be 50% for achievement of 80% of the median EPS, 100% for achieving the median EPS and 150% for achieving 120% of the median EPS.
The allocation of PSUs to eligible GMB members is reviewed by the ARCG Committee of the Board of Directors, which is comprised of three independent directors, and which makes a proposal and recommendation to the full Board of Directors. The vesting criteria of the PSUs are also monitored by the ARCG Committee. For further detail on the stock option plan, RSU Plan and PSU plan, including the total number of shares outstanding, fair value, and exercise prices, please see note 7.3 to the consolidated financial statements.
The impact of the organizational changes announced in December 2015 (cross reference to Management) on new grants under ArcelorMittal Equity Incentive Plan and the GMB PSU plan will be determined by ARCG Committee and the Board in course of 2016.
Performance consideration
Remuneration mix
The target total remuneration of the Chief Executive Officer and the GMB is structured to attract and retain executives; the amount of the remuneration actually received is dependent on the achievement of superior business and individual performance and on generating sustained shareholder value from relative performance.
The following remuneration charts, which illustrate the various elements of compensation of the Chief Executive Officer and the GMB, are applicable for 2015. For each of the charts below, the columns on the left, middle and on the right, respectively, reflect the breakdown of compensation if targets are not met, met and exceeded.
CEO Remuneration mix
Below Threshold Target
225%
Maximum
Base salary Other benefits Long term incentives
100%100%100%
100%
100%
120%
Other GMB Members - CEO Remuneration mix
Below Threshold Target
180%
Maximum
Base salary Short term incentives Long term incentives
100%100%100%
80%
9%
150%
9% 9%
80%
Other benefits
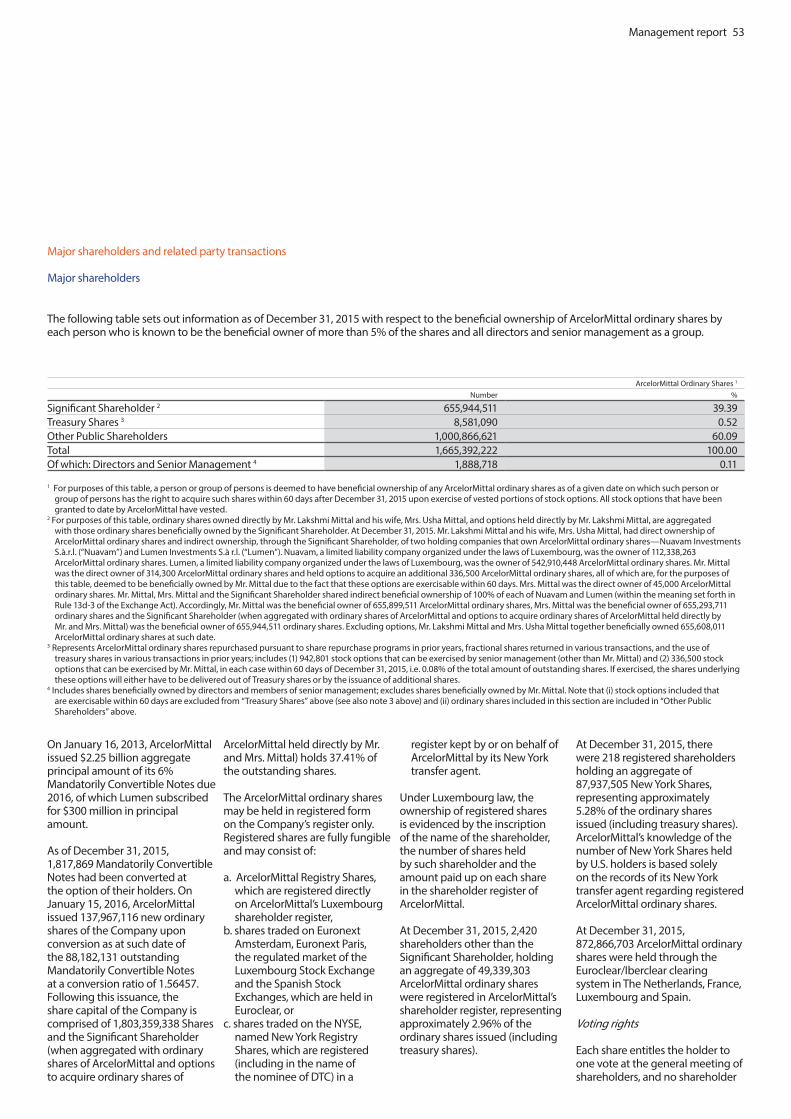
Management report 53
The following table sets out information as of December 31, 2015 with respect to the beneficial ownership of ArcelorMittal ordinary shares by each person who is known to be the beneficial owner of more than 5% of the shares and all directors and senior management as a group.
ArcelorMittal Ordinary Shares 1
Number %
Significant Shareholder 2 655,944,511 39.39 Treasury Shares 3 8,581,090 0.52 Other Public Shareholders 1,000,866,621 60.09 Total 1,665,392,222 100.00Of which: Directors and Senior Management 4 1,888,718 0.11
1 For purposes of this table, a person or group of persons is deemed to have beneficial ownership of any ArcelorMittal ordinary shares as of a given date on which such person or group of persons has the right to acquire such shares within 60 days after December 31, 2015 upon exercise of vested portions of stock options. All stock options that have been granted to date by ArcelorMittal have vested.
2 For purposes of this table, ordinary shares owned directly by Mr. Lakshmi Mittal and his wife, Mrs. Usha Mittal, and options held directly by Mr. Lakshmi Mittal, are aggregated with those ordinary shares beneficially owned by the Significant Shareholder. At December 31, 2015. Mr. Lakshmi Mittal and his wife, Mrs. Usha Mittal, had direct ownership of ArcelorMittal ordinary shares and indirect ownership, through the Significant Shareholder, of two holding companies that own ArcelorMittal ordinary shares—Nuavam Investments S.à.r.l. (“Nuavam”) and Lumen Investments S.à r.l. (“Lumen”). Nuavam, a limited liability company organized under the laws of Luxembourg, was the owner of 112,338,263 ArcelorMittal ordinary shares. Lumen, a limited liability company organized under the laws of Luxembourg, was the owner of 542,910,448 ArcelorMittal ordinary shares. Mr. Mittal was the direct owner of 314,300 ArcelorMittal ordinary shares and held options to acquire an additional 336,500 ArcelorMittal ordinary shares, all of which are, for the purposes of this table, deemed to be beneficially owned by Mr. Mittal due to the fact that these options are exercisable within 60 days. Mrs. Mittal was the direct owner of 45,000 ArcelorMittal ordinary shares. Mr. Mittal, Mrs. Mittal and the Significant Shareholder shared indirect beneficial ownership of 100% of each of Nuavam and Lumen (within the meaning set forth in Rule 13d-3 of the Exchange Act). Accordingly, Mr. Mittal was the beneficial owner of 655,899,511 ArcelorMittal ordinary shares, Mrs. Mittal was the beneficial owner of 655,293,711 ordinary shares and the Significant Shareholder (when aggregated with ordinary shares of ArcelorMittal and options to acquire ordinary shares of ArcelorMittal held directly by Mr. and Mrs. Mittal) was the beneficial owner of 655,944,511 ordinary shares. Excluding options, Mr. Lakshmi Mittal and Mrs. Usha Mittal together beneficially owned 655,608,011 ArcelorMittal ordinary shares at such date.
3 Represents ArcelorMittal ordinary shares repurchased pursuant to share repurchase programs in prior years, fractional shares returned in various transactions, and the use of treasury shares in various transactions in prior years; includes (1) 942,801 stock options that can be exercised by senior management (other than Mr. Mittal) and (2) 336,500 stock options that can be exercised by Mr. Mittal, in each case within 60 days of December 31, 2015, i.e. 0.08% of the total amount of outstanding shares. If exercised, the shares underlying these options will either have to be delivered out of Treasury shares or by the issuance of additional shares.
4 Includes shares beneficially owned by directors and members of senior management; excludes shares beneficially owned by Mr. Mittal. Note that (i) stock options included that are exercisable within 60 days are excluded from “Treasury Shares” above (see also note 3 above) and (ii) ordinary shares included in this section are included in “Other Public Shareholders” above.
On January 16, 2013, ArcelorMittal issued $2.25 billion aggregate principal amount of its 6% Mandatorily Convertible Notes due 2016, of which Lumen subscribed for $300 million in principal amount.
As of December 31, 2015, 1,817,869 Mandatorily Convertible Notes had been converted at the option of their holders. On January 15, 2016, ArcelorMittal issued 137,967,116 new ordinary shares of the Company upon conversion as at such date of the 88,182,131 outstanding Mandatorily Convertible Notes at a conversion ratio of 1.56457. Following this issuance, the share capital of the Company is comprised of 1,803,359,338 Shares and the Significant Shareholder (when aggregated with ordinary shares of ArcelorMittal and options to acquire ordinary shares of
ArcelorMittal held directly by Mr. and Mrs. Mittal) holds 37.41% of the outstanding shares.
The ArcelorMittal ordinary shares may be held in registered form on the Company’s register only. Registered shares are fully fungible and may consist of:
a. ArcelorMittal Registry Shares, which are registered directly on ArcelorMittal’s Luxembourg shareholder register,
b. shares traded on Euronext Amsterdam, Euronext Paris, the regulated market of the Luxembourg Stock Exchange and the Spanish Stock Exchanges, which are held in Euroclear, or
c. shares traded on the NYSE, named New York Registry Shares, which are registered (including in the name of the nominee of DTC) in a
register kept by or on behalf of ArcelorMittal by its New York transfer agent.
Under Luxembourg law, the ownership of registered shares is evidenced by the inscription of the name of the shareholder, the number of shares held by such shareholder and the amount paid up on each share in the shareholder register of ArcelorMittal.
At December 31, 2015, 2,420 shareholders other than the Significant Shareholder, holding an aggregate of 49,339,303 ArcelorMittal ordinary shares were registered in ArcelorMittal’s shareholder register, representing approximately 2.96% of the ordinary shares issued (including treasury shares).
At December 31, 2015, there were 218 registered shareholders holding an aggregate of 87,937,505 New York Shares, representing approximately 5.28% of the ordinary shares issued (including treasury shares). ArcelorMittal’s knowledge of the number of New York Shares held by U.S. holders is based solely on the records of its New York transfer agent regarding registered ArcelorMittal ordinary shares.
At December 31, 2015, 872,866,703 ArcelorMittal ordinary shares were held through the Euroclear/Iberclear clearing system in The Netherlands, France, Luxembourg and Spain.
Voting rights
Each share entitles the holder to one vote at the general meeting of shareholders, and no shareholder
Major shareholders and related party transactions
Major shareholders

54 Management report
benefits from specific voting rights. For more information relating to ArcelorMittal shares, see “Memorandum and Articles of Association, Voting and information rights”.
Related Party Transactions
ArcelorMittal engages in certain commercial and financial transactions with related parties, including associates and joint ventures of ArcelorMittal. Please refer to note 11 of ArcelorMittal’s consolidated financial statements.
Shareholder’s Agreement
The Significant Shareholder, a holding company owned by the Significant Shareholder and ArcelorMittal are parties to a shareholder and registration rights agreement (the “Shareholder’s Agreement”) dated August 13, 1997. Pursuant to the Shareholder’s Agreement and subject to the terms and conditions thereof, ArcelorMittal shall, upon the request of certain holders of restricted ArcelorMittal shares, use its reasonable efforts to register under the Securities Act of 1933, as amended, the sale of ArcelorMittal shares intended to be sold by those holders. By its terms, the Shareholder’s Agreement may not be amended, other than for manifest error, except by approval of a majority of ArcelorMittal’s shareholders (other than the Significant Shareholder and certain permitted transferees) at a general shareholders’ meeting.
Memorandum of Understanding
The Memorandum of Understanding entered into in connection with the Mittal Steel acquisition of Arcelor, certain provisions of which expired in August 2009 and August 2011, is described under “Material contracts, Memorandum of Understanding”.
Acquisition of ordinary shares and mandatorily convertible notes in the January 2013 offering of such securities by ArcelorMittal, and entry into the Lock-Up Letter
and Share Lending Agreement in connection therewith
ArcelorMittal issued 104,477,612 ordinary shares in an offering that closed on January 14, 2013 (the “Share Offering”) and issued $2,250,000,000 aggregate principal amount of 6.00% Mandatorily Convertible Subordinated Notes due 2016 (the “MCNs”) in an offering that closed on January 16, 2013. Lumen subscribed for 17,910,448 ordinary shares in the Share Offering and acquired $300 million in principal amount of MCNs. The underwriting agreement entered into in connection with such offerings provided as a closing condition that Lumen and Nuavam each execute a lock-up letter whereby they would each agree not to offer, sell, contract to sell, pledge, grant any option to purchase, make any short sale or otherwise dispose of, directly or indirectly, any ordinary shares, the acquired MCNs or other securities exchangeable for or convertible into ordinary shares owned by them for a period of at least 180 days from January 9, 2013, subject to certain limited exceptions or the prior written consent of the representatives. In connection with the Share Offering and the offering of the MCNs, ArcelorMittal entered into a share lending agreement with Lumen on January 9, 2013, pursuant to which Lumen agreed to make available for borrowing by ArcelorMittal up to a maximum amount of 48.9 million ordinary shares in exchange for a loan fee of $0.00046 per lent ordinary share, accruing daily from and including the date on which the loaned ordinary shares were delivered to the borrower to, but excluding, the date of return of the borrowed ordinary shares. Under the share lending agreement, deliveries of the loaned shares by Lumen was to occur on the dates an equal number of ordinary shares were required to be delivered by ArcelorMittal pursuant to the terms of the MCNs. The share lending agreement provided that ArcelorMittal could terminate all or any portion of any loan made there under at any time and
that all outstanding loans would terminate on the date which was three business days after the date on which a general meeting of shareholders of ArcelorMittal had approved a resolution approving sufficient authorized share capital and authorizing the Board of Directors of the Company to cancel the preferential subscription right of existing shareholders to allow return to Lumen of all borrowed ordinary shares. Under the share lending agreement, Lumen had no rights (including voting or disposition rights) with respect to any ordinary shares that had been loaned to ArcelorMittal and not yet returned to Lumen. Subject to this condition being met, it was expected that any ordinary shares to be delivered by ArcelorMittal to Lumen upon termination of the loan(s) would be newly issued ordinary shares issued in favor of Lumen (with a cancellation of the shareholders’ preferential subscription right). The extraordinary general meeting of shareholders of ArcelorMittal that took place on May 8, 2013 (the “May 2013 EGM”) approved sufficient authorized share capital and authorized the Board of Directors of the Company to cancel the preferential subscription right of existing shareholders to allow return to Lumen of all borrowed ordinary shares. Accordingly, the share lending agreement with Lumen was terminated three business days after the date of the May 2013 EGM.
Agreements with Aperam post-Stainless Steel Spin-Off
In connection with the spin-off of its stainless steel division into a separately focused company, Aperam, which was completed on January 25, 2011, ArcelorMittal entered into several agreements with Aperam and/ or certain Aperam subsidiaries. These agreements include a Master Transitional Services Agreement dated January 25, 2011 (the “Transitional Services Agreement”) for support for/from corporate activities, a purchasing services agreement for negotiation services from ArcelorMittal Purchasing (the
“Purchasing Services Agreement”) and a sourcing services agreement for negotiation services from ArcelorMittal Sourcing (the “Sourcing Services Agreement”), certain commitments regarding cost-sharing in Brazil and certain other ancillary arrangements governing the relationship between Aperam and ArcelorMittal following the spin-off, as well as certain agreements relating to financing.
The Transitional Services Agreement between ArcelorMittal and Aperam expired at year-end 2012. The parties agreed to renew a very limited number of services where expertise and bargain powers create values for both parties. ArcelorMittal will continue to provide certain services during 2016 relating to certain areas, including environmental and technical support and administration of the shareholders register.
In the area of research and development, Aperam entered into a frame arrangement with ArcelorMittal to establish a framework for future cooperation between the two groups in relation to certain ongoing or new research and development programs. Currently, only limited research and development support for existing projects are implemented through such agreement.
The purchasing and sourcing of raw materials generally were not covered by the Transitional Services Agreement. Aperam is responsible for the sourcing of its key raw materials, including nickel, chromium, molybdenum and stainless steel scrap. However, under the terms of the Purchasing Services Agreement, Aperam still relies on ArcelorMittal for services in relation to the negotiation of certain contracts with global or large regional suppliers, including those relating to the following key categories: metallic (carbon scraps), operating materials (rolls, electrodes, refractory materials), spare parts, industrial products and services. The

Management report 55
purchasing services agreement also permits Aperam to avail itself of the services and expertise of ArcelorMittal for certain capital expenditure items. The Purchasing Services Agreement and the Sourcing Services Agreement were each entered into for an initial term of two years, which was to expire on January 24, 2013. However, since that date, the Purchasing Services Agreement has been extended successively, while the Sourcing Services Agreement was limited to IT services as of October 2013. It is expected that the term of the Purchasing Services Agreement will be further extended until the end of January 2017. The Sourcing Service Agreement will remain in force at least until September 2016 as certain IT services are still provided but Aperam has switched to its own IT system. Beginning in 2016, Aperam purchases, in Europe, most of its natural gas with ArcelorMittal Energy.
Purchasing activities will continue to be provided to Aperam pursuant to existing contracts with ArcelorMittal entities that it has specifically elected to assume.
In connection with the spin-off, management also renegotiated an existing Brazilian cost-sharing agreement between ArcelorMittal Brasil and Aperam Inox América do Sul S.A. (formerly known as ArcelorMittal Inox Brasil), pursuant to which starting as of April 1, 2011, ArcelorMittal Brasil continued to perform purchasing, insurance and real estate activities for the benefit of certain of Aperam’s Brazilian subsidiaries, with costs being shared on the basis of cost allocation parameters agreed between the parties. From the demerger of ArcelorMittal BioEnergia Ltda on July 1, 2011, its payroll functions were also handled by ArcelorMittal Brasil. The real estate, insurance activities and payroll functions of Aperam’s Brazilian subsidiaries have not been handled by ArcelorMittal Brasil since January 1, 2013, June 30, 2013, and June 27, 2014 respectively.
Acquisition of inventories
Mr. Lakshmi N. Mittal acquired inventories on February 18, 2015 from ArcelorMittal Luxembourg pertaining to the Company’s former headquarters. Such inventories were valued by an independent expert and acquired at arm’s length.
Memorandum and Articles of Association
Below is a summary of ArcelorMittal’s Articles of Association, filed as an exhibit to this annual report on Form 20-F and incorporated by reference herein. The full text of the Company’s Articles of Association is also available on www.arcelormittal.com under “Investors—Corporate Governance-Board of Directors.”
Corporate purpose
Article 3 of the Articles of Association provide that the corporate purpose of ArcelorMittal is the manufacture, processing and marketing of steel, steel products and all other metallurgical products, as well as all products and materials used in their manufacture, their processing and their marketing, and all industrial and commercial activities connected directly or indirectly with those objects, including mining and research activities and the creation, acquisition, holding, exploitation and sale of patents, licenses, know-how and, more generally, intellectual and industrial property rights.
The Company may realize its corporate purpose either directly or through the creation of companies, the acquisition, holding or acquisition of interests in any companies or partnerships, membership in any associations, consortia and joint ventures.
In general, the Company’s corporate purpose comprises the participation, in any form whatsoever, in companies and partnerships and the acquisition by purchase, subscription or in
any other manner as well as the transfer by sale, exchange or in any other manner of shares, bonds, debt securities, warrants and other securities and instruments of any kind.
It may grant assistance to any affiliated company and take any measure for the control and supervision of such companies.
It may carry out any commercial, financial or industrial operation or transaction that it considers to be directly or indirectly necessary or useful in order to achieve or further its corporate purpose.
Form and transfer of shares
The shares of ArcelorMittal are issued in registered form only and are freely transferable. There are no restrictions on the rights of Luxembourg or non-Luxembourg residents to own ArcelorMittal shares.
Under Luxembourg law, the ownership of registered shares is evidenced by the inscription of the name of the shareholder, the number of shares and the amount paid up on each share in the shareholders’ register. Each transfer of shares is made by a written declaration of transfer recorded in the shareholders’ register of ArcelorMittal, dated and signed by the transferor and the transferee or by their duly appointed agent. ArcelorMittal may accept and enter into its shareholders’ register any transfer based on an agreement between the transferor and the transferee provided a true and complete copy of the agreement is provided to ArcelorMittal.
The Articles of Association provide that shares may be held through a securities settlement (clearing) system or a professional depositary of securities. Shares held in this manner have the same rights and obligations as the registered shares. Shares held through a securities settlement system or a professional depositary of securities may be transferred in accordance with customary procedures for the transfer of
securities in book-entry form.
The ArcelorMittal ordinary shares may be held in registered form on the Company’s register only. Registered shares are fully fungible and may consist of:
a. ArcelorMittal Registry Shares, which are registered directly on ArcelorMittal’s Luxembourg shareholder register,
b. shares traded on Euronext Amsterdam, Euronext Paris, the regulated market of the Luxembourg Stock Exchange and the Spanish Stock Exchanges, which are held in Euroclear, or
c. shares traded on the NYSE, named New York Registry Shares, which are registered in a register (including in the name of the nominee of DTC) kept by or on behalf of ArcelorMittal by its New York transfer agent.
Since March 2009, ArcelorMittal has used the services of BNP Paribas Securities Services to assist it with certain administrative tasks relating to the day-to-day administrative management of the shareholders’ register.
The law of April 6, 2013 concerning dematerialized securities allows Luxembourg issuers to opt for the full dematerialization of shares. If ArcelorMittal were to opt for full dematerialization in the future, shareholders would be required to hold their shares in a securities account at a bank or other financial intermediary, which would in turn hold the shares via an account with a securities depository such as Clearstream or Euroclear. Dematerialized securities would be solely represented by account entries with the securities depositary and would therefore exist only in electronic form. If ArcelorMittal were to opt for the full dematerialization of its shares, it would no longer be possible for shareholders to hold shares through a direct, nominative registration in the Company’s register of shareholders as is currently the case.

56 Management report
Issuance of shares
The issuance of shares by ArcelorMittal requires either an amendment of the Articles of Association approved by an extraordinary general meeting of shareholders (EGM) or a decision of the Board of Directors that is within the limits of the authorized share capital set out in the Articles of Association. In the latter case, the Board of Directors may determine the conditions for the issuance of shares, including the consideration (cash or in kind) payable for such shares.
The EGM may not validly deliberate unless at least half of the share capital is present or represented upon the first call. If the quorum is not met, the meeting may be reconvened as described in “General Meetings of Shareholders” below. The second meeting will be held regardless of the proportion of share capital represented. At both meetings, resolutions, in order to be adopted, must be carried by at least two-thirds of the votes cast.
The Company’s authorized share capital was increased by 19.84% of its then issued share capital to €8,249,049,316.38 represented by 1,995,857,213 shares at the extraordinary shareholders’ meeting held on May 8, 2013 and was unchanged at December 31, 2015. The authorization allowing the Board of Directors to issue further shares out of the authorized share capital was also renewed at the extraordinary shareholders’ meeting held on May 8, 2013, and expires five years from the date of publication of the EGM deed in the Official Luxembourg Gazette Mémorial C, which occurred on July 3, 2013. This authorization may be renewed from time to time by an EGM for periods not to exceed five years each.
Following the increase of the Company’s issued share capital by 104,477,612 ordinary shares in connection with its offering of shares on January 14, 2013, the Company’s total issued
share capital amounted to €6,883,209,119.84, represented by 1,665,392,222 ordinary shares and was unchanged at December 31, 2015. Following the mandatory conversion on January 15, 2016 of outstanding Notes of the Company’s $2.25 billion 6% Mandatorily Convertible Notes due 2016, the Company’s issued share capital was increased by €570,231,887.14 from €6,883,209,119.84 to €7,453,441,006.98 represented by 1,803,359,338 shares without nominal value.
Article 5 of the Company’s Articles of Association has been amended to reflect this change. The Company’s Articles of Association have been published on www.arcelormittal.com and filed with the Luxembourg Register of Commerce and Companies on February 2, 2016. The Company filed this version of the Articles of Association as exhibit 4.5 to the post-effective amendment to its registration statement on Form F-3 dated February 5, 2016 (File No. 333-202409).
Preemptive rights
Unless limited or cancelled by the Board of Directors as described below or by an EGM, holders of ArcelorMittal shares have a pro rata preemptive right to subscribe for newly issued shares, except for shares issued for consideration other than cash (i.e., in kind).
The Articles of Association provide that preemptive rights may be limited or cancelled by the Board of Directors in the event of an increase in the Company’s issued share capital until the date five years from the date of publication in the Official Luxembourg Gazette Mémorial C of the relevant meeting minutes, which publication occurred on July 3, 2013 with respect to the minutes of the EGM held on May 8, 2013. This power of the Board of Directors may from time to time be renewed by an EGM for subsequent periods not to exceed five years each.
Repurchase of shares
ArcelorMittal is prohibited by Luxembourg law from subscribing for its own shares. ArcelorMittal may, however, repurchase its own shares or have another person repurchase shares on its behalf, subject to certain conditions, including:
• a prior authorization of the general meeting of shareholders setting out the terms and conditions of the proposed repurchase, including the maximum number of shares to be repurchased, the duration of the period for which the authorization is given (which may not exceed five years) and the minimum and maximum consideration per share;
• the repurchase may not reduce the net assets of ArcelorMittal on a non-consolidated basis to a level below the aggregate of the issued share capital and the reserves that ArcelorMittal must maintain pursuant to Luxembourg law or its Articles of Association; and
• only fully paid-up shares may be repurchased. At December 31, 2015, all of ArcelorMittal’s issued ordinary shares were fully paid-up.
In addition, Luxembourg law allows the Board of Directors to approve the repurchase of ArcelorMittal shares without the prior approval of the general meeting of shareholders if necessary to prevent serious and imminent harm to ArcelorMittal. In such a case, the next general meeting of shareholders must be informed by the Board of Directors of the reasons for and the purpose of the acquisitions made, the number and nominal values, or in the absence thereof, the accounting par value of the shares acquired, the proportion of the issued share capital that they represent, and the consideration paid for them.
The general meeting of shareholders held on May 5, 2015
(the “General Meeting”) decided (a) to cancel with effect as of the date of the General Meeting the authorization granted to the Board of Directors by the general meeting of shareholders held on May 11, 2010 with respect to the share buy-back program, and (b) to authorize, effective immediately after the General Meeting, the Board of Directors, with option to delegate, and the corporate bodies of the other companies in the ArcelorMittal group in accordance with the Luxembourg law of August 10, 1915 on commercial companies, as amended (the “Law”), to acquire and sell shares in the Company in accordance with the Law and any other applicable laws and regulations, including but not limited to entering into off-market and over-the-counter transactions and to acquire shares in the Company through derivative financial instruments.
Any acquisitions, disposals, exchanges, contributions or transfers of shares by the Company or other companies in the ArcelorMittal group must be in accordance with Luxembourg laws transposing Directive 2003/6/EC regarding insider dealing and market manipulation as repealed and replaced by (EU) Regulation No. 596/2014 of the European Parliament and of the Council of April 16, 2014 on market abuse and EC Regulation No. 2273/2003 regarding exemptions for buy-back programmes and stabilization of financial instruments and may be carried out by all means, on or off-market, including by a public offer to buy-back shares, or by the use of derivatives or option strategies. The fraction of the capital acquired or transferred in the form of a block of shares may amount to the entire program.
Such transactions may be carried out at any time, including during a tender offer period, subject to applicable laws and regulations including Section 10(b) and Section 9(a)(2) of the Securities Exchange Act of 1934, as amended (the “Exchange Act”), and Rule 10b-5 promulgated under the Exchange Act.

Management report 57
The authorization is valid for a period of five years, i.e., until the annual general meeting of shareholders to be held in May 2020, or until the date of its renewal by a resolution of the general meeting of shareholders if such renewal date is prior to the expiration the five-year period.
Capital reduction
The Articles of Association provide that the issued share capital of ArcelorMittal may be reduced subject to the approval of at least two-thirds of the votes cast at an extraordinary general meeting of shareholders where at first call at least 50% of the issued share capital is required to be represented, with no quorum being required at a reconvened meeting.
General meeting of shareholders
The Shareholders’ Rights Law of May 24, 2011, which transposes into Luxembourg law Directive 2007/36/EC of the European Parliament and of the Council of July 11, 2007 on the exercise of certain rights of shareholders in listed companies of July 14, 2007 came into force on July 1, 2011.
The Shareholders’ Rights Law abolished the blocking period and introduced the record date system into Luxembourg law. As set out in the Articles of Association, the record date applicable to ArcelorMittal is the 14th day at midnight before the general meeting date. Only the votes of shareholders who are shareholders of the Company on the record date will be taken into account, regardless of whether they remain shareholders on the general meeting date. Shareholders who intend to participate in the general meeting must notify the Company at the latest on the date indicated in the convening notice of their intention to participate (by proxy or in person).
Ordinary general meetings of shareholders.
At an ordinary general meeting of
shareholders there is no quorum requirement and resolutions are adopted by a simple majority, irrespective of the number of shares represented. Ordinary general meetings deliberate on any matter that does not require the convening of an extraordinary general meeting.
Extraordinary general meetings of shareholders.
An extraordinary general meeting must be convened to deliberate on the following types of matters:
•an increase or decrease of the authorized or issued share capital,
•a limitation or exclusion of existing shareholders’ preemptive rights,
•the acquisition by any person of 25% or more of the issued share capital of ArcelorMittal,
•approving a merger or similar transaction such as a spin-off, and
•any transaction or matter requiring an amendment of the Articles of Association.
The extraordinary general meeting must reach a quorum of shares present or represented at the meeting of 50% of the share capital in order to validly deliberate. If this quorum is not reached, the meeting may be reconvened and the second meeting will not be subject to any quorum requirement. In order to be adopted by the extraordinary general meeting (on the first or the second call), any resolution submitted must be approved by at least two-thirds of the votes cast except for certain limited matters where the Articles of Association require a higher majority (see “Amendment of the Articles of Association”). Votes cast do not include votes attaching to shares with respect to which the shareholder has not taken part in the vote, has abstained or has returned a blank or invalid vote.
Voting and information rights
The voting and information rights of ArcelorMittal’s shareholders have been further expanded since the entry into force of the Shareholders’ Rights Law on July 1, 2011.
There are no restrictions on the rights of Luxembourg or non-Luxembourg residents to vote ArcelorMittal shares. Each share entitles the shareholder to attend a general meeting of shareholders in person or by proxy, to address the general meeting of shareholders and to vote. Each share entitles the holder to one vote at the general meeting of shareholders. There is no minimum shareholding (beyond owning a single share or representing the owner of a single share) required to be able to attend or vote at a general meeting of shareholders.
The Board of Directors may also decide to allow shareholders to vote by correspondence by means of a form providing for a positive or negative vote or an abstention on each agenda item. The conditions for voting by correspondence are set out in the Articles of Association and in the convening notice.
The Board of Directors may decide to arrange for shareholders to be able to participate in the general meeting by electronic means by way, among others, of (i) real-time transmission to the public of the general meeting, (ii) two-way communication enabling shareholders to address the general meeting from a remote location, or (iii) a mechanism allowing duly identified shareholders to cast their votes before or during the general meeting without the need for them to appoint a proxyholder who would be physically present at the meeting.
A shareholder may act at any general meeting of shareholders by appointing another person (who need not be a shareholder) as his or her attorney by means of a written proxy using the form
made available on the website of the Company. The completed and signed proxy must be sent to the Company in accordance with the instructions set out in the convening notice.
General meetings of shareholders are convened by the publication of a notice at least 30 days before the meeting date in a Luxembourg newspaper, in the Luxembourg official legal gazette, the Mémorial, Recueil des Sociétés et Associations, and by way of press release sent to the major news agencies. Ordinary general meetings are not subject to any minimum shareholder participation level. Extraordinary general meetings, however, are subject to a minimum quorum of 50% of the share capital. In the event the 50% quorum is not met upon the first call, the meeting may be reconvened by way of convening notice published in the same manner as the first notice, at least 17 days before the meeting date. No quorum is required upon the second call.
Shareholders whose share ownership is directly registered in the shareholders’ register of the Company must receive the convening notice by regular mail, unless they have accepted to receive it through other means (i.e., electronically). In addition, all materials relating to a general meeting of shareholders must be made available on the website of ArcelorMittal from the first date of publication of the convening notice.
Based on an amendment voted by the extraordinary general meeting of shareholders on May 8, 2012, the Articles of Association of ArcelorMittal provide that the annual general meeting of shareholders is held each year at a date and time set by the Board of Directors during the second or third week of May, between 9.00 a.m. and 4.00 p.m. Central European Time, in Luxembourg.
Luxembourg law requires the Board of Directors to convene a general meeting of shareholders
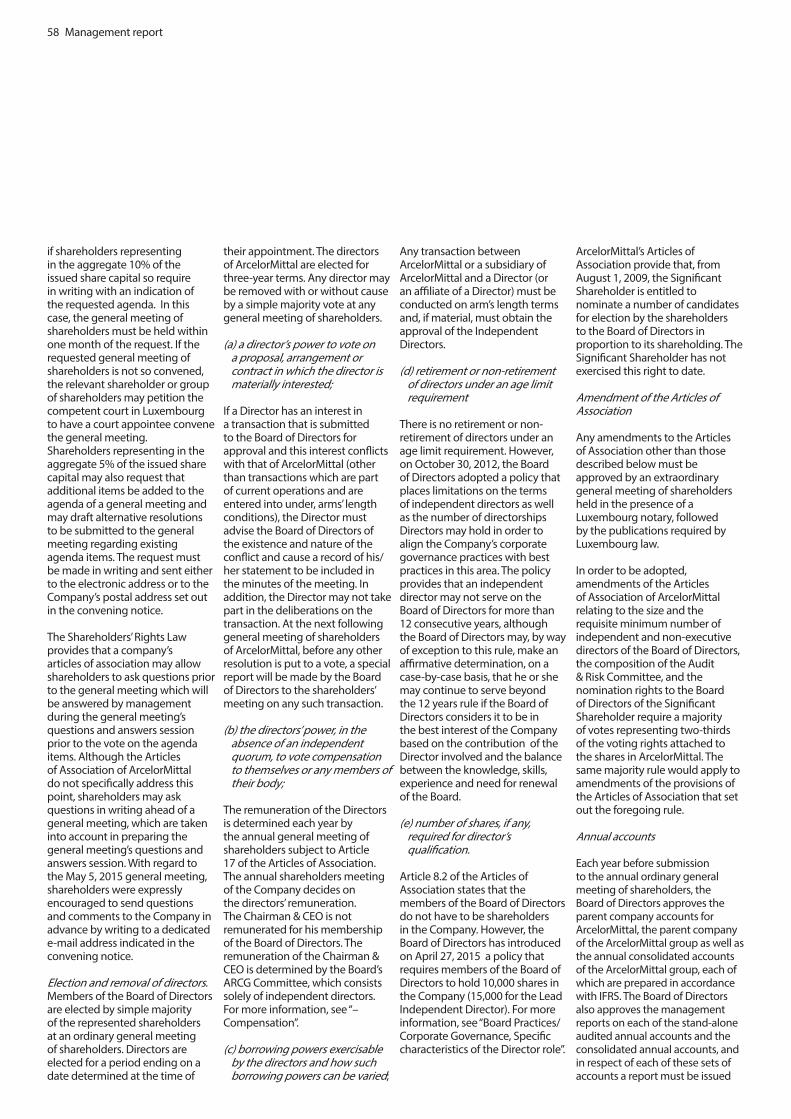
58 Management report
if shareholders representing in the aggregate 10% of the issued share capital so require in writing with an indication of the requested agenda. In this case, the general meeting of shareholders must be held within one month of the request. If the requested general meeting of shareholders is not so convened, the relevant shareholder or group of shareholders may petition the competent court in Luxembourg to have a court appointee convene the general meeting.Shareholders representing in the aggregate 5% of the issued share capital may also request that additional items be added to the agenda of a general meeting and may draft alternative resolutions to be submitted to the general meeting regarding existing agenda items. The request must be made in writing and sent either to the electronic address or to the Company’s postal address set out in the convening notice.
The Shareholders’ Rights Law provides that a company’s articles of association may allow shareholders to ask questions prior to the general meeting which will be answered by management during the general meeting’s questions and answers session prior to the vote on the agenda items. Although the Articles of Association of ArcelorMittal do not specifically address this point, shareholders may ask questions in writing ahead of a general meeting, which are taken into account in preparing the general meeting’s questions and answers session. With regard to the May 5, 2015 general meeting, shareholders were expressly encouraged to send questions and comments to the Company in advance by writing to a dedicated e-mail address indicated in the convening notice.
Election and removal of directors. Members of the Board of Directors are elected by simple majority of the represented shareholders at an ordinary general meeting of shareholders. Directors are elected for a period ending on a date determined at the time of
their appointment. The directors of ArcelorMittal are elected for three-year terms. Any director may be removed with or without cause by a simple majority vote at any general meeting of shareholders.
(a) a director’s power to vote on a proposal, arrangement or contract in which the director is materially interested;
If a Director has an interest in a transaction that is submitted to the Board of Directors for approval and this interest conflicts with that of ArcelorMittal (other than transactions which are part of current operations and are entered into under, arms’ length conditions), the Director must advise the Board of Directors of the existence and nature of the conflict and cause a record of his/her statement to be included in the minutes of the meeting. In addition, the Director may not take part in the deliberations on the transaction. At the next following general meeting of shareholders of ArcelorMittal, before any other resolution is put to a vote, a special report will be made by the Board of Directors to the shareholders’ meeting on any such transaction.
(b) the directors’ power, in the absence of an independent quorum, to vote compensation to themselves or any members of their body;
The remuneration of the Directors is determined each year by the annual general meeting of shareholders subject to Article 17 of the Articles of Association. The annual shareholders meeting of the Company decides on the directors’ remuneration. The Chairman & CEO is not remunerated for his membership of the Board of Directors. The remuneration of the Chairman & CEO is determined by the Board’s ARCG Committee, which consists solely of independent directors. For more information, see “–Compensation”.
(c) borrowing powers exercisable by the directors and how such borrowing powers can be varied;
Any transaction between ArcelorMittal or a subsidiary of ArcelorMittal and a Director (or an affiliate of a Director) must be conducted on arm’s length terms and, if material, must obtain the approval of the Independent Directors.
(d) retirement or non-retirement of directors under an age limit requirement
There is no retirement or non-retirement of directors under an age limit requirement. However, on October 30, 2012, the Board of Directors adopted a policy that places limitations on the terms of independent directors as well as the number of directorships Directors may hold in order to align the Company’s corporate governance practices with best practices in this area. The policy provides that an independent director may not serve on the Board of Directors for more than 12 consecutive years, although the Board of Directors may, by way of exception to this rule, make an affirmative determination, on a case-by-case basis, that he or she may continue to serve beyond the 12 years rule if the Board of Directors considers it to be in the best interest of the Company based on the contribution of the Director involved and the balance between the knowledge, skills, experience and need for renewal of the Board.
(e) number of shares, if any, required for director’s qualification.
Article 8.2 of the Articles of Association states that the members of the Board of Directors do not have to be shareholders in the Company. However, the Board of Directors has introduced on April 27, 2015 a policy that requires members of the Board of Directors to hold 10,000 shares in the Company (15,000 for the Lead Independent Director). For more information, see “Board Practices/Corporate Governance, Specific characteristics of the Director role”.
ArcelorMittal’s Articles of Association provide that, from August 1, 2009, the Significant Shareholder is entitled to nominate a number of candidates for election by the shareholders to the Board of Directors in proportion to its shareholding. The Significant Shareholder has not exercised this right to date.
Amendment of the Articles of Association
Any amendments to the Articles of Association other than those described below must be approved by an extraordinary general meeting of shareholders held in the presence of a Luxembourg notary, followed by the publications required by Luxembourg law.
In order to be adopted, amendments of the Articles of Association of ArcelorMittal relating to the size and the requisite minimum number of independent and non-executive directors of the Board of Directors, the composition of the Audit & Risk Committee, and the nomination rights to the Board of Directors of the Significant Shareholder require a majority of votes representing two-thirds of the voting rights attached to the shares in ArcelorMittal. The same majority rule would apply to amendments of the provisions of the Articles of Association that set out the foregoing rule.
Annual accounts
Each year before submission to the annual ordinary general meeting of shareholders, the Board of Directors approves the parent company accounts for ArcelorMittal, the parent company of the ArcelorMittal group as well as the annual consolidated accounts of the ArcelorMittal group, each of which are prepared in accordance with IFRS. The Board of Directors also approves the management reports on each of the stand-alone audited annual accounts and the consolidated annual accounts, and in respect of each of these sets of accounts a report must be issued
Management report 59
by the independent auditors.
The annual accounts, the annual consolidated accounts, the management reports and the auditor’s reports will be available on request from the Company and on the Company’s website from the date of publication of the convening notice for the annual ordinary general meeting of shareholders.
The parent company accounts and the consolidated accounts, after their approval by the annual ordinary general meeting of shareholders, are filed with the Luxembourg register of trade and companies.
Dividends
Except for shares held in treasury by the Company, each ArcelorMittal share is entitled to participate equally in dividends if and when declared out of funds legally available for such purposes. The Articles of Association provide that the annual ordinary general meeting of shareholders may declare a dividend and that the Board of Directors may declare interim dividends within the limits set by Luxembourg law.
Declared and unpaid dividends held by ArcelorMittal for the account of its shareholders do not bear interest. Under Luxembourg law, claims for dividends lapse in favor of ArcelorMittal five years after the date on which the dividends have been declared.
Merger and division
A merger whereby the Luxembourg company being acquired transfers to an existing or newly incorporated Luxembourg company all of its assets and liabilities in exchange for the issuance to the shareholders of the company being acquired of shares in the acquiring company, and a division whereby a company (the company being divided) transfers all its assets and liabilities to two or more existing or newly incorporated companies in exchange for the issuance
of shares in the beneficiary companies to the shareholders of the company being divided or to such company, and certain similar restructurings must be approved by an extraordinary general meeting of shareholders of the relevant companies held in the presence of a notary. These transactions require the approval of at least two-thirds of the votes cast at a general meeting of shareholders of each of the companies where at least 50% of the share capital is represented upon first call, with no such quorum being required at a reconvened meeting.
Liquidation
In the event of the liquidation, dissolution or winding-up of ArcelorMittal, the assets remaining after allowing for the payment of all liabilities will be paid out to the shareholders pro rata to their respective shareholdings. The decision to liquidate, dissolve or wind-up requires the approval of at least two-thirds of the votes cast at a general meeting of shareholders where at first call at least 50% of the share capital is represented, with no quorum being required at a reconvened meeting. Irrespective of whether the liquidation is subject to a vote at the first or a subsequent extraordinary general meeting of shareholders, it requires the approval of at least two-thirds of the votes cast at the extraordinary general meeting of shareholders.
Mandatory bid, squeeze-out right, sell-out right
Mandatory bid. The Luxembourg law of May 19, 2006 implementing Directive 2004/25/EC of the European Parliament and the Council of April 21, 2004 on takeover bids ( the “Takeover Law”), provides that, if a person acting alone or in concert acquires securities of ArcelorMittal which, when added to any existing holdings of ArcelorMittal securities, give such person voting rights representing at least one third of all of the voting rights attached to the issued shares in ArcelorMittal,
this person is obliged to make an offer for the remaining shares in ArcelorMittal. In a mandatory bid situation the “fair price” is in principle considered to be the highest price paid by the offeror or a person acting in concert with the offeror for the securities during the 12–month period preceding the mandatory bid.
ArcelorMittal’s Articles of Association provide that any person who acquires shares giving them 25% or more of the total voting rights of ArcelorMittal must make or cause to be made, in each country where ArcelorMittal’s securities are admitted to trading on a regulated or other market and in each of the countries in which ArcelorMittal has made a public offering of its shares, an unconditional public offer of acquisition for cash to all shareholders for all of their shares and also to all holders of securities giving access to capital or linked to capital or whose rights are dependent on the profits of ArcelorMittal. The price offered must be fair and equitable and must be based on a report drawn up by a leading international financial institution or other internationally recognized expert.
Squeeze-out right. The Takeover Law provides that, when an offer (mandatory or voluntary) is made to all of the holders of voting securities of ArcelorMittal and after such offer the offeror holds at least 95% of the securities carrying voting rights and 95% of the voting rights, the offeror may require the holders of the remaining securities to sell those securities (of the same class) to the offeror. The price offered for such securities must be a fair price. The price offered in a voluntary offer would be considered a fair price in the squeeze-out proceedings if the offeror acquired at least 90% of the ArcelorMittal shares carrying voting rights that were the subject of the offer. The price paid in a mandatory offer is deemed a fair price. The consideration paid in the squeeze-out proceedings must take the same form as the
consideration offered in the offer or consist solely of cash. Moreover, an all-cash option must be offered to the remaining ArcelorMittal shareholders. Finally, the right to initiate squeeze-out proceedings must be exercised within three months following the expiration of the offer.
Sell-out right. The Takeover Law provides that, when an offer (mandatory or voluntary) is made to all of the holders of voting securities of ArcelorMittal and if after such offer the offeror holds securities carrying more than 90% of the voting rights, the remaining security holders may require that the offeror purchase the remaining securities of the same class. The price offered in a voluntary offer would be considered “fair” in the sell-out proceedings if the offeror acquired at least 90% of the ArcelorMittal shares carrying voting rights and which were the subject of the offer. The price paid in a mandatory offer is deemed a fair price. The consideration paid in the sell-out proceedings must take the same form as the consideration offered in the offer or consist solely of cash. Moreover, an all-cash option must be offered to the remaining ArcelorMittal shareholders. Finally, the right to initiate sell-out proceedings must be exercised within three months following the expiration of the offer.
Disclosure of significant ownership in ArcelorMittal shares
Holders of ArcelorMittal shares and derivatives or other financial instruments linked to ArcelorMittal shares may be subject to the notification obligations of the Luxembourg law of January 11, 2008 on transparency requirements regarding information about issuers whose securities are admitted to trading on a regulated market (the “Transparency Law”). The following description summarizes these obligations. ArcelorMittal shareholders are advised to consult with their own legal advisers to determine whether the

60 Management report
notification obligations apply to them.
The Transparency Law provides that, if a person acquires or disposes of a shareholding in ArcelorMittal, and if following the acquisition or disposal the proportion of voting rights held by the person reaches, exceeds or falls below one of the thresholds of 5%, 10%, 15%, 20%, 25%, one-third, 50% or two-thirds of the total voting rights existing when the situation giving rise to a declaration occurs, the relevant person must simultaneously notify ArcelorMittal and the CSSF (the Luxembourg securities regulator) of the proportion of voting rights held by it further to such event within four Luxembourg Stock Exchange trading days of the day of execution of the transaction triggering the threshold crossing.
A person must also notify ArcelorMittal of the proportion of his or her voting rights if that proportion reaches, exceeds or falls below the above mentioned thresholds as a result of events changing the breakdown of voting rights.
The above notification obligations also apply to persons who directly or indirectly hold financial instruments linked to ArcelorMittal shares.
ArcelorMittal’s Articles of Association also provide that the above disclosure obligations also apply to:
•any acquisition or disposal of shares resulting in the threshold of 2.5% of voting rights in ArcelorMittal being crossed upwards or downwards,
•any acquisition or disposal of shares resulting in the threshold of 3.0% of voting rights in ArcelorMittal being crossed upwards or downwards, and
•with respect to any shareholder holding at least 3.0% of the voting rights in ArcelorMittal, to any acquisition or disposal of shares resulting in successive
thresholds of 1% of voting rights being crossed upwards or downwards.
Any person who acquires shares giving him or her 5% or more or a multiple of 5% or more of the voting rights must inform ArcelorMittal within 10 Luxembourg Stock Exchange trading days following the date on which the threshold was crossed by registered letter with return receipt requested as to whether he or she intends to acquire or dispose of shares in ArcelorMittal within the next 12 months or intends to seek to obtain control over ArcelorMittal or to appoint a member to ArcelorMittal’s Board of Directors.
For the purposes of calculating the percentage of a shareholder’s voting rights in ArcelorMittal, the following are taken into account:
•voting rights held by a third party with whom that person or entity has concluded an agreement and which obliges them to adopt, by concerted exercise of the voting rights they hold, a lasting common policy towards ArcelorMittal;
•voting rights held by a third party under an agreement concluded with that person or entity providing for the temporary transfer for consideration of the voting rights in question;
•voting rights attaching to shares pledged as collateral with that person or entity, provided the person or entity controls the voting rights and declares its intention to exercise them;
•voting rights attaching to shares in which a person or entity holds a life interest;
•voting rights which are held or may be exercised within the meaning of the four foregoing points by an undertaking controlled by that person or entity;
•voting rights attaching to shares deposited with that person
or entity which the person or entity may exercise at its discretion in the absence of specific instructions from the shareholders;
•voting rights held by a third party in its own name on behalf of that person or entity; and
•voting rights which that person or entity may exercise as a proxy where the person or entity may exercise the voting rights in its sole discretion.
In addition, the Articles of Association provide that, for the purposes of calculating a person’s voting rights in ArcelorMittal, the voting rights attached to shares underlying any other financial instruments owned by that person (such as convertible notes) must be taken into account for purposes of the calculation described above.
Disclosure of insider dealing transactions
Members of the Board of Directors, the GMB, other executives fulfilling senior management responsibilities within ArcelorMittal and falling with the definition of “Persons Discharging Senior Managerial Responsibilities” set out below and persons closely associated with them must disclose to the Luxembourg securities regulator CSSF and to ArcelorMittal all transactions relating to shares of ArcelorMittal or derivatives or other financial instruments linked to shares of ArcelorMittal conducted by them or for their account.
“Persons Discharging Senior Managerial Responsibilities” within ArcelorMittal are the members of the Board of Directors, the Executives Officers, and other executives occupying a high level management position with regular access to non-public material information relating, directly or indirectly, to ArcelorMittal and have the authority to make management decisions about the future development of the Company and its business strategy. (see “Key transactions and events
in 2015” for a discussion of recent management changes). Persons closely associated with them include their respective family members.
Both information on trading in ArcelorMittal shares by “Persons Discharging Senior Managerial Responsibilities” and ArcelorMittal’s Insider Dealing Regulations are available on www.arcelormittal.com under “Investors, Corporate Governance, Share Transactions by Management”.
In 2015, four notifications were received by ArcelorMittal from such persons and filed with the CSSF.
Publication of regulated information
Since January 2009, disclosure to the public of “regulated information” (within the meaning of the Luxembourg Transparency Law) concerning ArcelorMittal has been made by publishing the information through the centralized regulated information filing and storage system managed by the Luxembourg Stock Exchange and accessible in English and French on www.bourse.lu, in addition to the publication by ArcelorMittal of the information by way of press release. All news and press releases issued by the Company are available on www.arcelormittal.com in the “News and Media” section.
Limitation of directors’ liability/indemnification of Officers and Directors
The Articles of Association of ArcelorMittal provide that ArcelorMittal will, to the broadest extent permitted by Luxembourg law, indemnify every director and every member of the GMB as well as every former director or member of the GMB for fees, costs and expenses reasonably incurred in the defense or resolution (including a settlement) of all legal actions or proceedings, whether civil, criminal or administrative, he or she has been involved in his
Management report 61
or her role as former or current director or member of the GMB.The right to indemnification does not exist in the case of gross negligence, fraud, fraudulent inducement, dishonesty or for a criminal offense, or if it is ultimately determined that the director or member of the GMB has not acted honestly, in good faith and with the reasonable belief that he or she was acting in the best interests of ArcelorMittal. Luxembourg takeover law disclosure
The following disclosure is provided based on article 11 of the Luxembourg law of 19 May 2006 transposing Directive 2004/25/EC of 21 April 2004 on takeover bids (the “Takeover Law”). The Articles of Association of the Company are available on www.arcelormittal.com, under Investors , Corporate Governance.
With regard to articles 11 (1) (a) and (c) of the Takeover Law, the Company has issued a single category of shares (ordinary shares), and the Company’s shareholding structure showing each shareholder owning 2.5% or more of the Company’s share capital is available elsewhere in this report and on www.arcelormittal. com under Investors, Corporate Governance, Shareholding Structure, where the shareholding structure chart is updated monthly.
With regard to article 11(1) (b) of the Takeover Law, the ordinary shares issued by the Company are listed on various stock exchanges including NYSE Euronext and are freely transferable.
With regard to article 11(1) (d), each ordinary share of the Company gives right to one vote, as set out in article 13.6 of the Articles of Association, and there are no special control rights attaching to the shares. Article 8 of the Articles of Association provides that the Mittal Shareholder (as defined in the Articles of Association) may, at its discretion,
exercise the right of proportional representation and nominate candidates for appointment to the Board of Directors (defined as “Mittal Shareholder Nominees”). The Mittal Shareholder has not, to date, exercised that right.
Articles 11(1) (e) and (f) of the Takeover Law are not applicable to the Company. However, the sanction of suspension of voting rights automatically applies, subject to limited exceptions set out in the Transparency Law (as defined below), to any shareholder (or group of shareholders) who has (or have) crossed the thresholds set out in article 7 of the Articles of Association and articles 8 to 15 of the Luxembourg law of 11 January 2008 on the transparency requirements regarding issuers of securities (the “Transparency Law”) but have not notified the Company accordingly. The sanction of suspension of voting rights will apply until such time as the notification has been properly made by the relevant shareholder(s).
Article 11(1) (g) of the Takeover Law is not applicable to the Company.
With regard to article 11(1) (h) of the Law, the Articles of Association provide that the directors are elected by annual general meeting of shareholders for a term that may not exceed three years, and may be re-elected. The rules governing amendments to the Articles of Association are described elsewhere in this report and are set out in article 19 of the Articles of Association.
With regard to article 11(1) (i) of the Takeover Law, the general meeting of shareholders held on May 05, 2015 granted the Board of Directors a new share buy-back authorization whereby the Board may authorize the acquisition or sale of Company shares including, but not limited to, entering into off-market and over-the-counter transactions and the acquisition of shares through derivative financial instruments. Any acquisitions, disposals,
exchanges, contributions or transfers of shares by the Company or other companies in the ArcelorMittal group must be in accordance with Luxembourg laws transposing Directive 2003/6/EC regarding insider dealing and market manipulation and EC Regulation 2273/2003 regarding exemptions for buy-back programs and stabilization of financial instruments and may be carried out by all means, on or off-market, including by a public offer to buy-back shares, or by the use of derivatives or option strategies. The fraction of the capital acquired or transferred in the form of a block of shares may amount to the entire program. Such transactions may be carried out at any time, including during a tender offer period, in accordance with applicable laws and regulations. Any share buy-backs on the New York Stock Exchange must be performed in compliance with Section 10(b) and Section 9(a)(2) of the U.S. Securities Exchange Act of 1934, as amended (the “Exchange Act”), and Rule 10b-5 promulgated under the Exchange Act. The authorization is valid for a period of five years, i.e., until the annual general meeting of shareholders to be held in May 2020, or until the date of its renewal by a resolution of the general meeting of shareholders if such renewal date is prior to the expiration the five-year period. The maximum number of own shares that the Company may hold at any time directly or indirectly may not have the effect of reducing its net assets (“actif net”) below the amount mentioned in paragraphs 1 and 2 of Article of the Law. The purchase price per share to be paid shall not represent more than 110% of the trading price of the shares on the New York Stock Exchange and on the Euronext markets where the Company is listed, the Luxembourg Stock Exchange or the Spanish stock exchanges of Barcelona, Bilbao, Madrid and Valencia, depending on the market on which the purchases are made, and no less than one cent. For off-market transactions, the maximum purchase price shall be 110% of the reference
price on the Euronext markets where the Company is listed. The reference price will be deemed to be the average of the final listing prices per share on the relevant stock exchange during 30 consecutive days on which the relevant stock exchange is open for trading preceding the three trading days prior to the date of purchase. In the event of a share capital increase by incorporation of reserves or issue premiums and the free allotment of shares as well as in the event of the division or regrouping of the shares, the purchase price indicated above shall be adjusted by a multiplying coefficient equal to the ratio between the number of shares comprising the issued share capital prior to the transaction and such number following the transaction. The total amount allocated for the Company’s share repurchase program may not in any event exceed the amount of the Company’s then available equity.Articles 11(1) (j) and (k) of the Takeover Law are not applicable to the Company.
Material contracts
The following are material contracts, not entered into in the ordinary course of business, to which ArcelorMittal has been a party during the past two years.
Share Lending Agreement
In connection with ArcelorMittal’s issuance of 104,477,612 ordinary shares in an offering that closed on January 14, 2013 (the “Share Offering”) and $2,250,000,000 aggregate principal amount of 6.00% Mandatorily Convertible Subordinated Notes due 2016 (the “MCNs”) in an offering that closed on January 16, 2013, the Company entered into a share lending agreement with Lumen on January 9, 2013, see “Major shareholders and related party transactions—Related party transactions” for a full description of the Share Lending Agreement.

62 Management report
ArcelorMittal Equity Incentive Plan and GMB PSU Plan
On May 10, 2011, the annual general shareholders’ meeting approved the ArcelorMittal Equity Incentive Plan, a new equity-based incentive plan that replaced the Global Stock Option Plan. The ArcelorMittal Equity Incentive Plan provides for the grant of RSUs and PSUs to eligible Company employees. On May 8, 2013, the annual general meeting of shareholders approved the GMB PSU Plan, which provides for the grant of PSUs to GMB members. Until the introduction of the GMB PSU Plan in 2013, GMB members were eligible to receive RSUs and PSUs under the ArcelorMittal Equity Incentive Plan. On May 5, 2015, the annual general meeting of shareholders approved, in particular, the number of shares that may be allocated for the grant of PSUs to the GMB members and for the grant of RSUs and PSUs to eligible employees under the ArcelorMittal Equity Incentive Plan at a maximum of 5,000,000 shares (the “2015 Cap”). Such authorization is valid from the date of that annual general meeting of shareholders until the annual general meeting of shareholders to be held in 2016. For further information about the terms of the ArcelorMittal Equity Incentive Plan and the GMB PSU Plan, see “—Compensation—Remuneration framework—Long-term incentives: Equity-based incentives (Share Unit Plans)”. Since 2011, the Company has made the following grants to employees under the ArcelorMittal Equity Incentive Plan: a grant of RSUs in September 2011, a grant of PSUs in March 2012, a grant of both RSUs and PSUs in March 2013, a grant of both RSUs and PSUs in September 2013 (the GMB members were excluded from the afore-mentioned 2013 grants in light of the creation of the GMB PSU Plan) a grant of both RSUs and PSUs in December 2014 and a new grant of both RSUs and PSUs in December 2015. Under the GMB PSU Plan, the Company has made grants of PSUs to the GMB members in June 2013, June 2014 and June 2015. Copies of the Supplemental Terms for
2015-2016 to the ArcelorMittal Equity Incentive Plan and the Supplemental Terms for 2015-2016 to the GMB PSU Plan are filed as exhibits to this annual report on Form 20-F.
Memorandum of Understanding
On June 25, 2006, Mittal Steel, the Significant Shareholder and Arcelor signed a binding Memorandum of Understanding (“MoU”) to combine Mittal Steel and Arcelor in order to create the world’s leading steel company. In April 2008, the Board of Directors approved resolutions amending certain provisions of the MoU in order to adapt it to the Company’s needs in the post-merger and post-integration phase, as described under “Board practices/Corporate governance, Operation, Lead Independent Director”.
On the basis of the MoU, Arcelor’s Board of Directors recommended Mittal Steel’s offer for Arcelor and the parties to the MoU agreed to certain corporate governance and other matters relating to the combined ArcelorMittal group. Certain provisions of the MoU relating to corporate governance were incorporated into the Articles of Association of ArcelorMittal at the extraordinary general meeting of the shareholders on November 5, 2007.
Certain additional provisions of the MoU expired effective August 1, 2009 and on August 1, 2011. ArcelorMittal’s corporate governance rules will continue to reflect, subject to those provisions of the MoU that have been incorporated into the Articles of Association, the best standards of corporate governance for comparable companies and to conform with the corporate governance aspects of the NYSE listing standards applicable to non-U.S. companies and Ten Principles of Corporate Governance of the Luxembourg Stock Exchange.
The following summarizes the main provisions of the MoU that remain in effect or were in effect in 2015.
Standstill
The Significant Shareholder agreed not to acquire, directly or indirectly, ownership or control of an amount of shares in the capital stock of the Company exceeding the percentage of shares in the Company that it will own or control following completion of the Offer (as defined in the MoU) for Arcelor and any subsequent offer or compulsory buy-out, except with the prior written consent of a majority of the independent directors on the Company’s Board of Directors. Any shares acquired in violation of this restriction will be deprived of voting rights and shall be promptly sold by the Significant Shareholder. Notwithstanding the above, if (and whenever) the Significant Shareholder holds, directly and indirectly, less than 45% of the then-issued Company shares, the Significant Shareholder may purchase (in the open market or otherwise) Company shares up to such 45% limit. In addition, the Significant Shareholder is also permitted to own and vote shares in excess of the threshold mentioned in the immediately preceding paragraph or the 45% limit mentioned above, if such ownership results from (1) subscription for shares or rights in proportion to its existing shareholding in the Company where other shareholders have not exercised the entirety of their rights or (2) any passive crossing of this threshold resulting from a reduction of the number of Company shares (e.g., through self-tender offers or share buy-backs) if, in respect of (2) only, the decisions to implement such measures were taken at a shareholders’ meeting in which the Significant Shareholder did not vote or by the Company’s Board of Directors with a majority of independent directors voting in favor.
Once the Significant Shareholder exceeds the threshold mentioned in the first paragraph of this “Standstill” subsection or the 45% limit, as the case may be, as a consequence of any corporate event set forth in (1) or (2) above, it shall not be permitted to increase the percentage of shares it owns
or controls in any way except as a result of subsequent occurrences of the corporate events described in (1) or (2) above, or with the prior written consent of a majority of the independent directors on the Company’s Board of Directors.
If subsequently the Significant Shareholder sells down below the threshold mentioned in the first paragraph of this “Standstill” subsection or the 45% limit, as the case may be, it shall not be permitted to exceed the threshold mentioned in the first paragraph of this “Standstill” subsection or the 45% limit, as the case may be, other than as a result of any corporate event set out in (1) or (2) above or with the prior written consent of a majority of the independent directors.
Finally, the Significant Shareholder is permitted to own and vote shares in excess of the threshold mentioned in the first paragraph of this “Standstill” subsection or the 45% limit mentioned above if it acquires the excess shares in the context of a takeover bid by a third party and (1) a majority of the independent directors of the Company’s Board of Directors consents in writing to such acquisition by the Significant Shareholder or (2) the Significant Shareholder acquires such shares in an offer for all of the shares of the Company.
Non-compete
For so long as the Significant Shareholder holds and controls at least 15% of the outstanding shares of the Company or has representatives on the Company’s Board of Directors or GMB, the Significant Shareholder and its affiliates will not be permitted to invest in, or carry on, any business competing with the Company, except for PT ISPAT Indo.
Additional information
ArcelorMittal produces a range of publications to inform its shareholders. These documents are available in various formats: they can be viewed online, downloaded or obtained on request in paper

Management report 63
format. Please refer to www.arcelormittal.com, to the Investors menu, under Financial Reports.
Sustainable development
ArcelorMittal’s sustainable development information is detailed in the online Annual Review that will be published during the second quarter of 2016 and available on http://annualreview2015.arcelormittal.com.
ArcelorMittal as parent companyof the ArcelorMittal group
ArcelorMittal, incorporated under the laws of Luxembourg, is the parent company of the ArcelorMittal group and is expected to continue this role during the coming years.
The Company has no branch offices.
Group companies listed on the Luxembourg Stock Exchange
ArcelorMittal’s securities are traded on several exchanges, including the Luxembourg Stock Exchange, and its primary stock exchange regulator is the Luxembourg CSSF (Commission de Surveillance du Secteur Financier). ArcelorMittal’s CSSF issuer number is E-0001. In addition to ArcelorMittal, the securities of one other ArcelorMittal group company are listed on the Luxembourg Stock exchange. ArcelorMittal Finance S.C.A. is a société en commandite par actions with registered office address at 24-26, boulevard d’Avranches, L-1160 Luxembourg, Grand Duchy of Luxembourg, registered with
the Registre du Commerce et des Sociétés Luxembourg under number B 13.240. ArcelorMittal Finance is indirectly 100% owned by ArcelorMittal group and, in this connection, it issued a number of bonds listed on the Luxembourg Stock Exchange. ArcelorMittal Finance’s CSSF issuer number is E-0025.
Other listings
ArcelorMittal is listed on the stock exchanges of New York (MT), Amsterdam (MT), Paris (MT), Luxembourg (MT) and on the Spanish stock exchanges of Barcelona, Bilbao, Madrid and Valencia (MTS).
Indexes
ArcelorMittal is a member of more than 120 indices including the following leading indices: DJ SOTXX 50, DJ EURO STOXX 50, CAC40, AEX, FTSE Eurotop 100, MSCI Pan-Euro, DJ Stoxx 600, S&P Europe 500, Bloomberg World Index, IBEX 35 index and NYSE Composite Index. Recognized for its commitments to sustainable development, ArcelorMittal is also a member of the FTSE4Good Index.
Share price performance
During 2015 the price of ArcelorMittal shares decreased by 62% in US dollar terms; underperforming the Global Metals, Mining & Steel sector which
decreased by 45% over the period. The Company’s share price declined in the second half of 2015 onwards as global markets reacted to falling international steel prices primarily due to increased Chinese exports at unsustainable margins.
Dividend
Considering the challenging global economic conditions, and the Company’s priority to deleverage, ArcelorMittal’s board of directors proposes, subject to approval at the next annual general meeting on May 4, 2016, not do declare any dividend in respect to the 2015
financial year.Once the deleverage plan is complete and market conditions improve, the board intends to restart the dividend distribution once the Net debt/EBITDA ratio <2.0x.
Investor relations
By implementing high standards of financial information disclosure and providing clear, regular, transparent and even-handed information to all its shareholders, ArcelorMittal aims to be the first choice for investors in the sector.
To meet this objective and provide information to fit the needs of all parties, ArcelorMittal implements an active and broad investor communications policy: conference calls, road shows with the financial community, regular participation at investor conferences, plant visits and meetings with individual investors.
Individual investors
ArcelorMittal’s senior management plans to meet individual investors and shareholder associations in road shows throughout 2016. A dedicated toll free number for
individual investors is available at +352 4792 3198. Requests for information or meeting and conference center may also be sent to the private investor contact listed on http://corporate.arcelormittal.com/investors/contact.
Analysts and institutional investors
As the world’s leading steel company and major investment vehicle in the steel sector, ArcelorMittal constantly seeks to develop relationships with financial analysts and international investors. Depending on their geographical location, investors may

64 Management report
use the following e-mails:http://corporate.arcelormittal.com/investors/contact
Socially responsible investors
The Investor Relations team is also a source of information for the growing socially responsible investment community. The team organises focus events on ArcelorMittal’s sustainable development strategy and answers all requests for information sent to the Group.
Credit and fixed income investors
Credit and fixed income investors are followed by dedicated team from Treasury/Investors [email protected]
Financial calendar
The schedule is available on ArcelorMittal’s website www.arcelormittal.com under Investor>Financial calendar.
Financial results*
February 5, 2016 - Results for the 4th quarter 2015 and 12 months 2015.
May 6, 2016 - Results for the 1st
quarter 2016.
July 29, 2016 - Results for the 2nd quarter 2016 and 6 months 2016.
November 9, 2016 - Results for the 3rd quarter 2016 and 9 months 2016.
*Earnings results are issued before the opening of the stock exchanges on which ArcelorMittal is listed.
Meeting of shareholders
March 10, 2016 – Extraordinary General Meeting of Shareholders.
May 4, 2016 – Annual General Meeting of Shareholders.
Contact the investor relations team on the information detailed above or please visit www.arcelormittal.com/corp/investors/contact.
Controls and procedures
Disclosure controls and procedures
Management maintains disclosure controls and procedures that are designed to ensure that information required to be disclosed in the Company’s reports under the Securities Exchange Act of 1934, as amended (the “Exchange Act”) is recorded, processed, summarized and reported within time periods specified in the SEC’s rules and forms, and that such information is accumulated and communicated to management, including the Chief Executive Officer and Chief Financial Officer, as appropriate, to allow timely decisions regarding required disclosures. ArcelorMittal’s controls and procedures are designed to provide reasonable assurance of achieving their objectives.
Management carried out an evaluation, under the supervision and with the participation of its Chief Executive Officer and Chief Financial Officer, of the effectiveness of the design and operation of the Company’s disclosure controls and procedures (as defined in Exchange Act Rule 13a-15(e)) as of December 31, 2015. Based upon that evaluation, the Company’s Chief Executive Officer and Chief Financial Officer concluded that the Company’s disclosure controls and procedures were effective as of December 31, 2015 so as to provide reasonable assurance that (1) information required to be disclosed by the Company in the reports that the Company files under the Exchange Act is recorded, processed, summarized and reported within the time periods specified in the SEC’s rules and forms, and (2) that such information is accumulated and communicated to the Company’s management, including its Chief Executive Officer and its Chief Financial Officer, as appropriate, to allow timely decisions regarding required disclosures.
There are inherent limitations to the effectiveness of any system of disclosure controls and procedures, including the possibility of human error and the circumvention or overriding of the controls and procedures. Accordingly, even effective disclosure controls and
procedures can only provide reasonable assurance of achieving their control objectives.
Management’s Annual Report on Internal Control Over Financial Reporting
Management is responsible for establishing and maintaining adequate internal control over financial reporting. Internal control over financial reporting is a process designed to provide reasonable assurance regarding the reliability of financial reporting and the preparation of financial statements for external purposes in accordance with generally accepted accounting principles.
The Company’s internal control over financial reporting includes those policies and procedures that:
•pertain to the maintenance of records that, in reasonable detail, accurately and fairly reflect the transactions and dispositions of the assets of ArcelorMittal;
•provide reasonable assurance that transactions are recorded, as necessary, to permit preparation of financial statements in accordance with IFRS;
•provide reasonable assurance that receipts and expenditures of ArcelorMittal are made in accordance with authorizations of ArcelorMittal’s management and directors; and
•provide reasonable assurance that unauthorized acquisition, use or disposition of ArcelorMittal’s assets that could have a material effect on the financial statements would be prevented or detected on a timely basis.
Because of its inherent limitations, internal control over financial reporting is not intended to provide absolute assurance that a misstatement of the Company’s financial statements would be prevented or detected. In addition, projections of any evaluation of effectiveness to future periods are subject to the risk that controls may become inadequate because of changes in conditions, or that the degree of compliance with the policies or procedures may
deteriorate.Management assessed the effectiveness of internal control over financial reporting as of December 31, 2015 based upon the framework in Internal Control Integrated Framework (2013) issued by the Committee of Sponsoring Organizations of the Treadway Commission (“COSO”). Based on this assessment, management concluded that ArcelorMittal’s internal control over financial reporting was effective as of December 31, 2015.
Changes in Internal Control over Financial Reporting
Except as described below, there have been no changes in the Company’s internal control over financial reporting that occurred during the year ending December 31, 2015 that have materially affected or are reasonably likely to materially affect the Company’s internal control over financial reporting.
The Company re-insourced significant parts of the European IT- infrastructure (i.e. servers, network, databases) and related general IT controls which had previously been outsourced to a third-party service provider. The outsourcing agreement had covered the management of the Company’s IT infrastructure i.e. servers, network, databases) including the data centers in Europe, whereas the management of business applications, including those applications used for the purposes of processing financial reporting relevant data were excluded from the outsourcing agreement. Following the re-insourcing the management of the European IT-infrastructure and related controls is now under the responsibility of the business. The Company believes that the re-sourcing will enhance the efficiency and effectiveness of the Company’s IT-Infrastructure, as well as related controls. On a smaller scale, the Company is outsourcing parts of its IT Infrastructure to local service providers. The Company does not anticipate that this limited local outsourcing will materially impact internal controls over financial reporting.

Management report 65
Chief executive officer
Lakshmi N. Mittal
February 23, 2016
Chief financial officer
Aditya Mittal
February 23, 2016
Chief executive officer and chief financial officer’s responsibility statement
We confirm, to the best of our knowledge, that:
1. the consolidated financial statements of ArcelorMittal presented in this Annual Report and prepared in conformity with International Financial Reporting Standards as issued by the International Accounting Standards Board and as adopted by the European Union, give a true and fair view of the assets, liabilities, financial position, profit or loss of ArcelorMittal and the undertakings included within the consolidation taken as a whole; and
2. the management report includes a fair review of the development and performance of the business and position of ArcelorMittal and undertakings included within the consolidation taken as a whole, together with a description of the principal risks and uncertainties they face.
By order of the Board of Directors

66 Consolidated financial statements
Consolidated financial statements

Consolidated financial statements 67
NotesYear ended
December 31, 2015Year ended
December 31, 2014Year ended
December 31, 2013
Sales (including 6,124, 6,606 and 4,770 of sales to related parties for 2015, 2014 and 2013, respectively) 4.1 63,578 79,282 79,440Cost of sales (including 1,460, 1,355 and 1,310 of purchases from related parties for 2015, 2014 and 2013, respectively) 4.2 65,196 73,288 75,247Gross margin (1,618) 5,994 4,193Selling, general and administrative expenses 2,543 2,960 2,996Operating income (loss) (4,161) 3,034 1,197Income (loss) from investments in associates, joint ventures and other investments 2.6 (502) (172) (442)Financing costs - net 6.2 (2,858) (3,382) (3,115)Income (loss) before taxes (7,521) (520) (2,360)Income tax expense 9.1 902 454 215Net income (loss) (including non-controlling interests) (8,423) (974) (2,575)Net income (loss) attributable to equity holders of the parent (7,946) (1,086) (2,545)Net income (loss) attributable to non-controlling interests (477) 112 (30)Net income (loss) (including non-controlling interests) (8,423) (974) (2,575)
Year ended December 31, 2015
Year ended December 31, 2014
Year ended December 31, 2013
Earnings (loss) per common share (in U.S. dollars) Basic and diluted (4.43) (0.61) (1.46)Weighted average common shares outstanding (in millions) 10.3Basic and diluted 1,795 1,791 1,780
The accompanying notes are an integral part of these consolidated financial statements.
ArcelorMittal and subsidiariesConsolidated statements of operations(millions of U.S. dollars, except share and per share data)

68 Consolidated financial statements
ArcelorMittal and subsidiariesConsolidated statements of operations(millions of U.S. dollars, except share and per share data)
Year ended December 31, 2015
Year ended December 31, 2014
Year ended December 31, 2013
Net income (loss) (including non-controlling interests) (8,423) (974) (2,575)Items that can be recycled to the consolidated statements of operationsAvailable-for-sale investments: Gain (loss) arising during the period (439) 449 (34) Reclassification adjustments for loss (gain) included in the consolidated statements of operations 70 44 100 (369) 493 66 Derivative financial instruments: Gain (loss) arising during the period 107 181 (25) Reclassification adjustments for loss (gain) included in the consolidated statements of operations (93) (2) (120) 14 179 (145) Exchange differences arising on translation of foreign operations: Gain (loss) arising during the period (7,876) (4,198) (965) Reclassification adjustments for loss (gain) included in the consolidated statements of operations (11) (55) (25) (7,887) (4,253) (990) Share of other comprehensive income (loss) related to associates and joint ventures Gain (loss) arising during the period (666) (601) 2 Reclassification adjustments for (gain) loss included in the consolidated statements of operations 4 (61) -
(662) (662) 2Income tax benefit (expense) related to components of other comprehensive income (loss) that can be recycled to the consolidated statements of operations 79 (11) 114 Items that cannot be recycled to the consolidated statements of operations Employee benefits Recognized actuarial gains (losses) 24 (1,531) 2,206 Share of other comprehensive income (loss) related to associates and joint ventures (36) 4 (13) Income tax benefit (loss) related to components of other comprehensive income that cannot be recycled to the consolidated statements of operations (47) 94 (155) Total other comprehensive income (loss) (8,884) (5,687) 1,085 Total other comprehensive income (loss) attributable to: Equity holders of the parent (8,554) (5,536) 1,314 Non-controlling interests (330) (151) (229) (8,884) (5,687) 1,085Total comprehensive income (loss) (17,307) (6,661) (1,490)Total comprehensive income (loss) attributable to: Equity holders of the parent (16,500) (6,622) (1,231) Non-controlling interests (807) (39) (259)Total comprehensive income (loss) (17,307) (6,661) (1,490)
The accompanying notes are an integral part of these consolidated financial statements.

Consolidated financial statements 69
ArcelorMittal and subsidiariesConsolidated statements of financial position(millions of U.S. dollars, except share and per share data)
Assets Notes December 31, 2015 December 31, 2014
Current assets: Cash and cash equivalents 6.1.3 4,002 3,893Restricted cash 6.1.3 100 123Trade accounts receivable and other (including 216 and 469 from related parties at December 31, 2015 and 2014, respectively) 4.3 and 11.1 2,679 3,696Inventories 4.4 13,424 17,304Prepaid expenses and other current assets 4.5 1,859 2,627Assets held for sale 2.3 262 414Total current assets 22,326 28,057Non-current assets: Goodwill and intangible assets 5.1 5,592 8,104Biological assets 5.4 80 128Property, plant and equipment 5.2 35,700 46,465Investments in associates and joint ventures 2.4 4,911 5,833Other investments 2.5 692 1,202Deferred tax assets 9.4 6,625 7,962Other assets 4.6 920 1,428Total non-current assets 54,520 71,122Total assets 76,846 99,179
Liabilities and equity Notes December 31, 2015 December 31, 2014
Current liabilities:Short-term debt and current portion of long-term debt 6.1.2.1 2,308 2,522Trade accounts payable and other (including 256 and 290 to related parties at December 31, 2015 and 2014, respectively) 4.7 and 11.2 8,977 11,450Short-term provisions 8.1 770 1,024Accrued expenses and other liabilities 4.8 5,633 5,740Income tax liabilities 133 230Liabilities held for sale 2.3 220 157Total current liabilities 18,041 21,123Non-current liabilities: Long-term debt, net of current portion 6.1.2.2 17,478 17,275 Deferred tax liabilities 9.4 2,496 3,004Deferred employee benefits 7.2 9,216 10,074Long-term provisions 8.1 1,434 1,587Other long-term obligations 611 956Total non-current liabilities 31,235 32,896Total liabilities 49,276 54,019Contingencies and commitments 8.2 and 8.3 Equity: 10 Common shares (no par value, 1,995,857,213 and 1,995,857,213 shares authorized, 1,665,392,222 and 1,665,392,222 shares issued, and 1,656,811,132 and 1,654,373,809 shares outstanding at December 31, 2015 and 2014, respectively) 10,011 10,011Treasury shares (8,581,090 and 11,018,413 common shares at December 31, 2015 and 2014, respectively, at cost) (377) (399)Additional paid-in capital 20,294 20,258Mandatorily convertible notes 1,800 1,838Retained earnings 13,902 22,182Reserves (20,358) (11,804)Equity attributable to the equity holders of the parent 25,272 42,086Non-controlling interests 2,298 3,074Total equity 27,570 45,160Total liabilities and equity 76,846 99,179
The accompanying notes are an integral part of these consolidated financial statements.

70 Consolidated financial statements
Reserves
Items that can be recycled to the Consolidated Statements of Operations
Items that cannot be
recycled to the
Consolidated Statements
of Operations
Shares 1, 2Share
capitalTreasury
shares
Subordinated perpetual
capital securities
Mandatorily convertible
notes
Additional paid-in capital
Retained earnings
Foreign currency
translation adjustments
Unrealized gains
(losses) on derivative
financial instruments
Unrealized gains
(losses) on available
for sale securities
Recognized actuarial
(losses) gains
Equity attributable
to the equity
holders of the parent
Non-controlling
interests Total equity
Balance at December 31, 2012 1,549 9,403 (414) 650 - 19,082 26,186 (2,244) (214) (173) (5,260) 47,016 3,450 50,466 Net loss (including non-controlling interests) - - - - - - (2,545) - - - - (2,545) (30) (2,575)Other comprehensive income (loss) - - - - - - - (666) (110) 68 2,022 1,314 (229) 1,085Total comprehensive income (loss) - - - - - - (2,545) (666) (110) 68 2,022 (1,231) (259) (1,490)Offering of common shares 105 608 - - - 1,148 - - - - - 1,756 - 1,756 Mandatorily convertible notes - - - - 1,838 - - - - - - 1,838 - 1,838 Baffinland dilution - - - - - - - - - - - - (208) (208)Other changes in non-controlling interests (note 10.5) - - - - - - 722 - - - - 722 402 1,124Recognition of share based payments - - - - - 18 - - - - - 18 - 18Dividend (note 10.4) - - - - - - (332) - - (332) (23) (355)Coupon on subordinated perpetual capital securities - - - - - - (57) - - (57) - (57)Other movements - - - - - - 63 - - - - 63 18 81 Balance at December 31, 2013 1,654 10,011 (414) 650 1,838 20,248 24,037 (2,910) (324) (105) (3,238) 49,793 3,380 53,173 Net loss (including non-controlling interests) - - - - - - (1,086) - - - (1,086) 112 (974)Other comprehensive income (loss) - - - - - - - (4,717) (104) 510 (1,433) (5,536) (151) (5,687) Total comprehensive income (loss) - - - - - - (1,086) (4,717) (104) 510 (1,433) (6,622) (39) (6,661)Redemption of subordinated perpetual capital securities - - - (650) - - (7) - - - (657) - (657) Option premiums on treasury shares (note 10.2) - - - - - - (309) - 309 - - - - - Mandatory convertible bonds extension (note 10.2) - - - - - - - - - - - - (47) (47)Other changes in non-controlling interests (note 10.5) - - - - - - (34) - - - - (34) (75) (109) Recognition of share based payments - - 15 - - 10 - - - - - 25 - 25 Dividend (note 10.4) - - - - - - (333) - - - - (333) (118) (451)Coupon on subordinated perpetual capital securities - - - - - (22) - - - - (22) - (22)Other movements - - - - - - (64) - - - - (64) (27) (91) Balance at December 31, 2014 1,654 10,011 (399) - 1,838 20,258 22,182 (7,627) 89 405 (4,671) 42,086 3,074 45,160 Net loss (including non-controlling interests) - - - - - - (7,946) - - - (7,946) (477) (8,423)Other comprehensive income (loss) - - - - - - - (8,166) 25 (354) (59) (8,554) (330) (8,884)Total comprehensive income (loss) - - - - - - (7,946) (8,166) 25 (354) (59) (16,500) (807) (17,307)Other changes in non-controlling interests (note 10.5) - - - - - - - - - - - 148 (148)Recognition of share based payments - - 4 - - 16 - - - - - 20 - 20 Voluntary conversion of mandatorily convertible notes (note 10.2) 3 - 18 - (38) 20 - - - - - - - -Mandatory convertible bonds extension (note 10.2) - - - - - - - - - - - - (20) (20)Dividend (note 10.4) - - - - - - (331) - - - - (331) (86) (417)Other movements - - - - - - (3) - - - - (3) (11) (14)Balance at December 31, 2015 1,657 10,011 (377) - 1,800 20,294 13,902 (15,793) 114 51 (4,730) 25,272 2,298 27,570
1 Excludes treasury shares2 In millions of shares
ArcelorMittal and subsidiariesConsolidated statements of changes in equity(millions of U.S. dollars, except share and per share data)
The accompanying notes are an integral part of these consolidated financial statements.

Consolidated financial statements 71
NotesYear ended
December 31, 2015Year ended
December 31, 2014Year ended
December 31, 2013
Operating activities:Net income (loss) (including non-controlling interests) (8,423) (974) (2,575)
Adjustments to reconcile net income to net cash provided by operations:Depreciation and amortization 5.1,5.2,5.4 3,192 3,939 4,695 Impairment 5.1,5.2,5.3 4,764 264 444 Interest expense 6.2 1,383 1,565 1,890 Interest income 6.2 (105) (96) (113)Income tax (benefit) expense 9.1 902 454 215 Provisions for labor agreements and separation plans 37 90 361 Recycling of deferred gain on raw material hedges - - (92) Net gain on disposal of subsidiaries and net assets (72) (192) (28) (Income) loss from investments in associates, joint ventures and other investments 2.6 502 172 442 Provision on pensions and OPEB 7.2 558 591 670 Change in fair value adjustment on conversion options on the euro convertible bond, call options on ArcelorMittal shares and Mandatory Convertible Bonds 6.2 108 (112) 12 Income tax amnesty expenses 6.2 - 161 80Unrealized foreign exchange effects 425 413 341 Write-downs (recoveries) of inventories to net realizable value, provisions and other non-cash operating expenses net 746 398 (134)
Changes in assets and liabilities that provided (required) cash, net of acquisitions:Trade accounts receivable 335 537 115 Inventories 925 (122) (609)Trade accounts payable (1,291) (47) 1,258 Interest paid (1,561) (1,713) (1,967)Interest received 89 97 106 Income taxes paid (398) (337) (102)Dividends received from associates, joint ventures and other investments 227 209 219
Cash contributions to plan assets and benefits paid for pensions and OPEB 7.2 (556) (674) (709)VAT and other amount received (paid) from/to public authorities 166 (112) (14)Other working capital and provisions movements 198 (641) (209)Net cash provided by operating activities 2,151 3,870 4,296
Investing activities:Purchase of property, plant and equipment and intangibles (includes cash outflows in connection with exploration/evaluation activities of nil, nil and 2 respectively, in 2015, 2014 and 2013, respectively) (2,707) (3,665) (3,452)Disposal (acquisition) of net assets of subsidiaries, net of cash disposed of (10), (85) and (48) in 2015, 2014 and 2013, respectively 2.3 - 232 34 Acquisition of associates and joint ventures 2.4 - (258) (173)Disposals of financial assets 195 532 511 Other investing activities net 342 82 203 Net cash used in investing activities (2,170) (3,077) (2,877)
Financing activities: Payments of subordinated perpetual capital securities 10.2 - (657) - (Acquisition) disposal of non-controlling interests 10.5.2 - (17) 1,100 Proceeds from short-term debt 543 1,855 1,172 Proceeds from long-term debt 3,256 2,419 76
Payments of short-term debt (2,490) (4,545) (4,696)Payments of long-term debt (501) (1,282) (846)Proceeds from mandatorily convertible notes 10.2 - - 2,222 Common stock offering - - 1,756 Dividends paid (includes 85, 108 and 26 of dividends paid to non-controlling shareholders in 2015, 2014 and 2013 respectively) (416) (458) (415)Other financing activities net 3 (65) (128)Net cash (used in) provided by financing activities 395 (2,750) 241 Effect of exchange rate changes on cash (267) (230) 19 Net increase (decrease) in cash and cash equivalents 109 (2,187) 1,679
Cash and cash equivalents:At the beginning of the year 3,893 6,072 4,402 Reclassification of the period-end cash and cash equivalent (to) from held for sale 2.3 - 8 (9)At the end of the year 4,002 3,893 6,072
ArcelorMittal and subsidiariesConsolidated statements of cash flows (millions of U.S. dollars, except share and per share data)
The accompanying notes are an integral part of these consolidated financial statements.

72 Consolidated financial statements
Summary of notes to consolidated financial statements
Note 1: Accounting principles 1.1 Basis of presentation1.2 Use of estimates1.3 Accounting standards applied
Note 2: Scope of consolidation2.1 Basis of consolidation 2.2 Investments in subsidiaries2.3 Assets held for sale and divestments2.4 Investment in associates and joint arrangements2.5 Other investments2.6 Income (loss) from investments in associates, joint ventures and other
investments
Note 3: Segment reporting 3.1 Reportable segments 3.2 Geographical information 3.3 Sales by type of products
Note 4: Other operating data4.1 Revenue4.2 Cost of sales4.3 Trade accounts receivable and other4.4 Inventories4.5 Prepaid expenses and other current assets4.6 Other assets4.7 Trade accounts payable and other4.8 Accrued expenses and other liabilities
Note 5: Goodwill, intangible and tangible assets5.1 Goodwill and intangible assets 5.2 Property, plant and equipment5.3 Impairment of intangible assets, including goodwill, and tangible assets 5.4 Biological assets
Note 6: Financing and financial instruments6.1 Financial assets and liabilities6.2 Financing costs6.3 Risk management policy
Note 7: Personnel expenses and employee benefits7.1 Employees and key management personnel7.2 Deferred employee benefits7.3 Share-based payments
Note 8: Provisions, contingencies and commitments8.1 Provisions overview8.2 Environmental liabilities and legal proceedings8.3 Commitments
Note 9: Income taxes9.1 Income tax expense (benefit) 9.2 Income tax recorded directly in equity9.3 Uncertain tax positions 9.4 Deferred tax assets and liabilities 9.5 Tax losses, tax credits and other tax benefits carried forward
Note 10: Equity10.1 Share details 10.2 Equity and hybrid instruments10.3 Earnings per common share 10.4 Dividends 10.5 Non-controlling interests
Note 11: Related parties11.1 Sales and trade receivables 11.2 Purchases and trade payables11.3 Other transactions with related parties
Note 12: Principal accountant fees and services

Consolidated financial statements 73
Note 1: Accounting Principles
ArcelorMittal (“ArcelorMittal” or the “Company”), together with its subsidiaries, owns and operates steel manufacturing and mining facilities in Europe, North and South America, Asia and Africa. Collectively, these subsidiaries and facilities are referred to in the consolidated financial statements as the “operating subsidiaries”. These consolidated financial statements were authorized for issuance on February 23, 2016 by the Company’s Board of Directors.
1.1 Basis of presentation
The consolidated financial statements have been prepared on a historical cost basis, except for available-for-sale financial assets, derivative financial instruments, biological assets and certain assets and liabilities held for sale, which are measured at fair value less cost to sell, inventories, which are measured at the lower of net realizable value or cost and the financial statements of the Company’s Venezuelan operations, for which hyperinflationary accounting is applied (see note 2.2.2.). The consolidated financial statements have been prepared in accordance with International Financial Reporting Standards (“IFRS”) as issued by the International Accounting Standards Board (“IASB”) and as adopted by the European Union and are presented in U.S. dollars with all amounts rounded to the nearest million, except for share and per share data.
1.2 Use of estimates
The preparation of consolidated financial statements in conformity with IFRS recognition and measurement principles and, in particular, making the critical accounting judgments require the use of estimates and assumptions that affect the reported amounts of assets, liabilities, revenues and expenses. Management reviews its estimates on an ongoing basis using currently available information. Changes in facts and
circumstances or obtaining new information or more experience may result in revised estimates, and actual results could differ from those estimates.
1.3 Accounting standards applied
1.3.1 Adoption of new amendments to IFRS applicable in 2015
On January 1, 2015, the Company adopted the following amendments which did not have a material impact on the financial statements of the Company:
• Amendments to IAS 19 “Employee Benefits”, published on November 21, 2013, clarify the requirements that relate to how contributions from employees or third parties that are linked to service should be attributed to periods of service.
• Annual Improvements 2010-2012 published by the IASB on December 12, 2013 as part of its annual improvements process made amendments to the following standards:
o IFRS 2 “Share-based Payment”, amends the definition of vesting condition and market condition and adds definitions for performance condition and service condition
o IFRS 3 “Business Combinations”, provides additional guidance for accounting for contingent consideration in a business combination
o IFRS 8 “Operating Segments”, provides clarification of the requirements for the aggregation of operating segments and the
reconciliation of the total of the reportable segments’ assets to the entity’s assets
o IFRS 13 “Fair Value Measurement”, provides additional guidance for the measurement of short-term receivables and payables
o IAS 16 “Property, Plant and Equipment”, provides additional guidance for the proportionate restatement of accumulated depreciation when the revaluation method is applied
o IAS 24 “Related Party Disclosure”, provides additional guidance for the definition of key management personnel
o IAS 38 “Intangible Assets”, provides additional guidance for the proportionate restatement of accumulated depreciation when the revaluation method is applied
• Annual Improvements 2011-2013 published by the IASB on December 12, 2013 as part of its annual improvements process made amendments to the following standards:
o IFRS 1 “First-time Adoption of International Financial Reporting Standards”, provides additional guidance for the effectiveness of IFRSs
o IFRS 3 “Business Combinations”, clarifies the scope of the exception for joint arrangements
o IFRS 13 “Fair Value Measurement”, clarifies the scope of the portfolio exception
o IAS 40 “Investment Property”, provides clarification of the interrelationship of IFRS 3 and IAS 40 when classifying property as investment property or owner-occupied property
1.3.2 New IFRS standards and amendments applicable from 2016 onward
On May 6, 2014, the IASB published amendments to IFRS 11 “Joint Arrangements”. The amendments clarify the accounting for acquisitions of an interest in a joint operation when the operation constitutes a business. The amendments are effective
for annual periods beginning on or after January 1, 2016, with early application permitted. The Company does not expect that the adoption of these new amendments will have a material impact to its consolidated financial statements.
On May 12, 2014, the IASB published amendments to IAS 16 “Property, Plant and Equipment” and IAS 38 “Intangible Assets”. The IASB clarified that the use of revenue-based methods to calculate the depreciation of an asset is not appropriate because revenue generated by an activity that includes the use of an asset generally reflects factors other than the consumption of the economic benefits embodied in the asset. The IASB also clarified that revenue is generally presumed to be an inappropriate basis for measuring the consumption of the economic benefits embodied in an intangible asset. This presumption, however, can be rebutted in certain limited circumstances. The amendments are effective for annual periods beginning on or after January 1, 2016, with early application permitted. The Company does not expect that the adoption of these new amendments will have a material impact to its consolidated financial statements.
On June 30, 2014, the IASB issued amendments to IAS 16 and IAS 41 “Agriculture” which changes the financial reporting for bearer plants, such as grape vines, rubber trees and oil palms. The IASB decided that bearer plants should be accounted for and measured after initial recognition on a cost or revaluation basis in accordance with IAS 16, because their operation is similar to that of manufacturing. Consequently, the amendments include them within the scope of IAS 16, instead of IAS 41. The produce growing on bearer plants will remain within the scope of IAS 41. The amendments are effective for annual periods beginning on or after January 1, 2016, with early application permitted. The adoption of these amendments will not have a
74 Consolidated financial statements
material impact to the Company’s consolidated financial statements.
On August 12, 2014, the IASB published amendments to IAS 27 which will allow entities to use the equity method to account for investments in subsidiaries, joint ventures and associates in their separate financial statements. These amendments are effective for annual periods beginning on or after January 1, 2016, with early application permitted. The adoption of these new amendments will not have an impact on the consolidated financial statements of the Company as they apply to separate financial statements.
On September 25, 2014, the IASB issued Annual Improvements 2012-2014 to make amendments to the following standards:
• IFRS 5 “Non-current Assets Held for Sale and Discontinued Operations” introduces guidance relating to changes in methods of disposal,
• IFRS 7 “Financial Instruments: Disclosures” provides additional guidance to clarify whether a servicing contract is continuing involvement in a transferred asset and clarifies the applicability of the amendments to IFRS 7 on offsetting disclosure to condensed interim financial statements,
• IAS 19, clarifies determination of the discount rate in a regional market sharing the same currency,
• IAS 34 “Interim Financial Reporting” clarifies the meaning of ‘elsewhere in the interim report’ and the requirements relating to cross-reference disclosure in the interim financial report.
The amendments will be effective from annual periods commencing on or after January 1, 2016, with early application permitted. The Company does not expect that the adoption of these new
amendments will have a material impact to its consolidated financial statements.
On December 18, 2014, the IASB also issued amendments to IAS 1 “Presentation of Financial Statements” which clarify various presentation and disclosure requirements related to materiality, subtotals, disaggregation and accounting policies. These amendments are effective for annual periods beginning on or after January 1, 2016, with early application permitted. The adoption of these new amendments will not have a material impact on the consolidated financial statements of the Company.
The Company does not plan to early adopt the new accounting standards and amendments.
1.3.3 New IFRS standards and amendments not yet endorsed by the European Union
On January 30, 2014, the IASB issued IFRS 14 “Regulatory Deferral Accounts”. The aim of this standard is to enhance the comparability of financial reporting by entities that are engaged in rate-regulated activities. This standard is effective for annual periods beginning on or after January 1, 2016, with early application permitted. The adoption of this new standard will not have an impact on the consolidated financial statements of the Company as it applies to IFRS first-time adopters.
On May 28, 2014, the IASB issued IFRS 15 “Revenue from Contracts with Customers” which provides a unified framework for determining the timing, measurement and recognition of revenue. The focus of the new standard is to recognize revenue as performance obligations are met rather than based on the transfer of risks and rewards. IFRS 15 includes a comprehensive set of disclosure requirements including qualitative and quantitative information about contracts with customers to understand the nature, amount, timing and uncertainty of revenue.
The standard supersedes IAS 18 “Revenue”, IAS 11 “Construction Contracts” and a number of revenue-related interpretations. On September 11, 2015, the IASB issued an amendment formalizing a one-year deferral of the effective date for annual periods beginning on or after January 1, 2018, with early application permitted. The Company’s revenue is predominantly derived from the sale of goods under arrangements in which the transfer of risks and rewards of ownership and the fulfillment of the Company’s performance obligations occur at the same time. Therefore, the Company does not expect that the adoption of this new standard will have a material impact to its consolidated financial statements.
On July 24, 2014, the IASB issued the final version of IFRS 9 “Financial Instruments (2014)” which replaces IAS 39, bringing together the classification and measurement, impairment and hedge accounting. The final version of the standard contains requirements in the following areas:
• Classification and measurement: Financial assets are classified and measured by reference to the business model within which they are held and their contractual cash flow characteristics. Financial liabilities are classified in a similar manner to IAS 39, however there are differences in the requirements regarding the measurement of an entity’s own credit risk.
• Impairment: The standard introduces an ‘expected credit loss’ model for the measurement of the impairment of financial assets; it is therefore no longer necessary for a credit event to have occurred before a credit loss is recognized.
• Hedge accounting: The standard introduces a new hedge accounting model that is designed to be more closely aligned with how entities undertake risk management
activities when hedging financial and non-financial risk exposures
• Derecognition: The requirements for derecognition of financial assets and liabilities are carried forward from IAS 39.
IFRS 9 is effective for annual periods beginning on or after January 1, 2018, with early application permitted. The Company does not expect that the adoption of this new standard will have a material impact to its consolidated financial statements.
On September 11, 2014, the IASB issued amendments to IFRS 10 and IAS 28 “Investments in Associates and Joint Ventures” which address an inconsistency between the requirements in IFRS 10 and those in IAS 28 in dealing with the sale or contribution of assets between an investor and its associate or joint venture. The amendments set out that a full gain or loss is recognized when the assets constitute a business or a partial gain or loss is recognized when the assets do not constitute a business. On December 17, 2015, the IASB issued an amendment formalizing the deferral of these amendments indefinitely. The Company does not expect that the adoption of these new amendments will have a material impact to its consolidated financial statements.
On December 18, 2014, the IASB issued amendments to IFRS 10, IFRS 12 and IAS 28 which clarify the scope and measurement method regarding consolidation and disclosure of investment entities. These amendments are effective for annual periods beginning on or after January 1, 2016, with early application permitted. The adoption of these new amendments will not have an impact on the consolidated financial statements of the Company as they apply to investment entities.
On January 13, 2016, the IASB issued IFRS 16 “Leases” which will replace IAS 17 “Leases”. This
Consolidated financial statements 75
new standard specifies how to recognize, measure, present and disclose leases. The standard provides a single lessee accounting model, requiring lessees to recognize assets and liabilities for all leases unless the lease term is 12 months or less or the underlying asset has a low value. This standard is effective for annual periods beginning on or after January 1, 2019, with early application permitted if IFRS 15 has also been applied. The Company is still in the process of assessing whether there will be a material change to its consolidated financial statements upon adoption of this new standard.
On January 19, 2016, the IASB issued amendments to IAS 12 “Income Taxes”. These amendments clarify how to account for deferred tax assets related to debt instruments measured at fair value and how to recognize deferred tax assets for unrealized losses. These amendments are effective for annual periods beginning on or after January 1, 2017, with early application permitted. The Company is still in the process of assessing whether there will be a material change to its consolidated financial statements upon adoption of these new amendments.
Note 2: Scope of Consolidation
2.1 Basis of consolidation
The consolidated financial statements include the accounts of the Company, its subsidiaries and its interests in associated companies and joint arrangements. Subsidiaries are consolidated from the date the Company obtains control (ordinarily the date of acquisition) until the date control ceases. The Company controls an entity when it is exposed to or has rights to variable returns from its involvement with the entity and has the ability to affect those returns through its power over the entity.
Associated companies are those companies over which the
Company has the ability to exercise significant influence on the financial and operating policy decisions, which it does not control. Generally, significant influence is presumed to exist when the Company holds more than 20% of the voting rights. Joint arrangements, which include joint ventures and joint operations, are those over whose activities the Company has joint control, typically under a contractual arrangement. In joint ventures, ArcelorMittal exercises joint control and has rights to the net assets of the arrangement. The investment is carried using the equity method of accounting at the cost at the date of the acquisition, adjusted for ArcelorMittal’s share in undistributed earnings or losses since acquisition, less any impairment incurred. Any excess of the cost of the acquisition over the Company’s share of the net fair value of the identifiable assets, liabilities, and contingent liabilities of the associate or joint venture recognized at the date of acquisition is considered as goodwill. The goodwill is included in the carrying amount of the investment and is evaluated for impairment as part of the investment. The consolidated statements of operations include the Company’s share of the profit or loss of associates and joint ventures from the date that significant influence or joint control commences until the date significant influence or joint control ceases, adjusted for any impairment losses. Adjustments to the carrying amount may also be necessary for changes in the Company’s proportionate interest in the investee arising from changes in the investee’s equity that have not been recognized in the investee’s profit or loss. The Company’s share of those changes is recognized directly in equity. ArcelorMittal reviews all of its investments in associates and joint ventures at each reporting date to determine whether there is an indicator that the investment may be impaired. If objective evidence indicates that the investment is impaired, ArcelorMittal calculates the amount of the impairment of the investments as being the
difference between the higher of the fair value less costs to sell or its value in use and its carrying value. The amount of any impairment is included in income (loss) from associates, joint ventures and other investments in the consolidated statements of operations.
For investments in joint operations, in which ArcelorMittal exercises joint control and has rights to the assets and obligations for the liabilities relating to the arrangement, the Company recognizes its assets, liabilities and transactions, including its share of those incurred jointly.
Investments in other entities, over which the Company and/or its operating subsidiaries do not have the ability to exercise significant influence and have a readily determinable fair value, are accounted for as available-for-sale at fair value with any resulting gain or loss, net of related tax effect, recognized in the consolidated statements of other comprehensive income, until realized. Realized gains and losses from the sale of available-for-sale securities are determined on an average cost method. The Company reviews the available-for-sale investments at the end of each reporting period to assess whether there is any objective evidence of impairment. A significant or prolonged decline in the fair value of an available-for-sale investment below its cost is objective evidence of impairment. The Company considers a prolonged decline in fair value to occur when the market value remains continuously below the cost for more than two years. When the Company identifies a significant or prolonged decline in fair value, it records an impairment by reclassifying the amount accumulated in other comprehensive income to the consolidated statements of operations. Once an impairment loss is recognized for an investment, any increases in fair value are recorded in other comprehensive income while decreases in fair value are recorded in the consolidated statements
of operations. To the extent that these investments do not have a readily determinable fair value, they are accounted for under the cost method.
While there are certain limitations on the Company’s operating and financial flexibility arising from the restrictive and financial covenants of the Company’s principal credit facilities described in note 6.1.2, there are no significant restrictions resulting from borrowing agreements or regulatory requirements on the ability of consolidated subsidiaries, associates and jointly controlled entities to transfer funds to the parent in the form of cash dividends to pay commitments as they come due.
Inter-company balances and transactions, including income, expenses and dividends, are eliminated in the consolidated financial statements. Gains and losses resulting from inter-company transactions are also eliminated.
Non-controlling interests represent the portion of profit or loss and net assets not held by the Company and are presented separately in the consolidated statements of operations, in the consolidated statements of other comprehensive income and within equity in the consolidated statements of financial position.
2.2 Investments in subsidiaries
2.2.1 List of subsidiaries
The table below provides a list of the Company’s principal operating subsidiaries at December 31, 2015. Unless otherwise stated, the subsidiaries as listed below have share capital consisting solely of ordinary shares, which are held directly or indirectly by the Company and the proportion of ownership interests held equals to the voting rights held by the Company. The country of incorporation corresponds to their principal place of operations.
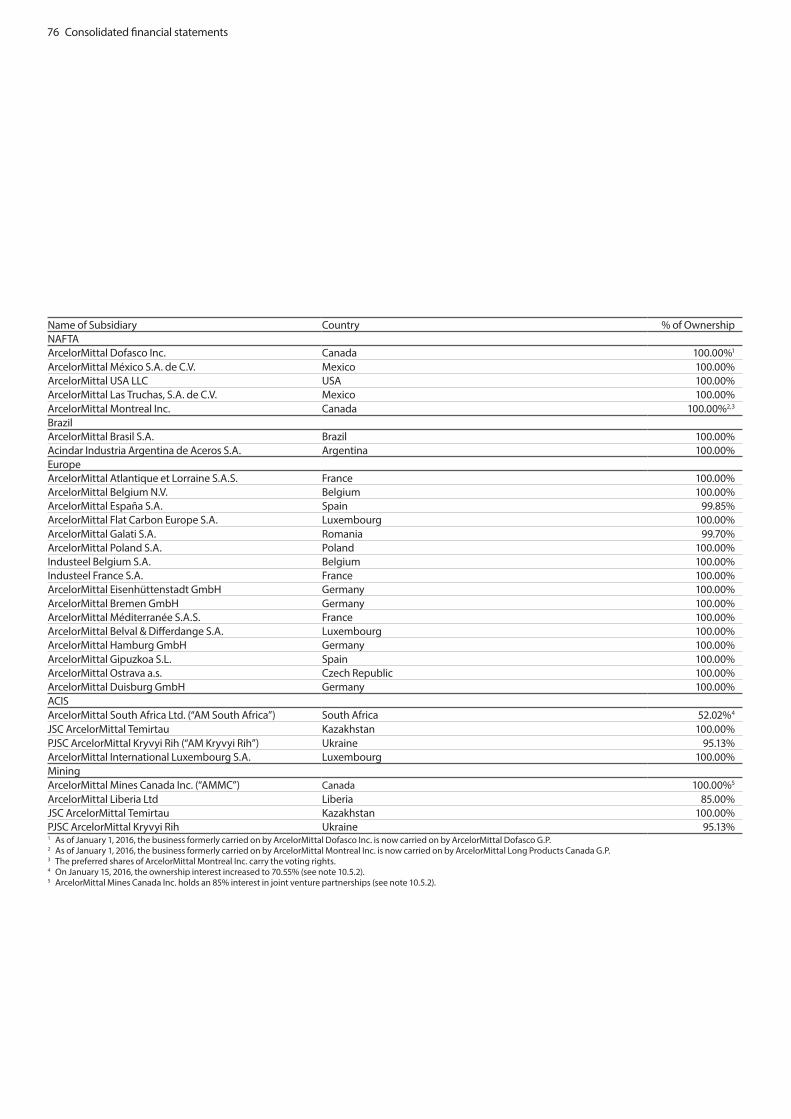
76 Consolidated financial statements
Name of Subsidiary Country % of OwnershipNAFTA ArcelorMittal Dofasco Inc. Canada 100.00%1
ArcelorMittal México S.A. de C.V. Mexico 100.00%ArcelorMittal USA LLC USA 100.00%ArcelorMittal Las Truchas, S.A. de C.V. Mexico 100.00%ArcelorMittal Montreal Inc. Canada 100.00%2,3
Brazil ArcelorMittal Brasil S.A. Brazil 100.00%Acindar Industria Argentina de Aceros S.A. Argentina 100.00%Europe ArcelorMittal Atlantique et Lorraine S.A.S. France 100.00%ArcelorMittal Belgium N.V. Belgium 100.00%ArcelorMittal España S.A. Spain 99.85%ArcelorMittal Flat Carbon Europe S.A. Luxembourg 100.00%ArcelorMittal Galati S.A. Romania 99.70%ArcelorMittal Poland S.A. Poland 100.00%Industeel Belgium S.A. Belgium 100.00%Industeel France S.A. France 100.00%ArcelorMittal Eisenhüttenstadt GmbH Germany 100.00%ArcelorMittal Bremen GmbH Germany 100.00%ArcelorMittal Méditerranée S.A.S. France 100.00%ArcelorMittal Belval & Differdange S.A. Luxembourg 100.00%ArcelorMittal Hamburg GmbH Germany 100.00%ArcelorMittal Gipuzkoa S.L. Spain 100.00%ArcelorMittal Ostrava a.s. Czech Republic 100.00%ArcelorMittal Duisburg GmbH Germany 100.00%ACIS ArcelorMittal South Africa Ltd. (“AM South Africa”) South Africa 52.02%4
JSC ArcelorMittal Temirtau Kazakhstan 100.00%PJSC ArcelorMittal Kryvyi Rih (“AM Kryvyi Rih”) Ukraine 95.13%ArcelorMittal International Luxembourg S.A. Luxembourg 100.00%Mining ArcelorMittal Mines Canada Inc. (“AMMC”) Canada 100.00%5
ArcelorMittal Liberia Ltd Liberia 85.00%JSC ArcelorMittal Temirtau Kazakhstan 100.00%PJSC ArcelorMittal Kryvyi Rih Ukraine 95.13%1 As of January 1, 2016, the business formerly carried on by ArcelorMittal Dofasco Inc. is now carried on by ArcelorMittal Dofasco G.P.2 As of January 1, 2016, the business formerly carried on by ArcelorMittal Montreal Inc. is now carried on by ArcelorMittal Long Products Canada G.P.3 The preferred shares of ArcelorMittal Montreal Inc. carry the voting rights.4 On January 15, 2016, the ownership interest increased to 70.55% (see note 10.5.2).5 ArcelorMittal Mines Canada Inc. holds an 85% interest in joint venture partnerships (see note 10.5.2).
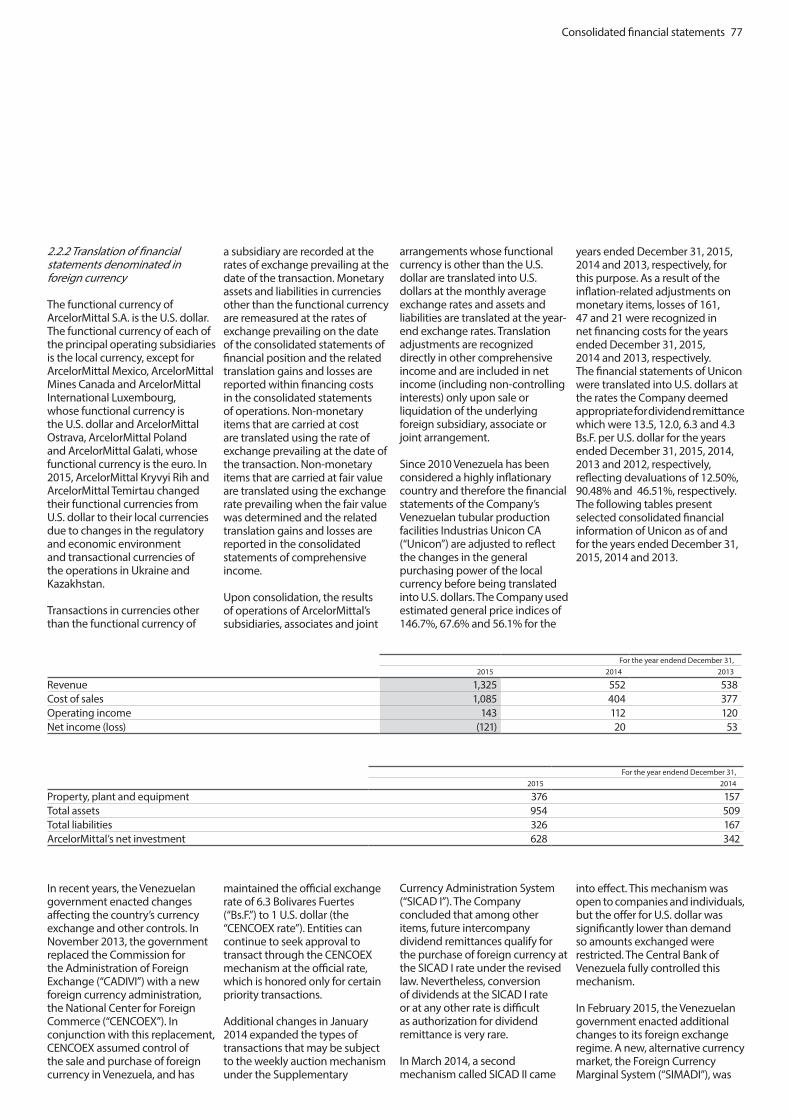
Consolidated financial statements 77
2.2.2 Translation of financial statements denominated in foreign currency
The functional currency of ArcelorMittal S.A. is the U.S. dollar. The functional currency of each of the principal operating subsidiaries is the local currency, except for ArcelorMittal Mexico, ArcelorMittal Mines Canada and ArcelorMittal International Luxembourg, whose functional currency is the U.S. dollar and ArcelorMittal Ostrava, ArcelorMittal Poland and ArcelorMittal Galati, whose functional currency is the euro. In 2015, ArcelorMittal Kryvyi Rih and ArcelorMittal Temirtau changed their functional currencies from U.S. dollar to their local currencies due to changes in the regulatory and economic environment and transactional currencies of the operations in Ukraine and Kazakhstan.
Transactions in currencies other than the functional currency of
a subsidiary are recorded at the rates of exchange prevailing at the date of the transaction. Monetary assets and liabilities in currencies other than the functional currency are remeasured at the rates of exchange prevailing on the date of the consolidated statements of financial position and the related translation gains and losses are reported within financing costs in the consolidated statements of operations. Non-monetary items that are carried at cost are translated using the rate of exchange prevailing at the date of the transaction. Non-monetary items that are carried at fair value are translated using the exchange rate prevailing when the fair value was determined and the related translation gains and losses are reported in the consolidated statements of comprehensive income. Upon consolidation, the results of operations of ArcelorMittal’s subsidiaries, associates and joint
arrangements whose functional currency is other than the U.S. dollar are translated into U.S. dollars at the monthly average exchange rates and assets and liabilities are translated at the year-end exchange rates. Translation adjustments are recognized directly in other comprehensive income and are included in net income (including non-controlling interests) only upon sale or liquidation of the underlying foreign subsidiary, associate or joint arrangement.
Since 2010 Venezuela has been considered a highly inflationary country and therefore the financial statements of the Company’s Venezuelan tubular production facilities Industrias Unicon CA (“Unicon”) are adjusted to reflect the changes in the general purchasing power of the local currency before being translated into U.S. dollars. The Company used estimated general price indices of 146.7%, 67.6% and 56.1% for the
years ended December 31, 2015, 2014 and 2013, respectively, for this purpose. As a result of the inflation-related adjustments on monetary items, losses of 161, 47 and 21 were recognized in net financing costs for the years ended December 31, 2015, 2014 and 2013, respectively. The financial statements of Unicon were translated into U.S. dollars at the rates the Company deemed appropriate for dividend remittance which were 13.5, 12.0, 6.3 and 4.3 Bs.F. per U.S. dollar for the years ended December 31, 2015, 2014, 2013 and 2012, respectively, reflecting devaluations of 12.50%, 90.48% and 46.51%, respectively. The following tables present selected consolidated financial information of Unicon as of and for the years ended December 31, 2015, 2014 and 2013.
For the year endend December 31,2015 2014 2013
Revenue 1,325 552 538 Cost of sales 1,085 404 377Operating income 143 112 120Net income (loss) (121) 20 53
For the year endend December 31,2015 2014
Property, plant and equipment 376 157Total assets 954 509Total liabilities 326 167ArcelorMittal’s net investment 628 342
In recent years, the Venezuelan government enacted changes affecting the country’s currency exchange and other controls. In November 2013, the government replaced the Commission for the Administration of Foreign Exchange (“CADIVI”) with a new foreign currency administration, the National Center for Foreign Commerce (“CENCOEX”). In conjunction with this replacement, CENCOEX assumed control of the sale and purchase of foreign currency in Venezuela, and has
maintained the official exchange rate of 6.3 Bolivares Fuertes (“Bs.F.”) to 1 U.S. dollar (the “CENCOEX rate”). Entities can continue to seek approval to transact through the CENCOEX mechanism at the official rate, which is honored only for certain priority transactions.
Additional changes in January 2014 expanded the types of transactions that may be subject to the weekly auction mechanism under the Supplementary
Currency Administration System (“SICAD I”). The Company concluded that among other items, future intercompany dividend remittances qualify for the purchase of foreign currency at the SICAD I rate under the revised law. Nevertheless, conversion of dividends at the SICAD I rate or at any other rate is difficult as authorization for dividend remittance is very rare.
In March 2014, a second mechanism called SICAD II came
into effect. This mechanism was open to companies and individuals, but the offer for U.S. dollar was significantly lower than demand so amounts exchanged were restricted. The Central Bank of Venezuela fully controlled this mechanism.
In February 2015, the Venezuelan government enacted additional changes to its foreign exchange regime. A new, alternative currency market, the Foreign Currency Marginal System (“SIMADI”), was

78 Consolidated financial statements
created with a floating exchange rate generally based on supply and demand. SIMADI substituted the previous SICAD II mechanism. In connection with the establishment of SIMADI, SICAD I became known as SICAD. As a reference, the SIMADI exchange rate started at 170.0 Bs.F. per U.S. dollar in February 2015, and closed at 198.7 Bs.F.as of December 31, 2015. The SICAD exchange rate has been set to 13.5 Bs.F. per U.S. dollar since September 1, 2015.
On February 17, 2016, the Venezuelan government devalued its currency by changing the CENCOEX rate from 6.3 to 10 Bs.F. per U.S. dollar. It also announced the elimination of the SICAD rate and said that beginning February 18, 2016, the SIMADI rate will be allowed to float freely beginning at a rate of approximately 203 Bs.F. per U.S. dollar.
Since 2013, Unicon has been able to settle certain of its U.S. dollar obligations for imported materials
at the official rate or SICAD rate and records the gains related to such transactions when the funds are authorized by CENCOEX and the liabilities are paid. In 2015 and 2014, the Company translated its Venezuelan operations at the SICAD rate because it concluded this rate corresponds to the dividend remittance rate in accordance with IFRS requirements and it has been able to settle certain of its U.S. dollar obligations for imported materials at the SICAD rate. The Company
is currently reconsidering the exchange rates it will apply going forward to translate its Venezuelan operations.
The following tables present the selected consolidated financial information of Unicon as of and for the year ended December 31, 2015, had the Company used the SIMADI rate compared to the SICAD rate.
For the year endend December 31, 2015SIMADI SICAD
Revenue 86 1,325Cost of sales 71 1,086Operating income 9 143Net loss (8) (121)
For the year endend December 31, 2015SIMADI SICAD
Property, plant and equipment 26 376Total assets 65 954Total liabilities 22 326ArcelorMittal’s net investment 43 628
It is possible that the Venezuelan government will further refine or alter mechanisms through which companies are able to access U.S. dollar, which could change the rate at which ArcelorMittal can access U.S. dollar and the rate used by the Company to translate the financial statements of its Venezuelan operations. This could have an unfavorable impact on the Company’s operating results and financial position. In addition, the foreign exchange controls in Venezuela may limit the ability to repatriate earnings and ArcelorMittal’s Venezuelan operations’ ability to remit dividends and pay intercompany balances at any official exchange rate or at all.
2.2.3 Business combinations
Business combinations are accounted for using the acquisition method as of the acquisition date,
which is the date on which control is transferred to ArcelorMittal. The Company controls an entity when it is exposed to or has rights to variable returns from its involvement with the entity and has the ability to affect those returns through its power over the entity.
The Company measures goodwill at the acquisition date as the total of the fair value of consideration transferred, plus the proportionate amount of any non-controlling interest, plus the fair value of any previously held equity interest in the acquiree, if any, less the net recognized amount (generally at fair value) of the identifiable assets acquired and liabilities assumed.
In a business combination in which the fair value of the identifiable net assets acquired exceeds the cost of the acquired business, the Company reassesses the fair value
of the assets acquired and liabilities assumed. If, after reassessment, ArcelorMittal’s interest in the net fair value of the acquiree’s identifiable assets, liabilities and contingent liabilities exceeds the cost of the business combination, the excess (bargain purchase) is recognized immediately as a reduction of cost of sales in the consolidated statements of operations.
Any contingent consideration payable is recognized at fair value at the acquisition date and any costs directly attributable to the business combination are expensed as incurred.
2.2.4 Acquisitions
There were no significant acquisitions in 2015 and 2014. On January 11, 2013, ArcelorMittal acquired control of the joint operation DJ Galvanizing, a hot dip
galvanizing line located in Canada, through the acquisition of the 50% interest held by the other joint operator. DJ Galvanizing is part of the NAFTA reportable segment. The revenue and the net result consolidated in 2015, 2014 and 2013 amounted to 22, 27 and 21 and (1), (2) and (3) respectively.The table below summarizes the estimated fair value of the assets acquired and liabilities assumed and the total purchase price allocation for significant acquisitions made in 2013.

Consolidated financial statements 79
2013DJ Galvanizing
Current assets 2Property, plant & equipment 112Total assets acquired 114Total net assets acquired 114Previously held equity interests 10Purchase price, net 57Bargain purchase (47)1
1 The amount is related to the fair valuation of the previously held 50% interest
2.3 Assets held for sale and divestments
Non-current assets and disposal groups that are classified as held for sale are measured at the lower of carrying amount and fair value less costs to sell. Assets and disposal groups are classified as held for sale if their carrying amount will be recovered through a sale transaction rather than through continuing use. This condition is regarded as met only when the sale is highly probable and the asset, or disposal group, is available for immediate sale in its present condition and is marketed for sale at a price that is reasonable in relation to its current fair value. Assets held for sale are presented separately in the consolidated statements of financial position and are not depreciated. Gains (losses) on disposal are recognized in cost of sales.
In December 2015, ArcelorMittal committed to a plan to sell its Long Carbon facilities in the US (Laplace, Steelton and Vinton). These various entities are part of the NAFTA reportable segment. The Company expects to close the transaction during the first quarter of 2016. At December 31, 2015, assets and liabilities subject to the transaction were classified as held for sale and the Company recorded in cost of sales an impairment charge of 231 to write their carrying amount down to the expected net proceeds from the sale. The fair value measurement of the Long Carbon facilities in the US was determined using the contract price, a Level 3 unobservable input.
In December 2015, ArcelorMittal committed to a plan to sell certain
of its ArcelorMittal Downstream Solutions operations in the Europe segment. Accordingly, at December 31, 2015, the carrying amount of assets and liabilities subject to the transaction were classified as held for sale and the Company recorded in cost of sales an impairment charge of 18. The Company expects to close the transaction during the first half of 2016.
On October 7, 2015, ArcelorMittal announced it reached an outline agreement for restructuring the shareholding of its Algerian activities (49% interest in the associates ArcelorMittal Algérie and ArcelorMittal Tebessa and 70% interest in the subsidiary ArcelorMittal Pipes and Tubes Algeria). As part of the agreement, ArcelorMittal will transfer such interests to IMETAL, an Algerian state-owned entity. ArcelorMittal Pipes and Tubes Algeria is part of the ACIS reportable segment. Assets and liabilities subject to the transaction were classified as held for sale at December 31, 2015. Previously, on January 10, 2015, ArcelorMittal had completed the sale of a 21% controlling stake in ArcelorMittal Tebessa, which holds two iron ore mines in Ouenza and Boukadra, Tebessa, to Sider and the Ferphos Group, two Algerian state-owned entities. The Company accounted for its remaining 49% stake under the equity method. This sale had been contractually agreed on November 25, 2014 in the framework of a strategic agreement signed on October 5, 2013. Accordingly, the related assets and liabilities were classified as held for sale at December 31, 2013 and they remained held for sale as of December 31, 2014. ArcelorMittal
Tebessa was part of the Mining reportable segment. The strategic agreement foresaw also the sale to Sider of a 21% controlling stake in ArcelorMittal Algérie (previously ArcelorMittal Annaba), which had been completed for a nil cash consideration on December 17, 2013. ArcelorMittal Algérie is an integrated steel plant in Algeria producing both flat and long steel products in El Hadjar, Annaba. It was part of the ACIS reportable segment. As a result of the 2013 sale, ArcelorMittal’s stake decreased from 70% to 49% and the Company accounted for its remaining interest under the equity method.
On March 30, 2015, following an agreement signed on October 21, 2014, the Company established the joint venture ArcelorMittal CLN Distribuzione Italia S.r.l. (“AMCDI”) with Coils Lamiere Nastri S.P.A. (“CLN”) through the contribution of assets and liabilities of its wholly owned subsidiary ArcelorMittal Distribution Solutions Italia S.R.L (“AMDSI”). ArcelorMittal holds a 49% stake in AMCDI, which is accounted for under the equity method. Assets and liabilities of AMDSI subject to the transaction were classified as held for sale at December 31, 2014. AMDSI was part of the Europe reportable segment.
On February 26, 2015, following an agreement signed on September 18, 2014, ArcelorMittal established the investment ArcelorMittal RZK Celik Servis Merkezi Sanayi ve Ticaret Anonim Sirketi (“AM RZK”) with a local partner in Turkey through the contribution of assets and liabilities of the Company’s wholly owned
subsidiary Rozak Demir Profil Ticaret ve Sanayi Anonim Sirketi (“Rozak”). ArcelorMittal holds a 50% stake in AM RZK and the investment is accounted for under the equity method. Assets and liabilities of Rozak subject to the transaction were classified as held for sale at December 31, 2014. Rozak was part of the Europe reportable segment.
On January 23, 2015, ArcelorMittal completed the disposal of the building on Avenue de la Liberté in Luxembourg city (the “Liberté Building”), formerly the headquarters of the Company, to the Banque et Caisse d’Epargne de l’Etat (“BCEE”) following a memorandum of understanding signed on November 14, 2014. The property was classified as held for sale at December 31, 2014.
The result on disposal for the above mentioned disposals in 2015 was immaterial. The aggregate net assets disposed of amounted to 97.
On December 31, 2014, ArcelorMittal completed the disposal of the Kuzbass coal mines (“Kuzbass”) located in the Kemerovo region in Russia to the Russian National Fuel Company. The existing intra group debt of 138 was assumed by the buyer who will repay a net amount of RUB 1.5 billion (25) in monthly installments until June 2017. Kuzbass was part of the Mining reportable segment.
On December 11, 2014, the Company contributed the shares of an energy production facility in the Czech Republic and a second energy production facility in Poland (Europe segment) with
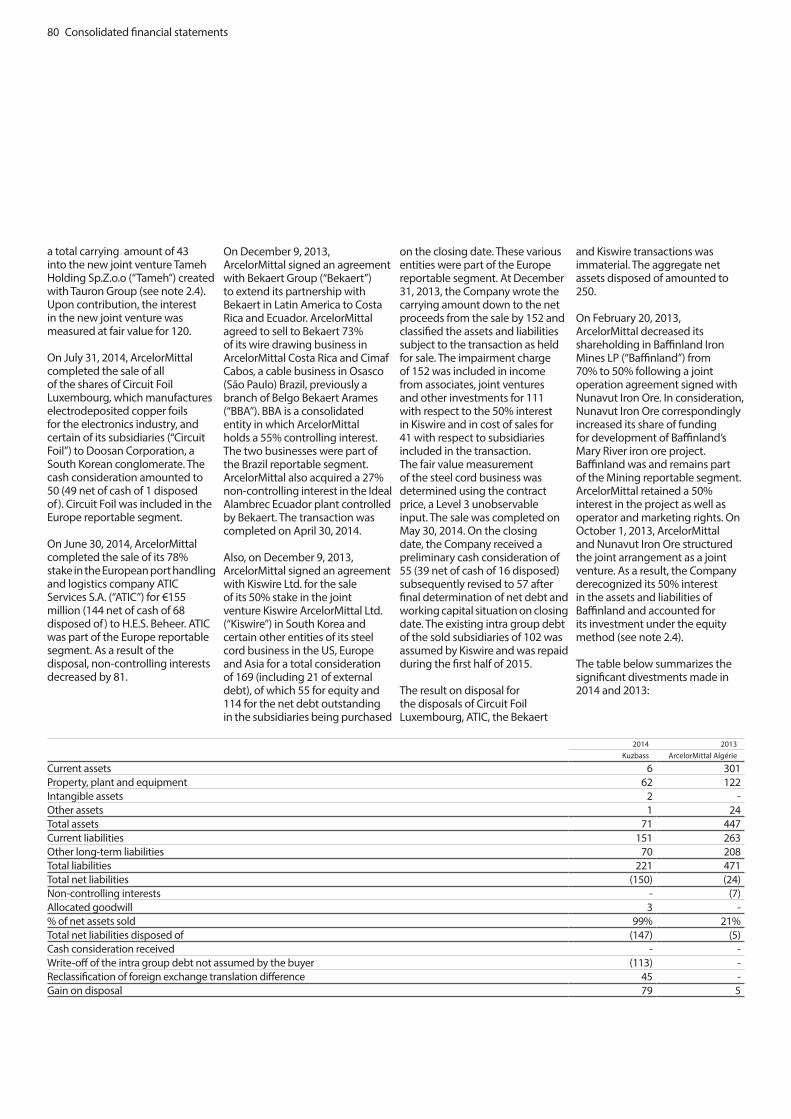
80 Consolidated financial statements
a total carrying amount of 43 into the new joint venture Tameh Holding Sp.Z.o.o (“Tameh”) created with Tauron Group (see note 2.4). Upon contribution, the interest in the new joint venture was measured at fair value for 120. On July 31, 2014, ArcelorMittal completed the sale of all of the shares of Circuit Foil Luxembourg, which manufactures electrodeposited copper foils for the electronics industry, and certain of its subsidiaries (“Circuit Foil”) to Doosan Corporation, a South Korean conglomerate. The cash consideration amounted to 50 (49 net of cash of 1 disposed of). Circuit Foil was included in the Europe reportable segment.
On June 30, 2014, ArcelorMittal completed the sale of its 78% stake in the European port handling and logistics company ATIC Services S.A. (“ATIC”) for €155 million (144 net of cash of 68 disposed of) to H.E.S. Beheer. ATIC was part of the Europe reportable segment. As a result of the disposal, non-controlling interests decreased by 81.
On December 9, 2013, ArcelorMittal signed an agreement with Bekaert Group (“Bekaert”) to extend its partnership with Bekaert in Latin America to Costa Rica and Ecuador. ArcelorMittal agreed to sell to Bekaert 73% of its wire drawing business in ArcelorMittal Costa Rica and Cimaf Cabos, a cable business in Osasco (São Paulo) Brazil, previously a branch of Belgo Bekaert Arames (“BBA”). BBA is a consolidated entity in which ArcelorMittal holds a 55% controlling interest. The two businesses were part of the Brazil reportable segment. ArcelorMittal also acquired a 27% non-controlling interest in the Ideal Alambrec Ecuador plant controlled by Bekaert. The transaction was completed on April 30, 2014.
Also, on December 9, 2013, ArcelorMittal signed an agreement with Kiswire Ltd. for the sale of its 50% stake in the joint venture Kiswire ArcelorMittal Ltd. (“Kiswire”) in South Korea and certain other entities of its steel cord business in the US, Europe and Asia for a total consideration of 169 (including 21 of external debt), of which 55 for equity and 114 for the net debt outstanding in the subsidiaries being purchased
on the closing date. These various entities were part of the Europe reportable segment. At December 31, 2013, the Company wrote the carrying amount down to the net proceeds from the sale by 152 and classified the assets and liabilities subject to the transaction as held for sale. The impairment charge of 152 was included in income from associates, joint ventures and other investments for 111 with respect to the 50% interest in Kiswire and in cost of sales for 41 with respect to subsidiaries included in the transaction. The fair value measurement of the steel cord business was determined using the contract price, a Level 3 unobservable input. The sale was completed on May 30, 2014. On the closing date, the Company received a preliminary cash consideration of 55 (39 net of cash of 16 disposed) subsequently revised to 57 after final determination of net debt and working capital situation on closing date. The existing intra group debt of the sold subsidiaries of 102 was assumed by Kiswire and was repaid during the first half of 2015.
The result on disposal for the disposals of Circuit Foil Luxembourg, ATIC, the Bekaert
and Kiswire transactions was immaterial. The aggregate net assets disposed of amounted to 250.
On February 20, 2013, ArcelorMittal decreased its shareholding in Baffinland Iron Mines LP (“Baffinland”) from 70% to 50% following a joint operation agreement signed with Nunavut Iron Ore. In consideration, Nunavut Iron Ore correspondingly increased its share of funding for development of Baffinland’s Mary River iron ore project. Baffinland was and remains part of the Mining reportable segment. ArcelorMittal retained a 50% interest in the project as well as operator and marketing rights. On October 1, 2013, ArcelorMittal and Nunavut Iron Ore structured the joint arrangement as a joint venture. As a result, the Company derecognized its 50% interest in the assets and liabilities of Baffinland and accounted for its investment under the equity method (see note 2.4).
The table below summarizes the significant divestments made in 2014 and 2013:
2014 2013 Kuzbass ArcelorMittal Algérie
Current assets 6 301Property, plant and equipment 62 122Intangible assets 2 -Other assets 1 24Total assets 71 447Current liabilities 151 263Other long-term liabilities 70 208Total liabilities 221 471Total net liabilities (150) (24)Non-controlling interests - (7)Allocated goodwill 3 -% of net assets sold 99% 21%Total net liabilities disposed of (147) (5)Cash consideration received - -Write-off of the intra group debt not assumed by the buyer (113) -Reclassification of foreign exchange translation difference 45 -Gain on disposal 79 5
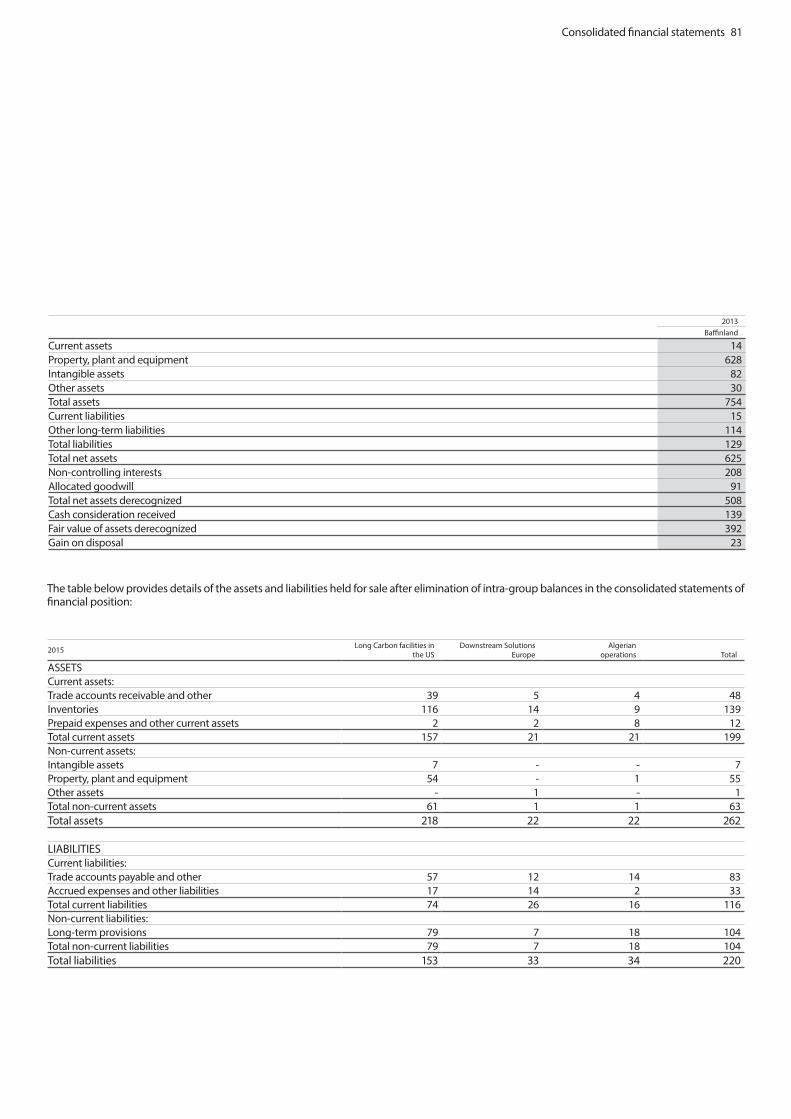
Consolidated financial statements 81
2013 Baffinland
Current assets 14Property, plant and equipment 628Intangible assets 82Other assets 30Total assets 754Current liabilities 15Other long-term liabilities 114Total liabilities 129Total net assets 625Non-controlling interests 208Allocated goodwill 91Total net assets derecognized 508Cash consideration received 139Fair value of assets derecognized 392Gain on disposal 23
The table below provides details of the assets and liabilities held for sale after elimination of intra-group balances in the consolidated statements of financial position:
2015 Long Carbon facilities in the US
Downstream Solutions Europe
Algerian operations Total
ASSETS Current assets:Trade accounts receivable and other 39 5 4 48Inventories 116 14 9 139Prepaid expenses and other current assets 2 2 8 12Total current assets 157 21 21 199Non-current assets:Intangible assets 7 - - 7Property, plant and equipment 54 - 1 55Other assets - 1 - 1Total non-current assets 61 1 1 63Total assets 218 22 22 262 LIABILITIESCurrent liabilities:Trade accounts payable and other 57 12 14 83Accrued expenses and other liabilities 17 14 2 33Total current liabilities 74 26 16 116Non-current liabilities:Long-term provisions 79 7 18 104Total non-current liabilities 79 7 18 104Total liabilities 153 33 34 220

82 Consolidated financial statements
2014Rozak AMDSI Liberté Building ArcelorMittal Tebessa Total
ASSETSCurrent assets:Cash and cash equivalents 1 - - - 1Trade accounts receivable and other 92 10 - - 102Inventories 76 53 - 28 157Prepaid expenses and other current assets 10 1 - 2 13Total current assets 179 64 - 30 273Non-current assets:Intangibles assets 13 - - - 13Property, plant and equipment 12 12 79 17 120Deferred tax assets - 4 - 3 7Other assets - 1 - - 1Total non-current assets 25 17 79 20 141Total assets 204 81 79 50 414LIABILITIESCurrent liabilities:Short-term debt and current portion of long-term debt 34 - - - 34Trade accounts payable and other 54 6 - 9 69Accrued expenses and other liabilities 3 5 - 3 11Total current liabilities 91 11 - 12 114Non-current liabilities:Long-term debt, net of current portion 24 - - - 24Long-term provisions 1 3 - 3 7Employee benefits - 2 - 5 7Deferred tax liabilities 3 2 - - 5Total non-current liabilities 28 7 - 8 43Total liabilities 119 18 - 20 157
2.4 Investment in associates and joint arrangements
The Company had the following investments accounted for under the equity method, at December 31, 2015 and 2014:
Category Carrying value
December 31, 2015Carrying value
December 31, 2014
Joint ventures 1,443 1,809Associates 2,688 2,996Individually immaterial joint ventures and associates1 780 1,028Total 4,911 5,8331 Individually immaterial joint ventures and associates represent in aggregate less than 20% of the total carrying amount of investments in joint ventures and associates at December
31, 2015 and 2014, and none of them has a carrying amount exceeding 100 at December 31, 2015 and 160 at December 31, 2014. In the context of the overall decrease in the balance of Investments in associates and joint ventures in the current year, in 2015 ArcelorMittal has individually disclosed Borcelik, which was not individually disclosed in 2014. AM Gonvarri Brasil and Kalagadi, the latter of which was fully impaired in 2015, are no longer disclosed individually as they are no longer considered significant.
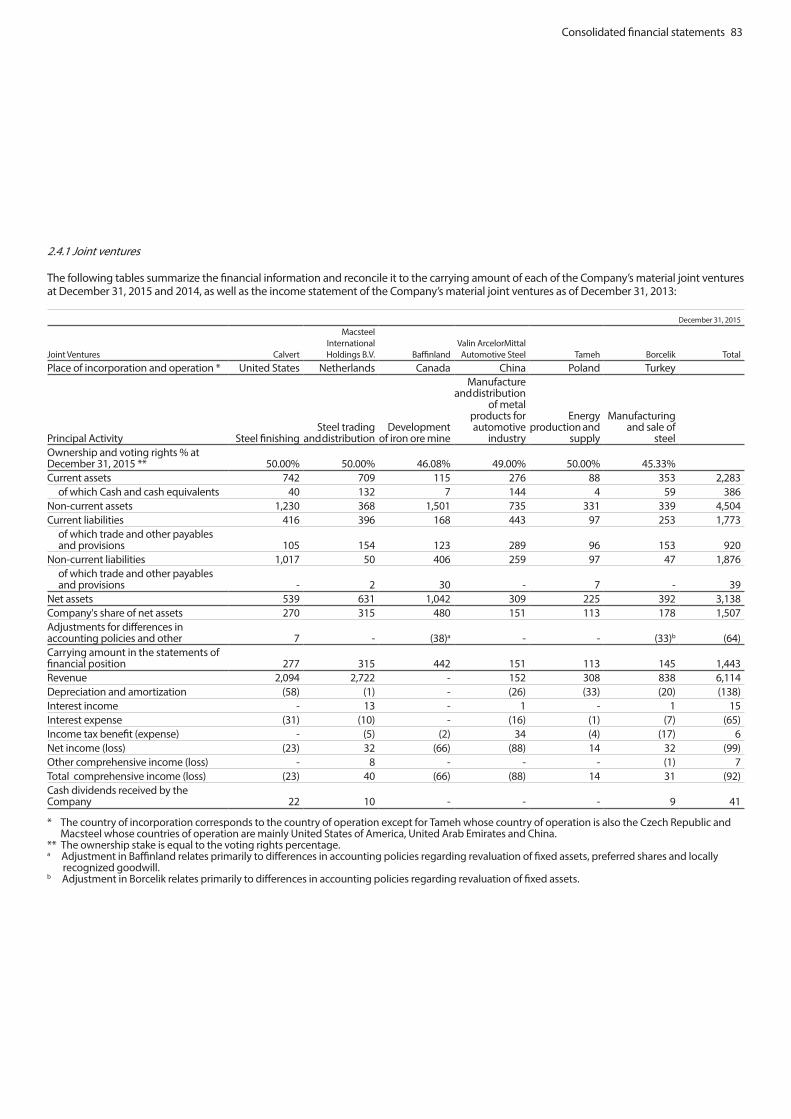
Consolidated financial statements 83
2.4.1 Joint ventures
The following tables summarize the financial information and reconcile it to the carrying amount of each of the Company’s material joint ventures at December 31, 2015 and 2014, as well as the income statement of the Company’s material joint ventures as of December 31, 2013:
December 31, 2015
Joint Ventures Calvert
Macsteel International Holdings B.V. Baffinland
Valin ArcelorMittal Automotive Steel Tameh Borcelik Total
Place of incorporation and operation * United States Netherlands Canada China Poland Turkey
Principal Activity Steel finishingSteel trading
and distributionDevelopment
of iron ore mine
Manufacture and distribution
of metal products for automotive
industry
Energy production and
supply
Manufacturing and sale of
steelOwnership and voting rights % at December 31, 2015 ** 50.00% 50.00% 46.08% 49.00% 50.00% 45.33%Current assets 742 709 115 276 88 353 2,283 of which Cash and cash equivalents 40 132 7 144 4 59 386Non-current assets 1,230 368 1,501 735 331 339 4,504Current liabilities 416 396 168 443 97 253 1,773 of which trade and other payables and provisions 105 154 123 289 96 153 920Non-current liabilities 1,017 50 406 259 97 47 1,876 of which trade and other payables and provisions - 2 30 - 7 - 39Net assets 539 631 1,042 309 225 392 3,138Company's share of net assets 270 315 480 151 113 178 1,507Adjustments for differences in accounting policies and other 7 - (38)a - - (33)b (64)Carrying amount in the statements of financial position 277 315 442 151 113 145 1,443Revenue 2,094 2,722 - 152 308 838 6,114Depreciation and amortization (58) (1) - (26) (33) (20) (138)Interest income - 13 - 1 - 1 15Interest expense (31) (10) - (16) (1) (7) (65)Income tax benefit (expense) - (5) (2) 34 (4) (17) 6Net income (loss) (23) 32 (66) (88) 14 32 (99)Other comprehensive income (loss) - 8 - - - (1) 7Total comprehensive income (loss) (23) 40 (66) (88) 14 31 (92)Cash dividends received by the Company 22 10 - - - 9 41
* The country of incorporation corresponds to the country of operation except for Tameh whose country of operation is also the Czech Republic and Macsteel whose countries of operation are mainly United States of America, United Arab Emirates and China.** The ownership stake is equal to the voting rights percentage.a Adjustment in Baffinland relates primarily to differences in accounting policies regarding revaluation of fixed assets, preferred shares and locally recognized goodwill. b Adjustment in Borcelik relates primarily to differences in accounting policies regarding revaluation of fixed assets.

84 Consolidated financial statements
December 31, 2014
Joint Ventures
ArcelorMittal Gonvarri Brasil
Produtos Siderúrgicos Calvert
Macsteel International Holdings B.V.
Kalagadi Manganese
(Propriety) Ltd Baffinland Valin ArcelorMittal Automotive Steel Tameh Total
Place of incorporation and operation * Brazil United States Netherlands South Africa Canada China Poland
Principal Activity
Production and distribution of
metal products Steel finishingSteel trading
and distribution MiningDevelopment
of iron ore mine
Manufacture and distribution
of metal products for automotive
industry
Energy production and
supplyOwnership and voting rights % at December 31, 2014 ** 50.00% 50.00% 50.00% 50.00% 50.00% 49.00% 50.00%Current assets 63 998 918 20 123 198 - 2,320 of which Cash and cash equivalents 12 14 136 1 8 90 - 261 Non-current assets 63 1,242 360 663 1,505 661 240 4,734 Current liabilities 22 586 612 193 101 194 - 1,708 of which trade and other payables and provisions 19 161 271 42 81 124 - 698 Non-current liabilities 3 1,076 55 363 411 252 - 2,160 of which trade and other payables and provisions 2 - 4 8 29 - - 43 Net assets 101 578 611 127 1,116 413 240 3,186 Company's share of net assets 51 289 306 64 558 202 120 1,590 Goodwill 50 - - 208 - - - 258 Adjustments for differences in accounting policies and other - 20 - - (59)a - - (39)Carrying amount in the statements of financial position 101 309 306 272 499 202 120 1,809Revenue 235 2,150 3,434 - - - - 5,819 Depreciation and amortization (5) (40) (1) - - - - (46)Interest income 6 - 11 - - 3 - 20 Interest expense - (19) (8) - - - - (27)Income tax benefit (expense) (4) - (6) (2) 3 - - (9)Net income (loss) 15 89 44 (6) (21) (6) - 115 Other comprehensive income (loss) - - 18 - - - - 18 Total comprehensive income (loss) 15 89 62 (6) (21) (6) - 133 Cash dividends received by the Company 20 - 5 - - - - 25
* The country of incorporation corresponds to the country of operation except for Tameh whose country of operation is also the Czech Republic and Macsteel whose countries of operation are mainly United States of America, United Arab Emirates and China.** The ownership stake is equal to the voting rights percentage.a Adjustment in Baffinland relates primarily to differences in accounting policies regarding revaluation of fixed assets, preferred shares and locally recognized goodwill.

Consolidated financial statements 85
December 31, 2013
Joint Ventures
ArcelorMittal Gonvarri Brasil
Produtos Siderúrgicos Gallatin Steel**
Macsteel International Holdings B.V.
Kalagadi Manganese
(Propriety) Ltd Baffinland Valin ArcelorMittal Automotive Steel Total
Place of incorporation and operation * Brazil United States Netherlands South Africa Canada China
Principal Activity
Production and distribution of
metal productsSteel
manufacturingSteel trading
and distribution MiningDevelopment
of iron ore mine
Manufacture and distribution
of metal products for automotive
industryOwnership and voting rights % at December 31, 2013 ** 50.00% 50.00% 50.00% 50.00% 50.00% 49.00%Revenue 398 999 2,580 - - - 3,977Depreciation and amortization (6) (20) (1) - - - (27)Interest income 6 - 7 - - - 13Interest expense (1) (1) (4) - - - (6)Income tax expense (6) - (5) (2) - - (13)Net income (loss) 19 35 35 (8) (8) - 73Other comprehensive income (loss) - - - - (29) - (29)Total comprehensive income (loss) 19 35 35 (8) (37) - 44Cash dividends received by the Company 8 1 - - - - 9
* The ownership stake is equal to the voting rights percentage.** The investment in Gallatin Steel Company was sold during 2014 (see below).
ArcelorMittal Gonvarri Brasil Produtos Siderúrgicos
ArcelorMittal Gonvarri Brasil Produtos Siderúrgicos S.A. is engaged in the manufacture, including auto parts, and sale of flat rolled steel, to serve, among others, the automotive and metal and mechanics industries in general. The entity processes and distributes steel primarily in Brazil, and is the result of the acquisition in 2008 of Gonvarri Brasil Produtos Siderúrgicos S.A. by AM Spain Holding and Gonvarri Steel Industries. At December 31, 2015 the carrying value of ArcelorMittal Gonvarri Brasil Produtos Siderúrgicos S.A. was no longer considered significant and therefore no longer separately disclosed.
Macsteel International Holdings B.V.
Macsteel International Holdings B.V. is a joint venture between Macsteel Holdings Luxembourg S.á .r.l. and ArcelorMittal South Africa which provides the Company with an international network of traders and trading channels including the shipping
and distribution of steel.Kalagadi Manganese
Kalagadi Manganese (Propriety) Ltd (“Kalagadi Manganese”) is a joint venture between ArcelorMittal and Kalahari Resource (Proprietary) Ltd that is engaged in exploring, mining, ore processing, and smelting manganese in the Kalahari Basin in South Africa. In addition, the Company has granted loans for the funding of the mining project amounting to 78 including accrued interest, which have been fully impaired in 2015.
In 2015, the Company tested the investment for impairment and determined that the value in use was lower than the carrying amount. In determining the value in use, the Company estimated its share in the present value (using a pre-tax discount rate of 12.48%) of the projected future cash flows expected to be generated over the current life-of-the-mine plan or long term production plan. The key assumptions for the value in use calculations are primarily the discount rates, capital expenditure, expected changes to average selling prices, shipments and direct costs during the period.
Based on the analysis of value in use, the Company recognized an impairment charge of 283 in income (loss) from investments in associates, joint ventures and other investments (see note 2.6) for the full carrying amount of the investment (205) and loans (78) as a result of a downward revision of cash flow projections resulting from the expectation of the persistence of a lower manganese price outlook. At December 31, 2015 the carrying value of Kalagadi was as such no longer considered significant and therefore no longer separately disclosed.
Valin ArcelorMittal Automotive Steel
Valin ArcelorMittal Automotive Steel (“VAMA”) is a joint venture between ArcelorMittal and Hunan Valin which produces steel for high-end applications in the automobile industry and supplies international automakers and first-tier suppliers as well as Chinese car manufacturers and their supplier networks. The plant was inaugurated on June 15, 2014.
Baffinland
Baffinland is a joint venture since October 1, 2013 between ArcelorMittal and Nunavut Iron Ore. Baffinland owns the Mary River project, which has direct shipping, high grade iron ore on Baffin Island in Nunavut (Canada) (see also note 2.3). During 2015, ArcelorMittal’s shareholding in Baffinland decreased from 50% to 46.08% following a capital increase only subscribed by Nunavut Iron Ore.
Calvert
On February 26, 2014, the Company together with Nippon Steel & Sumitomo Metal Corporation (“NSSMC”) completed the acquisition of ThyssenKrupp Steel USA (“TK Steel USA”), a steel processing plant in Calvert, Alabama, USA, for a total consideration of 1,550 financed through a combination of debt at the joint venture level and equity, of which 258 was paid by ArcelorMittal. The Company concluded that it has joint control of the arrangement, AM/NS Calvert (“Calvert”), together with NSSMC, and accounts for its 50% interest in the joint venture

86 Consolidated financial statements
under the equity method. The transaction includes a six-year agreement to purchase two million tonnes of slab annually from TK CSA, an integrated steel mill complex located in Rio de Janeiro, Brazil, using a market-based price formula. TK CSA has an option to extend the agreement for an additional three years on terms that are more favorable to the joint venture, as compared with the initial time period. The remaining slab balance is sourced from ArcelorMittal plants in the US, Brazil and Mexico. ArcelorMittal is principally responsible for marketing the product on behalf of the joint venture. Calvert serves the automotive, construction, pipe and tube, service center, and
appliance/ HVAC industries.
Tameh
On December 11, 2014, ArcelorMittal and Tauron Group contributed four energy production facilities located in Poland and the Czech Republic into the new arrangement Tameh. The Company concluded that it has joint control over Tameh and accounted for its 50% interest in the joint venture under the equity method. Tameh’s objective is to ensure energy supply to the Company’s steel plants in these countries as well as the utilization of steel plant gases for energy production processes.
Borcelik
Borçelik Çelik Sanayii Ticaret Anonim Şirketi (“Borçelik”), incorporated and located in Turkey, is a joint venture between ArcelorMittal and Borusan Holding involved in the manufacturing and sale of cold-rolled and galvanized flat steel products.
Gallatin Steel
Gallatin Steel Company (“Gallatin Steel”) was a joint venture between ArcelorMittal and Gerdau Ameristeel. Their manufacturing facility, located in Kentucky, USA, produces hot band coils. On October 8, 2014, ArcelorMittal and Gerdau Ameristeel completed
the sale of their respective 50% interests in Gallatin Steel to Nucor Corporation for a total consideration of 770. The gain on disposal for the Company’s stake was 193 and is included in income (loss) from investments in associates, joint ventures and other investments for the year ended December 31, 2014.
2.4.2 Associates
The following table summarizes the financial information and reconciles it to the carrying amount of each of the Company’s material associates at December 31, 2015 and 2014, as well as the income statement of the Company’s material associates as of December 31, 2013:
December 31, 2015Associates China Oriental DHS GROUP Gestampc Gonvarri Steel Industries Stalprodukt SAc TotalFinancial statements reporting date Jun 30, 2015 Sep 30, 2015 Sep 30, 2015 Sep 30, 2015 Sep 30, 2015Place of incorporation and operation * Bermuda Germany Spain Spain Poland
Principal ActivityIron and steel
manufacturingSteel
manufacturingManufacturing of
metal componentsSteel
manufacturing
Production and distribution of steel
productsOwnership and voting rights % at December 31, 2015 ** 46.99% 33.43% 35.00% 35.00% 28.47%Current assets 2,049 1,630 2,360 1,381 346 7,766Non-current assets 1,558 2,948 3,790 999 525 9,820Current liabilities 1,822 564 1,890 536 147 4,959Non-current liabilities 186 936 2,360 289 162 3,933Non controlling interests 90 139 441 133 27 830Net assets attributable to equity holders of the parent 1,509 2,939 1,459 1,422 535 7,864Company's share of net assets 709 983 511 498 152 2,853Adjustments for differences in accounting policies and other - 43a - (54)b 7 (4)Other adjustments *** (105) (34) (15) (3) (4) (161)Carrying amount in the statements of financial position 604 992 496 441 155 2,688Revenue 1,768 1,603 5,642 2,194 628 11,835Profit or loss from continuing operations 6 (47) 169 102 61 291Net income (loss) 10 (45) 109 102 47 223Other comprehensive income (1) - (35) (53) - (89)Total comprehensive income (loss) 9 (45) 74 49 47 134Cash dividends received by the Company - 4 15 14 - 33* The country of incorporation corresponds to the country of operation except for China Oriental whose country of operation is China.** The ownership stake is equal to the voting rights percentage, except for Stalprodukt whose voting rights correspond to 28.26%.*** Other adjustments correspond to the difference between the carrying amount at December 31, 2015 and the net assets situation corresponding to the latest financial statements ArcelorMittal is permitted to disclose.a The amount for DHS GROUP includes an adjustment to align with the Company’s accounting policies mainly linked to property, plant and equipment, inventory and pension.b Adjustment in Gonvarri Steel Industries relate primarily to differences in accounting policies regarding revaluation of fixed assets.c Date of the latest available financial statements is September 30, 2015.
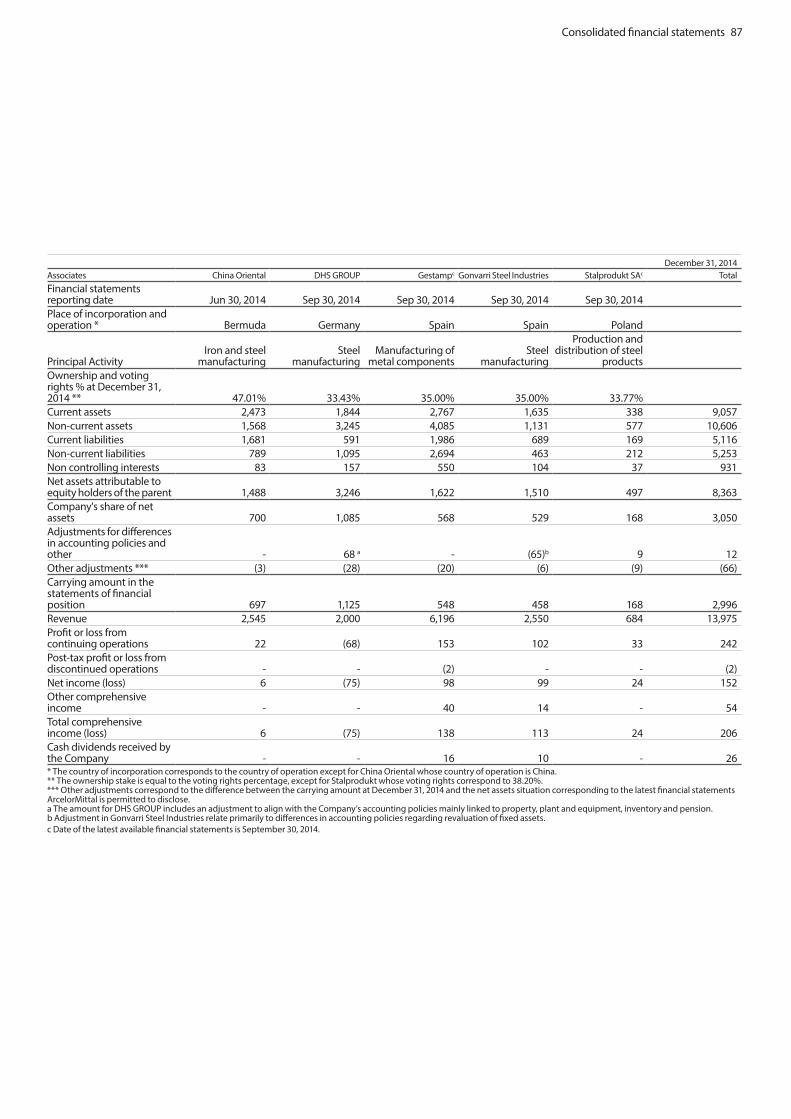
Consolidated financial statements 87
December 31, 2014Associates China Oriental DHS GROUP Gestampc Gonvarri Steel Industries Stalprodukt SAc TotalFinancial statements reporting date Jun 30, 2014 Sep 30, 2014 Sep 30, 2014 Sep 30, 2014 Sep 30, 2014Place of incorporation and operation * Bermuda Germany Spain Spain Poland
Principal ActivityIron and steel
manufacturingSteel
manufacturingManufacturing of
metal componentsSteel
manufacturing
Production and distribution of steel
productsOwnership and voting rights % at December 31, 2014 ** 47.01% 33.43% 35.00% 35.00% 33.77%Current assets 2,473 1,844 2,767 1,635 338 9,057 Non-current assets 1,568 3,245 4,085 1,131 577 10,606 Current liabilities 1,681 591 1,986 689 169 5,116 Non-current liabilities 789 1,095 2,694 463 212 5,253 Non controlling interests 83 157 550 104 37 931 Net assets attributable to equity holders of the parent 1,488 3,246 1,622 1,510 497 8,363 Company's share of net assets 700 1,085 568 529 168 3,050 Adjustments for differences in accounting policies and other - 68 a - (65)b 9 12 Other adjustments *** (3) (28) (20) (6) (9) (66)Carrying amount in the statements of financial position 697 1,125 548 458 168 2,996Revenue 2,545 2,000 6,196 2,550 684 13,975 Profit or loss from continuing operations 22 (68) 153 102 33 242 Post-tax profit or loss from discontinued operations - - (2) - - (2)Net income (loss) 6 (75) 98 99 24 152 Other comprehensive income - - 40 14 - 54 Total comprehensive income (loss) 6 (75) 138 113 24 206 Cash dividends received by the Company - - 16 10 - 26 * The country of incorporation corresponds to the country of operation except for China Oriental whose country of operation is China.** The ownership stake is equal to the voting rights percentage, except for Stalprodukt whose voting rights correspond to 38.20%.*** Other adjustments correspond to the difference between the carrying amount at December 31, 2014 and the net assets situation corresponding to the latest financial statements ArcelorMittal is permitted to disclose.a The amount for DHS GROUP includes an adjustment to align with the Company’s accounting policies mainly linked to property, plant and equipment, inventory and pension.b Adjustment in Gonvarri Steel Industries relate primarily to differences in accounting policies regarding revaluation of fixed assets.c Date of the latest available financial statements is September 30, 2014.
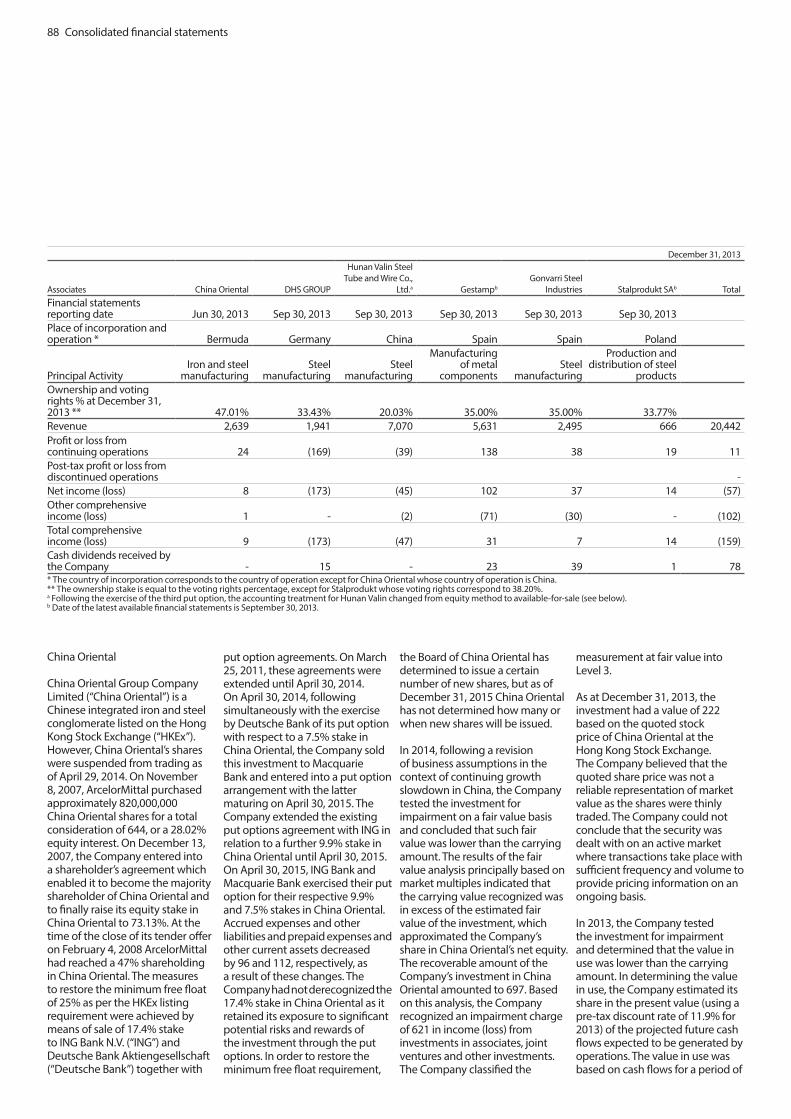
88 Consolidated financial statements
December 31, 2013
Associates China Oriental DHS GROUP
Hunan Valin Steel Tube and Wire Co.,
Ltd.a Gestampb
Gonvarri Steel Industries Stalprodukt SAb Total
Financial statements reporting date Jun 30, 2013 Sep 30, 2013 Sep 30, 2013 Sep 30, 2013 Sep 30, 2013 Sep 30, 2013Place of incorporation and operation * Bermuda Germany China Spain Spain Poland
Principal ActivityIron and steel
manufacturingSteel
manufacturingSteel
manufacturing
Manufacturing of metal
componentsSteel
manufacturing
Production and distribution of steel
productsOwnership and voting rights % at December 31, 2013 ** 47.01% 33.43% 20.03% 35.00% 35.00% 33.77%Revenue 2,639 1,941 7,070 5,631 2,495 666 20,442Profit or loss from continuing operations 24 (169) (39) 138 38 19 11Post-tax profit or loss from discontinued operations -Net income (loss) 8 (173) (45) 102 37 14 (57)Other comprehensive income (loss) 1 - (2) (71) (30) - (102)Total comprehensive income (loss) 9 (173) (47) 31 7 14 (159)Cash dividends received by the Company - 15 - 23 39 1 78* The country of incorporation corresponds to the country of operation except for China Oriental whose country of operation is China.** The ownership stake is equal to the voting rights percentage, except for Stalprodukt whose voting rights correspond to 38.20%.a Following the exercise of the third put option, the accounting treatment for Hunan Valin changed from equity method to available-for-sale (see below).b Date of the latest available financial statements is September 30, 2013.
China Oriental
China Oriental Group Company Limited (“China Oriental”) is a Chinese integrated iron and steel conglomerate listed on the Hong Kong Stock Exchange (“HKEx”). However, China Oriental’s shares were suspended from trading as of April 29, 2014. On November 8, 2007, ArcelorMittal purchased approximately 820,000,000 China Oriental shares for a total consideration of 644, or a 28.02% equity interest. On December 13, 2007, the Company entered into a shareholder’s agreement which enabled it to become the majority shareholder of China Oriental and to finally raise its equity stake in China Oriental to 73.13%. At the time of the close of its tender offer on February 4, 2008 ArcelorMittal had reached a 47% shareholding in China Oriental. The measures to restore the minimum free float of 25% as per the HKEx listing requirement were achieved by means of sale of 17.4% stake to ING Bank N.V. (“ING”) and Deutsche Bank Aktiengesellschaft (“Deutsche Bank”) together with
put option agreements. On March 25, 2011, these agreements were extended until April 30, 2014. On April 30, 2014, following simultaneously with the exercise by Deutsche Bank of its put option with respect to a 7.5% stake in China Oriental, the Company sold this investment to Macquarie Bank and entered into a put option arrangement with the latter maturing on April 30, 2015. The Company extended the existing put options agreement with ING in relation to a further 9.9% stake in China Oriental until April 30, 2015. On April 30, 2015, ING Bank and Macquarie Bank exercised their put option for their respective 9.9% and 7.5% stakes in China Oriental. Accrued expenses and other liabilities and prepaid expenses and other current assets decreased by 96 and 112, respectively, as a result of these changes. The Company had not derecognized the 17.4% stake in China Oriental as it retained its exposure to significant potential risks and rewards of the investment through the put options. In order to restore the minimum free float requirement,
the Board of China Oriental has determined to issue a certain number of new shares, but as of December 31, 2015 China Oriental has not determined how many or when new shares will be issued.
In 2014, following a revision of business assumptions in the context of continuing growth slowdown in China, the Company tested the investment for impairment on a fair value basis and concluded that such fair value was lower than the carrying amount. The results of the fair value analysis principally based on market multiples indicated that the carrying value recognized was in excess of the estimated fair value of the investment, which approximated the Company’s share in China Oriental’s net equity. The recoverable amount of the Company’s investment in China Oriental amounted to 697. Based on this analysis, the Company recognized an impairment charge of 621 in income (loss) from investments in associates, joint ventures and other investments. The Company classified the
measurement at fair value into Level 3.
As at December 31, 2013, the investment had a value of 222 based on the quoted stock price of China Oriental at the Hong Kong Stock Exchange. The Company believed that the quoted share price was not a reliable representation of market value as the shares were thinly traded. The Company could not conclude that the security was dealt with on an active market where transactions take place with sufficient frequency and volume to provide pricing information on an ongoing basis.
In 2013, the Company tested the investment for impairment and determined that the value in use was lower than the carrying amount. In determining the value in use, the Company estimated its share in the present value (using a pre-tax discount rate of 11.9% for 2013) of the projected future cash flows expected to be generated by operations. The value in use was based on cash flows for a period of

Consolidated financial statements 89
five years, which were extrapolated for the remaining years based on an estimated growth rate not exceeding the average long-term growth rate for the relevant markets. Based on the analysis of value in use, the Company recognized an impairment charge of 200 in income (loss) from investments in associates, joint ventures and other investments as a result of expectations regarding future performance.
DHS GROUP
DHS - Dillinger Hütte Saarstahl AG (“DHS GROUP”), incorporated and located in Germany, is a leading heavy plate producer in Europe. The group’s parent company is DHS Holding, which owns 95.28% of the shares in the operating company, AG der Dillinger Hüttenwerke. Dillinger Hütte produces heavy steel plate, cast slag pots and semi-finished products, such as pressings, and pressure vessel heads and shell sections. The Dillinger Hütte also includes a further rolling mill operated by Dillinger France in Dunkirk (France).
Gestamp
Gestamp Automoción (“Gestamp”) is a Spanish multi-national company, which is a leader in the European automotive industry. The activities of Gestamp and its subsidiaries are focused on the design, development, and manufacturing of metal components for the automotive industry via stamping, tooling, assembly, welding, tailor welded blanks, and die cutting. The entity also includes other companies dedicated to services such as research and development of new technologies.
On February 1, 2016, ArcelorMittal completed the sale of its 35% stake in Gestamp Automoción (“Gestamp”) to the majority shareholder, the Riberas family, for a total cash consideration of €875 million (952). The transaction is unconditional and payment is expected to be made to ArcelorMittal within six months. In
addition to the cash consideration, ArcelorMittal will receive a payment of €10 million (11) as a 2015 dividend. ArcelorMittal will continue its supply relationship with Gestamp through its 35% shareholding in Gonvarri Steel Industries, a sister company of Gestamp. ArcelorMittal sells coils to Gonvarri Steel Industries for processing before they pass to Gestamp and other customers. Further, ArcelorMittal will continue to have a board presence in Gestamp, collaborate in automotive R&D and remain its major steel supplier.
Gonvarri Steel Industries
Holding Gonvarri SL (“Gonvarri Steel Industries”) is dedicated to the processing of steel. The entity is a European leader in steel service centers and renewable energy components, with strong presence in Europe and Latin America.
Stalprodukt SA
Stalprodukt SA is a leading manufacturer and exporter of highly processed steel products based in Poland. As of December 31, 2015 and 2014, the investment had a market value of 155 and 261, respectively. On December 16, 2015, the Company sold 356,424 shares in Stalprodukt, which resulted in a decrease in the ownership percentage from 33.77% to 28.47%. The Company recorded a loss on disposal of 6 in income (loss) from investments in associates, joint ventures and other investments (see note 2.6).
Hunan Valin Steel Tube and Wire Co. Ltd.
Hunan Valin Steel Tube and Wire Co. Ltd. (“Hunan Valin”) is a leading steel producer in China engaged in the production and sale of billet, seamless tube, wire rod, reinforced bar, hot rolled coil, cold rolled coil, galvanized coil, sections and Hot Rolled (“HR”) plates. The products sold to domestic and overseas markets cover a wide range of market segments.
On June 6, 2012, ArcelorMittal and Valin Group finalized a share swap arrangement based upon a put option mechanism, which enabled ArcelorMittal to exercise over the following two years put options granted by the Valin Group with respect to Hunan Valin shares. Under this arrangement, ArcelorMittal could sell up to 20% of the total equity (600 million shares) in Hunan Valin to the Valin Group. The exercise period of the put options was equally spaced with gaps of six months and linked to the key development milestones of VAMA. Following the exercise of the put options, ArcelorMittal would retain a 10% shareholding in Hunan Valin as part of a long-term strategic cooperation agreement. ArcelorMittal’s acquisition of the additional 16% shareholding in VAMA, which would be financed by the sale of shares in Hunan Valin using the put options, was approved by the Chinese authorities in December 2012. The put option exercise dates were February 6, 2013, August 6, 2013, February 6, 2014 and August 6, 2014. The exercise price per share was CNY 4 for the first two dates and CNY 4.4 for the last two dates.
On February 6, 2013 and August 6, 2013, the Company exercised the first and second put options on Hunan Valin. Its interest in the associate decreased accordingly from 30% to 20%. The aggregate resulting gain on disposal was recorded as income (loss) from investments in associates, joint ventures and other investments and amounted to 45, including the proportional reclassification of the accumulated positive foreign exchange translation difference from other comprehensive income to the statements of operations of 33. The total consideration was 194, of which 169 was reinvested into a capital increase and into the acquisition of an additional 16% interest in VAMA, in which the Company increased accordingly its stake from 33% to 49%.
As a result of the exercise of the third put option on February 8, 2014, the Company’s interest in
Hunan Valin decreased from 20% to 15%. Accordingly, the Company discontinued the accounting for its investment under the equity method and reclassified its interest as available-for-sale within other investments in the statements of financial position. The resulting loss on disposal was recorded in income (loss) from investments in associates, joint ventures and other investments and amounted to 76. This amount consisted of a gain of 13 on disposal of the 5% stake and the reclassification of the accumulated positive foreign exchange translation difference from other comprehensive income to the statements of operations of 61, offset by a loss of 150 with respect to the remeasurement at fair value of the remaining interest of 15%.
On August 6, 2014, the Company exercised the fourth and last put option, which subsequently led to the decrease in its stake in Hunan Valin from 15% to 10%. The Company recognized a net gain of 62 including a gain of 64 in relation to the option, which was a Level 2 financial instrument, a loss on disposal of 14 and a proportional reclassification of the accumulated positive reserve for available-for-sale investments from other comprehensive income to the statements of operations of 12.
2.4.3 Other associates and joint ventures that are not individually material
The Group has interests in a number of other joint ventures and associates, none of which are regarded as individually material. The following table summarizes, in aggregate, the financial information of all individually immaterial joint ventures and associates that are accounted for using the equity method:

90 Consolidated financial statements
The Company’s unrecognized share of accumulated losses in ArcelorMittal Algérie amounted to 8, 49 and 4 for the years ended December 31, 2015, December 31, 2014 and December 31, 2013, respectively. The Company’s unrecognized share of accumulated losses in AM RZK amounted to 7 for the year ended December 31, 2015.
The Company assessed the recoverability of its investments accounted for using the equity method whenever there was an indication of impairment. In determining the value in use of its investments, the Company estimated its share in the present value of the projected future cash flows expected to be generated by operations of associates and joint ventures. Based on the analysis of the higher of fair value and value in use as of December 31, 2015 the Company recorded an impairment charge 69 in respect of its investment in Uttam Galva Steels Ltd (“Uttam Galva”) (a manufacturer of cold rolled steel and galvanized steel based in India in which the Company holds
a 29% interest). In determining the value in use of its investment in Uttam Galva, the Company estimated its share in the present value (using a pre-tax discount rate of 13.91%) of the projected future cash flows expected to be generated by operations. The value in use was based on cash flows for a period of five years, which were extrapolated for the remaining years based on an estimated growth rate not exceeding the average long-term growth rate for the relevant markets. In addition to the impairment of the carrying value, the Company recorded an impairment charge on the loans related to Uttam Galva for 69. In addition, the Company recorded in impairment charge of 283 in respect of its investment in Kalagadi (see above) and 22 with respect of the Company’s 25% interest in the Northern Cape Iron Ore Mining Project, an associate in South Africa. For the remaining investments the Company concluded that no impairment was required. For the year ended December 31, 2014 the Company recorded an impairment loss of 621 in respect of its investment
in China Oriental (see above). For the year ended December 31, 2013 the Company recorded an impairment loss of 111 in respect of its investment in Coal of Africa as a result of lower profitability and decline in market value. The Company applied a Level 1 fair value measurement and adjusted the carrying amount to the market value of 11 at December 31, 2013. The Company is not aware of any material contingent liabilities related to associates and joint ventures for which it is severally liable for all or part of the liabilities of the associates nor are there any contingent liabilities incurred jointly with other investors. See note 8.3 for disclosure of commitments related to associates and joint ventures.
2.4.4 Investments in joint operations
In addition to subsidiaries, joint ventures and associates as described above, the Company also had investments in the following joint operations as of December 31, 2015 and 2014:
Peña ColoradaPeña Colorada is an iron ore mine located in Mexico in which ArcelorMittal holds a 50% interest. Peña Colorada operates an open pit mine as well as concentrating facility and two-line pelletizing facility.
Hibbing Taconite MinesThe Hibbing Taconite Mines in which the Company holds a 62.3% interest are iron ore mines located in the USA and operations consist of open pit mining, crushing, concentrating and pelletizing.
I/N TekI/N Tek in which the Company holds a 60% interest operates a cold-rolling mill in the USA.
Double G CoatingsArcelorMittal holds a 50% interest in Double G Coating, a hot dip galvanizing and Galvalume facility in the USA.
Hibbing Taconite Mines and Peña Colorada are part of the Mining segment; other joint operations are part of NAFTA.
December 31, 2015 December 31, 2014
Associates Joint Ventures Associates Joint VenturesCarrying amount of interests in associates and joint ventures 297 483 442 586 Share of:Income (loss) from continuing operations 11 (15) (3) 13 Other comprehensive income (loss) (8) 6 - - Total comprehensive income (loss) 3 (9) (3) 13
December 31, 2015 December 31, 2014
Available-for-sale securities (at fair value) 646 1,022Investments accounted for at cost 46 180Total 692 1,202
Ereĝli Demir ve Çelik Fabrikalari T.A.S. (“Erdemir”)On October 10, 2013, following the completion of the sale of 233,169,183 shares in Erdemir by way of a single accelerated bookbuilt offering to institutional investors, the Company’s interest in Erdemir decreased from 18.74% to 12.08%. The sale proceeds amounted to 267. The loss on
disposal amounting to 57 was recorded in income (loss) from investments in associates, joint ventures and other investments. The loss corresponded to the proportional reclassification from other comprehensive income to the consolidated statements of operations of unrealized losses on available-for-sale securities.
As of December 31, 2015 and 2014, the fair value of ArcelorMittal’s remaining stake in Erdemir amounted to 441 and 809, respectively. Unrealized gains (losses) recognized in reserves amounted to nil and 299 for the year ended December 31, 2015 and 2014, respectively. The Company reviewed the investment in Erdemir for impairment
during the first quarter of 2014 and concluded that there was a prolonged decline in fair value that remained continuously below cost for more than two years. Accordingly, it recorded an impairment charge of 56 in income (loss) from investments in associates, joint ventures and other investments. During the fourth quarter of 2015, the fair
2.5 Other investments
The Company holds the following other investments:

Consolidated financial statements 91
value of Erdemir decreased further and the Company accordingly recorded an additional impairment charge of 101 in income (loss) from investments in associates, joint ventures and other investments for the year ended December 31, 2015.
Hunan ValinAs of December 31, 2015 and 2014, the fair value of ArcelorMittal’s remaining stake in Hunan Valin amounted to 153 and 192. Unrealized gains recognized in other comprehensive income amounted to 62 and 101 for the year ended December 31, 2015 and 2014.
GerdauOn July 14, 2015, ArcelorMittal entered into a share swap agreement with Gerdau whereby ArcelorMittal exchanged unlisted shares of Gerdau against listed shares and a cash consideration of 28. The share swap resulted in a gain of 55 recorded as income (loss) from investments in associates, joint ventures and other investments. The unlisted shares were accounted for at cost, whereas the exchanged listed shares are accounted for at fair value. As of December 31, 2015, the fair value of ArcelorMittal’s stake in Gerdau amounted to 36. Unrealized losses recognized in other comprehensive income amounted to 28 for the year ended December 31, 2015.
The Company reviewed the investments in Hunan Valin and Gerdau for impairment and concluded that there was no impairment trigger. Unconsolidated structured entities
ArcelorMittal has operating lease arrangements for six vessels (Panamax Bulk Carriers) involving structured entities whose main purpose is to hold legal title of the six vessels and to lease them to the Company. The operating lease arrangements for five vessels were entered in 2013 and for a sixth vessel in 2014. These entities are wholly-owned and controlled by a financial institution. They are funded through equity instruments
by the financial institution.
The aforesaid operating leases have been agreed for a 12 year period, during which the Company is obliged to pay to the structured entities minimum fees equivalent to approximately 4 per year and per vessel. In addition, ArcelorMittal holds call options to buy each of the six vessels from the structured entities at pre-determined dates and prices as presented in the table below. The structured entities hold put options enabling them to sell each of the vessels at the end of the lease terms at 6 each to the Company.
Call options’ strike prices
Exercise datesat the 60th
monthat the 72nd
monthat the 84th
monthat the 96th
monthat the 108th
monthat the 120th
monthat the 132nd
monthat the 144th
monthAmounts per vessel*First four vessels 28 26 25 23 21 19 17 14 Fifth vessel 29 27 26 24 22 20 17 14 Sixth vessel 31 30 28 27 26 24 20 14
* If actual fair values of each vessel are higher than strike prices at each of the exercise dates, ArcelorMittal is then obliged to share (50%/50%) the gain with the structured entities.
In addition, pursuant to these arrangements, the Company had a receivable of 33 and 37 at December 31, 2015 and December 31, 2014, respectively (classified as “Other assets”), which does not
bear interest, is forgiven upon default and will be repaid by the structured entities quarterly in arrears throughout the lease term. The outstanding balance will be used to offset payment of any
interim call options, if exercised.
2.6 Income (loss) from investments in associates, joint ventures and other investments
Income (loss) from investments in associates, joint ventures and other investments for the years ended December 31, 2015, 2014 and 2013 consisted of the following:
Year ended December 31, 2015 Year ended December 31, 2014 Year ended December 31,2013
Share in net earnings of equity-accounted companies (59) 267 (15)Impairment charges1 (565) (677) (422)Gain (loss) on disposal2 46 179 (4)Dividend income 76 59 55Other3 - - (56)Total (502) (172) (442)1 Mainly includes impairment charges in respect of the Company’s investments in Kalagadi, Uttam Galva and Northern Cape Iron Ore Mining Project (see note 2.4), and 101 in respect of the Company’s investment in Erdemir (see note 2.5) for the year ended December 31, 2015. Includes impairment charges of 56 relating to Erdemir (see note 2.5) and 621 relating to the Company’s 47% stake in the associate China Oriental (see note 2.4) for the year ended December 31, 2014. Includes impairment charges of 200 related to China Oriental (see note 2.4), 111 relating to the Company’s 50% interest in the associate Kiswire ArcelorMittal Ltd in the framework of the agreed sale of certain steel cord assets to the joint venture partner Kiswire Ltd. and 111 relating to the associate Coal of Africa as a result of lower profitability and decline in market value for the year ended December 31, 2013.
2 Mainly includes a net gain of 55 relating to the Gerdau share swap (see note 2.5) for the year ended December 31, 2015. Includes a 193 gain on disposal of the Company’s 50% interest in Gallatin (see note 2.4) and a net loss of 14 related to the disposal of the Hunan Valin shares (see note 2.4) for the year ended December 31, 2014. Includes a charge of 57 following the disposal of a 6.66% interest in Erdemir shares by way of a single accelerated bookbuilt offering to institutional investors and a gain of 45 with respect to the sale of a 10% interest in Hunan Valin following the exercise of the first and second put options (see note 2.4) and a gain of 8 following the exercise of put options reducing the Company’s stake in Coils Lamiere Nastri (“CLN”) S.p.a. from 35.00% to 24.55%, including a loss of 4 corresponding to the proportional reclassification of the accumulated negative foreign exchange translation reserve from other comprehensive income to the statements of operations for the year ended December 31, 2013.
3 Includes a 56 expense for contingent consideration with respect to the Gonvarri Brasil acquisition made in 2008 for the year ended December 31, 2013.

92 Consolidated financial statements
Note 3: Segment reporting 3.1 Reportable segments The Company is organized in five operating and reportable segments, which are components engaged in business activities from which they may earn revenues and incur expenses (including revenues and expenses relating to transactions with other components of the Company), for which discrete financial information is available and whose operating results are evaluated regularly by the chief operating decision maker “CODM” to make decisions about resources to be allocated to the segment and assess its performance. ArcelorMittal’s CODM is the group management board “GMB”.
These operating segments include the attributable goodwill, intangible assets, property, plant and equipment, and equity method investments. They do not include cash and short-term deposits, short-term investments, tax assets and other current financial assets. Attributable
liabilities are also those resulting from the normal activities of the segment, excluding tax liabilities and indebtedness but including post retirement obligations where directly attributable to the segment. The treasury function is managed centrally for the Company and is not directly attributable to individual operating segments or geographical areas.
ArcelorMittal’s segments are structured as follows:
• NAFTA represents the flat, long and tubular facilities of the Company located in North America (Canada, United States and Mexico). NAFTA produces flat products such as slabs, hot-rolled coil, cold-rolled coil, coated steel and plate. These products are sold primarily to customers in the following industries: distribution and processing, automotive, pipe and tubes, construction, packaging, and appliances. NAFTA also produces long products such as wire rod, sections, rebar, billets, blooms and wire drawing, and tubular
products;
• Brazil includes the flat operations of Brazil and the long and tubular operations of Brazil and neighboring countries including Argentina, Costa Rica, Trinidad and Tobago and Venezuela. Flat products include slabs, hot-rolled coil, cold-rolled coil and coated steel. Long products consist of wire rod, sections, bar and rebar, billets, blooms and wire drawing;
• Europe is the largest flat steel producer in Europe, with operations that range from Spain in the west to Romania in the east, and covering the flat carbon steel product portfolio in all major countries and markets. Europe produces hot-rolled coil, cold-rolled coil, coated products, tinplate, plate and slab. These products are sold primarily to customers in the automotive, general industry and packaging industries. Europe produces also long products consisting of sections, wire rod, rebar, billets, blooms and wire drawing, and tubular products. In addition, it includes Distribution Solutions,
primarily an in-house trading and distribution arm of ArcelorMittal. Distribution Solutions also provides value-added and customized steel solutions through further steel processing to meet specific customer requirements;
• ACIS produces a combination of flat, long products and tubular products. Its facilities are located in Asia, Africa and Commonwealth of Independent States; and
• Mining comprises all mines owned by ArcelorMittal in the Americas (Canada, USA, Mexico and Brazil), Asia (Kazakhstan), Europe (Ukraine and Bosnia & Herzegovina) and Africa (Liberia). It supplies the Company and third party customers with iron ore and coal.
The following table summarizes certain financial data relating to ArcelorMittal’s operations in its different reportable segments.
Year ended December 31, 2013 NAFTA Brazil Europe ACIS Mining Others* Elimination TotalSales to external customers 19,416 9,877 40,086 8,254 1,659 148 - 79,440Intersegment sales** 229 271 421 164 4,107 606 (5,798) -Operating income (loss) 630 1,204 (985) (457) 1,176 (298) (73) 1,197Depreciation 767 691 2,003 542 642 50 - 4,695Impairment - - 86 196 162 - - 444Capital expenditures 422 276 990 398 1,342 24 - 3,452Year ended December 31, 2014Sales to external customers 21,030 9,558 39,224 8,032 1,320 118 - 79,282Intersegment sales** 132 479 328 236 3,650 419 (5,244) -Operating income (loss) 386 1,388 737 95 565 (264) 127 3,034Depreciation 706 457 1,510 525 703 38 - 3,939Impairment 114 - 57 - 63 30 - 264Capital expenditures 505 497 1,052 573 993 45 - 3,665Year ended December 31, 2015Sales to external customers 17,225 7,954 31,586 5,932 824 57 - 63,578Intersegment sales** 68 549 307 196 2,563 311 (3,994) -Operating income (loss) (705) 628 171 (624) (3,522) (140) 31 (4,161)Depreciation 616 336 1,192 408 614 26 - 3,192Impairment 526 176 398 294 3,370 - - 4,764Capital expenditures 392 422 1,045 365 476 7 - 2,707
*Others include all other operational and non-operational items which are not segmented, such as corporate and shared services, financial activities, and shipping and logistics. **Transactions between segments are reported on the same basis of accounting as transactions with third parties except for certain mining products shipped internally and reported on a cost plus basis.

Consolidated financial statements 93
The reconciliation from operating income (loss) to net income is as follows:
Year ended December 31, 2015 Year ended December 31, 2014 Year ended December 31, 2013
Operating income (loss) (4,161) 3,034 1,197Loss from investments in associates and joint ventures (502) (172) (442)Financing costs - net (2,858) (3,382) (3,115)Income (loss) before taxes (7,521) (520) (2,360)Income tax expense 902 454 215Net loss (including non-controlling interests) (8,423) (974) (2,575)
The Company does not regularly provide assets for each reportable segment to the CODM
3.2 Geographical information
Geographical information, by country or region, is separately disclosed and represents ArcelorMittal’s most significant
regional markets. Attributed assets are operational assets employed in each region and include items such as pension balances that are specific to a country. Unless otherwise stated in the table
heading as a segment disclosures, these disclosure are specific to the country or region stated. They do not include goodwill, deferred tax assets, other investments or receivables and other non-
current financial assets. Attributed liabilities are those arising within each region, excluding indebtedness.
Year ended December 31, 2015 Year ended December 31, 2014 Year ended December 31, 2013
AmericasUnited States 13,619 17,312 15,625Brazil 3,809 6,299 6,576Canada 2,913 3,462 3,299Mexico 1,913 2,216 2,081Argentina 1,370 1,161 1,279Venezuela 1,334 612 676Others 951 1,235 1,505Total Americas 25,909 32,297 31,041EuropeGermany 5,473 6,649 6,834France 3,743 4,499 4,764Spain 3,406 3,907 3,900Poland 3,023 3,815 3,523Italy 2,278 2,701 2,771Turkey 1,962 2,576 2,469Czech Republic 1,476 1,579 1,608United Kingdom 1,246 1,480 1,442Belgium 1,108 1,268 1,264Netherlands 867 917 904Russia 638 1,216 1,618Romania 583 728 755Others 4,024 4,948 5,071Total Europe 29,827 36,283 36,923Asia & AfricaSouth Africa 2,111 2,629 2,908China 557 941 1,395Morocco 533 696 744Kazakhstan 456 668 791South Korea 242 593 277India 197 225 406Others 3,746 4,950 4,955Total Asia & Africa 7,842 10,702 11,476Total 63,578 79,282 79,440
Sales (by destination)

94 Consolidated financial statements
Revenues from external customers attributed to the country of domicile (Luxembourg) were 85, 53 and 118 as of December 31, 2015, 2014 and 2013, respectively.
Non-current assets* per significant country:
Year ended December 31, 2015 Year ended December 31, 2014
AmericasCanada 5,274 5,723United States 4,289 5,799Brazil 3,770 5,815Mexico 952 1,324Venezuela 376 157Argentina 179 210Trinidad and Tobago - 199Others 24 26Total Americas 14,864 19,253EuropeFrance 4,468 4,988Germany 2,546 2,900Belgium 2,493 2,666Ukraine 2,439 3,727Poland 2,140 2,373Spain 1,945 2,667Luxembourg 1,266 1,409Czech Republic 632 695Romania 610 681Boznia and Herzegovina 202 230Italy 174 201Others 251 304Total Europe 19,166 22,841Asia & AfricaKazakhstan 1,168 2,173South Africa 767 1,393Morocco 118 143Liberia 25 1,436Others 121 136Total Asia & Africa 2,199 5,281Unallocated assets 18,291 23,747Total 54,520 71,122
*Non-current assets do not include goodwill (as it is not allocated to the geographic regions), deferred tax assets, investment in associate and joint ventures, other investments and other non-current financial assets. Such assets are presented under the caption “Unallocated assets”.
3.3 Sales by type of products
The table below presents sales to external customer by product type. In addition to steel produced by the Company, amounts include material purchased for additional transformation and sold through distribution services. Others include mainly non-steel sales and services.
Year ended December 31, 2015 Year ended December 31, 2014 Year ended December 31, 2013
Flat products 36,226 44,863 43,737Long products 13,996 18,671 19,331Tubular products 2,809 2,518 2,401Mining products 824 1,319 1,659Others 9,723 11,911 12,312Total 63,578 79,282 79,440

Consolidated financial statements 95
Note 4: Operating data
4.1 Revenue
Revenue is measured at the fair value of the consideration received or receivable. Revenue is reduced for estimated customer returns and other similar allowances.
Revenue from the sale of goods is recognized when the Company has transferred to the buyer the
significant risks and rewards of ownership of the goods, no longer retains control over the goods sold, the amount of revenue can be measured reliably, it is probable that the economic benefits associated with the transaction will flow to the Company, and the costs incurred or to be incurred in respect of the transaction can be measured reliably.
Revenue from the sale of iron ore is recognized when the risk and rewards of ownership are transferred to the buyer. The selling price is contractually determined on a provisional basis, based on a reliable estimate of the selling price and adjustments in the price may subsequently occur depending on movements in the reference price or contractual iron ore prices to the date of the final pricing and final product
specifications.ArcelorMittal records amounts billed to a customer in a sale transaction for shipping and handling costs as sales and the related shipping and handling costs incurred as cost of sales.
4.2 Cost of sales
Cost of sales recognized in the years ended December 31, 2015, 2014 and 2013 is as follows:
Year ended December 31, 2015 Year ended December 31, 2014 Year ended December 31, 2013
Materials 41,788 50,760 51,780Labor costs 9,125 10,722 10,410Logistic expenses 4,252 5,020 4,294Depreciation and amortization 3,192 3,939 4,695Impairment 4,764 264 444Other 2,075 2,583 2,994Total 65,196 73,288 75,247
4.3 Trade accounts receivable and other
Trade accounts receivable are initially recorded at their fair value and do not carry any interest. ArcelorMittal maintains an allowance for doubtful accounts at an amount that it considers to be a reasonable estimate of losses resulting from the inability
of its customers to make required payments. In judging the adequacy of the allowance for doubtful accounts, ArcelorMittal considers multiple factors including historical bad debt experience, the current economic environment and the aging of the receivables. Recoveries of trade receivables previously reserved in the allowance for doubtful accounts are recognized
as gains in selling, general and administrative expenses. ArcelorMittal’s policy is to record an allowance and a charge in selling, general and administrative expense when a specific account is deemed uncollectible and to provide for each receivable overdue by more than 180 days because historical experience is such that such receivables are
generally not recoverable, unless it can be clearly demonstrated that the receivable is still collectible. Estimated unrecoverable amounts of trade receivables between 60 days and 180 days overdue are provided for based on past default experience. Trade accounts receivable and allowance for doubtful accounts as of December 31, are as follows:
Year ended December 31, 2015 Year ended December 31, 2014
Gross amount 2,849 3,871Allowance for doubtful accounts (170) (175)Total 2,679 3,696
The carrying amount of the trade accounts receivable and other approximates fair value. Before granting credit to any new customer, ArcelorMittal uses an internally developed credit scoring system to assess the potential customer’s credit quality and to define credit limits by customer. For all significant customers the credit terms must be approved by the credit committees of each individual segment. Limits and scoring attributed to customers are reviewed periodically. There are no customers who represent more than 5% of the total balance of trade accounts receivable.
Exposure to credit risk by reportable segment
The maximum exposure to credit risk for trade accounts receivable by reportable segment at December 31 is as follows:
2015 2014
NAFTA 277 307 Brazil 610 815 Europe 1,447 2,021 ACIS 274 450 Mining 69 100 Other activities 2 3 Total 2,679 3,696
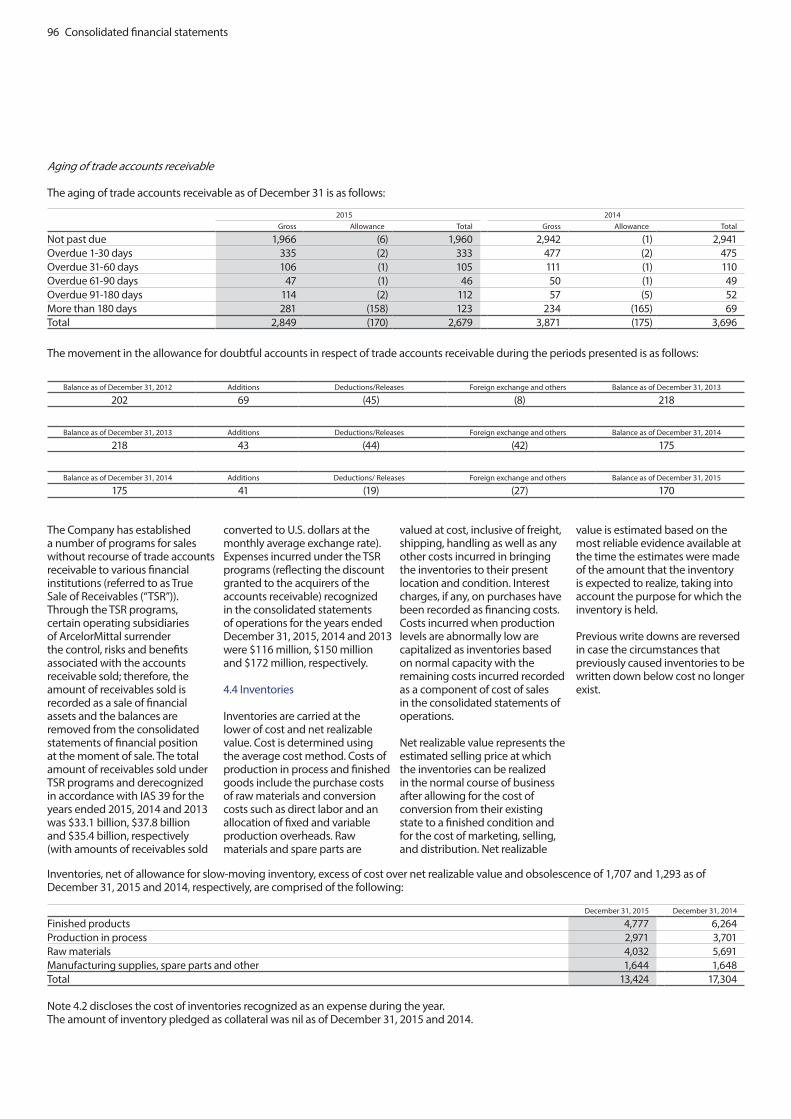
96 Consolidated financial statements
Aging of trade accounts receivable
The aging of trade accounts receivable as of December 31 is as follows:
2015 2014 Gross Allowance Total Gross Allowance Total
Not past due 1,966 (6) 1,960 2,942 (1) 2,941Overdue 1-30 days 335 (2) 333 477 (2) 475Overdue 31-60 days 106 (1) 105 111 (1) 110Overdue 61-90 days 47 (1) 46 50 (1) 49Overdue 91-180 days 114 (2) 112 57 (5) 52More than 180 days 281 (158) 123 234 (165) 69Total 2,849 (170) 2,679 3,871 (175) 3,696
The movement in the allowance for doubtful accounts in respect of trade accounts receivable during the periods presented is as follows:
Balance as of December 31, 2012 Additions Deductions/Releases Foreign exchange and others Balance as of December 31, 2013
202 69 (45) (8) 218
Balance as of December 31, 2013 Additions Deductions/Releases Foreign exchange and others Balance as of December 31, 2014
218 43 (44) (42) 175
Balance as of December 31, 2014 Additions Deductions/ Releases Foreign exchange and others Balance as of December 31, 2015
175 41 (19) (27) 170
The Company has established a number of programs for sales without recourse of trade accounts receivable to various financial institutions (referred to as True Sale of Receivables (“TSR”)). Through the TSR programs, certain operating subsidiaries of ArcelorMittal surrender the control, risks and benefits associated with the accounts receivable sold; therefore, the amount of receivables sold is recorded as a sale of financial assets and the balances are removed from the consolidated statements of financial position at the moment of sale. The total amount of receivables sold under TSR programs and derecognized in accordance with IAS 39 for the years ended 2015, 2014 and 2013 was $33.1 billion, $37.8 billion and $35.4 billion, respectively (with amounts of receivables sold
converted to U.S. dollars at the monthly average exchange rate). Expenses incurred under the TSR programs (reflecting the discount granted to the acquirers of the accounts receivable) recognized in the consolidated statements of operations for the years ended December 31, 2015, 2014 and 2013 were $116 million, $150 million and $172 million, respectively.
4.4 Inventories
Inventories are carried at the lower of cost and net realizable value. Cost is determined using the average cost method. Costs of production in process and finished goods include the purchase costs of raw materials and conversion costs such as direct labor and an allocation of fixed and variable production overheads. Raw materials and spare parts are
valued at cost, inclusive of freight, shipping, handling as well as any other costs incurred in bringing the inventories to their present location and condition. Interest charges, if any, on purchases have been recorded as financing costs. Costs incurred when production levels are abnormally low are capitalized as inventories based on normal capacity with the remaining costs incurred recorded as a component of cost of sales in the consolidated statements of operations.
Net realizable value represents the estimated selling price at which the inventories can be realized in the normal course of business after allowing for the cost of conversion from their existing state to a finished condition and for the cost of marketing, selling, and distribution. Net realizable
value is estimated based on the most reliable evidence available at the time the estimates were made of the amount that the inventory is expected to realize, taking into account the purpose for which the inventory is held.
Previous write downs are reversed in case the circumstances that previously caused inventories to be written down below cost no longer exist.
December 31, 2015 December 31, 2014
Finished products 4,777 6,264Production in process 2,971 3,701Raw materials 4,032 5,691Manufacturing supplies, spare parts and other 1,644 1,648Total 13,424 17,304
Note 4.2 discloses the cost of inventories recognized as an expense during the year.The amount of inventory pledged as collateral was nil as of December 31, 2015 and 2014.
Inventories, net of allowance for slow-moving inventory, excess of cost over net realizable value and obsolescence of 1,707 and 1,293 as of December 31, 2015 and 2014, respectively, are comprised of the following:

Consolidated financial statements 97
Balance as of December 31, 2012 Additions* Deductions/Releases Foreign exchange and others Balance as of December 31, 2013
1,427 440 (364) (8) 1,495
Balance as of December 31, 2013 Additions* Deductions/Releases Foreign exchange and others Balance as of December 31, 2014
1,495 355 (387) (170) 1,293
Balance as of December 31, 2014 Additions* Deductions/ Releases Foreign exchange and others Balance as of December 31, 2015
1,293 932 (312) (206) 1,707 * Additions exclude write-downs of inventories written back or utilized during the same financial year.
4.5 Prepaid expenses and other current assets
Prepaid expenses and other current assets consisted of the following:
December 31, 2015 December 31, 2014
VAT receivables 850 1,102 Income tax receivable 115 106 Derivative financial instruments 128 192 Prepaid expenses and non-trade receivables 406 544 Collateral related to the put agreement on China Oriental 1 - 112 Other2 360 571 Total 1,859 2,627 1 The consideration for the disposal of a 17.40% interest in China Oriental shares was paid to Macquarie Bank and ING as collateral to secure the obligations of the Company under put agreements. The put option agreements matured on April 30, 2015. See note 2.4.2. 2 Other includes mainly advances to employees, accrued interest, amounts receivables from public authorities and other miscellaneous receivables.
4.6 Other assets
Other assets consisted of the following:
December 31, 2015 December 31, 2014
Financial amounts receivable 166 454Long-term VAT receivables 197 279Cash guarantees and deposits 181 231Accrued interest 74 151Assets in pension funds1 18 32Income tax receivable 9 11Derivative financial instruments 90 4Other2 185 266Total 920 1,4281 The pension funds are mainly related to units in Canada.2 Other mainly includes cash deposits, receivables from public authorities and receivables from the sale of fixed assets.
4.7 Trade accounts payable and other
Trade accounts payable are obligations to pay for goods that have been acquired in the ordinary course of business from suppliers. Trade accounts payable have maturities from 15 to 180 days depending on the type of material, the geographic area in which the purchase transaction occurs and the various contractual agreements. The carrying value of trade accounts payable approximates fair value.
The movement in the inventory reserve is as follows:

98 Consolidated financial statements
4.8 Accrued expenses and other liabilities
Accrued expenses and other liabilities are comprised of the following as of December 31: 2015 2014
Accrued payroll and employee related expenses 1,568 1,869Collection under TSR programs 1,439 1,256Accrued interest and other payables 1,026 979Payable from acquisition of intangible, tangible & financial assets 852 915Other amounts due to public authorities 559 528Derivative financial instruments 133 134Unearned revenue and accrued payables 56 59Total 5,633 5,740
NOTE 5: GOODWILL, INTANGIBLE AND TANGIBLE ASSETS
5.1 Goodwill and intangible assets
The carrying amounts of goodwill and intangible assets are summarized as follows:
2015 2014Goodwill on acquisitions 5,143 7,322Concessions, patents and licenses 266 488Customer relationships and trade marks 170 278Other 13 16Total 5,592 8,104
Goodwill
Goodwill arising on an acquisition is recognized as previously described within the business combinations section in note 2.2.3. Goodwill is allocated to those groups of cash-generating units that are expected to benefit from the business combination in which the goodwill arose and in all cases is at the operating segment level, which represents the lowest level at which goodwill is monitored for internal management purposes.
Goodwill acquired in business combinations for each of the Company’s operating segments is as follows:
December 31, 2013Impairment and
reduction of goodwill
Foreign exchange differences and other
movements Divestments December 31, 2014
NAFTA 2,398 - (62) - 2,336Brazil 2,332 - (275) - 2,057Europe 663 - (48) (11) 604ACIS 1,456 - 1 - 1,457Mining 886 - (15) (3) 868Total 7,735 - (399) (14) 7,322
December 31, 2014Impairment and
reduction of goodwill
Foreign exchange differences and other
movements Divestments December 31, 2015
NAFTA 2,336 - (172) - 2,209Brazil 2,057 - (631) - 1,426Europe 604 - (57) - 547ACIS 1,457 - (496) - 961Mining 868 (854) (14) - -Total 7,322 (854) (1,325) - 5,143
Intangible assets
Intangible assets are recognized only when it is probable that the expected future economic benefits attributable to the assets will accrue to the Company and the cost can be reliably measured. Intangible assets acquired separately by ArcelorMittal are initially recorded at cost and those acquired in a business combination are initially
recorded at fair value at the date of the business combination. These primarily include the cost of technology and licenses purchased from third parties and operating authorizations granted by governments or other public bodies (concessions). Intangible assets are amortized on a straight-line basis over their estimated economic useful lives, which typically do not exceed five years. Amortization
is included in the consolidated statements of operations as part of depreciation.
ArcelorMittal’s industrial sites which are regulated by the European Directive 2003/87/EC of October 13, 2003 on carbon dioxide (“CO2”) emission rights, effective as of January 1, 2005, are located primarily in Belgium, Czech Republic, France, Germany, Luxembourg, Poland, Romania
and Spain. The emission rights allocated to the Company on a no-charge basis pursuant to the annual national allocation plan are recorded at nil value and purchased emission rights are recorded at cost. Gains and losses from the sale of excess rights are recognized in cost of sales in the consolidated statements of operations.

Consolidated financial statements 99
Other intangible assets are summarized as follows:
Concessions, patents and
licenses
Customer relationships
and trade marks Other Total
Cost At December 31, 2013 1,118 1,667 867 3,652Acquisitions 18 - 4 22Disposals (10) (10) - (20)Foreign exchange differences (129) (164) (5) (298)Divestments (note 2.3) (14) (3) (2) (19)Transfers to assets held for sale (note 2.3) - (47) - (47)Transfers and other movements (10) (18) (3) (31)Fully amortized intangible assets * (4) (77) (801) (882)At December 31, 2014 969 1,348 60 2,377Acquisitions 11 - 3 14Disposals (8) - (1) (9)Foreign exchange differences (160) (206) (6) (372)Transfers to assets held for sale (note 2.3) - (52) (29) (81)Transfers and other movements 10 (13) 9 6Fully amortized intangible asset* (92) - - (92)At December 31, 2015 730 1,077 36 1,843
Accumulated amortization and impairment lossesAt December 31, 2013 548 1,256 849 2,653Disposals (10) (10) - (20)Amortization charge 55 88 3 146Foreign exchange differences (87) (130) (5) (222)Divestments (note 2.3) (10) (3) (2) (15)Transfers to assets held for sale (note 2.3) - (34) - (34)Transfers and other movements (11) (20) - (31)Fully amortized intangible assets * (4) (77) (801) (882)At December 31, 2014 481 1,070 44 1,595Disposals (7) - - (7)Amortization charge 37 65 7 109Impairment charge 157 - - 157Foreign exchange differences (107) (163) (6) (276)Transfers to assets held for sale (note 2.3) - (52) (22) (74)Transfers and other movements (5) (13) - (18)Fully amortized intangible asset* (92) - - (92)At December 31, 2015 464 907 23 1,394
Carrying amount
At December 31, 2014 488 278 16 782
At December 31, 2015 266 170 13 449
* Fully amortized assets in 2014 correspond mainly to favorable contracts that are no longer used by the Company and exploration and evaluation assets. Fully amortized assets in 2015 correspond mainly to concessions.
Research and development costs not meeting the criteria for capitalization are expensed as incurred. These costs amounted to 227, 259 and 270 in the years ended December 31, 2015, 2014, and 2013, respectively.

100 Consolidated financial statements
5.2 Property, plant and equipment
Property, plant and equipment is recorded at cost less accumulated depreciation and impairment. Cost includes all related costs directly attributable to the acquisition or construction of the asset. Except for land and assets used in mining activities, property, plant and equipment is depreciated using the straight-line method over the useful lives of the related assets as presented in the table below.
Asset Category Useful Life Range
Land Not depreciatedBuildings 10 to 50 yearsProperty plant & equipment 15 to 50 yearsAuxiliary facilities 15 to 45 yearsOther facilities 5 to 20 years
During 2014, the Company performed a review of the useful lives of its assets and determined its maintenance and operating practices enabled a change in the useful lives of plant and equipment. Maintenance practices employed served to preserve and extend the operating life of certain of these assets, while operating practices in the current economic environment also contributed to the extension of asset useful life beyond previous estimates. The Company thus revised the useful lives due to its determination that certain of its existing assets had been used longer than previously anticipated and therefore, the estimated useful lives of certain plant and equipment were lengthened.
The Company’s most recent review of useful lives leveraged the experience and specialized knowledge of ArcelorMittal’s network of chief technical officers. The chief technical officer network includes engineers with facility-specific expertise relating to plant and equipment used in the principal production units of the Company’s operations. In performing this review, the Company gathered and evaluated data, including commissioning dates, designed capacities, maintenance records and programs, and asset performance history, among other attributes. In accordance with IAS 16, Property, Plant and Equipment, the Company considered this information at the level of components significant in relation to the total cost of the item of plant and equipment. Other factors the Company considered in its determination of useful lives included the expected use of the assets, technical or commercial obsolescence, and operational factors that led to improvements in monitoring and
process control that contribute to longer asset lives. In addition, the Company considered the accumulated technical experience and knowledge sharing programs that allowed for the exchange of best practices within the chief technical officer network and the deployment of these practices across the Company’s principal production units. Depreciation charge for the year ended December 31, 2014 decreased by 702 as a result of changes in estimated useful lives.
Major improvements, which add to productive capacity or extend the life of an asset, are capitalized, while repairs and maintenance are expensed as incurred. Where a tangible fixed asset comprises major components having different useful lives, these components are accounted for as separate items.
Property, plant and equipment under construction is recorded as construction in progress until it is ready for its intended use; thereafter it is transferred to the related class of property, plant and equipment and depreciated over estimated useful lives. Interest incurred during construction is capitalized if the borrowing cost is directly attributable to the construction. Gains and losses on retirement or disposal of assets are recognized in cost of sales.
Property, plant and equipment acquired by way of finance leases is stated at an amount equal to the lower of the fair value and the present value of the minimum lease payments at the inception of the lease. Each lease payment is allocated between the finance charges and a reduction of the lease liability. The interest element of the finance cost is charged to the consolidated statements of operations over the lease period
so as to achieve a constant rate of interest on the remaining balance of the liability.
The residual values and useful lives of property, plant and equipment are reviewed at each reporting date and adjusted if expectations differ from previous estimates. Depreciation methods applied to property, plant and equipment are reviewed at each reporting date and changed if there has been a significant change in the expected pattern of consumption of the future economic benefits embodied in the asset.
Mining assets comprise:
• Mineral rights acquired;• Capitalized developmental
stripping (as described below in “Stripping and overburden removal costs”).
Property, plant and equipment used in mining activities is depreciated over its useful life or over the remaining life of the mine, if shorter, and if there is no alternative use possible. For the majority of assets used in mining activities, the economic benefits from the asset are consumed in a pattern which is linked to the production level and accordingly, assets used in mining activities are primarily depreciated on a units-of-production basis. A unit-of-production is based on the available estimate of proven and probable reserves. Capitalization of pre-production expenditures ceases when the mining property is capable of commercial production as it is intended by management. General administration costs that are not directly attributable to a specific exploration area are charged to the consolidated statements of operations.
Mining Reserves
Reserves are estimates of the amount of product that can be economically and legally extracted from the Company’s properties. In order to estimate reserves, estimates are required about a range of geological, technical and economic factors, including quantities, grades, production techniques, recovery rates, production costs, transport costs, commodity demand, commodity prices and exchange rates.
Estimating the quantity and/or grade of reserves requires the size, shape and depth of ore bodies to be determined by analyzing geological data such as drilling samples. This process may require complex and difficult geological judgments to interpret the data.Because the economic assumptions used to estimate reserves change from period to period, and because additional geological data is generated during the course of operations, estimates of reserves may change from period to period. Changes in reported reserves may affect the Company’s financial results and financial position in a number of ways, including the following:
• Asset carrying amounts may be affected due to changes in estimated future cash flows.
• Depreciation, depletion and amortization charged in the consolidated statements of operations may change where such charges are determined by the units of production basis, or where the useful economic lives of assets change.
• Overburden removal costs recognized in the consolidated statements of financial position or charged to the consolidated statements of operations may

Consolidated financial statements 101
change due to changes in stripping ratios or the units of production basis of depreciation.
• Decommissioning, site restoration and environmental provisions may change where changes in estimated reserves affect expectations about the timing or cost of these activities.
Stripping and overburden removal costs
In open pit and underground mining operations, it is necessary to remove overburden and other waste materials to access the deposit from which minerals can be extracted. This process is referred to as stripping. Stripping costs can be incurred before the mining production commences (“developmental stripping”) or during the production stage (“production stripping”).
A mine can operate several open pits that are regarded as separate operations for the purpose of mine planning and production. In this case, stripping costs are accounted for separately, by re¬ference to the ore extracted from each separate pit. If, however, the pits are highly integrated for the purpose of mine planning and production, stripping costs are aggregated too.
The determination of whether multiple pit mines are considered separate or integrated operations depends on each mine’s specific circumstances. The following factors would point towards the stripping costs for the individual pits being accounted for separately:
• If mining of the second and subsequent pits is conducted consecutively with that of the first pit, rather than concurrently.
• If separate investment decisions are made to develop each pit, rather than a single investment decision being made at the outset.
• If the pits are operated as separate units in terms of mine planning and the sequencing of overburden and ore mining, rather than as an integrated unit.
• If expenditures for additional infrastructure to support the second and subsequent pits are relatively large.
• If the pits extract ore from separate and distinct ore bodies, rather than from a single ore body.
The relative importance of each factor is considered by local management to determine whether, on balance, the stripping costs should be attributed to the individual pit or to the combined output from the several pits.
Developmental stripping costs contribute to the future economic benefits of mining operations when the production begins and so are capitalized as tangible assets (construction in progress), whereas production stripping is a part of on-going activities and commences when the production stage of mining operations begins and continues throughout the life of a mine.
Capitalization of developmental stripping costs ends when the commercial production of the minerals commences.
Production stripping costs are incurred to extract the ore in the form of inventories and / or to improve access to an additional component of an ore body or deeper levels of material. Production stripping costs are accounted for as inventories to the extent the benefit from production stripping activity is realized in the form of inventories. Production stripping costs are recognized as a non-current asset (“stripping activity assets”) to the extent it is probable that future economic benefit in terms of improved access to ore will flow to the Company, the components of the ore body for which access has been improved can be identified and the costs relating to the stripping activity associated with that component can be measured reliably.
All stripping costs assets (either stripping activity assets or capitalized developmental stripping costs) are presented within a specific “mining assets” class of property, plant and equipment and then depreciated on a units-of-production basis.
Exploration and evaluation expenditure
Exploration and evaluation activities involve the search
for iron ore and coal resources, the determination of technical feasibility and the assessment of commercial viability of an identified resource. Exploration and evaluation activities include:
• researching and analyzing historical exploration data;
• conducting topographical, geological, geochemical and geophysical studies;
• carrying out exploratory drilling, trenching and sampling activities;
• drilling, trenching and sampling activities to determine the quantity and grade of the deposit;
• examining and testing extraction methods and metallurgical or treatment processes; and,
• detailed economic feasibility evaluations to determine whether development of the reserves is commercially justified and to plan methods for mine development.
Exploration and evaluation expenditure is charged to the consolidated statements of operations as incurred except in the following circumstances, in which case the expenditure is capitalized: (i) the exploration and evaluation activity is within an area of interest which was previously acquired in a business combination and measured at fair value on acquisition; or (ii) when management has a high degree of confidence in the project’s economic viability and it is probable that future economic benefits will flow to the Company.
Capitalized exploration and evaluation expenditures are generally recorded as a component of property, plant and equipment at cost less impairment charges, unless their nature requires them to be recorded as an intangible asset. As the asset is not available for use, it is not depreciated and all capitalized exploration and evaluation expenditure is monitored for indications of impairment. To the extent that capitalized expenditure is not expected to be recovered it is recognized as an expense in the consolidated statements of operations.
Cash flows associated with exploration and evaluation expenditure are classified as operating activities when they are related to expenses or as an investing activity when they are related to a capitalized asset in the consolidated statements of cash flows.
Development expenditure
Development is the establishment of access to the mineral reserve and other preparations for commercial production. Development activities often continue during production and include:
• sinking shafts and underground drifts (often called mine development);
• making permanent excavations;
• developing passageways and rooms or galleries;
• building roads and tunnels; and
• advance removal of overburden and waste rock.
Development (or construction) also includes the installation of infrastructure (e.g., roads, utilities and housing), machinery, equipment and facilities.
When proven reserves are determined and development is approved, expenditures capitalized as exploration and evaluation are reclassified as construction in progress and are reported as a component of property, plant and equipment. All subsequent development expenditures are capitalized and classified as construction in progress. On completion of development, all assets included in construction in progress are individually reclassified to the appropriate category of property, plant and equipment and depreciated accordingly.
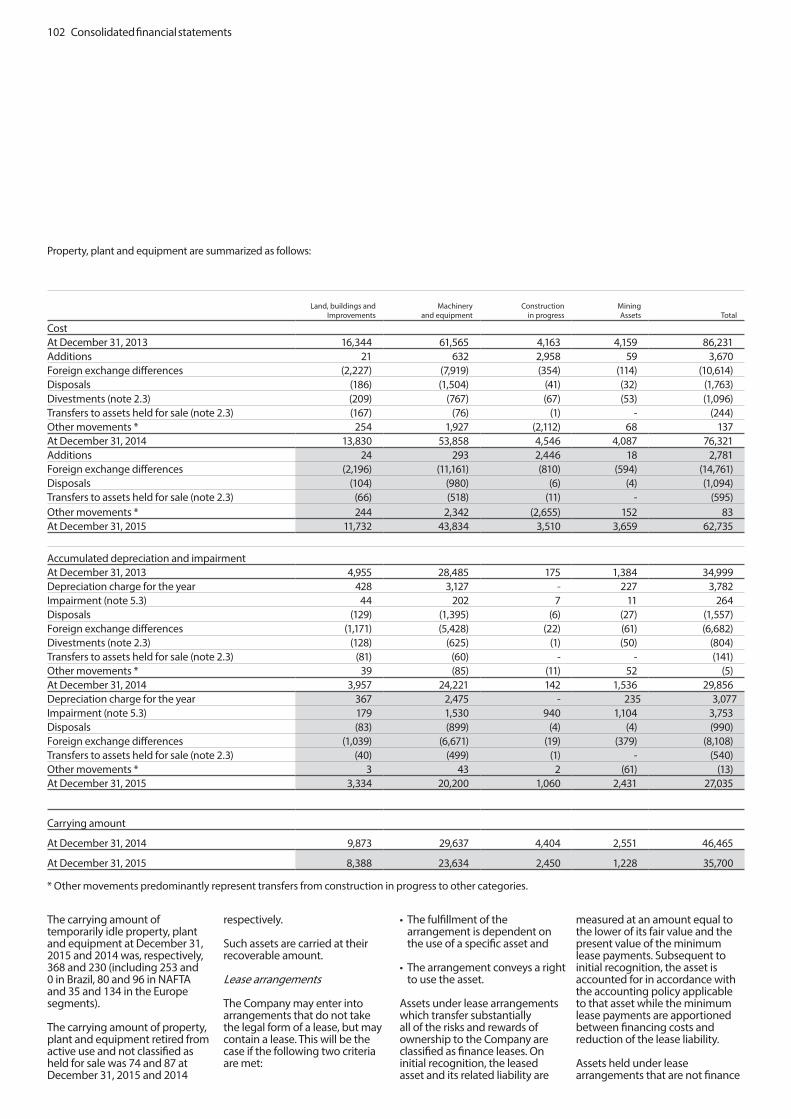
102 Consolidated financial statements
Property, plant and equipment are summarized as follows:
Land, buildings and
ImprovementsMachinery
and equipmentConstruction
in progressMining Assets Total
Cost At December 31, 2013 16,344 61,565 4,163 4,159 86,231Additions 21 632 2,958 59 3,670Foreign exchange differences (2,227) (7,919) (354) (114) (10,614)Disposals (186) (1,504) (41) (32) (1,763)Divestments (note 2.3) (209) (767) (67) (53) (1,096)Transfers to assets held for sale (note 2.3) (167) (76) (1) - (244)Other movements * 254 1,927 (2,112) 68 137At December 31, 2014 13,830 53,858 4,546 4,087 76,321Additions 24 293 2,446 18 2,781Foreign exchange differences (2,196) (11,161) (810) (594) (14,761)Disposals (104) (980) (6) (4) (1,094)Transfers to assets held for sale (note 2.3) (66) (518) (11) - (595)Other movements * 244 2,342 (2,655) 152 83At December 31, 2015 11,732 43,834 3,510 3,659 62,735
Accumulated depreciation and impairmentAt December 31, 2013 4,955 28,485 175 1,384 34,999Depreciation charge for the year 428 3,127 - 227 3,782Impairment (note 5.3) 44 202 7 11 264Disposals (129) (1,395) (6) (27) (1,557)Foreign exchange differences (1,171) (5,428) (22) (61) (6,682)Divestments (note 2.3) (128) (625) (1) (50) (804)Transfers to assets held for sale (note 2.3) (81) (60) - - (141)Other movements * 39 (85) (11) 52 (5)At December 31, 2014 3,957 24,221 142 1,536 29,856Depreciation charge for the year 367 2,475 - 235 3,077Impairment (note 5.3) 179 1,530 940 1,104 3,753Disposals (83) (899) (4) (4) (990)Foreign exchange differences (1,039) (6,671) (19) (379) (8,108)Transfers to assets held for sale (note 2.3) (40) (499) (1) - (540)Other movements * 3 43 2 (61) (13)At December 31, 2015 3,334 20,200 1,060 2,431 27,035
Carrying amount
At December 31, 2014 9,873 29,637 4,404 2,551 46,465
At December 31, 2015 8,388 23,634 2,450 1,228 35,700
* Other movements predominantly represent transfers from construction in progress to other categories.
The carrying amount of temporarily idle property, plant and equipment at December 31, 2015 and 2014 was, respectively, 368 and 230 (including 253 and 0 in Brazil, 80 and 96 in NAFTA and 35 and 134 in the Europe segments).
The carrying amount of property, plant and equipment retired from active use and not classified as held for sale was 74 and 87 at December 31, 2015 and 2014
respectively.
Such assets are carried at their recoverable amount.
Lease arrangements
The Company may enter into arrangements that do not take the legal form of a lease, but may contain a lease. This will be the case if the following two criteria are met:
• The fulfillment of the arrangement is dependent on the use of a specific asset and
• The arrangement conveys a right to use the asset.
Assets under lease arrangements which transfer substantially all of the risks and rewards of ownership to the Company are classified as finance leases. On initial recognition, the leased asset and its related liability are
measured at an amount equal to the lower of its fair value and the present value of the minimum lease payments. Subsequent to initial recognition, the asset is accounted for in accordance with the accounting policy applicable to that asset while the minimum lease payments are apportioned between financing costs and reduction of the lease liability.
Assets held under lease arrangements that are not finance

Consolidated financial statements 103
leases are classified as operating leases and are not recognized in the consolidated statements of financial position. Payments made under operating leases are recognized in cost of sales in the consolidated statements of operations on a straight-line basis over the lease terms.
The carrying amount of capitalized leases was 552 and 688 as of December 31, 2015 and 2014, respectively. The 552 and 688 include 513 and 607 related to machinery and equipment and 39 and 81 to buildings respectively.
The total future minimum lease payments related to finance leases are as follows:
2016 1412017-2020 5162021 and beyond 313Total 970
Type of asset 2015 2014 2013
Goodwill 854 - 4Intangible assets 157 - 162Tangible assets 3,753 264 278Total 4,764 264 444
The present value of the future minimum lease payments was 602 and 705 for the year ended December 31, 2015 and 2014, respectively. The 2015 calculation is based on an average discounting rate of 13.1% (12.9% in 2014) considering maturities from 1 to 16 years (same in 2014) including the renewal option when intended to be exercised.
The Company has pledged 304 and 273 of property, plant and equipment, inventories and other security interests and collateral as of December 31, 2015 and 2014, respectively, to secure banking facilities granted to the Company.
5.3 Impairment of intangible assets, including goodwill, and tangible assets
Impairment charges recognized for the years ended December 31, 2015, 2014 and 2013 were as follows:
Impairment test of goodwill
Goodwill is tested for impairment annually, as of October 31 or whenever changes in circumstances indicate that the carrying amount may not be recoverable, at the level of the groups of cash-generating units (“GCGU”) which correspond to the operating segments representing the lowest level at which goodwill is monitored for internal management purposes. Whenever the cash-generating units comprising the operating segments are tested for impairment at the same time as goodwill, the cash-generating units are tested first and any impairment of the assets is recorded prior to the testing of goodwill.
The recoverable amounts of the GCGUs are mainly determined based on their value in use. The
value in use of each GCGU is determined by estimating future cash flows. With respect to steel operations, the key assumptions for the value in use calculations are primarily the discount rates, growth rates, expected changes to average selling prices, shipments and direct costs during the period. Assumptions for average selling prices and shipments are based on historical experience and expectations of future changes in the market. Cash flow forecasts are derived from the most recent financial plans approved by management for the next five years. Beyond the specifically forecasted period, the Company extrapolates cash flows for the remaining years based on an estimated growth rate of 2%. This rate does not exceed the average long-term growth rate for the relevant markets.
Regarding mining operations, the key assumptions for the value in use calculations are primarily the discount rates, capital expenditure, expected changes to average selling prices, shipments and direct costs during the period. The value in use of each CGU was determined by estimating cash flows over the current life-of-the-mine plan or long term production plan. Cash flow forecasts include material from proven and probable ore reserves. The cash flow forecasts may also include net cash flows expected to be realized from extraction, processing and sale of material that does not currently qualify for inclusion in proved or probable ore reserves. Such non-reserve material is only included where there is a high degree of confidence in its economic extraction. This expectation is usually based on preliminary
drilling and sampling of areas of mineralization that are contiguous with existing reserves. Typically, the additional evaluation to achieve reserve status for such material has not yet been done because this would involve incurring evaluation costs earlier than is required for the efficient planning and operation of the mine.
Management estimates discount rates using pre-tax rates that reflect current market rates for investments of similar risk. The rate for each GCGU was estimated from the weighted average cost of capital of producers, which operate a portfolio of assets similar to those of the Company’s assets.
NAFTA Brazil Europe ACIS Mining
GCGU weighted average pre-tax discount rate used in 2015 (in %) 10.5 15.4 10.3 16.8 13.3
NAFTA Brazil Europe ACIS Mining
GCGU weighted average pre-tax discount rate used in 2014 (in %) 10.7 13.8 10.7 14.1 14.3
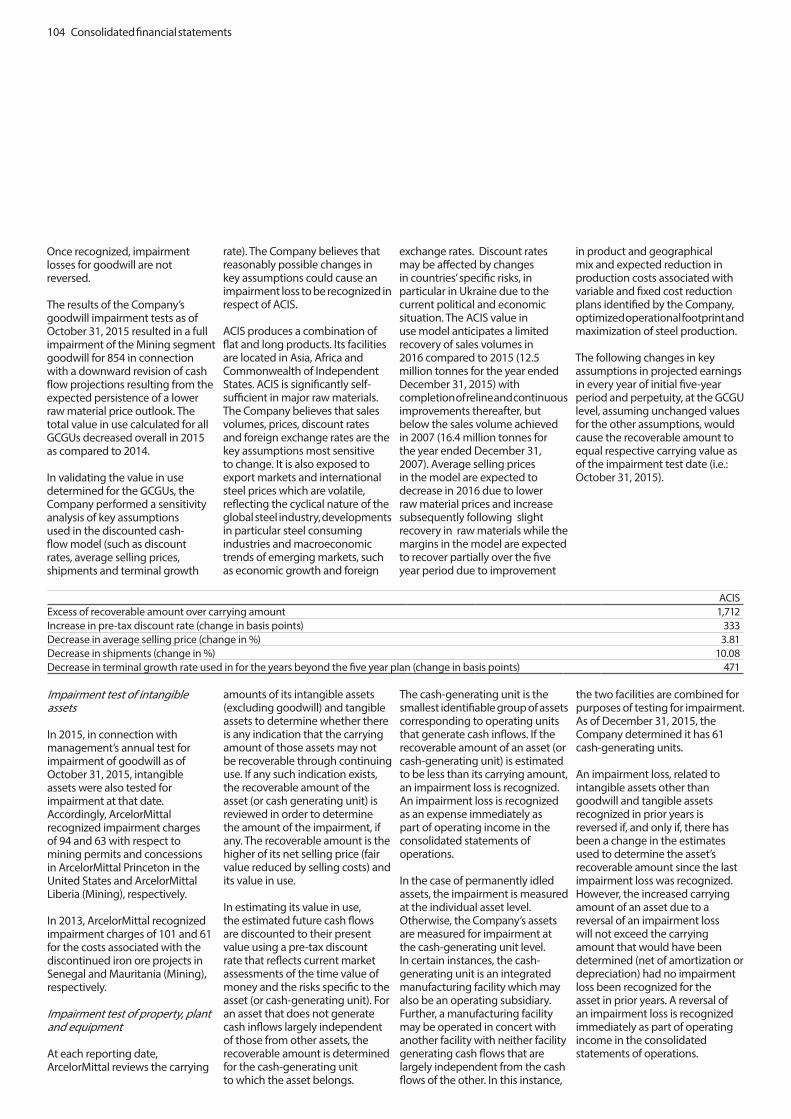
104 Consolidated financial statements
Once recognized, impairment losses for goodwill are not reversed.
The results of the Company’s goodwill impairment tests as of October 31, 2015 resulted in a full impairment of the Mining segment goodwill for 854 in connection with a downward revision of cash flow projections resulting from the expected persistence of a lower raw material price outlook. The total value in use calculated for all GCGUs decreased overall in 2015 as compared to 2014.
In validating the value in use determined for the GCGUs, the Company performed a sensitivity analysis of key assumptions used in the discounted cash-flow model (such as discount rates, average selling prices, shipments and terminal growth
rate). The Company believes that reasonably possible changes in key assumptions could cause an impairment loss to be recognized in respect of ACIS.
ACIS produces a combination of flat and long products. Its facilities are located in Asia, Africa and Commonwealth of Independent States. ACIS is significantly self-sufficient in major raw materials. The Company believes that sales volumes, prices, discount rates and foreign exchange rates are the key assumptions most sensitive to change. It is also exposed to export markets and international steel prices which are volatile, reflecting the cyclical nature of the global steel industry, developments in particular steel consuming industries and macroeconomic trends of emerging markets, such as economic growth and foreign
exchange rates. Discount rates may be affected by changes in countries’ specific risks, in particular in Ukraine due to the current political and economic situation. The ACIS value in use model anticipates a limited recovery of sales volumes in 2016 compared to 2015 (12.5 million tonnes for the year ended December 31, 2015) with completion of reline and continuous improvements thereafter, but below the sales volume achieved in 2007 (16.4 million tonnes for the year ended December 31, 2007). Average selling prices in the model are expected to decrease in 2016 due to lower raw material prices and increase subsequently following slight recovery in raw materials while the margins in the model are expected to recover partially over the five year period due to improvement
in product and geographical mix and expected reduction in production costs associated with variable and fixed cost reduction plans identified by the Company, optimized operational footprint and maximization of steel production.
The following changes in key assumptions in projected earnings in every year of initial five-year period and perpetuity, at the GCGU level, assuming unchanged values for the other assumptions, would cause the recoverable amount to equal respective carrying value as of the impairment test date (i.e.: October 31, 2015).
ACISExcess of recoverable amount over carrying amount 1,712Increase in pre-tax discount rate (change in basis points) 333Decrease in average selling price (change in %) 3.81Decrease in shipments (change in %) 10.08Decrease in terminal growth rate used in for the years beyond the five year plan (change in basis points) 471
Impairment test of intangible assets
In 2015, in connection with management’s annual test for impairment of goodwill as of October 31, 2015, intangible assets were also tested for impairment at that date. Accordingly, ArcelorMittal recognized impairment charges of 94 and 63 with respect to mining permits and concessions in ArcelorMittal Princeton in the United States and ArcelorMittal Liberia (Mining), respectively.
In 2013, ArcelorMittal recognized impairment charges of 101 and 61 for the costs associated with the discontinued iron ore projects in Senegal and Mauritania (Mining), respectively.
Impairment test of property, plant and equipment
At each reporting date, ArcelorMittal reviews the carrying
amounts of its intangible assets (excluding goodwill) and tangible assets to determine whether there is any indication that the carrying amount of those assets may not be recoverable through continuing use. If any such indication exists, the recoverable amount of the asset (or cash generating unit) is reviewed in order to determine the amount of the impairment, if any. The recoverable amount is the higher of its net selling price (fair value reduced by selling costs) and its value in use.
In estimating its value in use, the estimated future cash flows are discounted to their present value using a pre-tax discount rate that reflects current market assessments of the time value of money and the risks specific to the asset (or cash-generating unit). For an asset that does not generate cash inflows largely independent of those from other assets, the recoverable amount is determined for the cash-generating unit to which the asset belongs.
The cash-generating unit is the smallest identifiable group of assets corresponding to operating units that generate cash inflows. If the recoverable amount of an asset (or cash-generating unit) is estimated to be less than its carrying amount, an impairment loss is recognized. An impairment loss is recognized as an expense immediately as part of operating income in the consolidated statements of operations.
In the case of permanently idled assets, the impairment is measured at the individual asset level. Otherwise, the Company’s assets are measured for impairment at the cash-generating unit level. In certain instances, the cash-generating unit is an integrated manufacturing facility which may also be an operating subsidiary. Further, a manufacturing facility may be operated in concert with another facility with neither facility generating cash flows that are largely independent from the cash flows of the other. In this instance,
the two facilities are combined for purposes of testing for impairment. As of December 31, 2015, the Company determined it has 61 cash-generating units.
An impairment loss, related to intangible assets other than goodwill and tangible assets recognized in prior years is reversed if, and only if, there has been a change in the estimates used to determine the asset’s recoverable amount since the last impairment loss was recognized. However, the increased carrying amount of an asset due to a reversal of an impairment loss will not exceed the carrying amount that would have been determined (net of amortization or depreciation) had no impairment loss been recognized for the asset in prior years. A reversal of an impairment loss is recognized immediately as part of operating income in the consolidated statements of operations.

Consolidated financial statements 105
Impairment charges relating to property, plant and equipment were as follows for the years ended December 31, 2015, 2014 and 2013:
2015In 2015, the Company recognized a total impairment charge of property, plant and equipment amounting to 3,753.
This charge included 335 relating to the idling for an indefinite time of the Sestao facility in Spain (Europe segment), 19 in connection with the closure of the Georgetown facility in the US
(NAFTA) and 27 related to the Vereeniging meltshop closure in South Africa (ACIS). Additionally, the Company recognized impairment charges of 231 and 18 in connection with the intended sale of the Long Carbon facilities (ArcelorMittal Laplace, Steelton and Vinton) in the United States (NAFTA) and the intended sale of certain activities of ArcelorMittal Downstream Solutions (Europe segment), respectively.
In addition, the Company recorded impairment charges of 176, 276 and 45 relating to the ArcelorMittal Point Lisas facility currently idled
in Trinidad and Tobago (Brazil segment), Indiana Harbor East and West facilities in the United States (NAFTA) following deployment of asset optimization programs and other assets in Spain (Europe segment), respectively.
In connection with management’s annual test for impairment of goodwill as of October 31, 2015, property, plant and equipment was also tested for impairment at that date. Management concluded that the recoverable amount of certain of the Company’s property, plant and equipment in the Mining segment was lower than
their carrying amount due to a downward revision of cash flow projections primarily resulting from the expected persistence of a lower coking coal and iron ore price outlook. The Company also concluded that the value in use of property, plant and equipment of the Saldanha plant in ArcelorMittal South Africa was lower than its carrying amount following a revised competitive outlook. Accordingly, the Company recognized a total impairment charge of 2,617 consisting of the following:
Cash-Generating Unit Country Operating Segment Impairment Recorded2015
Pre-Tax Discount Rate2014
Pre-Tax Discount RateCarrying Value as of December 31, 2015
ArcelorMittal Liberia Liberia Mining 1,363 14.71% 17.80% 25ArcelorMittal Princeton United States Mining 590 8.50% 11.00% 4Las Truchas Mines Mexico Mining 220 10.96% 12.26% -ArcelorMittal Serra Azul Brazi Mining 176 9.90% 14.56% -Volcan mine Mexico Mining 10 10.25% 9.42% -Saldanha facility South Africa ACIS 258 14.18% 11.90% 64
2014In 2014, the Company recognized an impairment charge of property, plant and equipment amounting to 264.
This charge included 114 primarily relating to the idling of the steel
shop and rolling facilities of Indiana Harbor Long carbon operations in the United States (NAFTA). The Company recorded also an impairment charge of 57 with respect to the closure of mill C in Rodange, Luxembourg (Europe segment).
In connection with management’s annual test for impairment of goodwill as of October 31, 2014, property, plant and equipment was also tested for impairment at that date. Management concluded that the value in use of the Volcan iron ore mine in Mexico (Mining
segment) was lower than its carrying amount due to the end of life of the mine. Accordingly, an impairment charge of 63 was recognized:
Cash-Generating Unit Operating Segment Impairment Recorded2014
Pre-Tax Discount Rate2013
Pre-Tax Discount RateCarrying Value as of December 31, 2014
Volcan mine Mining 63 9.42% 23.77% 19
2013In connection with management’s annual test for impairment of goodwill as of October 31, 2013, property, plant and equipment was also tested for impairment at that date. As of December 31, 2013, management concluded that the carrying amount of property, plant and equipment did not exceed the value in use and therefore, no impairment loss was recognized on that basis.
The impairment charge of property, plant and equipment of 278 recognized in 2013 related to discontinued projects, intended
sales, long term idling or closure of facilities. This charge included 181 related to the finance leasing of Thabazimbi mine in ArcelorMittal South Africa (ACIS) following the transfer of the future operating and financial risks of the asset to Kumba as a result of the iron ore supply agreement signed with Sishen on November 5, 2013. The Company recorded an impairment loss of 55 in connection with the long term idling of the ArcelorMittal Tallinn galvanizing line in Estonia (Europe segment) and reversed an impairment loss of 52 at the Liège site of ArcelorMittal Belgium
(Europe segment) following the restart of the hot dip galvanizing line HDG5. ArcelorMittal also recognized an impairment charge of 24 relating to the closure of the organic coating and tin plate lines at the Florange site of ArcelorMittal Atlantique et Lorraine in France (Europe segment). Additionally, in connection with the agreed sale of certain steel cord assets in the US, Europe and Asia (Europe segment) to the joint venture partner Kiswire Ltd., ArcelorMittal recorded an impairment charge of 41 with respect to the subsidiaries included in this transaction (see note 2.6).
5.4 Biological assets
Biological assets are part of the Brazil operating segment and consist of eucalyptus forests located in the Brazilian state of Minas Gerais exclusively from renewable plantations and intended for the production of charcoal to be utilized as fuel and a source of carbon in the direct reduction process of pig iron production in some of the Company’s blast furnaces in Brazil. Charcoal is, in such instances, a substitute for coke. As a result of improvements in forest management
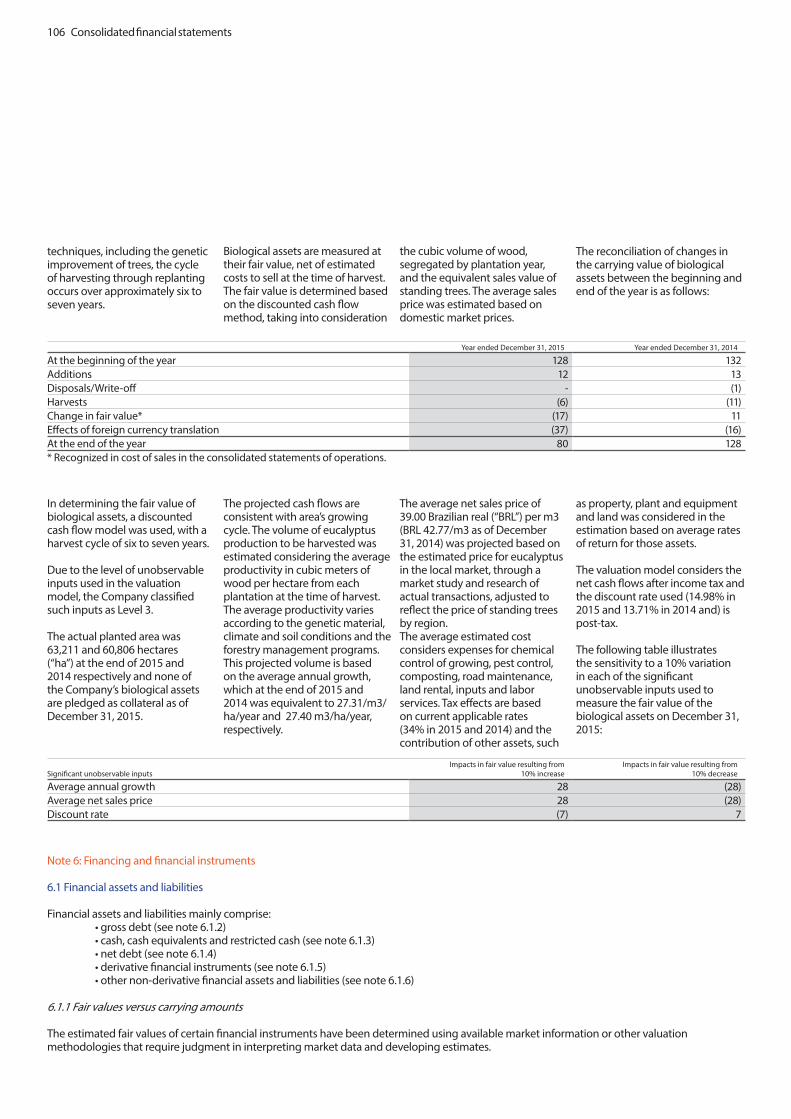
106 Consolidated financial statements
techniques, including the genetic improvement of trees, the cycle of harvesting through replanting occurs over approximately six to seven years.
Biological assets are measured at their fair value, net of estimated costs to sell at the time of harvest. The fair value is determined based on the discounted cash flow method, taking into consideration
the cubic volume of wood, segregated by plantation year, and the equivalent sales value of standing trees. The average sales price was estimated based on domestic market prices.
The reconciliation of changes in the carrying value of biological assets between the beginning and end of the year is as follows:
Year ended December 31, 2015 Year ended December 31, 2014
At the beginning of the year 128 132Additions 12 13Disposals/Write-off - (1)Harvests (6) (11)Change in fair value* (17) 11Effects of foreign currency translation (37) (16)At the end of the year 80 128* Recognized in cost of sales in the consolidated statements of operations.
In determining the fair value of biological assets, a discounted cash flow model was used, with a harvest cycle of six to seven years.
Due to the level of unobservable inputs used in the valuation model, the Company classified such inputs as Level 3.
The actual planted area was 63,211 and 60,806 hectares (“ha”) at the end of 2015 and 2014 respectively and none of the Company’s biological assets are pledged as collateral as of December 31, 2015.
The projected cash flows are consistent with area’s growing cycle. The volume of eucalyptus production to be harvested was estimated considering the average productivity in cubic meters of wood per hectare from each plantation at the time of harvest. The average productivity varies according to the genetic material, climate and soil conditions and the forestry management programs. This projected volume is based on the average annual growth, which at the end of 2015 and 2014 was equivalent to 27.31/m3/ha/year and 27.40 m3/ha/year, respectively.
The average net sales price of 39.00 Brazilian real (“BRL”) per m3 (BRL 42.77/m3 as of December 31, 2014) was projected based on the estimated price for eucalyptus in the local market, through a market study and research of actual transactions, adjusted to reflect the price of standing trees by region. The average estimated cost considers expenses for chemical control of growing, pest control, composting, road maintenance, land rental, inputs and labor services. Tax effects are based on current applicable rates (34% in 2015 and 2014) and the contribution of other assets, such
as property, plant and equipment and land was considered in the estimation based on average rates of return for those assets.
The valuation model considers the net cash flows after income tax and the discount rate used (14.98% in 2015 and 13.71% in 2014 and) is post-tax. The following table illustrates the sensitivity to a 10% variation in each of the significant unobservable inputs used to measure the fair value of the biological assets on December 31, 2015:
Significant unobservable inputsImpacts in fair value resulting from
10% increaseImpacts in fair value resulting from
10% decrease
Average annual growth 28 (28)Average net sales price 28 (28)Discount rate (7) 7
Note 6: Financing and financial instruments
6.1 Financial assets and liabilities
Financial assets and liabilities mainly comprise: • gross debt (see note 6.1.2) • cash, cash equivalents and restricted cash (see note 6.1.3) • net debt (see note 6.1.4) • derivative financial instruments (see note 6.1.5) • other non-derivative financial assets and liabilities (see note 6.1.6)
6.1.1 Fair values versus carrying amounts
The estimated fair values of certain financial instruments have been determined using available market information or other valuation methodologies that require judgment in interpreting market data and developing estimates.

Consolidated financial statements 107
Carrying amount in the consolidated
statements of financial position
Non-financial assets and liabilities
Loan and receivables
Liabilities at amortized cost
Fair value recognized in profit or loss
Available-for-sale assets Derivatives
ASSETSCurrent assets:Cash and cash equivalents 4,002 - 4,002 - - - -Restricted cash 100 - 100 - - - -Trade accounts receivable and other 2,679 - 2,679 - - - -Inventories 13,424 13,424 - - - - -Prepaid expenses and other current assets 1,859 1,202 529 - - - 128Assets held for sale 262 262 - - - - -Total current assets 22,326 14,888 7,310 - - - 128
Non-current assets:Goodwill and intangible assets 5,592 5,592 - - - - -Biological assets 80 - - - 80 - -Property, plant and equipment 35,700 35,700 - - - - -Investments in associates and joint ventures 4,911 4,911 - - - - -Other investments 692 - - - - 692 -Deferred tax assets 6,625 6,625 - - - - -Other assets 920 268 562 - - - 90Total non-current assets 54,520 53,096 562 - 80 692 90Total assets 76,846 67,984 7,872 - 80 692 218
LIABILITIES AND EQUITYCurrent liabilities:Short-term debt and current portion of long-term debt 2,308 - - 2,308 - - -Trade accounts payable and other 8,977 - - 8,977 - - -Short-term provisions 770 529 - 241 - - -Accrued expenses and other liabilities 5,633 1,005 - 4,495 - - 133Income tax liabilities 133 133 - - - - -Liabilities held for sale 220 220 - - - - -Total current liabilities 18,041 1,887 - 16,021 - - 133
Non-current liabilities:Long-term debt, net of current portion 17,478 - - 17,478 - - -Deferred tax liabilities 2,496 2,496 - - - - -Deferred employee benefits 9,216 9,216 - - - - -Long-term provisions 1,434 1,421 - 13 - - -Other long-term obligations 611 185 - 355 - - 71Total non-current liabilities 31,235 13,318 - 17,846 - - 71
Equity:Equity attributable to the equity holders of the parent 25,272 25,272 - - - - -Non-controlling interests 2,298 2,298 - - - - -Total equity 27,570 27,570 - - - - -Total liabilities and equity 76,846 42,775 - 33,867 - - 204
The following table summarizes assets and liabilities based on their categories at December 31, 2015.
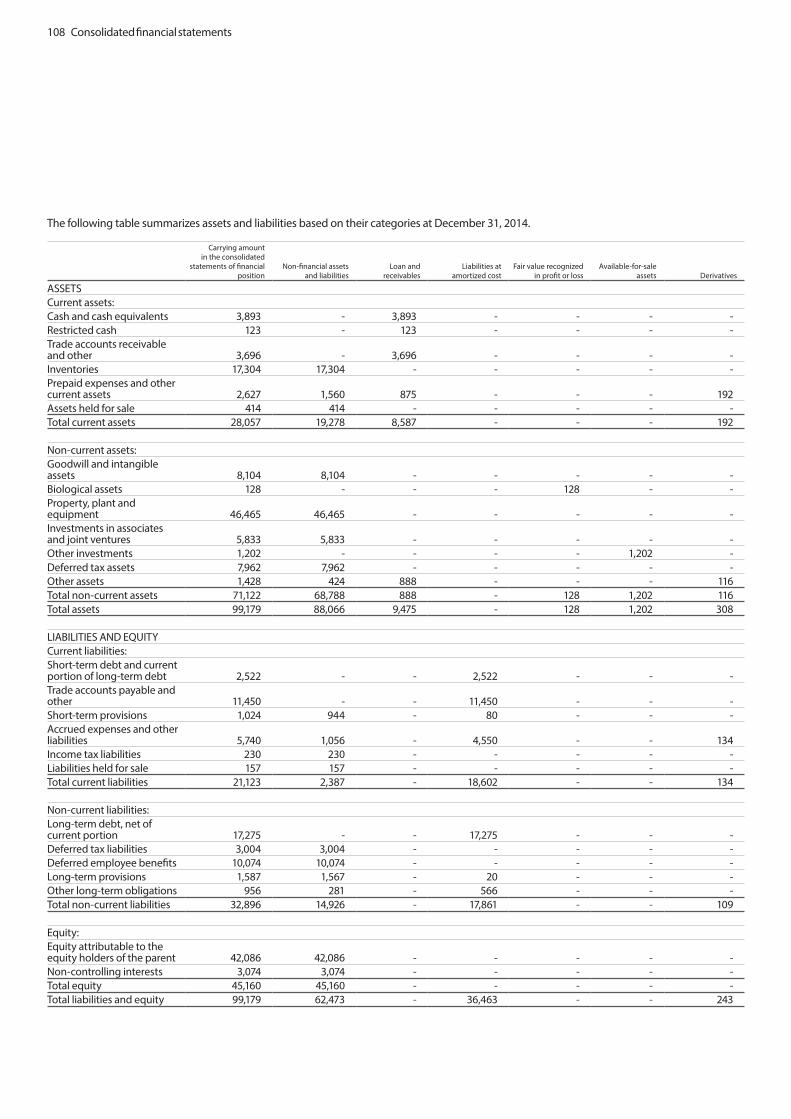
108 Consolidated financial statements
Carrying amount in the consolidated
statements of financial position
Non-financial assets and liabilities
Loan and receivables
Liabilities at amortized cost
Fair value recognized in profit or loss
Available-for-sale assets Derivatives
ASSETSCurrent assets:Cash and cash equivalents 3,893 - 3,893 - - - -Restricted cash 123 - 123 - - - -Trade accounts receivable and other 3,696 - 3,696 - - - -Inventories 17,304 17,304 - - - - -Prepaid expenses and other current assets 2,627 1,560 875 - - - 192Assets held for sale 414 414 - - - - -Total current assets 28,057 19,278 8,587 - - - 192
Non-current assets:Goodwill and intangible assets 8,104 8,104 - - - - -Biological assets 128 - - - 128 - -Property, plant and equipment 46,465 46,465 - - - - -Investments in associates and joint ventures 5,833 5,833 - - - - -Other investments 1,202 - - - - 1,202 -Deferred tax assets 7,962 7,962 - - - - -Other assets 1,428 424 888 - - - 116Total non-current assets 71,122 68,788 888 - 128 1,202 116Total assets 99,179 88,066 9,475 - 128 1,202 308
LIABILITIES AND EQUITYCurrent liabilities:Short-term debt and current portion of long-term debt 2,522 - - 2,522 - - -Trade accounts payable and other 11,450 - - 11,450 - - -Short-term provisions 1,024 944 - 80 - - -Accrued expenses and other liabilities 5,740 1,056 - 4,550 - - 134Income tax liabilities 230 230 - - - - -Liabilities held for sale 157 157 - - - - -Total current liabilities 21,123 2,387 - 18,602 - - 134
Non-current liabilities:Long-term debt, net of current portion 17,275 - - 17,275 - - -Deferred tax liabilities 3,004 3,004 - - - - -Deferred employee benefits 10,074 10,074 - - - - -Long-term provisions 1,587 1,567 - 20 - - -Other long-term obligations 956 281 - 566 - - -Total non-current liabilities 32,896 14,926 - 17,861 - - 109
Equity:Equity attributable to the equity holders of the parent 42,086 42,086 - - - - -Non-controlling interests 3,074 3,074 - - - - -Total equity 45,160 45,160 - - - - -Total liabilities and equity 99,179 62,473 - 36,463 - - 243
The following table summarizes assets and liabilities based on their categories at December 31, 2014.

Consolidated financial statements 109
The Company classifies the bases used to measure certain assets and liabilities at their fair value. Assets and liabilities carried or measured at fair value have been classified into three levels based upon a fair value hierarchy that reflects the significance of the inputs used in making the measurements.
The levels are as follows:
Level 1: Quoted prices in active markets for identical assets or liabilities that the entity can access at the measurement date;
Level 2: Significant inputs other than within Level 1 that are
observable for the asset or liability, either directly (i.e.: as prices) or indirectly (i.e.: derived from prices);
Level 3: Inputs for the assets or liabilities that are not based on observable market data and require management assumptions or inputs from unobservable markets.
The following tables summarize the bases used to measure certain assets and liabilities at their fair value.
As of December 31, 2015
Level 1 Level 2 Level 3 TotalAssets at fair value:Available-for-sale financial assets 646 - - 646Derivative financial current assets - 128 - 128Derivative financial non-current assets - 86 4 90Total assets at fair value 646 214 4 864
Liabilities at fair value:Derivative financial current liabilities - 133 - 133Derivative financial non-current liabilities - 71 - 71Total liabilities at fair value - 204 - 204 As of December 31, 2014 Level 1 Level 2 Level 3 TotalAssets at fair value:Available-for-sale financial assets 1,022 - - 1,022 Derivative financial current assets - 192 - 192 Derivative financial non-current assets - 4 112 116 Total assets at fair value 1,022 196 112 1,330
Liabilities at fair value:Derivative financial current liabilities - 134 - 134 Derivative financial non-current liabilities - 109 - 109 Total liabilities at fair value - 243 - 243
Available-for-sale financial assets classified as Level 1 refer to listed securities quoted in active markets. A quoted market price in an active market provides the most reliable evidence of fair value and is used without adjustment to measure fair value whenever available, with limited exceptions. The total fair value is either the price of the most recent trade at the time of the market close or the official close price as defined by the exchange on which the asset is most actively traded on the last trading day of the period, multiplied by the number of units held without consideration of transaction costs. The decrease in available-for-sale financial assets is related to the decrease in the fair value of the available-for-sale investments (note 2.5), partly offset by the reclassification of the investment
in Gerdau as available-for-sale following the share swap on July 14, 2015 (see note 2.5).
Derivative financial assets and liabilities classified as Level 2 refer to instruments to hedge fluctuations in interest rates, foreign exchange rates, raw materials (base metal), freight, energy and emission rights. The total fair value is based on the price a dealer would pay or receive for the security or similar securities, adjusted for any terms specific to that asset or liability. Market inputs are obtained from well-established and recognized vendors of market data and the fair value is calculated using standard industry models based on significant observable market inputs such as foreign exchange rates, commodity prices, swap rates and interest rates.
Derivative financial current assets classified as Level 3 refer to the call option on the 1,000 mandatory convertible bonds (see note 10.2). As a result of the repayment at maturity of the €1.25 billion Convertible Bonds on April 1, 2014, the conversion option in the €1.25 billion Convertible Bonds and the euro-denominated call options on treasury shares are extinguished. The fair valuation of Level 3 derivative instruments is established at each reporting date in relation to which an analysis is performed in respect of changes in the fair value measurement since the last period. ArcelorMittal’s valuation policies for Level 3 derivatives are an integral part of its internal control procedures and have been reviewed and approved according to the Company’s principles for establishing such
procedures. In particular, such procedures address the accuracy and reliability of input data, the accuracy of the valuation model and the knowledge of the staff performing the valuations.
ArcelorMittal establishes the fair valuation of the call option on the 1,000 mandatory convertible bonds through the use of binomial valuation models. Binomial valuation models use an iterative procedure to price options, allowing for the specification of nodes, or points in time, during the time span between the valuation date and the option’s expiration date. In contrast to the Black-Scholes model, which provides a numerical result based on inputs, the binomial model allows for the calculation of the asset and the option for multiple periods along

110 Consolidated financial statements
with the range of possible results for each period.
Observable input data used in the valuations include zero coupon yield curves, stock market prices, European Central Bank foreign exchange fixing rates and Libor interest rates.
Unobservable inputs are used to measure fair value to the extent that relevant observable inputs are not available. Specifically the Company computes unobservable volatility data based mainly on the movement of stock market prices observable in the active market over 90 working days.
The following table summarizes the reconciliation of the fair value of the conversion option classified as Level 3 with respect to the €1.25 billion convertible bonds, the euro-denominated call option on the Company’s own shares, the call option on the 1,000 mandatory convertible bonds for the years
ended December 31, 2015 and 2014, respectively:
Call option on 1,000 mandatory convertible bonds 1 Total
Balance as of December 31, 2013 - -Change in fair value 112 112Balance as of December 31, 2014 112 112Change in fair value (108) (108)Balance as of December 31, 2015 4 4 1 Please refer to note 10.2 for details on the mandatory convertible bonds. The call option on the 1,000 mandatory convertible bonds is classified into Level 3. The fair value of the call options was determined through a binomial model based on the estimated values of the underlying equity spot price of $124 and volatility of 10.06%.
6.1.2 Gross debt
Debt and liabilities, other than provisions, are stated at amortized cost. However, loans that are hedged under a fair value hedge are remeasured for the changes in the fair value that are attributable to the risk that is being hedged.
6.1.2.1 Short-term debt
Short-term debt, including the current portion of long-term debt, consisted of the following:
December 31, 2015 December 31, 2014
Short-term bank loans and other credit facilities including commercial paper * 437 1,249Current portion of long-term debt 1,806 1,200Lease obligations 65 73Total 2,308 2,522* The weighted average interest rate on short term borrowings outstanding were 4.3% and 2.7% as of December 31, 2015 and 2014, respectively.
During the first half of 2014, ArcelorMittal entered into certain short-term committed bilateral credit facilities. The facilities were extended during 2015. As of December 31, 2015, the facilities, totaling approximately 0.8 billion, remain fully available.
On June 10, 2014, ArcelorMittal entered into an agreement for financing with a financial institution for 1 billion. The financial institution had the right to request early repayment once per year beginning in February 2015 until the final maturity on April 20,
2017. On February 13, 2015, the Company elected to make an early repayment of such financing.
Commercial paper
The Company has a commercial paper program enabling borrowings of up to €1 billion. As of December 31, 2015, the outstanding amount was 71.
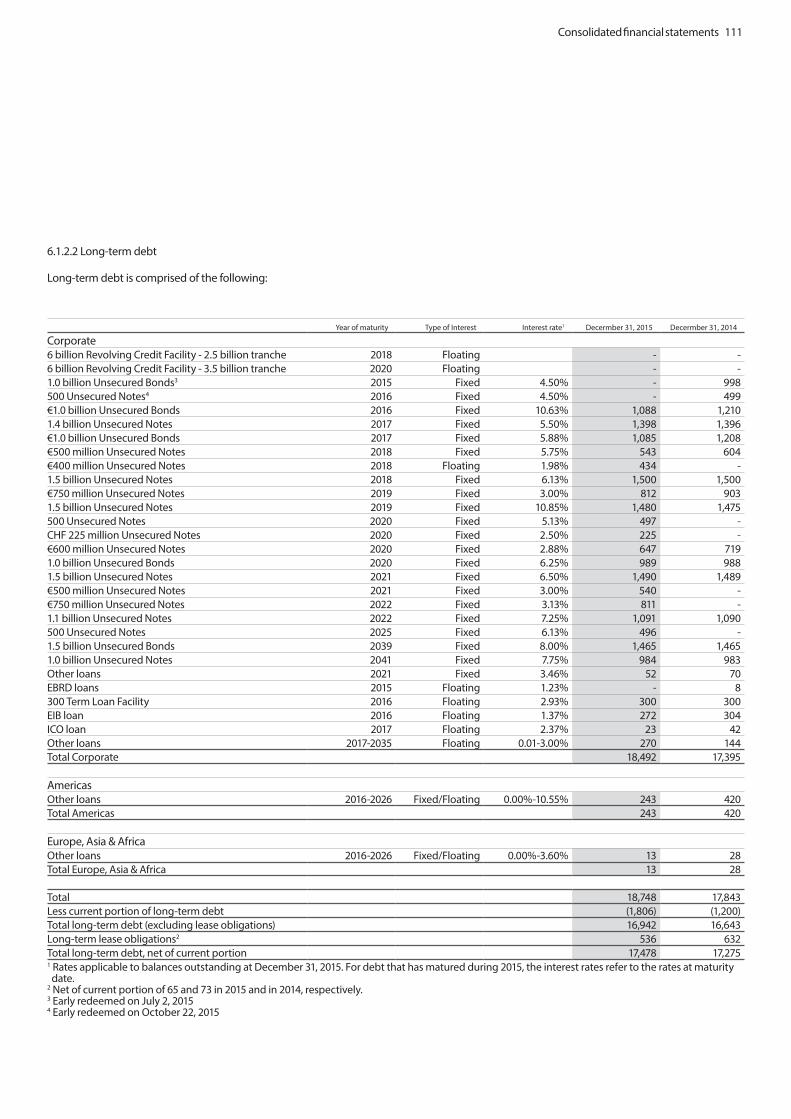
Consolidated financial statements 111
Year of maturity Type of Interest Interest rate1 Decermber 31, 2015 Decermber 31, 2014
Corporate 6 billion Revolving Credit Facility - 2.5 billion tranche 2018 Floating - -6 billion Revolving Credit Facility - 3.5 billion tranche 2020 Floating - -1.0 billion Unsecured Bonds3 2015 Fixed 4.50% - 998500 Unsecured Notes4 2016 Fixed 4.50% - 499€1.0 billion Unsecured Bonds 2016 Fixed 10.63% 1,088 1,2101.4 billion Unsecured Notes 2017 Fixed 5.50% 1,398 1,396€1.0 billion Unsecured Bonds 2017 Fixed 5.88% 1,085 1,208€500 million Unsecured Notes 2018 Fixed 5.75% 543 604€400 million Unsecured Notes 2018 Floating 1.98% 434 -1.5 billion Unsecured Notes 2018 Fixed 6.13% 1,500 1,500€750 million Unsecured Notes 2019 Fixed 3.00% 812 9031.5 billion Unsecured Notes 2019 Fixed 10.85% 1,480 1,475500 Unsecured Notes 2020 Fixed 5.13% 497 -CHF 225 million Unsecured Notes 2020 Fixed 2.50% 225 -€600 million Unsecured Notes 2020 Fixed 2.88% 647 7191.0 billion Unsecured Bonds 2020 Fixed 6.25% 989 9881.5 billion Unsecured Notes 2021 Fixed 6.50% 1,490 1,489€500 million Unsecured Notes 2021 Fixed 3.00% 540 -€750 million Unsecured Notes 2022 Fixed 3.13% 811 -1.1 billion Unsecured Notes 2022 Fixed 7.25% 1,091 1,090500 Unsecured Notes 2025 Fixed 6.13% 496 -1.5 billion Unsecured Bonds 2039 Fixed 8.00% 1,465 1,4651.0 billion Unsecured Notes 2041 Fixed 7.75% 984 983Other loans 2021 Fixed 3.46% 52 70EBRD loans 2015 Floating 1.23% - 8300 Term Loan Facility 2016 Floating 2.93% 300 300EIB loan 2016 Floating 1.37% 272 304ICO loan 2017 Floating 2.37% 23 42Other loans 2017-2035 Floating 0.01-3.00% 270 144Total Corporate 18,492 17,395 Americas Other loans 2016-2026 Fixed/Floating 0.00%-10.55% 243 420Total Americas 243 420 Europe, Asia & Africa Other loans 2016-2026 Fixed/Floating 0.00%-3.60% 13 28Total Europe, Asia & Africa 13 28 Total 18,748 17,843Less current portion of long-term debt (1,806) (1,200)Total long-term debt (excluding lease obligations) 16,942 16,643Long-term lease obligations2 536 632Total long-term debt, net of current portion 17,478 17,2751 Rates applicable to balances outstanding at December 31, 2015. For debt that has matured during 2015, the interest rates refer to the rates at maturity date.2 Net of current portion of 65 and 73 in 2015 and in 2014, respectively. 3 Early redeemed on July 2, 20154 Early redeemed on October 22, 2015
6.1.2.2 Long-term debt
Long-term debt is comprised of the following:
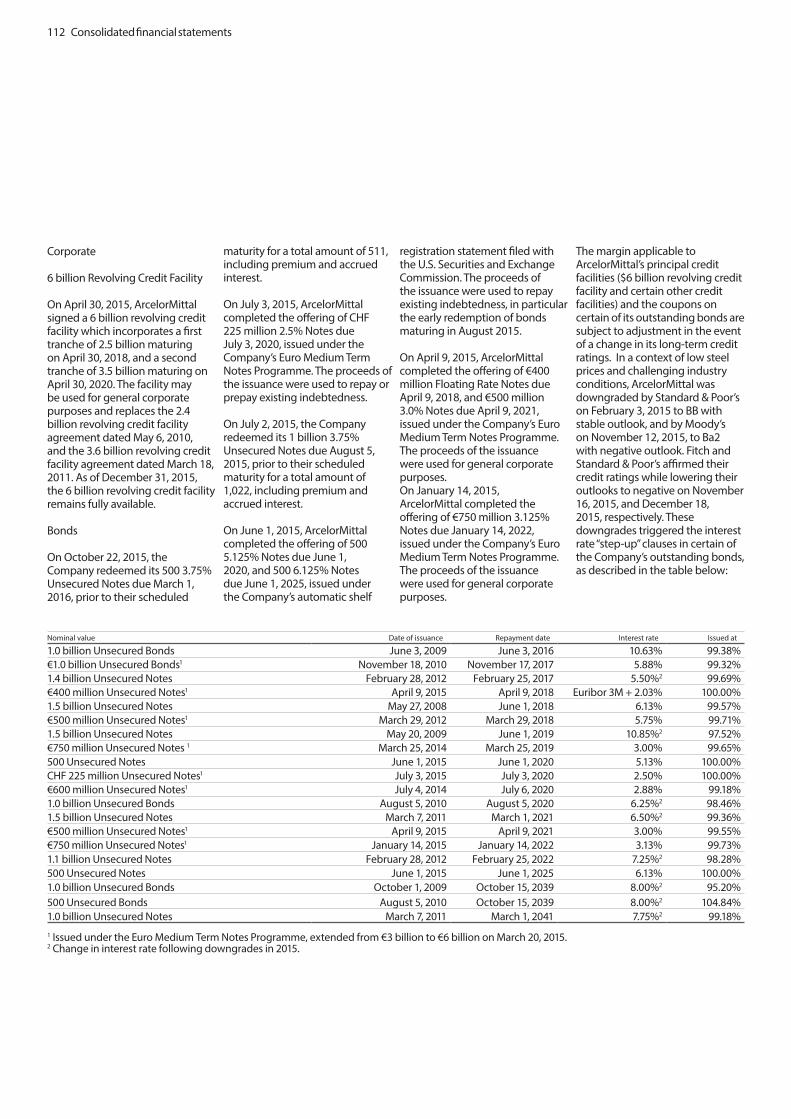
112 Consolidated financial statements
Corporate
6 billion Revolving Credit Facility
On April 30, 2015, ArcelorMittal signed a 6 billion revolving credit facility which incorporates a first tranche of 2.5 billion maturing on April 30, 2018, and a second tranche of 3.5 billion maturing on April 30, 2020. The facility may be used for general corporate purposes and replaces the 2.4 billion revolving credit facility agreement dated May 6, 2010, and the 3.6 billion revolving credit facility agreement dated March 18, 2011. As of December 31, 2015, the 6 billion revolving credit facility remains fully available.
Bonds
On October 22, 2015, the Company redeemed its 500 3.75% Unsecured Notes due March 1, 2016, prior to their scheduled
maturity for a total amount of 511, including premium and accrued interest.
On July 3, 2015, ArcelorMittal completed the offering of CHF 225 million 2.5% Notes due July 3, 2020, issued under the Company’s Euro Medium Term Notes Programme. The proceeds of the issuance were used to repay or prepay existing indebtedness.
On July 2, 2015, the Company redeemed its 1 billion 3.75% Unsecured Notes due August 5, 2015, prior to their scheduled maturity for a total amount of 1,022, including premium and accrued interest.
On June 1, 2015, ArcelorMittal completed the offering of 500 5.125% Notes due June 1, 2020, and 500 6.125% Notes due June 1, 2025, issued under the Company’s automatic shelf
registration statement filed with the U.S. Securities and Exchange Commission. The proceeds of the issuance were used to repay existing indebtedness, in particular the early redemption of bonds maturing in August 2015.
On April 9, 2015, ArcelorMittal completed the offering of €400 million Floating Rate Notes due April 9, 2018, and €500 million 3.0% Notes due April 9, 2021, issued under the Company’s Euro Medium Term Notes Programme. The proceeds of the issuance were used for general corporate purposes.On January 14, 2015, ArcelorMittal completed the offering of €750 million 3.125% Notes due January 14, 2022, issued under the Company’s Euro Medium Term Notes Programme. The proceeds of the issuance were used for general corporate purposes.
The margin applicable to ArcelorMittal’s principal credit facilities ($6 billion revolving credit facility and certain other credit facilities) and the coupons on certain of its outstanding bonds are subject to adjustment in the event of a change in its long-term credit ratings. In a context of low steel prices and challenging industry conditions, ArcelorMittal was downgraded by Standard & Poor’s on February 3, 2015 to BB with stable outlook, and by Moody’s on November 12, 2015, to Ba2 with negative outlook. Fitch and Standard & Poor’s affirmed their credit ratings while lowering their outlooks to negative on November 16, 2015, and December 18, 2015, respectively. These downgrades triggered the interest rate “step-up” clauses in certain of the Company’s outstanding bonds, as described in the table below:
Nominal value Date of issuance Repayment date Interest rate Issued at
1.0 billion Unsecured Bonds June 3, 2009 June 3, 2016 10.63% 99.38%€1.0 billion Unsecured Bonds1 November 18, 2010 November 17, 2017 5.88% 99.32%1.4 billion Unsecured Notes February 28, 2012 February 25, 2017 5.50%2 99.69%€400 million Unsecured Notes1 April 9, 2015 April 9, 2018 Euribor 3M + 2.03% 100.00%1.5 billion Unsecured Notes May 27, 2008 June 1, 2018 6.13% 99.57%€500 million Unsecured Notes1 March 29, 2012 March 29, 2018 5.75% 99.71%1.5 billion Unsecured Notes May 20, 2009 June 1, 2019 10.85%2 97.52%€750 million Unsecured Notes 1 March 25, 2014 March 25, 2019 3.00% 99.65%500 Unsecured Notes June 1, 2015 June 1, 2020 5.13% 100.00%CHF 225 million Unsecured Notes1 July 3, 2015 July 3, 2020 2.50% 100.00%€600 million Unsecured Notes1 July 4, 2014 July 6, 2020 2.88% 99.18%1.0 billion Unsecured Bonds August 5, 2010 August 5, 2020 6.25%2 98.46%1.5 billion Unsecured Notes March 7, 2011 March 1, 2021 6.50%2 99.36%€500 million Unsecured Notes1 April 9, 2015 April 9, 2021 3.00% 99.55%€750 million Unsecured Notes1 January 14, 2015 January 14, 2022 3.13% 99.73%1.1 billion Unsecured Notes February 28, 2012 February 25, 2022 7.25%2 98.28%500 Unsecured Notes June 1, 2015 June 1, 2025 6.13% 100.00%1.0 billion Unsecured Bonds October 1, 2009 October 15, 2039 8.00%2 95.20%500 Unsecured Bonds August 5, 2010 October 15, 2039 8.00%2 104.84%1.0 billion Unsecured Notes March 7, 2011 March 1, 2041 7.75%2 99.18%1 Issued under the Euro Medium Term Notes Programme, extended from €3 billion to €6 billion on March 20, 2015.2 Change in interest rate following downgrades in 2015.

Consolidated financial statements 113
European Bank for Reconstruction and Development (“EBRD”) Loans
The Company had entered into five separate agreements for on-lending with the European Bank for Reconstruction and Development (“EBRD”). As of December 31 2014, the only agreement outstanding was ArcelorMittal Temirtau, entered into on June 15, 2007. Following the repayment of the last installment for ArcelorMittal Temirtau on January 12, 2015, the EBRD loan was fully repaid as of December 31, 2015 as compared to 8 outstanding as of December 31, 2014.
300 Term Loan Facility
On December 20, 2013, ArcelorMittal entered into a term loan facility in an aggregate amount of 300, maturing on December 20, 2016. The facility may be used by the Group for general corporate purposes. Amounts repaid under this agreement may not be re-borrowed. As of December 31, 2015, the term loan facility was fully drawn.
European Investment Bank (“EIB”) Loan
The Company entered into an agreement with the EIB for the financing of activities for research, engineering and technological innovation related to process improvements and new steel product developments on July 15, 2010. The full amount of €250 million was drawn on September 27, 2011. The final repayment date under this agreement is September 27, 2016. The outstanding amount in total as of December 31, 2015 and 2014 was 272 and 304, respectively.
Instituto de Crédito Oficial (“ICO”) Loan The Company entered into an agreement with the ICO on April 9, 2010 for the financing of the Company investment plan in Spain for the period 2008-2011. The last installment under this agreement is due on April 7, 2017. The outstanding amount in total as of December 31, 2015 and 2014 was 23 and 42, respectively.
Other loans
The other loans relate to various debt with banks and public institutions.
Americas Other loans
The other loans relate mainly to loans contracted by ArcelorMittal Brasil with different counterparties.
Other
Certain debt agreements of the Company or its subsidiaries contain certain restrictive covenants. Among other things, these covenants limit encumbrances on the assets of ArcelorMittal and its subsidiaries, the ability of ArcelorMittal’s subsidiaries to incur debt and the ability of ArcelorMittal and its subsidiaries to dispose of assets in certain circumstances. Certain of these agreements also require compliance with a financial covenant.
The Company’s principal credit facilities (6 billion revolving credit facility and certain other credit facilities) include the following financial covenant: the Company must ensure that the ratio of “Consolidated Total Net Borrowings” (consolidated total borrowings less consolidated cash and cash equivalents) to “Consolidated EBITDA” (the consolidated net pre-taxation
profits of the Company for a Measurement Period, subject to certain adjustments as defined in the facilities) does not, at the end of each “Measurement Period” (each period of 12 months ending on the last day of a financial half-year or a financial year of the Company), exceed a certain ratio. ArcelorMittal’s principal credit facilities set this ratio to 4.25 to 1, whereas one minor facility has a ratio of 4.0 to 1.Failure to comply with any covenant would enable the lenders to accelerate the Company’s repayment obligations. Moreover, the Company’s debt facilities have provisions whereby certain events relating to other borrowers within the Company’s subsidiaries could, under certain circumstances, lead to acceleration of debt repayment under such credit facilities. Any invocation of these cross-acceleration clauses could cause some or all of the other debt to accelerate.The Company was in compliance with the financial covenants contained in the agreements related to all of its borrowings as of December 31, 2015.
2016 2,3082017 2,6712018 2,5992019 2,5132020 2,450Subsequent years 7,245Total 19,786
The carrying amount and the estimated fair value of the Company’s short and long-term debt is:
December 31, 2015 December 31, 2014
CarryingAmount
Estimated Fair Value
Carrying Amount
Estimated Fair Value
Instruments payable bearing interest at fixed rates 17,788 15,428 17,288 18,837 Instruments payable bearing interest at variable rates 1,561 1,353 1,260 1,237 Total long-term debt, including current portion 19,349 16,781 18,548 20,074 Short term bank loans and other credit facilities including commercial paper 437 439 1,249 1,253
As of December 31, 2015 the scheduled maturities of short-term debt, long-term debt and long-term lease obligations, including their current portion are as follows:
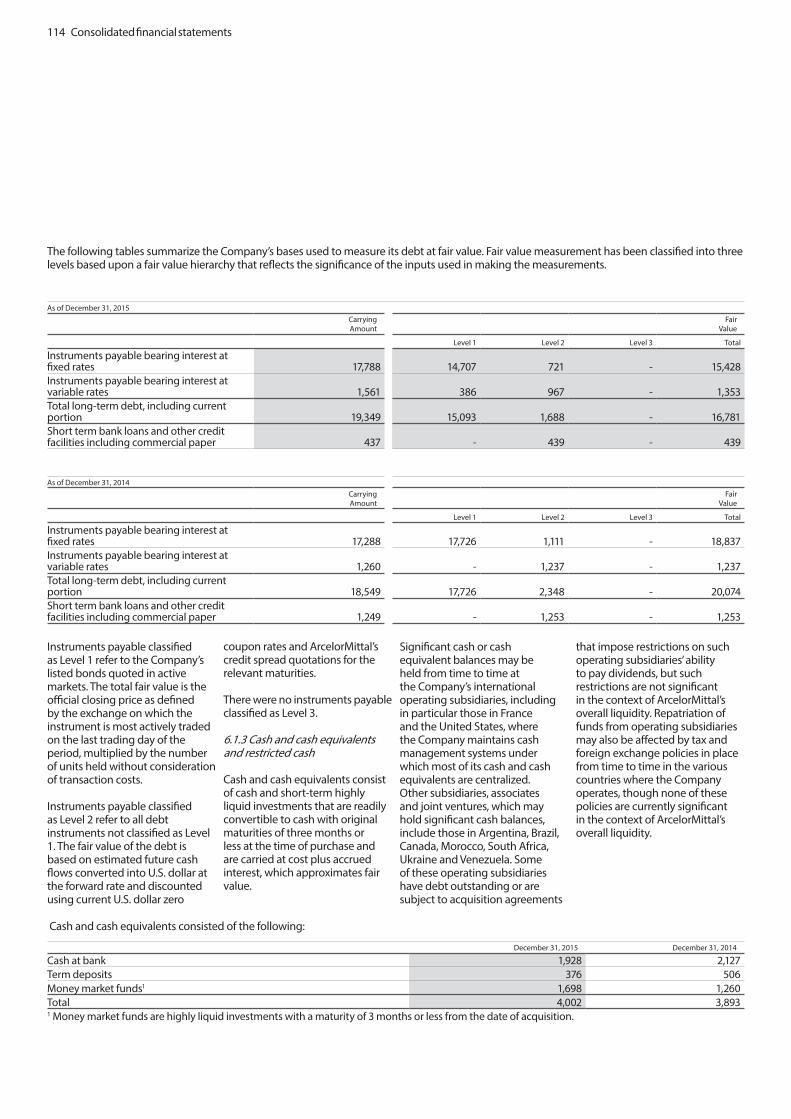
114 Consolidated financial statements
The following tables summarize the Company’s bases used to measure its debt at fair value. Fair value measurement has been classified into three levels based upon a fair value hierarchy that reflects the significance of the inputs used in making the measurements.
As of December 31, 2015
Carrying Amount
Fair Value
Level 1 Level 2 Level 3 Total
Instruments payable bearing interest at fixed rates 17,788 14,707 721 - 15,428Instruments payable bearing interest at variable rates 1,561 386 967 - 1,353Total long-term debt, including current portion 19,349 15,093 1,688 - 16,781Short term bank loans and other credit facilities including commercial paper 437 - 439 - 439 As of December 31, 2014
Carrying Amount
Fair Value
Level 1 Level 2 Level 3 Total
Instruments payable bearing interest at fixed rates 17,288 17,726 1,111 - 18,837 Instruments payable bearing interest at variable rates 1,260 - 1,237 - 1,237 Total long-term debt, including current portion 18,549 17,726 2,348 - 20,074 Short term bank loans and other credit facilities including commercial paper 1,249 - 1,253 - 1,253
Instruments payable classified as Level 1 refer to the Company’s listed bonds quoted in active markets. The total fair value is the official closing price as defined by the exchange on which the instrument is most actively traded on the last trading day of the period, multiplied by the number of units held without consideration of transaction costs.
Instruments payable classified as Level 2 refer to all debt instruments not classified as Level 1. The fair value of the debt is based on estimated future cash flows converted into U.S. dollar at the forward rate and discounted using current U.S. dollar zero
coupon rates and ArcelorMittal’s credit spread quotations for the relevant maturities.
There were no instruments payable classified as Level 3.
6.1.3 Cash and cash equivalents and restricted cash
Cash and cash equivalents consist of cash and short-term highly liquid investments that are readily convertible to cash with original maturities of three months or less at the time of purchase and are carried at cost plus accrued interest, which approximates fair value.
Significant cash or cash equivalent balances may be held from time to time at the Company’s international operating subsidiaries, including in particular those in France and the United States, where the Company maintains cash management systems under which most of its cash and cash equivalents are centralized. Other subsidiaries, associates and joint ventures, which may hold significant cash balances, include those in Argentina, Brazil, Canada, Morocco, South Africa, Ukraine and Venezuela. Some of these operating subsidiaries have debt outstanding or are subject to acquisition agreements
that impose restrictions on such operating subsidiaries’ ability to pay dividends, but such restrictions are not significant in the context of ArcelorMittal’s overall liquidity. Repatriation of funds from operating subsidiaries may also be affected by tax and foreign exchange policies in place from time to time in the various countries where the Company operates, though none of these policies are currently significant in the context of ArcelorMittal’s overall liquidity.
December 31, 2015 December 31, 2014
Cash at bank 1,928 2,127Term deposits 376 506Money market funds1 1,698 1,260Total 4,002 3,8931 Money market funds are highly liquid investments with a maturity of 3 months or less from the date of acquisition.
Cash and cash equivalents consisted of the following:

Consolidated financial statements 115
Restricted cash represents cash and cash equivalents not readily available to the Company, mainly related to insurance deposits, escrow accounts created as a result of acquisitions, and various other deposits or required balance obligations related to letters of
credit and credit arrangements. Changes in restricted cash are included within other investing activities (net) in the consolidated statements of cash flows.
Restricted cash of 100 and 123 included a cash deposit of 75
and 75 in connection with the mandatory convertible bonds (see note 10.2) at December 31, 2015 and December 31, 2014, respectively. At December 31, 2014, it also included a guarantee deposit of 23 related to a bank debt of an associate.
6.1.4 Net debt
The Company monitors its net debt in order to manage its capital. The following table presents the structure of the Company’s net debt by original currency:
Presented in USD by original currency as at December 31, 2015
Total USD EUR USD CHF CAD Other (in USD)
Short-term debt including the current portion of long-term debt 2,308 1,525 447 - 6 330Long-term debt 17,478 5,155 11,986 225 18 94Cash including restricted cash (4,102) (2,483) (588) (1) (296) (734)Net debt 15,684 4,197 11,845 224 (272) (310)
As a part of the Company’s overall risk and cash management strategies, several loan agreements have been swapped from their original currencies to other foreign currencies.
6.1.5 Derivative financial instruments
The Company uses derivative financial instruments principally to manage its exposure to fluctuations in interest rates, exchange rates, prices of raw materials, energy and emission rights allowances arising from operating, financing and investing activities. Derivative financial instruments are classified as current or non-current assets or liabilities based on their maturity dates and are accounted for at the trade date. Embedded derivatives are separated from the host contract and accounted for separately if they are not closely related to the host contract. The Company measures all derivative financial instruments based on fair values derived from market prices of the instruments or from option pricing models, as appropriate. Gains or losses arising from changes in fair value of derivatives
are recognized in the consolidated statements of operations, except for derivatives that are highly effective and qualify for cash flow or net investment hedge accounting. Changes in the fair value of a derivative that is highly effective and that is designated and qualifies as a fair value hedge, along with the gain or loss on the hedged asset, liability, or unrecognized firm commitment of the hedged item that is attributable to the hedged risk, are recorded in the consolidated statements of operations.
Changes in the fair value of a derivative that is highly effective and that is designated and qualifies as a cash flow hedge are recorded in other comprehensive income. Amounts deferred in equity are recorded in the consolidated statements of operations in the periods when the hedged item is recognized in the consolidated statements of operations and within the same line item.
The Company formally assesses, both at the hedge’s inception and
on an ongoing basis, whether the derivatives that are used in hedging transactions are highly effective in offsetting changes in fair values or cash flows of hedged items. When a hedging instrument is sold, terminated, expired or is exercised, the accumulated unrealized gain or loss on the hedging instrument is maintained in equity until the forecasted transaction occurs. If the hedged transaction is no longer probable, the cumulative unrealized gain or loss, which had been recognized in equity, is reported immediately in the consolidated statements of operations.
Foreign currency differences arising on the translation of a financial liability designated as a hedge of a net investment in a foreign operation are recognized directly as a separate component of equity, to the extent that the hedge is effective. To the extent that the hedge is ineffective, such differences are recognized in the consolidated statements of operations.
The Company manages the counter-party risk associated with its instruments by centralizing its
commitments and by applying procedures which specify, for each type of transaction and underlying, risk limits and/or the characteristics of the counter-party. The Company does not generally grant to or require from its counter-parties guarantees of the risks incurred. Allowing for exceptions, the Company’s counter-parties are part of its financial partners and the related market transactions are governed by framework agreements (mainly International Swaps and Derivatives Association agreements which allow netting only in case of counter-party default). Accordingly, derivative assets and derivative liabilities are not offset.

116 Consolidated financial statements
Assets Liabilities
Notional Amount
Fair Value
Average Rate*
Notional Amount
Fair Value Average Rate*
Interest rate swaps - fixed rate borrowings/loans 55 - 0.86% 50 - 1.60%
Foreign exchange rate instrumentsForward purchase of contracts 1,960 48 659 (7)Forward sale of contracts 943 24 353 (9)Currency swaps purchases 314 19 314 (90)Currency swaps sales 375 85 1,000 (24)Exchange option purchases 102 - 342 (5)Exchange options sales 132 3 307 (10)Total foreign exchange rate instruments 179 (145)
Raw materials (base metal), freight, energy, emission rightsTerm contracts sales 168 28 126 (5)Term contracts purchases 204 7 727 (54)Total raw materials (base metal), freight, energy, emission rights 35 (59)Total 214 (204)* The average rate is determined for fixed rate instruments on the basis of the U.S. dollar and foreign currency rates and for the variable rate instruments generally on the basis of Euribor or Libor.
Assets Liabilities
Notional Amount
Fair Value
Average Rate*
Notional Amount
Fair Value Average Rate*
Interest rate swaps - fixed rate borrowings/loans 50 - 0.74% 1,118 (54) 2.13%Total interest rate instruments - (54)
Foreign exchange rate instrumentsForward purchase of contracts 2,137 132 217 (3)Forward sale of contracts 475 5 287 (5)Currency swaps purchases 479 2 479 (95)Currency swaps sales 125 - 250 (3)Exchange option purchases 136 1 712 (8)Exchange options sales 218 1 715 (7)Total foreign exchange rate instruments 141 (121)
Raw materials (base metal), freight, energy, emission rightsTerm contracts sales 146 20 82 (13)Term contracts purchases 501 35 468 (55)Options sales/purchases 7 - 7 -Total raw materials (base metal), freight, energy, emission rights 55 (68)Total 196 (243)* The average rate is determined for fixed rate instruments on the basis of the U.S. dollar and foreign currency rates and for the variable rate instruments generally on the basis of Euribor or Libor.
The portfolio associated with derivative financial instruments classified as Level 2 as of December 31, 2015 is as follows:
The portfolio associated with derivative financial instruments classified as Level 2 as of December 31, 2014 is as follows:
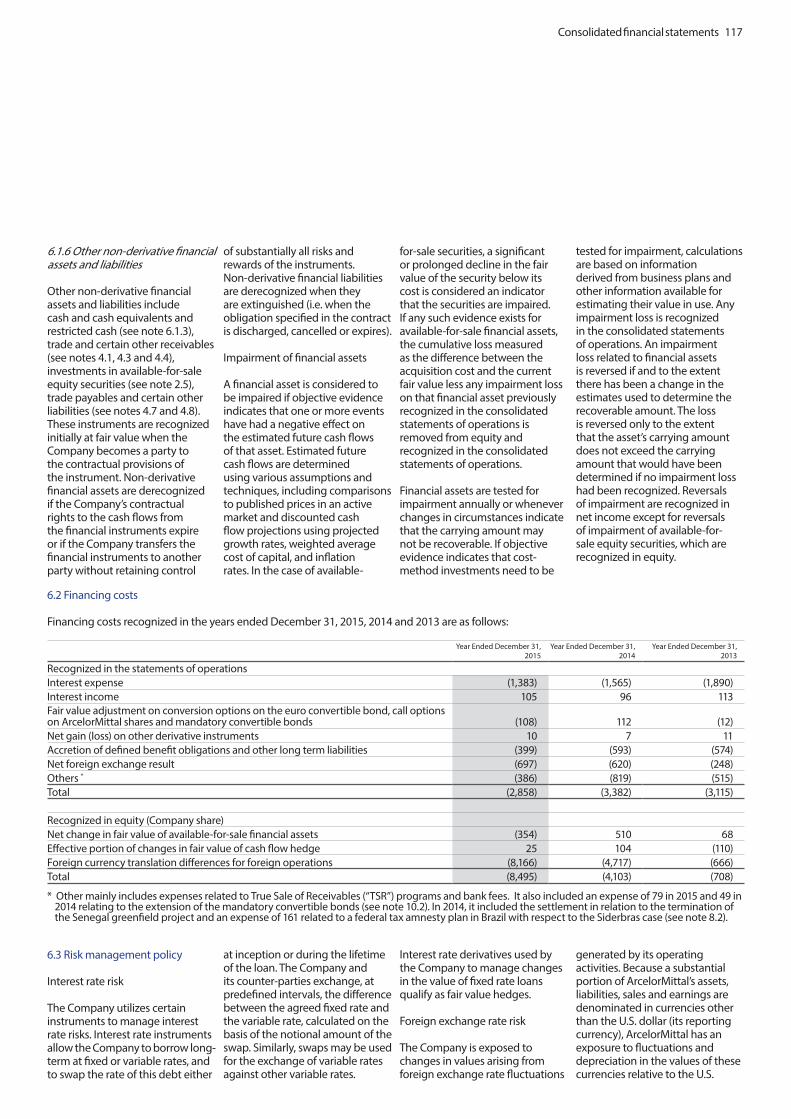
Consolidated financial statements 117
6.1.6 Other non-derivative financial assets and liabilities
Other non-derivative financial assets and liabilities include cash and cash equivalents and restricted cash (see note 6.1.3), trade and certain other receivables (see notes 4.1, 4.3 and 4.4), investments in available-for-sale equity securities (see note 2.5), trade payables and certain other liabilities (see notes 4.7 and 4.8). These instruments are recognized initially at fair value when the Company becomes a party to the contractual provisions of the instrument. Non-derivative financial assets are derecognized if the Company’s contractual rights to the cash flows from the financial instruments expire or if the Company transfers the financial instruments to another party without retaining control
of substantially all risks and rewards of the instruments. Non-derivative financial liabilities are derecognized when they are extinguished (i.e. when the obligation specified in the contract is discharged, cancelled or expires).
Impairment of financial assets
A financial asset is considered to be impaired if objective evidence indicates that one or more events have had a negative effect on the estimated future cash flows of that asset. Estimated future cash flows are determined using various assumptions and techniques, including comparisons to published prices in an active market and discounted cash flow projections using projected growth rates, weighted average cost of capital, and inflation rates. In the case of available-
for-sale securities, a significant or prolonged decline in the fair value of the security below its cost is considered an indicator that the securities are impaired. If any such evidence exists for available-for-sale financial assets, the cumulative loss measured as the difference between the acquisition cost and the current fair value less any impairment loss on that financial asset previously recognized in the consolidated statements of operations is removed from equity and recognized in the consolidated statements of operations. Financial assets are tested for impairment annually or whenever changes in circumstances indicate that the carrying amount may not be recoverable. If objective evidence indicates that cost-method investments need to be
tested for impairment, calculations are based on information derived from business plans and other information available for estimating their value in use. Any impairment loss is recognized in the consolidated statements of operations. An impairment loss related to financial assets is reversed if and to the extent there has been a change in the estimates used to determine the recoverable amount. The loss is reversed only to the extent that the asset’s carrying amount does not exceed the carrying amount that would have been determined if no impairment loss had been recognized. Reversals of impairment are recognized in net income except for reversals of impairment of available-for-sale equity securities, which are recognized in equity.
Year Ended December 31,
2015Year Ended December 31,
2014Year Ended December 31,
2013
Recognized in the statements of operationsInterest expense (1,383) (1,565) (1,890)Interest income 105 96 113Fair value adjustment on conversion options on the euro convertible bond, call options on ArcelorMittal shares and mandatory convertible bonds (108) 112 (12)Net gain (loss) on other derivative instruments 10 7 11Accretion of defined benefit obligations and other long term liabilities (399) (593) (574)Net foreign exchange result (697) (620) (248)Others * (386) (819) (515)Total (2,858) (3,382) (3,115)
Recognized in equity (Company share)Net change in fair value of available-for-sale financial assets (354) 510 68Effective portion of changes in fair value of cash flow hedge 25 104 (110)Foreign currency translation differences for foreign operations (8,166) (4,717) (666)Total (8,495) (4,103) (708)
* Other mainly includes expenses related to True Sale of Receivables (“TSR”) programs and bank fees. It also included an expense of 79 in 2015 and 49 in 2014 relating to the extension of the mandatory convertible bonds (see note 10.2). In 2014, it included the settlement in relation to the termination of the Senegal greenfield project and an expense of 161 related to a federal tax amnesty plan in Brazil with respect to the Siderbras case (see note 8.2).
6.3 Risk management policy
Interest rate risk
The Company utilizes certain instruments to manage interest rate risks. Interest rate instruments allow the Company to borrow long-term at fixed or variable rates, and to swap the rate of this debt either
at inception or during the lifetime of the loan. The Company and its counter-parties exchange, at predefined intervals, the difference between the agreed fixed rate and the variable rate, calculated on the basis of the notional amount of the swap. Similarly, swaps may be used for the exchange of variable rates against other variable rates.
Interest rate derivatives used by the Company to manage changes in the value of fixed rate loans qualify as fair value hedges. Foreign exchange rate risk
The Company is exposed to changes in values arising from foreign exchange rate fluctuations
generated by its operating activities. Because a substantial portion of ArcelorMittal’s assets, liabilities, sales and earnings are denominated in currencies other than the U.S. dollar (its reporting currency), ArcelorMittal has an exposure to fluctuations and depreciation in the values of these currencies relative to the U.S.
6.2 Financing costs
Financing costs recognized in the years ended December 31, 2015, 2014 and 2013 are as follows:

118 Consolidated financial statements
dollar. These currency fluctuations, especially the fluctuation of the value of the U.S. dollar relative to the euro, the Canadian dollar, Brazilian real, South African rand, Kazakh tenge, Venezuelan bolivar and Ukrainian hryvnia, as well as fluctuations in the other countries’ currencies in which ArcelorMittal has significant operations and/or sales, could have a material impact on its results of operations.
ArcelorMittal faces transaction risk, where its businesses generate sales in one currency but incur costs relating to that revenue in a different currency. For example, ArcelorMittal’s non-U.S. subsidiaries may purchase raw materials, including iron ore and coking coal, in U.S. dollars, but
may sell finished steel products in other currencies. Consequently, an appreciation of the U.S. dollar will increase the cost of raw materials; thereby impacting negatively on the Company’s operating margins, unless the Company is able to pass along the higher cost in the form of higher selling prices.
Following its Treasury and Financial Risk Management Policy, the Company hedges a portion of its net exposure to foreign exchange rates through foreign currency forwards, options and swaps.
ArcelorMittal faces translation risk, which arises when ArcelorMittal translates the statements of operations of its subsidiaries, its corporate net debt (see note 6.1.2)
and other items denominated in currencies other than the U.S. dollar, for inclusion in the consolidated financial statements.
The Company also uses the derivative instruments, described above, at the corporate level to hedge debt recorded in foreign currency other than the functional currency or the balance sheet risk incurred on certain monetary assets denominated in a foreign currency other than the functional currency.
Liquidity Risk
ArcelorMittal’s principal sources of liquidity are cash generated from its operations, its credit lines at the corporate level and various
working capital credit lines at the level of its operating subsidiaries. The Company actively manages its liquidity. Following the Treasury and Financial Risk Management Policy, the levels of cash, credit lines and debt are closely monitored and appropriate actions are taken in order to comply with the covenant ratios, leverage, fixed/floating ratios, maturity profile and currency mix.
The following are the non-discounted contractual maturities of financial liabilities, including estimated interest payments and excluding the impact of netting agreements:
December 31, 2015
Carrying amount Contractual Cash Flow Less than 1 Year 1-2 Years 2-5 Years More than 5 Years
Non-derivative financial liabilitiesBonds (17,681) (26,082) (2,223) (3,464) (6,279) (14,116)Loans over 100 (892) (1,149) (659) (83) (166) (241)Trade and other payables (8,977) (8,988) (8,988) - - -Other non-derivative financial liabilities (1,213) (1,376) (667) (182) (280) (247)Total (28,763) (37,595) (12,537) (3,729) (6,725) (14,604)
Derivative financial liabilitiesForeign exchange contracts (145) (145) (80) (33) (15) (17)Other commodities contracts1 (59) (59) (54) (5) - -Total (204) (204) (134) (38) (15) (17)
December 31, 2014
Carrying amount Contractual Cash Flow Less than 1 Year 1-2 Years 2-5 Years More than 5 Years
Non-derivative financial liabilitiesBonds (16,639) (25,143) (2,080) (2,735) (9,199) (11,129)Loans over 100 (2,071) (2,505) (1,132) (724) (320) (329)Trade and other payables (11,450) (11,463) (11,463) - - - Other non-derivative financial liabilities (1,087) (1,256) (518) (278) (309) (151)Total (31,247) (40,367) (15,193) (3,737) (9,828) (11,609)
Derivative financial liabilitiesInterest rate instruments (54) (54) - (1) (53) - Foreign exchange contracts (121) (121) (66) (46) (6) (3)Other commodities contracts1 (68) (68) (68) - - - Total (243) (243) (134) (47) (59) (3)1 Commodity contracts include base metals, freight, energy and emission rights.

Consolidated financial statements 119
Cash flow hedges
The following tables present the periods in which the derivatives designated as cash flows hedges are expected to mature:
December 31, 2015
assets/
(liabilities) (outflows)/inflows
Fair value3 months
and less3-6
months6-12
months 1-2 years
More than 2
yearsForeign exchange contracts 26 15 11 - - - Commodities (24) (11) (2) (6) (5) - Emission rights (16) - - (16) - - Total (14) 4 9 (22) (5) -
December 31, 2014
assets/
(liabilities)(outflows)
/inflows
Fair value3 months
and less3-6
months6-12
months 1-2 years
More than 2 years
Foreign exchange contracts 105 82 18 5 - - Commodities (4) (10) 3 2 1 - Emission rights 22 - - 22 - - Total 123 72 21 29 1 -
Associated gains or losses that were recognized in other comprehensive income are reclassified from equity to the consolidated statements of
operations in the same period during which the hedged forecasted cash flow affects the consolidated statements of operations. The following table
presents the periods in which the realized and unrealized gains or losses on derivatives designated as cash flows hedges, net of tax, recognized
in other comprehensive income are expected to impact the consolidated statements of operations:
December 31, 2015
assets/
(liabilities) (expense)/income
Carrying amount
3 months and less
3-6 months
6-12 months
1-2 years
More than 2 years
Foreign exchange contracts 10 (3) 11 2 - -Commodity contracts (10) (4) (3) (1) (2) -Emission rights 86 (1) - - 87 -Interest rate contracts (14) (1) - (1) (6) (6)Total 72 (9) 8 - 79 (6)
December 31, 2014
assets/
(liabilities) (expense)/income
Carrying amount
3 months and less
3-6 months
6-12 months
1-2 years
More than 2 years
Foreign exchange contracts 52 25 15 12 - -Commodity contracts (5) (5) (7) 6 1 -Emission rights 61 - - - - 61Total 108 20 8 18 1 61
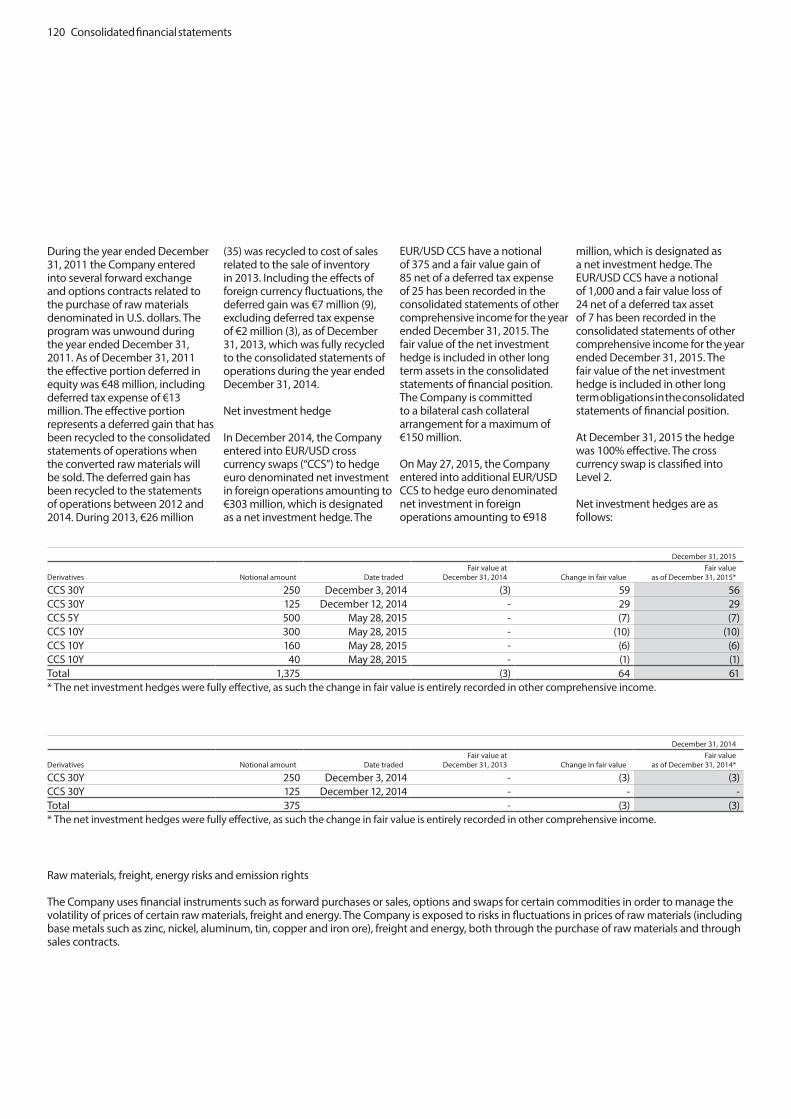
120 Consolidated financial statements
During the year ended December 31, 2011 the Company entered into several forward exchange and options contracts related to the purchase of raw materials denominated in U.S. dollars. The program was unwound during the year ended December 31, 2011. As of December 31, 2011 the effective portion deferred in equity was €48 million, including deferred tax expense of €13 million. The effective portion represents a deferred gain that has been recycled to the consolidated statements of operations when the converted raw materials will be sold. The deferred gain has been recycled to the statements of operations between 2012 and 2014. During 2013, €26 million
(35) was recycled to cost of sales related to the sale of inventory in 2013. Including the effects of foreign currency fluctuations, the deferred gain was €7 million (9), excluding deferred tax expense of €2 million (3), as of December 31, 2013, which was fully recycled to the consolidated statements of operations during the year ended December 31, 2014.
Net investment hedge
In December 2014, the Company entered into EUR/USD cross currency swaps (“CCS”) to hedge euro denominated net investment in foreign operations amounting to €303 million, which is designated as a net investment hedge. The
EUR/USD CCS have a notional of 375 and a fair value gain of 85 net of a deferred tax expense of 25 has been recorded in the consolidated statements of other comprehensive income for the year ended December 31, 2015. The fair value of the net investment hedge is included in other long term assets in the consolidated statements of financial position. The Company is committed to a bilateral cash collateral arrangement for a maximum of €150 million.
On May 27, 2015, the Company entered into additional EUR/USD CCS to hedge euro denominated net investment in foreign operations amounting to €918
million, which is designated as a net investment hedge. The EUR/USD CCS have a notional of 1,000 and a fair value loss of 24 net of a deferred tax asset of 7 has been recorded in the consolidated statements of other comprehensive income for the year ended December 31, 2015. The fair value of the net investment hedge is included in other long term obligations in the consolidated statements of financial position.
At December 31, 2015 the hedge was 100% effective. The cross currency swap is classified into Level 2.
Net investment hedges are as follows:
December 31, 2015
Derivatives Notional amount Date tradedFair value at
December 31, 2014 Change in fair valueFair value
as of December 31, 2015*
CCS 30Y 250 December 3, 2014 (3) 59 56 CCS 30Y 125 December 12, 2014 - 29 29 CCS 5Y 500 May 28, 2015 - (7) (7)CCS 10Y 300 May 28, 2015 - (10) (10)CCS 10Y 160 May 28, 2015 - (6) (6)CCS 10Y 40 May 28, 2015 - (1) (1)Total 1,375 (3) 64 61 * The net investment hedges were fully effective, as such the change in fair value is entirely recorded in other comprehensive income.
December 31, 2014
Derivatives Notional amount Date tradedFair value at
December 31, 2013 Change in fair valueFair value
as of December 31, 2014*
CCS 30Y 250 December 3, 2014 - (3) (3)CCS 30Y 125 December 12, 2014 - - -Total 375 - (3) (3)* The net investment hedges were fully effective, as such the change in fair value is entirely recorded in other comprehensive income.
Raw materials, freight, energy risks and emission rights
The Company uses financial instruments such as forward purchases or sales, options and swaps for certain commodities in order to manage the volatility of prices of certain raw materials, freight and energy. The Company is exposed to risks in fluctuations in prices of raw materials (including base metals such as zinc, nickel, aluminum, tin, copper and iron ore), freight and energy, both through the purchase of raw materials and through sales contracts.
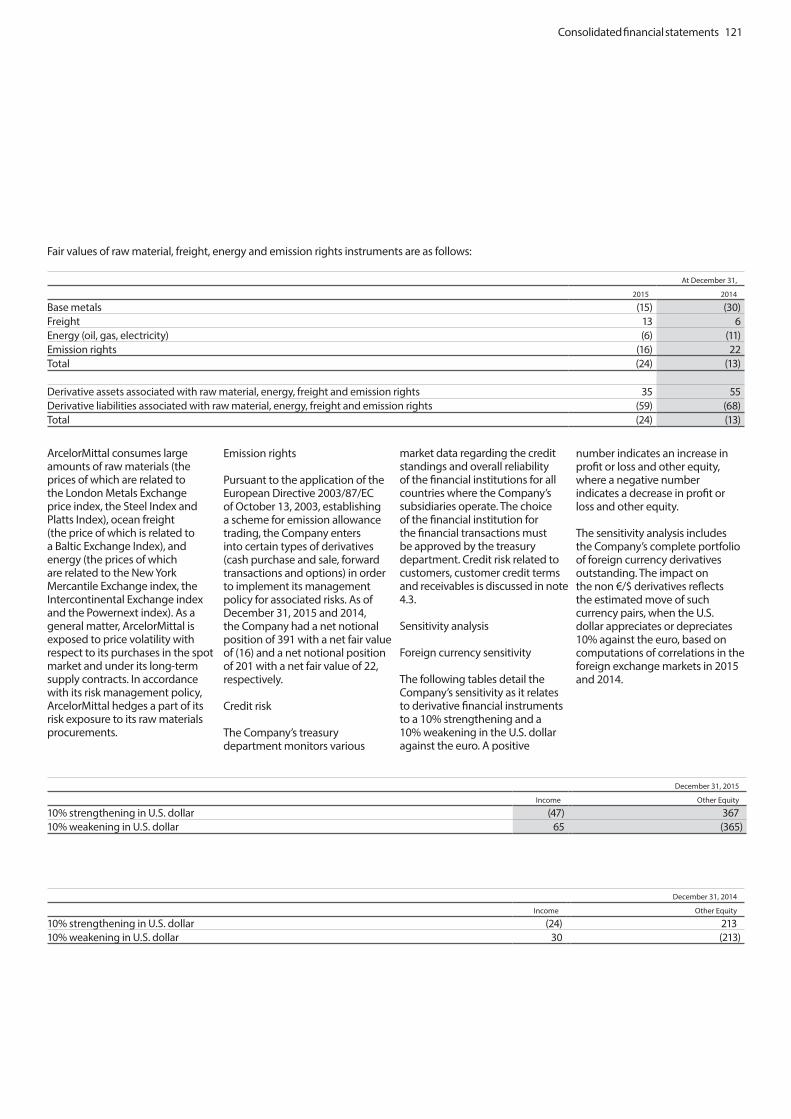
Consolidated financial statements 121
At December 31,
2015 2014
Base metals (15) (30)Freight 13 6Energy (oil, gas, electricity) (6) (11)Emission rights (16) 22Total (24) (13)
Derivative assets associated with raw material, energy, freight and emission rights 35 55Derivative liabilities associated with raw material, energy, freight and emission rights (59) (68)Total (24) (13)
ArcelorMittal consumes large amounts of raw materials (the prices of which are related to the London Metals Exchange price index, the Steel Index and Platts Index), ocean freight (the price of which is related to a Baltic Exchange Index), and energy (the prices of which are related to the New York Mercantile Exchange index, the Intercontinental Exchange index and the Powernext index). As a general matter, ArcelorMittal is exposed to price volatility with respect to its purchases in the spot market and under its long-term supply contracts. In accordance with its risk management policy, ArcelorMittal hedges a part of its risk exposure to its raw materials procurements.
Emission rights
Pursuant to the application of the European Directive 2003/87/EC of October 13, 2003, establishing a scheme for emission allowance trading, the Company enters into certain types of derivatives (cash purchase and sale, forward transactions and options) in order to implement its management policy for associated risks. As of December 31, 2015 and 2014, the Company had a net notional position of 391 with a net fair value of (16) and a net notional position of 201 with a net fair value of 22, respectively. Credit risk
The Company’s treasury department monitors various
market data regarding the credit standings and overall reliability of the financial institutions for all countries where the Company’s subsidiaries operate. The choice of the financial institution for the financial transactions must be approved by the treasury department. Credit risk related to customers, customer credit terms and receivables is discussed in note 4.3.
Sensitivity analysis
Foreign currency sensitivity
The following tables detail the Company’s sensitivity as it relates to derivative financial instruments to a 10% strengthening and a 10% weakening in the U.S. dollar against the euro. A positive
number indicates an increase in profit or loss and other equity, where a negative number indicates a decrease in profit or loss and other equity.
The sensitivity analysis includes the Company’s complete portfolio of foreign currency derivatives outstanding. The impact on the non €/$ derivatives reflects the estimated move of such currency pairs, when the U.S. dollar appreciates or depreciates 10% against the euro, based on computations of correlations in the foreign exchange markets in 2015 and 2014.
December 31, 2015
Income Other Equity
10% strengthening in U.S. dollar (47) 36710% weakening in U.S. dollar 65 (365)
December 31, 2014
Income Other Equity
10% strengthening in U.S. dollar (24) 213 10% weakening in U.S. dollar 30 (213)
Fair values of raw material, freight, energy and emission rights instruments are as follows:
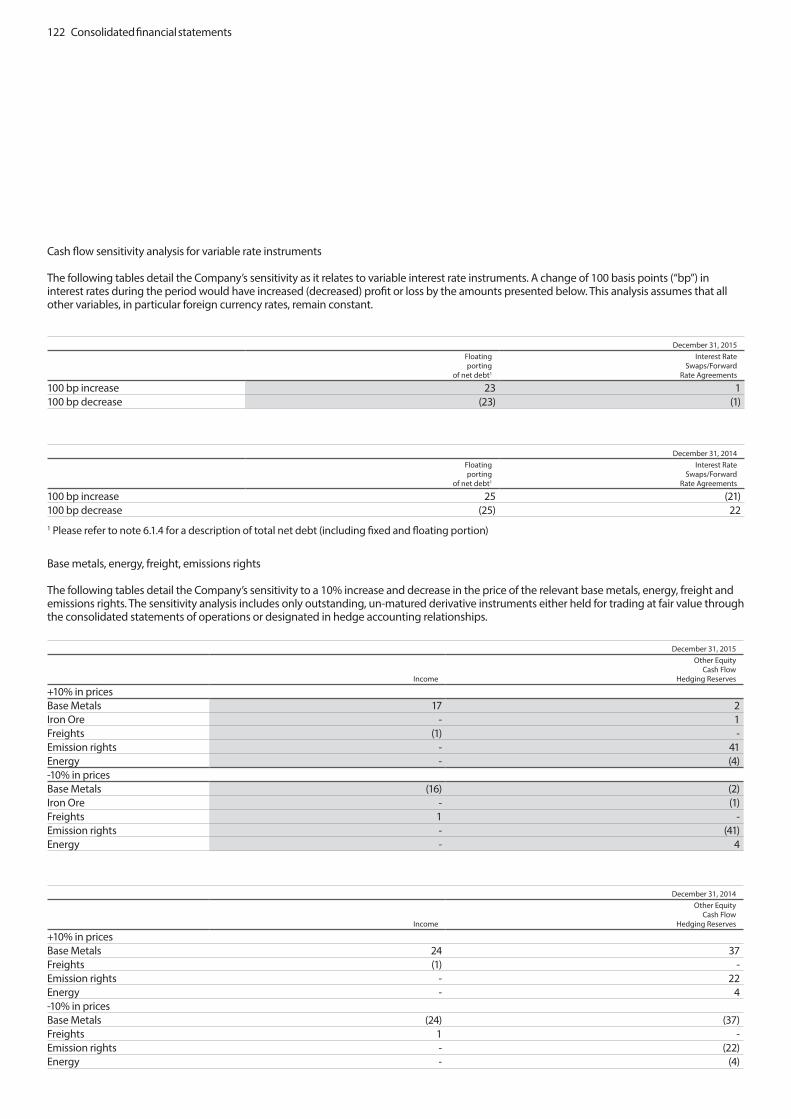
122 Consolidated financial statements
Cash flow sensitivity analysis for variable rate instruments
The following tables detail the Company’s sensitivity as it relates to variable interest rate instruments. A change of 100 basis points (“bp”) in interest rates during the period would have increased (decreased) profit or loss by the amounts presented below. This analysis assumes that all other variables, in particular foreign currency rates, remain constant.
December 31, 2015
Floating porting
of net debt1
Interest Rate Swaps/Forward
Rate Agreements
100 bp increase 23 1100 bp decrease (23) (1)
December 31, 2014
Floating porting
of net debt1
Interest Rate Swaps/Forward
Rate Agreements
100 bp increase 25 (21)100 bp decrease (25) 22 1 Please refer to note 6.1.4 for a description of total net debt (including fixed and floating portion)
Base metals, energy, freight, emissions rights
The following tables detail the Company’s sensitivity to a 10% increase and decrease in the price of the relevant base metals, energy, freight and emissions rights. The sensitivity analysis includes only outstanding, un-matured derivative instruments either held for trading at fair value through the consolidated statements of operations or designated in hedge accounting relationships.
December 31, 2015
Income
Other Equity Cash Flow
Hedging Reserves
+10% in pricesBase Metals 17 2Iron Ore - 1Freights (1) -Emission rights - 41Energy - (4)-10% in pricesBase Metals (16) (2)Iron Ore - (1)Freights 1 -Emission rights - (41)Energy - 4
December 31, 2014
Income
Other Equity Cash Flow
Hedging Reserves
+10% in pricesBase Metals 24 37 Freights (1) - Emission rights - 22 Energy - 4 -10% in pricesBase Metals (24) (37)Freights 1 - Emission rights - (22)Energy - (4)

Consolidated financial statements 123
Note 7 : Personnel expenses and deferred employee benefits
7.1 Employees and key management personnel
As of December 31, 2015, ArcelorMittal had approximately 209,000 employees and the total annual compensation of ArcelorMittal’s employees in 2015, 2014 and 2013 was as follows:
Year Ended December 31,
2015 2014 2013
Employee InformationWages and salaries 8,392 9,839 9,891Pension cost 237 216 248Other staff expenses 1,695 1,989 1,740Total 10,324 12,044 11,879
The total annual compensation of ArcelorMittal’s key management personnel, including its Board of Directors, expensed in 2015, 2014 and 2013 was as follows:
Year Ended December 31,
2015 2014 2013
Base salary and directors fees 7 11 12Short-term performance-related bonus 5 8 6Post-employment benefits - 1 1Share based compensation 7 7 3
The fair value of the stock options granted and shares allocated based on RSU and PSU plans to the ArcelorMittal’s key management personnel is recorded as an expense in the consolidated statements of operations over the relevant vesting periods.
As of December 31, 2015, 2014 and 2013, ArcelorMittal did not have outstanding any loans or advances to members of its Board of Directors or key management personnel, and, as of December 31, 2015, 2014 and 2013, ArcelorMittal had not given any guarantees for the benefit of any member of its Board of Directors or key management personnel.
7.2 Deferred employee benefits
ArcelorMittal’s operating subsidiaries sponsor different types of pension plans for their employees. Also, some of the operating subsidiaries offer other post-employment benefits, principally healthcare. These
benefits are broken down into defined contribution plans and defined benefit plans.
Defined contribution plans are those plans where ArcelorMittal pays fixed or determinable contributions to external life insurance or other funds for certain categories of employees. Contributions are paid in return for services rendered by the employees during the period. Contributions are expensed as incurred consistent with the recognition of wages and salaries. No provisions are established with respect to defined contribution plans as they do not generate future commitments for ArcelorMittal.
Defined benefit plans are those plans that provide guaranteed benefits to certain categories of employees, either by way of contractual obligations or through a collective agreement. For defined benefit plans, the cost of providing benefits is determined using the projected unit credit method, with
actuarial valuations being carried out at each fiscal year end.
The retirement benefit obligation recognized in the consolidated statements of financial position represents the present value of the defined benefit obligation less the fair value of plan assets. The present value of the defined benefit obligation is determined by discounting the estimated future cash outflows using interest rates of high quality corporate bonds that are denominated in the currency in which the benefits will be paid, and that have terms to maturity approximating to the terms of the related pension obligation. In countries where there is no deep market in such bonds, the market rates on government bonds are used. Actuarial gains and losses arising from experience adjustments and changes in actuarial assumptions are charged or credited to other comprehensive income in the period in which they arise. Any asset resulting from this calculation is limited to the present value of available refunds and
reductions in future contributions to the plan.
Current service cost, which is the increase of the present value of the defined benefit obligation resulting from the employee service in the current period, is recorded as an expense as part of cost of sales and selling, general and administrative expenses in the consolidated statements of operations. The net interest cost, which is the change during the period in the net defined benefit liability or asset that arises from the passage of time, is recognized as part of net financing costs in the consolidated statements of operations.
The Company recognizes gains and losses on the curtailment of a defined benefit plan when the curtailment occurs. The gain or loss on curtailment comprises any resulting change in the fair value of plan assets, any change in the present value of the defined benefit obligation, any related actuarial gains and losses and past service cost that had not

124 Consolidated financial statements
been previously recognized. Past service cost is the change in the present value of the defined benefit obligation resulting from a plan amendment or a curtailment. Past service cost is recognized immediately in the consolidated statements of operations in the period in which it arises.
Voluntary retirement plans primarily correspond to the practical implementation of social plans or are linked to collective agreements signed with certain categories of employees. Early retirement plans are those plans that primarily correspond to terminating an employee’s contract before the normal retirement date. Liabilities for early retirement plans are recognized when the affected employees have formally been informed and when amounts owed have been determined using an appropriate actuarial calculation. Liabilities relating to the early retirement
plans are calculated annually on the basis of the number of employees likely to take early retirement and are discounted using an interest rate which corresponds to that of highly-rated bonds that have maturity dates similar to the terms of the Company’s early retirement obligations. Termination benefits are provided in connection with voluntary separation plans. The Company recognizes a liability and expense when it can no longer withdraw the offer or, if earlier, when it has a detailed formal plan which has been communicated to employees or their representatives.
Other long-term employee benefits include various plans that depend on the length of service, such as long service and sabbatical awards, disability benefits and long term compensated absences such as sick leave. The amount recognized as a liability
is the present value of benefit obligations at the consolidated statements of financial position date, and all changes in the provision (including actuarial gains and losses or past service costs) are recognized in the consolidated statements of operations in the period in which they arise.
The expense associated with the above pension plans and post-employment benefits, as well as the carrying amount of the related liability/asset on the consolidated statements of financial position are based on a number of assumptions and factors such as discount rates, expected rate of compensation increase, healthcare cost trend rates, mortality rates and retirement rates.
• Discount rates: The discount rate is based on several high quality corporate bond indexes and yield curves in the appropriate jurisdictions (rated AA or higher
by a recognized rating agency). Nominal interest rates vary worldwide due to exchange rates and local inflation rates.
• Rate of compensation increase: The rate of compensation increase reflects actual experience and the Company’s long-term outlook, including contractually agreed upon wage rate increases for represented hourly employees.
• Healthcare cost trend rate: The healthcare cost trend rate is based on historical retiree cost data, near-term healthcare outlook, including appropriate cost control measures implemented by the Company, and industry benchmarks and surveys.
• Mortality and retirement rates : Mortality and retirement rates are based on actual and projected plan experience.
December 31,
2015 2014
Pension plan benefits 3,149 3,748Other post-employment benefits 5,549 5,659Early retirement benefits 357 461Defined benefit liabilities 9,055 9,868Termination benefits 161 206Total 9,216 10,074
The early retirement benefits and termination benefits are related mainly to European countries (Belgium, Spain, Germany and Luxembourg).
Pension Plans
A summary of the significant defined benefit pension plans is as follows:
U.S.
ArcelorMittal USA’s Pension Plan is a non-contributory defined benefit plan covering approximately 15% of its employees. Certain non-represented salaried employees
hired before 2003 receive pension benefits which are determined under a “Cash Balance” formula as an account balance which grows as a result of interest credits and of allocations based on a percentage of pay. Benefits for wage and salaried employees represented by a union are determined as a monthly benefit at retirement based on fixed rate and service. This plan is closed to new participants.
Represented employees hired after November 2005 and employees at locations which were acquired from International Steel Group Inc. receive defined
pension benefits through a multi-employer pension plan that is accounted for as a defined contribution plan, due to the limited information made available to each of the 541 (as of December 31, 2014) different participating employers. ArcelorMittal USA makes contributions to this multi-employer plan in the amount of $2.65 per contributory hour.
Canada
The primary pension plans are those of ArcelorMittal Dofasco, ArcelorMittal Mines Canada and ArcelorMittal Montreal.
The ArcelorMittal Dofasco pension plan is a hybrid plan providing the benefits of both a defined benefit and defined contribution pension plan. The defined contribution component is financed by both employer and employee contributions. The employer’s defined contribution is based on a percentage of company profits. The defined benefit pension plan was closed for new hires on December 31, 2010 and replaced by a new defined contribution pension plan with contributions related to age, service and earnings.
At the end of 2012, ArcelorMittal Dofasco froze and capped
Statements of Financial Position
Total deferred employee benefits including pension or other post-employment benefits, are as follows:

Consolidated financial statements 125
benefits for its hourly and salaried employees who were still accruing service under the defined benefit plan and began transitioning these employees to the new defined contribution pension plan for future pension benefits.
The ArcelorMittal Mines Canada defined benefit plan provides salary related benefit for non-union employees and a flat dollar pension depending on an employee’s length of service for union employees. This plan was closed for new non-union hires on December 31, 2009 and replaced by a defined contribution pension plan with contributions related to age and service. In 2014, ArcelorMittal Mines Canada communicated to its non-union employees who were still benefiting under the defined benefit plan that they would be transitioning to a defined contribution pension plan. This transition had no impact on the financial statements of the Company for the financial year 2014.
ArcelorMittal Montreal sponsors several defined benefit and defined contribution pension plans for its various groups of employees, with most defined benefit plans closed to new entrants several years ago. The primary defined benefit pension plan sponsored by ArcelorMittal Montreal provides certain unionized employees with a flat dollar pension depending on an employee’s length of service.
ArcelorMittal Montreal entered into a six-year collective labor agreement during the third quarter of 2014 with its Contrecoeur-West union group. The defined
benefit plan was closed to new hires. A new defined contribution type arrangement was established for new hires.
Brazil
The primary defined benefit plans, financed through trust funds, have been closed to new entrants. Brazilian entities have all established defined contribution plans that are financed by employer and employee contributions. Europe
Certain European operating subsidiaries maintain primarily unfunded defined benefit pension plans for a certain number of employees. Benefits are based on such employees’ length of service and applicable pension table under the terms of individual agreements. Some of these unfunded plans have been closed to new entrants and replaced by defined contributions pension plans for active members financed by employer and employee contributions.
As from December 2015 new Belgian legislation modifies the minimum guaranteed rates of return applicable to Belgian Defined Contribution Plans. For insured plans, the rates of 3,25% on employer contributions and 3,75% on employee contributions will continue to apply to the accumulated pre-2016 contributions. For contributions paid as from January, 1, 2016, a new variable minimum guaranteed rate of return will apply. Best estimate for the 2016 contributions being 1,75%.
In the Netherlands, most accrued pension rights were externalized with an insurance company in April 2014. The transaction removed 111 and 113 of defined benefit obligations and plan assets, respectively.
South Africa
Following an amendment of the rules of the ArcelorMittal South Africa Pension Fund (“the fund”) approved by the Financial Services Board on November 9, 2015 and effective April 1, 2015, ArcelorMittal South Africa has discontinued its participation in the fund and therefore no longer has any legal or constructive obligation to ensure the funding of the plan. Accordingly, the related benefit obligation was settled and the plan assets and unrecoverable surplus were derecognized from the 2015 consolidated statements of financial position.
South African entities have also implemented defined contributions pension plans that are financed by employer and employee contributions.
Others
A very limited number of defined benefit pension plans are in place in other countries.
The majority of the funded defined benefit pension plans described earlier provide benefit payments from trustee-administered funds. ArcelorMittal also sponsors a number of unfunded plans where the Company meets the benefit payment obligation as it falls due. Plan assets held in trusts are legally
separated from the Company and are governed by local regulations and practice in each country, as is the nature of the relationship between the Company and the governing bodies and their composition. In general terms, governing bodies are required by law to act in the best interest of the plan members and are responsible for certain tasks related to the plan (e.g. setting the plan’s investment policy).
In case of the funded pension plans, the investment positions are managed within an asset-liability matching (ALM) framework that has been developed to achieve long-term investments that are in line with the obligations of the pension plans.
A long-term investment strategy has been set for ArcelorMittal’s major funded pension plans, with its asset allocation comprising of a mixture of equities securities, fixed income securities, real estate and other appropriate assets. This recognizes that different asset classes are likely to produce different long-term returns and some asset classes may be more volatile than others. The long-term investment strategy ensures, in particular, that investments are adequately diversified.

126 Consolidated financial statements
Year Ended December 31, 2015
TOTAL U.S. CANADA BRAZIL EUROPE SOUTH AFRICA OTHERSChange in benefit obligation Benefit obligation at beginning of the period 11,859 3,935 3,623 733 2,723 587 258Current service cost 121 36 31 2 44 - 8Interest cost on DBO 419 150 126 66 49 11 17Past service cost - Plan amendments 4 - 1 - 2 1 - Plan participants’ contribution 3 - 1 1 - - 1Curtailments and settlements (513) (2) - - (1) (510) - Actuarial (gain) loss (256) (204) (55) (41) 30 2 12 Demographic assumptions (37) (37) (9) (1) 10 - - Financial assumptions (291) (150) (77) (23) (44) 3 - Experience adjustment 72 (17) 31 (17) 64 (1) 12Benefits paid (655) (261) (194) (38) (121) (18) (23)Foreign currency exchange rate differences and other movements 12 (1,099) (31) (605) (228) (125) (56) (54)Benefit obligation at end of the period 9,883 3,623 2,928 495 2,601 17 219 Change in plan assetsFair value of plan assets at beginning of the period 8,348 3,026 3,144 688 645 714 131Interest income on plan assets 312 105 108 66 12 14 7Return on plan assets greater/(less) than discount rate (182) (117) 61 (19) (6) (94) (7)Employer contribution 155 70 35 27 22 - 1Plan participants’ contribution 3 - 1 1 - - 1Settlements (512) (2) - - - (510) - Benefits paid (543) (256) (193) (38) (32) (18) (6)Foreign currency exchange rate differences and other movements 12 (753) (31) (523) (227) 112 (86) 2Fair value of plan assets at end of the period 6,828 2,795 2,633 498 753 20 129 Present value of the wholly or partly funded obligation (8,500) (3,597) (2,915) (493) (1,338) (17) (140)Fair value of plan assets 6,828 2,795 2,633 498 753 20 129Net present value of the wholly or partly funded obligation (1,672) (802) (282) 5 (585) 3 (11)Present value of the unfunded obligation (1,383) (26) (13) (2) (1,263) - (79)Prepaid due to unrecoverable surpluses (80) - (21) (53) (3) (3) - Net amount recognized (3,135) (828) (316) (50) (1,851) - (90) Net assets related to funded obligations 14 - 14 - - - - Recognized liabilities (3,149) (828) (330) (50) (1,851) - (90) Change in unrecoverable surplusUnrecoverable surplus at beginning of the period (205) - - (75) (3) (127) - Interest cost on unrecoverable surplus (10) - - (7) - (3) - Change in unrecoverable surplus in excess of interest 81 - (21) 4 - 98 - Exchange rates changes 54 - - 25 - 29 - Unrecoverable surplus at end of the period (80) - (21) (53) (3) (3) -
1 Other movements include Laplace for (29) in benefit obligations and (20) in plan assets as has been classified held for sale in December 2015. 2 The change in Belgian legislation, as described above, results into minimum guaranteed benefits at the date of leaving or retirement. Therefore, Belgian defined contribution plans classified as defined benefit plans. Other movements include 174 in benefit obligations and 174 in plan assets.
The following tables detail the reconciliation of defined benefit obligation (“DBO”), plan assets and statements of financial position.
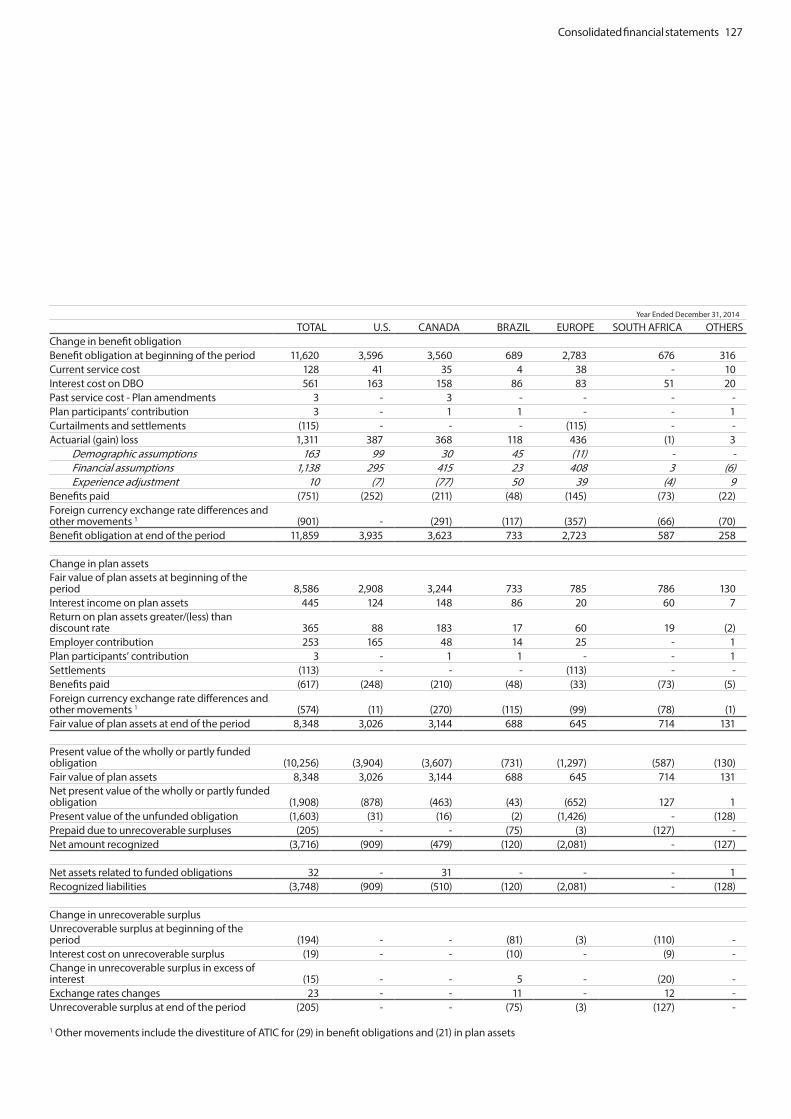
Consolidated financial statements 127
Year Ended December 31, 2014
TOTAL U.S. CANADA BRAZIL EUROPE SOUTH AFRICA OTHERSChange in benefit obligation Benefit obligation at beginning of the period 11,620 3,596 3,560 689 2,783 676 316Current service cost 128 41 35 4 38 - 10Interest cost on DBO 561 163 158 86 83 51 20Past service cost - Plan amendments 3 - 3 - - - -Plan participants’ contribution 3 - 1 1 - - 1Curtailments and settlements (115) - - - (115) - -Actuarial (gain) loss 1,311 387 368 118 436 (1) 3 Demographic assumptions 163 99 30 45 (11) - - Financial assumptions 1,138 295 415 23 408 3 (6) Experience adjustment 10 (7) (77) 50 39 (4) 9Benefits paid (751) (252) (211) (48) (145) (73) (22)Foreign currency exchange rate differences and other movements 1 (901) - (291) (117) (357) (66) (70)Benefit obligation at end of the period 11,859 3,935 3,623 733 2,723 587 258 Change in plan assetsFair value of plan assets at beginning of the period 8,586 2,908 3,244 733 785 786 130Interest income on plan assets 445 124 148 86 20 60 7Return on plan assets greater/(less) than discount rate 365 88 183 17 60 19 (2)Employer contribution 253 165 48 14 25 - 1Plan participants’ contribution 3 - 1 1 - - 1Settlements (113) - - - (113) - -Benefits paid (617) (248) (210) (48) (33) (73) (5)Foreign currency exchange rate differences and other movements 1 (574) (11) (270) (115) (99) (78) (1)Fair value of plan assets at end of the period 8,348 3,026 3,144 688 645 714 131 Present value of the wholly or partly funded obligation (10,256) (3,904) (3,607) (731) (1,297) (587) (130)Fair value of plan assets 8,348 3,026 3,144 688 645 714 131Net present value of the wholly or partly funded obligation (1,908) (878) (463) (43) (652) 127 1Present value of the unfunded obligation (1,603) (31) (16) (2) (1,426) - (128)Prepaid due to unrecoverable surpluses (205) - - (75) (3) (127) -Net amount recognized (3,716) (909) (479) (120) (2,081) - (127) Net assets related to funded obligations 32 - 31 - - - 1Recognized liabilities (3,748) (909) (510) (120) (2,081) - (128) Change in unrecoverable surplusUnrecoverable surplus at beginning of the period (194) - - (81) (3) (110) -Interest cost on unrecoverable surplus (19) - - (10) - (9) -Change in unrecoverable surplus in excess of interest (15) - - 5 - (20) -Exchange rates changes 23 - - 11 - 12 -Unrecoverable surplus at end of the period (205) - - (75) (3) (127) -
1 Other movements include the divestiture of ATIC for (29) in benefit obligations and (21) in plan assets

128 Consolidated financial statements
The following tables detail the components of net periodic pension cost:
Year Ended December 31, 2015
Net periodic pension cost (benefit) TOTAL U.S. CANADA BRAZIL EUROPESOUTH AFRICA OTHERS
Current service cost 121 36 31 2 44 - 8Past service cost - Plan amendments 4 - 1 - 2 1 - Past service cost - Curtailments (1) - - - (1) - - Net interest cost/(income) on net DB liability/(asset) 117 45 18 7 37 - 10Total 241 81 50 9 82 1 18 Year Ended December 31, 2014
Net periodic pension cost (benefit) TOTAL U.S. CANADA BRAZIL EUROPESOUTH AFRICA OTHERS
Current service cost 128 41 35 4 38 - 10 Past service cost - Plan amendments 3 - 3 - - - - Past service cost - Curtailments and settlements (2) - - - (2) - - Net interest cost/(income) on net DB liability/(asset) 135 39 10 10 63 - 13 Total 264 80 48 14 99 - 23
Year Ended December 31, 2013
Net periodic pension cost (benefit) TOTAL U.S. CANADA BRAZIL EUROPESOUTH AFRICA OTHERS
Current service cost 165 49 45 11 46 1 13 Past service cost - Plan amendments 1 - - - 1 - - Past service cost - Curtailments and settlements (4) - - - - (4) - Net interest cost/(income) on net DB liability/(asset) 195 63 35 20 62 - 15 Total 357 112 80 31 109 (3) 28
Other post-employment benefits
ArcelorMittal’s principal operating subsidiaries in the U.S., Canada, Europe and certain other countries, provide other post-employment benefits (“OPEB”), including medical benefits and life insurance benefits, to retirees. Substantially all union-represented ArcelorMittal USA employees are covered under post-employment life insurance and medical benefit plans that require a level of cost share from retirees. The post-employment life insurance benefit formula used in the determination of post-employment benefit cost
is primarily based on a specific amount for hourly employees. ArcelorMittal USA does not pre-fund most of these post-employment benefits.
The labor contract between ArcelorMittal USA and the United Steelworkers (“USW”) for 14 of the Company’s facilities in the United States expired on September 1, 2015. Employees continue to work under the existing contract as negotiations to reach a new labor agreement remain ongoing. The current labor agreement requires payments into an existing Voluntary Employee Beneficiary Association
(“VEBA”) trust at a fixed amount of 25 per quarter. The VEBA primarily provides limited healthcare benefits to the retirees of certain companies whose assets were acquired (referred to as Legacy Retirees). Additionally, ArcelorMittal USA’s retiree health care costs are capped at the 2008 per capita level for years 2010 and after. The VEBA can be utilized to the extent funds are available, for costs in excess of the cap for these retirees.
The Company has significant assets mostly in the aforementioned VEBA post-employment benefit plan. These assets consist of 74% in
fixed income and 26% in equities and alternatives. The total fair value of the assets in the VEBA trust was 648 as of December 31, 2015.

Consolidated financial statements 129
Year Ended December 31, 2015
TOTAL U.S. CANADA EUROPE OTHERSChange in benefit obligation Benefit obligation at beginning of the period 6,389 4,874 744 577 194Current service cost 96 50 9 28 9Interest cost on DBO 248 197 26 11 14Past service cost - Plan amendments (2) - (2) - -Plan participants’ contribution 18 18 - - -Actuarial (gain) loss 132 171 (49) 7 3 Demographic assumptions (75) (57) (29) 13 (2) Financial assumptions (159) (139) (15) (10) 5 Experience adjustment 366 367 (5) 4 -Benefits paid (350) (252) (33) (43) (22)Termination benefits 6 6 - - -Foreign currency exchange rate differences and other movements 1 (286) (69) (122) (64) (31)Benefit obligation at end of the period 6,251 4,995 573 516 167 Change in plan assetsFair value of plan assets at beginning of the period 730 719 - 11 -Interest income on plan assets 28 28 - - -Return on plan assets greater/(less) than discount rate (8) (8) - - -Employer contribution 191 191 - - -Plan participants’ contribution 18 18 - - -Benefits paid (252) (250) - (2) -Foreign currency exchange rate differences and other movements (1) - - (1) -Fair value of plan assets at end of the period 706 698 - 8 - Present value of the wholly or partly funded obligation (1,452) (1,388) - (64) -Fair value of plan assets 706 698 - 8 -Net present value of the wholly or partly funded obligation (746) (690) - (56) -Present value of the unfunded obligation (4,799) (3,607) (573) (452) (167)Net amount recognized (5,545) (4,297) (573) (508) (167) Net assets related to funded obligations 4 4 - - -Recognized liabilities (5,549) (4,301) (573) (508) (167)
1Other movements include Steelton for (69) in benefit obligations as has been classified held for sale in December 2015.
Summary of changes in the other post-employment benefit obligation and changes in plan assets are as follows:

130 Consolidated financial statements
Year Ended December 31, 2014
TOTAL U.S. CANADA EUROPE OTHERSChange in benefit obligation Benefit obligation at beginning of the period 5,974 4,390 762 614 208Current service cost 82 39 10 23 10Interest cost on DBO 279 210 34 20 15Past service cost - Plan amendments (17) - (17) - -Plan participants’ contribution 18 18 - - -Curtailments and settlements (6) - - (6) -Actuarial (gain) loss 576 465 56 57 (2) Demographic assumptions 382 402 (28) 7 1 Financial assumptions 519 363 84 75 (3) Experience adjustment (325) (300) - (25) -Benefits paid (347) (248) (39) (53) (7)Foreign currency exchange rate differences and other movements (170) - (62) (78) (30)Benefit obligation at end of the period 6,389 4,874 744 577 194 Change in plan assetsFair value of plan assets at beginning of the period 740 725 - 15 -Interest income on plan assets 33 33 - - -Return on plan assets greater/(less) than discount rate 1 1 - - -Employer contribution 188 188 - - -Plan participants’ contribution 18 18 - - -Benefits paid (248) (246) - (2) -Foreign currency exchange rate differences and other movements (2) - - (2) -Fair value of plan assets at end of the period 730 719 - 11 - Present value of the wholly or partly funded obligation (1,607) (1,530) - (77) -Fair value of plan assets 730 719 - 11 -Net present value of the wholly or partly funded obligation (877) (811) - (66) -Present value of the unfunded obligation (4,782) (3,344) (744) (500) (194)Net amount recognized (5,659) (4,155) (744) (566) (194)

Consolidated financial statements 131
The following tables detail the components of net periodic other post-employment cost:
Year Ended December 31, 2015
Components of net periodic OPEB cost (benefit) TOTAL U.S. CANADA EUROPE OTHERS
Current service cost 96 50 9 28 9Past service cost - Plan amendments (2) - (2) - - Cost of termination benefits 6 6 - - - Net interest cost/(income) on net DB liability/(asset) 220 169 26 11 14
Actuarial (gains)/losses recognized during the year (3) - - (3) - Total 317 225 33 36 23 Year Ended December 31, 2014
Components of net periodic OPEB cost (benefit) TOTAL U.S. CANADA EUROPE OTHERS
Current service cost 82 39 10 23 10 Past service cost - Plan amendments (17) - (17) - - Past service cost - Curtailments (6) - - (6) - Net interest cost/(income) on net DB liability/(asset) 246 177 34 20 15
Actuarial (gains)/losses recognized during the year 22 - - 22 - Total 327 216 27 59 25
Year Ended December 31, 2013
Components of net periodic OPEB cost (benefit) TOTAL U.S. CANADA EUROPE OTHERS
Current service cost 96 41 13 26 16Past service cost - Plan amendments 3 - - (2) 5Past service cost - Curtailments (24) - - (24) - Net interest cost/(income) on net DB liability/(asset) 248 174 37 21 16
Actuarial (gains)/losses recognized during the year (10) - - (10) - Total 313 215 50 11 37
The following tables detail where the expense is recognized in the consolidated statements of operations:
Year Ended December 31,
2015 2014 2013
Net periodic pension cost 241 264 357Net periodic OPEB cost 317 327 313Total 558 591 670 Cost of sales 197 158 193Selling, general and administrative expenses 27 30 34Financing costs - net 334 403 443Total 558 591 670

132 Consolidated financial statements
Plan Assets
The weighted-average asset allocations for the funded defined benefit pension plans by asset category were as follows:
December 31, 2015
U.S. CANADA BRAZIL EUROPE SOUTH AFRICA OTHERS
Equity Securities 46% 52% 3% 5% 27% 44%- Asset classes that have a quoted market price in an active market 24% 45% 3% 4% 27% 10%
- Asset classes that do not have a quoted market price in an active market 22% 7% - 1% - 34%
Fixed Income Securities (including cash) 38% 46% 95% 85% 61% 55%- Asset classes that have a quoted market price in an active market 5% 40% 95% 84% 61% 4%
- Asset classes that do not have a quoted market price in an active market 33% 6% - 1% - 51%
Real Estate - - 1% - 2% -- Asset classes that have a quoted market price in an active market - - - - 2% -
- Asset classes that do not have a quoted market price in an active market - - 1% - - -
Other 16% 2% 1% 10% 10% 1%- Asset classes that have a quoted market price in an active market - 2% 1% 7% 10% -
- Asset classes that do not have a quoted market price in an active market 16% - - 3% - 1%
Total 100% 100% 100% 100% 100% 100%
December 31, 2014
U.S. CANADA BRAZIL EUROPE SOUTH AFRICA OTHERS
Equity Securities 50% 56% 4% 3% 41% 43%- Asset classes that have a quoted market price in an active market 28% 49% 4% 3% 38% 10%
- Asset classes that do not have a quoted market price in an active market 22% 7% - - 3% 33%
Fixed Income Securities (including cash) 34% 42% 94% 88% 58% 56%- Asset classes that have a quoted market price in an active market 3% 37% 94% 87% 57% 5%
- Asset classes that do not have a quoted market price in an active market 31% 5% - 1% 1% 51%
Real Estate 4% - 1% - 1% -- Asset classes that have a quoted market price in an active market - - - - 1% -
- Asset classes that do not have a quoted market price in an active market 4% - 1% - - -
Other 12% 2% 1% 9% - 1%- Asset classes that have a quoted market price in an active market - 2% 1% 6% - -
- Asset classes that do not have a quoted market price in an active market 12% - - 3% - 1%
Total 100% 100% 100% 100% 100% 100%
These assets include investments in ArcelorMittal stock of approximately 1, but not in property or other assets occupied or used by ArcelorMittal. These assets may also include ArcelorMittal shares held by mutual fund investments. The invested assets produced an actual return of 150 and 844 in 2015 and 2014, respectively.
The Finance and Retirement Committees of the Boards of Directors for the respective operating subsidiaries have general supervisory authority over the respective trust funds. These committees have established asset allocation targets for the period as described below. Asset managers are permitted some flexibility to vary the asset allocation from the long-term investment strategy within control ranges agreed upon.

Consolidated financial statements 133
December 31, 2015
U.S. CANADA BRAZIL EUROPE SOUTH AFRICA OTHERS
Equity Securities 52% 52% 3% 4% 34% 40%Fixed Income Securities (including cash) 35% 47% 95% 85% 55% 59%Real Estate 4% - 1% - - -Other 9% 1% 1% 11% 11% 1%Total 100% 100% 100% 100% 100% 100%
Assumptions used to determine benefit obligations at December 31
Pension Plans Other Post-employment Benefits
2015 2014 2013 2015 2014 2013
Discount rate Range 2.05% - 17% 1.90% - 17% 3.25% - 14% 0.9% - 30% 1.80% - 25% 3% - 22% Weighted average 4.21% 4.29% 5.17% 4.49% 4.05% 4.86%Rate of compensation increase Range 2% - 11% 2% - 11% 2% - 10% 2% - 27% 2% - 21% 1.80% - 20% Weighted average 3.11% 3.40% 3.66% 3.98% 3.64% 3.40%
Healthcare Cost Trend Rate
Other Post-employment Benefits
2015 2014 2013
Healthcare cost trend rate assumed Range 2.00% - 7.00% 2.00% - 5.30% 2.00% - 6.09% Weighted average 4.75% 4.80% 4.83%
Cash contributions and maturity profile of the plans
In 2016, the Company is expecting its cash contributions to amount to 296 for pension plans, 281 for other post employment benefits plans, 88 for defined contribution plans and 71 for U.S. multi-employer plans. Cash contributions to defined contribution plans and to U.S. multi-employer plans sponsored by the Company, were respectively 104 and 72 in 2015. At December 31, 2015, the weighted average duration of the liabilities related to the pension and other post employment benefits plans were 12 years (2014: 11 years) and 14 years (2014: 12 years), respectively.
Risks associated with defined benefit plans
Through its defined benefit pension plans and OPEB plans, ArcelorMittal is exposed to a number of risks, the most significant of which are detailed below:
Changes in bond yields
A decrease in corporate bond yields will increase plan liabilities, although this will be partially offset by an increase in the value of the plans’ bond holdings.
Asset volatility
The plan liabilities are calculated using a discount rate set with reference to corporate bond yields;
if plan assets underperform this yield, this will create a deficit. In most countries with funded plans, plan assets hold a significant portion of equities, which are expected to outperform corporate bonds in the long-term while providing volatility and risk in the short-term. As the plans mature, ArcelorMittal intends to reduce the level of investment risk by investing more in assets that better match the liabilities. However, ArcelorMittal believes that due to the long-term nature of the plan liabilities, a level of continuing equity investment is an appropriate element of a long-term strategy to manage the plans efficiently.
Life expectancy
The majority of the plans provide benefits for the life of the covered members, so increases in life expectancy will result in an increase in the plans’ benefit obligations.
Assumption regarding future mortality rates has been set considering published statistics and where possible, ArcelorMittal’s own population’s experience. The current longevities at retirement underlying the values of the defined benefit obligation were approximately 22 years.
In 2014, the Society of Actuaries published new mortality base tables and new mortality improvement scales in the
134 Consolidated financial statements
U.S. Use of these new mortality assumptions resulted in increasing the pension and OPEB defined benefit obligations by 85 and 271, respectively. In 2015, the Society of Actuaries updated the mortality projection scale, which resulted in decreasing the pension and OPEB defined benefit obligations by 36 and 57, respectively.
Healthcare cost trend rate
The majority of the OPEB plans’ benefit obligations are linked to the change in the cost of various health care components. Future
healthcare cost will vary based on several factors including price inflation, utilization rate, technology advances, cost shifting and cost containing mechanisms. A higher healthcare cost trend will lead to higher OPEB plan benefit obligations.
In 2015, the healthcare cost trend rate assumption in the U.S. was adjusted, which resulted in increasing the OPEB defined benefit obligations by 232. Additionally recent experience, which is starting point for projecting future costs, was
unfavorable, resulting in increasing the OPEB defined benefit obligations by an additional 301.
Multi-employer plans
ArcelorMittal participates in one material multi-employer pension plan in the U.S. Under multi-employer plans, several participating employers make contributions into a pension plan. The assets of the plan are not limited to the participants of a particular employer. If an employer is unable to make required contributions to the plan,
any unfunded obligations may be borne by the remaining employers. Additionally, if an employer withdraws from the plan, it may be required to pay an amount based on the underfunded status of the plan. As of December 31, 2014, which is the latest period for which information is available, the multi-employer pension plan had a total actuarial liability of 4,399 and assets with market value of 3,827 for a funded ratio of about 87%. ArcelorMittal represented roughly 28% of total contributions made to the plan in the past three years.
Effect on 2016 Pre-Tax Pension Expense (sum of service cost and
interest cost)Effect of December
31, 2015 DBO
Change in assumption 100 basis points decrease in discount rate (36) 1,207 100 basis points increase in discount rate 28 (990)100 basis points decrease in rate of compensation (13) (172)100 basis points increase in rate of compensation 15 188 1 year increase of the expected life of the beneficiaries 12 275
The following table illustrates the sensitivity to a change of the significant actuarial assumptions related to ArcelorMittal’s OPEB plans (as of December 31, 2015 the defined benefit obligation for post-employment benefit plans was 6,251):
Effect on 2016 Pre-Tax OPEB Expense (sum of service cost and
interest cost))Effect of December
31, 2015 DBO
Change in assumption 100 basis points decrease in discount rate (3) 915 100 basis points increase in discount rate 2 (737)100 basis points decrease in healthcare cost trend rate (49) (667)100 basis points increase in healthcare cost trend rate 58 778 1 year increase of the expected life of the beneficiaries 17 320
The above sensitivities reflect the effect of changing one assumption at a time. Actual economic factors and conditions often affect multiple assumptions simultaneously, and the effects of changes in key assumptions are not necessarily linear.
7.3 Share-based payments
ArcelorMittal issues equity-settled share-based payments to certain employees, including stock options, restricted share units and performance share units. Equity-settled share-based payments are measured at fair value (excluding
the effect of non market-based vesting conditions) at the date of grant. The fair value determined at the grant date of the equity-settled share-based payments is expensed on a graded vesting basis over the vesting period, based on the Company’s estimate of the shares that will eventually vest
and adjusted for the effect of non market-based vesting conditions. For stock options, restricted share units and performance share units, fair value is measured using the Black-Scholes-Merton pricing model and the market value of the shares at the date of the grant after deduction of
Sensitivity analysis
The following information illustrates the sensitivity to a change of the significant actuarial assumptions related to ArcelorMittal’s pension plans (as of December 31, 2015, the defined benefit obligation for pension plans was 9,883):
Consolidated financial statements 135
dividend payments during the vesting period, respectively. The expected life used in the model has been adjusted, based on management’s best estimate, for the effects of non-transferability, exercise restrictions and behavioral considerations. In addition, the expected annualized volatility has been set by reference to the implied volatility of options available on ArcelorMittal shares in the open market, as well as, historical patterns of volatility. For the restricted share units and performance share units, the fair
value determined at the grant date of the equity-settled share-based payments is expensed on a straight line method over the vesting period and adjusted for the effect of non market-based vesting conditions.
Stock Option Plans
Prior to the May 2011 annual general shareholders’ meeting adoption of the ArcelorMittal Equity Incentive Plan described below, ArcelorMittal’s equity-based incentive plan took the form of a stock option plan known as the
Global Stock Option Plan.Under the terms of the ArcelorMittal Global Stock Option Plan 2009-2018 (which replaced the ArcelorMittalShares plan that expired in 2009), ArcelorMittal may grant options to purchase common shares to senior management of ArcelorMittal and its associates for up to 100,000,000 shares of common shares. The exercise price of each option equals not less than the fair market value of ArcelorMittal shares on the grant date, with a maximum term of 10 years. Options are
granted at the discretion of ArcelorMittal’s Appointments, Remuneration and Corporate Governance Committee, or its delegate. The options vest either ratably upon each of the first three anniversaries of the grant date, or, in total, upon the death, disability or retirement of the participant.
Date of grant Exercise prices
(per option)
August 2010 $30.66August 2009 36.38November 2008 21.14August 2008 78.44December 2007 70.81August 2007 61.09September 2006 32.07
No options were granted during the years ended December 31, 2015, 2014 and 2013.
The compensation expense recognized for stock option plans was nil, nil and 5 for each of the years ended December 31, 2015, 2014, and 2013, respectively. Option activity with respect to ArcelorMittalShares and ArcelorMittal Global Stock Option Plan 2009-2018 is summarized below as of and for each of the years ended December 31, 2015, 2014, and 2013:
Number of
Options
Range of Exercise
Prices (per option)
Weighted Average
Exercise Price (per option)
Outstanding, December 31, 2012 24,950,319 $21.14 – $78.44 $47.85 Forfeited (139,993) 30.66 – 78.44 40.54 Expired (3,246,700) 21.14 – 78.44 45.80 Outstanding, December 31, 2013 21,563,626 21.14 – 78.44 48.31 Expired (1,486,360) 27.31– 78.44 48.96 Outstanding, December 31, 2014 20,077,266 21.14 – 78.44 48.26 Expired (2,885,194) 27.31– 78.44 41.75 Outstanding, December 31, 2015 17,192,072 21.14 – 78.44 49.35
Exercisable, December 31, 2013 21,563,626 21.14 – 78.44 48.31 Exercisable, December 31, 2014 20,077,266 21.14 – 78.44 48.26 Exercisable, December 31, 2015 17,192,072 21.14 – 78.44 49.35
Dates of grant and exercise prices are as follows:
136 Consolidated financial statements
Options Outstanding
Exercise Prices (per option)Number of
options
Weighted average
contractual life (in years)
Options exercisable
(number of options) Maturity
$30.66 4,256,800 4.60 4,256,800 August 3, 202036.38 4,093,450 3.60 4,093,450 August 4, 201921.14 2,585 2.87 2,585 November 10, 2018
78.44 4,218,950 2.60 4,218,950 August 5, 201870.81 13,000 1.95 13,000 December 11, 201761.09 3,080,335 1.59 3,080,335 August 2, 201732.07 1,526,952 0.67 1,526,952 September 1, 2016
$21.14 – $78.44 17,192,072 2.98 17,192,072
The following table summarizes information about total stock options of the Company outstanding as of December 31, 2015:
Long-Term Incentives: Equity-Based Incentives (Share Unit Plans)
On May 10, 2011, the annual general meeting of shareholders approved the ArcelorMittal Equity Incentive Plan, a new equity-based incentive plan that replaced the Global Stock Option Plan. The ArcelorMittal Equity Incentive Plan is intended to align the interests of the Company’s shareholders and eligible employees by allowing them to participate in the success of the Company. The ArcelorMittal Equity Incentive Plan provides for the grant of Restricted Share Units (each, an “RSU”) and Performance Share Units (each, a “PSU”) to eligible Company employees and is designed to incentivize employees, improve the Company’s long-term performance and retain key employees. On May 8, 2013, the annual general meeting of shareholders approved the GMB PSU Plan, which provides for the grant of PSUs to GMB members. Until the introduction of the GMB PSU Plan in 2013, GMB members were eligible to receive RSUs and PSUs under the ArcelorMittal Equity Incentive Plan.
The maximum number of RSUs and PSUs available for grant during any given year is subject to the prior approval of the Company’s shareholders at the annual general meeting. The annual shareholders’ meeting on May 5, 2015 approved the maximum to be granted until the next annual shareholders’ meeting. For the period from the May 2015 annual general
shareholders’ meeting to the May 2016 annual general shareholders’ meeting, a maximum of 5,000,000 RSUs and PSUs may be allocated to eligible employees under the ArcelorMittal Equity Incentive Plan and the GMB PSU Plan combined.
ArcelorMittal Equity Incentive Plan
RSUs granted under the ArcelorMittal Equity Incentive Plan are designed to provide a retention incentive to eligible employees. RSUs are subject to “cliff vesting” after three years, with 100% of the grant vesting on the third anniversary of the grant contingent upon the continued active employment of the eligible employee within the Company. Between 500 and 700 of the Company’s most senior managers are eligible for RSUs.
The grant of PSUs under the ArcelorMittal Equity Incentive Plan aims to serve as an effective performance-enhancing scheme based on the employee’s contribution to the eligible achievement of the Company’s strategy. Awards in connection with PSUs are subject to the fulfillment of cumulative performance criteria over a three-year period from the date of the PSU grant. The employees eligible to receive PSUs are a sub-set of the group of employees eligible to receive RSUs. The target group for PSU grants initially included the Chief Executive Officer and the other GMB members. However, from 2013 onwards, the Chief
Executive Officer and other GMB members receive PSU grants under the GMB PSU Plan instead of the ArcelorMittal Equity Incentive Plan.
PSUs vest three years after their date of grant subject to the eligible employee’s continued employment with the Company and the fulfillment of targets related to the following performance measures: return on capital employed (ROCE) and a strategic measure which was total cost of employment (in U.S. dollars per tonne) for the steel business (TCOE) and the mining volume plan and ROCE for the Mining segment until 2013 grant. As from 2014, most of the Steel Business Units have kept only ROCE as performance measure and Mining continued with ROCE and mining volume plan. Each performance measure has a weighting of 50%. In case the level of achievement of both performance targets together is below 80%, there is no vesting, and the rights are automatically forfeited.
GMB PSU Plan
The GMB PSU Plan is designed to enhance the long-term performance of the Company and align the members of the GMB to the Company’s objectives. The members of the GMB including the Chief Executive Officer are eligible for PSU grants. The GMB PSU Plan provides for cliff vesting on the third year anniversary of the grant date, under the condition that the relevant GMB member continues
to be actively employed by the Group on that date. If the GMB member is retired on that date or in case of an early retirement by mutual consent, the relevant GMB member will not automatically forfeit PSUs and pro rata vesting will be considered at the end of the vesting period at the sole discretion of the Company, represented by the Appointment, Remuneration and Corporate Governance Committee of the Board of Directors. Awards under the GMB PSU Plan are subject to the fulfillment of cumulative performance criteria over a three-year period from the date of the PSU grant. The value of the grant at grant date will equal one year of base salary for the Chief Executive Officer and 80% of base salary for the other GMB members. Each PSU may give right to up to two shares of the Company. The two performance criteria required to be met for PSUs to vest are total shareholder return and earnings per share.

Consolidated financial statements 137
The following table summarizes the Company’s share unit plans outstanding as of December 31, 2015:
At Grant date Number of shares as of December 31, 2015
Grant date Type of plan Number of sharesNumber of
beneficiaries Maturity Fair value per share Shares outstanding Shares exited Shares forfeited
December 18, 2015 PSU 887,643 322 December 18, 2018 $3.83 887,643 - - December 18, 2015 RSU 1,105,361 576 December 18, 2018 3.83 1,105,361 - - June 30, 2015 GMB PSU 464,305 4 June 30, 2018 8.53 464,305 - - December 17, 2014 PSU 979,870 353 December 17, 2017 10.28 906,370 - 73,500December 17, 2014 RSU 1,173,910 620 December 17, 2017 10.28 1,091,152 741 82,017June 27, 2014 GMB PSU 843,376 6 June 27, 2017 16.85 767,746 - 75,630September 27, 2013 PSU 504,075 384 September 27, 2016 13.17 412,720 - 91,355September 27, 2013 RSU 1,065,415 682 September 27, 2016 13.17 903,246 13,143 149,026June 28, 2013 GMB PSU 631,077 7 June 28, 2016 16.60 542,632 - 88,445March 29, 2013 PSU 182,970 94 March 29, 2016 12.37 130,155 - 52,815March 29, 2013 RSU 1,071,190 681 March 29, 2016 12.37 861,419 20,438 189,333Total 8,909,192 $3.83 – $16.85 8,072,749 34,322 802,121
The compensation expenses recognized for RSUs and PSUs were immaterial for the years ended December 31, 2015, 2014 and 2013.
Share unit plan activity is summarized below as of and for each year ended December 31, 2015, 2014 and 2013:
Restricted share unit (RSU) Performance share unit (PSU)Number of shares Fair value per share Number of shares Fair value per share
Outstanding, December 31, 2012 1,242,753 $14.45 262,665 $16.87Granted 2,136,605 12.77 1,318,122 14.70Exited (14,788) 14.35 – –Forfeited (120,904) 13.92 (53,640) 15.85Outstanding, December 31, 2013 3,243,666 13.36 1,527,147 15.03Granted 1,173,910 10.28 1,823,246 13.32Exited (777,252) 14.43 – –Forfeited (230,718) 13.27 (90,215) 14.27Outstanding, December 31, 2014 3,409,606 12.06 3,260,178 14.10Granted 1,105,361 3.83 1,351,948 5.44Exited (321,980) 14.30 (24,721) 16.87Forfeited (231,809) 11.90 (475,834) 15.20Outstanding, December 31, 2015 3,961,178 9.59 4,111,571 11.11
Note 8: Provisions, contingencies and commitments
ArcelorMittal recognizes provisions for liabilities and probable losses that have been incurred when it has a present legal or constructive obligation as a result of past events, it is probable that the Company will be required to settle the obligation and a reliable estimate of the amount of the obligation can be made.
If the effect of the time value of money is material, provisions are discounted using a current pre-tax rate that reflects, where appropriate, the risks specific to the liability. Where discounting is used, the increase in the provision due to the passage of time is recognized as a financing cost. Future operating expenses or losses are excluded from recognition as provisions as they do not meet the definition of a liability. Contingent
assets and contingent liabilities are excluded from recognition in the statements of financial position.
Provisions for onerous contracts are recorded in the consolidated statements of operations when it becomes known that the unavoidable costs of meeting the obligations under the contract exceed the economic benefits expected to be received. Assets dedicated to the onerous contracts
are tested for impairment before recognizing a separate provision for the onerous contract.
Provisions for restructuring are recognized when and only when a detailed formal plan exists and a valid expectation in those affected by the restructuring has been raised, by starting to implement the plan or announcing its main features.
138 Consolidated financial statements
ArcelorMittal records asset retirement obligations (“ARO”) initially at the fair value of the legal or constructive obligation in the period in which it is incurred and capitalizes the ARO by increasing the carrying amount of the related non-current asset. The fair value of the obligation is determined as the discounted value of the expected future cash flows. The liability is accreted to its present value through net financing cost and the capitalized cost is depreciated in accordance with the Company’s depreciation policies for property, plant and equipment. Subsequently, when reliably measurable, ARO is recorded on the consolidated statements of financial position increasing the cost of the asset and the fair value of the related obligation. Foreign exchange gains or losses on AROs denominated in foreign currencies are recorded in the consolidated statements of operations.
ArcelorMittal is subject to changing and increasingly stringent environmental laws and regulations concerning air emissions, water discharges and waste disposal, as well as certain remediation activities that involve the clean-up of soil and groundwater. ArcelorMittal is currently engaged in the investigation and remediation of environmental contamination at a number of its facilities. Most of these are legacy obligations arising from acquisitions.
Environmental costs that relate to current operations or to an existing condition caused by past operations, and which do not contribute to future revenue generation or cost reduction, are expensed. Liabilities are recorded when environmental assessments and/or remedial efforts are
probable and the cost can be reasonably estimated based on ongoing engineering studies, discussions with the environmental authorities and other assumptions relevant to the nature and extent of the remediation that may be required. The ultimate cost to ArcelorMittal is dependent upon factors beyond its control such as the scope and methodology of the remedial action requirements to be established by environmental and public health authorities, new laws or government regulations, rapidly changing technology and the outcome of any potential related litigation. Environmental liabilities are discounted if the aggregate amount of the obligation and the amount and timing of the cash payments are fixed or reliably determinable.
The estimates of loss contingencies for environmental matters and other contingencies are based on various judgments and assumptions including the likelihood, nature, magnitude and timing of assessment, remediation and/or monitoring activities and the probable cost of these activities. In some cases, judgments and assumptions are made relating to the obligation or willingness and ability of third parties to bear a proportionate or allocated share of cost of these activities, including third parties who sold assets to ArcelorMittal or purchased assets from it subject to environmental liabilities. ArcelorMittal also considers, among other things, the activity to date at particular sites, information obtained through consultation with applicable regulatory authorities and third-party consultants and contractors and its historical experience with other circumstances judged to be comparable. Due to the numerous
variables associated with these judgments and assumptions, and the effects of changes in governmental regulation and environmental technologies, both the precision and reliability of the resulting estimates of the related contingencies are subject to substantial uncertainties. As estimated costs to remediate change, the Company will reduce or increase the recorded liabilities through write backs or additional accruals in the consolidated statements of operations. ArcelorMittal does not expect these environmental issues to affect the utilization of its plants, now or in the future.
ArcelorMittal is currently and may in the future be involved in litigation, arbitration or other legal proceedings. Provisions related to legal and arbitration proceedings are recorded in accordance with the principles described above.
Most of these claims involve highly complex issues. Often these issues are subject to substantial uncertainties and, therefore, the probability of loss and an estimation of damages are difficult to ascertain. Consequently, for a large number of these claims, ArcelorMittal is unable to make a reasonable estimate of the expected financial effect that will result from ultimate resolution of the proceeding. In those cases, ArcelorMittal has disclosed information with respect to the nature of the contingency. ArcelorMittal has not accrued a reserve for the potential outcome of these cases.
In a limited number of ongoing cases, the Company was able to make a reasonable estimate of the expected loss or range of
probable loss and has accrued a provision for such loss, but believes that publication of this information on a case-by-case basis would seriously prejudice the Company’s position in the ongoing legal proceedings or in any related settlement discussions. Accordingly, in these cases, the Company has disclosed information with respect to the nature of the contingency, but has not disclosed its estimate of the range of potential loss.
In the cases in which quantifiable fines and penalties have been assessed, the Company has indicated the amount of such fine or penalty or the amount of provision accrued that is the estimate of the probable loss.
These assessments can involve a series of complex judgments about future events and can rely heavily on estimates and assumptions. The assessments are based on estimates and assumptions that have been deemed reasonable by management. The Company believes that the aggregate provisions recorded for the above matters are adequate based upon currently available information. However, given the inherent uncertainties related to these cases and in estimating contingent liabilities, the Company could, in the future, incur judgments that have a material adverse effect on its results of operations in any particular period. The Company considers it highly unlikely, however, that any such judgments could have a material adverse effect on its liquidity or financial condition.

Consolidated financial statements 139
8.1 Provisions overview
The movements of provisions were as follows:
Balance at December 31,
2013 Additions (*)Deductions/
Payments
Effects of Foreign Exchange and other
movementsBalance at December
31, 2014
Environmental (see note 8.2) 915 81 (98) (43) 855Asset retirement obligations (see note 8.2) 516 41 (8) (244) 1 305Site restoration 75 3 (22) (10) 46Staff related obligations 169 77 (38) (18) 190Voluntary separation plans 138 27 (97) 85 153Litigation and other (see note 8.2) 954 144 (281) (59) 758 Tax claims 355 47 (86) (45) 271 Other legal claims 299 97 (93) (14) 289 Other unasserted claims 300 - (102) - 198Commercial agreements and onerous contracts 93 92 (43) (20) 122Other 229 52 (86) (13) 182
3,089 517 (673) (322) 2,611Short-term provisions 1,206 1,024Long-term provisions 1,883 1,587
3,089 2,611
Balance at December 31,
2014 Additions (*)Deductions/
Payments
Effects of Foreign Exchange and other
movementsBalance at December
31, 2015
Environmental (see note 8.2) 855 35 (96) (97) 697Asset retirement obligations (see note 8.2) 305 26 (5) (29) 297Site restoration 46 37 (23) 4 64Staff related obligations 190 56 (36) (43) 167Voluntary separation plans 153 48 (83) (21) 97Litigation and other (see note 8.2) 758 162 (329) (128) 2 463 Tax claims 271 22 (36) (68) 189 Other legal claims 289 140 (100) (60) 269 Other unasserted claims 198 - (193) 3 - 5Commercial agreements and onerous contracts 122 245 (81) (13) 273Other 182 53 (63) (26) 146
2,611 662 (716) (353) 2,204Short-term provisions 1,024 1,434Long-term provisions 1,587 770
2,611 2,204(*) Additions exclude provisions written back or utilized during the same year1 Effects of foreign exchange and other movements in 2014 are mainly related to depreciation of local currencies for 144 primarily in Russia (42) and Ukraine (79) and disposal of Kuzbass (54).2 Effects of foreign exchange and other movements in 2015 are mainly related to the depreciation of local currencies primarily in Brazil (104).3 The provision presented as “Other unasserted claims” relates to a commercial dispute in respect of which no legal action has commenced. The Company recognized a release of 193 in 2015 following the expiration of the statute of limitations.
140 Consolidated financial statements
There are uncertainties regarding the timing and amount of the provisions above. Changes in underlying facts and circumstances for each provision could result in differences in the amounts provided for and the actual outflows. In general, provisions are presented on a non-discounted basis due to the uncertainties regarding the timing or the short period of their expected consumption.
Environmental provisions have been estimated based on internal and third-party estimates of contaminations, available remediation technology, and environmental regulations. Estimates are subject to revision as further information develops or circumstances change.
Provisions for site restoration are related to costs incurred for dismantling of site facilities, mainly in France and in the United States.
Provisions for staff related obligations primarily concern the United States and Brazil and are related to various employees’ compensation.
Provisions for voluntary separation plans concern primarily plans in Belgium, South Africa, the United States and Spain which are expected to be settled within one year. In 2015 new voluntary separation plans were announced in the United States (19) and in South Africa (27).
Provisions for litigation are related to probable losses that will be incurred due to a present legal obligation and are expected to be settled in a period of one to four years. Further detail regarding legal matters is provided in note 8.2.
The provision for onerous contracts in 2015 mainly includes onerous hot and cold rolled contracts in the United States.
Other mainly includes provisions for technical warranties and guarantees.
8.2 Environmental liabilities and legal proceedings
Environmental Liabilities
ArcelorMittal’s operations are subject to a broad range of laws and regulations relating to the protection of human health and the environment at its multiple locations and operating subsidiaries. As of December 31, 2015, excluding asset retirement obligations, ArcelorMittal had established provisions of 697 for environmental remedial activities and liabilities. The provisions for all operations by geographic area were 431 in Europe, 140 in the United States, 95 in South Africa and 31 in Canada. In addition, ArcelorMittal and the previous owners of its facilities have expended substantial amounts to achieve or maintain ongoing compliance with applicable environmental laws and regulations. ArcelorMittal expects to continue to expend resources in this respect in the future.
United States
ArcelorMittal’s operations in the United States have environmental provisions of 140 (exclusive of asset retirement obligations) to address existing environmental liabilities, of which 20 is expected to be spent in 2016. The environmental provisions principally relate to the investigation, monitoring and remediation of soil and groundwater at ArcelorMittal’s current and former facilities. ArcelorMittal USA continues to have significant environmental provisions relating to investigation and remediation at Indiana Harbor East, Lackawanna, and its closed mining operations in southwestern Pennsylvania. ArcelorMittal USA’s environmental provisions also include 35, with anticipated spending of 4 during 2016, to specifically address the removal and disposal of asbestos-containing materials and polychlorinated biphenyls (“PCBs”).
All of ArcelorMittal’s major operating and former operating
sites in the United States are or may be subject to a corrective action program or other laws and regulations relating to environmental remediation, including projects relating to the reclamation of industrial properties. In some cases, soil or groundwater contamination requiring remediation is present at both currently operating and former ArcelorMittal facilities. In other cases, we are required to conduct studies to determine the extent of contamination, if any, that exists at these sites.
In 1990, ArcelorMittal USA’s Indiana Harbor East facility was party to a lawsuit filed by the U.S. Environmental Protection Agency (the “EPA”) under the U.S. Resource Conservation and Recovery Act (“RCRA”). In 1993, Inland Steel Company (predecessor to ArcelorMittal USA) entered into a Consent Decree, which, among other things, requires facility-wide RCRA Corrective Action and sediment assessment and remediation in the adjacent Indiana Harbor Ship Canal. In 2012, ArcelorMittal USA entered into a Consent Decree Amendment to the 1993 Consent Decree defining the objectives for limited sediment assessment and remediation of a small portion of the Indiana Harbor Ship Canal. The provisions for environmental liabilities include approximately 10 for such sediment assessment and remediation, and 5 for RCRA Corrective Action at the Indiana Harbor East facility itself. Remediation ultimately may be necessary for other contamination that may be present at Indiana Harbor East, but the potential costs of any such remediation cannot yet be reasonably estimated.
ArcelorMittal USA’s properties in Lackawanna, New York are subject to an Administrative Order on Consent with the EPA requiring facility-wide RCRA Corrective Action. The Administrative Order, entered into in 1990 by the former owner, Bethlehem Steel, requires the Company to perform a Remedial Facilities Investigation (“RFI”) and a
Corrective Measures Study, to implement appropriate interim and final remedial measures, and to perform required post-remedial closure activities. In 2006, the New York State Department of Environmental Conservation and the EPA conditionally approved the RFI. ArcelorMittal USA has executed Orders on Consent to perform certain interim corrective measures while advancing the Corrective Measures Study. These include installation and operation of a ground water treatment system and dredging of a local waterway known as Smokes Creek. A Corrective Measure Order on Consent was executed in 2009 for other site remediation activities. ArcelorMittal USA’s provisions for environmental liabilities include approximately 33 for anticipated remediation and post-remediation activities at this site. The provisioned amount is based on the extent of soil and groundwater contamination identified by the RFI and the remedial measures likely to be required, including excavation and consolidation of containment structures in an on-site landfill and continuation of groundwater pump and treatment systems.
ArcelorMittal USA is required to prevent acid mine drainage from discharging to surface waters at its closed mining operations in southwestern Pennsylvania. In 2003, ArcelorMittal USA entered into a Consent Order and Agreement with the Pennsylvania Department of Environmental Protection (the “PaDEP”) requiring submission of a plan to improve treatment facility operations and lower long-term wastewater treatment costs. In 2004, ArcelorMittal USA entered into a revised Consent Order and Agreement outlining a schedule for implementation of capital improvements and requiring the establishment of a treatment trust, estimated by the PaDEP to be the net present value of all future treatment cost. ArcelorMittal USA has been funding the treatment trust and has until 2017 to reach the current target value of approximately 46. This target value is based on average spending

Consolidated financial statements 141
over the last three years. The trust had a market value of 36 as of December 31, 2015. Once fully funded, ArcelorMittal can be reimbursed from the fund for the continuing cost of treatment of acid mine drainage. ArcelorMittal USA’s provisions for environmental liabilities include approximately 24 for this matter.
On August 8, 2006, the U.S. EPA Region V issued ArcelorMittal USA’s Burns Harbor, Indiana facility a Notice of Violation (“NOV”) alleging multiple violations of the Clean Air Act’s Prevention of Significant Deterioration (“PSD”) air permit requirements based on alleged failures by Bethlehem Steel dating back to early 1994. Based on recent court decisions and ongoing negotiations with the U.S. EPA, it is very likely that the US EPA will not enforce the alleged PSD permit violations by Bethlehem Steel against ArcelorMittal USA. The U.S. EPA Region V also conducted a series of inspections and issued information requests under the Federal Clean Air Act relating to the Burns Harbor, Indiana Harbor and Cleveland facilities. Some of the EPA’s information requests and subsequent allegations relate to recent operations while others relate to historical actions under former facility owners that occurred 14 to 28 years ago. In October 2011, the U.S. EPA issued NOVs to Indiana Harbor West, Indiana Harbor East, Indiana Harbor Long Carbon, Burns Harbor and Cleveland alleging operational noncompliance based primarily on self-reported Title V permit concerns. Compliance data relating to the self-reported items indicate that ArcelorMittal’s operations consistently achieve substantial rates of compliance with applicable permits and regulations. Comprehensive settlement discussions with the U.S. EPA and affected state agencies involving all of the NOVs are ongoing and a comprehensive settlement with the U.S. EPA, which is anticipated to encompass self-reported deviations through December 31, 2015 is being finalized for execution in 2016. The settlement will include payment
of penalties, currently estimated at 6 and a three year compliance schedule for Indiana Harbor East non-compliance. Efforts to mitigate the total penalty to be paid by proposing a supplemental environmental proposal are also being explored
In 2014, the ArcelorMittal Monessen coke plant was re-started after having been idled since 2008. Since re-start, state regulatory authorities (“PADEP”) issued numerous NOVs, the majority of which concern Clean Air Act violations. U.S. EPA Region 3 also issued an NOV and, in addition, issued an information request seeking detailed testing and information concerning air compliance related issues. PADEP issued a proposed penalty assessment of $780,100 for alleged violations occurring from April, 2014 thru May, 2015. Additional penalties may be forthcoming and are expected to be negotiated and addressed in Consent Decree negotiations with PADEP and U.S. EPA enforcement officials. In addition, a Citizens Suit was filed by a local environmental group under the Clean Air Act alleging that local residents were being impacted by many of the issues reflected in the outstanding NOVs.
Europe
Environmental provisions for ArcelorMittal’s operations in Europe total 431 and are mainly related to the investigation and remediation of environmental contamination at current and former operating sites in France (83), Belgium (228), Luxembourg (57), Poland (26), Germany (22), Czech Republic (8) and Spain (5). This investigation and remediation work relates to various matters such as decontamination of water discharges, waste disposal, cleaning water ponds and remediation activities that involve the clean-up of soil and groundwater. These provisions also relate to human health protection measures such as fire prevention and additional contamination prevention measures to comply with local
health and safety regulations.
France
In France, there is an environmental provision of 83, principally relating to the remediation of former sites, including several coke plants, and the capping and monitoring of landfills or basins previously used for residues and secondary materials. The remediation of the coke plants concerns mainly the Thionville, Moyeuvre Grande, Homecourt, Hagondange and Micheville sites, and is related to treatment of soil and groundwater. At Moyeuvre Petite, the recovery of the slag is almost complete and ArcelorMittal is responsible for closure and final rehabilitation of the site. At other sites, ArcelorMittal is responsible for monitoring the concentration of heavy metals in soil and groundwater. Provisions in France also cover the legal site obligations linked to the closure of the steel plant and rolling mill at Gandrange as well as of the wire mill in Lens.
ArcelorMittal Atlantique et Lorraine has an environmental provision that principally relates to the remediation and improvement of storage of secondary materials, the disposal of waste at different ponds and landfills and an action plan for removing asbestos from the installations and mandatory financial guarantees to cover risks of major accident hazard or for gasholders and waste storage. Most of the provision relates to the stocking areas at the Dunkirk site that will need to be restored to comply with local law and to the mothballing of the liquid phase in Florange, including study and surveillance of soil and water to prevent environmental damage, treatment and elimination of waste and financial guarantees demanded by Public Authorities. The environmental provisions also include treatment of slag dumps at Florange and Dunkirk sites as well as removal and disposal of asbestos-containing material at the Dunkirk and Mardyck sites.
Industeel France has an environmental provision that
principally relates to ground remediation at the Le Creusot site and to the rehabilitation of waste disposal areas at the Châteauneuf site.
Belgium
In Belgium, there is an environmental provision of 228 of which the most significant elements are legal site remediation obligations linked to the closure of the primary installations at ArcelorMittal Belgium (Liège). The provisions also concern the external recovery and disposal of waste, residues or by-products that cannot be recovered internally on the ArcelorMittal Gent and Liège sites and the removal and disposal of asbestos-containing material.
Luxembourg
In Luxembourg, there is an environmental provision of approximately 57, which relates to the post-closure monitoring and remediation of former production sites, waste disposal areas, slag deposits and mining sites.
In 2007, ArcelorMittal Luxembourg sold the former Ehlerange slag deposit (93 hectares) to the State of Luxembourg. ArcelorMittal Luxembourg is contractually liable to clean the site and move approximately 530,000 cubic meters of material to other sites. ArcelorMittal Luxembourg also has an environmental provision to secure, stabilize and conduct waterproofing treatment on mining galleries and entrances and various dumping areas in Monderçange, Dudelange, Differdange and Dommeldange. The environmental provision also relates to elimination of blast furnace dust and remediation of the soil to accommodate the expansion of the city of Esch-sur-Alzette. Other environmental provisions concern the cleaning of the Belval Blast Furnace water pond and former production sites. A provision of approximately 47 covers these obligations.
ArcelorMittal Belval and Differdange has an environmental

142 Consolidated financial statements
provision of approximately 4 to clean historical landfills in order to meet the requirements of the Luxembourg Environment Administration.
ArcelorMittal Bissen & Bettembourg has an environmental provision of approximately 2 to clean historical impact of former activity to meet the legal obligations.
Poland
ArcelorMittal Poland S.A.’s environmental provision of 26 mainly relates to the obligation to reclaim a landfill site and to dispose of the residues which cannot be internally recycled or externally recovered. The provision also concerns the storage and disposal of iron-bearing sludge which cannot be reused in the manufacturing process.
Germany
In Germany, the environmental provision of 22 essentially relates to ArcelorMittal Bremen’s post-closure obligations mainly established for soil remediation, groundwater treatment and monitoring at the Prosper coke plant in Bottrop.
Czech Republic
In the Czech Republic, there is an environmental provision of 8, which essentially relates to the post-closure dismantling of buildings and soil remediation at the corresponding areas of the Ostrava site.
Spain
In Spain, ArcelorMittal España has environmental provisions of 5 due to obligations of sealing landfills located in the Asturias site and post-closure obligations in accordance with national legislation. These obligations include the collection and treatment of leachates that can be generated during the operational phase and a period of 30 years after the closure.
South Africa
ArcelorMittal South Africa has environmental provisions of approximately 95 to be used over 13 years, mainly relating to environmental remediation obligations attributable to historical or legacy settling/evaporation dams and waste disposal activities. An important determinant in the final timing of the remediation work relates to the obtaining of the necessary environmental authorizations.
Approximately 24 of the provision relates to the decommissioned Pretoria Works site. This site is in a state of partial decommissioning and rehabilitation with one coke battery and a small-sections rolling facility still in operation. ArcelorMittal South Africa is in the process of transforming this old plant into an industrial hub for light industry, a process that commenced in the late 1990s. Particular effort is directed to landfill sites, with sales of slag from legacy disposal sites to vendors in the construction industry continuing unabated and encouraging progress being made at the Mooiplaats site. However, remediation actions for these sites are long-term in nature due to a complex legal process that needs to be followed.
The Vanderbijlpark Works site, which is the main flat carbon steel operation of the South Africa unit and has been in operation for more than 72 years, contains a number of legacy facilities and areas requiring remediation. The remediation entails the implementation of rehabilitation and decontamination measures of waste disposal sites, waste water dams, ground water and historically contaminated open areas. Approximately 18 of the provision is allocated to this site.
The Newcastle Works site is the main long carbon steel operation of the South Africa unit that has been in operation for more than 36 years. Approximately 19 of the provision is allocated to this site. As with all operating sites of
ArcelorMittal South Africa, the above retirement and remediation actions dovetail with numerous large capital expenditure projects dedicated to environmental management. In the case of the Newcastle site, the major current environmental capital project is for water treatment.
A provision of 29 relates to the environmental rehabilitation of the Thabazimbi Mine.
The remainder of the obligation of approximately 6 relates to Vereeniging site for the historical pollution that needs to be remediated at waste disposal sites, waste water dams and groundwater tables.
Canada
In Canada, ArcelorMittal Dofasco has an environmental provision of approximately 20 for the expected cost of remediating toxic sediment located in the Company’s East Boatslip site, and a provision of approximately 4 for the expected cost of remediating environmental issues at the former Sherman iron ore mine in Ontario once operated and managed by Dofasco (closed in 1990). ArcelorMittal Montreal has an environmental provision of approximately 7 for future disposal of sludge left in ponds after flat mills closure at Contrecoeur.
Asset Retirement Obligations (“AROs”)
AROs arise from legal requirements and represent management’s best estimate of the present value of the costs that will be required to retire plant and equipment or to restore a site at the end of its useful life. As of December 31, 2015, ArcelorMittal had established provisions for asset retirement obligations of 297, including 38 for Ukraine, 76 for Canada, 46 for the United States, 45 for Mexico, 19 for Belgium, 30 for Germany, 12 for South Africa, 6 for Brazil, 11 for Kazakhstan and 14 for Liberia.
The AROs in Ukraine are legal obligations for site rehabilitation at
the iron ore mining site in Kryvyi Rih, upon closure of the mine pursuant to its restoration plan.
The AROs in Canada are legal obligations for site restoration and dismantling of the facilities near the mining sites in Mont-Wright and Fire Lake, and at the facility of Port-Cartier in Quebec, upon closure of the mine pursuant to the restoring plan of the mines.
The AROs in the United States principally relate to mine closure costs of the Hibbing and Minorca iron ore mines and Princeton coal mines.
The AROs in Mexico relate to the restoration costs following the closure of the Las Truchas and El Volcan and the joint operation of Pena Colorada iron ore mines.
In Belgium, the AROs are to cover the demolition costs for primary facilities at the Liège sites.
In Germany, AROs principally relate to the Hamburg site, which is operating on leased land with the contractual obligation to remove all buildings and other facilities upon the termination of the lease, and to the Prosper coke plant in Bottrop for filling the basin, restoring the layer and stabilizing the shoreline at the harbor.
The AROs in South Africa are for the Pretoria, Vanderbijlpark, Coke and Chemical sites, and relate to the closure and clean-up of the plant associated with decommissioned tank farms, tar plants, chemical stores, railway lines, pipelines and defunct infrastructure.
In Brazil, the AROs relate to legal obligations to clean and restore the mining areas of Serra Azul and Andrade, both located in the State of Minas Gerais. The related provisions are expected to be settled in 2025 and 2029, respectively.
In Kazakhstan, the AROs relate to the restoration obligations of the iron ore and coal mines.

Consolidated financial statements 143
In Liberia, the AROs relate to iron ore mine and associated infrastructure and mine related environmental damage and compensation. They cover the closure and rehabilitation plan under both the current operating phase and the not yet completed Phase 2 expansion project.
Tax Claims
ArcelorMittal is a party to various tax claims. As of December 31, 2015, ArcelorMittal had recorded provisions in the aggregate of approximately 189 for tax claims in respect of which it considers the risk of loss to be probable. Set out below is a summary description of the tax claims (i) in respect of which ArcelorMittal had recorded a provision as of December 31, 2015, (ii) that constitute a contingent liability, or (iii) that were resolved in 2015, in each case involving amounts deemed material by ArcelorMittal. The Company is vigorously defending against each of the pending claims discussed below.
Brazil
In 2003, the Brazilian Federal Revenue Service granted ArcelorMittal Brasil (through its predecessor company, then known as CST) a tax benefit for certain investments. ArcelorMittal Brasil had received certificates from SUDENE, the former Agency for the Development of the Northeast Region of Brazil, confirming ArcelorMittal Brasil’s entitlement to this benefit. In September 2004, ArcelorMittal Brasil was notified of the annulment of these certificates. ArcelorMittal Brasil has pursued its right to this tax benefit through the courts against both ADENE, the successor to SUDENE, and against the Brazilian Federal Revenue Service. The Brazilian Federal Revenue Service issued a tax assessment in this regard for 451 in December 2007. In December 2008, the administrative tribunal of first instance upheld the amount of the assessment. ArcelorMittal Brasil appealed to the administrative tribunal of second instance, and, on
August 8, 2012, the administrative tribunal of the second instance found in favor of ArcelorMittal invalidating the tax assessment, thereby ending this case. On April 16, 2011, ArcelorMittal Brasil received a further tax assessment for the periods of March, June and September 2007, which, taking into account interest and currency fluctuations, amounted to 138 as of December 31, 2015. ArcelorMittal Brasil filed its defense in April 2011. In October 2011, the administrative tribunal of first instance upheld the tax assessment received by ArcelorMittal Brazil on April 16, 2011, but decided that no penalty (amounting to 77 at that time) was due. Both parties have filed an appeal with the administrative tribunal of second instance.
In 2011, SOL Coqueria Tubarão S.A. received 21 tax assessments from the Revenue Service of the State of Espirito Santo for ICMS (a value added tax) in the total amount of 27 relating to a tax incentive (INVEST) used by the Company. The dispute concerns the definition of fixed assets. In August 2015, the administrative tribunal of first instance upheld 21 of the tax assessments, while also issuing decisions partially favorable to the Company in 2 of the cases. In September 2015, ArcelorMittal Tubarão has filed appeals with respect to each of the administrative tribunal’s decisions. In January 2016, there were unfavorable decisions in two of the cases at the second administrative level.
In 2011, ArcelorMittal Brasil received a tax assessment for corporate income tax (known as IRPJ) and social contributions on net profits (known as CSL) in relation to (i) the amortization of goodwill on the acquisition of Mendes Júnior Siderurgia (for the 2006 and 2007 fiscal years), (ii) the amortization of goodwill arising from the mandatory tender offer (MTO) made by ArcelorMittal to minority shareholders of Arcelor Brasil following the two-step merger of Arcelor and Mittal Steel N.V. (for the 2007 tax year), (iii)
expenses related to pre-export financing used to finance the MTO, which were deemed by the tax authorities to be unnecessary for ArcelorMittal Brasil since the expenses were incurred to buy shares of its own company and (iv) CSL over profits of controlled companies in Argentina and Costa Rica. The amount claimed totals 438. On January 31, 2014, the administrative tribunal of first instance found in partial favor of ArcelorMittal Brasil, reducing the penalty component of the assessment from, according to ArcelorMittal Brasil’s calculations, 266 to 141 (as calculated at the time of the assessment), while upholding the remainder of the assessment. The Brazilian Federal Revenue Service has appealed the administrative tribunal’s decision to reduce the amount of the original penalty. ArcelorMittal Brasil has also appealed the administrative tribunal’s decision to uphold the tax authority’s assessment (including the revised penalty component).
In 2013, ArcelorMittal Brasil received a tax assessment in relation to the 2008-2010 tax years for corporate income IRPJ and CSL in relation to (i) the amortization of goodwill on the acquisition of Mendes Júnior Siderurgia, Dedini Siderurgia and CST, (ii) the amortization of goodwill arising from the mandatory tender offer made by ArcelorMittal to minority shareholders of Arcelor Brasil following the two-step merger of Arcelor and Mittal Steel N.V. and (iii) CSL and IRPJ over profits of controlled companies in Argentina, Costa Rica, Venezuela and the Netherlands. The amount claimed totals 387. ArcelorMittal Brasil has filed its defense, and the case is in the first administrative instance. In October 2014, the administrative tribunal of first instance found in favour of the Federal Revenue and ArcelorMittal Brasil filed its appeal on November 6, 2014.
For over 15 years, ArcelorMittal Brasil has been challenging the basis of calculation of the Brazilian Cofins and Pis social security taxes (specifically, whether Brazilian
VAT may be deducted from the base amount on which the Cofins and Pis taxes are calculated), in an amount of approximately 4. ArcelorMittal Brasil deposited the disputed amount in escrow with the relevant Brazilian judicial branch when it became due. Since the principal amount bears interest at a rate applicable to judicial deposits, the amount stood at 43 as of December 31, 2015.
In April 2014, Comércio Exterior S.A. (“Comex”), a Brazilian subsidiary of ArcelorMittal, received a tax assessment in the amount of 51 concerning certain deductions made by Comex in relation to the Fundap financial tax incentive; the Brazilian Federal Revenue Service considers that Comex owes corporate income tax (known as IRPJ) and social contributions on net profits (known as CSL) on the amounts deducted. Comex filed its defense in June 2014. In March 2015, there was an unfavourable decision at the administrative tribunal of first instance, in respect of which the Company has filed an appeal.
In May 2014, ArcelorMittal Comercializadora de Energia received a tax assessment from the state of Minas Gerais alleging that the Company did not correctly calculate tax credits on interstate sales of electricity from the February 2012 to December 2013 period. The amount claimed totals 41. ArcelorMittal Comercializadora de Energia filed its defense in June 2014. Following an unfavorable administrative decision in November 2014, ArcelorMittal filed an appeal in December 2014. In March 2015, there was a further unfavourable decision at the second administrative level. The Company received the tax enforcement notice in December 2015 and intends to file its defense.
In the period from May to July 2015, ArcelorMittal Brasil received nine tax assessments from the state of Rio Grande do Sul alleging that the Company, through its branches in that state, had not made advance payments
144 Consolidated financial statements
of ICMS (a value added-tax) on sales in that state covering the period from May 2010 to April 2015. The amount claimed totals 70. The administrative tribunal of first instance upheld the tax assessments in each of the nine cases, and ArcelorMittal Brasil appealed each of the administrative tribunal’s decisions. In December 2015, unfavourable decisions at the administrative tribunal of second instance were issued in five of the nine cases. The Company has filed another appeal against three of these adverse decisions and intends to file appeals in respect of the remaining two decisions upon receipt of formal notification thereof.
France
Following audits for 2006, 2007 and 2008 of ArcelorMittal France and other French ArcelorMittal entities, URSSAF, the French body responsible for collecting social contributions, commenced formal proceedings for these years alleging that the French ArcelorMittal entities owe 71 in social contributions on various payments, the most significant of which relate to profit sharing schemes, professional fees and stock options. Proceedings were commenced in relation to the 2006 claims in December 2009. Proceedings were commenced in relation to the 2007 and 2008 claims in February and March 2010, respectively. In three decisions dated December 10, 2012, the arbitration committee hearing the matter found that social contributions in an amount of 17, 11 and 5 are due in respect of the profit-sharing schemes, stock options and professional fees, respectively. These amounts cover the audits for 2006, 2007 and 2008. In March 2013, the Company filed appeals against the decisions relating to the profit-sharing schemes and stock options.
Following audits for 2009, 2010 and 2011 of ArcelorMittal France and other French ArcelorMittal entities, URSSAF commenced formal proceedings in December 2012 for these years alleging that
these entities owe 155 in social contributions (including interest and late fees relating thereto) on various payments, the most significant of which relate to voluntary separation schemes, profit sharing schemes, professional fees and stock options. In its decision dated April 24, 2013, the arbitration committee reduced the amount claimed by 29. The dispute is now in the judicial phase before the Tribunal des Affaires de Sécurité Sociale.
Mexico
In 2015, the Mexican Tax Administration Service issued three tax assessments to ArcelorMittal Mexico, alleging that ArcelorMittal Mexico owes 163 in respect of (i) improper interest deductions relating to certain loans, (ii) unpaid corporate income tax for interest payments improperly categorized as profit, and (iii) improper payment deductions for branding fee services and IT services in 2008. ArcelorMittal Mexico filed an annulment complaint in respect of each of the aforementioned assessments in November 2015.
Ukraine
In December 2010, the Ukrainian tax authorities issued a tax assessment in a total amount of 21 to ArcelorMittal Kryvyi Rih, alleging that it had breached tax law provisions relating to VAT for the December 2009 to October 2010 period. ArcelorMittal Kryvyi Rih appealed the assessment to a higher division of the tax authorities. The appeal was rejected, and ArcelorMittal Kryvyi Rih appealed this decision to the local District Administrative Court in February 2011. In March 2011, the local District Administrative Court decided in favor of ArcelorMittal Kryvyi Rih and the tax authorities filed an appeal. On June 26, 2012, the Court of Appeal ruled in favor of ArcelorMittal Kryvyi Rih, rejecting the appeal of the tax authorities, who on July 13, 2012 filed an appeal in cassation. On December 24, 2014, the Supreme Administrative Court of Ukraine left unchanged the
decisions of the lower courts in favour of ArcelorMittal Kryvyi Rih. The tax authorities did not appeal to the Supreme Court of Ukraine before the deadline of December 24, 2015 and the case is therefore closed.
In September 2012, the Ukrainian tax authorities conducted an audit of ArcelorMittal Kryvyi Rih, resulting in a tax claim of approximately 62. The claim relates to the cancellation of VAT refunds, cancellation of deductible expenses and queries on transfer pricing calculations. On January 2, 2013, ArcelorMittal Kryvyi Rih filed a lawsuit with the District Administrative Court to challenge the findings of this tax audit. On April 9, 2013, the District Administrative Court rejected the claim by the tax authorities and retained only a tax liability of approximately 0.2 against ArcelorMittal Kryvyi Rih. Both parties filed appeals and, on November 7, 2013, the Court of Appeal rejected the appeal by the tax authorities and retained only a tax liability of approximately 0.1 against ArcelorMittal Kryvyi Rih. On November 12, 2013, the tax authorities filed an appeal in cassation. On June 3, 2015, the Supreme Administrative Court of Ukraine decided entirely in favor of ArcelorMittal Kryvyi Rih. The tax authorities have until June 3, 2016 to appeal the judgment to the Supreme Court of Ukraine.
Competition/Antitrust Claims
ArcelorMittal is a party to various competition/antitrust claims. As of December 31, 2015, ArcelorMittal had recorded provisions in the aggregate of approximately 87 for such claims. Set out below is a summary description of competition/antitrust claims (i) in respect of which ArcelorMittal had recorded a provision as of December 31, 2015, (ii) that constitute a contingent liability, or (iii) that were resolved in 2015, in each case involving amounts deemed material by ArcelorMittal. The Company is vigorously defending against each of the pending claims discussed below.
United States
On September 12, 2008, Standard Iron Works filed a purported class action complaint in the U.S. District Court for the Northern District of Illinois against ArcelorMittal, ArcelorMittal USA LLC, and other steel manufacturers, alleging that the defendants had conspired to restrict the output of steel products in order to fix, raise, stabilize and maintain prices at artificially high levels in violation of U.S. antitrust law. Other similar direct purchaser lawsuits were also filed in the same court and were consolidated with the Standard Iron Works lawsuit. On May 29, 2014, ArcelorMittal and ArcelorMittal USA LLC entered into an agreement to settle the direct purchaser claims for an amount of 90 recognized in cost of sales. On October 17, 2014, the court gave its final approval of the settlement and dismissed ArcelorMittal and ArcelorMittal USA LLC from the lawsuit. In September 2015, the court certified a class of direct purchasers on whether there was a conspiracy, allowing the case to proceed against the remaining defendants as a class action, but did not certify a class on impact or damages. This ruling does not affect the settlement. Two putative class actions on behalf of indirect purchasers have been filed and one has been dismissed for want of prosecution; the remaining indirect purchasers’ action is not covered by the settlement of the direct purchaser claims or the court’s class certification decision. Brazil
In September 2000, two construction trade organizations filed a complaint with Brazil’s Administrative Council for Economic Defence (“CADE”) against three long steel producers, including ArcelorMittal Brasil. The complaint alleged that these producers colluded to raise prices in the Brazilian rebar market, thereby violating applicable antitrust laws. In September 2005, CADE issued its final decision against ArcelorMittal Brasil, imposing a fine of 38 (at
Consolidated financial statements 145
December 31, 2015 values). ArcelorMittal Brasil appealed the decision to the Brazilian Federal Court. In September 2006, ArcelorMittal Brasil offered a letter guarantee and obtained an injunction to suspend enforcement of this decision pending the court’s judgment.
There is also a related class action commenced by the Federal Public Prosecutor of the state of Minas Gerais against ArcelorMittal Brasil for damages based on the alleged violations investigated by CADE.
A further related lawsuit was commenced by four units of Sinduscons, a civil construction trade organization, in federal court in Brasilia against, inter alia, ArcelorMittal Brasil, in February 2011, claiming damages based on an alleged cartel in the rebar market as investigated by CADE and as noted above.
Romania
In 2010 and 2011, ArcelorMittal Galati entered into high volume electricity purchasing contracts with Hidroelectrica, a partially state-owned electricity producer. Following allegations by Hidroelectrica’s minority shareholders that ArcelorMittal Galati (and other industrial electricity consumers) benefitted from artificially low tariffs, the European Commission opened a formal investigation into alleged state aid in April 2012. The European Commission announced on June 12, 2015 that electricity supply contracts signed by Hidroelectrica with certain electricity traders and industrial customers (including the one entered by ArcelorMittal Galati) did not involve state aid within the meaning of the EU rules.
South Africa
In February 2007, the complaint previously filed with the South African Competition Commission by Barnes Fencing, a South African producer of galvanized wire, alleging that ArcelorMittal South Africa, as a “dominant firm”,
discriminated in pricing its low carbon wire rod, was referred to the Competition Tribunal. The Competition Commission seeks an order declaring that ArcelorMittal South Africa’s pricing in 2000-2003 in respect of low carbon wire rod amounted to price discrimination and an order that ArcelorMittal South Africa cease its pricing discrimination. In March 2008, the Competition Tribunal accepted the claimants’ application for leave to intervene. In November 2012, a second complaint alleging price discrimination regarding the same product over the 2004 to 2006 period was referred by the Competition Commission to the Competition Tribunal. ArcelorMittal is unable to assess the outcome of these proceedings or the amount of ArcelorMittal South Africa’s potential liability, if any.
On September 1, 2009, the South African Competition Commission referred a complaint against four producers of long carbon steel in South Africa, including ArcelorMittal South Africa, and the South African Iron and Steel Institute to the Competition Tribunal. The complaint referral followed an investigation into alleged collusion among the producers initiated in April 2008, on-site inspections conducted at the premises of some of the producers and a leniency application by Scaw South Africa, one of the producers under investigation. The Competition Commission recommended that the Competition Tribunal impose an administrative penalty against ArcelorMittal South Africa, Cape Gate and Cape Town Iron Steel Works in the amount of 10% of their annual revenues in South Africa (in the year preceding any final decision) and exports from South Africa for 2008. ArcelorMittal filed an application to access the file of the Competition Commission that was rejected. ArcelorMittal appealed the decision to reject the application, and applied for a review of that decision and a suspension of the obligation to respond to the referral on the substance pending
final outcome on the application for access to the documents. The appeal was upheld by the Competition Appeals Court (CAC) and the matter was referred back to the Competition Tribunal for a determination of confidentiality and scope of access to the documents. The Competition Commission appealed the decision of the CAC, and, on May 31, 2013, the Supreme Court of Appeal dismissed the appeal of the Competition Commission and confirmed the decision of the CAC. In 2014, ArcelorMittal South Africa requested the documents from the Competition Commission, which provided an index thereof. On July 7, 2011, ArcelorMittal filed an application before the Competition Tribunal to set aside the complaint referral based on procedural irregularities but this application was withdrawn by notice dated August 7, 2014. Issues of access to the Competition Commission’s documents remain open. It is too early for ArcelorMittal to assess the potential outcome of the procedure, including the financial impact.
In March 2012, the South African Competition Commission referred to the Competition Tribunal an allegation that ArcelorMittal South Africa and steel producer Highveld acted by agreement or concerted practice to fix prices and allocate markets in respect of certain flat carbon steel products over a period of 10 years (1999-2009) in contravention of the South African Competition Act. Pleadings remain open. If imposed, fines could amount to up to 10% of ArcelorMittal South Africa’s turnover in the year preceding any final decision by the South African Competition Tribunal.
In August 2013, the South African Competition Commission referred a complaint against four scrap metal purchasers in South Africa, including ArcelorMittal South Africa, to the South African Competition Tribunal for prosecution. The complaint alleges collusion among the purchasers to fix the price and other trading
conditions for the purchase of scrap over a period from 1998 to at least 2008. If imposed, fines could amount to 10% of ArcelorMittal South Africa’s turnover for the year preceding any final decision by the Competition Tribunal.
In relation to all these cases, ArcelorMittal South Africa has engaged with the Competition Commission and has made significant progress regarding a possible overall settlement. Whilst a draft settlement agreement is in the process of being finalized and is still subject to approval of the Competition Commission and the Competition Tribunal, a provision of 87 representing the present value of a proposed administrative penalty of 96 (R1.5 billion) has been recognized in cost of sales. ArcelorMittal South Africa has, subject to certain conditions being agreed upon with the Competition Commission, proposed to pay the administrative penalty over a period of 5 years subject to appropriate interest.
Other Legal Claims
ArcelorMittal is a party to various other legal claims. As of December 31, 2015, ArcelorMittal had recorded provisions of approximately 180 for other legal claims in respect of which it considers the risk of loss to be probable. Set out below is a summary description of the other legal claims (i) in respect of which ArcelorMittal had recorded a provision as of December 31, 2015, (ii) that constitute a contingent liability, or (iii) that were resolved in 2015, in each case involving amounts deemed material by ArcelorMittal. The Company is vigorously defending against each of the pending claims discussed below.
Argentina
Over the course of 2007 to 2015, the Argentinian Customs Office Authority (Aduana) notified the Company of certain inquiries that it is conducting with respect to prices declared by the Company’s

146 Consolidated financial statements
Argentinian subsidiary, Acindar, related to iron ore imports. The Customs Office Authority is seeking to determine whether Acindar incorrectly declared prices for iron ore imports from several different Brazilian suppliers and from ArcelorMittal Sourcing on 37 different claims concerning several shipments made between 2002 and 2014. The aggregate amount claimed by the Customs Office Authority in respect of all of the shipments is approximately 196. The investigations are subject to the administrative procedures of the Customs Office Authority and are at different procedural stages depending on the filing date of the investigation. By July 2015, in 22 of the total 37 cases, the administrative branch of the Customs Office Authority ruled against Acindar (representing total claims of 67). These decisions have been appealed to the Argentinian National Fiscal Court.
Canada
In April 2011, a proceeding was commenced before the Ontario (Canada) Superior Court of Justice under the Ontario Class Proceedings Act, 1992, against ArcelorMittal, Baffinland, and certain other parties relating to the January 2011 take-over of Baffinland by ArcelorMittal, Nunavut, Iron Ore Holdings and 1843208 Ontario Inc. The action seeks the certification of a class comprised of all Baffinland securities holders who tendered their Baffinland securities, and whose securities were taken up, in connection with the take-over between September 22, 2010 and February 17, 2011, or otherwise disposed of their Baffinland securities on or after January 14, 2011. The action alleges that the tender offer documentation contained certain misrepresentations and seeks damages in an aggregate amount of 720 (CAD$1billion) or rescission of the transfer of the Baffinland securities by members of the class.
Italy
In January 2010, ArcelorMittal
received notice of a claim filed by Finmasi S.p.A. relating to a memorandum of agreement (“MoA”) entered into between ArcelorMittal Distribution Services France (“AMDSF”) and Finmasi in 2008. The MoA provided that AMDSF would acquire certain of Finmasi’s businesses for an amount not to exceed 101, subject to the satisfaction of certain conditions precedent, which, in AMDSF’s view, were not fulfilled. Finmasi sued for (i) enforcement of the MoA, (ii) damages of 15 to 26 or (iii) recovery costs plus quantum damages for Finmasi’s alleged lost opportunity to sell to another buyer. In September 2011, the court rejected Finmasi’s claims other than its second claim. The court appointed an expert to determine the quantum of damages. In May 2013, the expert’s report was issued and valued the quantum of damages in the range of 41 to 65. ArcelorMittal appealed the decision on the merits. In May 2014, the Court of Appeals issued a decision rejecting ArcelorMittal’s appeal. On June 20, 2014, ArcelorMittal filed an appeal of the Court of Appeal’s judgment with the Italian Court of Cassation. On December 18, 2014, the Court of Milan issued a decision on the quantum of the damages and valued the quantum of damages in the sum of 26 plus interest. In June 2015, both parties served appeals of the decision on the quantum, with ArcelorMittal also seeking the suspension of the enforceability of the decision. On July 1, 2015, Finmasi formally notified to AMDSF the declaration of enforcement of the decision of December 18, 2014. On July 28, 2015, AMDSF filed an appeal against such declaration with the Court of Appeal of Rheims in France. At a hearing on December 1, 2015, the Italian Court of Appeal accepted the suspension of the enforcement of the decision of December 18, 2014, following the agreement of AMDSF to provide a guarantee for its value.
Luxembourg
In June 2012, the Company received writs of summons in
respect of claims made by 59 former employees of ArcelorMittal Luxembourg. The claimants allege that they are owed compensation based on the complementary pension scheme that went into effect in Luxembourg in January 2000. The aggregate amount claimed by such former employees (bearing in mind that other former employees may bring similar claims) is approximately 64. Given the similarities in the claims, the parties agreed to limit the pending proceedings to four test claims. In April 2013, the Esch-sur-Alzette labor court rejected two of these test claims. The relevant plaintiffs are appealing these decisions. In November 2013, the Luxembourg city labor court rejected the two other test claims, which are also being appealed.
Senegal
In 2007, ArcelorMittal Holdings AG entered into an agreement with the State of Senegal relating to an integrated iron ore mining and related infrastructure project. The Company announced at the time that implementation of the project would entail an aggregate investment of $2.2 billion. Project implementation did not follow the originally anticipated schedule after initial phase studies and related investments.
The Company engaged in discussions with the State of Senegal about the project over a long period. In early 2011, the parties engaged in a conciliation procedure, as provided for under their agreement, in an attempt to reach a mutually acceptable outcome. Following the unsuccessful completion of this procedure, in May 2011 the State of Senegal commenced an arbitration before the Court of Arbitration of the International Chamber of Commerce, claiming breach of contract and provisionally estimating damages of 750. In September 2013, the arbitral tribunal issued its first award ruling that Senegal is entitled to terminate the 2007 agreements. The arbitral tribunal also ruled that a new arbitration
phase would be held relating to the potential liability of ArcelorMittal as well as the amount of any damages which could be awarded to Senegal. The parties have since agreed to settle the dispute with the amount of the settlement being included within financing cost. On December 12, 2014, the arbitral tribunal issued a procedural order formally closing the arbitration.
South Africa
When the South African government split Iscor into separate steel and mining operations in 2001, the mining license at the Sishen Mine (the “Sishen Mining Right”) was split between ArcelorMittal South Africa (“AMSA”) and Sishen Iron Ore Company (Proprietary) Limited (“SIOC”). AMSA was granted 21.4% of the Sishen Mining Right, with the remaining 78.6% being granted to SIOC. A condition of the iron ore supply contracts entered into between SIOC and AMSA in 2001 was that if AMSA lost its share of the Sishen Mining Right, SIOC would no longer be obligated to supply iron ore to AMSA at the price specified in the 2001 agreements. Under revised mining legislation, each holder of a mining right was required to reapply for its mining licence. When AMSA failed to reapply for its portion of the Sishen Mining Right, SIOC served notice on AMSA that it would no longer supply iron ore to AMSA at the price specified in the 2001 agreements. The parties commenced an arbitration process (the “SIOC Arbitration”) in April 2010 to resolve this dispute.
After AMSA’s failure to reapply for its portion of the Sishen Mining Right, the South African government attempted to award the 21.4% of the Sishen Mining Right to Imperial Crown Trading (“ICT”) in 2010. SIOC brought legal action against the South African government and ICT to challenge the prospective grant of the Sishen Mining Right to ICT. AMSA applied to be joined as applicant in these proceedings. AMSA argued in the proceedings that SIOC holds
Consolidated financial statements 147
100% of the Sishen Mining Right, and that ICT was not entitled to any portion of the Sishen Mining Right. On December 15, 2011, the Court ruled that SIOC holds 100% of the Sishen Mining Right and set aside the grant of the prospecting right to ICT. Subsequently, SIOC has been granted the rights to the remaining 21.4% share of the Sishen Mining Right, subject to conditions imposed by the South African government. Discussions are currently on-going as to the particulars of such conditions.
On November 5, 2013, a supply contract with SIOC (the “2014 SIOC Contract”) was entered into between SIOC, an entity in which Kumba has a 73.9% interest, and AMSA. The 2014 SIOC Contract relates to the sale and purchase of up to 6.25 million tonnes per annum of iron ore (from either the Sishen and Thabazimbi mines or any alternative source), complying with agreed specifications and lump-fine ratios. The 2014 SIOC Contract is effective until 180 days after either (i) AMSA gives written notice to SIOC that it is no longer economically viable for AMSA to produce steel from Saldanha or any of its inland domestic steel plants or (ii) SIOC gives written notice to AMSA that it is no longer economically viable for SIOC to export iron ore produced from the Sishen Mine. The 2014 SIOC Contract was entered into in order to replace the Sishen Supply Agreement and the Thabazimbi Supply Agreement entered into between AMSA and SIOC in November 2001.
On November 6, 2015, AMSA agreed with SIOC to amend the pricing mechanism terms of the 2014 SIOC Contract from a cost-based price to an export parity price (“EPP”) with effect from October 1, 2015. The EPP is calculated on the basis of the Platts 62% Fe CFR China Fines Index (the “Index Price”) and, at certain Index Price levels, AMSA receives a discounted price. For example, if the Index price is between US$60/t and US$70/t, AMSA will receive a 5% discount to the EPP; between US$70/t and US$80/t, a 6.25% discount would apply and at an
Index price above US$80/t, a 7.5% discount would apply. The Index Price is less erratic and volatile than a cost-based price, allowing AMSA more visibility with regards to future prices of iron ore, and in turn, greater certainty regarding the cost of iron ore. The definitive agreement was signed by the parties in February 2016.Following AMSA’s and SIOC’s entry into the 2014 SIOC Contract in November 2013, the parties agreed to settle the SIOC Arbitration.
France
Retired and current employees of certain French subsidiaries of the former Arcelor have initiated lawsuits to obtain compensation for asbestos exposure in excess of the amounts paid by French social security (“Social Security”). Asbestos claims in France initially are made by way of a declaration of a work-related illness by the claimant to the Social Security authorities resulting in an investigation and a level of compensation paid by Social Security. Once the Social Security authorities recognize the work-related illness, the claimant, depending on the circumstances, can also file an action for inexcusable negligence (faute inexcusable) to obtain additional compensation from the company before a special tribunal. Where procedural errors are made by Social Security, it is required to assume full payment of damages awarded to the claimants. Due to fewer procedural errors made by Social Security, changes in the regulations and, consequently, fewer rejected cases, ArcelorMittal has been required to pay some amounts in damages since 2011.
The number of claims outstanding for asbestos exposure at December 31, 2015 was 374 as compared to 351 at December 31, 2014. The range of amounts claimed for the year ended December 31, 2015 was €30,000 to €650,000 (approximately $32,661 to $707,655). The aggregate costs and settlements for the year ended December 31, 2015 were approximately 3.3, of which
approximately 0.47 represents legal fees and approximately 2.8 represents damages paid to the claimant. The aggregate costs and settlements for the year ended December 31, 2014 were approximately 4, of which approximately 0.3 represents legal fees and approximately 3 represents damages paid to the claimant.
Minority Shareholder Claims Regarding the Exchange Ratio in the Second-Step Merger of ArcelorMittal into Arcelor
ArcelorMittal is the company that results from the acquisition of Arcelor by Mittal Steel N.V. in 2006 and a subsequent two-step merger between Mittal Steel and ArcelorMittal and then ArcelorMittal and Arcelor. Following completion of this merger process, several former minority shareholders of Arcelor or their representatives brought legal proceedings regarding the exchange ratio applied in the second-step merger between ArcelorMittal and Arcelor and the merger process as a whole.
ArcelorMittal believes that the allegations made and claims brought by such minority shareholders are without merit and that the exchange ratio and merger process complied with the requirements of applicable law, were consistent with previous guidance on the principles that would be used to determine the exchange ratio in the second-step merger and that the merger exchange ratio was relevant and reasonable to shareholders of both merged entities.
Set out below is a summary of ongoing matters in this regard. Several other claims brought before other courts and regulators were dismissed and are definitively closed.
On January 8, 2008, ArcelorMittal received a writ of summons on behalf of four hedge fund shareholders of Arcelor to appear before the civil court of Luxembourg. The summons was also served on all natural persons
sitting on the Board of Directors of ArcelorMittal at the time of the merger and on the Significant Shareholder. The plaintiffs alleged in particular that, based on Mittal Steel’s and Arcelor’s disclosure and public statements, investors had a legitimate expectation that the exchange ratio in the second-step merger would be the same as that of the secondary exchange offer component of Mittal Steel’s June 2006 tender offer for Arcelor (i.e., 11 Mittal Steel shares for seven Arcelor shares), and that the second-step merger did not comply with certain provisions of Luxembourg company law. They claimed, inter alia, the cancellation of certain resolutions (of the Board of Directors and of the Shareholders meeting) in connection with the merger, the grant of additional shares, or damages in an amount of approximately 196. By judgment dated November 30, 2011, the Luxembourg civil court declared all of the plaintiffs’ claims inadmissible and dismissed them. The judgment was appealed in May 2012 and the appeal proceedings are ongoing.
On May 15, 2012, ArcelorMittal received a writ of summons on behalf of Association Actionnaires d’Arcelor (“AAA”), a French association of former minority shareholders of Arcelor, to appear before the civil court of Paris. In such writ of summons, AAA claimed (on grounds similar to those in the Luxembourg proceedings summarized above) inter alia damages in a nominal amount and reserved the right to seek additional remedies including the cancellation of the merger. The proceedings before the civil court of Paris have been stayed, pursuant to a ruling of such court on July 4, 2013, pending a preparatory investigation (instruction préparatoire) by a criminal judge magistrate (juge d’instruction) triggered by the complaints (plainte avec constitution de partie civile) of AAA and several hedge funds (who quantified their total alleged damages at 268), including those who filed the claims before the Luxembourg courts described (and quantified) above.

148 Consolidated financial statements
8.3 Commitments
The Company’s commitments consist of the following:
December 31,
2015 20141
Purchase commitments 20,059 23,988Guarantees, pledges and other collateral 3,791 4,185Non-cancellable operating leases 1,446 1,662Capital expenditure commitments 280 712Other commitments 1,161 1,383Total 26,737 31,9301 The total commitments balance as of December 31, 2014 shown in the table above has been revised to correct the prior period disclosure, decreasing the balance by 389. The revision impacted only the disclosed amount and otherwise had no impact on the Company’s consolidated financial statements. The Company has evaluated the impact of the revision and determined that it did not have a material impact on any of its prior period annual and interim consolidated financial statements.
Purchase commitments
Purchase commitments consist primarily of major agreements for procuring iron ore, coking coal, coke and hot metal. The Company also has a number of agreements for electricity, industrial and natural gas, scrap and freight. In addition to those purchase commitments disclosed above, the Company enters into purchasing contracts as part of its normal operations which have minimum volume requirements but for which there are no take-or-pay or penalty clauses included in the contract. The Company does not believe these contracts have an adverse effect on its liquidity position. The decrease in purchase commitments is mainly related to the fulfillment
of commitments and the decline in raw material prices.
Purchase commitments include commitments given to associates for 558 and 317 as of December 31, 2015 and 2014, respectively. Purchase commitments include commitments given to joint ventures for 1,315 and 1,581 as of December 31, 2015 and 2014, respectively. Commitments given to joint ventures include 1,264 and 1,500 related to purchase of the output from Tameh as of December 31, 2015 and 2014, respectively. Additionally, the Company has committed to purchase 50% of the output from its joint venture Kalagadi once production commences (see note 2.4.1).
Guarantees, pledges and other collateral
Guarantees related to financial debt and credit line given on behalf of third parties were 102 and 101 as of December 31, 2015 and 2014, respectively. Additionally, 12 and 22 were related to guarantees given on behalf of associates as of December 31, 2015 and 2014, respectively. Guarantees of 1,224 and 1,087 were given on behalf of joint ventures as of December 31, 2015 and 2014, respectively. Guarantees given on behalf of joint ventures includes 519 and 573 for the guarantee issued on behalf of Calvert as of December 31, 2015 and 2014, respectively.
Pledges and other collateral mainly relate to mortgages entered into by the Company’s operating subsidiaries. Other sureties, first demand guarantees, letters of credit, pledges and other collateral included nil of commitments given on behalf of associates as of December 31, 2015 and 2014.
Non-cancellable operating leases
The Company leases various facilities, land and equipment under non-cancellable lease arrangements. Future minimum lease payments required under operating leases that have initial or remaining non-cancellable terms as of December 31, 2015 and 2014 according to maturity periods are as follows:
2015 2014
Less than 1 year 279 3341-3 years 454 5164-5 years 309 378More than 5 years 404 434Total 1,446 1,662
Non-cancellable operating leases include time charter arrangements for shipping activities. The operating leases expense was 538, 686 and 672 in 2015, 2014 and 2013, respectively. The non-cancellable operating leases commitments for the year ended December 31, 2015 are related to plant, machinery and equipment
(1,113), buildings (190), land (90) and other (53).
Capital expenditure commitments
Capital expenditure commitments mainly relate to commitments associated with investments in expansion and improvement projects by various subsidiaries.
In 2008, ArcelorMittal Temirtau announced a decision to expand its production capacity from 4 million tons to 6 million tons and committed to improve the safety and security in its mining area. There were no outstanding commitments for these projects as of December 31, 2015 and 2014, respectively. Accordingly, the
commitments as of December 31, 2014 have been retrospectively adjusted by 103 and 82 to correct the prior period disclosure.
In 2015, the Company re-assessed its commitments with respect to Phase 2 of the Liberia expansion project as a result of the delay of the project and rapid price

Consolidated financial statements 149
declines. The commitments for the project decreased by 468 at December 31, 2015 as compared to December 31, 2014.
In 2014, ArcelorMittal Atlantique et Lorraine committed to investment programs in connection with the Florange site and ArcelorMittal Belgium in connection with the closure of the Liège site. The remaining capital expenditure commitments were 76 and 96 as of December 31, 2015, respectively.
Other commitments
Other commitments given comprise mainly commitments incurred for gas supply to electricity suppliers.
Commitments to sell
In addition to the commitments presented above, the Company has firm commitments to sell for 490 and 435 as of December 31, 2015 and 2014, respectively mainly related to natural gas and electricity.
Note 9: Income taxes
The current tax payable or recoverable is based on taxable profit (loss) for the year. Taxable profit differs from profit as reported in the consolidated statements of operations because it excludes items of income or expense that are taxable or
deductible in other years or are never taxable or deductible. The Company’s current income tax expense (benefit) is calculated using tax rates that have been enacted or substantively enacted as of the consolidated statement of financial position date.
Tax is charged or credited to the consolidated statement of operations, except when it relates to items charged or credited to other comprehensive income or directly to equity, in which case the tax is recognized in other comprehensive income or in equity.
Deferred tax is recognized on differences between the carrying amounts of assets and liabilities, in the consolidated financial statements and the corresponding tax basis used in the computation of taxable profit, and is accounted for using the statements of financial position liability method. Deferred tax liabilities are generally recognized for all taxable temporary differences, and deferred tax assets are generally recognized for all deductible temporary differences and net operating loss carryforwards to the extent that it is probable that taxable profits will be available against which those deductible temporary differences can be utilized. Such assets and liabilities are not recognized if the taxable temporary difference arises from the initial recognition of non deductible goodwill or if the differences arise from the
initial recognition (other than in a business combination) of other assets and liabilities in a transaction that affects neither the taxable profit nor the profit reported in the consolidated statement of operations.
Deferred tax liabilities are recognized for taxable temporary differences associated with investments in subsidiaries, associates and joint ventures, except if the Company is able to control the reversal of the temporary difference and it is probable that the temporary difference will not reverse in the foreseeable future. Deferred tax assets arising from deductible temporary differences associated with such investments are only recognized to the extent that it is probable that there will be sufficient taxable profits against which the benefits of the temporary differences can be utilized and are expected to reverse in the foreseeable future.
Deferred tax assets and liabilities are measured at the tax rates that are expected to apply in the period in which the liability is settled or the asset realized, based on tax rates (and tax laws) that have been enacted or substantively enacted by the consolidated statements of financial position date. The measurement of deferred tax liabilities and assets reflects the tax consequences that would follow from the manner in which the Company expects, at the reporting
date, to recover or settle the carrying amount of its assets and liabilities.
The carrying amount of deferred tax assets is reviewed at each consolidated statement of financial position date and reduced to the extent that it is no longer probable that sufficient taxable profits will be available to enable all or part of the asset to be recovered. The Company reviews the deferred tax assets in the different jurisdictions in which it operates to assess the possibility of realizing such assets based on projected taxable profit, the expected timing of the reversals of existing temporary differences, the carry forward period of temporary differences and tax losses carried forward and the implementation of tax-planning strategies. Due to the numerous variables associated with these judgments and assumptions, both the precision and reliability of the resulting estimates of the deferred tax assets are subject to substantial uncertainties.
Deferred tax assets and liabilities are offset when there is a legally enforceable right to set off current tax assets against current tax liabilities, when they relate to income taxes levied by the same taxation authority and when the Company intends to settle its current tax assets and liabilities on a net basis.
Year ended December 31,
2015 2014 2013
Total current tax expense 331 544 305 Total deferred tax expense (benefit) 571 (90) (90)Total income tax expense (benefit) 902 454 215
9.1 Income tax expense (benefit)
The components of income tax expense (benefit) for each of the years ended December 31, 2015, 2014 and 2013, respectively, are summarized as follows:
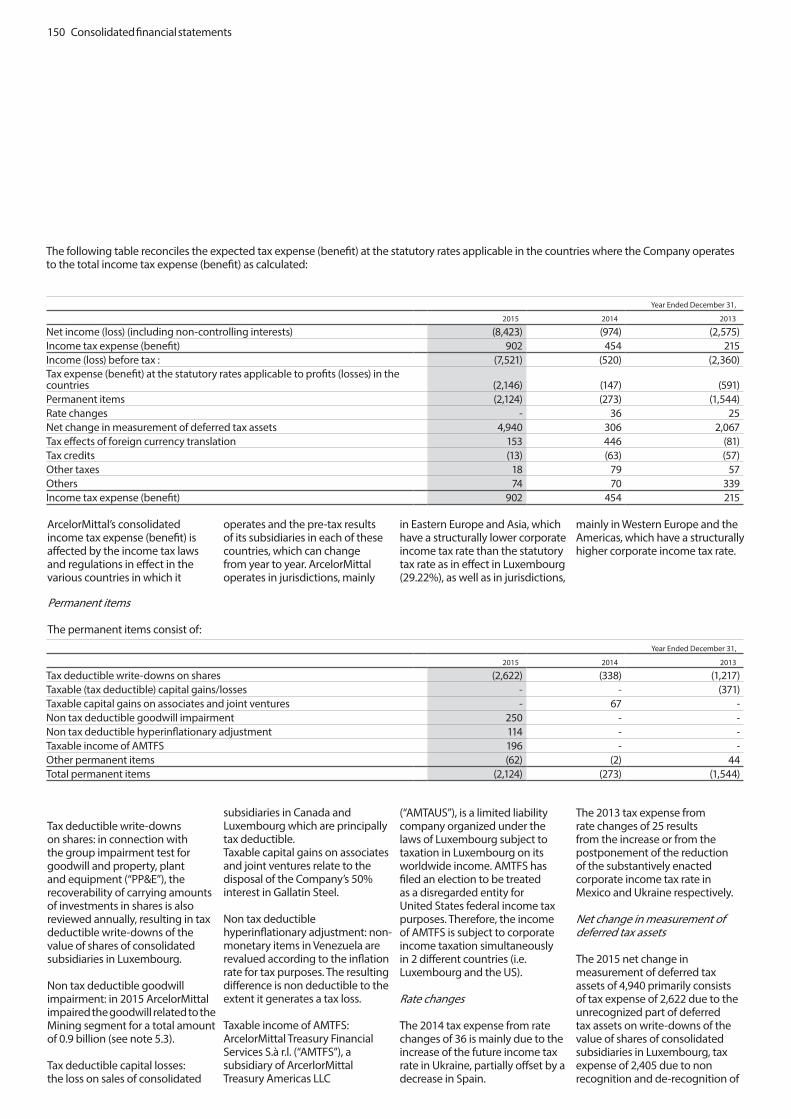
150 Consolidated financial statements
The following table reconciles the expected tax expense (benefit) at the statutory rates applicable in the countries where the Company operates to the total income tax expense (benefit) as calculated:
Year Ended December 31,
2015 2014 2013
Net income (loss) (including non-controlling interests) (8,423) (974) (2,575)Income tax expense (benefit) 902 454 215Income (loss) before tax : (7,521) (520) (2,360)Tax expense (benefit) at the statutory rates applicable to profits (losses) in the countries (2,146) (147) (591)Permanent items (2,124) (273) (1,544)Rate changes - 36 25Net change in measurement of deferred tax assets 4,940 306 2,067Tax effects of foreign currency translation 153 446 (81)Tax credits (13) (63) (57)Other taxes 18 79 57Others 74 70 339Income tax expense (benefit) 902 454 215
ArcelorMittal’s consolidated income tax expense (benefit) is affected by the income tax laws and regulations in effect in the various countries in which it
operates and the pre-tax results of its subsidiaries in each of these countries, which can change from year to year. ArcelorMittal operates in jurisdictions, mainly
in Eastern Europe and Asia, which have a structurally lower corporate income tax rate than the statutory tax rate as in effect in Luxembourg (29.22%), as well as in jurisdictions,
mainly in Western Europe and the Americas, which have a structurally higher corporate income tax rate.
Year Ended December 31,
2015 2014 2013
Tax deductible write-downs on shares (2,622) (338) (1,217)Taxable (tax deductible) capital gains/losses - - (371)Taxable capital gains on associates and joint ventures - 67 -Non tax deductible goodwill impairment 250 - -Non tax deductible hyperinflationary adjustment 114 - -Taxable income of AMTFS 196 - -Other permanent items (62) (2) 44Total permanent items (2,124) (273) (1,544)
Tax deductible write-downs on shares: in connection with the group impairment test for goodwill and property, plant and equipment (“PP&E”), the recoverability of carrying amounts of investments in shares is also reviewed annually, resulting in tax deductible write-downs of the value of shares of consolidated subsidiaries in Luxembourg.
Non tax deductible goodwill impairment: in 2015 ArcelorMittal impaired the goodwill related to the Mining segment for a total amount of 0.9 billion (see note 5.3).
Tax deductible capital losses: the loss on sales of consolidated
subsidiaries in Canada and Luxembourg which are principally tax deductible.Taxable capital gains on associates and joint ventures relate to the disposal of the Company’s 50% interest in Gallatin Steel.
Non tax deductible hyperinflationary adjustment: non-monetary items in Venezuela are revalued according to the inflation rate for tax purposes. The resulting difference is non deductible to the extent it generates a tax loss.
Taxable income of AMTFS: ArcelorMittal Treasury Financial Services S.à r.l. (“AMTFS”), a subsidiary of ArcerlorMittal Treasury Americas LLC
(“AMTAUS”), is a limited liability company organized under the laws of Luxembourg subject to taxation in Luxembourg on its worldwide income. AMTFS has filed an election to be treated as a disregarded entity for United States federal income tax purposes. Therefore, the income of AMTFS is subject to corporate income taxation simultaneously in 2 different countries (i.e. Luxembourg and the US).
Rate changes
The 2014 tax expense from rate changes of 36 is mainly due to the increase of the future income tax rate in Ukraine, partially offset by a decrease in Spain.
The 2013 tax expense from rate changes of 25 results from the increase or from the postponement of the reduction of the substantively enacted corporate income tax rate in Mexico and Ukraine respectively.
Net change in measurement of deferred tax assets The 2015 net change in measurement of deferred tax assets of 4,940 primarily consists of tax expense of 2,622 due to the unrecognized part of deferred tax assets on write-downs of the value of shares of consolidated subsidiaries in Luxembourg, tax expense of 2,405 due to non recognition and de-recognition of
Permanent items
The permanent items consist of:
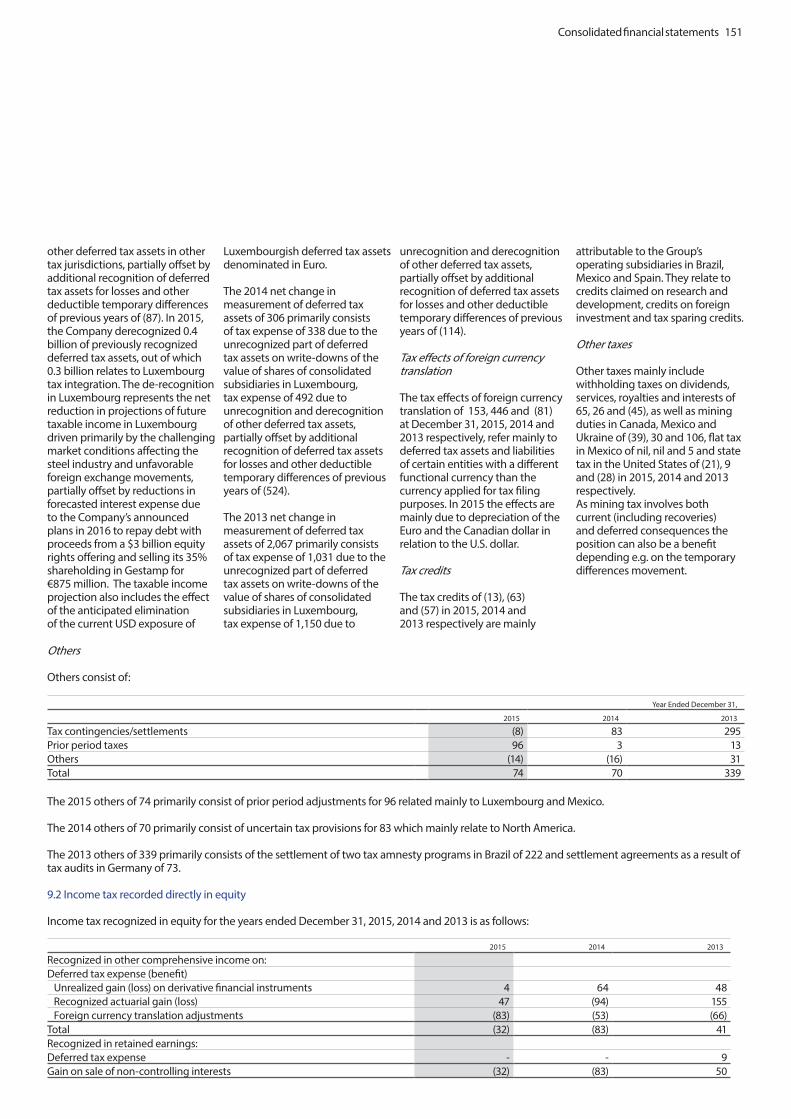
Consolidated financial statements 151
other deferred tax assets in other tax jurisdictions, partially offset by additional recognition of deferred tax assets for losses and other deductible temporary differences of previous years of (87). In 2015, the Company derecognized 0.4 billion of previously recognized deferred tax assets, out of which 0.3 billion relates to Luxembourg tax integration. The de-recognition in Luxembourg represents the net reduction in projections of future taxable income in Luxembourg driven primarily by the challenging market conditions affecting the steel industry and unfavorable foreign exchange movements, partially offset by reductions in forecasted interest expense due to the Company’s announced plans in 2016 to repay debt with proceeds from a $3 billion equity rights offering and selling its 35% shareholding in Gestamp for €875 million. The taxable income projection also includes the effect of the anticipated elimination of the current USD exposure of
Luxembourgish deferred tax assets denominated in Euro.
The 2014 net change in measurement of deferred tax assets of 306 primarily consists of tax expense of 338 due to the unrecognized part of deferred tax assets on write-downs of the value of shares of consolidated subsidiaries in Luxembourg, tax expense of 492 due to unrecognition and derecognition of other deferred tax assets, partially offset by additional recognition of deferred tax assets for losses and other deductible temporary differences of previous years of (524).
The 2013 net change in measurement of deferred tax assets of 2,067 primarily consists of tax expense of 1,031 due to the unrecognized part of deferred tax assets on write-downs of the value of shares of consolidated subsidiaries in Luxembourg, tax expense of 1,150 due to
unrecognition and derecognition of other deferred tax assets, partially offset by additional recognition of deferred tax assets for losses and other deductible temporary differences of previous years of (114).
Tax effects of foreign currency translation
The tax effects of foreign currency translation of 153, 446 and (81) at December 31, 2015, 2014 and 2013 respectively, refer mainly to deferred tax assets and liabilities of certain entities with a different functional currency than the currency applied for tax filing purposes. In 2015 the effects are mainly due to depreciation of the Euro and the Canadian dollar in relation to the U.S. dollar.
Tax credits
The tax credits of (13), (63) and (57) in 2015, 2014 and 2013 respectively are mainly
attributable to the Group’s operating subsidiaries in Brazil, Mexico and Spain. They relate to credits claimed on research and development, credits on foreign investment and tax sparing credits.
Other taxes
Other taxes mainly include withholding taxes on dividends, services, royalties and interests of 65, 26 and (45), as well as mining duties in Canada, Mexico and Ukraine of (39), 30 and 106, flat tax in Mexico of nil, nil and 5 and state tax in the United States of (21), 9 and (28) in 2015, 2014 and 2013 respectively. As mining tax involves both current (including recoveries) and deferred consequences the position can also be a benefit depending e.g. on the temporary differences movement.
Year Ended December 31,
2015 2014 2013
Tax contingencies/settlements (8) 83 295Prior period taxes 96 3 13Others (14) (16) 31Total 74 70 339
The 2015 others of 74 primarily consist of prior period adjustments for 96 related mainly to Luxembourg and Mexico.
The 2014 others of 70 primarily consist of uncertain tax provisions for 83 which mainly relate to North America.
The 2013 others of 339 primarily consists of the settlement of two tax amnesty programs in Brazil of 222 and settlement agreements as a result of tax audits in Germany of 73. 9.2 Income tax recorded directly in equity
Income tax recognized in equity for the years ended December 31, 2015, 2014 and 2013 is as follows:
2015 2014 2013
Recognized in other comprehensive income on: Deferred tax expense (benefit) Unrealized gain (loss) on derivative financial instruments 4 64 48 Recognized actuarial gain (loss) 47 (94) 155 Foreign currency translation adjustments (83) (53) (66)Total (32) (83) 41Recognized in retained earnings: Deferred tax expense - - 9Gain on sale of non-controlling interests (32) (83) 50
Others
Others consist of:
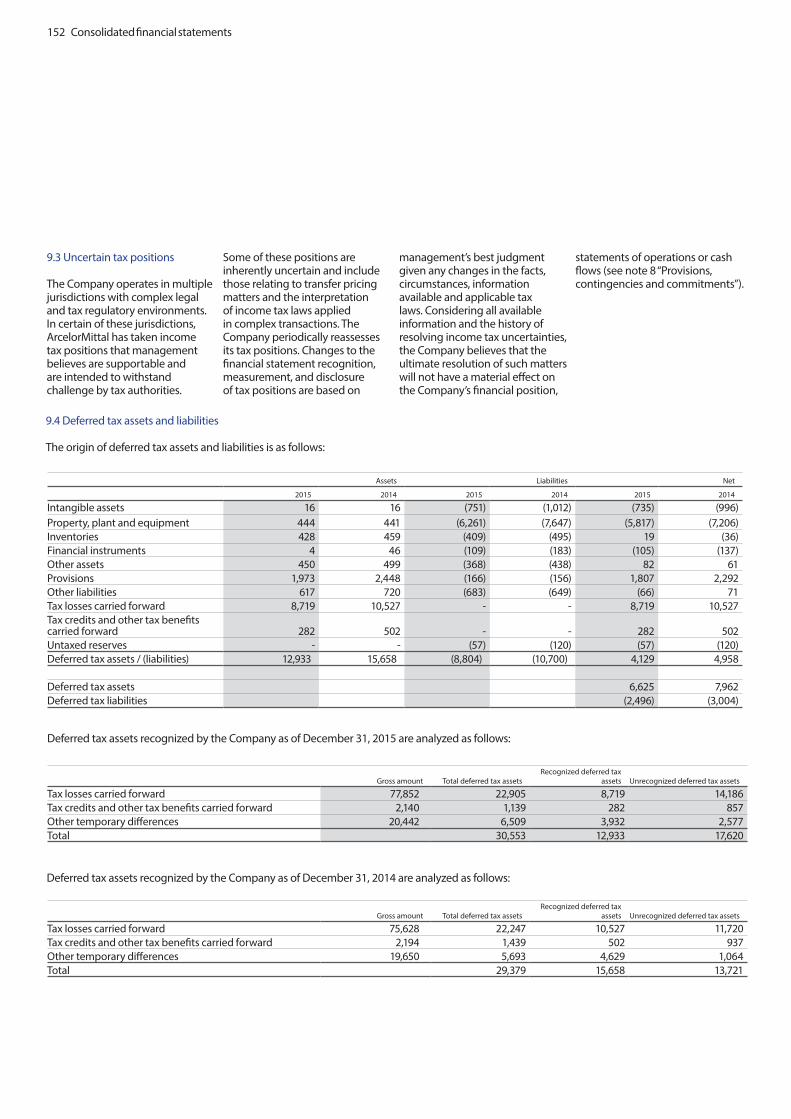
152 Consolidated financial statements
Assets Liabilities Net
2015 2014 2015 2014 2015 2014
Intangible assets 16 16 (751) (1,012) (735) (996)Property, plant and equipment 444 441 (6,261) (7,647) (5,817) (7,206)Inventories 428 459 (409) (495) 19 (36)Financial instruments 4 46 (109) (183) (105) (137)Other assets 450 499 (368) (438) 82 61Provisions 1,973 2,448 (166) (156) 1,807 2,292Other liabilities 617 720 (683) (649) (66) 71Tax losses carried forward 8,719 10,527 - - 8,719 10,527Tax credits and other tax benefits carried forward 282 502 - - 282 502Untaxed reserves - - (57) (120) (57) (120)Deferred tax assets / (liabilities) 12,933 15,658 (8,804) (10,700) 4,129 4,958
Deferred tax assets 6,625 7,962Deferred tax liabilities (2,496) (3,004)
9.3 Uncertain tax positions The Company operates in multiple jurisdictions with complex legal and tax regulatory environments. In certain of these jurisdictions, ArcelorMittal has taken income tax positions that management believes are supportable and are intended to withstand challenge by tax authorities.
Some of these positions are inherently uncertain and include those relating to transfer pricing matters and the interpretation of income tax laws applied in complex transactions. The Company periodically reassesses its tax positions. Changes to the financial statement recognition, measurement, and disclosure of tax positions are based on
management’s best judgment given any changes in the facts, circumstances, information available and applicable tax laws. Considering all available information and the history of resolving income tax uncertainties, the Company believes that the ultimate resolution of such matters will not have a material effect on the Company’s financial position,
statements of operations or cash flows (see note 8 “Provisions, contingencies and commitments”).
Deferred tax assets recognized by the Company as of December 31, 2015 are analyzed as follows:
Gross amount Total deferred tax assetsRecognized deferred tax
assets Unrecognized deferred tax assets
Tax losses carried forward 77,852 22,905 8,719 14,186 Tax credits and other tax benefits carried forward 2,140 1,139 282 857 Other temporary differences 20,442 6,509 3,932 2,577 Total 30,553 12,933 17,620
Deferred tax assets recognized by the Company as of December 31, 2014 are analyzed as follows:
Gross amount Total deferred tax assetsRecognized deferred tax
assets Unrecognized deferred tax assets
Tax losses carried forward 75,628 22,247 10,527 11,720 Tax credits and other tax benefits carried forward 2,194 1,439 502 937 Other temporary differences 19,650 5,693 4,629 1,064 Total 29,379 15,658 13,721
9.4 Deferred tax assets and liabilities
The origin of deferred tax assets and liabilities is as follows:

Consolidated financial statements 153
As of December 31, 2015, the majority of the deferred tax assets not recognized relate to tax losses carried forward attributable to various subsidiaries located in different jurisdictions (primarily France, Germany, Luxembourg, Spain and the United States) with different statutory tax rates. The amount of the total deferred tax assets is the aggregate amount of the various deferred tax assets recognized and unrecognized at the various subsidiaries and not the result of a computation with a given blended rate. The utilization of tax losses carried forward is restricted to the taxable income of the subsidiary or tax consolidation group to which it belongs. The utilization of tax losses carried forward also may be restricted by the character of the income, expiration dates and limitations on the yearly use of tax losses against taxable income.
The total amount of accumulated tax losses in Luxembourg with respect to the main tax consolidation amounts to approximately 55.4 billion as of December 31, 2015. Of this amount 24.6 billion is considered realizable, resulting in the recognition of 6.8 billion of deferred tax assets at the applicable income tax rate in Luxembourg. Under the Luxembourg tax legislation tax losses can be carried forward indefinitely and are not subject to any specific yearly loss utilization limitations. The tax losses carried forward relate primarily to tax deductible write-down charges taken on investments in shares of
consolidated subsidiaries recorded by certain of the ArcelorMittal group’s holding companies in Luxembourg. Of the total tax losses carried forward, 12.5 billion may be subject to recapture in the future if the write-downs that caused them are reversed creating taxable income unless the Company converts them to permanent through sales or other organizational restructuring activities.
The Company believes that it is probable that sufficient future taxable profits will be generated to support the recognized deferred tax asset for tax losses carried forward in Luxembourg. As part of its recoverability assessment the Company has taken into account (i) its most recent forecast approved by management and the Board of Directors, (ii) the low likelihood that the factors that have contributed to past losses in Luxembourg will recur, (iii) the fact that ArcelorMittal in Luxembourg is the main provider of funding to the Group’s consolidated subsidiaries, leading to significant amounts of taxable interest income, (iv) lower interest expense due to the Company’s announced plans in 2016 to repay debt with proceeds from a $3 billion equity rights offering and selling its 35% shareholding in Gestamp for €875 million, (v) the implementation in 2015 of an Industrial Franchising Arrangement between ArcelorMittal and numerous worldwide operating subsidiaries, (vi) the effect of the anticipated elimination of the current USD exposure of Luxembourgish
deferred tax assets denominated in Euro, and (vii) other significant and reliable sources of operational income earned from ArcelorMittal’s European and worldwide operating subsidiaries for centralized distribution and procurement activities performed in Luxembourg. In performing the assessment, the Company estimates at which point in time its earnings projections are no longer reliable, and thus taxable profits are no longer probable. Accordingly, the Company has established consistent forecast periods for its different income streams for estimating probable future taxable profits, against which the unused tax losses can be utilized in Luxembourg.
At December 31, 2015, based upon the level of historical taxable income and projections for future taxable income over the periods in which the deductible temporary differences are anticipated to reverse, management believes it is probable that ArcelorMittal will realize the benefits of the deferred tax assets of 6,625 recognized. The amount of future taxable income required to be generated by ArcelorMittal’s subsidiaries to utilize the deferred tax assets of 6,625 is at least 24,441. Historically, the Company has been able to generate taxable income in sufficient amounts and believes that it will generate sufficient levels of taxable income in coming years to permit the Company to utilize tax benefits associated with tax losses carried forward and other deferred tax assets that have been recognized in its consolidated
financial statements. In the event that a history of recent losses is present, the Company relied on convincing other evidence such as the character of (historical) losses and tax planning to support the deferred tax assets recognized. For the period ended December 31, 2015 ArcelorMittal recorded approximately 37 (December 31, 2014: 11) of deferred income tax liabilities in respect of deferred taxation that would arise if temporary differences on investments in subsidiaries, associates and interests in joint ventures were to be realized in the foreseeable future. No deferred tax liability has been recognized in respect of other temporary differences on investments in subsidiaries, associates and interests in joint ventures because the Company is in a position to control the timing of the reversal of the temporary difference and it is probable that such differences will not reverse in the foreseeable future. The amount of these unrecognized deferred tax liabilities is approximately 456.
9.5 Tax losses, tax credits and other tax benefits carried forward
At December 31, 2015, the Company had total estimated tax losses carried forward of 77,852.
Such amount includes net operating losses of 6,297 primarily related to subsidiaries in Canada, Kazakhstan, Mexico, the Netherlands and the United States, which expire as follows:
Year expiring Recognized Unrecognized Total
2016 26 2 28 2017 70 14 84 2018 73 9 82 2019 12 10 22 2020 63 44 107 2021 - 2035 1,321 4,653 5,974 Total 1,565 4,732 6,297
The remaining tax losses carried forward for an amount of 71,555 (of which 28,234 are recognized and 43,321 are unrecognized) are carried forward for unlimited period of time and primarily relate to the Company’s operations in Brazil, France, Germany, Luxembourg and Spain.
At December 31, 2015, the Company also had total estimated tax credits and other tax benefits carried forward of 2,140.

154 Consolidated financial statements
Such amount includes tax credits and other tax benefits of 910 primarily attributable to subsidiaries in Belgium, Spain and the United States of which 179 recognized and 731 unrecognized, which expire as follows:
Year expiring Recognized Unrecognized Total
2016 1 73 74 2017 - 80 80 2018 - 110 110 2019 - 1 1 2020 - 2 2 2021 - 2035 178 465 643 Total 179 731 910
Note 10: Equity
10.1 Share details
The Company’s shares consist of the following:
December 31, 2013 Movement in year December 31, 2014 Movement in year * December 31, 2015
Issued shares 1,665,392,222 - 1,665,392,222 - 1,665,392,222Treasury shares (11,792,674) 774,261 (11,018,413) 2,437,323 (8,581,090)Total outstanding shares 1,653,599,548 774,261 1,654,373,809 2,437,323 1,656,811,132* refer to note 10.2 on the mandatorily convertible notes
Following the completion of an offering of ordinary shares on January 14, 2013, ArcelorMittal increased share capital by €455 million (608) from €6,428 million (9,403) to €6,883 million (10,011) through the issuance of 104,477,612 new shares fully paid up. The aggregate number of shares issued and fully paid up increased to 1,665,392,222.
On January 15, 2016, following the maturity of the mandatorily convertible notes (see 10.2 below), the Company increased share capital by €570 million (622) from €6,883 million (10,011) to €7,453 million (10,633) through the issuance of 137,967,116 new shares fully paid up. The aggregate number of shares issued and fully paid up increased to 1,803,359,338.
On February 5, 2016, ArcelorMittal announced a proposed capital increase of $3 billion subject to shareholder approval by way of a
rights issue structured as non-statutory preferential subscription rights for ArcelorMittal shareholders. The Mittal family has committed to take up its pro-rata entitlement corresponding to approximately $1.1 billion. ArcelorMittal has entered into a standby underwriting commitment with three banks acting as joint global coordinators, pursuant to which the latter undertook to underwrite the capital increase for the remaining amount, subject to customary conditions.
Authorized shares
At the Extraordinary General Meeting held on May 8, 2012, the shareholders approved an increase of the authorized share capital of ArcelorMittal by €643 million represented by 156 million shares, or approximately 10% of ArcelorMittal’s outstanding capital. Following this approval,
which is valid for five years, the total authorized share capital was €7.7 billion represented by 1,773, 091,461 shares without nominal value.
At the Extraordinary General Meeting held on May 8, 2013, the shareholders approved an increase of the authorized share capital of ArcelorMittal by €524 million represented by 223 million shares, or approximately 8% of ArcelorMittal’s outstanding capital. Following this approval, which is valid for five years, the total authorized share capital was €8.2 billion represented by 1,995,857,213 shares without nominal value.
10.2 Equity instruments and hybrid instruments
Option premium on treasury shares
Following the repayment of the
800 Convertible Senior Notes on May 15, 2014, the Company reclassified from reserves to retained earnings premiums paid for an amount of 435 (309 net of tax) with respect to expired USD denominated call options on treasury shares acquired on December 18, 2010 in order to hedge its obligations arising from the potential conversion of the 800 Convertible Senior Notes into ArcelorMittal shares.
Subordinated perpetual capital securities
Subordinated perpetual capital securities issued by the Company are classified as equity as the Company has no contractual obligation to redeem the securities and coupon payment may be deferred under certain circumstances. Coupons become payable whenever the Company makes dividend payments. Coupon accruals are considered
The remaining tax credits and other tax benefits for an amount of 1,230 (of which 200 are recognized and 1,030 are unrecognized) are indefinite and primarily attributable to the Company’s operations in Belgium and Spain.
Tax losses, tax credits and other tax benefits carried forward are denominated in the currency of the countries in which the respective subsidiaries are located and operate. Fluctuations in currency exchange rates could reduce the U.S. dollar equivalent value of these tax losses carried forward in future years.

Consolidated financial statements 155
in the determination of earnings for the purpose of calculating earnings per share.
On September 28, 2012, the Company issued subordinated perpetual capital securities for a nominal amount of 650 and a coupon of 8.75%, which reset periodically over the life of the securities, with the first reset after five years and subsequently every five years thereafter. A step up in interest of 0.25% would have occurred on the second reset date and a subsequent step up of 0.75% (cumulative with the initial 0.25%) fifteen years later. The Company was entitled to call the securities in five years, ten years and on subsequent coupon payment dates. As the Company had no obligation to redeem the securities and the coupon payment may have been deferred by the Company under certain circumstances, it classified the net proceeds from the issuance of subordinated perpetual capital securities (642 net of transaction costs) as equity. Coupon payments to holders of subordinated perpetual capital securities in 2013 and 2014 were 57 and 22, respectively.
On February 20, 2014, ArcelorMittal redeemed all of its outstanding 650 subordinated perpetual capital securities following the occurrence of a “Ratings Agency Event”, as defined in the terms of the securities. The notes were redeemed for 657, at a redemption price of 101% of the principal amount, plus accrued coupon of 22.
Mandatorily convertible notes
Mandatorily convertible notes issued by the Company are accounted for as compound financial instruments. The net present value of the coupon payments at issuance date is recognized as long-term obligation and carried at amortized cost. The value of the equity component is determined based upon the difference of the cash proceeds received from the issuance of the notes and the net present value of the financial liability component on the date of issuance and is included in equity.
On January 16, 2013, ArcelorMittal issued mandatorily convertible subordinated notes (“MCNs”) with net proceeds of 2,222. The notes have a maturity of 3 years, were issued at 100% of the principal amount and are mandatorily converted into ordinary shares of ArcelorMittal at maturity unless converted earlier at the option of the holders or ArcelorMittal or upon specified events in accordance with the terms of the MCNs. The MCNs pay a coupon of 6.00% per annum, payable quarterly in arrears. The minimum conversion price of the MCNs was set at $16.75, corresponding to the placement price of shares in the concurrent ordinary shares offering as described above, and the maximum conversion price was set at approximately 125% of the minimum conversion price (corresponding to $20.94). The minimum and maximum conversion prices are subject to adjustment upon the occurrence of certain events, and were, as of December 31, 2015, $15.98 and $19.98, respectively. The
Company determined the notes met the definition of a compound financial instrument and as such determined the fair value of the financial liability component of the bond was 384 on the date of issuance and recognized it as long-term obligation. The value of the equity component of 1,838 was determined based upon the difference of the cash proceeds received from the issuance of the bond and the fair value of the financial liability component on the date of issuance and is included in equity.
During the fourth quarter of 2015, the Company delivered 2,275,026 treasury shares against 1,817,869 notes converted at the option of their holders. As a result of such voluntary conversions, the carrying amount of MCNs decreased by 38. On January 15, 2016, upon final maturity of the MCNs, the remaining outstanding 88,182,131 notes were converted into 137,967,116 new common shares. Accordingly, share capital and additional paid-in-capital increased by 622 and 1,178, respectively and the carrying amount of MCNs decreased by 1,800.
Mandatory convertible bonds
On December 28, 2009, the Company issued through Hera Ermac, a wholly-owned subsidiary, 750 unsecured and unsubordinated bonds mandatorily convertible into preferred shares of such subsidiary. The bonds were placed privately with a Luxembourg affiliate of Crédit Agricole (formerly Calyon) and are not listed. The Company has the option to call
the mandatory convertible bonds until ten business days before the maturity date. Hera Ermac invested the proceeds of the bonds issuance and an equity contribution by the Company in notes issued by subsidiaries of the Company linked to the values of shares of Erdemir and China Oriental Group Company Ltd (“China Oriental”). On April 20, 2011, the Company signed an agreement for an extension of the conversion date of the mandatory convertible bonds to January 31, 2013. On September 27, 2011, the Company increased the mandatory convertible bonds from 750 to 1,000.
On December 18, 2012, the Company signed an agreement for an extension of the conversion date of the mandatory convertible bonds to January 31, 2014. The other main features of the mandatory convertible bonds remained unchanged. The Company determined that this transaction led to the extinguishment of the existing compound instrument and the recognition of a new compound instrument including non-controlling interests for 949 (net of tax and fees) and debt for 49. The difference between the carrying amount of the previous instrument and the fair value of the new instrument amounted to 65 and was recognized as financing costs in the consolidated statements of operations.

156 Consolidated financial statements
On January 17, 2014, the conversion date of the 1,000 mandatory convertible bonds was extended from January 31, 2014 to January 29, 2016. The other main features of the mandatory convertible bonds remained unchanged. The Company determined that this transaction led to the extinguishment of the existing compound instrument and the recognition of a new compound instrument including non-controlling interests for 902 (net of tax and fees) and debt for 91. The difference between the carrying amount of the previous instrument and the fair value of the new instrument amounted to 49 and was recognized as financing costs in the consolidated statements of operations.
On November 20, 2015, the conversion date of the 1,000 mandatory convertible bonds was extended from January 29, 2016 to January 31, 2018. The other main features of the mandatory convertible bonds remained unchanged. The Company determined that this transaction led to the extinguishment of the existing compound instrument and the recognition of a new compound instrument including non-controlling interests for 880 (net of cumulative tax and fees) and debt for 106. The difference between the carrying amount of the previous instrument and the fair value of the new instrument amounted to 79 and was recognized as financing costs in the consolidated statements of operations.
10.3 Earnings per common share
Basic earnings per common share is computed by dividing net income (loss) by the weighted average number of common shares outstanding during the year.
Net income (loss) attributable to ordinary shareholders takes into consideration dividend rights of preferred shareholders such as holders of subordinated perpetual capital securities. Diluted earnings per share is computed by dividing income (loss) available to equity holders by the weighted average number of common shares and potential common shares from share unit plans and outstanding stock options as well as potential common shares from the
conversion of certain convertible bonds whenever the conversion results in a dilutive effect.
The following table provides the numerators and a reconciliation of the denominators used in calculating basic and diluted earnings per common share for the years ended December 31, 2015, 2014 and 2013:
Year Ended December 31, 2015 Year Ended December 31, 2014 Year Ended December 31, 2013
Net (loss) income attributable to equity holders of the parent (7,946) (1,086) (2,545)Interest assumed on the coupon and the premium for early redemption for subordinated perpetual capital securities - (14) (57)Net (loss) income considered for the purposes of basic and diluted earnings per share (7,946) (1,100) (2,602)
Weighted average common shares outstanding (in millions) for the purposes of basic and diluted earnings per share 1,795 1,791 1,780
For the purpose of calculating earnings per common share, diluted weighted average common shares outstanding excludes 8 million, 7 million and 5 million potential common shares from share unit plans and 17 million, 20 million and 22 million potential common shares from stock options outstanding for
the years ended December 31, 2015, 2014 and 2013, respectively, because such share unit plans and stock options are anti-dilutive.
10.4 Dividends
Calculations to determine the amounts available for dividends are based on ArcelorMittal’s
financial statements (“ArcelorMittal SA”) which are prepared in accordance with IFRS, as endorsed by the European Union. ArcelorMittal SA has no significant manufacturing operations of its own. Accordingly, it can only pay dividends or distributions to the extent it is entitled to receive cash dividend distributions
from its subsidiaries’ recognized gains, from the sale of its assets or records share premium from the issuance of common shares. Dividends are declared in U.S. dollars and are payable in either U.S. dollars or in euros.
Description Approved by
Dividend per share (in $) Payout date Total (in millions of $)
Dividend for financial year 2012 Annual General Shareholders’ meeting on May 8, 2013 0.20 July 15, 2013 332Dividend for financial year 2013 Annual General Shareholders’ meeting on May 8, 2014 0.20 July 15, 2014 333Dividend for financial year 2014 Annual General Shareholders’ meeting on May 5, 2015 0.20 June 15, 2015 331
Given the challenging global economic conditions and the Company’s priority to deleverage, ArcelorMittal’s Board of Directors proposed that no dividend be paid for financial year 2015. This proposal is subject to shareholder approval at the next annual general meeting on May 4, 2016.
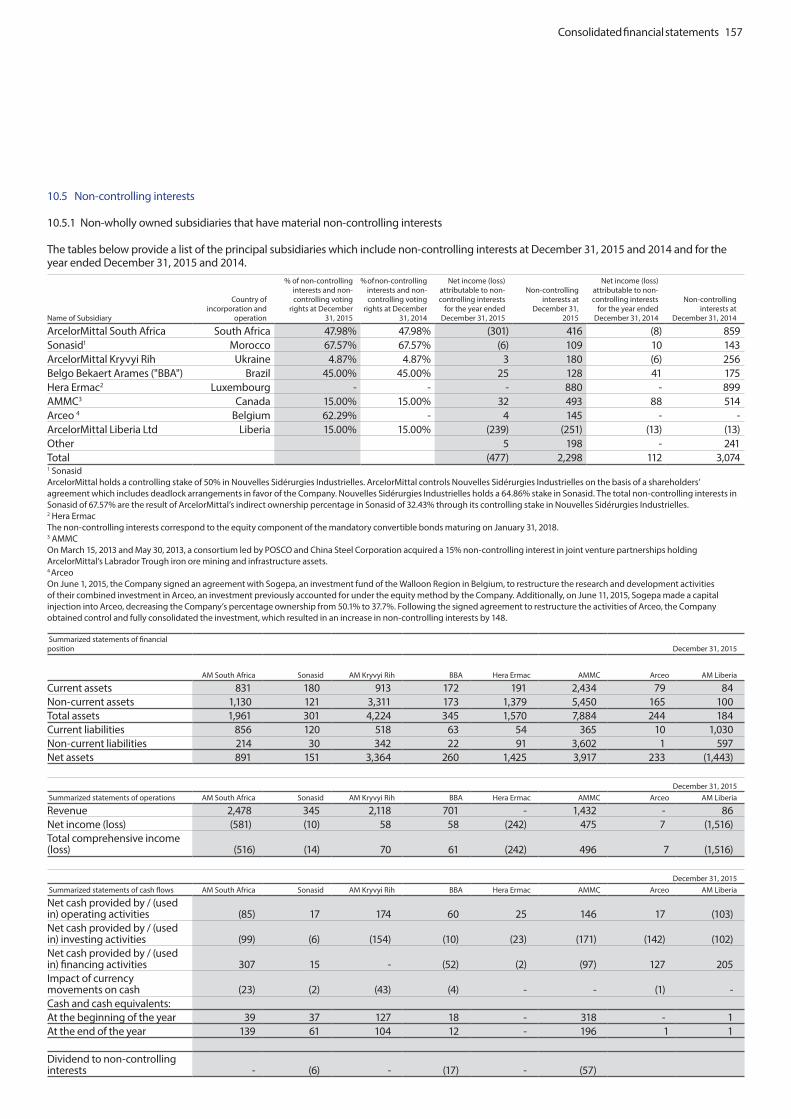
Consolidated financial statements 157
Name of Subsidiary
Country of incorporation and
operation
% of non-controlling interests and non-controlling voting
rights at December 31, 2015
% of non-controlling interests and non-controlling voting
rights at December 31, 2014
Net income (loss) attributable to non-controlling interests
for the year ended December 31, 2015
Non-controlling interests at
December 31, 2015
Net income (loss) attributable to non-controlling interests
for the year ended December 31, 2014
Non-controlling interests at
December 31, 2014
ArcelorMittal South Africa South Africa 47.98% 47.98% (301) 416 (8) 859Sonasid1 Morocco 67.57% 67.57% (6) 109 10 143ArcelorMittal Kryvyi Rih Ukraine 4.87% 4.87% 3 180 (6) 256Belgo Bekaert Arames ("BBA") Brazil 45.00% 45.00% 25 128 41 175Hera Ermac2 Luxembourg - - - 880 - 899AMMC3 Canada 15.00% 15.00% 32 493 88 514Arceo 4 Belgium 62.29% - 4 145 - -ArcelorMittal Liberia Ltd Liberia 15.00% 15.00% (239) (251) (13) (13)Other 5 198 - 241Total (477) 2,298 112 3,0741 Sonasid ArcelorMittal holds a controlling stake of 50% in Nouvelles Sidérurgies Industrielles. ArcelorMittal controls Nouvelles Sidérurgies Industrielles on the basis of a shareholders’ agreement which includes deadlock arrangements in favor of the Company. Nouvelles Sidérurgies Industrielles holds a 64.86% stake in Sonasid. The total non-controlling interests in Sonasid of 67.57% are the result of ArcelorMittal’s indirect ownership percentage in Sonasid of 32.43% through its controlling stake in Nouvelles Sidérurgies Industrielles. 2 Hera Ermac The non-controlling interests correspond to the equity component of the mandatory convertible bonds maturing on January 31, 2018. 3 AMMC On March 15, 2013 and May 30, 2013, a consortium led by POSCO and China Steel Corporation acquired a 15% non-controlling interest in joint venture partnerships holding ArcelorMittal’s Labrador Trough iron ore mining and infrastructure assets. 4 Arceo On June 1, 2015, the Company signed an agreement with Sogepa, an investment fund of the Walloon Region in Belgium, to restructure the research and development activities of their combined investment in Arceo, an investment previously accounted for under the equity method by the Company. Additionally, on June 11, 2015, Sogepa made a capital injection into Arceo, decreasing the Company’s percentage ownership from 50.1% to 37.7%. Following the signed agreement to restructure the activities of Arceo, the Company obtained control and fully consolidated the investment, which resulted in an increase in non-controlling interests by 148.
Summarized statements of financial position December 31, 2015
AM South Africa Sonasid AM Kryvyi Rih BBA Hera Ermac AMMC Arceo AM Liberia
Current assets 831 180 913 172 191 2,434 79 84Non-current assets 1,130 121 3,311 173 1,379 5,450 165 100Total assets 1,961 301 4,224 345 1,570 7,884 244 184Current liabilities 856 120 518 63 54 365 10 1,030Non-current liabilities 214 30 342 22 91 3,602 1 597Net assets 891 151 3,364 260 1,425 3,917 233 (1,443) December 31, 2015 Summarized statements of operations AM South Africa Sonasid AM Kryvyi Rih BBA Hera Ermac AMMC Arceo AM Liberia
Revenue 2,478 345 2,118 701 - 1,432 - 86Net income (loss) (581) (10) 58 58 (242) 475 7 (1,516)Total comprehensive income (loss) (516) (14) 70 61 (242) 496 7 (1,516) December 31, 2015 Summarized statements of cash flows AM South Africa Sonasid AM Kryvyi Rih BBA Hera Ermac AMMC Arceo AM Liberia
Net cash provided by / (used in) operating activities (85) 17 174 60 25 146 17 (103)Net cash provided by / (used in) investing activities (99) (6) (154) (10) (23) (171) (142) (102)Net cash provided by / (used in) financing activities 307 15 - (52) (2) (97) 127 205Impact of currency movements on cash (23) (2) (43) (4) - - (1) -Cash and cash equivalents:At the beginning of the year 39 37 127 18 - 318 - 1At the end of the year 139 61 104 12 - 196 1 1
Dividend to non-controlling interests - (6) - (17) - (57)
10.5 Non-controlling interests
10.5.1 Non-wholly owned subsidiaries that have material non-controlling interests
The tables below provide a list of the principal subsidiaries which include non-controlling interests at December 31, 2015 and 2014 and for the year ended December 31, 2015 and 2014.
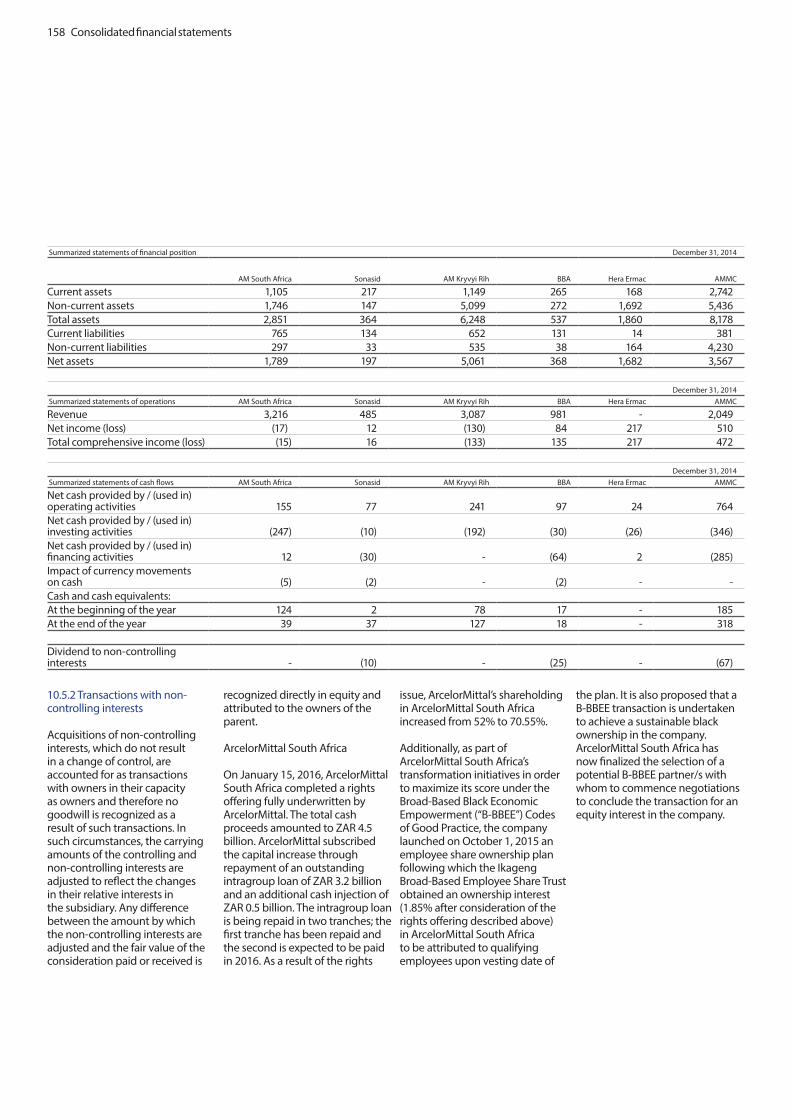
158 Consolidated financial statements
Summarized statements of financial position December 31, 2014
AM South Africa Sonasid AM Kryvyi Rih BBA Hera Ermac AMMC
Current assets 1,105 217 1,149 265 168 2,742Non-current assets 1,746 147 5,099 272 1,692 5,436Total assets 2,851 364 6,248 537 1,860 8,178Current liabilities 765 134 652 131 14 381Non-current liabilities 297 33 535 38 164 4,230Net assets 1,789 197 5,061 368 1,682 3,567 December 31, 2014 Summarized statements of operations AM South Africa Sonasid AM Kryvyi Rih BBA Hera Ermac AMMC
Revenue 3,216 485 3,087 981 - 2,049Net income (loss) (17) 12 (130) 84 217 510Total comprehensive income (loss) (15) 16 (133) 135 217 472 December 31, 2014 Summarized statements of cash flows AM South Africa Sonasid AM Kryvyi Rih BBA Hera Ermac AMMC
Net cash provided by / (used in) operating activities 155 77 241 97 24 764Net cash provided by / (used in) investing activities (247) (10) (192) (30) (26) (346)Net cash provided by / (used in) financing activities 12 (30) - (64) 2 (285)Impact of currency movements on cash (5) (2) - (2) - -Cash and cash equivalents:At the beginning of the year 124 2 78 17 - 185At the end of the year 39 37 127 18 - 318
Dividend to non-controlling interests - (10) - (25) - (67)
10.5.2 Transactions with non-controlling interests
Acquisitions of non-controlling interests, which do not result in a change of control, are accounted for as transactions with owners in their capacity as owners and therefore no goodwill is recognized as a result of such transactions. In such circumstances, the carrying amounts of the controlling and non-controlling interests are adjusted to reflect the changes in their relative interests in the subsidiary. Any difference between the amount by which the non-controlling interests are adjusted and the fair value of the consideration paid or received is
recognized directly in equity and attributed to the owners of the parent.
ArcelorMittal South Africa
On January 15, 2016, ArcelorMittal South Africa completed a rights offering fully underwritten by ArcelorMittal. The total cash proceeds amounted to ZAR 4.5 billion. ArcelorMittal subscribed the capital increase through repayment of an outstanding intragroup loan of ZAR 3.2 billion and an additional cash injection of ZAR 0.5 billion. The intragroup loan is being repaid in two tranches; the first tranche has been repaid and the second is expected to be paid in 2016. As a result of the rights
issue, ArcelorMittal’s shareholding in ArcelorMittal South Africa increased from 52% to 70.55%.
Additionally, as part of ArcelorMittal South Africa’s transformation initiatives in order to maximize its score under the Broad-Based Black Economic Empowerment (“B-BBEE”) Codes of Good Practice, the company launched on October 1, 2015 an employee share ownership plan following which the Ikageng Broad-Based Employee Share Trust obtained an ownership interest (1.85% after consideration of the rights offering described above) in ArcelorMittal South Africa to be attributed to qualifying employees upon vesting date of
the plan. It is also proposed that a B-BBEE transaction is undertaken to achieve a sustainable black ownership in the company. ArcelorMittal South Africa has now finalized the selection of a potential B-BBEE partner/s with whom to commence negotiations to conclude the transaction for an equity interest in the company.

Consolidated financial statements 159
There were no transactions with non-controlling interests in 2015. Transactions with non-controlling interests in 2014 and 2013 were as follows:2014 2013
Description ArcelorMittal Luxembourg AMMC) ArcelorMittal Liberia Total
Non-controlling interests 23 (374) (28) (402)Purchase price (selling price), net 17* (1,100)* (24) (1,124)Adjustment to equity attributable to the equity holders of the parent 6 726 (4) 722* Purchase price (selling price) was settled in cashTransactions with non-controlling interests include also the mandatory convertible bonds (see note 10.2).
ArcelorMittal Luxembourg
On November 20, 2014, the Company acquired the remaining 0.14% of non-controlling interests in ArcelorMittal Luxembourg following a mandatory squeeze out procedure. The total consideration paid was 17. The Company recorded an increase of 6 directly in equity.
ArcelorMittal Liberia
On September 10, 2013, non-controlling interests in ArcelorMittal Liberia (Mining segment) decreased from 30% to 15% following a capital increase in which the government of Liberia was diluted. As a result of the dilution, the Company recorded a decrease of 4 directly in equity.
ArcelorMittal Mines Canada
On March 15, 2013 and May 30, 2013, a consortium led by POSCO, China Steel Corporation (“CSC”) and certain financial investors, completed the acquisition of a 15% interest in the joint venture partnerships holding ArcelorMittal’s Labrador Trough iron ore mining and infrastructure assets for total consideration of 1,100 in cash settled in two installments of 810 and 290 for an 11.05% interest and a 3.95% interest, respectively. As part of the transaction, POSCO and CSC entered into long-term iron ore off-take agreements proportionate to their joint venture interests. Upon completion of the sale, the Company recognized non-controlling interests for 374 and an increase of 726 directly in equity.
Note 11: Related parties
Transactions with related parties, including associates and joint ventures of the Company, were as follows:
11.1 Sales and trade receivables Year ended December 31, December 31,
Sales Trade receivables Transactions Category 2015 2014 2013 2015 2014
Calvert1 Joint Venture 1,271 1,136 - 6 28Gonvarri Group Associate 1,233 1,456 1,364 32 91Macsteel Group Joint Venture 516 579 497 22 25I/N Kote L.P. Joint Venture 377 412 432 24 -Bamesa Group Associate 367 416 397 7 60AMCDI2 Joint Venture 310 - - 2 - Gestamp Group Associate 310 297 281 2 35CLN Group Associate 310 563 359 3 63Borcelik Celik Sanayii Ticaret A.S. Associate 305 516 435 4 2WDI Group Associate 181 238 207 - - Aperam Other 165 190 155 22 25AM RZK3 Joint Venture 148 - - 29 - Stalprodukt S.A. Associate 146 180 191 16 38Tameh4 Joint Venture 63 5 - 3 9Stalprofil S.A. Associate 53 82 74 4 12ArcelorMittal BE Group SSC AB Joint Venture 52 59 52 2 3DHS Group Associate 38 33 57 7 7Consolidated Wire Industries Limited Associate 34 50 40 1 -ArcelorMittal Algérie Spa5 Asset held for sale 19 93 - - 1Uttam Galva Steels Limited Associate - 27 9 - 11Other 226 274 220 30 59Total 6,124 6,606 4,770 216 4691 The joint venture Calvert LLC was acquired on February 26, 2014 (see note 2).2 The joint venture ArcelorMittal CLN Distribuzione Italia S.r.l. (“AMCDI”) was established on March 30, 2015 (see note 2).3 The joint venture ArcelorMittal RZK Celik Servis Merkezi Sanayi ve Ticaret Anonim Sirketi (“AM RZK”) was established on February 26, 2015 (see note 2).4 The joint venture Tameh was acquired on December 11, 2014 (see note 2).5 ArcelorMittal Algérie Spa became an associate on December 17, 2013 and is classified as held for sale at December 31, 2015 (see note 2).

160 Consolidated financial statements
11.2 Purchases and trade payables
Year ended December 31, December 31,Purchases Payables
Transactions Category 2015 2014 2013 2015 2014
Tameh1 Joint Venture 245 12 - 58 19Empire Iron Mining Partnership Associate 228 257 203 - - Gonvarri Group Associate 176 193 168 27 14Borcelik Celik Sanayii Ticaret A.S. Associate 165 175 165 30 37Aperam Other 131 168 113 11 34Exeltium Joint Venture 80 87 89 7 - CFL Cargo S.A. Associate 58 74 66 8 8Baycoat L.P. Joint Venture 42 43 48 5 6Vulkan Energiewirtschaft Oderbrücke GmbH Other 39 44 45 6 7Borusan Demir Delik Sanayi ve Ticaret A.S. Associate 33 34 43 2 2Alkat sp. z.o.o. Associate 32 36 34 3 3Uttam Galva Steels Limited Associate 31 65 67 - 10Steeltrack Associate 26 22 1 3 1Eko SchrottRecycling GmbH Other 24 35 34 1 3Macsteel Group Joint Venture 14 17 - - - Calvert2 Joint Venture 13 - - 32 109DHS Group Associate 1 12 45 - 1Kiswire ArcelorMittal Ltd.3 Other - 13 39 - - Other 122 68 150 63 36Total 1,460 1,355 1,310 256 2901 The joint venture Tameh was acquired on December 11, 2014 (see note 2).2 The joint venture Calvert LLC was acquired on February 26, 2014 (see note 2).3 The joint venture Kiswire ArcelorMittal Ltd. was sold in May 2014 (see note 2). Purchases include purchase transactions until May 2014.
11.3 Other transactions with related parties
At December 31, 2015, the Company had receivables from ArcelorMittal Tubular Products Al Jubail for the construction of a seamless tube mill in Saudi Arabia amounting to 99 including unsecured loans of 85 with various maturity dates ranging from 1 to 3 years.
As of December 3, 2014, AM Calvert signed a member capital expenditure loan agreement with the joint venture Calvert LLC and as of December 31, 2015, the loans amounted to 52 including accrued interest. The loans bear interest from 3% to 3.75% and have various maturity dates ranging from 1 to 28 years.
Other non-current liabilities include 42 with respect to loan payable to Baffinland Iron Mines Corporation in relation to the capital increase in Baffinland.
In May 2014 ArcelorMittal entered into a 5-year off take agreement with its joint venture Baffinland, whereby it will buy the lesser of 50% of the annual quantity of iron ore produced by Baffinland and 2 million tonnes of iron ore per year. The purchase price is referenced to the Platts IODEX 62% Fe CFR China index and until the end of 2017 ArcelorMittal will pay advances to Baffinland the equivalent of 80% of the purchase for the iron ore stockpiled by Baffinland outside the sailable season during which the iron ore can be shipped.
In May 2014, ArcelorMittal also entered into a sales contract with Baffinland whereby it agreed to act as a sales agent for all of Baffinland’s iron ore (excluding the shipments subject to the off take agreement mentioned above). In addition, until December 31, 2015, the Company agreed to advance to Baffinland the equivalent of 80% of the purchase price of the 50% of iron ore stockpiled by Baffinland outside the sailable
season up to a maximum of 1.5 million tonnes.
Transactions with related parties are mainly related to sales and purchases of raw materials and steel products.
Note 12: Principal accountant fees and services
Deloitte Audit S.à.r.l. acted as the principal independent registered public accounting firm for ArcelorMittal for the fiscal years ended December 31, 2015 and 2014. Set forth below is a breakdown of fees for services rendered in 2015 and 2014.
Audit Fees. Audit fees in 2015 and 2014 included $25.8 million and $30.5 million, respectively, for the audits of financial statements, and $0.7 million and $0.7 million in 2015 and 2014, respectively, for regulatory filings.
Audit-Related Fees. Audit-related fees in 2015 and 2014 were
$2.2 million and $1.9 million, respectively. Audit-related fees primarily include fees for employee benefit plan audits.
Tax Fees. Fees relating to tax planning, advice and compliance in 2015 and 2014 were $1.0 million and $1.5 million, respectively.
All Other Fees. Fees in 2015 and 2014 for all other services were $0.1 million and $0.3 million, respectively. All other fees relate to services not included in the first three categories.

161 Report of the réviseur d’entreprises agréé
Report of the réviseur d’entreprises agréé
To the Shareholders ofArcelorMittal Société Anonyme24-26, Boulevard d’AvranchesL-1160 LuxembourgGrand Duchy of Luxembourg
Report on the consolidated financial statements
Following our appointment by the General Meeting of the shareholders held on May 5, 2015, we have audited the accompanying consolidated financial statements of ArcelorMittal and its subsidiaries, which comprise the consolidated statement of financial position as at December 31, 2015, and the consolidated statements of operations, other comprehensive income, changes in equity and cash flows for the year then ended, and a summary of significant accounting policies and other explanatory information.
Responsibility of the Board of Directors for the consolidated financial statements
The Board of Directors is responsible for the preparation and fair presentation of these consolidated financial statements in accordance with International Financial Reporting Standards as adopted by the European Union, and for such internal control the Board of Directors determines is necessary to enable the preparation of consolidated financial statements that are free from material misstatement, whether due to fraud or error.
Responsibility of the réviseur d’entreprises agréé
Our responsibility is to express an opinion on these consolidated financial statements based on our audit. We conducted our audit in accordance with International Standards on Auditing as adopted for Luxembourg by the Commission de Surveillance du Secteur Financier. Those standards require that we comply with ethical requirements and plan and perform the audit to obtain reasonable assurance whether the consolidated financial statements are free from material misstatement.
An audit involves performing procedures to obtain audit evidence about the amounts and disclosures in the consolidated financial statements. The procedures selected depend on the réviseur d’entreprises agréé’s judgement, including the assessment of the risks of material misstatement of the consolidated financial statements, whether due to fraud or error. In making those risk assessments, the réviseur d’entreprises agréé considers internal control relevant to the entity’s preparation and fair presentation of the consolidated financial statements in order to design audit procedures that are appropriate in the circumstances, but not for the purpose of expressing an opinion on the effectiveness of the entity’s internal control. An audit also includes evaluating the appropriateness of accounting policies used and the reasonableness of accounting estimates made by the Board of Directors, as well as evaluating the overall presentation of the consolidated financial statements.
We believe that the audit evidence we have obtained is sufficient and appropriate to provide a basis for our audit opinion.
Opinion
In our opinion, the consolidated financial statements give a true and fair view of the consolidated financial position of ArcelorMittal and its subsidiaries as of December 31, 2015, and of its consolidated financial performance and its consolidated cash flows for the year then ended in accordance with International Financial Reporting Standards as adopted by the European Union.
Report on other legal and regulatory requirements
The consolidated management report, which is the responsibility of the Board of Directors, is consistent with the consolidated financial statements.
For Deloitte Auditsociété à responsabilité limitéeCabinet de révision agréé
Vafa Moayed, Réviseur d’entreprises agrééPartner
February 23, 2016560, rue de NeudorfL-2220 Luxembourg

162 Financial statements
Financial statements of ArcelorMittal parent company

Management report 163
Management report: Please refer to pages 2 to 64 except for the two following updates on recent developments.
• On March 11, 2016, ArcelorMittal announced the terms of a $3 billion capital increase by way of the issuance of 1,803,359,338 rights at a ratio of 7 shares for 10 rights following the adoption of enabling resolutions by the extraordinary general meeting of shareholders on March 10, 2016. The rights issue for an aggregate of 1,262,351,531 shares is structured as non-statutory preferential subscription rights for ArcelorMittal shareholders. The Mittal family has committed to take up its pro-rata 37.38% entitlement corresponding to approximately $1.1 billion. ArcelorMittal has entered into a standby underwriting commitment with different banks acting as joint global coordinators, pursuant to which the latter undertook to underwrite the capital increase for the remaining amount, subject to customary conditions. Subscription price of €2.20 per share represents a 35.3% discount to the theoretical ex-rights price, based on the closing price of ArcelorMittal’s shares on Euronext Amsterdam on March 10, 2016. Rights exercise periods run from March 15, 2016 until March 29, 2016 for rights held via book entry in Depositary Trust Company (“DTC”) or in the New York rights register and March 30, 2016 for rights held in the European clearing systems. Delivery of the new shares pursuant to rights held through the European clearing systems and in the European rights register is expected to take place on or about April 8, 2016. Delivery of the new shares to holders whose rights are held via book entry in DTC or directly on the New York rights register is expected to take place on or about April 11, 2016.
• On March 10, 2016, at the extraordinary general meeting, the shareholders approved a decrease of the authorized share capital of the Company by €8,049 million though a reduction of the accounting par value per share to €0.10 and a subsequent increase by €3 billion. Following this approval, which is valid for five years, the total authorized share capital was €3,200 million represented by 31,995,857,213 shares without par value. Following the extraordinary general meeting, ArcelorMittal also decreased share capital by €7,273 (10,376) from €7,453 (10,633) to €180 (257) through a reduction of the accounting par value per share to €0.10 without any distribution to shareholders, the balance being allocated to additional paid-in capital. The aggregate number of shares issued and fully paid up amounts to 1,803,359,338. The ordinary shares do not have a par value.

164 Management report
Chief executive officer and chief financial officer’s responsibility statement
We confirm, to the best of our knowledge, that:
1. the financial statements of ArcelorMittal parent company presented in this Report and prepared in conformity with International Financial Reporting Standards as issued by the International Accounting Standards Board and as adopted by the European Union, give a true and fair view of the assets, liabilities, financial position, profit or loss of ArcelorMittal; and
2. the management report includes a fair review of the development and performance of the business and position of ArcelorMittal and undertakings included within the consolidation taken as a whole, together with a description of the principal risks and uncertainties they face.
By order of the Board of Directors
Chief executive officer
Lakshmi N. Mittal
March 23, 2016
Chief financial officer
Aditya Mittal
March 23, 2016

Financial statements 165
Assets December 31, 2015 December 31, 2014Current assets:Cash and cash equivalents (note 4) 2,602 2,266Restricted cash (note 4) - 23Current loans to related parties (note 11) 1,219 1,286Prepaid expenses and other current assets, including 1,217 and 567 with related parties at December 31, 2015 and 2014, respectively (notes 5 and 11) 1,262 756Total current assets 5,083 4,331Non-current assets:Intangible assets (note 6) 30 38Property, plant and equipment (note 7) 3 8Investments in subsidiaries (note 8) 42,392 75,052Investments in associates, joint ventures and other investments (note 9) 612 1,119Non-current loans to related parties (note 11) 8,963 11,614Deferred tax assets (note 18) 6,803 7,898Other assets (note 10) 118 115Total non-current assets 58,921 95,844Total assets 64,004 100,175
Liabilities and equity December 31, 2015 December 31, 2014Current liabilitiesShort-term debt and current portion of long-term debt (note 12) 1,769 1,097Current loans from related parties (note 11) 3,216 4,768Accrued expenses and other liabilities, including 502 and 635 with related parties at December 31, 2015 and 2014, respectively (notes 11 and 19) 1,032 1,208Total current liabilities 6,017 7,073Non-current liabilities:Long-term debt, net of current portion (note 12) 16,794 16,349Non- current loans from related parties (note 11) 5,767 7,334Deferred employee benefits (note 22) 17 20Other long-term obligations (note 20) 26 238Total non-current liabilities 22,604 23,941Total liabilities 28,621 31,014Commitments and contingencies (notes 21 and 23)Equity : (note 14)Common shares 10,011 10,011Treasury shares (11) (20)Additional paid-in capital 19,291 19,255Mandatorily convertible notes 1,800 1,838Retained earnings 3,229 37,055Reserves 62 102Legal reserve 1,001 920Total equity 35,383 69,161Total liabilities and equity 64,004 100,175
The accompanying notes are an integral part of these financial statements.
ArcelorMittalStatements of financial position(millions of U.S. dollars, except share and per share data)

166 Financial statements
ArcelorMittalStatements of operations and statements of other comprehensive income(millions of U.S. dollars, except share and per share data)
Year ended December 31, 2015
Year ended December 31, 2014
Income from industrial franchise agreement fees (note 11) 841 -General and administrative expenses, including 959 and 630 with related parties in 2015 and 2014 (notes 11 and 15) (1,071) (614)Operating loss (230) (614)Income from subsidiaries and associates (note 17) 5,999 2,031Impairment of investments (notes 8 and 9) (34,398) (99)Impairment of loans (note 11) (1,656) -Financing costs - net, including 394 and 588 from related parties in 2015 and 2014, respectively (notes 11 and 16) (3,082) (1,436)Loss before taxes (33,367) (118)Income tax (expense) benefit (note 18) (47) 606Net income (loss) (33,414) 488
Year ended December 31, 2015
Year ended December 31, 2014
Earnings (loss) per common share (in U.S. dollars) Basic and diluted (4.43) (0.61)Weighted average ordinary shares outstanding (in millions) Basic and diluted 1,795 1,791
Year ended December 31, 2015
Year ended December 31, 2014
Net income (loss) (33,414) 488Items that can be recycled to the statements of operationsAvailable-for-sale investments:Gain (loss) arising during the period (39) 113Reclassification adjustments for loss (gain) included in the statements of operations - (12)
(39) 101Items that cannot be recycled to the statements of operationsEmployee benefitsRecognized actuarial (losses) gains (1) 2Other comprehensive income (loss) (40) 103Total comprehensive income (loss) (33,454) 591
The accompanying notes are an integral part of these financial statements.

Financial statements 167
Reserves
Items that can be recycled to the statements of operations
Items that cannot be
recycled to the statements of
operations
Shares 1.2 Share capitalTreasury
shares
Subordinated perpetual
capital securities
Mandatorily convertible
notes
Additional paid-in capital
Retained earnings Legal reserve
Unrealized gains (losses) on available-
for-sale financial assets
Unrealized gains (losses) on derivative
financial instruments
Recognized actuarial
(losses) gains Total Equity
Balance at December 31, 2013 1,665 10,011 (21) 650 1,838 19,271 37,218 920 - (309) (1) 69,577Net income (loss) - - - - - - 488 - - - - 488Other comprehensive income (loss)
- - - - - - - - 101 - 2 103
Total comprehensive income (loss)
- - - - - - 488 - 101 - 2 591
Recognition of share-based payments (note 14)
- - 16 - - (16) 24 - - - - 24
Redemption of subordinated perpetual capital securities (note 14)
- - - (650) - - (7) - - - - (657)
Option premiums on treasury shares (note 14)
- - - - - - (309) - - 309 - -
Acquisition of treasury shares - - (15) - - - - - - - (15)Dividend (note 14) - - - - - - (333) - - - - (333)Coupon on subordinated perpetual capital securities
- - - - - - (22) - - - - (22)
Directors' fees - - - - - - (2) - - - - (2)Other - - - - - - (2) - - - - (2)Balance at December 31, 2014 1,665 10,011 (20) - 1,838 19,255 37,055 920 101 - 1 69,161Net income (loss) - - - - - - (33,414) - - - - (33,414)Other comprehensive income (loss)
- - - - - - - - (39) - (1) (40)
Total comprehensive income (loss)
- - - - - - (33,414) - (39) - (1) (33,454)
Recognition of share-based payments (note 14)
- - 4 - - 16 - - - - - 20
Voluntary conversion of mandatorily convertible notes (note 14)
3 - 18 - (38) 20 - - - - - -
Acquisition of treasury shares (4) - (13) - - - - - - - - (13)Dividend (note 14) - - - - - - (333) - - - - (333)Directors' fees - - - - - - (2) - - - - (2)Allocation to legal reserve - - - - - - (81) 81 - - - -Other - - - - - - 4 - - - - 4Balance at December 31, 2015 1,664 10,011 (11) - 1,800 19,291 3,229 1,001 62 - - 35,383
1 Excludes treasury shares held by the Company2 In millions of shares
The accompanying notes are an integral part of these financial statements.
ArcelorMittalStatements of changes in equity (millions of U.S. dollars, except share and per share data)
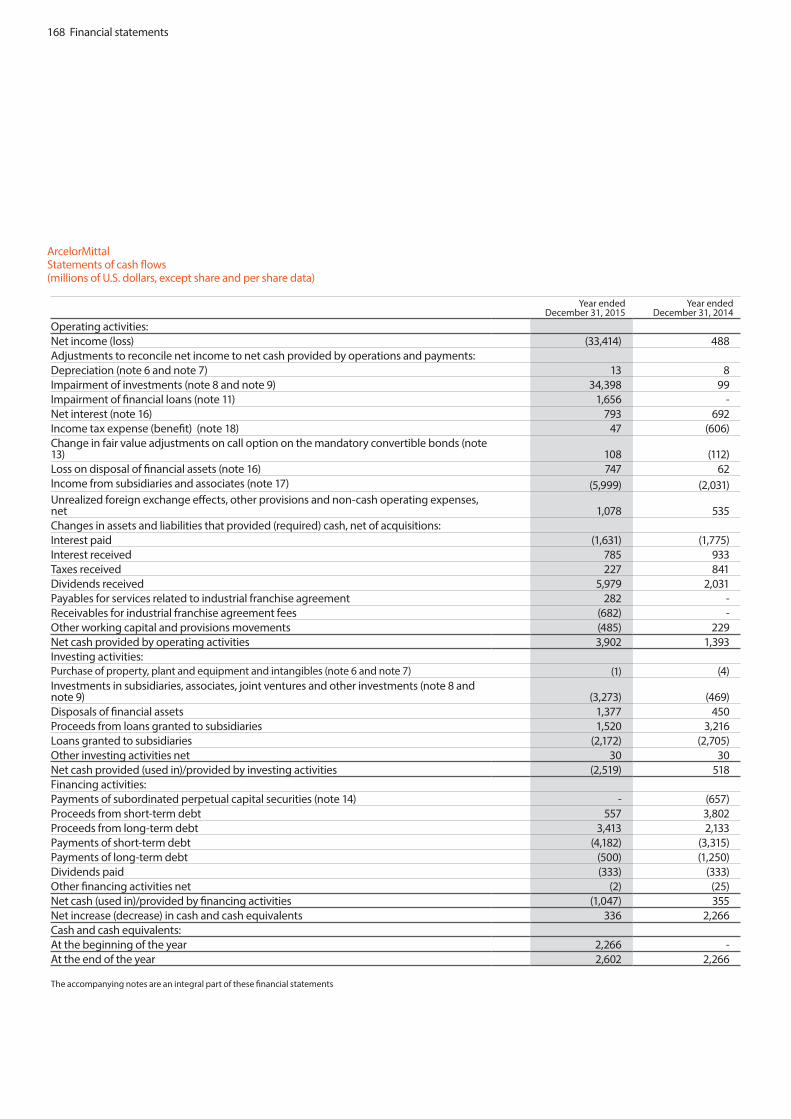
168 Financial statements
Year ended December 31, 2015
Year ended December 31, 2014
Operating activities: Net income (loss) (33,414) 488Adjustments to reconcile net income to net cash provided by operations and payments:Depreciation (note 6 and note 7) 13 8Impairment of investments (note 8 and note 9) 34,398 99Impairment of financial loans (note 11) 1,656 -Net interest (note 16) 793 692Income tax expense (benefit) (note 18) 47 (606)Change in fair value adjustments on call option on the mandatory convertible bonds (note 13) 108 (112)Loss on disposal of financial assets (note 16) 747 62Income from subsidiaries and associates (note 17) (5,999) (2,031)Unrealized foreign exchange effects, other provisions and non-cash operating expenses, net 1,078 535Changes in assets and liabilities that provided (required) cash, net of acquisitions:Interest paid (1,631) (1,775)Interest received 785 933Taxes received 227 841Dividends received 5,979 2,031Payables for services related to industrial franchise agreement 282 -Receivables for industrial franchise agreement fees (682) -Other working capital and provisions movements (485) 229Net cash provided by operating activities 3,902 1,393Investing activities:Purchase of property, plant and equipment and intangibles (note 6 and note 7) (1) (4)Investments in subsidiaries, associates, joint ventures and other investments (note 8 and note 9) (3,273) (469)Disposals of financial assets 1,377 450Proceeds from loans granted to subsidiaries 1,520 3,216Loans granted to subsidiaries (2,172) (2,705)Other investing activities net 30 30Net cash provided (used in)/provided by investing activities (2,519) 518Financing activities:Payments of subordinated perpetual capital securities (note 14) - (657)Proceeds from short-term debt 557 3,802Proceeds from long-term debt 3,413 2,133Payments of short-term debt (4,182) (3,315)Payments of long-term debt (500) (1,250)Dividends paid (333) (333)Other financing activities net (2) (25)Net cash (used in)/provided by financing activities (1,047) 355Net increase (decrease) in cash and cash equivalents 336 2,266Cash and cash equivalents:At the beginning of the year 2,266 -At the end of the year 2,602 2,266
The accompanying notes are an integral part of these financial statements
ArcelorMittalStatements of cash flows (millions of U.S. dollars, except share and per share data)

Financial statements 169
Note1 - General
ArcelorMittal (the “Company”) was incorporated as a “Société Anonyme” under Luxembourg law on June 8, 2001 for an unlimited period.
On November 6, 2014, the registered office of the Company was transferred to 24-26 boulevard d’Avranches, Luxembourg City and is registered at the Register of Trade and Commerce of Luxembourg under the number B82.454.
The financial year of the Company starts on January 1 and ends on December 31 each year.
The Company’s corporate goal is the manufacturing, processing and marketing of steel products, all other metallurgical products, mining products and any other activity directly or indirectly related thereto. The Company realizes its corporate goal either directly or through the creation of companies or the acquisition and holding of interests in companies, partnerships, associations, consortia and joint-ventures.
These financial statements correspond to the stand alone financial statements of the parent company, ArcelorMittal, and were authorized for issuance on March 23, 2016 by the Company’s Board of Directors. In conformity with the requirements of Luxembourg laws and regulations, the Company publishes consolidated financial statements in accordance with International Financial Reporting Standards (“IFRS”) as issued by the International Accounting Standards Board (“IASB”) and as adopted by the European Union.
Note 2 – Basis of presentation
Statement of compliance
The financial statements have been prepared in accordance with IFRS as adopted by the European Union and in particular with IAS 27 Separate Financial Statements as well as in accordance with
chapter IIbis and art 72bis of the Luxembourg law of December 19, 2002 as modified by the law of December 10, 2010.
Adoption of new IFRS standards, amendments and interpretations applicable in 2015
On January 1, 2015, the Company adopted the following amendments which did not have a material impact on the financial statements of the Company:
• Amendments to IAS 19 “Employee Benefits”, published on November 21, 2013, clarify the requirements that relate to how contributions from employees or third parties that are linked to service should be attributed to periods of service.
• Annual Improvements 2010-2012 published by the IASB on December 12, 2013 as part of its annual improvements process made amendments to the following standards:
o IFRS 2 “Share-based Payment”, amends the definition of vesting condition and market condition and adds definitions for performance condition and service condition
o IFRS 3 “Business Combinations”, provides additional guidance for accounting for contingent consideration in a business combination
o IFRS 8 “Operating Segments”, provides clarification of the requirements for the aggregation of operating segments and the reconciliation of the total of the reportable segments’ assets to the entity’s assets
o IFRS 13 “Fair Value Measurement”, provides additional guidance for the measurement of short-term receivables and payables
o IAS 16 “Property, Plant and Equipment”, provides additional guidance for the proportionate restatement of accumulated
depreciation when the revaluation method is applied
o IAS 24 “Related Party Disclosure”, provides additional guidance for the definition of key management personnel
o IAS 38 “Intangible Assets”, provides additional guidance for the proportionate restatement of accumulated depreciation when the revaluation method is applied
• Annual Improvements 2011-2013 published by the IASB on December 12, 2013 as part of its annual improvements process made amendments to the following standards:
o IFRS 1 “First-time Adoption of International Financial Reporting Standards”, provides additional guidance for the effectiveness of IFRSs
o IFRS 3 “Business Combinations”, clarifies the scope of the exception for joint arrangements
o IFRS 13 “Fair Value Measurement”, clarifies the scope of the portfolio exception
o IAS 40 “Investment Property”, provides clarification of the interrelationship of IFRS 3 and IAS 40 when classifying property as investment property or owner-occupied property
New IFRS standards and interpretations applicable from 2016 onward
On May 6, 2014, the IASB published amendments to IFRS 11 “Joint Arrangements”. The amendments clarify the accounting for acquisitions of an interest in a joint operation when the operation constitutes a business. The amendments are effective for annual periods beginning on or after January 1, 2016, with early application permitted. The adoption of these new amendments will not have a material impact to the Company’s financial statements.
On May 12, 2014, the IASB published amendments to IAS 16 “Property, Plant and Equipment” and IAS 38 “Intangible Assets”. The IASB clarified that the use of revenue-based methods to calculate the depreciation of an asset is not appropriate because revenue generated by an activity that includes the use of an asset generally reflects factors other than the consumption of the economic benefits embodied in the asset. The IASB also clarified that revenue is generally presumed to be an inappropriate basis for measuring the consumption of the economic benefits embodied in an intangible asset. This presumption, however, can be rebutted in certain limited circumstances. The amendments are effective for annual periods beginning on or after January 1, 2016, with early application permitted. The adoption of these new amendments will not have a material impact to the Company’s financial statements.
On June 30, 2014, the IASB issued amendments to IAS 16 and IAS 41 “Agriculture” which changes the financial reporting for bearer plants, such as grape vines, rubber trees and oil palms. The IASB decided that bearer plants should be accounted for and measured after initial recognition on a cost or revaluation basis in accordance with IAS 16, because their operation is similar to that of manufacturing. Consequently, the amendments include them within the scope of IAS 16, instead of IAS 41. The produce growing on bearer plants will remain within the scope of IAS 41. The amendments are effective for annual periods beginning on or after January 1, 2016, with early application permitted. The adoption of these amendments will not have a material impact to the Company’s financial statements.
On August 12, 2014, the IASB published amendments to IAS 27 which will allow entities to use the equity method to account for investments in subsidiaries, joint ventures and associates in their separate financial statements.
170 Financial statements
These amendments are effective for annual periods beginning on or after January 1, 2016, with early application permitted. The adoption of these new amendments will not have an impact on the financial statements of the Company as it does not intend to use the equity method to account for investments in subsidiaries, joint ventures and associates in its separate financial statements.
On September 25, 2014, the IASB issued Annual Improvements 2012-2014 to make amendments to the following standards:
• IFRS 5 “Non-current Assets Held for Sale and Discontinued Operations” introduces guidance relating to changes in methods of disposal,
• IFRS 7 “Financial Instruments: Disclosures” provides additional guidance to clarify whether a servicing contract is continuing involvement in a transferred asset and clarifies the applicability of the amendments to IFRS 7 on offsetting disclosure to condensed interim financial statements,
• IAS 19, clarifies determination of the discount rate in a regional market sharing the same currency,
• IAS 34 “Interim Financial Reporting” clarifies the meaning of ‘elsewhere in the interim report’ and the requirements relating to cross-reference disclosure in the interim financial report.
The amendments will be effective from annual periods commencing on or after January 1, 2016, with early application permitted. The adoption of these new amendments will not have a material impact to the Company’s financial statements.
On December 18, 2014, the IASB also issued amendments to IAS 1 “Presentation of Financial Statements” which clarify various presentation
and disclosure requirements related to materiality, subtotals, disaggregation and accounting policies. These amendments are effective for annual periods beginning on or after January 1, 2016, with early application permitted. The adoption of these new amendments will not have a material impact on the financial statements of the Company.
The Company will not early adopt the new accounting standards and amendments.
New IFRS standards and amendments not yet endorsed by the European Union
On January 30, 2014, the IASB issued IFRS 14 “Regulatory Deferral Accounts”. The aim of this standard is to enhance the comparability of financial reporting by entities that are engaged in rate-regulated activities. This standard is effective for annual periods beginning on or after January 1, 2016, with early application permitted. The adoption of this new standard will not have an impact on the financial statements of the Company as it applies to IFRS first-time adopters.
On May 28, 2014, the IASB issued IFRS 15 “Revenue from Contracts with Customers” which provides a unified framework for determining the timing, measurement and recognition of revenue. The focus of the new standard is to recognize revenue as performance obligations are met rather than based on the transfer of risks and rewards. IFRS 15 includes a comprehensive set of disclosure requirements including qualitative and quantitative information about contracts with customers to understand the nature, amount, timing and uncertainty of revenue. The standard supersedes IAS 18 “Revenue”, IAS 11 “Construction Contracts” and a number of revenue-related interpretations. On September 11, 2015, the IASB issued an amendment formalizing a one-year deferral of the effective date for annual periods beginning on or after January 1, 2018, with early application permitted. The
Company does not expect that the adoption of this new standard will have a material impact to its financial statements.
On July 24, 2014, the IASB issued the final version of IFRS 9 “Financial Instruments (2014)” which replaces IAS 39, bringing together the classification and measurement, impairment and hedge accounting. The final version of the standard contains requirements in the following areas:
(a)Classification and measurement: Financial assets are classified and measured by reference to the business model within which they are held and their contractual cash flow characteristics. Financial liabilities are classified in a similar manner to IAS 39, however there are differences in the requirements regarding the measurement of an entity’s own credit risk.
(b) Impairment: The standard introduces an ‘expected credit loss’ model for the measurement of the impairment of financial assets; it is therefore no longer necessary for a credit event to have occurred before a credit loss is recognized.
(c) Hedge accounting: The standard introduces a new hedge accounting model that is designed to be more closely aligned with how entities undertake risk management activities when hedging financial and non-financial risk exposures.
(d) Derecognition: The requirements for derecognition of financial assets and liabilities are carried forward from IAS 39.
IFRS 9 is effective for annual periods beginning on or after January 1, 2018, with early application permitted. The Company does not expect that the adoption of this new standard will have a material impact to its financial statements.
On September 11, 2014, the IASB issued amendments to IFRS 10 and IAS 28 “Investments in Associates and Joint Ventures” which address an inconsistency between the requirements in IFRS 10 and those in IAS 28 in dealing with the sale or contribution of assets between an investor and its associate or joint venture. The amendments set out that a full gain or loss is recognized when the assets constitute a business or a partial gain or loss is recognized when the assets do not constitute a business. On December 17, 2015, the IASB issued an amendment formalizing the deferral of these amendments indefinitely. The Company does not expect that the adoption of these new amendments will have a material impact to its financial statements.
On December 18, 2014, the IASB issued amendments to IFRS 10, IFRS 12 and IAS 28 which clarify the scope and measurement method regarding consolidation and disclosure of investment entities. These amendments are effective for annual periods beginning on or after January 1, 2016, with early application permitted. The adoption of these new amendments will not have an impact on the financial statements of the Company as they apply to investment entities.
On January 13, 2016, the IASB issued IFRS 16 “Leases” which will replace IAS 17 “Leases”. This new standard specifies how to recognize, measure, present and disclose leases. The standard provides a single lessee accounting model, requiring lessees to recognize assets and liabilities for all leases unless the lease term is 12 months or less or the underlying asset has a low value. This standard is effective for annual periods beginning on or after January 1, 2019, with early application permitted if IFRS 15 has also been applied. The Company does not expect that the adoption of this new standard will have a material impact to its financial statements.
Financial statements 171
On January 19, 2016, the IASB issued amendments to IAS 12 “Income Taxes”. These amendments clarify how to account for deferred tax assets related to debt instruments measured at fair value and how to recognize deferred tax assets for unrealized losses. These amendments are effective for annual periods beginning on or after January 1, 2017, with early application permitted. The Company is still in the process of assessing whether there will be a material change to its financial statements upon adoption of these new amendments.
Basis of measurement
The financial statements have been prepared on a historical cost basis, except for derivative financial instruments and available-for-sale financial assets which are measured at fair value.
Functional and presentation currency
These financial statements are presented in US dollars which is the Company’s functional currency. Unless otherwise stated, all amounts are rounded to the nearest million, except share and earnings per share data.
Use of estimates and judgments
The preparation of financial statements in conformity with IFRS requires management to make judgments, estimates and assumptions that affect the application of accounting policies and the reported amounts of assets, liabilities, income and expenses. Actual results may differ from these estimates.
Estimates and underlying assumptions are reviewed on an ongoing basis. Revisions to accounting estimates are recognized in the period in which the estimates are revised and in any future periods affected.
Information about critical judgments in applying accounting policies that have the most
significant effect on the amounts recognized in the financial statements is included in the following note. Note 3 – Significant accounting policies
The accounting policies set out below have been applied consistently by the Company to all periods presented in these financial statements. (a)Foreign currency
Transactions in foreign currencies are translated to the functional currency of the Company at exchange rates at the dates of the transactions. Monetary assets and liabilities denominated in foreign currencies at the reporting date are translated to the functional currency at the exchange rate at that date and the related foreign currency gain or loss are reported within financing costs in the statements of operations.
Non-monetary assets and liabilities denominated in foreign currencies that are measured at fair value are translated to the functional currency at the exchange rate at the date that the fair value was determined and the related gains and losses are reported in the statements of other comprehensive income.. Non-monetary items in a foreign currency that are measured at historical cost are translated using the exchange rate at the date of the transaction. Foreign currency differences arising from translation of non-monetary assets and liabilities are recognized in the statements of operations.
(b)Fair value
The Company classifies the bases used to measure certain assets and liabilities at their fair value. Assets and liabilities carried or measured at fair value have been classified into three levels based upon a fair value hierarchy that reflects the significance of the inputs used in making the measurements.
The levels are as follows:
Level 1: Quoted prices in active markets for identical assets or liabilities that the entity can access at the measurement date;
Level 2: Significant inputs other than within Level 1 that are observable for the asset or liability, either directly (i.e.: as prices) or indirectly (i.e.: derived from prices);
Level 3: Inputs for the assets or liabilities that are not based on observable market data and require management assumptions or inputs from unobservable markets.
(c) Financial instruments
(i)Non-derivative financial assets
The Company initially recognizes non-derivative financial assets on the date that they are originated, which is the date that the Company becomes a party to the contractual provisions of the instrument.
The Company derecognizes a financial asset when the contractual rights to the cash flows from the asset expire, or it transfers the right to receive the contractual cash flows from the financial asset in a transaction in which substantially all the risks and rewards of ownership of the financial asset are transferred. Any interest in transferred financial assets that is created or retained by the Company is recognized as a separate asset or liability.
Financial assets and liabilities are offset and the net amount presented in the statements of financial position when, and only when, the Company has legal right to offset the amounts and intends either to settle on a net basis or to realize the asset and settle the liability simultaneously.
The Company has the following non-derivative financial assets:
Loans and other financial assets
Loans and other financial assets are financial assets with fixed or determinable payments that are
not quoted in an active market. Such assets are recognized initially at fair value plus any directly attributable transaction costs. Subsequent to initial recognition, loans and other financial assets are measured at amortized cost using the effective interest method, less any impairment losses. Loans and other financial assets comprise receivables from other ArcelorMittal group entities, advances to suppliers and other receivables.
Cash and cash equivalents
Cash and cash equivalents consist of cash and short-term highly liquid investments that are readily convertible to cash with original maturities of three months or less at the time of purchase and are carried at cost plus accrued interest, which approximates fair value.
•Non-derivative financial liabilities and equity instruments
Classification as debt or equity
Debt and equity instruments are classified as either financial liabilities or as equity in accordance with the substance of the contractual arrangement.
Equity instruments
Any contract that evidences a residual interest in the assets of an entity after deducting all of its liabilities is accounted for as an equity instrument. Equity instruments issued by the Company are recorded at the proceeds received, net of direct issuance costs. A contract that is settled by the Company receiving or delivering a fixed number of its own shares for no future consideration, or exchanging a fixed number of its own shares for a fixed amount of cash or another financial asset, is also recognized as an equity instrument.
Mandatorily convertible notes
Mandatorily convertible notes issued by the Company are accounted for as compound financial instruments. The net present value of the coupon

172 Financial statements
payments at issuance date is recognized as long-term obligation and carried at amortized cost. The value of the equity component is determined based upon the difference of the cash proceeds received from the issuance of the notes and the net present value of the financial liability component on the date of issuance and is included in equity.
Financial liabilities
Financial liabilities such as loans and borrowings and other payables are recognized initially on the trade date, which is the date that the Company becomes a party to the contractual terms of the instrument.
Financial liabilities are recognized initially at fair value less any directly attributable transaction costs. Subsequent to initial recognition, these financial liabilities are measured at amortized cost using the effective interest method.
The Company derecognizes a financial liability when its contractual obligations are settled or cancelled or expired. Loans and borrowings are classified as current liabilities unless the Company has an unconditional right to defer settlement of the liability for at least twelve months after the financial position date.
•Derivative financial instruments
The Company enters into derivative financial instruments principally to manage its exposure to fluctuations in exchange rates. Derivative financial instruments are classified as current assets or liabilities based on their maturity dates and are accounted for at trade date. Embedded derivatives are separated from the host contract and accounted for separately if they are not closely related to the host contract. The Company measures all derivative financial instruments based on fair values derived from market prices of the instruments or from option pricing models, as appropriate. Gains or losses arising from changes in fair value
of derivatives are recognized in the statements of operations.
(d) Impairment
Financial assets are assessed at each reporting date to determine whether there is any objective evidence that it is impaired or whenever changes in circumstances indicate that the carrying amount many not be recoverable. A financial asset is impaired if objective evidence indicates that a loss event has occurred after the initial recognition of the asset, and that the loss event had a negative effect on the estimated future cash flows of that asset that can be estimated reliably.
Objective evidence that financial assets are impaired can include default or delinquency by a debtor, restructuring of an amount due to the Company on terms that the Company would not consider otherwise, indications that a debtor or issuer will enter bankruptcy, adverse changes in the payment status of borrowers, economic conditions that correlate with defaults or the disappearance of an active market for a security.
The recoverable amount of investments is the greater of value in use and fair value less costs to sell. In assessing value in use, the estimated future cash flows are discounted to their present value using a pre-tax discount rate that reflects current market assessments of the time value of money and the risks specific to the investment.
In the case of available-for-sale investments, a significant or prolonged decline in the fair value of the security below its cost is considered an indicator that the securities are impaired. If any such evidence exists for available-for-sale financial assets, the cumulative loss measured as the difference between the acquisition cost and the current fair value less any impairment loss on that financial asset previously recognized in the statements of operations is removed from other comprehensive income and recognized in the statements of
operations.
An impairment loss in respect of a financial asset measured at amortized cost is calculated as the difference between its carrying amount and the present value of the estimated future cash flows discounted at the asset’s original effective interest rate. Losses are recognized in the statements of operations and reflected in an allowance account against receivables. Interest on the impaired asset continues to be recognized.
When a subsequent event causes the amount of impairment loss to decrease or if there has been a change in the estimates used to determine the recoverable amount, the decrease in impairment loss is reversed through the statements of operations except for reversals of impairment of available-for-sale investments, which are recognized in other comprehensive income.
(e)Intangible assets
Intangible assets are recognized only when it is probable that the expected future economic benefits attributable to the assets will accrue to the Company and the cost can be reliably measured. Intangible assets acquired separately by the Company are initially recorded at cost; they include primarily the cost of technology and licenses purchased from third parties. Intangible assets are amortized on a straight-line basis over their estimated economic useful lives, which typically do not exceed five years. Amortization is included in the statements of operations as part of general and administrative expenses.
Amortization methods applied to intangible assets are reviewed at each reporting date and changed if there has been a significant change in the expected pattern of consumption of the future economic benefits embodied in the assets. (f )Investments in subsidiaries, associates, joint ventures and other investments
Subsidiaries are those companies over which the Company exercises control. The Company controls an entity when it is exposed to or has rights to variable returns from its involvement with the entity and has the ability to affect those returns through its power over the entity. Investments in subsidiaries are accounted for under the cost method.
Associated companies are those companies over which the Company has the ability to exercise significant influence on the financial and operating policy decisions and which are not subsidiaries. Generally, significant influence is presumed to exist when the Company holds more than 20% of the voting rights. Joint ventures are those companies over which the Company exercises joint control and has rights to the net assets of the arrangement. Investments in associates in which ArcelorMittal has the ability to exercise significant influence and joint ventures are accounted for at cost.
Investments in other entities, over which the Company does not have the ability to exercise significant influence and have a readily determinable fair value are accounted for at fair value with any resulting gain or loss recognized in the reserves in other comprehensive income. To the extent that these investments do not have a readily determinable fair value, they are accounted for under the cost method. The Company reviews all its investments at each reporting date to determine whether there is an indicator that the investment may be impaired. If objective evidence indicates that the investment is impaired, ArcelorMittal calculates the amount of the impairment of the investment as being the difference between the higher of the fair value less costs to sell or its value in use and its carrying value.
(g)Provisions and accruals
The Company recognizes provisions for liabilities and probable losses that have been incurred when it

Financial statements 173
has a present legal or constructive obligation as a result of past events and it is probable that the Company will be required to settle the obligation and a reliable estimate of the amount of the obligation can be made. If the effect of the time value of money is material, provisions are discounted using a current pre-tax rate that reflects, where appropriate, the risks specific to the liability. When discounting is used, the increase in the provision due to the passage of time is recognized as a financing cost. Provisions for onerous contracts are recorded in the statements of operations when it becomes known that the unavoidable costs of meeting the obligations under the contract exceed the economic benefits expected to be received.
(h)Income taxes
The Company is the head of a tax integration and is fully liable for the overall tax liability of the tax integration. Each of the entities included in the tax integration is charged with the amount of tax that relates to its individual taxable profit and this tax is paid to ArcelorMittal. Tax losses at entity level are transferred to the Company where they are offset with taxable profits for the determination of the net taxable income of the tax integration. Entities do not pay any tax expense to ArcelorMittal on their individual taxable profits prior to full utilization of their individual cumulative tax losses.
The tax currently payable is based on taxable profit (loss) for the year. Taxable profit differs from profit as reported in the statements of operations because it excludes items of income or expense that are never taxable or deductible. The Company’s current income tax expense (benefit) is calculated using tax rates that have been enacted or substantively enacted as of the statements of financial position date.
Deferred tax is recognized on differences between the carrying amounts of assets and liabilities, in the financial statements and the
corresponding tax basis used in the computation of taxable profit, and is accounted for using the statements of financial position liability method. Deferred tax liabilities are generally recognized for all taxable temporary differences, and deferred tax assets are generally recognized for all deductible temporary differences. Deferred tax assets are recognized for net operating loss carry forwards of all entities within the tax integration to the extent that it is probable that taxable profits will be available against which those carry forwards can be utilized.
Deferred tax assets and liabilities are measured at the tax rates that are expected to apply in the period in which the liability is settled or the asset realized, based on tax rates (and tax laws) that have been enacted or substantively enacted by the statements of financial position date. The measurement of deferred tax liabilities and assets reflects the tax consequences that would follow from the manner in which the Company expects, at the reporting date, to recover or settle the carrying amount of its assets and liabilities.
The carrying amount of deferred tax assets is reviewed at each statements of financial position date and reduced to the extent that it is no longer probable that sufficient taxable profits will be available to enable all or part of the asset to be recovered.
(i)Financing costs
Financing costs include interest income and expense, amortization of discounts or premiums on borrowings, foreign exchange gains and losses, accretion of long-term liabilities and defined benefit obligations and gains (losses) on disposal of investments.
(j)Income from investments and from industrial franchise agreement
Dividend income is recognized when the shareholders’ rights
to receive payment have been established. Interest income is accrued as earned, by reference to the principal outstanding and at the prevailing effective interest rate. Income from contractually arranged corporate services is deducted from general and administrative expenses.
On January 1, 2015, ArcelorMittal implemented an industrial franchise agreement (“IFA”) with group subsidiaries whereby the Company licenses its business model for manufacturing, processing and distributing steel to group subsidiaries. The business model includes the ArcelorMittal business intelligence, which is a package of business solutions and implementation support combined with the development and maintenance of intangibles such as the ArcelorMittal brand, ArcelorMittal global information technology solutions, ArcelorMittal global research & development and ArcelorMittal global purchase agreements. The industrial franchise fee is calculated as a percentage of the steel sales of the franchisee entities after deduction of purchases of steel products from other franchisee entities.
(k)Earnings per common share
Basic earnings per common share is computed by dividing net income as per the consolidated financial statements by the weighted average number of common shares outstanding during the year. Net income attributable to common shareholders takes into consideration dividend rights of preferred shareholders and holders of subordinated perpetual capital securities. Diluted earnings per share is computed by dividing income available to equity holders and assumed conversion by the weighted average number of common shares and potential common shares from outstanding stock options as well as potential common shares from the conversion of certain convertible bonds whenever the conversion results in a dilutive effect.
(l)Equity settled share-based payments
The Company issues equity-settled share-based payments to certain of its employees and employees of its subsidiaries, including stock options and restricted share units. Equity-settled share-based payments are measured at fair value (excluding the effect of non market-based vesting conditions) at the date of grant. The fair value determined at the grant date of the equity-settled share-based payments is recognized on a graded vesting basis over the vesting period, based on the Company’s estimate of the shares that will eventually vest and adjusted for the effect of non market-based vesting conditions. Such fair value is expensed with respect to share-based payments issued to the Company’s employees and recognized as a capital contribution for share-based payments issued to employees of subsidiaries. For stock options and restricted share units, fair value is measured using the Black-Scholes-Merton pricing model and the market value of the shares at the date of the grant after deduction of dividend payments during the vesting period, respectively. The expected life used in the model has been adjusted, based on management’s best estimate, for the effects of non-transferability, exercise restrictions and behavioral considerations. For the restricted share units, the fair value determined at the grant date of the equity-settled share-based payments is expensed and recognized as a capital contribution on a straight line method over the vesting period and adjusted for the effect of non market-based vesting conditions for the Company’s employees and employees of subsidiaries, respectively.
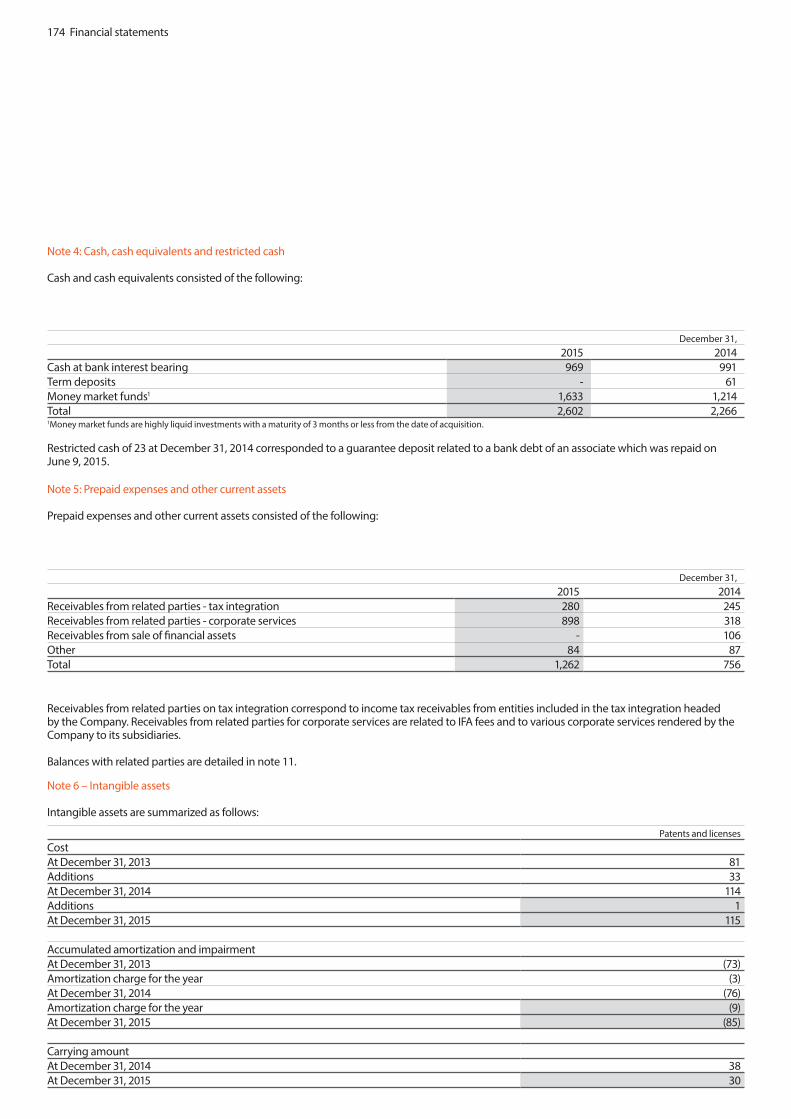
174 Financial statements
Note 4: Cash, cash equivalents and restricted cash
Cash and cash equivalents consisted of the following:
December 31, 2015 2014Cash at bank interest bearing 969 991Term deposits - 61Money market funds1 1,633 1,214Total 2,602 2,2661Money market funds are highly liquid investments with a maturity of 3 months or less from the date of acquisition.
Restricted cash of 23 at December 31, 2014 corresponded to a guarantee deposit related to a bank debt of an associate which was repaid on June 9, 2015.
Note 5: Prepaid expenses and other current assets
Prepaid expenses and other current assets consisted of the following:
December 31, 2015 2014Receivables from related parties - tax integration 280 245Receivables from related parties - corporate services 898 318Receivables from sale of financial assets - 106Other 84 87Total 1,262 756
Receivables from related parties on tax integration correspond to income tax receivables from entities included in the tax integration headed by the Company. Receivables from related parties for corporate services are related to IFA fees and to various corporate services rendered by the Company to its subsidiaries.
Balances with related parties are detailed in note 11.
Note 6 – Intangible assets
Intangible assets are summarized as follows:
Patents and licensesCost At December 31, 2013 81Additions 33At December 31, 2014 114Additions 1At December 31, 2015 115
Accumulated amortization and impairmentAt December 31, 2013 (73)Amortization charge for the year (3)At December 31, 2014 (76)Amortization charge for the year (9)At December 31, 2015 (85)
Carrying amountAt December 31, 2014 38At December 31, 2015 30

Financial statements 175
Land, buildings
and improvementsOther fixtures and fittings,
tools and equipment TotalCost At December 31, 2013 50 13 63Disposals (13) - (13)At December 31, 2014 37 13 50Disposals - (1) (1)At December 31, 2015 37 12 49
Accumulated depreciation and impairmentAt December 31, 2013 (35) (10) (45)Depreciation charge for the year (5) - (5)Disposals 8 - 8At December 31, 2014 (32) (10) (42)Depreciation charge for the year (3) (1) (4)At December 31, 2015 (35) (11) (46)
Carrying amountAt December 31, 2014 5 3 8At December 31, 2015 2 1 3
Note 7 - Property, plant and equipment
Property, plant and equipment are summarized as follows:
Note 8 - Investments in subsidiaries
Investments in subsidiaries are summarized as follows:
Cost At December 31, 2013 137,024Acquisition in cash4,6 and 7 469Acquisition in kind4 318Contributions in kind4 (318)Return of capital3 (316)Other1 90At December 31, 2014 137,267Capital increase1,5 3,273Disposals1,4 (5,177)Other 19At December 31, 2015 135,382
Accumulated impairmentAt December 31, 2013 (62,147)Impairment charge for the year (68)At December 31, 2014 (62,215)Impairment charge for the year (33,931)Disposal 3,156At December 31, 2015 (92,990)
Carrying amountAt December 31, 2014 75,052At December 31, 2015 42,392
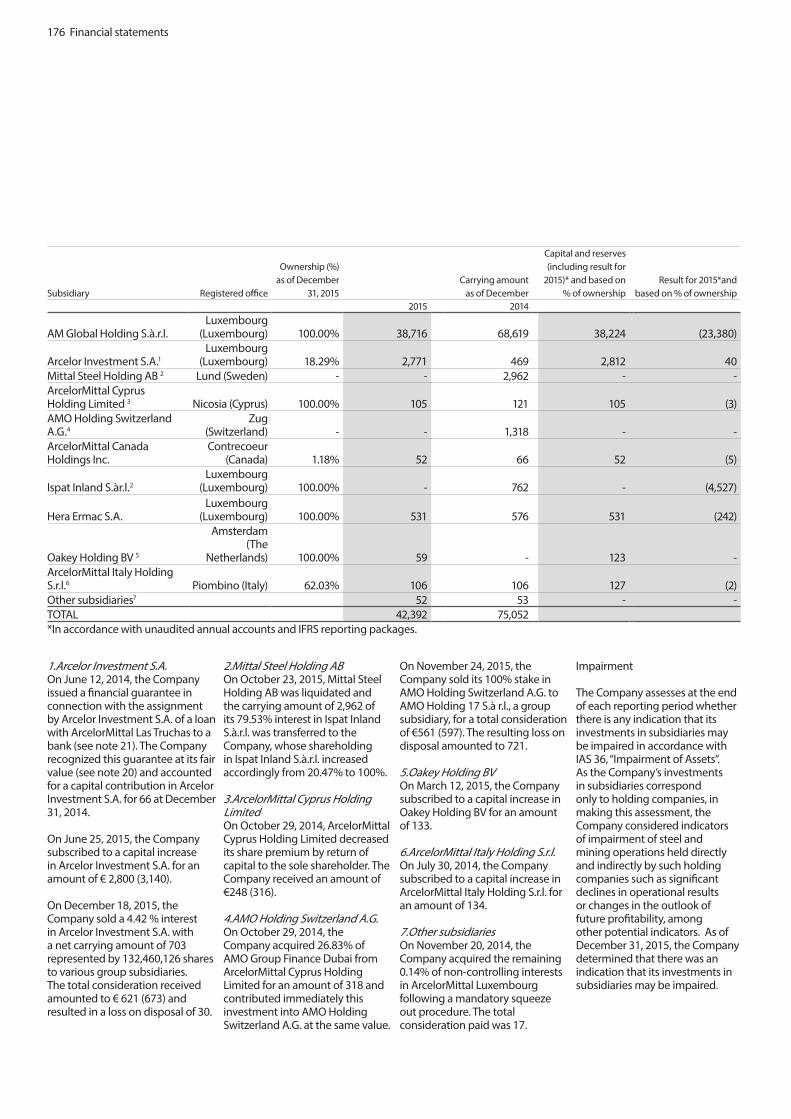
176 Financial statements
Subsidiary Registered office
Ownership (%) as of December
31, 2015Carrying amount
as of December
Capital and reserves (including result for
2015)* and based on % of ownership
Result for 2015*and based on % of ownership
2015 2014
AM Global Holding S.à.r.l. Luxembourg
(Luxembourg) 100.00% 38,716 68,619 38,224 (23,380)
Arcelor Investment S.A.1Luxembourg
(Luxembourg) 18.29% 2,771 469 2,812 40Mittal Steel Holding AB 2 Lund (Sweden) - - 2,962 - -ArcelorMittal Cyprus Holding Limited 3 Nicosia (Cyprus) 100.00% 105 121 105 (3)AMO Holding Switzerland A.G.4
Zug (Switzerland) - - 1,318 - -
ArcelorMittal Canada Holdings Inc.
Contrecoeur (Canada) 1.18% 52 66 52 (5)
Ispat Inland S.àr.l.2Luxembourg
(Luxembourg) 100.00% - 762 - (4,527)
Hera Ermac S.A.Luxembourg
(Luxembourg) 100.00% 531 576 531 (242)
Oakey Holding BV 5
Amsterdam (The
Netherlands) 100.00% 59 - 123 -ArcelorMittal Italy Holding S.r.l.6 Piombino (Italy) 62.03% 106 106 127 (2)Other subsidiaries7 52 53 - -TOTAL 42,392 75,052*In accordance with unaudited annual accounts and IFRS reporting packages.
1.Arcelor Investment S.A.On June 12, 2014, the Company issued a financial guarantee in connection with the assignment by Arcelor Investment S.A. of a loan with ArcelorMittal Las Truchas to a bank (see note 21). The Company recognized this guarantee at its fair value (see note 20) and accounted for a capital contribution in Arcelor Investment S.A. for 66 at December 31, 2014.
On June 25, 2015, the Company subscribed to a capital increase in Arcelor Investment S.A. for an amount of € 2,800 (3,140).
On December 18, 2015, the Company sold a 4.42 % interest in Arcelor Investment S.A. with a net carrying amount of 703 represented by 132,460,126 shares to various group subsidiaries. The total consideration received amounted to € 621 (673) and resulted in a loss on disposal of 30.
2.Mittal Steel Holding ABOn October 23, 2015, Mittal Steel Holding AB was liquidated and the carrying amount of 2,962 of its 79.53% interest in Ispat Inland S.à.r.l. was transferred to the Company, whose shareholding in Ispat Inland S.à.r.l. increased accordingly from 20.47% to 100%.
3.ArcelorMittal Cyprus Holding LimitedOn October 29, 2014, ArcelorMittal Cyprus Holding Limited decreased its share premium by return of capital to the sole shareholder. The Company received an amount of €248 (316).
4.AMO Holding Switzerland A.G.On October 29, 2014, the Company acquired 26.83% of AMO Group Finance Dubai from ArcelorMittal Cyprus Holding Limited for an amount of 318 and contributed immediately this investment into AMO Holding Switzerland A.G. at the same value.
On November 24, 2015, the Company sold its 100% stake in AMO Holding Switzerland A.G. to AMO Holding 17 S.à r.l., a group subsidiary, for a total consideration of €561 (597). The resulting loss on disposal amounted to 721.
5.Oakey Holding BVOn March 12, 2015, the Company subscribed to a capital increase in Oakey Holding BV for an amount of 133.
6.ArcelorMittal Italy Holding S.r.l.On July 30, 2014, the Company subscribed to a capital increase in ArcelorMittal Italy Holding S.r.l. for an amount of 134.
7.Other subsidiariesOn November 20, 2014, the Company acquired the remaining 0.14% of non-controlling interests in ArcelorMittal Luxembourg following a mandatory squeeze out procedure. The total consideration paid was 17.
Impairment
The Company assesses at the end of each reporting period whether there is any indication that its investments in subsidiaries may be impaired in accordance with IAS 36, “Impairment of Assets”. As the Company’s investments in subsidiaries correspond only to holding companies, in making this assessment, the Company considered indicators of impairment of steel and mining operations held directly and indirectly by such holding companies such as significant declines in operational results or changes in the outlook of future profitability, among other potential indicators. As of December 31, 2015, the Company determined that there was an indication that its investments in subsidiaries may be impaired.
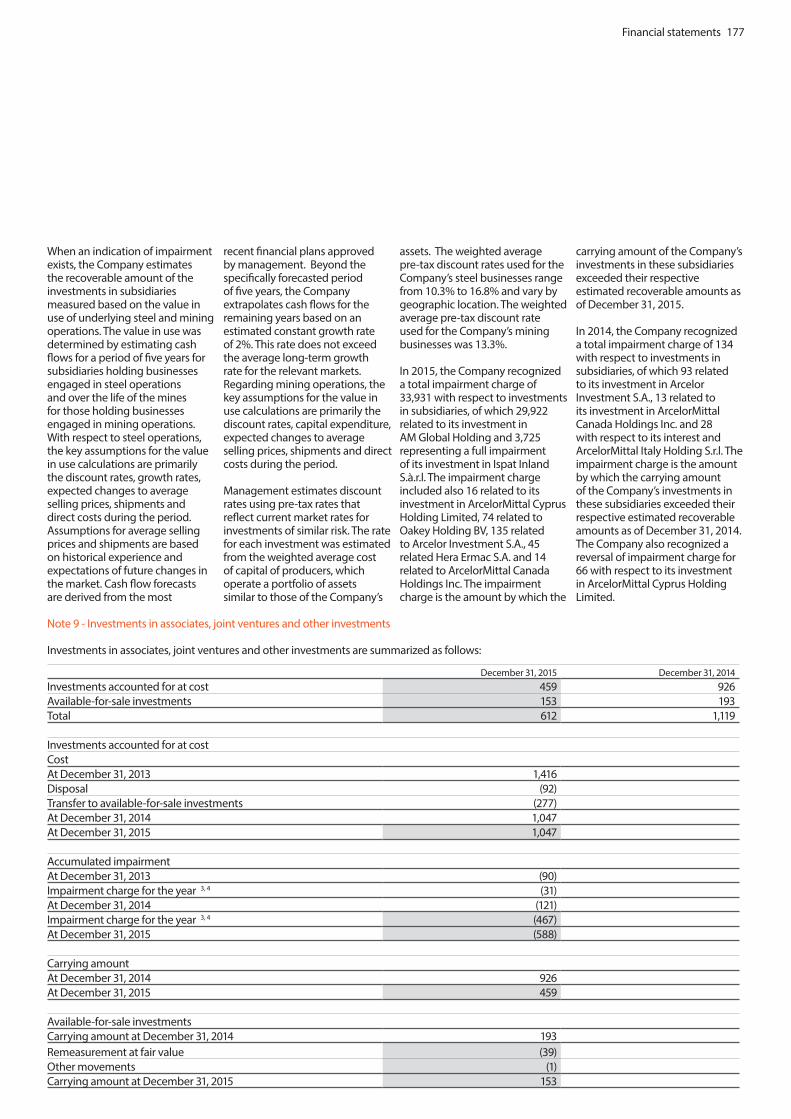
Financial statements 177
Subsidiary Registered office
Ownership (%) as of December
31, 2015Carrying amount
as of December
Capital and reserves (including result for
2015)* and based on % of ownership
Result for 2015*and based on % of ownership
2015 2014
AM Global Holding S.à.r.l. Luxembourg
(Luxembourg) 100.00% 38,716 68,619 38,224 (23,380)
Arcelor Investment S.A.1Luxembourg
(Luxembourg) 18.29% 2,771 469 2,812 40Mittal Steel Holding AB 2 Lund (Sweden) - - 2,962 - -ArcelorMittal Cyprus Holding Limited 3 Nicosia (Cyprus) 100.00% 105 121 105 (3)AMO Holding Switzerland A.G.4
Zug (Switzerland) - - 1,318 - -
ArcelorMittal Canada Holdings Inc.
Contrecoeur (Canada) 1.18% 52 66 52 (5)
Ispat Inland S.àr.l.2Luxembourg
(Luxembourg) 100.00% - 762 - (4,527)
Hera Ermac S.A.Luxembourg
(Luxembourg) 100.00% 531 576 531 (242)
Oakey Holding BV 5
Amsterdam (The
Netherlands) 100.00% 59 - 123 -ArcelorMittal Italy Holding S.r.l.6 Piombino (Italy) 62.03% 106 106 127 (2)Other subsidiaries7 52 53 - -TOTAL 42,392 75,052*In accordance with unaudited annual accounts and IFRS reporting packages.
When an indication of impairment exists, the Company estimates the recoverable amount of the investments in subsidiaries measured based on the value in use of underlying steel and mining operations. The value in use was determined by estimating cash flows for a period of five years for subsidiaries holding businesses engaged in steel operations and over the life of the mines for those holding businesses engaged in mining operations. With respect to steel operations, the key assumptions for the value in use calculations are primarily the discount rates, growth rates, expected changes to average selling prices, shipments and direct costs during the period. Assumptions for average selling prices and shipments are based on historical experience and expectations of future changes in the market. Cash flow forecasts are derived from the most
recent financial plans approved by management. Beyond the specifically forecasted period of five years, the Company extrapolates cash flows for the remaining years based on an estimated constant growth rate of 2%. This rate does not exceed the average long-term growth rate for the relevant markets. Regarding mining operations, the key assumptions for the value in use calculations are primarily the discount rates, capital expenditure, expected changes to average selling prices, shipments and direct costs during the period.
Management estimates discount rates using pre-tax rates that reflect current market rates for investments of similar risk. The rate for each investment was estimated from the weighted average cost of capital of producers, which operate a portfolio of assets similar to those of the Company’s
assets. The weighted average pre-tax discount rates used for the Company’s steel businesses range from 10.3% to 16.8% and vary by geographic location. The weighted average pre-tax discount rate used for the Company’s mining businesses was 13.3%.
In 2015, the Company recognized a total impairment charge of 33,931 with respect to investments in subsidiaries, of which 29,922 related to its investment in AM Global Holding and 3,725 representing a full impairment of its investment in Ispat Inland S.à.r.l. The impairment charge included also 16 related to its investment in ArcelorMittal Cyprus Holding Limited, 74 related to Oakey Holding BV, 135 related to Arcelor Investment S.A., 45 related Hera Ermac S.A. and 14 related to ArcelorMittal Canada Holdings Inc. The impairment charge is the amount by which the
carrying amount of the Company’s investments in these subsidiaries exceeded their respective estimated recoverable amounts as of December 31, 2015.
In 2014, the Company recognized a total impairment charge of 134 with respect to investments in subsidiaries, of which 93 related to its investment in Arcelor Investment S.A., 13 related to its investment in ArcelorMittal Canada Holdings Inc. and 28 with respect to its interest and ArcelorMittal Italy Holding S.r.l. The impairment charge is the amount by which the carrying amount of the Company’s investments in these subsidiaries exceeded their respective estimated recoverable amounts as of December 31, 2014. The Company also recognized a reversal of impairment charge for 66 with respect to its investment in ArcelorMittal Cyprus Holding Limited.
December 31, 2015 December 31, 2014Investments accounted for at cost 459 926Available-for-sale investments 153 193Total 612 1,119
Investments accounted for at costCostAt December 31, 2013 1,416Disposal (92)Transfer to available-for-sale investments (277)At December 31, 2014 1,047At December 31, 2015 1,047
Accumulated impairmentAt December 31, 2013 (90)Impairment charge for the year 3, 4 (31)At December 31, 2014 (121)Impairment charge for the year 3, 4 (467)At December 31, 2015 (588)
Carrying amountAt December 31, 2014 926At December 31, 2015 459
Available-for-sale investmentsCarrying amount at December 31, 2014 193Remeasurement at fair value (39)Other movements (1)Carrying amount at December 31, 2015 153
Note 9 - Investments in associates, joint ventures and other investments
Investments in associates, joint ventures and other investments are summarized as follows:

178 Financial statements
Investee Category Registered officeOwnership (%) at
December 31, 2015 December 31,2015 2014
Hunan Valin 1Available-for-sale
investment Changsha- Hunan (China) 10.08% 153 192VAMA2 Joint venture Loudi (China) 49.00% 206 206Kalagadi Manganese 3 Joint venture Rivonia (South Africa) 50.00% - 433China Oriental4 Associate Wanchan (Hong Kong) 17.40% 224 258Other 29 30Total 612 1,119
1.Hunan ValinHunan Valin Steel Tube and Wire Co., Ltd. (“Hunan Valin”) is a leading steel producer in China engaged in the production and sale of billet, seamless tube, wire rod, reinforced bar, hot rolled coil, cold rolled coil, galvanized coil, sections and HR plates. The products sold to domestic and overseas markets cover a wide range of market segments.
As a result of the exercise of the third put option on February 8, 2014 in the framework of a share swap arrangement signed on June 6, 2012 between ArcelorMittal and Valin Group, the Company’s interest in Hunan Valin decreased from 20% to 15%. Accordingly, the Company discontinued the accounting for its investment at cost and reclassified its interest as available-for-sale. The resulting net loss on the transaction amounted to 124. This amount consisted of a gain of 17 on disposal of the 5% stake offset by a loss of 141 with respect to the remeasurement at fair value of the remaining interest of 15% (see note 16).
On August 6, 2014, the Company exercised the fourth and last put option, which was settled for 106 on February 13, 2015. This exercise subsequently led to the decrease in the Company’s stake in Hunan Valin from 15% to 10%. The Company recognized in 2014 a total gain on disposal of 62 (see note 16).
The fair value of ArcelorMittal’s remaining stake in Hunan Valin amounted to 153 and 192 as of December 31, 2015 and 2014, respectively. Unrealized gains recognized in other
comprehensive income amounted to 62 and 101 for the year ended December 31, 2015 and 2014, respectively.
2.VAMAVAMA is a joint venture between the Company and Hunan Valin which will produce steel for high-end applications in the automobile industry and will supply international automakers and first-tier suppliers as well as Chinese car manufacturers and their supplier networks. The plant was inaugurated on June 15, 2014.
3.Kalagadi Manganese Kalagadi Manganese (Propriety) Ltd. (“Kalagadi Manganese”) is a joint venture between the Company and Kalahari Resource (Proprietary) Ltd that is engaged in exploring, mining, ore processing, and smelting manganese in the Kalahari Basin in South Africa. In addition, the Company has granted loans for the funding of the mining project amounting to 78 including accrued interest, which have been fully impaired in 2015.
In 2015, the Company tested the investment for impairment and determined that the value in use was lower than the carrying amount. In determining the value in use, the Company estimated its share in the present value (using a pre-tax discount rate of 12.48%) of the projected future cash flows expected to be generated over the current life-of-the-mine plan or long term production plan. The key assumptions for the value in use calculations are primarily the discount rates, capital expenditure, expected changes to average selling prices, shipments and
direct costs during the period. Based on the analysis of value in use, the Company recognized an impairment charge of 433 for the full carrying amount of the investment and of 78 for the loans as a result of a downward revision of cash flow projections resulting from the expectation of the persistence of a lower manganese price outlook.
On the basis of a value in use calculation applying a 14.13% pre-tax discount rate, the Company recognized a reversal of impairment charge for 90 with respect to its investment in Kalagadi Manganese for the year ended December 31, 2014.
4.China Oriental China Oriental Group Company Limited (“China Oriental”) is a Chinese integrated iron and steel conglomerate listed on the Hong Kong Stock Exchange (“HKSE”). However, China Oriental’s shares were suspended from trading as of April 29, 2014. Following the acquisition of a 47% stake in China Oriental by a subsidiary of ArcelorMittal on February 4, 2008 and in order to restore the minimum HKSE free float of 25%, the Company established put option agreements with ING Bank N.V. (“ING”) and Deutsche Bank Aktiengesellschaft (“Deutsche Bank”) with respect to a 17.4% stake sold to these banks. On March 25, 2011, these agreements were extended until April 30, 2014. The Company recognized the 17.4% stake as it retained its exposure to significant potential risks and rewards of the investment through the put options. On April 30, 2014, following simultaneously with
the exercise by Deutsche Bank of its put option with respect to a 7.5% stake in China Oriental, the Company sold this investment to Macquarie Bank and entered into a put option arrangement with the latter maturing on April 30, 2015. The Company extended the existing put option agreement with ING in relation to a further 9.9% stake in China Oriental until April 30, 2015. On April 30, 2015, ING and Macquarie Bank exercised their put option for their respective 9.9% and 7.5% stakes in China Oriental. In order to restore the minimum free float requirement, the Board of China Oriental has determined to issue a certain number of new shares, but as of December 31, 2015 China Oriental has not determined how many or when new shares will be issued. In 2015, the Company assessed the recoverability of its investment and recognized an impairment charge of 34. In 2014, the Company tested the investment for impairment on a fair value basis and concluded that such fair value was lower than the carrying amount. The results of the fair value analysis principally based on market multiples indicated that the carrying value recognized was in excess of the estimated fair value of the investment, which approximated the Company’s share in China Oriental’s net equity. The recoverable amount of the Company’s investment in China Oriental amounted to 258. Based on this analysis, the Company recognized an impairment charge of 121. The Company classified the measurement at fair value into Level 3.
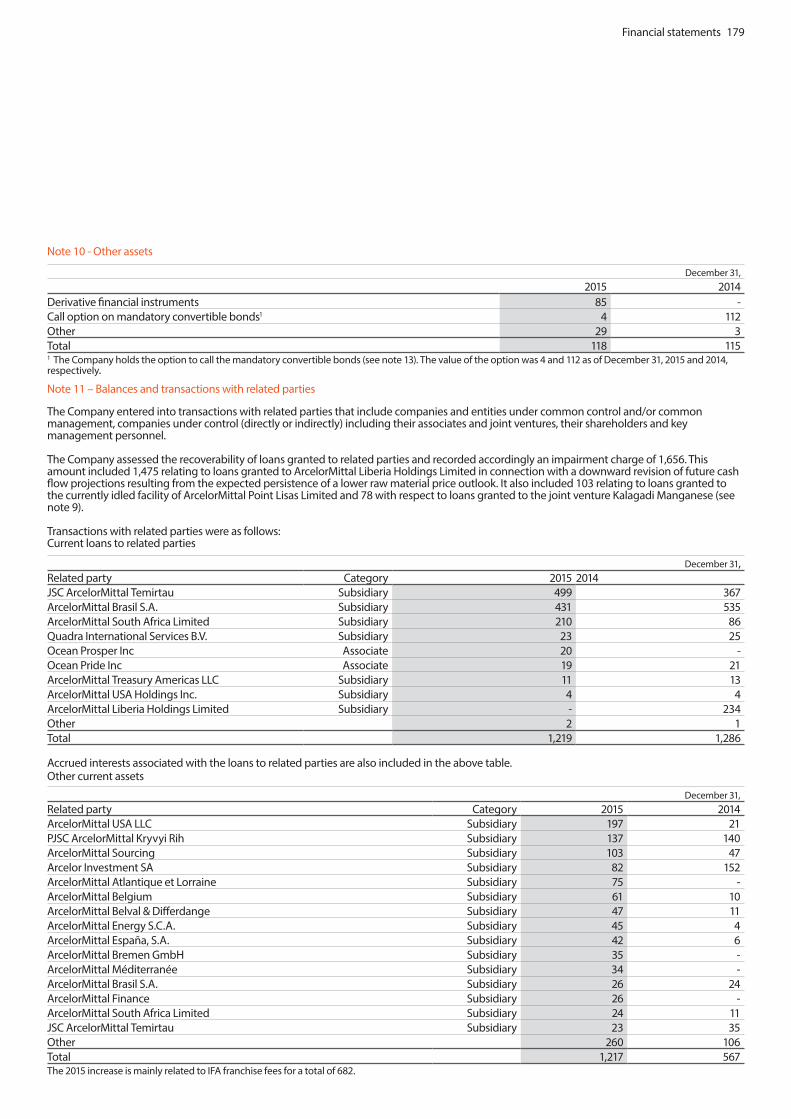
Financial statements 179
Note 10 - Other assets
December 31,2015 2014
Derivative financial instruments 85 -Call option on mandatory convertible bonds1 4 112Other 29 3Total 118 1151 The Company holds the option to call the mandatory convertible bonds (see note 13). The value of the option was 4 and 112 as of December 31, 2015 and 2014, respectively.
Note 11 – Balances and transactions with related parties
The Company entered into transactions with related parties that include companies and entities under common control and/or common management, companies under control (directly or indirectly) including their associates and joint ventures, their shareholders and key management personnel.
The Company assessed the recoverability of loans granted to related parties and recorded accordingly an impairment charge of 1,656. This amount included 1,475 relating to loans granted to ArcelorMittal Liberia Holdings Limited in connection with a downward revision of future cash flow projections resulting from the expected persistence of a lower raw material price outlook. It also included 103 relating to loans granted to the currently idled facility of ArcelorMittal Point Lisas Limited and 78 with respect to loans granted to the joint venture Kalagadi Manganese (see note 9). Transactions with related parties were as follows:Current loans to related parties
December 31,Related party Category 2015 2014JSC ArcelorMittal Temirtau Subsidiary 499 367ArcelorMittal Brasil S.A. Subsidiary 431 535ArcelorMittal South Africa Limited Subsidiary 210 86Quadra International Services B.V. Subsidiary 23 25Ocean Prosper Inc Associate 20 -Ocean Pride Inc Associate 19 21ArcelorMittal Treasury Americas LLC Subsidiary 11 13ArcelorMittal USA Holdings Inc. Subsidiary 4 4ArcelorMittal Liberia Holdings Limited Subsidiary - 234Other 2 1Total 1,219 1,286
Accrued interests associated with the loans to related parties are also included in the above table.Other current assets
December 31,Related party Category 2015 2014ArcelorMittal USA LLC Subsidiary 197 21PJSC ArcelorMittal Kryvyi Rih Subsidiary 137 140ArcelorMittal Sourcing Subsidiary 103 47Arcelor Investment SA Subsidiary 82 152ArcelorMittal Atlantique et Lorraine Subsidiary 75 - ArcelorMittal Belgium Subsidiary 61 10ArcelorMittal Belval & Differdange Subsidiary 47 11ArcelorMittal Energy S.C.A. Subsidiary 45 4ArcelorMittal España, S.A. Subsidiary 42 6ArcelorMittal Bremen GmbH Subsidiary 35 - ArcelorMittal Méditerranée Subsidiary 34 - ArcelorMittal Brasil S.A. Subsidiary 26 24ArcelorMittal Finance Subsidiary 26 - ArcelorMittal South Africa Limited Subsidiary 24 11JSC ArcelorMittal Temirtau Subsidiary 23 35Other 260 106Total 1,217 567The 2015 increase is mainly related to IFA franchise fees for a total of 682.

180 Financial statements
Non-current loans to related parties
December 31,Related party Category 2015 2014ArcelorMittal Treasury Americas LLC Subsidiary 4,938 5,919ArcelorMittal USA Holdings Inc. Subsidiary 1,700 1,700ArcelorMittal Brasil S.A. Subsidiary 1,196 1,778Quadra International Services B.V. Subsidiary 1,128 1,258ArcelorMittal Liberia Holdings Limited Subsidiary - 632ArcelorMittal Point Lisas Limited Subsidiary - 103Oakey Holding B.V.1 Subsidiary - 68ArcelorMittal Rzk Celyk Servys Merkezy2 Joint Venture - 67Kalagadi Manganese Proprietary Limited Joint Venture - 66Ocean Prosper Inc Associate - 22Other 1 1Total 8,963 11,6141 The loan was fully repaid on April 16, 2015.2 The loan was fully repaid on June 24, 2015.
Current loans from related parties
December 31,Related party Category 2015 2014ArcelorMittal Treasury S.N.C. 1 Subsidiary 1,512 4,118ArcelorMittal Holdings AG Subsidiary 940 -Ferrosure (Isle of Man) Insurance Co. Ltd Subsidiary 550 350ArcelorMittal International FZE Subsidiary 200 300ArcelorMittal Luxembourg S.A. 1 14 -Total 3,216 4,7681Current loans correspond to cash pooling balances.
Accrued expenses and other liabilities
Accrued expenses and other liabilities include balances with related parties amounting to 502 and 635 as of December 31, 2015 and 2014, respectively. Balance at December 31, 2014 was mainly related to amounts payable with respect to the acquisition of intellectual property rights (see note 15). Balance at December 31, 2015 was mainly related to amounts payable to the IFA costs (research & development, IT, purchasing and segment costs).
December 31,Related party Category 2015 2014ArcelorMittal Europe Subsidiary 206 - ArcelorMittal Treasury S.N.C. 1 Subsidiary 108 - ArcelorMittal Belval & Differdange Subsidiary 47 23ArcelorMittal Maizières Research SA Subsidiary 18 - ArcelorMittal Finance Subsidiary 11 12ArcelorMittal Atlantique et Lorraine Subsidiary 8 109ArcelorMittal Luxembourg S.A. Subsidiary 6 27ArcelorMittal España, S.A. Subsidiary 5 32ArcelorMittal Investigación y Desarrollo, S.L. Subsidiary 3 113ArcelorMittal Dofasco Inc. Subsidiary 3 79ArcelorMittal Méditerranée Subsidiary 3 36ArcelorMittal France Subsidiary 3 31ArcelorMittal Flat Carbon Europe S.A. Subsidiary 2 58Other 79 115Total 502 6351 Including financial instruments with ArcelorMittal Treasury S.N.C.

Financial statements 181
Non-current loans from related parties
December 31,Related party Category 2015 2014ArcelorMittal Finance Subsidiary 5,443 6,070ArcelorMittal Treasury Financial Services S.à r.l. Subsidiary 324 324ArcelorMittal Holdings AG Subsidiary - 940Total 5,767 7,334
Income from industrial franchise agreement (IFA) fees
Year ended December 31,Related party Category 2015 2014ArcelorMittal USA LLC Subsidiary 197 -ArcelorMittal Atlantique et Lorraine Subsidiary 75 -ArcelorMittal Belgium Subsidiary 61 -ArcelorMittal Poland S.A. Subsidiary 59 -ArcelorMittal Dofasco Inc. Subsidiary 59 -ArcelorMittal España, S.A. Subsidiary 46 -ArcelorMittal Bremen GmbH Subsidiary 37 -ArcelorMittal Méditerranée Subsidiary 34 -JSC ArcelorMittal Temirtau Subsidiary 29 -ArcelorMittal Belval & Differdange Subsidiary 24 -ArcelorMittal Montreal Inc Subsidiary 21 -ArcelorMittal Ostrava AS Subsidiary 21 -ArcelorMittal Eisenhüttensdadt GmbH Subsidiary 20 -ArcelorMittal Mexico S.A. de C.V. Subsidiary 19 -Other 139 -Total 841 -

182 Financial statements
General and administrative expenses
General and administrative expenses, net of income from contractually arranged corporate services, amounted to 959 and 630 in 2015 and 2014, respectively, for related parties. The increase in 2015 was mainly related to acquisition of intellectual property rights for 483 (see note 15) as well as research and development expenses for 275 charged by group subsidiaries to the Company starting 2015 as a result of the implementation of the industrial franchise agreement.
Year ended December 31,Related party Category 2015 2014ArcelorMittal USA LLC Subsidiary 272 16ArcelorMittal Europe Subsidiary 176 -ArcelorMittal Belgium Subsidiary 127 9ArcelorMittal Maizières Research SA Subsidiary 101 -ArcelorMittal Bremen GmbH Subsidiary 38 (4)ArcelorMittal Atlantique et Lorraine Subsidiary 32 114ArcelorMittal America Inc Subsidiary 24 -ArcelorMittal Eisenhüttenstadt GmbH Subsidiary 23 (3)OCAS NV Subsidiary 18 -ArcelorMittal Dofasco Inc. Subsidiary 14 121ArcelorMittal España, S.A. Subsidiary 14 38ArcelorMittal Méditerranée Subsidiary 10 40ArcelorMittal Investigación y Desarrollo, S.L. Subsidiary 9 116ArcelorMittal Belval & Differdange Subsidiary 7 24ArcelorMittal Mexico S.A. de C.V. Subsidiary 1 13ArcelorMittal Poland S.A. Subsidiary - 32ArcelorMittal Research & Development Subsidiary - 26ArcelorMittal Sagunto S.L. Subsidiary - 25ArcelorMittal Purchasing Subsidiary - 8Other 93 55Total 959 630
Financing costs – net
Financing costs –net included the following income from related parties for the year ended December 31, 2015 and 2014 :
Year ended December 31,Related party (income)/expenses Category 2015 2014ArcelorMittal Finance Subsidiary 255 318ArcelorMittal Treasury S.N.C. Subsidiary 22 11ArcelorMittal Holdings AG Subsidiary 19 20ArcelorMittal Liberia Holdings Limited Subsidiary - (91)Kalagadi Manganese Proprietary Limited Joint Venture - (7)ArcelorMittal France Subsidiary (1) 28JSC ArcelorMittal Temirtau Subsidiary (18) (14)ArcelorMittal South Africa Limited Subsidiary (20) (12)Quadra International Services B.V. Subsidiary (67) (79)ArcelorMittal USA Holdings Inc. Subsidiary (94) (126)ArcelorMittal Brasil S.A. Subsidiary (199) (292)ArcelorMittal Treasury Americas LLC Subsidiary (291) (341)Other - (3)Total (394) (588)
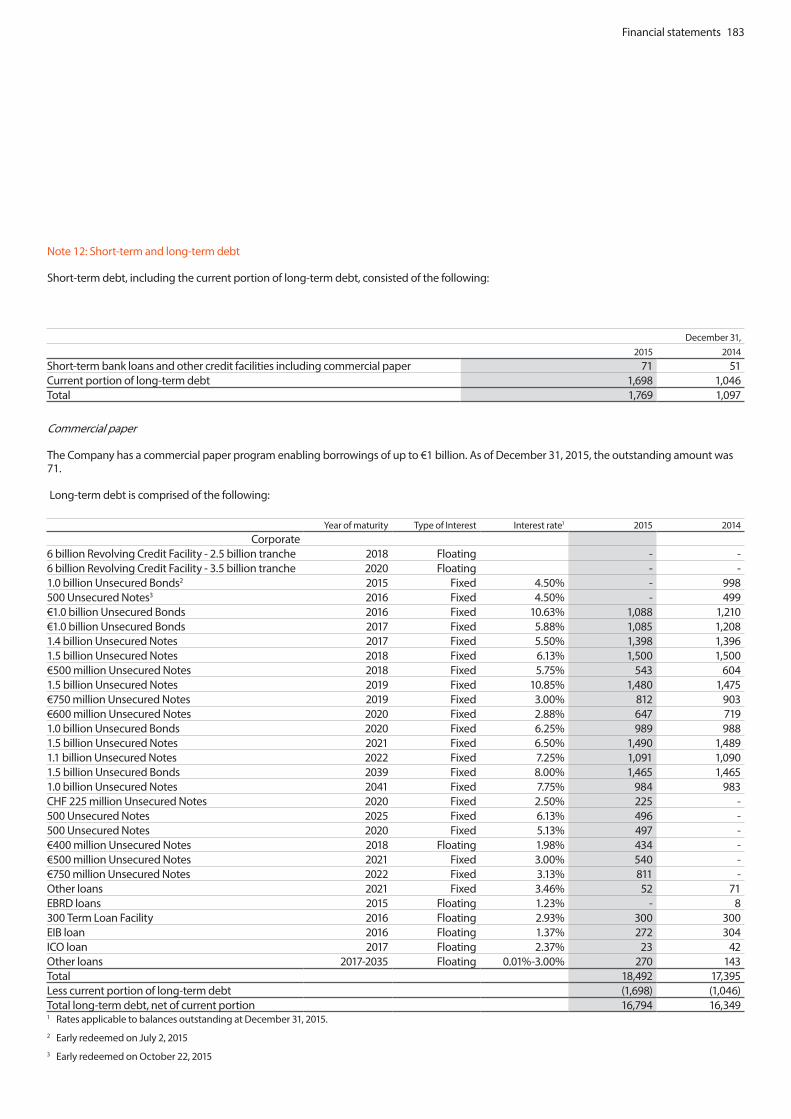
Financial statements 183
Note 12: Short-term and long-term debt
Short-term debt, including the current portion of long-term debt, consisted of the following:
December 31, 2015 2014Short-term bank loans and other credit facilities including commercial paper 71 51Current portion of long-term debt 1,698 1,046Total 1,769 1,097
Commercial paper
The Company has a commercial paper program enabling borrowings of up to €1 billion. As of December 31, 2015, the outstanding amount was 71.
Long-term debt is comprised of the following:
Year of maturity Type of Interest Interest rate1 2015 2014Corporate
6 billion Revolving Credit Facility - 2.5 billion tranche 2018 Floating - -6 billion Revolving Credit Facility - 3.5 billion tranche 2020 Floating - -1.0 billion Unsecured Bonds2 2015 Fixed 4.50% - 998500 Unsecured Notes3 2016 Fixed 4.50% - 499€1.0 billion Unsecured Bonds 2016 Fixed 10.63% 1,088 1,210€1.0 billion Unsecured Bonds 2017 Fixed 5.88% 1,085 1,2081.4 billion Unsecured Notes 2017 Fixed 5.50% 1,398 1,3961.5 billion Unsecured Notes 2018 Fixed 6.13% 1,500 1,500€500 million Unsecured Notes 2018 Fixed 5.75% 543 6041.5 billion Unsecured Notes 2019 Fixed 10.85% 1,480 1,475€750 million Unsecured Notes 2019 Fixed 3.00% 812 903€600 million Unsecured Notes 2020 Fixed 2.88% 647 7191.0 billion Unsecured Bonds 2020 Fixed 6.25% 989 9881.5 billion Unsecured Notes 2021 Fixed 6.50% 1,490 1,4891.1 billion Unsecured Notes 2022 Fixed 7.25% 1,091 1,0901.5 billion Unsecured Bonds 2039 Fixed 8.00% 1,465 1,4651.0 billion Unsecured Notes 2041 Fixed 7.75% 984 983CHF 225 million Unsecured Notes 2020 Fixed 2.50% 225 -500 Unsecured Notes 2025 Fixed 6.13% 496 -500 Unsecured Notes 2020 Fixed 5.13% 497 -€400 million Unsecured Notes 2018 Floating 1.98% 434 -€500 million Unsecured Notes 2021 Fixed 3.00% 540 -€750 million Unsecured Notes 2022 Fixed 3.13% 811 -Other loans 2021 Fixed 3.46% 52 71EBRD loans 2015 Floating 1.23% - 8300 Term Loan Facility 2016 Floating 2.93% 300 300EIB loan 2016 Floating 1.37% 272 304ICO loan 2017 Floating 2.37% 23 42Other loans 2017-2035 Floating 0.01%-3.00% 270 143Total 18,492 17,395Less current portion of long-term debt (1,698) (1,046)Total long-term debt, net of current portion 16,794 16,3491 Rates applicable to balances outstanding at December 31, 2015. 2 Early redeemed on July 2, 20153 Early redeemed on October 22, 2015

184 Financial statements
6 billion Revolving Credit Facility
On April 30, 2015, ArcelorMittal signed a 6 billion revolving credit facility which incorporates a first tranche of 2.5 billion maturing on April 30, 2018, and a second tranche of 3.5 billion maturing on April 30, 2020. The facility may be used for general corporate purposes and replaces the 2.4 billion revolving credit facility agreement dated May 6, 2010, and the 3.6 billion revolving credit facility agreement dated March 18, 2011. As of December 31, 2015, the 6 billion revolving credit facility remains fully available.
Bonds
On October 22, 2015, the Company redeemed its 500 3.75% Unsecured Notes due March 1, 2016, prior to their scheduled maturity for a total amount of 511, including premium and accrued interest.
On July 3, 2015, ArcelorMittal completed the offering of CHF 225 million 2.5% Notes due July 3, 2020, issued under the Company’s Euro Medium Term Notes Programme. The proceeds of the issuance were used to repay or prepay existing indebtedness.
On July 2, 2015, the Company redeemed its 1 billion 3.75% Unsecured Notes due August 5, 2015, prior to their scheduled maturity for a total amount of 1,022, including premium and accrued interest.
On June 1, 2015, ArcelorMittal completed the offering of 500 5.125% Notes due June 1, 2020, and 500 6.125% Notes due June 1, 2025, issued under the Company’s automatic shelf registration statement filed with the U.S. Securities and Exchange Commission (including a prospectus). The proceeds of the issuance were used to repay
existing indebtedness, in particular the early redemption of bonds maturing in August 2015.
On April 9, 2015, ArcelorMittal completed the offering of €400 million Floating Rate Notes due April 9, 2018, and €500 million 3.0% Notes due April 9, 2021, issued under the Company’s Euro Medium Term Notes Programme. The proceeds of the issuance were used for general corporate purposes.
On January 14, 2015, ArcelorMittal completed the offering of €750 million 3.125% Notes due January 14, 2022, issued under the Company’s Euro Medium Notes Programme. The proceeds of the issuance were used for general corporate purposes.
The margin applicable to ArcelorMittal’s principal credit facilities ($6 billion revolving credit facility and certain other credit
facilities) and the coupons on certain of its outstanding bonds are subject to adjustment in the event of a change in its long-term credit ratings. In a context of low steel prices and challenging industry conditions, ArcelorMittal was downgraded by Standard & Poor’s on February 3, 2015 to BB with stable outlook, and by Moody’s on November 12, 2015, to Ba2 with negative outlook. Fitch and Standard & Poor’s affirmed their credit ratings while lowering their outlooks to negative on November 16, 2015, and December 18, 2015, respectively. These downgrades triggered the interest rate “step-up” clauses in most of the Company’s outstanding bonds, as described in the table below:
Nominal value Date of issuance Repayment date Interest rate Issued at€1.0 billion Unsecured Bonds June 3, 2009 June 3, 2016 10.63% 99.38%€1.0 billion Unsecured Bonds(1) November 18, 2010 November 17, 2017 5.88% 99.32%1.4 billion Unsecured Notes February 28, 2012 February 25, 2017 5.50%(2) 99.69%€400 million Unsecured Notes (1) April 9, 2015 April 9, 2018 Euribor 3M+2.03%(1) 100.00%1.5 billion Unsecured Notes May 27, 2008 June 1, 2018 6.13% 99.57%€500 billion Unsecured Notes(1) March 29, 2012 March 29, 2018 5.75% 99.71%1.5 billion Unsecured Notes May 20, 2009 June 1, 2019 10.85%(2) 97.52%€750 million Unsecured Notes (1) March 25, 2014 March 25, 2019 3.00% 99.65%500 Unsecured Notes June 1, 2015 June 1, 2020 5.13% 100.00%CHF 225 million Unsecured Notes (1) July 3, 2015 July 3, 2020 2.50% 100.00%€600 million Unsecured Notes (1) July 4, 2014 July 6, 2020 2.88% 99.18%1.0 billion Unsecured Bonds August 5, 2010 August 5, 2020 6.25%(2) 98.46%1.5 billion Unsecured Notes March 7, 2011 March 1, 2021 6.50%(2) 99.36%€500 million Unsecured Notes (1) April 9, 2015 April 9, 2021 3.00% 99.55%€750 million Unsecured Notes (1) January 14, 2015 January 14, 2022 3.13% 99.73%1.1 billion Unsecured Notes February 28, 2012 February 25, 2022 7.25%(2) 98.28%500 Unsecured Notes June 1, 2015 June 1, 2025 6.13% 100.00%1.0 billion Unsecured Bonds October 1, 2009 October 15, 2039 8.00%(2) 95.20%500 Unsecured Bonds August 5, 2010 October 15, 2039 8.00%(2) 104.84%1.0 billion Unsecured Notes March 7, 2011 March 1, 2041 7.75%(2) 99.18%(1)Issued under the Euro Medium Term Notes Programme, extended from €3 billion to €6 billion on March 20, 2015(2)Change in interest rate following downgrades in 2015.

Financial statements 185
European Bank for Reconstruction and Development (“EBRD”) Loans
The Company had entered into five separate agreements for on-lending with the European Bank for Reconstruction and Development (“EBRD”). As of December 31 2014, the only agreement outstanding was ArcelorMittal Temirtau, entered into on June 15, 2007. Following the repayment of the last installment for ArcelorMittal Temirtau on January 12, 2015, the EBRD loan was fully repaid as of December 31, 2015 as compared to 8 outstanding as of December 31, 2014.
300 Term Loan Facility
On December 20, 2013, ArcelorMittal entered into a term loan facility in an aggregate amount of 300, maturing on December 20, 2016. The facility may be used by the Group for general corporate purposes. Amounts repaid under this agreement may not be re-borrowed. As of December 31, 2015, the term loan facility was fully drawn.
European Investment Bank (“EIB”) Loan
The Company entered into an agreement with the EIB for the financing of activities for research, engineering and technological innovation related to process improvements and new steel product developments on July 15, 2010. The full amount of €250 million was drawn on September 27, 2011. The final repayment date under this agreement is September 27, 2016. The outstanding amount in total as of December 31, 2015 and 2014 was 272 (€250 million) and 304 (€250 million), respectively.
Instituto de Crédito Oficial (“ICO”) Loan
The Company entered into an agreement with the ICO on April 9, 2010 for the financing of the Company investment plan in Spain for the period 2008-2011. The last installment under this agreement is due on April 7, 2017. The outstanding amount in total as of December 31, 2015 and 2014 was 23 (€21 million) and 42 (€35 million), respectively.
Other
Certain debt agreements of the Company or its subsidiaries contain certain restrictive covenants. Among other things, these covenants limit encumbrances on the assets of ArcelorMittal and its subsidiaries, the ability of ArcelorMittal’s subsidiaries to incur debt and ArcelorMittal’s ability to dispose of assets in certain circumstances. Certain of these agreements also require compliance with a financial covenant.
The Company’s principal credit facilities (6 billion Revolving Credit Facility and certain borrowing agreements) include the following financial covenant: the Company must ensure that the ratio of “Consolidated Total Net Borrowings” (consolidated total borrowings less consolidated cash and cash equivalents) to “Consolidated EBITDA” (the consolidated net pre-taxation profits of the Company for a Measurement Period, subject to certain adjustments as defined in the facilities) does not, at the end of each “Measurement Period”
(each period of 12 months ending on the last day of a financial half-year or a financial year of the Company), exceed a certain ratio. ArcelorMittal’s principle credit facilities set this ratio to 4.25 to 1.
Failure to comply with any covenant would enable the lenders to accelerate the Company’s repayment obligations. Moreover, the Company’s debt facilities have provisions whereby certain events relating to other borrowers within the Company’s subsidiaries could, under certain circumstances, lead to acceleration of debt repayment under such credit facilities. Any invocation of these cross-acceleration clauses could cause some or all of the other debt to accelerate.
The Company was in compliance with the financial covenants contained in the agreements related to all of its borrowings as of December 31, 2015.
As of December 31, 2015 the scheduled maturities of short-term debt and long-term debt including its current portion are as follows:
2016 1,7692017 2,5132018 2,5052019 2,4362020 2,366Subsequent 6,974Total 18,563
The Company monitors its net debt in order to manage its capital. The following table presents the structure of the Company’s net debt by original currencies:
Presented in USD by original currency as at December 31, 2015
Total USD EUR USD CHF CAD OtherShort-term debt including the current portion of long-term debt 1,769 1,416 353 - - - Long-term debt 16,794 5,015 11,554 225 - - Cash including restricted cash (2,602) (2,206) (117) - (267) (12)Net debt 15,961 4,225 11,790 225 (267) (12)
As a part of the Company’s overall risk and cash management strategies, several loan agreements have been swapped from their original currencies to other foreign currencies.
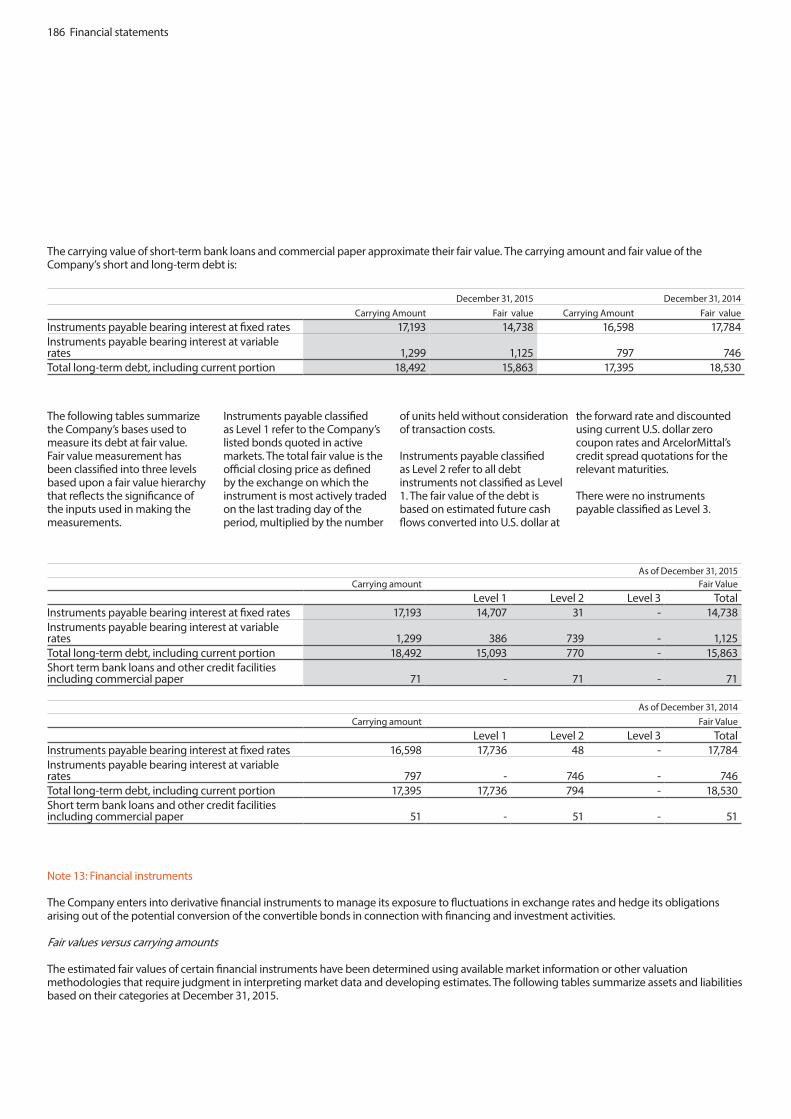
186 Financial statements
The carrying value of short-term bank loans and commercial paper approximate their fair value. The carrying amount and fair value of the Company’s short and long-term debt is:
December 31, 2015 December 31, 2014Carrying Amount Fair value Carrying Amount Fair value
Instruments payable bearing interest at fixed rates 17,193 14,738 16,598 17,784Instruments payable bearing interest at variable rates 1,299 1,125 797 746Total long-term debt, including current portion 18,492 15,863 17,395 18,530
The following tables summarize the Company’s bases used to measure its debt at fair value. Fair value measurement has been classified into three levels based upon a fair value hierarchy that reflects the significance of the inputs used in making the measurements.
Instruments payable classified as Level 1 refer to the Company’s listed bonds quoted in active markets. The total fair value is the official closing price as defined by the exchange on which the instrument is most actively traded on the last trading day of the period, multiplied by the number
of units held without consideration of transaction costs.
Instruments payable classified as Level 2 refer to all debt instruments not classified as Level 1. The fair value of the debt is based on estimated future cash flows converted into U.S. dollar at
the forward rate and discounted using current U.S. dollar zero coupon rates and ArcelorMittal’s credit spread quotations for the relevant maturities.
There were no instruments payable classified as Level 3.
As of December 31, 2015Carrying amount Fair Value
Level 1 Level 2 Level 3 TotalInstruments payable bearing interest at fixed rates 17,193 14,707 31 - 14,738Instruments payable bearing interest at variable rates 1,299 386 739 - 1,125Total long-term debt, including current portion 18,492 15,093 770 - 15,863Short term bank loans and other credit facilities including commercial paper 71 - 71 - 71
As of December 31, 2014Carrying amount Fair Value
Level 1 Level 2 Level 3 TotalInstruments payable bearing interest at fixed rates 16,598 17,736 48 - 17,784Instruments payable bearing interest at variable rates 797 - 746 - 746Total long-term debt, including current portion 17,395 17,736 794 - 18,530Short term bank loans and other credit facilities including commercial paper 51 - 51 - 51
Note 13: Financial instruments
The Company enters into derivative financial instruments to manage its exposure to fluctuations in exchange rates and hedge its obligations arising out of the potential conversion of the convertible bonds in connection with financing and investment activities.
Fair values versus carrying amounts The estimated fair values of certain financial instruments have been determined using available market information or other valuation methodologies that require judgment in interpreting market data and developing estimates. The following tables summarize assets and liabilities based on their categories at December 31, 2015.

Financial statements 187
Carrying amount in statements of financial
position
Non-financial assets and
liabilitiesLoan and
receivablesLiabilities at
amortized costAvailable-for-sale
assets DerivativesASSETSCurrent assets:Cash and cash equivalent 2,602 - 2,602 - - -Current loans to related parties 1,219 - 1,219 - - -Prepaid expenses and other current assets 1,262 992 253 - - 17Total current assets 5,083 992 4,074 - - 17
Non-current assets:Intangibles assets 30 30 - - - -Property, plant and equipment 3 3 - - - -Investments in subsidiaries 42,392 42,392 - - - -Investments in associates, joint ventures and other investments 612 459 - - 153 -Non-current loans to related parties 8,963 - 8,963 - - -Deferred tax assets 6,803 6,803 - - - -Other assets 118 4 25 - - 89Total non-current assets 58,921 49,691 8,988 - 153 89Total assets 64,004 50,683 13,062 - 153 106
LIABILITIES AND EQUITYCurrent liabilities:Short-term debt and current portion of long-term debt 1,769 - - 1,769 - -Current loans from related parties 3,216 - - 3,216 - -Accrued expenses and other liabilities 1,032 282 - 642 - 108Total current liabilities 6,017 282 - 5,627 - 108
Non-current liabilities:Long-term debt, net of current portion 16,794 - - 16,794 - -Non-current loans from related parties 5,767 - - 5,767 - -Deferred employee benefits 17 17 - - - -Other long-term obligations 26 - - 2 - 24Total non-current liabilities 22,604 17 - 22,563 - 24
Total equity 35,383 35,383 - - - -Total liabilities and equity 64,004 35,682 - 28,190 - 132
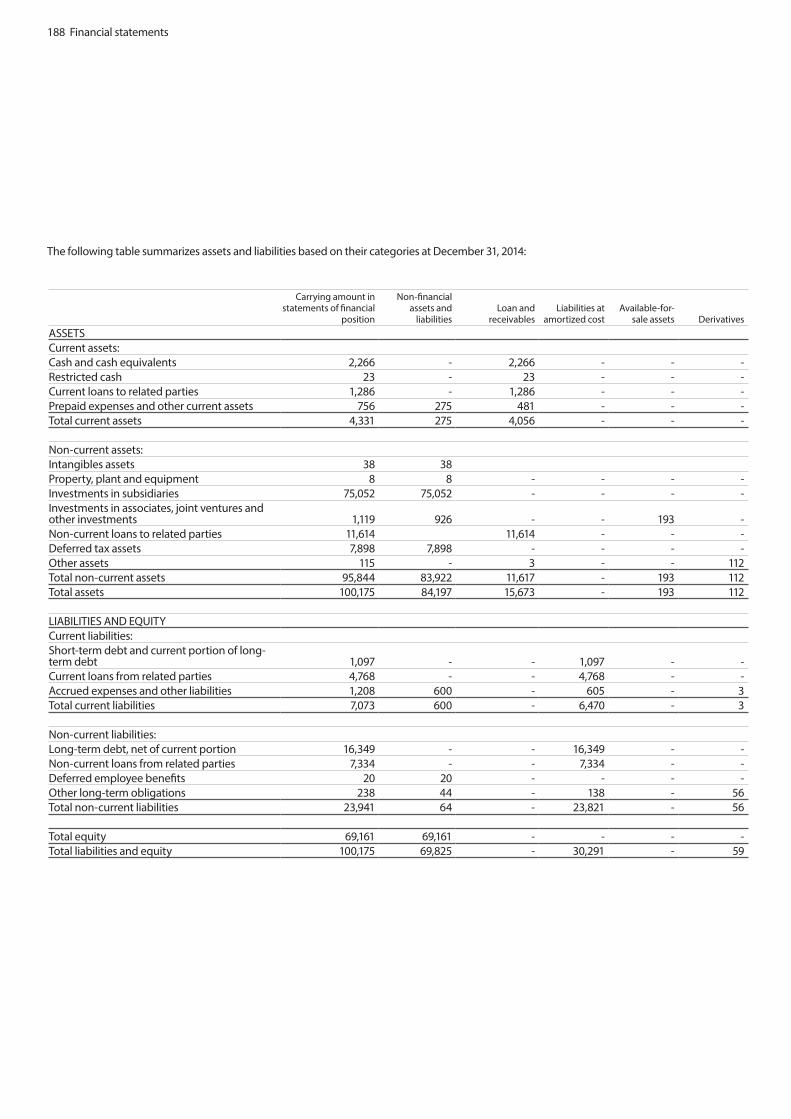
188 Financial statements
The following table summarizes assets and liabilities based on their categories at December 31, 2014:
Carrying amount in statements of financial
position
Non-financial assets and
liabilitiesLoan and
receivablesLiabilities at
amortized costAvailable-for-
sale assets DerivativesASSETSCurrent assets:Cash and cash equivalents 2,266 - 2,266 - - -Restricted cash 23 - 23 - - -Current loans to related parties 1,286 - 1,286 - - -Prepaid expenses and other current assets 756 275 481 - - -Total current assets 4,331 275 4,056 - - -
Non-current assets:Intangibles assets 38 38Property, plant and equipment 8 8 - - - -Investments in subsidiaries 75,052 75,052 - - - -Investments in associates, joint ventures and other investments 1,119 926 - - 193 -Non-current loans to related parties 11,614 11,614 - - -Deferred tax assets 7,898 7,898 - - - -Other assets 115 - 3 - - 112Total non-current assets 95,844 83,922 11,617 - 193 112Total assets 100,175 84,197 15,673 - 193 112
LIABILITIES AND EQUITYCurrent liabilities:Short-term debt and current portion of long-term debt 1,097 - - 1,097 - -Current loans from related parties 4,768 - - 4,768 - -Accrued expenses and other liabilities 1,208 600 - 605 - 3Total current liabilities 7,073 600 - 6,470 - 3
Non-current liabilities:Long-term debt, net of current portion 16,349 - - 16,349 - -Non-current loans from related parties 7,334 - - 7,334 - -Deferred employee benefits 20 20 - - - -Other long-term obligations 238 44 - 138 - 56Total non-current liabilities 23,941 64 - 23,821 - 56
Total equity 69,161 69,161 - - - -Total liabilities and equity 100,175 69,825 - 30,291 - 59

Financial statements 189
The following tables summarize the bases used to measure certain assets and liabilities at their fair value.
As of December 31, 2015Level 1 Level 2 Level 3 Total
Assets at fair value:Available-for-sale financial assets 153 - - 153Derivative financial current assets - 17 - 17Derivative financial non-current assets - 85 4 89Total assets at fair value 153 102 4 259
Liabilities at fair valueDerivative financial current liabilities - (108) - (108)Derivative financial non-current liabilities - (24) (24)Total liabilities at fair value - (132) - (132)
As of December 31, 2014Level 1 Level 2 Level 3 Total
Assets at fair value:Available-for-sale financial assets 193 - - 193Derivative financial non-current assets - - 112 112Total assets at fair value 193 - 112 305
Liabilities at fair valueDerivative financial current liabilities - 3 - 3Derivative financial non-current liabilities - 56 - 56Total liabilities at fair value - 59 - 59
Available-for-sale financial assets classified as Level 1 refer to listed securities quoted in active markets. The total fair value is either the price of the most recent trade at the time of the market close or the official close price as defined by the exchange on which the asset is most actively traded on the last trading day of the period, multiplied by the number of units held without consideration of transaction costs.
Derivative financial assets and liabilities classified as Level 2 refer to instruments to hedge fluctuations in foreign exchange rates. The total fair value is based on the price a dealer would pay or receive for the security or similar securities, adjusted for any terms specific to that asset or liability. Market inputs are obtained from well-established and recognized vendors of market data and the fair value is calculated using standard industry models based on significant observable market inputs such as foreign exchange rates, commodity prices, swap rates and interest rates.
Derivative financial non-current assets classified as Level 3 refer to the call option on the 1,000 mandatory convertible bonds (see below). As a result of the repayment at maturity of the €1.25 billion Convertible Bonds on April 1, 2014 (see note 12), the conversion option in the €1.25 billion Convertible Bonds and the euro-denominated call options on treasury shares are extinguished. The fair valuation of Level 3 derivative instruments is established at each reporting date in relation to which an analysis is performed in respect of changes in the fair value measurement since the last period. ArcelorMittal’s valuation policies for Level 3 derivatives are an integral part of its internal control procedures and have been reviewed and approved according to the Company’s principles for establishing such procedures. In particular, such procedures address the accuracy and reliability of input data, the accuracy of the valuation model and the knowledge of the staff performing the valuations.
ArcelorMittal establishes the fair valuation of the call option on the 1,000 mandatory convertible bonds through the use of binomial valuation models. Binomial valuation models use an iterative procedure to price options, allowing for the specification of nodes, or points in time, during the time span between the valuation date and the option’s expiration date. In contrast to the Black-Scholes model, which provides a numerical result based on inputs, the binomial model allows for the calculation of the asset and the option for multiple periods along with the range of possible results for each period.
Observable input data used in the valuations include zero coupon yield curves, stock market prices, European Central Bank foreign exchange fixing rates and Libor interest rates. Unobservable inputs are used to measure fair value to the extent that relevant observable inputs are not available. Specifically the Company computes unobservable volatility data based mainly on the
movement of stock market prices observable in the active market over 90 working days.
On December 28, 2009, the Company issued through a wholly-owned subsidiary unsecured and unsubordinated 750 bonds mandatorily convertible into preferred shares of such subsidiary. The bonds were placed privately with a Luxembourg affiliate of Crédit Agricole (formerly Calyon S.A.) and are not listed. The Company originally had the option to call the mandatory convertible bonds from May 3, 2010 until ten business days before the maturity date. On April 20, 2011, the conversion date of the mandatory convertible bonds was extended to January 31, 2013. On September 27, 2011, the Company increased the mandatory convertible bonds and the call option on the mandatory convertible bonds from 750 to 1,000. On December 18, 2012, the conversion date of the mandatory convertible bonds was extended to January 31, 2014. On November 20, 2015, the conversion date of the mandatory

190 Financial statements
convertible bonds was extended to January 31, 2018. The fair value of these call options was 4 as of December 31, 2015 and the change in fair value recorded in the statements of operations as financing costs was 108. These call options are classified into Level 3.
The following table summarizes the reconciliation of the fair value of the conversion option classified as Level 3 with respect to the call option on the 1,000 mandatory convertible bonds for the year ended December 31, 2015 and 2014, respectively:
Call option on 1,000 mandatory convertible bonds 1 TotalBalance as of December 31, 2013 - -Change in fair value 112 112Balance as of December 31, 2014 112 112Change in fair value (108) (108)Balance as of December 31, 2015 4 41 The call option on the 1,000 mandatory convertible bonds is classified into Level 3. The fair value of the call options was determined through a binomial model based on the estimated values of the underlying equity spot price of $124 and volatility of 10.06%.
Portfolio of Derivatives
Except for the call options on the mandatory convertible bond, certain cross currency swaps and some other limited exceptions, the Company’s portfolio of derivatives consists of transactions with ArcelorMittal Treasury S.N.C., which in turn enters into offsetting position with counterparties external to ArcelorMittal.
The portfolio associated with derivative financial instruments as of December 31, 2015 is as follows:
Assets Liabilities
Notional Amount
Fair Value
Notional Amount
Fair Value
Foreign exchange rate instrumentsForward sales of contracts 241 17 1,161 (108)Currency swap sales 375 85 1,000 (24)Total 102 (132)
The portfolio associated with derivative financial instruments as of December 31, 2014 is as follows: Assets Liabilities
Notional Amount
Fair Value
Notional Amount
Fair Value
AverageRate*
Interest rate swaps - fixed rate borrowings/loans - - 1,063 (53) 2.13%
Foreign exchange rate instrumentsForward sale of contracts 125 - 250 (3) -Currency swaps purchases 89 -Currency swaps sales - - 336 (3) -Total - (59)*the average rate is determined for fixed rate instruments on the basis of the U.S. dollar and foreign currency rates and for the variable instruments generally on the basis of Euribor or Libor.
Interest rate risk
The Company utilizes certain instruments to manage interest rate risks. Interest rate instruments allow the Company to borrow long-term at fixed or variable rates, and to swap the rate of this debt either at inception or during the lifetime of the loan. The Company and its counter-party exchange, at predefined intervals, the difference
between the agreed fixed rate and the variable rate, calculated on the basis of the notional amount of the swap. Similarly, swaps may be used for the exchange of variable rates against other variable rates.
Interest rate derivatives used by the Company to manage changes in the value of fixed rate loans qualify as fair value hedges.
Foreign exchange rate risk
The Company is exposed to changes in values arising from foreign exchange rate fluctuations generated by its investment and financing activities. Because of a substantial portion of ArcelorMittal’s assets, liabilities, income and expenses are denominated in currencies other than the U.S. dollar (its reporting
currency), ArcelorMittal has an exposure to fluctuations in the values of these currencies relative to the U.S. dollar. These currency fluctuations, especially the fluctuation of the value of the U.S. dollar relative to the euro and the Canadian dollar, could have a material impact on its results of operations. ArcelorMittal faces transaction risk, which arises when ArcelorMittal
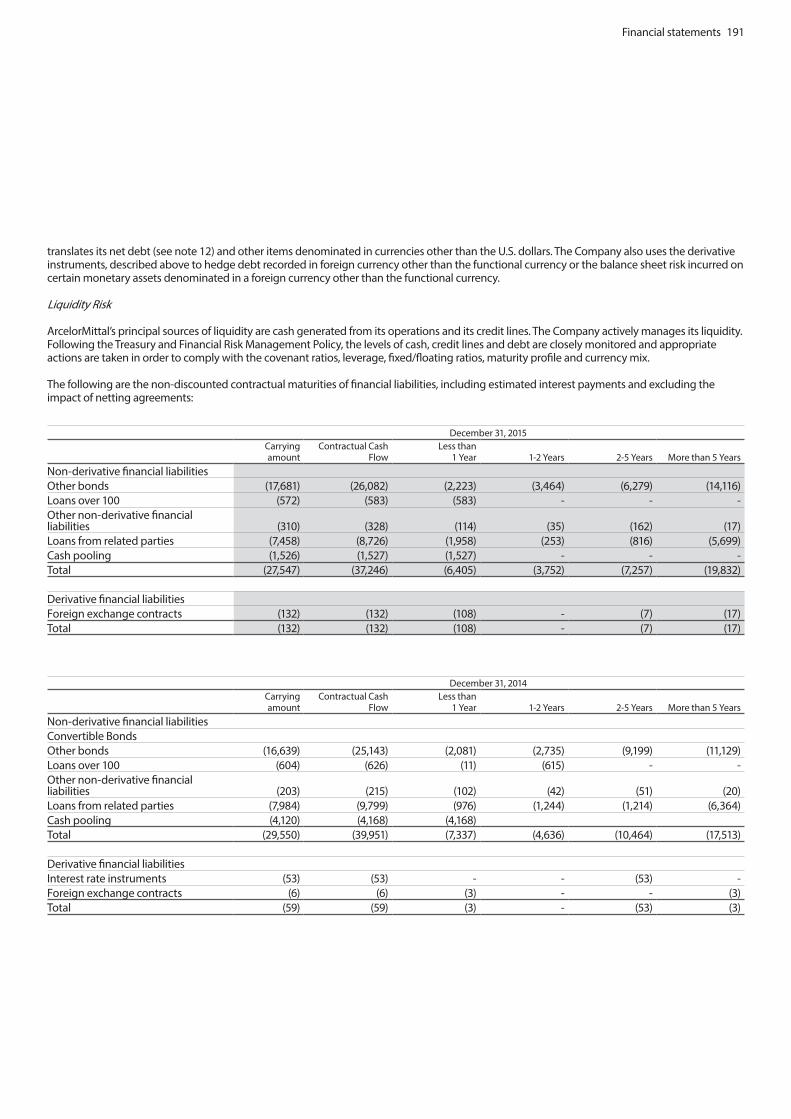
Financial statements 191
translates its net debt (see note 12) and other items denominated in currencies other than the U.S. dollars. The Company also uses the derivative instruments, described above to hedge debt recorded in foreign currency other than the functional currency or the balance sheet risk incurred on certain monetary assets denominated in a foreign currency other than the functional currency.
Liquidity Risk ArcelorMittal’s principal sources of liquidity are cash generated from its operations and its credit lines. The Company actively manages its liquidity. Following the Treasury and Financial Risk Management Policy, the levels of cash, credit lines and debt are closely monitored and appropriate actions are taken in order to comply with the covenant ratios, leverage, fixed/floating ratios, maturity profile and currency mix.
The following are the non-discounted contractual maturities of financial liabilities, including estimated interest payments and excluding the impact of netting agreements:
December 31, 2014 Carrying amount
Contractual Cash Flow
Less than 1 Year 1-2 Years 2-5 Years More than 5 Years
Non-derivative financial liabilitiesConvertible BondsOther bonds (16,639) (25,143) (2,081) (2,735) (9,199) (11,129)Loans over 100 (604) (626) (11) (615) - - Other non-derivative financial liabilities (203) (215) (102) (42) (51) (20)Loans from related parties (7,984) (9,799) (976) (1,244) (1,214) (6,364)Cash pooling (4,120) (4,168) (4,168)Total (29,550) (39,951) (7,337) (4,636) (10,464) (17,513)
Derivative financial liabilitiesInterest rate instruments (53) (53) - - (53) - Foreign exchange contracts (6) (6) (3) - - (3)Total (59) (59) (3) - (53) (3)
December 31, 2015Carrying amount
Contractual Cash Flow
Less than 1 Year 1-2 Years 2-5 Years More than 5 Years
Non-derivative financial liabilitiesOther bonds (17,681) (26,082) (2,223) (3,464) (6,279) (14,116)Loans over 100 (572) (583) (583) - - -Other non-derivative financial liabilities (310) (328) (114) (35) (162) (17)Loans from related parties (7,458) (8,726) (1,958) (253) (816) (5,699)Cash pooling (1,526) (1,527) (1,527) - - -Total (27,547) (37,246) (6,405) (3,752) (7,257) (19,832)
Derivative financial liabilitiesForeign exchange contracts (132) (132) (108) - (7) (17)Total (132) (132) (108) - (7) (17)
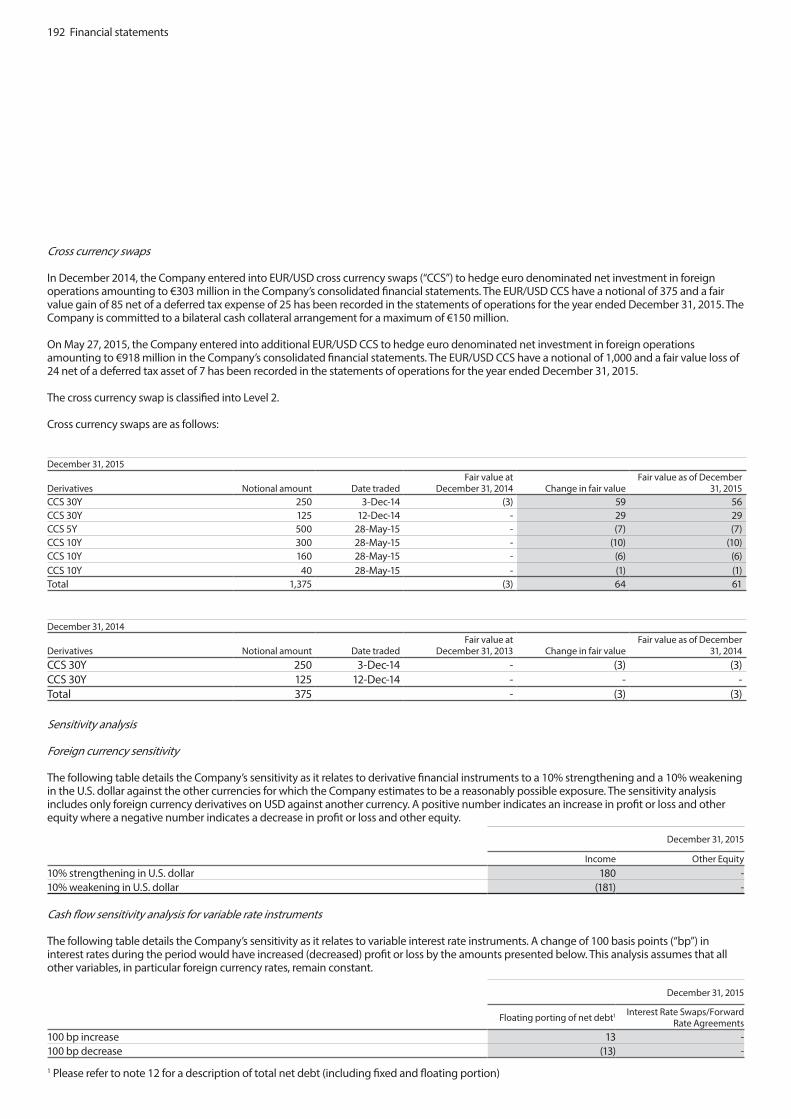
192 Financial statements
Cross currency swaps
In December 2014, the Company entered into EUR/USD cross currency swaps (“CCS”) to hedge euro denominated net investment in foreign operations amounting to €303 million in the Company’s consolidated financial statements. The EUR/USD CCS have a notional of 375 and a fair value gain of 85 net of a deferred tax expense of 25 has been recorded in the statements of operations for the year ended December 31, 2015. The Company is committed to a bilateral cash collateral arrangement for a maximum of €150 million.
On May 27, 2015, the Company entered into additional EUR/USD CCS to hedge euro denominated net investment in foreign operations amounting to €918 million in the Company’s consolidated financial statements. The EUR/USD CCS have a notional of 1,000 and a fair value loss of 24 net of a deferred tax asset of 7 has been recorded in the statements of operations for the year ended December 31, 2015.
The cross currency swap is classified into Level 2.
Cross currency swaps are as follows:
December 31, 2015
Derivatives Notional amount Date tradedFair value at
December 31, 2014 Change in fair valueFair value as of December
31, 2015CCS 30Y 250 3-Dec-14 (3) 59 56 CCS 30Y 125 12-Dec-14 - 29 29 CCS 5Y 500 28-May-15 - (7) (7)CCS 10Y 300 28-May-15 - (10) (10)CCS 10Y 160 28-May-15 - (6) (6)CCS 10Y 40 28-May-15 - (1) (1)Total 1,375 (3) 64 61
December 31, 2014
Derivatives Notional amount Date tradedFair value at
December 31, 2013 Change in fair valueFair value as of December
31, 2014CCS 30Y 250 3-Dec-14 - (3) (3)CCS 30Y 125 12-Dec-14 - - - Total 375 - (3) (3)
Sensitivity analysis
Foreign currency sensitivity
The following table details the Company’s sensitivity as it relates to derivative financial instruments to a 10% strengthening and a 10% weakening in the U.S. dollar against the other currencies for which the Company estimates to be a reasonably possible exposure. The sensitivity analysis includes only foreign currency derivatives on USD against another currency. A positive number indicates an increase in profit or loss and other equity where a negative number indicates a decrease in profit or loss and other equity.
Cash flow sensitivity analysis for variable rate instruments
The following table details the Company’s sensitivity as it relates to variable interest rate instruments. A change of 100 basis points (“bp”) in interest rates during the period would have increased (decreased) profit or loss by the amounts presented below. This analysis assumes that all other variables, in particular foreign currency rates, remain constant.
December 31, 2015
Income Other Equity10% strengthening in U.S. dollar 180 -10% weakening in U.S. dollar (181) -
December 31, 2015
Floating porting of net debt1 Interest Rate Swaps/Forward Rate Agreements
100 bp increase 13 -100 bp decrease (13) -
1 Please refer to note 12 for a description of total net debt (including fixed and floating portion)

Financial statements 193
Note 14 – Equity
Authorized shares
At the extraordinary general meeting held on May 8, 2013, the shareholders approved an increase of the authorized share capital of the Company by €524 million represented by 223 million shares, or approximately 8% of ArcelorMittal’s outstanding capital. Following this approval, which is valid for five years, the total authorized share capital was €8.2 billion represented by 1,995,857,213 shares without par value.
At the extraordinary general meeting held on March 10, 2016, the shareholders approved a decrease of the authorized share capital of the Company by €8,049 million through a reduction of the accounting par value per share to €0.10 and a subsequent increase by €3 billion. Following this approval, which is valid for five years, the total authorized share capital was €3.2 billion represented by 31,995,857,213 shares without par value.
Share capital
Following the completion of an offering of ordinary shares on January 14, 2013, ArcelorMittal increased share capital by €455 (608) from €6,428 (9,404) to €6,883 (10,011) through the issuance of 104,477,612 new shares fully paid up. The aggregate number of shares issued and fully paid up increased to 1,665,392,222.
On January 15, 2016, following the maturity of the mandatorily convertible notes, the Company increased share capital by €570 (622) from €6,883 (10,011) to €7,453 (10,633) through the issuance of 137,967,116 new shares fully paid up. The aggregate number of shares issued and fully paid up increased to 1,803,359,338.
Following the extraordinary general meeting held on March 10, 2016, ArcelorMittal decreased share capital by €7,273 (10,376) from €7,453 (10,633) to €180
(257) through a reduction of the accounting par value per share to €0.10 without any distribution to shareholders, the balance being allocated to additional paid-in capital. The aggregate number of shares issued and fully paid up amounts to 1,803,359,338. The ordinary shares do not have a par value.
On March 11, 2016, ArcelorMittal announced the terms of a $3 billion capital increase by way of the issuance of 1,803,359,338 rights at a ratio of 7 shares for 10 rights following the adoption of enabling resolutions by the extraordinary general meeting of shareholders on March 10, 2016. The rights issue for an aggregate of 1,262,351,531 shares is structured as non-statutory preferential subscription rights for ArcelorMittal shareholders. The Mittal family has committed to take up its pro-rata 37.38% entitlement corresponding to approximately $1.1 billion. ArcelorMittal has entered into a standby underwriting commitment with different banks acting as joint global coordinators, pursuant to which the latter undertook to underwrite the capital increase for the remaining amount, subject to customary conditions. Subscription price of €2.20 per share represents a 35.3% discount to the theoretical ex-rights price, based on the closing price of ArcelorMittal’s shares on Euronext Amsterdam on March 10, 2016. Rights exercise periods run from March 15, 2016 until March 29, 2016 for rights held via book entry in Depositary Trust Company (“DTC”) or in the New York rights register and March 30, 2016 for rights held in the European clearing systems. Delivery of the new shares pursuant to rights held through the European clearing systems and in the European rights register is expected to take place on or about April 8, 2016. Delivery of the new shares to holders whose rights are held via book entry in DTC or directly on the New York rights register is expected to take place on or about April 11, 2016.In accordance with Luxembourg
Company law, the Company is required to transfer a minimum of 5% of its net profits for each financial year to a legal reserve. This requirement ceases to be necessary once the balance of the legal reserve reaches 10% of common shares. The legal reserve is not available for distribution to the shareholder.
Treasury shares
As of December 31, 2015 and 2014, the Company held 1,557,833 and 995,156 treasury shares respectively.
Option premiums on treasury shares
Following the repayment of the 800 Convertible Senior Notes on May 15, 2014, the Company reclassified from reserves to retained earnings premiums paid for an amount of 435 (309 net of tax) with respect to expired USD denominated call options on treasury shares acquired on December 18, 2010 in order to hedge its obligations arising from the potential conversion of the 800 Convertible Senior Notes into ArcelorMittal shares.
Mandatorily convertible notes
On January 16, 2013, ArcelorMittal issued mandatorily convertible subordinated notes (“MCNs”) with net proceeds of 2,222. The notes have a maturity of 3 years, were issued at 100% of the principal amount and are mandatorily converted into ordinary shares of ArcelorMittal at maturity unless converted earlier at the option of the holders or ArcelorMittal or upon specified events in accordance with the terms of the MCNs. The MCNs pay a coupon of 6.00% per annum, payable quarterly in arrears. The minimum conversion price of the MCNs was set at $16.75, corresponding to the placement price of shares in the concurrent ordinary shares offering as described above, and the maximum conversion price was set at approximately 125% of the minimum conversion price (corresponding to $20.94).
The minimum and maximum conversion prices are subject to adjustment upon the occurrence of certain events, and were, as of December 31, 2015, $15.98 and $19.98, respectively. The Company determined the notes met the definition of a compound financial instrument and as such determined the fair value of the financial liability component of the bond was 384 on the date of issuance and recognized it as long-term obligation. The value of the equity component of 1,838 was determined based upon the difference of the cash proceeds received from the issuance of the bond and the fair value of the financial liability component on the date of issuance and is included in equity.
During the fourth quarter of 2015, the Company delivered 2,275,026 treasury shares against 1,817,869 notes converted at the option of their holders. As a result of such voluntary conversions, the carrying amount of MCNs decreased by 38. On January 15, 2016, upon final maturity of the MCNs, the remaining outstanding 88,182,131 notes were converted into 137,967,116 new common shares. Accordingly, share capital and additional paid-in-capital increased by 622 and 1,178, respectively and carrying amount of MCNs decreased by 1,800.
Subordinated perpetual capital securities
On September 28, 2012, the Company issued subordinated perpetual capital securities for a nominal amount of 650 and a coupon of 8.75%, which resets periodically over the life of the securities, with the first reset after five years and subsequently every five years thereafter. A step up in interest of 0.25% would have occurred on the second reset date and a subsequent step up of 0.75% (cumulative with the initial 0.25%) fifteen years later. The Company was entitled to call the securities in five years, ten years and on subsequent coupon payment dates. As the Company had no obligation to redeem the securities
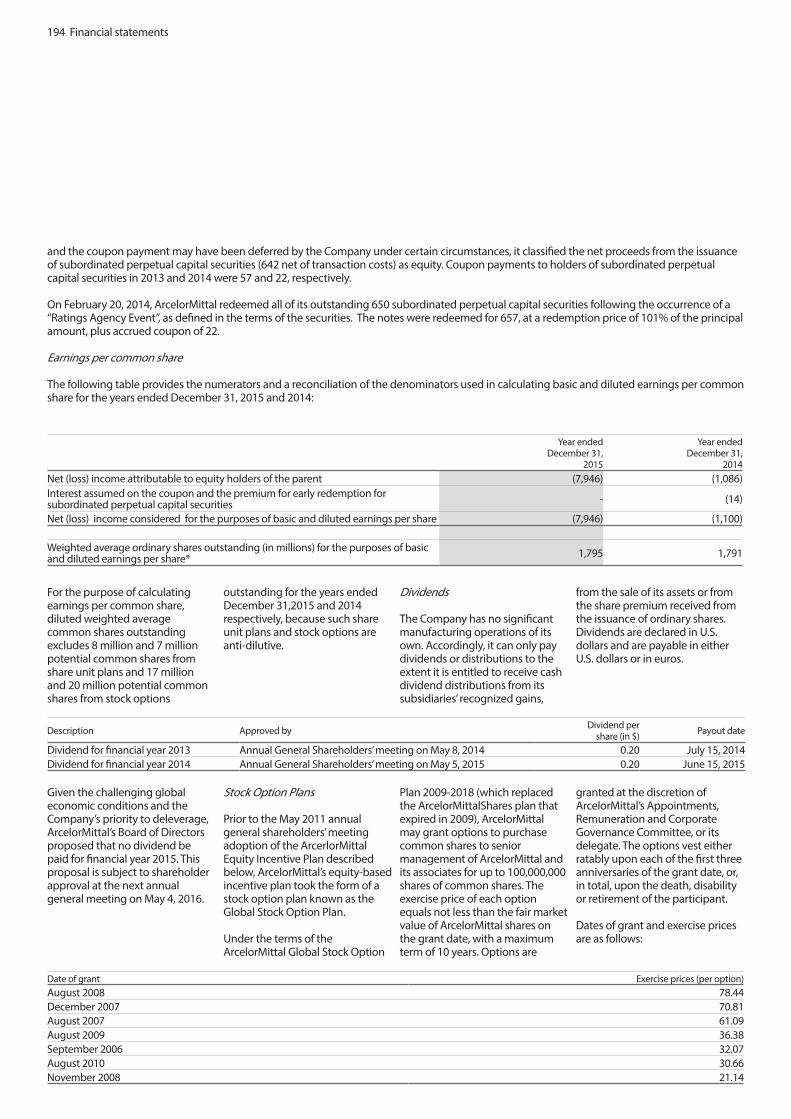
194 Financial statements
and the coupon payment may have been deferred by the Company under certain circumstances, it classified the net proceeds from the issuance of subordinated perpetual capital securities (642 net of transaction costs) as equity. Coupon payments to holders of subordinated perpetual capital securities in 2013 and 2014 were 57 and 22, respectively.
On February 20, 2014, ArcelorMittal redeemed all of its outstanding 650 subordinated perpetual capital securities following the occurrence of a “Ratings Agency Event”, as defined in the terms of the securities. The notes were redeemed for 657, at a redemption price of 101% of the principal amount, plus accrued coupon of 22.
Earnings per common share
The following table provides the numerators and a reconciliation of the denominators used in calculating basic and diluted earnings per common share for the years ended December 31, 2015 and 2014:
Year endedDecember 31,
2015
Year ended December 31,
2014Net (loss) income attributable to equity holders of the parent (7,946) (1,086)Interest assumed on the coupon and the premium for early redemption for subordinated perpetual capital securities - (14)
Net (loss) income considered for the purposes of basic and diluted earnings per share (7,946) (1,100) Weighted average ordinary shares outstanding (in millions) for the purposes of basic and diluted earnings per share* 1,795 1,791
For the purpose of calculating earnings per common share, diluted weighted average common shares outstanding excludes 8 million and 7 million potential common shares from share unit plans and 17 million and 20 million potential common shares from stock options
outstanding for the years ended December 31,2015 and 2014 respectively, because such share unit plans and stock options are anti-dilutive.
Dividends
The Company has no significant manufacturing operations of its own. Accordingly, it can only pay dividends or distributions to the extent it is entitled to receive cash dividend distributions from its subsidiaries’ recognized gains,
from the sale of its assets or from the share premium received from the issuance of ordinary shares. Dividends are declared in U.S. dollars and are payable in either U.S. dollars or in euros.
Description Approved by Dividend per share (in $) Payout date
Dividend for financial year 2013 Annual General Shareholders’ meeting on May 8, 2014 0.20 July 15, 2014Dividend for financial year 2014 Annual General Shareholders’ meeting on May 5, 2015 0.20 June 15, 2015
Given the challenging global economic conditions and the Company’s priority to deleverage, ArcelorMittal’s Board of Directors proposed that no dividend be paid for financial year 2015. This proposal is subject to shareholder approval at the next annual general meeting on May 4, 2016.
Stock Option Plans
Prior to the May 2011 annual general shareholders’ meeting adoption of the ArcerlorMittal Equity Incentive Plan described below, ArcelorMittal’s equity-based incentive plan took the form of a stock option plan known as the Global Stock Option Plan.
Under the terms of the ArcelorMittal Global Stock Option
Plan 2009-2018 (which replaced the ArcelorMittalShares plan that expired in 2009), ArcelorMittal may grant options to purchase common shares to senior management of ArcelorMittal and its associates for up to 100,000,000 shares of common shares. The exercise price of each option equals not less than the fair market value of ArcelorMittal shares on the grant date, with a maximum term of 10 years. Options are
granted at the discretion of ArcelorMittal’s Appointments, Remuneration and Corporate Governance Committee, or its delegate. The options vest either ratably upon each of the first three anniversaries of the grant date, or, in total, upon the death, disability or retirement of the participant.
Dates of grant and exercise prices are as follows:
Date of grant Exercise prices (per option)August 2008 78.44December 2007 70.81August 2007 61.09August 2009 36.38September 2006 32.07August 2010 30.66November 2008 21.14
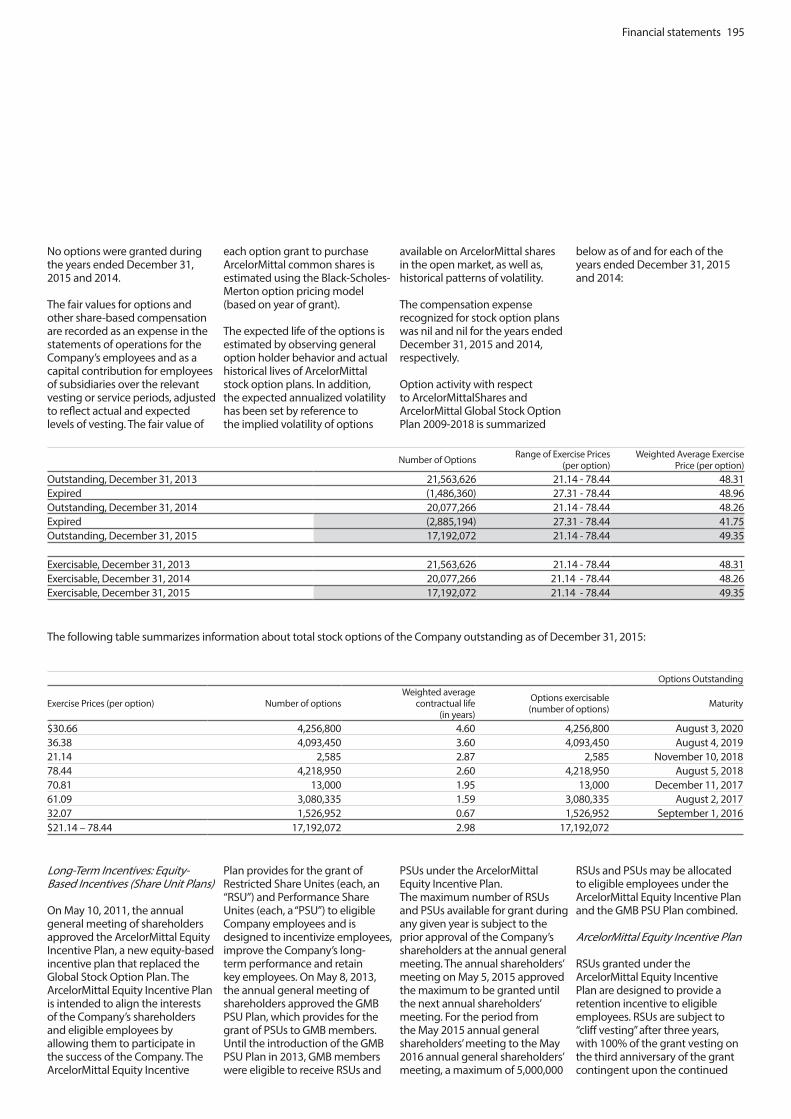
Financial statements 195
No options were granted during the years ended December 31, 2015 and 2014. The fair values for options and other share-based compensation are recorded as an expense in the statements of operations for the Company’s employees and as a capital contribution for employees of subsidiaries over the relevant vesting or service periods, adjusted to reflect actual and expected levels of vesting. The fair value of
each option grant to purchase ArcelorMittal common shares is estimated using the Black-Scholes-Merton option pricing model (based on year of grant).
The expected life of the options is estimated by observing general option holder behavior and actual historical lives of ArcelorMittal stock option plans. In addition, the expected annualized volatility has been set by reference to the implied volatility of options
available on ArcelorMittal shares in the open market, as well as, historical patterns of volatility.
The compensation expense recognized for stock option plans was nil and nil for the years ended December 31, 2015 and 2014, respectively.
Option activity with respect to ArcelorMittalShares and ArcelorMittal Global Stock Option Plan 2009-2018 is summarized
below as of and for each of the years ended December 31, 2015 and 2014:
Number of Options Range of Exercise Prices (per option)
Weighted Average Exercise Price (per option)
Outstanding, December 31, 2013 21,563,626 21.14 - 78.44 48.31Expired (1,486,360) 27.31 - 78.44 48.96Outstanding, December 31, 2014 20,077,266 21.14 - 78.44 48.26Expired (2,885,194) 27.31 - 78.44 41.75Outstanding, December 31, 2015 17,192,072 21.14 - 78.44 49.35 Exercisable, December 31, 2013 21,563,626 21.14 - 78.44 48.31Exercisable, December 31, 2014 20,077,266 21.14 - 78.44 48.26Exercisable, December 31, 2015 17,192,072 21.14 - 78.44 49.35
The following table summarizes information about total stock options of the Company outstanding as of December 31, 2015:
Options Outstanding
Exercise Prices (per option) Number of optionsWeighted average
contractual life (in years)
Options exercisable (number of options) Maturity
$30.66 4,256,800 4.60 4,256,800 August 3, 202036.38 4,093,450 3.60 4,093,450 August 4, 201921.14 2,585 2.87 2,585 November 10, 201878.44 4,218,950 2.60 4,218,950 August 5, 201870.81 13,000 1.95 13,000 December 11, 201761.09 3,080,335 1.59 3,080,335 August 2, 201732.07 1,526,952 0.67 1,526,952 September 1, 2016$21.14 – 78.44 17,192,072 2.98 17,192,072
Long-Term Incentives: Equity-Based Incentives (Share Unit Plans)
On May 10, 2011, the annual general meeting of shareholders approved the ArcelorMittal Equity Incentive Plan, a new equity-based incentive plan that replaced the Global Stock Option Plan. The ArcelorMittal Equity Incentive Plan is intended to align the interests of the Company’s shareholders and eligible employees by allowing them to participate in the success of the Company. The ArcelorMittal Equity Incentive
Plan provides for the grant of Restricted Share Unites (each, an “RSU”) and Performance Share Unites (each, a “PSU”) to eligible Company employees and is designed to incentivize employees, improve the Company’s long-term performance and retain key employees. On May 8, 2013, the annual general meeting of shareholders approved the GMB PSU Plan, which provides for the grant of PSUs to GMB members. Until the introduction of the GMB PSU Plan in 2013, GMB members were eligible to receive RSUs and
PSUs under the ArcelorMittal Equity Incentive Plan.The maximum number of RSUs and PSUs available for grant during any given year is subject to the prior approval of the Company’s shareholders at the annual general meeting. The annual shareholders’ meeting on May 5, 2015 approved the maximum to be granted until the next annual shareholders’ meeting. For the period from the May 2015 annual general shareholders’ meeting to the May 2016 annual general shareholders’ meeting, a maximum of 5,000,000
RSUs and PSUs may be allocated to eligible employees under the ArcelorMittal Equity Incentive Plan and the GMB PSU Plan combined.
ArcelorMittal Equity Incentive Plan
RSUs granted under the ArcelorMittal Equity Incentive Plan are designed to provide a retention incentive to eligible employees. RSUs are subject to “cliff vesting” after three years, with 100% of the grant vesting on the third anniversary of the grant contingent upon the continued

196 Financial statements
active employment of the eligible employee within the Group. Between 500 and 700 of the Group’s most senior managers are eligible for RSUs.
The grant of PSUs under the ArcelorMittal Equity Incentive Plan aims to serve as an effective performance-enhancing scheme based on the employee’s contribution to the eligible achievement of the Company’s strategy. Awards in connection with PSUs are subject to the fulfillment of cumulative performance criteria over a three-year period from the date of the PSU grant. The employees eligible to receive PSUs are a sub-set of the group of employees eligible to receive RSUs. The target group for PSU grants initially included the Chief Executive Officer and the other GMB members. However, from 2013 onwards, the Chief Executive Officer and other GMB members receive PSU grants under
the GMB PSU Plan instead of the ArcelorMittal Equity Incentive Plan.PSUs vest three years after their date of grant subject to the eligible employee’s continued employment with the Company and the fulfillment of targets related to the following performance measures: return on capital employed (ROCE) and a strategic measure which was total cost of employment (in U.S. dollars per tonne) for the steel business (TCOE) and the mining volume plan and ROCE for the Mining segment until 2013 grant. As from 2014, most of the Steel Business Units have kept only ROCE as performance measure and Mining continued with ROCE and mining volume plan. Each performance measure has a weighting of 50%. In case the level of achievement of both performance targets together is below 80%, there is no vesting, and the rights are automatically forfeited.
GMB PSU Plan
The GMB PSU Plan is designed to enhance the long-term performance of the Company and align the members of the GMB to the Company’s objectives. The members of the GMB including the Chief Executive Officer are eligible for PSU grants. The GMB PSU Plan provides for cliff vesting on the third year anniversary of the grant date, under the condition that the relevant GMB member continues to be actively employed by the Group on that date. If the GMB member is retired on that date or in case of an early retirement by mutual consent, the relevant GMB member will not automatically forfeit PSUs and pro rata vesting will be considered at the end of the vesting period at the sole discretion of the Company, represented by the Appointment, Remuneration and Corporate Governance Committee of the Board of Directors. Awards under
the GMB PSU Plan are subject to the fulfillment of cumulative performance criteria over a three-year period from the date of the PSU grant. The value of the grant at grant date will equal one year of base salary for the Chief Executive Officer and 80% of base salary for the other GMB members. Each PSU may give right to up to two shares of the Company. The two performance criteria required to be met for PSUs to vest are total shareholder return and earnings per share. The following table summarizes the Company’s share unit plans outstanding as of December 31, 2015:
At Grant date Number of shares as of December 31, 2015
Grant date Type of plan
Number of shares
Number of beneficiaries Maturity Fair value
per shareShares
outstandingShares exited
Shares forfeited
December 18, 2015 PSU 887,643 322 December 18, 2018 $3.83 887,643 - -December 18, 2015 RSU 1,105,361 576 December 18, 2018 3.83 1,105,361 - -June 30, 2015 GMB PSU 464,305 4 June 30, 2018 8.53 464,305 - -December 17, 2014 PSU 979,870 353 December 17, 2017 10.28 906,370 - 73,500December 17, 2014 RSU 1,173,910 620 December 17, 2017 10.28 1,091,152 741 82,017June 27, 2014 GMB PSU 843,376 6 June 27, 2017 16.85 767,746 - 75,630September 27, 2013 PSU 504,075 384 September 27, 2016 13.17 412,720 - 91,355September 27, 2013 RSU 1,065,415 682 September 27, 2016 13.17 903,246 13,143 149,026June 28, 2013 GMB PSU 631,077 7 June 28, 2016 16.6 542,632 - 88,445March 29, 2013 PSU 182,970 94 March 29, 2016 12.37 130,155 - 52,815March 29, 2013 RSU 1,071,190 681 March 29, 2016 12.37 861,419 20,438 189,333Total 8,909,192 $3.83 – $16.85 8,072,749 34,322 802,121
These equity incentive plans are accounted for as equity-settled share-based transactions. The fair value for the RSUs and PSUs allocated to the beneficiaries is recorded as an expense in the statements of operations for the Company’s employees and as a capital contribution for employees of subsidiaries over the relevant vesting or service periods. The compensation expense recognized for RSUs and PSUs were immaterial for the years ended December 31, 2015 and 2014.

Financial statements 197
Share unit plan activity is summarized below as of and for each year ended December 31, 2015 and 2014:
Restricted share unit (RSU) Performance share unit (PSU)Number of
sharesFair value per
shareNumber of
sharesFair value per
shareOutstanding, December 31, 2013 3,243,666 13.36 1,527,147 15.03Granted 1,173,910 10.28 1,823,246 13.32Exited (777,252) 14.43 - -Forfeited (230,718) 13.27 (90,215) 14.27Outstanding, December 31, 2014 3,409,606 12.06 3,260,178 14.10Granted 1,105,361 3.83 1,351,948 5.44Exited (321,980) 14.3 (24,721) 16.87Forfeited (231,809) 11.9 (475,834) 15.2Outstanding, December 31, 2015 3,961,178 9.59 4,111,571 11.11
Note 15: General and administrative expenses
In December 2014 and January 2015, the Company recorded an expense of 424 and 483, respectively, in connection with the transfer of the global coordination of current and future research and development activities within ArcelorMittal group on January 1, 2015. These amounts corresponded to the acquisition from various group subsidiaries of the rights to use intellectual property developed within the research and development cost sharing agreement led previously by ArcelorMittal Investigación y Desarollo, S.L. (“AMID”). In addition, in December 2014, the Company recorded an expense of 113 relating to the acquisition from AMID of the legal ownership and exploitation rights of this intellectual property.
This acquisition enabled the Company to implement effective January 1, 2015 an industrial franchise agreement with group subsidiaries replacing previous arrangements and whereby the Company licenses its business model for manufacturing, processing and distributing steel to group subsidiaries (see note 3).
The Company concluded that the acquisition of intellectual property rights did not meet the criteria to recognize an intangible asset and therefore the total amount was recognized in the statements of operations as general and administrative expenses.
Transactions with related parties are detailed in note 11.
Note 16: Financing costs
Financing costs recognized in the years ended December 31, 2015 and 2014 were as follows:
2015 2014
Recognized in the statements of operationsInterest expense (1,504) (1,691)Interest income 711 999Gain (loss) on disposal of investments (747) (62)Fair value adjustment on conversion options on the euro convertible bond, call options on ArcelorMittal shares and mandatory convertible bonds (note 13) (108) 112
Net gain on other derivative instruments 72 7Net foreign exchange result (1,457) (605)Other (49) (196)Total (3,082) (1,436)Recognized in other comprehensive incomeNet change in fair value of available-for-sale financial assets (39) 101Total (39) 101
In 2015, loss on disposal of investments of 747 included primarily losses of 721 and 30 with respect to the disposal of interests in AMO Holding Switzerland A.G. and Arcelor Investment S.A., respectively (see note 8). In 2014, loss on disposal of investments of 62 related to Hunan Valin and comprised gains on disposal of 17 and 62 following the exercise of the third put option on February 6, 2014 and fourth put option on August 6, 2014, respectively, and a loss of 141 with respect to the remeasurement at fair value of the Company’s 15% interest following its reclassification as available-for-sale investment.
Transactions with related parties are detailed in note 11.

198 Financial statements
Note 17 – Income from subsidiaries and associates
The income from subsidiaries and associates in 2015 is mainly related to dividends received from AMO Holding Switzerland A.G. for € 2,804 (3,144) and from AM Global Holding S.à.r.l. for € 2,600 (2,819).
In 2014, income from subsidiaries and associates comprised mainly the dividend of € 1,610 (1,978) received from AM Global Holding S.à.r.l. Note 18 – Income tax
Income tax expense (benefit)The components of the income tax expense (benefit) for each of the years ended December 31, 2015 and 2014 are summarized below:
2015 2014
Total current tax expense (benefit) (251) (491)Total deferred tax expense (benefit) 298 (115)Total income tax expense (benefit) 47 (606)
Year ended December 31, 2015
Year ended December 31, 2014
Net income (loss) (33,414) 488Income tax expense (benefit) 47 (606)Loss before tax : (33,367) (118)Tax benefit at the statutory rate (9,750) (34)Permanent items 8,315 (539)Taxable results transferred from subsidiaries included in the tax integration (1,238) (226)Net change in measurement of deferred tax assets 2,449 (129)Effects of foreign currency translation 233 311Other taxes 38 11Income tax expense (benefit) 47 (606)
Permanent items The permanent items consist of:
The following table reconciles the income tax expense (benefit) to the statutory tax expense (benefit) as calculated:
2015 2014Non-tax deductible impairment losses 9,884 68Non-tax deductible capital losses 220 -Exempt dividend income (1,753) (582)Exempt capital gains - (23)Other permanent items (36) (2)Total permanent items 8,315 (539)
Non tax-deductible impairment charges: Write-down charges taken on investments in shares of subsidiaries are generally tax deductible under the Luxembourg tax legislation. However the write-down charges are not tax-deductible if they (i) are neutralized with exempt dividend income, exempt capital gains and mark to market valuation, or (ii) arise within the tax consolidation. These non tax-deductible charges for 2015 amount to 33,827 and are mainly related to ArcelorMittal Global Holding and Ispat Inland. The non tax-deductible impairment charges for 2014 of
235 were related to the Company’s investments in Hunan Valin and Arcelor Investment S.A.
Non-tax deductible capital losses: The Capital losses made on disposal of shares are generally tax deductible under the Luxembourg tax legislation. In cases where the loss (i) relates to the received exempted dividend income, or (ii) is made on disposal of the entities within the same tax integration, the capital loss then is non tax-deductible. For 2015 these tax losses amount to 751 and are related to AMO Holding Switzerland and Arcelor Investments S.A.
Exempted dividend income: Under Article 166 of the Luxembourg tax law, dividend income, liquidation proceeds, and capital gains may be treated as tax-exempt so long as certain requirements are met relating to the parent’s participation in the subsidiary. The participation exemption applies if the Luxembourg parent maintains (or commits to hold) a minimum holding in a qualified subsidiary company (generally a shareholding of at least 10% or having an acquisition cost of at least EUR 1.2m) for an uninterrupted period of at least 12 months.
Net change in measurement of deferred tax assets The 2015 net change in measurement of deferred tax assets of 2,449 consists of tax expense of 2,151 due to the unrecognized tax loss for the period and de-recognition of DTA for 298. The de-recognition in Luxembourg represents the net reduction in projections of future taxable income in Luxembourg driven primarily by the challenging market conditions affecting the steel industry and unfavorable foreign exchange movements, partially offset by reductions in forecasted interest expense due to the Company’s announced plans

Financial statements 199
in 2016 to repay debt with proceeds from a $3 billion equity rights offering and selling its 35% shareholding in Gestamp Automoción for €875 million. The taxable income projection also includes the effect of the anticipated elimination of the current USD exposure of Luxembourgish deferred tax assets denominated in Euro.
Effects of foreign currency translation The effects of foreign currency translation of 233 and 311 for 2015 and 2014, respectively, are related to the different functional currency of the Company than the currency applied for tax filing purposes.
Uncertain tax positions ArcelorMittal takes income tax positions that management believes are supportable and are intended to withstand challenge by tax authorities. Some of these positions are inherently uncertain and include those relating to transfer pricing matters and the interpretation of income tax laws applied to complex transactions. The Company periodically reassesses its tax positions. Changes to the financial statement recognition, measurement, and disclosure of tax positions is based on management’s best judgment given any changes in the facts, circumstances, information available and applicable tax laws. Considering all available information and the history of resolving income tax uncertainties, the Company believes that the ultimate resolution of such matters will not have a material effect on the Company’s financial position, statements of operations or cash flows.
Deferred tax assets and liabilitiesThe origin of deferred tax assets and liabilities is as follows:
Gross amount Total deferred tax assets
Recognized deferred tax assets
Unrecognized deferred tax assets
Tax losses carried forward 61,478 17,581 6,797 10,783Other temporary differences 24 7 7 -Total 17,588 6,804 10,783
Assets Liabilities NetDecember
31, 2015December
31, 2014December
31, 2015December
31, 2014December
31, 2015December
31, 2014Concession, patents, licenses 7 - - - 7 -Treasury shares - - - (3) - (3)Financial instruments - - - - - -Provisions - 4 (1) - (1) 4Tax losses carried forward 6,797 7,897 - - 6,797 7,897Deferred tax assets / (liabilities) 6,804 7,901 (1) (3) 6,803 7,898
Deferred tax assets not recognized by the Company as of December 31, 2015 were as follows:
Deferred tax assets not recognized by the Company as of December 31, 2014 were as follows:
Gross amount Total deferred tax assets
Recognized deferred tax assets
Unrecognized deferred tax assets
Tax losses carried forward 52,843 15,082 7,897 7,185Other temporary differences 12 4 4 -Total 15,086 7,901 7,185
As of December 31, 2015, deferred tax assets not recognized relate only to tax losses carried forward. The utilization of tax losses carried forward is restricted to the taxable income of the Luxembourg tax consolidated group. The utilization of tax losses carried forward also may be restricted by the character of the income.The total amount of accumulated
tax losses in Luxembourg with respect to the main tax consolidation amounts to approximately 61,478 as of December 31, 2015. Of this amount 24,574 is considered realizable, resulting in the recognition of 6,797 of deferred tax assets at the applicable income tax rate in Luxembourg. Under the Luxembourg tax legislation
tax losses can be carried forward indefinitely and are not subject to any specific yearly loss utilization limitations. The tax losses carried forward relate primarily to tax deductible write-down charges taken on investments in shares of consolidated subsidiaries recorded by certain of the ArcelorMittal group’s holding companies in Luxembourg. Of the total tax
losses carried forward, 14,585 may be subject to recapture in the future if the write-downs that caused them are reversed creating taxable income unless the Company converts them to permanent through sales or other organizational restructuring activities.
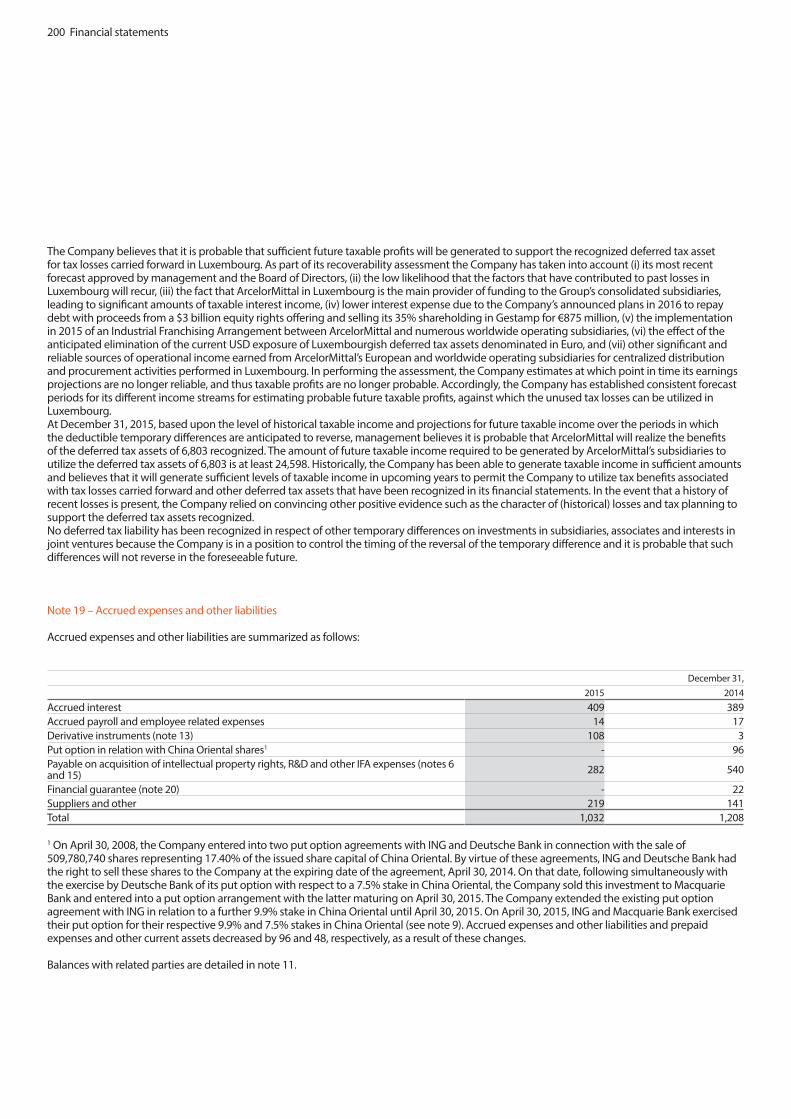
200 Financial statements
The Company believes that it is probable that sufficient future taxable profits will be generated to support the recognized deferred tax asset for tax losses carried forward in Luxembourg. As part of its recoverability assessment the Company has taken into account (i) its most recent forecast approved by management and the Board of Directors, (ii) the low likelihood that the factors that have contributed to past losses in Luxembourg will recur, (iii) the fact that ArcelorMittal in Luxembourg is the main provider of funding to the Group’s consolidated subsidiaries, leading to significant amounts of taxable interest income, (iv) lower interest expense due to the Company’s announced plans in 2016 to repay debt with proceeds from a $3 billion equity rights offering and selling its 35% shareholding in Gestamp for €875 million, (v) the implementation in 2015 of an Industrial Franchising Arrangement between ArcelorMittal and numerous worldwide operating subsidiaries, (vi) the effect of the anticipated elimination of the current USD exposure of Luxembourgish deferred tax assets denominated in Euro, and (vii) other significant and reliable sources of operational income earned from ArcelorMittal’s European and worldwide operating subsidiaries for centralized distribution and procurement activities performed in Luxembourg. In performing the assessment, the Company estimates at which point in time its earnings projections are no longer reliable, and thus taxable profits are no longer probable. Accordingly, the Company has established consistent forecast periods for its different income streams for estimating probable future taxable profits, against which the unused tax losses can be utilized in Luxembourg.At December 31, 2015, based upon the level of historical taxable income and projections for future taxable income over the periods in which the deductible temporary differences are anticipated to reverse, management believes it is probable that ArcelorMittal will realize the benefits of the deferred tax assets of 6,803 recognized. The amount of future taxable income required to be generated by ArcelorMittal’s subsidiaries to utilize the deferred tax assets of 6,803 is at least 24,598. Historically, the Company has been able to generate taxable income in sufficient amounts and believes that it will generate sufficient levels of taxable income in upcoming years to permit the Company to utilize tax benefits associated with tax losses carried forward and other deferred tax assets that have been recognized in its financial statements. In the event that a history of recent losses is present, the Company relied on convincing other positive evidence such as the character of (historical) losses and tax planning to support the deferred tax assets recognized.No deferred tax liability has been recognized in respect of other temporary differences on investments in subsidiaries, associates and interests in joint ventures because the Company is in a position to control the timing of the reversal of the temporary difference and it is probable that such differences will not reverse in the foreseeable future.
Note 19 – Accrued expenses and other liabilities
Accrued expenses and other liabilities are summarized as follows:
December 31, 2015 2014
Accrued interest 409 389Accrued payroll and employee related expenses 14 17Derivative instruments (note 13) 108 3Put option in relation with China Oriental shares1 - 96Payable on acquisition of intellectual property rights, R&D and other IFA expenses (notes 6 and 15) 282 540
Financial guarantee (note 20) - 22Suppliers and other 219 141Total 1,032 1,208
1 On April 30, 2008, the Company entered into two put option agreements with ING and Deutsche Bank in connection with the sale of 509,780,740 shares representing 17.40% of the issued share capital of China Oriental. By virtue of these agreements, ING and Deutsche Bank had the right to sell these shares to the Company at the expiring date of the agreement, April 30, 2014. On that date, following simultaneously with the exercise by Deutsche Bank of its put option with respect to a 7.5% stake in China Oriental, the Company sold this investment to Macquarie Bank and entered into a put option arrangement with the latter maturing on April 30, 2015. The Company extended the existing put option agreement with ING in relation to a further 9.9% stake in China Oriental until April 30, 2015. On April 30, 2015, ING and Macquarie Bank exercised their put option for their respective 9.9% and 7.5% stakes in China Oriental (see note 9). Accrued expenses and other liabilities and prepaid expenses and other current assets decreased by 96 and 48, respectively, as a result of these changes.
Balances with related parties are detailed in note 11.

Financial statements 201
Note 20 – Other long term obligations
Other long obligations are summarized as follows:
December 31, 2015
December 31, 2014
Liability component of the mandatorily convertible notes1 - 138Financial guarantee2 - 44Derivative instruments (note 13) 24 56Other 2 -Total 26 238
1 The liability component of the mandatorily convertible notes was transferred to accrued expenses and other liabilities as a result of the maturity of the notes on January 16, 2016. 2 On June 12, 2014, the Company issued a financial guarantee in connection with the assignment to a bank by Arcelor Investment S.A. of its loan granted to ArcelorMittal Las Truchas (see note 21). The Company recognized this guarantee at its fair value of 66 (of which 22 classified as accrued expenses and other liabilities see note 19) at December 31, 2014. The fair value was determined on the basis of the amount paid by the Company to Arcelor Investment S.A. upon exercise of the guarantee on February 18, 2015, following the early repayment of the loan on February 13, 2015. The Company classified the instruments as Level 3.
Note 21 - Commitments
Commitments given are summarized as follows:
December 31, 2015
December 31, 2014
Other commitments1 4,608 5,850Foreign exchange derivative instrument2 1,386 428Total 5,994 6,2781 Other commitments comprise amounts committed with regard to credit lines and guarantees given on behalf of subsidiaries, associates and joint ventures. Other commitments comprise commitments incurred under credit lines granted to subsidiaries and associates (910 and 1,003 as of December 31, 2015 and 2014, respectively), guarantees given to third parties on behalf of subsidiaries and associates (3,303 and 4,509 as of December 31, 2015 and 2014, respectively) and guarantees given to third parties by the Company (46 and 63 as of December 31, 2015 and 2014, respectively). The letter of credit facilities amounting to 475 and 450 were utilized for a total amount of 349 and 275 as of December 31, 2015 and 2014, respectively. The Company is jointly and severally liable for the following entities: ArcelorMittal Finance S.C.A., ArcelorMittal Treasury S.N.C., ArcelorMittal Sourcing and ArcelorMittal Energy S.C.A. 2 Foreign exchange derivative instruments mainly consist of currency swaps which matured in January 2016.
On November 29, 2013, the Company issued a guarantee in connection with the Joint Venture Formation agreement between ArcelorMittal USA and Nippon Steel & Sumitomo Metal Corporation to acquire ThyssenKrupp Steel USA. This guarantee covered the payment obligations of ArcelorMittal USA pursuant to the Joint Venture Formation agreement. This guarantee expired on June 26, 2014. On February 24, 2014, Calvert Acquisition LLC (which, after the acquisition described below, merged into the target company and changed its name to AM/NS Calvert LLC), a 50/50 joint venture between ArcelorMittal
and Nippon Steel & Sumitomo Metal Corporation, entered into two bridge loans of 660 each in order to finance in part the acquisition of ThyssenKrupp Steel USA, LLC. The Company issued two unconditional payment guarantees for 50% of the principal amount plus interest of each of the two above-mentioned bridge loans. The guarantees expired on May 27, 2014 and June 25, 2014. On May 22, 2014 AM/NS Calvert LLC entered into three new loan agreements for a total amount of 1,200. In this context, the Company issued three unconditional payment guarantees for 50 % of the principal of the three above mentioned loans. The two first
guarantees and the third one will expire on September, 26 2024 and May 30, 2025 respectively.
On December 28, 2009 and January 17, 2012, a wholly-owned subsidiary of the Company used the proceeds from the issuance of an unsecured and unsubordinated bond mandatorily convertible into preferred shares of such subsidiary to acquire notes linked to shares of the listed related parties Eregli Demir ve Celik Fab. T.A.S. (Turkey) and China Oriental (China). The notes were issued by the Company’s affiliates Arcelor Investment Services S.A., Expert Placement Services Ltd and ArcelorMittal Holdings
AG, respectively. The Company warrants to own directly or indirectly the entire legal and beneficial interest in the share capital of such companies for so long as any notes remain outstanding. ArcelorMittal also undertakes to provide any funding which would be necessary to these affiliates to meet their obligations with respect to the notes.
On April 3, 2014, the Company issued a guarantee in relation with bilateral cash management and financial transaction in favor of ArcelorMittal Treasury for a maximum amount of € 20 billion, covering overdraft granted by ArcelorMittal Treasury to

202 Financial statements
subsidiaries of ArcelorMittal group for 9,500 and 9,900 as of December 31, 2015 and 2014, respectively.
Corporate guarantee letter
On May 28, 2009, in the framework of a legal reorganization in Canada, the Company entered into a support agreement with ArcelorMittal Canada Holdings Inc. whereby it undertakes to take all such actions as necessary to enable ArcelorMittal Canada Holdings Inc. to reacquire the preferred shares held by its shareholder Mittal Steel International Holdings B.V. upon exercise of such right by the latter.
Note 22: Deferred employee benefits
Certain employees of ArcelorMittal are included in the unfunded defined benefit pension plan managed by the Company’s affiliate ArcelorMittal Luxembourg S.A. The Company has a defined benefit obligation with respect to this plan by virtue of a contractual arrangement with ArcelorMittal Luxembourg S.A. Benefits are based on such employees’ length of service and applicable pension table under the terms of the agreement. This defined benefit pension plan was closed to new entrants on December 31, 2007 and replaced by a defined contribution pension plan for active members financed by employer and employee contributions.
As of December 31, 2015 and 2014, the pension plan benefits were 17 and 20 respectively.
The following table details the reconciliation of the defined benefit pension obligation:
Year endedDecember 31,
2015
Year ended December 31,
2014Change in benefit obligationBenefit obligation at beginning of period 20 25Service cost 1 1Interest cost - 1Actuarial (gain) loss 1 (2)
Experience adjustment 1 (3)Demographic assumptions - (1)Financial assumptions - 2
Foreign currency exchange rate differences and other movements (5) (2)Benefits paid - (3)Benefit obligation at end of period 17 20
The following table details the components of the pension cost recognized in statements of operations:
Year endedDecember 31,
2015
Year endedDecember 31,
2014Net periodic pension costService cost 1 1Interest cost - 1Total 1 2
Service cost is included in general administrative expense. Interest cost is included in financing costs – net.
Assumptions used to determine benefit obligations
December 31, 2015
December 31, 2014
Discount rate 2.05% 1.90%Rate of compensation increase 2.71% 2.71%

Financial statements 203
Cash contributions and maturity profile of the plans
In 2016, the Company is expecting its cash contributions to amount to 1 for pension plans.At December 31, 2015, the duration of the liabilities related to the pension plan was 8 years (2014: 7 years).
Risks associated with defined benefit plans
Through its defined benefit pension plans, ArcelorMittal is exposed to a number of risks, the most significant of which is the change in bond yields. A decrease in corporate bond yields will increase plan liabilities. Sensitivity analysis
The following information illustrates the sensitivity to a change in certain assumptions related to ArcelorMittal’s pension plan (as of December 31, 2015, the defined benefit obligation (“DBO”) for pension was 17):
Effect on 2016 Pre-Tax Pension Expense (sum
of service cost and interest cost)1
Effect of December 31, 2015 DBO
Change in assumption100 basis point decrease in discount rate - 1100 basis point increase in discount rate - (1)100 basis point decrease in rate of compensation - (2)100 basis point increase in rate of compensation - 2
¹Amounts are not disclosed as they are below 1 and rounded to nearest million.
The above sensitivities reflect the effect of changing one assumption at a time. Actual economic factors and conditions often affect multiple assumptions simultaneously, and the effects of changes in key assumptions are not necessarily linear.
Note 23: Contingencies
The Company is currently and may in the future be involved in litigation, arbitration or other legal proceedings. Provisions related to legal and arbitration proceedings are recorded in accordance with the principles described in note 3.
On January 8, 2008, ArcelorMittal received a writ of summons on behalf of four hedge fund shareholders of Arcelor to appear before the civil court of Luxembourg. The summons was also served on all natural persons sitting on the Board of Directors of ArcelorMittal at the time of the merger and on the Significant Shareholder. The plaintiffs alleged in particular that, based on Mittal Steel’s and Arcelor’s disclosure and public statements, investors had a legitimate expectation that the
exchange ratio in the second-step merger would be the same as that of the secondary exchange offer component of Mittal Steel’s June 2006 tender offer for Arcelor (i.e., 11 Mittal Steel shares for seven Arcelor shares), and that the second-step merger did not comply with certain provisions of Luxembourg company law. They claimed, inter alia, the cancellation of certain resolutions (of the Board of Directors and of the Shareholders meeting) in connection with the merger, the grant of additional shares, or damages in an amount of approximately 196. By judgment dated November 30, 2011, the Luxembourg civil court declared all of the plaintiffs’ claims inadmissible and dismissed them. The judgment was appealed in May 2012 and the appeal proceedings are ongoing.
On May 15, 2012, ArcelorMittal received a writ of summons on behalf of Association Actionnaires d’Arcelor (“AAA”), a French association of former minority shareholders of Arcelor, to appear before the civil court of Paris. In such writ of summons, AAA claimed (on grounds similar to those in the Luxembourg proceedings summarized above) inter alia damages in a nominal
amount and reserved the right to seek additional remedies including the cancellation of the merger. The proceedings before the civil court of Paris have been stayed, pursuant to a ruling of such court on July 4, 2013, pending a preparatory investigation (instruction préparatoire) by a criminal judge magistrate (juge d’instruction) triggered by the complaints (plainte avec constitution de partie civile) of AAA and several hedge funds (who quantified their total alleged damages at 268), including those who filed the claims before the Luxembourg courts described (and quantified) above.
In April 2011, a proceeding was commenced before the Ontario (Canada) Superior Court of Justice under the Ontario Class Proceedings Act, 1992, against ArcelorMittal, Baffinland, and certain other parties relating to the January 2011 take-over of Baffinland by ArcelorMittal, Nunavut, Iron Ore Holdings and 1843208 Ontario Inc. The action seeks the certification of a class comprised of all Baffinland securities holders who tendered their Baffinland securities, and whose securities were taken up, in connection with the take-over between September 22, 2010 and February 17, 2011,
or otherwise disposed of their Baffinland securities on or after January 14, 2011. The action alleges that the tender offer documentation contained certain misrepresentations and seeks damages in an aggregate amount of 720 (CAD$1billion) or rescission of the transfer of the Baffinland securities by members of the class.
On September 12, 2008, Standard Iron Works filed a purported class action complaint in the U.S. District Court for the Northern District of Illinois against ArcelorMittal, ArcelorMittal USA LLC, and other steel manufacturers, alleging that the defendants had conspired to restrict the output of steel products in order to fix, raise, stabilize and maintain prices at artificially high levels in violation of U.S. antitrust law. Other similar direct purchaser lawsuits were also filed in the same court and were consolidated with the Standard Iron Works lawsuit. On May 29, 2014, ArcelorMittal and ArcelorMittal USA LLC entered into an agreement to settle the direct purchaser claims for an amount of 90 recognized by ArcelorMittal USA LLC. On October 17, 2014, the court gave its final approval of the settlement and dismissed ArcelorMittal and ArcelorMittal USA LLC from the
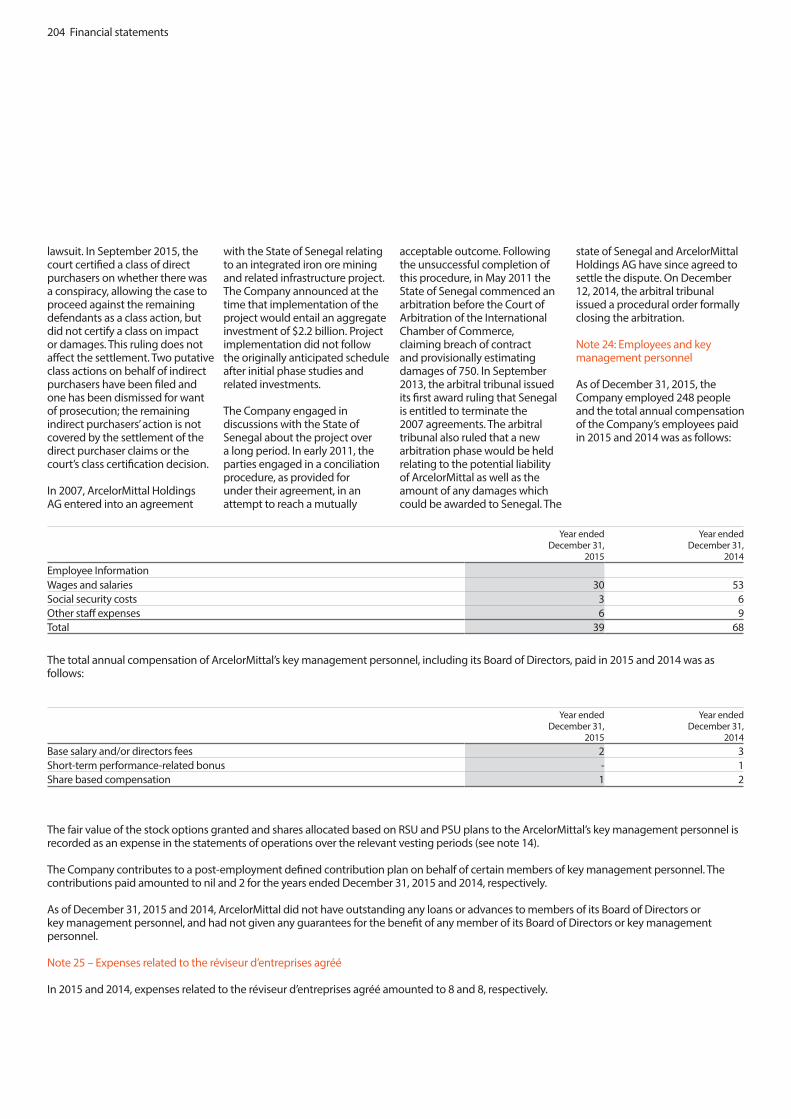
204 Financial statements
lawsuit. In September 2015, the court certified a class of direct purchasers on whether there was a conspiracy, allowing the case to proceed against the remaining defendants as a class action, but did not certify a class on impact or damages. This ruling does not affect the settlement. Two putative class actions on behalf of indirect purchasers have been filed and one has been dismissed for want of prosecution; the remaining indirect purchasers’ action is not covered by the settlement of the direct purchaser claims or the court’s class certification decision.
In 2007, ArcelorMittal Holdings AG entered into an agreement
with the State of Senegal relating to an integrated iron ore mining and related infrastructure project. The Company announced at the time that implementation of the project would entail an aggregate investment of $2.2 billion. Project implementation did not follow the originally anticipated schedule after initial phase studies and related investments.
The Company engaged in discussions with the State of Senegal about the project over a long period. In early 2011, the parties engaged in a conciliation procedure, as provided for under their agreement, in an attempt to reach a mutually
acceptable outcome. Following the unsuccessful completion of this procedure, in May 2011 the State of Senegal commenced an arbitration before the Court of Arbitration of the International Chamber of Commerce, claiming breach of contract and provisionally estimating damages of 750. In September 2013, the arbitral tribunal issued its first award ruling that Senegal is entitled to terminate the 2007 agreements. The arbitral tribunal also ruled that a new arbitration phase would be held relating to the potential liability of ArcelorMittal as well as the amount of any damages which could be awarded to Senegal. The
state of Senegal and ArcelorMittal Holdings AG have since agreed to settle the dispute. On December 12, 2014, the arbitral tribunal issued a procedural order formally closing the arbitration.
Note 24: Employees and key management personnel
As of December 31, 2015, the Company employed 248 people and the total annual compensation of the Company’s employees paid in 2015 and 2014 was as follows:
Year endedDecember 31,
2015
Year endedDecember 31,
2014Employee InformationWages and salaries 30 53Social security costs 3 6Other staff expenses 6 9Total 39 68
The total annual compensation of ArcelorMittal’s key management personnel, including its Board of Directors, paid in 2015 and 2014 was as follows:
Year ended December 31,
2015
Year ended December 31,
2014Base salary and/or directors fees 2 3Short-term performance-related bonus - 1Share based compensation 1 2
The fair value of the stock options granted and shares allocated based on RSU and PSU plans to the ArcelorMittal’s key management personnel is recorded as an expense in the statements of operations over the relevant vesting periods (see note 14).
The Company contributes to a post-employment defined contribution plan on behalf of certain members of key management personnel. The contributions paid amounted to nil and 2 for the years ended December 31, 2015 and 2014, respectively.
As of December 31, 2015 and 2014, ArcelorMittal did not have outstanding any loans or advances to members of its Board of Directors or key management personnel, and had not given any guarantees for the benefit of any member of its Board of Directors or key management personnel.
Note 25 – Expenses related to the réviseur d’entreprises agréé
In 2015 and 2014, expenses related to the réviseur d’entreprises agréé amounted to 8 and 8, respectively.

205 Report of the réviseur d’entreprises agréé 205
Report of the réviseur d’entreprises agréé
To the Shareholders of ArcelorMittal, Société Anonyme24-26, boulevard d’AvranchesL-1160 LuxembourgGrand Duchy of Luxembourg
Report on the financial statements of ArcelorMittal Société Anonyme
Following our appointment by the General Meeting of the Shareholders held on May 5, 2015, we have audited the accompanying financial statements of ArcelorMittal, Société Anonyme, which comprise the statement of financial position as at December 31, 2015, and the statement of operations, comprehensive income, changes in equity and cash flow for the year then ended, and a summary of significant accounting policies and other explanatory information.
Responsibility of the Board of Directors for the financial statements
The Board of Directors is responsible for the preparation and fair presentation of these financial statements in accordance with International Financial Reporting Standards as adopted by the European Union, and including information required to be disclosed under Luxembourg Laws and Regulations, and for such internal control as the Board of Directors’ determines is necessary to enable the preparation of financial statements that are free from material misstatement, whether due to fraud or error.
Responsibility of the réviseur d’entreprises agréé
Our responsibility is to express an opinion on these financial statements based on our audit. We conducted our audit in accordance with International Standards on Auditing as adopted for Luxembourg by the Commission de Surveillance du Secteur Financier. Those standards require that we comply with ethical requirements and plan and perform the audit to obtain reasonable assurance whether the financial statements are free from material misstatement.An audit involves performing procedures to obtain audit evidence about the amounts and disclosures in the financial statements. The procedures selected depend on the réviseur d’entreprises agréé’s judgement, including the assessment of the risks of material misstatement of the financial statements, whether due to fraud or error. In making those risk assessments, the réviseur d’entreprises agréé considers internal control relevant to the entity’s preparation and fair presentation of the financial statements in order to design audit procedures that are appropriate in the circumstances, but not for the purpose of expressing an opinion on the effectiveness of the entity’s internal control. An audit also includes evaluating the appropriateness of accounting policies used and the reasonableness of accounting estimates made by the Board of Directors, as well as evaluating the overall presentation of the financial statements.
We believe that the audit evidence we have obtained is sufficient and appropriate to provide a basis for our audit opinion.
Opinion
In our opinion, the financial statements give a true and fair view of the financial position of ArcelorMittal, Société Anonyme, as at December 31, 2015, and of its financial performance and its cash flows for the year then ended December 31, 2015 in accordance with International Financial Reporting Standards as adopted by the European Union.
Report on other legal and regulatory requirements
The management report, which is the responsibility of the Board of Directors, is consistent with the financial statements and includes the information required by the law of December 19, 2002 on the commercial and companies register and on the accounting records and annual accounts of undertakings, as amended with respect to the corporate governance statement.
For Deloitte AuditSociété à responsabilité limitéeCabinet de révision agréé
Vafa Moayed, Réviseur d’entreprises agrééPartner
March 23, 2016560, rue de NeudorfL-2220 Luxembourg

206 Risk factors
The following pages do not form part of the Company’s financial statements. These pages contain further information on the risks that ArcelorMittal is exposed to and further details on the Company’s Mining business.

Risk factors 207
Risks related to the global economy and the mining and steel industry
ArcelorMittal’s business, financial condition, results of operations, reputation or prospects could be materially adversely affected by one Tor more of the risks and uncertainties described below.
Risks related to the global economy and the mining and steel industry
Excess capacity, oversupply and destocking cycles in the steel industry and in the iron ore mining industry have in the past, are currently and may continue in the future to weigh on the profitability of steel producers, including ArcelorMittal.
The steel industry is affected by global and regional production capacity, fluctuations in steel imports/exports and tariffs and customer stocking and destocking cycles. The steel industry globally has historically suffered from structural overcapacity, which is amplified during periods of global or regional economic weakness due to weaker global or regional demand. In particular, China is both the largest global steel consumer and the largest global steel producer by a large margin, and the balance between its domestic production and consumption has been an important factor influencing global steel prices in recent years. Steel production capability in China currently appears to be well in excess of China’s home market demand, particularly in light of the recent slowdown in China’s economic growth rate and hence steel consumption. Chinese exports of steel products have as a result increased further in 2015, rising from 94 million tonnes in 2014 to 112 million tonnes in 2015. Moreover, overcapacity and unsustainably low domestic prices led Chinese exports to be sold at a loss, according to industry studies, during the second half of 2015, with a negative impact on the global steel industry. Decreased growth rates and hence demand
for steel in other regions, such as in the emerging markets, have similarly led to a rise in exports, particularly in Russia and Brazil where production capacity had substantially increased during the prior periods of high demand. This increase in exports and the decrease in the price of such exports, often at levels that may be at or below the cost of production, has significantly contributed to a sharp drop in steel prices globally, and particularly in the Group’s key markets in NAFTA and Europe as well as in ACIS markets. The imposition of tariffs on imports is under discussion in various markets, such as NAFTA, Europe and South Africa, and these may be necessary in order to restore the conditions for profitable operations. A continuation or an increase in exports of low-cost steel products from developing countries, along with a failure to implement corrective trade policies, would continue to depress steel prices in various markets globally.
In addition to the question of imports, there is a question of actual or potential overcapacity within specific markets. Europe is a case in point, with the contraction in demand in recent years (prior to stabilization and moderate increases in 2014/2015) leading to structural excess capacity in the European steel industry. Outside of Europe, steel production capacity in Asia, particularly in China, and certain other developing economies including Brazil, Russia, Ukraine and Turkey, has increased substantially since 2007 in response to rising steel consumption in those markets. Although the pace of capacity expansion in those countries has slowed down in recent years, structural overcapacity has increased due to a sharp decline in domestic steel demand, particularly in CIS and Brazil, negatively impacting prices.
As an integrated producer of steel, ArcelorMittal’s results are also sensitive to market prices of iron ore both as a manufacturer of steel (of which iron ore is a principal
raw material) and independently, as a miner and seller of iron ore to third parties. In recent periods, a combination of weak steel fundamentals and slower growth in the principal consuming markets (principally China) has weighed heavily on iron ore prices. This has been exacerbated by iron ore oversupply globally, as mines in operation and coming on line have continued to produce. Accordingly, global iron ore production increased in 2015, while prices plummeted to historical lows. A continuation of this trend of steel and iron ore oversupply would have a material adverse effect on ArcelorMittal’s results of operations and financial condition.
Protracted low steel and iron ore prices, and further decreases in steel and iron ore prices, would have an adverse effect on ArcelorMittal’s results of operations.
As a producer of steel and iron ore, ArcelorMittal’s results of operations are sensitive to the market prices of steel and iron ore in its markets and globally. Steel prices and iron ore prices have been under pressure in recent periods and particularly in 2015, with both steel and iron ore reaching historical lows in 2015. This has had a pronounced negative effect on ArcelorMittal’s results of operations, in the form of significant declines in revenues and operating income. Moreover, the particularly sharp decline in steel prices in the second half of 2015 triggered inventory related losses of $1.3 billion, and the significant decline in iron ore prices led to a $3.4 billion impairment of mining assets and goodwill in the fourth quarter of 2015.
Steel and iron ore prices are sensitive to trends in cyclical industries, such as the automotive, construction, appliance, machinery, equipment and transportation industries, which are significant markets for ArcelorMittal’s products. In the past, substantial price decreases
during periods of economic weakness have not always been offset by commensurate price increases during periods of economic strength. In addition, as indicated above, excess supply relative to demand in local markets generally results in increased exports and drives down global prices. Moreover, steel price decreases can sometimes develop their own momentum, as customers adopt a “wait and see” attitude and destock in the expectation of further price decreases.
Management currently considers it likely that, while stabilization is possible, steel prices will remain on the low side at least through 2016, given expectations regarding economic conditions and demand. Management expects iron ore prices to continue to remain under pressure in 2016 due to the supply/demand dynamics summarized above. In any case, the timing and extent of price recovery or return to prior levels cannot be predicted. In response to the decline in steel and iron ore prices, the Company has implemented a number of cost-saving measures intended to improve operating income, as well as measures to reduce its cash requirements, including through lower capital expenditures, interest expenses and the suspension of dividend payments. These actions may not prove sufficient to restore or maintain profitability or cash flows, particularly if the decline in steel and iron ore prices is more protracted than expected or prices decline further than expected, in which case ArcelorMittal’s results of operations and financial condition would be adversely affected.
Volatility in the supply and prices of raw materials, energy and transportation, and volatility in steel prices or mismatches between steel prices and raw material prices could adversely affect ArcelorMittal’s results of operations.
The prices of steel, iron ore, coking coal, coke and scrap are highly
208 Risk factors
volatile. For example, iron ore spot prices fluctuated between a peak of $160 per tonne (Platts index, CFR China, 62% Fe) in mid-February to $110 per tonne at the end of May in 2013, while culminating in a historical low of $44.50 per tonne in early July 2015 then recovered $59.25 per tonne at the beginning of September 2015, before demonstrating further volatility and surpassing the historical low at the end of December 2015 at $38.50 per tonne. Steel prices similarly demonstrated significant volatility in 2013, ranging from a high of $690 per tonne to a low of $586 per tonne (SteelFirst, EU domestic HRC ex-works Northern Europe). In the first half of 2014, steel prices increased steadily, continuing an upward trend beginning mid-2013. However, the second half of 2014 and the full year 2015 saw substantial decreases in steel prices, which dropped to $353 per tonne at the end of 2015, exceeding the historical lows, see “—Steel prices”. Such volatility may be affected by, among other things: industry structural factors (including the oligopolistic nature of the sea-borne iron ore industry and the fragmented nature of the steel industry); trends in demand for iron ore in the steel industry itself, and particularly from Chinese steel producers (as the largest group of producers); massive stocking and destocking activities (sudden drops in prices can lead end-users to delay orders pushing prices down further, as occurred in 2015); new laws or regulations; changes in the supply of iron ore, in particular due to new mines coming into operation; business continuity of suppliers; changes in pricing models or contract arrangements; expansion projects of suppliers; worldwide production, including interruptions thereof by suppliers; capacity-utilization rates; accidents or other similar events at suppliers’ premises or along the supply chain; wars, natural disasters, political disruption and other similar events; fluctuations in exchange rates; the bargaining power of raw material suppliers and the availability and cost of transportation. In addition, recent steel price volatility has
been impacted by lower domestic demand as well as extremely low price spreads from China.
As a producer and seller of steel, the Company is directly exposed to fluctuations in the market price for iron ore and steel and other raw materials, energy and transportation. In particular, steel production consumes substantial amounts of raw materials including iron ore, coking coal and coke, and the production of direct reduced iron, the production of steel in electric arc furnaces (“EAFs”) and the re-heating of steel involve the use of significant amounts of energy, making steel companies dependent on the price of and their reliable access to supplies of raw materials and energy. Although ArcelorMittal has substantial sources of iron ore and coal from its own mines and strategic long-term contracts (the Company’s self-sufficiency rates were 62% for iron ore and 15% for pulverized coal injection (“PCI”) and coal in 2015, assuming full shipments of iron ore and coal from its mines for own use), it nevertheless remains exposed to volatility in the supply and price of iron ore, coking coal and coke given that it obtains a significant portion of such raw materials under supply contracts from third parties.
Furthermore, while steel and iron ore price trends have historically been correlated, a lack of correlation or an abnormal lag in the corollary relationship between raw material and steel prices may also occur and result in a “price-cost squeeze” in the steel industry. ArcelorMittal has experienced price-cost squeezes at various points in recent years and may continue to do so. In some of ArcelorMittal’s segments, in particular Europe and NAFTA, there are several months between raw material purchases and sales of steel products incorporating those materials, rendering them particularly susceptible to price-cost squeeze. Because ArcelorMittal sources a substantial portion of its raw materials through long-term contracts with quarterly (or more frequent) formula-based
or negotiated price adjustments and as a steel producer sells a substantial part of its steel products at spot prices, it faces the risk of adverse differentials between its own production costs, which are affected by global raw materials and scrap prices, on the one hand, and trends for steel prices in regional markets, on the other hand.
Another area of exposure to price volatility is energy and transportation. Freight costs (i.e., shipping) are a substantial component of ArcelorMittal’s cost of goods sold. Freight costs were particularly low in the second half of 2015 due, among other things, to depressed oil prices and demand. If freight costs were to increase before iron ore or steel prices, this would directly and mechanically weigh on ArcelorMittal’s profitability (although it would make imports less competitive).
ArcelorMittal’s business and results are substantially affected by regional and global macroeconomic conditions. Recessions or prolonged periods of weak growth in the global economy or the economies of ArcelorMittal’s key selling markets have in the past had and in the future would be likely to have a material adverse effect on the mining and steel industries and on ArcelorMittal’s business, results of operations and financial condition.
The mining and steel industries have historically been highly volatile largely due to the cyclical nature of the business sectors that are the principal consumers of steel as described above. Demand for minerals, metals and steel products thus generally correlates to macroeconomic fluctuations in the global economy. This correlation and the adverse effect of macroeconomic downturns on metal mining companies and steel producers were evidenced in the 2008/2009 financial and subsequent economic crisis. The results of both mining companies and steel producers were substantially affected, with
many steel producers (including ArcelorMittal) in particular, recording sharply reduced revenues and operating losses. Economic growth (and hence steel and minerals demand) trends have varied across such markets since such period.
Most recently (i.e., in 2015), demand contracted in all major markets except Europe. While growth in Europe has remained sluggish, demand nevertheless improved as the steel consuming sectors gradually improved. Europe is a major market for ArcelorMittal, whose results have suffered in prior years from recession and stagnation in Europe. China saw domestic real steel demand decline year-on-year in 2015 due to the weakness of the real estate sector and overall slowdown in growth. In the United States, apparent demand for steel also declined in 2015 despite improved economic conditions, due to a reversal of the inventory cycle itself, driven by the abnormally high level of imports in 2014, which rose 38% year-on-year to more than 40 million tonnes. Moreover, steel demand declined in some other traditional net exporting regions in 2015, notably CIS and Japan, which has put added pressure on international export markets. Demand in Russia has been driven down by the recession that began in mid-2014 and accelerated in 2015. Recession has also driven down demand in Brazil, where the poor economic conditions resulted in contraction of the steel consuming sectors. The South African market has also remained extremely difficult, with low local demand and increased cheap imports. In Ukraine, economic conditions are also extremely difficult, with GDP shrinking by 12% in 2015, and high inflation.
A failure of the recovery in Europe to pick up speed, a continued slowdown in Chinese steel and iron ore demand, a slowdown in U.S. growth or a continued slowdown or protracted recession in emerging economies would likely result in continued and prolonged subdued demand for

Risk factors 209
(and hence the price of) steel and iron ore. These developments would have a material adverse effect on ArcelorMittal’s results of operations and financial condition.
Developments in the competitive environment in the steel industry could have an adverse effect on ArcelorMittal’s competitive position and hence its business, financial condition, results of operations or prospects.
The markets in which steel companies operate are highly competitive. Competition in the form of established producers expanding in new markets, smaller producers increasing production in anticipation of demand increases or amid recoveries, or exporters selling excess capacity from markets such as China—could cause ArcelorMittal to lose market share, increase expenditures or reduce pricing. Any of these developments could have a material adverse effect on its business, financial condition, results of operations or prospects.
Unfair trade practices in ArcelorMittal’s home markets could negatively affect steel prices and reduce ArcelorMittal’s profitability, while trade restrictions could limit ArcelorMittal’s access to key export markets.
ArcelorMittal is exposed to the effects of “dumping” and other unfair trade and pricing practices by competitors. Moreover, government subsidization of the steel industry remains widespread in certain countries, particularly those with centrally-controlled economies such as China. In periods of lower global demand for steel, there is an increased risk that such competitors will try to compensate with increased volumes of unfairly-traded steel exports into various markets, including North America and Europe and other markets such as South Africa, in which ArcelorMittal produces and sells its products. Such imports have had and could in the future have the effect of further reducing prices and
demand for ArcelorMittal products.
Instances of such perceived dumping have been especially acute in recent years, leading steelmakers in various markets, including the U.S., Europe and South Africa, to seek the imposition of anti-dumping measures. It remains unclear how policymakers in the relevant markets will respond, but even if anti-dumping measures are applied to such imported material, steelmakers may be slow to realize the benefits of such legislation, and the impact on steel prices may be less than originally estimated.
Against this backdrop of rising dumping and other unfair trade and pricing pressures, China is currently lobbying members of the World Trade Organization (“WTO”) to gain “Market Economy Status” (“MES”) by the end of 2016. If China were to be granted MES, such label could result in considerable reduction in the anti-dumping duty levels against China and in many cases preventing any duties at all. Such a development could exacerbate many of the negative externalities currently caused by China, including China’s already massive export increases (Chinese steel exports to the EU increased from 1.2 million tonnes in 2009 to 4.5 million tonnes in 2014) and Chinese overcapacity. No uniform position has been issued by WTO members to date and no assurance can be given that China will not be granted MES.
Conversely, ArcelorMittal has significant exposure to the effects of trade sanctions and barriers due to the global nature of its operations. Various countries have in the past instituted trade sanctions and barriers and the recurrence of such measures, or the imposition of the above-mentioned anti-dumping legislation, could materially and adversely affect ArcelorMittal’s business by limiting the Company’s access to steel markets.
Competition from other materials could reduce market prices and demand for steel
products and thereby reduce ArcelorMittal’s cash flows and profitability.
In many applications, steel competes with other materials that may be used as substitutes, such as aluminum (particularly in the automobile industry), cement, composites, glass, plastic and wood. In particular, as a result of increasingly stringent regulatory requirements, as well as developments in alternative materials, designers, engineers and industrial manufacturers, especially those in the automotive industry, are increasing their use of lighter weight and alternative materials, such as aluminum, composites, plastics and carbon fiber in their products. Loss of market share to substitute materials, increased government regulatory initiatives favoring the use of alternative materials, as well as the development of additional new substitutes for steel products could significantly reduce market prices and demand for steel products and thereby reduce ArcelorMittal’s cash flows and profitability.
ArcelorMittal is subject to strict environmental laws and regulations that could give rise to a significant increase in costs and liabilities.
ArcelorMittal is subject to a broad range of environmental laws and regulations in each of the jurisdictions in which it operates. These laws and regulations impose increasingly stringent environmental protection standards regarding, among others, air emissions, wastewater storage, treatment and discharges, the use and handling of hazardous or toxic materials, waste disposal practices and the remediation of environmental contamination. The costs of complying with, and the imposition of liabilities pursuant to, environmental laws and regulations can be significant, and compliance with new and more stringent obligations may require additional capital expenditures or modifications in operating practices. Failure to comply can result in civil
and or criminal penalties being imposed, the suspension of permits, requirements to curtail or suspend operations and lawsuits by third parties. Despite ArcelorMittal’s efforts to comply with environmental laws and regulations, environmental incidents or accidents may occur that negatively affect the Company’s reputation or the operations of key facilities.
ArcelorMittal also incurs costs and liabilities associated with the assessment and remediation of contaminated sites. In addition to the impact on current facilities and operations, environmental remediation obligations can give rise to substantial liabilities in respect of divested assets and past activities. This may also be the case for acquisitions when liabilities for past acts or omissions are not adequately reflected in the terms and price of the acquisition. ArcelorMittal could become subject to further remediation obligations in the future, as additional contamination is discovered or cleanup standards become more stringent.
Costs and liabilities associated with mining activities include those resulting from tailings and sludge disposal, effluent management, and rehabilitation of land disturbed during mining processes. ArcelorMittal could become subject to unidentified liabilities in the future, such as those relating to uncontrolled tailings breaches or other future events or to underestimated emissions of polluting substances. For example, the failure of a tailings ponds dam at ArcelorMittal’s mines could cause significant damage, including death, injury and environmental harm. While the Company carries out assessments of its facilities, it cannot guarantee that failures or breaches of a tailings ponds dam will not occur in the future.
ArcelorMittal’s operations may be located in areas where individuals or communities may regard its activities as having a detrimental effect on their natural environment and conditions of life. Any actions

210 Risk factors
taken by such individuals or communities in response to such concerns could compromise ArcelorMittal’s profitability or, in extreme cases, the viability of an operation or the development of new activities in the relevant region or country.
See note 8.2 to ArcelorMittal’s consolidated financial statements.
Laws and regulations restricting emissions of greenhouse gases could force ArcelorMittal to incur increased capital and operating costs and could have a material adverse effect on ArcelorMittal’s results of operations and financial condition.
Compliance with new and more stringent environmental obligations relating to greenhouse gas emissions may require additional capital expenditures or modifications in operating practices, as well as additional reporting obligations. The integrated steel process involves carbon and creates carbon dioxide (“CO2”), which distinguishes integrated steel producers from mini-mills and many other industries where CO2 generation is primarily linked to energy use.
The EU has established greenhouse gas regulations and is revising its emission trading system for the period after 2020 in a manner that may require ArcelorMittal to incur additional costs to acquire emissions allowances. In Kazakhstan the government has installed a domestic trading system which currently is in a pilot phase but would be similar to the EU system. South Africa envisages to start with a CO2 tax system in 2017. The United States required reporting of greenhouse gas emissions from certain large sources beginning in 2011 and has begun adopting and implementing regulations to restrict emissions of greenhouse gases under existing provisions of the Clean Air Act.
Further measures, in the EU, the United States, and many other countries, may be enacted in the future. In particular, in December
2015, the 195 countries participating in the United National Framework Convention on Climate Change reached an international agreement, the Paris Agreement. The 21st Conference of the Parties meeting (“COP21”) has confirmed the risk of climate change and the urgent need to address it. The Paris Agreement aims to implement the necessary drivers to achieve drastic reductions of carbon emissions. The Company takes this message seriously and investigates its possibilities to contribute to this by developing research and development programs, investigating its technical possibilities to reduce emissions and following the state of knowledge on climate change closely. Such obligations, whether in the form of a national or international cap-and-trade emissions permit system, a carbon tax, emissions controls, reporting requirements, or other regulatory initiatives, could have a negative effect on ArcelorMittal’s production levels, income and cash flows. Such regulations could also have a negative effect on the Company’s suppliers and customers, which could result in higher costs and lower sales. Moreover, the EU Commission’s decision to further reduce the allocation of CO2 emission rights to companies which is currently at the edge of covering technically achievable operating conditions, could negatively impact the global industry.
Furthermore, many developing nations have not yet instituted significant greenhouse gas regulations, and the Paris Agreement specifically recognized that peaking of greenhouse gas emissions will occur later in developing countries. As the Paris Agreement recognizes that the Intended Nationally Determined Contributions (“INDC”) for developing nations may be less stringent in light of different national circumstances, ArcelorMittal may be at a competitive disadvantage relative to steelmakers having more or all of their production in such countries. Depending on the extent
of the difference between the requirements in developed regions (such as Europe) and developing regions (such as China or the CIS), this competitive disadvantage could be severe and render production in the developed region structurally unprofitable.
See note 8.2 to ArcelorMittal’s consolidated financial statements. ArcelorMittal is subject to stringent health and safety laws and regulations that give rise to significant costs and could give rise to significant liabilities.
ArcelorMittal is subject to a broad range of health and safety laws and regulations in each of the jurisdictions in which it operates. These laws and regulations, as interpreted by relevant agencies and the courts, impose increasingly stringent health and safety protection standards. The costs of complying with, and the imposition of liabilities pursuant to, health and safety laws and regulations could be significant, and failure to comply could result in the assessment of civil and criminal penalties, the suspension of permits or operations, and lawsuits by third parties. In addition, under certain circumstances authorities could require ArcelorMittal facilities to curtail or suspend operations based on health and safety concerns.
Despite ArcelorMittal’s efforts to monitor and reduce accidents at its facilities, health and safety incidents do occur, some of which may result in costs and liabilities and negatively impact ArcelorMittal’s reputation or the operations of the affected facility. Such accidents could include explosions or gas leaks, fires or collapses in underground mining operations, vehicular accidents, and other accidents involving mobile equipment, or exposure to radioactive or other potentially hazardous materials. Some of ArcelorMittal’s industrial activities involve the use, storage and transport of dangerous chemicals and toxic substances, and ArcelorMittal is therefore subject to the risk of industrial accidents
which could have significant adverse consequences for the Company’s workers and facilities, as well as the environment. Such accidents could lead to production stoppages, loss of key personnel, the loss of key assets, or put at risk employees (and those of sub-contractors and suppliers) or persons living near affected sites.
See note 8.2 to ArcelorMittal’s consolidated financial statements.
Risks Related to ArcelorMittal
ArcelorMittal has a substantial amount of indebtedness, which could make it more difficult or expensive to refinance its maturing debt, incur new debt and/or flexibly manage its business.
As of December 31, 2015, ArcelorMittal had total debt outstanding of $19.8 billion, including $2.3 billion of short-term indebtedness (including payables to banks and the current portion of long-term debt) and $17.5 billion of long-term indebtedness. As of December 31, 2015, ArcelorMittal had $4.1 billion of cash and cash equivalents, including restricted cash, and $6.0 billion available to be drawn under existing credit facilities. As of December 31, 2015, the maturity schedule of outstanding debt was as follows: in 2016 ($2.3 billion), 2017 ($2.7 billion), 2018 ($2.6 billion), 2019 ($2.5 billion) and 2020 ($2.5 billion). See “Liquidity and capital resources”. The Company also relies on its true sale of receivables programs (for an aggregate program amount (i.e., the maximum amount of unpaid receivables that may be sold and outstanding at any given time) of $5.3 billion as of December 31, 2015), as a way to manage its long cycle working capital. ArcelorMittal’s gearing (long-term debt, plus short-term debt, less cash and cash equivalents and restricted cash, divided by total equity), was 57% at December 31, 2015 (compared to 35% at December 31, 2014). This high level is at risk of further increase should market conditions

Risk factors 211
further deteriorate. In addition, ArcelorMittal’s gearing would increase should the Company record an impairment charge for any of its tangible or intangible assets, such as property, plant and equipment, goodwill or deferred tax assets (see “Changes in assumptions underlying the carrying value of certain assets, including as a result of adverse market conditions, could result in the impairment of such assets, including intangible assets such as goodwill” below); ArcelorMittal recorded substantial impairments in this respect in 2012 and 2015. This could affect ArcelorMittal’s ability to, and the conditions under which it might, access financial markets to refinance maturing debt on acceptable terms. ArcelorMittal’s access to financial markets for refinancing also depends on the conditions in the global capital and credit markets, which are volatile. For example, during the 2008/2009 financial and economic crisis and again at the height of the eurozone sovereign debt crisis in 2012, access to the financial markets was restricted for many companies. Various macroeconomic and market factors could cause similar credit contractions at any time. Under such circumstances, the Company could experience difficulties in accessing the financial markets on acceptable terms or at all.
ArcelorMittal’s high level of debt outstanding could have adverse consequences more generally, including impairing its ability to obtain additional financing for working capital, capital expenditures, acquisitions, general corporate purposes or other purposes, and limiting its flexibility to adjust to changing market conditions or withstand competitive pressures, resulting in greater vulnerability to a downturn in general economic conditions. While ArcelorMittal is targeting a further reduction in “net debt” (i.e., long-term debt net of current portion plus payables to banks and current portion of long-term debt, less cash and cash equivalents, restricted cash and short-term investments), there is no assurance that it will succeed.
Moreover, ArcelorMittal could, in order to increase its financial flexibility and strengthen its balance sheet, implement capital raising measures such as equity offerings (as was done in May 2009, January 2013 and announced on February 5, 2016 in the form of a $3.0 billion rights offering), which could (depending on how they are structured) dilute the interests of existing shareholders or require them to invest further funds to avoid such dilution. In addition, ArcelorMittal has undertaken and may undertake further asset disposals in order to reduce debt. These asset disposals are subject to execution risk and may fail to materialize, and the proceeds received from such disposals may not reflect values that management believes are achievable and/or cause substantial accounting losses (particularly if the disposals are done in difficult market conditions). In addition, to the extent that the asset disposals include the sale of all or part of core assets (including through an increase in the share of non-controlling interests, such as the ArcelorMittal Mines Canada transaction in 2013), this could reduce ArcelorMittal’s consolidated cash flows and/or the economic interest of ArcelorMittal shareholders in such assets, which may be cash-generative and profitable ones.
In addition, credit rating agencies could downgrade ArcelorMittal’s ratings either due to factors specific to ArcelorMittal, a prolonged cyclical downturn in the steel industry and mining industries, macroeconomic trends (such as global or regional recessions) or trends in credit and capital markets more generally. In this respect, Standard & Poor’s, Moody’s and Fitch downgraded the Company’s rating to below “investment grade” in August, November and December 2012. On February 3, 2015, Standard & Poor’s further downgraded ArcelorMittal’s credit rating and, on December 18, 2015, it placed ArcelorMittal on negative outlook. On November 12, 2015, Moody’s further downgraded ArcelorMittal and placed it on negative outlook. On November 16, 2015, while Fitch affirmed its
credit rating of ArcelorMittal, it lowered its outlook to negative. The margin under ArcelorMittal’s principal credit facilities and certain of its outstanding bonds is subject to adjustment in the event of a change in its long-term credit ratings, and the 2012 and February 2015 downgrades resulted in increased interest expense in 2015. The November 2015 downgrade will similarly result in increased interest expense. See “—Liquidity and capital resources”. Any further downgrades in ArcelorMittal’s credit ratings would result in a further increase in its cost of borrowing and could significantly harm its financial condition and results of operations as well as hinder its ability to refinance its existing indebtedness on acceptable terms.
ArcelorMittal’s principal credit facilities contain restrictive covenants. These covenants limit, inter alia, encumbrances on the assets of ArcelorMittal and its subsidiaries, the ability of ArcelorMittal’s subsidiaries to incur debt and the ability of ArcelorMittal and its subsidiaries to dispose of assets in certain circumstances. ArcelorMittal’s principal credit facilities also include the following financial covenant: ArcelorMittal must ensure that the “Leverage Ratio”, being the ratio of “Consolidated Total Net Borrowings” (consolidated total borrowings less consolidated cash and cash equivalents) to “Consolidated EBITDA” (the consolidated net pre-taxation profits of the ArcelorMittal group for a Measurement Period, subject to certain adjustments as defined in the facilities), at the end of each “Measurement Period” (each period of 12 months ending on the last day of a financial half-year or a financial year of ArcelorMittal), is not greater than a ratio of 4.25 to one or 4.0 to 1 for one credit facility (See “—Liquidity and capital resources”). As of December 31, 2015, the Company was in compliance with the Leverage Ratios.
These restrictive and financial covenants could limit ArcelorMittal’s operating and financial flexibility. Failure to
comply with any covenant would enable the lenders to accelerate ArcelorMittal’s repayment obligations. Moreover, ArcelorMittal’s debt facilities have provisions whereby certain events relating to other borrowers within the ArcelorMittal group could, under certain circumstances, lead to acceleration of debt repayment under the credit facilities. Any invocation of these cross-acceleration clauses could cause some or all of the other debt to accelerate, creating liquidity pressures. In addition, the mere market perception of a potential breach of any financial covenant could have a negative impact on ArcelorMittal’s ability to refinance its indebtedness on acceptable conditions.
Furthermore, some of ArcelorMittal’s debt is subject to floating rates of interest and thereby exposes ArcelorMittal to interest rate risk (i.e., if interest rates rise, ArcelorMittal’s debt service obligations on its floating rate indebtedness would increase). Depending on market conditions, ArcelorMittal from time to time uses interest-rate swaps or other financial instruments to hedge a portion of its interest rate exposure either from fixed to floating or from floating to fixed. After taking into account interest-rate derivative financial instruments, ArcelorMittal had exposure to 91% of its debt at fixed interest rates and 9% at floating rates as of December 31, 2015. Finally, ArcelorMittal has foreign exchange exposure in relation to its debt, approximately 34% of which is denominated in euros as of December 31, 2015, while its financial statements are denominated in U.S. dollars. This creates balance sheet exposure, with a depreciation of the U.S. dollar against the euro leading to an increase in debt (including for covenant compliance measurement purposes).
See “Liquidity and capital resources”.
212 Risk factors
ArcelorMittal’s level of profitability and cash flow currently is and, depending on market and operating conditions, may in the future be, substantially affected by its ability to reduce costs and improve operating efficiency.
Difficult operating conditions in recent years, due in particular to macroeconomic conditions and supply/demand trends, have reduced ArcelorMittal’s operating profitability, decreased its positive cash flows and reduced its profitability. The steel industry has historically been cyclical, periodically experiencing difficult operating conditions. In light of this, ArcelorMittal has historically, and increasingly in recent periods, taken initiatives to reduce its costs and increase its operating efficiency. These initiatives have included various asset optimization and other programs throughout the Company. The most recent of these programs is the Action 2020 plan announced on February 5, 2016 that includes, among other aspects, several efficiency improvement initiatives. Implementation of cost saving and efficiency improvement initiatives is subject to operational challenges and limitations. Failure to implement fully such initiatives would prevent the attainment of announced profitability or cash flow improvement targets, and more generally could have a material adverse effect on the Company’s profitability and cash flow.
ArcelorMittal’s mining operations are subject to risks associated with mining activities.
ArcelorMittal operates mines and has substantially increased the scope of its mining activities in recent years. Mining operations are subject to the hazards and risks usually associated with the exploration, development and production of natural resources, any of which could result in production shortfalls or damage to persons or property. In particular, the hazards associated with open-pit mining operations include, among others:
• flooding of the open pit;
• collapse of the open-pit wall;
• accidents associated with the operation of large open-pit mining and rock transportation equipment;
• accidents associated with the preparation and ignition of large-scale open-pit blasting operations;
• production disruptions due to weather;
• hazards associated with the disposal of mineralized waste water, such as groundwater and waterway contamination; and
• collapse of tailings ponds dams or dams.
Hazards associated with underground mining operations, of which ArcelorMittal has several, include, among others:
• underground fires and explosions, including those caused by flammable gas;
• gas and coal outbursts;
• cave-ins or falls of ground;
• discharges of gases and toxic chemicals;
• flooding;
• sinkhole formation and ground subsidence;
• difficulties associated with mining in extreme weather conditions, such as the Arctic; and
• blasting, removing, and processing material from an underground mine.
ArcelorMittal is exposed to all of these hazards. The occurrence of any of the events listed above could delay production, increase production costs and result in death or injury to persons, damage to property and liability for
ArcelorMittal, some or all of which may not be covered by insurance, as well as substantially harm ArcelorMittal’s reputation, both as a company focused on ensuring the health and safety of its employees and more generally.
ArcelorMittal’s reserve estimates may materially differ from mineral quantities that it may be able to actually recover; ArcelorMittal’s estimates of mine life may prove inaccurate; and market price fluctuations and changes in operating and capital costs may render certain ore reserves uneconomical to mine.
ArcelorMittal’s reported reserves are estimated quantities of the ore and metallurgical coal that it has determined can be economically mined and processed under present and anticipated conditions to extract their mineral content. There are numerous uncertainties inherent in estimating quantities of reserves and in projecting potential future rates of mineral production, including factors beyond ArcelorMittal’s control. The process of estimating reserves involves estimating deposits of minerals that cannot be measured in an exact manner, and the accuracy of any reserve estimate is a function of the quality of available data, engineering and geological interpretation and judgment. As a result, no assurance can be given that the estimated amounts of ore or coal will be recovered or that it will be recovered at the anticipated rates. Estimates may vary, and results of mining and production subsequent to the date of an estimate may lead to revisions of estimates. Reserve estimates and estimates of mine life may require revisions based on actual market conditions, production experience and other factors. Fluctuations in the market prices of minerals and metals, reduced recovery rates or increased operating and capital costs due to inflation, exchange rates, mining duties or other factors may render proven and probable reserves uneconomic to exploit and may ultimately result in a revision of reserves. In
particular, a prolonged period of low prices or other indicators could lead to a review of the Group’s reserves. Such review would reflect the Company’s view based on estimates, assumptions and judgments and could result in a reduction in the Group’s reported reserves. The Group’s reserve estimates reported in this annual report do not exceed the quantities that the Company estimates could be extracted economically if future prices were at similar levels to the average contracted price for the three years ended to December 31, 2015. As a result, if the average contracted prices remain in 2016 at, near or below the low levels in the fourth quarter of 2015, the Company’s estimates of its reserves at year-end 2016 may decline.
Drilling and production risks could adversely affect the mining process.
Substantial time and expenditures are required to:
• establish mineral reserves through drilling;
• determine appropriate mining and metallurgical processes for optimizing the recovery of metal contained in ore and coal;
• obtain environmental and other licenses;
• construct mining and processing facilities and the infrastructure required for greenfield properties;
• obtain the ore or coal or extract
the minerals from the ore; and
• maintain the appropriate blend of ore to ensure the final product grades expected by the customer are achieved.
If a project proves not to be economically feasible by the time ArcelorMittal is able to exploit it, ArcelorMittal may incur substantial losses and be obliged to recognize impairments. In addition, potential changes or complications involving metallurgical and other technological processes that arise
Risk factors 213
during the life of a project may result in delays and cost overruns that may render the project not economically feasible.
ArcelorMittal faces rising extraction costs over time as reserves deplete.
Reserves are gradually depleted in the ordinary course of a given mining operation. As mining progresses, distances to the primary crusher and to waste deposits become longer, pits become steeper and underground operations become deeper. As a result, ArcelorMittal usually experiences rising unit extraction costs over time with respect to each of its mines.
ArcelorMittal has incurred and may incur in the future operating costs when production capacity is idled or increased costs to resume production at idled facilities.
ArcelorMittal’s decisions about which facilities to operate and at which levels are made based upon customers’ orders for products as well as the capabilities and cost performance of the Company’s facilities. Considering temporary or structural overcapacity in the current market situation, production operations are concentrated at several plant locations and certain facilities are idled in response to customer demand, although operating costs are still incurred at such idled facilities. When idled facilities are restarted, ArcelorMittal incurs costs to replenish raw material inventories, prepare the previously idled facilities for operation, perform the required repair and maintenance activities and prepare employees to return to work safely and resume production responsibilities. Such costs could have an adverse effect on its results of operations or financial condition.
ArcelorMittal’s greenfield and brownfield investment projects are inherently subject to financing, execution and completion risks.
While the Company’s current strategy is focused on cost improvement, non-core asset disposals and asset optimization, the Company had previously announced a number of envisaged greenfield or brownfield development projects, particularly in the mining sector, some of which are or may be ongoing. To the extent these projects go forward, they would entail substantial capital expenditures, and their timely completion and successful operation may be affected by factors beyond the control of ArcelorMittal. These factors include receiving financing on reasonable terms, obtaining or renewing required regulatory approvals and licenses, securing and maintaining adequate property rights to land and mineral resources, local opposition to land acquisition or project development, managing relationships with or obtaining consents from other shareholders, revision of economic viability projections, demand for the Company’s products, local environmental or health-related conditions (such as the Ebola epidemic in Liberia in 2014-2015), and general economic conditions. Any of these factors may cause the Company to delay, modify or forego some or all aspects of its development projects. The Company cannot guarantee that it will be able to execute its greenfield or brownfield development projects, and to the extent that they proceed, that it will be able to complete them on schedule, within budget, or achieve an adequate return on its investment. Conversely, should the Company decide to postpone or cancel development projects, it could incur various negative consequences such as litigation or impairment charges.
ArcelorMittal faces risks associated with its investments in joint ventures and associates.
ArcelorMittal has investments in various joint ventures and associates. See note 2.4 to ArcelorMittal’s consolidated financial statements. Joint ventures
and associates may be controlled and managed by joint venture or controlling partners that may not fully comply with ArcelorMittal’s standards, controls and procedures, including ArcelorMittal’s health, safety, environment and community standards, which could lead to higher costs, reduced production or environmental, health and safety incidents or accidents, which could adversely affect ArcelorMittal’s results and reputation.
In addition, certain of these joint ventures and associates are currently experiencing, or may in the future experience, difficult operating conditions and/or incur losses. Difficult operating conditions in joint ventures and associates in which ArcelorMittal has invested may expose it to loss of its investment, requirements for additional investments or calls on guarantees. As of December 31, 2015, ArcelorMittal had given $1.2 billion in guarantees on behalf of associates and joint ventures. See notes 2.4.1 and 2.4.2 to ArcelorMittal’s consolidated financial statements.
ArcelorMittal’s investments in joint ventures and associates may also result in impairments. For example, in 2014, the Company recorded an impairment charge of $621 million on its investment in China Oriental, following a revision of business assumptions in the context of the continuing economic slowdown in China. In 2015, the Company also recorded an impairment charge of $283 million in respect of its joint venture investment in Kalagadi Manganese (Propriety) Ltd, reflecting a write down of the full carrying amount of the investment and loans as a result of a downward revision of cash flow projections resulting from the expectation of the persistence of a lower manganese price outlook. As of December 31, 2015, ArcelorMittal’s investments accounted for under the equity method had a book value of $4.9 billion, including DHS Group ($992 million), China Oriental ($604 million) and Baffinland ($442 million).
A Mittal family trust has the ability to exercise significant influence over the outcome of shareholder votes.
As of December 31, 2015, a trust (HSBC Trust (C.I.) Limited, as trustee), of which Mr. Lakshmi N. Mittal, Mrs. Usha Mittal and their children are the beneficiaries, beneficially owned (within the meaning of Rule 13d-3 under the Securities Exchange Act of 1934, as amended) shares amounting (when aggregated with ordinary shares of ArcelorMittal and options to acquire ordinary shares held directly by Mr. and Mrs. Mittal) to 655,944,511 shares, representing 39.39% of ArcelorMittal’s outstanding shares (37.41% as of January 15, 2016 following the conversion of the mandatorily convertible notes). See “—Major shareholders and related party transactions—Major shareholders”. As a result, the trust has the ability to significantly influence the decisions adopted at the ArcelorMittal general meetings of shareholders, including matters involving mergers or other business combinations, the acquisition or disposition of assets, issuances of equity and the incurrence of indebtedness. The trust also has the ability to significantly influence a change of control of ArcelorMittal.
The loss or diminution of the services of the Chairman of the Board of Directors and Chief Executive Officer of ArcelorMittal could have an adverse effect on its business and prospects.
The Chairman of the Board of Directors and Chief Executive Officer of ArcelorMittal, Mr. Lakshmi N. Mittal, has for over 30 years contributed significantly to shaping and implementing the business strategy of Mittal Steel and subsequently ArcelorMittal. His strategic vision was instrumental in the creation of the world’s largest and most global steel group. The loss or any diminution of the services of the Chairman of the Board of Directors and Chief Executive Officer could have an

214 Risk factors
adverse effect on ArcelorMittal’s business and prospects. ArcelorMittal does not maintain key person life insurance on its Chairman of the Board of Directors and Chief Executive Officer.
ArcelorMittal is a holding company that depends on the earnings and cash flows of its operating subsidiaries, which may not be sufficient to meet future operational needs or for shareholder distributions and loss-making subsidiaries may drain cash flow necessary for such needs or distributions.
As a holding company, ArcelorMittal is dependent on the earnings and cash flows of, and dividends and distributions from, its operating subsidiaries to pay expenses, meet its debt service obligations, pay any cash dividends or distributions on its ordinary shares or conduct share buy-backs. Significant cash or cash equivalent balances may be held from time to time at the Company’s international operating subsidiaries, including in particular those in France and the United States, where the Company maintains cash management systems under which most of its cash and cash equivalents are centralized, and in Argentina, Brazil, Canada, Morocco, South Africa, Ukraine and Venezuela. Some of these operating subsidiaries have debt outstanding or are subject to acquisition agreements that impose restrictions on such operating subsidiaries’ ability to pay dividends, but such restrictions are not significant in the context of ArcelorMittal’s overall liquidity. These subsidiaries may also experience operating difficulties that impact their cash flows. ArcelorMittal South Africa, for example, has been experiencing significant difficulties in recent years. In order to decrease its significant outstanding debt, on January 15, 2016, ArcelorMittal South Africa closed a rights offering. The total cash proceeds amounted to R4.5 billion. ArcelorMittal underwrote the rights offering in its entirety. The Company fully subscribed to the capital increase, through repayment
of an outstanding intragroup loan of R3.2 billion and an additional cash injection of approximately R460 million. The intragroup loan is being repaid in two tranches; the first has been repaid and the second is expected to be paid in 2016. As a result of the rights issue, ArcelorMittal’s shareholding in ArcelorMittal South Africa increased from 52% to 71%. Other Group subsidiaries are experiencing losses and receiving intragroup financing.
Repatriation of funds from operating subsidiaries may also be affected by tax and foreign exchange policies in place from time to time in the various countries where the Company operates, though none of these policies are currently significant in the context of ArcelorMittal’s overall liquidity. Under the laws of Luxembourg, ArcelorMittal will be able to pay dividends or distributions only to the extent that it is entitled to receive cash dividend distributions from its subsidiaries, recognize gains from the sale of its assets or record share premium from the issuance of shares.
If the earnings and cash flows of its operating subsidiaries are substantially reduced, ArcelorMittal may not be in a position to meet its operational needs or to make shareholder distributions in line with announced proposals.
Changes in assumptions underlying the carrying value of certain assets, including as a result of adverse market conditions, could result in the impairment of such assets, including intangible assets such as goodwill.
At each reporting date, in accordance with the Company’s accounting policy described in note 5.3 to ArcelorMittal’s consolidated financial statements, ArcelorMittal reviews the carrying amounts of its tangible and intangible assets (goodwill is reviewed annually or whenever changes in circumstances indicate that the carrying amount may not be recoverable) to determine
whether there is any indication that the carrying amount of those assets may not be recoverable through continuing use. If any such indication exists, the recoverable amount of the asset (or cash generating unit) is reviewed in order to determine the amount of the impairment, if any.
If certain of management’s estimates change during a given period, such as the discount rate, capital expenditures, expected changes to average selling prices, growth rates, shipments and direct costs, the estimate of the recoverable amount of goodwill or the asset could fall significantly and result in impairment. While impairment does not affect reported cash flows, the decrease of the estimated recoverable amount and the related non-cash charge in the consolidated statements of operations could have a material adverse effect on ArcelorMittal’s results of operations. For example, in 2015, the Company recorded an impairment charge as a result of the annual impairment test of $3.7 billion including $0.9 billion with respect to the Mining segment goodwill and $2.8 billion related to tangible and intangible assets ($2.5 billion and $0.3 billion in the Mining and ACIS segments, respectively). Following these impairment charges, substantial amounts of goodwill, tangible and intangible assets remain recorded on its balance sheet (there was $5.1 billion of goodwill for the Company, $3.5 billion tangible and intangible assets for the Mining segment and $4.4 billion of tangible and intangible assets for ACIS on the balance sheet at December 31, 2015). No assurance can be given as to the absence of significant further impairment losses in future periods, particularly if market conditions (such as the iron ore price trend for Mining) deteriorate further than expected. In particular, management believes that reasonably possible changes in the key assumptions utilized in the October 31, 2015 impairment test would cause an additional impairment loss to be recognized in respect of ACIS. See note 5.3
to ArcelorMittal’s consolidated financial statements, in particular for a discussion of the assumptions used for determining ACIS’s value in use.
ArcelorMittal’s ability to fully utilize its recognized deferred tax assets depends on its profitability and future cash flows.
At December 31, 2015, ArcelorMittal had $6.6 billion recorded as deferred tax assets on its consolidated statements of financial position. These assets can be utilized only if, and only to the extent that, ArcelorMittal’s operating subsidiaries generate adequate levels of taxable income in future periods to offset the tax loss carry forwards and reverse the temporary differences prior to expiration. At December 31, 2015, the amount of future income required to recover ArcelorMittal’s deferred tax assets of $6.6 billion was at least $24.5 billion at certain operating subsidiaries. ArcelorMittal’s ability to generate taxable income is subject to general economic, financial, competitive, legislative, regulatory and other factors that are beyond its control. If ArcelorMittal generates lower taxable income than the amount it has assumed in determining its deferred tax assets, then the value of deferred tax assets will be reduced. In addition, assumptions regarding the future recoverability of deferred tax assets depend on management’s estimates of future taxable income in accordance with the tax laws applicable to ArcelorMittal’s subsidiaries in the countries in which they operate. If in the course of its assessments management determines that the carrying amount of any of its deferred tax assets may not be recoverable pursuant to such prevailing tax laws, the recoverable amount of such deferred tax assets may be impaired. Furthermore, changes in tax law may result in a reduction in the value of deferred tax assets. ArcelorMittal’s assumptions regarding its ability to generate future taxable income changed during 2015, resulting in a derecognition of $0.4 billion of deferred tax assets.
Risk factors 215
The Company’s investment projects may add to its financing requirements and adversely affect its cash flows and results of operations.
The steelmaking and mining businesses are capital intensive requiring substantial ongoing maintenance capital expenditure. In addition, ArcelorMittal has announced investment projects in the past and some are or may be ongoing. See note 8.3 to ArcelorMittal’s consolidated financial statements. ArcelorMittal expects to fund these capital expenditures primarily through internal sources. Such sources may not suffice, however, depending on the amount of internally generated cash flows and other uses of cash. If such sources prove insufficient, ArcelorMittal may need to choose between incurring external financing, further increasing the Company’s level of indebtedness, or foregoing investments in projects targeted for profitable growth.
Underfunding of pension and other post-retirement benefit plans at some of ArcelorMittal’s operating subsidiaries could require the Company to make substantial cash contributions to pension plans or to pay for employee healthcare, which may reduce the cash available for ArcelorMittal’s business.
ArcelorMittal’s principal operating subsidiaries in Brazil, Canada, Europe, South Africa and the United States provide defined benefit pension plans to their employees. Some of these plans are currently underfunded, see note 7.2 to ArcelorMittal’s consolidated financial statements for the total value of the plan assets and any deficit.
ArcelorMittal’s funding obligations depend upon future asset performance, which is tied to equity and debt markets to a substantial extent, the level of interest rates used to discount future liabilities, actuarial assumptions and experience, benefit plan changes and
government regulation. Because of the large number of variables that determine pension funding requirements, which are difficult to predict, as well as any legislative action, future cash funding requirements for ArcelorMittal’s pension plans and other post-employment benefit plans could be significantly higher than current estimates. The general life expectancy assumption has been increasing over the past years and has been driving consistent increases in the defined benefit obligation. ArcelorMittal also makes contributions to a multi-employer pension plan in the U.S. for which it is one of the largest employers. If the other contributors were to default on their obligations, ArcelorMittal would become liable for the plan. In these circumstances, funding requirements could have a material adverse effect on ArcelorMittal’s business, financial condition, results of operations or prospects.
ArcelorMittal could experience labor disputes that may disrupt its operations and its relationships with its customers and its ability to rationalize operations and reduce labor costs in certain markets may be limited in practice or encounter implementation difficulties.
A majority of the employees of ArcelorMittal and of its contractors are represented by labor unions and are covered by collective bargaining or similar agreements, which are subject to periodic renegotiation. Strikes or work stoppages could occur prior to, or during, negotiations preceding new collective bargaining agreements, during wage and benefits negotiations or during other periods for other reasons, in particular in connection with any announced intentions to close certain sites. ArcelorMittal periodically experiences strikes and work stoppages at various facilities. Prolonged strikes or work stoppages, which may increase in their severity and frequency, may have an adverse effect on the operations and financial results of ArcelorMittal. The risk of strikes
and work stoppages is particularly acute during collective bargaining agreement negotiations. For example, ArcelorMittal is currently negotiating the renewal of the collective bargaining agreement applicable to its U.S. employees.
Faced with temporary or structural overcapacity in various markets, particularly developed ones, ArcelorMittal has in the past sought and may in the future seek to rationalize operations through temporary or permanent idlings and/or closures of plants. These initiatives have in the past and may in the future lead to protracted labor disputes and political controversy. For example, in 2012, the announced closure of the liquid phase of ArcelorMittal’s plant in Florange, France attracted substantial media and political attention – even at one stage involving the threat of nationalization – and the resolution was negotiated with the government. Such situations carry the risk of delaying or increasing the cost of production rationalization measures, harming ArcelorMittal’s reputation and business standing in given markets and even the risk of nationalization.
ArcelorMittal is subject to economic policy, political, social and legal risks and uncertainties in the emerging markets in which it operates or proposes to operate, and these uncertainties may have a material adverse effect on ArcelorMittal’s business, financial condition, results of operations or prospects.
ArcelorMittal operates, or proposes to operate, in a large number of emerging markets. In recent years, many of these countries have implemented measures aimed at improving the business environment and providing a stable platform for economic development. ArcelorMittal’s business strategy has been developed partly on the assumption that this modernization, restructuring and upgrading of the business climate and physical infrastructure
will continue, but this cannot be guaranteed. Any slowdown in the development of these economies could have a material adverse effect on ArcelorMittal’s business, financial condition, results of operations or prospects, as could insufficient investment by government agencies or the private sector in physical infrastructure. For example, the failure of a country to develop reliable electricity and natural gas supplies and networks, and any resulting shortages or rationing, could lead to disruptions in ArcelorMittal’s production.
Moreover, some of the countries in which ArcelorMittal operates have been undergoing substantial political transformations from centrally-controlled command economies to market-oriented systems or from authoritarian regimes to democratically-elected governments and vice-versa. Political, economic and legal reforms necessary to complete such transformation may not progress sufficiently. On occasion, ethnic, religious, historical and other divisions have given rise to tensions and, in certain cases, wide-scale civil disturbances and military conflict. The political systems in these countries are vulnerable to their populations’ dissatisfaction with their government, reforms or the lack thereof, social and ethnic unrest and changes in governmental policies, any of which could have a material adverse effect on ArcelorMittal’s business, financial condition, results of operations or prospects and its ability to continue to do business in these countries. For example, in Ukraine, a period of widespread civil unrest resulted in the removal of the President from office in February 2014 and the establishment of an interim government, which has been followed by ongoing conflict in Crimea and the Donbass region, with Russia purportedly annexing Crimea in March 2014, a disputed referendum approving independence of Crimea from Ukraine in May 2014 and intermittent combats between the Ukrainian army and pro-Russian

216 Risk factors
rebels in the Donbass region. In addition, certain of ArcelorMittal’s operations are also located in areas where acute drug-related violence (including executions and kidnappings of non-gang civilians) occurs and the largest drug cartels operate, such as the states of Michoacan, Sinaloa and Sonora in Mexico.
Certain emerging markets where ArcelorMittal has operations are experiencing particularly difficult operating conditions. Brazil, for example, is going through severe recession, with significant declines seen in steel consumption and steel prices, currency depreciation and high interest rates. Kazakhstan is also going through a recession, and its currency sharply deteriorated at the end of 2015. The steel and mining industries in South Africa are subject to a challenging operating environment characterized by lower local demand, increased cheap imports and higher costs, resulting in losses in recent years for ArcelorMittal South Africa.
In addition, epidemics may affect ArcelorMittal’s operations in certain regions. For example, ArcelorMittal operates in Liberia, which underwent an Ebola virus disease epidemic in 2014 and 2015. This affected ArcelorMittal’s operations and projects in Liberia. There can be no assurance that other epidemics will not adversely affect ArcelorMittal’s ongoing operations, production targets and expansion plans, if any, in other markets in which it operates.
In addition, the legal systems in some of the countries in which ArcelorMittal operates remain less than fully developed, particularly with respect to the independence of the judiciary, property rights, the protection of foreign investment and bankruptcy proceedings, generally resulting in a lower level of legal certainty or security for foreign investment than in more developed countries. ArcelorMittal may encounter difficulties in enforcing court judgments or arbitral awards in some countries in which it operates because, among other reasons, those
countries may not be parties to treaties that recognize the mutual enforcement of court judgments. Assets in certain countries where ArcelorMittal operates could also be at risk of expropriation or nationalization, and compensation for such assets may be below fair value. For example, the Venezuelan government has implemented a number of selective nationalizations of companies operating in the country to date. Although ArcelorMittal believes that the long-term growth potential in emerging markets is strong, and intends them to be the focus of the majority of its near-term growth capital expenditures, legal obstacles could have a material adverse effect on the implementation of ArcelorMittal’s growth plans and its operations in such countries.
ArcelorMittal’s results of operations could be affected by fluctuations in foreign exchange rates, particularly the euro to U.S. dollar exchange rate, as well as by exchange controls imposed by governmental authorities in the countries where it operates.
ArcelorMittal operates and sells products globally and as a result, its business, financial condition, results of operations or prospects could be adversely affected by fluctuations in exchange rates. A substantial portion of ArcelorMittal’s assets, liabilities, operating costs, sales and earnings are denominated in currencies other than the U.S. dollar (ArcelorMittal’s reporting currency). Accordingly, its results of operations are subject to translation risk (i.e., the USD value of the revenues and profits generated in other currencies and its debt denominated in other currencies) and transaction risk (i.e., a mismatch between the currency of costs and revenues). Recent examples of the currency translation effect on ArcelorMittal’s financials include the decrease in the USD value of euro-denominated revenues and debt as a result of the sharp depreciation of the euro versus the USD since mid-2014.
Moreover, ArcelorMittal operates in several countries whose currencies are, or have in the past been, subject to limitations imposed by those countries’ central banks, or which have experienced sudden and significant devaluations. In emerging countries where ArcelorMittal has operations and/or generates substantial revenue, such as Argentina, Brazil, Venezuela, Kazakhstan and Ukraine, the risk of significant currency devaluation is high. On February 5, 2015, the National Bank of Ukraine decided to suspend its intervention in the UAH, which had kept a cap on the USD/UAH exchange rate and leaves its currency floating freely against the U.S. dollar. Consequently, the UAH has been significantly devalued against the USD, losing as much as 60% since 2014 highs, including intraday losses of up to 30%. In Venezuela, on February 10, 2015, the Finance Minister and the Central Bank President in Venezuela announced the creation of a new flexible rate system (Exchange agreement No 33) called Sistema Marginal de Divisas – Foreign Currency Marginal System (“SIMADI”). SIMADI substituted the previous SICAD II mechanism and was made available for both public and private companies as well as individuals. The SIMADI exchange rate closed at 198.7 Bs.F. per U.S. dollar as of December 31, 2015, while the SICAD exchange rate has been set to 13.50 Bs.F. per U.S. dollar since September 1, 2015.
Currency devaluations, the imposition of new exchange controls or other similar restrictions on currency convertibility, or the tightening of existing controls in the countries in which ArcelorMittal operates could adversely affect its business, financial condition, results of operations or prospects.
Disruptions to ArcelorMittal’s manufacturing processes could adversely affect its operations, customer service levels and financial results.
Steel manufacturing processes are dependent on critical steel-making
equipment, such as furnaces, continuous casters, rolling mills and electrical equipment (such as transformers), and such equipment may incur downtime as a result of unanticipated failures or other events, such as fires, explosions or furnace breakdowns. ArcelorMittal’s manufacturing plants have experienced, and may in the future experience, plant shutdowns or periods of reduced production as a result of such equipment failures or other events, one example being the flooding of the ArcelorMittal Tubarão site in October 2014 due to heavy rain and the stacker failure in Burns Harbor in March 2014. To the extent that lost production as a result of such a disruption cannot be compensated for by unaffected facilities, such disruptions could have an adverse effect on ArcelorMittal’s operations, customer service levels and results of operations.
Natural disasters or severe weather conditions could damage ArcelorMittal’s production facilities or adversely affect its operations.
Natural disasters could significantly damage ArcelorMittal’s production facilities and general infrastructure. For example, ArcelorMittal Mexico S.A. de C.V’s production facilities located in Lázaro Cárdenas, Michoacán, Mexico and ArcelorMittal Galati’s production facilities in Romania are located in or close to regions prone to earthquakes. The Lázaro Cárdenas area has, in addition, been subject to a number of tsunamis in the past. ArcelorMittal Point Lisas is located in Trinidad & Tobago, an area vulnerable to both hurricanes and earthquakes. The site of the joint venture AM/NS Calvert (“Calvert”) in the United States is located in an area subject to tornados. ArcelorMittal also has assets in locations subject to Arctic freeze such as the mining facilities through its joint venture in Baffinland and to bush fires, specifically in Kazakhstan and South Africa. More generally, changing weather patterns and climatic conditions in recent years,
Risk factors 217
possibly due to the phenomenon of global warming, have added to the unpredictability and frequency of natural disasters. Damage to ArcelorMittal production facilities due to natural disasters could, to the extent that lost production cannot be compensated for by unaffected facilities, adversely affect its business, results of operations or financial condition.
In addition to natural disasters, ArcelorMittal’s operations can be affected by severe weather conditions. This is due in particular to the long supply chain for certain of its operations and the location of certain operations in areas subject to harsh winter conditions (i.e., the Great Lakes Region, Canada and Kazakhstan). For example, supply chain issues caused by a particularly harsh winter (causing in particular the closure of the Great Lakes shipping lanes) negatively affected operations in Canada and the Northeastern United States during the first quarter of 2014.
ArcelorMittal’s insurance policies provide limited coverage, potentially leaving it uninsured against some business risks.
The occurrence of an event that is uninsurable or not fully insured could have a material adverse effect on ArcelorMittal’s business, financial condition, results of operations or prospects. ArcelorMittal maintains insurance on property and equipment in amounts believed to be consistent with industry practices, but it is not fully insured against all such risks. ArcelorMittal’s insurance policies cover physical loss or damage to its property and equipment on a reinstatement basis as arising from a number of specified risks and certain consequential losses, including business interruption arising from the occurrence of an insured event under the policies. Under ArcelorMittal’s property and equipment policies, damages and losses caused by certain natural disasters, such as earthquakes, floods and windstorms, are also covered. ArcelorMittal also purchases worldwide third-party public
and product liability insurance coverage for all of its subsidiaries. Various other types of insurance are also maintained, such as comprehensive construction and contractor insurance for its greenfield and major capital expenditures projects, directors and officers liability, transport, and charterers’ liability, as well as other customary policies such as car insurance, travel assistance and medical insurance.
In addition, ArcelorMittal maintains trade credit insurance on receivables from selected customers, subject to limits that it believes are consistent with those in the industry, in order to protect it against the risk of non-payment due to customers’ insolvency or other causes. Not all of ArcelorMittal’s customers are or can be insured, and even when insurance is available, it may not fully cover the exposure.
Notwithstanding the insurance coverage that ArcelorMittal and its subsidiaries carry, the occurrence of an event that causes losses in excess of limits specified under the relevant policy, or losses arising from events not covered by insurance policies, could materially harm ArcelorMittal’s financial condition and future operating results.
Product liability claims could have a significant adverse financial impact on ArcelorMittal.
ArcelorMittal sells products to major manufacturers engaged in manufacturing and selling a wide range of end products. ArcelorMittal also from time to time offers advice to these manufacturers. Furthermore, ArcelorMittal’s products are also sold to, and used in, certain safety-critical applications, such as, for example, pipes used in gas or oil pipelines and in automotive applications. There could be significant consequential damages resulting from the use of or defects in such products. ArcelorMittal has a limited amount of product liability insurance coverage, and a major claim for damages related
to ArcelorMittal products sold and, as the case may be, advice given in connection with such products could leave ArcelorMittal uninsured against a portion or the entirety of the award and, as a result, materially harm its financial condition and future operating results.
ArcelorMittal is subject to regulatory and compliance risks, which may expose it to investigations by governmental authorities, litigation and fines, in relation, among other things, to its pricing and marketing practices or other antitrust matters. The resolution of such matters could negatively affect the Company’s profitability and cash flows in a particular period or harm its reputation.
ArcelorMittal is the largest steel producer in the world. As a result, ArcelorMittal may be subject to exacting scrutiny from regulatory authorities and private parties, particularly regarding its trade practices and dealings with customers and counterparties. As a result of its position in steel markets and its historically acquisitive growth strategy, ArcelorMittal could be subject to governmental investigations and lawsuits based on antitrust laws in particular. These could require significant expenditures and result in liabilities or governmental orders that could have a material adverse effect on ArcelorMittal’s business, operating results, financial condition and prospects. ArcelorMittal and certain of its subsidiaries are currently under investigation by governmental entities in several countries, and are named as defendants in a number of lawsuits relating to various antitrust matters. See note 8.2 to ArcelorMittal’s consolidated financial statements. Antitrust proceedings, investigations and follow-on claims involving ArcelorMittal subsidiaries are also currently pending in various countries including Brazil and South Africa.
Because of the fact-intensive nature of the issues involved
and the inherent uncertainty of such litigation and investigations, the nature of the resolutions of such proceedings are difficult to forecast but negative outcomes are possible. An adverse ruling in the proceedings described above or in other similar proceedings in the future could subject ArcelorMittal to substantial administrative penalties and/or civil damages. In cases relating to other companies, civil damages have been as high as hundreds of millions of U.S. dollars in major civil antitrust proceedings during the last decade. In addition, ArcelorMittal operates in many jurisdictions around the world, increasing the risk of non-compliance with laws and regulations in relation to anti-corruption, economic sanctions and other ethical matters, despite its compliance policies and procedures. Unfavorable outcomes in current and potential future litigation and investigations could reduce ArcelorMittal’s liquidity and negatively affect its profitability, cash flows, results of operations and financial condition, as well as harm its reputation.
ArcelorMittal is currently and in the future may be subject to legal proceedings, the resolution of which could negatively affect the Company’s profitability and cash flows in a particular period.
ArcelorMittal’s profitability or cash flows in a particular period could be affected by adverse rulings in legal proceedings currently pending or by legal proceedings that may be filed against the Company in the future. See note 8.2 to ArcelorMittal’s consolidated financial statements.
ArcelorMittal’s business is subject to an extensive, complex and evolving regulatory framework and its governance and compliance processes may fail to prevent regulatory penalties and reputational harm, whether at operating subsidiaries, joint ventures or associates.

218 Risk factors
ArcelorMittal operates in a global environment, and, at a time of increased enforcement activity and enforcement initiatives worldwide, its business straddles multiple jurisdictions and complex regulatory frameworks. Such regulatory frameworks, including but not limited to the area of economic sanctions, are constantly evolving, and ArcelorMittal may as a result become subject to increasing limitations on its business activities and to the risk of fines or other sanctions for non-compliance. Moreover, ArcelorMittal’s governance and compliance processes, which include the review of internal controls over financial reporting, may not prevent breaches of law or accounting or governance standards at the Company or its subsidiaries. The risk of violation is also present at the Company’s joint ventures and associates where ArcelorMittal has only a non-controlling stake and does not control governance practices or accounting and reporting procedures.
In addition, ArcelorMittal may be subject to breaches of its Code of Business Conduct, other rules and protocols for the conduct of business, as well as to instances of fraudulent behavior and dishonesty by its employees, contractors or other agents. The Company’s failure to comply with applicable laws and other standards could subject it to fines, litigation, loss of operating licenses and reputational harm.
The income tax liability of ArcelorMittal may substantially increase if the tax laws and regulations in countries in which it operates change or become subject to adverse interpretations or inconsistent enforcement.
Taxes payable by companies in many of the countries in which ArcelorMittal operates are substantial and include value-added tax, excise duties, profit taxes, payroll-related taxes, property taxes, mining taxes and other taxes. Tax laws and regulations in some of these countries may be
subject to frequent change, varying interpretation and inconsistent enforcement. Ineffective tax collection systems and national or local government budget requirements may increase the likelihood of the imposition of arbitrary or onerous taxes and penalties, which could have a material adverse effect on ArcelorMittal’s financial condition and results of operations. In addition to the usual tax burden imposed on taxpayers, these conditions create uncertainty as to the tax implications of various business decisions. This uncertainty could expose ArcelorMittal to significant fines and penalties and to enforcement measures despite its best efforts at compliance, and could result in a greater than expected tax burden. See note 9 to ArcelorMittal’s consolidated financial statements.
In addition, many of the jurisdictions in which ArcelorMittal operates have adopted transfer pricing legislation. If tax authorities impose significant additional tax liabilities as a result of transfer pricing adjustments, it could have a material adverse effect on ArcelorMittal’s financial condition and results of operations.
It is possible that tax authorities in the countries in which ArcelorMittal operates will introduce additional revenue raising measures. The introduction of any such provisions may affect the overall tax efficiency of ArcelorMittal and may result in significant additional taxes becoming payable. Any such additional tax exposure could have a material adverse effect on the Company’s financial condition and results of operations.ArcelorMittal may face a significant increase in its income taxes if tax rates increase or the tax laws or regulations in the jurisdictions in which it operates, or treaties between those jurisdictions, are modified in an adverse manner. This may adversely affect ArcelorMittal’s cash flows, liquidity and ability to pay dividends.
ArcelorMittal’s reputation and business could be materially harmed as a result of data breaches, data theft, unauthorized access or successful hacking.
ArcelorMittal’s operations depend on the secure and reliable performance of its information technology systems. An increasing number of companies, including ArcelorMittal, have recently experienced intrusion attempts or even breaches of their information technology security, some of which have involved sophisticated and highly targeted attacks on their computer networks. ArcelorMittal’s corporate website was the target of a hacking attack in January 2012, which brought the website down for several days. Because the techniques used to obtain unauthorized access, disable or degrade service or sabotage systems change frequently and often are not recognized until launched against a target, the Company may be unable to anticipate these techniques or to implement in a timely manner effective and efficient countermeasures.
If unauthorized parties attempt or manage to bring down the Company’s website or force access into its information technology systems, they may be able to misappropriate confidential information, cause interruptions in the Company’s operations, damage its computers or process control systems or otherwise damage its reputation and business. In such circumstances, the Company could be held liable or be subject to regulatory or other actions for breaching confidentiality and personal data protection rules. Any compromise of the security of the Company’s information technology systems could result in a loss of confidence in the Company’s security measures and subject it to litigation, civil or criminal penalties, and adverse publicity that could adversely affect its reputation, financial condition and results of operations.
U.S. investors may have difficulty enforcing civil liabilities against ArcelorMittal and its directors and senior management.
ArcelorMittal is incorporated under the laws of the Grand Duchy of Luxembourg with its principal executive offices and corporate headquarters in Luxembourg. The majority of ArcelorMittal’s directors and senior management are residents of jurisdictions outside of the United States. The majority of ArcelorMittal’s assets and the assets of these persons are located outside the United States. As a result, U.S. investors may find it difficult to effect service of process within the United States upon ArcelorMittal or these persons or to enforce outside the United States judgments obtained against ArcelorMittal or these persons in U.S. courts, including actions predicated upon the civil liability provisions of the U.S. federal securities laws. Likewise, it may also be difficult for an investor to enforce in U.S. courts judgments obtained against ArcelorMittal or these persons in courts in jurisdictions outside the United States, including actions predicated upon the civil liability provisions of the U.S. federal securities laws. It may also be difficult for a U.S. investor to bring an original action in a Luxembourg court predicated upon the civil liability provisions of the U.S. federal securities laws against ArcelorMittal’s directors and senior management and non-U.S. experts named in this annual report.
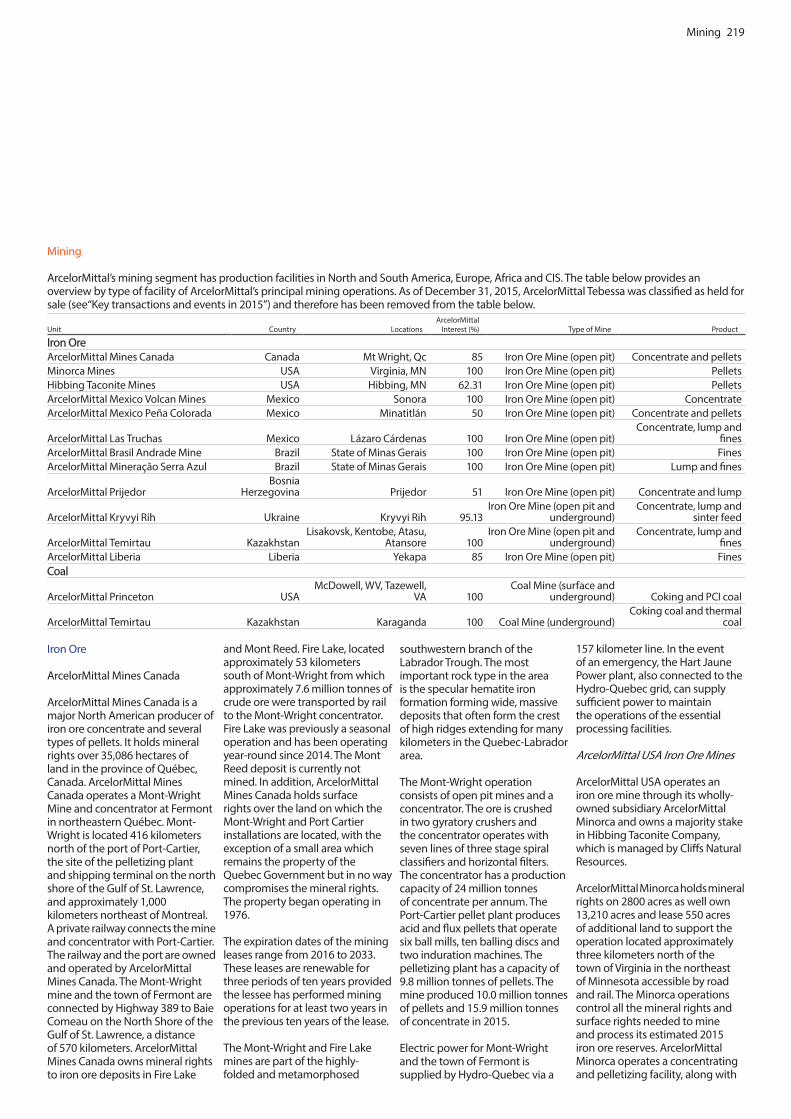
Mining 219
Iron Ore
ArcelorMittal Mines Canada
ArcelorMittal Mines Canada is a major North American producer of iron ore concentrate and several types of pellets. It holds mineral rights over 35,086 hectares of land in the province of Québec, Canada. ArcelorMittal Mines Canada operates a Mont-Wright Mine and concentrator at Fermont in northeastern Québec. Mont-Wright is located 416 kilometers north of the port of Port-Cartier, the site of the pelletizing plant and shipping terminal on the north shore of the Gulf of St. Lawrence, and approximately 1,000 kilometers northeast of Montreal. A private railway connects the mine and concentrator with Port-Cartier. The railway and the port are owned and operated by ArcelorMittal Mines Canada. The Mont-Wright mine and the town of Fermont are connected by Highway 389 to Baie Comeau on the North Shore of the Gulf of St. Lawrence, a distance of 570 kilometers. ArcelorMittal Mines Canada owns mineral rights to iron ore deposits in Fire Lake
and Mont Reed. Fire Lake, located approximately 53 kilometers south of Mont-Wright from which approximately 7.6 million tonnes of crude ore were transported by rail to the Mont-Wright concentrator. Fire Lake was previously a seasonal operation and has been operating year-round since 2014. The Mont Reed deposit is currently not mined. In addition, ArcelorMittal Mines Canada holds surface rights over the land on which the Mont-Wright and Port Cartier installations are located, with the exception of a small area which remains the property of the Quebec Government but in no way compromises the mineral rights. The property began operating in 1976.
The expiration dates of the mining leases range from 2016 to 2033. These leases are renewable for three periods of ten years provided the lessee has performed mining operations for at least two years in the previous ten years of the lease.
The Mont-Wright and Fire Lake mines are part of the highly-folded and metamorphosed
southwestern branch of the Labrador Trough. The most important rock type in the area is the specular hematite iron formation forming wide, massive deposits that often form the crest of high ridges extending for many kilometers in the Quebec-Labrador area.
The Mont-Wright operation consists of open pit mines and a concentrator. The ore is crushed in two gyratory crushers and the concentrator operates with seven lines of three stage spiral classifiers and horizontal filters. The concentrator has a production capacity of 24 million tonnes of concentrate per annum. The Port-Cartier pellet plant produces acid and flux pellets that operate six ball mills, ten balling discs and two induration machines. The pelletizing plant has a capacity of 9.8 million tonnes of pellets. The mine produced 10.0 million tonnes of pellets and 15.9 million tonnes of concentrate in 2015.
Electric power for Mont-Wright and the town of Fermont is supplied by Hydro-Quebec via a
157 kilometer line. In the event of an emergency, the Hart Jaune Power plant, also connected to the Hydro-Quebec grid, can supply sufficient power to maintain the operations of the essential processing facilities.
ArcelorMittal USA Iron Ore Mines
ArcelorMittal USA operates an iron ore mine through its wholly-owned subsidiary ArcelorMittal Minorca and owns a majority stake in Hibbing Taconite Company, which is managed by Cliffs Natural Resources.
ArcelorMittal Minorca holds mineral rights on 2800 acres as well own 13,210 acres and lease 550 acres of additional land to support the operation located approximately three kilometers north of the town of Virginia in the northeast of Minnesota accessible by road and rail. The Minorca operations control all the mineral rights and surface rights needed to mine and process its estimated 2015 iron ore reserves. ArcelorMittal Minorca operates a concentrating and pelletizing facility, along with
Mining
ArcelorMittal’s mining segment has production facilities in North and South America, Europe, Africa and CIS. The table below provides an overview by type of facility of ArcelorMittal’s principal mining operations. As of December 31, 2015, ArcelorMittal Tebessa was classified as held for sale (see“Key transactions and events in 2015”) and therefore has been removed from the table below.
Unit Country LocationsArcelorMittal
Interest (%) Type of Mine Product
Iron OreArcelorMittal Mines Canada Canada Mt Wright, Qc 85 Iron Ore Mine (open pit) Concentrate and pelletsMinorca Mines USA Virginia, MN 100 Iron Ore Mine (open pit) PelletsHibbing Taconite Mines USA Hibbing, MN 62.31 Iron Ore Mine (open pit) PelletsArcelorMittal Mexico Volcan Mines Mexico Sonora 100 Iron Ore Mine (open pit) ConcentrateArcelorMittal Mexico Peña Colorada Mexico Minatitlán 50 Iron Ore Mine (open pit) Concentrate and pellets
ArcelorMittal Las Truchas Mexico Lázaro Cárdenas 100 Iron Ore Mine (open pit)Concentrate, lump and
finesArcelorMittal Brasil Andrade Mine Brazil State of Minas Gerais 100 Iron Ore Mine (open pit) FinesArcelorMittal Mineração Serra Azul Brazil State of Minas Gerais 100 Iron Ore Mine (open pit) Lump and fines
ArcelorMittal Prijedor Bosnia
Herzegovina Prijedor 51 Iron Ore Mine (open pit) Concentrate and lump
ArcelorMittal Kryvyi Rih Ukraine Kryvyi Rih 95.13Iron Ore Mine (open pit and
underground)Concentrate, lump and
sinter feed
ArcelorMittal Temirtau KazakhstanLisakovsk, Kentobe, Atasu,
Atansore 100Iron Ore Mine (open pit and
underground)Concentrate, lump and
finesArcelorMittal Liberia Liberia Yekapa 85 Iron Ore Mine (open pit) FinesCoal
ArcelorMittal Princeton USAMcDowell, WV, Tazewell,
VA 100Coal Mine (surface and
underground) Coking and PCI coal
ArcelorMittal Temirtau Kazakhstan Karaganda 100 Coal Mine (underground)Coking coal and thermal
coal
220 Mining
two open pit iron ore mines – Laurentian and East Pits located 12 kilometers from the processing facilities. The processing operations consist of a crushing facility, a three-line concentration facility and a single-line straight grate pelletizing plant. The Minorca pelletizing facility produced 2.7 million metric tonnes of taconite pellets in 2015. Pellets are transported by rail to ports on Lake Superior. Lake vessels are used to transport the pellets to Indiana Harbor. The Minorca taconite plant was constructed and operated by Inland Steel between 1977 and 1998 when it was purchased by then ISPAT International, a predecessor company of ArcelorMittal.
The Hibbing Taconite Company holds mineral rights over 8,008.6 acres in 42 contiguous mineral leases, is located six kilometers north of Hibbing in the northeast of Minnesota accessible by road and rail. The Hibbing operations are jointly owned by ArcelorMittal USA, Cliffs Natural Resources (23.0%) and U.S. Steel (14.7%), and Cliffs Natural Resources is the operator of the joint venture mine and processing facilities. The Hibbing Taconite Company controls all of the mineral rights and surface rights needed to mine and process its estimated 2015 iron ore reserves. The operations consist of open pit mining, crushing, concentrating and pelletizing. The finished pellets are then transported by rail to the port of Allouez at Superior, Wisconsin, a distance of 130 kilometers and then over the Great Lakes by lake vessels to ArcelorMittal’s integrated steelmaking plants, principally Burns Harbor. The Hibbing Taconite Company began operating in the third quarter of 1976. The mine produced 8.1 million metric tonnes of taconite pellets in 2015 (of which 62.3% is ArcelorMittal’s share).
Both the Minorca and Hibbing mines are located in the Mesabi iron range where iron ore has been extracted for over 100 years. The ore bodies are within the Biwabik Iron Formation, a series
of shallow dipping Precambrian sedimentary rocks known as taconite with a total thickness in excess of 200 meters and running for approximately 200 kilometers. Although the first deposits mined in the Mesabi iron range consisted of oxidized hematite ores, production was shortened in the mid-1950 to low grade magnetic taconite ores. The processing of this ore involves a series of grinding and magnetic separation stages to remove the magnetite from the silica. Electric power constitutes the main source of energy for both Minorca and Hibbing and is provided from the Minnesota state power grid.
ArcelorMittal Mexico Mining Assets
ArcelorMittal Mexico operates three iron ore mines in Mexico, the El Volcan and Las Truchas mines, and, through a joint operation with Ternium S.A, the Peña Colorada mine.
Peña ColoradaPeña Colorada holds mineral rights over 99,188 acres located at about 60 kilometers by highway to the northeast of the port city of Manzanillo, in the province of Minatitlán in the northwestern part of the State of Colima, Mexico. ArcelorMittal owns 50% of Peña Colorada Ltd., and Ternium S.A. owns the other 50% of the company.
Peña Colorada operates an open pit mine as well as a concentrating facility and a two-line pelletizing facility. The beneficiation plant is located at the mine, whereas the pelletizing plant is located in Manzanillo. Major processing facilities include a primary crusher, a dry cobbing plant, one autogenous mill, horizontal and vertical ball mills and several stages of magnetic separation. The concentrate is sent as a pulp through a pipeline from the mineral processing plant. Peña Colorada has operated since 1974. The Peña Colorada mine receives electrical power from the Comisión Federal de Electricidad (CFE), which is a federal government company that serves the entire country.
Government concessions are granted by the Mexican federal government for a period of 50 years and are renewable. The expiration dates of the current mining concessions range from 2021 to 2062.
The Peña Colorada pelletizing facility produced 3.5 million tonnes of pellets in 2015. Both magnetite concentrate and iron ore pellets are shipped from Manzanillo to ArcelorMittal Mexico for export, as well as to Ternium’s steel plants, by ship and by rail.
Peña Colorada is a complex polyphase iron ore deposit. The iron mineralization at Peña Colorada consists of banded to massive concentrations of magnetite within breccia zones and results from several magmatic, metamorphic and hydrothermal mineralization stages with associated skarns, dykes and late faults sectioning the entire deposit.
El VolcanArcelorMittal holds mineral rights over 1,053 hectares to support its El Volcan operations located approximately 68 kilometers northwest of the city of Obregon and 250 kilometers from the Guaymas port facility in the state of Sonora, Mexico. The El Volcan operations control all of the mineral rights and surface rights needed to mine and process its estimated 2015 iron ore reserves. ArcelorMittal operates a concentrating facility along with an open pit mine and a pre-concentration facility at the mine site. The mine site is accessible by a 90-kilometer road from the city of Obregon, where the concentrator is located.
Government concessions are granted by the Mexican federal government for a period of 50 years and are renewable. The expiration dates of the current mining concessions range from 2055 to 2061.
The pre-concentration facilities at the mine include one primary crusher, one secondary crusher,
a dry cobbing high intensity magnetic pulley and three tertiary crushers. The concentration plant includes two ball mills on line, a magnetic separation circuit, flotation systems, a belt conveyor filter and a disposal area for tails. The major port installations include a tippler for railroad cars, a conveyor, transfer towers and two ship loading systems. The mine exploitation and crushing operations and all transport activities are performed by contractors. The concentrate and port operations are operated with ArcelorMittal’s own resources. The concentrate is transported by rail to the Pacific port of Guaymas and then shipped to the steel plant in Lázaro Cárdenas or exported. The mining operation uses two Caterpillar 3516B electric generators in continuous operation, with one generator operating 24 hours per day at an average consumption of 540 kilowatt hours while the second generator is on standby. The concentration facility uses electric power from the national grid.
The El Volcan mine concession was bought from the Sonora provincial government in 2004, followed by exploration of the property in 2005. The development of the mine started in 2007. Mining operations were halted during the 2008-2009 crisis and on several occasions due to structural problems in the crushing facilities. Operations resumed without interruption from 2010 until October 2015. The El Volcan operations produced 1.7 million tonnes of concentrate in 2015, which is a decrease from the normal 2.3 million capacity due to suspension of operations in October 2015 as the mine reaches end of mine life.
The iron mineralization includes magnetite rich skarn associated to the intrusion and extrusion of magmas rich in iron and formed in a volcanic environment.
Las Truchas
ArcelorMittal holds mineral rights over 52,473 hectares.

Mining 221
The Las Truchas mine is located approximately 27 kilometers southeast of the town of Lázaro Cárdenas in the State of Michoacán, Mexico. The Las Truchas operations are accessible by public highway and control all the mineral rights and surface rights needed to mine and process its estimated 2015 iron ore reserves.
Government concessions are granted by the Mexican federal government for a period of 50 years and are renewable. The expiration dates of the current mining concessions range from 2044 to 2059.
The Las Truchas mine is an integrated iron ore operation. It began operating in 1976 as a government enterprise (Sicartsa), and its mining activities consist of an open pit mine exploitation, crushing, dry cobbing preconcentrate and concentration plant. The aggregated 2015 production of concentrate, lumps and fines totaled 1.8 million tonnes. The concentrator includes one primary crusher, two secondary crushers and three tertiary crushers, one ball mill and one bar mill and two wet magnetic separation circuits. The electrical energy supplier for the Las Truchas mine is a state-owned company, Comisión Federal de Electricidad (CFE). The concentrated ore is pumped from the mine site through a 26-kilometer slurry pipeline to the steel plant facility in Lázaro Cárdenas.
The Las Truchas deposits consist of massive concentrations of magnetite of irregular morphology. The main Las Truchas deposits occur along about seven kilometers long and about two kilometers wide. The Las Truchas mineral deposits have been classified as hydrothermal deposits, which may have originated from injections of late stage-plutonic-activity through older sedimentary rocks. The mineralization of the Las Truchas iron deposits occurs in disseminated and irregular massive concentrations of magnetite within metamorphic rocks and skarns.
The mineralization also occurs as fillings of faults, breccia zones, and fractures.
ArcelorMittal Brasil—Andrade Mine
ArcelorMittal Brasil holds mineral rights over the central claims of the Andrade deposit of over 28,712,100 square meters located approximately 80 kilometers east of Belo Horizonte in the Minas Gerais state of Brazil. ArcelorMittal’s operations control all of the mineral rights and surface rights needed to mine and process its estimated 2015 iron ore reserves. ArcelorMittal operates an open pit mine and a crushing facility. The mine site is accessible by 110 kilometers of public highway from Belo Horizonte. Power is mostly generated from hydroelectric power plants and supplied by CEMIG, an open capital company controlled by the Government of the State of Minas Gerais.
Companhia Siderurgica Belgo-Mineira (“CSBM”) initiated mining operations at the property in 1944 in order to facilitate the supply of ore to its steel plant in Joao Monlevade. The mine was managed by CSBM until 2000. In 2000, Vale acquired the property, although the mine continued to be operated by CSBM until Vale entered into a 40-year lease for the Andrade mineral rights in 2004 (subject to the condition that the supply to CSBM would be assured). In November 2009, Vale returned the Andrade mine to CSBM, which then transferred it to ArcelorMittal. In 2015, the Andrade mine produced 1.5 million tonnes of sinter feed. An increase of the mine’s production capacity to 3.5 million tonnes per year of sinter feed was completed in 2012. In 2013 a cross road was built in order to improve shipments to the local Brazilian market.
ArcelorMittal Mineração Serra Azul
ArcelorMittal Mineração Serra Azul holds mineral rights over the central and east claims of the Serra Azul deposit over
5,505,400 square meters, located approximately 50 kilometers southwest of the town of Belo Horizonte in the Minas Gerais state of Brazil. ArcelorMittal’s operations control all of the mineral rights and surface rights needed to mine and process its estimated 2015 iron ore reserves. ArcelorMittal operates an open pit mine and a concentrating facility. The mine site is accessible by 80 kilometers of public highway from Belo Horizonte.
In addition to the open pit mine, processing operations consist of a crushing facility and a three-line concentration facility including screening, magnetic separation, spirals separators and jigging. Production is transported either by truck for local clients of lump, or by truck to two railway terminals located 35 and 50 kilometers, respectively, from the mine site for selling to local clients of sinter feed or for export through third-party port facilities located in the Rio de Janeiro State. Sinter feed production is shipped to ArcelorMittal’s plants in Europe as well as to the local Brazilian market including the ArcelorMittal Brasil integrated plants. The Compania Energética de Minas Gerais (CEMIG) supplies power through a 13,800 volt line from Mateus Leme, located 20 kilometers from the mine. The electricity is locally transformed into 380 volts by six transformers spread around the operation. Minas Itatiaucu (MIL) initiated mining operations at the property in 1946. In 2007, London Mining Brazil Mineracao Ltda (London Mining) purchased the mineral rights from MIL. Following the acquisition of the property from London Mining, ArcelorMittal has operated the mine since 2008. In 2015, ArcelorMittal Mineração Serra Azul produced 2.0 million tonnes of lumps and sinter fines.
Both the Andrade and Serra Azul mines are located in the Iron Quadrangle (Quadrilatero Ferrifero), a widely-explored and mined region. The mineralization occurs as Itabirites, banded hematite-silica rocks, with varying weathering degrees. While the Serra Azul ore reserve
estimates are constituted of rich friable Itabirites requiring some beneficiation, the Andrade ore reserve estimates are dominated by directly shippable hematite ore.
ArcelorMittal Prijedor
ArcelorMittal Prijedor, located near Prijedor in the Republic of Srpska in Bosnia and Herzegovina, is an iron ore mining operation that is 51% owned by ArcelorMittal. ArcelorMittal Prijedor holds mineral rights over 2,000 hectares to support ArcelorMittal’s steel-making operations located approximately 243 kilometers south of Prijedor in northern Bosnia (Zenica). ArcelorMittal Prijedor has no reason to believe that it will not maintain the operating licenses required to continue operations and process its estimated 2015 iron ore reserves. The operation is in close proximity to long-established public roads. The production process includes crushing, with hydro-cyclones and magnetic separation at the concentration plant. The plant is close to the mine site, and materials are transported through a conveyor. Power is supplied from the national grid through a local power distribution company. In 2015, ArcelorMittal Prijedor produced 2.1million tonnes of aggregated lumps and fines.
In 1916, Austrian mining companies established the first industrial production of iron ore in the Prijedor area. The mines were nationalized in the 1950s, and were then owned by Iron Mines Luubija Company until Mittal Steel acquired 51% of the company in 2004.
The Omarska deposit is composed of two ore bodies: Jezero and Buvac. The Jezero open pit began operating in 1983 and, following an interruption in production during the Bosnian civil war in the 1990s, production resumed in 2004.
However, since 2011, ore has only been produced at the Buvac pit. The Buvac pit was opened in 2008 and is located within a carboniferous clastic and carbonates sediments containing

222 Mining
iron mineralization in the form of beds concordant with host rocks or in the form of massive irregular blocks. The genesis of this deposit is attributed to hydrothermal replacement and syn-sedimentary processes. The Buvac ore body is mainly composed of limonite-goethite mineralization, which was formed during weathering oxidization of the primary siderite bodies.
ArcelorMittal Kryvyi Rih
ArcelorMittal Kryvyi Rih (“AMKR”) holds mineral rights to support its operations located roughly within the limits of the city of Kryvyi Rih, 150 kilometers southwest of Dnepropetrovsk, Ukraine over 1,301 hectares. AMKR’s operations control all of the mineral rights and surface rights needed to mine and process its estimated 2015 iron ore reserves. AMKR operates a concentrating facility, along with two open pit and one underground iron ore mines. The iron ore deposits are located within the southern part of the Krivorozhsky iron-ore basin. Access to the mines is via public roads, which are connected by a paved highway to Dnepropetrovsk. The area is well served by rail. Power is supplied by the Ukraine government and is generated from a mix of nuclear, gas and coal-fired power stations. AMKR has two iron ore mines: an open pit mine feeding a concentration plant that produced 10.1 million tonnes of concentrate in 2015, known as the Kryvyi Rih open cast, and an underground mine with production of 0.9 million tonnes of lump and sinter feed in 2015, known as the Kryvyi Rih underground mine. Operations began at the Kryvyi Rih open cast in 1959 and at the Kryvyi Rih underground mine in 1933. ArcelorMittal acquired the operations in 2005.
The expiration of the agreements on the subsoil use conditions and the subsoil use permits range from 2016 to 2021, while the expiration of the land lease agreements ranges from 2060 to 2061.
The iron ore extracted from the Kryvyi Rih open cast is first processed at the mine site through primary crushing. After initial processing, the product is loaded on a rail-loading facility and transported to the crushing plant. The concentrator production process includes crushing, classification, magnetic separation and filtering. The iron ore extracted from the Kryvyi Rih’s underground mine by a modified sub-level caving method is crushed on surface and transported by rail to the steel plant. The main consumer of the sinter and concentrate products is the ArcelorMittal Kryvyi Rih steel plant, with some concentrate being shipped to other ArcelorMittal affiliates in Eastern Europe, as well as to third parties. The iron mineralization is hosted by early Proterozoic rocks containing seven altered ferruginous quartzite strata with shale layers. The major iron ore bearing units in the open pit mines have carbonate-silicate-magnetite composition. In addition, oxidized quartzite is mined simultaneously with primary ore but cannot be processed at present and is stored separately for future possible processing. Only the magnetite mineralization is included in the 2015 open pit iron ore reserve estimates. The underground mine is hosted by a ferruginous quartzite with martite and jaspilite.
Lisakovsk, Kentobe, Atasu, Atansore (Temirtau Iron Ore)
ArcelorMittal Temirtau has four iron ore mining operations in Kazakhstan. The mines are Lisakovsk, Kentobe, Atasu and Atansore. The four mines are connected by all-weather roads and railways. Dispatch of ore from these mines to the ArcelorMittal steel plant is by railway. ArcelorMittal Termitau’s operations control all of the mineral rights and surface rights needed to mine and process its estimated 2015 iron ore reserves.
Lisakovsk is an open pit operation located in northwest Kazakhstan about 1,100 kilometers from Temirtau, with production of
0.9 illion tonnes of concentrate in 2015. The mine was initially commissioned in 1976 and was acquired by ArcelorMittal in 1999. The existing subsoil agreement expires in 2020. The production process comprises crushing, screening, grinding, wet jigging and wet magnetic separation. The iron mineralization at Lisakovsk occurs as oolite containing mainly hygoethite and goethite. The phosphorous content in the mineralization limits its utilization in the steel-making process. At Lisakovsk, natural gas is supplied by KazTransGazAimak JSC and transmitted through the local grid. Electric power for the other facilities is supplied by Prometey 2003 and Sarbai MES KEGOK.
Kentobe is an open pit operation, initially started in 1994 and acquired by ArcelorMittal in 2001, located about 300 kilometers southeast of Temirtau, with production of 0.7 million tonnes of concentrate in 2015. Clearance for extension of the existing subsoil agreement until 2026 was given by Kazakhstan Ministry of innovation and development and signing of addendum to the agreement is in process. Ore processing is performed by crushing and dry magnetic separation, producing coarse concentrate. The Kentobe mine is located in the Balkhash metallogenic province hosting numerous volcanic, sedimentary and hydrothermal deposits. The mineralization at Kentobe includes two types of iron ore: oxidized and primary magnetite. The magnetite mineralization constitutes the vast majority of the 2015 estimated ore reserves. Electric power is supplied to the Kentobe operations by Karaganda Energosbyt LLP.
Atasu is an underground mine operation located about 400 kilometers south/southwest from Temirtau with production of 0.8 million tonnes of lump and fines in 2015. The mine began operating in 1956 with open pit exploitation of near surface reserves. Surface operations ended in 1980. Underground operations commenced in 1976. ArcelorMittal acquired the mine
in 2003. The existing subsoil agreement expires in 2026. Processing comprises of crushing and wet jigging. The Atasu mine is hosted by the West Karazhal deposit, which is a primary magnetite ore with associated manganese mineralization. Studies have indicated that the deposit could have a sedimentary-volcanogenic origin caused by underwater hydrothermal activity. The mine receives electric power from the Prometei-2003 grid via NovoKarazhal substation.
Atansore is an open pit operation located about 500 kilometers northeast of Temirtau with production of 0.4 million tonnes of concentrate and fines in 2015. The mining lease was obtained by ArcelorMittal in 2004. The existing subsoil agreement expires in 2029. The Atansor deposit is located within skarn zones related to a volcanic intrusion that can be traced for more than 1.5 kilometers. The mineralization includes both martitic oxidized ore and primary magnetite ore. A new concentrator is processing the magnetite portion of the ore by simple dry crushing and magnetic separation while the low-grade oxidized portion of the ore is sold as fines to a third party for further beneficiation. At the Atansore operations, electric power is provided from the Kokshetauenergo center.
ArcelorMittal Liberia
ArcelorMittal Liberia Holdings Limited (“AMLH”), through its agent (and subsidiary) ArcelorMittal Liberia Limited (“AML”), has been mining ‘direct shipping ore, or DSO’ from the first of three deposits in the Mt. Tokadeh, Mt. Gangra and Mt. Yuelliton mountain ranges in northern Nimba, Liberia since June 2011. AML signed a Mineral Development Agreement (“MDA”) in 2005 with the Government of Liberia (“GOL”) that is valid for 25 years and renewable for an additional 25-year period. The MDA covers three deposits to support AML’s operations located approximately 300 kilometers

Mining 223
northeast of Monrovia, Liberia over 516 square kilometers. These three deposits are grouped under the name “Western Range Project”, which includes the Tokadeh, Gangra and Yuelliton deposits. In addition to the rights to explore and mine iron ore, the GOL has granted the right to develop, use, operate and maintain the Buchanan to Yekepa railroad and the Buchanan port. A phased approach has been taken to establish the final project configuration. Currently only high grade ore reserves of oxidized iron ore (DSO) are mined. This ore only requires crushing and screening to make it suitable for export. The materials-handling operation consists of stockyards at both the mine and port areas, linked by a 250-kilometer single track railway running from Tokadeh to the port of Buchanan. Production in 2015 was at 4.3 million tonnes. Drilling for DSO resource extension commenced in late 2015 and in 2016 the operation has been right sized to 3 million tonnes to focus on its ‘natural’ Atlantic markets.
The power for the current Liberia DSO operations is obtained from a combination of diesel and electric sources. Planning and construction of the project were commenced in 1960 by a group of Swedish companies, which ultimately became the Liberian American-Swedish Minerals Company (“LAMCO”), and production commenced on the Nimba deposit in 1963. Production reached a peak of 12 million metric tonnes in 1974 but subsequently declined due to market conditions. Production started at Mt. Tokadeh in 1985 to extend the life of the Nimba ore bodies to 1992 when operations ceased due to the Liberian civil war. In 2005, Mittal Steel won a bid to resume operations and signed the MDA with the GOL. Rehabilitation work on the railway started in 2008 and, in June 2011, ArcelorMittal started mining operations at Tokadeh, followed by a first shipment of iron ore in September 2011.
The Nimba Itabirites is a 250 to 450 meter thick recrystallized iron formation. Although theiron
deposits at Tokadeh, Gangra and Yuelliton fit the general definition of Itabirite as laminated metamorphosed oxide-facies iron formation, they are of lower iron grade than the ore previously mined at Mount Nimba. Tropical weathering has caused the decomposition of the rock forming minerals resulting in enrichment in the iron content that is sufficient to support a DSO operation.
Coal
ArcelorMittal Princeton
The ArcelorMittal Princeton (“AMP”) properties are located in McDowell County, West Virginia and Tazewell County, Virginia, approximately 30 miles west of the city of Princeton, West Virginia, where AMP’s corporate office is located. The properties consist of two operating areas: the Low Vol operations and the Mid Vol operations, which are situated south of U.S. Route 52. High-voltage power lines, typically 12,500 volts, deliver power to work stations where transformers reduce voltage for specific equipment requirements.
The larger Low Vol operations are located in McDowell County, West Virginia, near the communities of Northfork, Keystone, Eckman, Gary, Berwind, and War. The Eckman Plant, Dans Branch Loadout, Eckman 2 and Redhawk 1 surface mines are also located here, as well as the following deep mines: XMV Mine Nos. 32, 35, 39, 42 and 43.
The Mid Vol operations are in southeastern McDowell County, West Virginia and northwestern Tazewell County, Virginia. The nearest communities are Horsepen and Abbs Valley, Virginia as well as Anawalt, West Virginia.
The property has a long history of coal mining, mostly by predecessors in title to AMP. Significant underground mining of some of the deeper coal seams on the properties have occurred, notably the Pocahontas no. 3 and no. 4 seams. In addition, a substantial amount of the thicker
coal outcrops have been previously contour mined, providing access for highwall mining and on-bench storage of excess spoil from future, larger-scale surface mining. AMP was created in 2008 when the Mid-Vol Coal Group and the Concept Mining Group were integrated.The properties are located in the Pocahontas Coalfields of the Central Appalachian Coal Basin. The Carboniferous age coal deposits are situated in the Pottsville Group, New River and Pocahontas Formations. The rock strata, including the coal deposits, are sedimentary rocks formed by alluvial, fluvial, and deltaic sediments deposited in a shallow, subsiding basin. The most common rock types are various types of sandstone and shale. The coal deposits are typically in relatively thin coal beds, one to five feet thick.
The combined production of the mines in 2015 was 1.6 million tonnes of washed and directly shippable coal.
ArcelorMittal Temirtau (Karaganda Coal Mines)
ArcelorMittal Temirtau has eight underground coal mines and two coal preparation plants (CPP “Vostochnaya” and Temirtau Washery-2). The coal mines of ArcelorMittal Temirtau are located in the Karaganda Coal Basin. The basin is more than 3,000 square kilometers and was formed by strata of Upper Devonian and Carbonic ages, Mesozoic and Cainozoic formations. Due to structural peculiarities, the coal basin is divided into three geology-based mining areas: Karagandinskiy, Sherubay-Nurinskiy and Tentekskiy.
The mines are located in an area with well-developed infrastructure around the regional center of Karaganda city. Within a distance of 10 to 60 kilometers are the following satellite towns: Shakhtinsk, Saran and Abay, as well as Shakhan and Aktas. All mines are connected to the main railway, and coal is transported by railway to the coal wash plants and
power stations.
The Kostenko mine began operations in 1934 and merged with the neighboring Stakhanovskaya mine in 1998. The field of Kostenko mine falls within the Oktyabrskiy district of Karaganda city.
The Kuzembaeva mine was established in 1998. The nearest communities are Saran, Abay and Shakhtinsk, which are located 18 kilometers to the northeast, 15 kilometers to the southeast and 12 kilometers to the west, respectively. The eastern part of the mine falls within the center of Karaganda City.
The Saranskaya mine began operations in 1955. It merged with the Sokurskaya mine in mid-1997 and the Aktasskaya mine in 1998. The nearest communities are Saran, Abay and Shakhtinsk, which are located 18 kilometers to the northeast, 15 kilometers to the southeast and 12 kilometers to the west, respectively. Karaganda City is located approximately 35 kilometers to the northeast.
The Kostenko, Kuzembaeva and Saranskaya mines receive energy from public district networks through transforming substations of the Karagandaenergo Company.
The Abayskaya mine began operations in 1961. In 1996, it was merged with the Kalinina mine. The nearest communities are Saran, Abay and Shakhtinsk, which are located 18 kilometers to the northeast, 15 kilometers to the southeast and 20 kilometers to the west, respectively. Karaganda City is located approximately 30 kilometers to the northeast.
The Kazakhstanskaya mine began operations in 1969. The nearest community is Shakhtinsk. Karaganda City is located approximately 50 kilometers to the northeast. The railway station at MPS-Karabas is located approximately 35 kilometers to the southeast.

224 Mining
Reserves and resources (iron ore and coal)
IntroductionArcelorMittal has both iron ore and metallurgical coal reserves. The Company’s iron ore mining operations are located in the United States, Canada, Mexico, Brazil, Liberia, Bosnia, Ukraine and Kazakhstan. In Canada, the Company commenced mining the greenfield operation on Baffin Island through a joint venture. The Company’s metallurgical coal mining operations are located in the United States and Kazakhstan.
The estimates of proven and probable ore reserves and mineral resources at the Company’s mines and projects and the estimates of the mine life included in this annual report have been prepared by ArcelorMittal’s experienced engineers and geologists. The reserve calculations were prepared in compliance with the requirements of USA Securities and Exchange Commission’s (“SEC”) Industry Guide 7 and the mineral resource estimates were prepared in accordance with the requirements of Canadian National Instrument NI 43-101(which are
based on the Canadian Institute of Mining and Metallurgy (CIM) Best Practice Guidelines and Standard Definitions for all its operations and projects), under which:
• Reserves are the part of a mineral deposit that could be economically and legally extracted or produced at the time of the reserve determination.
• Proven reserves are reserves for which (a) quantity is computed from dimensions revealed in outcrops, trenches, working or
drill holes; grade and/or quality are computed from the results of detailed sampling; and (b) the sites for inspection, sampling and measurement are spaced so closely and the geologic character is so well defined that size, shape, depth and mineral content of reserves are well-established.
• Probable reserves are reserves for which quantity and grade and/or quality are computed from information similar to that used for proven reserves, but the sites for inspection, sampling and
The Lenina mine was put in operation in 1964 and was subsequently merged with Naklonnaya no. 1/2 mine in 1968. The nearest community is Shakhtinsk, located seven kilometers to the southeast, and Karaganda City, is located 50 kilometers to the northeast. The railway station MPS-Karabas is located 35 kilometers to the southeast.
The Shakhtinskaya mine began operations in 1973. The nearest community is Shakhtinsk, which is located 10 kilometers to the southeast, and Shakhan, which is located seven kilometers to the north. Saran is located 18 kilometers to the east. Karaganda City is located approximately 35 kilometers to the east.
The Tentekskaya mine began operations in 1979. The nearest community is Shakhtinsk. Karaganda City is located approximately 50 kilometers to the northeast. The railway station MPS-Karabas is located approximately 35 kilometers to the southeast.
Abayskaya, Shakhtinskaya, Lenina, Tentekskaya and Kazakhstanskaya mines receive energy from high-voltage lines of Karaganda.
The subsoil use contract and license (all coal mines in Temirtau) will expire in 2022. Total land area under mineral rights is 286 square kilometers.
The mines produce primarily coking coal used in steel-making at ArcelorMittal Temirtau as well as thermal coal for ArcelorMittal Temirtau’s power plants. For beneficiation of coking coal, two washeries are operated. Surplus coal is supplied to ArcelorMittal Kryvyi Rih in Ukraine, and to external customers in Russia and China. In 2015, the Karaganda Coal Mines produced 4.6 million tonnes of metallurgical coal and approximately 1.3 million tonnes of thermal coal consumed by the Temirtau steel operations.
Capital Expenditure Projects
The following tables summarize the Company’s principal growth and optimization projects involving significant capital expenditure completed in 2015 and those that are currently ongoing.
Ongoing Projects1 Segment Site Project Capacity / particulars Forecasted completion
Mining Liberia Phase 2 expansion projectIncrease production capacity to 15mt/ year
(high grade sinter feed) On hold 2
1 Ongoing projects refer to projects for which construction has begun (excluding various projects that are under development), even if such projects have been placed on hold pending improved operating conditions.
2 ArcelorMittal remains committed to Liberia where it operates a full value chain of mine, rail and port. It has been operating the mine on a DSO basis since 2011 and produced 4.3 million tonnes in 2015. In the current initial DSO phase, significant cost reduction and re-structuring has continued to ensure competitiveness at current prices. Drilling for DSO resource extension recently commenced and in 2016 the operation has been right sized to 3mtpa to focus on its ‘natural’ Atlantic markets. This repositioning for size and competitiveness also extends the life of the DSO phase as ArcelorMittal considers the appropriate next phase of development. ArcelorMittal had previously announced a Phase 2 project that envisaged the construction of 15 million tonnes of concentrate sinter fines capacity and associated infrastructure. The phase 2 project was initially delayed due to the declaration of force majeure by contractors in August 2014 due to the Ebola virus outbreak in West Africa. Rapid price declines over the period since force majeure have led to a reassessment of the project and ArcelorMittal is considering transitioning production to a higher grade sinter fines product but now in a phased approach as opposed to a major step up from 15 to 20mtpa as originally envisaged in phase 2. Extensive tonnage of concentrator feed material is already exposed in readiness for a concentrated sinter fines, and ArcelorMittal also has options in its concession to mine higher grade, lower gangue DSO ores. Work continues in 2016 to define the best business option.

Mining 225
measurement are farther apart or are otherwise less adequately spaced. The degree of assurance, although lower than that for proven reserves, is high enough to assume continuity between points of observation.
• The mineral resource estimates constitute the part of a mineral deposit that have the potential to be economically and legally extracted or produced at the time of the resource determination. The potential for economic viability is established through high level and conceptual engineering studies.
• A ‘measured mineral resource’ is that part of a mineral resource for which quantity, grade or quality, densities, shape, and physical characteristics are so well established that they can be estimated with confidence sufficient to allow the appropriate application of technical and economic parameters, to support production planning and evaluation of the economic viability of the deposit. The estimate is based on detailed and reliable exploration, sampling and testing information gathered through appropriate techniques from locations such as outcrops, trenches, pits, workings and drill holes that are spaced closely enough to confirm both geological and grade continuity.
• An ‘indicated mineral resource’ is that part of a mineral resource for which quantity, grade or quality, densities, shape and physical characteristics, can be estimated with a level of confidence sufficient to allow the appropriate application of technical and economic parameters, to support mine planning and evaluation of the economic viability of the deposit. The estimate is based on detailed and reliable exploration and testing information gathered through appropriate techniques from locations such as outcrops, trenches, pits, workings and drill holes that are spaced closely enough for geological and grade continuity to be reasonably
assumed.
• An ‘inferred mineral resource’ is that part of a mineral resource for which quantity and grade or quality can be estimated on the basis of geological evidence and limited sampling and reasonably assumed, but not verified, geological and grade continuity. The estimate is based on limited information and sampling gathered through appropriate techniques from locations such as outcrops, trenches, pits, workings and drill holes.
The ore reserve and mineral resource estimates are updated annually in order to reflect new geological information and current mine plan and business strategies. The Company’s reserve estimates are of in-place material after adjustments for mining depletion and mining losses and recoveries, with no adjustments made for metal losses due to processing. The mineral resource estimates are of in-situ wet metric tonnage material prior to adjustments for mining recovery and dilution factors and reported exclusive (in addition to ore reserve estimates).
For a description of risks relating to reserves and resource estimates, see the risk factor entitled ‘ArcelorMittal’s reserve and resource estimates may materially differ from mineral quantities that it may be able to actually recover; ArcelorMittal’s estimates of mine life may prove inaccurate; and market price fluctuations and changes in operating and capital costs may render certain ore reserves uneconomical to mine’ (more details page 212).
The demonstration of economic viability is established through the application of a life of mine plan for each operation or project providing a positive net present value on a cash-forward looking basis. Economic viability is demonstrated using forecasts of operating and capital costs based on historical performance, with forward adjustments based on planned process improvements, changes in production volumes and in fixed and variable
proportions of costs, and forecasted fluctuations in costs of raw material, supplies, energy and wages. Detailed independent verifications of the methods and procedures used are conducted on a regular basis by external consultants. Sites are reviewed on a rotating basis; certain of the Company’s operations with significant ore reserve estimates as of December 31, 2011 were independently audited in 2012 by Roscoe Postle Associates and SRK Consulting (UK) Limited and no material changes to the 2011 year-end iron ore and coal reserve estimates were recommended by them. In 2014, the year-end 2013 ore reserve estimates were independently audited and validated by Roscoe Postle Associates for the Company’s mines in Liberia and in Canada including the joint venture Baffinland and no material changes to the 2013 year-end iron ore and coal reserve estimates were recommended by them. In 2016, the 2015 year end ore reserve estimates were independently audited and validated by Roscoe Postle Associates for the Company’s Las Truchas and Peña mines in Mexico, and no material changes to the 2015 year-end iron ore reserve estimates were recommended.
ArcelorMittal owns less than 100% of certain mining operations; reserve and resource estimates have not been adjusted to reflect ownership interests and therefore reflect 100% of the reserves and resources of each mine. Please see the table above under “Mining” for the ownership interest of ArcelorMittal in each mine. All of the reserve figures presented represent estimates at December 31, 2015 (unless otherwise stated).
Mine life is derived from the life of mine plans and corresponds to the duration of the mine production scheduled from ore reserve estimates only.
The Company’s mineral leases are of sufficient duration (or convey a legal right to renew for sufficient duration) to enable all ore reserves
on the leased properties to be mined in accordance with current production schedules. Ore reserves may include areas where some additional approvals remain outstanding but where, based on the technical investigations the Company carries out as part of its mine planning process and its knowledge and experience of the approvals process, the Company expects that such approvals will be obtained as part of the normal course of business and within the timeframe required by the current life of mine schedule.
In Eastern Europe (Bosnia) and the Commonwealth of Independent States (CIS), ArcelorMittal has conducted in-house and independent reconciliations of ore reserve and mineral resource estimate classifications based on Industry Guide 7, National Instrument NI 43-101 and standards used by the State Committee on reserves, known as the GKZ in the CIS. The GKZ constitutes the legal framework for reserve and resource reporting in several former Soviet Union countries where ArcelorMittal operates mines. On the basis of these reconciliations, ArcelorMittal’s mineral resources have been classified as measured for categories A and B, indicated for category C1 and inferred for category C2. Ore reserves have been estimated by applying mine planning, technical and economic assessments defined as categories A, B and C1 only according to the GKZ standards. In general, provided Guide 7’s economic criteria for reserves are met (which is the case here), A+B is equivalent to ‘proven’ and C1 is equivalent to ‘probable’.
The reported iron ore and coal reserves contained in this annual report do not exceed the quantities that the Company estimates could be extracted economically if future prices were at similar levels to the average contracted price for the three years ended December 31, 2015. The average iron ore spot reference price for the last three years (2013 – 2015) was $95.96/dmt CFR China, 62% Fe, (PLATTS Index) duly

226 Mining
adjusted for quality, Fe content, logistics and other considerations. For the same period, the average coal spot reference price was $117.02/tonne FOB Australia, Hard Coking Coal (FOB Australia HCC Peak Downs, PLATTS Index). The Company establishes optimum design and future operating cut-off grade based on its forecast of commodity prices and operating and sustaining capital costs. The cut-off grade varies from operation to operation and during the life of each operation in order to optimize cash flow, return on investments and the sustainability of the mining operations. Sustainability in turn depends on expected future operating and capital costs. The reserve base can vary from year to year due to the revision of mine plans in response to market and operational conditions, in particular market price. See the risk factor entitled “ArcelorMittal’s reserve estimates may materially differ from mineral quantities that it may be able to actually recover; ArcelorMittal’s estimates of mine life may prove inaccurate; and market price fluctuations and changes in operating and capital costs may render certain ore reserves uneconomical to mine”.
Tonnage and grade estimates are reported as ‘Run of Mine’. Tonnage is reported on a wet metric basis.
Iron ore reserve and resource estimate
The tables below detail ArcelorMittal’s estimated iron ore reserves and resources as at December 31, 2015. The classification of the iron ore reserve estimates as proven or probable and of the iron ore resource estimates as measured, indicated or inferred reflects the variability in the mineralization at the selected cut-off grade, the mining selectivity and the production rate and ability of the operation to blend the different ore types that may occur within each deposit. Proven iron ore reserve and measured mineral resource estimates are based on drill hole spacing ranging from 25m x 25m to 100m x 100m, and probable iron ore reserve and indicated mineral resource estimates are based on drill hole spacing ranging from 50m x 50m to 300m x 300m. Inferred mineral resource estimates are based on drill hole spacing ranging from 100m x 100m to 500m x 500m.
As at December 31, 2015 As at December 31, 2014 Proven ore reserves Probable ore reserves Total ore reserves Total ore reserves Business units Million tonnes % Fe Million tonnes % Fe Million tonnes % Fe Million tonnes % Fe
Canada (excluding Baffinland) 2,034 28.7 106 27.7 2,140 28.6 2,129 28.7Baffinland - Canada 272 66.0 105 65.4 377 65.8 379 65.8Minorca - USA 122 23.6 4 22.7 126 23.5 134 23.4Hibbing - USA 242 19.6 25 19.6 267 19.6 264 19.0Mexico (excluding Peña Colorada) 42 31.6 37 29.7 79 30.7 119 27.3Peña Colorada - Mexico 106 22.4 123 21.1 229 21.7 237 23.2Brazil 59 64.6 22 51.1 81 60.9 148 55.6Liberia 5 51.9 489 48.1 494 48.2 501 48.3Bosnia 7 45.5 14 45.9 21 45.8 24 46.0Ukraine Open Pit 126 33.4 48 33.5 174 33.4 198 34.0Ukraine Underground 23 55.7 - - 23 55.7 24 55.0Kazakhstan Open Pit 31 37.6 240 39.5 271 39.3 276 39.3Kazakhstan Underground - - 27 45.1 27 45.1 28 45.0Total 4,309 34.9 4,461 35.1
As at December 31, 2015 As at December 31, 2014 Measured & Indicated
resources Inferred resourcesMeasured & Indicated
resources Inferred resources
Business units Million tonnes % Fe Million tonnes % Fe
Million tonnes % Fe Million tonnes % Fe
Canada (Excluding Baffinland) 3,588 30.0 1,850 29.5 3,663 30.0 1,850 29.4Baffinland - Canada 54 65.6 545 66.2 54 65.6 545 66.2Minorca - USA 339 22.3 7 22.2 339 22.3 7 22.2Hibbing - USA 130 20.1 - 17.5 260 18.2 1 16.2Mexico (Excluding Pena Colorada) 113 27.7 42 28.3 63 28.0 71 27.0Pena Colorada - Mexico 176 25.8 1 16.8 101 27.3 - -Brazil 306 40.7 77 37.8 246 38.7 77 37.8Liberia 45 43.6 2,211 38.8 45 43.6 2,211 38.8Bosnia 1 31.1 1 39.0 1 38.3 1 39.2Ukraine Open Pit 507 33.4 - - 507 33.4 - -Ukraine Underground 350 36.5 353 32.4 370 36.8 353 32.4Kazakhstan Open Pit 828 33.8 5 48.4 838 34.0 5 48.4Kazakhstan Underground 445 51.2 30 49.6 446 51.2 30 49.6Total 6,882 32.6 5,122 37.9 6,933 32.3 5,151 37.8

Mining 227
As at December 31, 2015 As at December 31, 2014 Proven ore reserves Probable ore reserves Total ore reserves Total ore reserves Business units Million tonnes % Fe Million tonnes % Fe Million tonnes % Fe Million tonnes % Fe
Canada (excluding Baffinland) 2,034 28.7 106 27.7 2,140 28.6 2,129 28.7Baffinland - Canada 272 66.0 105 65.4 377 65.8 379 65.8Minorca - USA 122 23.6 4 22.7 126 23.5 134 23.4Hibbing - USA 242 19.6 25 19.6 267 19.6 264 19.0Mexico (excluding Peña Colorada) 42 31.6 37 29.7 79 30.7 119 27.3Peña Colorada - Mexico 106 22.4 123 21.1 229 21.7 237 23.2Brazil 59 64.6 22 51.1 81 60.9 148 55.6Liberia 5 51.9 489 48.1 494 48.2 501 48.3Bosnia 7 45.5 14 45.9 21 45.8 24 46.0Ukraine Open Pit 126 33.4 48 33.5 174 33.4 198 34.0Ukraine Underground 23 55.7 - - 23 55.7 24 55.0Kazakhstan Open Pit 31 37.6 240 39.5 271 39.3 276 39.3Kazakhstan Underground - - 27 45.1 27 45.1 28 45.0Total 4,309 34.9 4,461 35.1
Supplemental information on iron ore operations
The table below provides supplemental information on the producing mines. As of December 31, 2015, ArcelorMittal Tebessa was classified as held for sale (see “Key transactions and events in 2015”) and therefore has been removed from the table below:
Operations/Projects % Ownership In Operation Since
2015 Run of Mine Production (Million
Tonnes) 12014 Saleable Production
(Million Tonnes) 2Estimated Mine Life
(Years) 3
Canada (Excluding Baffinland) 85 1976 70.7 25.9 30Baffinland - Canada 46.08 2014 1.5 1.3 18Minorca - USA 100 1977 8.9 2.7 14Hibbing - USA 62.3 1976 29.8 8.1 10Mexico (Excluding Peña Colorada) 100 1976 7.1 3.6 16Pena Colorada - Mexico 50 1974 7.9 3.5 16Brazil 100 1944 5.1 3.5 18Liberia 85 2011 4.3 4.3 22Bosnia 51 2008 2.7 2.1 8Ukraine Open Pit 95 1959 23.6 10.1 7Ukraine Underground 95 1933 0.9 0.9 13Kazakhstan Open Pit 100 1976 5.1 2.0 30Kazakhstan Underground 100 1956 1.1 0.9 14
1 Saleable production is constituted of a mix of direct shipping ore, concentrate, pellet feed and pellet products which have an iron content of approximately 65% to 66%. Exceptions in 2015 included the direct shipping ore produced in Bosnia, Ukraine underground and the Kazakh mines which have an iron content ranging between 55% to 60% and are solely for internal use at ArcelorMittal’s regional steel plants. The direct shipping ore produced from Liberia had an average iron content of approximately 59% in 2015 while the sinter fines produced for external customers in Brazil from the Serra Azul operations averaged approximately 62% and the lumps averaged 60.5%.
2 The estimated mine life reported in this table corresponds to the duration of the production file of each operation based on the 2015 year-end iron ore reserve estimates only. The production varies for each operation during the mine life and as a result the mine life is not the total reserve tonnage divided by the 2015 production.
3 Represents 100% of production.
Changes in iron ore reserve estimates: 2015 versus 2014
The Company’s iron ore reserve estimates have had a net decrease of 151 million metric tonnes of Run of Mine between December 31, 2014 and 2015. This decrease in reserves was mainly due to 169 million tonnes (“MT”) of mining depletion during 2015, the down grading of 61 million tonnes of itabarite at the Company’s Andrade mine and a net downgrading of 37 million tonnes across the Mexican operations (excluding Peña Colorada). The main increases in reserves were an increase of 33 million tonnes at Hibbing, 76 million tonnes at AMMC. There were other minor re-evaluations of the Company’s ore reserves. The average Fe grade decreased by 0.2% on an absolute basis mainly due to the downgrading of the Andrade itabarite.
However, the reserves mine life and quantities of concentrate and pellets produced from these reserve estimates are not materially impacted due to other adjustments made to mine plans and mining and processing recoveries.
Changes in measured and indicated iron ore mineral resource estimates
The 2015 versus 2014 measured and indicated mineral resource estimates have decreased between December 31, 2015 and 2014 by 51 million metric tonnes of run-of-mine mainly as a result of downgrades in , the USA (Hibbing), Canada (AMMC) and Ukraine and upgrades in Mexico (Pena Colorada & Las Truchas) and Brazil (Andrade).
Inferred mineral resource estimates for iron ore have decreased between December 31, 2015 and 2014 by 29 million metric tonnes mainly as result of a downgrade in Las Truchas.
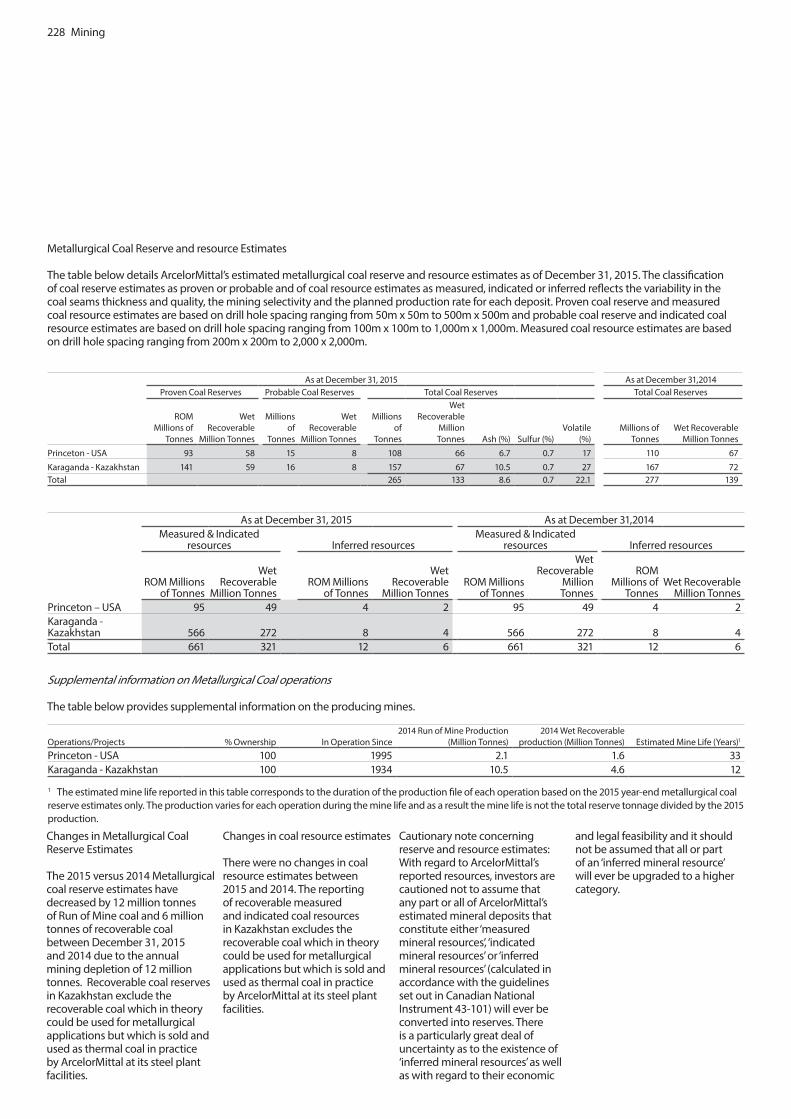
228 Mining
Changes in Metallurgical Coal Reserve Estimates
The 2015 versus 2014 Metallurgical coal reserve estimates have decreased by 12 million tonnes of Run of Mine coal and 6 million tonnes of recoverable coal between December 31, 2015 and 2014 due to the annual mining depletion of 12 million tonnes. Recoverable coal reserves in Kazakhstan exclude the recoverable coal which in theory could be used for metallurgical applications but which is sold and used as thermal coal in practice by ArcelorMittal at its steel plant facilities.
Changes in coal resource estimates
There were no changes in coal resource estimates between 2015 and 2014. The reporting of recoverable measured and indicated coal resources in Kazakhstan excludes the recoverable coal which in theory could be used for metallurgical applications but which is sold and used as thermal coal in practice by ArcelorMittal at its steel plant facilities.
Cautionary note concerning reserve and resource estimates: With regard to ArcelorMittal’s reported resources, investors are cautioned not to assume that any part or all of ArcelorMittal’s estimated mineral deposits that constitute either ‘measured mineral resources’, ‘indicated mineral resources’ or ‘inferred mineral resources’ (calculated in accordance with the guidelines set out in Canadian National Instrument 43-101) will ever be converted into reserves. There is a particularly great deal of uncertainty as to the existence of ‘inferred mineral resources’ as well as with regard to their economic
and legal feasibility and it should not be assumed that all or part of an ‘inferred mineral resource’ will ever be upgraded to a higher category.
Metallurgical Coal Reserve and resource Estimates
The table below details ArcelorMittal’s estimated metallurgical coal reserve and resource estimates as of December 31, 2015. The classification of coal reserve estimates as proven or probable and of coal resource estimates as measured, indicated or inferred reflects the variability in the coal seams thickness and quality, the mining selectivity and the planned production rate for each deposit. Proven coal reserve and measured coal resource estimates are based on drill hole spacing ranging from 50m x 50m to 500m x 500m and probable coal reserve and indicated coal resource estimates are based on drill hole spacing ranging from 100m x 100m to 1,000m x 1,000m. Measured coal resource estimates are based on drill hole spacing ranging from 200m x 200m to 2,000 x 2,000m.
As at December 31, 2015 As at December 31,2014Proven Coal Reserves Probable Coal Reserves Total Coal Reserves Total Coal Reserves
ROM Millions of
Tonnes
Wet Recoverable
Million Tonnes
Millions of
Tonnes
Wet Recoverable
Million Tonnes
Millions of
Tonnes
Wet Recoverable
Million Tonnes Ash (%) Sulfur (%)
Volatile (%)
Millions of Tonnes
Wet Recoverable Million Tonnes
Princeton - USA 93 58 15 8 108 66 6.7 0.7 17 110 67
Karaganda - Kazakhstan 141 59 16 8 157 67 10.5 0.7 27 167 72Total 265 133 8.6 0.7 22.1 277 139
As at December 31, 2015 As at December 31,2014Measured & Indicated
resources Inferred resourcesMeasured & Indicated
resources Inferred resources
ROM Millions of Tonnes
Wet Recoverable
Million TonnesROM Millions
of Tonnes
Wet Recoverable
Million Tonnes ROM Millions
of Tonnes
Wet Recoverable
Million Tonnes
ROM Millions of
Tonnes Wet Recoverable
Million Tonnes Princeton – USA 95 49 4 2 95 49 4 2Karaganda - Kazakhstan 566 272 8 4 566 272 8 4Total 661 321 12 6 661 321 12 6
Supplemental information on Metallurgical Coal operations
The table below provides supplemental information on the producing mines.
Operations/Projects % Ownership In Operation Since 2014 Run of Mine Production
(Million Tonnes) 2014 Wet Recoverable
production (Million Tonnes) Estimated Mine Life (Years)1
Princeton - USA 100 1995 2.1 1.6 33Karaganda - Kazakhstan 100 1934 10.5 4.6 12
1 The estimated mine life reported in this table corresponds to the duration of the production file of each operation based on the 2015 year-end metallurgical coal reserve estimates only. The production varies for each operation during the mine life and as a result the mine life is not the total reserve tonnage divided by the 2015 production.