Embed Size (px)
Citation preview

ANNUAL REPORT 2014/15

2 SANEDI Annual Report 2014/15
PLEASE RECYCLE THIS REPORTThis annual report was printed on Cocoon Silk 100% recycled. By using this recycled paper, SANEDI has reduced its environmental impact. Smaller solid ink areas are used on the cover and inside text, to increase the recycle properties of this report and reduce the carbon footprint.

3SANEDI Annual Report 2014/15
ANNUAL REPORT 2014/15

4 SANEDI Annual Report 2014/15
Part A: General information ------------------------------------------------------------------------------ 6
General information ------------------------------------------------------------------------------------ 6
Abbreviations and acronyms ------------------------------------------------------------------------- 7
Foreword by the Chairperson ------------------------------------------------------------------------ 9
Board of Directors --------------------------------------------------------------------------------------11
Chief Executive Officer’s overview -----------------------------------------------------------------12
Statement of responsibility and confirmation of the accuracy of the annual report --17
Strategic overview -------------------------------------------------------------------------------------18
Vision -------------------------------------------------------------------------------------------------18
Mission -----------------------------------------------------------------------------------------------18
Values -------------------------------------------------------------------------------------------------18
Legislation ------------------------------------------------------------------------------------------------18
Organisational structure ------------------------------------------------------------------------------19
Part B: Performance information ----------------------------------------------------------------------20
Auditor-general’s report: predetermined objectives ------------------------------------------20
Strategic outcome orientated goals ----------------------------------------------------------------21
Performance information by programme --------------------------------------------------------22
Applied energy research ------------------------------------------------------------------------------22
Clean energy solutions ---------------------------------------------------------------------------24
Smart Grids Programme -------------------------------------------------------------------------32
Working for Energy --------------------------------------------------------------------------------44
Data and knowledge management ------------------------------------------------------------48
Energy Efficiency programme -----------------------------------------------------------------------51
Energy Efficiency (12L and 12I) tax incentives ----------------------------------------------51
bigEE --------------------------------------------------------------------------------------------------52
Energy Efficiency and Demand Side Management (EEDSM) Hub ----------------------55
Report on performance against objectives -------------------------------------------------------56
Communications ----------------------------------------------------------------------------------------70
Contents

5SANEDI Annual Report 2014/15
Part C: Human resource management ----------------------------------------------------------------72
Personnel costs by programme ---------------------------------------------------------------------73
Personnel cost by salary band -----------------------------------------------------------------------73
Performance rewards ---------------------------------------------------------------------------------73
Reasons for staff leaving ------------------------------------------------------------------------------74
Labour relations, misconduct and disciplinary action -----------------------------------------74
Staff demographics ------------------------------------------------------------------------------------74
Training costs of personnel ---------------------------------------------------------------------------75
Part D: Financial information ----------------------------------------------------------------------------78
Report of the auditor-general to Parliament ----------------------------------------------------79
Annual financial statements
General information -----------------------------------------------------------------------------------84
Accounting Authority’s responsibilities and approval-------------------------------------86
Board audit and risk committee report ------------------------------------------------------87
Accounting Authority’s report ------------------------------------------------------------------90
Materiality and significance framework ------------------------------------------------------96
Statement of financial position at 31 March 2015 -----------------------------------------97
Statement of financial performance ----------------------------------------------------------98
Statement of change in net assets -------------------------------------------------------------99
Cash flow statement ---------------------------------------------------------------------------- 100
Accounting policies ------------------------------------------------------------------------------ 101
Notes to the annual financial statements -------------------------------------------------- 119
Contents

6 SANEDI Annual Report 2014/15
PART A:General Information
General information
Registered name: South African National Energy Development Institute (SANEDI)
Physical address: Block E, Upper Grayston Office Park, 150 Linden Road, Strathavon, Sandton
Postal address: P O Box 9935, Sandton, 2146
Telephone numbers: 011 0384300
Email address: [email protected]
Website address: www.sanedi.org.za
External auditors: The auditor-general of South Africa
Bankers: ABSA Capital
Company Secretary: CEF Secretariat

7SANEDI Annual Report 2014/15
Abbreviations and acronyms
AAAMSA Association of Architectural Aluminium
Manufacturers of South Africa
AFD French Development Agency
AGSA auditor-general of South Africa
ASSA Academy of Science for South Africa
BEE Black economic empowerment
CCS Carbon capture and storage
CCT Clean coal technologies
CEF CEF Group of Companies formerly known
as Central Energy Fund
CEM Clean Energy Ministerial
CES Clean Energy Solutions
CEO Chief Executive Officer
CER Centre of Energy Research
CESAR Centre for Energy Systems Analysis and
Research
CFT Carbon fuel tablet
CNES Centre of New Energy Systems
CO2 Carbon dioxide
COCATE Large-scale CCS transportation
infrastructure in Europe
CoRD Centres of Research and Development
CPI Consumer Price Index
CPUT Cape Peninsula University of Technology
CPV Concentrator Photovoltaics
CSAG Climate Systems Analysis Group
CSC Community steering committee
CSP Concentrated solar power
CSIR Council for Scientific and Industrial
Research
CSIR CSP CSIR Concentrated solar power
CSTDI Centre for Solar Technology, Development
and Innovation
DEA Department of Environmental Affairs
DID Gauteng Department of Infrastructure
Development
DKK Danish krone
DoT Department of Transport
DoE Department of Energy
DSM Demand side management
DST Department of Science and Technology
DTU Technical University of Denmark
DBREV Douglas Banks Renewable Energy Vision
dti Department of Trade and Industry
Dx Distribution grid
EDI Electricity Distribution Industry
EE Energy efficiency
EEDSM Energy efficiency and demand side
management
EMWG Energy Management Working Group
eNaTIS Electronic National Administration Traffic
Information System
EPD Energy Performance Database
EPWP Expanded Public Works Programme
ERC Energy Research Centre
ESI Electricity Supply Industry
ETDE Energy Technology Data Exchange
ETDEWEB Energy Technology Data Exchange World
Energy Base
FMPPI Framework for Managing Programme
Performance Information
GAAP Generally Accepted Accounting Practice
GEF Global environment facility
GHG Greenhouse gas
GIZ German Agency for International
Cooperation
GPDRT Gauteng Province Department of Roads
and Transport
GRAP Generally Recognised Accounting Practice
GSEP Global Superior Energy Performance
Partnership
HVAC Heating, Ventilation and Cooling
IAS International Accounting Standards
IDC Industrial Development Corporation
IEA International Energy Agency
IEP Integrated energy plan
IFPEN IFP Energies nouvelles
IIA Institute of Internal Auditors
ipv Institute for Photovoltaics
ISGAN International Smart Grid Action Network
IT Information technology
kW Kilowatt
LAN Local area network
M&V Monitoring and verification
MEASA Marine Energy Association of South Africa
MoU Memorandum of understanding
MTEC Medium-Term Expenditure Committee
MW Megawatt
NAAMSA National Association of Automobile
Manufacturers of South Africa

8 SANEDI Annual Report 2014/15
NBI National Business Initiative
NDA National Development Agency
Necsa South African Nuclear Energy Corporation
SOC Limited
NEEA National Energy Efficiency Agency
NIER Newcastle Institute of Energy Research
NOK Norwegian krone
NRF National Research Foundation
NWA Numerical wind atlas
OWA Observational wind atlas
PAA Public Audit Act
PCSP Pilot CO2 Storage Project
PDI Previously disadvantaged individual
PFMA Public Finance Management Act
PPA Power purchase agreement
PPC Parliament portfolio committee
PSA Plataforma Solar de AlmeríaPV Photovoltaics
RE Renewable energy
RECORD Renewable Energy Centre for Research and
Development
REEEP Renewable Energy and Energy Efficiency
Partnerships
R&D Research and development
SABS South African Bureau of Standards
SACCCS South African Centre for Carbon Capture
and Storage
SACRM South African Coal Roadmap
SADC Southern African Development Community
SAfECCS South Africa - Europe Cooperation on
Carbon Capture and Storage
SAGEN South Africa – German Energy Programme
SANAS South African National Accreditation
System
SANEDI South African National Energy
Development Institute
SANERI South African National Energy Research
Institute
SAPIA South African Petroleum Industry
Association
SAPVIA South African Photovoltaic Industry
Association
SARS South African Revenue Service
SARETEC South African Renewable Energy
Technology Centre
SASGI South African Smart Grids Initiative
SASTELA Southern Africa Solar Thermal and
Electricity Association
SATTIC South African Travel and Tourism Industry
Conference
SAWEA South African Wind Energy Association
SAWEP South African Wind Energy Programme
SAWS South African Weather Service
SAYAS South African Young Academy of Science
SEA Strategic environmental assessment
SETRM Solar Energy Technology Road Map
SLA Service level agreement
SMME Small Micro Medium Enterprises
SMART Specific, measurable, achievable, realistic
and time-bound
SOLTRAIN Southern African Solar Thermal Training
and Demonstration Initiative
TAF Technical assistance facility
TIA Technology Innovation Agency
Tx Transmission grid
UCT University of Cape Town
UCT CSAG University of Cape Town Climate Systems
Analysis Group
UNDP United Nations Development Programme
URL Uniform Resource Locator
VNWA Verified Numerical Wind Atlas
WASA Wind Atlas of South Africa
WAsP Wind Atlas Analysis and Application
Programme
WITS University of the Witwatersrand
WfE Working for Energy programme
WWF World Wildlife Fund
WRI World Resource Institute
WSU Walter Sisulu University
Abbreviations and acronyms

9SANEDI Annual Report 2014/15
Foreword by the Chairperson
In the quest to meet the government’s mandate of
facilitating the country’s transition to a low carbon
society, SANEDI has continued to make strides in
energy innovation and energy conservation. With the
current energy challenges that the country is facing
SANEDI’s role has become more critical in ensuring
that South Africa has the necessary information and
planning support to plan for a sustainable and secure
energy future that will satisfy the country’s economic,
social and environmental needs. There is no doubt that
changing the energy mix and making concrete steps
towards energy conservation are critical for meeting
these targets.
With the recent budget cuts which may impact a
great deal on delivering on this very important task,
SANEDI continues to strengthen partnerships with
international funders to ensure that essential financial
support for SANEDI programmes is sustained. One
such support was by the World Bank for the Pilot CO2
Storage Project (PCSP). The pilot monitoring project
at the Bongwana natural CO2 release was initiated
with international interest, while the stakeholder
engagement programme continued with about 40
engagements to date. The shale gas investigation work
plan was approved by the Department of Energy (DoE).
Another important milestone was the quantification
of South Africa’s renewable energy resources with the
completion of the wind atlas for South Africa (WASA)
phase 1 project in March 2014. The data has been
placed in the public domain for access by all, thus
levelling the playing field for the independent power
producers. The renewable programme also concluded
the year with successful projects and collaborations in
the renewable energy sector. Some of these include
the launch of the first ground verified high-accuracy
solar resource map for South Africa, the recognition
of renewable energy research excellence through the
RECORD RERE awards (in partnership with SANEA), the
launch of the state of energy research in South Africa
report, and the launch of the RECORD waste to energy
platform.
One of the programmes that has made strides is the
Working for Energy (WfE) programme. The programme
has successfully completed projects in KwaZulu-
Natal (installing 26 biogas digesters coupled to bio-
fertiliser production, rain water harvesting and solar
PV systems to demonstrate the ability of clean energy
interventions to provide sustainability), in Limpopo
(completing over 30 of the 55 biogas digesters),
and the greening of schools and early childhood
development centres across the country. The success
is a result of collaborations and partnerships with
organisations and various government departments
such as the Gauteng Department of Infrastructure
Development, the National Development Agency
(NDA) and the Department of Environmental Affairs
(DEA). The benefits of these clean energy interventions
will be expanded to other partners in other provinces
and sectors, such as agriculture, human resource
development, environment and small enterprise
development.
Ms N MlonziChairperson

10 SANEDI Annual Report 2014/15
SANEDI was instrumental in working together with
the South African National Treasury, the Department
of Energy and all interested and affected parties in
the country to ensure that the energy efficiency tax
incentives (referred to as 12L), were substantially
amended and improved. Furthermore, the South
African component of the internationally-funded
online benchmarking tool (bigEE), went live and is
proving to be a useful tool for local and international
stakeholders.
Traction has also been gained in meeting South
Africa’s commitments to the cool surfaces component
of the clean energy ministerial (CEM), through the
establishment of the South African Cool Surfaces
Association (SACSA), with assistance from the United
States of America’s Department of Energy. Lastly, the
technical assistance facility hosted by SANEDI and
funded by the French Development Agency (AFD)
Foreword by the Chairperson
to provide a green credit facility to finance small- to
medium-size energy efficiency and renewable energy
projects through three commercial banks in South
Africa has exceeded all expectations, with the entire
fund having been exhausted within the contract
period. This may lead to a second phase of this facility
for South Africa.
In closing, there is no doubt that the new financial year
will yield more successful results in the search for clean
and sustainable energy solutions. I would like to take
this opportunity to thank all our partners and funders,
without whose support we would not have managed
what we have achieved.
Ms N Mlonzi
Chairperson

11SANEDI Annual Report 2014/15
Ms N Mlonzi Mr J Marriott Ms M Modise
Dr D Hildebrandt Ms D Ramalope Mr C Manyungwana
Dr V Munsami Mr G Fourie Ms P Motsielwa
Dr C Sita Mr M Gordon Dr R Maserumule
Board of Directors
◊ Ms N Mlonzi (Chairperson), BProc LLB
◊ Mr J Marriott (Deputy Chairperson), BSc Chem Eng
◊ Ms M Modise, BSc (Hon), HED, MSc (Eng)
◊ Dr D Hildebrandt, BSc Chem Eng, MSc Chem Eng,
PhD Chem Eng
◊ Ms D Ramalope, BSc (Hon), MSc, MBL
◊ Mr C Manyungwana, Dip Management, Higher Dip
Public Managmenet and Administration, Post Grad
Dip Transport Management
◊ Dr V Munsami, BSc (Hon), MSc, PhD
◊ Mr G Fourie, Diploma Mech Eng,
BCom Economics, MBA
◊ Ms P Motsielwa, B Acc (CA)(SA)
◊ Dr C Sita, MSc Chem Eng (Polymer Engineering)
PhD Chem Eng (Polymer Engineering)
◊ Mr M Gordon (alternate director), BSc, MBA
◊ Dr R Maserumule (alternate director), BSc (Applied
Mathematics), PhD (Applied Mathematics)
12 SANEDI Annual Report 2014/15
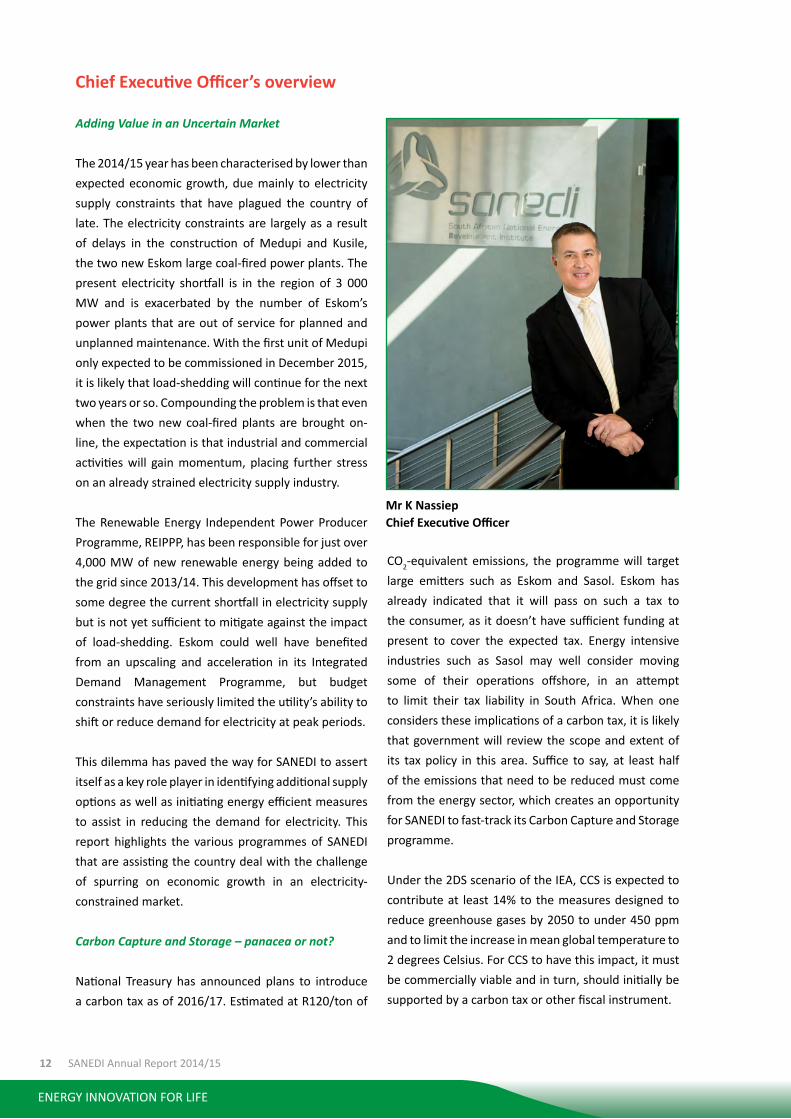
Chief Executive Officer’s overview
Adding Value in an Uncertain Market
The 2014/15 year has been characterised by lower than
expected economic growth, due mainly to electricity
supply constraints that have plagued the country of
late. The electricity constraints are largely as a result
of delays in the construction of Medupi and Kusile,
the two new Eskom large coal-fired power plants. The
present electricity shortfall is in the region of 3 000
MW and is exacerbated by the number of Eskom’s
power plants that are out of service for planned and
unplanned maintenance. With the first unit of Medupi
only expected to be commissioned in December 2015,
it is likely that load-shedding will continue for the next
two years or so. Compounding the problem is that even
when the two new coal-fired plants are brought on-
line, the expectation is that industrial and commercial
activities will gain momentum, placing further stress
on an already strained electricity supply industry.
The Renewable Energy Independent Power Producer
Programme, REIPPP, has been responsible for just over
4,000 MW of new renewable energy being added to
the grid since 2013/14. This development has offset to
some degree the current shortfall in electricity supply
but is not yet sufficient to mitigate against the impact
of load-shedding. Eskom could well have benefited
from an upscaling and acceleration in its Integrated
Demand Management Programme, but budget
constraints have seriously limited the utility’s ability to
shift or reduce demand for electricity at peak periods.
This dilemma has paved the way for SANEDI to assert
itself as a key role player in identifying additional supply
options as well as initiating energy efficient measures
to assist in reducing the demand for electricity. This
report highlights the various programmes of SANEDI
that are assisting the country deal with the challenge
of spurring on economic growth in an electricity-
constrained market.
Carbon Capture and Storage – panacea or not?
National Treasury has announced plans to introduce
a carbon tax as of 2016/17. Estimated at R120/ton of
Mr K Nassiep Chief Executive Officer
CO2-equivalent emissions, the programme will target
large emitters such as Eskom and Sasol. Eskom has
already indicated that it will pass on such a tax to
the consumer, as it doesn’t have sufficient funding at
present to cover the expected tax. Energy intensive
industries such as Sasol may well consider moving
some of their operations offshore, in an attempt
to limit their tax liability in South Africa. When one
considers these implications of a carbon tax, it is likely
that government will review the scope and extent of
its tax policy in this area. Suffice to say, at least half
of the emissions that need to be reduced must come
from the energy sector, which creates an opportunity
for SANEDI to fast-track its Carbon Capture and Storage
programme.
Under the 2DS scenario of the IEA, CCS is expected to
contribute at least 14% to the measures designed to
reduce greenhouse gases by 2050 to under 450 ppm
and to limit the increase in mean global temperature to
2 degrees Celsius. For CCS to have this impact, it must
be commercially viable and in turn, should initially be
supported by a carbon tax or other fiscal instrument.
13SANEDI Annual Report 2014/15
SANEDI, through its centre SACCCS (South African
Centre for Carbon Capture and Storage) has made
significant strides in the year towards identifying the
key steps required to take a decision on whether CCS is
a viable option for South Africa, both from a technical
as well as a commercial perspective. The work that is
being done in SANEDI has been recognised in a number
of ways over the past few years, including Cabinet
endorsement of the programme as well as its inclusion
in the National Climate Change Response Strategy
of South Africa. CCS features as a flagship priority
programme of government and therefore it is vital
that accurate and detailed information is presented
to government to enable effective policy-making and
regulation setting.
In the past year, SANEDI has successfully initiated its
Pilot CO2 Carbon Storage Project or PCSP, which will
allow the member organisations and institutions that
comprise the SACCCS Board of Governors to determine
the impact the transportation and injection of carbon
dioxide will have on the environment. Critical to
this pilot project’s success will be buy-in from the
communities affected by such activity and SANEDI has
therefore established a comprehensive stakeholder
engagement plan to deal with civil society’s concerns
in this area.
Funding remains a major consideration in the design
of the pilot project and it is estimated that in excess
of R500 million will be required for this project.
South Africa has demonstrated its commitment to
this programme with a grant of over R200 million
over the current MTEF period. Using this as leverage,
the team in SACCCS has secured a major coup with
the announcement this year that the World Bank
has pledged $27 million to this programme. This is
a remarkable feat, given the nascent nature of the
industry and the technical barriers still to be overcome.
It is testament to South Africa’s commitment and the
confidence in the SACCCS team in SANEDI that this
grant has been secured.
In the coming year, SANEDI will focus on geotechnical
aspects, particularly securing the permits to conduct
Chief Executive Officer’s overview
exploration activities in specified areas, such as the
Zululand basin. In addition, the team will focus on
understanding the movement of carbon dioxide
through a natural reservoir, engaging with traditional
leaders and their communities and assisting
government in developing an appropriate regulatory
framework.
Incentivising Energy Efficiency in Industrial and
Commercial Sectors
National Treasury has promulgated regulations in
November 2013 that introduce a tax incentive for
companies in industry and the commercial sector
that wish to implement energy saving measures in
their plants or buildings. This is Section 12L of the
Income Tax Act and follows on the implementation of

14 SANEDI Annual Report 2014/15
Section 12I earlier. Section 12I focused on awarding a
tax allowance for companies that invested capital in
energy saving measures. The tax benefit is therefore
based on the associated capital expenditure. In the
case of Section 12L, the focus is on the actual energy
savings and the allowance is based on the kWh saved.
SANEDI has been appointed in terms of the regulation
as the body responsible for verification of the savings
made and for administering the entire application
process for Section 12L. This follows on the success of
the efforts on SANEDI’s part to administer the energy
component of the Section 12I tax allowance, on behalf
of the dti. SANEDI is mandated through its establishing
Act, the National Energy Act, 2008 (Act No. 34 of
2008), to undertake measures to implement energy
efficiency in the country. It is therefore appropriate
that SANEDI direct efforts designed to stimulate and
encourage energy saving, particularly among the large
power users in South Africa.
In the absence of an Eskom-led IDM programme,
Section 12L will form the basis for an incentive for
energy efficiency in the coming years. While Eskom
may well receive additional funding for EEDSM in the
future, a tax incentive will provide a clear market signal
to consumers and will allow for appropriate longer-
term planning and investment in energy efficiency.
With the assistance of the Deutche Gesellschaft
für Internationale Zusammenarbeit (GIZ) and the
University of Pretoria, SANEDI has put in place an
online application and administrative tool that is
assisting applicants in getting their projects registered
and reviewed, as per the mandate of SANEDI under
the current regulations. Several roadshows around
the country have been held thus far, in order to help
raise awareness of the initiative. Feedback to date
suggests positive support for the scheme, although
there are concerns regarding the quantum of the
allowance, which is currently 45 c/kWh before tax, and
the exclusion of renewable energy and cogeneration
from the scheme. SANEDI has incorporated these
concerns into a report to National Treasury and it was
with pleasure that we received news from the Minister
of Finance that he was increasing the tariff applicable
from 45 c/kWh to 95 c/kWh in the 2015/16 tax year. In
addition, cogeneration has now been included in the
list of applicable technologies and will be eligible for
inclusion as of the 2015/16 tax year. This is pleasing
indeed, as cogeneration offers shorter-term option
to providing capacity under the current electricity-
constrained conditions.
Energy Efficiency in the Household – reaching
consumers with state of the art solutions
The only drawback to the current Sections 12I and 12L
schemes are that they don’t cater for the residential
sector, where significant saving potential exists.
SANEDI has approached the large power users as well
as the banks to institute a programme aimed at making
essential energy efficient products available to either
home loan clients or employees of large power users.
SANEDI has undertaken to provide for a revolving
credit facility, subject to funds being made available,
as well as to source the energy efficient products on a
bulk discount basis. To date, the large power users that
comprise the Electricity Intensive Users Group have
expressed their full support for the initiative as has one
of the major banks in South Africa.
The banks will administer the funds and the repayment
of loans on behalf of SANEDI, which reduces the
resource requirements dramatically. In the course of
the year, SANEDI has also developed plans to introduce
efficient high mast lights in Soshanguve, near Pretoria,
in an effort to provide for more sustainable lighting
solutions in these communities. The project is set to
commence in the middle of the next financial year
and will see 840 high mast lights converted to higher
efficiency using an e-box solution from Europe. Plans
are already underfoot to initiate manufacturing of the
product in SA.
Chief Executive Officer’s overview

15SANEDI Annual Report 2014/15
Closer to a Smart Grid solution in South Africa
SANEDI, through its affiliation to the International Smart
Grid Action Network (ISGAN), has been instrumental
in establishing a programme of action that will bring
us closer to upgrading our existing electricity network,
particularly the low voltage network under municipal
control. SANEDI has assisted in the establishment of
the South African Smart Grid Initiative (SASGI). This
initiative brings together the key stakeholders in
the electricity sector, such as AMEU, Eskom and the
electricity distribution entities in local government, to
create a single platform to deliberate on and chart a
way forward for the sector.
Through SASGI, SANEDI has been successful in
leveraging approximately R180 million from the EU
for the purposes of introducing smart grid technology
in several municipalities. The initial phase of this
project has now commenced and nine municipalities
are on board already. The initial focus has been on
smart meter technology and aligned to that, the back
office integration, tariffing and data management
associated with the meters. Already, several of these
municipalities have recorded an increase in revenue as
a result of the identification of previously unmetered
large consumers. The project is not only about
revenue management though. A smart grid involves
the integration of electricity, communication and ICT
technology to provide a more robust and customer
needs-driven solution.
We expect to announce more exciting results in this
area soon, as plans are underway to launch the second
phase of this project, again with possible support from
the EU.
Exciting developments in the Working for Energy
Programme
After a somewhat lengthy delay mainly due to
administrative issues in the Working for Energy
Programme, it is now well underway and several
notable projects are already nearing completion.
Partnering with the Fort Cox Agricultural College and
the University of Fort Hare, SANEDI has completed
demonstration projects in the Melani Village and the
College and has been able to successfully commence
construction of well over 100 biogas digesters in the
Nkonkobe District Municipality in the Eastern Cape.
Similar projects are underway in KwaZulu-Natal,
Limpopo and the North West Provinces. Demonstration
of cool surfaces technologies is also top of the agenda
since many of the facilities in low income communities
are without HVAC.
Chief Executive Officer’s overview

16 SANEDI Annual Report 2014/15
Aside from biogas digesters, SANEDI is also focused
on partnering with municipalities such as eThekwini
Metro to construct power plants that utilise sludge
from sewage, together with biomass, as feedstock for
electricity production.
Our long-standing relationship with Working for Water
has now culminated in the efforts to remove invasive
vegetation from farmlands in the Eastern Cape area
of Uitenhage. This vegetation, mainly in the form of
black wattle trees, will be used as feedstock for power
generation using South African-developed gasifier
technology.
Transformation and Empowerment in the workplace
As a responsible corporate citizen and a member of the
public sector, SANEDI is committed to a programme
of action that seeks to ensure employment equity is
realised in the workplace. During the course of the year,
our Chief Financial Officer was appointed. Ms Lethabo
Manamela, a Chartered Accountant, brings with her a
wealth of experience from the auditor-general. SANEDI
will continue to identify and recruit people with the
requisite skills that represent the demographics of the
country and support employment and gender equity
targets.
Currently within SANEDI there are 52 employees. The
breakdown by race and gender is as follows:
BLACKS COLOURED WHITE INDIANS
Fem
ales
Mal
es
Fem
ales
Mal
es
Fem
ales
Mal
es
Fem
ales
Mal
es
21 12 2 2 3 6 2 4
Chief Executive Officer’s overview
SANEDI prides itself on employing individuals of a high
calibre in terms of their qualifications and experience
and it is testament to the fact that an organisation
does not have to compromise the quality of its
service through adherence to an employment equity
programme.
Towards better corporate governance and sound
administration
SANEDI once again has produced an unqualified audit
report in terms of its financial management. There
has been a noticeable improvement in the quality of
service provided by the finance team as well as the
procurement and administrative support staff. It is
testament to their hard work and the support from the
technical staff that we are able to continue producing
pleasing results in terms of our external audit. There
is always room for improvement and in the coming
year, the focus will be on improving the quality of our
performance management system, ensuring that our
key performance indicatives are SMART (Strategic,
Measurable, Achievable, Realistic and Time-bound).
Overall though, the company has put in a strong
showing in terms of its performance, with over 72% of
its objectives met or exceeded.
Once again, this is due to the hard work of the entire
team at SANEDI and I would like to personally thank
and congratulate them on another sterling effort this
year.
Kadri Nassiep
Chief Executive Officer

17SANEDI Annual Report 2014/15
Statement of responsibility and confirmation of the accuracy of the
annual report
To the best of my knowledge and belief, I confirm the
following:
All information and amounts disclosed in the
annual report is consistent with the annual financial
statements audited by the auditor-general.
The annual report is complete, accurate and is free
from any omissions.
The annual report has been prepared in accordance
with the guidelines on the annual report as issued by
National Treasury.
The Annual Financial Statements (Part D) have been
prepared in accordance with the standards applicable
to the public entity.
The Accounting Authority is responsible for the
preparation of the annual financial statements and for
the judgements made in this information.
The Accounting Authority is responsible for establishing
and implementing a system of internal control that
has been designed to provide reasonable assurance
as to the integrity and reliability of the performance
information, the human resources information and the
annual financial statements.
The external auditors are engaged to express
an independent opinion on the annual financial
statements.
In our opinion, the annual report fairly reflects the
operations, the performance information, the human
resources information and the financial affairs of the
public entity for the financial year ended 31 March
2015.
Yours faithfully
Kadri Nassiep
Chief Executive Officer
21 August 2015
Ms N Mlonzi
Chairperson of the Board
21 August 2015

18 SANEDI Annual Report 2014/15
Legislation
The National Energy Act, 2008 (Act No. 34 of 2008),
Section 7 (2) gave effect to SANEDI’s existence
and provides for its primary mandate and specific
responsibilities. The Act provides for SANEDI to
direct, monitor and conduct energy research and
development as well as undertake measures to
promote energy efficiency throughout the economy.
The business case that established SANEDI outlines
the purpose of the entity and incorporates a set of
key activities that SANEDI undertakes on behalf of
the state. As the energy landscape is a continually
evolving space, it is clear that additional activities and
responsibilities will be undertaken by SANEDI in line
with its legislative mandate. The underlying principle
remains the same, however, in that SANEDI plays a
catalytic role in the development of the energy sector,
without becoming a player and referee in a particular
sector. SANEDI is mindful of the various role players
that are active in the energy efficiency sector and
endeavours to create value in the area in which it
operates.
Strategic overview
Vision
To serve as a catalyst for sustainable energy innovation,
transformation and technology diffusion in support of
South Africa’s sustainable development that benefits
our nation.
Mission
Advance innovation of clean energy solutions and
rational energy use that effectively supports South
Africa’s national energy objectives and the transition
towards a sustainable, low carbon energy future.
Values
Innovation
Accountability
Transparency
Integrity
Professionalism
National interest
Batho Pele

19SANEDI Annual Report 2014/15
Organisational structure
CHIEF EXECUTIVE OFFICER
Applied Energy Research
AdministrationEnergy
Efficiency
Clean Energy Solutions
Green Transport
Cleaner Fossil Fuels
Working for Energy
Smart Grids
Finance
Human Resources
Communications
Secretariat
Corporate Services
InformationTechnology
Knowledge Management
20 SANEDI Annual Report 2014/15
Auditor-general’s report: predetermined objectives
The report of the auditor-general on predetermined objectives is on page 79 to 83 of the annual report.
PART B:Performance Information

21SANEDI Annual Report 2014/15
Strategic outcome orientated goals
SANEDI is expected to contribute to government’s twelve outcomes, which are based on government’s Medium-
Term Strategic Framework (MTSF) that clearly articulates the agenda of the government. SANEDI contributes to
the following three outcomes that the Minister of Energy has committed to:
STRATEGIC OUTCOMES PROGRAMMES STRATEGIC OBJECTIVES
All/Crosscutting 1. Corporate governance
and administration
• Corporate, executive, financial, information,
supply chain management, governance and
compliance support to the Institute
• Strong collaborative approach and strategic
international collaboration
Enable well informed
and high confidence
energy planning,
decision-making
and support policy
development
2. Applied energy research
and development
including subprogrammes
for:
• Cleaner Fossil Fuels
including Carbon Capture
and Storage
• Clean Energy Solutions
• Smart Grids
• Working for Energy
• Data and Knowledge
Management
• Green Transport
Programme
• Knowledge creation in support of policy
direction i.e. viable cleaner energy options• Knowledge creation in the energy mobility
and green transport sector in support of
policy direction
• Intelligent energy systems infrastructure
• Demonstrate cleaner energy technology
opportunities and solutions
Support accelerated
transformation to a
less energy and carbon
intensive economy
• Due custodianship of knowledge and data
developed within SANEDI
Foster a culture of
energy efficiency and
more rational energy
use
3. Energy Efficiency
programme
• Support the Income Tax Amendment Act
section 12I and 12L relating to the tax
rebate for energy efficiency improvements• Management of the EEDSM Hub and
oversight of the Hub to a CORD• Provide industry support and capacity-
building• Provide a national champion coordinating
service for all energy efficiency awareness
and promotion initiatives• Establish a national measurement and
verification centre

22 SANEDI Annual Report 2014/15
Performance information by programme
Applied energy research
Cleaner Fossil Fuel inputs
Notwithstanding the progress in the application
of energy efficiency measures and the roll-out of
renewable energies, fossil fuels remain the main form
of primary energy in South Africa. Until renewables/
nuclear comprise a more dominate role in energy
supply, it is imperative that cleaner use of fossil fuels is
undertaken. To this end, two major projects are being
undertaken, namely, Carbon Capture and Storage, and
matters pertaining to the production and use of shale
gas.
Carbon Capture and Storage (CCS)
Carbon Capture and Storage (CCS) is a technology
whereby carbon dioxide (CO2) is captured from an
industrial process, such as fossil fuel power generation,
and permanently and safely stored in a deep geological
formation. It is a transition technology between fossil
fuels and renewable/nuclear that has been shown to
work internationally. The objective of the South Africa
CCS programme is to ascertain whether or not such
technology can be safely applied in the country.
The major deliverable for CCS in SANEDI is the Pilot
CO2 Storage Project (PCSP) that involves the injection,
storage and monitoring of 10 000 to 50 000 tonnes of
CO2 in South African geology.
The PCSP aims to:
• Demonstrate safe and secure CO2 handling,
injection, storage and monitoring;
• Increase human and technical capacity and raise
the awareness of CCS; and
• Support government in its development of a CCS
legal and regulatory framework in South Africa.
The PCSP also involves the development of a research
programme at the Bongwana natural CO2 release to
build capacity in the area of CO2 monitoring.
2014/15 saw critical progress in the PCSP, particularly
in the areas of funding, monitoring, permitting
and stakeholder engagement. The funding work
theme saw World Bank approval of the first of two
project concept notes (PCNs) for the PCSP and the
endorsement of the second. The approval of the PCN
for the World Bank executed activities means that
these activities can now commence. Most important
of these is the procurement of the project design and
advisory services consultant who is scheduled to lead
the development of foundation documentation, the
finalisation of analysis of existing data, and the planning
for the geological investigation and site selection stage.
The endorsement of the second PCN means that the
World Bank can proceed with the recipient appraisal
of SANEDI and the PCSP division to ensure SANEDI’s
financial management, procurement, environmental
and social policies and procedures adhere to the World
Bank partner requirements. Successful completion of
the recipient appraisal will facilitate the transfer of the
balance of the World Bank funding to SANEDI.
With respect to PCSP permitting, an application for
permission to undertake the basin exploration and
site characterisation programme to determine an
appropriate site for the PCSP has been made to the
Department of Mineral Resources. Commencement of
that phase awaits an appropriate response.
The PCSP monitoring work theme saw progress
made on the scoping of a research programme at
the Bongwana natural CO2 release near Harding in
KwaZulu-Natal (KZN). This release presents the PCSP
division and South Africa with the opportunity to build
capacity and experience in monitoring processes and
with monitoring equipment directly relevant to the
PCSP.
The PCSP stakeholder engagement (SE) programme has
continued with consultations with national, provincial
and local governments, environmental NGOs and
organised labour, as well as science and education
centres. The stakeholder engagement activities
moved from a national level to the point where the
local municipalities of uMhlabuyalingana in KZN and

23SANEDI Annual Report 2014/15
the Sundays River Valley in Eastern Cape are now being
engaged and familiarised with the PCSP. This progress
in engagement will then support the permitting
programme of the PCSP, which in 2014/15 commenced
the development of environmental management
plans, first in the Zululand basin and subsequently in
the Algoa basin, for the geological investigation and
site selection stage of the PCSP. The SE team was
afforded an opportunity to profile SANEDI/SACCCS
and the SE work internationally at the 2014 SaskPower
(symposium) conference and the 12th greenhouse gas
technology (GHGT) conference, whereby the SACCCS
SE lead as a panelist shared challenges faced by South
Africa in raising awareness on CCS. In preparation
for the PCSP Bongwana research programme,
consultations commenced with key stakeholders such
as the Mbizana local municipality (Eastern Cape) and
Ugu district municipality (KwaZulu-Natal) respectively.
The PCSP and the research programme at the Bongwana
natural CO2 release will also form the basis for SANEDI’s
CCS capacity building activities, developing skills at
student and professional levels that are relevant to
CCS as well as the extractive industry more generally
and any other industry requiring environmental
monitoring. The PCSP and the Bongwana programme
will also offer some training and study, and limited
employment opportunities to local communities living
adjacent to the projects.
Shale Gas
Shale gas has the potential to be a ‘game changer’
for energy supply in South Africa. Large potential
resources of shale gas, ease of handling and the
lesser environmental impact compared with coal are
numbered among the aspects that may be considered,
along with the associated challenges.
The SANEDI Shale Gas project was initiated to
assist the South African government to obtain an
independent assessment of the feasibility of shale
gas exploitation in the country. Important aspects of
the study are to develop scenarios on the matching of
Performance information by programme
supply with demand. The impacts of natural gas use
on greenhouse gas emissions are also being evaluated.
An investigation into the option of using pressurised
carbon dioxide for hydraulic fracturing instead of
water is underway and a risk assessment of shale
gas exploitation is planned. The impacts of shale gas
exploitation on water availability and the handling of
waste water is also an important part of the study.
The impact of shale gas on road use, existing industry
and farming as well as tourism and national parks is
being addressed, while national capacity-building with
regard to shale gas exploitation is part of the study.
During 2014/15, and following the approval of the
work plan by the Department of Energy, the project
got well underway and is due to be completed
during 2016/17. Preliminary results on the effects
of fuel switching from coal and crude oil to natural
gas use in various sectors of the economy have been
obtained. These effects include a substantial decrease
in the emissions of greenhouse gases, a reduction in
electricity use compared with the baseline, a reduction
of crude oil imports, and the need for a substantial gas
infrastructure pipeline network.
Figure 1: Example of bubbles of naturally released CO2 at Bongwana that will form the basis of the Bongwana natural CO2 release monitoring research programme. [Photo: B Beck]

24 SANEDI Annual Report 2014/15
Clean energy solutions
RECORD (Renewable Energy Centre of Research and
Development)
Current collaborative projects
1. Solar measuring station project – Solar MET project
(collaboration team: GIZ, SANEDI, DST, SU, NMMU,
SAWS, USTDA, Eskom)
• Installation/construction of solar MET stations
in specific locations in South Africa;
• Ultimate goal is to produce a verified ground
measurement solar map of the resource
available in SA;
• This will enable a levelling of the playing field
for potential solar installations; and
• The first version of this map based on
18 months of data is now available at http://
www.sauran.net.
2. Renewable energy testing, training and demo
facilities (collaboration teams: SANEDI, GIZ, CSIR,
TIA, Green Cape, CPUT, SU, NMMU)
• RECORD’s Centre for Solar Technology,
Development and Innovation (CSTDI) concept
has collaborative nodes spread across country
at centres of excellence viz, Stellenbosch
University (SU), Nelson Mandela Metropolitan
University (NMMU), University of North West
(UNW) and CSIR; and
• Centre for Energy Research (CER) at NMMU PV
testing and research facility is established and
commenced in 2014 with a three year PV yield
project.
Performance information by programme
Figure 2: DNI map of South Africa showing installed solar measuring stations; there is also one on Reunion Island.

25SANEDI Annual Report 2014/15
• South African Renewable Energy Technology
Centre (SARETEC) at CPUT is under way on the
Bellville campus premises:
Performance information by programme
o Building is almost complete and is on
schedule for opening in May 2015. The
official launch date is 19 May subject
to the availability of the Minister of the
Department of Higher Education and
Training (DHET);
o The wind turbine technician and PV
technician curriculum development is
still in process, but, in the case of wind, is
nearing completion;
o Discussions have begun on the
development of a bio energy training
programme and curriculum;
o The 2015 project agreement contract
between SANEDI and CPUT/SARETEC is
in process. This will support three wind
technician student bursaries; and
o A further agreement which will channel
funds from GIZ and the Danish government
towards equipment transport, curriculum
development, training courses and
bursaries through RECORD, is expected
shortly.
Figure 3: Instruments at CER at NMMU, jointly funded by RECORD and GIZ, which record solar impact and performance data in order to model best cases for South Africa.
Figure 4: Site of SARETEC building construction in January 2015.

26 SANEDI Annual Report 2014/15
State of energy research study
The state of energy
research study, requested
by RECORD and funded
by GIZ, was launched on
21 May 2014. It focuses
on the state of energy
research in the country
with respect to current
areas, related funding,
needs and resources.
According to Professor Daya Reddy, president of the
Academy of Science of South Africa: “This report can
be regarded as an important baseline assessment that
can inform future energy research investment in South
Africa. Such an assessment should be conducted on a
regular basis to ensure that it is current and provides
information useful for decision-makers. Although
considerable effort has been expended in trying to
compile a comprehensive report, it must be recognised
that a status report of this nature is heavily dependent
on stakeholder participation to supply data. Hence it is
important to view this report as the first in a potential
series of such reports and an opportunity to place a
‘peg in the sand’.”
Figure 5: Delivery of the Nordex donated nacelle at the SARETEC premises on 2 July 2014.
Performance information by programme
SAIREC 2015 Conference
The South African International Renewable Energy
Conference showcases renewable energy on a global
scale and South Africa was honoured to win the bid to
host this year’s conference in Cape Town. It will take
place on 4-7 October 2015. RECORD serves on the
local organising committee, most subcommittees and
on the international advisory committee.
W2E platform launch

27SANEDI Annual Report 2014/15
Performance information by programme
The Waste to Energy (W2E) research study was
completed in November 2014 and provided an
overview of current waste to energy research being
carried out at South African universities, universities
of technology and other research institutions. The
research identifies common themes and priorities,
as well as possible gaps not being covered by current
energy research. This review was then used in the
establishment of a waste to energy research platform
(W2EP) in December 2014, formed to look at priorities
in the research area that will be addressed to drive
W2E technologies from a research perspective.
RECORD RERE (Renewable Energy Research
Excellence) Award
This competition was again held in partnership with
the South African National Energy Association (SANEA).
These exciting awards recognise the contribution of
upcoming researchers and novel renewable energy
research in South Africa.
The award includes two categories of merit: up-
and-coming young researcher, and most promising
research leading to commercial application. RECORD
was pleased to present the RECORD RERE awards for
2014 on 14 August at the Maslow Hotel in Sandton.
RECORD/SANEDI is proud to acknowledge and reward
excellence in the renewable energy sector. The
RECORD RERE young researcher award 2014 is Karel
Malan PhD, a student at the University of Stellenbosch.
A commendation of excellence in this category was
awarded to Molelekoa Mosesane, a PhD student at
the Tshwane University of Technology. The RECORD
RERE commercial application award 2014 is EcoVest
Holdings, which was represented by Christiaan
Taljaard.
Figure 7: Winners of the RECORD RERE commercial application award 2014: (left to right) Dr Karen Surridge-Talbot, Dr Thembakazi Mali, Mr Christiaan Taljaard and Ms Marlett Balmer.
Figure 6: Winners of the RECORD RERE young researcher award 2014: (left to right) Dr Karen Surridge-Talbot, Mr Molelekoa Mosesane, Dr Thembakazi Mali, Mr Karel Malan and Ms Marlett Balmer.

28 SANEDI Annual Report 2014/15
The RECORD calendar competition
Energy security is paramount in South Africa in order
to accommodate a growing economy and sustainable
future. Due to the finite nature of fossil fuel reserves
and excellent renewable energy resources, South
Africa has forged ahead with tapping into this
environmentally friendly energy source of the future.
The South African government launched the highly
acclaimed REIPPPP programme in 2011, which
was hailed as global success story. To celebrate the
great achievements towards an environmentally
friendly future, RECORD/SANEDI and GIZ launched a
photography competition. The competition called on
amateur and professional photographers to submit
works interpreting the theme “REnergy for a green
future”.
The Renewal Energy and Energy Efficiency
Partnership (REEEP)
SANEDI has hosted the regional secretariat of the
Renewable Energy and Energy Efficiency Partnership
(REEEP) for Southern Africa since 2009. REEEP is an
international non-profit organisation that advances
markets for clean energy in developing countries,
in which scale and replication is built by connecting
funding to projects, practice to knowledge and
knowledge to policy. REEEP uses donor funding to
support a portfolio of high potential ventures that
Performance information by programme
create energy access and combat climate change,
often attracting private finance. REEEP monitors
and evaluates projects within their policy, financial
and commercial environments to gain insight into
opportunities and barriers. By continuously feeding
this knowledge back into the projects and programmes’
portfolio, as well as the policy framework, REEEP seeks
to grow markets for clean energy.
REEEP has been advancing clean energy in southern
Africa since the first projects in the region were
launched in July 2005. Since then, REEEP, through its
regional and international secretariats, has supported
22 and 20 projects in South Africa and southern Africa
respectively, and helped shape the region’s clean
energy progress over the decade.
Knowledge is power
For any country seeking to become sustainable
through the application of renewable energy and
energy efficiency, one of the initial hurdles for the
development and application of sound policy and
regulation is to have an accurate understanding of
the opportunities and constraints involved. In order
to assist in the overcoming of this hurdle, REEEP has
driven the development of various financial models and
risk mitigation strategies for projects such as energy
upgrades in low-income housing. REEEP continues
to play a critical role in knowledge management and
information collection, dissemination and sharing in
the region.
This function allows the region to use data as part of
energy development in policy formulation, research
and development, monitoring and evaluation, as well
as more practical implementation of renewable energy
and energy efficiency hardware. REEEP works closely
with the Southern African Development Community
(SADC) energy thematic group, Southern Africa
Power Pool (SAPP) and many other organisations
and committees in supporting energy development
and initiatives and their progress in the sector. REEEP
supports and promotes the engagement of industry,
civil society and all levels of government to transfer

29SANEDI Annual Report 2014/15
Performance information by programme
knowledge of industry best practices and raise
awareness of the benefits of clean energy. By making
useable data and information, solid business models,
and numerous examples of success stories available,
REEEP has demonstrated that change in the energy
sector is possible.
Building a foundation
Being able to pinpoint opportunities attracts further
investment and enables market growth for clean
energy. REEEP-funded gold standard workshops
have also helped market development and project
launches, with certification enabling the sale of carbon
credits and offsetting – key financial schemes for some
clean energy business models. REEEP has also worked
closely with municipal and provincial governments
to help move a legal framework forward to promote
large-scale rollout of solar water heaters and map out
the road to national legislation.
Moving forward
REEEP recognises the importance of building local
capacity to ensure the sustainability and replication
of clean energy markets in southern Africa. REEEP
is currently involved in a number of focal areas and
projects, including one exploring community-driven
energy service delivery, aiming to catalyse long-term
support from municipalities and investors and improve
local knowledge of the potential of sustainable
distributed energy markets. Focal areas in the region
currently include the food-energy-water nexus,
quantifying the benefits of access to renewable energy
and clean energy in buildings. Each of these initiatives
has not only been a step in the right direction for the
environment, but also for job creation and poverty
alleviation.
Focal area: Energy efficient buildings: 1 billion m2
REEEP presented its initiative for positive energy
buildings, “1 billion m2” at the May 2013 EE Global
conference. The effort, in collaboration with the
Global Buildings Performance Network (GBPN), strives
to bring about the creation of 1 billion square meters
of positive energy buildings — buildings that produce
more energy than they consume — by 2023.
In 2013/14 the 1 billion m2 effort focused on South
Africa and China, two critical areas for urban-built
environment growth over the next decade. REEEP
brought the initiative to South Africa, which faces
unique challenges in the buildings sector, primarily in
low-income housing. In March, REEEP co-hosted the
first of a series of high-level working groups on energy
efficiency in the housing sector together with SANEDI.
Over 30 delegates, from key international and local
hubs, including government representatives, scientists
and researchers, financiers and foundation leaders,
international organisations and the private sector,
among others, took part in the working group.
Figure 8: Energy Efficiency in the household sector: REEEP hosted its second EE workshop in Cape Town with a focus on how to overcome financial and regulatory challenges in implementing EE across various household types.

30 SANEDI Annual Report 2014/15
SolarTurtle
SANEDI is a proud sponsor of the prototype SolarTurtle
- a renewable energy micro-utility project for rural
electrification. The SolarTurtle functions as an
electricity distribution point, neatly packaged in a theft
resistant shipping container. The shipping container is
fitted with a solar battery charging station, which can
charge multiple battery packs of different sizes during
the day. Micro-grid capabilities are also possible for
surrounding businesses and institutes. This small
power station is assembled off-site then transported
to an off-grid community where it provides an easily
accessible source of electricity to the local community.
The SolarTurtle prototype project started in July
2014 and the PV system installation was completed
in March 2015. A standard 6m container has been
converted into a functional solar powered micro-utility
(Figure 1). The outside of the container boasts an array
of twelve 300Wp solar panels totalling 3.6kW (Figure
3). These panels are mounted on a unique panel
deployment system that is both robust and secure.
The inside of the container holds a 5kW SMA solar
PV system, and a solar battery charging station that
can recharge multiple battery packs at once (Figure
4). These bottled battery packs are carried home to
provide basic electricity for lighting, phone charging
and other energy efficient devices. The solar battery
charging station has been tested and the system
operates satisfactory.
The next step is to deploy the SolarTurtle in rural
communities in the Eastern Cape in the next few
months. At full capacity, the SolarTurtle is expected
to provide basic electricity for around 300 households
plus one or two institutions. The idea is to find a school
in an off-grid community next to which the SolarTurtle
can be deployed. This would allow the school to feed
electricity directly from the SolarTurtle. Schools also
make a natural distribution point. In the morning
learners can bring discharged batteries packs from
their area to school for recharging. After school the
recharged batteries can be returned home with them.
For their efforts the learners will earn a delivery fee. A
female entrepreneur will be approached and trained
to operate the SolarTurtle. She will be responsible for
deploying the solar panels every morning, recharging
the batteries and managing sales of electricity and
energy efficient devices, amongst others.
The SolarTurtle has already received a lot of attention. In
February 2014 the project was proclaimed as a climate
solver by the WWF1. Established by WWF Sweden in
2008, the climate solver platform is an international
platform that displays the best technologies to reduce
carbon emissions and support energy access while
creating awareness of the value of innovation as a tool
to tackle climate change.
The SolarTurtle was also a finalist in the better living
challenge (BLC) in October 2014. The BLC is a call to
designers and innovators, manufacturers and retailers,
students and professionals, self-taught designers,
tradesmen, architects and engineers to develop home
improvement solutions that support a better quality of
life for all. Over the course of two weeks hundreds of
people came to see the SolarTurtle and the response
was overwhelmingly positive. While the SolarTurtle
did not win the overall prize, it was voted as one of the
best projects by the public2. This is very encouraging
as it shows that the public finds the SolarTurtle both
novel and useful and can make a difference to their
lives.
In December 2014 the SolarTurtle was named a 110%
green flagship by the Western Cape government3. A
flagship is an organisation that has made more than
the usual commitment towards the green economy.
The SolarTurtle is proud to be associated with this
initiative.
1 http://www.wwf.org.za/?10381/wwf-sa-awards-recognise-climate-innovations
2 http://www.betterlivingchallenge.co.za/community-public-vote-awards-go/
3 https://www.westerncape.gov.za/110green/flagships/list/Q%2CR%2CS%2CT
Performance information by programme

31SANEDI Annual Report 2014/15
This year the SolarTurtle has been invited to the
WWF’s renewable energy festival hosted at Green
Point Stadium on 28 March. The event aims to educate
the public about the benefits of renewable energy,
the accessibility of alternative energy sources and
will also focus on offering solutions to South Africa’s
unemployment, energy and climate crises. The event
will serve as the unveiling of the completed SolarTurtle
before it heads to the rural Eastern Cape.
In short, the SolarTurtle is a social business linked to
a renewable energy micro-franchise model. Women
in communities take ownership of these solar
franchise businesses to provide a fast and sustainable
electrification solution. The technology can reduce
the use of kerosene, which is a primary energy source
in many rural communities, while increasing access
to cheaper, cleaner, safer energy for longer periods.
The first prototype has been built and will soon be
deployed in a rural community as a proof of concept.
Once this prototype has been tested it is expected that
many more of these SolarTurtles will be dotting the
rural landscape of South-Africa, thereby giving power
to the people.
Performance information by programme
Figure 9: SolarTurtle with its solar panels folded away for extra security and easy transport.
Figure 10: Two large side-frames unlock and unfold to reveal the solar panels hidden behind.
Figure 11: Once the two side frames are open gas struts lift all the panels up and lock into place.

32 SANEDI Annual Report 2014/15
Figure 12: Inside the container is a solar battery charging station that can recharge multiple Khaya Power4 bottled battery packs.
Smart Grids programme
4 www.khayapower.co.za
Performance information by programme
Figure 13: Unveiling of the SolarTurtle at the WWF Renewable
Energy Festival on 28 March 2015.
Background
It is undeniable that South Africa’s economy is coal
intensive. The distribution of electricity is represented
by a market disequilibrium which is constituted by a
high demand-side coupled with a constricted supply
in power generation. South Africa remains one of the
leading contributor to CO2 emissions. As such, in order
to achieve a low carbon future, economic strategic
planning needs to critically assess environmental
impacts along with sustainability in terms of the long-
term use of coal.
In the South African context, infrastructure is the
central nerve and a high level priority in ensuring a
secure and stable supply of electricity. However, the
ineffectual support of asset management is adversely
conditioned by two symptomatic challenges:
• The acquisition of adequate investment; and
• The consistent maintenance of infrastructure and
valuable assets.
To this end, aging power plants are pushed beyond
their capacity to support a rapidly evolving economy,
an increasing population and changing consumer
needs. Due to imperfect market conditions, state-
owned entity Eskom is faced with a situation of dealing
with a “market failure” in securing an adequate supply
of electricity. The financial implications are that the
costs outweigh the benefits based on the analysis of
economic values.
Strategic initiatives and technological advancements
are needed to modernise the electrical system by
urgently addressing the viability of an electrical utility
in the following ways:
• Revenue management;
• Non-technical and technical losses;
• Effective resource deployment;
• Supply quality, availability and reliability; and
• Customer base and promotion of customer choice.
The International Energy Agency (IEA) states that by
2030 energy demands will have increased by 45%. This
means an even greater dependency for developing
countries such as South Africa, where the adequate
and stable supply of electricity is a national crisis. A
sustainable energy supply is a critical component in
economic growth and development. The development
of clean energy strategies and technological
advancements are needed to change the status quo
in the quality of power, the security and efficiency of
energy and minimum cost to maximum benefit output.
33SANEDI Annual Report 2014/15
Performance information by programme
Understanding the “smart” in smart grids
The effective deployment of technology in the
electricity supply industry (ESI) is recognised worldwide
as a key business enabler. The implementation of
appropriate technology contributes, amongst others,
to improved customer service, improved business
efficiency and improved business sustainability. The
desirability of a smart grid project is steadily gaining
attention in South Africa. As a result, the attractiveness
of this technology is attracting much interest in respect
of the benefits it produces. Smart grid is an essential
transformative network that facilitates the efficiency
of energy and integration of renewable energy to meet
the energy demand of various consumers.
What is a smart grid?
The definition articulated by the European Technology
Platform Smart Grid (ETPSG) has been incorporated
into the South African Smart Gird Initiative (SASGI)
documentation framework for smart grids. They define
a smart grid as follows:
“A smart grid is an electricity network that can
intelligently integrate the actions of all users connected
to it - generators, consumers and those that do both –
in order to efficiently deliver sustainable, economic and
secure supplies.”
Based on the ETPSG definition, smart grid employs
innovative products and services together with
intelligent monitoring, control, communication, and
self-healing technologies to:
• Better facilitate and manage the connection and
operation of all sources of energy;
• Give consumers more choice so they can optimise
energy use;
• Provide consumers with greater information and
choice of supply;
• Significantly reduce the environmental impact of
the whole electricity supply system; and
• Deliver enhanced levels of reliability and security
of supply.
The shift towards implementing a smart grid strategy in
South Africa is intended to fast track the development
of an adequate electricity supply system or network
for two basic reasons, namely the improvement and
upgrade of the “business as usual” (BUA) grid, and
the outcome of substantial benefits that come with
establishing a smart grid. For much that has been
gathered, the value application of a smart grid has
benefits in the following key areas:
• Efficiency: By reducing the cost and improving
the manner in which electricity is produced,
distributed and consumed, greater efficiency will
result.
• Economics: Electricity is an essential commodity
for the economy. Smart grids render their
deliverables on a broader scale of benefits.
In comparison with the BUA grid, consumers
will benefit from prices being kept down, jobs
being created, and positive returns on the gross
domestic product (GDP).
• Reliability: By lessening the occurrence of
power cuts and the disadvantage of widespread
load shedding, the electricity supply will be
more reliable. Smart grids will also contribute
towards minimising the costs of interruption and
disturbances to the quality of power.
• Security: Greater security will be possible
through reducing risks caused, for example, by
theft or negligence.
• Environmental: Integrating renewable energy
into the grid will significantly improve the
generation, transmission and consumption of
electricity which will also constitute a reduction
in CO2 emissions in comparison to the BUA grid.
• Safety: There will be a reduction of injuries and
fatalities related to the grid.
Shaping the face of smart grids in South Africa
SANEDI’s Smart Grid programme aligns with the
strategic objectives of the Department of Energy
(Electricity Chief Directorate) and is focused on the
introduction of the various concepts of smart grids
in the South African electricity distribution industry

34 SANEDI Annual Report 2014/15
Performance information by programme
(EDI). A business plan was developed for rolling out
this programme, which builds into the DoE’s policy
development in the following areas:
• Distributed generation;
• Municipality revenue enhancement;
• Energy efficiency demand side management; and
• Asset management.
SANEDI’s Smart Grid team leading the South African
Smart Grids Initiative
Industry and stakeholder cooperation is regarded
as holding the key to the effective deployment of
technology. To this end, the South African Smart Grid
Initiative (SASGI) was established in 2012. SASGI is
an industry forum established under the guidance of
SANEDI and chaired by the Department of Energy. The
main objectives of SASGI are to facilitate cooperation,
to contribute to policy formulation, to provide
guidance in the establishment of standards, to identify
technology functionality, and to provide leadership in
the deployment of appropriate technology.
The following are the achievements of SASGI to date:
• Smart grids vision for South Africa (vision
document);
• Workgroups that provide technical support to the
Smart Grids team;
• Highly technically-competent members serving as
subject matter experts; and
• Easy access to local case studies.
SASGI’s role comprises a number of activities which
include coordinating and facilitating the smart
grid vision for South Africa. It also coordinates and
integrates issues relating to smart grids which emerge
within the electricity supply industry. It plays a role
in respect of evaluating options pertaining to grid
intelligence. Consideration is also given to the design
and implementation of smart grid demonstration
pilots and evaluation of results and lessons learnt.
Work groups are also co-opted intermittently and
subject matter experts are called on as and when
the need arises. SASGI also evaluates and makes
recommendations for adopting grid modernisation
and intelligence, thereby promoting smart grids. It
may have a role to play in engaging organised labour,
depending on the need and discussion issues at hand.
It plays a role in the assessment of smart grid
developments which are unfolding in the South African
electricity supply industry (ESI), focussing especially
on technology deployment, setting of standards
and specifications, and identifying local smart grid
enablers.
The South African smart grid vision statement is as
follows;
An economically evolved, technology enabled,
electricity system that is intelligent, interactive,
flexible and efficient and will enable South Africa’s
energy use to be sustainable for future generations.
Governance structure
The governance structure of SASGI is illustrated in
the figure below. SASGI has three focus areas: policy
formulation, technology and standards formulation,
and applied research.
The three focus areas are supported by higher learning
institutions, research and development institutions,
subject matter experts, solution architects, engineering
bodies, product developers, consultants and electricity
retailers.

35SANEDI Annual Report 2014/15
Performance information by programme
South Africans membership of the International
Smart Grid Action Network (ISGAN)
South Africa, represented by SANEDI, has been
accepted as a full member of the International
Smart Grid Action Network (ISGAN). As a member
of ISGAN, the aim is to promote the requirements
of South Africa and to leverage the international
experience to the benefit of the local ESI. Through
the SANEDI interventions and SASGI guidance the ESI,
and in particular the distribution sector, was able to
embark, amongst others, on a technology investment
optimisation approach.
In April 2011, ISGAN was formally established as
the IEA implementing agreement for a cooperative
programme on smart grids (ISGAN), operating under
the IEA framework for international energy technology
co-operation. Participation in ISGAN is voluntary, and
currently includes Australia, Austria, Belgium, Canada,
China, Denmark, the European Commission, Finland,
France, Germany, India, Ireland, Italy, Japan, Korea,
Mexico, Norway, the Netherlands, Russia, Singapore,
Spain, South Africa, Sweden, Switzerland, and the
United States (25 countries).
Figure 14: SASGI Governance Structure.
ISGAN is organised as the IIEA implementing
agreement for cooperative programme on smart grids.
The institution is managed by its executive committee
(exco). It is supported by a secretariat which is based at
the Korea Smart Grid Institute.
The ISGAN community includes representatives of
governments, transmission and distribution system
operators, national laboratories and research
institutions, power generators and more. Projects are
largely task shared through participation of in-kind
contributions, although it does have a common fund
for certain joint expenses at its secretariat.
The role of ISGAN
ISGAN is a mechanism for bringing high level
government attention and action to accelerate the
development and deployment of smarter electricity
grids around the world and is responsible for the
following:
• Sponsoring activities which build a global
understanding of smart grids, address gaps in
knowledge and tools, and accelerate smart grid
deployment;

36 SANEDI Annual Report 2014/15
Performance information by programme
• Building on the momentum of and knowledge
created by the substantial global investments
being made in smart grids;
• Fulfilling a key recommendation in the smart grid
technology action plan released by the major
economies forum global partnership in 2009; and
• Leveraging cooperation with other initiatives and
implementing agreements.
ISGAN is organised as a task shared IEA Implementing
Agreement (2011) and was launched as an initiative of
the clean energy ministerial in 2010.
ISGAN objectives
These objectives and the associated scope of activities
are described in the ISGAN Annex 1 programme of
work, issue 3.1 (revised August 2012).
• ISGAN facilitates dynamic knowledge sharing,
technical assistance, and project coordination,
where appropriate;
• ISGAN participants report periodically on progress
and projects to the ministers of the clean energy
ministerial, in addition to satisfying all IEA
implementing agreement reporting requirements;
• Consistent with the IEA framework for
international energy technology cooperation,
ISGAN is open to governments of IEA member as
well as non-member countries, on invitation of the
ISGAN executive committee;
• Though the primary focus is on government-to-
government cooperation, ISGAN is also open to
entities designated by participating governments,
and select private sector and industry associations
and international organisations;
• To work as efficiently as possible, ISGAN will strive
to establish collaboration strong cooperative ties
with existing smart grid organisations;
• ISGAN recognises that robust, reliable, and
smart electric grids play a key role in enabling
greenhouse gas (GHG) emission reductions
through the management of electricity demand,
integration of growing supplies of both utility-
scale and distributed, small-scale renewable
energy systems, accommodation of an increasing
number of electric and plug-in hybrid electric
vehicles, improvement of operational efficiency,
and application of energy efficient technologies to
their full potential.
Our projects
European Donor Funded Smart Grids Programme
The European Union (EU) made available a seed funding
of R179.4 million to National Treasury over a two-
year period which was intended to accelerate South
Africa’s journey toward achieving a smarter grid. This
programme was formally initiated in September 2014
with the revised end date being June 2016. It involves
two phases which run in parallel: first, the Smart Grid
Maturity Model (SGMM) survey and second, the Smart
Grid demonstration pilot.
The Department of Energy has identified four areas
within the EDI that require policy and regulatory input.
These four areas have resulted in the selection of nine
municipalities to participate in projects that are aimed
at addressing issues within the municipality and to
provide policy and regulatory input.
The Electricity Chief Directorate and the Smart Grids
team strategically want the projects to not only provide
input to national policy and regulation for the industry
but to develop a guide on how to deploy various smart
grid technologies, business case and lessons learned
reports.

37SANEDI Annual Report 2014/15
Performance information by programme
The table below illustrate the priority areas, projects and participating municipalities:
DoE Priorities Smart grid projects Participating municipalitiesDistributed Generation Active Network Management eThekwini
Monitoring and Evaluation of IPPs DoE implemented
Revenue enhancement Revenue enhancement Nala
Naledi
Govan Mbeki
Thabazimbi
Mogale City Advanced metering infrastructure in
residential and commercial customer base
City Power
Asset management Advanced Asset Management Msunduzi
Nelson Mandela BayEnergy Efficiency Demand Side
Management
Energy efficiency in Public buildings DoE Implemented
Table 1: Priorities, projects and municipalities
The Smart Grid Maturity Model Assessment is the
second part of the project done in parallel with the
demonstration projects. It is done to assess the
electricity network and organisational status of a utility.
This complements the demonstration projects as it
addresses root cause issues and provides a strategic
direction for the municipality in the long term.
Smart Grid Maturity Model (SGMM) Assessment
SGMM methodology
The Smart Grid Maturity Model (SGMM) was developed
by a collective of electricity distributors (utilities) and is
maintained by Carnegie Mellon Software Engineering
Institute (SEI). The model provides a management tool
using a common language and framework for defining
key elements of smart grid transformation, and helps
utilities to apply a programmatic approach in tracking
progress during the smart grid journey. The model also
enables utilities to plan, prioritise options and measure
progress during implementation.
An SEI certified navigator is assigned to assess the
smart grid maturity and required framework needed
to improve the status of the utility. The SGMM
methodology provided below in figure 1 illustrates the
seven steps which are required to achieve a smart grid
journey.
The smart grid journey comprises a number of
successive implementation steps:
• Formulating a smart grid vision which sets the
course for the smart grid journey;
• Conducting an “as is analysis” to determine the
utility’s current organisational and electricity
network status;
• Performing a gap analysis to assess what
corrective measures need to be taken to improve
the utility’s smart grid maturity status;
• Developing a smart grid strategy and roadmap
with key stakeholders in the utility who hold
various responsibilities in the electricity
distribution network value chain;

38 SANEDI Annual Report 2014/15
Performance information by programme
• Preparing a business case and value proposition
to implement the strategy and roadmap;
• Mapping out the required functionalities to
support the vision and strategy roll out; and
• Formulating implementation guidelines which
ensure the successful smart grid journey.
The entire SGMM methodology is mapped out below in figure 14.
Figure 15: Smart Grid Road Map (diagram from SEI).
The SGMM survey comprises the following:
• Sections 1 and 2 capture contact information for
the responding utility and the person completing
the survey;
• Section 3 collects key data about the responding
organisation and will be used to normalise survey
data and help to generate meaningful comparative
data for users;
• Section 4 collects grid performance data that is
used to correlate the impact of increasing smart
grid maturity with overall grid performance; and
Sections 5-12 present multiple choice questions
organised by SGMM domain that address each
expected characteristic in the model.
The survey evaluates each utility in a two by two
matrix format, comprising eight domains along the
X axis (as illustrated in Figure 15), and five maturity
levels along the Y axis (as shown in Figure 15). There
are over 175 questions in the SGMM survey, each
grouped under different domains and measured along
the five maturity levels. Some questions are repeated
in different domains in order to test the robustness of
previous questions appraised.
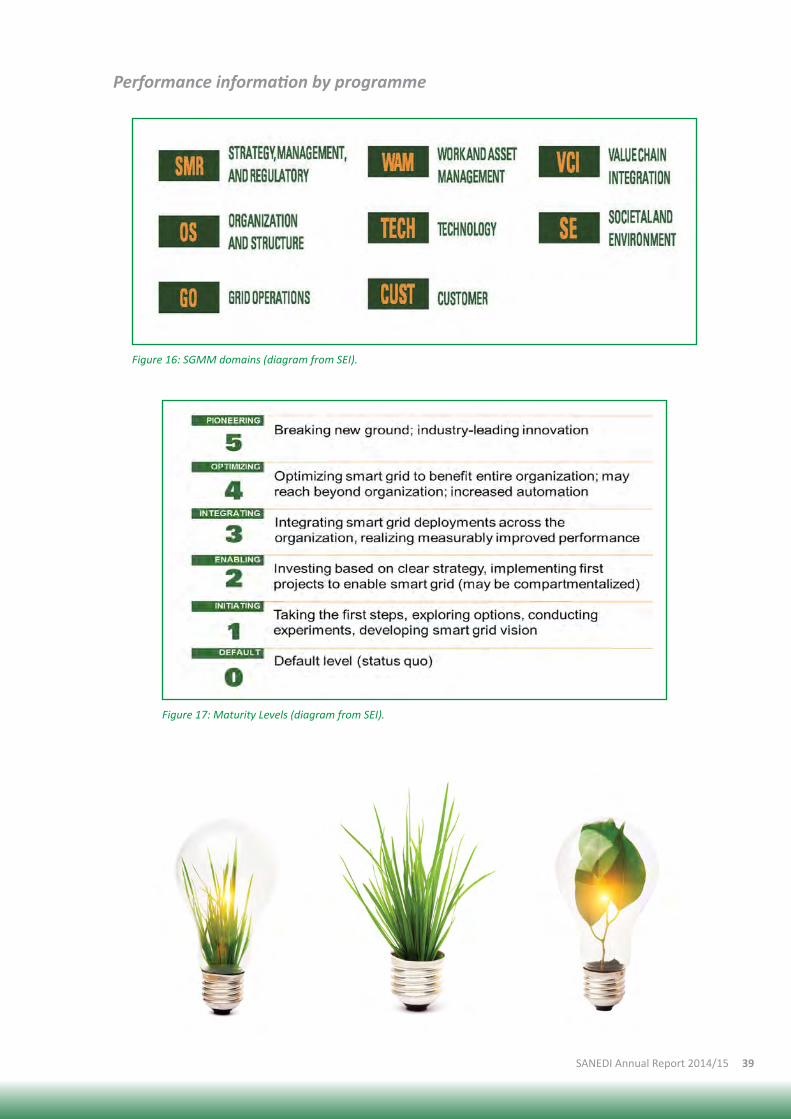
39SANEDI Annual Report 2014/15
Performance information by programme
Figure 16: SGMM domains (diagram from SEI).
Figure 17: Maturity Levels (diagram from SEI).

40 SANEDI Annual Report 2014/15
Performance information by programme
Projects in detail
All projects within the EU Donor funded Smart Grid
programme have the following in common: they have
been divided into seven phases, with approval of
deliverables that close out each phase. In completing
each of the seven phases, funding is broken down into
percentages to ensure that the allocated funds are
optimally used by the municipalities.
Implementation Deliverables Detail
1. Initiation phase Annexure A High-level scope of wor2. Analysis phase Annexure B Detailed scope of work, design and baseline assessment3. Design phase
4. Procurement phase Procurement report Details of all procurement of goods and services carried
out by municipality5. Implementation phase Implementation report Service level agreements, change control measures and
certificate of completion are documented6. Integration phase Integration report Change management strategy, capacity development
and skill transfer programme are documented7. Policy
recommendations and
lessons learned
Business case
How to guide
Project close-out
report
Business cases and how to guides for all four priority
areas are developed. A project close-out report closes
individual projects.
Table 2: Table of project phases and deliverables
Active Network Management Project (one
municipality)
The Active Network Management of small scale
embedded generation onto the distribution grid and
the implementation of an Advanced Distribution
Management System (ADMS).
Ethekwini is tasked with this project, as they have
relatively a good control of their grid. The objective of
this project is to document the systems and process
required by utilities to manage small scale embedded
generators within their grid. Ethekwini has already
identified that there is a growing number of residential
customers and small businesses that have started
putting up PV roof top panels. Ethekweni completed
a full SGMM survey in 2014 and have gone through
the entire methodology. They have a draft smart
grid vision document and are presently realigning
various business units in the electricity department
to this vision. There are seven phases in this project
and Ethekwini is presently is the third phase (project
design).
Advanced metering infrastructure in residential
and commercial customer base project (one
municipality)
The advanced metering infrastructure (AMI) in
residential and commercial customer base project
focuses on piloting the systems and processes to:
• Dispense free basic electricity (FBE) to 1 000
indigent customers;
• Implement inclining block tariff (IBT) with the
selected indigent customers;
• Implement a time of use (TOU) tariff in both
customer bases.

41SANEDI Annual Report 2014/15
Performance information by programme
City Power, on behalf of the City of Johannesburg, is
the participating utility. The objectives of this project
are far reaching. We have indigent customers within
the boundaries of every municipality, and it is thus
very important that free basic electricity is provided to
them through an efficient and reliable system. In order
for NERSA to provide for cross-subsidies for low income
domestic customers as required by the electricity
pricing policy (EPP1) the IBT has been introduced.
The initiation of the TOU tariff is a very important
element of the use and pricing of electricity in South
African municipalities. Customers are charged different
prices according to when the electricity is used. The
TOU tariff will significantly reduce the demand for
electricity in peak periods. The Smart Grids team
intends to document the benefits and savings of this
approach, and ultimately make it available to every
municipality in South Africa.
City Power has completed the SGMM assessment, and
is presently in the project design phase.
Advanced asset management project (two
municipalities)
The advanced asset management (AAM) project
originates from the DoE’s Electricity Chief Directorate,
and is intended to address the maintenance and
refurbishment backlogs in the distribution grid of
municipalities. The smart grids concept addresses
maintenance and refurbishment in a very advanced
way. Sensors and intelligent devices are installed
across assets such as transformers, substation, circuit
breakers and more. These field devices generate data
that is integrated into a back-office for data analytics.
Management and technical staffs can take informed
decisions based on what the data analytics provide.
The scope of the AAM project at Nelson Mandela
Bay is to focus on critical grid assets. The sensors
and intelligent devices are used to monitor, analyse
and report. These reports then inform scheduling of
maintenance and refurbishment of critical assets.
Workforce management is also automated with a
better control of the municipal grid.
Nelson Mandala Bay has concluded the SGMM
assessment and has also concluded three phases of
the demonstration project. The municipality is in the
fourth phase of the programme.
Revenue enhancement project (five municipalities)
The revenue enhancement projects are focused
on using advanced metering infrastructure/smart
grids concepts to address revenue challenges in
municipalities.
Municipalities have immense problems when it comes
to revenue collection. They lack proper management
processes and technical capabilities to effectively
manage the distribution of electricity. In order to
address the technical part, an advanced metering
infrastructure is required. The Smart Grids team plays
the role of introducing new management processes to
the municipalities and the supervision of every detail
of the project implementation phase.
The objectives of this project are to give municipalities
the technical ability to manage their customer bases
effectively, thereby reducing technical and non-
technical losses. As a result, revenue collection will be
improved and remain sustainable over time.
Five municipalities are participating and currently
concluding the project design phase.
Conclusion
Ultimately, there are four deliverables to be achieved
by the implementation of the EU donor funded Smart
Grids programme. These deliverables become the
basis and foundation on which future projects in this
space are determined.

42 SANEDI Annual Report 2014/15
Performance information by programme
The four deliverables are:
• Policy and regulatory recommendations
derived from the projects. The intent of
initiating smart grids projects through the
participating municipalities is to present a
policy recommendation that is applicable and
appropriate to South African conditions;
• How to guides on the various types of Smart
Grids components deployed. The essence of the
how to guide is to have a standardised blueprint
that provides a step-by-step approach to what
a smart grid is and how to implement it. The
purpose of this guide is to facilitate the successful
implementation of smart grids projects;
• Business cases outlining the benefit against cost.
The development of business cases will provide
a detailed outline of the viability of initiating a
smart grids project. Business cases will provide
a comprehensive account of the cost-benefit
analysis of implementing a smart grids project.
The effectiveness of this document is to inform
decision makers in their course of action; and
• Lessons learned from projects and shared
with industry. The knowledge base is an
important factor of the success of the smart
grids programme as such lessons will equip all
stakeholders to make informed decisions based
on the outcomes of their reports and what past
experiences have taught them.
Continuous efforts of the Smart Grids programme
Rooftop photovoltaic workshop
On 23-24 March 2015, a two-day global forum on the
outlook of distributed solar power in South Africa was
hosted at the Eskom Academy of Learning in Midrand,
Johannesburg. The forum was co-hosted by the
Department of Energy (DoE), South African National
Energy Development Institute (SANEDI), National
Energy Regulator of South Africa (NERSA), Eskom Clean
Energy Regulators Initiative, 21st Power Partnership,
International Smart Grid Action Network (ISGAN), and
the Global Smart Grid Federation (GSGF). This two-day
global forum focused on two goals:
• To share international experience and lessons
in sustainable PV integration with South African
stakeholders; and
• To facilitate an exchange of stakeholder
viewpoints regarding the technical, regulatory
and institutional implications of solar PV for South
African consumers, developers, utilities, and
others.
Over 200 delegates attended the forum and the
programme comprised the key themes:
• Setting the scene;
• Regulatory and utility business model frameworks
for solar photovoltaics;
• International perspective; and
• Experiences in integrating rooftop photovoltaics
on distribution networks with active distribution
network management.
Setting the Scene
Mr Kadri Nassiep (CEO of SANEDI) provided an
overview of the programme for the global forum on
unleashing rooftop photovoltaics in South Africa.
Regulatory and utility business model frameworks for
solar photovoltaics
The regulatory framework is the central set of
guidelines governing small scale renewable electricity
generation (SSREG) interconnection – spanning all
financial, procedural and technical aspects of the
programme – to facilitate controlled and standardised
deployment of distributed renewable generation.
Guided by the SSREG regulatory framework, utility
business models must begin shifting to maintain long-
term financial viability. This session focused on topics
at the nexus of regulatory and business models for

43SANEDI Annual Report 2014/15
Performance information by programme
distributed generation, and how approaches must
evolve to capture SSREG opportunities while mitigating
potential adverse impacts.
International perspective
A diverse range of international experiences were
presented, eg Spain (feed in tariff (FIT)), Germany (FIT),
Thailand (FIT Adder), the United States of America
(full retail rate net energy metering (NEM) and shift
toward unbundling), Cape Town City Electricity (rate
unbundling and avoided cost), Tamil Nadu (NEM),
Australia (NFIT at higher-than-retail-rate). Lessons
learned will be synthesised and key regulatory
principles for SSREG tariff design were enumerated.
Experiences in integrating rooftop photovoltaics
on distribution networks with active distribution
network management
Active distribution network management (ADNM)
brings together a range of advanced energy,
communications and control technologies to allow
more efficient, dynamic operation of electricity
distribution grids, thereby providing a foundation for
increasing amounts of distribution generation to be
effectively integrated into power systems.
The transition to ADNM, and in particular ADNM to
support rooftop PV (RTPV) integration, entails a host
of technical, institutional, policy and regulatory shifts
across the power sector, requiring holistic approaches
and governing frameworks that bridge the areas of
power engineering, information and communications
technology, utility business practices, electricity
consumer engagement, and more.
Global forum wrap-up
Some of the more pressing challenges include the
significant infrastructure investment backlogs which is
in the order of R35 billion and growing. The impending
significant tariff increases in the country will have
a huge impact on consumers. Efforts to place the
customer at the centre remain a serious challenge.
As a way forward, we must learn from both international
and local experiences shared on various platforms
that South Africa is party to. Grid modernisation is a
journey and not a once off event. South Africa must not
reinvent the wheel but must take advantage of ongoing
collaboration and relationships with institutions such
as ISGAN, GSGF, and SASGI among others. We must
constantly seek to align strategically to established
bodies like DoE, SANEDI, SABS, CSIR, NERSA and Eskom
to vigorously drive the technology journey.

44 SANEDI Annual Report 2014/15
Working for Energy Programme
The Working for Energy (WfE) Programme is a
multi-year renewable energy programme under the
environment and culture sector of the Expanded Public
Works Programme (EPWP). It is aimed at delivering
clean energy solutions to rural and urban low income
communities through labour intensive methods where
possible, with special emphasis on youth, women and
people with disabilities.
WfE is in its sixth year and has gained traction with
the roll out of its project pipeline in KwaZulu-Natal,
Limpopo, Gauteng, Eastern Cape and the Northern
Cape and the North West. The programme has four
components, namely, Energy Research, Renewable
Energy, Energy Saving and Community Outreach.
Performance information by programme
Research to investigate the sustainability of
decentralised renewable energy systems in South
Africa
The concept of the sustainability of minigrids as an
option for the electricity service delivery in remote
and rural communities in South Africa has not yet
been thoroughly investigated. To this end, SANEDI,
in partnership with the national Department of
Environmental Affairs (DEA) and the Department of
International Development (DFID) through CARDNO
Emerging Markets has initiated a study to determine
challenges impeding the implementation of minigrids
in South Africa. The study will be completed in
the next financial year and will provide proposed
implementation strategies for the implementation of
minigrids in South Africa.
Applied research in rural energy provision
Due to its novelty, most of WfE’s projects are at
extensive demonstration stage in terms of clean
energy options, with special emphasis on relevance
energy access, social acceptability, and assessing their
socio-economic impacts on targeted beneficiaries
and communities. The sustainability of the projects
has emerged as an area needing attention and the
number of project increase and need operation and
maintenance capabilities on the ground.
The full roll out will ensue only after the offerings
have been refined and the cost benefits are fully
understood. This stage will be followed by sustainable
fiscus funding for the WfE as part of government’s
service delivery interventions to communities on the
fringes of service delivery programmes of government.
WfE and EPWP
WfE has been fully integrated into the EPWP, where
applicable, and all new and current projects are
subjected to the EPWP protocols, in terms of job
creation, skills development and energy services
delivery.
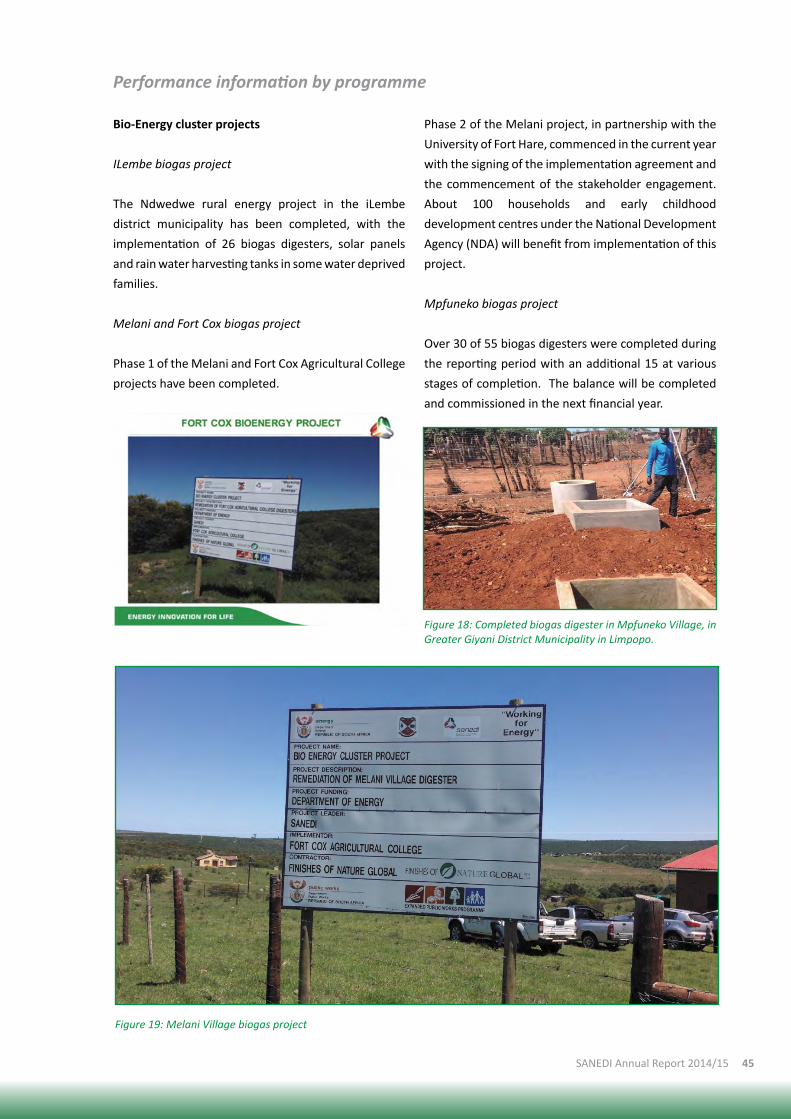
45SANEDI Annual Report 2014/15
Performance information by programme
Bio-Energy cluster projects
ILembe biogas project
The Ndwedwe rural energy project in the iLembe
district municipality has been completed, with the
implementation of 26 biogas digesters, solar panels
and rain water harvesting tanks in some water deprived
families.
Melani and Fort Cox biogas project
Phase 1 of the Melani and Fort Cox Agricultural College
projects have been completed.
Phase 2 of the Melani project, in partnership with the
University of Fort Hare, commenced in the current year
with the signing of the implementation agreement and
the commencement of the stakeholder engagement.
About 100 households and early childhood
development centres under the National Development
Agency (NDA) will benefit from implementation of this
project.
Mpfuneko biogas project
Over 30 of 55 biogas digesters were completed during
the reporting period with an additional 15 at various
stages of completion. The balance will be completed
and commissioned in the next financial year.
Figure 18: Completed biogas digester in Mpfuneko Village, in Greater Giyani District Municipality in Limpopo.
Figure 19: Melani Village biogas project

46 SANEDI Annual Report 2014/15
Performance information by programme
Lucingweni renewable energy legacy project
An MOA between SANEDI and the Nelson Mandela
Metropolitan University has been concluded for the
establishment of a renewable energy centre on its
campus using some of the renewable energy assets
reclaimed from the Lucingweni minigrid project
under the Renewable Energy Centre of Research and
Development (RECORD).
Greening of Tsireleco high school in Kimberley
An MOA between SANEDI and the Tsireleco high school
regarding the completion of the greening of the school
in the Sol Plaatjie Municipality has been concluded.
Project implementation will commence in the next
financial year. The efficient lighting and water heating
projects have been concluded. The anaerobic digester
will be installed in the next financial year.
Greening of Tygerkloof combined school
An MOA between SANEDI and the Tygerkloof
combined school regarding the greening of the school
in the Dr Ruth Mompati district municipality has been
concluded. Project implementation will commence in
the next financial year.
Greening of Gauteng schools
Through the partnership with the Gauteng
Department of Infrastructure Development, four
schools (Emmanuel, Lehlasedi, Seliba and Kgomoco
Primary Schools) in Sharpeville have been identified
for greening using clean energy interventions. These
include cool surfacing, biogas, efficient lighting and
solar water heating. All procurement matters have
been concluded and the implementation will ensue in
the next financial year.
Greening of Thusanang early childhood development
centre (ECDC)
An MOA between SANEDI and the Thusanang ECDC
regarding the greening of the ECDC in Tshwane
metropolitan municipality has been concluded. Project
implementation will commence in the next financial
year.
Figure 20: Identified Emmanuel, Lehlasedi, Seliba and Kgomoco Primary Schools in Sharpeville.
Figure 21: Thusanang Day Care Centre in Hammanskraal, Gauteng.

47SANEDI Annual Report 2014/15
Performance information by programme
EPWP reportingTo
tal N
o.
of
Bene
ficia
ries
Tota
l No.
of
Wor
kday
s
Full
Tim
e
Equi
vale
nts
Tota
l No.
of
Trai
ning
Day
s
82 140 6 109
While the working days derived during the
construction of the projects seem small relative to
the capital investments, the real sustainable jobs will
be created during the operation and maintenance of
these interventions. Identified beneficiaries will need
extensive training to enable them to undertake the
functions.
Future project pipeline
SANEDI continues to seek partnerships to leverage
resources from other relevant stakeholders that have
similar socio-developmental mandates in framing new
initiatives for the future. During this financial year,
SANEDI has been approved to implement waste to
energy projects with the Natural Resource Management
branch of the Department of Environmental Affairs.
These projects, which will focus on using waste from
the value added industries to various forms of energy,
will be implemented over the next MTRF.
Figure 22: Woody waste emanating from the value adding industry which can be used for
various energy forms in Heidelberg.
Figure 23: Waste produce farm which can be used for bioenergy from the Bana Ba Kwale agricultural farm, in partnership with the national Development Agency in the North West.
48 SANEDI Annual Report 2014/15
Data and knowledge management
Centre for Energy Systems Analysis and Research
(CESAR)
A Department of Science and Technology (DST) funded
programme
Background
The Centre for Energy Systems Analysis and Research
(CESAR) was established in May 2009 with the stated
aim of being the authority in the field of energy data
for the purpose of modelling and planning. CESAR
is one of the centres that previously resided with
SANERI, but is incorporated under the South African
National Energy Development Institute (SANEDI). The
CESAR programme managed by SANEDI has remained
a Department of Science and Technology (DST) funded
programme following the restructuring,
The CESAR programme was initiated to provide
a mechanism for energy modelling and planning
to support the alignment of national and local
government energy objectives. The aim is to develop
an energy data repository and technical capacity to
support national and local energy planning and policy.
In addition, CESAR aims to provide an energy platform
where national and local decision makers are assisted
in energy planning and to meet the objectives of the
integrated energy plan (IEP) and national climate
change response strategy.
Objectives
• To develop technical know-how, knowledge, and
human capacity in energy modelling and planning;
• To collect and maintain an open central database
of energy research and related data;
• To research and develop suitable models for the
South African energy system;
• To provide research support and advice on
government initiatives regarding energy data
collection, energy modelling and planning;
Performance information by programme
• To collaborate with international bodies regarding
research on energy data, energy modelling,
planning and policy development;
• To develop the necessary skills and resources to
support the following:
o Energy modelling
o Planning
o Analysis
o Energy technology innovation; and
• To contribute towards the development of a
centralised energy planning database which is
up to date and can support the requirements of
multiple government institutions (national and
local).
Energy Research Centre (ERC), University of Cape Town
(UCT) collaboration
Historical (2009 – 2012)
The CESAR programme within SANEDI contracted ERC
to undertake research during the period 2009 to 2012.
The study produced two data-rich working papers
which were extensively referenced in the transport
sections of two major national government reports,
the 2012 IEP and the 2013 mitigation potential study.
The study input data, assumptions, methodologies
and results were disseminated in presentations to the
South African National Energy Association (SANEA),
the 16th annual IUAPPA world clean air conference and
to students and staff of the University of Stellenbosch’s
mechanical engineering faculty as a research lecture.
The second working paper was accepted for the 2013
international energy workshop in Paris.
The aim of this project was to perform a comprehensive
analysis of regional transport demand in South
Africa in the medium- to long-term under different
scenario assumptions and in addition, considering
what the resulting demand for liquid fuels would be
and the associated projected CO2 emissions. The
project focused on the development of a number
of models which, when combined, can be used to
develop scenarios around the likely future energy and

49SANEDI Annual Report 2014/15
Performance information by programme
infrastructure requirements of the transport sector
and its major influences in terms of both energy and
emissions. The future energy demand of the transport
sector was calculated in terms of services performed
(‘useful’ energy) as well as the amount of energy
supplied (‘final’ energy). This allows analysis of the
substitution between alternative energy forms and
modes as well as an appraisal of the evolution of the
technological improvements in vehicles. A number
of modelling techniques were combined to provide
a novel and rigorous methodology for estimating
the current and future vehicle parc as well as the
associated energy demand. In the end five models
were developed for this study:
• A vehicle parc model;
• A time budget model;
• A computable general equilibrium model;
• A freight demand model; and
• A fuel demand model.
A detailed report consisting of an executive summary,
two papers and a report on two stakeholder workshops
that were held during the course of the project were
completed as deliverables. The papers are stand-
alone data-rich documents currently part of the ERC
working paper series. The first paper focused on the
characterisation of the current vehicle parc of South
Africa by province. The second paper focused on
the projection of the future demand under different
scenario assumptions. The complete data set required
to replicate the results of the model are provided in
spreadsheet format.
Summary of outputs
• The international energy workshop (IEW) 2012
held in Cape Town had over 180, 40 of which were
South African participants and over 94 papers
were presented, of which 10 were from South
Africa;
• The ERC programme produced five masters in
2009 and eight masters in 2010–2011;
• The UP programme produced two PhDs. One of
the PHD’s has joined the university as a lecturer;
• An open database for energy research data was
implemented with data providers Statistics South
Africa, DoE and NERSA. This initiative is sponsored
by SANEDI, DST and UCT. New user registrations
are managed by SANEDI and the ERC;
• Data-rich working papers and five models were
developed in the study: a vehicle parc model (in
Analytica); a time budget model (spreadsheet);
a computable general equilibrium model (in
GAMS, used to project income growth and GDP
growth in a consistent manner); a freight demand
model (spreadsheet); and a fuel demand model
(spreadsheet). Data with which to populate
transport sector models is sparse in South Africa,
and a broad range of input assumptions were
discussed in detail;
• Modelling of regional liquid fuels demand in the
transport sector study was completed as a direct
input into the IEP process for the transport sector
and the 2013 mitigation potential study;
• Provision of research support and advice on
government initiatives regarding energy data
collection, energy modelling and planning; and
• Support for the DoE and international bodies
regarding research on energy data, energy
modelling, planning and policy development.
Current (2014 – 2017)
In order to meet the mandate of CESAR, a collaboration
agreement between the ERC, University of Cape Town
and SANEDI was concluded in 2014 for the period
2014-2017. The collaboration agreement specifies that
the ERC will capacitate and train SANEDI-appointed
energy modellers with relevant technology skills and
knowledge. The long-term vision for the DST is to
develop a fully functioning energy modelling group at
CESAR within SANEDI.
Transport study phase 2
The transport phase 2 study follows up on the previous
study to build on the foundation that was developed,

50 SANEDI Annual Report 2014/15
refine areas that had gaps and focus on a new set of
aspects that were not covered under the transport
study phase 1. The main question is how to meet the
energy needs of the transport sector in the future
considering the uncertainty in future fuel prices
and technology costs compared to performance.
Continuing from the previous study an update of the
current vehicle parc model with key assumptions
as user inputs will be published on ERC and SANEDI
websites. All datasets will be in compatible form so
that it can be integrated for IEP purposes or other
public databases (Open Energy Database, Data First,
UCT). This will include technology assumptions for
the vehicle parc and future technologies as well as
more detail in the road freight and rail categories. A
transport sector link between CGE model and energy
system model in SATMGE will also be included.
The following are potential working papers to be
considered during the period of the study:
• Update of base year assumptions;
• Methodology for projections; and
• Transition scenarios, shocks and their implications.
Future projects
Together with CESAR (SANEDI), DoE and ERC (UCT) the
following projects are under consideration:
• Heavy industry study - development of energy
efficiency targets in heavy industry (nonferrous
metals, iron and steel, non-metallic minerals,
chemical sector based on the long range analysis
of technology choices in the industrial sector;
• Calibrated model for each of the industrial sectors
in TIMES;
• Validated data stored in a database;
• Economic model which can project future
production for key industrial sectors;
• Light industry study;
• Calibrated model for each of the sectors in TIMES;
• Validated data stored in a database; and
• Economic model which can project future
production for key sectors.
Conclusion
The energy sector is facing serious challenges, such as
climate mitigation, universal access to energy, energy
security and energy efficiency. These challenges and
uncertainties in turn threaten the economy, investment
decisions, investor confidence, economic development
and environmental commitments, amongst others
The DST’s interest in energy related data and modelling
relates to the prioritisation of the direction for research
and technology development, the multitudes of science
and technology related development opportunities
that could potentially stem from the energy sector and
the enormous opportunity for technology and science
skills incubation within priority focus areas.
The DST funded programme CESAR aims to provide
this mechanism for energy modelling and planning
to support the alignment of national and local
government energy objectives. These objectives can
only be achieved by an appropriate level of funding,
dedicated specialised skills and relevant tools.
Performance information by programme

51SANEDI Annual Report 2014/15
Energy Efficiency programme
Energy Efficiency (12L and 12I) tax
incentives
The promulgation of the regulations on the allowance
for energy efficiency savings in terms of section 12L of
the Income Tax Act as amended came into operation
on 1 November 2013.
These particular tax incentives are being introduced
for businesses that can show measurable energy
savings and SANEDI has been tasked with providing
an overall assurance function on behalf of the South
African Revenue Services (SARS) and various national
government departments.
The 12L regulation sets out the process for determining
the quantum of energy efficiency savings, and the
requirements for claiming the proposed tax deduction,
whilst in the case of 12I, energy efficiency forms a
mandatory component in a series of criteria relating to
this industrial manufacturing incentive.
Section 12L incentives include all energy efficiency
projects that reduce energy use and is claimable
until 2020. A decision of major importance was the
announcement by the Minister of Finance in his
budget vote speech to Parliament on 25 February 2015
that the expected tax relief would be increased from
a 45 cents deduction on taxable income per kilowatt
hour of energy saved (45c/kWh) to 95c/kWh and
that cogeneration projects would now be eligible for
this incentive, subject to all the conditions in the 12L
regulations being met.
These new developments have seen an exponential
increase in the interest shown for these energy
efficiency tax incentives, resulting in a massive stretch
on the current SANEDI resources allocated to this task.
Performance information by programme

52 SANEDI Annual Report 2014/15
bigEE (Bridging the information gap
on energy efficiency in buildings and
appliances in developing countries)
The international bigEE website launched the
South African page in January 2015 and the site has
since become operational and is upgraded on a
continual basis. The page displays data knowledge
on energy efficiency policies, best available energy
efficient appliances and the best technologies for
energy efficient buildings. It provides easy access to
information that is up to date and relevant for both
local and international investors in energy efficiency.
Furthermore the design, feel and look of the website
is attractive and user friendly. As such the website can
be used by any interested party to gather information -
from company CEOs, professors, students writing their
theses, to school pupils submitting assignments.
The website provides user friendly options such as
suggesting improvement, posing of questions, user
suggestions and any other opinion the user may desire
appropriate to voice out. In addition the user will find
national and international energy efficiency news.
The information on www.bigee.net provides energy
efficiency knowledge in three main categories:
buildings, appliances and policies.
Since www.bigee.net is an international website, it
provides country-specific information according to its
member countries’ levels of energy efficiency. To date,
South Africa has contributed enormously on the best
available technologies in appliances, policies and other
energy efficiency factors.
Energy efficiency best available technologies in
appliances
A substantial body of information about best available
technologies in appliances was gathered by SANEDI on
the most energy consuming appliances in building and
households and uploaded on the side. The summary
of the following appliances shows the most energy
intensive and most used appliances and also highlights
the levels of efficiency that can be gained from these
appliances.
In terms of the appliances the following will be the
BATs vs non-BAT information dissemination:
Electric heaters – the site includes best available
technology for electric water heaters in South Africa
and an updated standard that governs this appliance.
Also included is a graph showing market penetration
of this appliance between 2001 and 2011, as well as
country-wide savings potential.
Performance information by programme

53SANEDI Annual Report 2014/15
Energy efficient ovens (stoves) - website includes the
best available oven technology in South Africa. Ovens
are one of the biggest consumers of energy, so the
website shows those that are very energy efficient and
those that are not so energy efficient. The contents
also includes the country-wide savings potential. Also
included are graphs showing:
• Market share of cookers by fuel type (gas, electric
and dual fuel);
• Market share of electric ovens by functionality;
• Annual sales of all formats (electric stove, gas and
coal) from 1999 to 2013, as well as built-in ovens
and non-built in cookers from 1999 to 2013; and
• Energy class distribution of ovens (2014).
Energy efficient televisions - includes best available
technology in television in South Africa, country-wide
savings potential, how the global market is transforming
from LCD to LED as the new market standard, and how
the LED televisions are more energy efficient than LCD
and CRT. Furthermore the contents include graphs
showing penetration rate of TV in SA HH 2000-2013,
Performance information by programme
and annual sales from 2000-2011. The comparison
in energy consumption is explained in the following
types: LED, LCD, CRT, RPTV, and Plasma. Finally the
proposed energy label programme, from A+++ (most
efficient) to G (less efficient), which will identify the TV
in terms of energy consumption, is shown.
Swimming pool pumps - including best available
technology for these items. Contents also include
country-wide savings potential, pool pumps energy
requirement for different climatic zones in South
Africa (via climatic zone map) in terms of their
temperatures in summer and winter. Also available are
market characteristics for residential housing in South
Africa, which are broken down into six categories. The
standard type of pool pump by energy consumption
using 1.1kW swimming pool pump is also included.
A study by Eskom, used in a national programme to
promote energy efficiency, found that a 750W pump
uses at least 232 kWh of electricity per month. The
campaign recommended reducing the running time
of swimming pool pumsp by four hours per day to
achieve a 40% saving.

54 SANEDI Annual Report 2014/15
Energy efficient dishwashers - contents include best
available technology on this appliance in SA, country-
wide savings potential, graphs showing electricity
consumption of dishwashers, baseline scenario
(A) vs efficiency scenario (B), and annual sales by
subcategory.
Energy efficient clothes dryers and washer dryers -
website includes best available technologies of this
appliance in SA, country-wide savings potential, annual
sales of dryers and washer dryers (1999-2013), forecast
sales (2014-2018), and energy class distribution of
dryers and washer dryer models (2010).
Energy efficient refrigerators - contents include best
available technology of this appliance in SA, country-
wide saving potential and market characteristics
refrigerators (fridges), freezers and fridge/freezers.
Each sub-category is broken down further into size or
carrying capacity. These measures are listed below and
for the purposes of categorization these categories
will henceforth be referred to “small”, “medium”
and “large”. Penetration rates of refrigerators in SA
HH 2000-2011 (in terms of fridge/freezers and free-
standing freezers), penetration rates in SA HH by sub-
category (freezers, fridges, fridge-freezers) 2000-2013
and forecast 2014-2018, graphs showing distribution
of models by energy rating (small, medium and large
categories) as well as SA energy labeling A (more energy
efficient) to G (least energy efficient) and a proposed
energy labelling (A+++ to D) are also included.
Energy efficient washing machines - contents include
best available technology in this appliance in SA,
country-wide saving potential, and categories of
washing machines based on the most popular capacity
ranges in the market, organised under “small”,
“medium” and “large”. Graphs showing penetration
rate by washing machine type (auto front loading, auto
top loading and semi-auto) in SA HH 2003-2013 (%),
total number of units in SA HH by sub-category 2009-
2013, energy cass distribution of models for front and
top loaders (2010) and the proposed energy label from
A+++ to D A+++, with the most efficient and D the least
efficient, are included.
With the information provided, we are able to deduce
that South Africa is becoming one of the most energy
efficient countries with innovative energy efficient
technologies for buildings and appliances. This will
assist in decreasing the demand for electricity from
the grid, thus mitigating the risk of load shedding
which is currently one of the biggest energy challenges
in South Africa, and will also assist consumers of
electrical appliances to know what energy efficient
appliances are available, thus saving them money, as
well as what they can do to make their buildings more
energy-efficient.
Energy efficiency best available technologies in
buildings
The following is information on the best available
technologies in buildings. The work on buildings
information is ongoing.
Lighting – best available technology in SA in terms of
lighting design in buildings, and the types of bulbs that
are efficient.
HVAC- best available technology in SA in terms of
HVAC.
Water heating (solar, heat pump, etc) - the use of
electric geysers is gradually decreasing and the market
for solar geysers is developing quickly. This indicates
that energy efficiency is possible, since electric geysers
are one of the biggest consumers of electricity. The
demand for electricity from the national grid will
decrease as the uptake of solar geysers improves. This
information therefore indicates the best that South
Africa has with respect to SWH.
Performance information by programme

55SANEDI Annual Report 2014/15
Building insulation - energy efficiency in buildings
is inevitably linked to building insulation, since this
controls the level at which heat is gained in summer
and lost in winter. Building insulation therefore reduces
the need for heating and cooling of buildings, and the
website will include the best available technology in
building insulation in South Africa.
Plug devices (building functionality oriented devices)
upgrade - the website will include the best available
technology in South Africa in terms of plug devices
(that promote energy efficiency).
Building retrofit and maintenance – historically,
energy and electricity have been inexpensive, resulting
in many of South Africa’s buildings having been
constructed inefficiently. The energy efficient response
is retrofits and maintenance, whereby the building
owner removes the energy inefficient features and
components and replaces them with energy efficient
equipment and technologies. In this case the website
will include the methodology used by UP when dealing
with building retrofits and maintenance, known as
TEOP/POET (technology, equipment, operation and
performance).
Applications on alternative energy resource in
buildings - the website will include the best available
technology in terms of applications on alternative
energy resource in buildings.
Measurement and verification building energy
performance - the website will include the best
available technology in terms building measurement
and verification equipment in South Africa.
Energy Efficiency and Demand Side
Management (EEDSM) Hub
(University of Pretoria)
Although major funding and contractual challenges
were experienced in finalising the activities for this
reporting period, the Hub was still able to complete 89
EEDSM-projects, using external funding. 62 students
are registered at the Hub, with 23 being funded through
the DST/DoE/SANEDI assistance programme. Of the 23
students supported through SANEDI, six are women
and 17 are previously disadvantaged individuals (PDIs)
(56.5% are black, 30.4% are Asian and the remainder
white). Fourteen journal papers were published and 22
conference papers were also published and presented.
Performance information by programme

56 SANEDI Annual Report 2014/15
Report on performance against objectives
Programme 1: Administration and corporate governance
Objective Indicator Target Performance result
Reasons for variance Interventions put in place to address non-achievement
Corporate governance – to comply with relevant legislation/ policies/procedures
Annual reportStrategic plan Annual performance plan Quarterly reports
Compliance to relevant legislation/policies/procedures
Achieved All corporate documents were submitted as per the compliance calendar.
To have effective financial processes, systems and procedures
Percentage of creditors paid within 30 days after all relevant documentation have been received
100% of creditors paid within 30 days after all relevant documentation have been received
Achieved In terms of the PFMA, all invoices must be paid within 30 days
Effective and comprehensive stakeholder management
Measurable contact with main stakeholders through monthly and quarterly newsletters, DoE communicator’s forum meetings and reports, annual report contribution, participating in DoE official events
Number of monthly (lower level) newsletters 10
Not achieved The resource responsible for the monthly newsletters went on maternity leave and she was not replaced.
She is scheduled to resume duties on 1 June 2015. In the interim, an intern has been appointed
Number of quarterly newsletters: 4
Achieved The quarterly newsletter was completed, printed and distributed. The distribution will continue until the next issue is due.
DoE communicator’s forum meetings (and reports presented): 6
Achieved All communicator forum meetings held by the DoE were attended and presentations were rendered on behalf of SANEDI
Annual report contribution : 1(editorial and design)
Achieved Communications assisted in the drafting of the Chairperson’s report for the annual report.
DoE official events: 4
Achieved SANEDI participated and assisted with arrangements for the IEA-EE indicators workshops held in SA, as well as SAIREC SteerCo
Performance information by programme

57SANEDI Annual Report 2014/15
Programme 2 : Energy Research and Development
Objective Indicator Target Performance result
Reasons for variance Interventions put in place to address non-achievement
Advanced Fossil Fuels (including Carbon Capture and Storage)
Determination of the potential for shale gas in the energy economy of South Africa
An appraisal of shale gas energy matters with respect to carbon dioxide as an extraction agent, water and waste issues, demand and supply match, risk assessment, geography and surface issues
DoE approved workplan
Achieved
Contract in place for four tasks
Achieved Annual target for four contracts in place – 3 RfP’s closed and currently under evaluation. The 4th task not approved by DoE because of concern of overlap with work of PASA
The determination of the potential and appropriateness of technologies for the geological storage of carbon dioxide in SA
Pilot CO2 Storage Project (PCSP) as a “proof of concept” for CCS in SA
Interim PCSP foundation documentation
Not achieved Interim PCSP foundation documentation, pre-feasibility (exploration) plan and results for other Gate 2 deliverables not completed due to delays in World Bank approval of the project concept notes and procuring processes.
The World Bank has advertised for expressions of interest for project technical advisory services for the Pilot CO2 Storage Project – submissions close 20 April 2015.
The pilot monitoring project at Bongwana natural carbon dioxide releases planning commenced with international participation
Interim pre-feasibility data analyses
Not achieved
Interim feasibility (exploration) plan
Not achieved
Effective and comprehensive stakeholder management
Support activities Award of bursaries to suitable candidates
Achieved Currently, six bursars are studying
Clean Energy Solutions
Manage and coordinate Renewable Energy R&D through RECORD
Coordinate renewable energy R&D
Establish solar photovoltaic platform at NMMU and begin yield/performance measurements
Not achieved The report on the first year of the PV platform which was the 4th quarter target was not achieved.
The progress report from NMMU is awaited.
Prefeasibility study on compiling an ocean energy resource map
Not achieved Funding not available due to budgetary constraints
Seek funding for ocean energy resource map
Publish the “State of energy research in SA” study
Achieved

58 SANEDI Annual Report 2014/15
Objective Indicator Target Performance result
Reasons for variance Interventions put in place to address non-achievement
Clean Energy Solutions
Facilitate renewable energy research collaboration
Implement information exchange sessions with funding counterparts
Achieved Some funding received
Fund and manage existing projects
Achieved
Manage algal bioenergy platform
Achieved
Initiate “State of waste to energy research in SA” study
Achieved
Contribute to renewable energy skills development
Ongoing support to SARETEC (South African Renewable Energy Technology Centre) and preparation of first classes in South Africa
Achieved Ongoing HCD collaboration with GIZ
Renewable energy skills development bursary through Douglas Banks Renewable Energy Vision (DBREV) Fund
Achieved
Collaborative study/training conducted through GIZ
Achieved
Marketing and awareness creation
Raising renewable energy and RECORD awareness through events, conferences, website, articles, etc
Achieved
Present the RECORD Renewable Energy Research Excellence Award in partnership with SANEA
Achieved
Facilitation and support of renewable energy industry association knowledge sharing events
Achieved
Report on performance against objectives

59SANEDI Annual Report 2014/15
Objective Indicator Target Performance result
Reasons for variance Interventions put in place to address non-achievement
Clean Energy Solutions
Collaborative projects, pilots, demonstrations
Manage and coordinate the WASA programme
Creation of an observational wind atlas.Conceptualise a framework for WASA phase II.
Not achieved Care was taken with the site selection process that no EIA issues were triggered and the sites to be representative of the WASA 2 domain which resulted in that the site selection process was only concluded in November 2014. The impact of that is that the mast selection can only be completed by August 2015 after which the site description report can be finalised and submitted
Facilitate the construction and operation of the mobile waste to energy plant
Building of mobile waste to energy plant
Partially achieved
Mobile plant construction has delayed due to a late start and therefore ordering and receipt of parts.
Talks with DST for collaboration have been initiated
Support municipalities through establishing a waste to energy hub
Waste to energy hub concept document produced
Partially achieved
Proposal sent to a number of donors but no support has been received, However, progress has been made on the web based guideline for MSW for municipalities
Facilitate the development of the SA Solar Energy Technology Road Map (SETRM)
Complete and produce road map
Not achieved Draft roadmap document with the DoE and DST waiting for an interdepartmental consultation
Facilitate the development and uptake of EE in the housing and building sector in SA through collaborative efforts and demonstration
Update and maintain the EE housing database on the SANEDI website with current information
Achieved
Coordinate the set- up of solar measuring stations
Set up two MET stations and initiate solar atlas with DST
Achieved
Report on performance against objectives

60 SANEDI Annual Report 2014/15
Objective Indicator Target Performance result
Reasons for variance Interventions put in place to address non-achievement
Clean Energy Solutions
Representation of SA in international fora, whereby technical knowledge is gained and skills are shared and transferred
Maintain and manage existing IEA and REEEP implementation agreements including Horizon 2020 and other EU-SA initiatives with DST and execute key objectives outlined in the respective agreements/contracts
Achieved
Smartgrids
Stakeholder engagement (SASGI) activities Steering Committee meetings
Industry participation and contribution towards establishing Smart Grids in SA • Minutes • Workshops • Seminars
Four meetings Achieved
Policy Work Group dealing with industry inputs towards developing a national policy
Metering code established
Metering code guidelines for SA
Partially achieved
This target has direct relationship with NRS0409. Had several meetings with NERSA and ESKOM to discuss the way forward to establish a smart metering code for SA. Had a comprehensive literature review and came to the conclusion that New Zealand and Australia have a smart metering code relevant to SA. NERSA has the responsibility to adapt both standards to relevant SA standards.
Report on performance against objectives

61SANEDI Annual Report 2014/15
Objective Indicator Target Performance result
Reasons for variance Interventions put in place to address non-achievement
Smart Grids
Investigate the role of the DSO
Investigate the role of the DSO report
Partially achieved
The ToR has been developed. Delays can be attributed to the formal project approval being received from the DoE in Sept 2014. Collaboration agreement with University of Pretoria to produce first draft.
Technology and standards workgroup that deals with industry inputs towards the development of national smartgrid standards
Smart meter functionality guideline report
Develop an industry approved guideline
Not achieved Met with the NRS049 team – they have a document that covers the electricity smart metering functionality. It is their mandate to produce the report and not SANEDI’s.
AMI security guideline
AMI security guideline report
Partially achieved
The ToR has been developed for the University of Pretoria to carry out the evaluation using the NIST (USA) guideline as reference. Delays can be attributed to the formal project approval being received from the DoE in Sept 2014.
Applied Research Workgroup is established to get industry inputs and share project knowledge with the industry
SGMM assessment of EU donor funded projects
Five SGMM reports
Achieved
Documenting of industry existing case studies
Four case studies document
Achieved
Marketing and awareness workgroup is established to deal with the development of the standardised message for the industry
Establish the SASGI website for information clearing for the industry
SASGI minutes ISGAN informationpresentations
Achieved
Attend conferences and share knowledge
Utility week and AMEU
Achieved
Training and development workgroups is established to deal with industry SG skills development
Establish a smart meter test and evaluation centre at the University of Pretoria
Establish a smart meter test and evaluation centre at the University of Pretoria
Achieved The value proposition was demonstrated to industry. Industry advised that it is not necessary at present to establish a smart meter test and evaluation centre.
Report on performance against objectives

62 SANEDI Annual Report 2014/15
Objective Indicator Target Performance result
Reasons for variance Interventions put in place to address non-achievement
Smart Grids
ISGAN Participate in ISGAN Exco meetings Participate in Annexure 3 activities Participate in Annexure 6 meetings
Attend two Exco meetings
Achieved SANEDI hosted the 9th ISGAN EXCO and public workshop at the Radisson Hotel in Sandton. There was representation from the DoE, the municipalities and international communities.
EU donor funded programme : IPP net metering study
To demonstrate that IPPs can be net metered and net billed
Create the infrastructure for billing and net metering with a chosen utility. Monitor and evaluate outputs
Not achieved The DoE has yet to define this project as it requires input from its IPP office
AMI integration (FBE, IBT, EEDSM)
To demonstrate systems, process to implement AMI in a utility• Assess• Design• Procure• Development• Installation• Training• Monitoring
and verification
• Handover
Create the necessary infrastructure, systems and process to do best practice AMI• FBE• TOU, IBT• EEDSM
in commercial buildings
Partially achieved
City Power has completed its project approval phase. Delays can be attributed to the formal project approval being received from the DoE in Sept 2014.
Revenue enhancement study
To demonstrate systems, process to improve municipal electricity revenue collection• Assess• Design• Procure• Development• Installation• Training• Monitoring
and verification
• Handover
Create infrastructure, systems and process to do best practice AMI, FBE, TOU, IBT, EEDSM in commercial buildings
Partially achieved
All five municipalities have completed the project approval phase. Outstanding are six other phases. Delays can be attributed to the formal project approval being received from the DoE in Sept 2014.
Public buildings (EEDSM)
Demonstrate that energy efficiency and demand management can be optimized by incorporating smart grid technology.
Installation of a smart meter in DoE chosen buildings Installation of a building management system in DoE chosen public buildings Installation of control sensors in DoE chosen buildings
Not achieved This is a DoE Energy Efficiency Directorate (Mr Mabusela) responsibility
Report on performance against objectives

63SANEDI Annual Report 2014/15
Objective Indicator Target Performance result
Reasons for variance Interventions put in place to address non-achievement
Smart Grids
Active network management (IPP integration onto the distribution grid)
To demonstrate Active network management systems in a DSO.• Assess• Design• Procure• Development• Installation• Training• Monitoring
and verification
• Handover
Create the necessary infrastructure, systems and process to do best practice ANM in a DSO
Partially achieved
The target addresses imbedded generation. The IPP element in it has been removed.
Asset Management (ADAM)
To demonstrate systems, process to improve utility asset management• Assess• Design• Procure• Development• Installation• Training• Monitoring
and verification
• Handover
Create infrastructure, systems and process to do best practice asset management
Partially achieved
Nelson Mandela Municipality is making good progress whilst Mzundusi is going to be dropped from the project due to internal challenges. Delays can be attributed to the formal project approval being received from the DoE in Sept 2014.
Working for Energy Renewable Energy Provision
Melani village biogas project Phase 2(University of Fort Hare)
55 biogas digesters implementated and handed over
Not achieved Implementation agreement finalised between the University of Fort Hare with the service provider. Stakeholder engagement process commenced. Site selection is in process.
Mass implementation to ensue in the next quarter.
Gauteng DID greening of schools project
Five biogas digesters completed
Not achieved Negotiation with preferred service provider in process, since all received RFP’s were extremely high priced. Negotiation process is unfolding.
Alternative delivery method has been contemplated
NDA greening of facilities project
Five biogas digesters completed
Not achieved Negotiation with preferred service provider in process, since all received RFP’s were extremely high priced. Negotiation process is unfolding.
Alternative delivery method has been contemplated
Report on performance against objectives

64 SANEDI Annual Report 2014/15
Objective Indicator Target Performance result
Reasons for variance Interventions put in place to address non-achievement
Working for Energy
Mpfuneko biomass project
Complete implementation of 20 biogas digesters project and hand over
Partially achieved
Construction is at the level of 49 biogas digesters. Balance of six digesters will be completed in the next two quarters and commission, M&V, hand over is expected at the end of the financial year.
Illembe rural biogas project
Project hand over to Ndwedwe district municipality
Not achieved Process awaiting response from the Ministry in respect of the launch of the project. Continuous engagement with SoE oversight branch and the Office of the Minister
Lucingweni community ECDC conversion project
Complete implementation of community ECDC conversion project and hand over
Not achieved Contract has been concluded with Nelson Mandela Metropolitan University to remove obsolete equipment in the facility and clear the site for conversion, establish a clean energy centre under the RECORD and safekeeping of balance of material for Walter Sisulu University and Cape Peninsula University of Technology.
School and clinic renewable energy demonstration centre project
Implementation of a demonstration centre for renewable energy and energy efficiency under the department of science within the school
Partially achieved
Two solar water heaters have been installed and commissioned and the energy efficiency lighting has been partially done.
WFE is currently looking at alternative costs effective processes for digesters
Greening of Tshireleco high school
Complete implementation of a biogas digester project and hand over
Not achieved Delays were encountered soliciting RFQ’s
Report on performance against objectives

65SANEDI Annual Report 2014/15
Objective Indicator Target Performance result
Reasons for variance Interventions put in place to address non-achievement
Working for Energy
Tygerkloof high school
Scoping and planning completed
Not achieved Alternative turnkey contract has been concluded with the school to source specified technologies from the OEM. Water quality assessment, water purification system, low pressure biogas digester installation envisaged by the end of quarter 2 in the 2015/16 financial year
Working for Outreach Programme
Implementation of the outreach programme for the Working for Energy Programme
Not achieved Awaiting dates from Ministry regarding the launch of the program as requested by the Chairperson
NDA greening of schools project
Scoping and planning completed of SWH Projects
Not achieved Project completion envisaged by the end of Quarter 2 of the 2015/16 financial year.
Gauteng DID greening of schools project
Scoping and planning completed of SWH Projects
Not Achieved Baseline studies completed. RFQ are being evaluated. Installation envisaged by the end of Quarter 2of the 2015/16 financial year
Objective Indicator Target Performance result
Reasons for variance Interventions put in place to address non-achievement
Data and Knowledge Management
Integrated EE data respository
Functional, accurate, integrated and user- friendly database
Database fully developed and populated
Achieved
Report on performance against objectives
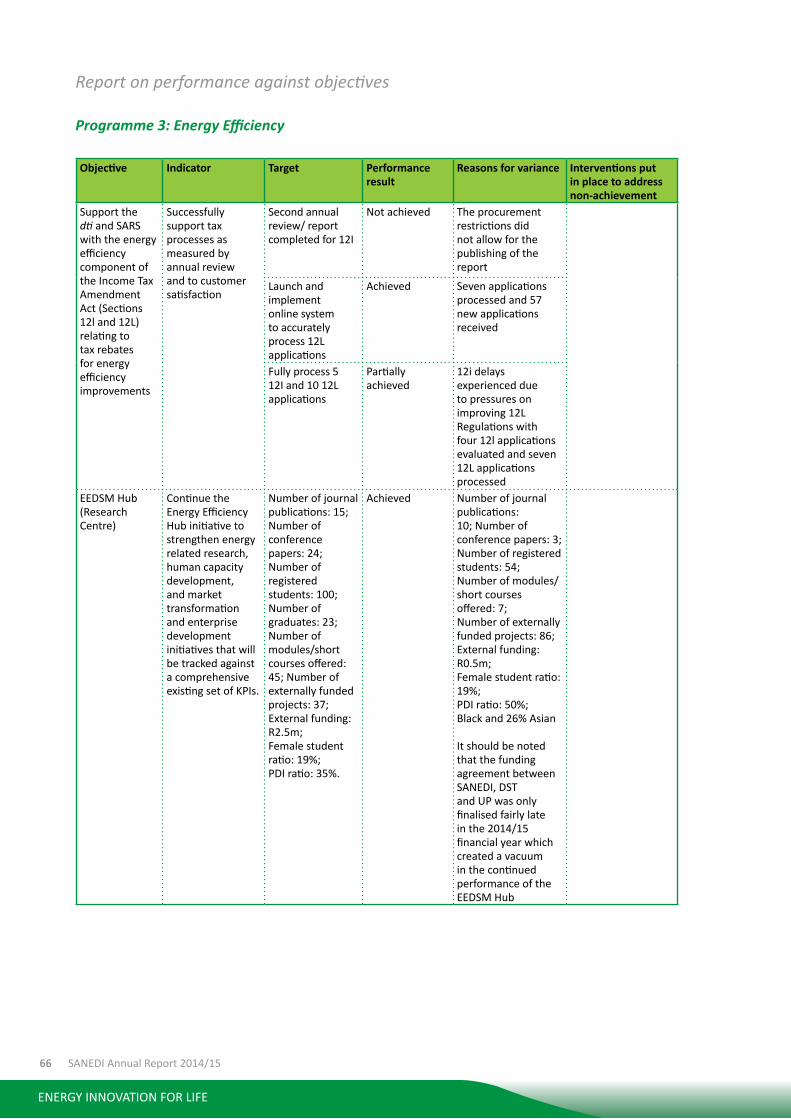
66 SANEDI Annual Report 2014/15
Report on performance against objectives
Programme 3: Energy Efficiency Objective Indicator Target Performance
result Reasons for variance Interventions put
in place to address non-achievement
Support the dti and SARS with the energy efficiency component of the Income Tax Amendment Act (Sections 12l and 12L) relating to tax rebates for energy efficiency improvements
Successfully support tax processes as measured by annual review and to customer satisfaction
Second annual review/ report completed for 12I
Not achieved The procurement restrictions did not allow for the publishing of the report
Launch and implement online system to accurately process 12L applications
Achieved Seven applications processed and 57 new applications received
Fully process 5 12I and 10 12L applications
Partially achieved
12i delays experienced due to pressures on improving 12L Regulations with four 12l applications evaluated and seven 12L applications processed
EEDSM Hub (Research Centre)
Continue the Energy Efficiency Hub initiative to strengthen energy related research, human capacity development, and market transformation and enterprise development initiatives that will be tracked against a comprehensive existing set of KPIs.
Number of journal publications: 15; Number of conference papers: 24; Number of registered students: 100; Number of graduates: 23; Number of modules/short courses offered: 45; Number of externally funded projects: 37;External funding: R2.5m;Female student ratio: 19%;PDI ratio: 35%.
Achieved Number of journal publications: 10; Number of conference papers: 3; Number of registered students: 54; Number of modules/short courses offered: 7; Number of externally funded projects: 86; External funding: R0.5m; Female student ratio: 19%; PDI ratio: 50%;Black and 26% Asian
It should be noted that the funding agreement between SANEDI, DST and UP was only finalised fairly late in the 2014/15 financial year which created a vacuum in the continued performance of the EEDSM Hub

67SANEDI Annual Report 2014/15
Report on performance against objectives
Objective Indicator Target Performance result
Reasons for variance Interventions put in place to address non-achievement
Industry support
Support industry stakeholders towards achieving improved energy efficiency in collaboration with international partners
Complete bigEE project successfully
Achieved It is important to note the launch of the South Africa page and continual up –dating of information as new data is collected. Browsers are continually encouraged to leave comments for the improvement of the website. Since there was no initial target work is upgraded on a continual basis.
Best available technologies and non-best available technologies actor constellation
Achieved The appliances aspect of the project has been completed and uploaded on the website, data has been collected in the form of documents containing the technical aspect of the technology appliance in question. The appliance sub- project will sign off in the close of May 2015With regards to the buildings, a contract with the University of Pretoria has been entered into objectives outlined.
Best available technologies and non – best available technologies
Achieved Unstructured data with regards to appliances is in the process of analysis. With regards to buildings, data has been collected, analysed and adopted.With regards to best practices, 20 best practice examples are to be submitted. 20 residential best practice and 10 commercial best practices gathered and submitted. 10 extra buildings were gathered. Data on the industrial buildings still necessary.

68 SANEDI Annual Report 2014/15
Objective Indicator Target Performance result
Reasons for variance Interventions put in place to address non-achievement
Actor constellation
Achieved With regards to best practices, 20 best practice examples are to be submitted. 20 residential best practice and 10 commercial best practices gathered and submitted. 10 extra buildings were gathered. Data on the industrial buildings still necessary.
EE policies Achieved The EE policies covers both appliances and buildings. There are no considerable differences.
Climatic zone map Achieved The climatic zone map was developed and is constantly being updated by the CSIR
Provide TAF function, as per contracted outputs
Achieved The entire facility is almost completely committed to RE/EE projects with the three participating banks
National M&V position paper developed
Partially achieved
Document completed but not yet uploaded on the international platform
Report on performance against objectives

69SANEDI Annual Report 2014/15
Report on performance against objectives
Objective Indicator Target Performance result
Reasons for variance Interventions put in place to address non-achievement
National M&V Centre
Establish a national consolidated independent M&V function
Consolidate all existing energy (electricity and other energy where relevant)efficiency activities
Partially achieved
Longer-term activity requiring detailed interaction with the shareholder and other stakeholders. However, the basic building blocks are in place and the activity is now regarded as urgent by all the key role-players, including the DoE.
This is an ongoing activity, involving the shareholder and multiple external stakeholders.
National Champion for EE
Join and participate in IEA-DSM task 24 relating to the study and benchmarking of consumer behaviour impacts on the efficient use of energy amongst all participating countries
Join and participate in IEA-DSM Task 24 relating to the study and benchmarking of consumer behaviour impacts on the efficient use of energy amongst all participating countries
Not achieved Due to budgetary constraints, SANEDI exco decided to not formally participate in this IEA task
National M & V Centre
Establish a national consolidated, independent M&V function
Consolidate all existing energy (electricity and other energy where relevant) efficiency activities
Partially achieved
All systems and the M&V process are in place with SANAS for tax related incentives
National M&V position paper developed
Achieved Awaiting DoE’s input/decision on taking this proposal forward

70 SANEDI Annual Report 2014/15
Communications
Communications is a fundamental element
contributing towards the direct success of SANEDI in
the field of energy and its role in contributing to cleaner
and smarter energy in South Africa. The operative
function of communications contributes effectively
to SANEDI’s business activities, both internally and
externally. SANEDI’s communications team has been
hard at work advancing SANEDI through upholding an
excellent standard of promoting the institution to its
stakeholders. This has been achieved by solidifying its
relationships and continuously forging more mutually-
beneficial relationships that will contribute to its
credibility in the public eye. In 2014/15, the team has
taken significant steps in circulating accurate and
consistent information to the public and achieving
maximum exposure of its programmes and as an
organisation. Many of the initiatives set SANEDI on
a platform to earn it much deserved attention in the
energy space and showcase some of the excellent
work it does in this country.
One of the vehicles that has been very successful in
marketing SANEDI activities is participation in various
conferences by means of presentations and exhibitions.
One of these conferences was Sustainability Week and
Africa Energy Indaba.
Report on performance against objectives
A quarterly
newsletter was
introduced,
structured to
produce a current
and up-to-date
report of SANEDI’s
activities and keep
its stakeholders
informed about
what is happening
in the organisation.

71SANEDI Annual Report 2014/15
Report on performance against objectives
Mandela Day 2014
SANEDI joined hands with the Department of Energy
and Soweto TV to bring a better life to the babies and
toddlers of the Kidos Educare Centre in Protea South,
Soweto.
This was the second time SANEDI had visited the
centre. Last year SANEDI partnered with Soweto TV
and St Gobain to donate some basic necessities to the
centre. After realising that the centre is in desperate
need for improvement, the partners agreed on a
second phase of the project, which was to provide
the day care centre with a new temporary structure,
water harvesting tanks, fencing and mini kitchen. The
team was joined by the Deputy Minister of Energy, Ms
Thembisile Majola, and the staff from the Ministry. The
success of Mandela Day 2015 was a team effort by all
three organisations - Department of Energy, SANEDI
and Soweto TV.

72 SANEDI Annual Report 2014/15
PART C:Human resource management
Human resources management (HRM) in organisations
is designed to maximise employee performance of
an employer’s strategic objectives. HR, or people
management, as it is known in private companies is
concerned with the management of people within
an organisation within the parameters of policies,
procedures and systems. The HR department, in
partnership with line departments in an organisation,
undertake a number of activities which include
employee recruitment, training and development and
performance appraisal. Labour relations also plays a
critical role in the management of staff.
SANEDI’s HR function is contracted to the CEF Group
of Companies and is managed through a service level
agreement. It is envisaged that a human resources
manager will be appointed
SANEDI is still dependent on CEF’s human resources
policies, procedures, programmes, systems and
processes to attract, develop and retain requisite
skills within SANEDI through effective recruitment
and selection processes, facilitation of training and
development, transparent performance management
processes, attractive remuneration, an effective payroll
system, and a healthy and safe work environment
as well as skills development through an internship
programme.
SANEDI has a performance management system
that provides standards by which the performance
of individual employees is monitored and measured
to allow for management of performance and the
rewarding of deserving employees.
The following policies have been developed for
SANEDI:
• Performance management policy;
• Internship policy;
• Leave policy and procedure;
• Study assistance for employees policy; and
• HIV/AIDS and other life threatening diseases.
The performance management policy of SANEDI
recognises the value of a performance based
institutional culture that promotes employee
productivity, engagement, and development by
aligning individual performance goals with the entitiy’s
mission, strategic goals, and objectives.

73SANEDI Annual Report 2014/15
The internship programme is aimed at giving students
the opportunity to apply their knowledge in real world
environments. At the same time, they will develop
skills which will help them perform better at their
jobs. They are provided with experience that will make
them stronger and more confident in their abilities.
The experience also helps develop their work ethic. By
effectively being engaged in the internship programme,
students will increase their skills and make themselves
valuable in the job market. Their employers are likely
to benefit as well.
The study assistance policy for employees is designed
to encourage personal and professional development
of staff thereby benefitting the organisation.
Employees are encouraged to take responsibility for
their own development. The purpose of the policy
is to provide assistance to all permanent employees
for part time study in order to obtain appropriate
academic qualifications. The field of study embarked
on must be related to the employee’s position or the
general objectives of the company.
Personnel costs by programme
Programme Total expenditure
for the entity
Personnel expenditure (TCTC)
Personnel expenditure
as a % of total expenditure
No of employees
Average personnel cost per employee
Corporate governance and administration R45 456 606 R15 484 707 34% 22 R703 850 Energy Research and Development R58 222 924 R20 062 110 34% 33 R607 943 Energy Efficiency R9 088 457 R2 599 695 29% 2 R1 299 848
Personnel cost by salary band
LevelPersonnel
expenditure
% personnel expenditure to total
personnel cost No of employees Average personnel cost per employee
Top management /senior management (P1-4) R4 039 441 11% 2
R2 058 466
Middle management (P5-7) R24 009 278 64% 18
R1 348 848
Junior staff (P8-12) R9 700 300 26% 37 R263 521
Performance rewards
Level Performance rewards Personnel expenditure % of performance rewards
to total personnel cost Top management /Senior management (P1-4) R717 042 R4 039 441 17%Middle management (P5-7) R4 921 096 R24 009 278 20%Junior staff (P8-12) R1 507 860 R9 700 300 15%
Human resource management

74 SANEDI Annual Report 2014/15
Reasons for staff leaving
Reason Number % of total no of staff leaving
Death 0 0%Resignation 2 67%Dismissal 0 0%Retirement 0 0%Ill Health 0 0%Expiry of contract 0 0%Other 1 33%TOTAL 3 100%
Labour relations, misconduct and disciplinary action
Nature of disciplinary action Number Verbal warning 0Written warning 0Final written warning 0Dismissal 0
Staff demographics
SANEDI has a staff complement of 52. The profile is as follows:
Category WM IM CM BM WF IF CF BFCEO 0 0 1 0 0 0 0 0CFO 0 0 0 0 0 0 0 1Senior managers 4 1 0 1 0 0 0 1Financial manager 0 0 0 0 0 0 1 0Manager: CS/Office of the CEO 0 0 0 0 0 1 0 0IT manager 0 1 0 0 0 0 0 0System administrator 0 0 0 0 0 0 0 1Accountants 0 0 0 2 0 0 0 1Centre managers 0 0 0 0 2 0 0 0Project managers 0 1 1 1 0 0 0 0Geologist 0 0 0 0 0 0 0 1Public awareness officer 0 0 0 1 0 0 0 2Project officers 0 1 0 3 0 0 0 0Project coordinators 0 0 0 0 1 0 0 2Procurement officer 0 0 0 0 0 0 0 1Admin officer 0 0 0 0 0 1 0 2Research assistants 0 0 0 0 1 0 0 0Personal assistant 0 0 0 0 0 0 1 1
Human resource management
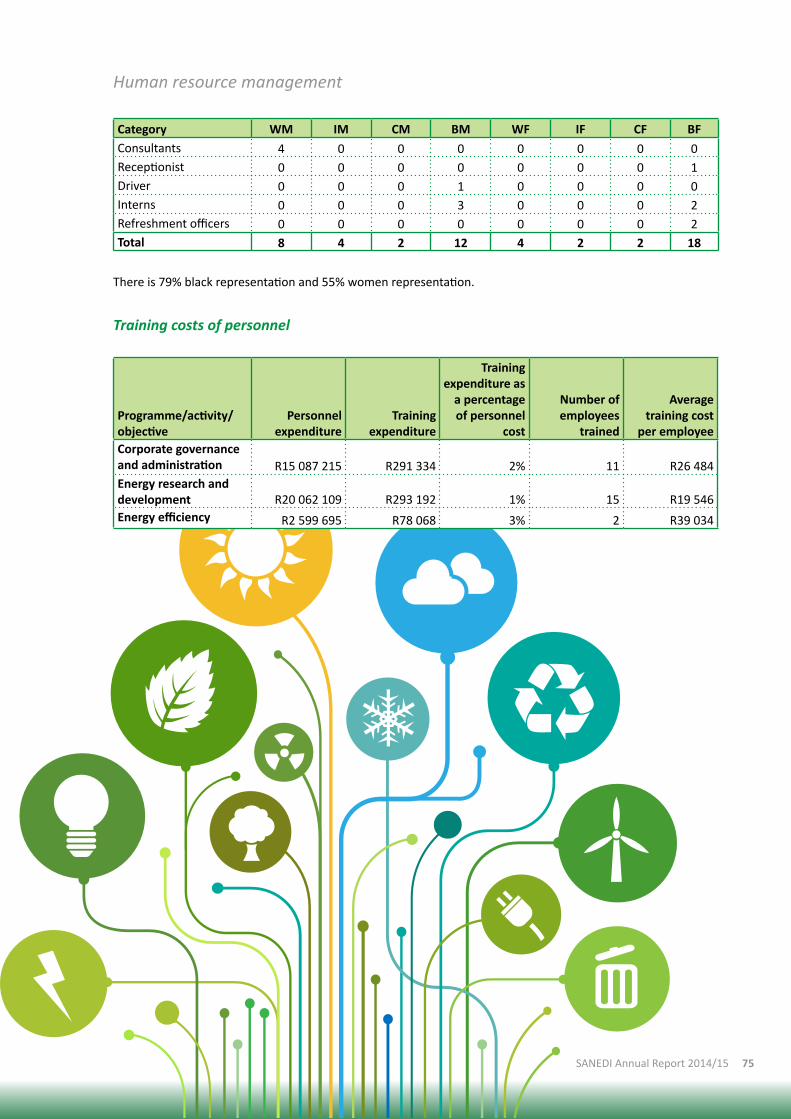
75SANEDI Annual Report 2014/15
Human resource management
Category WM IM CM BM WF IF CF BFConsultants 4 0 0 0 0 0 0 0Receptionist 0 0 0 0 0 0 0 1Driver 0 0 0 1 0 0 0 0Interns 0 0 0 3 0 0 0 2Refreshment officers 0 0 0 0 0 0 0 2Total 8 4 2 12 4 2 2 18
There is 79% black representation and 55% women representation.
Training costs of personnel
Programme/activity/objective
Personnel expenditure
Training expenditure
Training expenditure as
a percentage of personnel
cost
Number of employees
trained
Average training cost
per employeeCorporate governance and administration R15 087 215 R291 334 2% 11 R26 484 Energy research and development R20 062 109 R293 192 1% 15 R19 546 Energy efficiency R2 599 695 R78 068 3% 2 R39 034

76 SANEDI Annual Report 2014/15
The following staff were not at the photoshoot:
− R Abrahamse
− J Nankoo
− E Nkile
− R Hamid
− S Sekoa
K Nassiep
CEO
Dr M Bipath
L Smith
N Algio
Dr S Hietkamp
J Schaffler S Nyathi
B Beck
A Otto S JumbaC Snyman
E Nyandoro
T Mokoena N Faleni
L Radebe
R Raselavhe
P ModikoS Tshivhase
F Manganyi
Dr AD Surridge W Ingcobo
Dr T MaliW Jali
K Mpheqeke
D Batte
Human resource management
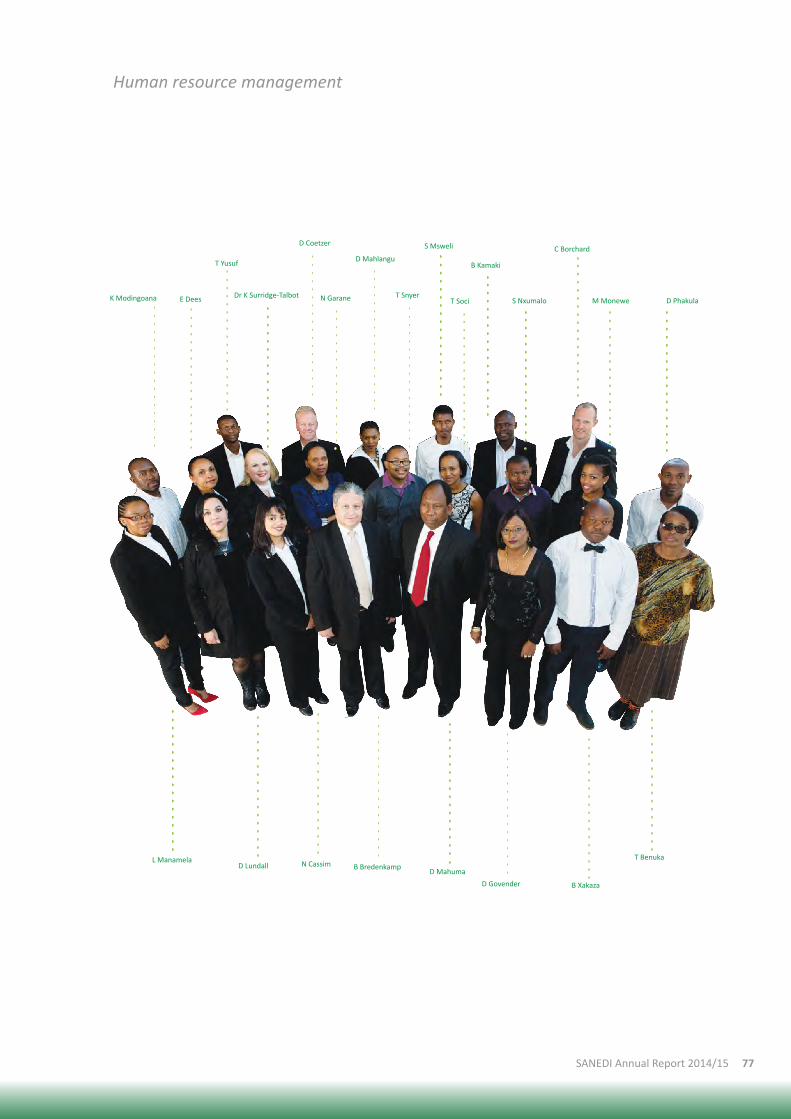
77SANEDI Annual Report 2014/15
E DeesK Modingoana
T Yusuf
Dr K Surridge-Talbot
D Coetzer S Msweli
S Nxumalo
C Borchard
M Monewe D Phakula
B Kamaki
N Garane
D Mahlangu
T Soci
L ManamelaD Lundall N Cassim B Bredenkamp
D Mahuma
D Govender B Xakaza
T Benuka
T Snyer
Human resource management

78 SANEDI Annual Report 2014/15
RepoRt of the auditoR-geneRal to paRliament on the South afRican national eneRgy development inStitute
PART D:Financial Information

79SANEDI Annual Report 2014/15
RepoRt of the auditoR-geneRal to paRliament on the South afRican national eneRgy development inStitute
Report on the financial statements
Introduction
1. I have audited the financial statements of the South African National Energy Development Institute (SANEDI)
set out on pages 97 to 134, which comprise the statement of financial position as at 31 March 2015, the
statement of financial performance , statement of changes in net assets and cash flow statement and the
statement of comparative and actual information for the year then ended, as well as the notes, comprising
a summary of significant accounting policies and other explanatory information.
Accounting Authority’s responsibility for the financial statements
2. The Accounting Authority is responsible for the preparation and fair presentation of these financial
statements in accordance with South African Standards of Generally Recognised Accounting Practice (SA
Standards of GRAP) and the requirements of the Public Finance Management Act of South Africa, 1999 (Act
No. 1 of 1999) (PFMA), and for such internal control as the Accounting Authority determines is necessary
to enable the preparation of financial statements that are free from material misstatement, whether due
to fraud or error.
Auditor-general’s responsibility
3. My responsibility is to express an opinion on these financial statements based on my audit. I conducted my
audit in accordance with International Standards on Auditing. Those standards require that I comply with
ethical requirements, and plan and perform the audit to obtain reasonable assurance about whether the
financial statements are free from material misstatement.
4. An audit involves performing procedures to obtain audit evidence about the amounts and disclosures
in the financial statements. The procedures selected depend on the auditor’s judgement, including the
assessment of the risks of material misstatement of the financial statements, whether due to fraud or
error. In making those risk assessments, the auditor considers internal control relevant to the entity’s
preparation and fair presentation of the financial statements in order to design audit procedures that are
appropriate in the circumstances, but not for the purpose of expressing an opinion on the effectiveness of
the entity’s internal control. An audit also includes evaluating the appropriateness of accounting policies
used and the reasonableness of accounting estimates made by management, as well as evaluating the
overall presentation of the financial statements.
5. I believe that the audit evidence I have obtained is sufficient and appropriate to provide a basis for my
audit opinion.
Opinion
6. In my opinion, the financial statements present fairly, in all material respects, the financial position of the
South African National Energy Development Institute as at 31 March 2015 and its financial performance
and cash flows for the year then ended, in accordance with SA Standards of GRAP and the requirements
of the PFMA.
Emphasis of matter
7. I draw attention to the matter below. My opinion is not modified in respect of this matter.

80 SANEDI Annual Report 2014/15
RepoRt of the auditoR-geneRal to paRliament on the South afRican national eneRgy development inStitute
Restatement of corresponding figures
8. As disclosed in note 19 to the annual financial statements, the corresponding figures for 31 March 2014
have been restated as a result of a correction of error discovered during 2014 in the financial statements
of the South African National Energy Development Institute for the year ended, 31 March 2014.
Report on other legal and regulatory requirements
9. In accordance with the Public Audit Act of South Africa, 2004 (Act No. 25 of 2004) (PAA) and the general
notice issued in terms thereof, I have a responsibility to report findings on the reported performance
information against predetermined objectives for selected programmes presented in the annual
performance report, non-compliance with legislation and internal control. The objective of my tests was
to identify reportable findings as described under each subheading but not to gather evidence to express
assurance on these matters. Accordingly, I do not express an opinion or conclusion on these matters.
Predetermined objectives
10. I performed procedures to obtain evidence about the usefulness and reliability of the reported performance
information for the following selected programmes presented in the annual performance report of the
public entity for the year ended 31 March 2015:
• Programme 2: Applied Energy Research on page 57 to 65
• Programme 3: Energy Efficiency on page 66 to 69
11. I evaluated the reported performance information against the overall criteria of usefulness and reliability.
12. I evaluated the usefulness of the reported performance information to determine whether it was
presented in accordance with the National Treasury’s annual reporting principles and whether the
reported performance was consistent with the planned programmes. I further performed tests to
determine whether indicators and targets were well defined, verifiable, specific, measurable, time bound
and relevant, as required by the National Treasury’s Framework for managing programme performance
information (FMPPI).
13. I assessed the reliability of the reported performance information to determine whether it was valid,
accurate and complete.
14. The material findings in respect of the selected programmes are as follows:
Programme 2: Applied Energy Research
Usefulness of reported performance information
Measurability of indicators and/or targets
Performance targets not specific
The National Treasury Framework for managing programme performance information (FMPPI) requires
that performance targets be specific in clearly identifying the nature and required level of performance.
A total of 28% of the targets were not specific in clearly identifying the nature and the required level of
performance. This was due to the fact that management was aware of the requirements of the FMPPI but
did not receive the necessary training to enable application of the principles.

81SANEDI Annual Report 2014/15
RepoRt of the auditoR-geneRal to paRliament on the South afRican national eneRgy development inStitute
Performance targets not measurable
The National Treasury Framework for managing programme performance information (FMPPI) requires
that performance targets be measurable. The required performance could not be measured for a total of
21% of the targets. This was due to the fact that management was aware of the requirements of the FMPPI
but did not receive the necessary training to enable application of the principles.
Performance indicators not well-defined
The National Treasury Framework for managing programme performance information (FMPPI) requires
that indicators/measures should have clear unambiguous data definitions so that data is collected
consistently and is easy to understand and use. A total of 100% of the indicators were not well defined in
that clear, unambiguous data definitions were not available to allow for data to be collected consistently.
This was due to the fact that management was aware of the requirements of the FMPPI but did not receive
the necessary training to enable application of the principles.
Indicators not verifiable
The National Treasury Framework for managing programme performance information (FMPPI) requires
that it must be possible to validate the processes and systems that produce the indicator. A total of 100%
of the indicators were not verifiable in that valid processes and systems that produce the information on
actual performance did not exist. This was due to the fact that management was aware of the requirements
of the FMPPI but did not receive the necessary training to enable application of the principles.
Reliability of reported performance information
The National Treasury Framework for managing programme performance information (FMPPI) requires
that institutions should have appropriate systems to collect, collate, verify and store performance
information to ensure valid, accurate and complete reporting of actual achievements against planned
objectives, indicators and targets.
The information presented with respect to Programme 2: Applied Energy Research was not reliable when
compared to the source information and/or evidence provided.
This was due to the lack of standard operating procedures for the accurate recording of actual achievements.
Programme 3: Energy Efficiency
Measurability of indicators and targets
Performance target not specific
The National Treasury Framework for managing programme performance information (FMPPI) requires
that performance targets be specific in clearly identifying the nature and required level of performance.
A total of 69% of the targets were not specific in clearly identifying the nature and the required level of
performance. This was due to the fact that management was aware of the requirements of the FMPPI but
did not receive the necessary training to enable application of the principles.

82 SANEDI Annual Report 2014/15
RepoRt of the auditoR-geneRal to paRliament on the South afRican national eneRgy development inStitute
Performance targets not measurable
The National Treasury Framework for managing programme performance information (FMPPI) requires
that performance targets be measurable. The required performance could not be measured for a total of
85% of the targets. This was due to the fact that management was aware of the requirements of the FMPPI
but did not receive the necessary training to enable application of the principles.
Performance indicators not well-defined
The National Treasury Framework for managing programme performance information (FMPPI) requires
that indicators/measures should have clear unambiguous data definitions so that data is collected
consistently and is easy to understand and use. A total of 100% of the indicators were not well defined in
that clear, unambiguous data definitions were not available to allow for data to be collected consistently.
This was due to the fact that management was aware of the requirements of the FMPPI but did not receive
the necessary training to enable application of the principles.
Performance indicators not verifiable
The National Treasury Framework for managing programme performance information (FMPPI) requires
that it must be possible to validate the processes and systems that produce the indicator. A total of 100%
of the indicators were not verifiable in that valid processes and systems that produce the information on
actual performance did not exist. This was due to the fact that management was aware of the requirements
of the FMPPI but did not receive the necessary training to enable application of the principles.
Reliability of reported performance information
The National Treasury Framework for managing programme performance information (FMPPI) requires
that institutions should have appropriate systems to collect, collate, verify and store performance
information to ensure valid, accurate and complete reporting of actual achievements against planned
objectives, indicators and targets.
I was unable to obtain the information and explanations I considered necessary to satisfy myself as to the
reliability of information presented with respect to Programme 3: Energy efficiency. This was due to the
fact that the annual performance report, contrary to the requirements of the FMPPI, was presented in
such a manner that the nature and level of actual performance was not clearly identified. Consequently,
the actual performance could not be measured. The institution’s records did not permit the application of
alternative audit procedures.
Additional matter
15. I draw attention to the following matter:
Achievement of planned targets
16. Refer to the annual performance report on page(s) 56 to 69 for information on the achievement of the
planned targets for the year. This information should be considered in the context of the material findings
on the usefulness and reliability of the reported performance information for the selected programmes
reported in paragraph 14 of this report.
83SANEDI Annual Report 2014/15
RepoRt of the auditoR-geneRal to paRliament on the South afRican national eneRgy development inStitute
Compliance with legislation
17. I performed procedures to obtain evidence that the public entity had complied with applicable legislation
regarding financial matters, financial management and other related matters. My findings on material
non-compliance with specific matters in key legislation, as set out in the general notice issued in terms of
the PAA, are as follows:
Annual financial statements
18. The financial statements submitted for auditing were not prepared in all material respects in accordance
with the requirements of section 55(1)(b) of the PFMA. Material misstatements identified by the AGSA
relating to valuation of conditional grants, accuracy of revenue from exchange transactions, valuation of
property, plant and equipment, notes on prior period errors and changes in accounting policies, were
subsequently corrected resulting in the financial statements receiving an unqualified audit opinion.
Expenditure management
19. The Accounting Authority did not take effective steps to prevent irregular expenditure, as required by
section 51(1)(b)(ii) of the Public Finance Management Act.
Internal control
20. I considered internal control relevant to my audit of the financial statements, annual report on performance
against predetermined objectives and compliance with legislation. The matters reported below are
limited to the significant internal control deficiencies that resulted in the findings on the annual report
on performance against predetermined objectives and the findings on non-compliance with legislation
included in this report.
Leadership
21. Management did not exercise adequate oversight responsibility regarding financial and performance
reporting and compliance as well as related internal controls.
Financial and performance management
22. Non-compliances with laws and regulations could have been avoided had the Accounting Authority
implemented proper controls over monitoring of compliance with laws and regulations.
23. The financial statements contained misstatements that were corrected. This was mainly due to staff
members not fully understanding the requirements and the application of the financial reporting
framework.
Pretoria
31 July 2015

84 SANEDI Annual Report 2014/15
annual financial statementsfor the year ended 31 march 2015
General information
Country of incorporation and domicile South Africa
Nature of business and principal activities Energy research and development
Registered office Block C, Upper Grayston Office Park
150 Linden Street
Strathavon
Sandton
2199
Business address Block E, Upper Grayston Office Park
150 Linden Street
Strathavon
Sandton
2199
Postal address PO Box 9935 Sandton 2146
Bankers ABSA
Auditors Auditor-general of South Africa
Secretary Vacant

85SANEDI Annual Report 2014/15
annual financial statementsfor the year ended 31 march 2015
Index
Accounting Authority’s responsibilities and approval 86
Board audit and risk committee report 87
Accounting Authority’s report 90
Materiality and significance framework 96
Annual financial statements:
Statement of financial position 97
Statement of financial performance 98
Statement of changes in net assets 99
Cash flow statement 100
Accounting policies 101
Notes to the annual financial statements 119
86 SANEDI Annual Report 2014/15
annual financial statementsfor the year ended 31 march 2015
Accounting Authority’s responsibilities and approval
In terms of the Public Finance Management Act, 1999 (Act No. 1 of 1999), the SANEDI Board of Directors (the
board) are required to maintain adequate accounting records and are responsible for the content and integrity of
the annual financial statements and related financial information included in this report. It is the responsibility of
the board to ensure that the annual financial statements fairly represent the state of affairs of the entity, as at the
end of the financial year, including the results of its operations and cash flows for the reporting period.
The annual financial statements have been prepared in accordance with Standards of Generally Recognised
Accounting Practice (GRAP), including any interpretations, guidelines and directives issued by the Accounting
Standards Board.
The annual financial statements are based on appropriate accounting policies, consistently applied and supported
by reasonable and prudent judgments and estimates.
The board acknowledges that it is ultimately responsible for overall internal financial controls established by
the entity and places considerable importance on maintaining a strong control environment. To enable the
board to meet these responsibilities, the Accounting Authority has set standards for internal controls, aimed at
reducing the risk of error or deficit in a cost effective manner. The standards include the proper delegation of
responsibilities within a clearly defined framework, effective accounting procedures and adequate segregation
of duties, to reduce and/ or avoid risk to the entity. These controls are monitored throughout the entity and all
employees are required to maintain the highest ethical standards, in ensuring the entity’s business is conducted
in a manner that, in all reasonable circumstances, is above reproach. The focus of risk management in the entity
is on identifying, assessing, managing and monitoring all known forms of risk across the entity. While operating
risk cannot be fully eliminated, the entity endeavours to minimise it by ensuring that appropriate infrastructure,
controls, systems and ethical behaviour are applied and managed within predetermined policies and procedures.
The board is of the opinion that, based on the information and explanations given by management, the internal
controls in place provide reasonable assurance that the financial records can be relied on for the preparation of
the annual financial statements. Although extreme diligence is applied, these internal financial controls can only
provide reasonable, and not absolute assurance against material misstatement or deficit.
The Accounting Authority is primarily responsible for the financial affairs of the entity.
The external auditors were engaged to express an independent opinion on the annual financial statements and
have been given unrestricted access to all financial records and related data.
The audited annual financial statements set out on pages 97 to 134 which have been prepared on a going concern
basis, were approved by the Accounting Authority on 31 July 2015 and were signed on its behalf by:
Ms Rosette Nothemba Mlonzi
Chairperson
SANEDI Board of Directors
Accounting Authority’s responsibilities and approval

87SANEDI Annual Report 2014/15
annual financial statementsfor the year ended 31 march 2015
Board audit and risk committee report
We are pleased to present our report for the financial year ended 31 March 2015.
Charter
The audit and risk committee (the committee) has adopted a formal terms of reference as its audit committee
charter. The charter is reviewed and approved on an annual basis. The committee has regulated its affairs in
compliance with this charter and has discharged all its responsibilities as contained therein.
Membership
The committee members were appointed by the Board of Directors. The committee comprises three independent
non-executive members, two of whom are experts in the field of finance with the other members being
representatives of the shareholder. The committee is required to meet on a minimum of four occasions per
annum, as per the charter.
Board audit committee and board risk committee
Name Appointed Re-appointed ResignedMs P Motsielwa (Chairperson) 23 October 2013Mr V Magan 1 January 2008 1 January 2011Dr C Sita 23 October 2013Ms M Modise 23 October 2013Dr R Maserumule (alternate member) 23 October 2013 Dr D Hildebrandt 23 October 2013
During the financial year, four meetings were held and attendance was as follows:
24 April 2014
26 May 2014
27 May 2014
28 July 2014
22 October 2014
Ms P Motsielwa (Chairperson) Y Y Y Y YMr V Magan Y Y Y Y NDr C Sita N Y Y Y YMs M Modise N Y N Y YDr R Maserumule (alternate member) Y N N N YDr D Hildebrandt Y N Y N Y
Y = Attended meeting
N = Apology received
Internal audit
The committee considered and approved the internal audit charter and approved the annual work plan for the
internal audit function. The internal audit function is responsible for reviewing and providing assurance on the
adequacy and effectiveness of the internal control environment across operations. The chief audit executive is
responsible for reporting the findings of the internal audit work against the agreed audit plan to the committee
on a quarterly basis.
The chief audit executive has direct access to the committees, primarily through its chairperson. The audit
committee is also responsible for the assessment of the performance of the internal audit function. The internal
audit function is required to undergo a quality review by an independent reviewer every four years. This was
Board audit and risk committee report

88 SANEDI Annual Report 2014/15
annual financial statementsfor the year ended 31 march 2015
undertaken in April 2013 and the review reported positive results and rated the internal audit function as “general
conformance”, in accordance with the IIA Standards.
The internal audit function is independent and had the necessary resources, budget, standing and authority within
the entity to enable it to discharge its functions. The chief audit executive, through a service level agreement,
reports functionally to the chairperson of the audit committee and administratively to CEF SOC Limited.
We are satisfied that the internal audit function is operating effectively and that it has addressed the risks
pertinent to the entity in its audits. We believe that internal audit contributes to the improvement of internal
controls within the entity.
Internal control effectiveness
The system of internal controls is designed to provide cost-effective assurance that assets are safeguarded and
that liabilities are effectively managed. In line with PFMA requirements, internal audit and the Auditor-General
of South Africa (AGSA) provide the audit committee and management with assurance that the internal controls
are adequate and effective. This is achieved by means of evaluating the effectiveness of the management of
identified risks, as well as the identification of corrective actions and suggested enhancements to the controls
and processes.
Internal and external audit provides the audit committee with reasonable assurance that the majority of internal
controls are appropriate and effective. This is achieved by means of the risk management process, as well as the
identification of corrective actions and suggested enhancements to the controls and processes.
The system of internal control was not entirely effective during the year under review, as several instances of
non-compliance with internal controls were reported by both internal audit and AGSA. From the various reports
of the internal and external auditors, we noted deficiencies with various internal controls which were brought to
the attention of management. Corrective measures have been undertaken to rectify these deficiencies. We also
take note of the improvement in the control environment as noted from the reduction in the number of issues
raised by the internal and external auditors.
Corporate governance
We acknowledge that the entity continues to strive towards applying sound principles of good corporate
governance. To this extent the entity has endeavoured to ensure that oversight sub-committees aimed at assisting
the board to advance its strategic direction are established and operational with all respective charters reviewed
on an annual basis.
There were, however, challenges with the operational effectiveness of the committees for the year under review.
This was mainly caused by inability of the committee meetings to quorate as some departmental representatives
do not have alternates for the committee. The matter has been escalated to the office of the Minister of Energy
and is receiving urgent attention.
Overall we are satisfied with advancements made by the entity towards applying best practice on corporate
governance in the interest of the entity and its stakeholders.
Board audit and risk committee report

89SANEDI Annual Report 2014/15
annual financial statementsfor the year ended 31 march 2015
Risk management
The Board assigned the oversight responsibility of the risk management function to the committee. The entity
implemented a risk management strategy, which includes a fraud prevention plan. A formal risk assessment
was undertaken for the year ended 31 March 2015 with quarterly reviews, updates and reports. Consequently,
internal audit used this data to prepare the three-year rolling strategic plan and an annual operating audit plan.
The risk committee monitored the significant risks faced by the entity through risk reporting, evaluation of the
reports and participation in risk assessment workshop. We are satisfied that significant risks have been managed
to an acceptable level.
Appointment of auditors
The AGSA continues to serve as the independent external auditors of the public entity as mandated by the Public
Audit Act, 2004 (Act No. 25 of 2004). We have reviewed the audit strategy and audit fees and we are satisfied that
the audit strategy adopted is adequate for an organisation of this nature and size. We are also satisfied as to the
independence, skill and competence of the auditor.
The auditors continue to have unrestricted access to the committee and we are satisfied that they have had
unrestricted access to systems and records to enable them to arrive at their opinion.
Annual financial statements
We have:
• Reviewed and discussed the unaudited annual financial statements to be included in the annual report,
with the AGSA and the accounting officer;
• Reviewed the entity’s compliance with legal and regulatory provisions;
• Reviewed the AGSA management report and management responses thereto;
• Reviewed accounting policies and practices;
• Reviewed information on pre-determined objectives to be included in the annual report; and
• Reviewed the annual financial statements for any significant adjustments resulting from the audit.
Auditor-general’s report
The audit committee has met the auditor-general of South Africa and discussed its report to ensure that there
are no unresolved issues. We have also reviewed SANEDI’s implementation plan for the audit issues raised in the
AGSA management report and continuous oversight will be exercised to ensure that all matters are adequately
addressed.
Conclusion
The committee expresses its sincere appreciation to the board, chief executive officer, management, internal
audit and the AGSA for their ongoing support. The committee also congratulates SANEDI for achieving another
unqualified audit report.
Ms P Motsielwa (Chairperson)
31 July 2015
Board audit and risk committee report

90 SANEDI Annual Report 2014/15
annual financial statementsfor the year ended 31 march 2015
Accounting Authority’s report
The directors present the Accounting Authority report that forms part of the audited annual financial statements
for the year ended 31 March 2015.
The South African National Energy Development Institute (SANEDI) is incorporated in terms of section 7 of the
National Energy Act 2008 (Act No. 34 of 2008), and is listed as a national public entity in terms of schedule 3 of
the Public Finance Management Act, 1999 (Act No 1 of 1999) (PFMA), as amended.
1. The Board of Directors acts as the Accounting Authority in terms of the PFMA.
Name Appointed Resigned/term ended
Ms N Mlonzi 1 September 2011Mr J Marriott 1 September 2011Mr M Vilana 1 September 2011Ms D Ramalope 17 October 2011Mr M Gordon (alternate director) 17 October 2011Dr D Hildebrandt 1 September 2011Dr R Maserumule (alternate director) 26 June 2012Ms P Motsielwa 23 October 2013Ms M Modise 1 September 2011Mr C Manyungwane (alternate director) 3 September 2013 Dr V Munsami 1 February 2013 Mr G Fourie 1 January 2013
Attendance at meetings
Name 11 June 2014 29 July 2014 8 October 2014Ms M Mlonzi Y Y YMr J Marriott Y Y NMr M Vilana N N NMs D Ramalope Y Y NMr M Gordon (alternate director) N N NDr D Hildebrandt Y Y NDr R Maserumule (alternate director) N N NMs M Modise N Y YDr C Sita N N YMr C Manyungwane (alternate director) N N NMs P Motsielwa Y Y YMr G Fourie N Y Y
Y = Attended meeting
N = Apology received
Accounting Authority’s report

91SANEDI Annual Report 2014/15
annual financial statementsfor the year ended 31 march 2015
2. Board audit committee and board risk committee
Name Appointed Re-appointed ResignedMr V Magan 1 January 2008 1 January 2011Ms P Motsielwa 23 October 2013Dr C Sita 23 October 2013Dr R Maserumule (alternate director) 23 October 2013Dr D Hildebrandt 23 October 2013
Attendance at meetings
Name 25 April 2014
26 May 2015
27 May 2015
28 July 2014
22 October 2014
Mr V Magan Y Y Y Y NMs P Motsielwa Y Y Y Y YDr C Sita Y N Y Y YMs M Modise N Y N Y YDr R Maserumule (alternate member) Y N N N YDr D Hildebrandt Y N Y N Y
Y = Attended meeting
N = Apology received
3. Nature of business
Main business and operations
The main business and operations for the South African National Energy Development Institute (SANEDI)
are defined in Chapter 4 of the Energy Act, 2008 (Act No. 34 of 2008). In terms of the Act, the main
business and operations of SANEDI are:
• Energy research and development; and
• Energy efficiency.
The principal activities of the South African National Energy Development Institute are outlined below:
• Undertake energy efficiency measures as directed by the Minister;
• Increase energy efficiency throughout the economy;
• Increase the gross domestic product per unit of energy consumed;
• Optimise the utilisation of finite energy resources;
• Direct, monitor, conduct and implement energy research and technology development in all fields
of energy, other than nuclear energy; and
• Promote energy research and technology innovation.
In addition to the above, SANEDI is expected to provide the following:
• Training and development in the field of energy research and technology development;
• Establishment and expansion of industries in the field of energy;
Accounting Authority’s report

92 SANEDI Annual Report 2014/15
annual financial statementsfor the year ended 31 march 2015
• Commercialisation of energy technologies resulting from energy research and development
programmes;
• Register patents and intellectual property in its name resulting from its activities;
• Issue licenses to other persons for the use of its patents and intellectual property;
• Publish information concerning its objectives and core functions;
• Establish facilities for the collection and dissemination of information in connection with research,
development and innovation;
• Undertake any other energy technology development related activity, as directed by the Minister,
with the concurrence of the Minister of Science and Technology;
• Promote relevant energy research through cooperation with any entity, institution or person
equipped with the relevant skills and expertise within and outside the Republic;
• Make grants to educational and scientific institutions in aid of research, by promoting the training
of research workers by granting bursaries or grants in aid of research;
• Undertake the investigations or research that the Minister, after consultation with the Minister of
Science and Technology, may assign to it; and
• Advise the Minister and the Minister of Science and Technology on research in the field of energy
technology.
4. Review of financial position
The entity’s business and operations and the results thereof are clearly reflected in the accompanying
annual financial statements. All material subsequent events have also been adequately disclosed in the
financial statements note 20.
The entity’s assets continue to exceed liabilities, with a positive cash balance being maintained in respect
of third party funding earmarked for research projects.
The overall allocation for the financial year under review was R168 million. We continue to allocate a large
percentage of the overall budget towards funding research programmes with a total of 64% allocated for
projects and 36% for administrative activities as we strive towards the achievement of set targets.
There were no unspent administrative allocation funds at the end of the financial year. All other programme
funding is being spent as agreed with the relevant third parties.
5. Going concern
SANEDI’s assets exceed its liabilities by R15 million. SANEDI has applied for approval of the current surplus
funds of R0.035 million from the National Treasury in terms of section 53(3) of the PFMA.
The directors believe that the entity will operate for the next foreseeable 12 months given the revised
allocation received from MTEC for the next financial year.
6. Review of operations
Government Gazette No. 34175, dated 1 April 2011 states that in terms of section 21 of the National
Energy Act, 2008 (Act No. 34 of 2008):
Accounting Authority’s report

93SANEDI Annual Report 2014/15
annual financial statementsfor the year ended 31 march 2015
“I (The President of the Republic of South Africa), hereby fix 01 April 2011 as the date on which Chapter 4
of the said Act shall come into operation.
Chapter 4 of the National Energy Act, 2008 (No. 34 of 2008) provides for the establishment of the South
African National Energy Development Institute (SANEDI) as a successor to the previously created South
African National Energy Research Institute (Pty) Ltd (SANERI) and the National Energy Efficiency Agency
(NEEA) (a division of CEF SOC (Ltd). All assets, liabilities, and staff of SANERI and NEEA are legislated to be
vested in SANEDI.
The establishment of SANEDI therefore comprises the incorporation of two functioning bodies into one.
The relevant sections of the National Energy Act (sections 7 to 15) are operationalised. All employees
(including board members) of SANERI and NEEA are transferred to SANEDI and all assets and liabilities are
transferred to SANEDI. Funding which is currently allocated to SANERI through the science vote should be
budgeted for within the DoE budget and allocated to SANEDI through transfers and subsidies. Mechanisms
to ensure that CEF continues to provide support services and systems for SANEDI are in place.”
Below are summaries of the highlights of the year:
Centre for Carbon Capture and Storage
The World Bank has advertised for expressions of interest for project technical advisory services for
the pilot CO2 storage project (PCSP) - submissions closed 20 April 2015. The pilot monitoring project at
Bongwana natural CO2 releases planning commenced with international participation. The South African
shale gas delegation (SANEDI, DoE, DST, DSW, PetroSA, PASA) to the USA took place in March, 2015. The
first shale gas task (task 7 COs emission reductions due to fuel switching from coal to gas) was completed
and the draft report is being addressed by the shale gas steering committee.
Energy efficiency
bigEE (Bridging information gap on energy efficiency in buildings and appliances)
The international bigEE website launched the South Africa page in late January 2015 and the page has since
been operational and upgraded on continual basis. The page displays data knowledge on energy efficiency
policies, best available energy efficient appliances and the best technologies for energy efficient buildings.
It provides easy access to information that is up to date and relevant for both local and international
investors of energy efficiency. Furthermore the design, feel and look of the website is attractive and user
friendly. As such the website can be used by any interested party to gather information - from company
CEOs, professors, students writing their theses, to school pupils submitting assignments.
Since the launch of the bigEE project to date, 70% of the funds have been utilised and about 80% of the
work completed. The remaining objectives to be achieved are related to energy efficient buildings. The
appliances data has been collected, analysed and uploaded and will be closing in the coming months. All
additional aspects such as climatic zone map, actor constellation in both appliances and buildings have
been completed and will in future only be updated with time.
Accounting Authority’s report

94 SANEDI Annual Report 2014/15
annual financial statementsfor the year ended 31 march 2015
Appliances
The appliances part of the project has been completed and the subproject sign off will be end of May
2015. The data that can be expected on the web has been collected in the form of documents relating
to refrigerators and freezers, washing machine, tumble dryers, TVs and other electrical appliances. The
documents are specifically outline the technical aspect of the captured appliance technology. In addition
to the appliances, five policy documents have been developed as well. The following documents outline
the policy position of South Africa regarding the appliances and the topics that have been covered:
• “Template 8” (policy package in South Africa);
• “Template 7” for SWH/HP programme;
• “Template 7” for residential mass rollout programme/CFL programme;
• “Template 7” for SANS 10400XA; and
• “Template 7” 12L tax incentive.
The information is available on www.bigEE.net/ (select South Africa).
Buildings
On the building aspect of the project, seemingly insurmountable challenges were encountered, and it
was only in the third quarter that solutions started to emerge. The project has leverages on the EEDSM
partnership between SANEDI and the University of Pretoria. The EEDSM head has been contracted to
assist in collecting data on best available technologies in buildings.
Wind Atlas of South Africa (WASA)
A WASA presentation was made to the Danish Minister for Climate, Energy and Buildings, the Danish
ambassador and delegation on 2 Sept 2014 at the University of Cape Town (UCT).
The Danish Minister encouraged the application of WASA to enhance the wind data and analysis in the
revised and future revisions of the independent resource plan (IRP). The issue of awareness raising and
training of the WASA phase 1 results was also raised with the Danish ambassador, who indicated that his
office could assist with this endeavour.
While an environmental impact assessment (EIA) is no longer required for wind met masts, any other
EIA listed activities that are triggered can result in a full EIA having to be done which could take up to six
months and more to complete. Therefore, special care was taken in the selection of the wind met masts
sites so that they will not trigger a full EIA and can still meet the input requirements for the WASA 2
modelling to be representative of the WASA 2 domain.
The WASA 2 wind measurements work package (WP22) CSIR team improvised and a rapid environmental
screening study was undertaken that confirmed that no other environmental issues were triggered at the
identified sites. This resulted in the masts’ site selection only being completed at the end of November
2014. The masts, installation and equipment tenders, that are dependent on the site selection, were
published in January 2015. Contracting of service providers is taking place with the masts and equipment
installation envisaged to be completed by June or July 2015 and with wind measurements, data capturing
and display to start July or August 2015.
Accounting Authority’s report

95SANEDI Annual Report 2014/15
annual financial statementsfor the year ended 31 march 2015
7. Subsequent events
The directors are not aware of any other matters or circumstances arising since the end of the financial
year, not otherwise dealt with in the annual financial statements which significantly affect the financial
position of the entity or the results of the operations.
8. Approval
The audited annual financial statements set out on pages 97 to 134 which have been prepared on the
going concern basis, were approved by the Accounting Authority on 31 July 2015 and were signed on its
behalf by:
Ms Rosette Nothemba Mlonzi
Chairperson - SANEDI Board
Accounting Authority’s report

96 SANEDI Annual Report 2014/15
annual financial statementsfor the year ended 31 march 2015
Materiality and significance framework
For purposes of materiality (as per PFMA sections 50(1) and 55 (2)) and significance (as per PFMA sections 54(2))
framework the following acceptable levels were agreed with the Executive Authority in consultation with the
Auditor- General of South Africa:
• Section 50(1): Material facts to be disclosed to the Minister of Energy are considered to be facts that may
influence the decisions or actions of the Stakeholders of the Public Entity.
• Section 55(2): Disclosure of material losses in the annual financial statements will be for all losses through
criminal conduct and any irregular expenditure and fruitless and wasteful expenditure that occurred
during the year.
• Section 54(2): The criteria to determine the level of significance was based on the guiding principles as
set out in the “Practice Note on applications under Section 54 of the PFMA No. 1 of 1999 (as amended)
by Public Entities” as published by National Treasury during 2006 subject to adjustments for any Section
54(4) exemptions.
The significant Rand level was determined as being 1% of revenue as follows:
APPROVAL LEVELS IN TERMS OF SECTION 54
Public Entity’s board approval levels < 1 134 500
Obtain DoE approval and inform National Treasury > 1 134 500
Materiality and significance framework

97SANEDI Annual Report 2014/15
annual financial statementsfor the year ended 31 march 2015
Statement of financial position at 31 March 2015
Notes2015
R’000
Restated2014
R’000Assets
Non-current assets 5 107 8 292Property, plant and equipment 2 2 781 3 926Intangible assets 3 2 326 4 366
Current assets 371 802 154 155Receivables from exchange transactions 4 6 743 2 893VAT receivable 207 -Cash and cash equivalents 5 364 852 151 262
Total assets 376 909 162 447
LiabilitiesCurrent liabilities (361 369) (146 942)Payables from exchange transactions 8 (14 901) (10 058)Unspent conditional grants and receipts 6 (338 957) (129 618)Provisions 7 (7 511) (7 266)
Total liabilities (361 369) (146 942)
Net assetsAccumulated surplus (15 540) (15 505)
Statement of financial position

98 SANEDI Annual Report 2014/15
annual financial statementsfor the year ended 31 march 2015
Statement of financial performance
Notes2015
R’000
Restated2014
R’000Revenue Revenue from non-exchange transactions 9 106 965 84 091Revenue from exchange transactions 9 6 421 9 520
Total revenue 113 386 93 611
Expenditure
Employee related costs 11 (39 955) (34 032)Project costs (51 770) (16 573)Depreciation and amortisation 2,3 (4 846) (3 040)Repairs and maintenance (342) (163)Bad debts (538) -Operating expenses 10 (15 868) (30 363)(Loss)/Gain on foreign exchange (39) (53)Impairments 2 7 (819)
Total expenditure (113 351) (85 043)
Surplus for the year 35 8 568
Statement of financial performance

99SANEDI Annual Report 2014/15
annual financial statementsfor the year ended 31 march 2015
Statement of change in net assets
Notes
Accumulated surplus
R’000
Total net assetsR’000
Opening balance as at 31 March 2014 8 402 8 402
Prior period errors 19 (1 465) (1 465)
Surplus for the year 8 568 8 568
Restated opening balance as at 31 March 2014 15 505 15 505
Surplus for the year 35 35
Balance at 31 March 2015 15 540 15 540
Statement of changes in net assets

100 SANEDI Annual Report 2014/15
annual financial statementsfor the year ended 31 march 2015
Cash flow statement
Notes2015
R’000
Restated2014
R’000Cash flows from operating activities
Receipts 321 660 161 998
Grants 301 478 145 481
Interest income 17 640 9 298
Membership fees and sponsorships 2 542 7 219
Payments (106 290) (149 527)
Employee costs (29 954) (32 744)
Suppliers (72 048) (44 983)
Transfers of funds (4 288) (71 800)
Net cash flows from operating activities 12 215 370 12 471
Cash flows from investing activitiesPurchase of property, plant and equipment (419) (3 133)
Proceeds from sale of property, plant and equipment 14 58
Purchase of other intangible assets (1 375) (4 213)
Net cash flows from investing activities (1 780) (7 288)
Net increase in cash and cash equivalents 213 590 5 183
Cash and cash equivalents at the beginning of the year 5 151 262 146 079
Cash and cash equivalents at end of the year 5 364 852 151 262
Cash flow statement

101SANEDI Annual Report 2014/15
annual financial statementsfor the year ended 31 march 2015
Accounting policies
1. Presentation of annual financial statements
1.1. Basis of preparation
The annual financial statements have been prepared in accordance with the effective Standards of
Generally Recognised Accounting Practice (GRAP) including any interpretations, guidelines and directives
issued by the Accounting Standards Board.
These annual financial statements have been prepared on an accrual basis of accounting and are in
accordance with historical cost convention unless specified otherwise. They are presented in South African
Rand.
The financial statements have been prepared on a going concern basis and the accounting policies have
been applied consistently throughout the period.
1.2. Translation of foreign currencies
Foreign currency transactions
A foreign currency transaction is recorded, on initial recognition in Rands, by applying to the foreign
currency amount the spot exchange rate between the functional currency and the foreign currency at the
date of the transaction. At each reporting date:
• Foreign currency monetary items are translated using the closing rate;
• Non-monetary items that are measured in terms of historical cost in a foreign currency are
translated using the exchange rate at the date of the transaction; and
• Non-monetary items that are measured at fair value in a foreign currency are translated using the
exchange rates at the date when the fair value was determined.
Exchange differences arising on the settlement of monetary items or on translating monetary items at
rates different from those at which they were translated on initial recognition during the period or in
previous annual financial statements are recognised in surplus or deficit in the period in which they arise.
When a gain or loss on a non-monetary item is recognised directly in net assets, any exchange component
of that gain or loss is recognised directly in net assets. When a gain or loss on a non-monetary item is
recognised in surplus or deficit, any exchange component of that gain or loss is recognised in surplus or
deficit.
Cash flows arising from transactions in a foreign currency are recorded in Rands by applying to the foreign
currency amount the exchange rate between the Rand and the foreign currency at the date of the cash
flow.
Accounting policies

102 SANEDI Annual Report 2014/15
annual financial statementsfor the year ended 31 march 2015
1.3. Events after the reporting date
Recognised amounts in the annual financial statements are adjusted to reflect events arising after the
reporting date that provide evidence of conditions that existed at the reporting date. Events after the
reporting date that are indicative of conditions that arose after the reporting are dealt with by way of a
note.
1.4. Property, plant and equipment
Property, plant and equipment are tangible non-current assets that are held for use in the supply of goods
or services or for administrative purposes, and are expected to be used during more than one period.
Carrying amounts
All property, plant and equipment are stated at cost less accumulated depreciation and accumulated
impairment losses.
The cost of an item of property, plant and equipment is recognised as an asset when:
• It is probable that future economic benefits or service potential associated with the item will flow
to the entity; or
• The cost or fair value of the item can be measured reliably.
The cost of an item of property, plant and equipment is the purchase price and other costs attributable
to bring the asset to the location and condition necessary for it to be capable of operating in the manner
intended by management. Trade discounts and rebates are deducted in arriving at the cost.
Where an item of property, plant and equipment is acquired at no cost, or for a nominal cost, its cost is its
fair value as at date of acquisition.
Where an item of property, plant and equipment is acquired in exchange for a non-monetary asset or
monetary assets, or a combination of monetary and non-monetary assets, the asset acquired is initially
measured at fair value (the cost). If the acquired non-monetary asset’s fair value is not determinable, its
deemed cost is the carrying amount of the asset given up.
Cost includes costs incurred initially to acquire or construct an item of property, plant and equipment
and costs incurred subsequently to add to, or to replace a part of, or service it. If a replacement cost is
recognised in the carrying amount of an item of property, plant and equipment, the carrying amount of
the replaced part is derecognised.
Finance costs directly associated with the construction or acquisition of major assets are capitalised at
interest rates relating to loans specifically raised for that purpose, or at the average borrowing rate where
the general pool of borrowings is utilised.
Derecognition
The carrying amount of an item of property, plant and equipment is derecognised on disposal or when no
future economic benefits are expected from its use.
Accounting policies

103SANEDI Annual Report 2014/15
annual financial statementsfor the year ended 31 march 2015
The gain or loss arising from the derecognition of an item of property, plant and equipment is determined
as the difference between the net disposal proceeds, if any, and the carrying amount of the item. Such
difference is recognised in the surplus or deficit when the item is derecognised.
Depreciation
Depreciation is charged so as to write off the depreciable amount of the assets, other than land, over their
estimated useful lives to estimated residual values, using the straight line method to write off the cost
of each asset that reflects the pattern in which the asset’s future economic benefits are expected to be
consumed by the entity.
Where significant parts of an item have different useful lives to the item itself, these parts are depreciated
over their estimated useful lives.
The following methods and rates are used during the year to depreciate property, plant and equipment to
estimated residual values:
Item Average useful life
Furniture, fittings and communication equipment 2 – 15 years
Office equipment 5 years
Computer equipment 3 years
Leasehold improvements Over the period of the lease
Each part of an item of property, plant and equipment with a cost that is significant in relation to the total
cost of the item is depreciated separately.
The methods of depreciation, useful lives and residual values are reviewed annually.
1.5 Intangible assets
An asset is identified as an intangible asset when it:
• Is capable of being separated or divided from an entity and sold, transferred, licensed, rented or
exchanged, either individually or together with a related contract, assets or liability; or
• Arises from contractual rights or other legal rights, regardless whether those rights are transferable
or separate from the entity or from other rights and obligations. An intangible asset is an identifiable
non-monetary asset without physical substance.
Initial recognition
An intangible asset is recognised when:
• It is probable that the expected future economic benefits or service potential that are attributable
to the asset will flow to the entity and
• The cost or fair value of the asset can be measured reliably.
Cost
Intangible assets are initially recognised at cost if acquired separately or internally generated or at fair
value if acquired as part of a business combination. If assessed as having an indefinite useful life, the
Accounting policies

104 SANEDI Annual Report 2014/15
annual financial statementsfor the year ended 31 march 2015
intangible asset is not amortised but tested for impairment annually and impaired if necessary. If assessed
as having a finite useful life, it is amortised over its useful life using a straight line basis and tested for
impairment if there is an indication that it may be impaired.
Research
Expenditure on research (or on the research phase of an internal project) is recognised as an expense
when it is incurred.
Development costs
Development costs are capitalised only if they result in an asset that can be identified, and it is probable
that the asset will generate future economic benefits and the development cost can be reliably measured.
Otherwise it is recognised in surplus or deficit.
Derecognition
Intangible assets are derecognised on disposal, or when no future economic benefits or service potential
are expected from its use or disposal.
The gain or loss arising from the derecognition of an intangible asset is determined as the difference
between the net disposal proceeds, if any, and the carrying amount of the intangible asset. Such a
difference is recognised in surplus or deficit when the intangible asset is derecognised.
Amortisation is recognised in profit and loss, on a straight line basis, to their residual values as follows:
Item Useful life
Computer software 2 years
1.6 Non-current assets held for sale and disposal groups
Non-current assets and disposal groups are classified as held for sale if their carrying amount will be
recovered principally through a sale transaction rather than through continuing use. This condition is
regarded as met only when the sale is highly probable and the asset (or disposal group) is available for
immediate sale in its present condition. Management must be committed to the sale, which should be
expected to qualify for recognition as a completed sale within one year from the date of classification.
Non-current assets held for sale (or disposal group) are measured at the lower of their carrying amount
and fair value less costs to sell.
A non-current asset is not depreciated (or amortised) while it is classified as held for sale, or while it is part
of a disposal group classified as held for sale.
Interest and other expenses attributable to the liabilities of a disposal group classified as held for sale are
recognised in surplus or deficit.
Accounting policies

105SANEDI Annual Report 2014/15
annual financial statementsfor the year ended 31 march 2015
1.7 Impairment of non-cash-generating assets
Cash-generating assets are those assets held by the entity with the primary objective of generating a
commercial return. When an asset is deployed in a manner consistent with that adopted by a profit-
orientated entity, it generates a commercial return.
Non-cash-generating assets are assets other than cash-generating assets.
Identification
The entity assesses at each reporting date whether there is any indication that a non-cash-generating
asset may be impaired. If any such indication exists, the entity estimates the recoverable service amount
of the asset.
Recoverable service amount is the higher of a non-cash-generating asset’s fair value less costs to sell and
its value in use.
When the carrying amount of a non-cash-generating asset exceeds its recoverable service amount, it is
impaired.
Irrespective of whether there is any indication of impairment, the entity also tests a non-cash-generating
intangible asset with an indefinite useful life or a non-cash-generating intangible asset not yet available for
use for impairment annually by comparing its carrying amount with its recoverable service amount. This
impairment test is performed at the same time every year. If an intangible asset was initially recognised
during the current reporting period, that intangible asset is tested for impairment before the end of the
current reporting period.
Value in use
Value in use of an asset is the present value of the asset’s remaining service potential.
The present value of the remaining service potential of an asset is determined using the following
approaches:
Depreciated replacement cost approach
The present value of the remaining service potential of a non-cash-generating asset is determined as the
depreciated replacement cost of the asset. The replacement cost of an asset is the cost to replace the
asset’s gross service potential. This cost is depreciated to reflect the asset in its used condition. An asset
may be replaced either through reproduction (replication) of the existing asset or through replacement
of its gross service potential. The depreciated replacement cost is measured as the reproduction or
replacement cost of the asset, whichever is lower, less accumulated depreciation calculated on the basis
of such cost, to reflect the already consumed or expired service potential of the asset.
The replacement cost and reproduction cost of an asset is determined on an “optimised” basis. The
rationale is that the entity would not replace or reproduce the asset with a like asset if the asset to be
replaced or reproduced is an overdesigned or overcapacity asset. Overdesigned assets contain features
which are unnecessary for the goods or services the asset provides. Overcapacity assets are assets that
Accounting policies

106 SANEDI Annual Report 2014/15
annual financial statementsfor the year ended 31 march 2015
have a greater capacity than is necessary to meet the demand for goods or services the asset provides.
The determination of the replacement cost or reproduction cost of an asset on an optimised basis thus
reflects the service potential required of the asset.
Restoration cost approach
Restoration cost is the cost of restoring the service potential of an asset to its pre-impaired level. The
present value of the remaining service potential of the asset is determined by subtracting the estimated
restoration cost of the asset from the current cost of replacing the remaining service potential of the asset
before impairment. The latter cost is determined as the depreciated reproduction or replacement cost of
the asset, whichever is lower.
Recognition and measurement
If the recoverable service amount of a non-cash-generating asset is less than its carrying amount, the
carrying amount of the asset is reduced to its recoverable service amount. This reduction is an impairment
loss.
An impairment loss is recognised immediately in surplus or deficit.
After the recognition of an impairment loss, the depreciation (amortisation) charge for the non-cash-
generating asset is adjusted in future periods to allocate the non-cash-generating asset’s revised carrying
amount, less its residual value (if any), on a systematic basis over its remaining useful life.
Reversal of an impairment loss
The entity assesses at each reporting date whether there is any indication that an impairment loss
recognised in prior periods for a non-cash-generating asset may no longer exist or may have decreased. If
any such indication exists, the entity estimates the recoverable service amount of that asset.
An impairment loss recognised in prior periods for a non-cash-generating asset is reversed if there has
been a change in the estimates used to determine the asset’s recoverable service amount since the last
impairment loss was recognised. The carrying amount of the asset is increased to its recoverable service
amount. The increase is a reversal of an impairment loss. The increased carrying amount of an asset
attributable to a reversal of an impairment loss does not exceed the carrying amount that would have
been determined (net of depreciation or amortisation) had no impairment loss been recognised for the
asset in prior periods.
A reversal of an impairment loss for a non-cash-generating asset is recognised immediately in surplus or
deficit.
After a reversal of an impairment loss is recognised, the depreciation (amortisation) charge for the non-
cash-generating asset is adjusted in future periods to allocate the non-cash-generating asset’s revised
carrying amount, less its residual value (if any), on a systematic basis over its remaining useful life.
Accounting policies

107SANEDI Annual Report 2014/15
annual financial statementsfor the year ended 31 march 2015
Re-designation
The redesignation of assets from a cash-generating asset to a non-cash-generating asset or from a non-
cash-generating asset to a cash-generating asset only occurs when there is clear evidence that such a
redesignation is appropriate.
1.8 Leases
A lease is classified as a finance lease if it transfers substantially all the risks and rewards incidental to
ownership. A lease is classified as an operating lease if it does not transfer substantially all the risks and
rewards incidental to ownership.
Operating lease payments are recognised as an expense on a straight line basis over the lease term. The
difference between the amounts recognised as an expense and the contractual payments are recognised
as an operating lease asset or liability.
The aggregate benefit of incentives is recognised as a reduction of rental expense over the lease term on
a straight line basis over the lease term.
Any contingent rent is recognised separately as an expense when paid or payable and is not straight lined
over the lease term.
1.9 Financial instruments
A financial instrument is any contract that gives rise to a financial asset of one entity and a financial liability
or a residual interest of another entity. A financial asset is:
• Cash;
• A residual interest of another entity; or
• A contractual right to:
– Receive cash or another financial asset from another entity; and
– Exchange financial assets or financial liabilities with another entity under conditions that are
potentially favourable to the entity.
A financial liability is any liability that is a contractual obligation to:
• Deliver cash or another financial asset to another entity; or
• Exchange financial assets or financial liabilities under conditions that are potentially unfavourable
to the entity.
Financial instruments at amortised cost are non-derivative financial assets or non-derivative financial
liabilities that have fixed or determinable payments, excluding those instruments that:
• The entity designates at fair value at initial recognition; or
• Are held for trading.
Accounting policies

108 SANEDI Annual Report 2014/15
annual financial statementsfor the year ended 31 march 2015
Financial instruments at fair value comprise financial assets or financial liabilities that are:
• Derivatives;
• Combined instruments that are designated at fair value; and
• Instruments held for trading.
A financial instrument is held for trading if:
• It is acquired or incurred principally for the purpose of selling or repurchasing it in the near-term; or
• On initial recognition is part of a portfolio of identified financial instruments that are managed
together and for which there is evidence of a recent actual pattern of short term profit-taking;
• Non-derivative financial assets or financial liabilities with fixed or determinable payments that are
designated at fair value at initial recognition; and
• Financial instruments that do not meet the definition of financial instruments at amortised cost or
financial instruments at cost. Financial assets and financial liabilities are recognised on the entity’s
statement of financial position when the entity becomes a party to the contractual provisions of
the instrument.
Financial assets
The entity’s principal financial assets are accounts receivable as cash and cash equivalents.
The entity has the following types of financial assets (classes and category) as reflected on the face of the
statement of financial position or in the notes thereto:
Class Category
Loans receivable Financial asset measured at amortised cost
Trade and other receivables Financial asset measured at amortised cost
Cash and cash equivalents Financial asset measured at amortised cost
Investments Financial asset measured at amortised cost
Financial liabilities
The entity has the following types of financial liabilities (classes and category) as reflected on the face of
the statement of financial position or in the notes thereto:
Class Category
Trade and other payables Financial liability measured at amortised cost
Initial recognition
The entity recognises a financial asset or a financial liability in its statement of financial position when the
entity becomes a party to the contractual provisions of the instrument.
Initial measurement
The entity measures a financial asset and financial liability at amortised cost initially at its fair value, plus
transaction costs that are directly attributable to the acquisition or issue of the financial asset or financial
liability.
Accounting policies

109SANEDI Annual Report 2014/15
annual financial statementsfor the year ended 31 march 2015
Subsequent measurement
The entity measures all financial assets and financial liabilities after initial recognition using the following
category:
• Financial instruments at amortised cost.
All financial assets measured at amortised cost, or cost, are subject to an impairment review.
The amortised cost of a financial asset or financial liability is the amount at which the financial asset
or financial liability is measured at initial recognition, minus principal repayments, plus or minus the
cumulative amortisation using the effective interest method of any difference between that initial amount
and the maturity amount, and minus any reduction (directly or through the use of an allowance account)
for impairment or uncollectability.
Gains and losses
For financial assets and financial liabilities measured at amortised cost or cost, a gain or loss is recognised
in surplus or deficit when the financial asset or financial liability is derecognised or impaired, or through
the amortisation process.
Trade and other receivables
Trade receivables are measured at initial recognition at fair value, and are subsequently measured at
amortised cost using the effective interest rate method. Appropriate allowances for estimated irrecoverable
amounts are recognised in profit or loss when there is objective evidence that the asset is impaired.
Significant financial difficulties of the debtor, probability that the debtor will enter bankruptcy or financial
reorganisation and default or delinquency in payments (more than 30 days overdue) are considered
indicators that the trade receivable is impaired. The allowance recognised is measured as the difference
between the asset’s carrying amount and the present value of estimated future cash flows discounted at
the effective interest rate computed at initial recognition.
The carrying amount of the asset is reduced through the use of an allowance account, and the amount
of the loss is recognised in the income statement within operating expenses. When a trade receivable is
uncollectable, it is written off against the allowance account for trade receivables. Subsequent recoveries
of amounts previously written off are credited against operating expenses in the income statement.
Trade and other receivables are classified as loans and receivables.
Trade and other payables
All financial liabilities are measured at amortised cost, comprising original debt less principal payments
and amortisations.
Cash and cash equivalents
Cash and cash equivalents comprise cash on hand and demand deposits, and other short-term highly liquid
investments that are readily convertible to a known amount of cash and are subject to an insignificant risk
of changes in value. These are initially and subsequently recorded at fair value.
Accounting policies

110 SANEDI Annual Report 2014/15
annual financial statementsfor the year ended 31 march 2015
Derecognition
The entity derecognises financial assets using trade date accounting. The entity derecognises a financial
asset only when:
• The contractual rights to the cash flows from the financial asset expire, are settled or waived;
• The entity transfers to another party substantially all of the risks and rewards of ownership of the
financial asset; or
• The entity despite having retained some significant risks and rewards of ownership of the financial
asset, has transferred control of the asset to another party and the other party has the practical
ability to sell the asset in its entirety to an unrelated third party, and is able to exercise that ability
unilaterally and without needing to impose additional restrictions on the transfer.
In this abovementioned case, the entity:
– Derecognises the asset and
– Recognises separately any rights and obligations created or retained in the transfer.
The carrying amounts of the transferred asset are allocated between the rights or obligations retained
and those transferred on the basis of their relative fair values at the transfer date. Newly created rights
and obligations are measured at their fair values at that date. Any difference between the consideration
received and the amounts recognised and derecognised is recognised in surplus or deficit in the period of
the transfer.
On derecognition of a financial asset in its entirety, the difference between the carrying amount and the
sum of the consideration received is recognised in surplus or deficit.
Financial liabilities
The entity removes a financial liability (or a part of a financial liability) from its statement of financial
position when it is extinguished, i.e. when the obligation specified in the contract is discharged, cancelled,
expires or is waived.
The difference between the carrying amount of a financial liability (or part of a financial liability)
extinguished or transferred to another party and the consideration paid, including any non-cash assets
transferred or liabilities assumed, is recognised in surplus or deficit. Any liabilities that are waived, forgiven
or assumed by another entity by way of a non-exchange transaction are accounted for in accordance with
the Standard of GRAP on revenue from non-exchange transactions (taxes and transfers).
Fair value measurement considerations
The best evidence of fair value is quoted prices in an active market. If the market for a financial instrument
is not active, the entity establishes fair value by using a valuation technique. Valuation techniques include
using recent arm’s length market transactions between knowledgeable, willing parties, if available,
reference to the current fair value of another instrument that is substantially the same, discounted cash
flow analysis and option pricing models. If there is a valuation technique commonly used by market
participants to price the instrument and that technique has been demonstrated to provide reliable
estimates of prices obtained in actual market transactions, the entity uses that technique. The chosen
valuation technique makes maximum use of market inputs and relies as little as possible on entity-
Accounting policies

111SANEDI Annual Report 2014/15
annual financial statementsfor the year ended 31 march 2015
specific inputs. It incorporates all factors that market participants would consider in setting a price and is
consistent with accepted economic methodologies for pricing financial instruments. Periodically, an entity
calibrates the valuation technique and tests it for validity using prices from any observable current market
transactions in the same instrument (i.e. without modification or repackaging) or based on any available
observable market data.
Provisions
Provisions are recognised when:
• The entity has a present obligation as a result of a past event;
• It is probable that an outflow of resources embodying economic benefits will be required to settle
the obligation; and
• A reliable estimate can be made of the obligation
The amount of a provision is the best estimate of the expenditure expected to be required to settle the
present obligation at the reporting date. Where the effect of time value of money is material, the amount
of a provision is the present value of the expenditures expected to be required to settle the obligation. The
discount rate is a pre-tax rate that reflects current market assessments of the time value of money and the
risks specific to the liability.
Where some or all of the expenditure required to settle a provision is expected to be reimbursed by another
party, the reimbursement is recognised when, and only when, it is virtually certain that reimbursement
will be received if the entity settles the obligation. The reimbursement is treated as a separate asset. The
amount recognised for the reimbursement does not exceed the amount of the provision.
Provisions are reviewed at each reporting date and adjusted to reflect the current best estimate. Provisions
are reversed if it is no longer probable that an outflow of resources embodying economic benefits or
service potential will be required to settle the obligation.
Where discounting is used, the carrying amount of a provision increases in each period to reflect the
passage of time. This increase is recognised as an interest expense.
A provision is used only for expenditures for which the provision was originally recognised. Provisions
are not recognised for future operating deficits.If an entity has a contract that is onerous, the present
obligation (net of recoveries) under the contract is recognised and measured as a provision.
Contingent assets and contingent liabilities
Contingent assets and contingent liabilities are not recognised, but disclosed in the notes.
1.10 Revenue
1.10.1 Revenue from exchange transactions exchange
Exchange transactions are transactions in which one entity receives assets or services, or has liabilities
extinguished, and directly gives approximately equal value (primarily in the form of cash, goods, services,
or use of assets) to another entity in exchange.
Accounting policies

112 SANEDI Annual Report 2014/15
annual financial statementsfor the year ended 31 march 2015
Measurement revenue is measured at the fair value of the consideration received or receivable, net of
trade discounts and volume rebates.
Sale of goods
Revenue from the sale of goods is recognised when all the following conditions have been satisfied:
• The entity has transferred to the purchaser the significant risks and rewards of ownership of the
goods;
• The entity retains neither continuing managerial involvement to the degree usually associated with
ownership nor effective control over the goods sold;
• The amount of revenue can be measured reliably;
• It is probable that the economic benefits or service potential associated with the transaction will
flow to the entity; and
• The costs incurred or to be incurred in respect of the transaction can be measured reliably
Rendering of services
When the outcome of a transaction involving the rendering of services can be estimated reliably, revenue
associated with the transaction is recognised by reference to the stage of completion of the transaction
at the reporting date. The outcome of a transaction can be estimated reliably when all the following
conditions are satisfied:
• The amount of revenue can be measured reliably;
• It is probable that the economic benefits or service potential associated with the transaction will
flow to the entity;
• The stage of completion of the transaction at the reporting date can be measured reliably; and
• The costs incurred for the transaction and the costs to complete the transaction can be measured
reliably.
When services are performed by an indeterminate number of acts over a specified time frame, revenue is
recognised on a straight line basis over the specified time frame unless there is evidence that some other
method better represents the stage of completion. When a specific act is much more significant than any
other acts, the recognition of revenue is postponed until the significant act is executed.
When the outcome of the transaction involving the rendering of services cannot be estimated reliably,
revenue is recognised only to the extent of the expenses recognised that are recoverable.
Service revenue is recognised by reference to the stage of completion of the transaction at the reporting
date. Stage of completion is determined by services performed to date as a percentage of total services to
be performed.
Interest, royalties and dividends
Revenue arising from the use by others of entity assets yielding interest, royalties and dividends is
recognised when:
Accounting policies

113SANEDI Annual Report 2014/15
annual financial statementsfor the year ended 31 march 2015
• It is probable that the economic benefits or service potential associated with the transaction will
flow to the entity; and
• The amount of the revenue can be measured reliably.
Interest is recognised in surplus or deficit, using the effective interest rate method.
1.10.2 Revenue from non-exchange transactions
Non-exchange transactions are transactions that are not exchange transactions. In a non-exchange
transaction, an entity either receives value from another entity without directly giving approximately
equal value in exchange, or gives value to another entity without directly receiving approximately equal
value in exchange.
Stipulations on transferred assets are terms in laws or regulation, or a binding arrangement imposed upon
the use of a transferred asset by entities external to the reporting entity.
Conditions on transferred assets are stipulations that specify that the future economic benefits or service
potential embodied in the asset is required to be consumed by the recipient as specified or future
economic benefits or service potential must be returned to the transferor.
Restrictions on transferred assets are stipulations that limit or direct the purposes for which a transferred
asset may be used, but do not specify that future economic benefits or service potential is required to be
returned to the transferor if not deployed as specified.
Recognition
An inflow of resources from a non-exchange transaction recognised as an asset is recognised as revenue,
except to the extent that a liability is also recognised in respect of the same inflow.
As the entity satisfies a present obligation recognised as a liability in respect of an inflow of resources
from a non-exchange transaction recognised as an asset, it reduces the carrying amount of the liability
recognised and recognises an amount of revenue equal to that reduction.
Measurement
Revenue from a non-exchange transaction is measured at the amount of the increase in net assets
recognised by the entity.
When, as a result of a non-exchange transaction, the entity recognises an asset, it also recognises revenue
equivalent to the amount of the asset measured at its fair value as at the date of acquisition, unless it is
also required to recognise a liability. Where a liability is required to be recognised it will be measured as
the best estimate of the amount required to settle the obligation at the reporting date, and the amount
of the increase in net assets, if any, recognised as revenue. When a liability is subsequently reduced,
because the taxable event occurs or a condition is satisfied, the amount of the reduction in the liability is
recognised as revenue.
Accounting policies

114 SANEDI Annual Report 2014/15
annual financial statementsfor the year ended 31 march 2015
Gifts and donations, including goods and services in-kind, including goods in-kind, are recognised as assets
and revenue when it is probable that the future economic benefits or service potential will flow to the
entity and the fair value of the assets can be measured reliably.
Services in-kind are not recognised.
Membership fees
Revenue from membership fees are recognised as revenue from non-exchange revenue and are recognised
and measured in accordance with GRAP 23.
Conditional grants and receipts
Revenue received from conditional grants, donations and funding are recognised as revenue to the extent
that the entity has complied with any of the conditions embodied in the agreement. To the extent that the
conditions have not been met a liability is recognised.
1.11. Irregular, fruitless and wasteful expenditure and unauthorised expenditure
Irregular expenditure as defined in section 1 of the PFMA is expenditure incurred in contravention of, or
that is not in accordance with:
• A requirement of the Public Finance Management Act, 1999 (Act No. 29 of 1999) (PFMA); or
• A requirement of the State Tender Board Act, 1986 (Act No.86 of 1986), or any regulations made in
terms of the Act; or
• A requirement in any provincial legislation providing for procurement procedures in that provincial
government.
All expenditure relating to irregular expenditure is recognised as an expense in the statement of financial
performance in the year that the expenditure was incurred. The expenditure is classified in accordance
with the nature of the expense, and where recovered, it is subsequently accounted for as revenue in the
statement of financial performance.
Fruitless expenditure means expenditure which was made in vain and would have been avoided had
reasonable care been exercised. All expenditure relating to fruitless and wasteful expenditure is recognised
as an expense in the statement of financial performance in the year that the expenditure was incurred.
The expenditure is classified in accordance with the nature of the expense, and where recovered, it is
subsequently accounted for as revenue in the statement of financial performance.
Unauthorised expenditure means:
• Overspending of a vote or a main division within a vote; and
• Expenditure not in accordance with the purpose of a vote or, in the case of a main division, not in
accordance with the purpose of the main division.
All expenditure relating to unauthorised expenditure is recognised as an expense in the statement of
financial performance in the year that the expenditure was incurred. The expenditure is classified in
accordance with the nature of the expense, and where recovered, is subsequently accounted for as
revenue in the statement of financial performance.
Accounting policies

115SANEDI Annual Report 2014/15
annual financial statementsfor the year ended 31 march 2015
When the Accounting Authority determines the appropriateness of disciplinary steps against an official,
the Accounting Authority must take into account:
• The circumstances of the transgression;
• The extent of the expenditure involved, and
• The nature and seriousness of the transgressio
All unauthorised, irregular or fruitless and wasteful expenditures are disclosed as a note to the annual
financial statements of the entity.
1.12. Borrowing costs
Borrowing costs directly attributable to the acquisition, construction or production of qualifying assets
are added to the cost of those assets, until the assets are substantially ready for their intended use or
sale. Qualifying assets are assets that necessarily take a substantial period to get ready for their intended
use or sale. Investment income earned on the temporary investment of specific borrowings pending their
expenditure on qualifying assets is deducted from the cost of those assets.
Other borrowing costs are recognised as an expense in the period in which they are incurred.
1.13. Key accounting judgments and key sources of estimation uncertainty
In preparing the annual financial statements, management is required to make estimates and assumptions
that affect the amounts represented in the annual financial statements and related disclosures. Use of
available information and the application of judgment are inherent in the formation of estimates. Actual
results in the future could differ from these estimates which may be material to the annual financial
statements.
Significant judgment includes:
Going concern
Management considers key financial metrics in its approved medium-term budgets, together with its
existing term facilities, to conclude that the going concern assumption used in the compiling of its annual
financial statements is relevant.
Other provisions
For other provisions, estimates are made of legal or constructive obligations resulting in the raising
of provisions, and the expected date of probable outflow of economic benefits to assess whether the
provision should be discounted.
Impairment testing
The recoverable (service) amounts of individual assets and cash-generating units have been determined
based on the higher of value-in-use calculations and fair values less costs to sell. These calculations require
the use of estimates and assumptions.
The entity reviews and tests the carrying value of assets when events or changes in circumstances suggest
that the carrying amount may not be recoverable. If there are indications that impairment may have
occurred, estimates are prepared of expected future cash flows for each group of assets.
Accounting policies

116 SANEDI Annual Report 2014/15
annual financial statementsfor the year ended 31 march 2015
Useful lives of property, plant and equipment and intangible assets
The entity’s management determines the estimated useful lives and related depreciation charges for
property, plant and equipment and intangible assets. This estimate is based on the condition and use of
the individual assets, in order to determine the remaining period over which the asset can and will be
used.
Fair value estimation
The fair value of financial instruments traded in active markets (such as trading and available-for-sale
securities) is based on quoted market prices at the end of the reporting period. The quoted market price
used for financial assets held by the entity is the current bid price.
The fair value of financial instruments that are not traded in an active market (for example, over-the
counter derivatives) is determined by using valuation techniques. The entity uses a variety of methods
and makes assumptions that are based on market conditions existing at the end of each reporting
period. Quoted market prices or dealer quotes for similar instruments are used for long-term debt. Other
techniques, such as estimated discounted cash flows, are used to determine fair value for the remaining
financial instruments. The carrying values of trade receivables and payables are assumed to approximate
their fair values.
1.14 Employee benefits
Short-term employee benefits
Short-term employee benefits are employee benefits (other than termination benefits) that are due to
be settled within twelve months after the end of the period in which the employees render the related
service. Short-term employee benefits include items such as:
• wages, salaries and social security contributions;
• short-term compensated absences (such as paid annual leave and paid sick leave) where the
compensation for the absences is due to be settled within twelve months after the end of the
reporting period in which the employees render the related employee service;
• bonus, incentive and performance related payments payable within twelve months after the end
of the reporting period in which the employees render the related service and non-monetary
benefits (for example, medical care, and free or subsidised goods or services such as housing, cars
and cellphones) for current employees.
When an employee has rendered service to the entity during a reporting period, the entity recognises the
undiscounted amount of short-term employee benefits expected to be paid in exchange for that service:
• as a liability (accrued expense), after deducting any amount already paid. If the amount already
paid exceeds the undiscounted amount of the benefits, the entity recognises that excess as an
asset (prepaid expense) to the extent that the prepayment will lead to for example, a reduction in
future payments or
• a cash refund and
• as an expense, unless another Standard requires or permits the inclusion of the benefits in the
cost of an asset.
Accounting policies

117SANEDI Annual Report 2014/15
annual financial statementsfor the year ended 31 march 2015
The expected cost of compensated absences is recognised as an expense as the employees render services
that increase their entitlement or, in the case of non-accumulating absences, when the absence occurs.
The entity measures the expected cost of accumulating compensated absences as the additional amount
that the entity expects to pay as a result of the unused entitlement that has accumulated at the reporting
date.
The entity recognises the expected cost of bonus, incentive and performance related payments when the
entity has a present legal or constructive obligation to make such payments as a result of past events and a
reliable estimate of the obligation can be made. A present obligation exists when the entity has no realistic
alternative but to make the payments.
Post-employment benefits: Defined contribution plans
When an employee has rendered service to the entity during a reporting period, the entity recognises
the contribution payable to a defined contribution plan in exchange for that service: as a liability (accrued
expense), after deducting any contribution already paid. If the contribution already paid exceeds the
contribution due for service before the reporting date, an entity recognise that excess as an asset (prepaid
expense) to the extent that the prepayment will lead to, for example, a reduction in future payments
or a cash refund; and as an expense, unless another Standard requires or permits the inclusion of the
contribution in the cost of an asset.
1.15 Related parties
The entity operates in an economic sector currently dominated by entities directly or indirectly owned by
the South African Government. As a consequence of the constitutional independence of the three spheres
of government in South Africa, only entities within the national sphere of government are considered to
be related parties.
Key management are those persons responsible for planning, directing and controlling the activities of
the entity, including those charged with the governance of the entity in accordance with legislation, in
instances where they are required to perform such functions.
Close members of the family of a person are considered to be those family members who may be expected
to influence, or be influenced by, that management in their dealings with the entity.
Only transactions with related parties not at arm’s length or not in the ordinary course of business are
disclosed.
1.16 Budget information
A reconciliation between the statement of financial performance and the budget has been included in the
annual financial statements, as the recommended disclosure as determined by National Treasury, as the
annual financial statements and the budget are not on the same basis of accounting. Refer to note 23 -
Reconciliation between budget and statement of financial performance.
Accounting policies

118 SANEDI Annual Report 2014/15
annual financial statementsfor the year ended 31 march 2015
1.17 Prior period error
Prior period errors are omissions from, and misstatements in, the entity’s financial statements for one or
more prior periods arising from a failure to use, or misuse of, reliable information that was available and
could reasonably be expected to have been obtained and taken into account in preparing these financial
statements. Such errors result from mathematical mistakes, mistakes in applying accounting policies,
oversights and/or misinterpretations of facts.
A prior period error shall be corrected by retrospective restatement except to the extent that it is
impracticable to determine either the period-specific effects or the cumulative effect of the error.
Any prior period error affecting the third set of comparable financial statements shall be disclosed as a
narrative note to the prior period error note. The statement of changes in net assets will be amended in
the prior year comparative financial statements as one line item.
1.18 New standards and interpretations
Standards and interpretations effective and adopted in the current year
In the current year, the entity has adopted the following standards and interpretations that are effective
for the current financial year and that are relevant to its operations:
Standards and interpretations not yet effective or relevant
The following approved Standards of GRAP that have been issued, but are not yet effective, are likely
to affect the annual financial statements when they are adopted as these Standards have been used to
formulate and inform the current accounting policies and disclosures:
1. GRAP 20: Related party disclosures
2. GRAP 32: Service concession arrangements: grantor; and
3. GRAP 108: Statutory receivables
Adoption of the amendments to the Standards of GRAP issued in 2012 and various interpretations of the
Standards of GRAP did not have a significant effect on the financial statements.
Accounting policies

119SANEDI Annual Report 2014/15
annual financial statementsfor the year ended 31 march 2015
Notes to the annual financial statements
2. Property, plant and equipment
2015 2014
CostAccumulateddepreciation
Carrying values Cost
Accumulated depreciation
Carrying values
Furniture and fixtures 1 630 (674) 956 1 626 (407) 1 219Office equipment 223 (79) 144 156 (48) 108Computer equipment 3 601 (2 123) 1 478 3 413 (1 075) 2 338Leasehold improvements 74 (50) 24 74 (32) 42Communication equipment 288 (109) 179 273 (54) 219Total 5 816 (3 035) 2 781 5 542 (1 616) 3 926
Reconciliation of property, plant and equipment – 2015
Opening balance Additions
Disposals/ impairments Depreciation Total
Furniture and fixtures 1 219 4 - (267) 956Office equipment 108 67 - (31) 144Computer equipment 2 338 333 (133) (1 060) 1 478Leasehold improvements 42 - - (18) 24Communication equipment 219 15 - (55) 179Total 3 926 419 (133) (1 431) 2 781
Reconciliation of property, plant and equipment – 2014
Opening balance Additions
Disposals/ impairments Depreciation Total
Furniture and fixtures 1 297 183 (3) (258) 1 219Office equipment 133 2 - (27) 108Computer equipment 456 2 776 (19) (875) 2 338Leasehold improvements 890 - (749) (99) 42Communication equipment 172 172 (68) (57) 219Total 2 948 3 133 (839) (1 316) 3 926
Management has reviewed useful lives at 31 March 2015 and concluded that they fairly reflect the expected usage of assets. Proceeds, amounting to R13 727 were received from the company insurance for a stolen laptop.
3. Intangibles assets
31 March 2015
2015 2014
CostAccumulated depreciation
Carrying values Cost
Accumulated depreciation
Carrying values
Computer software 7 840 (5 514) 2 326 6 465 (2 099) 4 366
Notes to the annual financial statements

120 SANEDI Annual Report 2014/15
annual financial statementsfor the year ended 31 march 2015
3. Intangibles assets (continued)
Reconciliation of intangibles assets– 2015
Opening balance Additions Amortisation Total
Computer software 4 366 1 375 (3 415) 2 326
Reconciliation of intangibles assets– 2014
Opening balance Additions Amortisation Total
Computer software 1 877 4 213 (1 724) 4 366
4. Receivables from exchange transactions
Financial assets at amortised cost
2015R’000
Restated2014
R’000Receivables from exchange transactions 7 883 7 021Employee costs in advance – 15Prepayments 32 98Project prepayments 2 883 –PAYE control 34 –UIF control 3 –Provision for bad debts (5 180) (4 646)Recoverable fruitless and wasteful expenditure 12 –Interest receivable 1 076 405
6 743 2 893
Trade and other receivables are not pledged as security. The entity does not hold any collateral as security.
Trade and other receivables past due but not impaired
Trade and other receivables which are less than 3 months past due are not considered to be impaired; however,
conditions should not exist that indicate impairment.
At 31 March 2015 R1.7 million (2014: R1.8 million) were past due but not impaired.
The ageing of amounts past due but not impaired is as follows:1 – 3 months past due - 1 162 3 – 6 months past due 1 131 6386 – 12 months past due 538 -
Notes to the annual financial statements

121SANEDI Annual Report 2014/15
annual financial statementsfor the year ended 31 march 2015
Trade and other receivables impairedThe amount of the provision was R5.2 million as of 31 March 2015 (2014: R4.7 million) 2015
R’000
Restated2014
R’000The ageing of these receivables is as follows:Over 6 months 5 180 4 646
Reconciliation of provision for impairment of trade and other receivables:Opening balance 4 646 6 821Amounts written off as uncollectable – (2 175)Additional provision 534 –Provision for doubtful debts 5 180 4 646
The creation and release of provision for impaired receivables have been included in operating expenses in
surplus. The maximum exposure to credit risk at the reporting date is the fair value of each class of receivable
mentioned above.
5. Cash and cash equivalents
Cash and cash equivalents consist of:Cash on hand 15 10Bank balances 364 837 151 252
364 852 151 262
There are no restrictions placed on the realisation or usability of cash balances. The entity does not have access
to any additional undrawn facilities.
6. Unspent conditional grants and third party funds
Unspent conditional grants and receipts comprises:Unspent grants and third party funds 338 957 129 618
Movement during the yearBalance at the beginning of the year 129 618 125 248Prior period error - 417Additions during the year and interest 264 619 95 202Income recognition during the year (55 280) (19 449)Transfers* - (71 800)
338 957 129 618
*An amount of R106 million was repaid, on 30 April 2015, to the RDP Fund for the EU AID demo project and the
Danish renewable energy programme.
These amounts are invested in money market accounts and interest accrues to the invested money.
Notes to the annual financial statements

122 SANEDI Annual Report 2014/15
annual financial statementsfor the year ended 31 march 2015
6. Unspent conditional grants and third party funds (continued)2015
R’000
Restated2014
R’000Unspent conditional grants and receipts comprises:Danish commercial building project 460 472European Union project (COCATE) 457 524FP7 135 67SA Carbon Capture and Storage centre 190,693 85 736Centre for energy systems and research 4,984 4 110SA road map 755 734SDC EE monitoring and Implementation project 1 380 940Working for energy programme 19,755 25 137EU AID demo project 94,343 4 288REEEP 431 797Wind resource mapping 2 331 4 221Shale gas 9 134 1 627Danish renewable energy programme 13 545 -EEDSM 179 1 024Energy efficiency - (51)SASGI - (8)Green transport 375 -
338 957 129 618
7. Provisions
Reconciliation of provisions – 2015Opening balance
R‘000Utilised
R‘000Additions
R‘000Closing
R‘000Bonus provision 7 266 (7 266) 7 511 7 511
Reconciliation of provisions – 2014Opening balance
R‘000
UtilisedR‘000
AdditionsR‘000
Bonus provision
R‘000Bonus provision 7 921 (7 921) 7 266 7 266
The bonus provision is calculated based on a percentage of the entity’s performance and the individual
performance ratings of staff members.
Notes to the annual financial statements

123SANEDI Annual Report 2014/15
annual financial statementsfor the year ended 31 march 2015
8. Payables from exchange transactions
2015R’000
Restated2014
R’000Trade payables 745 889Accruals 11 630 6 695PAYE control - 7WCA 93 -UIF control 6 11SDL control - 21Salary control 28 144Garnishee control 29 -Medical aid fund control 20 38Leave provision 2 350 2 253
14 901 10 058
9. Revenue
9.1 Revenue non exchange is made up as follows:
MTEF allocation 51 685 61 374Recognition of unspent conditional grants 55 280 22 717
106 965 84 091
9.2 Revenue from exchange transactions is made up as follows:
Interest received 832 225Membership fees and sponsorships 5 512 7 260Other income 77 2 035
6 421 9 520113 386 93 611
Interest is earned on monies in invested in money market accounts with various banks through CEF (SOC) Limited per the service level agreement.
9.2.1 Other Income
Income from tenders 19 67Other debtors written-off - (66)Income from current account - 9Profit on sale of assets - 25Refund - 2 000PV of creditors 58
77 2 035
Notes to the annual financial statements

124 SANEDI Annual Report 2014/15
annual financial statementsfor the year ended 31 march 2015
10. Operating expenses
2015R’000
Restated2014
R’000Advertising 258 1 092Bank charges 30 23Audit fees 818 715Consulting and legal fees 228 6 792IT licence fees 363 -Entertainment 186 114Electricity 505 -Insurance 283 205Conferences and seminars 1 364 70Lease rentals on operating lease 3 251 3 949Marketing and promotional expenditure 1 512 5 420Postage and courier 3 16Printing and stationery 658 489Subscriptions and membership fees 1 931 451Telephone and fax 563 384Travel – local 1 380 3 199Travel – overseas 678 2 496Administration expenses 1 857 4 948
15 868 30 36311. Employee related costsBasic 29 135 25 396Bonus 7 796 5 090Medical aid – entity contributions 450 438UIF 77 68WCA 51 45SDL 358 320Other payroll levies 6 5Leave pay provision charge 164 1 145Employee welfare and training 425 154Recruitment and relocation costs 96 -Provident and pension contributions 1 144 1 156Travel, motor car, accommodation, subsistence and other allowances 253 215
39 955 34 032
In terms of SANEDI’s leave pay policy, employees are entitled to accumulated vested leave pay benefits not taken
within a leave cycle, provided that any leave pay benefits not taken within a period of one year after the end of
the leave cycle are forfeited.
Notes to the annual financial statements

125SANEDI Annual Report 2014/15
annual financial statementsfor the year ended 31 march 2015
12. Cash generated from operations
2015R’000
Restated2014
R’000Surplus 35 8 568adjustments for: Depreciation and amortisation 4 846 3 040Impairments (7) 819Foreign exchange transactions - 53Accrued expenses (82) (1,496)Movement on bonus provision 245 655Provision for bad debts reversal - (2 175)
Changes in working capital:
210 333 3 007Trade and other receivables (3 849) (632)Payables from exchange transactions 4 843 (731)Unspent conditional grants and receipts 209 339 4 370
215 370 12 471
13. Commitments
Operating lease commitments: CEF (SOC) LimitedMinimum lease payments due –Within one year 408 339
Block C, Upper Grayston Office Park, 152 Ann Crescent, Strathavon, Sandton. The entity has leased Portion 13,
remaining Extent of Erf 14, Portion 1 of Erf 14 Simba Township, together with the building erected thereon
from CEF (SOC) Limited. The agreement commenced on 1 April 2012 and the rent payable shall annually, on the
anniversary date, escalate by 10% or alternatively, shall escalate in accordance with the CPI, whichever is greater.
Either party shall be entitled to terminate this lease on six months’ written notice to the other party.
Operating lease commitments: City Square Trading 522 (Pty) Ltd
Minimum lease payments due –Within one year 2 589 2 369Second to fifth year inclusive 3 567 6 451
6 156 8 820
Block E, Upper Grayston Office Park, Erf 20 Simba Township, Sandton. SANEDI leased units 9 – 12 on the second
floor of Block E, Upper Grayston Office Park, located at Erf 20 Simba Township, Sandton, from City Square Trading
522 (Pty) Ltd. The lease commenced on 1 May 2012 and the rent payable shall annually, on the anniversary date,
escalate by 8.25%. The lease terminates on 30 April 2017. SANEDI has the option to extend the lease for another
5 years.
SANEDI also leased unit 1 on the ground floor of Block E, Upper Grayston Office Park, located at Erf 20 Simba
Township, Sandton, from City Square Trading 522 (Pty) Ltd. The lease commenced on 1 January 2013 and the rent
payable shall annually, on the anniversary date, escalate by 8.25%. The lease terminates on 31 December 2017.
SANEDI has the option to extend the lease for another five years.
Notes to the annual financial statements

126 SANEDI Annual Report 2014/15
annual financial statementsfor the year ended 31 march 2015
13. Commitments (continued) 2015
R’000
Restated2014
R’000Printing equipment Operating lease commitments for printing equipmentMinimum lease payments due – Within one year 59 72 Second to fifth year inclusive 50 181
109 253
SANEDI has entered into a 36 months’ lease for photocopiers. The lease has no escalation clause and is payable monthly in advance. Defaults and breaches
There was no default during the period of principal, interest, sinking fund or redemption terms of loans payable.
No terms were renegotiated before the financial statements were authorised for issue.
Contractual commitments
Within one year 149 647 21 886Second to fifth year inclusive 5 786 -
155 433 21 886
SANEDI has entered into various contracts with service providers for the achievement of its key deliverables for
the Danish renewable energy programme; Working for Energy (WfE) programme; the Centre for Energy Systems
Research, the Hub for energy efficiency and demand side management and various projects under the clean
energy programme.
Capital commitments approved not contracted for
Within one year 840 1 080
These are capex commitments budgeted for and approved by the board but not contracted for.
14. Contingencies
Surplus funds
SANEDI has a surplus for the year ended 31 March 2015 amounting to R0.035 million (Surplus 2014:
R8.6 million). A request has been submitted to National Treasury to retain the surplus, in terms of Section
53 of the Public Finance Management Act.
Notes to the annual financial statements

127SANEDI Annual Report 2014/15
annual financial statementsfor the year ended 31 march 2015
15. Related parties
Compensation to key management – 31 March 2015
Basic Salary Allowances
Performance Bonus
Subsistence and travel Leave
Entity contributions
2015
R’000Mr KM Nassiep - chief executive officer 1 825 132 717 97 182 32 2 985Ms L Manamela -chief financial officer 1 064 24 - - 29 15 1 132Dr AD Surridge 1 191 108 537 2 45 92 1 975Mr D Batte 1 242 24 426 - 136 21 1 849Dr M Bipath 1 122 84 499 - 51 183 1 939Dr T Mali 1 141 66 423 51 (44) 181 1 818Mr C Snyman 1 068 24 310 32 61 18 1 513Mr D Mahuma 1 242 24 356 7 118 20 1 767Mr B Bredenkamp 1 183 24 499 85 88 182 2 061Total 11 078 510 3 767 274 666 744 17 039
31 March 2014
Basic Salary Allowances
Performance Bonus
Subsistence and travel Leave
Entity contributions
2014R’000
Mr KM Nassiep - chief executive officer 1 719 132 769 75 71 206 2 972Ms L Manamela - chief financial officer
84 2 - - - 10 96
Dr AD Surridge 1 123 108 465 7 - 204 1 907Mr D Batte 1 174 24 397 - - 86 1 681Dr M Bipath 1 058 84 500 15 49 200 1 906Dr T Mali 1 076 66 429 46 46 222 1 885Mr C Snyman 905 21 - 0 - 75 1 001Mr D Mahuma 1 174 24 247 35 - 77 1 557Mr B Bredenkamp 1 118 24 465 85 224 1 916Total 9 431 485 3 272 263 166 1 304 14 921
Members’ emoluments
Committee fees2015
R’000
Restated2014
R’000Mr J Marriott 7 32Ms N Mlonzi 23 24Ms M Modise* - -Mr M Vilana* - -Dr D Hilderbrant 6 24Mr M Gordan* - -Prof E Meyer* - -Ms D Ramalope* - -Dr R Maserumule * (alternate director) - -Ms P Motsielwa 25 8
Notes to the annual financial statements

128 SANEDI Annual Report 2014/15
annual financial statementsfor the year ended 31 march 2015
Committee fees (continued)2015
R’000
Restated2014
R’000Mr G Fourie* - -Mr C Manyungwana* - -Dr C Sita* - -Dr V Munsami* - -
61 88
* These members are not remunerated in their personal capacity
Board audit committee
Committee fees Ms P Motsielwa 25 -Mr V Magan 15 27Ms M Thomani - -Ms M Nyathi - 12Dr C Sita* - -Dr R Maserumule - -Dr D Hildebrandt 15 4
55 43
* These members are not remunerated in their personal capacity.
SANEDI has been established by the Department of Energy and in terms of national legislation. SANEDI is
ultimately controlled by the Department of Energy.
Grants Received
Department of Energy 162 685 134 344Department of Science and Technology 5 100 6 000
All transactions with related parties are arm’s length and will not be disclosed separately.
16. Financial instruments
Introduction
The entity has a risk management and central treasury function that manages the financial risks relating to
the entity’s operations. The entity’s liquidity, credit, foreign exchange and interest rate risks are monitored
continually. Approved policies exist for managing these risks.
Risk profile
The entity utilises the services of risk management and the treasury department in CEF (SOC) Limited to
manage the financial risks relating to the entity’s operations.
Notes to the annual financial statements

129SANEDI Annual Report 2014/15
annual financial statementsfor the year ended 31 march 2015
Risk management objectives and policies
The entity’s objective in using financial instruments is to reduce the uncertainty over future cash flows
arising from movements in foreign exchange and interest rates. Throughout the year under review it has
been, and remains, the entity’s policy that no speculative trading in derivative instruments be undertaken.
Credit risk
Financial assets, which potentially subject the entity to concentrations of credit risk, pertain principally to
trade receivables and investments in the South African money market. Trade receivables are presented
net of the allowance for doubtful debts.
The exposure to credit risk with respect to trade receivables is not concentrated due to a large customer
base.
The entity manages counter party exposures arising from money market and derivative financial
instruments by only dealing with well-established financial institutions of a high credit rating. Losses are
not expected as a result of non-performance by these counter parties.
Credit limits with financial institutions are revised and approved by the board quarterly.
Fair value
The entity’s financial instruments consist mainly of cash and cash equivalents, trade receivables and trade
payables.
As at 31 March 2014 no financial asset was carried at an amount in excess of its fair value and fair values
could be reliably measured for all financial assets that are available for sale or held for trading.
The following methods and assumptions are used to determine the fair value of each class of financial
instrument:
Cash and cash equivalents
The carrying amounts of cash and cash equivalents approximates fair value due to the relatively short term
maturity of these financial assets.
Trade receivables
The carrying amounts of trade receivables net of provision for bad debt, approximates fair value due to the
relatively short term maturity of this financial asset.
Trade payables
The carrying amounts of trade payables approximates fair value due to the relatively short-term maturity
of these liabilities.
The carrying value of short-term borrowings approximates fair value due to the relatively short-term
maturity of these liabilities. The fair values of other long term borrowings are not materially different from
the carrying amounts.
Notes to the annual financial statements

130 SANEDI Annual Report 2014/15
annual financial statementsfor the year ended 31 march 2015
Maturity profile
The maturity profiles of financial assets and liabilities at the statement of financial position date are as follows:
At 31 March 2015
Less than 1 year
Between 1 and 5 years Over 5 years Non-interest Total
Cash and cash equivalents 364 852 - - - 364 852Trade and other receivables 6 743 - - - 6 743VAT receivable 207 - - - 207Total financial assets 371 802 - - - 371 802
Liabilities Trade and other payables 14 901 - - - 14 901
At 31 March 2014
Less than 1 year
Between 1 and 5 years Over 5 years
Held to maturity
Investments Total Cash and cash equivalents 151 262 - - - 151 262Trade and other receivables 2 893 - - - 2 893Loans receivableTotal financial assets 154 155 - - - 154 155
Liabilities Trade and other payables 10 058 - - - 10 058
Financial instruments by category:
31 March 2015
Loans and receivables
Fair value through Profit
and loss – held for trading
Fair value through Profit and loss –des-
ignated Non-interest Total Cash and cash equivalents 364 852 - - - 364 852Trade and other receivables 6 743 - - - 6 743VAT receivable 207 - - - 207Total financial assets 371 802 - - - 371 802
Liabilities Trade and other payables 14 901 - - - 14 901
Notes to the annual financial statements

131SANEDI Annual Report 2014/15
annual financial statementsfor the year ended 31 march 2015
At 31 March 2014
Loans and receivables
Fair value through Profit
and loss – held for trading
Fair value through Profit and loss –des-
ignated Non-interest Total Cash and cash equivalents 151 262 - - - 151 262Trade and other receivables 2 893 - - - 2 893Loans receivableTotal financial assets 154 155 - - - 154 155
Liabilities Trade and other payables 10 058 - - - 10 058
Liquidity risk
The entity manages liquidity risk through proper management of working capital, capital expenditure and actual
versus forecasted cash flows. Adequate reserves and liquid resources are also maintained. The table below
analyses SANEDI’s financial liabilities based on the remaining period at the statement of financial position to
the contractual maturity date. The amounts disclosed in the table are the contractual undiscounted cash flows.
Balances due within 12 months equal their carrying balances as the impact of discounting is not significant.
At 31 March 2015
Less than 1 year
Between 1 and 5 years Over 5 years Non-interest Total
Liabilities Trade and other payables 14 901 - - - 14 901Commitments 149 647 5 786 - - 155 433Total financial liabilities 164 548 5 786 - - 170 334
At 31 March 2014
Less than 1 year
Between 1 and 5 years
Over 5 years Held to maturity
investments
Total
Liabilities Trade and other payables 10 058 - - - 10 058Commitments 21 886 - - - 21 886Total financial liabilities 31 944 - - - 31 944
17. Fruitless and wasteful expenditure
2015R’000
Restated2014
R’000Reconciliation of fruitless and wasteful expenditure
Opening balance 2 -Fruitless and wasteful expenditure – relating to current year 34 2Less: Amounts condoned by the Board of Directors - -
Fruitless and wasteful expenditure awaiting condonation 36 2
Notes to the annual financial statements

132 SANEDI Annual Report 2014/15
annual financial statementsfor the year ended 31 march 2015
Current year fruitless and wasteful expenditure is as a result of:
• Interest caused by delays with interbank transfers, resulting in payments being allocated late; and
• Two late payments to supplier. Amount will be recovered from the employee who caused the irregular
expenditure.
The necessary steps have been taken to recover the money from the individual staff. Staff have signed an
acknowledgement of debt.
Prior year fruitless and wasteful expenditure was incurred as a result of late payments made to a supplier. All
fruitless and wasteful expenditure was condoned by the Board after the financial year.
18. Irregular expenditure
2015R’000
Restated2014
R’000Reconciliation of irregular expenditure
Opening balance 19 102 12 644Irregular expenditure – relating to current year 426 6 458Less: Amounts condoned by Board (19 102) -
Irregular expenditure awaiting condonation 426 19 102
Condonation of irregular expenditure
At the board meetings held on 11 June 2014 and 29 June 2015, the Board of Directors approved the condonation
of irregular expenditure.
As at the 31 March 2015, none of the irregular expenditure had been condoned by the National Treasury.
Contravention of legislation (Preferential Procurement Policy Framework Act).
No tax clearance certificates
• Goods and services were procured from suppliers without obtaining confirmation that that their tax
matters were in good order resulting in irregular expenditure of R0.098 million. (2014: R1 211 million).
BEEE scores not considered
• Goods and services were procured from suppliers without taking into account the BEEE score of the
subcontractor resulting in irregular expenditure of R0.151 million. (2014: R0.726 million).
Deviation not approved by appropriate authority
• Goods and services were procured from suppliers without deviation from open procurement process
being approved by the Accounting Authority resulting in irregular expenditure of R0.177 million. (2014:
R1.377 million).
Notes to the annual financial statements

133SANEDI Annual Report 2014/15
annual financial statementsfor the year ended 31 march 2015
19. Prior period errors
Trade and other receivables
• Prepayments relating to straight-lining of operating lease were corrected.
Trade and other payable/revenue from exchange transactions
• Uncleared balances relating to travel and subsistence, salary advances and PAYE were incorrectly accounted
for, resulting in duplicate entries in the clearing accounts. The balances for clearing accounts were written
off to the statement of financial performance.
Deferred income/revenue from non-exchange
• SACCCS, REEEP, Coal Roadmap and CESAR deferred income balance was corrected with monies incorrectly accounted for under SANEDI.
Operating expenditure
• Invoices relating to the prior year were corrected with monies incorrectly accounted for under the current financial year.
The correction of the error(s) results in adjustments as follows:
Statement of financial position Restated2014
R’000Property, plant and equipment 5Receivables from exchange (963)Trade and other payable (528)Deferred Income (417)
Statement of financial performance
Revenue from non-exchange transactions (849)Revenue from exchange transactions 936Personnel costs (4)Depreciation 2Operating expenses 130Repairs and maintenance 1Project costs 222
Prior period errors, amounting to R1.5 million, affecting the 2012/13 financial year impacts directly on the accumulated surplus.
Notes to the annual financial statements

134 SANEDI Annual Report 2014/15
annual financial statementsfor the year ended 31 march 2015
20. Events after balance sheet date
Subsequent to the financial year, on 30 April 2015, an amount of R106 million was repaid to the RDP fund
for the EU AID demo project and the Danish renewable energy programme.
21. Statement of comparative and actual information
NotesOriginal budget
Budget adjustments
Final budget
Final outcome Variance
Actual outcome
as a percentage of original
budget
Actual outcome
as a percentage
of final budget
Financial performanceGrants and other receipts 1 319 684 - 319 684 113 386 206 298 35% 35%
Total income 319 684 - 319 684 113 386 206 298 35% 35%
Employee costs 2 43 439 - 43 439 39 955 3 484 92% 92%Depreciation and asset impairment - - - 4 846 (4 846) -100% -100%Project costs 3 259 549 - 259 549 51 770 207 779 20% 20%Operating expenditure 4 16 696 - 16 696 16 780 (84) 101% 101%
-Total expenditure 319 684 - 319 684 113 351 206 333 35% 35%
Surplus for the year 35
Notes1. Additional Grants from the RDP funds were received for the EU smart metering projects. Moreover
interest that was not budgeted for was earned on grants from money market investments.
2. The increase in employee costs is due to new project related vacancies which arose as a result of new
projects undertaken during the year. These vacancies were not additionally budgeted for. Key vacancies
such as the one for the company secretary and the HR manager were not filled during the year.
3. The variance in projects expenses was as a result of delays in the approval of project plans and finalisation
of project agreements with affected parties. Further details are provided in the performance report.
4. Operating expenditure is in line with the budget and the variance was as a result of cost saving measures
that were applied by the entity during the year.
Notes to the annual financial statements

135SANEDI Annual Report 2014/15

ANNUAL REPORT 2014/15
A state-owned entity established under Section 7 of the National Energy Act 2008, (Act No. 34 of 2008).
Telephone: 011 038 4300Physical Address: BLOCK E,
Upper Grayston Office Park, 150 Linden Road, Strathavon, Sandton
Postal Address: PO Box 9935, Sandton, 2146 Email: [email protected]
Website: www.sanedi.org.za
RP244/2015ISBN: 978-0-621-43838-3
PLEASE RECYCLE THIS REPORT