Embed Size (px)
Citation preview

ANNUAL REPORT 2013 OF J.P. MORGAN AG

KEY FIGURES OF J.P. MORGAN AG
€m 2013 2012 2011 2010
Net revenue 105.7 100.1 99.0 99.7
Net Interest Income 13.9 10.0 25.4 8.3
Net Commission Income 59.8 50.1 44.4 62.0
Total expenses 89.7 77.6 84.7 77.6
Income before Tax and extraordinary items 16.1 22.5 14.3 22.1
Net Income 9.8 22.5 14.3 22.1
Equity 611 275 275 305
Return on Equity (RoE) 2.21% 8.16% 5.19% 7.24%
Cost-Income-Ratio 84.78% 77.55% 85.55% 77.83%
Pretax profit margin 15.22% 22.45% 14.45% 22.17%
Tier 1 capital ratio 87.90% 37.80% 17.18% 18.01%
Total capital ratio 112.70% 71.90% 32.17% 33.56%
HIGH VALUE PAYMENTS > PAGE 3: TREASURY SERVICES
€BN Monthly data
750
700
650
600
550
500
450
400
2010 2011 2012 2013
ASSETS UNDER CUSTODY > PAGE 4: INVESTOR SERVICES
€BN Monthly data
250
225
200
175
150
125
100
75
50
25
2010 2011 2012 2013
1,00
0 tr
ansa
ctio
ns

CONTENTS
Annual Report 2013
Management Report 2
Assurance by the Board 22
Balance Sheet of J.P. Morgan AG, Frankfurt am Main 24
Income Statement
of J.P. Morgan AG, Frankfurt am Main 28
Notes to the Financial Statement
of J.P. Morgan AG, Frankfurt am Main 30
Statement of Changes in Equity 50
Cash Flow Statement 51
Auditor’s Report 52
Supervisory Board Report 54

2 ManageMent RepoRt
COO and CFO prepare corresponding presentations on finan-
cial performance, complete risk reports, and scorecards of
the corporate functions for the purposes of discussion, con-
sideration, and passing resolutions. Minutes of the Manage-
ment Board meetings are recorded by a Legal Department
employee.
For its meetings, the Supervisory Board receives an up-to-
date summary of the business division scorecards, used in
the Management Board meetings, a presentation on financial
performance, the complete MaRisk risk reports, and a sum-
mary of the scorecards of the corporate functions for the pur-
poses of discussion, consideration, and passing resolutions.
Supervisory Board meeting minutes are taken by the Head of
the Legal Department or an external attorney.
The Supervisory Board’s Audit Committee normally meets
with the auditor twice a year to discuss the audit plan as well
as the annual financial statements and audit report. Minutes
of the meeting of the Supervisory Board’s Audit Committee
are recorded by a Legal Department employee.
The Bank has a full banking license pursuant to Section 1(1)
of the KWG (Kreditwesengesetz [German Banking Act]) (Nos.
1 to 5 and 7 to 9) and conducts banking business with insti-
tutional clients, banks, corporate clients and clients from the
public sector.
INTERNAL CONTROL SYSTEM
In addition to regular meetings of the Management Board
and the Supervisory Board, the Local Operating Committee,
representing all key corporate functions, manages corporate
governance in everyday business on behalf of the Manage-
ment Board. J.P. Morgan AG’s corporate functions continue
to support not only the Bank’s business segments but also
Business and Regulatory Framework
ORGANIzATION AND LEGAL STRUCTURE
J.P. Morgan AG, based in Frankfurt am Main, is an indi-
rectly owned 100% subsidiary of JPMorgan Chase & Co.,
based in Columbus, Ohio, in the United States of America.
J.P. Morgan AG works on various levels, mainly in liquidity
management and in the business segments, providing ser-
vices to and receiving them from various Group affiliates. After
registration in the commercial registry on November 4, 2013,
J.P. Morgan Beteiligungs- und Verwaltungsgesellschaft mbH
fully merged with J.P. Morgan AG. Since then, the shares of
J.P. Morgan AG are held directly by J.P. Morgan International
Finance Limited, based in Newark, in the United States of
America.
J.P. Morgan AG is managed by a three-member Management
Board “Vorstand” and controlled by a six-member Supervi-
sory Board “Aufsichtsrat”. The Management Board generally
convenes on a monthly basis while the Supervisory Board
meets at least four times a year. In 2013, the Supervisory
Board held five meetings and the Audit Committee held two
meetings. The Supervisory Board receives a written MaRisk-
compliant (Mindestanforderungen an das Risikomanagement
[Minimum Requirements for Risk Management]) risk report
on a quarterly basis. The names of the members of the Man-
agement Board and the Supervisory Board are listed in the
notes.
A detailed presentation is prepared each month for the Man-
agement Board meetings by the two divisions, Treasury Ser-
vices and Investment Services, in the form of scorecards,
containing all of the transactions essential for discussing the
business performance in the past month and reflecting the
development of the divisions’ KPIs and KRIs. Likewise, the
MANAGEMENT REPORT AS OF DECEMBER 31, 2013

3ManageMent RepoRt
SEGMENTS AND ESSENTIAL PRODUCTS AND
PROCESSES
J.P. Morgan AG is an integral part of the global J.P. Morgan
Group and forms the backbone of the J.P. Morgan Group’s
operations in Germany. The full integration of the Bank into
J.P. Morgan’s global Treasury Services and Investor Services
segments of the Group’s Corporate & Investment Bank is
of crucial importance, as it provides us with the necessary
international network to deliver client services that do jus-
tice to J.P. Morgan’s mission “First class business in a first
class way”. In 2013, the Bank continued to concentrate on its
core business, in order to measure up to the demands of the
J.P. Morgan Group by fulfilling its roles from Frankfurt am
Main as a central bank of the Group for € payments and as a
Global Custodian for the German investment market.
Thus, in 2013, we made the necessary preparations to be
able to expand our existing product portfolio in the upcoming
business year with other business areas, and worked in close
cooperation with our clients on the implementation of the
technical framework conditions for the transition to SEPA. In
addition, we implemented the regulatory requirements of the
Kapitalanlagegesetzbuch (KAGB) [German Investment Code]
on July 22, 2013 and supported the Kapitalverwaltungsgesell-
schaften (KVGs) [capital management companies] during the
migration of existing fund structures under the new AIF regime.
Treasury Services
J.P. Morgan AG is globally responsible for the € Clearing Oper-
ations division. In the coming years, in view of an increasing
unification of the European payment transactions and due
to our high investments in technology, we expect to deliver
our leading global technology and our client service in the
mass payment market centrally from J.P. Morgan AG and in
close cooperation with our sister companies both to corporate
all other Group units in Frankfurt am Main. The Treasury
Services and Investor Services segments are each managed
by one Member of the Board – “Markt” – and controlled by
a Member of the Board – “Marktfolge”. In addition to the
key controlling variables of interest income and commission
income, a conservative risk policy that in particular limits the
possible credit and counterparty risk, provides the basis for
successful management of J.P. Morgan AG by the Manage-
ment Board.
All aspects of the business segments are transparently cov-
ered by a wide-ranging set of scorecards and controlled in
particular by the means of trend analysis and key performance
indicators on a monthly basis in meetings of the Business Con-
trol Committees, comprised of Sales, Operations and control
functions, with the inclusion of the international chief risk
officer of the Group. This enables the Management Board to
identify changes or risks in the business performance in a
timely manner and to make appropriate decisions and imple-
ment the necessary measures.
Moreover, comprehensive reports on all data represent-
ing loan utilization, overdrafts, level of collateral and key
ratios according to SolvV (Solvabilitätsverordnung) and LiqV
(Liquiditätsverordnung) are produced on a daily basis by the
Finance and Credit Division for the Management Board. These
reports are continuously being developed to meet the increas-
ing regulatory requirements, and included the LCR and the
Leverage Ratio as additional figures in 2013.
From a regulatory perspective, to be able to fulfill the addi-
tional requirements of MaRisk, J.P. Morgan AG has already
created the position of a MaRisk Compliance Officer.

4 ManageMent RepoRt
“Portfolio Insight”. The interactive reporting corresponds to
the latest state of technology and offers multinational clients
an optimal and easy to use solution for asset allocation for
all pension plans. In addition, Portfolio Insight offers better
reporting for investment compliance and credit rating of all
assets of the clients.
Another novelty offered by J.P. Morgan to clients is Trans-
action Cost Analysis (TCA), a tool for active transaction cost
management for the asset managers authorized by clients.
The detailed reporting serves for improved transparency of
incurred trading and settlement charges. Moreover, TCA also
offers the evaluation of implicit costs (consideration of rate
and market volatilities), thus making a decisive contribution
to effective performance control.
In view of the further strategic target, J.P. Morgan AG plans
to position itself in the insourcing of custodian bank services
sector, in order to provide support to custodian banks with low
economies of scale in fulfillment of the increasing regulatory
and client specific requirements.
SALES MARKETS AND COMPETITIVE POSITION
In Treasury Services, there is a need to differentiate between
relationship management and our function as global operating
hub for € Clearing Operations. In relationship management,
J.P. Morgan AG is responsible for institutional clients, banks,
corporate clients and public sector clients based in Germany
or Austria. In the area of banking, this includes subsidiary
companies based in Germany or Austria whose parent com-
panies have their headquarters in other countries.
Based on our global responsibility for the € Clearing Oper-
ations division resting with the core team in Frankfurt am
Main, as well as teams in sister companies of the Group in
clients and to financial institutions throughout Europe, and
to achieve substantial business growth. We are continually
expanding our top position as a € clearer in TARGET2 and EBA
by offering improved features to our multinational corporate
clients and financial institutions both domestically and abroad.
On the basis of these infrastructure services, our sales teams
offer highly advanced solutions in the areas of cash, treasury and
trade finance management, as well as ECA-covered financing
deals to corporate clients, insurance companies, asset manag-
ers, and financial institutions. Advanced technology and expan-
sion of the Group’s locations within the scope of the Global
Corporate Banking concept enable our sales teams to offer
ever more comprehensive global cash management solutions
that provide notable advantages in the management of liquid-
ity, particularly for our international clients. Together with our
highly developed service concept, this allowed us to continue
to grow with selected, international target clients, above all in
global cash management and in trade finance management.
Investor Services
In the global business sector of Investor Services of the Group,
J.P. Morgan AG acts as a fully-licensed and regulated custody
bank and custodian, which has been offering global custody
and custodian bank services to institutional clients in Germany
since 1995. In this function, J.P. Morgan AG is currently man-
aging 200 investment funds with 748 segments (administra-
tive units) for its circle of clients.
In addition to services in connection with securities custody
and settlement of trading transactions, a comprehensive range
of products, additional services, and above all, client report-
ing is provided.
To generate organic growth in the future in other client seg-
ments as well, J.P. Morgan introduced the new reporting tool
5ManageMent RepoRt
products. Similarly, J.P. Morgan AG provides support to its
clients also in the implementation of new requirements under
the KAGB and the necessary migration of funds. Potential new
business areas result from this for the Investor Services sector,
which we will analyze in the coming year in detail in terms
of their appeal.
As we had predicted, in the current financial year, the Euro-
pean Central Bank generally maintained its low interest rate
policy, due to the crisis, which did not allow for any recovery
of interest margins for the business of J.P. Morgan AG. For the
coming financial year, we do not expect any recovery and will
align our business model accordingly, so that we can sustain-
ably strengthen the results of J.P. Morgan AG.
PERSONNEL DEVELOPMENT
The number of J.P. Morgan AG employees hardly changed in
2013, decreasing only slightly from 248 to an average of 244.
Similar to the previous year, the attrition rate in 2013 was 8%,
and thus decreased only slightly as compared to the 10%
last year, continuing to fluctuate within normal levels. Out of
all employees, 18% made use of flexible work arrangements
offered, as compared to 15% in the previous year.
In line with our business concept, we continue to put the
highest emphasis on the qualitative selection of new hires
and continued training and education programs for our staff.
The J.P. Morgan AG human resources policy focuses on the
highest level of quality and diversity among employees, and
the Bank is simultaneously committed to adjusting to the
needs of our employees.
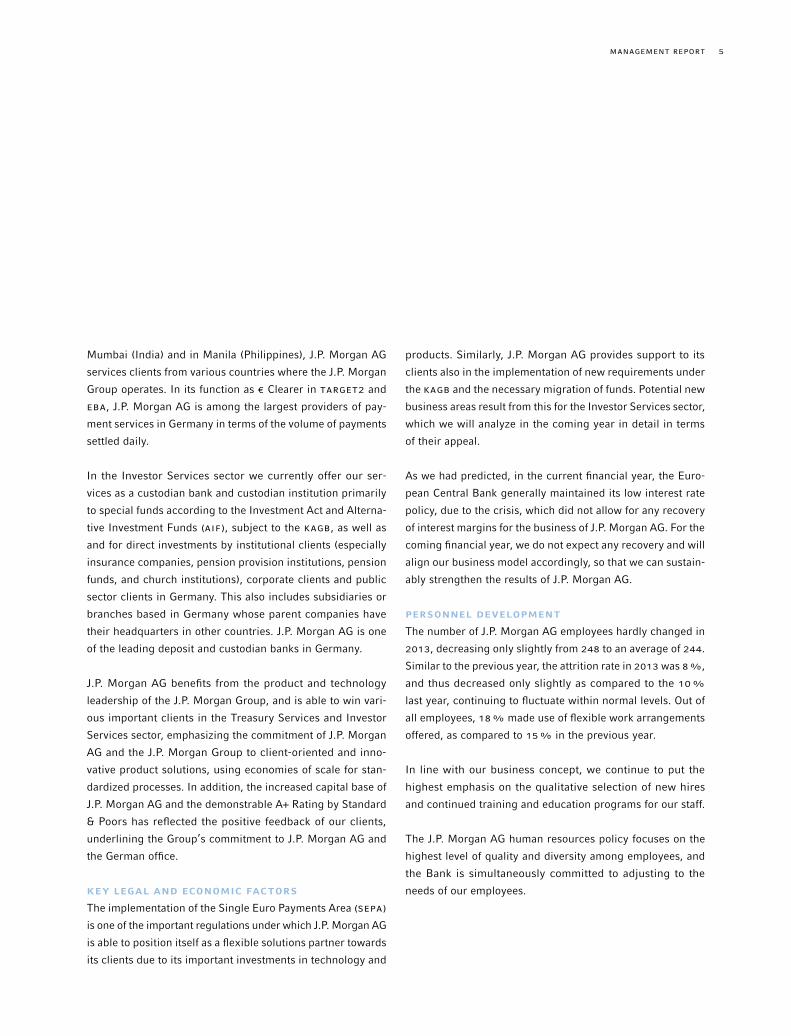
Mumbai (India) and in Manila (Philippines), J.P. Morgan AG
services clients from various countries where the J.P. Morgan
Group operates. In its function as € Clearer in TARGET2 and
EBA, J.P. Morgan AG is among the largest providers of pay-
ment services in Germany in terms of the volume of payments
settled daily.
In the Investor Services sector we currently offer our ser-
vices as a custodian bank and custodian institution primarily
to special funds according to the Investment Act and Alterna-
tive Investment Funds (AIF), subject to the KAGB, as well as
and for direct investments by institutional clients (especially
insurance companies, pension provision institutions, pension
funds, and church institutions), corporate clients and public
sector clients in Germany. This also includes subsidiaries or
branches based in Germany whose parent companies have
their headquarters in other countries. J.P. Morgan AG is one
of the leading deposit and custodian banks in Germany.
J.P. Morgan AG benefits from the product and technology
leadership of the J.P. Morgan Group, and is able to win vari-
ous important clients in the Treasury Services and Investor
Services sector, emphasizing the commitment of J.P. Morgan
AG and the J.P. Morgan Group to client-oriented and inno-
vative product solutions, using economies of scale for stan-
dardized processes. In addition, the increased capital base of
J.P. Morgan AG and the demonstrable A+ Rating by Standard
& Poors has reflected the positive feedback of our clients,
underlining the Group’s commitment to J.P. Morgan AG and
the German office.
KEY LEGAL AND ECONOMIC FACTORS
The implementation of the Single Euro Payments Area (SEPA)
is one of the important regulations under which J.P. Morgan AG
is able to position itself as a flexible solutions partner towards
its clients due to its important investments in technology and

6 ManageMent RepoRt
The overall results of the Bank in 2013 from regular busi-
ness activities amount to € 16.1 million, which is 28% lower
than the previous year’s figure. This deterioration of the result
despite increased overall revenue is due primarily to the fact
that the consolidated expenses increased as compared to the
previous year. Overall, we assess 2013 as a difficult year. We
were able to keep existing business in both business areas,
win new clients, and successfully expand our business with
existing clients, but the fluctuations in the consolidated
expenses could not be fully compensated due to a continuing
weak, all-time low interest result.
Earnings, Financial and Assets Position
EARNINGS
Due to the continued business growth, in 2013 J.P. Morgan AG
managed to increase commission income sharply. In the finan-
cial year, at € 59.8 million the commission income was 19%
higher than the previous year’s value. The interest income
developed positively as compared to the previous year and at
€ 13.9 million was 38% higher than in the previous year. The
main influencing factor on the interest income was the can-
celation of the profit participation right caused by the merger
with J.P. Morgan Beteiligungs- und Verwaltungsgesellschaft
mbH. The estimates for 2013 for both the interest and the
commission income were slightly outperformed. The remain-
ing operational revenues fell by 20% to currently € 32.1 mil-
lion for the year 2013.
The personnel and administrative expenses increased by
14% as compared to the previous year. This increase resulted
mainly from increased expenses on pension provision com-
mitments, due to the reduction of the calculatory interest rate
according to BilMoG (Bilanzrechtsmodernisierungsgesetz),
The underlying features of J.P. Morgan AG’s remuneration
system are presented in a separate Remuneration Report
which can be found at the following website:
http: / /www.jpmorgan.com/pages / international /germany
BUSINESS DEVELOPMENT
The economic development had essentially positive effects in
2013 on the business of J.P. Morgan AG, however our results
still suffer from the low interest policy of the Central Banks
and the high expenses on pension provision commitments,
so we are unable to be satisfied by the business performance.
The operative result of both sectors improved clearly in 2013,
as compared to the previous year. Although the overall results
without the special effects due to the merger of J.P. Morgan
AG and J.P. Beteiligungs- und Verwaltungsgesellschaft mbH
remained static at low levels in consequence of low interest
margins and the zero percent mark of ECB, the commission
income in Treasury Services and Investor Services increased
as compared to the previous year.
The reduced spreads, which could be attained for client depos-
its, remained an important influencing factor for the interest
result. The corrective effect from the set-up of a short-term
treasury portfolio is comparatively low due to the extremely
conservative investment strategy.
As compared to the budget for the financial year, the interest
result and the commission income in 2013 were clearly bet-
ter than expected. The total assets per December 31, 2013
changed significantly as compared to the reporting date per
December 31, 2012, due to our measures of reducing con-
centration risk for the Group, and therefore they do not serve
as an indicator of the strength of our business development
when compared directly.

7ManageMent RepoRt
first additional purchases were already made. The risk limits
were revised appropriately for the portfolio monitoring.
In addition, the Management Board decided to build up a port-
folio with Hermes-backed loans, which is planned for 2014.
J.P. Morgan AG held sufficient liquidity at all times in 2013.
The liquidity ratio is managed conservatively; it reached 1.80
on December 31, 2013, and averaged 1.65 for the year.
Capital Structure
Due to the merger between J.P. Morgan AG and J.P. Morgan
Beteiligungs- und Verwaltungsgesellschaft mbH, the liable
equity increased by 33% to € 843 million as compared to
December 31, 2012. Per December 31, 2013, the Tier 1 capital
ratio was 87.9% and there was a total capital ratio of 112.7%.
With this amount of capital available, J.P. Morgan AG remains
in a comfortable position to support existing business, as well
as the planned business growth as required with capital. J.P.
Morgan AG’s equity capital was composed of the following
components as at the reporting date of December 31, 2013:
Tier 1: € 657 million share capital, reserves and
funds for general banking risks
Upper Tier 2: € 0 million
Lower Tier 2: € 186 million subordinated loan
Total Tier 2: € 186 million
Off Balance Sheet Business
Within the division of Trade Finance, most credit risk expo-
sure in the form of contingent liabilities taken on J.P. Morgan
AG’s own books continues to be directly collateralized within
the Group. For the issues made by J.P. Morgan AG, we com-
pleted total return swaps with JPMorgan Chase Bank, N.A.,
for hedging purposes.
increased expenses on the use of internal Group services, and
a higher amount of bank levy fees. The income from regular
business activity reduced significantly by 28% to € 16.1 mil-
lion. Due to the merger of J.P. Morgan AG with J.P. Beteili-
gungs- und Verwaltungsgesellschaft mbH and the elimination
of the fiscal unit and the profit transfer agreement, the tax
expenses for 2012 and 2013 amounted to € 6.3 million. The
net income for the financial year 2013 was thus € 9.8 million.
The result means a return on equity of 2.21%, as compared
to 8.16% in the previous year.
FINANCIAL POSITION
Principles and Objectives
J.P. Morgan AG’s balance sheet is driven by deposits provided
by their institutional clients and banks through the € Clearing
segment and the custodian bank business, and continued to
show an unchanged positive financial position in 2013. Clients
are enabled to utilize credits solely in the form of intra-day
lines and short-term overnight overdrafts to cover technical
shorts in cash positions in both business segments. Excess
liquidity generated by these deposit-driven business policies
is invested mainly in reverse repo transactions with JPMorgan
Chase Bank, N.A., and in short-term investments at the Fed-
eral Bank. The equity capital of J.P. Morgan AG was invested,
in turn, in a short-term treasury portfolio with investment
grade debtors.
To continue to take into consideration our goal of permanent
liquidity and, at the same time, enable an adequate inter-
est margin, the Management Board decided to reduce the
restrictions on maturity transformations and supplement the
existing short-term treasury portfolio with long-term securi-
ties of investment grade debtors. At the time of this report,
8 ManageMent RepoRt
as at the reporting date, by € 77 million to € 102 million, and
deposits increased by € 631 million to € 6,123 million as at
the reporting date. The receivables of the credit institutions
reduced due to the low treasury activities by € 4,992 million
to € 9,659 million (of which, credit with central banks of € 590
million) and the liabilities decreased by € 5,602 million to
€ 3,589 million as at the reporting date. The balance sheet
total of J.P. Morgan AG thus reduced, reaching € 10,705 mil-
lion as at the reporting date. The solvency ratio per December
31, 2013 was 112.7, amounting to an average of 47.4 for the
year 2013.
There is a securities portfolio with short-term, first-class
debtor securities in the amount of the J.P. Morgan AG equity
capital. Due to the short duration of the balance sheet, the
Bank’s financial standing remains extremely strong.
Financial and Non-Financial Performance Indicators
FINANCIAL PERFORMANCE INDICATORS
Financial performance indicators, defined for internal control
of J.P. Morgan AG, comprise in particular absolute KPIs (Key
Performance Indicators) such as the net interest income, net
commission income, and income from regular business activ-
ity. In addition, return on equity, cost-income ratio, and gross
profit margin are used to measure performance. The KPIs are
derived directly from the information in the balance sheet
and the income statement in the annual financial statement,
and for the current and previous financial years amount to
the following:
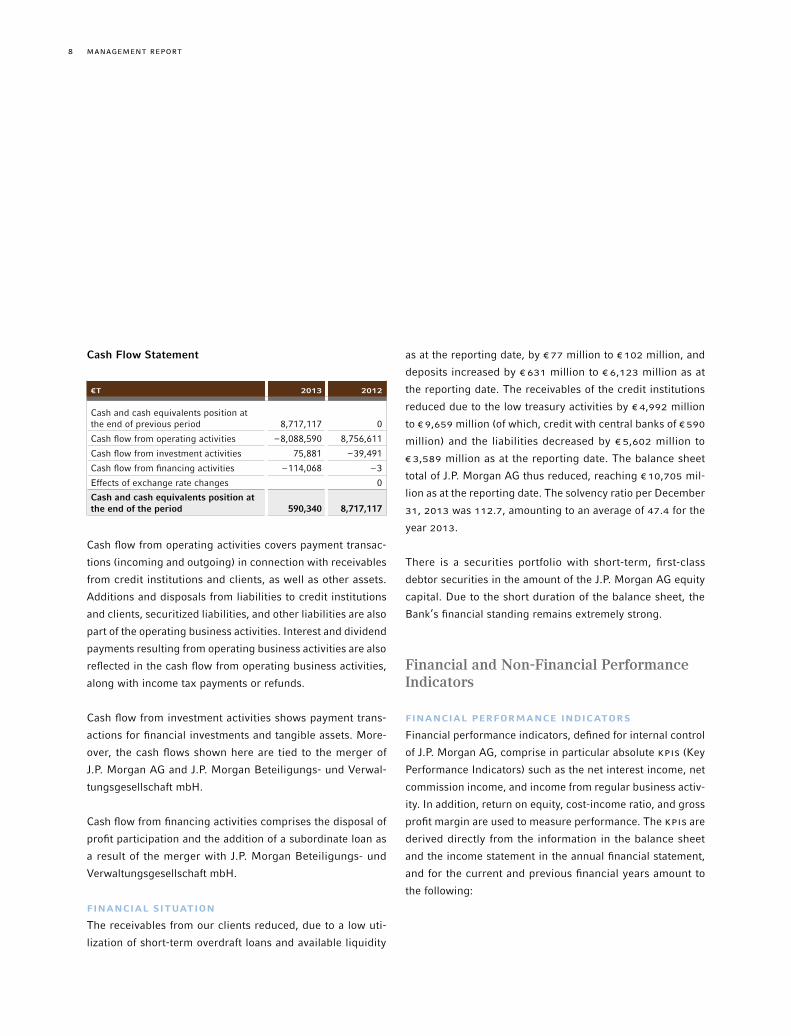
Cash Flow Statement
€t 2013 2012
Cash and cash equivalents position at the end of previous period 8,717,117 0
Cash flow from operating activities –8,088,590 8,756,611
Cash flow from investment activities 75,881 –39,491
Cash flow from financing activities –114,068 –3
Effects of exchange rate changes 0
Cash and cash equivalents position at the end of the period 590,340 8,717,117
Cash flow from operating activities covers payment transac-
tions (incoming and outgoing) in connection with receivables
from credit institutions and clients, as well as other assets.
Additions and disposals from liabilities to credit institutions
and clients, securitized liabilities, and other liabilities are also
part of the operating business activities. Interest and dividend
payments resulting from operating business activities are also
reflected in the cash flow from operating business activities,
along with income tax payments or refunds.
Cash flow from investment activities shows payment trans-
actions for financial investments and tangible assets. More-
over, the cash flows shown here are tied to the merger of
J.P. Morgan AG and J.P. Morgan Beteiligungs- und Verwal-
tungsgesellschaft mbH.
Cash flow from financing activities comprises the disposal of
profit participation and the addition of a subordinate loan as
a result of the merger with J.P. Morgan Beteiligungs- und
Verwaltungsgesellschaft mbH.
FINANCIAL SITUATION
The receivables from our clients reduced, due to a low uti-
lization of short-term overdraft loans and available liquidity

9ManageMent RepoRt
calculation of pension provision commitments, an increase in
bank levy fees,, and an increase in expenses for deposit insur-
ance, due to the increased balance sheet total per December
31, 2012. This effect also contributed to an increased cost-
income ratio and a reduced gross profit margin. Excluding
the income effects of pension plans, the operative business
income improved by 23.3% (2012: € 14,767 million; 2013:
€ 18,215 million), the cost-income ratio by 1.6% (2012:
84.0%; 2013: 82.7%), and the gross profit margin by 8.2%
(2012: 16%; 2013: 17%).
Return on Equity (RoE) fell from 8.16% last year to 2.21%.
Essentially, the increase in equity of J.P. Morgan AG, driven
by the merger with J.P. Morgan Beteiligungsgesellschaft mbH
and the first-time reporting of tax expenses, also as a result
of the merger, contributed to this change. The RoE, if calcu-
lated in consideration of the operative income, would result
in 4.11% for 2013.
Our KPIs developed positively overall in all sectors, as com-
pared to the estimates. The interest income was slightly above
our expectations overall. The commission income, at 7%
above estimates, clearly increased. The cost-income ratio of
84.78% is also clearly under the estimates. Correspondingly,
the gross profit margin is 29.2% higher than estimated. In
particular, the clearly improved commission income in the
Treasury Services sector contributed to this improvement.
As compared with the estimates, the KPIs are classified as
satisfactory. In contrast, as compared to the previous year,
we cannot be satisfied with the performance.
NON-FINANCIAL PERFORMANCE INDICATORS
Non-financial performance indicators are guided by the role
of J.P. Morgan AG as a transaction bank in € payment trans-
€m 2013 2012
Net revenue 105.7 100.1
Net Interest Income 13.9 10.0
Net Commission Income 59.8 50.1
Total expenses 89.7 77.6
Income before Tax and extraordinary items 16.1 22.5
Net Income 9.8 22.5
Equity 611 275
Return on Equity (RoE)(earnings after tax /average equity capital) 2.21% 8.16%
Cost-Income Ratio (net earnings / total expenses) 84.78% 77.55%
Gross profit margin (income from regular business /net earnings) 15.22% 22.45%
Tier 1 capital ratio 87.90% 37.80%
Total capital ratio 112.70% 71.90%
The increase in net interest income of 38% as compared to
the previous year was mainly due to a reduction of the inter-
est expense, in consequence of the merger of J.P. Morgan AG
and J.P. Beteiligungs- und Verwaltungsgesellschaft mbH. With
this special effect, the interest income is relatively stable as
compared to the previous year, due to the continuing low base
interest and the associated low money market interest rates.
The development of the commission income was positive.
Increasing revenue from payment transactions and new cli-
ent acquisitions in the custodian bank business contributed
to a further improvement of the income.
The operative income reduced by 28% compared to 2012.
The change was caused by the increased expenses on pension
provisions, the effect of the change in interest rate used for the

10 ManageMent RepoRt
actions and as a Global Custodian. Along with the actual vol-
umes settled by J.P. Morgan AG for its clients, we focus on
the degree of automation and the actual losses from opera-
tive errors. In addition, we measure the fluctuation rate as an
indicator of stability of our operative platform from the point
of view of employees.
2013 2012
Number of payment instructions – high value 8.9 M 8.5 M
Number of payment instructions – low value 38.8 M 35.5 M
Straight-through processing rate 98.17% 97.99%
Assets under custody (in € b) 230 216
Customer satisfaction – custodian bank (internal score) 2,550 2,528
Operative losses (in € m) 0 0.1
Fluctuation rate 8% 10%
S&P rating A + n /a
The non-financial performance indicators could be improved
without exception, thanks to the strong client-oriented
approach and innovative drive of our employees, the continu-
ing investments in our technology platform, and the constant
expansion of our range of services. In the upcoming years,
this will also be our strong starting base in the competition
as a transaction bank and a Global Custodian.
Relationships with Related Companies and Persons
With regard to the related companies of J.P. Morgan AG, we
have identified our parent company JPMorgan Chase Bank,
N.A., as well as J.P. Morgan Beteiligungs- und Verwaltungs
GmbH (until July 1, 2013) and J.P. Morgan International
Finance Ltd. We consider the members of the Management
Board and the Supervisory Board of J.P. Morgan AG and their
family members as related persons.
The following financial transactions are carried out with
related companies:
− Money market transactions, investing and borrowing money
− Transactions in Total Return Swaps
− Reverse repos
− Nostro accounts
− Provision of subordinated capital
− Purchasing and supplying corporate services
All transactions have been closed on normal market terms.
There are no transactions conducted with related persons.
Supplementary Report
In the first quarter of 2014, J.P. Morgan AG began to make the
first investments in first-class securities with long-term matur-
ities, in order to sustainably reinforce the interest income of
J.P. Morgan AG.
Alison Livesey left the Supervisory Board of J.P. Morgan AG
per December 31, 2013 and Karl Altenburg per February 13,
2014; Ms. Melanie Martin (nee Wells) was appointed to the
Supervisory board on February 4, 2014 and Martin Wiesmann
on February 24, 2014.
There were no other events of special significance.

11ManageMent RepoRt
particularly in the rapidly developing markets of Asia, the
Middle East and Latin America. The reorganization within the
Group and the creation of Corporate & Investment Banking as
a super-ordinate business area also contributed significantly
to the ability to take advantage of cross-selling opportunities.
We view the disproportionate regulation of the financial mar-
kets as presenting continued risk for our business; however,
we continue to assume that regulators worldwide will develop
and implement a coordinated and measured concept for the
regulation of financial markets in such a way as to prevent this
from simultaneously restricting economic and capital market
activity beyond measure.
We see further risks in the political destabilization of some
countries or regions, which could lead to a clear deteriora-
tion of the market situation, with potential negative effects
on solvency of our clients, and resulting sustained losses. In
addition, we see the increasing price pressures in the transac-
tion business with many competitors to be a big risk for the
business performance of J.P. Morgan AG.
ExPECTATIONS FOR THE BANK’S FUTURE
PERFORMANCE
Thanks to our consistent conservative risk policy, we do not
expect any risk-related losses for the next two years.
For the next two years, we expect a further increase in our
commission income, whereby we assume that Investor Ser-
vices will have a bigger share in the expected increase of
commission income due to acquisition of new clients. As far
as interest income is concerned, as an annual comparison,
in 2014 we expect a continuing increase due to the cautious
removal of our restrictions concerning maturity transforma-
Outlook
SIGNIFICANT OPPORTUNITIES AND RISKS FOR THE
UPCOMING FINANCIAL YEARS
In general, we have a growing confidence in the global
economy, and especially the economy in Germany and other
European countries, in connection with the macroeconomic
development with a continued stagnating interest level in the
Eurozone.
Also over the next years we expect to see a continuation of
the trend toward professionalizing cash management in com-
panies, pension funds and insurers, with the goal of further
integration of the value added chain in the liquidity manage-
ment of a company for continued income optimization. At the
same time, we see a continued trend for the large institutional
investors to adapt their investment strategies to an economy
which is becoming more and more global and the resulting
demand for Global Custodian services.
Furthermore, we see a continued major investment need for
banks, in order to be able to implement the opportunities from
the Single Euro Payments Area (SEPA) implementation and the
requirements under the KAGB in clear Business Propositions
for clients and, therefore, competitive advantages on the mar-
ket. The leading global position of our parent company and
the worldwide investments in the technology that forms the
basis of our business help us to achieve this goal.
We undertake to provide the greatest customer service pos-
sible through the Global Corporate Banking Organization,
which has been built up in the last few years and which pro-
vides us with a strong, expanded presence in the core markets
around the world and an expansion of our product spectrum,
12 ManageMent RepoRt
In the operative business, we expect moderate increases in
revenue both in Treasury Services and in the Investor Services
division.
Therefore, in 2014, the Return on Equity will be below 2%,
the profit margin is expected to be 11%, and the cost-income
ratio will increase to 88%. We expect the tier 1 capital ratio
and the total capital ratio to be unchanged in the current
financial year.
FINANCIAL SOLVENCY
J.P. Morgan AG is solvent at all times owing to the business
model-driven structure of our balance sheet. In addition, the
Bank manages a high liquidity ratio (1.64 on 03 /04 /2014),
and operates a very strictly limited maturity transformation to
achieve an additional interest rate margin.
Risk report
MANAGEMENT AND CONTROLLING
The Management Board of the “Marktfolge” is responsible
for risk management at J.P. Morgan AG, with regular report-
ing to the general management, as well as to J.P. Morgan
AG’s Supervisory Board. J.P. Morgan AG classifies a risk as a
potential loss or a failure to realize a profit due to internal or
external factors.
Independent control functions are in charge of the operational
implementation of the risk control and monitoring, taking into
account the Group-wide infrastructure and policies. They
report directly to the Management Board “Back Office” as
the Chief Risk Officer (CRO).
tion in the scope of our risk capacity, despite the assumption
of a continuing zero interest policy of the ECB.
Thanks to a continued disciplined cost management, we
assume that we can keep our costs for the coming years at
the level of the costs in 2013, so we expect a clear improve-
ment in the operative income.
ASSUMPTIONS
These expectations are based on the assumptions of a stable
political situation in Germany and in Europe, with successful
crisis management and a stagnating economic performance
of the European countries in the next two years. However, we
believe that Germany will continue to have an above-average
development rate, as compared to other European countries.
With respect to the global economy, we assume that the
dynamic development of the emerging countries of the past
years will continue to decline, and with it, emphasis will be
placed again on the significance of the established industrial
countries. Moreover, we assume that the ECB will maintain
its zero-interest policy in 2014 as well, and there may be a
slight increase in the interest level in mid-2015 at the earliest.
We expect that the correspondingly higher margins can be
applied to our client investments.
DEVELOPMENT OF SEGMENTS
In the budget for the upcoming years, we assume a growth of
total income in the Investor Services division of 8% p. a. for
2014 and 2015, while we expect stable revenues as compared
to 2013 for the Treasury Services division.
In 2014, we expect net revenue of € 104 million, according to
preliminary estimates. This reflects our conservative expec-
tations of interest rates and a decrease of other income due
to the change in the calculatory rate for pension obligations.

13ManageMent RepoRt
− There are clearly defined organizational structures and doc-
umented processes for all risk affected business areas, from
which the responsibilities and competencies of all functions
involved are derived.
− There is a clear segregation of duties between Front Office
and Back Office in order to avoid potential conflicts of inter-
est.
− For the risk identification, measuring, aggregating, manag-
ing, monitoring and communicating of the risk categories,
suitable procedures are defined and implemented at J.P.
Morgan AG, including the Group-wide infrastructure.
− Appropriate limits for all significant risk categories have
been adequately defined and are effectively controlled.
RISK-BEARING CAPABILITY AND STRESS TESTING
The risk-bearing capability analysis is a core component of
the overall bank control of J.P. Morgan AG, with the goal of
guaranteeing a suitable risk profile and adequate capital at all
times. J.P. Morgan AG decided on a going-concern approach,
defined as allowing the Bank to continue the core business
activities even if all items of the defined risk covering potential
were consumed through exposure to risks.
In the financial year 2013, the risk-bearing capacity concept
of J.P. Morgan AG was revised and a new method was imple-
mented per June 30, 2013. Both the definition of the risk cov-
erage as well as the quantification of the various types of risk
were adjusted. The confidence level of 95% corresponds to
the underlying assumptions of the going-concern approach;
risk coverage potential and the economic capital model are
configured accordingly. The observation period is one year.
According to the risk inventory credit risks, operational risks
and market risks are quantified as relevant risk categories
in the risk-bearing capacity. Liquidity risks are part of the
integrated stress testing.
These include, in particular, the Market and Credit Risk Officer
for the risk monitoring of liquidity and market price risks, the
Governance Officer as risk controller, the Treasury & Credit
Control for the monitoring of liquidity and market price risks,
and the Local Operational Risk Manager for monitoring the
operational risks.
RISK STRATEGY AND RISK MANAGEMENT
The risk strategy is derived directly from J.P. Morgan AG’s
business strategy. It is defined by the general management
of J.P. Morgan AG and is approved each year by the Super-
visory Board.
The risk strategy defines how J.P. Morgan AG will manage the
risks it has taken as part of its business activities. By limiting
and managing the risks, risk-bearing capability and liquidity
are ensured at all times. The risk strategy covers all main risks
and is, if necessary, further specified for individual risk types
in the form of partial risk strategies and then substantiated
and operationalized using policies, guidelines and working
instructions. The integrity and suitability of the risk strategy is
reviewed during the annual risk assessment. This ensures that
the risk strategy takes all relevant risks faced by J.P. Morgan
AG into consideration.
The classification of individual risk types as a relevant risk is
based on whether the occurrence of the risk could have a seri-
ous negative effect on J.P. Morgan AG’s risk-bearing capabil-
ity. The analysis also defines the risk appetite by allocating the
available risk covering potential to the individual risk types.
This facilitates compliance with the limits, and allows for the
monitoring of that compliance throughout the financial year.
The following principles also apply for the risk management
and monitoring:

14 ManageMent RepoRt
concern approach is currently calculated by Risk Management
on a quarterly basis. We will develop the risk-bearing capabil-
ity concept further in 2014.
RISK CATEGORIES
Credit Risk
Credit (or counterparty default) risk is the most significant risk
category in J.P. Morgan AG due to its core activities, as a result
of the potential drawdown of overdraft facilities by clients who
hold their transactional cash account for € Clearing or Global
Custody activities with J.P. Morgan AG. Depending on the
credit rating of the client, the allocation of overdraft facilities is
accompanied by the implementation of defined risk-mitigation
steps (e. g., the provision of collateral).
Within the division of Trade Finance, the credit risks in the
form of contingent liabilities taken on J.P. Morgan AG’s own
books continue to be for the most part directly collateralized
within the Group. There are no significant call risks. Due to
the business model, the main credit risk concentrations are
transactions within the Group. We do not expect to see any
changes in the creditworthiness here.
The risk coverage potential is defined primarily based on the
reserve for general banking risks, the accrued profit (or loss)
for the financial year, and a modified projected profit for the
next 12 months, minus a safety cushion deducted for budget
variations.
The capital requirement for the occurring risks is quantified
based on internal, institute-specific calculation approaches.
The actual calculation of the risk-bearing capability is per-
formed on a quarterly basis. The utilization as at December
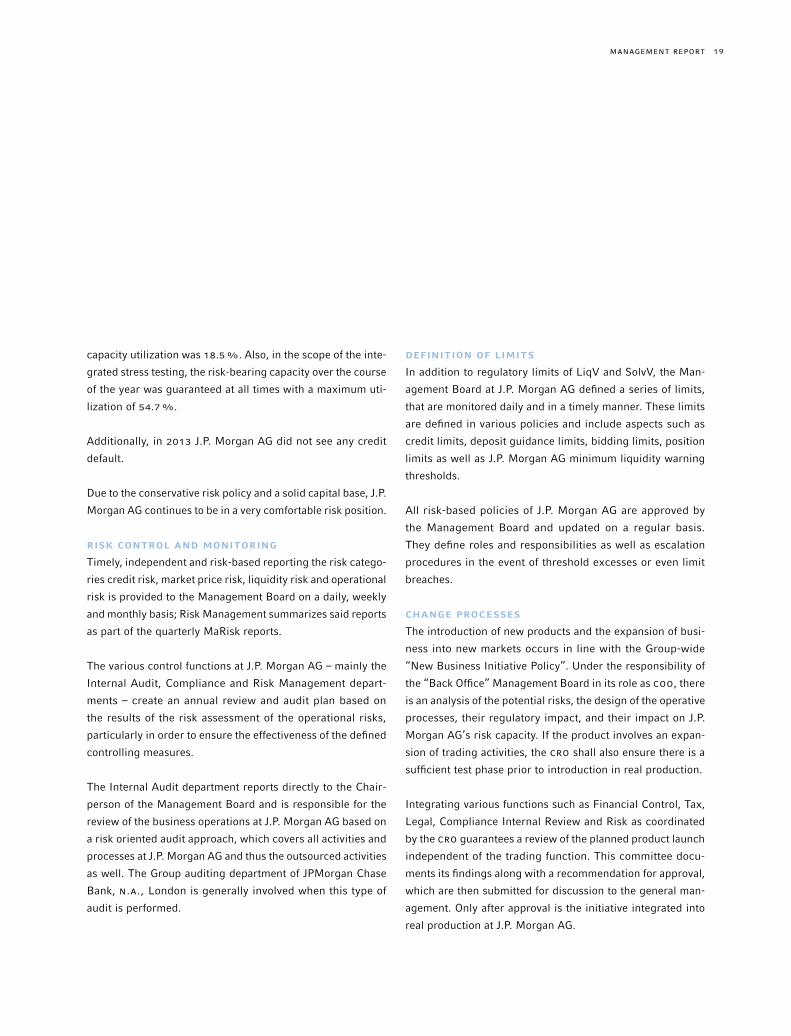
31, 2013, was 18.5%. Also, in the scope of integrated stress
testing, the risk-bearing capacity was guaranteed, with a
maximum utilization of 54.7%.
Stress scenarios are defined for each risk type to review the
risk-bearing capacity. They are interconnected in the scope
of integrated macroeconomic stress scenarios. Some of the
scenarios are analyzed on a monthly basis, others quarterly.
The risk-bearing capability concept and the stress tests are
validated on an annual basis.
The regulatory capital requirement for the individual risk cat-
egories is monitored by the Chief Financial Officer (CFO) on a
daily basis and is shown in the table below (all figures given in
€M). The economic capital requirement pursuant to the going
Regulatory Economic
€m 12 /31 /2012 06 /30 /2013 12 /31 /2013 06 /30 /2013 12 /31 /2013
Risk Category
Credit risk 47.1 106.5 38.1 12.7 5.9
Operational risk 14.1 14.1 14.4 6.7 6.5
Market risk 9.0 6.7 7.4 1.2 0.4
Capital requirement 70.2 127.6 59.9 20.5 12.9
Risk coverage potential 631.7 631.7 843.2 68.0 69.6

15ManageMent RepoRt
and in the J.P. Morgan AG MaRisk Guidelines. The Manage-
ment Board makes credit decisions on the basis of the clearly
defined separate responsibilities for “Front Office” and “Back
Office”.
J.P. Morgan AG uses an unexpected loss model with a confi-
dence level of 95% to calculate the economic capital require-
ment. As the basis for the Exposure at Default (EAD) the cli-
ent’s drawing behavior is estimated for the payment transac-
tions account on the basis of historical data, or otherwise
Since J.P. Morgan AG does not run an active trading book,
issuer risk, replacement risk, and settlement risk play an
extremely minor role.
By means of its credit risk strategy, which is derived from the
general business and risk strategy, the Management Board
defines the risk profile in regards to its clients and credit
products. Moreover, credit organization and processes for
risk steering, potential measures to minimize risk and risk
reporting are defined more closely in the Group-wide policies
€m Divisions
6,000 100%
5,500
5,000
4,500 75%
4,000
3,500
3,000 50%
2,500
2,000
1,500 25%
1,000
500
Banks Asset Mgmt Central Government Automotive Broker Dealer Other 0%
5,461
600384
990
374
3,735
€m Countries
6,000 100%
5,000 75%
4,000
3,000 50%
2,000 25%
1,000
Germany USA UK Russia Japan China Other 0%
5,902
1,514 1,386835 817
248842
16 ManageMent RepoRt
Procedures for intensified loan management as well as the
treatment of problematic loans exist but did not require appli-
cation during the financial year 2013.
Operational risk
Operational risk is defined under supervisory regulations as
the risk of loss resulting from inadequate or failed internal
processes or systems of people or from external events. This
definition also covers legal risks and compliance risks. The
legal department is generally involved in case of legal risks.
The legal department decides whether an external law firm
needs to be mandated.
The necessary processes for identifying, measuring, aggregat-
ing, managing, monitoring and communicating risks are stip-
ulated in Group-wide risk policies and guidelines and stated
in the J.P. Morgan AG Operational Risk Manual, for which
Risk Management and the Local Operational Risk Manager
are responsible.
J.P. Morgan AG uses an institute-specific approach for calcu-
lating the capital requirements for operational risks as part
of the risk-bearing capability considerations. Under this ap-
proach, the operational risks are assessed on the product level
based on a regular assessment and analysis of the end-to-
end processing by all of the control functions at J.P. Morgan
AG. The residual risk assessment is then used to derive a rat-
ing on the product level. These ratings are allocated a prob-
ability of occurrence which is required for the final calculation
of the loss potential or the economic capital requirement for
J.P. Morgan AG’s operational risks. Information from the insti-
tutionalized loss event database, the qualitative results from
the regular Control Self Assessments, the definition of the
risk-based Outsourcing Controlling, the results from the Inter-
nal Audit, as well as the Control Testing by the Compliance
market value positions per the reporting date are taken into
consideration. EAD, Probability of Default (PD), and Loss Given
Default (LGD) are the important input parameters for the risk
model.
A series of different scenarios are considered within the scope
of the credit risk stress test that assume that client ratings,
income from securities, drawing behavior, portfolio concen-
trations or correlations could significantly worsen over the
course of time. There is thus a regular validation of the stress
tests and their results.
J.P. Morgan AG uses the credit risk standard approach (KSA)
for the regulatory quantification of the credit risk.
Daily monitoring of counterparty default risk at the individual
client level is done by Treasury & Credit Control, using the
Group-wide credit limit control system, which records indi-
vidual limits and utilization at the account level and /or at
the level of single borrower units. The system does not allow
unauthorized intra-day limit breaches. Daily activities mainly
focus on the monitoring of so-called intraday lines of credit
and overdraft facility usage. A corresponding report of daily
exposures and all new accounts and lines and /or all changes
of existing lines is being presented daily for approval to the
Credit Risk Officer as well as the general management. More-
over, compliance with the approved limit structure, the moni-
toring of the risk-bearing capability as well as the analysis
of the portfolio structure (e. g., maturities, credit products,
segments and countries) including concentration risk is sum-
marized in monthly or quarterly reports to the Management
Board.
The chart on page 15 shows the division and country risk
concentrations as at December 31, 2013.

17ManageMent RepoRt
lated assuming the day of lowest excess liquidity in the given
quarter. In both scenarios, J.P. Morgan AG’s liquidity needs
are covered. Moreover, J.P. Morgan AG performs a series
of simulations to analyze the intra-day liquidity situation, in
which a changed payment pattern by market participants and
clients is assumed.
Liquidity management is handled by the J.P. Morgan AG Trea-
sury Function in compliance with Group-wide policies and
J.P. Morgan AG’s Liquidity Risk Policy. Compliance with this
policy is ensured by the Treasury & Credit Control department,
which reports to the CRO.
Liquidity risk is not quantified as a risk category in the risk
sustainability model. However, liquidity costs of stress sce-
narios are taken into account as a deduction position of risk
coverage potential in the scope of stress testing.
Market Price Risk
J.P. Morgan AG defines market price risk as the risk of poten-
tial loss due to changed market price risks. Given J.P. Morgan
AG’s business activities, only interest rate risks as well as
exchange-rate risks have an impact, if a limited one, while
share price and commodity price risks have no importance
whatsoever for the Bank’s risk profile. See J.P. Morgan’s
published analyses for assessing interest rate and currency
developments.
Since J.P. Morgan AG has no active trading book, interest rate
risks arise solely in treasury management of € liquidity. Mar-
ket price risks arise from a portfolio of variable interest rate
securities. Exchange-rate risks are solely generated through
the settlement of FX payments on behalf of clients who hold a
payment transaction or deposit account with J.P. Morgan AG
and from intra-Group settlements in US$.
Department and the Local Operational Risk Manager are then
used to calculate the amount of the loss event. The assump-
tions made using this approach are scrutinized during the
scenario analysis (stress test) on the product level and their
effectiveness on the economic risk capital is reviewed. A sum-
mary of the results is presented to the Management Board as
part of the quarterly MaRisk reports.
Operational risks are only essentially limited in the frame-
work of business continuity, destined to enable due opera-
tion of critical processes, such as to give J.P. Morgan AG the
resiliency to recover from an incident which may impact the
business. The resiliency risk scenarios include loss of people,
unavailability of IT systems as well as the closure of its office
building. Corresponding recovery plans have been developed
incorporating the Group-wide infrastructure and are tested
on a regular basis.
Liquidity risk
J.P. Morgan AG defines liquidity risk as the risk of loss arising
from the firm’s inability to meet its current or future commit-
ments in total or when they come due. At J.P. Morgan AG
there are refinancing risks and market liquidity risks due to
the business model but these are only very limited.
In the business and risk strategy, the J.P. Morgan AG Man-
agement Board defines the management of liquidity risks,
which are specified in detail in the Liquidity Risk Policy. The
risk mitigating instruments here include warning thresholds
and escalation mechanisms to the Management Board. The
policy defines a number of stress scenarios which analyze
the effects of sudden withdrawals of liquidity on the liquidity
situation and thus J.P. Morgan AG’s capacity to act. The stress
scenarios include both the sudden outflow of liquidity as well
as a sudden increase in utilization of credit lines both calcu-

18 ManageMent RepoRt
rate risks, only limits for the spot positions are defined due to
the low significance.
Treasury & Credit Control is responsible for the daily monitor-
ing of the market price risks. Daily adherence to limits and
the impacts on the risk capacity are summarized in reports
to the Management Board on a monthly and quarterly basis.
Risks from financial instruments are incurred by the Bank
mainly from the acquisition of debentures from public issu-
ers and from issued products that are hedged by the total
return swaps.
Reputation Risk
The outstanding reputation of J.P. Morgan is an invaluable,
but fragile asset in the interaction with its client base, but
also in its interaction with other market participants as well
as governmental regulators and authorities.
In this context, J.P. Morgan AG stresses the importance of
Compliance, Risk Management, the Legal Department, Finan-
cial Control and Internal Audit, and the necessity of their
active representation in various governance meetings in order
to ensure compliance with internal J.P. Morgan procedures
and /or regulatory requirements. It also ensures that these
units are involved as soon as possible in any escalation pro-
cesses with clients.
Summary
In 2013, the significant increase of the total capital led to an
additional improvement of capital available with a total capital
ratio of 112.7% as of December 31, 2013.
This is also reflected in the fundamentally revised risk-bearing
capacity in 2013. Per December 31, 2013 the risk-bearing
The scope for managing market price risks is defined by the
Management Board in the business and risk strategy and
defined more closely in the Asset Limits and the Triggers
Policy. Risk positions may only be employed within approved
limits; these positions are valued and accordingly monitored
on an ongoing basis.
Market risks are quantified by means of the value-at-risk
approach. This is based on the historical simulation with a
95% confidence level and one-day holding period.
$T Value at Risk
12 /31 /2013 194
60-Day Trend 211
Average 2013 350
To calculate interest rate change risk for its investment book,
J.P. Morgan AG uses the price value of a basis point inter-
est approach. Exceeded limits are generally escalated to the
Management Board. In addition to the year-end value, the
table below also shows the maximum, minimum and average
price value (always absolute values) of a basis point interest
approach for the market risk in absolute terms over 2013.
$Basis Point Interest
Approach
12 /31 /2013 6,534
Minimum 2013 266
Maximum 2013 48,053
Average 2013 21,851
The impact of a shift of 200 basis points of the interest rate
risks is reviewed as a stress scenario. To limit the exchange
19ManageMent RepoRt
DEFINITION OF LIMITS
In addition to regulatory limits of LiqV and SolvV, the Man-
agement Board at J.P. Morgan AG defined a series of limits,
that are monitored daily and in a timely manner. These limits
are defined in various policies and include aspects such as
credit limits, deposit guidance limits, bidding limits, position
limits as well as J.P. Morgan AG minimum liquidity warning
thresholds.
All risk-based policies of J.P. Morgan AG are approved by
the Management Board and updated on a regular basis.
They define roles and responsibilities as well as escalation
procedures in the event of threshold excesses or even limit
breaches.
CHANGE PROCESSES
The introduction of new products and the expansion of busi-
ness into new markets occurs in line with the Group-wide
“New Business Initiative Policy”. Under the responsibility of
the “Back Office” Management Board in its role as COO, there
is an analysis of the potential risks, the design of the operative
processes, their regulatory impact, and their impact on J.P.
Morgan AG’s risk capacity. If the product involves an expan-
sion of trading activities, the CRO shall also ensure there is a
sufficient test phase prior to introduction in real production.
Integrating various functions such as Financial Control, Tax,
Legal, Compliance Internal Review and Risk as coordinated
by the CRO guarantees a review of the planned product launch
independent of the trading function. This committee docu-
ments its findings along with a recommendation for approval,
which are then submitted for discussion to the general man-
agement. Only after approval is the initiative integrated into
real production at J.P. Morgan AG.
capacity utilization was 18.5%. Also, in the scope of the inte-
grated stress testing, the risk-bearing capacity over the course
of the year was guaranteed at all times with a maximum uti-
lization of 54.7%.
Additionally, in 2013 J.P. Morgan AG did not see any credit
default.
Due to the conservative risk policy and a solid capital base, J.P.
Morgan AG continues to be in a very comfortable risk position.
RISK CONTROL AND MONITORING
Timely, independent and risk-based reporting the risk catego-
ries credit risk, market price risk, liquidity risk and operational
risk is provided to the Management Board on a daily, weekly
and monthly basis; Risk Management summarizes said reports
as part of the quarterly MaRisk reports.
The various control functions at J.P. Morgan AG – mainly the
Internal Audit, Compliance and Risk Management depart-
ments – create an annual review and audit plan based on
the results of the risk assessment of the operational risks,
particularly in order to ensure the effectiveness of the defined
controlling measures.
The Internal Audit department reports directly to the Chair-
person of the Management Board and is responsible for the
review of the business operations at J.P. Morgan AG based on
a risk oriented audit approach, which covers all activities and
processes at J.P. Morgan AG and thus the outsourced activities
as well. The Group auditing department of JPMorgan Chase
Bank, N.A., London is generally involved when this type of
audit is performed.

20 ManageMent RepoRt
With a view to the accounting, the risk management system is
geared to identify, evaluate and communicate risks from faulty
bookkeeping, accounting, and reporting in a timely manner.
USE OF IT
The software used in the Bank to input accounting processes
is made up of the IT systems used throughout the Group. The
orderly functioning of the programs and interfaces utilized is
regularly assessed and confirmed. As part of the examination
of our IT, the group auditors check the due operation of the
accounting-relating applications at all computer center loca-
tions. The complete IT system, including that for accounting,
is secured against unauthorized access.
KEY REGULATIONS AND CONTROL ACTIVITIES TO
ENSURE DUE, ORDERLY AND RELIABLE ACCOUNTING
The internal control system’s structure and measures ensure
that business transactions are entered swiftly and completely
in line with the statutory and the internal regulations and that
assets and liabilities are accurately calculated, valued and car-
ried in the annual financial statements. The booking docu-
mentation provides a reliable information base and a clear
paper trail.
The regulations of the Financial Accounting Standards Board
are applied within the J.P. Morgan Group as uniform valua-
tion and accounting principles according to US-GAAP, supple-
mented and commented on by the Group’s “Accounting Poli-
cies” section. Here, again, stipulations are made with regards
to the intra-Group settlement policies. As part of the prepara-
tion of the individual financial statements of J.P. Morgan AG,
a reconciliation statement is prepared from US-GAAP to the
annual financial statements in accordance with the German
Internal Control System
GENERAL REMARKS
Please refer to the explanations provided in the risk report for
a presentation of the risks and the measures for limiting risks.
The internal control system (ICS) and the risk management
system, that cover the J.P. Morgan AG accounting processes
focus on the guidelines, procedures and measures taken to
ensure the efficacy, economic viability and orderliness of the
accounting as well as to guarantee adherence to the key statu-
tory regulations. The internal control system consists of two
areas, Control and Monitoring. In organizational terms, the
Financial Control & Tax division is responsible for the control.
The monitoring measures consist of elements integrated into
the process and external, independent elements. Among
other things, the integrated measures include a monthly con-
trol process covering all the Bank’s activities, during which
the balance sheet as at that date and the P&L statement are
examined to assess their correct presentation and risks, and
validity is then confirmed. Moreover, in all instances the four
eye principle is applied, along with technical controls, mainly
by software-controlled audit mechanisms. Furthermore, quali-
fied staff members with due expertise and specialist functions
such as Financial Control & Tax take part in the process-inte-
grated monitoring and control functions.
The Management and Supervisory Boards (in particular the
Audit Committee) as well as the internal audit department
are involved in the internal monitoring system in the form of
process-independent audit measures. The audit of the annual
financial statements constitutes a key element of process-
independent monitoring.

21ManageMent RepoRt
Commercial Code. Here, local work directives cover the details
of the formal requirements and the tangible data for the indi-
vidual financial statements.
Dependency Report
FINAL DECLARATION ON THE REPORT OF THE
MANAGEMENT BOARD ON RELATIONSHIPS wITH
AFFILIATED COMPANIES PURSUANT TO SECTION 312
AKTG (AKTIENGESETz [STOCK COMPANIES ACT])
In the 2013 financial year, J.P. Morgan AG was a dependent
company of J.P. Morgan International Finance Limited, New-
ark /Delaware, USA, within the scope of Section 312 AktG in
the period from November 4, 2013 to December 31, 2013.
Therefore, the Management Board of J.P. Morgan AG issued
a Report on Relationships with Affiliated Companies, pursu-
ant to Section 312, Par. 1, AktG, containing the following final
declaration:
The company received adequate counter-performance for
each legal transaction listed in the Report on Relationships
with Affiliated Companies, which were known to the company
at the time the transactions were carried out. At the request
of or in the interest of the parent company or its affiliated
companies measures were neither taken nor refrained from.

22 ManageMent RepoRt
Assurance by the Board
We hereby assure that to the best of our knowledge and in line
with the applicable accounting principles for interim report-
ing, this report offers a fair picture of the Bank’s assets, finan-
cial / liquidity and earnings situation that corresponds to the
facts and that the course of business, the business results and
the Bank’s positions are presented in such a way as to convey
a true and fair picture, and that the material opportunities
and risks of the Bank’s presumable future performance in the
remainder of the current business year are described.
Frankfurt am Main, April 22, 2014
J.P. Morgan AG
Frankfurt am Main
The Management Board
BURKhARD KüBEL-SORGER STEFAN BEhR
MIChELLE GRUNDMANN

23FINANCIAL STATEMENTS
Financial statements 2013 of J.P. Morgan AG

24 BALANCE ShEET
ASSETS
€
Note2013
€2012
€t
Cash reserves
– Cash on hand 100 –
– Credit with Central banks 590,339,827 8,717,117
incl.: with Deutsche Bundesbank EUR 590,339,827 8,717,117
2.1. 590,339,927 8,717,117
Debt instruments of public agencies and bills of exchange, eligible for refinancing with central banks
– Treasury bills, discounted treasury notes and similar debt instruments issued by public-sector institutions – –
incl.: eligible for refinancing with Deutsche Bundesbank EUR – –
– Bill of exchange – –
incl.: eligible for refinancing with Deutsche Bundesbank EUR – – –
Receivables from credit institutions
– due daily 8,915,218,078 5,554,994
– other receivables 153,723,614 378,962
2.2. 9,068,941,692 5,933,956
Receivables from clients 2.3. 101,985,782 178,530
incl.: secured by mortgage EUR – –
incl.: municipal credits EUR – –
Bonds and other fixed-interest securities
– Money market instruments
from public issuers – –
including: eligible as collateral at Deutsche Bundesbank EUR – – –
from other issuers – –
including: eligible as collateral at Deutsche Bundesbank EUR – – –
– –
– bonds and debt securities
from public issuers 890,601,570 641,055
including: eligible as collateral at Deutsche Bundesbank EUR 890,601,570 641,055
from other issuers – –
including: eligible as collateral at Deutsche Bundesbank EUR – – –
890,601,570 641,055
– own debt securities –
Nominal amount EUR – – –
2.5. 890,601,570 641,055
BALANCE ShEET AS AT DECEMBER 31, 2013 OF J.P. MORGAN AG, FRANKFURT AM MAIN

25
ASSETS (CONTINUED)
BALANCE ShEET
€
Note2013
€2012
€t
Shares and other non-fixed interest securities – –
Investments 2.4. 248,368 244
incl.: in credit institutions EUR 88,965 89
incl.: in financial services institutions EUR – –
Shares in affiliated companies
incl.: in credit institutions EUR – –
incl.: in financial services institutions EUR – –
Trust assets
incl.: fiduciary loans EUR – –
Tangible assets 2.6. 3,618,161 5,305
Other assets 2.7. 7,185,899 3,290
Accrued and deferred expenses 2.8. 698,230 1,205
Excess of plan assets over pension liabilities 2.9. 41,038,999 37,777
Total assets 10,704,658,628 15,518,479

26
LIABILITIES
€
Note2013
€2012
€t
Liabilities due to credit institutions
– due daily 2,165,325,668 8,023,500
– with agreed maturity or notice period 1,423,759,660 1,167,229
2.11. 3,589,085,328 9,190,729
Liabilities due to clients
– savings
with agreed notice period of three months – –
with agreed notice period of more than three months – –
– –
– other liabilities
due daily 5,781,505,844 5,076,970
with agreed maturity or notice period 341,478,451 414,846
6,122,984,295 2.12. 6,122,984,295 5,491,816
Securitized liabilities
– issued debt instruments 114,614,423 154,614
– other securitized liabilities – –
2.13. 114,614,423 154,614
incl.: money market instruments EUR – –
incl.: own acceptances and promissory notes outstanding EUR – –
Trust liabilities – –
incl.: fiduciary loans EUR – –
Other liabilities 2.14. 8,342,471 36,649
Deferred income 61,158 81
Provisions
– Provisions for pensions and similar obligations – –
– Tax provisions 3,485,507 –
– other provisions 13,104,914 12,792
2.15. 16,590,421 12,792
Subordinated liabilities 2.16. 185,988,576 150,056
Profit participation right 2.17. – 150,000
incl.: maturity after less than two years EUR – – –
BALANCE ShEET

27
LIABILITIES (CONTINUED)
€
Note2013
€2012
€t
Fund for general banking risks 2.18. 56,300,000 56,300
Equity
– Called-in capital
Subscribed capital 160,000,000 2.19. 160,000
minus unclaimed outstanding deposits – –
– Capital reserves 411,122,704 2.19. 85,663
– Retained earnings
Legal reserves 6,000,000 6,000
Reserve for interests in a dominant or majority stake holding company – –
Reserves as stated in the Articles of Association – –
other revenue reserves 23,777,629 23,778
29,777,629
– Balance sheet profit 9,791,623 –
610,691,956 275,441
Total liabilities 10,704,658,628 15,518,479
Contingent liabilities
– Contingent liabilities from rediscounted, settled bills – –
– Liabilities from guarantees and indemnity agreements 43,338,366 116,309
– Collateral provided for third-party liabilities – –
2.22. 43,338,366 116,309
Other commitments
– Repurchase obligations under reverse repurchasing agreements – –
– Placement and underwriting obligations – –
– Irrevocable loan commitments – –
– –
BALANCE ShEET

28 INCOME STATEMENT
FOR THE PERIOD FROM JANUARY 1, 2013 TO DECEMBER 31, 2013
€
Note2013
€2012
T€
Interest income from
– Lending and money-market transactions 15,716,890 35,234
– Fixed-income securities and debt register claims 8,131,590 23,848,480 5,123
Interest expenses 9,951,646 30,320
3.1. 13,896,834 10,037
Current income from
– Equities and other non-fixed-income securities 7,489 –
– Investments 960 9
– Shares in affiliated companies – –
8,449 9
Commissions income 60,844,054 54,296
Commissions expenses 1,092,982 4,218
3.2. 59,751,072 50,078
Net income from trading portfolio – –
Other operating income 3.3. 32,091,340 39,920
General administrative expenses
– Personnel expenses
Wages and salaries 25,023,986 23,615
Social security contributions and expenses for pension provisions and benefits 6,445,060 31,469,046 3,929
incl.: for retirement benefits EUR 3,865,361 1,438
– other administrative expenses 53,310,242 44,463
3.4. 84,779,288 72,007
Depreciation, amortization and write-downs of intangible and tangible fixed assets 2.6. 2,469,912 2,592
Other operating expenses 3.5. 2,279,442 2,997
Depreciation and value adjustments in respect of receivables and specific securities and allocations to provisions for credit risks 127,054 3.7. –
Income from allocations to receivables and specific securities as well as allocations to loans-transaction accruals – 3.6. 15
–127,054 15
Depreciation, amortization and write-downs of equity investments, shares in affiliated companies and securities classified as fixed assets – –
INCOME STATEMENT OF J.P. MORGAN AG, FRANKFURT AM MAIN

29INCOME STATEMENT
FOR THE PERIOD FROM JANUARY 1, 2013 TO DECEMBER 31, 2013 (CONTINUED)
€
Note2013
€2012
T€
Income from reversals of write-downs, shares in affiliated companies and securities classified as fixed assets – –
– –
Income from regular business activity 16,091,999 22,463
Extraordinary income – –
Extraordinary expenses – –
Extraordinary result – –
Taxes on income and revenue 6,286,663 –
including changes in deferred taxes: EUR –
Other taxes, not indicated under other operating expenses 13,713 14
3.8. –6,300,376 –14
Profit transferred on the basis of profit pooling, profit and loss transfer, or partial profit transfer agreements – 22,449
Annual net profit 9,791,623 –
Profit / loss carried forward – –
Retained profit 9,791,623 –

Notes30
1. General remarks
1.1. GENERAL PRINCIPLES
J.P. Morgan AG, Frankfurt am Main, is a registered stock corporation under German law active
in Germany in the main segments of transaction banking, securities custody and deposit and
loans business.
The J.P. Morgan AG annual financial statements have been prepared according to the regula-
tions of the German Commercial Code and the Decree on Accounting for Banks and Financial
Service Providers.
Given our classification as a corporation focused on the capital market as per section 264d of the
hGB (Handelsgesetzbuch [Commercial Code]), we are obliged to prepare a cash flow statement
and a schedule of movements in equity.
The structure of the balance sheet and the income statement is unchanged over the prior year.
1.2. CHANGED ACCOUNTING AND VALUATION METHODS
The accounting and valuation methods adopted in the 2012 annual financial statements, except
for the situations presented below, remained unchanged.
By a framework resolution of the Management Board of J.P. Morgan AG, the securities of the
investment assets, reported under “Bonds and other fixed-income securities”, were transformed
into liquidity reserve with the intention of achieving ongoing revenue in addition to active control
of liquidity risks provision. The securities are now assessed per the reporting date according to
the strict lowest value principle pursuant to Section 253, Par. 4, hGB. Depreciations and write-ups
of the securities in the liquidity reserve are reported in the income statement under “Deprecia-
tion and value adjustments in respect of receivables and specific securities and allocations to
provisions for credit risks” and /or “Income from allocations to receivables and specific securities
as well as allocations to loans-transaction accruals”. Premiums, which are incurred in purchas-
ing the current securities in the portfolio, are linearly depreciated over the remaining life of the
respective security and are reported in interest expense. For future purchases of securities for
liquidity reserve there will be no depreciation or accrual of premiums or discounts.
Internal institutional criteria for the allocation of securities in the investment and trading books
were revised in 2013.
J.P. MORGAN AG, FRANKFURT AM MAIN NOTES TO ThE ANNUAL FINANCIAL STATEMENTS 2013

Notes 31
1.3. FOREIGN CURRENCY CONVERSION
Foreign-currency receivables and liabilities have been converted using the European Central Bank
reference rates applicable at the reporting date. Transactions denominated in foreign currency
are translated at the end-of-month rate for the month in which the business was transacted.
Exchange gains / losses are recognized in profit or loss in other income.
2. Key accounting and valuation principles and explanations
2.1. CASH RESERVES
€t 12 /31 /2013 12 /31 /2012
Cash reserves 590,340 8,717,117
– Cash on hand – –
– Credit with central banks 590,340 8,717,117
incl.: with Deutsche Bundesbank 590,340 8,717,117
Liquid funds are reported at nominal value. As at the reporting date, there is € 100 in liquid funds
in the cash on hand, and liquidity was invested with Deutsche Bundesbank.
2.2. RECEIVABLES FROM CREDIT INSTITUTIONS
€t 12 /31 /2013 12 /31 /2012
Receivables from credit institutions 9,068,942 5,933,956
incl.: receivables from affiliated companies 8,838,937 5,916,642
Breakdown by remaining maturity:
– due daily 8,915,218 5,554,994
– other receivables 153,724 378,962
1. up to three months, 153,724 378,962
2. more than three months to one year, – –
3. more than one year up to five years, – –
4. more than five years – –
Receivables from banks are reported at the nominal value or at the lower cost of acquisition plus
accrued interest.

Notes32
2.3. RECEIVABLES FROM CLIENTS
€t 12 /31 /2013 12 /31 /2012
Receivables from clients 101,986 178,530
incl.: receivables from affiliated companies 10,981 9,688
Breakdown by remaining maturity:
– due daily 10,194 11,359
– undefined maturity 91,038 166,121
– other receivables 754 1,050
1. up to three months, – –
2. more than three months to one year, – –
3. more than one year and up to five years, 754 1,050
4. more than five years – –
Receivables from clients are reported at nominal value or at the lower cost of acquisition plus
accrued interest.
2.4. INVESTMENTS
€t 12 /31 /2013 12 /31 /2012
Investments 248 244
incl.: in credit institutions 89 89
The investments are reported at acquisition cost. There is a contingent obligation to make an
additional contribution of € 600,000 under an investment in a credit institution.
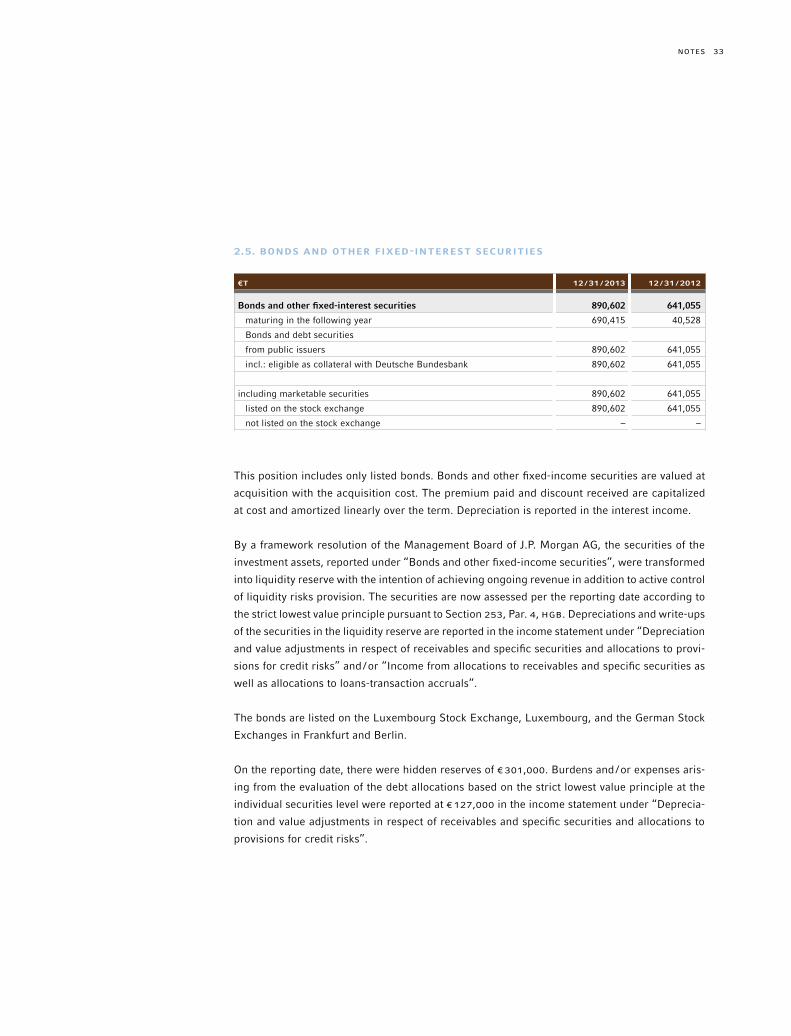
Notes 33
2.5. BONDS AND OTHER FIxED-INTEREST SECURITIES
€t 12 /31 /2013 12 /31 /2012
Bonds and other fixed-interest securities 890,602 641,055
maturing in the following year 690,415 40,528
Bonds and debt securities
from public issuers 890,602 641,055
incl.: eligible as collateral with Deutsche Bundesbank 890,602 641,055
including marketable securities 890,602 641,055
listed on the stock exchange 890,602 641,055
not listed on the stock exchange – –
This position includes only listed bonds. Bonds and other fixed-income securities are valued at
acquisition with the acquisition cost. The premium paid and discount received are capitalized
at cost and amortized linearly over the term. Depreciation is reported in the interest income.
By a framework resolution of the Management Board of J.P. Morgan AG, the securities of the
investment assets, reported under “Bonds and other fixed-income securities”, were transformed
into liquidity reserve with the intention of achieving ongoing revenue in addition to active control
of liquidity risks provision. The securities are now assessed per the reporting date according to
the strict lowest value principle pursuant to Section 253, Par. 4, hGB. Depreciations and write-ups
of the securities in the liquidity reserve are reported in the income statement under “Depreciation
and value adjustments in respect of receivables and specific securities and allocations to provi-
sions for credit risks” and /or “Income from allocations to receivables and specific securities as
well as allocations to loans-transaction accruals”.
The bonds are listed on the Luxembourg Stock Exchange, Luxembourg, and the German Stock
Exchanges in Frankfurt and Berlin.
On the reporting date, there were hidden reserves of € 301,000. Burdens and /or expenses aris-
ing from the evaluation of the debt allocations based on the strict lowest value principle at the
individual securities level were reported at € 127,000 in the income statement under “Deprecia-
tion and value adjustments in respect of receivables and specific securities and allocations to
provisions for credit risks”.

Notes34
2.6. CHANGE IN FIxED ASSETS
€tOther equipment and
office equipmentTechnical equipment
and machinery Financial assets Total
Cumulative acquisition cost as at 01 /01 /2013 20,383 6,565 641,212 668,160
Additions 441 551 289,606 290,598
Disposals –5 –1,758 –930,818 –932,581
Cumulative acquisition cost as at 12 /31 /2013 20,818 5,358 0 26,176
Scheduled depreciation in the current year 2,044 426 4,449 6,919
Cumulated depreciation as at 12 /31 /2013 18,279 4,279 0 22,558
Residual value as at 12 /31 /2013 2,539 1,079 0 3,618
Residual value as at 12 /31 /2012 4,142 1,162 640,554 645,859
Tangible assets are valued at acquisition cost minus scheduled straight-line depreciation.
Due to the reallocation of the securities of the investment assets into liquidity reserves, they are
registered in the fixed assets schedule as disposals for the 2013 financial year.
2.7. OTHER ASSETS
€t 12 /31 /2013 12 /31 /2012
Other assets 7,186 3,290
This is mainly receivables from payment transaction services in the amount of € 1.8 million, € 1.1
million from the active value of reinsurance, € 1.1 million in receivables from capital income tax,
and € 0.9 million in turnover tax receivables.

Notes 35
2.8. ACCRUED AND DEFERRED ExPENSES
€t 12 /31 /2013 12 /31 /2012
Accrued and deferred expenses 698 1,205
Accrued and deferred expenses include € 696,000 for the monthly pension payments already
made in 2013 based on statements.
2.9. ExCESS OF PLAN ASSETS OVER PENSION LIABILITIES
In line with section 246 (2) sentence 2 of the hGB, assets that serve to cover debts from pension
obligations and similar long-term obligations must be netted against the liabilities. The excess
carrying value of the balance is then entered under the item for “Positive consolidation difference
from asset offsetting”. The actuarial report was calculated using the Prof. Dr. Klaus Heubeck
2005 G mortality tables.
The evaluation was carried out in accordance with the accepted principles of actuarial mathemat-
ics using the so-called “Projected Unit Credit Method” (PUC method).
€t 12 /31 /2013 12 /31 /2012
Valuation parameters (BilMoG)
– Pension obligations:
Actuarial interest rate 4.88% 5.04%
Future increase of benefits 3.00% 3.00%
Increase of pension 2.00% 2.00%
In order to account for fluctuation, age-specific and gender-specific fluctuation probabilities were used
Mercer Standard
Mercer Standard
– Partial retirement:
Actuarial interest rate 4.88% 5.04%
Future increase of benefits 3.00% 3.00%
Increase of pension 0.00% 0.00%

Notes36
€ 12 /31 /2013
Pension obligations 01 /01 /2013 125,115,366
Allocations 11,400,064
Allocations from deferred compensation 0
Consumption (pension payments) –4,882,952
Pension obligations 12 /31 /2013 131,632,477
Assets 01 /01 /2013 162,892,105
Additions 731,074
Disposals 0
Reversal of impairment on part values that have risen again 0
Market valuation in relation to acquisition costs (under other operating income) 9,048,295
Assets 12 /31 /2013 172,671,473
Net pension assets 01 /01 /2013 37,776,739
Net pension assets 12 /31 /2013 41,038,999
Acquisition costs of assets 01 /01 /2013 117,708,591
Acquisition costs of assets 12 /31 /2013 118,708,758
Trend for allocations to pension provisions
Allocations 11,400,064
Proof of expenses for partial retirement under “Wages and salaries” –228,822
Proof of change in the discount rate and discounting /compounding of pension liabilities under other operative income –8,502,983
Allocations to pension provisions 01 /01 / – 12 /31 /2013 2,668,259
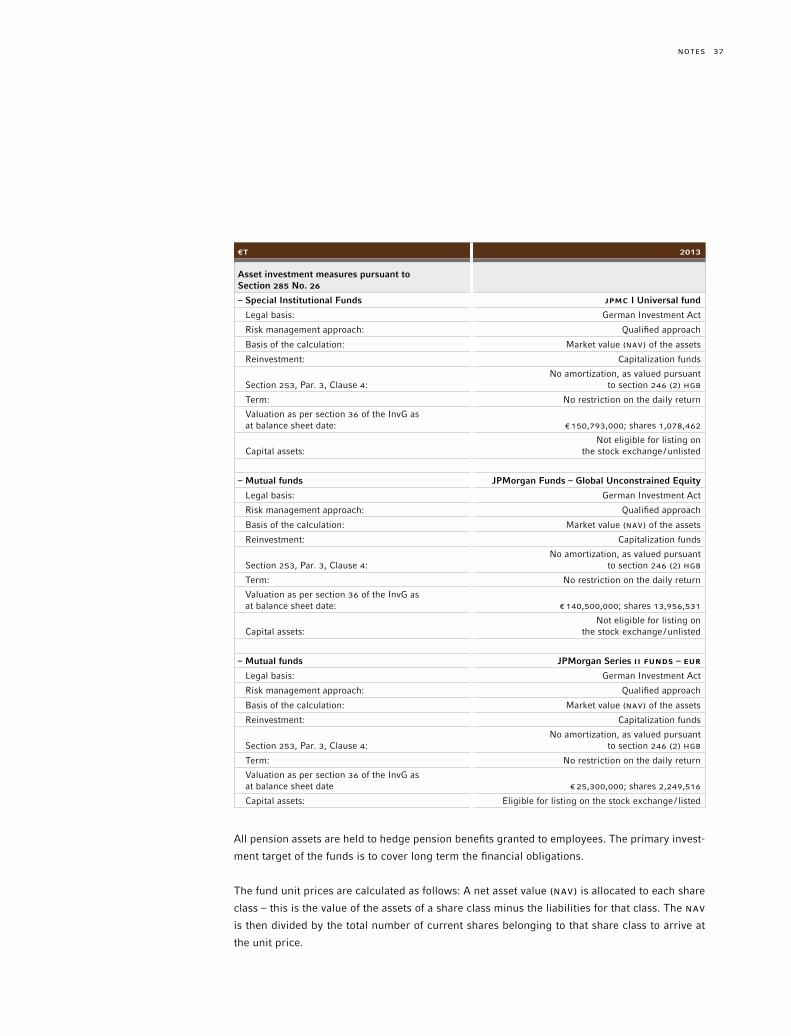
Notes 37
€t 2013
Asset investment measures pursuant to Section 285 No. 26
– Special Institutional Funds JPMC I Universal fund
Legal basis: German Investment Act
Risk management approach: Qualified approach
Basis of the calculation: Market value (NAV) of the assets
Reinvestment: Capitalization funds
Section 253, Par. 3, Clause 4:No amortization, as valued pursuant
to section 246 (2) hGB
Term: No restriction on the daily return
Valuation as per section 36 of the InvG as at balance sheet date: € 150,793,000; shares 1,078,462
Capital assets:Not eligible for listing on
the stock exchange /unlisted
– Mutual funds JPMorgan Funds – Global Unconstrained Equity
Legal basis: German Investment Act
Risk management approach: Qualified approach
Basis of the calculation: Market value (NAV) of the assets
Reinvestment: Capitalization funds
Section 253, Par. 3, Clause 4:No amortization, as valued pursuant
to section 246 (2) hGB
Term: No restriction on the daily return
Valuation as per section 36 of the InvG as at balance sheet date: € 140,500,000; shares 13,956,531
Capital assets:Not eligible for listing on
the stock exchange /unlisted
– Mutual funds JPMorgan Series II FUNDS – EUR
Legal basis: German Investment Act
Risk management approach: Qualified approach
Basis of the calculation: Market value (NAV) of the assets
Reinvestment: Capitalization funds
Section 253, Par. 3, Clause 4:No amortization, as valued pursuant
to section 246 (2) hGB
Term: No restriction on the daily return
Valuation as per section 36 of the InvG as at balance sheet date € 25,300,000; shares 2,249,516
Capital assets: Eligible for listing on the stock exchange / listed
All pension assets are held to hedge pension benefits granted to employees. The primary invest-
ment target of the funds is to cover long term the financial obligations.
The fund unit prices are calculated as follows: A net asset value (NAV) is allocated to each share
class – this is the value of the assets of a share class minus the liabilities for that class. The NAV
is then divided by the total number of current shares belonging to that share class to arrive at
the unit price.

Notes38
2.10. OTHER ACCOUNTING AND VALUATION METHODS
Other assets are valued under consideration of the strict lowest value principle.
Expenses and income deferrals have been formed and allocated to the respective balance sheet
item.
Liabilities are carried at the sums repayable and securitized liabilities are held at their nominal
value.
Appropriate provisions have been made for uncertain liabilities. There were no imminent losses
from pending transactions.
Interest driven business, in the banking book, was valued using the periodical approach (p&l
based method) for loss free valuation. In accordance with this method, no write off is required.
Provisions were valued at the settlement amount, factoring in expected increases in prices and
costs.
Provisions with a remaining term of more than one year have been discounted / revalued at the
average market interest rates as calculated and announced by Deutsche Bundesbank (section 253
(2) of the hGB). Income and expenses from discounting and revaluing were entered not netted,
depending on whether the provisions were made for loan losses or for non-banking business,
under the interest income/ interest expense item (section 277 (5) of the hGB) or in other operating
income/expenses (section 340a (2) in connection with section 277 (5) of the hGB).
Deferred taxes are calculated for temporary differences between the commercial valuations of
assets, liabilities and deferred income and their taxable value and tax loss. The underlying tem-
porary differences are mainly due to different valuations of securities, pension obligations and
the valuation of plan assets and provisions and lead to a net deferred tax asset (surplus). For
the calculation of deferred taxes, a corporate income tax rate including solidarity surcharge of
15.38% and an industrial tax rate of 16.10% were assumed. The right available under Section
274, Par. 1, Clause 2, hGB for activation of deferred taxes is not exercised.
Valuation units were set up for registered bonds, bearer bonds and debentures issued that are
hedged by total return swaps (TRS) against market price risk. The TRS were concluded in a clear
hedging relationship to the respective liability and their effectiveness tested. Owing to the clear
hedging relationship, the transactions involved are micro-hedges that represent an efficient and
perfect hedging relationship for the entire term. The fair values covered by the total return swaps
in relation to the underlying liabilities are calculated using customary valuation models. Efficiency
is measured by comparing the market valuation for the liabilities to that of the respective total
return swap.

Notes 39
The fair value of all Total Return Swaps at December 31, 2013 was € 20,413,000. Valuation was
carried out using internal valuation procedures. The Group uses valuation procedures to establish
the fair value of financial instruments where prices quoted in active markets are not available.
Therefore, where possible, parameter inputs to the valuation procedures are based on observ-
able data derived from prices of relevant financial instruments traded in an active market. The
use of these models involves some level of management estimation and judgment, the degree
of which will depend on the price transparency for the financial instrument and its market and
the instrument’s complexity.
The term of the individual TRS matches that of the liabilities hedged and was as follows at
December 31, 2013:
€tTotal Return
Swap Liabilities
Total Return Swaps Overview
Maturity
2014 61,812 61,812
2015 68,606 68,606
2016 40,913 40,913
2018 25,000 25,000
2020 150,000 150,000
2022 110,000 110,000
In total, 150 valuation units were formed, and 15 total return swaps established to cover 20
liability items.
The effective portion of the valuation units formed is presented according to the freezing method.
2.11. LIABILITIES TO CREDIT INSTITUTIONS
€t 12 /31 /2013 12 /31 /2012
Liabilities to credit institutions 3,589,085 9,190,729
incl.: liabilities to affiliated companies 2,294,588 5,428,769
Maturity structure:
– due daily 2,165,326 8,023,500
– with agreed duration or termination notice 1,423,760 1,167,229
1. up to three months, 1,137,504 879,005
2. more than three months to one year, – 328
3. more than one year and up to five years, 36,256 37,896
4. more than five years 250,000 250,000

Notes40
2.12. LIABILITIES TO CLIENTS
€t 12 /31 /2013 12 /31 /2012
Liabilities to clients 6,122,984 5,491,816
incl.: liabilities to affiliated companies 18,697 213,161
Maturity structure:
– due daily 5,781,506 5,076,970
– with agreed duration or termination notice 341,478 414,846
1. up to three months, 39,227 26,254
2. more than three months to one year, 237,252 298,592
3. more than one year and up to five years, 25,000 –
4. more than five years 40,000 90,000
2.13. SECURITIzED LIABILITIES
€t 12 /31 /2013 12 /31 /2012
Securitized liabilities 114,614 154,614
incl.: acceptances outstanding and promissory notes in circulation
Maturity structure:
issued debt instruments 114,614 154,614
– maturing in the following year 114,614 154,614
Other securitized liabilities with agreed maturity or notice period – –
1. up to three months, – –
2. more than three months to one year, – –
3. more than five years – –
Securitized liabilities result from bearer debentures issued. The possibility of their termination
before maturity was taken into consideration when grouping them by remaining term.
In the financial year 2013, no further debentures were issued.
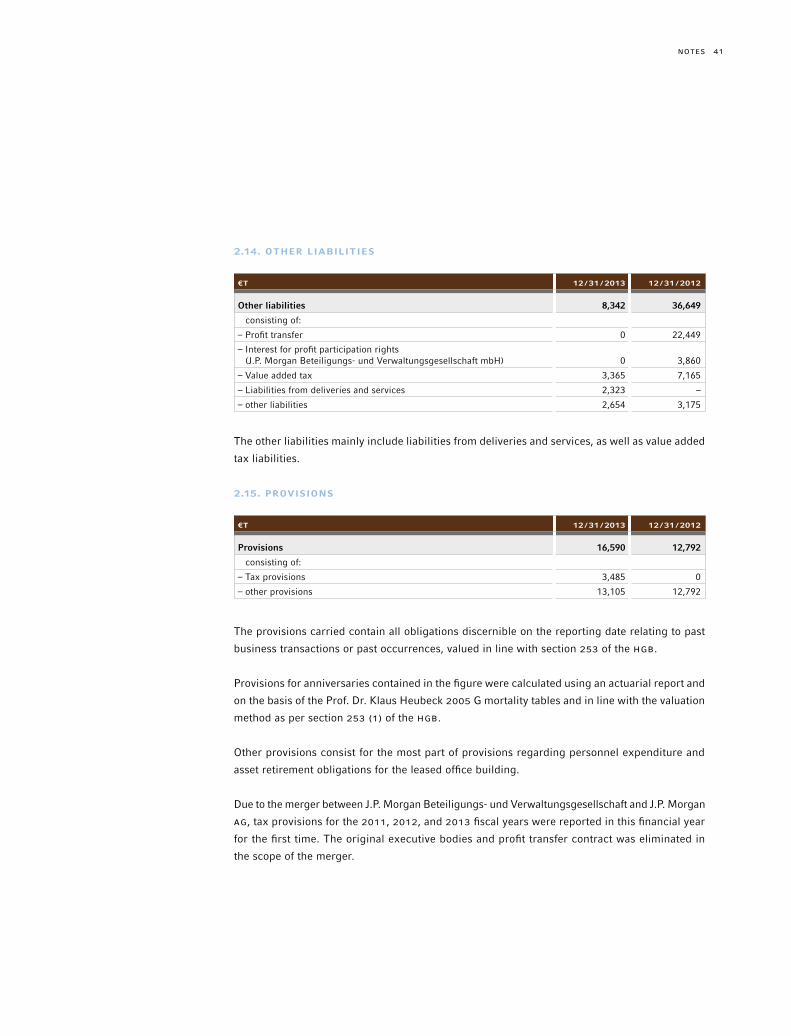
Notes 41
2.14. OTHER LIABILITIES
€t 12 /31 /2013 12 /31 /2012
Other liabilities 8,342 36,649
consisting of:
– Profit transfer 0 22,449
– Interest for profit participation rights (J.P. Morgan Beteiligungs- und Verwaltungsgesellschaft mbH) 0 3,860
– Value added tax 3,365 7,165
– Liabilities from deliveries and services 2,323 –
– other liabilities 2,654 3,175
The other liabilities mainly include liabilities from deliveries and services, as well as value added
tax liabilities.
2.15. PROVISIONS
€t 12 /31 /2013 12 /31 /2012
Provisions 16,590 12,792
consisting of:
– Tax provisions 3,485 0
– other provisions 13,105 12,792
The provisions carried contain all obligations discernible on the reporting date relating to past
business transactions or past occurrences, valued in line with section 253 of the hGB.
Provisions for anniversaries contained in the figure were calculated using an actuarial report and
on the basis of the Prof. Dr. Klaus Heubeck 2005 G mortality tables and in line with the valuation
method as per section 253 (1) of the hGB.
Other provisions consist for the most part of provisions regarding personnel expenditure and
asset retirement obligations for the leased office building.
Due to the merger between J.P. Morgan Beteiligungs- und Verwaltungsgesellschaft and J.P. Morgan
AG, tax provisions for the 2011, 2012, and 2013 fiscal years were reported in this financial year
for the first time. The original executive bodies and profit transfer contract was eliminated in
the scope of the merger.
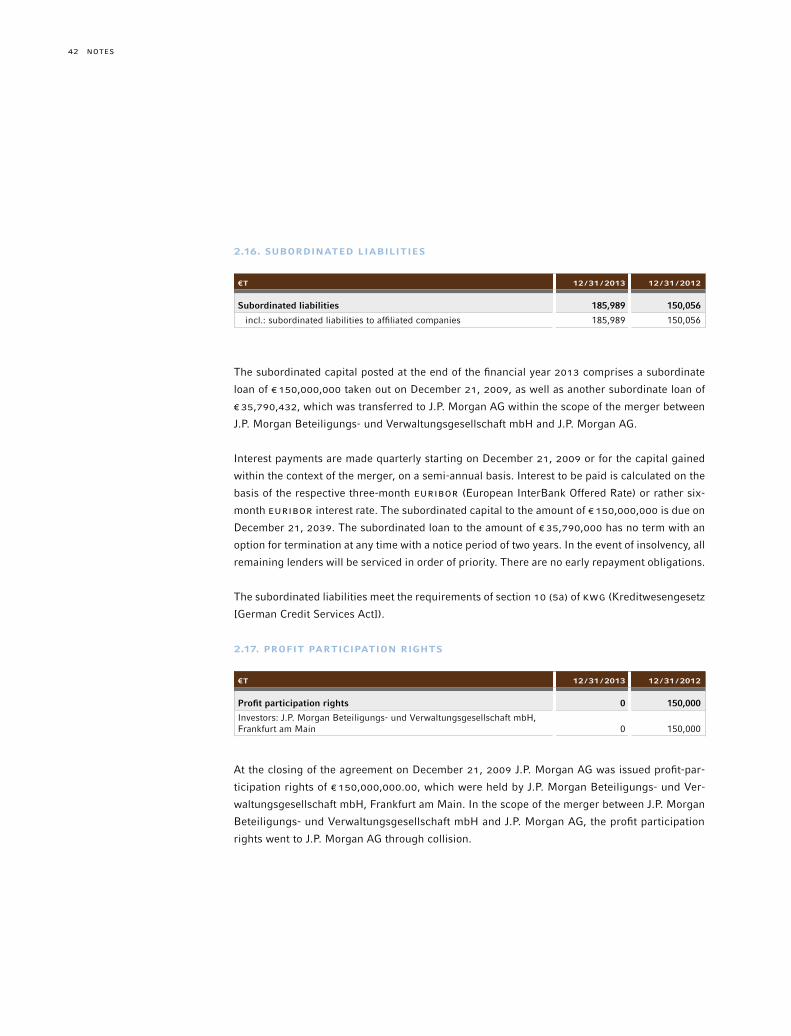
Notes42
2.16. SUBORDINATED LIABILITIES
€t 12 /31 /2013 12 /31 /2012
Subordinated liabilities 185,989 150,056
incl.: subordinated liabilities to affiliated companies 185,989 150,056
The subordinated capital posted at the end of the financial year 2013 comprises a subordinate
loan of € 150,000,000 taken out on December 21, 2009, as well as another subordinate loan of
€ 35,790,432, which was transferred to J.P. Morgan AG within the scope of the merger between
J.P. Morgan Beteiligungs- und Verwaltungsgesellschaft mbH and J.P. Morgan AG.
Interest payments are made quarterly starting on December 21, 2009 or for the capital gained
within the context of the merger, on a semi-annual basis. Interest to be paid is calculated on the
basis of the respective three-month EURIBOR (European InterBank Offered Rate) or rather six-
month EURIBOR interest rate. The subordinated capital to the amount of € 150,000,000 is due on
December 21, 2039. The subordinated loan to the amount of € 35,790,000 has no term with an
option for termination at any time with a notice period of two years. In the event of insolvency, all
remaining lenders will be serviced in order of priority. There are no early repayment obligations.
The subordinated liabilities meet the requirements of section 10 (5a) of KWG (Kreditwesengesetz
[German Credit Services Act]).
2.17. PROFIT PARTICIPATION RIGHTS
€t 12 /31 /2013 12 /31 /2012
Profit participation rights 0 150,000
Investors: J.P. Morgan Beteiligungs- und Verwaltungsgesellschaft mbH, Frankfurt am Main 0 150,000
At the closing of the agreement on December 21, 2009 J.P. Morgan AG was issued profit-par-
ticipation rights of € 150,000,000.00, which were held by J.P. Morgan Beteiligungs- und Ver-
waltungsgesellschaft mbH, Frankfurt am Main. In the scope of the merger between J.P. Morgan
Beteiligungs- und Verwaltungsgesellschaft mbH and J.P. Morgan AG, the profit participation
rights went to J.P. Morgan AG through collision.

Notes 43
2.18. FUNDS FOR GENERAL BANKING RISKS
€t 12 /31 /2013 12 /31 /2012
As at 01 /01 /2013 56,300 56,300
Additions – –
Disposals – –
As at 12 /31 /2013 56,300 56,300
2.19. SUBSCRIBED CAPITAL AND CAPITAL RESERVE
The share capital amounts to € 160,000,000 divided into 160,000,000 shares. As part of the
merger between J.P. Morgan Beteiligungs- und Verwaltungsgesellschaft mbH and J.P. Morgan
AG all 160,000,000 shares were passed on to J.P. Morgan International Finance Limited, Newark /
Delaware, USA. The shares are 100% paid-in.
The increase in capital reserve by € 325,460,000 is due to the net assets transfer in consequence
of the merger of J.P. Morgan Beteiligungs- und Verwaltungsgesellschaft mbH and J.P. Morgan AG.
The right to choose under Section 24, UmwG (Umwandlungsgesetz [Transformation Act]) was
exercised.
2.20. OTHER ITEMS DUE TO AFFILIATED COMPANIES
€t 12 /31 /2013 12 /31 /2012
Other items due to affiliated companies
Other assets 5 0
Other liabilities 2,098 3,860
Liabilities from profit transfer 0 22,449
2.21. FOREIGN CURRENCY ASSETS AND LIABILITIES
€t 12 /31 /2013 12 /31 /2012
Foreign currency assets and liabilities
Assets 1,186,739 1,248,319
Liabilities 1,167,155 1,278,376

Notes44
2.22. CONTINGENT LIABILITIES
€t 12 /31 /2013 12 /31 /2012
Contingent liabilities
Liabilities from guarantees and indemnity agreements 43,338 116,309
Guarantees were secured using cash collateral to the amount of € 7,251.11.
The guarantees are generally covered by counter-guarantees.
There are no significant call risks.
3. Explanatory Notes to the Income Statement
3.1. NET INTEREST INCOME
€t 01 /01 / – 12 /31 /2013 01 /01 / – 12 /31 /2012
Interest income (net) 13,897 10,037
Interest income from: 23,848 40,357
Lending and money-market transactions 15,717 35,234
Fixed-income securities and debt register claims 8,132 5,123
Interest expenses: 9,952 30,320
The interest income has risen by 38% in comparison to the previous year. The increase is largely
due to higher bond inventories and resulting increased interest income, as well as the elimination
of the interest expense on participation right due to the merger between J.P. Morgan Beteiligungs-
und Verwaltungsgesellschaft mbH and J.P. Morgan AG. The interest expenses for the participation
rights issued on December 21, 2009 decreased by € 3,860,000 (expenses in 2013: € 0).
3.2. COMMISSION INCOME
€t 01 /01 / – 12 /31 /2013 01 /01 / – 12 /31 /2012
Commission income (net) 59,751 50,078
The commission income increased by 19% in comparison to the previous year. In particular,
increasing income from payment transactions and new customer acquisition in the custodian
bank business have contributed positively to this increase.

Notes 45
3.3. OTHER OPERATING INCOME
€t 01 /01 / – 12 /31 /2013 01 /01 / – 12 /31 /2012
Other operating income 32,091 39,920
of which:
– Services rendered for Group entities 29,767 31,971
– Miscellaneous other operating income 2,324 7,950
Other operating income mainly includes services performed for Group entities, as well as changes
in fair value of the plan assets and income from the plan assets, calculatory interest changes, and
effects of discounting /compounding of pension liabilities.
The decrease in other operating income of 20% in comparison to the previous year is primar-
ily due to the net interest income of € 545,000 (income in 2012: € 7,856,000) from the earnings
and the fair value of the plan assets as well as the expenses from the discounting of the pension
provisions.
3.4. GENERAL ADMINISTRATIVE ExPENSES
€t 01 /01 / – 12 /31 /2013 01 /01 / – 12 /31 /2012
General administrative expenses 84,779 72,007
of which:
Personnel expenses 31,469 27,544
– Wages and salaries 25,024 23,615
– Social security contributions and expenses for pension provisions and benefits 6,445 3,929
• from which for pensions 3,865 1,438
Other administrative expenses 53,310 44,463
The increase in general administrative expenses resulted from increased expenses on pensions
and increased contributions to deposit insurance fund, bank fees, and increased services to
companies of the Group.
3.5. OTHER OPERATING ExPENSES
€t 01 /01 / – 12 /31 /2013 01 /01 / – 12 /31 /2012
Other operating expenses 2,279 2,997
Other operating expenses primarily cover expenses on payment transactions.
Other operating expenses include expenses on currency exchange in the amount of € 81,000.

Notes46
3.6. INCOME FROM ALLOCATION TO RECEIVABLES AND CERTAIN SECURITIES, AS
wELL AS FROM THE REVERSAL OF ACCRUALS IN LENDING BUSINESS
€t 01 /01 / – 12 /31 /2013 01 /01 / – 12 /31 /2012
Income from allocations 0 15
3.7. wRITE-OFFS AND VALUE IMPAIRMENTS ON RECEIVABLES AND SPECIFIC
SECURITIES, AS wELL AS ALLOCATIONS TO LENDING BUSINESS ACCRUALS
€t 01 /01 / – 12 /31 /2013 01 /01 / – 12 /31 /2012
Write-offs of securities in the liquidity reserve 127 0
By a framework resolution of the Management Board of J.P. Morgan AG, the securities of the
investment assets, reported under “Bonds and other fixed-income securities”, were transformed
into liquidity reserve with the intention of achieving ongoing revenue in addition to active control
of liquidity risks provision. The securities are now assessed per the reporting date according to
the strict lowest value principle pursuant to Section 253, Par. 4, hGB. Depreciation and write-ups
of the securities in the liquidity reserve are reported in the income statement under “Depreciation
and value adjustments in respect of receivables and specific securities and allocations to provi-
sions for credit risks” and /or “Income from allocations to receivables and specific securities as
well as allocations to loans-transaction accruals”.
On the reporting date expenses arising from the evaluation of the debt allocations based on
the strict lowest value principle at the individual securities level were reported at € 127,000 in
the income statement under “Depreciation and value adjustments in respect of receivables and
specific securities and allocations to provisions for credit risks”.
3.7. TAx ON INCOME AND REVENUE AND OTHER TAxES
€t 01 /01 / – 12 /31 /2013 01 /01 / – 12 /31 /2012
Taxes 6,300 14
Industrial tax 3,404 0
Corporate tax 2,883 0
Other 14 14
In the fiscal year period tax expenses of € 2,258,000 were recorded, resulting from reversal of
provisions for 2012.

Notes 47
4. Other information
Market value on 12 /31 /2013 Market value on 12 /31 /2012 Market value on 12 /31 /2011
€t positive negative positive negative positive negative
Total Return Swaps 35,834 56,247 27,420 92,720 22,888 85,834
Forward transactions which were not yet settled at the reporting date consisted only of total return
swaps. The total return swaps were concluded to hedge against market risks.
4.1. RELATIONS TO AFFILIATED COMPANIES
In the scope of the merger between J.P. Morgan Beteiligungs- und Verwaltungsgesellschaft mbH,
Frankfurt am Main, and J.P. Morgan AG, Frankfurt am Main, J.P. Morgan International Finance
Limited, Newark /Delaware, USA, is now the shareholder of J.P. Morgan AG.
The profit transfer agreement between J.P. Morgan Beteiligungs- und Verwaltungsgesellschaft
mbH, Frankfurt am Main, and J.P. Morgan AG, Frankfurt am Main, lapsed at the time of the
merger. A dependency report pursuant to Section 312 AktG is issued. The final declaration in
the report of the Management Board on the Relationships with Affiliated Companies is provided
in the Management Report.
Per December 31, 2013, the distribution restriction was € 53,963,000.
The consolidated annual financial statements for the smallest and largest group of companies is
disclosed by JPMorgan Chase & Co., New York, whose shares are traded on the New York Stock
Exchange and on some European and Asian exchanges. The consolidated annual financial state-
ments can be obtained on request from J.P. Morgan AG, Frankfurt am Main.
The Bank is a member of the Deposit Protection Fund of the Association of German Banks.
4.2. NUMBER OF EMPLOYEES
On average for the year there were 244 employees, distributed as follows:
Number 12 /31 /2013 12 /31 /2012
Yearly average 244 248
Distribution of employees
Authorized signatories 14 14
Authorized officers 118 127
Commercial employees 112 107
Employees sent overseas are not included in this chart.

Notes48
4.3. TOTAL REMUNERATION OF THE ACTIVE MEMBERS OF THE BOARDS
The remuneration paid to members of the Management Board amounted to € 3,354,000. A large
portion of this came from restricted stock units which had a fair value on their grant date of
€ 240,000. In total, 6,664 units were granted.
The remuneration paid to members of the Supervisory Board amounted to € 7,000.
No loans were granted to Board members during the business year.
4.4. TOTAL PAYMENTS TO FORMER BOARD MEMBERS AND THEIR DEPENDENTS
Pension provisions for these persons totaled € 20,804,000 as at December 31, 2013. The total
remuneration for former members of the Management Board and their dependents amounted
to € 703,000.
4.5. FEE ExPENSES¹
€t 01 /01 / – 12 /31 /2013 01 /01 / – 12 /31 /2012
Total fee expenses for the financial year calculated by the auditors for 267 297
Services relating to the audit of the financial statements 189 208
of which, for the previous year –2 26
of which, expenses in the current financial year 0 2
of which, expenses for creating provisions 192 180
Other audit-related services 78 123
of which, for the previous year –3 32
of which, expenses in the current financial year 0 2
of which, expenses for creating provisions 81 89
Tax advisory services 0 –34
of which, for the previous year 0 –36
of which, expenses in the current financial year 0 2
of which, expenses for creating provisions 0 0
¹ Net expenses, excluding VAT
4.6. ExPLANATORY NOTES ON OTHER FINANCIAL COMMITMENTS
The Company utilizes services from various Group member companies as part of its outsourcing
functions. The business procurement contracts have a notice period of three months.
The rental contract for the business premises runs until December 31, 2014.

Notes 49
Management Board
Burkhard Kübel-Sorger Chairperson of the Board (since June 1, 2013), Executive Director, J.P. Morgan AG
Thomas Meyer (till May 31, 2013) Chairperson of the Board, Managing Director, J.P. Morgan AG
Michelle Grundmann (since February 1, 2013) Managing Director, J.P. Morgan AG
Stefan Behr (since June 1, 2013) Managing Director, J.P. Morgan AG
Oliver Berger (until January 31, 2013) Managing Director, J.P. Morgan AG
Supervisory Board
Mark S. Garvin Chairperson, J.P. Morgan Europe Limited, London
Frédéric P. Mouchel (since October 1, 2013) Vice Chairperson, Managing Director, JPMorgan Chase Bank N.A., London Branch
Alexander Caviezel (until September 30, 2013) Vice Chairperson, Managing Director, JPMorgan Chase Bank N.A., Zurich Branch
Karl-Georg Altenburg Senior Country Officer Germany, Austria & Switzerland, Managing Director, JPMorgan Chase Bank N.A., Frankfurt Branch
Alison P. Livesey (until December 31, 2013) Managing Director, JPMorgan Chase Bank N.A., New York
Thomas Freise Employee Representative of J.P. Morgan AG
Christoph Fickel Employee Representative of J.P. Morgan AG
Frankfurt am Main, April 22, 2014
J.P. Morgan AG
Frankfurt am Main
Management Board
BURKhARD KüBEL-SORGER STEFAN BEhR MIChELLE GRUNDMANN

50 STATEMENT OF ChANGES IN EqUITy
STATEMENT OF CHANGES IN EqUITY 2013
€tSubscribed
capitalCapital
reservesLegal
reserves
Other revenue reserves
Balance sheet
profit / loss
Profit / loss carried
forward Total
Participa-tion rights
capital
As at 01 /01 /2012 160,000 85,663 6,000 23,777 0 0 275,441 150,000
Annual net profit for 2012 before appropriation of earnings 22,449 22,449
Transfer of profits to JPM BV –22,449 –22,449
As at 12 /31 /2012 160,000 85,663 6,000 23,777 0 0 275,441 150,000
As at 01 /01 /2013 160,000 85,663 6,000 23,777 0 0 275,441 150,000
Capital increase from the merger with J.P. Morgan Beteiligungs- und Verwaltungsgesellschaft mbH 325,460 325,460 –150,000
Annual net profit for 2013 before appropriation of earnings 9,791 9,791
As at 12 /31 /2013 160,000 411,123 6,000 23,777 9,791 0 610,692 0

51CASh FLOW STATEMENT
CASH FLOw STATEMENT 2013
T€ 12 /31 /2013 12 /31 /2012
Annual net profit before profit transfers 9,792 22,449
Non-cash items included in net income for the year and reconciliation to cash flow from operating activities:
Depreciation, amortization, adjustments, write-ups to fixed and other assets, changes in provisions and net changes due to hedge accounting 567 –10,677
Change to other non-cash items – –
Profit from the sale of assets – –
Result from the sale of tangible assets – –
Other adjustments (interest income) –13,905 –10,037
Subtotal –3,547 1,735
Change in assets and liabilities from operating activities after adjustment for non-cash items:
Receivables from credit institutions –3,134,985 2,836,986
Receivables from clients 76,544 –163,001
Trading securities – –
Other assets from operating activities –3,330 3,232
Liabilities to credit institutions –5,601,644 5,141,855
Liabilities to clients 631,168 1,021,982
Securitized liabilities –40,000 –28,893
Other liabilities from operating activities –28,327 –67,322
Interest and dividends received 23,857 40,357
Interest paid –9,952 –30,320
Income tax payments / refunds 1,625 –
Cash flow from operating activities –8,088,590 8,756,612
Cash flow from investing activities 75,881 –39,491
Deposits from the sale of:
Financial assets /positive consolidation difference 40,000 –
Tangible fixed assets 1,764 1,698
Payments for acquisition of:
Financial assets /positive consolidation difference –290,350 –41,189
Tangible fixed assets –992 –
Effects from changes to the consolidated Group of companies – –
Payments from mergers within the Group 325,460 –
Cash flow from financing activities –114,068 –3
Deposits from capital increases – –
Dividend payments – –
Changes in funds from other financing activities (subordinated capital) –114,068 –3
Cash and non cash equivalent at the end of the previous period 8,717,117 0
Cash flow from operating activities –8,088,590 8,756,612
Cash flow from investing activities 75,881 –39,491
Cash flow from financing activities –114,068 –3
Effects from exchange rate changes – –
Cash and non cash equivalent at the end of the period 590,340 8,717,117
Incl.: cash on hand 0 0
Cash in central banks 590,340 8,717,117
Debt instruments of public agencies and bills of exchange, eligible for refinancing with central banks 0 0

52 AUDITOR’S REPORT
AUDITOR’S REPORT
We have audited the annual financial statements comprising the balance sheet, the income
statement, the notes to the financial statements, the statement of cash flows and the statement
of changes in equity, together with the bookkeeping system, and the management report of
J.P. Morgan AG, Frankfurt am Main, for the business year from January 1 to December 31, 2013.
The maintenance of the books and records and the preparation of the annual financial statements
and management report in accordance with German commercial law are the responsibility of
the Company’s Management Board. Our responsibility is to express an opinion on the annual
financial statements, together with the bookkeeping system, and the management report based
on our audit.
We conducted our audit of the annual financial statements in accordance with Section 317, hGB
and the generally accepted standards for the audit of financial statements established by IDW
(Institut der Wirtschaftsprüfer [Institute of Public Auditors in Germany]). Those standards require
that we plan and perform the audit such that misstatements materially affecting the presenta-
tion of the net assets, financial position and results of operations in the annual financial state-
ments in accordance with the principles of proper accounting and in the management report are
detected with reasonable assurance. Knowledge of the business activities and the economic and
legal environment of the Company and expectations as to possible misstatements are taken into
account in the determination of audit procedures. The effectiveness of the accounting-related
internal control system and the evidence supporting the disclosures in the books and records,
the annual financial statements and the management report are examined primarily on a test
basis within the framework of the audit. The audit includes assessing the accounting principles
used and significant estimates made by the Company’s Board of Managing Directors, as well as
evaluating the overall presentation of the annual financial statements and management report.
We believe that our audit provides a reasonable basis for our opinion.
Our audit has not led to any reservations.

53AUDITOR’S REPORT
In our opinion based on the findings of our audit, the annual financial statements comply with
the legal requirements and give a true and fair view of the net assets, financial position and
results of operations of the Company in accordance with the principles of proper accounting. The
management report is consistent with the annual financial statements and as a whole provides
a suitable view of the Company’s position and suitably presents the opportunities and risks of
future development.
Frankfurt am Main, April 22, 2014
PricewaterhouseCoopers
Stock Company
Audit Company
EVA hANDRICK P.P. MURIEL ATTON
Public Auditor Public Auditor
54 SUPERVISORy BOARD REPORT
SUPERVISION AND CONTROL
The Supervisory Board monitored the Management Board continuously throughout the year
on the basis of written and oral reports and performed its duties in accordance with the law.
Important matters of business management were examined by the Supervisory Board in regards
to the Bank’s economic situation, the business politics, liquidity, capital and risk management.
Moreover, the Supervisory Board was informed in detail on the risk management by means of
the quarterly MaRisk reports.
PERSONNEL CHANGES IN THE MANAGEMENT BOARD
Mr. Oliver Berger left the Board of J.P. Morgan AG on January 31, 2013 and Mr. Thomas Meyer
on May 31, 2013. Ms. Michelle Grundmann was appointed to the Board on February 1, 2013 and
Mr. Stefan Behr on June 1, 2013. Mr. Burkhard Kübel-Sorger became Chairperson on June 1,
2013.
PERSONNEL CHANGES IN THE SUPERVISORY BOARD
In the 2013 financial year the Supervisory Board was composed of: Mark S. Garvin (Chairperson),
Alexander Caviezel (Vice Chairperson till September 30, 2013), Frédérik Mouchel (Vice Chair-
person since October 1, 2013), Karl-Georg Altenburg, Alison Livesey as well as the Employee
Representatives Christoph Fickel and Thomas Freise.
At the start of the financial year, Ms. Alison Livesey left per December 31, 2013 and Mr. Karl-Georg
Altenburg per February 13, 2014. Ms. Melanie Martin (nee Wells) was appointed to the Supervi-
sory Board on February 4, 2014 and Mr. Martin Wiesmann on February 24, 2014.
AUDIT COMMITTEE
On April 28, 2014, in the financial year, the Audit Committee discussed the annual financial
statements, the audit report, and on September 9, 2014 the audit plan.
The audit committee is responsible for checking the accounting process, the effectiveness of the
internal control system, the effectiveness of the risk management system and the effectiveness
of the internal audit system as well as the statutory audit, in particular, the independence of the
auditor and any additional services performed by the auditor.
On the basis of the recommendation of the audit committee (Section 124, Par. 3, Clause 2 of
the AktG) it was proposed at the Annual General Meeting to elect PricewaterhouseCoopers AG,
Frankfurt am Main, as statutory auditor for the Annual Financial Statements and the Management
Report for the 2014 financial year.
SUPERVISORy BOARD REPORT
55SUPERVISORy BOARD REPORT
ANNUAL FINANCIAL STATEMENTS
The Annual Financial Statements and the Management Report for the 2013 financial year, as
well as all relevant accounting records have been examined by the auditing firm selected at the
Annual General Meeting, PricewaterhouseCoopers AG, Frankfurt am Main. The auditing firm
issued an unqualified audit opinion.
The Annual Financial Statements and the Management Report were discussed and reviewed with
the auditors by the audit committee during the meeting on April 28, 2013. Based on the final
result of the audit committee’s investigation, the Supervisory Board did not raise any objections.
Financial statements and the Management Report per December 31, 2013 presented by the Man-
agement Board were approved by the Supervisory Board today. The Annual Financial Statements,
as submitted by the Management Board, are hereby approved and determined.
The Supervisory Board would like to express its sincere gratitude to the Management Board and
all employees of the Bank for their dedication and joint hard work.
April 28, 2013
The Supervisory Board
MARK S. GARVIN
Chairperson

56 IMPRINT
PUBLISHED BY
J.P. Morgan AG, Frankfurt am Main
Junghofstraße 14
60311 Frankfurt am Main
LAYOUT / DESIGN
hEISTERS & PARTNER, Corporate & Brand Communication, Mainz
PRINTED BY
Druckerei und Verlag Klaus Koch GmbH, Wiesbaden


J.P. Morgan AG, Frankfurt am Main
Junghofstraße 14
60311 Frankfurt am Main