Embed Size (px)
Citation preview

Annual Report 2013

CONTENTS
CEO’s review ....................................................... 1Key figures .......................................................... 3Highlights ............................................................. 4Market environment .......................................... 8Members of the Leadership Team ...............12Members of the Board of Directors ............14Review by the Board of Directors 2013 .....16Auditor’s report ................................................30Consolidated financial statements, IFRS ..32
Consolidated statement of income .............32Consolidated statement of financial position .......................................34Consolidated statement of cash flows .......36Consolidated statement of changes in equity ......................................38Notes to the consolidated financial statements .....................................39
Key financial figures of the Group ........... 103Share-related key figures ........................... 105Definitions of key financial figures ........... 106
Parent company financial statements, FAS ......................107
Income statement of the parent company ................................... 107Balance sheet of the parent company ................................... 108Cash flow statement of the parent company .............................. 110Statement of changes in equity of the parent company .............................. 111
Corporate Governance in 2013 ................. 112Risk management ......................................... 120Shares and shareholders ............................ 126
This Annual Report includes Financial Statements and Corporate Governance Statement. For our environmental and social reporting, please check our Sustainability Report 2013.
“We are making fundamental changes to reshape our future
to ensure we can seize the opportunities that
the stainless steel industry holds.”
Mika Seitovirta, CEO

CEO foreword
Y ear 2013 marked a new beginning for Outokumpu as a global leader in stainless steel. Through the acquisition of Inoxum we gained a truly global reach with a more diverse and balanced customer base and the broadest range of products in the industry.
Our presence grew especially in Germany, the largest stainless steel market in Europe, where we now hold a 50% market share and world-class cold-rolling centers that serve the most de-manding and attractive end-customer segments. We continue to invest in this important market, while at the same time en-suring we cut excess capacity to increase efficiency and reduce our cost levels. Furthermore, we got a strong foothold in Ameri-cas with a new stainless steel mill in United States and a cold-rolling center in Mexico, and a 20% market share in the growing NAFTA market.
Throughout our first year we shared news about how our products and expertise are used all over the world in a vari-ety of applications from small Mexican coins to large chemi-cal tankers, to thermal power plants in India, to the tallest sky-scraper in China.
Outokumpu Annual Report 2013 Our year 2013
1

However, our journey started in strong headwinds. The demand for stainless steel remained even weaker than expect-ed, particularly in Europe. Nickel price declined 18% from beginning of 2013 till year end, which negatively affected our financial performance as it contributed to the market sentiment and caused in-ventory losses. Furthermore, we were burdened by the remedy requirement of the European Commission that dictated the divestiture of the stainless steel op-erations in Terni, Italy and additional Eu-ropean service centers. The Terni remedy requirement did not only tie our time and resources, but also significantly ham-pered the ramp-up of the Calvert stain-less steel mill in Alabama, USA as we were forced us to continue the deliveries from Terni to our mills in United States and Mexico that could have already been supplied by Calvert melt shop alone.
Despite these obstacles we made sig-nificant progress in many areas. The syn-ergy savings that were at the core of the Inoxum acquisition started to material-ize immediately from the first quarter of 2013, and exceeded the full year 2013 targets already during the third quarter. As planned, the synergy savings accu-mulated mainly through the streamlining of operations in all areas and increased purchasing power in raw material and general procurement.
To accelerate efficiencies and cost savings we launched a new P150 pro-gram with the target to reduce our costs by 150 million euros annually. A new P300 program was initiated to reduce our working capital by 300 million euros by end of 2014. All in all, the synergy and cost savings reached 199 million eu-ros in 2013, giving us further confidence in the targeted annual cost savings of 450 million euro that we expect to reach in 2017. The P300 program exceeded its targets already in 2013, and all in all we achieved a working capital reduction of 351 million euros through active invento-ry management and other measures.
While we executed our strategy deci-sively, the weak market with sluggish de-mand and low prices and the challenges with the Calvert ramp-up our results off-set the good progress: for the full year 2013 we reported an underlying operat-ing result of -377 million euros.
We are in the middle of a large trans-formation. In the weak market we have had to carry it out at the expense of our balance sheet. Thus, we made focused efforts to address this: in November 2013 we announced comprehensive
measures that included the divestment of Terni and VDM businesses to Thyssen-Krupp, new financing arrangement with longer maturities and debt reduction as well as the rights issue of approximately 665 million euro. These measures signif-icantly strengthen Outokumpu’s financial position and balance sheet so that we can continue the decisive implementa-tion of our strategy to turn the company to sustainable profitability.
In 2013 our environmental leadership was once again recognized by several rankings and ratings. For example, Outo-kumpu was included in the Dow Jones Sustainability Index for the seventh con-secutive year. We further improved our scores, and were ranked as the best stainless steel company and one of the top three in the steel sector globally.
Stainless steel itself is a key enabler of sustainable, modern society. It is de-signed to last for centuries with high strength, high corrosion resistance and durability. And when a product comes to the end of its long life, 100% of the stainless steel can be used to make new stainless steel.
Because of these qualities that per-fectly meet the needs of societies and business around the world, stainless steel has limitless opportunities as an advance material that can build a world
that lasts forever. And so, even in the current global economy, the global de-mand stainless steel is growing: Steel & Metals Market Research (SMR), an inde-pendent market research company fore-casts continued 5% growth in the stain-less steel demand in 2014–2015.
We are making fundamental changes to reshape our future to ensure we can seize the opportunities that the stain-less steel industry holds. We have a clear strategy that we are executing de-cisively to restructure our operations to ensure competitive cost level and lever-age the investments we have made in our ferrochrome operations and the Cal-vert mill in the United States. In fact, we expect our Americas business area to reach break-even EBITDA already for the full year 2014.
I am confident that we have all the el-ements in place to make a turnaround. I believe the synergy benefits, strong posi-tion in all the key markets and unparal-leled expertise that builds on a legacy of 100 years in stainless steel lay a solid foundation for Outokumpu to once again become a company that creates true shareholder value.
Mika SeitovirtaCEO
“Stainless steel is a key enabler of sustainable, modern society. It
is designed to last for centuries with high strength, high corrosion
resistance and durability.”Mika Seitovirta, CEO
Outokumpu Annual Report 2013 Our year 2013
2

Key figures Group key figures, comparable
2013 2012
Sales (€ million) 6 745 7 961
EBITDA (€ million) -165 -267
Underlying EBITDA (€ million) -32 -66
EBIT (€ million) -510 -754
Underlying EBIT (€ million) -377 -412
Net result (€ million) -1 003 n/a
Net cash generated from operating activities (€ million) 34 n/a
Capital expenditure (€ million) 183 763
Stainless steel deliveries (1 000 tonnes) 2 585 2 723
Personnel at the end of the period 12 561 14 073
Please note that these figures have been restated to only include continuing operations. All comperable figures from 2012 are presented as if the Outokumpu would have completed the Inoxum transaction at the beginning of 2012 and are unaudited management estimates.
Capital structure2013 2012
Long-term debt (€ million) 3 270 2 935
Current debt (€ million) 893 718
Cash and cash equivalents (€ million) -607 -222
Net interest-bearing debt at the end of the year (€ million) 3 556 3 431
Debt-to-equity ratio at the end of the year (%) 188.0 116.2
The figures for 2012 have been restated after Outokumpu adopted a new definition of net interest-bearing debt and gearing in January 2014.
Sales, 6 745 € million
Stainless EMEA 55%
Stainless Americas 13%
Stainless APAC 6%
Specialty Stainless 23%
Other operations 3%
Sales, 6 745 € million
Stainless EMEA 55%
Stainless Americas 13%
Stainless APAC 6%
Specialty Stainless 23%
Other operations 3%
Sales
6 745 € million
Combined savings, € million*
2013 2015 2017
199
380450
* 2015 and 2017 include savings from planned efficiency measures in the new industrial plan for Europe.
Sales, 6 745 € million
Stainless EMEA 55%
Stainless Americas 13%
Stainless APAC 6%
Specialty Stainless 23%
Other operations 3%
Outokumpu Annual Report 2013 Our year 2013
3

Highlights Outokumpu’s year 2013 was characterized by the integration between Outokumpu and Inoxum, the related industrial restructuring and heavy cost saving measures, the ferrochrome expansion and the ramp-up of the Calvert stainless steel mill. Good progress was made in these areas despite strong headwinds. However, in a weak market the results remained unsatisfactory.
JANUARY FEBRUARY
T he year 2013 marked the first year for Outokumpu as the new global leader fol-lowing the acquisition of In-oxum, which was a perfect fit
for Outokumpu: Outokumpu’s presence grew, especially in the Americas and Asia, the product portfolio was comple-mented by, for example, ferritic grades and Outokumpu’s customer base ex-panded from industrial segments to cover consumer goods and appliances. What is more, it created annual synergy saving potential of 200 million euro that is expected to materialize in full by the end of 2017. In short, the acquisition hit all of Outokumpu’s strategic objectives with a single stroke.
For the new Outokumpu, the strategy is twofold: restructure the company to achieve synergy and cost savings, and leverage the investments in Ferrochrome and Calvert to create profitable growth. The clear objective is to reach sustain-able profitability. Thus, for 2013 the pri-orities were clear: customers, synergy savings, the Calvert ramp-up, cash flow and strengthening the company’s bal-ance sheet.
Start of the new companyIn January, the new Outokumpu started operations, and the integration of two stainless steel giants began. In the stainless steel business, thousands of employees, several plants in China, Germany, Mexico and USA, new customers in consumer goods segments and countless grades and surface finishes joined the company.
Long service life in extreme temperaturesOutokumpu supplied stainless steel for Vantrunk for cable ladders and cable trays to support cable in the massive Gorgon liquefied natural gas project in Australia, the largest construction project ever undertaken in Austra-lia. The chosen material ensures a 20-year service life in a temperature range from -50 to +450 degrees Cel-sius. “We have developed a strong and reliable supply chain. Outokumpu plays a key role in helping us to deliver our customer promise,” commented Vantrunk.
Outokumpu Annual Report 2013 Our year 2013
4

MARCH–APRIL MAY
Outokumpu launched new stainless steel grades, surface
finishes, vision, mission and brand at Outokumpu Experience.
Strong efforts to cut costs and inventory levelsBoth companies had been heavily loss-making for years. In April, the company started new projects to re-duce working capital by 300 million euros by the end of 2014 and to cut costs by 150 million euros. The results were excellent: P150 beat its targets, reaping savings of 104 million euros already in 2013, with the rest mate-rializing in 2014, and P300 dropped inventory days to 88, reaching its tar-gets for year-end.
Pioneering solar plant in NevadaOutokumpu won another contract for the pioneering Crescent Dunes solar plant project in Tonopah, Nevada, USA and now supplies lean duplex on top of the quarto plate deliveries announced earlier. Duplex is used in the zenithal anchor bolts or mounting bolts of the solar panels, which allow the panels to turn in two planes and thus to follow the sun and capture its energy more efficiently. “Technical explanations and credibility of the technician contact at Outokumpu convinced us,” said Cobra Thermosolar Plants.
Lighter tanks, less maintenanceOutokumpu’s stainless steel helps Ja-protek, a Finnish company that produc-es pressure vessels and large tanks, to construct lighter storage tanks and to decrease maintenance costs tak-ing into account the total cost of in-vestment throughout the product’s life cycle. “The main reasons for switch-ing to stainless steel were the longer life-cycle time and lower maintenance costs as well as the good properties of LDX 2101® that make it ideal for big tanks,” commented Japrotek.
Experience OutokumpuA global event, Outokumpu Experience brought together more than 700 professionals, investors and analysts of stainless steel under one roof in London, UK. Outokumpu launched at the event its new vision – a world that lasts forever, new formable duplex grades FDX 25™ and FDX 27™ that conquer the one weakness in duplex grades, their formability, and new surface finishes, 2R2, Gritline and Laser. Later in the year, Outo-kumpu also launched new high-chromium austenitic and ferritic grades.
12 250 tonnes, five chemical tankersOutokumpu won a contract to supply 12 250 tonnes of tailor-made stain-less steel for the construction of five chemical tankers in a Chinese ship-yard, ordered by Stolt Tankers. The use of duplex grade enables reduced weight, high strength and excellent corrosion resistance. The contract formed a unique scope of supply within the stainless steel industry, including duplex 2205® grade in tailor-made di-mensions as well as services such as welding and forming.
JUNE
Outokumpu Annual Report 2013 Our year 2013
5

Strategic partnership in ChinaOutokumpu signed a one-year strate-gic partnership agreement with Sino-pec, China’s largest energy and chemi-cal company, on material develop-ment and deliveries of stainless steel. Outokumpu supplies rolled billets of duplex stainless steel for seamless pipe for the oil refinery and liquefied natural gas plants. “Outokumpu, as the biggest stainless steel supplier in the world, demonstrated their leader-ship through technical capabilities and good local customer service,” com-mented Sinopec.
Coins with exceptional surface qualityOutokumpu’s stainless steel is used in Mexico for the production of coins by Casa de Moneda de Mexico (the Mexican Mint) for the Latin American marketplace. Outokumpu is a regu-lar supplier to Casa de Moneda for its Mexican currency and now supports Casa de Moneda’s export business for stainless steel coin blanks. The ap-plication required exceptional surface quality, and mastery of such applica-tions awarded Outokumpu even this contract. “As we continue to expand our business, we rely on the techni-cal expertise, quality and expansive portfolio that Outokumpu offers,” com-mented Casa de Moneda.
China’s highest skyscraperOutokumpu is providing stainless steel for Ping An Finance Center in Shen-zhen, China. The façade will be the largest stainless steel façade in the world, as the center is set to become the highest skyscraper in China and the second highest in the world, with a height of 660 meters. The architectur-al firm Kohn Pedersen Fox said: “The performance of the material is one of the best. The timely technical support and tailored advice will greatly help us along the construction process as well.”
AUGUST
Ferrochrome ramps upThe ramp-up of the ferrochrome ex-pansion was a clear success and pro-ceeded as expected. Outokumpu inau-gurated the new ferrochrome smelter in Tornio, Finland in June. At year-end, production reached 434 000 tonnes as targeted.
Calvert progressing In Alabama, the Calvert ramp-up progressed throughout the year and despite difficulties related to the remedy obligations with Terni delivering materials to Calvert that impacted the second-quarter results. The mill improved its per-formance steadily, reaching the targets set by year-end.
JUNE JULY
Outokumpu Annual Report 2013 Our year 2013
6
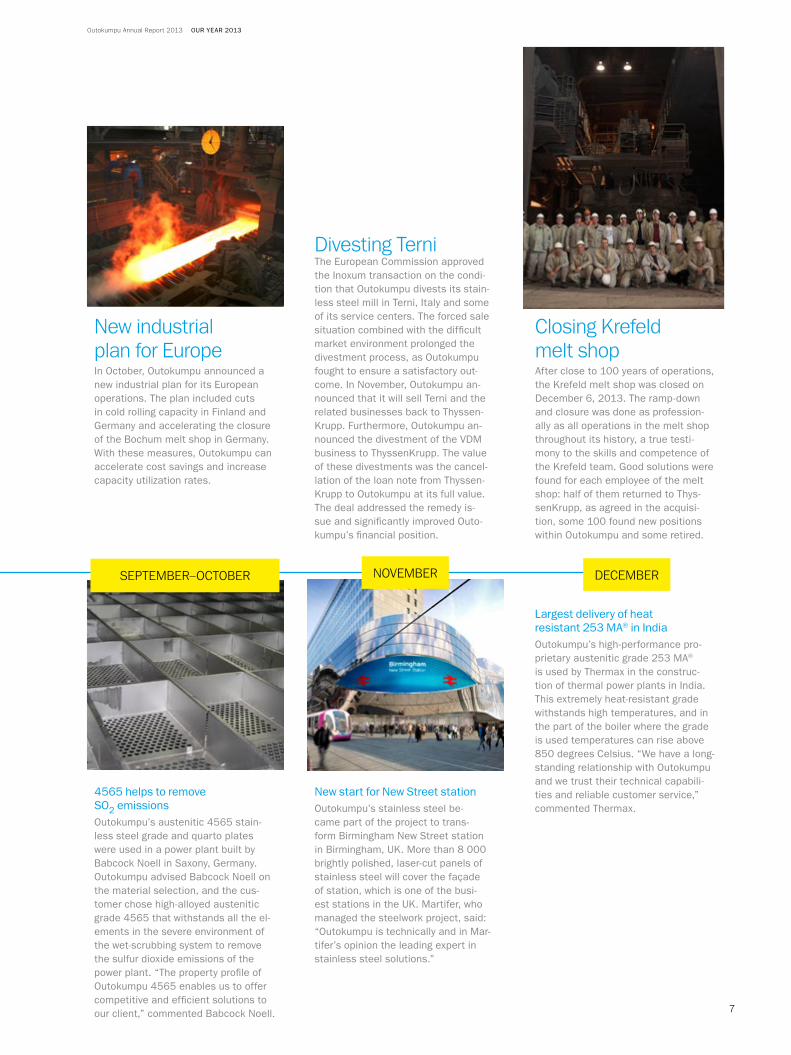
4565 helps to remove SO2 emissionsOutokumpu’s austenitic 4565 stain-less steel grade and quarto plates were used in a power plant built by Babcock Noell in Saxony, Germany. Outokumpu advised Babcock Noell on the material selection, and the cus-tomer chose high-alloyed austenitic grade 4565 that withstands all the el-ements in the severe environment of the wet-scrubbing system to remove the sulfur dioxide emissions of the power plant. “The property profile of Outokumpu 4565 enables us to offer competitive and efficient solutions to our client,” commented Babcock Noell.
New start for New Street station Outokumpu’s stainless steel be-came part of the project to trans-form Birmingham New Street station in Birmingham, UK. More than 8 000 brightly polished, laser-cut panels of stainless steel will cover the façade of station, which is one of the busi-est stations in the UK. Martifer, who managed the steelwork project, said: “Outokumpu is technically and in Mar-tifer’s opinion the leading expert in stainless steel solutions.”
Largest delivery of heat resistant 253 MA® in IndiaOutokumpu’s high-performance pro-prietary austenitic grade 253 MA® is used by Thermax in the construc-tion of thermal power plants in India. This extremely heat-resistant grade withstands high temperatures, and in the part of the boiler where the grade is used temperatures can rise above 850 degrees Celsius. “We have a long-standing relationship with Outokumpu and we trust their technical capabili-ties and reliable customer service,” commented Thermax.
NOVEMBER DECEMBERSEPTEMBER–OCTOBER
Divesting TerniThe European Commission approved the Inoxum transaction on the condi-tion that Outokumpu divests its stain-less steel mill in Terni, Italy and some of its service centers. The forced sale situation combined with the difficult market environment prolonged the divestment process, as Outokumpu fought to ensure a satisfactory out-come. In November, Outokumpu an-nounced that it will sell Terni and the related businesses back to Thyssen-Krupp. Furthermore, Outokumpu an-nounced the divestment of the VDM business to ThyssenKrupp. The value of these divestments was the cancel-lation of the loan note from Thyssen-Krupp to Outokumpu at its full value. The deal addressed the remedy is-sue and significantly improved Outo-kumpu’s financial position.
Closing Krefeld melt shopAfter close to 100 years of operations, the Krefeld melt shop was closed on December 6, 2013. The ramp-down and closure was done as profession-ally as all operations in the melt shop throughout its history, a true testi-mony to the skills and competence of the Krefeld team. Good solutions were found for each employee of the melt shop: half of them returned to Thys-senKrupp, as agreed in the acquisi-tion, some 100 found new positions within Outokumpu and some retired.
New industrial plan for EuropeIn October, Outokumpu announced a new industrial plan for its European operations. The plan included cuts in cold rolling capacity in Finland and Germany and accelerating the closure of the Bochum melt shop in Germany. With these measures, Outokumpu can accelerate cost savings and increase capacity utilization rates.
Outokumpu Annual Report 2013 Our year 2013
7

Market environment
AMERICASIn the NAFTA region, stain-less steel consumption increased by 3% in 2013, with most of the growth in the US and Mexico. Outo-kumpu focused on the ramp-up of its new inte-grated stainless steel mill in Calvert, Alabama, USA. The ramp up is progress-ing and the business area Stainless Americas targets a break-even EBITDA in 2014.
EMEAThe overall stainless steel demand consumption increased only slightly, with a decline in Western Europe and growth in Eastern Europe, Africa and Middle East. Outokumpu reaps up significant savings of nearly 200 million euros from the merger, including the closure of the melt shop in Krefeld, Germany. Outokumpu continues restructuring in both melting and cold rolling in 2014 to improve capacity utilization of its mills.
35% share of stainless steel deliveries in Europe
8% share globally
5
Outokumpu Annual Report 2013 Our year 2013
8

Our market position In 2013, total global steel production was 1.6 billion tonnes, of which approxi-mately 92% was carbon steel and ap-proximately 2.4% was stainless steel. Stainless steel is a versatile and widely used material that plays a key role in many important areas, including urban-ization, transportation and the produc-tion and consumption of food, water and other beverages as well as ener-gy. Stainless steel’s attractive proper-ties, which include corrosion resistance, high strength-to-weight ratio, heat toler-ance, aesthetic qualities and the ability to be recycled, have contributed to the increased use of stainless steel in new and existing applications. As a result, stainless steel consumption has been growing more rapidly than that of any other metal in recent decades.Source: World Steel Association, SMR February 2014
Outokumpu is one of the world’s leading stainless steel producers and is widely recognized for its product quality, ex-cellence in both standard and special grades, such as duplex stainless steel grades, and as a global leader in re-search, development and technical sup-port. Outokumpu operates around the world. Its main production facilities are located in Finland, Germany, Sweden, the UK, the US, Mexico and China. The Group’s site in Tornio, Finland is one of the world’s most cost-effective and highly-integrated single-site stainless steel production facilities which focus-es on high-volume standard grades of stainless steel. The Group’s production sites in Germany focus on more custom-ized deliveries of ferritic and austenitic grades, including bright annealed sur-faces, and the production sites in Swe-den focus on special grades. The Group is ramping up a new and fully integrat-ed production site in Calvert, Alabama, USA, which will complement the product portfolio of the Mexican plant and supply it with feedstock material.
The global stainless steel slab produc-tion capacity in 2013 totaled approxi-mately 43.9 million tonnes. The larg-est producers based on this measure are Tisco, Outokumpu, Posco, Baosteel, Yusco, Acerinox, and Aperam. Global stainless steel production was 30.4 mil-lion tonnes in 2013, an increase of 7% compared to 2012. In Europe, stainless steel production was 5.5 million tonnes in 2013, a decrease of 4% compared to 2012; Europe has not yet recovered from the impact of the financial crisis and is far away from returning to the 2006 level of 7.3 million tonnes. In China, stainless steel production has increased signifi-cantly during the past ten years, from 1.2 million tonnes in 2003 to 15.9 mil-lion tonnes in 2013. Outokumpu had an approximately 35% share of stainless steel deliveries in Europe and an approx-imately 8% share globally in 2013. Source: Eurofer and SMR February 2014
Major stainless steel producersEstimated slab melting capacity
million tonnes 2013 2015
Tisco 4.2 4.2
Outokumpu 3.7 2.8*
Posco 3.7 3.9
Baosteel 3.5 4.5
Yusco 3.0 2.8
Acerinox 2.7 2.9
Aperam 1.9 1.9 Source: SMR, excluding Terni operations of
Outokumpu. * Closure of Krefeld melt shop (-0.6 million tonnes); assuming closure of Bochum meltshop subject to union negotiation (-0.8 million tonnes); assuming ramp-up of Calvert melt shop (+0.6 million tonnes)
Economic and population growth, increasing mobility,
urbanization and modernization are driving the
future demand of stainless steel”.
APACIn the Asia and Pacific, stainless steel consumption continued to grow rapidly, especially in China, India, Japan and South Korea. Through the Inoxum transaction, Outokumpu increased its presence in Asia with a cold rolling mill in Shanghai, China that adds to the service centers in China and Australia. In the APAC region, Outokumpu focuses on special grades and won significant deals in 2013, including deliveries to Sinopec and Ping An Finance Center in China.
Production locationsService center locations
Number of locations
Outokumpu Annual Report 2013 Our year 2013
9

Market reviewGlobal consumption of stainless steel products increased by 6%, from 31.2 million tonnes in 2012 to 32.9 million tonnes in 2013. Global consumption levels were negatively influenced by the continuing decline in the nickel price, increasing concerns over the outcome of the euro crisis and the reduced growth per-spectives of the Chinese economy. Growth dynamics differed significantly from region to region. Some global markets have also sensed growth opportunities in 2013, especially from the Consumer Goods & Medical and ABC & Infrastructure indus-tries.
In EMEA, stainless steel consumption only slightly increased, by 0.7% to 6.8 million tonnes in 2013. The main driver was the drop in consumption levels in major Western European con-suming countries such as Italy, Germany, France and Spain. In Europe, consumption totaled 5.5 million tonnes in 2013, a de-crease of 2% compared to 2012, and remained far below the 2008 level of 5.9 million tonnes. Other regions in EMEA per-formed substantially better than Western Europe (Eastern Eu-rope +2%, Middle East +10% and CIS +8% compared to 2012). The reduced European demand in 2013 was attributable to low-er demand in all end-use segments.
In the Americas, stainless steel consumption increased to 3.4 million tonnes in 2013, with mainly the NAFTA region ex-periencing growth (+3% to 2.8 million tonnes). After a compar-atively weak start in 2013, dynamics in the US market have significantly accelerated from the second quarter of 2013 on. The US growth was topped by a strong Mexican market. South America was dominated by the robust Brazilian market, while other markets such as Argentina, Colombia and Chile were even or declining. In NAFTA, growth in 2013 was mainly attributable to increased demand from the Automotive & Heavy Transport, ABC & Infrastructure and Consumer Goods & Medical seg-ments.
In APAC, stainless steel consumption has grown rapidly in re-cent years (22.7 million tonnes in 2013), which has been the main factor supporting global growth. China’s share of APAC demand reached 62% in 2013 (+10% to 14.1 million tonnes in 2013 compared to 2012), followed by India with a share of 12% (+7% to 2.8 million tonnes), Japan with a share of 9% (+6% to 1.9 million tonnes) and South Korea with a share of 8% ( +6% to 1.7 million tonnes). Growth in the consumption of the Con-sumer Goods & Medical, ABC & Infrastructure and Industrial & Heavy Industry segments mainly contributed to increased con-sumption in China.Source: SMR February 2014
Average transaction prices in 2013 for 2 mm cold rolled 304 stainless steel sheet in the three regions; Europe, the USA and China remained significantly below previous year’s levels. While in the first quarter of 2013 price levels in all three regions in-creased quarter-on-quarter, the transaction prices dropped sharply in the second and third quarter. In the fourth quarter of 2013, small base price increases have been acknowledged in Europe as well as in the USA. Asian price advantages remained present in 2013 and kept up the attractiveness of imported material in the European market. The price advantages result from high investments of Asian mills in new state-of-the-art facilities with high production capacities, economies of scale and partially significant cost advantages, for example from us-ing alternative raw materials such as nickel pig iron. Outokum-
End-uses of stainless steel
Consumer Goods & Medical 45.2%
Chemical / Petrochemical & Energy 17.3%
Automotive & Heavy Transport 11.0%
ABC & Infrastructure 15.2%
Industrial & Heavy Industry 8.5%
Others 2.9%
Source: SMR, stainless steel finished products*, February 2014.
*Rolled and forged products excl. 13Cr tubes.Market price comparison with competing materials
300
250
200
150
100
50
0
06 07 08 09 10 11 12 13 Stainless steel* Zinc Carbon steel galvanized sheet
Aluminium Carbon steel cold rolled coil Copper
2006=100
Source: CRU, LME and Metal Bulletin. Including December 2013.
* Stainless steel prices are for grade 1.4301.
World stainless steel end-use demand outlook
40
35
30
25
20
15
10
5
0
Consumer Goods & Medical (4.9%*) Chemical / Petrochemical & Energy (4.5%*) Automotive & Heavy Transport (6.0%*)
ABC & Infrastructure (5.9%*) Industrial & Heavy Industry (5.3%*) Others (4.3%*)
2013 2015
Source: SMR, stainless steel finished products**, February 2014.
* CAGR 2013–2015.
**Rolled and forged products excl. 13Cr tubes.
million tonnes
End-uses of stainless steel
Consumer Goods & Medical 45.2%
Chemical / Petrochemical & Energy 17.3%
Automotive & Heavy Transport 11.0%
ABC & Infrastructure 15.2%
Industrial & Heavy Industry 8.5%
Others 2.9%
Source: SMR, stainless steel finished products*, February 2014.
*Rolled and forged products excl. 13Cr tubes.
Outokumpu Annual Report 2013 Our year 2013
10

pu intends to improve its competitiveness and attractiveness against imported material coming from Asia by optimizing its production network, further developing its raw material strate-gy, delivering faster, more reliably, more flexibly and introducing a new daily alloy surcharge pricing system.Source: CRU February 2014
OutlookThe long-term prospects for stainless steel consumption remain robust. Key global megatrends in urbanization, modernization and increased mobility, combined with growing global demand for energy, food and water, will ensure the continuing growth of stainless steel consumption in the future. SMR estimates that global stainless steel demand will reach 34.6 million tonnes and 36.4 million tonnes in 2014 and 2015, respectively. Be-tween 2013 and 2015, global consumption is expected to in-crease at an annual growth rate of 5% CAGR, while growth is es-timated to be mainly driven by increased consumption in APAC (+6% CAGR). In EMEA and Americas, total stainless steel de-mand is estimated to increase by 4% and 4% CAGR, respective-ly, from 2013 to 2015. Growth will be mainly supported from increased demand in the Automotive & Heavy Transport (+6%) and the ABC & Infrastructure (+6%) segments. Between 2013 and 2015, the Consumer Goods & Medical and the Chemical/Petrochemical & Energy segments are expected to grow at aver-age annual growth rates of 5%, respectively. Source: SMR February 2014
Ferrochrome price
2.5
2.0
1.5
1.0
0.5
0
09 10 11 12 13
Source: Quarterly contract prices agreed between South African ferrochrome producers and European buyers, including Q4/2013.
USD/lb
Molybdenum price
40
35
30
25
20
15
10
5
0
0908 10 11 12 13
Source: Metal Bulletin – Molybdenum Drummed molybdic oxide. Free market $ per lb Mo in warehouse.
USD/lb
Nickel price
50 000
45 000
40 000
35 000
30 000
25 000
20 000
15 000
10 000
5 000
0
0908 10 11 12 13
Source: LME settlement, monthly average prices, including December 2013.
USD/t
German stainless steel price*
5 000
4 000
3 000
2 000
1 000
0
94 95 96 97 98 99 00 01 02 03 04 05 06 07 08 09 10 11 12 13
Base price
Alloy surcharge
Transaction price
Source: CRU. Including February 2014.
* Stainless steel price for cold rolled 304 2mm sheet.
EUR/t
Outokumpu Annual Report 2013 Our year 2013
11

Mika Seitovirtab. 1962, Finnish citizenM.Sc. (Econ.)CEO 2011–Chairman of the Leadership Team 2011–Responsibility: Group management, strategy and business excellence, legal and internal audit.Employed by the Outokumpu Group since 2011 Work experiencePresident and CEO: Glaston Corporation (formerly Kyro Corporation) 2007–2009Managing Director: Hartwall Oy 2003–2006Managing Director: Volvo Auto 1998–2003Finance Director, Deputy to Sales Company President: Volvo Deutschland 1994–1998 Several positions at Volvo Auto 1986–1994Business Development Manager at Aro Yhtymä 1989–1990
Positions of trustDeputy Chairman of the Board of Directors: Shanghai Krupp Stainless Co. Ltd. 2013–Board member: Federation of Finnish Technology Industries 2013–Board member: East Office of Finnish Industries 2013–Board member: World Steel Association 2013–Board member: International Stainless Steel Forum 2011–Board member: Association of Finnish Steel and Metal Producers 2011–Member of the Supervisory Board: Varma Mutual Pension Insurance Company 2011–Board member: Are 2009–2011Senior Advisor, Advisory Group: Ratos 2008–2011Board member: Aro-Yhtymä 2006–2011Board member: Handelsbanken Finland 2004–2011
Reinhard Floreyb. 1965, Austrian citizenM. Sc. (Eng.), M.A.CFO 2013–Member of the Leadership team 2012–Responsibility: Finance and control, treasury and risk management, taxation, integration and M&A, corporate affairs and compliance, and investor relations.Employed by the Outokumpu Group since 2012 Work experienceExecutive Vice President – Integration and Strategy: Outokumpu Oyj 2012–2013 CFO: Inoxum GmbH 2011–2012Member of Executive Board: ThyssenKrupp Steel Americas, LLC 2010–2011CFO – Steel Americas business area: ThyssenKrupp AG 2009–2011SVP – Corporate Center Mergers and Acquisitions: ThyssenKrupp AG 2005–2009SVP – Corporate Development/M&A: ThyssenKrupp Steel AG 2002–2005Various positions at McKinsey & Company 1995–2002
Positions of trustMember of the Board of Directors: Shanghai Krupp Stainless Co. Ltd. 2011–Executive Member of the Board: Acciai Speciali Terni S.p.A. 2011–2014
Pekka Erkkiläb. 1958, Finnish citizenM.Sc. (Eng.)Executive Vice President, Chief Technology Officer 2013– Member of the Leadership Team 2013–Responsibility: Global production and technology strategy, capital investment optimization, R&D, raw material and general procurement and energy.Employed by the Outokumpu Group since 2013 (and in 1983–2000 and 2004–2010)
Work experiencePresident, Ferrous Solutions business area: Outotec Oyj 2010–2013 Executive Vice President, General Stainless and Production Operations: Outokumpu Oyj 2004–2010Executive Vice President, later President: AvestaPolarit Oyj 2001–2004President: Outokumpu Chrome Oy 1996–2000Various management positions: Outokumpu Tornio Works 1983–1995
Positions of trustChairman of the Board: Manga LNG Oy 2013–Board member: University of Oulu 2009– Board member: Grängesberg Iron AB 2009–
Austin Lub. 1971, Chinese citizen (People’s Republic)MBA, B.Sc. (Econ.)President – Stainless APAC 2012–Member of the Leadership team 2012–Responsibility: Stainless APAC business area.Employed by the Outokumpu Group since 2012 Work experienceSenior Vice President – APAC Focus Area: Outokumpu Oyj 2012Vice President, Regional General Manager, China: General Electric 2009–2011Business Leader, Life Science Ingredient: Lonza Group 2008–2009Marketing Director: General Electric Plastics, China 2005–2008 Various positions in General Electric Plastics in China 1996–2005 Various positions in China MinMetals Co. 1993–1996
Leadership Team on Dec 31, 2013
Mika Seitovirta Reinhard Florey Austin LuPekka Erkkilä
Outokumpu Annual Report 2013 MeMbers Of the leadership teaM
12

Kari Parventob. 1957, Finnish citizenM.Sc. (Eng.)President – Stainless Americas 2012–Member of the Leadership Team 2010–Responsibility: Stainless Americas business area.Employed by the Outokumpu Group since 2010 Work experienceExecutive Vice President – Ferrochrome, Group R&D and Environment and Quality: Outokumpu 2012Executive Vice President – Group Sales and Marketing: Outokumpu Oyj 2010–2011President, Underground Mining: Sandvik Group 2009–2010President, Underground Hard Rock Mining: Sandvik Group 2007–2009Managing Director, Sandvik Mining and Construction Oy (“SMC Oy”) : Sandvik Group 2007–2010Managing Director, SMC Australia and Sandvik Materials Handling Pty Ltd. Australia: Sandvik Group 2005–2007Business Development Manager, Sandvik Tamrock Finland: Sandvik Group 2004–2005Managing Director: Kuusakoski Sverige AB 2003–2004 and Country Manager, Scandinavia: Kuusakoski Group 2000–2004 as well as the Managing Director of Kuusakoski AB between 2000 and 2003
Positions of trustChairman of the Board: SMC Austria GmbH 2009–2010Board member: SMC Corporation Finland 2007–2010
Johann Steinerb. 1966, German citizenM.Sc. (Econ.)Executive Vice President - Human Resources, Health, Safety and IT 2013– Member of the Leadership team 2013–Responsibility: Human resources, health and safety and IT.Employed by the Outokumpu Group since 2013 Work experienceExecutive Vice President - Human Resources and Health, Safety and Sustainability 2013Group HR Director: SAG Group GmbH 2012Operating Partner: Humatica AG 2010–2012 Group HR Director: Clariant International AG 2002–2008 VP Executive Policies: EADS (former DaimlerChrysler Aerospace AG) 1999–2002 Senior Consultant: Towers Perrin 1993–1998
Jarmo Tonterib. 1952, Finnish citizenM.Sc. (Econ.), M.Sc. (Tech.)President – Stainless EMEA 2013–President – Specialty Stainless 2012–Member of the Leadership Team 2011–Responsibility: Stainless EMEA and Specialty Stainless business areas.Employed by the Outokumpu Group since 2011 Work experienceExecutive Vice President – Specialty Stainless: Outokumpu Oyj 2011–2012Managing Director: Ovako Group 2005–2011Managing Director and member of Rautaruukki management Board: Fundia (Rautaruukki Group) 2000–2005Managing Director: Gasell (Rautaruukki Group) 1992–2000 Managing Director: Lokomo Steel (Repola Group) 1990–1992Director of the metallurgical division: Kuusakoski 1985–1990 Sales engineer on metallurgical process technology: Outokumpu Oy 1978–1985
Positions of trustBoard member: Dannemora Mineral AB 2012–2013Board member: FN Steel Group 2010–2014
Kari Tuuttib. 1970, Finnish citizenM.Sc. (Econ.)Executive Vice President – Marketing, Communications and Sustainability. 2013–Member of the Leadership team 2012–Responsibility: Marketing, communications and sustainability.Employed by the Outokumpu Group since 2011 Work experienceExecutive Vice President – Marketing, Communications and IR: Outokumpu Oyj 2012–2013Senior Vice President – Marketing, Communications and IR: Outokumpu Oyj 2011–2012Director, Marketing Creation: Nokia Oyj 2009–2011Vice President, Communications: Nokia Oyj 2008Director, Communications, Multimedia Business Group: Nokia Oyj 2002–2007Senior Manager, Investor Relations: Nokia Oyj 1999–2002Manager, Treasury: Nokia Oyj 1995–1999Analyst, Treasury: Merita Bank 1994–1995
Leadership Team on Dec 31, 2013
Jarmo TonteriKari Parvento Johann Steiner Kari Tuutti
Outokumpu Annual Report 2013 MeMbers Of the leadership teaM
13

Jorma OllilaChairman of the Board of Directors b. 1950, Finnish citizenM.Sc. (Pol.) (University of Helsinki 1976) M.Sc. (Econ.) (London School of Economics 1978)M.Sc. (Eng.) (Helsinki University of Technology 1981) Outokumpu Board member 2013–Chairman of the Board 2013–Chairman of the Remuneration Committee Chairman of the Board Finance Working Group
Work experienceChairman of the Board: Nokia Corporation 2006–2012 Chairman and Chief Executive Officer: Nokia Corporation 1999–2006 President and Chief Executive Officer: Nokia Corporation 1992–1999 President: Nokia Mobile Phones 1990–1992 Senior Vice President, Finance: Nokia 1986–1989Various managerial positions within corporate banking: Citibank 1978–1985
Positions of trustChairman of the Board: Royal Dutch Shell Plc, 2006– Vice Chairman of the Board: Otava Books and Magazines Group 1996– Board member: Tetra Laval Group 2013–Board member: University of Helsinki 2009–Chairman of the Boards of Directors and the Supervisory Boards: The Research Institute of the Finnish Economy ETLA and Finnish Business and Policy Forum EVA 2005–
Independent of the company and its significant shareholders.
Olli VaartimoVice Chairman of the Board of Directors b. 1950, Finnish citizenM.Sc. (Econ.)Outokumpu Board member 2010–Vice Chairman of the Board 2011–Chairman of the Audit CommitteeMember of the Board Finance Working Group
Work experienceCFO: Metso Oyj 2003–2011Executive Vice President, Deputy to the President and CEO: Metso Oyj 2003–2010Member of the Executive Team 1999–2011 and Vice Chairman of the Executive Team 2004–2010: Metso OyjPresident and CEO (acting): Metso Oyj 2003–2004President and CEO: Metso Minerals Oy 1999–2003President and CEO: Nordberg Group, Rauma Oyj 1993–1999Executive Vice President: Rauma Oyj 1991–1998
Positions of trustChairman of the Board: Valmet Automotive Oy 2003–Board member: Northland Resources SA 2013–Board member: Kuusakoski Oy 2008–Board member: Kuusakoski Group Oy 2008–Board member: Alteams Oy 2008–
Independent of the company and its significant shareholders.
Markus Akermannb. 1947, Swiss citizenM.Econ. (University of St.Gallen, Switzerland)Outokumpu Board member 2013–Member of the Audit Committee Member of the Board Finance Working Group
Work experienceChairman of the Board: Holcim Group Support Ltd 2002-2012 Member of the Board: Holcim Ltd 2002–2013Chief Executive Officer: Holcim Group 2002–2012Member of the Group Executive Committee with responsibility for Latin America, international trading activities and Corporate Human Resources and Training: Holcim Group 1993–2001Member of the Board and Managing Director: Holcim Apasco SA de CV, Mexico 1993–2012Area Manager Central America, Andean Countries and international trading activities: Holcim Group 1986–1993
Positions of trustMember of the Board: Votorantim Cimentos S.A. 2013–Member of the Board: ACC Mumbai, India 2005–2012Member of the Board: Ambuja Cements Ltd Mumbai, India 2006–2012Member of the Executive Board: World Business Council for Sustainable Development (WBCSD) 2008–2011
Independent of the company and its significant shareholders.
Harri Kerminenb. 1951, Finnish citizenM.Sc. (Eng.), MBAOutokumpu Board member 2012–Member of the Remuneration Committee
Work experiencePresident and CEO: Kemira Oyj, 2008–2012President of the Kemira Pulp & Paper business area: Kemira Oyj 2006–2007President of the Kemira Specialty business area: Kemira Oyj 2000–2006Managing Director: Kemira Pigments Oy 2002–2003Vice President, Human Resources: Kemira Chemicals Oy 1996–2000Manager of Oulu plant: Kemira Oyj 1994–1996Production Manager: Kemira Kemi AB 1990Project Manager: Kemira Oy/Kemira Oyj, plant construction projects in Finland, Sweden, Belgium and the US 1989–1994
Positions of trustChairman of the Board: HST Partners Oy: 2012-Chairman of the Board: MetGen Oy 2012–Chairman of the Board: Finpro ry 2011–Chairman of the Board: Finnish Industry Investment 2012Chairman of the Board: Chemical Industry Federation of Finland 2011–2012Vice Chairman of the Board: Finnair Oyj 2012-Vice Chairman of the Board: Chemical Industry Federation of Finland 2009–2011Board member: Tikkurila Oyj 2012–Board member: Achemos Grupe 2012–Board member: Normet Oy 2012–Board member: Finnair Oyj 2011–2012
Jorma Ollila Olli Vaartimo Markus Akermann Harri Kerminen
Board of Directors on Dec 31, 2013Outokumpu Annual Report 2013 MeMbers Of the bOard Of directOrs
14

Board member: Confederation of Finnish Industries and Employers TT-Foundation 2011–2013Board member: Confederation of Finnish Industries EK 2011–2012Board member: Formia Emissions Control 2012Board member: CEFIC 2008–2012Board member: Finpro ry 2010–2011
Independent of the company and its significant shareholders.
Heikki Malinenb. 1962, Finnish citizenM.Sc. (Econ.), MBA (Harvard)Outokumpu Board member 2012–Member of the Audit Committee
Work experiencePresident and CEO: Itella Corporation 2012–President and CEO: Pöyry PLC 2008–2012Executive Vice President, Strategy, member of the UPM Executive Team: UPM-Kymmene Corporation, Helsinki, Finland 2006–2008President: UPM North America, Chicago, USA 2004–2005President of Sales: UPM North America, Chicago, USA 2002–2003Managing Partner: Jaakko Pöyry Consulting, New York, USA 2000–2001Engagement Manager: McKinsey & Co, Atlanta, USA 1997–1999Director, Business Development UPM Paper Divisions, Helsinki, Finland 1994–1996
Positions of trustChairman: American Chamber of Commerce (AmCham Finland) 2009–Board member: Service Sector Employers PALTA 2013–Board member: East Office of Finnish Industries 2012– Board member: Federation of Finnish Technology Industries 2011–2012 Board member: Botnia Oy 2006–2008Supervisory Board member: Ilmarinen Mutual Pension Insurance Company 2013
Independent of the company and its significant shareholders.
Elisabeth Nilssonb. 1953, Swedish citizenM.Sc. (Tech.)Outokumpu Board member 2011–Member of the Remuneration Committee
Work experienceGovernor: Östergötlands län 2010–President: Jernkontoret (Swedish Steel Producers’ Association) 2005–2010General Manager, Metallurgy Division: SSAB Oxelösund 2003–2005Managing Director: SSAB Merox 2001–2003Manager, Department for Environment, Health and Safety: SSAB 1996–2001Manager, Continuous Casting Department: SSAB Oxelösund 1991–1996
Positions of trustChairman of the Board: Göta Kanalbolaget 2011–Chairman of the Board: Risbergska donationsfonden 2010–Chairman of the Board: Tåkernfonden 2010–Chairman of the Board: Övralidsstiftelsen 2010–Chairman: Foundation Mefos 2005–2010
Chairman: Svenska Bergsmannaföreningen 2007–2009Member: Royal Swedish Academy of Engineering Science IVA 2007–Board member: Northland Resources SA 2013–Board member: Sveaskog AB 2010–2012Board member: 4:e AP-fonden 2010–2011Board member: Swerea AB 2008–2011Board member: Euromaint AB 2004–2007Board member: Swedish Maritime Administration 1996–2006
Independent of the company and its significant shareholders.
Siv Schalinb. 1962, Finnish citizenM.Sc. (Econ.), MBAOutokumpu Board member 2011–Member of the Audit Committee
Work experiencePresident: Docrates Oy 2012–President and General Manager, Patient Care Solutions: GE Healthcare Finland Oy 2008–2012Vice President, Service: GE Healthcare EMEA 2005–2008General Manager: GE Healthcare Sweden 2004–2005Director, Critical Care: Instrumentarium Oyj 2003–2004Area Manager, Nordic Countries: Instrumentarium Oyj 2002Vice President, Components Division: Össur hf. 2000–2001President: Össur USA Inc. 1997–2000
Positions of trustBoard member: Association of Private Health Care Providers in Finland 2013–Supervisory Board member, Arcada University of Applied Sciences 2009–Chairman, Managing Director and member of the Board of several GE Healthcare group companies 2008–2012Vice Chairman: FIHTA (Finnish Healthcare Technology Association) 2008–2012
Independent of the company and its significant shareholders.
Heikki Malinen Elisabeth Nilsson Siv Schalin
Board of Directors on Dec 31, 2013Outokumpu Annual Report 2013 MeMbers Of the bOard Of directOrs
15

Update on strategic initiatives
Divestment of Terni and VDM to ThyssenKrupp and comprehensive measures to strengthen balance sheet
On November 30, 2013, Outokumpu announced plans to deleverage and strengthen its balance sheet, and to divest Terni and VDM. Outokumpu has signed a binding agreement with ThyssenKrupp whereby Outokumpu will sell the Terni remedy assets, the VDM business and certain service centers to ThyssenKrupp. Outokumpu’s loan note to ThyssenKrupp will be used as a consideration for the transaction (the loan note value was EUR 1.283 million on December 31, 2013 and EUR 1.229 million on December 31, 2012). The transaction is subject to approval by the European Commission as well as other relevant regulatory approvals. The transaction will also constitute final settlement of all remedy-related obligations between Outokumpu and ThyssenKrupp.
Financial package and rights issueAs a result of the transaction to sell Terni and VDM, Outokumpu’s net debt is expected to decrease by approximately EUR 1.3 billion and gearing to decrease by approximately 68 percentage points (Dec 31, 2013: gearing of 188.0%). Balance sheet and liquidity will be further strengthened by a planned rights issue, new liquidity facility of EUR 500 million and extensions of existing loans and credit facilities. Please see “Events after the end of the reporting period” for more information.
An Extraordinary General Meeting will be held on February 14, 2014 to decide on the proposed authorization to the Board of Directors to undertake the share issue. The rights issue is planned to be carried out immediately after the closing of the sale of Terni and VDM to ThyssenKrupp, which is expected to take place during the first quarter of 2014.
In relation to the planned approximately EUR 650 million rights issue, Outokumpu has received irrevocable commitments to subscribe for their respective allocation of the rights issue from shareholders representing 52.8% of all its shares, with the remaining 47.2% of the rights issue being underwritten by Outokumpu’s core banks, subject to customary terms and conditions.
Outokumpu management is confident that the conditions for the closing of the transaction will be met and closing will take place during the first quarter of 2014.
New industrial plan in Europe On October 1, 2013, Outokumpu announced plans for further structural changes in its European operations aimed at improving its financial performance and efficiency, and ultimately returning the company to profitability. Specifically, the planned changes include:
· Acceleration of the Bochum melt shop closure in Germany to achieve more efficient production structure and higher capacity utilization rates.
· Reduction of annealing and pickling capacity by 200 000 tonnes in Finland and cold rolling capacity by 300 000–350 000 tonnes in Germany to increase capacity utilization and lower costs.
· Optimization of the company’s service center network by closing service center in Langenhagen, Germany.
· Further cost savings through leaner overheads and organization at all sites, functions and activities across European operations.
The planned structural changes are expected to result in up-to 1 000 additional job reductions in Europe, bringing the total planned global reduction up-to 3 500 jobs compared to 2012. The industrial plan is expected to result in additional savings of more than EUR 100 million and the overall savings programs are expected to result in annual savings of EUR 380 million in 2015 and EUR 450 million in 2017, compared to the 2012 level.
Outokumpu and the respective unions in Germany have continued discussions regarding the new industrial plan in Europe, including the planned acceleration of the Bochum melt shop closure. Outokumpu expects to find a solution with the unions that will enable the implementation of the new industrial concept.
Synergy savings clearly exceeded target for 2013 The ongoing integration work and the related synergies are proceeding successfully. The year 2013 ended with savings of EUR 95 million and therefore clearly exceeded the forecast of EUR 75 million for 2013. The main reason was good performance in raw material procurement savings, especially stainless scrap. The Krefeld melt shop ramp-down and the headcount reductions contributed as well to the overall achievement. Outokumpu expects cumulative synergy savings in 2014 of more than EUR 170 million, with a larger relative share coming from production optimization. The target of EUR 200 million of synergy savings by the end of 2017 remains unchanged.
Krefeld melt shop ramp-down completedAccording to the agreed timeline, the Krefeld melt shop in Germany has been ramped-down completely; the last day of operations was December 6, 2013. The closure was announced in January 2012 in connection with the Outokumpu and Inoxum merger as part of the original synergy saving plan and leads to a cut in Outokumpu’s melt capacity by 600 000 tonnes. From 2014 onwards, this will contribute
Review by the Board of Directors 2013
Outokumpu’s year 2013 was characterized by the integration between Outokumpu and Inoxum, the related industrial restructuring and heavy cost saving measures, the ferrochrome expansion in Finland and the ramp-up of the Calvert stainless steel mill in USA. Good progress was made in these areas despite strong headwinds. However, financial results remained unsatisfactory and were at heavy loss.
Outokumpu Annual Report 2013 review by the bOard Of directOrs 2013
16

EUR 50 million annually of savings to the overall planned efficiency measures. In 2013, cost savings related to the Krefeld melt shop closure amounted to EUR 15 million.
Ongoing value-enhancing and cost-saving projects
Ferrochrome production ramp-up The ramp-up of new capacity at the Ferrochrome operations in Finland has progressed as planned in 2013, with ferrochrome production of 434 000 tonnes (2012: 230 000 tonnes). The full technical production capacity of 530 000 tonnes is expected to be reached in 2015.
Calvert ramp-upThe integrated stainless steel mill in Calvert, USA, continues to trend positively with improvements over the third quarter, although overall the ramp-up is running behind original targets. The ramp-up of the cold rolling mill is proceeding with an expanded product portfolio to match customer needs. The production covers both standard austenitic and ferritic grades as well as widths ranging from 36 to 72 inches wide. Product quality is improving as the ramp up progresses, and delivery reliability remains a key. Additionally, the melt shop ramp-up continues with a record melt achieved in October, 2013. Melt shop operations are aligned with the higher production levels of 2014. The Calvert melt shop supplies steel to both the Calvert cold rolling mill and Outokumpu’s cold rolling mill in San Luis Potosi, Mexico (Mexinox). Previously, Mexinox received the majority of its hot rolled coil from Europe. With the increase in Calvert’s supply to Mexinox, fourth quarter shipments from Europe have decreased significantly and are expected to end within the first quarter of 2014, recognizing Outokumpu’s “melted in America” advantage.
P150 beats its target for 2013 Outokumpu introduced its P150 cost reduction program in the beginning of 2013. The aim of this program is to reduce Outokumpu’s annual costs by EUR 150 million by the end of 2014 on top of the synergy measures. The main drivers of the program are savings in procurement, IT, operational costs as well as in general and administration costs, including headcount reductions. During 2013, EUR 104 million of cost savings were reached, exceeding the latest expectation of more than EUR 75 million. The fourth quarter contributed EUR 38 million. The main reasons were good performance in raw material procurement savings, especially stainless scrap, as well as savings on operational costs, for example by improved metal recovery and optimized material usage. The original target of EUR 150 million of savings by the end of 2014 remains unchanged. However, Outokumpu is working on identifying and implementing further cost saving potential.
P300 exceeds 2013 expectations In February 2013, Outokumpu announced a two-year working capital reduction program, P300. The program target is a net working capital reduction of EUR 300 million to be achieved through active inventory, accounts receivable and accounts payable management. After a difficult second quarter due to the ramp-up of Calvert which led to an increase in working capital, good progress has been made in all business areas.
The total reduction of net working capital during 2013 was EUR 351 million or 27%. The main driver has been the reduction of inventories leading to a significant improvement in all key metrics, such as in inventory tonnes, days and value.
In 2014, Outokumpu will continue to tightly manage net working capital and inventories in line with the anticipated market demand. The target for working capital efficiency measured in inventory days for the continuing operations is 91 (2013: actual 88). Special focus will be on accounts receivable and accounts payable.
Divestment of non-core assets
Luvata loan receivableAs part of the measures to strengthen its financial position and liquidity, Outokumpu continued to divest its non-core assets during 2013. In December, Outokumpu sold its loan receivable from Luvata Fabrication Ltd for a cash consideration of USD 157 million to Proventus Capital Management AB. The loan receivable related to the divestiture of fabricated copper products business to Nordic Capital in 2005, in which the long-term subordinated vendor note of some USD 123 million was part of the overall consideration. The divestment had a direct cash flow effect of EUR 114 million and Outokumpu booked EUR 49 million as a non-recurring financial expense in the fourth quarter.
Electricity distribution network at TornioIn December, Outokumpu sold the electricity distribution network at the Tornio site in Finland to InfraVia European Fund II. With the transaction, five Outokumpu employees transferred to a new industrial electricity distribution company established by InfraVia II that will continue to operate the network at the Tornio site. The cash consideration of the transaction was EUR 63 million. In the financial reporting the transaction is recognized as a sale and leaseback resulting in a finance lease.
Outokumpu Annual Report 2013 review by the bOard Of directOrs 2013
17
Market development
Stainless steel demand down in all markets, most notably in Europe
Global real demand for stainless steel products increased by 5.6% from 31.2 million tonnes in 2012 to 32.9 million tonnes in 2013. In the Americas and APAC regions, consumption rose by 4.0% and 7.9%, respectively year-on-year. Consumption in EMEA remained weak during 2013, with a decrease of 0.7%.
Global demand for stainless steel products in 2013 was split among the segments: Consumer Goods & Medical (45.2%), Chemical/Petrochemical & Energy (17.3%), Automotive & Heavy Transport (11.0%), Architecture/Building/Construction & Infrastructure (15.2%), Industrial & Heavy Industry (8.5%) and Others (2.9%). The main drivers for the demand increase in 2013 were the Consumer Goods & Medical (+7.7%), Architecture/Building/Construction & Infrastructure (+6.3%) and Industrial & Heavy Industries (+4.3%). In the Chemical/Petrochemical & Energy, Automotive & Heavy Transport and Others segments demand increased in 2013 by 2.9%, 1.9% and 5.2%, respectively.
Imports into the EU are expected to reach 23.6% of total consumption in 2013, which is higher than the average level of 18.6% in 2012. This mainly reflects a further increase in Asian imports during 2013. The largest countries in terms of imports to the EU included China, Taiwan, South Korea, the USA, South Africa, India and Japan.
Average imports into the NAFTA region reached 13.4% of the total consumption in 2013, below the average level of 18.6% in 2012. Import levels have been constantly declining since the fourth quarter of 2012, mainly due to anti-dumping cases against other countries and the ramp-up of Outokumpu’s integrated stainless steel mill in Calvert.
Stainless steel transaction prices
According to CRU, average transaction prices in 2013 for 2mm cold rolled 304 stainless steel sheet in Europe, the USA and China remained significantly below the previous year’s levels. In Europe, the total decline of 8.8% in the transaction price was the result of a drop in the base price by 2.8% and a decrease in the alloy surcharge by 13.7%. In the US, the fall in the alloy surcharge by 15.6% was the main price driver year-on-year for the 8.8% decline in the transaction price. The Chinese transaction price dropped by 10.3% in 2013 compared to 2012.
Price development of alloying metals
The average nickel price1) came down strongly in 2013, by 14.3%, and was 15 012 USD/tonne (2012: 17 511 USD/tonne). The London Metal Exchange (LME) cash price for nickel declined by 18.2% since the beginning of the year. A growing surplus on the markets put pressure on prices, especially during the first half of the year. The price hit the year low of 13 160 USD/tonne in early July. Some signs of improvement were seen in December due to improved demand from the stainless steel industry and an anticipated Indonesian nickel ore export ban. Since the beginning of 2014 nickel price has been in the region of 13 365–14 645 USD/tonne.
The European average benchmark price2) for ferrochrome in 2013 was 1.16 USD/lb., down 3.8% from 1.21 USD/lb. in 2012. The price rose in the first half of the year, driven by expectations of improved demand for stainless steel and reduced South African ferrochrome supply due to a power buy-back program from the national electricity supplier. For the second half of the year, the price decreased due to increased ferrochrome supply from South Africa and weak stainless steel demand, to a level of 1.125 USD/lb. for both the third and fourth quarters. For the first quarter of 2014, the benchmark price rose to a level of 1.18 USD/lb.
The molybdenum average price3) in 2013 was 10.35 USD/lb., down 19.0% from 12.78 USD/lb. in 2012. The price declined during the first half of the year and was mainly stagnant during the second half.
1) Nickel Cash LME Daily Official Settlement, USD per tonne2) Ferro-chrome Contract: Ferro-chrome Lumpy CR charge basis 52% Cr
quarterly major European destinations USD per lb. Cr 3) MetalBulletin – Molybdenum Drummed molybdic oxide Free market USD
per lb. Mo in warehouse
Business areas Following the planned divestment of the Terni remedy assets, VDM business and certain service centers to ThyssenKrupp, Outokumpu has changed the names of its business areas to be:
· Stainless EMEA · Stainless Americas · Stainless APAC · Specialty Stainless
Note: This report contains comparisons to both Outokumpu stand alone as well as comparable figures for the combined entity based on management estimates for 2012. Tables that are marked with ‘comparable’ show the combined entity comparisons for 2012. In the text itself, only comparable numbers will be stated and analyzed. No verbal analysis is done based on the official financial statements 2012 since it presents Outokumpu stand alone and such analysis would not be meaningful.
Million tonnes 2013e 2012 2011
EMEA 6.8 6.9 6.8
Americas 3.4 3.3 3.1
APAC 22.7 21.0 20.0
Total 32.9 31.2 29.9
Market development of total stainless steel real demand in 2013
Source: SMR February 2014e = estimate
Outokumpu Annual Report 2013 review by the bOard Of directOrs 2013
18

Terni remedy assets, the VDM business and certain service centers are reported as discontinued operations. Quarterly 2013 profit and loss figures including related key figures have been restated for this reason. All comparable 2012 figures as well as restated quarterly 2013 figures are unaudited. For the full year 2013, deliveries decreased by 138,000 or 5.1% tonnes to 2,585,000 tonnes (2012: 2,723,000 tonnes).
Stainless EMEA
The key focus of Stainless EMEA is to maintain and expand Outokumpu’s strong European stainless coil position through customer and product leadership, to improve financial performance and to drive cost efficiency by leveraging the company’s own chrome mine and expanded ferrochrome production. The successful implementation of Outokumpu’s industrial plan targeting to restructure the company’s operations in Europe, introduced in October 2013, will be key in returning the company to profitability.
Stainless EMEA’s deliveries for the full year 2013 declined by 8.7% year-on-year, due to the continued weak market. In addition, some volumes continued to be rerouted to Avesta in Sweden and Bochum in Germany towards the end of the year due to the production disturbances at the Tornio hot rolling mill in September. Ferrochrome ramp-up continued in line with the plans and production was 434 000 tonnes in 2013 (2012: 230 000 tonnes). The Krefeld melt shop was closed as planned in December 2013.
For the full year 2013, Stainless EMEA’s EBIT was EUR -158 million, compared to EUR -281 million in the previous year. Non-recurring items accumulated to EUR -55 million (2012: EUR -125 million) and related primarily to headcount reductions announced in spring 2013. The reduction in operational losses was mainly driven by savings related to the closure of the Krefeld melt shop and headcount reductions, savings from the P150 program, as well as the focus on high-quality products with better margins. This partly compensated for the lower deliveries.
Stainless Americas
Stainless Americas’ key focus is to build up a strong position in the Americas market by focusing on superior product quality, technical service, and delivery reliability. Improvement in Stainless Americas’ financial performance is a priority and this is driven by the ramp-up of the Calvert facility. The aim is to finalize the Calvert technical ramp-up during 2014 and implement the full commercial ramp-up into 2016. In addition, Stainless Americas focuses on ensuring performance of the Mexican operations.
Deliveries for 2013 increased by 16.3% totaled 465 000 tonnes, compared to 400 000 tonnes in 2012, mainly driven by the ramp up of the Calvert mill.
The EBIT for 2013 was EUR -270 million (2012: EUR -182 million). The main drivers for the unsatisfactory performance during the year were the inventory-related losses in connection with falling nickel prices during the first half, production issues and high production unit costs due to low utilization rates during the Calvert ramp-up.
The high inventory levels at the beginning of the year were to a large degree caused by the continued deliveries of stainless steel from Terni. The shipments of the material from Europe to Stainless Americas will end in the first quarter of 2014 and this is estimated to have a positive impact on financial performance. Inventory levels were brought down during the second half of 2013 and are now well aligned with the anticipated delivery volumes of about 530 000 tonnes for 2014.
Stainless APAC
Stainless APAC’s key focus is to contribute to the growth of Outokumpu by establishing a profitable foothold in the APAC region and to focus on selected customer and product segments in which the Outokumpu offering is differentiated from its competitors.
In 2013, deliveries increased from 104 000 tonnes to 184 000 tonnes, mainly driven by SKS business. Some recovery in the project business was seen towards the end of the year.
For the full year 2013, the EBIT was EUR -7 million compared to EUR -14 million in 2012.
Specialty Stainless
Following the planned divestment of the VDM business to ThyssenKrupp, Outokumpu presents VDM as discontinued operations and has restated its financial figures. The following table and commentary reflect the key business area figures without the VDM business.
The key focus of Specialty Stainless is to identify new customers and sales opportunities to drive profitability. In addition, Specialty Stainless is finalizing its ongoing investments for example, in Degerfors, Sweden, and continuing several cost reduction and efficiency improvement initiatives.
In 2013, deliveries in Specialty Stainless declined by 9.1% to 490 000 tonnes, compared to 539 000 tonnes in the previous year.
The EBIT loss for the full year 2013 decreased to EUR 33 million, compared to a loss of EUR 133 million in 2012. EBIT in 2012 included non-recurring items of EUR -93 million. Excluding non-recurring items, EBIT improved year-on-year from EUR -40 million to EUR -33 million in 2013. Despite the lower deliveries, profitability improved thanks to a better mix as well as a streamlined cost base.
Financial performance Outokumpu’s financial performance for 2013 as a whole was unsatisfactory although losses were reduced. Stainless steel deliveries were down by 5.1% to 2 585 000 tonnes (2012: 2 723 000 tonnes), underlying EBITDA was EUR -32 million (2012: EUR -66 million), and underlying EBIT was EUR -377 million (2012: EUR -412 million). The main drivers for reduced losses were the improved performance of the Ferrochrome business as well as decreased overall cost levels thanks to ongoing cost takeout initiatives. On the other hand, the significantly lower deliveries and lower base prices had a major negative impact on performance.
Sales, 6 745 € million
Stainless EMEA 55%
Stainless Americas 13%
Stainless APAC 6%
Specialty Stainless 23%
Other operations 3%
Outokumpu Annual Report 2013 review by the bOard Of directOrs 2013
19

Lower deliveries in 2013
For the full year 2013, deliveries decreased by 138 000 or 5.1% tonnes to 2 585 000 tonnes (2012: 2,723,000 tonnes).
Average capacity utilization of the Outokumpu facilities declined during the year: starting at 75–80% in the first quarter, 70–75% in the second quarter and reaching a low level at 65–70% for the second half of the year.
Deliveries, continuing operations
1 000 tonnes2013 2012
Comparable2012 2011
Cold rolled 1 879 1 890 728 740White hot strip 370 436 315 309Quarto plate 77 88 88 106Long products 62 59 59 60Semi-finished products 399 274 261 187Stainless steel 1) 186 206 193 129Ferrochrome 212 68 68 58Tubular products 12 44 44 48Total deliveries 2 797 2 791 1 495 1 449Stainless steel deliveries 2 585 2 723 1 428 1 391
1) Black hot rolled, slabs, billets and other stainless steel products
Sales and earnings declined in sluggish markets
In 2013, Outokumpu sales decreased by 15.3% to EUR 6 745 million due to low overall demand for stainless steel and Outokumpu products, lower base prices and a 14.3% decline in average nickel price.
Sales
€ million2013 2012
Comparable2012
Restated 1)
2011
Stainless EMEA 4 267 5 738 2 648 3 042Stainless Americas 906 923 2 1Stainless APAC 388 294 128 137Specialty Stainless 1 619 1 921 1 937 2 304Other operations 538 565 564 702Intra-group sales -974 -1 480 -742 -1 178The Group 6 745 7 961 4 538 5 009
1) Adjusted due to reallocation of R&D operations in Avesta, Sweden from Other operations to Specialty Stainless.
In 2013, the underlying EBITDA improved from EUR -66 million to EUR -32 million, and the underlying EBIT from EUR -412 million to EUR -377 million. For the full year the non-recurring items amounted to EUR -78 million and raw material-related inventory effect of EUR -56 million adding up to total adjustments to EBIT of EUR -133 million during 2013. Reported EBIT in 2013 was EUR -510 million (2012: EUR -754 million).
The main drivers for the reduced losses were the improved performance of the Ferrochrome business as well as decreased overall cost levels thanks to ongoing cost takeout initiatives. On the other hand, the significantly lower deliveries and lower base prices had a major negative impact on performance.
Higher financial expenses
The financial income and expense for the full year 2013 amounted to EUR -310 million, and of that interest expenses amounted to EUR 210 million. Market price losses decreased from EUR -64 million in 2012 to EUR -37 million in 2013. Financial expenses in the fourth quarter include a fair value change of EUR -41 million for the remaining 16% stake in Talvivaara Sotkamo Ltd due to the decline in the share price of Talvivaara Mining Company Plc during the year with a remaining fair value of EUR 13 million at the end of the year.
Negative net result for the period
For the full year, the net result was EUR -1,003 million (2012 Outokumpu stand alone: EUR -536 million) and earnings per share of continuing operations was EUR -0.40 (2012 Outokumpu stand alone: EUR -0.46).
Sales by market area
Europe 66% (Finland 3%)
North and South America 19%
Asia 13%
Australia and Oceania 1%
Africa 1%
Operating result
800
600
400
200
0
–200
–400
–600
–800
09 10 11 12 13
€ million
Year 2012 restated due to adoption of revised IAS 19 standard.
Outokumpu Annual Report 2013 review by the bOard Of directOrs 2013
20

Profitability
€ million2013 2012
Comparable2012 2011
EBITStainless EMEA -158 -281 -113 -84Stainless Americas -270 -182 0 0Stainless APAC -7 -14 -8 -3Specialty Stainless -33 -133 -133 -106Other operations -39 -148 -130 -72Intra-group items -3 5 -1 14
-510 -754 -385 -251
Share of results in associated companies and joint ventures -2 - 0 -5Financial income and expenses -310 - -138 11Result before taxes -822 - -524 -244Income taxes -11 - -12 65Net result for the financial year from continuing operations -832 - - -Net result for the financial year from discontinued operations -170 - - -Net result for the financial year -1 003 - -536 -180
Operating profit margin, % -7.6 -9.5 -8.5 -5.0Return on capital employed, % -10.3 - -8.2 -6.3Earnings per share -0.48 - -0.46 -0.62Earnings per share, continuing operations, EUR -0.40 - - -
Net cash generated from operating activities 34 - 266 338
Positive operating cash flow driven by decrease in working capital
For the full year 2013, net cash from operating activities was positive as well at EUR 34 million, mainly driven by the release of working capital of EUR 297 million since the beginning of the year.
Earnings per share
2
1
0
–1
–2
–3
–4
09 10 11 12 13
€
Capital expenditure
Capital expenditure for continuing operations declined significantly during 2013 and amounted to EUR 183 million (2012: EUR 763 million). This was mainly spent on the new production facility in Calvert, USA, the doubling of the ferrochrome production in Tornio, Finland, the quarto plate project in Degerfors, Sweden as well as to maintenance-related investments.
Capital expenditure, continuing operations€ million 2013 2012 2011Stainless EMEA 69 357 181Stainless Americas 44 - -Stainless APAC 3 0 1Specialty Stainless 54 65 60Other operations 14 2 733 13The Group 183 3 155 255The Group, comparable 183 763 -
Depreciation and amortization 332 230 235
Balance sheet shows higher gearing
On November 30, 2013, Outokumpu announced the divestment of Terni remedy assets, the VDM business and certain service centers to ThyssenKrupp. Outokumpu presents the businesses to be divested as discontinued operations separately from the continuing operations 2013 result. In the statement of financial position, the additional reclassifications to assets held for sale are shown in the December 31, 2013 figures. In comparison periods, only original Terni remedy assets are classified to assets held for sale, and the additional reclassifications are included in the figures on each line. The ThyssenKrupp loan note which will be used as a consideration for the divestment is presented in long-term debt and will be derecognized at closing of the divestment in the first quarter of 2014.
* Year 2012 continuing operations, comparable figures.
Capital expenditure and depreciation
1 000
800
600
400
200
0
09 10 11 12* 13
10
8
6
4
2
0
%€ million
Capital expenditure
Depreciation
Capital expenditure, % of sales
Outokumpu Annual Report 2013 review by the bOard Of directOrs 2013
21

Outokumpu has finalized the accounting related to the Inoxum transaction of 2012 based on the final valuation of the identifiable asset and liabilities. The completion of the accounting did not materially change the provisional valuation and did not have a material impact on the 2013 income statement or financial position.
During 2013, total assets decreased by EUR 865 million to EUR 8 823 million (Dec 31, 2012: EUR 9 688 million), to a large degree driven by a reduction in current assets by EUR 1 078 million to EUR 2 679 million (Dec 31, 2012: EUR 3 757 million). The main reason for this decline was focused and successful inventory management throughout the company: Inventories came down by EUR 1 112 million to EUR 1 216 million, (Dec 31, 2012: EUR 2 328 million). Approximately half of the inventory reduction was attributable to continuing operations and the other half reflects the reclassification of assets to assets held for sale and also the actual inventory decrease in those units.
Cash and cash equivalents increased by EUR 385 million to EUR 607 million at the end of 2013 (Dec 31, 2012: EUR 222 million) and it was mostly related to the continuing operations.
Total non-current assets decreased by EUR 711 million from EUR 4 655 million to EUR 3 944 million during 2013. The largest changes were recognized in property, plant and equipment, which decreased by EUR 462 milion to EUR 3 254 million (Dec 31, 2012: EUR 3 716 million). Approximately EUR 200 million of the reduction in property, plant and equipment was attributable to continuing operations reflecting mainly capital expenditure, depreciation and smaller disposals. The rest reflects the reclassification of assets to assets held for sale, but also the actual decrease in property, plant and equipment in those units.
Equity-to-assets ratio
60
50
40
30
20
10
0
09 10 11 12 13
%
Year 2012 restated due to adoption of revised IAS 19 standard and completing the Inoxum acquisition accounting.
Debt-to-equity ratio
09 10 11 12 13
Years 2009–2012 have been restated due to Outokumpu’s change in net interest-bearing debt definition.
%200
175
150
125
100
75
50
25
0
Net interest-bearing debt
4 000
3 500
3000
2 500
2 000
1 500
1 000
500
0
09 10 11 12 13
€ million
Years 2009–2012 have been restated due to Outokumpu’s change in net interest-bearing debt definition.
The change in non-current trade and other receivables of EUR 161 million was primarily related to the sale of the Luvata receivable.
The goodwill was EUR 465 million at the end of 2013 (Dec 31, 2012: EUR 477 million).
Assets held for sale increased by EUR 924 million to EUR 2 200 million, mostly due to the reclassification of VDM and certain service centers, compared to EUR 1 276 million at the end of 2012, when only the Terni remedy assets were included. Liabilities directly attributable to these assets increased by EUR 262 million to EUR 1 048 million (Dec 31, 2012: EUR 786 million). These figures combine to a net value of EUR 1 152 million for the assets held for sale on the balance sheet.
Equity decreased by EUR 1 039 million, mainly reflecting the net loss of EUR 1 003 million of Outokumpu Group in 2013.
Non-current liabilities increased by EUR 169 million mainly driven by higher long-term debt of EUR 3 270 million, compared to EUR 2 935 million at the end of the previous’ year. The increase in long-term debt was mostly driven by continuing operations and related to the committed revolving credit facility of EUR 900 million signed in July. Long-term debt also includes the total amount of the ThyssenKrupp loan note of EUR 1 283 million (Dec 31, 2012: EUR 1 229 million).
Current liabilities went down by EUR 234 million to EUR 2 093 million (Dec 31, 2012: EUR 2 327 million), primarily because of the decline in trade and other payables by EUR 407 million to EUR 1 136 million (Dec 31, 2012: EUR 1 543 million). Continuing operations contributed some EUR 170 million to this decline and discontinued operations the rest, reflecting the reclassification of liabilities to liabilities directly attributable to assets held for sale as well as the actual decrease of trade and other payables in those units.
Net interest-bearing debt at the end of December 2013 totaled EUR 3 556 million, up by EUR 125 million compared to the end of 2012 (Dec 31, 2012: 3 431 million). During the last quarter of the year, net debt declined by EUR 305 million, mostly due to positive cash flow driven by working capital release during the fourth quarter. Gearing at the end of December 2013 was 188.0%, compared to 116.2% at the end of December 2012. The planned divestiture of the Terni and VDM businesses to ThyssenKrupp in exchange for the EUR 1.3 billion loan note is expected to be reduce gearing by 68 percentage points compared to the end of 2013.
Outokumpu Annual Report 2013 review by the bOard Of directOrs 2013
22

Key financial indicators on financial position
€ million2013 2012
Restated 1)
2012
Net interest-bearing debtLong-term debt 3 270 2 935 1 161Current debt 893 718 998
Cash and cash equivalents -607 -222 -168Net interest-bearing debt 3 556 3 431 1 991
Shareholders' equity 1 891 2 952 2 050Return on equity, % -41.4 -21.4 -8.2Debt-to-equity ratio, % 188.0 116.2 97.1Equity-to-assets ratio, % 21.5 30.5 39.3Net interest expenses 197 66 65
1) Figures for 2012 have been restated as a result of adoption of the revised IAS 19 Employee Benefits standard.
Financing
Cash and liquidity reserves At the end of 2013, cash was EUR 607, while the overall liquidity reserves are in excess of EUR 1 000 million.
Refinancing During the year Outokumpu took decisive steps to refinance its loan portfolio. In July, Outokumpu Oyj signed a EUR 900 million committed revolving credit facility with a maturity in June 2015. The facility replaced the EUR 750 million facility that had been put to place in June 2011 and the EUR 250 million facility that became effective in December 2012. At the end of 2013, EUR 590 million of the EUR 900 million revolving credit facility had been drawn. The EUR 900 million revolving credit facility includes two financial covenants, one based on gearing and the other on liquidity. There have been no breaches of financial covenants in 2013.
At the end of November, Outokumpu announced comprehensive plans to strengthen the company’s balance sheet, including renewal and maturity extension of the loan portfolio, new liquidity facility and a planned rights issue of approximately EUR 650 million. See “Events after the end of the reporting period” for more information.
PeopleOutokumpu’s headcount for continuing operations decreased by 1 512 and totaled 12 561 at year end (2012: 14 073). The average number of employees was 13 150 during the year. The decrease in the number of employees was mainly related to the sale of the majority in OSTP tubular joint venture in January 2013 as well as to the ongoing integration and cost reduction programs. The lost-time injury rate (lost-time accidents per million working hours) for the full year 2013 was 4.5 and in line with the Outokumpu target. This rate represents an all-time low level of lost time injuries. There was one serious accident, which was investigated and follow-up actions implemented. Outokumpu’s overall target for safety for 2014 will be 4.0 lost-time accidents for million hours worked.
In response to the difficult market situation, Outokumpu initiated actions to reduce costs and enable the Group to achieve sustainable profitability. In connection with the P150 cost savings program, headcount reduction measures as announced in April 2013 are currently being implemented. Additional reduction of up-to 1 000 jobs is expected in Europe by the planned structural changes as per the new EMEA industrial plan, bringing the total planned global reduction to 3 500 jobs. The planned reductions are related to capacity reductions in Europe as well as streamlining all overlapping activities in sales, production, supply chain and support functions.
Total wages and salaries in 2013 amounted to EUR 583 million (2012: EUR 340 million and 2011 EUR 379 million). Indirect employee costs totaled EUR 222 million (2012: EUR 133 million and 2011 EUR 150 million).
Personnel, continuing operations
Dec 312013 2012
Comparable2012 2011
Stainless EMEA 6 890 7 476 7 977 3 582Stainless Americas 2 006 1 974 1 974 5Stainless APAC 630 662 662 121Specialty Stainless 2 650 2 741 4 764 3 063Other operations 385 1 220 1 272 1 482The Group 12 561 14 073 16 649 8 253
Personnel on December 31, 2013
20 000
15 000
10 000
5 000
0
09 10 11 12 13
Year 2009 reported as full-time equivalent.
Year 2013 reported for continuing operations.
EnvironmentEmissions into the air and discharges into water remained within permitted limits at the Outokumpu sites and the breaches that occurred were temporary, were identified and had only a minimal impact on the environment. Outokumpu is not a party in any significant juridical or administrative proceeding concerning environmental issues, nor is it aware of any realized environmental risks that could have a material adverse effect on Outokumpu’s financial position. This conclusion was made also in internal environmental audits which were performed at each production site during 2013.
Despite the start of the new EU CO2 Emission Trading period 2013–2020, the authorities have not yet allocated the final amounts of CO2 emissions allowances for all Outokumpu European production units. However, our operations under the EU Emissions Trading Scheme (ETS) will continue to receive free emissions allocations according to efficiency-based benchmarks and historical activity. The coming allocation is foreseen to be sufficient for the operations this year. During 2013, Outokumpu sold in total 600 000 emissions allowances (EUA’s) to external markets.
Due to the increased electricity price caused by EU ETS, the UK government is paying national compensation to electricity-intensive industry. Outokumpu’s SMACC melt shop in Sheffield, UK will get a compensation of about EUR 1 million annually.
Outokumpu Annual Report 2013 review by the bOard Of directOrs 2013
23

In 2013, Outokumpu maintained its membership in the DJSI World Index for the seventh consecutive year and it was also recognized by CDP (also known as the Carbon Disclosure Project).
Outokumpu’s sustainability report will be published together with the 2013 annual report in March 2014.
Research and developmentResearch and development work at Outokumpu aims to ensure the company’s future competitiveness, profitability and growth. R&D work is focused on technical market and application development, product development and process development. Outokumpu has three research centers, located in Avesta, Sweden, in Krefeld and Benrath, Germany and in Tornio, Finland, and R&D work is also carried out at Outokumpu production sites globally. The research centers employed total of around 230 people. In 2013, Outokumpu’s R&D expenditure for continuing operations totaled EUR 26 million which is 0.4% of the operating costs (2012: EUR 19 million and 0.4%, 2011: EUR 21 million and 0.4%).
The highlights of Outokumpu’s new product launches in 2013 include new formable duplex steels FDX 25™ and FDX 27™, the high-strength, corrosion-resistant austenitic grade Outokumpu 4420, the high-chromium ferritic grade Outokumpu 4622, and EDX 2304™, an enhanced duplex grade 2304 developed for offshore industry. Other examples of new product innovations include the GritLine surface finish and austenitic grades H500, H800 and H1000 for lightweight applications.
Risks and uncertaintiesOutokumpu operates in accordance with the risk management policy approved by the Board of Directors. This policy defines the objectives, approaches and areas of responsibility in risk management activities. In addition to supporting Outokumpu’s strategy, the aim of risk management is identifying, evaluating and mitigating risks from the perspective of shareholders, customers, suppliers, personnel, creditors and other stakeholders.
Outokumpu has defined “risk” as anything that could have an adverse impact on achieving the Group’s objectives. Risks can therefore be threats, uncertainties or lost opportunities for the company’s current or future operations. The risk management process is an integral part of overall management processes and is divided into four stages: risk identification, risk evaluation, risk prioritization and risk mitigation.
One of the main focus areas during 2013 was to monitor and strengthen Outokumpu’s financial position, as low profitability and a stretched balance sheet led to increased risk of financial distress for Outokumpu. Financing measures initiated during the fourth quarter will help to reduce refinancing risk, strengthen liquidity and improve significantly Outokumpu’s financial position. There was one major realized operational risk: a machinery breakdown loss at the Tornio hot rolling mill, which also had significant business interruption impacts. Outokumpu was able to mitigate the losses to a large extent.
Strategic and business risks
The key strategic and business risks currently include: risks related to Outokumpu’s ability to achieve the anticipated synergy savings from the acquisition of Inoxum, reduction of cost and release of cash from working capital; risks related to the ramp-up of production in Calvert, USA, and uncertainties related to the subsequent, profitable market entry for stainless steel volumes generated from the project; risks and uncertainties in implementing the announced new industrial plan
in Europe; risks related to Outokumpu’s ability to expand the Group’s business in growth markets; risks related to structural overcapacity and continued weak markets for stainless steel; risks related to stainless steel market developments and competitor actions, including the possible impact of Nickel Pig Iron (NPI) technology on the competitive situation; the risk of litigation or adverse political action affecting trade or changes that have an impact on environmental legislation, and risks and uncertainties related to the Fennovoima project.
Operational risks
Operational risks include inadequate or failed internal processes, employee actions, systems, or events such as natural catastrophes and misconduct or crime. Risks of these types are often connected with production operations, logistics, financial processes, major investment projects, other projects or information technology and, should they materialize, can lead to personal injury, liability, loss of property, interrupted operations or environmental impacts. Outokumpu’s operational risks are partly covered by insurance. Key operational risks for Outokumpu are: a major fire or accident; IT dependency; project implementation risks and personnel related risks. To minimize possible damage to property and business interruptions which could result from a fire occurring at some of its major production sites, Outokumpu has systematic fire and security audit programs in place.
Financial risks
Key financial risks for Outokumpu include: changes in the price of nickel, molybdenum, electricity and fuels; currency risks associated with the euro, the US dollar and the Swedish krona; interest rate risks connected with the euro, the US dollar and Swedish krona; risks related to Talvivaara’s share price; risks and uncertainties related to taxation; risks and uncertainties related to the announced divestment of Terni remedy assets and VDM to ThyssenKrupp in exchange for the ThyssenKrupp loan note; risks and uncertainties related to the implementation of financing measures; Outokumpu’s ability to maintain adequate liquidity and capital structure; increases in the prices of metals and other raw material, which may tie excessive amounts of cash to working capital and reduce cash flow; and continued low stainless steel prices, which would further weaken cash flow and the profitability of Outokumpu.
Outokumpu evaluates both liquidity and refinancing risks related to its capital management as well as major investment decisions. The nickel price remained quite stable during the second half of the year; however, the price decline earlier in the year continued to have a negative impact on Outokumpu’s profitability. Outokumpu changed its nickel hedging policy in 2013 to cover a higher ratio of hedging of inventory-related exposures. In addition, the amount of debt and the margins increased by the end of the year. Continuing reductions in the value of the Group’s stake in Talvivaara Sotkamo Ltd had a negative impact on earnings and on the balance sheet.
Short-term risks and uncertainties
Outokumpu is exposed to the following risks and uncertainties in the short term: risks and uncertainties in implementing the new industrial plan in Europe, the risk related to possible failures or delays in or inadequate profitability of ramping up the stainless steel mill in Calvert, USA; risks related to stainless steel market developments and competitor actions; risks and uncertainties, related to the announced divestment of Terni remedy assets and VDM to ThyssenKrupp in exchange for the ThyssenKrupp loan note; risks and uncertainties related to the implementation of financing measures; risks related to Outokumpu’s ability to maintain adequate liquidity and capital
Outokumpu Annual Report 2013 review by the bOard Of directOrs 2013
24

structure; major failures or delays in achieving the anticipated synergy benefits, reduction of cost and release of cash from working capital; risks and uncertainties related to the Fennovoima project; the risk of increases in metals and other raw material prices, which may tie excessive amounts of cash to working capital and reduce cash flow; and the risk of continued low stainless steel prices, which would further weaken cash flow and the profitability of Outokumpu in the short term. A further reduction in the nickel and other alloying metals prices presents a risk for Outokumpu, for example by causing inventory-related losses and other adverse business impacts. Possible adverse changes in the global economic environment, which would impact the stainless steel industry, are risks for Outokumpu. These kinds of adverse developments may weaken the Group’s financial position further and also have an impact on Outokumpu’s customers’ payment behavior and increase default rates.
In order to increase its risk tolerance, Outokumpu has initiated significant financing measures including for example a new liquidity facility of EUR 500 million, maturity extensions of a debt portfolio of about EUR 1.5 billion and a planned rights issue of approximately EUR 650 million in connection with the announced sale of the Terni and VDM operations. All these measures will significantly de-risk Outokumpu in 2014 by improving liquidity, strengthening the balance sheet, reducing variations in free cash flow and decreasing exposure to operational risks.
Closing the sale of the Terni and VDM assets as well as the completion of the financing measures will significantly reduce Outokumpu’s financial and operational risks. This is expected to return risk tolerance to acceptable level and enable the execution of Outokumpu’s restructuring measures back to sustainable profitability.
Significant legal proceedingsThe following is an update on pending legal proceedings. All legal disputes and litigations related to the Terni remedy assets, the VDM business and certain service centers will move over to ThyssenKrupp once the asset sale transaction with ThyssenKrupp is completed. Due to the contractual agreements between ThyssenKrupp and Outokumpu, there will be no further liability risk for Outokumpu resulting from these legal disputes.
European Commission cartel investigation in the industrial copper tube sector
In connection with the industrial copper tubes EU cartel investigation, completed in May 2009, Outokumpu has, since 2004, been in the process of addressing civil action related to the cartel investigations raised by Carrier Corporation (“Carrier”) in the United States and in the UK against Outokumpu and its former fabricated copper products business in the United States and Europe (see the 2012 annual report for further details of the case). In April 2013, Outokumpu and Carrier signed a settlement agreement that covers all damage suits against Outokumpu by Carrier in the US and UK. The total settlement amount, including cost reimbursement, is EUR 11 million. The settlement also covers all former Outokumpu subsidiaries included in the claims. According to the settlement agreement, all damage suits by Carrier against Outokumpu are now rescinded. The settlement amount has been booked as a non-recurring item in the 2013 operating result.
Dispute over invention rights
In January 2013, Outokumpu and Outotec entered into a legal dispute over invention rights. In August 2013, Outotec submitted another application for summons at the District Court of Helsinki regarding another patent relating to the invention. The ferrochrome-nickel
production method is developed by Outokumpu and it has filed the patent applications related to this invention. Outotec claims it has rights to the inventions. Outokumpu finds these allegations to be completely without merit.
Lawsuits regarding a fire in AST’s Turin facility
In December 2007, a fire on line 5 at AST’s production facility in Turin, Italy, caused the death of seven AST employees. In May 2008, the public prosecutor of Turin brought charges against AST and six of its employees. In April 2011, the court announced its verdict, under which all of the individual defendants were found guilty and given prison sentences ranging from ten years and ten months to 16 years and six months. Proceedings in the appellate court commenced in November 2012, and in February 2013 the court issued the operative part of its judgment, in which the sentences of the individuals were reduced to a range from seven years to ten years. All defendants and AST have filed an appeal to the Corte di Cassazione in Rome. The first hearings are expected to take place in April 2014.
Rejection of exemption from renewable energy charges for German plants
On July 8, 2013, Nirosta and VDM received rejections from the competent authority Bundesamt für Wirtschaft und Ausfuhrkontrolle (“BAFA”) with respect to their applications for an exemption from the German Renewable Energy Charge. Nirosta and VDM both filed complaints against the decision of BAFA. Since then, Nirosta and VDM have been able to reach an agreement with BAFA by which the exemption for 2013 was still granted. The renewable energy charge reduction resulted in a EUR 25 million refund on energy costs for the entities in Germany for 2013 (EUR 20 million related to continuing operations). The complaint has therefore become redundant. On December 18, 2013, the EU Commission initiated a state aid procedure against Germany in connection with the Renewable Energy Charge system and the exemptions for energy-intensive industries. While Nirosta and Outokumpu will still receive such benefits in 2014, it cannot be excluded that such benefits are endangered by that state aid procedure for 2015.
U.S. antidumping order on stainless steel strip and sheet from Mexico, Germany and Italy
On July 27, 1999, the U.S. Department of Commerce (the “USDOC”) issued antidumping duty orders on imports of stainless steel strip and sheet from Mexico, Germany and Italy, among other countries. The antidumping duty orders on stainless steel strip and sheet from Mexico, Germany and Italy were revoked effective July 25, 2011 due to a negative determination by the United States International Trade Commission (USITC). The U.S. petitioners in the antidumping case appealed the USITC’s determination to the U.S. Court of International Trade in New York with regard to the revocation of the antidumping duty order on imports from Mexico. On November 15, 2012, the court dismissed the appeal by the plaintiffs. A complaint by the plaintiffs against that court order was rejected by the U.S. Court of Appeals on January 9, 2014. The revocation of the duty orders on stainless steel imports have therefore become legally binding as the plaintiffs have no further means of challenging the decision by the USITC.
Share development and shareholdersOutokumpu’s share capital did not change during 2013 and was EUR 311 million at the end of the year. As of December 31, 2013, the total number of Outokumpu shares was 2 078 081 348, and Outokumpu held 975 888 of its own shares. According to its Articles
Outokumpu Annual Report 2013 review by the bOard Of directOrs 2013
25

of Association, Outokumpu has only one single class of shares, and all shares have equal voting power at General Meetings of shareholders.
The following table sets out the largest shareholders as per December 31, 2013 and December 31, 2012.
Shareholders
%Dec 31
2013Dec 31
2012Foreign investors 41.7 43.2Finnish corporations 26.1 25.2Finnish private households 22.1 14.4Finnish public sector institutions 6.6 11.3Finnish financial and insurance institutions 2.5 4.7Finnish non-profit organizations 1.0 1.2
Shareholders with over 5% of shares and voting rights
ThyssenKrupp AG 29.9 29.9Solidium Oy (owned by the Finnish State) 21.8 21.8
Information regarding shares and shareholders is updated daily on Outokumpu’s website at www.outokumpu.com/en/investors/share-info/.
In connection with the agreed sale of the Terni remedy assets, the VDM business and certain service centers to ThyssenKrupp, ThyssenKrupp has entered into an agreement to divest its 29.9% shareholding in Outokumpu to a group of institutional investors, to comply with the buyer suitability requirements of the European competition rules. In connection with the divestment by ThyssenKrupp, Solidium has agreed to acquire a part of the shares resulting in an increase of its ownership in Outokumpu from its current level of 21.8% to 29.9%. Similarly, Ahlström Capital has agreed to acquire shares representing 5.0% of all shares in Outokumpu.
Management shareholdings and share-based incentive programs
As of December 31, 2013, the members of the Board of Directors and the members of the Outokumpu Leadership Team (OLT) held altogether 943 452 shares or 0.05% of the total shares outstanding.
Outokumpu has established share-based incentive programs for the OLT members and for selected managers and key employees. In 2013, 40 000 reward shares have been paid out based on the restricted shares program 2010 in relation to the end of the retention period. The reward shares were paid with treasury shares in the company’s possession. Due to the payment of the reward shares, the number of treasury shares held by Outokumpu decreased to 975 888 at the end of 2013 (Dec 31, 2012: 1 015 888).
For the earning period 2010–2012, no shares have been paid out because the targets set for this period have not been met.
More details on the share-based incentive programs can be found on the Outokumpu web page.
The continued losses of Outokumpu in 2013, the weak stainless steel market development as well as uncertainty related to the divestment of the Terni remedy assets were reflected in Outokumpu share price. The Outokumpu share price declined by 48% and was EUR 0.41 on the last trading day of 2013 (EUR 0.79 on December 28, 2012). During 2013, the price of the Outokumpu share peaked at EUR 0.85 and was EUR 0.35 at its lowest (2012 high/low: EUR 2.10/EUR 0.64). At the end of 2013, the company’s market capitalization was EUR 845 million, compared to EUR 1 650 million at the previous year’s end.
For details on relate party transactions, please see note 31. Related party transactions.
Jan–Dec 2013 Jan–Dec 2012Fully paid share capital at the end of the period € million 311.1 311.1
Number of shares at the end of the period 2 078 081 348 2 078 081 348Average number of shares outstanding 1) 2 077 080 035 1 130 421 112Average number of shares outstanding, rights-issue-adjusted 1) 2 077 080 035 1 156 005 029Number of shares outstanding at the end of the period 1) 2 077 105 460 2 077 065 460Number of treasury shares held at the end of the period 975 888 1 015 888
Share price at the end of the period 2) € 0.41 0.79Average share price 2) € 0.53 0.97Highest price during the period 2) € 0.85 2.10Lowest price during the period 2) € 0.35 0.64
Market capitalization at the end of period € million 845 1 650Share turnover 3) million shares 1 564.5 1 297.7Value of shares traded 3) € million 835.1 1 773.9
Source of share information: NASDAQ OMX Helsinki (only includes OMX Helsinki trading) 1) The number of own shares repurchased is excluded. There are currently no programs with diluting effect in place. 2) Comparative share prices adjusted regarding the effect of the rights issue. 3) Jan–Dec 2012 figures include the effect of share subsciption rights traded during March 15–28, 2012.
Share information
Outokumpu Annual Report 2013 review by the bOard Of directOrs 2013
26

According to the Charter of the Nomination Board, the Nomination Board consists of the representatives of Outokumpu’s four largest shareholders, registered in the Finnish book-entry system on October 1, who accept the assignment.
On October 1, 2013 the four largest shareholders of Outokumpu were ThyssenKrupp AG, Solidium Oy, The Social Insurance Institute of Finland and Varma Mutual Pension Insurance Company. They have appointed the following people as their representatives on the Nomination Board:
· Guido Kerkhoff, CFO at ThyssenKrupp AG and also member of the Outokumpu Board of Directors,
· Kari Järvinen, Managing Director at Solidium Oy, · Tuula Korhonen, Investment Director at The Social Insurance Institute of Finland and
· Pekka Pajamo, CFO at Varma Mutual Pension Insurance Company.
The Nomination Board elected from among its members Kari Järvinen as Chairman. In addition, the Chairman of the Outokumpu Board of Directors Jorma Ollila serves as an expert member in the Nomination Board. Nomination Board has held its first meeting on October 16, 2013.
Changes to the Board of Directors and the Nomination Board
Guido Kerkhoff, CFO of ThyssenKrupp, stepped down from the Outokumpu Board of Directors as of November 30, 2013 and from the Nomination Board as of December 2, 2013. This decision was made in connection with the planned transaction to sell the Terni remedy assets and the VDM business to ThyssenKrupp. To comply with the buyer suitability requirements of the European competition rules, ThyssenKrupp has entered into an agreement to divest its 29.9% shareholding in Outokumpu to a group of institutional investors.
Market and business outlook
Market outlook
Global real demand for total stainless steel products is estimated to total 32.9 million tonnes in 2013 and forecasted to reach 34.6 million tonnes and 36.4 million tonnes in 2014 and 2015, respectively. Between 2013 and 2015, global consumption is expected to increase at an annual growth rate of 5.1%, while growth is forecasted to be mainly driven by increased consumption in APAC (+5.7%) and in the Americas (+3.8%). In EMEA, total stainless steel demand is estimated to increase by 3.8% from 2013 to 2015.
For the first quarter of 2014, the latest forecasts provided by Steel & Metals Market Research (SMR) see some improvement in the European market to the level of 1.8 million tonnes compared to the very low level of 1.6 million tonnes in the fourth quarter of 2013. Demand in APAC is estimated to remain flat at the level of 5.8 million tonnes and the Americas market is expected to grow from 0.8 million tonnes to 0.9 million tonnes during the first quarter of 2014.
Changes to the leadership teamAs announced on July 24, 2013, Outokumpu appointed Reinhard Florey as Executive Vice President and Chief Financial Officer as of November 1, 2013. Reinhard Florey took on the role from Esa Lager, whose intention to leave the position by the end of 2013 was announced on February 14, 2013.
Pekka Erkkilä was appointed Chief Technology Officer and a member of the Outokumpu Leadership Team as of September 1, 2013. Pekka Erkkilä has over 30 years of experience in stainless steel and mining industries and was employed by Outokumpu during 1983–2010. He is responsible for Outokumpu’s global production, technology and R&D strategy as well as capital investments optimization.
Annual General MeetingThe Annual General Meeting (AGM) was held on March 18, 2013, in Helsinki. In accordance with a proposal by the Board of Directors, the AGM decided that no dividend shall be paid for the financial year 2012. The AGM authorized the Board of Directors to decide to repurchase the Group’s own shares. The maximum number of shares to be repurchased is 200 000 000. Outokumpu held 975 888 of its own shares at the end of 2013.
The AGM also authorized the Board of Directors to decide on the issuance of shares as well as other special rights entitling it to shares. The AGM authorized the Board of Directors to resolve to issue a maximum of 400 000 000 shares through one or several share issues and/or by the granting special rights entitling to shares, excluding option rights granted to the company’s management and personnel under incentive plans. Pursuant to this authorization, the maximum number of new shares to be issued through any share issue and/or by granting special rights entitling to shares is 200 000 000, and, in addition, the maximum number of treasury shares to be transferred is 200 000 000.
These authorizations are valid until the end of the next AGM, but no longer than May 31, 2014. To date the authorizations have not been used.
The AGM decided to increase the number of Board members, including the Chairman and Vice Chairman, to eight. The Annual General Meeting decided to re-elect Olli Vaartimo, Harri Kerminen, Guido Kerkhoff, Heikki Malinen, Elisabeth Nilsson and Siv Schalin of the current members and elect Markus Akermann and Jorma Ollila as new members, for the following term. The Annual General Meeting elected Jorma Ollila as the Chairman and Olli Vaartimo as the Vice Chairman of the Board of Directors.
At its first meeting, the Outokumpu Board of Directors appointed two permanent committees consisting of Board members. Olli Vaartimo (Chairman), Markus Akermann, Heikki Malinen, and Siv Schalin were elected as members of the Board Audit Committee. Jorma Ollila (Chairman), Guido Kerkhoff, Elisabeth Nilsson, and Harri Kerminen were elected as members of the Board Remuneration Committee.
KPMG Oy Ab, Authorized Public Accountants, was re-elected as the company’s auditor for the period ending at the close of the next AGM.
Nomination BoardOutokumpu’s Annual General Meeting has established a Nomination Board to annually prepare proposals on the composition of the Board of Directors and director remuneration for the Annual General Meeting.
Outokumpu Annual Report 2013 review by the bOard Of directOrs 2013
27

Market development for total stainless steel real demand between 2010 and 2015Million tonnes 2010 2011 2012 2013e 2014f 2015fEMEA 6.4 6.8 6.9 6.8 7.1 7.3Americas 2.5 3.1 3.3 3.4 3.5 3.7APAC 18.5 20.0 21.0 22.7 24.0 25.3Sum 27.3 29.9 31.2 32.9 34.6 36.4
Source: SMR February 2014e = estimate, f = forecast
The long-term outlook for stainless steel demand remains positive. Key global megatrends such as urbanization, modernization, and increased mobility combined with growing global demand for energy, food, and water are expected to support the future growth of stainless steel demand. According to SMR, growth in stainless steel consumption between 2013 and 2015 will mainly be attributable to increased demand from the Automotive & Heavy Transport (+6.0%), Architecture/Building/Construction & Infrastructure (+5.9%) and Industrial & Heavy Industries (+5.3%) segments. The Consumer Goods & Medical and Chemical/Petrochemical & Energy segments are expected to grow at average annual growth rates of 4.9% and 4.5%, respectively.
Sources: SMR February 2014
Business and financial outlook for the first quarter of 2014
Outokumpu expects modest improvement in the underlying market demand for the first quarter. The company estimates sequentially higher delivery volumes and some improvement in base prices. The progress in the cost efficiency initiatives and synergies is estimated to be steady.
For the first quarter of 2014, Outokumpu estimates that the underlying EBIT will be better than in the fourth quarter, but still a loss. Operating cash flow is expected to be negative during the first quarter of 2014, driven by an increase in inventories related to anticipated higher deliveries. At current metal prices, marginal raw material-related timing gains are expected, if any. Outokumpu’s operating result in the first quarter of 2014 could be impacted by non-recurring items associated with the Group’s ongoing restructuring programs.
This outlook reflects the current scope of continuing operations of Outokumpu.
Key targets updated · Capital expenditure to be below EUR 200 million in 2014 (2013: EUR 183 million).
· Net working capital management remains high on the agenda. The original target of EUR 300 million reduction in net working capital is expected to be exceeded by the end of 2014. The target for working capital efficiency measured in inventory days for the continuing operations is 91.
· Cumulative synergy savings connected with the Inoxum integration expected to reach EUR 170 million during 2014 (2013: EUR 95 million).
· The P150 program is expected to reach cumulative savings of EUR 150 million in 2014 as originally planned (2013: EUR 104 million).
· The European industrial plan expected to result in additional savings of more than EUR 100 million in 2017.
· Everything combined Outokumpu’s overall savings programs are expected to result in annual savings of approximately EUR 320 million in 2014, EUR 380 million in 2015, EUR 440 million in 2016 and EUR 450 million in 2017.
· Ferrochrome production is targeted to be approximately 490 000 tonnes in 2014 (2013: 434 000 tonnes). Once fully ramped up in 2015 (technical capacity of 530 000 tonnes), annual ferrochrome deliveries will range between 500 000 and 530 000 tonnes depending on maintenance activities.
· Continued progress in the Calvert operational ramp-up is expected in the coming months. We estimate EBITDA in Stainless Americas to break-even for the full year 2014 and delivery volumes of about 530 000 tonnes.
Board of Directors’ proposal for profit distribution
In accordance with the Board of Directors’ established dividend policy, the pay-out ratio over a business cycle should be at least one third of the Group’s profit for the period, with the aim of having stable annual payments to shareholders. In its annual dividend proposal, the Board of Directors will, in addition to financial results, take into consideration the Group’s investment and development needs.
According to the Group’s financial statements on December 31, 2013 distributable funds of the parent company totaled EUR 1 504 million, of which retained earnings EUR 46 million.
The Board of Directors is proposing to the Annual General Meeting scheduled for April 14, 2014 that no dividend be paid from the parent company’s distributable funds and that net result for the financial year 2013 be allocated to retained earnings.
Events after the end of the reporting period
EU Commission approves the Terni and VDM transaction
On February 12, the European Commission approved the sale of the Terni, VDM business and certain service centers to ThyssenKrupp. Most of the other regulatory approvals have also been obtained.
Update on financing plan
On January 27, 2014 Outokumpu told that it is proceeding with the comprehensive measures to strengthen the company’s balance sheet as announced on November 30, 2013. The company has received commitments to, and signed a mandate letter for, a new EUR 900 million revolving credit facility maturing in February 2017. This facility will replace the facility for the same amount signed on July 12, 2013 and maturing in June 2015. Outokumpu has also made progress in extending and amending its bilateral loan portfolio of about EUR 600 million. Outokumpu has obtained the required consent from most lenders to extend the loan maturities until February 2017, and expects to complete this process in February 2014. Outokumpu and ThyssenKrupp have also agreed to amend and extend the outstanding credit facility in the amount of EUR 250 million granted by ThyssenKrupp. This facility will be settled at the closing of the sale of the Terni and VDM units to ThyssenKrupp to end all financing agreements between the two companies.
Outokumpu has also decided to grant a security package to secure its debt financing. As security, Outokumpu plans to pledge certain of its subsidiary shares for example in Finland, Sweden and the USA as well as certain other assets. The security package ensures financing on competitive prices and its benefits clearly surpass its costs, which are only marginal.
Outokumpu Annual Report 2013 review by the bOard Of directOrs 2013
28

Since the granting of the proposed security package required the consent of the holders of the Outokumpu’s notes maturing in 2015 and 2016 Outokumpu launched a consent solicitation process for the notes. In the noteholders’ meetings held on February 7, 2014 in Helsinki the holders of the 2015 and 2016 notes resolved to approve the proposals relating to the granting of security and certain amendments of the terms and conditions of the respective notes and to certain authorization and waivers related to the subordination deed. Accordingly and except for certain limited circumstances, the consents and waivers became effective immediately after being sanctioned and the amendments to terms and conditions of the both notes will enter into force upon the completion of certain refinancing measures.
EGM called for February 14, 2014
On January 23, 2013 Outokumpu convened an Extraordinary General Meeting for February 14, 2014 in Espoo, Finland The Board of Directors proposed that the Extraordinary General Meeting authorizes the Board of Directors to undertake a share issue for consideration in which shareholders have the right to subscribe for new shares in proportion to their existing holdings of the shares of the company. The Board of Directors has the right to decide upon the offering to parties determined by the Board of Directors of any shares that may remain unsubscribed for pursuant to the shareholders’ pre-emptive subscription right. The authorization is for a maximum of 65 billion new shares. The Board of Directors is authorized to determine the other terms and conditions of the share issue.
Strategic review of operations in Nyby, Kloster and Dahlerbrück concluded
In June 2013, Outokumpu announced a strategic review of its thin and precision strip operations in Kloster and Nyby, Sweden and in Dahlerbrück, Germany with the aim of reducing capacities and achieving cost savings through increased efficiencies. As a result of the review, the company plans to discontinue its operations in Kloster, Sweden. Outokumpu will continue the operations in Nyby, Sweden and in Dahlerbrück, Germany as before.
Proved ore reserves of the Kemi mine significantly larger after new drillings
As announced in January 2014, Outokumpu has updated its estimates on the proved ore reserves and mineral resources of the Kemi mine in Finland. The proved ore reserves have significantly increased compared to earlier estimates, and are now altogether 50.1 million tonnes instead of the earlier estimated some 33 million tonnes.
In Espoo, February 12, 2014
Board of Directors
Jorma Ollila
Olli Vaartimo
Markus Akermann
Harri Kerminen
Heikki Malinen
Elisabeth Nilsson
Siv M. Schalin
OUTOKUMPU OYJ
Outokumpu Annual Report 2013 review by the bOard Of directOrs 2013
29

To the Annual General Meeting of Outokumpu Oyj
We have audited the accounting records, the financial statements, the report of the Board of Directors, and the administration of Outokumpu Oyj for the year ended 31 December, 2013. The financial statements comprise the consolidated statement of financial position, income statement, statement of comprehensive income, statement of changes in equity and statement of cash flows, and notes to the consolidated financial statements, as well as the parent company’s balance sheet, income statement, cash flow statement and notes to the financial statements.
Responsibility of the Board of Directors and the President and CEO
The Board of Directors and the President and CEO are responsible for the preparation of consolidated financial statements that give a true and fair view in accordance with International Financial Reporting Standards (IFRS) as adopted by the EU, as well as for the preparation of financial statements and the report of the Board of Directors that give a true and fair view in accordance with the laws and regulations governing the preparation of the financial statements and the report of the Board of Directors in Finland. The Board of Directors is responsible for the appropriate arrangement of the control of the company’s accounts and finances, and the President and CEO shall see to it that the accounts of the company are in compliance with the law and that its financial affairs have been arranged in a reliable manner.
Auditor’s Responsibility
Our responsibility is to express an opinion on the financial statements, on the consolidated financial statements and on the report of the Board of Directors based on our audit. The Auditing Act requires that we comply with the requirements of professional ethics. We conducted our audit in accordance with good auditing practice in Finland. Good auditing practice requires that we plan and perform the audit to obtain reasonable assurance about whether the financial statements and the report of the Board of Directors are free from material misstatement, and whether the members of the Board of Directors of the parent company or the President and CEO are guilty of an act or negligence which may result in liability in damages towards the company or have violated the Limited Liability Companies Act or the articles of association of the company.
An audit involves performing procedures to obtain audit evidence about the amounts and disclosures in the financial statements and the report of the Board of Directors. The procedures selected depend on the auditor’s judgment, including the assessment of the risks of material misstatement, whether due to fraud or error. In making those risk assessments, the auditor considers internal control relevant to the entity’s preparation of financial statements and report of the Board of Directors that give a true and fair view in order to design audit procedures that are appropriate in the circumstances, but not for the purpose of expressing an opinion on the effectiveness of the
Auditor’s report company’s internal control. An audit also includes evaluating the appropriateness of accounting policies used and the reasonableness of accounting estimates made by management, as well as evaluating the overall presentation of the financial statements and the report of the Board of Directors.
We believe that the audit evidence we have obtained is sufficient and appropriate to provide a basis for our audit opinion.
Opinion on the consolidated financial statements
In our opinion, the consolidated financial statements give a true and fair view of the financial position, financial performance, and cash flows of the group in accordance with International Financial Reporting Standards (IFRS) as adopted by the EU.
Opinion on the company’s financial statements and the report of the Board of Directors
In our opinion, the financial statements and the report of the Board of Directors give a true and fair view of both the consolidated and the parent company’s financial performance and financial position in accordance with the laws and regulations governing the preparation of the financial statements and the report of the Board of Directors in Finland. The information in the report of the Board of Directors is consistent with the information in the financial statements.
Other opinions
We support the adoption of the financial statements. The proposal by the Board of Directors regarding the treatment of distributable funds is in compliance with the Limited Liability Companies Act. We support that the Board of Directors of the parent company and the President and CEO be discharged from liability for the financial period audited by us.
Espoo, February 13, 2014
KPMG Oy Ab
Virpi Halonen Authorized Public Accountant
This document is an English translation of the Finnish auditor’s report. Only the Finnish version of the report is legally binding.
30
Outokumpu Annual Report 2013 auditOr's repOrt

31
Outokumpu Annual Report 2013 auditOr's repOrt

Consolidated financial statements, IFRSConsolidated statement of income
€ million Note 20132012
Restated 1)
Continuing operations
Sales 3 6 745 4 538
Cost of sales -6 847 -4 503
Gross margin -102 35
Other operating income 6 24 23Selling and marketing expenses -144 -115Administrative expenses -230 -181Research and development expenses -26 -19Other operating expenses 6 -31 -128
Operating result -510 -385
Share of results in associated companies and joint ventures 13 -2 -0
Financial income and expenses 8Interest income 13 13Interest expenses -210 -80Market price gains and losses -37 -64Other financial income 0 2Other financial expenses -76 -10
Total financial income and expenses -310 -138
Result before taxes -822 -524
Income taxes 9 -11 -12
Net result for the financial year from continuing operations -832 -536
Net result for the financial year from discontinued operations 5 -170 -
Net result for the financial year -1 003 -536
Attributable toEquity holders of the Company -997 -534Non-controlling interests -6 -2
Earnings per share for result attributable to the equity holders of the Company (basic and diluted), € 2) 10
Earnings per share, continuing operations -0.40 -0.46Earnings per share, discontinued operations -0.08 -Earnings per share -0.48 -0.46
1) Figures for 2012 have been restated due to adoption of revised IAS 19 Employee Benefits standard. Restatement had an effect on the following notes: 7. Employee benefit expenses, 8. Financial income and expenses, 9. Income taxes, 10. Earnings per share, and 25. Employee benefit obligations.
2) Figures for 2012 calculated based on the rights-issue-adjusted weighted average number of shares.
Outokumpu Annual Report 2013 cOnsOlidated financial stateMents, ifrs
32

Consolidated statement of comprehensive income
€ million Note 20132012
Restated 1)
Net result for the financial year -1 003 -536
Other comprehensive income
Items that may be reclassified subsequently to profit or loss:
Exchange differences on translating foreign operations -40 -6
Available-for-sale financial assets 16
Fair value changes during the financial year -2 -5
Reclassification adjustments from other comprehensive income to profit or loss -0 -1
Income tax relating to available-for-sale financial assets 9 0 1
Cash flow hedges 20
Fair value changes during the financial year -11 14
Reclassification adjustments from other comprehensive income to profit or loss -4 -3Income tax relating to cash flow hedges 9 4 -3
Net investment hedges
Income tax relating to net investment hedges 9 1 -
Items that will not be reclassified to profit or loss:
Remeasurements of defined benefit plans 25
Changes during the financial year 15 -44
Income tax relating to remeasurements 9 -8 11
Other comprehensive income for the financial year, net of tax -44 -36
Total comprehensive income for the financial year -1 047 -571
Attributable toEquity holders of the Company -1 040 -569
Non-controlling interests -7 -2
1) Figures for 2012 have been restated due to adoption of revised IAS 19 Employee Benefits standard. Restatement had an effect on the following notes: 7. Employee benefit expenses, 8. Financial income and expenses, 9. Income taxes, 10. Earnings per share, and 25. Employee benefit obligations.
Outokumpu Annual Report 2013 cOnsOlidated financial stateMents, ifrs
33

Consolidated statement of financial position
€ million Note 20132012
Restated 1) 2)
ASSETS
Non-current assetsIntangible assets 11 570 607
Property, plant and equipment 12 3 254 3 716
Investments in associated companies and joint ventures 13 66 51
Available-for-sale financial assets 16 15 16
Investments at fair value through profit or loss 17 2 2
Derivative financial instruments 20 2 2
Deferred tax assets 9 24 89
Trade and other receivables 22 11 172
3 944 4 655
Current assetsInventories 21 1 216 2 328
Available-for-sale financial assets 16 4 5
Investments at fair value through profit or loss 17 17 59
Derivative financial instruments 20 21 54
Trade and other receivables 22 813 1 089
Cash and cash equivalents 23 607 222
2 679 3 757
Assets held for sale 5 2 200 1 276
TOTAL ASSETS 8 823 9 688
1) Figures for 2012 have been restated due to completing the Inoxum acquisition accounting (see Note 4. Acquisitions and disposals).2) Figures for 2012 have been restated due to adoption of revised IAS 19 Employee Benefits standard. Restatement had an effect on the following notes: 7.
Employee benefit expenses, 8. Financial income and expenses, 9. Income taxes, 10. Earnings per share, and 25. Employee benefit obligations.
Outokumpu Annual Report 2013 cOnsOlidated financial stateMents, ifrs
34

€ million Note 20132012
Restated 1) 2)
EQUITY AND LIABILITIES
Equity attributable to the equity holders of the CompanyShare capital 311 311
Premium fund 714 714
Invested unrestricted equity reserve 1 462 1 462
Other reserves 17 30
Retained earnings -617 410
1 887 2 926
Non-controlling interests 4 26
Total equity 24 1 891 2 952
Non-current liabilitiesLong-term debt 3) 27 3 270 2 935
Derivative financial instruments 20 15 39
Deferred tax liabilities 9 26 92
Defined benefit and other long-term employee benefit obligations 25 317 434
Provisions 26 115 119
Trade and other payables 28 48 5
3 791 3 622
Current liabilitiesCurrent debt 27 893 718
Derivative financial instruments 20 35 24
Provisions 26 25 37
Current tax liabilities 9 4 4
Trade and other payables 28 1 136 1 543
2 093 2 327
Liabilities directly attributable to assets held for sale 5 1 048 786
TOTAL EQUITY AND LIABILITIES 8 823 9 688
1) Figures for 2012 have been restated due to completing the Inoxum acquisition accounting (see Note 4. Acquisitions and disposals).2) Figures for 2012 have been restated due to adoption of revised IAS 19 Employee Benefits standard. Restatement had an effect on the following notes: 7.
Employee benefit expenses, 8. Financial income and expenses, 9. Income taxes, 10. Earnings per share, and 25. Employee benefit obligations.3) Includes Outokumpu’s loan note to ThyssenKrupp.
Outokumpu Annual Report 2013 cOnsOlidated financial stateMents, ifrs
35

Consolidated statement of cash flows€ million Note 2013 2012
Cash flow from operating activities
Net result for the financial year 1) -1 003 -536
Adjustments for
Taxes 9 11 12
Depreciation and amortization 11, 12 332 230
Impairments 11, 12 14 106
Share of results in associated companies and joint ventures 13 2 0
Gain/loss on sale of intangible and tangible assets 6 -5 -1
Gain/loss on sale of financial assets 8 50 -1
Gain/loss on divestments 4 -4 19
Interest income 8 -13 -12
Dividend income 8 -1 -0
Interest expense 8 210 67
Exchange rate differences 8 31 65
Other non-cash adjustments 1) 218 -7
844 478
Change in working capital
Change in trade and other receivables 43 683
Change in inventories 480 277
Change in trade and other payables -172 -535
Change in provisions -55 -31
297 394
Dividends received 2 0
Interest received 3 3
Interest paid -106 -72
Income taxes paid -3 -1
Net cash from operating activities 34 266
Outokumpu Annual Report 2013 cOnsOlidated financial stateMents, ifrs
36

€ million Note 2013 2012
Cash flow from investing activitiesAcquisition of subsidiaries, net of cash 4 - -915
Purchases of available-for-sale financial assets 16 -2 -5
Purchases of property, plant and equipment 12 -281 -295
Purchases of intangible assets 11 -4 -2
Disposal of businesses, net of cash 4 -1 19
Proceeds from sale of property, plant and equipment 12 70 1
Proceeds from sale of intangible assets 11 3 0
Proceeds from sale of loan receivable 114 -
Change in other long-term receivables -7 1
Net cash from investing activities -108 -1 196
Cash flow before financing activities -74 -929
Cash flow from financing activitiesRights issue 24 - 972
Borrowings of long-term debt 1 114 611
Repayments of long-term debt -696 -384
Change in current debt 52 -188
Repayments of finance lease liabilities -12 -12
Other financing cash flow 1 -3
Net cash from financing activities 459 994
Net change in cash and cash equivalents 385 65
Cash and cash equivalents at the beginning of the financial year 222 168
Foreign exchange rate effect on cash and cash equivalents -11 -11
Discontinued operations net change in cash effect 12 -
Net change in cash and cash equivalents 385 65
Cash and cash equivalents at the end of the financial year 23 607 222
1) Figures for 2012 have been restated due to adoption of revised IAS 19 Employee Benefits standard.Cash flows are presented for continuing operations.
Outokumpu Annual Report 2013 cOnsOlidated financial stateMents, ifrs
37

Consolidated statement of changes in equityAttributable to the equity holders of the Company
€ million Share
capitalPremium
fund
Invested unrestricted
equity reserve
Other reserves
Fair value
reserves
Cumula-tive trans-lation dif-ferences
Remea-surements of defined
benefit plans
Treasury shares
Other retained earnings
Non-controlling
interestsTotal
equity
Equity on Jan 1, 2012 1) 311 714 - 7 19 -76 -42 -25 1 127 14 2 050Result for the period - - - - - - - - -534 -2 -536
Other comprehensive income - - - - 3 -5 -34 - - 0 -36Total comprehensive income for the financial year - - - - 3 -5 -34 - -534 -2 -571Transactions with owners of the Company
Contributions and distributions
Share issues 2) - - 1 462 - - - - - - - 1 462
Share-based payments - - - - - - - 0 1 - 1
Changes in ownership interests
OSTP reorganization - - - - - - - - -4 4 -Non-controlling interest in Inoxum - - - - - - - - - 11 11
Equity on Dec 31, 2012 1) 311 714 1 462 7 22 -81 -75 -25 591 26 2 952Result for the period - - - - - - - - -997 -6 -1 003
Other comprehensive income - - - - -13 -38 8 - - -1 -44Total comprehensive income for the financial year - - - - -13 -38 8 - -997 -7 -1 047Transactions with owners of the Company
Contributions and distributions
Share-based payments - - - - - - - 1 -1 - 1
Changes in ownership interests
Disposal of subsidiary - - - - - - 3 - -3 -15 -15
Equity on Dec 31, 2013 311 714 1 462 7 9 -119 -65 -24 -410 4 1 891
1) Figures for 2012 have been restated due to adoption of revised IAS 19 Employee Benefits standard. Restatement of equity Jan 1, 2012 was immaterial.2) Shares issued in the Outokumpu rights issue in March–April 2012 and in the directed share issue to ThyssenKrupp AG in connection with the Inoxum
acquisition in December 2012.
Outokumpu Annual Report 2013 cOnsOlidated financial stateMents, ifrs
38
Notes to the consolidated financial statements
1. Corporate information
Outokumpu Oyj is a Finnish public limited liability company organized under the laws of Finland and domiciled in Espoo, Finland. The parent company, Outokumpu Oyj, has been listed on the NASDAQ OMX Helsinki since 1988. A copy of the consolidated financial statements is available at the Group’s website www.outokumpu.com, from Outokumpu Oyj/Corporate Communications, P.O. Box 140, 02201 Espoo, Finland or via e-mail at [email protected].
Outokumpu is the global leader in stainless steel. We create advanced materials that are efficient, long lasting and recyclable – helping to build a world that lasts forever. Stainless steel is an ideal material to create lasting solutions in demanding applications from cutlery to bridges, energy to medical equipment. Stainless steel is 100% recyclable, corrosion-resistant, maintenance-free, durable and hygienic. Outokumpu employs more than 12 000 professionals in more than 40 countries.
In its meeting on February 12, 2014 the Board of Directors of Outokumpu Oyj approved the publishing of these consolidated financial statements. According to the Finnish Limited Liability Companies Act, shareholders have the right to approve or reject the financial statements in the Annual General Meeting held after the publication of the financial statements. The Annual General Meeting also has the right to make a decision to amend the financial statements.
2. Accounting principles for the consolidated financial statements
Basis of preparationThe consolidated financial statements of Outokumpu have been prepared in accordance with International Financial Reporting Standards (IFRSs) as adopted by the European Union. The consolidated financial statements have been prepared in compliance with the IAS and IFRS standards as well as the SIC and IFRIC interpretations in force on December 31, 2013. The consolidated financial statements also comply with the regulations of Finnish accounting and company legislation complementing the IFRSs.
The consolidated financial statements are presented in millions of euros and have been prepared under the historical cost convention, unless otherwise stated in the accounting principles. All figures presented have been rounded, and consequently the sum of individual figures may deviate from the presented aggregate figure. Key figures have been calculated using exact figures.
The consolidated financial statements of Outokumpu for 2013 have been prepared on a going concern basis.
Outokumpu has suffered from low profitability resulting to a stretched financial position. As a consequence, Outokumpu has taken industrial restructuring and efficiency measures to improve profitability. Also, Outokumpu has taken measures to strengthen its financial position, which include the divestment of the Terni remedy assets, the VDM business and certain service centers to ThyssenKrupp, the planned rights issue of EUR 650 million, a new liquidity facility of EUR 500 million and extensions of existing loans and credit facilities.
Outokumpu has signed a binding agreement with ThyssenKrupp to sell the Terni remedy assets, the VDM business and certain service centers to ThyssenKrupp. Outokumpu’s loan note to ThyssenKrupp will be used as a consideration for the transaction, which will result to a strengthening of Outokumpu’s financial position. The rights issue (subject to approval by Extraordinary General Meeting on February 14, 2014), the new liquidity facility of EUR 500 million and extensions of existing loans and credit facilities are all subject to the divestment. Outokumpu management is confident that the conditions for the closing of the transaction will be met and closing will take place during the first quarter 2014.
Strengthening of financial position will further enhance the execution of Outokumpu’s strategy that decisively aims at sustainable profitability through industrial restructuring and efficiency measures. Outokumpu management is confident that the measures described above will mitigate the risks related to company’s liquidity and capital structure.
As from January 1, 2013 Outokumpu has applied the following new and amended standards and interpretations. The adoption of amended or new standards did not have a material impact on the consolidated financial statements for 2013.
· Amendment to IAS 1 Presentation of Financial Statements: The main change resulting from the amendment is the requirement to group items of other comprehensive income by whether they will subsequently be reclassified through profit or loss if certain conditions are met. Outokumpu has modified the presentation of other comprehensive income accordingly in the consolidated financial statements.
Outokumpu Annual Report 2013 nOtes tO the cOnsOlidated financial stateMents
39

· Amendment to IAS 19 Employee Benefits: Remeasurements of the net defined benefit liability, including all actuarial gains and losses, are immediately recognized in other comprehensive income, thus eliminating the so-called corridor approach. Finance costs are calculated on a net funding basis. In addition, all past service costs are immediately recognized in profit or loss. Outokumpu waived the corridor approach already in the 2012 consolidated financial statements. Therefore the impact regarding the defined benefit pension plans is limited to the restatement of the expected return on assets assumption and recognition of the previously unrecognized past service cost. The amendment also resulted in additional disclosures.
· IFRS 13 Fair Value Measurement: IFRS 13 establishes a single source of all fair value measurements and disclosure requirements for use across IFRSs. The new standard also provides a precise definition of fair value. IFRS 13 does not extend the use of fair value accounting, but it provides guidance on how to measure fair value under IFRSs when fair value is required or permitted. The new standard resulted in additional disclosures.
· Amendments to IFRS 7 Financial Instruments: Disclosures: The amended standard requires the presentation of information that will allow evaluation of the effects of netting arrangements on the entity’s financial position. The amendment resulted in additional disclosures.
· Annual Improvements to IFRSs 2009-2011 (May 2012): Through the Annual Improvements process, minor and non-urgent amendments are grouped together and carried out once a year. The improvements affected a total of five standards. Their impact has not been significant.
Other new or amended standards and interpretations had no impact on Outokumpu’s consolidated financial statements.
Restatements of financial statementsIn 2013, Outokumpu adopted amended IAS 19 Employee Benefits standard. As Outokumpu had already adopted the amended standard requirement regarding waiving of the so-called corridor method in 2012, changes on Outokumpu’s accounting policies were limited to the following: to immediately recognizing all past service costs, and to replace interest cost and expected return on plan assets with a net interest amount that is calculated by applying the discount rate to the net defined benefit liability. The resulting restatement had a minor impact on employee benefit expenses, interest income and interest expenses, and defined benefit and other long-term employee benefit obligations in the consolidated financial statements for 2012.
Outokumpu has finalized the accounting related to the Inoxum transaction in 2012 based on the final valuation of the identifiable asset and liabilities. Outokumpu had 12 months from the closing of the transaction to retrospectively adjust the provisional amounts that were presented in detail in the note 4 of Outokumpu’s financial statements 2012. Final identifiable assets acquired and liabilities assumed, as well as goodwill arising from the acquisition are presented in the note 4 for these financial statements.
Adoption of new and amended IFRS standards and interpretations
Outokumpu has not yet applied the following new and amended standards and interpretations already issued. The Group will adopt them as of the effective date or, if the date is other than the first day of the financial year, from the beginning of the subsequent financial year (* = not yet endorsed by the European Union as at December 31, 2013).
· IFRS 10 Consolidated Financial Statements and related amendments (effective in the EU for financial years beginning on or after January 1, 2014): IFRS 10 builds on existing principles by identifying the concept of control as the determining factor when deciding whether an entity should be incorporated within the consolidated financial statements. The standard also provides additional guidance to assist in the determination of control where this is difficult to assess. Based on Outokumpu’s evaluation, the new standard does not affect significantly Outokumpu’s future financial statements.
· IFRS 11 Joint Arrangements and related amendments (effective in the EU for annual periods beginning on or after January 1, 2014): In the accounting of joint arrangements IFRS 11 focuses on the rights and obligations of the arrangement rather than its legal form. There are two types of joint arrangements: joint operations and joint ventures. In future jointly controlled entities are to be accounted for using only one method, equity method, and the other alternative, proportional consolidation is no longer allowed. Based on Outokumpu’s evaluation, the new standard does not have a material impact on Outokumpu’s future financial statements.
· IFRS 12 Disclosures of Interests in Other Entities and related amendments (effective in the EU for financial years beginning on or after January 1, 2014): IFRS 12 includes the disclosure requirements for all forms of interests in other entities, including associates, joint arrangements, structured entities and other off-balance sheet vehicles. The new standard will have an impact on the disclosures of Outokumpu’s future financial statements.
· IAS 28 (revised 2011) Investments in Associates and Joint Ventures (effective in the EU for financial years beginning on or after January 1, 2014): Following the issue of IFRS 11, the revised IAS 28 includes the requirements for joint ventures, as well as associates, to be equity accounted. The revised standard is not expected to have a significant impact on Outokumpu’s future financial statements.
· Amendments to IAS 32 Financial Instruments: Presentation (effective for annual periods beginning on or after January 1, 2014): The amendments provide clarifications on the application of requirements for offsetting financial assets and financial liabilities on the statement of financial position. The amended standard is to be applied retrospectively. The amendments are not expected to have a significant impact on Outokumpu’s future financial statements.
· Amendments to IAS 36 Impairment of Assets (effective for financial years beginning on or after January 1, 2014): The objective of the amendments is to clarify that the scope of the disclosures of information about the recoverable amount of assets, where that amount is based on fair value less costs of disposal, is limited to impaired assets. The amended standard is not assessed to have a significant impact on Outokumpu’s consolidated financial statements.
Outokumpu Annual Report 2013 nOtes tO the cOnsOlidated financial stateMents
40

· Amendments to IAS 39 Financial Instruments: Recognition and Measurement (effective for financial years beginning on or after January 1, 2014): The amendments made to IAS 39 provide an exception to the requirement to discontinue hedge accounting in certain circumstances where a derivative, which has been designated as a hedging instrument, is novated from one counterparty to a central counterparty as a consequence of laws or regulations. The amendments are not assessed to have an impact on Outokumpu’s consolidated financial statements.
· IFRIC 21 Levies* (effective for financial years beginning on or after January1, 2014): The interpretation clarifies the accounting treatment of levies. A liability for a levy is recognised when the activity that triggers payment, as identified by the relevant legislation, occurs. The interpretation is applicable to all levies other than income taxes, fines, penalties and outflows that are in scope of other standards. The interpretation is not assessed to have a significant impact on Group’s consolidated financial statements.
· Amendments to IAS 19 Employee Benefits – Defined Benefit Plans: Employee Contributions* (effective for financial years beginning on or after July 1, 2014): The amendments clarify the accounting treatment under IAS 19 in respect of defined benefit plans that involve contributions from employees or third parties towards the cost of benefits. The amendments are not assessed to have an impact on Outokumpu’s consolidated financial statements.
· Annual Improvements to IFRSs (2011–2013 cycle* and 2011–2012 cycle*, December 2013) (effective for financial years beginning on or after July 1, 2014): The annual improvements process provides a mechanism for minor and non-urgent amendments to IFRSs to be grouped together and issued in one package annually. The amendments cover in total four (2011–2013 cycle) and seven (2010–2012 cycle) standards. Their impacts vary standard by standard but are not significant.
· IFRS 9 Financial Instruments* and subsequent amendments (scheduling postponed): IFRS 9 is the first step of the IASB’s three-phase project to replace the current IAS 39 Financial Instruments: Recognition and Measurement. The amendments resulting from the first phase address the classification, measurement and recognition of financial assets and financial liabilities. Different ways of measurement for financial assets have been retained, but simplified. Based on measurement, financial assets are classified into two main groups: financial assets at amortized cost and financial assets at fair value. Classification depends on a company’s business model and the characteristics of contractual cash flows. For financial liabilities, the standard retains most of the IAS 39 requirements. IFRS 9 is estimated to have a significant impact on the Group’s accounting for financial instruments.
Other new or amended standards and interpretations are not expected to have an impact on Outokumpu’s consolidated financial statements when adopted.
Management judgements and use of estimates
The preparation of the financial statements in accordance with IFRSs requires management to make judgements and make estimates and assumptions that affect the reported amounts of assets and liabilities and the disclosure of contingent assets and contingent liabilities at the reporting date, as well as the reported amounts of income and expenses during the reporting period. The management estimates
and judgements are continuously monitored and they are based on prior experience and other factors, such as future expectations assumed to be reasonable considering the circumstances. Although these estimates are based on management’s best knowledge of the circumstances at the end of the reporting period, actual results may differ from the estimates and assumptions. Management believes that the following accounting principles represent those matters requiring the exercise of judgement where a different opinion could result in significant changes to reported results.
Business combinations
In significant business combinations, the Group has used external advisor to assist in evaluating the fair values of assets acquired and liabilities assumed. The procedures included for example analysis of market conditions, market data covering e.g. economic and regulatory trends; analysis and inspection of acquired companies and their operating and financial projections; and development of discounted cash flow models and discount rates used in the models. Regarding analysis of property, plant and equipment, the scope included a study of the major assets at various facilities and research in the marketplace in order to identify replacement costs, useful lives and other pertinent information used in the valuation process.
Management believes that the estimates and assumptions used are reasonable for determining fair values, although different estimates and assumptions could significantly affect the amounts reported in Note 4. Acquisitions and disposals.
Classification of assets and liabilities as held for sale
Outokumpu announced on November 30, 2013 the disposal of the Terni, certain service centers and the VDM business. Considering circumstances and information available, management has concluded the sale highly probable and presents the related assets and liabilities classified as held for sale in the consolidated financial statements. No impairment loss has been recognized on these assets or liabilities as management expects that their fair value less costs to sell does not materially differ from their carrying amounts.
Inventories
Inventories are stated at the lower of cost and net realizable value (NRV). Net realizable value is the estimated selling price in the ordinary course of business, less the estimated costs of completion and the estimated costs necessary to make the sale. The most important commodity price risk for Outokumpu is caused by fluctuation in nickel and other alloy prices. The majority of stainless steel sales contracts include an alloy surcharge clause, with the aim of reducing the risk arising from the time difference between raw material purchase and product delivery. However, the risk is significant because the delivery cycle in production is longer than the alloy surcharge mechanism provides for. Thus, only the price for the products to be sold in near future is known. That is why a significant part of the future price for each product to be sold is estimated according to management’s best knowledge in NRV calculations. Due to fluctuations in nickel and other alloy prices, the realized prices can deviate significantly from what has been used in NRV calculations on the closing date.
Outokumpu Annual Report 2013 nOtes tO the cOnsOlidated financial stateMents
41

Property, plant and equipment and intangible assets and impairments
Management estimates relate to carrying amounts and useful lives of assets as well as other underlying assumptions. Different assumptions and assigned lives could have a significant impact on the reported amounts. Management estimates in relation to goodwill relate to the estimation of the value in use of the cash-generating units to which goodwill has been allocated. The value in use calculation requires management to estimate the future cash flows expected to arise from the cash-generating units and a suitable discount rate in order to calculate present value. The future projections of cash flows include, among other estimates, projections of future prices and delivery volumes, production costs and maintenance capital expenditures.
Carrying amounts of assets are regularly reviewed to determine whether there is any evidence of impairment as described in these accounting principles. Preparation of the estimated future cash flows and discount rates for the impairment testing requires management to make assumptions relating to future expectations (e.g. future product pricing, production levels, production costs, market supply and demand, projected maintenance capital expenditure and weighted average cost of capital). A pre-tax discount rate used for the net present value calculation of projected cash flows reflects the weighted average cost of capital. The key assumptions used in the impairment testing, including sensitivity analysis, are explained further in Note 11. Intangible assets and Note 12. Property, plant and equipment.
Income taxes
Group operates and earns income in numerous countries and is subject to changing tax laws in multiple jurisdictions within the countries. Significant judgments are necessary in determining the worldwide income tax liabilities of the Group. Although management believes they have made reasonable estimates about the resolution of tax uncertainties, the final outcome of these uncertainties could have an effect on the income tax liabilities and deferred tax liabilities in the period.
At the end of reporting period, the Group assesses whether the realization of future tax benefits is sufficiently probable to recognize deferred tax assets. This assessment requires judgment with respect to, among other things, benefits that could be realized from future taxable income, available tax strategies, as well as other positive and negative factors. The recorded amount of deferred tax assets could be reduced if estimates of taxable income and benefits from available tax strategies are lowered, or if current tax regulations are enacted that impose restrictions on the Group’s ability to utilize future tax benefits.
Fair values of derivatives and other financial instruments
The fair value of financial instruments which cannot be determined based on quoted market prices and rates are based on different valuation techniques. The Group uses its judgment to select a variety of methods and make assumptions that are mainly based on market conditions existing at the end of each reporting period. Factors regarding valuation techniques and their assumptions could affect the reported fair values.
The Group has used discounted cash flow analysis for various derivative contracts and in case of options Black-Scholes-Merton model has been applied.
Employee benefits
The present value of pension obligations is subject to actuarial assumptions which actuaries use in calculating these obligations. Actuarial assumptions include, among others, discount rate, the annual rate of increase in future compensation levels and inflation rate. The assumptions used are presented in Note 25. Employee benefit obligations.
Provisions
The most significant provisions in the statement of financial position relate to restructuring programs and primarily include termination benefits to employees. The applied judgment mainly relates to the estimated amounts of termination benefits.
The Group has also made provisions for known environmental liabilities based on management’s best estimate of the remediation costs. The precise amount and timing of these costs could differ significantly from the estimate.
Principles of consolidation
Subsidiaries
The consolidated financial statements include the parent company Outokumpu Oyj and all those subsidiaries where over 50% of the subsidiary’s voting rights are controlled directly or indirectly by the parent company, or the parent company is otherwise in control of the company at the end of the reporting period. Control is the power to govern the financial and operational policies of an entity so as to obtain benefits from its activities. The existence of potential control is also taken into account if the instruments entitling to potential voting rights are currently exercisable. Acquired subsidiaries are consolidated from the date that control was obtained by the Group, and disposed subsidiaries until control ceases.
Acquired or established subsidiaries are accounted for by using the acquisition method. The consideration transferred and the identifiable assets acquired and liabilities assumed in the acquired company are measured at fair value at the acquisition date. The consideration transferred includes any assets transferred by the acquirer, liabilities incurred by the acquirer to former owners of the acquiree and the equity interests issued by the acquirer. Any contingent consideration related to the business combination is measured at fair value at the acquisition date and it is classified as either liability or equity. Contingent consideration classified as liability is remeasured at its fair value at the end of each reporting period and the subsequent changes to fair value are recognized in profit or loss. Contingent consideration classified as equity is not subsequently remeasured. The consideration transferred does not include any transactions accounted for separately from the acquisition. All acquisition-related costs, with the exception of costs to issue debt or equity securities, are recognized as expenses in the periods in which costs are incurred and services rendered.
Outokumpu Annual Report 2013 nOtes tO the cOnsOlidated financial stateMents
42

Goodwill arising on an acquisition is recognized as the excess of the aggregate of the consideration transferred and the amount of any non-controlling interests or previously held equity interests in the acquiree, over the Group’s share of the fair value of the identifiable assets acquired and liabilities assumed at the acquisition date. Non-controlling interest in the acquiree is measured acquisition-by-acquisition either at fair value or at value, which equals to the proportional share of the non-controlling interest in the identifiable net assets acquired. Changes in the parent company’s ownership interest in a subsidiary are accounted for as equity transactions if the parent company retains control of the subsidiary.
To those business combinations, which have taken place before January 1, 2010 accounting principles effective at that time have been applied.
All intra-group transactions, receivables, liabilities and unrealized margins, as well as distribution of profits within the Group, are eliminated in the preparation of consolidated financial statements. The result for the period and items recognized in other comprehensive income are allocated to the equity holders of the company and non-controlling interests and presented in the statement of income and statement of other comprehensive income. Non-controlling interests are presented separately from the equity allocated to the equity holders of the company. Comprehensive income is allocated to the equity holders of the company and to non-controlling interests even in situations where the allocation would result in the non-controlling interests’ share being negative, unless non-controlling interests have an exemption not to meet obligations which exceed non-controlling interests’ investment in the company.
Associated companies and joint ventures
Companies, where Outokumpu generally holds voting rights of 20–50% and in which Outokumpu otherwise has significant influence, but not control, over the financial and operating policies, are included in the consolidated financial statements as associated companies. Associated companies are consolidated by using the equity method from the date that significant influence was obtained until it ceases.
The Group’s share of the associated company’s result for the period is separately disclosed below the operating result in the consolidated statement of income. Outokumpu’s share of changes recognized in the associated company’s other comprehensive income is recognized in the Group’s other comprehensive income. When Outokumpu’s share of the associated company’s losses exceeds the carrying amount of the investment, the investment is recognized at zero value in the statement of financial position and recognition of further losses is discontinued, except to the extent that the Group has incurred obligations in respect of the associated company. The interest in an associated company comprises the carrying amount of the investment under the equity method together with any long-term interest that, in substance, forms a part of the net investment in the associated company.
Joint ventures in which Outokumpu has contractually based joint control with a third party are also accounted for by using the equity method described above.
Non-current assets held for sale and discontinued operations
Non-current assets (or disposal groups) and assets and liabilities related to discontinued operations are classified as held for sale if their carrying amounts are expected to be recovered primarily through sale rather than through continuing use. Classification as held for sale requires that the following criteria are met; the sale is highly probable, the asset (or disposal group) is available for immediate sale in its present condition subject to usual and customary terms, the management is committed to the sale and the sale is expected to be completed within one year from the date of classification.
Prior to classification as held for sale, the assets or assets and liabilities related to a disposal group in question are measured according to the respective IFRS standards. From the date of classification, non-current assets (or a disposal group) held for sale are measured at the lower of the carrying amount and the fair value less costs to sell, and the recognition of depreciation and amortization is discontinued.
Assets included in disposal groups but not in the scope of the measurement requirements of IFRS 5, as well as liabilities, are measured according to the related IFRS standards also after the date of classification.
Discontinued operation is a component of an entity that either has been disposed of, or is classified as held for sale, and represents a separate major line of business or geographical area of operations, is part of a single co-ordinated plan to dispose of a separate major line of business or geographical area of operations or is a subsidiary acquired exclusively with a view to resale.
Result from discontinued operations is shown separately in the consolidated statement of income and the comparative figures are restated accordingly. Assets held for sale, disposal groups and liabilities included in disposal groups are presented in the statement of financial position separately from other items. The comparatives for statement of financial position items are not restated.
Segment reportingAn operating segment is a component of the Group that engages in business activities from which it may earn revenues and incur expenses, and for which discrete financial information is available. Outokumpu has four reportable operating segments which represent the strategic business areas of the Group. The business areas are located in different geographical areas, they are managed separately and they are separately reported in the internal management reporting to CEO who is Outokumpu’s chief operating decision maker. Outokumpu’s segment information is based on the internal management reporting which is prepared according to IFRS accounting principles.
Outokumpu’s reportable operating segments are: Stainless EMEA, Stainless Americas, Stainless APAC and Specialty Stainless. Pricing of intersegment transactions is based on arm’s length prices. Operating result of the operating segments is reported to the CEO regularly in order for him to review their performance and make decisions about resources to be allocated to the segments. Operating result is defined
Outokumpu Annual Report 2013 nOtes tO the cOnsOlidated financial stateMents
43

correspondingly in management reporting as in these accounting principles.
Other operations mainly consist of such business development and Corporate Management expenses that are not allocated to the businesses.
Foreign currency transactionsTransactions of each subsidiary included in the consolidated financial statements are measured using the currency that best reflects the economic substance of the underlying events and circumstances relevant to that subsidiary (“the functional currency”). The consolidated financial statements are presented in euros which is the functional and presentation currency of the parent company. Group companies’ foreign currency transactions are translated into local functional currencies using the exchange rates prevailing at the dates of the transactions. Receivables and liabilities in foreign currencies are translated into functional currencies at the exchange rates prevailing at the end of the reporting period. Foreign exchange differences arising from interest-bearing assets and liabilities and related derivatives are recognized in finance income and expenses in the statement of income. Foreign exchange differences arising in respect of other financial instruments are included in operating result under sales, purchases or other operating income and expenses. The effective portion of exchange differences arisen from instruments designated as hedges of the net investments in foreign operations is recognized in other comprehensive income.
For those subsidiaries whose functional and presentation currency is not the euro, the income and expenses for the statements of income and comprehensive income, and the items for statement of cash flows, are translated into euro using the average exchange rates of the reporting period. The assets and liabilities for the statement of financial position are translated using the exchange rates prevailing at the reporting date. The translation differences arising from the use of different exchange rates explained above are recognized in Group’s other comprehensive income. Any goodwill arising on the acquisition of foreign operations and any fair value adjustments to the carrying amounts of assets and liabilities arising on the acquisition of those foreign operations are treated as assets and liabilities of those foreign operations. They are translated into euro using the exchange rates prevailing at the reporting date. When a foreign operation is sold, or is otherwise partially or completely disposed of, the translation differences accumulated in equity are reclassified in profit or loss as part of the gain or loss on the sale.
Revenue recognitionRevenue from the sale of goods is recognized after the significant risks and rewards of ownership have been transferred to the buyer, and the Group retains neither a continuing managerial involvement to the degree usually associated with ownership, nor effective control of those goods. Usually this means that revenue is recognized upon delivery of goods to customers in accordance with agreed terms of delivery.
Outokumpu ships stainless steel products to customers under a variety of delivery terms. The used terms are based on Incoterms 2013 collection of delivery terms, published and defined by the International Chamber of Commerce Terms of Trade.
The most common delivery terms used by Outokumpu are “C” terms, whereby the Group arranges and pays for the carriage and certain other costs. The Group ceases to be responsible for the goods and revenue is recognized once the goods have been handed over to the carrier to be delivered to the agreed destination.
Less frequently used are “D” terms, under which the Group is obliged to deliver the goods to the buyer at the agreed destination, in which case revenue is recognized when the goods are delivered to the buyer. Also “F” terms are less frequently used, under which the buyer arranges and pays for the carriage, and revenue is recognized when the goods are handed over to the carrier contracted by the buyer.
Income taxesCurrent and deferred income taxes are determined in accordance with IAS 12 Income taxes on entity level to the extent an entity is subject to income taxation. The Group’s income tax in the statement of income includes current income taxes of the Group companies based on taxable profit for the period, together with tax adjustments for previous periods and the change in deferred income taxes. In several countries (France, Germany, the UK, Italy, the Netherlands, Sweden and the USA) Outokumpu companies are included in income tax consolidation groups / group taxation systems. The share of results in associated companies is reported in the statement of income based on the net result and thus including the income tax effect.
Deferred income taxes are stated using the balance sheet liability method to reflect the net tax effects of temporary differences between the carrying amounts of assets and liabilities in the financial statements and the corresponding tax basis at the reporting date, as well as for unused tax losses or credits carry forward. Deferred tax assets are recognized for all deductible temporary differences to the extent that it is probable that future taxable profits will be available, against which deductible temporary differences can be utilized. A valuation allowance is recognized against a deferred tax asset if the realization of the related tax benefit is not probable. The ability to recognize deferred tax assets is reviewed at the end of each reporting period. Deferred tax liabilities are usually recognized in the statement of financial position in full except to the extent that the deferred taxes arise from the initial recognition of an asset or liability in a transaction which is not a business combination and at the time of the transaction, affects neither accounting profit nor taxable profit.
Deferred taxes are calculated at the enacted or substantially enacted tax rates that are expected to apply when the asset or the liability is settled. Generally, deferred tax is charged or credited to the statement of income, except if the taxes are related to items of other comprehensive income or to transactions or other events recognized directly in equity, in which case the related income taxes are also recognized either in other comprehensive income or directly in equity, respectively.
Research and development costsResearch costs are expensed in the reporting period in which they are incurred. Development costs are capitalized when it is probable that the development project will generate future economic benefits for the Group, and certain criteria related to commercial and technological feasibility are met. These projects relate to the development of new or
Outokumpu Annual Report 2013 nOtes tO the cOnsOlidated financial stateMents
44

substantially improved products or production processes. Capitalized development costs mainly comprise materials and supplies and direct labour costs as well as related overhead costs. Development costs recognized as expenses are not subsequently capitalized.
Subsequent to initial recognition, capitalized development costs are measured at cost less accumulated amortization and impairment losses. Capitalized development costs are amortized on a straight-line basis over their estimated useful lives which is generally five years. Recognition of amortization is commenced as the asset is ready for use. The accounting treatment of the government grants received for research and development activities is described below under Government grants.
Goodwill and other intangible assetsGoodwill arising on a business combination is recognized at the acquisition date at an amount representing the excess of the consideration transferred in an acquisition over the fair value of the identifiable assets acquired, liabilities assumed and any non-controlling interest and any previously held equity interests in the acquiree, if any. Goodwill is not amortized, but tested for impairment. In respect of associated companies, goodwill is included in the carrying amount of the investment. Goodwill is measured at cost less accumulated impairment losses.
Intangible assets other than goodwill include land-use rights, customer relationships, capitalized development costs, patents, licenses and software. An intangible asset is recognized only if it is probable that the future economic benefits attributable to the asset will flow to the Group and the cost of the asset can be measured reliably. All other expenditure is expensed as incurred. Intangible assets are recognized initially at cost. After initial recognition, assets are measured at cost less amortizations and accumulated impairment losses if the intangible asset has a finite useful life. Cost comprises the purchase price and all costs directly attributable to bringing the asset ready for its intended use. Intangible assets acquired in a business combination are measured at fair value at the acquisition date.
Intangible assets are amortized on a straight-line basis over their expected useful lives. Assets tied to a certain fixed period are amortized over the contract term. Amortization periods used for intangible assets are the following:
Customer relationships up to 5 yearsSoftware up to 10 yearsCapitalized development costs up to 10 yearsIntangible rights up to 20 years
Recognition of amortization is discontinued when the intangible asset is classified as held for sale. The estimated useful lives and residual values are reviewed at least at the end of each financial year. If they differ substantially from previous estimates, the useful lives are adjusted accordingly.
Gains and losses on disposal of intangible assets are included in other operating income and expenses.
Emission allowancesEmission allowances are intangible assets measured at cost. Allowances received free of charge are recognized at nominal value, i.e. at zero carrying amount. A provision to cover the obligation to return emission allowances is recognized at fair value at the end of the reporting period provided that the emission allowances received free of charge will not cover the actual emissions. The purchased emission allowance quotas recognized in intangible rights are derecognized as they have been offset against the obligation or, when the emission allowances are sold. The obligation to deliver allowances equal to emissions is recognized under other operating expenses. Gains from the sale of excess allowances are recognized as other operating income in the statement of income.
Property, plant and equipmentProperty, plant and equipment acquired by the Group companies are measured at cost. The cost includes all expenditure directly attributable to the acquisition of the asset. Government grants received are deducted from the cost. Property, plant and equipment acquired in business combinations are measured at fair value at the acquisition date. Borrowing costs (mainly interest costs) directly attributable to the acquisition or construction of a qualifying asset are capitalized in the statement of financial position as part of the carrying amount of the asset. Qualifying asset is an asset that necessarily takes a substantial period of time to get ready for its intended use or sale. Other borrowing costs are recognized as expenses in the period in which they are incurred. Property, plant and equipment are carried in the statement of financial position at cost less accumulated depreciation and impairment losses.
Property, plant and equipment are depreciated on a straight-line basis over their expected useful lives. Depreciation is based on the following estimated useful lives:
Buildings 25–40 yearsHeavy machinery 15–20 yearsLight machinery and equipment 3–15 years
Land is not depreciated as the useful life of land is assumed to be indefinite. Mine properties are depreciated using the units-of-production method based on the depletion of ore reserves over their estimated useful lives. Recognition of depreciation on an item of property, plant and equipment is discontinued when the item is classified as held for sale. Expected useful lives and residual values are reviewed at least at the end of each financial year and, if they differ significantly from previous estimates, the useful lives are revised accordingly.
Ordinary repairs and maintenance costs are expensed during the reporting period in which they are incurred. The cost of major renovations is included in the asset’s carrying amount when it is probable that the Group will derive future economic benefits in excess of the originally assessed standard of performance of the existing asset and the cost can be reliably measured. Costs arising on such major renovations are accounted for as capital expenditure and depreciated on a straight-line basis over their estimated useful lives.
Outokumpu Annual Report 2013 nOtes tO the cOnsOlidated financial stateMents
45

Gains and losses on sale and disposals of property, plant and equipment are determined by the difference between the received net proceeds and the carrying amount of the asset. Gains and losses on sale and disposals are presented in other operating income or expenses, thus included in operating result.
Government grantsGovernment or other grants are recognized as income on a systematic basis over the periods necessary to match them with the related costs which they are intended to compensate. Investment grants related to acquisitions of property, plant and equipment and intangible assets are deducted from the cost of the asset in question in the statement of financial position and recognized as income on a systematic basis over the useful life of the asset in the form of reduced depreciation expense.
Impairment of property, plant and equipment and intangible assets
Carrying amounts of non-current assets are regularly reviewed to determine whether there is any evidence of impairment. If any such evidence of impairment emerges, the asset’s recoverable amount is estimated. Goodwill is tested at least annually, irrespective of whether there is any evidence of impairment.
The recoverable amount of an asset is the higher of fair value less costs to sell and value in use. For goodwill testing purposes the recoverable amount is based on value in use which is determined by reference to discounted future net cash flows expected to be generated by the asset. In Outokumpu, goodwill is tested on operating segment level. The discount rate used is a pre-tax rate that reflects the current market view on the time value of money and the asset-specific risks. An impairment loss is the amount by which the carrying amount of an asset exceeds its recoverable amount. An impairment loss is recognized immediately in profit or loss. The estimated useful life of the asset that is subject to depreciation or amortization is also reassessed when an impairment loss is recognized.
A previously recognized impairment loss is reversed if there has been a change in the estimates used to determine the recoverable amount. However, the reversal must not cause that the adjusted carrying amount is higher than the carrying amount that would have been determined if no impairment loss had been recognized in prior years. Impairment losses recognized for goodwill are not reversed.
Leases
Group as a lessee
Lease agreements of property plant and equipment, in which the Group has substantially all the rewards and risks of ownership, are classified as finance leases. An asset acquired through finance lease is recognized as property, plant and equipment in the statement of financial position, within a group determined by the asset’s characteristics, at the commencement of the lease term at the lower of fair value and the present value of minimum lease payments.
Respective lease liabilities less finance charges are included in other interest-bearing financial liabilities. Each lease payment is allocated between the finance charge and the reduction of the outstanding liability. The finance charge is allocated to each period during the lease term so as to produce a constant periodic rate of interest on the remaining balance of the liability. Property, plant and equipment acquired under finance lease contracts are depreciated over the shorter of the useful life of the asset and the lease term. If a sale and leaseback transaction results in a finance lease, any excess of sales proceeds over the sold asset’s carrying amount will not be immediately recognized but deferred and amortized over the lease term.
At inception of significant other arrangements, the Group determines whether these arrangements are, or contain a lease component. At inception of an arrangement that contains a lease the Group separates payments and other consideration required by the arrangement into those for the lease and those for other elements. Lease accounting principles are applied to lease payments.
Leases of assets where the lessor retains substantially all the risks and benefits of ownership are classified as operating leases. Payments made under operating lease contracts are expensed on a straight-line basis over the lease terms.
Group as a lessor
Leases of property, plant and equipment where the Group has substantially transferred all the rewards and risks of ownership to the lessee are classified as finance leases. Assets leased out through such contracts are recognized as interest-bearing receivables and measured at the lower of the fair value of the leased asset and the present value of minimum lease payments. Interest income from finance lease is recognized in the statement of income so as to achieve a constant periodic rate of return on the net investment in the finance lease.
Rental income received from property, plant and equipment leased out by the Group under operating leases is recognized on a straight-line basis over the lease term.
Financial instruments
Financial assets
The Group’s financial assets are classified as financial assets at fair value through profit or loss, loans and receivables and available-for-sale financial assets. Outokumpu did not hold financial instruments classified as held-to-maturity investments in the current or previous reporting period. Classification is made upon initial recognition based on the purpose of use of the financial asset.
If an item is not measured at fair value through profit or loss, significant transaction costs are included in the initial carrying amount of the financial asset. Financial assets are derecognized when the Group loses the rights to receive the contractual cash flows on the financial asset or it transfers substantially all the risks and rewards of ownership outside the Group.
Outokumpu Annual Report 2013 nOtes tO the cOnsOlidated financial stateMents
46

At the end of the reporting period, the Group estimates whether there is objective evidence on impairment of items other than financial assets measured at fair value through profit or loss. A financial asset is assumed to be impaired if there is objective evidence on impairment and the effect on the estimated future cash flows generated by the financial assets can be reliably measured. Objective evidence on impairment may be e.g. a significant deterioration in the counterparty’s results, a contract breach by the debtor and, in case of equity instruments (available-for-sale financial assets), a significant or long-term decrease in the value of an instrument below its carrying amount. In such situations, the fair value development of equity instruments is reviewed for the past three quarters of the reporting period. The Group has determined percentual limits for the review, the breach of which will result in the recognition of an impairment loss. An impairment loss is recognized immediately in profit or loss.
Financial assets at fair value through profit or lossThe category of financial assets at fair value through profit or loss includes derivatives, to which hedge accounting is not applied, as well as other financial items at fair value through profit or loss held for trading purposes. A financial asset is classified in this category if it has been acquired with the main purpose of selling the asset within a short period of time.
These financial assets are recognized at the trade date at fair value and subsequently remeasured at fair value at the end of each reporting period. The fair value measurement is based on quoted rates and market prices as well as on appropriate valuation methodologies and models. Realized and unrealized gains and losses arising from changes in fair values are recognized in profit or loss in the reporting period in which they are incurred.
Loans and receivablesLoans and receivables are non-derivative financial assets with fixed or determinable payments that are not quoted in active markets. Loans and receivables arise when the Group gives out a loan or delivers goods or services directly to a debtor.
Loans and receivables are recognized at the settlement date and measured initially at fair value. After initial recognition, loans and receivables are measured at amortized cost by using the effective interest rate method.
Outokumpu uses factoring for working capital management. Sold trade receivables have been derecognized when the related risks and rewards of ownership have been transferred in material respect.
Available-for-sale financial assetsAvailable-for-sale financial assets are non-derivative financial assets which are either designated in this category or not classified in any other category of financial assets. The purchases and sales of these items are recognized at the trade date. Available-for-sale financial assets are included in non-current assets, unless the Group has the intention to dispose of the investment within 12 months from the reporting date.
This category includes share investments, both in listed and unlisted companies. Investments in shares are measured at fair value, or if fair value cannot be reliably measured, at cost less any impairment losses. The fair value measurement is based on quoted rates and market prices at the end of the reporting period, as well as on
appropriate valuation techniques, such as recent transaction prices and cash flow discounting. These valuation techniques maximize the use of observable market data where it is available and rely as little as possible on entity-specific estimates made by Outokumpu. Fair value changes of share instruments measured at fair value are recognized in other comprehensive income and presented in equity within fair value reserve, net of tax, until the shares in question are disposed of or impaired, in which case, the accumulated changes in fair value are transferred from equity to be recognized in profit or loss as reclassification adjustments.
Cash and cash equivalents Cash and cash equivalents comprise cash in hand, deposits held at call with banks and other highly liquid investments with original maturities of three months or less. These are readily convertible to a known amount of cash and the risk of changes in value is low. Bank overdrafts are included in current liabilities in the statement of financial position.
Financial liabilities
The Group’s financial liabilities are classified as either financial liabilities at fair value through profit or loss or other financial liabilities (financial liabilities recognized at amortized cost). A financial liability (or part of the liability) is not derecognized until the liability has ceased to exist, that is, when the obligation identified in a contract has been fulfilled or cancelled or is no longer effective.
Financial liabilities at fair value through profit or lossIn Outokumpu Group, the category of financial liabilities at fair value through profit or loss includes derivatives that do not meet the criteria of hedge accounting. Realized and unrealized gains and losses arising from changes in fair value of derivatives are recognized in profit or loss in the reporting period in which they are incurred.
Other financial liabilitiesFinancial liabilities recognized at amortized cost include the loans of the Group, finance lease liabilities and trade and other payables. Loans and trade and other payables are recognized at the settlement date and measured initially at fair value. After initial recognition they are carried at amortized cost using the effective interest rate method. Significant transaction costs are included in the original carrying amount.
Significant costs related to revolving credit facilities are amortized over the expected loan term.
Derivative instruments and hedge accounting
DerivativesAll the Group’s derivatives, including embedded derivatives, are initially recognized at fair value on the trade date, on which the Group becomes a contractual counterparty, and are subsequently measured at fair value. Gains and losses arising on fair value measurement are accounted for depending on the purpose of use of the derivative contract. The gains and losses arising from fair value changes of derivative contracts, to which hedge accounting is applied and which are effective hedging instruments, are presented congruent with the hedged item. Changes in fair value of derivative contracts not
Outokumpu Annual Report 2013 nOtes tO the cOnsOlidated financial stateMents
47

qualifying for hedge accounting are recognized in operating result in other operating income and expenses. If a derivative is designated for financing activities, the gain or loss effects arising from the instrument are recognized within financial income and financial expenses.
The fair value measurement of derivatives is based on quoted market prices and rates as well as on discounted cash flows at the end of the reporting period. The fair value of currency, interest rate and metal options is determined by utilising commonly applied option valuation models, such as Black-Scholes-Merton model. Fair values of certain derivatives are based on valuations of external counterparties.
Hedge accountingHedge accounting refers to the method of accounting, which aims to assign one or several hedging instruments so that their fair value or cost flows offset completely or partly the changes in fair value or cash flows of the hedged item. Outokumpu applies hedge accounting to certain foreign exchange and commodity derivatives. Derivatives, to which hedge accounting is not applied, have been acquired to reduce the profit or loss and/or cash flow effects of operations or financing activities.
In the beginning of each hedging arrangement, the Group documents the relationship between the hedging instrument and the hedged item, as well as the objectives of risk management and strategy of the hedging arrangement. Hedging instruments are subject to prospective and retrospective effectiveness testing. Hedge effectiveness is the degree to which changes in the fair value or cash flows of the hedged item that are attributable to a hedged risk are offset by changes in the fair value or cash flows of the hedging instrument. The hedging relationship is considered to be highly effective if the changes in fair values or cash flows of the hedging instrument offset the cash flow changes of the hedged item by 80–125%. Hedge accounting is discontinued when the requirements of hedge accounting are no longer met.
Cash flow hedgesIn cash flow hedging, the Group is hedging against changes in cash flows, which result from the realization of a risk associated with a recognized asset or liability or a highly probable forecast transaction. Fair value changes of derivatives designated to hedge forecast cash flows are recognized in other comprehensive income and presented within the fair value reserve in equity to the extent that the hedge is effective. Such fair value changes accumulated in equity are reclassified in profit or loss in the period in which the hedged cash flows affect profit or loss. The fair value changes related to the ineffective portion of the hedging instrument are recognized immediately in profit or loss.
Fair value hedgesChanges in the fair value of derivatives that are designated and qualify as fair value hedges are recorded in the statement of income, together with any changes in the fair value of the hedged asset or liability that are attributable to the hedged risk.
Net investment hedgesThe equities of the subsidiaries located outside the euro area are hedged against changes in exchange rates with the aim to reduce the effects of changes in exchange rates on the Group’s equity. Fair value changes of qualifying financial instruments, which are designated as hedges for translation risk related to net investments in foreign operations, are recognized in other comprehensive income to the extent that the hedge is effective. The ineffective portion of the fair value changes of the hedging instrument is immediately recognized in financial income
and financial expenses. When a foreign operation is sold or otherwise disposed of, partly or in full, the fair value changes accumulated in equity are transferred to profit or loss as part of the gain or loss on disposal.
Measurement of fair valuesA number of the Group’s accounting policies and disclosures require the measurement of fair values, for both financial and non-financial assets and liabilities. Fair value hierarchy is based on the source of inputs used in determining fair values. In level one, fair values are based on public quotations for identical instruments. In level two, fair values are based on market rates and prices, discounted future cash flows and, in respect of options, on valuation models. For assets and liabilities in level three, there is no reliable market source available and thus fair value measurement cannot be based on observable market data. Therefore, the measurement methods are chosen so that the information available for the measurement and the characteristics of the measured objects can be adequately taken into account.
InventoriesInventories are stated at the lower of cost and net realizable value. The cost of raw material is determined by the weighted average method. The cost of self-produced finished goods and work in progress comprises raw materials, direct labour, other direct costs and related production and procurement overheads, but excludes borrowing costs. Cost of purchased products includes all purchasing costs including direct transportation, handling and other costs. Net realizable value is the estimated selling price in the ordinary course of business, less the estimated costs of completion and the estimated costs necessary to make the sale. Spare parts are carried as inventory and their cost is recognized in profit or loss as consumed. Major spare parts are recognized in property, plant and equipment when they are expected to be used over more than one financial year.
Treasury sharesWhen the parent company or its subsidiaries purchase the company’s own shares, the consideration paid, including any attributable transaction costs, net of taxes, is deducted from the parent company’s equity as treasury shares until the shares are cancelled. When such shares are subsequently sold or reissued, any consideration received is recognized directly in equity.
Provisions and contingent liabilitiesA provision is recognized when Outokumpu has a present legal or constructive obligation as a result of a past event, and it is probable that an outflow of economic benefits will be required to settle the obligation and a reliable estimate can be made of the amount of the obligation. The Group’s provisions mainly relate to restructuring plans, onerous contracts, environmental liabilities, litigation and tax risks. The amount recognized as a provision corresponds to the management’s best estimate of the costs required to fulfil an existing obligation at the end of the reporting period. If part of the obligation may potentially be compensated by a third party, the compensation is recognized as a separate asset when it is virtually certain that the compensation will be received. Non-current provisions are discounted to net present value at the end of the reporting period using risk-free discount rates.
Outokumpu Annual Report 2013 nOtes tO the cOnsOlidated financial stateMents
48

The cost of an item of property, plant and equipment also comprises the initial estimate of costs of dismantling and removing the item and restoring the site on which it is located at the end of the useful life of the item on a present value basis. Such a liability may exist for decommissioning a plant, rehabilitating environmental damage, landscaping or removing equipment. A provision presenting the asset retirement obligation is recognized in the same amount at the same date. Adjustments to the provision due to subsequent changes in the estimated timing or amount of the outflow of resources, or in the change in the discount rate are deducted from or added to the cost of the corresponding asset in a symmetrical manner. The costs will be depreciated over the asset’s remaining useful life.
Environmental provisions are based on the interpretation of the effective environmental laws and regulations related to the Group at the end of the reporting period. Such environmental expenditure, that arises from restoring the conditions caused by prior operations are recognized as expenses in the period in which they are incurred. A restructuring provision is recognized when a detailed restructuring plan has been prepared and its implementation has been started or the main parts of the plan have been communicated to those, who are impacted by the plan. Restructuring provision mainly comprise employee termination benefits.
A contingent liability is a possible obligation that arises from past events and whose existence will be confirmed only by the occurrence of uncertain future events not wholly within the control of the entity. Such present obligation that probably does not require settlement of a payment obligation and the amount of which cannot be reliably measured is also considered to be a contingent liability. Contingent liabilities are disclosed in the notes to the financial statements.
Employee benefits
Post-employment and other long-term employee benefits
Group companies in different countries have various post-employment benefit plans in accordance with local conditions and practices. The plans are classified as either defined contribution plans or defined benefit plans.
The fixed contributions to defined contribution plans are recognized as expenses in the period to which they relate. The Group has no legal or constructive obligation to pay further contributions if the receiving party is not able to pay the benefits in question. All such arrangements that do not meet these requirements are defined benefit plans.
Defined benefit plans are funded with payments to the pension insurance companies. The present value of the defined benefit obligations is determined separately for each plan by using the projected unit credit method. The plan assets are measured at fair value at the end of the reporting period. The fair value of the plan assets at the end of the reporting period is deducted from the defined benefit liability recognized at present value in the statement of financial position. Current service costs, past service costs and gains or losses on non-routine settlements are recognized in functional costs above operating result. Net interest expense or income is recognized in financial items under interest expense or interest
income. All remeasurements of the net defined benefit liability (asset) are recognized directly in other comprehensive income.
For other long-term employee benefits, all service costs and remeasurements are recognized immediately in the statement of income. Interest expenses are recognized in financial items under interest expenses.
Share-based payment transactions
The share-based incentive programs are accounted for partly as equity-settled and partly as cash-settled. The equity-settled and cash-settled parts both include market and non-market based vesting conditions. The fair values of programs over vesting periods are determined at the grant date and the portion paid in cash is re-measured based on market conditions at the end of each reporting period. Market prices and applicable statistical models are used in determining the fair values. The impact of non-market based vesting conditions is assessed at the end of each reporting period. The programs include maximum limits for the pay-outs and the limits have been taken into account in the fair value measurement of the benefits.
Operating resultIn Outokumpu Group, operating result is the net sum which is formed by adding other operating income to sales and then deducting the cost of purchase adjusted by change in the inventory and the cost of manufacture for own use, the cost of employee benefits, depreciation, amortization, any impairments, and other operating expenses. All other items of the statement of income are presented below the operating result. Exchange gains and losses and fair value changes of derivatives are included in operating result, if they arise from business-related items. Otherwise they are recognized in financial items.
Non-recurring itemsNon-recurring items are defined as items which are unusual because of their nature, size or incidence. Only material events are classified as non-recurring.
DividendsThe dividend proposed by the Board of Directors is not deducted from distributable equity until approved by the Annual General Meeting of Shareholders.
Earnings per shareBasic earnings per share is calculated by dividing the net result attributable to the equity holders of the company by the weighted average number of shares in issue during the period, excluding shares purchased by Outokumpu and held as treasury shares. Diluted earnings per share is calculated by adjusting the weighted average number of ordinary shares outstanding with the assumption that convertible instruments are converted and options exercised. The Group did not have such instruments at the end of the financial year.
Outokumpu Annual Report 2013 nOtes tO the cOnsOlidated financial stateMents
49

3. Segment information
Outokumpu’s business is divided into four business areas which are Stainless EMEA, Stainless Americas, Stainless APAC and Specialty Stainless. In addition to the business area structure, Group Functions cover the CFO’s office, HR and Health, Safety and Sustainability, Marketing, Communications and IR as well as Strategy, Integration Procurement, IT and Legal.
Business areas have responsibility for sales, profitability, production and supply chain management and they are Outokumpu’s reportable segments under IFRS. The performance of the segments is reviewed based on segment’s operating result which is defined in the accounting principles for the consolidated financial statements. The review is done regularly by the CEO based on internal management reporting which is based on IFRS.
Outokumpu is the leader in the advanced materials with the strongest technical expertise and widest range of products across all our customer segments. Our offering covers stainless steel and wide range of high performance stainless steel special grades. Below is the description of the activities of the four reportable segments:
Stainless EMEA consists of stainless operations as well as ferrochrome production in Europe. The high-volume and tailored standard stainless steel grades are primarily used for example in architecture, building and construction, transportation, catering, appliances, chemical, petrochemical and energy sectors, as well as other process industries. The business area has production facilities in Finland and Germany as well as a finishing plant in the Netherlands.
Stainless Americas produce standard austenitic and ferritic grades as well as tailored products. Its largest customer segments are automotive and transport, consumer appliances, oil and gas, chemical and petrochemical industries, food and beverage processing as well as building and construction industry. The business area has production units in the US and Mexico as well as a service center in Argentina.
Stainless APAC includes cold rolling facility and coil and plate service center in China as well as a coil service center in Australia. The production concentrates mainly on high quality stainless steel flat products for the consumer and automotive industries in China. The service center in China specializes in selling, processing and distributing high quality stainless steel products, including high performance stainless.
Specialty Stainless consists of four business lines which are Special Coil, Special Plate, Long Products and Thin Strip. The Special Coil and Thin Strip business lines offer wide range of high performance stainless steel special grades and products in a variety of dimensions, with manufacturing operations centered in Sweden. Special Plate is comprised of the quarto plate production facilities in Sweden and in the US. These units produce individually rolled thick and wide plates in standard and special stainless steel grades. Long products are used in a wide range of applications such as springs, wires, surgical equipment, automotive parts and construction. The manufacturing is concentrated in the integrated sites in the UK, Sweden and the US.
Other operations consist of activities outside the four reportable segments described above as well as industrial holdings. Such business development and Corporate Management expenses that are not allocated to the business areas are also reported under Other operations. Sales of Other operations consist of electricity, nickel warrants, internal commissions and services.
Outokumpu does not have individual significant customers as defined in IFRS 8.
Outokumpu Annual Report 2013 nOtes tO the cOnsOlidated financial stateMents
50

Operating segments
2013
€ million
Reconciliation
Stainless EMEA
Stainless Americas
Stainless APAC
Specialty Stainless
Reportable segments
totalOther
operations Eliminations Group
External sales 3 700 884 377 1 528 6 489 256 - 6 745
Inter-segment sales 567 23 11 90 691 283 -974 -
Sales 4 267 906 388 1 619 7 180 538 -974 6 745
Operating result -158 -270 -7 -33 -468 -39 -3 -510Share of results in associated companies and joint ventures - - - - - - - -2
Financial income - - - - - - - 13
Financial expenses - - - - - - - -323
Result before taxes - - - - - - - -822
Income taxes - - - - - - - -11Net result for the financial year from continuing operations - - - - - - - -832Net result for the financial year from discontinued operations - - - - - - - -170
Net result for the financial year - - - - - - - -1 003
Non-recurring items
Redundancy provisions -51 - - -0 -51 -3 - -54Inventory write-down related to efficiency programs -4 -8 -0 - -12 - - -12
Carrier settlement - - - - - -11 - -11
Costs related to Inoxum transaction - - - - - -1 - -1
Depreciation -178 -68 -13 -56 -314 -1 - -316
Amortization -2 -1 -2 -1 -7 -9 - -16
Assets in operating capital 3 459 1 221 251 1 062 5 993 321 -465 5 849Investments in associated companies and joint ventures - - - - - - - 66
Other financial assets - - - - - - - 683
Deferred tax assets - - - - - - - 24
Assets held for sale - - - - - - - 2 200
Total assets - - - - - - - 8 823
Liabilities in operating capital 1 241 180 63 320 1 804 239 -460 1 583
Other financial liabilities - - - - - - - 4 275
Deferred tax liabilities - - - - - - - 26Liabilities directly attributable to assets held for sale - - - - - - - 1 048
Total liabilities - - - - - - - 6 932
Operating capital 2 218 1 040 189 743 4 189 82 -5 4 266
Net deferred tax asset - - - - - - - -1
Capital employed - - - - - - - 4 265
Outokumpu Annual Report 2013 nOtes tO the cOnsOlidated financial stateMents
51

2012
€ million
Reconciliation
Stainless EMEA 1)
Stainless Americas 1)
Stainless APAC 1)
Specialty Stainless 2)
Reportable segments
total 1) 2)Other
operations 2) Eliminations Group 2)
External sales 2 341 - 119 1 764 4 223 314 - 4 538
Inter-segment sales 307 2 9 173 491 250 -742 -
Sales 2 648 2 128 1 937 4 715 564 -742 4 538
Operating result -112 0 -8 -134 -254 -130 -1 -385Share of results in associated companies and joint ventures - - - - - - - -0
Financial income - - - - - - - 16
Financial expenses - - - - - - - -154
Result before taxes - - - - - - - -524
Income taxes - - - - - - - -12
Net result for the financial year - - - - - - - -536
Non-recurring items
Redundancy provisions -3 - - - -3 - - -3Inventory write-down related to efficiency programs -4 - -6 -7 -17 -2 - -19
Costs related to Inoxum acquisition - - - - - -64 - -64
Kloster and Nyby impairments - - - -86 -86 - - -86Losses from divestment of the Group's Brass operations - - - - - -18 - -18Impairment of stock locations divestment -10 - - - -10 - - -10
Depreciation -128 -0 -1 -67 -197 -4 - -201
Amortization -10 - -0 -7 -17 -12 - -29
Assets in operating capital 4) 3 830 1 483 283 1 215 6 812 297 637 7 746Investments in associated companies and joint ventures - - - - - - - 51
Other financial assets - - - - - - - 526
Deferred tax assets - - - - - - - 89
Assets held for sale - - - - - - - 1 276
Total assets - - - - - - - 9 688
Liabilities in operating capital 4) 1 443 311 67 361 2 182 154 -216 2 120
Other financial liabilities - - - - - - - 3 737
Deferred tax liabilities - - - - - - - 92Liabilities directly attributable to assets held for sale - - - - - - - 786
Total liabilities - - - - - - - 6 735
Operating capital 2 387 1 172 216 854 4 629 144 853 5 626
Net deferred tax liability - - - - - - - -3
Capital employed - - - - - - - 5 623
1) Figures related to statement of financial position restated due to completing the Inoxum acquisition accounting.2) Adjusted due to reallocation of R&D operations in Avesta, Sweden from Other operations to Specialty Stainless.3) Restated due to adoption of revised IAS 19 Employee Benefits standard.4) 2012 figures for EMEA Stainless and Specialty Stainless exclude companies classified to assets held for sale in Nov 30, 2013, which are presented in
Other operations column.
Outokumpu Annual Report 2013 nOtes tO the cOnsOlidated financial stateMents
52

Geographical information
€ million Finland Germany Sweden The UKOther
EuropelNorth
AmericaAsia andAustralia
Othercountries Inter-area Group
2013Sales by destination 207 1 597 207 470 1 981 1 292 948 42 - 6 745
Sales by origin 2 620 2 088 1 130 557 554 1 147 390 60 -1 802 6 745
Non-current assets 1 791 358 368 68 137 925 173 3 - 3 824
2012
Sales by destination 197 741 196 300 1 926 466 629 83 - 4 538
Sales by origin 2 666 294 1 445 697 684 359 142 25 -1 775 4 538
Non-current assets 1 853 620 378 81 171 1 003 214 4 - 4 323
Sales by destination is presented for external sales.Sales and non-current assets are presented by the locations of the Group companies. Non-current assets exclude financial instruments, deferred tax assets and defined benefit plan assets. Non-current assets for 2012 are restated due to completion of Inoxum acquistion accounting.
4. Acquisitions and disposals
Inoxum acquisitionOn January 31, 2012, Outokumpu entered into a business combination agreement with ThyssenKrupp AG for the purchase of the entire share capital of both Inoxum GmbH and ThyssenKrupp Nirosta GmbH (“Inoxum”), the parent companies of the Group comprising the stainless steel business of ThyssenKrupp. The acquired companies have sites in Germany, Italy, the US, Mexico and China. The ownership and control transferred to Outokumpu on December 28, 2012, which was the date of acquisition.
The combination of Outokumpu and Inoxum created a new global leader in stainless steel with a complementary and innovative product offering across key customer segments. The transaction creates significant cost synergy benefits that neither company could have realized on its own. The transaction enables a strategic optimization of production capacities, production locations and supply routes. Outokumpu and Inoxum are complementary in terms of product offering. This, coupled with its extensive network of local service centers, enables the combined entity to supply a broad product offering with shorter delivery times and customized solutions for its customers globally. In addition, it provides a diversification across different grades reducing volatility from any temporary shifts in demand between grades. Following completion of the transaction, Outokumpu also has a global and well-balanced customer base, covering key end-user segments.
Following the European Commission’s demand for an industrial remedy related to the Inoxum transaction, Outokumpu committed to the divestiture of the Inoxum’s stainless steel mill in Terni, Italy, and selected European service centers (remedy assets) which are classified as held for sale in the consolidated financial statements. See note 5 Assets held for sale and discontinued operations for additional information.
The initial accounting for Inoxum acquisition was provisional on December 31, 2012 due to the size and complexity of the transaction and the acquisition date being close to the preparation of Outokumpu consolidated financial statements. Therefore, the amounts recognized for identifiable assets acquired and liabilities assumed, goodwill and items of consideration were determined only provisionally. Based on the information obtained during the measurement period about facts and circumstances that existed as of the acquisition date, Outokumpu has retrospectively adjusted the provisional amounts on December 28, 2012 as presented in the tables below.
Outokumpu Annual Report 2013 nOtes tO the cOnsOlidated financial stateMents
53

Identifiable assets acquired and liabilities assumed
€ million FinalReported as
provisional
Intangible assets 86 108
Property, plant and equipment 2 185 2 166
Deferred tax assets 160 160
Inventories 1 801 1 781
Trade receivables 549 549
Other assets 190 190
Cash and cash equivalents 84 84
5 055 5 038
Interest-bearing liabilities 250 250
Defined benefit and other long-term employee benefit obligations 376 376
Deferred tax liabilities 89 87
Trade and other liabilities 1 612 1 601
2 327 2 314
Identifiable assets acquired and liabilities assumed include the Terni remedy assets acquired as part of the Inoxum transaction on December 28, 2012.
Consideration and goodwill arising on acquisition
€ million FinalReported as
provisional
Cash 1 000 1 000
Shares to ThyssenKrupp 491 491
Loan note to ThyssenKrupp 1 229 1 229
Total consideration transferred 2 720 2 720Non-controlling interests, based on their proportionate interest in the recognized amounts of assets and liabilities of Inoxum 11 11
Fair value of identifiable net assets acquired 2 728 2 724
Goodwill arising on acquisition 4 7
The fair value of the 621 042 573 Outokumpu Oyj shares transferred to the seller (EUR 491 million) was determined based on the share price of EUR 0.79 at the date of acquisition.
The principal amount of the loan note was the amount by which the balance of ThyssenKrupp’s receivables against Inoxum and Inoxum’s receivables against ThyssenKrupp exceeded the EUR 1 billion cash consideration at the acquisition date. The EUR 1 229 million represented loan note’s estimated fair value at the date of acquisition.
Final goodwill of EUR 4 million was considered mainly attributable to assembled workforce. None of the goodwill recognized is expected to be deductible for income tax purposes.
Net cash outflow on acquisition€ million 2012
Consideration paid in cash 1 000
Cash and cash equivalent balances acquired -84
Net cash outflow on acquisition 915
Had Inoxum been consolidated in Outokumpu Group from January 1, 2012, management estimates that the consolidated statement of income for 2012 would have shown net sales of approximately EUR 9 400 million and net loss of approximately EUR 900 million.
Outokumpu Annual Report 2013 nOtes tO the cOnsOlidated financial stateMents
54

Disposals
Year 2013
On January 18, 2013 Outokumpu’s partner in the OSTP business, Tubinoxia S.r.l. exercised its call option and acquired additional 15% of the company’s shares from Outokumpu. Consequently, Outokumpu lost the control over OSTP, and OSTP is consolidated as an associated company in the Group’s financial statements. OSTP provides stainless steel process tubes and pipes and fittings. OSTP employed approximately 770 people in Sweden, Finland, Saudi Arabia, Estonia and Canada.
Effect of disposal on the financial position of the Group€ million 2013
Non-current assets 30
Current assets 79
Non-current liabilities -26
Current liabilities -56
Net assets 27
Disposal-related gain 4
Disposal of non-controlling interest -15Recognition of remaining interest in associate at fair value -17
Consideration received, satisfied in cash 2
Cash and cash equivalents disposed of -2
Net cash outflow -1
Year 2012
BrassIn June, Outokumpu sold its brass-rod plant in Drünen in the Netherlands, the last of the Group’s brass operations. Resulting from this transaction, a loss of EUR 18 million was booked into other operating expenses.
AmariIn September, Outokumpu completed a transaction to divest part of the Group’s stock operations in Europe to Amari, a privately owned group of companies focusing on multi-metal distribution. With the transaction, 10 of the Group’s stock operations in nine countries were transferred to Amari, thereby halving the number of the Group’s own stock locations. Furthermore, approximately 100 Outokumpu employees transferred to Amari. In connection to the transaction, Outokumpu booked a non-recurring impairment of EUR 10 million into other operating expenses.
Effect of disposal on the financial position of the Group€ million 2012
Non-current assets 23
Current assets 49
Non-current liabilities -3
Current liabilities -19
Net assets 49
Disposal-related losses and impairments -28
Consideration received, satisfied in cash 21
Cash and cash equivalents disposed of -2
Net cash inflow 19
Outokumpu Annual Report 2013 nOtes tO the cOnsOlidated financial stateMents
55

6. Income and expenses
Depreciation and amortization by function€ million 2013 2012
Cost of sales -315 -212
Selling and marketing expenses -2 -10
Administrative expenses -14 -7
Research and development expenses -1 -1
-332 -230
5. Assets held for sale and discontinued operations
On November 30, 2013 Outokumpu announced its plans to divest the VDM business and the remedy assets which include Terni and certain service centers to ThyssenKrupp. The sale of VDM is the result of strategic review conducted of the business during 2013, and the divestment of Terni and certain European service centers aims to address the remedy requirements of the European Commission related to the Inoxum acquisition in 2012. Outokumpu’s loan note to ThyssenKrupp will be used as a consideration for the transaction. The sale framework agreement also includes customary terms and conditions regarding the businesses’ level of working capital and net debt.
VDM develops high performance alloys for the use in extreme conditions, for example in high and low temperatures, high in the atmosphere and deep underground. Following the announcement, VDM assets and related liabilities were classified as held for sale on November 30, 2013 and reported as a discontinued operation. VDM assets classified as held for sale and related liabilities are measured at carrying values.
Terni is an integrated stainless steel production facility in Italy. Terni entities were classified as held for sale at the closing of Inoxum transaction in December 2012 together with a service center in Germany, which was included in remedy assets at that time. Following the announcement in November 2013 additional remedy assets to be divested, i.e. Tubificio di Terni and service centers in France, Spain and Turkey were also classified as held for sale. Remedy assets classified as held for sale and related liabilities are measured at carrying values. Remedy entities’ results are reported under discontinued operations in the 2013 statement of income.
Result from discontinued operations€ million 2013
Sales and other operating income 3 302Expenses -3 392Net financial expenses -22Result before tax -112Income tax -58Net result from discontinued operations -170
EUR 1 090 million of the sales and other operating income and EUR 1 072 million of the expenses are attributable to VDM. EUR 2 212 million of the sales and other operating income and EUR 2 293 million of the expenses are attributable to Terni remedy assets. In addition, the expenses include transaction costs relating to the sale of Terni and VDM of EUR 27 million.
Assets held for sale and liabilities directly attributable to assets held for sale € million 2013
Intangible assets and property, plant and equipment 885Other assets 147Inventories 844Trade and other receivables 325
2 200
Interest-bearing debt 15Defined benefit and other long-term employee benefit obligations 129Other liabilities 112Trade and other payables 792
1 048
EUR 829 million of the total assets and EUR 323 million of the total liabilities are attributable to VDM. EUR 1 371 million of the total assets and EUR 725 million of the total liabilities are attributable to Terni remedy assets.
Cash flows€ million 2013
Operating cash flow 115Investing cash flow -77Financing cash flow -26
12
In 2013, there are EUR -9 million (2012: EUR -4 million) cumulative net income and expenses related to discontinued operations included in other comprehensive income. They are mainly due to exchange differences on translating foreign operations, remeasurements of defined benefit pension plans and fair value changes of hedging instruments.
Outokumpu Annual Report 2013 nOtes tO the cOnsOlidated financial stateMents
56

Other operating income€ million 2013 2012
Exchange gains and losses from foreign exchange derivatives 4 20Market price gains and losses from commodity derivatives 1 -4Market price gains and losses from derivative financial instruments 5 17Gains on sale of other intangible and tangible assets 7 1
Other income items 12 5
24 23
In 2013, the market price gains and losses from derivative financial instruments included a gain of EUR 4 million (2012: a gain of EUR 6 million) from ineffective portion of cash flow hedges.
Other operating expenses€ million 2013 2012
Carrier settlement -11 -
Impairments -13 -105Losses on sale of intangible and tangible assets -2 -0Losses from divestment of the Group's Brass operations - -18
Other expense items -6 -5
-31 -128
Non-recurring items in operating result € million 2013 2012
Redundancy provisions -54 -3Inventory write-downs related to efficiency programs -12 -19
Carrier settlement -11 -
Costs related to Inoxum acquisition -1 -64
Nyby and Kloster impairments - -86Losses from divestment of the Group's Brass operations - -18
Impairment of stock locations divestment - -10
-78 -200
In April 2013, as part of its intention to significantly reduce operating expenses and return to profitability, Outokumpu announced plans that result in job reductions. The reductions relate to capacity reductions, particularly to the previously announced closure of Krefeld meltshop in Germany, as well as streamlining overlapping activities in sales, production, supply chain and support functions. As a result, a non-recurring redundancy cost of EUR 54 million was recognized in 2013.
Inventories were written down in 2013 and 2012 in connection with Outokumpu’s efficiency programs. The write-downs amounted to non-recurring costs of EUR 12 million in 2013 (2012: EUR 19 million).
In May 2013 Outokumpu Oyj and Carrier Corporation signed a settlement agreement that covers all damage suits against Outokumpu by Carrier in the US and UK pursuant to the European Commission’s industrial tubes cartel decision of 2003. The total
settlement amount was EUR 11 million. The settlement covered also all former Outokumpu subsidiaries included in the claims.
In 2013, Outokumpu booked EUR 1 million of non-recurring costs related to Inoxum acquisition in addition to costs of EUR 64 million in 2012. Out of the costs in 2012, EUR 12 million was related to real estate transfer taxes in Germany.
In 2012 an impairment loss of EUR 70 million related to Nyby and EUR 16 million related to Kloster was recognized as a result of impairment tests on assets of Nyby and Kloster business lines.
In 2012, Outokumpu sold the remaining units of its Brass operations. The losses booked from divestment were approximately EUR 18 million. In 2012, Outokumpu also divested part of its European stock operations to Amari. Related to the transaction, impairment of EUR 10 million was booked.
P100 program-related cost savings resulted to non-recurring redundancy provisions of EUR 3 million in 2012.
Auditor fees – KPMG€ million 2013 2012
Audit -2.7 -1.9
Audit related services -0.1 -0.3
Tax advisory -0.2 -0.1
Other services -0.7 -3.4
-3.7 -5.7
7. Employee benefit expenses€ million 2013 2012
Wages and salaries -583 -340
Termination benefits -45 -10
Social security costs -94 -53Post-employment and other long-term employee benefits
Defined benefit plans 1) -11 -5
Defined contribution plans -49 -54
Other long-term employee benefits -10 -1
Expenses from share-based payments -1 -0Other personnel expenses -12 -10
-805 -473
1) Defined benefit plans in 2012 have been restated as a result of adoption of the revised IAS 19 Employee Benefits standard.
Profit-sharing bonuses based on the Finnish Personnel Funds Act were not recognized in 2013 nor 2012.
Outokumpu Annual Report 2013 nOtes tO the cOnsOlidated financial stateMents
57

8. Financial income and expenses € million 2013 2012
Dividend income on available-for-sale financial assets 0 0
Interest income
Loans and receivables 11 11
Bank accounts and deposits 1 1
Interest income on defined benefit plan assets 1) 0 1
Gains on the sale of investments at fair value through profit or loss - 0
Gains on the sale of available-for-sale financial assets 0 1
Other financial income 0 0
Total financial income 13 16
Interest expenses
Debt at amortized cost -181 -66
Finance lease arrangements -7 -5
Derivatives -12 -6
Interest expense on defined benefit obligations and other long-term employee benefits 1) -10 -4
Capitalized interests 2 8
Impairment of financial assets -2 -0
Loss from the sale of financial assets -50 -
Fees related to committed credit facilities -17 -11
Other financial expense items -10 -7
Total financial expenses -286 -90
Exchange gains and losses
Derivatives 49 -24
Cash, loans and receivables -57 14
Other market price gains and losses
Derivatives 12 -3
Subsequent fair valuation of Talvivaara Sotkamo Ltd -41 -52
Other -0 -0
Total market price gains and losses -37 -64
-310 -138
1) Figures for 2012 have been restated as a result of adoption of the revised IAS 19 Employee Benefits standard.
Exchange gains and losses in the consolidated statement of income€ million 2013 2012
In sales -7 -9
In purchases 2) 18 7
In other income and expenses 2) 4 19
In financial income and expenses 2) -8 -10
7 7
2) Includes exchange gains and losses on elimination of intra-group transactions.
Exchange gains and losses include EUR 56 million net exchange gain on derivative financial instruments (2012: EUR 0 million net exchange loss) of which EUR 4 million gain on derivatives has been recognized in other operating income, EUR 4 million gain as adjustment to purchases and EUR 49 million gain in financial items.
Non-recurring items in financial income and expenses In 2013, a non-recurring loss of EUR 49 million on the sale of Luvata loan receivable is included in the financial expenses as loss from sale of financial assets. In 2012, there were no non-recurring items in financial income and expenses.
Outokumpu Annual Report 2013 nOtes tO the cOnsOlidated financial stateMents
58
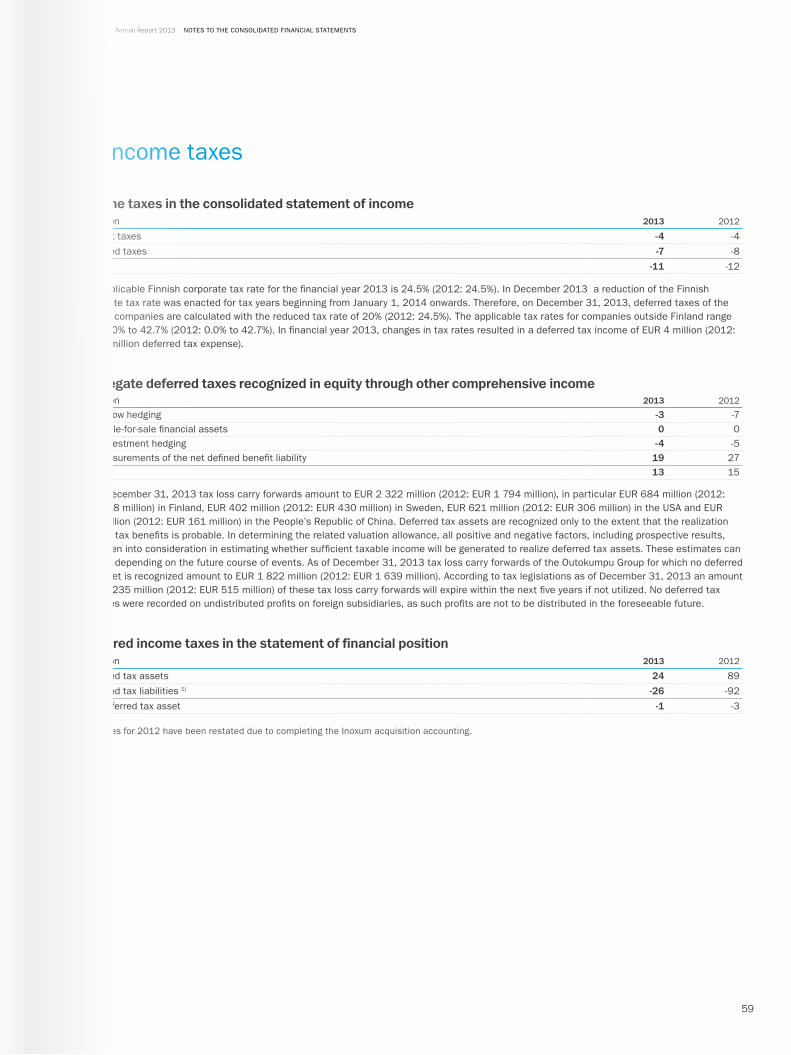
9. Income taxes
Income taxes in the consolidated statement of income € million 2013 2012
Current taxes -4 -4
Deferred taxes -7 -8
-11 -12
The applicable Finnish corporate tax rate for the financial year 2013 is 24.5% (2012: 24.5%). In December 2013 a reduction of the Finnish corporate tax rate was enacted for tax years beginning from January 1, 2014 onwards. Therefore, on December 31, 2013, deferred taxes of the Finnish companies are calculated with the reduced tax rate of 20% (2012: 24.5%). The applicable tax rates for companies outside Finland range from 0.0% to 42.7% (2012: 0.0% to 42.7%). In financial year 2013, changes in tax rates resulted in a deferred tax income of EUR 4 million (2012: EUR 1 million deferred tax expense).
Aggregate deferred taxes recognized in equity through other comprehensive income€ million 2013 2012
Cash flow hedging -3 -7Available-for-sale financial assets 0 0Net investment hedging -4 -5Remeasurements of the net defined benefit liability 19 27
13 15
As of December 31, 2013 tax loss carry forwards amount to EUR 2 322 million (2012: EUR 1 794 million), in particular EUR 684 million (2012: EUR 538 million) in Finland, EUR 402 million (2012: EUR 430 million) in Sweden, EUR 621 million (2012: EUR 306 million) in the USA and EUR 158 million (2012: EUR 161 million) in the People’s Republic of China. Deferred tax assets are recognized only to the extent that the realization of such tax benefits is probable. In determining the related valuation allowance, all positive and negative factors, including prospective results, are taken into consideration in estimating whether sufficient taxable income will be generated to realize deferred tax assets. These estimates can change depending on the future course of events. As of December 31, 2013 tax loss carry forwards of the Outokumpu Group for which no deferred tax asset is recognized amount to EUR 1 822 million (2012: EUR 1 639 million). According to tax legislations as of December 31, 2013 an amount of EUR 235 million (2012: EUR 515 million) of these tax loss carry forwards will expire within the next five years if not utilized. No deferred tax liabilities were recorded on undistributed profits on foreign subsidiaries, as such profits are not to be distributed in the foreseeable future.
Deferred income taxes in the statement of financial position€ million 2013 2012
Deferred tax assets 24 89
Deferred tax liabilities 1) -26 -92
Net deferred tax asset -1 -3
1) Figures for 2012 have been restated due to completing the Inoxum acquisition accounting.
Outokumpu Annual Report 2013 nOtes tO the cOnsOlidated financial stateMents
59

Movement in deferred tax assets and liabilities during the financial year
€ million
Net deferred taxes
Jan 1, 2013Translation differences
Recognized in profit or loss
Recognized in other
comprehensive income
Companies sold
Reclassifica-tion to assets and liabilities held for sale
Net deferred taxes
Dec 31, 2013
Intangible assets 7 -0 -7 - - 3 3
Property, plant and equipment -203 -2 112 - 0 21 -72
Other financial assets -2 0 2 0 - - 0
Inventories -33 -0 10 - 0 32 9
Derivative financial assets -15 - 0 5 - 6 -4
Trade and other receivables 6 -0 -16 - - -1 -12
Long-term and current debt 40 -0 30 - - -1 69Defined benefit and other long-term employee benefit obligations 60 -1 3 -8 -1 -10 44
Provisions 10 - 9 - - -1 18
Derivative financial liabilities 6 - 9 - - -2 13
Trade and other payables 8 -1 17 - -1 1 25
Tax losses carried forward 540 -16 130 - -21 -3 629
424 -19 296 -2 -22 45 723Valuation allowance -427 18 -337 - 22 1 -724
-3 -1 -41 -2 0 46 -1
Significant components of the deferred tax assets and liabilities are as follows:
2013 2012
€ millionDeferred tax
assetDeferred tax
liabilities NetDeferred tax
assetDeferred tax
liabilities 1) Net
Intangible assets 12 -9 3 13 -6 7
Property, plant and equipment 118 -190 -72 26 -229 -203
Other financial assets 0 0 0 0 -2 -2
Inventories 20 -11 9 28 -61 -33
Derivative financial assets 8 -12 -4 9 -24 -15
Trade and other receivables 3 -15 -12 9 -3 6
Long-term and current debt 69 -0 69 40 -0 40Defined benefit and other long-term employee benefit obligations 56 -12 44 74 -14 60
Provisions 24 -6 18 15 -5 10
Derivative financial liabilities 13 -1 13 6 0 6
Trade and other payables 40 -15 25 15 -7 8
Tax loss carry forwards 629 - 629 540 0 540
993 -270 723 774 -351 424
Valuation allowance -724 - -724 -427 - -427
Offset -245 245 - -258 258 0
24 -26 -1 89 -92 -3
1) Figures for 2012 have been restated due to completing the Inoxum acquisition accounting.
Deferred taxes have been reported as a net balance of those group companies that file a consolidated tax return, or that may otherwise be consolidated for current tax purposes.
Outokumpu Annual Report 2013 nOtes tO the cOnsOlidated financial stateMents
60

€ million
Net deferred taxes
Jan 1, 2012Translation differences
Recognized in profit or loss
Recognized in other
comprehensive income
Companies acquired 1)
Companies sold
Net deferred taxes
Dec 31, 2012
Intangible assets -5 - 2 - 10 - 7
Property, plant and equipment -102 - -20 - -82 - -203
Other financial assets -1 - -2 1 - - -2
Inventories -10 - 8 - -30 -1 -33
Derivative financial assets 1 - -4 -1 -11 - -15
Trade and other receivables -15 - 22 - -1 - 6
Long-term and current debt 7 - 32 - 1 - 40Defined benefit and other long-term employee benefit obligations 26 - -15 10 39 - 60
Provisions 11 - -8 - 7 - 10
Derivative financial liabilities 0 - 1 - 5 - 6
Trade and other payables 1 - 4 - 4 -1 8
Tax losses carried forward 234 - 117 - 189 - 540
147 - 137 10 132 -2 424
Valuation allowance -108 - -144 - -175 - -427
39 - -7 10 -43 -2 -3
1) Figures for 2012 have been restated due to completing the Inoxum acquisition accounting.
In 2013, the income tax expense of EUR 11 million presented in the consolidated statement of income is EUR 222 million higher than the expected income tax benefit of EUR 201 million, which would result if the Finnish corporate tax rate of 24.5% were applied to the Group’s result before taxes. In 2012, the reported income tax expense of EUR 12 million is EUR 140 million higher than the expected income tax benefit of EUR 128 million calculated with the Finnish corporate tax rate of 24.5%. The following table reconciles the expected income tax benefit to the income tax expense presented in the consolidated statement of income:
€ million 2013 2012
Hypothetical income taxes at Finnish tax rate on consolidated result before tax 201 128Difference between Finnish and foreign tax rates 58 2Tax effect of non-deductible expenses and tax exempt income -75 -6Tax effect of losses for which no deferred tax asset is recognized -204 -109Changes in the carrying amounts of deferred tax assets from prior years 0 -30Taxes for prior years 25 1Impact of the changes in the tax rates on deferred tax balances 2) 4 -1Effects of consolidation and eliminations 0 6Other items -20 -2Income taxes in the consolidated statement of income -11 -12
2) In 2013, the majority of the impact of the changes in the tax rates was attributable to the enacted decrease in the Finish and UK tax rates, in Finland from 24.5% to 20.0% on January 1, 2014 and in the UK from 24.0% to 23.0% on April 1, 2013, from 23.0 to 21.0% on April 1, 2014 and from 21.0% to 20.0% on April 1, 2015. In 2012, the majority of the impact of the changes in the tax rates was attributable to the enacted decrease in the Swedish and UK tax rates, in Sweden from 26.3% to 22.0% on January 1, 2013 and in the UK from 25.0% to 24.0% on April 1, 2013.
Outokumpu Oyj is currently subject to a tax audit in Finland. Currently no information exists on the outcome of the audit. Preliminary tax audit report is expected to be issued in February–March 2014.
Outokumpu Annual Report 2013 nOtes tO the cOnsOlidated financial stateMents
61

10. Earnings per share2013 2012
Result attributable to the equity holders of the Company, € million 1) -997 -534
Result from continuing operations attributable to the equity holders of the Company, € million -826 -
Result from discontinued operations attributable to the equity holders of the Company, € million -170 -
Weighted average number of shares, in thousands 2 077 080 1 156 005
Diluted average number of shares, in thousands 2 077 080 1 156 005
Earnings per share for result attributable to the equity holders of the Company, €
Earnings per share 1) -0.48 -0.46
Earnings per share, continuing operations -0.40 -0.46
Earnings per share, discontinued operations -0.08 -
1) Defined benefit plans in 2012 have been restated as a result of adoption of the revised IAS 19 Employee Benefits standard.
Outokumpu did not have any diluting effect share options in 2013 nor 2012.
Outokumpu Annual Report 2013 nOtes tO the cOnsOlidated financial stateMents
62

11. Intangible assets
€ millionCustomer
relationshipsOther intangible
assets 1) Goodwill Total
Historical cost on Jan 1, 2013 2) 49 319 494 861
Translation differences -0 -4 -0 -4
Additions - 6 - 6
Disposals - -3 - -3
Disposed subsidiaries -2 -7 -10 -18
Reclassifications 3) - 0 -0 -0
Reclassifications to assets held for sale - -13 -12 -25
Historical cost on Dec 31, 2013 47 298 472 817
Accumulated amortization and impairment on Jan 1, 2013 -48 -189 -17 -254
Translation differences 0 2 - 2
Disposals - 1 - 1
Disposed subsidiaries 1 7 10 18
Amortization -0 -18 - -18
Reclassifications - 1 - 1
Reclassifications to assets held for sale - 1 - 1
Accumulated amortization and impairment on Dec 31, 2013 -47 -193 -7 -247
Carrying value on Dec 31, 2013 - 105 465 570Carrying value on Jan 1, 2013 2) 0 130 477 607
Historical cost on Jan 1, 2012 49 231 490 769
Translation differences -0 2 0 3
Additions - 1 - 1
Acquired subsidiaries 2) - 85 4 89
Disposals - -1 -0 -1
Disposed subsidiaries - -0 - -0
Reclassifications 3) - 1 - 1
Reclassifications to assets held for sale - -0 - -0
Historical cost on Dec 31, 2012 2) 49 319 494 861
Accumulated amortization and impairment on Jan 1, 2012 -40 -163 -12 -215
Translation differences 0 -2 - -2
Disposals - 0 0 1
Disposed subsidiaries - 0 - 0
Amortization -8 -21 - -29
Impairments - -3 -6 -9
Reclassifications 3) - -0 - -0
Reclassifications to assets held for sale - 0 - 0
Accumulated amortization and impairment on Dec 31, 2012 -48 -189 -17 -254
Carrying value on Dec 31, 2012 2) 0 130 477 607
Carrying value on Jan 1, 2012 9 67 478 554
1) Other intangible assets include capitalized land-use rights, development costs, patents, licenses and software. 2) Restated due to completing the Inoxum acquisition accounting (see Note 4. Acquisitions and disposals). 3) Construction work in progress related to intangible assets is presented in the corresponding item of PPE. When the asset is taken into use, it is
reclassified to the appropriate asset account.
Intangible assets mainly comprise acquired assets.
Outokumpu Annual Report 2013 nOtes tO the cOnsOlidated financial stateMents
63

Impairment testing of goodwill Goodwill acquired through business combinations has been allocated for impairment testing as follows:
€ million 2013 2012
Stainless EMEA 408 416
Specialty Stainless 1) 56 60
465 4771) 2012 restated due to completing the Inoxum acquisition accounting (see
Note 4. Acquisitions and disposals).
During the year 2013, impairment testing of goodwill was carried out on a quarterly basis.
The recoverable amounts of Stainless EMEA and Specialty Stainless are based on value-in-use calculations which are estimated using discounted cash flow projections. Key assumptions used in the value-in-use calculations are discount rate, terminal value growth rate, average global growth in end-use consumption of stainless steel and base price development. The values assigned to the key assumptions are based on the strategic plans approved by the management for 2014 after which cash flows are projected for a period of 11 years, including terminal value based on conservative assumptions. The longer period is justified due to the integration of Inoxum and related synergies. Shorter period would not give fair view of the business and forecasts.
Discount rate is the weighted average pre-tax cost of capital (WACC), as defined for Outokumpu. The components of WACC are risk-free yield rate, Outokumpu credit margin, market risk premium, equity beta and industry capital structure. The pre-tax WACC used for EMEA is 10.9% and Specialty Stainless 11.0% (2012: 11.4% and 11.5% respectively).
In the terminal value, growth rate assumption of 0.5% (2012: 0.5%) is used which management believes to be prudent based on current economic circumstances, although historical growth rates and forecasts of independent market analysts indicate higher long-term growth rates.
Assumed average global growth in end-use consumption of stainless steel of 3.5% (2014–2023) follows independent analysts’ view on long-term market development.
Base price forecast is based on conservative assumptions, which are in line with expectations of general inflation.
In addition, committed investments and expected synergies have been included in the cash flow projections.
The estimated recoverable amount of Stainless EMEA exceeds its carrying amount by approximately EUR 1,228 million. Increase of 4 percentage point in after-tax WACC would cause the carrying amount to exceed the recoverable amount. Also, 16% decrease in annual delivery volumes or 7% decrease in base prices would cause the carrying amount to exceed the recoverable amount. Terminal growth rate of 0% would not lead to impairment.
The estimated recoverable amount of Specialty Stainless exceeds its carrying amount by approximately EUR 711 million. Increase of 4 percentage point in after-tax WACC would cause the carrying amount to exceed the recoverable amount. Also, 7% decrease in annual delivery volumes or 4% decrease in base prices would cause the
carrying amount to exceed the recoverable amount. Terminal growth rate of 0% would not lead to impairment.
As a result of the performed impairment test to Group’s cash-generating units, no impairment losses were recognized in 2013. In 2012, EUR 5 million goodwill related to Outokumpu Tubular business’ (OSTP) was impaired in the statement of income in connection with the business’ asset valuation. OSTP was divested in 2013.
Emission allowances Following the Inoxum transaction, Outokumpu had 7 active sites (excluding VDM and Remedy assets) operating under EU’s Emissions Trading Scheme (ETS) in 2013. These include the production plants in Tornio, Finland; Avesta, Degerfors and Nyby in Sweden; Sheffield in the UK; as well as Krefeld and Bochum in Germany.
Outokumpu has not yet received all the emission allowances for 2013 by the end of the reporting period (2012: 1.3 million tonnes excluding former Inoxum sites) as the allocation is pending for the authorities’ final decision. The pre-verified carbon dioxide emissions under ETS were approximately 1 030 000 tonnes in 2013 (2012: 759 000 tonnes excluding former Inoxum sites). Outokumpu sold 0.6 million tonnes of emission allowances in 2013 (2012: no emission allowances sold).
For the trading period 2013–2020, all relevant Outokumpu sites have applied free emission allowances. Preliminary allocation for years 2013 and 2014 is estimated to be some 1 million tonnes annually in total. Considering the Group’s operations and the Group’s emission allowance surplus position, the amount of allowances is foreseen to be sufficient for compliance. Position is frequently monitored and optimized according to the definitions set in corporate risk policies.
See Note 19. Financial risk management, capital management and insurances for information on the management of the emission allowance price risk.
Outokumpu Annual Report 2013 nOtes tO the cOnsOlidated financial stateMents
64

12. Property, plant and equipment
€ million LandMine
properties Buildings
Machinery and
equipment
Other tangible
assets
Advancespaid and
construction work in
progress 1) Total
Historical cost on Jan 1, 2013 2) 173 46 1 307 4 808 142 295 6 772
Translation differences -2 - -14 -79 -1 -7 -101
Additions 1 - 33 189 0 7 231
Disposals - - -6 -35 0 -0 -41
Disposed subsidiaries -1 - -29 -120 -2 -1 -152
Reclassifications 2 0 23 66 -8 -102 -19
Reclassifications to assets held for sale -28 - -55 -230 - -9 -323
Historical cost on Dec 31, 2013 146 46 1 260 4 600 132 184 6 368
Accumulated depreciation and impairment on Jan 1, 2013 -6 -7 -507 -2 429 -63 -45 -3 056
Translation differences 0 - 5 37 0 1 44
Disposals - - 3 33 -0 - 36
Disposed subsidiaries 0 - 23 100 2 0 124
Reclassifications - - 0 65 0 1 66
Depreciation -0 -2 -47 -291 -5 - -346
Impairments -3 - 0 0 -0 -7 -9
Reclassifications to assets held for sale - - 3 23 - 0 26
Accumulated depreciation and impairment on Dec 31, 2013 -9 -9 -520 -2 462 -66 -49 -3 115
Carrying value on Dec 31, 2013 137 37 740 2 139 66 134 3 254Carrying value on Jan 1, 2013 2) 167 40 800 2 380 79 250 3 716
Historical cost on Jan 1, 2012 49 36 965 3 336 121 274 4 782
Translation differences 1 - 6 43 1 3 53
Additions 0 2 78 188 10 76 354
Acquired subsidiaries 2) 133 - 241 1 157 8 133 1 673
Disposals -0 - -9 -23 -0 -0 -33
Disposed subsidiaries -4 - -1 -13 -1 -1 -19
Reclassifications 1 8 48 141 3 -190 11
Reclassifications to assets held for sale -6 - -21 -22 - - -49
Historical cost on Dec 31, 2012 2) 173 46 1 307 4 808 142 295 6 772
Accumulated depreciation and impairment on Jan 1, 2012 -7 -6 -462 -2 206 -55 -41 -2 777
Translation differences -0 - -4 -31 -0 -1 -36
Disposals 0 - 9 23 0 0 32
Disposed subsidiaries 2 - 1 11 0 - 14
Reclassifications 0 - -6 -6 - 0 -12
Depreciation - -1 -33 -162 -5 - -201
Impairments -1 - -20 -69 -3 -2 -96
Reclassifications to assets held for sale - - 9 11 - - 20
Accumulated depreciation and impairment on Dec 31, 2012 -6 -7 -507 -2 429 -63 -45 -3 056
Carrying value on Dec 31, 2012 2) 167 40 800 2 380 79 250 3 716
Carrying value on Jan 1, 2012 42 30 503 1 130 66 233 2 005
1) Advances paid and construction work in progress includes also intangible assets. When the asset is ready to be taken into use, it is reclassified to appropriate asset account either in property, plant and equipment or in intangible assets.
2) Restated due to completing the Inoxum acquisition accounting (see Note 4. Acquisitions and disposals).
Borrowing costs amounting to EUR 2 million were capitalized on investment projects during the financial year (2012: EUR 8 million). Total interest capitalized on December 31, 2013 was EUR 38 million (Dec 31, 2012: EUR 41 million). Outokumpu determines separate capitalization rates for each quarter. The average rate used during 2013 was 4.3%.
Outokumpu Annual Report 2013 nOtes tO the cOnsOlidated financial stateMents
65

ImpairmentsAs a result of the impairment test performed to Group’s cash-generating units, no impairment losses were recognized in 2013. However, immaterial impairment losses related to single assets and totaling EUR 9 million were recognized in various Group companies.
In 2012, impairment test was carried out to the assets of Nyby and Kloster leading to the recognition of an impairment loss of EUR 70 million related to Nyby and EUR 16 million related to Kloster, mainly allocated to machinery and equipment. Additionally, an impairment of EUR 10 million was recognized related to the divested stock locations. The impairment mainly related to buildings and machinery and equipment.
Assets leased by finance lease agreements
€ million Land BuildingsMachinery and
equipment Total
Historical cost 29 37 270 335
Accumulated depreciation -0 -5 -70 -75
Carrying value on Dec 31, 2013 28 32 200 260
Historical cost 27 34 212 272
Accumulated depreciation - -4 -57 -61
Carrying value on Dec 31, 2012 27 30 155 211
Outokumpu Annual Report 2013 nOtes tO the cOnsOlidated financial stateMents
66

13. Investments in associated companies and joint ventures€ million 2013 2012
Investments in associated companies and joint ventures at cost
Historical cost on Jan 1 30 23
Translation differences -0 0
Investments in associated companies and joint ventures in acquired subsidiaries 1) - 6
Reclassification from investments in subsidiaries 2) 11 -
Investments in associated companies and joint ventures 6 -
Impairments -3 -
Reclassification to assets held for sale -0 -
Disposals 3) -0 -
Historical cost on Dec 31 43 30
Equity adjustment to investments in associated companies and joint ventures on Jan 1 21 16
Translation differences -1 1
Dividends received -2 -
Share of results in associated companies and joint ventures -2 0
Recognition of remaining interest in associate at fair value 2) 6 -
Equity adjustments to investments in associated companies and joint ventures in acquired subsidiaries 1) - 5
Reclassification to assets held for sale -0 -
Disposals 3) 0 -
Equity adjustment on Dec 31 23 21
Carrying value of investments in associated companies and joint ventures on Dec 31 66 51
1) As part of Inoxum transaction in 2012 Outokumpu acquired Fischer Mexicana S.A. de C.V. in Mexico (50% ownership), MOL Katalysatortechnik GmbH in Germany (20.46% ownership) and Evidal Schmöle Verwaltungsgesellschaft GmbH (50% ownership).
2) Subsidiary OSTP Holding Oy became an associate as a result of Outokumpu’s loss in control in January 2013.3) KDAB i Västerås AB was liquidated in April, 2013.
Associated companies and joint venturesDomicile Ownership, %
OSTP Holding Oy Finland 49
Fagersta Stainless AB Sweden 50
Fischer Mexicana S.A. de C.V. Mexico 50
Rapid Power Oy Finland 33
Ilserv S.r.l. 1) Italy 35
Euroacciai S.r.l. Sarezzo (BS) 1) Italy 30
Terni Frantumati S.p.A. 1) Italy 21
MOL Katalysatortechnik GmbH 1) Germany 20
1) Classified to assets held for sale.
Information on associated companies and joint ventures € million Domicile Assets Liabilities Sales Profit Ownership, %
2013OSTP Holding Oy Finland 117 73 198 -3 49
Fagersta Stainless AB Sweden 69 40 137 -7 50
Fischer Mexicana S.A. de C.V. 1) Mexico 36 9 52 8 50
Rapid Power Oy Finland 129 76 43 0 33
2012
Fagersta Stainless AB Sweden 64 28 157 -0 50
Fischer Mexicana S.A. de C.V. 2) Mexico 31 8 66 9 50
Rapid Power Oy Finland 153 100 47 0 33
1) Figures are based on the information on September 30, 2013. 2) Company was acquired as part of the Inoxum transaction on December 28, 2012. The profit was not consolidated to the statement of income in 2012.
Outokumpu Annual Report 2013 nOtes tO the cOnsOlidated financial stateMents
67

14. Carrying values and fair values of financial assets and liabilities by measurement category
Measured at
2013€ million
Category inaccordancewith IAS 39
Amortizedcost Cost
Fair valuerecognized
in othercomprehensive
income
Fair valuerecognized
throughprofit or loss
Carryingamount
on Dec 31, 2013
Fair valueon Dec 31,
2013
Non-current financial assetsAvailable-for-sale financial assets a) - 13 2 - 15 15Investments at fair value through profit or loss c) - - - 2 2 2
Trade and other receivables b) 11 - - - 11 11
Hedge accounted derivatives e) - - 0 - 0 0
Derivatives held for trading d) - - - 2 2 2
Current financial assetsAvailable-for-sale financial assets a) - 3 0 - 4 4Investments at fair value through profit or loss c) - - - 17 17 17
Trade and other receivables b) 754 - - - 754 754
Cash and cash equivalents b), c) 607 - - - 607 607
Hedge accounted derivatives e) - - 1 - 1 1
Derivatives held for trading d) - - - 19 19 19
1 372 17 4 41 1 433 1 433
Non-current financial liabilitiesLong-term debt f) 3 270 - - - 3 270 3 189
Hedge accounted derivatives e) - - 4 - 4 4
Derivatives held for trading d) - - - 11 11 11
Current financial liabilitiesCurrent debt f) 893 - - - 893 893
Trade and other payables f) 997 - - - 997 997
Hedge accounted derivatives e) - - 3 - 3 3
Derivatives held for trading d) - - - 31 31 31
5 160 - 7 42 5 210 5 129
Categories in accordance with IAS 39: a) Available-for-sale financial assets b) Loans and receivables c) Financial assets at fair value through profit or loss d) Derivatives held for trading e) Hedge accounted derivatives f) Other financial liabilities
Outokumpu Annual Report 2013 nOtes tO the cOnsOlidated financial stateMents
68

Measured at
2012€ million
Category inaccordancewith IAS 39
Amortizedcost Cost
Fair valuerecognized
in othercomprehensive
income
Fair valuerecognized
throughprofit or loss
Carryingamount
on Dec 31, 2012
Fair valueon Dec 31,
2012
Non-current financial assetsAvailable-for-sale financial assets a) - 11 5 - 16 16Investments at fair value through profit or loss c) - - - 2 2 2
Trade and other receivables b) 172 - - - 172 174
Hedge accounted derivatives e) - - 2 - 2 2
Derivatives held for trading d) - - - 0 0 0
Current financial assetsAvailable-for-sale financial assets a) - 3 2 - 5 5Investments at fair value through profit or loss c) - - - 59 59 59
Trade and other receivables b) 1 033 - - - 1 033 1 033
Cash and cash equivalents b), c) 222 - - - 222 222
Hedge accounted derivatives e) - - 16 - 16 16
Derivatives held for trading d) - - - 37 37 37
1 428 14 25 98 1 566 1 568
Non-current financial liabilitiesLong-term debt f) 2 935 - - - 2 935 2 883
Hedge accounted derivatives e) - - 0 - 0 0
Derivatives held for trading d) - - - 39 39 39
Current financial liabilitiesCurrent debt f) 718 - - - 718 718
Trade and other payables f) 1 374 - - - 1 374 1 374
Hedge accounted derivatives e) - - 3 - 3 3
Derivatives held for trading d) - - - 22 22 22
5 027 - 3 61 5 094 5 042
Categories in accordance with IAS 39: a) Available-for-sale financial assets b) Loans and receivables c) Financial assets at fair value through profit or loss d) Derivatives held for trading e) Hedge accounted derivatives f) Other financial liabilities
Outokumpu Annual Report 2013 nOtes tO the cOnsOlidated financial stateMents
69

15. Fair value hierarchy of financial assets and liabilitiesFair value
2013€ million
Carrying amount Level 1 Level 2 Level 3 Total
Financial assets measured at fair value Available-for-sale financial assets 2 1 2 0 2
Investments at fair value through profit or loss 19 4 - 15 19
Hedge accounted derivatives 1 - 1 - 1
Derivatives held for trading 22 - 22 - 22
45 5 25 15 45
Financial assets not measured at fair value Non-current trade and other receivables 11 - 11 - 11
Financial liabilities measured at fair value Hedge accounted derivatives 7 - 7 - 7
Derivatives held for trading 42 - 42 - 42
50 - 50 - 50
Financial liabilities not measured at fair value Long-term debt 3 270 386 2 803 - 3 189
The fair value of long-term debt is determinated by using discounted cash flow method and taking into consideration the market credit spread applied for Outokumpu. The fair value of long-term non-current trade and other receivable is determinated by discounted cash flow method and taken into account credit risk of the counterparty. The carrying amounts of current financial assets and current financial liabilities not measured at fair value are reasonable estimation of their fair value.
Outokumpu Annual Report 2013 nOtes tO the cOnsOlidated financial stateMents
70

Fair value
2012€ million
Carrying amount Level 1 Level 2 Level 3 Total
Financial assets measured at fair value Available-for-sale financial assets 7 3 - 4 7
Investments at fair value through profit or loss 61 6 - 55 61
Hedge accounted derivatives 19 - 19 - 19
Derivatives held for trading 37 - 37 - 37
124 9 56 59 124
Financial assets not measured at fair value Non-current trade and other receivables 172 - 14 160 172
Financial liabilities measured at fair value Hedge accounted derivatives 3 - 3 - 3
Derivatives held for trading 60 - 60 - 60
60 - 63 - 63
Financial liabilities not measured at fair value Long-term debt 2 935 385 2 498 - 2 883
Reconciliation of changes on level 3 2013
€ millionAvailable-for-sale financial assets
Investment at fair value through profit or loss
Carrying value on Jan 1 4 55
Fair value changes -2 -41
Transfer to level 2 -2 -
Disposals -0 -
Carrying balance on Dec 31 0 15
Accounting principles contain information on how fair values are defined on different levels in the fair value hierarchy. There were no transfers between level 1 and 2 during the year.
The fair value of the level three relates mostly investments in Talvivaara Sotkamo Ltd. Valuation of the investment to Talvivaara Sotkamo Ltd is based on the share value of Talvivaara Mining Company Plc. Change of +/- 10% in the share price of Talvivaara Mining Company Ltd leads to an increase of EUR 1 million or decrease of EUR 1 million in the value. The ownerships in energy producing companies are valued at fair value. Valuation model of energy producing companies is based on discounted cash flow model, which takes into account the future prices of electricity, discount rate and inflation rate, the estimated amount of electricity to be received and estimated production costs. The valuation model is very sensitive to electricity price, +/- 10% change in electricity price leads to an increase of EUR 1 million or decrease of EUR 0 million in valuation.
Outokumpu Annual Report 2013 nOtes tO the cOnsOlidated financial stateMents
71

16. Available-for-sale financial assets€ million 2013 2012
Carrying value on Jan 1 21 23
Translation differences 0 0
Additions 2 4
Available-for-sale assets from acquired subsidiaries - 0
Fair value changes -3 -4
Disposals -0 -0
Impairments -2 -
Gains and losses from disposals reclassified to profit or loss 0 -1
Carrying value on Dec 31 19 21
Non-current listed equity securities 0 1
Non-current unlisted equity securities 15 15
Current available-for-sale financial assets 4 5
19 21
Listed equity securities, at fair value 1 3
Unlisted equity securities and other investments, at fair value 2 4
Unlisted equity securities and other investments, at cost 17 14
19 21
Fair value reserve in equity€ million 2013 2012
Fair value 19 21
Cost 20 20
Fair value reserve before tax -1 1
Deferred tax liability 0 0
Fair value reserve -1 1
Unlisted equity securities and other investments at cost consist of EUR 12 million holdings in Voimaosakeyhtiö SF providing ownership to Fennovoima Oy. As the Fennovoima project is in early stage, the fair value cannot be reliably measured. Unlisted equity securities at fair value consist of holdings in energy producing companies and other investments not listed in any stock exchange. The valuation method of these investments is described in Note 15. Fair value hierarchy of financial assets and liabilities.
17. Investments at fair value through profit or loss€ million 2013 2012
Carrying value on Jan 1 61 106
Translation differences -0 0
Additions 0 1
Subsequent fair value changes of Talvivaara Sotkamo Ltd -41 -52
Other movement -2 6
Carrying value on Dec 31 19 61
Subsequent valuation of the 16% ownership in Talvivaara Sotkamo Ltd reflects the changes in the share price of Talvivaara Mining Company Plc, which on December 31, 2013 was EUR 0.08 per share.
In December 2013, the district court of Espoo took the decision to commence the corporate reorganization process in respect of Talvivaara Sotkamo Ltd. The corporate reorganization process of Talvivaara Mining Company Plc commenced in November 2013. Reports on the financial status of both companies are to be compiled by March 28, 2014, and proposals for the respective reorganization programs by May 28, 2014.
Outokumpu Annual Report 2013 nOtes tO the cOnsOlidated financial stateMents
72

18. Share-based payment plans
During 2013 Outokumpu’s share based programs included Share-based Incentive Program 2009–2013 (plan 2011–2013); Performance Share Plan 2012 (plans 2012–2014 and 2013–2015); Resticted Share Program 2010–2013; and Restricted Share Pool Program (plans 2012–2014 and 2013–2015). Share-based programs are part of the Group’s incentive and commitment-building system for key employees. The objective of the programs is to retain, motivate and reward selected employees for good performance which supports Outokumpu’s strategy.
Regarding the Share-based Incentive program, the targets set for the earnings period 2010–2012 were not met and therefore no reward was paid to the participants in 2013.
The EBIT criterion previously applied in the on-going earnings period 2011–2013 of the Share-based Incentive Program and in the on-going plan 2012–2014 of the Performance Share Plan was for the year 2013 replaced with the EBITDA criterion. The targets set for the earnings period 2011–2013 were not met and therefore no reward will be paid to the participants in 2014.
In 2013, the Board approved the commencement of the Plan 2013–2015 of the Performance Share Plan and its participants, 164 Outokumpu Group managers and key employees. The earning criteria
applied in the plan are EBITDA, Outokumpu share-price adjusted with dividends and the achievement of Inoxum transaction related synergies. The share rewards possibly to be delivered based on the plan will be delivered in the spring 2016.
Under the Restricted Share Program 2010–2013 Outokumpu granted restricted shares to retain, reward and motivate selected key employees. In line with the terms and conditions of the program, in total 48 000 shares were delivered to the program participants during fall 2013. In addition, the participants received cash equaling the taxes and social security charges imposed on the share award. No more shares will be granted based on this program.
The Board of Directors will decide on the start of a new plan for the Performance Share Plan 2012 and the Restricted Share Pool program during April 2014.
The total estimated fair value of share-based incentive programs and restricted share plans is EUR 3 million on December 31, 2013. This value is recognized as an expense in the statement of income during the vesting periods.
Detailed information of the share-based incentive programs can be found in Outokumpu’s home page www.outokumpu.com.
Share-based payments included in employee benefit expenses€ million 2013 2012
Equity-settled share-based payment transactions -1 -1
Cash-settled share-based payment transactions -0 0
-1 -0
Total carrying amount of liabilities for cash-settled arrangements on Dec 31 0 0
Outokumpu Annual Report 2013 nOtes tO the cOnsOlidated financial stateMents
73
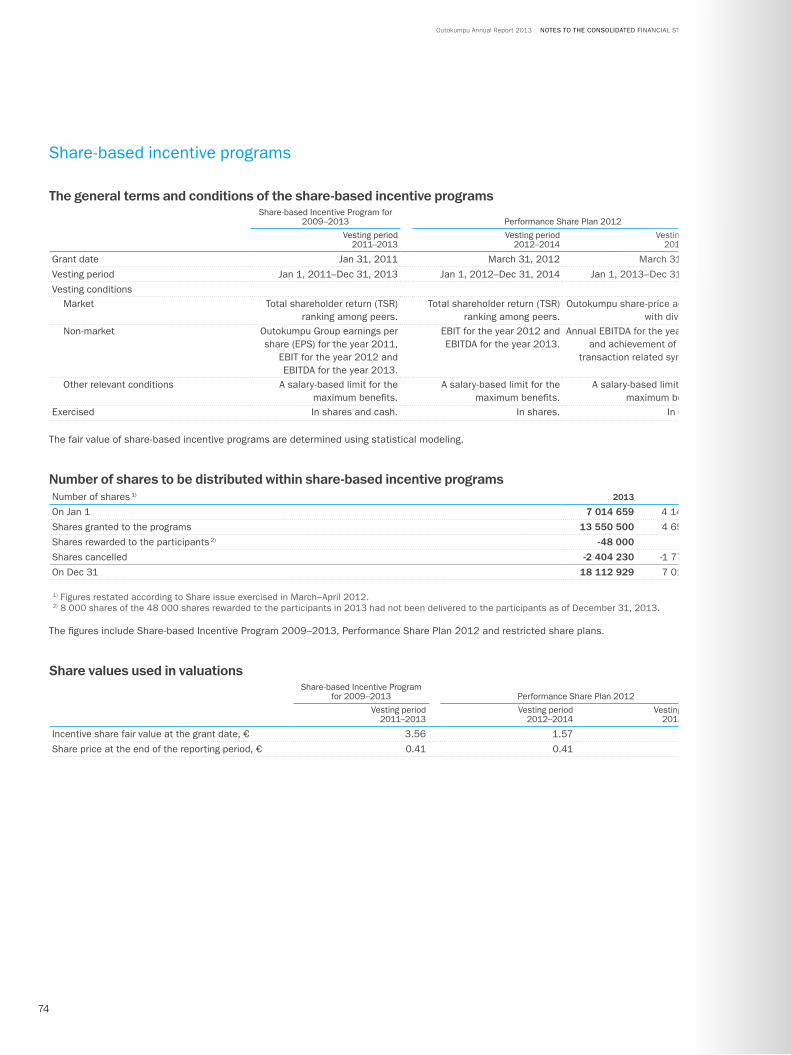
Share-based incentive programs
The general terms and conditions of the share-based incentive programsShare-based Incentive Program for
2009–2013 Performance Share Plan 2012
Vesting period2011–2013
Vesting period2012–2014
Vesting period2013–2015
Grant date Jan 31, 2011 March 31, 2012 March 31, 2013
Vesting period Jan 1, 2011–Dec 31, 2013 Jan 1, 2012–Dec 31, 2014 Jan 1, 2013–Dec 31, 2015
Vesting conditionsMarket Total shareholder return (TSR)
ranking among peers.Total shareholder return (TSR)
ranking among peers.Outokumpu share-price adjusted
with dividends.Non-market Outokumpu Group earnings per
share (EPS) for the year 2011, EBIT for the year 2012 and EBITDA for the year 2013.
EBIT for the year 2012 and EBITDA for the year 2013.
Annual EBITDA for the year 2013 and achievement of Inoxum
transaction related synergies.
Other relevant conditions A salary-based limit for the maximum benefits.
A salary-based limit for the maximum benefits.
A salary-based limit for the maximum benefits.
Exercised In shares and cash. In shares. In shares.
The fair value of share-based incentive programs are determined using statistical modeling.
Number of shares to be distributed within share-based incentive programsNumber of shares 1) 2013 2012
On Jan 1 7 014 659 4 140 600
Shares granted to the programs 13 550 500 4 650 523
Shares rewarded to the participants 2) -48 000 -
Shares cancelled -2 404 230 -1 776 464
On Dec 31 18 112 929 7 014 659
1) Figures restated according to Share issue exercised in March–April 2012.2) 8 000 shares of the 48 000 shares rewarded to the participants in 2013 had not been delivered to the participants as of December 31, 2013.
The figures include Share-based Incentive Program 2009–2013, Performance Share Plan 2012 and restricted share plans.
Share values used in valuationsShare-based Incentive Program
for 2009–2013 Performance Share Plan 2012
Vesting period2011–2013
Vesting period2012–2014
Vesting period2013–2015
Incentive share fair value at the grant date, € 3.56 1.57 0.59
Share price at the end of the reporting period, € 0.41 0.41 0.41
Outokumpu Annual Report 2013 nOtes tO the cOnsOlidated financial stateMents
74

19. Financial risk management, capital management and insurances
The objectives of financial risk management are to reduce the impact of price fluctuations and other factors of uncertainty in financial markets on earnings, cash flows and capital structure, as well as to ensure sufficient liquidity. The objective of capital management is to secure the ability to continue as a going concern and to optimize the cost of capital in order to enhance value to shareholders. The main objectives of insurance management are to provide protection against catastrophe risks and to reduce earnings variation caused by hazards.
The Board has approved the risk management policy, which defines responsibilities, risk management process and other main principles of risk management. The Board oversees risk management on a regular basis and the Chief Financial Officer is responsible for implementation and development of financial risk management. In 2013, the Group’s Financial Risk Policy was reviewed and changes to it were approved by the Chief Executive Officer. Main changes to the policy were related to metal risk management.
Financial risks consist of market, country, credit, liquidity and refinancing risks. Subsidiary companies hedge their currency risk against Treasury and Risk Management function, which does most of the Group’s derivative contracts with banks and other financial institutions. The function is also responsible for managing liquidity and refinancing risk as well as interest rate, fuel and emission allowance price risk. Credit risk management is partly centralized and Treasury and Risk Management function monitors the risk. Energy function is responsible for managing electricity price risk and Raw Material Procurement function is responsible for managing Group’s metal price risk. In addition, metal hedging activities have been carried out by Outokumpu Nirosta, Outokumpu VDM and Acciai Speciali Terni.
Treasury and Risk Management function sources a substantial part of the Group’s insurances. The most important insurance lines are property damage and business interruption, liability, marine cargo and credit. The Group’s captive insurance company Visenta Försäkrings AB retains a selected part of risk.
Exposure to financial risk is identified as part of the Group’s risk management process. This approach aims to secure, that any emerging risk is identified early and each significant risk is
described, quantified, managed and communicated properly. In risk quantification, both likelihood of an adverse event and the impact on that event are assessed. For market risk, the adverse scenario is based on a predefined price change in a risk factor, e.g. in exchange rate or metal price. Furthermore, the impact analysis is based on measured underlying exposure, e.g. the amount of forecasted currency cash flow or the amount of net debt by currency. The likelihood of the adverse scenario is based on the market volatility of the underlying risk factor. Eventually, the impacts of key risks are quantified in terms of changes in net earnings, cash flows and gearing.
Market riskMarket risk is caused by changes in foreign exchange and interest rates, as well as commodity, energy and security prices. These price changes may have a significant impact on Group’s earnings, cash flows and capital structure.
Outokumpu uses derivative contracts to mitigate the above-mentioned impacts of market price changes. Hedge accounting is applied to committed currency denominated electricity purchases (EUR/SEK spot rate risk), and to limited extend sales of stainless steel products and purchases of raw materials (nickel price). The derivatives, for which hedge accounting is not applied, have been entered into for the purpose of reducing impacts of market price changes on earnings and/or cash flows related to business or financing activities. The use of non-hedge-accounted derivatives may cause timing differences between derivative gains/losses and the earnings impact of the underlying exposure.
Stainless steel business is highly cyclical, which in many cases result in significant changes in the underlying exposures to different market risk factors. Consequently applying hedging policies in a consistent way may, from time to time, lead to rather big changes in the amounts of outstanding and reported derivate contracts. Nominal amounts and fair values of derivatives are presented in Note 20. Fair values and nominal amounts of derivative instruments. Sensitivity of financial instruments to market prices is described in the following table.
Outokumpu Annual Report 2013 nOtes tO the cOnsOlidated financial stateMents
75

Foreign exchange positions of EUR-based companies2013 2012
€ million SEK USD GBP Other SEK USD GBP Other
Trade receivables and payables 8 -49 13 18 6 -258 14 32
Loans and bank accounts 1) 303 1 157 -87 -108 456 976 -38 -96
Derivatives 2) -43 -1 082 51 100 -141 -852 -20 60
Net position 268 25 -23 10 321 -134 -44 -4
Foreign exchange positions of SEK-based companies 2013 2012
€ million SEK USD GBP Other SEK USD GBP Other
Trade receivables and payables 53 12 -4 5 49 7 -4 12
Loans and bank accounts 1) 13 8 0 1 -15 21 1 2
Derivatives 2) -119 -21 -3 -11 -127 -37 1 -21
Net position -53 -2 -6 -4 -93 -9 -3 -7
1) Includes cash, interest-bearing debt and receivables.2) Includes derivatives to hedge committed cash flows.
Outokumpu has income translation risk in US dollars and based on the policy this risk is not hedged. The Group has significant currency denominated net investment positions in US dollars, Swedish kronas, British pounds, Chinese yuans and Australian dollars. At the end of the year there were no hedges related to net investment exposure. The effective portion of gains (EUR 15 million, net of tax) on earlier financial year net investment hedges is recognized in other comprehensive income. Currency denominated debt at subsidiary companies and changes in currency prices have an impact on Group’s capital structure. This exposure is also monitored centrally.
Foreign exchange rate riskA major part of the Group’s sales is in euros and US dollars. A significant part of expenses arise in euros, US dollars, Swedish kronas, Mexican pesos, Chinese yuans and British pounds. In Europe, Outokumpu’s products are priced mainly in euros and therefore costs in Swedish krona and British pounds give rise to a significant foreign exchange risk impacting profitability and cash flows. Following the ramp-up of ferrochrome production, the US dollar price risk relating to forecasted cash flows has increased and is significant.
Outokumpu hedges most of its fair value risk, e.g. risks related to currency denominated accounts receivables, accounts payables, interest-bearing debt, cash and loan receivables. Cash flow risk related to firm commitments is hedged to a large extent, whereas forecasted and probable cash flows can be hedged selectively and with separate decisions only. The Group’s fair value currency position is presented on a more detailed level in the table below.
Sensitivity of financial instruments to market risks2013 2012
€ million In profit or loss
Other comprehensive
income In profit or loss
Other comprehensive
income
+/-10% change in EUR/USD exchange rate -2/+2 - +9/-11 +0/-0
+/-10% change in EUR/SEK exchange rate -4/+5 -20/+24 -6/+8 -22/+27
+/-10% change in USD nickel price -7/+7 +3/-3 -1/+1 +4/-4
+/-10% change in electricity price - +1/0 - +4/-2
+/-10% change in share prices +1/-1 +0/-0 +4/-4 +1/-1
+/-1% parallel shift in interest rates -23/+23 - -19/+19 -
This sensitivity analyses applies to financial instruments only. Other assets, liabilities and off-balance sheet items such as sales and purchase orders, are not in the scope of these analyses. The calculations are net of tax. During the year the volatility for nickel has been in the range 15–25%. With +/-20% change in USD nickel price, the effect in profit or loss is about EUR-14/+14 million for nickel derivatives.
Outokumpu Annual Report 2013 nOtes tO the cOnsOlidated financial stateMents
76

Currency distribution and re-pricing of outstanding net debtDec 31, 2013
€ millionCurrency Net debt 1) Derivatives 2) Average rate, % Duration, year Rate sensitivity 3)
EUR 3 244 -1 403 4.6 0.9 12.5
SEK 441 305 3.9 0.7 5.1
USD -183 1 241 0.5 0.4 6.4
Others 39 -129 13.5 0.2 -0.8
3 540 15 23.2
Dec 31, 2012
€ millionCurrency Net debt 1) Derivatives 2) Average rate, % Duration, year Rate sensitivity 3)
EUR 2 804 -1 361 4.4 1.1 7.2
SEK 515 510 3.5 1.1 4.6
USD -135 968 6.2 0.1 7.0
Others 80 -94 9.8 0.0 -0.2
3 264 22 18.6
1) Includes cash and cash equivalents, interest-bearing debt and receivables. 2) Net derivative liabilities include nominal value of interest rate and cross currency swaps, interest rate options and currency forwards earmarked to the
interest-bearing net debt. Currency forwards are not included in average rate calculation.3) The effect of one percentage point increase in interest rates to financial expenses over the following year.
Interest rate riskThe Group’s interest rate risk is monitored as cash flow risk i.e. impact of interest rate changes on net interest expenses, and fair value risk i.e. impact of interest rate changes on fair value of monetary assets and liabilities. In order to manage the balance between risk and cost in an optimal way, a significant part of loans has short-term interest rate as a reference rate. This approach typically helps to reduce average interest rate of debt while it may also provide some mitigation against a risk of adverse changes in business environment, which tends to result to decrease in short-term interest rates.
Cash flow risk related to financial instruments is reduced with interest rate swaps, where Outokumpu pays fixed rate and receives variable rate. In 2013, Outokumpu entered into five fixed rate payer swaps totaling USD 250 million and a EUR 100 million swaption transactions in order to increase the duration of debt.
Euro, US dollar, Swedish krona and Chinese yuan have substantial contribution to the overall interest rate risk. Approximately 84% of the Group’s interest-bearing liabilities have an interest period of less than one year and the average interest rate of long-term interest bearing debt on December 31, 2013 was 4.3% (Dec 31, 2012: 4.2%). Interest rate position is presented on a more detailed level in the table below. In addition to exposures related to market level of interest rates, Outokumpu is exposed to market level of credit margins. The volatility of credit margins has been high and combined with the increase in debt this risk is significant. The anticipated financing measures are expected to lead to more stable credit margins.
Outokumpu Annual Report 2013 nOtes tO the cOnsOlidated financial stateMents
77

Commodity and energy price riskOutokumpu uses a substantial amount of raw materials and energy for which prices are determined in regulated markets, such as London Metal Exchange and NASDAQ OMX Commodities Europe. Timing differences between raw material purchase and pricing of products; changes in inventory levels and values; the capability to pass on changes in raw material and energy prices to end-product prices; and the impact on gross profit caused by the level of alloy metal prices and the extent of purchase discounts (e.g. related to stainless steel scrap purchases) all affect risks and hedging activities.
Nickel price is the most important commodity price risk for Outokumpu. A majority of stainless steel sales contracts include an alloy surcharge clause, with the aim of reducing the risk arising from the time difference between raw material purchase and product delivery. In 2013 Outokumpu introduced the daily alloy surcharge pricing model, which aims to reduce Outokumpu’s metal price risk while helping customers to manage their risk. Outokumpu’s exposure to nickel price is caused by price fixed purchase orders, nickel-containing material in inventories, price fixed sales orders and forecasted but not yet ordered deliveries for the upcoming few weeks. Following the review of hedging policy this long position in nickel has been reduced with derivatives so that only some part of inventories has been left unhedged. Risk related to purchase discounts and the level of nickel price is not hedged.
Nickel derivatives and LME warehouse warrants have been used to manage impacts of price changes on earnings. Metal prices have a major impact on the Group’s working capital and thus cash flow from operations. This risk has not been hedged with derivatives, however strict working capital management helps to reduce the cash flow risk. Outokumpu has managed molybdenum risk with similar type of principles, which have been applied in managing nickel price risk. The financial market for molybdenum is far less liquid compared with nickel, which in many cases has led to decision not to use derivatives in managing this particular risk. The underlying exposure to changes in metal prices varies a lot due to the cyclical nature of stainless steel business.
Outokumpu’s main sites in Europe are participating in the EU Emissions Trading Scheme (ETS). Realized and forecasted carbon dioxide emissions and granted emission allowances are monitored centrally. Emission allowance price risk is managed with the aim of securing the cost of compliance for the current trading period and reducing the cost of compliance e.g. by swapping EUAs to Kyoto credits within the limits set in ETS.
The Group has energy intensive production processes using electricity, propane, natural gas and other fuels. The Group hedges both propane and natural gas price risk by locking future purchase prices with derivative contracts. Electricity used by the Nordic production sites is purchased and managed centrally while at other sites electricity is purchased locally. Electricity price risk is reduced with fixed price supply contracts and ownerships in energy producing companies. Electricity consumption of the Group’s Nordic production sites was 3.3 TWh (2012: 2.8 TWh).
Security price riskOutokumpu has investments in equity securities and loan receivables. On December 31, 2013 the biggest investments were in Talvivaara Sotkamo Ltd, Voimaosakeyhtiö SF and OSTP Holding Oy. The captive insurance company Visenta Försäkrings AB has investments in highly rated and liquid fixed income securities, such as bonds issued by governments.
Country and credit riskAll external sales must be covered by approved credit limits or secured payment terms. Most of the outstanding trade receivables have been secured by credit insurances, which typically cover some 90% of an insured amount. Part of the credit risk related to trade receivables is managed with bank guarantees, letters of credit and advance payments.
On December 31, 2013 the maximum exposure to credit risk of trade receivables was EUR 564 million (2012: EUR 853 million). Large part of trade receivables is covered by insurance or by secured payment terms, however there are also unsecured trade receivables based on separate decisions. For part of accounts receivable Outokumpu uses factoring, which transfers substantial part of all risks and rewards to the buyer of the receivables. The Group’s trade receivables are generated by a large number of customers. However, there have been a few significant customer credit risk concentrations during the year 2013 and at the end of the year. Age analysis of accounts receivables is in Note 22. Trade and other receivables.
Treasury and Risk Management function monitors credit risk related to receivables from financial institutions. Outokumpu seeks to reduce these risks by limiting the counterparties to banks and other financial institutions with good credit standing. For the derivative transactions, Outokumpu prefers to have ISDA framework agreements in place. Investments related to liquidity management are made in short-term deposits and liquid financial instruments with low credit risk.
Outokumpu Annual Report 2013 nOtes tO the cOnsOlidated financial stateMents
78

Liquidity and refinancing riskOutokumpu raises most of its interest-bearing debt centrally. The Group seeks to reduce liquidity and refinancing risk by having sufficient amount of cash and credit lines available and by having balanced maturity profile of debt. Efficient cash and liquidity management is also reducing liquidity risk. Finance plans are prepared and reviewed quarterly with a particular focus on the Group’s forecasted cash flows, projected funding requirements and planned funding transactions during the forecast period. The amount and adequacy of liquidity reserves, the amounts of scheduled annual repayments of long-term debt as well as forecasted gearing levels are key targets and outcomes of the planning. Low profitability combined with high gearing required significant financing measures to be initiated during the last quarter of 2013. These measures aim to reduce refinancing risk in 2014–2016 and to increase liquidity.
In July 2013, Outokumpu Oyj signed a EUR 900 million revolving credit facility maturing in June 2015. Also a bilateral facility of EUR 100 million maturing in January 2014 became available. In October 2013, Outokumpu Oyj agreed a EUR 50 million pension loan and amended maturity date of a certain bilateral loan to January 2014. In November 2013, Outokumpu signed a sale and lease back transaction related to a sale of local electricity grid at Tornio site. This transaction is reported as a financial lease liability of EUR 63 million. In December 2013, Outokumpu Oyj signed an amendment to the backup facility with ThyssenKrupp, shifting the maturity to January 2014. The EUR 900 million facility includes two financial covenants, one based on gearing and the other on liquidity. Same financial covenants are included in to certain other loans and facilities. There have been no breaches of financial covenants in 2013.
At the end of November Outokumpu announced comprehensive plans to strengthen the Group’s balance sheet. The financing measures initiated include refinancing of the EUR 900 million revolving facility, extending maturities of bilateral loans amounting some EUR 600 million and agreeing a new EUR 500 million liquidity facility. The above mentioned financing measures are subject to successful closing of Terni and VDM transaction. The extended maturities are planned for February 2017, which is expected to have significant reduction in refinancing risk during 2014–16. In connection with financing measures Outokumpu Oyj is planning to grant security to the 2015 and 2016 bonds as well as to majority of its bank loans. The security is expected to include pledges on subsidiary shares and certain real estates as well as guarantees granted by several subsidiary companies. In addition, the upcoming fully committed and underwritten rights issue of EUR 650 million will have a positive impact on both capital structure and liquidity. The right issue is subject to EGM approval and successful closing Terni and VDM transaction.
The main funding programs and credit facilities are: a Finnish Commercial Paper Program totaling EUR 800 million, a committed revolving credit facility of EUR 900 million, a committed revolving backup facility of EUR 160 million granted by ThyssenKrupp Nederland Holding B.V., two committed revolving credit facilities of EUR 100 million each, a committed revolving credit facility of EUR 46 million and two committed revolving credit facilities totaling SEK 2 933 million. As at December 31, 2013 Outokumpu had a total amount of some EUR 1.6 billion committed credit facilities. Of these committed credit facilities some EUR 310 million were unutilized in the end of 2013. More information on liquidity and refinancing is presented in the following table.
Contractual cash flows
2013€ million
BalanceDec 31 2014 2015 2016 2017 2018 2019–
Bonds 399 - 250 150 - - -
Loans from financial institutions 1 645 493 786 80 204 34 48
Pension loans 223 31 35 37 33 29 59
Finance lease liabilities 266 22 31 11 89 5 108
Loans from related party 1 443 160 - 204 204 204 672
Commercial papers 187 187 - - - - -
Trade payables 815 815 - - - - -
Other liabilities 1 1 0 - - - -
Interest payments and facility charges 62 109 85 78 50 45 359
Interest rate derivatives 26 22 5 1 - - -
Other derivatives 2 1 2 0 - - -
1 841 1 194 560 580 318 1 247
On December 31, 2013, the Group had cash and cash equivalent marketable securities amounting to EUR 607 million and committed and available credit facilities, available and undrawn TyEL pension loans in Finland, and other agreed and undrawn loans totaling EUR 399 million. The future interest cash flows include interest payments of ThyssenKrupp loan note some EUR 210 million, which can be deferred. The loan note is planned to be used as a consideration for the planned transaction during the first quarter of 2014. However, at year end the loan note was classified as long term debt and cash flows reported according to remaining contractual maturity.
Outokumpu Annual Report 2013 nOtes tO the cOnsOlidated financial stateMents
79

2012€ million
BalanceDec 31 2013 2014 2015 2016 2017 2018–
Bonds 399 - - 250 150 - -
Loans from financial institutions 1 286 362 366 200 75 209 75
Pension loans 210 37 31 35 30 26 51
Finance lease liabilities 218 14 21 30 10 88 55
Loans from related party 1 230 - - - 204 204 822
Commercial papers 301 301 - - - - -
Trade payables 1 210 1 210 - - - - -
Other liabilities 10 4 0 5 - - -
Interest payments and facility charges 21 77 59 62 68 40 421
Interest rate derivatives 39 10 25 4 2 1 -
Other derivatives -32 -31 -2 -2 0 - -
1 983 500 584 540 568 1 423
On December 31, 2012, the Group had cash and cash equivalent marketable securities amounting to EUR 222 million and committed and available credit facilities, available and undrawn TyEL pension loans in Finland, and other agreed and undrawn loans totaling EUR 1 254 million. The future interest cash flows include interest payments of ThyssenKrupp loan note some EUR 260 million, which can be deferred.
Capital managementThe objective of the capital management is to secure the ability to continue as a going concern and to optimize the cost of capital in order to enhance value to shareholders. As part of this objective, the Group seeks to maintain access to loan and capital markets at all times despite the cyclical nature of the stainless steel industry. The Board of Directors reviews the capital structure of the Group on a regular basis.
Capital structure and debt capacity are taken into account when deciding on new investments. Practical tools to manage capital include dividend policy, share buybacks and share issues. Debt capital is managed considering the requirement to secure liquidity and the capability to refinance maturing debt. Revolving facilities as well as some other loans include two financial covenants, which relate to gearing and liquidity.
The ThyssenKrupp loan note of EUR 1.28 billion is subordinated to defined priority debt, which as at December 31, 2013 included e.g. bank loans, bonds, pension loans, financial leases and commercial paper of Outokumpu Oyj.
The Group’s internal capital structure is reviewed on a regular basis with an aim to optimize it e.g. by applying internal dividends and equity adjustments. Net investment and debt in foreign entities is monitored and Outokumpu has capability to hedge this translation risk.
Outokumpu’s captive insurance company, Visenta Försäkrings AB, has to comply with capital adequacy requirements set by authority. During the reporting period Visenta has been well capitalized to meet externally imposed requirements.
The management monitors Group’s capital structure on the basis of gearing ratio, which is calculated as net debt divided by total equity. Net debt is calculated as total current and long-term debt less cash and cash equivalents.
InsurancesThe Group’s business is capital intensive and key production processes are rather tightly integrated and have interdependencies. Property damage and business interruption is the most important insurance line and substantial part of the insurance premiums relate to these types of risks. Business operations, sales to auto industries in particular, may cause significant liability risk. Outokumpu aims to partly mitigate liability risk by having reasonable insurances in place. Other significant insurance lines include marine cargo and credit.
Visenta Försäkrings AB can act as direct insurer and as reinsurer. The captive insurance company is registered in Sweden and it has assets worth some EUR 21 million. Visenta underwrites e.g. property and business interruption insurance policies.
The Group’s financial target is to maintain the gearing ratio below 75%. Financial objectives include also a return on capital employed of over 13% and always the best among peers. Weighted average cost of capital (WACC) is defined and applied to monitor efficiency of capital use and to provide market driven guidance for managing capital structure, making capital allocation decisions and assessing actions on working capital management.
On December 31, 2013, net interest-bearing debt was EUR 3 556 million (2012: EUR 3 431 million), total equity EUR 1 891 million (2012: EUR 2 953 million) and gearing 188.0% (2012: 116.2%). The increase in gearing during 2013 resulted primarily from negative net earnings. The upcoming fully committed and underwritten rights issue of EUR 650 million will have a positive impact on both capital structure and liquidity. The right issue is subject to EGM approval and successful closing Terni and VDM transaction.
Outokumpu Annual Report 2013 nOtes tO the cOnsOlidated financial stateMents
80
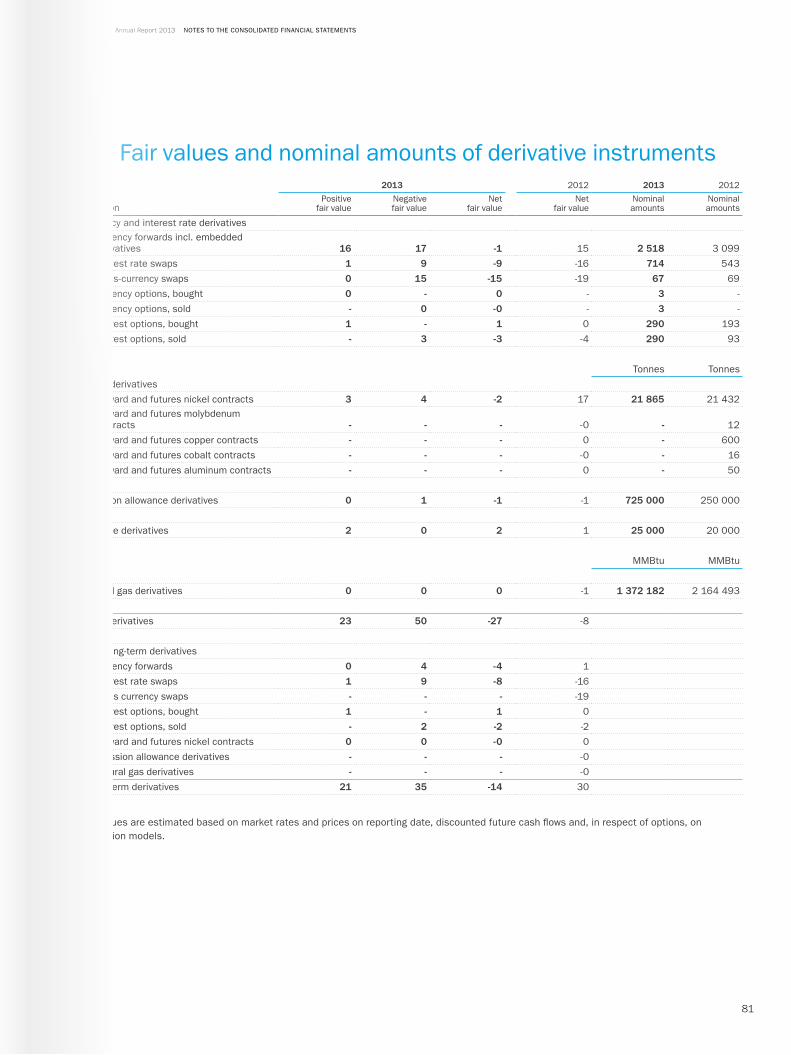
20. Fair values and nominal amounts of derivative instruments2013 2012 2013 2012
€ millionPositive
fair valueNegativefair value
Netfair value
Netfair value
Nominalamounts
Nominalamounts
Currency and interest rate derivativesCurrency forwards incl. embedded derivatives 16 17 -1 15 2 518 3 099
Interest rate swaps 1 9 -9 -16 714 543
Cross-currency swaps 0 15 -15 -19 67 69
Currency options, bought 0 - 0 - 3 -
Currency options, sold - 0 -0 - 3 -
Interest options, bought 1 - 1 0 290 193
Interest options, sold - 3 -3 -4 290 93
Tonnes Tonnes
Metal derivatives
Forward and futures nickel contracts 3 4 -2 17 21 865 21 432Forward and futures molybdenum contracts - - - -0 - 12
Forward and futures copper contracts - - - 0 - 600
Forward and futures cobalt contracts - - - -0 - 16
Forward and futures aluminum contracts - - - 0 - 50
Emission allowance derivatives 0 1 -1 -1 725 000 250 000
Propane derivatives 2 0 2 1 25 000 20 000
MMBtu MMBtu
Natural gas derivatives 0 0 0 -1 1 372 182 2 164 493
Total derivatives 23 50 -27 -8
Less long-term derivatives
Currency forwards 0 4 -4 1
Interest rate swaps 1 9 -8 -16
Cross currency swaps - - - -19
Interest options, bought 1 - 1 0
Interest options, sold - 2 -2 -2
Forward and futures nickel contracts 0 0 -0 0
Emission allowance derivatives - - - -0
Natural gas derivatives - - - -0 Short-term derivatives 21 35 -14 30
Fair values are estimated based on market rates and prices on reporting date, discounted future cash flows and, in respect of options, on evaluation models.
Outokumpu Annual Report 2013 nOtes tO the cOnsOlidated financial stateMents
81

Hedge accounted cash flow hedges Outokumpu has hedged currency spot price risk related to SEK denominated long-term electricity supply agreement for the Finnish production sites. The currency derivatives, which hedge the currency risk, mature in other periods (years 2014–2015) than the underlying cash flows of electricity purchases. The derivatives will be prolonged later to mature at the same period as the underlying cash flows. The effective portion of hedges is recognized in other comprehensive
Master netting agreements and similar agreements Outokumpu enters into derivative transactions with most counterparties under ISDA agreements. In general the amounts owed by each counterparty on a single day in respect of all transactions outstanding in the same currency are same currency are aggregated into a single net amount that is payable by one party to the other. In certain circumstances, e.g. when a credit event such as a default occurs, all outstanding transactions under the agreement are terminated, the termination value is assessed and only a single
amount is payable in settlement of all transactions. ISDA agreements do not meet the criteria for offsetting in the statement of financial position. The right to offset is enforceable only on the occurrence future credit events. The following table sets out the carrying amounts of recognized financial instruments that are subject to the agreements described above.
2013 2012
Nominalamount,
SEK million
Fair value of out-standing cash
flow hedges,€ million
Othercompre-hensiveincome,€ million
Nominalamount,
SEK million
Fair value of out-standing cash
flow hedges,€ million
Othercompre-hensiveincome,€ million
Maturity < 1 year 390 1 2 390 2 3
Maturity 1–5 years 1 562 -4 8 1 562 8 11
Maturity 5–10 years 390 -1 2 781 5 7
2 343 -4 12 2 733 15 21
income net of tax and will be reclassified to profit and loss as adjustment to purchases at the same period as the underlying hedged cash flows affect income. During 2013, effective portion of EUR 4 million gain was recognized in profit or loss as adjustment to purchases (2012: gain of EUR 3 million). The ineffective portion of the hedges, gain of EUR 4 million, (2012: gain of EUR 6 million) is recognized in other operating income and expenses.
Outokumpu has also some minor cash flow hedges mainly used to hedge future cash flows against commodity price risks arising from fixed price sales. Cash flows from future transactions are currently hedged for a maximum of 36 months. At the end of the reporting
period, the fair value of these hedging instruments was EUR 2 million negative. Ineffective portion of these hedges gain EUR 0 million is recognized in other operating income and expenses.
€ million 2013 2012 1)
Derivative assetsGross amounts of recognized financial assets in the statements of financial position 23 30
Related financial instruments that are not offset 19 24
5 6
Derivative liabilitiesGross amounts of recognized financial liabilities in the statements of financial position 50 57
Related financial instruments that are not offset 19 24
31 33
1) 2012 figures exclude VDM, which is included in the derivative assets and liabilities in the consolidated statement of financial position.
Outokumpu Annual Report 2013 nOtes tO the cOnsOlidated financial stateMents
82

21. Inventories€ million 2013 2012 1)
Raw materials and consumables 314 581
Work in progress 508 962
Finished goods and merchandise 423 789
Net realizable value reserve -29 -10
Advance payments 1 6
1 216 2 328
1) Restated due to completing the Inoxum acquisition accounting (see Note 4. Acquisitions and disposals).
The most important commodity price risk for Outokumpu is caused by fluctuation in nickel and other alloy prices. Majority of stainless steel sales contracts include an alloy surcharge clause, with the aim of reducing the risk arising from the time difference between raw material purchase and product delivery. However, the risk is remarkable, because the delivery cycle in production is longer than the alloy surcharge mechanism expects. Thus, only the price for the products to be sold in near future is known. That is why a significant part of the future prices for the products to be sold is estimated according to management’s best knowledge in net realizable value (NRV) calculations. Due to fluctuation in nickel and other alloy prices, the realized prices can deviate significantly from what has been used in NRV calculations on the closing date.
22. Trade and other receivables€ million 2013 2012
Non-currentLoans receivable 6 164
Other receivables 5 8
11 172
CurrentTrade receivables 564 853
VAT receivable 58 62
Income tax receivable 18 17
Loans receivable 9 2
Prepaid insurance expenses 5 10
Other accruals 38 29
Other receivables 1) 122 117
813 1 089
Allowance for impairment of trade receivables
Allowance on Jan 1 25 10
Acquired subsidiaries - 12
Additions 3 6
Disposed subsidiaries -0 -2
Deductions -4 -1
Recovery of doubtful receivables -2 -0
Reclassification to assets held for sale -4 -0
Allowance on Dec 31 19 25
Age analysis of trade receivables
Neither impaired, nor past due 481 721
Past due 1–30 days 67 94
Past due 31–60 days 6 16
More than 60 days 10 22
564 853
1) 2012 Restated due to completing the Inoxum acquisition accounting.
Outokumpu Annual Report 2013 nOtes tO the cOnsOlidated financial stateMents
83

23. Cash and cash equivalents€ million 2013 2012
Cash at bank and in hand 592 215
Short term bank deposits 16 7
607 222
Bank overdrafts 1) -0 -0
607 222
1) Presented in current debt in the statement of financial position.
Fair value of cash and cash equivalents does not significantly differ from the carrying value. The average effective interest rate of cash and cash equivalents at the end of 2013 was 0.4% (Dec 31, 2012: 0.7%).
The maximum exposure to credit risk at the reporting date is the carrying amount of the loan and trade receivables. Most of the outstanding trade receivables have been secured by credit insurance policies, which typically covers some 90% of an insured credit loss. Credit risks related to trade receivables are presented in more detail in Note 19. Financial risk management, capital management and insurances.
As at December 31, 2013 Outokumpu has derecognized sales receivables totaling EUR 197 million (2012: EUR 242 million), which represents fair value of the assets. Net proceeds received totaled EUR 182 million (2012: EUR 225 million). Underlying assets have maturity less than one year. The maximum amount of loss related to derecognized assets are estimated to be EUR 5 million (2012: EUR 8 million). This estimation is based on insurance policies and contractual arrangements of factoring companies and Outokumpu. The analysis does not include impact of any operational risk related to Outokumpu’s contractual responsibilities.
Outokumpu Annual Report 2013 nOtes tO the cOnsOlidated financial stateMents
84

24. Equity
Share capital, premium fund and invested unrestricted equity reserve
€ million
Number of shares,
1 000Share
capitalPremium
fund
Invested unrestricted
equity reserve Total
On Jan 1, 2012 181 978 311 714 - 1 025
Shares subscribed with CEO's share incentive plan 1) 25 - - - -
Rights issue in March–April 2012 1 274 020 - - 972 972
Directed share issue to ThyssenKrupp AG 621 043 - - 491 491
On Dec 31, 2012 2 077 065 311 714 1 462 2 487
Shares subscribed with Restricted share program 1) 40 - - - -
On Dec 31, 2013 2 077 105 311 714 1 462 2 487Treasury shares 1), 2) 976
Total number of shares on Dec 31, 2013 2 078 081
1) Shares granted from treasury shares without effect to share capital.2) The company has not acquired treasury shares in 2012 nor in 2013.
According to the Articles of Association, the Outokumpu share does not have nominal value.
Premium fund includes proceeds from share subscription and other contribution based on the old Finnish Limited Liability Companies Act for the part the contributions exceed the account equivalent value allocated to share capital.
Invested unrestricted equity reserve includes net proceeds from the rights issue in 2012 and directed share issue to ThyssenKrupp AG in 2012.
Fair value reservesFair value reserves include movements in the fair values of available-for-sale financial assets and derivative instruments used for cash flow hedging. The figures are presented net of tax.
€ million 2013 2012
Available-for-sale financial assets reserve -1 1
Hedge reserves 11 21
9 22
Other reservesReserve fund includes amounts transferred from the distributable equity under the Articles of Association or by a decision of the General Meeting of Shareholders. Other reserves include other items based on the local regulations of the Group companies.
€ million 2013 2012
Reserve fund 4 5
Other reserves 3 3
7 7
Retained earnings Retained earnings include remeasurements of defined benefit plans, treasury shares, cumulative translation differences and other retained earnings.
Distributable fundsOn December 31, 2013 the distributable funds of the parent company totaled EUR 1 504 million of which retained earnings totaled EUR 46 million.
Outokumpu Annual Report 2013 nOtes tO the cOnsOlidated financial stateMents
85
25. Employee benefit obligations
Outokumpu has established several defined benefit and defined contribution plans in various countries. The most significant defined benefit plans are in Germany and in the UK.
GermanyIn Germany Outokumpu has several defined benefit plans, of which major plans include a management plan, open pension plans for normal staff, and other pension promises, which are nearly all closed for new entrants. Basis to all pension promises in Germany are bargaining agreements and/or individual contracts (management promises). Management plan and other pension promises are based on annuity payments, whereas plans for normal employees are based on one lump sum payment after retirement.
In addition, all the promises are embedded in Germany in the BetrAVG law. The law contains rules for vested rights, pension protection scheme and regulations for the pension adjustments. In Germany no funding requirements exist, thus the plans are materially all unfunded.
The UKThe UK scheme provides pensions in retirement and death benefits to members. Pension benefits are linked to a member's final salary at retirement (or leaving if earlier) and their length of service. Since April 1, 2003 the UK scheme has been closed to new entrants, but is still open to future accrual for members still employed by the company at that date.
The scheme is registered under UK legislation and is contracted out of the State Second Pension. The scheme is subject to the scheme funding requirements outlined in UK legislation.
The scheme was established from October 1, 2001 under trust and is governed under the scheme's current Trust Deed and Rules dated April 5, 2006. The trustees are responsible for the operation and governance of the scheme, including making decisions regarding the scheme's funding and investment strategy. By law, one third of the trustees must be member nominated. In 2013 there were four employer nominated and four member nominated trustees.
Risks associated with defined benefit plans
Through its defined benefit pension plans, Outokumpu is exposed to a number of risks, the most significant of which are detailed below:
Asset volatility: The level of equity returns is a key factor in the overall investment return. If a plan holds significant proportion of equities, which are expected to outperform corporate bonds in the long-term, it might face higher volatility and risk in the short-term. The investment portfolio might also be subject to a range of other risks typical of the assets held, in particular credit risk on bonds and exposure to the property market.
Change in bond yields: A decrease in corporate bond yields will increase plan liabilities, although this will be partially offset by an increase in the value of the plans' bond holdings (if any). In a situation where the return on plan assets is lower than the corporate bond yields, a plan may face a shortfall which might lead to increased contributions.
Inflation risk: Inflation rate is linked to both future pension and salary increase, and higher inflation will lead to higher liabilities.
Longevity: The majority of Outokumpu's defined benefit obligations are to provide benefits for the life of the member, so increases in life expectancy will result in an increase in the plans' liabilities.
FundingFunding requirements are generally based on pension fund's actuarial measurement framework set out in the funding policies.
In the UK, a preliminary funding evaluation was made during November 2013. The valuation revealed a deficit of EUR 30 million. The valuation is finalized during Q1 2014 and based on the results Outokumpu will negotiate of the recovery plan to eliminate the possible shortfall.
Defined benefit obligationsOutokumpu adopted the revised IAS 19 standard in 2013. As the so-called corridor method had already been waived in 2012, the effect of the adoption of the revised standard was limited to the recognition of previously unrecognized past service costs, aligning discount rate and expected return on plan assets, and presentation of net interest expense. Comparative figures for 2012 have been restated accordingly.
Outokumpu Annual Report 2013 nOtes tO the cOnsOlidated financial stateMents
86

Defined benefit cost recognized in the consolidated statements of income and comprehensive income€ million 2013 2012
In operating result -11 -5In financial income and expenses -10 -2Defined benefit cost recognized in the consolidated statement of income -21 -7In other comprehensive income 15 -44Total defined benefit cost recognized -6 -51
Amounts recognized in the consolidated statement of financial position € million 2013 2012
Present value of funded defined benefit obligations 420 424Present value of unfunded defined benefit obligations 265 354Fair value of plan assets -411 -406Net defined benefit liability 275 372
Defined benefit liability 275 372Other long-term employee benefit liabilities 42 61Defined benefit assets 0 -Net liability 317 434
Movement in net defined benefit liability2013 2012
€ million
Present value of
obligation
Fair value of plan assets
Net defined benefit liability
Present value of
obligation
Fair value of plan assets
Net defined benefit liability
Jan 1 777 -406 372 427 -379 48Current service cost 14 - 14 5 - 5Interest expense/(income) 28 -16 12 20 -19 1Remeasurements arising from
Return on plan assets - -6 -6 - -9 -9Demographic assumptions -0 - -0 1 - 1Financial assumptions -6 - -6 49 - 49Experience adjustment -2 - -2 4 - 4
Exchange differences -10 8 -2 6 -7 -1Employer contributions - -18 -18 - -8 -8Contributions by plan participants 1 -1 - 1 -1 -Benefits paid -27 27 - -19 19 -Acquired subsidiaries - - - 308 -3 305Disposed subsidiaries -8 - -8 - - -Reclassification to assets and liabilities held for sale -81 0 -81 -22 - -22Other change -0 0 -0 -1 1 -0Dec 31 685 -411 275 777 -406 372
The present value of obligations and the fair value of plan assets comprise mainly of German and UK plans. The present value of obligation for German plans on December 31, 2013 was EUR 230 million (2012: EUR 308 million). For the UK, the present value of obligation was EUR 364 million (2012: EUR 359 million), and the fair value of plan assets was EUR 361 million (2012: EUR 355 million) on December 31, 2013.
The expected contributions to be paid to the defined benefit plans in 2014 are EUR 15 million.
Outokumpu Annual Report 2013 nOtes tO the cOnsOlidated financial stateMents
87

Allocation of plan assets€ million 2013 2012
Equity instruments 101 119Debt instruments 256 229Real estate 10 12Investment funds 3 3Other assets 38 40
408 402
Allocation of plan assets covers 99% of total defined benefit plan assets. The plan assets are mainly invested in quoted instruments. Debt instruments include mostly government and corporate bonds (investment grade).
Asset-liability matching strategiesThe majority of defined benefit assets are in the UK. The UK scheme’s benchmark asset allocation is 35%/65% return-seeking/liability matching. This strategy reflects the scheme’s liability profile and the trustees’ and company’s attitude to risk. The trustee monitors the investment objectives and asset allocation policy on a regular basis.
Significant actuarial assumptionsGermany The UK Other countries
Discount rate, %2013 3.50 4.50 4.342012 3.40 4.25 3.74
Future salaryincrease, %
2013 - 4.75 2.682012 - 4.15 2.76
Inflation rate, %2013 - 3.50 -2012 - 2.90 -
Future benefitincrease, %
2013 1.52 3.20 -2012 1.22 2.80 -
Medical cost trendrate, %
2013 - - 6.80–7.102012 - - 6.50
Life expectancy2013
Modified fromRT 2005 G
105 % SAPS All Pensioner Amounts tables
Standard mortality tables
2012Modified from
RT 2005 G105 % SAPS All Pensioner
Amounts tablesStandard
mortality tables
The significant actuarial assumptions are presented separately for the significant countries, and for other countries a weighted average of the assumptions is presented.
The weighted average duration of the overall defined benefit obligation is 17.6 years. In Germany and in the UK the weighted average durations are 13.5 and 21.6 years, respectively.
Outokumpu Annual Report 2013 nOtes tO the cOnsOlidated financial stateMents
88

Sensitivity analysis of significant actuarial assumptionsReasonably possible changes at the reporting date to one of the weighted principal assumptions, while holding all other assumptions constant, would have affected the defined benefit obligation as shown below:
Germany Change in assumption Increase in assumption Decrease in assumption
Discount rate 0.5% Decrease by 6% Increase by 7%Future benefit increase 0.5% Increase by 4% Decrease by 4%Life expectancy 1 year Increase by 2%
The UKChange in assumption Increase in assumption Decrease in assumption
Discount rate 0.5% Decrease by 10% Increase by 11%Inflation rate 0.5% Increase by 7% Decrease by 7%Future benefit increase 0.5% Increase by 3% Decrease by 4%Future salary increase 0.5% Increase by 1% Decrease by 1%Life expectancy 1 year Increase by 3%
Other countries Change in assumption Increase in assumption Decrease in assumption
Discount rate 0.5% Decrease by 6% Increase by 6%Medical cost trend rate 0.5% Increase by 6% Decrease by 5%Future salary increase 0.5% Increase by 1% Decrease by 1%Life expectancy 1 year Increase by 3%
Other long-term employee benefitsOther long-term employee benefits mainly relate to long-service remunerations and early retirement provisions in Germany as well as long-service remunerations in Finland. In Germany, the employees are entitled to receive a one-time indemnity every ten years after 25 years of service. Under the early retirement agreements, employees work additional time prior to retirement, which is subsequently paid for in instalments after retirement. In Finland, the employees are entitled to receive a one time indemnity every five years after 20 years of service.
The other long-term employee benefit liabilities recognized in the consolidated statement of financial position on December 31, 2013 were EUR 42 million (2012: EUR 61 million).
Multi-employer defined benefit plansITP pension plans operated by Alecta in Sweden and plans operated by Stichting Bedrijfspensioenfonds voor de metaalindustrie in the Netherlands are multi-employer defined benefit pension plans. However, it has not been possible to get sufficient information for the calculation of obligations and assets by employer from the plan operators, and therefore these plans have been accounted for as defined contribution plans in the consolidated financial statements.
The expected contributions to the ITP pension plans in Sweden are EUR 3 million in 2014. The contributions to the ITP pension plans vary depending on e.g. unemployment rates and demographics. The average cost for 2014 is determined as 11.78% of total salary in total for white collar employees in all companies in Sweden.
Outokumpu Annual Report 2013 nOtes tO the cOnsOlidated financial stateMents
89

26. Provisions
€ millionRestructuring
provisionsEnvironmental
provisionsOther
provisions Total
Provisions on Jan 1, 2013 1) 91 49 17 156
Translation differences -0 -0 -0 -1
Increases in provisions 49 6 6 61
Utilized during the financial year -53 -1 -4 -58
Unused amounts reversed -6 -0 -1 -7
Reclassification to held-for-sale -7 -1 -2 -10
Disposed subsidiaries -2 - 0 -2
Provisions on Dec 31, 2013 72 53 16 141
€ million 2013 2012
Non-current provisions 115 119
Current provisions 1) 25 37
141 156
1) Restated due to completing the Inoxum acquisition accounting (see Note 4. Acquisitions and disposals).
Restructuring provisionsAs part of its intention to significantly reduce operating expenses and return the company to profitability, Outokumpu announced plans to result in job reductions in April 2013. The reductions relate to capacity reductions particularly to the previously announced closure of Krefeld melt shop in Germany, as well as streamlining overlapping activities in sales, production, supply chain and support functions. As a result, addition of EUR 49 million to restructuring provisions were recognized in 2013. In addition, the restructuring provisions include provisions recognized in previous years for reductions related to relocation of Düsseldorf-Benrath production facility. The restructuring provisions are expected to be paid between the years 2014–2021.
Environmental provisions Majority of the environmental provisions are for closing costs of production facilities and landfill areas, removal of problem waste and landscaping in facilities in Finland, in the UK, in the US and in Germany. Most of the EUR 6 million increase in 2013 relate to expected increase in costs provided for landfill areas and cleaning measures.
The outflow of economic benefits related to environmental provisions is expected to take place mainly over a period of more than 10 years. Due to the nature of these provisions, there are uncertainties regarding both the amount and the timing of the outflow of economic benefits.
Other provisionsOther provisions comprise mainly provisions for claims and are mainly current nature.
Provisions are based on management’s best estimates at the end of the reporting period.
Outokumpu Annual Report 2013 nOtes tO the cOnsOlidated financial stateMents
90

27. Interest-bearing debt€ million 2013 2012
Non-currentBonds 399 399
Loans from financial institutions 1 152 924
Pension loans 192 173
Finance lease liabilities 244 204
Loans from related parties 1 283 1 230
Other long-term liabilities 0 6
3 270 2 935
CurrentLoans from financial institutions 493 362
Pension loans 31 37
Finance lease liabilities 22 14
Commercial paper 187 301
Loans from related parties 160 -
Other current liabilities 1 4
893 718
Part of the term loans and credit facilities include financial covenants, which are described in Note 19. Financial risk management, capital management and insurances.
Bonds
€ millionInterestrate, %
Notionalamount 2013 2012
2010 fixed rate bond maturing 2015 5.125 250 250 250
2012 fixed rate bond maturing 2016 5.875 150 150 150
400 400
Finance lease liabilities
Minimum lease payments
€ million 2013 2012
Not later than 1 year 36 20
Between 1 and 5 years 187 67
Later than 5 years 313 315
Future finance charges -271 -185
Present value of minimum lease payments 266 218
Present value of minimum lease payments
€ million 2013 2012
Not later than 1 year 21 14
Between 1 and 5 years 136 46
Later than 5 years 108 158
Present value of minimum lease payments 266 218
Finance lease liabilities include lease payments on a building, which has been subleased with a finance lease agreement. Finance lease receivable relating to this agreement is EUR 6 million (2012: EUR 6 million).
Outokumpu Annual Report 2013 nOtes tO the cOnsOlidated financial stateMents
91

28. Trade and other payables€ million 2013 2012
Non-currentAccruals 48 5
CurrentTrade payables 1) 815 1 214
Accrued employee-related expenses 98 111
Accrued interest expenses 62 21
VAT payable 47 24
Advances received 7 18
Withholding tax and social security liabilities 9 11
Other accruals 41 58
Other payables 57 85
1 136 1 543
1) Figure for 2012 Restated due to completing the Inoxum acquisition accounting (see Note 4. Acquisitions and disposals).
Outokumpu Annual Report 2013 nOtes tO the cOnsOlidated financial stateMents
92

29. Commitments and contingent liabilities€ million 2013 2012
Mortgages and pledges on Dec 31
Mortgages on real estate 284 320
Other pledges 8 9
Guarantees on Dec 31
On behalf of subsidiaries
For commercial and other guarantees 34 27
On behalf of associated companies
For financing 7 0
Other commitments 28 32
The Group has pledged real estate mortgages created in the Tornio production plant for a value of EUR 250 million as security for its pension loans and other commitments.
Outokumpu Oyj is, in relation to its shareholding in Kymppivoima Tuotanto Oy and Etelä-Pohjanmaan Voima Oy, liable for the costs, commitments and liabilities relating to electricity provided by Rapid Power Oy. The net debt of Rapid Power Oy at the end of 2013 amounted to approximately EUR 65 million (2012: EUR 75 million), out of which Outokumpu is liable for one third. Outokumpu Oyj is, in relation to its shareholding in Etelä-Pohjanmaan Voima Oy, liable for the costs, commitments and liabilities relating to electricity provided by Tornion Voima Oy. The net debt of Tornion Voima Oy at the end of 2013 amounted to approximately EUR 34 million (2012: EUR 36 million), out of which Outokumpu is liable for under one fifth. These liabilities are reported under other commitments above.
Certain guarantees issued by ThyssenKrupp on behalf of Inoxum companies have not yet been transferred to Outokumpu Oyj as of December 31, 2013. However, Outokumpu Oyj has given ThyssenKrupp a counter-guarantee for these commitments. The outstanding amount of guarantees to be transferred totals EUR 72 million as of December 31, 2013, including guarantees for commercial and financing. Part of the above mentioned guarantees has already been replaced by Outokumpu Oyj and Outokumpu aims to replace the remaining guarantees in the near future.
Present value of minimum lease payments on operating leases€ million 2013 2012
Not later than 1 year 10 18
Between 1 and 5 years 32 38
Later than 5 years 40 47
82 103
Operating leases include lease agreements on Group companies’ premises.
Group’s off-balance sheet investment commitments totaled EUR 47 million on December 31, 2013 (Dec 31, 2012: EUR 163 million).
Outokumpu has through Voimaosakeyhtiö SF approximately 15 % ownership in nuclear power company Fennovoima Oy. Outokumpu is liable for Fennovoima’s operating costs in proportion to its share of ownership.
Outokumpu Annual Report 2013 nOtes tO the cOnsOlidated financial stateMents
93

30. Disputes and litigations
Civil Actions Regarding Outokumpu’s Divested Fabricated Copper Products Business
European Commission cartel investigation in the sanitary copper tube sector
In September 2004, the European Commission imposed a fine on Outokumpu in relation to cartel investigations in the sanitary copper tube sector. The European Commission concluded that a number of companies, including Boliden AB (“Boliden”), IMI Plc, IMI Kynoch Ltd (together with IMI Plc, “IMI”), KME Group, Wieland Werke, Outokumpu and Outokumpu Copper Products (now Luvata), were involved in price fixing and market sharing in the sanitary copper tube sector in Europe between June 1988 and March 2001.
In October 2012, a damages contribution claim was brought in the courts of England and Wales against Outokumpu by Boliden and IMI after Boliden and IMI were served claims on financial loss related to the European Commission’s 2004 conclusion regarding price fixing and market sharing in the sanitary copper tube sector in Europe by the members of Travis Perkins PLC. Outokumpu believes that the claim is without merit and plans to defend itself in any related proceedings. No provisions have been booked in connection with these claims.
European Commission cartel investigation in the industrial copper tube sector
In connection with the industrial copper tubes EU-cartel investigation, completed in May 2009, Outokumpu has since 2006, been in the process of addressing following civil complaints related to the cartel investigations raised in the United States against Outokumpu and its former fabricated copper products business in the United States.
A civil complaint in the United States, which was filed by Carrier Corporation (“Carrier”) in 2006 against Outokumpu Oyj and Outokumpu Copper Franklin, Inc. in the United States District Court for the Western District of Tennessee, alleged that Outokumpu Oyj and Outokumpu Copper Franklin, Inc. participated in a global price fixing and market allocation cartel with respect to copper tubing for air conditioning and heat exchangers and related applications (ACR Tube) between at least 1989 and 2001. The complaint sought an undisclosed amount of damages. In July 2007, Carrier’s complaint was dismissed. Carrier subsequently filed an appeal and, in March 2012, the United States Court of Appeals for the Sixth Circuit reversed the decision dismissing the complaint and remanded the case to the United States District Court for the Western District of Tennessee for further proceedings. In 2010, a civil action was brought in the courts of England and Wales against Outokumpu (and two other defendant groups) by the same claimant group as that brought the actions in the United States. The claimants alleged that they suffered losses across Europe because of the cartel and are seeking damages from the three main defendant groups, either jointly or jointly and severally. In April 2013, Outokumpu and Carrier signed a settlement agreement that covers all damage suits against Outokumpu by Carrier in the US
and UK. The total settlement amount, including cost reimbursement, was EUR 11 million. The settlement covers also all former Outokumpu subsidiaries included in the claims. According to the settlement agreement, all damage suits by Carrier against Outokumpu are now released. The settlement amount has been booked as a non-recurring item in the second quarter 2013 EBIT.
Customs Investigation of Exports to Russia by Tornio Works
In March 2007, Finnish Customs authorities initiated a criminal investigation into Outokumpu’s Tornio Works’ export practices to Russia. It was suspected that a forwarding agency based in Southeastern Finland had prepared defective and/or forged invoices regarding the export of stainless steel to Russia. The preliminary investigation focused on possible complicity by Outokumpu’s Tornio Works in the preparation of defective and/or forged invoices by the forwarding agent. In June 2009, the Finnish Customs completed its preliminary investigation and forwarded the matter to the prosecution authorities for consideration of possible charges. In November 2010, the public prosecutor concluded that the Finnish Customs authorities’ suspicions regarding possible accounting offences and forgery were groundless. Despite the public prosecutor’s conclusion, in March 2011, charges were filed against Outokumpu and five of its employees for alleged money laundering in connection with the Russian export practices by Tornio Works between 2004 and 2006. On behalf of the Finnish State, the prosecutor also presented a claim for forfeiture of the funds subject to money laundering. In June 2011, all claims were dismissed and the Finnish State was ordered to pay Outokumpu EUR 1.2 million in compensation for legal costs. In August 2011, the Finnish State prosecutor appealed the District Court judgment with respect to Outokumpu and three of the charged employees and the order to compensate Outokumpu for its legal costs. The appeal proceedings commenced in the Kouvola Court of Appeal in February 2012 and in April 2012, the Court issued a verdict dismissing all charges brought by the prosecutor. In June 2012, Finland’s state prosecutor filed a petition for leave to appeal to the Finnish Supreme Court.
Dispute over invention rights, Outotec vs. Outokumpu
In January 2013, Outokumpu and Outotec entered into a legal dispute over invention rights related to a ferrochrome production method. In August 2013 Outotec submitted another application for summons at the District Court of Helsinki regarding another patent relating to the invention. The production method is developed by Outokumpu and it has filed the patent applications related to this invention. Outotec claims it has rights to the inventions. Outokumpu finds these allegations to be completely without merit.
Lawsuits Regarding a Fire in AST’s Turin Production Facility
In December 2007, a fire in line 5 at AST’s production facility in Turin, Italy caused the death of seven AST employees. In May 2008, the public prosecutor of Turin brought charges against AST and six of
Outokumpu Annual Report 2013 nOtes tO the cOnsOlidated financial stateMents
94

its employees (three officers and three senior employees). AST was charged with negligent manslaughter and negligent causation of personal injury caused by the violation of workplace safety regulations. AST’s CEO was charged with willful manslaughter, willful arson and malicious removal or omission of safety measures at the workplace. The remaining five AST employees were charged with negligent manslaughter, negligent arson and malicious removal or omission of safety measures at the workplace. Oral hearings took place between January 2009 and April 2011, when the court announced its verdict. All of the individual defendants were found guilty and given prison sentences ranging from 10 years and 10 months to 16 years and 6 months. The court also sentenced AST to a EUR 1 million fine; seizure of EUR 0.8 million worth of AST property (the amount of the investment in the Turin production facility that allegedly would have been necessary to prevent the fire); exclusion from public benefits, financings, subsidies and aids for six months; a ban on advertising its products or services for six months; and publication of the verdict in several nationwide newspapers and the Terni city hall. In addition, the defendants were found jointly and severally liable in criminal proceedings for compensation payments amounting to approximately EUR 5.8 million to 52 plaintiffs (namely, several institutions, former employees of the Turin production facility and relatives of the victims of the fire). The court ordered that line 5, which was seized as evidence immediately after the fire, remain seized until the verdict becomes final. All defendants and AST filed an appeal against that judgment. In February 2013 the Turin Court of Assizes amended the first degree judgment by reducing the criminal sentences for all defendants to a range between 7 and 10 years of imprisonment. Further, the Court of Assizes released Line 5. The court submitted its written reasoning in May 2013. All defendants and AST have filed an appeal to the Corte di Cassazione in Rome. First hearings are expected to take place in April 2014.
With regard to civil claims, AST has entered into a settlement agreement with 50 of the 52 plaintiffs who were awarded compensation by the court in the criminal proceedings (the “Criminal Settlement Agreement”). Under the terms of the Criminal Settlement Agreement, the 50 plaintiffs waived any and all claims in connection with the incident and agreed not to pursue any further claims during the appeal. Pursuant to the Criminal Settlement Agreement, AST paid the 50 plaintiffs a settlement amount of EUR 7.4 million (including interests and legal expenses) in January 2012. Also in January 2012, Inoxum paid the remaining two plaintiffs their portion of the court-ordered settlement, which amounted to EUR 0.2 million. In 2008, prior to the commencement of the court proceedings, Inoxum reached a settlement agreement with the families of the deceased employees (the “Pre-trial Settlement Agreement”). Pursuant to the Pre-trial Settlement Agreement, Inoxum paid approximately EUR 13 million (including fees) to the families of the deceased employees. The settlement, which was paid in 2008, was fully covered by insurance and it is expected that insurance will also cover the settlements paid in January 2012. In the course of 2012 and 2013 several former employees are relatives of employees of the Turin production facility filed separate civil claims for reimbursement of damages totaling to approximately EUR 5–10 million plus revaluation, interests and expenses. All of these proceedings are on-going.
Cartel Fine Imposed by the European Commission
In March 2011, the European Court of Justice upheld a EUR 3.2 million cartel fine imposed on ThyssenKrupp Stainless AG, a legal predecessor of Nirosta, in a decision of the European Commission from December 2006 (the “2006 Decision”). The 2006 Decision is based on a 1998 European Commission finding (the “1998 Finding”) that between 1993 and 1998, certain stainless steel producers, including Inoxum and certain of its legal predecessors, had violated Article 65(1) of the European Coal and Steel Community Treaty by participating in a price-fixing arrangement with other stainless steel producers.
The alleged price-fixing arrangement consisted of modifying and applying in a concerted fashion the reference values used to calculate the alloy surcharge to the base price of stainless steel. The 1998 Finding was appealed and subsequently annulled on procedural grounds with respect to Inoxum’s liability for one of its legal predecessors. Subsequent to this annulment, the European Commission opened new proceedings, which resulted in the 2006 Decision. Inoxum’s appeals of the 2006 Decision were unsuccessful. In April 2011, Inoxum filed a complaint (Verfassungsbeschwerde) with the German Constitutional Court (Bundesverfassungsgericht) requesting that the Court declare the 2006 Decision incompatible with certain fundamental rights under the German Constitution (Grundgesetz). As at the end of the reporting period, the German Constitutional Court has not decided whether it will to accept the constitutional complaint. With accrued interest, Inoxum would be liable to pay over EUR 4.9 million if its action with the German Constitutional Court is unsuccessful and the fine imposed by the 2006 Decision is enforced.
Lawsuit Claiming Injuries from Exposure to Asbestos
VDM is one of many defendants in a lawsuit filed in the courts of the State of New York, United States, in which the plaintiff claims injuries from exposure to aerospace asbestos-containing products allegedly made from VDM steel, to which the plaintiff has allegedly been exposed beginning at age 14 while performing brake repair work on autos, while in the Navy working around boilers, during the 1960s and 1970s performing other work including working with “pennies” used as shock absorber with pile-driver hammers. The plaintiff claims the pennies contained asbestos and that, while there is no claim that the pile-driver hammers contained asbestos, some of the pile-driver hammers were manufactured by “Krupp.” The plaintiff did not allege that VDM made the pennies. ThyssenKrupp USA has already been dismissed from the case. VDM is working to get the claims against it dismissed as it is believed that the action is without merit.
Outokumpu Annual Report 2013 nOtes tO the cOnsOlidated financial stateMents
95

U.S. Antidumping Order on Stainless Steel Strip and Sheet from Mexico, Germany and ItalyIn July 1999, the U.S. Department of Commerce (the “USDOC”) issued antidumping duty orders on imports of stainless steel strip and sheet from Mexico, Germany and Italy, among other countries. U.S. antidumping and countervailing duty laws permit an imposition of special additional duties on imports that are determined to be sold at less than fair value or to be subsidized by foreign government actions. Mexinox USA, AST and Nirosta have been Inoxum’s importers of record for stainless steel strip and sheet imported into the United States since the antidumping duty order was issued. Therefore, Mexinox USA, AST and Nirosta were responsible for making cash deposits of estimated antidumping duties and would be liable for finally assessed antidumping duties. The USDOC assesses duties at annual reviews covering twelve-month periods. Mexinox USA has been finally assessed approximately USD 27 million in duties during the first five periods and will be automatically assessed amounts for two other periods. Mexinox USA has potential antidumping duty liability of approximately USD 36 million for the remaining five periods. The Government of Mexico brought actions before the World Trade Organization (“WTO”) Dispute Settlement Body with regard to these determinations. Mexico received a favorable decision and compliance proceedings are ongoing; however, WTO disputes normally are prospective in nature and do not result in refunds of finally-assessed duties. The antidumping duty orders on stainless steel strip and sheet from Mexico, Germany and Italy were revoked effective July 2011 due to a negative determination by the USITC. Accordingly, any antidumping deposits made on entries after this date should be refunded with interest and no further antidumping duties should be assessed on imports of stainless steel strip and sheet from Mexico, Germany and Italy after that date, subject to the appeal proceedings regarding imports from Mexico discussed below. The U.S. petitioners in the antidumping case appealed the USITC’s determination to the U.S. Court of International Trade in New York with regard to the revocation of the antidumping duty order on imports from Mexico. In November 2012, the court dismissed the appeal by the plaintiffs. A complaint by the plaintiffs against that court order was rejected by the U.S. Court of Appeals in January, 2014. The revocation of the duty orders on stainless steel imports have therefore become legally binding as the plaintiffs have no further means of challenging the decision by the USITC.
Rejection of Exemption from Renewable Energy Charges for German Outokumpu PlantsIn July 2013 Nirosta and VDM received rejections from the competent authority Bundesamt für Wirtschaft und Ausfuhrkontrolle (“BAFA”) with respect to their applications for an exemption from the German Renewable Energy Charge. Under German law, there is a surcharge which is added to the general electricity price for every consumer of electric energy and which is used to subsidize renewable energy producers. That surcharge has been increasing in the last years and has reached an all-time high of 5.277 cent/KWh in 2013. However,
the German Renewable Energy Act foresees that certain energy-intensive companies may apply for a reduction of that surcharge to 0.05 cent/KWh. Nirosta as well as VDM have benefited from that exemption in the last years.
In 2013 the competent authority challenged the applications of Nirosta and VDM for legal reasons. In the past years Nirosta and VDM have both applied an exemption for certain aggregates in order to meet the requirements set forth by the Renewable Energy Act. This act stipulates that electricity intensive companies in the producing sector can benefit from the exemption if their electricity consumption is higher than at least 1 gigawatts and the ratio of electricity costs to gross value added exceeds at least 14%. The act also foresees that this application can also be undertaken by so-called independent economic units (selbstständiger Unternehmensteil) in case the whole legal entity does not fulfil the requirements mentioned above. Therefore Nirosta applied that exemption for its melt shops in Krefeld and Bochum and VDM applied for its units in Werdohl and Unna. As said above, in the past year the competent authority always recognized the melt shops in Krefeld and Unna as well as VDM’s operations in Werdohl and Unna as independent economic units. This year the competent authority denied that acknowledgement as independent economic units – inter alia – with the argument that these units do not have external turnovers and/or all relevant functions (e.g. sales, purchasing) that are needed to be fully independent and can therefore not be treated as real independent economic units.
The economic risks for Nirosta for 2013 have been approximately EUR 20 million and for VDM approximately EUR 5–6 million. Nirosta and VDM both filed complaints against the decision of the BAFA. After that, Nirosta and VDM have been able to reach an agreement with BAFA by which the exemption for 2013 was still granted. The complaint has therefore been become redundant.
In December 2013 the EU Commission initiated a state-aid procedure against Germany in connection with the Renewable Energy Charge system and the exemptions for energy intensive industries. While Nirosta and OTK will still receive such benefits in 2014, it cannot be excluded that such benefits are endangered by that state aid procedure for 2015. Certain legal disputes and litigations related to the Terni remedy assets, certain service centers as well as the VDM business will move over to ThyssenKrupp once the asset sale transaction with ThyssenKrupp is completed.
Outokumpu Annual Report 2013 nOtes tO the cOnsOlidated financial stateMents
96

31. Related party transactions
Outokumpu’s related party includes key management of the company, ThyssenKrupp AG, and associated companies and joint ventures. The transactions with related parties are presented in the tables below. Key management includes Leadership Team members and members of the Board of Directors. The principal associated companies and joint ventures are listed in Note 13. Investments in associated companies and joint ventures. Subsidiaries are presented in Note 32. Subsidiaries on December 31, 2013.
Outokumpu is an associated company to ThyssenKrupp AG and Solidium Oy. ThyssenKrupp’s ownership in Outokumpu was 29.9% and Solidium’s 21.8% on December 31, 2013.
Transactions and balances with ThyssenKrupp AG€ million 2013 2012
Sales 376 -
Purchases -175 -
Interest expenses -62 -1
Trade and other receivables 23 31
Other financial assets 1 9
Trade and other payables 22 41
Loan note to ThyssenKrupp 1 283 1 230
Other interest-bearing debt 214 54
Other financial liabilities 3 8
Certain guarantees issued by ThyssenKrupp on behalf of Inoxum companies have not yet been transferred to Outokumpu Oyj as of December 31, 2013. However, Outokumpu Oyj has given ThyssenKrupp a counter-guarantee for these commitments. The outstanding amount of guarantees to be transferred totals EUR 72 million as of December 31, 2013, including guarantees for commercial and financing. Part of the above mentioned guarantees has already been replaced by Outokumpu Oyj and Outokumpu aims to replace the remaining guarantees in near future.
On November 30, 2013 Outokumpu announced to have signed a binding agreement with ThyssenKrupp to sell the Terni remedy assets, the VDM business and certain service centers to ThyssenKrupp. Outokumpu’s loan note to ThyssenKrupp will be used as a consideration for the transaction (Dec 31, 2013: loan note was EUR 1,283 million). The transaction is subject to approval by the European Commission as well as other relevant regulatory approvals. The transaction will also constitute final settlement of all remedy related obligations between Outokumpu and ThyssenKrupp. Closing of the transaction is expected for the first quarter 2014.
Transactions and balances with associated companies and joint ventures € million 2013 2012
Sales 161 0
Purchases -6 -3
Interest income 0 -
Trade and other receivables 44 8
Trade and other payables 1 0
Other related party items On December 31, 2012 the related party transactions included also a purchase price receivable of EUR 2 million. The receivable relates to the sale of 36% of the Outokumpu Stainless Tubular Products (OSTP) business on September 30, 2011 to Tubinoxia, a company controlled by the managing director of OSTP. The receivable was paid in January 2013.
Outokumpu Annual Report 2013 nOtes tO the cOnsOlidated financial stateMents
97

Employee benefits for key management
€ thousand 2013 2012
Short-term employee benefits 4 469 2 706
Termination benefits 1 860 -
Post-employment benefits 1) 654 434
Share-based payments 190 129
7 172 3 269
1) Includes only supplementary pensions.
Employee benefits for CEO and Deputy CEO
€ thousand
Salaries and other short-term
benefits Bonuses
Post- employment
benefitsShare-based
payments Total
2013CEO 755 123 338 57 1 273Deputy to the CEO 2) 640 74 192 18 924
2012 3)
CEO 4) 754 90 251 129 1 224Deputy to the CEO 300 71 188 - 559
2) Reinhard Florey as of November 1, 2013; Esa Lager until October 31, 2013 3) Post-employment benefits have been added to the information reported on 2012 financial statements. 4) 2012 salaries and other short-term benefits include the compensation of EUR 142 thousand for taxes and social security contributions related to the
Inoxum transaction incentive scheme.
Outokumpu CEO’s retirement age is 63 and the targeted pension is 60% of the annual salary at the age of 63. The cost for the CEO’s post-employment benefits include both the statutory pension expenses based on the Finnish Employees Pensions Act and the expenses for a defined contribution pension plan arranged by Outokumpu. The current deputy to the CEO resides in Germany and is entitled to the pension benefits in accordance with the German Essener Verband.
Employee benefits for Board of Directors€ thousand 2013 2012
Chairman Jorma Ollila, as of March 18, 2013 151 -Chairman Ole Johansson, until March 18, 2013 4 93Vice Chairman Olli Vaartimo 94 59Member Markus Akermann, as of March 18, 2013 79 -Member Harri Kerminen, as of March 14, 2012 73 44Member Heikki Malinen, as of March 14, 2012 73 45Member Elisabeth Nilsson 84 58Member Siv Schalin 73 49Member Guido Kerkhoff, December 29, 2012–November 30, 2013 74 -Member Iman Hill, until March 18, 2013 6 49Member Evert Henkes, until March 14, 2012 - 8Member Anna Nilsson-Ehle, until March 14, 2012 - 10Member Jussi Pesonen, until March 14, 2012 - 4
711 418
There were no outstanding loans receivable from key management on December 31, 2013 (Dec 31, 2012: EUR - million). More information on key management’s employee benefits can be found on the page Remuneration.
Outokumpu Annual Report 2013 nOtes tO the cOnsOlidated financial stateMents
98

32. Subsidiaries on December 31, 2013
CountryGroup
holding, %
Stainless EMEAOutokumpu A/S Denmark 100
Outokumpu Benelux B.V. The Netherlands 100
Outokumpu B.V. The Netherlands 100
Outokumpu Chrome Oy Finland 100
Outokumpu Distribution Hungary Kft. 2) Hungary 100
Outokumpu Distribution Benelux B.V. 2) The Netherlands 100
Outokumpu Distribution France S.A.S. 2) France 100
Outokumpu Distribution International GmbH 2) Germany 100
Outokumpu Distribution Polska Sp. z o.o. 2) Poland 100
Outokumpu Distribution UK Ltd. 2) The UK 100
Outokumpu EMEA GmbH 2) Germany 100
Outokumpu EMEA Oy *) 2) Finland 100
Outokumpu Tornio Infrastructure Oy 1) Finland 100
Outokumpu Istanbul Dis Ticaret Limited Sirketi *) Turkey 100
Outokumpu Kft. Hungary 100
Outokumpu, Lda. *) Portugal 100
Outokumpu Nirosta Precision GmbH 2) Germany 100
Outokumpu N.V. Belgium 100
Outokumpu PSC Finland Oy 2) Finland 100
Outokumpu Rossija Oy *) Finland 100
Outokumpu S.A. Spain 100
Outokumpu Shipping Oy Finland 100
Outokumpu Sp. z o.o. Poland 100
Outokumpu S.r.l. Romania 100
Outokumpu s.r.o. Czech Republic 100
Outokumpu Stainless B.V. The Netherlands 100
Outokumpu Stainless Holding GmbH Germany 100
Outokumpu Stainless Oy Finland 100
Sogepar Ireland Limited Ireland 100
Sogepar UK Limited The UK 100
Stainless AmericasMexinox USA Inc. The US 100
Outokumpu Brasil Comercio de Metais Ltda. Brazil 100
Outokumpu Fortinox S.A. 2) Argentina 80
Outokumpu Mexinox Distribution S.A. de C.V. 2) Mexico 100
Outokumpu Mexinox S.A. de C.V. 2) Mexico 100
Outokumpu Participations Mexico S.A. de C.V. 2) Mexico 100
Outokumpu Stainless USA, LLC 2) The US 100
ThyssenKrupp Mexinox CreateIT, S.A. de C.V. Mexico 100
Outokumpu Annual Report 2013 nOtes tO the cOnsOlidated financial stateMents
99

CountryGroup
holding, %
Stainless APACOutokumpu Asia Pacific Ltd China 100Outokumpu India Private Limited India 100Outokumpu K.K. Japan 100Outokumpu Management (Shanghai) Co., Ltd. *) 1) China 100Outokumpu Pty Ltd Australia 100Outokumpu (S.E.A.) Pte. Ltd. Singapore 100Outokumpu Stainless (GZ) Trading Co. Ltd. 2) China 100Outokumpu Stainless International (Guangzhou) Ltd. 2) China 100Outokumpu Stainless Steel (China) Co. Ltd. China 100Outokumpu Stainless Trading (Shanghai) Co Ltd China 100Shanghai Krupp Stainless Co., Ltd. China 60
Specialty StainlessAvesta Klippcenter AB Sweden 100Outokumpu AS Norway 100Outokumpu Ges.m.b.H Austria 100Outokumpu Industriunderhåll AB Sweden 51Outokumpu Middle East FZCO UAE 100Outokumpu Nordic AB Sweden 100Outokumpu Prefab AB Sweden 100Outokumpu Press Plate AB Sweden 100Outokumpu PSC Benelux B.V. The Netherlands 100Outokumpu PSC Germany GmbH Germany 100Outokumpu (Pty) Ltd South Africa 100Outokumpu S.p.A. Italy 100Outokumpu Stainless AB Sweden 100Outokumpu Stainless Bar, Inc. The US 100Outokumpu Stainless Coil, Inc. The US 100Outokumpu Stainless Ltd The UK 100Outokumpu Stainless Pipe, Inc. The US 100Outokumpu Stainless Plate, Inc. The US 100Polarit Welding, Inc. The US 100ZAO Outokumpu Russia 100
Outokumpu Annual Report 2013 nOtes tO the cOnsOlidated financial stateMents
100

CountryGroup
holding, %
Other operations2843617 Canada Inc. Canada 100AvestaPolarit Pension Trustees Ltd The UK 100Granefors Bruk AB *) Sweden 100Orijärvi Oy *) Finland 100Outokumpu Americas, Inc. 2) The US 100Outokumpu Copper Fabrication AB *) Sweden 100Outokumpu Holding Germany GmbH *) 1), 2) Germany 100Outokumpu Holding Italia S.p.A. 2) Italy 100Outokumpu Holding Nederland B.V. 2) The Netherlands 100Outokumpu Holding UK Limited The UK 100Outokumpu Metals Off-Take Oy *) Finland 100Outokumpu Mines Inc. *) Canada 100Outokumpu Mining Australia Pty. Ltd. Australia 100Outokumpu Mining Oy Finland 100Outokumpu Nirosta GmbH 2) Germany 100Outokumpu Stainless Holdings Ltd The UK 100Outokumpu Treasury Belgium N.V./SA *) Belgium 100Outokumpu Zinc B.V. *) The Netherlands 100Viscaria AB *) Sweden 100Visent Invest AB Sweden 100Visenta Försäkrings AB Sweden 100
Discontinued operationsAcciai Speciali Terni S.p.A. 2) Italy 100Aspasiel S.r.l. Italy 100Outokumpu Celik Servis Merkezi A.S. 2) Turkey 100Outokumpu Distribution Iberica, S.A. 2) Spain 100Outokumpu Gebouwen B.V. The Netherlands 100Outokumpu GmbH Germany 100Outokumpu S.A.S. France 100Outokumpu VDM Australia Pty. Ltd. 2) Australia 100Outokumpu VDM Austria GmbH 2) Austria 100Outokumpu VDM Benelux B.V. 2) The Netherlands 100Outokumpu VDM Canada Ltd. 2) Canada 100Outokumpu VDM de Mexico S.A. de C.V. 2) Mexico 100Outokumpu VDM France S.A.S. 2) France 100Outokumpu VDM GmbH 2) Germany 100Outokumpu VDM (Guangzhou) Trading Co. Ltd. 2) China 100Outokumpu VDM High Performance Metals Trading Co. Ltd. 2) China 100Outokumpu VDM Italia S.r.l. 2) Italy 100Outokumpu VDM Japan K.K. 2) Japan 100Outokumpu VDM Korea Co. Ltd. 2) South Korea 100Outokumpu VDM Schweiz AG 2) Switzerland 100Outokumpu VDM UK Limited 2) The UK 100Outokumpu VDM USA, Inc. 2) The US 100Società delle Fucine S.r.l. Italy 100Terninox S.p.A. Italy 100Tubificio di Terni S.p.A. Italy 97
Foreign branchesOutokumpu Asia Pacific Ltd., branch office in Republic of KoreaOutokumpu Asia Pacific Ltd., agencies in China and TaiwanOutokumpu (S.E.A.) Pte. Ltd., agency in Thailand
This list does not include all dormant companies or all holding companies.
The Group holding corresponds to the Group’s share of voting rights.1) Established company2) Name changed*) Shares and stock held by the parent company
Outokumpu Annual Report 2013 nOtes tO the cOnsOlidated financial stateMents
101

33. Events after the end of the reporting period
EU Commission approves the Terni and VDM transaction
On February 12, the European Commission approved the sale of the Terni, VDM business and certain service centers to ThyssenKrupp. Most of the other regulatory approvals have also been obtained.
Update on financing planOn January 27, 2014 Outokumpu told that it is proceeding with the comprehensive measures to strengthen the company’s balance sheet as announced on November 30, 2013. The company has received commitments to, and signed a mandate letter for, a new EUR 900 million revolving credit facility maturing in February 2017. This facility will replace the facility for the same amount signed on July 12, 2013 and maturing in June 2015. Outokumpu has also made progress in extending and amending its bilateral loan portfolio of about EUR 600 million. Outokumpu has obtained the required consent from most lenders to extend the loan maturities until February 2017, and expects to complete this process in February 2014. Outokumpu and ThyssenKrupp have also agreed to amend and extend the outstanding credit facility in the amount of EUR 250 million granted by ThyssenKrupp. This facility will be settled at the closing of the sale of the Terni and VDM units to ThyssenKrupp to end all financing agreements between the two companies.
Outokumpu has also decided to grant a security package to secure its debt financing. As security, Outokumpu plans to pledge certain of its subsidiary shares for example in Finland, Sweden and the USA as well as certain other assets. The security package ensures financing on competitive prices and its benefits clearly surpass its costs, which are only marginal.
Since the granting of the proposed security package required the consent of the holders of the Outokumpu’s notes maturing in 2015 and 2016 Outokumpu launched a consent solicitation process for the notes. In the noteholders’ meetings held on February 7, 2014 in Helsinki the holders of the 2015 and 2016 notes resolved to approve the proposals relating to the granting of security and certain amendments of the terms and conditions of the respective notes and to certain authorization and waivers related to the subordination deed. Accordingly and except for certain limited circumstances, the consents and waivers became effective immediately after being sanctioned and the amendments to terms and conditions of the both notes will enter into force upon the completion of certain refinancing measures.
EGM called for February 14, 2014On January 23, 2013 Outokumpu convened an Extraordinary General Meeting for February 14, 2014 in Espoo, Finland The Board of Directors proposed that the Extraordinary General Meeting authorizes the Board of Directors to undertake a share issue for consideration in which shareholders have the right to subscribe for new shares in proportion to their existing holdings of the shares of the company. The Board of Directors has the right to decide upon the offering to parties determined by the Board of Directors of any shares that may remain unsubscribed for pursuant to the shareholders’ pre-emptive subscription right. The authorization is for a maximum of 65 billion new shares. The Board of Directors is authorized to determine the other terms and conditions of the share issue.
Strategic review of operations in Nyby, Kloster and Dahlerbrück concluded
In June 2013, Outokumpu announced a strategic review of its thin and precision strip operations in Kloster and Nyby, Sweden and in Dahlerbrück, Germany with the aim of reducing capacities and achieving cost savings through increased efficiencies. As a result of the review, the company plans to discontinue its operations in Kloster, Sweden. Outokumpu will continue the operations in Nyby, Sweden and in Dahlerbrück, Germany as before.
Proved ore reserves of the Kemi mine significantly larger after new drillings
As announced in January 2014, Outokumpu has updated its estimates on the proved ore reserves and mineral resources of the Kemi mine in Finland. The proved ore reserves have significantly increased compared to earlier estimates, and are now altogether 50.1 million tonnes instead of the earlier estimated some 33 million tonnes.
Outokumpu Annual Report 2013 nOtes tO the cOnsOlidated financial stateMents
102

Key financial figures of the Group
2013 2012 1), 2) 2011 2010 2009
Scope of activity
Sales € million 6 745 4 538 5 009 4 229 2 641- change in sales % 48.6 -9.4 18.4 60.1 -52.3- exports from and sales outside Finland, of total sales % 96.9 95.7 95.7 94.3 94.6
Capital employed on Dec 31 € million 4 265 5 623 3 770 4 176 3 642Operating capital on Dec 31 € million 4 266 5 626 3 730 4 222 3 701
Capital expenditure, continuing operations € million 183 3 155 255 161 248- in relation to sales % 2.7 69.5 5.1 3.8 9.4
Depreciation and amortization € million 332 230 235 235 214Impairments € million 13 105 106 20 15
Research and development costs € million 26 19 21 22 19- in relation to sales % 0.4 0.4 0.4 0.5 0.7
Personnel on 31 Dec 3) 12 561 16 649 8 253 8 431 7 754- average for the year 4) 13 150 7 853 8 651 8 475 8 091
Profitability
Operating result € million -510 -385 -251 -83 -441- in relation to sales % -7.6 -8.5 -5.0 -2.0 -16.7
EBITDA € million -165 -50 89 172 -212
Share of results of associated companies and joint ventures € million -2 -0 -5 -10 -13
Result before taxes € million -822 -524 -244 -143 -479- in relation to sales % -12.2 -11.5 -4.9 -3.4 -18.1
Net result for the financial year € million -1 003 -536 -180 -124 -336- in relation to sales % -14.9 -11.8 -3.6 -2.9 -12.7
Return on equity % -41.4 -21.4 -8.2 -5.2 -12.8Return on capital employed % -10.3 -8.2 -6.3 -2.1 -11.7Return on operating capital % -10.3 -8.2 -6.3 -2.1 -11.4
Outokumpu Annual Report 2013 Key financial figures Of the grOup
103

2013 2012 1), 2) 2011 2010 2009
Financing and financial position
Liabilities € million 5 884 5 949 3 177 3 271 2 400
Net interest-bearing debt 5) € million 3 556 3 431 1 991 2 269 1 538- in relation to sales 5) % 52.7 75.6 39.7 53.6 58.2
Net financial expenses € million 310 138 -11 50 25- in relation to sales % 4.6 3.1 -0.2 1.2 0.9
Net interest expenses € million 197 66 65 38 22- in relation to sales % 2.9 1.5 1.3 0.9 0.8
Interest cover -3.2 -6.9 -2.8 -2.8 -21.2
Share capital € million 311 311 311 311 309Other equity € million 1 580 2 641 1 739 2 026 2 144
Equity-to-assets ratio % 21.5 30.5 39.3 41.7 50.6Debt-to-equity ratio 5) % 188.0 116.2 97.1 97.0 62.7
Net cash generated from operating activities 6) € million 34 266 338 -497 201
Dividends € million - 7) - - 45 64
1) Figures for 2012 have been restated due to completing the Inoxum acquisition accounting. 2) Figures for 2012 have been restated due to adoption of revised IAS 19 Employee Benefits standard. Years 2011–2009 have not been restated accordingly. 3) Personnel reported as headcount. Year 2009 reported as full-time equivalent. Year 2013 reported for continuing operations. 4) Year 2012 average personnel does not include Inoxum personnel as it was on December 31, 2012. Year 2013 reported for continuing operations.5) Definition for net interest-bearing debt has been changed. Years 2012–2009 have been adjusted accordingly. 6) Cash flow for 2013 presented for continuing operations.7) The Board of Directors’ proposal to the Annual General Meeting.
Outokumpu Annual Report 2013 Key financial figures Of the grOup
104

Share-related key figures 2013 2012 2011 2010 2009
Earnings per share 1), 2) € -0.48 -0.46 -0.62 -0.68 -1.86Earnings per share, continuing operations € -0.40 - - - -
Cash flow per share 1) € 0.02 0.23 1.20 -2.74 1.11
Equity per share 2), 3) € 0.91 1.41 11.19 12.84 13.54
Dividend per share € -4) - - 0.25 0.35Dividend payout ratio % neg. neg. neg. neg. neg.Dividend yield % 0.0 0.0 0.0 1.8 2.6
Price/earnings ratio neg. neg. neg. neg. neg.
Development of share price 5)
Average trading price € 0.53 0.97 2.25 13.84 11.49Lowest trading price € 0.35 0.64 1.21 12.03 7.72Highest trading price € 0.85 2.10 3.78 17.88 15.67Trading price at the end of the period € 0.41 0.79 1.33 13.88 13.26Change during the period 6) % -48.8 -40.3 -63.4 4.7 60.1
Change in the OMXH index during the period % 26.5 8.3 -30.1 18.7 19.5
Market capitalization at the end of the period € million 845 1 650 930 2 540 2 413
Development in trading volume Trading volume 7) 1 000 shares 1 564 532 1 297 738 337 942 331 397 355 102In relation to weighted average number of shares 1) % 75.3 112.5 120.5 182.3 196.4
Adjusted average number of shares 8), 9) 2 077 080 035 1 156 005 029 280 526 501 181 751 107 180 825 569Number of shares at the end of the period 8), 10) 2 078 081 348 2 077 065 460 181 977 861 181 937 361 180 969 654
1) 2012 and 2011 calculated based on the rights-issue-adjusted weighted average number of shares. 2010–2009 have not been restated. 2) Figures for 2012 have been restated due to adoption of revised IAS 19 Employee Benefits standard. Years 2011–2009 have not been restated accordingly. 3) 2012 includes shares and equity effect of the March–April, 2012 rights issue and the directed share issue to ThyssenKrupp AG in connection with the
Inoxum acquisition in December. 4) The Board of Directors’ proposal to the Annual General Meeting. 5) 2011 share prices adjusted according to the effect of the rights issue. 2010–2009 have not been adjusted. 6) 2011 calculated based on the unadjusted comparable share prices. 2012 calculated based on the adjusted comparable share prices. 7) Includes only NASDAQ OMX Helsinki trading. 8) Excluding treasury shares. 9) 2011 presented as rights-issue-adjusted weighted average. The actual number of shares was 181 970 316. 2010–2009 have not been adjusted. 10) Rights-issue-adjusted number of shares at the end of the period for 2011 is 280 538 133 and 2010 is 280 475 698. Figure for 2009 are not available.
Outokumpu Annual Report 2013 Key financial figures Of the grOup
105

Definitions of key financial figures
Capital employed =
Total equity + net interest-bearing debt + net derivative liabilities + net accrued interest expenses – net assets held for sale – loans receivable – available for sale financial assets – investments at fair value through profit or loss – investments in associated companies and joint ventures
Operating capital = Capital employed + net deferred tax liability
Research and development costs = Research and development expenses in the income statement(including expenses covered by grants received)
Underlying operational result = Operating result excluding raw material-related inventory gains/losses and non-recurring items
EBITDA = Operating result before depreciation, amortization and impairments
Return on equity =Net result for the financial year
× 100Total equity (average for the period)
Return on capital employed (ROCE) =Operating result
× 100Capital employed (average for the period)
Return on operating capital (ROOC) =Operating result
× 100Operating capital (average for the period)
Net interest-bearing debt = Long-term debt + current debt – cash and cash equivalents
Interest cover =Result before taxes + net interest expensesNet interest expenses
Equity-to-assets ratio =Total equity
× 100Total assets – advances received
Debt-to-equity ratio =Net interest-bearing debt
× 100Total equity
Earnings per share =Net result for the financial year attributable to the equity holdersAdjusted average number of shares during the period
Cash flow per share =Net cash generated from operating activitiesAdjusted average number of shares during the period
Equity per share =Equity attributable to the equity holdersAdjusted number of shares at the end of the period
Dividend per share =Dividend for the financial yearAdjusted number of shares at the end of the period
Dividend payout ratio =Dividend for the financial year
× 100Net result for the financial year attributable to the equity holders
Dividend yield =Dividend per share
× 100Adjusted trading price at the end of the period
Price/earnings ratio (P/E) =Adjusted trading price at the end of the periodEarnings per share
Average trading price =EUR amount traded during the periodAdjusted number of shares traded during the period
Market capitalization at end of the period = Number of shares at the end of the period × Trading price at the end of the period
Trading volume = Number of shares traded during the period, and in relation to the weighted average number of shares during the period
Outokumpu Annual Report 2013 Key financial figures Of the grOup
106

Parent company financial statements, FASIncome statement of the parent company € million 2013 2012
Sales 460 300
Cost of sales -423 -230
Gross margin 38 69
Other operating income -3 12
Selling and marketing expenses -36 -45
Administrative expenses -101 -75
Research and development expenses -0 -4
Other operating expenses -343 -39
Operating result -446 -83
Financial income and expenses -108 -61
Result before extraordinary items -554 -144
Result before appropriations and taxes -554 -144
Appropriations
Change in depreciation difference -0 -0
Income taxes -0 -0
Result for the financial year -554 -144
The parent company’s financial statements have been prepared in accordance with Finnish accounting standards (FAS). The parent company’s complete financial statements (available only in Finnish) can be read on the company’s internet pages www.outokumpu.com.
Outokumpu Annual Report 2013 parent cOMpany financial stateMents, fas
107

Balance sheet of the parent company € million 2013 2012
ASSETS
Non-current assets
Intangible assets 26 33
Property, plant and equipment 14 15
Financial assets
Shares in Group companies 2 724 2 973
Loan receivables from Group companies 1 419 888
Shares in associated companies 18 18
Other shares and holdings 19 19
Other financial assets 8 159
4 189 4 057
Total non-current assets 4 228 4 105
Current assets
Current receivables
Interest-bearing 2 602 2 852
Non interest-bearing 144 127
2 746 2 979
Cash and cash equivalents 473 81
Total current assets 3 219 3 060
TOTAL ASSETS 7 447 7 165
Outokumpu Annual Report 2013 parent cOMpany financial stateMents, fas
108
€ million 2013 2012
EQUITY AND LIABILITIES
Shareholders' equityShare capital 311 311
Premium fund 720 720
Invested unrestricted equity reserve 1 459 1 459
Retained earnings 600 744
Result for the financial year -554 -144
2 536 3 090
Untaxed reservesAccumulated depreciation difference 1 1
Liabilities
Non-current liabilities
Interest-bearing 2 979 2 678
Non interest-bearing - -
2 979 2 678
Current liabilities
Interest-bearing 1 576 1 266
Non interest-bearing 355 130
1 932 1 396
Total liabilities 4 910 4 074
TOTAL EQUITY AND LIABILITIES 7 447 7 165
Outokumpu Annual Report 2013 parent cOMpany financial stateMents, fas
109

Cash flow statement of the parent company€ million 2013 2012
Cash flow from operating activities
Result for the financial year -554 -144
Adjustments forTaxes 0 0
Depreciation and amortization 9 12
Impairments 333 59
Gain/loss on sale of intangible assets, property, plant and equipment 0 0
Interest income -130 -60
Dividend income -13 -11
Interest expense 185 73
Change in provisions 0 4
Losses from disposal of financial assets 49 -
Exchange gains and losses -7 -12
Rights issue expenses 2 35
Other adjustments 0 -0
429 102
Change in working capital Change in trade and other receivables 77 28
Change in trade and other payables 69 14
145 43
Dividends received 13 11
Interest received 91 37
Interest paid -91 -70
Income taxes paid -0 -0
14 -23
Net cash from operating activities 34 -22
Cash flow from investing activitiesAcquisition of subsidiaries and other shares and holdings 1) -2 -53
Purchases of property, plant and equipment -0 -1
Purchases of intangible assets -5 -5
Proceeds from disposal of subsidiaries and other disposals - 212
Capital recovery from subsidiaries 0 -
Proceeds from disposal of other shares and holdings 0 2
Proceeds from sale of property, plant and equipment 3 -
Proceeds from sale of intangible assets - 3
Change in other long-term receivables -442 -170
Net cash from investing activities -446 -12
Cash flow before financing activities -412 -34
Cash flow from financing activitiesRights issue - 1 006
Rights issue expenses -2 -35
Borrowings of long-term debt 1 107 611
Repayments of long-term debt -716 -378
Change in current debt 164 -145
Cash flow from group contributions - 30
Other financing cash flow 251 -1 029
Net cash from financing activities 804 60
Net change in cash and cash equivalents 392 26
Net change in cash and cash equivalents in the balance sheet 392 26
1) Cash flow from investing activities includes the cash flow related to the acquisition of Inoxum subsidiary shares.
Outokumpu Annual Report 2013 parent cOMpany financial stateMents, fas
110

Statement of changes in equity of the parent company
€ millionShare
capitalPremium
fund
Invested unrestricted
equity reserveRetained earnings
Total equity
Equity on Jan 1, 2012 311 720 - 744 1 775Result for the financial year 1) - - - -144 -144Rights issues 2) - - 1 459 - 1 459Equity on Dec 31, 2012 311 720 1 459 600 3 090Result for the financial year - - - -554 -554
Equity on Dec 31, 2013 311 720 1 459 46 2 536
Distributable funds on Dec 31€ million 2013 2012Retained earnings 1) 600 744Result for the financial year -554 -144Invested unrestricted equity reserve 1 459 1 459Distributable funds on Dec 31 1 504 2 059
1) Including amendment, amount of -3.5 EUR million, to the accounting principles related to the Employee Benefits.2) Shares issued in the Outokumpu rights issue in March–April 2012 and in the directed share issue to ThyssenKrupp AG in connection with the Inoxum
acquisition.
Commitments and contingent liabilities at the parent company€ million 2013 2012
Mortgages and pledges on Dec 31Mortgages on real estate - -Other pledges - -
Guarantees on Dec 31On behalf of subsidiaries
For financing 525 264For commercial and other guarantees 35 26
On behalf of associated companiesFor financing 7 -
Other commitments 28 32
Outokumpu Oyj is, in relation to its shareholding in Kymppivoima Tuotanto Oy and Etelä-Pohjanmaan Voima Oy, liable for the costs, commitments and liabilities relating to electricity provided by Rapid Power Oy. The net debt of Rapid Power Oy at the end of 2013 amounted to approximately EUR 65 million (2012: EUR 75 million), out of which Outokumpu is liable for one third. Outokumpu Oyj is, in relation to its shareholding in Etelä-Pohjanmaan Voima Oy, liable for the costs, commitments and liabilities relating to electricity provided by Tornion Voima Oy. The net debt of Tornion Voima Oy at the end of 2013 amounted to approximately EUR 34 million (2012: EUR 36 million), out of which Outokumpu is liable for under one fifth. These liabilities are reported under other commitments above.
Certain guarantees issued by ThyssenKrupp on behalf of Inoxum companies have not yet been transferred to Outokumpu Oyj as of December 31, 2013. However, Outokumpu Oyj has given ThyssenKrupp a counter-guarantee for these commitments. The outstanding amount of guarantees to be transferred totals EUR 72 million as of December 31, 2013, including guarantees for commercial and financing. Part of the above mentioned guarantees has already been replaced by Outokumpu Oyj and Outokumpu aims to replace the remaining guarantees in the near future.
Outokumpu Oyj will guarantee between February 2014–January 2017 certain subsidiaries’ ability to satisfy their financial liabilities when due.
Outokumpu Annual Report 2013 parent cOMpany financial stateMents, fas
111

Corporate Governance in 2013
Regulatory frameworkOutokumpu Oyj, the Group’s parent company, is a public limited liability company incorporated and domiciled in Finland. In its corporate governance and management, Outokumpu Oyj complies with Finnish legislation, the company’s Articles of Association and the Corporate Governance Policy resolved and approved by the company’s Board of Directors.
Outokumpu Oyj follows the Finnish Corporate Governance Code (available at http://cgfinland.fi/en/), effective as of October 1, 2010 issued by the Securities Market Association and adopted by the NASDAQ OMX Helsinki stock exchange. Outokumpu Oyj complies with all regulations and recommendations issued by NASDAQ OMX Helsinki.
Tasks and responsibilities of governing bodies
The governing bodies of the parent company Outokumpu Oyj, i.e. the General Meeting of Shareholders, the Board of Directors and the President and Chief Executive Officer (CEO), have the ultimate responsibility for Group management and Group operations. The Outokumpu Leadership Team reports to the CEO and is responsible for the efficient management of the Group’s operations. Outokumpu’s primary corporate governance information source is the Group’s corporate governance website at www.outokumpu.com/en/investors/Governance/. Please visit the website for the latest Corporate Governance Statement and the latest corporate governance information.
Outokumpu’s organizational structureIn 2013, the Outokumpu organization consisted of four business areas. Business area names were changed in February 2014 and are Stainless EMEA, Stainless Americas, Stainless APAC and Specialty Stainless. All business areas are supported by Group-level functions and with each business area fully accountable for sales, profit, production and supply chain management.
General Meeting of ShareholdersThe General Meeting of Shareholders usually convenes once a year. Under the Finnish Companies Act, certain important decisions such as the approval of financial statements, decisions on dividends and increases or reductions in share capital, amendments to the Articles of Association, and election of the Board of Directors and auditors fall within the exclusive domain of the General Meeting of Shareholders.
The Board of Directors convenes a General Meeting of Shareholders. The Board of Directors can decide to convene a General Meeting on its own initiative, but is obliged to convene a General Meeting if the auditor or shareholders holding at least 10% of Outokumpu’s shares so request. In addition, each shareholder has the right to bring before a General Meeting any matter that falls within the domain of the General Meeting, provided that a written request to do so has been received by the Board of Directors early enough to allow the matter to be placed on the agenda included in the notice announcing the General Meeting. According to its Articles of Association, Outokumpu has only one single class of shares and all shares have equal voting rights at General Meetings.
CEO
Marketing, Communications and Sustainability
Human Resources, Health and Safety and ITCFO’s Office CTO’s Office
Stainless AmericasStainless EMEA Specialty StainlessStainless APAC
Organization as of November 2013. Business area names were changed in February 2014.
Organization
Outokumpu Annual Report 2013 cOrpOrate gOvernance
112

Board of DirectorsThe general objective of the Board of Directors is to direct Outokumpu’s business in a manner that secures a significant and sustained increase in the value of the company for its shareholders.
Board members offer their expertise and experience for the benefit of the company. The tasks and responsibilities of the company’s Board of Directors are determined on the basis of the Finnish Companies Act as well as other applicable legislation. The Board of Directors has general authority to decide and act in all matters not reserved for other corporate governance bodies by law or under the provisions of the company’s Articles of Association. The general task of the Board of Directors is to organize the company’s management and operations. In all situations, the Board of Directors must act in accordance with the company’s best interests.
The Board of Directors has established rules of procedure which define its tasks and operating principles. The main duties of the Board of Directors are as follows:
With respect to directing the company’s business and strategies: · To decide on Outokumpu’s basic strategy and monitor its implementation.
· To decide on annual limits for the Group’s capital expenditure, monitor related implementation, review quarterly plans and decide on changes.
· To decide on major and strategically important investments. · To decide on major and strategically important business acquisitions and divestments.
· To decide on any significant financing arrangements. · To decide on any other commitments by any Group companies that are out of the ordinary in terms of either their value or nature, taking into account the size, structure and field of the Group’s operations.
With respect to organizing the company’s management and operations: · To nominate and dismiss the CEO and his deputy, and to decide on their terms of service, including incentive schemes, on the basis of a proposal made by the Board’s Remuneration Committee.
· To nominate and dismiss members of the Outokumpu Leadership Team, to define their areas of responsibility, and to decide on their terms of service, including incentive schemes, on the basis of a proposal made by the Board’s Remuneration Committee.
· To monitor the adequacy and allocation of the Group’s top management resources.
· To decide on any significant changes to the Group’s business organization.
· To define the Group’s ethical values and working methods. · To ensure that policies outlining the principles of corporate governance are in place.
· To ensure that policies outlining the principles behind managing the company’s insider issues are being observed.
· To ensure that the company has guidelines for any other matters which the Board deems necessary and which fall within the scope of the Board’s duties and authority.
With respect to the preparation of matters to be resolved by General Meetings of Shareholders: · To establish a dividend policy and issue a proposal on dividend distribution.
· To make other proposals to General Meetings of Shareholders.
With respect to financial control and risk management: · To discuss and approve interim reports and annual accounts. · To monitor significant risks related to the Group’s operations and the management of such risks.
· To ensure that adequate procedures concerning risk management are in place.
The Board of Directors also assesses its own activities on a regular basis.
The Board of Directors shall have a quorum when more than half of its members are present. A decision by the Board of Directors shall be the opinion supported by more than half of the members present at a meeting. In the event of a tie, the Chairman shall have the casting vote.
The Annual General Meeting elects the Chairman, the Vice Chairman and the other members of the Board of Directors for a term expiring at the close of the following Annual General Meeting. The entire Board of Directors is therefore elected at each Annual General Meeting. A Board member may be removed from office at any time by a resolution passed by a General Meeting of Shareholders. Proposals to the Annual General Meeting concerning the election of Board members which have been made known to the Board of Directors prior to the Annual General Meeting will be made public if such a proposal is supported by shareholders holding a minimum of 10% of all the company’s shares and voting rights and the person being proposed has consented to such nomination.
Under the company’s Articles of Association, the Board shall have a minimum of five and a maximum of twelve members. A Board consisting of eight members was elected at the 2013 Annual General Meeting. Following the transaction between Outokumpu and ThyssenKrupp AG announced on November 30, 2013, Mr. Kerkhoff tendered his resignation from the Board of Directors, effective immediately. The Board of Directors meets at least five times each year. In 2013, the Board of Directors met 15 times and the average attendance rate was 93%.
See the Members of the Board of Directors on p. 14.
Shares and options of the members of the Board of Directors on December 31, 2013 Member Shares
Jorma Ollila 96 969
Olli Vaartimo 92 167
Markus Akermann 41 558
Harri Kerminen 54 999
Heikki Malinen 54 999
Siv Schalin 65 239
Elisabeth Nilsson 65 239
471 170
Outokumpu Annual Report 2013 cOrpOrate gOvernance
113

Board committeesThe Board of Directors has set up two permanent committees consisting of Board members and has confirmed rules of procedure for these committees. Both committees report to the Board of Directors.
The Audit Committee comprises four Board members. The task of the Audit Committee is to deal with matters relating to financial statements, auditing work, internal controls, the scope of internal and external audits, fees paid to auditors, the Group’s tax position, the Group’s financial policies and other procedures for managing Group risks. In addition, the Audit Committee prepares a recommendation for the Annual General Meeting concerning the election of an external auditor and auditing fees. The Audit Committee met seven times during 2013 and the average attendance rate was 100%.
The Remuneration Committee comprises the Chairman of the Board and three other Board members. Following the resignation of Guido Kerkhoff from the Board of Directors, the Remuneration Committee comprises the Chairman of the Board and two other Board members. The task of the Remuneration Committee is to prepare proposals for the Board of Directors concerning the appointment of the company’s top management and principles relating to the compensation they receive. The Board of Directors has authorized the Remuneration Committee to determine the terms of service and benefits enjoyed by the Outokumpu Leadership Team members other than the company’s CEO. The Remuneration Committee met six times during 2013 and the average attendance rate was 91%.
To handle specific tasks, the Board of Directors can also set up temporary working groups consisting of Board members. These working groups report to the Board of Directors. A temporary working group, the Board Finance Working Group, was set up during 2013 and the working group comprises the Chairman and Vice Chairman of the Board and one other Board member. The main task of the working group is to oversee and review in greater detail the status of and activities relating to company’s strategic roadmap, capital structure, balance sheet, major transactions, major corporate finance activities and other matters having strategic significance for the company. The Board Finance Working Group met four times during 2013 and the average attendance rate was 100%.
Nomination BoardOutokumpu’s Annual General Meeting has established a Nomination Board to annually prepare proposals on the composition of the Board of Directors along with director remuneration for the Annual General Meeting.
The Outokumpu 2013 Annual General Meeting decided that, according to the Charter of the Nomination Board, the Nomination Board consists of the representatives of Outokumpu’s four largest shareholders, registered in the Finnish book-entry securities system on October 1, who accept the assignment and that the Chairman of the Board should act as an expert member of the Nomination Board.
Outokumpu’s largest shareholders were determined on the basis of shareholdings registered in the Finnish book-entry system. Holdings of shareholders who have an obligation under the Finnish Securities Markets Act to disclose changes in shareholdings (the flagging obligation) are divided into several funds or registers and will be summed when calculating the related share of voting rights, provided that a written request to this effect was presented by the shareholder
or shareholders concerned to the Board of Directors of the Company no later than September 30, 2013. Should a shareholder not wish to use the nomination right, the right to nominate is transferred to the next largest shareholder who would otherwise not have a right to nominate.
Shareholder representatives on the Nomination Board in 2013 were: ThyssenKrupp AG, Solidium Oy, the Social Insurance Institution of Finland and Varma Mutual Pension Insurance Company. These shareholders chose the following individuals as their representatives on the Nomination Board: Guido Kerkhoff, CFO of ThyssenKrupp AG and also a member of the Outokumpu Board of Directors; Kari Järvinen, Managing Director of Solidium Oy; Tuula Korhonen, Investment Director of the Finnish Social Insurance Institution and Pekka Pajamo, CFO of Varma Mutual Pension Insurance Company. Kari Järvinen was elected as Chairman of the Nomination Board and Jorma Ollila, Chairman of the Outokumpu Board of Directors, served as an expert member. Following the transaction between Outokumpu and ThyssenKrupp AG, announced on November 30, 2013, Mr. Kerkhoff tendered his resignation from the Nomination Board on December 2. The Nomination Board has submitted its proposals regarding Board composition and director remuneration to Outokumpu’s Board of Directors, and the Board has incorporated these proposals into the notice announcing the Outokumpu 2014 Annual General Meeting of Shareholders.
CEO and deputy to the CEO The Chief Executive Officer (CEO) is responsible for the company’s operational management, in which the objective is to secure significant and sustainable growth in the value of the company for its shareholders.
The CEO prepares matters on which decisions are to be made by the Board of Directors, develops the Group’s operations in line with the targets agreed with the Board of Directors, and ensures the proper implementation of Board decisions. The CEO is also responsible for ensuring that existing legislation and applicable regulations are observed throughout the Group.
The CEO chairs the meetings of the Outokumpu Leadership Team. The deputy to the CEO is responsible for attending to the CEO’s duties in the event that the CEO is prevented from doing so. Since 2011, the Group’s Chief Financial Officer has acted as deputy to the CEO.
Leadership TeamThe task of the Outokumpu Leadership Team is the overall management of Outokumpu’s business. Members of the team have extensive authority in their individual areas of responsibility and their duty is to develop the Group’s operations in line with the targets set by the Board of Directors and the CEO.
At the end of 2013, the members of the Outokumpu Leadership Team held the following positions: President and Chief Executive Officer, Executive Vice President – Chief Financial Officer, President – Stainless EMEA, President – Stainless APAC, President – Stainless Americas, President – Specialty Stainless, Executive Vice President – Marketing, Communications and Sustainability, Executive Vice President – Chief Technology Officer and Executive Vice President – Human Resources, Health, Safety & IT. The Leadership Team typically meets at least once a month.
See the members of the Leadership Team on p. 12.
Outokumpu Annual Report 2013 cOrpOrate gOvernance
114
Group managementOutokumpu’s corporate management consists of the Chief Executive Officer (CEO), members of the Outokumpu Leadership Team, and managers and experts who assist the CEO and members of the Leadership Team.
The task of corporate management is to manage the Group as a whole. Duties include the coordination and execution of strategy and corporate planning, integration, financial control, tax, internal audit, human resources, environment, energy, health and safety, IT, marketing, communications and corporate responsibility, R&D, legal affairs, corporate affairs and compliance and IPR, investor relations as well as treasury and risk management. Certain support functions have also been centralized at Group level. The Outokumpu Group is managed in accordance with the organization of its business, in which the Group’s legal company structure also provides the legal framework for Outokumpu’s operations. Clear financial and operational targets have been established for all the Group’s operational businesses.
In 2013, Outokumpu’s organization was based on four Business Areas with sales, profit, production and supply chain management responsibility, with the focus being on improving the ability to respond rapidly to customer needs, while Group-level functions with global processes ensure efficiency.
The Business Areas were renamed in February 2014 and are:
· Stainless EMEA · Stainless Americas · Stainless APAC · Specialty Stainless
As well as being responsible for their own sales, the Business Areas are responsible for profit and operating cash flow and are supported by Group-level functions in key areas such as financial control, taxation, human resources, environment, energy, health and safety, IT, marketing and communications, corporate responsibility, R&D, legal affairs, compliance and IPR, as well as treasury and risk management. The Business Areas are geared to achieve the Group’s business and synergy targets while maintaining the focus on responding to customer needs.
The Outokumpu Business Areas report directly to individual Leadership Team members.
Remuneration As confirmed by the 2013 Outokumpu Annual General Meeting, annual remuneration for members of Outokumpu’s Board of Directors are as follows: Chairman EUR 140 000, Vice Chairman EUR 80 000 and other members EUR 60 000, with 40% of this paid as Outokumpu shares purchased from the market and 60% paid in cash.
The annual fee is paid once a year and members of the Board are not entitled to any other share-based rewards. In addition to their annual remuneration, all members of the Board of Directors are paid a meeting fee of EUR 600 (EUR 1 200 for members of the Board of Directors residing outside Finland). The meeting fee is also payable for attending meetings of Board committees.
The service contract of Outokumpu’s CEO is valid until further notice and may be terminated by Outokumpu with 12 months’ notice or by the CEO with six months’ notice. Upon termination by Outokumpu or a material change in ownership of Outokumpu, the CEO will receive additional compensation equivalent to his basic salary in the preceding 12 months plus the monetary value of his employee benefits at the moment of termination, provided that his employment is not terminated due to neglect caused by him. For the other members of the Leadership Team, who are employed in Finland, the notice period is six months for both parties, in addition to which there will be additional compensation equivalent to their basic salary in the preceding 12 months plus the monetary value of their employee benefits at the moment of termination, provided that their employment is terminated for another reason than one caused by the employee. The termination benefits of the Leadership Team members employed outside of Finland vary in line with the local market practices.
In the 2013 financial year, the performance-based incentive payable to the Group CEO and members of the Leadership Team in addition to their base salary and employee benefits was based on an EBITDA target (earnings before interest, taxes, depreciation and amortization) and operational targets with emphasis on cash flow, working capital and delivery of synergies. The maximum incentive payment was 50% of the annual base salary for the CEO and the other members of the Leadership Team. The total amount of short-term and long-term incentives must not exceed 200% of an individual’s annual salary. Should this limit have been exceeded, the share-based reward would have been reduced accordingly.
Shares and options of the Leadership Team members on December 31, 2013
Share-based incentive programmes Restricted Share Pool
2012–2014Member Shares 2011–2013 2012–2014 2013–2015Mika Seitovirta 200 000 96 000 544 000 1 063 500 -Austin Lu - - 65 200* 324 000* -Jarmo Tonteri 144 282 - - - -Reinhard Florey - - - 324 000 117 284Kari Tuutti 20 000 - 65 200 324 000 -Kari Parvento 8 000 36 000 170 000 324 000 -Johann Steiner - - - 324 000 -Pekka Erkkilä 100 000 - - 270 000 -Total 472 282Board and Leadership Team 943 452
* Due to local legislation, the possible LTI reward will be paid in cash instead of shares.
Outokumpu Annual Report 2013 cOrpOrate gOvernance
115

No separate remuneration is paid to the Group CEO or members of the Leadership Team for membership of this committee or the Group’s other internal governing bodies.
The retirement age for the members of the Leadership Team is 63 years and they participate in the local retirement programs applicable to employees in the country where their employing company is located. The members residing in Finland participate in the Finnish TyEL pension system, in addition to which they are entitled to a defined contribution pension plan. The targeted pension is 60% of
the annual salary at the age of 63 and the maximum premium is 25% of an individual’s annual earnings. The member of the Leadership Team who is employed in Sweden belongs to Swedish ITP pension plan and the member who resides in Germany is entitled to pension benefits in accordance with the Essener Verband. One member of the Leadership Team resides in China and is covered by the state pension plan in China, in addition to which cash compensation is paid for a supplementary pension plan. In line with Outokumpu’s policy, the CEO’s retirement age is 63 and the targeted pension is 60% of the annual salary at the age of 63.
Fees, salaries and employee benefits paid
2013€
Salaries and fees with employee
benefits
Performance/ project-related
bonusesAnnual
remuneration 3) Options Total
Board of DirectorsChairman of the Board, Johansson 1) 3 600 - - - 3 600Chairman of the Board, Ollila 10 800 - 140 000 - 150 800Vice Chairman of the Board, Vaartimo 14 400 - 80 000 - 94 400Board member, Akermann 19 200 - 60 000 - 79 200Board member, Nilsson 24 000 - 60 000 - 84 000Board member, Schalin 12 600 - 60 000 - 72 600Board member, Kerminen 12 600 - 60 000 - 72 600Board member, Malinen 13 200 - 60 000 - 73 200Board member, Kerkhoff 1) 14 400 - 60 000 - 74 400Board member, Hill 1) 6 000 - - - 6 000
CEO, Seitovirta 755 040 157 500 - - 912 540Deputy to the CEO 2) 449 445 77 175 - - 526 620Other Leadership Team Members 4) 2 664 604 353 274 - - 3 017 878
1) Johansson and Hill January 1–March 18, 2013, Kerkhoff January 1–November 30, 2013.2) Lager January 1–October 31, 2013 and Florey November 1–December 31, 2013.3) Annual remuneration: 40% is paid as Outokumpu shares purchased from the market and 60% paid in cash.4) Including Kotilainen January 1–February 28, 2013 and Albrecht-Früh January 1–June 13, 2013.
2012€
Salaries and fees with employee
benefits
Performance/ project-related
bonusesAnnual
remuneration 3) Options Total
Board of DirectorsChairman of the Board, Johansson 12 600 - 80 000 - 92 600Vice Chairman of the Board, Vaartimo 13 800 - 45 500 - 59 300Board member, Henkes 1) 8 400 - - - 8 400Board member, Nilsson 21 600 - 36 000 - 57 600Board member, Nilsson-Ehle 1) 9 600 - - - 9 600Board member, Pesonen 1) 3 600 - - - 3 600Board member, Schalin 12 600 - 36 000 - 48 600Board member, Hill 13 200 - 36 000 - 49 200Board member, Kerminen 7 800 - 36 000 - 43 800Board member, Malinen 9 000 - 36 000 - 45 000
CEO, Seitovirta 882 692 2) 90 000 - - 972 692Deputy CEO, Lager 300 341 70 636 - - 370 977Other Group Executive Committee Members 4) 1 390 112 194 314 - - 1 584 426
1) March 1–March 31, 2012. 2) This figure includes the compensation of 271 223 euros for the value of the shares of the Inoxum transaction scheme at the time of the delivery and taxes
and social security contributions related to that. 3) Annual remuneration: 40% is paid as Outokumpu shares purchased from the market and 60% paid in cash.4) Including Hautala January 1–December 28, 2012 and Albrecht-Früh, Florey, Lu and Tuutti December 29–December 31, 2012.
Outokumpu Annual Report 2013 cOrpOrate gOvernance
116

Insider managementOutokumpu’s insider rules are based on and comply with the Guidelines for Insiders issued by the NASDAQ OMX Helsinki stock exchange. Permanent insiders with a duty to declare consist of members of the company’s Board of Directors, the Auditor in Charge, the CEO, and other members of the Outokumpu Leadership Team.
Outokumpu maintains a public register of permanent insiders who have the duty to declare. Employees of the Group who receive inside information on a regular basis as a result of their position or the duties they perform are registered in a non-public register of permanent company-specific insiders. Permanent insiders must not purchase or sell securities issued by the company in the 14 days prior to the publication of interim reports or the company’s annual accounts (the so-called “closed window”).
Separate, non-public, project-specific insider registers are maintained for insider projects. Persons defined as project-specific insiders are those who, in the course of their duties in connection with a project, receive information concerning the Group which, if or when realized, is likely to have a significant effect on the value of the company’s publicly-traded securities.
Outokumpu’s Head of Corporate Affairs and Compliance is responsible for the coordination and supervision of insider issues.
See the year-end 2013 shareholding of the Board of Directors on p. 113 and Leadership Team on p. 115.
Up-to-date information on holdings by Outokumpu’s permanent insiders who have a duty to declare is available on Outokumpu’s website.
Financial reporting According to the Finnish Limited Liability Companies Act and the Finnish Code of Corporate Governance, the Board of Directors is responsible for a company’s internal controls. The purpose of this section is to provide shareholders and other parties with a description of how internal control and risk management of financial reporting is organized in Outokumpu.
As a listed company, the Group has to comply with a variety of regulations. To ensure that all the stated requirements are met, Outokumpu has introduced principles for financial reporting and internal control and distributed these throughout the company’s organization.
Control environment
The foundation for Outokumpu’s control environment is the business culture established within the Group and its associated methods of operation. The basis for the company’s compliance and control
Outokumpu did not provide any guarantees or other similar commitments on behalf of members of its Board of Directors in 2013. No members of the Board of Directors or the Leadership Team or closely-related persons or institutions have any significant business relationships with the Group.
routines is provided by Group policies and principles which define the way in which Outokumpu’s organization operates. These policies and principles are, for example, the Group’s Corporate Responsibility Policy and Ethical Principles. The Outokumpu Code of Conduct describes the Group’s basic values and offers standardized, practical guidelines for managers and employees to follow. Outokumpu’s compliance program targets at globally mitigating legal risks for the Group as well as for each individual employee and specifically to prevent any infringements of regulations on antitrust, corruption and export controls by a set of preventive and supervisory measures. The Outokumpu performance management process is a key management activity and an important factor in enabling an efficient control environment. In all sections of the Group’s operations, planning activities and the setting of both operational and financial targets are executed in accordance with Outokumpu’s overall business targets. Management follow-up of related achievements is carried out through monthly management reporting routines and in performance review meetings.
Outokumpu operates in accordance with the risk management policy approved by the Group’s Board of Directors. This policy defines the objectives of risk management activities, the approaches to be taken and areas of responsibility. As well as supporting the Outokumpu strategy, risk management activities help in defining a balanced risk profile from the perspective of shareholders and other stakeholders such as customers, suppliers, personnel and lenders. More information on risk management within Outokumpu can be found in the Risk management section on p. 120.
Outokumpu’s control process for financial reporting is based on Group policies, principles and instructions relating to financial reporting, as well as on the responsibility and authorization structure within the Group. Policies relating to financial reporting are usually owned and approved by the CEO, the CFO or the Corporate Controller. Financial reporting in Outokumpu is carried out in a harmonized way using a common chart of accounts.
Financial reporting is prepared in accordance with International Financial Reporting Standards (IFRS). The Outokumpu Accounting Principles (OAP) are Outokumpu’s application guidance as regards IFRS. The aim of the OAP and other financial reporting instructions is to ensure that uniform financial processes and reporting practices are used throughout the Group. Financial statements by the parent company and stand-alone Finnish subsidiaries are prepared in accordance with generally accepted accounting principles in Finland, while foreign subsidiaries follow local accounting principles. Outokumpu also complies with regulations regarding financial reporting published by the Financial Supervisory Authority (FIN-FSA) and NASDAQ OMX Helsinki.
The Outokumpu Controller’s Manual contains financial reporting policies and instructions. Policies and instructions for financial reporting are reviewed on a regular basis and revised when necessary. During the 2013 financial year, instructions relating to defined benefit pension plans, termination benefits, provisions and accounting of certain by-products in the manufacturing process were specified and updated.
Some changes were also due to amendments in applicable IFRS standards, mainly relating to employee benefits. In 2014, Outokumpu will continue to follow changes in IFRS standards closely. No major impact on the financial reporting due to the implementation of new standards is expected in 2014.
Outokumpu Annual Report 2013 cOrpOrate gOvernance
117
Risk identification and assessment
Risk management processes connected with the Group’s financial reporting are coordinated by Outokumpu’s Treasury and Risk Management function. Related risks are classified as operational risks and can arise as a consequence of inadequate or failed internal processes, employee actions, systems or other events such as misconduct or crime. The aim of the Outokumpu risk management process is to identify, evaluate, control and mitigate such risks. Major risks are reported to and evaluated by the Audit Committee on a regular basis. Outokumpu’s risk management process includes arranging workshops on the identification of key risks, including operational risks, for Business Areas and other Group functions. Deliverables include risk maps and risk identification plans.
Internal audit
Outokumpu’s Internal Audit function has an independent role and a twofold objective: to provide assurance and to offer consulting services which add value and improve the organization’s operations. Internal Audit’s most important task is assisting the Audit Committee and the Leadership Team in fulfilling their control functions. To do this, Internal Audit identifies and monitors significant operational risks within the Group, ascertains the adequacy and effective operation of internal controls and provides the Audit Committee and the Leadership Team with a direct source of correct and reliable information. Other tasks carried out by Internal Audit include monitoring the Group’s principles, controls and policies and follow-up of the audit conclusions by the company’s external auditors.
The internal auditor reports to the Audit Committee and administratively to the CEO.
Control activities
In addition to the Board of Directors and Audit Committee, operational management teams in Outokumpu are responsible for ensuring that internal controls relating to financial reporting are in place at all Outokumpu units. The aim of control activities is to discover, prevent and correct potential errors and deviations in financial reporting. Control activities also aim to ensure that authorization structures are designed and implemented in a way that conflicting divisions of work do not exist (i.e. one person performing an activity and also being responsible for controlling that activity). Control activities consist of different kind of measures and include reviews of financial reports by Group management and in Business Area management teams, the reconciliation of accounts, analyses of the logic behind reported figures, forecasts compared to actual reported figures and analyses of the Group’s financial reporting processes, among others. A key component is the monitoring of monthly performance against financial and operational targets. These control activities take place at different levels of the organization. The most important accounting items in Outokumpu are the valuation and reporting of inventories and other items of working capital. Also, in difficult market situations, asset impairment calculations and related sensitivity analyses are increasingly important. These items are carefully monitored and controlled both within Business Areas and at Group level. Impairment calculations were prepared on a quarterly basis during 2013.
Integration of the acquired Inoxum companies into Outokumpu’s accounting and reporting processes was ongoing in 2013 and is still continuing in 2014. This includes further specification of accounting and reporting roles and responsibilities, and implementation of harmonized ways of working and reporting timetables within the Group. In relation to the Inoxum transaction, the measurement of acquired assets and liabilities at fair value was prepared in 2013. In accordance with the commitments given to the European Commission in the context of the merger with Inoxum to divest the AST (Acciai Speciali Terni) stainless steel operations in Terni, Italy and certain European service centers and other remedy assets, Outokumpu has held the remedy assets separate and ring-fenced from the operations of the Group. In 2014, special attention will also be paid to ensuring smooth outsourcing of certain European Group companies’ accounting and reporting procedures to the new external service provider.
Information technology and solutions play an important role in guaranteeing that the Group’s internal controls have a solid foundation. A new consolidation system project has been started to ensure timely and uniform financial and management reporting from the Group entities and an effective closing process within the whole Group. The system will be implemented in 2014.
Information and communication
Group-wide policies and principles are available to all Outokumpu employees. Instructions relating to financial reporting are communicated to all the parties involved. The main communication channels employed are Outokumpu’s intranet and other easily-accessible databases. Face-to-face controller meetings are also organized. Senior Controller meetings are organized on a quarterly basis or more frequently when this is considered necessary to share information and discuss issues of topical interest to the Group.
Outokumpu has established different networks and communities in which financial reporting and internal control issues and related instructions are discussed and reviewed. These networks usually consist of personnel from the Business Areas and Group functions. The aim of these networks, communities and common instructions is to ensure that unified financial processes and reporting practices are used throughout the Group. The networks and communities play an important role in establishing the effectiveness of internal controls relating to financial reporting and in developing Outokumpu policies, instructions and processes.
Follow-up
Both management in all Outokumpu companies and personnel in accounting and controlling functions are responsible for the follow-up and monitoring of internal controls connected with financial reporting. The Internal Audit and Risk Management functions also engage in follow-up and control activities. The findings of the follow-up procedures are reported to the Audit Committee and the Outokumpu Leadership Team on a regular basis.
Outokumpu Annual Report 2013 cOrpOrate gOvernance
118

AuditorsUnder its Articles of Association, the company shall have a minimum of one and a maximum of two auditors who are qualified auditors or firms of independent public accountants authorized by the Central Chamber of Commerce of Finland.
The Annual General Meeting elects the auditors to a term of office ending at the close of the next Annual General Meeting. Proposals to the Annual General Meeting on the election of auditors which have been made known to the Board of Directors prior to the Annual General Meeting will be made public if the proposal is made by the Board Audit Committee or if it is supported by shareholders holding a minimum of 10% of all the company’s shares and voting rights and the person or company proposed has consented to such nomination. The company’s auditors submit the statutory auditor’s report to the company’s shareholders in connection with the company’s financial statements. The auditors also report their findings to the Board Audit Committee on a regular basis and at least once a year to the full Board of Directors. The parent company, Outokumpu Oyj, is audited by KPMG Oy Ab, and the responsible auditor is Virpi Halonen, Authorized Public Accountant. KPMG Oy Ab is also responsible for overseeing and coordinating the auditing of all Group companies.
Both Outokumpu and KPMG Oy Ab emphasize the requirement that an auditor be independent of the company being audited. In its global independence policy, KPMG has stated its commitment to observing and complying with the Code of Ethics of the International Federation of Accountants (IFAC).
Outokumpu’s Board Audit Committee continuously monitors non-audit services purchased by the Group from KPMG Oy Ab at a global level. In 2013, auditors were paid fees totaling EUR 3.7 million, of which non-auditing services accounted for EUR 1.0 million.
Outokumpu Annual Report 2013 cOrpOrate gOvernance
119

Risk management process in Outokumpu
Leadership Team
Business areas and Group functions
Operations
Identification
Evaluation and prioritization
Mitigation
Regular risk updates
Risk monitoring and control
Risk reporting(external/internal)
Res
pons
ibili
ty
for
risks
Enterprise-wide risks
Bottom-upIdentification, evaluation, mitigation and reporting.
Top-downPolicies,
guidelines and requirements.
Outokumpu operates in accordance with the risk management policy approved by the company’s Board of Directors. This defines the objectives, approaches and areas of responsibility in the Group’s risk management activities. As well as supporting Outokumpu’s strategy, the aim of risk management is identifying, evaluating and mitigating risks from the perspective of shareholders, customers, suppliers, personnel, creditors and other stakeholders.
Risk management organizationThe Outokumpu Board of Directors carries ultimate responsibility for risk management within the Group. Outokumpu’s CEO and members of the Leadership Team are responsible for defining and implementing risk management procedures, and for ensuring that risks are both properly addressed and taken into account in strategic and business planning. Business Areas and Group functions are responsible for managing risks connected with their own operations. Auditors and Internal Audit monitor risk management processes, and the Leadership Team, the Board’s Audit Committee and the Board of Directors review both key risks and actions taken to manage these risks on a regular basis. The Treasury and Risk Management function supports implementation of Outokumpu’s risk management policy, facilitates and coordinates risk management, and prepares quarterly risk reports for management, the Board’s Audit Committee and the auditors.
Risk management processOutokumpu has defined risk as anything that could have an adverse impact on achieving the Group’s objectives. Risks can therefore be threats, uncertainties or lost opportunities connected with current or future operations. Outokumpu’s appetite for risk and risk tolerance are defined in relation to Group earnings, cash flows and capital structure. The risk management process is an integral part of the overall management processes and it is divided into four stages: risk identification, risk evaluation, risk prioritization and risk mitigation. Within Outokumpu, the risk management process is monitored and controlled at different organizational levels in a systematic manner. Regular risk updates are performed to make sure that the process is operating in an uninterrupted manner. The monitoring and analysis of results and risk updates also ensure that accurate information is provided both internally – to Business Area management teams and members of the Leadership Team – and externally to parties such as shareholders and other stakeholders.
Focus areas 2013The reporting year 2013 was highlighted by the integration work for risk management as well, as the completion of the Inoxum transaction took place on December 28, 2012. During the year risk management policy was updated and risk management processes were aligned for the combined Outokumpu. The integrated process includes
Risk managementOutokumpu Annual Report 2013 risK ManageMent
120

stronger focus on operational risks with SAP based risk management software, being applied as a group-wide reporting tool for consistent identification and reporting of operational risks. Additionally, the Group’s key risks were updated during 2013 as well.
In 2013, Outokumpu continued its systematic fire safety and loss prevention audit programs. Some 30 fire safety and loss prevention audits were carried out in 2013 using the Group’s own resources and expertise in co-operation with external advisors.
One of the main focus areas was to monitor and strengthen Outokumpu’s financial position, as low profitability and stretched balance sheet led to increased risk of financial distress for Outokumpu during 2013. In order to increase its tolerance of risk, Outokumpu decided to initiate significant financing measures in connection with the planned sale of the Terni and VDM operations. All these measures will significantly derisk Outokumpu by improving liquidity, strengthening the balance sheet, reducing variation of free cash flow and decreasing exposure to operational risks.
Strategic and business risks
Outokumpu’s turnaround plan
On November 30, 2013, Outokumpu announced plans to deleverage and strengthen its balance sheet, and to divest Terni and VDM. Outokumpu has signed a binding agreement with ThyssenKrupp whereby Outokumpu will sell the Terni remedy assets, the VDM business and certain service centers to ThyssenKrupp. The future development of Outokumpu will depend on the successful implementation of Outokumpu’s turnaround plan and its ability to achieve the targeted financial objectives. Outokumpu’s ability to meet its goals is subject to several risks and uncertainties, many of which are beyond Outokumpu’s control, including, Outokumpu’s ability to: increase production and sales in the Americas upon ramp-up of production at the Calvert integrated production facility; implement the new industrial restructuring plan for its operations in Europe; achieve the anticipated synergy benefits, reduction of cost and release of cash from working capital; improve overall profitability and enhance operational efficiencies; and achieve growth outside Europe, in particular in Asia and the Americas as well as in other growth markets.
Some of Outokumpu’s credit facilities and other loans include financial covenants based on gearing and liquidity levels. If Outokumpu is not able to comply with the financial covenants included in its credit facilities and other loans, this could have a material adverse effect on its financial condition. A significant portion of Outokumpu’s financing will mature in 2017 and there can be no certainty that additional financing will be available to Outokumpu at a commercially reasonable cost, or at all.
Outokumpu believes that ongoing and planned re-structuring actions, including the new industrial plan in the EMEA region, the ramp-up of the Calvert mill in the USA and the ongoing cost saving programs will
help to continue to make significant progress in all key areas to return Outokumpu to sustainable profitability and maintain its position in global stainless steel markets.
Stainless steel industry and markets
In recent years, stainless steel production capacity in Asia, particularly in China, has increased significantly and Asia has transitioned from being a net importer of European stainless steel to being a significant exporter of stainless steel to Europe. Rapid growth in Chinese stainless steel production capacity combined with low growth in European stainless consumption and decreasing exports from Europe to formerly undersupplied Asian markets has exacerbated overcapacity in Europe and limited growth opportunities for European stainless steel producers. This kind of overcapacity can distort the structure of the stainless steel market especially in Europe, impact Outokumpu’s profitability and could also limit Outokumpu’s future growth.
The stainless steel market is cyclical and demand for stainless steel products is affected by global, regional and national economic conditions, levels of industrial investment activity and levels of industrial production. The demand for stainless steel in 2013 continued to be influenced by the prevailing economic conditions. Growth dynamics of the stainless steel industry differed significantly from region to region. While demand decreased slightly during 2013 in Europe, there was some growth in the demand rates in the Americas and APAC regions. Outokumpu faces significant exposure to the economic conditions, levels of industrial investment activity and levels of industrial production in particular in Europe.
Stainless steel prices are volatile, reflecting the cyclical nature of the global stainless steel market. Low stainless steel prices have an adverse effect on stainless steel producers due to lower revenues and margins as well as potential inventory write-downs. Asian price advantages resulted in Asian materials being imported into the European market. The price advantages result from high investments of Asian mills in new, state-of-the-art facilities with high production capacities, economies of scale and partially significant cost advantages, for example, from using alternative raw materials, such as nickel pig iron. Due to fluctuations in stainless steel prices, the expected selling price of stainless steel may at times deviate significantly from the book value of material in inventory, which could result in inventory write-downs and thus have an adverse effect on Outokumpu’s profitability.
However, Outokumpu has clear operational priorities for the future which include implementation of the savings programs, finalization of the Calvert ramp-up, actions related to the new industrial plan in Europe and improvement in customer satisfaction through enhanced delivery reliability, enabling Outokumpu to achieve sustainable profitability.
Outokumpu Annual Report 2013 risK ManageMent
121

Ferrochrome business risks
Since global demand for stainless steel is forecasted to increase in the long term, Outokumpu expects that global demand for ferrochrome, a key ingredient in stainless steel production, will increase correspondingly. Outokumpu produces ferrochrome at its Tornio ferrochrome production facility using chromite extracted from its Kemi chrome mine, aiming to maintain both a high utilization rate at its ferrochrome production facility and the Group’s competitive position in the ferrochrome market by consuming a significant amount of ferrochrome internally and also by selling certain volumes on the global market. However, in global terms, ferrochrome markets continue to be in a situation of oversupply and as new production capacity is coming on stream in Asia, the risk of a decline in the ferrochrome price exists. There is also the risk that costs associated with Outokumpu’s ferrochrome production will be raised by increases in the costs of electrical power and metallurgical coke, changes in the exchange rate of the US dollar and increased costs related to tightening environmental legislation in Europe. The investment program to double the annual ferrochrome production capacity and the increase of production capacity of the Kemi chromite mine was finalized in Q4 2012 and is scheduled to be ramped up to full production capacity in 2015.
Raw materials
Stainless steel and ferrochrome production requires consumption of substantial amounts of certain raw materials (primarily nickel, recycled stainless steel, ferrochrome, chromite, molybdenum, recycled carbon steel and titanium) and supplies. Most of these raw materials and supplies are subject to significant price volatility due to fluctuating customer demand, speculation and scarcity, which may, from time to time, be compounded by decreases in extraction and production due to natural disasters, political or financial instability or unrest.
Outokumpu is exposed to price volatility of raw materials and supplies, which it purchases primarily under short- or long-term contracts, but also on the spot market. Increases in the prices of certain raw materials, such as nickel, ferrochrome, molybdenum and iron, are generally passed on to customers through alloy surcharges. Outokumpu has historically hedged a part of its exposure to changing nickel prices and, on a case-by-case basis, molybdenum prices.
Although the alloy surcharge is intended to allow stainless steel producers to pass on the costs of raw materials to customers, it does not eliminate Outokumpu’s exposure to raw materials price volatility. Therefore, Outokumpu may not be able to pass on all of its raw materials costs to customers, which can have negative impacts on Outokumpu’s profitability.
As of January 1, 2014, Outokumpu has applied a daily alloy surcharge instead of the previous monthly model for certain customers in Europe. In this model, Outokumpu communicates the alloy surcharges on a daily basis for its customers on its website. Customers can decide whether to fix the alloy surcharge on the order date or on any other date between the order and mid-week prior to the delivery week. Outokumpu believes that the daily alloy surcharge system decreases volatility in raw material prices because Outokumpu can reflect changes in raw material prices faster in its products and makes hedging of raw materials positions easier.
Legal risks
Outokumpu and its subsidiaries are subject to several litigation cases. For a company such as Outokumpu, there is a general risk, which mainly relates to Outokumpu being litigated against by business partners and/or in connection with its business activities in the future. For the specific risks relating to existing litigations, please see Note 32 to the financial statements, “Disputes and litigations”
Outokumpu’s products are used in a wide range of applications. For instance, certain of Outokumpu’s products are used in safety-critical applications, such as pipes used in the oil, gas, chemical and petrochemical industries. In addition, certain of Outokumpu’s stainless steel products are used in the automotive industry, where key customers require extensive third-party certifications regarding the products purchased. Therefore, Outokumpu is exposed to product liability claims arising eg. from automotive industry customers. Such claims may result in severe damages and have impacts on Outokumpu’s profitability.
Outokumpu may be exposed to unfair trade and pricing practices by competitors and other protectionist measures in any of the markets in which it operates. In addition, several countries grant substantial subsidies to companies active in their respective local stainless steel industries. The pricing advantage enjoyed by these producers on their subsidized products may impair or eliminate Outokumpu’s ability to compete with such producers. This and other practices may have a material adverse effect on Outokumpu’s profitability to the extent heavily subsidized stainless steel products are exported into Outokumpu’s key markets, the EU and the United States. In addition, Outokumpu has significant exposure to the effects of trade actions and barriers due to the global nature of its operations. Such trade actions and barriers could limit Outokumpu’s further growth and access to stainless steel markets.
Outokumpu manages and mitigates its legal risks by running internal governance and compliance programs and policies. The instructions these programs and policies provide, should be followed even if they extend beyond local minimum legal requirements. Outokumpu has incorporated compliance rules into the Code of Conduct used by all its businesses, and has also made it clear that all personnel whose activities violate existing policy or rules, or risk breaching competition legislation and regulations in other ways, will be subject to disciplinary measures.
Environmental (business) risks
Outokumpu faces environmental risks related to its business operations. The main environmental for Outokumpu are business risks related to emission trading scheme and new environmental and consumer protection demands.
The European Union’s Emission Trading Scheme (ETS) forms a business risk for the Group, indirectly in electricity prices and directly from the buying of emission allowances. Outokumpu has however secured part of its future electricity supply – and the associated prices – through long-term contracts. Additionally, the Group is participating in nuclear power projects.
Outokumpu operates its business in accordance with prevailing laws and regulations, including environmental, chemical and product safety
Outokumpu Annual Report 2013 risK ManageMent
122

legislation. EU regulatory activity in this area has developed rapidly, and new consumer safety, environment and ecology-related initiatives, directives and other regulations have been generated by the European Commission at a high rate in recent years. Radical changes in this kind of legislation could have long-term impacts on Outokumpu’s operations. The Group attempts to mitigate risks of this type through the systematic identification and management of environmental, chemical and product safety risks, through emissions trading, by launching environmental initiatives and by maintaining a proactive dialogue with both stakeholders and parties involved in the framing of environmental legislation.
Operational risks
Major disasters and business interruptions
Outokumpu’s production processes are dependent on the continuous operation of critical production equipment, including furnaces, continuous casters, rolling mills and electrical equipment (e.g. electric motors and transformers), and production downtime may occur as a result of unexpected mechanical failures or other events. Operations may also be disrupted for a variety of other reasons including fire, explosion, flooding, the release of substances harmful to the environment or health, strikes, transportation disruptions or acts of God. Furthermore, accidents may lead to production downtimes that affect specific items of machinery or production plants, or possibly result in plant closures, including closure for the duration of any ongoing investigation. This type of disruptions may cause significant business interruptions and impact negatively on Outokumpu’s profitability.
Primarily because of the high temperatures required for production, fire is a significant risk for Outokumpu. Most of the Group’s production facilities are located in extensive industrial zones. A fire in any industrial zone could lead to major damage to property and interruptions in production. Extreme weather conditions and natural disasters may also affect Outokumpu’s operations, especially as a result of physical risks such as damage to property or the loss of production through flooding, hurricane or drought. Outokumpu monitors such risks by continuously evaluating its production facilities and production processes from a risk management perspective and also by arranging regular fire-safety audits. Insurances cover a large proportion of the associated risks.
Environmental accidents
The main environmental accident risks at production sites are related to use of acids, production of hazardous waste, landfill activities, long-term contamination of soil or groundwater or long-term effects of hazardous pollutants. The Group also has environmental liabilities and risks at old mines and old sites. Outokumpu has certified environmental management systems in place at several production sites to manage the environmental accident risks in a systematic way. Maintaining such management systems also includes external environmental audits. In addition, Outokumpu also started internal environmental auditing program during 2013 to monitor and to ensure local legal compliance and the level of environmental risk management.
Project risks
Currently, Outokumpu has an approximately 15 percent indirect ownership interest in Fennovoima Oy (“Fennovoima”), which was granted a decision-in-principle by the Government of Finland to build a new nuclear power plant in Finland. In 2013, Fennovoima selected Rosatom Overseas CJSC as a power plant supplier. According to the plans, infrastructure work at the site will begin in 2015 and is expected to last approximately two to three years. The construction of the plant would begin after the infrastructure work and the power plant would start commercial operations in 2024. The project involves a number of potential risks for Outokumpu, including delays, cancellation, non-completion (for external or internal reasons), technical risks (including tightening nuclear safety regulations in the future), budget overruns (including non-competitive cost of power or increased cost of production), financing risks (including cost and availability of financing) and political risks (including public acceptance risks). Fennovoima’s articles of association provide that all of its shareholders are responsible for financing the project in proportion to their ownership during the construction period. When operational, shareholders will be able to procure electricity at cost against payment of their pro rata share of operating expenses of the power plant (the so-called “Mankala” principle). Accordingly, there can be no assurance that one or more of the project risks will not occur or that Outokumpu’s share of financing the project will not increase as a result of any future defaults by other shareholders in Fennovoima.
IT dependency and security risks
Outokumpu has a number of information technology (IT) applications and different software programs in use at several locations. The primary risk associated with these IT systems is the potential loss of availability in global or critical applications. Outokumpu’s most critical application or system is SAP, which covers, among others, part of Outokumpu’s sales and purchase processes. The loss of SAP or other critical applications or hardware could have a significant negative impact on Outokumpu’s business. Problems with IT systems could also result in leakages of sensitive information, the theft of intellectual property and production systems being unavailable, all of which could have a similar impact if realized. Furthermore, the integration of IT systems after the Inoxum transaction may be time consuming and costly and there can be no assurance that the integration process will proceed as currently expected. System integration might also result in the loss of critical data or malfunctions in processing data. IT security threats have increased significantly during the past years and Outokumpu is becoming a more interesting target due to its position in stainless market. Cyber-attacks use weaknesses in computers and computer networks to target not only IT systems or company information, but also value chains and physical infrastructure such as automation systems in factories. Outokumpu is taking all necessary steps to ensure that the IT systems and solutions used by the Group are reliable, and is also instituting secure information management at all company locations to avoid data loss or situations in which mission-critical information becomes unavailable. Additionally, Outokumpu aims to improve its cyber readiness in the near future in order to prevent possible cyber attacks.
Outokumpu Annual Report 2013 risK ManageMent
123

Personnel
Outokumpu’s ability to continue and grow its business as well as provide high-quality products depends, to a large extent, on the contributions made by its leadership team and key personnel. The loss of key individuals or other employees who have specific knowledge of, or relationships with, trade customers in markets in which Outokumpu operates could have significant impacts on Outokumpu’s business. If Outokumpu is unable to attract, retain and motivate qualified employees at all levels, it could have a material adverse effect on Outokumpu’s business, financial condition and results of operations. There can be no assurance that Outokumpu will be able to retain such senior managers and key employees and successfully manage them, which could disrupt Outokumpu’s business and have a material adverse effect on its business, financial condition and results of operations. Outokumpu has deployed HR processes to attract and retain senior managers for key positions in the Group. Succession planning for group key positions is also undertaken as part of the talent review process to mitigate the loss of senior managers. Outokumpu’s People Strategy also highlights the need to proactively develop the Group’s resource and competence base and leadership capabilities to meet the rapidly-changing requirements of our business and the environment in which we operate.
Compliance, crime and reputational harm
Outokumpu operates globally and its activities span multiple jurisdictions and complex regulatory frameworks at a time of increased enforcement activity and enforcement initiatives globally in areas such as competition law and anti-corruption. Outokumpu’s governance and compliance processes may not prevent breaches of law or governance standards. Outokumpu also faces the risk of fraud by its employees, losses of critical research and development data, misconduct as well as violations at its joint ventures and other companies in which it has an interest, particularly if it only has a minority stake and does not control accounting or other rules and protocols for the conduct of business. Outokumpu’s failure to comply with applicable laws and other standards could subject it to fines, loss of operating licenses and reputational harm. Effective internal controls are necessary for Outokumpu to provide reliable financial reports and effectively prevent and detect fraud. If Outokumpu cannot provide reliable financial reports or prevent fraud, this could have a material adverse effect on its financial results. Additionally, at the operational level, individual employees may not comply with Outokumpu’s policies and guidelines and as a result may cause Outokumpu to incur compliance costs and cause reputational damage. Inadequate internal controls could also cause investors and other third parties to lose confidence in Outokumpu’s reported financial information, which could have a material adverse effect on Outokumpu’s business, financial condition and results of operations.
Financial risksKey current financial risks for Outokumpu are:
· Changes in the prices of electrical power, fuels, nickel and molybdenum
· Currency developments affecting the euro, the Swedish krona and the US dollar
· Interest rate changes connected with, the US dollar, the euro and the Swedish krona
· Developments in the Talvivaara share price · Other credit-related uncertainties · Risks related to refinancing and liquidity · Risks and uncertainties related to the implementation of the announced financing measures.
Both the financial risks listed above and related processes for risk management within Outokumpu are described in additional detail in Note 19 to the Group’s consolidated financial statements.
Internal auditOutokumpu’s Internal Audit as independent, objective assurance, control and consulting function within the Group supports the organization in achievement of its objectives through systematic, disciplined approach to evaluate and improve the effectiveness and efficiency of governance processes, the internal control system and the risk management system.
With commitment to integrity and accountability, Internal Audit provides value to governing bodies and senior management as an objective source of independent advice. Internal Audit performs its function on behalf of and directly reporting to the Audit Committee and to the Leadership Team, but is functionally assigned to the CEO. The annual operational audit plan is approved by the Audit Committee.
In 2013 Internal Audit performed six extended operational audits and ten condensed audits. Two regular audits (IT & AAF) were assigned to external service providers. The results of all performed audits including their risk appraisals have been reported in writing. In view of the Outokumpu Code of Conduct and the Corporate Responsibility Policy, no major risks have been identified.
The confidential whistleblowing hotline (“Helpline”) available on the company intranet and on the Internet is set up to anonymously inform Internal Audit about any activities or observations which may have caused or could result in risk exposure or damage for the Group. Investigation of one communicated case in 2013 resulted in no evidence of potential misconduct. Same results came out from three further investigations based on allegations brought forward through other channels. No incidents have been observed in view of discrimination or human rights violation.
Outokumpu Annual Report 2013 risK ManageMent
124

Outokumpu Annual Report 2013 risK ManageMent
125

Shares and shareholders
Shares and share capitalOutokumpu’s shares are listed on the NASDAQ OMX Large Cap list of the Helsinki Stock Exchange under the trading code OUT1V and are incorporated into the Finnish book-entry securities system. The total share capital has not changed during 2013 and was EUR 311 million at the end of the year. The total number of Outokumpu shares was 2 078 081 348, and Outokumpu held 975 888 of its own shares.
All Outokumpu’s shares carry equal voting and dividend rights. The follwing tables and graphs illustrate Outokumpu’s shareholder structure at the end of 2013. Up-to-date information is available at www.outokumpu.com/en/investors/share-info/shareholders.
Outokumpu in the capital marketsOutokumpu’s regular and active dialogue with global investors and analysts continued in 2013. The completion of the Inoxum transaction at the end of 2012, the disposal process of the Terni remedy asset as well as the new Outokumpu strategic roadmap met high interest from the capital markets. Towards the end of the year, an important topic was the comprehensive plan to strengthen the company’s capital structure, including the divestiture of the Terni remedy assets and the VDM business to ThyssenKrupp, as well as a financial plan to renew the company’s debt portfolio and the planned rights issue.
In addition to the Annual General Meeting held in Helsinki in March 2013, Outokumpu hosted quarterly results webcasts for analysts, investors and media representatives. Outokumpu management attended several industry seminars and road shows to meet with investors. A total of 11 roadshows in Europe and in the US were arranged during the year. Cities visited by roadshows included New York, Boston, Frankfurt, Geneva, Helsinki, London, Paris, Oslo and Stockholm. Outokumpu also met investors at five industry seminars in Chicago, Copenhagen, Helsinki, and London. In addition, Outokumpu hosted a Capital Markets Day in London in May 2013 with 68 investors and analysts attending.
In addition Outokumpu organized three site visits for analysts and institutional investors in 2013, two to the chrome mine in Kemi and the stainless steel plant in Tornio, Finland and one to our new stainless steel plant in Calvert, USA. In total, more than 200 one-on-one meetings, conference calls and video conferences with investors were held during the year.
Shareholders by group on December 31, 2013
ThyssenKrupp AG 29.9%
Solidium Oy* 21.8%
Varma Mutual Pension Insurance Company 1.1%
Ilmarinen Mutual Pension Insurance Company 1.1%
The Social Insurance Institution of Finland 3.0%
Other Finnish organizations 9.0%
Finnish households and private
persons 22.1%
International shareholding 12.0%
* Solidium Oy is wholly-owned by The Finnish State.
Shareholders by group on December 31, 2013Shareholders by group Shares %
Foreign investors 627 206 596 30.18The public sector and public organizations 591 299 827 28.45
Households/private persons 460 100 803 22.14Nominee accounts held by custodian banks 240 395 074 11.57
Private corporations 86 716 798 4.17
Financial and insurance institutions 51 771 942 2.49
Non-profit organizations 20 590 308 0.99
Total 2 078 081 348 100.00
Outokumpu Annual Report 2013 shares and sharehOlders
126

Share price development and market capitalization
The continued losses of Outokumpu in 2013, the weak stainless steel market development as well as the uncertainty related to the divestment of the Terni remedy assets were reflected in Outokumpu’s share price. The Outokumpu share price declined by 48% and reached EUR 0.41 at the last trading day of 2013 (EUR 0.79 on December 28, 2012). During 2013, the price of the Outokumpu share peaked at EUR 0.85 and was EUR 0.35 at its lowest (2012 high/low: EUR 2.10/EUR 0.64). At the end of 2013, the company’s market capitalization was EUR 845 million, compared to EUR 1 650 million at the previous year’s end.
In 2013, the average daily turnover in Outokumpu shares on the NASDAQ OMX Helsinki exchange was 6.0 million shares. This does not include the extraordinary peak in trading volume of 77.3 million shares on December 2, 2013 following the announcement of Outokumpu’s plan to sell the Terni remedy assets as well as the VDM business to ThyssenKrupp and to further deleverage and strengthen its balance sheet with a comprehensive financial package.
In total, 1 564.5 million Outokumpu shares were traded on the NASDAQ OMX Helsinki Stock Exchange during 2013, representing a value of EUR 835 million (2012: 1 129.7 million shares which corresponded EUR 1 773.9 million).
In addition to the NASDAQ OMX Helsinki Stock Exchange, Outokumpu’s share is traded also on various alternative trading platforms. The volume of Outokumpu’s shares traded on the NASDAQ OMX Helsinki Stock Exchange represented 74% of the total volume of Outokumpu’s shares traded in 2013 (source: Fidessa Fragmentation Index, www.fragmentation.fidessa.com).
More information about shares at www.outokumpu.com/en/Investors/Share-info
Outokumpu share price development in 2013
130
120
110
100
90
80
70
60
50
40
Jan JunFeb JulMar AugApr SepMay Oct Nov Dec
Outokumpu NASDAQ OMX
%, Dec 31, 2012 = 100
Monthly trading volume
300
250
200
150
100
50
0
09 10 11 12 13
Source: Fidessa. Including all trading venues. Note that during 2012, Outokumpu increased its number of shares twice as results of a rights offering and a directed share issue.
million shares
Trading venue development 2010–2013
100
90
80
70
60
50
40
30
20
10
0
NASDAQ OMX Helsinki
Others, including MTFs, OTC and Dark pool trading.
10 11 12 13
%
Source: Fidessa.
Market capitalization and share price development
3 000
2 400
1 800
1 200
600
0
5.0
4.0
3.0
2.0
1.0
0.0
09 10 11 12 13
€/share€ million
Month-end market capitalization Share price
Source: NASDAQ OMX Helsinki.
Outokumpu Annual Report 2013 shares and sharehOlders
127

Share-based incentive programsOutokumpu’s Board of Directors has confirmed that share-based incentive programs are part of the incentive and commitment scheme for the company’s key personnel.
The objectives are to reward key personnel for good performance and thereby support Outokumpu’s strategy, and to direct management attention towards increasing Outokumpu’s profitability and shareholder value. The programs offer the possibility of receiving Outokumpu shares as an incentive, provided that the targets set by the Board for each earnings period are achieved.
Share-based incentive programs
Earnings periodThe number of people in scope
on Dec 31, 2013 2011–2013 952012–2014 872013–2015 154
Performance criteria and pay-out history of share-based incentive programsShare-based incentive program 2009–2013In February 2009, the Board of Directors confirmed a five-year share-based incentive program comprising three earnings periods, each lasting three calendar years and commencing at the beginning of 2009, 2010 and 2011. The earning criteria for the program were based on the development of total shareholder return (TSR) and earnings per share (EPS) until 2011, earnings before interest and taxes (EBIT) for the year 2012, and earnings before interest, taxes, depreciation and amortization (EBITDA) for the year 2013. The Board of Directors has confirmed that the targets set for the earnings periods 2009–2011, 2010–2012 and 2011–2013 were not met, therefore, no reward was paid to participants in the program.
Performance Share Plan 2012The Board of Directors of Outokumpu approved on January 31, 2012, the establishment of a share-based incentive plan, Performance Share Plan 2012, which is part of the remuneration and commitment program for the key management of Outokumpu Group. The plan offers a possibility to receive Outokumpu shares as a long-term incentive reward if the targets set by the Board of Directors for each earnings period are achieved. Performance Share Plan consists of annually commencing performance share plans. Each plan contains a three-year earnings period, after which any share rewards earned will be delivered to the participants.
Plan for 2012–2014The first plan commenced at the beginning of 2012 and any share rewards to be delivered based on it will be delivered in spring 2015. The earnings criteria applied in the 2012–2014 plan are: EBIT for the year 2012, EBITDA for the year 2013 and EBIT improvement for the year 2014, and relative total shareholder return (TSR) over the three-year earnings period.
The Board of Directors approved 98 people to fall within the scope of the program for the 2012–2014 plan. On December 31, 2013, a total
of 95 people remained as participants in the plan. If the performance targets set by the Board of Directors for the plan are attained in full, the maximum number of shares to be delivered to the remaining participants will be no more than 3 784 600 gross shares, from which applicable taxes will be deducted and the remaining net value will be delivered to the participants as Outokumpu shares.
Plan for 2013–2015The second plan commenced at the beginning of 2013 and any share rewards to be delivered based on the second plan will be delivered in spring 2016. The earnings criteria applied in the plan 2013–2015 are: EBITDA for the year 2013, EBIT improvement for the year 2014, the Outokumpu share price adjusted by dividends at the end of the three-year period, and the achievement of annual Inoxum transaction-related synergies.
On February 13, 2013 the Board of Directors approved 164 people to fall within the scope of the program for the 2013–2015 plan. At the end of the year, 154 people remained as participants in the plan. If the maximum level of performance set by the Board of Directors for the 2013–2015 plan is attained, the maximum number of shares to be delivered to the remaining participants is no more than 12 837 750 gross shares, from which applicable taxes will be deducted and the remaining net value will be delivered to the participants as Outokumpu shares.
Restricted Share PoolThe Board of Directors of Outokumpu approved on January 31, 2012, the establishment of a Restricted Share Pool program, which enables long-term rewards for selected individual employees of Outokumpu Group.
The Restricted Share Pool is a part of the remuneration and commitment program for selected key resources of Outokumpu Group. It consists of annually commencing plans with a three-year vesting period, after which the allocated share rewards will be delivered to the participants provided that their employment with Outokumpu continues uninterrupted throughout the duration of the plan and until the shares are delivered. Restricted share grants are approved annually by the CEO on the basis of the authorization granted by the Board of Directors, with the exception of any allocations to Leadership Team members, which will be approved by the Board of Directors.
The first plan commenced at the beginning of 2012 and the share rewards to be delivered based on the plan will be delivered in spring 2015. In line with the authorization relating to the first plan within the Restricted Share Pool, the maximum number of shares that could be allocated within the first plan was 800 000 gross shares. In 2012, four people were invited to participate in the 2012–2014 plan and they were granted in total 322 123 gross shares, from which applicable taxes will be deducted, and the remaining net value will be delivered to the participants in Outokumpu shares.
The second plan of the Program commenced at the beginning of 2013 and any share rewards will be delivered in spring 2016. The maximum number of shares that could be allocated within the second 2013–2015 plan was 2 000 000 gross shares. In 2013, three people were invited to participate in the 2013–2015 plan and they were granted in total 122 500 gross shares, from which applicable taxes will be deducted and the remaining net-value will be delivered to the participants in Outokumpu shares.
Outokumpu Annual Report 2013 shares and sharehOlders
128

Principal shareholders on December 31, 2013Shares %
ThyssenKrupp AG 621 042 572 29.89
Solidium Oy 453 802 237 21.84
The Social Insurance Institution of Finland 62 493 263 3.01
Varma Mutual Pension Insurance Company 23 690 337 1.14
Ilmarinen Mutual Pension Insurance Company 23 153 368 1.11
State Pension Fund 11 000 000 0.53
Mutual Insurance Company Pension Fennia 9 599 537 0.46
Taaleritehdas Arvomarkka Osake Fund 8 500 000 0.41
Nordea Fennia Fund 8 000 000 0.38
Kaleva Mutual Insurance Company 7 000 000 0.34
Nordea Pro Suomi Fund 4 925 000 0.24
Ili 122-8016778 4 600 000 0.22
Nordea Life Assurance Finland Ltd. 4 027 000 0.19
Eestilä Matti Juha 3 000 000 0.14
1 244 833 314 59.9Nominee accounts held by custodian banks 240 395 074 11.57
Treasury Shares 975 888 0.05
Other shareholders 591 877 072 28.53
Total 2 078 081 348 100.00
Other termsThe aggregate reward of an individual participant under the above programs, together with other short-term and long-term incentives of the participant, may not exceed 200% of the participant’s annual base salary.
No new shares will be issued in connection with the above share-based incentive programs and therefore the programs have no diluting effect.
According to the share ownership plan of the Outokumpu Group, the members of the Leadership Team are obliged to own Outokumpu shares received under incentive programs to the value of their annual gross base salary. Fifty percent of the net shares received from the Performance Share Plan and Restricted Share Pool programs described above must be used to fulfill the above ownership requirement.
Inoxum transaction-related incentive schemeIn 2012, the Board of Directors of Outokumpu approved a retention plan for the members of the Leadership Team to ensure that Outokumpu has key employees in place for the successful implementation of the Inoxum Transaction and the integration of Inoxum into Outokumpu’s existing stainless steel business.
For the CEO, the plan is a share-based scheme pursuant to which 25 000 reward shares were granted to the CEO in February 2012. Outokumpu has paid the taxes and any social security contributions related to the reward shares.
The reward shares may not be transferred or disposed of in any other manner until March 31, 2015. In addition, the CEO would forfeit the
reward shares if his service contract were terminated or notice of the termination of his service contract were given before March 31, 2015. Furthermore, the reward shares are subject to a claw-back provision until March 31, 2015. The reward shares are subject to Outokumpu’s share ownership guidelines applicable to its executive management. Outokumpu’s limitations on variable pay were applied in connection with the delivery of the reward shares.
For the other members of the Leadership Team, the retention plan was a cash-based plan according to which they were entitled to receive a cash reward of two months’ gross base salary on December 31, 2012 and March 31, 2013 if the criteria for payment were met. In line with the plan, the second cash reward was paid on March 31, 2013 to the Leadership Team members who were part of the Leadership Team in 2012.
Management shareholdingOn December 31, 2013, members of the Outokumpu Board of Directors and the Leadership Team held a total of 943 452 Outokumpu shares, corresponding to 0.05% of the company’s shares and voting rights. If the members of the Leadership Team were to receive the maximum number of shares for the 2012–2014 and 2013–2015 periods of the performance share and restricted share plans (a total of 3 915 184 shares) their shareholding obtained via the programs would amount to 0.19% of the company’s shares and voting rights.
Details of Outokumpu’s management shareholdings can be found in the section “Board of Directors and Leadership Team”.
Outokumpu Annual Report 2013 shares and sharehOlders
129

Distribution of shareholders on December 31, 2013
Number of sharesNumber of
shareholders%
of shareholdersTotal
shares%
of share capitalAverage
shareholding
1–100 3 289 5.02 199 899 0.01 61
101–1 000 18 028 27.53 10 398 330 0.50 577
1 001–10 000 33 823 51.64 133 942 920 6.45 3 960
10 001–100 000 9 694 14.80 261 136 106 12.57 26 938
100 001–1 000 000 614 0.94 140 443 113 6.76 228 735
1 000 001–10 000 000 39 0.06 96 384 129 4.64 2 471 388
10 000 001–100 000 000 4 0.01 120 336 968 5.79 30 084 242
100 000 001– 2 0.00 1 074 844 809 51.72 537 422 404
Shares in nominee accounts held by custodian banks - - 240 395 074 11.57 -
Shares not transferred to book-entry securities system total 762
65 493 100.00 2 078 081 348 100.00
Information for investors
Annual General Meeting 2014Outokumpu Oyj’s Annual General Meeting 2014 will be held on Monday, April 14, 2014 at 2.00 pm EET at the Dipoli Congress Center. The address is Otakaari 24, Espoo, Finland. To attend the Annual General Meeting, shareholders must be registered on April 2, 2014 in the company’s shreholders’ register held by Euroclear Finland Ltd.
A holder of nominee-registered shares has the right to participate in the Annual General Meeting by virtue of such shares, based on which he/she on April 2, 2014 would be entitled to be registered in the shareholders’ register of the company held by Euroclear Finland Ltd. The right to participate in the Annual General Meeting requires, in addition, that the shareholder on the basis of such shares has been registered into the temporary shareholders’ register held by Euroclear Finland Ltd. at the latest by April 9, 2014 by 10.00 am EET. The account management organization of the custodian bank has to register a holder of nominee-registered shares, who wants to participate in the Annual General Meeting, into the temporary shareholders’ register of the company at the latest by the time stated above.
Shareholders who wish to attend the Annual General Meetings must notify Outokumpu no later than April 9, 2014 by 10.00 am EET. Notifications can be made at www.outokumpu.com/en/investors/General-meetings/, by e-mail to the address [email protected], by telefax: +358 (0)9 421 2428, by telephone: +358 (0)9 421 2474 or +358 (0)9 421 3808 (Mon to Fri, from 12.00 noon to 4.00 pm EET), registration by phone starts on Friday, March 14, 2014 or by regular mail to:
Outokumpu Oyj Share Register P.O. Box 140 FI-02201 Espoo, Finland.
Shareholders may attend and vote at the AGM in person or by proxy. In accordance with Finnish practice, Outokumpu does not send proxy forms to its shareholders. Shareholders wishing to vote by proxy should therefore submit their own proxy forms to Outokumpu’s Share Register during the registration period.
The complete notice to the AGM and additional information concerning the AGM is available on the Outokumpu website on the Annual General Meeting webpage.
Payment of dividend
Outokumpu’s Board of Directors proposes that no dividend be paid for the 2013 financial year.
Investor information
Information for investors can be obtained from the Outokumpu website at www.outokumpu.com/en/Investors. Outokumpu’s financial reports include annual and interim reports, as well as stock exchange and press releases. Outokumpu’s stock exchange releases are available in English and Finnish.
To order financial reports, please contact Outokumpu Corporate Communications:
Outokumpu OyjCorporate CommunicationsRiihitontuntie 7 B, PO Box 14002201 EspooFinlande-mail: [email protected]
Dividend/share
0.5
0.4
0.3
0.2
0.1
0
09 10 11 12 13
€
Years 2011 and 2012 no dividend was paid. For 2013, the Board proposes that no dividend will be paid.
Outokumpu Annual Report 2013 shares and sharehOlders
130

Stock exchange releases in 2013
January 2 Outokumpu supplements its listing particularsJanuary 18 Outokumpu – Tubinoxia becomes majority shareholder in the OSTP tubular joint ventureJanuary 22 Outokumpu – Shareholders’ Nomination Board to give its proposal for the composition of the Board of Directors by the end of JanuaryJanuary 23 Outokumpu – Publishing of the 2012 Annual Accounts BulletinJanuary 24 Outokumpu and Outotec enter into a legal dispute over invention rights January 28 Outokumpu – Proposal by the Nomination Board to the Annual General MeetingFebruary 14 Outokumpu changes its reporting segmentsFebruary 14 Outokumpu’s Annual Accounts Bulletin 2012: Positive operating cash flow but negative operating results in a weak market
environmentFebruary 14 Outokumpu – CFO Esa Lager intends to leave his position by end of 2013February 14 Outokumpu – Share-based incentive schemesFebruary 14 Outokumpu – Notice to the Annual General MeetingFebruary 20 Outokumpu comments on the Terni divestmentFebruary 25 Outokumpu Annual Report 2012 publishedFebruary 28 Outokumpu’s stainless steel supports cable in the demanding Gorgon natural gas project in AustraliaMarch 4 Outokumpu appoints Olli-Matti Saksi as Senior Vice President – Sales, Stainless Coil EMEAMarch 18 Outokumpu – Resolutions of the Annual General Meeting 2013March 18 Outokumpu Board decisions at their first meetingApril 9 Outokumpu – Publishing of the first-quarter 2013 financial resultsApril 17 Outokumpu supplies lean duplex for a pioneering solar plant project in Nevada, USAApril 25 Outokumpu proceeds with efficiency measuresApril 25 Outokumpu – Unsatisfactory results in a weaker than expected market environmentMay 2 Outokumpu has reached a settlement with Carrier regarding civil proceedings pursuant to EU industrial tube cartel decisionMay 7 Outokumpu stainless steel creates lighter tanks and lower maintenance costsMay 13 Outokumpu conducts a strategic review of its VDM high performance alloys businessMay 22 Outokumpu unveils new vision, products and pricing model, comments on its strategy progressJune 5 Outokumpu inaugurates new ferrochrome works in Tornio, FinlandJune 7 Outokumpu comments on the Terni divestment processJune 10 Outokumpu supplies 12 250 tonnes of tailor-made stainless steel for Stolt chemical tankersJune 13 Outokumpu signs a strategic agreement with Sinopec, China’s largest energy and chemical companyJune 14 Outokumpu renews leadership team to accelerate strategy executionJune 18 Outokumpu changes its financial reporting schedule 2013July 10 Outokumpu – Publishing of the second-quarter 2013 financial resultsJuly 12 Outokumpu signs EUR 900 million revolving credit facilityJuly 24 Outokumpu – Good progress on synergies, cost saving and ferrochrome offset by weak market and disappointing progress in AmericasJuly 24 Outokumpu appoints Reinhard Florey as Chief Financial OfficerJuly 31 Outokumpu wins a new contract with Casa de Moneda de MexicoAugust 12 Outokumpu provides stainless steel façade for China’s highest skyscraperSeptember 2 Outokumpu stainless steel efficiently removes SO2 emissions at power plantSeptember 6 Outokumpu appoints Johanna Henttonen as Head of Investor RelationsSeptember 13 Outokumpu’s sustainability performance again recognized by Dow Jones Sustainability IndexesOctober 1 Outokumpu introduces new industrial plan in Europe to improve financial performanceOctober 7 Outokumpu – Publishing of the third-quarter 2013 financial resultsOctober 9 Outokumpu – Financial reporting schedule for the year 2014October 10 Outokumpu featured in Climate Disclosure and Performance Leadership IndexesOctober 16 Outokumpu’s shareholders’ Nomination Board held its first meetingNovember 1 Outokumpu – Financial results still unsatisfactory – but positive operating cash flow of EUR 124 millionNovember 1 Outokumpu introduces daily alloy surcharge pricing model in EuropeNovember 12 Outokumpu stainless steel shines in the New Street station in Birmingham, UKNovember 21 Outokumpu Chief Medical Officer Markku Huvinen’s long-term study published in British Medical JournalNovember 26 Outokumpu sells electricity distribution network at Tornio site to OFI InfraViaNovember 30 Outokumpu announces comprehensive measures to strengthen its balance sheet and divests Terni and VDM to ThyssenKruppDecember 2 Outokumpu – Announcement regarding an agreement which, if completed, will result in change of holdings
(Chapter 9, Section 10 of the Finnish Securities Market Act)December 2 Outokumpu – Announcement regarding an arrangement which, if completed, will result in change of holdings
(Chapter 9, Section 10 of the Finnish Securities Market Act)December 2 Outokumpu – Announcement regarding an arrangement which, if completed, will result in change in holdings
(Chapter 9, Section 10 of the Finnish Securities Market Act)December 6 Outokumpu – Krefeld melt shop ramp-down completedDecember 9 Outokumpu comments the transaction with ThyssenKrupp announced on November 30, 2013December 19 Outokumpu granted 25 million euros relief from the German renewable energy charge for 2013December 19 Outokumpu sells Luvata vendor note to Proventus Capital PartnersDecember 20 Outokumpu supplies 700 tonnes of heat-resistant stainless steel for thermal power plant in India
Release archive: www.outokumpu.com/en/news-events/news
Outokumpu Annual Report 2013 shares and sharehOlders
131


Outokumpu Oyj
Corporate ManagementRiihitontuntie 7 B, P.O. Box 140FI-02201 Espoo, FinlandTel. +358 9 4211Fax +358 9 421 3888
www.outokumpu.com

www.outokumpu.com