Embed Size (px)
Citation preview
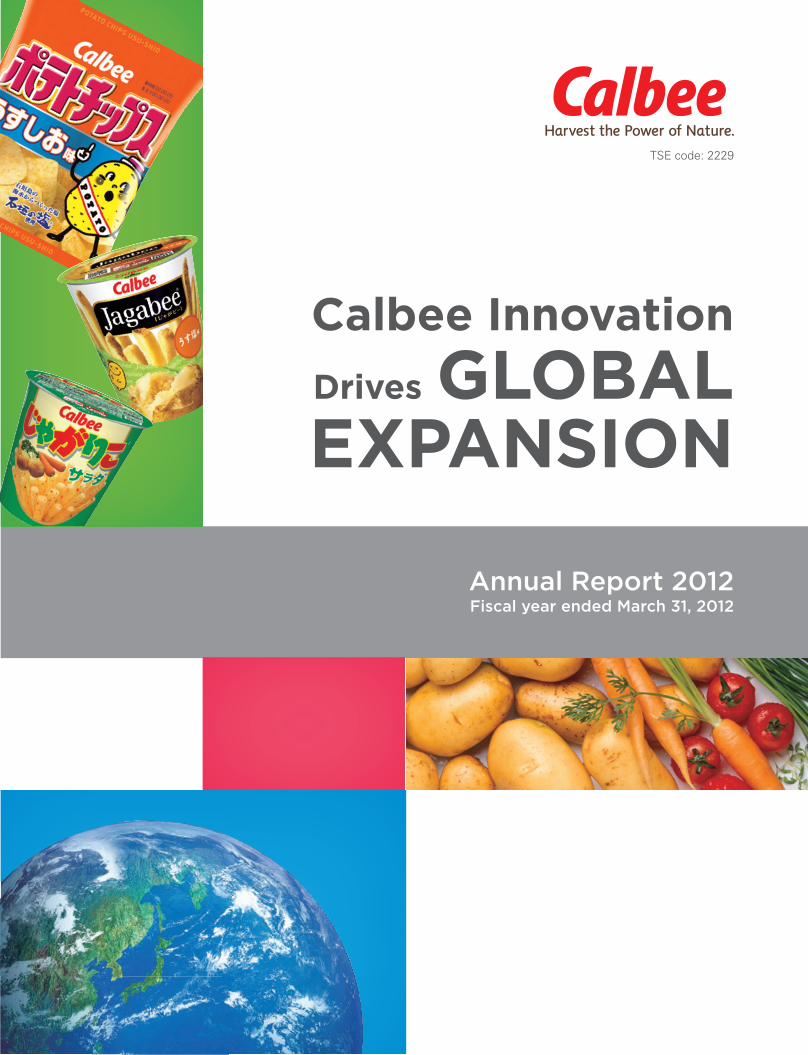
Annual Report 2012Fiscal year ended March 31, 2012
Calbee Innovation
Drives GLOBAL EXPANSION
TSE code: 2229An
nu
al R
ep
ort 2
012
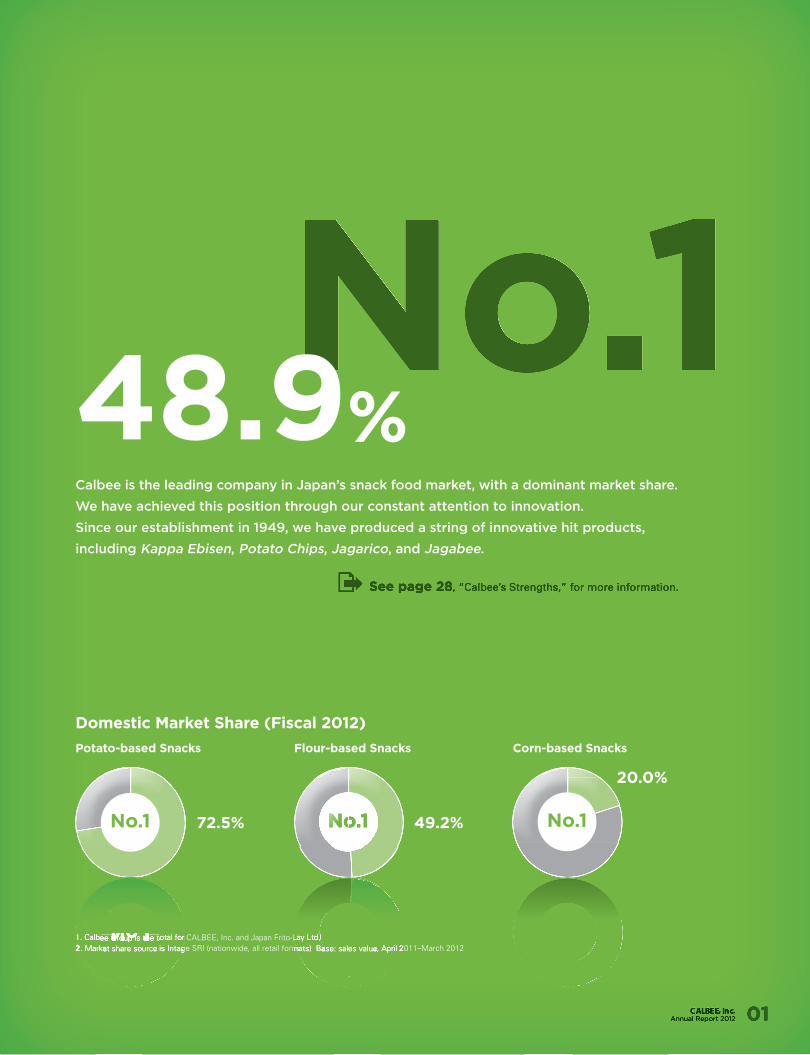
Domestic Market Share (Fiscal 2012)
72.5% 49.2%
20.0%
Potato-based Snacks Flour-based Snacks
No.1No.1No.1No.1No.1No.1No.1No.1No.1
Corn-based Snacks
No.1
1. Calbee Group is the total for CALBEE, Inc. and Japan Frito-Lay Ltd. 2. Market share source is Intage SRI (nationwide, all retail formats) Base: sales value, April 2011–March 2012
48.9%
See page 28, “Calbee’s Strengths,” for more information.
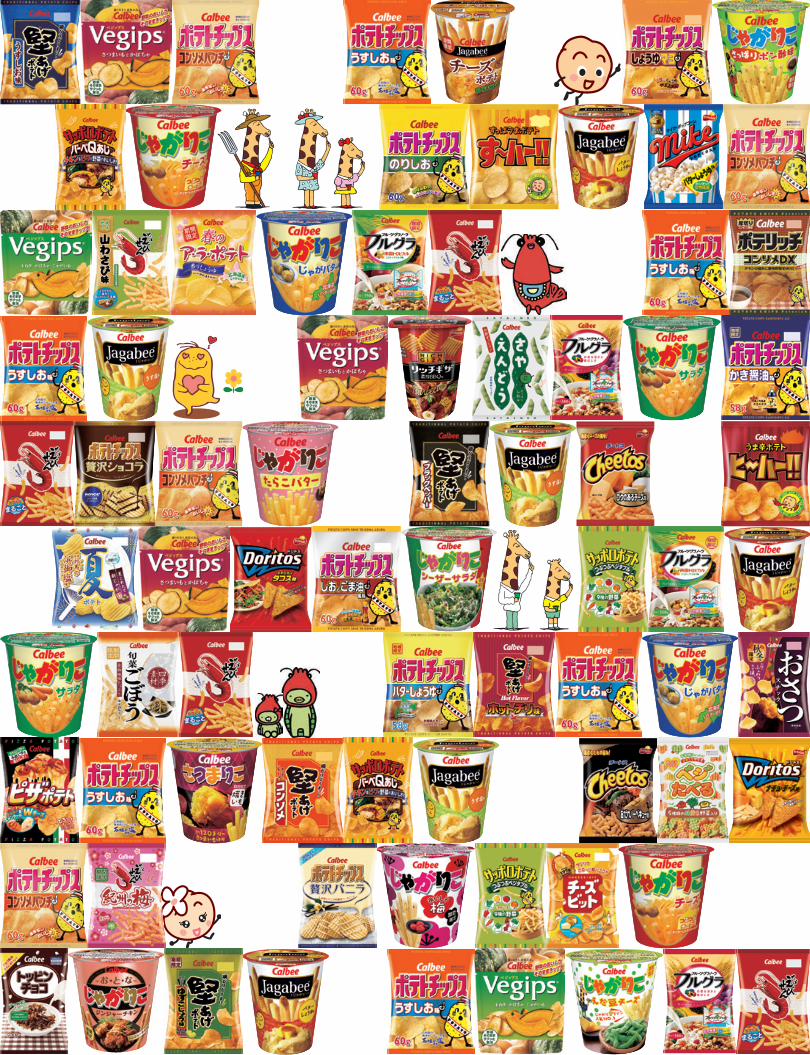
Calbee is the leading company in Japan’s snack food market, with a dominant market share.
We have achieved this position through our constant attention to innovation.
Since our establishment in 1949, we have produced a string of innovative hit products,
including Kappa Ebisen, Potato Chips, Jagarico, and Jagabee.
No.1
1. Calbee Group is the total for CALBEE, Inc. and Japan Frito-Lay Ltd. 2. Market share source is Intage SRI (nationwide, all retail formats) Base: sales value, April 2011–March 2012 1. Calbee Group is the total for CALBEE, Inc. and Japan Frito-Lay Ltd. 2. Market share source is Intage SRI (nationwide, all retail formats) Base: sales value, April 2011–March 2012 1. Calbee Group is the total for CALBEE, Inc. and Japan Frito-Lay Ltd. 2. Market share source is Intage SRI (nationwide, all retail formats) Base: sales value, April 2011–March 2012 1. Calbee Group is the total for CALBEE, Inc. and Japan Frito-Lay Ltd. 2. Market share source is Intage SRI (nationwide, all retail formats) Base: sales value, April 2011–March 2012 1. Calbee Group is the total for CALBEE, Inc. and Japan Frito-Lay Ltd. 2. Market share source is Intage SRI (nationwide, all retail formats) Base: sales value, April 2011–March 2012
No.11. Calbee Group is the total for CALBEE, Inc. and Japan Frito-Lay Ltd.
No.11. Calbee Group is the total for CALBEE, Inc. and Japan Frito-Lay Ltd. 1. Calbee Group is the total for CALBEE, Inc. and Japan Frito-Lay Ltd. 2. Market share source is Intage SRI (nationwide, all retail formats) Base: sales value, April 2011–March 2012 1. Calbee Group is the total for CALBEE, Inc. and Japan Frito-Lay Ltd. 2. Market share source is Intage SRI (nationwide, all retail formats) Base: sales value, April 2011–March 2012 2. Market share source is Intage SRI (nationwide, all retail formats) Base: sales value, April 2011–March 2012 2. Market share source is Intage SRI (nationwide, all retail formats) Base: sales value, April 2011–March 2012 1. Calbee Group is the total for CALBEE, Inc. and Japan Frito-Lay Ltd. 2. Market share source is Intage SRI (nationwide, all retail formats) Base: sales value, April 2011–March 2012
No.1 No.1
Annual Report 2012 01
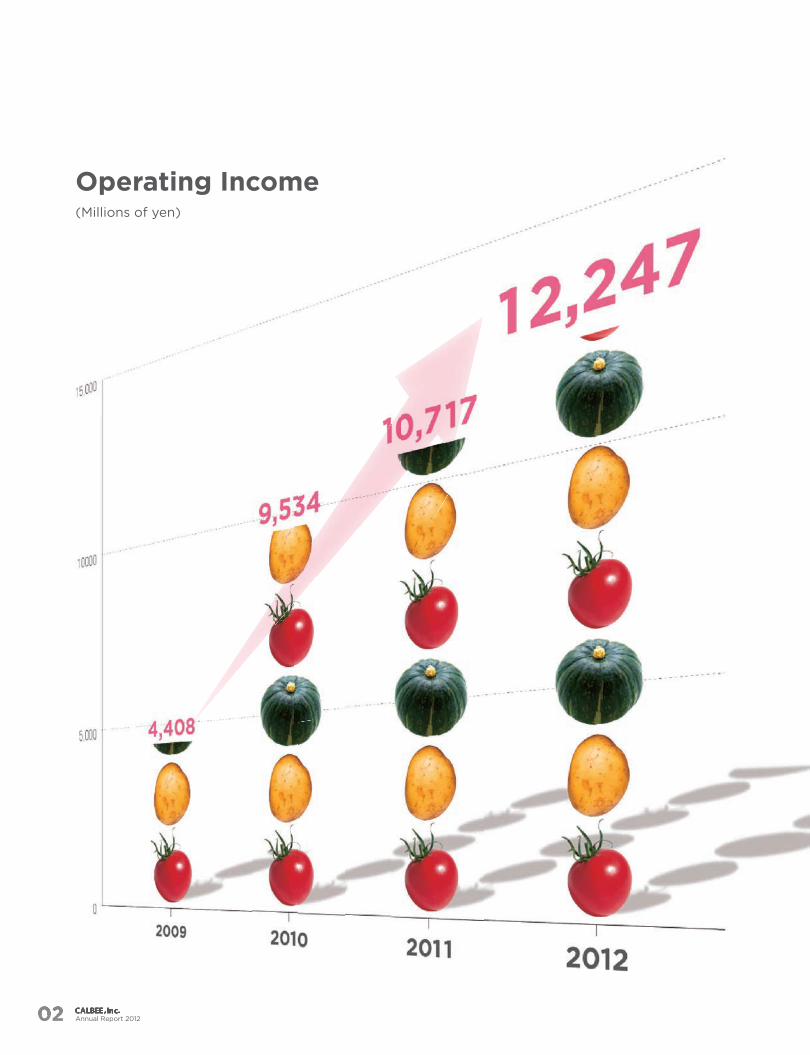
Operating Income (Millions of yen)
Annual Report 20120202
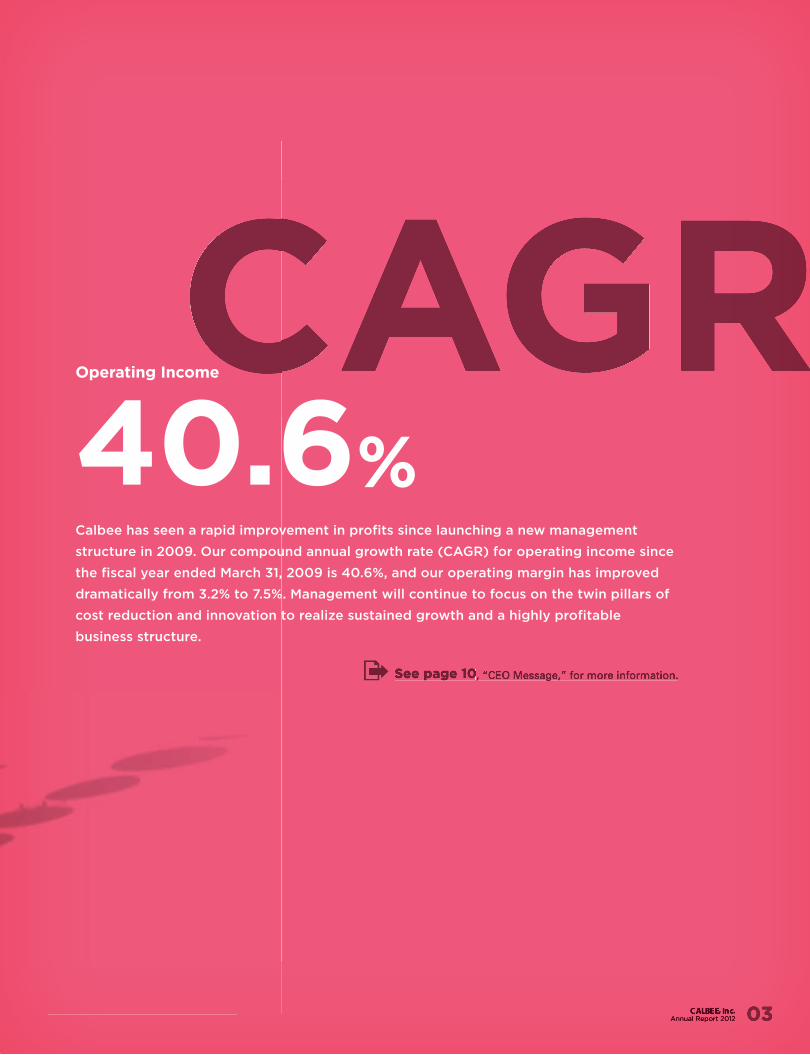
40.6%Calbee has seen a rapid improvement in profits since launching a new management
structure in 2009. Our compound annual growth rate (CAGR) for operating income since
the fiscal year ended March 31, 2009 is 40.6%, and our operating margin has improved
dramatically from 3.2% to 7.5%. Management will continue to focus on the twin pillars of
cost reduction and innovation to realize sustained growth and a highly profitable
business structure.
Operating Income
See page 10, “CEO Message,” for more information.
Annual Report 2012 03

Annual Report 201204
Calbee products are made using processing methods that utilize whole natural
ingredients such as potatoes and other vegetables, as well as prawns. Consequently,
the quality and volume of our products are highly dependent on growing methods
and changes in the weather. We have therefore built close partnerships with
producers in the farming and fishing industries to create high-quality raw materials.
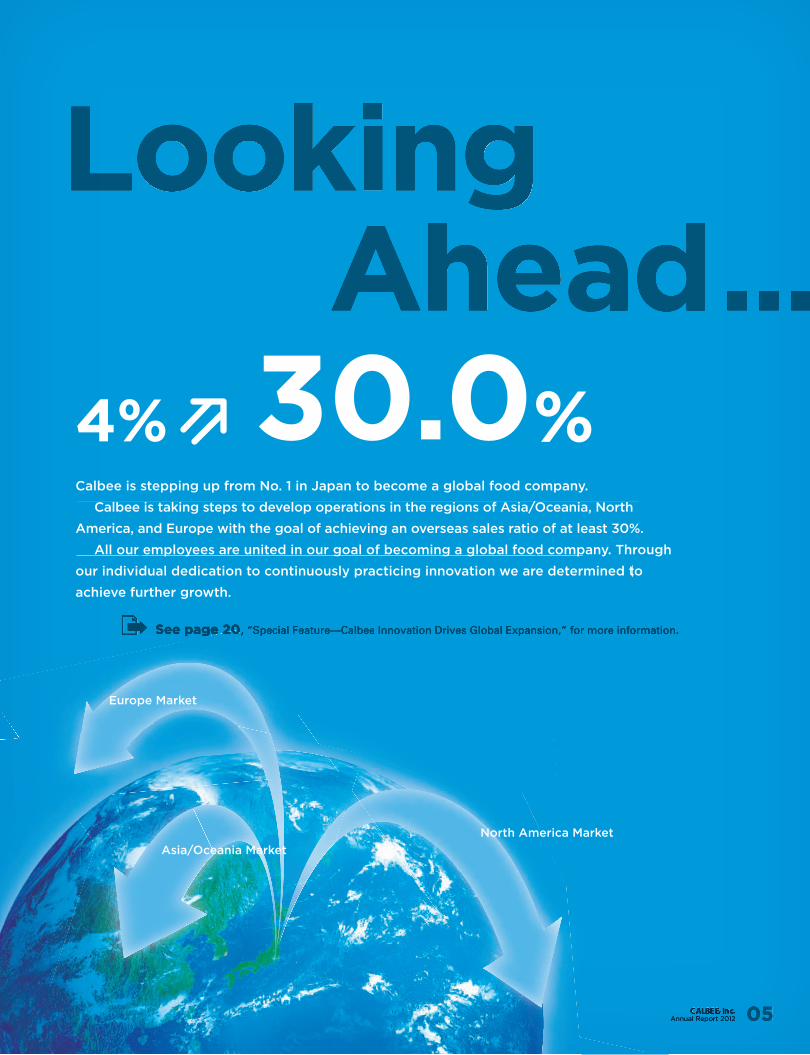
Asia/Oceania Market
Europe Market
Calbee is stepping up from No. 1 in Japan to become a global food company.
Calbee is taking steps to develop operations in the regions of Asia/Oceania, North
America, and Europe with the goal of achieving an overseas sales ratio of at least 30%.
All our employees are united in our goal of becoming a global food company. Through
our individual dedication to continuously practicing innovation we are determined to
achieve further growth.
4% 30.0%
North America Market
See page 20See page 20, “Special Feature—Calbee, “Special Feature—Calbee Innovation Drives Global Expansion,” for more information.
Annual Report 2012 05
07 Calbee Performance Highlights
08 Message from Management
Our Recipe for Success: Relentless Innovation 10 CEO Message Chairman of the Board & CEO, Representative Director Akira
Matsumoto explains Calbee’s growth strategies and measures to enhance corporate value.
16 COO Message
President & COO, Representative Director Shuji Ito talks about the market environment in Japan and business results during fiscal 2012.
20 Special Feature
22 China Strategies for the Fast-Growing Chinese Market
24 North America Pursuing New Challenges in North America, the World’s Largest
Snack Market
24 Other Countries in Asia Building the Asian Market
26 At a Glance
28 Calbee’s Strengths
30 Corporate Social Responsibility
34 Corporate Governance
39 Board of Directors, Auditors and Executive Officers
41 Financial Section (including Business Risks)
83 Corporate History
84 Corporate Data
85 Investor Information
Forward-looking StatementsThis annual report contains forward-looking statements concerning the future plans, performance and strategies of CALBEE, Inc. and its subsidiaries and affiliated companies. These forward-looking statements are not historical facts. They are judgments and assumptions based on information available to the Company at the time of publication and projections or future policies cannot be assured or guaranteed. Actual results may differ materially from those projected due to changes in economic or market conditions. As such, investors should not place undue reliance on forward-looking statements.
Contents
28Calbee’s Strengths
26At a Glance
COO Message
16
Special Feature
20
CEO Message
10
Annual Report 201206
20102009 2011 2012
146,453137,377
155,529163,269
2010 2011 20122009
9,534
10,717
12,247
4,408 6.5
3.2
6.97.5
2010 2011 20122009
4,017
2,524
4,253
7,097
2.71.8
2.7
4.3
2010 2011 20122009
7.1
5.0
6.5
9.6
2010 2011 20122009
93,65892,17099,394
108,475
63,77053,932
72,92580,418
65.256.0
70.771.6
2010 2011 20122009
3,390
5,079
4,050
5,423
7,9158,325
7,2446,676
2010 2011 20122009
0.1
0.0 0.0
0.4
2010 2011 20122009
182.1183.8172.7
163.4
124.3134.7
111.1 100.1
2010 2011 20122009
71.4
18.2
71.4 71.4
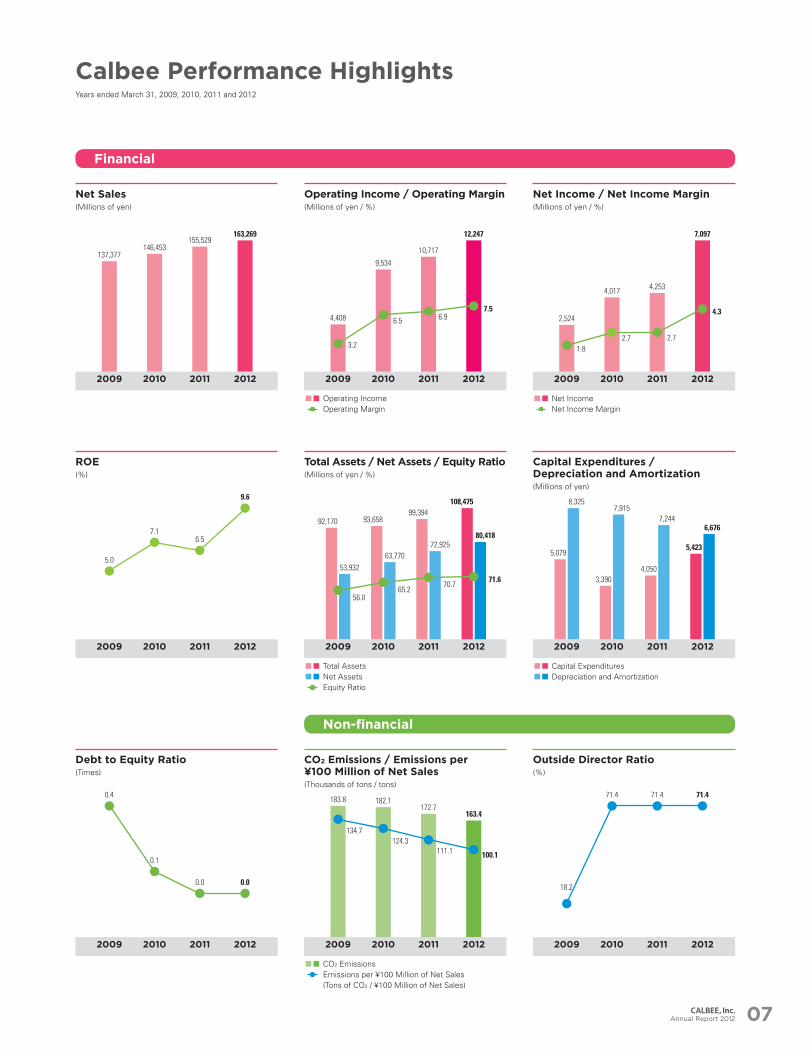
Calbee Performance HighlightsYears ended March 31, 2009, 2010, 2011 and 2012
Net Sales(Millions of yen)
ROE(%)
Debt to Equity Ratio(Times)
Operating Income / Operating Margin(Millions of yen / %)
Total Assets / Net Assets / Equity Ratio(Millions of yen / %)
CO2 Emissions / Emissions per ¥100 Million of Net Sales (Thousands of tons / tons)
Net Income / Net Income Margin(Millions of yen / %)
Capital Expenditures / Depreciation and Amortization(Millions of yen)
Outside Director Ratio(%)
Non-financial
Financial
Operating Income Operating Margin
Net Income Net Income Margin
Total Assets Net Assets Equity Ratio
Capital Expenditures Depreciation and Amortization
CO2 Emissions Emissions per ¥100 Million of Net Sales
(Tons of CO2 / ¥100 Million of Net Sales)
Annual Report 2012 07
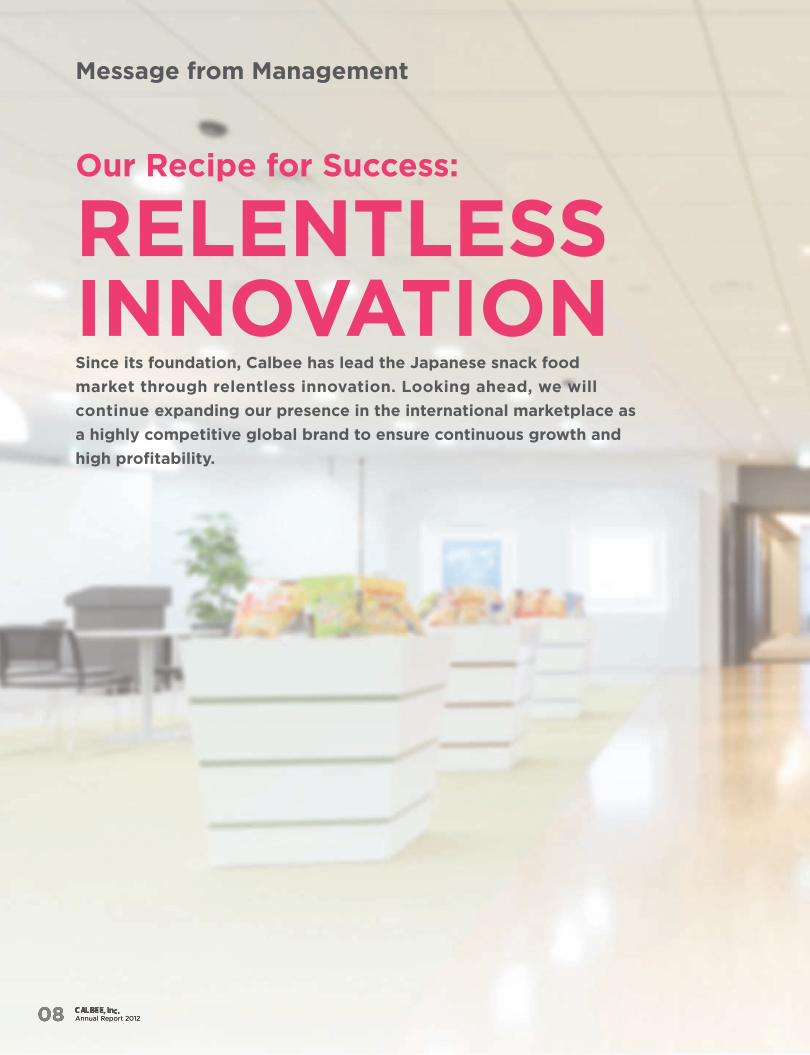
Our Recipe for Success:
RELENTLESS INNOVATIONSince its foundation, Calbee has lead the Japanese snack food
market through relentless innovation. Looking ahead, we will
continue expanding our presence in the international marketplace as
a highly competitive global brand to ensure continuous growth and
high profitability.
Message from Management
Annual Report 201208
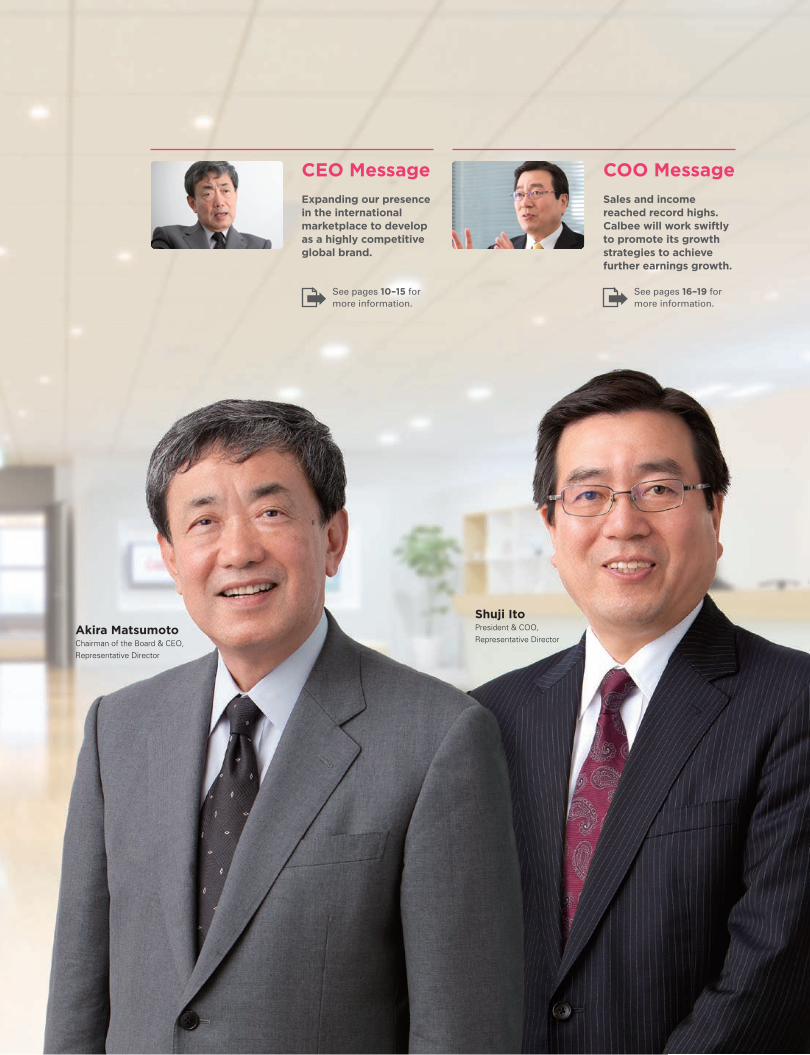
Akira Matsumoto Chairman of the Board & CEO, Representative Director
Shuji Ito President & COO, Representative Director
CEO Message
Expanding our presence in the international marketplace to develop as a highly competitive global brand.
See pages 10–15 for
more information.
COO Message
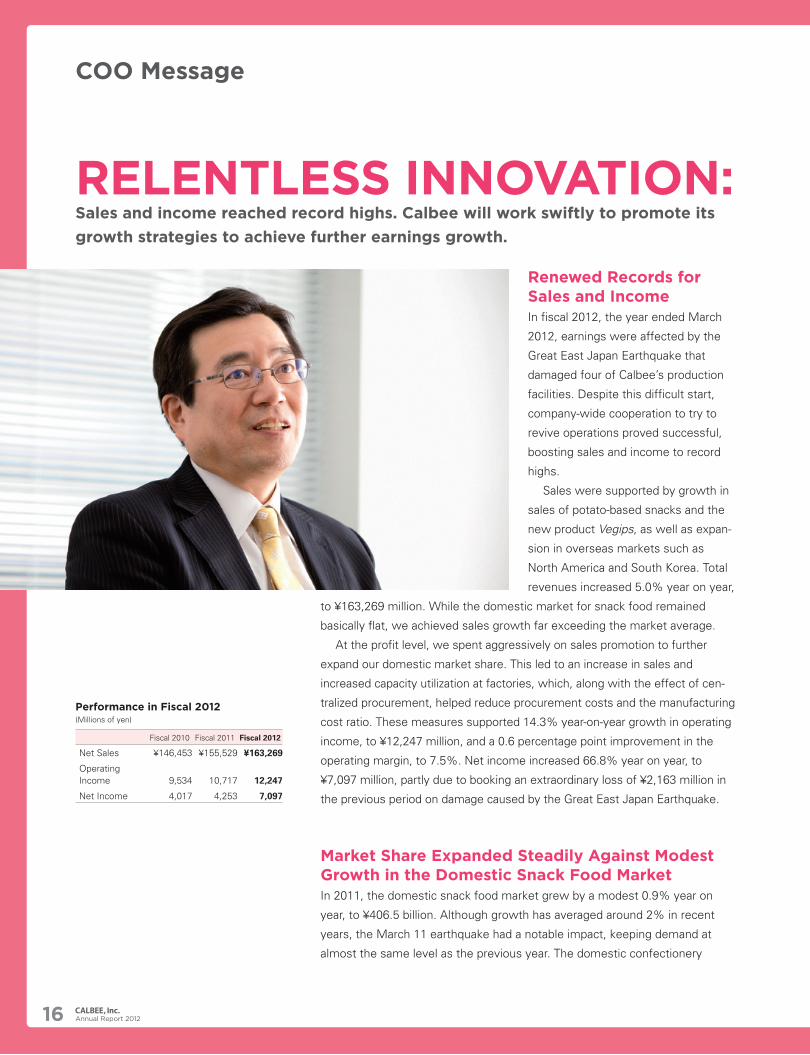
Sales and income reached record highs. Calbee will work swiftly to promote its growth strategies to achieve further earnings growth.
See pages 16–19 for more information.
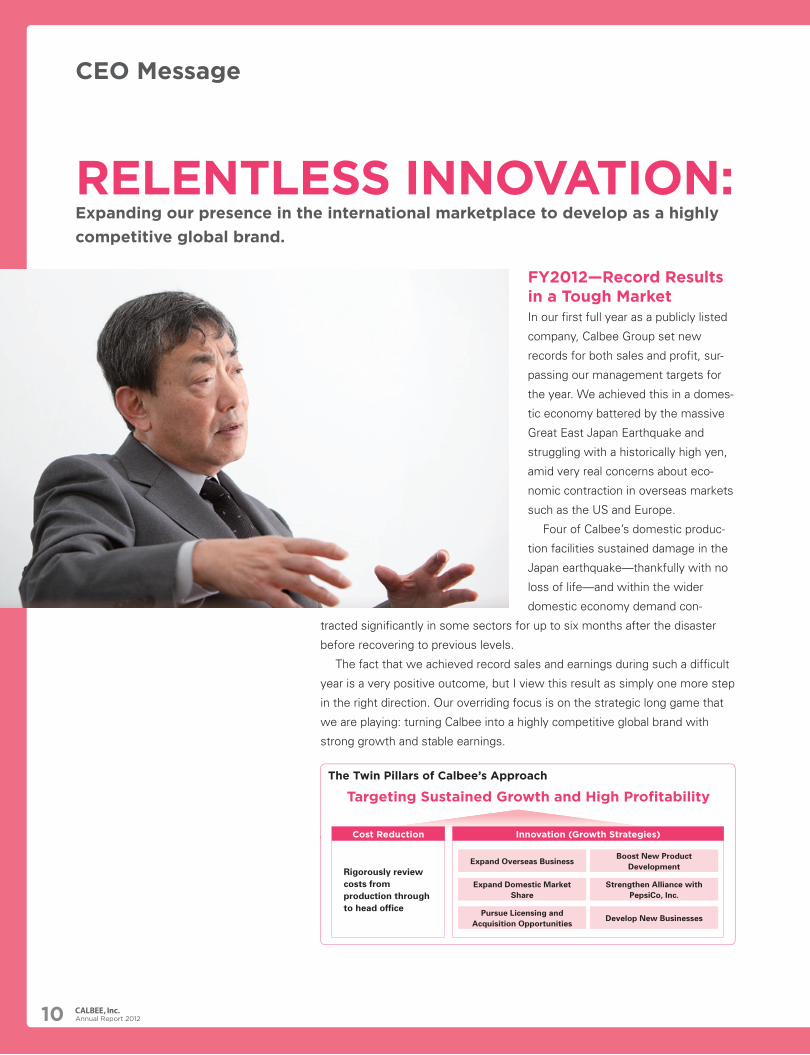
FY2012—Record Results in a Tough MarketIn our first full year as a publicly listed
company, Calbee Group set new
records for both sales and profit, sur-
passing our management targets for
the year. We achieved this in a domes-
tic economy battered by the massive
Great East Japan Earthquake and
struggling with a historically high yen,
amid very real concerns about eco-
nomic contraction in overseas markets
such as the US and Europe.
Four of Calbee’s domestic produc-
tion facilities sustained damage in the
Japan earthquake—thankfully with no
loss of life—and within the wider
domestic economy demand con-
tracted significantly in some sectors for up to six months after the disaster
before recovering to previous levels.
The fact that we achieved record sales and earnings during such a difficult
year is a very positive outcome, but I view this result as simply one more step
in the right direction. Our overriding focus is on the strategic long game that
we are playing: turning Calbee into a highly competitive global brand with
strong growth and stable earnings.
CEO Message
RELENTLESS INNOVATION:Expanding our presence in the international marketplace to develop as a highly
competitive global brand.
The Twin Pillars of Calbee’s Approach
Targeting Sustained Growth and High Profitability
Rigorously review costs from production through to head office
Cost Reduction Innovation (Growth Strategies)
Expand Overseas Business
Expand Domestic Market Share
Pursue Licensing and Acquisition Opportunities
Boost New Product Development
Strengthen Alliance with PepsiCo, Inc.
Develop New Businesses
Annual Report 201210
Building a Lean Business with Profitability on a Par with Global PeersAs I have outlined in previous reports, we have been making significant struc-
tural changes within Calbee so that we can support long-term growth with
lean, low-cost operations. Our profitability has been too low for too long, so
from 2009 we began a concerted effort to drive costs out of our business.
The result over the three years to date is that we have expanded our operat-
ing income at a compound annual growth rate of 40.6%, and improved our
operating margin from 3.2% to 7.5%, based on key initiatives to centralize
procurement and improve capacity utilization.
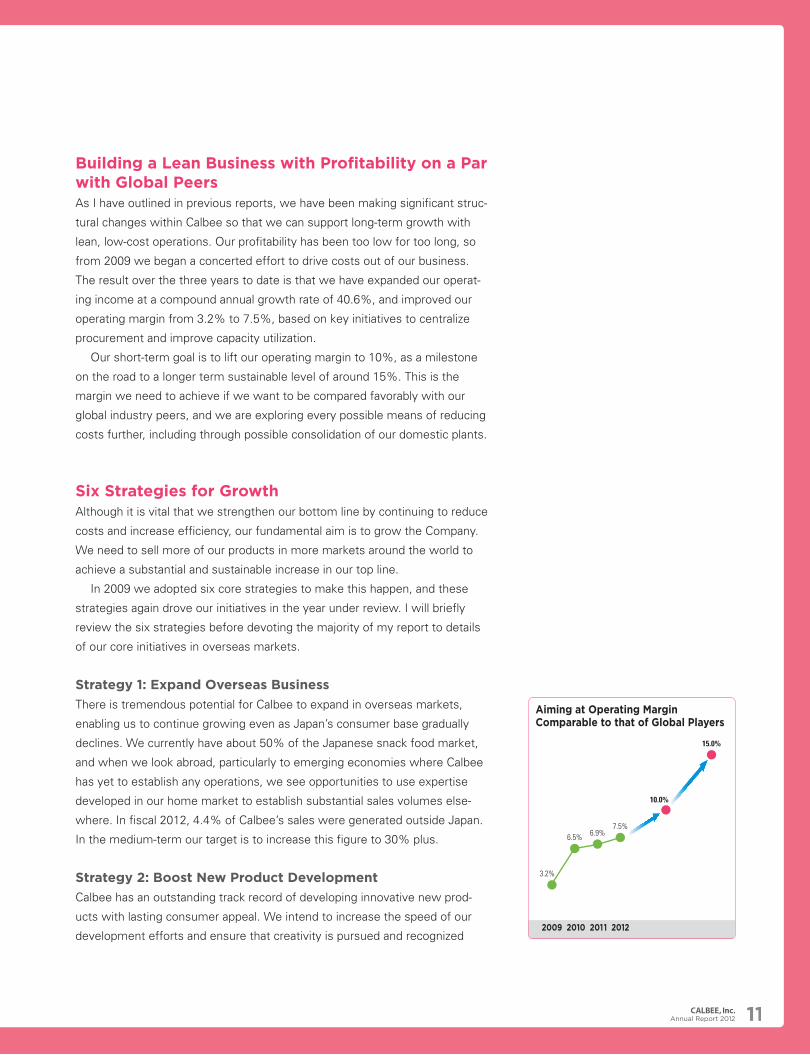
Our short-term goal is to lift our operating margin to 10%, as a milestone
on the road to a longer term sustainable level of around 15%. This is the
margin we need to achieve if we want to be compared favorably with our
global industry peers, and we are exploring every possible means of reducing
costs further, including through possible consolidation of our domestic plants.
Six Strategies for GrowthAlthough it is vital that we strengthen our bottom line by continuing to reduce
costs and increase efficiency, our fundamental aim is to grow the Company.
We need to sell more of our products in more markets around the world to
achieve a substantial and sustainable increase in our top line.
In 2009 we adopted six core strategies to make this happen, and these
strategies again drove our initiatives in the year under review. I will briefly
review the six strategies before devoting the majority of my report to details
of our core initiatives in overseas markets.
Strategy 1: Expand Overseas Business
There is tremendous potential for Calbee to expand in overseas markets,
enabling us to continue growing even as Japan’s consumer base gradually
declines. We currently have about 50% of the Japanese snack food market,
and when we look abroad, particularly to emerging economies where Calbee
has yet to establish any operations, we see opportunities to use expertise
developed in our home market to establish substantial sales volumes else-
where. In fiscal 2012, 4.4% of Calbee’s sales were generated outside Japan.
In the medium-term our target is to increase this figure to 30% plus.
Strategy 2: Boost New Product Development
Calbee has an outstanding track record of developing innovative new prod-
ucts with lasting consumer appeal. We intend to increase the speed of our
development efforts and ensure that creativity is pursued and recognized
3.2%
6.5% 6.9%7.5%
10.0%
15.0%
2010 2011 20122009
Aiming at Operating Margin Comparable to that of Global Players
Annual Report 2012 11
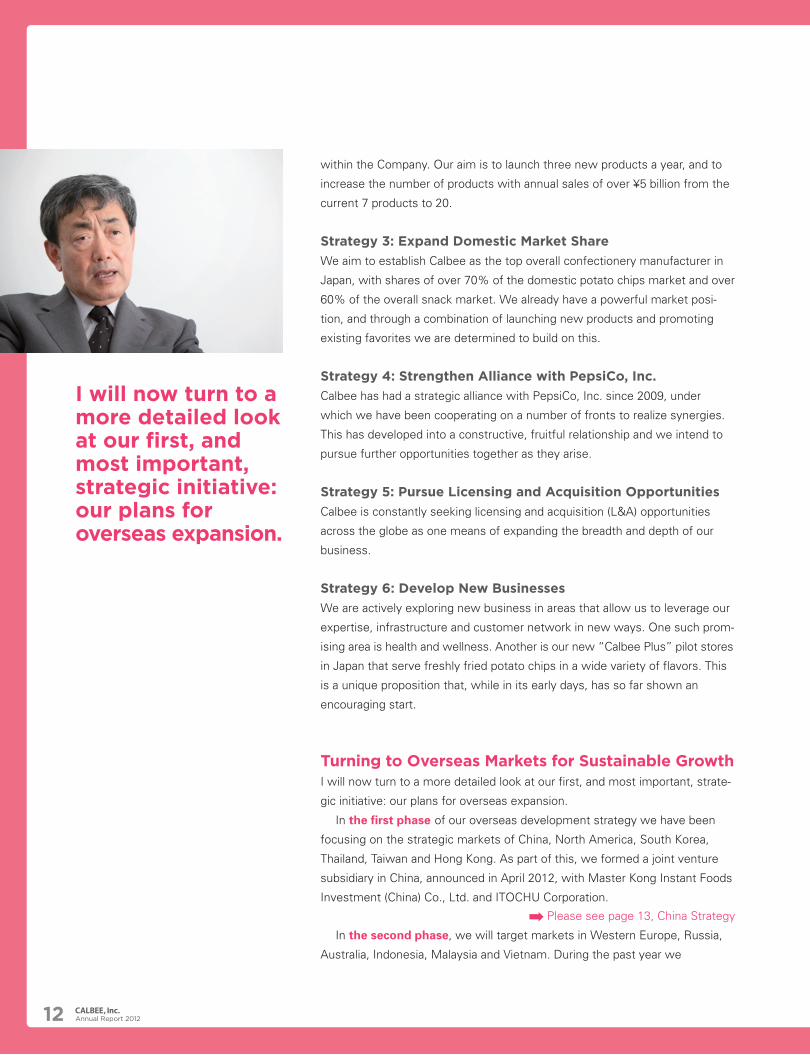
I will now turn to a more detailed look at our first, and most important, strategic initiative: our plans for overseas expansion.
within the Company. Our aim is to launch three new products a year, and to
increase the number of products with annual sales of over ¥5 billion from the
current 7 products to 20.
Strategy 3: Expand Domestic Market Share
We aim to establish Calbee as the top overall confectionery manufacturer in
Japan, with shares of over 70% of the domestic potato chips market and over
60% of the overall snack market. We already have a powerful market posi-
tion, and through a combination of launching new products and promoting
existing favorites we are determined to build on this.
Strategy 4: Strengthen Alliance with PepsiCo, Inc.
Calbee has had a strategic alliance with PepsiCo, Inc. since 2009, under
which we have been cooperating on a number of fronts to realize synergies.
This has developed into a constructive, fruitful relationship and we intend to
pursue further opportunities together as they arise.
Strategy 5: Pursue Licensing and Acquisition Opportunities
Calbee is constantly seeking licensing and acquisition (L&A) opportunities
across the globe as one means of expanding the breadth and depth of our
business.
Strategy 6: Develop New Businesses
We are actively exploring new business in areas that allow us to leverage our
expertise, infrastructure and customer network in new ways. One such prom-
ising area is health and wellness. Another is our new “Calbee Plus” pilot stores
in Japan that serve freshly fried potato chips in a wide variety of flavors. This
is a unique proposition that, while in its early days, has so far shown an
encouraging start.
Turning to Overseas Markets for Sustainable GrowthI will now turn to a more detailed look at our first, and most important, strate-
gic initiative: our plans for overseas expansion.
In the first phase of our overseas development strategy we have been
focusing on the strategic markets of China, North America, South Korea,
Thailand, Taiwan and Hong Kong. As part of this, we formed a joint venture
subsidiary in China, announced in April 2012, with Master Kong Instant Foods
Investment (China) Co., Ltd. and ITOCHU Corporation.
Please see page 13, China Strategy
In the second phase, we will target markets in Western Europe, Russia,
Australia, Indonesia, Malaysia and Vietnam. During the past year we
Annual Report 201212
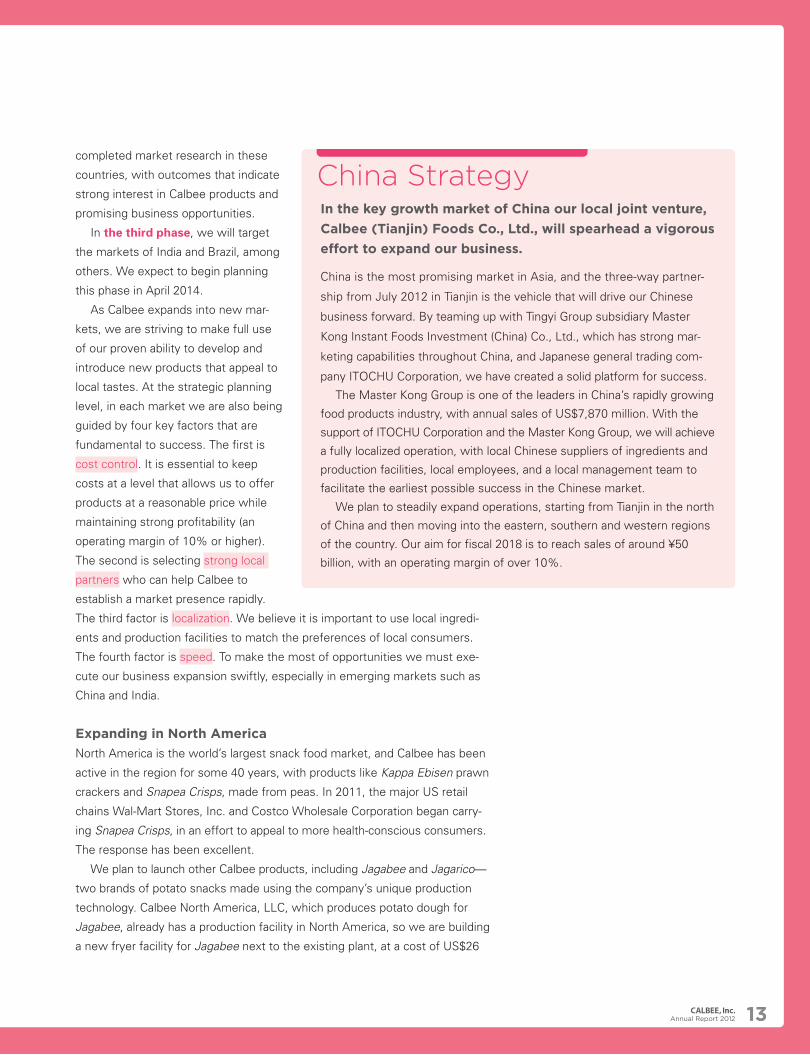
In the key growth market of China our local joint venture,
Calbee (Tianjin) Foods Co., Ltd., will spearhead a vigorous
effort to expand our business.
China is the most promising market in Asia, and the three-way partner-
ship from July 2012 in Tianjin is the vehicle that will drive our Chinese
business forward. By teaming up with Tingyi Group subsidiary Master
Kong Instant Foods Investment (China) Co., Ltd., which has strong mar-
keting capabilities throughout China, and Japanese general trading com-
pany ITOCHU Corporation, we have created a solid platform for success.
The Master Kong Group is one of the leaders in China’s rapidly growing
food products industry, with annual sales of US$7,870 million. With the
support of ITOCHU Corporation and the Master Kong Group, we will achieve
a fully localized operation, with local Chinese suppliers of ingredients and
production facilities, local employees, and a local management team to
facilitate the earliest possible success in the Chinese market.
We plan to steadily expand operations, starting from Tianjin in the north
of China and then moving into the eastern, southern and western regions
of the country. Our aim for fiscal 2018 is to reach sales of around ¥50
billion, with an operating margin of over 10%.
China Strategycompleted market research in these
countries, with outcomes that indicate
strong interest in Calbee products and
promising business opportunities.
In the third phase, we will target
the markets of India and Brazil, among
others. We expect to begin planning
this phase in April 2014.
As Calbee expands into new mar-
kets, we are striving to make full use
of our proven ability to develop and
introduce new products that appeal to
local tastes. At the strategic planning
level, in each market we are also being
guided by four key factors that are
fundamental to success. The first is
cost control. It is essential to keep
costs at a level that allows us to offer
products at a reasonable price while
maintaining strong profitability (an
operating margin of 10% or higher).
The second is selecting strong local
partners who can help Calbee to
establish a market presence rapidly.
The third factor is localization. We believe it is important to use local ingredi-
ents and production facilities to match the preferences of local consumers.
The fourth factor is speed. To make the most of opportunities we must exe-
cute our business expansion swiftly, especially in emerging markets such as
China and India.
Expanding in North America
North America is the world’s largest snack food market, and Calbee has been
active in the region for some 40 years, with products like Kappa Ebisen prawn
crackers and Snapea Crisps, made from peas. In 2011, the major US retail
chains Wal-Mart Stores, Inc. and Costco Wholesale Corporation began carry-
ing Snapea Crisps, in an effort to appeal to more health-conscious consumers.
The response has been excellent.
We plan to launch other Calbee products, including Jagabee and Jagarico—
two brands of potato snacks made using the company’s unique production
technology. Calbee North America, LLC, which produces potato dough for
Jagabee, already has a production facility in North America, so we are building
a new fryer facility for Jagabee next to the existing plant, at a cost of US$26
Annual Report 2012 13
million. We plan to begin selling products from this plant in April 2013, and
will be announcing more details about our local partner and the product speci-
fications over the coming few months.
Growing Our Business in Asia
In South Korea, our joint venture with HAITAI Confectionery & Foods Co.,
Ltd. generated ¥1,225 million in sales for the year under review, achieving the
targets we set on establishment in July 2011. There has been a fabulous
consumer response to Jagabee potato snacks, which we began producing
and selling locally in January 2012. Jagabee is one of our most popular prod-
ucts in Japan, and as it grows in South Korea we are enhancing its market
positioning and improving the efficiency of local procurement to ensure
maximum profitability.
In Hong Kong, Calbee has captured a leading share of the snack food
market through a joint venture we established in 1994 with Four Seas
Mercantile Holdings Ltd. We are currently pursuing further opportunities for
growth by expanding the product lineup.
In Thailand, the flooding in 2012 did not affect Calbee’s local operations.
Our business in Thailand has been growing rapidly, and sales of our locally
developed product Jaxx have soared, contributing to a 19% year-on-year
increase in net sales. We are looking to build on this momentum with our
planned launch of Jagabee.
In Taiwan, a sales licensing agreement that we formed in 2002 with Lian
Hwa Foods Corporation ended in June 2011. We have now reached an agree-
ment with Wei Chuan Foods Corporation, which has a strong sales network
in Taiwan, to establish a joint venture company in August 2012, through
which we will work to increase our product sales and market share in the
Taiwan market.
Building a Trusted Global Brand with Global Standards of Corporate GovernanceAs we launch and expand Calbee in more countries and regions, we are form-
ing relationships with an increasingly diverse range of consumers, business
partners and other stakeholders that need to know they can trust our brand.
In the same way, when we listed on the Tokyo Stock Exchange in March 2011
we committed to increased scrutiny from investors, potentially anywhere in
the world, who need to know they can trust our business.
Strong corporate governance is essential to meeting both these needs for
trust. Our policy is to operate a management structure that meets global
standards of excellence in terms of transparency and clarity, with the respon-
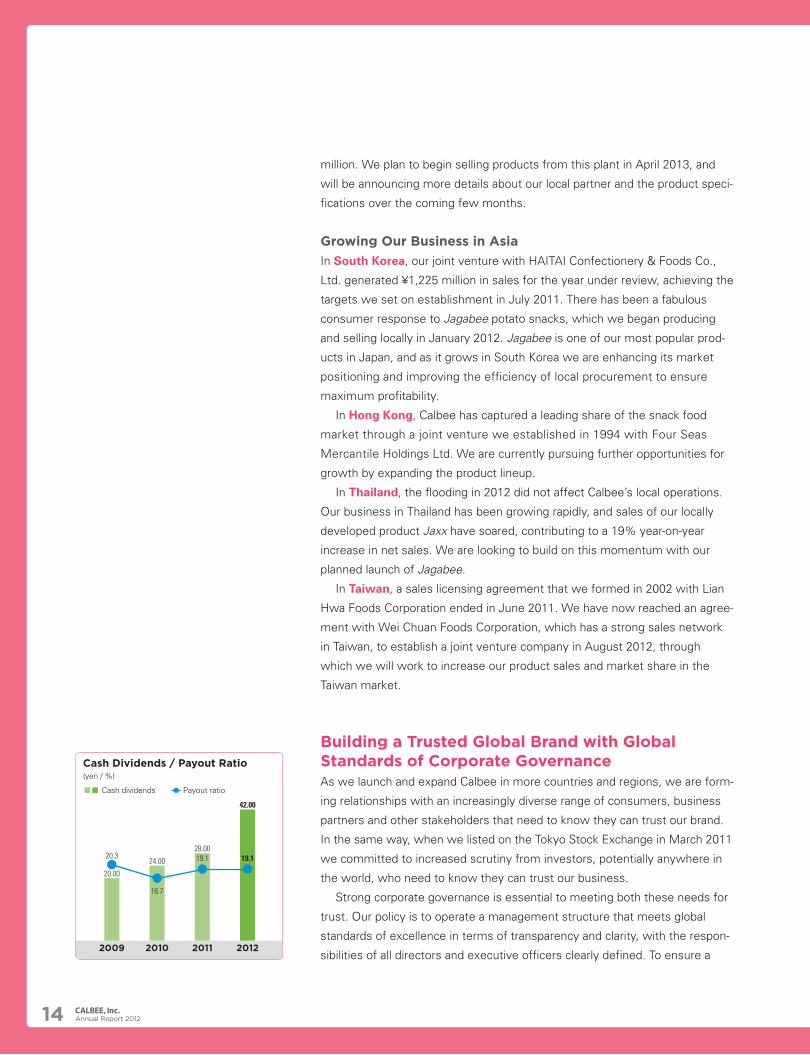
sibilities of all directors and executive officers clearly defined. To ensure a 2010 2011 20122009
24.00
20.00
28.00
42.00
16.7
20.3 19.1 19.1
Cash Dividends / Payout Ratio (yen / %)
Cash dividends Payout ratio
Annual Report 201214
high degree of independence and an appropriate level of supervision, outside
directors account for five out of the seven members on our Board.
We recognize that one of the primary objectives of management should be
to provide shareholders with an appropriate return on their investment. There-
fore, while striving to maintain steady earnings growth and a solid financial
position as a newly listed company, we have chosen a policy from the outset
that channels regular return of profits to investors and reflects improvements
in our performance. Over the course of fiscal 2012 Calbee was able to gener-
ate healthy profits, and we therefore lifted the year-end dividend to ¥42 per
share, ¥10 more than our initial projection (¥32 per share) and ¥14 per share
more than the year-end dividend for fiscal 2011.
Bringing Calbee to Communities and Consumers WorldwideIn parallel to our shareholder returns policy, we operate a variety of corporate
citizenship programs, including activities promoted by the Social Contribution
Committee, regional dietary education programs, and measures that help
increase employment opportunities for people with disabilities. We took an
active role in the establishment of the Great East Japan Earthquake Orphans’
Fund, which was set up to ensure that children affected by the Great East
Japan Earthquake are able to continue their education and realize their future
aspirations. We value diversity in the workplace, and in both our domestic and
overseas operations are trying to develop a workforce that includes a stimu-
lating variety of backgrounds and experiences.
Since being founded in 1949, Calbee’s unique, high-quality food products
and many industry innovations have made us a leader in the Japanese snack
food market. Now, we are intensively engaged in bringing the Calbee brand to
more consumers in more parts of the world. We appreciate the trust inves-
tors have shown us in our first full public year, and look forward to your sup-
port over many exciting years ahead.
Akira Matsumoto
Chairman of the Board & CEO, Representative Director
We appreciate the trust investors have shown us in our first full public year, and look forward to your support over many exciting years ahead.
Annual Report 2012 15
Renewed Records for Sales and IncomeIn fiscal 2012, the year ended March
2012, earnings were affected by the
Great East Japan Earthquake that
damaged four of Calbee’s production
facilities. Despite this difficult start,
company-wide cooperation to try to
revive operations proved successful,
boosting sales and income to record
highs.
Sales were supported by growth in
sales of potato-based snacks and the
new product Vegips, as well as expan-
sion in overseas markets such as
North America and South Korea. Total
revenues increased 5.0% year on year,
to ¥163,269 million. While the domestic market for snack food remained
basically flat, we achieved sales growth far exceeding the market average.
At the profit level, we spent aggressively on sales promotion to further
expand our domestic market share. This led to an increase in sales and
increased capacity utilization at factories, which, along with the effect of cen-
tralized procurement, helped reduce procurement costs and the manufacturing
cost ratio. These measures supported 14.3% year-on-year growth in operating
income, to ¥12,247 million, and a 0.6 percentage point improvement in the
operating margin, to 7.5%. Net income increased 66.8% year on year, to
¥7,097 million, partly due to booking an extraordinary loss of ¥2,163 million in
the previous period on damage caused by the Great East Japan Earthquake.
Market Share Expanded Steadily Against Modest Growth in the Domestic Snack Food MarketIn 2011, the domestic snack food market grew by a modest 0.9% year on
year, to ¥406.5 billion. Although growth has averaged around 2% in recent
years, the March 11 earthquake had a notable impact, keeping demand at
almost the same level as the previous year. The domestic confectionery
RELENTLESS INNOVATION:Sales and income reached record highs. Calbee will work swiftly to promote its
growth strategies to achieve further earnings growth.
Performance in Fiscal 2012(Millions of yen)
Fiscal 2010 Fiscal 2011 Fiscal 2012
Net Sales ¥146,453 ¥155,529 ¥163,269
Operating Income 9,534 10,717 12,247
Net Income 4,017 4,253 7,097
COO Message
Annual Report 201216
market is worth an estimated ¥3.2 trillion, but it also faces weak growth
prospects due to deflation, low birth rates and a decline in disposable income.
Annual growth is unlikely to pick up in the foreseeable future.
Under these conditions, Calbee’s best prospect for strengthening the
domestic business is to capture a dominant market share. Thanks to aggres-
sive promotion efforts, we increased our share of the domestic potato chip
market by 0.7 percentage points, to 63.2% in fiscal 2012 from 62.5% in the
previous year. Competitors had managed to erode Calbee’s market share with
a low price strategy, but since bottoming out in the fiscal year ended March
2010, it has been on a recovery track. We will continue our efforts to expand
market share, targeting 70% of the potato chip market by the end of March
2013. Moreover, by reviving market share in the potato chips segment and
launching new products, we boosted our overall share of the domestic snack
food market by 0.4 percentage points, to 48.9%. We aim to continue this
trend of market share growth, and to capture around 60% of the domestic
market in the medium term.
Please see page 43 for details
Sales Growth Supported by New and Limited-time Products, as well as Rapid Overseas ExpansionSales in the first quarter of fiscal 2012 declined year on year due to the impact
of the Great East Japan Earthquake. From the second quarter onward, how-
ever, sales rebounded to achieve a ¥7.7 billion year-on-year increase for the full
fiscal year.
In potato-based snacks, Calbee scored a notable hit with a limited-time offer
of Jagarico Tarako Butter (Cod Roe and Butter flavor). This item generated the
highest sales ever for a limited-edition product, and greatly contributed to
overall sales growth.
Sales of another new product—Vegips—reached ¥1.3 billion. Vegips is a
new type of vegetable chip product that brings out the unique savory and
sweet flavor and texture of vegetables such as onions and pumpkin. It was
first launched in the Kinki and Chubu regions in February 2011, and has
enjoyed a positive reception from consumers. We introduced Vegips in
Kyushu in April 2012 and are now building additional production lines to
expand our sales area even further. We intend to launch the product in Kanto
in July 2012, and will offer Vegips nationwide during fiscal 2013. In the cat-
egory of flour-based snacks, we have revamped our popular Kappa Ebisen
brand, and continue to generate steady sales with items like Osatsu Snack
and Cheese Bit. Sales of cereals were supported by the success of the Fruits
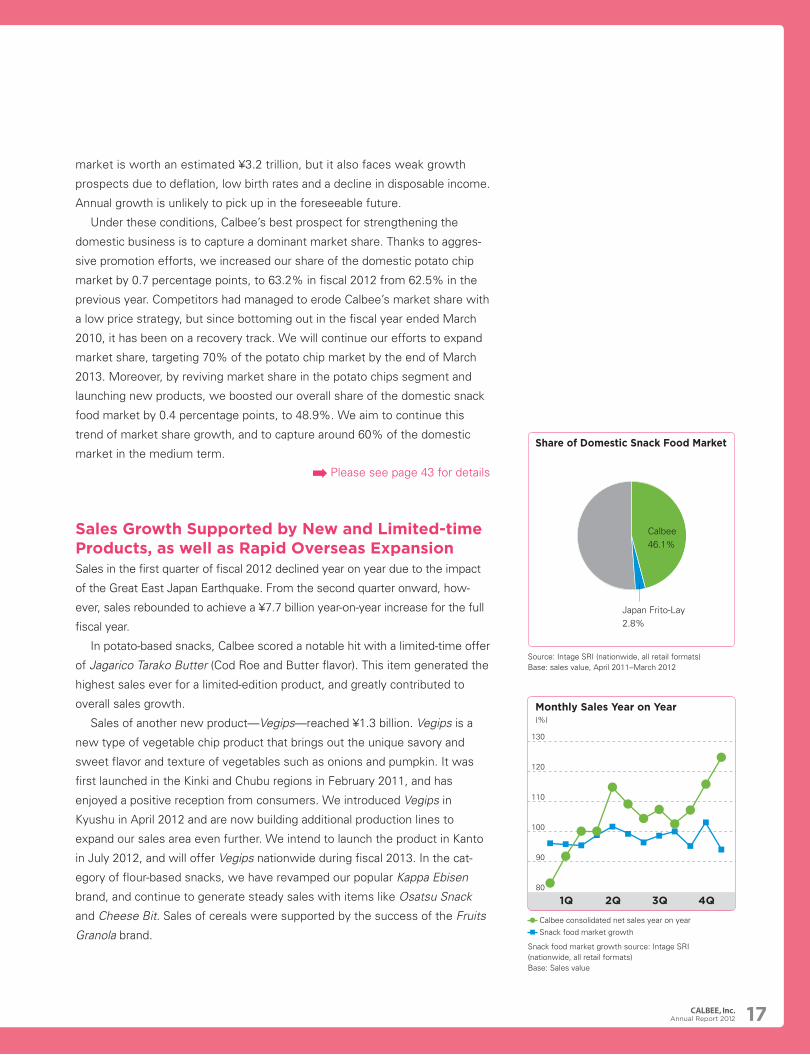
Granola brand. Calbee consolidated net sales year on year Snack food market growth
Snack food market growth source: Intage SRI (nationwide, all retail formats)Base: Sales value
Share of Domestic Snack Food Market
Source: Intage SRI (nationwide, all retail formats)Base: sales value, April 2011–March 2012
1Q 2Q 3Q 4Q80
120
110
100
90
130
Calbee 46.1%
Japan Frito-Lay 2.8%
Monthly Sales Year on Year(%)
Annual Report 2012 17
Calbee’s overseas operations received a boost in July 2011 with the estab-
lishment of a Korean joint venture, HAITAI-CALBEE Co., Ltd., in partnership
with a large Korean confectionery manufacturer HAITAI Confectionery &
Foods Co., Ltd. In North America, leading retail chains Wal-Mart Stores, Inc.
and Costco Wholesale Corporation began carrying Calbee’s Snapea Crisps,
while sales in Thailand were similarly brisk. As a result, total overseas sales
grew 41% year on year, to ¥7,155 million.
Sales Growth and Cost Cutting Efforts Drove Earnings GrowthCost reduction efforts made strong headway in fiscal 2012, as in the previous
year. Calbee made further progress in centralized procurement efforts, and
reviewed production items at each factory to improve efficiency. Closer coor-
dination between production and marketing helped to standardize production
activity. As a result, the cost of sales ratio for the period improved by 0.5
percentage points to 57.7% despite a rise in raw materials costs. This was 1
percentage point better than the initial target.
At the start of the fiscal year, Calbee forecast a ¥2,500 million increase in
raw materials prices, but in actuality prices rose by ¥1,290 million year on
year. Most of this rise was successfully offset by cost reductions of ¥1,001
We aim to launch three new products a year, and to cultivate strong brands.
During fiscal 2012, Calbee launched three new products—Okome Bore, the Company’s first rice-based snack, Hitokuchi
Bizen, a nutritional product containing cereals and fruit, and Vegips. As we noted earlier, Vegips has received a very favor-
able response. In fiscal 2012, Calbee invested ¥750 million at the Konan factory (western Japan) to develop production
capacity for Vegips. This year the company will invest ¥1.2 billion to establish a production line in eastern Japan, to sup-
port the nationwide launch of Vegips. We expect this to add some ¥2.0 billion to annual sales. By contrast, Okome Bore,
and Hitokuchi Bizen did not achieve the anticipated sales levels so we are reconsidering our strategy for these products.
In the future, Calbee plans to continue introducing three new products per
year. Our aim is to increase the number of products that generate over ¥5
billion in annual sales from 7 items currently to around 20 items. We believe
that on average, at least one of the three products launched each year will
become a hit. By strengthening its management of the new product pipeline,
Calbee hopes to accelerate the pace of new product development, and is
likely to increase spending on research and development over the long term.
In the current fiscal year ending March 31, 2013, we plan to continue devel-
oping snack food products based on ingredients such as beans and fruit, and
employing new production technologies.
New Product Development
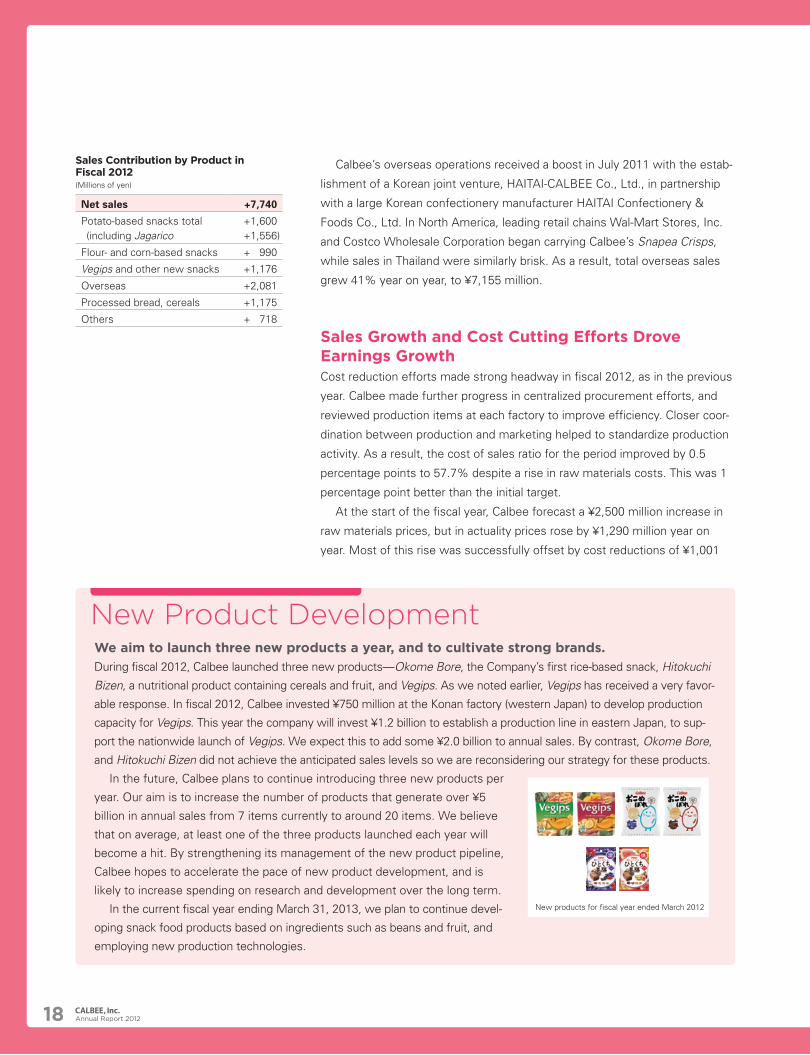
Sales Contribution by Product in Fiscal 2012(Millions of yen)
New products for fiscal year ended March 2012
Net sales +7,740
Potato-based snacks total (including Jagarico
+1,600+1,556)
Flour- and corn-based snacks + 990
Vegips and other new snacks +1,176
Overseas +2,081
Processed bread, cereals +1,175
Others + 718
Annual Report 201218
million stemming from the promotion of centralized procurement. Concerted
efforts to control capital investment reduced total depreciation expenses by
¥291 million, while improvements in capacity utilization had a ¥795 million
impact on total cost of sales.
Looking to the future, rising raw material prices and continued deflation in
Japan are lingering concerns. We will address these risks by continuing to
seek ways to reduce costs across the entire Group. By steadily improving its
profit structure, Calbee aims to build a solid business foundation that can
remain highly competitive both in the domestic market and globally.
Further Steps to Enhance EarningsCalbee’s management is based on two pillars for promoting business vitality:
continued cost reduction and innovation (six strategies for growth). We aim to
cultivate a simple, transparent and decentralized corporate structure in which
employees are motivated and act with initiative. Guided by these aims, Calbee
will work swiftly to deliver steady earnings growth and high profitability.
Thank you for your continued interest and support in Calbee.
Shuji Ito
President & COO, Representative Director
By steadily improving its profit structure, Calbee aims to build a solid business foundation that can remain highly competitive both in the domestic market and globally.
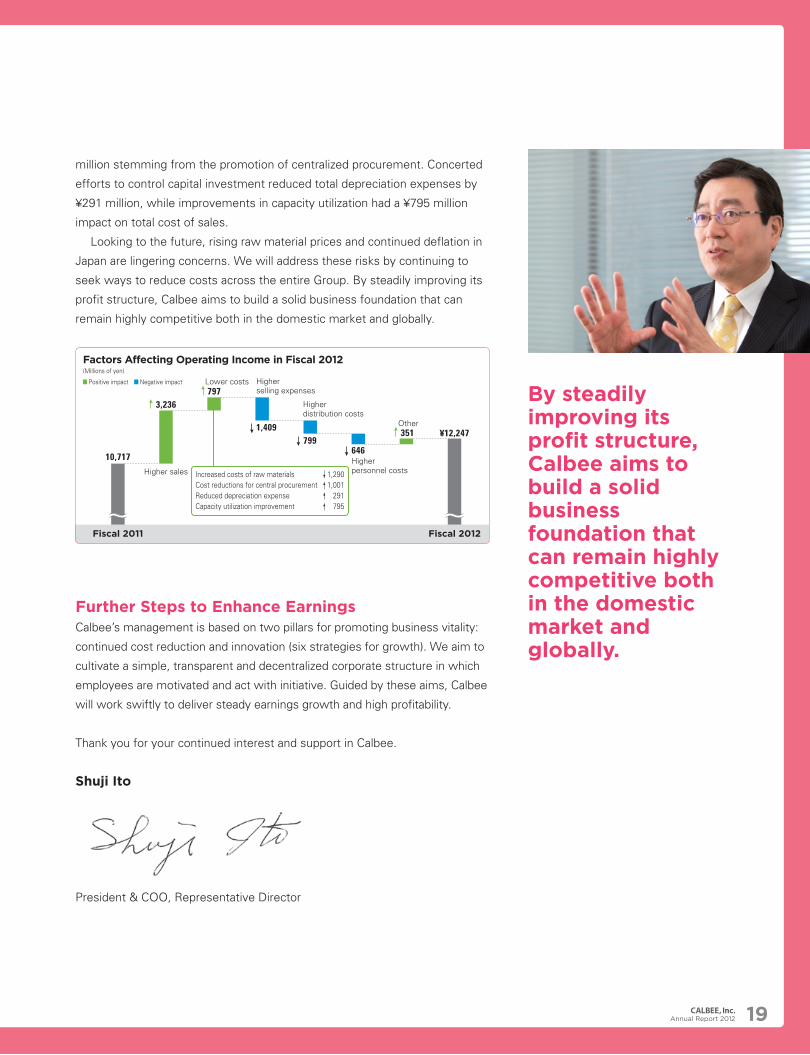
Fiscal 2011 Fiscal 2012
10,717
¥12,247
3,236
Higher sales
797Higher selling expenses
Lower costs
Other
Higher distribution costs
Higher personnel costs
1,409799
646
351
Factors Affecting Operating Income in Fiscal 2012 (Millions of yen)
Increased costs of raw materials 1,290Cost reductions for central procurement 1,001Reduced depreciation expense 291Capacity utilization improvement 795
Positive impact Negative impact
Annual Report 2012 19
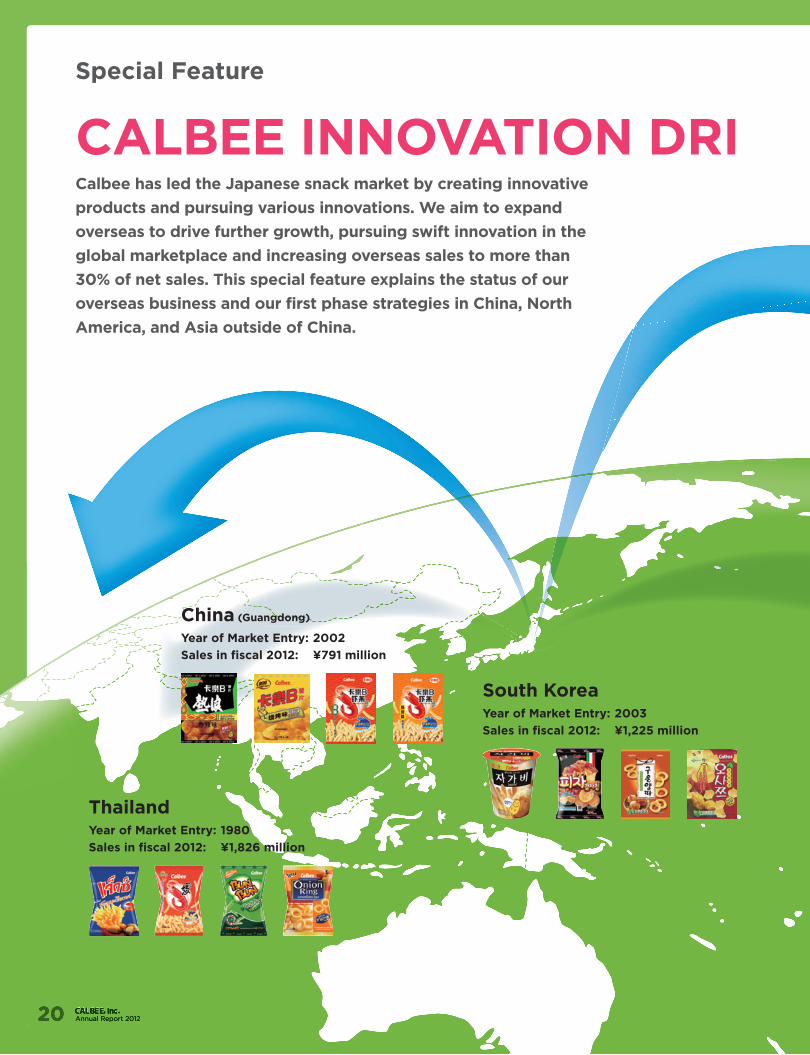
Special Feature
Calbee has led the Japanese snack market by creating innovative
products and pursuing various innovations. We aim to expand
overseas to drive further growth, pursuing swift innovation in the
global marketplace and increasing overseas sales to more than
30% of net sales. This special feature explains the status of our
overseas business and our first phase strategies in China, North
America, and Asia outside of China.
CALBEE INNOVATION DRI VES GLOBAL EXPANSION
ThailandYear of Market Entry: 1980
Sales in fiscal 2012: ¥1,826 million
South KoreaYear of Market Entry: 2003
Sales in fiscal 2012: ¥1,225 million
China (Guangdong)
Year of Market Entry: 2002
Sales in fiscal 2012: ¥791 million
Annual Report 201220
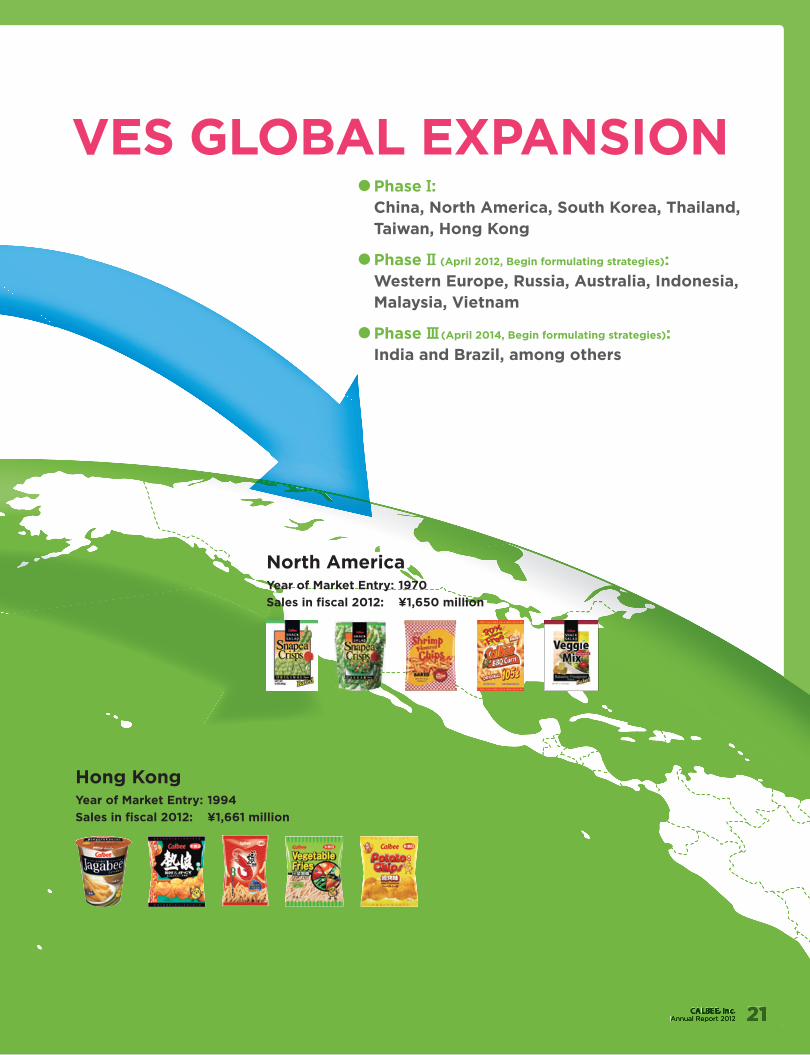
Phase I: China, North America, South Korea, Thailand,
Taiwan, Hong Kong
Phase II (April 2012, Begin formulating strategies): Western Europe, Russia, Australia, Indonesia,
Malaysia, Vietnam
Phase III (April 2014, Begin formulating strategies): India and Brazil, among others
CALBEE INNOVATION DRI VES GLOBAL EXPANSION
Hong KongYear of Market Entry: 1994
Sales in fiscal 2012: ¥1,661 million
North AmericaYear of Market Entry: 1970
Sales in fiscal 2012: ¥1,650 million
Annual Report 2012 21
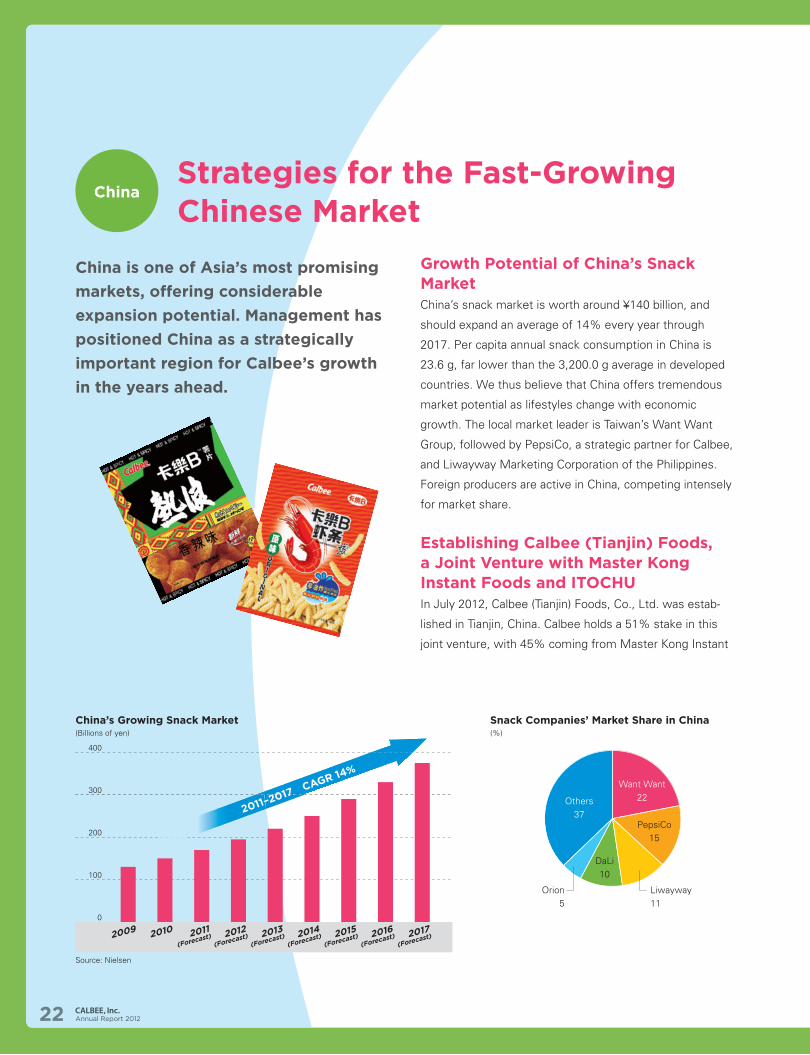
Growth Potential of China’s Snack MarketChina’s snack market is worth around ¥140 billion, and
should expand an average of 14% every year through
2017. Per capita annual snack consumption in China is
23.6 g, far lower than the 3,200.0 g average in developed
countries. We thus believe that China offers tremendous
market potential as lifestyles change with economic
growth. The local market leader is Taiwan’s Want Want
Group, followed by PepsiCo, a strategic partner for Calbee,
and Liwayway Marketing Corporation of the Philippines.
Foreign producers are active in China, competing intensely
for market share.
Establishing Calbee (Tianjin) Foods, a Joint Venture with Master Kong Instant Foods and ITOCHUIn July 2012, Calbee (Tianjin) Foods, Co., Ltd. was estab-
lished in Tianjin, China. Calbee holds a 51% stake in this
joint venture, with 45% coming from Master Kong Instant
400
300
200
100
0
China’s Growing Snack Market(Billions of yen)
Source: Nielsen
China
2009 2010 2011
(Forecast) 2012
(Forecast) 2013
(Forecast) 2014
(Forecast) 2015
(Forecast) 2016
(Forecast) 2017
(Forecast)
Snack Companies’ Market Share in China(%)
China is one of Asia’s most promising
markets, offering considerable
expansion potential. Management has
positioned China as a strategically
important region for Calbee’s growth
in the years ahead.
Strategies for the Fast-Growing Chinese Market
Want Want22
PepsiCo15
Liwayway11
Orion5
DaLi10
Others372011–2017 CAGR 14%
Annual Report 201222
2014 2015 2016 2017 20182013
50
40
30
20
10
0
Foods Investment (China) Co., Ltd., a part of the Tingyi
(Cayman Islands) Holding Corp.; and 4% from ITOCHU
Corporation. Calbee (Tianjin) Foods will start operations in
December 2012.
Master Kong has the dominant share in China’s noodle
and beverage sectors and is a fast-growing leader in the
nation’s food industry. Calbee aims to swiftly establish a
strong competitive position and brands in the Chinese
market by leveraging Master Kong’s strong local sales
networks.
We will start with products that incorporate flour-based
dough from our Qingdao factory. Initial offerings will be
Kappa Ebisen (prawn crackers) and Sapporo Potato. There-
after, we plan to introduce Jagarico, Jagabee, and Potato
Chips. It is vital to ensure stable procurement of high quality
potatoes at low cost for producing Potato Chips. We will
therefore seek support from Master Kong and ITOCHU in
building a structure for stable procurement.
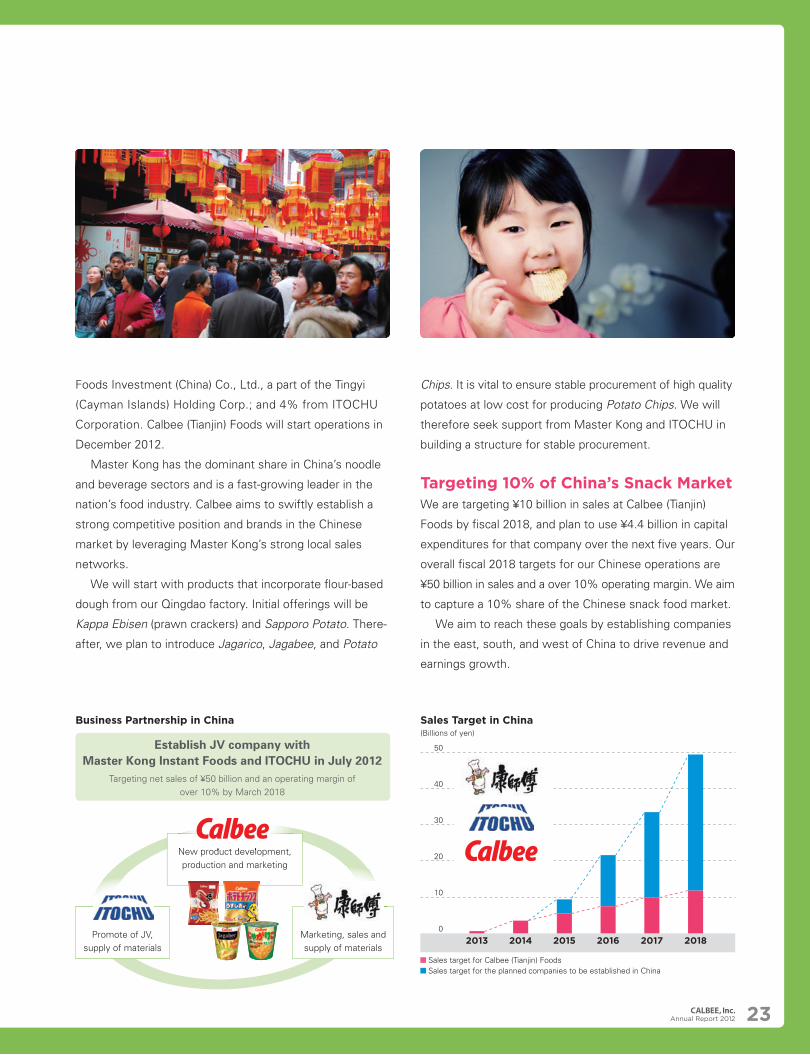
Targeting 10% of China’s Snack MarketWe are targeting ¥10 billion in sales at Calbee (Tianjin)
Foods by fiscal 2018, and plan to use ¥4.4 billion in capital
expenditures for that company over the next five years. Our
overall fiscal 2018 targets for our Chinese operations are
¥50 billion in sales and a over 10% operating margin. We aim
to capture a 10% share of the Chinese snack food market.
We aim to reach these goals by establishing companies
in the east, south, and west of China to drive revenue and
earnings growth.
Business Partnership in China Sales Target in China(Billions of yen)
Establish JV company with Master Kong Instant Foods and ITOCHU in July 2012
Targeting net sales of ¥50 billion and an operating margin of over 10% by March 2018
New product development, production and marketing
Promote of JV, supply of materials
Marketing, sales and supply of materials
Sales target for Calbee (Tianjin) Foods Sales target for the planned companies to be established in China
New product development,
Annual Report 2012 23
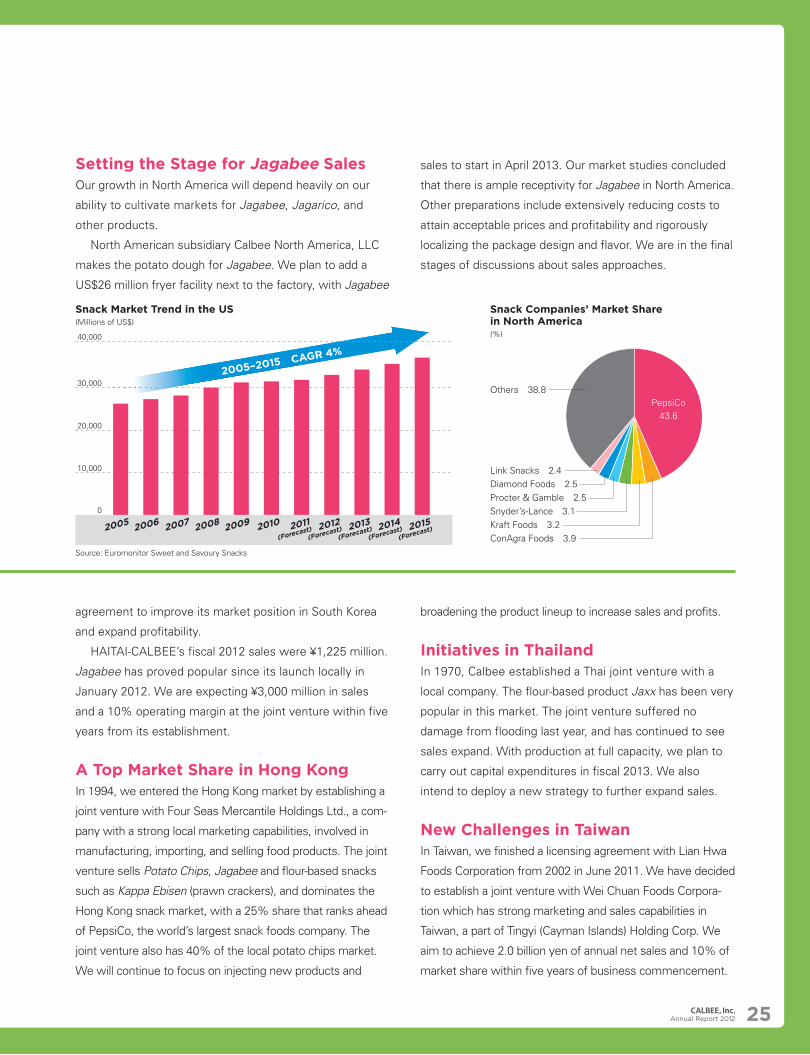
Initiatives in the World’s Largest Snack MarketThe North American snack market was worth US$31.2
billion in 2009, making it the world’s largest. There is still
considerable growth potential. Strategic partner PepsiCo is
far larger than even the second-ranked player in that market.
In 1970, Calbee established an American subsidiary that
has offered such products as Kappa Ebisen (prawn crack-
ers) and Snapea Crisps. We have sold Snapea Crisps in
North America for more than a decade. In fiscal 2012, we
started doing business with such major supermarket
chains as Wal-Mart Stores, Inc. and Costco Wholesale
Corporation, and expect sales to increase.
Initiatives in South KoreaSouth Korea ranks after Japan and China in promising
Asian markets. In July 2011, we jointly established HAITAI-
CALBEE Co., Ltd. with HAITAI Confectionery &
Foods Co., Ltd. This partner ranks alongside
NONGSHIM CO., LTD, ORION CORP., and Lotte
Co., Ltd. as a leading South Korean confectionery
maker. Together with its parent company CROWN
Confectionery Co., Ltd., HAITAI Confectionery & Foods
accounts for about 21% of South Korea’s snack food
market. In 2003, Calbee concluded a licensing agreement
with HAITAI Confectionery & Foods, mainly for flour-based
snacks, which had helped to increase the market share of
Calbee products in South Korea to 5%. On forming the
joint venture in 2011, Calbee decided to end the licensing
As the world’s biggest snack market,
North America is as important as
China for Calbee’s future
growth. We aim to develop
this market aggressively
with competitive
offerings such
as Jagabee.
We will continue
efforts in South Korea,
Thailand, Taiwan, and
Hong Kong to further
expand our market shares
and profitability.
Asian Snack Food Market 2011(Millions of US$)
South Korea 864.8
Thailand 775.3
Taiwan 729.0
Hong Kong 109.9
Source: Euromonitor Sweet and Savoury Snacks
North America
Other Countries
in Asia
Pursuing New Challenges in North America, the World’s Largest Snack Market
Building the Asian Market
Annual Report 201224
40,000
30,000
20,000
10,000
0
Setting the Stage for Jagabee SalesOur growth in North America will depend heavily on our
ability to cultivate markets for Jagabee, Jagarico, and
other products.
North American subsidiary Calbee North America, LLC
makes the potato dough for Jagabee. We plan to add a
US$26 million fryer facility next to the factory, with Jagabee
agreement to improve its market position in South Korea
and expand profitability.
HAITAI-CALBEE’s fiscal 2012 sales were ¥1,225 million.
Jagabee has proved popular since its launch locally in
January 2012. We are expecting ¥3,000 million in sales
and a 10% operating margin at the joint venture within five
years from its establishment.
A Top Market Share in Hong KongIn 1994, we entered the Hong Kong market by establishing a
joint venture with Four Seas Mercantile Holdings Ltd., a com-
pany with a strong local marketing capabilities, involved in
manufacturing, importing, and selling food products. The joint
venture sells Potato Chips, Jagabee and flour-based snacks
such as Kappa Ebisen (prawn crackers), and dominates the
Hong Kong snack market, with a 25% share that ranks ahead
of PepsiCo, the world’s largest snack foods company. The
joint venture also has 40% of the local potato chips market.
We will continue to focus on injecting new products and
Snack Market Trend in the US(Millions of US$)
2005 2006 2007 2008 2009 2010 2011
(Forecast) 2012
(Forecast) 2013
(Forecast) 2014
(Forecast) 2015
(Forecast)
sales to start in April 2013. Our market studies concluded
that there is ample receptivity for Jagabee in North America.
Other preparations include extensively reducing costs to
attain acceptable prices and profitability and rigorously
localizing the package design and flavor. We are in the final
stages of discussions about sales approaches.
broadening the product lineup to increase sales and profits.
Initiatives in ThailandIn 1970, Calbee established a Thai joint venture with a
local company. The flour-based product Jaxx has been very
popular in this market. The joint venture suffered no
damage from flooding last year, and has continued to see
sales expand. With production at full capacity, we plan to
carry out capital expenditures in fiscal 2013. We also
intend to deploy a new strategy to further expand sales.
New Challenges in TaiwanIn Taiwan, we finished a licensing agreement with Lian Hwa
Foods Corporation from 2002 in June 2011. We have decided
to establish a joint venture with Wei Chuan Foods Corpora-
tion which has strong marketing and sales capabilities in
Taiwan, a part of Tingyi (Cayman Islands) Holding Corp. We
aim to achieve 2.0 billion yen of annual net sales and 10% of
market share within five years of business commencement.
Source: Euromonitor Sweet and Savoury Snacks
Snack Companies’ Market Share in North America(%)
PepsiCo43.6
Link Snacks 2.4
ConAgra Foods 3.9Kraft Foods 3.2Snyder’s-Lance 3.1Procter & Gamble 2.5Diamond Foods 2.5
Others 38.8
2005–2015 CAGR 4%
Annual Report 2012 25
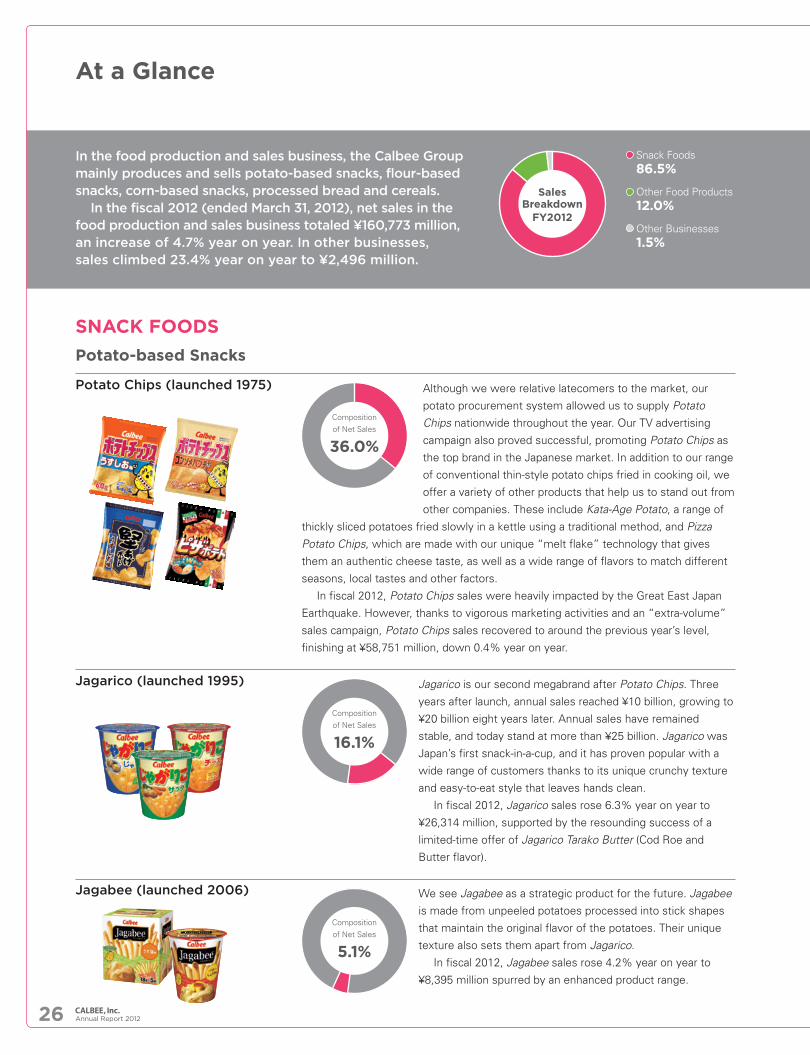
Snack Foods 86.5%
Other Food Products 12.0%
Other Businesses 1.5%
At a Glance
In the food production and sales business, the Calbee Group mainly produces and sells potato-based snacks, flour-based snacks, corn-based snacks, processed bread and cereals.
In the fiscal 2012 (ended March 31, 2012), net sales in the food production and sales business totaled ¥160,773 million, an increase of 4.7% year on year. In other businesses, sales climbed 23.4% year on year to ¥2,496 million.
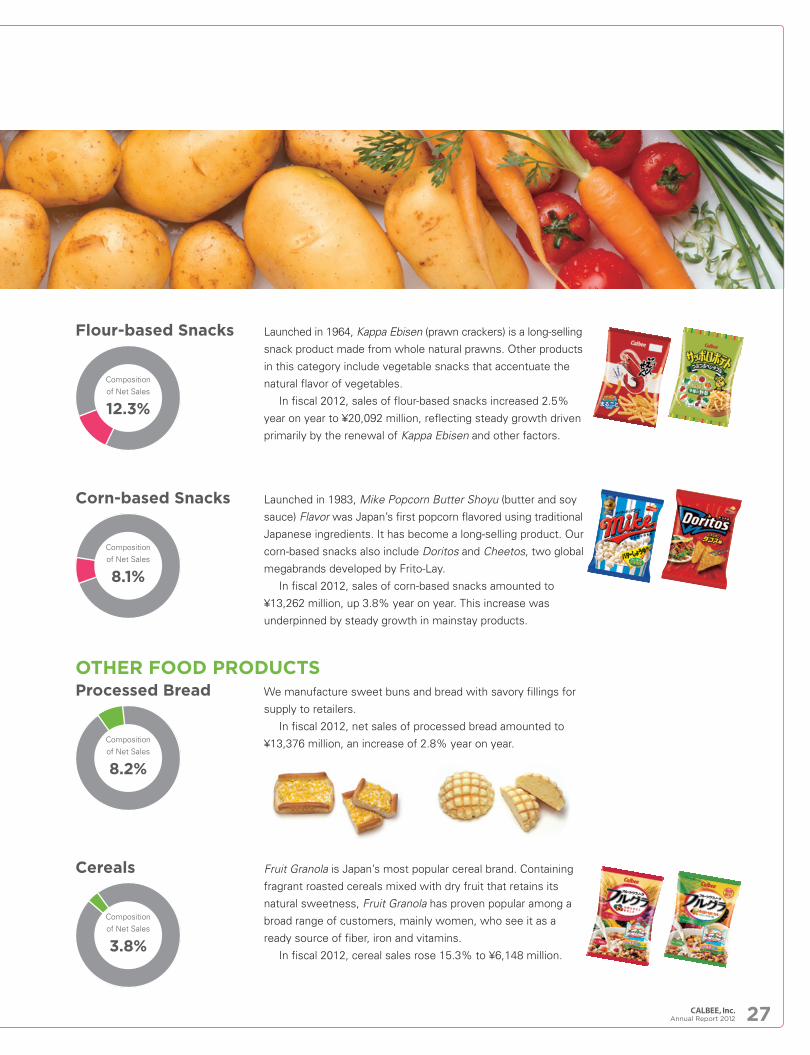
Although we were relative latecomers to the market, our
potato procurement system allowed us to supply Potato
Chips nationwide throughout the year. Our TV advertising
campaign also proved successful, promoting Potato Chips as
the top brand in the Japanese market. In addition to our range
of conventional thin-style potato chips fried in cooking oil, we
offer a variety of other products that help us to stand out from
other companies. These include Kata-Age Potato, a range of
thickly sliced potatoes fried slowly in a kettle using a traditional method, and Pizza
Potato Chips, which are made with our unique “melt flake” technology that gives
them an authentic cheese taste, as well as a wide range of flavors to match different
seasons, local tastes and other factors.
In fiscal 2012, Potato Chips sales were heavily impacted by the Great East Japan
Earthquake. However, thanks to vigorous marketing activities and an “extra-volume”
sales campaign, Potato Chips sales recovered to around the previous year’s level,
finishing at ¥58,751 million, down 0.4% year on year.
Jagarico is our second megabrand after Potato Chips. Three
years after launch, annual sales reached ¥10 billion, growing to
¥20 billion eight years later. Annual sales have remained
stable, and today stand at more than ¥25 billion. Jagarico was
Japan’s first snack-in-a-cup, and it has proven popular with a
wide range of customers thanks to its unique crunchy texture
and easy-to-eat style that leaves hands clean.
In fiscal 2012, Jagarico sales rose 6.3% year on year to
¥26,314 million, supported by the resounding success of a
limited-time offer of Jagarico Tarako Butter (Cod Roe and
Butter flavor).
We see Jagabee as a strategic product for the future. Jagabee
is made from unpeeled potatoes processed into stick shapes
that maintain the original flavor of the potatoes. Their unique
texture also sets them apart from Jagarico.
In fiscal 2012, Jagabee sales rose 4.2% year on year to
¥8,395 million spurred by an enhanced product range.
Potato-based Snacks
SNACK FOODS
Jagarico (launched 1995)
Jagabee (launched 2006)
Potato Chips (launched 1975)
Composition of Net Sales
36.0%
Composition of Net Sales
16.1%
Composition of Net Sales
5.1%
Sales Breakdown
FY2012
Annual Report 201226
Flour-based Snacks
Corn-based Snacks
Cereals
Processed Bread
Launched in 1964, Kappa Ebisen (prawn crackers) is a long-selling
snack product made from whole natural prawns. Other products
in this category include vegetable snacks that accentuate the
natural flavor of vegetables.
In fiscal 2012, sales of flour-based snacks increased 2.5%
year on year to ¥20,092 million, reflecting steady growth driven
primarily by the renewal of Kappa Ebisen and other factors.
Launched in 1983, Mike Popcorn Butter Shoyu (butter and soy
sauce) Flavor was Japan’s first popcorn flavored using traditional
Japanese ingredients. It has become a long-selling product. Our
corn-based snacks also include Doritos and Cheetos, two global
megabrands developed by Frito-Lay.
In fiscal 2012, sales of corn-based snacks amounted to
¥13,262 million, up 3.8% year on year. This increase was
underpinned by steady growth in mainstay products.
We manufacture sweet buns and bread with savory fillings for
supply to retailers.
In fiscal 2012, net sales of processed bread amounted to
¥13,376 million, an increase of 2.8% year on year.
Fruit Granola is Japan’s most popular cereal brand. Containing
fragrant roasted cereals mixed with dry fruit that retains its
natural sweetness, Fruit Granola has proven popular among a
broad range of customers, mainly women, who see it as a
ready source of fiber, iron and vitamins.
In fiscal 2012, cereal sales rose 15.3% to ¥6,148 million.
OTHER FOOD PRODUCTS
Composition of Net Sales
12.3%
Composition of Net Sales
8.2%
Composition of Net Sales
3.8%
Composition of Net Sales
8.1%
Annual Report 2012 27
180,000
150,000
120,000
90,000
60,000
30,000
1950 1960 1970 1980 1990 2000 2010
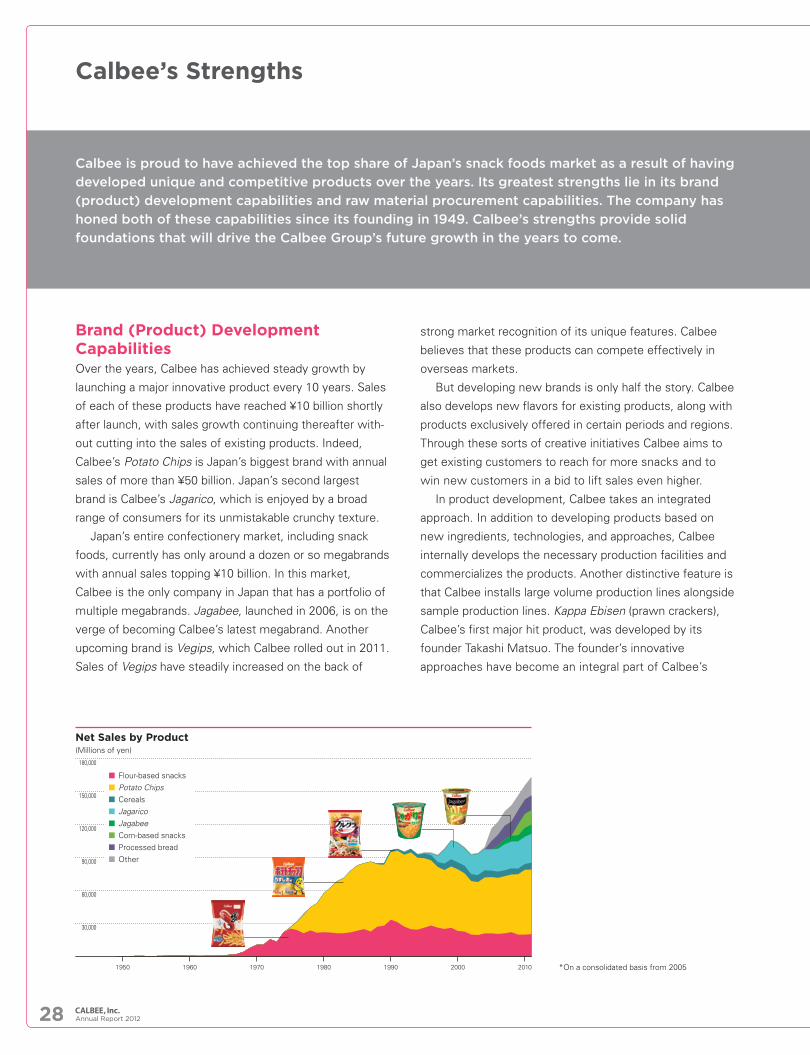
Brand (Product) Development CapabilitiesOver the years, Calbee has achieved steady growth by
launching a major innovative product every 10 years. Sales
of each of these products have reached ¥10 billion shortly
after launch, with sales growth continuing thereafter with-
out cutting into the sales of existing products. Indeed,
Calbee’s Potato Chips is Japan’s biggest brand with annual
sales of more than ¥50 billion. Japan’s second largest
brand is Calbee’s Jagarico, which is enjoyed by a broad
range of consumers for its unmistakable crunchy texture.
Japan’s entire confectionery market, including snack
foods, currently has only around a dozen or so megabrands
with annual sales topping ¥10 billion. In this market,
Calbee is the only company in Japan that has a portfolio of
multiple megabrands. Jagabee, launched in 2006, is on the
verge of becoming Calbee’s latest megabrand. Another
upcoming brand is Vegips, which Calbee rolled out in 2011.
Sales of Vegips have steadily increased on the back of
strong market recognition of its unique features. Calbee
believes that these products can compete effectively in
overseas markets.
But developing new brands is only half the story. Calbee
also develops new flavors for existing products, along with
products exclusively offered in certain periods and regions.
Through these sorts of creative initiatives Calbee aims to
get existing customers to reach for more snacks and to
win new customers in a bid to lift sales even higher.
In product development, Calbee takes an integrated
approach. In addition to developing products based on
new ingredients, technologies, and approaches, Calbee
internally develops the necessary production facilities and
commercializes the products. Another distinctive feature is
that Calbee installs large volume production lines alongside
sample production lines. Kappa Ebisen (prawn crackers),
Calbee’s first major hit product, was developed by its
founder Takashi Matsuo. The founder’s innovative
approaches have become an integral part of Calbee’s
Calbee’s Strengths
Calbee is proud to have achieved the top share of Japan’s snack foods market as a result of having
developed unique and competitive products over the years. Its greatest strengths lie in its brand
(product) development capabilities and raw material procurement capabilities. The company has
honed both of these capabilities since its founding in 1949. Calbee’s strengths provide solid
foundations that will drive the Calbee Group’s future growth in the years to come.
Net Sales by Product(Millions of yen)
Flour-based snacks Potato Chips Cereals Jagarico Jagabee Corn-based snacks Processed bread Other
*On a consolidated basis from 2005
Annual Report 201228
corporate DNA. In keeping with this spirit, employees
outside the R&D Group also actively participate in
product development.
In addition, Calbee is working to reinforce management
of the product pipeline, while shortening the lead time for
developing new products. Calbee is also stepping up
efforts to develop snack ingredients other than potatoes.
Within the next few years, Calbee aims to increase the
number of product items with annual sales in excess of ¥5
billion to 20, compared with 7 such product items today.
Raw Material Procurement CapabilitiesCalbee products are made using processing methods that
utilize whole natural ingredients such as potatoes and
other vegetables, as well as prawns. Consequently, the
quality and volume of our products are highly dependent
on growing methods for these ingredients and changes in
the weather. Calbee has therefore worked closely with
producers in the farming and fishing industries to improve
the quality of raw materials.
Calbee has focused on building a stable procurement
system for potatoes, the primary ingredient for its products,
since before it fully entered the potato chips business. We
started building this system in 1974 to ensure steady pro-
curement of high-quality potatoes optimal for production.
In 1980, we spun off our Potato Procurement Department
to establish CALBEE POTATO INC. This company works to
boost quality in a number of ways, such as cultivating new
potato varieties, developing new growing technologies,
and conducting research into stockpiling techniques.
Furthermore, Calbee has stationed personnel known as
“fieldmen” across Japan to support around 2,500 con-
tracted potato growers. This support covers the cultivation
techniques and process management needed to achieve a
stable harvest and quality. Calbee is Japan’s largest purchaser
of potatoes, using around 8% of all potatoes produced in
Japan (50% of all potatoes used for processing).
Calbee must prepare for fluctuations in the supply of
domestic potatoes due to smaller harvests following poor
weather and other factors. Accordingly, Calbee has built a
system that enables imports of potatoes from overseas.
Because potatoes are particularly susceptible to pests,
Japan has put strict regulations on imports of raw potatoes
in order to protect plants from the intrusion of harmful
pests into the country. As a result, Calbee’s Hiroshima and
Kagoshima factories, which are located in port areas, are
the only places in Japan permitted to import raw potatoes.
Meanwhile, Calbee produces Jagabee from processed
potatoes sourced from its US subsidiary Calbee North
America, LLC, a joint venture with the biggest potato
grower in the US, R.D. OFFUTT COMPANY. Calbee also
sources raw materials from other countries based on their
suitability for processing.
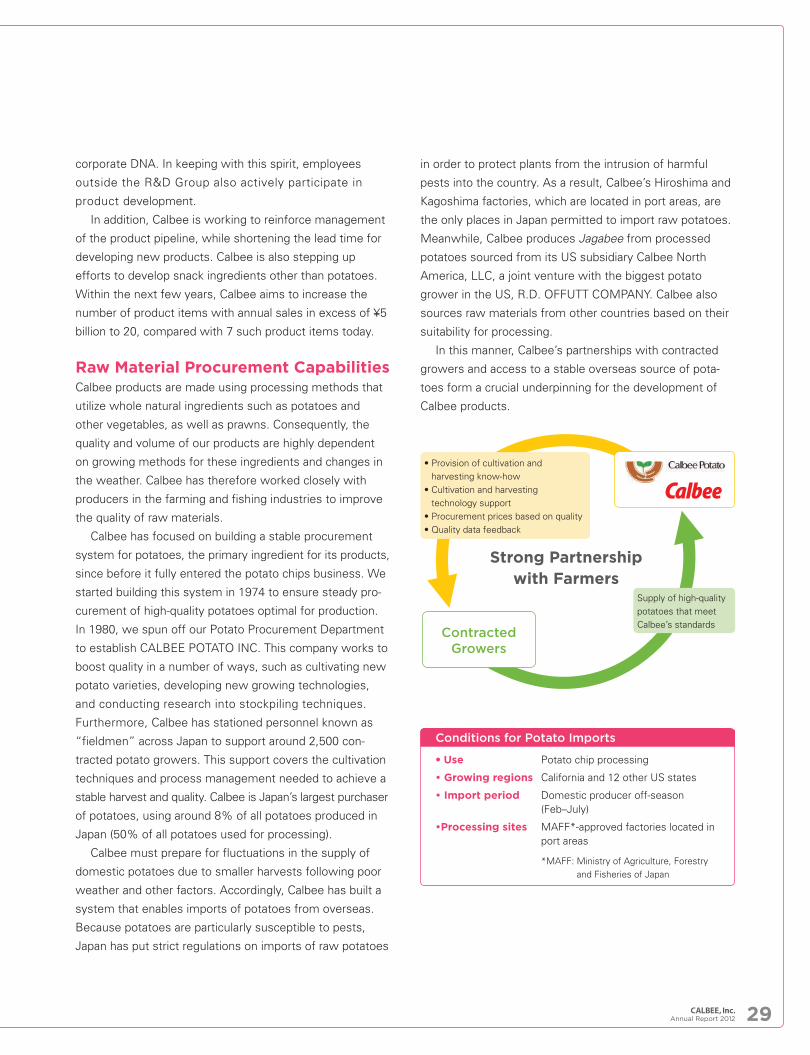
In this manner, Calbee’s partnerships with contracted
growers and access to a stable overseas source of pota-
toes form a crucial underpinning for the development of
Calbee products.
Conditions for Potato Imports
• Use Potato chip processing
• Growing regions California and 12 other US states
• Import period Domestic producer off-season (Feb–July)
•Processing sites MAFF*-approved factories located in port areas
*MAFF: Ministry of Agriculture, Forestry and Fisheries of Japan
Strong Partnership with Farmers
Contracted Growers
• Provision o cultivation and harvesting know-how
• Cultivation and harvestin technology support
• Procurement prices based on uality• Quality data eedback
Supply of high-quality potatoes that meet Calbee’s standards
Annual Report 2012 29
SOCIAL CONTRIBUTION ACTIVITIESBasic Policy
Calbee has a Social Contri-
bution Committee, whose
goal is to help employees
across the entire Calbee
Group conduct activities that
contribute to the commu-
nity. The committee was
first formed two years ago,
and has 11 members
selected via an internal appli-
cation process. Today, we have organized Social Contribu-
tion Committees in each region where Calbee is active,
each organizing a wide range of activities in accordance
with the Group’s social contribution mission statement.
Based on key themes, the committees organize activities
to clean up and protect environments around the Group’s
factories and offices. They also support sports events and
implement other initiatives as part of Calbee’s efforts to
fulfill its responsibility to local communities and contribute
to global society.
Social Contribution Mission StatementAs employees of the Calbee Group and as good citizens, we endeavor to contribute to local communities where we work and to global society as a whole.
The Calbee Group strives to be respected, admired and loved as a corporate group that gives
consideration to local communities where it operates and to the natural resources and
environments of Japan and other countries worldwide. The Group implements a wide range of
corporate social responsibility (CSR) activities with these objectives in mind. We view CSR
activities not as charity or advertising efforts, but as contributions and long-term investments. We
strive to have our various activities recognized by society, and to reflect them in our business too.
Initiatives with Customers
The Calbee Group seeks to help children around the world
by donating a portion of its sales proceeds to international
NGOs and other groups dedicated to protecting children’s
rights and welfare.
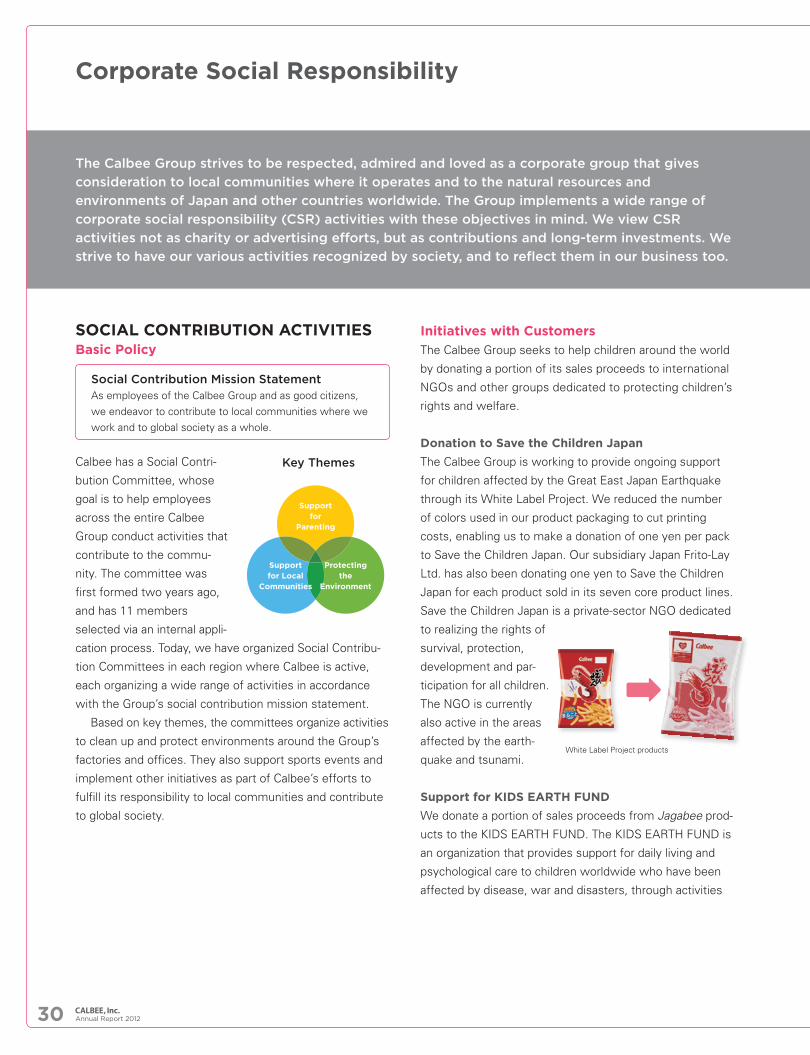
Donation to Save the Children Japan
The Calbee Group is working to provide ongoing support
for children affected by the Great East Japan Earthquake
through its White Label Project. We reduced the number
of colors used in our product packaging to cut printing
costs, enabling us to make a donation of one yen per pack
to Save the Children Japan. Our subsidiary Japan Frito-Lay
Ltd. has also been donating one yen to Save the Children
Japan for each product sold in its seven core product lines.
Save the Children Japan is a private-sector NGO dedicated
to realizing the rights of
survival, protection,
development and par-
ticipation for all children.
The NGO is currently
also active in the areas
affected by the earth-
quake and tsunami.
Support for KIDS EARTH FUND
We donate a portion of sales proceeds from Jagabee prod-
ucts to the KIDS EARTH FUND. The KIDS EARTH FUND is
an organization that provides support for daily living and
psychological care to children worldwide who have been
affected by disease, war and disasters, through activities
Support for Local
Communities
Protecting the
Environment
Support for
Parenting
Key Themes
White Label Project products
Corporate Social Responsibility
Annual Report 201230
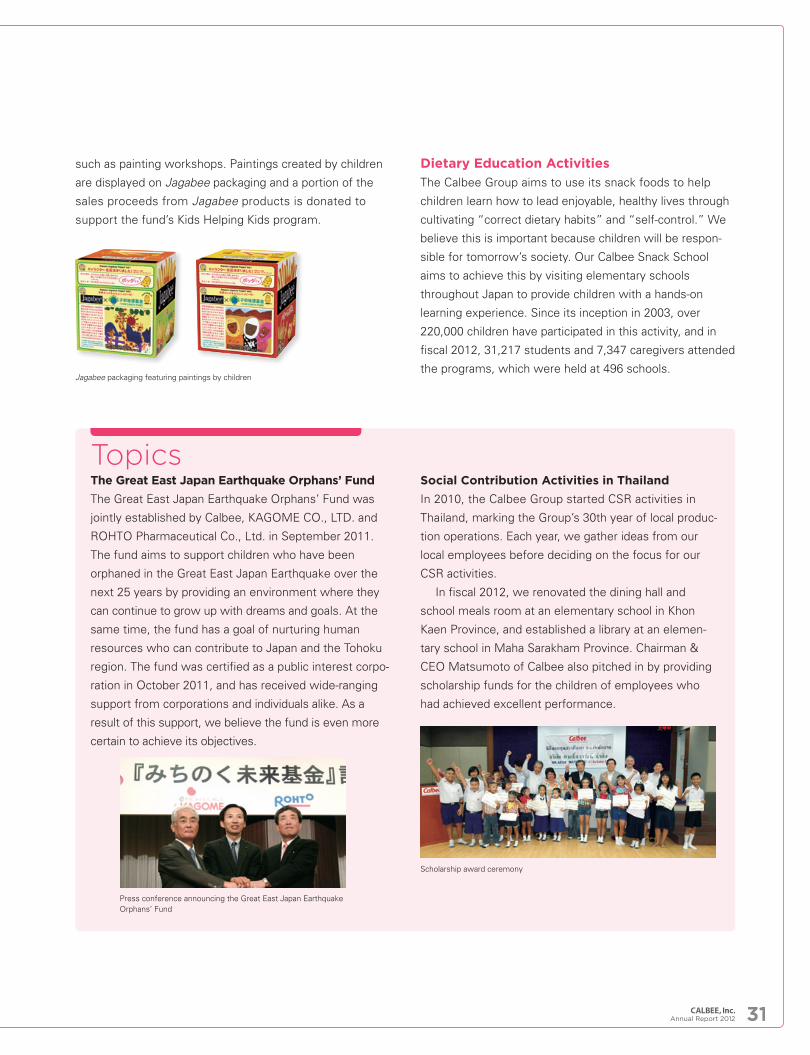
The Great East Japan Earthquake Orphans’ Fund
The Great East Japan Earthquake Orphans’ Fund was
jointly established by Calbee, KAGOME CO., LTD. and
ROHTO Pharmaceutical Co., Ltd. in September 2011.
The fund aims to support children who have been
orphaned in the Great East Japan Earthquake over the
next 25 years by providing an environment where they
can continue to grow up with dreams and goals. At the
same time, the fund has a goal of nurturing human
resources who can contribute to Japan and the Tohoku
region. The fund was certified as a public interest corpo-
ration in October 2011, and has received wide-ranging
support from corporations and individuals alike. As a
result of this support, we believe the fund is even more
certain to achieve its objectives.
such as painting workshops. Paintings created by children
are displayed on Jagabee packaging and a portion of the
sales proceeds from Jagabee products is donated to
support the fund’s Kids Helping Kids program.
Topics
Dietary Education Activities
The Calbee Group aims to use its snack foods to help
children learn how to lead enjoyable, healthy lives through
cultivating “correct dietary habits” and “self-control.” We
believe this is important because children will be respon-
sible for tomorrow’s society. Our Calbee Snack School
aims to achieve this by visiting elementary schools
throughout Japan to provide children with a hands-on
learning experience. Since its inception in 2003, over
220,000 children have participated in this activity, and in
fiscal 2012, 31,217 students and 7,347 caregivers attended
the programs, which were held at 496 schools.
Social Contribution Activities in Thailand
In 2010, the Calbee Group started CSR activities in
Thailand, marking the Group’s 30th year of local produc-
tion operations. Each year, we gather ideas from our
local employees before deciding on the focus for our
CSR activities.
In fiscal 2012, we renovated the dining hall and
school meals room at an elementary school in Khon
Kaen Province, and established a library at an elemen-
tary school in Maha Sarakham Province. Chairman &
CEO Matsumoto of Calbee also pitched in by providing
scholarship funds for the children of employees who
had achieved excellent performance.
Jagabee packaging featuring paintings by children
Press conference announcing the Great East Japan Earthquake Orphans’ Fund
Scholarship award ceremony
Annual Report 2012 31
PROMOTING DIVERSITY“Without diversity, Calbee no growth.” The Calbee
Group considers diversity to be an important manage-
ment strategy and is promoting employment and
deployment of diverse human resources.
Diversity Promotion Committee Initiatives
We established a Diversity Promotion Committee in April
2010. The committee is guided by the idea that a diverse
and enthusiastic workforce can energize a company. In
fiscal 2012, the committee vigorously pursued its objec-
tives for a second year with 28 members including employ-
ees from the production side. We also held lectures to
support creation of an environment that motivates female
employees and nurtures their career development. In
another initiative we held Diversity Forum 2011 with the
objective of providing an opportunity to deepen our
recognition and understanding of diversity.
Harnessing Diverse Human Resources
The Calbee Group is working to develop workplaces where
a diverse array of human resources, regardless of gender,
nationality or disability, can work while demonstrating their
respective abilities to the fullest.
Promoting Women’s Success in the Workforce
Currently, the ratio of female managers in the Calbee
Group stands at 10.2%, an increase from 5.9% in 2010.
The Group plans to increase this ratio to 15% over the
medium term and 40% over the long term. In fiscal 2012,
the Calbee Group held its first career development seminar
for female employees. Women often find it difficult to plan
their careers because of few role models and changes in
working styles due to major life events. Therefore, the
Calbee Group aims to continue providing opportunities for
women to plan and advance their careers.
Promoting Employment of People with Disabilities
The Calbee Group is implementing measures directed at
expanding employment of people with disabilities.
In November 2007, the Calbee Group established Calbee
Eatalk Co., Ltd. with the aim of creating a workplace where
anyone can unlock their full potential on the job, regardless
of disability, and also to promote the employment of
people with disabilities at other companies by organizing
tours and lecture events focused on these companies.
Through these measures, the Calbee Group achieved
an employment ratio for people with disabilities of 2.2%
in the fiscal year ended March 31, 2012. This was higher
than the 1.8% statutory employment ratio for people with
disabilities in Japan.
Recruitment of Foreign Nationals Expanded
Calbee seeks to energize its workplaces by embracing a
diverse array of cultures and values through the recruit-
ment of employees of various nationalities. Moreover,
Calbee has expanded recruitment of foreign nationals with
the view to driving future overseas business expansion. As
part of this drive, in fiscal 2012, Calbee recruited 5 interna-
tional students out of a total of 21 new graduate recruits.
The new foreign recruits represent a diverse spectrum
of nationalities, including China, Hong Kong and Malaysia.
Diversity Forum 2011
Production line at Calbee Eatalk Co., Ltd.
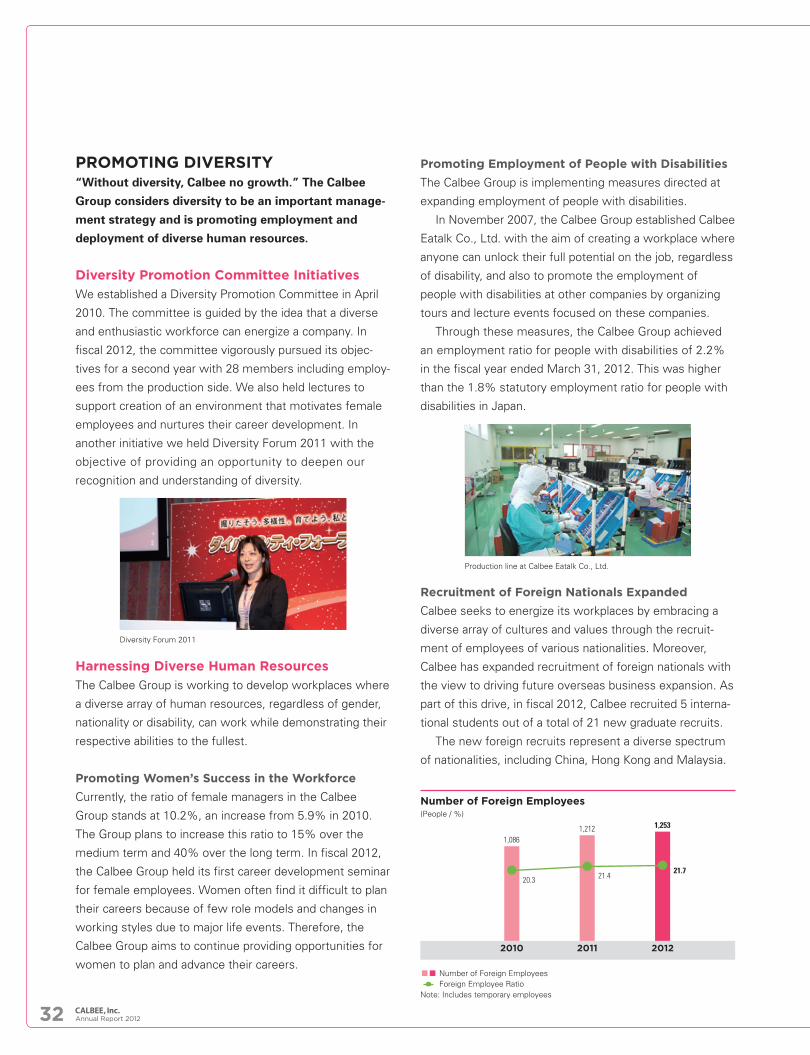
2010 2011 2012
1,0861,212 1,253
20.3 21.421.7
Number of Foreign Employees(People / %)
Number of Foreign Employees Foreign Employee Ratio Note: Includes temporary employees
Annual Report 201232
Using Resources Efficiently
Each Calbee factory is working to reduce waste such as
vegetable matter like potato skin and unusable potato parts
left over after the production process. To this end, each
factory is targeting 100% recovery of waste resources by
promoting zero emissions and recycling. Specific initiatives
include separating waste, limiting the creation of waste,
using leftover vegetable matter for animal feed, cleaning
effluent using microorganisms, and recycling used oils and
plastic packaging.
In fiscal 2012, the Group’s factories generated a com-
bined 42.2 thousand tons of waste, of which 40.6 thou-
sand tons were recycled. The recycling rate at the Group’s
15 main factories stood at 96.1%.
ENVIRONMENTAL INITIATIVESBasic Policy
Working to solve environmental issues, such as preventing
global warming and reducing waste, is a vital social quality
for companies that pursue sustainable development. In
order to minimize the impact of the Calbee Group’s prod-
ucts and business activities on the environment, we aim
to use natural resources efficiently, utilize recyclable
resources that are managed in a sustainable manner, and
reduce waste emission volume to zero. We are putting
priority on reducing CO2 emissions, water usage, and
waste as key areas specific to our business activities.
Combating Global Warming
The Calbee Group launched a CO2 Reduction Project in
2008 and is working to conserve energy and reduce
resource usage across the Group.
In our production activities, we compile and disclose
energy consumption for each processing line, make
improvements to production schedules, and with the aim
of fundamentally reducing energy usage, convert energy
sources to alternative fuels.
In our distribution and transport activities, we are
reviewing distribution routes, improving truck fuel efficiency,
and expanding the use of rail transport.
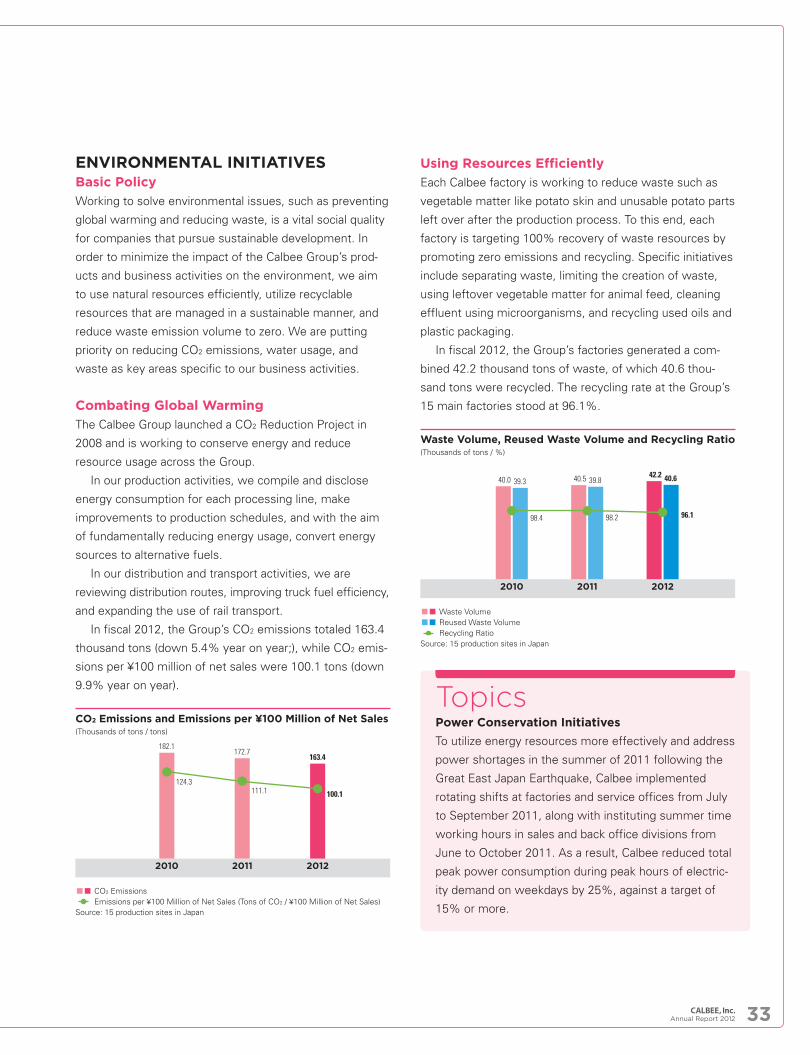
In fiscal 2012, the Group’s CO2 emissions totaled 163.4
thousand tons (down 5.4% year on year;), while CO2 emis-
sions per ¥100 million of net sales were 100.1 tons (down
9.9% year on year).
Power Conservation Initiatives
To utilize energy resources more effectively and address
power shortages in the summer of 2011 following the
Great East Japan Earthquake, Calbee implemented
rotating shifts at factories and service offices from July
to September 2011, along with instituting summer time
working hours in sales and back office divisions from
June to October 2011. As a result, Calbee reduced total
peak power consumption during peak hours of electric-
ity demand on weekdays by 25%, against a target of
15% or more.
Topics
2010 2011 2012
182.1172.7
163.4
124.3111.1 100.1
2010 2011 2012
40.0 40.5 42.239.3 39.8 40.6
98.4 98.2 96.1
CO2 Emissions and Emissions per ¥100 Million of Net Sales(Thousands of tons / tons)
Waste Volume, Reused Waste Volume and Recycling Ratio(Thousands of tons / %)
CO2 Emissions Emissions per ¥100 Million of Net Sales (Tons of CO2 / ¥100 Million of Net Sales) Source: 15 production sites in Japan
Waste Volume Reused Waste Volume Recycling Ratio Source: 15 production sites in Japan
Annual Report 2012 33
Basic Approach
As stated in our corporate philosophy, “We are committed
to harnessing nature’s gifts, to bringing taste and fun, and
to contributing to healthy lifestyles.” Based on this think-
ing, we aim to win the trust and meet the expectations of
shareholders, customers, business partners, local com-
munities, and all our other stakeholders, and increase cor-
porate value, which encompasses value for shareholders,
customers and employees. We believe reinforcing and
enhancing corporate governance plays an important role
in this process.
Matters Concerning Organizational Form and
Organizational Management
Organizational form Company with Board of Auditors
Directors Number of directors stipulated by the Articles of Incorporation
Up to 13
Number of directors (of which, outside directors) 7 (5)Term of office 2 years
Statutory auditors Number of auditors stipulated by the Articles of Incorporation
Up to 4
Number of auditors (of which, outside auditors) 4 (3)Term of office 4 years
Rights plan and other measures to protect against acquisition
None
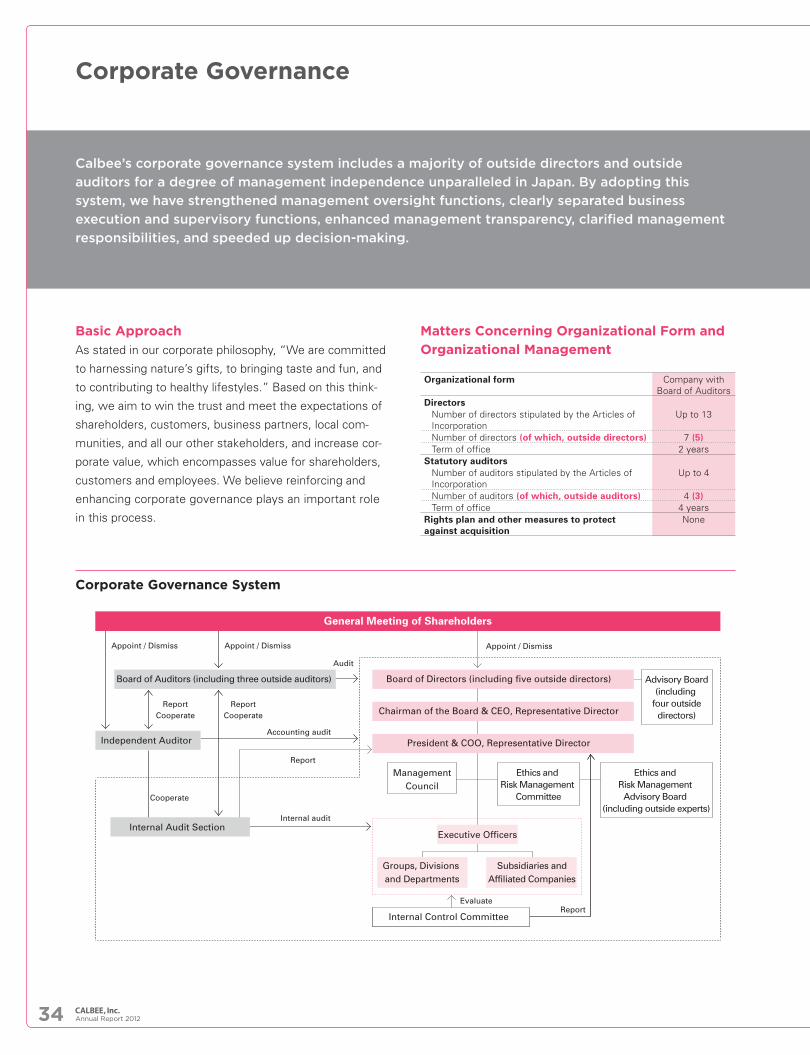
Corporate Governance System
Board of Directors (including five outside directors)
Chairman of the Board & CEO, Representative Director
President & COO, Representative Director
ManagementCouncil
Ethics and Risk Management
Committee
Ethics and Risk Management
Advisory Board (including outside experts)
Advisory Board(including
four outsidedirectors)
Executive Officers
Groups, Divisions and Departments
Subsidiaries andAffiliated Companies
Board of Auditors (including three outside auditors)
Independent Auditor
Internal Audit Section
Appoint / Dismiss Appoint / Dismiss Appoint / Dismiss
Audit
Internal Control Committee
ReportCooperate
ReportCooperate
Accounting audit
Cooperate
Report
Internal audit
ReportEvaluate
General Meeting of Shareholders
Corporate Governance
Calbee’s corporate governance system includes a majority of outside directors and outside
auditors for a degree of management independence unparalleled in Japan. By adopting this
system, we have strengthened management oversight functions, clearly separated business
execution and supervisory functions, enhanced management transparency, clarified management
responsibilities, and speeded up decision-making.
Annual Report 201234
Board of Directors and Business Execution
To enhance management transparency, we have appointed
outside directors with a high degree of independence and
introduced an executive officer system. This separation of
business execution and supervisory functions aimed at
actively strengthening the monitoring of the Board of
Directors is a key characteristic of the Calbee Group’s
corporate governance system.
The Board of Directors is comprised of two directors
and five outside directors. As a general rule, the board
meets once every month to discuss resolutions on matters
stipulated by law, formulate and make decisions on key
management policies and strategies, and supervise busi-
ness execution. All the outside directors have extensive
management experience and knowledge and perform a
business execution supervisory role from an independent
standpoint. In fiscal 2012, average attendance at board
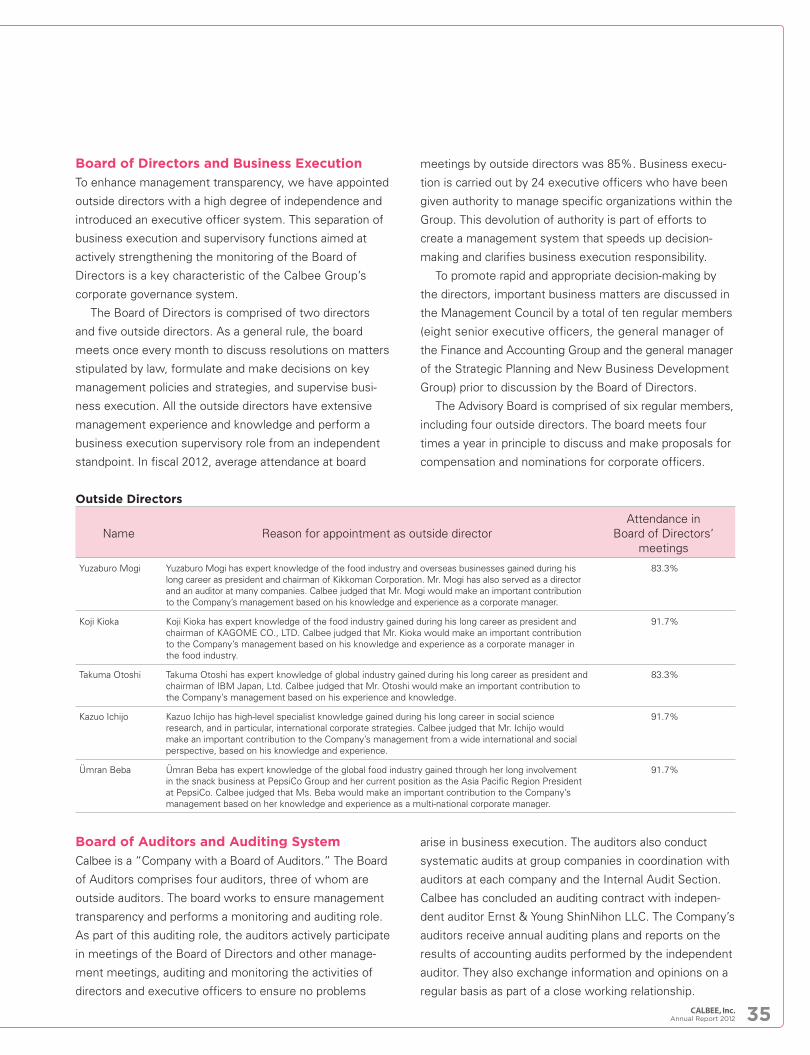
Outside Directors
Name Reason for appointment as outside directorAttendance in
Board of Directors’ meetings
Yuzaburo Mogi Yuzaburo Mogi has expert knowledge of the food industry and overseas businesses gained during his long career as president and chairman of Kikkoman Corporation. Mr. Mogi has also served as a director and an auditor at many companies. Calbee judged that Mr. Mogi would make an important contribution to the Company’s management based on his knowledge and experience as a corporate manager.
83.3%
Koji Kioka Koji Kioka has expert knowledge of the food industry gained during his long career as president and chairman of KAGOME CO., LTD. Calbee judged that Mr. Kioka would make an important contribution to the Company’s management based on his knowledge and experience as a corporate manager in the food industry.
91.7%
Takuma Otoshi Takuma Otoshi has expert knowledge of global industry gained during his long career as president and chairman of IBM Japan, Ltd. Calbee judged that Mr. Otoshi would make an important contribution to the Company’s management based on his experience and knowledge.
83.3%
Kazuo Ichijo Kazuo Ichijo has high-level specialist knowledge gained during his long career in social science research, and in particular, international corporate strategies. Calbee judged that Mr. Ichijo would make an important contribution to the Company’s management from a wide international and social perspective, based on his knowledge and experience.
91.7%
Ümran Beba Ümran Beba has expert knowledge of the global food industry gained through her long involvement in the snack business at PepsiCo Group and her current position as the Asia Pacific Region President at PepsiCo. Calbee judged that Ms. Beba would make an important contribution to the Company’s management based on her knowledge and experience as a multi-national corporate manager.
91.7%
Board of Auditors and Auditing System
Calbee is a “Company with a Board of Auditors.” The Board
of Auditors comprises four auditors, three of whom are
outside auditors. The board works to ensure management
transparency and performs a monitoring and auditing role.
As part of this auditing role, the auditors actively participate
in meetings of the Board of Directors and other manage-
ment meetings, auditing and monitoring the activities of
directors and executive officers to ensure no problems
arise in business execution. The auditors also conduct
systematic audits at group companies in coordination with
auditors at each company and the Internal Audit Section.
Calbee has concluded an auditing contract with indepen-
dent auditor Ernst & Young ShinNihon LLC. The Company’s
auditors receive annual auditing plans and reports on the
results of accounting audits performed by the independent
auditor. They also exchange information and opinions on a
regular basis as part of a close working relationship.
meetings by outside directors was 85%. Business execu-
tion is carried out by 24 executive officers who have been
given authority to manage specific organizations within the
Group. This devolution of authority is part of efforts to
create a management system that speeds up decision-
making and clarifies business execution responsibility.
To promote rapid and appropriate decision-making by
the directors, important business matters are discussed in
the Management Council by a total of ten regular members
(eight senior executive officers, the general manager of
the Finance and Accounting Group and the general manager
of the Strategic Planning and New Business Development
Group) prior to discussion by the Board of Directors.
The Advisory Board is comprised of six regular members,
including four outside directors. The board meets four
times a year in principle to discuss and make proposals for
compensation and nominations for corporate officers.
Annual Report 2012 35
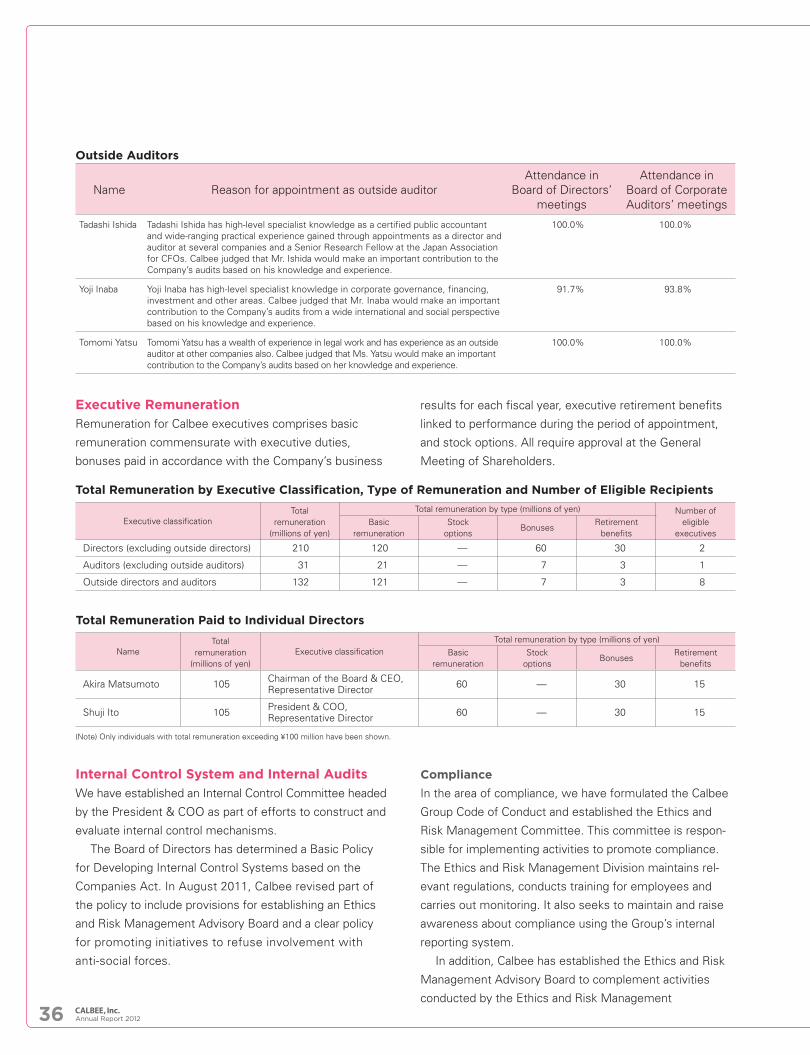
Outside Auditors
Name Reason for appointment as outside auditorAttendance in
Board of Directors’ meetings
Attendance in Board of Corporate Auditors’ meetings
Tadashi Ishida Tadashi Ishida has high-level specialist knowledge as a certified public accountant and wide-ranging practical experience gained through appointments as a director and auditor at several companies and a Senior Research Fellow at the Japan Association for CFOs. Calbee judged that Mr. Ishida would make an important contribution to the Company’s audits based on his knowledge and experience.
100.0% 100.0%
Yoji Inaba Yoji Inaba has high-level specialist knowledge in corporate governance, financing, investment and other areas. Calbee judged that Mr. Inaba would make an important contribution to the Company’s audits from a wide international and social perspective based on his knowledge and experience.
91.7% 93.8%
Tomomi Yatsu Tomomi Yatsu has a wealth of experience in legal work and has experience as an outside auditor at other companies also. Calbee judged that Ms. Yatsu would make an important contribution to the Company’s audits based on her knowledge and experience.
100.0% 100.0%
Executive Remuneration
Remuneration for Calbee executives comprises basic
remuneration commensurate with executive duties,
bonuses paid in accordance with the Company’s business
Internal Control System and Internal Audits
We have established an Internal Control Committee headed
by the President & COO as part of efforts to construct and
evaluate internal control mechanisms.
The Board of Directors has determined a Basic Policy
for Developing Internal Control Systems based on the
Companies Act. In August 2011, Calbee revised part of
the policy to include provisions for establishing an Ethics
and Risk Management Advisory Board and a clear policy
for promoting initiatives to refuse involvement with
anti-social forces.
Compliance
In the area of compliance, we have formulated the Calbee
Group Code of Conduct and established the Ethics and
Risk Management Committee. This committee is respon-
sible for implementing activities to promote compliance.
The Ethics and Risk Management Division maintains rel-
evant regulations, conducts training for employees and
carries out monitoring. It also seeks to maintain and raise
awareness about compliance using the Group’s internal
reporting system.
In addition, Calbee has established the Ethics and Risk
Management Advisory Board to complement activities
conducted by the Ethics and Risk Management
results for each fiscal year, executive retirement benefits
linked to performance during the period of appointment,
and stock options. All require approval at the General
Meeting of Shareholders.
Total Remuneration by Executive Classification, Type of Remuneration and Number of Eligible Recipients
Total Remuneration Paid to Individual Directors
Executive classificationTotal
remuneration (millions of yen)
Total remuneration by type (millions of yen) Number of eligible
executivesBasic
remunerationStock
optionsBonuses
Retirement benefits
Directors (excluding outside directors) 210 120 — 60 30 2
Auditors (excluding outside auditors) 31 21 — 7 3 1
Outside directors and auditors 132 121 — 7 3 8
NameTotal
remuneration (millions of yen)
Executive classificationTotal remuneration by type (millions of yen)
Basic remuneration
Stock options
BonusesRetirement
benefits
Akira Matsumoto 105 Chairman of the Board & CEO, Representative Director 60 — 30 15
Shuji Ito 105 President & COO, Representative Director 60 — 30 15
(Note) Only individuals with total remuneration exceeding ¥100 million have been shown.
Annual Report 201236
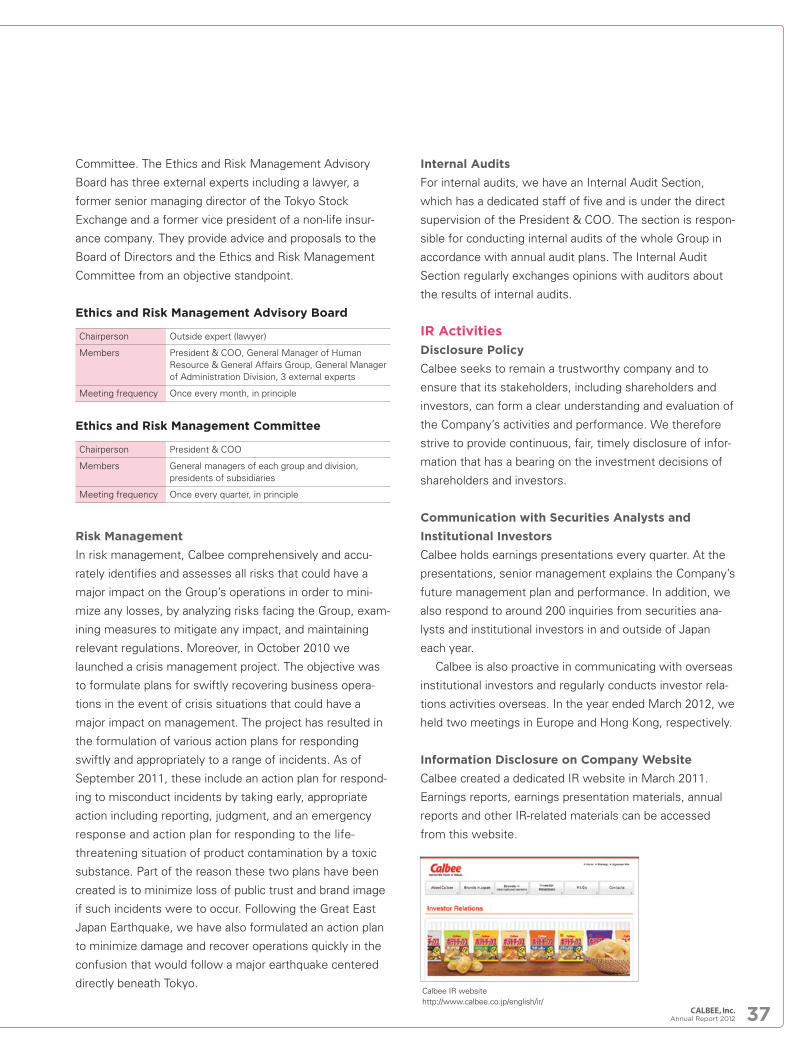
Committee. The Ethics and Risk Management Advisory
Board has three external experts including a lawyer, a
former senior managing director of the Tokyo Stock
Exchange and a former vice president of a non-life insur-
ance company. They provide advice and proposals to the
Board of Directors and the Ethics and Risk Management
Committee from an objective standpoint.
Ethics and Risk Management Advisory Board
Chairperson Outside expert (lawyer)
Members President & COO, General Manager of Human Resource & General Affairs Group, General Manager of Administration Division, 3 external experts
Meeting frequency Once every month, in principle
Ethics and Risk Management Committee
Chairperson President & COO
Members General managers of each group and division, presidents of subsidiaries
Meeting frequency Once every quarter, in principle
Risk Management
In risk management, Calbee comprehensively and accu-
rately identifies and assesses all risks that could have a
major impact on the Group’s operations in order to mini-
mize any losses, by analyzing risks facing the Group, exam-
ining measures to mitigate any impact, and maintaining
relevant regulations. Moreover, in October 2010 we
launched a crisis management project. The objective was
to formulate plans for swiftly recovering business opera-
tions in the event of crisis situations that could have a
major impact on management. The project has resulted in
the formulation of various action plans for responding
swiftly and appropriately to a range of incidents. As of
September 2011, these include an action plan for respond-
ing to misconduct incidents by taking early, appropriate
action including reporting, judgment, and an emergency
response and action plan for responding to the life-
threatening situation of product contamination by a toxic
substance. Part of the reason these two plans have been
created is to minimize loss of public trust and brand image
if such incidents were to occur. Following the Great East
Japan Earthquake, we have also formulated an action plan
to minimize damage and recover operations quickly in the
confusion that would follow a major earthquake centered
directly beneath Tokyo.
Internal Audits
For internal audits, we have an Internal Audit Section,
which has a dedicated staff of five and is under the direct
supervision of the President & COO. The section is respon-
sible for conducting internal audits of the whole Group in
accordance with annual audit plans. The Internal Audit
Section regularly exchanges opinions with auditors about
the results of internal audits.
IR Activities
Disclosure Policy
Calbee seeks to remain a trustworthy company and to
ensure that its stakeholders, including shareholders and
investors, can form a clear understanding and evaluation of
the Company’s activities and performance. We therefore
strive to provide continuous, fair, timely disclosure of infor-
mation that has a bearing on the investment decisions of
shareholders and investors.
Communication with Securities Analysts and
Institutional Investors
Calbee holds earnings presentations every quarter. At the
presentations, senior management explains the Company’s
future management plan and performance. In addition, we
also respond to around 200 inquiries from securities ana-
lysts and institutional investors in and outside of Japan
each year.
Calbee is also proactive in communicating with overseas
institutional investors and regularly conducts investor rela-
tions activities overseas. In the year ended March 2012, we
held two meetings in Europe and Hong Kong, respectively.
Information Disclosure on Company Website
Calbee created a dedicated IR website in March 2011.
Earnings reports, earnings presentation materials, annual
reports and other IR-related materials can be accessed
from this website.
Calbee IR websitehttp://www.calbee.co.jp/english/ir/
Annual Report 2012 37
An Outside Director’s View
PepsiCo formed its alliance with Calbee because of Calbee’s powerful innovation capabilities, the prospect for international collaboration, and Calbee’s leadership in the Japanese market. Effective corporate governance is vital to maximizing these strengths for the benefit of Calbee’s shareholders.
Ümran Beba Director, Asia Pacific Region President, PepsiCo, Inc.
As an outside director, my role is to help Calbee achieve growth in Japan and internationally. I strive to seek win-win propositions that increase value for Calbee’s shareholders. Corporate governance is a vital part of ensuring that Calbee can realize these aspirations.
With five of the seven Calbee directors being outside directors, the Company has a good base from which to develop a strong corporate gover-nance culture. Importantly, the board includes people from various industries, people with international business experience, and a female director. I would like to see the gender ratio improve in future.
Bringing in Akira Matsumoto as the Chairman of the Board & CEO was an important step in Calbee’s progress from a family company to a public company. He has a lot of professional management experience, and is showing strong leadership in changing the dynamics of the company to suit its new status. In my experience, Mr. Matsumoto and the President & COO, Mr. Ito, are both very receptive to input from the outside directors. I would like to see the Company work on its bench-building process to ensure good continuity in management.
The next step in Calbee’s journey, I believe, is building strong corporate governance into the Company culture so that everyone understands the impact of their actions. Solid corporate governance is not the function of finance or the function of committees; rather, it’s the function of everybody with proportional ownership.
By promoting a fair and transparent governance structure, we aim to further enhance corporate value.
Koji KiokaCorporate Adviser, KAGOME CO., LTD.
The Board of Directors comprises two in-house directors and five highly inde-pendent outside directors. Calbee adopted this structure in 2009, before its shares were listed. It was unusual at the time for an unlisted company to have such a rigorous corporate governance structure. Although dramatic reforms to the corporate governance system carried some risks, I believe that Calbee has made strong progress in managing them and progressing toward fair, transparent, and innovative management. The Company faced a tough business climate in fiscal 2012, the first full fiscal year after listing, because of the impact of the Great East Japan Earthquake. I believe, however, that overall the Company has handled the challenges well, recovering from the disaster, turning business performance around, and providing support to affected areas. Some Japanese corporations have greatly damaged their corporate value because of their unsound governance systems. In contrast, Calbee is noteworthy for having increased its corporate value in the past three years.
I attribute that achievement to well-balanced leadership by the CEO, who was a senior executive at foreign companies for many years, and the COO, who has been with Calbee for his entire career and who has built strong, trust relationships internally and externally. The outside directors all deliberate and propose ideas from different perspectives based on their management experience and expertise, and the Board of Directors provides sound supervision of management. The members of the Board of Auditors are also performing their duties in full, as they use their specialist knowledge and capabilities to evaluate management transparency, decision-making processes, and other aspects of management.
I look for the Company to further enhance corporate value by continuing to progress with its sound governance structure.
Annual Report 201238
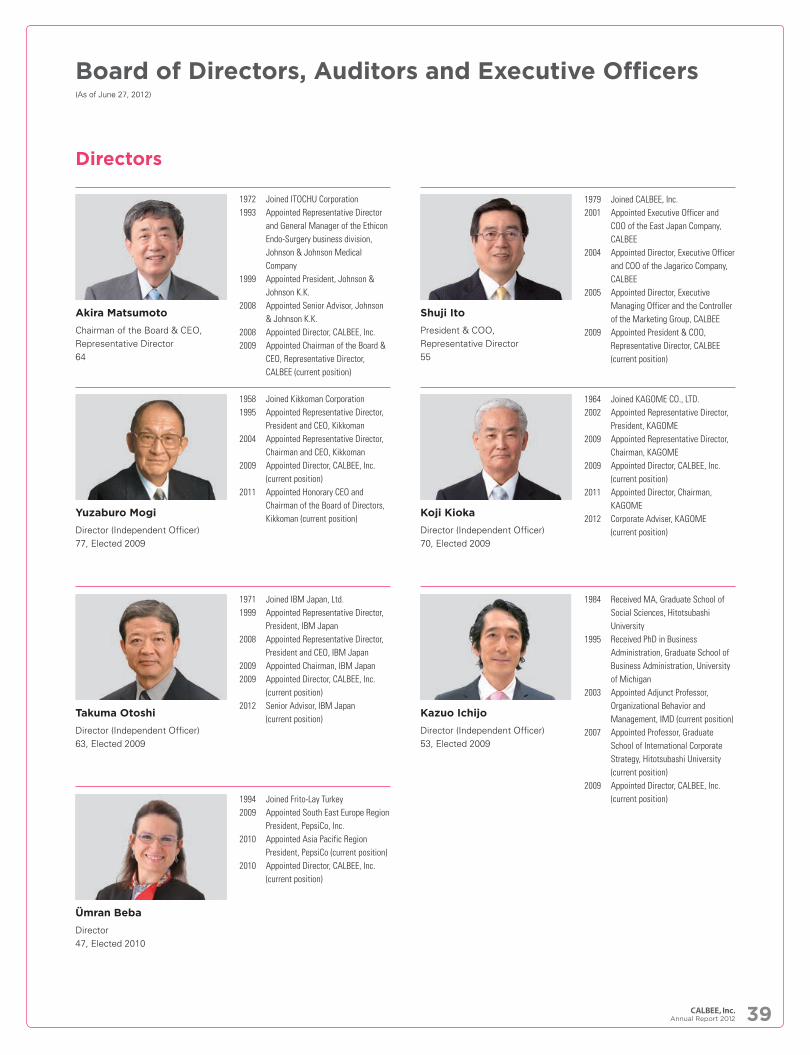
Yuzaburo Mogi
Director (Independent Officer)77, Elected 2009
Akira Matsumoto
Chairman of the Board & CEO, Representative Director 64
Shuji Ito
President & COO, Representative Director 55
Takuma Otoshi
Director (Independent Officer)63, Elected 2009
Kazuo Ichijo
Director (Independent Officer)53, Elected 2009
Ümran Beba
Director47, Elected 2010
Koji Kioka
Director (Independent Officer)70, Elected 2009
1972 Joined ITOCHU Corporation1993 Appointed Representative Director
and General Manager of the Ethicon Endo-Surgery business division, Johnson & Johnson Medical Company
1999 Appointed President, Johnson & Johnson K.K.
2008 Appointed Senior Advisor, Johnson & Johnson K.K.
2008 Appointed Director, CALBEE, Inc.2009 Appointed Chairman of the Board &
CEO, Representative Director, CALBEE (current position)
1971 Joined IBM Japan, Ltd.1999 Appointed Representative Director,
President, IBM Japan2008 Appointed Representative Director,
President and CEO, IBM Japan2009 Appointed Chairman, IBM Japan2009 Appointed Director, CALBEE, Inc.
(current position)2012 Senior Advisor, IBM Japan
(current position)
1984 Received MA, Graduate School of Social Sciences, Hitotsubashi University
1995 Received PhD in Business Administration, Graduate School of Business Administration, University of Michigan
2003 Appointed Adjunct Professor, Organizational Behavior and Management, IMD (current position)
2007 Appointed Professor, Graduate School of International Corporate Strategy, Hitotsubashi University (current position)
2009 Appointed Director, CALBEE, Inc. (current position)1994 Joined Frito-Lay Turkey
2009 Appointed South East Europe Region President, PepsiCo, Inc.
2010 Appointed Asia Pacific Region President, PepsiCo (current position)
2010 Appointed Director, CALBEE, Inc. (current position)
1964 Joined KAGOME CO., LTD.2002 Appointed Representative Director,
President, KAGOME2009 Appointed Representative Director,
Chairman, KAGOME2009 Appointed Director, CALBEE, Inc.
(current position)2011 Appointed Director, Chairman,
KAGOME2012 Corporate Adviser, KAGOME
(current position)
1979 Joined CALBEE, Inc.2001 Appointed Executive Officer and
COO of the East Japan Company, CALBEE
2004 Appointed Director, Executive Officer and COO of the Jagarico Company, CALBEE
2005 Appointed Director, Executive Managing Officer and the Controller of the Marketing Group, CALBEE
2009 Appointed President & COO, Representative Director, CALBEE (current position)
Board of Directors, Auditors and Executive Officers(As of June 27, 2012)
Directors
1958 Joined Kikkoman Corporation1995 Appointed Representative Director,
President and CEO, Kikkoman2004 Appointed Representative Director,
Chairman and CEO, Kikkoman2009 Appointed Director, CALBEE, Inc.
(current position)2011 Appointed Honorary CEO and
Chairman of the Board of Directors, Kikkoman (current position)
Annual Report 2012 39
Executive Vice Presidents
Takayoshi Naganuma
Haruhiko Sekiguchi
Executive Managing Officer
Masatoshi AkiGeneral Manager of R&D Group
Senior Executive Officers
Shoji TobayamaGeneral Manager of Human Resource and General Affairs Group
Makoto EharaPresident & Representative Director of Japan Frito-Lay Ltd.
Takeshi TaniguchiGeneral Manager of Operation Group
Executive Officers
Naoya IwasakiGeneral Manager of Hokkaido Division
Masakazu FujiiGeneral Manager of East Japan Division
Yoshihiko HosokawaGeneral Manager of Central Japan Division
Masaru KomadaGeneral Manager of West Japan Division
Hideki IshibeGeneral Manager of Sales Group
Hiroaki YamasakiGeneral Manager of Marketing Group
Hideo AbeGeneral Manager of Engineering Department
Akira ImotoGeneral Manager of Quality Assurance Group
Koichi KikuchiGeneral Manager of Finance and Accounting Group
Yasuyuki KajiganoGeneral Manager of Information System Group
Kaoru IshigakiGeneral Manager of Administration Division
Satoshi EguchiGeneral Manager of Strategic Planning and New Business Development Group
Yasuhide HayashiGeneral Manager of Overseas Business Division I
Seishi UenoGeneral Manager of Overseas Business Division II
Yutaka Okabe
General Manager of Overseas Business Division III
Naosuke Takaoka
President & Representative Director of Oisia FOODS CO., LTD.
Yoji Inaba
Statutory Auditor (Independent Officer)63, Elected 2007
Tadashi Ishida
Statutory Auditor (Independent Officer)68, Elected 2011
Isao Hirakawa
Statutory Auditor56, Elected 2012
Tomomi Yatsu
Statutory Auditor (Independent Officer)52, Elected 2009
1973 Joined Japan Development Bank (now Development Bank of Japan)
1986 Appointed Senior Economist, Energy Economics Analysis Division, OECD/IEA
1994 Appointed Washington Bureau Chief, Japan Development Bank
1997 Appointed Executive Director, The Japan Economic Research Institute
1997 Appointed Specialist, Electricity Industry Advisory Board, Ministry of International Trade and Industry
2003 Appointed Professor, Faculty of Law, Nihon University (current position)
2007 Appointed Statutory Auditor, CALBEE, Inc. (current position)
1974 Joined Arthur Young, Tokyo Office1980 Joined Asahi & Co. (now KPMG
AZSA LLC)1980 Registered as Certified Public
Accountant (Japan)2003 Appointed CFO & Executive Vice
President, McDonald’s Co. (Japan), Ltd.
2011 Appointed Statutory Auditor, CALBEE, Inc. (current position)
1986 Joined Sanwa-Tohmatsu Aoki (now Deloitte Touche Tohmatsu LLC)
1990 Registered as Certified Public Accountant
2001 Registered as Attorney-at-Law2001 Joined New Tokyo International Law
Office (now Bingham McCutchen Murase, Sakai Mimura Aizawa — Foreign Law Joint Enterprise)
2007 Appointed Partner, Sakai Mimura Aizawa — Foreign Law Joint Enterprise (current position)
2009 Appointed Statutory Auditor, CALBEE, Inc. (current position)
1980 Joined Kanebo, Ltd.2006 Appointed Administrative
Management Director, Kanebo2008 Appointed Executive Officer and
Chief Financial Officer, CALBEE, Inc.2010 Appointed Executive Officer and
General Manager of Finance & Accounting Group, CALBEE
2012 Appointed Statutory Auditor, CALBEE (current position)
Auditors
Executive Officers
Annual Report 201240
Financial Section
Contents
42 Financial Highlights
43 Management’s Discussion and Analysis
47 Business Risks
50 Consolidated Balance Sheets
52 Consolidated Statements of Income
52 Consolidated Statements of Comprehensive Income
53 Consolidated Statements of Changes in Net Assets
54 Consolidated Statements of Cash Flows
55 Notes to Consolidated Financial Statements
82 Independent Auditor’s Report
Annual Report 2012 41
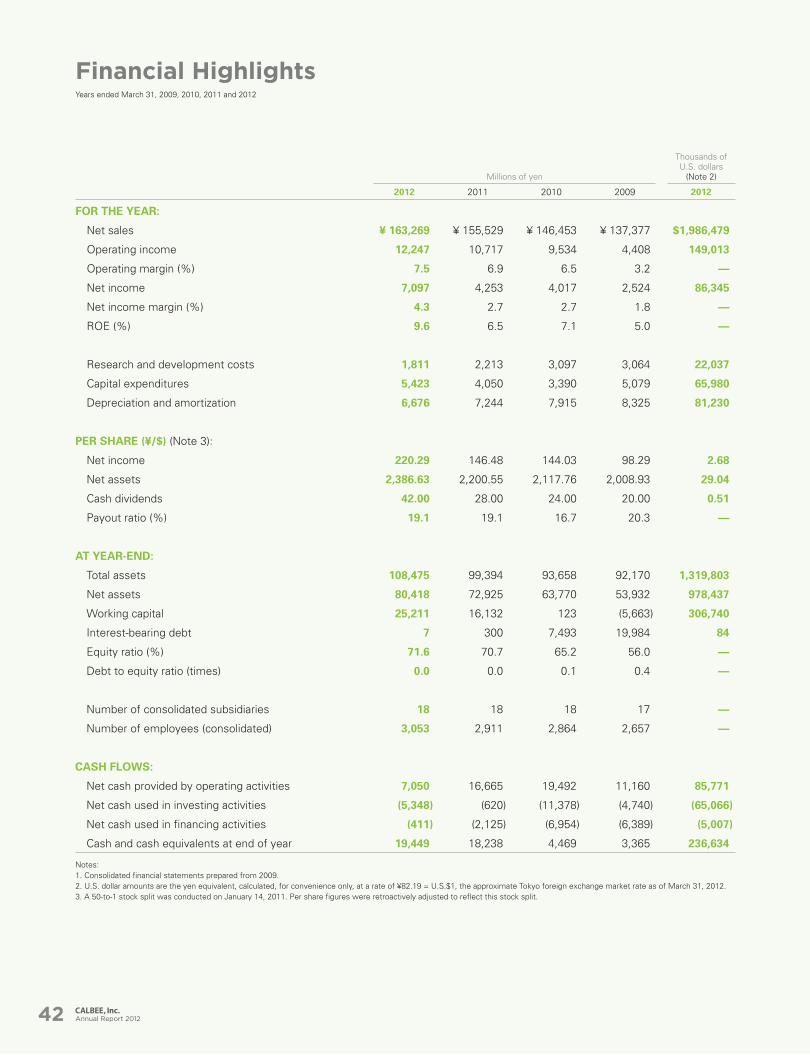
Millions of yen
Thousands of U.S. dollars
(Note 2)
2012 2011 2010 2009 2012
FOR THE YEAR:
Net sales ¥ 163,269 ¥ 155,529 ¥ 146,453 ¥ 137,377 $1,986,479
Operating income 12,247 10,717 9,534 4,408 149,013
Operating margin (%) 7.5 6.9 6.5 3.2 —
Net income 7,097 4,253 4,017 2,524 86,345
Net income margin (%) 4.3 2.7 2.7 1.8 —
ROE (%) 9.6 6.5 7.1 5.0 —
Research and development costs 1,811 2,213 3,097 3,064 22,037
Capital expenditures 5,423 4,050 3,390 5,079 65,980
Depreciation and amortization 6,676 7,244 7,915 8,325 81,230
PER SHARE (¥/$) (Note 3):
Net income 220.29 146.48 144.03 98.29 2.68
Net assets 2,386.63 2,200.55 2,117.76 2,008.93 29.04
Cash dividends 42.00 28.00 24.00 20.00 0.51
Payout ratio (%) 19.1 19.1 16.7 20.3 —
AT YEAR-END:
Total assets 108,475 99,394 93,658 92,170 1,319,803
Net assets 80,418 72,925 63,770 53,932 978,437
Working capital 25,211 16,132 123 (5,663) 306,740
Interest-bearing debt 7 300 7,493 19,984 84
Equity ratio (%) 71.6 70.7 65.2 56.0 —
Debt to equity ratio (times) 0.0 0.0 0.1 0.4 —
Number of consolidated subsidiaries 18 18 18 17 —
Number of employees (consolidated) 3,053 2,911 2,864 2,657 —
CASH FLOWS:
Net cash provided by operating activities 7,050 16,665 19,492 11,160 85,771
Net cash used in investing activities (5,348) (620) (11,378) (4,740) (65,066)
Net cash used in financing activities (411) (2,125) (6,954) (6,389) (5,007)
Cash and cash equivalents at end of year 19,449 18,238 4,469 3,365 236,634
Notes:1. Consolidated financial statements prepared from 2009.2. U.S. dollar amounts are the yen equivalent, calculated, for convenience only, at a rate of ¥82.19 = U.S.$1, the approximate Tokyo foreign exchange market rate as of March 31, 2012.3. A 50-to-1 stock split was conducted on January 14, 2011. Per share figures were retroactively adjusted to reflect this stock split.
Financial HighlightsYears ended March 31, 2009, 2010, 2011 and 2012
Annual Report 201242
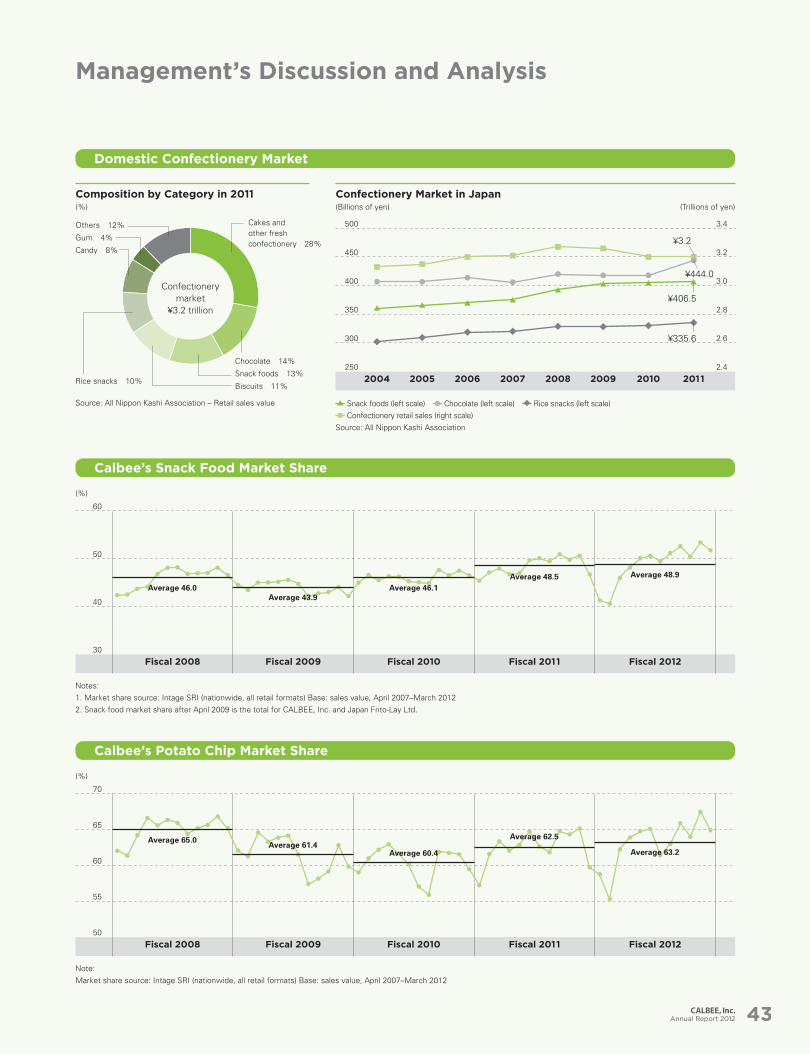
30
60
50
40
Fiscal 2008 Fiscal 2009 Fiscal 2010 Fiscal 2011 Fiscal 2012
50
70
65
60
55
Fiscal 2008 Fiscal 2009 Fiscal 2010 Fiscal 2011 Fiscal 2012
250
500
450
400
350
300
2.4
3.4
3.2
3.0
2.8
2.6
20052004 2006 2007 2008 2009 2010 2011
Notes:1. Market share source: Intage SRI (nationwide, all retail formats) Base: sales value, April 2007–March 20122. Snack food market share after April 2009 is the total for CALBEE, Inc. and Japan Frito-Lay Ltd.
Note:Market share source: Intage SRI (nationwide, all retail formats) Base: sales value, April 2007–March 2012
(%)
(%)
Domestic Confectionery Market
Calbee’s Snack Food Market Share
Calbee’s Potato Chip Market Share
Composition by Category in 2011(%)
Confectionery Market in Japan(Billions of yen) (Trillions of yen)
Source: All Nippon Kashi Association – Retail sales value Snack foods (left scale) Chocolate (left scale) Rice snacks (left scale) Confectionery retail sales (right scale)
Source: All Nippon Kashi Association
¥3.2
¥444.0
¥406.5
¥335.6
Cakes and other fresh confectionery 28%
Chocolate 14%
Snack foods 13%
Biscuits 11%Rice snacks 10%
Candy 8%
Gum 4%
Others 12%
Confectionery market
¥3.2 trillion
Management’s Discussion and Analysis
Average 46.0
Average 65.0
Average 43.9
Average 61.4
Average 46.1
Average 60.4
Average 48.5
Average 62.5
Average 48.9
Average 63.2
Annual Report 2012 43
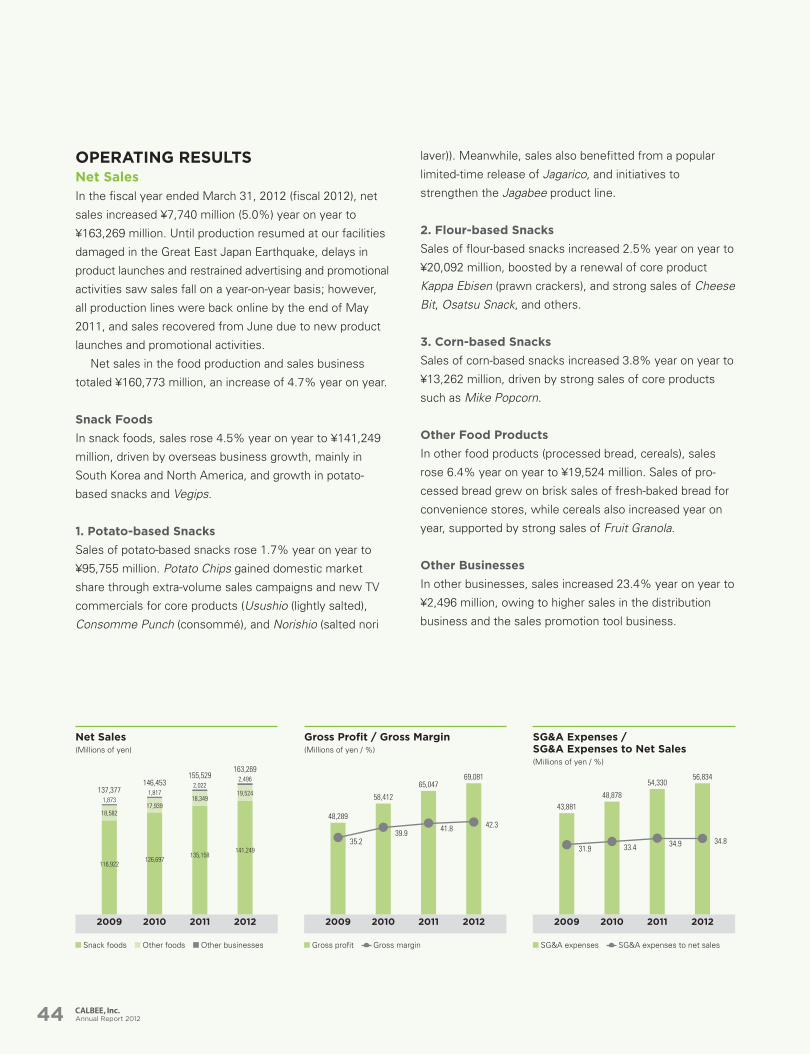
OPERATING RESULTSNet Sales
In the fiscal year ended March 31, 2012 (fiscal 2012), net
sales increased ¥7,740 million (5.0%) year on year to
¥163,269 million. Until production resumed at our facilities
damaged in the Great East Japan Earthquake, delays in
product launches and restrained advertising and promotional
activities saw sales fall on a year-on-year basis; however,
all production lines were back online by the end of May
2011, and sales recovered from June due to new product
launches and promotional activities.
Net sales in the food production and sales business
totaled ¥160,773 million, an increase of 4.7% year on year.
Snack Foods
In snack foods, sales rose 4.5% year on year to ¥141,249
million, driven by overseas business growth, mainly in
South Korea and North America, and growth in potato-
based snacks and Vegips.
1. Potato-based Snacks
Sales of potato-based snacks rose 1.7% year on year to
¥95,755 million. Potato Chips gained domestic market
share through extra-volume sales campaigns and new TV
commercials for core products (Usushio (lightly salted),
Consomme Punch (consommé), and Norishio (salted nori
laver)). Meanwhile, sales also benefitted from a popular
limited-time release of Jagarico, and initiatives to
strengthen the Jagabee product line.
2. Flour-based Snacks
Sales of flour-based snacks increased 2.5% year on year to
¥20,092 million, boosted by a renewal of core product
Kappa Ebisen (prawn crackers), and strong sales of Cheese
Bit, Osatsu Snack, and others.
3. Corn-based Snacks
Sales of corn-based snacks increased 3.8% year on year to
¥13,262 million, driven by strong sales of core products
such as Mike Popcorn.
Other Food Products
In other food products (processed bread, cereals), sales
rose 6.4% year on year to ¥19,524 million. Sales of pro-
cessed bread grew on brisk sales of fresh-baked bread for
convenience stores, while cereals also increased year on
year, supported by strong sales of Fruit Granola.
Other Businesses
In other businesses, sales increased 23.4% year on year to
¥2,496 million, owing to higher sales in the distribution
business and the sales promotion tool business.
20102009 2011 2012
1,8171,873
2,0222,496
17,93918,582
18,34919,524
126,697116,922
135,158141,249
146,453137,377
155,529163,269
2010 2011 20122009
58,412
65,04769,081
48,289
39.935.2
41.8 42.3
2010 2011 20122009
48,878
54,33056,834
43,881
33.431.934.9 34.8
Net Sales(Millions of yen)
Gross Profit / Gross Margin(Millions of yen / %)
SG&A Expenses / SG&A Expenses to Net Sales(Millions of yen / %)
Gross profit Gross margin Snack foods Other foods Other businesses SG&A expenses SG&A expenses to net sales
Annual Report 201244
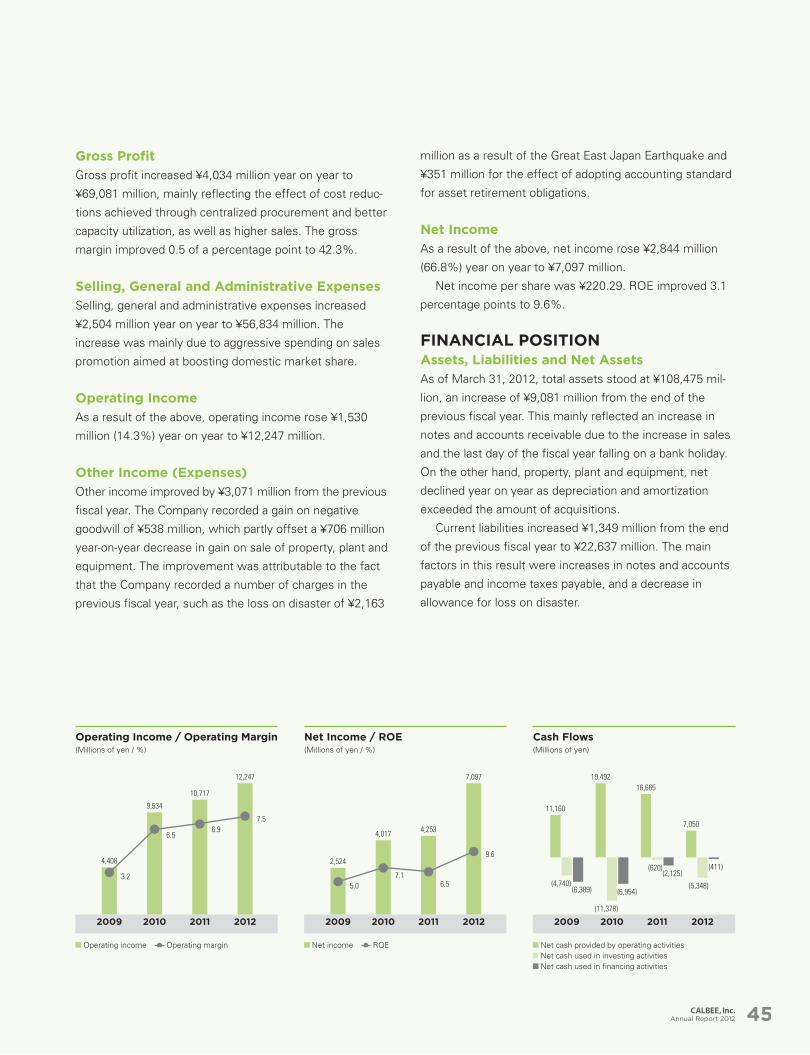
Gross Profit
Gross profit increased ¥4,034 million year on year to
¥69,081 million, mainly reflecting the effect of cost reduc-
tions achieved through centralized procurement and better
capacity utilization, as well as higher sales. The gross
margin improved 0.5 of a percentage point to 42.3%.
Selling, General and Administrative Expenses
Selling, general and administrative expenses increased
¥2,504 million year on year to ¥56,834 million. The
increase was mainly due to aggressive spending on sales
promotion aimed at boosting domestic market share.
Operating Income
As a result of the above, operating income rose ¥1,530
million (14.3%) year on year to ¥12,247 million.
Other Income (Expenses)
Other income improved by ¥3,071 million from the previous
fiscal year. The Company recorded a gain on negative
goodwill of ¥538 million, which partly offset a ¥706 million
year-on-year decrease in gain on sale of property, plant and
equipment. The improvement was attributable to the fact
that the Company recorded a number of charges in the
previous fiscal year, such as the loss on disaster of ¥2,163
million as a result of the Great East Japan Earthquake and
¥351 million for the effect of adopting accounting standard
for asset retirement obligations.
Net Income
As a result of the above, net income rose ¥2,844 million
(66.8%) year on year to ¥7,097 million.
Net income per share was ¥220.29. ROE improved 3.1
percentage points to 9.6%.
FINANCIAL POSITIONAssets, Liabilities and Net Assets
As of March 31, 2012, total assets stood at ¥108,475 mil-
lion, an increase of ¥9,081 million from the end of the
previous fiscal year. This mainly reflected an increase in
notes and accounts receivable due to the increase in sales
and the last day of the fiscal year falling on a bank holiday.
On the other hand, property, plant and equipment, net
declined year on year as depreciation and amortization
exceeded the amount of acquisitions.
Current liabilities increased ¥1,349 million from the end
of the previous fiscal year to ¥22,637 million. The main
factors in this result were increases in notes and accounts
payable and income taxes payable, and a decrease in
allowance for loss on disaster.
2010 2011 20122009
9,534
10,717
12,247
4,408
6.5
3.2
6.97.5
20102009 2011 2012
11,160
(4,740)(6,389)
19,492
(11,378)
(6,954)
16,665
(620)(2,125)
7,050
(5,348)
(411)
2010 2011 20122009
4,017 4,253
7,097
2,524
7.15.0 6.5
9.6
Operating Income / Operating Margin(Millions of yen / %)
Net Income / ROE(Millions of yen / %)
Cash Flows(Millions of yen)
Net income ROE Operating income Operating margin Net cash provided by operating activities Net cash used in investing activities Net cash used in financing activities
Annual Report 2012 45
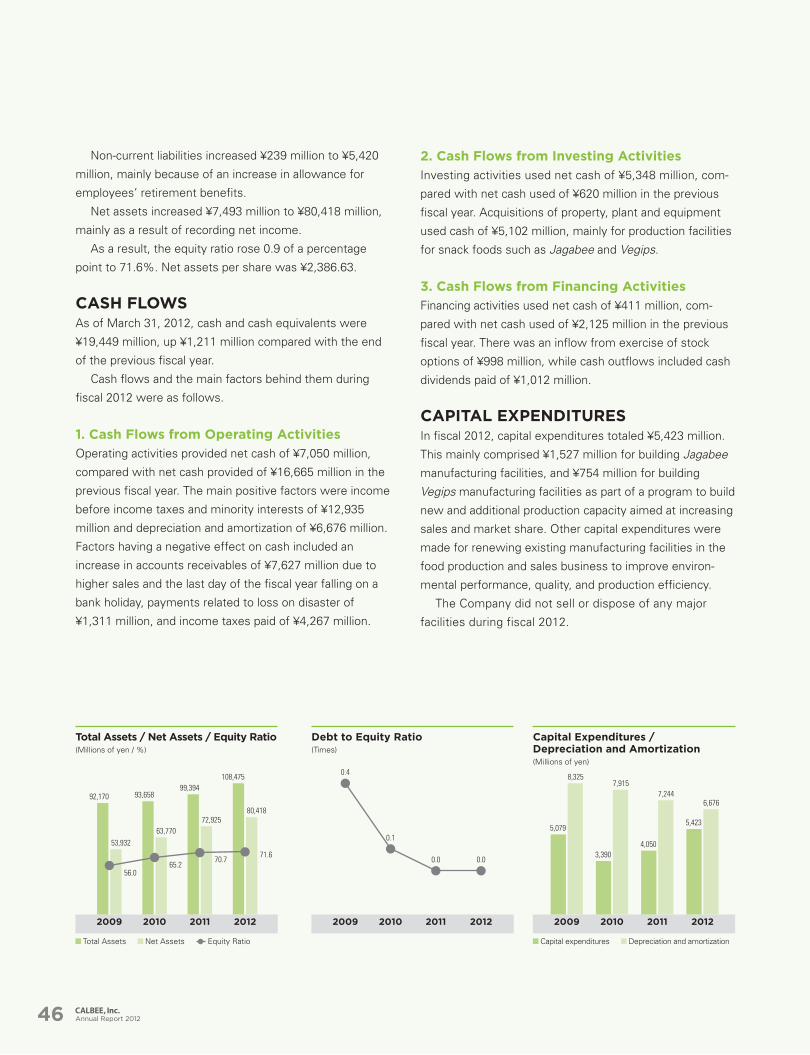
Non-current liabilities increased ¥239 million to ¥5,420
million, mainly because of an increase in allowance for
employees’ retirement benefits.
Net assets increased ¥7,493 million to ¥80,418 million,
mainly as a result of recording net income.
As a result, the equity ratio rose 0.9 of a percentage
point to 71.6%. Net assets per share was ¥2,386.63.
CASH FLOWSAs of March 31, 2012, cash and cash equivalents were
¥19,449 million, up ¥1,211 million compared with the end
of the previous fiscal year.
Cash flows and the main factors behind them during
fiscal 2012 were as follows.
1. Cash Flows from Operating Activities
Operating activities provided net cash of ¥7,050 million,
compared with net cash provided of ¥16,665 million in the
previous fiscal year. The main positive factors were income
before income taxes and minority interests of ¥12,935
million and depreciation and amortization of ¥6,676 million.
Factors having a negative effect on cash included an
increase in accounts receivables of ¥7,627 million due to
higher sales and the last day of the fiscal year falling on a
bank holiday, payments related to loss on disaster of
¥1,311 million, and income taxes paid of ¥4,267 million.
2. Cash Flows from Investing Activities
Investing activities used net cash of ¥5,348 million, com-
pared with net cash used of ¥620 million in the previous
fiscal year. Acquisitions of property, plant and equipment
used cash of ¥5,102 million, mainly for production facilities
for snack foods such as Jagabee and Vegips.
3. Cash Flows from Financing Activities
Financing activities used net cash of ¥411 million, com-
pared with net cash used of ¥2,125 million in the previous
fiscal year. There was an inflow from exercise of stock
options of ¥998 million, while cash outflows included cash
dividends paid of ¥1,012 million.
CAPITAL EXPENDITURESIn fiscal 2012, capital expenditures totaled ¥5,423 million.
This mainly comprised ¥1,527 million for building Jagabee
manufacturing facilities, and ¥754 million for building
Vegips manufacturing facilities as part of a program to build
new and additional production capacity aimed at increasing
sales and market share. Other capital expenditures were
made for renewing existing manufacturing facilities in the
food production and sales business to improve environ-
mental performance, quality, and production efficiency.
The Company did not sell or dispose of any major
facilities during fiscal 2012.
20102009 2011 2012
3,390
5,079
4,050
5,423
7,9158,325
7,2446,676
2010 2011 20122009
93,65892,17099,394
108,475
63,77053,932
72,92580,418
65.256.0
70.771.6
2010 2011 20122009
0.1
0.0 0.0
0.4
Capital Expenditures / Depreciation and Amortization(Millions of yen)
Capital expenditures Depreciation and amortization
Total Assets / Net Assets / Equity Ratio(Millions of yen / %)
Total Assets Net Assets Equity Ratio
Debt to Equity Ratio(Times)
Annual Report 201246
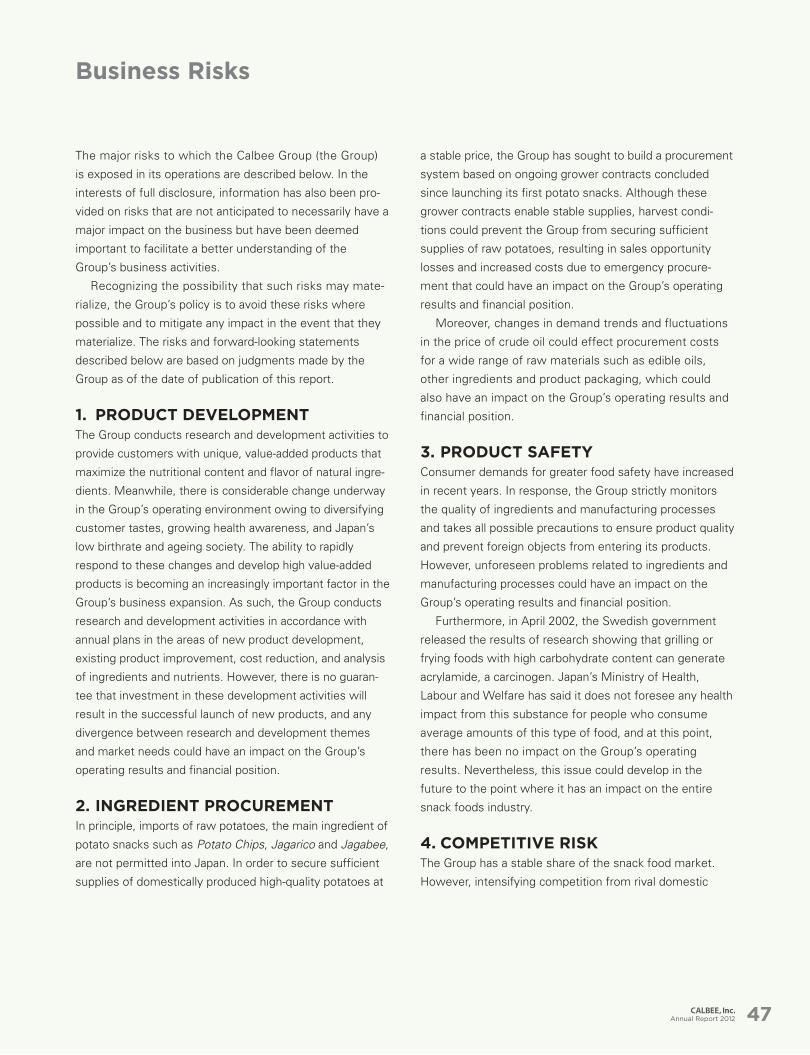
The major risks to which the Calbee Group (the Group)
is exposed in its operations are described below. In the
interests of full disclosure, information has also been pro-
vided on risks that are not anticipated to necessarily have a
major impact on the business but have been deemed
important to facilitate a better understanding of the
Group’s business activities.
Recognizing the possibility that such risks may mate-
rialize, the Group’s policy is to avoid these risks where
possible and to mitigate any impact in the event that they
materialize. The risks and forward-looking statements
described below are based on judgments made by the
Group as of the date of publication of this report.
1. PRODUCT DEVELOPMENTThe Group conducts research and development activities to
provide customers with unique, value-added products that
maximize the nutritional content and flavor of natural ingre-
dients. Meanwhile, there is considerable change underway
in the Group’s operating environment owing to diversifying
customer tastes, growing health awareness, and Japan’s
low birthrate and ageing society. The ability to rapidly
respond to these changes and develop high value-added
products is becoming an increasingly important factor in the
Group’s business expansion. As such, the Group conducts
research and development activities in accordance with
annual plans in the areas of new product development,
existing product improvement, cost reduction, and analysis
of ingredients and nutrients. However, there is no guaran-
tee that investment in these development activities will
result in the successful launch of new products, and any
divergence between research and development themes
and market needs could have an impact on the Group’s
operating results and financial position.
2. INGREDIENT PROCUREMENTIn principle, imports of raw potatoes, the main ingredient of
potato snacks such as Potato Chips, Jagarico and Jagabee,
are not permitted into Japan. In order to secure sufficient
supplies of domestically produced high-quality potatoes at
a stable price, the Group has sought to build a procurement
system based on ongoing grower contracts concluded
since launching its first potato snacks. Although these
grower contracts enable stable supplies, harvest condi-
tions could prevent the Group from securing sufficient
supplies of raw potatoes, resulting in sales opportunity
losses and increased costs due to emergency procure-
ment that could have an impact on the Group’s operating
results and financial position.
Moreover, changes in demand trends and fluctuations
in the price of crude oil could effect procurement costs
for a wide range of raw materials such as edible oils,
other ingredients and product packaging, which could
also have an impact on the Group’s operating results and
financial position.
3. PRODUCT SAFETYConsumer demands for greater food safety have increased
in recent years. In response, the Group strictly monitors
the quality of ingredients and manufacturing processes
and takes all possible precautions to ensure product quality
and prevent foreign objects from entering its products.
However, unforeseen problems related to ingredients and
manufacturing processes could have an impact on the
Group’s operating results and financial position.
Furthermore, in April 2002, the Swedish government
released the results of research showing that grilling or
frying foods with high carbohydrate content can generate
acrylamide, a carcinogen. Japan’s Ministry of Health,
Labour and Welfare has said it does not foresee any health
impact from this substance for people who consume
average amounts of this type of food, and at this point,
there has been no impact on the Group’s operating
results. Nevertheless, this issue could develop in the
future to the point where it has an impact on the entire
snack foods industry.
4. COMPETITIVE RISKThe Group has a stable share of the snack food market.
However, intensifying competition from rival domestic
Business Risks
Annual Report 2012 47
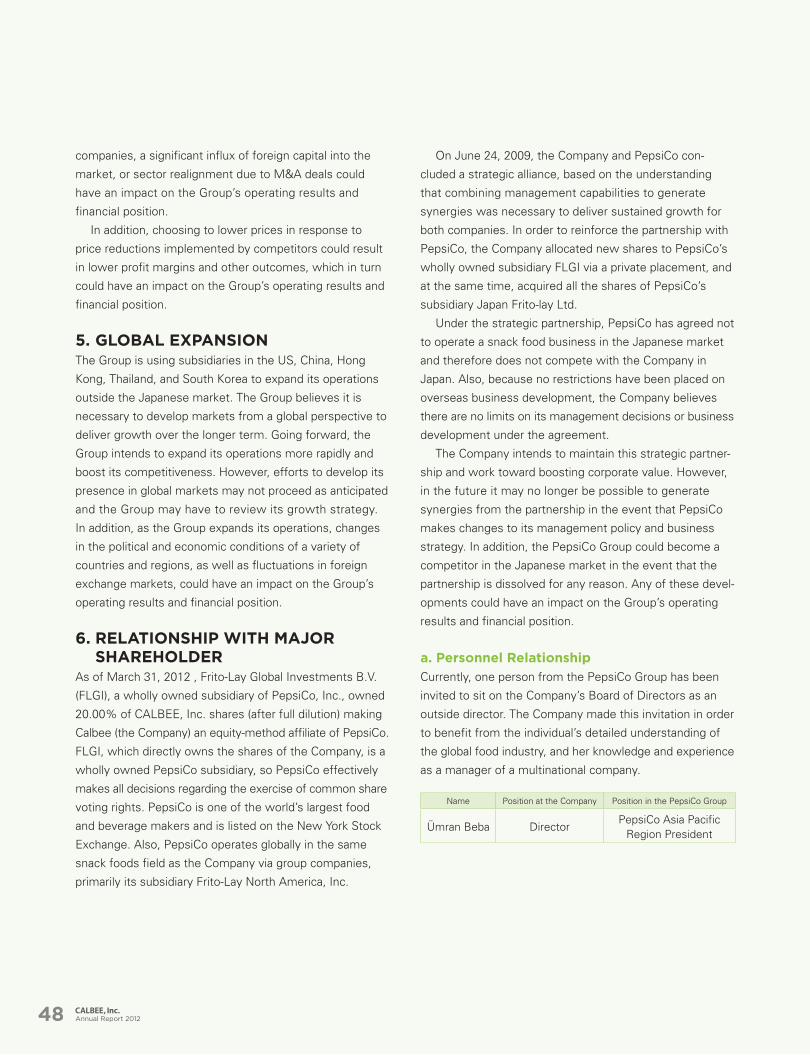
companies, a significant influx of foreign capital into the
market, or sector realignment due to M&A deals could
have an impact on the Group’s operating results and
financial position.
In addition, choosing to lower prices in response to
price reductions implemented by competitors could result
in lower profit margins and other outcomes, which in turn
could have an impact on the Group’s operating results and
financial position.
5. GLOBAL EXPANSIONThe Group is using subsidiaries in the US, China, Hong
Kong, Thailand, and South Korea to expand its operations
outside the Japanese market. The Group believes it is
necessary to develop markets from a global perspective to
deliver growth over the longer term. Going forward, the
Group intends to expand its operations more rapidly and
boost its competitiveness. However, efforts to develop its
presence in global markets may not proceed as anticipated
and the Group may have to review its growth strategy.
In addition, as the Group expands its operations, changes
in the political and economic conditions of a variety of
countries and regions, as well as fluctuations in foreign
exchange markets, could have an impact on the Group’s
operating results and financial position.
6. RELATIONSHIP WITH MAJOR SHAREHOLDER
As of March 31, 2012 , Frito-Lay Global Investments B.V.
(FLGI), a wholly owned subsidiary of PepsiCo, Inc., owned
20.00% of CALBEE, Inc. shares (after full dilution) making
Calbee (the Company) an equity-method affiliate of PepsiCo.
FLGI, which directly owns the shares of the Company, is a
wholly owned PepsiCo subsidiary, so PepsiCo effectively
makes all decisions regarding the exercise of common share
voting rights. PepsiCo is one of the world’s largest food
and beverage makers and is listed on the New York Stock
Exchange. Also, PepsiCo operates globally in the same
snack foods field as the Company via group companies,
primarily its subsidiary Frito-Lay North America, Inc.
On June 24, 2009, the Company and PepsiCo con-
cluded a strategic alliance, based on the understanding
that combining management capabilities to generate
synergies was necessary to deliver sustained growth for
both companies. In order to reinforce the partnership with
PepsiCo, the Company allocated new shares to PepsiCo’s
wholly owned subsidiary FLGI via a private placement, and
at the same time, acquired all the shares of PepsiCo’s
subsidiary Japan Frito-lay Ltd.
Under the strategic partnership, PepsiCo has agreed not
to operate a snack food business in the Japanese market
and therefore does not compete with the Company in
Japan. Also, because no restrictions have been placed on
overseas business development, the Company believes
there are no limits on its management decisions or business
development under the agreement.
The Company intends to maintain this strategic partner-
ship and work toward boosting corporate value. However,
in the future it may no longer be possible to generate
synergies from the partnership in the event that PepsiCo
makes changes to its management policy and business
strategy. In addition, the PepsiCo Group could become a
competitor in the Japanese market in the event that the
partnership is dissolved for any reason. Any of these devel-
opments could have an impact on the Group’s operating
results and financial position.
a. Personnel Relationship
Currently, one person from the PepsiCo Group has been
invited to sit on the Company’s Board of Directors as an
outside director. The Company made this invitation in order
to benefit from the individual’s detailed understanding of
the global food industry, and her knowledge and experience
as a manager of a multinational company.
Name Position at the Company Position in the PepsiCo Group
Ümran Beba DirectorPepsiCo Asia Pacific
Region President
Annual Report 201248
b. Business Relationship
The Company’s subsidiary Japan Frito-Lay Ltd. receives
imports of snack foods from Frito-Lay, Inc., a PepsiCo
Group company.
c. Capital Relationship
Under the strategic partnership with PepsiCo, the Company
and PepsiCo have agreed that from the perspective of
maintaining the strategic partnership, PepsiCo shall not
own more than 20.00% of the Company’s shares. In
future, PepsiCo’s ownership ratio in the Company may be
subject to change, owing to changes in the management
policies or business strategies of PepsiCo or the Company,
or as a result of other factors such as changes in the
Company’s internal or external business environment.
7. LEGAL REGULATIONSIn the course of its business activities, the Group is subject
to a range of legal regulations, including the Food Sanitation
Act, Act against Unjustifiable Premiums and Misleading
Representations, Measurement Act, Unfair Competition
Prevention Act, Plant Protection Act, and Consumer Product
Safety Act. The Group may incur additional costs to
respond to revisions to these regulations or their abolish-
ment and the implementation of new regulations, and this
could have an impact on the Group’s operating results and
financial position.
The Group has also received a variety of permits and
licenses necessary to conduct its business activities.
However, the Group’s business activities may be restricted
if these permits and licenses are cancelled due to legal
infringements or other reasons, which could have an impact
on the Group’s operating results and financial position.
8. NATURAL DISASTER RISKThe Group conducts necessary periodic inspections of its
manufacturing lines to avoid the risk of shutdowns to
these lines. It has also built a stable product supply frame-
work by dispersing its manufacturing sites. However, there
is no guarantee that manufacturing facilities will not be
damaged as a result of a natural disaster or other event.
Any such damage to facilities could lead to a drop in sales
and an increase in costs, which could have an impact on
the Group’s operating results and financial position.
9. RISKS RELATED TO NON-CURRENT ASSET IMPAIRMENT LOSSES
The Group owns a wide range of assets such as business
facilities and real estate. The Group may be required to
record impairment losses on these assets owing to factors
such as the level of use, declining market prices, and
anticipated cash flows. Recording of such losses could
have an impact on the Group’s operating results and
financial position.
10. RISKS RELATED TO INTELLECTUAL PROPERTY RIGHTS
The Group works to protect and manage its various intel-
lectual property rights through a specialist department. It
also strives to avoid infringements of rights owned by third
parties. However, unauthorized use of the Group’s intel-
lectual property rights by a third party or pursuit of dam-
ages by a third party for infringement of their rights by the
Group, could have an impact on the Group’s operating
results and financial position.
11. ENVIRONMENTAL RISKThe Group is aiming to save energy and reduce CO2
emissions by implementing initiatives to conserve energy
based on the approach of curbing energy losses. This is
part of its efforts to comply with environmental laws and
regulations. However, the Group may have to invest in
new facilities and change its waste disposal methods as a
result of revisions to environmental regulations and this
could have an impact on the Group’s operating results and
financial position.
Annual Report 2012 49
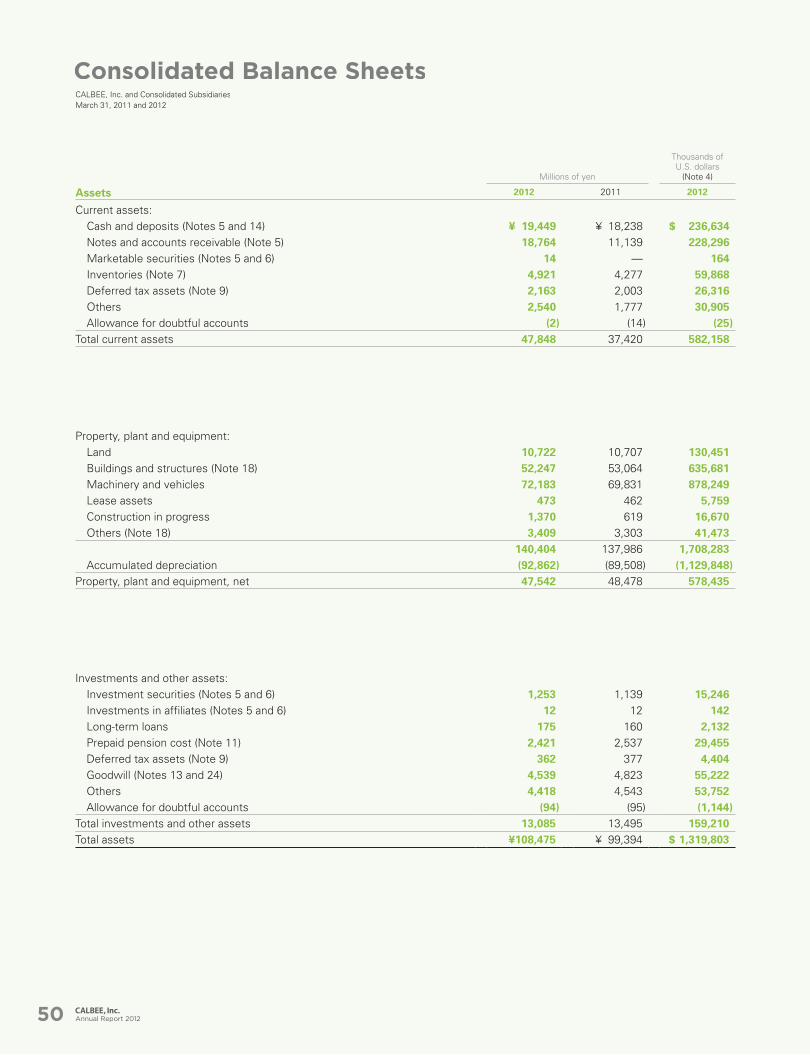
Millions of yen
Thousands of U.S. dollars
(Note 4)
Assets 2012 2011 2012
Current assets:Cash and deposits (Notes 5 and 14) ¥ 19,449 ¥ 18,238 $ 236,634Notes and accounts receivable (Note 5) 18,764 11,139 228,296Marketable securities (Notes 5 and 6) 14 — 164Inventories (Note 7) 4,921 4,277 59,868Deferred tax assets (Note 9) 2,163 2,003 26,316Others 2,540 1,777 30,905Allowance for doubtful accounts (2) (14) (25)
Total current assets 47,848 37,420 582,158
Property, plant and equipment:Land 10,722 10,707 130,451Buildings and structures (Note 18) 52,247 53,064 635,681Machinery and vehicles 72,183 69,831 878,249Lease assets 473 462 5,759Construction in progress 1,370 619 16,670Others (Note 18) 3,409 3,303 41,473
140,404 137,986 1,708,283Accumulated depreciation (92,862) (89,508) (1,129,848)
Property, plant and equipment, net 47,542 48,478 578,435
Investments and other assets:Investment securities (Notes 5 and 6) 1,253 1,139 15,246Investments in affiliates (Notes 5 and 6) 12 12 142Long-term loans 175 160 2,132Prepaid pension cost (Note 11) 2,421 2,537 29,455Deferred tax assets (Note 9) 362 377 4,404Goodwill (Notes 13 and 24) 4,539 4,823 55,222Others 4,418 4,543 53,752Allowance for doubtful accounts (94) (95) (1,144)
Total investments and other assets 13,085 13,495 159,210Total assets ¥108,475 ¥ 99,394 $ 1,319,803
Consolidated Balance SheetsCALBEE, Inc. and Consolidated SubsidiariesMarch 31, 2011 and 2012
Annual Report 201250
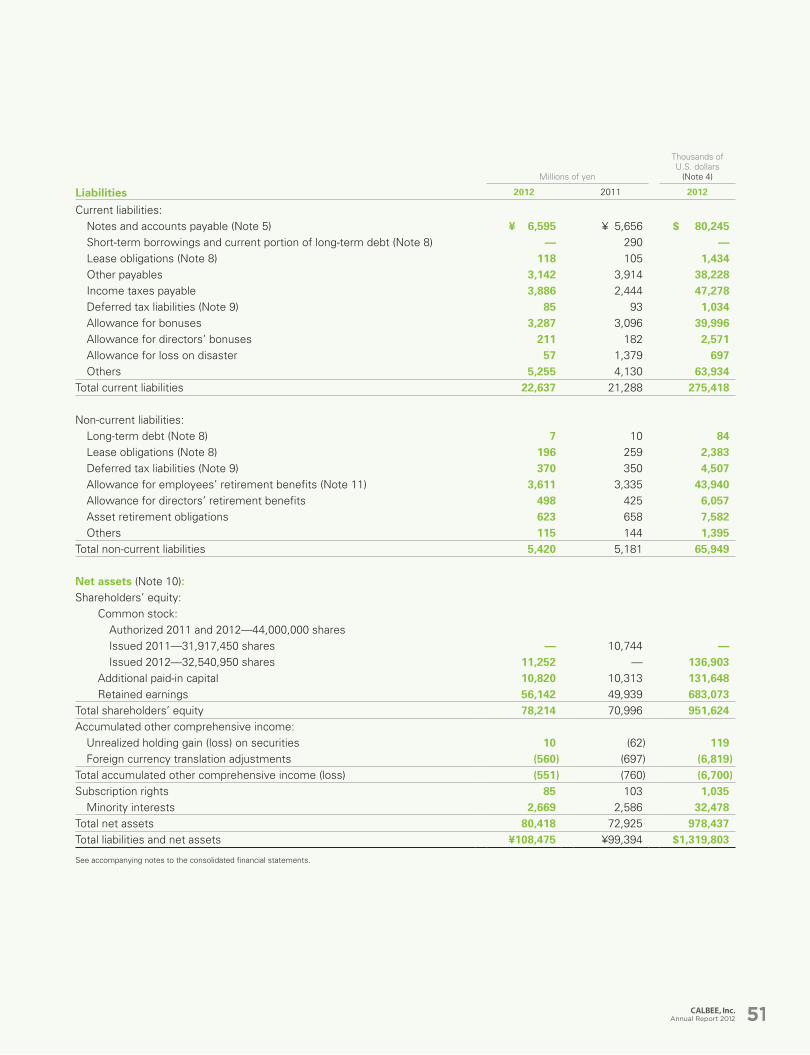
Millions of yen
Thousands of U.S. dollars
(Note 4)
Liabilities 2012 2011 2012
Current liabilities:Notes and accounts payable (Note 5) ¥ 6,595 ¥ 5,656 $ 80,245Short-term borrowings and current portion of long-term debt (Note 8) — 290 —Lease obligations (Note 8) 118 105 1,434Other payables 3,142 3,914 38,228Income taxes payable 3,886 2,444 47,278Deferred tax liabilities (Note 9) 85 93 1,034Allowance for bonuses 3,287 3,096 39,996Allowance for directors’ bonuses 211 182 2,571Allowance for loss on disaster 57 1,379 697Others 5,255 4,130 63,934
Total current liabilities 22,637 21,288 275,418
Non-current liabilities:Long-term debt (Note 8) 7 10 84Lease obligations (Note 8) 196 259 2,383Deferred tax liabilities (Note 9) 370 350 4,507Allowance for employees’ retirement benefits (Note 11) 3,611 3,335 43,940Allowance for directors’ retirement benefits 498 425 6,057Asset retirement obligations 623 658 7,582Others 115 144 1,395
Total non-current liabilities 5,420 5,181 65,949
Net assets (Note 10):Shareholders’ equity:
Common stock:Authorized 2011 and 2012—44,000,000 sharesIssued 2011—31,917,450 shares — 10,744 —Issued 2012—32,540,950 shares 11,252 — 136,903
Additional paid-in capital 10,820 10,313 131,648Retained earnings 56,142 49,939 683,073
Total shareholders’ equity 78,214 70,996 951,624Accumulated other comprehensive income:
Unrealized holding gain (loss) on securities 10 (62) 119Foreign currency translation adjustments (560) (697) (6,819)
Total accumulated other comprehensive income (loss) (551) (760) (6,700)Subscription rights 85 103 1,035
Minority interests 2,669 2,586 32,478Total net assets 80,418 72,925 978,437Total liabilities and net assets ¥108,475 ¥99,394 $1,319,803
See accompanying notes to the consolidated financial statements.
Annual Report 2012 51
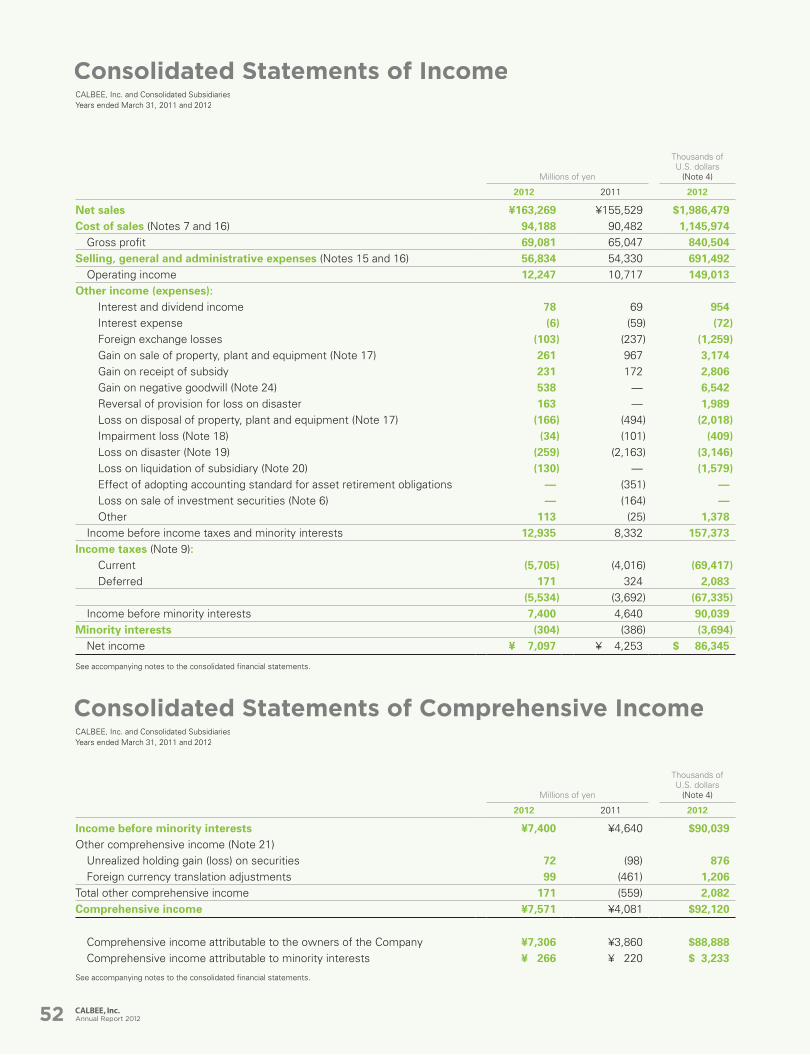
Consolidated Statements of IncomeCALBEE, Inc. and Consolidated SubsidiariesYears ended March 31, 2011 and 2012
Millions of yen
Thousands of U.S. dollars
(Note 4)
2012 2011 2012
Net sales ¥163,269 ¥155,529 $1,986,479Cost of sales (Notes 7 and 16) 94,188 90,482 1,145,974
Gross profit 69,081 65,047 840,504Selling, general and administrative expenses (Notes 15 and 16) 56,834 54,330 691,492
Operating income 12,247 10,717 149,013Other income (expenses):
Interest and dividend income 78 69 954Interest expense (6) (59) (72)Foreign exchange losses (103) (237) (1,259)Gain on sale of property, plant and equipment (Note 17) 261 967 3,174Gain on receipt of subsidy 231 172 2,806Gain on negative goodwill (Note 24) 538 — 6,542Reversal of provision for loss on disaster 163 — 1,989Loss on disposal of property, plant and equipment (Note 17) (166) (494) (2,018)Impairment loss (Note 18) (34) (101) (409)Loss on disaster (Note 19) (259) (2,163) (3,146)Loss on liquidation of subsidiary (Note 20) (130) — (1,579)Effect of adopting accounting standard for asset retirement obligations — (351) —Loss on sale of investment securities (Note 6) — (164) —Other 113 (25) 1,378
Income before income taxes and minority interests 12,935 8,332 157,373Income taxes (Note 9):
Current (5,705) (4,016) (69,417)Deferred 171 324 2,083
(5,534) (3,692) (67,335)Income before minority interests 7,400 4,640 90,039
Minority interests (304) (386) (3,694)Net income ¥ 7,097 ¥ 4,253 $ 86,345
See accompanying notes to the consolidated financial statements.
Consolidated Statements of Comprehensive IncomeCALBEE, Inc. and Consolidated SubsidiariesYears ended March 31, 2011 and 2012
Millions of yen
Thousands of U.S. dollars
(Note 4)
2012 2011 2012
Income before minority interests ¥7,400 ¥4,640 $90,039Other comprehensive income (Note 21)
Unrealized holding gain (loss) on securities 72 (98) 876Foreign currency translation adjustments 99 (461) 1,206
Total other comprehensive income 171 (559) 2,082Comprehensive income ¥7,571 ¥4,081 $92,120
Comprehensive income attributable to the owners of the Company ¥7,306 ¥3,860 $88,888Comprehensive income attributable to minority interests ¥ 266 ¥ 220 $ 3,233
See accompanying notes to the consolidated financial statements.
Annual Report 201252
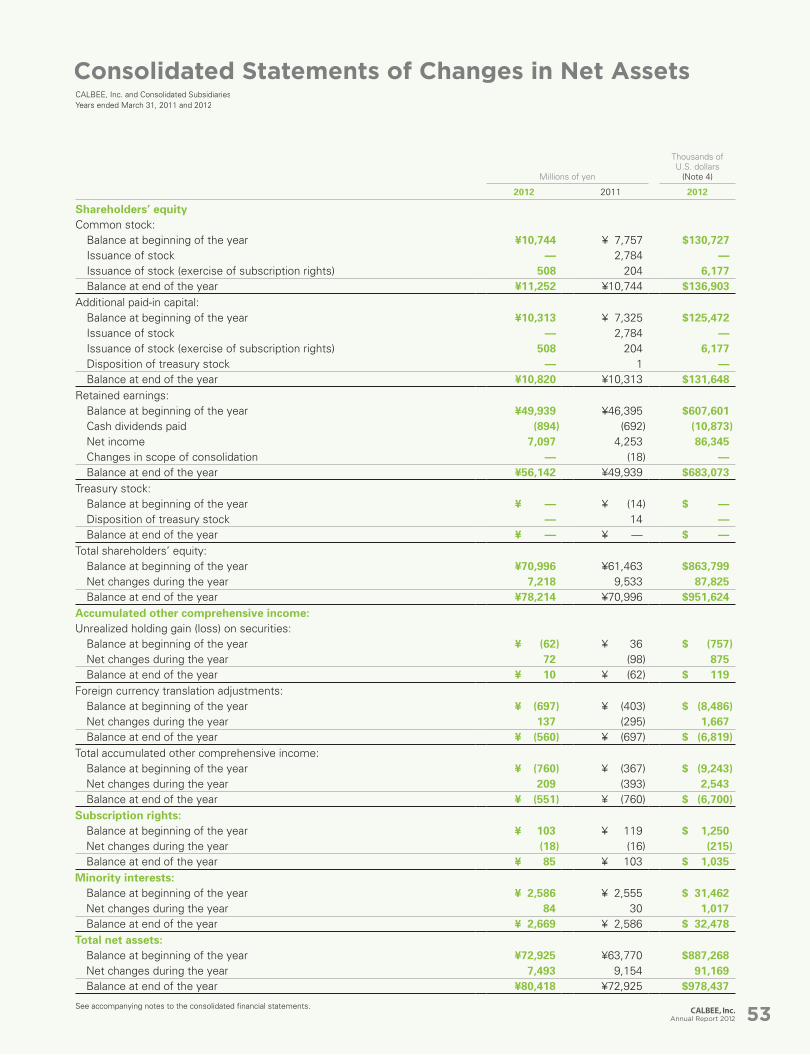
Consolidated Statements of Changes in Net AssetsCALBEE, Inc. and Consolidated SubsidiariesYears ended March 31, 2011 and 2012
Millions of yen
Thousands of U.S. dollars
(Note 4)
2012 2011 2012
Shareholders’ equityCommon stock:
Balance at beginning of the year ¥10,744 ¥ 7,757 $130,727Issuance of stock — 2,784 —Issuance of stock (exercise of subscription rights) 508 204 6,177Balance at end of the year ¥11,252 ¥10,744 $136,903
Additional paid-in capital:Balance at beginning of the year ¥10,313 ¥ 7,325 $125,472Issuance of stock — 2,784 —Issuance of stock (exercise of subscription rights) 508 204 6,177Disposition of treasury stock — 1 —Balance at end of the year ¥10,820 ¥10,313 $131,648
Retained earnings:Balance at beginning of the year ¥49,939 ¥46,395 $607,601Cash dividends paid (894) (692) (10,873)Net income 7,097 4,253 86,345Changes in scope of consolidation — (18) —Balance at end of the year ¥56,142 ¥49,939 $683,073
Treasury stock:Balance at beginning of the year ¥ — ¥ (14) $ —Disposition of treasury stock — 14 —Balance at end of the year ¥ — ¥ — $ —
Total shareholders’ equity:Balance at beginning of the year ¥70,996 ¥61,463 $863,799Net changes during the year 7,218 9,533 87,825Balance at end of the year ¥78,214 ¥70,996 $951,624
Accumulated other comprehensive income:Unrealized holding gain (loss) on securities:
Balance at beginning of the year ¥ (62) ¥ 36 $ (757)Net changes during the year 72 (98) 875Balance at end of the year ¥ 10 ¥ (62) $ 119
Foreign currency translation adjustments:Balance at beginning of the year ¥ (697) ¥ (403) $ (8,486)Net changes during the year 137 (295) 1,667Balance at end of the year ¥ (560) ¥ (697) $ (6,819)
Total accumulated other comprehensive income:Balance at beginning of the year ¥ (760) ¥ (367) $ (9,243)Net changes during the year 209 (393) 2,543Balance at end of the year ¥ (551) ¥ (760) $ (6,700)
Subscription rights:Balance at beginning of the year ¥ 103 ¥ 119 $ 1,250Net changes during the year (18) (16) (215)Balance at end of the year ¥ 85 ¥ 103 $ 1,035
Minority interests:Balance at beginning of the year ¥ 2,586 ¥ 2,555 $ 31,462Net changes during the year 84 30 1,017Balance at end of the year ¥ 2,669 ¥ 2,586 $ 32,478
Total net assets:Balance at beginning of the year ¥72,925 ¥63,770 $887,268Net changes during the year 7,493 9,154 91,169Balance at end of the year ¥80,418 ¥72,925 $978,437
See accompanying notes to the consolidated financial statements.
Annual Report 2012 53
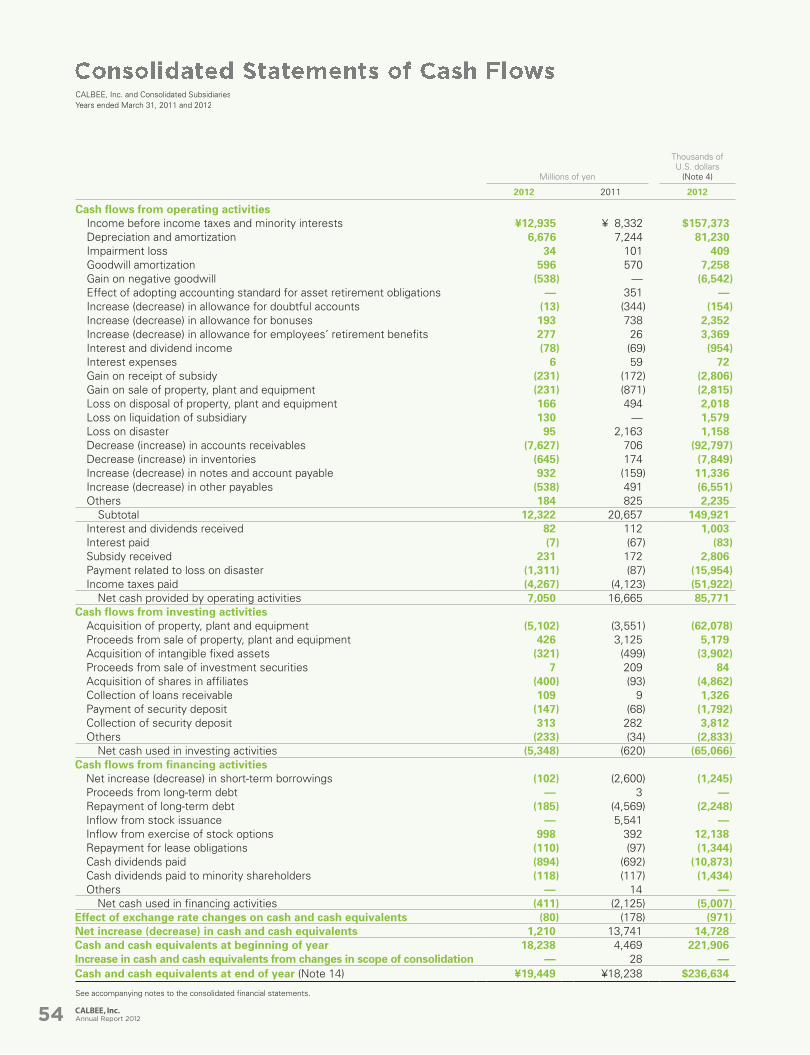
Millions of yen
Thousands of U.S. dollars
(Note 4)
2012 2011 2012
Cash flows from operating activitiesIncome before income taxes and minority interests ¥12,935 ¥ 8,332 $157,373Depreciation and amortization 6,676 7,244 81,230Impairment loss 34 101 409Goodwill amortization 596 570 7,258Gain on negative goodwill (538) — (6,542)Effect of adopting accounting standard for asset retirement obligations — 351 —Increase (decrease) in allowance for doubtful accounts (13) (344) (154)Increase (decrease) in allowance for bonuses 193 738 2,352Increase (decrease) in allowance for employees’ retirement benefits 277 26 3,369Interest and dividend income (78) (69) (954)Interest expenses 6 59 72Gain on receipt of subsidy (231) (172) (2,806)Gain on sale of property, plant and equipment (231) (871) (2,815)Loss on disposal of property, plant and equipment 166 494 2,018Loss on liquidation of subsidiary 130 — 1,579Loss on disaster 95 2,163 1,158Decrease (increase) in accounts receivables (7,627) 706 (92,797)Decrease (increase) in inventories (645) 174 (7,849)Increase (decrease) in notes and account payable 932 (159) 11,336Increase (decrease) in other payables (538) 491 (6,551)Others 184 825 2,235
Subtotal 12,322 20,657 149,921Interest and dividends received 82 112 1,003Interest paid (7) (67) (83)Subsidy received 231 172 2,806Payment related to loss on disaster (1,311) (87) (15,954)Income taxes paid (4,267) (4,123) (51,922)
Net cash provided by operating activities 7,050 16,665 85,771Cash flows from investing activities
Acquisition of property, plant and equipment (5,102) (3,551) (62,078)Proceeds from sale of property, plant and equipment 426 3,125 5,179Acquisition of intangible fixed assets (321) (499) (3,902)Proceeds from sale of investment securities 7 209 84Acquisition of shares in affiliates (400) (93) (4,862)Collection of loans receivable 109 9 1,326Payment of security deposit (147) (68) (1,792)Collection of security deposit 313 282 3,812Others (233) (34) (2,833)
Net cash used in investing activities (5,348) (620) (65,066)Cash flows from financing activities
Net increase (decrease) in short-term borrowings (102) (2,600) (1,245)Proceeds from long-term debt — 3 —Repayment of long-term debt (185) (4,569) (2,248)Inflow from stock issuance — 5,541 —Inflow from exercise of stock options 998 392 12,138Repayment for lease obligations (110) (97) (1,344)Cash dividends paid (894) (692) (10,873)Cash dividends paid to minority shareholders (118) (117) (1,434)Others — 14 —
Net cash used in financing activities (411) (2,125) (5,007)Effect of exchange rate changes on cash and cash equivalents (80) (178) (971)Net increase (decrease) in cash and cash equivalents 1,210 13,741 14,728Cash and cash equivalents at beginning of year 18,238 4,469 221,906Increase in cash and cash equivalents from changes in scope of consolidation — 28 —Cash and cash equivalents at end of year (Note 14) ¥19,449 ¥18,238 $236,634
See accompanying notes to the consolidated financial statements.
Consolidated Statements of Cash FlowsCALBEE, Inc. and Consolidated SubsidiariesYears ended March 31, 2011 and 2012
Annual Report 201254
1. Basis of Presentation
The accompanying consolidated financial statements of CALBEE, Inc. (the “Company”) and its consolidated
subsidiaries have been prepared from the consolidated financial statements filed with the Kanto Local Finance
Bureau as required by the Financial Instruments and Exchange Law of Japan and in conformity with generally
accepted accounting principles and practices in Japan, which are different in certain respects as to the appli-
cation and disclosure requirements of International Financial Reporting Standards. Accordingly, International
Financial Reporting Standards are not applied in preparing the accompanying consolidated financial statements.
The consolidated financial statements are not intended to present the financial position, results of operations
or cash flows in accordance with accounting principles and practices generally accepted in countries and
jurisdictions other than Japan.
In preparing the accompanying consolidated financial statements, certain reclassifications have been made
to present the information in a form familiar to readers outside Japan. The accounts and the financial statements
of the Company and its subsidiaries are maintained in Japanese yen.
As permitted, amounts of less than one million yen are rounded to the nearest one million yen. As a result,
the totals shown in the accompanying consolidated financial statements (both in yen and U.S. dollars) do not
necessarily agree with the sum of the individual amounts.
2. Summary of Significant Accounting Policies
(a) Basis of consolidation and accounting for investments in affiliates
The accompanying consolidated financial statements include the accounts of the Company and significant
subsidiaries in which the Company holds, directly or indirectly, more than 50% of the voting rights or where
it exercises control. The consolidated financial statements consist of the Company and its 18 (18 in 2011)
significant subsidiaries as listed below.
Notes to Consolidated Financial StatementsCALBEE, Inc. and Consolidated SubsidiariesYears ended March 31, 2011 and 2012
Consolidated subsidiaries
• Calbee Shokuhin Co., LTD.
• CALBEE POTATO INC.
• Snack Food Service Co., Ltd.
• Garden Bakery, Inc.
• Tower Bakery, Inc.
• Star Bakery, Inc.
• Calnac Co., Ltd.
• Oisia FOODS CO., LTD.
• Japan Frito-Lay Ltd.
• Calbee Eatalk Co., Ltd.
• Calbee America, Inc. (Note 3)
• Calbee Tanawat Co., Ltd. (Note 3)
• Calbee Four Seas Co., Ltd.
• CALBEE FOUR SEAS (SHANTOU) CO., LTD. (Note 3)
• QINGDAO CALBEE FOODS CO., LTD. (Note 3)
• YANTAI CALBEE CO., LTD. (Note 3)
• RDO-CALBEE FOODS, LLC (Note 3)
• HAITAI-CALBEE Co., Ltd. (Notes 1 and 3)
Notes: 1. On July 1, 2011, the Company established a joint venture company HAITAI-CALBEE Co., Ltd. with a major Korean snack foods manufac-ture, HAITAI Confectionery & Foods Co., Ltd., to expand the market share of Calbee products in Korean, which is the third biggest snack food market in Asia after Japan and China. HAITAI-CALBEE Co., Ltd. is included in the scope of consolidation from the year ended March 31, 2012.
2. CIL COMPANY LIMITED was liquidated on September, 2011 and it is included only in the consolidated statements of income for the year ended March 31, 2012.
3. The fiscal year-end of these subsidiaries is December 31.
Annual Report 2012 55
Investments in subsidiaries and affiliates which are not consolidated or accounted for by the equity method
are carried at cost.
For the year ended March 31, 2012 and 2011, all subsidiaries are consolidated and there is no affiliate
which is accounted for by equity method.
For the years ended March 31, 2012 and 2011, three affiliates, Potato Foods Co., LTD., Hiroshima Agricultural
Produce Distributors Cooperative, and Socio Kobo Co., Ltd., were not accounted for using the equity method as
they were not significant in terms of net income and retained earnings of the consolidated financial statements.
All significant intercompany balances and transactions have been eliminated in consolidation. Accounts of
subsidiaries whose year-ends differ by three months from March 31 have been included using pro forma
financial information prepared as of March 31.
(b) Foreign currency translation
All monetary assets and liabilities denominated in foreign currencies are translated into yen at the exchange
rate in effect at the balance sheet date and gains or losses arising from such translation is credited or charged
to income.
Assets and liabilities of overseas subsidiaries are translated into yen at the exchange rate in effect at the
balance sheet date, whereas shareholders’ equity of such subsidiaries is translated at the historical rate that
prevailed on the date of their acquisition. Income and expenses of overseas subsidiaries are translated into yen
using the average exchange rate during the fiscal year. Translation adjustments are included in foreign cur-
rency translation adjustments and minority interests in net assets section of the accompanying consolidated
balance sheets.
(c) Cash and cash equivalents
For the purpose of the consolidated statements of cash flows, cash and cash equivalents consist of cash on
hand, deposits with banks available for withdrawal on demand and short-term highly liquid investments with
an original maturity of three months or less which are readily convertible into cash and subject to insignificant
risk of changes in value.
(d) Allowance for doubtful accounts
Allowance for doubtful accounts is provided based on the Company’s actual historical experience of credit loss
for active accounts and on an individual basis after an analysis of collectibility for certain doubtful accounts.
(e) Marketable and investment securities
Marketable and investment securities are valued using the following methods.
Securities for which fair values are readily available:
Marked-to-market using market prices at the fiscal year-end, with any changes in unrealized holding
gains or losses, net of applicable income taxes, included directly in net assets. Cost of securities sold is
determined using the moving average method.
Securities for which fair values are not readily available:
Stated at cost based on the moving-average method.
Annual Report 201256
(f) Inventories
Inventories are stated at cost using the average method for finished goods and work-in-process. The moving-
average method is applied for commercial goods, raw materials and supplies. The book value of inventories is
written down to reflect any declines in profitability.
(g) Property, plant and equipment (except for leases)
Property, plant and equipment is stated at cost less accumulated depreciation. Depreciation is calculated
primarily by the declining balance method over the estimated useful lives of the respective assets, except for
buildings (excluding leasehold improvements) acquired subsequent to March 31, 1998, for which depreciation
is calculated by the straight-line method. The useful lives of buildings are as follows:
Useful lives (years)
Buildings 15 to 31 years
Machinery and equipment 10 years
After property, plant and equipment acquired prior to April 1, 2007 are depreciated to the depreciable limit
(5% of the acquisition price), the remaining balance is further depreciated to memorandum value using the
straight-line method over five years beginning in the following year.
(h) Intangible assets (except for leases)
Intangible assets are amortized using the straight-line method. Software for internal use is amortized using
the straight-line method over the estimated useful life of five years.
(i) Leases
Finance lease assets that do not transfer ownership of the property to the lessee are depreciated using the
straight-line method over the lease term with no residual value, except for those leased prior to April 1, 2008,
which are accounted for in a similar manner to operating lease transactions.
(j) Allowance for bonuses
Allowance for bonuses is provided for the bonus payments to employees and directors in the estimated
bonus amount attributable to the current fiscal year.
(k) Allowance for loss on disaster
Estimated expenses to restore damaged assets and losses as a result of the Great East Japan Earthquake are
recorded as an allowance for loss on disaster.
Annual Report 2012 57
(l) Allowance for employees’ retirement benefits
Allowance for employees’ retirement benefits is provided for the retirement benefits payable to employees
based on projected retirement benefit obligations and plan assets at the consolidated balance sheet date.
Unrecognized prior service cost is amortized by the straight-line method over a specified number of years
(five years) within the average remaining service period of employees at the time the cost incurred.
Net unrecognized actuarial gain or loss is amortized beginning in the following fiscal year by the straight-
line method over a specified number of years (12 years) within the average remaining service period of
employees at the time the difference arose.
For part-time employees, amount payable at the fiscal year-end in accordance with internal regulations is
provided for.
Certain consolidated subsidiaries apply the simplified method.
(m) Allowance for directors’ retirement benefits
To provide for the payment of directors’ retirement benefit, the amount payable under internal regulations at
the consolidated balance sheet date is recorded.
(n) Consumption taxes
Transactions subject to consumption tax and local consumption tax are stated at the amount, net of
consumption taxes.
3. Changes in Significant Accounting Policies
Accounting standard for accounting changes and correction of errors
Effective April 1, 2011, the Company adopted ASBJ Statement No. 24, “Accounting Standard for Accounting
Changes and Correction of Errors” issued on December 4, 2009 and ASBJ Guidance No. 24, “Guidance on
Accounting Standard for Accounting Changes and Correction of Errors” issued on December 4, 2009.
4. U.S. Dollar Amounts
For the convenience of the reader, the accompanying consolidated financial statements are also presented in
U.S. dollars by converting Japanese yen amounts at the rate of ¥82.19 = $1, the approximate rate in effect on
March 31, 2012. The inclusion of such amounts is not intended to imply that yen amounts have been or could
be readily converted, realized or settled in U.S. dollars at that or any other rate.
Annual Report 201258
5. Financial Instruments
(1) Policy for financial instruments
The Company’s fund management policy is to use highly secure financial instruments, such as term deposits,
with purchases of financial instruments carried out in accordance with internal regulations including the rules
of Board of Directors. As for funding, domestic consolidated subsidiaries are prohibited from borrowing from
third parties and are only allowed to borrow from the Company. The Company borrows necessary funds from
third parties if necessary. The Company uses derivatives in order to hedge foreign exchange risk and interest
rate risk and does not enter into derivative transactions for speculative or trading purposes.
(2) Nature of financial instruments and the related risks and risk management
Trade receivables consist of notes and accounts receivable are exposed to customers’ credit risk. In order to
reduce such risk, the Company monitors the credit standing, due dates and outstanding balance by individual
customer in accordance with the Group credit management policy.
Investment securities consist of shares of companies with business relationship and debt securities for
surplus fund management, and are exposed to market volatility risk. In order to reduce such risk, the
Company reviews the market values and the financial position of the issuers on a regular basis.
Trade payables consist of notes and accounts payable and borrowings are exposed to liquidity risk.
The Company manages such risk by preparing fund management plans on a monthly basis. Also, the
Company enhanced its centralized funding and cash management functions by implementing a cash
management system.
To hedge exchange rate volatility risk related to monetary payables denominated in foreign currencies, the
Company uses forward foreign exchange contracts. These derivative transactions are executed and managed
in accordance with the internal regulations governing the transaction authorizations. The Company considers
that credit risk arising from non-performance of counterparties is minimal because the counterparties to the
derivative transactions are limited to domestic banks with high credit standing.
(3) Supplementary explanation of the estimated fair value of financial instruments
The contract amount of derivative transactions shown in Note 23 Derivative Financial Instruments does not
represent market risk.
Annual Report 2012 59
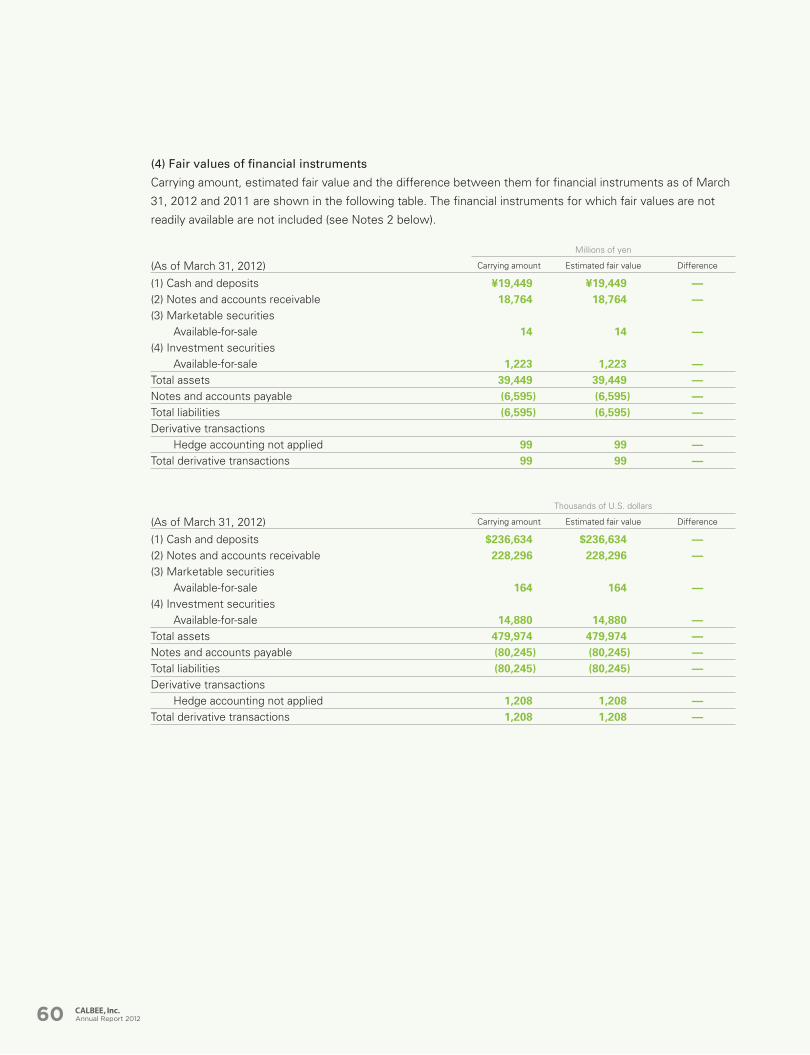
(4) Fair values of financial instruments
Carrying amount, estimated fair value and the difference between them for financial instruments as of March
31, 2012 and 2011 are shown in the following table. The financial instruments for which fair values are not
readily available are not included (see Notes 2 below).
Millions of yen
(As of March 31, 2012) Carrying amount Estimated fair value Difference
(1) Cash and deposits ¥19,449 ¥19,449 —(2) Notes and accounts receivable 18,764 18,764 —(3) Marketable securities
Available-for-sale 14 14 —(4) Investment securities
Available-for-sale 1,223 1,223 —Total assets 39,449 39,449 —Notes and accounts payable (6,595) (6,595) —Total liabilities (6,595) (6,595) —Derivative transactions
Hedge accounting not applied 99 99 —Total derivative transactions 99 99 —
Thousands of U.S. dollars
(As of March 31, 2012) Carrying amount Estimated fair value Difference
(1) Cash and deposits $236,634 $236,634 —(2) Notes and accounts receivable 228,296 228,296 —(3) Marketable securities
Available-for-sale 164 164 —(4) Investment securities
Available-for-sale 14,880 14,880 —Total assets 479,974 479,974 —Notes and accounts payable (80,245) (80,245) —Total liabilities (80,245) (80,245) —Derivative transactions
Hedge accounting not applied 1,208 1,208 —Total derivative transactions 1,208 1,208 —
Annual Report 201260
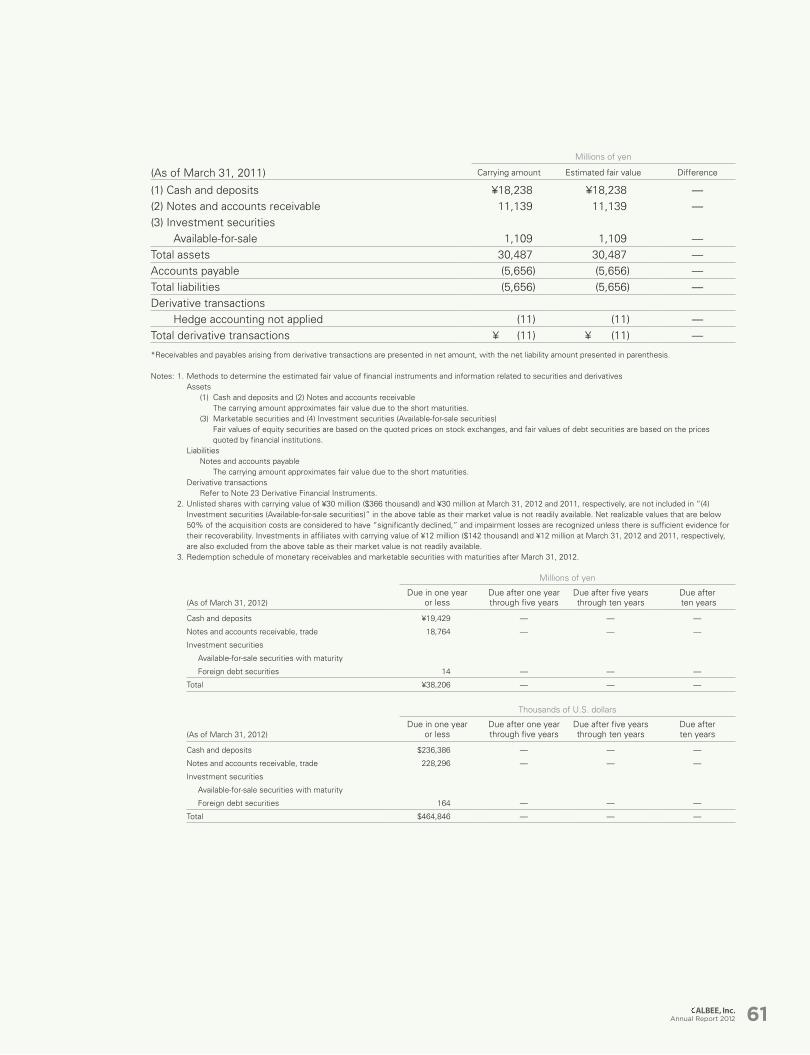
Millions of yen
(As of March 31, 2011) Carrying amount Estimated fair value Difference
(1) Cash and deposits ¥18,238 ¥18,238 —(2) Notes and accounts receivable 11,139 11,139 —(3) Investment securities
Available-for-sale 1,109 1,109 —Total assets 30,487 30,487 —Accounts payable (5,656) (5,656) —Total liabilities (5,656) (5,656) —Derivative transactions
Hedge accounting not applied (11) (11) —Total derivative transactions ¥ (11) ¥ (11) —
*Receivables and payables arising from derivative transactions are presented in net amount, with the net liability amount presented in parenthesis.
Notes: 1. Methods to determine the estimated fair value of financial instruments and information related to securities and derivatives Assets (1) Cash and deposits and (2) Notes and accounts receivable The carrying amount approximates fair value due to the short maturities. (3) Marketable securities and (4) Investment securities (Available-for-sale securities) Fair values of equity securities are based on the quoted prices on stock exchanges, and fair values of debt securities are based on the prices
quoted by financial institutions. Liabilities Notes and accounts payable The carrying amount approximates fair value due to the short maturities. Derivative transactions Refer to Note 23 Derivative Financial Instruments. 2. Unlisted shares with carrying value of ¥30 million ($366 thousand) and ¥30 million at March 31, 2012 and 2011, respectively, are not included in “(4)
Investment securities (Available-for-sale securities)” in the above table as their market value is not readily available. Net realizable values that are below 50% of the acquisition costs are considered to have “significantly declined,” and impairment losses are recognized unless there is sufficient evidence for their recoverability. Investments in affiliates with carrying value of ¥12 million ($142 thousand) and ¥12 million at March 31, 2012 and 2011, respectively, are also excluded from the above table as their market value is not readily available.
3. Redemption schedule of monetary receivables and marketable securities with maturities after March 31, 2012.
Millions of yen
(As of March 31, 2012)Due in one year
or lessDue after one year through five years
Due after five years through ten years
Due after ten years
Cash and deposits ¥19,429 — — —
Notes and accounts receivable, trade 18,764 — — —
Investment securities
Available-for-sale securities with maturity
Foreign debt securities 14 — — —
Total ¥38,206 — — —
Thousands of U.S. dollars
(As of March 31, 2012)Due in one year
or lessDue after one year through five years
Due after five years through ten years
Due after ten years
Cash and deposits $236,386 — — —
Notes and accounts receivable, trade 228,296 — — —
Investment securities
Available-for-sale securities with maturity
Foreign debt securities 164 — — —
Total $464,846 — — —
Annual Report 2012 61
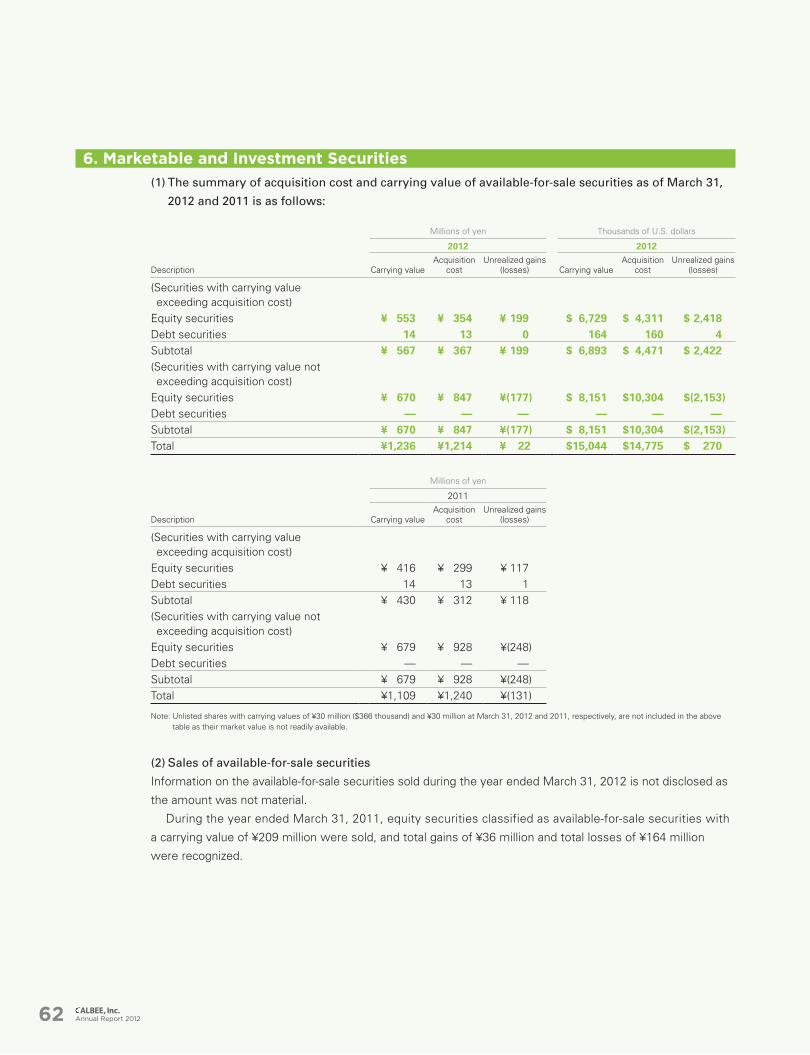
6. Marketable and Investment Securities
(1) The summary of acquisition cost and carrying value of available-for-sale securities as of March 31,
2012 and 2011 is as follows:
Millions of yen Thousands of U.S. dollars
2012 2012
Description Carrying valueAcquisition
costUnrealized gains
(losses) Carrying valueAcquisition
costUnrealized gains
(losses)
(Securities with carrying value exceeding acquisition cost)Equity securities ¥ 553 ¥ 354 ¥ 199 $ 6,729 $ 4,311 $ 2,418Debt securities 14 13 0 164 160 4Subtotal ¥ 567 ¥ 367 ¥ 199 $ 6,893 $ 4,471 $ 2,422(Securities with carrying value not exceeding acquisition cost)Equity securities ¥ 670 ¥ 847 ¥(177) $ 8,151 $10,304 $(2,153)Debt securities — — — — — —Subtotal ¥ 670 ¥ 847 ¥(177) $ 8,151 $10,304 $(2,153)Total ¥1,236 ¥1,214 ¥ 22 $15,044 $14,775 $ 270
Millions of yen
2011
Description Carrying valueAcquisition
costUnrealized gains
(losses)
(Securities with carrying value exceeding acquisition cost)Equity securities ¥ 416 ¥ 299 ¥ 117Debt securities 14 13 1Subtotal ¥ 430 ¥ 312 ¥ 118(Securities with carrying value not exceeding acquisition cost)Equity securities ¥ 679 ¥ 928 ¥(248)Debt securities — — —Subtotal ¥ 679 ¥ 928 ¥(248)Total ¥1,109 ¥1,240 ¥(131)
Note: Unlisted shares with carrying values of ¥30 million ($366 thousand) and ¥30 million at March 31, 2012 and 2011, respectively, are not included in the above table as their market value is not readily available.
(2) Sales of available-for-sale securities
Information on the available-for-sale securities sold during the year ended March 31, 2012 is not disclosed as
the amount was not material.
During the year ended March 31, 2011, equity securities classified as available-for-sale securities with
a carrying value of ¥209 million were sold, and total gains of ¥36 million and total losses of ¥164 million
were recognized.
Annual Report 201262
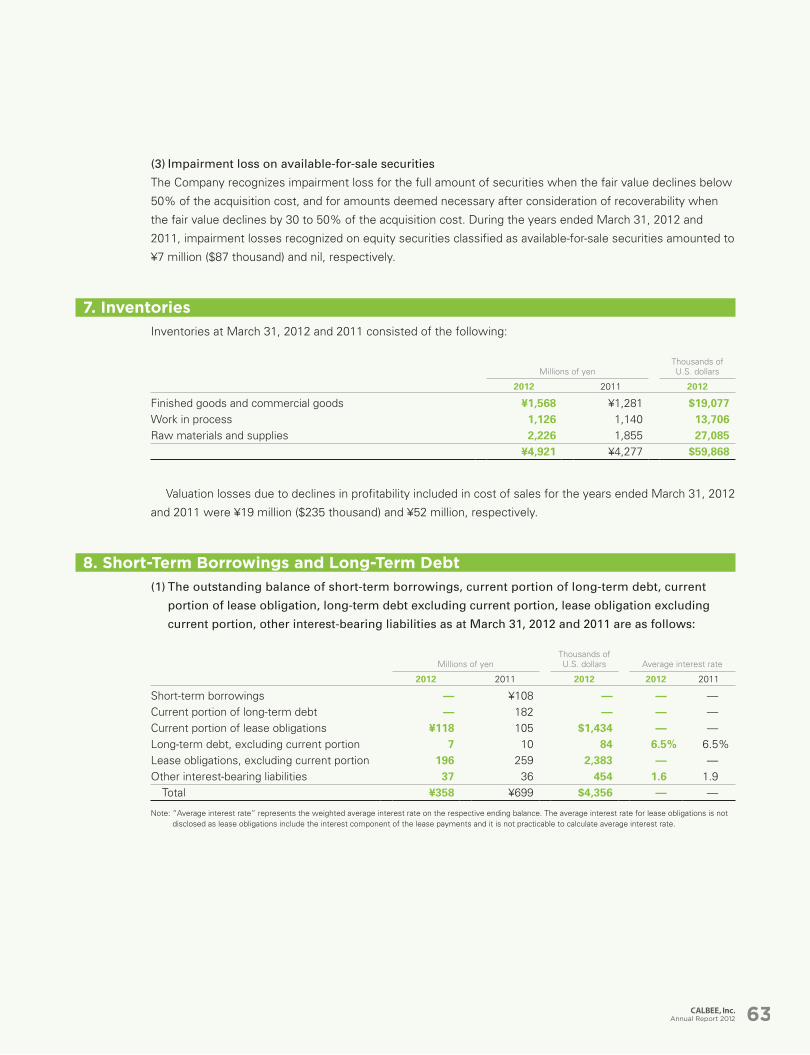
(3) Impairment loss on available-for-sale securities
The Company recognizes impairment loss for the full amount of securities when the fair value declines below
50% of the acquisition cost, and for amounts deemed necessary after consideration of recoverability when
the fair value declines by 30 to 50% of the acquisition cost. During the years ended March 31, 2012 and
2011, impairment losses recognized on equity securities classified as available-for-sale securities amounted to
¥7 million ($87 thousand) and nil, respectively.
7. Inventories
Inventories at March 31, 2012 and 2011 consisted of the following:
Millions of yenThousands of U.S. dollars
2012 2011 2012
Finished goods and commercial goods ¥1,568 ¥1,281 $19,077Work in process 1,126 1,140 13,706Raw materials and supplies 2,226 1,855 27,085
¥4,921 ¥4,277 $59,868
Valuation losses due to declines in profitability included in cost of sales for the years ended March 31, 2012
and 2011 were ¥19 million ($235 thousand) and ¥52 million, respectively.
8. Short-Term Borrowings and Long-Term Debt
(1) The outstanding balance of short-term borrowings, current portion of long-term debt, current
portion of lease obligation, long-term debt excluding current portion, lease obligation excluding
current portion, other interest-bearing liabilities as at March 31, 2012 and 2011 are as follows:
Millions of yenThousands of U.S. dollars Average interest rate
2012 2011 2012 2012 2011
Short-term borrowings — ¥108 — — —Current portion of long-term debt — 182 — — —Current portion of lease obligations ¥118 105 $1,434 — —Long-term debt, excluding current portion 7 10 84 6.5% 6.5%Lease obligations, excluding current portion 196 259 2,383 — —Other interest-bearing liabilities 37 36 454 1.6 1.9
Total ¥358 ¥699 $4,356 — —
Note: “Average interest rate” represents the weighted average interest rate on the respective ending balance. The average interest rate for lease obligations is not disclosed as lease obligations include the interest component of the lease payments and it is not practicable to calculate average interest rate.
Annual Report 2012 63
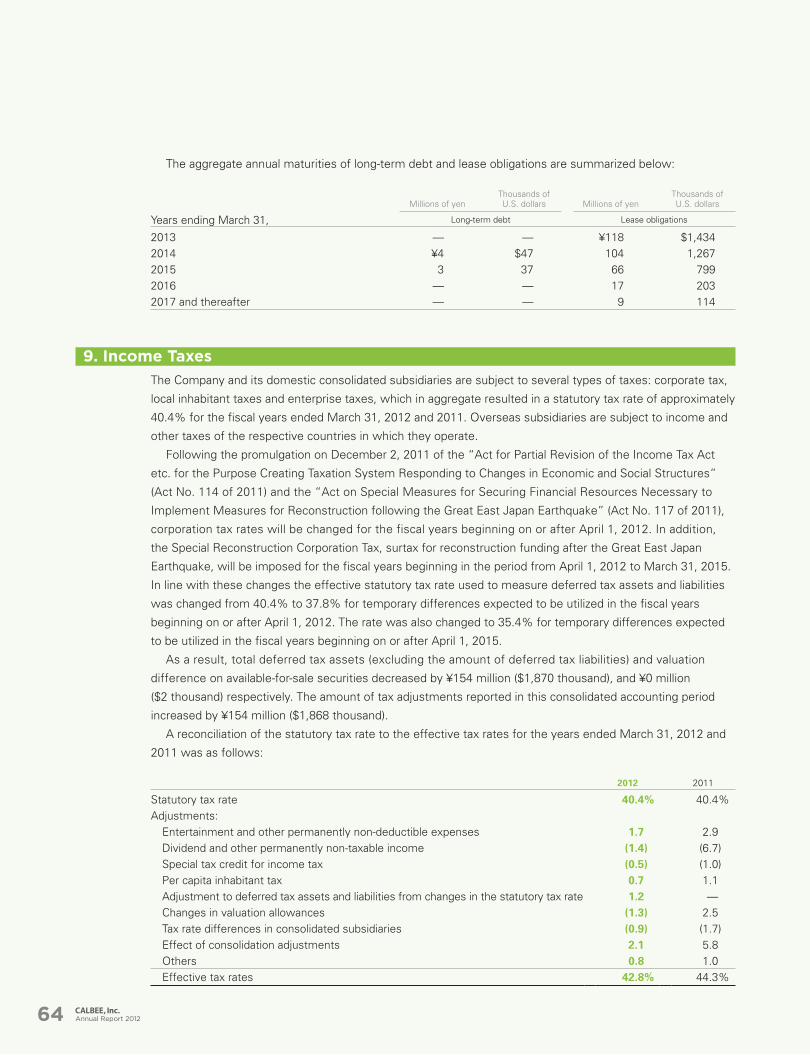
The aggregate annual maturities of long-term debt and lease obligations are summarized below:
Millions of yenThousands of U.S. dollars Millions of yen
Thousands of U.S. dollars
Years ending March 31, Long-term debt Lease obligations
2013 — — ¥118 $1,4342014 ¥4 $47 104 1,2672015 3 37 66 7992016 — — 17 2032017 and thereafter — — 9 114
9. Income Taxes
The Company and its domestic consolidated subsidiaries are subject to several types of taxes: corporate tax,
local inhabitant taxes and enterprise taxes, which in aggregate resulted in a statutory tax rate of approximately
40.4% for the fiscal years ended March 31, 2012 and 2011. Overseas subsidiaries are subject to income and
other taxes of the respective countries in which they operate.
Following the promulgation on December 2, 2011 of the “Act for Partial Revision of the Income Tax Act
etc. for the Purpose Creating Taxation System Responding to Changes in Economic and Social Structures”
(Act No. 114 of 2011) and the “Act on Special Measures for Securing Financial Resources Necessary to
Implement Measures for Reconstruction following the Great East Japan Earthquake” (Act No. 117 of 2011),
corporation tax rates will be changed for the fiscal years beginning on or after April 1, 2012. In addition,
the Special Reconstruction Corporation Tax, surtax for reconstruction funding after the Great East Japan
Earthquake, will be imposed for the fiscal years beginning in the period from April 1, 2012 to March 31, 2015.
In line with these changes the effective statutory tax rate used to measure deferred tax assets and liabilities
was changed from 40.4% to 37.8% for temporary differences expected to be utilized in the fiscal years
beginning on or after April 1, 2012. The rate was also changed to 35.4% for temporary differences expected
to be utilized in the fiscal years beginning on or after April 1, 2015.
As a result, total deferred tax assets (excluding the amount of deferred tax liabilities) and valuation
difference on available-for-sale securities decreased by ¥154 million ($1,870 thousand), and ¥0 million
($2 thousand) respectively. The amount of tax adjustments reported in this consolidated accounting period
increased by ¥154 million ($1,868 thousand).
A reconciliation of the statutory tax rate to the effective tax rates for the years ended March 31, 2012 and
2011 was as follows:
2012 2011
Statutory tax rate 40.4% 40.4%Adjustments:
Entertainment and other permanently non-deductible expenses 1.7 2.9Dividend and other permanently non-taxable income (1.4) (6.7)Special tax credit for income tax (0.5) (1.0)Per capita inhabitant tax 0.7 1.1Adjustment to deferred tax assets and liabilities from changes in the statutory tax rate 1.2 —Changes in valuation allowances (1.3) 2.5Tax rate differences in consolidated subsidiaries (0.9) (1.7)Effect of consolidation adjustments 2.1 5.8Others 0.8 1.0Effective tax rates 42.8% 44.3%
Annual Report 201264
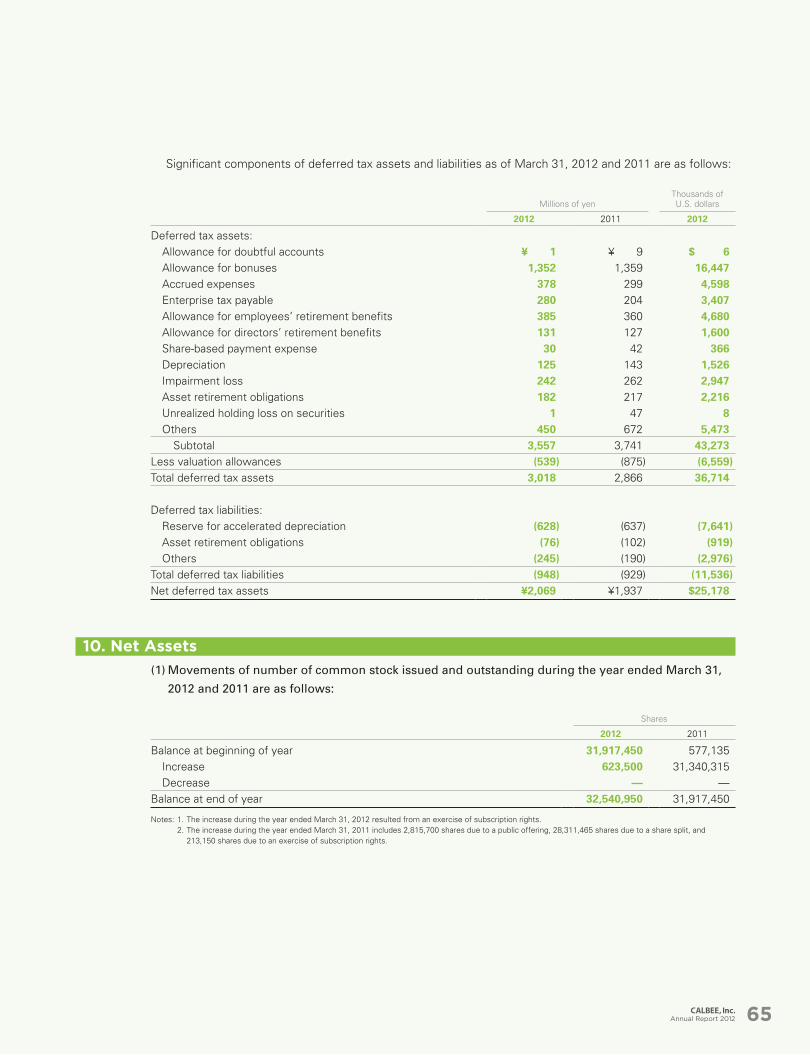
Significant components of deferred tax assets and liabilities as of March 31, 2012 and 2011 are as follows:
Millions of yenThousands of U.S. dollars
2012 2011 2012
Deferred tax assets:Allowance for doubtful accounts ¥ 1 ¥ 9 $ 6Allowance for bonuses 1,352 1,359 16,447Accrued expenses 378 299 4,598Enterprise tax payable 280 204 3,407Allowance for employees’ retirement benefits 385 360 4,680Allowance for directors’ retirement benefits 131 127 1,600Share-based payment expense 30 42 366Depreciation 125 143 1,526Impairment loss 242 262 2,947Asset retirement obligations 182 217 2,216Unrealized holding loss on securities 1 47 8Others 450 672 5,473
Subtotal 3,557 3,741 43,273Less valuation allowances (539) (875) (6,559)Total deferred tax assets 3,018 2,866 36,714
Deferred tax liabilities:Reserve for accelerated depreciation (628) (637) (7,641)Asset retirement obligations (76) (102) (919)Others (245) (190) (2,976)
Total deferred tax liabilities (948) (929) (11,536)Net deferred tax assets ¥2,069 ¥1,937 $25,178
10. Net Assets
(1) Movements of number of common stock issued and outstanding during the year ended March 31,
2012 and 2011 are as follows:
Shares
2012 2011
Balance at beginning of year 31,917,450 577,135Increase 623,500 31,340,315Decrease — —
Balance at end of year 32,540,950 31,917,450
Notes: 1. The increase during the year ended March 31, 2012 resulted from an exercise of subscription rights. 2. The increase during the year ended March 31, 2011 includes 2,815,700 shares due to a public offering, 28,311,465 shares due to a share split, and
213,150 shares due to an exercise of subscription rights.
Annual Report 2012 65
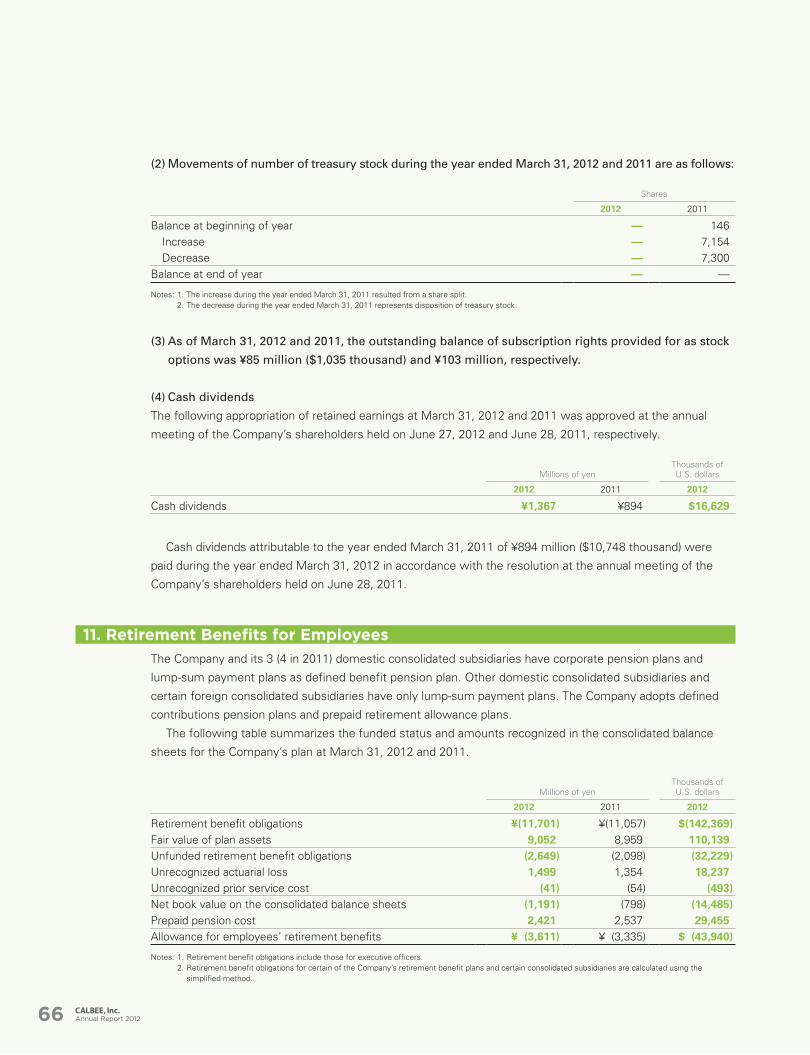
(2) Movements of number of treasury stock during the year ended March 31, 2012 and 2011 are as follows:
Shares
2012 2011
Balance at beginning of year — 146Increase — 7,154Decrease — 7,300
Balance at end of year — —
Notes: 1. The increase during the year ended March 31, 2011 resulted from a share split. 2. The decrease during the year ended March 31, 2011 represents disposition of treasury stock.
(3) As of March 31, 2012 and 2011, the outstanding balance of subscription rights provided for as stock
options was ¥85 million ($1,035 thousand) and ¥103 million, respectively.
(4) Cash dividends
The following appropriation of retained earnings at March 31, 2012 and 2011 was approved at the annual
meeting of the Company’s shareholders held on June 27, 2012 and June 28, 2011, respectively.
Millions of yenThousands of U.S. dollars
2012 2011 2012
Cash dividends ¥1,367 ¥894 $16,629
Cash dividends attributable to the year ended March 31, 2011 of ¥894 million ($10,748 thousand) were
paid during the year ended March 31, 2012 in accordance with the resolution at the annual meeting of the
Company’s shareholders held on June 28, 2011.
11. Retirement Benefits for Employees
The Company and its 3 (4 in 2011) domestic consolidated subsidiaries have corporate pension plans and
lump-sum payment plans as defined benefit pension plan. Other domestic consolidated subsidiaries and
certain foreign consolidated subsidiaries have only lump-sum payment plans. The Company adopts defined
contributions pension plans and prepaid retirement allowance plans.
The following table summarizes the funded status and amounts recognized in the consolidated balance
sheets for the Company’s plan at March 31, 2012 and 2011.
Millions of yenThousands of U.S. dollars
2012 2011 2012
Retirement benefit obligations ¥(11,701) ¥(11,057) $(142,369)Fair value of plan assets 9,052 8,959 110,139Unfunded retirement benefit obligations (2,649) (2,098) (32,229)Unrecognized actuarial loss 1,499 1,354 18,237Unrecognized prior service cost (41) (54) (493)Net book value on the consolidated balance sheets (1,191) (798) (14,485)Prepaid pension cost 2,421 2,537 29,455Allowance for employees’ retirement benefits ¥ (3,611) ¥ (3,335) $ (43,940)
Notes: 1. Retirement benefit obligations include those for executive officers. 2. Retirement benefit obligations for certain of the Company’s retirement benefit plans and certain consolidated subsidiaries are calculated using the
simplified method.
Annual Report 201266
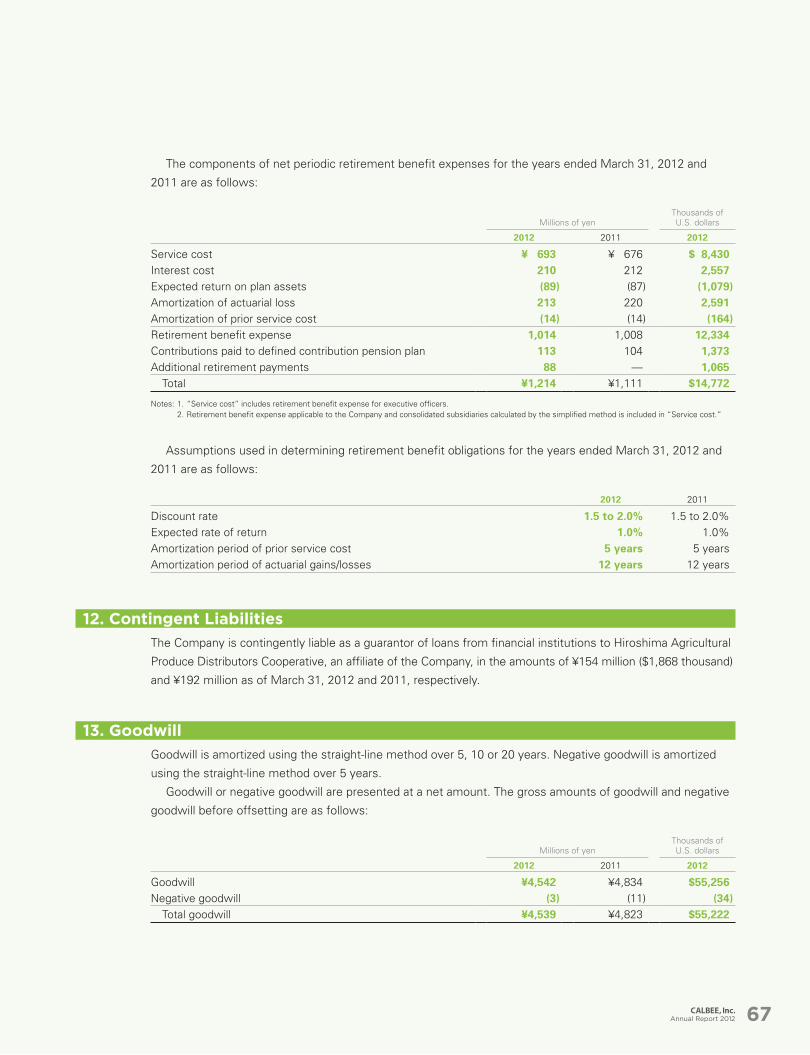
The components of net periodic retirement benefit expenses for the years ended March 31, 2012 and
2011 are as follows:
Millions of yenThousands of U.S. dollars
2012 2011 2012
Service cost ¥ 693 ¥ 676 $ 8,430Interest cost 210 212 2,557Expected return on plan assets (89) (87) (1,079)Amortization of actuarial loss 213 220 2,591Amortization of prior service cost (14) (14) (164)Retirement benefit expense 1,014 1,008 12,334Contributions paid to defined contribution pension plan 113 104 1,373Additional retirement payments 88 — 1,065
Total ¥1,214 ¥1,111 $14,772
Notes: 1. “Service cost” includes retirement benefit expense for executive officers. 2. Retirement benefit expense applicable to the Company and consolidated subsidiaries calculated by the simplified method is included in “Service cost.”
Assumptions used in determining retirement benefit obligations for the years ended March 31, 2012 and
2011 are as follows:
2012 2011
Discount rate 1.5 to 2.0% 1.5 to 2.0%Expected rate of return 1.0% 1.0%Amortization period of prior service cost 5 years 5 yearsAmortization period of actuarial gains/losses 12 years 12 years
12. Contingent Liabilities
The Company is contingently liable as a guarantor of loans from financial institutions to Hiroshima Agricultural
Produce Distributors Cooperative, an affiliate of the Company, in the amounts of ¥154 million ($1,868 thousand)
and ¥192 million as of March 31, 2012 and 2011, respectively.
13. Goodwill
Goodwill is amortized using the straight-line method over 5, 10 or 20 years. Negative goodwill is amortized
using the straight-line method over 5 years.
Goodwill or negative goodwill are presented at a net amount. The gross amounts of goodwill and negative
goodwill before offsetting are as follows:
Millions of yenThousands of U.S. dollars
2012 2011 2012
Goodwill ¥4,542 ¥4,834 $55,256Negative goodwill (3) (11) (34)
Total goodwill ¥4,539 ¥4,823 $55,222
Annual Report 2012 67
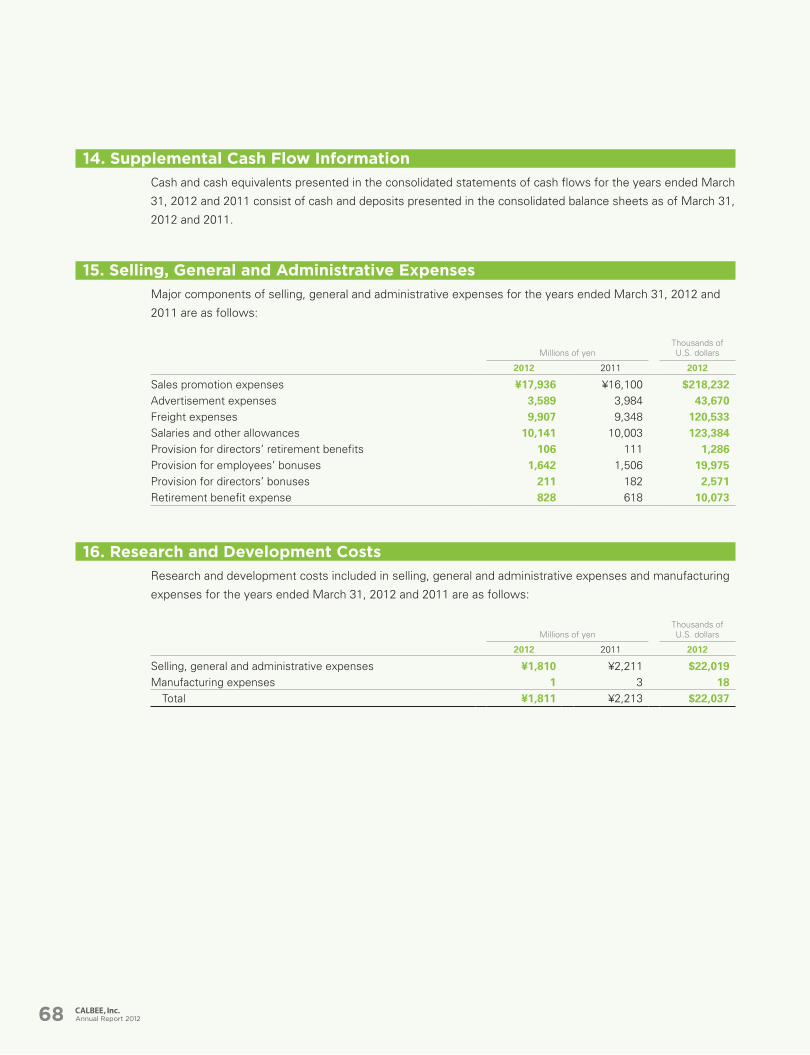
14. Supplemental Cash Flow Information
Cash and cash equivalents presented in the consolidated statements of cash flows for the years ended March
31, 2012 and 2011 consist of cash and deposits presented in the consolidated balance sheets as of March 31,
2012 and 2011.
15. Selling, General and Administrative Expenses
Major components of selling, general and administrative expenses for the years ended March 31, 2012 and
2011 are as follows:
Millions of yenThousands of U.S. dollars
2012 2011 2012
Sales promotion expenses ¥17,936 ¥16,100 $218,232Advertisement expenses 3,589 3,984 43,670Freight expenses 9,907 9,348 120,533Salaries and other allowances 10,141 10,003 123,384Provision for directors’ retirement benefits 106 111 1,286Provision for employees’ bonuses 1,642 1,506 19,975Provision for directors’ bonuses 211 182 2,571Retirement benefit expense 828 618 10,073
16. Research and Development Costs
Research and development costs included in selling, general and administrative expenses and manufacturing
expenses for the years ended March 31, 2012 and 2011 are as follows:
Millions of yenThousands of U.S. dollars
2012 2011 2012
Selling, general and administrative expenses ¥1,810 ¥2,211 $22,019Manufacturing expenses 1 3 18
Total ¥1,811 ¥2,213 $22,037
Annual Report 201268
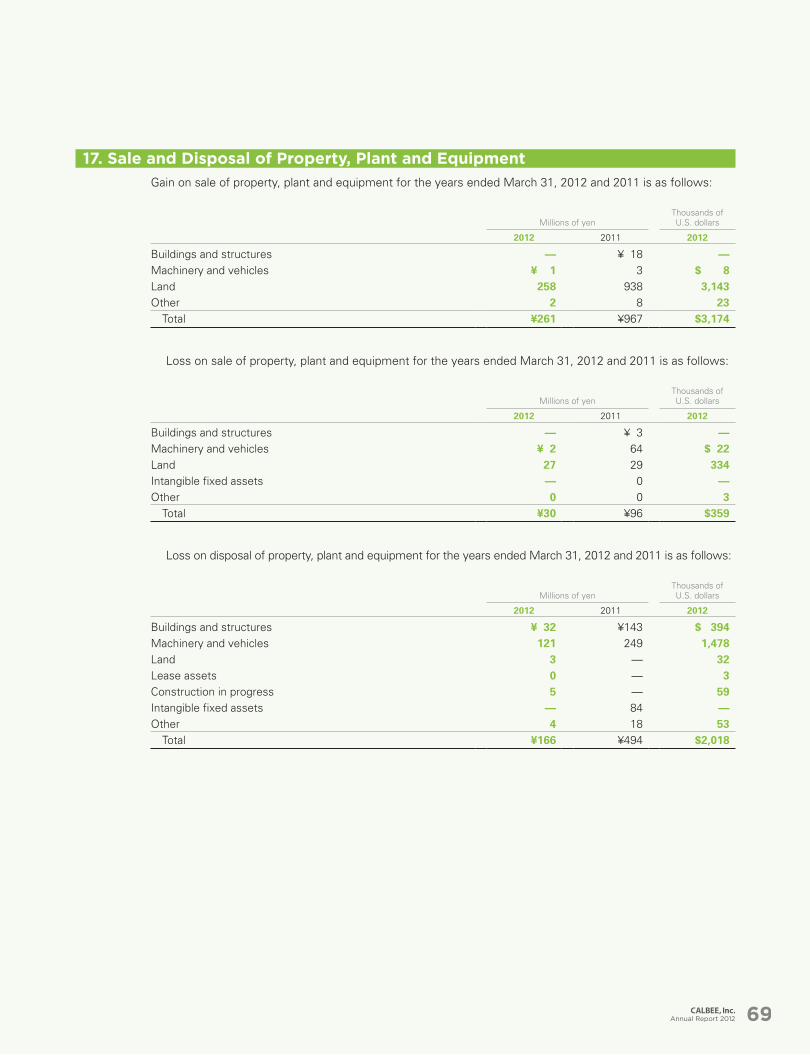
17. Sale and Disposal of Property, Plant and Equipment
Gain on sale of property, plant and equipment for the years ended March 31, 2012 and 2011 is as follows:
Millions of yenThousands of U.S. dollars
2012 2011 2012
Buildings and structures — ¥ 18 —Machinery and vehicles ¥ 1 3 $ 8Land 258 938 3,143Other 2 8 23
Total ¥261 ¥967 $3,174
Loss on sale of property, plant and equipment for the years ended March 31, 2012 and 2011 is as follows:
Millions of yenThousands of U.S. dollars
2012 2011 2012
Buildings and structures — ¥ 3 —Machinery and vehicles ¥ 2 64 $ 22Land 27 29 334Intangible fixed assets — 0 —Other 0 0 3
Total ¥30 ¥96 $359
Loss on disposal of property, plant and equipment for the years ended March 31, 2012 and 2011 is as follows:
Millions of yenThousands of U.S. dollars
2012 2011 2012
Buildings and structures ¥ 32 ¥143 $ 394Machinery and vehicles 121 249 1,478Land 3 — 32Lease assets 0 — 3Construction in progress 5 — 59Intangible fixed assets — 84 —Other 4 18 53
Total ¥166 ¥494 $2,018
Annual Report 2012 69
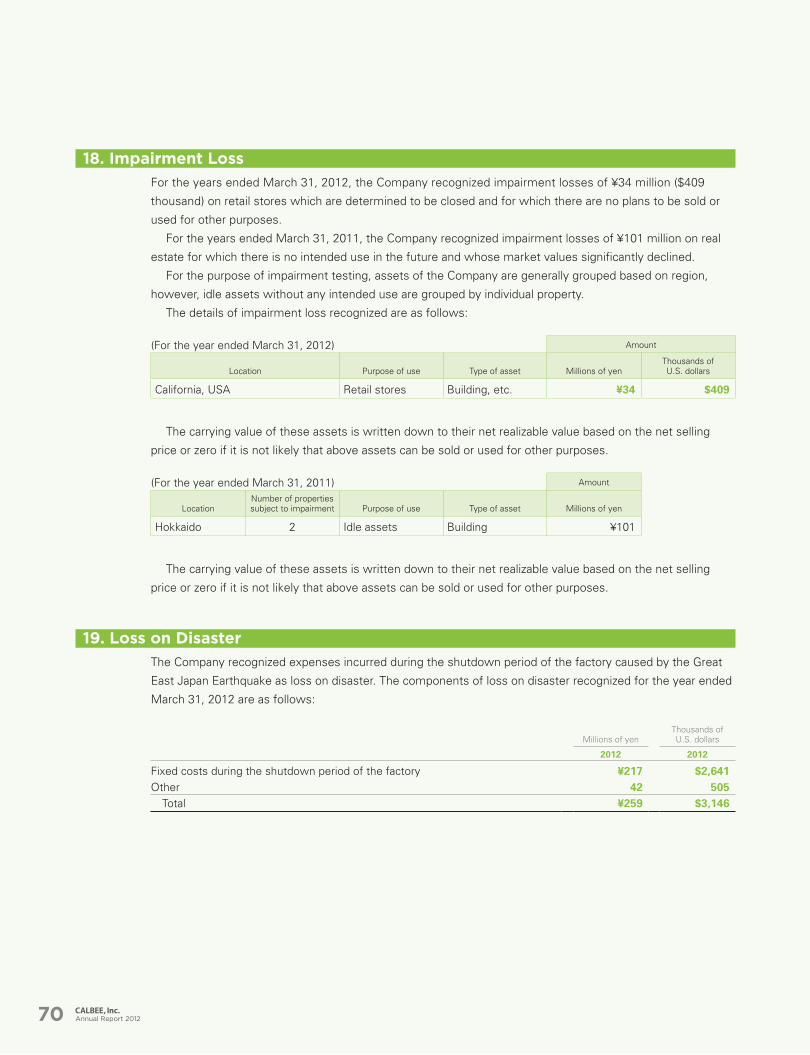
18. Impairment Loss
For the years ended March 31, 2012, the Company recognized impairment losses of ¥34 million ($409
thousand) on retail stores which are determined to be closed and for which there are no plans to be sold or
used for other purposes.
For the years ended March 31, 2011, the Company recognized impairment losses of ¥101 million on real
estate for which there is no intended use in the future and whose market values significantly declined.
For the purpose of impairment testing, assets of the Company are generally grouped based on region,
however, idle assets without any intended use are grouped by individual property.
The details of impairment loss recognized are as follows:
(For the year ended March 31, 2012) Amount
Location Purpose of use Type of asset Millions of yenThousands of U.S. dollars
California, USA Retail stores Building, etc. ¥34 $409
The carrying value of these assets is written down to their net realizable value based on the net selling
price or zero if it is not likely that above assets can be sold or used for other purposes.
(For the year ended March 31, 2011) Amount
LocationNumber of properties subject to impairment Purpose of use Type of asset Millions of yen
Hokkaido 2 Idle assets Building ¥101
The carrying value of these assets is written down to their net realizable value based on the net selling
price or zero if it is not likely that above assets can be sold or used for other purposes.
19. Loss on Disaster
The Company recognized expenses incurred during the shutdown period of the factory caused by the Great
East Japan Earthquake as loss on disaster. The components of loss on disaster recognized for the year ended
March 31, 2012 are as follows:
Millions of yenThousands of U.S. dollars
2012 2012
Fixed costs during the shutdown period of the factory ¥217 $2,641Other 42 505
Total ¥259 $3,146
Annual Report 201270
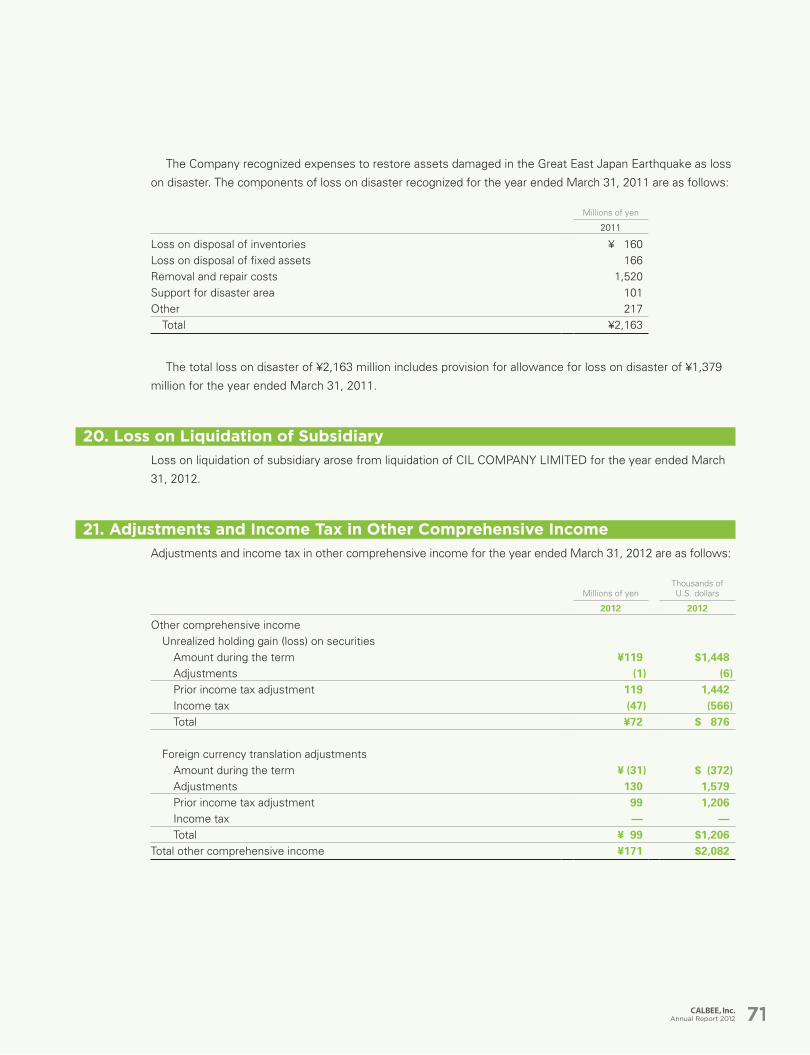
The Company recognized expenses to restore assets damaged in the Great East Japan Earthquake as loss
on disaster. The components of loss on disaster recognized for the year ended March 31, 2011 are as follows:
Millions of yen
2011
Loss on disposal of inventories ¥ 160Loss on disposal of fixed assets 166Removal and repair costs 1,520Support for disaster area 101Other 217
Total ¥2,163
The total loss on disaster of ¥2,163 million includes provision for allowance for loss on disaster of ¥1,379
million for the year ended March 31, 2011.
20. Loss on Liquidation of Subsidiary
Loss on liquidation of subsidiary arose from liquidation of CIL COMPANY LIMITED for the year ended March
31, 2012.
21. Adjustments and Income Tax in Other Comprehensive Income
Adjustments and income tax in other comprehensive income for the year ended March 31, 2012 are as follows:
Millions of yenThousands of U.S. dollars
2012 2012
Other comprehensive incomeUnrealized holding gain (loss) on securities
Amount during the term ¥119 $1,448Adjustments (1) (6)Prior income tax adjustment 119 1,442Income tax (47) (566)Total ¥72 $ 876
Foreign currency translation adjustmentsAmount during the term ¥ (31) $ (372)Adjustments 130 1,579Prior income tax adjustment 99 1,206Income tax — —Total ¥ 99 $1,206
Total other comprehensive income ¥171 $2,082
Annual Report 2012 71
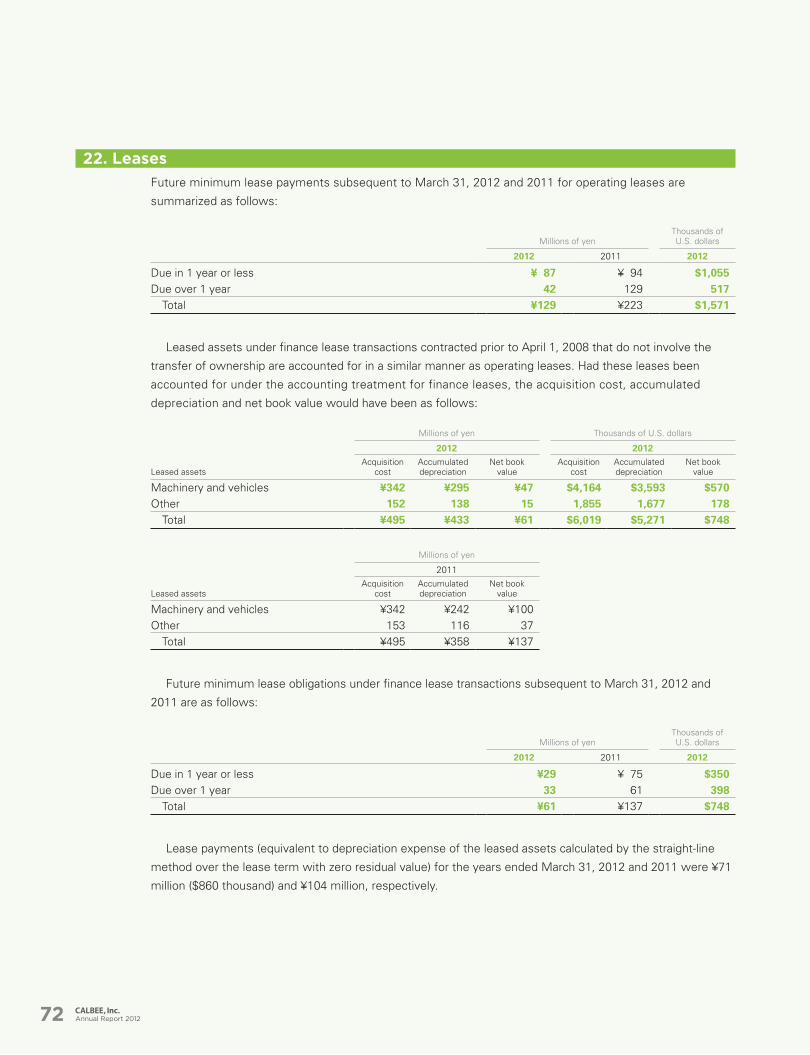
22. Leases
Future minimum lease payments subsequent to March 31, 2012 and 2011 for operating leases are
summarized as follows:
Millions of yenThousands of U.S. dollars
2012 2011 2012
Due in 1 year or less ¥ 87 ¥ 94 $1,055Due over 1 year 42 129 517
Total ¥129 ¥223 $1,571
Leased assets under finance lease transactions contracted prior to April 1, 2008 that do not involve the
transfer of ownership are accounted for in a similar manner as operating leases. Had these leases been
accounted for under the accounting treatment for finance leases, the acquisition cost, accumulated
depreciation and net book value would have been as follows:
Millions of yen Thousands of U.S. dollars
2012 2012
Leased assetsAcquisition
costAccumulated depreciation
Net book value
Acquisition cost
Accumulated depreciation
Net book value
Machinery and vehicles ¥342 ¥295 ¥47 $4,164 $3,593 $570Other 152 138 15 1,855 1,677 178
Total ¥495 ¥433 ¥61 $6,019 $5,271 $748
Millions of yen
2011
Leased assetsAcquisition
costAccumulated depreciation
Net book value
Machinery and vehicles ¥342 ¥242 ¥100Other 153 116 37
Total ¥495 ¥358 ¥137
Future minimum lease obligations under finance lease transactions subsequent to March 31, 2012 and
2011 are as follows:
Millions of yenThousands of U.S. dollars
2012 2011 2012
Due in 1 year or less ¥29 ¥ 75 $350Due over 1 year 33 61 398
Total ¥61 ¥137 $748
Lease payments (equivalent to depreciation expense of the leased assets calculated by the straight-line
method over the lease term with zero residual value) for the years ended March 31, 2012 and 2011 were ¥71
million ($860 thousand) and ¥104 million, respectively.
Annual Report 201272
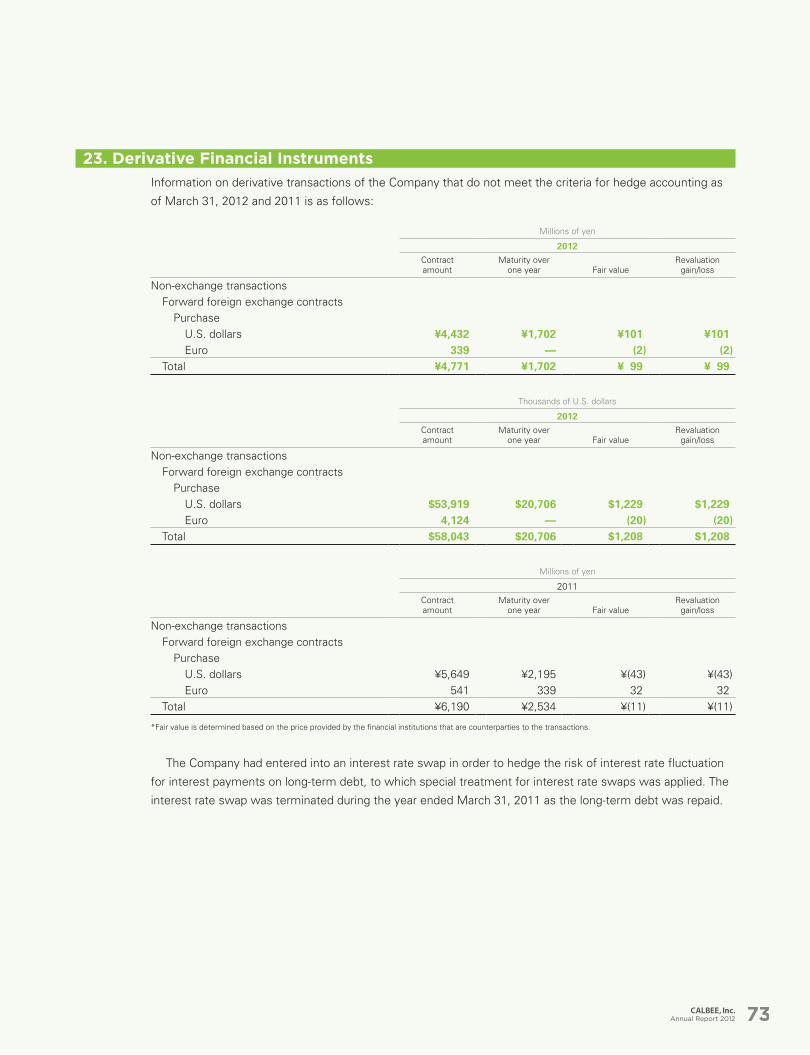
23. Derivative Financial Instruments
Information on derivative transactions of the Company that do not meet the criteria for hedge accounting as
of March 31, 2012 and 2011 is as follows:
Millions of yen
2012Contract amount
Maturity over one year Fair value
Revaluation gain/loss
Non-exchange transactionsForward foreign exchange contracts
PurchaseU.S. dollars ¥4,432 ¥1,702 ¥101 ¥101Euro 339 — (2) (2)
Total ¥4,771 ¥1,702 ¥ 99 ¥ 99
Thousands of U.S. dollars
2012Contract amount
Maturity over one year Fair value
Revaluation gain/loss
Non-exchange transactionsForward foreign exchange contracts
PurchaseU.S. dollars $53,919 $20,706 $1,229 $1,229Euro 4,124 — (20) (20)
Total $58,043 $20,706 $1,208 $1,208
Millions of yen
2011Contract amount
Maturity over one year Fair value
Revaluation gain/loss
Non-exchange transactionsForward foreign exchange contracts
PurchaseU.S. dollars ¥5,649 ¥2,195 ¥(43) ¥(43)Euro 541 339 32 32
Total ¥6,190 ¥2,534 ¥(11) ¥(11)
*Fair value is determined based on the price provided by the financial institutions that are counterparties to the transactions.
The Company had entered into an interest rate swap in order to hedge the risk of interest rate fluctuation
for interest payments on long-term debt, to which special treatment for interest rate swaps was applied. The
interest rate swap was terminated during the year ended March 31, 2011 as the long-term debt was repaid.
Annual Report 2012 73
24. Business Combinations
Establishment of a joint venture
On July 1, 2011, the Company established a joint venture with a major Korean snack foods manufacture,
HAITAI Confectionery & Food Co., Ltd. to expand the market share of Calbee products in Korea, which is the
third biggest snack food market in Asia after Japan and China.
A joint venture company, HAITAI-CALBEE Co., Ltd., was established through financial investment by the
Company and investment in kind by HAITAI Confectionery & Food Co., Ltd. for the manufacture and sale of
snack foods. The Company has 50% of the voting rights of HAITAI-CALBEE Co., Ltd.
Fiscal period of a combined company included the consolidated financial statements is from July 1, 2011
to March 31, 2012.
Acquisition cost of ¥873 million ($10,621 thousand) is stock consideration, and no direct expense incurred
for the acquisition.
Goodwill of ¥326 million ($3,969 thousand) arose from the additional earnings capability envisaged under
future business development and were amortized for 5 years.
Common control transaction
The Company held 43.6% of voting rights (inclusive of 10.6% held indirectly) of the outstanding shares of
Calnac Co., Ltd., a consolidated subsidiary of the Company, but additional acquisition of shares was made on
September 30, 2011 and January 31, 2012 to further strengthen inter-group alliances and enhance corporate
value for entire group. As the result, the proportion of voting rights held by the Company increased to 100.0%
(inclusive of 10.6% held indirectly).
The acquisition was accounted for as a transaction under common control (a transaction with a minority
shareholder) in accordance with ASBJ Statement No. 21, “Accounting Standard for Business Combinations”
and ASBJ Guidance No. 10, “Guidance on Accounting Standard for Business Combinations and Accounting
Standard for Business Divestitures,” issued on December 26, 2008.
Acquisition cost of ¥400 million ($4,862 thousand) is stock consideration, and no direct expense incurred
for the acquisition.
Negative goodwill of ¥538 million ($6,542 thousand) arose from the acquisition of additional shares of
Calnac Co., Ltd. as the difference between the acquisition cost and the resulting decrease in minority interests
and were recognized as gain on negative goodwill.
Annual Report 201274
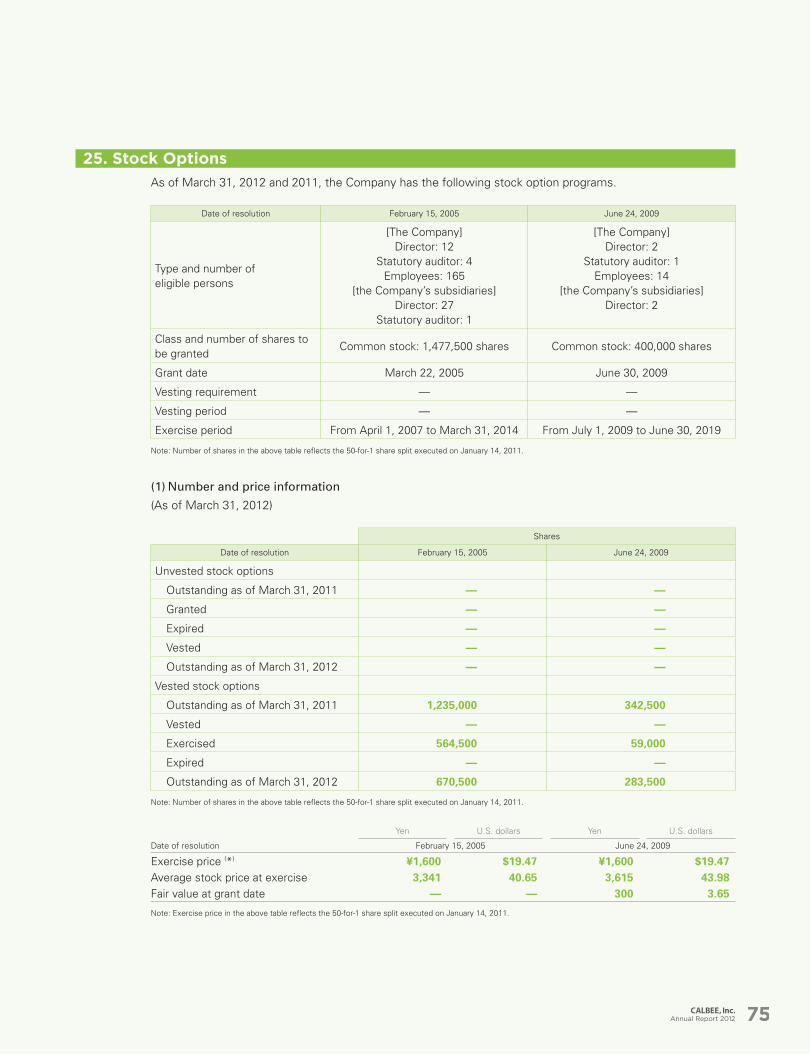
25. Stock Options
As of March 31, 2012 and 2011, the Company has the following stock option programs.
Date of resolution February 15, 2005 June 24, 2009
Type and number of eligible persons
[The Company]Director: 12
Statutory auditor: 4Employees: 165
[the Company’s subsidiaries]Director: 27
Statutory auditor: 1
[The Company]Director: 2
Statutory auditor: 1Employees: 14
[the Company’s subsidiaries]Director: 2
Class and number of shares to be granted
Common stock: 1,477,500 shares Common stock: 400,000 shares
Grant date March 22, 2005 June 30, 2009
Vesting requirement — —
Vesting period — —
Exercise period From April 1, 2007 to March 31, 2014 From July 1, 2009 to June 30, 2019
Note: Number of shares in the above table reflects the 50-for-1 share split executed on January 14, 2011.
(1) Number and price information
(As of March 31, 2012)
Shares
Date of resolution February 15, 2005 June 24, 2009
Unvested stock options
Outstanding as of March 31, 2011 — —
Granted — —
Expired — —
Vested — —
Outstanding as of March 31, 2012 — —
Vested stock options
Outstanding as of March 31, 2011 1,235,000 342,500
Vested — —
Exercised 564,500 59,000
Expired — —
Outstanding as of March 31, 2012 670,500 283,500
Note: Number of shares in the above table reflects the 50-for-1 share split executed on January 14, 2011.
Yen U.S. dollars Yen U.S. dollars
Date of resolution February 15, 2005 June 24, 2009
Exercise price (*) ¥1,600 $19.47 ¥1,600 $19.47Average stock price at exercise 3,341 40.65 3,615 43.98Fair value at grant date — — 300 3.65
Note: Exercise price in the above table reflects the 50-for-1 share split executed on January 14, 2011.
Annual Report 2012 75
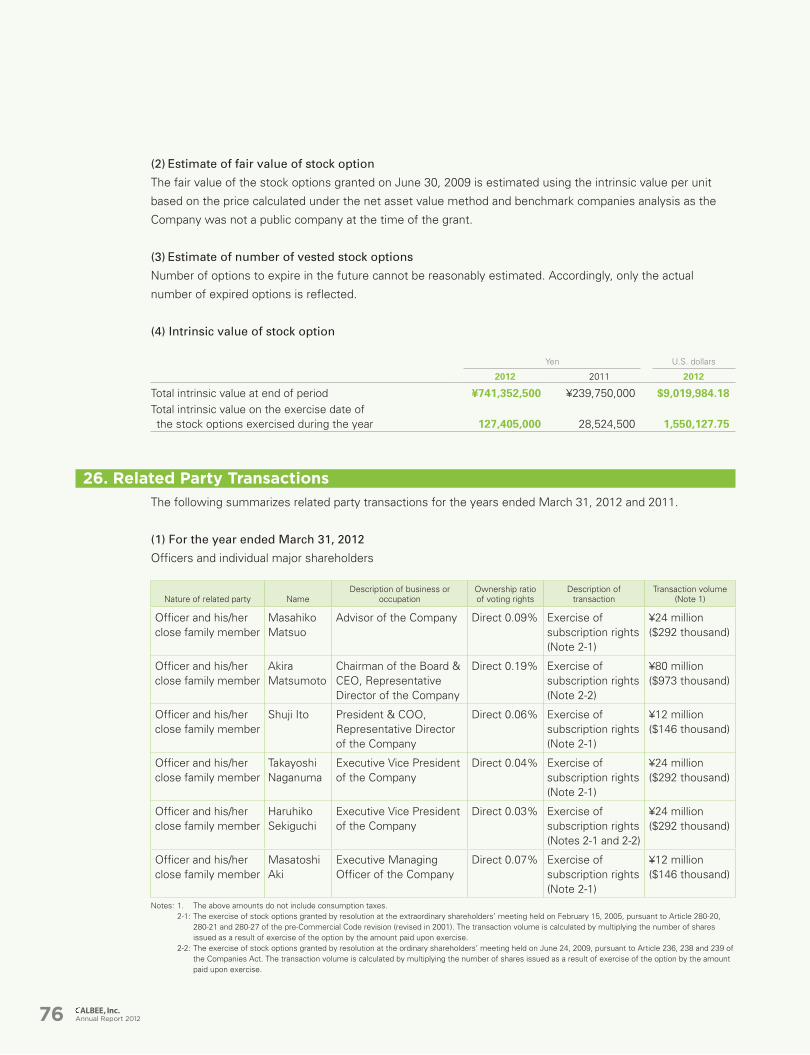
(2) Estimate of fair value of stock option
The fair value of the stock options granted on June 30, 2009 is estimated using the intrinsic value per unit
based on the price calculated under the net asset value method and benchmark companies analysis as the
Company was not a public company at the time of the grant.
(3) Estimate of number of vested stock options
Number of options to expire in the future cannot be reasonably estimated. Accordingly, only the actual
number of expired options is reflected.
(4) Intrinsic value of stock option
Yen U.S. dollars
2012 2011 2012
Total intrinsic value at end of period ¥741,352,500 ¥239,750,000 $9,019,984.18Total intrinsic value on the exercise date of the stock options exercised during the year 127,405,000 28,524,500 1,550,127.75
26. Related Party Transactions
The following summarizes related party transactions for the years ended March 31, 2012 and 2011.
(1) For the year ended March 31, 2012
Officers and individual major shareholders
Nature of related party NameDescription of business or
occupationOwnership ratio of voting rights
Description of transaction
Transaction volume (Note 1)
Officer and his/her close family member
Masahiko Matsuo
Advisor of the Company Direct 0.09% Exercise of subscription rights (Note 2-1)
¥24 million ($292 thousand)
Officer and his/her close family member
Akira Matsumoto
Chairman of the Board & CEO, Representative Director of the Company
Direct 0.19% Exercise of subscription rights (Note 2-2)
¥80 million ($973 thousand)
Officer and his/her close family member
Shuji Ito President & COO, Representative Director of the Company
Direct 0.06% Exercise of subscription rights (Note 2-1)
¥12 million ($146 thousand)
Officer and his/her close family member
Takayoshi Naganuma
Executive Vice President of the Company
Direct 0.04% Exercise of subscription rights (Note 2-1)
¥24 million ($292 thousand)
Officer and his/her close family member
Haruhiko Sekiguchi
Executive Vice President of the Company
Direct 0.03% Exercise of subscription rights (Notes 2-1 and 2-2)
¥24 million ($292 thousand)
Officer and his/her close family member
Masatoshi Aki
Executive Managing Officer of the Company
Direct 0.07% Exercise of subscription rights (Note 2-1)
¥12 million ($146 thousand)
Notes: 1. The above amounts do not include consumption taxes. 2-1: The exercise of stock options granted by resolution at the extraordinary shareholders’ meeting held on February 15, 2005, pursuant to Article 280-20,
280-21 and 280-27 of the pre-Commercial Code revision (revised in 2001). The transaction volume is calculated by multiplying the number of shares issued as a result of exercise of the option by the amount paid upon exercise.
2-2: The exercise of stock options granted by resolution at the ordinary shareholders’ meeting held on June 24, 2009, pursuant to Article 236, 238 and 239 of the Companies Act. The transaction volume is calculated by multiplying the number of shares issued as a result of exercise of the option by the amount paid upon exercise.
Annual Report 201276
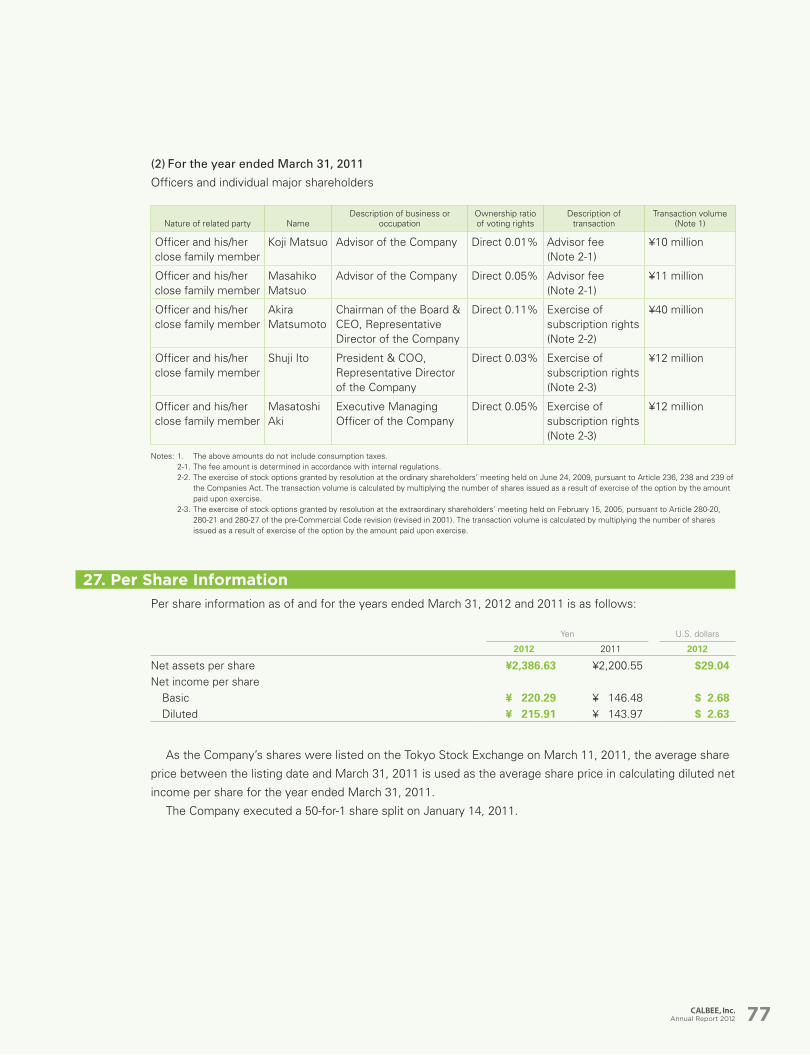
(2) For the year ended March 31, 2011
Officers and individual major shareholders
Nature of related party NameDescription of business or
occupationOwnership ratio of voting rights
Description of transaction
Transaction volume (Note 1)
Officer and his/her close family member
Koji Matsuo Advisor of the Company Direct 0.01% Advisor fee (Note 2-1)
¥10 million
Officer and his/her close family member
Masahiko Matsuo
Advisor of the Company Direct 0.05% Advisor fee (Note 2-1)
¥11 million
Officer and his/her close family member
Akira Matsumoto
Chairman of the Board & CEO, Representative Director of the Company
Direct 0.11% Exercise of subscription rights (Note 2-2)
¥40 million
Officer and his/her close family member
Shuji Ito President & COO, Representative Director of the Company
Direct 0.03% Exercise of subscription rights (Note 2-3)
¥12 million
Officer and his/her close family member
Masatoshi Aki
Executive Managing Officer of the Company
Direct 0.05% Exercise of subscription rights (Note 2-3)
¥12 million
Notes: 1. The above amounts do not include consumption taxes. 2-1. The fee amount is determined in accordance with internal regulations. 2-2. The exercise of stock options granted by resolution at the ordinary shareholders’ meeting held on June 24, 2009, pursuant to Article 236, 238 and 239 of
the Companies Act. The transaction volume is calculated by multiplying the number of shares issued as a result of exercise of the option by the amount paid upon exercise.
2-3. The exercise of stock options granted by resolution at the extraordinary shareholders’ meeting held on February 15, 2005, pursuant to Article 280-20, 280-21 and 280-27 of the pre-Commercial Code revision (revised in 2001). The transaction volume is calculated by multiplying the number of shares issued as a result of exercise of the option by the amount paid upon exercise.
27. Per Share Information
Per share information as of and for the years ended March 31, 2012 and 2011 is as follows:
Yen U.S. dollars
2012 2011 2012
Net assets per share ¥2,386.63 ¥2,200.55 $29.04Net income per share
Basic ¥ 220.29 ¥ 146.48 $ 2.68Diluted ¥ 215.91 ¥ 143.97 $ 2.63
As the Company’s shares were listed on the Tokyo Stock Exchange on March 11, 2011, the average share
price between the listing date and March 31, 2011 is used as the average share price in calculating diluted net
income per share for the year ended March 31, 2011.
The Company executed a 50-for-1 share split on January 14, 2011.
Annual Report 2012 77
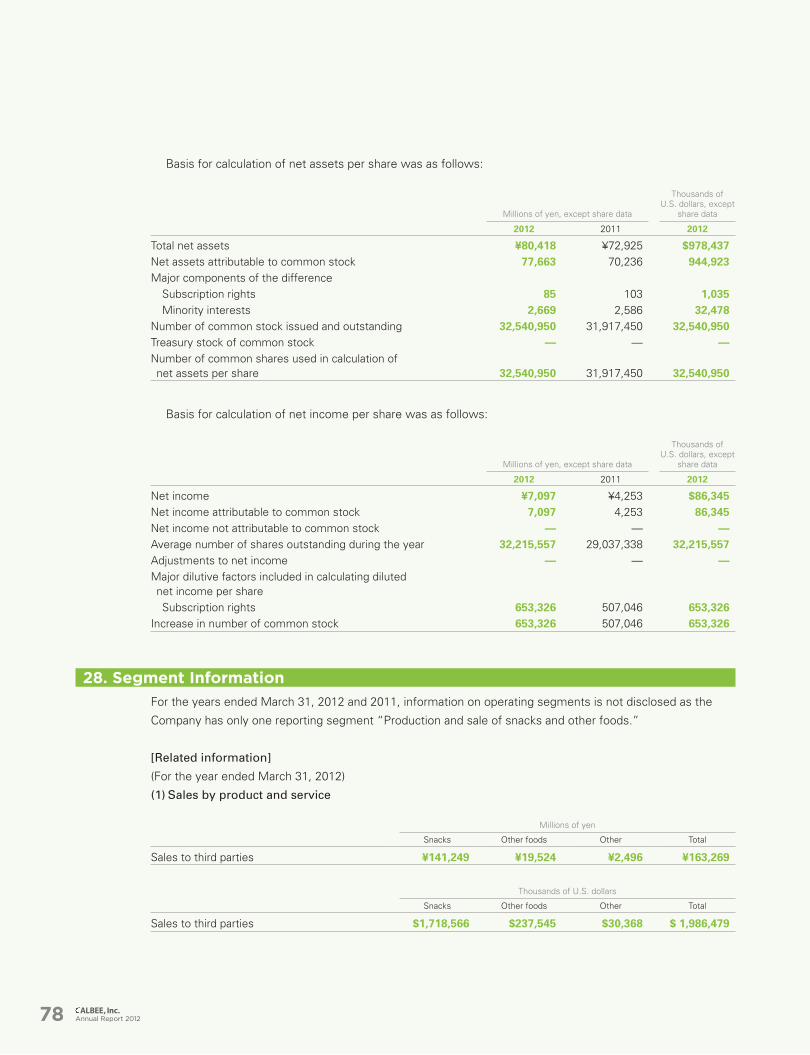
Basis for calculation of net assets per share was as follows:
Millions of yen, except share data
Thousands of U.S. dollars, except
share data
2012 2011 2012
Total net assets ¥80,418 ¥72,925 $978,437Net assets attributable to common stock 77,663 70,236 944,923Major components of the difference
Subscription rights 85 103 1,035Minority interests 2,669 2,586 32,478
Number of common stock issued and outstanding 32,540,950 31,917,450 32,540,950Treasury stock of common stock — — —Number of common shares used in calculation of net assets per share 32,540,950 31,917,450 32,540,950
Basis for calculation of net income per share was as follows:
Millions of yen, except share data
Thousands of U.S. dollars, except
share data
2012 2011 2012
Net income ¥7,097 ¥4,253 $86,345Net income attributable to common stock 7,097 4,253 86,345Net income not attributable to common stock — — —Average number of shares outstanding during the year 32,215,557 29,037,338 32,215,557Adjustments to net income — — —Major dilutive factors included in calculating diluted net income per share
Subscription rights 653,326 507,046 653,326Increase in number of common stock 653,326 507,046 653,326
28. Segment Information
For the years ended March 31, 2012 and 2011, information on operating segments is not disclosed as the
Company has only one reporting segment “Production and sale of snacks and other foods.”
[Related information]
(For the year ended March 31, 2012)
(1) Sales by product and service
Millions of yen
Snacks Other foods Other Total
Sales to third parties ¥141,249 ¥19,524 ¥2,496 ¥163,269
Thousands of U.S. dollars
Snacks Other foods Other Total
Sales to third parties $1,718,566 $237,545 $30,368 $ 1,986,479
Annual Report 201278
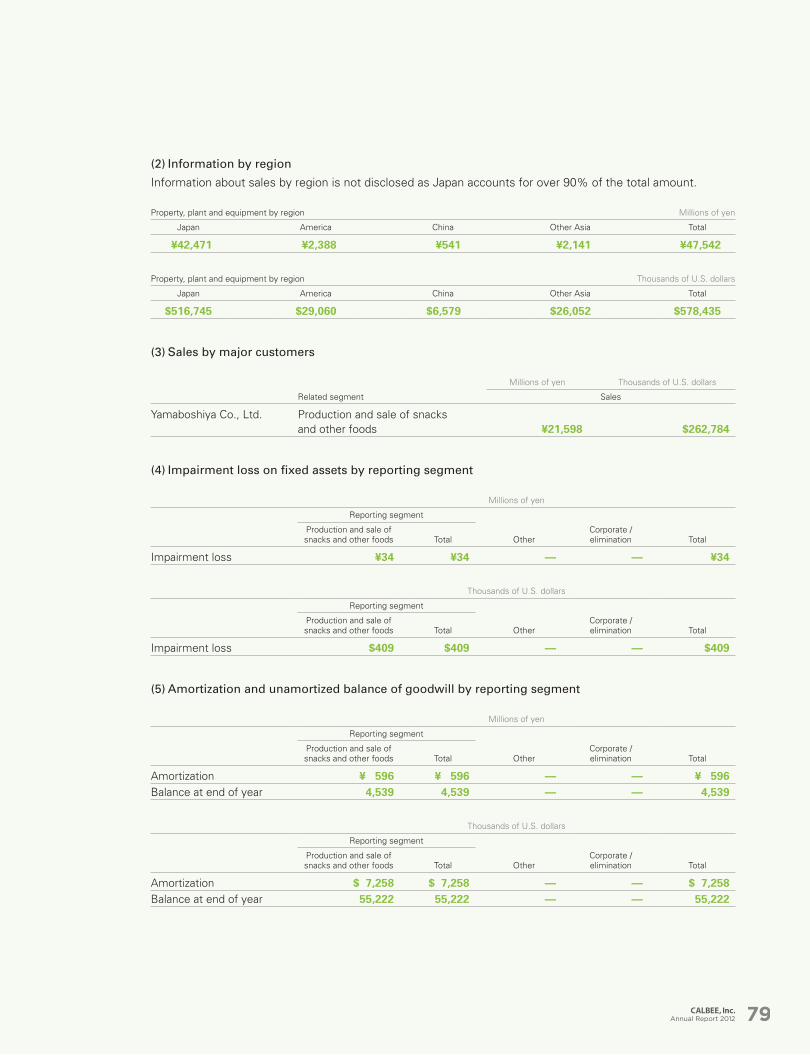
(2) Information by region
Information about sales by region is not disclosed as Japan accounts for over 90% of the total amount.
Property, plant and equipment by region Millions of yen
Japan America China Other Asia Total
¥42,471 ¥2,388 ¥541 ¥2,141 ¥47,542
Property, plant and equipment by region Thousands of U.S. dollars
Japan America China Other Asia Total
$516,745 $29,060 $6,579 $26,052 $578,435
(3) Sales by major customers
Millions of yen Thousands of U.S. dollars
Related segment Sales
Yamaboshiya Co., Ltd. Production and sale of snacks and other foods ¥21,598 $262,784
(4) Impairment loss on fixed assets by reporting segment
Millions of yen
Reporting segment
Production and sale of snacks and other foods Total Other
Corporate / elimination Total
Impairment loss ¥34 ¥34 — — ¥34
Thousands of U.S. dollars
Reporting segment
Production and sale of snacks and other foods Total Other
Corporate / elimination Total
Impairment loss $409 $409 — — $409
(5) Amortization and unamortized balance of goodwill by reporting segment
Millions of yen
Reporting segment
Production and sale of snacks and other foods Total Other
Corporate / elimination Total
Amortization ¥ 596 ¥ 596 — — ¥ 596Balance at end of year 4,539 4,539 — — 4,539
Thousands of U.S. dollars
Reporting segment
Production and sale of snacks and other foods Total Other
Corporate / elimination Total
Amortization $ 7,258 $ 7,258 — — $ 7,258Balance at end of year 55,222 55,222 — — 55,222
Annual Report 2012 79
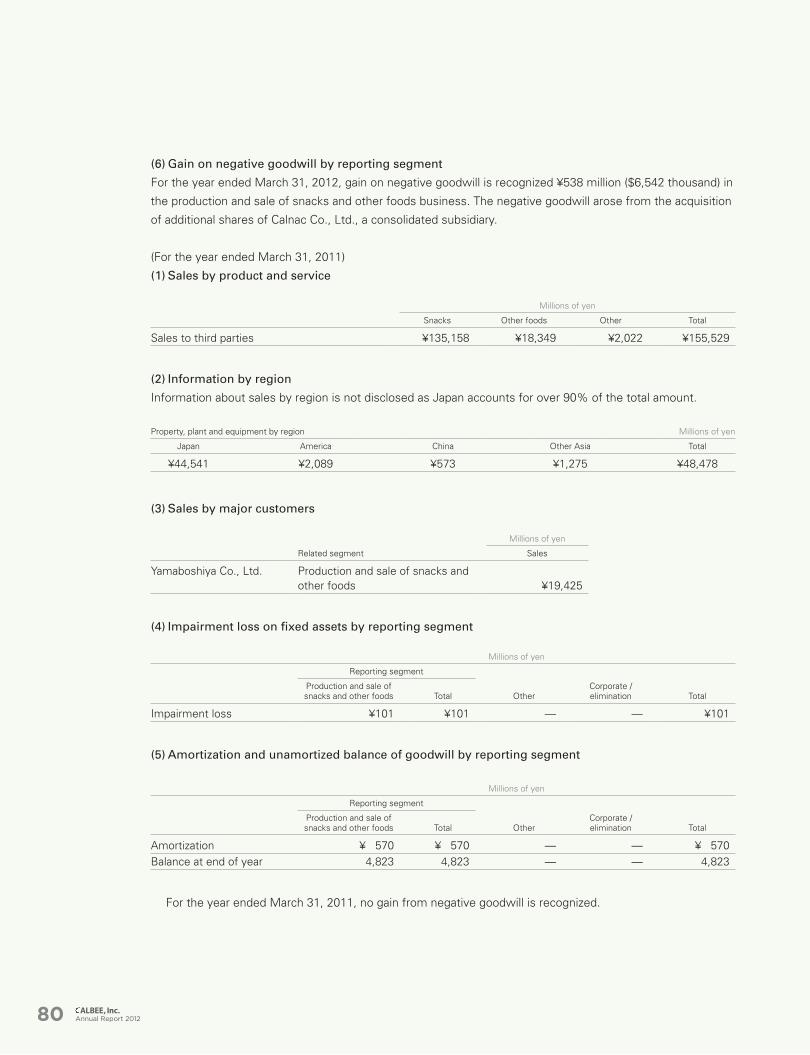
(6) Gain on negative goodwill by reporting segment
For the year ended March 31, 2012, gain on negative goodwill is recognized ¥538 million ($6,542 thousand) in
the production and sale of snacks and other foods business. The negative goodwill arose from the acquisition
of additional shares of Calnac Co., Ltd., a consolidated subsidiary.
(For the year ended March 31, 2011)
(1) Sales by product and service
Millions of yen
Snacks Other foods Other Total
Sales to third parties ¥135,158 ¥18,349 ¥2,022 ¥155,529
(2) Information by region
Information about sales by region is not disclosed as Japan accounts for over 90% of the total amount.
Property, plant and equipment by region Millions of yen
Japan America China Other Asia Total
¥44,541 ¥2,089 ¥573 ¥1,275 ¥48,478
(3) Sales by major customers
Millions of yen
Related segment Sales
Yamaboshiya Co., Ltd. Production and sale of snacks and other foods ¥19,425
(4) Impairment loss on fixed assets by reporting segment
Millions of yen
Reporting segment
Production and sale of snacks and other foods Total Other
Corporate / elimination Total
Impairment loss ¥101 ¥101 — — ¥101
(5) Amortization and unamortized balance of goodwill by reporting segment
Millions of yen
Reporting segment
Production and sale of snacks and other foods Total Other
Corporate / elimination Total
Amortization ¥ 570 ¥ 570 — — ¥ 570Balance at end of year 4,823 4,823 — — 4,823
For the year ended March 31, 2011, no gain from negative goodwill is recognized.
Annual Report 201280
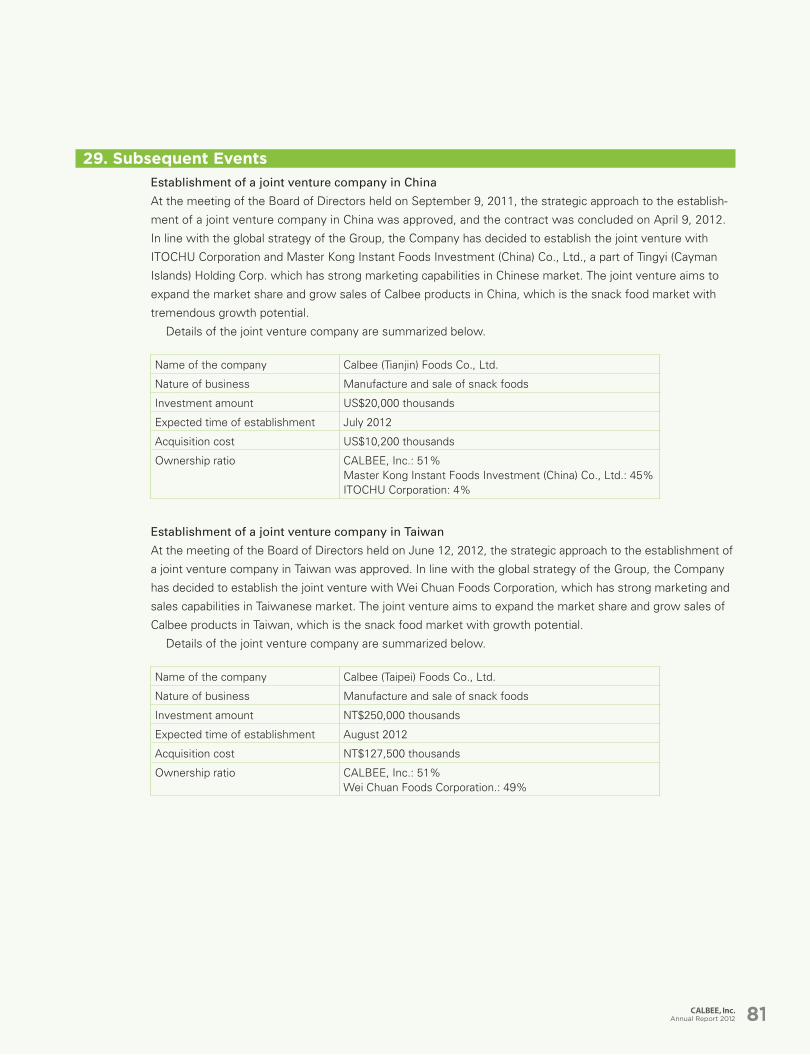
29. Subsequent Events
Establishment of a joint venture company in China
At the meeting of the Board of Directors held on September 9, 2011, the strategic approach to the establish-
ment of a joint venture company in China was approved, and the contract was concluded on April 9, 2012.
In line with the global strategy of the Group, the Company has decided to establish the joint venture with
ITOCHU Corporation and Master Kong Instant Foods Investment (China) Co., Ltd., a part of Tingyi (Cayman
Islands) Holding Corp. which has strong marketing capabilities in Chinese market. The joint venture aims to
expand the market share and grow sales of Calbee products in China, which is the snack food market with
tremendous growth potential.
Details of the joint venture company are summarized below.
Name of the company Calbee (Tianjin) Foods Co., Ltd.
Nature of business Manufacture and sale of snack foods
Investment amount US$20,000 thousands
Expected time of establishment July 2012
Acquisition cost US$10,200 thousands
Ownership ratio CALBEE, Inc.: 51%Master Kong Instant Foods Investment (China) Co., Ltd.: 45%ITOCHU Corporation: 4%
Establishment of a joint venture company in Taiwan
At the meeting of the Board of Directors held on June 12, 2012, the strategic approach to the establishment of
a joint venture company in Taiwan was approved. In line with the global strategy of the Group, the Company
has decided to establish the joint venture with Wei Chuan Foods Corporation, which has strong marketing and
sales capabilities in Taiwanese market. The joint venture aims to expand the market share and grow sales of
Calbee products in Taiwan, which is the snack food market with growth potential.
Details of the joint venture company are summarized below.
Name of the company Calbee (Taipei) Foods Co., Ltd.
Nature of business Manufacture and sale of snack foods
Investment amount NT$250,000 thousands
Expected time of establishment August 2012
Acquisition cost NT$127,500 thousands
Ownership ratio CALBEE, Inc.: 51%Wei Chuan Foods Corporation.: 49%
Annual Report 2012 81
Independent Auditor’s Report
Annual Report 201282
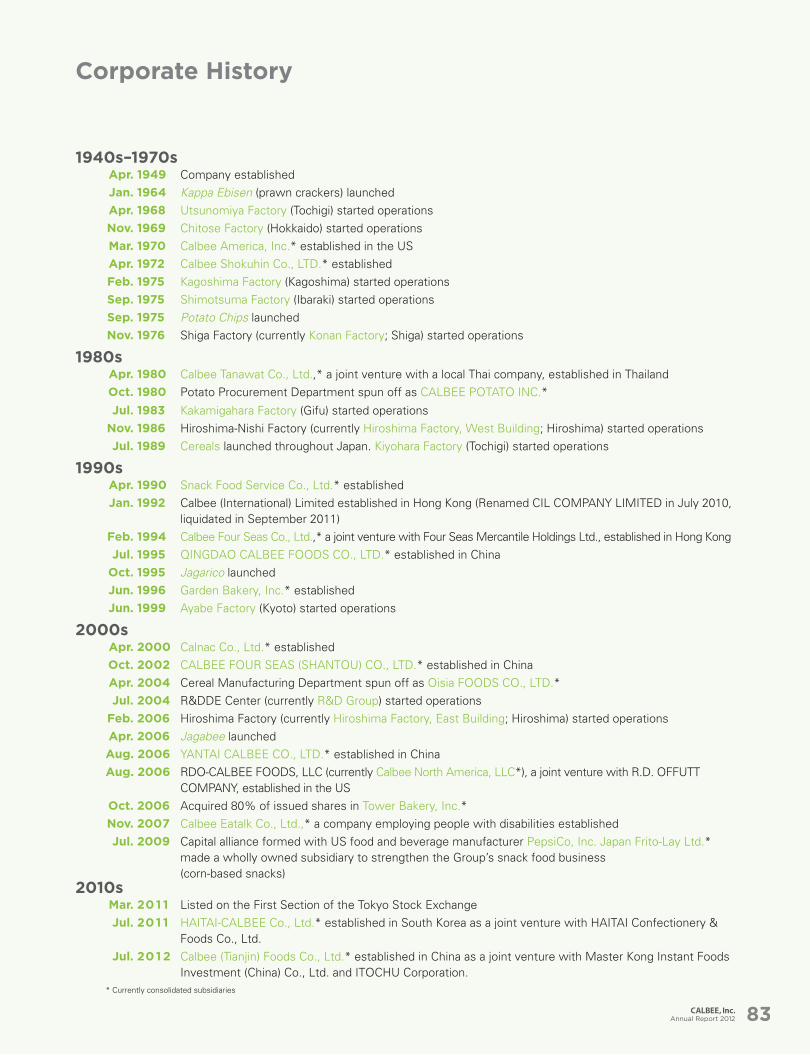
Corporate History
1940s–1970sApr. 1949 Company establishedJan. 1964 Kappa Ebisen (prawn crackers) launchedApr. 1968 Utsunomiya Factory (Tochigi) started operationsNov. 1969 Chitose Factory (Hokkaido) started operationsMar. 1970 Calbee America, Inc.* established in the USApr. 1972 Calbee Shokuhin Co., LTD.* establishedFeb. 1975 Kagoshima Factory (Kagoshima) started operationsSep. 1975 Shimotsuma Factory (Ibaraki) started operationsSep. 1975 Potato Chips launchedNov. 1976 Shiga Factory (currently Konan Factory; Shiga) started operations
1980sApr. 1980 Calbee Tanawat Co., Ltd.,* a joint venture with a local Thai company, established in ThailandOct. 1980 Potato Procurement Department spun off as CALBEE POTATO INC.*
Jul. 1983 Kakamigahara Factory (Gifu) started operationsNov. 1986 Hiroshima-Nishi Factory (currently Hiroshima Factory, West Building; Hiroshima) started operationsJul. 1989 Cereals launched throughout Japan. Kiyohara Factory (Tochigi) started operations
1990sApr. 1990 Snack Food Service Co., Ltd.* establishedJan. 1992 Calbee (International) Limited established in Hong Kong (Renamed CIL COMPANY LIMITED in July 2010,
liquidated in September 2011)Feb. 1994 Calbee Four Seas Co., Ltd.,* a joint venture with Four Seas Mercantile Holdings Ltd., established in Hong KongJul. 1995 QINGDAO CALBEE FOODS CO., LTD.* established in China
Oct. 1995 Jagarico launchedJun. 1996 Garden Bakery, Inc.* establishedJun. 1999 Ayabe Factory (Kyoto) started operations
2000sApr. 2000 Calnac Co., Ltd.* establishedOct. 2002 CALBEE FOUR SEAS (SHANTOU) CO., LTD.* established in ChinaApr. 2004 Cereal Manufacturing Department spun off as Oisia FOODS CO., LTD.*Jul. 2004 R&DDE Center (currently R&D Group) started operations
Feb. 2006 Hiroshima Factory (currently Hiroshima Factory, East Building; Hiroshima) started operationsApr. 2006 Jagabee launchedAug. 2006 YANTAI CALBEE CO., LTD.* established in ChinaAug. 2006 RDO-CALBEE FOODS, LLC (currently Calbee North America, LLC*), a joint venture with R.D. OFFUTT
COMPANY, established in the USOct. 2006 Acquired 80% of issued shares in Tower Bakery, Inc.*Nov. 2007 Calbee Eatalk Co., Ltd.,* a company employing people with disabilities establishedJul. 2009 Capital alliance formed with US food and beverage manufacturer PepsiCo, Inc. Japan Frito-Lay Ltd.*
made a wholly owned subsidiary to strengthen the Group’s snack food business (corn-based snacks)
2010sMar. 201 1 Listed on the First Section of the Tokyo Stock ExchangeJul. 201 1 HAITAI-CALBEE Co., Ltd.* established in South Korea as a joint venture with HAITAI Confectionery &
Foods Co., Ltd.Jul. 201 2 Calbee (Tianjin) Foods Co., Ltd.* established in China as a joint venture with Master Kong Instant Foods
Investment (China) Co., Ltd. and ITOCHU Corporation.* Currently consolidated subsidiaries
Annual Report 2012 83
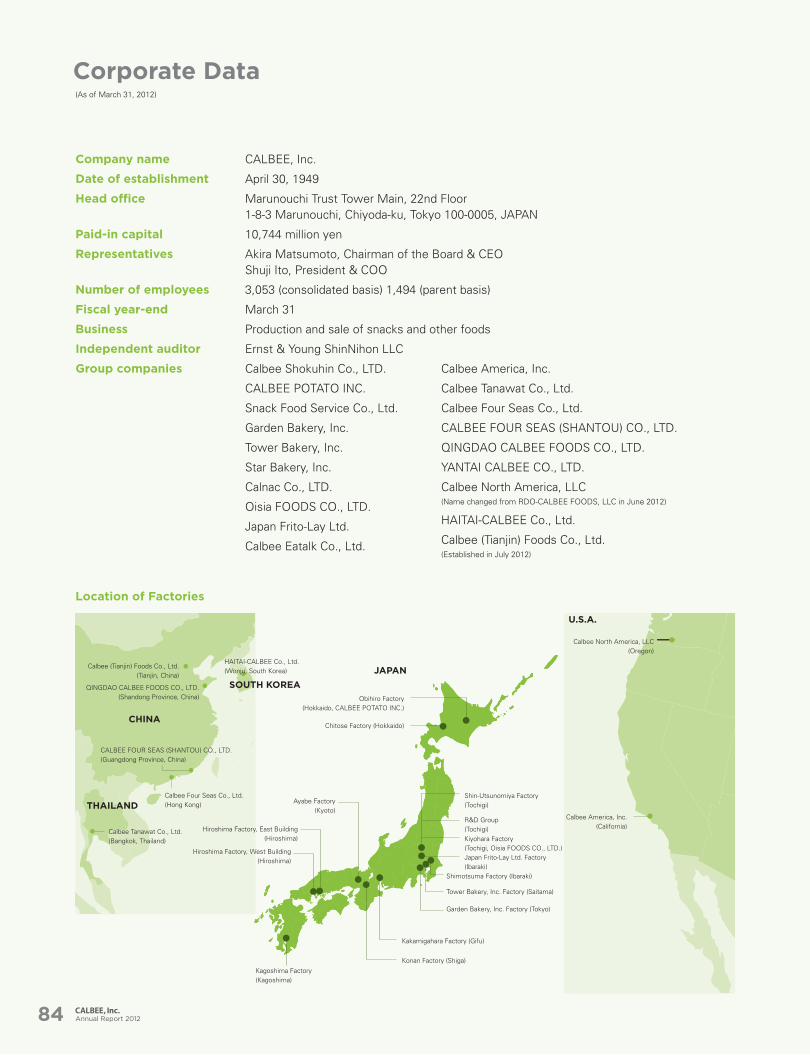
Corporate Data(As of March 31, 2012)
Company name CALBEE, Inc.
Date of establishment April 30, 1949
Head office Marunouchi Trust Tower Main, 22nd Floor1-8-3 Marunouchi, Chiyoda-ku, Tokyo 100-0005, JAPAN
Paid-in capital 10,744 million yen
Representatives Akira Matsumoto, Chairman of the Board & CEO Shuji Ito, President & COO
Number of employees 3,053 (consolidated basis) 1,494 (parent basis)
Fiscal year-end March 31
Business Production and sale of snacks and other foods
Independent auditor Ernst & Young ShinNihon LLC
Group companies Calbee Shokuhin Co., LTD.
CALBEE POTATO INC.
Snack Food Service Co., Ltd.
Garden Bakery, Inc.
Tower Bakery, Inc.
Star Bakery, Inc.
Calnac Co., LTD.
Oisia FOODS CO., LTD.
Japan Frito-Lay Ltd.
Calbee Eatalk Co., Ltd.
Location of Factories
QINGDAO CALBEE FOODS CO., LTD. (Shandong Province, China)
HAITAI-CALBEE Co., Ltd.(Wonju, South Korea)
Obihiro Factory (Hokkaido, CALBEE POTATO INC.)
Chitose Factory (Hokkaido)
Ayabe Factory (Kyoto)
Hiroshima Factory, East Building (Hiroshima)
Hiroshima Factory, West Building (Hiroshima)
Kagoshima Factory (Kagoshima)
Shin-Utsunomiya Factory (Tochigi)
R&D Group(Tochigi)Kiyohara Factory(Tochigi, Oisia FOODS CO., LTD.) Japan Frito-Lay Ltd. Factory(Ibaraki)
Shimotsuma Factory (Ibaraki)
Tower Bakery, Inc. Factory (Saitama)
Garden Bakery, Inc. Factory (Tokyo)
Kakamigahara Factory (Gifu)
Konan Factory (Shiga)
CALBEE FOUR SEAS (SHANTOU) CO., LTD. (Guangdong Province, China)
Calbee Four Seas Co., Ltd. (Hong Kong)
Calbee Tanawat Co., Ltd. (Bangkok, Thailand)
SOUTH KOREA
CHINA
THAILAND
JAPAN
U.S.A.
Calbee North America, LLC (Oregon)
Calbee America, Inc. (California)
Calbee (Tianjin) Foods Co., Ltd.(Tianjin, China)
Calbee America, Inc.
Calbee Tanawat Co., Ltd.
Calbee Four Seas Co., Ltd.
CALBEE FOUR SEAS (SHANTOU) CO., LTD.
QINGDAO CALBEE FOODS CO., LTD.
YANTAI CALBEE CO., LTD.
Calbee North America, LLC (Name changed from RDO-CALBEE FOODS, LLC in June 2012)
HAITAI-CALBEE Co., Ltd.
Calbee (Tianjin) Foods Co., Ltd.(Established in July 2012)
Annual Report 201284
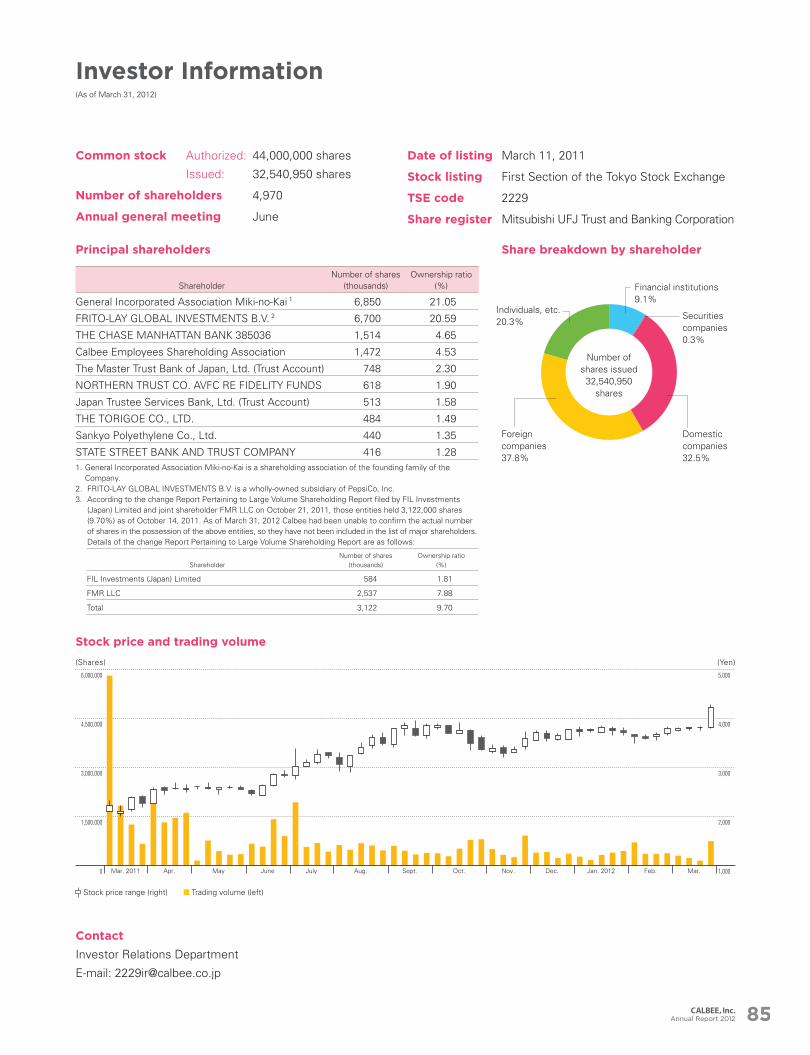
Investor Information(As of March 31, 2012)
ShareholderNumber of shares
(thousands)Ownership ratio
(%)
General Incorporated Association Miki-no-Kai 1 6,850 21.05
FRITO-LAY GLOBAL INVESTMENTS B.V. 2 6,700 20.59
THE CHASE MANHATTAN BANK 385036 1,514 4.65
Calbee Employees Shareholding Association 1,472 4.53
The Master Trust Bank of Japan, Ltd. (Trust Account) 748 2.30
NORTHERN TRUST CO. AVFC RE FIDELITY FUNDS 618 1.90
Japan Trustee Services Bank, Ltd. (Trust Account) 513 1.58
THE TORIGOE CO., LTD. 484 1.49
Sankyo Polyethylene Co., Ltd. 440 1.35
STATE STREET BANK AND TRUST COMPANY 416 1.281. General Incorporated Association Miki-no-Kai is a shareholding association of the founding family of the
Company.2. FRITO-LAY GLOBAL INVESTMENTS B.V. is a wholly-owned subsidiary of PepsiCo, Inc.3. According to the change Report Pertaining to Large Volume Shareholding Report filed by FIL Investments
(Japan) Limited and joint shareholder FMR LLC on October 21, 2011, those entities held 3,122,000 shares (9.70%) as of October 14, 2011. As of March 31, 2012 Calbee had been unable to confirm the actual number of shares in the possession of the above entities, so they have not been included in the list of major shareholders. Details of the change Report Pertaining to Large Volume Shareholding Report are as follows:
ShareholderNumber of shares
(thousands)Ownership ratio
(%)
FIL Investments (Japan) Limited 584 1.81
FMR LLC 2,537 7.88
Total 3,122 9.70
Principal shareholders
Stock price and trading volume
Share breakdown by shareholder
Stock price range (right) Trading volume (left)
(Yen)
Common stock Authorized: 44,000,000 shares
Issued: 32,540,950 shares
Number of shareholders 4,970
Annual general meeting June
Contact
Investor Relations Department
E-mail: [email protected]
Date of listing March 11, 2011
Stock listing First Section of the Tokyo Stock Exchange
TSE code 2229
Share register Mitsubishi UFJ Trust and Banking Corporation
Number of shares issued 32,540,950
shares
Financial institutions 9.1%
Foreign companies 37.8%
Individuals, etc. 20.3%
Domestic companies 32.5%
Securities companies 0.3%
(Shares)
0
1,500,000
3,000,000
4,500,000
6,000,000 5,000
4,000
3,000
2,000
1,000Mar. 2011 Apr. May June July Aug. Sept. Oct. Nov. Dec. Jan. 2012 Feb. Mar.
Annual Report 2012 85
Marunouchi Trust Tower Main, 22nd Floor1-8-3 Marunouchi, Chiyoda-ku, Tokyo 100-0005, JAPAN
http://www.calbee.co.jp/english/ir/
This annual report was printed entirely on FSC®-certified paper and a waterless printing process.Printed in Japan
An
nu
al R
ep
ort 2
012