Embed Size (px)
Citation preview
Convergence
Annual Report 2012- 2013

Annual Report 2012 - 2013
Contents
1. Foreword page 1
2. Introduction page 4
3. Summary of Progress page 7
4. Creating Wealth and Reducing Poverty page 17
5. Supporting Healthier Lifestyles page 28
6. Developing Successful Neighbourhoods page 33
7. Next Steps page 40
Appendix A
Convergence Indicators page 44
Appendix B
Action Plan Tables page 47
Appendix C
Equalities Analysis page 73

1
1. Foreword
The Growth Boroughs of Barking and Dagenham, Greenwich, Hackney, Newham, Tower Hamlets and Waltham Forest are now synonymous with the successful 2012 Olympic and Paralympic Games, watched by billions. They also make up the UK’s strongest potential growth area, providing the launch-pad for Britain’s economy to move into growth. Staging the Games was only ever part of the story. The real goal was the delivery of a lasting legacy of renewal for what has traditionally been London’s and the UK’s poorest area and a major boost for UK plc.
The Greatest Olympic Legacy
When the UK bid for the right to host the “2012 Games” the bid addressed the issue of Legacy in these terms:
“The most enduring legacy of the Olympics will be the regeneration of an entire community for the direct benefit of everyone who lives there.”
This inspiring statement was subsumed into the Host City Contract and remains a driver for our legacy work. The task now for the Growth Boroughs, the Mayor and Government is to ensure that the economic investment and growth in the area fully exploits the Games success, leads to further necessary investment to realise growth and creates new opportunities for residents to benefit in terms of training, jobs, housing, health, environment, safety and leisure. We measure improvements for Growth Borough residents in those things against the conditions enjoyed by other Londoners; currently the residents of the Growth Boroughs do not enjoy the same levels of employment, educational attainment, housing, health or safety as other Londoners; working together, the Growth Boroughs and the Mayor of London, with the support of Government, have set a 20 year target to ensure that by 2030 Growth Borough residents will have the same social and economic chances as their neighbours across London. This is Convergence: it is the cornerstone of our policies. The achievement of Convergence by 2030 is the key 2012 Legacy from the Games. It is the achievement of Convergence that will ensure the regeneration of communities in the Growth Boroughs for the direct benefit of everyone who lives there.

2
On the path to success
Our partnership has already achieved significant success in planning for the Games, in Games
time and for legacy. In recognition of this in 2013 the Growth Boroughs were shortlisted for the
Local Government Chronicle Management Team of the year award where the Governance
arrangements and financial and legal structures, including a formal Joint Committee, were noted
along with our evidenced commitment in the run up to the Games through fortnightly meetings of
the Chief Executives Management Team and monthly meetings of our Leaders and Mayor’s to
ensure a coherent approach to our work.
Through the joint work of the boroughs, the Mayor of London, GLA family, and other partners we
have ensured:
Ga
me
s P
rep
ara
tion
Joint delivery of regulatory services for construction and operation of the Olympic Park with £5m funding from ODA
Successful joint employment projects, the Local Employment and Training Framework (LETF) and City Strategy Pathfinder
A highly successful Cultural Festival now recognised as the successor to the Cultural Olympiad with annual sponsorship of c.£1m annually through CREATE our cultural charity.
Training for and placement of local people in jobs (8394 local residents); participation by local businesses in Olympic Contracts (£50m) (with the ODA)
Significant additional investment in Public Realm between 2009 and 2012 (£110m) resulting
in 35 improvements to public spaces
All state schools joined the London 2012 Get Set network
Delivery of £6.5bn. transport infrastructure to improve transport capacity and reliability across the transport network, including Queen Elizabeth Olympic Park
Creation of a more accessible transport network through step-free stations, signage and accessible bus stops
Ga
me
s T
ime
1.2 million local residents watched the Torch Relays
40,000 residents participated in Test Events
4000 residents worked as official volunteers
Participation of local residents filling key vacant seats
24,332 residents employed by LOCOG and Contractors (of whom 8683 previously workless)
Complete continuity of local service provision
Effective games time emergency and operational management in Park and Riverside Olympic Zones (including challenges of local business and resident access and parking)
Securing of additional Government funds of £14m to support additional costs of operating local services in games-time
Record levels of patronage on the transport network with over 26 million trips made on average each day, while, at the same time, keeping London ‘open for business’
Fo
r leg
acy
Development of the Host Boroughs Strategic Regeneration Framework (SRF) with the organising principle of Convergence, and publication of a Convergence Action Plan.
Securing regional and national support for the principle of Convergence as the core of the Olympic Legacy for the Host Boroughs - “within 20 years the residents of the Host Boroughs will enjoy the same life chances as other Londoners”
Inclusion of Convergence in the London Plan, the London Enterprise Panel’s Jobs and Growth Plan, HMG Legacy Statement, LLDC strategic objectives, the Mayor’s Olympic Legacy

3
Supplementary Planning Guidance and his Olympic & Paralympic Transport Legacy Plan.
Convergence has influenced development of TfL’s east and south east sub-regional transport plan and in December 2012, TfL published Travel in London 51, which included a spotlight focussing around the Olympic and Paralympic Games.
Incorporation of Convergence into LLDC procurement processes, resulting in Growth Borough residents making up 44% of the Transformation workforce on QEOP, 60 Growth Borough construction apprentices and 90% of Copper Box employees being Growth Borough residents.
11 contract wins by Growth Borough SMEs totalling over £1m in value as a result of LLDC’s work to secure local supply chain opportunities for local diverse SMEs.
Development of a Legacy Careers Tools project piloting in 5 Growth Borough secondary schools, helping Year 9 pupils to make informed GCSE choices through provision of market intelligence on future growth sector opportunities.
Work continues to open up access to, and around Queen Elizabeth Olympic Park, including improved walking, cycle & bus links and the DLR double tracking at Pudding Mill Lane.
Development of rigorous Convergence reporting, review and action planning cycle
Linking of socio/economic Convergence with economic growth with the help of Commissioned Oxford Economics forecasts of economic growth in the Host/Growth Boroughs
The achievement, one or two years early, of mid term targets for: o pupils achieving 5 GCSE’s (A-C) o % population with no qualifications o children achieving a good level of development at age 5
o male and female life expectancy
o violent crime levels o number of affordable units built.
A legacy for all Concerns have been raised that Convergence will be achieved through gentrification and that
the benefits promised to long-term residents of the Growth Boroughs may not be delivered.
Work on a suite of Convergence related projects aim to ensure that this is not the case. This is
backed up and reinforced by many other projects in individual boroughs including those to tackle
child poverty, reduce unemployment levels and build community capacity. In Newham this
includes a strategic approach to building individual and community Resilience2 so residents are
ready to benefit from economic growth. To keep this issue under review, additional work in
2013/14 will be undertaken to track the benefits on long-term residents.
1 Travel in London 5- this annual report summarises trends and developments relating to travel and transport in
Greater London.
2 See http://www.newham.gov.uk/Pages/Services/Resilience.aspx

4
2. Introduction The Olympic and Paralympic Games held in the summer of 2012 provided a magnificent
showcase for the UK, London and in particular the Growth Boroughs. This world-wide success
coupled with the accelerating shift of investment and development to inner east and south east
London has now created a unique opportunity to capitalise on this for the benefit of residents.
The Games also demonstrated what can be achieved when new physical infrastructure and the
energy of the area and its people are harnessed. The volunteers, many of whom were from the
Growth Boroughs, brought an additional diverse, friendly and feel good dimension.
The six London boroughs that hosted the Games, alongside the London Mayor and his
functional bodies, have been have working with regional and national partners to ensure that the
Games showcase results in a lasting regeneration legacy for the area.
This report describes the progress that we have made towards regenerating the area and
achieving Convergence. It also sets out the actions that we will take over the next period in order
to progress our work towards our ultimate goal of Convergence by 2030.
Already the residents of the Growth Boroughs are starting to feel the benefits of this in terms of
jobs and investment in their area but the scale of the task to achieve Convergence is huge as we
work to rectify centuries of poverty and deprivation against a background of reducing public
spending, welfare reform, rapid population growth and demographic change.
The Greatest Regeneration Challenge
The challenge of Convergence is to ensure that over 20 years the scale of disadvantage
experienced by Growth Borough residents is greatly reduced through:
Higher educational attainment
Achievement of greater skills and qualifications
Increases in the number of economically active adults
Reduction in child poverty
Increase in life expectancy
Reduction in housing overcrowding
Reduction in violent crime
This Annual Report indicates the progress we have made over the last year and highlights what
remains to be achieved.
The single most important factor in tackling the persistent long-term deprivation in the Growth
Boroughs is getting more residents into work and better paid work. In securing this, we will need
to fully exploit all the opportunities brought forward as a result of the catalytic effect of the
Games to realise the economic growth projections forecasted by Oxford Economics,3 and
ensure that the residents of the Growth Boroughs are able to take full advantage of the
opportunities that such growth will bring.
3 Oxford Economics 2013 refresh of the 2010 Host Boroughs Employment Model - 2.0 - Upward Revisions

5
We know that measuring unemployment percentages in a growing population and in an area
that is undergoing significant change, will not effectively capture legacy impacts for the long term
residents of the area. In order to get a more accurate picture of how the area is growing, and the
impacts on existing residents, we have developed new targets and indicators to measure
growth, and we will also be tracking numbers as well as percentages of those who are
unemployed and on key benefits.
The Report and Action Plan already show the way in which the Mayor and the Growth Boroughs
are tackling disadvantage. The Oxford Economics model of the future economy of the Growth
Boroughs points to the area’s potential to be a major economic driver and a centre for London’s
growth in new industries as well as highlighting the need for investment in the skill levels of
residents to ensure that they benefit from the new employment opportunities. This will also
require further investment in infrastructure that will attract and retain businesses and talented
people.
The diagram below illustrates graphically the virtuous cycle which is at the core of the way we
are working.
Structure of the report
The report is set out against the three themes of the Convergence Action Plan4 capturing data
trends and progress against key actions. The three themes are:
Creating Wealth and Reducing Poverty
Supporting Healthier Lifestyles
Developing Successful Neighbourhoods.
4 see http://www.growthboroughs.com/convergence
Increase median income
Reduce benefit levels
£5 bn+ increase to GVA
Virtuous growth cycle

6
Under each theme there are a number of indicators that were chosen to track progress towards
meeting Convergence along with key actions for work to be undertaken between 2011 and 2015
to underpin its delivery.
During the last year, progress has been made in most areas. Clearly two returns of data on
indicators such as child poverty and life expectancy do not provide robust trend data as the
period is too short but they do provide a snapshot indication and should be viewed in this
context. A detailed breakdown of progress against all the indicators and actions appears in the
tables within appendix B.
Throughout the document the boroughs are referred to as the Host Boroughs for work up until
Games time and Growth Boroughs from that point onwards.

7
3. Summary of Progress
People living in the Growth Borough area die younger, earn less, have fewer qualifications, are
more likely to be unemployed, live in overcrowded accommodation or be a victim of crime than
an average Londoner. This statement was equally true a hundred or a hundred and fifty years
ago.
The Growth Boroughs hold 18% of London’s population
but 62% of the areas of highest deprivation.5
Our challenge is to change this, so that by 2030 it is no longer the reality. This is why we are
taking forward work on the central goal of Convergence which is now an accepted part of the
joint Government and GLA legacy programme. This legacy goal is also being taken forward by
the Elected Mayors and Leaders of the Growth Boroughs, the London Legacy Development
Corporation alongside the public and private sectors, to realise the economic potential of the
Growth Boroughs area and achieve significant improvements to the socio-economic conditions
of local people.
The action plan to deliver Convergence and ensure that, “The most enduring legacy of the
Olympics will be the regeneration of an entire community for the direct benefit of everyone who
lives there”6 is summarised below.
Convergence
Within 20 years the communities who host the 2012 Games will have the same social and economic chances as their neighbours across London
Creating wealth and reducing poverty
Supporting healthier lifestyles
Developing successful neighbourhoods
To ensure that the Work Programme is effectively delivered and supports Convergence.
To maximise the Olympic Employment legacy.
To develop partnership architecture with employers and training providers to support achievement of Convergence outcomes.
To increase the levels and relevance of qualifications of Host Borough residents.
To give the children of the Host Boroughs the best start in life.
To reduce the number of people dying prematurely from preventable causes.
To reduce the number of people whose health affects their ability to secure or maintain work.
To increase physical activity and social capital through changes in the built environment.
To increase sports and physical activity participation including those sports benefiting from a facility legacy from the 2012 Games.
Using Olympic and Paralympic momentum to motivate and raise aspirations.
To reduce levels of violent crime and gang activity.
To complete the Olympic public realm programme and secure the legislative changes necessary for more effective environmental enforcement.
To increase the number of affordable homes and reduce overcrowding.
To deliver new city districts with a range of accessible and high quality facilities.
To maximise the inward investment legacy.
To ensure that cultural activity builds stronger communities and supports economic growth.
To reduce the inequality gap in outcomes between disadvantaged groups and social classes with the average for London
5 Measured in terms of the index of multiple deprivation (IMD) the Growth Boroughs have 69 of 112 of London’s
Lower Super Output Areas (LSOA’s) in the bottom 5%. 6 Statement from the Host City Contract - a commitment by the UK Government

8
Wider context
In summer 2012 the Olympic and Paralympic Games showcased the area and its people in a
very positive light and provided a great springboard for additional investment announced since
then such as the Asian Business Park at Royal Albert Docks.
Together with delivery against the action plan, major physical developments within the Growth
Borough area have taken place and while the post Games transformation work to the park is not
yet complete, the venues including the Stadium, Copper Box, Velodrome and Aquatics Centre
were all completed in terms of their Games time configuration. Their legacy configuration will
largely be completed during 2014 with the Stadium completing in 2016.
The Westfield shopping centre with 1.9m sq ft of retail and leisure facilities has continued to be
successful in terms of turnover and footfall. Both developments provided and are providing
Growth Borough residents with significant new employment opportunities. The Westfield
workforce comprises 43% Growth Borough residents.
Other new local landmarks such as the ArcelorMittal Orbit and Emirates Air Line, the UK’s first
urban cable car, are providing new visitor attractions for the longer term. The Emirates Air Line
provides a new river crossing between the Royal Docks and the Greenwich Peninsula.
Since the Games, development has moved forward apace in a number of areas against a
changing national and regional backdrop.
National picture
The Chancellor's Autumn 2012 Budget Statement announced a long-term funding settlement for
TfL enabling it to effectively plan for the future. The Government also gave strong guarantees for
key infrastructure projects including the electrification of the Gospel Oak to Barking line and a
commitment to look at Crossrail 2. Additional funding was provided for new affordable rented
homes. The March 2013 Budget saw the introduction of the 'Help to Buy' scheme to help
working people buy a home, £8m funding over 2 years for the Skills Investment Fund, and help
for SMEs.
The Government's reform of working-age and disability benefits came into force this year. Local
authorities in the Growth Boroughs are already working with local partners to raise awareness of
the changes amongst those most likely to be affected.
In March 2013 a new school sports funding package for primary schools was announced to
improve physical education and inspire the Olympic and Paralympic stars of the future. The
Prime Minister and the Mayor also agreed to establish a joint Government/GLA legacy
programme, focused on four core themes: economic growth; sport as part of a healthier lifestyle;
developing communities by providing channels for those people inspired by the Games; and
East London regeneration. The programme also contains cross-cutting strands of work on
Paralympic legacy, sustainability and transport.
A new legacy governance structure was established: Lord Coe was appointed as the Prime
Minister’s Legacy Ambassador and a Legacy Cabinet Committee chaired by the Prime Minister
was formed, involving the Legacy Ambassador, the Mayor of London and ministers from relevant
Departments, to oversee the joint programme of work. It is supported by a Government Officials
Group. A Joint Legacy Unit in the Cabinet Office, staffed by government officials and GLA staff
was created to support the Legacy Cabinet Committee, and help to co-ordinate work on legacy
delivery within government departments and the GLA.

9
A Paralympic Legacy Advisory Group was also established to lead the cross-cutting work on the
Paralympic legacy, alongside a Legacy Strategic Communications Group.
London region
The Mayor unveiled his vision for London’s future to 2020 to address the challenges facing the
capital, including a rising population and the need for a significant number of new homes and
jobs, increasing skills and investment in infrastructure projects including Crossrail 2, new tube
extensions and river crossings. In the area of Sport and Healthy Living, the Mayor pledged a
further £7 million for his Sports Legacy Fund, over the next three years, to improve the capital’s
sports facilities, enable clubs to train more coaches and improve sports participation. A new
Health Board for London was established to champion the health needs of people across the
capital and a number of initiatives were launched to promote healthy lifestyles such as Healthy
Schools London and Well London.
Following the success of the Games, the Mayor of London became chair of the London Legacy
Development Corporation, which also became the local planning authority for the Park and
surrounding area and began the process of preparing its local development plan and community
infrastructure levy (CIL) charging schedule. He also appointed a Mayor’s Olympic and
Paralympic Legacy Adviser to oversee and co-ordinate the legacy programme across the GLA,
Functional Bodies and London & Partners and be Vice Chair of the LLDC.
London was announced as host of the 2017 Paralympic Athletics World Championships,
becoming the first city to host the IAAF and the IPC World Athletics Championships side-by-side
in the Olympic Stadium, and providing further opportunities to deliver economic impact and
promote a community sports legacy in the Growth Boroughs.
The GLA and partners have agreed future proposals to support economic legacy in the Growth
Boroughs. The Authority is working with the GLA Family and the Growth Boroughs to develop a
proposal for a joint Convergence programme as part of the 2014 – 2020 European Structural
and Investment Funds Programme, to provide a programme of interventions to strengthen
delivery of Convergence, ensure Growth Borough residents are better skilled to take advantages
of opportunities arising from new investment and jobs in the area, and maximise investment,
infrastructure and linkages to ensure that the area can fulfil its potential as a centre for London’s
growth.
Growth Boroughs and Queen Elizabeth Olympic Park
Work to transform Queen Elizabeth Olympic Park into London’s newest urban district began in
earnest following the Games. Legacy users were appointed for the Stadium and the Press and
Broadcast Centres - meaning that all eight permanent venues now have their futures secured.
Added to this work commenced on Chobham Manor, the first of five new neighbourhoods on the
Park to create 850 homes, alongside the 2,800 at East Village (the former Athletes’ Village). The
Legacy Corporation also developed its regeneration strategy with the aim of bringing forward
plans for areas outside of the Park to ensure that regeneration in these areas works hand-in-
hand with the Park and its employment and apprenticeship programmes linked to transformation
of the Park continues to exceed their targets for employing local people.
In the approach to the first anniversary of the Games, the North Park aimed to open with a
programme of concerts and events, including the Anniversary Games.
Westfield Stratford City announced plans to build the UK’s largest indoor ski facility in Stratford,
and elsewhere in East and Southeast London, major deals were announced at the Royal Albert

10
Docks, Silvertown Quays, and Greenwich Peninsula that will deliver significant regeneration in,
and around, the Growth Boroughs and bring thousands of jobs, commercial and leisure activity,
and new homes.
Work took place to identify how new freedoms provided through the Localism Act and new
funding arrangements can be targeted to support work on Convergence. A review of options for
the Growth Boroughs in terms of City Growth Strategies or other models are also being
considered to marshal additional resources to our legacy goals.
Progress against the indicators and action plan
Progress is summarised in the tables and bullets below. The tables show that the Convergence
gap is reducing for most of the indicators that we currently have new data for and more than half
are on track to meet their 2014/15 targets. A great achievement is that we have already met
2014/15 targets for:
o pupils achieving 5 GCSE’s (A-C) o % population with no qualifications o male and female life expectancy o children achieving a good level of development at age 5 o number of affordable units built
o violent crime levels.
Within the tables, indicators are rated red, amber or green (RAG rated) to display progress at a
glance. Indicators are green if they are on track to achieve the 2014/15 target, amber if the
indicator is not on track to meet the target but there is some improvement in reducing the gap
and red if the gap has increased. The target is that by 2030 full Convergence with the London
average has been reached but the tables below are being tracked against the 2014/15 targets,
largely set as mid term targets in 2009. A number of these indicators are tracking long term,
deep set problems in the boroughs such as unemployment and income levels and shifts on
these are expected to take a considerable number of years to realise.
Indicator Status
Pupils achieving 5 GCSE’s (A-C)
% population with no qualifications
Life expectancy (a) male (b) female
Children achieving a good level of development at age 5
Number of affordable units built
Violent crime levels.
Already achieved mid term target
6
Pupils achieving at least level 4 in English and Maths at key stage 2
19 year olds achieving level 2 threshold
19 year olds achieving level 3 threshold
On track
3
Proportion of children in families on key benefits
Mortality rates from all circulatory diseases at ages under 75
Mortality rates from all cancers at ages under 75
% of pupils who participate in PE and school sport
No new data
4
Economic growth (a) income (b) jobs New indicator
Employment rate (economically active people in employment)
Working age population qualified to at least level 4
Recommended adult activity
Slight improvement
but not on track
4

11
Indicator Status
No sport or activity
Unemployment rate
Median Earnings
Obesity levels in school children in year 6
Overcrowding
No improvements
or getting worse 4
The tables show that the trajectory of 9 indicators are green and on track but 8 are off track or
getting worse. New methodologies, baselines and targets have been set to measure economic
growth so progress is not being rated against them this year. Of the eight indicators that are not
on track, four have a slightly reduced Convergence gap. The Convergence gaps for
unemployment, median earnings, obesity and overcrowding are widening. Data for the
proportion of children in working age families receiving key benefits and mortality rates for
circulatory diseases and cancers is not yet available and data on the % of pupils who participate
in PE and school sport is no longer available. The performance information has been verified by
the GLA Intelligence Unit.
Creating Wealth and Reducing Poverty
The primary medium term aim within this theme is to reduce unemployment and in relation to the
action plan the following developments have taken place:
Over 24,300 people from the Growth Boroughs worked on the Games, of these at least 8,600 people were previously workless. A number of people who worked at the Games have also achieved new qualifications while training for their roles.
The Growth Boroughs, Growth Boroughs Unit (GBU), JCP and the GLA worked collaboratively to create a package of post games support for ‘Games Graduates,’ (people leaving their games time roles) providing up to 5,000 people with face to face interviews and helping connect up to 3,500 people online with over 100 employers who were looking to recruit Games Graduates.
The LLDC, working closely with the 6 Boroughs is continuing to overperform on Employment and Skills targets. In the transformation phase of the Olympic Park development, LLDC’s contractors have recruited 41% locally against a target of 25%.
The outcomes of the GLA Host Boroughs Employment and Skills Programme Performance in 2012-13 are outlined below. The partnership performed particularly well under Job Starts and Job entries7.
Profile Actuals
Starts 2818 2818
LOCOG Job Entry 161 98
Job Entry 757 757
26 week 1000 921
52 weeks 1123 729
Of the indicator set for this theme there are 5 that are on track and four that are not. Of the four
indicators that are not on track, two have a slightly reduced Convergence gap and two have
become worse. The indicator for child poverty, “proportion of children in families receiving key
data” is awaiting a new data release.
7 Job starts refer to programme starts (enrolement/registration) Job entries are direct job entries

12
Indicators Gap 2009
Gap 2012
2014/15 Target Progress and RAG8 rating
Theme: Creating wealth and reducing poverty
Employment rate – aged 16-64 5.5% 4.5% Narrow the gap to 2-3%
Gap reduced slightly -not on track
Unemployment rate 16+ 2.3% 2.5% Narrow the gap to 1-1.5%
Gap increased -not on track
Median earnings for full time workers living in the area
£30.7 - £38.7 Narrow the gap to £25
Gap increased -not on track
Proportion of children in working age
families receiving key benefits 8.4
6.6
(2010)
Narrow the gap to -5-6%
Awaiting data
Pupils achieving at least Level 4 in English & Maths at Key Stage 2
2.2
(2009/10) 0.9
Convergence with London average
On track
Pupils achieving 5 GCSE grades A* - C
(including Maths & English) 7.4 - 2.3
Narrow the gap to 3 – 4%
Achieved
19 year olds achieving level 2 threshold (new)
4.4 - 2.4 Narrow the gap to 1-1.5%
On track
19 year olds achieving Level 3 threshold 7.5 - 5.1 Narrow the gap to within 3-4%
On track
Percentage of working age population with no qualifications
5.4 3.8 Narrow the gap to within 3-4%
Achieved
Working age population qualified to at least Level 4
7.5 - 5.8 Narrow the gap to between 3-4%
Gap reducing but not on track
Supporting Healthier Lifestyles
The primary aim within this theme is to increase life expectancy. Progress against the action
plan includes:
A successful roll out of Celebrate and Protect, the innovative campaign to increase
childhood immunisation, with funding from NHS London, now being supported by NHS
England (London Region).
The Growth Boroughs have delivered over 25% of London’s new community food
growing spaces under the Capital Growth programme, creating over 500 new growing
spaces in the Host Boroughs
Motivate East was awarded over £560,000 to deliver a series of initiatives designed to
respond to the needs of disabled people in East London from 2013 and will generate
around 26,000 opportunities to participate in sports and physical activity and create over
72 volunteer ambassadors roles to promote participation of disabled people.
As part of the new national Stoptober campaign, there was a 20% rise in smoking
quitters during the October 2012 compared to October 2011, with increased numbers of
people accessing stop smoking services, inspired by the Games.
8 RAG rating indicates a Red, Amber or Green status for an indicator

13
Building of the UK’s first compact athletic facility at Stoke Newington School and Sixth
Form Centre, which has driven innovation in increasing physical activity through athletics
in small urban spaces.
The LLDC funded the Take 12 Challenge that recruited over 12,000 Growth Borough
residents to undertake either 12 hours of physical activity in 12 weeks, or to walk, run,
swim or cycle 12 kilometres in 12 weeks, signposting previously inactive people into
regular sports and physical activity. In addition they developed Active People, Active
Park to stimulate local demand for the kinds of activities that will be available in Queen
Elizabeth Olympic Park.
The GLA hosted the Fit Cities Fit World 2013 conference, funded and planned by the
GLA, LLDC, Growth Boroughs and NHS North East London and the City and CABE at
the Design Council, to promote healthy urban planning agenda.
Of the indicator set for this theme two are on track to achieve Convergence, three are not on
track, and two are awaiting further data. Of the three that are not on track, the Convergence gap
has narrowed for two but increased in relation to childhood obesity.
Indicators Gap 2009
Gap 2012
2014/15 Target Progress and RAG rating
Theme: Supporting Healthier Lifestyles Life expectancy:
(male)
2.2
(07/09)
1.7 (09/11)
Narrow the gap to 2 years
Achieved
(female) 1.7 (07/09)
1.4 (09/11)
Narrow the gap to 1.5 years
Children achieving a good level of
development at age 5 (%)
6.0
(09/10) 1.0
(11/12)
Narrow the gap to 3.2%
Achieved
Obesity levels in school children in yr 6 2.2 3.0
(2011) Narrow the gap to 1%
Gap increased.
Mortality rates from all circulatory
diseases at ages under 75 26.0
Narrow the gap to 25 pts
Data expected in December 2013
Mortality rates from all cancers at ages
under 75 19.6
Narrow the gap to 10 pts
Data expected in December 2013
Recommended Adult Activity (3 times
30 mins per week)
2.6%
(08/10) 2.5%
Narrow the gap to 1%
Gap reducing but not on track
No Sport or Activity (0 times 30 mins
per week)
5.4%
(08/10) 4.4%
Narrow the gap to 2%
Gap reducing but not on track
Developing Successful Neighbourhoods
The primary aim of this theme is to improve neighbourhood satisfaction. Progress against the
action plan includes:
The public realm programme was completed in July 2012 before the Games. It
comprised 35 improvements to public spaces in the boroughs especially areas
immediately adjacent to the Olympic Park. The schemes represented an overall
investment of just over £100m. Funding came from a range of sources including DCLG,
the boroughs, TfL and the GLA.
Between 2009 and 2013 over 50,000 new homes were planned with over 19,500
completions projected (full data confirmation awaited for private sector schemes) and a

14
confirmed delivery of over 14,000 affordable homes. Consequently we have already
exceeded our 2014/15 target of 12,000.
CREATE 2012 was again a huge success in highlighting the vast arts base in the
Growth Boroughs and taking a greater range of arts to the doorsteps of residents. In
2012 over 1.1m people attended events, £1.7m of new investment and £1.5m worth of
new commissions were secured and there was a total media reach of £7m including
articles in The Financial Times and features in The Culture Show, The Review Show,
New York Times and Vogue.
The outcomes from the Borough’s and TfL’s Olympic Legacy Transport Action Plan have
been fed into ongoing work such as the 2013 update to the sub-regional transport plans.
Construction of Crossrail continues with the first phases of services scheduled to open
early in 2017 when this new service will provide a step change in access for people in
the east and south east sub-region. Development of the package of River Crossings is
also ongoing, with consultation’s having taken place in 2012 and work continuing in
2013.
The LLDC has ensured that the North Park and venues open on time in July 2013, and
secured post-Games operators for all major venues remaining in the Park, including the
Stadium, Aquatics Centre, Copper Box and the management of the parklands. All
operator contracts have community access and local labour targets agreed that are
higher than all previous targets set.
Of the indicator and target set for this theme performance on two of them two has been very
good and they have already achieved their 2014/15 target, performance on overcrowding has
deteriorated. Additionally, as reported in last years annual report we aimed to develop new
indicators that would better capture the trend data on the growing East and South east London
economy and these are included below. We also attempted to identify area satisfaction
measures using different data sets to the Place Survey data we were using in 2009 and 2010.
We have not found a robust alternative to the Place Survey so have dropped this indicator.
Indicators Gap 2009
Gap 2012
2014/15 Target Progress and RAG rating
Theme: Developing successful neighbourhoods Violent crime levels (Violence against
the person, per 1,000 population )
6.1 (09/10)
3.1 (12/13)
To narrow the gap to 3-4% Achieved
Economic growth A - income
Economic Growth B - jobs
21.4%
36.4%
18.4%
34.8%
To narrow the gap to 15.5% To narrow the gap to 28%
New indicator New indicator
Overcrowding measure (Bedroom standard.9
2.9
(2010)
Data change to Census
To narrow gap
Data on bedroom standard can not be tracked but census data 2001 – 2011 shows an increased
gap from 3.7 to 6.2.
9 The bedroom standard is based on the composition of the household and their ages. According to the bedroom standard,
households are overcrowded if they lack one bedroom according to the standard and are severely overcrowded if they lack two or more bedrooms according to the standard.
15
Target - By 2014/15 London Target
HB Target
HB actual to date
Progress
Additional housing units: Total planned
Affordable - delivered
150,000 35,000
50,000 12,000
50,000 14,000
Between 2009 and 2013 over 50,000 new homes were planned with over 19,500 completions projected (full data confirmation awaited for private sector schemes) and a confirmed delivery of over 14,000 affordable homes. The planned units target has been achieved and the affordable homes one has been exceeded
Equalities
The six Growth Boroughs hold 18% of London’s population but 62% of its areas with the highest
levels of deprivation. Beneath this fundamental inequality that is the spur for Convergence, lie
other layers of inequality that also need to be addressed.
The GLA has carried out an analysis of Convergence indicators against available equalities data. It shows differences in the inequality gaps for different equality groups between London overall and the Growth Boroughs, and therefore where additional action may need to be focused. This is detailed in Appendix C.
This work shows that the greatest Convergence gap for employment is age related for those aged 50+ (8.6%) closely followed by BAME women (8.3%). These gaps have grown rather than reduced between 2010 and 2012, as has the gap for BAME employment overall (to 5.6% in 2012). Although the Convergence gap for disabled people has reduced slightly, the overall difference in employment rates compared with non-disabled people remains very high, at nearly 30%.
On median income the greatest Convergence gap is on male earnings where men from the Growth Boroughs earn 8.8% less than the male average for London. Female earnings continue to be lower than those of men both in the Growth Boroughs and in London as a whole. The gap between men and women in the Growth Boroughs at 8.1% has grown since 2010 but remains lower that the gap between male and female earnings across London as a whole.
Gaps in terms of both race and gender have continued to close in relation to pupils’ success at GCSE level and this continues to be a good news story.
For adults with no qualifications or for those with degree level or above, the Convergence gap is reducing but remains high for people 50 and over and for people who are disabled.
We have no new data since last year for many of the health indicators. New physical activity rate data shows Convergence rates narrowing for men, women and BAME groups. It is widening for people who are disabled although participation levels among this group is increasing (from 8% to 11.8%).
The data shows that additional work needs to be focused on:-
the employment rates of women, especially BAME women and people aged 50 and over.
the qualification levels of the over 50 and people who are disabled.
It is intended that work to address these issues will be included in proposals for 2014-20 ESF funding where appropriate.
To ensure that we measure improvement among those who were workless in 2009 we will also
track numbers of those in receipt of benefits alongside the data for employment and
unemployment. This is an extra measure to ensure that those baselined in 2009 are measured

16
and that this measurement is not masked by population growth and migration into the Growth
Boroughs (or gentrification) since 2009. This is detailed in section 3 of this report.
Equalities targets had been set for all Games time employment and, with the exception of those
for disabled people, these were all met.
Health equity audits were completed in 2011/12 to better target interventions to disadvantaged
groups and in 2012/13 work targeting the most disadvantaged and those furthest from the
Convergence goal has been undertaken with Resolving Chaos who have completed detailed
economic analysis of the most chaotic individuals in both Hackney and Greenwich10 and trained
staff in Barking and Dagenham and Newham in an understanding of the model. Resulting from
this a new wrap around service had been initiated in Greenwich and proposals are awaiting
funding decisions in Hackney.
The future management of Convergence
The Growth Boroughs have agreed to continue working in partnership post games to ensure that
Convergence and other legacy promises are delivered for the benefit of residents.
As noted on pages 8 and 9 above a new legacy governance structure was established following
the Games to oversee the joint Government/GLA legacy programme.
New liaison arrangements have been agreed between the Mayor of London and Growth
Borough Leaders and Mayors, who will now meet annually to discuss strategic matters of mutual
interest relating to Convergence, regeneration, transport and economic legacy in the Growth
Boroughs. The Leaders and Mayors of the four Growth Boroughs on which the LLDC area sits
are represented on the LLDC Board and Planning Decisions Committee and LLDC’s Deputy
Chair and Chief Executive regularly meet with the respective Chief Executives to undertake joint
planning and exchange information.
10 Reports to be available on the Growth Boroughs web site ……..

17
3. Creating Wealth and Reducing Poverty
This theme covers ten indicators, of which “Pupils achieving 5 GCSE grades A*-C” and, “Percentage of working age population with no qualification,” have already achieved their mid term targets.
A further three are on course to achieving their mid term targets:
Pupils achieving at least Level 4 in English & Maths at Key Stage 2
19 year olds achieving Level 2 threshold
19 year olds achieving level 3 threshold
Four indicators are not on course to achieve their targets. The first two:
Economically active people in employment
Working age population qualified to at least Level 4
have improved since the baseline was recorded in 2009 but the Convergence gap has widened for both:
Median earnings for full time workers living in the area
Unemployment rate
We are awaiting the latest data for the indicator on the, “Proportion of children in families receiving key benefits,” which based on the previous years data had been on course to achieve its mid term target:
Indicators Gap 2009
Gap 2012
2014/15 Target Progress and RAG11 rating
Theme: Creating wealth and reducing poverty
Employment rate – aged 16-64 5.5% 4.5% Narrow the gap to 2-3%
Gap reduced slightly -not on track
Unemployment rate 16+ 2.3% 2.5% Narrow the gap to 1-1.5%
Gap increased -not on track
Median earnings for full time workers living in the area
£30.7 - £38.7 Narrow the gap to £25
Not on track - gap increased
Proportion of children in working age
families receiving key benefits 8.4
6.6
(2010)
Narrow the gap to -5-6%
Awaiting data
Pupils achieving at least Level 4 in English & Maths at Key Stage 2
2.2
(2009/10) 0.9
Convergence with London average
On track
Pupils achieving 5 GCSE grades A* - C
(including Maths & English) 7.4 - 2.3
Narrow the gap to 3 – 4%
Achieved
19 year olds achieving level 2 threshold (new)
4.4 - 2.4 Narrow the gap to 1-1.5%
On track
19 year olds achieving Level 3 threshold 7.5 - 5.1 Narrow the gap to within 3-4%
On track
Percentage of working age population with no qualifications
5.4 3.8 Narrow the gap to within 3-4%
Achieved
Working age population qualified to at least Level 4
7.5 - 5.8 Narrow the gap to between 3-4%
Gap reducing but not on track
11 RAG rating indicates a Red, Amber or Green status for an indicator

18
Employment and unemployment
We were extremely successful in supporting Growth Borough residents into temporary Games
time work and surpassed the LOCOG target of 8,000 workless Growth Borough residents by
over 6,000. We supported over 14,013 workless people into exciting, though temporary work
and achieved unprecedented levels of job interview to job offer ratios where 90% of people we
prepared and trained for interview were successful.
The focus of the partnership then shifted to a post games response to the anticipated volume of
people who once again would be out of work.
JCP expected JSA claims would spike in September 12 over and above the usual on-flow during
this period. However this anticipated spike did not materialise to the extent of the forecast12. On
the ground, it was reported by JCP offices that demand was no higher than usual. Some of the
contributing factors to the avoidance of the ‘cliff-edge’ include well managed recruitment events
organised by JCP with the support of the GBU, 6 Borough Brokerages and the GLA. In addition
to this, a large proportion of the temporary workforce was retained by their Games time
employers.
Unemployment Rate
RAG Rating: Red Progress year on year: ▲0.4% Baseline: ▲ 0.3%
The unemployment rate in the 6 Growth Boroughs increased marginally in 2012 to 11.4%, this
coupled with a decrease in London’s unemployment rate has resulted in the Convergence gap
widening to 2.5%. A significant step change is required to bring this indicator back on track.
Unemployment Rate Sep-09 Sep-10 Sep-11 Sep-12 2015 Target
6 Growth Boroughs 10.6 11.9 11.3 11.4
Narrow gap
to 1-1.5%
London 8.4 8.9 9.2 8.9
Gap -2.2 -3.0 -2.1 -2.5
Source: ONS, Model based unemployment
Local Authority and JCP Service Level Agreements (SLAs)
Within our action plan we had identified the importance of the Work Programme in supporting
Growth Borough residents into work and accepted the need to agree delivery targets with Work
Programme providers and Jobcentre Plus. The 6 Growth Boroughs are in the process of
agreeing individual SLAs with JCP to work collaboratively in achieving joint locally set claimant
count targets. This follows the example of good practice in Enfield where an SLA between the
local authority, JCP and other key stakeholders contributed to a 7.5% decrease in the borough’s
claimant count. Once the Growth Boroughs and JCP agree SLAs, the GBU will monitor
performance against these agreements at a sub-regional level and share best practice across
the partnership.
12 http://www.london.gov.uk/priorities/business-economy/championing-london/2012-economic-legacy

19
Work Programme
The latest data, released on the 27th of June, shows that over the first two contract years,
44,740 people were referred to the Work Programme in the 6 Growth Boroughs, of which just
over 10% (4,500) were supported into a job lasting at least 6 months (or 3 months for the most
disadvantaged).
The Work Programme has shown improvement in its second year of delivery compared to Year
one, however it is not meeting the levels expected by DWP nationally and regionally and failing
in the Growth Boroughs to a greater extent. The programme is still failing the most
disadvantaged and particularly in the Growth Boroughs, failing young people too.
In the Growth Boroughs, there is a 9.5% gap in performance for 18-24 year olds claiming JSA
and a 13.9% gap for new ESA claimants when compared to the minimum levels expected by
DWP in year 2. Considering that any underperformance of 10% or more across any client group
means that participants would be more likely to have found work without the support of the
programme, then only 0.5% of 18-24 JSA claimants were supported into work above the ‘do-
nothing’ approach and 3.9% of new ESA claimant participants were more likely to have found
work in the 2nd year had they not been on the Programme.
The 25+ JSA claimant group is benefiting from the Programme in the Growth Boroughs, with
performance surpassing DWP targets by 2.6%, albeit not fairing better than the London average.
Five of the six Growth Boroughs fall within the bottom ten local authorities where the Work
Programme is performing the worst in London in terms of job outcomes, and there is a 6% gap
between the Growth Boroughs and the London average performance of the Work Programme
for 18-24 year olds.
6.0
7.0
8.0
9.0
10.0
11.0
12.0
13.0
14.0
15.0
16.0
Sep-09 Dec-09 Mar-10 Jun-10 Sep-10 Dec-10 Mar-11 Jun-11 Sep-11 Dec-11 Mar-12 Jun-12 Sep-12 Dec-12 Mar-13
Unemployment Rate
Barking and Dagenham Greenwich Hackney Newham Tower Hamlets Waltham Forest
Source: ONS, Model based unemployment

20
Jobseekers Allowance (JSA) Claimants and Incapacity Benefit Claimants
Employment and unemployment percentages in a growing population will not necessarily
effectively capture legacy impacts for the current population as the numbers can be masked by
the movement of higher income groups into the area. As part of our attempts to address this and
as part of the development of new targets and indicators to measure growth, we are now
tracking the number of Jobseekers Allowance claimants and Incapacity Benefit claimants.
JSA Claimant Count
The 6 Growth Boroughs claimant count in September 12 had decreased by 4,230 compared to
the same period in the previous year. One of the key factors behind this decrease is the number
of claimants securing Games time employment and then following this up with a post-games
position.
42,725
36,725 37,595
53,285 52,605
59,735
55,505
30,000
35,000
40,000
45,000
50,000
55,000
60,000
65,000
Sep 06 Sep 07 Sep 08 Sep 09 Sep 10 Sep 11 Sep 12
6 Growth Boroughs Claimant Count
6 Growth Boroughs
Source: ONS
Incapacity Benefit and Employment Support Allowance
The number of IB and ESA claimants in the Growth Boroughs has been steadily increasing since
2008. In August 2012, the number of claimants rose by 950 compared to the previous year.
67,830
66,970
66,260
68,300
68,940 68,950
69,900
64,000
65,000
66,000
67,000
68,000
69,000
70,000
71,000
Aug-06 Aug-07 Aug-08 Aug-09 Aug-10 Aug-11 Aug-12
6 Growth Boroughs IB and ESA Count
6 Growth Boroughs
Source: ONS

21
The 6 Growth Boroughs claimant rate in May 2013 is mapped below and displays in red the wards where the claimant rate is highest.
JSA claimant rate by ward

22
Employment Rate
RAG Rating: Amber Progress year on year: ▼0.3% Baseline: ▼1.0%
The employment rate is increasing in the Growth Boroughs; in September 12, the Growth
Boroughs employment rate improved by 0.9 percentage points compared to the previous year,
whilst London’s increase was limited to 0.6 percentage points. Despite the rate of improvement,
the employment rate is unlikely to meet its mid-tem target of closing the Convergence gap to 2-
3% under its current trajectory.
Employment Rate Sep-09 Sep-10 Sep-11 Sep-12 2015 Target
6 Growth Boroughs 62.8 63.4 63.2 64.1
Narrow gap
to 2-3%
London 68.3 68.2 68.0 68.6
Gap -5.5 -4.8 -4.8 -4.5
Sources: Annual Population Survey, ONS
It is important to note however that between September 2012 and March 2013, 4 of the 6
Growth Boroughs achieved their highest Employment rate on record:
Tower Hamlets (Sep 12 - 62%)
Waltham Forest (Sep 12 – 69.8%)
Greenwich (Dec 12 – 69.6%)
Newham (Dec 12 and Mar 13 – 60.5%)
Employment and unemployment
rates
Employment Rate
Unemployment Rate
Sep-09 Sep-10 Sep-11 Sep-12
Sep-09 Sep-10 Sep-11 Sep-12
Barking & Dagenham
63.1 62.6 63.1 63.2 10.5 12.9 12.6 12.3
Greenwich 65.1 65.6 68.1 67.8 10.3 10.5 10.5 10.8
Hackney 67.4 70.8 66.3 65.0 10.5 10.1 11.3 8.3
Newham 55.3 58.6 54.6 57.2 13.5 13.1 15.2 15.4
Tower Hamlets 60.4 59.7 59.1 62.0 12.9 12.8 13.0 13.2
Waltham Forest 66.2 63.9 69.1 69.8 10.4 12.0 10.9 8.5
6 Growth Boroughs 62.8 63.4 63.2 64.1 10.7 12.0 11.4 11.4
London 68.3 68.2 68.0 68.6 8.4 8.9 9.2 8.9
Gap -5.5 -4.8 -4.8 -4.5 2.3 3.1 2.2 2.2
Sources: ONS, Model based unemployment & Annual Population Survey
Median earnings and qualifications at level 4
Median Earnings
RAG Rating: Red Progress year on year: ▲ £0.40 Baseline: ▲ £8.00
The median earnings Convergence gap has increased due to London’s earnings growing at a
faster pace than in the Growth Boroughs. The gap has grown by £8 since the baseline was

23
recorded in 2009. This indicator is RAG rated red as it is unlikely to reach its mid term target of
closing the gap to £25.
Median Earnings Sep-09 Sep-10 Sep-11 Sep-12 2015 Target
6 Growth Boroughs 567.5 £568.1 £570.5 £574.6
Narrow gap to
£25
London 598.2 £606.8 £608.8 £613.3
Gap £30.7 £38.7 £38.3 £38.7
Working age population qualified to at least Level 4
RAG Rating: Amber Progress year on year: ▲ 1.0% Baseline: ▼ 1.7%
The percentage of working age residents with Level 4 qualifications is improving in the 6
Boroughs and since the baseline was recorded in 2009, the GB indicator is currently up by 9.6
percentage points. However, the spike in the Growth Boroughs in 2011, which accounts for 6.6
percentage points of the increase from baseline, is slowly starting to plateau, and thus the gap
has increased to 5.8%, which falls narrowly outside the trajectory line to reach the 2015 mid term
target.
Steps to ensure that the indicator remains on course to reach its mid term and 2030 target will
be considered in the new 6 Growth Boroughs Skills Strategy which will underpin a new Skills
Partnership headed by a steering group attended by the 6 Borough universities, FE institutions,
LLDC, and the chair of the CWRP group.
32.2 34.5
41.1 41.839.7 41.8
45.947.6
25.0
30.0
35.0
40.0
45.0
50.0
Jan 09-Dec 09 Jan 10-Dec 10 Jan 11-Dec 11 Jan 12-Dec 12
Percentage of working age population with NVQ Level 4 qualifications
6 Growth Boroughs London
Source: Annual Population Survey, ONS
Qualifications, Key Stage 2 to NVQ Level 3.
Pupils achieving at least Level 4 in English & Maths at Key Stage 2
RAG Rating: Green Progress year on year: ▼ 0.6% Baseline: ▼ 2.1%

24
Growth Borough pupils achieving at least Level 4 in English & Maths at Key Stage 2 have
increased by 6 percentage points in 2012, narrowing the Convergence gap to 0.9%. This
indicator is likely to reach Convergence by 2015.
Pupils achieving at least Level 4 in English & Maths at Key Stage 2
Sep-09 Sep-10 Sep-11 Sep-12 2015 Target
6 Growth Boroughs 70.0 73.8 74.9 80.9 Narrow gap to 0%
London 73.0 76.0 76.4 81.8
Gap 3.0 2.2 1.5 0.9
Source: DfE
70.0
73.8 74.9
80.9
73.0
76.0 76.4
81.8
60.0
65.0
70.0
75.0
80.0
85.0
2009 2010 2011 2012
Pupils achieving at least Level 4 in English and Maths at Key Stage 2
6 Growth Boroughs London
Source: DfE
Pupils achieving 5 GCSE grades A* - C (including Maths & English)
RAG Rating: Green (Achieved) Progress year on year: ▼ 2.1% Baseline: ▼ 4.9%
The indicator for pupils achieving 5 GCSE grades A* - C (including Maths & English) has met its
mid-term target. Having increased in the Growth Boroughs by 2.5 percentage points in 2012
against a London average increase of 0.4 percentage points, the indicator could potentially
achieve Convergence under this indicator by 2015.
Pupils achieving 5 GCSE grades A* - C (including Maths & English)
Sep-09 Sep-10 Sep-11 Sep-12 2015 Target
6 Growth Boroughs 46.6 51.7 57.3 59.8 Narrow the gap
to 3-4% London 54.0 58.0 61.9 62.3
Gap 7.4 6.3 4.6 2.5
Source: DfE

25
46.6
51.7
57.3 59.8
54.0
58.0
61.9 62.3
30.0
35.0
40.0
45.0
50.0
55.0
60.0
65.0
2009 2010 2011 2012
Percentage achieving 5+ A*-C grades inc. English & mathematics GCSEs
6 Growth Boroughs London
Source: DfE
19 year olds achieving level 2 qualifications
RAG Rating: Green Progress year on year: ▲ 0.1% Baseline: ▼ 2.2%
The performance of 19 year olds in the Growth Boroughs achieving level 2 qualifications
continued to increase steadily, although the Convergence gap has increased marginally, by 0.06
percentage points, due to London’s rate improving at a slightly faster pace.
19 year olds achieving level 2 qualifications
Sep-09 Sep-10 Sep-11 Sep-12 2015 Target
6 Growth Boroughs 73.9 78.3 81.1 83.5 Narrow gap to 1-1.5%
London 78.5 81.0 83.5 85.9
Gap 4.6 2.7 2.3 2.4
73.9
78.3
81.1
83.5
78.5
81.0
83.5
85.9
66.0
68.0
70.0
72.0
74.0
76.0
78.0
80.0
82.0
84.0
86.0
88.0
19 in 2009 19 in 2010 19 in 2011 19 in 2012
% of 19 year olds achieving at least Level 2 qualifications
6 Growth Boroughs London
DfE: Level 2 and 3 Attainment by Young People in England Measured Using Matched Administrative Data: Attainment by Age 19 in 2012

26
19 year olds achieving level 3 qualifications
The percentage of 19 year olds achieving level 3 qualifications decreased by 0.5 percentage
points year on year, and by 2.4 percentage points since the 2009 baseline.
RAG Rating: Green Progress year on year: ▼ 0.5% Baseline: ▼ 2.4%
19 year olds achieving level 3 qualifications
Sep-09 Sep-10 Sep-11
Sep-12
2015 Target
6 Growth Boroughs 45.3 49.0 53.4 55.9 Narrow the gap to 3-4% London 52.7 55.8 59.0 61.0
Gap 7.5 6.8 5.6 5.1
45.349.0
53.4 55.952.7 55.8 59.0 61.0
0.0
10.0
20.0
30.0
40.0
50.0
60.0
70.0
2009 2010 2011 2012
19 year olds achieving Level 3 threshold
6 Growth Boroughs London
DfE: Level 2 and 3 Attainment by Young People in England Measured Using Matched Administrative Data: Attainment by Age 19 in 2012
Increasingly the move to raise the participation age to 17 in 2013 and 18 by 2015 and the 16-19
programmes of learning reforms as recommended by Alison Wolf13 will impact on the levels of
achievement and have the potential to increase the rate of improvement but may not impact on
the Convergence gap. Additional concerted work will be needed to remove the gap.
Percentage of working age population with no qualifications
The indicator for the percentage of the population with no qualifications met its mid term target in
2011 and despite a 0.4 percentage point increase in 2012, remains within the ‘achieved target’
category.
RAG Rating: Green (achieved) Progress year on year: ▲ 0.4% Baseline: ▼ 1.6%
Percentage of working age population with no
Sep-09 Sep-10 Sep-11 Sep-12 2015
13 The Wolf report on vocational education is available at
https://www.education.gov.uk/publications/eOrderingDownload/The%20Wolf%20Report.pdf

27
qualifications Target
6 Growth Boroughs 17.1 14.5 12.7 12.2 Close gap to 3-
4% London 11.7 10.0 9.3 8.4
Gap -5.4 -4.5 -3.4 -3.8
17.1
14.5
12.7 12.211.7
10.09.3
8.4
0.0
2.0
4.0
6.0
8.0
10.0
12.0
14.0
16.0
18.0
Jan 09-Dec 09 Jan 10-Dec 10 Jan 11-Dec 11 Jan 12-Dec 12
Percentage of working age population with no qualifications
6 Growth Boroughs London
Sources: Labour Force Survey, ONS
Child Poverty
RAG Rating: tbc Progress year on year: tbc Baseline: ▼ tbc
We are still awaiting the latest DWP data for this indicator. The DWP have noted on their
website that Children in out-of-work benefit households statistics release which was due to be
published on 12 June 2013 has been postponed and “Work is continuing to resolve the issues
with the series.”
We hope to be able to report on this indicator in the next version of the 2012-13 report. In 2011,
the Growth Boroughs were only 0.2% away from achieving the mid term target.
Proportion of children in working age families receiving key benefits
Sep-09
Sep-10 Sep-11
Sep-12
2015 Target
6 Growth Boroughs 34.6 31.8 30.1 Narrow the gap
to 5-6% London 26.3 25.2 23.9
Gap -8.4 -6.6 -6.2
Source: DWP Work and Pensions Longitudinal Study, HMRC Child Benefit administrative data.

28
4. Supporting Healthier Lifestyles
Background
The Olympic and Paralympic Games was undoubtedly a tremendous success in terms of
staging a world class sporting event. It was a wonderful spectacle and a wonderful cultural
events as well as being the best games ever for Team GB in terms of medals. We are now
examining whether we are able to sustain the enthusiasm of the Games to achieve a strong
sporting and physical activity legacy for residents in the Growth Boroughs.
The last decade has been one of steadily improving health outcomes for Growth Boroughs
residents, with very significant reductions in premature deaths from cardiovascular diseases and
cancers, especially in the first part of the decade as the quality of primary care services, and
treatment for these diseases improved. Overall the Convergence gap on health outcomes has
been narrowing.
The last year has also been one of massive change for the NHS and health services, as Primary
Care Trusts were replaced by GP-led Clinical Commissioning Groups, the Public Health function
moved back to local authorities, and Strategic Health Authorities were abolished (to be replaced
by a national body for specialist and primary care commissioning – the National Commissioning
Board for England – now known as NHS England (and NHS London for its London region arm).
It is a credit to the NHS that against this backdrop of massive reorganisation, the NHS in London
and in the Growth Boroughs maintained services for residents during Games time. The Health
Act 2011 also established Health and Wellbeing Boards at local authority level, and tasked all
parts of the system to work together to deliver integrated health and social care services.
Indicators
Eight indicators covering childhood obesity, mortality and life expectancy were selected to track
progress under this outcome area.
Indicators Gap 2009
Gap 2012
2014/15 Target Progress and RAG rating
Theme: Supporting Healthier Lifestyles Life expectancy:
(male)
2.2
(07/09)
1.7 (09/11)
Narrow the gap to 2 years
Achieved
(female) 1.7 (07/09)
1.4 (09/11)
Narrow the gap to 1.5 years
Children achieving a good level of
development at age 5 (%)
6.0
(09/10) 1.0
(11/12)
Narrow the gap to 3.2%
Achieved
Obesity levels in school children in yr 6 2.2 3.0
(2011) Narrow the gap to 1%
Gap increased.
Mortality rates from all circulatory
diseases at ages under 75 26.0
Narrow the gap to 25 pts
Data expected in December 2013
Mortality rates from all cancers at ages
under 75 19.6
Narrow the gap to 10 pts
Data expected in December 2013
Recommended Adult Activity (3 times
30 mins per week)
2.6%
(08/10) 2.5%
Narrow the gap to 1%
Gap reducing but not on track
No Sport or Activity (0 times 30 mins
per week)
5.4%
(08/10) 4.4%
Narrow the gap to 2%
Gap reducing but not on track

29
Of the seven indicators we are currently on track to meet medium term Convergence targets for
two of them (life expectancy and child development at age five). We are not on track for three of
them and we are waiting for new data for two of them. Of the three that are not on track, the two
relating to adult activity levels are amber and show slight improvement and the one relating to
childhood obesity is red as the Convergence gap has increased. For the two where we await
new data, this was due to be released by ONS in July 2013 (covering 2011) and is now
expected in December 2013. This data will reflect the population increases identified by the
Census 2011. Based on 2010 data (the last available) the gap for premature deaths from CVD
was on track, but there was still some way to go in terms of premature deaths from cancers.
Life expectancy
(male) RAG Rating: Green (Achieved) Progress year on year: ▼0.4 Baseline: ▼0.5
(female) RAG Rating: Green (Achieved) Progress year on year: ▼0.2 Baseline: ▼0.3
There has been good progress on narrowing the life expectancy gap for both men and women,
and against a backdrop of overall improvement, there have been significant improvements in
male life expectancy for Greenwich, and both male and female life expectancy for Waltham
Forest.
Life expectancy
76.4
81.4
76.9
81.7
77.7
82.2
78.6
83.1
79.0
83.3
79.3
83.6
70.0
72.0
74.0
76.0
78.0
80.0
82.0
84.0
86.0
Male Female Male Female Male Female
2007-2009 2008-2010 2009-11
6 HostBoroughs
London
Source - ONS
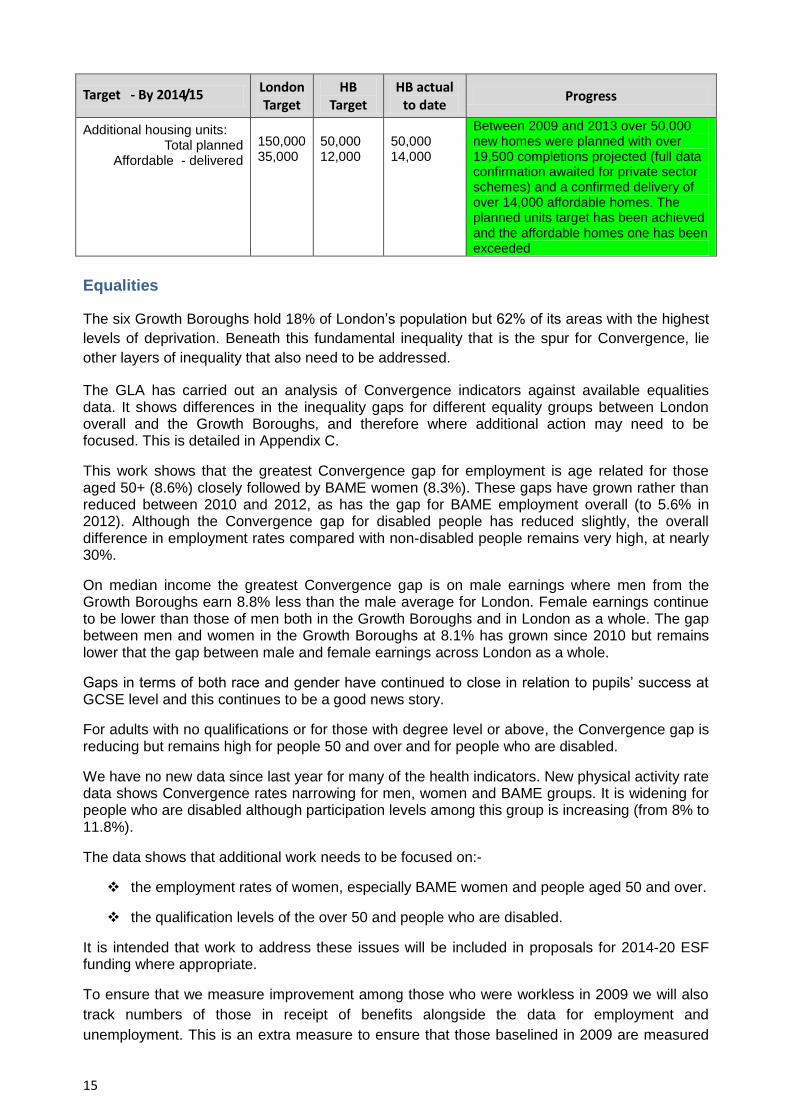
Children’s development
RAG Rating: Green (Achieved) Progress year on year: ▼3.3% Baseline: ▼5.0%
The indicator to track good levels of development in early childhood is a new indicator, taken
from the Marmot Review indicator set, introduced in the 2011-15 action plan and progress is
being reported for the first time. The convergence gap for this indicator is just 1%, there has
been a significant narrowing of the gap over the last three years from 6% in 2009, and at the
current rate of progress, Convergence could be achieved by 2013/14, although the impact of
30
Welfare Reform, and reductions in investment in early years services such as Children’s Centres
may have a negative impact on this indicator.
Children achieving a good level of
development at age 5 (%)
48.7
55.2
63.4
54.759.5
64.4
-
10.0
20.0
30.0
40.0
50.0
60.0
70.0
2009/10 2010/11 2011/12
6 Host Boroughs London
Source DFE
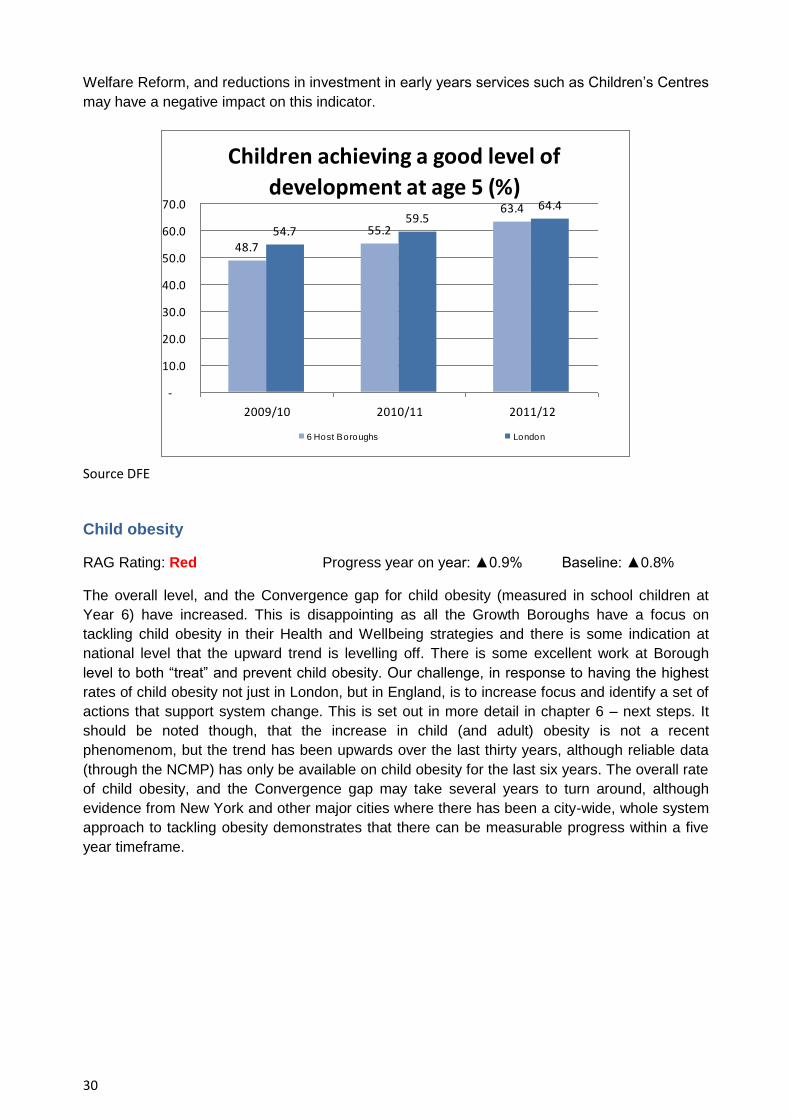
Child obesity
RAG Rating: Red Progress year on year: ▲0.9% Baseline: ▲0.8%
The overall level, and the Convergence gap for child obesity (measured in school children at
Year 6) have increased. This is disappointing as all the Growth Boroughs have a focus on
tackling child obesity in their Health and Wellbeing strategies and there is some indication at
national level that the upward trend is levelling off. There is some excellent work at Borough
level to both “treat” and prevent child obesity. Our challenge, in response to having the highest
rates of child obesity not just in London, but in England, is to increase focus and identify a set of
actions that support system change. This is set out in more detail in chapter 6 – next steps. It
should be noted though, that the increase in child (and adult) obesity is not a recent
phenomenom, but the trend has been upwards over the last thirty years, although reliable data
(through the NCMP) has only be available on child obesity for the last six years. The overall rate
of child obesity, and the Convergence gap may take several years to turn around, although
evidence from New York and other major cities where there has been a city-wide, whole system
approach to tackling obesity demonstrates that there can be measurable progress within a five
year timeframe.

31
Obesity levels, school children in year 6
24.0% 24.1%25.5%
21.8% 21.9% 22.5%
0.0%
5.0%
10.0%
15.0%
20.0%
25.0%
30.0%
2009/10 2010/11 2011/12
6 Host Boroughs London
Graph 10. Source: The Health and Social Care Information Centre, Lifestyle Statistics / Department of Health
Obesity Team NCMP Dataset
Sport and physical activity
RAG Rating: Amber Progress year on year: ▲0.5% Baseline: ▼0.1%
(Recommended Adult Activity (3 times 30 mins per week)
RAG Rating: Amber Progress year on year: ▼0.6% Baseline: ▼1.0%
(No Sport or Activity (0 times 30 mins per week)
Whilst elite sport was given a great boost by the Olympics and Paralympics, and some Olympic
and Paralympic sports have seen increased participation since the Games, the overall picture for
sports and physical activity participation has been fairly static in London and the Growth
Boroughs. Since the first Active People Survey in 2005, the year that London was awarded the
2012 Games, the percentage of adults taking part in 30 minutes of sport once a week increased
from 35% to 36%. And for the Growth Boroughs, the increase has been slightly more – from
30.4% to 31.7% - but the Convergence gap has barely narrowed from 4.6% to 4.3%.
In terms of the sedentary population, (those people who undertake no moderate physical
activity, and put their health at significant risk because of this inactivity), the percentage of
inactive people has actually increased for both London and the Growth Boroughs. In 2012,
53.1% of adults were inactive, that is more than half the adult population. The Chief Medical
Officer’s recommended level of moderate physical activity in order to maintain good health is at
least 150 minutes a week.

32
No sport or activity (0 times 30
minutes per week)52.7% 52.8% 53.1%
47.3% 47.8% 48.7%
0.0%
10.0%
20.0%
30.0%
40.0%
50.0%
60.0%
2008-10 2009-11 2010-12
6 Host Boroughs London
Graph 11, sources: Office for National Statistics, Sport England, Active People Survey
The actions that we are advocating to prevent child obesity will also, if implemented at scale and
across the Growth Boroughs, have a positive impact on levels of adult physical activity and
sedentary behaviour. The opening of Queen Elizabeth Olympic Park and legacy venues from
July 2013 onwards, and the investments that the Growth Boroughs have made in sports and
leisure facilities, and parks and open spaces, will all contribute to improving access to physical
activity opportunities, and removing barriers to inactivity. There are also some very positive
increases in the number and proportion of journeys by bicycle in some of the Growth Boroughs,
most significantly in Hackney and there is a will to share learning and action between the Growth
Boroughs about what works to increase walking, cycling and everyday physical activity, as well
as sports and leisure activities.
The boroughs, LLDC and TfL continue to work to ensure the full potential of the investment in
walking and cycling routes as part of the Olympic and Paralympic Games are maximised in
order to support healthier lifestyles. Investment continues with the extension of Cycle
Superhighway 2 to Stratford, and furthermore the announcement of Stratford being shortlisted as
a ‘mini-Holland’ as part of the Mayor’s Vision for Cycling.
Data on the percentage of pupils who participate in PE and School Sport is unfortunately no
longer collected and reported nationally.

33
5. Developing Successful Neighbourhoods
Four indicators and one target covering crime, housing and neighbourhoods were selected to
track progress under this outcome area. Over 2012/13 there has also been a slight recalibration
of the actions against theme headings and those on culture and inward investment now come
under the heading of Developing Successful neighbourhoods. As reported in last years annual
report we aimed to develop new indicators that would better capture the trend data on the
growing East and South east London economy. We also attempted to identify area satisfaction
measures using different data sets to the Place Survey data we were using in 2009 and 2010.
The new measures for growth are within the indicator table below but we have not found a
robust alternative to the Place Survey.
Indicators Gap 2009
Gap 2012
2014/15 Target Progress and RAG rating
Theme: Developing successful neighbourhoods
Violent crime levels (Violence against
the person, per 1,000 population )
6.1 (09/10)
3.1 (12/13)
To narrow the gap to 3-4% Achieved
Economic growth A - income
14
Economic Growth B - jobs
21.4%
36.4%
18.4%
34.8%
To narrow the gap to 15.5% To narrow the gap to 28%
New indicator New indicator
Overcrowding measure (Bedroom standard.15 The data for this standard can no longer be tracked and 2011 census data is being used to provide trend data)
2.9
(2010)
New data from
different source
To narrow the gap
Data on bedroom standard can not be tracked but census data 2001 – 2011 shows an increased
gap from 3.7 to 6.2.
Target - By 2014/15 London Target
HB Target
HB actual to date
Progress
Additional housing units: Total planned
Affordable - delivered
150,000 35,000
50,000 12,000
50,000 14,000
Between 2009 and 2013 over 50,000 new homes were planned with over 19,500 completions projected (full data confirmation awaited for private sector schemes) and a confirmed delivery of over 14,000 affordable homes. The planned units target has been achieved and the affordable homes one has been exceeded.
14 New measure to track economic growth is explained as an equation where X = Convergence Indicator, AE =
Average Earnings, ER = Employment Rate, JD = Job Density , gb = Growth Boroughs, l = London excluding the Growth Boroughs
15 The bedroom standard is based on the composition of the household and their ages. According to the bedroom
standard, households are overcrowded if they lack one bedroom according to the standard and are severely overcrowded if they lack two or more bedrooms according to the standard.

34
Investment and Growth
The Oxford Economics work developing an economic model and forecast for the Growth
Boroughs identified that the Growth Boroughs have captured a growing share of London’s
employment and GVA and have been amongst the fastest growing boroughs over the recession
in London (with respect to employment) and they have experienced amongst the largest growth
in population.
Oxford Economics project that an additional 190,400 jobs above base could be created in the
sub-region by 2030 generating an additional £36bn in GVA and that higher employment levels
would generate an additional £20bn in workplace earnings or £15bn in resident terms, leading to
significantly higher levels of consumer spending in the sub-region.
The 20 major sites with planning permission and private sector partners within the Growth
Boroughs will account for £18.7bn investment and 409 hectares of development. These include:
Stratford’s International Quarter
Queen Elizabeth Olympic Park
University Square
Strand East
Business East
Industries Park
Canning Town/Custom House
Silvertown Quay
Wood Wharf
Greenwich Peninsula
iCity
London will continue to grow east as the Royal Docks and London Riverside offer the next
opportunities for expansion.
Economic Growth - Income
RAG Rating: New indicator Progress year on year: ▲1.6% Baseline: ▲ 3.0%
Economic Growth - Jobs
RAG Rating: New indicator Progress year on year: ▲▼N/A Baseline: ▲▼ N/A
Violent Crime
RAG Rating: Green (Achieved) Progress year on year: ▼1.2 Baseline: ▼ 3.0
The Convergence gap for violent crime has reduced from 6.1 (violent crimes per 1000 people) in
2009/10 to 3.1 in 2012/13 as shown in the table below.
This narrowing of the gap means that the indicator has already met the short term target of
narrowing the gap to 3 to 4% by 2014/15.
Work to tackle gangs has continued in 2012/13 on a borough by borough basis. Joint work with
MOPAC to address issues of violence against women and girls is at a developmental stage.

35
Violence against the person, per 1,000
population
28.926.0
24.021.3
22.821.2
19.718.2
0.0
5.0
10.0
15.0
20.0
25.0
30.0
35.0
2009/10 2010/11 2011/12 2012/13
6 Host Boroughs London
Source: Home Office Statistics
Housing
Affordability, availability and overcrowding issues are key to our ability to achieve the
Convergence indicators for housing. Recent policy and reforms, especially caps to Universal
Credit and the local housing allowance will impact negatively on some Growth Borough
residents and therefore Convergence, as they have higher proportions of people on benefits and
higher levels of overcrowding. Also tenures in the Growth Boroughs differ from the average for
London, with Hackney, Newham and Tower Hamlets in particular having a much higher
percentage of social rented and private rented housing. Barking and Dagenham and Waltham
Forest rates are also high in comparison to the outer London average.
Social rented Private rented Total rented Total owner occupied
Barking & Dagenham 33.7 17.7 51.4 46.4
Greenwich 34.3 19.8 54.1 43.3
Hackney 43.7 29.0 72.7 23.8
Newham 29.6 34.1 63.7 33.3
Tower Hamlets 39.6 32.6 72.2 24.2
Waltham Forest 22.1 25.9 48.0 49.9
London 24.1 25.1 49.2 48.2
Source: ONS
The targets for housing are to plan and build additional units, of which 24% should be affordable
and to reduce overcrowding.
In relation to the additional units, medium term targets for 2014/15 were for 50,000 to be planned
and 12,000 of affordable units to be delivered. Data returns from boroughs show both of these
to be exceeded with over 50,000 new homes planned, over 19,500 completions projected (full
data confirmation awaited for private sector schemes) and a confirmed delivery of over 14,000
affordable homes. As part of this in 2012/13, the GLA supported the building of 1,942 affordable
units through grant support.
Overcrowding rates in the Growth Boroughs are already higher than that of the London average
and this gap has widened between the last two censuses. When added to the welfare reform
measures such as the introduction of benefit caps there is a significant risk that these levels may
increase. Currently we do not have a joint strategy to address this worsening trajectory.

36
Changes in other housing factors:
Social housing waiting lists have grown by over 22,000 since 2009, a figure that
represents 86% of the increase in social housing waiting lists for London.
Homeless acceptances are over 1000 higher in 12/13 than they were in 2008/9,
representing 50% of the increase across London during that period.
Although the number of people in temporary accommodation (22% of the London total)
has risen in both 2012 and 2013 it remains lower than the 2009 figure.
Social housing waiting list (as at 1/4)
Homelessness Acceptances per
year
Number of People in Temporary
Housing (on 31/3)
2009 2012 2008/9 2012/13 2009 2013
Growth Borough Totals 93,445 115,743 2,742 3,823 11,212 8,725
London Totals 354,389 380,301 12,780 14,812 47,780 39,017
Growth Borough figures as a % of the London total 26% 30% 21% 26% 23% 22%
Source: London Boroughs and GLA
The Mayor launched a new Housing Covenant, including support for the intermediate housing
market development of specialised housing for London’s older people and disabled adults,
support for the private rented sector, and to increase the supply of new homes in London and
improve the quality of existing properties.
Public realm
Work across the Growth Boroughs to improve the public realm in 2012/13 focussed on
completing the public realm improvement programme.
By Games time it had delivered 34 improvement schemes funded by a £100M programme of
funding.
Improvements to Leyton High Road
Projects include Stratford
Shopping Centre screening,
Cutty Sark Gardens, Gordon
Square Woolwich and Leyton
High Road. Projects have
improved the look and feel of
streets and public spaces
through introducing high quality
materials especially around the
fringes of the Olympic Park.
To measure the success of
public realm we had used
measures from the discontinued
Place Survey.

37
We have not bee able to
identify robust alternative data
sources to track this so we have
removed these indicators from
the data set.
In 2013/14 additional public
realm projects will be identified
to continue to support the
integration of Queen Elizabeth
Olympic Park into the
surrounding neighbourhoods.
Improvements to Cutty Sark Gardens
Transport
Good transport links are crucial to many of our other plans and aspirations. Improving public
transport links to make it easier for residents to access jobs is vital, especially as car ownership
levels are low and Growth Borough residents have a greater reliance on public transport.
Car ownership
rate per household Range of rate
Growth Boroughs 0.6 0.4 – 0.8
London 0.8 0.4 – 1.2
Source: DFT
Strategic investment in improving transport links can also enable land to be opened up for
investment, creating jobs and housing as well as to connect residents and employment centres
and business and industrial centres to maximise growth.
The Growth Boroughs, in 2011/12, collectively identified priorities for strategic investment in the document, “Securing the Olympic & Paralympic Transport Legacy,”16 which identifies priority projects that fall in to one of the following three categories:
Economic Drivers Wider Legacy Projects Supporting Transport Projects
The boroughs actively engage with GLA and TfL in order to develop transport proposals and priorities. The east and south east sub-regional transport plan, developed collaboratively between the boroughs and TfL, highlights investment in a number of areas across the Growth Boroughs, including:
The delivery of Crossrail from 2018, adding 10 per cent to London’s rail capacity
Additional carriages on London Overground to provide 25 per cent increase in peak
capacity
The upgrade of the District line (along with the Circle, Hammersmith & City and
Metropolitan lines), including an increase in capacity of 24 per cent across the line
16_Document.at.http://static.squarespace.com/static/50b4ab77e4b0214dc1f631e9/t/50b4b54de4b044271b61ee8
7/1354020173216/olympic-Legacy-Transport-Action-Plan.pdf

38
Devolution from DfT to TfL of suburban rail services in north east London, enhancing the
quality of service for the area
Enhancements to the Lea Valley rail corridor, enabling a much-enhanced inner
suburban, outer suburban and Stansted airport service.
Double tracking of the DLR network between Stratford and Bow Church to improve
reliability and recovery from delay, and to allow an increase in frequency
Step-free access at London Underground stations including Whitechapel, Tower Hill and
Bromley-By-Bow, together with all Crossrail stations. Development and upgrade of
stations such as Hackney Wick, Pudding Mill Lane, Lea Bridge and Surrey Canal Road
Electrification of the Barking to Gospel Oak line, enabling more capacity and faster
journey times along the line and leading the way for the extension of the Overground to
Barking Riverside
East London Transit 1b. Providing additional bus infrastructure from Barking town centre
to Barking Riverside development
Increased investment in cycling across the Capital, including new and extended cycle
networks and Barclays Cycle Superhighways. The shortlisting of Stratford as a mini-
Holland.
Additional Thames river crossings, such as the proposed crossings at Silvertown and
Gallions Reach. The proposed package of measures would address some of the
highway problems in east and south east London, including unreliability and congestion
experienced at the Blackwall Tunnel, and the impending life expiry of the existing
Woolwich Ferry infrastructure
A £300m fund to support investment in transport infrastructure in key areas of London to
unlock growth and act as a catalyst for future development
Furthermore, Local Implementation Plans (LIPs) set out how boroughs will deliver better
transport in their area, in the context of the Mayor’s Transport Strategy (MTS). They are a vital
tool in supporting jobs and growth and delivering a better quality of life for those who live and
work in the Capital. The LIPs programme provided funding to enable improvements ahead of
the Games in 2012 with lasting legacy benefits for the Growth Boroughs. In addition to this, as
part of the on-going LIP programme, further schemes are in the process of being implemented
including, for example, Kingsland High Street in Hackney,
Culture
Culture, the creative industry and the arts are a powerful means of creating better community
involvement, showcasing some of the most positive and aspiring aspects of a neighbourhood
and supporting job creation and the visitor economy. Within the Growth Boroughs the shared
vehicle for carrying this forward is CREATE.
CREATE has delivered an East and Southeast London annual Cultural festival since 2008 and
has worked to compliment the Cultural Olympiad and make its reach more significant across the
Growth Boroughs. CREATE is also a legacy vehicle which aims to support the growth of
Europe’s largest cultural quarter, actively involve local people and make a significant contribution
to the positive promotion of east London as a cultural destination pre and post Games. CREATE

39
Jobs is a new programme which is delivered in partnership with the creative and cultural sector
and delivers apprenticeships, work placements and employment mentoring for local young
people.
CREATE 2012 highlighted the scale of the arts base in the Growth Boroughs and took a greater
range of arts to the doorsteps of residents. In 2012 over 1.1m people attended events, over
55,000 residents took an active part and £1.7m of new investment and £1.5m worth of new
commissions were secured. There was a total media reach of £7m including articles in The
Financial Times and features in The Culture Show, The Review Show, New York Times and
Vogue.
David Bailey’s exhibition
The 2012 festival saw a range of projects including:
A London-Rio carnival exchange programme which provided many collaborations and Kingsland Road with a one day Rio style carnival.
The return of David Bailey to Newham for a major exhibition of work celebrating his pictures of the East End taken over a 50 year period.
A genre busting urban music event in Walthamstow that provided the finale moment for Create London’s three–year music strand, Urban Classic.

40
6. Next Steps
Together with continued work to address the action plan there are additional factors that need
addressing in 2013/14 if we are to ensure a continued and relevant focus on legacy. These are:
Ensuring growth benefits long-term residents
Placing additional focus on the areas where the Convergence indicators are not on track,
including equalities gaps.
Growing the Growth Boroughs
Economic growth in the east of London is critical if we are to deliver Convergence and create a
new virtuous cycle for East London where the growth leads to job creation, a significant
percentage of these jobs are secured by existing growth borough residents and the reliance on
benefits diminishes. Harnessing the energy of the 2012 Games and the opportunities provided
by the new park is a catalyst for this but alone it will not achieve the step change necessary.
The move from Host Boroughs to Growth Boroughs requires the boroughs to agree both
priorities for growth and potential funding mechanisms. There will be a focus on this in the
coming months. We also need to agree a methodology for measuring and tracking the impact of
growth. Currently the Convergence indicators provide information on employment levels, median
income and skill levels but to fully measure growth we are working with Oxford Economics and
the GLA to develop and agree a methodology for capturing progress in achieving growth. Once
developed the economic investment indicators will be added to the suite of Convergence
indicators.
There will also be further analysis on the implications of the 2011 Census results once all the
data is available. The first data release shows that there are 174,000 more people living in the
Growth Boroughs than were indicated by the 2010 mid-year estimates. This has implications in
terms of funding and may be an issue where joint work could lead to more proportionate funding
for the Growth Boroughs and London generally.

41
Recovery Plan
There are eight amber and red indicators that are not on track to achieve their 2014/15 target.
Planned actions to address these are explained below.
Indicators Progress and RAG
rating
Recovery plan
Theme: Creating wealth and reducing poverty
Employment
rate – aged 16-
64
Gap reducing slightly -not on track
Structural Funds:
The GLA, GBU LLDC and TfL are working in partnership to ensure that the London allocation of EU Structural Funds (2014-20) takes account of the Convergence principle. Currently the four organisations are working towards including Convergence strands/priorities into the Draft LEP EU Structural and Investment Fund (ESIF) Strategy.
A total of €748.6 million of EU Structural Funds will be made available to London. EU Structural Funds, largely consisting of ESF and ERDF. ESF is used to train and support unemployed people to get a job, whereas ERDF is used to improve regional and local economic competitiveness, including attracting private investment. The GBU will continue to lobby for the GBs to receive a greater investment from this pot of funding, any subsequent programmes will target Convergence indicators that are not on track to achieving their targets, in particular, the Employment Rate, Unemployment Rate and Median Earnings.
Employer Forum:
An Employer Forum will be organised in late 2013 to discuss new ways of working, focussing on the mismatch of skills and employment opportunities in the local area.
Work Programme:
In June 2013, DWP released the latest performance data for the Work programme covering the first 22 months of delivery (June 2011 – March 2013)
Overall, the programme is showing signs of improvement for 25+ JSA client group; however the major cause for concern is its failure to help the disadvantaged, particularly in the most deprived areas. In addition to this, it is surprising that the programme is not adequately supporting the 18-24 year old JSA claimants, the group normally with the fewest barriers to work.
There is a greater need for collaboration between prime contractors and local authorities. DWP must relax data sharing rules that hold back Primes from sharing information about programme operation with boroughs in order to reduce the risk of the duplication of provision by multiple agencies. Local authorities already have existing links with specialist organisations to help the most disadvantaged.
Service Level Agreements
The 6 Boroughs have engaged with JCP in exploring the development of Service level Agreements (SLAs). These SLAs will provide a framework to collaboratively approach dealing with unemployment levels, focusing on a target claimant count figure rather than the JCP’s usual measure of claimant off-flows. The GBU have encouraged local authorities to embed convergence related targets into these agreements.
Barking and Dagenham have agreed an SLA agreement with JCP and it is envisaged that all 6 Boroughs will be able to agree SLAs in 2013-14. The GBU monitor the performance of the collaborative work locally and report these at a sub-regional level.. The quarterly CWRP meeting
Unemployment rate 16+
Not on track - gap increased
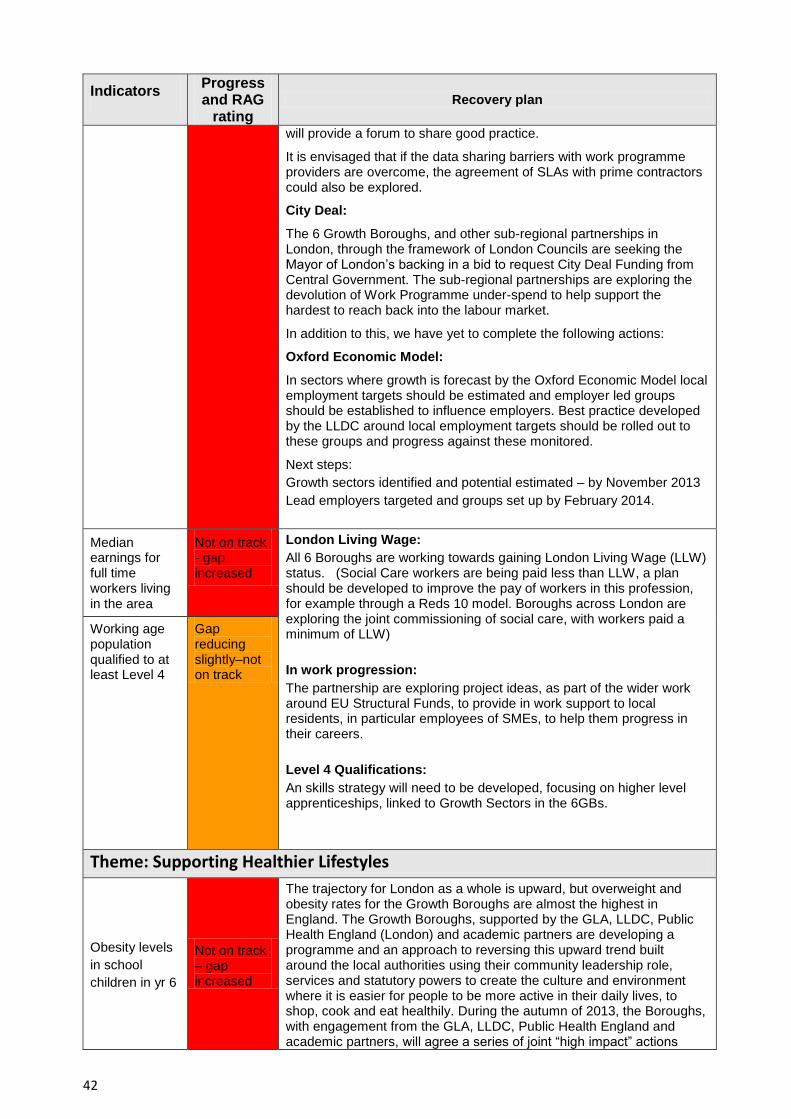
42
Indicators Progress and RAG
rating
Recovery plan
will provide a forum to share good practice.
It is envisaged that if the data sharing barriers with work programme providers are overcome, the agreement of SLAs with prime contractors could also be explored.
City Deal:
The 6 Growth Boroughs, and other sub-regional partnerships in London, through the framework of London Councils are seeking the Mayor of London’s backing in a bid to request City Deal Funding from Central Government. The sub-regional partnerships are exploring the devolution of Work Programme under-spend to help support the hardest to reach back into the labour market.
In addition to this, we have yet to complete the following actions:
Oxford Economic Model:
In sectors where growth is forecast by the Oxford Economic Model local employment targets should be estimated and employer led groups should be established to influence employers. Best practice developed by the LLDC around local employment targets should be rolled out to these groups and progress against these monitored.
Next steps:
Growth sectors identified and potential estimated – by November 2013
Lead employers targeted and groups set up by February 2014.
Median earnings for full time workers living in the area
Not on track - gap increased
London Living Wage:
All 6 Boroughs are working towards gaining London Living Wage (LLW) status. (Social Care workers are being paid less than LLW, a plan should be developed to improve the pay of workers in this profession, for example through a Reds 10 model. Boroughs across London are exploring the joint commissioning of social care, with workers paid a minimum of LLW)
In work progression:
The partnership are exploring project ideas, as part of the wider work around EU Structural Funds, to provide in work support to local residents, in particular employees of SMEs, to help them progress in their careers.
Level 4 Qualifications:
An skills strategy will need to be developed, focusing on higher level apprenticeships, linked to Growth Sectors in the 6GBs.
Working age population qualified to at least Level 4
Gap reducing slightly–not on track
Theme: Supporting Healthier Lifestyles
Obesity levels
in school
children in yr 6
Not on track – gap increased
The trajectory for London as a whole is upward, but overweight and obesity rates for the Growth Boroughs are almost the highest in England. The Growth Boroughs, supported by the GLA, LLDC, Public Health England (London) and academic partners are developing a programme and an approach to reversing this upward trend built around the local authorities using their community leadership role, services and statutory powers to create the culture and environment where it is easier for people to be more active in their daily lives, to shop, cook and eat healthily. During the autumn of 2013, the Boroughs, with engagement from the GLA, LLDC, Public Health England and academic partners, will agree a series of joint “high impact” actions

43
Indicators Progress and RAG
rating
Recovery plan
aimed at reversing the upward trend in child obesity, and even more ambitiously to deliver a sustained downward trend in the level of excess weight in Growth Boroughs children by 2020. We will do a few things well and at scale which impact on the obesogenic environment and help bring about system change.
No Sport or
Activity (0
times 30 mins
per week)
Not on track – gap reduced
The Growth Boroughs continue to invest in extending sports and physical activity opportunities, and through targeted Borough programmes like Greenwich Get Active, Hackney’s New Age Games and the LLDC-funded Active People, Active Park programme and Take 12 Challenge are engaging previously inactive people. Joint funding bids will lever additional resources for these targeted activities. And through significant Growth Boroughs and GLA investment in improvements for cyclists and walkers, and extensive Parks and open space programmes, some of the barriers to everyday physical activity will be reduced.
Recommended
Adult Activity
(3 times 30
mins per week)
Not on track – gap reduced
The shift of public health functions to the local authorities is providing opportunities to achieve best value from investment in sports and physical activity programmes, and new joint working relationships between Health, Parks, Sports, Culture and Traffic and Transportation services in the Boroughs will help remove the barriers to everyday activity and lead to better provision for pedestrians and cyclists. The Boroughs continue to invest significantly in sports programmes, and there is major new investment in Parks and sports facilities in many of the Boroughs. The opening of new world class facilities in the Queen Elizabeth Olympic Park, including waterways and high quality park land, allied with continued engagement with national Sports Governing Bodies, will significantly increase local sports participation opportunities, as will the £1 million investment in disability and inclusive sports through Motivate East.
Theme: Developing Successful Neighbourhoods
Overcrowding
rates
Data on bedroom standard can not be tracked but census data 2001 – 2011 shows an increased gap from 3.7 to 6.2
Growth Boroughs and LLDC are developing additional housing units with LLDC announcing that they are to accelerate delivery of new homes, including private rented units in two neighbourhoods in the western part of QEOP but this is not expected to impact significantly on this indicator. The full impact of the welfare reforms on the residents of the Growth Boroughs will need to be collated and analysed before a strategy of additional work can be developed.
Equalities
The review of the equality impact assessment and action plan together with the GLA analysis of
equalities issues against the three Convergence themes highlights a number of areas for further
action. A few of these are highlighted in the recovery plans above to ensure a focus on those
furthest from the average as an essential part of the work to close the gap. In addition we will
meet regularly with the GLA to keep actions and potential projects under review.

44
Convergence Indicators Appx A
Theme: Creating Wealth Reducing Poverty
Key Measure London 6 Growth Borough Gap or difference 2014/15 Target Progress
2009 2011 2012 2009 2011 2012 2009 2011 2012
Economically active people in employment
(Sep) 68.3 67.9 68.6 62.8 63.2 64.1 - 5.5 - 4.7 - 4.5 - 2-3%
Gap reducing slightly – not on track
Indicators
Unemployment rate (Sep) 8.4 9.2 8.9 10.6 11.3 11.4 2.3 2.2 2.5 1-1.5% Not on track - Increasing
Median earnings for full time workers living in
the area (calendar year) £598.20 £608.8 £613.3 £567.50 £570.5 £574.6 - £30.70 - £38.3 - £38.7 - £25.00 Not on track –
Increasing
Proportion of children in families receiving
key benefits (calendar year) 26.3 23.9 34.6 30.1 -8.4 -6.2 - 5-6% Data awaited
Pupils achieving at least Level 4 in English &
Maths at Key Stage 2 (academic year) 73.0 76.4 81.8 70.0 74.9 80.9 3.0 1.5 0.9 0% On Track
Pupils achieving 5 GCSE grades A*-C (inc
Maths & English) in schools (academic year) 54.0 61.9 61.3 46.6 57.3 59.0 - 7.4 - 4.6 - 2.3 - 3-4% Achieved
19 year olds achieving Level 2 threshold
(calendar year) 78.5 83.5 85.9 73.9 81.1 83.5 - 4.6 - 2.3 - 2.4 - 1-1.5% On track
19 year olds achieving level 3 threshold
(calendar year) 52.7 59.0 61.0 45.3 53.4 55.9 - 7.5 - 5.6 - 5.1 - 3-4% On Track
Percentage of working age population with
no qualifications (calendar year) 11.7 9.3 8.4 17.1 12.7 12.2 5.4 3.4 3.8 3-4% Achieved
Working age population qualified to at least
Level 4 (calendar year) 39.7 45.9 47.6 32.2 41.1 41.8 - 7.5 - 4.8 - 5.8 - 3-4% Not on track

45
Theme: Supporting Healthier Lifestyles
Key Measure London 6 Growth Boroughs Gap or difference 2014/15
Target Progress
2009 2011 2012 2009 2011 2012 2009 2011 2012
Life expectancy:
(male)
78.6
(07-09)
79.0
(08-10)
79.3
(09-11)
76.4
(07-09)
76.9
(08-10)
77.7
(09-11) 2.2 2.1 1.7
Narrow the gap to 2 years
Achieved
(female) 83.1 83.3 83.6 81.4 81.7 82.2 1.7 1.6 1.4 Narrow the gap to 1.5 years
Achieved
Indicators
Children achieving a good level of development at age 5 (%)
54.7%
(09/10)
59.5%
(10/11)
64.4%
(11/12)
48.7%
(09/10)
55.2%
(10/11)
63.4%
(11/12) 6.0% 4.3% 1.0% Narrow the
gap to 3.2% Achieved
Obesity levels in school children in year 6 21.8%
(09/10)
21.9%
(10/11)
22.5%
(11/12)
24.0%
(09/10)
24.0%
(10/11)
25.5%
(11/12) 2.2% 2.1% 3% Narrow the
gap to 1%
Not on track,
gap increased.
Mortality rates from all circulatory diseases at ages under 75
70.1
(2009)
68.2
(2010)
96.1
(2009)
89.7
(2010) 26.0 21.5 Narrow the
gap to 25 pts
Data available
December
2013
Mortality rates from all cancers at ages under 75
107.6
(2009)
102.9
(2010)
127.2
(2009)
115.1
(2010) 19.6 12.2 Narrow the
gap to 10 pts
Data available
December
2013
Recommended Adult Activity (3 times 30 mins per week)
20.9%
(08/10)
20.2%
(09/11)
21.0%
(10/12)
18.3%
(08/10)
18.2%
(09/11)
18.4%
(10/11) 2.6% 2.0% 2.5% Narrow the
gap to 1% Not on track, gap reduced
No Sport or Activity (0 times 30 mins per week)
47.3%
(08/10)
47.8%
(09/11)
48.7%
(10/11)
52.7%
(08/10)
52.8%
(09/11)
53.1%
(10/12) 5.4% 5.0% 4.4% Narrow the
gap to 2%
Not on track, reduction due to London getting worse faster
Percentage of pupils who participate in PE and School Sport
83.6
(09/10)
84.3 +0.7
Achieve 100%
Data no longer
collected

46
Theme: Developing successful neighbourhoods
Indicators London 6 Growth Borough Gap or difference 2014/15
Target Progress
2009 2011 2012 2009 2011 2012 2009 2011 2012
Violent crime levels
Violence against the person, per 1,000
population
22.8
(2009/10) 19.7
(2011/12)
18.2 (2012/13)
28.9 (2009/10)
24 (2011/12)
21.3 (2012/13)
6.1 4.3 3.1 To narrow the gap to 3-4%
Achieved
Economic growth A - income
17
Economic Growth B - jobs
100% 100% 100% 78.6% 80% 81.6% 21.4% 20% 18.4%
To narrow the gap to 15.5%
New indicator captures income and employment levels in comparison to that for the rest of London
100% 100% 100% 63.6 65.2
(2010) Not yet
available 36.4
34.8
(2010)
Not yet
available
To narrow the gap to 28%
New indicator provides the ratio for job density and the employment rate for Growth Boroughs in comparison to the rest of London.
% of households defined as overcrowded
7.5
(2010)
10.4
(2010) 2.9
To narrow the gap to 2.2%
The data for measure-ing against the base-line is no longer produced. Census data available however & shows an increase and an increased gap between 2001-11. Gap increased from 3.7 to 6.2
Target London Target
By 2014/15 HB Target by
2014/15 HB achieved
to date Progress
Additional housing units: Total planned
Affordable - delivered
150,000 35,000
50,000 12,000
50,000 14,000
Between 2009 and 2013 over 50,000 new homes were planned with over 19,500 completions projected (full data confirmation awaited for private sector schemes) and a confirmed delivery of over 14,000 affordable homes. The planned units target has been achieved and the affordable homes one has been exceeded.
17 New measure to track economic growth is explained as an equation where X = Convergence Indicator, AE = Average Earnings, ER = Employment Rate, JD = Job Density , gb = Growth
Boroughs, l = London excluding the Growth Boroughs
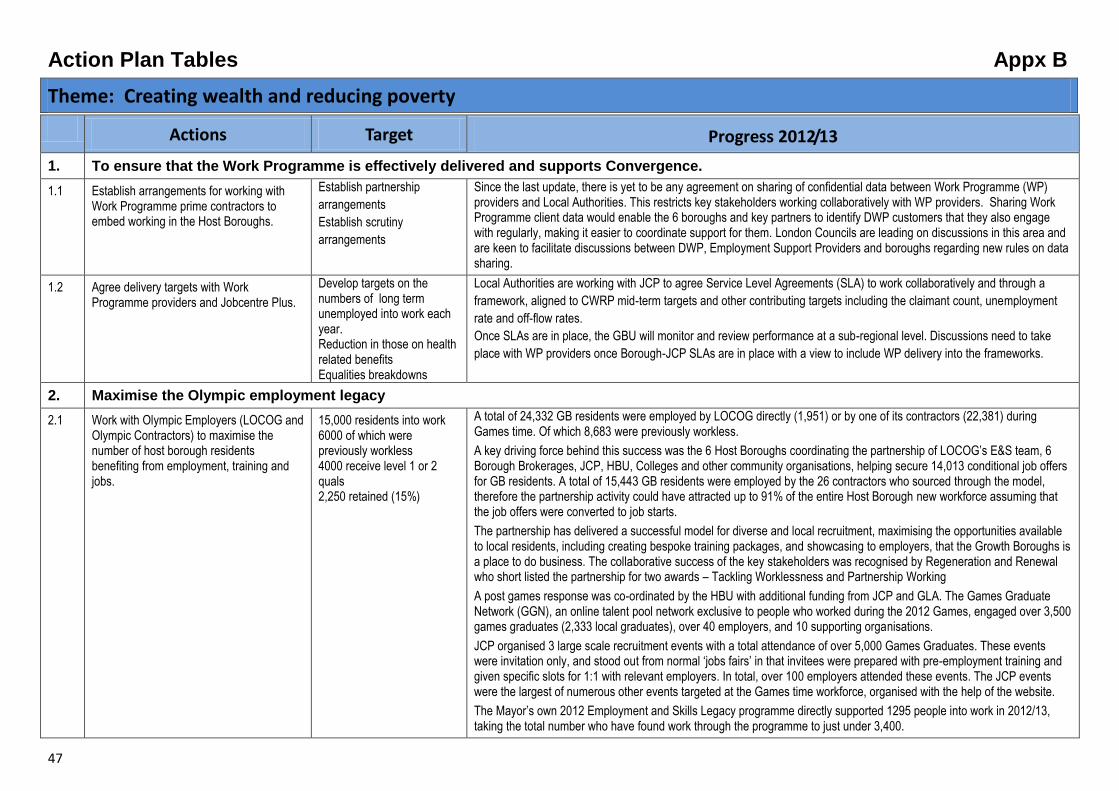
47
Action Plan Tables Appx B
Theme: Creating wealth and reducing poverty
Actions Target Progress 2012/13
1. To ensure that the Work Programme is effectively delivered and supports Convergence.
1.1 Establish arrangements for working with Work Programme prime contractors to embed working in the Host Boroughs.
Establish partnership
arrangements
Establish scrutiny
arrangements
Since the last update, there is yet to be any agreement on sharing of confidential data between Work Programme (WP) providers and Local Authorities. This restricts key stakeholders working collaboratively with WP providers. Sharing Work Programme client data would enable the 6 boroughs and key partners to identify DWP customers that they also engage with regularly, making it easier to coordinate support for them. London Councils are leading on discussions in this area and are keen to facilitate discussions between DWP, Employment Support Providers and boroughs regarding new rules on data sharing.
1.2 Agree delivery targets with Work Programme providers and Jobcentre Plus.
Develop targets on the numbers of long term unemployed into work each year. Reduction in those on health related benefits Equalities breakdowns
Local Authorities are working with JCP to agree Service Level Agreements (SLA) to work collaboratively and through a
framework, aligned to CWRP mid-term targets and other contributing targets including the claimant count, unemployment
rate and off-flow rates.
Once SLAs are in place, the GBU will monitor and review performance at a sub-regional level. Discussions need to take
place with WP providers once Borough-JCP SLAs are in place with a view to include WP delivery into the frameworks.
2. Maximise the Olympic employment legacy
2.1 Work with Olympic Employers (LOCOG and Olympic Contractors) to maximise the number of host borough residents benefiting from employment, training and jobs.
15,000 residents into work 6000 of which were previously workless 4000 receive level 1 or 2 quals 2,250 retained (15%)
A total of 24,332 GB residents were employed by LOCOG directly (1,951) or by one of its contractors (22,381) during Games time. Of which 8,683 were previously workless.
A key driving force behind this success was the 6 Host Boroughs coordinating the partnership of LOCOG’s E&S team, 6 Borough Brokerages, JCP, HBU, Colleges and other community organisations, helping secure 14,013 conditional job offers for GB residents. A total of 15,443 GB residents were employed by the 26 contractors who sourced through the model, therefore the partnership activity could have attracted up to 91% of the entire Host Borough new workforce assuming that the job offers were converted to job starts.
The partnership has delivered a successful model for diverse and local recruitment, maximising the opportunities available to local residents, including creating bespoke training packages, and showcasing to employers, that the Growth Boroughs is a place to do business. The collaborative success of the key stakeholders was recognised by Regeneration and Renewal who short listed the partnership for two awards – Tackling Worklessness and Partnership Working
A post games response was co-ordinated by the HBU with additional funding from JCP and GLA. The Games Graduate Network (GGN), an online talent pool network exclusive to people who worked during the 2012 Games, engaged over 3,500 games graduates (2,333 local graduates), over 40 employers, and 10 supporting organisations.
JCP organised 3 large scale recruitment events with a total attendance of over 5,000 Games Graduates. These events were invitation only, and stood out from normal ‘jobs fairs’ in that invitees were prepared with pre-employment training and given specific slots for 1:1 with relevant employers. In total, over 100 employers attended these events. The JCP events were the largest of numerous other events targeted at the Games time workforce, organised with the help of the website.
The Mayor’s own 2012 Employment and Skills Legacy programme directly supported 1295 people into work in 2012/13, taking the total number who have found work through the programme to just under 3,400.

48
Actions Target Progress 2012/13 During and after the Games the Mayor funded a series of interventions to promote ‘London’s Newest Workforce’ to employers. These included a London House reception at which LOCOG contractors were able to share their very positive feedback on their new recruits with other employers.
2.2 Working with LOCOG and other Olympic volunteering package providers to ensure that host borough residents who volunteer for games time work benefit from the training and gain qualifications.
Develop targets for NVQ qualifications
No mechanisms were in place to track the number of volunteers receiving NVQ qualifications. However it is anticipated that the numbers were very low due to volunteers being equipped with industry related training rather than formal qualifications.
The Team London Ambassadors programme had the following number of volunteers from the six host boroughs who completed all three modules of training, accreditation and undertook their shifts:
• Newham: 171
• Greenwich: 156
• Hackney: 122
• Tower Hamlets: 182
• Waltham Forrest: 133
• Barking & Dagenham 60
In total there were 824 Team London Ambassadors from the Host Boroughs (12% of all volunteers).
1,000 ambassadors undertook the World Host customer service accreditation and 1,000 also completed the Heartstart training in conjunction with NHS & London Ambulance Service . A breakdown on a borough basis is not available, assuming a normal distribution then 120 ambassadors from the host boroughs completed the two forms of accreditation.
The Team London programme continues to offer opportunities to all volunteers to develop their skills through the 4 arms of the Team London programme:
• Visitor Welcome Service
• Events Calendar
• Ambassador in Every School (piloting
• New Team London volunteer portal (launching May 2013)
In addition, Hackney Community College was the venue for the majority of LOCOG’s Games Maker volunteer training, (c50,000 people trained at HCC) raising the profile of both volunteering and training in the host boroughs.
2.3 Create Skills 2012 will use the Cultural Olympiad as a springboard to offer over 1,000 new opportunities for young people to get experience of working in the Creative and Cultural sector.
200 eight week work experience place-ments for 18 – 21 year olds per annum
50 cultural apprenticeships per annum for 18-21 year olds
Between April 12 and March 2013, Create Jobs placed 221 JCP clients in up to 8 weeks of work experience. In 2011/12, 50 JCP clients were placed into work experience.
In 2012/13, with the Royal Opera House’s Creative Jobs Programme’, Create Jobs advocated for local employers and young people to participate in 6 months paid placements aimed at JCP clients aged 18-24. 11 young people aged 18-24 were JCP clients from Host boroughs (28% of the total pan London clients). The programme, originally scheduled for 2011-12, was delayed until 2012/13.
2.4 Establish employment and training targets for local residents in relation to the future development and running of the Queen Elizabeth Olympic Park and other development sites in the Host Boroughs.
To be determined LLDC will apply targets for each of its contracts with developers and contractors relating to:
% Host Borough residents into employment
% previously unemployed people in the workforce
% BAME people in the workforce
% women in the workforce
% disabled people in the workforce
% of apprenticeships in the workforce

49
Actions Target Progress 2012/13 The varied nature of the works and contracts involved in the development and running of the Park is such that setting fixed targets across the indicators above would not allow the LLDC to effectively measure or demonstrate the value of its investment in terms of employment and skills benefits to Host Borough residents. For construction LLDC minimum Local Employment target is set at 25%, with a view to improving on this base in each subsequent construction phase. On the Transformation Phase LLDC has secured a commitment to 25% local employment and the following equalities targets: 25% BAME communities in the workforce
5% women in the workforce 3% disabled people in the workforce
For end use activities LLDC will negotiate on a contract by contract basis between a range of 25% and 80% for local employment and a 3%.target for apprenticeships. This will ensure that the targets are specific to the phases and varied activities of its development. This approach has already demonstrated success in terms of its contractors for the EFM and SEM on the Park, where LLDC has secured an amalgamated local employment target of 75% and equalities targets of:
48% BAME communities in the workforce 50% women in the workforce 5% disabled people in the workforce
As of 31st March, 2013 Transformation performance in terms of employment and skills was as follows: Local employment (6HBs) 42% BAME 58% Women 5.6% Disabled 2.2% Previously unemployed 18% Apprentices 4%
Moving forward, sustainability of the success of the apprenticeships target in particular will be supported by relationships established through the 2012/13 year between local colleges, Park contractors and tenants, e.g. a digital academy for apprentices on the Park (run by Hackney Community College).
2.5 Develop a consistent approach to Responsible Procurement across the Host Boroughs, Enterprise Zone, HCA, LLDC and future regeneration activity ensuring that employment and training opportunities are generated, including apprenticeships and opportunities for unemployed residents.
Review and pilot the LLDC “How To” guide to maximise local community benefits from public sector procure-ment across Host Borough developments. Other targets to be developed
LLDC continues to embed community benefit requirements in all its contracts for the construction, maintenance and
operation of the QEOP.
GLA’s apprenticeship campaign has seen apprenticeship starts across the Host Boroughs increase fourfold from 2,060 in
2006/7 to 10,760 in 2011/12, while a new Tech City Apprenticeship programme, developed by Hackney Community
College, will meet the skills and employment needs of the growing technology cluster around the Shoreditch and Old Street
area, creating up to 500 apprentice places over the next year.
Establish a strategy and approach to ESF and other potential funding streams for employment and training.
To be determined The partnership is actively seeking funding opportunities for employment and skills activities in the Growth Boroughs as
agreed by CEs as a key priority of the GBU. A new Post Games structure has been agreed with all partners and aligned
with the 6 Growth boroughs priorities moving forward, namely the delivery of the convergence targets. A new group,
Creating Wealth and Reducing Poverty Management Group replaces the ESPMG and will have some key working/action
groups in place to ensure timely and effective responses to opportunities can be realised. A funding strategy has been
developed and has been forwarded to CEs for approval. The funding strategy outlines key E&S opportunities the Growth
Boroughs are well placed to bid for. Some of the key funding opportunities and the performance of current partnership
programmes are listed below:

50
Actions Target Progress 2012/13 Structural Funds ESF/ERDF 2014-20
The GBU have been in discussion with London Councils around shaping the prospectus of the post 2014 ESF and ERDF
funding to align more with Growth Borough priorities. The GBU will be outlining the priorities of the Growth Boroughs and a
proposing what a GB ESF funded programme could look like to BIS/LEP.
The GLA is currently exploring ways to embed Convergence into development of the 2014-2020 ESF and ERDF
programmes.
BIS
A delegation from BIS visited the Growth Boroughs in Feb 2013 and since then there has been continued dialogue with BIS
around employment and skills funding opportunities for the sub-region. BIS have offered to assist the Growth Boroughs in
influencing government departments and regional government on employment and skills issues/
LEP
A CWRP working group will consider how to build upon the 6 Growth Boroughs relationship with the LEP/
GLA
The GLA HB Employment and Skills Programme Performance in 2012-13 is outlined below. The partnership performed
particularly well under Job Starts and Job entries.
Profile Actuals
Starts 2818 2818
LOCOG Job Entry 161 98
Job Entry 757 757
26 week 1000 921
52 weeks 1123 729
The partnership has requested and received acceptance of an extension of the GLA GB E&S Programme by 6 months.
Programme delivery was due to end by March 2014, but the programme will be given another 6 months to maximise
delivery using an under spend of sustained outcomes yet to be delivered. The granting of this extension displays GLAs
confidence in the 6 Borough partnerships being able to achieve challenging targets working with the hardest to reach
clients.
GLA’s ESF Youth (round 4) programme which started full delivery in the last quarter of 2012-13 has 72 starters so far.
LDA’s ESF Youth Programme, which delivered up to June 2012, achieved the following outcomes in its final year, with
regards to Growth Borough participants:
Starters - 16
Progression to FE or training – 47
Job Entry - 8
6 month sustained employment - 129
6 month sustained FE or training – 54

51
Actions Target Progress 2012/13 DWP
The HBU successfully bid for and were granted DWP Flexible Support Funds to commission the Games Graduate Network,
a post games response to help people leaving their Olympic jobs into new opportunities. The GBU will also be supporting
local authority bids for small scale projects to support residents affected by Welfare reform into employment.
Housing
Preliminary discussions are also taking place with Housing Associations who have funding set aside for employment and
skills activities. The discussions are looking at ways to reduce duplication and strategically coordinate support for local
residents with GBs, JCP, WP and Third sector organisations.
3. Develop partnership architecture with employers and providers to support achievement of Convergence outcomes
3.1 Establish an employer forum to engage employers in the sub-region with a focus on developing higher level skills as well as partnering on job readiness
consult with stakeholders
develop membership, TOR and integration
implement the resulting recommendations and sustain
Develop targets for local recruitment with key employers e.g. NHS, Olympic park venue managers
Targets to be determined
Employer Engagement in 2012-13 focussed on post games recruitment. Through the Games Graduate Network, 40 employers ranging from Whitbread and Hilton Hotels to Crossrail and Skanska to Asda and Debenhams. These employers were active in recruiting from the talent pool of Games time workers and from Jan 13, engaged directly with borough brokerages to recruit from a wider pool of candidates. A 6 Borough partnership strategy on employer engagement is yet to be agreed. In order to develop a post games skills and employability strategy, a new partnership agreement needs to be discussed across all partners, in order to put in place a structure that works to meet employer’s needs. This will be taken by forward by the CWRP working group.
3.2 Establish a learning provider forum to co-ordinate training requirements and support partners to meet employer training needs;
consult with providers and institutes of higher education
work with employers to identify need
develop a proposition, TOR
implement resulting recommendation and provide ongoing support
develop partnership strategy for apprenticeships
Targets to be determined A learning provider forum is yet to be established. This will be taken forward in 2013/14 as part of an over arching action plan to improve access to employment, by developing a closer link between skills improvement and development and awareness of employment opportunities. The capacity to deliver this will be dependant on accessing new resources. Loughborough University and Hackney Community College have both committed to a presence on the Park and could take lead roles in this forum.
The LLDC is committed to delivering a minimum 3% apprenticeships in all their construction contracts. Currently LLDC has 55 apprentices on site as of 1st April which equates to 4.2% of the workforce.
4 To increase the levels and relevance of qualifications of Host Borough residents
4.1 Improve learner awareness of current and emerging opportunities and sectors, influencing course choices in favour of
To be determined
This action is yet to be progressed. Actions to be taken forward in 2013/14 include: - Employment targets should be estimated and employer led groups established to influence employers. Best practice established by the LLDC around local employment targets should be rolled out to these groups and progress against these
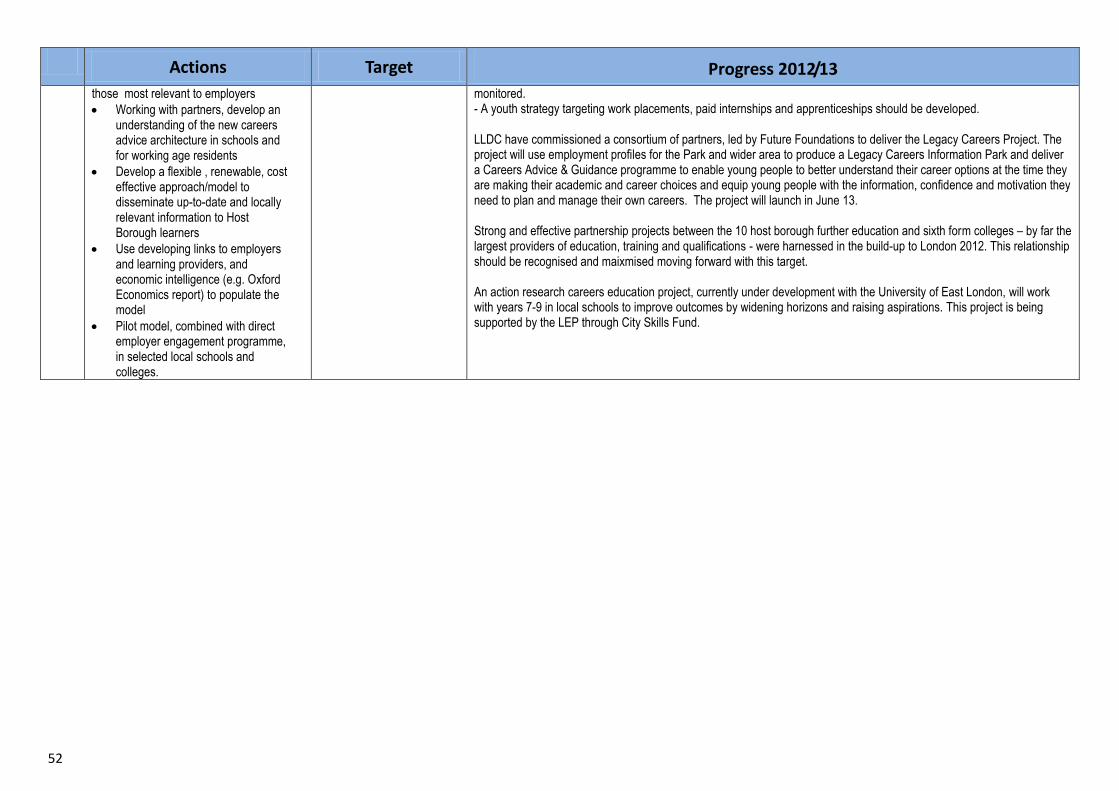
52
Actions Target Progress 2012/13 those most relevant to employers
Working with partners, develop an understanding of the new careers advice architecture in schools and for working age residents
Develop a flexible , renewable, cost effective approach/model to disseminate up-to-date and locally relevant information to Host Borough learners
Use developing links to employers and learning providers, and economic intelligence (e.g. Oxford Economics report) to populate the model
Pilot model, combined with direct employer engagement programme, in selected local schools and colleges.
monitored. - A youth strategy targeting work placements, paid internships and apprenticeships should be developed. LLDC have commissioned a consortium of partners, led by Future Foundations to deliver the Legacy Careers Project. The project will use employment profiles for the Park and wider area to produce a Legacy Careers Information Park and deliver a Careers Advice & Guidance programme to enable young people to better understand their career options at the time they are making their academic and career choices and equip young people with the information, confidence and motivation they need to plan and manage their own careers. The project will launch in June 13. Strong and effective partnership projects between the 10 host borough further education and sixth form colleges – by far the largest providers of education, training and qualifications - were harnessed in the build-up to London 2012. This relationship should be recognised and maixmised moving forward with this target. An action research careers education project, currently under development with the University of East London, will work with years 7-9 in local schools to improve outcomes by widening horizons and raising aspirations. This project is being supported by the LEP through City Skills Fund.

53
Theme: Supporting Healthier Lifestyles
Key Actions 2011 – 2015 Target Progress 2012/13
1. To give the children of the Host Boroughs the best start in life
We will develop short and medium
term actions and targets for:
ante-natal screening
smoking in pregnancy
breast feeding initiation and
continuation
child immunisations
Narrow the gap on children achieving a good level of development at age 5
Narrow the gap in obesity levels in school children to 1%
to improve uptake of childhood immunisations in practices using Celebrate and Protect by 2-3%
to improve breast feeding initiation by 2-3%
ante-natal screening target
smoking in pregnancy target
The main focus for 2012/13 was the roll out of Celebrate and Protect, an innovative joint working partnership between the NHS, Local Government and Sanofi Pasteur MSD to promote the uptake of childhood vaccinations across London boroughs, based around a core of five of the six Host Boroughs. This has levered in an additional £50,000 to promote child immunisation uptake through birthday card reminders sent from GPs to around 37,000 children in the Host Boroughs through to March 2013. Celebrate and Protect was launched in July 2012 and has been rolled out in 175 GP practices across nine Boroughs. The project is being externally evaluated by the Collaboration for Leadership in Applied Health Research & Care Unit [CLAHRC] at Imperial College.
A Wave Two ‘scale up’ of Celebrate and Protect, modelled at 100% participation, launched in February 2013, with approximately 139,000 children due to be sent birthday cards from around 450 participating GP practices in ten London boroughs. Key financial support and endorsement has come from NHS London who were keen to see the health legacy aspect developed further and the programme embedded at a larger scale prior to transition to the National Commissioning Board London [NCB London] where the project transferred to in April 2013 alongside its other responsibilities for immunisation.
The Love Mums breast feeding promotion campaign developed by Barking and Dagenham was also taken up by Waltham Forest, and there remains scope for other Host Boroughs to adopt this model.
The Best Start in Life pilot has been developed in Waltham Forest to align maternal and early childhood services and improve communication between partners (GPs, Health Visitors, Midwifery and Children’s Centres). This is to improve services being delivered and offering a seamless transition for families between services.
Tenergy is a programme of ten minute, daily activity sessions for Barking and Dagenham children of primary school age. It consists of prepared sequences of movement, accompanied by music and coordinated by class teachers, who are trained to build the daily routines in classrooms and school halls. A successful pilot phase was carried out in 2011 but it was not possible to extend the programme in 2012 due to NHS funding cuts. Through the implementation of the Public Health Grant and Public Health Commissioned Programmes plans are in place to return to Tenergy training and participation in schools throughout the borough.
Hackney’s Healthy Lifestyles Project is an integral part of the Borough’s strategic obesity pathway and offers several 10 week healthy lifestyles programmes for children and teens. The programme includes a combination of physical activity, drama, dietetic input, and psychological support including support for their families. Culturally separate provision is made for Orthodox Jewish participants located in Orthodox Jewish venues.70 – 80% of children had reduction of BMI to healthy level and waist circumference. There are clear exit routes on to Sport Health Education Life (SHEL) multi sports holiday programmes. SHEL uses sport and physical activity as a vehicle to deliver a fun programme through professional athletes trained to deliver in 27 primary schools in Hackney. SHEL achieved increased levels of physical activity and overall interest in community sports. Hackney delivered four SHEL - Multi Sports Health Camps for 180 children aged 7

54
Key Actions 2011 – 2015 Target Progress 2012/13
– 13yrs combining practical sport and physical activity sessions with key health messages. 94% of children from BME groups, many from deprived and/or single parent families, children in care through social services. Through low charges, the project supported single parents to work during school holiday period and kept children at risk off streets within a structured environment.
Fitness Fun is a physical activity programme offering free or low cost activities in schools, youth centres and children’s centres out of school hours involving 257 parents and 576 children and young people. 90% of participants complete the programme, and it is being expanded to more sites in 2013.
Be Active Keep Healthy is a healthy lifestyles initiative for Hackney’s Orthodox Jewish children aged 8 – 15. 96% of the referrals came through the Jewish press, and evaluation shows 99% of participants completed the 10 week programme, which is continuing in 2013 engaging around 350 participants on increasing physical activity levels by an average of 4%.
Health Schools London, funded by the Mayor of London, was developed in 12/13 and launched in April 2013. It is a voluntary awards programme that recognises schools’ achievements in improving pupil health and wellbeing particularly in reducing childhood obesity through healthy eating and physical activity. All six Growth Boroughs have schools registered on the programme (a total of 114 schools to date). Of these, 67 have achieved a bronze award.
2. To reduce the number of people dying prematurely from preventable causes.
Encourage people who undertake
little or no physical activity to be
more active, through interventions
designed with and targeted at
sedentary populations
Increase the number of school children who participate in PE and sport
Reduce the gap on sedentary adults (those doing no sport or activity) to 2%
Reduce the gap on adults achieving the recommended level of activity (3 x 30 minutes a week) to 1%
The Personal Best programme, targeted at primary school age children in Hackney, has been running since 2008 and aims to use the 2012 Olympic and Paralympic Games as a tool to inspire young people to take part in sport and physical activity. In 2012, 42 schools took part, involving 2790 children, of which around 6% were disabled. 100% of participants improved in at least one element of the programme, and evidence from surveys of children taking part in the finals shows that at least 70% had not represented their school before.
Since its launch in 2011, the Hackney New Age Games, a physical activity programme for older people, has involved 290 people. Participant surveys indicate that the programme almost doubled the numbers taking part in four or more hours of activity each week, and 65% of those surveyed said they had noticed a change in their fitness or lifestyle since starting the programme. The programme is continuing in 2013.
Give It a Go in Waltham Forest offers six free weekly coaching sessions to residents. This built on an earlier Give It A Go programme which increased the numbers of 14-25 year olds engaged in sports clubs and increased by 10% the number of inactive participants in the clubs.
Waltham Forest continues to offer Free Swimming to all under 18 year olds and over 60s who reside in the Borough. Under 18’s has seen a 75% rise in visits and 60 a 35% increase.
Waltham Forest has opened the new Leyton Gym and completely refurbished Walthamstow Leisure Centre (formally Kelmscott Leisure Centre), work has also commenced on the new Leyton Leisure Centre as part of a long term multi-million pound investment in new and improved facilities with GLL.
UEL SportsDock in partnership with Newham Council, UEL School of Health, Sport and Bioscience and local sports clubs delivered Every Child A Sports Person (ECASP) sessions to local schools. Over 250 students took part in the sessions at the new £21million SportsDock facility, with local sports clubs. School students were also given advice on university life and attending higher education. The aim of ECASP is to

55
Key Actions 2011 – 2015 Target Progress 2012/13
provide weekly sports sessions to all Year 7 children across Newham’s 15 secondary schools.
Newham’s Let’s Get Moving programme was awarded significant funding from Sport England in 2012 to further develop and expand the physical activity care pathway in Newham, starting with training all Newham’s GPs about the benefits of physical activity and offering physical activity surgeries to support inactive people into health improving sports and physical activities.
Every single Newham school and college enrolled into the London 2012 Get Set Network, meaning that over 54,000 young people aged 3-19 took part in Games-related activities through their curriculum. Of these, one in eight aged 10-18 received a free ticket to the Games through the Ticketshare scheme (over 4,000 tickets in total) and many others attended the Games through their school or with their family. In addition, young people were involved in Games time activities either directly, for example as ceremonies performers or Young Gamesmakers or through Newham services (e.g. summer schools or youth service provision).
The LLDC have commissioned and funded a number of projects that target inactive people to support them into the type of activities that will be available in the QEOP including:
Active People, Active Park managed by PAEL and to be delivered in Hackney, Newham, Tower Hamlets and Waltham Forest this programme was developed during 2012/13 starting delivery in May 2013, aiming to engage around 2,000 children and adults, leading up to the opening of the North Park in July 2013. Activities include social jogging, low impact physical activity sessions for hard to reach, girl’s fitness, Nordic walking and a childhood obesity referral programme. The programme will also develop people and capacity through tutor training and volunteer leadership training.
Make A Splash, a temporary swimming pool at The Score, Leyton, jointly funded by the LLDC, LBWF, the GLA and British Gas from January to March 2013 taught 1234 children to swim and trained 12 ‘community activators’ to ensure the benefits are sustained.
Take 12 Challenge aims to inspire thousands of adults and young people across the host boroughs to become more active with a particular focus on providing a pathway into activity for the less active. With a target of 12,000 people signing up across the Host Boroughs, by April 2013 over 8,000 people already signed up. The Take 12 Challenge sets participants the goal of travelling 12km or undertaking 12 hours of physical activity, completed over a 12 week period, individually or as part of a team.
Boxing Healthy Initiative Days launched in March 2013, this innovative programme delivered by the Barry McGuigan Boxing Academy is targeting 1,200 children and adults across Hackney, Newham, Tower Hamlets and Waltham Forest to get informal and fun taster sessions delivered by experienced and accredited BMBA coaches, drawing on local expertise and involving community leaders and professionals. Non-contact boxing and fitness techniques will be used as hooks to engage groups that do not undertake the recommended amount of physical activity, including girls and women, smokers and recent quitters along with NEETs.
During 2013 the BMBA and LLDC will deliver the Happy Hearts Schools Programme, a 6 week fitness education course to 8-11 year olds across 6 primary schools in the Host Boroughs. The 1 hour per week innovative course is designed to provide an educational platform for children to learn about health and fitness through boxing. The theme of each session will change from week to week with practical sessions that are fun, educational and beneficial for health with this being used to stimulate learning.

56
Key Actions 2011 – 2015 Target Progress 2012/13
Share best practice on strengthening the systematic approach in primary care and across care pathways to preventing ill health, with a focus on supporting more patients to become more physically active.
Reduce the gap on sedentary adults (those doing no sport or activity) to 2%
Reduce the gap on adults achieving the recommended level of activity (3 x 30 minutes a week) to 1%
Narrow the gap for mortality rates from circulatory diseases to 25 points
Narrow the gap in life expectancy to less than 2 years for men and 1.5 years for women
Healthy Start Vitamins best practice was shared across the Host Boroughs, as boroughs such as Newham have the best take-up in London. This NHS scheme provides free vitamins to pregnant women and young children to improve maternal and child health, and contribute to giving children in the Host Boroughs the best start in life.
Get Healthy, Get Into Sport is a research programme funded by Sport England to strengthen the evidence base for using sport to engage inactive adults into physical activity. Both Newham and Barking and Dagenham were successful in receiving funding in 2012, and Newham is establishing ways to share their learning across the Host Boroughs through 2013.
All six Host Boroughs Public Health Teams and local authority sports and physical activity teams participated in the Tackling Sedentary Behaviour Task Group, sharing best practice of what works best to support people into physical activity, and developing funding bids for joint programmes across the Host Boroughs, including Active People, Active Park.
The LLDC Healthy Living Group was launched in March 2013 to identify partnership opportunities and new projects which will assist in delivering the objectives set out in the LLDC’s Sport and Healthy Living Policy. By considering new ways of aggregating our joint collateral with GLL, LVRPA, PAEL and the Growth Boroughs, we aim to increase our collective chances to ensure the people of East London have real opportunity and choice in their new sports facilities and Park.
The LLDC is working with NHS and academic partners in the Growth Boroughs to maximise synergies between the new school for East Village and Sir Ludwig Guttman Health and Wellbeing Centre (formerly the Olympic Polyclinic, which opens to the public in August 2013) and LLDC Park and venues, to begin initiatives to combat preventable diseases through delivering early intervention in the community and through supporting changed behaviours and promoting better lifestyle choices.
Well London uses a community development approach to improve the health and well-being of individuals and communities living in disadvantaged neighbourhoods. It has five projects: community engagement, training, volunteering, engaging young people, and sharing knowledge; and a suite of themed projects: healthy eating, physical activity, mental well-being, creativity and the arts, and open spaces. In 2012, Phase 2 of Well London started in Waltham Forest, Tower Hamlets, Hackney and Greenwich. In May 2013, the Big Lottery Fund announced a further award of £1.8m which will enable these programmes to continue to 2015. Two further programmes, based in primary care settings, will start in Newham in the Stratford Village GP Surgery and the East Village.
Increase availability of healthy food by the retail and commercial sector, and support and develop initiatives to up-skill local communities around healthy eating and cooking
Reduce the convergence gap in the consumption of 5 a day
Narrow the gap for mortality rates from circulatory diseases to 25 points
In October 2012 the LLDC adopted its Food Strategy, building on the LOCOG 2012 Food Vision and the Mayor of London’s Food Strategy, the LLDC has an opportunity to create an exciting new food destination for London that will support sustainability, healthy eating and Convergence opportunities including the creation of targeted employment, skills and business opportunities. At its heart is Food Charter which will promote healthy eating through adherence to the Mayor’s Healthier Catering Commitment for London. NHS Public Health contributed to development of this strategy, highlighting priorities for healthy options, and pricing and promotion to support healthy options being choices
The Host Boroughs have delivered over 25% of London’s new community food growing spaces under the Capital Growth programme supported by the Mayor, London Food Link and the Big Lottery. The programme aimed to create 2,012 new growing spaces in London by 2012, and far exceeded this with

57
Key Actions 2011 – 2015 Target Progress 2012/13
2,025 spaces registered, of which over 500 were in the Host Boroughs.
Waltham Forest’s new leisure centres contract requires the contractor to ensure 50% of the vending available in the Borough’s leisure centres is healthy.
Share best practice on stop
smoking services and tobacco
control and explore opportunities for
collaboration to reduce smoking
prevalence
Reduce the convergence gap in smoking rates
Narrow the gap in mortality rates from all cancers to 10 points
Narrow the gap in life expectancy to less than 2 years for men and 1.5 years for women.
The smoking cessation services in the Growth Boroughs continue to be some of the most effective in London.
The service in Hackney saw increased numbers of clients entering the service and going on to quit during summer 2012, which they believe was a result of people being inspired by the Olympics and Paralympics. As part of the new national Stoptober campaign, there was a 20% rise in quitters during the October 2012 compared to October 2011 in Hackney.
The majority of Children’s Play Areas in Hackney now smokefree.
During 2012 Waltham Forest re-commissioned its stop smoking services with Barking and Dagenham, Redbridge and Havering in order to improve quality and drive up quitter numbers.
Waltham Forest commissioned a range of community organisations to increase awareness and compliance with the bowel cancer screening programme. GP practices with low uptake were identified and these groups worked with them and their practice populations to understand and reduce barriers.
Set out a programme of health equity audits for the Host Boroughs, to better target interventions to disadvantaged groups.
Plan developed Completed in 2011/12
Search out and share best practice to address minority health needs, utilising the robust evidence base about working through primary care to reduce health inequalities
Best practice and case studies written up and disseminated
No further action in 2012/13
3. To reduce the number of people whose health affects their ability to secure or maintain work
Improve workplace health and wellbeing, through initiatives such as promotion of Healthy Workplace Toolkit for SMEs and mental health awareness training
Reduce the incidence of work related ill health and injuries and their causes
Health and Wellbeing was incorporated in the Barts Health Public Health vision and the Health and Wellbeing incorporated in the new Public Health department.
Health Behaviour questions were incorporated in the 2013 staff survey and have formed the basis for targets for improving the wellbeing of the 15,000 employees of Barts Health, the majority of whom live in the Host Boroughs.
Whipps Cross University Hospital was awarded the Gold Challenge for physical activity as part of the Olympics Legacy.
The LLDC is working closely with Barts Health, the Homerton Hospital, and East London Foundation Trust to signpost staff (and patients, and their families) to the Copper Box and recruitment to the Take 12 campaign.

58
Key Actions 2011 – 2015 Target Progress 2012/13
The GLA established the London Healthy Workplace Charter which provides a framework for action to help employers of all sizes and sectors build good practice in health and work for their employees. In 2012/13 three employers in Greenwich were accredited. The scheme will expand and develop over the coming year.
Deliver and evaluate “Working for Better Health” pilots in primary care, with two aims of supporting people with long term conditions and on Incapacity Benefit to get back into employment and supporting GPs, mental health and AHPs with early intervention and improved use of the Med 3 (Fit Note)
Reduce the number of people whose health affects their ability to secure or maintain work
Narrow the gap on long terms sickness rates to 1%
Pilot primary care based Work Clubs with JCP advisors were established in two GP practices in Waltham Forest and Newham. Referral by GPs was low, and the learning from this has been shared with the London Health Inequalities Network to inform any future primary care based projects to support people with health barriers into employment.
The Growth Boroughs Working for Better Health brought together Public Health, JCP, GLA, NHS London and NHS provider organisations with an interest in tackling employment barriers to health, and acted as a conduit for information on health, work and benefits throughout the year and enabled JCP to access wider groups of clinicians in terms of disseminating information
Work with local NHS employers to put in place local employment targets and method statements to increase proportion of local residents employed in the 6 Boroughs
Increase the proportion of local residents employed by the NHS (starting with Barts Health)
Contributes to narrowing the gap on the employment rate
Barts Health NHS Trust (which was created by the merger of several NHS Hospital Trusts in North East London creating the largest NHS Trust in England, employing over 15,000 staff and serving over a 1 million residents) has made local employment a key part of its Public Health plan. Its Community Works for Health programme was Highly Commended by the HSK awards, especially in relation to its Bridge into Nursing scheme which helps under represented groups into nursing careers.
The Community Works for Health pathway was developed significantly in the year, especially in relation to expanding apprenticeships in clinical and non-clinical areas. 2013/14 will see the programme expanded across Newham and Waltham Forest as an exemplar for the public sector.
Develop a health and employment outcomes framework to increase employment support within clinical pathways and prioritising the risk of long term unemployment in treatment planning
Establish employment support interventions in primary care, in partnership with DWP and GPs.
Contributes to narrowing the gap on the employment rate to 3%.
A second Health, Work and Welfare Summit was convened by the GLA and DWP at City Hall in November, and the Host Boroughs Working for Better Health group presented on our joint work with primary care and JobCentrePlus to tackle ill health barriers to work.
The reforms in the NHS delayed this area of work though the changes in public health and commissioning. However the Public Health outcomes framework will form the basis for the development of this area in 2013/14.
4. To increase physical activity and social capital through changes in the built environment
Work with partners including the GLA and the London Legacy Development Corporation (LLDC) to ensure that health and wellbeing outcomes are addressed through the Olympic legacy Supplementary Planning Guidance (OLSPG) and subsequent planning applications.
SPG’s and planning applications address health and wellbeing outcomes
Nearly 200 professionals, experts and academics from the fields of public health, planning, architecture, design and community engagement took part in the Fit Cities Fit World 2013 conference hosted by the GLA in March 2013. The conference was funded and planned by the GLA, LLDC, Host Boroughs, NHS North East London and the City and CABE at the Design Council to promote the healthy urban planning agenda, building on Host Boroughs and GLA leadership.
London was invited to host Fit Cities, Fit World, which had previously on been organised in New York City, after NHS North East London and the City and the LLDC presented our work to the Fit Cities event in New York in early 2012.

59
Key Actions 2011 – 2015 Target Progress 2012/13
Revise the Mayor’s Supplementary Planning Guidance (SPG): Providing children and young people’s play and informal recreation to reflect the new London Plan Policy.
SPG revised
Shaping Neighbourhoods: Play and Informal Recreation Supplementary Planning Guidance (SPG) was published by the Mayor in September 2012. The guidance supports the implementation of the London Plan Policy 3.6 on ‘Children and Young People’s Play and Informal Recreation Facilities.
Review the Mayor’s Best Practice Guidance (BPG) on Health Issues in Planning to take account of the of the Healthy Urban Planning report
BPG revised Completed
Comment and provide input to the Mayor’s Revised London Housing Strategy
Strategy Revised Completed
Develop health and wellbeing outcomes tool (checklist) for use by development control officers, engaging Members and senior planning, policy and development control officers in the health and wellbeing agenda.
Toolkit developed
Toolkit utilised
Use of the tool for assessing all master-planning and major applications
Development of a toolkit to support the implementation of planning policy to deliver healthy urban developments, led by the Host Boroughs and involving the GLA Planning Team and Healthy Urban Development Unit continued in 2012/13, with the toolkit being piloted by some Borough Planning Teams. A revised version, which will be accessible to local authority councillors, community organisations and residents, will be launched later in 2013.
NHS organisations and TfL contribute to legacy park design and use to support the provision of space and facilities that encourage people to pursue healthier lifestyles e.g. fitness trails, activity trails, marked walking routes, active play including active transport considerations.
Reduce the gap on sedentary adults (those doing no sport or activity) to 2%
Reduce the gap on adults achieving the recommended level of activity (3 x 30 minutes a week) to 1%
The Host Boroughs and PAEL continue to work in partnership with the LLDC and their venue operators (GLL and LVRPA) on programmes and projects to engage local people into the Park, leading up to the opening weekend for the North Park in July 2013, including Active People, Active Park as outlined above.
The LLDC has worked tirelessly post-Games to ensure that the North Park and venues open on time in July 2013, and has run regular Park Tours for Host Boroughs residents so that they can see the transformation at first hand.
Around 300 school children from East London participated in a competition to come up with ideas for public spaces within the Queen Elizabeth Olympic Park.
Deliver a range of interventions to increase the rate of walking and cycling. These include Barclays Cycle Super-highways, Barclays Cycle Hire, Biking Boroughs, Olympic Walking and Cycling routes, cycle training, legible London and better streets initiatives.
Increase the combined mode share of cycling and walking
Reduce the gap on sedentary adults (those doing no sport or activity) to 2 %
Reduce the gap on adults achieving the recommended level of
With start up funding provided by the LLDC, the Good Gym unlocks volunteering potential by providing people with meaningful ways to exercise. The project connects people who want to get fit with physical tasks that need to be done, and which benefit the community. Members of the Good Gym get involved in various physical and social tasks, anything from shifting rubble, and planting gardens to making deliveries and friendly visits to older people. The Good Gym connects individual ‘runners’ who live and/or work in the Host Boroughs with ‘coaches’ who are isolated older people to whom they make regular visits and deliveries. The LLDC have supported the social enterprise to expand its operations from Tower Hamlets across the rest of the Host Boroughs. Over 1000 members signed-up and the project will exceed its targets by July 2013.
Waltham Forest adopted the Go Dutch campaign in partnership with the London Cycling Campaign in

60
Key Actions 2011 – 2015 Target Progress 2012/13
activity (3 x 30 minutes a week) to 1%
2012 to make London more liveable by making our streets as safe and convenient for cycling as they are in Holland. Waltham Forest is committed to delivering a comprehensive cycling action plan, to be implemented over three years, and including ensuring that Council lorries, and those of our contractors, are fitted with the appropriate cycle safety devices; identifying the borough’s 20 most dangerous junctions and roads and introduce measures to improve cycle safety; maintain, upgrade and expand secure cycle parking provision at all its tube and rail stations - and ensure it is included in all new developments; introducing a 20mph default speed limit across the borough in all our residential areas, improving safety and quality of life for all Waltham Forest residents. In addition, the Council is working with Bikeworks, a not for profit organisation, to provide a Community Cycling Hub in Leytonstone to aimed at making cycling accessible and attractive to the whole community. Opening in June 2013, offering recycled bikes for sale at low cost and a wide range of cycling related services, including bike maintenance classes, cycle mechanic training and all ability cycling.
Royal Borough of Greenwich piloted a Cycle Loan Scheme to all residents to try out cycling without having to purchase a bike. The scheme was targeted at poorer neighbourhoods, where residents were offered a month’s hire for £10, which included one year’s third party cycle insurance and membership of the London Cycling Campaign. Of the 154 participants, 56% were from the most deprived areas of Greenwich. Over 80% of participants used their bikes for at least 30 minutes a week, with around a third cycling for at least 150 minutes a week. There was modal shift from cars and public transport to cycling, many reported substantial savings on petrol and fares, as well as measurable health impacts. At the end of the hire period, 30% of participants purchased a bicycle (20% directly through the scheme).
A focus on active travel in 2012/13 is a key element of QEOP delivery plan. Land has been safeguarded within QEOP for TFL Cycle Hire Scheme extension subject to ongoing discussions with TFL to develop a suitable programme.
Barking and Dagenham has been awarded ‘Outer London Biking Borough’ status by Transport for London. The award recognises the borough’s dedication to encouraging, facilitating and promoting cycling, as exemplified by the increasing number of cycle journeys being made year on year in the local area. Working in partnership with Sustrans and Transport for London, Barking and Dagenham have provided and upgraded over 10km of their Greenways network, enabling residents to cycle on enjoyable and quiet routes through parks and open spaces, or along waterways.
In 2012/13 Barking and Dagenham secured funding from Sustrans for an Active Travel Officer. The officer is employed for 2.5 days per week to work on the Gascoigne Residential Estate. This falls within one of the most deprived areas in the borough. The officer works with the local community to promote participation in physical activity through walking and cycling as a means of accessing employment, schools, local parks and green spaces in addition to leisure purposes.
In 2013, Newham was shortlisted for the Mayor’s £100 million "mini-Holland" funding. This would involve a complete redesign of Stratford town centre, removing the gyratory and new off-road Superhighway routes.
The outline planning approval for the Legacy Communities Scheme (LCS) in QEOP includes conditions to safeguard for future Barclays Cycle Hire docking stations. Details of the locations within each Planning Delivery Zone have to be submitted in advance of the submission of Zonal Masterplans, for example, there will be space safeguarded for up to two docking stations in PDZ6 / Chobham Farm which will be the first phase to be brought forward. TfL is also securing other similar conditions at other sites around Stratford,

61
Key Actions 2011 – 2015 Target Progress 2012/13
such as Chobham Manor, to help facilitate a network of docking stations.
5. To increase sports and physical activity participation especially in sports benefiting from a facility legacy from the 2012 Games
Implement the 7 sport plans, allied to the Olympic & Paralympic venues which foster talent, cater for elite sportspeople and encourage sports participation by residents of all ages, income levels and backgrounds.
Increase the combined mode share of cycling and walking
Reduce the gap on sedentary adults (those doing no sport or activity) to 2 %
Reduce the gap on adults achieving the recommended level of activity (3 x 30 minutes a week) to 1%
The Boroughs and partners reviewed the 7 Sports Plans in 2012 and agreed that:
Post Games, the LLDC will continue to develop an Aquatics Beacon programme with the ASA and partners for delivery at the Aquatics Centre in 2014 with GLL.
Cycling will continue as a priority for the Boroughs, including BMX Clubs and a focus on active travel work. LVRPA will continue to chair the 6GB Cycling Group, the group is currently undertaking an audit of current cycling provision across East London in partnership with TFL. The Lee Valley VeloPark will open on 4th March 2014.
Athletics will continue, with a case to be made for funding to various agencies as part of hosting the World Athletics Championships in 2017
Hockey development will be led by LVRPA, and Tennis development will continue, the emphasis on improving facilities, Lee Valley Hockey and Tennis Centre as a future Regional hub site for disability tennis and community tennis investment. The Lee Valley Hockey and Tennis Centre will open in May 2014.
Basketball plans are well developed with GLL set to deliver a strong legacy programme at the Copper Box in partnership with the London Lions, and Reach and Teach with Midnight Madness.
As part of the tennis plan, Waltham Forest resurfaced courts in Abbotts Park & created 2 new mini courts.
A sporting festival also welcomed the torch relay with over 6000 residents in attendance, and a further Festival of Sport took place over two days in August 2012 where residents were encouraged to come and try a number of sports available. Over 10,000 residents came along to the festival, many went on to join local sports clubs.
There needs to be renewed focus on Disability sports, although Motivate East will provide new resources and focus for this work across the Boroughs.
Waltham Forest has set up the first hockey club for people with a disability and is being supported by England Hockey, and has held an Inter-Borough athletic and swimming championships for people with a disability. The Borough also hosted two weeks of sports camps in August 2012 for young people and adults to take part in sport as well as a Paralympics Day in September 2012. Disabled young people also attended both the residential and one day Time to Shine events.
There is agreement for 2013/14 to analyse the Convergence gap for women and girls participation in sport, and plans will be developed during this year to address this gap.
Work collaboratively to develop a programme of community, regional and major sporting events to promote engagement in sport and disabled sport and build the foundations of a long term sporting culture.
Reduce the gap on adults achieving the recommended level of activity (3 x 30 minutes a week) to 1%
Annual programme of sporting events
Motivate East was awarded over £560,000 in 2012 to deliver a series of initiatives designed to respond to the needs of disabled people in East London from 2013. The programme is led by the LLDC, and delivered by LLDC, with Pro-Active East London, the Boroughs, Greenwich Leisure Limited, UEL and Lee Valley Regional Park Authority, the Rabbit Agency and the Bromley by Bow Centre. The Sport England award has been matched by funding from the project partners meaning that over £1 million will be channelled specifically into sport for disabled people. Motivate East is a multi-sport participation programme culminating in an annual festival of disability sport and arts on Queen Elizabeth Olympic Park (7th

62
Key Actions 2011 – 2015 Target Progress 2012/13
established September 2013). The funding will pay for a variety of equipment to be distributed across a wide range of community locations using bespoke designed portable throw down surfaces in order to reach more than traditional sports facilities, giving disabled people new and enhanced opportunities to get involved in sport and physical activity at a time and place convenient to them. The programme will also recruit both high profile and local Paralympic Legacy Agents to promote and drive participation in disability sport across the region. The three year project will commence in 2013, and will generate around 26,000 opportunities to participate and create over 72volunteers to act as ambassadors to promote participation of disabled people in sports and physical activity introducing 10 people each to sport/ physical activity.
Building on the success of the West Ham Boxing Club pilot project in 2011/12, the London Satellite Club Programme will go national with backing from Sport England and in London from the Pro-Active Partnerships. An allocation of funding from Sport England has been agreed for London, which includes the Host Boroughs. All Pro-Active Partnerships are currently working together to devise a single project plan for London to ensure there is a collaborative approach towards implementation.
In Newham, the Borough’s sports programme supported local clubs and organisations to deliver more activity for residents. In the course of the year we delivered 1,459 additional events, with 68,280 participants. As a consequence the total sporting activity delivered 155,726 participants.
Ensure that there is a community sports legacy to any bids that London makes to host major sporting events in the Olympic Park
Reduce the gap on adults achieving the recommended level of activity (3 x 30 minutes a week) to 1%
Additional targets are being developed
Three international aquatic events to be delivered with British Swimming in 2014, 2015 and 2016, a three year programme with GLL and London and Partners/ UK Sport. The Olympics Stadium has secured the 2017 World Athletics Championships. EuroHockey Championships in 2015 in Stratford.
Pro-Active East London worked with LB Newham on promoting East London as a place to invest into community sport from both the NGB and commercial sectors during Games time.
The LLDC Major Events Strategy includes a full range of events from small to large, local to international for all abilities. An intrinsic aim for all events is to promote local ownership and community engagement which ensures community legacy programme content for all major events.
The LLDC is working closely with Sport England to assess interest from National Governing Bodies (NGBs) in using the Queen Elizabeth Olympic Park (the Park) and venues, working closely with venue operator Greenwich Leisure Limited (GLL), and discussions are ongoing with British Swimming and other NGBs for high performance squads to use the Aquatics Centre and Copper Box.
The London Lions British Basketball League team will be based in the Copper Box from the 2013/14 season and the venue will host at least 21 basketball games per year. The franchise has partnered with the Reach & Teach Sports Network who will work to grow and develop the game at the grassroots level and support clubs throughout London to help increase the number of people playing, watching and coaching.
Loughborough University announced plans in March 2013 to open a postgraduate campus in the former Press and Broadcast Centres, and LLDC will meet the University in May to discuss high performance sports on the Park.
The Sainsbury’s Anniversary Games will be held in the Stadium from 26-28 July 2013, and will incorporate the 2013 London Grand Prix (a two-day meeting), and the IPC International Challenge on 28 July. The Games will feature 28 London 2012 medallists including Jessica Ennis, Mo Farah, Greg Rutherford, and Usain Bolt.
The National Lottery Anniversary Run will take place on 21 July 2013 in partnership with the London

63
Key Actions 2011 – 2015 Target Progress 2012/13
Borough of Newham. The 5 mile course will lead up-to 10,000 runners through the Park to finish on the track inside the Stadium. There is also a shorter distance Family Run where children can participate accompanied by an adult.
To celebrate the legacy for cycling, the Prudential Ride London to Surrey 100 ride will start in the Park then follow route on closed roads through the capital and into Surrey, finishing on the Mall. The elite Prudential Ride London to Surrey Classic will also start in the Park on 4 August 2013, and will see around 150 of the world’s top cyclists competing.
Plans for the Annual Festival of Disability Sport on the 7th September 2013 in the Copper Box and re-opened North Park are moving forward in partnership with BPA and The Mayor’s Liberty Festival with the aim to launch this in May 2013.
A full programme of community events will be delivered by GLL in the Copper Box from July 2013 and at the Aquatics Centre from April 2014.
The GLA led a successful London bid to host the 2017 IPC Athletics World Championships in the Olympic Stadium a month before the IAAF World Athletics Championships, making London the first city to host the two Championships side-by-side. As underwriters of the IPC Championships, the GLA is looking at ways in which the event can do more to bring about an increase in sports participation, and has built in at the planning stage a clear commitment with a designated budget.
LVRPA in partnership with various organisations have secured the ITF Wheelchair Tennis Masters for the next three years. In addition, the 2015 Euro Hockey Championship have been secured and the 2016 World Track Cycling Championships. LVRPA are working with the various NGB’s and partners to secure maximum legacy benefits surrounding these events, engaging with the communities surrounding QEOP.
Develop mechanisms to ensure 50% of those working in host borough sport and leisure facilities are host borough residents and secure more employment routes including apprenticeships into the leisure industry.
50% of those employed in facilities are host borough residents
For end use activities LLDC will negotiate on a contract by contract basis between a range of 25% and 80% for local employment and a 3%.target for apprenticeships. This will ensure that the targets are specific to the phases and varied activities of its development. This approach has already demonstrated success in terms of its contractors for the EFM and SEM on the Park, where LLDC has secured an amalgamated local employment target of 75% and equalities targets of: 48% BAME communities in the workforce; 50% women in the workforce; 5% disabled people in the workforce.
6. To use Olympic and Paralympic momentum to motivate, raise aspirations and promote community involvement
Continue development of Cross Borough Sports Plans to increase adult and young people’s participation levels, including participation of people with disabilities with a focus in 2011/12 on athletics, aquatics, cycling, basketball and disability sport.
• Reduce to 2% the gap on sedentary adults (those doing no sport or activity).
• Reduce to 1% the gap on adults achieving the recommended level of activity (3 x 30 mins a wk)
Sportivate delivered 40 sports projects across the Host Boroughs, with 1,793 retained participants.
Give It A Go (Mayors Legacy Funding/Free Sport) funded 34 sports projects across the host boroughs, and 706 participants attended.
14 Community Games events took place in the Host Boroughs in 2012, with a mixture of new and existing events buying into the Community Games ethos, 40,000 participants were engaged, 10 Community Games grants were awarded by PAEL to support the delivery of events, £3,739 awarded within the host boroughs.
LLDC commissioned Street Games to produce a report on the most appropriate projects to deliver the objectives set out in the Sport and Health Living Policy.
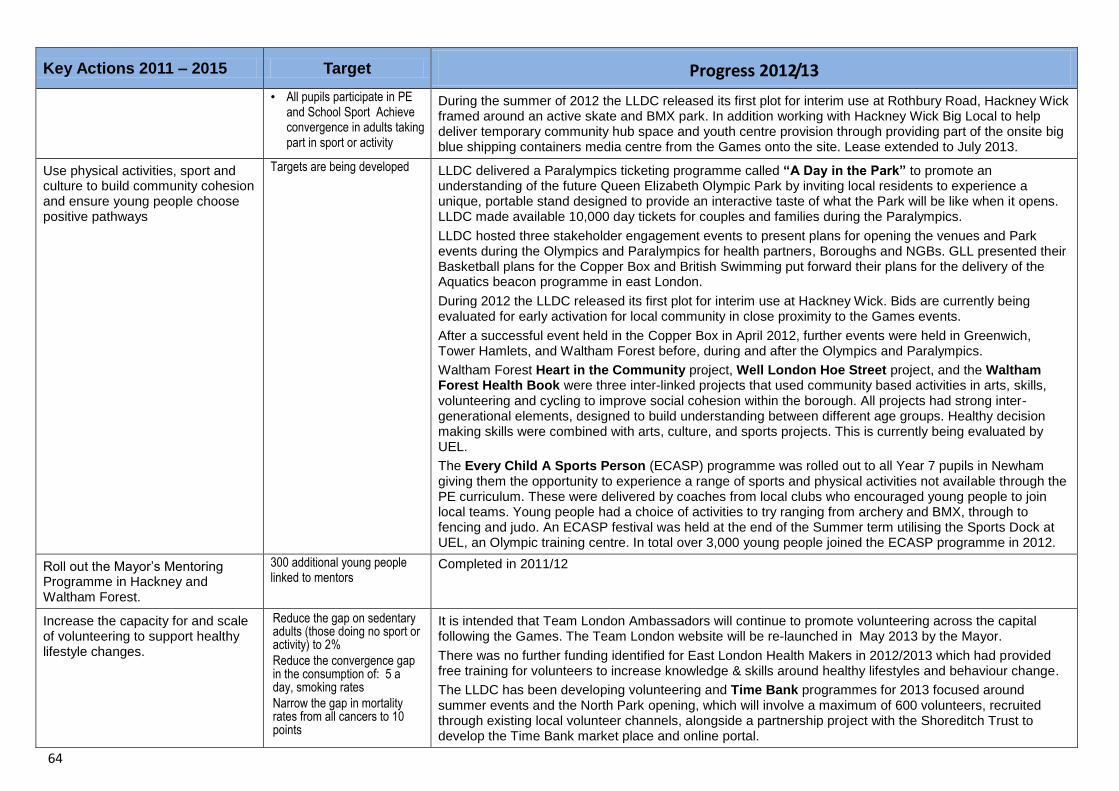
64
Key Actions 2011 – 2015 Target Progress 2012/13
• All pupils participate in PE and School Sport Achieve convergence in adults taking part in sport or activity
During the summer of 2012 the LLDC released its first plot for interim use at Rothbury Road, Hackney Wick framed around an active skate and BMX park. In addition working with Hackney Wick Big Local to help deliver temporary community hub space and youth centre provision through providing part of the onsite big blue shipping containers media centre from the Games onto the site. Lease extended to July 2013.
Use physical activities, sport and culture to build community cohesion and ensure young people choose positive pathways
Targets are being developed LLDC delivered a Paralympics ticketing programme called “A Day in the Park” to promote an understanding of the future Queen Elizabeth Olympic Park by inviting local residents to experience a unique, portable stand designed to provide an interactive taste of what the Park will be like when it opens. LLDC made available 10,000 day tickets for couples and families during the Paralympics.
LLDC hosted three stakeholder engagement events to present plans for opening the venues and Park events during the Olympics and Paralympics for health partners, Boroughs and NGBs. GLL presented their Basketball plans for the Copper Box and British Swimming put forward their plans for the delivery of the Aquatics beacon programme in east London.
During 2012 the LLDC released its first plot for interim use at Hackney Wick. Bids are currently being evaluated for early activation for local community in close proximity to the Games events.
After a successful event held in the Copper Box in April 2012, further events were held in Greenwich, Tower Hamlets, and Waltham Forest before, during and after the Olympics and Paralympics.
Waltham Forest Heart in the Community project, Well London Hoe Street project, and the Waltham Forest Health Book were three inter-linked projects that used community based activities in arts, skills, volunteering and cycling to improve social cohesion within the borough. All projects had strong inter-generational elements, designed to build understanding between different age groups. Healthy decision making skills were combined with arts, culture, and sports projects. This is currently being evaluated by UEL.
The Every Child A Sports Person (ECASP) programme was rolled out to all Year 7 pupils in Newham giving them the opportunity to experience a range of sports and physical activities not available through the PE curriculum. These were delivered by coaches from local clubs who encouraged young people to join local teams. Young people had a choice of activities to try ranging from archery and BMX, through to fencing and judo. An ECASP festival was held at the end of the Summer term utilising the Sports Dock at UEL, an Olympic training centre. In total over 3,000 young people joined the ECASP programme in 2012.
Roll out the Mayor’s Mentoring Programme in Hackney and Waltham Forest.
300 additional young people linked to mentors
Completed in 2011/12
Increase the capacity for and scale of volunteering to support healthy lifestyle changes.
Reduce the gap on sedentary adults (those doing no sport or activity) to 2%
Reduce the convergence gap in the consumption of: 5 a day, smoking rates
Narrow the gap in mortality rates from all cancers to 10 points
It is intended that Team London Ambassadors will continue to promote volunteering across the capital following the Games. The Team London website will be re-launched in May 2013 by the Mayor.
There was no further funding identified for East London Health Makers in 2012/2013 which had provided free training for volunteers to increase knowledge & skills around healthy lifestyles and behaviour change.
The LLDC has been developing volunteering and Time Bank programmes for 2013 focused around summer events and the North Park opening, which will involve a maximum of 600 volunteers, recruited through existing local volunteer channels, alongside a partnership project with the Shoreditch Trust to develop the Time Bank market place and online portal.

65
Key Actions 2011 – 2015 Target Progress 2012/13
Develop more employment routes into health and social care careers including through links from leisure and volunteering.
Targets are being developed
(Joint activity with creating
wealth theme)
PAEL Sport Makers Coaching Bursary funded 15 successful applicants, offering coaches 50% of the cost of a coaching qualification (Level 1 or Level 2) provided they have already delivered and logged 10 hours of volunteering on www.sportmakers.co.uk. The coaches also received two CPD workshops in order to up skill them ready to deliver a further 10 hours with their new qualification.
14 Sport Makers workshops were delivered in Host Boroughs, attended by 321 volunteers who registered as a Sport Maker and between them delivered 5391 hours of volunteering between October and December 2012.

66
Theme: Developing Successful Neighbourhoods
Key Actions 2011 – 2015 Target Progress 2012/13
1. To reduce levels of violent crime and gang activity.
Develop analysis of gang issues across host borough area
Report presented UEL was commissioned to analyse Host Borough approaches on gang reduction strategies. Report identifies that each borough has a useful but different approach to addressing gang issues. CE’s agreed that work going forward will be as part of the Met Police approach along with working in partnership through the community safety partnerships. The UEL report has been shared with MOPAC to support the analysis of issues that MOPAC carries out.
Building a cross borough gangs strategy to reduce youth crime and build safer neighbourhoods with regard to the broader strategic approach on gangs in London
No target now as a six borough approach is not being taken.
Host Boroughs’ analysis will help inform work with the Mayor’s Office for Policing and Crime (MOPAC) and Metropolitan Police Service (MPS). A meeting was held between the Growth Boroughs Unit and MOPAC to look at options for developing work in the six boroughs.
The LCRB Anti Gangs Strategy has been ratified, a Governance structure has been established and working groups are in place to take forward the action points contained within the document. These working groups are comprised of relevant agencies including the MPS and London Councils.
Undertake a strategic assessment to gain a better understanding of the levels of all forms of violence against women and girls and identify any gaps in service provision
To be determined Meeting between MOPAC and Growth Boroughs staff agreed to review data on VAWG and then look at
options for taking work forward in both the Developing Successful Neighbourhoods and Supporting Healthier
Lifestyles themes.
2. To increase the number of affordable housing units and reduce overcrowding and fuel poverty.
Provide 50,000 new homes of which a minimum of 12,000 are affordable housing including shared ownership by 2014/15
50,000 new homes
12,000 affordable new homes delivered
Between 2009 and 2013 over 50,000 new homes were planned with over 19,500 completions projected (full
data confirmation awaited for private sector schemes) and a confirmed delivery of over 14,000 affordable
homes. As part of this in 2012/13, the GLA supported the building of 1,942 affordable units through grant
support.
The LLDC Legacy Communities Scheme was granted outline planning permission in September 2012 and
includes 6,780 new homes which are expected to be developed over 18 years. The LLDC’s scheme includes a
35% affordable housing target (subject to viability) which comprises 30% social rent, 30% affordable rent and
40% intermediate housing.
In summer 2012 the LLDC selected Taylor Wimpey and L&Q as its development partner for its first phase at
Chobham Manor. The LLDC is working closely with Taylor Wimpey and L&Q in preparing a detailed zonal
masterplan which will be submitted for planning approval in May 2013. Subject to planning approval
commencement of development is expected in early 2014 with the first occupations in 2015.

67
Key Actions 2011 – 2015 Target Progress 2012/13
To develop joint working methodology for tackling overcrowding.
Reduce levels of overcrowding
2001 census data shows an increase in overcrowding rates in the growth boroughs since 2001 along with a growing Convergence gap. Analysis to date across the Growth Boroughs indicates that overcrowding will become worse still as a result of welfare reforms.
The London Overcrowding Board has met three times to date. Its key early decisions were to:
focus its efforts initially on tackling overcrowding in social housing, rather than the private rented sector;
oversee a target that every severely overcrowded household in social housing is offered a suite of options that may potentially alleviate or mitigate their situation;
take forward a number of workstreams to increase the options for severely overcrowded social tenants.
Develop a retrofit programme to achieve low carbon homes and alleviate fuel poverty and unaffordable fuel bills.
To be determined As of the end of March 2013, approximately 12,500 homes have been retrofitted across the Growth Boroughs as part of the London RE:NEW programme - the Mayor's pan-London home retrofitting programme. All boroughs have programmes to make homes more energy efficient and redress fuel poverty, mapping the blocks to priorities work and funding. Examples include: Hackney, Greenwich and Waltham Forests involvement in the Big London Energy Switch, Hackneys work to attract ECO subsidy, Greenwich’s work on Combined Heat and Power, anaerobic digester in B&D.
3. To complete the Olympic public realm improvements programme and secure the legislative changes necessary for more effective environmental enforcement.
Implement the Multi Area Agreement (MAA) for the area around the Olympic Park: developing a joint plan for improvement and maintenance; achieving legislative change; and improving connectivity across the communities and neighbourhoods surrounding the park.
Complete the public realm improvement programme
Build new connections across the Park
The public realm programme was completed by Games time with the delivery of 34 improvement schemes funded by a £100M programme of funding. Projects include Cutty Sark Gardens, Stratford Town Centre, Gordon Square and a live sites programme.
The Olympic S106 agreement included a contribution of £20m towards monitoring and mitigating transportation effects of the Games planning permissions, known as OPTEMS (Olympic Park Transport and Environmental Management Scheme) and is being allocated typically towards delivering local connectivity improvement schemes outside the Olympic Park. The OLSPG (July 2012) identifies improving local connectivity and permeability as a development principle, and includes identified gaps which need completing or improving. Many of these gaps are included in the draft LLDC Infrastructure Delivery Plan so that funding from CIL can be invested to support further development.
The LLDC is continuing work to ensure the QEOP has good connectivity into neighbouring areas.
4. To deliver new city districts with a range of accessible and high quality facilities
Work with LLDC to develop the
Olympic Park as a new high quality
district in East London that benefits
new and existing communities
.
Chobham academy education facility opens Health-centre opens to the public Venues open to the public Acres of public space improved and returned to public use
The Queen Elizabeth Olympic Park includes five retained world-class sports venues, premium utilities and communications infrastructure, improved cycle, pedestrian and road connections, newly invigorated waterways and some of the best transport links in Europe.
The transformation of the Parklands and Public Realm will be completed and will reopen to the public. The LLDC:
is working closely alongside the Lea Valley Regional Park Authority to ensure that the Lea Valley Tennis and Hockey Centre and Velopark are successfully completed and handed over to LVRPA.

68
Key Actions 2011 – 2015 Target Progress 2012/13
secured outline planning permission for the Legacy Communities Scheme (LCS) in September 2012 which proposes comprehensive mixed use development across five new neighbourhoods with 6,780 new homes with supporting social infrastructure including a new secondary school, two primary schools, nine nurseries, health centres, multi-purpose community space and open space. Around 12,000sqm of employment space is also proposed, which could provide around 4,400 new jobs by 2031, and together with the retained venues and programming on the Park is likely t o create up to 8,000 new jobs.
secured iCITY as the preferred bidder for the legacy use of the Press and Broadcast Centres. The buildings will be transferred to iCITY in early 2014 once planning permission for the new design has been secured. iCITY has a vision to create a digital and creative hub with the capacity to generate over 4,500 jobs. The first tenant, BT Sport, is already fitting out space for studios in the Broadcast Centre and will start broadcasting its new sports channels from summer 2013.
Milestones:
Copper Box re-opening 27/07/13
Aquatics Centre re – opening Spring 2014
Stadium transformation construction work commences in September 2013 and continues until 2016.
The Stadium becomes fully operational in the Summer of 2016.
Working with investors, developers, the Mayor and TfL ensure that emerging and improving city districts and town centres across the Host Boroughs are well connected, support Convergence, are well integrated with existing communities and deliver local employment and training opportunities.
Targets detailed in the Host Boroughs Olympic Legacy Transport Action Plan
The Host Boroughs produced an Olympic Legacy Transport Action Plan, including an investment strategy and this has fed into the Mayor of London’s Olympic and Paralympic Transport Legacy Action Plan. The aims, actions and principles of these have fed into the objectives for ongoing work across the GLA family. The Boroughs actively collaborate with TfL through the development of the east and south east sub-regional transport plan, together with the continuing development of growth areas, including:
The joint Royal Docks Infrastructure Study and Delivery Plan, including the Enterprise Zone, was developed in 2012/13 to deliver real tangible infrastructure and benefits to the Docks in order to unlock development.
work to understand potential infrastructure alternatives for Barking Riverside (London Riverside), including the DLR extension to Dagenham Dock and a London Overground extension from Barking to Barking Riverside.
The Emirates Air Line cable car between North Greenwich and Royal Victoria has already carried over 1.8million passengers.
Provide a number of new high quality
buildings and facilities for the public as
a result of the 2012 games.
18 new facilities developed
The Mayor’s Sports Legacy Programme has contributed more than £1.4m of investment towards 20 new or refurbished sports facilities across the 6 host boroughs. Funded projects range from an extensive multi-million Lido refurbishment in Greenwich, the development of a new BMX track in Tower Hamlets, and enhancement to existing tennis facilities in Hackney
Ensure that boroughs link into the cultural development plans for the park to ensure that residents and local arts organisations are encouraged to engage with cultural activity and opportunities for employment in the park’s arts and events programme.
Targets are being developed
The LLDC Major Events strategy includes full range of events from small to large, local to international for all abilities. An intrinsic aim for all events is to promote local ownership and community engagement which ensures community legacy programme content for all major events. GLL will deliver a programme of community events in the Copper Box from July 2013 and at the Aquatics Centre from April 2014. Forthcoming events include:
Sainsbury’s Anniversary Games – Diamond League Athletics IPC 26-28/07/13
Badminton World Federation – London Grand Prix, Copper Box 01-06/1013
Anniversary Games will be held from the 26 -28 July incorporate the 2013 London Grand Prix (a two-day

69
Key Actions 2011 – 2015 Target Progress 2012/13
meeting), and the IPC International Challenge on 28 July.
Legacy for cycling, the Prudential Ride London-Surrey 100 and Elite Prudential ride will both start in the Park (around 150 of the world’s top cyclists competing in the Elite race).
Plans for the Annual Festival of Disability Sport on the 7th September in the Copper Box and re-opened North Park are moving forward in partnership with BPA and The Mayor’s Liberty Festival with the aim to launch this in May 2013.
The Stadium will host 2015 Rugby World Cup matches n September/October 2015.
There is also a non sporting summer events programme delivered by Live Nation in June and July including Hard Rock Festival and Wireless.
The LLDC continues to work closely with Sport England to assess interest from National Governing Bodies (NGBs) in using the Queen Elizabeth Olympic Park (the Park) and venues, London Lions British Basketball League team will be based in the Copper Box from the 2013/14 season Linked to Reach & Teach Sports Network to grow and develop the game at the grassroots level and support clubs throughout London to help increase the number of people playing the sport, watching and coaching. Loughborough University announced plans in March 2013 to open a postgraduate campus in the former Press and Broadcast Centres, and LLDC will meet the University in May to discuss high performance sports on the Park. Pro-Active East London worked with LB Newham on promoting East London as a place to invest into community sport from both the NGB and commercial sectors during Games time. Three international aquatic events will be delivered with British Swimming in 2014, 2015 and 2016, a three year programme with GLL and London and Partners/ UK sport, preparing the European Swimming Bid for 2016 event in London to be presented to LEN and Sport England in September 2012. Final bid to for 2016 European and Masters Swimming Championships in May 2013
5. Maximise the inward investment legacy
Develop an approach to realise the
potential opportunities for east London
that are outlined in the Oxford
Economics modelling
Present report to OPRSG Develop inward investment website Increase job density.
A joint approach to investment promotion between the GLA, Host Boroughs and London and Partners was agreed with OPRSG.
At MIPIM in March 2013, GLA/L&P produced a set of co-branded proposition brochures that outlined a broad range of regeneration and development opportunities across London including Growth Boroughs. This material will be refined further in collaboration with the GLA and LLDC with the aim of bringing in significant additional growth.
Develop and implement business support proposals.
To be developed The LLDC continues to put in place supply chain diversification plans in its contracts for the construction, management and operation of the Park. To date there have been 9 contract wins totalling ca. £250,000 through the Transformation construction project. LLDC is working with GLL and Balfour Beatty Workplace and their respective supply chains to identify opportunities for local firms to bid for contracts. The LLDC has continued its match-funding commitment to the Fit for Legacy ERDF project and is using the project to source local firms for Legacy contracts

70
Key Actions 2011 – 2015 Target Progress 2012/13
Develop and implement green business proposals in line with the SRF sustainability framework.
Green existing business stock. Attract environmentally –oriented investment and business into the area.
Dagenham Dock is being developed as a London Sustainable Industries Park. The TEG Group started construction on London’s first anaerobic digestion plant in Dagenham Dock’s London Sustainable Industries Park. The GLA progressed with the implementation of a £10m programme of infrastructure works to deliver serviced plots for green industries. This work included roads, utility connections, sustainable urban drainage and significant landscaping alongside a new cycle route. LBBD, UEL and the IfS formed part of the international EU funded TURAS research project looking at sustainable development. Barking Riverside is a major case study area. RBG have formed a joint venture company with EON to deliver low carbon energy on Greenwich peninsula through a combined heat and power project. Further stages of the project will include the building and deployment of an anaerobic digester.
Develop a programme of transport improvements to increase connectivity across the six host boroughs, including river crossings and the expansion of light rail.
Improved the average number of jobs that a resident can reach within 45 minutes on public transport.
Additional targets will be developed
Outcomes from the Olympic Legacy Transport Action Plan’s have been fed into ongoing work such as the 2013 update to the sub-regional transport plans, OAPFs, and other pieces of ongoing work.
Construction of Crossrail continues, with the first phases of services scheduled to open early in 2017 (on existing Network Rail suburban services into Liverpool Street Station). Overall the new service will provide a step change in access for people in the east and south east sub-region, including a number of town centres and opportunity areas. As a complementary measure to maximise investment, TfL, Crossrail and Local Authorities are developing urban realm masterplans to improve connectivity to the stations.
Development of the package of River Crossings is ongoing, with consultation’s having taken place in 2012 and work continuing in 2013.
Work is ongoing to understand potential infrastructure alternatives to unlock development in Barking Riverside, including the DLR extension to Dagenham Dock and a London Overground extension from Barking to Barking Riverside.
Develop a tourism, business tourism and visitor offer for the Host Boroughs.
London & Partners (L&P) as part of its promotional activity is highlighting the diversity and opportunities on offer for businesses, tourists and students, with a strong focus on the East London story to take advantage of the post-Olympic interest and the accelerated regeneration in East London. L&P continues to work with key stakeholders in East London, including the Growth Boroughs, organisations such as TCIO and LLDC, the Mayor of London and the GLA.
L&P worked with the Growth Boroughs and private sector in East London to facilitate the coordination of marketing of the area within the overall promotion of London. Following the 2012 Games, L&P chaired 2 meetings with key private sector representatives from East London to ensure there was consistent messaging about the legacy for the whole of East London during the focus on the area one year after the Games. Post the anniversary it was decided that those members overlapped significantly with members of London First East London group, and that the general promotion of the area could be covered off as a specific theme at relevant times during their regular meetings.
6. Ensure that cultural activity builds stronger communities and supports economic growth
Develop and promote the sports, culture and visitor offer to attract national and international events (Joint activity with the creating wealth theme)
10 National and international events attracted
Highlights of Create 2012 include:
Oliver Award nominated You Me Bum Bum Train staged in Stratford
Turner prize winner Jeremy Deller’s Sacrilege Host Boroughs
Brokered BBC Radio 1 Weekender event with LBH with international artists Jay Z, Rihanna, Jack White

71
Key Actions 2011 – 2015 Target Progress 2012/13
and Florence and the Machine.
International artist David Bailey in LBN.
Frieze Projects East across Host Boroughs, an internationally recognised brand international artists
Rio London Carnival Exchange in LBH.
LLDC is launching a regional scheme to appoint the first Young Poet Laureate for London in June 2013. The young person will be appointed in October 2013 and undertake a year-long role making connections with QEOP.
An ambitious programme for artworks on hoardings has been commissioned working with international artists to raise the visitor offer during the transformation phase of the Park.
Following the success of the 2012 Games, London has strengthened its position globally as a leading city for major sporting and cultural events, with SportCal announcing London as the No.1 Global Sports City for 2012 (Global Sports Impact Project). Working with city stakeholders inc. GLA LLDC, LVRPA, L & P has ensured that the city will host major international sporting events in Olympic legacy venues in 2013 and beyond. L & P has actively promoted the city’s current status as the world’s number 1 destination for major sports events in industry press.
The local organising committee (LOC) for the 2017 IAAF World Championships has been formally constituted and is now operational under the name of London 2017 Ltd. The Board of London 2017 Ltd has agreed that as far as possible, the delivery of the 2017 IPC World Athletics Championships should be integrated with the IAAF Championships. With this in mind, proposals are being developed by GLA and UK Athletics staff over how to ensure this happens as effectively as possible, allowing for both events to benefit from cost savings and improved event delivery.
Building on the “Biggest Cultural Quarter in Europe” strap line to help change perceptions of East London.
Higher % of London cultural funding allocated to Host Boroughs. Attendance numbers at publicly funded arts/culture venues and events.
Over 1.1m people attended Create 2012 events.
£1.7m of new investment was secured.
1.5m worth of new commissions were secured.
Total media reach of 7m including articles in The FT and features in The Culture Show, The Review Show, New York Times and Vogue.
LLDC have developed two projects to engage local audiences with arts and culture in and around the Park, including securing £75,000 public funding from Arts Council England.
Projects are a Mobile Artist in Residence initiative and Spoke, an extensive live poetry scheme to engage with schools and local community groups.
Working to significantly increase local participation and employment opportunities across the cultural and creative sector
Better connect the cultural quarters in the growth boroughs to local communities
Supporting the culture and creative industries to make a positive contribution across all aspects of the convergence agenda
Over 400 young people given opportunities through Create Jobs.
Over 74,000 local people were actively involved in participatory events.
Barking Bathhouse commended in Mayor of London’s Gift of the Games
Mobile Artist in Residence initiative and Spoke both increasing participation. Both projects include ambitious mentorship schemes that will work with young people (16 – 25) to explore careers in the creative and cultural sector.
LLDC Arts & Culture contracts are procured through open tenders and local professionals and SME’s

72
Key Actions 2011 – 2015 Target Progress 2012/13
encouraged to apply. To date five contracts have been procured with four being let to local suppliers, and one still out to tender.
7. To develop partnership arrangements for the developing successful neighbourhoods theme
Establish “developing successful neighbourhoods” partnership arrangements
consult with stakeholders
develop a proposition for chair, membership, terms of reference and forward plan
Hold meetings
Stakeholders consulted
Terms of reference
developed
Partnership established
Partnership up and running.
Partnership development and agenda planning meeting held in July 2012 and meetings held in September
2012 and February and May 2013.
Terms of reference were agreed in September 2012 and amended in February to include culture and inward
investment objectives under the DSN umbrella..

73
Equalities Analysis Appendix C
Doreen Kenny
GLA Diversity and Social Policy
Background – 2011Census data
Revised 30 August 2013
Convergence indicators
In the following analysis, the term ‘gap’ is used to denote the distance between rates in the growth
boroughs and rates in London, while ‘difference’ is used to compare the rates between groups within the
growth boroughs average and within the London average.
Creating wealth and reducing poverty
1. Key measure: Employment rate 16-64
The overall employment rate in the growth boroughs in 2012 was 4.4 percentage points lower than the
average for London. This was a slight decrease of the gap from 2010, when it was 4.7 percentage
points.
Table 1 Employment rate of all residents aged 16 to 64, September 2010 and 2012
Source: Annual Population Survey
Gender
The employment rate for women in the growth boroughs in 2012 was 6.1 percentage points lower than
for women in London overall while for men it was 2.8 percentage points lower than the average for men
in London. The decrease in the gap from 2010 was slightly more pronounced for men than women.
The difference between men’s and women’s employment rates was wider in the growth boroughs (18.7
percentage points in 2012) than in London as a whole (15.4 percentage points). These differences have
increased since 2010, when they stood at 16.6 percentage points in the growth boroughs and 13.4
percentage points in London.
Table 2 Employment rate by gender, September 2010 and 2012
Source: Annual Population Survey
Age
The gap in the employment rate for people aged 16 to 24 decreased from 3.2 percentage points in 2012
to just 0.3 percentage points in 2012. However for older age groups the gap between the growth
boroughs and the London average increased. For those aged 25 to 49 the gap increased from 3.4
percentage points in 2010 to 4.3 percentage points in 2012. For those aged 50 to 64, the gap increased
more, from 6.6 to 8.6 percentage points.
Employment rate % 2010 2012
Growth boroughs 63.4 64.2
London 68.1 68.6
Gap 4.7 4.4
Men Women Difference
% 2010 2012 2010 2012 2010 2012
Growth boroughs 71.6 73.5 55.0 54.8 16.6 18.7
London 74.7 76.3 61.3 60.9 13.4 15.4
Gap 3.1 2.8 6.3 6.1
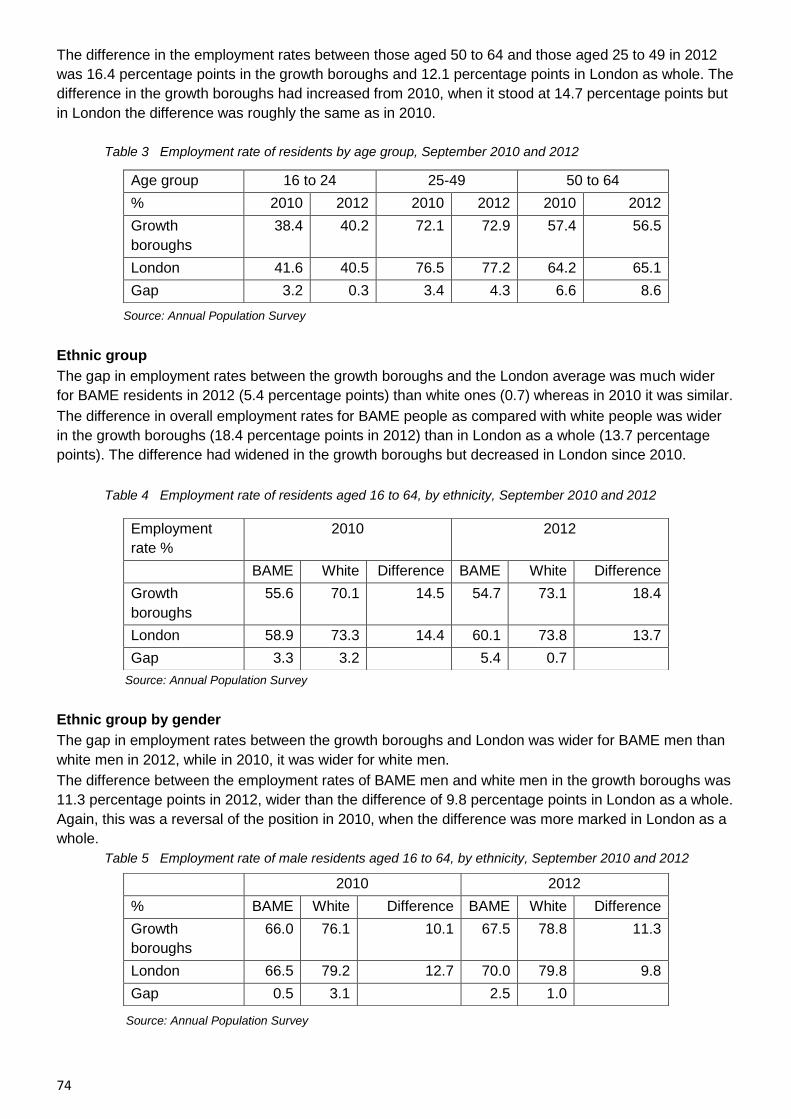
74
The difference in the employment rates between those aged 50 to 64 and those aged 25 to 49 in 2012
was 16.4 percentage points in the growth boroughs and 12.1 percentage points in London as whole. The
difference in the growth boroughs had increased from 2010, when it stood at 14.7 percentage points but
in London the difference was roughly the same as in 2010.
Table 3 Employment rate of residents by age group, September 2010 and 2012
Source: Annual Population Survey
Ethnic group
The gap in employment rates between the growth boroughs and the London average was much wider
for BAME residents in 2012 (5.4 percentage points) than white ones (0.7) whereas in 2010 it was similar.
The difference in overall employment rates for BAME people as compared with white people was wider
in the growth boroughs (18.4 percentage points in 2012) than in London as a whole (13.7 percentage
points). The difference had widened in the growth boroughs but decreased in London since 2010.
Table 4 Employment rate of residents aged 16 to 64, by ethnicity, September 2010 and 2012
Source: Annual Population Survey
Ethnic group by gender
The gap in employment rates between the growth boroughs and London was wider for BAME men than
white men in 2012, while in 2010, it was wider for white men.
The difference between the employment rates of BAME men and white men in the growth boroughs was
11.3 percentage points in 2012, wider than the difference of 9.8 percentage points in London as a whole.
Again, this was a reversal of the position in 2010, when the difference was more marked in London as a
whole.
Table 5 Employment rate of male residents aged 16 to 64, by ethnicity, September 2010 and 2012
Source: Annual Population Survey
Age group 16 to 24 25-49 50 to 64
% 2010 2012 2010 2012 2010 2012
Growth
boroughs
38.4 40.2 72.1 72.9 57.4 56.5
London 41.6 40.5 76.5 77.2 64.2 65.1
Gap 3.2 0.3 3.4 4.3 6.6 8.6
Employment
rate %
2010 2012
BAME White Difference BAME White Difference
Growth
boroughs
55.6 70.1 14.5 54.7 73.1 18.4
London 58.9 73.3 14.4 60.1 73.8 13.7
Gap 3.3 3.2 5.4 0.7
2010 2012
% BAME White Difference BAME White Difference
Growth
boroughs
66.0 76.1 10.1 67.5 78.8 11.3
London 66.5 79.2 12.7 70.0 79.8 9.8
Gap 0.5 3.1 2.5 1.0

75
The gap between the growth boroughs and the London average in the employment rate of BAME
women widened from 5.8 percentage points in 2010 to 8.3 in 2012, while for white women the gap
decreased from 3.5 to 0.4 percentage points. The difference in employment rates for BAME women
compared with white women was 24.6 percentage points in the growth boroughs in 2012 and 16.7
percentage points in London as a whole. Both had widened since 2010, but by more in the growth
boroughs.
Table 6 Employment rate of female residents aged 16 to 64, by ethnicity, September 2010 to 2012
Source: Annual Population Survey
Detailed ethnic groups
The sample size does not allow disaggregation for the growth boroughs of the BAME grouping by
individual ethnic groups and gender, but data for London shows the large variation in employment rates,
especially for women. The lowest employment rates are for Bangladeshi/Pakistani women (32 per cent)
and highest for white women (67 per cent) and Indian women (60 per cent). Age, qualifications, length of
time in the UK and having young children all have a bearing on employment rates. For men, the range is
much less marked – between 64 per cent for Black or Black British men, 73 per cent for
Bangladeshi/Pakistani men to 79 per cent for Indian men and 80 per cent for white men.
Disability
The employment rate of disabled people in the growth boroughs was even lower than the rate in London
as a whole – 40.4 per cent in 2012, compared with 46.3 per cent. The gap in the employment rates of
disabled people between the growth boroughs and the London average narrowed slightly to 5.9
percentage points in 2012, but was still wider than the gap for non-disabled people (3.3 percentage
points).
The difference between the employment rates of disabled people and non-disabled people remained at
29.6 percentage points in the growth boroughs in 2012, wider than the difference in London as a whole
(27 percentage points).
Table 7 Employment rate of residents aged 16 to 64, by whether or not disabled, September 2010 and 2012
Source: Annual Population Survey
2010 2012
% BAME White Difference BAME White Difference
Growth
boroughs
45.8 63.6 17.8 42.4 67.0 24.6
London 51.6 67.1 15.5 50.7 67.4 16.7
Gap 5.8 3.5 8.3 0.4
Employment rate % 2010 2012
Disabled Non-
disabled
Difference Disabled Non-
disabled
Difference
Growth boroughs 38.9 68.5 29.6 40.4 70.0 29.6
London 45.3 72.6 27.2 46.3 73.3 27.0
Gap 6.4 4.1 5.9 3.3

76
2. Unemployment rate
In 2012, the unemployment rate was 2.4 percentage points higher in the growth boroughs (11.5 per cent)
than the London average (9.1 per cent), but the gap had decreased since 2010.
Gender
The gap in unemployment rates between the growth boroughs and the London average increased for
men but decreased for women between 2010 and 2012. Women were more likely to be unemployed
than men in both the growth boroughs and in London as a whole but the difference was less marked in
the growth boroughs in 2012.
Table 8 Unemployment rate of residents aged 16 to 64, by gender, September 2010 and 2012
Source: Annual Population Survey
Age
Unemployment rates are much higher for 16 to 24 year olds than older age groups, but in 2012 the rate
for young people decreased in the growth boroughs to below the London average. The gap between the
growth boroughs and the London average in 2012 also decreased for 25 to 49 year olds from 2.7 to 2.2
percentage points, but increased for people aged 50 to 64 (from 1.6 to 3 percentage points).
Table 9 Unemployment rate of residents aged 16 to 64, by age group, September 2010 and 2012
Source: Annual Population Survey
Ethnicity
The unemployment rate in the growth boroughs is very high for BAME people (16.8 per cent in 2012)
compared with white people (7.1 per cent), and both are higher than the London average (13.6 per cent,
compared with 6.5 per cent). The gap between the growth boroughs and the London average narrowed
for white people but widened for BAME people between 2010 and 2012.
The difference between BAME and white unemployment rates has widened in the growth boroughs
since 2010, whereas in London as a whole the difference narrowed slightly.
Table 10 Unemployment rate of residents aged 16 and over, by ethnicity, September 2010 and 2012
Source: Annual Population Survey
2010 2012 2010 2012
% Total Total Men Women Difference Men Women Difference
Growth boroughs 12.1 11.5 12.2 12.0 0.2 11.2 11.5 0.3
London 9.0 9.1 9.1 8.8 0.3 8.6 9.3 0.7
Gap 3.1 2.4 3.1 3.2 3.6 2.2
2010 2012 2010 2012 2010 2012
% 16-24 25-49 50-64
Growth boroughs 28.1 23.4 9.9 9.6 8.0 9.8
London 23.4 24.3 7.2 7.4 6.4 5.8
Gap 4.7 -0.9 2.7 2.2 1.6 3.0
2010 2012
% BAME White Difference BAME White Difference
Growth boroughs
15.9 9.1 6.8 16.8 7.1 9.7
London 14.0 6.4 7.6 13.6 6.5 7.1
Gap 1.9 2.7 3.2 0.6

77
Disability
Unemployment rates are higher for disabled people, but the gap between the growth boroughs and the
London average was slightly wider for non-disabled than disabled people in 2012. The gap had
decreased slightly for both disabled people and non-disabled people since 2010.
The difference in unemployment rates between disabled people and non-disabled people was similar in
the growth boroughs and London as a whole, at just over five percentage points.
Table 11 Unemployment rate of residents aged 16 to 64, by whether or not disabled, September 2010 and 2012
Source: Annual Population Survey
3. Median earnings for full-time workers living in the area
Median gross weekly earnings for full-time workers in the growth boroughs were over six per cent (£38)
lower than the average for London in both 2010 and 2012, but the gap was far more marked for men
than women. However, these figures are for full-time workers, and women are much less likely than men
to be working full-time or at all. The overall gap in earnings between the growth boroughs and the
London average did not change between 2010 and 2012, but for men it reduced slightly, while for
women it widened.
The difference between men and women’s full-time earnings was less pronounced in the growth
boroughs than the London average, but the difference increased in the growth boroughs between 2010
and 2012 and reduced slightly in London as a whole.
Table 12 Median gross weekly earnings for residents working full-time, 2010 and 2012
Source: Annual Survey of Hours and Earnings
4. Pupils achieving at least Level 4 in English & Maths at Key Stage 2
The proportion of ten year olds achieving at least level 4 in English and Maths in 2012 was less than one
per cent lower in the growth boroughs than the England average and this gap had narrowed since 2011.
Gender
The gap between the growth boroughs and London was wider for girls than boys, but it narrowed for
both between 2011 and 2012. The difference in attainment between boys and girls decreased in both the
growth boroughs and in London as a whole.
Employment rate % 2010 2012
Disabled Non-disabled Difference Disabled Non-disabled Difference
Growth boroughs 16.5 11.5 5.0 16.0 10.8 5.2
London 13.5 8.4 5.1 13.8 8.4 5.4
Gap 3.0 3.1 2.2 2.4
2010 2012 2010 2012
All All Men Women Difference Men Women Difference
Growth boroughs
£568 £575 £584 £544 6.8% £594 £546 8.1%
London £606 £613 £645 £567 12.2% £651 575 11.7%
Gap (£) £38 £38 £51 £23 £57 £29
Gap (%) 6.3% 6.3% 9.1% 3.9% 8.8% 5.1%

78
Table 13 Percentage of 10 year olds achieving at least level 4 in English and Maths, by gender, 2011 and 2012
2011 2012 2011 2012
Total Total Boys Girls Difference Boys Girls Difference
Growth boroughs
74.9 80.9 72.8 77.1 4.3 79.4 82.4 3.0
London 76.4 81.8 74.1 78.7 4.6 80.1 83.5 3.4
Gap 1.5 0.9 1.2 1.7 0.7 1.1
Source: DfE Key Stage 2 results 2011 and 2012
Boys, by ethnicity
For BAME boys, the achievement level is slightly higher in the growth boroughs than the London
average, while for white boys it is lower. The gap for white pupils narrowed slightly from 4.7 percentage
points in 2011 to 3.4 in 2012, while for BAME boys it remained at less than one per cent. BAME boys
out-perform white boys in the growth boroughs, but the difference decreased slightly between 2011 and
2012. In London as a whole white boys do slightly better than BAME boys, but again the difference has
narrowed.
Table 14 Percentage of 10 year old boys achieving at least level 4 in English and Maths, by ethnicity, 2011 and
2012
Source: DfE Key Stage 2 results 2011 and 2012
Girls, by ethnicity.
BAME girls in the growth boroughs have very similar achievement rates to BAME girls in London as a
whole, while white girls do not do as well. The gap for white girls narrowed slightly between 2011 and
2012, but not by as much as for white boys. The difference in attainment between BAME girls and white
girls widened in the growth boroughs, but almost disappeared in London as a whole.
Table 15 Percentage of 10 year old girls achieving at least level 4 in English and Maths, by ethnicity, 2011 and
2012
2011 2012
BAME White Difference BAME White Difference
Growth boroughs 77.4 76.3 1.1 83.2 80.8 2.4
London 77.9 79.8 1.9 83.3 83.8 0.5
Gap 0.5 3.5 0.2 3.0
Source: DfE Key Stage 2 results 2011 and 2012
Gender and ethnicity together
Table 16 summarises achievement levels by gender and ethnicity for 2012. This shows that in the
growth boroughs achievement rates were highest for BAME girls, with rates for BAME boys almost
reaching those for white girls. Achievement rates were lowest for white boys. In London as a whole,
achievement rates were highest for white girls, closely followed by BAME girls, with rates for BAME boys
slightly behind those for white boys.
2011 2012
BAME White Difference BAME White Difference
Growth boroughs
74.1 70.3 3.8 80.4 77.1 3.3
London 73.5 74.9 1.4 79.8 80.5 0.7
Gap 0.6 4.7 0.6 3.4

79
Table 16 Percentage of 10 year olds achieving at least level 4 in English and Maths, by ethnicity and
gender, 2012
Source: DfE Key Stage 2 results 2012
5. Pupils achieving 5 GCSE grades A*-C in maintained schools
A lower proportion of pupils in the growth boroughs in maintained schools achieve five or more GCSEs
graded A* to C than the London average but the gap overall narrowed considerably, from 6.7 percentage
points in 2010 to 2.6 in 2012. The gap narrowed to a similar level for both boys and girls.
The difference in attainment between boys and girls widened in 2012, but by more in London as a whole
than in the growth boroughs.
Table 17 Percentage of pupils at key stage 4 in maintained schools achieving 5 or more GCSEs graded
A* to C, by gender, 2010 and 2012
Source: DfE GCSE results 2010 and 2012
Boys, by ethnicity
The gap in attainment for both BAME and white boys between the growth boroughs and the London
average reduced markedly in 2012, and almost disappeared for BAME boys. The difference in
attainment between BAME boys and white boys widened in the growth boroughs, with BAME boys out-
performing white boys in both years whereas in London as a whole, there was less difference, although
BAME boys overtook white boys in 2012.
Table 18 Percentage of boys at key stage 4 in maintained schools achieving 5 or more GCSEs graded A* to C, by ethnicity, 2010 and 2012
Source: DfE GCSE results 2010 and 2012
Girls, by ethnicity
Similarly, the gap in attainment between the growth boroughs and London narrowed considerably for
both BAME and white girls in 2012.
The difference in attainment between BAME and white girls narrowed in both the host boroughs and
London as a whole, but BAME girls still had a considerably higher achievement rate than white girls in
the growth boroughs, with a difference of 6.8 percentage points.
Boys Girls
BAME White BAME White
Growth boroughs 80.4 77.1 83.2 80.8
London 79.8 80.5 83.3 83.8
Gap 0.6 3.4 0.2 3.0
2010 2012 2010 2012
Total Total Boys Girls Difference Boys Girls Difference
Growth boroughs 50.6 59.8 46.6 54.6 8.0 55.5 64.0 8.5
London 57.3 62.3 53.6 60.9 7.3 58.1 66.8 8.7
Gap 6.7 2.6 7.1 6.3 2.6 2.8
2010 2012
BAME White Difference BAME White Difference
Growth boroughs
48.6 43.1 5.5 57.9 50.8 7.1
London 53.0 54.3 1.3 58.6 57.4 1.2
Gap 4.4 11.2 0.7 6.6

80
Table 19 Percentage of girls at key stage 4 in maintained schools achieving 5 or more GCSEs graded A* to C, by ethnicity, 2010 and 2012
Source: DfE GCSE results 2010 and 2012
Gender and ethnicity together
Table 20 summarises GCSE achievement levels for both boys and girls by ethnicity in 2012. This shows
that achievement levels were highest for BAME girls in both the growth boroughs and in London as a
whole, but in the growth boroughs white girls are further behind than the London average. Achievement
levels for BAME boys in the growth boroughs were not far behind those of white girls, while those for
white boys were further behind in the growth boroughs than in London as a whole.
Table 20 Percentage of pupils at key stage 4 in maintained schools achieving 5 or more GCSEs graded A* to C, by ethnicity and gender, 2012
Source: DfE GCSE results 2012
6. Percentage of working age population with no qualifications
The proportion of 16 to 64 year olds with no qualifications is considerably higher in the growth boroughs
than the London average, although the gap decreased from 4.5 percentage points in 2010 to 3.8 in
2012.
Gender
Women are more likely than men to have no qualifications, and the gap between the growth boroughs
and the London average was slightly wider for women than men in 2012, at 4 percentage points,
compared with 3.5.
In 2012, the difference between the rates for men and women decreased to 0.8 percentage points in the
growth boroughs and 0.3 percentage points in London as a whole.
Table 21 Percentage of 16-64 year olds with no qualifications, by gender, 2010 and 2012
Source: Annual Population Survey
Age
The oldest age group, aged 50 to 64, is the one most likely to lack qualifications, and this is where the
gap between the growth boroughs and London as a whole is most pronounced. Between 2010 and
2012, this gap reduced from 14.3 percentage points to 9.2. The gap widened for those aged 16 to 24 to
1.9 percentage points in 2012, but stayed roughly the same for 25 to 49 year olds.
2010 2012
BAME White Difference BAME White Difference
Growth boroughs
58.0 48.2 9.8 66.2 59.4 6.8
London 62.3 59.3 3.0 67.4 65.9 1.5
Gap 4.3 11.1 1.2 6.5
Boys Girls
BAME White BAME White
Growth boroughs 57.9 50.8 66.2 59.4
London 58.6 57.4 67.4 65.9
Gap 0.7 6.6 1.2 6.5
2010 2012 2010 2012
Total Total Men Women Difference Men Women Difference
Growth boroughs 14.5 12.2 14.0 15.1 1.1 11.8 12.6 0.8
London 10.0 8.4 9.3 10.6 1.3 8.3 8.6 0.3
Gap 4.5 3.8 4.7 4.5 3.5 4.0

81
Table 22 Percentage of 16 to 64 year olds with no qualifications, by age group, 2010 and 2012
Source: Annual Population Survey
Ethnicity
Between 2010 and 2012, the gap between the growth boroughs and London narrowed for BAME
residents than for white residents. The difference in rates of those lacking qualifications widened
between 2010 and 2012 in both the growth boroughs and London as a whole, but by slightly more in the
growth boroughs.
Table 23 Percentage of 16 to 64 year olds with no qualifications, by ethnicity, 2010 and 2012
Source: Annual Population Survey
Disability
Disabled people are much more likely to lack qualifications than non-disabled people, and the gap
between the growth boroughs and London as a whole is more marked for disabled people. However, the
gap reduced more for disabled people than non-disabled people between 2010 and 2012. The difference
between disabled people and non-disabled people narrowed in the growth boroughs from 18.3
percentage points in 2010 to 16.2 in 2012, whereas the difference in the London average decreased by
less, from 12.8 to 11.7.
Table 24 Percentage of 16 to 64 year olds with no qualifications, by whether or not disabled, 2010 and
2012
% 2010 2012
Disabled Not disabled
Difference Disabled Not disabled
Difference
Growth boroughs
29.4 11.1 18.3 25.1 8.9 16.2
London 20.5 7.7 12.8 18.1 6.4 11.7
Gap 8.9 3.3 7.0 2.5
Source: Annual Population Survey
7. Percentage of working-age population with at least NVQ level 4 qualifications (degree or
equivalent)
The proportion of working aged people in the growth boroughs with degree level qualifications and above
was 5.8 percentage points lower than the London average in 2012. The gap had narrowed since 2010,
when it was more than seven percentage points.
Gender
The gap between the growth boroughs and London was wider for women than men, but the gap had
reduced for both since 2010. However, the difference between men and women was wider in the growth
% 2010 2012 2010 2012 2010 2012
16-24 25-49 50-64
Growth boroughs 10.0 9.0 11.0 10.0 32.2 23.8
London 8.9 7.1 7.5 6.7 18.0 14.6
Gap 1.1 1.9 3.4 3.3 14.3 9.2
% 2010 2012
BAME White Difference BAME White Difference
Growth boroughs 15.4 13.6 1.8 14.0 10.3 3.7
London 11.0 9.2 1.8 10.5 7.1 3.4
Gap 4.3 4.4 3.5 3.2

82
boroughs than in London and it had widened slightly from 2010, while the difference in the London
average had reduced to less than one percentage point.
Table 25 Percentage of working aged residents with level 4 qualifications, by gender, 2010 and 2012
Source: Annual Population Survey
Age
In 2012, the youngest age group were slightly more likely to have level 4 qualifications in the growth
boroughs than in London as a whole, unlike in 2010, when they were more than three percentage points
behind. The gap between the growth boroughs and the London average narrowed for those aged 25 to
49. The gap for the oldest age group was 10.4 percentage points in 2012, similar to the gap in 2010.
Table 26 Percentage of working aged residents with level 4 qualifications, by age group, 2010 and 2012
Source: Annual Population Survey
Ethnicity
The gap between the growth boroughs and London was wider for BAME than white residents in 2012,
whilst in 2010, the gap was far more marked for white people. The difference in the proportions of BAME
and white people with at least level 4 qualifications increased within the growth boroughs but reduced in
London as a whole in 2012 compared with 2010.
Table 27 Percentage of working aged residents with level 4 qualifications, by ethnicity, 2010 and 2012
Source: Annual Population Survey
Disability
Disabled people are much less likely to have degree-level or higher qualifications than non-disabled
people. The gap between the growth boroughs and the London average widened for disabled people
between 2010 and 2012 but narrowed for non-disabled people.
The difference between disabled people and non-disabled people was similar in the growth boroughs to
the London average in 2010, but was wider in the growth boroughs in 2012, at 22.5 percentage points,
compare with 18.5 in London as a whole.
% 2010 2012 2010 2012
Total Total Men Women Difference Men Women Difference
Growth boroughs
34.5 41.8 36.0 33.0 3.0 43.4 40.2 3.2
London 41.8 47.6 42.6 41.0 1.6 48.1 47.2 0.7
Gap 7.3 5.8 6.6 8.0 4.7 7.0
% 2010 2012 2010 2012 2010 2012
16-24 25-49 50-64
Growth boroughs 18.7 24.6 41.5 49.9 25.0 30.1
London 22.0 23.7 49.2 56.2 35.3 40.5
Gap 3.3 - 0.9 7.7 6.3 10.3 10.4
% 2010 2012
BAME White Difference BAME White Difference
Growth boroughs
32.9 36.1 3.2 38.5 45.1 6.6
London 37.7 44.3 6.5 44.3 49.7 5.4
Gap 4.8 8.2 5.8 4.6

83
Table 28 Percentage of working aged residents with level 4 qualifications, by whether or not disabled,
2010 and 2012
Source: Annual Population Survey
Supporting healthier lifestyles
8. Key measure: Life expectancy – male/female
In 2009-11, life expectancy in the growth boroughs lagged behind the London average by 1.5 years for
males and 1.4 years for females, but the gap had decreased most markedly for men since 2008/10. The
difference between male and female life expectancy decreased in the growth boroughs but stayed at a
similar level in London as a whole.
Table 29 Life expectancy at birth, males and females, 2008-2010 and 2009-11
Years Males Females Difference
2008-10 2009-11 2008-10 2009-11 2008-10 2009-11
Growth Boroughs 76.9 77.7 81.6 82.2 4.8 4.5
London 78.8 79.3 83.2 83.6 4.3 4.3
Gap 2.1 1.5 1.6 1.4
Source: Office for National Statistics
No other breakdown of the figures is available.
9. Mortality rates from all cancers at ages under 75
Death rates from cancer for people aged under 75 are considerably higher in the growth boroughs than
the London average, at 12.2 per 100,000 more, although the gap had decreased considerably since
2009. The gap is more marked for males than females. The difference in rates between men and women
declined in both the growth boroughs and London as a whole, but in 2010 it was still twice as wide in the
growth boroughs as the London average.
Table 30 Age-standardised death rates from all cancers for people aged less than 75 per 100,000
population, males and females, 2009 and 2010
Rate per 100,000
All under 75 Males Females Difference
2009 2010 2009 2010 2009 2010 2009 2010
Growth Boroughs 126.7 115.1 145.3 130.7 108.7 100.9 44.4 29.8
London 107.6 102.9 122.0 116.3 95.3 91.3 26.7 15.0
Gap 19.1 12.2 23.3 14.4 13.4 9.5
Source: NHS
No other breakdown of the figures is available.
% 2010 2012
Disabled Non-disabled
Difference Disabled Non-disabled
Difference
Growth boroughs
22.1 37.4 15.3 23.9 46.4 22.5
London 28.9 44.5 15.6 32.3 50.8 18.5
Gap 6.8 7.1 8.4 4.4
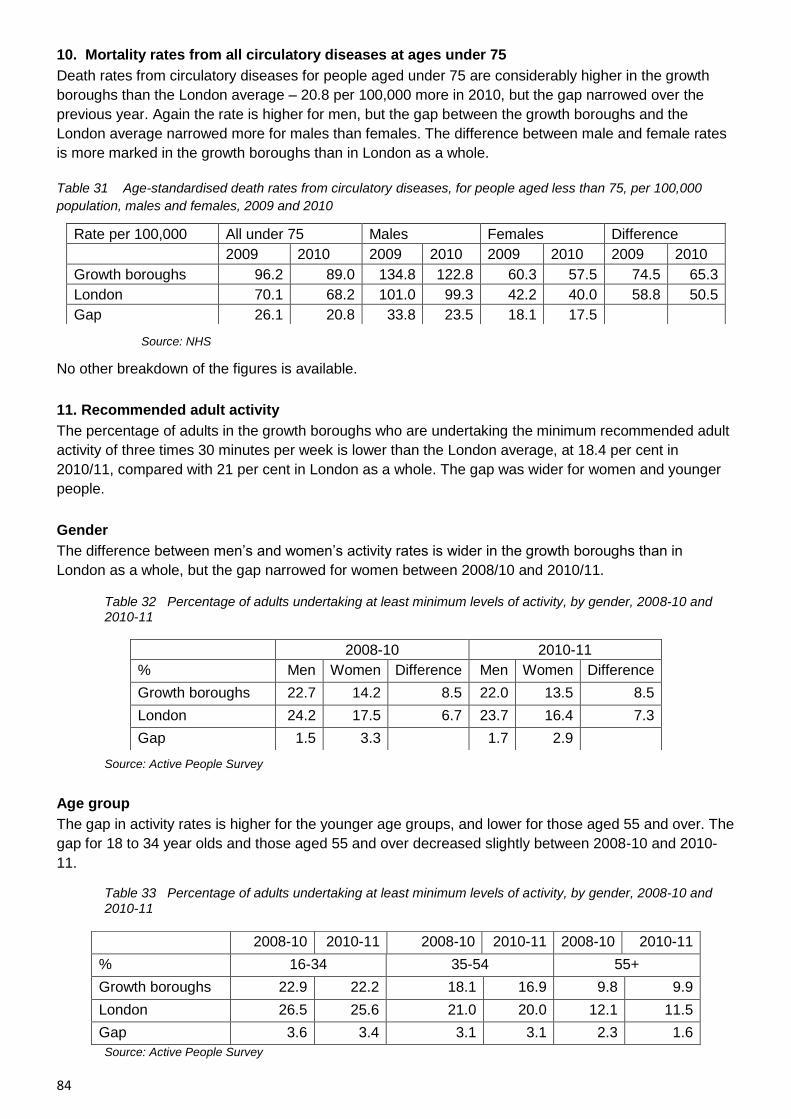
84
10. Mortality rates from all circulatory diseases at ages under 75
Death rates from circulatory diseases for people aged under 75 are considerably higher in the growth
boroughs than the London average – 20.8 per 100,000 more in 2010, but the gap narrowed over the
previous year. Again the rate is higher for men, but the gap between the growth boroughs and the
London average narrowed more for males than females. The difference between male and female rates
is more marked in the growth boroughs than in London as a whole.
Table 31 Age-standardised death rates from circulatory diseases, for people aged less than 75, per 100,000
population, males and females, 2009 and 2010
Source: NHS
No other breakdown of the figures is available.
11. Recommended adult activity
The percentage of adults in the growth boroughs who are undertaking the minimum recommended adult
activity of three times 30 minutes per week is lower than the London average, at 18.4 per cent in
2010/11, compared with 21 per cent in London as a whole. The gap was wider for women and younger
people.
Gender
The difference between men’s and women’s activity rates is wider in the growth boroughs than in
London as a whole, but the gap narrowed for women between 2008/10 and 2010/11.
Table 32 Percentage of adults undertaking at least minimum levels of activity, by gender, 2008-10 and 2010-11
Source: Active People Survey
Age group
The gap in activity rates is higher for the younger age groups, and lower for those aged 55 and over. The
gap for 18 to 34 year olds and those aged 55 and over decreased slightly between 2008-10 and 2010-
11.
Table 33 Percentage of adults undertaking at least minimum levels of activity, by gender, 2008-10 and 2010-11
Source: Active People Survey
Rate per 100,000 All under 75 Males Females Difference
2009 2010 2009 2010 2009 2010 2009 2010
Growth boroughs 96.2 89.0 134.8 122.8 60.3 57.5 74.5 65.3
London 70.1 68.2 101.0 99.3 42.2 40.0 58.8 50.5
Gap 26.1 20.8 33.8 23.5 18.1 17.5
2008-10 2010-11
% Men Women Difference Men Women Difference
Growth boroughs 22.7 14.2 8.5 22.0 13.5 8.5
London 24.2 17.5 6.7 23.7 16.4 7.3
Gap 1.5 3.3 1.7 2.9
2008-10 2010-11 2008-10 2010-11 2008-10 2010-11
% 16-34 35-54 55+
Growth boroughs 22.9 22.2 18.1 16.9 9.8 9.9
London 26.5 25.6 21.0 20.0 12.1 11.5
Gap 3.6 3.4 3.1 3.1 2.3 1.6

85
Ethnicity
Activity levels among BAME groups were lower in the growth boroughs than among white groups in
2010-11, at 16.2 per cent compared with 19 per cent, but the growth boroughs BAME rate was close to
the London BAME average, while the white rate was lower. There was also less difference between
BAME and white activity rates in the growth boroughs than in London as a whole.
Table 34 Percentage of adults undertaking at least minimum levels of activity, by ethnicity, 2008-10 and
2010-11
Source: Active People Survey
Limiting illness or disability
Disabled people have lower activity rates than non-disabled people but they improved between 2008-10
and 2010-11. The gap between the growth boroughs and the London average in 2010-11 was the same
for those who are not disabled as for disabled people. The difference in activity rates between disabled
and non-disabled people was also the same in the growth boroughs as for London as a whole.
Table 35 Percentage of adults undertaking at least minimum levels of activity, by whether or not disabled, 2008-10 and 2010-11
Source: Active People Survey
12. Adult participation in sport
Adults in the growth boroughs are less likely to participate in any sport than the London average, but the
gap narrowed from 5.6 percentage points in 2008-10 to 3.7 in 2010-11.
Gender
Women are less likely to participate in sport than men, but the gap between the growth boroughs and the
London average narrowed more for women than men between 2008-10 and 2010-11. The difference
between men’s and women’s participation rates narrowed in the growth boroughs in 2010-11 but
widened in London as a whole, reaching a very similar level of difference.
Table 36 Percentage of adults aged 16 and over who do not participate in any sport, by gender, 2008-10 and 2010-11
Source: Active People Survey
2008-10 2010-11
% BAME White Difference BAME White Difference
Growth boroughs 16.4 20.1 3.7 16.2 19.0 2.8
London 18.1 22.2 4.1 16.9 21.8 5.1
Gap 1.7 2.1 0.7 2.8
2008-10 2010-11
% Disabled Not disabled Difference Disabled Not disabled Difference
Growth boroughs 8.0 20.0 12.0 11.8 19.7 7.9
London 8.8 22.6 13.8 14.0 21.9 7.9
Gap 0.8 2.6 2.2 2.2
2008-10 2010-11 2008-10 2010-11
Total Total Men Women Difference Men Women Difference
Growth boroughs 52.8 52.3 45.1 60.4 15.3 44.8 59.5 14.7
London 47.3 48.6 40.9 53.5 12.6 41.1 55.9 14.8
Gap 5.6 3.7 4.3 6.9 3.8 3.1

86
Ethnicity
BAME groups are less likely to participate in sport than white groups, with nearly 55 per cent of BAME
adults in the growth boroughs not participating in any sport in 2010-1. The gap between the growth
boroughs and the London average was wider for white groups than BAME groups. The difference
between white and BAME participation rates was less marked in the growth boroughs than the London
average.
Table 37 Percentage of adults aged 16 and over who do not participate in any sport, by ethnicity, 2008-10
and 2010-11
Source: Active People Survey
Age
Non-participation rates are higher in the growth boroughs for all age groups, but the gap is most
pronounced for 35 to 54 year olds, at 6.3 percentage points in 2010-11.
Table 38 Percentage of adults aged 16 and over who do not participate in any sport, by age group, 2010-
11
Source: Active People Survey
Disability
Adults with a disability or limiting long-term illness are much less likely to participate in sport and the gap
between the growth boroughs and the London average is slightly more pronounced for disabled people.
The difference between the participation rates of disabled people and non-disabled people was similar in
the growth boroughs to that in London as a whole.
Table 39 Percentage of adults aged 16 and over who do not participate in any sport, by whether or not
have a limiting long term illness (LLTI), 2010-11
Source: Active People Survey
2008-2010 2010-2011
BAME White Difference BAME White Difference
Growth boroughs 55.4 49.7 5.7 54.8 49.5 5.3
London 53.0 43.9 9.1 53.8 45.2 8.6
Gap 2.4 5.8 1.0 3.7
2010-11 2010-11 2010-11
% 16-34 35-54 55+
Growth boroughs 40.6 52.9 73.5
London 36.6 46.6 69.3
Gap 4.0 6.3 4.2
% Disabled Not disabled Difference
Growth boroughs 67.7 46.9 20.8
London 63.9 43.7 20.2
Gap 3.8 3.1

87
Developing successful neighbourhoods
13. Key measure: Violent crime levels
The violent crime rate is not available at borough level broken down by victim characteristics, so we are
using racist and religious hate crime instead. The rate of racist and religious hate crime was higher in the
growth boroughs than the London average – 1.21 per thousand population in 2012, compared with 1.13
per thousand. The gap appears to be widening.
Table 40 Rate of racist and religious hate crime per 1,000 population, 2010 to 2012
2010 2011 2012
Growth
boroughs 1.16 1.03 1.21
London 1.13 0.97 1.13
Gap 0.03 0.06 0.08
Source: Metropolitan Police Service
General Statistics
Age and gender
The growth boroughs have a higher proportion of their population in the younger age groups. The 2011
Census showed 36 per cent of the growth borough population aged less than 25, compared with 32 per
cent in London as a whole, a difference of nearly four percentage points. The proportion of the
population aged 50 and over was smaller, at 20.3 per cent in the growth boroughs, compared with 25.5
per cent in London.
The growth boroughs have a very slightly lower proportion of the population who are female. This is
likely to be a reflection of the younger age structure, females being under-represented in younger age
groups and over-represented in older age groups.
Table A1 Population in 2011 Census, by age and gender
Growth boroughs London
% %
under 15 20.7 18.7
15-24 15.3 13.5
25-34 22.4 19.9
35-49 21.3 22.4
50-64 12.0 14.4
65-74 4.4 5.8
75 & over 3.9 5.3
Female 49.7 50.7
Male 50.3 49.3
Source: 2011 Census © Crown copyright
Ethnic group
The total BAME population stood at 50.8 per cent in the growth boroughs in 2011, compared with 40.1
per cent in London as a whole. The main differences are higher proportions of Black Africans, Pakistanis
and Bangladeshis. BAME groups make up nearly two-thirds (65.8%) of the under 16 population in the
growth boroughs compared with just over half in London as a whole (53.6%)

88
Nearly half (48.8%) of the main working age population in the growth boroughs are from BAME groups,
compared with 39.3% in London as a whole. For those aged 65 and over, 28.1% in the growth boroughs
are from BAME groups, compared with 21.9% in London.
Table A2/5 Age groups by proportion in each ethnic group, growth boroughs and London, Census
2011
All Ages Under 16 16+64 65+
Ethnic
group
Growth
boroughs
London Growth
boroughs
London Growth
boroughs
London Growth
boroughs
London
% % % % % % % %
White: British 35.7 44.9 25.7 36.5 35.5 43.8 64.3 66.6
White: Irish 1.4 2.2 0.3 0.6 1.5 2.1 3.7 5.1
White: Gypsy or Irish Traveller
0.1 0.1 0.2 0.2 0.1 0.1 0.1 0.0
Other White 11.9 12.6 8.0 9.1 14.1 14.7 3.8 6.3
White & Black Caribbean
1.5 1.5 3.1 3.3 1.2 1.1 0.5 0.4
White and Black African
1.0 0.8 2.2 1.9 0.7 0.6 0.2 0.1
White and Asian
1.0 1.2 1.9 2.7 0.8 1.0 0.3 0.4
Other Mixed 1.4 1.5 2.7 3.0 1.1 1.2 0.4 0.4
Indian 5.4 6.6 4.2 5.4 5.9 7.1 4.0 5.9
Pakistani 4.8 2.7 6.0 3.7 4.6 2.7 2.5 1.3
Bangladeshi 9.2 2.7 14.1 4.5 8.3 2.5 4.1 1.0
Chinese 1.6 1.5 0.8 0.8 2.0 1.8 0.8 0.8
Other Asian 4.1 4.9 4.1 5.4 4.4 5.1 2.0 2.4
Black African 10.5 7.0 14.7 10.8 10.0 6.7 3.2 2.0
Black Caribbean
4.8 4.2 4.1 4.1 4.6 4.1 7.7 5.1
Other Black 2.4 2.1 4.4 4.1 2.0 1.7 0.9 0.6
Arab 0.9 1.3 1.1 1.8 0.9 1.3 0.2 0.4
Any other ethnic group
2.3 2.1 2.4 2.2 2.3 2.3 1.3 1.1
Total BAME 50.8 40.1 65.8 53.6 48.8 39.3 28.1 21.9
All population 100.0 100.0 100.0 100.0 100.0 100.0 100.0 100.0
Source: 2011 Census © Crown copyright
Economic Activity Men
In the 2011 Census, male residents of the growth boroughs were less likely to be in employment, but
more likely to be students. The full-time employment rate was lower than the London average by nearly
five percentage points, but the part-time rate was somewhat higher. The percentage who were self-
employed was lower and the unemployment rate was higher, at 7.4 per cent compared with the London
average of 5.8 per cent.
The lower percentage of retired men and the higher proportion of students are likely to be a reflection of
the relatively younger population in the growth boroughs, but this is not reflected in the proportion who
were long-term sick or disabled, which was higher than the average.

89
Table A6 Economic activity rates of male residents aged 16 to 74, Census 2011
Growth boroughs
%
London
%
Economically active:
Employee part-time 8.4 6.7
Employee full-time 40.0 44.8
Self-employed 14.3 16.1
Unemployed 7.4 5.8
Full-time student 6.0 4.1
Economically inactive:
Retired 5.7 7.1
Student 9.1 7.9
Looking after home /family 1.2 0.9
Long term sick/disabled 4.6 3.9
Other 3.4 2.8
All male usual residents aged 16 to 74 100.0 100.0 Source: 2011 Census © Crown copyright
Women
The full-time employment rate of women was three percentage points lower in the growth boroughs than the London average, but the part-time rate was just one percentage point lower. The unemployment rate was 5.9 per cent, compared with an average of 4.6 per cent in London. As with male residents, there were a higher percentage of students, a lower percentage of retired people and a higher percentage of long-term sick and disabled. The proportion of women who were economically inactive because of looking after their home and family was two percentage points higher.
Table A7 Economic activity rates of female residents aged 16 to 74, Census 2011
Growth boroughs %
London
%
Economically active:
Employee part-time 14.0 15.0
Employee full-time 32.0 35.0
Self-employed 6.1 7.3
Unemployed 5.9 4.6
Full-time student 4.9 4.0
Economically inactive:
Retired 7.7 9.6
Student 8.7 7.7
Looking after home /family 11.5 9.5
Long term sick/disabled 4.5 3.6
Other 4.6 3.6
All female usual residents aged 16 to 74 100.0 100.0 Source: 2011 Census © Crown copyright
Occupations
Men in the growth boroughs in employment were less likely to be in senior, managerial and professional
occupations, and associate professional and technical occupations than men in London generally. They
were slightly more likely to be involved in skilled trades, but considerably more likely to be involved in the
lowest paid occupations, especially elementary occupations.

90
Table A8 Male residents in employment, by occupation
Growth boroughs
London
Managers, directors and senior officials 10.4 14.0
Professional occupations 18.3 21.6
Associate professional and technical occupations 15.4 17.1
Administrative and secretarial occupations 6.1 6.0
Skilled trades occupations 14.3 13.7
Caring, leisure and other service occupations 4.0 3.4
Sales and customer service occupations 8.1 6.2
Process, plant and machine operatives 9.4 8.0
Elementary occupations 14.0 10.1
All male residents aged 16 to 74 in employment 100.0 100.0 Source: 2011 Census © Crown copyright
Women in employment in the growth boroughs were less likely to be in senior and professional positions
than the London average, and more likely to be in service and elementary occupations. They were also
less likely to be intermediate occupations –associate professional and technical occupations, like nurses,
and administrative and secretarial positions.
Table A9 Female residents in employment, by occupation
Growth boroughs London
% %
Managers, directors and senior officials 7.1 8.8
Professional occupations 21.7 23.4
Associate professional and technical occupations 14.3 15.4
Administrative and secretarial occupations 16.9 18.2
Skilled trades occupations 2.6 2.2
Caring, leisure and other service occupations 14.1 13.0
Sales and customer service occupations 10.0 9.0
Process, plant and machine operatives 1.2 1.0
Elementary occupations 12.1 9.0
All female residents aged 16 to 74 in employment 100.0 100.0
Source: 2011 Census © Crown copyright
Residents in employment, by industry
Men
There were no large differences between the growth boroughs and the London average in the
breakdown by industry of men in employment. There was a somewhat higher proportion employed in
accommodation and food service and in wholesale and retail trade and motor repair; and a lower
proportion involved in information and communication, in financial and insurance services, and in
professional, scientific and technical areas.
Table A10 Male residents in employment, by industry
Growth boroughs %
London %
Manufacturing 3.9 4.1
Utilities 1.0 1.0
Construction 11.2 10.7

91
Wholesale & retail trade, motor repair 13.9 13.2
Transport & storage 7.6 7.4
Accommodation & food service 8.9 6.6
Information & communication 7.2 8.5
Financial & insurance services 7.8 8.7
Real estate 1.7 2.0
Professional, scientific & technical 8.8 10.8
Administrative & support services 6.8 5.8
Public administration & defence 4.3 4.7
Education 5.8 5.4
Human health & social work activities 5.4 5.2
Other 5.7 6.0
All female residents aged 16 to 74 in employment 100.0 100.0
Source: 2011 Census © Crown copyright
Women
Differences in the industry breakdown were even less marked for women in employment. Again, a
somewhat higher proportion were involved in accommodation and food service and a lower proportion in
professional, scientific and technical areas. A slightly higher proportion of women in the growth boroughs
were involved in education and human and health activities.
Table A11 Female residents in employment, by industry
Growth boroughs % London %
Manufacturing 2.0 2.3
Utilities 0.2 0.2
Construction 1.7 1.8
Wholesale & retail trade, motor repair 12.7 12.9
Transport & storage 2.0 2.3
Accommodation & food service 7.5 5.9
Information & communication 4.4 5.1
Financial & insurance services 6.4 6.4
Real estate 1.9 2.0
Professional, scientific & technical 9.5 10.9
Administrative & support services 6.7 5.9
Public administration & defence 5.4 5.5
Education 15.0 14.4
Human health & social work activities 17.5 17.0
Other 7.0 7.3
All female residents aged 16 to 74 in employment 100.0 100.0
Source: 2011 Census © Crown copyright
Overcrowding
The extent of overcrowding is derived from the occupancy rating in the Census. There are two
measures, one based on the number of rooms in a household's accommodation, and one based on the
number of bedrooms. The ages of the household members and their relationships to each other are
used to derive the number of rooms/bedrooms they require, based on a standard formula.
On the measure using rooms, nearly 28 per cent of households in the growth boroughs were
overcrowded in 2011, compared with nearly 22 per cent in London as a whole. On this measure, the
difference was largely due to the extent of overcrowding in three boroughs – Hackney, Newham and
Tower Hamlets, where around a third of households are overcrowded.
On the bedrooms measure, 16.5 per cent of households in the growth boroughs were overcrowded,
compared with 11.6 per cent in London. On this measure, Newham stands out, with 25.4 per cent of
households overcrowded.
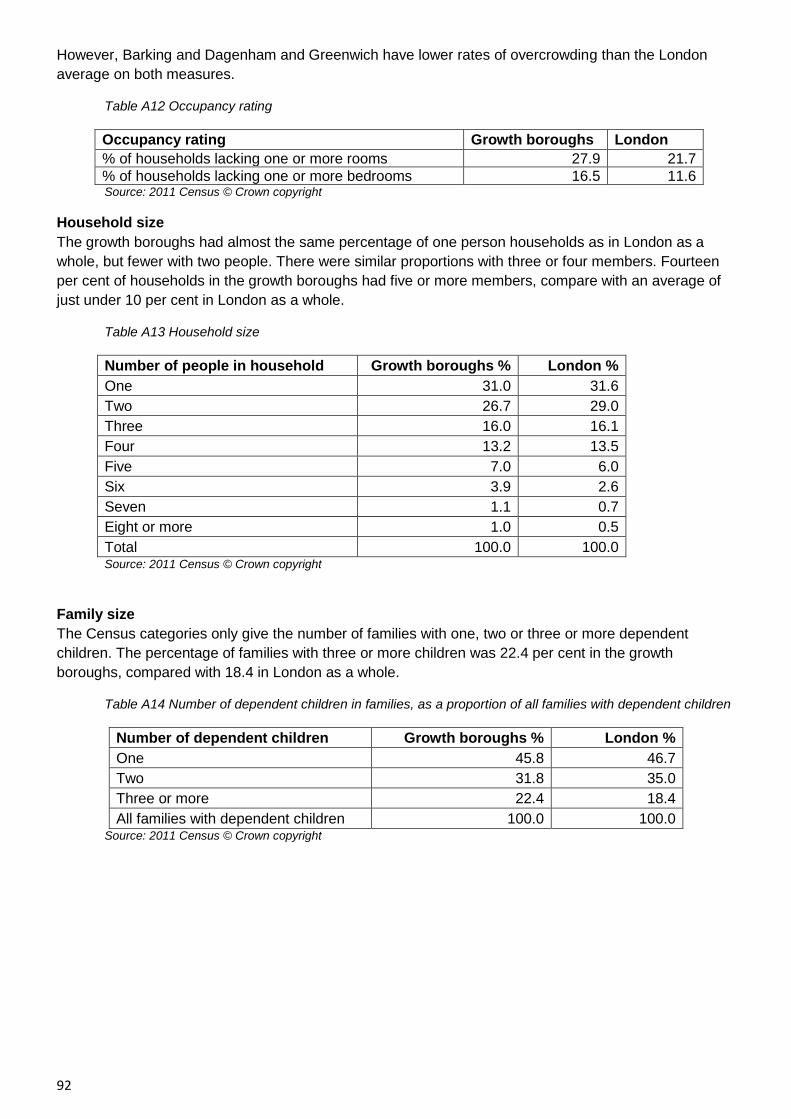
92
However, Barking and Dagenham and Greenwich have lower rates of overcrowding than the London
average on both measures.
Table A12 Occupancy rating
Occupancy rating Growth boroughs London
% of households lacking one or more rooms 27.9 21.7
% of households lacking one or more bedrooms 16.5 11.6 Source: 2011 Census © Crown copyright
Household size
The growth boroughs had almost the same percentage of one person households as in London as a
whole, but fewer with two people. There were similar proportions with three or four members. Fourteen
per cent of households in the growth boroughs had five or more members, compare with an average of
just under 10 per cent in London as a whole.
Table A13 Household size
Number of people in household Growth boroughs % London %
One 31.0 31.6
Two 26.7 29.0
Three 16.0 16.1
Four 13.2 13.5
Five 7.0 6.0
Six 3.9 2.6
Seven 1.1 0.7
Eight or more 1.0 0.5
Total 100.0 100.0 Source: 2011 Census © Crown copyright
Family size
The Census categories only give the number of families with one, two or three or more dependent
children. The percentage of families with three or more children was 22.4 per cent in the growth
boroughs, compared with 18.4 in London as a whole.
Table A14 Number of dependent children in families, as a proportion of all families with dependent children
Number of dependent children Growth boroughs % London %
One 45.8 46.7
Two 31.8 35.0
Three or more 22.4 18.4
All families with dependent children 100.0 100.0 Source: 2011 Census © Crown copyright