Embed Size (px)
Citation preview

ANNUAL REPORT 2009


CONTENTS
1
COONNTTEENNTS
1
2 Glossary
3 Sasfi n Group’s Mission, Markets and Values
4 The Sasfi n Group
5 The Board of Directors
6 Executive Committee
7 Business Banking
8 Capital
9 Wealth Management
10 Treasury
11 Logistics and Risk Management
12 Corporate Services
13 Group Salient Features
16 Group Structure
19 Chairman’s Report
23 Chief Executive Offi cer’s Report
28 Risk Management Report
30 Compliance Report
31 Corporate Governance Report
36 Sustainability Report
39 Directors’ Responsibility Statement
39 Company Secretary’s Certifi cate
40 Report of the Independent Auditors
40 Audit Committee Report
41 Directors’ Report
44 Consolidated Statement of Financial Position
45 Consolidated Income Statement
46 Consolidated Statement of Comprehensive Income
47 Statement of Changes in Equity
48 Cash Flow Statements
49 Notes to the Consolidated Financial Statements
110 Company Financial Statements
113 Notes to the Company Financial Statements
120 Shareholder and Administrative Information
122 Notice of Annual General Meeting
Insert Form of Proxy
IBC Sasfi n Group Contact Information
A N N U A L R E P O R T 2 0 0 9
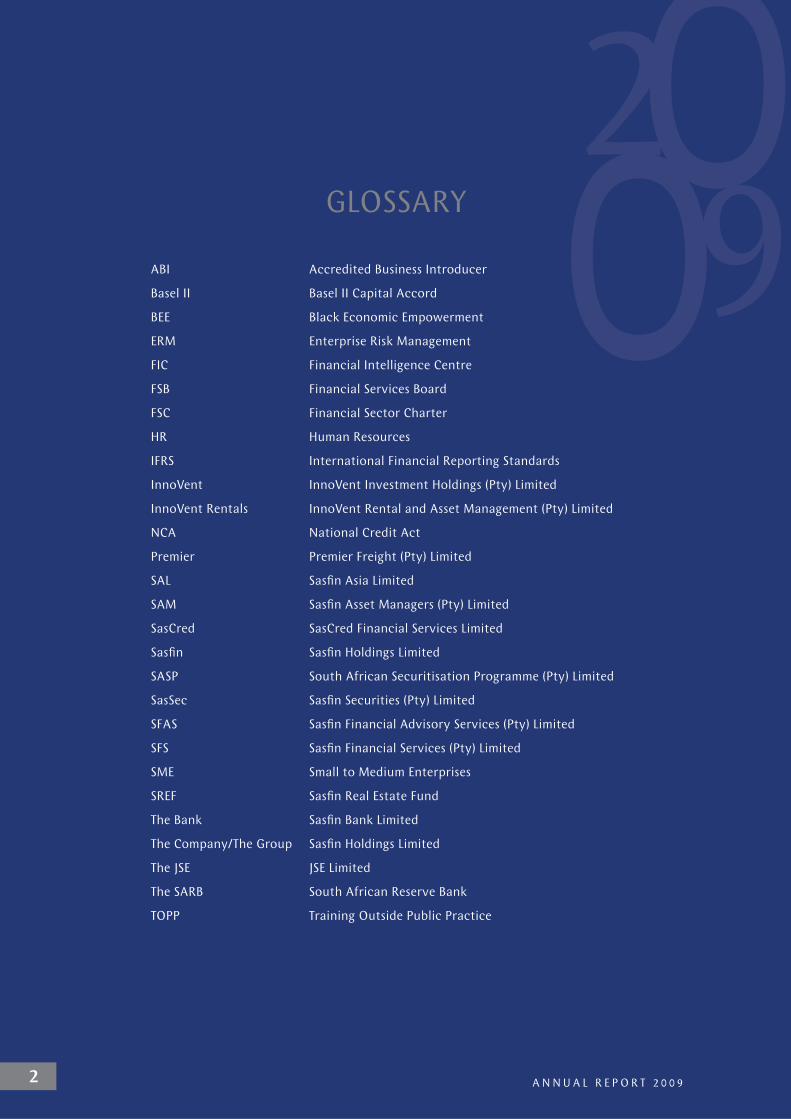
GLOSSARY
ABI Accredited Business Introducer
Basel II Basel II Capital Accord
BEE Black Economic Empowerment
ERM Enterprise Risk Management
FIC Financial Intelligence Centre
FSB Financial Services Board
FSC Financial Sector Charter
HR Human Resources
IFRS International Financial Reporting Standards
InnoVent InnoVent Investment Holdings (Pty) Limited
InnoVent Rentals InnoVent Rental and Asset Management (Pty) Limited
NCA National Credit Act
Premier Premier Freight (Pty) Limited
SAL Sasfi n Asia Limited
SAM Sasfi n Asset Managers (Pty) Limited
SasCred SasCred Financial Services Limited
Sasfi n Sasfi n Holdings Limited
SASP South African Securitisation Programme (Pty) Limited
SasSec Sasfi n Securities (Pty) Limited
SFAS Sasfi n Financial Advisory Services (Pty) Limited
SFS Sasfi n Financial Services (Pty) Limited
SME Small to Medium Enterprises
SREF Sasfi n Real Estate Fund
The Bank Sasfi n Bank Limited
The Company/The Group Sasfi n Holdings Limited
The JSE JSE Limited
The SARB South African Reserve Bank
TOPP Training Outside Public Practice
2

OUR MISSIONTo be the preferred specialist banking and fi nancial services provider
in our chosen markets.
OUR MARKETSEntrepreneurial corporate, commercial and private clients seeking wealth creation,
enhancement and preservation.
OUR VALUESThe Sasfi n Group has identifi ed the following core values as being imperative
to the achievement of its objectives:
satisfy all our stakeholders.
act with integrity, fairness and trust in all matters.
stay transparent and honest while striving for excellence.
focus 100% on our clients’ needs.
instil passion and create a culture of entrepreneurial thinking and innovation.
nurture our personnel and contribute to the development of our country.
3

4 A N N U A L R E P O R T 2 0 0 9
THE SASFIN GROUP
Sasfi n is an independent banking and fi nancial services group,listed on the JSE since 1987.
Having evolved from a family-owned textile company established in 1951, Sasfi n
understands and appreciates what it takes to be a successful entrepreneur and the
perseverance and dedication needed to grow and manage a business. We partner
each and every client with respect and honesty offering tailor-made solutions to
meet business challenges. Each of our fi ve divisions, Business Banking, Capital, Wealth
Management, Treasury and Logistics and Risk Management offer a range of specialised
products and services to assist clients at all stages of their development.

THE BOARD OF DIRECTORS
Seated from left to right: Martin Glatt (Chairman), Dolly Mokgatle,
Roland Sassoon (Chief Executive Offi cer)
Standing from left to right: Eddie Blight, Malcolm Segal (Financial Director),
Norman Axten, Shahied Rylands, Marius Smith
5

6
EXECUTIVE COMMITTEE
Seated from left to right: Malcolm Segal, Louis Dirker, Kurt Diedrick,
Naseema Fakir, Brenton Booth, Dawie Olivier,
Maston Lane, Linda Fröhlich, Enzo Pietropaolo,
Howard Brown, Deon van der Westhuizen,
Nirri Ranchod, Gavin Came, Leonard Eiser,
Roland Sassoon
Standing from left to right: Tyrone Soondarjee, Gary Patterson, Gary Taylor,
DJ Kumbula, Tracey Chinman, Zakhe Khuzwayo

7
BUSINESS BANKING
Business Banking assists entrepreneurs with tailor-made fi nancial and managerial
solutions to assist in business growth. Be it Trade Finance, Debtor Finance, Rental
Finance or Capital Equipment Finance, Sasfi n’s experienced lending arm affords
entrepreneurs the opportunity, insight and expert advice to unlock business
potential by improving access to working capital and assist with cash fl ow challenges.
Seated from left to right: Linda Fröhlich, Nirri Ranchod
Standing from left to right: DJ Kumbula, Deon Kleynhans,
Zakhe Khuzwayo, Brenton Booth
BUSINESS BANKING

8
Sasfi n’s specialised team assists entrepreneurs in optimising their business
potential through opportunities in private equity, property private equity,
corporate fi nance and mergers and acquisitions.
Seated: Malcolm Segal
Standing from left to right: Vernon Leas, Gayle Burbaitzky,
Eton Price, Neil Eppel, Leonard Eiser
CAPITAL

WEALTH MANAGEMENT
With access to leading specialists, Sasfi n is equipped to offer expertise and practical
advice in the creation and enhancement of individual investment portfolios. The
Sasfi n Wealth Management division includes three subsidiary divisions: Sasfi n
Securities, Sasfi n Financial Advisory Services and Sasfi n Asset Managers. Sasfi n Wealth
Management offers a lucrative mix of investment products, advisory services and a
blend of local and international investments. Furthermore, Sasfi n Asset Consulting is
a highly focused, hands-on unit with the capabilities to offer unbiased quantitative
and qualitative assessments on fund assets and liabilities.
From left to right: Gillian Scott, David Shapiro, Dale Franklin,
Gavin Came, Gerhardt van Niekerk 9

10
TREASURY
Treasury offers a comprehensive range of products and services to manage both
personal and company cash investment requirements through products such as
domestic money market portfolios and asset-backed securitisation. In addition,
Sasfi n’s International Treasury provides solutions to all personal or company
foreign exchange requirements.
Seated from left to right: Louis Dirker, Shereen Botha, Anneke van Wyk
Standing from left to right: Lynette van der Westhuizen, Enzo Pietropaolo

11
LOGISTICS AND RISK MANAGEMENT
Logistics and Risk Management provides clients with services not normally considered
within the scope of ordinary banking but which are complementary to their needs.
This division conveniently allows clients full access to a dynamic range of services
from a single supplier. These exclusive services include healthcare consulting, freight
forwarding and clearing and short-term insurance.
From left to right: Steven Romberg, Gary Taylor, Tony Lenhoff

12
CORPORATE SERVICES
R I S K A N D C R E D I T
• Approves and controls credit
• Ensures credit policies are
updated and strictly enforced
• Group risk management
I N F O R M A T I O N T E C H N O L O G Y
• Develops the Group’s
IT strategy
• Enables and facilitates
business through close and
continuous partnerships
• Upgrades and maintains the
Group’s IT infrastructure
M A R K E T I N G
• Strategic communication
• Advertising
• Public relations
• Product launches and
promotional requirements
B U S I N E S S D E V E L O P M E N T
• Accredited Business
Introducer programme
• Customer relationship
management
• Develops new business
channels
FINANCE AND ADMINISTRATION
• Financial and statutory
reporting
• Regulatory reporting
• Group administration and
facilities management
• Group accounting
• Group secretarial
• Group taxation
C O M P L I A N C E
• Group compliance deals with
internal control procedures,
legislation and regulations,
including the Financial Sector
Charter
I N T E R N A L A U D I T
• Carries out the internal audit
functions and provides reasonable
assurance that the Group’s
objectives will be met
H U M A N R E S O U R C E S
• Skills development and
training
• Transformation
• Talent management
13A N N U A L R E P O R T 2 0 0 9
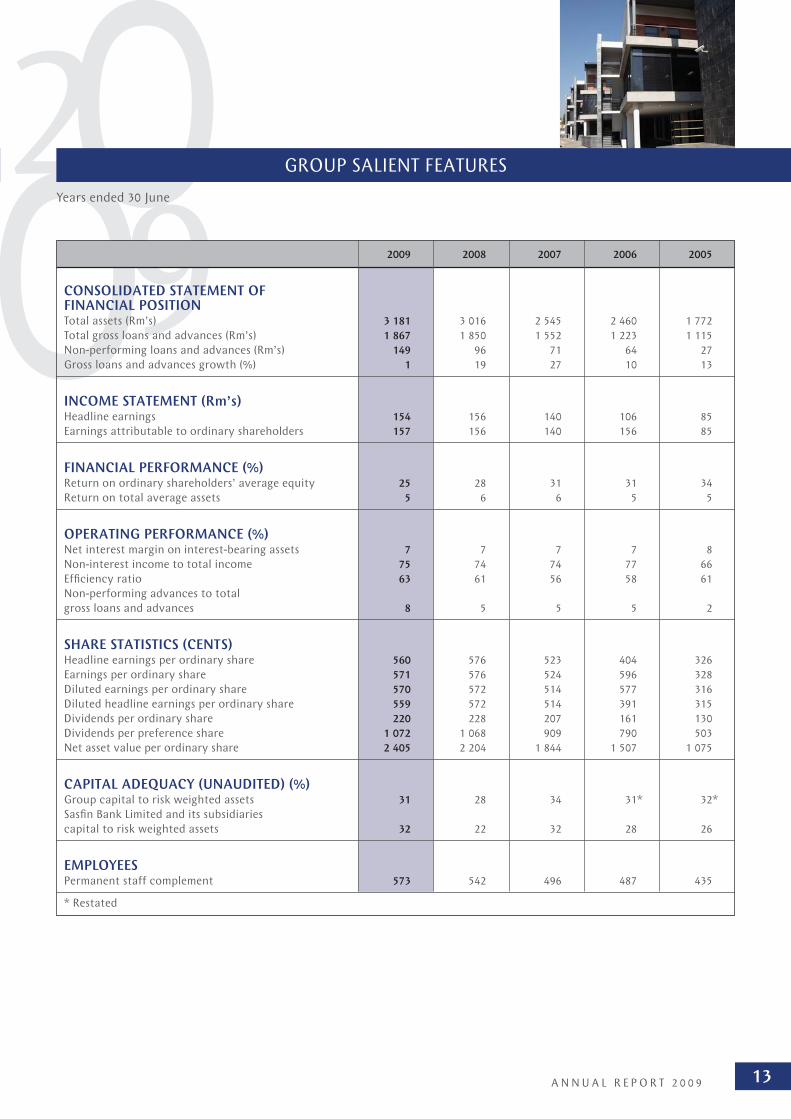
GROUP SALIENT FEATURES
Years ended 30 June
2009 2008 2007 2006 2005
CONSOLIDATED STATEMENT OF FINANCIAL POSITIONTotal assets (Rm’s) 3 181 3 016 2 545 2 460 1 772
Total gross loans and advances (Rm’s) 1 867 1 850 1 552 1 223 1 115
Non-performing loans and advances (Rm’s) 149 96 71 64 27
Gross loans and advances growth (%) 1 19 27 10 13
INCOME STATEMENT (Rm’s)Headline earnings 154 156 140 106 85
Earnings attributable to ordinary shareholders 157 156 140 156 85
FINANCIAL PERFORMANCE (%)Return on ordinary shareholders’ average equity 25 28 31 31 34
Return on total average assets 5 6 6 5 5
OPERATING PERFORMANCE (%)Net interest margin on interest-bearing assets 7 7 7 7 8
Non-interest income to total income 75 74 74 77 66
Effi ciency ratio 63 61 56 58 61
Non-performing advances to total
gross loans and advances 8 5 5 5 2
SHARE STATISTICS (CENTS)Headline earnings per ordinary share 560 576 523 404 326
Earnings per ordinary share 571 576 524 596 328
Diluted earnings per ordinary share 570 572 514 577 316
Diluted headline earnings per ordinary share 559 572 514 391 315
Dividends per ordinary share 220 228 207 161 130
Dividends per preference share 1 072 1 068 909 790 503
Net asset value per ordinary share 2 405 2 204 1 844 1 507 1 075
CAPITAL ADEQUACY (UNAUDITED) (%)Group capital to risk weighted assets 31 28 34 31* 32*
Sasfi n Bank Limited and its subsidiaries
capital to risk weighted assets 32 22 32 28 26
EMPLOYEESPermanent staff complement 573 542 496 487 435
* Restated
14
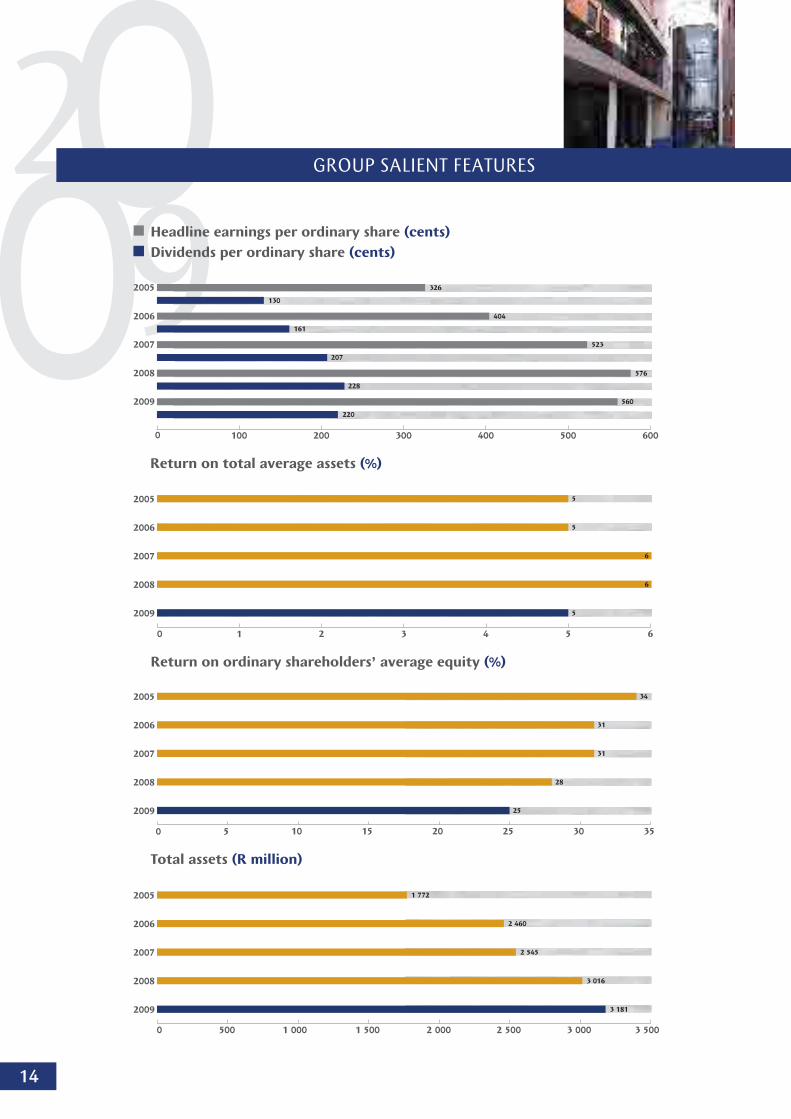
GROUP SALIENT FEATURES
Headline earnings per ordinary share (cents)
Dividends per ordinary share (cents)
100 200 300 400 500 600
2009
2008
2007
2006
2005 326
130
404
161
523
576
228
220
560
207
Return on ordinary shareholders’ average equity (%)
0 5 10 15 20 25 30 35
2009
2008
2007
2006
2005 34
31
31
28
25
2009
2008
2007
2006
2005
Total assets (R million)
1 772
2 460
2 545
3 016
3 181
0 500 1 000 1 500 2 000 2 500 3 000 3 500
0
Return on total average assets (%)
0 1 2 3 4 5 6
2009
2008
2007
2006
2005 5
5
5
6
6
6

15A N N U A L R E P O R T 2 0 0 9
GROUP SALIENT FEATURES
Loans and advances
Gross advances (R million)
Non-performing loans: Advances (%)
Credit impairments: Advances (%)
2005
1 1
15
1 2
23
1 5
52
1 8
50
1 8
67
2006 2007 2008 20090
200
400
600
800
1 000
1 200
1 400
1 600
1 800
2 000
0
1
2
3
4
5
6
7
8
9
2,4
2,3
5,2
2,7
4,6
2,8
5,2
2,5
8,0
3,5
%
R m
illion
2005 2006 2007 2008 2009
Gross advances (R million) 1 115 1 223 1 552 1 850 1 867
Non-performing loans: Advances (%) 2,4 5,2 4,6 5,2 8,0
Credit impairments: Advances (%) 2,3 2,7 2,8 2,5 3,5
Net asset value per ordinary share (cents)
5,4
5,0
0 500
2009
2008
2007
2006
2005 1 075
1 507
1 844
2 204
2 405
1 000 1 500 2 000 2 500 3 000
Group capital adequacy (unaudited) (%)
Bank and its subsidiaries capital adequacy (unaudited) (%)
2005 2006 2007 2008 2009
2632
2831
3234
2228
3231

16
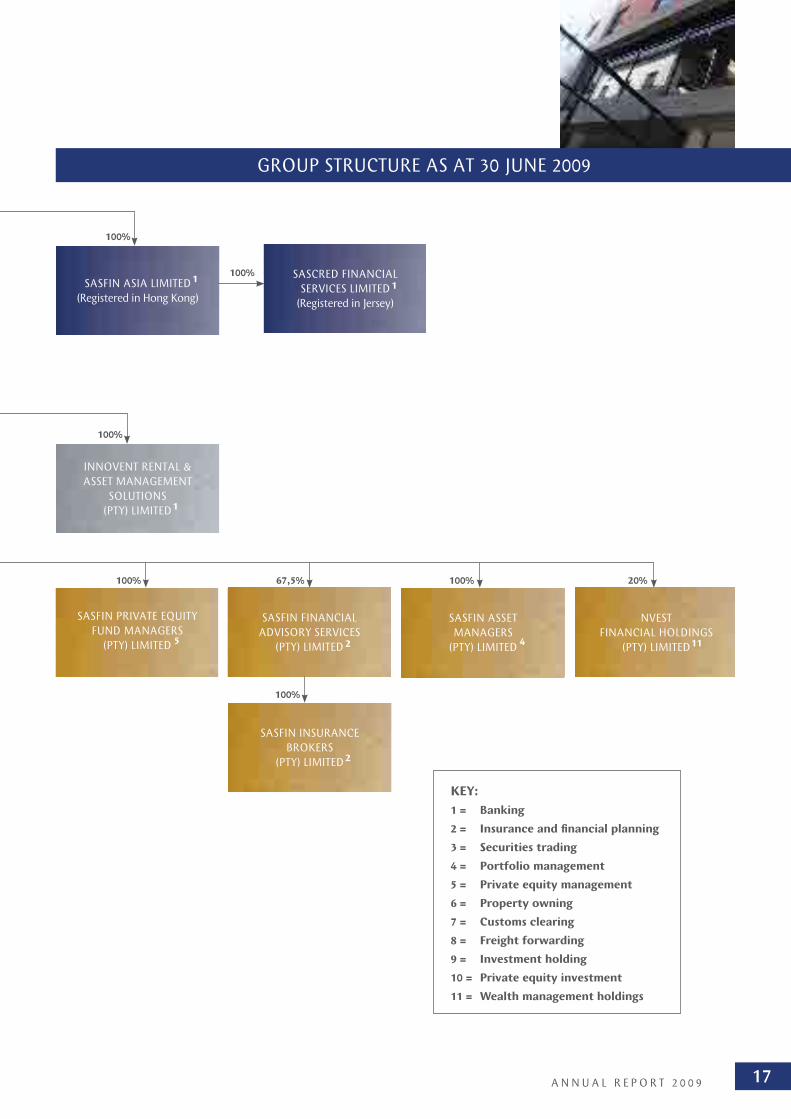
GROUP STRUCTURE AS AT 30 JUNE 2009
SASFIN FINANCIAL SERVICES
(PTY) LIMITED
SASFIN PROPERTIES (PTY) LIMITED,
SASFIN PROPERTIES II (PTY) LIMITED
AND
SASFIN PROPERTIES III (PTY) LIMITED
SASFIN PRIVATE EQUITY
INVESTMENT HOLDINGS
(PTY) LIMITED
SASFIN HOLDINGS
LIMITED
SASFIN BANK LIMITED
SASFIN SECURITIES
(PTY) LIMITED
PREMIER FREIGHT
(PTY) LIMITED
SASFIN - MDM
PRIVATE EQUITY
FUND I
90%
90%
100%
100%
63%
100%
52.4%
1
9
6
10
7
5
3/4
INNOVENT SPV 2
(PTY) LIMITED 9
INNOVENT INVESTMENT
HOLDINGS
(PTY) LIMITED
INNOVENT SPV 1
(PTY) LIMITED
100%
100%
99
SOUTH AFRICAN
SECURITISATION
PROGRAMME (PTY) LIMITED(Residual ownership
held via a trust)
1
33,6%
6%
6%
4%
4%
100%
HECNY
TRANSPORTATION SA
(PTY) LIMITED 8
50%
Sasfi n Holdings
Limited owns
R26m preference
shares in
InnoVent SPV 1
(Pty) Limited
17A N N U A L R E P O R T 2 0 0 9
GROUP STRUCTURE AS AT 30 JUNE 2009
KEY:
1 = Banking
2 = Insurance and fi nancial planning
3 = Securities trading
4 = Portfolio management
5 = Private equity management
6 = Property owning
7 = Customs clearing
8 = Freight forwarding
9 = Investment holding
10 = Private equity investment
11 = Wealth management holdings
SASFIN ASIA LIMITED
(Registered in Hong Kong)
SASCRED FINANCIAL
SERVICES LIMITED
(Registered in Jersey)
SASFIN PRIVATE EQUITY
FUND MANAGERS
(PTY) LIMITED
SASFIN FINANCIAL
ADVISORY SERVICES
(PTY) LIMITED
SASFIN INSURANCE
BROKERS
(PTY) LIMITED
SASFIN ASSET
MANAGERS
(PTY) LIMITED
NVEST
FINANCIAL HOLDINGS
(PTY) LIMITED
100%
100%
100%67,5% 20%
100%
5 2
2
4 11
INNOVENT RENTAL &
ASSET MANAGEMENT
SOLUTIONS
(PTY) LIMITED
100%
1
11
100%

MARTIN GLATT CHAIRMAN
18

19A N N U A L R E P O R T 2 0 0 9
CHAIRMAN’S REPORT
It gives me great pleasure to present Sasfi n’s 2009 Annual Report, the 22nd
since its listing on the JSE in 1987. “
“
RESULTSAgainst the backdrop of the global economic crisis, Sasfi n has
produced satisfactory results for the year under review, with
headline earnings, at R154 million, 2% down on the previous
year, representing an acceptable return of 25% on average
shareholders’ equity.
CAPITAL INJECTIONSAfter protracted negotiations and an extensive due diligence
investigation, the IFC agreed to subscribe for 3,01 million
shares in Sasfi n at R24,81 per share, and to inject a further
R82,45 million into the Bank by way of Tier ll capital. These
agreements are subject to various conditions that are expected
to be fulfi lled by the end of September. The IFC has also provided
a US$10 million guarantee for bank facilities for Sasfi n Asia
Limited. Sasfi n is delighted with its association with the IFC,
which, as part of the World Bank, is very infl uential and has
already added real value to the Company.
CAPITAL ADEQUACYThe Group’s Capital Adequacy Ratio at year end increased
from 28% to 31%, compared with the minimum required
ratio determined in accordance with Basel ll of 9,75%. With
the injection of the Tiers I and ll capital referred to above,
Sasfi n’s Capital Adequacy increases to approximately 36%. This
represents a strong ‘war chest’ for the Company in these times
of interesting opportunities.
LIQUIDITY During November 2008, which coincided with the peak of the
global credit crunch, Sasfi n succeeded in not only rolling its
securitisation notes of R702 million, but in placing an additional
R198 million of notes at attractive rates. This is a show of
confi dence by the debt capital market in the quality of Sasfi n’s
securitised assets, its systems and its vanilla securitisation
structure, which is the oldest such structure in South Africa. This
structure maintained its excellent rating after the credit crunch,
due to the quality and spread of its uncorrelated debtors, and
its high yield, which results in strong embedded value for the
protection of note holders.
Sasfi n’s liquidity, which is based on diverse funding from deposits
(mainly from its private clients), securitisation, interbank
facilities and a strong capital base, has in these volatile times
proved to be robust.
CREDIT LOSSESAs a result of the deterioration in the economic environment,
Sasfi n’s annual credit losses have increased signifi cantly and
now stand at 1% of average loan and advances. Whilst this
compares favourably with most South African banks, the
Company is constantly reviewing its credit granting processes
in an endeavour to maintain an acceptable level of credit losses
going forward.
ECONOMIC ENVIRONMENT For the decade to 2007, the global economy had experienced a
protracted period of benignity, during which there was a major
migration of industry to various under developed economies,
notably China and India. This created huge trade imbalances and
reverse capital fl ows with economies in the western world. Part of
this debt was employed by fi nancial institutions in unsustainable
sub-prime housing loans, credit cards and leverage buy-outs,
using sophisticated fi nancial structures.
As the money supply was tightened in response to increased
infl ation, these loans started to unravel, which in turn decimated
the Tier 1 capital of many of the world’s great fi nancial institutions,
and the resultant credit crunch led to a collapse in the global
economy, the severity of which has not been witnessed in living
memory.
A number of countries in the developed world have resorted
to quantitative monetary stimulation, including bank bailouts,
involving trillions of dollars, the cost of which, in terms of
taxation, infl ation and interest, will be felt for years to come.
Fortunately the main emerging economies are continuing to
grow, albeit at much reduced rates.
Whilst South Africa has also moved into recession, it is
fortunately in relatively good economic shape, with consumer
credit, infl ation and current account and fi scal defi cits expected
to reduce over time. For this we must compliment Government,
20
and in particular, Trevor Manuel, our past Minister of Finance,
Tito Mboweni, the Governor of the Reserve Bank and Errol Kruger,
the Registrar of Banks, who in contrast to their counterparts
in many developed economies, have maintained a disciplined
economy in general and in the banking sector in particular.
However, South Africa’s scourge of unemployment and violent
crime remains endemic, with the labour unions’ recent pyrrhic
victories exacerbating the situation for all South Africans.
As a large exporter of primary products, South Africa has been
badly affected by the sharp fall in commodity prices, which now
appears to be recovering. The fl ight of capital brought about
by the global credit crunch has caused a national liquidity
shortage, which is now starting to ease. However, the recovery
in the global economy remains fragile and another dip cannot
be ruled out.
THE BANKING INDUSTRYThe implosion of some of the world’s most illustrious banks and
fi nancial institutions in the fi nancial services sector is widely
expected to lead to a ‘back-to-basics’ approach. Banks worldwide
are focusing on strong capital ratios, prioritising solvency over
profi tability, cleaning up risky areas on group balance sheets
and installing appropriate buffers that stand up to stress testing.
Increased government intervention is likely to become a way of
life in the fi nancial sector. Regulators have become far more
mindful of the risks banks take and will be tempted to tighten
the screws considerably, particularly for those banks that are
deemed “too-big-to-fail”.
There has been a public outcry at the breaches of trust placed
in many of the world’s leading fi nancial institutions by the
investing public, inter alia for:
• investing client savings in questionable funds, on which
institutions had received generous management and
performance fees, justifi ed by their claims of due diligence
and sanitation, which, in hindsight was clearly lacking, and
• paying extraordinary performance bonuses to senior
executives, which encouraged a cavalier approach to risk
taking.
Swashbuckling fi nancial structuring is a thing of the past.
Banking has reverted to far more conservatism, which is vital for
the health of the entire economic system.
SASFIN’S PROSPECTSThe major banks have come to realise that to appropriately
manage their inherent risks, a management intensive service is
necessary for the small and medium sized commercial market.
For this market to be viable, increased pricing is necessary,
which improves the overall competitive position of Sasfi n’s
Business Banking division. Sasfi n’s Wealth Management division
also benefi ts from the general disillusionment with the larger
fi nancial institutions. The withdrawal from certain specialised
areas by larger banks represents great opportunity for smaller
more personalised fi nanciers, like Sasfi n.
With increased regulation, bank licences are becoming far more
onerous and expensive to maintain. The fl ip side of this is that
a bank licence now represents a huge barrier to entry, which
Sasfi n intends to leverage off more fully in future.
Sasfi n has:
• high capital adequacy and strong liquidity,
• a good reputation,
• a solid base of depositors,
• excellent management, staff and systems
• products that meet the needs of its target market, and
• an excellent client base.
Whilst Sasfi n recognises the need to improve in a number of its
functions, it is well placed to not only continue to weather the
storm, but to achieve strong growth, as and when the economy
turns.
CHAIRMAN’S REPORT CONTINUED
21A N N U A L R E P O R T 2 0 0 9
APPRECIATIONI extend my appreciation to my fellow directors and Sasfi n’s
management and staff, who have excelled themselves in diffi cult
conditions. In particular I would like to thank our executive
directors, Roland Sassoon and Malcolm Segal for their continued
valued contribution. I also thank our professional advisors, and
the SARB for their invaluable guidance, our valued clients for
their support and our shareholders for their faith in Sasfi n. I take
this opportunity of welcoming as the new Governor of the SARB,
Gill Marcus, who is so well qualifi ed to step into the very large
shoes to be left by her esteemed predecessor, Tito Mboweni.
It is my intention to retire as Chairman and director during the
course of the current year. I take this opportunity of thanking
my colleagues for their loyalty and support during the 22 years
of my chairmanship and of expressing my confi dence in their
ability to continue to take the Group to higher levels for the
benefi t of all its stakeholders.
I particularly commend Roland Sassoon on his achievements as
Chief Executive Offi cer during this period and wish him further
success.
Martin Glatt
Chairman
2 September 2009
CHAIRMAN’S REPORT CONTINUED

ROLAND SASSOON CHIEF EXECUTIVE OFFICER
22
23A N N U A L R E P O R T 2 0 0 9
CHIEF EXECUTIVE OFFICER’S REPORT
SASFIN’S TARGET MARKET Entrepreneurs have a pioneering spirit, with a propensity
to sail uncharted waters. This is often accompanied by a
lack of fi nancial sophistication, frustrating their ability to
secure appropriate fi nancial facilities. A proactive and highly
personalised relationship with a banking group that empathises
with their needs and understands their inherent risks is therefore
essential.
Sasfi n not only satisfi es these criteria, but is equipped to service
its growing base of corporate, business and private clients in this
target market, with its:
• entrepreneurial culture, having its origins as a textile merchant,
• dedicated and talented human resources,
• comprehensive range of banking and fi nancial products,
• state-of-the-art information technology,
• considerable fi nancial resources, and
• capable risk and credit management.
RESULTSGiven the sharp economic decline, Sasfi n produced satisfactory
results for the year under review. The Group achieved profi t for
the year of R189 million (2008: R184 million), whilst headline
earnings for the year under review decreased by 2% from
R156 million to R154 million, representing returns on ordinary
shareholders’ average equity of 25% (2008: 28%) and on total
average assets of 5% (2008: 6%).
DEVELOPMENTSDuring the year under review, the Group took the following
signifi cant steps:
• It negotiated, subject to various conditions, for the injection
of US$10 million each of Tier l and Tier ll capital from the
IFC. This follows the US$10 million bank guarantee that was
provided by the IFC last year. Apart from the increase in
capital adequacy and liquidity that this brings, having the
IFC as a partner has strategic signifi cance, in view of the
enormous infl uence in international fi nancial circles that the
IFC, as a member of the World Bank, wields.
• At fi nancial year end Sasfi n moved into its newly developed
premises in Waverley, with excellent modern facilities,
including best of breed infrastructure for banking storage,
security and business continuity. This new facility will enable
the Group to continue to expand strongly.
• Sasfi n has invested considerable human and fi nancial
resources in upgrading its IT systems, which is expected to
result in a signifi cant improvement in effi ciency.
• Sasfi n has refi ned its stress testing models in terms of Basel ll
in respect of capital adequacy as well as liquidity, which are
now continuously applied.
• Subsequent to the departure of the Group Managing Director,
the following signifi cant staff appointments were made:
– Malcolm Segal took on the added role of Group Financial
Director and, together with the Chief Executive Offi cer,
assumed the “four eye” responsibilities in terms of SARB
regulations.
– Maston Lane was promoted to Group Chief Operations
Offi cer
– Gavin Came was promoted to Head of Wealth Management
Division
These developments are all designed to open the way for Sasfi n’s
next expansion phase.
PROSPECTSThe banking industry is feeling the effects of the economic
contraction, in both volumes and credit losses, which are likely
to persist, albeit on a reduced scale, for most of the current
fi nancial year.
As the big banking groups shy away from Sasfi n’s target market
of small to medium sized businesses, Sasfi n expects to attract a
bigger share of this market. However, it should be emphasised
that, although Sasfi n has the capacity for strong growth, it will
remain very conservative in its lending activities during these
diffi cult times.
CAPITAL ADEQUACYOn 30 June 2009, the Group capital adequacy was 31% (2008:
28%), and that of the Bank 32% (2008: 22%), which is well above
the prescribed minimum requirement. With the injection of
capital by the IFC, the Group capital adequacy is expected to
increase to 36%, which will enable continued expansion.
24
OPERATING DIVISIONS:
BUSINESS BANKINGContribution to profi t for the year: 2009: R65,5 million
(2008: R61,4 million).
The Business Banking division houses the lending activities of the
Group.
EQUIPMENT RENTAL FINANCE UNIT
This unit fi nances offi ce automation and allied equipment through
operating rentals. By providing excellent service, this unit has
increased its market share and is benefi ting from improved
margins which have offset the increased costs of funding and
credit losses. This unit is confi dent of continuing to operate at
these enhanced levels.
BUSINESS FINANCE UNIT
This unit houses the Group’s trade, debtor and capital equipment
fi nancing activities. Resulting from the global credit crunch in
late 2008, this unit experienced a contraction in activity and a
rise in credit losses. The void of fi nancing available to SMEs has
opened up opportunities to grow this business at acceptable
margins and the pipeline of new applications for the current
fi nancial year is encouraging.
CAPITAL Contribution to profi t for the year: 2009: R28,1 million
(2008: R43,4 million).
Sasfi n Capital undertakes the Group’s proprietary private equity
and third party fund management activities and also houses the
Corporate Finance unit.
As might be expected in the current economic environment,
results for the year were down by 35% on the prior year.
PRIVATE EQUITY UNIT
Given the economic climate, the Group adopted a conservative
stance to this asset class and the focus of management was on
the performance of the existing portfolio investments as opposed
to originating and executing new investments.
Together with 3rd party funds, the Group has R238 million in
proprietary and managed private equity investments.
The mark to market revaluation surplus of the private equity
portfolios was adversely affected by:
• the general slowdown in economic conditions which
generally impacted on the trading performance of portfolio
companies,
• the downward adjustment of proxy price earnings multiples
of equivalent companies listed on the JSE by reference to
which the portfolios are valued, and
• the softening of the real estate market.
There has recently been evidence of a revival in the demand for
growth and development capital as entrepreneurs start to focus
beyond the immediate diffi cult trading conditions.
CORPORATE FINANCE UNIT
This unit provides merger and acquisition origination and
execution support services as well as the full range of JSE Sponsor
and AltX Designated Advisor services to a sizeable portfolio
of listed companies. It generally focuses on companies with a
market capitalisation of less than R5 billion and also provides
corporate advisory services to the Group.
The unit failed to achieve its budget for the year, mainly as a
result of delays caused by the economic slowdown.
The team has a good blend of youth and experience and is well
positioned in its target market and is thus expected to deliver
improved performance in the year ahead.
TREASURYContribution to profi t for the year: 2009: R60,5 million
(2008: R34,3 million)
This division undertakes the Group’s Domestic and International
treasury services.
DOMESTIC TREASURY
This unit manages the funding of the Group, which is mainly
through equity, including preference shares, securitisation,
deposits and interbank facilities.
Despite the effects of the global credit crisis, Group Treasury not
only refi nanced R702 million of securitisation notes falling due
in November 2008, but also issued an additional R198 million
of notes. This achievement is indicative of the outstanding
performance of the Group’s securitisation vehicle, as well as the
confi dence that the market has in it, which is the oldest active
securitisation vehicle in South Africa, having been incorporated
in 1991.
Whilst deposits declined by 20% during the year under review,
there are clear indications of a rise in deposits in the current
fi nancial year.
In line with developments in the banking industry since the
Global Credit Crunch, margins charged out to divisions on loans
have increased.
Future focus will be to broaden the depositor base by offering a
wider range of products to individuals and SME’s.
INTERNATIONAL TREASURY
The Bank, as an Authorised Foreign Exchange Dealer, provides a
full range of foreign exchange services through this unit.
CHIEF EXECUTIVE OFFICER’S REPORT CONTINUED
25A N N U A L R E P O R T 2 0 0 9
This unit was established to complement the Group’s modular
range of banking products and fi nancial services focused on the
needs of corporate, commercial and individual clients.
In order to facilitate import and export transactions for the
Group’s clients, the Bank offers spot and foreign exchange
contracts and related swaps, as well as Customer Foreign
Currency accounts, and advising of letters of credits anywhere in
the world, while individual clients can avail of the Bank’s ability
to transfer discretionary or foreign investment allowances in all
major currencies across the globe.
This unit went through a period of systems development, having
invested heavily in state of the art Treasury IT systems and is now
poised for solid growth.
WEALTH MANAGEMENTContribution to profi t for the year: 2009: R21,3 million
(2008: R32,9 million).
This division comprises SasSec’s domestic 120 year old stock
broking and portfolio management unit, the newly launched
asset management subsidiary, SAM and the Financial Advisory
and Asset Consulting units.
Apart from offering a full range of independent advisory
services through Sasfi n Financial Planning, SAM and Sasfi n
Asset Consultancy, Sasfi n now offers a range of unit trusts and
multi-managed Retirement Investment Funds, with assets now
comfortably exceeding R5 billion.
STOCK BROKING AND PORTFOLIO MANAGEMENT UNIT
The global credit crunch and consequent market collapse,
initially felt in the latter part of 2008, had an impact on SasSec,
with assets under administration down by 14% to end the year
at R25 billion.
During the year, the East London Branch of SasSec was sold to
a broad-based fi nancial consulting business, NVest Financial
Holdings Limited, in exchange for a 20% interest.
ASSET MANAGEMENT UNIT
The asset-managed products, previously housed elsewhere in this
division, are being transferred to SAM. These include the Sasfi n
Twenty Ten and Sasfi n Equity Funds, the Sasfi n International
Fund and the Group’s Managed Funds, as well as certain bespoke
portfolios managed for third party institutional clients. Two
additional funds, The Sasfi n Wealth Preserver Fund and the Sasfi n
Balanced Fund, were promoted for the fi rst time under the Sasfi n
banner. SAM also houses portfolios constructed specifi cally
for pension and provident fund assets. A focused team is now
dedicated to promote this growing range of retail and wholesale
funds.
FINANCIAL PLANNING UNIT
SFAS has maintained its client-facing focus by continuing to
appoint new planners which now number over 20. This business
grew its top line revenue by about 17% in diffi cult market
conditions. In a new development, planners from this unit are
now physically placed within all the divisions of Sasfi n, allowing
for a deeper focus on the joint promotion of the respective
services of each division. This unit is expected to steadily increase
its support for SAM and SasSec.
ASSET CONSULTING UNIT
Assets under mandate now exceed R4 billion. This unit is
benefi ting from the governance that is emerging from the roll
out of SAM and has in turn commenced placing a proportion of
its funds with SAM.
LOGISTICS AND RISK MANAGEMENTContribution to profi t for the year: 2009: R13,6 million
(2008: R12,4 million).
This division comprises the Group’s Freight Services, Healthcare
Consulting and Short-term Insurance Broking units.
FREIGHT SERVICES UNIT
The restructuring of Premier’s sales and marketing department
has been successfully completed, resulting in good growth
despite the economic slowdown.
Premier produced an excellent result and in fact achieved an
all time record in its 32 year history. Premier traded strongly
in the fi rst six months of its fi nancial year, with a slowdown in
the second six months, but still managed to produce a stellar
performance.
Management continues to focus strongly on cost containment
to ensure that Premier remains profi table during the economic
downturn, whilst being poised to take advantage when the
economy turns.
SHORT-TERM INSURANCE BROKING UNIT
The short-term insurance broking business that was housed in
Sasfi n Insurance Brokers (Pty) Limited is now a division of SFAS.
This operation, which was previously outsourced, is managed in
house and is on target and poised to grow signifi cantly as the
Group’s divisions continue to provide support.
HEALTHCARE CONSULTING UNIT
This unit continued to make a solid contribution especially since
its revenues are only marginally negatively affected by economic
downturns.
CHIEF EXECUTIVE OFFICER’S REPORT CONTINUED
26
CORPORATE SERVICES:
MARKETING AND BUSINESS DEVELOPMENTSasfi n’s marketing department is involved in articulating
the Group’s value offering to its staff, clients, shareholders,
stakeholders and the investment community at large, through
a strategic integrated communications-based programme. A
highlight in the past year’s marketing activities was a full-
scale communications programme for Sasfi n’s move to its new
premises in Johannesburg. The internal programme was aimed
at enthusing staff about the new move to mark a fresh start and
to ensure staff buy-in for a smooth relocation. The external leg
of the programme facilitated the introduction of clients, media
and external stakeholders to the new building and showcasing
its state of the art features.
The Group has strengthened its marketing strategy in line with
its theme of “Growth in Progress”. A new advertising agency
has been appointed to infuse Sasfi n’s corporate advertising
programme with a fresh creative strategy that will reinforce
the Group’s positioning as a growing contender in the fi nancial
services sector.
Sasfi n has also continued with a robust media relations campaign,
maintaining relationships with key journalists by keeping them
informed of major group announcements and newsworthy
activities. The Group continues to follow the strictest protocol
when engaging media, ensuring that information is accurate and
timeous and that media have full access to Sasfi n’s executive
management for direct comment.
Marketing support is also extended to the Group’s various
business units by packaging and promoting new products,
facilitating business development processes and brokering
stakeholder contact.
The marketing department continues to keep abreast of
emerging communication tools and technologies that will hone
the organisation’s ability to engage its internal and external
target audiences effectively.
INFORMATION TECHNOLOGY The past year was one fi lled with excitement and opportunity
in the technology arena. With a move to the new Head Offi ce,
it was opportune to start preparing and streamlining the
infrastructured environment to achieve uninterrupted services
during the move, and improved effi ciencies afterwards. Under
the auspices of the architecture team, the end of July 2009 saw
the IT environment in the Group migrate to the new data centre,
and running at even higher effi ciency and reliability than has
ever been the case.
With the pressures of the contracting economy worldwide
weighing heavily, Sasfi n’s Group IT has also been able to improve
levels of service, whilst spending less in the operations area than
projected. Furthermore, with the improved environment put in
place during the migration process, operating costs are forecast
to reduce in the coming fi nancial year.
FINANCE AND ADMINISTRATION During the year, this department was involved in major upgrades
necessary in terms of the Basel II Capital Accord, including a
working ICAAP model. It is responsible for Group accounting and
reporting, including statutory reporting to the SARB, with whom
it maintains open and constructive communication channels.
It is also responsible for Group administration. It continues to
discharge its responsibilities with integrity and effi ciency.
COMPLIANCEThis independent department, established and operational inter
alia in terms of Section 47 of the Banks Act and Regulation
49 of the Banking Regulations as well as other key regulatory
legislation covering the broader group, including FAIS, the
Securities Services Act and FICA, continues to act as a key
interface with the regulatory authorities and is an essential
component of the Group’s risk management framework. Further
details are provided in the expanded Compliance Report on
page 30.
GROUP INTERNAL AUDITGroup Internal Audit is an independent risk management
function, whose purpose and responsibilities are governed by
standards of the Institute of Internal Auditors. Its independence
is assured through its functional reporting to the Chairman of the
Group Audit and Compliance Committee, who is an independent
non-executive director of Sasfi n. The Head of Group Internal
Audit reports administratively to the Chief Executive Offi cer.
In the year under review, the audit methodology was brought
in line with international best practice, the staff skills capability
was strengthened and a new audit management system was
introduced to ensure consistency of the application of the audit
methodology.
RISK AND CREDIT Sasfi n’s credit and risk policies are well established, with
principles that have been tried and tested over many years within
the Group. Adherence to these policies are monitored by a Credit
Review Committee which meets monthly, and a Risk and Capital
Management Committee which meets quarterly, both of which
report to the Board with recommendations to ensure relevance
in an ever-changing fi nancial and regulatory environment.
Policies include set standards of presentation of credit proposals,
acceptable fi nancial criteria, delegated mandates, security
standards, review frequencies, risk monitoring and recovery of
accounts in default.
CHIEF EXECUTIVE OFFICER’S REPORT CONTINUED
27A N N U A L R E P O R T 2 0 0 9
Given the current tighter economic conditions, clients showing
early signs of fi nancial distress are closely monitored with a
view to taking swift action, by providing the necessary fi nancial
assistance where the risk remains acceptable, failing which, the
most effective exit strategy is planned and executed. Tools such
as asset and fi nancial audits, interim reviews and regular client
visits are used for this purpose.
Credit decisions are made by two or more credit managers
according to a delegated mandate structure, with all new facility
approvals being debated at daily credit meetings, which include
senior executive management.
Where Sasfi n is likely to incur a loss on a specifi c account, an
independent analysis is made of the events and circumstances
that led to this position, in order to gain full value from the
experience and to make any appropriate changes in policy.
HUMAN RESOURCESThe HR department provides comprehensive human resource
management services across the Group and serves as a strategic
partner alongside the various business units and departments,
facilitating employees’ commitment and success through
positive human relationships.
The Group’s transformation objectives are progressing in line
with targets. A mentorship programme has been developed
for talented employees from disadvantaged backgrounds,
in order to retain their talent, and help them achieve greater
levels of success within the organisation. All appointments are
made with due consideration being paid to employment equity
commitments.
Staff development and growth is continually enhanced and
employees are encouraged to pursue further education and
training, ranging from basic adult literacy programmes and
learnerships to post-graduate degrees. Formal learning is
complemented by on-the-job training.
Sasfi n’s study loan scheme enables employees to manage the cost
of higher education. Once more, the Workplace Skills Plans and
Implementation Reports met the requirements of the relevant
authorities, from whom a full rebate of Skills Development Levies
was received.
Performance management initiatives are well received within
the Group, where both management and employees benefi t from
regular feedback and review.
Employee Wellness remains a priority, with on-site consultants
being available to assist employees with their healthcare needs.
HIV training is provided to employees, and annual wellness
days are arranged for staff to avail themselves of free medical
screening.
Among the new initiatives introduced this past year, are the Cell
C Take-a-girl-child-to-work Day, the publication of a quarterly
HR newsletter and an induction video for all new employees.
The HR department remains sensitive to the needs of the Group’s
most important asset: its people, in achieving the Group’s
business objectives and helping them realise their personal
growth and career ambitions.
BLACK ECONOMIC EMPOWERMENTWhilst there is continuing uncertainty about the status of the
FSC, Sasfi n has consistently improved its scorecard and has again
been awarded an “A” rating for BEE by the FSC Council during
the year under review.
In order to maintain the impetus of the broad based BEE
imperative and monitor its compliance in this regard, Sasfi n has
established a Transformation committee.
APPRECIATIONI am grateful to each of Sasfi n’s dedicated and extremely
competent directors, general managers and staff members for
their wonderful service to the Group. In particular, I thank
Malcolm Segal, Maston Lane and Gavin Came for taking on
expanded roles in the Company.
I also thank Sasfi n’s clients for their loyalty and support, and our
professional advisors and the Registrar of Banks and his offi ce,
for their sound guidance.
I would like to pay tribute to Martin Glatt, who after 22 years
as our chairman, will be retiring. It was during the 1987 stock
exchange boom that Martin decided to back Sasfi n for a listing
on the Development Capital Market of its shares at 60 cents a
share. No sooner had the prospectuses been printed, the stock
market collapsed and we were faced with the prospect of an
aborted listing. Fortunately, Martin came to the rescue by taking
up a larger issue of shares. It is that level of commitment that
has characterised Martin’s involvement with the Company, for
which he will be sorely missed.
I look forward in the year ahead to further enhancing the
“win-win” relationships that exist with all Sasfi n’s stakeholders.
Roland Sassoon
Chief Executive Offi cer
2 September 2009
CHIEF EXECUTIVE OFFICER’S REPORT CONTINUED

28
INTRODUCTIONSasfi n’s risk management approach provides effective mechanisms to address the identifi cation, measurement and evaluation of actual and potential risk areas. This, combined with a balanced approach to risk, and keeping in mind our optimum levels of risk appetite, ensures that we retain our entrepreneurial drive and remain able to achieve our core strategic, operational, fi nancial and compliance objectives.
Risks can be described as the possibility that unforeseen future events could occur which could impact on the ability of the Group to achieve its desired objectives.
Failure to manage substantive risk effectively and in a timely manner can have severe consequences on business. Effective risk management therefore remains a key focus of management processes within Sasfi n and our risk management framework addresses such risks as credit, funding, liquidity and interest rate risks, market, business and operational risks which include pricing, market penetration, service levels, the security of our staff, HR risks, assets and information, business disruption, legal documentation or contractual risk, technology risk, settlement, payment and processing risk, reputational risk, fraud risk and compliance with regulatory and statutory requirements risks.
PHILOSOPHYThe business of banking and fi nancial services is conducted within an environment of complex interrelated risks. This has become even more applicable with the advent of the new regulations relating to banks, as amended for the Basel II Capital Accord, which has ushered in a more risk-sensitive approach to banking than any of its predecessors.
At Sasfi n, risk management is regarded as being one of our competitive advantages.
Our risk management programme supports the view that the management of risk is the responsibility of all, and Sasfi n proactively identifi es risk in delivering products and services to the market in an effi cient and cost effective manner. The programme also supports the analysis of problems from various angles, to identify not only the risk mitigation, but also to anticipate and act on potential opportunities – thereby challenging conventional wisdom and creating better solutions.
STRUCTURERisk is managed and monitored in accordance with the risk management framework of the board of directors, board committees, executive and operational management, compliance offi cers and the risk management functions of the operational units.
The risk management framework is designed to ensure:
• the detection and minimisation of signifi cant risks;• the reliability of fi nancial information;• the reliability and integrity of operational processes; and• compliance with statutory and regulatory requirements.
Sasfi n employs three lines of defence. The fi rst line of defence
includes the internal controls management has implemented in
business. The second and third lines of defence are the Group
Risk and Group Internal Audit Departments, respectively.
Sasfi n has also applied an integrated approach to risk
management. Group Internal Audit is able to utilise the risk
assessment performed by Group Risk, in order to risk-rate their
audits. In doing so, the Internal Audit function provides the
board and management with an independent assessment of the
effectiveness of the risk management processes within the Group.
The risk management responsibilities are carried by the following
key committees:
• Boards of directors
• Group executive
• Directors’ Affairs (Corporate Governance)
• Directors’ Strategy and Review
• Asset and Liability
• Risk and Capital Management
• Credit Review
• Group and subsidiaries’ Audit and Compliance
• Information Technology Steering
• Human Resources and Remuneration
• Group Strategy
ENTERPRISE RISK MANAGEMENT (ERM)ERM is a process implemented by an entity’s board of directors,
management and other personnel and is applied in strategy
setting across the enterprise. It is designed to identify potential
events that may affect the entity and to manage risks remaining
within its risk appetite to provide reasonable assurance regarding
the achievement of entity objectives.
Sasfi n’s ERM, which has been rolled out across the organisation,
supports the Basel ll Capital Accord imperatives relative to the
determination and alignment of strategic objectives, capital
requirements and risk management. The requirements of Basel II
have also been incorporated into the Regulations to the Banks
Act 94 of 1990. Sasfi n also subscribes to the COSO Enterprise
Risk Management Framework, which is then integrated with the
requirements of the Basel II Capital Accord and the Regulations
to the Banks Act.
Capital requirements are calculated using a risk-sensitive
approach. The management of capital and capital adequacy is
detailed in note 37 to the Financial Statements.
Sasfi n’s approach to the management of key risk areas is as
follows:
CREDIT RISK
Represents the risk of loss incurred directly by providing credit
or indirectly by assuming a fi nancial obligation or by becoming
exposed to counterparty failure.
RISK MANAGEMENT REPORT
29A N N U A L R E P O R T 2 0 0 9
Credit risk exists in both on- and off-balance sheet exposures and may arise from the non-performance by a borrower, counterparty or an issuer such as a securities fi rm.
Credit risk management processes are governed by the Group’s credit policy guidelines. These guidelines are reviewed regularly and any amendments thereto are subject to the evaluation and approval of the Credit Review committee. Facilities granted to counterparties are governed by internal and prudential limits, which restrict large exposures relative to the Group’s capital.
Credit facilities are approved within the credit mandate structure.
Large facilities are ratifi ed by the Credit Review committee, with facilities above R18 million requiring approval by the Group board of directors.
Counterparty creditworthiness is evaluated in terms of policy guidelines and limits are set before credit is granted.
Risk mitigation includes:
Trade Finance Various types of collateral are obtained to secure the exposure but the primary security is usually Notarial Bonds over movables, and ownership over goods fi nanced.
Debtor Finance Various types of collateral are obtained to secure the exposure but the primary security is usually the receivables purchased.
Equipment Finance The primary security is the asset being fi nanced.
The impairment policy of the Group is conservative and satisfi es regulatory requirements.
LIQUIDITY RISKThe risk arising from the potential inability of the Group to accommodate decreases in liabilities or to fund increases in assets in full, at the right time, place and currency.
This area of risk is closely monitored by the Asset and Liability committee and is managed according to the policies of the committee and in accordance with the following process:
• maintenance of balance sheet liquidity ratios• assessment of depositor concentration in terms of the overall
funding mix• ensuring an adequate portfolio of marketable assets and
short term investments, and• liquidity contingency plans relevant to changing needs.
INTEREST RATE RISKRepresents the risk that fl uctuating interest rates could unfavourably affect the Group’s earnings and the value of its assets, liabilities and/or capital.
This area of risk is closely monitored by the Asset and Liability committee, which approves the policies and limits for the management of interest rate risk and monitors these exposures and the effectiveness of the risk management processes.
Group Treasury’s responsibility is to establish and maintain an interest rate risk management framework and to recommend appropriate risk limits.
MARKET RISKRepresents the risk of loss due to adverse movements in the market, for example, where interest rates rise because of changes in such factors as exchange rates, infl ation and market liquidity. Sasfi n does not enter into Proprietary Trading.
Approach:
• The board of directors grants general authority to undertake market risk. Limits are set for individual business units to contain losses within specifi ed limits in the event of adverse market movements.
• Prospective investments require formal authorisation and have to undergo deal sanctioning. Market risk from investments is managed in accordance with its purpose and strategic benefi t. Periodic reviews and reassessments are undertaken.
• Limited foreign exchange risk arises due to the low value of such transactions. It is Group policy not to have any material uncovered foreign exchange transactions.
OPERATIONAL RISKRepresents the risk of loss resulting from inadequate or failed internal processes, people and systems and/or from external events. Operational risk incorporates legal risk and excludes strategic risk.
Operational risk includes, amongst others, the potential for loss arising from fl aws or malfunctioning in automated systems, business continuity planning, failures in internal fi nancial and administrative controls and non-compliance with Group policies and procedures.
Control mechanisms have been established within the different divisions to manage operational risk. Divisional management apply their specialised knowledge of the markets in which they operate to fi ne-tune their risk control procedures and systems of internal control. Losses arising from Operational risk are tracked on a regular basis.
RISK MANAGEMENT REPORT CONTINUED
30
The Group’s independent compliance function has been established, inter alia, in terms of Section 47 of the Banks Act and Regulation 49 of the Banking Regulations as well as in terms of other key regulatory legislation applicable to the Group as a whole, including FAIS, the Securities Services Act, FICA and the NCA. It thus operates in terms of the overall applicable legislative and regulatory framework. The objective of the function is to ensure that Sasfi n continuously manages its regulatory and supervisory risks and complies with applicable laws, regulations and supervisory requirements. At the strategic level, Sasfi n sees compliance as a tool supporting an effective level of corporate governance within the organisation. Operational policy documents and procedure manuals are regularly reviewed by the compliance department which provides both legal and regulatory support to the Group.
Over the last few years, Sasfi n has been faced with a veritable raft of new regulation and regulatory changes, which has placed considerable additional pressure on banks, and indeed their clients, to ensure that Sasfi n satisfi es the demands of the regulatory environment. Arguably, this increased workload has had a disproportionate impact on smaller banks.
Sasfi n’s compliance function operates independently from the overall risk management function and internal audit function, which have themselves been bolstered to facilitate the additional responsibilities arising from the implementation of Basel ll and the increasingly sophisticated legal environment. This structure supports best practice principles and has strengthened Sasfi n management of Risk, Internal Audit and Compliance.
FICA, in particular, imposes onerous requirements relative to the identifi cation of clients and the reporting of suspicious transactions. As at June 2009, Sasfi n has managed to achieve a compliance level of 99,5%. All remaining accounts have been frozen in accordance with the regulations. During the past year, the Financial Advisory Task Force, an intergovernmental body which sets international anti-money laundering and counter-terrorism policies, conducted its fi ve-yearly country review of South Africa and made a number of recommendations. As a result thereof, substantial changes to FICA are anticipated, which ought to enhance the effectiveness of the anti-money laundering process.
The Compliance division also oversees and monitors the process of transformation within Sasfi n. This process is guided by the provisions of the FSC. The FSC came into being in January 2004, following a Nedlac Financial Sector Summit. The FSC was more recently gazetted as a sector code in terms of section 12 of the Broad Based Black Economic Empowerment Act but as a result of the inability of all stakeholders to agree on the alignment process with the generic codes, has not yet been ratifi ed in terms of section 9 of the Act. This process has been dogged by disagreements between the various stakeholders which have not as yet been resolved. This, however, does not detract from the key objectives of the Charter which commit the fi nancial sector to “actively promoting a transformed, vibrant and globally
competitive fi nancial sector that refl ects the demographics
of South Africa, and contributes to the establishment of an
equitable society by effectively providing accessible fi nancial
services to black people and by directing investment into
targeted sectors of the economy.”
Sasfi n has submitted its report to the FSC Council in the year
under review and is pleased to have retained its “A” rating
with an improved score of 89,36%. It has substantially met the
targets in respect of the key pillars of ownership and control,
procurement, access to fi nancial services, corporate social
investment and enterprise development.
The ongoing expansion of the number of services and products
offered by Sasfi n do increase the burden of compliance, as these
products are almost always subjected to regulation. In particular,
the expansion of Sasfi n’s foreign exchange department and the
increased number and complexity of wealth management related
products pose a continual challenge to the compliance division.
Sasfi n is registered as an authorised credit provider in terms of
the NCA. Whilst the regulatory framework surrounding the NCA
is indeed onerous, it is to be noted that the NCA is primarily
aimed at the protection of the individual consumer, who is not
part of Sasfi n’s target market. Unlike the retail banks, Sasfi n has
not experienced any adverse impact on the demand for credit
placed upon it as a result of the NCA. Likewise the recently
enacted Consumer Protection Bill although likely to create an
additional compliance burden, is not expected to materially
impact on Sasfi n’s target market.
The new Companies Act constitutes a comprehensive overhaul of
the Company Law legislative framework. Sasfi n is actively taking
steps to adjust to the new corporate environment which will
be created once the Act comes into operation. The compliance
division continues to monitor the legislative environment
and ensures that line management complies with all laws and
regulations as part of their normal operational duties.
GENERALIn terms of Regulation 39 of the Banks Act, the Bank’s board
of directors is required to report to the Registrar of Banks on
the effectiveness of the system of internal controls relating to
fi nancial and regulatory reporting and their compliance with the
Banks Act and Regulations.
To the best of their knowledge, the relevant boards of directors
are of the opinion that there are no indications of any material
breakdown in the functioning of these controls, procedures and
systems, during the period under review.
While the cost of compliance is increasing in parallel with
the escalating regulatory load, Sasfi n believes that a rigorous
compliance regime is essential to the future well being and
strategic development of the Group.
COMPLIANCE REPORT
31A N N U A L R E P O R T 2 0 0 9
Sasfi n prides itself on being a good corporate citizen, recognising
that effective corporate governance practices are essential to
achieving and maintaining trust and confi dence in both the
organisation and the banking system as a whole. Sasfi n actively
manages its corporate governance through the relationships
between management, the boards of directors, shareholders and
other stakeholders. To this end, Sasfi n endorses the principles
incorporated in the Code of Corporate Practices and Conduct as
set out in the King II Report which forms the basis upon which the
Group’s commitment to sound corporate governance is pursued.
Sasfi n also endorses the FSC in order to raise the skills and fully
incorporate the enormous talent of the previously disadvantaged
members of the South African society. The various committees
of the boards of directors are charged with monitoring and
evaluating conformity with the provisions of these requirements,
as well as the International Financial Reporting Standards, the JSE
Listings Requirements, the Banks Act and all the other statutes
and regulations to which the Group is bound to ensure integrity,
accountability, transparency and equal opportunity in the
conduct of the Group’s various business enterprises.
REGULATORY ENVIRONMENTGiven the important fi nancial intermediation role of banks
in a sophisticated economy, their high degree of sensitivity
to potential diffi culties arising from ineffective corporate
governance and the need to safeguard depositors’ funds,
corporate governance for banking organisations is of
great importance to both local and international fi nancial
systems and merits targeted supervisory guidance. This is
particularly so in the wake of the international liquidity crisis
which vividly exposed the effects of poor governance in other
jurisdictions.
The SARB, through its Bank Supervision Department, carries
the responsibility for ensuring that a sound and well-regulated
banking system exists in South Africa and that prudent risk
management practices are embedded within the banking
environment. The directors of a bank are required in terms of
the Banks Act to report annually to the Registrar of Banks on
the effi cacy of the systems of internal control and to provide
reasonable assurance as to the integrity and reliability of the
fi nancial statements, as well as on Corporate Governance.
Additionally, the directors are required to safeguard, verify and
maintain accountability for the Bank’s assets.
• Sasfi n is committed to adherence to and application of high
standards of corporate governance. The senior management
and boards of directors of Sasfi n take their responsibilities to
ensuring effective corporate governance seriously.
• Sasfi n, from time to time reviews its corporate governance
to ensure compliance with accepted corporate-governance
principles.
• Sasfi n is mindful that it operates on the basis of continuous
improvement, especially given the ever evolving governance
standards in South Africa and internationally.
Sasfi n has a compliance programme, which is under the control
of a General Manager who reports to the Chief Executive Offi cer
and who has unrestricted access to the Chairman of the Audit
and Compliance committee. The JSE regulates the activities of
SasSec. Sasfi n Bank and SFAS also fall under the regulatory arm
of the Financial Services Board. The Compliance department
allocates full time resources to both SasSec and SFAS who ensure
that appropriate standards are maintained.
The directors bear responsibility for setting and maintaining the
Group’s systems of internal controls and protecting its assets
and earnings against material fi nancial loss. They are committed
to discharging these responsibilities as cost-effectively as
possible. Business risks are assessed on an ongoing basis and
risk management procedures are modifi ed and implemented
as needed. The Group has a comprehensive reporting system,
which is monitored and reviewed monthly by management and
the directors. The system facilitates budgetary control, provides
reasonable assurance as to the accuracy of fi nancial statements
and safeguards the Group’s assets.
THE KING II CODE OF CORPORATE PRACTICES AND CONDUCTThe boards of directors of companies in the Group are committed
to maintaining the standards of integrity and openness detailed
in the Code of Corporate Practices and Conduct recommended in
the King Report on Corporate Governance. Sasfi n adheres both
to the specifi ed provisions of the King Code and to its underlying
principles of fairness, transparency, accountability, social
responsibility and environmental consciousness. The Group is
committed to meeting the exacting governance standards which
are anticipated in the King III report.
THE BOARDS OF DIRECTORSThe responsibilities of the Group’s boards of directors include
reviewing and guiding corporate strategy, risk propensity,
budgets and business plans. These boards meet regularly to
monitor executive management and thereby retain full and
effective control over their operations. The Chairpersons of
the Company, the Bank and its main subsidiaries, are all non-
executive directors. These boards include non-executive directors
of suffi cient calibre, experience and number for their views
to carry signifi cant weight in business decisions. The various
boards are responsible for setting policy, monitoring corporate
performance and overseeing major capital expenditure. Where
necessary, independent professional advice is canvassed. The
company secretary ensures that statutory and other procedures
are followed.
CORPORATE GOVERNANCE REPORT
32
SASFIN HOLDINGS LIMITED AND SASFIN BANK LIMITED BOARD CHARTERThe boards subscribe to good corporate governance and strive to
be effective in lending and controlling the companies. As a bank-
controlling company or bank, the boards recognise that they are
bound by the Banks Act and as such, consist of both executive
and non-executive directors (including independent directors)
to the extent appropriate in terms of that Act. The concept of
a unitary board, consisting of executive directors, with their
intimate knowledge of the business, and non-executive directors
who can bring a broader view to the Company’s activities,
particularly those who have intimate knowledge of banking
and fi nancial service industries, remains the favoured board
structure. Management of business risk and the exercise of
commercial judgement are the essence of this mutual association
and exchange of business experience and knowledge. The boards
accept they have a collective responsibility to provide effective
corporate governance that involves a set of relationships
between management, the boards, shareowners and other
relevant stakeholders, in a manner whereby the boards:
• determine the entity’s purpose and values,
• determine the strategies to achieve the entity’s purpose (that
is, its strategic intent and objectives as a business enterprise)
and to implement its values (that is, its organisational
behaviour and norms to achieve its purpose) in order to
ensure that it survives and thrives,
• exercise leadership, enterprise, integrity and judgement in
directing the entity so as to achieve its continuing prosperity,
• ensure that procedures and practices are in place that
protect the entity’s assets and reputation,
• monitor and evaluate the implementation of strategies,
policies, management performance criteria and business
plans,
• ensure compliance with all relevant laws, regulations and
codes of best business practice,
• ensure that technology and systems used are adequate to
run the business properly and for it to compete through the
effi cient use of its assets, processes and human resources,
• identify key risk areas and key performance indicators
in order to generate economic profi t, so as to enhance
shareowner value in the long term and recognise the wider
interests of society,
• regularly assess performance and effectiveness as a whole,
and that of individual directors, including the Chief Executive
Offi cer, and
• ensure that the entity has developed a succession plan for its
exe cutive directors and senior management.
The boards strive to focus on performance in directing the
commercial and economic fortunes of the entity, and not only
concentrate on issues of conformance. The boards recognise
that enterprise is the disposition to engage in undertakings of
risk and are constituted in a manner that provides a balance
between enterprise and control. All directors recognise that
absolute integrity is necessary to meet their onerous obligations
and responsibilities.
The boards comprise a balance of executive and non-executive
directors, with a majority of non-executive directors, of whom
suffi cient are independent of management for minority interests
to be protected, and conform to the “four-eyes” principle as
required by the South African Reserve Bank. The boards also take
cognisance of gender and racial mix.
The boards are selected from individuals of integrity from a broad
range of backgrounds, who can bring a blend of knowledge,
skills, objectivity, experience and commitment to the board
under the fi rm and objective leadership of a chairperson, who
is an independent non-executive director, and who accept the
responsibilities and duties that the post entails and who provides
the direction necessary for effective boards. Non-executive
directors are appointed for a three-year period and are not
automatically re-appointed.
The boards strive to exercise objective judgement on the
corporate affairs of the business enterprise, independent from
management and insist on suffi cient management information
to enable a proper and objective assessment to be made by
the directors collectively. The boards guide and set the pace
of the entity’s operations and future developments. In so
doing, the boards regularly review and evaluate the present
and future strengths, weaknesses and opportunities of, and
threats to the entity. Comparisons with competitors, locally and
internationally, and best practice are major ingredients in this
process – especially in the era of the global economy and the
rapid transmission of information electronically.
The boards recognise that transactions between the entity and
its managers, directors or large or dominant shareowners are
rife with potential confl icts of interest. The personal interests of
directors or persons closely associated with the director do not
take precedence over those of the entity and its shareowners. All
directors avoid confl icts of interest, even where these can only
be perceived to exist. Full and timely disclosure of any confl ict,
or potential confl ict, is made known to the board. Where
an actual or potential confl ict does arise, on declaring their
interest, a director may participate in the debate and/or vote
on the matter, but must give careful consideration to his/her
integrity in such circumstances and the potential consequences
it may have for the board, the entity and themselves personally,
but in any major issue are expected to recuse themselves.
Any director with a substantial interest in the entity, such as
a major shareowner, is expected to recognise the potential
for a confl ict of interest and accept that his/her primary
duty and responsibility is to always act in the interests of the
CORPORATE GOVERNANCE REPORT CONTINUED

33A N N U A L R E P O R T 2 0 0 9
entity. The boards, in motivating management and employees
effectively and productively, promote a culture that supports
enterprise and innovation with appropriate short- and long-
term performance related rewards that are fair and achievable.
The boards seek to drive the business enterprise profi ciently
through proper and considered decision-making processes, and
recognise entrepreneurial endeavour amongst its management
without contravening laws and regulations. However, prudent
risk management is the essence of all decision making.
The boards recognise that companies do not act independently
from the societies in which they operate. Accordingly, corporate
actions are compatible with societal objectives concerning social
cohesion, individual welfare and equal opportunities for all. At
times, however, a trade-off is considered between short-term
social costs and decisions that derive longer term benefi ts for
the entity and thereby those having an interest in it.
The boards determine a policy for the frequency, purpose,
conduct and duration of its meetings and those of its formally
established committees. It also adopts effi cient and timely
methods for informing and briefi ng board members before
meetings. The information needs of the board must be well
defi ned and regularly monitored. Each member is allowed to
play a full and constructive role in the boards’ affairs and has a
responsibility to be satisfi ed that the board has been furnished
with all the relevant information before making a decision.
The boards meet at least once a quarter and more frequently
if necessary, and make use of board-appointed committees to
assist the managing of the business on a more frequent basis.
Minutes of these meetings are circulated to all board members.
BOARD COMMITTEESThe boards have established the following committees and
ensure that each committee (other than Executive Management)
is chaired by a non-executive director and has a membership
of a majority of non-executive directors, except for the Credit
Review committee, as large exposures are agreed by the boards:
• Bank Audit and Compliance
• Executive Management
• Risk and Capital Management
• Directors’ Affairs
• Human Resources and Remuneration
• Directors’ Strategy and Review
• Asset and Liability
• Information Technology Steering
• Credit Review
• Transformation
These committees conform to statutory requirements, where
applicable. Further management committees, as required, are
approved by the boards.
The boards defi ne their own levels of materiality, reserving
specifi c powers to them and delegating other matters to the
committees and management with the necessary written
authority. Any such delegations by the boards have due regard
for the directors’ statutory and fi duciary responsibilities to the
Group/Bank, while taking into account strategic and operational
effectiveness and effi ciencies.
The strategies, policies, mutually agreed management
performance criteria and business plans of the the entities are
clearly defi ned and reliable measurements have been put in
place. The directors implement a risk framework which ensures
comprehensive assessments against accurate and relevant
fi nancial and non-fi nancial information, as appropriate, and which
are obtainable from the Group’s own internal reporting systems
as well as from external sources, so that an informed assessment
can be made of all issues facing the boards. Accordingly, the
boards ensure that internal control procedures provide reliable
and valid information for monitoring and evaluation. The internal
controls include not only fi nancial matters, but also operational
and compliance controls and management of the business risks
associated with the entity.
NON-EXECUTIVE DIRECTORSIn addition to two executive directors and a non-executive
Chairman, the boards consist of a further fi ve independent non-
executive directors. Non-executive directors offer independent
judgement to management and, other than their fees, and in
some cases shareholdings, there are no extraneous factors that
might materially infl uence their judgement. If there is an actual
or potential confl ict of interest, the non-executive directors
concerned are excused from the related decision-making
process. The non-executive directors’ fees are market related and
refl ect their committed time and levels of responsibility. There is
a policy for the appointment of directors. Such appointments
are transparent and a matter of the board as a whole. Non-
executive directors are selected through a formal process and
when new non-executive directors are appointed by existing
directors, such appointments require confi rmation at the next
Annual General Meeting. Non-executive directors are appointed
for specifi c terms and their re-appointment is not automatic.
EXECUTIVE DIRECTORSThere are two executive directors on the board of the Company
and the Bank, namely, the Chief Executive Offi cer and the
Financial Director, who is also responsible for Sasfi n Capital.
A clear demarcation exists between the executive functions
of these directors and the functions of the non-executive
Chairman of the two main boards. The boards’ Human Resources
and Remuneration committee determines the emoluments and
perquisites of executive directors.
CORPORATE GOVERNANCE REPORT CONTINUED

34
THE GROUP AUDIT AND COMPLIANCE COMMITTEEThe Group Audit and Compliance committee is chaired by an independent non-executive director, Mr ETB Blight, and includes a further two independent non-executive directors.
The executive directors, the Group Chief Finance Offi cer, the Chief Operating Offi cer and the general managers, Compliance, the Internal Auditor and the External Auditors attend the committee by invitation and have unrestricted access to the committee Chairman.
With the agreement of SARB, the mandate of the committee has been expanded to cover compliance matters over and above the following responsibilities:
• ensuring the effectiveness of the systems of internal control• ensuring that appropriate systems exist to validate the
integrity of the accounting and fi nancial systems• assessing the effectiveness of the internal audit, risk and
compliance functions, and• reviewing the scope and quality of the external audit.
The committee sets principles for recommending the use of external auditors for non-audit services.
This committee also reviews any internal matters raised in the key risk committees mentioned in the Risk Management section of this document. In addition, SasSec, SFAS and Premier also have Audit committees which report into the Group Audit and Compliance committee.
The committee is satisfi ed that the fi nancial director has the appropriate expertise and experience to fulfi l his function.
INTERNAL AUDITThe Internal Audit function reports directly to the CEO. The Chairman of the Audit and Compliance committee meets separately with the Internal Auditor on a monthly basis, and with the External Auditors on a quarterly basis. In addition, the Internal Auditor has direct access to the Chairman of the Group Audit and Compliance committee should the need arise.
Internal Audit is an independent, objective assurance and consulting activity designed to add value and improve an organisation’s operations.
It helps an organisation accomplish its objectives by bringing a systematic, disciplined approach to evaluate and improve the effectiveness of risk management, control and governance processes.
The Sasfi n Internal Audit function utilises risk based audit methodologies and standards that are consistent with the Standards for the Professional Practice of Internal Auditing as advocated by the Institute of Internal Auditors.
This department has performed effectively over the past 12 months and we are satisfi ed that they add signifi cant value to the Group.
GROUP RISK AND CAPITAL MANAGEMENT COMMITTEEThe Group Risk and Capital Management committee is chaired by an independent non-executive director, Mr NA Axten, and also includes a further independent non-executive director and the
Chief Executive Offi cer.
CORPORATE GOVERNANCE REPORT CONTINUED
The record of attendance at board and committee meetings for the Sasfi n Group for 2009 is as follows:
Group Group Human Risk Resources Group and Directors’ Sasfi n Sasfi n and Audit Capital Asset Strategy Holdings Bank Remune- and Com- Manage- Credit and IT Directors’ and Trans- Limited Limited ration pliance ment Review Liability Steering Affairs Review formation board board committee committee committee committee committee committee committee committee committee
Meetings planned 4 4 2 4 7 9 11 4 4 7 4Meetings held 5 5 4 5 7 12 14 4 4 6 4
DIRECTORSCN Axten 4 4 – 5 7 11 12 – 4 6 –ETB Blight 5 5 – 5 7 4*. 14 4 4 6 –MB Glatt 5 5 4 – – – – – 3 6 –AW Greenstein 3 4 – – – – 5 1 – 3 2DD Mokgatle 5 5 – 2 – 11 13 – 4 – 4MS Rylands 5 5 4 5 – 1 14 4 1 – –RDEB Sassoon 5 5 4 4 7 12 14 4 4 6 4M Segal 5 5 2 5 2 5 8 – 3 4 1ML Smith 5 4 – – – – – – 4 – 4
*Attends meetings on a quarterly basis only.
Where no attendance is recorded, the director concerned is not a committee member.
AW Greenstein resigned on 3 December 2008.
35A N N U A L R E P O R T 2 0 0 9
DIRECTORS’ AFFAIRS COMMITTEE (CORPORATE GOVERNANCE)The Directors’ Affairs committee is chaired by a non-executive
director and includes a further three independent non-
executive directors. Boards and board committees all undertake
a self-assessment annually in order to ensure high governance
standards.
The Group Executive Management committee consists of both
executive directors and senior management, and by invitation,
the board Chairman and two independent non-executive
directors. These meetings enhance transparency and good
corporate governance, share information, and signifi cantly
enhance good corporate governance and understanding of the
business.
In addition to the above, the Company’s board has appointed
independent non-executive directors to the following boards/
committees, which meet at appropriate intervals:
• Sasfi n Financial Services (Pty) Limited
• Sasfi n Securities (Pty) Limited
• Sasfi n Financial Advisory Services (Pty) Limited
• Subsidiary Audit committees
• Sasfi n Asset Managers (Pty) Limited
• Premier Freight (Pty) Limited
HUMAN RESOURCES AND REMUNERATION COMMITTEEDue to the size of the organisation, the Group has a combined HR
and Remuneration committee, which is chaired by Mr MB Glatt,
and which includes the functions of a Nomination committee
and which functions as a single committee of the Company and
the Bank boards respectively:
• The committee assists the board in providing management
with guidance on the adequacy and effi ciency of
remuneration and HR policies, procedures and practices that
are applied within the Group.
• These policies, amongst others, cover the following aspects:
– conditions of and remuneration for the appointment of
both executive and non-executive directors (the Directors’
Affairs committee attends to appointments, performance
and succession plans for positions in this category);
– conditions of and remuneration for appointment of senior
management; and
– guidelines for the appointment of other management and
personnel.
• Comprehensive HR policies, which include those matters
dealt with in the FSC related to black empowerment and
employment equity.
• Comprehensive procedures which ensure compliance with
laws and regulatory requirements and which ensure that
structures are in place which enable agreed policies to be
carried out effectively in:
– Empowerment,
– Staff training and development,
– Promotions,
– Identifi cation of key people,
– Succession planning of key posts below executive director
level,
– Performance reviews, salary and commission payments
– Disciplinary hearings and employment termination,
– Recruitment, and
– Employment equity.
The committee consists of two non-executive directors (one as
Chairman, Mr MB Glatt) and an executive director, for a period
concurrent with their term of appointment to the board of
directors.
Directors’ emoluments, interests and share options are shown on
pages 41 and 42.
CORPORATE GOVERNANCE REPORT CONTINUED
36
INTRODUCTIONSasfi n is acutely aware of the role of business in society. It
has therefore embraced business ethics within integrated
sustainability reporting by adopting the “triple bottom line”
sustainability reporting relating to the environment, society and
the economy. Many of the issues arising from the adoption of the
sustainability reporting structure has been incorporated into the
FSC. As a responsible corporate citizen, a regulated institution
and a signatory to the FSC, Sasfi n is committed to implementing
the requisite practices and policies throughout the organisation
in a meaningful and appropriate way for the long-term benefi t of
the Group, its various stakeholder groupings, the environment
and the community in which it exists.
The South African banking and fi nancial services sector is
dominated by a few very large entities. Although Sasfi n’s scale
of operations is considerably smaller than most of its peers, it
has nevertheless achieved much and is proud of what it has
achieved in the context of corporate social investment and
sustainability. It has a long history of positive interaction with
the wider community which has always positively refl ected the
moral conscience of the Group.
The Group is committed to creating and developing and creating
social capital through informal networks, accumulated know-
how and trust that make Sasfi n effective. This is the product of
many interrelated policies and practices.
SHAREHOLDERSSasfi n has historically adopted a policy of transparency in relation
to both formal and informal shareholder communication, as
well as interfacing with potential shareholders, analysts and the
media. Sasfi n consistently strives to improve its annual report
and make it more user-friendly and meaningful. Sasfi n complies
with the enhanced public disclosure standards required in terms
of Regulation 43 of the Banking Regulations. These regulations
incorporate the objectives of Pillar 3 of Basel II which encourages
market discipline by ensuring that all market participants are
provided with extensive information on risk profi les and capital
positions. It discloses material and relevant information to the
public on a quarterly, semi-annual and annual basis. However,
Sasfi n does not limit its shareholder communication to its
formal reporting obligations. Sasfi n has an investor relations
programme. It also has in place a regular programme of media
intervention, where it seeks to develop closer relationships
with media members and to assist them in understanding and
appreciating the nuances of the Group. Within the parameters
of the applicable regulations, the Group’s Chief Executive Offi cer
regularly responds to approaches from shareholders, the media,
fi nancial analysts and other interested parties for information
about the Group and its operations.
The Group continues to work on improving its segmental
reporting and on creating an accurate picture of its sources of
business, capital and cost allocations amongst business units
and the viability of each business unit within the context of the
overall Group. This should help to further explain the Group’s
performance to investors.
Sasfi n also adheres to the Promotion of Access to Information
Act (2 of 2000) and maintains a comprehensive manual to give
effect to these responsibilities.
CLIENTSSasfi n, as a banking and fi nancial services group, attracts a diverse
range of clients across its business units. Sasfi n services both
companies and individuals through its specialist banking and
fi nancial service activities. Sasfi n’s core trade fi nance facilities
have been offered to clients for more than a quarter of a century
and its stock broking and portfolio management activities for
more than a century. Sasfi n recognises the diversity of its target
markets and the different requirements of its client bases, while
at the same time employing strategies to enhance its cross-sell
ratio and to retain and attract new clients. Sasfi n’s client base
refl ects the demographics of South Africa, particularly with
regard to credit extension within the SME sector.
Historically, Sasfi n has focused on the SME market in terms of
its core lending activities and on the high net worth individual
market in terms of its wealth management activities. It sees a
virtual circle between the two, with HNWI’s providing a steady
and reliable source of funding for the bank’s lending activities.
This circle has expanded and broadened signifi cantly over the
past year.
Sasfi n considers itself a specialist in its target markets, which
are growth areas in which Sasfi n will continue to participate.
Sasfi n is committed to facilitating the growth of the SME sector
which is an essential component of the South African economy
and which must fl ourish if South Africa is to achieve the
growth targets required to reduce unemployment and alleviate
poverty. Sasfi n is proud to focus on this vital sector, which is not
adequately catered for by the big banks.
Sasfi n has consistently been able to broaden its range of products
and services and thereby embrace the wider needs of its markets.
Sasfi n has regular client interactions, including a monthly Asset
Management Forum at which investment issues are profi led,
a businesspersons’ networking club (held approximately
every six weeks), client lunches and cocktail functions, client
visits undertaken by senior management and regular client
newsletters. These interactions are designed not only to raise
awareness of Sasfi n in the community, but also serve to educate
clients and improve the overall standard of business in the wider
community.
Sasfi n works on various targeted educational initiatives and
sponsors a television programme, on CNBC Africa – known as
African Entrepreneur which is aimed at educating the public
SUSTAINABILITY REPORT
37A N N U A L R E P O R T 2 0 0 9
at large throughout the continent on commercial and fi nancial
matters. It also sponsors a grow your business course offered
by the Wits Business School and a Junior Achievement schools
entrepreneurship programme.
Sasfi n understands that its clients largely measure it in terms of
its service levels. Its size structure and approach allow it to offer
a personal service-unique in many ways- and to develop a deep
understanding of its clients’ fi nancial needs. Sasfi n subscribes to
the Code of Banking Practice and submits to the jurisdiction of
the Ombudsman for Banking Services.
STAFF DEVELOPMENT AND TRANSFORMATIONEmployee development, well-being and transformation are
critical success factors for the Group. Sasfi n recognises that its
human resources and intellectual capital are its most valuable
resources and it has implemented policies and practices focused
on enhancing the standard of its human resources, improving
capacity and recognising and rewarding achievement.
Employee development does not of course exist in a vacuum.
Sasfi n is aware of the historic imbalances which still exist in South
African society. Sasfi n has created a transformation committee
to deal specifi cally with legislation which has been put in place
since 1994 and which deals with redressing past imbalances,
particularly the Broad Based Black Economic Empowerment
Act, the Employment Equity Act and the Skills Development
Act. This committee, operates under the chairmanship of one
of Sasfi n’s non-executive directors, Dolly Mokgatle. The board
will continue to formulate, monitor and review all aspects of
the Group’s broad based BEE policies and ensure that the Group
aligns its employment and broader transformation policies with
the FSC’s targets and enhances cultural diversity and gender
sensitivity. Sasfi n’s level of compliance as measured against the
FSC scorecard improved further in the year under review and
now refl ects a score of 89,36%. Further details appear in the
compliance report.
Various incentive and reward programmes, including the Group’s
Share Option Scheme, are in use at Sasfi n aimed at rewarding
excellent performance. Allocations in terms of this scheme are
dealt with in note 39 of the Notes to the Consolidated Financial
Statements in this Annual Report.
Sasfi n has applied considerable resources to training. Internal
training courses have been developed and are offered to staff.
External training is also offered and encouraged. These are both
work function specifi c and focused on self development. Sasfi n’s
dedicated training facility, equipped with the latest technology
and training aids, continues to be well utilised.
Sasfi n acknowledges the huge impact that HIV/AIDS has had
and will continue to have on the South African economy, on
its social structure and on its workforce, and is committed to
contributing towards combating this scourge. Thankfully Sasfi n
has had only very few HIV/AIDS cases amongst its staff. The
Group has formulated and implemented an HIV/AIDS policy
under the auspices of its HR department. It offers counselling to
staff that are exposed to HIV/AIDS sufferers within their family
units and supports many HIV/AIDS related charitable and other
concerns through its Corporate Social Investment programmes.
Sasfi n has also taken a proactive stance and has implemented
AIDS awareness courses for staff including the provision of
voluntary testing. It is anticipated, that due to the relatively
high educational level of most of Sasfi n’s staff, and the well
documented correlation between HIV/AIDS and low educational
levels, that the prevalence of the scourge on Sasfi n’s staff will
be markedly lower than that prevailing in the general South
African population. Sasfi n has also successfully run a number of
“Wellness Days” during which, the importance of overall good
health has been emphasised and employees have been afforded
the opportunity of free confi dential health assessments.
EMPOWERMENTSasfi n is committed to the FSC and its principles of broad based
transformation.
The General Manager, Compliance, together with the HR
Manager and the transformation committee, are tasked on
behalf of the board with ensuring compliance in terms of work-
force restructuring, procurement and other operational areas.
The Group has submitted its annual report to the FSC council
which has been able to provide all stakeholders with the
assurance that our scorings model accurately refl ects the Groups
progress in this fi eld. The FSC still confl icts in a number of areas
with the Codes of Good Practice published by the Department
of Trade and Industry and a process of alignment, driven by
relevant stakeholders, is currently underway. This process,
over which we have no control, has taken much longer than
was initially anticipated Once this exercise has been completed
Sasfi n will be able to fi ne tune its policies where necessary. The
Transformation Committee monitors the achievement of target
objectives on a regular basis, and the Sasfi n board reviews
progress at its quarterly meetings.
Sasfi n will continue to identify and support appropriate black
empowerment initiatives and opportunities in all areas of its
business activities.
GOVERNMENT AND REGULATORSSasfi n strives to be a moral and law abiding corporate citizen.
It supports democracy but does not contribute to any specifi c
political party. Sasfi n’s personnel are free to determine their own
political party affi liations.
Sasfi n puts considerable effort into building constructive and
transparent relationships with its regulators, the primary
relationship being with the Registrar of Banks and his department
of banking supervision at the SARB. In addition, Sasfi n is
SUSTAINABILITY REPORT CONTINUED

38
regulated by the exchange control department at the SARB, the
JSE, the Securities Regulation Panel, the Financial Intelligence
Centre and the Financial Services Board of South Africa.
Sasfi n complies with the listing requirements of the JSE and
ensures compliance on an ongoing basis as required from time to
time by changes to those requirements.
SOCIAL RESPONSIBILITYFor South Africa to succeed as a winning nation, it must foster
the development of entrepreneurial businesses. This has become
a neglected market segment particularly following the liquidity
squeeze which has affected the entire sector. Sasfi n is one of the
few South African banks geared to providing the personalised
service that this market needs and in so doing, plays a meaningful
role in the development of the South African economy and the
broadening of opportunities for new business people, many
of whom were previously marginalised from the mainstream
economy.
The Group gives back to the community by supporting worthy
institutions that are effi ciently controlled and ensuring that the
funds reach those in need.
Sasfi n supports a number of programmes aimed at the upliftment
of the disadvantaged, as well as other worthwhile social causes.
Sasfi n’s contribution in the fi eld of Corporate Social Investment
substantially exceeds the target set by the FSC.
THE ENVIRONMENTSasfi n is committed to the sustainable use of the world’s scarce
resources. In adhering to both global and national environmental
protection standards and initiatives Sasfi n has embarked on
the roll out of an environmental protection initiative which
provides a platform to address various key issues pertaining to
environmental conservation, the prevention of environmental
degradation and sustainable development. Sasfi n has committed
itself to reducing its impact on the environment, particularly
in respect of water consumption, energy consumption, waste
disposal and carbon emission.
Flowing from the IFC transaction, Sasfi n has incorporated the
IFC’s sustainability, environmental and labour standards into
its policies and it intends amending its articles of association to
entrench these standards into its business.
In its endeavour to manage its environmental impact, Sasfi n
adheres to relevant legislative requirements, codes and standards,
recycle paper glass and plastic products, employ energy and
water saving devices, actively manage its waste products and
maintain a safe and healthy environment for its employees and
clients. Sasfi n’s new premises have been specifi cally designed
with the objective of minimising energy use and reducing the
environmental impact of its operations.
Sasfi n also engages with its clients ensuring that they are
not in breach of any environmental or social laws and that
the businesses that Sasfi n fi nance takes place in a controlled
environment that places as little strain on its surroundings as
possible.
Sasfi n has a policy of withholding fi nancial assistance from any
organisation that it considers to be engaged in socially, morally
or environmentally reprehensible activities.
SUSTAINABILITY REPORT CONTINUED

39A N N U A L R E P O R T 2 0 0 9
DIRECTORS’ RESPONSIBILITY STATEMENT
COMPANY SECRETARY’S CERTIFICATE
In accordance with Companies Act requirements, the directors are responsible for the preparation of the annual fi nancial
statements which conform with International Financial Reporting Standards (“IFRS”) and which, in accordance with those
standards, fairly present the state of affairs of Sasfi n Holdings Limited (“the Company”) and Sasfi n Holdings (“the Group”) as at the
end of the fi nancial year, and the net income and cash fl ows for that period.
It is the responsibility of the independent auditors to report on the fair presentation of the fi nancial statements.
The directors are ultimately responsible for the internal controls. Management enables the directors to meet these responsibilities.
Standards and systems of internal control are designed and implemented by management to provide reasonable assurance as
to the integrity and reliability of the fi nancial statements in terms of IFRS and to adequately safeguard, verify and maintain
accountability for Group assets. Accounting policies supported by judgements, estimates and assumptions which comply with
IFRS, are applied on a consistent and going concern basis. Systems and controls include the proper delegation of responsibilities
within a clearly defi ned framework, effective accounting procedures and adequate segregation of duties.
Systems and controls are monitored throughout the Group. Greater detail of such, including the operation of the internal audit
function, is provided in the corporate governance section and the risk management section.
Based on the information and explanations given by management and the internal auditors, the directors are of the opinion that
the accounting controls are adequate and that the fi nancial records may be relied upon for preparing the fi nancial statements
in accordance with IFRS and maintaining accountability for the Group’s assets and liabilities. Nothing has come to the attention
of the directors to indicate that any breakdown in the functioning of these controls, resulting in material loss to the Group, has
occurred during the year and up to the date of this report.
The directors have a reasonable expectation that the Company and the Group have adequate resources to continue in operational
existence for the foreseeable future. For this reason, they continue to adopt the going concern basis in preparing the fi nancial
statements.
The Company and Group fi nancial statements prepared in accordance with IFRS which appear on pages 41 to 119 were approved
by the board of directors on 2 September 2009 and signed on its behalf by:
MB Glatt RDEB Sassoon
Non-executive Chairman Chief Executive Offi cer
In terms of Section 268(G)(d) of the Companies Act, 1973, as amended, I hereby certify that the Company has lodged with the
Registrar of Companies, for the fi nancial year ended 30 June 2009, all such returns as are required of a public company in terms
of the Companies Act and that all such returns are true, correct and up to date.
S Jackson
Group Secretary
2 September 2009

40
REPORT OF THE INDEPENDENT AUDITORS
TO THE MEMBERS OF SASFIN HOLDINGS LIMITED
We have audited the Group annual fi nancial statements and the annual fi nancial statements of Sasfi n Holdings Limited which comprise the statements of fi nancial position at 30 June 2009 and the income statements, the statements of comprehensive income, the statements of changes in equity and cash fl ow statements for the year then ended, and the Notes to the Consolidated Financial Statements, which include a summary of signifi cant accounting policies and other explanatory notes and the directors’ report as set out on pages 41 to 119.
DIRECTORS’ RESPONSIBILITY FOR THE FINANCIAL STATEMENTSThe Company’s directors are responsible for the preparation and fair presentation of these annual fi nancial statements in accordance with International Financial Reporting Standards and in the manner required by the Companies Act of South Africa. This responsibility includes: designing, implementing and maintaining internal controls relevant to the preparation and fair presentation of the Group fi nancial statements that are free from material misstatement, whether due to fraud or error; selecting and applying appropriate accounting policies and making accounting estimates that are reasonable in the circumstances.
AUDITORS’ RESPONSIBILITYOur responsibility is to express an opinion on these fi nancial statements based on our audit. We conducted our audit in accordance with International Standards on Auditing. Those standards require that we comply with ethical requirements and plan and perform the audit to obtain reasonable assurance whether the fi nancial statements are free from material misstatement.
An audit involves performing procedures to obtain audit evidence about the amounts and disclosures in the fi nancial statements. The procedures selected depend on the auditors’ judgment, including the assessment of the risks of material misstatement of the fi nancial statements, whether due to fraud or error. In making those risk assessments, the auditors consider internal control relevant to the entity’s preparation and fair presentation of the fi nancial statements in order to design audit procedures that are appropriate in the circumstances, but not for the purpose of expressing an opinion on the effectiveness of the entity’s internal control. An audit also includes evaluating the appropriateness of accounting policies used and the reasonableness of accounting estimates made by management, as well as evaluating the overall presentation of the fi nancial statements.
We believe that the audit evidence we have obtained is suffi cient and appropriate to provide a basis for our audit opinion.
OPINIONIn our opinion, these fi nancial statements present fairly, in all material respects, the consolidated and separate fi nancial position of Sasfi n Holdings Limited at 30 June 2009, its consolidated and separate income statements, its consolidated and separate statements of comprehensive income, consolidated and separate statements of changes in equity and consolidated and separate cash fl ows for the year then ended in accordance with International Financial Reporting Standards, and in the manner required by the Companies Act of South Africa.
KPMG Inc. PKF (Jhb) Inc.Registered auditor Registered auditor
Per Heather Berrange Per Garron ChaitowitzChartered Accountant (SA) Chartered Accountant (SA) Registered Auditor Registered AuditorDirector Director 2 September 2009 2 September 2009
85 Empire Road 42 Wierda Road WestParktown, 2122 Wierda Valley, 2196
AUDIT COMMITTEE REPORT
COMPLIANCE WITH THE CORPORATE LAWS AMENDMENT ACT
In 2008, the Group Audit committee’s functions and responsibilities were reconstituted to ensure compliance with the Corporate Laws Amendment Act which came into effect on 14 December 2007. The committee members are all independent non-executive directors of the Group. Four Audit committee meetings were held during the year, during which the members fulfi lled all their functions as prescribed by the Companies Act. A detailed list of the functions of the Audit committee is contained in the Corporate Governance report. The Audit committee has satisfi ed itself that the auditors are independent of the Group and are thereby able to conduct their audit functions without any infl uence from the Group.
ETB BlightChairman, Group Audit committee
2 September 2009
41A N N U A L R E P O R T 2 0 0 9
DIRECTORS’ REPORT
NATURE OF BUSINESSThe Company is a bank-controlling company listed under the “Financials: Speciality and Other Finance sector” of the JSE, whose
subsidiaries provide a wide range of complementary banking, fi nancial and related services to its target market of entrepreneurial
commercial, corporate and private clients.
FINANCIAL RESULTSThe results of the Company and the Group are set out in the annual fi nancial statements and accompanying notes.
DIRECTORS AND COMPANY SECRETARYThe directors of the Company are:
CN Axten, ETB Blight, MB Glatt, DD Mokgatle, MS Rylands, RDEB Sassoon, M Segal and ML Smith.
Appointment: M Segal was appointed as fi nancial director with effect from 28 May 2009.
Resignation: AW Greenstein resigned on 3 December 2008.
S Jackson is the company secretary at the date of this report. His business and postal address are shown on page 124.
DIRECTORS’ INTERESTSAt the fi nancial year end the directors held, directly and indirectly, interests in the Company’s issued ordinary share capital as
refl ected below:
2009 2008
Direct Indirect Direct Indirect
benefi cial benefi cial Total benefi cial benefi cial Total
Number Number Number Number Number Number
MB Glatt – 2 843 778 2 843 778 – 2 763 902 2 763 902
AW Greenstein – – – 429 638 – 429 638
RDEB Sassoon – 12 459 332 12 459 332 – 12 109 372 12 109 372
– 15 303 110 15 303 110 429 638 14 873 274 15 302 912
At the fi nancial year-end, the directors held, directly and indirectly, interests in the Company’s non-redeemable, non-cumulative,
non-participating preference shares:
2009 2008
Indirect Indirect
benefi cial Total benefi cial Total
Number Number Number Number
MB Glatt 10 000 10 000 10 000 10 000
10 000 10 000 10 000 10 000
There have been no changes to the above holdings since the year-end to the date of this report.
Details of share options held by executive directors are given on pages 106 and 107.
Malcolm Segal has options over 150 000 ordinary shares at a strike price of 1 900 cents, vesting between 2009 and 2010.
Malcolm Segal has options over 50 000 ordinary shares at a strike price of 3 325 cents, vesting between 2009 and 2011.

42
DIRECTORS’ REPORT CONTINUED
DIRECTORS’ EMOLUMENTSThe emoluments of the directors of the Company for the year ended 30 June 2009 were as follows:
Services as Cash Other Incentive Total Total
directors package* benefi ts** bonus*** 2009 2008
R R R R R R
Executive directors
RDEB Sassoon – 2 064 651 385 666 1 500 000 3 950 317 3 734 570
AW Greenstein**** – 856 639 221 664 1 000 000 2 078 303 3 093 052
M Segal – 1 767 169 595 978 1 000 000 3 363 147 3 230 075
Non-executive director
MB Glatt 440 000 – – – 440 000 400 000
Independent non-executive directors
CN Axten 256 500 – – – 256 500 221 975
ETB Blight 384 800 – – – 384 800 303 510
ML Smith 150 325 – – – 150 325 126 400
MS Rylands 246 541 – – – 246 541 209 475
DD Mokgatle 220 000 – – – 220 000 200 000
1 698 166 4 688 459 1 203 308 3 500 000 11 089 933 11 519 057
* The emoluments to the executive directors are paid by subsidiaries of the Company.
** Other benefi ts comprise: provident fund, medical aid, group life, company car and equity settled share options.
*** The incentive bonuses paid relate to performances in the prior fi nancial year.
**** AW Greenstein resigned on 3 December 2008.
GROUP SHARE INCENTIVE SCHEMEInformation on options granted to employees and executive directors under the Group Share Incentive Scheme is given on
page 106.
ANALYSIS OF SHAREHOLDERSThe analysis of ordinary and preference shareholders is given on page 120.
SUBSIDIARIES, SPECIAL PURPOSE ENTITIES, ASSOCIATED AND JOINT VENTURE COMPANIESThe interests in subsidiaries, special purpose entities, associated and joint venture companies that were considered material to the
Group’s fi nancial position and results are set out in note 38 of the Notes to the Consolidated Financial Statements.
On 1 July 2008, Sasfi n Financial Services (Pty) Limited, a subsidiary of the Group, acquired a 20% equity interest in NVest Financial
Holdings (Pty) Limited, an Eastern Cape fi nancial and investment advisory business for an amount of R3,6 million. This investment
is classifi ed as an associate and the details thereof are disclosed in note 38. The Group’s equity investment in Pioneer Employee
Benefi ts (Pty) Limited has been written off as the company is in the process of being liquidated.
The interest of the Company in the aggregate net income and losses after taxation (before inter-group dividends) of subsidiaries,
special purpose entities, associated and joint venture companies is:
2009 2008
R’000 R’000
Net income 164 218 157 904
Net losses 7 314 1 812

43A N N U A L R E P O R T 2 0 0 9
DIRECTORS’ REPORT CONTINUED
DIVIDENDSORDINARY SHARE DIVIDENDS
On 13 October 2008, a fi nal ordinary dividend of 144 cents per share was paid to ordinary shareholders.
On 9 April 2009, a cash dividend of 71 cents with a scrip dividend alternative was recorded in the Company’s books. The scrip
dividend was determined by multiplying the number of ordinary shares held by 71 cents and then dividing by the issue price.
On 30 April 2009 an amount of 600 529 ordinary shares were taken up at a share price of R24,60 (par value R0,01 and share
premium R24,59).
PREFERENCE SHARE DIVIDENDS
On 3 October 2008, a dividend of 552 cents per share was paid to preference shareholders.
On 27 March 2009, a dividend of 584 cents per share was paid to preference shareholders.
SHARE CAPITALORDINARY SHARE CAPITAL
There were no changes in the authorised share capital. 80 238 ordinary shares were issued to the Sasfi n Share Incentive Trust, and
a further 600 529 ordinary shares were issued in terms of the scrip dividend option at R24,60 per share.
PREFERENCE SHARE CAPITAL
There were no changes to the authorised and issued preference share capital.
PROPERTY, PLANT AND EQUIPMENTThe Group completed the development of its new premises in Waverley, Johannesburg and took occupation on 30 June 2009. Refer
to note 9 of the Notes to the Consolidated Financial Statements for the full details.
SUBSEQUENT EVENTSTransactions with International Finance Corporation (“IFC”), a member of the World Banking Group.
SUBSCRIPTION OF SHARES
In an announcement released on SENS and published in the press on 7 July 2009, Sasfi n shareholders were advised that Sasfi n had
entered into a subscription agreement, in terms of which, subject to the fulfi lment or waiver, as the case may be, of the suspensive
conditions, it will allot and issue new Sasfi n ordinary shares to IFC as a specifi c issue of shares for cash on the terms and conditions
contained in the subscription agreement and at a total subscription consideration of approximately the Rand equivalent of
US$10 million determined with reference to the Rand/US$ exchange rate immediately after the fulfi lment or waiver, as the case
may be, of the suspensive conditions.
SUBORDINATED TIER 2 LOAN TO SASFIN BANK LIMITED
IFC has also entered into a subordinated loan agreement (“subordinated loan agreement”) with Sasfi n Bank Limited, in terms of
which, subject to the fulfi lment or waiver, as the case may be, of certain suspensive conditions, IFC shall provide Sasfi n Bank
Limited with a subordinated loan intended to qualify as tier 2 capital in the amount of R82,45 million.
GENERAL
In order to give effect to the specifi c issue of shares for cash, the Company is required to amend its articles of association to
provide for the inclusion of IFC’s policy rights, as contemplated in the subscription agreement.

44
CONSOLIDATED STATEMENT OF FINANCIAL POSITION
As at 30 June 2009
2009 2008 Note R’000 R’000
ASSETS Cash and cash balances 3 423 671 449 315
Short-term negotiable securities 4 49 689 55 106
Loans and advances to customers 5 1 801 485 1 803 516
Other receivables 6 318 751 327 107
Investment securities 7 261 211 232 777
Investment in associated companies 8 56 707 36 196
Property, plant and equipment 9 187 638 94 627
Investment property 10 27 999 –
Taxation 12 827 –
Intangible assets and goodwill 11 33 808 9 417
Deferred tax asset 12 7 366 7 691
Total assets 3 181 152 3 015 752
LIABILITIESInterbank funding and deposits from banks 13 69 777 21 359
Deposits from customers 14 881 380 1 108 051
Long-term loan 15 100 000 –
Other payables 16 262 631 286 092
Debt securities issued 17 873 735 703 037
Taxation 2 118 3 689
Deferred tax liability 12 60 777 52 605
Total liabilities 2 250 418 2 174 833
EQUITYOrdinary share capital 18 280 273
Ordinary share premium 19 43 196 27 266
Reserves 629 825 573 941
Preference share capital 20 19 19
Preference share premium 21 199 259 199 259
Total equity attributable to equity holders of the parent 872 579 800 758
Minority interest 58 155 40 161
Total equity 930 734 840 919
Total liabilities and equity 3 181 152 3 015 752
Commitments and contingent liabilities 22 74 855 216 141

45A N N U A L R E P O R T 2 0 0 9
CONSOLIDATED INCOME STATEMENT
For the year ended 30 June 2009
2009 2008
Note R’000 R’000
Interest income 28 371 072 336 054
Interest expense 29 211 510 180 906
Net interest income 159 562 155 148
Non-interest income 30 471 680 432 210
Total income 631 242 587 358
Impairment charges on loans and advances 31 18 762 4 299
Net income after impairments 612 480 583 059
Operating costs 399 306 360 622
Staff costs 32.1 168 153 144 719
Other operating expenses 32.2 231 153 215 903
Profi t from operations 213 174 222 437
Share of associated companies’ income 8 167 4 932
Profi t before income tax 221 341 227 369
Income tax expense 33 32 332 42 940
Profi t for the year 189 009 184 429
Profi t attributable to:
Minority interest 10 459 9 614
Preference shareholders 21 646 18 723
Equity holders of the parent 156 904 156 092
Profi t for the year 189 009 184 429
Weighted average number of shares in issue (‘000) 27 471 27 094
Earnings per ordinary share (cents) 34.4 571 576
Diluted earnings per ordinary share (cents) 34.6 570 572

46
CONSOLIDATED STATEMENT OF COMPREHENSIVE INCOME
For the year ended 30 June 2009
2009 2008 Note R’000 R’000
Profi t for the year 189 009 184 429
Other comprehensive income for the year, net of income tax (41 399) 4 187
Foreign currency translation reserve (43 693) 5 016
Net gains/(losses) on re-measurement of available-for-sale fi nancial assets 197 (829)
Gains/(losses) on re-measurement of available-for-sale fi nancial assets 217 (1 032)
Income tax effect (20) 203
Net revaluation of investment property 2 097 –
Revaluation of investment property 2 912 –
Income tax effect (815) –
Total comprehensive income for the year 147 610 188 616
Attributable to:
Minority interest 10 532 9 308
Preference shareholders 21 646 18 723
Equity holders of the parent 115 432 160 585
Total recognised income and expense for the year 147 610 188 616
47A N N U A L R E P O R T 2 0 0 9
STATEMENT OF CHANGES IN EQUITY
For the year ended 30 June 2009
Ordinary Foreign Regula- Total Preference share Share- currency Avail- Property tory ordinary share Total capital Distri- based trans- able- re- general share- capital share- and butable payment lation for-sale valuation credit-risk holders’ and Minority holders’ premium reserves reserve reserve reserve reserve reserve equity premium interest equity R’000 R’000 R’000 R’000 R’000 R’000 R’000 R’000 R’000 R’000 R’000
GROUP Balance at 30 June 2007 25 703 461 094 1 742 – 2 610 – 7 083 498 232 199 278 76 905 774 415 Total comprehensive income for the year – 174 814 – 5 016 (522) – – 179 308 – 9 308 188 616
– Total profi t for the year – 174 814 – – – – – 174 814 – 9 614 184 428 – Net income/(expenses)
recognised directly in equity – – – 5 016 (522) – – 4 494 – (306) 4 188
Issue of shares 1 836 – – – – – – 1 836 – – 1 836 Consolidation of InnoVent SPV 2 (Pty) Limited – – – – – – – – – (39 546) (39 546)Transfer to regulatory general credit-risk reserve – (1 117) – – – – 1 117 – – – –Dividends to equity holders – (77 896) – – – – – (77 896) – (6 506) (84 402)
Balance at 30 June 2008 27 539 556 895 1 742 5 016 2 088 – 8 200 601 480 199 278 40 161 840 919
Balance at 30 June 2008 27 539 556 895 1 742 5 016 2 088 – 8 200 601 480 199 278 40 161 840 919 Total comprehensive income for the year – 178 550 – (43 693) 124 2 097 – 137 078 – 10 532 147 610
– Total profi t for the year – 178 550 – – – – – 178 550 – 10 459 189 009 – Net income/(expenses)
recognised directly in equity – – – (43 693) 124 2 097 – (41 472) – 73 (41 399)
Issue of shares 15 937 – – – – – – 15 937 – – 15 937 Change in minorities – – – – – – – – – 9 881 9 881 Share-based payment reserve movements – – (747) – – – – (747) – – (747)Transfer to/from regulatory general credit-risk reserve – 8 200 – – – – (8 200) – – – –Dividends to equity holders(ordinary and preference) – (80 447) – – – – – (80 447) – (2 419) (82 866)
Balance at 30 June 2009 43 476 663 198 995 (38 677) 2 212 2 097 – 673 301 199 278 58 155 930 734
Restated in accordance with IAS 1Foreign currency translation reserve The translation reserve comprises all foreign exchange differences arising from the translation of the fi nancial statements of foreign operations as well as from the translation of liabilities that hedge the Bank’s net investment in foreign operations.
Available-for-sale reserveThe fair value reserve includes the cumulative net change in the fair value of available-for-sale investments until the investment is derecognised or impaired.
Regulatory general credit-risk reserveIn terms of the new Banking Regulations, effective 1 January 2008, general credit-risk reserves are no longer required and the balance as at 30 June 2009 has been transferred to distributable reserves.
Property revaluation reserveThis reserve arises on the revaluation of investment property net of taxes.
Share-based payment reserveThis represents the fair value of equity-settled options granted in terms of the Group’s share-based compensation plans.
DividendsThe following dividends were declared by the Group relating to profi t for the year under review:
220 cents per ordinary share (2008: 228 cents)1 072 cents per preference share (2008: 1 068 cents)
On 9 April 2009, a cash dividend of 71 cents with a scrip dividend alternative was recorded in the Company’s books. The scrip dividend was determined by multiplying the number of ordinary shares held by 71 cents and then dividing by the issue price. On 30 April 2009, an amount of 600 529 ordinary shares were taken up at a share price of R24,60 (par value R0,01 and share premium R24,59).
After 30 June 2009, the following dividends were proposed by the directors in respect of 2009. The dividends have not been provided for and will attract Secondary Tax on Companies at 10% when paid:
149 cents per ordinary share (2008: 144 cents)488,12 cents per preference share (2008: 551,71 cents)

48
CASH FLOW STATEMENTS
2009 2008 Note R’000 R’000
Cash fl ows from operating activities
Cash receipts from customers 35.1 851 199 773 486
Cash paid to customers, employees and suppliers 35.1 (646 494) (531 694)
Cash infl ow from operating activities 35.1 204 705 241 792
Taxation paid 35.2 (38 233) (65 401)
Dividend paid 35.3 (65 674) (77 896)
Cash fl ows from operating activities before changes
in operating assets and liabilities 100 798 98 495
Changes in operating assets and liabilities (258 997) 61 743
Change in loans and advances (16 731) (299 612)
Change in other receivables 8 356 (40 331)
Change in deposits (226 671) 362 270
Change in other payables (23 951) 39 416
Net cash from operating activities (158 199) 160 238
Cash fl ows from investing activities (189 152) (73 879)
Proceeds from the disposal of property, plant and equipment 683 580
Acquisition of property, plant and equipment (133 302) (51 253)
Acquisition of intangible assets (24 391) (2 959)
Increase in investment securities (29 679) (44 190)
Acquisition of investments in associates (2 463) 23 943
Net cash fl ows from fi nancing activities 262 585 (6 845)*
Issue of shares – 1 836
Proceeds from issue of debt securities 873 735 28 063
Repayment of debt securities (703 037) –
Proceeds from long-term borrowings 100 000 –
Change in minority interest (8 113) (36 744)
Net change in cash and cash equivalents (84 766) 79 514
Cash and cash equivalents at beginning of the year 483 062 400 580
Effect of exchange rate fl uctuations on cash held 5 287 2 968
Cash and cash equivalents at end of the year 35.4 403 583 483 062
* Reclassifi ed
For the year ended 30 June 2009
49A N N U A L R E P O R T 2 0 0 9
NOTES TO THE CONSOLIDATED FINANCIAL STATEMENTS
1. REPORTING ENTITY Sasfi n Holdings Limited (the “Company”) is a company domiciled in South Africa. The annual fi nancial statements of the
Company for the year ended 30 June 2009 comprise the Company and its subsidiaries, together referred to as the “Group”,
and the Group’s interest in associates and jointly controlled entities. The Group is primarily involved in fi nancial services.
The principal accounting policies adopted in the preparation of the consolidated and separate fi nancial statements are set out below. All references to “the Group” within the accounting policies, include “the Company” fi nancial statements where applicable.
1.1 STATEMENT OF COMPLIANCE The fi nancial statements are prepared in accordance with, and comply with IFRS and the requirements of the South
African Companies Act of 1973. The fi nancial statements are prepared in accordance with the going concern principle under the historical cost basis except for certain fi nancial assets and liabilities measured at fair value as discussed below.
1.2 BASIS OF PREPARATION The accounting policies are consistent with those applied in the previous year.
The fi nancial statements are presented in South African Rands, which is Sasfi n Holdings Limited’s functional currency, rounded to the nearest thousand.
The preparation of fi nancial statements in conformity with IFRS requires management to make judgements, estimates and assumptions that affect the application of policies and reported amounts of assets and liabilities, income and expenses. The estimates and associated assumptions are based on historical experience and various other factors that are believed to be reasonable under the circumstances, the results of which form the basis of making the judgements about carrying values of assets and liabilities that are not readily apparent from other sources. Actual results may differ from these estimates.
The estimates and underlying assumptions are reviewed on an ongoing basis. Revisions to accounting estimates are recognised in the period in which the estimate is revised if the revision affects only that period, or in the period of the revision and future periods if the revision affects both current and future periods (refer to note 2).
1.3 BASIS OF CONSOLIDATION 1.3.1 Subsidiaries Subsidiaries are those entities over whose fi nancial and operating policies the Group has the power to exercise
control, so as to obtain benefi ts from their activities. In assessing control, potential voting rights that presently are exercisable or convertible are taken into account.
The Group fi nancial statements incorporate the assets, liabilities and results of the Company and its subsidiaries. The results of the subsidiaries are included from the effective date that control commences until control ceases.
Special purpose entities Special purpose entities are entities that are created to accomplish a narrow and well-defi ned objective such
as the securitisation of particular assets, or the execution of a specifi c borrowing or lending transaction. A Special purpose entity is consolidated if, based on an evaluation of the substance of its relationship with the Group and the Special purpose entity’s risks and rewards, the Group concludes that it controls the Special purpose entity. The following circumstances may indicate a relationship in which, in substance, the Group controls and consequently consolidates a Special purpose entity:
• The activities of the Special purpose entity are being conducted on behalf of the Group according to its specifi c business needs so that the Group obtains benefi ts from the Special purpose entity’s operation.
• The Group has the decision-making powers to obtain the majority of the benefi ts of the activities of the Special purpose entity or, by setting up an ‘autopilot’ mechanism, the Group has delegated these decision-making powers.
• The Group has rights to obtain the majority of the benefi ts of the Special purpose entity and therefore may
be exposed to risks incident to the activities of the Special purpose entity.
• The Group retains the majority of the residual ownership risks related to the Special purpose entity or its
assets in order to obtain benefi ts from its activities.
For the year ended 30 June 2009
50
NOTES TO THE CONSOLIDATED FINANCIAL STATEMENTS CONTINUED
1. REPORTING ENTITY continued
1.3 BASIS OF CONSOLIDATION continued
1.3.1 Subsidiaries continued
The assessment of whether the Group has control over a special purpose entity is carried out at inception and
normally no further reassessment of control is carried out in the absence of changes in the structure or terms of
the special purpose entity, or additional transactions between the Group and the special purpose entity. Day-
to-day changes in market conditions normally do not lead to a reassessment of control. However, sometimes
changes in market conditions may alter the substance of the relationship between the Group and the special
purpose entity and in such instances the Group determines whether the change warrants a reassessment of
control based on the specifi c facts and circumstances. Where the Group’s voluntary actions, such as lending
amounts in excess of existing liquidity facilities or extending terms beyond those established originally, change
the relationship between the Group and Special purpose entity, the Group performs a reassessment of control
over the Special purpose entity.
Accordingly, the Group’s securitisation vehicle, South African Securitisation Programme (Pty) Limited, the
warehouse vehicle, Sasfi n Warehouse No.1 (Pty) Limited and the Sasfi n Share Incentive Trust have been
consolidated.
In the separate fi nancial statements investments in subsidiaries are carried at cost less impairment.
1.3.2 Associates
An associate is an entity over which the Group has signifi cant infl uence but not control over the fi nancial
and operating activities. Investments in associated companies are equity accounted in the Group fi nancial
statements, from the date that signifi cant infl uence commences until signifi cant infl uence ceases. Equity
accounted income represents the Group’s proportionate share of profi ts or losses of these entities. The Group’s
investment in an associate is written down when it is considered to be impaired. When the Group’s share
of losses exceeds the carrying amount of the associate, the carrying amount is reduced to nil (inclusive of
debt outstanding) and recognition of further losses is discontinued except to the extent that the Group has
guaranteed obligations in respect of the associate. Goodwill is included in the investment balance.
In the separate fi nancial statements investments in associates are carried at cost less impairment.
1.3.3 Joint ventures
A joint venture is an entity controlled jointly by the Group and one or more other ventures in terms of
a contractual arrangement. Investments in joint ventures are proportionately consolidated in the Group
fi nancial statements, from the date that joint control commences until the date that joint control ceases.
In the separate fi nancial statements investments in joint ventures are carried at cost less impairment.
1.3.4 Transactions with minority shareholders
The Group applies a policy of treating transactions with minority shareholders that do not result in the gain or
loss of control, as transactions with equity owners of the Group, and accounted for directly in equity.
1.3.5 Transactions eliminated on consolidation
Intergroup balances and any unrealised gains and losses or income and expenses arising from intergroup
transactions, are eliminated in preparing the consolidated fi nancial statements. Unrealised gains arising from
transactions with associates and jointly controlled entities are eliminated to the extent of the Group’s interest
in the entity. Unrealised losses are eliminated in the same way as unrealised gains, but only to the extent there
is no evidence of impairment.
1.4. INTANGIBLE ASSETS
1.4.1 Goodwill
Goodwill represents the cost of acquisition over the fair value of the Group’s share of net identifi able assets,
liabilities and contingent liabilities of the acquiree on the acquisition date. Goodwill arises on the acquisition
of subsidiaries net assets that constitute a business. Goodwill is stated at cost less accumulated impairment
losses and is not amortised. Goodwill is allocated to cash-generating units and is tested at least annually or
more frequently if required for impairment.
For the year ended 30 June 2009

51A N N U A L R E P O R T 2 0 0 9
NOTES TO THE CONSOLIDATED FINANCIAL STATEMENTS CONTINUED
1. REPORTING ENTITY continued
1.4. INTANGIBLE ASSETS continued
1.4.1 Goodwill continued
“Negative goodwill” arising on an acquisition is recognised directly in the income statement.
1.4.2 Software development
Expenditure on internally developed software is recognised as an asset when the Group is able to demonstrate
its intention and ability to complete the development and use the software in a manner that will generate
future economic benefi ts, and can reliably measure the costs to complete the development.
Direct software development costs that are clearly associated with an identifi able and unique system, which
will be controlled by the Group and have a probable economic benefi t exceeding one year, are recognised as
intangible assets. Direct costs include software development, employee costs and an appropriate portion of
overheads. Subsequent expenditure is capitalised only when it increases future economic benefi ts embodied
in the asset.
Direct software development costs recognised as intangible assets are amortised on the straight-line basis over
the expected useful lives of the assets, being between two and fi ve years from the date that it is available for
use. Amortisation is recognised in profi t or loss for the period. Capitalised computer software is carried at cost
less accumulated amortisation and less accumulated impairment losses. Computer software is tested annually
for impairment.
1.5. FINANCIAL INSTRUMENTS
Financial instruments, as refl ected on the balance sheet, include all fi nancial assets and fi nancial liabilities, including
derivative instruments, but exclude investments in subsidiaries, associated companies and joint ventures, employee
benefi t plans, property, plant and equipment, deferred taxation, taxation payable, intangible assets and goodwill.
Financial instruments are accounted for in terms of the principles of IAS 32 Financial Instruments: Presentation and
IAS 39 Financial Instruments: Recognition and Measurement.
Initial recognition
Financial instruments are recognised on the balance sheet when the Group or Company becomes a party to the
contractual provisions of a fi nancial instrument. All purchases of fi nancial assets that require delivery within the time
frame established by regulation or market convention (‘regular way’ purchases) are recognised at trade date, which
is the date on which the Group or Company commits to the purchase of the asset. Financial liabilities are recognised
on trade date, which is when the Group or Company becomes a party to the contractual provisions of the fi nancial
instrument.
Initial measurement
Financial instruments are initially recognised at fair value plus, in the case of a fi nancial asset or fi nancial liability not
at fair value through profi t or loss, transaction costs that are incremental and directly attributable to the acquisition
or issue of the fi nancial asset or fi nancial liability.
Subsequent measurement
Subsequent to initial measurement, fi nancial instruments are either measured at fair value or amortised cost,
depending on their classifi cation:
Financial assets and fi nancial liabilities at fair value through profi t or loss
Financial instruments at fair value through profi t and loss consist of held for trading instruments and instruments that
the Group or Company have elected, on initial recognition, to designate at fair value through profi t or loss.
The Group has designated fi nancial assets and liabilities at fair value through profi t and loss in the following
circumstances:
• The assets or liabilities are managed, evaluated and reported internally on a fair value basis.
• The designation eliminates or signifi cantly reduces an accounting mismatch which would otherwise arise.
• The asset or liability contains an embedded derivative that signifi cantly modifi es the cash fl ows that would otherwise
be required under the contract.
For the year ended 30 June 2009

52
NOTES TO THE CONSOLIDATED FINANCIAL STATEMENTS CONTINUED
1. REPORTING ENTITY continued
1.5. FINANCIAL INSTRUMENTS continued
Financial assets and fi nancial liabilities at fair value through profi t or loss continued
Financial assets and fi nancial liabilities at fair value through profi t or loss are measured at fair value, with fair-value
gains and losses (excluding impairment losses, interest income and interest expense calculated on the amortised-cost
basis relating to those interest-bearing instruments that have been designated as at fair value through the income
statement) reported in non-interest revenue as they arise.
Non-trading fi nancial liabilities
All fi nancial liabilities, other than those at fair value through profi t and loss, are classifi ed as non-trading fi nancial
liabilities and are measured at amortised cost using the effective interest method.
Held-to-maturity fi nancial assets
Held-to-maturity fi nancial assets are non-derivative fi nancial assets with fi xed or determinable payments and fi xed
maturity that the Group or Company has the intent and ability to hold to maturity, other than those that meet the
defi nition of loans and receivables or those that were designated as at fair value through profi t and loss or available-
for-sale. Held-to-maturity fi nancial assets are measured at amortised cost using the effective interest method, with
interest income and impairment losses recognised in the income statement.
Any sale or reclassifi cation of more than an insignifi cant amount of held-to-maturity investments not close to that
maturity would result in the reclassifi cation of all held-to-maturity investments as available-for-sale, and prevent the
Group from classifying fi nancial assets as held-to-maturity for the current and following two fi nancial years.
Loans and receivables
Loans and receivables are non-derivative fi nancial assets with fi xed or determinable payments that are not quoted in
an active market, other than those classifi ed as at fair value through profi t and loss or available-for-sale. Financial
assets classifi ed as loans and receivables are carried at amortised cost using the effective interest method, with interest
income and impairment losses recognised in the income statement. The majority of advances are included in the loans
and receivables category.
Available-for-sale fi nancial assets
Financial assets are classifi ed as available-for-sale, if designated as such, or where the intention with regard to the
instrument and its origination and designation does not fall within the ambit of the other fi nancial asset classifi cations.
Available-for-sale instruments are typically assets that are held for a longer period and in respect of which short-term
fl uctuations in value do not affect the Group’s or Company’s hold or sell decision.
Available-for-sale fi nancial assets are measured at fair value, with fair-value gains and losses recognised directly in
equity along with the associated deferred taxation. When an investment is derecognised, the cumulative gain or
loss in equity is transferred to profi t or loss. Impairment losses, interest calculated on the effective interest rate
method, foreign exchange gains or losses and dividends are recognised in profi t or loss. When available-for-sale equity
instruments are determined to be impaired to the extent that the fair value decline is prolonged and signifi cant, the
resultant losses are recognised in the income statement.
Measurement basis of fi nancial instruments
Amortised cost
Amortised-cost fi nancial assets and fi nancial liabilities are measured at the amount determined on initial recognition,
minus principal repayments plus or minus the cumulative amortisation using the effective interest rate method
determined on initial recognition and any difference between that initial amount and the maturity amount, less any
cumulative impairment losses or uncollectability.
Borrowings
Borrowings are recognised initially at fair value, generally being their issue proceeds, net of directly attributable
transactions costs incurred, and are subsequently stated at amortised cost and interest is recognised over the period
of the borrowing using the effective interest rate method.
Preference shares are classifi ed as equity.
For the year ended 30 June 2009

53A N N U A L R E P O R T 2 0 0 9
NOTES TO THE CONSOLIDATED FINANCIAL STATEMENTS CONTINUED
1. REPORTING ENTITY continued
1.5. FINANCIAL INSTRUMENTS continued
Measurement basis of fi nancial instruments continued
Fair value
Direct and incremental transaction costs are included in the initial fair value of fi nancial assets and fi nancial liabilities,
other than those at fair value through profi t and loss. The best evidence of the fair value of a fi nancial asset or
fi nancial liability at initial recognition is the transaction price, unless the fair value of the instrument is evidenced
by comparison with other current observable market transactions in the same instrument or based on a valuation
technique whose variables include only market observable data.
If quoted bid prices are unavailable, the fair value of fi nancial assets and fi nancial liabilities is estimated using pricing
models or discounted cash fl ow techniques. Where discounted cash fl ow techniques are used, estimated future cash
fl ows are based on management’s best estimates and the discount rate used is a market-related rate at the balance
sheet date for an instrument with similar terms and conditions. Where pricing models are used, inputs are based on
market-related measures at the balance sheet date.
The fair value of a fi nancial liability with a demand feature is not less than the amount payable on demand, discounted
from the fi rst date on which the amount could be required to be paid.
Investments in equity instruments that do not have a quoted market price in an active market and whose fair value
cannot be reliably measured, and derivatives that are linked to and have to be settled by delivery of such unquoted
equity instruments, are not measured at fair value but at cost less impairment losses. Fair value is considered reliably
measurable if:
• the variability in the range of reasonable fair value estimates is not signifi cant for that instrument; or
• the probabilities of the various estimates within the range can be reasonably assessed and used in estimating fair
value.
Derecognition
All fi nancial assets and fi nancial liabilities are derecognised on trade date, which is when the Group or Company
commits to selling a fi nancial asset or redeeming a fi nancial liability.
The Group or Company derecognises a fi nancial asset when and only when:
• the contractual rights to the cash fl ows arising from the fi nancial asset have expired or have been forfeited; or
• it transfers the fi nancial asset, including substantially all the risks and rewards of ownership of the asset; or
• it neither transfers nor retains substantially all the risks and rewards of ownership of the asset, but no longer retains
control of the asset.
A fi nancial liability is derecognised when and only when the liability is extinguished, i.e. when the obligation specifi ed
in the contract is discharged, cancelled or has expired.
The difference between the carrying amount of a fi nancial asset or fi nancial liability (or part thereof) that is
derecognised and the consideration paid or received, including any non-cash assets transferred or liabilities assumed,
is recognised in the income statement for the period.
Offsetting fi nancial instruments and related income
Financial assets and liabilities are offset and the net amount reported in the statement of fi nancial position only when
there is a legally enforceable right to set off and there is an intention of settling on a net basis or realising the asset
and settling the liability simultaneously. Income and expense items are offset only when permitted by the accounting
standards, or for gains and losses arising from a group of similar transactions.
1.6 DERIVATIVE FINANCIAL INSTRUMENTS AND HEDGE ACCOUNTING
A derivative is a fi nancial instrument whose value changes in response to an underlying variable, requires little or no
initial net investment and is settled at a future date. Derivatives are initially recognised at fair value on the date on
which the derivatives are entered into and subsequently remeasured at fair value.
All derivative instruments are carried as assets when the fair value is positive and as liabilities when the fair value is
negative, subject to offsetting principles (refer to note 1.5).
For the year ended 30 June 2009
54
NOTES TO THE CONSOLIDATED FINANCIAL STATEMENTS CONTINUED
1. REPORTING ENTITY continued
1.6 DERIVATIVE FINANCIAL INSTRUMENTS AND HEDGE ACCOUNTING continued
Embedded derivatives included in hybrid instruments are treated and disclosed as separate derivatives when their
economic characteristics and risks are not closely related to those of the host contract, the terms of the embedded
derivative are the same as those of a stand-alone derivative and the combined contract is not recognised at fair value
with any gains or losses from the change in fair value recognised in the income statement. If it is not possible to
determine the fair value of an embedded derivative, the hybrid instrument is measured at fair value with changes in
profi t or loss. The host contracts are accounted for and measured applying the rules of the relevant category of that
fi nancial instrument.
The method of recognising fair value gains or losses depends on whether derivatives are held for trading or are
designated as hedging instruments, and if so, the nature of the hedged item. All gains and losses from changes in
the fair value of derivatives that are classifi ed as held for trading are recognised in the income statement. When
derivatives are designated in a hedging relationship, the Group designates them as either:
• hedges of the fair value of recognised fi nancial assets or liabilities or fi rm commitments (fair value hedge);
• hedges of highly probable future cash fl ows attributable to a recognised asset or liability, a forecast transaction, or
a highly probable forecast intergroup transaction in the consolidated fi nancial statements (cash fl ow hedge); or
• hedges of net investment in a foreign operation (net investment hedge).
Hedge accounting is applied to derivatives designated in this way provided certain criteria are met. The Group
documents, at the inception of the hedging relationship, the relationship between hedged items and hedging
instruments, as well as its risk management objective and strategy for undertaking various hedging relationships. The
Group also documents its assessment, both at the inception of the hedge and on an ongoing basis, of whether the
derivatives that are used in hedging relationships are highly effective in offsetting changes in fair values or cash fl ows
of hedged items.
1.6.1 Fair value hedges
Where a hedging relationship is designated as a fair value hedge, the hedged item is adjusted for the change
in fair value in respect of the risk being hedged. Gains or losses on the remeasurement of both the derivative
and the hedged item are recognised in the income statement. Fair value adjustments relating to the hedging
instrument are allocated to the same income statement category as the related hedged item. Any ineffectiveness
is also recognised in the same income statement category as the related hedged item.
If the derivative expires, is sold, terminated, exercised, no longer meets the criteria for fair value hedge
accounting, or the designation is revoked, hedge accounting is discontinued prospectively. Any adjustment
up to that point, to a hedged item for which the effective interest method is used, is amortised to the income
statement as part of the hedged item’s recalculated effective interest rate over the period to maturity.
1.6.2 Cash fl ow hedges
The effective portion of changes in the fair value of derivatives that are designated and qualify as cash fl ow
hedges are recognised in the cash fl ow hedging reserve. The ineffective part of any gain or loss is recognised
immediately in the income statement.
Amounts accumulated in equity are transferred to the income statement in the periods in which the hedged
cash fl ows affect profi t or loss. However, when the forecast transaction that is hedged results in the recognition
of a non-fi nancial asset or a non-fi nancial liability, the cumulative gains or losses previously deferred in equity
are transferred from equity and included in the initial measurement of the cost of the asset or liability.
When a hedging instrument expires or is sold, or when a hedge no longer meets the criteria for hedge
accounting, hedge accounting is prospectively discontinued and the cumulative gains or losses recognised
in equity remain in equity until the forecast transaction is recognised in the case of a non-fi nancial asset or a
non-fi nancial liability, or until the forecast transaction affects the income statement in the case of a fi nancial
asset or a fi nancial liability. If the forecast transaction is no longer expected to occur, the cumulative gains or
losses recognised in equity are immediately transferred to the income statement.
For the year ended 30 June 2009
55A N N U A L R E P O R T 2 0 0 9
NOTES TO THE CONSOLIDATED FINANCIAL STATEMENTS CONTINUED
1. REPORTING ENTITY continued
1.6 DERIVATIVE FINANCIAL INSTRUMENTS AND HEDGE ACCOUNTING continued
1.6.3 Net investment hedges
Where considered appropriate, the Group hedges net investments in foreign operations using derivative
instruments in its consolidated fi nancial statements. For such hedges, the designated component of the hedging
instrument that relates to the effective portion of the hedge is recognised directly in the Foreign Currency
Translation Reserve. Any ineffective portion is immediately recognised in the income statement. On the partial
disposal of a foreign operation, a proportionate share of those deferred gains and losses is recognised directly
in profi t or loss. On disposal of a foreign operation, all remaining deferred gains and losses are recognised
directly in profi t or loss.
1.6.4 Derivatives that do not qualify for hedge accounting
All gains and losses from changes in the fair values of derivatives that do not qualify for hedge accounting are
recognised immediately in the income statement.
Embedded derivatives
Certain derivatives embedded in other fi nancial and non-fi nancial instruments, such as the conversion option
in a convertible bond, are treated as separate derivatives and recognised on a stand-alone basis, when their
risks and characteristics are not closely related to those of the host contract and the host contract is not
carried at fair value, with unrealised gains and losses reported in the income statement and the statement
would meet the defi nition of a derivative if it was contained in a separate contract.
If it is not possible to determine the fair value of the embedded derivative, the entire hybrid instrument is
categorised as at fair value through profi t and loss and measured at fair value, with changes in fair value being
recognised in profi t and loss.
1.7 PROPERTY, PLANT AND EQUIPMENT
1.7.1 Owned assets
Property, plant and equipment is stated at cost less accumulated depreciation and impairment losses. The cost
of property, plant and equipment includes expenditure directly attributable to the acquisition of property,
plant and equipment. Subsequent costs are included in the carrying amount of the asset, or recognised as a
separate asset, when it is probable that future economic benefi ts are expected to fl ow to the Group. When
parts of an item of property, plant and equipment have different useful lives, they are accounted for as
separate items (major components) of property, plant and equipment.
Freehold buildings, comprising mainly offi ces, are generally owner-occupied properties and accounted for in
terms of the cost method. The buildings are depreciated on the straight-line basis over the estimated useful
lives to the current value of their estimated residual value. The freehold land portion is not depreciated. Owner
occupied properties are held for use in the supply of services or for administration services.
Repairs and maintenance of property, plant and equipment are recognised directly in the income statement.
Gains or losses on disposal of property, plant and equipment are included in the income statement.
1.7.2 Leased assets
Leases in terms of which the Group assumes substantially all the risks and rewards of ownership are classifi ed
as fi nance leases. Assets which are leased in terms of fi nancial lease agreements are capitalised at the lower of
fair value and the present value of minimum lease payments at inception of the lease. The capital element of
future obligations under the leases is included as a liability in the balance sheet. Lease payments are allocated
between fi nance charges and capital repayment using the effective rate method.
Subsequent to initial recognition, the asset is accounted for in accordance with the accounting policy
applicable to that asset.
Other leases are classifi ed as operating leases (refer to note 1.11).
For the year ended 30 June 2009
56
NOTES TO THE CONSOLIDATED FINANCIAL STATEMENTS CONTINUED
1. REPORTING ENTITY continued
1.7 PROPERTY, PLANT AND EQUIPMENT continued
1.7.3 Depreciation
Depreciation is calculated on the straight-line basis, at rates which are estimated to amortise the assets to their
anticipated residual values over their useful lives. The assets’ residual values and useful lives are reviewed and
adjusted annually if appropriate. Leased assets are depreciated over the shorter of the lease term and their
useful lives and is not depreciated.
Buildings 50 years
Computer equipment 3 years
Computer software 2 – 3 years
Furniture and fi ttings 6 – 10 years
Motor vehicles 5 years
There has been no change to useful lives from those applied in the previous year.
1.8 INVESTMENT PROPERTY
Investment properties are held to earn rental income or for capital appreciation or both. Investment property
includes the cost of initial purchase, developments transferred from property under development, subsequent cost of
development and fair value adjustments.
Investment property is refl ected at valuation based on fair value at the reporting date. If the valuation cannot be
reliably determined, the Group uses alternative valuation methods such as discounted cash fl ow projections or recent
prices on active markets. The fair values are the estimated amounts for which a property could be exchanged on
the date of valuation between a willing buyer and a willing seller in an arm’s length transaction. The fair value is
determined annually by independent professional valuators.
Fair value adjustments on investment property are included in the income statement as investment gains or losses in
the period in which these gains or losses arise and are adjusted for any double counting arising from the recognition of
lease income on the straight-line basis compared to the accrual basis normally assumed in the fair value determination.
The deemed cost for any reclassifi cation between investment property and owner-occupied property is at the
property’s carrying value, at the date of reclassifi cation.
1.9 FOREIGN CURRENCIES
1.9.1 Functional and presentation currency
Items included in the fi nancial statements of each of the Group’s entities are measured using the currency
of the primary economic environment in which the entity operates (“functional currency”). The functional
currency of the Company and the Group’s consolidated presentation currency is ZAR and all amounts unless
otherwise indicated, are stated in thousands of ZAR (R’000).
1.9.2 Group companies
The results and fi nancial position of all foreign operations that have a functional currency different from the
group’s presentation currency are translated into the presentation currency as follows:
• Assets and liabilities are translated at the closing rate on the balance sheet date; and
• Income and expenses are translated at average exchange rates for the year, to the extent that such average
rates approximate actual rates.
• Equity is translated into the presentation currency at the spot rate on the date of issue of the equity
instruments; and
• Reserves are translated at the average exchange rate for the year, to the extent that such average rates
approximate actual rates.
For the year ended 30 June 2009

57A N N U A L R E P O R T 2 0 0 9
NOTES TO THE CONSOLIDATED FINANCIAL STATEMENTS CONTINUED
1. REPORTING ENTITY continued
1.9 FOREIGN CURRENCIES continued
1.9.2 Group companies continued
On consolidation, exchange differences arising from the translation of the group’s net investment in foreign
operations are accounted for directly in a separate component of equity, being the foreign currency translation
reserve. On the partial disposal of a foreign operation, where control is not lost, a proportionate share of the
balance of the foreign currency translation reserve is transferred to the same reserve in which the profi t or loss
on partial disposal is recognised. On disposal of a foreign operation, any gains and losses that remain deferred
in equity are recognised in the income statement at the time at which the profi t or loss on disposal of the
foreign operation is recognised.
Goodwill and fair value adjustments arising on the acquisition of foreign operations are treated as assets and
liabilities of the foreign operation and are translated at closing rates at the balance sheet date.
Foreign currency gains and losses on intergroup loans are recognised in profi t or loss unless settlement of the
loan is neither planned nor likely to occur in the foreseeable future, in which case the foreign currency gains
and losses are initially recognised in the foreign currency translation reserve in the consolidated fi nancial
statements. Those gains and losses are recognised in profi t or loss at the earlier of settling the loan or at the
time at which the foreign operation is disposed.
1.9.3 Transactions and balances
Foreign currency transactions are translated into the functional currency using the exchange rates prevailing
at the date of the transactions. Foreign exchange gains and losses resulting from the settlement of such
transactions and from the translation of monetary assets and liabilities denominated in foreign currencies at
year end exchange rates, are recognised in the income statement except when deferred in equity as qualifying
cash fl ow hedges and qualifying net investment hedges.
Non-monetary assets and liabilities denominated in foreign currencies that are measured at historical cost are
translated to the functional currency using the exchange rate at the transaction date, and those measured at
fair value are translated to the functional currency at the exchange rate at the date that the fair value was
determined. Exchange differences on non-monetary items are accounted for based on the classifi cation of the
underlying items. Foreign exchange gains and losses on equities classifi ed as available-for-sale fi nancial assets
are included in the available-for-sale reserve in equity whereas the exchange differences on equities held at fair
value through profi t or loss are reported as part of the fair value gain or loss in the income statement.
1.10 PROVISIONS
A provision is recognised in the balance sheet when the Group has a present legal or constructive obligation as a result
of a past event, it is probable that an outfl ow of economic benefi ts will be required to settle the obligation, and a
reliable estimate of the amount of the obligation can be made. If the effect is material, provisions are determined by
discounting the expected future cash fl ows at a pre-tax rate that refl ects current market assessments of the time value
of money and, where appropriate, the risks specifi c to the liability.
Contingent liabilities, which include certain guarantees other than fi nancial guarantees, and letters of credit pledged
as collateral security, are possible obligations that arise from past events whose existence will be confi rmed only by
the occurrence or non-occurrence of one or more uncertain future events not wholly within the Group’s control.
Contingent liabilities are not recognised in the fi nancial statements but are disclosed in the Notes to the Consolidated
Financial Statements unless they are remote.
1.11 INSTALMENT FINANCE
1.11.1 Group as the lessor
Rental, lease and instalment sale contracts are regarded as fi nancing transactions, with rentals and instalments
receivable, less unearned fi nance charges, being included in advances on the balance sheet. The difference
between the gross receivable and the present value of the receivable is recognised as unearned fi nance charges.
For the year ended 30 June 2009

58
NOTES TO THE CONSOLIDATED FINANCIAL STATEMENTS CONTINUED
1. REPORTING ENTITY continued
1.11 INSTALMENT FINANCE continued
1.11.1 Group as the lessor continued
Where the Group is the lessor in a lease agreement that transfers substantially all of the risks and rewards of
ownership of the asset to the lessee, the arrangement is classifi ed as a fi nance lease.
Finance income is recognised over the term of the lease using the net investment method, which refl ects the
periodic rate of return.
All other leases are operating leases and operating lease income is recognised in the income statement on a
straight-line basis over the term of the lease.
1.11.2 Group as the lessee
Payments made under operating leases are recognised in the income statement on a straight-line basis over the
term of the lease. Penalties for early termination of operating lease contracts are recognised as an expense in
the period in which termination took place.
Payments made under fi nance leases are apportioned between the fi nance charge and the reduction of the
outstanding liability. The fi nance charge is allocated to each period during the lease term so as to produce a
consistent periodic rate of interest on the liability outstanding.
1.12 REVENUE AND EXPENDITURE
Banking and Financial Services Activities
Revenue is derived substantially from the business banking and related fi nancial services activities and comprises net
interest income and non-interest income and is recognised as set out below.
1.12.1 Interest income and interest expense
Interest is recognised on a time proportion basis, taking into account the carrying amount and the effective
interest rate. The effective interest rate is the rate that exactly discounts estimated future cash payments
or receipts through the expected life of the fi nancial instrument to the carrying amount on the fi nancial
statements. When calculating the effective interest rate, the Company estimates cash fl ows considering all
contractual terms of the fi nancial instrument but does not consider future credit losses. The calculation
includes all fees paid or received between parties to the contract that are an integral part of the effective
interest rate, transaction costs and all other premiums or discounts.
Where fi nancial assets have been impaired, the accrual of interest income based on the original terms of the
loan is discounted, any increase of the present value of impaired loans to the passage of time is recorded as
interest income. The effective interest rate is established on initial recognition of the fi nancial instrument and
is not subsequently revised.
1.12.2 Fees and commission
Fee and commission income is recognised in the income statement as the services are performed in accordance
with the terms of the relevant agreements.
1.12.3 Other
Income, other than interest, fees and commission, which includes fair value gains or losses, foreign exchange
gains and dividends from investments, is recognised in profi t or loss when the amount of income from the
transaction or service can be measured reliably. Dividend income is recognised when the right to receive
income is established.
1.13 COMMITMENTS AND CONTINGENCIES
Items are classifi ed as commitments where the Group commits itself to future transactions or if the items will result in
the acquisition of assets.
Transactions are classifi ed as contingencies where the Group’s obligations depend on uncertain future events or
the amount of the obligation can not be measured with suffi cient reliability and principally consist of third-party
obligations underwritten by banking subsidiaries.
For the year ended 30 June 2009
59A N N U A L R E P O R T 2 0 0 9
NOTES TO THE CONSOLIDATED FINANCIAL STATEMENTS CONTINUED
1. REPORTING ENTITY continued
1.14 FUNDS UNDER ADMINISTRATION
Where Group companies hold and invest funds on behalf of clients and act as trustees in any fi duciary capacity, the
assets and liabilities representing these activities are not refl ected on the statement of fi nancial position. Income
relating to these activities is recognised in the income statement in the period in which the services are rendered.
1.15 CASH AND CASH EQUIVALENTS
For the purpose of the cash fl ow statement, cash and cash equivalents comprise cash on hand, short-term negotiable
securities, short-term interbank funds net of interbank funding and balances with central bank, all of which are
available for use by the Group unless otherwise stated. Cash and cash equivalents are carried at amortised cost in the
statement of fi nancial position.
1.16 IMPAIRMENT
1.16.1. Impairment of fi nancial assets
The Group or Company assesses at each balance sheet date whether there is objective evidence that a fi nancial
asset or group of fi nancial assets is impaired. A fi nancial asset or a group of fi nancial assets is impaired and
impairment losses are incurred if, and only if, there is objective evidence of impairment as a result of one or
more events that occurred after the initial recognition of the asset (a loss event) and that loss event (or events)
has an impact on the estimated future cash fl ows of the fi nancial asset or group of fi nancial assets that can
be reliably estimated. For an investment in an equity security, a signifi cant or prolonged decline in its fair
value below the cost is objective evidence of impairment. Objective evidence that a fi nancial asset or group of
assets is impaired includes observable data that has come to the attention of the Group or Company about the
following loss events:
• a breach of contract, such as a default or delinquency in interest or principal payments;
• the Group or Company, for economic or legal reasons relating to the borrower’s fi nancial diffi culty, granting
to the borrower a concession that the Group or Company would not otherwise consider;
• it becoming probable that the borrower will enter bankruptcy or other fi nancial reorganisation;
• the disappearance of an active market for that fi nancial asset because of fi nancial diffi culties; or
• observable data indicating that there is a measurable decrease in the estimated future cash fl ows from a
group of fi nancial assets since the initial recognition of those assets, although the decrease cannot yet be
identifi ed with the individual fi nancial assets in the group, including:
– adverse changes in the payment status of borrowers in the group; or
– national or local economic conditions that correlate with defaults on the assets in the group.
Assets carried at amortised cost
If there is objective evidence that an impairment loss on loans and receivables or held-to-maturity investments
carried at amortised cost has been incurred, the amount of the loss is measured as the difference between
the asset’s carrying amount and the present value of estimated future cash fl ows (excluding future credit
losses that have not been incurred) discounted at the fi nancial asset’s original effective interest rate. The
carrying amount of the asset is reduced through the use of an allowance account and the amount of the loss
is recognised in the income statement.
The Group or Company fi rst assesses whether there is objective evidence of impairment individually for
fi nancial assets that are individually signifi cant, and individually or collectively for fi nancial assets that are not
individually signifi cant. If the Group or Company determines that there is no objective evidence of impairment
for an individually assessed fi nancial asset, whether signifi cant or not, it includes the asset in a group of
fi nancial assets with similar credit risk characteristics and collectively assesses them for impairment.
If, in a subsequent period, the amount of the impairment loss decreases and the decrease can be related
objectively to an event occurring after the impairment was recognised (such as an improvement in the debtor’s
credit rating), the previously recognised impairment loss is reversed by adjusting the allowance account. The
reversal does not result in a carrying amount of the fi nancial asset that exceeds what the amortised cost would
have been had the impairment not been recognised at the date on which the impairment is reversed. The
amount of the reversal is recognised in the income statement for the period.
For the year ended 30 June 2009

60
NOTES TO THE CONSOLIDATED FINANCIAL STATEMENTS CONTINUED
1. REPORTING ENTITY continued
1.16 IMPAIRMENT continued
1.16.1. Impairment of fi nancial assets continued
Financial assets carried at cost
If there is objective evidence that an impairment loss has been incurred on an unquoted equity instrument
that is not carried at fair value, because its fair value cannot be reliably measured, or on a derivative asset
that is linked to and has to be settled by delivery of such an unquoted equity instrument, the amount of the
impairment loss is measured as the difference between the carrying amount of the fi nancial asset and the
present value of estimated future cash fl ows discounted at the current market rate of return for a similar
fi nancial asset. Such impairment losses are not reversed.
Available-for-sale fi nancial assets
When a decline in the fair value of an available-for-sale fi nancial asset has been recognised directly in equity
and there is objective evidence that the asset is impaired, the cumulative net loss that has been recognised
directly in equity is removed from equity and recognised in the income statement even though the fi nancial
asset has not been derecognised. The amount of the cumulative loss that is removed from equity and recognised
in the income statement is the difference between the acquisition cost (net of any principal repayment and
amortisation) and current fair value, less any impairment loss on that fi nancial asset previously recognised in
the income statement.
If, in a subsequent period, the fair value of debt instruments classifi ed as available-for-sale increases and the
increase can be objectively related to an event occurring after the impairment loss was recognised in the
income statement, the impairment loss is reversed, with the amount of the reversal recognised in the income
statement for the period. Impairment losses recognised in the income statement for an investment in an equity
instrument classifi ed as available-for-sale are not reversed through the income statement.
1.16.2. Impairment of non-fi nancial assets
The carrying amounts of the Group’s assets, other than deferred tax assets (see accounting policy 1.17) and
fi nancial instruments (see accounting policy 1.5), are reviewed at each balance sheet date to determine
whether there is any indication of impairment. If any such indication exists, the asset’s recoverable amount
is estimated. Goodwill is tested annually for impairment irrespective of whether impairment indicators are
identifi ed.
An impairment loss is recognised whenever the carrying amount of an asset or its cash-generating unit exceeds
its recoverable amount. Impairment losses are recognised in the income statement.
Impairment losses recognised in respect of cash-generating units are allocated fi rst to reduce the carrying
amount of any goodwill allocated to cash-generating units (group of units) and then, to reduce the carrying
amount of the other assets in the unit (group of units) on a pro rata basis.
Calculation of recoverable amount
The recoverable amount of other assets is the greater of their fair value less costs to sell, and value in use.
In assessing value in use, the estimated future cash fl ows are discounted to their present value using a pre-
tax discount rate that refl ects current market assessments of the time value of money and the risks specifi c
to the asset. For an asset that does not generate largely independent cash infl ows, the recoverable amount is
determined for the cash-generating unit to which the asset belongs.
Reversals of impairment
In respect of other assets, an impairment loss is reversed if there has been a change in the estimates used to
determine the recoverable amount. An impairment loss is reversed only to the extent that the assets carrying
amount does not exceed the carrying amount that would have been determined net of depreciation, if no
impairment loss had been recognised. Reversals of impairment are not recognised for goodwill.
For the year ended 30 June 2009
61A N N U A L R E P O R T 2 0 0 9
NOTES TO THE CONSOLIDATED FINANCIAL STATEMENTS CONTINUED
1. REPORTING ENTITY continued
1.17 CAPITALISATION OF BORROWING COSTS
Borrowing costs that relate to qualifying assets, i.e. assets that necessarily take a substantial period of time to
get ready for their intended use or sale, are neither measured at fair value nor capitalised.
1.18 EMPLOYEE BENEFITS
1.18.1 Defi ned contribution plan
A defi ned contribution plan is a post-employments benefi t plan under which an entity pays fi xed contributions
into a separate entity and will have no legal or constructive obligation to pay further amounts.
Payments to defi ned contribution plans are recognised as an employee benefi t expense in the income statement
as they fall due. All employees are required to be members of the defi ned contribution provident fund.
1.18.2 Equity compensation plans
The Group or Company operates equity-settled and cash-settled share-based compensation plans
The Group has applied the requirements of IFRS 2 to share-based payments . In accordance with the transitional
provisions, IFRS 2 has been applied to all grants of share options after 7 November 2002 that were not vested
as of 1 July 2004, the effective date of transition to IFRS.
The fair value of equity-settled options granted is recognised as an employee expense in the income statement,
with a corresponding increase in equity. The fair value is measured at grant date and spread on a straight-line
basis over the vesting period, based on the Group’s estimate of share options that will eventually vest.
Share-based payments settled in cash are accounted for as liabilities at fair value until settled. The liability is
recognised over the vesting period and is revalued at every balance sheet date. Any changes in the liability are
accounted for through profi t or loss.
Fair value is measured by use of the Black-Scholes model, taking into account the terms and conditions upon
which the options were granted. The amount recognised as an expense is adjusted to refl ect the actual number
of share options that are expected to vest.
1.19 INCOME TAX
Income tax and capital gains tax on the profi t or loss for the year comprises current and deferred taxation. Income tax
and capital gains tax are recognised in profi t or loss except to the extent that they relate to items recognised directly
to equity, in which case key are recognised in equity.
1.19.1 Current tax
Current tax comprises income tax payable, calculated on the basis of expected taxable income for the year
using the tax rates enacted or substantially enacted at the balance sheet date, and any adjustment of tax
payable for prior years.
1.19.2 Deferred taxation
Deferred income tax and deferred capital gains tax are provided for on the comprehensive basis using the
balance sheet method, based on temporary differences at tax rates enacted at the balance sheet date. The
amount of deferred tax provided is based on the expected manner of realisation or settlement of the carrying
amount of the asset or liability and is not discounted. Deferred tax assets are reviewed at each balance sheet
date and are reduced to the extent that is no longer probable that the related tax benefi t will be realised.
Current and deferred tax relating to items which are charged or credited directly to equity, are also charged
to equity and are subsequently recognised in the income statement when the related deferred gain or loss is
recognised.
For the year ended 30 June 2009

62
NOTES TO THE CONSOLIDATED FINANCIAL STATEMENTS CONTINUED
1. REPORTING ENTITY continued
1.19 INCOME TAX continued
1.19.2 Deferred taxation continued
Deferred tax is not recognised for the following temporary differences: the initial recognition of goodwill, the
initial recognition of assets and liabilities in a transaction that is not a business combination, which affects
neither accounting nor taxable profi ts and losses, investments in subsidiaries and joint ventures where the
Group controls the timing of the reversal of temporary differences and it is probable that these differences will
not reverse in foreseeable future.
Deferred tax assets are recognised to the extent that it is probable that future profi ts will be available against
which the associated unused tax losses and deductible temporary differences can be utilised. Deferred tax
assets are reduced to the extent it is no longer probable that the related tax benefi t will be realised.
1.19.3 Secondary tax on companies
Secondary taxation on companies (“STC”) that arises from the distribution of dividends is recognised at the
same time as the liability to pay the related dividend. To the extent that it is probable that dividends will be
declared against which unused STC credits can be utilised, a deferred tax asset is recognised for STC credits.
1.20 SEGMENT REPORTING
A segment is a distinguishable component of the Group that is engaged either in providing products or services whose
operating results are regularly reviewed by management in order to make decisions about resources to be allocated
to segments and assessing segment performance, which is subject to risks and rewards that are different from those
of other segments. The Group’s primary format for segment reporting is based on business segments.
Segment results include revenue, impairments, expenses and taxes directly attributable to a segment and the relevant
portion of enterprise revenue and expenses that can be allocated on a reasonable basis to a segment, whether from
internal transactions or from transactions with other Group segments. Segment assets and liabilities comprise those
operating assets and liabilities that are directly attributable to a segment or can be allocated to the segment on a
reasonable basis.
1.21 FINANCIAL GUARANTEE CONTRACTS
A fi nancial guarantee contract is a contract that requires the issuer to make specifi ed payments to reimburse the
holder for a loss it incurs because a specifi ed debtor fails to make payment when due in accordance with the original
or modifi ed terms of a debt instrument.
These fi nancial guarantee contracts are classifi ed as insurance contracts as defi ned in IFRS 4 Insurance Contracts.
A liability is recognised when it is probable that an outfl ow of resources embodying economic benefi ts will be required
to settle the contract and a reliable estimate can be made of the amount of the obligation. The amount recognised
is the best estimate of the expenditure required to settle the contract at the balance sheet date. Where the effect of
discounting is material, the liability is discounted. The discount rate used is a pre-tax rate that refl ects current market
assessments of the time value of money and, where appropriate, the risks specifi c to the liability.
The Company performs liability adequacy tests on fi nancial guarantee contract liabilities to ensure that the carrying
amount of the liabilities is suffi cient in view of estimated future cash fl ows. When performing the liability adequacy
test, the Company discounts all expected contractual cash fl ows and compares this amount to the carrying value of
the liability. Where a shortfall is identifi ed, an additional provision is made.
For the year ended 30 June 2009
63A N N U A L R E P O R T 2 0 0 9
NOTES TO THE CONSOLIDATED FINANCIAL STATEMENTS CONTINUED
1. REPORTING ENTITY continued
1.22 SHARE CAPITAL
Ordinary share capital
Ordinary shares are classifi ed as equity. Incremental costs directly attributable to the issue of ordinary shares and
share options are recognised as a deduction from equity, net of any tax effects.
Dividends are recognised as distributions within equity in the period in which they are payable to shareholders.
When share capital recognised as equity is repurchased, the amount of the consideration paid, including directly
attributable costs, net of tax effects, is recognised as a deduction from equity. Repurchased shares are classifi ed as
treasury shares and presented as a deduction from total equity unless cancelled.
Preference share capital
Preference share capital is classifi ed as equity if it is non-redeemable and any dividends are discretionary, or it is
redeemable only at the Company’s option.
1.23 EARNINGS PER SHARE
The Group presents basic and diluted earnings per share (“EPS”) data for its ordinary shares. Basic EPS is calculated
by dividing the profi t or loss attributable to ordinary shareholders of the parent by the weighted average number of
ordinary shares outstanding during the period. Diluted EPS is determined by adjusting the profi t or loss attributable to
ordinary shareholders and the weighted average number of shares outstanding for the effects of all dilutive potential
ordinary shares, which comprise share options granted to employees.
For the year ended 30 June 2009

64
NOTES TO THE CONSOLIDATED FINANCIAL STATEMENTS CONTINUED
2. KEY ASSUMPTIONS AND ESTIMATES APPLIED BY MANAGEMENT In preparing the fi nancial statements, estimates and assumptions are continually evaluated based on historical and other
factors, including expectations of uncertain future events that are believed to be reasonable under the circumstances. The results of estimates and assumptions form the basis of making judgements about the carrying value of assets and liabilities. Actual results may differ from the estimates made that could affect the reported amounts of assets and liabilities in future years.
CREDIT IMPAIRMENT OF LOANS AND ADVANCES Performing loans The Group assesses its loan portfolio for impairment on a yearly basis or at least at each balance sheet date.
The Group adopts an incurred-loss approach to impairment. Impairment losses are incurred, only if there is objective evidence of impairment as a result of one or more past events that has occurred since initial recognition. This necessitates the establishment of ‘impairment triggers’ on the occurrence of which an impairment loss is recognised.
Credit impairment is based on discounted estimated future cash fl ows on an asset or group of assets, where such objective evidence of impairment exists. The discount rate used to calculate the recoverable amount excludes consideration of any anticipated future credit losses. The impairment for performing loans is calculated on a portfolio basis, based on historical loss ratios, including industry and specifi c economic conditions and other indications present at the reporting date.
The Group has created an allowance for incurred but not reported (“IBNR”) losses. The purpose of the IBNR allowance is to allow for latent losses on a portfolio of loans and advances that have not yet been individually evidenced. Generally, a period of time will elapse between the incurrence of an impairment event and objective evidence of the impairment becoming evident, which is known as the ‘emergence period’. The IBNR provision is based on the probability that loans that are ostensibly performing at the calculation date are impaired, and objective evidence of that impairment becomes evident during the emergence period.
Non-performing loans Loans and advances are individually impaired if the amounts are due and remain unpaid and also take into account breaches
of key loan covenants.
Management estimates of future cash fl ows on individually impaired loans are based on historical loss experience for assets with similar credit risk characteristics, and the recoverability of security or collateral in our possession.
The methodology and assumptions used for estimating both the timing and amount of future cash fl ows is based on the present value of estimated future cash fl ows and salvage value of securities held.
Intangible assets and goodwill The Group tests annually whether goodwill has suffered any impairment, in accordance with the accounting policy
disclosed. The recoverable amounts of cash-generating units (“CGU”) have been based on the higher of fair value less costs to sell and value-in-use calculations. The assumptions applied for these variables match those applied in the preparation of group budgets and forecasts. Assumptions are supported by past experience. The estimated impairment of intangibles and goodwill is RNil (2008: RNil). Please refer to note 11.
Deferred taxation asset The deferred taxation asset is recognised based on the probability that suffi cient future taxable profi ts will be available to
realise the asset carried for assessed losses within a three- to fi ve-year horizon.
Private equity investment valuations Private equity investments are based on the underlying value of the net assets and unrecognised intangible assets within
the investment vehicles concerned. These values are established by the directors and/or the trustees of those vehicles or prevailing market conditions. The basis of valuation is reviewed by the Investment committee of the Group.
Fair value of fi nancial instruments The fair value of fi nancial instruments that are not quoted in active markets is determined by using valuation techniques.
Where valuation techniques or models are used to determine fair values, they are validated and periodically independently reviewed by qualifi ed senior personnel. All models are authorised before they are used, and models are calibrated and back tested to ensure that outputs refl ect actual data and comparative market prices. To the extent practical, models use only observable data, however areas such as credit risk (both own and counterparty), volatilities and correlations require
management to make estimates (refer note 23).
For the year ended 30 June 2009
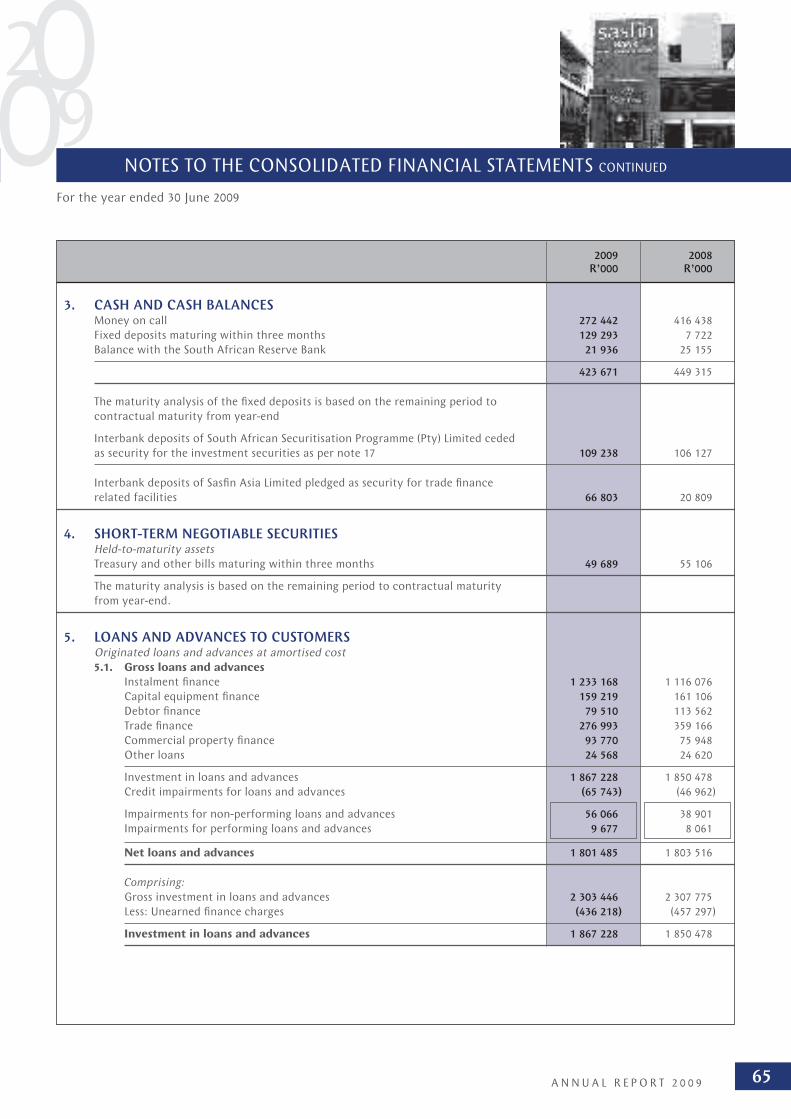
65A N N U A L R E P O R T 2 0 0 9
NOTES TO THE CONSOLIDATED FINANCIAL STATEMENTS CONTINUED
2009 2008 R’000 R’000
3. CASH AND CASH BALANCES Money on call 272 442 416 438
Fixed deposits maturing within three months 129 293 7 722
Balance with the South African Reserve Bank 21 936 25 155
423 671 449 315
The maturity analysis of the fi xed deposits is based on the remaining period to
contractual maturity from year-end
Interbank deposits of South African Securitisation Programme (Pty) Limited ceded
as security for the investment securities as per note 17 109 238 106 127
Interbank deposits of Sasfi n Asia Limited pledged as security for trade fi nance
related facilities 66 803 20 809
4. SHORT-TERM NEGOTIABLE SECURITIES Held-to-maturity assets
Treasury and other bills maturing within three months 49 689 55 106
The maturity analysis is based on the remaining period to contractual maturity
from year-end.
5. LOANS AND ADVANCES TO CUSTOMERS Originated loans and advances at amortised cost
5.1. Gross loans and advances
Instalment fi nance 1 233 168 1 116 076
Capital equipment fi nance 159 219 161 106
Debtor fi nance 79 510 113 562
Trade fi nance 276 993 359 166
Commercial property fi nance 93 770 75 948
Other loans 24 568 24 620
Investment in loans and advances 1 867 228 1 850 478
Credit impairments for loans and advances (65 743) (46 962)
Impairments for non-performing loans and advances 56 066 38 901
Impairments for performing loans and advances 9 677 8 061
Net loans and advances 1 801 485 1 803 516
Comprising:
Gross investment in loans and advances 2 303 446 2 307 775
Less: Unearned fi nance charges (436 218) (457 297)
Investment in loans and advances 1 867 228 1 850 478
For the year ended 30 June 2009

66
NOTES TO THE CONSOLIDATED FINANCIAL STATEMENTS CONTINUED
For the year ended 30 June 2009
2009 2008 R’000 R’000
5. LOANS AND ADVANCES TO CUSTOMERS continued
Originated loans and advances at amortised cost continued
5.1. Gross loans and advances continued
Loans and advances are refl ected at amortised cost which is a reasonable
approximation of fair value.
Trade fi nance loans are ceded as security for trade fi nance related facilities 204 309 271 538
Included in instalment fi nance loans are securitised assets ceded as security
for debt securities issued per note 17 928 351 736 850
Gross loans and advances
Maturity analysis
Maturing within one year 510 342 572 179
Maturing after one year but within fi ve years 1 353 669 1 276 875
Maturing after fi ve years 3 217 1 424
1 867 228 1 850 478
The maturity analysis is based on the remaining periods to contractual
maturity from year-end.
Sectoral analysis
Agriculture 12 348 14 363
Community, social and personal services 416 850 365 586
Construction 69 743 58 746
Electricity and water 27 011 13 611
Finance, real estate and business services 396 611 312 893
Manufacturing 242 174 300 154
Mining 76 277 48 289
Trade and accommodation 504 976 565 904
Transport and communication 121 238 170 932
1 867 228 1 850 478
Geographic analysis
South Africa 1 845 213 1 783 929
Rest of Africa 20 402 31 361
Outside Africa 1 613 35 188
1 867 228 1 850 478
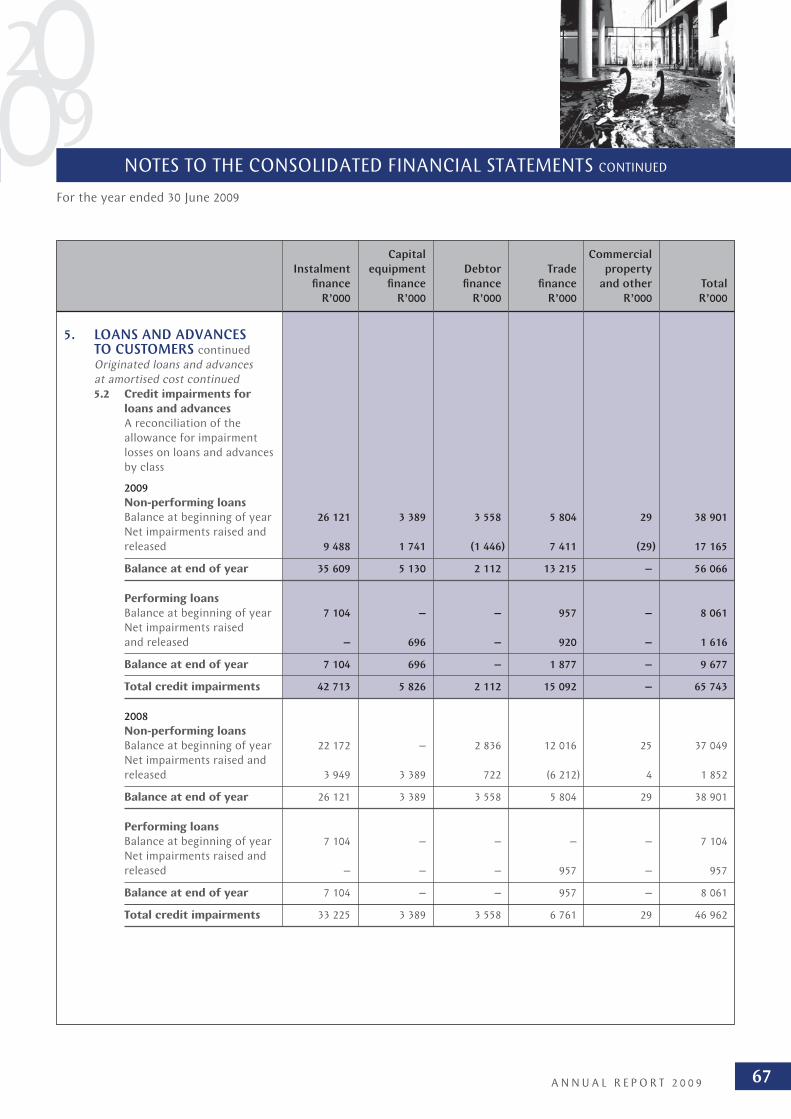
67A N N U A L R E P O R T 2 0 0 9
NOTES TO THE CONSOLIDATED FINANCIAL STATEMENTS CONTINUED
For the year ended 30 June 2009
Capital Commercial
Instalment equipment Debtor Trade property
fi nance fi nance fi nance fi nance and other Total
R’000 R’000 R’000 R’000 R’000 R’000
5. LOANS AND ADVANCES TO CUSTOMERS continued
Originated loans and advances
at amortised cost continued
5.2 Credit impairments for
loans and advances
A reconciliation of the
allowance for impairment
losses on loans and advances
by class
2009
Non-performing loans
Balance at beginning of year 26 121 3 389 3 558 5 804 29 38 901
Net impairments raised and
released 9 488 1 741 (1 446) 7 411 (29) 17 165
Balance at end of year 35 609 5 130 2 112 13 215 – 56 066
Performing loans
Balance at beginning of year 7 104 – – 957 – 8 061
Net impairments raised
and released – 696 – 920 – 1 616
Balance at end of year 7 104 696 – 1 877 – 9 677
Total credit impairments 42 713 5 826 2 112 15 092 – 65 743
2008
Non-performing loans
Balance at beginning of year 22 172 – 2 836 12 016 25 37 049
Net impairments raised and
released 3 949 3 389 722 (6 212) 4 1 852
Balance at end of year 26 121 3 389 3 558 5 804 29 38 901
Performing loans
Balance at beginning of year 7 104 – – – – 7 104
Net impairments raised and
released – – – 957 – 957
Balance at end of year 7 104 – – 957 – 8 061
Total credit impairments 33 225 3 389 3 558 6 761 29 46 962
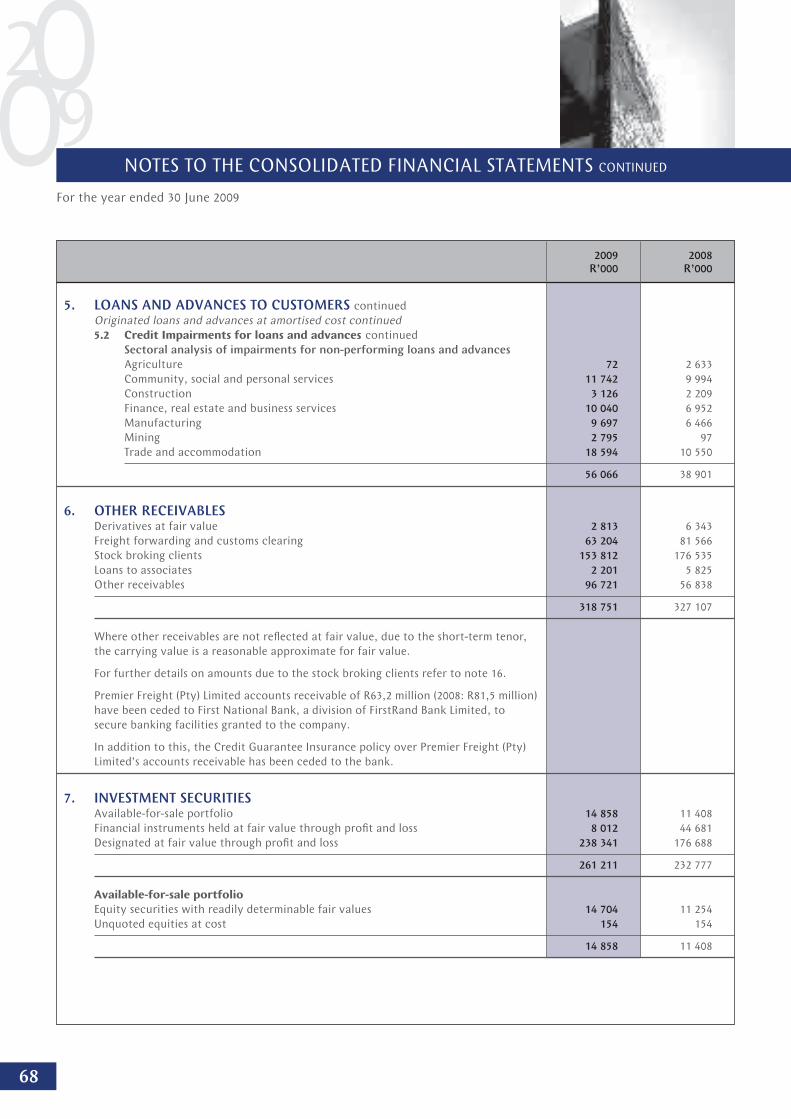
68
NOTES TO THE CONSOLIDATED FINANCIAL STATEMENTS CONTINUED
For the year ended 30 June 2009
2009 2008 R’000 R’000
5. LOANS AND ADVANCES TO CUSTOMERS continued
Originated loans and advances at amortised cost continued
5.2 Credit Impairments for loans and advances continued
Sectoral analysis of impairments for non-performing loans and advances
Agriculture 72 2 633
Community, social and personal services 11 742 9 994
Construction 3 126 2 209
Finance, real estate and business services 10 040 6 952
Manufacturing 9 697 6 466
Mining 2 795 97
Trade and accommodation 18 594 10 550
56 066 38 901
6. OTHER RECEIVABLES Derivatives at fair value 2 813 6 343
Freight forwarding and customs clearing 63 204 81 566
Stock broking clients 153 812 176 535
Loans to associates 2 201 5 825
Other receivables 96 721 56 838
318 751 327 107
Where other receivables are not refl ected at fair value, due to the short-term tenor,
the carrying value is a reasonable approximate for fair value.
For further details on amounts due to the stock broking clients refer to note 16.
Premier Freight (Pty) Limited accounts receivable of R63,2 million (2008: R81,5 million)
have been ceded to First National Bank, a division of FirstRand Bank Limited, to
secure banking facilities granted to the company.
In addition to this, the Credit Guarantee Insurance policy over Premier Freight (Pty)
Limited’s accounts receivable has been ceded to the bank.
7. INVESTMENT SECURITIES Available-for-sale portfolio 14 858 11 408
Financial instruments held at fair value through profi t and loss 8 012 44 681
Designated at fair value through profi t and loss 238 341 176 688
261 211 232 777
Available-for-sale portfolio
Equity securities with readily determinable fair values 14 704 11 254
Unquoted equities at cost 154 154
14 858 11 408
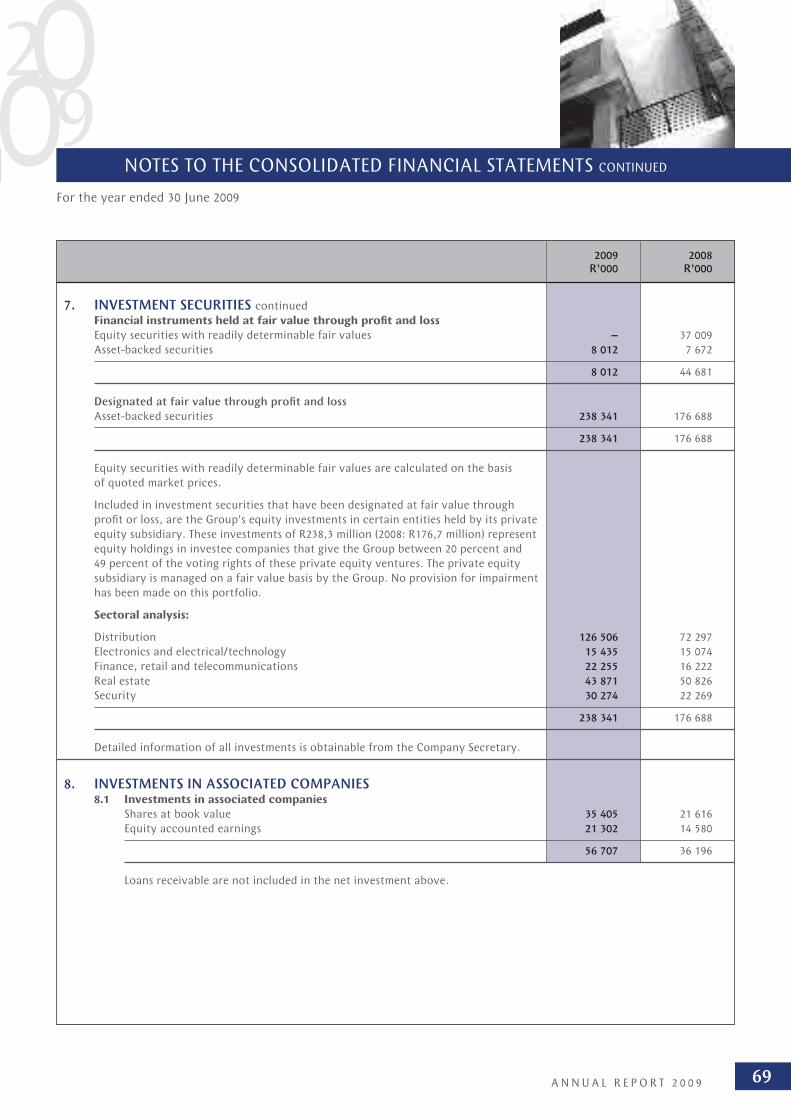
69A N N U A L R E P O R T 2 0 0 9
NOTES TO THE CONSOLIDATED FINANCIAL STATEMENTS CONTINUED
For the year ended 30 June 2009
2009 2008 R’000 R’000
7. INVESTMENT SECURITIES continued
Financial instruments held at fair value through profi t and loss
Equity securities with readily determinable fair values – 37 009
Asset-backed securities 8 012 7 672
8 012 44 681
Designated at fair value through profi t and loss
Asset-backed securities 238 341 176 688
238 341 176 688
Equity securities with readily determinable fair values are calculated on the basis
of quoted market prices.
Included in investment securities that have been designated at fair value through
profi t or loss, are the Group’s equity investments in certain entities held by its private
equity subsidiary. These investments of R238,3 million (2008: R176,7 million) represent
equity holdings in investee companies that give the Group between 20 percent and
49 percent of the voting rights of these private equity ventures. The private equity
subsidiary is managed on a fair value basis by the Group. No provision for impairment
has been made on this portfolio.
Sectoral analysis:
Distribution 126 506 72 297
Electronics and electrical/technology 15 435 15 074
Finance, retail and telecommunications 22 255 16 222
Real estate 43 871 50 826
Security 30 274 22 269
238 341 176 688
Detailed information of all investments is obtainable from the Company Secretary.
8. INVESTMENTS IN ASSOCIATED COMPANIES 8.1 Investments in associated companies
Shares at book value 35 405 21 616
Equity accounted earnings 21 302 14 580
56 707 36 196
Loans receivable are not included in the net investment above.

70
NOTES TO THE CONSOLIDATED FINANCIAL STATEMENTS CONTINUED
For the year ended 30 June 2009
NVest InnoVent
Financial Investment
Holdings Holdings
(Pty) Limited (Pty) Limited
R’000 R’000
8. INVESTMENTS IN ASSOCIATED COMPANIES continued
8.1 Investments in associated companies continued
Summarised fi nancial information of associated companies
equity accounted:
2009
Carrying value 6 752 18 264
Total assets 288 654 145 319
Total liabilities 254 214 97 206
Group’s proportionate share of total liabilities 50 843 32 661
Equity 34 440 48 113
Total revenue 57 395 272 826
Total net profi t after tax 14 659 17 930
Share of income – current year 3 120 5 048
Equity accounted earnings 3 120 18 182
InnoVent Pioneer
Investment Employee
Holdings Benefi ts
(Pty) Limited (Pty) Limited
2008
Carrying value 19 084 647
Total assets 109 316 2 689
Total liabilities 52 185 533
Equity 57 131 2 156
Total revenue 176 103 3 304
Total net profi t after tax 14 511 128
Share of income – current year 4 876 56
Equity accounted earnings 13 933 647
Loan to the Company 5 152 –
2009 2008 R’000 R’000
8.2 Investments in joint ventures proportionately consolidated
Hecny Transportation South Africa (Pty) Limited
Effective shareholding in the joint venture 32% 32%
Group’s proportionate share of assets and liabilities which is included in the
fi gures of the consolidated fi nancial statements:
Non-current assets 18 58
Current assets 2 363 6 211
Current liabilities 550 2 073
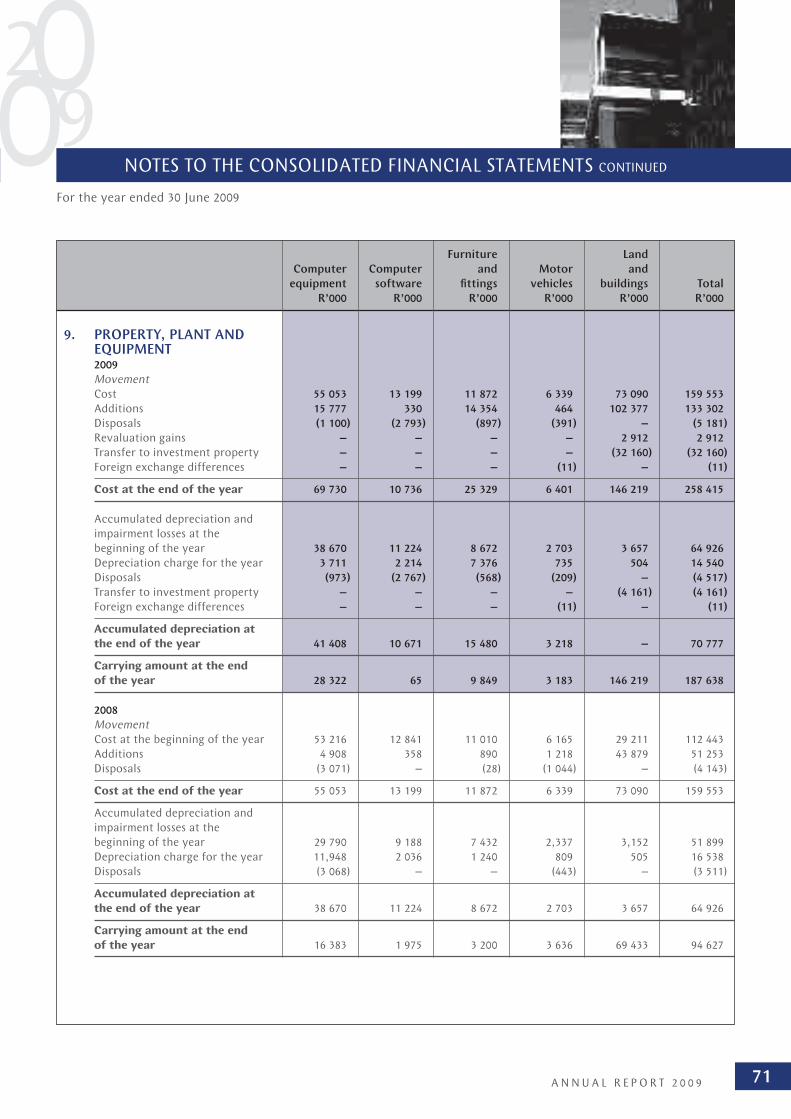
71A N N U A L R E P O R T 2 0 0 9
NOTES TO THE CONSOLIDATED FINANCIAL STATEMENTS CONTINUED
Furniture Land
Computer Computer and Motor and
equipment software fi ttings vehicles buildings Total
R’000 R’000 R’000 R’000 R’000 R’000
9. PROPERTY, PLANT AND EQUIPMENT
2009
Movement
Cost 55 053 13 199 11 872 6 339 73 090 159 553
Additions 15 777 330 14 354 464 102 377 133 302
Disposals (1 100) (2 793) (897) (391) – (5 181)
Revaluation gains – – – – 2 912 2 912
Transfer to investment property – – – – (32 160) (32 160)
Foreign exchange differences – – – (11) – (11)
Cost at the end of the year 69 730 10 736 25 329 6 401 146 219 258 415
Accumulated depreciation and
impairment losses at the
beginning of the year 38 670 11 224 8 672 2 703 3 657 64 926
Depreciation charge for the year 3 711 2 214 7 376 735 504 14 540
Disposals (973) (2 767) (568) (209) – (4 517)
Transfer to investment property – – – – (4 161) (4 161)
Foreign exchange differences – – – (11) – (11)
Accumulated depreciation at
the end of the year 41 408 10 671 15 480 3 218 – 70 777
Carrying amount at the end
of the year 28 322 65 9 849 3 183 146 219 187 638
2008
Movement
Cost at the beginning of the year 53 216 12 841 11 010 6 165 29 211 112 443
Additions 4 908 358 890 1 218 43 879 51 253
Disposals (3 071) – (28) (1 044) – (4 143)
Cost at the end of the year 55 053 13 199 11 872 6 339 73 090 159 553
Accumulated depreciation and
impairment losses at the
beginning of the year 29 790 9 188 7 432 2,337 3,152 51 899
Depreciation charge for the year 11,948 2 036 1 240 809 505 16 538
Disposals (3 068) – – (443) – (3 511)
Accumulated depreciation at
the end of the year 38 670 11 224 8 672 2 703 3 657 64 926
Carrying amount at the end
of the year 16 383 1 975 3 200 3 636 69 433 94 627
For the year ended 30 June 2009
72
NOTES TO THE CONSOLIDATED FINANCIAL STATEMENTS CONTINUED
For the year ended 30 June 2009
9. PROPERTY, PLANT AND EQUIPMENT continued
The land and buildings comprise the Group’s investment in its new premises which was completed on 30 June 2009.
The Group took occupation on this date. The development includes the cost of land and development costs incurred
to date and capitalised interest. The total cost of development amounts to approximately R170 million and is funded
from the Group’s internal resources of R70 million and through external funding arrangements amounting to
R100 million, see note 15.
The Group’s investment in the property situated at 13 – 15 Scott Street, Waverley was reclassifi ed from owner-occupied
to investment property, see note 10, and is now carried at fair value. At year-end, this investment was transferred at fair
value to investment property.
2009 2008 R’000 R’000
10. INVESTMENT PROPERTY Transfer from property, plant and equipment 27 999 –
Carrying value at 30 June 2009 27 999 –
These premises are encumbered for unutilised interbank facilities provided
to Sasfi n Bank Limited.
11. INTANGIBLE ASSETS AND GOODWILL Intangible assets
Software development
Carrying value at the beginning of the year 5 688 2 729
Additions at cost 24 391 2 959
Carrying value at the end of the year 30 079 5 688
During 2008 and 2009, the Group identifi ed no events or circumstances that would
indicate that the Group’s intangible assets may be impaired.
Goodwill
Carrying value at the beginning of the year 3 729 3 729
Carrying value at the end of the year 3 729 3 729
Total 33 808 9 417
Goodwill represents the excess of the fair value of certain assets and liabilities
acquired by the Group during the course of the year.
Impairment testing of goodwill is done annually or more frequently if required
by comparing the net carrying value of the cash-generating units to the estimated
value in use. The value-in-use represents estimated future cash fl ows of underlying
annuity income. Accounting estimates and assumptions applied in testing for
impairment of goodwill are detailed in note 2.
Goodwill is assessed on an annual basis by reference to the entities’ profi t performance
and underlying net asset value.
No impairment losses on goodwill were recognised during 2009 (2008: nil).

73A N N U A L R E P O R T 2 0 0 9
NOTES TO THE CONSOLIDATED FINANCIAL STATEMENTS CONTINUED
2009 2008 R’000 R’000
12. DEFERRED TAX Deferred tax reconciliation
Opening balances (44 914) (39 047)
Deferred tax assets 7 691 2 856
Deferred tax liabilities (52 605) (41 903)
Charge to the income statement (7 662) (11 528)
Recognised in equity (835) 5 661
Closing balance (53 411) (44 914)
Comprising:
Deferred tax assets 7 366 7 691
Deferred tax liabilities (60 777) (52 605)
(53 411) (44 914)
Deferred tax on temporary differences arising from:
Instalment fi nance (44 601) (36 538)
Tax losses 5 737 3 344
Fair value adjustments (22 461) (21 439)
Provisions 4 315 4 542
Impairments 8 829 6 328
Prepayments 40 115
Other (5 270) (1 266)
(53 411) (44 914)
13. INTERBANK FUNDING AND DEPOSITS FROM BANKS Short-term interbank loans and deposits 69 777 21 359
Financial liabilities at amortised cost 69 777 21 359
14. DEPOSITS FROM CUSTOMERS Financial liabilities at amortised cost
Demand deposits 697 727 900 449
Notice deposits 5 033 6 720
Fixed deposits 178 620 200 882
881 380 1 108 051
Geographic analysis
South Africa 880 889 1 094 058
North America 170 155
Australia and New Zealand – 13 534
Switzerland 215 –
Israel 106 304
881 380 1 108 051
For the year ended 30 June 2009

74
NOTES TO THE CONSOLIDATED FINANCIAL STATEMENTS CONTINUED
2009 2008 R’000 R’000
14. DEPOSITS FROM CUSTOMERS continued
Maturity analysis
Withdrawable on demand 698 961 900 449
Maturing within one month 17 476 83 406
Maturing after one month but within six months 150 401 104 427
Maturing after six months but within 12 months 14 542 5 590
Maturing after one year but within fi ve years – 14 179
881 380 1 108 051
The maturity analysis is based on the remaining period to contractual maturity
from year-end.
15. LONG-TERM BORROWINGS Advances during the year 100 000 –
100 000 –
The Group obtained a mortgage loan of R100 million from Nedbank Limited, secured
over land and buildings per note 9. The loan bears interest at a fi xed rate of 10,9%
per annum and is repayable over a period of 10 years. The fi xed rate interest is for a
period of 60 months. Repayments will be made by way of interest only for the fi rst
30 months. The capital together with interest thereon will be repaid in equal monthly
instalments over the remainder of the loan term.
16. OTHER PAYABLES Derivative liabilities 2 656 2 546
Audit fees and other services 4 125 3 676
Accounts payable 118 148 123 936
Cash-settled share-based payment liability 1 148 1 639
Stock broking clients 136 554 154 295
80 877 97 189
Amounts due to clients 1 796 634 2 024 779
Less: JSE trustees (930 129) (838 466)
Borrowers control (773 016) (1 076 164)
JSE trustees – fi nancial rand (12 612) (12 960)
Overseas brokers on market deals 289 8 409
Brokers on market deals 54 715 47 295
Marketable and uncertifi ed securities taxes 22 721
Dividends payable 651 681
262 631 286 092
For the year ended 30 June 2009

75A N N U A L R E P O R T 2 0 0 9
NOTES TO THE CONSOLIDATED FINANCIAL STATEMENTS CONTINUED
16. OTHER PAYABLES continued
Where other payables are not refl ected at fair value due to the short-term nature, the carrying value is a reasonable
approximate for fair value.
All unsettled transactions settle on the trading rules applicable for the specifi c exchange where the deal was booked.
Included in amounts payable in respect of stock broking activities is an amount due in settlement of these transactions.
The amounts receivable from JSE Trustees (Pty) Limited and Money Market deposits are funds managed for clients.
An amount payable to settle these transactions is included under amounts payable in respect of stock broking activities.
Scrip borrowing and scrip lending balances represent deposits made with lenders and deposits received from borrowers,
respectively. To the extent that there is no right to offset these balances, the amounts are shown on a gross basis.
2009 2008 R’000 R’000
17. DEBT SECURITIES ISSUED FINANCIAL LIABILITIES AT AMORTISED COST
Category analysis
2009
Class A notes (BESA code ERSA1)
Unsubordinated, secured, compulsory redeemable, asset-backed notes of R1 000 000
each. These notes bear interest at three month JIBAR plus 1,15%. Scheduled maturity
date is 17 November 2009. 364 927 –
Class A notes (BESA code ERSA2)
Unsubordinated, secured, compulsory redeemable, asset-backed notes of R1 000 000
each. These notes bear interest at three month JIBAR plus 1,50%. Scheduled maturity
date is 17 November 2010. 152 707 –
Class A notes (BESA code ERSA3)
Unsubordinated, secured, compulsory redeemable, asset-backed notes of R1 000 000
each. These notes bear interest at three month JIBAR plus 1,80%. Scheduled maturity
date is 17 November 2011. 204 356 –
Class A notes (BESA code ERSAU)
Unsubordinated, secured, compulsory redeemable, asset-backed notes of R1 000 000
each. These notes bear interest at 12,824%. Scheduled maturity date is 17 November
2009. These notes are not listed on BESA. 62 591 –
Class B notes (BESA code ERS3B)
Unsubordinated, secured, compulsory redeemable, asset-backed notes of R1 000 000
each. These notes bear interest at three month JIBAR plus 3,10%. Scheduled maturity
date is 17 November 2011. 59 753 –
Class C notes (BESA code ERS3C)
Unsubordinated, secured, compulsory redeemable, asset-backed notes of R1 000 000
each. These notes bear interest at three month JIBAR plus 3,60%. Scheduled maturity
date is 17 November 2011. 29 401 –
873 735 –
The fl oating rate notes are secured by a cession of rentals and equipment underlying
the instalment fi nance assets as well as the bank accounts owned by South African
Securitisation Programme (Pty) Limited – refer to notes 3 and 5. 873 735 –
For the year ended 30 June 2009
76
NOTES TO THE CONSOLIDATED FINANCIAL STATEMENTS CONTINUED
For the year ended 30 June 2009
2009 2008 R’000 R’000
17. DEBT SECURITIES ISSUED continued
FINANCIAL LIABILITIES AT AMORTISED COST continued
Category analysis continued
2008
Class A notes
Unsubordinated, secured, compulsory redeemable, asset-backed notes of R1 000 000
each – redeemed on 17 November 2008 – 621 789
Class B notes
Subordinated, secured, compulsory redeemable, asset-backed notes of R1 000 000 each
– redeemed on 17 November 2008 – 44 679
Class C notes
Subordinated, secured, compulsory redeemable, asset-backed notes of R1 000 000 each
– redeemed on 17 November 2008 – 13 215
Class 2 B notes
Subordinated, secured, compulsory redeemable, asset-backed notes of R1 000 000 each
– redeemed on 17 November 2008 – 23 354
– 703 037
The fl oating rate notes were secured by a cession of rentals and equipment underlying
the instalment fi nance assets as well as the bank accounts owned by South African
Securitisation Programme (Pty) Limited – refer to notes 3 and 5. The A notes bore
interest at three month JIBAR plus 0,52%, the B notes at three month JIBAR plus 1,39%
and the C notes at three month JIBAR plus 2,25%. The B and C notes were subordinated
in favour of the A notes and the C notes are subordinated in favour of the B notes. – 703 037
Geographic analysis
South Africa 873 735 703 037
873 735 703 037
Maturity analysis
Maturing after one month but within six months 427 518 703 037
Maturing after one year but within three years 446 217 –
873 735 703 037
The maturity analysis is based on the remaining period to contractual maturity from
year-end.
The Group has not had any defaults of principal, interest or other breaches with
respect to its debt securities during the year.

77A N N U A L R E P O R T 2 0 0 9
NOTES TO THE CONSOLIDATED FINANCIAL STATEMENTS CONTINUED
2009 2008 R’000 R’000
18. ORDINARY SHARE CAPITAL Authorised
40 000 000 (2008: 40 000 000) ordinary shares of 1 cent each 400 400
Issued
28 001 287 (2008: 27 351 853) ordinary shares of 1 cent each
Balance at the beginning of the year 273 270
Issued during the year 7 3
Balance at the end of the year 280 273
The Group has a share incentive trust in terms of which shares are issued and options
are granted. Details of the share incentive trust are set out in note 39 as required by
the JSE. The Share Incentive Trust has been consolidated into the Group’s annual
fi nancial statements. The Group issued 80 238 (2008: 338 479) shares to the Sasfi n
Share Incentive Trust. The number of shares held by the Sasfi n Share Incentive Trust
amounts to 31 333 (2008: 64 192) or R595 327 (2008: R578 276) at year-end.
The unissued shares are under the control of the directors until the next Annual
General Meeting.
19. ORDINARY SHARE PREMIUM Balance at the beginning of the year 27 266 25 433
Issued during the year 15 930 1 833
Balance at the end of the year 43 196 27 266
20. PREFERENCE SHARE CAPITAL Authorised
5 000 000 (2008: 5 000 000) non-redeemable, non-cumulative, non-participating
preference shares of 1 cent each 50 50
Issued
1 905 000 (2008: 1 905 000) preference shares of 1 cent each
Balance at the end of the year 19 19
The preference shares were listed under the Specialist Securities – Preference Shares
sector of the JSE. Dividends are paid semi-annually at a rate of 75% of the
ruling prime rate at time to time.
21. PREFERENCE SHARE PREMIUM Balance at the end of the year 199 259 199 259
For the year ended 30 June 2009
78
NOTES TO THE CONSOLIDATED FINANCIAL STATEMENTS CONTINUED
2009 2008 R’000 R’000
22. COMMITMENTS AND CONTINGENT LIABILITIES Commitments
Capital expenditure authorised and contracted for 1 661 24 637
Property under development 22 746 116 465
Contracted 22 746 90 131
Un-contracted – 26 334
Non-cancellable operating lease rentals for premises are payable as follows: 11 636 10 997
One year 4 880 3 419
One to fi ve years 6 756 7 578
Funds to meet these commitments will be provided from internal Group resources
or external funding arrangements as deemed necessary.
Contingencies
Unutilised letters of credit established and confi rmed orders placed on behalf of clients 23 954 40 118
Guarantees 14 858 23 924
74 855 216 141
For the year ended 30 June 2009
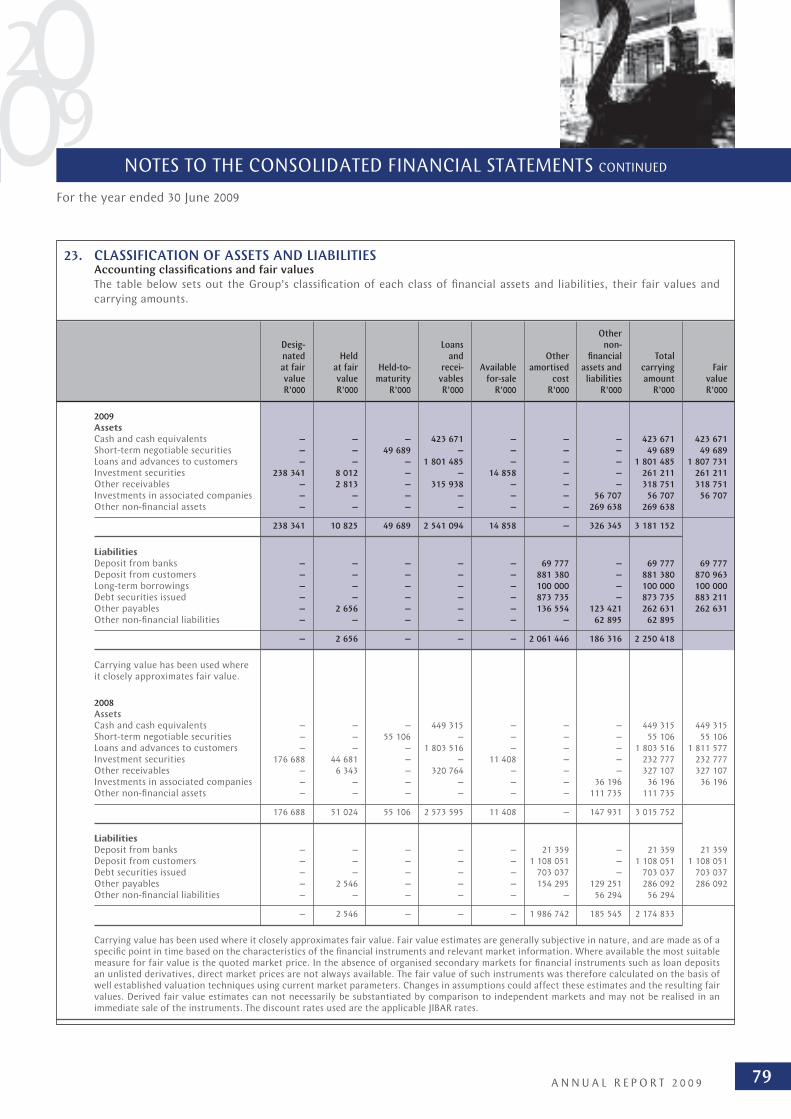
79A N N U A L R E P O R T 2 0 0 9
NOTES TO THE CONSOLIDATED FINANCIAL STATEMENTS CONTINUED
23. CLASSIFICATION OF ASSETS AND LIABILITIES Accounting classifi cations and fair values
The table below sets out the Group’s classifi cation of each class of fi nancial assets and liabilities, their fair values and
carrying amounts.
Other Desig- Loans non- nated Held and Other fi nancial Total at fair at fair Held-to- recei- Available amortised assets and carrying Fair value value maturity vables for-sale cost liabilities amount value R’000 R’000 R’000 R’000 R’000 R’000 R’000 R’000 R’000
2009 Assets Cash and cash equivalents – – – 423 671 – – – 423 671 423 671 Short-term negotiable securities – – 49 689 – – – – 49 689 49 689 Loans and advances to customers – – – 1 801 485 – – – 1 801 485 1 807 731 Investment securities 238 341 8 012 – – 14 858 – – 261 211 261 211 Other receivables – 2 813 – 315 938 – – – 318 751 318 751 Investments in associated companies – – – – – – 56 707 56 707 56 707 Other non-fi nancial assets – – – – – – 269 638 269 638
238 341 10 825 49 689 2 541 094 14 858 – 326 345 3 181 152
Liabilities Deposit from banks – – – – – 69 777 – 69 777 69 777 Deposit from customers – – – – – 881 380 – 881 380 870 963 Long-term borrowings – – – – – 100 000 – 100 000 100 000 Debt securities issued – – – – – 873 735 – 873 735 883 211 Other payables – 2 656 – – – 136 554 123 421 262 631 262 631 Other non-fi nancial liabilities – – – – – – 62 895 62 895
– 2 656 – – – 2 061 446 186 316 2 250 418
Carrying value has been used where it closely approximates fair value.
2008 Assets Cash and cash equivalents – – – 449 315 – – – 449 315 449 315 Short-term negotiable securities – – 55 106 – – – – 55 106 55 106 Loans and advances to customers – – – 1 803 516 – – – 1 803 516 1 811 577 Investment securities 176 688 44 681 – – 11 408 – – 232 777 232 777 Other receivables – 6 343 – 320 764 – – – 327 107 327 107 Investments in associated companies – – – – – – 36 196 36 196 36 196 Other non-fi nancial assets – – – – – – 111 735 111 735
176 688 51 024 55 106 2 573 595 11 408 – 147 931 3 015 752
Liabilities Deposit from banks – – – – – 21 359 – 21 359 21 359 Deposit from customers – – – – – 1 108 051 – 1 108 051 1 108 051 Debt securities issued – – – – – 703 037 – 703 037 703 037 Other payables – 2 546 – – – 154 295 129 251 286 092 286 092 Other non-fi nancial liabilities – – – – – – 56 294 56 294
– 2 546 – – – 1 986 742 185 545 2 174 833
Carrying value has been used where it closely approximates fair value. Fair value estimates are generally subjective in nature, and are made as of a specifi c point in time based on the characteristics of the fi nancial instruments and relevant market information. Where available the most suitable measure for fair value is the quoted market price. In the absence of organised secondary markets for fi nancial instruments such as loan deposits an unlisted derivatives, direct market prices are not always available. The fair value of such instruments was therefore calculated on the basis of well established valuation techniques using current market parameters. Changes in assumptions could affect these estimates and the resulting fair values. Derived fair value estimates can not necessarily be substantiated by comparison to independent markets and may not be realised in an immediate sale of the instruments. The discount rates used are the applicable JIBAR rates.
For the year ended 30 June 2009

80
NOTES TO THE CONSOLIDATED FINANCIAL STATEMENTS CONTINUED
24. FOREIGN SUBSIDIARY During the current year, Sasfi n Asia Limited, a subsidiary within the Group, changed its functional currency from South
African Rand to US Dollars with effect from 1 March 2009. The change in functional currency was required as the underlying
transactions, events and modus operandi changed.
2009 2008 R’000 R’000
25. SECURITISATION In the ordinary course of business, the Group enters into transactions that result
in the transfer of fi nancial assets to third parties or special purpose vehicles. The information below sets out the extent of such transfers, and the Group’s retained interest in transferred assets.
Transferred assets South African Securitisation Programme (Pty) Limited (“SASP”) 928 351 735 282
The Group has transferred offi ce automation rental instalment contracts to SASP but has retained substantially all of the credit risk associated with the transferred assets, and continues to recognise these assets within loans and advances to customers.
The Group securitised a further R200 million worth of fi nance leases on
17 November 2008.
26. FUNDS UNDER ADMINISTRATION Sasfi n Securities (Pty) Limited, in a fi duciary capacity on behalf of clients,
administers client funds in respect of the following:
On a discretionary basis Unlisted equities 78 169 103 561 Listed equities 23 344 788 27 400 594 Gilts 135 043 110 538 Unit trusts 1 205 Funds held in money market accounts 1 715 757 1 914 630
25 273 758 29 529 528
Included in Funds under Administration is an amount of R369 million (2008: R358 million) in respect of related parties as defi ned in note 36.
27. CAPITALISATION OF BORROWING COSTS Borrowing costs incurred during the year 11 476 –
Total borrowing costs capitalised during the year 11 476 –
The borrowing costs relates to the funding obtained for the development of the new premises in Waverley. The building was ready for use on 30 June 2009 and on thisdate the Group ceased to capitalise borrowing costs. The capitalisation rates for the two sources of funding used for the development are as follows:
• Internal funding – 2% below the prime rate • External funding (mortgage bond) – 0,85% below the prime rate up until
30 May 2009 and 10,9% for the month of June 2009.
For the year ended 30 June 2009

81A N N U A L R E P O R T 2 0 0 9
NOTES TO THE CONSOLIDATED FINANCIAL STATEMENTS CONTINUED
For the year ended 30 June 2009
2009 2008 R’000 R’000
28. INTEREST INCOME Interbank 29 908 46 883
Short-term negotiable securities 5 728 4 473
Instalment fi nance 206 278 176 607
Capital equipment 27 753 21 339
Debtor fi nance 18 239 20 443
Trade fi nance 38 883 41 191
Commercial property fi nance 18 501 6 927
Other 25 782 18 191
Interest earned on fi nancial assets held at amortised cost 371 072 336 054
29. INTEREST EXPENSE Interbank funding 4 697 1 645
Demand deposits 79 625 72 238
Notice deposits 602 648
Fixed deposits 27 217 23 789
Debt securities 96 392 82 586
Other 27 217 –
Interest paid on fi nancial liabilities held at amortised cost 211 510 180 906
30. NON-INTEREST INCOME Fee and commission income 213 885 184 194
Agency revenue 61 870 50 344
Net brokerage income and asset management fees 94 656 129 248
Confi rming fees 21 310 31 624
Dividend income 26 106 38 830
– on securities held at fair value through profi t or loss 3 129 3 618
– on investments designated at fair value 22 977 32 168
– on other non-fi nancial assets – 3 044
Fair value adjustments on fi nancial instruments held at fair value through
profi t and loss 2 441 (1 625)
Net gains and losses on derivative instruments and foreign exchange transactions 51 515 (352)
Profi t/(loss) on disposal of property, plant and equipment 19 (53)
Net loss on disposal of fi nancial instruments held at fair value through profi t and loss (122) –
471 680 432 210
82
NOTES TO THE CONSOLIDATED FINANCIAL STATEMENTS CONTINUED
2009 2008 R’000 R’000
31. IMPAIRMENT CHARGES ON LOANS AND ADVANCES Net impairments raised and released for non-performing loans 17 147 3 342
Net impairments raised and released for performing loans 1 615 957
18 762 4 299
32. OPERATING COSTS 32.1 STAFF COSTS
Salaries and wages 145 307 119 345
Directors’ emoluments 11 090 11 519
Executive directors 9 392 10 058
Non-executive directors 1 698 1 461
Contributions to defi ned contribution plans 12 994 12 533
Cash-settled share-based payments (491) 1 322
Equity-settled share-based payments (747) –
168 153 144 719
32.2 OTHER OPERATING EXPENSES
Auditors’ remuneration 7 627 5 619
Audit fees – Current year 5 177 4 352
– Under provision prior year 1 925 437
Other services 525 830
Consulting fees 5 003 4 431
Depreciation 14 540 16 538
Operating lease charges 8 839 7 209
– Premises 8 793 7 170
– Plant and equipment 46 39
Other 195 144 182 106
231 153 215 903
For the year ended 30 June 2009

83A N N U A L R E P O R T 2 0 0 9
NOTES TO THE CONSOLIDATED FINANCIAL STATEMENTS CONTINUED
2009 2008 R’000 R’000
33. INCOME TAX EXPENSE Current tax expense 16 755 28 785
Current year 21 481 34 377
Overprovision in prior years (4 726) (5 592)
Deferred tax expense 7 662 11 528
Current year 7 645 12 950
Tax rate change – (1 129)
Overprovision in prior years 17 (293)
Capital gains tax 701 (478)
Secondary tax on companies 7 214 3 105
32 332 42 940
Reconciliation of rate of taxation % %
South African normal tax rate 28,0 28,0
Adjusted for: (13,4) (8,7)
Revaluation of investments 0,6 1,5
Exempt income 0,3 (10,5)
Non-deductible expenses 1,1 0,3
Capital gains (1,4) (0,4)
Foreign entity (15,3) –
Tax losses utilised 0,4 (0,3)
Overprovision in prior years (2,1) (2,3)
Secondary tax on companies 3,3 1,4
Change in tax rate – (0,5)
Other (0,3) 2,1
Effective rate 14,6 19,3
Income tax recognised directly in equity
Available-for-sale investment securities 20 203
Revaluation of investment property 815 –
835 203
Losses, balance of allowances and credits for which a deferred tax asset
has been raised:
Estimated tax losses available to offset future taxable income 20 283 12 344
Accumulated STC credits which have arisen as a result of dividends received
exceeding dividends declared 1 655 991
For the year ended 30 June 2009

84
NOTES TO THE CONSOLIDATED FINANCIAL STATEMENTS CONTINUED
Minorities Profi t and attributable preference to ordinary Gross Direct tax shareholders shareholders R’000 R’000 R’000 R’000
34. EARNINGS PER SHARE 34.1 HEADLINE EARNINGS 2009 Profi t before direct taxation 221 341 32 332 32 105 156 904 Headline adjustable items reversed (3 666) (416) (129) (3 121)
Profi t on sale of property and equipment – IAS 16 (34) (9) – (25)
Gain on the disposal of businesses and divisions – IAS 27 (3 632) (407) (129) (3 096)
217 675 31 916 31 976 153 783
2008 Profi t before direct taxation 227 369 42 940 28 337 156 092 Headline adjustable items added 65 9 2 54
Loss on sale of property and equipment – IAS 16 65 9 2 54
227 434 42 949 28 339 156 146
2009 2008 ’000 ’000
34.2 WEIGHTED AVERAGE NUMBER OF ORDINARY SHARES Weighted average number of ordinary shares at 30 June 27 471 27 094 Effect of share options 48 207
Weighted average number of ordinary shares (diluted) at 30 June 27 519 27 301
34.3 HEADLINE EARNINGS PER ORDINARY SHARE (CENTS) The calculation of headline earnings per ordinary share is based on headline
earnings of R153,7 million (2008: R156,1 million) and the weighted average of 27 471 365 (2008: 27 093 620) ordinary shares in issue for the year. 560 576
34.4 EARNINGS PER ORDINARY SHARE (CENTS) The calculation of earnings per ordinary share is based on
earnings of R156,9 million (2008: R156,1 million) and the weighted average of 27 471 365 (2008: 27 093 620) ordinary shares in issue for the year. 571 576
34.5 DILUTED HEADLINE EARNINGS PER ORDINARY SHARE (CENTS) The calculation of diluted headline earnings per ordinary share is based on
headline earnings of R153,7 million (2008: R156,1 million) and diluted shares of 27 519 050 (2008: 27 300 520). 559 572
34.6 DILUTED EARNINGS PER ORDINARY SHARE (CENTS) The calculation of diluted earnings per ordinary share is based on
earnings of R156,9 million (2008: R156,1 million) and diluted shares
of 27 519 050 (2008: 27 300 520). 570 572
For the year ended 30 June 2009

85A N N U A L R E P O R T 2 0 0 9
NOTES TO THE CONSOLIDATED FINANCIAL STATEMENTS CONTINUED
For the year ended 30 June 2009
2009 2008 R’000 R’000
35. CASH FLOW STATEMENT NOTES 35.1 CASH RECEIPTS FROM CUSTOMERS
Interest income 371 072 336 054
Other income 480 127 437 432
851 199 773 486
Cash paid to customers, employees and suppliers
Interest expense 211 510 180 906
Total operating expenses 434 984 350 788
646 494 531 694
Cash infl ow from operating activities 204 705 241 792
Reconciliation of operating profi t to cash fl ows from operating activities
Profi t before income tax 221 341 227 369
Loss on disposal of available-for-sale investments 2 740 12
Loss/(profi t) on disposal of property, plant and equipment (19) 53
Impairment charges on loans and advances 18 762 4 299
Exchange rate fl uctuations on cash held (5 287) (1 401)
Increase in foreign currency translation (43 693) (6 703)
Cash-settled share-based payments (491) –
Equity-settled share-based payments (747) –
Fair value adjustments on fi nancial instruments held at fair value
through profi t and loss (2 441) 1 625
Depreciation 14 540 16 538
204 705 241 792
35.2 TAXATION PAID
Unpaid at the beginning of the year 48 603 71 064
Charge to the income statement 32 332 42 940
Unpaid at the end of the year (42 702) (48 603)
38 233 65 401
35.3 DIVIDENDS PAID
Charge to distributable reserves 80 447 77 896
Shares issued in terms of script dividend option (14 773)
65 674 77 896
35.4 CASH AND CASH EQUIVALENTS AT END OF THE YEAR
Cash and cash balances 423 671 449 315
Short-term negotiable securities 49 689 55 106
Interbank funding and deposits from banks (69 777) (21 359)
403 583 483 062

86
NOTES TO THE CONSOLIDATED FINANCIAL STATEMENTS CONTINUED
For the year ended 30 June 2009
2009 2008 R’000 R’000
36. RELATED PARTY TRANSACTIONS The following are defi ned as related parties of the Group:
• Subsidiaries (refer to note 38)
• Associated undertakings and joint ventures (refer to note 8)
• Key management personnel
IAS 24 – Related Parties, requires the identifi cation of “key management personnel”.
Accordingly, the Group has defi ned key management personnel as those persons
having authority and responsibility for planning, directing and controlling
the activities of the Company, directly or indirectly, including any director
(whether executive or otherwise) of the Company, as well as close members of
the family of any of these individuals. Key management personnel are considered
to be the directors of the Company.
Details of directors’ emoluments and shareholding are disclosed in the Directors’
Report on page 41.
Transactions with key management personnel
Key management personnel and their immediate relatives have transacted
with the Group during the year as follows:
Debt securities issued 36 000 –
Deposits from customers 18 185 36
Transactions are made on terms equivalent to those in an arm’s length basis as offered
to the Group’s clients.
37. FINANCIAL RISK MANAGEMENT 37.1 INTRODUCTION AND OVERVIEW
Risk management is fundamental to the Group’s business activities, enabling management to operate more effectively
in a changing and highly regulated environment. The Group remains committed to the objectives of increasing
shareholder value by developing and growing business that is consistent with agreed risk appetite, by seeking
appropriate balance between risk and reward.
This note presents information about the Group’s exposure to the various classes of risks, the Group’s objectives,
policies and processes for measuring and managing risk, and the Group’s management of capital.
Risk management framework
Governance structure
The responsibility for risk management resides at all levels, from members of the board of directors to individuals
throughout the Group. The board has overall responsibility for the establishment and oversight of the Group’s risk
management framework. The board has established the Group Asset and Liability (ALCO) and Group Risk and Capital
Management (GRCM) committees, which are responsible for developing and monitoring group risk management
policies in their specifi ed areas. All board committees have both executive and non-executive directors as members
and include members of Executive Management as well, and report regularly to the board of directors on their
activities.
The Group’s risk management policies are established to identify and analyse the risks faced by the Group, to set
appropriate risk limits and controls, and to monitor risks and adherence to limits. Risk management policies and
systems are reviewed regularly to refl ect changes in market conditions, products and services offered. The Group,
through its training and management standards and procedures, aims to develop a disciplined and constructive
control environment, in which all employees understand their roles and obligations.

87A N N U A L R E P O R T 2 0 0 9
NOTES TO THE CONSOLIDATED FINANCIAL STATEMENTS CONTINUED
For the year ended 30 June 2009
37. FINANCIAL RISK MANAGEMENT continued
37.1 INTRODUCTION AND OVERVIEW continued
The Group uses a three line of defence model:
• In the fi rst line of defence, business unit management is primarily responsible for risk management. Their
assessment, evaluation and measurement of risk needs is integrated with the day-to-day activities of the business.
This process includes the implementation of the Group’s risk management policies, identifi cation of key areas of
risk and implementation of correctional action where required. Business unit management is also accountable for
appropriate reporting to the governance bodies within the Group.
• The second line of defence consists of the Group risk management unit which is independent of line management.
The Group function is primarily responsible for setting group’s risk management framework and policy, and
providing oversight and independent reporting to Executive Management and to the board and Risk and Capital
committees respectively.
• The third line of defence consists of group internal audit function which provides an independent assessment
of the adequacy and effectiveness of the overall risk management framework and reports directly to the Group
Audit and Compliance committee (GACC). The GACC is responsible for monitoring compliance with the Group’s
risk management policies and procedures, and for reviewing the adequacy of the risk management framework in
relation to the risks faced by the Group. The GACC is assisted in these functions by Group Internal Audit. Group
Internal Audit undertakes both regular and ad-hoc reviews of risk management controls and procedures, the results
of which are reported to the Audit committee.
Risk governance standards, policies and procedures
The Group has developed a set of policies, procedures and standards for each major risk type. The policies and procedures sets out and ensures alignment and consistency in a manner in which the major risk types across the Group are identifi ed, measured, managed and reported on.
All policies and procedures are applied consistently across the Group and are approved by GRCM. It is the responsibility of business unit management to ensure the requirements of risk policies and procedures are properly implemented and adhered to on a regular basis. Business units and Group risk functions are required to self assess and report on a quarterly basis to the Group Compliance Offi cer.
Risk categories The principal risks to which the Group is exposed and which it manages are listed hereunder:
Credit risk Credit risk is the risk of loss to the Group as a result of failure by a client or counterparty to meet its contractual
obligations to the Group.
Market risk Market risk is defi ned as the risk of change in the actual or effective market value or earnings of a portfolio of fi nancial
instruments caused by adverse movements in market variables such as equity, currency exchange rates, interest rates, credit spreads and the implied volatilities in all of the above.
Liquidity risk Liquidity risk arises when the Group is unable to make its payment obligations when they fall due. This is as a result of
the Group’s inability to liquify assets or to obtain funding timeously to meet its liquidity needs.
Operational risk Operational risk is defi ned as the risk of loss resulting from inadequate or failed business operations caused through
process, people or systems, or alternatively through external events.
Business risk Business risk is the risk of loss due to adverse operating conditions caused by market-driven pressures such as
decreased demand, increased competition, cost increases or by Group specifi c causes such as poor choice of strategy, reputational damage or losses incurred to protect reputation. These losses may be increased through infl exible cost structures or ineffi ciencies.
88
NOTES TO THE CONSOLIDATED FINANCIAL STATEMENTS CONTINUED
37. FINANCIAL RISK MANAGEMENT continued 37.2 CREDIT RISK Credit risk is the risk of fi nancial loss to the Group if a customer or counterparty to a fi nancial instrument fails to meet
its contractual obligations, and arises principally from the Group’s loans and advances to customers, deposits with other banks and investment securities. For risk management reporting purposes, the Group considers and consolidates all elements of credit risk exposure (such as individual obligor default risk, country and sector risk).
Management of credit risk The board of directors has delegated responsibility for the management of credit risk to its Credit Review Committee
of the Group. A separate Group Credit department exists, reporting to the Chief Risk Offi cer, which is responsible for oversight of the Group’s credit risk, including:
• Formulating credit policies in consultation with business units, covering collateral requirements, credit assessment, risk grading and reporting, documentary and legal procedures, and compliance with regulatory and statutory requirements;
• Establishing the authorisation structure for the approval and renewal of credit facilities. Authorisation limits are allocated to business unit Credit Offi cers. Larger facilities require approval by Group Credit, Head of Group Credit, Credit Review Committee of the Group or the board of directors as appropriate;
• Reviewing and assessing credit risk. Group Credit assesses all credit exposures in excess of designated limits, prior to facilities being committed to customers by the business unit concerned. Renewals and reviews of facilities are subject to the same review process;
• Limiting concentrations of exposure to counterparties, geographies and industries for loans and advances, deposits with banks and investment securities;
• Developing and maintaining the Group’s risk indicators in order to categorise exposures according to the degree of risk of fi nancial loss faced and to focus management on the attendant risks. The risk system is used in determining where impairment provisions may be required against specifi c credit exposures. The current risk framework consists of four B to E grades refl ecting varying degrees of risk of default and the availability of collateral or other credit risk mitigation. The responsibility for setting risk grades lies with the fi nal approving executive/committee as appropriate. Risk grades are subject to regular reviews by Group Risk;
• Reviewing compliance of business units with agreed exposure limits, including those for selected industries, country risk and product types. Regular reports are provided to Group Credit on the credit quality of local portfolios and appropriate corrective action is taken;
• Providing advice, guidance and specialist skills to business units to promote best practice throughout the Group in the management of credit risk; and
Each business unit is required to implement group credit policies and procedures, with credit approval authorities delegated from the Group Credit Committee. Each business unit is responsible for the quality and performance of its credit portfolio and for monitoring and controlling all credit risks in its portfolios, including those subject to Group approval.
Regular audits of business units and Group credit processes are undertaken by Group Internal Audit. In addition, large exposures are reviewed and authorised by the board.
Securitisation The Group uses securitisation primarily as an alternative source of funding for its instalment fi nance operations, by
adding fl exibility to structural liquidity risk and diversifying the funding base. All securitisable assets are subject to the Group’s credit risk policies and procedures.
The Group fulfi ls a number of roles in the process of securitising these assets including that of originator, sponsor, hedge counterparty and administrator, and applies its Group credit risk policies and procedures to these functions.
Deposits with other banks The Group places funds on a daily basis with other banks. These deposits are generally held on overnight call or on a
short term tenor, and are available on demand or at maturity. The deposits are made in accordance with the mandates and directives provided by the ALCO and Risk and Capital Management committees. In terms of these policies, deposits can only be made with banking institutions that have AAA or AA ratings as provided by the accredited global rating agencies, and may not exceed the defi ned internal benchmarks of the Group. Deposits with other banks are reported on a daily basis to Executive Management and to ALCO on a monthly basis to ensure compliance with the Group’s
ALCO policy. Collateral is generally not held for deposit with other banks.
For the year ended 30 June 2009
89A N N U A L R E P O R T 2 0 0 9
NOTES TO THE CONSOLIDATED FINANCIAL STATEMENTS CONTINUED
37. FINANCIAL RISK MANAGEMENT continued
37.2 CREDIT RISK continued
Other receivables
Included in other receivables, is the Group’s exposure to its Freight & Forwarding customers. These majority of these
customers are Gauteng based. This subsidiary has defi ned credit risk management policies and procedures. Clients are
granted credit limits in terms of this policy and exposures and utilisation levels are monitored on a monthly basis by
management. The Group insures its receivables with a major insurance underwriter to mitigate its exposure to any
losses. Details of impairment and collateral are provided in the notes that follow.
Impaired loans and securities
Impaired loans and securities are loans and securities for which the Group determines that it is probable that it will be
unable to collect all principal and interest due according to the contractual terms of the loan/securities agreement(s).
These loans are graded in the Group’s internal credit risk grading system.
Past due but not impaired loans
Loans and securities where contractual interest or principal payments are past due but the Group believes that
impairment is not appropriate on the basis of the level of security/collateral available and/or the stage of collection
of amounts owed to the Group.
Loans with renegotiated terms
Loans with renegotiated terms are loans that have been restructured due to deterioration in the borrower’s fi nancial
position and where the Group has made concessions that it would not otherwise consider. Once the loan is restructured
it remains in this category independent of satisfactory performance after restructuring.
Credit impairment
The Group establishes an allowance for impairment losses that represents its estimate of incurred losses in its loan
portfolio. The main components of this allowance are a specifi c loss component that relates to individually signifi cant
exposures, and a portfolio loan loss allowance established for groups of homogeneous assets in respect of losses that
have been incurred but have not been identifi ed on loans subject to individual assessment for impairment.
Write-off policy
The Group writes off a loan/security balance (and any related allowances for impairment losses) when Group Credit
determines that the loans/securities are uncollectible. This determination is reached after considering information
such as the occurrence of signifi cant changes in the borrower/issuer’s fi nancial position such that the borrower/
issuer can no longer pay the obligation, or that proceeds from collateral will not be suffi cient to pay back the entire
exposure.
Credit risk measurement and determination
The Group uses its internally developed models and practices to measure and manage credit risk, by utilising skilled
resources to ensure it is properly managed and controlled. The Group has adopted the standardised approach in terms
of Basel II to measure credit risk through the majority of its business, and uses the regulatory risk buckets per SARB as
a measurement criterion for assessing performing counterparties as follows:
Categorisation of counterparty SARB risk bucket
• Performing loans and advances A
• Non performing loans and advances
• Special mention B
• Sub-standard C
• Doubtful D
• Loss E
For the year ended 30 June 2009
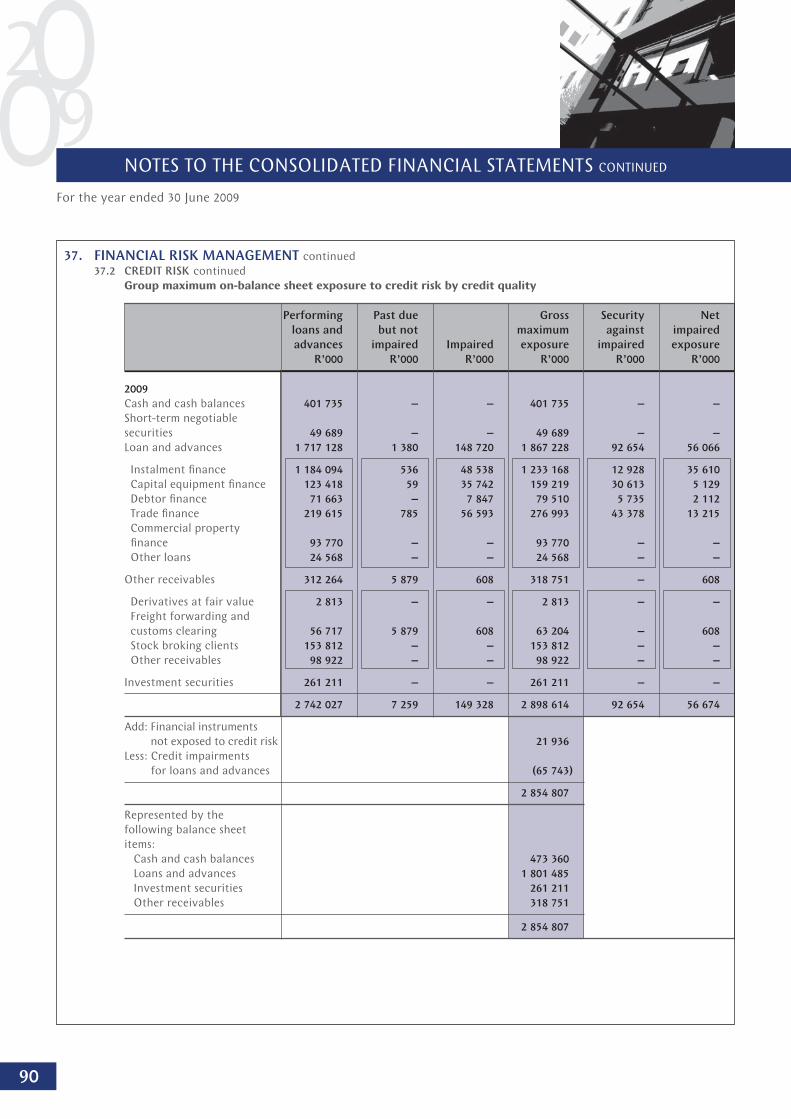
90
NOTES TO THE CONSOLIDATED FINANCIAL STATEMENTS CONTINUED
37. FINANCIAL RISK MANAGEMENT continued
37.2 CREDIT RISK continued
Group maximum on-balance sheet exposure to credit risk by credit quality
Performing Past due Gross Security Net
loans and but not maximum against impaired
advances impaired Impaired exposure impaired exposure
R’000 R’000 R’000 R’000 R’000 R’000
2009
Cash and cash balances 401 735 – – 401 735 – –
Short-term negotiable
securities 49 689 – – 49 689 – –
Loan and advances 1 717 128 1 380 148 720 1 867 228 92 654 56 066
Instalment fi nance 1 184 094 536 48 538 1 233 168 12 928 35 610
Capital equipment fi nance 123 418 59 35 742 159 219 30 613 5 129
Debtor fi nance 71 663 – 7 847 79 510 5 735 2 112
Trade fi nance 219 615 785 56 593 276 993 43 378 13 215
Commercial property
fi nance 93 770 – – 93 770 – –
Other loans 24 568 – – 24 568 – –
Other receivables 312 264 5 879 608 318 751 – 608
Derivatives at fair value 2 813 – – 2 813 – –
Freight forwarding and
customs clearing 56 717 5 879 608 63 204 – 608
Stock broking clients 153 812 – – 153 812 – –
Other receivables 98 922 – – 98 922 – –
Investment securities 261 211 – – 261 211 – –
2 742 027 7 259 149 328 2 898 614 92 654 56 674
Add: Financial instruments
not exposed to credit risk 21 936
Less: Credit impairments
for loans and advances (65 743)
2 854 807
Represented by the
following balance sheet
items:
Cash and cash balances 473 360
Loans and advances 1 801 485
Investment securities 261 211
Other receivables 318 751
2 854 807
For the year ended 30 June 2009

91A N N U A L R E P O R T 2 0 0 9
NOTES TO THE CONSOLIDATED FINANCIAL STATEMENTS CONTINUED
37. FINANCIAL RISK MANAGEMENT continued
37.2 CREDIT RISK continued
Group maximum on-balance sheet exposure to credit risk by credit quality continued
Performing Past due Gross Security Net
loans and but not maximum against impaired
advances impaired Impaired exposure impaired exposure
R’000 R’000 R’000 R’000 R’000 R’000
2008
Cash and cash balances 424 160 – – 424 160 – –
Short-term negotiable
securities 55 106 – – 55 106 – –
Loan and advances 1 752 222 2 264 95 992 1 850 478 57 092 38 901
Instalment fi nance 1 233 389 1 026 42 767 1 277 182 13 257 29 510
Debtor fi nance 104 351 – 9 211 113 562 5 653 3 558
Trade fi nance 313 943 1 238 43 985 359 166 38 182 5 804
Commercial property
fi nance 75 948 – – 75 948 – –
Other loans 24 591 – 29 24 620 – 29
Other receivables 295 409 31 166 532 327 107 – 532
Derivatives at fair value 6 343 – – 6 343 – –
Freight forwarding and
customs clearing 49 868 31 166 532 81 566 – 532
Stock broking clients 176 535 – – 176 535 – –
Other receivables 62 663 – – 62 663 – –
Investment securities 232 777 – – 232 777 – –
2 759 674 33 430 96 524 2 889 628 57 092 39 433
Add: Financial instruments
not exposed to credit risk 25 155
Less: Credit impairments
for loans and advances (46 962)
2 867 821
Represented by the
following balance sheet
items:
Cash and cash balances 504 421
Loans and advances 1 803 516
Investment securities 232 777
Other receivables 327 107
2 867 821
For the year ended 30 June 2009
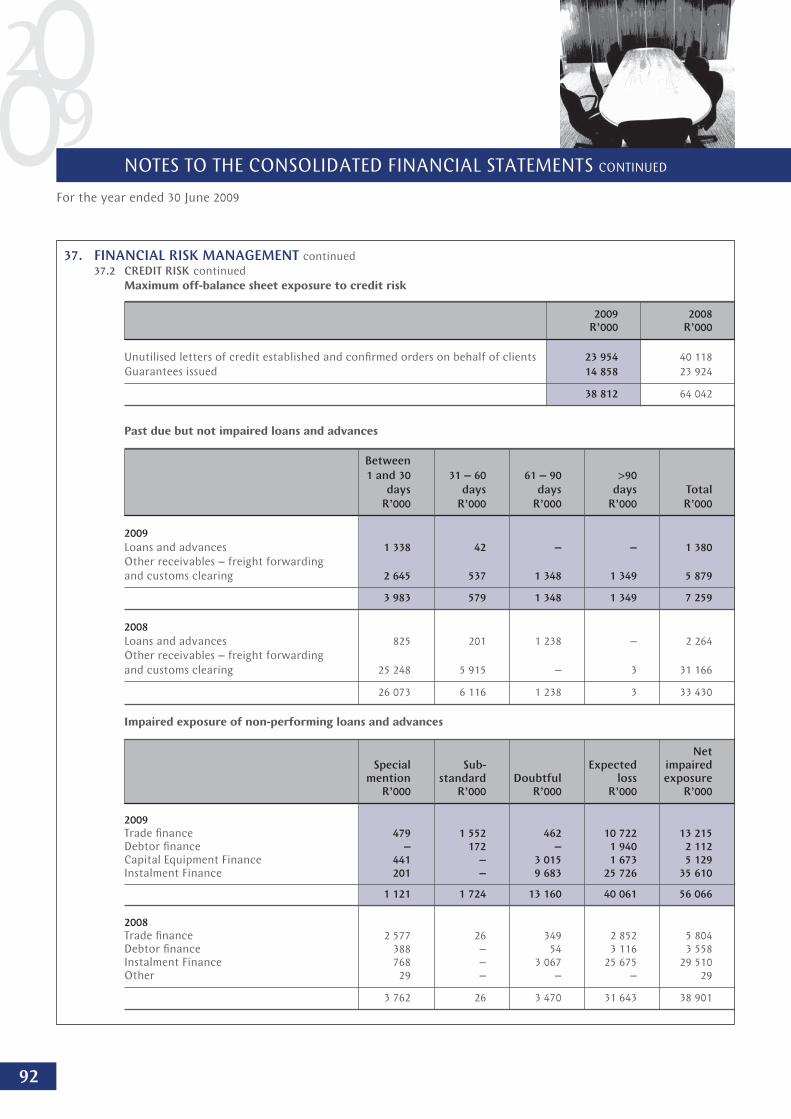
92
NOTES TO THE CONSOLIDATED FINANCIAL STATEMENTS CONTINUED
37. FINANCIAL RISK MANAGEMENT continued
37.2 CREDIT RISK continued
Maximum off-balance sheet exposure to credit risk
2009 2008 R’000 R’000
Unutilised letters of credit established and confi rmed orders on behalf of clients 23 954 40 118
Guarantees issued 14 858 23 924
38 812 64 042
Past due but not impaired loans and advances
Between
1 and 30 31 – 60 61 – 90 >90
days days days days Total
R’000 R’000 R’000 R’000 R’000
2009
Loans and advances 1 338 42 – – 1 380
Other receivables – freight forwarding
and customs clearing 2 645 537 1 348 1 349 5 879
3 983 579 1 348 1 349 7 259
2008
Loans and advances 825 201 1 238 – 2 264
Other receivables – freight forwarding
and customs clearing 25 248 5 915 – 3 31 166
26 073 6 116 1 238 3 33 430
Impaired exposure of non-performing loans and advances
Net Special Sub- Expected impaired mention standard Doubtful loss exposure R’000 R’000 R’000 R’000 R’000
2009 Trade fi nance 479 1 552 462 10 722 13 215 Debtor fi nance – 172 – 1 940 2 112 Capital Equipment Finance 441 – 3 015 1 673 5 129 Instalment Finance 201 – 9 683 25 726 35 610
1 121 1 724 13 160 40 061 56 066
2008 Trade fi nance 2 577 26 349 2 852 5 804 Debtor fi nance 388 – 54 3 116 3 558 Instalment Finance 768 – 3 067 25 675 29 510 Other 29 – – – 29
3 762 26 3 470 31 643 38 901
For the year ended 30 June 2009
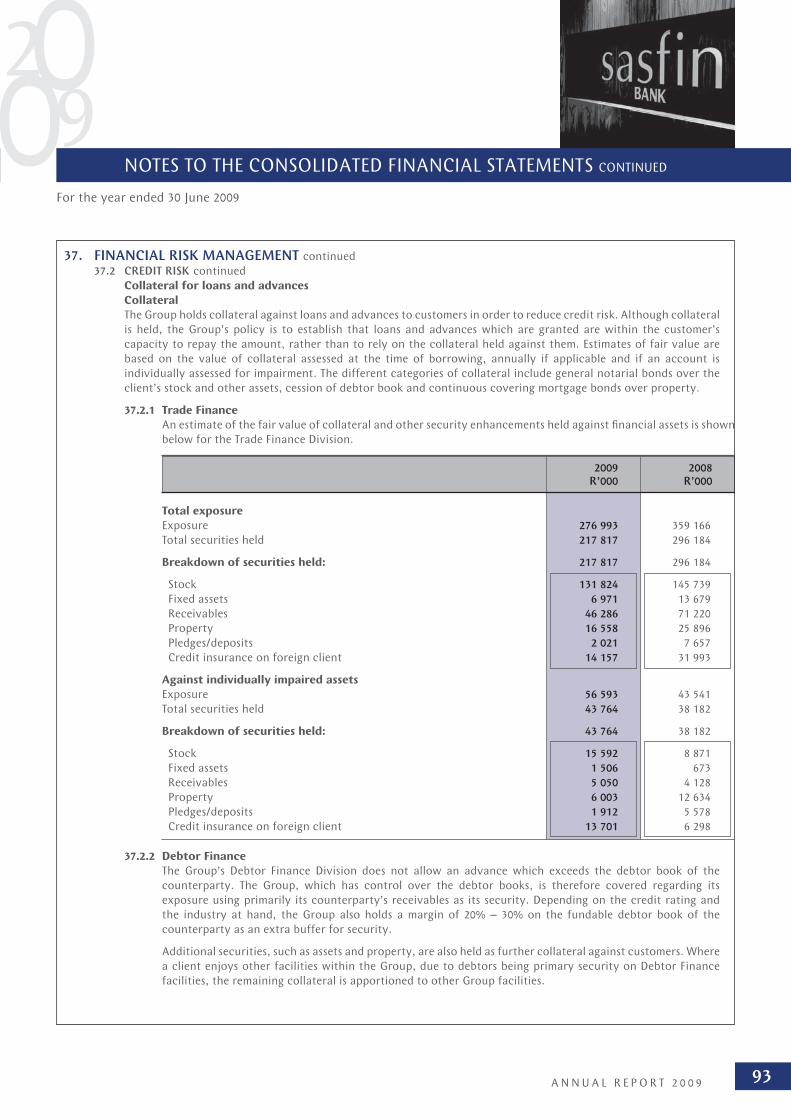
93A N N U A L R E P O R T 2 0 0 9
NOTES TO THE CONSOLIDATED FINANCIAL STATEMENTS CONTINUED
37. FINANCIAL RISK MANAGEMENT continued
37.2 CREDIT RISK continued
Collateral for loans and advances
Collateral
The Group holds collateral against loans and advances to customers in order to reduce credit risk. Although collateral
is held, the Group’s policy is to establish that loans and advances which are granted are within the customer’s
capacity to repay the amount, rather than to rely on the collateral held against them. Estimates of fair value are
based on the value of collateral assessed at the time of borrowing, annually if applicable and if an account is
individually assessed for impairment. The different categories of collateral include general notarial bonds over the
client’s stock and other assets, cession of debtor book and continuous covering mortgage bonds over property.
37.2.1 Trade Finance
An estimate of the fair value of collateral and other security enhancements held against fi nancial assets is shown
below for the Trade Finance Division.
2009 2008 R’000 R’000
Total exposure
Exposure 276 993 359 166
Total securities held 217 817 296 184
Breakdown of securities held: 217 817 296 184
Stock 131 824 145 739
Fixed assets 6 971 13 679
Receivables 46 286 71 220
Property 16 558 25 896
Pledges/deposits 2 021 7 657
Credit insurance on foreign client 14 157 31 993
Against individually impaired assets
Exposure 56 593 43 541
Total securities held 43 764 38 182
Breakdown of securities held: 43 764 38 182
Stock 15 592 8 871
Fixed assets 1 506 673
Receivables 5 050 4 128
Property 6 003 12 634
Pledges/deposits 1 912 5 578
Credit insurance on foreign client 13 701 6 298
37.2.2 Debtor Finance
The Group’s Debtor Finance Division does not allow an advance which exceeds the debtor book of the
counterparty. The Group, which has control over the debtor books, is therefore covered regarding its
exposure using primarily its counterparty’s receivables as its security. Depending on the credit rating and
the industry at hand, the Group also holds a margin of 20% – 30% on the fundable debtor book of the
counterparty as an extra buffer for security.
Additional securities, such as assets and property, are also held as further collateral against customers. Where
a client enjoys other facilities within the Group, due to debtors being primary security on Debtor Finance
facilities, the remaining collateral is apportioned to other Group facilities.
For the year ended 30 June 2009

94
NOTES TO THE CONSOLIDATED FINANCIAL STATEMENTS CONTINUED
2009 2008 R’000 R’000
37. FINANCIAL RISK MANAGEMENT continued 37.2 CREDIT RISK continued 37.2.2 Debtor Finance continued Total debtor fi nance exposure 79 510 113 562
Receivables 77 398 110 004 Specifi c impairment 2 112 3 558
For the purpose of this disclosure, the collateral is valued at the lower of exposure to client and receivables held as security.
Against individually impaired assets Exposure 7 847 9 211 Total securities held 5 925 5 653
Breakdown of securities held: 5 925 6 176
Stock 906 187 Fixed assets 139 189 Receivables 4 182 5 653 Property 698 147
37.2.3 Instalment fi nance Rentals The primary collateral held for our rentals department is the actual
salvageable value of the equipment being fi nanced. The Group has valued the assets, using the depreciated value as the fair value.
Book 1 233 168 1 116 076 Salvageable value 1 078 152 970 558
For the purpose of this disclosure the collateral is valued at the lower of exposure to client and the salvageable value of the assets being fi nanced.
In addition to the salvageable value of the asset being fi nanced, which can be valued, clients may be required to sign personal surety on the contract, depending on their credit rating and the industry in which they operate. This is a further measure to reduce our credit risk although a fair value is hard to attain for these sureties, and as such no fi nancial value is allocated.
Capital equipment fi nance The primary collateral for capital equipment fi nance is the plant/equipment
being fi nanced. However, other security such as general notarial bonds over other assets and continuous covering mortgage bonds over property are sometimes taken to increase the collateral cover.
Total exposure 159 219 161 106
Against individually impaired assets Total exposure 35 742 7 230 Recoverable amount from plant 30 613 4 187
Collateral repossessed Recoverable amount from plant 4 000 –
For the year ended 30 June 2009

95A N N U A L R E P O R T 2 0 0 9
NOTES TO THE CONSOLIDATED FINANCIAL STATEMENTS CONTINUED
37. FINANCIAL RISK MANAGEMENT continued 37.2 CREDIT RISK continued 37.2.3 Instalment fi nance continued Capital equipment fi nance continued The collateral is valued at the lower of exposure to the client and the salvageable value of the asset being
fi nanced.
In addition to the salvageable value of the asset being fi nanced, which can be valued, clients may be required to sign personal surety on the contract, depending on their credit rating and the industry in which they operate. This is a further measure to reduce our credit risk although a fair value is hard to attain for these sureties.
37.2.4 Commercial Property Finance and other The primary collateral held for Commercial Property Finance and other loans, comprises mainly fi rst and
second covering mortgage bonds and in some instances suretyships. The collateral is measured in terms of market related property valuations.
2009 2008 R’000 R’000
Total exposure 118 338 100 567 Recoverable amount from collateral 116 557 85 628
37.3 LIQUIDITY RISK Liquidity risk is the risk that the Group will encounter diffi culty in meeting obligations from its fi nancial liabilities
when they fall due and to replace funds when they are withdrawn. The consequences of this may be the failure to meet obligations to repay depositors/investors and fulfi l commitments to lend.
This risk is inherent in all banking and fi nancial service operations and can be impacted by a range of institutional specifi c and market-wide events.
Management of liquidity risk The Group’s approach to managing liquidity is to ensure, as far as possible, that it will always have suffi cient liquidity
to meet its liabilities when due, under both normal and stressed conditions, without incurring unacceptable losses or risking damage to the Group’s reputation. The Group ALCO sets limits and mandates for the Group Treasury department to manage the liquidity risk within this framework.
Group Treasury receives information from other business units regarding the liquidity profi le of their fi nancial assets and liabilities and details of other projected cash fl ows arising from projected future business. Group Treasury then maintains a portfolio of short-term liquid assets, largely made up of short-term liquid investment securities, inter-bank loans and other inter-bank facilities, to ensure that suffi cient liquidity is maintained within the Group as a whole. The liquidity requirements of business units and subsidiaries are met through short-term loans from Group Treasury to cover any short-term fl uctuations and longer-term funding to address any structural liquidity requirements. The Group believes that the management of liquidity should encompass an overall balance sheet approach which consolidates all sources and uses of liquidity whilst maintaining a balance between liquidity, profi tability and interest rate considerations.
Liquidity risk measurement The daily liquidity position is monitored, reported in the form of cash fl ow measurement and projections in terms
of key periods ranging from demand to long-term periods. Regular liquidity stress testing is conducted under a variety of scenarios covering both normal and more severe market conditions. All liquidity policies and procedures are subject to review and approval by ALCO. Daily reports cover the liquidity position of both the Group and operating subsidiaries and foreign branches. A summary report, including any exceptions and remedial action taken, is submitted regularly to ALCO. Sources of liquidity are regularly reviewed to maintain a wide diversifi cation by fi nancial, product and form.
Exposure to liquidity risk The key measure used by the Group for managing liquidity risk is the ratio of net liquid assets to deposits from
customers. For this purpose net liquid assets are considered as including cash and cash equivalents and investment grade debt securities for which there is an active and liquid market less any deposits from banks, debt securities issued, other borrowings and commitments maturing within the next month. The Group ALCO monitors the exposure to liquidity risk in terms of internal benchmarks it has set and defi ned for Group Treasury to maintain. A similar, but not identical, calculation is used to measure the Group’s compliance with the liquidity limit established by the Group’s lead regulator, South African Reserve Bank.
For the year ended 30 June 2009

96
NOTES TO THE CONSOLIDATED FINANCIAL STATEMENTS CONTINUED
37. FINANCIAL RISK MANAGEMENT continued 37.3 LIQUIDITY RISK continued Contractual maturity analysis of fi nancial liabilities
Less than Carrying Gross one 1 – 3 4 – 12 1 – 5 6 – 10 amount outfl ow month months months years years Total R’000 R’000 R’000 R’000 R’000 R’000 R’000 R’000
30 June 2009 Deposits from banks 69 777 69 777 69 777 – – – – 69 777 Deposits from customers 881 380 881 380 683 968 113 991 83 421 – – 881 380 Debt securities issued 873 735 940 628 – 19 953 455 140 465 535 – 940 628 Long-term borrowings 100 000 174 062 – 2 725 8 175 65 287 97 875 174 062 Other payables 262 631 262 631 243 245 11 576 6 890 920 – 262 631
2 187 523 2 328 478 996 990 148 245 553 626 531 742 97 875 2 328 478 Loan commitments 23 954 23 954 3 759 6 774 13 421 – – 23 954
Total 2 211 477 2 352 432 1 000 749 155 019 567 047 531 742 97 875 2 352 432
30 June 2008 Deposits from banks 21 359 21 359 21 359 – – – 21 359 Deposits from customers 1 108 051 1 108 051 983 855 88 252 21 765 14 179 1 108 051 Debt securities issued 703 037 703 037 – – 703 037 – 703 037 Other payables 286 092 286 092 279 870 6 222 – – 286 092
2 118 539 2 118 539 1 285 084 94 474 724 802 14 179 2 118 539 Loan commitments 40 118 40 118 40 118 40 118
Total 2 158 657 2 158 657 1 285 084 134 592 724 802 14 179 2 158 657
The above table shows the undiscounted cash fl ows on the Group’s fi nancial liabilities and unrecognised loan commitments on the basis of their earliest possible contractual maturity. The Group’s expected cash fl ows on these instruments vary signifi cantly from this analysis. For example, demand deposits from customers are expected to maintain a stable or increasing balance; and unrecognised loan commitments are not all expected to be drawn down immediately. For this reason behavioural profi ling is applied to assets, liabilities and off-balance sheet commitments with an undeterminable maturity or drawn-down period.
37.4 MARKET RISK Market risk is the risk that changes in market prices, such as interest rate, equity prices, foreign exchange rates and credit spreads
(not relating to changes in the obligor’s/issuer’s credit standing) will affect the Group’s income or the value of its holdings of fi nancial instruments. The objective of market risk management is to manage and control market risk exposures within acceptable parameters, while optimising the return on risk.
Settlement risk The Group is exposed to market price risk through its stock broker trading activities on behalf of clients; and credit risk if
counterparties fail to perform as contracted.
The risks are mitigated by the fact that the brokers client base comprises mostly controlled clients (i.e. cash and scrip held before trading). Appropriate client acceptance and monitoring procedures are enforced by the Company. Credit limits are determined and set for all controlled clients. The limit is monitored regularly to ensure that the client does not exceed the limit set and is unable to pay for purchase transactions entered into.
For the year ended 30 June 2009
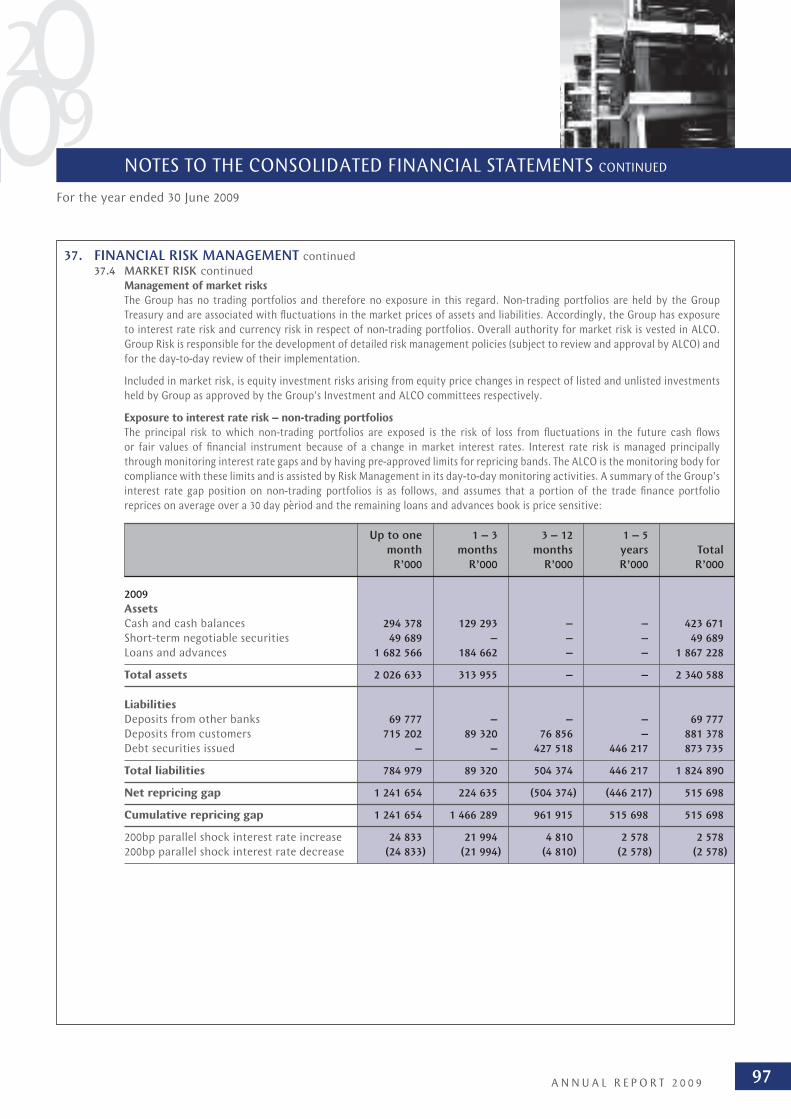
97A N N U A L R E P O R T 2 0 0 9
NOTES TO THE CONSOLIDATED FINANCIAL STATEMENTS CONTINUED
37. FINANCIAL RISK MANAGEMENT continued
37.4 MARKET RISK continued
Management of market risks
The Group has no trading portfolios and therefore no exposure in this regard. Non-trading portfolios are held by the Group
Treasury and are associated with fl uctuations in the market prices of assets and liabilities. Accordingly, the Group has exposure
to interest rate risk and currency risk in respect of non-trading portfolios. Overall authority for market risk is vested in ALCO.
Group Risk is responsible for the development of detailed risk management policies (subject to review and approval by ALCO) and
for the day-to-day review of their implementation.
Included in market risk, is equity investment risks arising from equity price changes in respect of listed and unlisted investments
held by Group as approved by the Group’s Investment and ALCO committees respectively.
Exposure to interest rate risk – non-trading portfolios
The principal risk to which non-trading portfolios are exposed is the risk of loss from fl uctuations in the future cash fl ows
or fair values of fi nancial instrument because of a change in market interest rates. Interest rate risk is managed principally
through monitoring interest rate gaps and by having pre-approved limits for repricing bands. The ALCO is the monitoring body for
compliance with these limits and is assisted by Risk Management in its day-to-day monitoring activities. A summary of the Group’s
interest rate gap position on non-trading portfolios is as follows, and assumes that a portion of the trade fi nance portfolio
reprices on average over a 30 day period and the remaining loans and advances book is price sensitive:
Up to one 1 – 3 3 – 12 1 – 5
month months months years Total
R’000 R’000 R’000 R’000 R’000
2009
Assets
Cash and cash balances 294 378 129 293 – – 423 671
Short-term negotiable securities 49 689 – – – 49 689
Loans and advances 1 682 566 184 662 – – 1 867 228
Total assets 2 026 633 313 955 – – 2 340 588
Liabilities
Deposits from other banks 69 777 – – – 69 777
Deposits from customers 715 202 89 320 76 856 – 881 378
Debt securities issued – – 427 518 446 217 873 735
Total liabilities 784 979 89 320 504 374 446 217 1 824 890
Net repricing gap 1 241 654 224 635 (504 374) (446 217) 515 698
Cumulative repricing gap 1 241 654 1 466 289 961 915 515 698 515 698
200bp parallel shock interest rate increase 24 833 21 994 4 810 2 578 2 578
200bp parallel shock interest rate decrease (24 833) (21 994) (4 810) (2 578) (2 578)
For the year ended 30 June 2009
98
NOTES TO THE CONSOLIDATED FINANCIAL STATEMENTS CONTINUED
37. FINANCIAL RISK MANAGEMENT continued
37.4 MARKET RISK continued
Exposure to interest rate risk – non-trading portfolios continued
Up to 1 1 – 3 3 – 12 1 – 5 month months months years Total R’000 R’000 R’000 R’000 R’000
2008
Assets
Cash and cash balances 441 593 7 722 – – 449 315
Short-term negotiable securities 55 106 – – – 55 106
Loans and advances 1 611 034 239 444 – – 1 850 478
Total assets 2 107 733 247 166 – – 2 354 899
Liabilities
Deposits from other banks 21 359 – – – 21 359
Deposits from customers 983 855 88 252 21 765 14 179 1 108 051
Debt securities issued – 703 037 – – 703 037
Total liabilities 1 005 214 791 289 21 765 14 179 1 832 447
Net repricing gap 1 102 519 (544 123) (21 765) (14 179) 522 452
Cumulative repricing gap 1 102 519 558 396 536 631 522 452 522 452
200bp parallel shock interest rate increase 22 050 8 376 2 683 2 612 2 612
200bp parallel shock interest rate decrease (22 050) (8 376) (2 683) (2 612) (2 612)
The tables summarise the Group’s exposure to interest rate risk through categorisation of assets and liabilities into
time buckets, determined as being the earlier of the contractual re-pricing date or maturity.
The management of interest rate risk against interest rate gap limits is supplemented by monitoring the sensitivity
of the Group’s fi nancial assets and liabilities to various standard and non-standard interest rate scenarios. Standard
scenarios that are considered on a monthly basis include a 200 basis point (bp) parallel fall or rise in all yield curves.
An analysis of the Group’s sensitivity to a cumulative increase or decrease in market interest rates is as follows:
2009 2008 R’000 R’000
200 bp parallel shock interest rate increase 2 578 2 612
200 bp parallel shock interest rate decrease (2 578) (2 612)
Overall non-trading interest rate risk positions are managed by Group Treasury, which uses advances to banks,
deposits from banks and derivative instruments to manage the overall position arising from the Group’s non-trading
activities.
Market risk on equity investments
Sasfi n Capital division enters into private equity investments in unlisted entities in accordance with delegated
authority limits as defi ned by the Group’s Investment committee. Market risk on these investments is managed in
accordance with purpose and strategic benefi ts to the Group, and not only on investment returns and mark-to-
market considerations. Periodic reviews and assessments are undertaken on the performance of the investments.
The table below illustrates the market risk sensitivity for all investment securities fi nancial assets held by the
Group assuming a 10% shift in the relevant share price or proxy-share price.
For the year ended 30 June 2009
99A N N U A L R E P O R T 2 0 0 9
NOTES TO THE CONSOLIDATED FINANCIAL STATEMENTS CONTINUED
37. FINANCIAL RISK MANAGEMENT continued
37.4 MARKET RISKS continued
Market risk sensitivity on investment securities
10% reduction 10% increase in fair value Fair value in fair value R’000 R’000 R’000
2009 Listed Equity securities at fair value 5 731 6 368 7 005 Impact on gains and losses recognised in profi t and loss for the year 9 10 11 Impact on equity 196 217 239
Unlisted Equity securities at fair value 229 359 254 843 280 327 Impact on profi t and loss 2 188 2 431 2 674
2008 Listed Equity securities at fair value 35 814 39 793 43 772 Impact on profi t and loss (4 090) (4 545) (4 999) Impact on equity (745) (828) (911)
Unlisted Equity securities at fair value 173 685 192 984 212 282 Impact on profi t and loss 30 412 33 791 37 171
37.5 CURRENCY RISK The Group incurs currency risk as a result of services acquired from foreign suppliers. The currencies in which the
Company primarily deals are US Dollars, Euros and British Pounds. The Group utilises forward exchange contracts to hedge their estimated future foreign currency exposure from purchases.
Foreign currency risk sensitivity analysis
Japanese British US Dollar Euro Yen Pounds Other Total
2009 Forward exchange contracts (2 927) 513 – 1 939 97 (878) Import bills 20 315 11 975 – – 1 191 33 481 Debtor fi nance – – – (287) – (287) Bank balances 31 733 6 126 7 913 1 264 30 47 066 Bank overdrafts (5 261) (2 486) (1) (1) (25) (7 974) Import suppliers (1 352) (144) – (160) – (1 656) Usance creditors (1 933) (1 070) – – – (3 003) Investments 3 209 – – – – 3 209 Other payables: Loans (50 585) (3 371) (7 926) – – (61 882) Other payables (1 681) (180) (6) (1 779) (90) (3 736)
Total net (short)/long position (8 482) 11 363 (20) 976 1 203 5 040
Sensitivity – 5% (424) 568 (1) 49 60 252
For the year ended 30 June 2009

100
NOTES TO THE CONSOLIDATED FINANCIAL STATEMENTS CONTINUED
37. FINANCIAL RISK MANAGEMENT continued 37.5 CURRENCY RISK continued Foreign currency risk sensitivity analysis continued
Japanese British US Dollar Euro Yen Pounds Other Total
2008 Forward exchange contracts (9 275) 1 112 4 519 1 398 (6 670) (8 916) Import bills 31 696 4 064 – – 6 903 42 663 Debtor fi nance – – – 2 438 – 2 438 Bank balances (1 781) 577 (0) 5 166 422 4 384 Import suppliers (11 420) (3 979) (4 142) – (78) (19 619) Investments 3 343 – – – – 3 343 Other payables (1 179) (747) (14) (4 076) (186) (6 202)
Total net (short)/long position 11 384 1 027 363 4 926 391 18 091
Sensitivity – 5% 569 51 18 246 20 904
The foreign exchange rates prevailing at balance sheet date are: British Pounds 12,75 15,77 Euro 10,86 12,48 United States Dollar 7,72 7,90 Japanese Yen 0,08 0,74
The average foreign exchange rates used for the fi nancial year are: United States Dollar 8,04 7,95
Derivative fi nancial instruments
National Positive Negative Net principal fair value fair value fair value R’000 R’000 R’000 R’000
2009 Hedging Exchange rate contracts Forwards maturing within one year 81 049 794 (2 656) (1 863) Equity derivatives 2 019 2 019 – 2 019
Total derivatives 83 068 2 813 (2 656) 156
2008 Hedging Exchange rate contracts Forwards maturing within one year 176 300 6 343 (2 546) 3 797
Total derivatives 176 300 6 343 (2 546) 3 797
A multi currency option was entered into, where the South African Rand was hedged against a weakest basket of currencies. A premium of R6,1 million was paid. The option was entered in order to hedge its US Dollar denominated investment in its foreign subsidiary.
2009 2008 R’000 R’000
Fair value of the currency option at year end – 4 263
For the year ended 30 June 2009

101A N N U A L R E P O R T 2 0 0 9
NOTES TO THE CONSOLIDATED FINANCIAL STATEMENTS CONTINUED
37. FINANCIAL RISK MANAGEMENT continued
37.5 CURRENCY RISK continued
Hedging
Forward exchange contracts are entered into as fair value hedges for foreign currency liabilities.
Derivative instruments
These transactions have been entered into in the normal course of business and no material losses are anticipated
other than those for which provision has been made in the income statement. There are no commitments or
contingent commitments under derivative fi nancial instruments that are settled other than with cash.
Notional principal
Represents the gross notional value of all outstanding contracts as at year-end. The gross notional value is the sum
of the absolute value of all purchases and sales of derivative instruments. This value will not affect the amount
receivable or payable under a derivative contract due to the cash-settled nature of the various contracts. The gross
notional value represents only the measure of involvement by the Group in derivative contracts and not its exposure
to market or credit risks arising from such contracts.
37.6 BASEL II
With effect from 1 January 2008, the Group’s lead regulator, the South African Reserve Bank (“SARB”), adopted
the new Basel II Capital Adequacy Framework (“Basel II”) banking regulation, and all banks in South Africa had to
legislatively comply with these new regulations.
Basel II incentivises banks through lower capital requirements, to measure and improve their risk management
processes. The formulation of the Basel II framework encapsulates more fl exible and risk-sensitive systems, and
consists of three pillars:
• Pillar I sets out the minimum capital requirements that banks are required to meet in respect of credit, market and
operational risks. The requirements with regards to Pillar I are largely rules based, computed on applicable risk-
weightings to various asset classes and exposures. Pillar I also contains details of the components of regulatory
capital.
• Pillar II (supervisory review): sets out the requirement that banks must assess their capital adequacy relative to
their risk profi le. The assessment is to be completed on an annual basis and submitted to the SARB for assessment
and review.
• Pillar III sets out the disclosure requirements for banks that have adopted the new accord, thus encouraging
transparency and corporate governance and regular disclosures of its capital adequacy levels and ratios.
The Group has adopted the following Basel II approaches in respect of risk assessment and measurement, as
summarised hereunder:
Risk Type Approach
Credit risk Standardised approach
Operational risk Basic indicator approach
Market risk Standardised approach based on its internal risk-weighting assessments
Consolidation approach
The Group adopted the aggregation approach in terms of Basel II regulations which includes the full risk weighted
exposures of all the subsidiaries in the Group.
Capital management
The Group manages its capital to achieve a prudent balance between maintaining capital ratios to support business
growth and depositor confi dence, and aims to provide investors and shareholders above market-related returns on
a sustainable basis. The Group has formulated its Internal Capital Adequacy Assessment Process (“ICAAP”), which
is more widely encompassing of all risks faced by the Group, and ensures the Group maintains adequate capital
levels for legal and regulatory compliance purposes. The Group ensures that its actions do not compromise sound
governance and appropriate business practices, and the Group is indeed adequately capitalised at all times. The
management of the Group’s capital is under the duties and responsibilities of the Group Risk and Capital Management
committee (“GRCMC”).
For the year ended 30 June 2009

102
NOTES TO THE CONSOLIDATED FINANCIAL STATEMENTS CONTINUED
37. FINANCIAL RISK MANAGEMENT continued
37.6 BASEL II continued
Regulatory capital
The SARB sets and monitors capital requirements for the Group as a whole. During the year under review, the Group
complied with all regulatory imposed capital requirements in terms of the new regulations. The capital adequacy
ratio (“CAR”), which refl ects the capital strength of the Group, is calculated by dividing the capital held by the
entities by its risk-weighted assets and exposures as computed.
These are defi ned as follows:
2009 2008 % %
Minimum capital requirements
Pillar I (base risk) 8,00 8,00
Pillar II a (banking industry systemic risk) 1,50 1,50
Pillar II b (Sasfi n’s specifi c “add-on” as determined by SARB) 0,25 0,25
Total regulatory capital (CAR) 9,75 9,75
Capital is split into two tiers in regard to the Sasfi n Group:
• Tier I (Primary capital) represents permanent forms of capital which includes share capital and premium, retained
earnings, and a portion of perpetual non-cumulative non-redeemable preference shares that qualify as Tier I
capital.
• Tier II (secondary capital) includes the remaining portion of non-cumulative preference shares, general debt
reserves, revaluation reserves and other qualifying reserves.
Economic capital
Economic capital is the basis for measuring and reporting the quantifi able economic and fi nancial risks faced by the
Group. This is used for risk management, capital management, capital planning and allocation, evaluation of new
businesses and performance measurement across the Group.
The Group is assisted in its process through its adoption of an ICAAP policy and model, which refl ects management’s
internal identifi cation and assessment of risk. The process requires the Group to assess its capital adequacy against
estimates to absorb unexpected losses that may arise from risks inherent in the business. Available capital is then
compared to the required minimum capital in terms of Pillar I and Pillar II as defi ned, and a buffer is held for
uncertainties to ensure that the Group is adequately capitalised. Stress testing and scenario analysis is performed to
ensure the bank is adequately capitalised (i.e. suffi cient capital resources to meet the capital demands of the Group
under a severely stressed scenario). In terms of the Group’s governance process, the ownership of this process rests
with the GRCMC.
For the year ended 30 June 2009

103A N N U A L R E P O R T 2 0 0 9
NOTES TO THE CONSOLIDATED FINANCIAL STATEMENTS CONTINUED
37. FINANCIAL RISK MANAGEMENT continued
37.6 BASEL II continued
Qualifying capital and reserves – Basel II
2009 2008
CAR CAR R’000 % R’000 %
Tier I
Share capital 280 273
Share premium 43 196 27 266
Non-redeemable non-cumulative
non-participating preference shares 157 917 117 420
Retained earnings 635 784 673 640
Special reserve funds – 8 200
Prescribed deductions against
qualifying capital (51 586) (133 828)
Total tier I capital 785 591 27,61 692 971 24,99
Tier II
Non-redeemable non-cumulative
non-participating preference shares 101 361 81 858
General allowance for credit impairment 3 994 1 495
Share-based payment reserve – 1 646
Available-for-sale reserve – 2 169
Total tier II capital 105 355 3,70 87 168 3,14
Total qualifying capital (Tier I and II) 890 946 31,32 780 139 28,13
Summary of qualifying capital
Tier I 785 591 692 971
Tier II 105 355 87 168
Total qualifying capital 890 946 31,32 780 139 28,13
Total minimum required qualifying capital 277 379 9,75 270 320 9,75
Surplus qualifying capital 613 567 21,57 509 819 18,38
Reconciliation of qualifying capital to
total equity of the Group
Tier I qualifying capital 785 591 692 971
Tier II qualifying capital 105 355 87 168
Minority interests 58 155 40 161
Non-qualifying reserves (18 367) 20 619
Total equity of the Group 930 734 840 919
For the year ended 30 June 2009

104
NOTES TO THE CONSOLIDATED FINANCIAL STATEMENTS CONTINUED
37. FINANCIAL RISK MANAGEMENT continued
37.6 BASEL II continued
Qualifying capital and reserves – Basel II continued
2009 2008
Basel II Basel II R’000 % R’000 %
Credit risk-banking activities 1 323 781 47 1 447 007 52
Operational risk 580 101 20 590 731 21
Market risk non-trading activities
of Banking division 356 428 12 132 499 5
Equity risk 555 676 20 276 626 10
Other 28 924 1 325 647 12
Total risk-weighted exposures 2 844 910 100 2 772 510 100
37.7 OPERATIONAL RISK Operational risk is the risk of direct or indirect loss arising from a wide variety of causes associated with the Group’s
processes, personnel, technology and infrastructure, and from external factors other than credit, market and liquidity risks such as those arising from legal and regulatory requirements and generally accepted standards of corporate behaviour. Operational risks arise from all of the Group’s operations and are faced by all business entities.
The Group’s objective is to manage operational risk so as to balance the avoidance of fi nancial losses and damage to the Group’s reputation with overall cost effectiveness and to avoid control procedures that restrict initiative and creativity.
The primary responsibility for the development and implementation of controls to address operational risk is assigned to senior management within each business unit. This responsibility is supported by the development of overall Group standards for the management of operational risk in the following areas:
• Requirements for appropriate segregation of duties, including the independent authorisation of transactions; • Requirements for the reconciliation and monitoring of transactions; • Compliance with regulatory and other legal requirements; • Documentation of controls and procedures; • Requirements for the periodic assessment of operational risks faced, and the adequacy of controls and procedures
to address the risks identifi ed; • Requirements for the reporting of operational losses and proposed remedial action; • Development of contingency plans; • Training and professional development; • Ethical and business standards; and • Risk mitigation, including insurance where this is effective.
In terms of JSE rules, should several brokers simultaneously be affected by operational risk, it is at the discretion of the market controller to determine if a fair and valid market exists or not.
The Group has a formally defi ned and developed business continuity plan and is an integral part of its risk mitigation to business continuity risk. As part of a regular review of its plan, the Group conducted an off-site simulation to test the effectiveness and responsiveness of its BCP, which included connectivity to IT infrastructure, data recovery, communication, management of scarce resources and potential down-time and recovery therefrom.
Compliance with Group standards is supported by a programme of periodic reviews undertaken by Internal Audit. The results of Internal Audit reviews are discussed with the management of the business unit to which they relate, with summaries submitted to the Audit Committee and senior management of the Group.
The Group risk department conducted enterprise risk management (“ERM”) assessments across the various divisions on a periodic basis to determine the levels of operational risk throughout the organisation. The results thereof are reported to the Group’s Risk and Capital committee on a regular basis.
For the year ended 30 June 2009

105A N N U A L R E P O R T 2 0 0 9
NOTES TO THE CONSOLIDATED FINANCIAL STATEMENTS CONTINUED
38. SUBSIDIARY COMPANIES, SPECIAL PURPOSE ENTITIES AND ASSOCIATED COMPANIES
Issued Issued Shares at
ordinary pre- Effective holding
book value Indebtedness
Nature of business
capital ference 2009 2008 2009 2008 2009 2008 capital % % R’000 R’000 R’000 R’000
SUBSIDIARIES Of Sasfi n Holdings Limited Sasfi n Bank Limited Bank R1 149 376 R60 000 90 90 8 246 8 246 (203 024) (73 609) Premier Freight (Pty) Limited Freight forwarding and R317 – 63 63 13 566 13 566 – – customs clearing Sasfi n Properties (Pty) Limited Property holding company R100 – 100 100 – – – – Sasfi n Properties II (Pty) Limited Property holding company R1 – 100 100 – – – – Sasfi n Properties III (Pty) Limited Property holding company R100 – 100 100 – – 54 579 45 328 Sasfi n Financial Services (Pty) Limited Investment holding company R12 494 – 90 90 11 11 (41 011) (41 011) Sasfi n Private Equity Investment Investment holding company R100 000 – 100 100 150 150 265 435 190 310
Holdings (Pty) Limited InnoVent SPV 2 (Pty) Limited* Investment holding R100 R40 000 100 100 47 536 44 089 – –
ASSOCIATED COMPANIES InnoVent Investment Holdings Asset based fi nance R1 000 – 33,6 33,6 82 82 – – (Pty) Limited
OTHER The Sasfi n Share Incentive Trust Group share incentive scheme – – – – 995 1 103 973 548 InnoVent SPV 1 (Pty) Limited Investment holding R100 R26 666 – – 31 691 29 409 – –
102 277 96 656 76 952 121 566
SUBSIDIARIES Of Sasfi n Bank Limited Quorum Leasing Services (Pty) Limited Instalment sale fi nance R100 100 100 Sasfi n Asia Limited Overseas trade fi nance HK$1 500 000 100 100
(incorporated in Hong Kong)
Of Sasfi n Asia Limited SasCred Financial Services Limited International trade fi nance (incorporated in Jersey) and wealth management GBP50 000 100 100
SUBSIDIARIES Of Sasfi n Financial Services
(Pty) Limited Sasfi n Securities (Pty) Limited** Member of the JSE R100 100 100 Sasfi n Private Equity Fund Managers Private equity R100 100 100 (Pty) Limited Sasfi n Financial Advisory Services Financial advisory services R270 67,5 67,5 (Pty) Limited Sasfi n Asset Managers (Pty) Limited Asset management R1 000 100 100
Of Sasfi n Financial Advisory Services (Pty) Limited
Sasfi n Insurance Brokers (Pty) Limited Insurance brokers R1 100 100
SPECIAL PURPOSE ENTITIES Of Sasfi n Bank Limited South African Securitisation Programme Securitisation vehicle R100 000 100 100
(Pty) Limited
ASSOCIATED COMPANIES Of Sasfi n Financial Services (Pty) Limited NVest Financial Holdings (Pty) Limited Financial and intermediary R500 20 – services
JOINT VENTURE COMPANIES Of Premier Freight (Pty) Limited Hecny Transportation South Africa International freight forwarder R3 750 31,5 31,5 (Pty) Limited
The fi nancial position of the companies listed above is material for a proper appreciation of the affairs of the Group. Detailed information in respect of all non-material subsidiaries is obtainable from the Group Secretary.
Loans advanced by the Company to Group companies are unsecured, interest is charged at prime less 3%, there are no terms of repayment.
All subsidiaries, special purpose entities, associated and joint venture companies have co-terminous year-ends except for Pioneer Employee Benefi ts (Pty) Limited which has a 31 December year-end. * Sasfi n has exercised its call option over the ordinary shares in InnoVent SPV 2 (Pty) Limited in December 2008. This entity is now a wholly-owned subsidiary of the Group and has been consolidated
into the Group results. ** Sasfi n Securities (Pty) Limited disposed of its branch in East London on 1 July 2009 for an amount of R3 632 316 to NVest Financial Holdings (Pty) Limited. The Group then acquired 20% of NVest
Financial Holdings (Pty) Limited.
For the year ended 30 June 2009
106
NOTES TO THE CONSOLIDATED FINANCIAL STATEMENTS CONTINUED
39. SHARE BASED PAYMENTS 39.1 THE SASFIN SHARE INCENTIVE SCHEME – EQUITY SETTLED
The Group has an established share option scheme which entitles staff to purchase shares in the Company. In accordance
with the scheme options are exercisable at the market price of the shares at the date of the grant.
Grants within this scheme, which were offered before 7 November 2002, exist. The recognition and measurement principles in IFRS 2 have not been applied to these grants in accordance with the transitional provisions of IFRS 1 and IFRS 2.
Trust The Sasfi n Share Incentive Trust
Description of the arrangement Share options are granted to personnel holding various job levels with the Group, the granting of share options is at
the discretion of the trustees, acting on recommendation of executive management. The granting of share options is based on job level and performance. Grant dates are determined by the trustees.
Vesting requirements and contractual life of options The terms and conditions of the grants are three years of service, thereafter share options vest over three consecutive
years. The contractual life of the options is three years.
The number and weighted average exercise prices of the equity based share options are as follows:
Option Weighted Number of ordinary shares price range average price Option (cents) (cents) expiry period
98 363 1 420 – 4 500 2 770 Year to 30 June 2010 91 667 1 900 – 4 500 2 868 Year to 30 June 2011 91 667 4 500 2 868 Year to 30 June 2012
281 697*
* Included in the outstanding options are the following to executive directors:
– M Segal has options over 150 000 ordinary shares at a strike price of 1 900 cents, vesting between 2009 and 2010.
– M Segal has options over 50 000 ordinary shares at a strike price of 3 325 cents, vesting between 2009 and 2011.
2009 2008
Group equity-share incentive Weighted Weighted
scheme reconciliation average average
exercise price Number of exercise price Number of
(cents) options (cents) options
Options outstanding at beginning
of the year 2 241 394 431 1 429 769 452
Exercised 815 (112 734) 586 (311 345)
Lapsed – – 525 (63 676)
Options outstanding at end of the year 2 834 281 697 2 241 394 431
The fair value received in return for share options granted is measured by reference to the fair value of share options
granted. The estimate of the fair value of the services received is measured based on the Black-Scholes model. The
contractual life of the option (three years) is used as an input into this model. Expectations of early exercise are
incorporated into the Black Scholes model which takes into account the share price volatility and the dividend yield
and an appropriate risk free return.
For the year ended 30 June 2009

107A N N U A L R E P O R T 2 0 0 9
NOTES TO THE CONSOLIDATED FINANCIAL STATEMENTS CONTINUED
39. SHARE BASED PAYMENTS continued
39.2 THE SASFIN SHARE APPRECIATION SCHEME – CASH SETTLED
The Group has devised a share scheme whereby employees will be awarded a cash bonus based on the movements
in the Company’s share price. The amount of the bonus is based on the Company’s listed share price movement on
the JSE.
The market price movements of the ordinary share options valued during the year ranged from 3 196 (2008: 2 635)
cents to 2 100 (2008: 5 805) cents and the subscription benchmark prices ranged from 3 200 cents to 4 810 cents.
The fair value of services received in return for share options granted is based on the fair value of the options
granted, measured using the Black-Scholes model, with the following assumptions:
2009 2008
Fair value at measurement date R’000 1 148 1 639
Weighted average exercise price cents 3 177 3 515
Average expected volatility % 30,00 38,21
Average dividend yield rate % 8,65 4,68
Average risk free rate % 8,13 10,72
Volatility is determined using expected volatility of the Company’s ordinary shares listed on the JSE.
Group cash-settled share incentive scheme reconciliation
2009 2008
Weighted Weighted
average average
exercise price Number of exercise price Number of
(cents) options (cents) options
Options outstanding at beginning of the year 3 515 366 132 3 200 294 532
Granted 2 800 410 980 4 810 71 600
Lapsed 3 515 (932)
Options outstanding at end of the year 3 177 776 180 3 515 366 132
* Included in the outstanding options are the following to executive directors:
39.3 THE SASFIN SHARE INCENTIVE TRUST
2009 2008 R’000 R’000
Balance sheet
Assets 1 008 878
Liabilities 45 66
Loan from Sasfi n Holdings Limited 973 548
Equity (10) 264
1 008 878
For the year ended 30 June 2009
108
NOTES TO THE CONSOLIDATED FINANCIAL STATEMENTS CONTINUED
39. SHARE BASED PAYMENTS continued
39.3 THE SASFIN SHARE INCENTIVE TRUST continued
2009 2008 R’000 R’000
Income statement
Income 114 109
Operating expenses (386) (20)
Net profi t for the year (272) 89
At year end, the trust held 31 333 (2008: 64 192) shares in the Company.
40. SEGMENT REPORTING Segment information is presented in respect of the Group’s business and geographical segments. The primary format, which
is business segments, is based on the Group’s management and internal reporting structure.
Business segments pay interest to the Treasury division at variable rates linked to prime, to refl ect the allocation of funding
costs.
Segment capital expenditure is the total cost incurred during the period to acquire property and equipment, and intangible
assets other than goodwill.
BUSINESS SEGMENTS
The Group comprises the following main business segments:
Business Banking – includes the Group’s Equipment Rental Finance and Business Finance units, comprising Debtor Finance,
Trade Finance and Capital Equipment Finance.
Capital – includes private equity, property private equity and corporate fi nance activities such as acquisitions, mergers and
buy-outs.
Logistics and Risk Management – international freight forwarding and clearing, as well as healthcare consulting and short-
term insurance are housed within this division.
Wealth Management – this division comprises various units, private client portfolio management and stock broking; asset
consulting; fi nancial and investment planning, fi duciary services and asset and fund management.
Treasury – comprises Domestic Treasury and Money Market operation, Exchange Control Services, and International
Treasury and Foreign Exchange services and Securitisation Commercial Paper, and Securitisation Funding Structures.
The Group also has central Corporate Services, and these include information technology, human resources, fi nance
and administration, marketing, risk and credit, legal and compliance and internal audit. These costs are allocated to the
business segments on a reasonable basis.
For the year ended 30 June 2009
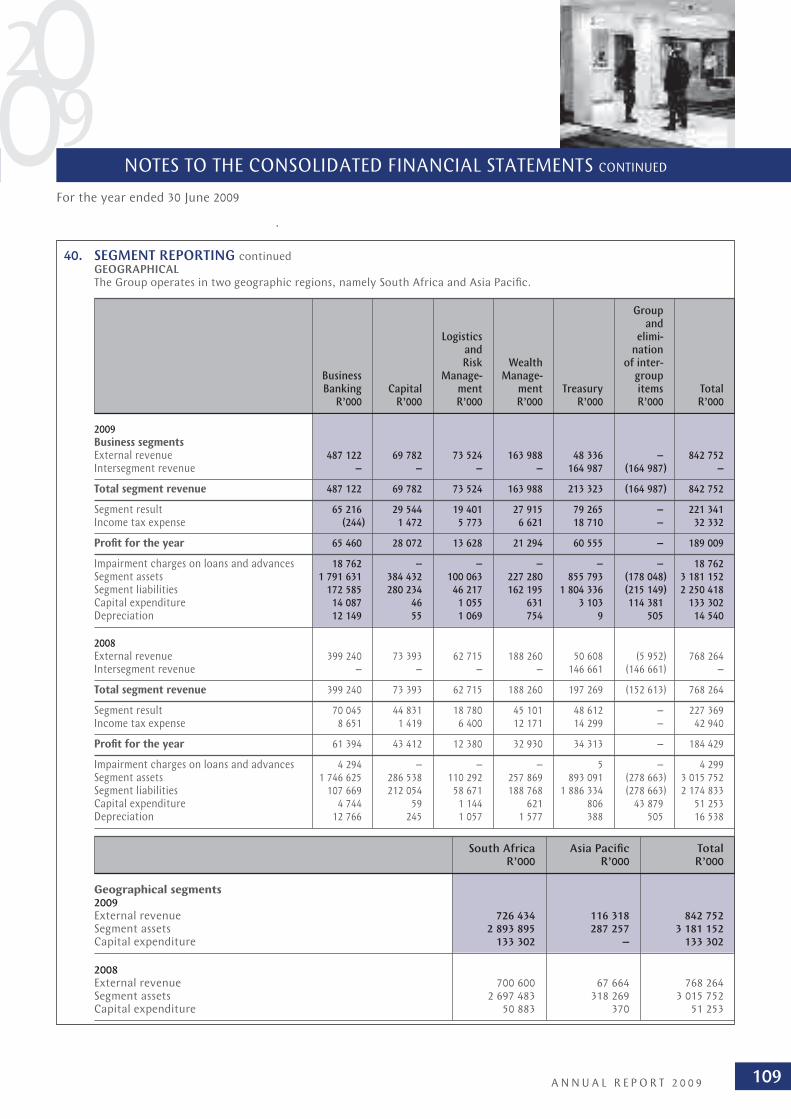
109A N N U A L R E P O R T 2 0 0 9
NOTES TO THE CONSOLIDATED FINANCIAL STATEMENTS CONTINUED
For the year ended 30 June 2009
40. SEGMENT REPORTING continued GEOGRAPHICAL The Group operates in two geographic regions, namely South Africa and Asia Pacifi c.
Group and Logistics elimi- and nation Risk Wealth of inter- Business Manage- Manage- group Banking Capital ment ment Treasury items Total R’000 R’000 R’000 R’000 R’000 R’000 R’000
2009 Business segments External revenue 487 122 69 782 73 524 163 988 48 336 – 842 752 Intersegment revenue – – – – 164 987 (164 987) –
Total segment revenue 487 122 69 782 73 524 163 988 213 323 (164 987) 842 752
Segment result 65 216 29 544 19 401 27 915 79 265 – 221 341 Income tax expense (244) 1 472 5 773 6 621 18 710 – 32 332
Profi t for the year 65 460 28 072 13 628 21 294 60 555 – 189 009
Impairment charges on loans and advances 18 762 – – – – – 18 762 Segment assets 1 791 631 384 432 100 063 227 280 855 793 (178 048) 3 181 152 Segment liabilities 172 585 280 234 46 217 162 195 1 804 336 (215 149) 2 250 418 Capital expenditure 14 087 46 1 055 631 3 103 114 381 133 302 Depreciation 12 149 55 1 069 754 9 505 14 540
2008 External revenue 399 240 73 393 62 715 188 260 50 608 (5 952) 768 264 Intersegment revenue – – – – 146 661 (146 661) –
Total segment revenue 399 240 73 393 62 715 188 260 197 269 (152 613) 768 264
Segment result 70 045 44 831 18 780 45 101 48 612 – 227 369 Income tax expense 8 651 1 419 6 400 12 171 14 299 – 42 940
Profi t for the year 61 394 43 412 12 380 32 930 34 313 – 184 429
Impairment charges on loans and advances 4 294 – – – 5 – 4 299 Segment assets 1 746 625 286 538 110 292 257 869 893 091 (278 663) 3 015 752 Segment liabilities 107 669 212 054 58 671 188 768 1 886 334 (278 663) 2 174 833 Capital expenditure 4 744 59 1 144 621 806 43 879 51 253 Depreciation 12 766 245 1 057 1 577 388 505 16 538
South Africa Asia Pacifi c Total R’000 R’000 R’000
Geographical segments 2009 External revenue 726 434 116 318 842 752 Segment assets 2 893 895 287 257 3 181 152 Capital expenditure 133 302 – 133 302
2008 External revenue 700 600 67 664 768 264 Segment assets 2 697 483 318 269 3 015 752 Capital expenditure 50 883 370 51 253

110
COMPANY FINANCIAL STATEMENTS
For the year ended 30 June 2009
2009 2008 STATEMENT OF FINANCIAL POSITION Note R’000 R’000
AssetsCash and cash balances 41.1 5 029 – Other receivables 41.2 6 881 25 Investment securities 41.3 – 33 666 Investments in associated companies 41.4 31 773 29 491 Subsidiary companies 41.5 451 693 303 352* Deferred tax asset 41.6 3 314 2 286
Total assets 498 690 368 820
Liabilities Other payables 41.7 1 121 795 Loans from subsidiary companies 244 334 114 620* Taxation – 1 548
Total liabilities 245 455 116 963
EquityOrdinary share capital 41.8 280 273 Ordinary share premium 41.9 43 789 27 843 Reserves 9 888 24 463 Preference share capital 41.10 19 19 Preference share premium 41.11 199 259 199 259
Total equity 253 235 251 857
Total liabilities and equity 498 690 368 820
*Reclassifi ed
2009 2008 INCOME STATEMENT
Note R’000 R’000
Interest income 41.12 36 001 20 498* Interest expense 41.13 27 883 6 948
Net interest income 8 118 13 550 Other income 41.14 62 025 80 966*
Total income 70 143 94 516 Operating costs 2 123 2 569
Staff costs 41.15 286 712 Other operating expenses 41.16 1 837 1 857
Profi t before income tax 68 020 91 947 Income tax expense 41.17 1 317 2 308
Profi t for the year 66 703 89 639
*Reclassifi ed

111A N N U A L R E P O R T 2 0 0 9
Ordinary Share Total ordi- Preference Total
STATEMENT OF
share Distri- based nary share- share share-
CHANGES IN EQUITY
capital and butable payment holders’ capital and holders’
premium reserves reserve equity premium equity
R’000 R’000 R’000 R’000 R’000 R’000
30 June 2007 26 085 10 978 1 742 38 805 199 278 238 083
Total comprehensive income
for the year – 89 639 – 89 639 – 89 639
Total profi t for the year – 89 639 – 89 639 – 89 639
Issue of shares 2 031 – – 2 031 – 2 031
Preference share dividends – (18 723) – (18 723) – (18 723)
Ordinary share dividends – (59 173) – (59 173) – (59 173)
30 June 2008 28 116 22 721 1 742 52 579 199 278 251 857
Total comprehensive income
for the year – 66 703 – 66 703 – 66 703
Total profi t for the year – 66 703 – 66 703 – 66 703
Issue of shares 15 953 – – 15 953 – 15 953
Share-based payments reserve
movements – – (747) (747) – (747)
Preference share dividends – (21 646) – (21 646) – (21 646)
Ordinary share dividends – (58 885) – (58 885) – (58 885)
30 June 2009 44 069 8 893 995 53 957 199 278 253 235
COMPANY FINANCIAL STATEMENTS CONTINUED
For the year ended 30 June 2009
2009 2008 STATEMENT OF COMPREHENSIVE INCOME Note R’000 R’000
Profi t for the year 66 703 89 639 Other comprehensive income for the year, net of income tax – –
Total comprehensive income for the year 66 703 89 639
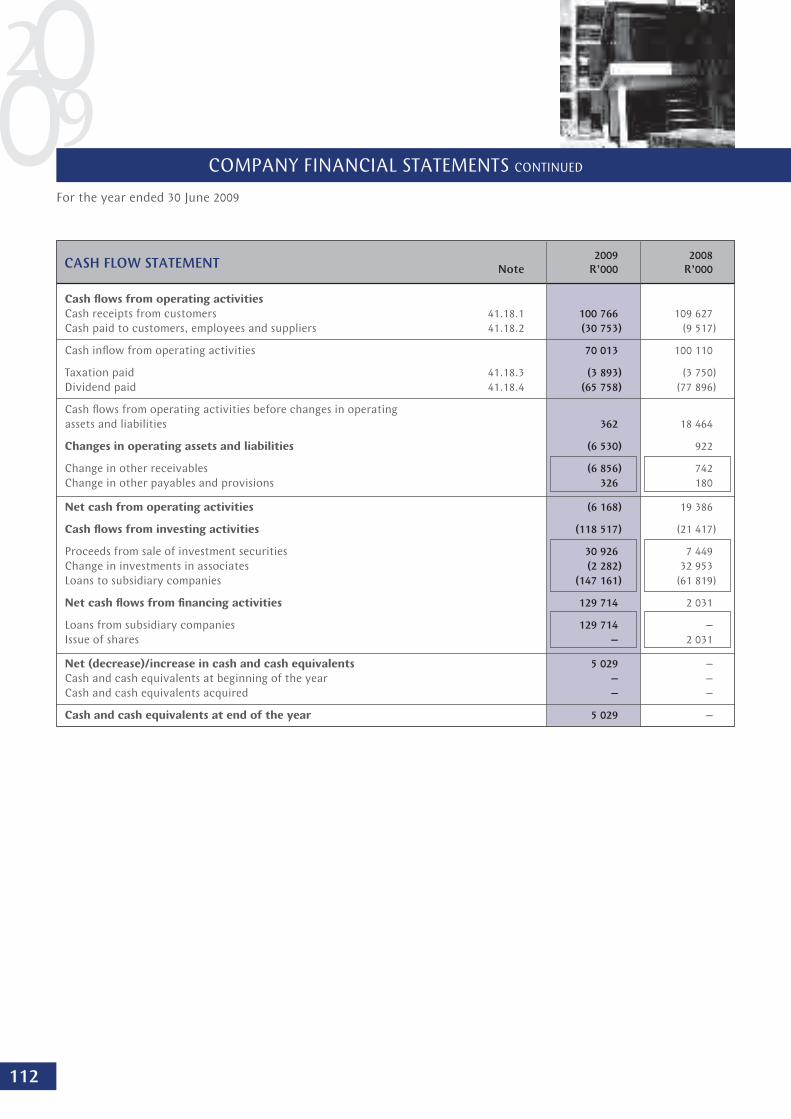
112
COMPANY FINANCIAL STATEMENTS CONTINUED
2009 2008 CASH FLOW STATEMENT Note R’000 R’000
Cash fl ows from operating activities
Cash receipts from customers 41.18.1 100 766 109 627
Cash paid to customers, employees and suppliers 41.18.2 (30 753) (9 517)
Cash infl ow from operating activities 70 013 100 110
Taxation paid 41.18.3 (3 893) (3 750)
Dividend paid 41.18.4 (65 758) (77 896)
Cash fl ows from operating activities before changes in operating
assets and liabilities 362 18 464
Changes in operating assets and liabilities (6 530) 922
Change in other receivables (6 856) 742
Change in other payables and provisions 326 180
Net cash from operating activities (6 168) 19 386
Cash fl ows from investing activities (118 517) (21 417)
Proceeds from sale of investment securities 30 926 7 449
Change in investments in associates (2 282) 32 953
Loans to subsidiary companies (147 161) (61 819)
Net cash fl ows from fi nancing activities 129 714 2 031
Loans from subsidiary companies 129 714 –
Issue of shares – 2 031
Net (decrease)/increase in cash and cash equivalents 5 029 –
Cash and cash equivalents at beginning of the year – –
Cash and cash equivalents acquired – –
Cash and cash equivalents at end of the year 5 029 –
For the year ended 30 June 2009
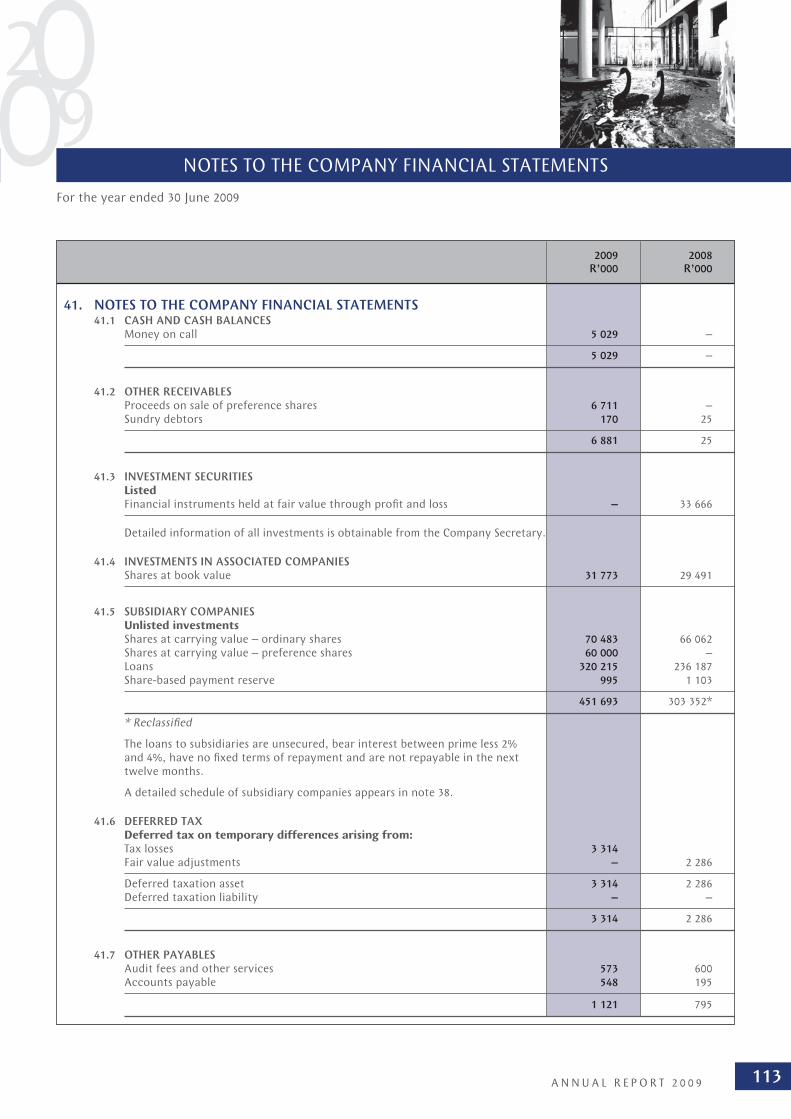
113A N N U A L R E P O R T 2 0 0 9
NOTES TO THE COMPANY FINANCIAL STATEMENTS
2009 2008 R’000 R’000
41. NOTES TO THE COMPANY FINANCIAL STATEMENTS 41.1 CASH AND CASH BALANCES Money on call 5 029 –
5 029 –
41.2 OTHER RECEIVABLES Proceeds on sale of preference shares 6 711 – Sundry debtors 170 25
6 881 25
41.3 INVESTMENT SECURITIES Listed Financial instruments held at fair value through profi t and loss – 33 666
Detailed information of all investments is obtainable from the Company Secretary.
41.4 INVESTMENTS IN ASSOCIATED COMPANIES Shares at book value 31 773 29 491
41.5 SUBSIDIARY COMPANIES Unlisted investments Shares at carrying value – ordinary shares 70 483 66 062 Shares at carrying value – preference shares 60 000 – Loans 320 215 236 187 Share-based payment reserve 995 1 103
451 693 303 352*
* Reclassifi ed
The loans to subsidiaries are unsecured, bear interest between prime less 2% and 4%, have no fi xed terms of repayment and are not repayable in the next twelve months.
A detailed schedule of subsidiary companies appears in note 38.
41.6 DEFERRED TAX Deferred tax on temporary differences arising from: Tax losses 3 314 Fair value adjustments – 2 286
Deferred taxation asset 3 314 2 286 Deferred taxation liability – –
3 314 2 286
41.7 OTHER PAYABLES Audit fees and other services 573 600 Accounts payable 548 195
1 121 795
For the year ended 30 June 2009

114
NOTES TO THE COMPANY FINANCIAL STATEMENTS CONTINUED
2009 2008 R’000 R’000
41. NOTES TO THE COMPANY FINANCIAL STATEMENTS continued
41.8 ORDINARY SHARE CAPITAL
Authorised
40 000 000 (2008: 40 000 000) ordinary shares of 1 cent each 400 400
Issued
28 032 620 (2008: 27 351 853) ordinary shares of 1 cent each
Balance at the beginning of the year 273 270
Issued during the year 7 3
Balance at the end of the year 280 273
The Group has a share incentive trust in terms of which ordinary shares are
issued and options are granted. Details of the share incentive trust are set
out in note 35 as required by the JSE. The Group issued 80 238 (2008: 338 479)
ordinary shares to the Sasfi n Share Incentive Trust. The number of ordinary
shares held by the Sasfi n Share Incentive Trust amounts to 31 333 (2008: 64 192)
or R595 327 (2008: R578 276) at year-end.
The unissued ordinary shares are under the control of the directors until the
next Annual General Meeting.
41.9 ORDINARY SHARE PREMIUM
Balance at the beginning of the year 27 843 25 815
Issued during the year 15 946 2 028
Balance at the end of the year 43 789 27 843
41.10 PREFERENCE SHARE CAPITAL
Authorised
5 000 000 (2008: 5 000 000) non-redeemable, non-cumulative, non-participating
preference shares of 1 cent each 50 50
Issued
1 905 000 (2008: 1 905 000) preference shares of 1 cent each
Balance at the beginning of the year 19 19
Balance at the end of the year 19 19
The preference shares were listed under the Specialist Securities – Preference
Shares sector of the JSE. Dividends are paid semi-annually at a rate of 75%
of the prime rate.
41.11 PREFERENCE SHARE PREMIUM
Balance at the beginning of the year 199 259 199 259
Balance at the end of the year 199 259 199 259
For the year ended 30 June 2009
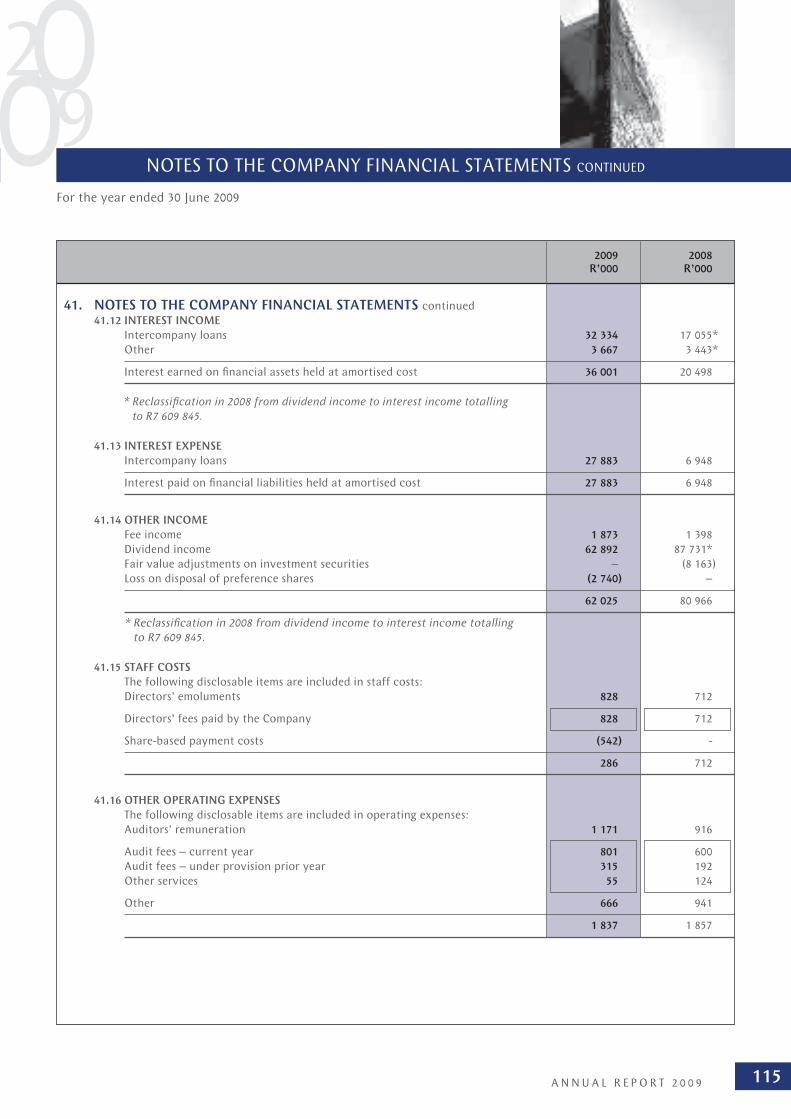
115A N N U A L R E P O R T 2 0 0 9
NOTES TO THE COMPANY FINANCIAL STATEMENTS CONTINUED
2009 2008 R’000 R’000
41. NOTES TO THE COMPANY FINANCIAL STATEMENTS continued
41.12 INTEREST INCOME
Intercompany loans 32 334 17 055*
Other 3 667 3 443*
Interest earned on fi nancial assets held at amortised cost 36 001 20 498
* Reclassifi cation in 2008 from dividend income to interest income totalling
to R7 609 845.
41.13 INTEREST EXPENSE
Intercompany loans 27 883 6 948
Interest paid on fi nancial liabilities held at amortised cost 27 883 6 948
41.14 OTHER INCOME
Fee income 1 873 1 398
Dividend income 62 892 87 731*
Fair value adjustments on investment securities – (8 163)
Loss on disposal of preference shares (2 740) –
62 025 80 966
* Reclassifi cation in 2008 from dividend income to interest income totalling
to R7 609 845.
41.15 STAFF COSTS
The following disclosable items are included in staff costs:
Directors’ emoluments 828 712
Directors’ fees paid by the Company 828 712
Share-based payment costs (542) -
286 712
41.16 OTHER OPERATING EXPENSES
The following disclosable items are included in operating expenses:
Auditors’ remuneration 1 171 916
Audit fees – current year 801 600
Audit fees – under provision prior year 315 192
Other services 55 124
Other 666 941
1 837 1 857
For the year ended 30 June 2009

NOTES TO THE COMPANY FINANCIAL STATEMENTS CONTINUED
2009 2008 R’000 R’000
41. NOTES TO THE COMPANY FINANCIAL STATEMENTS continued
41.17 INCOME TAX EXPENSE South African normal tax (1 086) (797)
Current tax – current year (58) 1 489 Deferred tax – current year (1 028) (2 286)
Secondary tax on companies 2 403 3 105
1 317 2 308
Reconciliation of rate of taxation % % South African normal tax rate 28,0 28,0 Adjusted for: (26,1) (25,4)
Exempt income (25,9) (29,0) Non-deductible expenses – 0,2 Capital gains – – Secondary tax on companies 3,5 3,4 Other (3,7) –
Effective rate 1,9 2,6
41.18 CASH FLOW NOTES 41.18.1 CASH RECEIPTS FROM CUSTOMERS Interest Income 36 001 12 888 Other income 64 765 96 739
100 766 109 627
41.18.2 CASH PAID TO CUSTOMERS, EMPLOYEES AND SUPPLIERS Interest expense 27 883 6 948 Total operating expenses 2 870 2 569
30 753 9 517
Cash infl ow from operating activities 70 013 100 110
RECONCILIATION OF OPERATING PROFIT TO CASH FLOWS FROM OPERATING ACTIVITIES
Profi t before income tax 68 020 91 947 Share-based payments (747) – Fair value adjustments on fi nancial instruments held at fair value
through profi t and loss 2 740 8 163
70 013 100 110
41.18.3 TAXATION PAID Unpaid at the beginning of the year (738) 704 Charge to the income statement 1 317 2 308 Unpaid at the end of the year 3 314 738
3 893 3 750
For the year ended 30 June 2009
116

117A N N U A L R E P O R T 2 0 0 9
NOTES TO THE COMPANY FINANCIAL STATEMENTS CONTINUED
2009 2008 R’000 R’000
41. NOTES TO THE COMPANY FINANCIAL STATEMENTS continued 41.18 CASH FLOW NOTES continued 41.18.4 DIVIDENDS PAID Charge to distributable reserves 80 531 77 896 Shares issued in terms of script dividend option (14 773) –
65 758 77 896
41.19 RELATED PARTY TRANSACTIONS The following are defi ned as related parties of the Group: • Subsidiaries (refer to note 38) • Associated undertakings and joint ventures (refer to note 38) • Key management personnel
Transactions between Group companies comprise: Interest on funding accounts received 32 334 12 875 Interest on funding accounts paid 27 883 6 945 Administration fees received 1 873 1 398
IAS 24 – Related Parties requires the identifi cation of “key management personnel”. Accordingly, the Group has defi ned key management personnel as those persons having authority and responsibility for planning, directing and controlling the activities of the Company, directly or indirectly, including any director (whether executive or otherwise) of the Company as well as close members of the family of any of these individuals. Key management personnel are considered to be the directors of the Company.
Details of directors’ emoluments and shareholding are disclosed in the Directors’ Report on page 41.
41.20 CLASSIFICATION OF ASSETS AND LIABILITIES Accounting classifi cations and fair values The table below sets out the Group’s classifi cation of each class of fi nancial assets and liabilities, and their fair values.
Other non- Designated fi nancial Total at fair Loans and assets and carrying Fair value receivables liabilities amount value R’000 R’000 R’000 R’000 R’000
2009 Assets Cash and cash balances 5 029 5 029 5 029 Other receivables 6 881 6 881 6 881 Investments in subsidiary companies
and associated companies 483 466 483 466 483 466 Other non-fi nancial assets 3 314 3 314 3 314
– 11 910 486 780 498 690
Liabilities Other payables 1 121 1 121 1 121 Other non-fi nancial liabilities 244 334 244 334 244 334
– – 245 455 245 455
Carrying value has been used where it closely approximates fair value.
For the year ended 30 June 2009
118
NOTES TO THE COMPANY FINANCIAL STATEMENTS CONTINUED
41. NOTES TO THE COMPANY FINANCIAL STATEMENTS continued
41.20 CLASSIFICATION OF ASSETS AND LIABILITIES continued
Other non- Designated fi nancial Total at fair Loans and assets and carrying value receivables liabilities amount Fair value R’000 R’000 R’000 R’000 R’000
2008
Assets
Investment securities 33 666 33 666 33 666
Other receivables 25 25 25
Investments in subsidiary companies
and associated companies 332 843 332 843 332 843
Other non-fi nancial assets 2 286 2 286 2 286
33 666 25 335 129 368 820
Liabilities
Other payables 795 795 795
Other non-fi nancial liabilities 1 548 1 548 1 548
Other non-fi nancial assets 114 620 114 620 114 620
– – 116 963 116 963
Carrying value has been used where it closely approximates fair value.
41.21 LIQUIDITY, CREDIT AND MARKET RISK INFORMATION
Other assets and liabilities consist mainly of non-fi nancial assets and liabilities or fi nancial assets and liabilities at
amortised cost which are not subject to liquidity, credit and market risk for IFRS 7 purposes. Investment securities
consist of RNil (2008: R33,7 million) investments held at fair value. These investments are subject to market risk being
the listed market prices of the instruments.
For the year ended 30 June 2009
119A N N U A L R E P O R T 2 0 0 9
NOTES TO THE COMPANY FINANCIAL STATEMENTS CONTINUED
42. RELEVANT STANDARDS AND INTERPRETATIONS BECOMING EFFECTIVE FOR YEARS ENDING AFTER 30 JUNE 2009
Standard/Interpretation Effective date
IFRS 2 (AC 139) amendment IFRS 2 Share-based Payment: Annual periods commencing on or after 1 January 2009*
Vesting Conditions and
Cancellations
IFRS 8 (AC 145) Operating Segments Annual periods commencing on or after 1 January 2009*
IAS 23 (AC 114) Borrowing Costs Annual periods commencing on or after 1 January 2009*
IAS 27 (AC 132) and Cost of an Investment in a Annual periods commencing on or after 1 January 2009*
IFRS 1 (AC 138) amendment Subsidiary, Jointly Controlled
Entity or Associate
IAS 32 (AC 125) and IAS 32 (AC 125) Financial Annual periods commencing on or after 1 January 2009*
IAS 1 (AC 101) amendment Instruments: Presentation and
IAS 1(AC 101) Presentation of
Financial Statements: Puttable
Financial Instruments and
Obligations Arising on Liquidation
Amendments to IFRS 7 Improving Disclosures about Annual periods commencing on or after 1 January 2009*
(AC 144) Financial Instruments
AC 503 revised Accounting For Black Economic Annual periods commencing on or after 1 January 2009*
Empowerment (BEE) Transactions
IFRS 3 (AC 140) Business Combinations Annual periods commencing on or after 1 July 2009*
IAS 27 (AC 132) amendment Consolidated and Separate Annual periods commencing on or after 1 July 2009*
Financial Statements
IAS 39 (AC 133) amendment Eligible Hedged Items Annual periods commencing on or after 1 July 2009*
IFRS 5 (AC 142) amendment Improvements to IFRSs – IFRS 5 Annual periods commencing on or after 1 July 2009*
Non-current Assets Held for Sale
and Discontinued Operations
IFRS 2 (AC 139) amendment Share based Payment – Group Annual periods commencing on or after 1 January 2010*
Cash-settled Share-based
Payment Transactions
* The adoption of this accounting statement should not have a signifi cant impact on the Group’s results.
IAS 1
The Group has early adopted IAS 1, effective fi nancial periods ending 30 June 2009, and included a Statement of
Comprehensive Income and has changed the format of the Statement of Changes in Equity accordingly.
IFRS 8
IFRS 8 will be adopted by the Group for the fi rst time for its fi nancial reporting period ending 30 June 2010.
In terms of this IFRS, segment reporting will be based on the information that management uses internally for evaluating
segment performance and when deciding how to allocate resources to operating segments. Such information may be
different from what is used to prepare the income statement and balance sheet.
The operating segments of the Group are the same as the current business segments based on IAS 14.
The adoption of IAS 39 will not have any impact on the accounting policies adopted for segments.
For the year ended 30 June 2009

120
SHAREHOLDER AND ADMINISTRATIVE INFORMATION
Shareholders Shares heldANALYSIS OF PREFERENCE SHAREHOLDERS
Number % Number %
ANALYSIS OF HOLDINGBrokers 1 0,1 27 - Close Corporations 14 1,5 34 391 1,8 Endowment Funds 2 0,2 1 400 0,1 Individuals 721 77,9 1 135 074 59,5 Mutual Funds 2 0,2 35 514 1,9 Nominees and Trusts 159 17,2 512 166 26,9 Other Corporations 5 0,5 40 727 2,1 Public Companies 1 0,1 1 000 0,1 Private Companies 21 2,3 144 701 7,6
926 100,0 1 905 000 100,0
SHAREHOLDER SPREADPublic shareholders 925 99,9 1 895 000 99,5 Non-public shareholders– Directors and Associates 1 0,1 10 000 0,5
926 100,0 1 905 000 100,0
Shareholders Shares heldANALYSIS OF ORDINARY SHAREHOLDERS
Number % Number %
ANALYSIS OF HOLDINGBanks 5 0,3 18 006 0,1 Brokers 6 0,3 140 449 0,5 Close Corporations 37 2,0 140 244 0,5 Endowment Funds 4 0,2 3 091 845 11,0 Individuals 1 452 77,9 4 745 248 17,0 Insurance Companies 5 0,3 194 625 0,7 Investment Companies 4 0,2 387 708 1,4 Mutual Funds 20 1,1 2 480 824 8,8 Nominees and Trusts 231 12,4 3 258 068 11,6 Other Corporations 27 1,4 32 977 0,1 Pension Funds 6 0,3 546 751 2,0 Private Companies 58 3,1 2 505 858 8,9 Public Companies 8 0,4 10 458 684 37,3 Share Trusts 1 0,1 31 333 0,1
1 864 100,0 28 032 620 100,0
SHAREHOLDER SPREADPublic shareholders 1 857 99,6 12 571 046 44,8 Non-public shareholders– Directors and Associates 7 0,4 15 461 574 55,2
1 864 100,0 28 032 620 100,0
For the year ended 30 June 2009
121A N N U A L R E P O R T 2 0 0 9
SHAREHOLDER AND ADMINISTRATIVE INFORMATION CONTINUED
SHAREHOLDERS’ DIARY
Year-end 30 June
Reports published:
• Interim for six months to December 2008 5 March 2009
• Preliminary announcement of annual results 8 September 2009
• Annual fi nancial statements 26 October 2009
Interim ordinary share dividend paid 14 April 2009
Final ordinary share dividend paid 12 October 2009
Preference share dividend number 9 paid 30 March 2009
Preference share dividend number 10 paid 5 October 2009
Annual General Meeting 3 December 2009
Number of % ofANALYSIS OF MAJOR ORDINARY SHAREHOLDERS shares issued shares
Unitas Enterprises Limited 9 378 487 33,46
The Sassoon Children’s Trust 3 080 845 10,99
Marsas Holdings (Pty) Limited 1 982 589 7,07
Saprop Investments Limited 1 060 999 3,78
The Sydney Sassoon Trust 922 808 3,29
Glattfi n Trust 861 189 3,07
PERFORMANCE OF ORDINARY SHARES ON THE JSE 2009 2008
Shares traded (number) 5 816 447 5 902 469
Price (cents)
Highest 3 196 5 900
Lowest 2 100 2 600
Year-end 2 625 2 639
Market capitalisation (R’000) 735 034 721 815
122
NOTICE OF ANNUAL GENERAL MEETING
SASFIN HOLDINGS LIMITED(Incorporated in the Republic of South Africa)
Registration Number 1987/002097/06
Ordinary Share Code: SFN ISIN: ZAE000006565
Preference Share Code: SFNP ISIN: ZAE000060273
(“Sasfi n” or “the Company”)
Notice is hereby given that the 22nd Annual General Meeting of shareholders of the Company will be held at the Company’s
premises, 29 Scott Street, Waverley, Johannesburg on Thursday, 3 December 2009 at 14h00, to consider and if deemed fi t, to pass,
with or without modifi cation, the following ordinary resolutions:
1. Ordinary resolution number 1 “Resolved to receive, consider and adopt the Annual Financial Statements and the Group Annual Financial Statements for
the year ended 30 June 2009, including the reports of the directors and the auditors.”
2. Ordinary resolution number 2 “Resolved that Mr CN Axten be re-elected as an independent non-executive director of the Company.”
Mr Axten retires by rotation as a director of the Company in accordance with the Company’s articles of association
and is eligible and offers himself for re-election.
Mr Axten was appointed an independent non-executive director of Sasfi n Holdings Limited and Sasfi n Bank Limited on
1 November 1999. He is the chairman of the Group Risk and Capital Management committee and the Credit Review
committee. He is also a member of, amongst others, the ALCO, Directors’ Affairs committee, Group Audit and Compliance
committee and the Directors’ Strategy and Review committee. Mr Axten spent his entire working life with the Barclays
Bank/First National Bank Group. He retired in 1996 as the Senior General Manager of the Group. He is a member and Past
President of the Institute of Bankers and was also President of the Association of Mortgage Lenders. He served for some time
as the CEO of the Banking Council. Mr Axten completed the Executive Development Programme at the University of the
Witwatersrand and also the Advanced Management Programme of Harvard University. He is 73 years old.
3. Ordinary resolution number 3 “Resolved that Mr M Segal be re-elected as a director of the Company.”
Mr Segal retires by rotation as a director of the Company in accordance with the Company’s articles of association and is
eligible and offers himself for re-election.
Mr Segal was appointed an executive director on the boards of Sasfi n Holdings Limited and Sasfi n Bank Limited on 6 September
2005. He was appointed as fi nancial director of Sasfi n Holdings Limited in May 2009. He heads Sasfi n Capital. Mr Segal is a
member of the Executive committee, the Directors’ Strategy and Review committee and the Group Audit and Compliance
committee, amongst others. He is also past Chairman of the South African Private Equity and Venture Capital Association
(“SAVCA”). Mr Segal obtained a BComm. degree from the University of the Witwatersrand and is registered as a Chartered
Accountant in both South Africa and Israel. He was a partner in one of the fi ve largest fi rms of Chartered Accountants
in South Africa from 1972 to 1997, during which time he was National Chairman from 1989. He left to become one of the
founders of MDM Growth Investments Limited, of which he was the Chief Executive. That company was acquired by Sasfi n
Holdings Limited in 2005. Mr Segal is 60 years of age.
123A N N U A L R E P O R T 2 0 0 9
NOTICE OF ANNUAL GENERAL MEETING CONTINUED
4. Ordinary resolution number 4 “Resolved that Mr ML Smith be re-elected as an independent non-executive director of the Company.”
Mr Smith retires by rotation as a director of the Company in accordance with the Company’s articles of association and is
eligible and offers himself for re-election.
Mr Smith joined the board of directors of Sasfi n Holdings Limited and Sasfi n Bank Limited on 1 December 1999 as an
independent non-executive director. He is also a member of the Directors’ Affairs committee and the Transformation
committee. He obtained a BComm. degree from the University of Stellenbosch and is a Fellow of the Faculty of Actuaries. He
also completed the Advanced Executive programme of the University of South Africa. Mr Smith held senior positions with
Sanlam Limited, Bank of Johannesburg, Senbank and Trust Bank from 1962 until 1986. He joined Metropolitan Life Limited
in 1986, retiring as managing director in 1998. He is a non-executive director of Metropolitan Life and of Metropolitan Life
(Namibia). Mr Smith is 69 years of age.
5. Ordinary resolution number 5 “Resolved that the directors be authorised to determine the remuneration of the Company’s auditors.”
6. Ordinary resolution number 6 “Resolved that KPMG Inc. and PKF (Jhb) Inc. be re-appointed as joint auditors of the Company and that Mrs H Berrange and
Mr GM Chaitowitz be re-appointed as the individual designated auditors of the Company for the next fi nancial year.”
7. Ordinary resolution number 7 “Resolved that the aggregate executive and non-executive directors’ fees for the past fi nancial year of R11 089 933 be
approved.”
8. Ordinary resolution number 8 “Resolved that the unissued ordinary shares in the authorised ordinary share capital of the Company be and are hereby
placed under the control of the directors of the Company who are authorised to allot and issue the ordinary shares at their
discretion, and on such terms and conditions and at such times as they deem fi t until the next Annual General Meeting of
the Company, subject to the provisions of the Companies Act, 61 of 1973 as amended (“the Companies Act”), the Banks Act,
94 of 1990, as amended (“the Banks Act”) and the JSE Limited Listings Requirements (“JSE Listings Requirements”).
9. Ordinary resolution number 9 “Resolved that the directors have the power to allot and issue ordinary shares in the authorised but unissued share capital
of the Company for cash as and when the directors consider it appropriate in the circumstances, subject to the Companies
Act, any share incentive trust deed entered into by the Company, the articles of association of the Company, the Banks Act
and the JSE Listings Requirements, when applicable, and the following limitations, namely that:
9.1 this authority shall not endure beyond the earlier of the next Annual General Meeting of the Company or beyond
15 (fi fteen) months from the date of this meeting;
9.2 there will be no restrictions in regard to the persons to whom the shares may be issued, provided that such shares are
to be issued to public shareholders (as defi ned by the JSE Listings Requirements) but not to related parties;
9.3 upon any issue of ordinary shares representing on a cumulative basis within a fi nancial year, 5% (fi ve percent) or
more of the number of ordinary shares in issue, the Company shall, by way of a paid press announcement in terms of
11.22 of the JSE Listings Requirements, give full details thereof, including the effect on the net asset value per share,
net tangible asset value per share, earnings per share, headline earnings per share of the Company, the number of
securities issued and the average discount to the weighted average traded price of the securities over the 30 days prior
to the date that the price of such issue was determined or agreed by the Company and the party subscribing for the
securities;
124
NOTICE OF ANNUAL GENERAL MEETING CONTINUED
9.4 that issues in the aggregate in any one fi nancial year shall not exceed 15% (fi fteen percent) of the number of issued ordinary shares of the Company (including instruments which are compulsorily convertible into ordinary shares) at the date of application less any ordinary shares issued, or to be issued in the future arising from options/convertible securities issued during the current fi nancial year, plus any ordinary shares to be issued pursuant to an announced, irrevocable and fully underwritten rights offer or to be issued pursuant to any acquisition for which fi nal terms have been announced;
9.5 the maximum discount at which ordinary shares may be issued is 10% (ten percent) of the weighted average traded price of the ordinary shares over the 30 (thirty) business days prior to the date that the price of the issue is determined or agreed by the Company and the party subscribing for the securities, and
9.6 under the JSE Listings Requirements a 75% (seventy-fi ve percent) majority of votes cast by the ordinary shareholders present or represented by proxy at the annual general meeting is required to approve the resolution.”
10. Ordinary resolution number 10 “Resolved that the unissued non-redeemable, non-cumulative, non-participating, variable rate preference shares in the
authorised preference share capital of the Company be and are hereby placed under the control of the directors of the Company who are authorised to allot and issue the preference shares at their discretion, and on such terms and conditions and at such times as they deem fi t until the next Annual General Meeting of the Company, subject to the provisions of the Companies Act, 61 of 1973 as amended (“the Companies Act”), the Banks Act, 94 of 1990, as amended (“the Banks Act”) and the JSE Listings Requirements.
VOTING AND PROXIESAll holders of the issued ordinary shares are entitled to attend and vote at the Annual General Meeting. Holders of preference shares are only entitled to attend the Annual General Meeting.
Ordinary shareholders who hold their shares in certifi cated form or who are own name registered dematerialised shareholders who are unable to attend the Annual General Meeting but who wish to be represented thereat, are required to complete and return the attached form of proxy so as to be received at the registered offi ce of the Company and the Company’s transfer secretaries, Computershare Investor Services (Pty) Limited, Ground Floor, 70 Marshall Street, Johannesburg, 2001 by not later than 14h00 on Tuesday, 1 December 2009. Ordinary shareholders who have dematerialised their shares through a Central Securities Depository Participant (“CSDP”) or broker, other than by own name registration who wish to attend the Annual General Meeting must instruct their CSDP or broker to issue them with the necessary authority to attend the meeting, in terms of the custody agreement entered into between such shareholders and their CSDP or broker. Ordinary shareholders who have dematerialised their shares through a CSDP or broker, other than by own name registration who wish to vote by way of proxy, must provide their CSDP or broker with their voting instructions, in terms of the custody agreement entered into between such shareholders and their CSDP or broker. These instructions must be provided to their CSDP or broker by the cut-off time or date advised by their CSDP or broker for instructions of this nature.
On a show of hands, every shareholder present in person or represented by proxy shall have one vote only. On a poll, every shareholder shall have one vote for each share of which he/she is the registered holder.
By order of the board
S JacksonCompany Secretary
2 September 2009
Registered offi ce Transfer secretaries29 Scott Street Computershare Investor Services (Pty) LimitedWaverley PO Box 610512090 MarshalltownPO Box 95104 2107Grant Park 2051

FORM OF PROXY
SASFIN HOLDINGS LIMITED(Incorporated in the Republic of South Africa)
Registration Number 1987/002097/06
Ordinary Share Code: SFN ISIN: ZAE000006565
Preference Share Code: SFNP ISIN: ZAE000060273
(“Sasfi n” or “the Company”)
FOR USE ONLY BY CERTIFICATED ORDINARY SHAREHOLDERS AND OWN NAME REGISTERED DEMATERIALISED ORDINARY
SHAREHOLDERS AT THE ANNUAL GENERAL MEETING OF SASFIN SHAREHOLDERS TO BE HELD AT 29 SCOTT STREET, WAVERLEY,
JOHANNESBURG ON THURSDAY, 3 DECEMBER 2009 AT 14H00 OR SUCH LATER TIME THAT MAY BE APPLICABLE (“THE ANNUAL
GENERAL MEETING”).
I/We (Names in capital letters)
of (address)
being a member(s) of Sasfi n and entitled, on a poll, to votes hereby
appoint of or failing him / her
of or failing them,
the Chairman of the Annual General Meeting as my/our proxy to vote for me/us and on my/our behalf at the Annual General
Meeting of the Company to be held on Thursday, 3 December 2009 and at any adjournment thereof.
Please indicate with an “X” in the appropriate spaces how you wish your votes to be cast. Unless this is done, the proxy will be
deemed to have been authorised as he/she thinks fi t.
In favour Against Abstain
1. To receive and consider the Annual Financial Statements
2. To re-elect Mr CN Axten as an independent non-executive director
3. To re-elect Mr M Segal as an independent non-executive director
4. To re-elect Mr ML Smith as an independent non-executive director
5. To authorise the directors to determine the auditors’ remuneration
6. To re-appoint the joint auditors for the next fi nancial year
7. To approve the directors’ fees for the past year
8. To place the unissued ordinary shares under the control of the directors
9. To grant the directors a general authority to issue ordinary shares for cash
10. To place the unissued preference shares under the control of the directors
Signature: Date:
Please read the notes on the reverse side hereof.

NOTES TO THE FORM OF PROXY
1. A Sasfi n ordinary shareholder may insert the name of a proxy or the names of two alternative proxies of the Sasfi n
shareholder’s choice in the space/s provided, with or without deleting “the Chairman of the Annual General Meeting”, but
any such deletion must be initialled by the Sasfi n ordinary shareholder concerned. The person whose name appears fi rst on
the form of proxy and who is present at the Annual General Meeting will be entitled to act as proxy to the exclusion of those
whose names follow.
2. A proxy is entitled to attend, speak and vote at the Annual General Meeting in place of the shareholder whom he or she is
representing. A proxy need not be a member of the Company.
3. Please insert an “X” in the relevant spaces according to how you wish your votes to be cast. However, if you wish to cast
your votes in respect of a lesser number of ordinary shares than you own in Sasfi n, insert the number of ordinary shares held
in respect of which you desire to vote. Failure to comply with the above will be deemed to authorise the proxy to vote or to
abstain from voting at the Annual General Meeting as he/she deems fi t in respect of all the shareholder’s votes exercisable
thereat. A Sasfi n shareholder or his/her proxy is not obliged to use all the votes exercisable by the Sasfi n shareholder or by
his/her proxy, but the total of the votes cast and in respect whereof abstentions are recorded may not exceed the total of
the votes exercisable by the shareholder or by his/her proxy.
4. The date must be fi lled in on this form of proxy when it is signed.
5. The completion and lodging of this form of proxy will not preclude the relevant Sasfi n shareholder from attending the
Annual General Meeting and speaking and voting in person thereat to the exclusion of any proxy appointed in terms hereof.
Where there are joint holders of shares, the vote of the senior joint holder who tenders a vote, as determined by the order
in which the names stand in the register of members, will be accepted.
6. Documentary evidence establishing the authority of a person signing this form of proxy in a representative capacity must
be attached to this form of proxy unless previously recorded by the transfer secretaries of Sasfi n or waived by the Chairman
of the Annual General Meeting of Sasfi n shareholders.
7. Any alterations or corrections made to this form of proxy must be initialled by the signatory/ies.
8. A minor must be assisted by his/her parent or guardian unless the relevant documents establishing his/her legal capacity are
produced or have been registered by the transfer secretaries of Sasfi n.
9. Forms of proxy must be received by the Company, Sasfi n Holdings Limited at 29 Scott Street, Waverley, 2090 (PO Box 95104,
Grant Park, 2051) and the Company’s transfer secretaries, Computershare Investor Services (Pty) Limited, Ground Floor,
70 Marshall Street, Johannesburg, 2001 by not later than 14h00 on Tuesday, 1 December 2009.
10. The Chairman of the Annual General Meeting may in his absolute discretion, accept or reject any form of proxy which is
completed other than in accordance with these notes.
11. If required, additional forms of proxy are available from the transfer secretaries of Sasfi n.
12. Dematerialised shareholders, other than by own name registration, must NOT complete this form of proxy but must
provide their CSDP or broker with their voting instructions in terms of the custody agreement entered into between such
shareholders and their CSDP or broker.
SASFIN BANK LIMITED
JOHANNESBURG
29 Scott Street
Waverley 2090
PO Box 95104 Grant Park 2051
Tel: +27 11 809 7500
Fax: +27 11 887 2489/6167
CAPE TOWN
4th Floor Southern Life Centre
8 Riebeeck Street
Cape Town 8001
PO Box 7520 Roggebaai 8012
Tel: +27 21 443 6800
Fax: +27 21 443 6886
DURBAN
1st Floor Sasfi n House
7 The Boulevard
Westway Offi ce Park
Spine Road
Westville 3630
PO Box 2771 Westway Offi ce
Park 3635
Tel: +27 31 265 1385
Fax: +27 31 265 1296/1297
SASFIN ASIA LIMITED
Suites 3833-34
38th Floor
Sun Hung Kai Centre
30 Harbour Road
Hong Kong
Tel: +852 3107 3067
Fax: +852 3107 0198
SASCRED FINANCIAL SERVICES
LIMITED
Suites 3833-3834
38th Floor
Sun Hung Kai Centre
30 Harbour Road
Hong Kong
Tel: +852 3107 3067
Fax: +852 3107 0198
SASFIN SECURITIES
(PTY) LIMITED
CAPE TOWN
4th Floor Southern Life Centre
8 Riebeeck Street
Cape Town 8001
PO Box 7520 Roggebaai 8012
Tel: +27 21 443 6800
Fax: +27 21 443 6882
DURBAN
1st Floor Sasfi n House
7 The Boulevard
Westway Offi ce Park
Spine Road
Westville 3630
PO Box 2707 Westway Offi ce
Park 3635
Tel: +27 31 265 1332
Fax: +27 31 265 1350
JOHANNESBURG
29 Scott Street
Waverley 2090
PO Box 299 Johannesburg 2000
Tel: +27 11 809 7500
Fax: +27 11 809 7765
PLETTENBERG BAY (AGENCY)
2 Village Square
Main Street
Plettenberg Bay 6600
PO Box 494 Plettenberg Bay
6600
Tel: +27 44 533 0897
Fax: +27 44 533 0909
PORT ELIZABETH
Ground Floor Greyville House
Ring Road
Greenacres 6045
PO Box 27401 Greenacres 6057
Tel: +27 41 363 5989
Fax: +27 41 363 1692
PRETORIA
Building A Ground Floor
South Wing
Lord Charles Offi ce Park
337 Brooklyn Road
Brooklyn 0181
PO Box 36002 Menlo Park 0102
Tel: +27 12 425 6000
Fax: +27 12 425 6060
SCRIP ADMINISTRATION
29 Scott Street
Waverley 2090
PO Box 299 Johannesburg 2000
Tel: +27 11 809 7500
Fax: +27 11 887 6110
SASFIN FINANCIAL ADVISORY
SERVICES (PTY) LIMITED
JOHANNESBURG
29 Scott Street
Waverley 2090
PO Box 95104 Grant Park 2051
Tel: +27 11 809 7500
Fax: +27 11 809 7794
CAPE TOWN
4th Floor Southern Life Centre
8 Riebeeck Street
Cape Town 8001
PO Box 7520 Roggebaai 8012
Tel: +27 21 443 6800
Fax: +27 21 443 6882
PRETORIA
Building A Ground Floor South
Wing
Lord Charles Offi ce Park
337 Brooklyn Road
Brooklyn 0181
PO Box 36002, Menlo Park 0102
Tel: +27 12 425 6003
Fax: +27 12 425 6200
INNOVENT RENTAL AND ASSET
MANAGEMENT SOLUTIONS
(PTY) LIMITED
10th Floor Sandton Offi ce
Towers
Sandton City 2196
PO Box 782005 Sandton 2146
Tel: +27 11 884 8274
Fax: +27 11 784 6599
PREMIER FREIGHT
(PTY) LIMITED
JOHANNESBURG
90 Electron Avenue
Isando 1620
PO Box 11288 Aston Manor 1630
Tel: +27 11 573 9000
Fax: +27 11 573 9599
CAPE TOWN
13th Floor Southern Life Centre
8 Riebeeck Street
Cape Town 8001
PO Box 6455 Roggebaai 8012
Tel: +27 21 421 5836
Fax: +27 21 419 3896
DURBAN
22 Keswick Road
Morningside
Durban 4001
PO Box 47669 Greyville 4023
Tel: +27 31 312 9352
Fax: +27 31 312 0088
PORT ELIZABETH
1st Floor Mercantile Plaza
Ring Road
Greenacres 6045
PO Box 1192 Port Elizabeth 6000
Tel: +27 41 363 7660
Fax: +27 41 363 5384
NVEST FINANCIAL HOLDINGS
(PTY) LIMITED
NFB House
42 Beach Road
Nahoon
East London 5241
PO Box 8132 Nahoon 5210
Tel: +27 43 735 2000
Fax: +27 43 735 2001
SASFIN GROUP CONTACT INFORMATION
Designed by Insignia
Produced by
Email address: info@sasfi n.com
Web addresses:
www.sasfi n.com
www.sasfi nsecurities.co.za
www.sasfi nam.com
www.premierfreight.co.za
www.innovent.co.za
Call: 0861-sasfi n or toll-free 0800 002 538


![· Pietropaolo,[d] Enrico Rizzarelli[a ... (D4D6) were obtained from ENZO Life Science and Cell Signalling, respectively. The ubiquitylation kit was purchased by ABCAM](https://img.pdfslide.us/doc/110x75/5c676f9209d3f226588be0fe/-pietropaolod-enrico-rizzarellia-d4d6-were-obtained-from-enzo-life.jpg)


![Botany] Carnivorous Plants of the World - James Pietropaolo](https://img.pdfslide.us/doc/110x75/547ec23bb4af9f9e128b45a0/botany-carnivorous-plants-of-the-world-james-pietropaolo.jpg)