Embed Size (px)
Citation preview

To be the Best...
Annual Report 2009

Table of Contents
Letter to Shareholders . . . . . . . . . . . . 1
Marketers. . . . . . . . . . . . . . . . . . . . 2-3
Designers . . . . . . . . . . . . . . . . . . . . 4-5
Manufacturers . . . . . . . . . . . . . . . . 6-7
As Determined . . . . . . . . . . . . . . . . 8-9
Management’s Discussion and Analysis of Financial Condition and Results of Operations . . . . . . . . . . . . . . . . . .10-16
Financial Statementsand Notes . . . . . . . . . . . . . . . . . . .17-40
Shareholder Information . . . . . . . . . 41
Net Sales(In Thousands)
Earnings Per Share(Diluted)
About the Cover: The photos on the front cover are representative of the four major product categories produced by Baldor: industrial electric motors, mechanical power transmission products, drives and generators.
To be the Best...

We are glad that 2009 is over! While we accomplished many good things during 2009 to make our company stronger and better, last year was one of the most difficult years in the company’s history.
Sales for the year 2009 ended at $1.52 billion. This was down 22% from the year before, when we had record sales of $1.95 billion. Net earnings were $59.8 million, compared to record net earnings the year before of $99.4 million. Earnings per share were $1.28, compared to $2.15 the year before. Cash flow from operations was an all-time-record of $205.7 million.
While last year was a difficult year, we continued to invest in new products and new equipment for our manufacturing plants. We also made many manufacturing productivity improvements, as well as good improvements in manufacturing safety and product quality. These actions position us well for the recovery we are beginning to experience.
During the year we closed one plant and consolidated those operations into a nearby plant. Due to the close proximity of these two plants, we were able to offer all of our employees in the closed plant an opportunity to continue working for the company. Most took advantage of this opportunity. This was an important factor in our decision because of our no-layoff strategy at Baldor. We
don’t believe in sending talented, experienced people “out the door” in tough times and are pleased to report we were able to navigate last year’s tough economy without manufacturing layoffs.
Because our sales and earnings fell further than expected, it was necessary to renegotiate our credit agreement early in the year, resulting in higher interest rates and an unusual non-cash gain. Even with these higher interest rates, we made good progress on our debt, reducing it by $120.8 million during the year and $347 million since taking on the debt 35 months ago. Reducing debt will continue to be our priority for free cash flow.
As we write this letter, we’re beginning to see an improvement in our incoming order rate. For the first two months of 2010, incoming orders are ahead of shipments. Our manufacturing facilities are ready to increase output and we’re not faced with hiring new people and training them. We expect improved order rates and higher productivity to drive improved financial performance in 2010.
In December of this year, the energy bill passed by Congress in 2007 becomes effective. It requires us to raise the efficiency of many of the motors we produce. We expect implementation of this law to begin having a positive impact on our sales late in 2010 and 2011.
Shareholders, Employees, Customers and Friends.
About 30 years ago we created the Baldor Mission Statement. This Mission Statement describes who we are and who we want to be. Over the years, we’ve made minor changes to the Mission Statement as our business has changed. Also, we’ve made our Mission Statement a very important part of our culture, using it widely throughout the company.
On the following pages we talk about some of the important strategies of our company and how they relate to our Mission Statement. We hope this report will help you better understand Baldor and the many things we’re doing “to be the best!”
Thank you for your confidence in Baldor Electric Company. We recognize we must continue to earn it day by day and are determined to do so!
Best regards,
John A. McFarlandChairman and CEO
Ronald E. Tucker President and COO

Our Denver district offi ce and warehouse pictured above has more than 20,000 square feet of warehouse and offi ce space, stocking motors from fractional through 500 horsepower, drives and generators. With more than 300 combined years of experience, the Denver staff does an outstanding job of taking care of our Rocky Mountain customers.
...Marketers...
2
To be the Best...
We’ve always believed that fi rst you must win the mind of the customer before you can win the order. Being marketing-driven means the customer is always at the core of everything we do. As such, the importance of having the right products, in the right place, at the right time, creates the most important part of the marketing strategy…preference!
All district warehouses tailor their inventory to suit the needs of the local customers they are serving.
While many companies today have a marketing strategy of searching the world for the cheapest products available and attempting to rebrand, re-label or repackage them, Baldor’s strategy is to market, design and manufacture high-quality products for value-minded customers. Our Value Formula identifi es how we believe customers perceive value and what determines their purchasing decisions.
Baldor offers the broadest line of industrial electric motors and mechanical power transmission products available. Because we serve so many different industries, the breadth of our products offers us a unique opportunity to solve many customer application problems with off-the-shelf products. Our strategy of acting locally while thinking globally allows our warehouses to tailor
inventories to suit the needs of the customers they serve on a daily basis. Having numerous stocking locations with the right product available around the clock provides a benefi t to customers that separates us from our competition.
In today’s business climate, the issue of energy effi ciency is becoming increasingly important as electricity costs continue to rise, while at the same time manufacturers need to reduce operating costs to remain competitive. Baldor’s products offer many energy saving opportunities.

3
Baldor’s Installed Base Evaluation team provides a service not offered by anyone else in our industry. The information gathered provides the foundation for customers to develop a solid motors, drives and mechanical power transmission products management plan.
...Marketers...We also provide a unique service to customers via our Installed Base Evaluation Team. Using state-of-the-art data collection equipment and software, Baldor’s IBE specialists capture critical information about electrical and mechanical products in operation. The data is analyzed to produce a comprehensive report with recommendations for immediate actions, plus long-term strategies that lead to signifi cant energy savings and productivity improvements for the customers.
Our added-value approach to taking care of our customers has propelled us to the market-leading position for industrial electric motors and mechanical power transmission products in North America, confi rming that customers always look for the best value available.
Being the best marketer in our industry is a position we take very seriously and will continue to protect and expand upon. Focusing on providing the customers the greatest overall value allows us to “be the best marketers…as determined by our customers.”
Control Design’s Reader’s Choice Awards 2009
Baldor • Reliance® Premium Effi ciencySuper-E® Motor
Motor, Industrial Electric
Baldor
Regal Beloit
General Electric
Siemens E&A
AutomationDirect
42%
9%
6%
6%
5%

...Designers...New product designs result from listening to customers’ requests for assistance in solving specifi c application problems, something we refer to as the “voice of the customer.” Other new products are sometimes derivatives of existing products that provide enhancements over and above the product currently being offered. By working closely with our sales force, who receive feedback from our customers daily, our marketing and engineering teams develop product concepts which are then engineered into value-added solutions.
We believe that new products are the lifeblood of continued success. Our goal is to have 25% of our annual business result from products we have introduced in the previous fi ve years. For this reason, we devote considerable time and investment to our research and development efforts at our Advanced Engineering Technology Centers.
It is also important that we maintain a high level of discussion and compliance with agencies of infl uence, such as the Department of Energy, Department of Defense, U.S. Bureau of Mines, U.S. Navy, American Bureau of Shipping, U.S. Coast Guard, NASA and NEMA. Currently we are working with the Department of Energy in the
4
While some may consider the industrial electric motor and mechanical power transmission industries to be mature, they are in fact evolving and technologically changing in many ways. The move toward a more energy-effi cient economy mandates that our products perform more effi ciently and effectively, and our design teams are constantly working to refi ne the functionality and application of our products.
To be the Best...
New and innovative products, such as the Cooling Tower motor and drive being installed above, offer solutions for our customers’ most demanding applications. Direct input from customers helps us produce new products that solve problems.

5
...Designers...
development of the next generation of premium effi cient industrial motors. Our reputation as an industrial innovator allows us the opportunity to work with these agencies, leading the world in the development of new advanced technologies in our product fi elds.
Since 1920, Baldor has kept its focus on producing the best motors available, which use a minimum amount of energy. The Energy Independence and Security Act of 2007 updates mandated energy effi ciency standards from the Energy
Policy Act of 1992 and will become effective in December 2010. Baldor already has premium effi cient motors that are in compliance with the new legislation, with more motors meeting these new energy standards than any company in the world. We will continue to expand our offering of premium effi cient motors, ensuring a continued leadership position in the industries we serve.
Design engineers work closely with our test lab personnel during new product development to ensure that the products meet the performance specifi cations requested by our customers.
Baldor’s Super-E premium effi cient motors already meet the effi ciency standards of the Energy Independence and Security Act.

...Manufacturers...
6
Baldor operates 25 manufacturing facilities in fi ve countries, producing high-quality industrial electric motors, mechanical power transmission products, drives and generators. At the heart of these facilities are some of the best employees in the world. Baldor’s philosophy of investing in people continues to pay big dividends for our company and will be particularly evident as we exit the recession of 2009. Staying true to our managing philosophy, we have retained our experienced people, with reductions in our manufacturing workforce coming primarily from attrition.
To be the Best...
Productivity and plant effi ciency is at the forefront of our manufacturing processes. The safety of our team members is paramount and a key benefi t resulting from the implementation of Lean Flex Flow and process automation. We are proud that we provide clean and safe work environments for all employees and have an outstanding safety record in all plants around the world.
Over the past three years, we have focused considerable attention on completing the integration of the Baldor and Reliance motor lines. This project will be completed in 2010, with all motor plants utilizing Lean Flex Flow, our proprietary manufacturing process. Integrating the motor plants allows each plant to focus on a smaller variety of products, providing many opportunities for work-in-process parts consolidation, fewer machine set-ups and increased automation. Lean Flex Flow provides greater fl exibility in manufacturing, eliminating unnecessary waste. In 2009, a dozen major Lean Flex Flow projects were completed in seven facilities, freeing up more than 50,000 square feet of valuable manufacturing space. Lean Flex Flow also results in less inventory, improved quality,
Our towable generators built in our Oshkosh, WI, plant have gained a reputation in the industry of being one of the most reliable and high quality generators available. The Oshkosh generator plant manufactures generators up to 2.5 megawatts.
Baldor’s motor plant in China recently completed their fi rst production of IEC premium effi cient motors to be sold throughout the Asian market.

7
...Manufacturers...
Our team of dedicated employees in our Greenville, SC, plant takes pride in knowing that our Baldor•Dodge® gear products set the standard in the industry for quality and craftsmanship.
Investments in automation and robotics allow our manufacturing facilities to be competitive globally.
shorter product lead-time and overall improved productivity.
We continue to make capital investments in more highly automated production equipment at all of our plants. Doing so makes us more competitive in the global marketplace,
providing new opportunities to expand our business. During 2009, we began manufacturing our fi rst premium effi cient industrial electric motors in China. These motors are designed and manufactured to meet the high quality standards that Baldor is known for in North America, but they will
be built locally to be sold throughout the Asia-Pacifi c market. Unlike other manufacturers in China, Baldor has decided to establish a niche in the market by producing a premium effi cient motor designed to consume less electricity than other motors currently being sold in the Asia-Pacifi c market.

...as determined
8
To be the Best...
We believe that we have the leadership position in the industries we serve, but what is more important is that our customers believe this as well. Of course the obvious indication that this is true is when customers continue to provide us with their orders; however, studies performed by independent third party research fi rms also tell us that customers prefer our products over our competitors. Gaining customer preference provides growth opportunities for Baldor.
In 2009, we were able to produce our largest motor to date, a highly customized 15,000 horsepower “drop-in” replacement motor for a petroleum refi nery in Louisiana. This was no easy task. The customer chose Baldor because we were the only company that had the capability to produce a motor that could drop into the same dimensional requirements as the motor it was replacing, while also achieving the required performance levels. Telling customers what we can do – rather than what we can’t do – earns customer preference and
new opportunities. Being “easy to do business with” remains an integral part of our business philosophy.
Education and training continue to prove benefi cial to our customers and Baldor. Customers regularly attend Baldor product training classes, learning about the benefi ts of using Baldor products and doing business with our company. Feedback we receive from customers comparing us to other companies in our industry tells us “there is no comparison.”
We are proud that Baldor excels above all others in education and training of customers, both locally and at our corporate training facilities.
Our mission, “to be the best (as determined by our customers) marketers, designers and manufacturers…,” remains the foundation of our culture. It is another way of saying who we are and what we do. Customers provide our job security and the work that keeps our company growing. Customers also
We believe that we have the leadership position in the industries we serve, but what is more important is that our customers
by our customers...Food Processing Reader’s Choice Awards 2009
Baldor Washdown Duty Motors
Motors and Drives
Baldor
Rockwell
SEW Eurodrive
40%
11%
7%
Customer training and education is an investment in our future.

9
...as determined
Every employee throughout our company is committed “to be the best” as determined by our customers. After all, it is customers and the orders they provide that give us a secure future.
The Baldor Value Formula illustrates the importance of Quality, Service, Cost and Time in shaping our customers’ perception of Value.
( ) = Value = Quality = Service = Cost = Time = perceived
VQSCT p
by our customers...
want to do business with “best in class” suppliers who are dependable and provide exceptional value. We will continue to provide this value by being the best marketers, best designers and best manufacturers. But ultimately, it is the customers who decide whether we deliver on our mission…to be the best!

10
(In thousands, except per share data) Per Common Share Data
Diluted Basic Net Net Net Net Total Long-Term Sales Income Earnings Earnings Dividends Assets Obligations
2009 (c) $ 1,524,072 $ 59,796 $ 1.28 $ 1.29 $ 0.68 $ 2,651,537 $ 1,156,0052008 (b) 1,954,679 99,423 2.15 2.15 0.68 2,834,159 1,318,5782007 (a) 1,824,899 94,102 2.08 2.11 0.68 2,821,626 1,355,9052006 811,280 48,118 1.46 1.48 0.67 523,982 97,0252005 721,569 43,021 1.28 1.30 0.62 507,205 70,0252004 648,195 35,052 1.05 1.06 0.57 501,560 104,0252003 561,391 24,779 0.74 0.75 0.53 476,955 79,4652002 549,507 23,895 0.69 0.70 0.52 472,761 105,285
2001 557,459 22,385 0.65 0.66 0.52 457,527 98,6732000 621,242 46,263 1.34 1.36 0.50 464,978 99,8321999 585,551 43,723 1.19 1.21 0.45 423,941 56,305
(a) Includes Reliance assets acquired and liabilities assumed at January 31, 2007, and results of operations beginning February 1, 2007.(b) Includes Maska assets acquired and liabilities assumed at August 29, 2008, and results of operations beginning August 30, 2008.(c) Net income and EPS includes $21.6 million gain, after tax, on debt modification and long-term obligations include $42.2 million related to
the noncash debt discount. The discount is being amortized over the remaining life of the debt. See Note G, Long-term obligations, of the Long-term obligations, of the Long-term obligationsNotes to the Consolidated Financial Statements.
Eleven-Year Summary of Financial Data
Earnings Per Share(Diluted)
Dividends Per Share
Operating ProfitNet Sales(In thousands)
11
Forward-looking Statements
This annual report, the documents incorporated by reference into this annual report, and other written reports and oral statements made time to time by Baldor and its representatives may contain statements that are forward-looking. The forward-looking statements (generally identified by words or phrases indicating a projection or future expectation such as “assume”, “believe”, “can”, “continue”, “could”, “depend”, “estimate”, “expect”, “forecast”, “future”, “if”, “intend”, “may”, “ongoing”, “pending”, “probable”, “projected”, “should”, “subject to”, “will”, “would”, or any grammatical forms of these words or other similar words) are based on our current expectations and are subject to risks and uncertainties. Accordingly, you are cautioned that any such forward-looking statements are not guarantees of future performance and involve risks and uncertainties, and that actual results may differ materially from those projected in the forward-looking statements as a result of various factors, including those more fully described in “Risk Factors”. Baldor is under no duty or obligation to update any of the forward-looking statements after the date of this annual report.
OverviewWe are a leading marketer, designer, and manufacturer of industrial electric motors, drives, generators, and other mechanical power transmission products, currently supplying over 10,000 customers in more than 200 industries. Our products are sold to a diverse customer base consisting of original equipment manufacturers (“OEM’s”) and distributors, serving markets in the United States and throughout the world. OEM’s primarily use our products in new installations which expands our installed base and leads to future replacement product sales. Overall our domestic sales are generated equally between OEM’s and distributors. Approximately 59% of our industrial motor products and approximately 24% of our mechanical power transmission products are sold directly to OEM’s with the remainder being sold to distributors.
Generally, our financial performance is driven by industrial spending and the strength of the economies in which we sell our products, and is also influenced by:
Investments in manufacturing capacity, including •upgrades, modifications, and expansions of existing manufacturing facilities, and the creation of new manufacturing facilities;
Capacity utilization;•
Our customers’ needs for greater variety, timely •delivery, and higher quality at a competitive cost; and
Our large installed base, which creates a significant •replacement demand.
Demand for our products is closely tied to growth trends in the economy and levels of industrial activity and capital investment. Specific drivers of demand for our products include process automation, efforts in energy conservation
and productivity improvement, regulatory and safety requirements, new technologies and replacement of worn parts. Our products are typically critical parts of customers’ end-applications, and the end user’s cost associated with their failure is high. Consequently, we believe that end users of our products base their purchasing decisions on quality, reliability, efficiency and availability as well as customer service. We believe key success factors in our industry include strong reputation and brand preference, good customer service and technical support, product availability, and a strong distribution network.
Business conditions were challenging in 2009 as a result of the broad-based impact of the global economic recession. For the year ended January 2, 2010, our sales decreased 22.0%, operating profit decreased 27.1%, and diluted EPS decreased 40.5%. Sales to our domestic distributor customers decreased 21.1% as distributors aggressively reduced inventories during 2009. This destocking process substantially ended during the third quarter and incoming order rates from our distributors improved through the fourth quarter. Sales to our domestic OEM customers declined 23.2% as a result of overall declines in capital spending.
During 2009, we implemented a number of sales strategies aimed at enhancing our sales organization and gaining new customers during the economic downturn, including a bounty hunt commission strategy targeted at obtaining specifically identified new customers. Through the bounty hunt initiative, we gained over 400 new customers. As these customers’ businesses recover, we will realize additional benefits of our strategy.
Sales of our Super-E premium-efficient motor products continued to grow during 2009 ahead of the December 2010 effective date of the 2007 Energy Independence and Security Act (“EISA”). While these motors sell at a 20% to 30% price premium over standard-efficiency motors, partly because they cost more to produce, they consume less energy and result in overall decreased total cost of ownership to our customers. Once EISA takes effect in 2011, we expect premium-efficient motors to comprise approximately 50% of our total motor sales.
During the fourth quarter of 2008, we proactively began implementing cost reduction initiatives across the Company, and began accelerating integration projects related to our recent acquisitions. As a result of these initiatives, we achieved more than $92 million of cost reductions for fiscal year 2009. We expect these cost reductions to amount to approximately $115 million on an annual basis beginning in 2010. During 2009, we consolidated two of our manufacturing facilities into other existing facilities in the United States at a one-time cost of $5.0 million. These consolidations will provide annual cost savings of approximately $9.0 million. Our proactive cost reduction actions combined with continued productivity improvements resulted in sequentially improving operating margins each quarter of 2009 when compared to fourth quarter 2008 in spite of declining revenues. In addition, third and fourth
Management’s Discussion and Analysis of Financial Condition and Results of Operations

10
(In thousands, except per share data) Per Common Share Data
Diluted Basic Net Net Net Net Total Long-Term Sales Income Earnings Earnings Dividends Assets Obligations
2009 (c) $ 1,524,072 $ 59,796 $ 1.28 $ 1.29 $ 0.68 $ 2,651,537 $ 1,156,005 2008 (b) 1,954,679 99,423 2.15 2.15 0.68 2,834,159 1,318,578 2007 (a) 1,824,899 94,102 2.08 2.11 0.68 2,821,626 1,355,905 2006 811,280 48,118 1.46 1.48 0.67 523,982 97,025 2005 721,569 43,021 1.28 1.30 0.62 507,205 70,025 2004 648,195 35,052 1.05 1.06 0.57 501,560 104,025 2003 561,391 24,779 0.74 0.75 0.53 476,955 79,465 2002 549,507 23,895 0.69 0.70 0.52 472,761 105,285 2001 557,459 22,385 0.65 0.66 0.52 457,527 98,673 2000 621,242 46,263 1.34 1.36 0.50 464,978 99,832 1999 585,551 43,723 1.19 1.21 0.45 423,941 56,305
(a) Includes Reliance assets acquired and liabilities assumed at January 31, 2007, and results of operations beginning February 1, 2007. (b) Includes Maska assets acquired and liabilities assumed at August 29, 2008, and results of operations beginning August 30, 2008. (c) Net income and EPS includes $21.6 million gain, after tax, on debt modification and long-term obligations include $42.2 million related to
the noncash debt discount. The discount is being amortized over the remaining life of the debt. See Note G, Long-term obligations, of the Notes to the Consolidated Financial Statements.
Eleven-Year Summary of Financial Data
Earnings Per Share(Diluted)
Dividends Per Share
Operating ProfitNet Sales (In thousands)
11
Forward-looking Statements
This annual report, the documents incorporated by reference into this annual report, and other written reports and oral statements made time to time by Baldor and its representatives may contain statements that are forward-looking. The forward-looking statements (generally identified by words or phrases indicating a projection or future expectation such as “assume”, “believe”, “can”, “continue”, “could”, “depend”, “estimate”, “expect”, “forecast”, “future”, “if”, “intend”, “may”, “ongoing”, “pending”, “probable”, “projected”, “should”, “subject to”, “will”, “would”, or any grammatical forms of these words or other similar words) are based on our current expectations and are subject to risks and uncertainties. Accordingly, you are cautioned that any such forward-looking statements are not guarantees of future performance and involve risks and uncertainties, and that actual results may differ materially from those projected in the forward-looking statements as a result of various factors, including those more fully described in “Risk Factors”. Baldor is under no duty or obligation to update any of the forward-looking statements after the date of this annual report.
OverviewWe are a leading marketer, designer, and manufacturer of industrial electric motors, drives, generators, and other mechanical power transmission products, currently supplying over 10,000 customers in more than 200 industries. Our products are sold to a diverse customer base consisting of original equipment manufacturers (“OEM’s”) and distributors, serving markets in the United States and throughout the world. OEM’s primarily use our products in new installations which expands our installed base and leads to future replacement product sales. Overall our domestic sales are generated equally between OEM’s and distributors. Approximately 59% of our industrial motor products and approximately 24% of our mechanical power transmission products are sold directly to OEM’s with the remainder being sold to distributors.
Generally, our financial performance is driven by industrial spending and the strength of the economies in which we sell our products, and is also influenced by:
Investments in manufacturing capacity, including •upgrades, modifications, and expansions of existing manufacturing facilities, and the creation of new manufacturing facilities;
Capacity utilization;•
Our customers’ needs for greater variety, timely •delivery, and higher quality at a competitive cost; and
Our large installed base, which creates a significant •replacement demand.
Demand for our products is closely tied to growth trends in the economy and levels of industrial activity and capital investment. Specific drivers of demand for our products include process automation, efforts in energy conservation
and productivity improvement, regulatory and safety requirements, new technologies and replacement of worn parts. Our products are typically critical parts of customers’ end-applications, and the end user’s cost associated with their failure is high. Consequently, we believe that end users of our products base their purchasing decisions on quality, reliability, efficiency and availability as well as customer service. We believe key success factors in our industry include strong reputation and brand preference, good customer service and technical support, product availability, and a strong distribution network.
Business conditions were challenging in 2009 as a result of the broad-based impact of the global economic recession. For the year ended January 2, 2010, our sales decreased 22.0%, operating profit decreased 27.1%, and diluted EPS decreased 40.5%. Sales to our domestic distributor customers decreased 21.1% as distributors aggressively reduced inventories during 2009. This destocking process substantially ended during the third quarter and incoming order rates from our distributors improved through the fourth quarter. Sales to our domestic OEM customers declined 23.2% as a result of overall declines in capital spending.
During 2009, we implemented a number of sales strategies aimed at enhancing our sales organization and gaining new customers during the economic downturn, including a bounty hunt commission strategy targeted at obtaining specifically identified new customers. Through the bounty hunt initiative, we gained over 400 new customers. As these customers’ businesses recover, we will realize additional benefits of our strategy.
Sales of our Super-E premium-efficient motor products continued to grow during 2009 ahead of the December 2010 effective date of the 2007 Energy Independence and Security Act (“EISA”). While these motors sell at a 20% to 30% price premium over standard-efficiency motors, partly because they cost more to produce, they consume less energy and result in overall decreased total cost of ownership to our customers. Once EISA takes effect in 2011, we expect premium-efficient motors to comprise approximately 50% of our total motor sales.
During the fourth quarter of 2008, we proactively began implementing cost reduction initiatives across the Company, and began accelerating integration projects related to our recent acquisitions. As a result of these initiatives, we achieved more than $92 million of cost reductions for fiscal year 2009. We expect these cost reductions to amount to approximately $115 million on an annual basis beginning in 2010. During 2009, we consolidated two of our manufacturing facilities into other existing facilities in the United States at a one-time cost of $5.0 million. These consolidations will provide annual cost savings of approximately $9.0 million. Our proactive cost reduction actions combined with continued productivity improvements resulted in sequentially improving operating margins each quarter of 2009 when compared to fourth quarter 2008 in spite of declining revenues. In addition, third and fourth
Management’s Discussion and Analysis of Financial Condition and Results of Operations

12
quarter 2009 operating margins each improved when compared to the same periods of 2008.
Results of Operations2009 compared to 2008For fiscal year 2009, we reported diluted EPS of $1.28, down 40.5% from $2.15 per diluted share in 2008. Average diluted shares outstanding was 46.8 million for 2009 compared to 46.3 million for 2008. Net income was $59.8 million for fiscal year 2009, down 39.9% from $99.4 million in 2008.
Net sales for the year decreased 22.0% to $1.52 billion compared to $1.95 billion in 2008. Sales of industrial electric motor products decreased 23.5% from 2008 and comprised 64.1% of total sales for the year compared to 65.3% for the same period last year. While overall motor product sales decreased, sales of Super-E premium-efficient motors grew 4.0% for the year and increased to 14.1% of total motor sales in 2009 compared to 10.4% in 2008. Sales of mounted bearings, gearing, and other mechanical power transmission products decreased 20.4% from 2008 and comprised 29.2% of total sales in 2009 compared to 28.6% in 2008. Our mechanical power transmission product sales are heavily weighted toward distributor customers. Consequently, inventory destocking had a significant impact on sales of these products in 2009. Sales of other products decreased 14.3% from 2008 and comprised 6.7% of total sales in 2009 compared to 6.1% in 2008. These products outperformed motors and mechanical power transmission products primarily due to growth in our generator product sales which increased 15.5% for the year. During 2009, we made organizational changes in our generator group and continued to integrate those products into our distribution network. As a result, we continue to gain new customers and expand our presence in the generator marketplace.
Gross margin was 29.0% for the year as compared to 29.6% in 2008. As a result of continued product design improvements, reduction of waste, and price improvement in certain commodities, our materials cost as a percentage of sales improved during 2009 when compared to 2008. Manufacturing costs as a percentage of sales increased in 2009 as a result of decreased sales. Our cost reduction efforts helped to partially offset the margin impact of decreased sales and production levels.
Operating margin decreased to 11.9% for the year from 12.7% in 2008. Selling and administrative expenses decreased by $64.7 million in 2009, but increased 0.5% as a percentage of sales. We realized significant cost reductions during 2009 which substantially offset the margin impact of declining sales.
Interest expense increased $4.6 million from 2008. While we benefitted from reducing our outstanding debt balance, interest rates on our variable rate debt increased as a result of the March 31, 2009 amendment of our senior secured credit facility.
Pre-tax income for 2009 decreased 33.6% from 2008. Pre-tax income for 2009 included a $35.7 million noncash gain and $7.5 million noncash debt discount amortization related to the modification of our senior secured credit
facility completed March 31, 2009. The total discount of approximately $49.7 million is being amortized over the remaining term of the credit facility which matures January 31, 2014.
Our effective income tax rate was 40.9% in 2009 compared to 34.7% in 2008. Our 2009 effective income tax rate was primarily impacted by a cash dividend from a foreign subsidiary, which was utilized to repay debt and resulted in a 3.0% increase in the effective income tax rate, and an increase in the valuation allowance for certain net operating loss carry forwards of foreign subsidiaries which resulted in a 1.9% increase in the effective tax rate.
2008 compared to 2007For fiscal year 2008, we reported diluted EPS of $2.15, up 3.4% from $2.08 per diluted share in 2007. Average diluted shares outstanding was 46.3 million for 2008 compared to 45.2 million for 2007. Net income was $99.4 million for fiscal year 2008, up 5.7% from $94.1 million in 2007.
Net sales for 2008 increased 7.1% to $1.95 billion compared to $1.82 billion in 2007. Sales of industrial electric motor products increased 9.6% for 2008 as compared to 2007 and comprised 65.3% of total sales for 2008 compared to 64.2% for 2007. Sales of Super-E premium-efficient motors grew by 25.0% in 2008 and comprised 10.4% of total motor product sales. Sales of mounted bearings, gearing, and other mechanical power transmission products grew 11.1% during 2008 as compared to 2007 and comprised 28.6% of total sales compared to 26.5% in 2007. Sales of mechanical power transmission products in 2008 included $11.7 million from our Maska acquisition completed on August 29, 2008. Sales of other products decreased 6.0% during 2008 as compared to 2007 and comprised 6.1% of total sales compared to 9.3% in 2007.
Gross margin decreased slightly to 29.6% in 2008 as compared to 30.1% in 2007. Raw material costs were substantially higher in 2008 than in 2007. While the increased costs were partially offset by product design improvements and price increases implemented during the year, margins were negatively impacted in 2008.
Operating margin decreased to 12.7% in 2008 from 13.8% in 2007. Selling and administrative expenses increased slightly as a percentage of sales in 2008 primarily due to increased commission expense as we integrated the Reliance motor products into our sales network, and the inclusion of Maska expenses beginning August 30, 2008.
Interest expense decreased $5.7 million from 2007 to 2008 even though there was a full year of interest expense in 2008 related to the debt incurred on January 31, 2007 to fund our acquisition of Reliance, compared to eleven months of interest in 2007. Interest rates on our variable rate debt decreased in 2008 and we reduced our outstanding debt balance by a net amount of $49.4 million during the year.
Our effective income tax rate was 34.7% in 2008 compared to 36.1% in 2007. The change was primarily related to increased earnings generated outside the United States and the domestic production activities deduction.
13
Our Expectations for 2010While 2009 was a very difficult year, we believe we made many decisions during the year that will benefit us in the long-term. During 2009, we achieved cost reductions that will amount to approximately $115.0 million in 2010, while continuing to invest in new products, new customers, and productivity improvements and retaining our talented and experienced workforce. We expect to maintain these cost reductions as business improves in 2010 and we believe the long-term focus of our decisions during the recession has positioned us to take advantage of opportunities as the economy recovers. Our current outlook is for a slight sales increase along with improved earnings in 2010. See “Forward-looking statements” concerning important factors that could impact actual results.
Environmental RemediationWe believe, based on our internal reviews and other factors, that any future costs relating to environmental remediation and compliance will not have a material effect on our capital expenditures, earnings, cash flows, or competitive position.
Liquidity and Capital Resources: Our primary sources of liquidity are cash flows from operations and funds available under our senior secured revolving credit facility. We expect that short-term and long-term funding requirements will continue to be met by these sources. At January 2, 2010, we had no outstanding borrowings under the revolving credit facility. We have approximately $180.2 million of borrowing capacity under the senior secured revolving credit facility which matures in 2012. The recent financial market conditions have not affected our ability to borrow from our revolving credit facility.
Cash flows from operations amounted to $205.7 million in 2009, $99.1 million in 2008, and $163.0 million in 2007. During 2009, our reductions in inventories, in response to declining business levels, contributed approximately $68.4 million to operating cash flows. While we aggressively reduced our inventory levels in 2009, we continue to maintain adequate inventories to serve our existing customers as well as new business. In addition to reduced inventories we had reductions in accounts receivables, and accounts payables and accrued expenses, relative to the decline in sales. These normal fluctuations contributed a net of $19.0 million to operating cash flows in 2009. Finally during 2009, we recovered $19.1 million of margin deposits on our commodity hedges that were funded during the fourth quarter of 2008.
Net cash used in investing activities was $42.3 million in 2009, $59.4 million in 2008, and $1,742.9 million in 2007. Investing activities in 2009 were primarily related to property, plant and equipment additions. Investing activities in 2008 included $23.3 million proceeds from a real estate transaction and $41.3 million (net of cash acquired) used to acquire Maska. Investing activities in 2007 included $1.8 billion (net of cash acquired) used to acquire Reliance. The Reliance acquisition was funded with proceeds from the issuance of Baldor common stock and borrowings under our senior secured credit facility and senior unsecured notes. In addition, 2007 included proceeds of $49.9 million from the divestiture of certain U.S. service centers.
Net cash used in financing activities of $161.3 million in 2009 included dividends paid to shareholders of $31.6 million, amendment fees of $7.3 million related to the March 31, 2009 amendment of our senior secured credit facility, and net debt payments of $121.8 million. Net cash used in financing activities of $64.4 million in 2008 included dividends paid to shareholders of $31.4 million and net debt reductions of $52.0 million. During 2008, we made principal payments of approximately $112.0 million on our term loan and notes payable and we had borrowings on our revolving credit facility of approximately $40.0 million and $19.1 million to fund the acquisition of Maska and margin deposits on our commodity hedges, respectively. Net cash provided by financing activities of $1.6 billion in 2007 included dividends paid to shareholders of $31.2 million, proceeds of $1.6 billion from new debt incurred and equity issued in the acquisition of Reliance (net of repayments and issuance costs).
We have a corporate family credit rating of BB- and senior secured debt rating of Ba3 with a stable outlook by Moody’s Investors Services, Inc. (“Moody’s”). We have a long-term issuer credit rating of B1 and senior secured debt rating of BB+ with a stable outlook by Standard & Poor’s Rating Service (“S&P”). We have senior unsecured debt ratings of B3 by Moody’s and B by S&P. Both ratings agencies recently affirmed our ratings, and Moody’s upgraded our liquidity rating from SGL-3 to SGL-2 following the successful amendment of our credit agreement on March 31, 2009. Our senior secured credit facility has a downward rating trigger that increases the margin paid on variable rate borrowings from 3.25% to 3.50% for any period during which our Moody’s corporate family rating is below BB- or our S&P long-term issuer rating is below B1. We have no downward rating triggers that would accelerate the maturity of amounts drawn under our senior secured credit facility. Also, we have no downward rating triggers under our senior unsecured notes.
Our senior secured credit facility and senior unsecured notes contain various customary covenants, which limit, among other things, indebtedness and dispositions of assets, and which require us to maintain compliance with certain quarterly financial ratios. The primary financial ratios in our credit agreement are total leverage (total debt/EBITDA, as defined) and senior secured leverage (senior secured debt/EBITDA, as defined). We have maintained compliance with all covenants and were in compliance at January 2, 2010. Our total leverage ratio and senior secured leverage ratios were 3.93x and 2.14x, respectively, at January 2, 2010. These were within our maximum covenant requirements of 5.25x and 2.75x, respectively. Our maximum covenant requirements step down to 5.00x and 2.50x, respectively at December 31, 2010. We expect to remain in compliance with these covenants in 2010.
On March 31, 2009, we amended our senior secured credit facility. The amendment relaxed our total leverage and senior secured leverage ratio requirements to help ensure we maintain sufficient headroom under our covenants during the economic recession. In conjunction with the amendment, the margin applied to LIBOR on our variable term loan and revolver borrowings was increased to 3.25%, and a LIBOR floor of 2.00% was implemented.

14
The amendment of the senior secured term loan was considered a substantial modification of the debt. As a result, the senior secured term loan was recorded at fair value as of the modification date which resulted in a noncash debt discount of $49.7 million being recorded in long-term obligations on the consolidated balance sheet and a $35.7 million gain on debt modification included in income from continuing operations in the consolidated statement of income. Fees paid related to the amendment of $5.7 million along with unamortized fees related to the original agreement of $8.3 million were considered when calculating the gain. The discount is being amortized to other expense over the remaining term of the debt. Amortization amounted to $7.5 million during 2009.
The amendment did not change the borrowing capacity of the revolving credit facility; therefore, fees of $1.6 million related to the amendment were deferred and are being amortized over the remaining term of the facility agreement along with unamortized fees of $1.1 million related to the original agreement.
The table below summarizes our contractual obligations as of January 2, 2010.
(In thousands) Payments due by years
2015 and Total 2010 2011-2012 2013-2014 ThereafterContractual Obligations: Long-term debt obligations (a) $ 1,740,602 $ 104,754 $ 207,854 $ 759,295 $ 668,699 Operating lease obligations 71,492 14,191 22,692 12,964 21,645
Other Commercial Commitments: Letters of Credit 19,772 19,772 — — —
(a) Includes interest on both fixed and variable rate obligations. Interest associated with variable rate obligations is based upon interest rates in effect at January 2, 2010. The contractual amounts to be paid on variable rate obligations are affected by changes in market interest rates. Future changes in market interest rates could materially affect the contractual amounts to be paid.
Dividend Policy: Dividends paid to shareholders amounted to $0.68 per common share in 2009, 2008, and 2007. Our objective is for shareholders to receive dividends while also participating in Baldor’s growth. The terms of our credit agreement and indenture limit our ability to increase dividends in the future.
Market Risk: Market risks relating to our operations result primarily from changes in commodity prices, interest rates, concentrations of credit, and foreign exchange rates. To help maintain stable pricing for customers, we enter into various commodity hedging transactions. To manage interest rate risk on variable rate outstanding debt, we enter into various interest rate hedging transactions.
We purchase copper and aluminum, and periodically utilize commodity futures contracts for hedging purposes to reduce the effects of changing prices in these commodities. Generally, contract terms of a hedge instrument closely mirror those of the hedged item providing a high degree of risk reduction and correlation. We had derivative contracts designated as commodity cash flow hedges with a fair value of $17.4 million recorded in other current assets at January 2, 2010. A hypothetical 10% change in the fair value of open positions would not have a material effect on our results of operations.
Our interest rate risk is primarily related to our senior secured credit facility which bears interest at variable rates. Additionally, our long-term obligations include senior unsecured notes totaling $550.0 million which bear interest at a fixed rate of 8.625%. We utilize various interest rate hedge instruments to manage future exposure to interest rate risk on a portion of the variable rate obligations. Effective March 31, 2009, we amended our senior secured credit agreement. In conjunction with the amendment, a LIBOR floor was added to the variable rate borrowings. As a result, we determined that our existing interest rate instruments were no longer expected to be highly effective and were discontinued as cash flow hedges. Details regarding the instruments as of January 2, 2010, are as follows:
Notional RateInstrument Amount Maturity Paid Rate Received (1) Fair Value (2)
Swap $ 250.0 million April 30, 2012 5.12% LIBOR $ (16.6) millionCollar $ 100.0 million April 30, 2012 LIBOR LIBOR; Floor 4.29%; Cap 6.50% $ (5.4) million
(1) LIBOR is determined each reset date based on London and New York business days. (2) Fair value is an estimated amount that the Company would have paid at January 2, 2010, to terminate the agreement.
15
Our financial instruments that are exposed to concentrations of credit risk consist primarily of cash equivalents and trade receivables. Cash equivalents are in high quality securities placed with major banks and financial institutions. Concentrations of credit risk with respect to receivables is limited due to our large number of customers and their dispersion across geographic areas and industries. We perform periodic credit evaluations of customers’ financial conditions and generally do not require collateral. No single customer represents more than 10% of net accounts receivable or sales for any period presented in this report. We have not experienced an increase in customer bad debts as a result of market conditions.
Foreign affiliates comprise approximately 12% of our consolidated net sales and generally conduct business in their respective local currencies. As a result, our exposure to foreign currency risk is not significant. We continue to monitor the effects of foreign currency exchange rates and will utilize foreign currency hedges where appropriate.
Critical Accounting EstimatesOur consolidated financial statements are prepared in accordance with accounting principles generally accepted in the United States (“GAAP”), which requires us to make estimates and assumptions that affect the reported amounts of assets, liabilities, revenues, expenses and the related disclosures during the periods reported. We base our assumptions, estimates and judgments on historical experience, current trends and other factors management believes to be relevant at the time our consolidated financial statements are prepared. On a regular basis, we review the accounting policies, assumptions, estimates and judgments to ensure that our financial statements are presented fairly and in accordance with GAAP. However, because future events and their effects cannot be determined with certainty, actual results could differ from our assumptions and estimates, and such differences could be material.
Our significant accounting policies are discussed in Note A, Significant Accounting Policies, of the Notes to Consolidated Financial Statements. We believe that the following accounting estimates are the most critical to aid in fully understanding and evaluating our reported financial results, and they require our most subjective or complex judgments, resulting from the need to make estimates about the effect of matters that are inherently uncertain.
Allowance for Doubtful Accounts: We record allowances for doubtful accounts based on customer-specific analysis, current assessments of past due balances and economic conditions, and historical experience. We have not made any material changes in the accounting methodology used to establish our allowance for doubtful accounts and do not believe there is a reasonable likelihood that there will be a material change in the assumptions used to determine the allowance. However, additional allowances for doubtful accounts may be required if there is deterioration in past due balances, if economic conditions are less favorable than anticipated, or for customer-specific circumstances, such as financial difficulty.
Inventories: We value inventories at the lower of cost or market with cost being determined principally by the last-
in, first-out (LIFO) method, except for non-U.S. inventories, which are determined by the first-in, first-out (FIFO) method. The valuation of LIFO inventories is made at the end of each year based on inventory levels and costs at that time. The net realizable value of inventory is reviewed on an on-going basis with consideration given to deterioration, obsolescence, and other factors. We have not made any material changes in the accounting methodology used to value our inventories and do not believe there is a reasonable likelihood that there will be a material change in the future estimates or assumptions used to determine inventory values in the future. However, if actual conditions differ from those estimated by management, adjustments to inventory values may be required.
Self-Insurance Liabilities: We are self-insured for certain losses related to health, workers’ compensation and general and product liability claims. However, we obtain third-party insurance coverage to limit our exposure to these claims. When estimating our self-insured liabilities, we consider a number of factors, including historical claims experience, demographic factors, and valuations provided by independent third-party actuaries. Periodically, we review our assumptions and the valuations provided by independent third-party actuaries to determine the adequacy of our self-insured liabilities. Our self-insured liabilities contain uncertainties because management is required to make assumptions and to apply judgment to estimate the ultimate cost to settle reported claims and claims incurred but not reported at each balance sheet date. We have not made any material changes in the accounting methodology used to establish our self-insured liabilities and do not believe there is a reasonable likelihood that there will be a material change in assumptions used to calculate these liabilities. However, if actual results are not consistent with our estimates or assumptions, adjustments to the reserves could be required that could be material.
Acquisitions – Purchase Price Allocation: We account for acquired businesses using the purchase method of accounting, which requires that the assets acquired and liabilities assumed be recorded at the date of acquisition at their respective fair values. Any excess of the purchase price over the estimated fair values of the net assets acquired is recorded as goodwill. The judgments made in determining the estimated fair value assigned to each class of assets acquired and liabilities assumed, as well as asset lives, can materially impact our results of operations. Accordingly, for significant items, we typically obtain assistance from third party valuation specialists. The valuations are based on information available near the acquisition date and are based on expectations and assumptions that have been deemed reasonable by management.
There are multiple methods that can be used to determine the fair value of assets acquired and liabilities assumed. For intangible assets, we typically use relief from royalty, income and market approach methodologies. These methodologies start with a forecast of expected future net cash flow, which are then adjusted to present value by applying an appropriate discount rate that reflects the risk factors associated with the cash flow streams. Some of the more significant estimates and assumptions inherent in the income method or other

16
Financial Statements for a discussion of impairment testing and sensitivity analyses performed in 2009.
Share-Based Compensation: We have share-based compensation plans which include stock options and non-vested stock units. See Note A, Significant Accounting Policies, and Note K, Stock Plans, of the Notes to Consolidated Financial Statements for a discussion of our share-based compensation programs.
We determine the fair value of our stock option awards at the date of grant using a Black-Scholes option-pricing model. Option-pricing models require management to make assumptions and to apply judgment to determine the fair value of our awards. These assumptions and judgments include estimating the future volatility of our stock price, expected dividend yield, future employee turnover rates and future employee stock option exercise behaviors. Changes in these assumptions can materially affect the fair value estimate.
We amortize the fair value of restricted stock unit awards, which is based on the closing market price on the date of grant, to compensation expense generally on a straight-line basis over the vesting period, taking into consideration an estimate of shares expected to vest.
We do not believe there is a reasonable likelihood there will be a material change in the future estimates of assumptions used to determine share-based compensation expense. However, if actual results are not consistent with our estimates or assumptions, we may be exposed to changes in share-based compensation expense that could be material.
Fair Value Measurements: In measuring the fair value of our commodity derivative instruments designated as cash flow hedges, we obtain quoted market prices from a third party broker at each measurement date for a majority of the instruments. These quoted market prices are for identical assets/liabilities traded in an active market. For the remaining portion of the instruments, we obtain valuations from a third party broker that are based on inputs readily observable.
In measuring the fair value of our interest rate derivatives, we obtain valuations from a third party broker at each measurement date. These valuations are derived from inputs readily observable (e.g. interest rates, yield curves and volatilities) and can be matched to the terms of our derivatives.
We have not made any material changes in the accounting methodology used to estimate the fair value of our derivative instruments and do not believe there is a reasonable likelihood there will be a material change in future estimates or assumptions. However, the use of different assumptions in deriving these fair values could have a material impact on the estimated fair values recorded in our financial statements.
Recently Issued Accounting PronouncementsSee Note Q, Recently Issued Accounting Pronouncements, of the Notes to Consolidated Financial Statements for recently issued accounting pronouncements.
methods include the amount and timing of projected future cash flows; the discount rate selected to measure the risks inherent in the future cash flows; and the assessment of the asset’s life cycle and the competitive trends impacting the asset including consideration of any technical, legal, regulatory, or economic barriers to entry. Determining the useful life of an intangible asset also requires judgment as different types of intangible assets will have different useful lives and certain assets may even be considered to have indefinite useful lives. We do not believe there is a reasonable likelihood that there will be a material change in the future estimates or assumptions used to complete the purchase price allocation and estimate the fair value of acquired assets and liabilities.
Goodwill and Indefinite-Lived Intangibles: At January 2, 2010, goodwill and indefinite-lived intangibles amounted to $1.0 billion and $354.8 million, respectively. We evaluate goodwill and other intangible assets for impairment annually. However, we could be required to evaluate the recoverability of goodwill and other intangible assets prior to the required annual assessment if we experience disruptions to the business, unexpected significant declines in operating results, divestiture of a significant component of the business or a sustained decline in market capitalization. Our impairment evaluation is completed by performing an internal valuation analysis, considering other publicly available market information and utilizing the assistance of an independent valuation firm.
We determine fair value from a highest and best use perspective, using widely accepted valuation techniques including discounted cash flows and market participant analyses. See Note A, Significant Accounting Policies, of the Notes to Consolidated Financial Statements for a discussion of methodologies applied. These types of analyses contain uncertainties because they require management to make assumptions and to apply judgment to estimate industry economic factors and future revenues and profitability. We conduct impairment testing based on our current business strategy in light of present industry and economic conditions, as well as our future expectations. No material changes have been made in the accounting methodology used to perform impairment testing and we do not believe there is a reasonable likelihood that there will be a material change in the future, of the estimates or assumptions used to test for impairment of goodwill and other intangible assets. However, if actual results are not consistent with our estimates or assumptions, we may incur an impairment charge that could be material.
During the fourth quarter of 2009, we completed our annual impairment testing of goodwill and other indefinite-lived intangible assets using the methodology described above, and determined there was no impairment. We believe it is unlikely that we are at risk of failing step one of the annual goodwill impairment test at the reporting unit level. However, the fair value of one of our indefinite-lived intangibles exceeded the carrying value of $225.9 million by only 3.1%. Should business conditions not improve in the near future, it is reasonably possible that this indefinite-lived intangible could be partially impaired. See Note A, Significant Accounting Policies, of the Notes to Consolidated
17
Baldor Electric CompanyConsolidated Balance Sheets
(In thousands, except share amounts) January 2, January 3,ASSETS 2010 2009 Current Assets: Cash and cash equivalents $ 15,270 $ 13,098 Accounts receivable, less allowance for doubtful accounts of $4,023 at January 2, 2010 and $4,247 at January 3, 2009 229,174 275,789 Inventories: Finished products 163,861 190,077 Work-in-process 44,176 56,716 Raw materials 126,598 164,574 334,635 411,367 LIFO valuation adjustment (58,071) (66,447) 276,564 344,920 Prepaid expenses 3,150 4,619 Other current assets 79,076 78,727 Total Current Assets 603,234 717,153Property, Plant Land and improvements 16,483 17,070and Equipment: Buildings and improvements 121,643 139,277 Machinery and equipment 618,501 603,913 Allowances for depreciation and amortization (393,662) (359,914) Net Property, Plant and Equipment 362,965 400,346Other Assets: Goodwill 1,032,733 1,033,575 Intangible assets, net of amortization 637,070 653,271 Other 15,535 29,814 Total Assets $ 2,651,537 $ 2,834,159
LIABILITIES AND SHAREHOLDERS’ EQUITY Current Liabilities: Accounts payable $ 61,776 $ 98,046 Accrued employee compensation 7,436 11,165 Accrued profit sharing 7,815 16,554 Accrued warranty costs 9,330 9,477 Accrued insurance obligations 9,635 10,667 Accrued interest expense 27,782 22,830 Other accrued expenses 55,090 110,006 Dividends payable 7,924 7,863 Note payable — 735 Current maturities of long-term obligations 7,108 7,609 Total Current Liabilities 193,896 294,952Long-Term Obligations 1,156,005 1,318,578Other Liabilities 69,581 72,731Deferred Income Taxes 308,212 308,371Commitments and Contingencies Shareholders’ Equity: Preferred stock, $0.10 par value January 2, January 3, Authorized shares: 5,000,000 2010 2009 Issued and outstanding shares: None Common stock, $0.10 par value Authorized shares: 150,000,000 Issued shares: 55,538,933 55,388,068 5,554 5,538 Outstanding shares: 46,612,596 46,253,575 Additional paid-in capital 551,830 546,313 Retained earnings 562,497 534,330 Accumulated other comprehensive loss (7,209) (53,721) Treasury stock, at cost: 8,926,337 9,134,493 (188,829) (192,933) Total Shareholders’ Equity 923,843 839,527 Total Liabilities and Shareholders’ Equity $ 2,651,537 $ 2,834,159
See notes to consolidated financial statements.
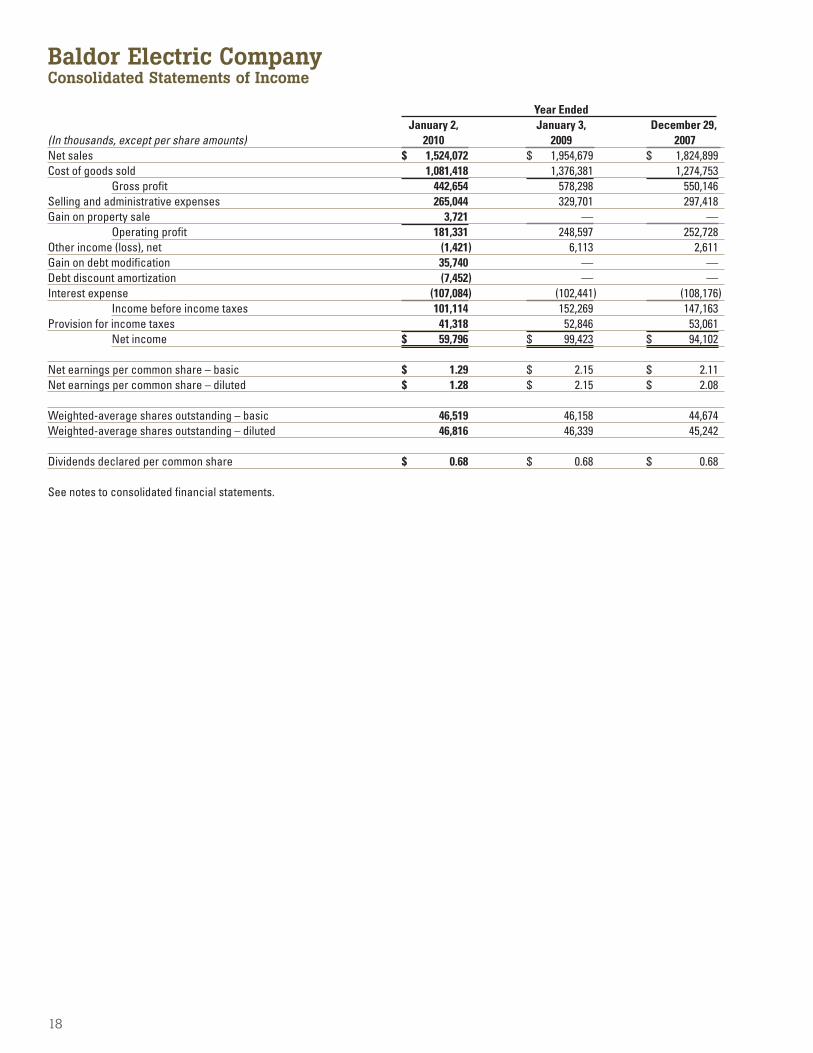
18
Baldor Electric CompanyConsolidated Statements of Income Year Ended January 2, January 3, December 29 ,(In thousands, except per share amounts) 2010 2009 2007 Net sales $ 1,524,072 $ 1,954,679 $ 1,824,899Cost of goods sold 1,081,418 1,376,381 1,274,753
Gross profit 442,654 578,298 550,146Selling and administrative expenses 265,044 329,701 297,418Gain on property sale 3,721 — — Operating profit 181,331 248,597 252,728Other income (loss), net (1,421) 6,113 2,611Gain on debt modification 35,740 — —Debt discount amortization (7,452) — —Interest expense (107,084) (102,441) (108,176) Income before income taxes 101,114 152,269 147,163Provision for income taxes 41,318 52,846 53,061 Net income $ 59,796 $ 99,423 $ 94,102 Net earnings per common share – basic $ 1.29 $ 2.15 $ 2.11Net earnings per common share – diluted $ 1.28 $ 2.15 $ 2.08 Weighted-average shares outstanding – basic 46,519 46,158 44,674Weighted-average shares outstanding – diluted 46,816 46,339 45,242 Dividends declared per common share $ 0.68 $ 0.68 $ 0.68 See notes to consolidated financial statements.
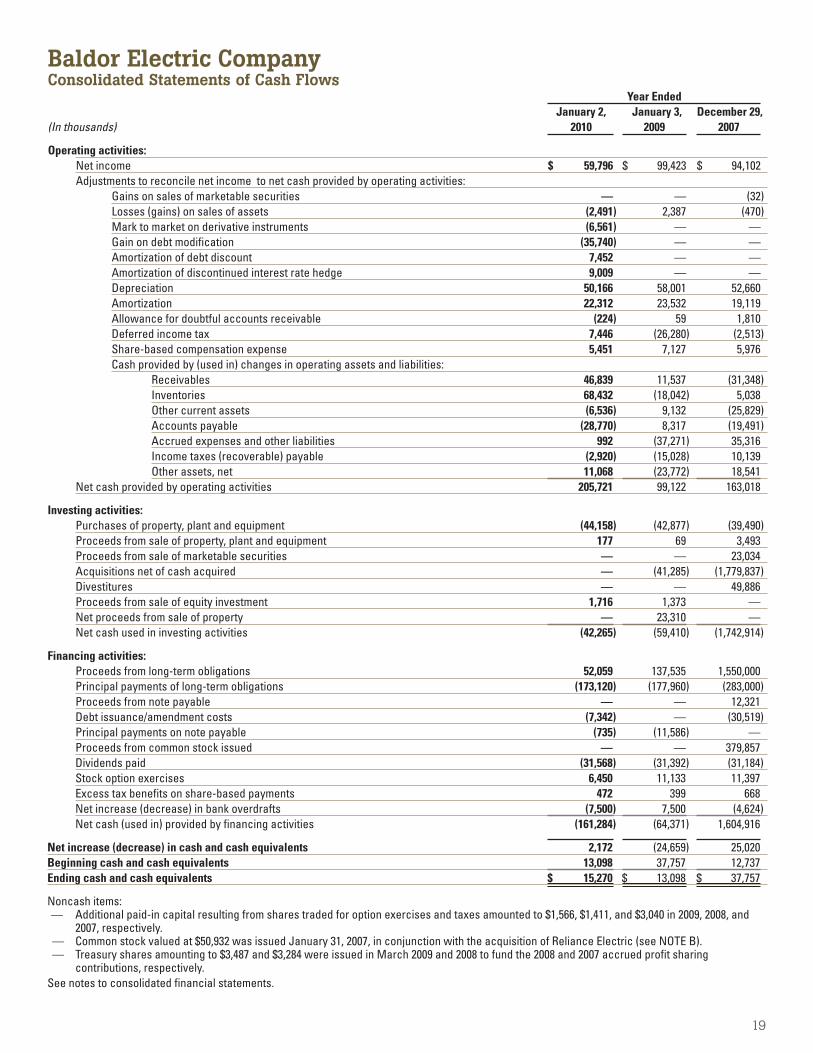
19
Baldor Electric CompanyConsolidated Statements of Cash Flows Year Ended January 2, January 3, December 29,(In thousands) 2010 2009 2007 Operating activities: Net income $ 59,796 $ 99,423 $ 94,102 Adjustments to reconcile net income to net cash provided by operating activities: Gains on sales of marketable securities — — (32) Losses (gains) on sales of assets (2,491) 2,387 (470) Mark to market on derivative instruments (6,561) — — Gain on debt modification (35,740) — — Amortization of debt discount 7,452 — — Amortization of discontinued interest rate hedge 9,009 — — Depreciation 50,166 58,001 52,660 Amortization 22,312 23,532 19,119 Allowance for doubtful accounts receivable (224) 59 1,810 Deferred income tax 7,446 (26,280) (2,513) Share-based compensation expense 5,451 7,127 5,976 Cash provided by (used in) changes in operating assets and liabilities: Receivables 46,839 11,537 (31,348) Inventories 68,432 (18,042) 5,038 Other current assets (6,536) 9,132 (25,829) Accounts payable (28,770) 8,317 (19,491) Accrued expenses and other liabilities 992 (37,271) 35,316 Income taxes (recoverable) payable (2,920) (15,028) 10,139 Other assets, net 11,068 (23,772) 18,541 Net cash provided by operating activities 205,721 99,122 163,018 Investing activities: Purchases of property, plant and equipment (44,158) (42,877) (39,490) Proceeds from sale of property, plant and equipment 177 69 3,493 Proceeds from sale of marketable securities — — 23,034 Acquisitions net of cash acquired — (41,285) (1,779,837) Divestitures — — 49,886 Proceeds from sale of equity investment 1,716 1,373 — Net proceeds from sale of property — 23,310 — Net cash used in investing activities (42,265) (59,410) (1,742,914) Financing activities: Proceeds from long-term obligations 52,059 137,535 1,550,000 Principal payments of long-term obligations (173,120) (177,960) (283,000) Proceeds from note payable — — 12,321 Debt issuance/amendment costs (7,342) — (30,519) Principal payments on note payable (735) (11,586) — Proceeds from common stock issued — — 379,857 Dividends paid (31,568) (31,392) (31,184) Stock option exercises 6,450 11,133 11,397 Excess tax benefits on share-based payments 472 399 668 Net increase (decrease) in bank overdrafts (7,500) 7,500 (4,624) Net cash (used in) provided by financing activities (161,284) (64,371) 1,604,916 Net increase (decrease) in cash and cash equivalents 2,172 (24,659) 25,020Beginning cash and cash equivalents 13,098 37,757 12,737Ending cash and cash equivalents $ 15,270 $ 13,098 $ 37,757 Noncash items:— Additional paid-in capital resulting from shares traded for option exercises and taxes amounted to $1,566, $1,411, and $3,040 in 2009, 2008, and
2007, respectively.— Common stock valued at $50,932 was issued January 31, 2007, in conjunction with the acquisition of Reliance Electric (see NOTE B).— Treasury shares amounting to $3,487 and $3,284 were issued in March 2009 and 2008 to fund the 2008 and 2007 accrued profit sharing contributions, respectively.
See notes to consolidated financial statements.

20
Baldor Electric CompanyConsolidated Statements of Shareholders’ Equity Accumulated Additional Other Treasury Common Stock Paid-in Retained Comprehensive Stock (In thousands except per share amounts) Shares Amount Capital Earnings Income (Loss) (at cost) Total
BALANCE AT DECEMBER 30, 2006 41,475 $ 4,147 $ 88,067 $ 403,381 $ (927) $ (189,839) $ 304,829
Comprehensive income Net income — — — 94,102 — — 94,102 Other comprehensive income (loss): Postretirement plan actuarial loss, net of tax benefit of $859 — — — — (1,471) — (1,471) Translation adjustments — — — — 8,311 — 8,311 Unrealized adjustment on derivatives, net of tax benefits of $3,798 — — — — (5,940) — (5,940) Total other comprehensive loss 900Total comprehensive income 95,002Stock option plans (net of 99 shares exchanged and $1,610 tax benefit) 358 36 15,077 — — (3,780) 11,333Cash dividends at $0.68 per share — — — (31,184) — — (31,184)Acquisition 13,304 1,330 429,459 — — — 430,789
BALANCE AT DECEMBER 29, 2007 55,137 $ 5,513 $ 532,603 $ 466,299 $ (27) $ (193,619) $ 810,769
Comprehensive income Net income — — — 99,423 — — 99,423 Other comprehensive income (loss): Postretirement plan actuarial loss, net of tax benefit of $2,720 — — — — (4,333) — (4,333) Translation adjustments — — — — (20,481) — (20,481) Unrealized adjustment on derivatives, net of tax benefits of $18,886 — — — — (28,880) — (28,880) Total other comprehensive income (53,694)Total comprehensive income 45,729Stock option plans (net of 57 shares exchanged and $961 tax benefit) 251 25 12,918 — — (1,806) 11,137Cash dividends at $0.68 per share — — — (31,392) — — (31,392)Treasury stock issued — — 792 — — 2,492 3,284
BALANCE AT JANUARY 3, 2009 55,388 $ 5,538 $ 546,313 $ 534,330 $ (53,721) $ (192,933) $ 839,527
Comprehensive income Net income — — — 59,796 — — 59,796 Other comprehensive income (loss): Postretirement plan actuarial loss, net of tax benefit of $355 — — — — (850) — (850) Translation adjustments — — — — 12,694 — 12,694 Unrealized adjustment on derivatives, net of tax benefits of $22,665 — — — — 34,668 — 34,668 Total other comprehensive income 46,512Total comprehensive income 106,308Stock option plans (net of 67 shares exchanged and $472 tax benefit) 151 16 7,840 — — (1,706) 6,150Cash dividends at $0.68 per share — — — (31,629) — — (31,629)Treasury stock issued — — (2,323) — — 5,810 3,487
BALANCE AT JANUARY 2, 2010 55,539 $ 5,554 $ 551,830 $ 562,497 $ (7,209) $ (188,829) $ 923,843 See notes to consolidated financial statements.
21
NOTE A Significant Accounting PoliciesLine of Business: The Company operates in one segment that markets, designs and manufactures industrial electric motors, drives, generators, and other mechanical power transmission products, within the power transmission equipment industry. Products are sold throughout the United States and in more than 70 countries.
Use of Estimates: The preparation of financial statements in conformity with accounting principles generally accepted in the United States requires management to make estimates and assumptions that affect the amounts reported in the consolidated financial statements and accompanying notes. Actual results may differ from those estimates.
Consolidation: The consolidated financial statements include the accounts of the Company and its affiliates. Intercompany accounts and transactions have been eliminated in consolidation. The Company does not have any investments in, or contractual arrangements with, any variable interest entities.
Fiscal Year: The Company’s fiscal year ends on the Saturday nearest to December 31, which results in a 52-week or 53-week year. Fiscal year 2009, ending on January 2, 2010, and fiscal year 2007 contained 52 weeks. Fiscal year 2008 contained 53 weeks.
Cash Equivalents: Cash equivalents consist of highly liquid investments having original maturities of three months or less.
Accounts Receivable: Trade receivables are recorded in the balance sheets at the outstanding balance, adjusted for charge-offs and allowance for doubtful accounts. Allowance for doubtful accounts are recorded based on customer-specific analysis, general matters such as current assessments of past due balances and historical experience. Concentrations of credit risk with respect to receivables are limited due to the large number of customers and their dispersion across geographic areas and industries. The Company generally does not require that its customers provide collateral. No single customer represented greater than 10% of net accounts receivable at January 2, 2010, and January 3, 2009.
Changes in the allowance for doubtful accounts are as follows:
January 2, January 3, December 29,(In thousands) 2010 2009 2007 Balance at beginning of year $ 4,247 $ 4,126 $ 1,744Amounts assumed in acquisition — 62 2,715Charges to costs and expenses 1,545 1,264 888Deductions (1,769) (1,205) (1,221)Balance at end of year $ 4,023 $ 4,247 $ 4,126
Inventories: The Company uses the last-in, first-out (LIFO) method of valuing inventories held in the United States. The LIFO calculation is made only at year-end based on the inventory levels and costs at that time. Accordingly, interim LIFO adjustments are based on management’s estimates of expected year-end inventory levels and costs which are subject to the final year-end LIFO inventories valuation. Inventories held at foreign locations are valued using the lower of cost measured using the first-in, first-out method (FIFO) or market.
Property, Plant and Equipment: Property, plant and equipment are stated at cost. Depreciation and amortization are computed principally using the straight-line method over the estimated useful lives of the assets ranging from 10 to 39 years for buildings and improvements and 3 to 15 years for machinery and equipment. Capitalized software costs amounting to $26.4 million and $25.5 million, net of accumulated amortization, at January 2, 2010, and January 3, 2009, respectively, are included in machinery and equipment and are amortized over their estimated useful life of 15 years. Amortization expense was $2.8 million and $2.6 million for 2009 and 2008, respectively. Costs associated with repairs and maintenance are expensed as incurred.
Self-Insurance Liabilities: The Company’s self-insurance programs primarily cover exposure to general and product liability, workers’ compensation and health insurance. The Company self-insures from the first dollar of loss up to specified retention levels. Eligible losses in excess of self-insurance retention levels and up to stated limits of liability are covered by policies purchased from third-party insurers. The aggregate self-insurance liability is estimated using the Company’s claims experience and risk exposure levels. Future adjustments to the self-insured liabilities may be required to reflect emerging claims experience and other factors.
Business Combinations: The Company accounts for acquired businesses using the purchase method of accounting, which requires that the assets acquired and liabilities assumed be recorded at the date of acquisition at their respective fair values. Any excess of the purchase price over the estimated fair values of the net assets acquired is
Baldor Electric Company Notes to Consolidated Financial StatementsJanuary 2, 2010
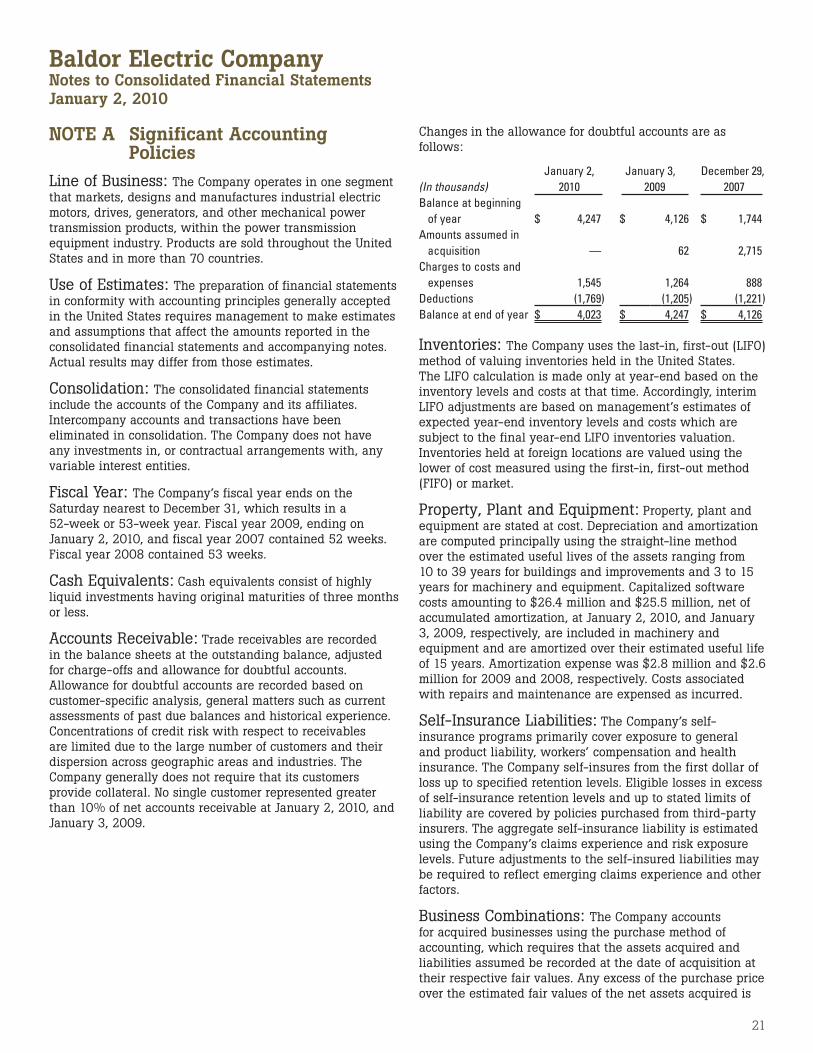

22
recorded as goodwill. The judgments made in determining the estimated fair value assigned to each class of assets acquired and liabilities assumed, as well as asset lives, can materially impact our results of operations. Accordingly, for significant items, the Company typically obtains assistance from third party valuation specialists. The valuations are based on information available near the acquisition date and are based on expectations and assumptions that have been deemed reasonable by management.
There are multiple methods that can be used to determine the fair value of assets acquired and liabilities assumed. For intangible assets, the Company typically uses relief from royalty, income and market approach methodologies. These methodologies start with a forecast of the expected future net cash flows. These cash flows are then adjusted to present value by applying an appropriate discount rate that reflects the risk factors associated with the cash flow streams. Some of the more significant estimates and assumptions inherent in the income method or other methods include the amount and timing of projected future cash flows; the discount rate selected to measure the risks inherent in the future cash flows; and the assessment of the asset’s life cycle and the competitive trends impacting the asset, including consideration of any technical, legal, regulatory, or economic barriers to entry. Determining the useful life of an intangible asset also requires judgment as different types of intangible assets will have different useful lives and certain assets may even be considered to have indefinite useful lives.
Impairment of Goodwill and Indefinite-Lived Intangibles: At January 2, 2010, goodwill and indefinite-lived intangibles amounted to $1.0 billion and $354.8 million, respectively. Goodwill and intangible assets with indefinite useful lives are tested for impairment annually in the fourth quarter. However, the Company could be required to evaluate the recoverability of goodwill and other intangible assets prior to the required annual assessment if the Company experiences disruptions to the business, unexpected significant declines in operating results, divestiture of a significant component of the business or a sustained decline in market capitalization.
Goodwill impairment is determined using a two-step process. The first step (“Step 1”) is to identify if a potential impairment exists by comparing the fair value of a reporting unit with its carrying amount, including goodwill. If the fair value of a reporting unit exceeds its carrying amount, goodwill of the reporting unit is not considered to have a potential impairment and the second step of the impairment test is not necessary. However, if the carrying amount of a reporting unit exceeds its fair value, the second step is performed to determine if goodwill is impaired and to measure the amount of impairment loss to recognize, if any. The second step compares the implied fair value of goodwill with the carrying amount of goodwill. If the implied fair value of goodwill exceeds the carrying amount, then goodwill is not considered impaired. However, if the carrying amount of goodwill exceeds the implied fair value, an impairment loss is recognized in an amount equal to that excess. The implied fair value of goodwill is determined in the same manner as the amount of goodwill recognized in
a business combination (i.e., the fair value of the reporting unit is allocated to all the assets and liabilities, including any unrecognized intangible assets, as if the reporting unit had been acquired in a business combination and the fair value of the reporting unit was the purchase price paid to acquire the reporting unit).
Fair value of a reporting unit is determined using a combination of the Income Approach, which utilizes a discounted cash flow model, and the Market Approach, which utilizes a guideline public company methodology. Judgments and assumptions related to revenue, gross profit, operating expenses, interest, capital expenditures, cash flows, and market conditions are inherent in developing the discounted cash flow model. In applying the guideline public company method, the Company utilized valuation multiples derived from stock prices and enterprise values of publicly traded companies comparable to Baldor.
In 2009 and 2008, Step 1 of the annual impairment tests resulted in no indication of goodwill impairment. In conjunction with the annual goodwill impairment testing, the Company performed a sensitivity analysis, at the reporting unit level, on the discounted cash flows utilized in the analysis. This sensitivity analysis indicated that a higher discount rate or more conservative revenue growth assumptions still resulted in estimated fair value exceeding carrying value. Furthermore, a hypothetical decrease of 10% in the estimated fair value of each of the reporting units would still result in the fair value of each reporting unit exceeding the carrying value. Future changes in judgments and/or assumptions could result in a fair value that differs from these estimates which could ultimately result in the recognition of impairment charges in the financial statements.
Subsequent to the annual testing at October 1, 2008, the Company’s market capitalization decreased significantly as a result of market-driven declines in the stock trading price. While the stock did not trade at a price below book value for a sustained period of time through fiscal year-end 2008, the Company performed an interim test of goodwill at January 3, 2009 due to the decline in market capitalization and overall market conditions. In updating the annual testing analysis from October 1, 2008, the Company reviewed expectations of cash flows and other critical assumptions utilized in the analysis. Based on results of the interim Step 1 test, management concluded that goodwill was not impaired at January 3, 2009.
In conjunction with our annual testing of goodwill, the Company evaluated the reasonableness of the estimated fair value of its reporting units by reconciling to the Company’s market capitalization at each date. This reconciliation allowed the Company to consider market expectations in corroborating the reasonableness of the fair value of its reporting units.
For the other intangible assets, if the carrying value of the intangible asset exceeds its fair value, an impairment loss is recognized by an amount equal to that excess. A relief from royalty methodology is utilized to estimate the fair value of indefinite-lived intangible assets.
23
The Company’s fiscal 2009 and 2008 annual impairment analyses of the other intangible assets did not result in an impairment charge. However, based on sensitivity analysis performed in conjunction with the 2009 annual test, a 5% decline in the estimated fair value of one of the Company’s indefinite-lived intangible assets with a carrying value of $225.9 million would have resulted in the estimated fair value falling below the carrying value by approximately $4.7 million. Management will continue to monitor business conditions and projected revenues related to its indefinite-lived intangibles and will perform additional interim testing if deemed necessary.
Long-Lived Assets: The Company periodically evaluates the carrying value of long-lived assets held and used, including intangible assets, when events or circumstances warrant such a review. The Company recognizes impairment losses equal to the excess of the carrying value over the estimated fair value of long-lived assets used in operations when indicators of impairment are present and the undiscounted cash flows expected to be generated by the asset are not sufficient to recover the carrying amount of the asset. Fair value is generally derived using a discounted cash flow model.
Financial Derivatives: The Company uses derivative financial instruments to reduce its exposure to the risk of increasing commodity prices. Contract terms of the hedging instrument closely mirror those of the hedged forecasted transaction providing for the hedge relationship to be highly effective both at inception and continuously throughout the term of the hedging relationship. Additionally, the Company utilizes derivative financial instruments to limit exposure to increasing interest rates on variable rate borrowings. The Company does not engage in speculative transactions, nor does the Company hold or issue financial instruments for trading purposes.
The Company recognizes all derivatives on the balance sheets at fair value. Derivatives that do not meet the criteria for hedge accounting are adjusted to fair value through income. If the derivative is designated as a cash flow hedge, changes in the fair value are recognized in accumulated other comprehensive income (loss) until the hedged transaction is recognized in income. If a hedging instrument is terminated, any unrealized gain (loss) at the date of termination is carried in accumulated other comprehensive income (loss) until the hedged transaction is recognized in income. The ineffective portion of a derivative’s change in fair value is recognized in income in the period of change.
Derivative assets and liabilities executed with the same counterparty under a master netting agreement and collateral accounts (i.e. margin deposits) are netted with the corresponding derivative assets and liabilities in the consolidated balance sheets. The fair value liability as of January 3, 2009, is net of $19.1 million of margin deposits. There were no margin deposits required at January 2, 2010.
Pension and Postretirement Health Plan: The Company uses the fiscal year end as a measurement date for its postretirement health plan.
Income Taxes: Provision for income taxes are provided based on the liability method of accounting. Deferred income taxes are provided for the expected future tax consequences of temporary differences between the basis of assets and liabilities reported for financial and tax purposes.
The Company reviews all of its open tax year income tax filings in order to identify, evaluate, and properly report in its financial statements all material uncertain tax positions taken over the past year. Upon completion of this evaluation and analysis, a determination is made regarding whether the tax positions can be sustained based upon the more-likely-than-not standard, i.e., greater than 50% certainty. Any tax position which is determined not to be sustainable based upon the more-likely-than-not standard is recorded as a liability, with penalties and interest accrued on the uncertain tax positions.
The uncertain tax positions reverse upon either the settlement of an audit, voluntary disclosure and payment, or the expiration of the statute of limitations in the respective taxing jurisdiction.
Research and Engineering: Costs associated with research, new product development, and product and cost improvements are expensed as incurred and amounted to approximately $31.2 million in 2009, $35.4 million in 2008, and $34.3 million in 2007.
Shipping and Handling Costs: The Company classifies all amounts billed to customers for shipping and handling as revenue and classifies gross shipping and handling costs paid as selling expense. Costs included in selling and administrative expenses related to shipping and handling amounted to approximately $34.5 million in 2009, $56.0 million in 2008, and $48.6 million in 2007.
Revenue Recognition: The Company sells products to its customers FOB shipping point. Title passes to the customer when the product is shipped. Accordingly, revenue is recognized when the product is shipped. Volume discounts and rebates are recorded as a reduction of revenue in conjunction with the sale of the related products. Reserves for sales returns and allowances are recorded as a reduction to revenues, based on historical experience and any specifically known amounts.

24
The Company has granted restricted stock units under its share-based compensation plans. The Company amortizes the fair value of restricted stock unit awards, which is based on the closing market price on the date of grant, to compensation expense generally on a straight-line basis over the vesting period, taking into consideration an estimate of shares expected to vest.
NOTE B AcquisitionsOn January 31, 2007, Baldor acquired all of the equity of Reliance Electric from Rockwell and certain of its affiliates. Reliance was a leading manufacturer of industrial electric motors and other mechanical power transmission products. The acquisition extended Baldor’s product offerings, provided a manufacturing base in China for the Asian markets, increased the Company’s manufacturing capabilities and flexibility, strengthened the management team, and provided strong opportunities for synergies and cost savings. The purchase price was $1.83 billion, consisting of $1.78 billion in cash and 1.58 million shares of Baldor common stock valued at $50.93 million, based on the average closing price per share of Baldor’s common stock on the New York Stock Exchange for the three days preceding and the three days subsequent to November 6, 2006, the date of the definitive purchase agreement. The cash portion of the purchase price was funded with proceeds from the issuance of 10,294,118 shares of Baldor common stock at a price of $34.00 per common share, proceeds from the issuance of $550.0 million of 8.625% senior notes due 2017, and borrowings of $1.00 billion under a new $1.20 billion senior secured credit facility. In conjunction with an over-allotment option in the common stock offering, 1,430,882 additional common shares were issued at a price of $34.00 per share. Proceeds from the over-allotment offering of approximately $46.5 million were utilized to reduce borrowings under the senior secured credit facility. Reliance’s results of operations are included in the consolidated financial statements beginning February 1, 2007.
In process research and development amounting to $1.0 million and backlog amounting to $0.7 million were expensed as of the acquisition date and included in cost of goods sold in 2007.
The table below presents summarized unaudited pro forma results of operations as if the acquisition had been effective at the beginning of the fiscal year ended December 29, 2007.
(In millions, except for per share data) 2007
Net sales $ 1,919.0Income before income taxes 151.3Net income 96.7
Net earnings per common share – diluted $ 2.09
Product Warranties: The Company accrues for product warranty claims based on historical experience and the expected costs to provide warranty service. The warranty period generally ranges from one to two years. Changes in the carrying amount of product warranty reserves are as follows:
January 2, January 3,(In thousands) 2010 2009
Balance at beginning of period $ 9,477 $ 9,216Charges to costs and expenses 11,711 12,536Payments (11,858) (12,275)Balance at end of period $ 9,330 $ 9,477
Amounts included in selling and administrative costs related to product warranty expense amounted to $11.7 million in 2009, $12.5 million in 2008, and $11.6 million in 2007.
Foreign Currency Translation: Assets and liabilities of foreign affiliates are translated into U.S. dollars at year-end exchange rates. Income statement items are translated at average exchange rates prevailing during the period. Foreign affiliates generally conduct business in their respective local currencies. Translation adjustments, including those related to intercompany advances that are of a long-term investment nature, are recorded in accumulated other comprehensive income (loss) in shareholders’ equity.
Earnings Per Common Share: Basic earnings per common share is based upon the weighted average number of common shares outstanding. Diluted earnings per common share includes all dilutive common stock equivalents.
Share-Based Compensation: The Company has share-based compensation plans, which are described more fully herein under NOTE K – Stock Plans.
Fair value of the stock options is estimated using a Black-Scholes option pricing formula. The variables used in the option pricing formula for each grant are determined at the time of grant as follows: (1) volatility is based on the daily composite closing price of Baldor’s stock over a look-back period of time that approximates the expected option life; (2) risk-free interest rates are based on the yield of U.S. Treasury Strips as published in the Wall Street Journal or provided by a third-party on the date of the grant for the expected option life; (3) dividend yields are based on Baldor’s dividend yield published in the Wall Street Journal or provided by a third-party on the date of the grant; and (4) expected option life represents the period of time the options are expected to be outstanding. Assumptions used in the fair-value valuation are adjusted to reflect current developments at the date of grant.
The simplified method for estimating the expected life for employee stock options uses the mid-point between the vesting term and the contractual term of the stock option. The Company used the simplified method through second quarter 2009 and began using historical data for grants issued beginning third quarter 2009. Prior to the third quarter 2009, the Company did not have a method to capture historical exercise data from which to estimate the expected term.
25
On August 29, 2008, Baldor acquired Poulies Maska, Inc. (“Maska”) of Ste-Claire, Quebec, Canada. The purchase price was $43.2 million which was funded by cash and borrowings under the revolving credit facility. Maska was a designer, manufacturer and marketer of sheaves, bushings, couplings and related mechanical power transmission components. The acquisition gave Baldor additional manufacturing plants in both Canada and China and expanded the Company’s market share of sheaves and bushings in North America. Maska’s results of operations are not material to the Company’s consolidated financial statements and accordingly, pro forma information has not been presented. The Company’s consolidated financial statements include the results of operations of Maska beginning August 30, 2008.
The excess of the purchase price over the estimated fair values is assigned to goodwill. Adjustments to the estimated fair values may be recorded during the allocation period, not to exceed one year from the date of acquisition.
The following table summarizes the estimated fair values of assets acquired and liabilities assumed at the date of acquisition.
(In thousands)
Current assets $ 24,609Property, plant and equipment 18,270Intangible assets subject to amortization – Trade names 3,174 (useful life of 10 years) Goodwill 5,999Total assets acquired 52,052
Current liabilities 5,556Long-term obligations 2,311Deferred income taxes 1,022Total liabilities assumed 8,889Net assets acquired $ 43,163
NOTE C Financial DerivativesThe Company uses derivative financial instruments to reduce its exposure to the risk of increasing commodity prices by maintaining sufficient commodity hedge contracts to ensure the Company pays a certain price or remains within a limited price range even when market prices fluctuate outside that range. Contract terms of the hedging instrument closely mirror those of the hedged forecasted transaction providing for the hedge relationship to be highly effective both at inception and continuously throughout the term of the hedging relationship. Additionally, the Company utilizes derivative financial instruments to limit exposure to increasing interest rates on variable rate borrowings. The Company does not regularly engage in speculative transactions, nor does the Company hold or issue financial instruments for trading purposes.
The Company recognizes all of its derivative instruments as either assets or liabilities in the consolidated balance sheets at fair value. The accounting for changes in the fair value (i.e., gains or losses) of a derivative instrument depends on whether it has been designated and qualifies as part of a hedging relationship and further, on the type of hedging relationship. For those derivative instruments that are designated and qualify as hedging instruments, the
Company designates the hedging instrument based upon the exposure being hedged (i.e., fair value hedge, cash flow hedge, or a hedge of a net investment in a foreign operation).
Cash Flow HedgesThe Company has entered into certain commodity forward contracts to manage the price risk associated with forecasted purchases of materials used in the Company’s manufacturing process. The effective portion of the gain or loss on the derivative instruments is reported as a component of other comprehensive income and reclassified into earnings in the same period or periods during which the hedged transaction affects earnings. Gains and losses on the derivative instruments representing either hedge ineffectiveness or hedge components excluded from the assessment of the effectiveness are recognized in earnings in the current period. Ineffective portions of the Company’s commodity cash flow hedges were not material during 2009, 2008, or 2007.
As of January 2, 2010, the Company had the following outstanding commodity forward contracts:
Commodity Volume in Pounds Copper 12,091,500
Losses recognized on commodity cash flow hedges increased cost of sales by $18.2 million in 2009 and $718,000 in 2008, and gains recognized reduced cost of sales by $1.3 million in 2007. The Company expects after-tax gains totaling $10.5 million at January 2, 2010, recorded in accumulated other comprehensive income (loss) related to commodity cash flow hedges, will be recognized in cost of sales within the next twelve months.
The Company has entered into interest rate instruments related to variable rate long-term obligations. The notional amount is $350.0 million and the instruments mature on April 30, 2012. Unrealized after-tax losses of $11.8 million are recorded in accumulated other comprehensive income at January 2, 2010. On March 31, 2009, the Company amended its senior secured credit agreement. In conjunction with the amendment, a LIBOR floor was added to the variable rate borrowings. As a result, the Company determined that its existing interest rate hedges were no longer expected to be highly effective. Accordingly, effective March 31, 2009, the interest rate hedge instruments were discontinued as cash flow hedges. Accumulated after-tax losses recorded in accumulated other comprehensive income (loss) prior to the discontinuance remain in accumulated other comprehensive income and are recognized in earnings as the forecasted transactions occur or become probable of not occurring. Amortization related to the discontinuance of the interest rate hedge was $9.0 million during 2009 and is included in interest expense on the consolidated statements of income. The change in fair value of the interest rate hedge instrument was $6.6 during 2009 and is included in interest expense on the consolidated statements of income.

26
The following table sets forth the pretax impact of cash flow hedge derivative instruments on the consolidated statements of income (in thousands):
Derivatives designated as hedging Gain (Loss) Recognized Gain (Loss) Reclassified frominstruments – Cash flow hedges in OCI on Derivative Accumulated OCI into Income 2009 2008 2009 2008 Interest rate contracts (1) $ (34) $ (17,834) $ (9,009) $ —Commodity contracts 30,259 (30,650) (18,153) (718) Total $ 30,225 $ (48,484) $ (27,162) $ (718) (1) Effective March 31, 2009, the interest rate instruments were discontinued as cash flow hedges. The loss reclassified from Accumulated OCI for 2009 represents the amortization related to the discontinuance as cash flow hedge.
Derivatives not designated as Location of Gain (Loss) Amount of Gain (Loss) hedging instruments Recognized in Income on Derivative Recognized in Income on Derivative 2009 2008 Interest rate contracts (1) Interest Expense $ 6,561 $ —Total $ 6,561 $ — (1) Effective March 31, 2009, the interest rate instruments were discontinued as cash flow hedges.
The following table sets forth the fair value of all derivative instruments outstanding at January 2, 2010 and January 3, 2009 and the classification in the consolidated balance sheets (in thousands):
Balance Sheet Classification 2009 2008 Derivative Assets Derivatives designated as hedging instruments Commodity contracts Other Current Assets $ 17,386 $ —Total derivative assets – designated 17,386 — Total derivative assets $ 17,386 $ — Derivative Liabilities Derivatives designated as hedging instruments Commodity contracts Other Accrued Expenses $ — $ 31,026Interest rate contracts (1) Other Accrued Expenses — 28,496Total derivative liabilities – designated $ — $ 59,522
Derivatives not designated as hedging instruments Interest rate contracts (1) Other Accrued Expenses $ 21,969 $ —Total derivative liabilities – not designated 21,969 — Total derivative liabilities $ 21,969 $ 59,522 (1) Effective March 31, 2009, the interest rate instruments were discontinued as cash flow hedges.
Unrealized gains or losses related to the Company’s cash flow hedges are recorded in accumulated other comprehensive income (loss) at each measurement date. Unrealized gains or losses related to instruments that are not designated as hedges are recorded through the statement of income at each measurement date.
27
NOTE D Goodwill and Other Intangible AssetsThe amounts of goodwill at January 2, 2010 and January 3, 2009 are as follows:
(In thousands) Balance at January 3, 2009 $ 1,033,575Purchase accounting adjustments related to Maska valuation 3,912Adjustment related to Reliance purchase price allocation (5,003)Translation adjustment 249Balance at January 2, 2010 $ 1,032,733
During the fourth quarter of 2009, the Company determined there was a computational error related to deferred income taxes and income taxes payable balances established in the initial Reliance purchase price allocation. The Company evaluated the impact of this error on the initial purchase price allocation and concluded that the error was not of a magnitude to require restatement of the initial purchase price allocation. The computational error had less than 1% impact on goodwill, total assets, net deferred tax liabilities and current liabilities as of December 29, 2007. As a result, the adjustment was reflected in 2009.
The amounts of other intangible assets by type are as follows:
January 2, January 3, (In thousands) 2010 2009 Gross carrying value: Trade names – indefinite lived $ 354,800 $ 354,800 Trademarks – definite lived 3,174 2,946 Customer relationships 292,000 292,000 Technology 32,000 32,000Less accumulated amortization: Trademarks (423) — Customer relationships (38,054) (24,337) Technology (6,427) (4,138)Total intangible assets $ 637,070 $ 653,271
Amortization expense on customer relationships of $13.7 million and $15.4 million was recognized during 2009 and 2008, respectively. Amortization expense on technology of $2.3 million and $1.6 million was recognized during 2009 and 2008, respectively. Amortization expense on definite lived trademarks of $423,000 was recognized during 2009.
(In millions) 2010 2011 2012 2013 2014
Estimated amortization $16.5 $16.8 $16.2 $14.5 $14.0expense of intangible assets
Intangibles are amortized over their estimated period of benefit of five to 30 years (weighted average of 30 years), beginning with the date the benefits from intangible items are realized.
NOTE E Income TaxesThe Company paid income taxes of $32.6 million, $94.1 million, and $44.6 million during 2009, 2008, and 2007, respectively.
The Company has income taxes recoverable of $7.1 million included in the “Other current assets” on the Consolidated Balance Sheet as of January 2, 2010 and January 3, 2009, respectively.
The components of the provision for income taxes were:
(In thousands) 2009 2008 2007 Current: Federal $ 24,708 $ 59,047 $ 41,918 State 5,539 12,152 8,608 Foreign 3,625 7,927 5,048 33,872 79,126 55,574
Deferred: Federal 5,390 (25,793) (2,316) State 910 (2,106) (197) Foreign 1,146 1,619 — 7,446 (26,280) (2,513) $ 41,318 $ 52,846 $ 53,061
The following table reconciles the difference between the Company’s effective income tax rate and the federal statutory rate: 2009 2008 2007 Statutory federal income tax rate 35.0% 35.0% 35.0%State income taxes, net of federal tax benefit 3.8% 4.5% 3.7%Domestic production activities deduction (0.9%) (2.0%) (1.6%)Foreign tax rate differential (2.3%) (1.8%) (1.9%)Taxable distribution from foreign subsidiary 3.0% — —Other items, net 0.4% (1.3%) 0.9%Change in valuation allowance 1.9% 0.3% 0.0%Effective income tax rate 40.9% 34.7% 36.1%
The Company has accumulated but undistributed earnings of foreign subsidiaries aggregating approximately $52.5 million at January 2, 2010, that are expected to be indefinitely reinvested in the business. It is not practicable to estimate the tax liability that might be payable on the repatriation of these foreign earnings.
Deferred income taxes reflect the net effects of temporary differences between the carrying amounts of assets and liabilities for financial reporting purposes and the amounts used for income tax purposes.

28
The principle components of deferred tax assets (liabilities) are as follows: January 2, January 3,(In thousands) 2010 2009 Accrued liabilities $ 5,852 $ 8,073Bad debt reserves 917 917Derivative instruments, unrealized loss 846 23,511Employee compensation and benefits 614 608Foreign net operating loss carry forwards 1,930 1,395Inventory reserves 3,706 3,533Post retirement benefits 20,810 22,147Prepaid loan costs 5,845 —Product warranty 3,576 3,781Self-insurance reserves 4,028 4,477Share-based compensation 4,766 3,842State income taxes 18,007 17,840Other items 8,666 5,830Deferred tax assets 79,563 95,954 Property, plant, and equipment (64,180) (65,082)Intangible assets (281,021) (286,807)Gain on debt modification (17,697) —Other items (11,379) (15,075)Deferred tax liabilities (374,277) (366,964) Valuation allowance (2,533) (406)Net deferred tax liabilities $ (297,247) $ (271,416)
Deferred income taxes are included in the Consolidated Balance Sheets as follows: January 2, January 3,(In thousands) 2010 2009 Other current assets $ 10,965 $ 36,955Deferred income taxes (308,212) (308,371)Net deferred tax liabilities $ (297,247) $ (271,416)
Management reviews the components of deferred tax assets to ascertain that, based upon the information available at the time of the preparation of financial statements, it is more likely-than-not, that the Company expects to utilize these future deductions. In the event that management determines that it is more likely-than-not these future deductions will not be utilized, a valuation allowance is recorded, reducing the deferred tax asset to the amount expected to be realized.
In 2009 and 2008, valuation allowances of $2.5 million and $406,000, respectively, were recorded for certain net operating loss carry-forwards of foreign subsidiaries and state incentive tax credits that do not yet meet the more-likely-than not standard. Of these net operating loss carry-forwards, $1.4 million will expire in various years through 2028. The remaining $5.6 million carry-forwards have no expiration. The state incentive tax credits of $780,000 will expire in various years through 2012.
The Company has $1.1 million and $824,000 in gross unrecognized tax benefits as of January 2, 2010 and January 3, 2009, respectively. The amount of unrecognized tax benefits at January 2, 2010 and January 3, 2009 that would impact the effective tax rate if these tax benefits were recognized is $862,000 and $536,000, respectively. The Company does not believe the amounts of unrecognized tax benefits will significantly increase or decrease over the next twelve month period.
The Company recognizes interest and penalties related to uncertain tax positions as interest expense and selling and administrative expenses, respectively. During 2009 the total amount of expense for interest and penalties was $213,000. The total amount of accrued interest and penalties for such unrecognized tax benefits is $461,000 at January 2, 2010.
The following table summarizes the activity related to the unrecognized tax benefits:
January 2, January 3, December 29,(In thousands) 2010 2009 2007 Unrecognized benefit at beginning of year $ 824 $ 824 $ 454Additions as a result of acquisition — — 481Additions for tax positions related to prior years 410 32 321Reductions for settlements (128) (32) (432)Unrecognized benefit at end of year $ 1,106 $ 824 $ 824
The Company files its income tax returns according to the tax laws of the various jurisdictions in which it operates, which includes the U.S. federal jurisdiction, and various state and foreign jurisdictions. The Company files a consolidated U.S. federal income tax return. Tax years 2004 and forward generally remain subject to examination by federal and state taxing authorities.
NOTE F Note PayableThe Company’s wholly-owned Chinese subsidiary entered into a short-term note payable during the fourth quarter of 2007. The principal balance was $735,000 at January 3, 2009 and was paid off during the first quarter of 2009.
NOTE G Long-term ObligationsLong-term obligations are as follows:
Interest Rate at January 2, January 2, January 3, ($ In thousands) 2010 2010 2009 Senior secured term loan, variable interest rate 5.250% $ 304,026 $ 361,627Senior secured term loan, variable interest rate – hedged 9.852% 350,000 350,000Revolving credit facility, variable interest rate 5.250 % — 60,000Senior unsecured notes, fixed interest rate 8.625% 550,000 550,000Other 6.277% 1,324 4,560 1,205,350 1,326,187Less current maturities 7,108 7,609 1,198,242 1,318,578Less discount on senior secured term loan 42,237 — $ 1,156,005 $ 1,318,578
29
The revolving credit (“RC”) agreement, which matures April 30, 2012, provides for aggregate borrowings of up to $200.0 million, including a swingline loan commitment not to exceed $20.0 million and letter of credit (“LC”) commitment not to exceed $30.0 million, and contains minimum borrowing thresholds for each type of borrowing. As of January 2, 2010, the Company had no outstanding borrowings under the revolver. An RC commitment fee is due quarterly at the annual rate of 0.625% on the unused amount of the RC commitment. At January 2, 2010, $19.8 million of LC’s were issued which reduces the aggregate LC and RC availability. Availability totaled $180.2 million at January 2, 2010. LC participation fees of 3.25% and fronting fees of 0.125% per annum on unissued LC’s are due quarterly based upon the aggregate amount of LC’s issued and available for issuance, respectively. Interest on RC borrowings accrues at 3.25% plus LIBOR (0.23% at January 2, 2010) with a minimum rate of 2.0% or 1.25% per annum plus Prime (3.25% at January 2, 2010).
The senior secured credit facility is collateralized by substantially all of the Company’s assets.
Senior Unsecured NotesThe senior unsecured notes are general unsecured obligations of the Company, subordinated to the senior secured credit facility described above, and mature February 15, 2017. Interest is at a fixed rate and is payable semi-annually in arrears on February 15 and August 15 commencing August 15, 2007.
At any time prior to February 15, 2010, the Company may redeem up to 35.0% of the aggregate principal amount of the notes at a redemption price of 108.625% of the principal amount, plus accrued and unpaid interest to the redemption date, with the net cash proceeds of one or more equity offerings with certain restrictions. At any time prior to February 15, 2012, the Company may redeem all or a part of the notes at a redemption price equal to the sum of (i) 100% of the principal amount thereof, plus (ii) the applicable premium as defined in the agreement as of the date of redemption, plus (iii) accrued and unpaid interest to the redemption date. On or after February 15, 2012, the Company may redeem all or a part of the notes at the redemption prices (expressed as percentages of principal amount) set forth below plus accrued and unpaid interest on the notes redeemed to the applicable redemption date.
Year Percentage 2012 104.313% 2013 102.875% 2014 101.438% 2015 and thereafter 100.000%
The indenture agreement contains certain restrictions and requirements including restrictions and requirements regarding mergers, consolidation or sale of assets, certain payments, the incurrence of indebtedness and liens, and issuance of preferred stock, and note holder options if a change of control occurs. These notes are also subject to the term and revolving credit loans maximum total leverage and fixed charges ratios.
Interest paid was $92.5 million in 2009, $99.3 million in 2008, and $76.4 million in 2007.
Maturities of long-term obligations are as follows: 2010 - $7.1 million; 2011 - $7.1 million; 2012 - $7.1 million; 2013 – $475.9 million; and thereafter $708.2 million.
Amendment of Senior Secured Term and Revolving Credit FacilityEffective March 31, 2009, the Company amended its senior secured credit facility. The amendment relaxed certain financial ratio covenants through the remaining term of the agreement. In conjunction with the amendment, pricing on the outstanding term loan borrowings and future revolver borrowings was increased from 1.75% to 3.25% and a LIBOR floor of 2.00% was added to the variable rate borrowings.
The modification of the senior secured term loan was accounted for as an extinguishment of debt. As a result, the senior secured term loan was recorded at fair value as of the modification date which resulted in a noncash debt discount of $49.7 million being recorded in long-term obligations on the consolidated balance sheet and a $35.7 million gain on debt modification in income from continuing operations in the consolidated statement of income. The discount is being amortized to other expense over the remaining term of the debt. Fees paid related to the amendment of $5.7 million along with unamortized fees related to the original agreement of $8.3 million were deducted when calculating the gain. The unamortized balance of the discount is $42.2 million at January 2, 2010. Amortization amounted to $7.5 million in 2009.
The amendment did not change the borrowing capacity of the revolving credit facility; therefore, fees of $1.6 million related to the amendment were deferred and are being amortized over the remaining term of the facility agreement and unamortized fees of $1.1 million related to the original agreement continue to be amortized over the remaining term.
Senior Secured Term and Revolving Credit FacilityInterest on the term loan is due periodically and calculated based on 3.25% plus a variable adjusted London Inter-Bank Offered Rate (“LIBOR”) with a minimum LIBOR rate of 2.0%. Quarterly principal payments of $1.7 million are due beginning January 29, 2010, and continue through January 31, 2013, at which date subsequent quarterly principal payments increase to $158.0 million through the loan due date of January 31, 2014.
Additional principal payments may be due based upon a prescribed annual excess cash flow calculation until such time as a prescribed total leverage ratio is achieved. There were no additional payments due based on the Company’s calculations for the fiscal year ended January 2, 2010 and January 3, 2009. Additional principal payments may also be due based upon the net available proceeds from the disposition of assets, a casualty event, an equity issuance or incurrence of additional debt.
This loan agreement limits and restricts certain dividend and capital expenditure payments, establishes maximum total leverage and senior secured leverage ratios, and requires the Company maintain a fixed charge ratio. These restrictions and ratios were all met as of January 2, 2010.

30
Unrealized Foreign Currency Total Accumulated Gains (Losses) on Post Retirement Translation Other Comprehensive(In thousands) Derivatives Plan Adjustments Adjustments Income (Loss) Balance at December 30, 2006 $ (1,293) $ — $ 366 $ (927) Net change 2007 (5,940) (1,471) 8,311 900Balance at December 29, 2007 (7,233) (1,471) 8,677 (27)Net change 2008 (28,880) (4,333) (20,481) (53,694)Balance at January 3, 2009 (36,113) (5,804) (11,804) (53,721)Net change 2009 34,668 (850) 12,694 46,512Balance at January 2, 2010 $ (1,445) $ (6,654) $ 890 $ (7,209)
Legal Proceedings and Contingent LiabilitiesThe Company is subject to a number of legal actions arising in the ordinary course of business. Management expects the ultimate resolution of these actions will not materially affect the Company’s financial position, results of operations, or cash flows.
Prior to the Company’s acquisition of Reliance Electric, Reliance’s parent company, Rockwell Automation, determined actions by a small number of employees at certain of Reliance’s operations in one jurisdiction may have violated the Foreign Corrupt Practices Act (“FCPA”) or other applicable laws. Reliance did business in this jurisdiction with government owned enterprises or government owned enterprises evolving to commercial businesses. These actions involved payments for non-business travel expenses and certain other business arrangements involving potentially improper payment mechanisms for legitimate business expenses. Rockwell voluntarily disclosed these actions to the U.S. Department of Justice (“DOJ”) and the Securities and Exchange Commission (“SEC”) beginning in September 2006. Rockwell has agreed to update the DOJ and SEC periodically regarding any further developments as the investigation continues. If violations of the FCPA occurred, Rockwell and Reliance may be subject to consequences that could include fines, penalties, other costs and business-related impacts. Rockwell and Reliance could also face similar consequences from local authorities. The Company has been indemnified by Rockwell against government penalties arising from these potential violations. This indemnification covers only penalties and may not cover expenses incurred by the Company for future compliance. The Company conducts compliance training on a regular schedule.
NOTE I Shareholders’ EquityShare RepurchasesNo shares were repurchased during 2009 or 2008. Future repurchases are limited under terms of the Company’s senior secured credit facility.
Accumulated Other Comprehensive Income (Loss)Balances of related after-tax components comprising accumulated other comprehensive income (loss), included in shareholders’ equity are as follows:
NOTE H Commitments and ContingenciesOperating Lease CommitmentsThe Company leases certain computers, buildings, and other equipment under operating lease agreements. Related rental expense was $14.6 million in 2009, $12.5 million in 2008, and $11.5 million in 2007. Future minimum payments for operating leases having non-cancelable lease terms in excess of one year are: 2010 - $14.2 million; 2011 - $12.6 million; 2012 - $10.1 million; 2013 - $6.8 million, 2014 - $6.2 million; and thereafter - $21.6 million.
On July 21, 2005, the Company entered into a five-year operating lease agreement on a new manufacturing facility in Columbus, Mississippi. At the end of the initial five-year lease term, the Company has the option to extend the lease for up to two successive five-year periods under terms similar to the terms of the original lease or purchase the property at a stated amount that approximates the fair value of the property. The Company has annual operating lease commitments of $1.2 million related to the lease. As part of the lease agreement, the Company is subject to an 82% residual value guarantee at the end of the lease term in the event the value of the property has decreased. The maximum potential liability under the residual value guarantee would be $13.6 million should the property become worthless by the end of the lease term. The Company has recorded a liability of $393,000 classified in other liabilities, which represents the fair value of the guarantee, based on a probability-weighted calculation of the expected value of the property at the end of the lease term.
The Company leases certain manufacturing facilities under operating leases entered into by Reliance in a November 2005 sale-leaseback transaction. Reliance retained rights to reacquire land adjacent to three of the properties included in the transaction. As a result, no sale was recorded on these three properties and the assets continue to be carried in Property, Plant and Equipment on the Company’s balance sheet at a net book value of $11.4 million as of January 2, 2010. Proceeds of $18.7 million from the sale-leaseback transaction are recorded as a deferral in Other Liabilities at January 2, 2010 and January 3, 2009. Operating lease payments of $1.4 million per year related to these properties are included in future minimum lease payments.
31
January 2, January 3, 2010 2009 Other Postretirement Benefits Change in benefit obligation: Benefit obligation at beginning $ 50,974 $ 49,095 of year Acquisition — — Service cost 87 134 Interest cost 3,107 3,056 Actuarial (gain) loss 7,403 6,404 Benefits paid (7,311) (7,715) Divestiture — — Curtailment (6,653) —Benefit obligation at end of year 47,607 50,974
Change in plan assets: Fair value of plan assets — — at beginning of year Employer contributions 7,311 7,715 Benefits paid (7,311) (7,715)Fair value of assets at end of year — — Funded status $ (47,607) $ (50,974)
Included in accumulated other comprehensive loss are the following pre-tax amounts that have not yet been recognized in net periodic benefit cost:
(In thousands) January 2, January 3,Pension Benefits 2010 2009 Unrecognized net actuarial loss $ 352 $ 394Prior service cost 944 98Total $ 1,296 $ 492
(In thousands) January 2, January 3, Other Postretirement Benefits 2010 2009 Unrecognized net actuarial loss $ 9,362 $ 8,978
Net Periodic Benefit CostComponents of net periodic benefit cost for pension and postretirement benefit plans recognized in the Consolidated Statements of Income for the year ended January 2, 2010, January 3, 2009, and December 29, 2007 are as follows:
Year Ended (In thousands) January 2, January 3, December 29, Pension Benefits 2010 2009 2007 Service cost $ 364 $ 424 $ 423Interest cost 254 188 156Expected return on assets (181) (187) (182)Amortization of prior 10 9 — service costs Amortization of net loss 32 28 —Settlements 62 — —Net periodic benefit cost $ 541 $ 462 $ 397
NOTE J Profit-Sharing Plan, Pension Plan and Other Postretirement BenefitsThe Company has a profit-sharing plan covering most domestic employees with more than two years of service. The Company’s contribution is derived by a formula that resulted in contributions of approximately 12% of pre-tax earnings of participating companies. Profit sharing expense amounted to approximately $7.9 million in 2009, $16.5 million in 2008, and $17.1 million in 2007.
As a result of the acquisition of Reliance, the Company assumed defined benefit pension and postretirement benefit plans covering certain union employees and retirees. Estimated liabilities amounting to approximately $48.4 million at January 2, 2010 and $51.9 million at January 3, 2009 are included in other liabilities on the consolidated balance sheets.
During 2009, the number of participants in the Company’s defined benefit pension and postretirement benefit plans decreased as a result of plant restructuring. This reduction was accounted for as a curtailment. The curtailment resulted in adjustments of approximately $6.8 million to the estimated pension and postretirement liabilities and accumulated other comprehensive income.
The following table provides a reconciliation of the changes in the plans’ benefit obligations, assets and funded status at January 2, 2010 and January 3, 2009:
January 2, January 3, (In thousands) 2010 2009 Pension Benefits Change in benefit obligation: Benefit obligation at beginning $ 3,160 $ 3,697 of year Service cost 293 362 Interest cost 254 189 Actuarial (gain) loss 1,135 (300) Benefits paid (162) (119) Curtailment (167) — Settlements (247) — Translation 21 (669)Benefit obligation at end of year 4,287 3,160 Change in plan assets: Fair value of plan assets 2,185 3,160 at beginning of year Employer contributions 1,379 333 Benefits paid (162) (119) Actual return (loss) on assets 445 (573) Settlements (350) — Translation — (616)Fair value of assets at end of year 3,497 2,185 Funded status $ (790) $ (975)

32
A one-percentage point change in assumed healthcare cost trend rate would impact the postretirement benefit obligation and total service and interest cost by approximately $300,000 and $4.5 million, respectively.
The expected medical trend rate for 2010 is 9.00%.
ContributionsThe Company’s policy is to fund at least the minimum contribution required to meet applicable employee benefit tax laws. In the Company’s sole discretion, additional amounts may be funded from time to time. The Company currently expects to contribute $550,000 to the defined benefit pension plans in 2010 and expects to make contributions of approximately $4.3 million to the postretirement plan in 2010.
Estimated Future Benefit PaymentsThe following is a summary of expected future benefit payments: Other Pension Postretirement(In thousands) Benefits Benefits 2010 $ 131 $ 4,2842011 139 4,2412012 149 3,8492013 162 3,7362014 173 4,0022015 - 2019 1,053 18,789
NOTE K Stock PlansThe purpose of granting stock options and non-vested stock units is to encourage ownership in the Company. This provides an incentive for the participants to contribute to the success of the Company and aligns the interests of the participants with the interests of the shareholders of the Company. Historically, the Company has used newly-issued shares to fulfill stock option exercises. Once options are granted, the Company does not re-price any outstanding options. The 2006 Plan is the only Plan under which awards can be granted. When the 2006 Plan was adopted, the Company’s other stock plans were effectively cancelled except with respect to then outstanding grants and no further awards have since been or will be granted from those plans. In May 2009, shareholders approved an amendment to the 2006 Plan increasing the shares authorized by 1,500,000.
A summary of the Company’s stock plans and summary details about each Plan as of January 2, 2010, follows.
Shares TypicalPlan Authorized Current Plan Status Grant Life 1990 501,600 Cancelled in 2006; except for options outstanding 6 years1994 4,000,000 Cancelled in 2006; except for options outstanding 10 years1996 200,000 Expired in 2001; except for options outstanding 10 years2001 200,000 Cancelled in 2006; except for options outstanding 10 years2006 4,500,000 Active 10 years
(In thousands) Year Ended Other Postretirement January 2, January 3, December 29, Benefits 2010 2009 2007 Service cost $ 87 $ 134 $ 152Interest cost 3,107 3,056 2,674Expected return on assets — — —Amortization of prior — — — service costs Amortization of net loss 367 — —Net periodic benefit cost $ 3,561 $ 3,190 $ 2,826
The Company expects approximately $350,000, pre-tax, in accumulated other comprehensive income to be recognized as net periodic benefit cost related to amortization of net loss during 2010.
The Company has established a set of investment objectives related to the assets of the pension plans. The primary strategy is to maximize the long-term return on plan assets at an acceptable level of investment risk. For the international pension plan, the long-term investment target allocations are: 60% for equity securities, 35% for debt securities, and 5% for other including cash and cash equivalents. For the domestic pension plan, the investment allocation is 100% cash and cash equivalents. A majority (in excess of 80%) of the international pension assets are invested in the Montrusco Bolton Balanced Fund as of year-end 2009 and 2008. The weighted average asset allocation for the pension plan, by asset category, is as follows:
Percentage of Plan Assets Asset Category at Year-End 2009 2008 Equity securities 55% 63%Debt securities 29% 32%Cash 16% 5%Total 100% 100%
AssumptionsWeighted average assumptions are as follows:
Year Ended January 2, January 3, 2010 2009 Pension Benefits Discount rate to determine net periodic benefit cost 6.25% - 7.50% 5.75% - 6.25%Discount rate to determine benefit obligations 5.00% - 6.15% 6.25% - 7.50%Long-term rate of return on plan assets 6.75% 7.00%
Other Postretirement Benefits Discount rate to determine net periodic benefit cost 6.25% 6.25%Discount rate to determine benefit obligations 5.70% 6.25%Medical trend – current year 9.00% 9.00%Medical trend – ultimate year 2028 5.00% 5.50%
The Company establishes the expected long-term rate of return on plan assets by considering historical rates of return along with anticipated rates of return on the current investment mix.
33
A summary of non-vested stock unit activity under the Plans during 2009 is presented below:
Weighted-Average Grant-DateNon-vested Stock Units Shares Fair Value Per Unit Non-vested at January 3, 2009 141,368 $ 31.62Granted 74,072 13.38Vested (57,514) 36.28Forfeited (10,550) 23.57Non-vested at January 2, 2010 147,376 19.86
The total fair value of stock units vested during 2009, 2008, and 2007 was $854,000, $1.2 million, and $396,000, respectively.
As of January 2, 2010, there was $698,000 of total unrecognized compensation cost expected to be recognized over a weighted-average period of 1.0 year related to non-vested stock units granted under the Plans.
The fair value of options is estimated using a Black-Scholes option pricing formula and is amortized to expense over the options’ applicable vesting periods. Listed in the table below are the weighted-average assumptions for those options granted in the period indicated.
Year Ended January 2, January 3, December 29, 2010 2009 2007 Volatility 37.3% 28.1% 25.2%Risk-free interest rates 2.4% 3.0% 5.1%Dividend yields 4.1% 2.5% 1.5%Expected option life 6.3 years 6.0 years 6.4 years
NOTE L Earnings Per ShareThe table below details earnings per common share for the years indicated:
(In thousands, except per share data) 2009 2008 2007 Numerator: Net income $ 59,796 $ 99,423 $ 94,102Denominator Reconciliation: Weighted-average shares – basic 46,519 46,158 44,674 Effect of dilutive securities – Stock options and non-vested stock units 297 181 568 Weighted-average shares – diluted 46,816 46,339 45,242
Earnings per common share – basic $ 1.29 $ 2.15 $ 2.11Earnings per common share – diluted $ 1.28 $ 2.15 $ 2.08
The total number of anti-dilutive securities excluded from the above calculations was 2,083,763 at January 2, 2010, 1,494,369 at January 3, 2009, and 439,816 at December 29, 2007.
1990 Plan: Only non-qualified options were granted from this Plan. Options vest and become 50% exercisable at the end of one year and 100% exercisable at the end of two years. All outstanding stock options granted under this Plan are currently exercisable.
1994 Plans: Incentive stock options vest and become fully exercisable with continued employment of six months for officers and three years for non-officers. Restrictions on non-qualified stock options lapsed after a period of five years or earlier under certain circumstances. All outstanding stock options granted under these plans are currently exercisable.
1996 and 2001 Plans: Each non-employee director was granted an annual grant consisting of non-qualified stock options to purchase: (1) 3,240 shares at a price equal to the market value at date of grant, and (2) 2,160 shares at a price equal to 50% of the market value at date of grant. These options immediately vested and became exercisable on the date of grant.
2006 Plan: Awards granted under the 2006 Plan have included: incentive stock options, non-qualified stock options, and non-vested stock units. Non-vested stock units were awarded with no exercise price. Other awards permitted under this Plan include stock appreciation rights, restricted stock, and performance awards; however, no such awards have been granted. Option re-pricing is not permitted.
A summary of option activity under the Plans during 2009 is presented below:
Weighted- Weighted- Average Average Remaining Aggregate Exercise Contractual Intrinsic Shares Price Term Value (In thousands)Outstanding at January 3, 2009 2,702,845 $ 31.11Granted 598,958 16.65 Exercised (95,805) 18.99 Expired (105,501) 23.17 Forfeited (54,060) 35.98 Outstanding at January 2, 2010 3,046,437 28.80 6.6 years $ 11,147Vested or expected to vest at January 2, 2010 2,998,430 28.83 6.6 years $ 10,903 Exercisable at January 2, 2010 1,715,773 28.12 5.3 years $ 4,289
The weighted-average grant-date fair value of options granted was $4.62 in 2009, $6.60 in 2008, and $13.62 in 2007. The total intrinsic value of options exercised was $865,000 in 2009, $2.2 million in 2008, and $4.8 million in 2007.
As of January 2, 2010, there was $4.1 million of total unrecognized compensation cost related to non-vested options granted under the Plans expected to be recognized over a weighted-average period of 1.3 years.

34
NOTE M Foreign OperationsThe Company’s foreign operations include both export sales and the results of its foreign subsidiaries in Canada, Europe, Australia, Far East, Mexico, and China. Consolidated sales, income before income taxes, and identifiable assets consist of the following:
(In thousands) 2009 2008 2007 Net Sales: United States Companies Domestic customers $ 1,253,342 $ 1,584,605 $ 1,509,586 Export customers 90,182 151,063 122,642 1,343,524 1,735,668 1,632,228Foreign Affiliates 180,548 219,011 192,671 $ 1,524,072 $ 1,954,679 $ 1,824,899
Income Before Income Taxes: United States Companies $ 85,661 $ 122,349 $ 124,982 Foreign Affiliates 15,453 29,920 22,181 $ 101,114 $ 152,269 $ 147,163
Long-Lived Assets: United States Companies $ 1,990,807 $ 2,052,269 $ 2,074,653 Foreign Affiliates 41,961 34,923 12,937 $ 2,032,768 $ 2,087,192 $ 2,087,590
Foreign currency gains and losses included in other income (loss) on the consolidated statements of income amounted to ($3.8) million in 2009, $3.8 million in 2008, and ($1.1) million in 2007.
NOTE N Sale of PropertyIn September 2008, the Company sold real property with a book value of $22.3 million. Proceeds from the sale totaled $30.7 million, of which $6.1 million was invested in the entity which acquired the real property. Due to continuing involvement in the property, no gain was recognized, the value of the real property remained on the consolidated balance sheets at January 3, 2009 and continued to be depreciated, and the proceeds were recorded as a liability in other accrued expenses on the consolidated balance sheets at January 3, 2009. During the third quarter of 2009, the Company sold its equity interest in the acquirer for $1.7 million, eliminating the Company’s continuing involvement in the property. As a result, the property, related liability and equity investment were removed from the balance sheet and a net gain of $3.7 million was recognized in income from continuing operations in 2009.
NOTE 0 Fair Value MeasuresFair value is generally determined based on the exchange price that would be received for an asset or paid to transfer a liability (an exit price) in the principal or most advantageous market for the asset or liability in an orderly transaction between market participants on the measurement date. The fair value hierarchy categorizes the inputs used in valuation techniques into three levels as follows:
Level 1 – Quoted prices in active markets for identical assets or liabilities.
Level 2 – Observable inputs other than Level 1 prices such as quoted prices for similar assets or liabilities; quoted prices in markets that are not active; or other inputs that are observable or can be corroborated by observable market data for substantially the full term of the assets or liabilities.
Level 3 – Unobservable inputs that are supported by little or no market activity, but which are significant to the fair value of the assets or liabilities as determined by market participants.
Assets (liabilities) measured at fair value on a recurring basis are summarized below:
Fair Value Measurements (In thousands) as of January 2, 2010 Level 1 Level 2 Level 3 Total Interest rate swap $ — $ (16,608) $ — $ (16,608)Interest rate collar — (5,361) — (5,361)Copper swaps 17,386 — — 17,386Total $ 17,386 $ (21,969) $ — $ (4,583)
The Company’s methods and assumptions used to estimate the fair value of debt include quoted market prices (level 1) for fixed rate debt and other quoted prices (level 2) for variable rate debt. The carrying amounts and estimated fair values of the Company’s long-term debt at January 2, 2010 are summarized below:
(In thousands) Carrying Value Estimated Fair Value Senior notes $ 550,000 $ 567,188Term loan $ 611,789 $ 612,168
The carrying amounts of cash and cash equivalents, receivables, and trade payables at January 2, 2010, approximate their fair value due to the short term maturity of these instruments.
NOTE P Restructuring ChargesIn April 2009, the Company announced a plan to consolidate manufacturing operations of its Ft. Mill, SC and Columbus, IN plants into other existing plants in the United States. Both restructurings are part of manufacturing integration resulting from the Company’s 2007 acquisition of Reliance Electric. The Company incurred one-time restructuring charges of approximately $5.0 million during 2009. These charges are included in cost of goods sold in the consolidated statements of income.
A summary of the restructuring costs is below: Costs Estimated YTD Remaining at Total January 2, January 2, (In thousands) Cost 2010 2010 One-time termination costs $ 2,823 $ 2,823 $ —Employee relocation costs 104 104 —Transportation costs 2,100 2,100 —Total $ 5,027 $ 5,027 $ —
Included in other current assets are long-lived assets amounting to $2.0 million that have been classified as held for sale. The assets are recorded at net book value as it is lower than fair value less cost to sale.
35
NOTE R Summary of Quarterly Results of Operations (Unaudited)
Quarter (In thousands, except per share data) First Second Third Fourth 2009: Net sales $ 402,479 $ 384,678 $ 380,448 $ 356,413 Gross profit 116,426 109,222 114,969 102,359 Net income 36,418 7,795 12,592 2,988 Net earnings per common share – basic 0.79 0.17 0.27 0.06 Net earnings per common share – diluted 0.79 0.17 0.27 0.06 2008: Net sales $ 470,526 $ 503,973 $ 506,154 $ 474,022 Gross profit 143,723 152,846 146,754 134,973 Net income 25,639 29,372 25,810 18,601 Net earnings per common share – basic 0.56 0.64 0.56 0.40 Net earnings per common share – diluted 0.56 0.63 0.55 0.40
•2008includesresultsofoperationsofMaskabeginningAugust30,2008. •Allquarterspresentedcontain13weekswiththeexceptionoffourthquarter2008,whichhas14weeks. •First quarter 2009 includes $21.6 million, net of tax, related to the gain on debt modification.
to evaluate the nature and financial effects of the business combination. The Company adopted the guidance at the beginning of 2009.
In March 2008, the FASB issued guidance that expands disclosure requirements about how derivative and hedging activities affect an entity’s financial position, financial performance, and cash flows. It became effective for fiscal years beginning after November 15, 2008; therefore, the Company adopted the guidance during the first quarter of fiscal 2009. See Note C, Financial Derivatives, of the Notes to Consolidated Financial Statements for required disclosures.
In May 2009, the FASB issued guidance which establishes general standards of accounting for and disclosure of events that occur after the balance sheet date but before financial statements are issued. It became effective on a prospective basis for interim or annual financial periods ending after June 15, 2009 and the adoption did not have a material impact on the consolidated financial statements and disclosures.
NOTE Q Recently Issued Accounting PronouncementsIn September 2006, the Financial Accounting Standards Board (FASB) issued guidance that establishes a framework for measuring fair value in U.S. generally accepted accounting principles and expands disclosures about fair value measurements. In February 2008, the FASB issued guidance that delayed the effective date for nonfinancial assets and liabilities, except for those recognized or disclosed at fair value on a recurring basis. The Company adopted the guidance at the beginning of 2009 and the adoption did not have a material impact on the consolidated financial statements.
In December 2007, the FASB issued guidance that establishes principles and requirements on how an acquirer recognizes and measures in its financial statements identifiable assets acquired, liabilities assumed, non-controlling interest in the acquiree, goodwill or gain from a bargain purchase and accounting for transaction costs. Additionally, the guidance determines what information must be disclosed to enable users of the financial statements
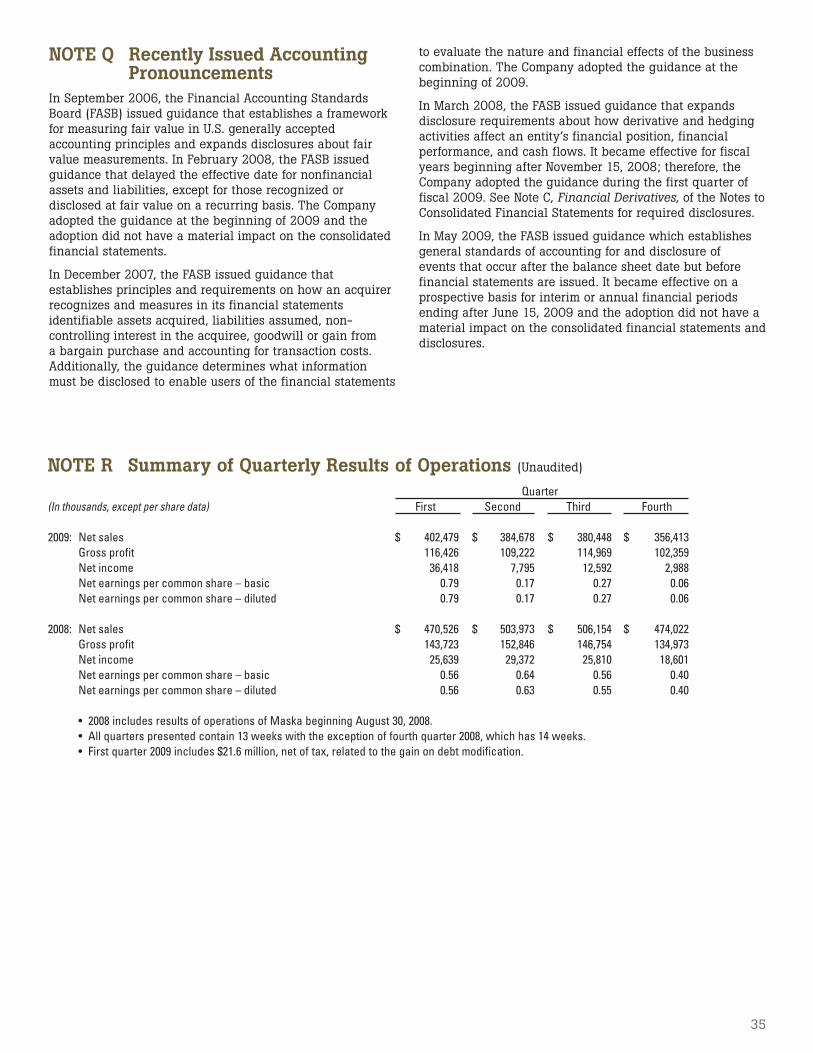
35
NOTE R Summary of Quarterly Results of Operations (Unaudited)
Quarter (In thousands, except per share data) First Second Third Fourth 2009: Net sales $ 402,479 $ 384,678 $ 380,448 $ 356,413 Gross profit 116,426 109,222 114,969 102,359 Net income 36,418 7,795 12,592 2,988 Net earnings per common share – basic 0.79 0.17 0.27 0.06 Net earnings per common share – diluted 0.79 0.17 0.27 0.06 2008: Net sales $ 470,526 $ 503,973 $ 506,154 $ 474,022 Gross profit 143,723 152,846 146,754 134,973 Net income 25,639 29,372 25,810 18,601 Net earnings per common share – basic 0.56 0.64 0.56 0.40 Net earnings per common share – diluted 0.56 0.63 0.55 0.40
•2008includesresultsofoperationsofMaskabeginningAugust30,2008. •Allquarterspresentedcontain13weekswiththeexceptionoffourthquarter2008,whichhas14weeks. •Firstquarter2009includes$21.6million,netoftax,relatedtothegainondebtmodification.
to evaluate the nature and financial effects of the business combination. The Company adopted the guidance at the beginning of 2009.
In March 2008, the FASB issued guidance that expands disclosure requirements about how derivative and hedging activities affect an entity’s financial position, financial performance, and cash flows. It became effective for fiscal years beginning after November 15, 2008; therefore, the Company adopted the guidance during the first quarter of fiscal 2009. See Note C, Financial Derivatives, of the Notes to Consolidated Financial Statements for required disclosures.
In May 2009, the FASB issued guidance which establishes general standards of accounting for and disclosure of events that occur after the balance sheet date but before financial statements are issued. It became effective on a prospective basis for interim or annual financial periods ending after June 15, 2009 and the adoption did not have a material impact on the consolidated financial statements and disclosures.
NOTE Q Recently Issued Accounting PronouncementsIn September 2006, the Financial Accounting Standards Board (FASB) issued guidance that establishes a framework for measuring fair value in U.S. generally accepted accounting principles and expands disclosures about fair value measurements. In February 2008, the FASB issued guidance that delayed the effective date for nonfinancial assets and liabilities, except for those recognized or disclosed at fair value on a recurring basis. The Company adopted the guidance at the beginning of 2009 and the adoption did not have a material impact on the consolidated financial statements.
In December 2007, the FASB issued guidance that establishes principles and requirements on how an acquirer recognizes and measures in its financial statements identifiable assets acquired, liabilities assumed, non-controlling interest in the acquiree, goodwill or gain from a bargain purchase and accounting for transaction costs. Additionally, the guidance determines what information must be disclosed to enable users of the financial statements

36
Report of Independent Registered Public Accounting FirmThe Board of Directors and Shareholders of Baldor Electric Company
We have audited Baldor Electric Company’s internal control over financial reporting as of January 2, 2010, based on criteria established in Internal Control – Integrated Framework issued by the Committee of Sponsoring Organizations of the Treadway Commission (the COSO criteria). Baldor Electric Company’s management is responsible for maintaining effective internal control over financial reporting, and for its assessment of the effectiveness of internal control over financial reporting included in the accompanying Report of Management on Internal Control Over Financial Reporting. Our responsibility is to express an opinion on the company’s internal control over financial reporting based on our audit.
We conducted our audit in accordance with the standards of the Public Company Accounting Oversight Board (United States). Those standards require that we plan and perform the audit to obtain reasonable assurance about whether effective internal control over financial reporting was maintained in all material respects. Our audit included obtaining an understanding of internal control over financial reporting, assessing the risk that a material weakness exists, testing and evaluating the design and operating effectiveness of internal control based on the assessed risk, and performing such other procedures as we considered necessary in the circumstances. We believe that our audit provides a reasonable basis for our opinion.
A company’s internal control over financial reporting is a process designed to provide reasonable assurance regarding the reliability of financial reporting and the preparation of financial statements for external purposes in accordance with generally accepted accounting principles. A company’s internal control over financial reporting includes those policies and procedures that (1) pertain to the maintenance of records that, in reasonable detail, accurately and fairly reflect the transactions and dispositions of the assets of the company; (2) provide reasonable assurance that transactions are recorded as necessary to permit preparation of financial statements in accordance with generally accepted accounting principles, and that receipts and expenditures of the company are being made only in accordance with authorizations of management and directors of the company; and (3) provide reasonable assurance regarding prevention or timely detection of unauthorized acquisition, use or disposition of the company’s assets that could have a material effect on the financial statements.
Because of its inherent limitations, internal control over financial reporting may not prevent or detect misstatements. Also, projections of any evaluation of effectiveness to future periods are subject to the risk that controls may become inadequate because of changes in conditions, or that the degree of compliance with the policies or procedures may deteriorate.
In our opinion, Baldor Electric Company maintained, in all material respects, effective internal control over financial reporting as of January 2, 2010, based on the COSO criteria.
We also have audited, in accordance with the standards of the Public Company Accounting Oversight Board (United States), the consolidated balance sheets of Baldor Electric Company as of January 2, 2010 and January 3, 2009, and the related consolidated statements of income, shareholders’ equity, and cash flows for each of the three years in the period ended January 2, 2010, and our report dated March 3, 2010 expressed an unqualified opinion thereon.
Tulsa, OklahomaMarch 3, 2010
37
Report of Independent Registered Public Accounting FirmThe Board of Directors and Shareholders of Baldor Electric Company
We have audited the accompanying consolidated balance sheets of Baldor Electric Company as of January 2, 2010 and January 3, 2009, and the related consolidated statements of income, shareholders’ equity, and cash flows for each of the three years in the period ended January 2, 2010. These financial statements are the responsibility of the Company’s management. Our responsibility is to express an opinion on these financial statements based on our audits.
We conducted our audits in accordance with the standards of the Public Company Accounting Oversight Board (United States). Those standards require that we plan and perform the audit to obtain reasonable assurance about whether the financial statements are free of material misstatement. An audit includes examining, on a test basis, evidence supporting the amounts and disclosures in the financial statements. An audit also includes assessing the accounting principles used and significant estimates made by management, as well as evaluating the overall financial statement presentation. We believe that our audits provide a reasonable basis for our opinion.
In our opinion, the financial statements referred to above present fairly, in all material respects, the consolidated financial position of Baldor Electric Company at January 2, 2010 and January 3, 2009, and the consolidated results of its operations and its cash flows for each of the three years in the period ended January 2, 2010, in conformity with U.S. generally accepted accounting principles.
As described in Note E to the consolidated financial statements, the Company adopted a new accounting principle related to accounting for uncertain income tax positions in 2007.
We also have audited, in accordance with the standards of the Public Company Accounting Oversight Board (United States), Baldor Electric Company’s internal control over financial reporting as of January 2, 2010, based on criteria established in Internal Control – Integrated Framework issued by the Committee of Sponsoring Organizations of the Treadway Commission and our report dated March 3, 2010, expressed an unqualified opinion thereon.
Tulsa, OklahomaMarch 3, 2010

38
Report of Management on Responsibility for Financial Reporting
Management is responsible for the integrity and objectivity of the financial information contained in this annual report. The accompanying financial statements have been prepared in conformity with accounting standards generally accepted in the United States, applying informed judgments and estimates where appropriate.
The Audit Committee of the Board of Directors is composed solely of independent outside directors and is responsible for recommending to the Board the independent registered public accounting firm to be retained for the coming year. The Audit Committee meets regularly with the independent registered public accounting firm, with Audit Services, as well as with Baldor management, to review accounting, auditing, internal accounting controls, and financial reporting matters. The independent registered public accounting firm, Ernst & Young LLP, and Audit Services have direct access to the Audit Committee without the presence of management to discuss the results of their audits.
JOHN A. MCFARLANDChairman and Chief Executive Officer
GEORGE E. MOSCHNERChief Financial Officer and Secretary
39
Report of Management on Internal Control over Financial Reporting
Management is responsible for establishing and maintaining adequate internal control over financial reporting, as such term is defined in Exchange Act Rule 13a-15(f) and 15d-15(f). We maintain a system of internal controls that provide reasonable assurance that transactions are executed in accordance with management’s authorization and recorded properly to permit the preparation of consolidated financial statements in accordance with accounting principles generally accepted in the United States and that assets are safeguarded from unauthorized use or disposition.
We conducted an evaluation of the effectiveness of our internal control over financial reporting based on the framework in Internal Control – Integrated Framework issued by the Committee of Sponsoring Organizations of the Treadway Commission. This assessment included review of the documentation of controls, assessment of the design effectiveness of the controls, testing of the operating effectiveness of controls, and a conclusion on this assessment. Although there are inherent limitations in the effectiveness of any system of internal controls over financial reporting, based on our assessment, we have concluded that our internal control over financial reporting was effective as of January 2, 2010.
The Company’s independent registered public accounting firm, Ernst & Young LLP, has audited the financial statements included in this Form 10-K and has issued an attestation report on the Company’s internal controls over financial reporting.
JOHN A. MCFARLANDChairman and Chief Executive Officer
GEORGE E. MOSCHNERChief Financial Officer and Secretary

40
Officers John A. McFarland Chairman and Chief Executive Officer
Ronald E. Tucker President and Chief Operating Officer
George E. Moschner Chief Financial Officer and Secretary
Randall P. Breaux Vice President - Marketing
Roger V. Bullock Vice President - Drives Sales
Randy L. Colip Executive Vice President - Sales
Bryant G. Dooly, Jr. Treasurer and Controller
Yvon Fortier Vice President - Maska
Jason W. Green Vice President - Human Resources
Gene J. Hagedorn Executive Vice President - Materials
Jeffrey R. Hubert Vice President - Generators
Larry L. Johnston, Jr. Vice President - Audit Services
Amy Lakin Vice President - Materials
Tracy L. Long Vice President - Investor Relations
Thomas A. Mascari Vice President - Drives
Robert S. Nemecek Vice President - Dodge Marketing
William P. Pizzichil Vice President - Engineering
L. Edward Ralston Executive Vice President
William K. Ramsbey Vice President - Manufacturing
Mark L. Shackelford Vice President - Information Services
R. Wayne Thurman Executive Vice President - Engineering
Randal G. Waltman Executive Vice President - Manufacturing
Board of DirectorsJohn A. McFarland Chairman and Chief Executive Officer
Ronald E. Tucker President and Chief Operating Officer
Jefferson W. Asher, Jr. Independent Management Consultant
Merlin J. Augustine, Jr. Founder and CEO of M&N Augustine Foundation for Human Development, Inc. Former Assistant Vice Chancellor of Finance and Administration and Director of Customer Relations at the University of Arkansas in Fayetteville
Richard E. Jaudes Partner at Thompson Coburn LLP, Attorneys at Law
Jean A. Mauldin Vice President and Chief Financial Officer of TAMKO Building Products Former Chief Financial Officer of Merial, Limited
Robert J. Messey Director of Stereotaxis, Inc. (NASDAQ:STXS) Former Senior Vice President and Chief Financial Officer of Arch Coal, Inc.
Robert L. Proost Financial Consultant and Lawyer Former Corporate Vice President, Chief Financial Officer, & Director of Administration of A. G. Edwards & Sons, Inc.
R. L. Qualls Independent Business and Financial Consultant Director of Bank of the Ozarks, Inc. (NASDAQ:OZRK)
Barry K. Rogstad Independent Business Consultant Former President of American Business Conference
Shareholder Information
Dividends PaidThe terms of our senior secured credit facility and the indenture for the senior unsecured notes limit our ability to increase dividends above a certain amount to the holders of our common stock. Quarterly dividend rates per share paid for fiscal years 2009, 2008, and 2007 are listed in the table below. 2009 2008 20071st quarter $ 0.17 $ 0.17 $ 0.172nd quarter 0.17 0.17 0.173rd quarter 0.17 0.17 0.174th quarter 0.17 0.17 0.17Year $ 0.68 $ 0.68 $ 0.68
Common Stock Price RangeAs reported by the NYSE, the high and low composite sale prices per share for our common stock for each quarterly period during the past two fiscal years are listed below.
2009 2008 HIGH LOW HIGH LOW1st quarter $ 20.26 $ 10.21 $ 34.26 $ 24.082nd quarter 26.24 16.41 39.89 25.513rd quarter 30.58 20.66 39.90 30.454th quarter 30.82 24.97 30.60 10.71
ShareholdersAt January 30, 2010, there were 2,002 shareholders of record.
Shareholders’ Annual MeetingThe Company’s Annual Meeting of Shareholders will be held at 10:30 a.m. local time, Saturday, May 1, 2010, at the Fort Smith Convention Center in Fort Smith, Arkansas.
Independent Registered Public Accounting FirmErnst & Young LLP1700 One Williams CenterTulsa, Oklahoma 74172General CounselThompson Coburn LLPOne US Bank PlazaSt. Louis, Missouri 63101CertificationsThe Company has filed the Chief Executive Officer and Chief Financial Officer certifications required by Section 302 of the Sarbanes-Oxley Act in its Form 10-K. Additionally, the Chief Executive Officer has provided the required annual certifications to the New York Stock Exchange.Corporate DocumentsBaldor’s Form 10-K is filed with the Securities and Exchange Commission and the NYSE. Copies of the Form 10-K, Code of Ethics for Certain Executives, and certain other corporate governance documents are available, without charge, upon request to Baldor’s Investor Relations Department. Please refer to the contact information under “Investor Relations”. These documents can also be viewed in the Investor Relations portion of Baldor’s corporate website at www.baldor.com.
This annual report is printed on recycled paper using soy-based inks.
TickerBaldor’s common stock trades on the New York Stock Exchange (NYSE) with the ticker symbol BEZ.
Investor InformationTo request additional copies of the Annual Report to Shareholders, or other materials and information about Baldor Electric Company, please contact us at:Attn: Investor RelationsBaldor Electric CompanyP. O. Box 2400Fort Smith, Arkansas 72902Phone: (479) 648-5769Fax: (479) 648-5701Email: [email protected]: www.baldor.comTransfer Agent and RegistrarContinental Stock Transfer & Trust Company17 Battery Place, 8th FloorNew York, New York 10004Toll-free: (800) 509-5586Phone: (212) 509-4000 Fax: (212) 509-5150Internet: www.continentalstock.com

Baldor Electric CompanyWorld Headquarters
P.O. Box 2400Fort Smith, Arkansas 72902www.baldor.com©2010 Baldor Electric Company