Embed Size (px)
Citation preview
ANNUAL REPORT 2009

CONTENTS
Highlights 0f 2009 ............................................... 1
Portfolio overview .............................................. 2
Administration report ......................................... 3
Consolidated statement of comprehensive income .................................. 8
Consolidated statement of financial position ............................................ 9
Parent Company income statement ................ 11
Parent Company balance sheet ....................... 12
Consolidated statement of changes in equity ......................................... 13
Parent Company statement of changes in equity ......................................... 14
Cash flow statement ......................................... 15
Notes .................................................................. 16
Audit report ...................................................... 39
Corporate governance report .......................... 40
Board of Directors ............................................. 43
Give-year overview ........................................... 44
Definitions ......................................................... 45
SHAREHOLDER INFORMATION
Financial calendar 2010Interim report January – March 28 AprilAnnual General Meeting 28 AprilInterim report January – June 24 AugustInterim report January – September 29 October
Distribution policyBure’s annual report is sent by mail to all persons who so request. Interim reports are distributed only in digital form. To subscribe, go to www.bure.se/alertme
Investor Relations/Shareholder contactAndreas Berglin, +46 8-614 00 [email protected]
Contact Bure Equity ABAddress: Nybrogatan 6, SE-114 34 StockholmTel: +46 8-614 00 20Fax: +46 8-614 00 38E-mail: [email protected]: www.bure.se
Annual General Meeting of Bure Equity AB (publ)The Annual General Meeting will be held on Wednesday, 28 April 2010, 3:00 p.m. at Filmstaden Bergakungen, Skånegatan 16, Göteborg. The doors will open at 2:00 p.m.
ParticipationShareholders who wish to participate in the meeting must be entered in their own names in the register of shareholders maintained by Euroclear Sweden AB (formerly VPC AB) no later than Thursday, 22 April 2010.
In order to participate in the AGM, shareholders whose shares are registered in the name of a nominee must temporarily re-register the shares in their own names with Euroclear Sweden AB (formerly VPC). Shareholders must notify their nominees well in advance to ensure that an entry is made in the register of shareholders by Thursday, 22 April 2010.
NotificationNotice of participation must be received by Bure no laterthan 12:00 p.m. on Thursday, 22 April 2010, via:Mail: Bure Equity, Mässans gata 8, SE-412 51 GöteborgE-mail: [email protected]: www.bure.seTel: +46 31-708 64 39Fax: +46 31-708 64 82
The notification should include the shareholder’s name, personal/ corporate ID number, address and telephone number. Shareholders who wish to be represented by a proxy must submit a dated form of proxy. The original proxy document must be sent to the company at the above address well in advance of the AGM. Persons representing a legal entity must enclose a copy of the registration certificate or other appropriate document.
An entrance card will be sent by mail after Thursday, 22 April 2010.
BURE’S ANNUAL REPORT 2009, 1
HIGHLIGHTS OF 2009
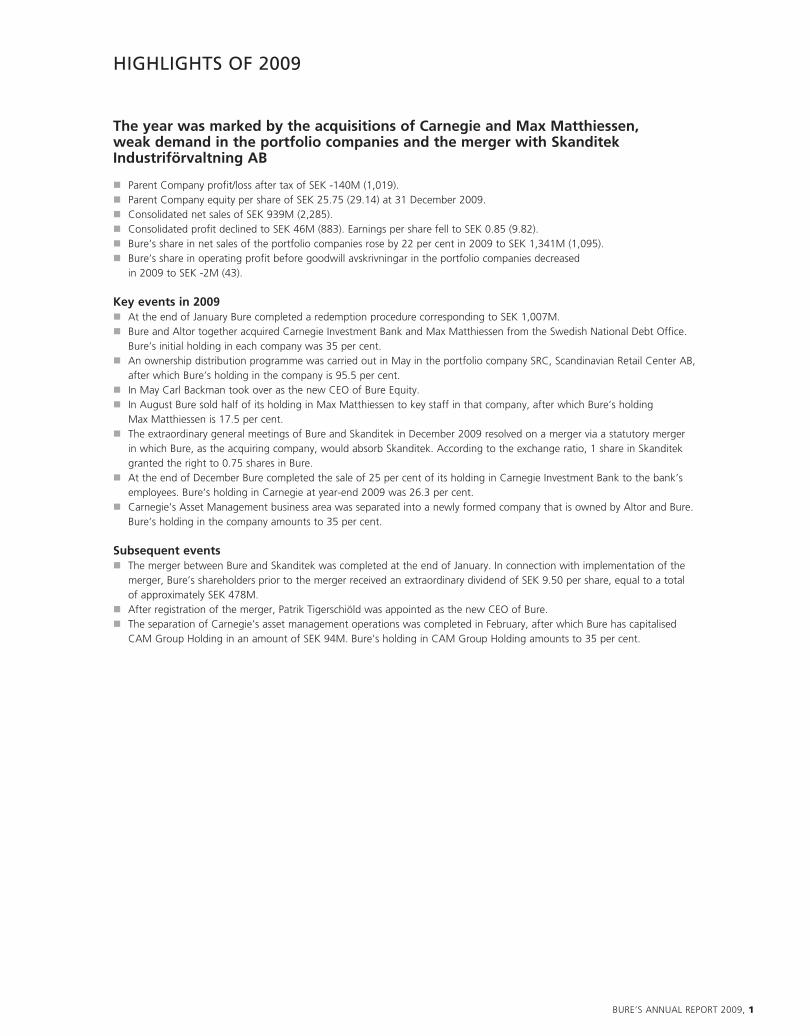
The year was marked by the acquisitions of Carnegie and Max Matthiessen, weak demand in the portfolio companies and the merger with Skanditek Industriförvaltning AB
Parent Company profit/loss after tax of SEK -140M (1,019). Parent Company equity per share of SEK 25.75 (29.14) at 31 December 2009. Consolidated net sales of SEK 939M (2,285). Consolidated profit declined to SEK 46M (883). Earnings per share fell to SEK 0.85 (9.82). Bure’s share in net sales of the portfolio companies rose by 22 per cent in 2009 to SEK 1,341M (1,095). Bure’s share in operating profit before goodwill avskrivningar in the portfolio companies decreased
in 2009 to SEK -2M (43).
Key events in 2009 At the end of January Bure completed a redemption procedure corresponding to SEK 1,007M. Bure and Altor together acquired Carnegie Investment Bank and Max Matthiessen from the Swedish National Debt Office.
Bure’s initial holding in each company was 35 per cent. An ownership distribution programme was carried out in May in the portfolio company SRC, Scandinavian Retail Center AB,
after which Bure’s holding in the company is 95.5 per cent. In May Carl Backman took over as the new CEO of Bure Equity. In August Bure sold half of its holding in Max Matthiessen to key staff in that company, after which Bure’s holding
Max Matthiessen is 17.5 per cent. The extraordinary general meetings of Bure and Skanditek in December 2009 resolved on a merger via a statutory merger
in which Bure, as the acquiring company, would absorb Skanditek. According to the exchange ratio, 1 share in Skanditek granted the right to 0.75 shares in Bure. At the end of December Bure completed the sale of 25 per cent of its holding in Carnegie Investment Bank to the bank’s
employees. Bure’s holding in Carnegie at year-end 2009 was 26.3 per cent. Carnegie’s Asset Management business area was separated into a newly formed company that is owned by Altor and Bure.
Bure’s holding in the company amounts to 35 per cent.
Subsequent events The merger between Bure and Skanditek was completed at the end of January. In connection with implementation of the
merger, Bure’s shareholders prior to the merger received an extraordinary dividend of SEK 9.50 per share, equal to a total of approximately SEK 478M. After registration of the merger, Patrik Tigerschiöld was appointed as the new CEO of Bure. The separation of Carnegie’s asset management operations was completed in February, after which Bure has capitalised
CAM Group Holding in an amount of SEK 94M. Bure’s holding in CAM Group Holding amounts to 35 per cent.

2, BURE’S ANNUAL REPORT 2009
PARENT COMPANY HOLDINGS AT 31 DECEMBER 2009
Unlisted holdings
% ofcapital
% ofvotes
Book value,SEK M
Carnegie (ABCIB Holding)2 26.25 26.25 398
Mercuri International1 100.00 100.00 200
EnergoRetea1 94.45 94.45 104
Max Matthiessen (MM Holding)3 17.51 23.34 4
SRC, Scandinavian Retail Center 1 95.50 95.50 12
Celemi 30.37 30.37 9
Other dormant companies 100.00 100.00 8
Total 735
Other net assets according to the Parent Company balance sheet 561
Equity in the Parent Company 1,296
Equity per share divided between 50,348,808 shares 25.75
1 Ownership distribution programmes have been carried out in the subsidiaries Mercuri, EnergoRetea and SRC. See also information about dilution on page 36.
2 The book value of Carnegie includes Bure’s 35 per cent share (SEK 184M) in the commitment for future purchase consideration to the Swedish National Debt Office. In addition,
there are receivables with a book value of SEK 33M in a company owned by the employees in Carnegie.
3 Aside from the book value of the shares in Max Matthiessen, there are receivables amounting to SEK 2M. In addition, there are receivables of SEK 26M på a company owned by
key staff in Max Matthiessen. Bure’s mathematical share in profit is approximately 12 per cent due to profit-sharing agreements.
Comments on the table:The bulk of Bure’s investments consist of unlisted holdings, which means that excess values are not recognised. Unlisted companies are carried continuously at book value. The readers are instead given the opportunity to form their own opinions on the value of the respective holdings based on the provided information about the earnings and financial positions of the individual portfolio companies.
Bure performs ongoing cash flow valuations of all its holdings to determine the need for adjustment of book values. If a discounted cash flow valuation indicates a value that shows that the market value of a holding has fallen below its carrying amount, an impairment loss is recognised. Correspondingly, a previous impairment loss may be reversed if the value of the holding is recovered. For obvious reasons, a more critical assess-ment is made before deciding to reverse a value.
Valuation of a company is always uncertain, since it is based on an assessment of future development. The values determined in the cash flow valuations are based on the management’s estimates of the future cash flows generated in the respective portfolio company.
Bure’s portfolio companies in 2009:
PORTFOLIO OVERVIEW

BURE’S ANNUAL REPORT 2009, 3
ADMINISTRATION REPORT
The Board of Directors and the President of Bure Equity AB(publ), corporate identification number 556454-8781, domiciled in Stockholm, Sweden, hereby submit the annual report and consolidated accounts for the 2009 financial year.
Operations and focusBure Equity AB is an investment company whose mission is to acquire, develop and divest operating companies in a way that gives Bure’s shareholders a good return on invested capital through access to a portfolio of professionally managed companies.
Parent Company profit and financial positionResults for the full yearThe Parent Company’s profit/loss after tax for the full year was SEK -140M (1,019), including exit gains of SEK 22M (812). Reversals amounted to SEK 0M (170) and impairment losses in the portfolio companies to SEK 185M (0), of which the latter is divided between SEK 158M for shares in Mercuri and SEK 26M for shares in Max Matthiessen. Administrative expenses totalled SEK 37M (38). Costs for bonuses are included in an amount of SEK 1M (4). In addition, costs of SEK 4M were recognised in connection with the previous change of CEO in 2009. Profit was charged with personnel and other costs relating to the merger with Skanditek in a total amount of SEK 14M. The Parent com-pany’s net financial items are reported at SEK 51M (75). Net financial items were positively affected by a total amount of SEK 34M attributable to group contributions received less impairment losses in dormant subsidiaries. Return on cash and cash equivalents was 2.1 per cent.
Financial positionEquity in the Parent Company at the end of the period totalled SEK 1,296M (2,445) and the equity/assets ratio was 80 per cent (98). The Parent Company’s cash and cash equivalents and short-term investments at 31 December 2009 amounted to SEK 633M (1,814). At the end of the period the Parent Company had a reported net loan receivable of SEK 663M (1,848), which had a positive impact on net financial items. The composition of the net loan receivable is shown in the table below.
Placement of excess liquidityBure may normally place excess liquidity in fixed-income invest-ments secured by collateral with counterparties such as the Swedish Government, Swedish banks or Swedish residential mortgage institutions. Furthermore, an investment advisor appointed by the Bure’s Board may decide on certain alternative investments. At year-end 2009, SEK 550M was placed in short-term deposits in Swedish banks and the remaining SEK 83M in bank accounts.
Composition of net loan receivable
Net loan receivable/debtSEK M
31 Dec2009
31 Dec2008
Interest-bearing assets
Receivables from subsidiaries 39 43
Other interest-bearing receivables 79 19
Cash and cash equivalents 633 1,814
751 1,876
Interest-bearing liabilities
Liabilities to subsidiaries 88 28
88 28
Net loan receivable 663 1,848
InvestmentsCarnegieIn May Bure, together with Altor Fund III, acquired Carnegie Investment Bank AB (“Carnegie”) from the Swedish National Debt Office via the newly formed holding companies, ABCIB Holding AB and CIBVESTCO AB. Bure’s holding was initially 35 per cent and purchase consideration amounted to SEK 307M, of which SEK 252M in shares and SEK 55M in loans. In addition, Bure has committed itself to pay SEK 184M plus interest, equal to Bure’s share before ownership distribution (35 per cent) of the future base purchase price to the Swedish National Debt Office in April 2010. This has taken place through a conditional share-holder contribution to Carnegie in the same amount, which means that SEK 184M has been capitalised in Bure’s balance sheet. Under the agreement, the contribution will be repaid to Bure before the ordinary dividend in Carnegie. In connection with the acquisition of Carnegie, a letter of intent was signed for a distribution of ownership to the employees in Carnegie. In November the ownership distribution was completed and Bure sold 25 per cent of ABCIB Holding to some 250 individuals in Carnegie. The transaction was carried out at the same price at which Altor and Bure acquired ABCIB Holding AB. The sale was carried out indirectly via the holding in CIBVESTCO (20 per cent) and directly in ABCIB Holding (5 per cent). Bure’s holding in Carnegie at the end of the year was 26.3 per cent and Bure’s invested capital in Carnegie after distribution of ownership to the employees amounts to SEK 247M, divided between SEK 214M in shares and SEK 33M in loans
In December Carnegie decided to separate its operations in the Asset Management business area into a new holding company, CAM G roup Holding A/S, with Altor and Bure as principal own-ers. The separation took place at year-end 2009 and includes asset management operations in Denmark, Norway and Sweden. As a result of transaction, it was necessary for Bure to capitalise the new holding company in an amount of approximately SEK 94M at the beginning of 2010. Bure’s holding in CAM Group Holding A/S amounts to 35 per cent.
Max MatthiessenIn May Bure, together with Altor Fund III, acquired Max Matthiessen from the Swedish National Debt Office. Bure’s share of the investment was SEK 62M, divided between SEK 19M in shares and SEK 43M in loans. Bure’s holding on the acquisition date amounted to 35 per cent. The acquisition of Max Matthiessen was carried out via a newly formed holding company, MM Holding AB. In the same manner as in the Carnegie acquisition, a letter of intent was signed for a distribu-tion of ownership to key individuals in Max Matthiessen. The ownership distribution was carried out in August and 50 key staff acquired 50 per cent of Max Matthiessen through MM Holding at Bure’s book value. Bure’s holding at year-end 2009 was 17.5 per cent and its invested capital amounts to SEK 58M, divided between SEK 15M in shares and SEK 43M in loans. Bure’s mathematical share of profit in MM Holding is around 12 per cent with consideration to profit-sharing agreements.
Divestitures – exitsIn 2009 Bure carried out ownership distribution programmes to the employees in Carnegie and Max Matthiessen, see also under the heading ”Investments”. Bure also received conditional con-sideration of SEK 42.3M from the sale of Textilia in 2008.

4, BURE’S ANNUAL REPORT 2009
The capital gain arising from the conditional consideration was SEK 22.2M. Bure has sold 4.5 per cent and issued purchase options equal 13.5 per cent of the company to key individuals in SRC, Scandinavian Retail Center.
Reported equity per shareEquity per share at the end of the year amounted to SEK 25.75, compared to SEK 29.14 at year-end 2008.
Merger between Bure and SkanditekAt the extraordinary general meetings in December 2009, the boards of Bure and Skanditek Industriförvaltning AB proposed a merger between the companies. The EGMs resolved in favour of the proposal and the merger was completed in January 2010. The merger is seen as a natural step in the development of both companies, whose combined resources will make the new com-pany a stronger player in the financial market. The merger was carried out in January 2010 through a statutory merger in which Bure, as the acquiring company, absorbed Skanditek. According to the exchange ratio, four shares in Skanditek grant the right to three new shares in Bure. In connection with the merger, an extraordinary cash dividend was paid to Bure’s shareholders prior to the merger in an amount of SEK 9.50 per share, equal to a total of SEK 478M. For additional information about the merger, see Note 15 ”Acquisitions and divestitures”.
Consolidated profit and financial position Results for the full yearConsolidated operating profit including discontinued operations for the full year was SEK 42M (859). Consolidated operating profit in continuing operations for the full year was SEK 19M (66).and included exit gains/losses of SEK -63M (8). Of total exit gains/losses, SEK -61 is attributable to the distribution of owner-ship in Carnegie. To a large extent, the exit losses in the Group due to the distribution of ownership are an accounting effect that is attributable to reversal of the negative goodwill that arose on the acquisition of Carnegie and thereby increased Bure’s share in profit and the consolidated value of the shares in Carnegie. The ownership distribution has had no impact on earn-ings in the Parent Company. Profit for the year was not affected by any reversals of previously recognised impairment losses (62). Profit was charged with total goodwill impairment losses of SEK 48M that are attributable to Mercuri. Of total operating profit/loss, SEK -60M (42) is attributable to profit in existing sub-sidiaries. Profit from subsidiaries discontinued or held for sale amounted to SEK 23M (793). Shares in profit/loss of associates amounted to SEK 227M, of which SEK 242M is attributable to Carnegie, SEK -14M to Max Matthiessen and SEK -1M to Celemi. The high share in profit from Carnegie is largely due to the reversal of the negative goodwill that arose on the acquisition of the company. The remaining profit consists of the Parent Company’s administrative expenses and group adjustments. Consolidated profit after financial items was SEK 27M (141).
Financial position Equity at the end of the period totalled SEK 1,497M (2,481) and the equity/assets ratio was 70 per cent (83). Equity per share was SEK 29.73 (29.56). At 31 December 2009 the Group had a reported net loan receivable of SEK 607M (1,892), which con-sisted of interest-bearing assets of SEK 794M (2,085) and interest-bearing liabilities of SEK 187M (193).
Bure’s loss carryforwardsAt year-end 2009 the Bure Group had preliminary loss carry-forwards of approximately SEK 720M, of which SEK 308M refers to the Parent Company. As of 2010, the loss carryforwards in the Parent Company will be suspended until the end of 2015 in respect of the merger between Bure and Skanditek. The loss carry forwards in the subsidiaries will be available to offset against taxable profits in certain wholly owned subsidiaries. The total deferred tax asset in the Group, which was valued at SEK 32M based on the outstanding loss carryforwards at year-end, corre-sponds to around SEK 120M of the total loss carryforwards.
The Group’s R&D activitiesThe Group currently conducts no research and development activities. R&D expenses have been charged to profit in an amount of SEK 0M (0).
Environmental impactThe Parent Company conducts no operations that require permits according to the Swedish Environmental Code.
Personnel and salariesInformation about the average number of employees, salaries and benefits of senior executives is shown in Notes 34–36.
Board of Directors and procedural plan Bure’s Board of Directors during 2009 has consisted of five members. The composition of the Board and information about the Board members and President is presented in the corporate governance report for 2009. The Parent Company’s CFO Jonas Alfredson has served as Board Secretary during the year. The work of the Board of Directors is governed by a procedural plan that was most recently adopted by the statutory meeting on 28 April 2009. The work of the Board follows a yearly plan with fixed decision points that is adopted every year in connection with the statutory meeting. The Board normally holds six meet-ings during the year, and meets more frequently when required. In the past financial year the Board held 18 meetings, consisting of 7 scheduled meetings and 11 extra meetings, of which 7 were held per capsulam. The Board formed a quorum at all meetings. Board members Patrik Tigerschiöld and Björn Björnsson were each absent from one scheduled meeting and two extra meet-ings (due to impartiality) and Ann-Sofi Lodin was absent from one scheduled meeting.
Among other things, the procedural plan contains instructions regarding the division of responsibilities between the Board, the Chairman, the President and the Board’s committees. According to the procedural plan, the Board is responsible for the com-pany’s organisation and management of the company’s affairs. The Board continuously monitors the financial situation of the company and the Group, which is reported on a monthly basis so that the Board is able to meet the monitoring obligations required by law, the stock exchange’s rules for issuers and good board practice. The procedural plan states that the Board must decide on matters that are not part of operating activities or that are of major importance, such as material financial commit-ments and agreements, as well as any significant changes in the organisation. Every year, Bure’s Board of Directors establishes and documents the company’s goals and strategies and discusses marketing, strategy and budgetary issues. The Board determines

BURE’S ANNUAL REPORT 2009, 5
the company’s finance policy, right of authorisation and decision-making process. The Board has formulated special instructions regarding the responsibilities and powers of Bure’s President. Furthermore, the Board has drawn up special reporting instruc-tions for the Executive Management.
Twice a year, the company’s auditors attend a Board meeting to report on the year’s audit and their evaluation of the company’s internal control systems. The auditors report their observations from the annual audit directly to the Board of Directors. Once a year, the auditors meet with the Board without the presence of any member of the Executive Management.
In 2009 the Board of Directors of Bure Equity AB was paid total fees of SEK 990,000, of which the Chairman received SEK 350,000.
The Board’s committeesThe Board’s procedural plan contains instructions regarding the compensation committee and the audit committee. The work of both committees is performed by the Board as a whole. The compensation committee discusses and decides on matters relat-ing to remuneration in the form of salary, pensions and bonuses or other terms of employment for the President and staff report-ing directly to the President. According to the customary proce-dure, the proposed principles for compensation to the President and Executive Management will be put before the 2010 AGM for decision. At present, there are no outstanding share or share-price related incentive schemes for the Executive Management or Board of the Parent Company. The role of the audit committee is to continuously support the Board in matters relating to account-ing, internal control and auditing of the annual accounts and interim reports.
Nominating Committee Bure’s Articles of Association contain provisions regarding elec-tion of Board members. A nominating committee has been appointed according to the instructions adopted by Bure’s 2008 AGM. For more information about the work of the nominating committee, see page 40.
Capital distributionIn January 2009 Bure completed the voluntary redemption pro-cedure for a total of SEK 1,007M that was decided in December 2008. For each share, the holder received one redemption right. Five redemption rights granted entitlement to redeem two shares for SEK 30 each. An extraordinary general meeting in December 2009 approved a one-time dividend of SEK 9.50 per share, equal to SEK 478M, conditional on completion of the merger between Bure and Skanditek Industriförvaltning. The dividend was paid at the end of January 2010.
Total capital distribution in 2009, SEK M
Voluntary redemption procedure, completed in January 2009 by decision of the EGM in December 2008 1,007
Total capital distributed in 2009 1,007
Cash extraordinary dividend paid in January 2010 by decision of the EGM in December 2009 478
Total capital distributed as of February 2010 1,485
Significant risks and uncertaintiesThe current climate of financial unrest in the market is creating widespread uncertainty about future development. In light of the high volatility in the financial markets, there is a special emphasis on monitoring the effects on Bure’s investments and their valu-ations. In 2009 Bure carried out a share redemption procedure for SEK 1,007M and made investments in Carnegie and Max Matthiessen with a combined negative liquidity effect of approxi-mately SEK 305M. The share redemption procedure and invest-ments have reduced net cash and thereby increased the level of financial risk in the company. Liquidity risk is the risk that the Group will be unable to finance loan payments and other liquid-ity flows as they fall due either with its own funds or with new financing. One source of uncertainty was eliminated during the year when Bure’s subsidiary Mercuri won an arbitration ruling against a former president in Mercuri who had lodged a claim of SEK 63M pertaining to value development in the company. The results of the ruling had no effect on earnings. In other respects, no significant changes have taken place during the year in the risks and uncertainties to which the Parent Company and the Group are exposed.
Financial risk managementThe Bure Group is exposed to a number of different financial risks – currency risk, interest rate risk and general liquidity risk including cash flow risk. Bure has a number of basic principles for management of risks. Bure’s finance policy states that the Parent Company shall be essentially debt-free. Furthermore, each portfolio company shall be financially independent from the Parent Company, which means that the Parent Company is normally not financially liable for obligations in the portfolio companies and that the companies are responsible for their own financing arrangements. Financing of the respective portfolio companies shall be well adapted to each company’s individual situation, where total risk is managed through a balanced spread between operating and financial risk. For a more detailed description of the Group’s risk exposure and risk management, see Note 24, Financial instruments. Most of the Group’s revenue is denominated in Swedish kronor and euros. The underlying costs are normally generated in the same currency as revenues, which means that transaction exposure is limited. Since the Group has investments outside Sweden via its subsidiaries, the consolidated balance sheet and income statement are exposed to translation differences arising on the translation of the foreign subsidiaries’ financial statements.
Sensitivity analysisThe Bure Group’s results are affected by a number of factors. Those described here should be seen only as indications, and do not to any extent include compensatory measures that can be taken in response to specific events. Bure’s sensitivity to financial factors can be broken down into interest rate sensitivity and cur-rency sensitivity. A one per cent change in the interest rate would have a short-term effect of around SEK +/- 6M on reported profit in the Group and SEK +/- 4M in the Parent Company. Sensitivity to different currencies is deemed limited. The most important currency, apart from the Swedish krona, is the euro. A five per cent change in the euro exchange rate would have an estimated effect on profit of less than SEK 2M. The estimated effect on profit of a change in Bure’s sales varies, depending on the com-pany to which the change relates. In most of the companies,

6, BURE’S ANNUAL REPORT 2009
the short-term marginal effect of a change in sales is fairly high (50 per cent is not unusual), whether an increase or a decrease. This naturally depends on the reason for the change in sales. For example, there is a large difference between a volume effect and a price effect.
Financial targets and strategyThe goal is for the potential value growth of each individual investment to clearly contribute to long-term growth in Bure’s market capitalisation. Each individual investment shall have an annual internal rate of return (IRR) of more than 12 per cent. Bure shall be a clear, professional and long-term owner with principal shareholder responsibility and an active owner agenda. Bure will focus on operating efficiency, growth-promoting measures and the capital structure of the portfolio companies. The Parent Company shall be essentially debt-free and the portfolio companies shall have a level of debt over time that is adequate in relation to their assessed operating risk.
Ownership structure and the Bure shareBure is listed on OMX Nordic Exchange, Stockholm, in the Mid Cap segment. At year-end 2009 Bure had 18,128 shareholders.
Bure’s 10 largest shareholders at 31 December 2009
%Skanditek 19.6Catella Fonder 6.8SEB Fonder 3.5Eikos 2.6Öresund 2.5Swedbank 2.0JP Morgan Bank 1.9Nordea Fonder 1.8Avanza 1.7Folksam 1.6Total 44.0
The Articles of Association contain no limitations on the right to transfer shares nor, to the Board of Directors’ knowledge, is the company party to an significant agreements that will have any impact, be altered or cease to apply if control over the company changes as a result of a public tender offer.
Share capital and number of sharesBure’s share capital on 31 December 2009 amounted to SEK 300.1M and was divided between 50,348,808 shares, which is equal to a quota value of around SEK 5.96. After the end of the financial year, the merger between Bure and Skanditek was carried out according to the decision of the EGM on 1 December 2009. As a result, 49,013,235 shares were issued to Skanditek’s shareholders and Skanditek’s holding of 9,716,316 shares in Bure was cancelled. The number of shares in Bure at 31 January was 89,645,727 and the share capital amounted to SEK 534.3M. All issued shares in Bure are of the same class and grant equal rights to votes and equity in the company. Bure has no out-standing warrant or option programmes with a dilutive effect.
Treasury sharesNo treasury shares were repurchased during 2009. Bure held no shares in treasury at the end of the year.
Principles for remuneration to senior executivesThe Board intends to propose that Bure’s AGM approve un changed principles for salary and other terms of remunera-tion for senior executives. These principles were most recently adopted by the AGM on 28 April 2009 and are as follows:
The ability to pay a market-based level of remuneration to the company’s senior executives is of strategic importance for Bure. The remuneration system should offer competitive terms in an industry with fierce competition for qualified manpower and at the same time enable Bure to retain key employees.
The Board’s proposal for resolution regarding principles for remuneration and other terms of employment for senior execu-tives contains the following main points. Bure shall offer a total compensation package that is market-based and enables the company to recruit and retain the top senior executives. Remuneration to senior executives shall consist of fixed salary, variable remuneration, pension and other forms of compensa-tion. Together, these form parts of the individual’s total com-pensation package. In order to encourage key personnel to align their long-term objectives with those of Bure’s shareholders, these individuals shall be offered incentives in the form of share-based instruments, in addition to salary, pension and other forms of compensation.
Fixed salary shall take into account the individual’s areas of responsibility and experience, and shall be reviewed yearly. Variable remuneration shall be based on simple and transparent models and shall generally not exceed fixed salary. There shall be an upper limit to the amount of variable remuneration and a minimum level before such remuneration may be paid. Pension terms shall be comparable to those applicable to equivalent senior executives in the market, and shall be based on defined contribution pension solutions. The combined amount of termi-nation benefits and severance pay shall not exceed 18 monthly salaries for the President or other senior executives.
The details regarding the parameters for determining the amount of variable remuneration are established every year by the Board of Directors. These parameters must be well balanced and con-sistent with the overall interests of the shareholders.
These principles apply to the company’s executive management, consisting of the President and the CFO, and also provide guid-ance for Bure’s actions as owner in the portfolio companies with regard to senior executives in these companies. For additional information see Note 34, “Remuneration of senior executives”.
Future outlookThe beginning of 2010 has been marked by continued un certainty about development of the global recession and when the economy will regain momentum. The focus in the portfolio companies will be on measures to promote growth and improve profitability. There are certain signs of recovery and we look to the future with confidence. Due to the nature of its business, Bure makes no forecasts about future earnings.
Subsequent eventsThe merger between Bure and Skanditek was completed at the end of January when it was registered by the Swedish Companies Registration Office. Through the registration, the merger became effective from a legal perspective, which means that Skanditek was dissolved and all of its assets and liabilities were transferred to Bure. In connection with implementation of the merger, Bure’s shareholders prior to the merger received an extraordinary dividend of SEK 9.50 per share, equal to a total of approximately SEK 478M.
After registration of the merger, Mathias Uhlén was appointed as a new member of the Board of Bure and Patrik Tigerschiöld

BURE’S ANNUAL REPORT 2009, 7
The undersigned certify that the consolidated financial statements and the annual report have been prepared in accordance with International Financial Reporting Standards (”IFRS”) as adopted for use in the European Union, and with the application of generally accepted accounting principles, and give a true and fair view of the financial position and results of the Group and the Parent Company, and that the administration report gives a true and fair view of the development of operations, financial position and results of the Group and the Parent Company and describes the significant risks and uncertainties to which the Group companies are exposed.
Stockholm, 8 March 2010
Björn Björnsson Håkan Larsson Kjell Duveblad Chairman Board member Board member
Ann-Sofi Lodin Mathias Uhlén Patrik Tigerschiöld Board member Board member President & CEO
Our audit report was submitted on 8 March 2010 Ernst & Young AB
Staffan Landén Authorised Public Accountant
resigned from the Board. Following the merger, Patrik Tigerschiöld was appointed as the new President of Bure. The separation of Carnegie’s Asset Management business area in February has been completed, after which Bure has capitalised CAM Group Holding in an amount of SEK 94M. Bure’s holding in CAM Group Holding is 35 per cent.
Proposed appropriation of profitThe company’s annual report will be submitted for adoption by the Annual General Meeting on 28 April 2010. The following funds are at the disposal of the Annual General Meeting accord-ing to the Parent Company balance sheet:
Retained profit SEK 1,135,922,342Loss for the year SEK -139,727,718 SEK 996,194,624
The Board proposes that the profit be distributed as follows:
To be paid to the shareholders as a dividend of SEK 0.30 per share SEK 26,893,718To be carried forward SEK 969,300,906
In January 2010, after the end of the financial year, the extra-ordinary cash dividend decided by the extraordinary general meeting in December 2009 was paid. Disposable profits after the extraordinary cash dividend amount to SEK 490,987,230.
Authorisation to repurchase and transfer sharesThe Board is currently authorised to repurchase treasury shares equal to no more than 10 per cent of all outstanding shares in the company. The Board will propose that the 2010 AGM grant the Board a new authorisation to repurchase and trans-fer treasury shares equal to no more than 10 per cent of all outstanding shares in the company during the period until the 2011 AGM.

8, BURE’S ANNUAL REPORT 2009
CONSOLIDATED STATEMENT OF COMPREHENSIVE INCOME
GroupSEK M Note 2009 2008
Continuing operationsOperating income 2 939.0 1,096.6
Exit gains 3 0.1 8.5Other operating income 19.8 19.1
Shares in profi t of associates 4 227.2 3.0
Total operating income 1,186.1 1,127.2
Operating expensesGoods for resale -16.9 -22.6Other external expenses 8, 9, 19 -287.5 -333.3Personnel costs 35, 36 -697.9 -712.7Depreciation/amortisation and impairment losses 5, 10, 11, 12, 13, 14 -75.3 -38.0Reversal of previously recognised impairment losses 12 – 61.7Other operating expenses -26.5 -15.7Exit losses 3 -63.3 -0.8
Total operating expenses -1,167.4 -1,061.4
Operating profi t 18.7 65.8
Interest income and similar profi t/loss items 6 18.6 91.8Interest expenses and similar profi t/loss items 6 -9.9 -17.1
Profi t after fi nancial items 27.3 140.5Income tax expense 7 -4.8 -26.9
Profi t from continuing operations 22.5 113.6Profi t from discontinued operations 27 22.9 769.0PROFIT FOR THE PERIOD 45.5 882.6
Other comprehensive incomeTranslation differences -19.9 37.2Comprehensive income for the period 25.6 919.8
Profi t attributable to non-controlling interests 0.3 0.6Profi t attributable to owners of the Parent Company 45.2 882.0Total profi t for the year 45.5 882.6
Average basic number of shares, thousands 25 53,292 89,782Average diluted number of shares, thousands 25 53,292 89,782
– attributable to owners of the Parent Company in continuing operations 0.42 1.26– attributable to owners of the Parent Company in discontinued operations 27 0.43 8.56Basic earnings per share, SEK 0.85 9.82
– attributable to owners of the Parent Company in continuing operations 0.42 1.26– attributable to owners of the Parent Company in discontinued operations 27 0.43 8.56Diluted earnings per share, SEK 0.85 9.82

BURE’S ANNUAL REPORT 2009, 9
CONSOLIDATED STATEMENT OF FINANCIAL POSITION
GroupSEK M Note 31 Dec 2009 31 Dec 2008
NON-CURRENT ASSETSIntangible assetsPatents, licenses, etc. 10 2.6 4.9Goodwill 11 392.8 453.5
Total intangible assets 395.4 458.4
Tangible assetsBuildings, land and land improvements 12 8.1 8.5Equipment, tools, fi xtures and fi ttings 14 57.7 66.7
Total tangible assets 65.8 75.2
Financial assetsInvestments in associates 16 602.0 16.0Available-for-sale fi nancial assets 17 2.2 2.9Other non-current receivables 54.5 28.6Deferred tax assets 7 32.6 31.2
Total fi nancial assets 691.3 78.7
Total non-current assets 1,152.5 612.3
CURRENT ASSETSInventories, etc.Raw materials and consumables 0.4 0.8Prepayments to suppliers 0.1 0.1
Total inventories, etc. 0.5 0.9
Current receivablesTrade receivables 24 145.0 195.8Other current receivables 104.0 67.9Work in progress, less progress billings 19.3 21.4Current tax assets 10.5 11.6Accrued income 18 6.8 26.2
Total current receivables 285.6 322.9
Short-term investments 24 550.1 1,270.2Cash and cash equivalents 164.9 788.7
Total current assets 1,001.1 2,382.7
TOTAL ASSETS 2,153.6 2,995.0
10, BURE’S ANNUAL REPORT 2009
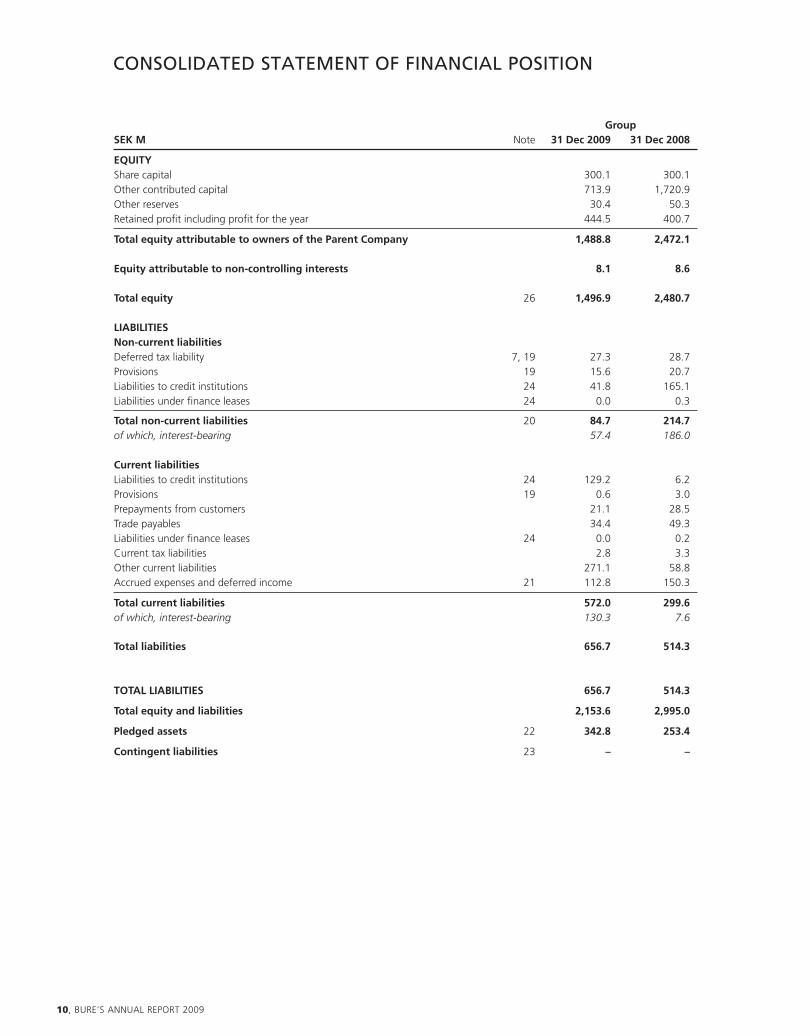
CONSOLIDATED STATEMENT OF FINANCIAL POSITION
GroupSEK M Note 31 Dec 2009 31 Dec 2008
EQUITYShare capital 300.1 300.1Other contributed capital 713.9 1,720.9Other reserves 30.4 50.3Retained profi t including profi t for the year 444.5 400.7
Total equity attributable to owners of the Parent Company 1,488.8 2,472.1
Equity attributable to non-controlling interests 8.1 8.6
Total equity 26 1,496.9 2,480.7
LIABILITIESNon-current liabilitiesDeferred tax liability 7, 19 27.3 28.7Provisions 19 15.6 20.7Liabilities to credit institutions 24 41.8 165.1Liabilities under fi nance leases 24 0.0 0.3
Total non-current liabilities 20 84.7 214.7of which, interest-bearing 57.4 186.0
Current liabilitiesLiabilities to credit institutions 24 129.2 6.2Provisions 19 0.6 3.0Prepayments from customers 21.1 28.5Trade payables 34.4 49.3Liabilities under fi nance leases 24 0.0 0.2Current tax liabilities 2.8 3.3Other current liabilities 271.1 58.8Accrued expenses and deferred income 21 112.8 150.3
Total current liabilities 572.0 299.6of which, interest-bearing 130.3 7.6
Total liabilities 656.7 514.3
TOTAL LIABILITIES 656.7 514.3
Total equity and liabilities 2,153.6 2,995.0
Pledged assets 22 342.8 253.4
Contingent liabilities 23 – –

BURE’S ANNUAL REPORT 2009, 11
Parent CompanySEK M Note 2009 2008
Operating incomeInvesting activitiesExit gains 3 22.4 811.9Dividends 33 8.5 –Reversal of previously recognised impairment losses 5 – 170.0
30.9 981.9
Administrative expensesPersonnel costs 25, 35, 36 -28.1 -27.2Other external expenses 8, 9, 35 -8.6 -10.7Impairment losses 5 -184.8 –Depreciation of tangible assets 14 -0.1 -0.1
-221.6 -38.0
Operating profi t before fi nancial items -190.7 943.9
Financial itemsProfi t from participations in group companies 6 33.9 –Interest income and similar profi t/loss items 6 17.6 77.4Interest expenses and similar profi t/loss items 6 -0.5 -2.1
Operating profi t/loss after fi nancial items -139.7 1,019.2
Profi t before tax -139.7 1,019.2
Income tax expense 7 – –
Profi t for the year -139.7 1,019.2
Average number of shares, thousands 53,292 89,782Average diluted number of shares, thousands 53,292 89,782Basic earnings per share, SEK 25 -2.62 11.35Diluted earnings per share, SEK 25 -2.62 11.35Proposed dividend per share, SEK 0.30 –
PARENT COMPANY INCOME STATEMENT

12, BURE’S ANNUAL REPORT 2009
PARENT COMPANY BALANCE SHEET
Parent CompanySEK M Note 31 Dec 2009 31 Dec 2008
NON-CURRENT ASSETS
Tangible assetsEquipment, tools, fi xtures and fi ttings 14 0.3 0.4
Total tangible assets 0.3 0.4
Financial assetsParticipations in group companies 15, 29, 30 323.9 583.1Investments in associates 16, 32 411.0 8.5Other non-current receivables 51.2 18.9Other fi nancial assets 17 0.1 0.5
Total fi nancial assets 786.2 611.0
Other non-current assets 786.5 611.4
CURRENT ASSETS
Current receivablesReceivables from group companies 134.4 43.5Other current receivables 56.4 19.6Current tax assets – 1.2Deferred expenses and accrued income 18 10.9 8.8
Total current receivables 201.7 73.1
Short-term investments 24 550.1 1,190.1Cash and cash equivalents 83.0 623.5
Total current assets 834.8 1,886.7
TOTAL ASSETS 1,621.3 2,498.1
EQUITYRestricted equityShare capital 300.1 300.1
Total restricted equity 300.1 300.1
Non-restricted equityRetained profi t 1,135.9 1,125.9Profi t for the year -139.7 1,019.2
Total non-restricted equity 996.2 2,145.1
Total equity 26 1,296.3 2,445.2
LIABILITIES
Current liabilitiesTrade payables 1.1 0.9Liabilities to group companies 98.4 35.3Other current liabilities 203.5 0.7Accrued expenses and deferred income 21 22.0 16.0
Total current liabilities 325.0 52.9of which, interest-bearing 88.1 28.4
TOTAL LIABILITIES 325.0 52.9
Total equity and liabilities 1,621.3 2,498.1
Pledged assets 22 – –
Contingent liabilities 23 – –

BURE’S ANNUAL REPORT 2009, 13
CONSOLIDATED STATEMENT OF CHANGES IN EQUITY
Equity attributable to owners of the Parent Company
Other Retained profi tSEK M Share contributed Reserves incl. profi t Non-controlling TotalGroup capital capital for the year interests equity
Equity at 1 January 2008 842.1 1,178.9 12.9 712.2 7.7 2,753.9
Profi t for the year – – – 882.0 0.6 882.6Other comprehensive income – – 37.2 37.2
Comprehensive income for the period – – 37.2 882.0 0.6 919.8
Sale to (+)/acquisition from (-) non-controlling interests
– – – -0.3 0.5 0.2
Cash dividend (SEK 1 per share) – – – -92.6 – -92.6Repurchase of shares – – – -368.9 – -368.9Reduction of share capital -542.0 542.0 – – – –Cancellation of treasury shares -77.4 77.4 – – – –Bonus issue 77.4 -77.4 – – – –Distribution of shareholdings – – – -717.5 – -717.5Costs related to new share issue – – – -0.5 – -0.5Transactions with non-controlling interests – – – -13.7 – -13.7
Equity at 31 December 2008 300.1 1,720.9 50.3 400.7 8.6 2,480.7
Equity at 1 January 2009 300.1 1,720.9 50.3 400.7 8.6 2,480.7
Profi t for the year – – – 45.2 0.3 45.5Other comprehensive income – – -19.9 – – -19.9
Comprehensive income for the period – – -19.9 45.2 0.3 25.6
Sale to non-controlling interests – – – 0.8 -0.8 0.0Completed redemption procedure – -1,007.0 – – – -1,007.0Costs for completed redemption procedure – – – -2.2 – -2.2
Equity at 31 December 2009 300.1 713.9 30.4 444.5 8.1 1,496.9
See also Note 26 on page 34.

14, BURE’S ANNUAL REPORT 2009
PARENT COMPANY STATEMENT OF CHANGES IN EQUITY
Non-SEK M Share Statutory Fair value restricted Total Parent Company capital reserve reserve equity equity
Equity at 1 January 2008 842.1 671.4 – 1,098.9 2,612.4Reversal of share premium reserve – -87.9 – 87.9 –Reversal of statutory reserve – -583.5 – 583.5 –Reduction of share capital -542.0 – – 542.0 –Repurchase of shares – – – -368.9 -368.9Cancellation of treasury shares -77.4 – – 77.4 –Bonus issue 77.4 – – -77.4 –Costs related to redemption procedure – – – -0.5 -0.5Cash dividend (SEK 1 per share) – – – -92.6 -92.6Distribution of shareholdings – – – -717.5 -717.5Shareholder contributions received/paid – – – -6.9 -6.9
Total changes in equity not recognised -542.0 -671.4 – 27.0 -1,186.4in the income statement
Subtotal 300.1 – – 1,125.9 1,426.0
Profi t for the year 1,019.2 1,019.2
Equity at 31 December 2008 300.1 – – 2,145.1 2,445.2
Equity at 1 January 2009 300.1 – – 2,145.1 2,445.2Completed redemption procedure -120.0 – – -887.0 -1,007.0Bonus issue 120.0 – – -120.0 –Costs for completed redemption procedure – – – -2.2 -2.2
Total changes in equity not recognised 0.0 -1,009.2 -1,009.2in the income statement
Subtotal 300.1 – – 1,135.9 1,436.0
Profi t/loss for the year -139.7 -139.7
Equity at 31 December 2009 300.1 – – 996.2 1 296.3
See also Note 26 on page 34.

BURE’S ANNUAL REPORT 2009, 15
CASH FLOW STATEMENT
Parent Company GroupSEK M Note 2009 2008 2009 2008
Operating activitiesProfi t/loss after fi nancial items -139.7 1,019.2 27.3 140.5Profi t from discontinued operations – – 22.9 793.3Depreciation/amortisation and impairment losses/reversals 184.8 -170.0 75.3 27.3Dividends received from associates – – – 0.1Shares in profi t/loss of associates – – -227.2 -14.1Capital gains/losses from investing activities 3 -22.4 -811.9 40.3 -683.8Profi t/loss from participations in group companies 6 -33.9 – – –Effect of share issue in MM Holding – – 6.8 –Other non-cash items, net – 0.3 -0.9 –Paid tax – – -7.0 -23.5
Cash fl ow from operating activitiesbefore changes in working capital -11.2 37.6 -62.6 239.9
Cash fl ow from changes in working capitalChange in inventories – – 2.3 -20.7Change in current receivables -17.5 80.9 14.2 -16.9Change in provisions – – -2.8 14.3Change in current liabilities 20.1 -98.8 -30.4 30.2
Cash fl ow from changes in working capital 2.6 -17.9 -16.7 6.9
Cash fl ow from operating activities -8.6 19.7 -79.3 246.8
Investing activitiesInvestments in subsidiaries 15 -1.4 -36.7 -1.4 -101.1Acquisition of other non-current assets – – -16.2 -140.6Investments in associates and other shares -248.6 -0.1 -263.1 14.8Sale of subsidiaries 15 0.7 696.2 41.8 692.6Sale of associated companies and other shares 58.6 9.6 19.6 18.0
Cash fl ow from investing activities -190.1 669.0 -219.3 483.6Financing activitiesLoans raised/amortisation of debt 60.0 83.3 -0.5 -43.0Loans granted/recovery of receivables -83.6 3.2 -32.0 3.9Shareholder contributions paid/received 51.0 80.3 – –Completion of redemption procedure incl. transaction costs -1,009.2 -0.5 -1,009.2 -0.5Repurchase of shares and warrants – -368.9 – -368.9Selling expenses for divested companies – -3.0 – –Capital distribution to the shareholders – -92.6 – -92.6Payments to non-controlling interests – – 0.6 0.3
Cash fl ow from fi nancing activities -981.8 -298.2 -1,041.1 -500.8
Cash fl ow for the year -1,180.5 390.5 -1,339.7 229.6
Cash and cash equivalents at beginning of year 1,813.6 1,423.1 2,058.9 1,816.1
Exchange difference, cash and cash equivalents/value change in hedge funds
26 – – -4.2 13.2
Cash and cash equivalents at end of year 633.1 1,813.6 715.0 2,058.9
Interest paid -0.3 -0.7 -5.3 -13.9
Interest received 17.5 84.5 18.5 88.9
Cash and cash equivalents, the change in which is explained in the cash flow statement, also include short-term investments with a time to maturity of up to three months. Blocked bank accounts in continuing operations in the Group are included in cash and cash equivalents in an amount of SEK 0.0M (5.2). Short-term investments amount to SEK 550.1M (1,190.1) in the Parent Company and SEK 1,270.2M (1,367.4) in the Group. Operating activities for the Parent Company include dividends from subsidiaries of SEK 8.5M.

16, BURE’S ANNUAL REPORT 2009
NOTES
NOTE 1 – Accounting policies
General informationBure Equity AB (publ), corporate identification number 556454-8781, domiciled in Stockholm. The address of the head office is Nybrogatan 6, Stockholm, Sweden. The Parent Company is quoted on the NASDAQ OMX Nordic Exchange Stockholm, Mid Cap segment. These consolidated financial statements were approved by the Board for publication on 8 March 2010.
Basis of presentationThe consolidated financial statements are presented in compli-ance with the International Financial Reporting Standards (IFRS) as endorsed for application in the EU. In addition to IFRS, the Swedish Financial Reporting Board’s recommendation RFR 1.2, Supplementary Accounting Rules for Groups, is applied.
The consolidated financial statements have been prepared according to the acquisition method of accounting, aside from financial assets measured at fair value either through profit or loss or in other comprehensive income. The preparation of financial statements according to IFRS requires the manage-ment to make estimates and assumptions. Areas involving a higher degree of judgement or complexity, or areas where assumptions and estimates affect the reported income state-ment and balance sheet, are disclosed in Note 11.
Principles of consolidationThe consolidated financial statements are presented according to IAS 27, Consolidated and Separate Financial Statement, with the application of the acquisition method as stated in IFRS 3, Business Combinations. The consolidated financial statements include the Parent Company and all companies in which the Parent Company has a controlling influence, normally comprising companies in which Bure directly or indirectly holds more than 50 per cent of the voting rights. Companies acquired during the year are consolidated from the date of acquisition. Companies sold during the year are consolidated until the date of sale. Consolidation of associated companies is carried out according to IAS 28, Investments in Associates. Associated companies are reported according to the equity method, and refer to companies in which Bure holds between 20 and 50 per cent of the votes or otherwise has a significant influence. Under the equity method, the Group’s book value for the investment in the associated company, plus the Group’s share in profit/loss of the associated company less dividends received, is recognised in the consolidated balance sheet within “Investments in associates”. In the consolidated income statement, “Shares in profit/loss of associates” comprises Bure’s share in the net profit/loss of associated companies less any impairment losses on goodwill. Acquired goodwill is tested for impairment where there is an indication as described in the standard. If the recoverable amount is lower than the carrying amount, an impairment loss is recognised in the income statement. Bure’s share in the transactions which the associated com-panies have reported in other comprehensive income are reported in the statement of comprehensive income.
Non-controlling interests and non-owner transactionsNon-controlling interests refer to that portion of profit/loss and net assets in partially owned subsidiaries that is attributable to other owners. The NCI’s share in profit or loss is included
in profit or loss in the consolidated income statement and the NCI’s share in net assets is included in equity in the con-solidated balance sheet. Information is provided regarding the amount of each item that is attributable to owners of the Parent Company and to the NCI. On the acquisition of NCIs where the consideration paid exceeds the fair value of acquired net assets, the difference is accounted for as goodwill. On the sale of NCIs where the consideration received differs from the recognised value of the sold share in net assets, a gain or loss arises that is recognised in the income statement.
Foreign currency translationItems included in the financial statements of the Group’s subsidiaries are measured using the currency of the primary economic environment in which the subsidiary operates (the functional currency). The consolidated financial statements are presented in million Swedish kronor (SEK M), which is the functional and presentation currency of the Parent Company. Transactions in foreign currencies are translated to the func-tional currency at the rate of exchange ruling on the transac-tion date. Foreign exchange gains/losses arising on payment of such transactions and on translation of monetary assets and liabilities denominated in foreign currency at the closing day rate of exchange are recognised in profit or loss. Foreign exchange gains/losses on non-monetary items, such as shares classified as available-for-sale financial assets, are taken to the fair value reserve in equity. Goodwill and other intangible assets arising on the acquisition of a foreign operation are treated as assets of such operations and are translated to SEK at the closing day rate of exchange.
The assets and liabilities of foreign operations are translated at the closing day rate of exchange and all income and expenses in the income statement are translated at the aver-age rate during the year. All resulting translation differences are recognised in other comprehensive income. Goodwill and negative goodwill arising from business combinations with respect to assets in foreign currency are translated at the current rate of exchange.
In cases where the investment in a foreign operation is hedged through borrowing in the foreign operation’s func-tional currency, any translation differences arising on the loan are recognised in other comprehensive income to the extent that they are matched by translation differences attributable to the foreign operation.
Exchange gains or losses on financial receivables and liabili-ties are recognised in financial income or expense. Exchange gains/losses are recognised in operating profit.
Business combinationsBusiness combinations are reported according to the acquisi-tion method of accounting, whereby the net assets of the acquiree are measured at fair value on the acquisition date. These fair values also include the share in net assets attribut-able to non-controlling interests. Identifiable net assets also consist of assets, liabilities and provisions that are not recog-nised in the balance sheet of the acquiree. No provisions may be made for planned restructuring measures in connection with the acquisition, so-called restructuring reserves. The dif-ference between the fair value of consideration given and the fair value of net assets acquired is recorded as goodwill

BURE’S ANNUAL REPORT 2009, 17
to the extent that no other identifiable and separable intan-gible assets have been identified. Any goodwill arising from the business combination ultimately consists of the synergies that the acquiree is expected to give rise to in the existing operation. All intangible assets identified in connection with business combinations, excluding goodwill, are amortised on a straight-line basis. Each individual intangible asset (except for goodwill) is amortised over its estimated life, unless it is assessed to have an indefinite life. An intangible asset is assessed to have an indefinite life when all relevant circum-stances have been taken into account and there is no foresee-able limit to the period over which the asset is expected to generate net cash inflows. The useful life of goodwill is gener-ally assumed to be indefinite.
GoodwillGoodwill arising from business combinations is recognised as a non-current asset and is tested for impairment at least annu-ally. Since it is not possible to test goodwill for impairment separately from other assets, goodwill must be allocated to cash-generating units in which a separable cash flow can be identified. Assets and liabilities already existing in the Group on the acquisition date may also be allocated to these cash-generating units. The cash-generating units to which goodwill has been allocated correspond to the lowest level of the Group at which goodwill is monitored. The lowest organisa-tional level in accordance with the standard may not be higher than a segment as described in IFRS 8, Operating Segments. When the recoverable amount of a cash-generating unit falls below its carrying amount, an impairment loss is recognised in the income statement. When the recoverable amount of a cash-generating unit falls below its carrying amount, an impairment loss is first recognised through a reduction in goodwill. If this value is in turn lower than the difference between the recoverable amount and carrying amount, impairment losses should be recognised on other assets on a pro rata basis.
Intangible assets (except for goodwill)The intangible assets recognised in the balance sheet are those that have either been acquired as part of a business combina-tion (see above), separately purchased or internally generated. Intangible assets are capitalised in the balance sheet when it is probable that the economic benefits attributable to the asset will flow to Bure and the cost of the asset can be measured reliably. The Group currently conducts no research and devel-opment activities, for which reason no internally generated intangible assets are recorded in the balance sheet.
Tangible assetsTangible assets are recognised at cost less accumulated depre-ciation and impairment losses. Depreciation is calculated on the depreciable amount, normally comprising historical cost less any estimated residual value at the end of the useful life. Depreciation is carried out on a straight-line basis over the estimated useful life of the asset. Because Bure has subsidiaries whose operations differ widely, it is not practicable to establish general rules for useful life. The useful lives and residual values applied in the accounts are regularly reviewed and adjusted for changes.
LeasingLeases are classified as either finance or operating leases. A lease is classified as a finance lease if it transfers substantially all the risks and rewards incident to ownership to the lessee. All other leases are classified as operating leases. Finance leases are recorded as a non-current asset and a financial liability in the consolidated balance sheet. Finance lease payments are
apportioned between interest and reduction of the outstand-ing liability. The leased assets are depreciated according to the same principles as owned assets. For operating leases, the lease payments should be recognised as an expense in the income statement over the lease term on a straight-line basis. Certain smaller finance leases for company cars and office equipment are recorded as operating leases.
Financial instrumentsClassification of financial assets and liabilitiesFinancial instruments are classified in the following categories:1. Financial assets measured at fair value through profit or
loss. This group, in turn, consists of two sub-groups: • Held-for-trading financial assets. For Bure, this category
includes financial derivatives with positive values. • Financial assets and liabilities initially classified in this sub-
group according to the fair value option. Such assets are recorded as current assets and fair value changes are recog nised directly in other comprehensive income.
2. Held-to-maturity investments. The Bure Group has no financial investments in this category at present.
3. Loans and receivables: This category consists of cash and cash equivalents, trade receivables, loan receivables and accrued income. These are classified as current assets except for items with an expected maturity of longer than 12 months after the balance sheet date. Trade receivables, loan receivables and accrued income are measured at amortised cost with a deduction for doubtful debts. Provisions for doubtful debts are made after indi-vidual assessment of each customer/counterparty’s ability to pay and when there is objective evidence that the Group will not be able to collect the amount due. In assessment of loss risks, the value of any furnished collateral is taken into account. In cases where the reserved amount is recovered, the provision is reduced by a corresponding amount.
4. Available-for-sale financial assets: This category consists of non-derivative financial assets not designated to any of the above categories. In the Bure Group these include holdings of shares and other securities. Assets in this category are recognised as non-current assets unless the management’s intention is to sell the asset within the coming 12-month period. Available-for-sale financial assets are measured at fair value. Unrealised changes in fair value after the acquisi-tion date are deferred to other comprehensive income. On disposal, any unrealised gains/losses are recycled to the income statement. Fair value is determined primarily on the basis of quoted market prices. If none such exist, fair value is determined through alternative valuation techniques such as discounted cash flows.
5. Financial liabilities measured at fair value directly in other comprehensive income. For Bure, this category includes financial derivatives with negative values.
6. Financial liabilities measured at amortised cost: These liabili-ties are recognised net in the balance sheet after deduction of any transaction costs. This category includes liabilities under finance leases, loans with fixed and variable interest, trade payables and accrued expenses. Liabilities with an expected maturity of less than 12 months are recognised as current, in other case as non-current.
18, BURE’S ANNUAL REPORT 2009
Impairment of financial assetsAt each balance sheet date, the management conducts a review to look for objective evidence that a financial asset may be impaired. For available-for-sale financial assets, an impairment loss is recognised if the identified decrease in fair value is significant and permanent. The difference between fair value and historical cost is then reclassified from other comprehensive income to profit or loss in the income state-ment. Reversals of previously recognised impairment losses on own equity instruments (shares) are not recognised in the income statement under any circumstances.
Financial risk managementThe Bure Group is exposed to a number of different financial risks such as currency risk, interest rate risk and general liquid-ity risk. Bure’s overall risk objective is regulated in the Parent Company’s finance policy. Because the subsidiaries are mutu-ally autonomous, each has adopted its own separate finance policy. A more detailed description of financial risk manage-ment is provided in Note 26, Financial instruments.
InventoriesInventories are stated at the lower of cost and fair value.
ProvisionsA provision is recognised in the balance sheet when the Group has a present obligation (legal or constructive) that has arisen as a result of a past event, it is probable that an outflow of resources will be required to settle the obligation and the amount can be estimated reliably. In cases where the company expects a provision to be reimbursed by another party, for example within the framework of an insurance agreement, the reimbursement is recognised as a separate asset only when it is virtually certain that reimbursement will be received. If the cash outflow to settle an obligation is expected to occur after more than 12 months, the future pay-ment should be measured at discounted present value using a discount rate the reflects short-term market expectations with consideration to transaction-specific risks. The cost of the provision is capitalised in the income statement.
A provision to a restructuring reserve is recognised in the period when the Group has a legal or constructive obligation to carry out the plan and those affected have a valid expecta-tion. A provision is recognised only for direct expenditures that are caused by the restructuring and are an effect of remaining contractual obligations without lasting economic benefits or that consist of a fine resulting from termination of the obligation.
Revenue recognitionRevenue arising from the sale of goods is recognised when the significant risks and rewards of ownership have been trans-ferred to the buyer. Income from the sale of services is recog-nised when it can be measured reliability, when it is probable that the economic benefits associated with the transaction will flow to the company and when the expenses expected to arise as a result of the transaction can be measured reliably.
Revenue from service contracts is recognised when the total income and expenses in a completed project can be meas-ured reliability and it is probable that the economic benefits associated with the specific transaction will flow to the com-pany. The stage of completion of a contract is determined by comparing the proportion of contract costs incurred to date with the estimated total contract costs. In accordance with the rules on the percentage of completion method in IAS 18,
estimated revenue for work in progress less progress billings is recognised under the heading ”Receivables”. In cases where the progress billings exceed costs incurred, these are recog-nised under the heading ”Liabilities” as prepayments from customers.
Borrowing costsBorrowing costs are expensed in the period in which they are incurred. In cases where borrowing costs arise in connection with the acquisition, construction or production of a qualifying asset, these costs are capitalised as part of the cost of the asset.
PensionsContributions payable under defined contribution pension plans are recognised as an expense in the period in which they arise. Defined benefit pension obligations secured through insurance with Alecta have been reported as defined benefit plans, due to a lack of sufficient information for these to be reported as defined benefit plans. Alecta’s collective funding ratio at 31 December 2009 was 141 per cent. Aside from Alecta, there are defined benefit plans of insignificant scope in the Group.
Non-current assets held for sale and disposal groups(IFRS 5)A non-current asset/liability or disposal group for which the carrying amount will be recovered primarily through a sale and not through use is reported in a separate category in the balance sheet as “Non-current assets held for sale”. A discon-tinued operation is a component of an entity that either has been disposed of or is classified as held for sale according to a co-ordinated plan and represents a separate major line of business or geographical area of operations.
The application of IFRS 5 has had no other effect on the prior period financial reports than a change in presentation of the income statement, balance sheet and cash flow statement. For discontinued operations, this means that profit/loss after tax from discontinued operations is stated on a separate line in the income statement. Non-current assets held for sale/dis-posal groups where a decision to sell has been made and the sale is highly probable are disclosed separately in the balance sheet with related liabilities.
Operating segmentsOperating segments are reported within the framework of IFRS 8. Bure’s operations are monitored and supervised by the executive management based on the individual company holdings, which are therefore regarded as operating seg-ments. Buying and selling between the operating segments is limited.
Income taxesDeferred tax assets and liabilities are recognised when there are temporary differences between the carrying amounts and tax bases of assets and liabilities. Deferred tax assets relat-ing to loss carryforwards are recognised to the extent that it is likely that these loss carryforwards can be offset against future taxable profits. The year’s reported tax expense con-sists of tax payable on the year’s taxable profit (current tax) and deferred tax. Bure’s share in the income taxes reported by associates are included in shares in profit/loss of associates in the income statement.
BURE’S ANNUAL REPORT 2009, 19
Cash flow statementCash and cash equivalents refer to bank deposits and short-term investments with a maturity of less than three months.
Critical accounting estimates and assumptionsIn preparing the financial statements, the Group makes esti-mates and assumptions concerning the future. The resulting accounting estimates will, by definition, rarely correspond to the actual results. The estimates and assumptions that are associated with a significant risk for material adjustments to the carrying amounts of assets and liabilities in the next financial year are disclosed below:
Impairment testing of tangible and intangible assetsTangible assets and intangible assets, aside from those with indefinite useful lives, are depreciated/amortised over the period when they are expected to generate economic ben-efits, i.e their useful lives. If there is an indication of impair-ment, the asset’s recoverable amount is calculated, and consists of the higher of the asset’s fair value loss costs to sell and its value in use. An impairment loss is recognised when the recoverable amount of an asset is lower than its carrying amount. The recoverable amount is determined on the basis of management estimates, for example of future cash flows.
Goodwill and intangible assets with indefinite useful lives are tested for impairment at least annually or more frequently when there is an indication of a decline in value. In order to test these assets, they must be allocated to cash-generating units and their respective useful lives must be calculated. The necessary calculations require the management to estimate the expected future cash flow attributable to the defined cash-generating units and to choose a suitable discount rate for use in discounting this cash flow. The Group has evalu-ated the estimates where changes could have a significant impact on the fair value of the assets and would therefore require the recognition of an impairment loss. Among other things, these estimates are related to the expected rate of inflation and the choice of discount rate. The assumptions applied in impairment tests, including a sensitivity analysis, are described in more detail in Note 11.
Measurement of financial instruments at fair valueTo the extent that Bure has financial instruments measured at fair value, the fair values have been determined on the basis of quoted market prices for the instruments in question.
Deferred tax assetsDeferred tax is calculated on the basis of temporary differ-ences between the tax base and carrying amount of an asset or liability and on unutilised loss carryforwards. Deferred tax assets are recognised only when it is probable that these can be utilised against future profits. The assessment of probability that loss carryforwards can be utilised against future profits is made through calculation of expected future cash flows. This assessment is made at the same time as impairment testing of shares in subsidiaries. In cases where the actual outcome differs from the estimates or when the management adjusts these estimates, this can lead to changes in the value of deferred tax assets.
Provisions for doubtful debtsTrade receivables are initially measured at fair value and sub-sequently at the amount in which they are expected to be settled. Provisions for doubtful debts are made after individual assessment of each customer/counterparty’s ability to pay and when there is objective evidence that the Group will not be
able to collect the amount due. Losses tied to doubtful debts are recognised in the income statement under other operat-ing expenses. In cases where the previously reserved amount is recovered, the provision is reversed.
Share-Based PaymentIn the Bure Group, share- and option-based programmes have been granted to senior executives in certain subsidiaries. In all cases, the senior executives have paid a price equal to fair market value for the options granted. Consequently, profit for the year was not affected by any expense for the programmes. In cases where the options are exercised, they will give rise to a dilutive effect that is dealt with in accordance with IAS 33. In cases where the options are “out of money”, there is no dilutive effect.
Accounting for restructuring provisionsA restructuring provision is recognised when the Group has a present obligation (legal or constructive) that has arisen as a result of a past event, it is probable that an outflow of resources will be required to settle the obligation and the amount can be estimated reliably. Restructuring provisions consists mainly of costs for cancellation of leases, other agree-ments and termination benefits.
Determining the stage of completion and assessment of loss risks in fixed price contractsCertain parts of the Group apply the percentage of comple-tion method of accounting, whereby estimates are made regarding the stage of completion of a project on the balance sheet date. In cases where changes arise in the estimated contract revenue, contract costs and stage of completion, a correction is made in the period when the management became aware of the circumstances. Provisions are made for loss risks in projects where the estimated contract costs are expected to exceed contract revenue.
Changed accounting policies in the Group
Revised IAS 1 Presentation of Financial Statements According to the revised standard, the statement of changes in equity may include only changes in equity resulting from transactions with owners. Other transactions that were previ-ously reported in the statement of changes in equity are now reported in comprehensive income. Comprehensive income is presented either in a separate report in connection with the income statement or as an extension of the income state-ment. Bure has chosen the first alternative.
IFRS 8 – Operating segmentsThe IASB first published IFRS 8 in November 2006. As of the effective date, IFRS 8 replaces IAS 14 Segment Reporting. The new standard requires additional disclosures about the Group’s operating segments and replaces the earlier require-ment to identify primary and secondary segments in the Group on the basis of business segments and geographical areas. For Bure this will not entail any change, since the oper-ating segments determined according to IFRS 8 are the same as the reporting segments previously identified on the basis of IAS 14, i.e. companies. Disclosures in accordance with IFRS 8 are found in Note 2, including restated comparative figures.
IFRS 2 Share-Based Payment The amended standard provides guidance on the determina-tion of whether a condition is a vesting condition for share-based payment. Vesting conditions are service conditions and performance conditions only. Non-vesting conditions are not

20, BURE’S ANNUAL REPORT 2009
dependent on the recipient of the equity instruments. The recognised expense is based on the vesting conditions. The so-called non-vesting conditions affect only the fair value of the equity instruments granted. The change has not had any impact on Bure’s financial statements.
IAS 23 Borrowing Costs The amended standard requires the capitalisation of borrow-ing costs that are directly attributable to the acquisition, construction or production of an asset that takes a substantial period of time to get ready for its intended use or sale as part of the cost of that asset, provided that a number of criteria are met. As a result, the previous optional accounting treat-ment is no longer permitted. Bure has not made any invest-ments to which this accounting standard applies.
IFRIC 13 Customer Loyalty Programmes IFRIC 13 addresses accounting by entities that grant loyalty award credits to customers who buy other goods or services. In accordance with IFRIC 13, the customer pays for the future award in the form of goods or services on the date of the initial sale. For example, the transaction could give rise to points that can be redeemed to purchase goods or services in the future, either from the entity or from a third party. That portion of the proceeds from the initial sale that comprise pay-ment for award credits should be recognised in deferred income and reclassified to the income statement when the future trans-action takes place. The interpretation has not had any impact on Bure’s financial statements. Amendment to IFRS 1 First-time Adoption of International Financial Reporting Standards and IAS 27 Consolidated andSeparate Financial Statements The amendment to IFRS 1 has had no impact on Bure’s financial statements. The amendment to IAS 27 states that all dividends from subsidiaries, jointly controlled entities and associated companies should be recognised in the parent company’s income statement. Under special circumstances, such dividends can be an indication that the value of the shares in the subsidiary has decreased and that an impairment test should therefore be carried out.
IAS 32 Financial Instruments: Presentation – Disclosure and IAS 1 Presentation of Financial Statements – Puttable Instruments and Obligations Arising on Liquidation The amendment permits the classification of certain puttable instruments as equity (despite the fact that such instruments are normally classified and recognised as liabilities) in cases where a number of specific criteria are met. In order to clas-sify these instruments as equity it is essential that the holders of the financial instruments have the same rights, neither more nor less, and therefore also the same rights in the event of a liquidation of operations. The amendments to IAS 32 have not had any impact on Bure’s financial statements.
IAS 39 Financial Instruments: Recognition and Measurement – Eligible Hedged Items The amendment clarifies which types of financial risks are deemed eligible for hedging. The amendment has not had any impact on Bure’s financial statements.
IFRS 7 Financial Instruments: Disclosures – Improving Disclosures about Financial InstrumentsThe amendment requires enhanced disclosures about fair value measurement of financial instruments. These disclosures should specify whether or not the fair value measurements are based on observable market data and whether or not the
applied valuation techniques are based on observable market data. If a fair value change has been recognised in the income statement, the entity must disclose how the change in value has been determined. The proposed changes apply only to financial instruments measured at fair value. In cases where Bure has financial instruments measured at fair value, the fair value is determined exclusively on the basis of observable market data.
IAS 39 Financial Instruments: Recognition and Measurement and IFRIC 9 Reassessment of Embedded Derivatives Whether or not a contract contains any embedded derivatives is assessed on initial recognition a financial instrument. Subsequent reassessment is prohibited unless there is a significant change in the terms of the contract or when a financial instrument is reclassified and is subsequently no longer classified as a financial instrument measured at fair value through profit or loss. If any of these criteria are met, a reassessment should be made. Bure has not identified any embedded derivatives.
IFRIC 14 The Limit on a Defined Benefit Asset, Minimum Funding Requirements and their Interaction IFRIC 14 addresses the interaction between a minimum statu-tory or contractual funding requirement and the standard’s limit on measurement of the defined benefit asset or liabil-ity. On certain conditions, for example, it may be necessary according to national legislation for a company to contribute more capital to a pension plan than prescribed by IAS 19. Such contributions are classified and recognised as plan assets in the balance sheet. IFRIC 14 clarifies the conditions under which a net asset can be recognised in cases where no other restrictions exit. The interpretation has not had any impact on Bure’s financial statements.
IFRIC 15 Agreement for the Construction of Real Estate The Group owns no properties.
IFRIC 16 Hedges of a Net Investment in a Foreign OperationIFRIC describes the accounting treatment for hedges of a net investment in a foreign operation; where in the group the hedging instrument can be held and how the entity should determine the amount of exchange gains or losses in rela-tion to the net investment and the hedging instrument to be reclassified to profit or loss when the foreign operation is disposed of. The interpretation has not had any impact on the Group’s financial results or position.
Future accounting changesBelow is a description of the new standards and interpreta-tions that are effective for financial periods starting on or after 1 January 2010.
IFRS 3R Business Combinations and IAS 27R Consolidated and Separate Financial Statements The amendments may affect the amount of recorded good-will, recorded profit or loss in the period of the acquisition and future recorded profit or loss. Transaction costs should be recognised in the income statement in the period in which they arise. The acquirer can choose to measure non-control-ling interests (NCIs) either at fair value, so-called “full good-will”, or at its proportionate share of the acquiree’s identifi-able net assets. In the first alternative, both the NCI equity item and the amount of recorded goodwill will increase by a corresponding amount. Changes in the fair value of contrac-tual contingent consideration are subsequently recognised in the income statement and do not affect the value of recorded goodwill.
BURE’S ANNUAL REPORT 2009, 21
In accordance with IAS 27, all changes in a parent com-pany’s ownership interest in a subsidiary that do not result in a loss of control are accounted for as equity transactions. Furthermore, IAS 27R changes the accounting treatment for both losses in subsidiaries and the loss of control of a sub-sidiary. To the extent that Bure acquires operations, sells or acquires outstanding non-controlling interests in the future, the new standards will lead to accounting changes.
IFRIC 12 Service Concession ArrangementsIFRIC 12 deals with arrangements in which a public sector body contracts with a private operator to develop, operate and maintain the grantor’s assets, for example infrastructure assets. The grantor, which could be the government, owns the asset and controls any significant residual interest in the asset at the end of the term of the arrangement. Bure does not conduct operations of this type and the interpretation will therefore not give rise to any accounting changes.
IFRIC 17 Distributions of Non-Cash Assets to OwnersIFRIC 17 clarifies the accounting treatment for all types of non-cash distributions. An entity should measure the dividend payable at the fair value of the net assets to be distributed, which means that a liability is recognised when the dividend is appropriately authorised. The liability is then remeasured at each reporting date and at settlement, with changes recog-nised directly in equity. On the date of distribution, the entity should recognise the difference between the carrying amount of the net assets distributed and the fair value of the liability in the income statement as a capital gain or loss. In cases where Bure distributes non-cash assets in the future, the interpreta-tion will affect the future accounting treatment.
IFRIC 18 Transfers of Assets from CustomersIFRIC 18 applies to all agreements in which an entity receives from a customer an item of property, plant and equipment (or cash to construct or acquire an item of property, plant and equipment) that the entity must then use either to con-nect the customer to a network or to provide the customer with ongoing access to a supply of goods or services, or to do both. It is essential that there is a clear connection between the recipient and the customer. The decisive factor for the accounting treatment is whether or not control over the asset in question has been transferred, since this affects who can or should recognise the asset in the balance sheet. When it can be concluded that the recipient should recognise an asset, this is treated as an exchange transaction, i.e. the recipient is assumed to have provided a service in return. The value of the asset received is recognised in revenue.
IFRS 2 Share-based Payment: Group Cash-Settled Share-Based Payment TransactionsIFRS 2 and IFRIC 11 have previously not clarified how an individual subsidiary that receives goods or services should account for the transaction in cases where another entity in the group recognises an obligation to settle the transaction. Under these circumstances, the Parent Company recognises an obligation (liability) and a corresponding increase in shares in subsidiaries, which in turn, since they have no obligation to make the required cash or share-based payments (expense), is recognised in the income statement at the same time that in increase in equity is recognised.
Improvements and minor amendments to IFRSsEach year, the IASB publishes proposed improvements in the existing IFRSs and IFRICs. These include both editorial and accounting changes. The changes have not had any impact on the financial statements for 2009.
Parent Company accounting policiesUnless otherwise stated, the Parent Company applies the same accounting policies as the Group, with the addition of the Swedish Financial Reporting Board’s recommendation RFR 2.2, Accounting for Legal Entities. Any deviations between the poli-cies applied by the Parent Company and the Group are a result of limitations in the scope for IFRS conformity in the Parent Company due to its application of the Swedish Annual Accounts Act.
Financial assetsShares in subsidiaries and unlisted associated companies are measured in accordance with the acquisition method of accounting. For holdings in subsidiaries and unlisted associated companies, recoverable value is determined through ongoing cash flow and market value analyses. Fair value changes are determined through impairment testing after application of the valuation rules established by the Board.
Income taxesThe equity share of untaxed reserves is included in retained profit. The tax share of untaxed reserves has been recognised as deferred tax liabilities within non-current liabilities.

22, BURE’S ANNUAL REPORT 2009
Sweden Rest of Europe North America Asia Other markets2009 2008 2009 2008 2009 2008 2009 2008 2009 2008
Sales by market 395 430 496 611 14 20 21 31 13 5
Assets by market 1,670 2,461 454 508 6 10 22 15 2 1
Investments by market 469 6 3 10 – – – – – 1
NOTE 2 – Segment reporting
Reporting by operating segmentBure has adopted the new IFRS 8 standard for reporting of operating segments. Since Bure already previously reported its segments in a similar manner, no chances have been made in the grounds for segmentation or in calculation of profit/loss by segment compared to the previous year’s annual report.
Consolidation adjustments relating to positive and negative goodwill have been attributed to the respective companies. Transactions between the various segments are insignificant in scope and account for less than 0.1 per cent of total sales. Dormant companies or companies not classified as portfolio companies are reported under the heading “Other companies”.
SEK M Mercuri EnergoRetea SRCOther
companiesDiscontinued operations
Eliminations, etc.
Parent Company TOTAL
2009 2008 2009 2008 2009 2008 2009 2008 2009 2008 2009 2008 2009 2008 2009 2008
Operating incomeTotal operating income 615 784 278 274 32 37 15 7 -1 -5 939 1,097
Shares in profit 1 226 3 227 3
Profit/loss
Profit/loss by segment -73 6 13 21 – 1 227 1 6 167 34
Unallocated costs: -37 -38 -37 -38
Reversals/impairment losses in investing activities -21 219 -108 -246 170 -49 62Dividends -9 9 – –Exit gains/losses -1 -1 -85 -803 22 812 -63 8
Operating profit/loss -95 6 13 20 – 1 227 1 – – 125 -905 -252 944 18 66
Net financial items 9 75The year’s income tax expense -5 -27
Continuing operations 22 114
Profit from discontinuedoperations 23 769
Profit for the year 45 883
Other disclosures
Assets 492 683 213 212 22 21 143 215 – – -238 -89 886 1,906 1,519 2,947Shares in equity 4 4 187 4 411 9 602 16
Unallocated assets 33 31
Total assets 2,154 2,995
Liabilities 148 196 67 67 10 9 123 52 – – -234 -89 325 53 439 287
Unallocated liabilities 217 227
Total liabilities 657 514
Investments 5 13 2 4 – – – – – – – – 455 – 472 17
Amortisation/depreciation -9 -9 -3 -3 – – -14 -6 – -42 – -6 – – -27 -66

BURE’S ANNUAL REPORT 2009, 23
Operating incomeBreakdown of operating income by type Net sales
SEK M 2009 2008
Sale of goods – 14Service contracts 902 1,052Other sales 37 31
Total sales in continuing operations 939 1,097Other operating income 247 30Total operating income in continuing opera-tions 1,186 1,127Total operating income in discontinued opera-tions 23 1,876Total revenue 1,209 3,003
NOTE 3 – Exit gains/lossesGroup 2009Total exit gains/losses in the Group during 2009 amounted to SEK -40.3M (683.8), of which SEK 22.9M (676.1) is attribut-able to discontinued operations (Textilia and Socran). The exit loss is mainly due to the ownership distribution programme in Carnegie, SEK -61.1M. To a large extent, the exit loss in the Group relating to the ownership distribution programmes an accounting effect that is attributable to dissolution of the neg-ative goodwill that arose on the acquisition of Carnegie and subsequently increased Bure’s share in profit and the consoli-dated value of the shares in Carnegie. In the Parent Company, the ownership distribution has had no effect on profit.
Parent Company 2009Total exit gains in the Parent Company during 2009 amount-ed to SEK 22.4M (811.9). These gains are mainly attributable to contingent consideration in Textilia.
Group 2008Total exit gains in the Group during 2008 amounted to SEK 683.8M, of which SEK 676.1M (693.9) is attributable to discontinued operations (refers to the sale of Citat, Textilia, Anew Learning and AcadeMedia).
Parent Company 2008Total exit gains in the Parent Company during 2008 amount-ed to SEK 811.9M. These gains are mainly attributable to the sale of Citat, SEK 124M, and the sale of Anew Learning in connection with the distribution of AcadeMedia, SEK 681M. Furthermore, the company has received option revenue of close to SEK 8M relating to properties in Vittra. The sale of the Textilia group generated a capital loss of SEK 2M after reversal of a previous impairment loss of SEK 170M. The final agreement for the sale of Carl Bro A/S led to a capital gain of SEK 1M.
GroupParent
CompanySEK M 2009 2008 2009 2008
Continuing operationsABCIB Holding (Carnegie) -61.1 – – –MM Holding (Max Matthiessen) -1.3 – – –Other holdings -0.8 – – –
Total -63.2 – – –
Discontinued operationsTextilia 22.2 58.2 22.2 -2.1Citat – 68.4 – 124.0Anew Learning – 563.9 – 686.2AcadeMedia – -17.3 – -5.1Other holdings 0.7 10.6 0.2 8.9
Total discontinued operations 22.9 683.8 22.4 811.9
Total -40.3 683.8 22.4 811.9
NOTE 4 – Shares in profi t of associates (net)
GroupSEK M 2009 2008
Carnegie 242.5 –Max Matthiessen -14.8 –Celemi -1.4 2.8Others 0.9 0.2
Total 227.2 3.0Discontinued operations – 11.1Total shares in profit 227.2 14.1
NOTE 5 – Impairment losses and reversals
GroupParent
CompanySEK M 2009 2008 2009 2008
Investing activities, impairment lossesMercuri International Group AB – – -157.7 –SCF -0.8 – -0.8 –MM Holding, shares – – -26.3 –Total impairment losses – – -184.8 –Impairment losses in discontinued operations – -6.5 – –
Total impairment losses – -6.5 – –
Investing activities, reversalsLänia (Textilia) – – – 170.0Total reversals – – – 170.0Net impairment losses/reversals -0.8 -6.5 -184.8 170.0
NOTE 6 – Interest and similar profi t/loss items
GroupParent
CompanySEK M 2009 2008 2009 2008
Income from financial assets atfair value through profit or loss
-Fair value change in hedge fund – 8.7 – 3.6 -Dividends – – – 5.1Impairment loss on shares in dormant subsidiaries – – -51.3 –Contributions paid – – -10.3 –Group contributions received – – 95.5 –Capital gain/loss on financial items 0.1 -0.4 – –Exchange differences on financialreceivables/liabilities -4.5 4.0 – –Interest income 18.5 83.5 17.6 68.7Interest expense -5.3 -21.1 -0.5 -2.1Other financial items -0.1 – – –
Total interest and similarprofit/loss items 8.7 74.7 51.0 75.3Discontinued operations – 0.1Total interest and similarprofit/loss items 8.7 74.8
Operating profit includes exchange differences on operating receivables and liabilities in the following amounts 0.3 5.2 – –

24, BURE’S ANNUAL REPORT 2009
NOTE 7 – Income taxesGroup
SEK M 2009 2008
Current tax -6.3 -13.3Deferred tax 1.5 -13.6
Total -4.8 -26.9Tax in discontinued operations – -24.3
Items included in deferred tax GroupSEK M 2009 2008
Deferred tax assets:Taxed deficit 32.6 31.2
Total 32.6 31.2
Deferred tax liabilities:Untaxed reserves 4.5 4.8Excess values identified on consolidation 22.9 24.4Temporary differences -0.1 -0.5
Total 27.3 28.7
Deferred tax, net 5.3 2.5
Composition of tax expenseReported profit before tax 27.3 140.5Effect of associated companies, net -227.2 -3.0
Reported profit before tax -199.9 137.5Tax according to the applicable tax rate, 26.3% (28%) 52.6 -38.5
Tax effect of non-deductible expenses: Impairment losses on goodwill -12.7 -4.3 Other non-deductible expenses -7.0 -6.7 Exit losses -16.6 –Tax effect of non-taxable income: Exit gains – 2.2 Tax-deductible items 2.2 4.9Capitalisation of loss carryforwards 2.2 12.4Non-taxable reversal – 17.3Realised gain on capital investment – -4.1Effect of uncapitalised loss carryforwards -19.6 -9.9Effect of different tax rate in foreign country -1.0 -0.9Adjustment in taxes for prior years -1.9 -0.8Other -3.0 1.6
Total -4.8 -26.9
NOTE 8 – LeasesGroup Parent Company
SEK M 2009 2008 2009 2008
The period’s lease payments (operating)Cars 15.7 15.8 0.2 0.3Premises 47.4 33.9 1.5 1.1Other equipment 8.2 4.8 0.3 0.2
Total 71.3 54.5 2.0 1.6
Group Parent CompanyContracted lease payments 2010 2011–2013 > 2013 2010 2011–2013 > 2013
Operating leases Cars 11.8 10.2 – 0.2 0.1 –Premises 38.9 76.1 – 1.2 1.7 –Other equipment 5.7 8.8 – 0.1 – –
Total 56.4 95.1 – 1.5 1.8 –
Finance leasesCars 0.5 0.1 – – – –
Total 0.5 0.1 – – – –
Interest 0.0 – – –Present value of future lease payments: 0.0 – – –
Gross change in deferred taxAt beginning of year 2.5 66.6Companies acquired – -3.3Companies sold – -40.5Reported in sold operations – -6.3Translation differences 1.3 -0.4Recognised in the income statement 1.5 -13.6
At end of year 5.3 2.5
At year-end 2009 the Bure Group had total preliminary loss carryforwards of approximately SEK 720M. Of this amount, SEK 308M refers to the Parent Company. The total deferred tax assets based on these loss carryforwards amount to SEK 32.6M (31.2), which is almost exclusively attributable to loss carryforwards in subsidiaries that are expected to be offset against future profits. Furthermore, there are loss carryforwards and temporary differences between carrying amounts and tax values amounting to SEK 596M for which no deferred tax asset has been recognised, since it is cur-rently deemed unlikely that the loss carryforwards can be utilised against future profits in the Group. Of uncapitalised loss carry forwards, SEK 308M refers to the Parent Company. As of 2010, the loss carryforwards in the Parent Company will be suspended until the end of 2015 in respect of the merger between Bure and Skanditek. The loss carryforwards in the subsidiaries will be available to offset against taxable profits in certain wholly owned subsidiaries. A limited portion of the Group’s loss carryforwards is subject to expiration. This is not expected to affect the value of any capitalised loss carryforwards.

BURE’S ANNUAL REPORT 2009, 25
NOTE 10 – Patents, licences, etc.
GroupSEK M 2009 2008
Opening cost 14.3 22.1The year’s acquisitions 0.9 1.4Sales/Reclassifications -7.2 -9.6Translation differences -0.2 0.4
Closing cost 7.8 14.3
Opening amortisation -9.4 -11.2The year’s acquisitions 0.0 0.0Sales/Reclassifications 6.0 4.0The year’s amortisation -2.0 -2.0Translation differences 0.2 -0.2
Closing accumulated amortisation -5.2 -9.4
Carrying amount 2.6 4.9
R&D expenses of SEK 0.0M (0.0) were expensed during the year.
NOTE 9 – Fees to auditors
GroupParent
CompanySEK M 2009 2008 2009 2008
Fees to Ernst & YoungAuditing fees 3.4 2.9 0.6 0.6Consulting fees 2.3 2.5 1.6 1.8
Total fees to Ernst & Young 5.7 5.4 2.2 2.4
GroupParent
CompanySEK M 2009 2008 2009 2008
Fees to other auditorsAuditing fees 0.1 0.1 0.0 0.0Consulting fees 0.1 0.1 0.0 0.0
Total fees to other auditors 0.2 0.2 0.0 0.0
Growth, % EBITA, %Forecast Terminal Forecast Terminal Discount
Goodwill period period period period rate, %1
Mercuri 283.2 2–5 3 4–6 5 14.2EnergoRetea 104.9 7–9 3 7–9 7–8 14.2SRC 4.7 -9–2 3 3–4 4 14.2
Total 392.81 Refers to the discount rate before tax.
The above valuations do not represent fair market value, but are instead estimated in accordance with IAS 36 to determine the recoverable amount of cash-generating units. Based on the above, the goodwill values in the table can be considered well founded. The forecast period is five years. The recoverable amount exceeds the carrying amount by a wide margin. If, for example, the growth or EBITA assumption should change by one percentage point, there is still a secure margin for Bure’s estimated value of goodwill.The growth assumption is based on a combination of general economic assumptions and sector-specific assumptions.
NOTE 11 – Goodwill
GroupSEK M 2009 2008
Opening cost 805.3 1,205.8The year’s acquisitions 0.0 25.1Sales/Reclassifications -1.3 -492.5Translation differences -15.5 66.9
Closing cost 788.5 805.3
Opening amortisation -121.8 -173.9Sales/Reclassifications -0.1 66.3Translation differences 4.9 -14.3
Closing accumulated amortisation -117.0 -121.8
GroupSEK M 2009 2008
Opening impairment losses -229.9 -265.0Sales/Reclassifications -0.2 67.9The year’s impairment losses -48.1 -15.3Translation differences -0.5 -17.5
Closing accumulated impairment losses -278.7 -229.9
Carrying amount 392.8 453.6
The recoverable amount of the Group’s goodwill items is measured by determining value in use. These calculations are based on estimated future cash flows with consideration to financial budgets approved by the company’s management.

26, BURE’S ANNUAL REPORT 2009
NOTE 12 – Buildings, land and land improvements
GroupSEK M 2009 2008
Opening cost 14.4 96.8The year’s acquisitions 0.0 6.6Sales/Reclassifications -0.3 -90.1Translation differences -0.4 1.1
Closing cost 13.7 14.4
Opening amortisation -5.9 -17.4The year’s acquisitions 0.1 -1.3Sales/Reclassifications 0.3 14.6The year’s depreciation -0.3 -1.1Translation differences 0.2 -0.7
Closing accumulated depreciation -5.6 -5.9
Opening impairment losses 0.0 -61.7Reversal of previous impairment losses 0.0 61.7
Closing accumulated impairment losses 0.0 0.0
Carrying amount 8.1 8.5
Tax assessment values, buildings 3.2 2.9Carrying amount, buildings 7.4 7.8Tax assessment values, land 1.3 1.0Carrying amount, land 0.7 0.7
Not all buildings have been assigned tax assessment values. The reported values include properties held under finance leases attribut-able to Textilia. Textilia was divested during 2008.
2009 2008Opening cost – 90.1Sales/Reclassifications – -90.1
Closing cost – 0.0
Opening accumulated depreciation – -13.8The year’s depreciation – –Sales/Reclassifications – 13.8
Closing accumulated depreciation – 0.0
Opening accumulated impairment losses – -61.7Reversal of previous impairment losses – 61.7
Closing accumulated impairment losses – 0.0
Carrying amount – 0.0
There are no commitments for future property investments (SEK 0M).
NOTE 13 – Plant and machinery
GroupSEK M 2009 2008
Opening cost 0.0 128.6The year’s sales – -128.6
Closing cost 0.0 0.0
Opening amortisation 0.0 -54.3Sales/Disposals – 62.9The year’s depreciation – -8.6
Closing accumulated depreciation 0.0 0.0
Carrying amount 0.0 0.0
The reported values include machinery held under finance leases in the following amounts:
2009 2008Opening cost 0.0 38.6The year’s sales – -38.6
Closing cost 0.0 0.0
Opening accumulated depreciation 0.0 -15.2The year’s sales – 17.6The year’s depreciation – -2.4
Closing accumulated depreciation 0.0 0.0
Carrying amount 0.0 0.0
There are no future investment commitments for acquisition of machinery. The discontinued operations refer to Textilia.

BURE’S ANNUAL REPORT 2009, 27
NOTE 15 – Acquisitions and divestitures
Acquisitions in 2009In 2009 Bure acquired non-controlling interests in EnergoRetea amounting to a total of 1.2 per cent. The total purchase price was just under SEK 1.4M. In addition, 51.4 per cent of Socran was acquired for SEK 0.1M.
Merger between Bure and SkanditekThe extraordinary general meetings of Bure and Skanditek inDecember 2009 resolved on a merger. After the end of the period, in January 2010, the merger was completed through a statutory merger in which Bure absorbed Skanditek. The merger will be reported according to the acquisition method at 29 January 2010. The purchase price to Skanditek’s share-holders has been paid in the form of merger consideration that consists of the value of newly issued shares in Bure. For each share in Skanditek, the holder received 0.75 shares in Bure. Skanditek owned approximately 20 per cent of Bure before the merger, which means that Bure has acquired shares in itself. These shares were cancelled in January 2010, and in the accounts are regarded as treasury shares and are recognised directly in equity. The fair value of theses shares amounted at 29 January 2010 to SEK 264.3M. In connection with the merger, a special cash dividend was paid to Bure’s shareholders prior to the merger in an amount of SEK 9.50 per share, equal to a total of SEK 478M. Skanditek’s share of the dividend amounted to SEK 92.3M.
Skanditek Industriförvaltning AB (publ)Preliminary calculation of the value of acquired assets and liabilities on the acquisition dateSEK M 29 Jan 2010
Tangible assets 43.1Financial assets 1,304.9Current assets 329.6 of which, cash and cash equivalents 244.3Total assets 1,677.6Non-current liabilities -4.9Current liabilities -62.0Total acquired net assets 1,610.7Negative goodwill -287.3
Total merger consideration, value of newly issued shares including direct costs in connection with acquisition 1,323.4
Effect on the Group’s cash and cash equivalents:
Merger consideration paid through newly issued shares -1,323.4Direct costs in connection with the acquisition -6.7Acquired cash and cash equivalents in acquired subsidiary 244.3
Effect on the Group’s cash and cash equivalents,total net outflow 237.6
The prepared purchase price allocations are preliminary.
Acquisitions in 2008In 2008 the acquisition of group companies affected cash and cash equivalents in total amount of SEK 78M. The most significant acquisi-tions were CLC Installationsconsult, Didaktus and UVS Gymnasium.
Cont’d on next page ➤
NOTE 14 – Equipment, tools, fi xtures and fi ttings
GroupParent
CompanySEK M 2009 2008 2009 2008
Opening cost 186.2 579.2 4.9 4.8The year’s acquisitions 16.7 52.0 – 0.1Sales/Reclassifications -25.6 -445.0 – –Translation differences 2.6 10.0 – –
Closing cost 179.9 186.2 4.9 4.9
Opening depreciation -119.1 -404.2 -4.5 -4.3The year’s acquisitions – -3.9 – –Sales/Reclassifications 23.9 307.4 – –The year’s depreciation -24.1 -10.7 -0.1 -0.1Translation differences -3.0 -7.7 – -0.1
Closing accumulateddepreciation -122.3 -119.1 -4.6 -4.5
GroupParent
CompanySEK M 2009 2008 2009 2008
Opening impairment losses -0.4 – – –Sales/Reclassifications – – – –The year’s reversals/impairment losses 0.4 -0.3 – –Translation differences – -0.1 – –
Closing accumulated impairment losses 0.0 -0.4 – –
Carrying amount 57.6 66.7 0.3 0.4
The reported values include equipment held under finance leases in the following amounts:
GroupSEK M 2009 2008
Opening cost 1.3 62.0The year’s acquisitions – 0.1Sales/Reclassifications -0.5 -60.8Translation differences -0.1 0.0
Closing cost 0.7 1.3
Opening depreciation -1.0 -50.1Sales/Reclassifications 0.4 57.2The year’s depreciation – -7.9Translation differences – -0.2
Closing accumulateddepreciation -0.6 -1.0
Carrying amount 0.1 0.3

28, BURE’S ANNUAL REPORT 2009
Fair value corresponds to carrying amount in the specification above.In the third quarter EnergoRetea acquired CLC Installationsconsult.The acquisition of CLC is intended to strengthen EnergoRetea’s operations in southern Sweden with expertise in energy, HVAC and sanitation, control and fire protection systems, cooling and electrical engineering. The acquisition will increase Bure’s consolidated annual sales by approximately SEK 54M and profit by around SEK 5M. In the second quarter Anew Learning acquired the Didaktus group and UVS Gymnasium, both of which operate independent schools. In the third quarter, Anew Learning was sold to AcadeMedia.
Divestitures in 2009The payment of a conditional purchase price for the sale of Textilia affected profit in an amount of SEK 22.3M. The total effect on cash and cash equivalents was SEK 40.8M, due to the payment of a previ-ously unsettled purchase price commitment of SEK 18.5M.
Total value of sold assets and liabilities in Textilia during 2009
SEK M 2009
Assets –Liabilities –Capital gain 22.2
Total purchase consideration –
Previously unsettled portion of purchase consideration now paid 18.5
Effect on the Group’s cash and cash equivalents,total net inflow 40.7
Bure sold a non-controlling interest in Scandinavian Retail Center equal to 4.5 per cent of the company. The sales price amounted to SEK 0.6M and the capital gain was SEK 0.1M. In addition, after the distribution of SEK 0.5M, Socran was sold for SEK 0.2M, which pro-vided a capital gain of SEK 0.2M.
Divestitures in 2008In the fourth quarter Bure sold the Anew Learning group, which affected cash and cash equivalents in a total amount of SEK 274M
Total value of sold assets and liabilities in Anew Learning:
SEK M 2008
Intangible assets 264.9Tangible assets 46.3Current assets 140.1Cash and cash equivalents –Liabilities -204.5Capital gain 563.9
Total purchase consideration for Anew Learning 810.7
Cash and cash equivalents in divested subsidiary –Purchase consideration in the form of shares in AcadeMedia -536.3
Effect on the Group’s cash and cash equivalents,total net inflow 274.4
In the third quarter Bure also sold the Textilia group, which affected cash and cash equivalents in a total amount of SEK 145M.
Total value of sold assets and liabilities in Textilia:
SEK M 2008
Tangible assets 226.1Current assets 58.5Cash and cash equivalents 18.8Liabilities -160.0Capital gain 58.2
Total purchase consideration for Textilia 201.6
Cash and cash equivalents in divested subsidiary -18.8Unsettled purchase consideration commitments -37.4
Effect on the Group’s cash and cash equivalents,total net inflow 145.4
CLC InstallationsconsultTotal value of acquired assets and assumed liabilities during the year:
SEK M 2008
Tangible assets 6.0Current assets 9.9Cash and cash equivalents 10.2Total assets 26.1Current liabilities -12.4Total acquired net assets 13.7Goodwill 25.0
Total purchase consideration 38.7
Purchase consideration paid in cash 38.0Unsettled purchase consideration commitments –Direct costs arising from the acquisition 0.7
Effect on the Group’s cash and cash equivalents:
Purchase consideration paid in cash including direct costs 38.7Cash and cash equivalents in acquired subsidiary -10.2
Effect on the Group’s cash and cash equivalents,total net outflow 28.5
DidaktusTotal value of acquired assets and assumed liabilities during the year:
SEK M 2008
Tangible assets 6.0Current assets 13.1Cash and cash equivalents 5.2Total assets 24.3Current liabilities -21.9Total acquired net assets 2.4Goodwill 41.9
Total purchase consideration 44.3
Purchase consideration paid in cash 43.5Unsettled purchase consideration commitments –Direct costs arising from the acquisition 0.8
Effect on the Group’s cash and cash equivalents:
Purchase consideration paid in cash including direct costs 44.3Cash and cash equivalents in acquired subsidiary -5.2
Effect on the Group’s cash and cash equivalents,total net outflow 39.1
UVS GymnasiumTotal value of acquired assets and assumed liabilities during the year:
SEK M 2008
Tangible assets 1.8Current assets 0.6Cash and cash equivalents –Total assets 2.4Current liabilities -3.6Total acquired net assets -1.2Goodwill 11.6
Total purchase consideration 10.4
Purchase consideration paid in cash 10.4Unsettled purchase consideration commitments 1.6Direct costs arising from the acquisition 0.1
Effect on the Group’s cash and cash equivalents:
Purchase consideration paid in cash including direct costs 10.4Cash and cash equivalents in acquired subsidiary –
Effect on the Group’s cash and cash equivalents,total net outflow 10.4
➤ Cont’d from previous page

BURE’S ANNUAL REPORT 2009, 29
NOT 16 – Investments in associates
SEK M No. of shares% of capital /
votes
Carrying amount in Parent Company
Carrying amount in
GroupCorporate ID
number Domicile
Celemiab Group AB 258,010 30.4 8.5 11.2 556562 - 3997 MalmöABCIB Holding AB 525,000 26.25 398.3 573.2 556780-4983 StockholmMM Holding AB 1,786,750 17.51/23.34 3.9 13.2 556780-4421 StockholmValot Group AB 35,000 35 0.0 0.0 556784-4005 StockholmCam Group Holding A/S 1,750 35 0.2 0.2 32657044 Copenhagen, DKInnovationsKapital Fond 1 AB 244 23.0 0.0 0.0 556541 - 0056 Göteborg
Other equity shares – 4.2
Carrying amount 411.0 602.0
The difference between the carrying amount in the Group and in the Parent Company is due to the fact that shares in profit of associates are included in the consolidated accounts in accordance with the equity method. The difference, SEK 191M, consists of accumulated shares in profit of associates less amortisation/impairment of goodwill, dividends received, elimination of intra-group gains and adjustments for profit-sharing agreements.
For information about shares in profit of associates, see Note 4.
Other financial information, significant associated companies:
SEK M Assets Liabilities excl. equity Net sales Operating profit
Celemiab Group AB 27 5 38 -5ABCIB Holding 1 13,997 11,888 1,445 811MM Holding 2 602 453 347 -6
1 Operating profit includes the reversal of negative goodwill in an amount of SEK 633M.2 Bure’s mathematical share in profit of MM Holding amounts to approximately 12 per cent with consideration to profit-sharing agreements.
In the third quarter Bure sold the Citat group excluding SRC, which affected cash and cash equivalents in a total amount of SEK 187M.
SEK M 2008
Intangible assets 125.4Tangible assets 11.0Current assets 101.2Cash and cash equivalent 70.1Liabilities -75.9Capital gain 25.3
Total purchase consideration for the Citat group 257.1
Cash and cash equivalents in divested subsidiary -70.1
Effect on the Group’s cash and cash equivalents, total new inflow 187.0
In the first quarter Citat sold its holding in Appelberg Publishing Group, which affected cash and cash equivalents in a total amount of SEK 65M in 2008.
SEK M 2008
Intangible assets 28.4Current assets 12.1Cash and cash equivalents 22.9Liabilities -18.6Capital gain 43.2
Total purchase consideration for all divestitures in the Bure Group during the year 88.0
Cash and cash equivalents in divested subsidiary -22.9
Effect on the Group’s cash and cash equivalents, total new inflow 65.1
Sale and acquisition of shares in Anew Learning and distribution of shares in AcadeMediaIn the third quarter of 2008, preparations were started for a merger between Bure’s wholly owned subsidiary Anew Learning AB and the associated company AcadeMedia AB. The merger was completed in the fourth quarter of 2008 through AcadeMedia’s acquisition of Bure’s shares Anew Learning in exchange for 6,310,000 newly issued shares in AcadeMedia and a cash sum of SEK 274M. Through this transaction, Bure came to own 70 per cent of AcadeMedia. In connection with the transaction, the option holders in Anew Learning called for their right to buy shares in Anew Learning. These shares where acquired by Bure at the same time that Bure sold 120,152 shares in AcadeMedia.Two alternative methods are currently applied within the framework of IAS to recognise the sale of non-controlling interests, since this is not explicitly covered by IAS 27. According to the revised IAS 27, which is effective 1 January 2010, the sale of a non-controlling interest is recognised directly in equity on the condition that control over the com-pany is retained.After the merger, Bure decided to distribute the entire hold-ing in AcadeMedia to its shareholders. During the brief peri-od that arose between the merger with AcadeMedia and the distribution of shares, Bure treated the shareholding within the framework of non-current assets held for sale, IFRS 5.The net gain on the sale of Anew Learning in the Group amounted to SEK 550M, of which SEK 564M has been recognised in the income statement and SEK -14M, which was attributable to the transaction with non-controlling interests in Anew Learning, has been recognised in equity in accordance with the new rules in IAS 27.
Other divestituresAside from the above, a number of smaller divestitures took place during 2008. A non-controlling interest in EnergoRetea was sold for a capital gain of SEK 1M. EnergoRetea has in turn sold ENS, which resulted in a capital loss of SEK 1M. The payment of contingent consideration for Carl Bro generated a capital gain of SEK 1M for the year. An option premium also provided a capital gain of SEK 8M.

30, BURE’S ANNUAL REPORT 2009
NOTE 17 – Available-for-sale (AFS) fi nancial assets
GroupParent
CompanySEK M 2009 2008 2009 2008
Opening cost 2.9 0.3 0.5 0.3The year’s acquisitions 0.9 2.2 0.9 0.3Sales -0.7 -0.2 -0.5 -0.1Reclassification – 0.2 – –Translation differences -0.1 0.4 – –
Closing cost 3.0 2.9 0.9 0.5
Opening revaluation gains/losses 0.0 0.0 0.0 –Revaluation gains/losses recognised in equity – – – –The year’s reversals of revaluation gains/losses – – – –
Closing accumulated revaluation gains/losses 0.0 0.0 0.0 0.0
Opening accumulated impairment losses 0.0 0.0 0.9 0.0
The year’s impairment losses -0.8 -0.8
Closing accumulated impairment losses -0.8 -0.8
Carrying amount 2.2 2.9 0.1 0.5
Listed shares and participa-tions1 2.1 2.6 – –
Unlisted shares and participa-tions 0.1 0.3 0.1 0.5
Measured at fair value 0.1 – – –
Measured at amortised cost2 – 0.3 – 0.5Total 2.2 2.9 0.1 0.5
1 The holdings have been classified as available for sale, for which reason revaluation gains/losses are recognised in equity.
2 Due to the lack of an active market for these instruments, there are no grounds for valuation other than at cost.
NOTE 18 – Accrued income
GroupParent
CompanySEK M 2009 2008 2009 2008
Accrued interest income 3.0 7.5 3.0 7.5Work in progress, less progress billings 3.7 10.1 – –Other accrued income 0.1 8.6 7.9 –
Total 6.8 26.2 10.9 7.5Discontinued operations – – – –Total 6.8 26.2 10.9 7.5
NOTE 19 – Provisions
Change in the restructuring reserve GroupSEK M 2009 2008
Opening restructuring reserve 2.4 0.0
The year’s increase in connection with restructuring in subsidiaryMercuri – 2.4
Total – 2.4
Dissolved during the year according to planMercuri -1.1 –
Mercuri -1.1 –
Dissolved not utilisedMercuri -1.2 –
Mercuri -1.2 -Translation differences -0.1 –
Closing restructuring reserve 0.0 2.4
Change in deferred tax liability GroupSEK M 2009 2008
Opening deferred tax liability 28.7 28.2
The year’s increase in connection with acquisi-tionEnergoRetea – 2.5Total – 2.5
Provisions made/increased during the yearEnergoRetea 0.3 1.2
Total 0.3 1.2
Utilised / dissolved during the yearEnergoRetea -0.3 -1.1Translation differences -1.4 3.3
Closing deferred tax liability 27.3 28.7
Change in other provisions GroupSEK M 2009 2008
Opening other provisions 21.3 25.3
The year’s provisionsMercuri 0.3 0.2
Total 0.3 0.2
Utilised / dissolved during the yearMercuri 0.4 -1.7
Total 0.4 -1.7
Discontinued operations – -2.0Translation differences -1.3 -0.5
Closing other provisions 20.7 21.3Less financial assets -4.5 –
Other provisions according to the balance sheet 16.2 21.3
Estimated reversal of provisions in the Group 2010 2011 2012 >2012
Pension provisions – – – 20.1Deferred tax liability – – – 27.3Other provisions 0.6 – – –
Total 0.6 – – 47.4

BURE’S ANNUAL REPORT 2009, 31
NOTE 23 – Contingent liabilities
There is no contingent consideration in the Group that has not already been capitalised. Bure has no remaining commit-ments to acquire additional shares in subsidiaries.
NOTE 20 – Non-current liabilities
GroupParent
CompanySEK M 2009 2008 2009 2008
Total non-current liabilities 84.7 214.7 – –
of which, non-current liabilities directly connected to AFS financial assets – – – –of which, maturing later than five years after the balance sheet date 2.4 2.4 – –
NOTE 21 – Accrued expenses and deferred income
GroupParent
CompanySEK M 2009 2008 2009 2008
Accrued vacation pay 29.3 25.9 1.3 1.4Accrued social security expenses 27.8 34.8 3.3 3.2Prepaid income 8.7 83.6 – –Other accrued expenses 47.0 6.0 17.4 11.4
Total 112.8 150.3 22.0 16.0Discontinued operations – –Total 112.8 150.3
NOTE 22 – Pledged assets
GroupParent
CompanySEK M 2009 2008 2009 2008
To secure own liabilities and provisionsfor liabilities to credit institutionsFloating charges 12.2 12.2 – –Shares in subsidiaries/associates 329.1 239.7 – –Blocked bank accounts 1.5 1.5 – –
Pledged trade receivables 342.8 253.4 – –Discontinued operations – –Total 342.8 253.4 – –

32, BURE’S ANNUAL REPORT 2009
NOTE 24 – Financial instruments
Financial risks – objectives and policiesThe Group is exposed to a number of different financial risks through its operations. Bure is an investment company with an important overall objective that is regulated in the Parent Company’s finance policy. The Parent Company shall be free from indebtedness and the subsidiaries shall have independ-ent financing to ensure their financial autonomy from the Parent Company and other group companies. Consequently, the subsidiaries shall also be able to independently manage their own liquidity risk. A separate finance policy has been established for each individual subsidiary. The policy document provides guidelines for management of cash, surplus liquidity, debt financing, currency and interest rate risk. However, since the operations of the subsidiaries vary, the objectives of the respective subsidiary may also differ. Bure can manage its capital structure among other things through new share issues, dividends, redemption procedures or share buybacks. In 2009 Bure carried out capital distributions that are described in more detail on page 5. Bure also has an authorisation for the repurchase and resale of treasury shares, see page 7. The Parent Company and the Group have a strong financial position and a restricted level of debt, for which reason the level of financial risk is limited. The Group’s net loan receivable at 31 December 2009 was SEK 607M (1,892) and the Parent Company’s was SEK 663M (1,848). See also pages 3–4.
Currency riskCurrency risk refers to the risk that the Group’s commercial flows (transaction risk) will be affected by exchange rate fluc-tuations. Transaction risk in the Group is limited, since nearly all income is matched by expenses in the same currency. Because the Bure Group has investments outside Sweden via its sub-sidiaries, the Group’s balance sheet and income statement are
exposed to translation risk arising on the translation of the financial statements of foreign subsidiaries to Swedish kronor (SEK). This risk is normally not hedged. The most significant currency aside from SEK is the euro. A change of +/- 5 per cent in the euro rate would have an impact on profit before tax of approximately SEK 2M. In Mercuri Group, there are loans to a wholly owned subsidiary that are denominated in euros. Mercuri has hedged this receivable by taking up a correspond-ing share of its financing through loans in euros.
Interest rate risk The Group is exposed to interest rate risk through changes in the interest rate on liabilities with variable interest due to move-ments in market rates. Fixed interest liabilities are also exposed to interest rate risk, but to a significantly lesser degree since the interest rate changes when the loans mature and are extended on new terms. In view of the amount distributed in connec-tion with the extraordinary cash distribution in January 2010, a change of +/- 1 per cent in the interest rate for the Group would have a short-term impact of SEK 6M on consolidated profit before tax. Interest rate risk in borrowings can be main-tained at a desired level through the use of derivatives such as swaps, forwards and options. At present, there are no hedges of interest rate risk.
Credit riskCredit risk is the risk that Bure’s counterparties will be unable to meet their payment obligations and that any collateral fur-nished will not cover the amount due, thereby causing Bure to incur a financial loss. Bure’s policy is to carry out a credit assessment of all customers with which it does business. The maximum credit exposure on the balance sheet date was SEK 257M (see table on page 33, fair value of financial instru-ments). There are no significant concentrations of credit risk in the Group.
Age structure of receivables (SEK M) 2009 2008
Receivables ReservesNet
receivableSecured by
collateral Receivables ReservesNet
receivableSecured by
collateral
Not yet due 192.1 0.1 192.0 – 156.5 0.0 156.5 –Overdue 1–30 days 44.4 0.1 44.3 – 46.0 0.2 45.8 –Overdue 31–60 days 10.9 0.3 10.6 – 14.8 0.1 14.7 –Overdue 61–90 days 3.2 0.0 3.2 – 9.0 0.0 9.0 –Overdue 91–180 days 2.5 0.3 2.2 – 4.9 1.2 3.7 –Overdue >180 days 7.9 5.0 2.9 – 15.2 2.7 12.5 –
Total 261.0 5.8 255.2 – 246.4 4.2 242.2 –
Specification of reserve for bad debt losses (SEK M)SEK M 2009 2008
Opening balance 4.5 3.7The year’s provisions 3.7 3.7Amount written off -0.9 -1.9Reversal of unutilised reserves -1.4 -0.9Foreign exchange gains/losses -0.1 -0.1
Total at 31 December 5.8 4.5
Provisions to the reserve for bad debt losses are made after individual assessment of each customer’s ability to pay.
Liquidity risk and refinancing riskLiquidity risk is the risk that the Group will be unable to finance loan payments and other liquidity flows as they fall due either with its own funds or with new financing. In order to maintain sufficient liquidity, Bure maintains a liquidity reserve that is at least adequate to cover one year’s forecasted liquidity requirement and other liquidity needs in the existing company structure. The liquidity reserve consists of available cash and cash equivalents, bank overdraft facilities and com-mitted unutilised credit facilities. That portion of the liquid-ity reserve that exceeds the liquidity requirement as defined above, and which may according to Bure’s policy be invested over a longer investment horizon, can be distributed to the shareholders or used in a buyback programme. Decisions regarding the use of excess liquidity within the framework of the finance policy are made by the President on the basis of recommendations from the CFO. The tables on the following page show the maturity structure of the Bure Group’s finan-cial liabilities at 31 December 2009 and 31 December 2008.

BURE’S ANNUAL REPORT 2009, 33
Interest-free liabilities <1 month <3 months 3-12 months 1-5 years > 5 years Total
Trade payables 34.3 0.1 – – – 34.4Accrued expenses 104.1 – – – – 104.1Other financial liabilities 271.0 – – – – 271.0
Total 409.4 0.1 – – – 409.5
Liquidity reserve (SEK M) Group Parent Company2009 2008 2009 2008
Investments 550.1 1,270.2 550.1 1,190.0Hedge funds – 0.1 – 0.1Bank deposits 164.9 788.7 83.0 623.5Unutilised committed credits 36.2 29.9 – –
Total 751.2 2,088.9 633.1 1,813.6
Fair value of financial instrumentsThe table below shows the carrying amounts and fair values of Bure’s financial instruments.
2009 2008Financial assets (SEK M) Carrying amount Fair value Carrying amount Fair value
Held-for-trading (HFT) financial assets measured at fair valuethrough profit or loss- Hedge fund – – 0,1 0,1Available-for-sale (AFS) financial assets 2.2 2.2 2.9 2.9Loans and receivables- Other long-term receivables 54.5 54.5 18.9 18.9- Trade receivables 145.0 145.0 195.8 195.8- Work in progress, less progress billings 19.3 19.3 – –- Other current receivables 29.6 29.6 1.3 1.3- Accrued income 6.8 6.8 26.2 26.2- Cash and cash equivalents and short-term investments 715.0 715.0 2,058.9 2,058.9
Total financial assets 972.4 972.4 2,304.1 2,304.1
2009 2008Financial liabilities (SEK M) Carrying amount Fair value Carrying amount Fair value
Other financial liabilities measured at amortised costNon-current liabilities- Liabilities to credit institutions 41.8 41.8 165.1 165.1- Liabilities under finance leases – – 0.3 0.3Current liabilities- Liabilities to credit institutions 129.2 129.2 6.2 6.2- Trade payables 34.3 34.3 49.3 49.3- Liabilities under finance leases – – 0.2 0.2- Other current liabilities 271.0 271.0 82.1 82.1- Accrued expenses 104.1 104.1 66.7 66.7
Total financial liabilities 580.4 580.4 369.9 369.9
INTEREST RATE RISK AND MATURITY STRUCTURE OF FINANCIAL LIABILITIES (SEK M)
Financial items with fixed interest <1 month <3 months 3-12 months 1-5 years > 5 years Total
Borrowings – – – – – –
Total – – – – – –
Financial items with variable interest <1 month <3 months 3-12 months 1-5 years > 5 years Total
Bank overdraft facilities 6.9 – 24.8 – – 31.7Other borrowings – 2.5 95.0 39.4 2.4 139.3
Total 6.9 2.5 119.8 39.4 2.4 171.0

34, BURE’S ANNUAL REPORT 2009
NOTE 25 – Earnings per shareBure reports earnings per share in accordance with IAS 33, Earnings Per Share. Earnings per share are reported both before and after dilution.Earnings per share are calculated by dividing net profit/loss by the weighted average number of shares outstanding during the year. In the Group, profit attributable to owners of the Parent Company is used for calculation of earnings per share. In the event of a negative result, the net loss is divided only by the weighted average number of shares outstanding.
NOTE 26 – EquityAccording to the Articles of Association, the share capital shall amount to no less than SEK 100,000,000 and no more than SEK 400,000,000. Each share grants equal rights to the company’s profits and assets. All shares are fully paid up. In connection with the merger between Bure and Skanditek which was registered in January 2010, the Articles of Association were changed based on a previous conditional resolution by the extraordinary general meeting in December 2009. According to the new Articles of Association, the share capital shall amount to no less than SEK 300,000,000 and no more than SEK 1,200,000,000.
Specification of applied parameters 2009 2008
Parent Company profit, SEK M -139.7 1,019.2Consolidated profit excl. non-controlling interests, SEK M 45.2 882.0
Average number of shares, thousands 53,292 89,782
Diluted average number of shares, thousands 53,292 89,782
Information about changes in equity is provided below. For other changes in the equity of the Group and the Parent Company, see statements of changes in equity on pages 13 and 14.
2009 2008No. of shares Quota value Share capital No. of shares Quota value Share capital
Number of registered sharesRegistered number on 1 January 83,914,680 3.58 300.1 98,377,837 8.56 842.1Exercise of warrantsCancellation of treasury shares -14,463,157 -77.4Reduction of share capital -542.0Bonus issue 77.4Bonus issueRedemption procedure -33,565,872Registered number at 31 December 50,348,808 5.96 300.1 83,914,680 3.58 300.1
Treasury sharesTreasury shares at 1 January -5,153,200Share buybacks in 2009 -9,309,957Cancellation of treasury shares 14,463,157Outstanding treasury shares at 31 December 0 0Shares outstanding at 31 December 50,348,808 5.96 300.1 83,914,680 3.58 300.1
Description and reporting of repurchase of treasury shares In January 2009 Bure carried out a large-scale redemption procedure in which 40 per cent of the shares outstanding were redeemed for a value of SEK 30 each, or a total of SEK 1,007M.
Restricted and non-restricted equityAccording to Swedish law, shareholders’ equity must be divided into non-restricted and restricted equity, of which restricted equity is not available for distribution to the shareholders. Restricted equity in the Parent Company consists of the share capital, statutory reserve and revaluation reserve. In Bure’s case, the statutory reserve consists of capital contributed in connection with the company’s formation. The statutory reserve also includes the former share premium reserve, which must be transferred to the statutory reserve in accordance with the new Swedish Companies Act.Non-restricted equity includes retained profit and net profit for the year, which are available for distribution to the shareholders. Consolidated equity consists of the share capital, contributed capital, other reserves and retained profit including profit for the year. Other contributed capital refers to capital contributed by the shareholders. Other reserves consists of translation reserves, which include all exchange differences arising on translation of the financial statements of foreign operations. Furthermore, other reserves also include a fair value reserve which refers to unrealised value gains/losses on shares and participations. Retained profit including profit for the year includes earned profits in the Parent Company and its subsidiaries.
Fair value TranslationChange in other reserves, SEK M reserve reserve Total
Reserves at 1 January 2008 0.0 12.9 12.9
Translation differences – 37.4 37.4Reserves at 31 December 2008 0.0 50.3 50.3Reserves at 1 January 2009 0.0 50.3 50.3
Translation differences – -19.9 -19.9Reserves at 31 December 2009 0.0 30.4 30.4

BURE’S ANNUAL REPORT 2009, 35
NOTE 27 – Profi t from discontinued operations and non-current assets held for sale
SEK M 2009 2008
Net sales – 1,188.8Exit gains/losses 22.9 676.1Shares in profit – 11.1Other income – 0.6
Total operating income 22.9 1,876.6
Raw materials and consumables – -31.8Goods for resale – -90.6Other external expenses – -338.9Personnel costs – -577.6Amortisation/depreciation and impairment losses – -44.5Other operating expenses – –
Total operating expenses – -1,083.4
Operating profit 22.9 793.2
Net financial items 0.1
Profit after financial items 22.9 793.3
Income tax expense – -24.3
Profit from discontinued operations 22.9 769.0
Basic earnings per share 0.43 8.56Diluted earnings per share 0.43 8.56Cash flow from operating activities – 110.8Cash flow from investing activities 41.4 482.1Cash flow from financing activities – -56.3
Net cash flow from discontinued operations 41.4 536.6Average basic number of shares 53,292 89,782
Average diluted number of shares 53,292 89,782
Discontinued operations refer to previously unrecognised conditional consideration for the sale of the subsidiary Textilia in 2009 and Citat, Textilia, Anew Learning and AcadeMedia in 2008.
NOTE 28 – Events after the balance sheet date- The merger between Bure and Skanditek was completed at
the end of January. In connection with implementation of the merger, Bure’s shareholders prior to the merger received an extraordinary dividend of SEK 9.50 per share, equal to a total of approximately SEK 478M.
- After registration of the merger, Patrik Tigerschiöld was appointed as the new CEO of Bure.
- The separation of Carnegie’s asset management business area was completed in February, after which Bure has capitalised CAM Group Holding in an amount of SEK 94M, equal to its holding in the company. Bure’s holding in CAM Group Holding amounts to 35 per cent.
NOTE 30 – Participations in group companies
SEK MNumber of
shares% of capital/
votes Carrying amount in
Parent CompanyCorporate ID
number Domicile
Portfolio companies Mercuri International Group AB2 1,000 100.00 200.0 556518 - 9700 GöteborgScandinavian Retail Center SRC AB 6,475 95.50 11.9 556573 - 0263 HelsingborgEnergoRetea Group AB1, 2 944,500 94.45 104.0 556551 - 7355 Stockholm
315.9
Dormant companiesBure Hälsa och Sjukvård AB 1,000 100.00 0.1 556548 - 1230 GöteborgBure Tillväxt AB 1,000 100.00 0.2 556566 - 4512 GöteborgBure Utvecklings AB 10,000 100.00 1.2 556472 - 7112 GöteborgBusiness Communication Group Scandinavia AB 113,907 100.00 0.1 556548 - 1297 GöteborgSancera AB 1,000 100.00 0.1 556551 - 6910 GöteborgCindra AB 1,000 100.00 0.1 556542 - 7415 GöteborgCintera AB 1,000 100.00 0.1 556554 - 6958 GöteborgCR&T Holding AB 363,180 100.00 5.9 556524 - 3176 GöteborgCR&T Ventures AB 100,000 100.00 0.1 556597 - 1149 GöteborgGårda Äldrevård Holding AB 1,000 100.00 0.1 556548 - 8144 GöteborgInvestment AB Bure 1,000 100.00 0.1 556561 - 0390 Göteborg
8.0Total 323.9
1 EnergoRetea Group owns 100 per cent of the subsidiaries Energo and Retea.2 See disclosures on next page regarding options/warrants issued on the holdings in EnergoRetea and Mercuri.
NOTE 29 – Participations in group companies, the year’s change
Parent CompanySEK M 2009 2008
Opening cost 1,008.8 1,507.2The year’s acquisitions/additions 1.4 48.6Repayment of shareholder contributions -51.0 -100.8Divestitures -0.6 90.2Distribution of shareholdings – -711.3Reclassifications – 175.0
Closing cost 958.6 1,008.8
Opening impairment losses -425.7 -595.7Reversal of previous impairment losses – 170.0The year’s impairment losses -209.0 –
Closing accumulated impairment losses -634.7 425.7Carrying amount 323.9 583.1
Impairment losses in 2009 refer to the holding in Mercuri in an amount of SEK 157.7M and a write-down of shares in dormant com-panies in an amount of SEK 51.3M due to group contributions paid. The reversal in 2008 refers to the holding Länia Material (Textilia) in connection with the sale of the company. The reclassification refers to the holding in AcadeMedia, which was previously classified as invest-ments in associates. The distribution of shares refers to the holding in AcadeMedia.
Cont’d on next page ➤

36, BURE’S ANNUAL REPORT 2009
DISCLOSURESDilutive effects of existing ownership distribution programmesThe following information is provided as a disclosure regarding the dilutive effects in the companies where Bure has carried out ownership distri-bution programmes:
Scope SRC EnergoRetea Mercuri
Holding represented by no. of options/warrants granted, %1 13.5 2.6 21.0Exercise date for subscription rights May 2014 May 2012 Aug 2011Exercise price calculated on 100% of the company, SEK M2 20 175 443
Exercise price for premature exercise of subscriptionrights on different dates2 Period SRC EnergoRetea Mercuri
Exercise price calculated on 100% of the company, SEK M2 31 Dec 2009 13 139 37831 Dec 2010 15 153 41631 Dec 2011 16 16931 Dec 2012 1831 Dec 2013 1931 May 2014 20
1 The specified percentage refers to the number of warrants/options sold to date. Further dilution may thus arise. Subscription rights may be exercised prematurely in certain situations, e.g. in connection with an exit. The exercise price then varies with respect to the date.
2 The exercise price will be indexed, normally by 10 per cent annually, with adjustment of the exercise price monthly.
CHANGES IN OUTSTANDING OPTION/WARRANT PROGRAMMES DURING 2009 SRC EnergoRetea Mercuri
No. of options/warrants outstanding at beginning of period – 20,500 234No. of options/warrants sold during the period 915 – 16No. of options/warrants exercised during the period – – 40No. of options/warrants outstanding at end of period 915 20,5001 210
1 Aside from the outstanding options/warrants, Bure has 5,500 (10,000) acquired shares with option rights.
NOTE 32 – Investments in associates, the year’s change
GroupParent
CompanySEK M 2009 2008 2009 2008
Opening cost 74.1 270.8 66.5 251.7The year’s acquisitions 471.3 – 471.3 –Shares in profit 227.2 14.1 – –Divestitures -105.1 – -42.6 –Translation differences -6.5 -0.5 – –Reclassifications – -210.3 – -185.2
Closing cost 661.0 74.1 495.2 66.5
Opening impairment losses -58.1 -58.1 -58.1 -58.1The year’s impairment losses -0.9 -6.5 -26.2 –Reversal of impairment losses – – – –Reclassifications – 6.5 – –
Closing accumulatedimpairment losses -59.0 -58.1 -84.3 -58.1
Carrying amount 602.0 16.0 410.9 8.5
NOTE 31 – Related party transactions
Bure’s related parties are:Skanditek (due to board representation and share owner-ship), Board members and companies closely related to them, Bure’s subsidiaries, associated companies and the executive management in the Parent Company.For the salaries and remuneration of senior executives, see Note 36.Aside from fees from the Parent Company, the elected Board members in the Parent Company have also received total fees of SEK 0.2M from subsidiaries in the Group.Purchases and sales between the Parent Company and group companies are insignificant in scope. Profit in the Parent Company includes intra-group interest income of SEK 0.6M (2.9) and intra-group interest expenses of SEK 0.3M (2.1).
➤ Cont’d from previous page

BURE’S ANNUAL REPORT 2009, 37
NOTE 33 – Dividends
In 2009 the Parent Company Bure Equity AB received divi-dends of SEK 8.0M from Bure Utvecklings AB and SEK 0.5M from Socran Förvaltnings AB, both of which were subsidiaries at the time of the dividend payments. Socran Förvaltnings AB was divested in December.
NOTE 34 – Average number of employees
2009 2008No. of
employeesOf whom,
womenNo. of
employeesOf whom,
women
Parent Company 7 2 9 2Subsidiaries 828 305 930 353
Total Group 835 307 939 355
Geographic breakdown of employees:
Parent CompanySweden 7 2 9 2
SubsidiariesSweden 378 126 395 137
Denmark 26 10 33 14England 27 10 43 16Finland 84 35 91 38Norway 21 5 30 8Germany 26 9 30 9France 60 20 63 20Czech Republic 30 12 38 17USA 5 1 5 1China 20 11 20 11Other countries 151 66 182 82
Total Group 835 307 939 355
NOTE 35 – Salary, other remuneration and social security expenses
2009 2008
SEK MSalary and other
remunerationSocial security
expensesPension
costs1Salary and other
remunerationSocial security
expensesPension
costs1
Parent Company 17.3 6.1 3.7 17.7 7.4 2.9Subsidiaries 468.9 112.4 49.8 493.2 104.7 44.3
Total Group 486.2 118.5 53.5 510.9 112.1 47.2
Board and President
(of which, bonus)
Other employees
Board and President
(of which, bonus)
Other employees
Parent CompanySweden 9.5 0.4 7.8 9.5 0.7 8.2
SubsidiariesSweden 7.8 0.3 175.2 6.8 0.4 168.8Denmark - - 24.0 2.6 - 25.4England 1.2 - 25.2 1.4 - 27.1Finland 3.1 0.1 54.4 2.2 0.7 64.3Norway 0.8 - 14.2 1.3 - 18.4Germany 4.0 0.5 19.8 5.8 0.7 18.9France 4.7 1.0 44.8 4.6 1.4 41.9Other countries 19.5 0.9 70.2 20.5 2.8 83.1
Total Group 50.6 3.2 435.6 54.7 6.7 456.1
The 2009 AGM resolved that the Board of Directors would be paid total fees of SEK 990,000 (990,000), of which the Chairman received SEK 350,000 and the other Board members received SEK 160,000 each. No member of the Board was employed by the company in 2009. No special fees were paid for work on the Board’s committees (51,350).
1 Of the Parent Company’s pension costs, SEK 2.1M (1.7) is attributable to the Board and President and refers to both the current and outgoing President.
Pension costs are stated including payroll tax and are broken down by country and between the Board and President and other employees.For additional information, see also Note 36 for ”Remuneration of senior executives”.

38, BURE’S ANNUAL REPORT 2009
NOTE 36 – Remuneration of senior executives
2009 Fixed annual salary / Variable remun- Other Pension OtherSEK M Board fees eration/bonus benefits1 costs remuneration Total
Board Chairman 0.4 – – – – 0.4Other Board members 0.6 – – – – 0.6President 1.6 0.4 0.1 0.7 3.6 6.4President, outgoing 0.9 – – 0.9 1.9 3.8Vice President, outgoing 0.4 – – 0.1 – 0.5Other senior executives 1.0 0.2 0.1 0.3 1.5 3.1
4.9 0.6 0.2 2.1 7.0 14.8
2008 Fixed annual salary / Variable remun- Other Pension OtherSEK M Board fees eration/bonus benefits1 costs remuneration Total
Board Chairman 0.4 – – – – 0.4Other Board members 0.6 – – – 0.1 0.7President 1.7 0.7 0.0 0.4 – 2.8President, outgoing 0.9 – 0.2 1.0 5.2 7.3Vice President 1.3 1.5 0.1 0.3 – 3.1Other senior executives 1.0 0.3 0.1 0.3 – 1.7
5.9 2.4 0.4 2.1 5.3 16.01 Other benefits refer to company car and meal benefits.
Board of DirectorsThe 2009 AGM resolved that the Board of Directors would be paid total fees of SEK 990,000 (990,000). Of this amount, the Chairman received SEK 350,000 and the other Board members received SEK 160,000 each. No special fees were paid for work on the Board’s committees.
PresidentThe incoming President Carl Backman had an annual salary of SEK 2.4M. Bonuses have been paid in an amount of SEK 0.4M. Pension premiums are of the defined contribution type and correspond to 25 per cent of pension-qualifying salary, which consists of basic salary. The retirement age for the President is 65 years. Bonuses may be paid in a maximum amount of 50 per cent of annual salary. Bonus payments are not pension-qualifying. The President has the right to a term of notice of 6 months in the event of termination by the company and 6 months in the event of his resignation. The President is entitled to termination benefits corresponding to 12 monthly salaries. Termination benefits are not payable in the event of retirement or death. Board fees have been deducted from salary in an amount of SEK 0.2M. Decisions regarding the salary and benefits of the President are made by the Board of Directors on the recommendations of the Board’s appointed compensation committee. Carl Backman left his post on 31 January 2009. For the contractual term of notice and termination benefits, Bure has made total provisions of SEK 5.1M for termination costs including social security expenses and pension costs.
In 2009 the outgoing President, Martin Henricson, who left his post on 30 April 2009, had an annual salary of SEK 2.7M. For the contractual term of notice and termination benefits, Bure has made total provisions of SEK 3.5M for termination costs including social security expenses and pension costs.
Other senior executivesOther senior executives refer to the CFO. The CFO’s salary has been reduced by SEK 0.1M in respect of board fees received from group companies. The pension premiums are of the defined contribution type and correspond to a maximum of 25 per cent of annual salary. The pension cost refers to the cost excluding payroll tax that has been charged to the year’s profit. The retirement age for other senior executives is 65 years. Bonuses for other senior executives may be paid in a maximum amount of 50 per cent of annual salary. Other senior executives have a term of notice of 6 months in the event of termination by the company and 6 months in the event of their own resignation. Other senior executives are entitled to termina-tion benefits corresponding to 12 monthly salaries. Termination benefits are not payable in the event of retirement or death. Decisions regarding the salary of other senior executives are made by the President after consultation with the compensation committee. Jonas Alfredson left his post on 31 January. For the contractual term of notice and termination benefits, Bure has made total provisions of SEK 1.9M for termination costs including social security expenses and pension costs.
Variable compensation (bonus)In 2009 had a variable compensation system for all employees in which the maximum variable salary component was equal to 10–75 per cent of fixed salary. 70 per cent of the bonus was based on quantitative targets related to share price development and operating profit in the portfolio companies and the remaining 30 per cent was based on discretionary assessment.For information about the preparatory and decision-making process applied by the company, see “Administration report”.The proposed principles for remuneration and other terms of employment of senior executives in 2010 will be put before the AGM for approval.
Information about the senior executives’ holdings of shares and warrantsCarl Backman, President, 87,500 shares held through an insurance-like solution. Jonas Alfredson, CFO, 0 shares.
NOTE 37 – Gender distribution in senior positions
Parent Company2009 2008
Total number of women on Board of Directors 1 1Total number of women in Executive Management – –
Total number of men on Board of Directors 4 4Total number of men in Executive Management 2 3
Total number of people in Board of Directors 5 5Total number of people in Executive Management 2 3
In the subsidiaries, 26 per cent (23) of the board members, presidents and senior executives are women. The comparative figure has been adjusted for the share in discontinued operations.
NOTE 38 – Sickness absence
Not reported due to the exemption rule in the applicable legislation which states that no information shall be given if the number of employees in the group is fewer than ten or if the information can be related to a single individual. By group is meant both gender and age group.

BURE’S ANNUAL REPORT 2009, 39
AUDIT REPORT
To the Annual General Meeting of Bure Equity AB (publ),corporate identification number 556454-8781
We have audited the annual accounts, the consolidated accounts, the accounting records and the administration of the Board of Directors and the President of Bure Equity AB (publ) for the financial year 2009. The company’s annual report and consolidated annual report are included in this document on pages 3–38. These accounts and the administration of the company well as the application of the Annual Accounts Act when preparing the annual accounts and the application of International Financial Reporting Standards IFRSs as adopted by the EU and the Annual Accounts Act when preparing the consolidated accounts are the responsibility of the Board of Directors and the President. Our responsibility is to express an opinion on the annual accounts, the consolidated accounts and the administration based on our audit.
We conducted our audit in accordance with generally accepted auditing standards in Sweden. Those standards require that we plan and perform the audit to obtain reasonable but not absolute assurance that the annual accounts and the consolidated accounts are free of material misstatement. An audit includes examining, on a test basis, evidence supporting the amounts and disclosures in the accounts. An audit also includes assessing the accounting principles used and their application by the Board of Directors and the President and significant estimates made by the Board of Directors and the President when preparing the annual accounts and consolidated accounts as well as evaluating the overall presentation of information in the annual accounts and the consolidated accounts.
As a basis for our opinion concerning discharge from liability, we examined significant decisions, actions taken and circum-stances of the company in order to be able to determine the liability, if any, to the company of any Board member or the President. We also examined whether any Board member or the President has, in any other way, acted in contravention of the Companies Act, the Annual Accounts Act or the Articles of Association. We believe that our audit provides a reasonable basis for our opinion set out below.
The annual accounts have been prepared in accordance with the Annual Accounts and give a true and fair view of the company’s financial position and results of operations in accordance with generally accepted accounting principles in Sweden. The consoli-dated accounts have been prepared in accordance with the International Financial Reporting Standards (IFRS) adopted by the EU and the Annual Accounts Act and give a true and fair view of the Group’s financial position and results of operations. The statutory administration report is consistent with the other parts of the annual accounts and the consolidated accounts.
We recommend to the Annual General Meeting of shareholders that the income statements and balance sheets of the Parent Company and the Group be adopted, that the profit of the Parent Company be dealt with in accordance with the proposal in the administration report and that the members of the board of directors and the managing director be discharged from liability for the financial year.
Göteborg, 8 March 2010Ernst & Young AB, Göteborg
Staffan LandénAuditor in Charge
Authorised Public Accountant

40, BURE’S ANNUAL REPORT 2009
CORPORATE GOVERNANCE REPORT
Corporate governance report for 2009Corporate governance in Bure is regulated by Swedish law, primarily the Swedish Companies Act and NASDAQ OMX Stockholm’s (”the Nordic Exchange”) Rules for Issuers. Bure is quoted on the Mid Cap list of the NASDAQ OMX Nordic Exchange, and is therefore subject to compliance with the revised rules in the Swedish Code of Corporate Governance (the Code) as of 1 July 2008. These rules are being applied successively to the extent prescribed in the Code and in pace with the issuance of statements and recommendations by advisory organisations (such as the Swedish Corporate Governance Board) on specific issues related to the Code. This report on Bure’s corporate governance in 2009 has not been examined by the company’s auditors. For additional information about corporate governance matters not dealt with in this corporate governance report, visit www.bure.se.
Nomination committee ahead of the 2010 AGMOn 19 October 2009 Bure announced the composition of the nomination committee, which has been appointed in accordance with the instructions for the nominating com-mittee that were adopted by Bure’s 2008 AGM. These state that the Board Chairman, not later than at the end of the third quarter of each year, shall ensure that the company’s three largest shareholders are given the opportunity to each appoint one member to the nomination committee. Should any of these three shareholders waive its right to appoint a member, the shareholder next in order of voting power will be contacted to appoint a member to the committee. The mandate period is one year. Furthermore, the Board Chairman shall be a member of the nomination committee.
On 16 February 2010 Bure announced changes in the nomi-nation committee due to the merger with Skanditek Industri-förvaltning AB. Adapted to Bure’s new ownership structure, the nomination committee now consists of:• Dag Tigerschiöld, representing the Tigerschiöld family• Ulf Strömsten, representing Catella’s mutual funds • Peter Rudman, representing Nordea’s mutual funds• Björn Björnsson, Chairman of Bure Equity AB
Work of the Board of Directors Bure’s Board of Directors has consisted of five members. The composition of the Board and the roles of its members and the President are presented at the end of the corporate governance report. The company’s CFO Jonas Alfredson has served as Secretary of the Board.
The work of the Board of Directors is governed by a proce-dural plan that was most recently adopted at the statutory meeting on 28 April 2009. The work of the Board follows a yearly plan containing fixed decision points that is adopted every year in connection with the statutory meeting. The Board normally holds six meetings during the year, and meets more frequently when required. In the past financial year, the Board held 18 meetings, consisting of 7 scheduled
meetings and 11 extra meetings, of which 7 were held per capsulam. The Board formed a quorum at all meetings. Board members Patrik Tigerschiöld and Björn Björnsson were both absent from one scheduled meeting and two extra meetings (due to impartiality) and Ann-Sofi Lodin was absent from one scheduled meeting. Among other things, the Board’s pro-cedural plan contains instructions regarding the division of responsibilities between the Board, the Chairman, the President and the Board’s committees.
Due to the merger between Bure and Skanditek Industriförvalt-ning AB, a new procedural plan was adopted on 1 February 2010.
According to the procedural plan, the Board is responsible for the company’s organisation and management of the company’s affairs. The Board continuously monitors the financial situation of the company and the Group, which is reported on a monthly basis, so that the Board is able to meet the monitoring obligations required by law, the NASDAQ OMX Nordic Exchange’s Rules for Issuers and good board practice. The procedural plan states that it is the responsibility of the Board to decide on matters that are not part of operating activities or that are of major importance, such as material financial commitments and agreements, as well as any significant changes in the organisation. Once a year, the Board carries out a systematic evaluation of its per-formance in order to develop the work of the Board and to provide the nomination committee with a relevant basis for decision ahead of the AGM.
Every year, Bure’s Board of Directors establishes and docu-ments the company’s goals and strategies and discusses mar-keting, strategic and budgetary issues. The Board establishes the company’s finance policy, right of authorisation and decision- making procedure. The Board has formulated spe-cific instructions regarding the responsibilities and powers of Bure’s President and Vice President, as well as special report-ing instructions for the Executive Management.
The company’s auditors attend two Board meetings every year to report on the year’s audit and their evaluation of the company’s internal control system. The auditors present their observations from the annual audit directly to the Board. Once a year, the auditors meet with the Board without the presence of any member of the Executive Management.
In 2009 the Board of Directors of Bure Equity AB was paid total fees of SEK 990,000, of which the Chairman received SEK 350,000.
Board committeesThe Board’s procedural plan contains instructions regarding the compensation committee and audit committee. The work of both the compensation committee and the audit commit-tee is performed by the Board as a whole.

BURE’S ANNUAL REPORT 2009, 41
The compensation committee discusses and decides on matters relating to remuneration in the form of salary, pensions and bonuses or other terms of employment for the President and staff reporting directly to the President. Proposed principles for compensation to the President and Executive Management will be put before the 2010 AGM for decision. At present, there are no outstanding share-based or share price-based incentive schemes for the Board or Executive Management.
The role of the audit committee is to continuously support the Board in matters relating to auditing, internal control and review of the annual accounts and interim reports.
Financial reporting Bure’s financial reporting is based on the applicable laws, regu-lations, rules, agreements and recommendations for companies listed on the NASDAQ OMX Nordic Exchange. A more detailed description of the accounting policies is provided on pages 16–21 of the annual report. The audit report for the financial year is found on page 39 of the annual report. The Board and the auditors communicate on an ongoing basis. The Board continuously ensures that the company’s finance and account-ing organisation is properly dimensioned and has adequate resources. The Board is provided with monthly reports on the development of the portfolio companies, the Parent Company and the Group. Every year, the Parent Company issues instruc-tions regarding the financial information to be reported by the subsidiaries. This information includes income statements, bal-ance sheets, cash flow statements and financial key ratios. A more extensive reporting package is required in connection with the annual closing of the books.
Deviations from the CodeAccording to section 10.6 of the Code, the Board of Directors is required to evaluate the need for a special audit function on a yearly basis. The Board’s assessment is that Bure has no need for this function under the present circum-stances. At the same time, the Board has clear instructions and continuously ensures that the responsible individuals in the organisation have the requisite expertise and resources to fulfil their duties in the preparation of financial reports. The evaluation of the need for an internal audit function will be reassessed in 2010.
Presentation of the Board of Directors, President and auditorsSince the time of the AGM, the Board of Directors has con-sisted of five members. The President is not a member of the Board. Of the company’s five Board members, all are inde-pendent in relation to the company’s major shareholders.
Board member Kjell Duveblad was also chairman and a mem-ber of the board of the subsidiary EnergoRetea Group AB in 2009. Board members Björn Björnsson and Ann-Sofi Lodin were members of the board of AcadeMedia during the year.
Björn Björnsson, Chairman Björn is 63 years old, M.Pol.Sc, active as a consultant in his own company. Elected to the Board in 2002. Björn is dependent in relation to the company and its management and independent in relation to the company’s major shareholders.
Håkan Larsson, Vice ChairmanHåkan is 62 years old, M.B.A. Previously President of Rederi AB Transatlantic and employed by the Schenker Group. Elected to the Board in 2002. Håkan is independent in rela-tion to company, its management and the company’s major shareholders.
Ann-Sofi Lodin, Board memberAnn-Sofi is 47 years old, M.Pol.Sc. and economist. CEO of Carema Sjukvård. Previously employed by the healthcare company Global Health Partner as COO and the healthcare group Capio, in positions such as General Director of Capio Sjukvård Norden and General Director of Capio Lundby Sjukhus. Elected to the Board in 2006. Ann-Sofi is dependent in relation to the company and its management and inde-pendent in relation to the company’s major shareholders.
Kjell Duveblad, Board memberKjell is 55 years old, M.B.A, and operates his own management and IT consulting business. Previously employed by IBM and asRegional Manager of Oracle in Sweden, the Nordic region and the Baltic countries. Elected to the Board in 2005. Kjell is dependent in relation to the company and its management and independent in relation to the company’s major shareholders.
Mathias Uhlén, Board memberMathias is 55 years old, Ph.D. Engineering, professor of micro-biology. Former board member of Skanditek Industri-förvaltning since 1992. Elected to the Board in 2010. Mathias is independent in relation to company, its management and the company’s major shareholders.
Patrik Tigerschiöld, President and CEOPatrik is 45 years old, M.B.A. Former President of Skanditek Industri förvaltning, Chairman of Bure, previously employed by SEB and former President of SEB Allemansfonder. Patrik is dependent in relation to the company’s major shareholders. Holdings in Bure (incl. related parties) on 8 March 2010: 6,166,537 shares.
A description of the Board member’s shareholdings and other assignments are shown on page 43.
The principles for remuneration and other terms of employ-ment, and information about shareholdings, etc., for the President and other senior executives are shown in Note 36 of the annual report.

42, BURE’S ANNUAL REPORT 2009
Information about the auditorsErnst & Young AB has been elected as Bure’s auditing firm, and has appointed Staffan Landén, 46 years old, as Auditor in Charge. Staffan Landén is auditor of several listed com-panies such as Alfa Laval AB and AcadeMedia AB and internationally active companies such as Papyrus AB and Capio AB.
Board report on internal control over financial reporting for the financial year 2009As stated in the Swedish Companies Act and the Swedish Code of Corporate Governance, the Board of Directors is responsible for the company’s internal control. This report has been prepared in accordance with the Swedish Code of Corporate Governance, sections 10.5 and 10.6, and is thereby limited to internal control over financial reporting. This description is not part of the formal annual report.
Control environmentThe procedural plan for the Board and instructions for thePresident ensure a clearly defined division of roles and responsibilities that promotes effective management of the company’s risks. Furthermore, the Board has established a number of normative documents for internal control, and among other things emphasises the importance of having clear and written instructions and policies that also apply to the Group’s subsidiaries. The Executive Management regu-larly reports to the Board according to established routines and is responsible for the system of internal controls that is necessary for management of significant risks in day-to-day operations. This includes guidelines that promote an under-standing and awareness among the various executives for the importance of their respective roles in maintaining good internal control.
Risk assessment and control activitiesIn assessing the risk for irregularities in the company’s finan-cial reporting, Bure has developed a model in which a number of areas with a heightened risk for errors have been identified. Special attention has been given to the creation of controls to prevent and detect deficiencies in these areas. Areas where material deficiencies are noted are dealt with immediately.
Information and communicationSignificant guidelines, manuals, policies, etc., of relevance for financial reporting are continuously updated and com-municated to the appropriate employees. There are both for-mal and information communication paths to the Executive Management and Board for significant information from the employees. For external communication, there are guidelines to ensure that the company lives up to the highest demands regarding complete and accurate information to the market.
MonitoringThe Board continuously monitors and evaluates the infor-mation provided by the Executive Management. This includes ensuring that action is taken with respect to any deficiencies or recommendations identified in internal and external audits.
Internal auditThe Board has not found reason to set up an internal audit function. The Board’s opinion is that there is no need for this function in the company and that it is not financially justifi-able in an organisation as small as Bure’s. The Board has clear instructions and continuously ensures that the respon-sible individuals in the organisation have the requisite exper-tise and resources to fulfil their duties in the preparation of financial reports. The evaluation of the need for an internal audit function will be reassessed in 2010.
This report has not been examined by the company’s auditors.
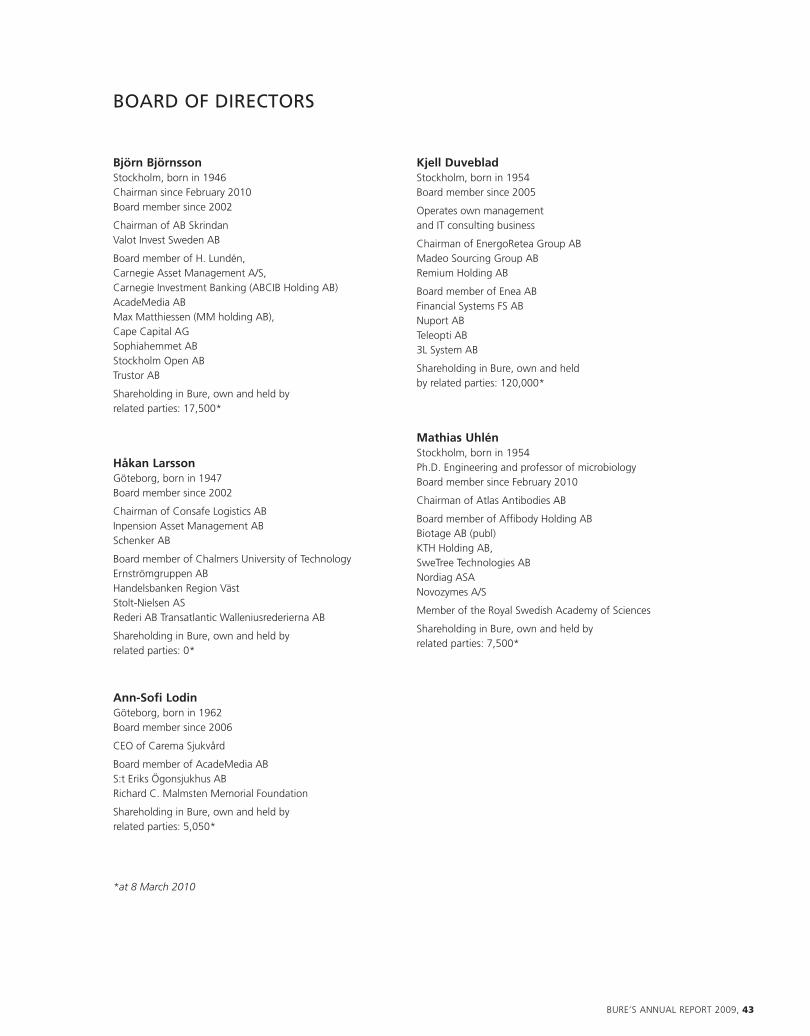
BURE’S ANNUAL REPORT 2009, 43
Björn BjörnssonStockholm, born in 1946Chairman since February 2010 Board member since 2002
Chairman of AB Skrindan Valot Invest Sweden AB
Board member of H. Lundén, Carnegie Asset Management A/S, Carnegie Investment Banking (ABCIB Holding AB)AcadeMedia AB Max Matthiessen (MM holding AB), Cape Capital AGSophiahemmet ABStockholm Open AB Trustor AB
Shareholding in Bure, own and held by related parties: 17,500*
Håkan LarssonGöteborg, born in 1947Board member since 2002
Chairman of Consafe Logistics AB Inpension Asset Management AB Schenker AB
Board member of Chalmers University of TechnologyErnströmgruppen ABHandelsbanken Region VästStolt-Nielsen AS Rederi AB Transatlantic Walleniusrederierna AB
Shareholding in Bure, own and held by related parties: 0*
Ann-Sofi LodinGöteborg, born in 1962Board member since 2006
CEO of Carema Sjukvård
Board member of AcadeMedia AB S:t Eriks Ögonsjukhus AB Richard C. Malmsten Memorial Foundation
Shareholding in Bure, own and held by related parties: 5,050*
Kjell DuvebladStockholm, born in 1954Board member since 2005
Operates own managementand IT consulting business
Chairman of EnergoRetea Group AB Madeo Sourcing Group AB Remium Holding AB
Board member of Enea AB Financial Systems FS AB Nuport AB Teleopti AB 3L System AB
Shareholding in Bure, own and held by related parties: 120,000*
Mathias UhlénStockholm, born in 1954Ph.D. Engineering and professor of microbiologyBoard member since February 2010
Chairman of Atlas Antibodies AB
Board member of Affi body Holding ABBiotage AB (publ)KTH Holding AB, SweTree Technologies ABNordiag ASANovozymes A/S
Member of the Royal Swedish Academy of Sciences
Shareholding in Bure, own and held by related parties: 7,500*
BOARD OF DIRECTORS
*at 8 March 2010

44, BURE’S ANNUAL REPORT 2009
FIVE-YEAR OVERVIEW
Data per share 1, 5 2005 2006 2007 2008 2009
Equity (net asset value), SEK2 33.36 46.73 28.02 29.14 25.75Equity (net asset value) after full exercise of outstanding warrants, SEK2 18.99 26.30 28.02 29.14
25.75
Share price, SEK 23.80 33.40 37.90 24.70 34.80Share price as a percentage of equity 125 127 135 85 135
Parent Company equity per share, SEK 33.36 46.73 28.02 29.14 25.75Parent Company diluted equity per share, SEK 18.99 26.30 28.02 29.14 25.75Consolidated equity per share, SEK3 32.81 43.57 29.54 29.56 29.73Consolidated diluted equity per share, SEK2 18.73 24.77 29.54 29.56 29.73
Parent Company earnings per share, SEK 6.22 13.85 8.11 11.35 -2.62Parent Company diluted earnings per share, SEK3 3.08 6.99 6.36 11.35 -2.62Consolidated earnings per share, SEK 9.37 14.21 12.39 9.82 0.85Consolidated diluted earnings per share, SEK3 4.63 7.17 9.71 9.82 0.85
Number of shares, thousands 60,358 62,819 93,225 83,915 50,349Number of warrants outstanding, thousands 69,362 66,901 – –Total number of shares incl. warrants outstanding, thousands 129,720 129,720 93,225 83,915 50,349Diluted number of shares according to IAS 33, thousands 115,772 122,836 93,225 83,915 50,349Average number of shares, thousands 54,172 61,071 84,465 89,782 53,292Average diluted number of shares according to IAS 33, thousands 109,585 121,086 107,782 89,782 53,292
Key fi gures
Dividend, SEK per share6 – – 1.00 8.55 0.30Direct return, % – – 2.64 34.63 0.86Total return, % 36.8 40.3 16.7 -2.8 40.9Market capitalisation, SEK M 1,437 2,098 3,533 2,073 1,752Diluted market capitalisation, SEK M4 3,087 4,333 3,533 2,073 1,752Equity (net asset value), SEK M 2,014 2,935 2,612 2,445 1,296Return on equity, % 19.2 34.2 24.7 40.3 -10.7
Parent Company profi t and fi nancial position
Exit gains/losses, SEK M 353.7 625.6 451.9 811.9 22.4Profi t/loss after tax, SEK M 337.2 846.1 685.2 1,019.2 -139.7Total assets, SEK M 2,109 3,112 2,695 2,498 1,621Equity, SEK M 2,014 2,935 2,612 2,445 1,296Equity/assets ratio, % 95.4 94.3 97.0 97.9 80Net loan debt (-)/ receivable (+) 404 1,080 1,462 1,848 663Net loan debt (-)/ receivable (+) after full exerciseof outstanding warrants 854 1,556 1,462 1,848 663
Consolidated profi t and fi nancial position
Net sales, SEK M 2,022.7 2,147.1 2,647.8 1,096.6 939.0Profi t after tax, SEK M 543.7 884.9 1,047.1 882.6 45.5Total assets, SEK M 4,032 3,885 3,747 2,995 2,154Equity, SEK M 1,980 2,737 2,754 2,481 1,497Equity/assets ratio, % 49.1 70.5 73.5 82.8 69.5Net loan debt (-)/ receivable (+) 201 1,178 1,514 1,892 607Net loan debt (-)/ receivable (+) after full exercise of outstanding warrants 651 1,655 1,514 1,892 607
1 All historical data per share has been adjusted for shares in issue with a time-weighting factor as prescribed by IAS 33.2 Net asset value for the full years 2005–2009 corresponds to equity per share.3 In the event of a negative result, the average number of shares before dilution is also used for calculation after dilution.4 Market capitalisation taking into account the total number of shares after full exercise of outstanding warrants multiplied by the share price on the closing date for
the period in question.5 All key fi gures per share have been restated with respect to the 1-for-10 reverse share split and have been adjusted by a factor of 10. 6 The dividend for 2008 refers to the distribution of shares in AcadeMedia, equal to SEK 8.55 per share. The Board proposes a dividend of SEK 0.30 per share for the
fi nancial year 2009.
DEFINITIONS
Basic earnings per shareProfi t/loss after taxes divided by the average number of shares outstanding during the year. For the Group, profi t/loss for the year less non-controlling interests in profi t for the year.
Diluted earnings per shareEarnings per share divided by the average number of share outstanding during the year after full dilution. For the Group, profi t/loss for the year less non-controlling interests in profi t for the year. The average number of shares after full dilution is calculated according to the rules in IFRS, IAS 33 Earnings per Share.
Direct returnDividend proposed to the AGM divided by the share price at 31 December and extra dividends paid during the year.
EBITAOperating profi t before goodwill impairment and amorti-sation of excess values arising on consolidation.
Equity/assets ratioEquity in relation to total assets. As of the transition to IFRS on 1 January 2005, non-controlling interests are included in total equity.
Equity per shareEquity divided by the number of shares outstanding. After transition to IFRS on 1 January 2005, non-controlling interests are included in total equity.
GrowthIncrease in net sales in relation to net sales for the previ-ous year. The key fi gure thus includes both organic and acquisition-driven growth.
Market capitalisation, SEK MShare price multiplied by the total number of shares out standing.
Net asset value discount/premiumThe net asset value discount/premium consists of the differ-ence between the share price and reported equity per share in the Parent Company, divided by reported equity per share. It is important to be aware that reported equity per share does not include excess values in Bure’s holdings.
Net loan liabilitySame defi nition as net loan receivable, but is used when interest-bearing liabilities exceed interest-bearing assets.
Net loan receivableFinancial interest-bearing assets minus interest-bearing liabilities.
Repurchase of treasury sharesFor several years, Swedish companies have been permitted to repurchase up to ten per cent of their own outstanding shares, provided that this is approved by the Annual General Meeting within the framework of nonrestricted equity.
Return on equityProfi t/loss after tax divided by average equity.
Total returnThe total of the year’s share price growth and dividend paid divided by the share price on 1 January.
This annual report was produced by Bure. Art direction, illustrations and layout: Citat Paper: Eurobulk. Printing: Prinfo Alfredssons.
BURE’S ANNUAL REPORT 2009, 45

Bure Equity AB (publ), Nybrogatan 6, SE-114 34 Stockholm, Sweden, Tel +46 8-614 00 20, Fax +46 8-614 00 38, www.bure.se