Embed Size (px)
Citation preview
Year ended March 31, 2008
ANNUAL REPORT
2008
Contents
2
3
4-7
8
12
13
14-15
Prof ile
Financial highlights
To our shareholders
Review of operations byproduct sector
Global operations
News & Topics
Corporate governance / Corporatesocial responsibility (CSR)
Cover Sheet :The Nichicon Group is concentrating management resources on its four priority markets while working to enhance its global competitiveness. As the ratio of foreign sales to total sales exceeded 60% in the fiscal year ended March 31, 2007, our current target is to achieve 70%, we will continue to meet the needs of our customers globally in the future, taking advantage of our expertise to offer a wide range of high performance products. The photograph on the cover sheet and the pictures of flowing waves on the inside pages represent the waves that connect our global customers to us and the strong momentum of the Nichicon Group, with its innovative products for new fields such as electric cars.
9
10
11
Forward Looking StatementsProjections of operating results and changes in the operating environment are based on information available to management at the time this report was prepared. As such. these projections entail risks and uncertainties. Readers should be aware that actual results and events may differ substantially from these projections.
Research and Development Activities
Business Risks and Other Risks
Financial Section
Financial Review
Consolidated Balance Sheets
Consolidated Statements of Income
Consolidated Statements ofChanges in Equity
Consolidated Statements of Cash Flows
Notes to the Consolidated FinancialStatements
Report of Independent Auditors
Consolidated Subsidiaries
Corporate Data/ Investor Information
16
17
39
40
Capacitors for electronics
Circuit products
Capacitors for electric apparatusand power utilities, capacitorapplied systems/others
18-19
20-21
22
23
24
25-36
37-38
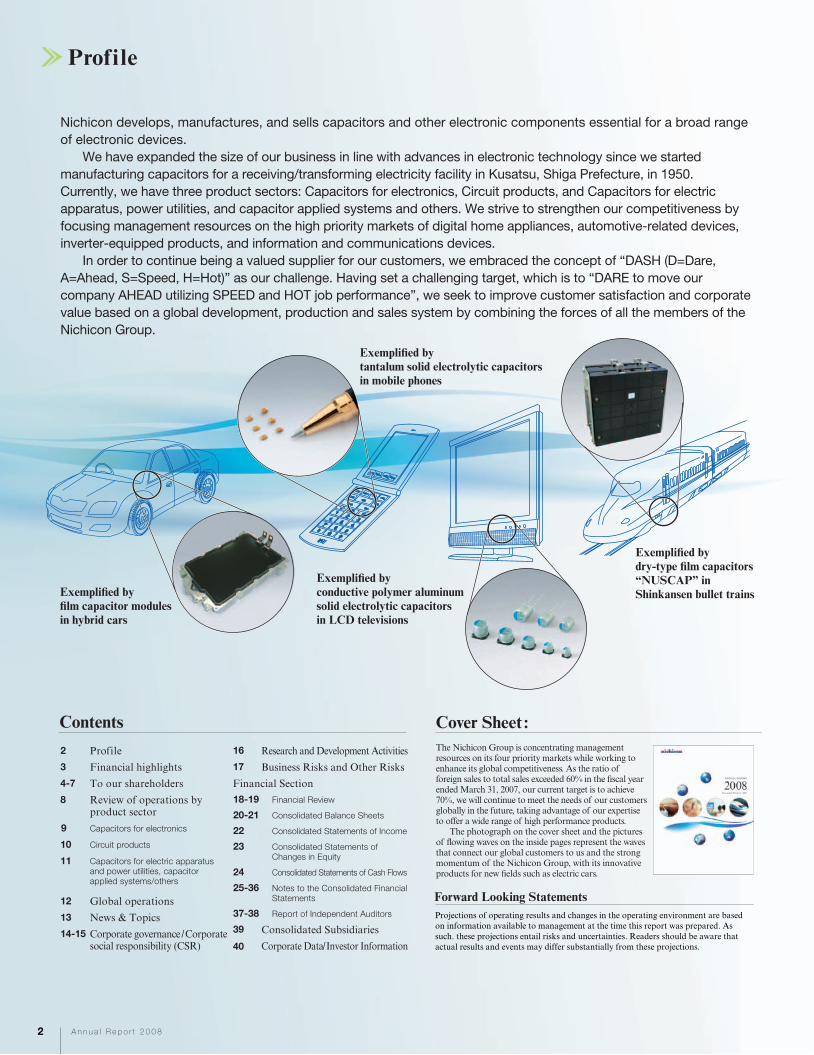
Nichicon develops, manufactures, and sells capacitors and other electronic components essential for a broad range
of electronic devices.
We have expanded the size of our business in line with advances in electronic technology since we started
manufacturing capacitors for a receiving/transforming electricity facility in Kusatsu, Shiga Prefecture, in 1950.
Currently, we have three product sectors: Capacitors for electronics, Circuit products, and Capacitors for electric
apparatus, power utilities, and capacitor applied systems and others. We strive to strengthen our competitiveness by
focusing management resources on the high priority markets of digital home appliances, automotive-related devices,
inverter-equipped products, and information and communications devices.
In order to continue being a valued supplier for our customers, we embraced the concept of “DASH (D=Dare,
A=Ahead, S=Speed, H=Hot)” as our challenge. Having set a challenging target, which is to “DARE to move our
company AHEAD utilizing SPEED and HOT job performance”, we seek to improve customer satisfaction and corporate
value based on a global development, production and sales system by combining the forces of all the members of the
Nichicon Group.
Exemplified bytantalum solid electrolytic capacitorsin mobile phones
Exemplified byconductive polymer aluminumsolid electrolytic capacitorsin LCD televisions
Exemplified bydry-type film capacitors“NUSCAP” in Shinkansen bullet trainsExemplified by
film capacitor modulesin hybrid cars
2 A n n u a l R e p o r t 2 0 0 8
Prof ile
NICHICON CORPORATION AND CONSOLIDATED SUBSIDIARIESYears ended March 31
Millions of Yen
Yen U.S. dollars
Thousands ofU.S. dollars
2007 2006 20042005 2008
¥ 106,8716,0476,6894,081
10,9738,930
166,840128,613
¥ 51.6117.00
1,659.75
77.1%3.3
¥ 104,0966,3146,3544,071
12,3708,808
155,879122,024
¥ 51.4615.00
1,555.42
78.3%3.4
¥ 100,8494,6185,4842,1912,5649,737
145,511117,883
¥ 27.2813.00
1,502.66
81.0%1.9
¥ 118,7136,7278,2904,241
11,9089,416
169,648126,187
¥ 56.1420.00
1,697.32
74.4%3.3
2008
¥ 119,5674,6103,1971,2789,433
10,503
153,989118,935
¥ 17.3121.00
1,664.70
77.2%1.0
77.2%1.0
$ 1,193,28846,01131,90512,75094,145
104,823
1,536,8181,186,983
$ 0.170.21
16.61
For the year :
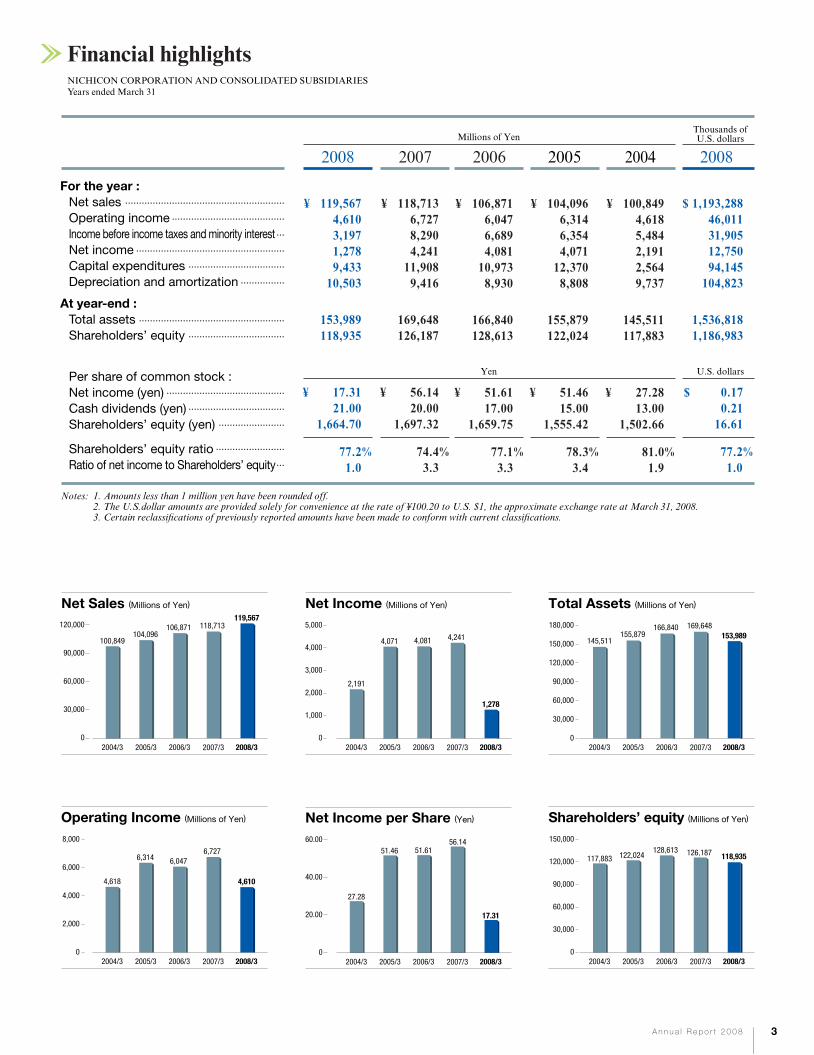
Net sales
Operating income
Income before income taxes and minority interest
Net income
Capital expenditures
Depreciation and amortization
At year-end :
Total assets
Shareholders’ equity
Per share of common stock :
Net income (yen)
Cash dividends (yen)
Shareholders’ equity (yen)
Shareholders’ equity ratio
Ratio of net income to Shareholders’ equity
・・・・・・・・・・・・・・・・・・・・・・・・・・・・・・・・・・・・・・・・・・・・・・・・・・・・・・・・・・
・・・・・・・・・・・・・・・・・・・・・・・・・・・・・・・・・・・・・・・・・
・・・
・・・・・・・・・・・・・・・・・・・・・・・・・・・・・・・・・・・・・・・・・・・・・・・・・・・・・・
・・・・・・・・・・・・・・・・・・・・・・・・・・・・・・・・・・・
・・・・・・・・・・・・・・・・
・・・・・・・・・・・・・・・・・・・・・・・・・・・・・・・・・・・・・・・・・・・・・・・・・・・・・
・・・・・・・・・・・・・・・・・・・・・・・・・・・・・・・・・・・
・・・・・・・・・・・・・・・・・・・・・・・・・・・・・・・・・・・・・・・・・・・
・・・・・・・・・・・・・・・・・・・・・・・・・・・・・・・・・・・
・・・・・・・・・・・・・・・・・・・・・・・・
・・・・・・・・・・・・・・・・・・・・・・・・・
・・・
Notes: 1. Amounts less than 1 million yen have been rounded off.2. The U.S.dollar amounts are provided solely for convenience at the rate of ¥100.20 to U.S. $1, the approximate exchange rate at March 31, 2008.3. Certain reclassifications of previously reported amounts have been made to conform with current classifications.
0
1,000
2,000
3,000
4,000
5,000
Net Income per Share (Yen)
56.1451.6151.46
27.28
17.31
2008/32004/3 2005/3 2006/3 2007/3
Total Assets (Millions of Yen)
169,648166,840155,879
145,511153,989
2008/32004/3 2005/3 2006/3 2007/3
180,000
150,000
90,000
120,000
60,000
30,000
0
Shareholders’ equity (Millions of Yen)
128,613122,024117,883 118,935
2008/32004/3 2005/3 2006/3 2007/3
8,000
4,000
6,000
2,000
0
60.00
20.00
40.00
0 0
30,000
60,000
90,000
120,000
150,000
Net Sales (Millions of Yen)
118,713106,871104,096
100,849
119,567120,000
90,000
30,000
60,000
02008/32004/3 2005/3 2006/3 2007/3
Operating Income (Millions of Yen)
6,7276,0476,314
4,618 4,610
2008/32004/3 2005/3 2006/3 2007/3
Net Income (Millions of Yen)
4,2414,0814,071
2,191
1,278
2008/32004/3 2005/3 2006/3 2007/3
126,187
3A n n u a l R e p o r t 2 0 0 8
Financial highlights

4
To our shareholders
A n n u a l R e p o r t 2 0 0 8A n n u a l R e p o r t 2 0 0 8A n n u a l R e p o r t 2 0 0 8
Chairman & CEO
Ippei TakedaPresident & COO
Sachihiko Araki
Pursuing Further Growth and OvercomingGlobal Economic Fluctuations by taking Advantageof Our Strengths in Development,Production and Sales Efforts
5
During the first half of fiscal year ending March 31, 2008, the Japanese economy enjoyed an increase in capital investment and solid exports, especially to Asian countries. However, we experienced strong deceleration in the second half and thereafter, due to concerns over credit constriction on a worldwide scale triggered by the intensification of the U.S. subprime loan problem, dramatic fluctuations in the exchange rate, the surge in crude oil prices and other such factors. In overseas markets, BRICs (Brazil, Russia, India and China) continued to perform solidly but the U.S. and Europe have tended to slow down. In the electronic components industry, demand has been solid due in part to the expansion of the digital home appliances industry (e.g., flat-screen televisions) and the progress in electronics applications for automobiles. But competition among companies has further intensified and raw material prices are remaining high. In this business environment, the Nichicon Group accelerated its pace of launching new products that meet customers’ needs in the market for sophisticated digital and environmental-friendly products. In terms of profit, however, the surge in raw material prices and the rapidly appreciating yen against the U.S. dollar toward the fiscal
year end have squeezed profit margins. To tackle this difficult environment, we have been aggressively promoting improvement activities including further enhancing productivity and reducing costs. As a result, consolidated sales were 119,567 million yen (up 0.7% from the previous fiscal year), operating income was 4,610 million yen (down 31.5% from the previous fiscal year), and profit was 1,278 million yen (down 69.9% from the previous fiscal year).
Sales of products for digital home appliances and automotive-related devices were solid in the Asian and European markets, but demand decreased in the U.S. market. As a result, foreign sales amounted to 72,979 million yen (down 0.7% from the previous fiscal year), and the ratio of foreign sales to consolidated sales fell by 0.9 percentage points from the previous fiscal year to 61.0%. Our future target is to further promote globalization and increase the foreign sales ratio to 70%.
In these circumstances, environmentally-friendly products and automotive-related devices in particular have contributed strongly to sales. In the field of environmentally-friendly products, aluminum electrolytic capacitors used in inverter-equipped products and digital home appliances that can reduce power consumption performed well. Momentary voltage sag compensators that employ the “EVerCAP®”, an environmentally-friendly electric double-layer capacitor that promotes energy-saving, has also proven beneficial. “EVerCAP®” has been praised for being an environmentally-friendly product in itself for being free of lead—which is a heavy metal—and also for having superior cost performance due to its semi-permanent life.
A n n u a l R e p o r t 2 0 0 8
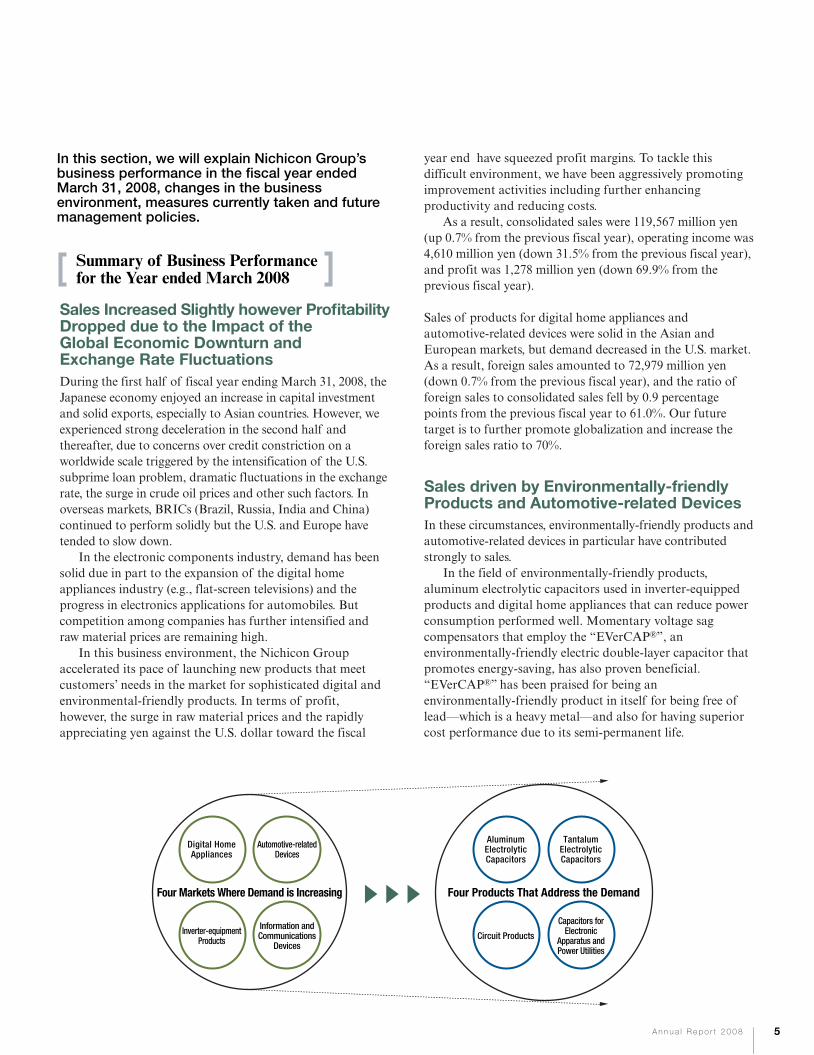
Four Markets Where Demand is Increasing
Digital HomeAppliances
Automotive-relatedDevices
Inverter-equipmentProducts
Information andCommunications
Devices
Four Products That Address the Demand
AluminumElectrolyticCapacitors
TantalumElectrolyticCapacitors
Circuit Products
Capacitors forElectronic
Apparatus andPower Utilities
▲
▲
In this section, we will explain Nichicon Group’s business performance in the fiscal year ended March 31, 2008, changes in the business environment, measures currently taken and future management policies.
Sales Increased Slightly however ProfitabilityDropped due to the Impact of theGlobal Economic Downturn andExchange Rate Fluctuations
Sales driven by Environmentally-friendlyProducts and Automotive-related Devices
Summary of Business Performancefor the Year ended March 2008

Concrete Results yielded by Training andEducation Programs based on our FrameworkAgreement with Ritsumeikan University
6
Promoting the Vertical Integration ofProduction and Group-wide Consolidationof Technical Expertise
The Nichicon Group had resolved to make capital investments exceeding 10 billion yen per year over the past few years. During the current year, we have made capital investments amounting to 9,433 million yen and enhanced our production capacity, conserved energy and streamlined manufacturing processes. Globally, we are enhancing our production sites in Wuxi and Tianjin in China as well as our production facility in Malaysia.Especially at Nichicon Electronics (Wuxi) Co., Ltd., whose production facility was doubled in size in March 2007, we are accelerating efforts to establish world-class quality and execute production at the optimal location.
In Japan, we are promoting the vertical integration of all production processes to be executed in-house, starting with the processing of raw materials and ending with the finished product. We engage in the in-house manufacturing of aluminum electrolytic capacitors, tantalum electrolytic capacitors and plastic film capacitors from the point of processing materials to the point of completing the product. We not only improve productivity but we also boost the performance and quality of the capacitors. Moreover, from the current fiscal year, we have started consolidating our development framework in order to develop products with higher added value by garnering the technical expertise of the entire Group. As the first stage of this initiative, we have consolidated the respective development divisions of the aluminum electrolytic capacitors group and the electric double-layer capacitors group—which were previously located at different sites—at the Ohmachi Factory in Nagano Prefecture. We will seek to enhance the new product development framework by firmly instilling lateral thinking—i.e., sharing of information—into the vertically-organized framework that has been built on a site-by-site basis.
Manpower is absolutely indispensable for creating new products with high added value. The Nichicon Group is working to develop personnel who can think and act on their own (“ko-do”-type individuals), according to our policy of “people are Nichicon’s source of energy”. As part of this initiative, we established the Joint Research and Education Program with Ritsumeikan University for the purpose of technical research and development as well as Human Resource development. We have been dispatching about 30 members of our engineering staff each year to the Graduate School of Technology Management (MOT) at Ritsumeikan University since 2005. Our goal is to mold them into “engineers who understand business management”, so that they not only engage in the manufacturing of products but also have an awareness of the process of generating profits. The momentary voltage sag compensator that employs electric double-layer capacitors derived from this initiative has become a successful product and is contributing significantly to sales.
A n n u a l R e p o r t 2 0 0 8
In the field of automotive-related devices, the number of orders we received for capacitors and module products increased as a result of the progress in electronic applications for automobiles including hybrid cars. Nichicon supplies products to automobile manufacturers in Japan and overseas by capitalizing on its strength as the only company in the world that can supply both highly reliable aluminum electrolytic capacitors and plastic film capacitors that are used in inverters for hybrid cars. Furthermore, we have developed an integrated charger and DC-DC converter module for the next-generation electric cars. Given that the market for electric cars—which help reduce environmental impact—is expected to expand in the future, we will treat them as strategic products and work on them accordingly.

7
To our shareholders
Tackling Six Challenges to EnhanceOur Corporate Profit Structure and SeekingFurther Progress
Becoming a Promising Company forShareholders by Consistently DevelopingProducts that Meet Customers’ Expectations
Nichicon is to have stable increases in dividends by increasing corporate value and strengthening the corporate profit structure. The dividend for the year was 1 yen higher than last fiscal year which was 21 yen. This is the fourth consecutive annual increase in dividends.
We will continue to consistently establish our competitive advantage in the market by strategically developing products that meet customers’ expectations by taking a long-term view. We are committed to making “wholehearted” efforts to become an appealing company for shareholders. Your continued support and understanding would be greatly appreciated.
June 27, 2008
In order to enhance our corporate profit structure and continue to grow by taking advantage of our unique strengths amid increasing concerns over the global economic downturn, we are tackling six challenges: ① launch of competitive new products; ② improvement of quality and productivity; ③ innovation; ④enhancement of marketing capabilities; ⑤ human resources development; and ⑥ cultivation of emerging markets. To launch new competitive products and improve quality and productivity, we plan to make a capital investment totaling 12,000 million yen in the year ending March 31, 2009, in order to enhance the production capacity of a wide range of products, from small-capacity, low-power products, which form the core of our business to large-capacity, high-power products. Of this capital investment, 80% will be spent on aluminum electrolytic capacitors so that we can further enjoy the benefits of our vertically-integrated production. For innovation, we will enhance development so as to release products foreseeing customers’ needs in the four major target markets on a continual basis. To cultivate emerging markets, we will dispatch key personnel overseas from Japan to enhance production and marketing in Asia and reinforce our administration and engineering systems, and seek to attain homogeneous production quality worldwide. Furthermore, we will work to continuously improve quality, which is the greatest responsibility for electronic components manufacturers. Based on these efforts, for the year ending March 31, 2009, net sales is projected at 120,000 million yen (up 0.4% year-on-year), and net income at 1,500 million yen (up 17.4% year-on-year). The exchange rate assumed for the earnings forecast is US$1.00 = ¥103.
The Nichicon Group recognizes that the return of higher profit to its shareholders is a key issue in its management. One of the fundamentals of business management at
A n n u a l R e p o r t 2 0 0 8
Efforts and Business Forecast for theFiscal Year Ending March 2009
President & COO
Sachihiko Araki
Chairman & CEO
Ippei Takeda

Nichicon’s products are classified into three sectors: capacitors
for electronics and circuit products; capacitors for electric
apparatus and power utilities; and capacitors for applied
systems/others. These product groups have a presence on a
global scale. We are seeking to enhance our competitiveness
by putting effort into proposal-based sales that involve tapping
customer’s needs by working with them closely, and developing
products in pursuit of high quality and advanced functionality.
8 A n n u a l R e p o r t 2 0 0 8
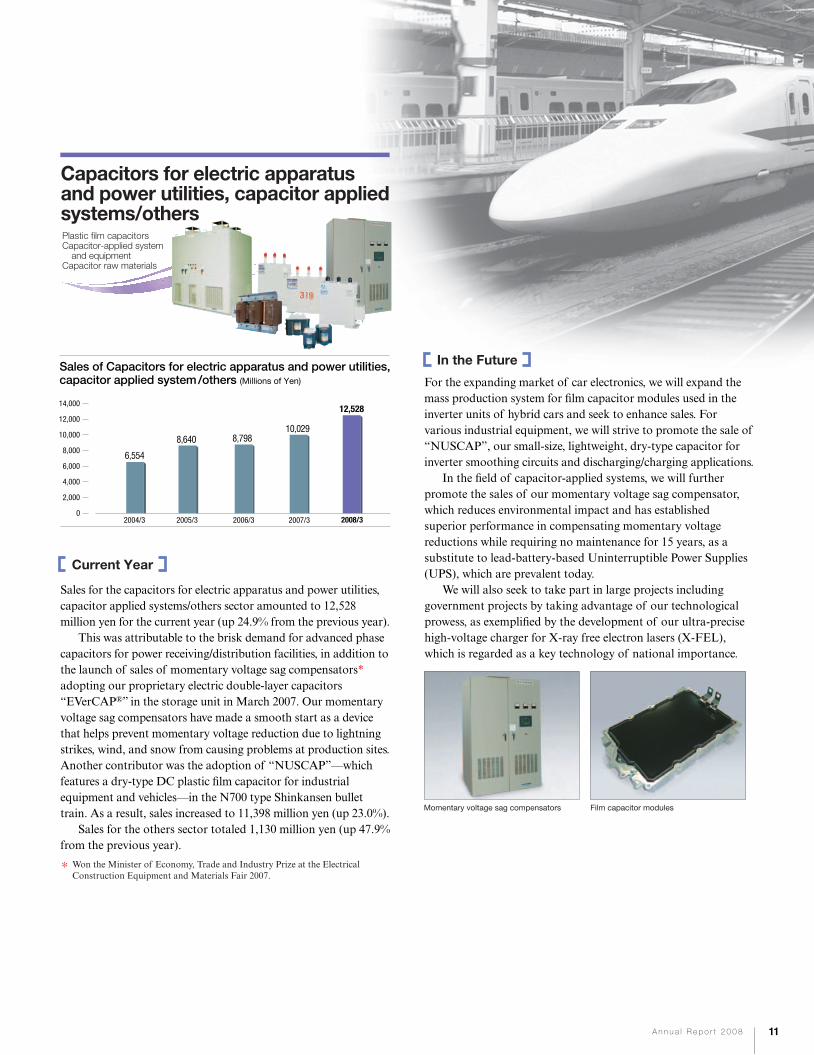
The sector of capacitors for electric apparatus/power utilities and capacitor applied systems mainly provides buildings and factories with the necessary industrial equipment to receive/transform electricity. Its product lineup consists of smoothing capacitors used for railroad vehicles and hybrid cars, as well as special equipment that employs capacitors and high-voltage/large current control technology. This sector’s sales for the current year amounted to 12,528 million yen (increasing by 24.9% from the previous year), and its sales rate stood at 10.5% (up 2.1 points from the previous period).
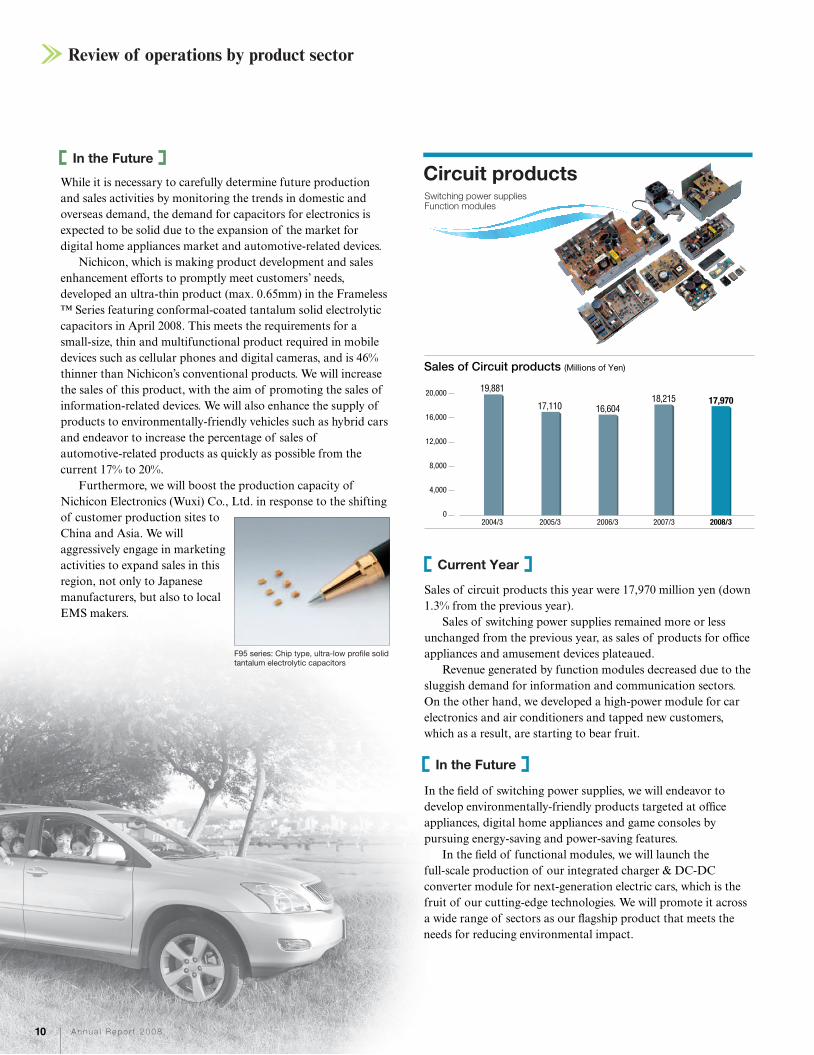
The circuit products sector provides switching power supplies that serve as the heart of electronic equipment. Functional modules, on which various electronic components such as IC chips, capacitors, and semiconductors are mounted, also come under this category. We develop products meeting the need for high-density mounting by bringing together elemental technologies such as micro-fabrication, mounting and connection technologies. This sector’s sales for the current year amounted to 17,970 million yen (down 1.3% from the previous year), and its sales rate stood at 15.0% (down 0.4 points from the previous period).
Sales by Product Sector (unit: million yen)
118,713
106,871104,096100,849
119,567
140,000
100,000
120,000
60,000
80,000
40,000
20,000
02008/32004/3 2005/3 2006/3 2007/3
Capacitors for electric apparatusand power utilities, capacitorapplied systems/others
Circuit products
74,414
19,881
6,554 8,640
17,110
78,346
10,029
18,215
90,469
12,528
17,970
89,069
Capacitors for electronics
Capacitors for the electronics sector is Nichicon’s main sector, accounting for more than 70% of consolidated sales. It meets customers’ needs with a wide range of products, such as aluminum electrolytic capacitors that boast top world class shares and tantalum electrolytic capacitors for information and communications devices, as well as plastic film capacitors (which excel in their high speed characteristics and can address high voltages) and positive thermistors (which utilize changes in resistance values caused by temperature fluctuations). This sector’s sales for the current year amounted to 89,069 million yen (decreasing by 1.5% from the previous year), and its sales rate stood at 74.5% (down 1.7 points from the previous period).
8,798
16,604
81,469
Capacitors for electronics Circuit products
Capacitors for electric apparatus and power utilities, capacitor applied systems/others74.5%
15.0%
10.5%
Sales Breakdown by Product Sector
Capacitors for electricapparatus and powerutilities, capacitor appliedsystems/others
Circuit products
Capacitors for electronics
2008/3
119,567(million yen)
Review of operations by product sector

❶ ❷
❸
❶ ❷
❸ ❹❹
GW series: 105°C high ripple current large can type aluminum electrolytic capacitors (right)
NK series: 85°C smaller sized screw-terminaltype aluminum electrolytic capacitors (left)
Conductive Polymer Tantalum Solid Electrolytic CapacitorsF31 series (bottom)F32 series (middle)
F11 series: Decoupling device for high frequency (top)
LF series: Miniature type, Low ESL conductivepolymer aluminum solid electrolytic capacitors
Miniature type aluminum electrolytic capacitorsTS series: Miniature sized, for switching power supplies (left)
TT series: Miniature sized, low impedance, high reliability (right)
9A n n u a l R e p o r t 2 0 0 8
Sales of capacitors for the electronics sector amounted to 89,069 million yen for the current year (decreasing by 1.5% from the previous year). Overall, sales slightly fell short of the previous year’s level due in part to the sluggish growth of information and communication-related orders received. However, sales were solid in regards to products targeted at digital home appliances, as well as environmentally-friendly products amid the global trend to reduce environmental impact, such as products targeted at inverter-equipped products and in-car equipment. Nichicon’s strength lies in its ability to cover digital home appliances and products that meet environmental needs with its diverse product lineup. For example, in the field of capacitors for hybrid cars, which need to be highly reliable to withstand use in harsh environments, Nichicon boasts world-class quality in its products and a wide product range. We are receiving an increasing number of inquiries not only from domestic leading automobile manufacturers but also from overseas manufacturers. Furthermore, we engage in integrated production starting with the processing of materials that determine the performance of aluminum electrolytic capacitors, tantalum electrolytic capacitors and plastic film capacitors. We are boosting our competitiveness by improving quality and productivity. New aluminum electrolytic capacitors developed in the current year including: the “LF Series/low-ESL product” ❶, which feature ultra-low ESL*1 and small-size conductive polymer aluminum solid electrolytic capacitors; the “TS Series” and “TT Series” ❷, which feature small-size, long-life products to meet the
Sales of Capacitors for electronics (Millions of Yen)
90,46981,46978,34674,414
89,069100,000
80,000
40,000
60,000
20,000
02008/32004/3 2005/3 2006/3 2007/3
requirements of the digital appliance market (including LCD displays) and the information and communication devices market; the “GW Series” ❸, which feature snap-in terminal type aluminum electrolytic smoothing capacitors with high allowable ripple current ratings*2 for switching power supplies and inverter-equipped products; and the “NK Series” ❸, which feature small-size screw-terminal type aluminum electrolytic capacitors for various industrial equipment such as high-voltage inverter circuits. In the field of tantalum electrolytic capacitors, we dramatically enhanced the rated range of the “F31/F32 Series” ❹, which feature conductive polymer tantalum electrolytic capacitors targeted at personal computers and mobile devices such as portable game consoles. We have also enhanced the product lineup of the “F11 Series” ❹, a high-frequency decoupling device for high-performance PCs and next-generation game consoles.
Capacitors forelectronics
Current Year
Aluminum electrolytic capacitorsTantalum electrolytic capacitorsPlastic film capacitorsPositive thermistors “Posi-R®”
ESL (Equivalent Series Inductance): A numerical value representing the series inductance equivalent to the reactance of a capacitor. A capacitor with lower ESL is more ideal.Allowance ripple (current): As indicated by the meaning of the word “ripple”, ripple current refers to a direct current with ripple-like alternating current components. It is also called “pulsating current”. A capacitor with a higher allowance for ripple current is superior.
*1
*2
A n n u a l R e p o r t 2 0 0 8
Review of operations by product sector
10
In the field of switching power supplies, we will endeavor to develop environmentally-friendly products targeted at office appliances, digital home appliances and game consoles by pursuing energy-saving and power-saving features. In the field of functional modules, we will launch the full-scale production of our integrated charger & DC-DC converter module for next-generation electric cars, which is the fruit of our cutting-edge technologies. We will promote it across a wide range of sectors as our flagship product that meets the needs for reducing environmental impact.
While it is necessary to carefully determine future production and sales activities by monitoring the trends in domestic and overseas demand, the demand for capacitors for electronics is expected to be solid due to the expansion of the market for digital home appliances market and automotive-related devices. Nichicon, which is making product development and sales enhancement efforts to promptly meet customers’ needs, developed an ultra-thin product (max. 0.65mm) in the Frameless™ Series featuring conformal-coated tantalum solid electrolytic capacitors in April 2008. This meets the requirements for a small-size, thin and multifunctional product required in mobile devices such as cellular phones and digital cameras, and is 46% thinner than Nichicon’s conventional products. We will increase the sales of this product, with the aim of promoting the sales of information-related devices. We will also enhance the supply of products to environmentally-friendly vehicles such as hybrid cars and endeavor to increase the percentage of sales of automotive-related products as quickly as possible from the current 17% to 20%. Furthermore, we will boost the production capacity of Nichicon Electronics (Wuxi) Co., Ltd. in response to the shifting of customer production sites to China and Asia. We will aggressively engage in marketing activities to expand sales in this region, not only to Japanese manufacturers, but also to local EMS makers.
Sales of circuit products this year were 17,970 million yen (down 1.3% from the previous year). Sales of switching power supplies remained more or less unchanged from the previous year, as sales of products for office appliances and amusement devices plateaued. Revenue generated by function modules decreased due to the sluggish demand for information and communication sectors. On the other hand, we developed a high-power module for car electronics and air conditioners and tapped new customers, which as a result, are starting to bear fruit.
Sales of Circuit products (Millions of Yen)
18,21516,60417,110
19,88117,970
20,000
16,000
8,000
12,000
4,000
02008/32004/3 2005/3 2006/3 2007/3
Circuit productsSwitching power supplies Function modules
Current Year
In the Future
In the Future
F95 series: Chip type, ultra-low profile solidtantalum electrolytic capacitors
A n n u a l R e p o r t 2 0 0 8 11
Momentary voltage sag compensators
Sales for the capacitors for electric apparatus and power utilities, capacitor applied systems/others sector amounted to 12,528 million yen for the current year (up 24.9% from the previous year). This was attributable to the brisk demand for advanced phase capacitors for power receiving/distribution facilities, in addition to the launch of sales of momentary voltage sag compensators* adopting our proprietary electric double-layer capacitors “EVerCAP®” in the storage unit in March 2007. Our momentary voltage sag compensators have made a smooth start as a device that helps prevent momentary voltage reduction due to lightning strikes, wind, and snow from causing problems at production sites. Another contributor was the adoption of “NUSCAP”—which features a dry-type DC plastic film capacitor for industrial equipment and vehicles—in the N700 type Shinkansen bullet train. As a result, sales increased to 11,398 million yen (up 23.0%). Sales for the others sector totaled 1,130 million yen (up 47.9% from the previous year).
For the expanding market of car electronics, we will expand the mass production system for film capacitor modules used in the inverter units of hybrid cars and seek to enhance sales. For various industrial equipment, we will strive to promote the sale of “NUSCAP”, our small-size, lightweight, dry-type capacitor for inverter smoothing circuits and discharging/charging applications. In the field of capacitor-applied systems, we will further promote the sales of our momentary voltage sag compensator, which reduces environmental impact and has established superior performance in compensating momentary voltage reductions while requiring no maintenance for 15 years, as a substitute to lead-battery-based Uninterruptible Power Supplies (UPS), which are prevalent today. We will also seek to take part in large projects including government projects by taking advantage of our technological prowess, as exemplified by the development of our ultra-precise high-voltage charger for X-ray free electron lasers (X-FEL), which is regarded as a key technology of national importance.
12,000
14,000
10,000
8,000
6,000
4,000
2,000
0
Sales of Capacitors for electric apparatus and power utilities,capacitor applied system/others (Millions of Yen)
10,0298,7988,640
6,554
12,528
2008/32004/3 2005/3 2006/3 2007/3
Plastic film capacitors Capacitor-applied system
and equipment Capacitor raw materials
Capacitors for electric apparatusand power utilities, capacitor appliedsystems/others
Film capacitor modules
2008.10.14 11:00 yasue
Current Year
In the Future
Won the Minister of Economy, Trade and Industry Prize at the Electrical Construction Equipment and Materials Fair 2007.
*
5,64711,036
39,413
48,000
5,41810,100
47,999
43,354
6,72211,297
55,485
45,209
55,956
9,776 7,247
46,588
120,000
0
20,000
40,000
60,000
80,000
100,000
118,713106,871104,096100,849
119,567
2008/32004/3 2005/3 2006/3 2007/3
5,30111,379
37,761
46,408
Net Sales by Location (Millions of Yen)
Europe and othersBritain, France, Austria
AsiaChina and ASEAN
The AmericasThe U.S., Brazil, Mexico
Japan
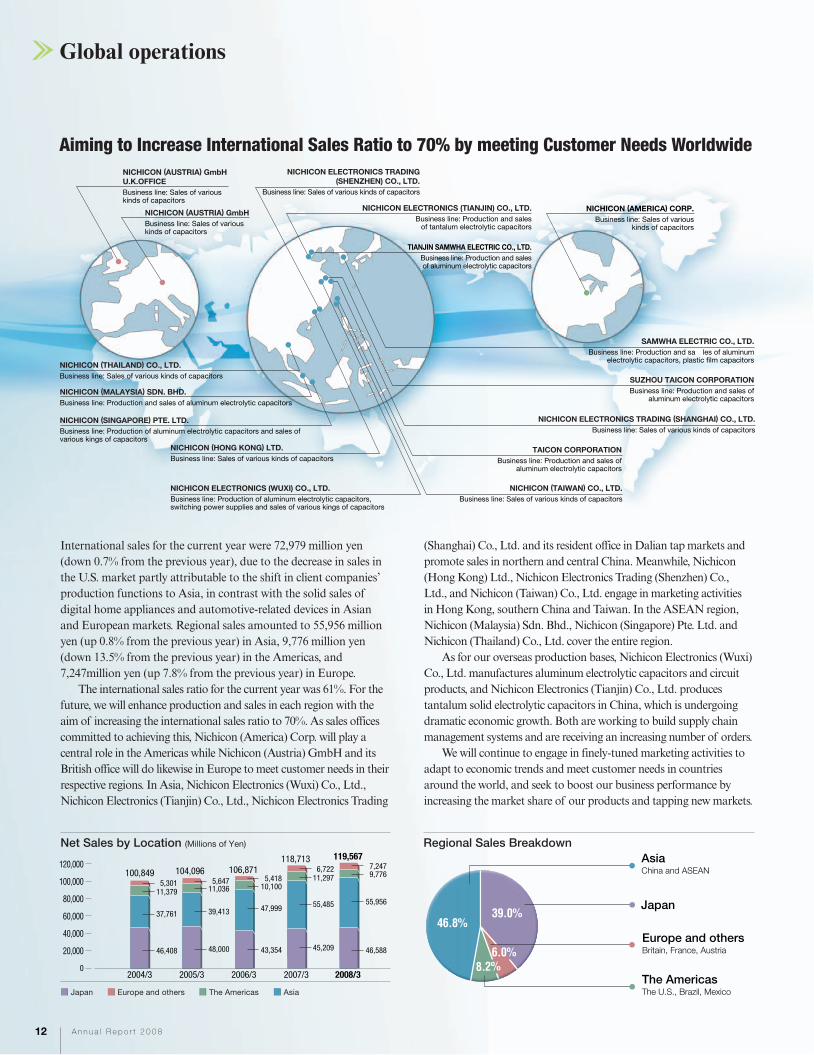
Aiming to Increase International Sales Ratio to 70% by meeting Customer Needs Worldwide
International sales for the current year were 72,979 million yen (down 0.7% from the previous year), due to the decrease in sales in the U.S. market partly attributable to the shift in client companies’ production functions to Asia, in contrast with the solid sales of digital home appliances and automotive-related devices in Asian and European markets. Regional sales amounted to 55,956 million yen (up 0.8% from the previous year) in Asia, 9,776 million yen (down 13.5% from the previous year) in the Americas, and 7,247million yen (up 7.8% from the previous year) in Europe.
The international sales ratio for the current year was 61%. For the future, we will enhance production and sales in each region with the aim of increasing the international sales ratio to 70%. As sales offices committed to achieving this, Nichicon (America) Corp. will play a central role in the Americas while Nichicon (Austria) GmbH and its British office will do likewise in Europe to meet customer needs in their respective regions. In Asia, Nichicon Electronics (Wuxi) Co., Ltd., Nichicon Electronics (Tianjin) Co., Ltd., Nichicon Electronics Trading
(Shanghai) Co., Ltd. and its resident office in Dalian tap markets and promote sales in northern and central China. Meanwhile, Nichicon (Hong Kong) Ltd., Nichicon Electronics Trading (Shenzhen) Co., Ltd., and Nichicon (Taiwan) Co., Ltd. engage in marketing activities in Hong Kong, southern China and Taiwan. In the ASEAN region, Nichicon (Malaysia) Sdn. Bhd., Nichicon (Singapore) Pte. Ltd. and Nichicon (Thailand) Co., Ltd. cover the entire region.
As for our overseas production bases, Nichicon Electronics (Wuxi) Co., Ltd. manufactures aluminum electrolytic capacitors and circuit products, and Nichicon Electronics (Tianjin) Co., Ltd. produces tantalum solid electrolytic capacitors in China, which is undergoing dramatic economic growth. Both are working to build supply chain management systems and are receiving an increasing number of orders.
We will continue to engage in finely-tuned marketing activities to adapt to economic trends and meet customer needs in countries around the world, and seek to boost our business performance by increasing the market share of our products and tapping new markets.
SAMWHA ELECTRIC CO., LTD.
Business line: Production and sa les of aluminumelectrolytic capacitors, plastic film capacitors
NICHICON ELECTRONICS (WUXI) CO., LTD.
Business line: Production of aluminum electrolytic capacitors,switching power supplies and sales of various kings of capacitors
SUZHOU TAICON CORPORATION
Business line: Production and sales ofaluminum electrolytic capacitors
NICHICON (MALAYSIA) SDN. BHD.
Business line: Production and sales of aluminum electrolytic capacitors
TAICON CORPORATION
Business line: Production and sales ofaluminum electrolytic capacitors
NICHICON ELECTRONICS (TIANJIN) CO., LTD.
Business line: Production and salesof tantalum electrolytic capacitors
NICHICON (THAILAND) CO., LTD.
Business line: Sales of various kinds of capacitors
NICHICON (HONG KONG) LTD.
Business line: Sales of various kinds of capacitors
NICHICON (AUSTRIA) GmbH
Business line: Sales of variouskinds of capacitors
NICHICON (AMERICA) CORP.
Business line: Sales of variouskinds of capacitors
NICHICON (AUSTRIA) GmbH
U.K.OFFICE
Business line: Sales of variouskinds of capacitors
NICHICON (TAIWAN) CO., LTD.
Business line: Sales of various kinds of capacitors
TIANJIN SAMWHA ELECTRIC CO., LTD.
Business line: Production and salesof aluminum electrolytic capacitors
NICHICON ELECTRONICS TRADING
(SHENZHEN) CO., LTD.
Business line: Sales of various kinds of capacitors
NICHICON (SINGAPORE) PTE. LTD.
Business line: Production of aluminum electrolytic capacitors and sales ofvarious kings of capacitors
Regional Sales Breakdown
39.0%
8.2%
46.8%
6.0%
Global operations
12 A n n u a l R e p o r t 2 0 0 8
NICHICON ELECTRONICS TRADING (SHANGHAI) CO., LTD.
Business line: Sales of various kinds of capacitors
Japan Europe and others AsiaThe Americas

Nichicon develops Integrated Charger &DC-DC Converter Module forNew-generation Electric Car “i MiEV”
Nichicon receives 2008 Award of Excellenceas Outstanding Electrical ManufacturingEngineer for developing Ultra-preciseHigh-voltage Charger for X-FEL
Nichicon participates in the national project “X-FEL (X-ray free electron laser) plan” certified as a key technology of national importance, serving as the driving force of science and technology in Japan, and takes charge of the development of the power supply component for the stable operation of X-FEL. X-FEL is a completely new technology, and is attracting attention as a “dream light source” that is believed to be capable of observing the size of matter at the molecular level as well as instantaneous movements. The stable operation of X-FEL requires a high-voltage charger that charges capacitors with an extremely high level of precision—i.e., a margin of error of 0.01%. Given that the precision of high-voltage chargers based on conventional technology has a margin of error of around 0.1%, we worked on developing an ultra-precise high-voltage charger that adopts a new system of circuitry and architecture, and succeeded in developing a charger that fulfills the required performance. We performed a continuous running test by applying actual load for approximately one year, and completed verifying its stable operation.
Nichicon received the 2008 Award of Excellence as Outstanding Electrical Manufacturing Engineer from the Japan Electrical Manufacturers’ Association (JEMA), in recognition of its contribution to establishing this key technology of national importance.
Mitsubishi Motors Corporation is planning to launch a new-generation electric car dubbed “i MiEV” in the Japanese market in 2009. Electric cars, which do not release CO2 while running, are attracting a great deal of attention from the viewpoint of preventing environmental pollution and global warming. Nichicon has developed and supplies an integrated module consisting of a charger and DC-DC converter for this electric car. The module, which incorporates cutting-edge technologies, charges two batteries (one high-voltage battery and one low-voltage battery) that are indispensable for driving “i MiEV”, and can easily be charged using a household wall socket thanks to its design. As the market for electric cars is expected to expand on a full scale in the future, we will work on developments to further miniaturize the converter and improve its charging efficiency.
Nichicon receives the Preferred QualitySupplier (PQS) Award from Intel
In March 2008, Nichicon received the 2007 PQS (Preferred Quality Supplier) Award from Intel Corporation, for its highly-acclaimed technology and supply capacity of aluminum electrolytic capacitors and conductive polymer aluminum solid electrolytic capacitors. This prestigious award, which Nichicon also received last year, is presented to products and services that substantially contributed to Intel’s business activities. Nichicon is highly regarded by Intel’s management in charge of its system manufacturing division as a long-term technology partner that continues to provide high-quality voltage regulators and capacitors.
Integrated Charger &DC-DC Converter Module
X-FEL
250MeV R&D250MeV R&D
News & Topics
13A n n u a l R e p o r t 2 0 0 8

1414 A n n u a l R e p o r t 2 0 0 8A n n u a l R e p o r t 2 0 0 814 A n n u a l R e p o r t 2 0 0 8
Corporate governance / Corporate social responsibility (CSR)
Group companies
Accountingauditor
Board of auditors
Shareholders’ meeting
CSRoffice
Audit &Legal team
Board ofDirectors
Chairman & CEO
President & COO
CSRPromotionCommittee
Operating DivisionsOperating Officers
Business Divisions
Corporate Governance and Internal Control System
The Nichicon Group is committed to working on a group-wide scale to ensure the efficiency, soundness and transparency of management and to continuously improve its corporate value and fulfill corporate social responsibility (CSR).
Nichicon introduced the “operating officer system” in June 2003, and through close cooperation with our board of directors, we have made efforts to improve our management system and organization so that it can effectively address ongoing changes in the business climate.
Our auditors along with the audit & legal team strive to improve the effectiveness and efficiency of audits by closely working together through the exchange of information and opinions on such matters as audit plans and the audit execution status.
Our company worked to develop and systematize its internal control system pursuant to the former commercial code. Following the establishment of the revised “Corporate Law” in May 2006 and the “Financial Instruments and Exchange Law” (the so-called J-SOX act) in June 2006, we organized the “Internal Control System Development Project” in August 2006 in order to facilitate the reinforcement of its internal controls as required by the aforementioned two laws.
In respect to the internal control system required by the Corporate Law, we have been working to organize and improve the structure to ensure the appropriateness of its operations and facilitating the smooth implementation of this structure under the definition of “Structure to Ensure the Appropriateness of Operations,” which is comprised of the ten items* below, including compliance by the Directors and employees with laws and regulations, the articles of incorporation and the “Nichicon Group Code of Conduct,” etc. Going forward, the J-SOX act requires the submission of an “internal control report,” in respect to the appropriateness and credibility of financial reporting, from March 2009 and thus we are reviewing the functionality of the company-wide controls and operational processing control system.
Promotion of Compliance and Enhancementof Crisis-Control Structure
The Nichicon Group has been working on the issues of corporate governance and compliance from an early stage from the perspective that corporations have an obligation to fulfill their social responsibilities in a proactive manner. In October 2002, we created “The Nichicon Group Code of Conduct”, which put together a set of rules for compliance and the prohibition of anti-social actions, and in June 2003, we established a dedicated section named the “CSR Office” ahead of other companies. We further established the “Nichicon Group’s CSR Charter” in December 2005, which serves as an important set of rules and action guidelines for every member within the Nichicon Group of companies. For the purpose of accelerating these initiatives toward the aforementioned CSR, we set up the “CSR Promotion Committee” chaired by the President (COO) in November 2006. The entire Group is working on the five primary initiatives of “Corporate Governance,” “Compliance,” “Risk Management,” “Environmental Management” and “Information Security,” which are also important issues from the standpoint of constructing an internal control system. In respect to information security, we defined our “Basic Policies on Information Security” in February 2007 in order to prevent risks of information leakage, etc. These basic policies were distributed to employees in the “Information Security Handbook,” with an aim to utilizing information assets effectively while making every effort to execute information security measures.
Structure to ensure that the job performance of Directors complies with laws and regulations and the articles of incorporation; structure to otherwise ensure appropriateness of operations
Structure to store and manage information concerning the job performance of Directors
Regulations and structure concerning management of risk of loss
Structure to ensure efficiency of job performance of Directors
Structure to ensure that the job performance of employees complies with laws and regulations and the articles of incorporation
Structure to ensure appropriateness of the operation of the business group comprising the Company and its subsidiaries
Matters concerning the employee(s) when the Auditor requires such employee(s) to assist with his/her job
Matters concerning independency from the Directors with respect of the employee(s) in the preceding item
Structure for the Directors and the employees to make reporting to the Auditors; structure of otherwise reporting to Auditors
Structure to otherwise ensure effective audit by the Auditors
1.
2.
3.
4.
5.
6.
7.
8.
9.
10.
Corporate Governance SystemStructure to Ensure Appropriateness of Operations*
1515A n n u a l R e p o r t 2 0 0 8A n n u a l R e p o r t 2 0 0 8 15A n n u a l R e p o r t 2 0 0 8
Reduction of Waste and Effective Use of Resources
Proper Management of Chemical Substances and Risk Management
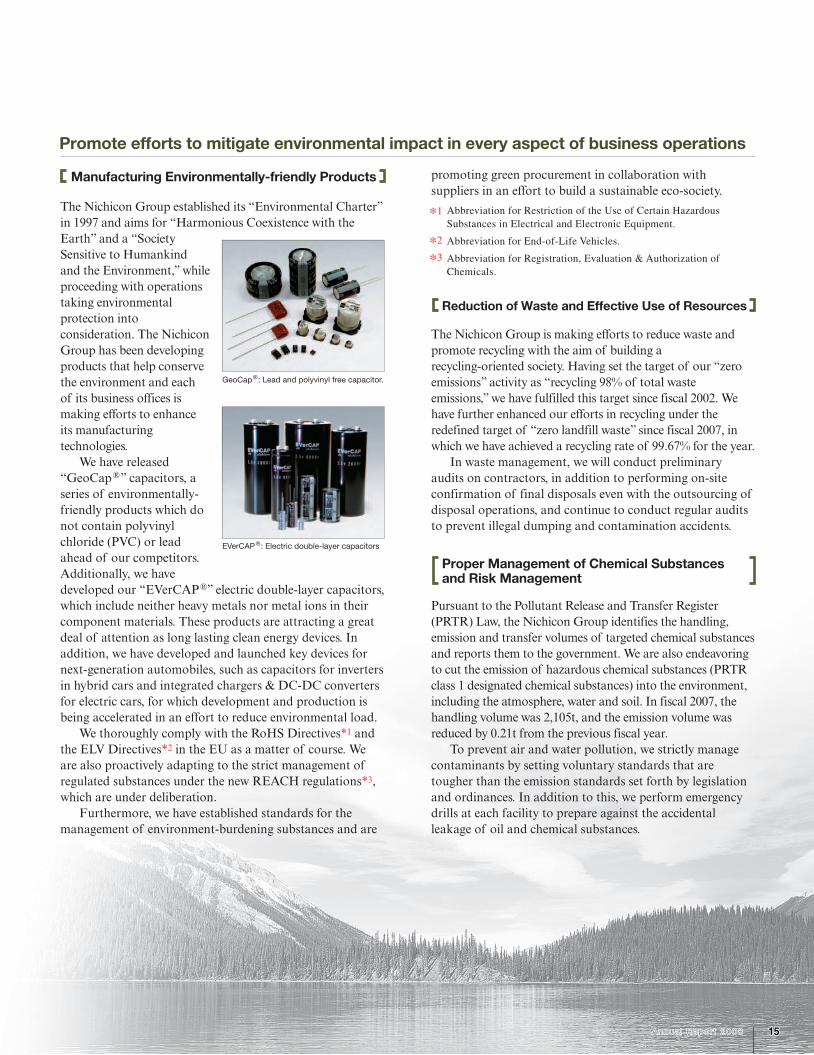
The Nichicon Group established its “Environmental Charter” in 1997 and aims for “Harmonious Coexistence with the Earth” and a “Society Sensitive to Humankind and the Environment,” while proceeding with operations taking environmental protection into consideration. The Nichicon Group has been developing products that help conserve the environment and each of its business offices is making efforts to enhance its manufacturing technologies. We have released “GeoCap®” capacitors, a series of environmentally- friendly products which do not contain polyvinyl chloride (PVC) or lead ahead of our competitors. Additionally, we have developed our “EVerCAP®” electric double-layer capacitors, which include neither heavy metals nor metal ions in their component materials. These products are attracting a great deal of attention as long lasting clean energy devices. In addition, we have developed and launched key devices for next-generation automobiles, such as capacitors for inverters in hybrid cars and integrated chargers & DC-DC converters for electric cars, for which development and production is being accelerated in an effort to reduce environmental load. We thoroughly comply with the RoHS Directives*1 and the ELV Directives*2 in the EU as a matter of course. We are also proactively adapting to the strict management of regulated substances under the new REACH regulations*3,which are under deliberation. Furthermore, we have established standards for the management of environment-burdening substances and are
Abbreviation for Restriction of the Use of Certain Hazardous Substances in Electrical and Electronic Equipment.
Abbreviation for End-of-Life Vehicles.
Abbreviation for Registration, Evaluation & Authorization of Chemicals.
*1
*2
*3
GeoCap®: Lead and polyvinyl free capacitor.
EVerCAP®: Electric double-layer capacitors
Promote efforts to mitigate environmental impact in every aspect of business operations
Manufacturing Environmentally-friendly Products promoting green procurement in collaboration with suppliers in an effort to build a sustainable eco-society.
The Nichicon Group is making efforts to reduce waste and promote recycling with the aim of building a recycling-oriented society. Having set the target of our “zero emissions” activity as “recycling 98% of total waste emissions,” we have fulfilled this target since fiscal 2002. We have further enhanced our efforts in recycling under the redefined target of “zero landfill waste” since fiscal 2007, in which we have achieved a recycling rate of 99.67% for the year. In waste management, we will conduct preliminary audits on contractors, in addition to performing on-site confirmation of final disposals even with the outsourcing of disposal operations, and continue to conduct regular audits to prevent illegal dumping and contamination accidents.
Pursuant to the Pollutant Release and Transfer Register (PRTR) Law, the Nichicon Group identifies the handling, emission and transfer volumes of targeted chemical substances and reports them to the government. We are also endeavoring to cut the emission of hazardous chemical substances (PRTR class 1 designated chemical substances) into the environment, including the atmosphere, water and soil. In fiscal 2007, the handling volume was 2,105t, and the emission volume was reduced by 0.21t from the previous fiscal year. To prevent air and water pollution, we strictly manage contaminants by setting voluntary standards that are tougher than the emission standards set forth by legislation and ordinances. In addition to this, we perform emergency drills at each facility to prepare against the accidental leakage of oil and chemical substances.
16 A n n u a l R e p o r t 2 0 0 8
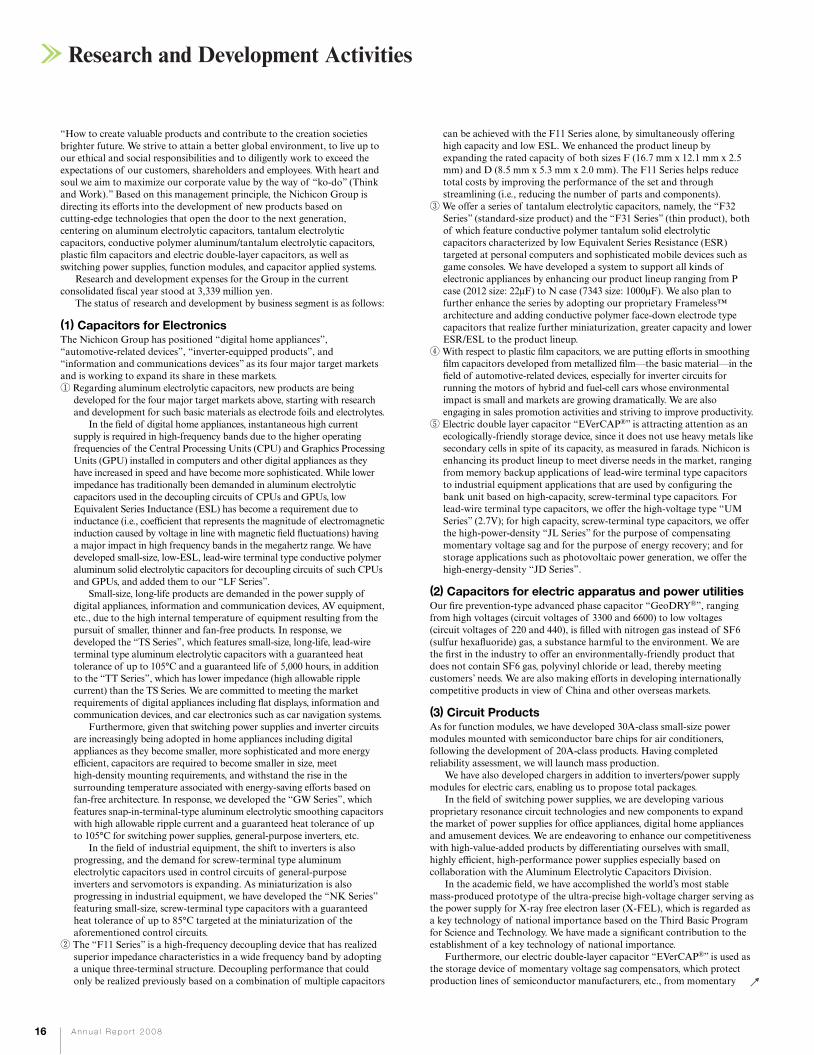
“How to create valuable products and contribute to the creation societies brighter future. We strive to attain a better global environment, to live up to our ethical and social responsibilities and to diligently work to exceed the expectations of our customers, shareholders and employees. With heart and soul we aim to maximize our corporate value by the way of “ko-do” (Think and Work).” Based on this management principle, the Nichicon Group is directing its efforts into the development of new products based on cutting-edge technologies that open the door to the next generation, centering on aluminum electrolytic capacitors, tantalum electrolytic capacitors, conductive polymer aluminum/tantalum electrolytic capacitors, plastic film capacitors and electric double-layer capacitors, as well as switching power supplies, function modules, and capacitor applied systems. Research and development expenses for the Group in the current consolidated fiscal year stood at 3,339 million yen. The status of research and development by business segment is as follows:
(1) Capacitors for ElectronicsThe Nichicon Group has positioned “digital home appliances”, “automotive-related devices”, “inverter-equipped products”, and “information and communications devices” as its four major target markets and is working to expand its share in these markets.① Regarding aluminum electrolytic capacitors, new products are being
developed for the four major target markets above, starting with research and development for such basic materials as electrode foils and electrolytes. In the field of digital home appliances, instantaneous high current supply is required in high-frequency bands due to the higher operating frequencies of the Central Processing Units (CPU) and Graphics Processing Units (GPU) installed in computers and other digital appliances as they have increased in speed and have become more sophisticated. While lower impedance has traditionally been demanded in aluminum electrolytic capacitors used in the decoupling circuits of CPUs and GPUs, low Equivalent Series Inductance (ESL) has become a requirement due to inductance (i.e., coefficient that represents the magnitude of electromagnetic induction caused by voltage in line with magnetic field fluctuations) having a major impact in high frequency bands in the megahertz range. We have developed small-size, low-ESL, lead-wire terminal type conductive polymer aluminum solid electrolytic capacitors for decoupling circuits of such CPUs and GPUs, and added them to our “LF Series”. Small-size, long-life products are demanded in the power supply of digital appliances, information and communication devices, AV equipment, etc., due to the high internal temperature of equipment resulting from the pursuit of smaller, thinner and fan-free products. In response, we developed the “TS Series”, which features small-size, long-life, lead-wire terminal type aluminum electrolytic capacitors with a guaranteed heat tolerance of up to 105°C and a guaranteed life of 5,000 hours, in addition to the “TT Series”, which has lower impedance (high allowable ripple current) than the TS Series. We are committed to meeting the market requirements of digital appliances including flat displays, information and communication devices, and car electronics such as car navigation systems. Furthermore, given that switching power supplies and inverter circuits are increasingly being adopted in home appliances including digital appliances as they become smaller, more sophisticated and more energy efficient, capacitors are required to become smaller in size, meet high-density mounting requirements, and withstand the rise in the surrounding temperature associated with energy-saving efforts based on fan-free architecture. In response, we developed the “GW Series”, which features snap-in-terminal-type aluminum electrolytic smoothing capacitors with high allowable ripple current and a guaranteed heat tolerance of up to 105°C for switching power supplies, general-purpose inverters, etc. In the field of industrial equipment, the shift to inverters is also progressing, and the demand for screw-terminal type aluminum electrolytic capacitors used in control circuits of general-purpose inverters and servomotors is expanding. As miniaturization is also progressing in industrial equipment, we have developed the “NK Series” featuring small-size, screw-terminal type capacitors with a guaranteed heat tolerance of up to 85°C targeted at the miniaturization of the aforementioned control circuits.
② The “F11 Series” is a high-frequency decoupling device that has realized superior impedance characteristics in a wide frequency band by adopting a unique three-terminal structure. Decoupling performance that could only be realized previously based on a combination of multiple capacitors →
can be achieved with the F11 Series alone, by simultaneously offering high capacity and low ESL. We enhanced the product lineup by expanding the rated capacity of both sizes F (16.7 mm x 12.1 mm x 2.5 mm) and D (8.5 mm x 5.3 mm x 2.0 mm). The F11 Series helps reduce total costs by improving the performance of the set and through streamlining (i.e., reducing the number of parts and components).
③We offer a series of tantalum electrolytic capacitors, namely, the “F32 Series” (standard-size product) and the “F31 Series” (thin product), both of which feature conductive polymer tantalum solid electrolytic capacitors characterized by low Equivalent Series Resistance (ESR) targeted at personal computers and sophisticated mobile devices such as game consoles. We have developed a system to support all kinds of electronic appliances by enhancing our product lineup ranging from P case (2012 size: 22μF) to N case (7343 size: 1000μF). We also plan to further enhance the series by adopting our proprietary Frameless™ architecture and adding conductive polymer face-down electrode type capacitors that realize further miniaturization, greater capacity and lower ESR/ESL to the product lineup.
④With respect to plastic film capacitors, we are putting efforts in smoothing film capacitors developed from metallized film—the basic material—in the field of automotive-related devices, especially for inverter circuits for running the motors of hybrid and fuel-cell cars whose environmental impact is small and markets are growing dramatically. We are also engaging in sales promotion activities and striving to improve productivity.
⑤ Electric double layer capacitor “EVerCAP®” is attracting attention as an ecologically-friendly storage device, since it does not use heavy metals like secondary cells in spite of its capacity, as measured in farads. Nichicon is enhancing its product lineup to meet diverse needs in the market, ranging from memory backup applications of lead-wire terminal type capacitors to industrial equipment applications that are used by configuring the bank unit based on high-capacity, screw-terminal type capacitors. For lead-wire terminal type capacitors, we offer the high-voltage type “UM Series” (2.7V); for high capacity, screw-terminal type capacitors, we offer the high-power-density “JL Series” for the purpose of compensating momentary voltage sag and for the purpose of energy recovery; and for storage applications such as photovoltaic power generation, we offer the high-energy-density “JD Series”.
(2) Capacitors for electric apparatus and power utilitiesOur fire prevention-type advanced phase capacitor “GeoDRY®”, ranging from high voltages (circuit voltages of 3300 and 6600) to low voltages (circuit voltages of 220 and 440), is filled with nitrogen gas instead of SF6 (sulfur hexafluoride) gas, a substance harmful to the environment. We are the first in the industry to offer an environmentally-friendly product that does not contain SF6 gas, polyvinyl chloride or lead, thereby meeting customers’ needs. We are also making efforts in developing internationally competitive products in view of China and other overseas markets.
(3) Circuit ProductsAs for function modules, we have developed 30A-class small-size power modules mounted with semiconductor bare chips for air conditioners, following the development of 20A-class products. Having completed reliability assessment, we will launch mass production. We have also developed chargers in addition to inverters/power supply modules for electric cars, enabling us to propose total packages. In the field of switching power supplies, we are developing various proprietary resonance circuit technologies and new components to expand the market of power supplies for office appliances, digital home appliances and amusement devices. We are endeavoring to enhance our competitiveness with high-value-added products by differentiating ourselves with small, highly efficient, high-performance power supplies especially based on collaboration with the Aluminum Electrolytic Capacitors Division. In the academic field, we have accomplished the world’s most stable mass-produced prototype of the ultra-precise high-voltage charger serving as the power supply for X-ray free electron laser (X-FEL), which is regarded as a key technology of national importance based on the Third Basic Program for Science and Technology. We have made a significant contribution to the establishment of a key technology of national importance. Furthermore, our electric double-layer capacitor “EVerCAP®” is used as the storage device of momentary voltage sag compensators, which protect production lines of semiconductor manufacturers, etc., from momentary
Research and Development Activities
17A n n u a l R e p o r t 2 0 0 8
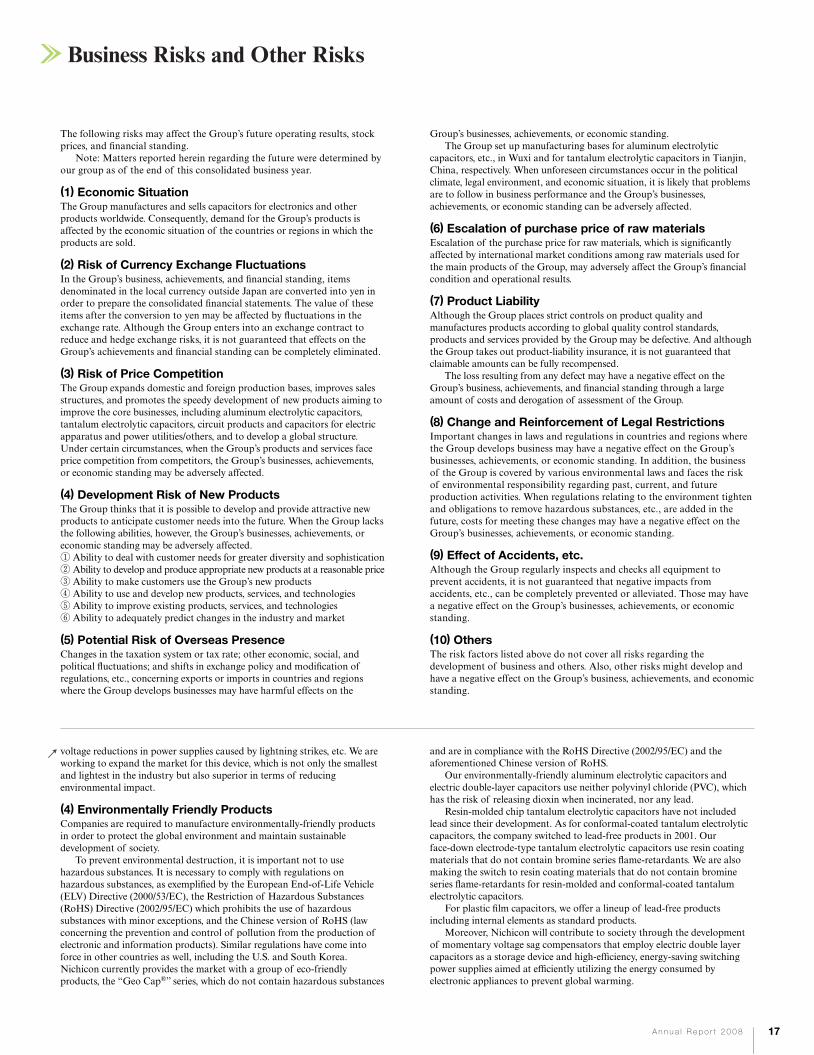
The following risks may affect the Group’s future operating results, stock prices, and financial standing. Note: Matters reported herein regarding the future were determined by our group as of the end of this consolidated business year.
(1) Economic SituationThe Group manufactures and sells capacitors for electronics and other products worldwide. Consequently, demand for the Group’s products is affected by the economic situation of the countries or regions in which the products are sold.
(2) Risk of Currency Exchange FluctuationsIn the Group’s business, achievements, and financial standing, items denominated in the local currency outside Japan are converted into yen in order to prepare the consolidated financial statements. The value of these items after the conversion to yen may be affected by fluctuations in the exchange rate. Although the Group enters into an exchange contract to reduce and hedge exchange risks, it is not guaranteed that effects on the Group’s achievements and financial standing can be completely eliminated.
(3) Risk of Price CompetitionThe Group expands domestic and foreign production bases, improves sales structures, and promotes the speedy development of new products aiming to improve the core businesses, including aluminum electrolytic capacitors, tantalum electrolytic capacitors, circuit products and capacitors for electric apparatus and power utilities/others, and to develop a global structure. Under certain circumstances, when the Group’s products and services face price competition from competitors, the Group’s businesses, achievements, or economic standing may be adversely affected.
(4) Development Risk of New ProductsThe Group thinks that it is possible to develop and provide attractive new products to anticipate customer needs into the future. When the Group lacks the following abilities, however, the Group’s businesses, achievements, or economic standing may be adversely affected.① Ability to deal with customer needs for greater diversity and sophistication② Ability to develop and produce appropriate new products at a reasonable price③ Ability to make customers use the Group’s new products④ Ability to use and develop new products, services, and technologies⑤ Ability to improve existing products, services, and technologies⑥ Ability to adequately predict changes in the industry and market
(5) Potential Risk of Overseas PresenceChanges in the taxation system or tax rate; other economic, social, and political fluctuations; and shifts in exchange policy and modification of regulations, etc., concerning exports or imports in countries and regions where the Group develops businesses may have harmful effects on the
Group’s businesses, achievements, or economic standing. The Group set up manufacturing bases for aluminum electrolytic capacitors, etc., in Wuxi and for tantalum electrolytic capacitors in Tianjin, China, respectively. When unforeseen circumstances occur in the political climate, legal environment, and economic situation, it is likely that problems are to follow in business performance and the Group’s businesses, achievements, or economic standing can be adversely affected.
(6) Escalation of purchase price of raw materialsEscalation of the purchase price for raw materials, which is significantly affected by international market conditions among raw materials used for the main products of the Group, may adversely affect the Group’s financial condition and operational results.
(7) Product LiabilityAlthough the Group places strict controls on product quality and manufactures products according to global quality control standards, products and services provided by the Group may be defective. And although the Group takes out product-liability insurance, it is not guaranteed that claimable amounts can be fully recompensed. The loss resulting from any defect may have a negative effect on the Group’s business, achievements, and financial standing through a large amount of costs and derogation of assessment of the Group.
(8) Change and Reinforcement of Legal RestrictionsImportant changes in laws and regulations in countries and regions where the Group develops business may have a negative effect on the Group’s businesses, achievements, or economic standing. In addition, the business of the Group is covered by various environmental laws and faces the risk of environmental responsibility regarding past, current, and future production activities. When regulations relating to the environment tighten and obligations to remove hazardous substances, etc., are added in the future, costs for meeting these changes may have a negative effect on the Group’s businesses, achievements, or economic standing.
(9) Effect of Accidents, etc.Although the Group regularly inspects and checks all equipment to prevent accidents, it is not guaranteed that negative impacts from accidents, etc., can be completely prevented or alleviated. Those may have a negative effect on the Group’s businesses, achievements, or economic standing.
(10) OthersThe risk factors listed above do not cover all risks regarding the development of business and others. Also, other risks might develop and have a negative effect on the Group’s business, achievements, and economic standing.
→voltage reductions in power supplies caused by lightning strikes, etc. We are working to expand the market for this device, which is not only the smallest and lightest in the industry but also superior in terms of reducing environmental impact.
(4) Environmentally Friendly ProductsCompanies are required to manufacture environmentally-friendly products in order to protect the global environment and maintain sustainable development of society. To prevent environmental destruction, it is important not to use hazardous substances. It is necessary to comply with regulations on hazardous substances, as exemplified by the European End-of-Life Vehicle (ELV) Directive (2000/53/EC), the Restriction of Hazardous Substances (RoHS) Directive (2002/95/EC) which prohibits the use of hazardous substances with minor exceptions, and the Chinese version of RoHS (law concerning the prevention and control of pollution from the production of electronic and information products). Similar regulations have come into force in other countries as well, including the U.S. and South Korea. Nichicon currently provides the market with a group of eco-friendly products, the “Geo Cap®” series, which do not contain hazardous substances
and are in compliance with the RoHS Directive (2002/95/EC) and the aforementioned Chinese version of RoHS. Our environmentally-friendly aluminum electrolytic capacitors and electric double-layer capacitors use neither polyvinyl chloride (PVC), which has the risk of releasing dioxin when incinerated, nor any lead. Resin-molded chip tantalum electrolytic capacitors have not included lead since their development. As for conformal-coated tantalum electrolytic capacitors, the company switched to lead-free products in 2001. Our face-down electrode-type tantalum electrolytic capacitors use resin coating materials that do not contain bromine series flame-retardants. We are also making the switch to resin coating materials that do not contain bromine series flame-retardants for resin-molded and conformal-coated tantalum electrolytic capacitors. For plastic film capacitors, we offer a lineup of lead-free products including internal elements as standard products. Moreover, Nichicon will contribute to society through the development of momentary voltage sag compensators that employ electric double layer capacitors as a storage device and high-efficiency, energy-saving switching power supplies aimed at efficiently utilizing the energy consumed by electronic appliances to prevent global warming.
Business Risks and Other Risks

Operating income and income before income taxes and minority interestAs a result of the above performance, the current year’s operating income fell to 4,610 million yen (down 31.5% from the previous year) and the ratio of operating income to net sales was 3.9% (down 1.8 points from the previous year). On a regional basis, the higher sales costs driven by the surge in material prices put pressure on domestic operating income, which fell to 2,668 million yen (down 57.7% from the previous year), yet operating income in Asia amounted to 1,038 million yen (up 76.9% from the previous year) due to profit from increased production and the effects of cost reductions as a result of improved productivity, etc. Operating income in the Americas improved to 174 million yen from an operating deficit of 280 million yen in the previous year following an adjustment in prices and a reduction in sales costs, while operating income in Europe amounted to 400 million yen, which was ten times greater than the previous year due to a reduction in sales costs, etc. Within the category of other income and expenses, interest income and cash dividends increased by 103 million yen from the previous year. In addition, net foreign exchange loss increased by 2,019 million yen (the net amount against the foreign exchange gain in the previous year) and the net loss on sales or the disposal of property, plants and equipment decreased by 197 million yen from the previous year. As for the miscellaneous category, 400 million yen of realized gains on sales of investment securities, etc. was declared as non-operating profit, while 175 million yen of loss on the disposal of inventory was declared as non-operating expenses. Consequently, net other income decreased by 2,976 million yen from the previous year. As a result, compared to the previous year, the current year’s income before income taxes and minority interest decreased by 61.4% to 3,197 million yen.
Income taxesTaxable income declined due to a decrease in income before income taxes and minority interest, which resulted from decreased operating income and increased foreign exchange loss, etc. Consequently, current income taxes decreased to 1,469 million yen (down 57.8% from the previous year). The amount to be adjusted for deferred income taxes according to the tax effect accounting system was 249 million yen. The effective tax rate for the current year has increased to 53.8% from 47.9% in the previous year.
Minority interestMinority interest, deductible from income before income taxes and minority interest, was 201 million yen in the current year, while it was 80 million yen for the previous year. This was mainly due to the increase in the net income of consolidated subsidiaries corresponding to the interest held by minority shareholders.
SalesDue to the launch of new products in the market that match customer needs, including sophisticated, digital and environmentally-friendly products, as well as increases in manufacturing volume, our sales for the current year amounted to 119,567 million yen (up 0.7% from the previous year). Overseas sales accounted for 61.0% (72,979 million yen, down 0.7% from the previous year) of total sales, a drop of 0.9 points year-on-year. There were various factors behind this result, but the main factor was a drop in sales in the Americas, where sales fell to 9,776 million yen (down 13.5% from the previous year’s 11,297 million yen), while sales in the Asian and European regions increased to 55,956 million yen (up 0.8% from the previous year’s 55,485 million yen) and 7,247 million yen (up 7.8% from the previous year’s 6,722 million yen), respectively. With regard to sales according to sector, sales in the capacitors for electronics sector decreased to 89,069 million yen (down 1.5% from the previous year) due to slower performance of orders for information and communications-related products, although demand for digital home appliances and inverter-equipped products expanded. Regarding the circuit products sector, function modules experienced sluggish demand for information and communications-related products, although we have newly developed areas for products to be mounted in vehicles and for inverter-equipped products. In addition, sales growth of switching power supplies was slower in the fields of office appliances and amusement devices. As a result, overall sales decreased by 1.3% from the previous year to 17,970 million yen. Sales of capacitors for electric apparatus and power utilities amounted to 11,398 million yen (up 23.0% from the previous year), due to such factors as solid private capital investment and increased demand for hybrid cars and other vehicles.
Cost of sales and selling, general and administrative expensesThe cost of sales amounted to 101,676 million yen (up 3.2% from the previous year). This increase is mainly due to the effect of the rise in the price of crude oil, which in turn caused the prices of various materials to appreciate and also to the increase of depreciation cost, etc., in relation to the continuity of aggressive capital investment. Although we further adjusted prices and made every effort to improve efficiency, including continuous cost reduction through innovation of manufacturing technology and improved productivity, etc., the cost rate for sales settled at 85.0% (up 2.0 points from the previous year). Selling, general and administrative expenses amounted to 13,281 million yen (down 1.1% from the previous year). This was mainly due to the decrease in freight charges by 329 million yen from the previous year, while research and development expenses increased by 223 million yen from the previous year. Consequently, the administrative expense rate of sales settled at 11.1% (down 0.2 points from the previous year).
18 A n n u a l R e p o r t 2 0 0 8
Financial Review
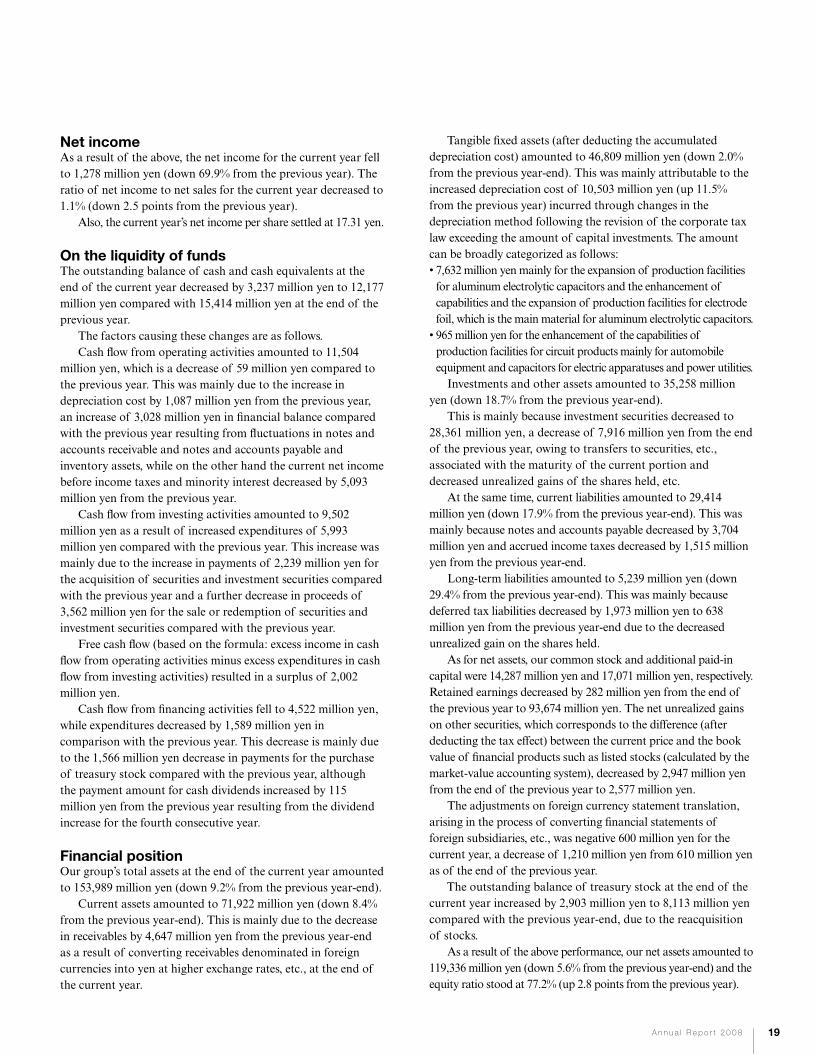
Net incomeAs a result of the above, the net income for the current year fell to 1,278 million yen (down 69.9% from the previous year). The ratio of net income to net sales for the current year decreased to 1.1% (down 2.5 points from the previous year). Also, the current year’s net income per share settled at 17.31 yen.
On the liquidity of fundsThe outstanding balance of cash and cash equivalents at the end of the current year decreased by 3,237 million yen to 12,177 million yen compared with 15,414 million yen at the end of the previous year. The factors causing these changes are as follows. Cash flow from operating activities amounted to 11,504 million yen, which is a decrease of 59 million yen compared to the previous year. This was mainly due to the increase in depreciation cost by 1,087 million yen from the previous year, an increase of 3,028 million yen in financial balance compared with the previous year resulting from fluctuations in notes and accounts receivable and notes and accounts payable and inventory assets, while on the other hand the current net income before income taxes and minority interest decreased by 5,093 million yen from the previous year. Cash flow from investing activities amounted to 9,502 million yen as a result of increased expenditures of 5,993 million yen compared with the previous year. This increase was mainly due to the increase in payments of 2,239 million yen for the acquisition of securities and investment securities compared with the previous year and a further decrease in proceeds of 3,562 million yen for the sale or redemption of securities and investment securities compared with the previous year. Free cash flow (based on the formula: excess income in cash flow from operating activities minus excess expenditures in cash flow from investing activities) resulted in a surplus of 2,002 million yen. Cash flow from financing activities fell to 4,522 million yen, while expenditures decreased by 1,589 million yen in comparison with the previous year. This decrease is mainly due to the 1,566 million yen decrease in payments for the purchase of treasury stock compared with the previous year, although the payment amount for cash dividends increased by 115 million yen from the previous year resulting from the dividend increase for the fourth consecutive year.
Financial positionOur group’s total assets at the end of the current year amounted to 153,989 million yen (down 9.2% from the previous year-end). Current assets amounted to 71,922 million yen (down 8.4% from the previous year-end). This is mainly due to the decrease in receivables by 4,647 million yen from the previous year-end as a result of converting receivables denominated in foreign currencies into yen at higher exchange rates, etc., at the end of the current year.
Tangible fixed assets (after deducting the accumulated depreciation cost) amounted to 46,809 million yen (down 2.0% from the previous year-end). This was mainly attributable to the increased depreciation cost of 10,503 million yen (up 11.5% from the previous year) incurred through changes in the depreciation method following the revision of the corporate tax law exceeding the amount of capital investments. The amount can be broadly categorized as follows:• 7,632 million yen mainly for the expansion of production facilities
for aluminum electrolytic capacitors and the enhancement of capabilities and the expansion of production facilities for electrode foil, which is the main material for aluminum electrolytic capacitors.
• 965 million yen for the enhancement of the capabilities of production facilities for circuit products mainly for automobile equipment and capacitors for electric apparatuses and power utilities.
Investments and other assets amounted to 35,258 million yen (down 18.7% from the previous year-end). This is mainly because investment securities decreased to 28,361 million yen, a decrease of 7,916 million yen from the end of the previous year, owing to transfers to securities, etc., associated with the maturity of the current portion and decreased unrealized gains of the shares held, etc. At the same time, current liabilities amounted to 29,414 million yen (down 17.9% from the previous year-end). This was mainly because notes and accounts payable decreased by 3,704 million yen and accrued income taxes decreased by 1,515 million yen from the previous year-end. Long-term liabilities amounted to 5,239 million yen (down 29.4% from the previous year-end). This was mainly because deferred tax liabilities decreased by 1,973 million yen to 638 million yen from the previous year-end due to the decreased unrealized gain on the shares held. As for net assets, our common stock and additional paid-in capital were 14,287 million yen and 17,071 million yen, respectively. Retained earnings decreased by 282 million yen from the end of the previous year to 93,674 million yen. The net unrealized gains on other securities, which corresponds to the difference (after deducting the tax effect) between the current price and the book value of financial products such as listed stocks (calculated by the market-value accounting system), decreased by 2,947 million yen from the end of the previous year to 2,577 million yen. The adjustments on foreign currency statement translation, arising in the process of converting financial statements of foreign subsidiaries, etc., was negative 600 million yen for the current year, a decrease of 1,210 million yen from 610 million yen as of the end of the previous year. The outstanding balance of treasury stock at the end of the current year increased by 2,903 million yen to 8,113 million yen compared with the previous year-end, due to the reacquisition of stocks. As a result of the above performance, our net assets amounted to 119,336 million yen (down 5.6% from the previous year-end) and the equity ratio stood at 77.2% (up 2.8 points from the previous year).
19A n n u a l R e p o r t 2 0 0 8
20 A n n u a l R e p o r t 2 0 0 8
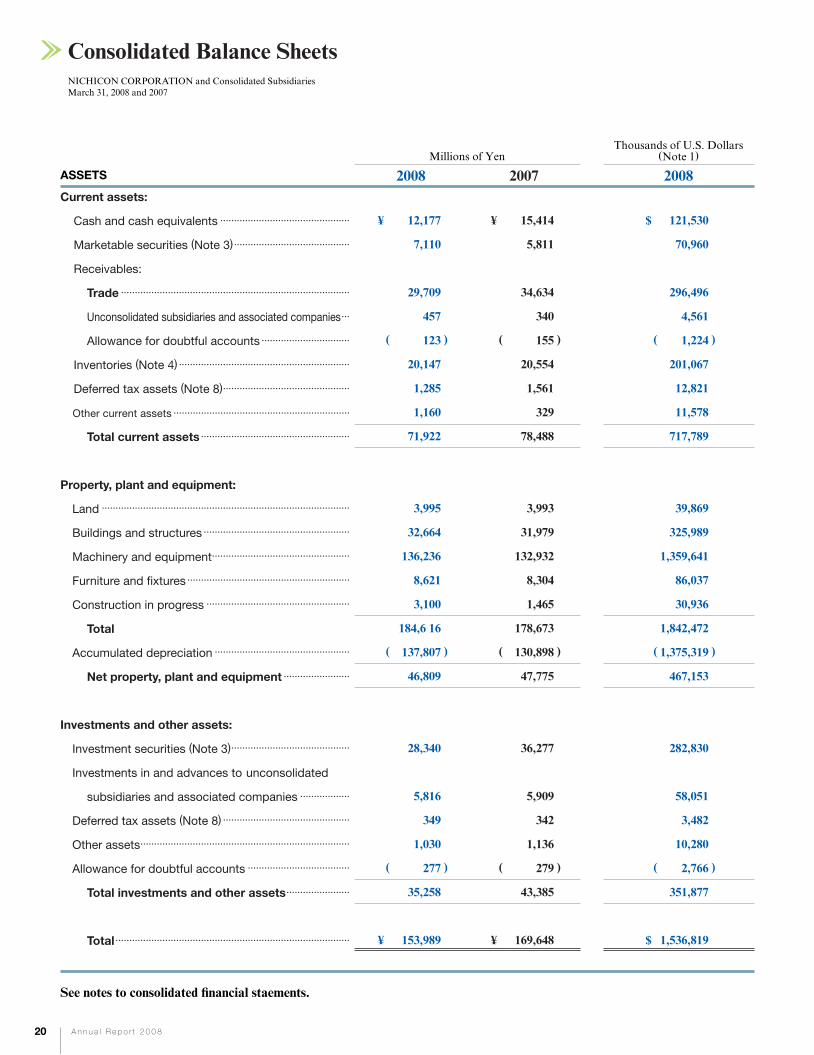
NICHICON CORPORATION and Consolidated SubsidiariesMarch 31, 2008 and 2007
Consolidated Balance Sheets
Millions of YenThousands of U.S. Dollars
(Note 1)
2008
( )
( )
( )
2007 2008Current assets:
Cash and cash equivalents・・・・・・・・・・・・・・・・・・・・・・・・・・・・・・・・・・・・・・・・・・・・・・・
Marketable securities (Note 3)・・・・・・・・・・・・・・・・・・・・・・・・・・・・・・・・・・・・・・・・・・
Receivables:
Trade・・・・・・・・・・・・・・・・・・・・・・・・・・・・・・・・・・・・・・・・・・・・・・・・・・・・・・・・・・・・・・・・・・・・・・・・・・・・・・・・・・・
Unconsolidated subsidiaries and associated companies・・・
Allowance for doubtful accounts・・・・・・・・・・・・・・・・・・・・・・・・・・・・・・・・
Inventories (Note 4)・・・・・・・・・・・・・・・・・・・・・・・・・・・・・・・・・・・・・・・・・・・・・・・・・・・・・・・・・・・・・・
Deferred tax assets (Note 8)・・・・・・・・・・・・・・・・・・・・・・・・・・・・・・・・・・・・・・・・・・・・・・
Other current assets・・・・・・・・・・・・・・・・・・・・・・・・・・・・・・・・・・・・・・・・・・・・・・・・・・・・・・・・・・・・・・・・
Total current assets・・・・・・・・・・・・・・・・・・・・・・・・・・・・・・・・・・・・・・・・・・・・・・・・・・・・・・
Property, plant and equipment:
Land・・・・・・・・・・・・・・・・・・・・・・・・・・・・・・・・・・・・・・・・・・・・・・・・・・・・・・・・・・・・・・・・・・・・・・・・・・・・・・・・・・・・・・・・・・
Buildings and structures・・・・・・・・・・・・・・・・・・・・・・・・・・・・・・・・・・・・・・・・・・・・・・・・・・・・・
Machinery and equipment・・・・・・・・・・・・・・・・・・・・・・・・・・・・・・・・・・・・・・・・・・・・・・・・・・
Furniture and fixtures・・・・・・・・・・・・・・・・・・・・・・・・・・・・・・・・・・・・・・・・・・・・・・・・・・・・・・・・・・・
Construction in progress・・・・・・・・・・・・・・・・・・・・・・・・・・・・・・・・・・・・・・・・・・・・・・・・・・・・
Total
Accumulated depreciation・・・・・・・・・・・・・・・・・・・・・・・・・・・・・・・・・・・・・・・・・・・・・・・・・
Net property, plant and equipment・・・・・・・・・・・・・・・・・・・・・・・・
Investments and other assets:
Investment securities (Note 3)・・・・・・・・・・・・・・・・・・・・・・・・・・・・・・・・・・・・・・・・・・・
Investments in and advances to unconsolidated
subsidiaries and associated companies・・・・・・・・・・・・・・・・・・
Deferred tax assets (Note 8)・・・・・・・・・・・・・・・・・・・・・・・・・・・・・・・・・・・・・・・・・・・・・・
Other assets・・・・・・・・・・・・・・・・・・・・・・・・・・・・・・・・・・・・・・・・・・・・・・・・・・・・・・・・・・・・・・・・・・・・・・・・・・・・
Allowance for doubtful accounts・・・・・・・・・・・・・・・・・・・・・・・・・・・・・・・・・・・・・
Total investments and other assets・・・・・・・・・・・・・・・・・・・・・・・
Total・・・・・・・・・・・・・・・・・・・・・・・・・・・・・・・・・・・・・・・・・・・・・・・・・・・・・・・・・・・・・・・・・・・・・・・・・・・・・・・・・・・・・
ASSETS
¥
¥
( )
( )
( )
$
$
121,530
70,960
296,496
4,561
1,224
201,067
12,821
11,578
717,789
39,869
325,989
1,359,641
86,037
30,936
1,842,472
1,375,319
467,153
282,830
58,051
3,482
10,280
2,766
351,877
1,536,819
See notes to consolidated financial staements.
12,177
7,110
29,709
457
123
20,147
1,285
1,160
71,922
3,995
32,664
136,236
8,621
3,100
184,6 16
137,807
46,809
28,340
5,816
349
1,030
277
35,258
153,989
( )
( )
( )
¥
¥
15,414
5,811
34,634
340
155
20,554
1,561
329
78,488
3,993
31,979
132,932
8,304
1,465
178,673
130,898
47,775
36,277
5,909
342
1,136
279
43,385
169,648
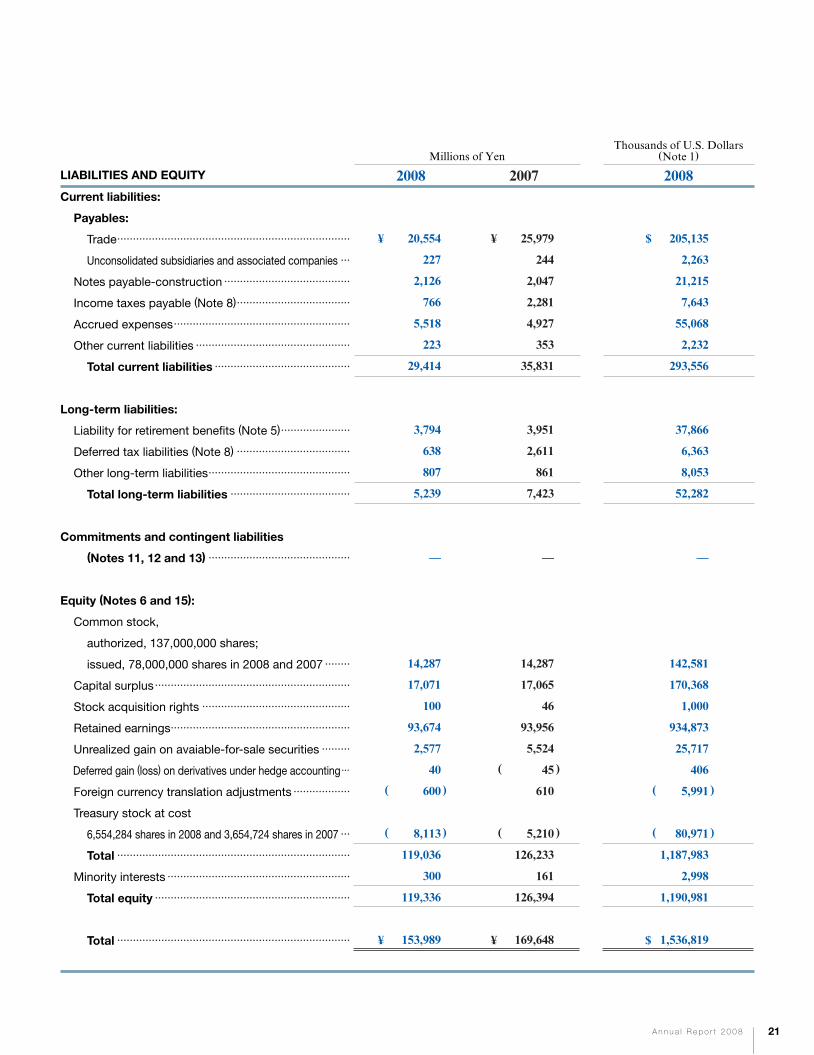
Current liabilities:
Payables:
Trade・・・・・・・・・・・・・・・・・・・・・・・・・・・・・・・・・・・・・・・・・・・・・・・・・・・・・・・・・・・・・・・・・・・・・・・・・・
Unconsolidated subsidiaries and associated companies・・・
Notes payable-construction・・・・・・・・・・・・・・・・・・・・・・・・・・・・・・・・・・・・・・・・
Income taxes payable (Note 8)・・・・・・・・・・・・・・・・・・・・・・・・・・・・・・・・・・・・
Accrued expenses・・・・・・・・・・・・・・・・・・・・・・・・・・・・・・・・・・・・・・・・・・・・・・・・・・・・・・・・
Other current liabilities・・・・・・・・・・・・・・・・・・・・・・・・・・・・・・・・・・・・・・・・・・・・・・・・・
Total current liabilities・・・・・・・・・・・・・・・・・・・・・・・・・・・・・・・・・・・・・・・・・・・
Long-term liabilities:
Liability for retirement benefits (Note 5)・・・・・・・・・・・・・・・・・・・・・・
Deferred tax liabilities (Note 8)・・・・・・・・・・・・・・・・・・・・・・・・・・・・・・・・・・・・
Other long-term liabilities・・・・・・・・・・・・・・・・・・・・・・・・・・・・・・・・・・・・・・・・・・・・・
Total long-term liabilities・・・・・・・・・・・・・・・・・・・・・・・・・・・・・・・・・・・・・・
Commitments and contingent liabilities
(Notes 11, 12 and 13)・・・・・・・・・・・・・・・・・・・・・・・・・・・・・・・・・・・・・・・・・・・・・
Equity (Notes 6 and 15):
Common stock,
authorized, 137,000,000 shares;
issued, 78,000,000 shares in 2008 and 2007・・・・・・・・
Capital surplus・・・・・・・・・・・・・・・・・・・・・・・・・・・・・・・・・・・・・・・・・・・・・・・・・・・・・・・・・・・・・・
Stock acquisition rights・・・・・・・・・・・・・・・・・・・・・・・・・・・・・・・・・・・・・・・・・・・・・・・
Retained earnings・・・・・・・・・・・・・・・・・・・・・・・・・・・・・・・・・・・・・・・・・・・・・・・・・・・・・・・・・
Unrealized gain on avaiable-for-sale securities・・・・・・・・・
Deferred gain (loss) on derivatives under hedge accounting・・・
Foreign currency translation adjustments・・・・・・・・・・・・・・・・・・
Treasury stock at cost
6,554,284 shares in 2008 and 3,654,724 shares in 2007・・・
Total・・・・・・・・・・・・・・・・・・・・・・・・・・・・・・・・・・・・・・・・・・・・・・・・・・・・・・・・・・・・・・・・・・・・・・・・・・
Minority interests・・・・・・・・・・・・・・・・・・・・・・・・・・・・・・・・・・・・・・・・・・・・・・・・・・・・・・・・・・
Total equity・・・・・・・・・・・・・・・・・・・・・・・・・・・・・・・・・・・・・・・・・・・・・・・・・・・・・・・・・・・・・・
Total・・・・・・・・・・・・・・・・・・・・・・・・・・・・・・・・・・・・・・・・・・・・・・・・・・・・・・・・・・・・・・・・・・・・・・・・・・
Millions of YenThousands of U.S. Dollars
(Note 1)
2008 2007 2008LIABILITIES AND EQUITY
¥ 20,554
227
2,126
766
5,518
223
29,414
3,794
638
807
5,239
—
14,287
17,071
100
93,674
2,577
40
600
8,113
119,036
300
119,336
153,989
¥ 25,979
244
2,047
2,281
4,927
353
35,831
3,951
2,611
861
7,423
—
14,287
17,065
46
93,956
5,524
45
610
5,210
126,233
161
126,394
169,648
$ 205,135
2,263
21,215
7,643
55,068
2,232
293,556
37,866
6,363
8,053
52,282
—
142,581
170,368
1,000
934,873
25,717
406
5,991
80,971
1,187,983
2,998
1,190,981
1,536,819
21A n n u a l R e p o r t 2 0 0 8
¥ $¥
( )
( )
( )
( )
( )
( )
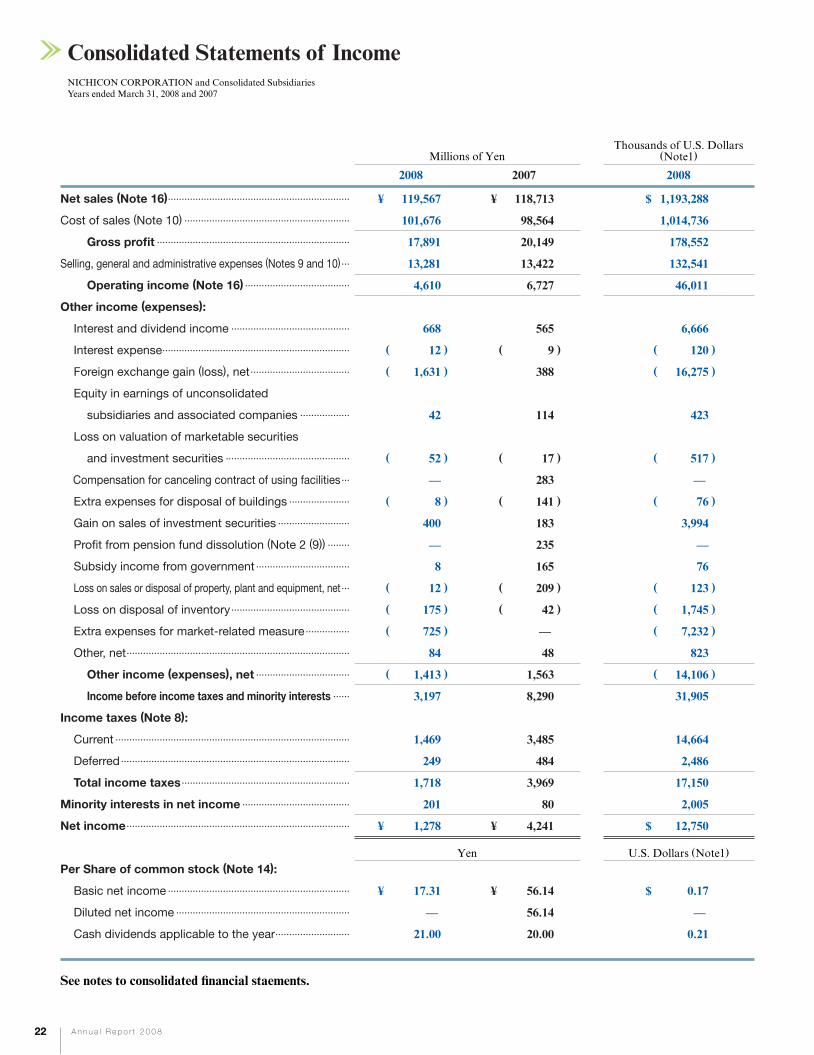
22 A n n u a l R e p o r t 2 0 0 8
Net sales (Note 16)・・・・・・・・・・・・・・・・・・・・・・・・・・・・・・・・・・・・・・・・・・・・・・・・・・・・・・・・・・・・・・・・・・
Cost of sales (Note 10)・・・・・・・・・・・・・・・・・・・・・・・・・・・・・・・・・・・・・・・・・・・・・・・・・・・・・・・・・・・・
Gross profit・・・・・・・・・・・・・・・・・・・・・・・・・・・・・・・・・・・・・・・・・・・・・・・・・・・・・・・・・・・・・・・・・・・・・・
Selling, general and administrative expenses (Notes 9 and 10)・・・
Operating income (Note 16)・・・・・・・・・・・・・・・・・・・・・・・・・・・・・・・・・・・・・・
Other income (expenses):
Interest and dividend income・・・・・・・・・・・・・・・・・・・・・・・・・・・・・・・・・・・・・・・・・・・
Interest expense・・・・・・・・・・・・・・・・・・・・・・・・・・・・・・・・・・・・・・・・・・・・・・・・・・・・・・・・・・・・・・・・・・・・
Foreign exchange gain (loss), net・・・・・・・・・・・・・・・・・・・・・・・・・・・・・・・・・・・・
Equity in earnings of unconsolidated
subsidiaries and associated companies・・・・・・・・・・・・・・・・・・
Loss on valuation of marketable securities
and investment securities・・・・・・・・・・・・・・・・・・・・・・・・・・・・・・・・・・・・・・・・・・・・・
Compensation for canceling contract of using facilities・・・
Extra expenses for disposal of buildings・・・・・・・・・・・・・・・・・・・・・・
Gain on sales of investment securities・・・・・・・・・・・・・・・・・・・・・・・・・・
Profit from pension fund dissolution (Note 2 (9))・・・・・・・・
Subsidy income from government・・・・・・・・・・・・・・・・・・・・・・・・・・・・・・・・・・
Loss on sales or disposal of property, plant and equipment, net・・・
Loss on disposal of inventory・・・・・・・・・・・・・・・・・・・・・・・・・・・・・・・・・・・・・・・・・・・
Extra expenses for market-related measure・・・・・・・・・・・・・・・・
Other, net・・・・・・・・・・・・・・・・・・・・・・・・・・・・・・・・・・・・・・・・・・・・・・・・・・・・・・・・・・・・・・・・・・・・・・・・・・・・・・・・・
Other income (expenses), net・・・・・・・・・・・・・・・・・・・・・・・・・・・・・・・・・・
Income before income taxes and minority interests・・・・・・
Income taxes (Note 8):
Current・・・・・・・・・・・・・・・・・・・・・・・・・・・・・・・・・・・・・・・・・・・・・・・・・・・・・・・・・・・・・・・・・・・・・・・・・・・・・・・・・・・・・
Deferred・・・・・・・・・・・・・・・・・・・・・・・・・・・・・・・・・・・・・・・・・・・・・・・・・・・・・・・・・・・・・・・・・・・・・・・・・・・・・・・・・・・
Total income taxes・・・・・・・・・・・・・・・・・・・・・・・・・・・・・・・・・・・・・・・・・・・・・・・・・・・・・・・・・・・・・
Minority interests in net income・・・・・・・・・・・・・・・・・・・・・・・・・・・・・・・・・・・・・・・
Net income・・・・・・・・・・・・・・・・・・・・・・・・・・・・・・・・・・・・・・・・・・・・・・・・・・・・・・・・・・・・・・・・・・・・・・・・・・・・・・・・・
Per Share of common stock (Note 14):
Basic net income・・・・・・・・・・・・・・・・・・・・・・・・・・・・・・・・・・・・・・・・・・・・・・・・・・・・・・・・・・・・・・・・・・
Diluted net income・・・・・・・・・・・・・・・・・・・・・・・・・・・・・・・・・・・・・・・・・・・・・・・・・・・・・・・・・・・・・・・
Cash dividends applicable to the year・・・・・・・・・・・・・・・・・・・・・・・・・・・
Yen U.S. Dollars (Note1)
2008
( )
( )
( )
( )
( )
( )
( )
( )
2007 2008
¥
¥
¥
119,567
101,676
17,891
13,281
4,610
668
12
1,631
42
52
—
8
400
—
8
12
175
725
84
1,413
3,197
1,469
249
1,718
201
1,278
17.31
—
21.00
( )
( )
( )
( )
( )
¥
¥
¥
118,713
98,564
20,149
13,422
6,727
565
9
388
114
17
283
141
183
235
165
209
42
—
48
1,563
8,290
3,485
484
3,969
80
4,241
56.14
56.14
20.00
( )
( )
( )
( )
( )
( )
( )
( )
$
$
$
1,193,288
1,014,736
178,552
132,541
46,011
6,666
120
16,275
423
517
—
76
3,994
—
76
123
1,745
7,232
823
14,106
31,905
14,664
2,486
17,150
2,005
12,750
0.17
—
0.21
See notes to consolidated financial staements.
NICHICON CORPORATION and Consolidated SubsidiariesYears ended March 31, 2008 and 2007
Consolidated Statements of Income
Millions of Yen Thousands of U.S. Dollars
(Note1)
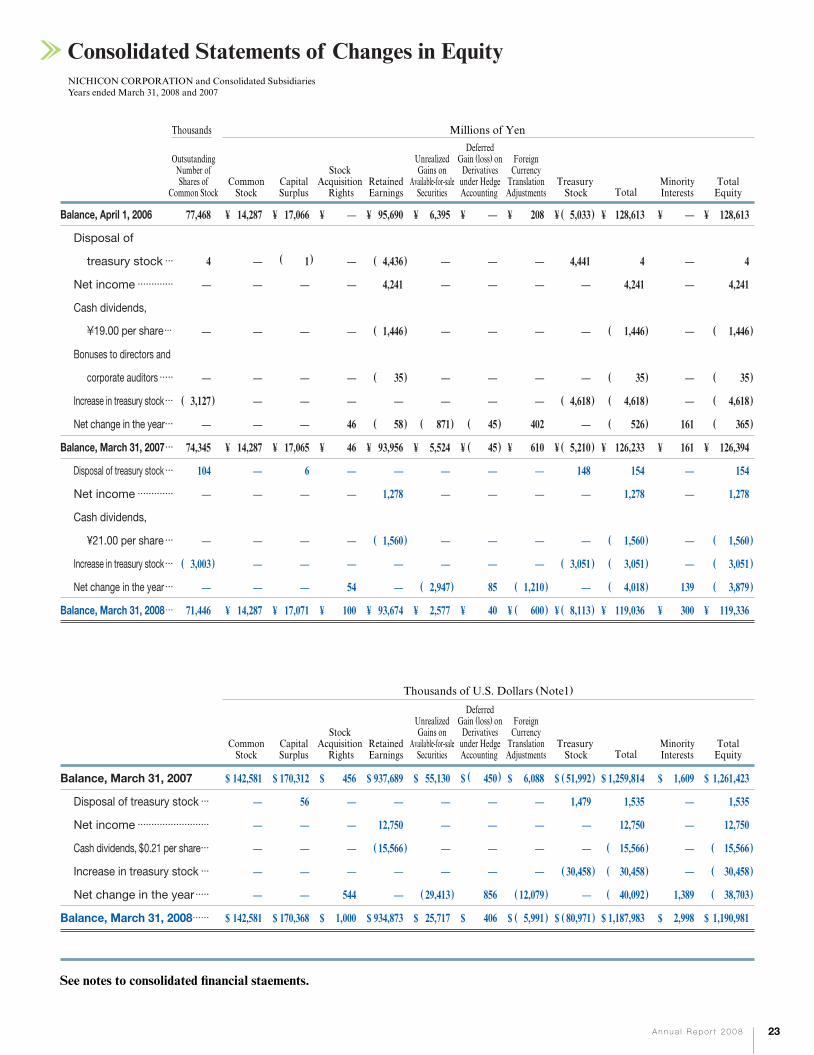
( ) ( )
( )
( )
( )
( )
( )
( )
( )
( ) ( )
( )
( )
( )
( )
( )
( )
( )
( )
( )
( )
( )
See notes to consolidated financial staements.
Millions of YenThousands
Balance, April 1, 2006
Disposal of
treasury stock・・・
Net income・・・・・・・・・・・・・
Cash dividends,
¥19.00 per share・・・
Bonuses to directors and
corporate auditors・・・・・
Increase in treasury stock・・・
Net change in the year・・・
Balance, March 31, 2007・・・
Disposal of treasury stock・・・
Net income・・・・・・・・・・・・・
Cash dividends,
¥21.00 per share・・・
Increase in treasury stock・・・
Net change in the year・・・
Balance, March 31, 2008・・・
( )
( )
77,468
4
—
—
—
3,127
—
74,345
104
—
—
3,003
—
71,446
Balance, March 31, 2007
Disposal of treasury stock・・・
Net income・・・・・・・・・・・・・・・・・・・・・・・・・・
Cash dividends, $0.21 per share・・・
Increase in treasury stock・・・
Net change in the year・・・・・
Balance, March 31, 2008・・・・・・
142,581
—
—
—
—
—
142,581
170,312
56
—
—
—
—
170,368
456
—
—
—
—
544
1,000
937,689
—
12,750
15,566
—
—
934,873
55,130
—
—
—
—
29,413
25,717
450
—
—
—
—
856
406
6,088
—
—
—
—
12,079
5,991
51,992
1,479
—
—
30,458
—
80,971
1,259,814
1,535
12,750
15,566
30,458
40,092
1,187,983
1,609
—
—
—
—
1,389
2,998
1,261,423
1,535
12,750
15,566
30,458
38,703
1,190,981
23A n n u a l R e p o r t 2 0 0 8
$
$
¥
¥
¥
14,287
—
—
—
—
—
—
14,287
—
—
—
—
—
14,287
$
$
¥
¥
¥
17,066
1
—
—
—
—
—
17,065
6
—
—
—
—
17,071
$
$
¥
¥
¥
—
—
—
—
—
—
46
46
—
—
—
—
54
100
$
$
¥
¥
¥
—
—
—
—
—
—
161
161
—
—
—
—
139
300
$
$
¥
¥
¥
—
—
—
—
—
—
45
45
—
—
—
—
85
40
( )
( )
$
$
¥
¥
¥
208
—
—
—
—
—
402
610
—
—
—
—
1,210
600
( )
( )
$
$
¥
¥
¥
6,395
—
—
—
—
—
871
5,524
—
—
—
—
2,947
2,577
( )
( )
( )
( )
( )
$
$
¥
¥
¥
5,033
4,441
—
—
—
4,618
—
5,210
148
—
—
3,051
—
8,113
( )
( )
( )
( )
( )
( )
( )
( )
( )
( )
( )
( )
( )
( )
$
$
¥
¥
¥
128,613
4
4,241
1,446
35
4,618
526
126,233
154
1,278
1,560
3,051
4,018
119,036
$
$
¥
¥
¥
128,613
4
4,241
1,446
35
4,618
365
126,394
154
1,278
1,560
3,051
3,879
119,336
$
$
¥
¥
¥
95,690
4,436
4,241
1,446
35
—
58
93,956
—
1,278
1,560
—
—
93,674
NICHICON CORPORATION and Consolidated SubsidiariesYears ended March 31, 2008 and 2007
Consolidated Statements of Changes in Equity
OutsutandingNumber ofShares of
Common StockCommon
StockCapitalSurplus
StockAcquisition
RightsRetainedEarnings
UnrealizedGains on
Available-for-saleSecurities
DeferredGain (loss) on
Derivativesunder HedgeAccounting
ForeignCurrency
TranslationAdjustments
TreasuryStock Total
MinorityInterests
TotalEquity
Thousands of U.S. Dollars (Note1)
CommonStock
CapitalSurplus
StockAcquisition
RightsRetainedEarnings
UnrealizedGains on
Available-for-saleSecurities
DeferredGain (loss) on
Derivativesunder HedgeAccounting
ForeignCurrency
TranslationAdjustments
TreasuryStock Total
MinorityInterests
TotalEquity
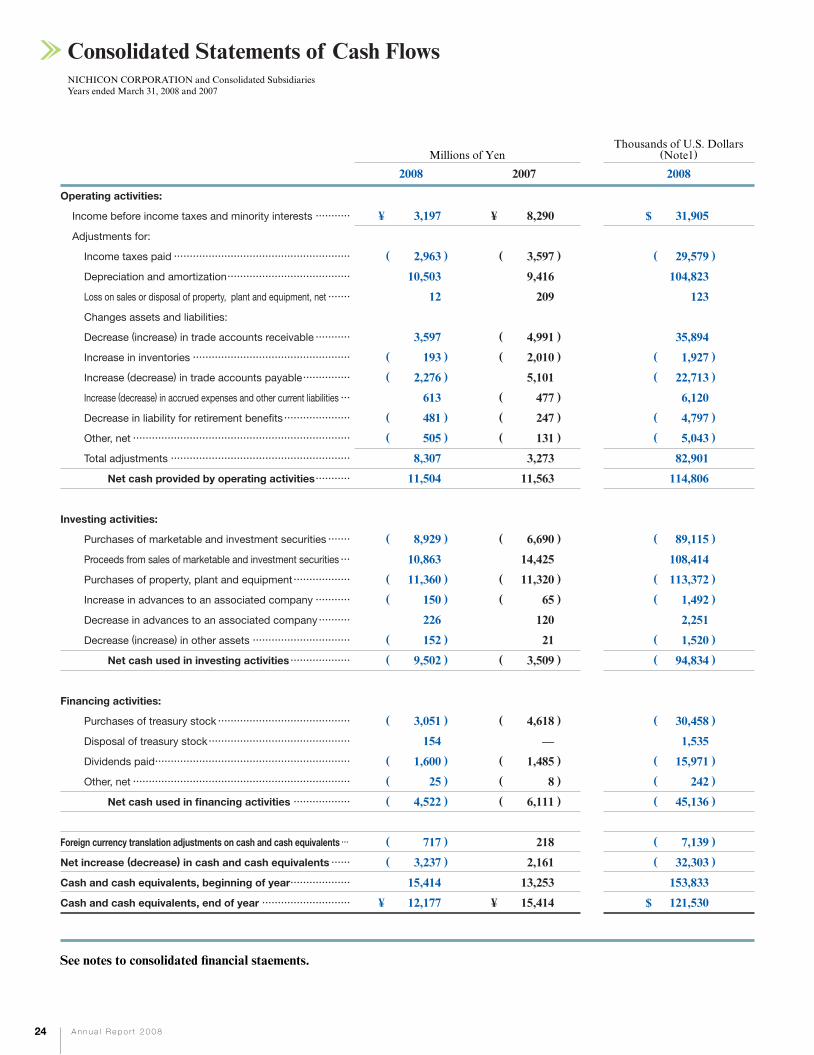
Millions of Yen Thousands of U.S. Dollars
(Note1)
2008
( )
( )
( )
( )
( )
( )
( )
( )
( )
( )
( )
( )
( )
( )
( )
( )
2007 2008
Operating activities:
Income before income taxes and minority interests・・・・・・・・・・・
Adjustments for:
Income taxes paid・・・・・・・・・・・・・・・・・・・・・・・・・・・・・・・・・・・・・・・・・・・・・・・・・・・・・・・・
Depreciation and amortization・・・・・・・・・・・・・・・・・・・・・・・・・・・・・・・・・・・・・・・
Loss on sales or disposal of property, plant and equipment, net・・・・・・・
Changes assets and liabilities:
Decrease (increase) in trade accounts receivable・・・・・・・・・・・
Increase in inventories・・・・・・・・・・・・・・・・・・・・・・・・・・・・・・・・・・・・・・・・・・・・・・・・・・
Increase (decrease) in trade accounts payable・・・・・・・・・・・・・・・
Increase (decrease) in accrued expenses and other current liabilities・・・
Decrease in liability for retirement benefits・・・・・・・・・・・・・・・・・・・・・
Other, net・・・・・・・・・・・・・・・・・・・・・・・・・・・・・・・・・・・・・・・・・・・・・・・・・・・・・・・・・・・・・・・・・・・・・
Total adjustments・・・・・・・・・・・・・・・・・・・・・・・・・・・・・・・・・・・・・・・・・・・・・・・・・・・・・・・・・
Net cash provided by operating activities・・・・・・・・・・・
Investing activities:
Purchases of marketable and investment securities・・・・・・・
Proceeds from sales of marketable and investment securities・・・
Purchases of property, plant and equipment・・・・・・・・・・・・・・・・・・
Increase in advances to an associated company・・・・・・・・・・・
Decrease in advances to an associated company・・・・・・・・・・
Decrease (increase) in other assets・・・・・・・・・・・・・・・・・・・・・・・・・・・・・・・
Net cash used in investing activities・・・・・・・・・・・・・・・・・・・
Financing activities:
Purchases of treasury stock・・・・・・・・・・・・・・・・・・・・・・・・・・・・・・・・・・・・・・・・・・
Disposal of treasury stock・・・・・・・・・・・・・・・・・・・・・・・・・・・・・・・・・・・・・・・・・・・・・
Dividends paid・・・・・・・・・・・・・・・・・・・・・・・・・・・・・・・・・・・・・・・・・・・・・・・・・・・・・・・・・・・・・・
Other, net・・・・・・・・・・・・・・・・・・・・・・・・・・・・・・・・・・・・・・・・・・・・・・・・・・・・・・・・・・・・・・・・・・・・・
Net cash used in financing activities・・・・・・・・・・・・・・・・・・
Foreign currency translation adjustments on cash and cash equivalents・・・
Net increase (decrease) in cash and cash equivalents・・・・・・
Cash and cash equivalents, beginning of year・・・・・・・・・・・・・・・・・・・
Cash and cash equivalents, end of year・・・・・・・・・・・・・・・・・・・・・・・・・・・・
3,197
2,963
10,503
12
3,597
193
2,276
613
481
505
8,307
11,504
8,929
10,863
11,360
150
226
152
9,502
3,051
154
1,600
25
4,522
717
3,237
15,414
12,177
( )
( )
( )
( )
( )
( )
( )
( )
( )
( )
( )
( )
( )
( )
¥
¥
¥
¥
8,290
3,597
9,416
209
4,991
2,010
5,101
477
247
131
3,273
11,563
6,690
14,425
11,320
65
120
21
3,509
4,618
—
1,485
8
6,111
218
2,161
13,253
15,414
( )
( )
( )
( )
( )
( )
( )
( )
( )
( )
( )
( )
( )
( )
( )
( )
$
$
31,905
29,579
104,823
123
35,894
1,927
22,713
6,120
4,797
5,043
82,901
114,806
89,115
108,414
113,372
1,492
2,251
1,520
94,834
30,458
1,535
15,971
242
45,136
7,139
32,303
153,833
121,530
See notes to consolidated financial staements.
24 A n n u a l R e p o r t 2 0 0 8
NICHICON CORPORATION and Consolidated SubsidiariesYears ended March 31, 2008 and 2007
Consolidated Statements of Cash Flows
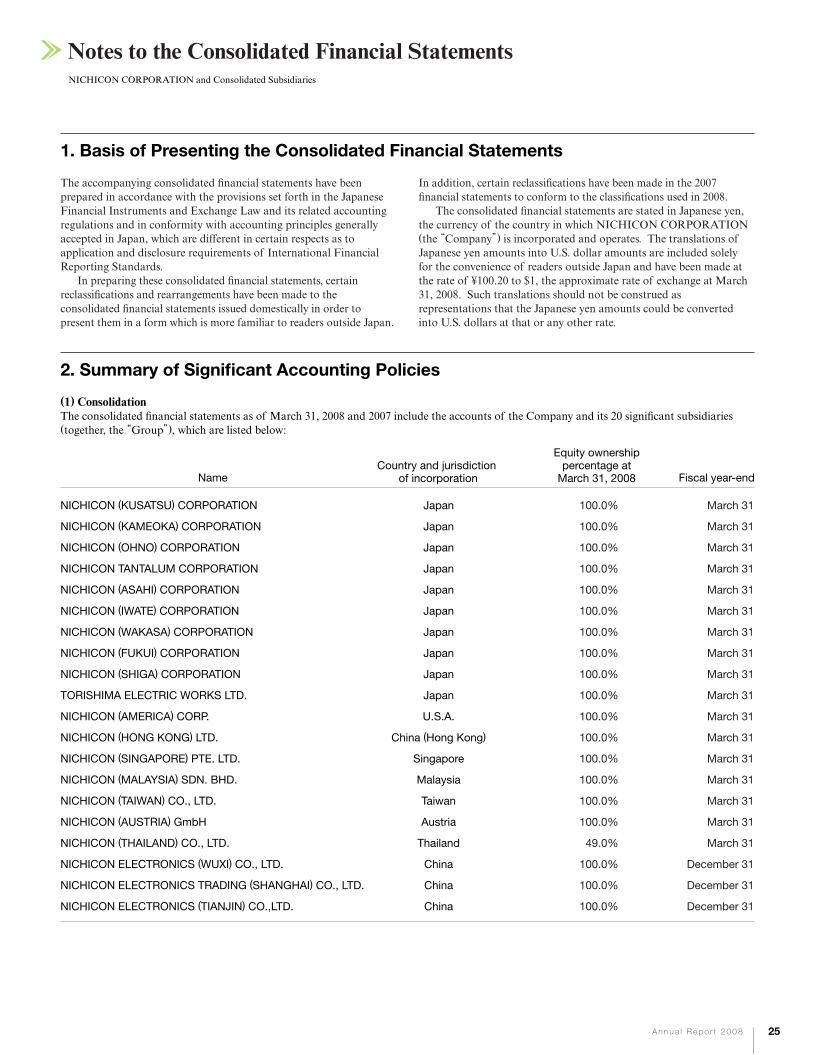
The accompanying consolidated financial statements have been prepared in accordance with the provisions set forth in the Japanese Financial Instruments and Exchange Law and its related accounting regulations and in conformity with accounting principles generally accepted in Japan, which are different in certain respects as to application and disclosure requirements of International Financial Reporting Standards. In preparing these consolidated financial statements, certain reclassifications and rearrangements have been made to the consolidated financial statements issued domestically in order to present them in a form which is more familiar to readers outside Japan.
In addition, certain reclassifications have been made in the 2007 financial statements to conform to the classifications used in 2008. The consolidated financial statements are stated in Japanese yen, the currency of the country in which NICHICON CORPORATION (the “Company”) is incorporated and operates. The translations of Japanese yen amounts into U.S. dollar amounts are included solely for the convenience of readers outside Japan and have been made at the rate of ¥100.20 to $1, the approximate rate of exchange at March 31, 2008. Such translations should not be construed as representations that the Japanese yen amounts could be converted into U.S. dollars at that or any other rate.
1. Basis of Presenting the Consolidated Financial Statements
(1) ConsolidationThe consolidated financial statements as of March 31, 2008 and 2007 include the accounts of the Company and its 20 significant subsidiaries (together, the “Group”), which are listed below:
2. Summary of Significant Accounting Policies
NICHICON (KUSATSU) CORPORATION
NICHICON (KAMEOKA) CORPORATION
NICHICON (OHNO) CORPORATION
NICHICON TANTALUM CORPORATION
NICHICON (ASAHI) CORPORATION
NICHICON (IWATE) CORPORATION
NICHICON (WAKASA) CORPORATION
NICHICON (FUKUI) CORPORATION
NICHICON (SHIGA) CORPORATION
TORISHIMA ELECTRIC WORKS LTD.
NICHICON (AMERICA) CORP.
NICHICON (HONG KONG) LTD.
NICHICON (SINGAPORE) PTE. LTD.
NICHICON (MALAYSIA) SDN. BHD.
NICHICON (TAIWAN) CO., LTD.
NICHICON (AUSTRIA) GmbH
NICHICON (THAILAND) CO., LTD.
NICHICON ELECTRONICS (WUXI) CO., LTD.
NICHICON ELECTRONICS TRADING (SHANGHAI) CO., LTD.
NICHICON ELECTRONICS (TIANJIN) CO.,LTD.
100.0%
100.0%
100.0%
100.0%
100.0%
100.0%
100.0%
100.0%
100.0%
100.0%
100.0%
100.0%
100.0%
100.0%
100.0%
100.0%
49.0%
100.0%
100.0%
100.0%
NameCountry and jurisdiction
of incorporation
Equity ownership percentage at March 31, 2008 Fiscal year-end
25A n n u a l R e p o r t 2 0 0 8
NICHICON CORPORATION and Consolidated Subsidiaries
Notes to the Consolidated Financial Statements
Japan
Japan
Japan
Japan
Japan
Japan
Japan
Japan
Japan
Japan
U.S.A.
China (Hong Kong)
Singapore
Malaysia
Taiwan
Austria
Thailand
China
China
China
March 31
March 31
March 31
March 31
March 31
March 31
March 31
March 31
March 31
March 31
March 31
March 31
March 31
March 31
March 31
March 31
March 31
December 31
December 31
December 31

26 A n n u a l R e p o r t 2 0 0 8
Under the control or influence concept, those companies in which the Company, directly or indirectly, is able to exercise control over operations are fully consolidated, and those companies over which the Group has the ability to exercise significant influence are accounted for by the equity method. Investments in one associated company are accounted for by the equity method. Investments in six (none in 2007) unconsolidated subsidiaries and three (nine in 2007) associated companies are stated at cost. If the equity method of accounting had been applied to the investments in these companies, the effect on the accompanying consolidated financial statements would not be material. All significant intercompany balances and transactions have been eliminated in consolidation. All material unrealized profit included in assets resulting from transactions within the Group is eliminated.
(2) Cash EquivalentsCash and cash equivalents are composed of cash in hand, bank deposits that are able to be withdrawn on demand and highly liquid time deposits with an insignificant risk of changes in value and which have maturities of three months or less when purchased.
(3) InventoriesFinished products and work in process are principally valued at cost determined by the average method. Other inventories are principally valued at cost determined by the moving-average method.
(4) Allowance for Doubtful AccountsThe allowance for doubtful accounts is stated in amounts considered to be appropriate based on the companies’ past credit loss experience and an evaluation of potential losses in the receivables outstanding.
(5) Marketable and Investment SecuritiesMarketable and investment securities are classified and accounted for, depending on management’s intent, as follows:
i) Held-to-maturity debt securities, which are expected to be held to maturity with the positive intent and ability to hold to maturity are reported at amortized cost.
ii) Available-for-sale securities, which are not classified as the aforementioned securities, are reported at fair value, with unrealized gains and losses, net of applicable taxes, reported in a separate component of equity.
Non-marketable available-for-sale securities are stated at cost determined by the moving-average method. For other than temporary declines in fair value, investment securities are reduced to net realizable value by a charge to income.
(6) Property, Plant and EquipmentProperty, plant and equipment are stated at cost. Depreciation of property, plant and equipment of the Company and its consolidated domestic subsidiaries is computed substantially by the declining-balance method, while the straight-line method is applied to buildings acquired after April 1, 1998. The range of useful lives is from 7 to 50 years for buildings and structures, and from 4 to 11 years for machinery and equipment. Depreciation of consolidated foreign subsidiaries is computed principally by the straight-line method. Property, plant and equipment acquired on and after April 1, 2007 are depreciated by the declining-balance method in accordance with the revised corporate tax law, which is effective for fiscal years beginning on and after April 1,2007. The effect of this treatment was to decrease operating income, income before income taxes and minority interests for the year ended March 31, 2008 by ¥282 million ($2,818 thousand). Property, plant and equipment had been depreciated up to 95%
of acquisition cost with 5% of residual value carried until previous fiscal years. However, such 5% portion of property, plant and equipment is now being systematically amortized over 5 years starting in the following year in which the carrying value of property, plant and equipment reaches 5% of the acquisition cost in accordance with the revised corporate tax law. The effect of this treatment was to decrease operating income, income before income taxes and minority interests for the year ended March 31, 2008 by ¥722 million ($7,204 thousand). Under certain conditions such as exchanges of fixed assets of similar kinds and sales and purchases resulting from expropriation and acquisitions made with the benefit of a government subsidy, Japanese tax laws permit companies to defer the profit arising from such transactions by reducing the cost of the assets acquired or by providing a special reserve in shareholders’ equity. The amount of deducted acquisition cost of property, plant and equipment as of March 31, 2008 and 2007 was ¥3,639 million ($36,320 thousand).
(7) Capitalized Computer Software CostsCapitalized computer software costs comprise costs of software used in the Group business. Amortization of capitalized computer software costs, which are included in “Other” in investments and other assets, is computed using the straight-line method over 5 years, the estimated useful life of the assets.
(8) Long-lived assetsThe Group reviews its long-lived assets for impairment whenever events or changes in circumstance indicate the carrying amount of an asset or asset group may not be recoverable. An impairment loss would be recognized if the carrying amount of an asset or asset group exceeds the sum of the undiscounted future cash flows expected to result from the continued use and eventual disposition of the asset or asset group. The impairment loss would be measured as the amount by which the carrying amount of the asset exceeds its recoverable amount, which is the higher of the discounted cash flows from the continued use and eventual disposition of the asset or the net selling price at disposition.
(9) Retirement and Pension PlansUnder the terms of the Company’s retirement plan; employees of the Company with more than 3 years of service are generally entitled to receive lump-sum payments at the time of retirement. The amount of the retirement benefit is, in general, determined based on the length of service, the cause of retirement, and the remuneration at the time of retirement. The Company and its consolidated domestic subsidiaries have a tax-qualified pension plan. The amount of severance indemnities to be paid by the Company and its domestic subsidiaries is reduced by the benefits payable under these pension plans. Certain overseas-consolidated subsidiaries have defined contribution pension plans. The amount of accrued severance indemnities for employees was provided based on the amount of projected benefit obligations minus pension plan assets at fair value at the end of the fiscal year. Effective June 28, 2007, the Company terminated its unfunded retirement allowance plan for all directors and corporate auditors. The outstanding balance of retirement allowances for directors and corporate auditors as of June 28, 2007 was reclassified to long-term liabilities in the year ended March 31, 2008. The Company obtained authorization for dissolution of the corporate pension fund from the Minister of Health, Labour and Welfare on March 31, 2007, and dissolved the corporate pension fund. Accordingly, the Company shifted from the defined benefit
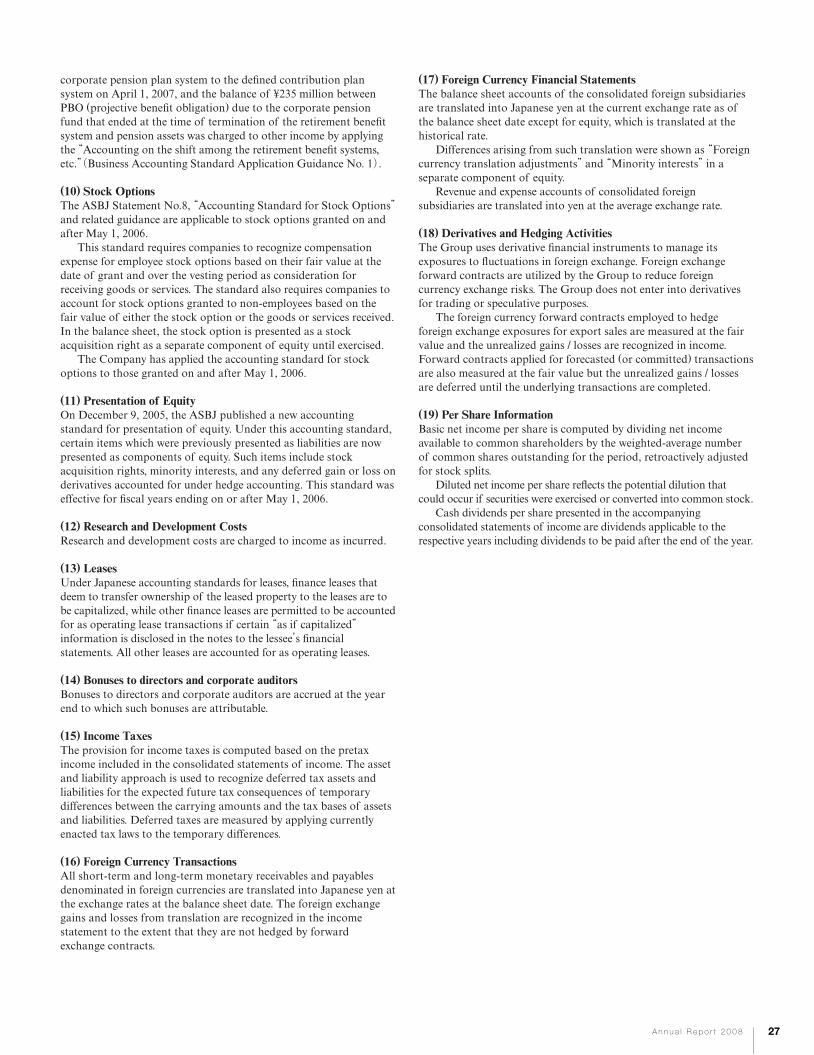
27A n n u a l R e p o r t 2 0 0 8
corporate pension plan system to the defined contribution plan system on April 1, 2007, and the balance of ¥235 million between PBO (projective benefit obligation) due to the corporate pension fund that ended at the time of termination of the retirement benefit system and pension assets was charged to other income by applying the “Accounting on the shift among the retirement benefit systems, etc.”(Business Accounting Standard Application Guidance No. 1).
(10) Stock OptionsThe ASBJ Statement No.8, “Accounting Standard for Stock Options” and related guidance are applicable to stock options granted on and after May 1, 2006. This standard requires companies to recognize compensation expense for employee stock options based on their fair value at the date of grant and over the vesting period as consideration for receiving goods or services. The standard also requires companies to account for stock options granted to non-employees based on the fair value of either the stock option or the goods or services received. In the balance sheet, the stock option is presented as a stock acquisition right as a separate component of equity until exercised. The Company has applied the accounting standard for stock options to those granted on and after May 1, 2006.
(11) Presentation of EquityOn December 9, 2005, the ASBJ published a new accounting standard for presentation of equity. Under this accounting standard, certain items which were previously presented as liabilities are now presented as components of equity. Such items include stock acquisition rights, minority interests, and any deferred gain or loss on derivatives accounted for under hedge accounting. This standard was effective for fiscal years ending on or after May 1, 2006.
(12) Research and Development CostsResearch and development costs are charged to income as incurred.
(13) LeasesUnder Japanese accounting standards for leases, finance leases that deem to transfer ownership of the leased property to the leases are to be capitalized, while other finance leases are permitted to be accounted for as operating lease transactions if certain “as if capitalized” information is disclosed in the notes to the lessee’s financial statements. All other leases are accounted for as operating leases.
(14) Bonuses to directors and corporate auditorsBonuses to directors and corporate auditors are accrued at the year end to which such bonuses are attributable.
(15) Income TaxesThe provision for income taxes is computed based on the pretax income included in the consolidated statements of income. The asset and liability approach is used to recognize deferred tax assets and liabilities for the expected future tax consequences of temporary differences between the carrying amounts and the tax bases of assets and liabilities. Deferred taxes are measured by applying currently enacted tax laws to the temporary differences.
(16) Foreign Currency TransactionsAll short-term and long-term monetary receivables and payables denominated in foreign currencies are translated into Japanese yen at the exchange rates at the balance sheet date. The foreign exchange gains and losses from translation are recognized in the income statement to the extent that they are not hedged by forward exchange contracts.
(17) Foreign Currency Financial StatementsThe balance sheet accounts of the consolidated foreign subsidiaries are translated into Japanese yen at the current exchange rate as of the balance sheet date except for equity, which is translated at the historical rate. Differences arising from such translation were shown as “Foreign currency translation adjustments” and “Minority interests” in a separate component of equity. Revenue and expense accounts of consolidated foreign subsidiaries are translated into yen at the average exchange rate.
(18) Derivatives and Hedging ActivitiesThe Group uses derivative financial instruments to manage its exposures to fluctuations in foreign exchange. Foreign exchange forward contracts are utilized by the Group to reduce foreign currency exchange risks. The Group does not enter into derivatives for trading or speculative purposes. The foreign currency forward contracts employed to hedge foreign exchange exposures for export sales are measured at the fair value and the unrealized gains / losses are recognized in income. Forward contracts applied for forecasted (or committed) transactions are also measured at the fair value but the unrealized gains / losses are deferred until the underlying transactions are completed.
(19) Per Share InformationBasic net income per share is computed by dividing net income available to common shareholders by the weighted-average number of common shares outstanding for the period, retroactively adjusted for stock splits. Diluted net income per share reflects the potential dilution that could occur if securities were exercised or converted into common stock. Cash dividends per share presented in the accompanying consolidated statements of income are dividends applicable to the respective years including dividends to be paid after the end of the year.

Millions of Yen
Securities classified as:Available-for-sale equity securities・・・・・・・・・・・・・・・・・・・・・・・・・・・・・・・・・・・Held-to-maturity debt securities・・・・・・・・・・・・・・・・・・・・・・・・・・・・・・・・・・・・・・・・
¥ 8,52122,383
¥ 12,90322,355
¥ 1,19064
¥ 5,57236
The carrying amounts and aggregate fair values of marketable and investment securities at March 31, 2008 and 2007 were as follows:
Cost Unrealized Gains Unrealized Losses Fair Value
Available-for-sale securities whose fair value was not readily determinable as of March 31, 2008 and 2007 were as follows:
Carrying amount
$ 85,043223,381
$ 128,771223,107
$ 11,885637
$ 55,613364
Millions of Yen Thousands of U.S. Dollars
2008 2007 2008
Current:Government and corporate bonds・・・・・・・・・・・・・・・・・・・・・・・・・・・・・・・・・・・Total・・・・・・・・・・・・・・・・・・・・・・・・・・・・・・・・・・・・・・・・・・・・・・・・・・・・・・・・・・・・・・・・・・・・・・・・・・・・・・・・・・・・・・・・・・・・・・・
Non-current:Marketable equity securities・・・・・・・・・・・・・・・・・・・・・・・・・・・・・・・・・・・・・・・・・・・・・・・Government and corporate bonds・・・・・・・・・・・・・・・・・・・・・・・・・・・・・・・・・・・Total・・・・・・・・・・・・・・・・・・・・・・・・・・・・・・・・・・・・・・・・・・・・・・・・・・・・・・・・・・・・・・・・・・・・・・・・・・・・・・・・・・・・・・・・・・・・・・・
¥¥
¥
¥
7,1107,110
13,06715,27328,340
¥¥
¥
¥
5,8115,811
16,52719,75036,277
$$
$
$
70,96070,960
130,400152,430282,830
Marketable and investment securities as of March 31, 2008 and 2007 consisted of the following:
Proceeds from sales of available-for-sale securities for the years ended March 31, 2008 and 2007 were ¥1,262 million ($12,603 thousand) and ¥361 million, respectively. Gross realized gains on these sales,
computed on the moving average cost basis, were ¥400 million ($3,994thousand) and ¥183 million for the year ended March 31, 2008 and 2007, respectively.
3. Marketable And Investment Securities
28 A n n u a l R e p o r t 2 0 0 8
Millions of Yen Thousands of U.S. Dollars
2008 2007 2008
Available-for-sale:Equity securities・・・・・・・・・・・・・・・・・・・・・・・・・・・・・・・・・・・・・・・・・・・・・・・・・・・・・・・・・・・・・・・・・・・・・・・ ¥ 164 ¥ 918 $ 1,629
March 31, 2008
Millions of Yen
Securities classified as:Available-for-sale equity securities・・・・・・・・・・・・・・・・・・・・・・・・・・・・・・・・・・・Held-to-maturity debt securities・・・・・・・・・・・・・・・・・・・・・・・・・・・・・・・・・・・・・・・・
¥ 6,25625,562
¥ 15,60925,417
¥ 235149
¥ 9,5884
Cost Unrealized Gains Unrealized Losses Fair ValueMarch 31, 2007
Thousands of U.S. Dollars
Securities classified as:Available-for-sale equity securities・・・・・・・・・・・・・・・・・・・・・・・・・・・・・・・・・・・Held-to-maturity debt securities・・・・・・・・・・・・・・・・・・・・・・・・・・・・・・・・・・・・・・・・
Cost Unrealized Gains Unrealized Losses Fair ValueMarch 31, 2008
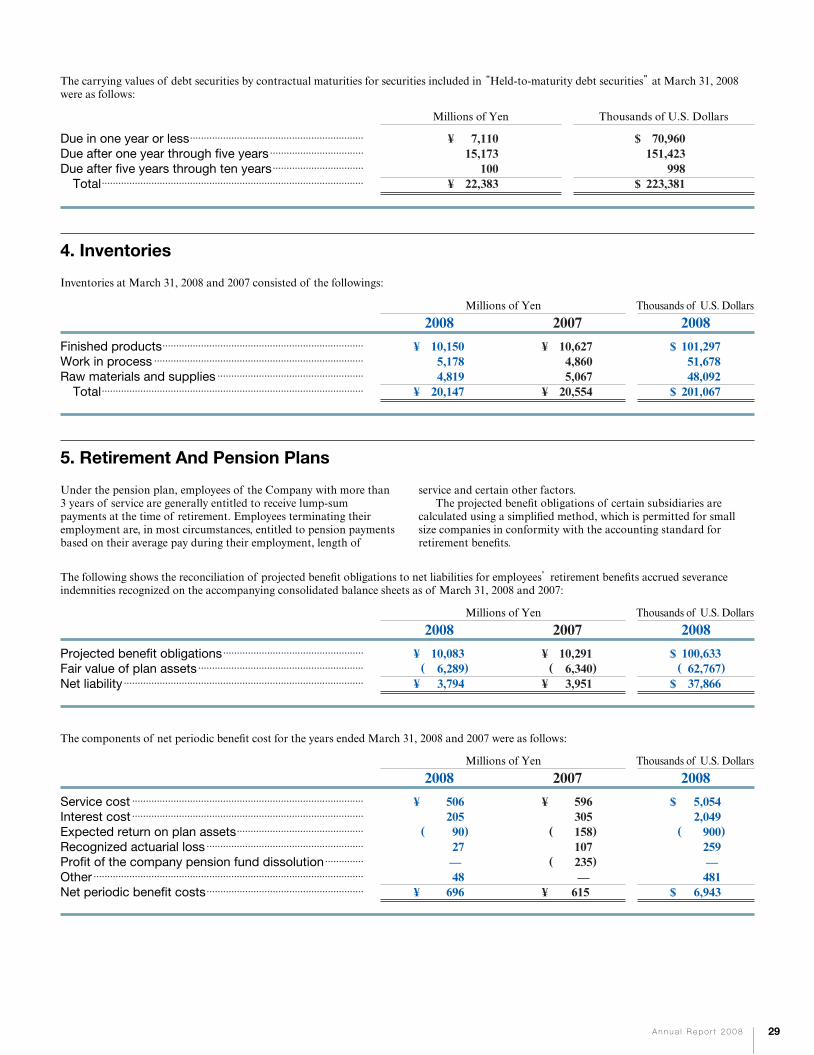
The carrying values of debt securities by contractual maturities for securities included in “Held-to-maturity debt securities” at March 31, 2008 were as follows:
Under the pension plan, employees of the Company with more than 3 years of service are generally entitled to receive lump-sum payments at the time of retirement. Employees terminating their employment are, in most circumstances, entitled to pension payments based on their average pay during their employment, length of
service and certain other factors. The projected benefit obligations of certain subsidiaries are calculated using a simplified method, which is permitted for small size companies in conformity with the accounting standard for retirement benefits.
29A n n u a l R e p o r t 2 0 0 8
080929→080929_yas
Due in one year or less・・・・・・・・・・・・・・・・・・・・・・・・・・・・・・・・・・・・・・・・・・・・・・・・・・・・・・・・・・・・・・・Due after one year through five years・・・・・・・・・・・・・・・・・・・・・・・・・・・・・・・・・・Due after five years through ten years・・・・・・・・・・・・・・・・・・・・・・・・・・・・・・・・・
Total・・・・・・・・・・・・・・・・・・・・・・・・・・・・・・・・・・・・・・・・・・・・・・・・・・・・・・・・・・・・・・・・・・・・・・・・・・・・・・・・・・・・・・・・・・・・・・・
Millions of Yen Thousands of U.S. Dollars
¥
¥
7,11015,173
10022,383
$
$
70,960151,423
998223,381
Millions of Yen Thousands of U.S. Dollars
2008 2007 2008
Finished products・・・・・・・・・・・・・・・・・・・・・・・・・・・・・・・・・・・・・・・・・・・・・・・・・・・・・・・・・・・・・・・・・・・・・・・・・Work in process・・・・・・・・・・・・・・・・・・・・・・・・・・・・・・・・・・・・・・・・・・・・・・・・・・・・・・・・・・・・・・・・・・・・・・・・・・・・Raw materials and supplies・・・・・・・・・・・・・・・・・・・・・・・・・・・・・・・・・・・・・・・・・・・・・・・・・・・・・
Total・・・・・・・・・・・・・・・・・・・・・・・・・・・・・・・・・・・・・・・・・・・・・・・・・・・・・・・・・・・・・・・・・・・・・・・・・・・・・・・・・・・・・・・・・・・・・・・
¥
¥
10,1505,1784,819
20,147
¥
¥
10,6274,8605,067
20,554
$
$
101,29751,67848,092
201,067
Inventories at March 31, 2008 and 2007 consisted of the followings:
4. Inventories
( )
Millions of Yen Thousands of U.S. Dollars
2008 2007 2008
Projected benefit obligations・・・・・・・・・・・・・・・・・・・・・・・・・・・・・・・・・・・・・・・・・・・・・・・・・・・Fair value of plan assets・・・・・・・・・・・・・・・・・・・・・・・・・・・・・・・・・・・・・・・・・・・・・・・・・・・・・・・・・・・・Net liability・・・・・・・・・・・・・・・・・・・・・・・・・・・・・・・・・・・・・・・・・・・・・・・・・・・・・・・・・・・・・・・・・・・・・・・・・・・・・・・・・・・・・・・
¥
¥
10,083 6,2893,794
( )¥
¥
10,291 6,3403,951
( )$
$
100,63362,76737,866
The following shows the reconciliation of projected benefit obligations to net liabilities for employees’ retirement benefits accrued severance indemnities recognized on the accompanying consolidated balance sheets as of March 31, 2008 and 2007:
5. Retirement And Pension Plans
( )
Millions of Yen Thousands of U.S. Dollars
2008 2007 2008
Service cost・・・・・・・・・・・・・・・・・・・・・・・・・・・・・・・・・・・・・・・・・・・・・・・・・・・・・・・・・・・・・・・・・・・・・・・・・・・・・・・・・・・・Interest cost・・・・・・・・・・・・・・・・・・・・・・・・・・・・・・・・・・・・・・・・・・・・・・・・・・・・・・・・・・・・・・・・・・・・・・・・・・・・・・・・・・・・Expected return on plan assets・・・・・・・・・・・・・・・・・・・・・・・・・・・・・・・・・・・・・・・・・・・・・・Recognized actuarial loss・・・・・・・・・・・・・・・・・・・・・・・・・・・・・・・・・・・・・・・・・・・・・・・・・・・・・・・・・Profit of the company pension fund dissolution・・・・・・・・・・・・・・Other・・・・・・・・・・・・・・・・・・・・・・・・・・・・・・・・・・・・・・・・・・・・・・・・・・・・・・・・・・・・・・・・・・・・・・・・・・・・・・・・・・・・・・・・・・・・・・・・・・ Net periodic benefit costs・・・・・・・・・・・・・・・・・・・・・・・・・・・・・・・・・・・・・・・・・・・・・・・・・・・・・・・・・
¥
¥
5062059027—48
696
( )
( )
¥
¥
596305158107235—
615
( )
$
$
5,0542,049
900259—481
6,943
The components of net periodic benefit cost for the years ended March 31, 2008 and 2007 were as follows:

7. Stock Options
The stock options outstanding as of March 31, 2008 were as follows:
30 A n n u a l R e p o r t 2 0 0 8
Assumptions used for the years ended March 31, 2008 and 2007 are set forth as follows:
2008 2007
Discount rate・・・・・・・・・・・・・・・・・・・・・・・・・・・・・・・・・・・・・・・・・・・・・・・・・・・・・・・・・・・・・・・・・・・・・・・・・・・・・・・・・・Expected rate of return on plan assets・・・・・・・・・・・・・・・・・・・・・・・・・・・・・・・Amortization period of prior service cost・・・・・・・・・・・・・・・・・・・・・・・・・・・Recognition period of actuarial gain / loss・・・・・・・・・・・・・・・・・・・・・・・・
2.1%1.5%1 year1 year
2.1%1.5%1 year1 year
Since May 1, 2006, Japanese companies have been subject to the Corporate Law of Japan (the “Corporate Law”), which reformed and replaced the Commercial Code of Japan. The significant provisions in the Corporate Law that affect financial and accounting matters are summarized below:
(a) DividendsThe Corporate Law permits companies to distribute dividends-in-kind (non-cash assets) to shareholders subject to a certain limitation and additional requirements. Semiannual interim dividends may also be paid once a year upon resolution by the Board of Directors if the articles of incorporation of the company so stipulate. The Corporate Law provides certain limitations on the amounts available for dividends or the purchase of treasury stock. The limitation is defined as the amount available for distribution to the shareholders, but the amount of net assets after dividends must be maintained at no less than ¥3 million.
(b) Increases / decreases and transfer of common stock, reserve and surplusThe Corporate Law requires that an amount equal to 10% of
dividends must be appropriated as a legal reserve (a component of retained earnings) or as additional paid-in capital (a component of capital surplus) depending on the equity account charged upon the payment of such dividends until the total of aggregate amount of legal reserve and additional paid-in capital equals 25% of the common stock. Under the Corporate Law, the total amount of additional paid-in capital and legal reserve may be reversed without limitation. The Corporate Law also provides that common stock, legal reserve, additional paid-in capital, other capital surplus and retained earnings can be transferred among the accounts under certain conditions upon resolution of the shareholders.
(c) Treasury stock The Corporate Law also provides for companies to purchase treasury stock and dispose of such treasury stock by resolution of the Board of Directors. The amount of treasury stock purchased cannot exceed the amount available for distribution to the shareholders which is determined by specific formula.
6. Equity
Stock Option
1280
directors and auditorsexecutive officers
998
directors and auditorsexecutive officers
9110
directors and auditorsexecutive officers
9124
directors and auditorsexecutive officers
5136
directors and auditorsexecutive officers
180,000 shares
280,000 shares
510,000 shares
576,000 shares
591,000 shares
2003.7.08
2002.7.08
2004.7.08
2005.7.08
2006.7.10
From July 1, 2004To June 30, 2007
From July 1, 2005To June 30, 2008
From July 1, 2006To June 30, 2009
From July 1, 2007To June 30, 2010
From July 1, 2008To June 30, 2011
¥1,755
¥1,450
¥1,514
¥1,574
¥1,485
Persons Granted Date of GrantNumber of Options Granted Exercise Price
2002Stock Options
2003Stock Options
2004Stock Options
2005Stock Options
2006Stock Options
Exercise Period

For the year ended March 31, 2007Non-vestedMarch 31, 2006 ̶ Outstanding
Granted・・・・・・・・・・・・・・・・・・・・・・・・・・・・・・・・・・・・・・・・・・・・・・・・・・・・・・・・・・・・Canceled・・・・・・・・・・・・・・・・・・・・・・・・・・・・・・・・・・・・・・・・・・・・・・・・・・・・・・・・・Vested・・・・・・・・・・・・・・・・・・・・・・・・・・・・・・・・・・・・・・・・・・・・・・・・・・・・・・・・・・・・・・・
March 31, 2007 ̶ Outstanding・・・・・・・・・・・・・・・・・・・・VestedMarch 31, 2006 ̶ Outstanding・・・・・・・・・・・・・・・・・・・・
Vested・・・・・・・・・・・・・・・・・・・・・・・・・・・・・・・・・・・・・・・・・・・・・・・・・・・・・・・・・・・・・・・Exercised・・・・・・・・・・・・・・・・・・・・・・・・・・・・・・・・・・・・・・・・・・・・・・・・・・・・・・・・・Canceled・・・・・・・・・・・・・・・・・・・・・・・・・・・・・・・・・・・・・・・・・・・・・・・・・・・・・・・・・
March 31, 2007 ̶ Outstanding・・・・・・・・・・・・・・・・・・・・
Average stock price at exerciseFair value price at grant date
For the year ended March 31, 2008Non-vestedMarch 31, 2007 ̶ Outstanding・・・・・・・・・・・・・・・・・・・・
Granted・・・・・・・・・・・・・・・・・・・・・・・・・・・・・・・・・・・・・・・・・・・・・・・・・・・・・・・・・・・・Canceled・・・・・・・・・・・・・・・・・・・・・・・・・・・・・・・・・・・・・・・・・・・・・・・・・・・・・・・・・Vested・・・・・・・・・・・・・・・・・・・・・・・・・・・・・・・・・・・・・・・・・・・・・・・・・・・・・・・・・・・・・・・
March 31, 2008 ̶ Outstanding・・・・・・・・・・・・・・・・・・・・VestedMarch 31, 2007 ̶ Outstanding・・・・・・・・・・・・・・・・・・・・
Vested・・・・・・・・・・・・・・・・・・・・・・・・・・・・・・・・・・・・・・・・・・・・・・・・・・・・・・・・・・・・・・・Exercised・・・・・・・・・・・・・・・・・・・・・・・・・・・・・・・・・・・・・・・・・・・・・・・・・・・・・・・・・Canceled・・・・・・・・・・・・・・・・・・・・・・・・・・・・・・・・・・・・・・・・・・・・・・・・・・・・・・・・・
March 31, 2008 ̶ Outstanding・・・・・・・・・・・・・・・・・・・・
Average stock price at exerciseFair value price at grant date
The stock option activity is as follows:
The assumptions used to measure fair value of 2006 Stock Options. Estimate method: Volatility of stock price:Estimated remaining outstanding period: Estimated dividend: Interest rate with risk free:
Black-Scholes option pricing model24%
three and a half years¥17 per share
1.22%
31A n n u a l R e p o r t 2 0 0 8
—————
137,000——
9,000128,000
——
—————
128,000——
128,000—
——
2002Stock Options
—591,00013,000
—578,000
—————
—222
578,000—
37,000—
541,000
—————
—222
2006Stock Options
557,000—
22,000—
535,000
—————
——
535,000—
39,000496,000
—
—496,00010,2007,000
478,800
1,834—
2005Stock Options
464,000—
17,000447,000
—
—447,000
—11,000
436,000
——
—————
436,000—
28,50020,000
387,500
1,776—
2004Stock Options
—————
236,500—
4,00018,000
214,500
1,578—
—————
214,500—
64,900—
149,600
1,805—
2003Stock Options
(Shares)
¥
¥
¥
¥¥ ¥
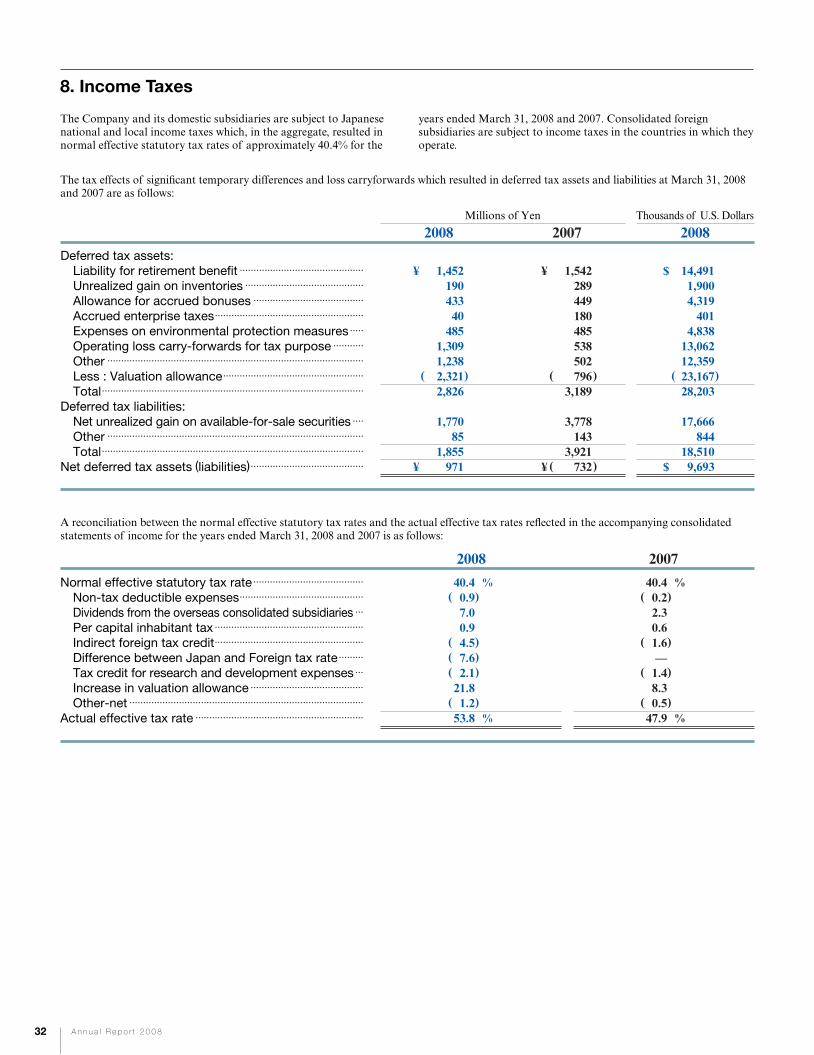
32 A n n u a l R e p o r t 2 0 0 8
A reconciliation between the normal effective statutory tax rates and the actual effective tax rates reflected in the accompanying consolidated statements of income for the years ended March 31, 2008 and 2007 is as follows:
Normal effective statutory tax rate・・・・・・・・・・・・・・・・・・・・・・・・・・・・・・・・・・・・・・・・Non-tax deductible expenses・・・・・・・・・・・・・・・・・・・・・・・・・・・・・・・・・・・・・・・・・・・・・Dividends from the overseas consolidated subsidiaries・・・Per capital inhabitant tax・・・・・・・・・・・・・・・・・・・・・・・・・・・・・・・・・・・・・・・・・・・・・・・・・・・・・・Indirect foreign tax credit・・・・・・・・・・・・・・・・・・・・・・・・・・・・・・・・・・・・・・・・・・・・・・・・・・・・・・Difference between Japan and Foreign tax rate・・・・・・・・・Tax credit for research and development expenses・・・Increase in valuation allowance・・・・・・・・・・・・・・・・・・・・・・・・・・・・・・・・・・・・・・・・・Other-net・・・・・・・・・・・・・・・・・・・・・・・・・・・・・・・・・・・・・・・・・・・・・・・・・・・・・・・・・・・・・・・・・・・・・・・・・・・・・・・・・・・・・
Actual effective tax rate・・・・・・・・・・・・・・・・・・・・・・・・・・・・・・・・・・・・・・・・・・・・・・・・・・・・・・・・・・・・・
%
%
( )
( )( )( )
( )
2008
40.40.97.00.94.57.62.1
21.81.2
53.8
%
%
( )
( )
( )
( )
2007
40.40.22.30.61.6—
1.48.30.5
47.9
The Company and its domestic subsidiaries are subject to Japanese national and local income taxes which, in the aggregate, resulted in normal effective statutory tax rates of approximately 40.4% for the
years ended March 31, 2008 and 2007. Consolidated foreign subsidiaries are subject to income taxes in the countries in which they operate.
8. Income Taxes
( ) ( )
( )
Millions of Yen Thousands of U.S. Dollars
2008 2007 2008
Deferred tax assets:Liability for retirement benefit・・・・・・・・・・・・・・・・・・・・・・・・・・・・・・・・・・・・・・・・・・・・・Unrealized gain on inventories・・・・・・・・・・・・・・・・・・・・・・・・・・・・・・・・・・・・・・・・・・・Allowance for accrued bonuses・・・・・・・・・・・・・・・・・・・・・・・・・・・・・・・・・・・・・・・・Accrued enterprise taxes・・・・・・・・・・・・・・・・・・・・・・・・・・・・・・・・・・・・・・・・・・・・・・・・・・・・・・Expenses on environmental protection measures・・・・・Operating loss carry-forwards for tax purpose・・・・・・・・・・・Other・・・・・・・・・・・・・・・・・・・・・・・・・・・・・・・・・・・・・・・・・・・・・・・・・・・・・・・・・・・・・・・・・・・・・・・・・・・・・・・・・・・・・・・・・・・・・Less : Valuation allowance・・・・・・・・・・・・・・・・・・・・・・・・・・・・・・・・・・・・・・・・・・・・・・・・・・・Total・・・・・・・・・・・・・・・・・・・・・・・・・・・・・・・・・・・・・・・・・・・・・・・・・・・・・・・・・・・・・・・・・・・・・・・・・・・・・・・・・・・・・・・・・・・・・・・
Deferred tax liabilities:Net unrealized gain on available-for-sale securities・・・・Other・・・・・・・・・・・・・・・・・・・・・・・・・・・・・・・・・・・・・・・・・・・・・・・・・・・・・・・・・・・・・・・・・・・・・・・・・・・・・・・・・・・・・・・・・・・・・Total・・・・・・・・・・・・・・・・・・・・・・・・・・・・・・・・・・・・・・・・・・・・・・・・・・・・・・・・・・・・・・・・・・・・・・・・・・・・・・・・・・・・・・・・・・・・・・・
Net deferred tax assets (liabilities)・・・・・・・・・・・・・・・・・・・・・・・・・・・・・・・・・・・・・・・・・
¥
¥
1,45219043340
4851,3091,2382,3212,826
1,77085
1,855971
( )
14,4911,9004,319
4014,838
13,06212,35923,16728,203
17,666844
18,5109,693
¥
¥
1,542289449180485538502796
3,189
3,778143
3,921732
$
$
The tax effects of significant temporary differences and loss carryforwards which resulted in deferred tax assets and liabilities at March 31, 2008 and 2007 are as follows:
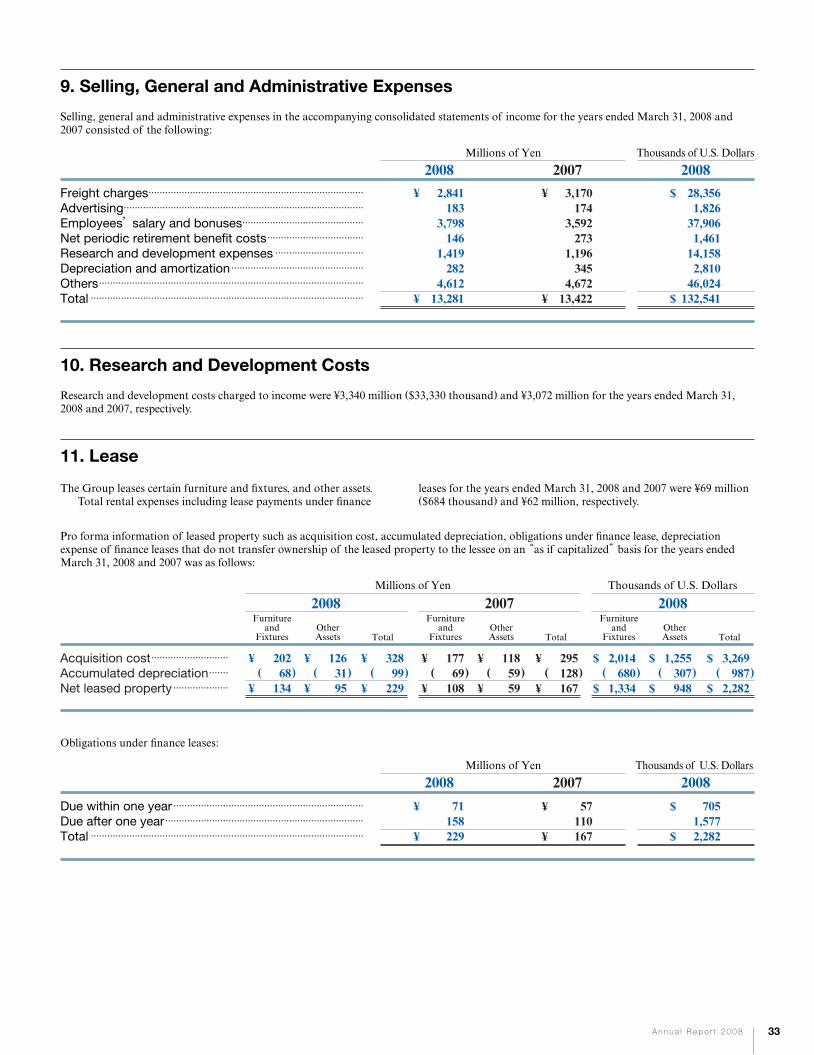
Millions of Yen Thousands of U.S. Dollars
2008 2007 2008
Freight charges・・・・・・・・・・・・・・・・・・・・・・・・・・・・・・・・・・・・・・・・・・・・・・・・・・・・・・・・・・・・・・・・・・・・・・・・・・・・・・Advertising・・・・・・・・・・・・・・・・・・・・・・・・・・・・・・・・・・・・・・・・・・・・・・・・・・・・・・・・・・・・・・・・・・・・・・・・・・・・・・・・・・・・・・・Employees’ salary and bonuses・・・・・・・・・・・・・・・・・・・・・・・・・・・・・・・・・・・・・・・・・・・・Net periodic retirement benefit costs・・・・・・・・・・・・・・・・・・・・・・・・・・・・・・・・・・・Research and development expenses・・・・・・・・・・・・・・・・・・・・・・・・・・・・・・・・Depreciation and amortization・・・・・・・・・・・・・・・・・・・・・・・・・・・・・・・・・・・・・・・・・・・・・・・・Others・・・・・・・・・・・・・・・・・・・・・・・・・・・・・・・・・・・・・・・・・・・・・・・・・・・・・・・・・・・・・・・・・・・・・・・・・・・・・・・・・・・・・・・・・・・・・・・・Total・・・・・・・・・・・・・・・・・・・・・・・・・・・・・・・・・・・・・・・・・・・・・・・・・・・・・・・・・・・・・・・・・・・・・・・・・・・・・・・・・・・・・・・・・・・・・・・・・・・
¥
¥
2,841183
3,798146
1,419282
4,61213,281
¥
¥
3,170174
3,592273
1,196345
4,67213,422
$
$
28,3561,826
37,9061,461
14,1582,810
46,024132,541
Selling, general and administrative expenses in the accompanying consolidated statements of income for the years ended March 31, 2008 and 2007 consisted of the following:
9. Selling, General and Administrative Expenses
10. Research and Development Costs
Research and development costs charged to income were ¥3,340 million ($33,330 thousand) and ¥3,072 million for the years ended March 31, 2008 and 2007, respectively.
Obligations under finance leases:
Pro forma information of leased property such as acquisition cost, accumulated depreciation, obligations under finance lease, depreciation expense of finance leases that do not transfer ownership of the leased property to the lessee on an “as if capitalized” basis for the years ended March 31, 2008 and 2007 was as follows:
33A n n u a l R e p o r t 2 0 0 8
Millions of Yen Thousands of U.S. Dollars
2008 2007 2008
Due within one year・・・・・・・・・・・・・・・・・・・・・・・・・・・・・・・・・・・・・・・・・・・・・・・・・・・・・・・・・・・・・・・・・・・・・Due after one year・・・・・・・・・・・・・・・・・・・・・・・・・・・・・・・・・・・・・・・・・・・・・・・・・・・・・・・・・・・・・・・・・・・・・・・・Total・・・・・・・・・・・・・・・・・・・・・・・・・・・・・・・・・・・・・・・・・・・・・・・・・・・・・・・・・・・・・・・・・・・・・・・・・・・・・・・・・・・・・・・・・・・・・・・・・・・
¥
¥
71158229
¥
¥
57110167
$
$
7051,5772,282
( )
The Group leases certain furniture and fixtures, and other assets. Total rental expenses including lease payments under finance
leases for the years ended March 31, 2008 and 2007 were ¥69 million ($684 thousand) and ¥62 million, respectively.
11. Lease
2008Millions of Yen Thousands of U.S. Dollars
Acquisition cost・・・・・・・・・・・・・・・・・・・・・・・・・・・・Accumulated depreciation・・・・・・・Net leased property・・・・・・・・・・・・・・・・・・・・
¥
¥
20268
134( )
¥
¥
1263195
( )¥
¥
32899
229( )
¥
¥
17769
108( )
¥
¥
1185959
( )¥
¥
295128167
( )$
$
2,014680
1,334( )
$
$
1,255307948
( )$
$
3,269987
2,282
Furnitureand
FixturesOtherAssets Total
2007Furniture
andFixtures
OtherAssets Total
2008Furniture
andFixtures
OtherAssets Total
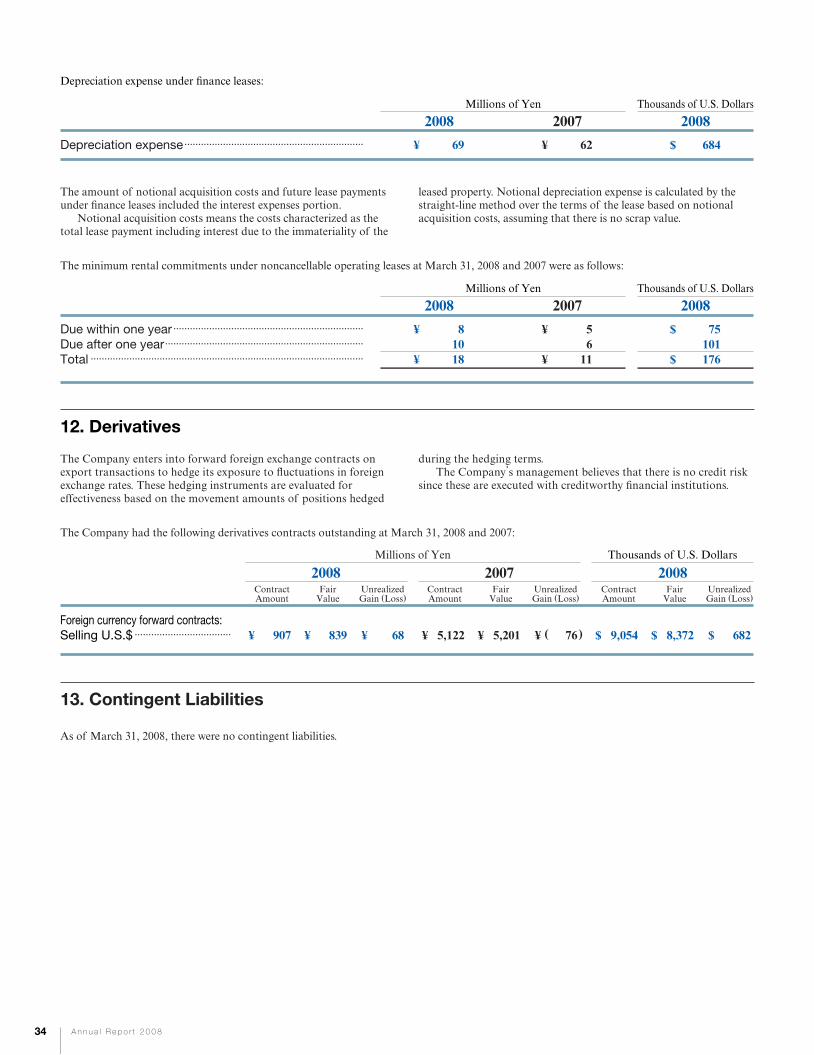
34 A n n u a l R e p o r t 2 0 0 8
As of March 31, 2008, there were no contingent liabilities.
13. Contingent Liabilities
Depreciation expense under finance leases:
Millions of Yen Thousands of U.S. Dollars
2008 2007 2008
Due within one year・・・・・・・・・・・・・・・・・・・・・・・・・・・・・・・・・・・・・・・・・・・・・・・・・・・・・・・・・・・・・・・・・・・・・Due after one year・・・・・・・・・・・・・・・・・・・・・・・・・・・・・・・・・・・・・・・・・・・・・・・・・・・・・・・・・・・・・・・・・・・・・・・・Total・・・・・・・・・・・・・・・・・・・・・・・・・・・・・・・・・・・・・・・・・・・・・・・・・・・・・・・・・・・・・・・・・・・・・・・・・・・・・・・・・・・・・・・・・・・・・・・・・・・
¥
¥
81018
¥
¥
56
11
$
$
75101176
The minimum rental commitments under noncancellable operating leases at March 31, 2008 and 2007 were as follows:
Millions of Yen Thousands of U.S. Dollars
2008 2007 2008
Depreciation expense・・・・・・・・・・・・・・・・・・・・・・・・・・・・・・・・・・・・・・・・・・・・・・・・・・・・・・・・・・・・・・・・・ ¥ 69 ¥ 62 $ 684
The amount of notional acquisition costs and future lease payments under finance leases included the interest expenses portion. Notional acquisition costs means the costs characterized as the total lease payment including interest due to the immateriality of the
leased property. Notional depreciation expense is calculated by the straight-line method over the terms of the lease based on notional acquisition costs, assuming that there is no scrap value.
2008
The Company had the following derivatives contracts outstanding at March 31, 2008 and 2007:
The Company enters into forward foreign exchange contracts on export transactions to hedge its exposure to fluctuations in foreign exchange rates. These hedging instruments are evaluated for effectiveness based on the movement amounts of positions hedged
during the hedging terms. The Company’s management believes that there is no credit risk since these are executed with creditworthy financial institutions.
12. Derivatives
Millions of Yen Thousands of U.S. Dollars
Foreign currency forward contracts:Selling U.S.$・・・・・・・・・・・・・・・・・・・・・・・・・・・・・・・・・・・ ¥ 907 ( )¥ 839 ¥ 68
2007
¥ 5,122 ¥ 5,201 ¥ 76
2008
$ 9,054 $ 8,372 $ 682
ContractAmount
FairValue
UnrealizedGain (Loss)
ContractAmount
FairValue
UnrealizedGain (Loss)
ContractAmount
FairValue
UnrealizedGain (Loss)
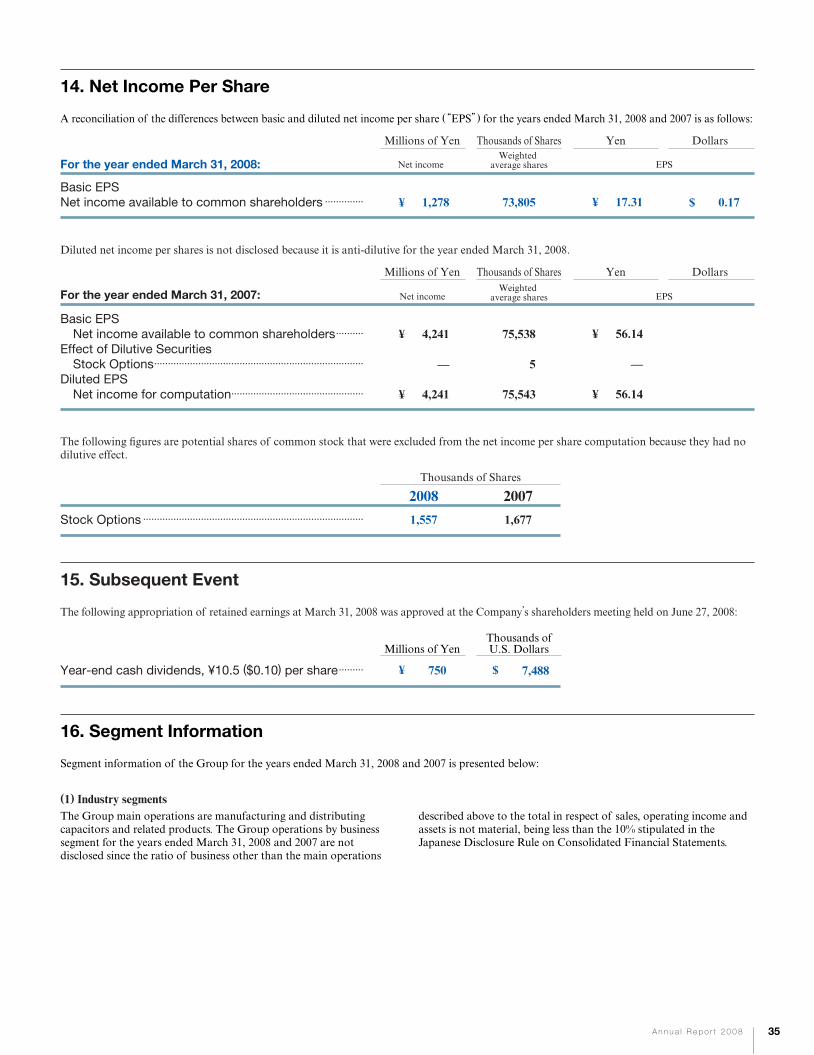
For the year ended March 31, 2008:
35A n n u a l R e p o r t 2 0 0 8
Millions of Yen Yen DollarsThousands of Shares
Basic EPSNet income available to common shareholders・・・・・・・・・・・・・・ ¥ 1,278 73,805 ¥ 17.31 $ 0.17
A reconciliation of the differences between basic and diluted net income per share (“EPS”) for the years ended March 31, 2008 and 2007 is as follows:
Diluted net income per shares is not disclosed because it is anti-dilutive for the year ended March 31, 2008.
Thousands of Shares
2008 2007
Stock Options・・・・・・・・・・・・・・・・・・・・・・・・・・・・・・・・・・・・・・・・・・・・・・・・・・・・・・・・・・・・・・・・・・・・・・・・・・・・・・・・ 1,557 1,677
The following figures are potential shares of common stock that were excluded from the net income per share computation because they had no dilutive effect.
14. Net Income Per Share
The following appropriation of retained earnings at March 31, 2008 was approved at the Company’s shareholders meeting held on June 27, 2008:
15. Subsequent Event
Net incomeWeighted
average shares EPS
Millions of YenThousands ofU.S. Dollars
Year-end cash dividends, ¥10.5 ($0.10) per share・・・・・・・・・ ¥ 750 $ 7,488
For the year ended March 31, 2007:
Basic EPSNet income available to common shareholders・・・・・・・・・・
Effect of Dilutive SecuritiesStock Options・・・・・・・・・・・・・・・・・・・・・・・・・・・・・・・・・・・・・・・・・・・・・・・・・・・・・・・・・・・・・・・・・・・・・・・・・・・・
Diluted EPSNet income for computation・・・・・・・・・・・・・・・・・・・・・・・・・・・・・・・・・・・・・・・・・・・・・・・・
¥
¥
4,241
—
4,241
75,538
5
75,543
¥
¥
56.14
—
56.14
Segment information of the Group for the years ended March 31, 2008 and 2007 is presented below:
(1) Industry segmentsThe Group main operations are manufacturing and distributing capacitors and related products. The Group operations by business segment for the years ended March 31, 2008 and 2007 are not disclosed since the ratio of business other than the main operations
described above to the total in respect of sales, operating income and assets is not material, being less than the 10% stipulated in the Japanese Disclosure Rule on Consolidated Financial Statements.
16. Segment Information
Millions of Yen Yen DollarsThousands of Shares
Net incomeWeighted
average shares EPS
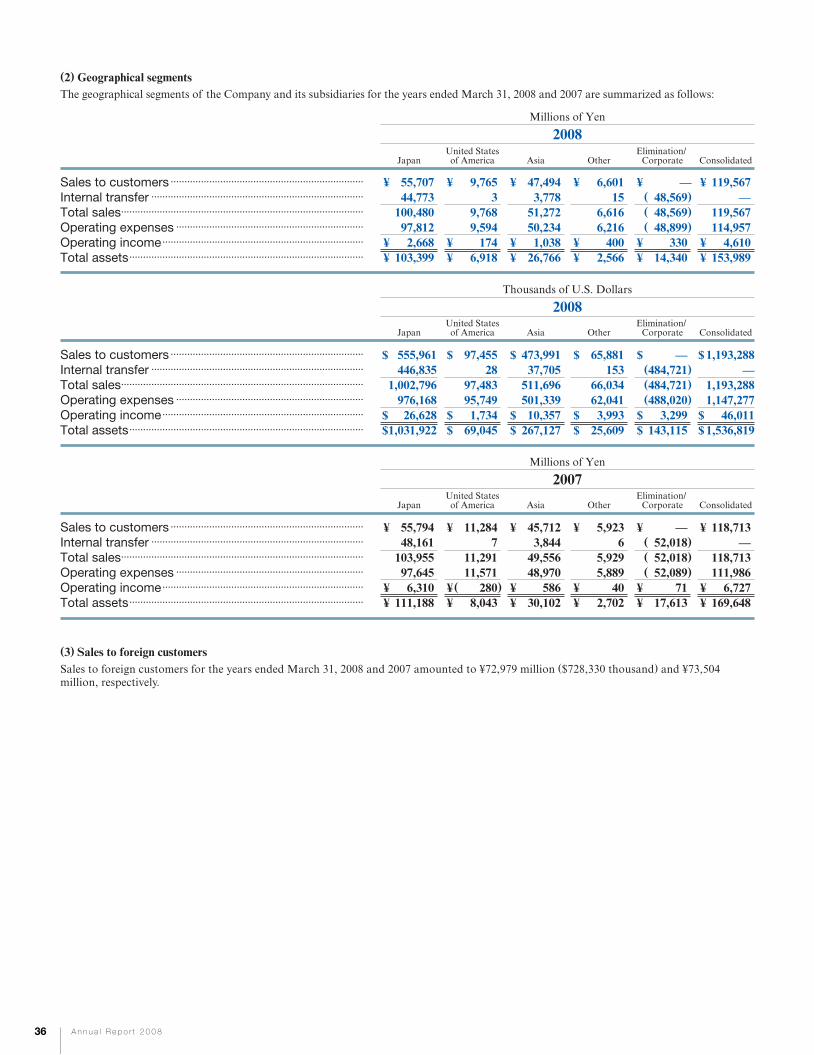
36 A n n u a l R e p o r t 2 0 0 8
(2) Geographical segmentsThe geographical segments of the Company and its subsidiaries for the years ended March 31, 2008 and 2007 are summarized as follows:
Sales to foreign customers for the years ended March 31, 2008 and 2007 amounted to ¥72,979 million ($728,330 thousand) and ¥73,504 million, respectively.
(3) Sales to foreign customers
Millions of Yen
Sales to customers・・・・・・・・・・・・・・・・・・・・・・・・・・・・・・・・・・・・・・・・・・・・・・・・・・・・・・・・・・・・・・・・・・・・・・Internal transfer・・・・・・・・・・・・・・・・・・・・・・・・・・・・・・・・・・・・・・・・・・・・・・・・・・・・・・・・・・・・・・・・・・・・・・・・・・・・・Total sales・・・・・・・・・・・・・・・・・・・・・・・・・・・・・・・・・・・・・・・・・・・・・・・・・・・・・・・・・・・・・・・・・・・・・・・・・・・・・・・・・・・・・・・・Operating expenses・・・・・・・・・・・・・・・・・・・・・・・・・・・・・・・・・・・・・・・・・・・・・・・・・・・・・・・・・・・・・・・・・・・・Operating income・・・・・・・・・・・・・・・・・・・・・・・・・・・・・・・・・・・・・・・・・・・・・・・・・・・・・・・・・・・・・・・・・・・・・・・・・Total assets・・・・・・・・・・・・・・・・・・・・・・・・・・・・・・・・・・・・・・・・・・・・・・・・・・・・・・・・・・・・・・・・・・・・・・・・・・・・・・・・・・・・・
JapanUnited Statesof America Asia Other
Elimination/Corporate Consolidated
JapanUnited Statesof America Asia Other
Elimination/Corporate Consolidated
JapanUnited Statesof America Asia Other
Elimination/Corporate Consolidated
Millions of Yen
Sales to customers・・・・・・・・・・・・・・・・・・・・・・・・・・・・・・・・・・・・・・・・・・・・・・・・・・・・・・・・・・・・・・・・・・・・・・Internal transfer・・・・・・・・・・・・・・・・・・・・・・・・・・・・・・・・・・・・・・・・・・・・・・・・・・・・・・・・・・・・・・・・・・・・・・・・・・・・・Total sales・・・・・・・・・・・・・・・・・・・・・・・・・・・・・・・・・・・・・・・・・・・・・・・・・・・・・・・・・・・・・・・・・・・・・・・・・・・・・・・・・・・・・・・・Operating expenses・・・・・・・・・・・・・・・・・・・・・・・・・・・・・・・・・・・・・・・・・・・・・・・・・・・・・・・・・・・・・・・・・・・・Operating income・・・・・・・・・・・・・・・・・・・・・・・・・・・・・・・・・・・・・・・・・・・・・・・・・・・・・・・・・・・・・・・・・・・・・・・・・Total assets・・・・・・・・・・・・・・・・・・・・・・・・・・・・・・・・・・・・・・・・・・・・・・・・・・・・・・・・・・・・・・・・・・・・・・・・・・・・・・・・・・・・・
¥
¥¥
55,70744,773
100,48097,8122,668
103,399
¥
¥¥
9,7653
9,7689,594
1746,918
¥
¥¥
47,4943,778
51,27250,2341,038
26,766
¥
¥¥
6,60115
6,6166,216
4002,566
—( )( )( )
¥
¥¥
48,56948,56948,899
33014,340
¥
¥¥
119,567—
119,567114,957
4,610153,989
¥
¥¥
55,79448,161
103,95597,6456,310
111,188
¥
¥¥
11,2847
11,29111,571
2808,043
¥
¥¥
45,7123,844
49,55648,970
58630,102
¥
¥¥
5,9236
5,9295,889
402,702
( )( )( )
( )
¥
¥¥
—52,01852,01852,089
7117,613
¥
¥¥
118,713—
118,713111,986
6,727169,648
Thousands of U.S. Dollars
Sales to customers・・・・・・・・・・・・・・・・・・・・・・・・・・・・・・・・・・・・・・・・・・・・・・・・・・・・・・・・・・・・・・・・・・・・・・Internal transfer・・・・・・・・・・・・・・・・・・・・・・・・・・・・・・・・・・・・・・・・・・・・・・・・・・・・・・・・・・・・・・・・・・・・・・・・・・・・・Total sales・・・・・・・・・・・・・・・・・・・・・・・・・・・・・・・・・・・・・・・・・・・・・・・・・・・・・・・・・・・・・・・・・・・・・・・・・・・・・・・・・・・・・・・・Operating expenses・・・・・・・・・・・・・・・・・・・・・・・・・・・・・・・・・・・・・・・・・・・・・・・・・・・・・・・・・・・・・・・・・・・・Operating income・・・・・・・・・・・・・・・・・・・・・・・・・・・・・・・・・・・・・・・・・・・・・・・・・・・・・・・・・・・・・・・・・・・・・・・・・Total assets・・・・・・・・・・・・・・・・・・・・・・・・・・・・・・・・・・・・・・・・・・・・・・・・・・・・・・・・・・・・・・・・・・・・・・・・・・・・・・・・・・・・・
$
$$
555,961446,835
1,002,796976,16826,628
1,031,922
$
$$
97,45528
97,48395,7491,734
69,045
$
$$
473,99137,705
511,696501,33910,357
267,127
$
$$
65,881153
66,03462,0413,993
25,609
( )( )( )
$
$$
—484,721484,721488,020
3,299143,115
$
$$
1,193,288—
1,193,2881,147,277
46,0111,536,819
2008
2008
2007
Report of Independent Auditors
37A n n u a l R e p o r t 2 0 0 8
38 A n n u a l R e p o r t 2 0 0 8
Report of Independent Auditors
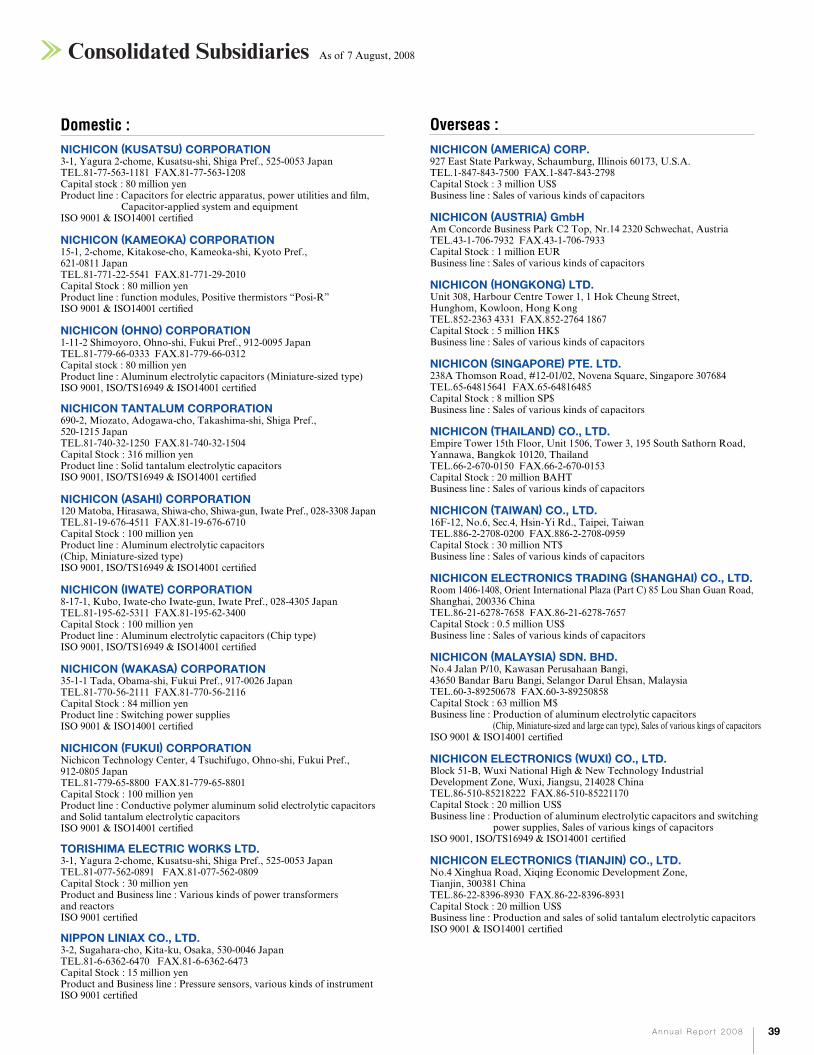
39A n n u a l R e p o r t 2 0 0 8
NICHICON TANTALUM CORPORATION690-2, Miozato, Adogawa-cho, Takashima-shi, Shiga Pref.,520-1215 JapanTEL.81-740-32-1250 FAX.81-740-32-1504Capital Stock : 316 million yenProduct line : Solid tantalum electrolytic capacitorsISO 9001, ISO/TS16949 & ISO14001 certified
NICHICON (KAMEOKA) CORPORATION15-1, 2-chome, Kitakose-cho, Kameoka-shi, Kyoto Pref.,621-0811 JapanTEL.81-771-22-5541 FAX.81-771-29-2010Capital Stock : 80 million yenProduct line : function modules, Positive thermistors “Posi-R”ISO 9001 & ISO14001 certified
NICHICON (OHNO) CORPORATION1-11-2 Shimoyoro, Ohno-shi, Fukui Pref., 912-0095 JapanTEL.81-779-66-0333 FAX.81-779-66-0312Capital stock : 80 million yenProduct line : Aluminum electrolytic capacitors (Miniature-sized type)ISO 9001, ISO/TS16949 & ISO14001 certified
NICHICON (KUSATSU) CORPORATION3-1, Yagura 2-chome, Kusatsu-shi, Shiga Pref., 525-0053 JapanTEL.81-77-563-1181 FAX.81-77-563-1208Capital stock : 80 million yenProduct line : Capacitors for electric apparatus, power utilities and film,
Capacitor-applied system and equipmentISO 9001 & ISO14001 certified
NICHICON (ASAHI) CORPORATION120 Matoba, Hirasawa, Shiwa-cho, Shiwa-gun, Iwate Pref., 028-3308 JapanTEL.81-19-676-4511 FAX.81-19-676-6710Capital Stock : 100 million yenProduct line : Aluminum electrolytic capacitors(Chip, Miniature-sized type)ISO 9001, ISO/TS16949 & ISO14001 certified
NICHICON (IWATE) CORPORATION8-17-1, Kubo, Iwate-cho Iwate-gun, Iwate Pref., 028-4305 JapanTEL.81-195-62-5311 FAX.81-195-62-3400Capital Stock : 100 million yenProduct line : Aluminum electrolytic capacitors (Chip type)ISO 9001, ISO/TS16949 & ISO14001 certified
NICHICON (WAKASA) CORPORATION35-1-1 Tada, Obama-shi, Fukui Pref., 917-0026 JapanTEL.81-770-56-2111 FAX.81-770-56-2116Capital Stock : 84 million yenProduct line : Switching power suppliesISO 9001 & ISO14001 certified
Domestic : Overseas :
NICHICON (THAILAND) CO., LTD.Empire Tower 15th Floor, Unit 1506, Tower 3, 195 South Sathorn Road,Yannawa, Bangkok 10120, ThailandTEL.66-2-670-0150 FAX.66-2-670-0153Capital Stock : 20 million BAHTBusiness line : Sales of various kinds of capacitors
NICHICON (AMERICA) CORP.927 East State Parkway, Schaumburg, Illinois 60173, U.S.A.TEL.1-847-843-7500 FAX.1-847-843-2798Capital Stock : 3 million US$Business line : Sales of various kinds of capacitors
NICHICON (HONGKONG) LTD.Unit 308, Harbour Centre Tower 1, 1 Hok Cheung Street,Hunghom, Kowloon, Hong KongTEL.852-2363 4331 FAX.852-2764 1867Capital Stock : 5 million HK$Business line : Sales of various kinds of capacitors
NICHICON (SINGAPORE) PTE. LTD.238A Thomson Road, #12-01/02, Novena Square, Singapore 307684TEL.65-64815641 FAX.65-64816485Capital Stock : 8 million SP$Business line : Sales of various kinds of capacitors
NICHICON ELECTRONICS TRADING (SHANGHAI) CO., LTD.Room 1406-1408, Orient International Plaza (Part C) 85 Lou Shan Guan Road,Shanghai, 200336 ChinaTEL.86-21-6278-7658 FAX.86-21-6278-7657Capital Stock : 0.5 million US$Business line : Sales of various kinds of capacitors
NICHICON ELECTRONICS (TIANJIN) CO., LTD.No.4 Xinghua Road, Xiqing Economic Development Zone,Tianjin, 300381 ChinaTEL.86-22-8396-8930 FAX.86-22-8396-8931Capital Stock : 20 million US$Business line : Production and sales of solid tantalum electrolytic capacitorsISO 9001 & ISO14001 certified
NICHICON ELECTRONICS (WUXI) CO., LTD.Block 51-B, Wuxi National High & New Technology IndustrialDevelopment Zone, Wuxi, Jiangsu, 214028 ChinaTEL.86-510-85218222 FAX.86-510-85221170Capital Stock : 20 million US$Business line : Production of aluminum electrolytic capacitors and switching
power supplies, Sales of various kings of capacitors ISO 9001, ISO/TS16949 & ISO14001 certified
NICHICON (TAIWAN) CO., LTD.16F-12, No.6, Sec.4, Hsin-Yi Rd., Taipei, TaiwanTEL.886-2-2708-0200 FAX.886-2-2708-0959Capital Stock : 30 million NT$Business line : Sales of various kinds of capacitors
NICHICON (AUSTRIA) GmbHAm Concorde Business Park C2 Top, Nr.14 2320 Schwechat, AustriaTEL.43-1-706-7932 FAX.43-1-706-7933Capital Stock : 1 million EURBusiness line : Sales of various kinds of capacitors
NICHICON (FUKUI) CORPORATIONNichicon Technology Center, 4 Tsuchifugo, Ohno-shi, Fukui Pref.,912-0805 JapanTEL.81-779-65-8800 FAX.81-779-65-8801Capital Stock : 100 million yenProduct line : Conductive polymer aluminum solid electrolytic capacitorsand Solid tantalum electrolytic capacitors ISO 9001 & ISO14001 certified
NIPPON LINIAX CO., LTD.3-2, Sugahara-cho, Kita-ku, Osaka, 530-0046 JapanTEL.81-6-6362-6470 FAX.81-6-6362-6473Capital Stock : 15 million yenProduct and Business line : Pressure sensors, various kinds of instrumentISO 9001 certified
TORISHIMA ELECTRIC WORKS LTD.3-1, Yagura 2-chome, Kusatsu-shi, Shiga Pref., 525-0053 JapanTEL.81-077-562-0891 FAX.81-077-562-0809Capital Stock : 30 million yenProduct and Business line : Various kinds of power transformers and reactorsISO 9001 certified
NICHICON (MALAYSIA) SDN. BHD.No.4 Jalan P/10, Kawasan Perusahaan Bangi,43650 Bandar Baru Bangi, Selangor Darul Ehsan, MalaysiaTEL.60-3-89250678 FAX.60-3-89250858Capital Stock : 63 million M$Business line : Production of aluminum electrolytic capacitors
(Chip, Miniature-sized and large can type), Sales of various kings of capacitorsISO 9001 & ISO14001 certified
Consolidated Subsidiaries As of 7 August, 2008
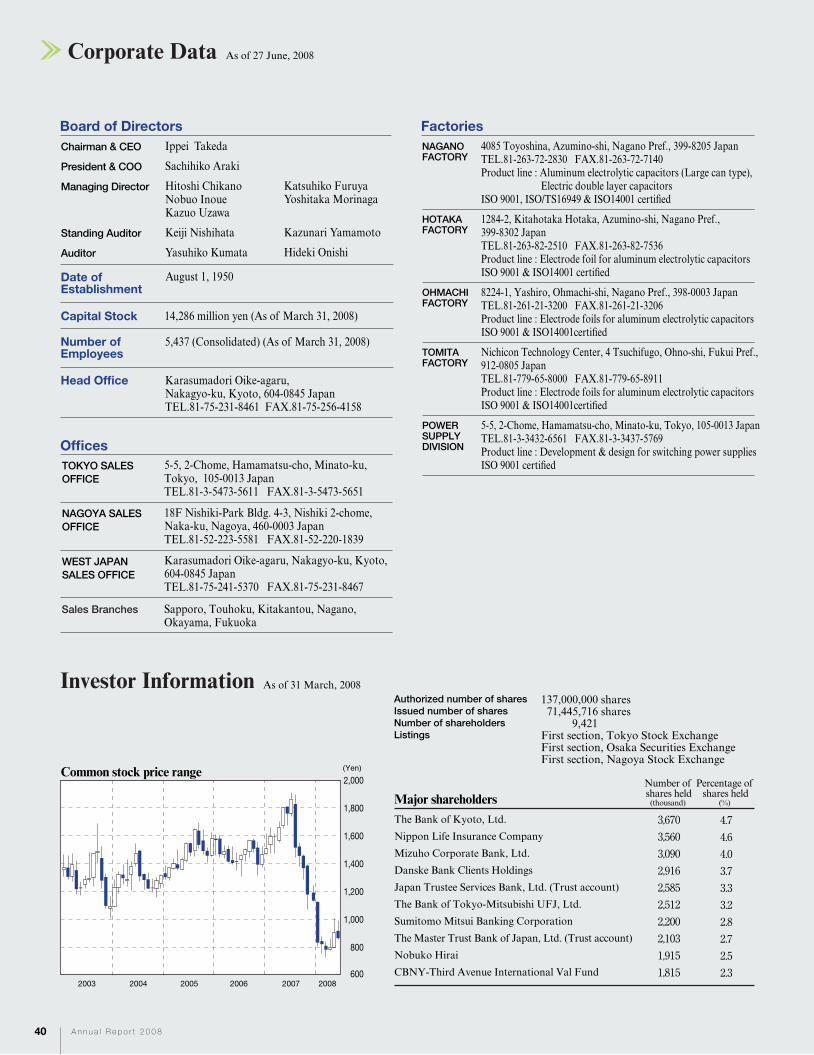
40 A n n u a l R e p o r t 2 0 0 8
Authorized number of shares
Issued number of shares
Number of shareholders
Listings
137,000,000 shares 71,445,716 shares 9,421First section, Tokyo Stock ExchangeFirst section, Osaka Securities ExchangeFirst section, Nagoya Stock Exchange
3,6703,5603,0902,9162,5852,5122,2002,1031,9151,815
4.74.64.03.73.33.22.82.72.52.3
The Bank of Kyoto, Ltd.
Nippon Life Insurance Company
Mizuho Corporate Bank, Ltd.
Danske Bank Clients Holdings
Japan Trustee Services Bank, Ltd. (Trust account)
The Bank of Tokyo-Mitsubishi UFJ, Ltd.
Sumitomo Mitsui Banking Corporation
The Master Trust Bank of Japan, Ltd. (Trust account)
Nobuko Hirai
CBNY-Third Avenue International Val Fund
Investor Information
Major shareholdersNumber of shares held
(thousand)
Percentage of shares held
(%)
Ippei Takeda
Sachihiko Araki
Hitoshi ChikanoNobuo InoueKazuo Uzawa
Keiji Nishihata
Yasuhiko Kumata
Katsuhiko FuruyaYoshitaka Morinaga
Kazunari Yamamoto
Hideki Onishi
Chairman & CEO
President & COO
Managing Director
Standing Auditor
Auditor
Board of Directors Factories
Corporate Data As of 27 June, 2008
As of 31 March, 2008
4085 Toyoshina, Azumino-shi, Nagano Pref., 399-8205 JapanTEL.81-263-72-2830 FAX.81-263-72-7140Product line : Aluminum electrolytic capacitors (Large can type),
Electric double layer capacitorsISO 9001, ISO/TS16949 & ISO14001 certified
1284-2, Kitahotaka Hotaka, Azumino-shi, Nagano Pref., 399-8302 JapanTEL.81-263-82-2510 FAX.81-263-82-7536Product line : Electrode foil for aluminum electrolytic capacitorsISO 9001 & ISO14001 certified
8224-1, Yashiro, Ohmachi-shi, Nagano Pref., 398-0003 JapanTEL.81-261-21-3200 FAX.81-261-21-3206Product line : Electrode foils for aluminum electrolytic capacitorsISO 9001 & ISO14001certified
Nichicon Technology Center, 4 Tsuchifugo, Ohno-shi, Fukui Pref., 912-0805 JapanTEL.81-779-65-8000 FAX.81-779-65-8911Product line : Electrode foils for aluminum electrolytic capacitors ISO 9001 & ISO14001certified
5-5, 2-Chome, Hamamatsu-cho, Minato-ku, Tokyo, 105-0013 JapanTEL.81-3-3432-6561 FAX.81-3-3437-5769Product line : Development & design for switching power suppliesISO 9001 certified
NAGANOFACTORY
HOTAKAFACTORY
OHMACHIFACTORY
TOMITAFACTORY
POWERSUPPLYDIVISION
August 1, 1950
14,286 million yen (As of March 31, 2008)
5,437 (Consolidated) (As of March 31, 2008)
Date ofEstablishment
Capital Stock
Number ofEmployees
Head Office Karasumadori Oike-agaru, Nakagyo-ku, Kyoto, 604-0845 JapanTEL.81-75-231-8461 FAX.81-75-256-4158
5-5, 2-Chome, Hamamatsu-cho, Minato-ku, Tokyo, 105-0013 JapanTEL.81-3-5473-5611 FAX.81-3-5473-5651
Offices
TOKYO SALES
OFFICE
18F Nishiki-Park Bldg. 4-3, Nishiki 2-chome, Naka-ku, Nagoya, 460-0003 JapanTEL.81-52-223-5581 FAX.81-52-220-1839
NAGOYA SALES
OFFICE
Karasumadori Oike-agaru, Nakagyo-ku, Kyoto, 604-0845 JapanTEL.81-75-241-5370 FAX.81-75-231-8467
WEST JAPAN
SALES OFFICE
Sapporo, Touhoku, Kitakantou, Nagano,Okayama, Fukuoka
Sales Branches
(Yen)Common stock price range
1,800
2,000
1,600
1,000
1,200
1,400
800
6002003 2004 2005 2006 2007 2008
Karasumadori Oike-agaru, Nakagyo-ku, Kyoto, 604-0845 JapanTEL. 81-75-231-8461 FAX. 81-75-256-4158
URL http://www.nichicon.co.jp/ http://www.nichicon.com
Printed on 100% recycled paper.This catalog is printed withenvironmentally friendly soy ink.