Embed Size (px)
Citation preview

ANNUAL REPORT
2008
Report and Statement of Accounts for the
Year Ended 31 December 2008

MissionStatement
The mission of the Bank of Jamaica
is to formulate and implementmonetary and regulatory policies
to safeguard the value of the domesticcurrency and to ensure the soundness
and development of the financial systemby being a strong and efficient
organisation with highly motivatedand professional employeesworking for the benefit of
the people of Jamaica.

TheGovernor BankOfJamaica NethersolePlace Kingston,Jamaica,W.I.
31 March 2009
The Hon. Audley Shaw, M.P.Minister of Finance and the Public ServiceMinistry of Finance and the Public Service30 National Heroes CircleKingston 4
Dear Minister:
In accordance with Section 44 (1) of the Bank of Jamaica Act, 1960, I have the honour of transmitting herewith the Bank’s Report for the year 2008 and a copy of the Statement of the Bank’s Accounts as at 31 December 2008 duly certified by the Auditors.
Yours sincerely,
Derick Latibeaudiere

BANKOFJAMAICA
PRINCIPALOFFICERS
GOVERNORThe Hon. Derick Latibeaudiere, O.J.
SENIORDEPUTYGOVERNORMrs. Audrey Anderson, C.D.
DEPUTYGOVERNORS1. Mr. Rudolph Muir - General Counsel & Bank Secretary
2. Mrs. Myrtle Halsall - Research & Economic Programming and
Banking & Market Operations Divisions
3. Mrs. Gayon Hosin - Financial Institutions Supervisory Division
4. Mr. Livingstone Morrison - Finance & Technology Division and Payments System and Risk Management Sub-Division GENERALMANAGER Mr. Kenloy Peart
DIVISIONCHIEFS 1. Mrs. Natalie Haynes - Banking & Market Operations Division
2. Mr. John Robinson - Research & Economic Programming Division
DEPUTYGENERALMANAGER Mr. Calvin Brown

FINANCIALCONTROLLER Mr. Herbert Hylton - Finance & Technology Division
DEPUTYGENERALCOUNSEL Mr. Randolph Dandy - Legal Department
CHIEFINTERNALAUDITOR Mr. Horace Lowers - Internal Audit Department

BOARDOFDIRECTORS
THEHON.DERICKLATIBEAUDIERE,O.J.Governor & Chairman
MRS. AUDREY ANDERSON, C.D. Deputy Chairman
MR. DENNIS CHUNG
MRS. SHARON CROOKS
DR. WESLEY HUGHES, C.D.
MR. MARK MYERS
DR. JEFFREY PYNE

CONTENTS
EconomicandFinancialSystemReview
1. Overview 1
2. TheFinancialSystem 5 2.1. Monetary Policy Management 5 2.2. Money Supply 10 2.3. Commercial Banks 12 2.4. Other Financial Intermediaries 21 2.4.1. Financial Institutions Act Licensees 21 2.4.2. Building Societies 25 2.5. Development Banks 28 2.5.1. Development Bank of Jamaica 28 2.5.2. National Export Import Bank of Jamaica 31 2.6. Financial Stability Assessment of Deposit-Taking Institutions (DTIs) 33 3. MoneyMarketOperations 40 3.1. Bank of Jamaica Operations 40 3.2. Interest Rates 43 4. TheStockMarket 47 5. SupervisionofDeposit-TakingFinancialInstitutions 52 6. SupervisionofCambiosandRemittanceCompanies 69 6.1. Cambios 69 6.2. Remittance Companies 70 7. ExternalSectorDevelopments 72 7.1. International Economic Developments 72 7.2. Balance of Payments 78 7.3. Foreign Exchange Management 86 7.3.1. Bank of Jamaica International Reserves 86 7.3.2. Reserve Management 90 7.3.3. The Foreign Exchange Market 92 8. ProductionandPrices 95 8.1. Production 95 8.2. Prices 100
9. PublicFinance 107
10. EconomicOutlook 114
Corporate&AdministrativeReview
11. BankingServicesandCurrencyOperations 116 11.1. Banking Services 116 11.2. Currency Operations 117
12. PaymentsSystemDevelopments 119

13. FinancialLegislation 125
14. Administration 129
15. CompensationofSeniorExecutiveManagement 132
16. CalendarofMonetaryPolicyDevelopments 133
FinalAccountsfortheYearEnded31December2008
Abbreviations
ABM Automated Banking MachinesACH Automatic Clearing HouseACP African, Pacific and Caribbean (countries)AML Anti-money Laundering ASBA Association of Banking Supervisors of the Americas
BCBS Basel Committee on Banking SupervisionBCP Basel Core Principles for Effective Banking SupervisionBIS Bank for International SettlementsBOJ Bank of JamaicaBOP Balance of Payments
CAR Capital Adequacy RatioCARICOM Caribbean CommunityCD Certificate of DepositCFATF Caribbean Financial Action Task ForceCPC Chief Parliamentary CounselCFT Counter-Financing of TerrorismCGBS Caribbean Group of Banking Supervisorsc.i.f. Cost, insurance and freightCIFTS Customer Inquiry Funds Transfer SystemCPI Consumer Price IndexCSD Central Securities Depository
DJIA Dow Jones Industrial IndexDTI Deposit-taking InstitutionsDVBP Dollar Value of a Basis Point
ECI Export Credit InsuranceEPA Economic Partnership AgreementEU European UnionEWS Early Warning System EXIM National Export-Import Bank of Jamaica
FATF Financial Action Task ForceFed Federal Reserve (US)FIA Financial Institutions ActFID Financial Investigations DivisionFINSTAB Financial Stability DepartmentFISD Financial Institutions Supervisory DivisionFIU Financial Intelligence Unitf.o.b. Free on boardFSC Financial Services CommissionFY Fiscal Year
GCT General Consumption TaxGDP Gross Domestic Product

GFA Gross Foreign AssetsGKMA Greater Kingston Metropolitan AreaGOJ Government of Jamaica
HMF Honourable Minister of Finance
IADB Inter-American Development BankICBS International Conference of Banking SupervisorsIFRS International Financial Reporting StandardsIMF International Monetary FundIPCP Index of Primary Commodity PricesIPDF Insurance Policy Discounting FacilityIPI Import Price Index
JBDC Jamaica Business Development CentreJCCUL Jamaica Cooperative Credit Union LeagueJCSD Jamaica Central Securities DepositoryJGA Jamaica Guild of ArtistsJNBS Jamaica National Building SocietyJSE Jamaica Stock ExchangeJTB Jamaica Tourist Board
KYC Know Your Customer
LIBOR London Inter-bank Offer RateLRS Local Registered Stocks
MOU Memorandum of UnderstandingMPI Micro-prudential Index
NDA Net Domestic AssetsNIM Net Interest MarginNIR Net International Reserves NPL Non-Performing LoansNROCC National Road Operating & Construction Company
OMO Open Market OperationsOPEC Organization of Petroleum Exporting CountriesOUC Other Urban Centres
PAYE Pay As You Earn (income tax)PCB People’s Cooperative BankPCMB PanCaribbean Merchant Bank PD Primary DealersPDA Primary Dealers AssociationPOCA Proceeds of Crime ActPOS Point of Sale
RTGS Real Time Gross Settlement

SCT Special Consumption TaxSIPS Systemically Important Payments SystemSRC Scientific Research CouncilSSM Special Safeguard MechanismSWIPS System-wide Important Payment System
TCI Trade Credit Insurance
UK United KingdomUN United NationsUSA United States of America
VMBS Victoria Mutual Building SocietyVR Variable Rate
WASR Weighted Average Selling RateWATBY Weighted Average Treasury YieldWTI West Texas Intermediate (crude oil)WTO World Trade Organization

- � -
During 2008, the Jamaica Authorities were confronted with severe challenges emanating mainly from developments in the external
environment. The global economy was affected by rapid increases in international commodity prices in the first half of the year, particularly crude oil prices. In the second half of the year, the turmoil that characterized the global financial markets in 2007 intensified, which led to a sharp tightening of international credit conditions. The combined effect of the commodity price shock and the tightening of credit conditions led to recession in the major developed economies, particularly the United States (US). These developments, together with weather- related shocks during the year, had an adverse impact on the Jamaican economy.
Inflation in Jamaica remained elevated for the year. Over the first six months of the year, inflation in Jamaica accelerated to 11.5 per cent, compared to 4.7 per cent in the last half of 2007. This acceleration was influenced primarily by the sharp increases in international commodity prices. Against the background of a reversal in commodity prices over the second half of the year, a more moderate inflation rate of 4.8 per cent was realised for that period. Other factors affecting inflation for the year included supply shocks from adverse weather conditions and adjustments in administered prices. The impact of a sharp depreciation in the exchange rate on domestic prices was also evident in the last quarter. Consequently, the annual point to point inflation rate at December 2008 remained elevated at 16.8 per cent, similar to 2007.
The Jamaican economy contracted by 0.9 per cent in 2008, associated in part with weather-related shocks as well as the negative impact of the increase in commodity prices on consumer spending. This decline was in contrast to growth of 1.5 per cent in 2007. The main industries that contracted were Agriculture, Forestry & Fishing, Manufacture, Construction and Transport, Storage & Communication. Partly offsetting the impact of the declines in these sectors was growth in Financing & Insurance Services, Real Estates, Renting & Business Activities and Hotels & Restaurants.
The agriculture sector was adversely affected by the lagged impact of adverse weather conditions. For the manufacturing sector, the contraction was related in part to the slowdown in construction as the main cement producer curtailed production because of low demand. The decline in Construction was evident in private and public sector capital projects as well as residential construction. Transport, Storage & Communication was negatively affected by the slowdown in the growth of the travel industry.
There was a deterioration of 4.3 percentage points in the current account deficit of the balance of payments to 20.0 per cent of GDP in 2008. This deterioration was influenced principally by increases in the values of fuel and food imports, driven by the commodity price shocks. The deficit was also negatively affected by the cessation of banana exports because of the destruction of the crop by Tropical Storm Gustav.
Partly offsetting the impact of these changes were increased earnings from alumina, ethanol and
Economic and Financial System Review
1. Overview

Bank of Jamaica
- � -
mineral fuel exports, all associated with the increase in international commodity prices. Gross private remittance inflows also grew by 6.1 per cent in 2008, albeit slower than the 15.9 per cent expansion in 2007. The travel sub-account improved by US$104.3 million, related to a 3.9 per cent increase in stopover visitors. The growth in stopover visitor arrivals reflected the impact of the addition of new room capacity during the year. However, an estimated 3.1 per cent decline in the average length of stay of stopover visitors as well as a 7.7 per cent contraction in cruise visitor arrivals partly offset the impact of the increase in stopover arrivals on the travel sub-account
Within the financial account, private capital inflows were buoyed during the first half of the year by inflows from the sale of a local rum manufacturing company to a Trinidadian firm. Over the latter part of the year, flows were reversed by a significant increase in calls to repay margin arrangements on GOJ global bonds and the termination of some repurchase arrangements and lines of credit with overseas brokers and distributors. The margin calls occurred in the context of sharp reductions in the prices of GOJ global and Jamaican corporate bonds. Net official investment inflows also declined in 2008, reflecting a reduction of US$185.8 million in gross official receipts. Gross official inflows included proceeds from a Eurobond issue of US$350 million in February 2008. Taken in conjunction with official capital inflows, net private capital inflows were not sufficient to finance the deficit on the current account. As a result, the net international reserves (NIR) declined by US$104.8 million during the year.
The foreign exchange market was subject to considerable pressures in 2008, particularly in
the last quarter of the year. These pressures were largely related to an acceleration in the international financial crisis. Relative to the US dollar, the weighted average selling rate of the Jamaica Dollar depreciated by 12.2 per cent for the year, compared with 4.9 per cent in 2007. Some of the pressures in the market reflected the impact of the increase in commodity prices on imports and, consequently, foreign exchange demand. Over the latter half of the year, the pressures were largely related to the reduction in net private capital inflows. Most of the market instability occurred in the last quarter of the year when the exchange rate depreciated by 9.7 per cent, compared with average depreciation of 1.0 per cent over the first three quarters.
The Bank responded to the challenges of accelerating inflation and instability in domestic financial markets in 2008 in several ways. Early in the year, the Bank reintroduced the 365-day tenor to the spectrum of open market operations (OMO) instruments and offered variable rate instruments to the market. During the December 2008 quarter, the Bank established a special loan facility for security dealers and deposit taking institutions (DTIs) with US dollar liquidity needs to repay margin arrangements on GOJ global bonds. An intermediation facility in both foreign and local currency was also established to enhance the flow of credit in the system. The Bank increased interest rates on the entire spectrum of OMO instruments on two occasions during the December quarter by an average of 548 basis points (bps). The cash reserve requirement ratio was also increased to 11.0 per cent from 9.0 per cent. Throughout the year, the Bank sold foreign currency amounting to approximately US$917.8 million to the market, compared with US$1 329.0 million in 2007.
Overview

Annual Report 2008
- � -
In response to the deterioration in the macroeconomic environment, market-determined yields rose during the year, particularly in the last quarter. The Government of Jamaica’s (GOJ) weighted average treasury bill yields (WATBY) on the 3-month and 6-month instruments increased to 22.01 per cent and 24.45 per cent respectively, at the December 2008 auction, relative to 12.89 per cent and 13.34 per cent at the December 2007 auction.
Reflecting the overall slowdown in the Jamaican economy in 2008 and the relatively tighter monetary conditions, growth in the monetary base slowed to 9.6 per cent for the year, relative to 12.6 per cent in 2007. The growth in broad money supply (M3*) also decelerated sharply to 5.9 per cent from 15.9 per cent in 2007. Most of the components of M3* contributed to the slower rate of growth. There was also a slower rate of growth in the use of alternative means of payment, relative to the previous year.
The slower rate of growth in the money supply was influenced by the reduction in the NIR and an increase in the Bank’s OMO instruments, the former being largely due the Bank’s actions in the foreign exchange market over the year. The growth in BOJ OMOs was uneven throughout the year. Over the first half, there was strong demand for the Bank’s instruments, influenced by a widening of the differential between interest rates on US and Jamaica Dollar instruments. However, over the second half of the year, there was a contraction in outstanding OMOs, mainly associated with the uncertainties in the global financial markets and seasonal demand for currency.
For the period April to December 2008, the
Government incurred a deficit equivalent to 5.2 per cent of GDP, compared to the budgeted deficit of 4.3 per cent of GDP. The deviation from budget reflected a shortfall in revenue and grants, driven by the unanticipated slowdown in the domestic economy. The impact of the shortfall in receipts on the deficit was partly offset by expenditure restraint, particularly those for capital projects. The Government largely financed its operations from the domestic market.
The balance sheets of licensed DTIs were not immune to the developments in the international financial markets during 2008. The impact of these developments was primarily manifested in a decline of 6.6 per cent in the institutions’ investment portfolios and a tempering of equity growth. Cash and bank balances also grew marginally, related to the liquidation of placements at overseas institutions, some of which was to satisfy calls on their foreign liabilities. The overall growth in the assets of the DTIs consequently decelerated to 8.1 per cent, compared with 14.2 per cent for 2007.
In 2008, the prudential returns of the DTIs were subjected to more frequent stress testing by the Bank. Against the background of the intensifying global financial turmoil, the BOJ’s aggregate early warning systems showed some deterioration during the second half of the year. However, the stress tests revealed that the capital adequacy ratios (CARs) for the banking system remained above the 10.0 per cent minimum benchmark, in response to hypothetical market, credit and liquidity shocks.
The Bank continued the process of reviewing legislations and regulations during 2008. In relation to the consolidation of legislations governing the
Overview

Bank of Jamaica
- � -
operations of DTIs, focus was placed on current issues such as, inter-alia, the proposed role of credit bureaux and provisions for electronic reporting. The BOJ also revised two of its Standards during the year. In this regard, the Bank issued the Standard of Best Practice for the Effective Corporate Governance in DTIs, which established the minimum expectations for an effective governance framework in these entities. The second, Revised AML/CFT Guidance Notes, incorporated the provisions of the Proceeds of Crime Act (POCA) and the POCA (Money Laundering Prevention) Regulations.
Regulations to establish the supervisory regime that will be applicable to credit unions were completed in 2008. This Bill will restrict the deposit-taking activities of cooperative societies to those which operate as credit unions. Secondly, it will bring credit unions under the regulatory ambit of the Minister of Finance and the Bank of Jamaica.
The Bank advanced the modernization of the payments and settlement infrastructure in 2008. A significant milestone was achieved in terms of the delivery of the software for the Real Time Gross Settlement (RTGS) System and the Central Securities Depository (CSD) to the Bank in September 2008. The Bank was also able to train and certify all participants in the use of both systems by end-2008. Another important milestone was the drafting of the rules and procedures that will guide the systems.
The outlook for the domestic economy in 2009 is for a moderation in inflation, despite the potential effect of the accelerated exchange rate depreciation which obtained in the latter part of 2008. It is anticipated that the fall in inflation will occur in the context of a
decline in GDP, higher unemployment and tightened credit conditions. This projection is also based on the expectation that the global recession will deepen during the year. The maintenance of relative stability in the foreign exchange market will be the main challenge for the Bank in 2009.
Overview

- � -
�.�. Monetary Policy Management�.�.�. Introduction
During 2008, the Bank tightened monetary policy sharply in response to severe challenges emanating from adverse
developments in the external environment. This was in addition to measures taken to ease liquidity constraints in the foreign exchange market. The challenges, some of which were unprecedented, were manifested in accelerated inflation during the first half of the year and instability in the financial markets, particularly the foreign exchange market, during the second half of the year. The acceleration in inflation was primarily influenced by the impact of sharp increases in global commodity prices, particularly those for energy and grains. A trend reversal of these prices started in the September quarter, influenced by a reduction in global demand, due to an intensification of the global credit crisis. This was triggered by the collapse of two large financial institutions in the US which heightened uncertainty in global financial markets and led to severe tightening in the credit market. As a result of these developments, significant imbalances emerged in the Jamaican foreign exchange market reflecting extraordinary foreign exchange needs of domestic financial institutions and firms. This also had an adverse impact on inflation.
�.�.�. Developments and ChallengesThe acceleration in inflation which began in the December 2007 quarter and continued into the first half of 2008, presented a major challenge for the Central Bank in its management of inflation. The impetus to domestic price adjustments was fuelled
mainly by sharp increases in international commodity prices, due to rising demand for commodities in emerging economies, mainly China. The impact of this demand was exacerbated by supply shortages as a number of countries implemented export bans on certain commodities in response to concerns about domestic food security. In addition, there was continued speculation in commodities futures markets, given the weakness in the US dollar. Crude oil and rice prices, in particular, rose by 38.9 per cent and 138.6 per cent, respectively, between December 2007 and end-July 2008. Consequently, annual inflation rose to 26.5 per cent by July 2008. The acceleration in inflation contributed to heightened demand for foreign currency and consequently some instability in the foreign exchange market as investors sought a hedge. These problems were exacerbated by high Jamaica Dollar liquidity. In this context, the challenge for the Central Bank between January and June 2008 was to temper medium-term inflation expectations by limiting the pass-through of rising commodity prices to underlying inflation.
The Bank responded to these developments by increasing interest rates on three occasions during the first half of 2008 (see Chart �). In addition, on 16 January 2008, the Bank reintroduced the 365-day tenor with a large premium.1 The Bank also offered a special variable rate instrument as well as its regular menu of open market instruments, and sold foreign currency during the first half of the year to the market to mitigate inflationary impulses (see Table �A). The resultant widening of the interest rate differential
1 This tenor had been removed from the spectrum of open market instruments in April 2006
2. The Financial System

Bank of Jamaica
- � -
between Jamaica Dollar and foreign-currency denominated assets influenced unwinding of foreign currency holdings by some investors.
There was a subsequent decline in the rate of inflation during the second half of the calendar year. The deceleration in inflation was strongly influenced by the decline in oil and commodity prices, particularly since September. The Bank, however, remained severely challenged to meet its monetary policy objectives due to the impact of heightened instability in the global financial markets on Jamaica’s foreign exchange market. There was a significant increase in calls on Jamaican financial institutions to repay external margin arrangements on GOJ global bonds and the termination by overseas brokers and distributors of some repurchase arrangements and lines of credit. Further, there was also a reduction in US dollar supply from major foreign currency earners as well as from remittances. This was exacerbated by the strong seasonal demand for foreign currency in the latter part of the year. The domestic money market was also affected, albeit to a lesser extent, as some institutions were reluctant to extend credit in the inter-bank market. This was in the context of high levels of Jamaica Dollar liquidity concentrated within a few institutions. In light of these developments, the exchange rate depreciated sharply in the December quarter (see Foreign Exchange Market).
The Bank responded to these later challenges with a number of measures. On 15 October, 2008, the Bank established a US dollar Special Loan Facility for securities dealers and DTIs. An Intermediation Facility in foreign currency was established on 12 November 2008 to enhance the flow of credit in the system. This facility was also extended to include
Jamaica Dollar transactions. The Bank also tightened monetary policy by increasing interest rates across the entire spectrum of OMO instruments on two occasions during the December quarter. In addition, the Bank offered a 15-day special certificate of deposit (CD) during 18-19 November 2008, to absorb excess liquidity. Upon the maturity of this instrument, the Bank increased the required cash reserve ratio on prescribed Jamaica Dollar liabilities to 11.0 per cent from 9.0 per cent, effective 03 December 2008. The Bank also signalled that the reserve ratio would be further increased by 3.0 percentage points in the ensuing months if economic conditions necessitated this action (see Table �A).
�.�.�. Base Money ManagementIn the context of these challenges, the monetary base expanded by $6.2 billion or 9.6 per cent in 2008, relative to 12.6 per cent in 2007, and the end-December programme target of 12.6 per cent. The expansion in the monetary base reflected an increase of $1.8 billion or 3.8 per cent in net currency issue, and a net increase of $4.7 billion or 27.4 per cent in the cash reserves. The deceleration in the growth of the monetary base, relative to 2007 was influenced mainly by a contraction of 11.7 per cent for the first two quarters of the calendar year, reflecting a 16.6 per cent reduction in net currency issue.
Base money expanded by 24.0 per cent for the second half of 2008, mainly due to a 24.2 per cent expansion in the final quarter of the year. This reflected a seasonal increase in currency issue as well as a net increase of 21.7 per cent in the cash reserves, consequent on the increase in the statutory requirement. Net currency issue increased by 24.5 per cent for the second half of 2008. This contributed
The Financial System

Annual Report 2008
- � -
to annual growth of 3.8 per cent as at end-2008, relative to growth of 11.6 per cent and 18.7 per cent in 2007 and 2006, respectively. The deceleration in the annual growth in currency was attributed to a decline in real wages and increased unemployment.The expansion in the monetary base reflected an increase of $14.0 billion in net domestic assets (NDA), mainly reflecting a net drawdown of $11.3 billion on Government deposits at the Bank as well
Table �A
INTEREST RATES ON BANK OF JAMAICA SPECIAL INSTRUMENTS �008
Variable Rate Fixed RatePeriod of Issue
Certificate of Deposit Margin Certificate of
Deposit18 Jan. - 22 Jan. 12.80% 1.5001 Sept. - 5 Sept 14.58% 1.25018 Nov. - 19 Nov. 20.50%
as an increase in BOJ holdings of GOJ securities (see Table �B). The liquidity emanating from these impulses was partly reabsorbed through net placements of $17.2 billion on OMO securities. Absorption was also effected through the Bank’s net sales of foreign currency to the market which contributed to a decline of US$104.8 million or $7.8 billion in the NIR (see Table �B).
Chart �
The Financial System

Bank of Jamaica
- 8 -
Table �B
BANK OF JAMAICA - SUMMARYFLOWS - J$MN
�00� �008 �008Total Jan - Mar Apr - Jun Jul - Sept Oct - Dec Total
Net International Reserves (US$) -��9.8 �0�.� ���.� ��.� - ��8.� - �0�.8NET INT’L RESERVES (J$) -�0 �8�.� �� �9�.8 �0 ��8.� � ���.� -�� ��0.� -� �9�.8Assets -34 660.2 14 390.3 26 681.0 -14 230.5 -35 163.5 -8 322.6Liabilities 4 074.6 403.5 16 222.4 15 845.6 503.1 32 974.6
NET DOMESTIC ASSETS �� 8��.� -�� �08.� -�� ��8.0 -� �8�.� �8 �88.� �� 0��.�
Net Claims on Public Sector ���.8 � ���.� ���.9 -� 8��.� �0 ���.9 �8 9��.� - Central Govt. Deposits 6 079.0 701.9 -18 390.3 7 111.3 21 911.8 11 334.6 - Govt. Securities -13 260.2 61.2 1.6 5 968.1 7 719.0 13 749.9 - Other 7 506.9 2 126.0 18 936.7 -17 906.6 844.1 4 000.2
Net Credit to Banks -2 115.8 - 599.9 469.3 - 771.3 - 10.6 - 912.5Open Market Operations 40 015.7 -23 437.8 -12 656.6 4 615.9 14 291.0 -17 187.5Other - 358.4 62.6 919.9 - 704.8 3 833.1 4 110.8
MONETARY BASE � �8�.� -� ���.� -� �99.� - ��.� �� 9�8.0 � ���.�
- Currency Issue 4 903.4 -6 975.4 - 861.5 - 442.9 10 084.8 1 805.0 - Cash Reserve 2 438.1 390.2 416.9 334.0 3 582.5 4 723.6 - Current Account - 59.9 170.4 - 754.8 36.6 260.7 - 287.0
Memo:NIR Stock (US$MN) e.o.p.) 1 877.7 2 083.4 2 228.8 2 251.1 1 772.9 1 772.9Growth in Monetary Base (%) 12.6 - 9.8 - 2.0 - .1 24.2 9.6Inflation (%) 16.8 5.2 6.0 4.7 .0 16.9
The Financial System
Annual Report 2008
- 9 -
Table �C
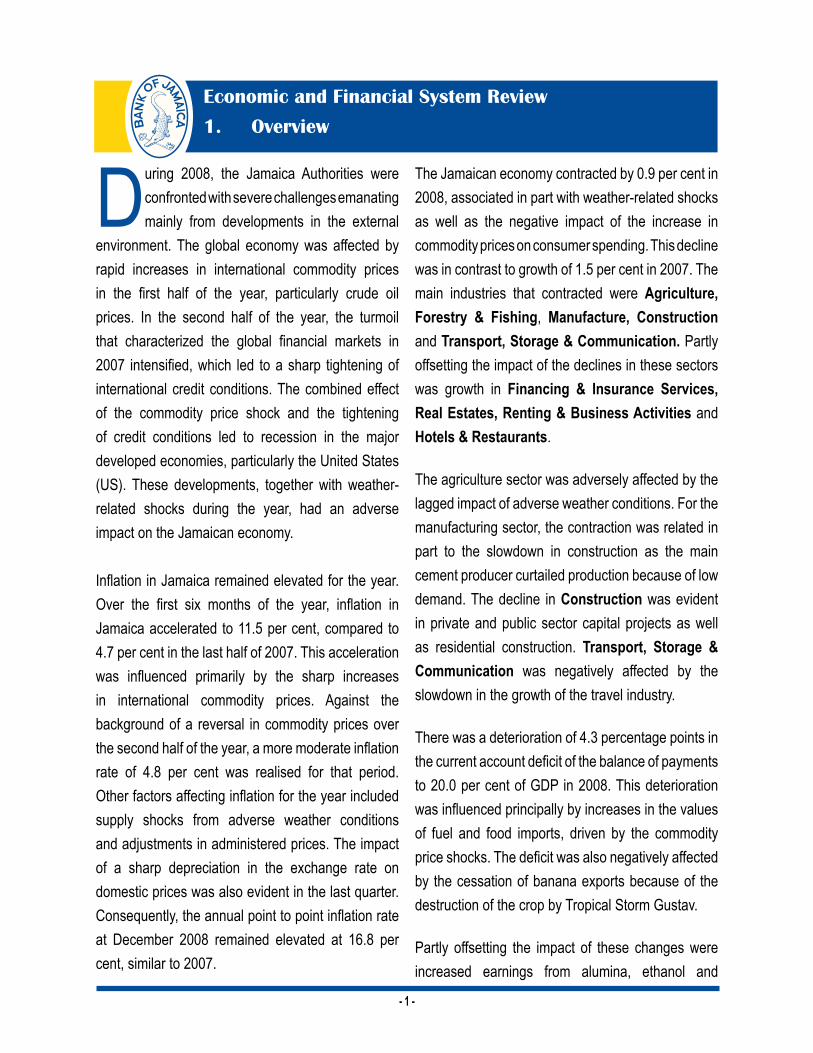
BANK OF JAMAICA - ECONOMIC PROGRAMME TARGETS STOCKS - J$MNDecember �008
Target Outturn Deviation FromTarget
Net International Reserves (US$) 1 707.7 1 772.9 65.2
NET INT’L RESERVES (J$) 130 056.9 128 520.4 -1 536.5
NET DOMESTIC ASSETS -56 552.1 -57 021.8 - 469.7
MONETARY BASE 73 504.8 71 498.6 -2 006.2
The Financial System

Bank of Jamaica
- �0 -
�.�. Money Supply
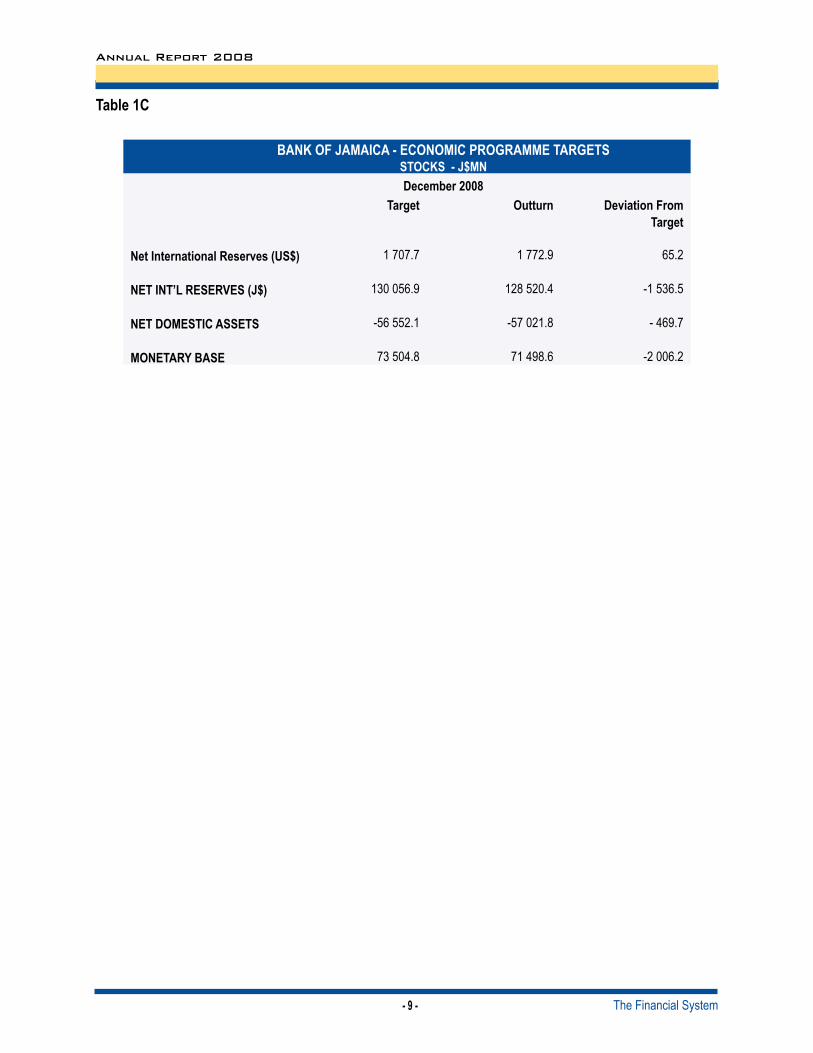
During 2008, growth in broad money supply, M3*2 decelerated sharply to 5.9 per cent from 15.9 per cent in 2007 (see Table �). With the exception of Other Deposits, all the components of M3* contributed to the slower rate of growth. The deceleration in M3* was influenced by the slowdown in economic activity.
The aggregate of currency in circulation and demand deposits, M1*, declined by 4.8 per cent, compared with an expansion of 20.4 per cent in 2007. Growth in Currency with the Public decelerated to 3.2 per cent in 2008 from 13.7 per cent in 2007. This translated into a real reduction of 11.6 per cent for 2008, relative to a real growth of 2.7 per cent for 2007. There was a faster rate of growth in the use of alternative means of payment such as point-of-sale (POS) transactions, predominantly credit cards, consistent with a reduction in real wages (see Table �).
Table �ALTERNATIVE MEANS OF PAYMENT TO CASHAnnual Growth �00� �008
Value (%) 40.3 24.9 Volume (%) 6.6 15.9 Value (J$MN) 22 437.1 19 431.9
Demand deposits declined by 9.9 per cent, relative to an expansion of 25.0 per cent in 2007. This reduction reflected a 43.8 per cent decline in demand deposits denominated in foreign currency as well as a slower rate of growth in the local currency component. The reduction in foreign currency demand deposits reflected a decline in the deposits of business firms
2 Money supply M3* is defined as M2* plus Other Deposits. M2* represents banking system domestic and foreign currency liabilities to the private sector in the form of notes and coins as well as demand, time and saving deposits. Other Deposits are largely comprised of commercial banks’ reserves.
and the tightness in the domestic and overseas credit markets.
Growth in Quasi Money decelerated to 9.4 per cent in 2008 from 14.9 per cent in 2007 (see Table �). This slower rate of growth was reflected in both savings and time deposits, in particular, the foreign currency component. The deceleration in these foreign currency deposits was influenced by a widening of the interest rate differential between US and Jamaica Dollar instruments as well as tightness in the overseas credit market.
The slower rate of growth in M3* was influenced by a reduction in the NIR and a build-up in BOJ open market instruments. The reduction in the NIR was largely due to the Bank’s sale of foreign currency to the market. There was strong demand for BOJ open market instruments during the first half of the year, influenced by the widening of the differential between US and Jamaica Dollar instruments. However, with increased uncertainty in the global and domestic markets as well as the need to pay for currency orders and finance the cash reserve increase in December, there was a net unwinding of OMO instruments in the second half of the year.
The expansion in M3* was largely due to increases in banking sector credit to the private and public sectors. Growth in private sector credit slowed during 2008 and reflected a reduced rate of expansion in local currency loans. The slowdown was primarily reflected in Distribution, Personal Loans and Transport (see Commercial Banks). The increase in credit to the public sector was concentrated in the final quarter of the year and reflected a net drawdown of Government deposits at the BOJ as well as an increase in BOJ holdings of GOJ securities.
The Financial System
Annual Report 2008
- �� -
Table �
MONEY SUPPLY, M�*
(DOMESTIC AND FOREIGN CURRENCY)(FLOWS)
�00� �008 �00� �008 (J$M) (J$M) % % Money Supply (M�)* �� 999.� �� �8�.� ��.� �.�
Money Supply (M�)* �� 8��.� -� �0�.� �0.� -�.8 Currency with the public 4 894.0 1 320.9 13.7 3.2 Demand Deposits 12 920.1 -6 425.1 25.0 -9.9
Quasi Money �� �8�.0 �8 �8�.� ��.9 9.� Savings Deposits 18 590.4 12 069.5 14.4 8.2 Time Deposits 6 594.6 6 316.0 16.2 13.3 Other Deposits � �0�.� 8 ��0.8 ��.� ��.� Total Money Supply (M�)* �9 �0�.� �� ���.� ��.9 �.9 Net Foreign Assets -�� ���.0 -�8 9��.� -��.� -��.� Bank of Jamaica -30 585.4 -6 544.7 -16.5 -4.8 Commercial Banks 4 462.4 -32 371.4 -22.5 210.3 Credit to Private Sector �� �80.8 �� �0�.� �8.� ��.�
Local Currency 20 929.9 17 763.3 24.1 16.5Foreign Currency 16 250.9 27 438.8 37.9 46.4
Net Claims on Public Sector �� ���.� �� �98.9 8.� ��.8Net Claims on Financial Institutions -� �90.� -� ���.� ��.� ��.�BOJ Open Market Operations �0 0��.� -�� �8�.� -��.9 ��.0Other Items (Net) -�� ���.� 8 ���.� -��.9 ��8.�
TOTAL �9 �0�.� �� ���.� ��.9 �.9
The Financial System

Bank of Jamaica
- �� -
�.�. Commercial Banks�.�.�. OverviewThe consolidated balance sheet of the commercial banks showed continued growth during 2008, albeit at a slower rate relative to 2007. This slowdown was in spite of the addition of PanCaribbean Bank, which was converted from a merchant bank in June 2008. The entry of PanCaribbean Bank increased the number of entities in the group to seven.
The deceleration in asset growth mainly reflected a reduction in the institutions’ placements with overseas banks, Investments as well as a slowdown in the rate of growth in Loans which was offset by a notable build-up in Balances with the Bank of Jamaica. The latter reflected placements in the BOJ’s foreign currency deposit facility as well as an increase in the cash reserve requirement of the deposit taking institutions (DTIs) to 11.0 per cent from 9.0 per cent on 03 December. The adjustment led to an increase in the liquid asset ratio for the banking sector to 25.0 per cent from 23.0 per cent.
The slower rate of expansion in the banks’ asset base occurred in the context of a significant deceleration in the rate of growth in local currency deposits. Commercial banks were also able to garner increased financing from their overseas affiliates in spite of the general tightening in the global financial markets.
During the year, there was a worsening in the banks’ asset quality, as reflected in an increase in past due loans, relative to the stock of loans.
�.�.�. Assets and Liabilities The commercial banks’ asset base increased by 11.6 per cent in 2008, relative to an expansion of
14.3 per cent in 2007 (see Table �). Abstracting for the impact of the new bank, the sector would have grown by 9.0 per cent in 2008. This slower rate of growth reflected reductions in the institutions’ Cash and Bank Balances with commercial banks and Investments as well as a marginal slowdown in the rate of growth in Loans. Balances with overseas banks were drawn down mainly in the final quarter of the year in the context of the intensification of the global financial crisis. Investments also declined during this quarter as banks unwound BOJ and GOJ securities. The impact of this was partly offset by an increase in the holdings of foreign government securities by one institution during December (see Table �). As a consequence, commercial banks’ holdings of securities as a proportion of total assets declined to 29.3 per cent at end-2008 from 34.3 per cent in 2007. The proceeds from the securities which were unwound as well as the cash and bank balances received from overseas banks financed the build-up in deposits with the Bank of Jamaica.
There continued to be strong growth in the banks’ stock of loans, which expanded by 26.3 per cent in 2008 relative to 27.5 per cent in 2007.3 The marginal deceleration was reflected in a slowdown in local currency denominated loans as there was acceleration in the foreign currency component, partly due to exchange rate depreciation (see Section �.�.�). Notwithstanding the slowdown in loans, the share of total loans in total assets increased to 44.5 per cent, the highest proportion for the four-year period ended December 2008 (see Chart �).
3 The commercial banks’ stock of loans refers to aggregate book value of all extensions of credit, net of the provisions for losses.
The Financial System

Annual Report 2008
- �� -
Table �COMMERCIAL BANKS
SUMMARY OF ASSETS AND LIABILITIES (J$MN) Stock Flows Flows Flows % % %
�008 �00� �00� �008 �00� �00� �008
ASSETS (�) ��� ���.� �� 8��.� �0 8��.� �� �88.� ��.� ��.� ��.�Cash and Bank Balances 102 570.3 7 112.3 11 254.3 7 736.0 9.3 13.5 8.2 Placements with Overseas Banks 31 451.2 5 194.4 6 620.5 -9 950.8 17.6 19.0 -24.0 Due from BOJ 46 609.4 2 612.3 1 208.3 16 672.0 10.0 4.2 55.7
Other Accounts desig. as Liquid 10 544.9 1 556.0 -3 206.0 9 694.9 62.2 -79.0 1140.6 Cash Reserve 36 064.6 2 514.7 4 414.3 6 977.2 11.3 17.9 24.0
Investments 156 439.7 31 471.6 4 644.8 -6 938.1 24.7 2.9 -4.2 -Domestic Currency 96 790.4 15 160.8 -1 819.9 -7 492.9 16.7 -1.7 -7.2
BOJ Securities 35 098.3 11 603.2 -5 739.1 -1 261.6 38.0 -13.6 -3.5 Jamaica Government Securities 57 691.2 2 506.4 5 788.9 -5 468.1 4.6 10.1 -8.7 -Foreign Currency 59 649.3 16 310.8 6 464.7 0 554.8 44.9 12.3 0.9
Ja. Gov. Foreign Securities 45 793.8 7 921.6 5 804.4 -1789.1 23.4 13.9 -3.8Foreign Govt. Securities 3 399.9 153.1 1.1 3 245.7 0.0 0.7 2 104.8Other Foreign Securities 10 455.6 8 236.1 659.2 -901.8 334.5 6.2 -7.9
Securities Purchased for resale 3 334.4 2 448.2 -3 196.0 -650.5 51.7 -44.5 -16.3Loans (Net of provisioning) 242 479.4 21 338.9 41 473.5 50 427.0 16.5 27.5 26.3
Domestic 132 797.8 14 939.0 22 880.8 17 859.1 19.4 24.9 15.5Foreign 113 369.7 6 414.9 18 745.2 33 233.2 11.7 30.5 41.5Accounts Receivable 13 054.7 -523.6 -102.2 6 647.7 -7.4 -1.6 103.8Fixed Assets 9 435.7 333.0 355.7 1 024.1 4.3 4.4 12.2Other Assets 17 339.3 695.8 6 435.9 -1 557.7 5.9 51.6 -8.2 LIABILITIES & CAPITAL ��� ���.� �� 8��.� �0 8��.� �� �88.� ��.� ��.� ��.�Deposits 333 960.0 36 660.6 38 233.2 12 801.3 14.9 13.5 4.0 Domestic 205 487.7 26 976.9 22 540.5 7 091.9 18.1 12.8 3.6 Foreign 128 472.4 9 683.8 15 692.7 5 709.4 9.9 14.7 4.7Due to Bank of Jamaica 197.1 -51.9 -149.2 163.7 -22.1 -81.7 489.8Due to Commercial banks 65 911.2 11 600.3 4 574.3 22 745.1 43.0 11.9 52.7
Domestic currency 1 151.4 -158.7 1 097.5 -781.2 -16.0 131.4 -40.4Foreign Currency 64 759.8 11 759.0 3 476.8 23 526.2 45.2 9.2 57.1
Head Off./Parent Co. 11 015.7 768.2 265.7 4 862.7 15.0 4.5 79.0 Overseas banks 53 358.5 10 577.9 3 883.2 18 278.0 51.3 12.4 52.1
Due to Specialised Institutions 4 512.2 286.4 -202.2 503.0 7.3 -4.8 12.5Securities sold under Repurchase Agreements 24 990.4 -3 397.7 7 014.7 4 843.6 -20.6 53.4 24.0Other Liabilities 52 067.5 10 783.2 6 369.9 9 556.2 42.5 17.6 22.5Capital Account 63 015.1 6 995.2 5 025.4 6 075.7 15.6 9.7 10.7 (1) Assets exculde contingent accounts Data account for provisioning Investments and Cash and Bank Balances adjusted to reflect reclassification of Certificates of Deposit from “other accounts designated as liquid” to BOJ securities
The Financial System

Bank of Jamaica
- �� -
Chart � Loans and Securities as a Proportion of Commercial Banks’ Assets
Chart �The Composition of Commercial Banks’ Assets
at �� December �00� and �� December �008
The slower growth in the banks’ assets during 2008 occurred in the context of a significant deceleration in the rate of growth of deposits, particularly in the first half of the year (see Table �). Growth in local currency deposits slowed to 3.6 per cent, well below the average of 11.0 per cent in the last five calendar years. This development could be attributed to a slowdown in economic activity and the fallout in the alternative investment schemes which affected deposits. The slower build-up in private sector deposits was also evident in the foreign currency
component and reflected a decline in demand deposits as well as lower rates of growth in savings and time deposits. In contrast, there was robust expansion in other deposits which includes ‘funds held by overseas residents’.
The deceleration in foreign currency deposits, primarily demand deposits, largely occurred during the second half of 2008. In particular, there was a reduction in foreign currency deposits of business firms. In contrast, during the last quarter of the year,
The Financial System

Annual Report 2008
- �� -
individuals accumulated holdings of foreign currency deposits in the context of the general uncertainty. Consequently, the ratio of these deposits to total private sector deposit liabilities was 30.1 per cent at end-2008, relative to 30.6 per cent at end-2007 (see Chart �).
Consequent on the sharp deceleration in the growth of deposits, the commercial banks recorded a notable expansion in funds due to commercial banks overseas during 2008. The growth rate of this source of financing increased to 52.1 per cent during 2008 from 12.4 per cent in 2007.
Table �COMMERCIAL BANKS’
TOTAL DEPOSITS (J$MN) Stocks Flows Flows Flows % % % �008 �00� �00� �008 �00� �00� �008 Deposits 336 613.1 38 156.8 37 872.3 13 861.0 15.5 13.3 4.3 Private Sector 271 199.2 22 500.3 38 105.0 11 903.4 11.3 17.2 4.6 Demand /1 58 101.4 8 557.4 12 920.1 -6 482.2 19.9 25.0 -10.0 Savings 159 359.6 12 905.0 18 590.4 12 069.6 11.1 14.4 8.2 Time 53 738.3 1 037.9 6 594.6 6 316.0 2.6 16.2 13.3 Government 29 935.6 14 518.1 0 436.4 -6 671.8 67.0 1.2 -18.2 Other 35 478.3 1 138.4 -0 669.1 8 629.4 4.3 -2.4 32.1
/1 Deposits adjusted for Net Items in the Process of Collection
Table �COMMERCIAL BANKS’
LOCAL AND FOREIGN CURRENCY DEPOSITS /�(PRIVATE SECTOR) (J$M)
Stocks Flows Flows Flows % % % �008 �00� �00� �008 �00� �00� �008 Private Sector Deposits 271 199.2 22 500.3 38 105.0 11 903.4 11.3 17.2 4.6Local Currency 168 966.3 20 391.5 15 660.2 7 296.7 16.2 10.7 4.5Foreign Currency 102 232.9 2 108.8 22 444.8 4 606.7 2.9 29.9 4.7
/1 Deposits adjusted for Net Items in the Process of Collection
The Financial System

Bank of Jamaica
- �� -
Chart � FOREIGN CURRENCY DEPOSITS TO TOTAL DEPOSITS
December �00� to �008
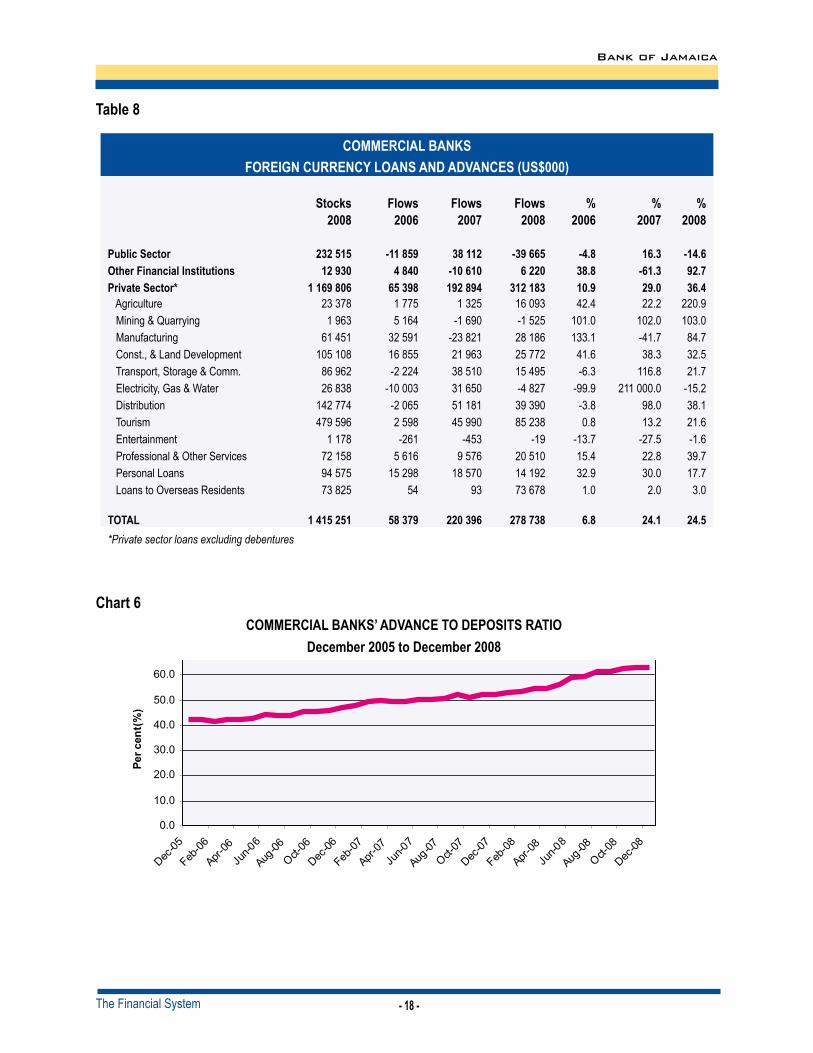
�.�.�. Loans and AdvancesThe stock of commercial bank loans and advances at end-2008 reflected a slower rate of increase of 26.2 per cent, relative to an expansion of 27.1 per cent in 2007(see Table �). This was in spite of PanCaribbean Bank adding $5.9 billion to the loan stock during the year, 78.0 per cent of which was denominated in foreign currency. The slowdown was influenced by a reduction in loans to the public sector as loans to other financial institutions increased while the growth in loans to the private sector was flat, relative to 2007. In real terms, however, the growth in the total stock of loans and advances decelerated to 8.0 per cent in 2008, compared to 8.8 per cent in 2007. Loans outstanding to the private sector continued to dominate the commercial banks’ loan portfolio, accounting for 87.0 per cent at end- 2008, compared to 83.4 per cent at end-2007.
Commercial banks’ loans to the private sector grew by 31.7 per cent in 2008, relative to an increase of 31.1 per cent in 2007. The growth in 2008 was primarily
reflected in Tourism, Personal Loans, Professional & Other Services and Overseas Residents. Loans to Tourism were largely denominated in foreign currency and reflected financing for working capital as well as the purchase of a property by one institution (see Table 8). Growth in Personal Loans decelerated to 15.2 per cent, relative to an increase of 31.8 per cent in 2007. This slower growth reflected a deceleration in the growth in instalment credit which includes financing for motor cars. Growth in loans for motor cars slowed to 19.8 per cent in 2008, relative to 63.0 per cent in 2007. This lower growth may be attributed largely to higher interest rates, adjustments to Government’s motor vehicle import policy as well as a decline in real income and the general slowdown in the economy. There was strong growth in loans to Overseas Residents which was predominantly used to finance payment of dividends. This expansion contributed to an increase in the proportion of foreign currency loans to total loans and advances to 46.1 per cent at end-2008 from 41.1 per cent at end-2007.
The Financial System

Annual Report 2008
- �� -
Table �
COMMERCIAL BANKS’TOTAL LOANS AND ADVANCES (J$MN)
Stocks Flows Flows Flows % % % �008 �00� �00� �008 �00� �00� �008 Public Sector �0 ���.� -� ���.� � ���.� -88�.8 -��.� ��.� -�.8Other Financial Institutions � ��0.� ���.� -���.0 ��0.� ��.� -��.� ��.8Private Sector ��� ���.� �� ���.� �8 ���.8 �� ��9.� ��.� ��.� ��.� Agriculture and Fishing 4 588.1 466.8 -134.7 2 424.3 25.5 -5.9 112.0 Mining and Quarrying 700.9 390.5 -130.1 187.5 154.3 -20.2 36.5 Manufacturing 9 302.6 1 187.3 393.8 3 043.5 25.4 6.7 48.6 Construction & Land Development 12 902.1 2 533.2 931.8 3 924.7 46.0 11.6 43.7 Transport, Storage & Communication 11 468.2 -1 503.5 4 485.6 3 276.8 -28.9 121.0 40.0 Tourism 40 769.0 1 364.6 5 280.5 11 206.2 6.0 21.7 37.9 Distribution 23 099.6 4 918.7 5 159.0 4 370.8 56.9 38.0 23.3 Professional & Other Services 16 769.6 1 556.4 2 589.3 4 943.1 20.3 28.0 41.8 Personal Loans 84 877.3 14 761.9 17 780.4 11 175.3 35.9 31.8 15.2 Electricity, Gas & Water 3 353.5 -556.2 2 215.2 948.1 -74.5 1 165.3 39.4 Entertainment 414.8 17.1 - 5.5 129.0 6.2 -1.9 45.1 Overseas Residents 5 986.2 19.5 10.2 5 940.1 118.8 28.4 12 883.5 TOTAL ��� ���.� �� 09�.� �� ���.0 �� 09�.� ��.9 ��.� ��.�
* Private Sector loans exclude debentures
Chart �
Distribution of Private Sector Loans and Advancesas at �� December �00� and �� December �008
The Financial System
Bank of Jamaica
- �8 -
Table 8
COMMERCIAL BANKSFOREIGN CURRENCY LOANS AND ADVANCES (US$000)
Stocks Flows Flows Flows % % % �008 �00� �00� �008 �00� �00� �008 Public Sector ��� ��� -�� 8�9 �8 ��� -�9 ��� -�.8 ��.� -��.�Other Financial Institutions �� 9�0 � 8�0 -�0 ��0 � ��0 �8.8 -��.� 9�.�Private Sector* � ��9 80� �� �98 �9� 89� ��� �8� �0.9 �9.0 ��.� Agriculture 23 378 1 775 1 325 16 093 42.4 22.2 220.9 Mining & Quarrying 1 963 5 164 -1 690 -1 525 101.0 102.0 103.0 Manufacturing 61 451 32 591 -23 821 28 186 133.1 -41.7 84.7 Const., & Land Development 105 108 16 855 21 963 25 772 41.6 38.3 32.5 Transport, Storage & Comm. 86 962 -2 224 38 510 15 495 -6.3 116.8 21.7 Electricity, Gas & Water 26 838 -10 003 31 650 -4 827 -99.9 211 000.0 -15.2 Distribution 142 774 -2 065 51 181 39 390 -3.8 98.0 38.1 Tourism 479 596 2 598 45 990 85 238 0.8 13.2 21.6 Entertainment 1 178 -261 -453 -19 -13.7 -27.5 -1.6 Professional & Other Services 72 158 5 616 9 576 20 510 15.4 22.8 39.7 Personal Loans 94 575 15 298 18 570 14 192 32.9 30.0 17.7 Loans to Overseas Residents 73 825 54 93 73 678 1.0 2.0 3.0 TOTAL � ��� ��� �8 ��9 ��0 �9� ��8 ��8 �.8 ��.� ��.�*Private sector loans excluding debentures
Chart � COMMERCIAL BANKS’ ADVANCE TO DEPOSITS RATIO
December �00� to December �008
The Financial System

Annual Report 2008
- �9 -
The ratio of total non-performing loans to total loans increased to 2.6 per cent at end-2008, from 2.0 per cent at end-2007 and 2.2 per cent at end-20064. The ratio of commercial banks’ loans to deposits increased to 62.7 per cent at end-2008, from 52.3 per cent at end-2007 (see Chart �).
�.�.�. Liquid AssetsTotal liquid assets of the commercial banks increased by 25.8 per cent in 2008. This largely reflected higher 4 Non-performing loans are classified as loans past due for three
months and over. The international maximum benchmark for non-performing loans is 10.0 per cent.
holdings of short-term instruments due to increased uncertainty as well as the increase in the required liquid assets ratio. At end-2008, the ratio of average liquid assets to prescribed liabilities increased to 37.4 per cent from 30.0 per cent at end-December 2007 (see Table 9). With the higher holdings of securities, the banks’ excess reserves as a proportion of prescribed liabilities increased to 12.4 per cent at end-2008 from 7.0 per cent at end-2007.
Table 9COMMERCIAL BANKS
LIQUID ASSETS �00� �00� �008 Dec Dec Mar Jun Sep DecStatutory Liquidity (%) Cash Reserve Ratio 9.0 9.0 9.0 9.0 9.0 11.0 Liquid Assets Ratio 23.0 23.0 23.0 23.0 23.0 25.0 Average Liquid Assets Holdings (%) 42.3 30.0 33.4 36.7 39.7 37.4 Liquid Assets (J$BN)
Notes and Coins 6.5 6.5 7.0 3.9 5.3 7.0Current Account 1.3 2.9 1.4 0.5 0.5 1.4Cash Reserve 14.8 17.3 17.7 18.1 18.4 22.0Treasury Bills 1.2 2.1 1.9 1.6 1.5 0.8Local Registered Stocks* -2.3 -1.9 -1.2 -2.0 -0.8 -0.7Other Government Securities 1.3 2.2 1.7 3.4 3.6 4.4BOJ Open Market Instruments 42.1 30.9 35.6 38.5 46.3 34.3Other Placements with BOJ 4.1 0.9 4.3 4.5 6.4 3.2Repo Agreements with counter-parties 1.4 1.5 0.2 0.7 0.9 0.2
Total 70.4 62.4 68.6 69.2 82.1 72.6 Prescribed Liabilities (J$BN) 164.7 191.7 196.1 201.0 204.5 178.2Excess Reserves (J$BN) 31.7 13.5 20.5 27.5 34.2 22.2*Net of securities pledged as collateral
The Financial System
Bank of Jamaica
- �0 -
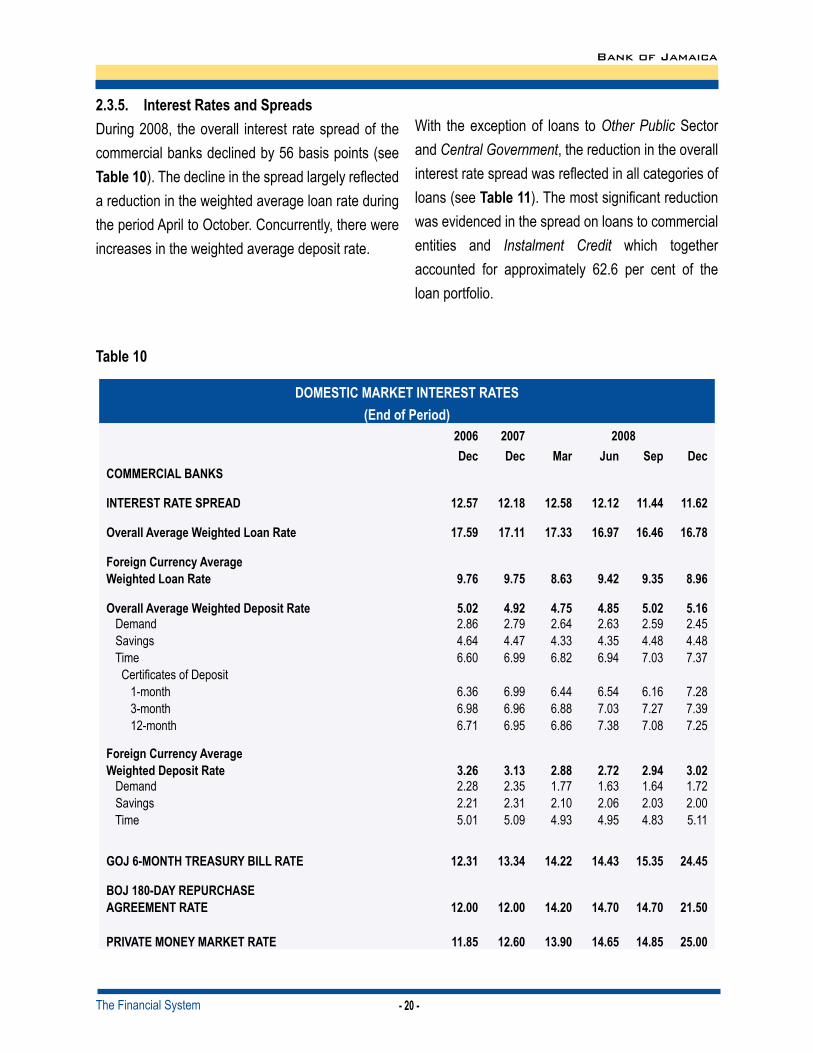
�.�.�. Interest Rates and SpreadsDuring 2008, the overall interest rate spread of the commercial banks declined by 56 basis points (see Table �0). The decline in the spread largely reflected a reduction in the weighted average loan rate during the period April to October. Concurrently, there were increases in the weighted average deposit rate.
With the exception of loans to Other Public Sector and Central Government, the reduction in the overall interest rate spread was reflected in all categories of loans (see Table ��). The most significant reduction was evidenced in the spread on loans to commercial entities and Instalment Credit which together accounted for approximately 62.6 per cent of the loan portfolio.
Table �0
DOMESTIC MARKET INTEREST RATES(End of Period)
�00� �00� �008 Dec Dec Mar Jun Sep DecCOMMERCIAL BANKS INTEREST RATE SPREAD ��.�� ��.�8 ��.�8 ��.�� ��.�� ��.�� Overall Average Weighted Loan Rate ��.�9 ��.�� ��.�� ��.9� ��.�� ��.�8 Foreign Currency Average Weighted Loan Rate 9.�� 9.�� 8.�� 9.�� 9.�� 8.9� Overall Average Weighted Deposit Rate �.0� �.9� �.�� �.8� �.0� �.�� Demand 2.86 2.79 2.64 2.63 2.59 2.45 Savings 4.64 4.47 4.33 4.35 4.48 4.48 Time 6.60 6.99 6.82 6.94 7.03 7.37 Certificates of Deposit 1-month 6.36 6.99 6.44 6.54 6.16 7.28 3-month 6.98 6.96 6.88 7.03 7.27 7.39 12-month 6.71 6.95 6.86 7.38 7.08 7.25 Foreign Currency Average Weighted Deposit Rate �.�� �.�� �.88 �.�� �.9� �.0� Demand 2.28 2.35 1.77 1.63 1.64 1.72 Savings 2.21 2.31 2.10 2.06 2.03 2.00 Time 5.01 5.09 4.93 4.95 4.83 5.11 GOJ �-MONTH TREASURY BILL RATE ��.�� ��.�� ��.�� ��.�� ��.�� ��.�� BOJ �80-DAY REPURCHASE AGREEMENT RATE ��.00 ��.00 ��.�0 ��.�0 ��.�0 ��.�0 PRIVATE MONEY MARKET RATE ��.8� ��.�0 ��.90 ��.�� ��.8� ��.00
The Financial System

Annual Report 2008
- �� -
Table �� COMMERCIAL BANKS’ INTEREST RATE SPREADS
(BY SECTOR) �00� �00� �008 Dec Dec Mar Jun Sep Dec OVERALL AVERAGE WEIGHTED LOAN RATE ��.�9 ��.�� ��.�� ��.9� ��.�� ��.�8 OVERALL AVERAGE WEIGHTED DEPOSIT RATE �.0� �.9� �.�� �.8� �.0� �.�� OVERALL SPREAD ��.�� ��.�8 ��.�8 ��.�� ��.�� ��.��
Instalment Credit 16.63 16.02 15.96 15.63 15.47 15.23Mortgage 8.07 2.48 2.75 2.62 2.49 2.42Personal 22.62 20.50 20.51 20.38 19.38 19.78Commercial 8.34 8.95 9.04 8.76 7.66 7.85Central Government 8.81 10.31 10.48 9.85 10.07 17.17Other Public Sector 7.10 4.59 6.17 6.22 8.23 8.18
�.�. Other Financial Intermediaries�.�.�. Financial Institutions Act Licensees (FIAs) The consolidated balance sheet of the FIA licensees recorded a notable decline in 2008, relative to end-2007�. The contraction was mainly influenced by the conversion of Pan Caribbean Merchant Bank (PCMB) to a commercial bank in June 2008 and the continued realignment of the balance sheet of another entity towards core business6. These respective factors mainly resulted in declines in Loans and Advances and Investments. The consolidated balance sheet of the FIAs was also influenced by the impact of the global financial crisis. This was reflected in reductions in the institutions’ Cash and Bank Balances with
5 Includes merchant banks and trust companies.6 Pan Caribbean Merchant Bank converted to PanCaribbean Bank
and accounted for 22.0 per cent or $8 815.4 million of the sub-sector’s asset base at end-May.
Commercial Banks, and Investments, mainly holdings of non-GOJ foreign currency securities. The FIAs also unwound securities sold under repurchase agreements while increasing their liabilities with the BOJ.
The cash reserve requirement of the FIAs was increased by 2 percentage points to 11.0 per cent on 3 December 2008. The adjustment led to an increase in the statutory liquid asset ratio for the sub-sector to 25.0 per cent from 23.0 per cent.
The Financial System

Bank of Jamaica
- �� -
Table �� ASSETS AND LIABILITIES OF FIAs
(J$MN) Stock Flows Flows %
Change%
Change �008* �00� �008 �00� �008 Assets (�) Cash and Bank Balances with Commercial Banks 302.1 580.8 -2 358.8 27.9 -88.6 Balances with Other Financial Institutions 7.2 1.7 -0.7 27.3 -8.5 Balances with Bank of Jamaica 978.5 155.0 64.3 20.4 7.0 Investments 15 495.2 -2 356.4 -8 746.8 -8.9 -36.1 Securities Purchased with a View to Resale 3 190.1 -122.9 253.0 -4.0 8.6 Loans & Advances (net of provision) 10 710.2 3 044.9 -3 422.4 27.5 -24.2 Accounts Receivable 1 171.2 -379.5 -7.4 -24.4 -0.6 Other Assets 800.7 21.0 305.3 4.4 61.6 TOTAL �� ���.� 9��.� -�� 9��.� �.� -�9.9 Liabilities and Capital Deposits 14 519.4 3 136.3 -2 633.9 22.4 -15.4 Balances due to Commercial Banks 542.3 -281.6 -30.5 -33.0 -5.3 Balances due to Specialised Institutions 143.8 35.0 -196.4 11.5 -57.7 Borrowings from Other Financial Institutions 673.7 -405.5 -583.7 -24.4 -46.4 Securities sold under Repurchase Agreements 7 279.8 -1 699.7 -10 832.5 -8.6 -59.8 Other Liabilities 4 841.0 -294.3 4 075.2 -27.8 532.1 Capital & Reserves 4 655.2 454.4 -3 711.6 5.7 -44.4 TOTAL �� ���.� 9��.� -�� 9��.� �.� -�9.9 Memorandum Items Foreign Currency Assets 19 099.7 18.0 -10 752.4 0.1 -36.0 Foreign Currency Liabilities 12 634.8 2 129.8 -3 686.4 15.0 -22.6 (1) Assets exclude contingent accounts * Provisional Data �.�.�.�. Assets & Liabilities
The assets of the FIA licensees amounted to $32 655.3 million at end-2008, representing a contraction of 29.9 per cent for the calendar year. Adjusting for the impact of PCMB, the sector would have declined by 13.9 per cent, relative to a decline of 0.9 per cent in 2007. This overall contraction largely reflected declines in Investments, Cash and Bank Balances with Commercial Banks and Loans & Advances (net of provision). Investments declined by 36.1 per cent, relative to a reduction of 8.9 per cent in 2007 and accounted for approximately 63.0 per cent of
the overall contraction (see Table ��). Taking into account the impact of PCMB, Investments declined by 29.8 per cent, relative to 10.5 per cent in 2007. The decline in investments of the remaining entities occurred mainly in the first four months of the year and primarily reflected reductions in the institutions’ holdings of corporate securities denominated in foreign currency as one institution realigned its portfolio towards core business. The impact of the decline in these securities was partly offset by an increase in the holdings of GOJ foreign currency
The Financial System

Annual Report 2008
- �� -
denominated securities. Cash and bank balances placed with overseas commercial banks declined in response to the general uncertainty that obtained in global financial markets and the intensification of the credit crisis in the final quarter of the year. This led institutions to unwind cash balances as well as securities to finance calls on the liabilities during that quarter.
Loans and Advances contracted by 24.2 per cent in 2008, mainly due to the conversion of PCMB to a commercial bank, which affected the foreign currency loans portfolio7. Abstracting for this, growth in loans and advances decelerated to 9.7 per cent in 2008 from growth of 33.7 per cent in 2007. This deceleration reflected the slowdown in economic activity in 2008.
Consequent on the overall decline in foreign currency loans and cash balances with commercial banks abroad, the sub-sector’s holdings of foreign currency assets declined by 36.0 per cent for 2008. With the exclusion of PCMB, the foreign currency assets declined by 21.2 per cent, relative to 2.7 per cent in 2007. The decline in 2008 led to a reduction in the ratio of foreign currency assets to total assets of the remaining entities to 51.9 per cent at end-2008 compared to 65.2 per cent at end-2007.
The impact of the declines in some of the major categories of assets was partly offset by increases in Balances with the Central Bank, Securities Purchased with a View to Resale and Other Assets, mainly in the final quarter of the year. The expansion in balances with the BOJ mainly resulted from the increase in the cash reserve requirement in the final 7 At the point of exit, Pan Caribbean accounted for 76.8 per cent of
total foreign currency loans and 30.0 per cent of total loans.
quarter of the year, after the exit of PanCaribbean. Without the impact of Pan Caribbean, the securities purchased with a view to resale would have increased by 34.9 per cent, relative to the overall increase of 8.6 per cent.
The deposits of the FIAs contracted by 15.4 per cent during 2008, in contrast to an increase of 22.4 per cent in 2007. This decline was mainly influenced by the removal of the foreign currency deposits of Pan Caribbean, which had accounted for 85.3 per cent of its balance sheet at the time of exit and 26.7 per cent of the sector’s total deposits. Abstracting for this impact, growth in deposits decelerated to 18.9 per cent from 20.8 per cent in 2008 in keeping with the slowdown in the economy.
During the year, there were continued declines in Securities sold under Repurchase Agreements and Borrowings from Other Financial Institutions as one large institution continued to realign its balance sheet towards core activities. In addition, these declines were influenced by the tightening of credit in the global financial market and the attendant call on the liabilities in the latter half of the year. Consequent on these developments, deposits became the largest source of financing, accounting for approximately 52.0 per cent of total liabilities compared to 45.0 per cent of total liabilities in 2007. With the exclusion of Pan Caribbean, deposits accounted for 37.2 per cent of liabilities in 2007.
The entities’ consolidated capital base declined by 44.4 per cent in 2008, relative to growth of 5.7 per cent during 2007. After adjusting for the impact of PCMB, the capital base declined by 8.4 per cent, relative to growth of 3.2 per cent in 2007. The decline
The Financial System

Bank of Jamaica
- �� -
for the remaining entities reflected reduction in retained earnings and reserves.
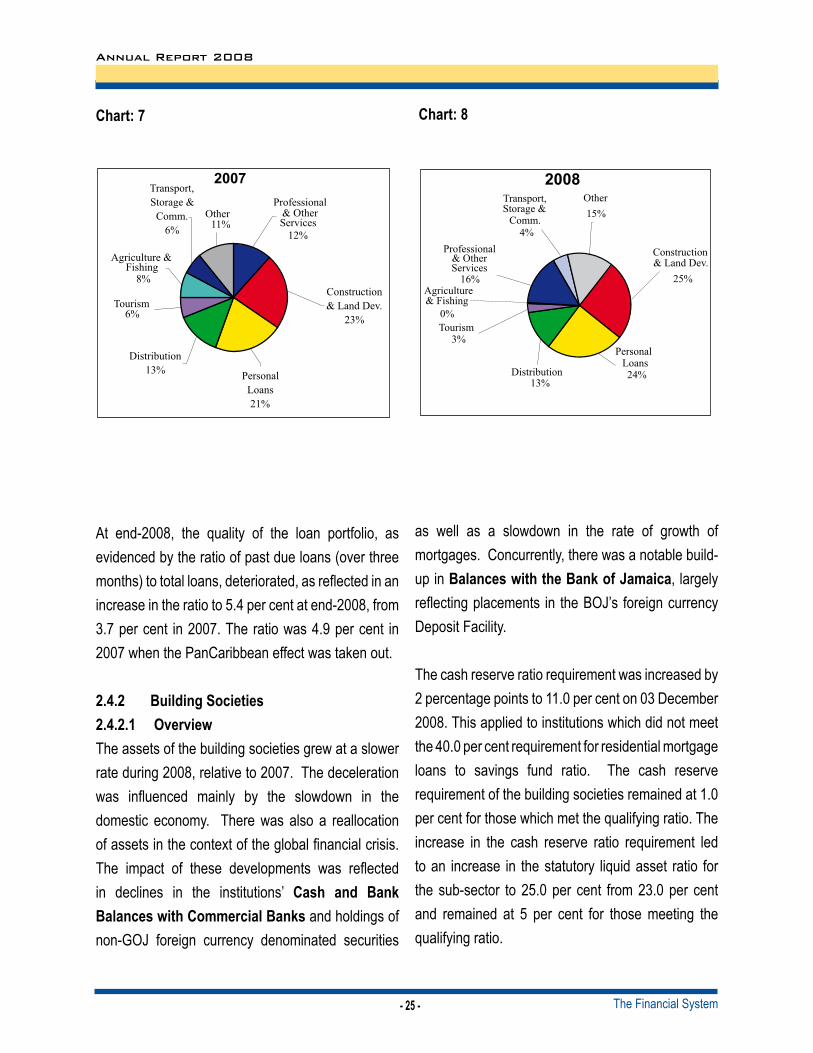
�.�.�.�. Sectoral Distribution of LoansLoans and advances to the private sector declined by 23.4 per cent in 2008, relative to growth of 21.8 per cent in 2007 (see Table ��). Taking account of
the impact of PCMB, there were net repayments in all sectors with the exceptions of Mining & Quarrying, Professional & Other Services and Electricity. FIA licensees extended loans mainly to Construction & Land Development, Electricity and Personal (see Chart �).Table ��
SECTORAL DISTRIBUTION OF LOANS AND ADVANCESOF
INSTITUTIONS LICENCED UNDER THE FINANCIAL INSTITUTIONS ACT(J$M)
�00� �008* �00� �008 �00� �008Stock Stock Flows Flows (%) (%)
Public Sector ���.� ���.9 ��.� -�08.� ��.0 -�0.9Financial Institutions ���.� ���.� ��0.8 -��.9 � 0�0.� -�.�Private Sector �� ��0.� �0 0��.� � ���.� -� 0��.0 ��.8 -��.� Agriculture & Fishing 1 029.6 28.4 -7.4 -1 001.2 -0.7 -97.2 Mining & Quarrying 10.2 47.3 -9.7 37 -48.6 361.8 Manufacturing 519.1 363.5 95.6 -155.6 22.6 -30.0 Construction & Land Development 2 977.5 2 514.9 1 313.6 -462.6 78.9 -15.5 Transport, Storage & Communication 842.2 443.4 233 -398.8 38.2 -47.4 Tourism 810.7 283.5 -185.1 -527.1 -18.6 -65.0 Distribution 1 763.0 1 276.6 -111.6 -486.3 -6.0 -27.6 Professional & Other Services 1 534.4 1 601.9 209.6 67.5 15.8 4.4 Personal Loans 2 767.9 2 451.3 783.6 -316.5 39.5 -11.4 Electricity 14.6 2 451.3 4.4 2 436.7 43.7 16 694.4 Entertainment 89.3 24.5 -17 -64.8 -16.0 -72.5 Overseas Residents 772.2 820.8 45.5 48.6 6.3 6.3TOTAL �� �0�.� �0 8��.9 � 0�0.� -� �89.� ��.� -��.9
* ProvisionalTotals include provisions for loan losses
The Financial System
Annual Report 2008
- �� -
Chart: � Chart: 8
At end-2008, the quality of the loan portfolio, as evidenced by the ratio of past due loans (over three months) to total loans, deteriorated, as reflected in an increase in the ratio to 5.4 per cent at end-2008, from 3.7 per cent in 2007. The ratio was 4.9 per cent in 2007 when the PanCaribbean effect was taken out.
�.�.� Building Societies�.�.�.� Overview The assets of the building societies grew at a slower rate during 2008, relative to 2007. The deceleration was influenced mainly by the slowdown in the domestic economy. There was also a reallocation of assets in the context of the global financial crisis. The impact of these developments was reflected in declines in the institutions’ Cash and Bank Balances with Commercial Banks and holdings of non-GOJ foreign currency denominated securities
as well as a slowdown in the rate of growth of mortgages. Concurrently, there was a notable build-up in Balances with the Bank of Jamaica, largely reflecting placements in the BOJ’s foreign currency Deposit Facility.
The cash reserve ratio requirement was increased by 2 percentage points to 11.0 per cent on 03 December 2008. This applied to institutions which did not meet the 40.0 per cent requirement for residential mortgage loans to savings fund ratio. The cash reserve requirement of the building societies remained at 1.0 per cent for those which met the qualifying ratio. The increase in the cash reserve ratio requirement led to an increase in the statutory liquid asset ratio for the sub-sector to 25.0 per cent from 23.0 per cent and remained at 5 per cent for those meeting the qualifying ratio.
The Financial System

Bank of Jamaica
- �� -
Table ��
ASSETS AND LIABILITIES OF BUILDING SOCIETIES
(J$M) STOCK STOCK FLOW FLOW Per Cent Per Cent �00� �008 �00� �008 �00� �008 ASSETS Cash and Balances with Commercial Banks 20 432.3 13 142.8 6 641.7 -7 289.4 48.2 -35.7 Balances with Other Financial Institutions 28.7 35.3 -1 488.7 6.6 -98.1 22.9 Balances with Bank of Jamaica 1 876.8 7 389.9 267.2 5 513.1 16.6 293.8 Investments (net of provision) 26 879.9 22 655.6 2 640.4 -4 224.2 10.9 -15.7 Securities Purchased with View to Resale 7 925.5 11 651.5 -6 331.0 3 726.0 -44.4 47.0 Loans and Advances (net of provision) 58 258.3 75 415.4 15 170.6 17 157.1 35.2 29.5 - of which Mortgages 57 680.1 74 665.1 15 082.5 16 985.0 35.4 29.4 Accounts Receivables 3 858.5 3 792.9 -107.5 -65.6 -2.7 -1.7 Fixed Assets 2 082.0 2 364.7 -60.3 282.6 -2.8 13.6 Other Assets 1 410.6 2 083.6 498.1 673.0 54.6 47.7 TOTAL ��� ���.� ��8 ���.8 �� ��0.� �� ��9.� ��.� ��.9 LIABILITIES and CAPITAL Savings Fund 84 377.3 93 285.3 10 792.3 8 908.0 14.7 10.6 Due to Commercial Banks 3 824.7 5 365.1 960.6 1 540.4 33.5 40.3 Due to Specialized Institutions 9 251.4 14 093.4 3 197.0 4 842.0 52.8 52.3 Due to Other Financial Institutions 890.9 1102.6 -672.2 211.7 -43.0 23.8 Other Liabilities 3 206.8 4 072.8 286.6 866.0 9.8 27.0 Capital and Reserves 21 201.5 20 612.6 2 666.2 -588.9 14.4 -2.8 TOTAL ��� ���.� ��8 ���.8 �� ��0.� �� ��9.� ��.� ��.9 INDICATIVE RATIOS (Per Cent) Liquid Assets : Total Assets 18.2 14.8 Liquid Assets : Savings Fund 26.5 22.0 Advance : Savings Fund 69.0 80.8 Mortgage Loans : Savings Fund 68.4 80.0
�.�.�.� Assets and Liabilities The total assets of the building societies stood at $138 531.8 million at end-2008, reflecting growth of 12.9 per cent for the year, compared to an increase of 16.3 per cent in 2007. The deceleration mainly reflected reductions in the institutions’ Cash and Bank Balances with Commercial Banks and Investments. Balances with overseas banks were drawn down mainly in the final quarter of the year, following the intensification of the global financial
crisis. A slowdown in the rate of growth in mortgages of all institutions also contributed to the deceleration in the growth rate of the asset base (see Section �.�.�.�).
Most of the decline in Investments occurred early in the year and mainly reflected a reduction in one entity’s holdings of local corporate securities. There were also reductions in the sectors’ holdings
The Financial System

Annual Report 2008
- �� -
of foreign government securities and corporate securities denominated in foreign currency in the final quarter of the year. The proceeds from the unwinding of these securities as well as the drawdown of cash and bank balances from overseas banks financed the acquisition of additional GOJ foreign currency denominated securities and the build-up in balances with the Bank of Jamaica. The increase in the holdings of GOJ global bonds was consistent with higher returns on these instruments.
The assets of the building societies continued to be financed largely from the savings fund, although there was a slowdown in the growth rate of this source of financing to 10.6 per cent from 14.7 per cent in the previous year. This deceleration was reflected in savings denominated in foreign currency while there was marginal growth in the domestic currency component. Building societies, however, recorded an increase of 40.3 per cent in funds due to commercial banks, both local and overseas, in the September and December quarters, respectively. This growth rate represented an acceleration, relative to expansion of 33.5 per cent in 2007. The increased placement with domestic banks was concentrated in one institution. Growth in liabilities to specialized institutions, particularly the National Housing Trust, remained strong, reflecting the mortgage financing arrangement between the two institutions.
Capital and Reserves declined by 2.8 per cent during 2008, compared to a growth rate of 14.4 per cent in the previous year. This decline arose largely from the erosion in reserve holdings, given the reduction in the market value of the securities held by the institutions.
During 2008, there was a decline in the liquid assets to total assets ratio to 14.8 per cent, from 18.2 per cent at end-2007, mainly reflecting the decline in Cash and Bank Balances with Commercial Banks. In addition, the liquid assets to savings fund ratio declined to 22.0 per cent, from 26.5 per cent at end-2007, reflecting the faster deceleration in liquid assets, relative to the savings fund. In contrast, the growth in loans outpaced that of the savings fund which resulted in an increase in the advance to savings fund ratio to 80.8 per cent at end-2008, from 69.0 per cent at end-2007.
There was deterioration in the quality of the loan portfolio. At end-2008, the ratio of total past due loans (over three months) to total loans, was 3.6 per cent relative to 3.0 per cent at end-2007.
�.�.�.� Building Societies’ New Mortgage Loans During the review year, there was a sharp deceleration in growth in the value of new mortgage loans issued by building societies. Concurrently, the number of new mortgages issued continued to decline, albeit at a slower rate, relative to 2007 (see Table ��). The slower growth in the value of new mortgages was reflected largely in the slowdown in growth of residential mortgage loans to 27.9 per cent, from 60.5 per cent in 2007. In addition, there were declines of 31.5 per cent and 98.1 per cent in new commercial and agricultural mortgage loans, respectively.
The number of new mortgage accounts declined by 1.2 per cent during 2008, following a decline of 4.7 per cent in 2007. The reduction in 2008 was mainly reflected in a 96.4 per cent decline in the number of agricultural and other new accounts as well as a slowdown in the growth rate in the number of
The Financial System

Bank of Jamaica
- �8 -
new residential mortgages. The average loan size increased to $4.8 million in 2008 from $3.9 million in 2007. At end-2008, the weighted average mortgage
loan rate charged by building societies was 12.56 per cent, a reduction of 4.0 basis points for the year. This was a slower decline relative to the decline of 128.0 basis points for 2007.
Table ��BUILDING SOCIETIES NEW MORTGAGE LOANS
�00� to �008 Stock Stock Flow Flow % Change % Change �00� �008 �00� �008 �00� �008 Value of New Accounts (J$M) Residential 14 582.7 18 655.5 5498.1 4 072.8 60.5 27.9 Commercial 196.8 134.8 87.1 -61.9 79.5 -31.5 Agricultural & Other 0 727.9 0 013.9 -456.1 -714.0 -38.5 -98.1 TOTAL �� �0�.� �8 80�.� � ��9.� � �9�.9 �9.� ��.� Number of New Accounts Residential 3 719 3 885 132 166 3.7 4.5 Commercial 16 18 -12 2 -42.9 12.5 Agricultural & Other 223 8 -316 -215 -58.6 -96.4 TOTAL � 9�8 � 9�� -�9� -�� -�.� -�.� Weighted Average Mortgage Loan Rate (%) 12.60 12.56 -1.28 -0.04
�.�. Development Banks�.�.�. Development Bank of JamaicaDuring 2008, the Development Bank of Jamaica continued to provide medium and long-term financing through Approved Financial Institutions (AFIs) and People’s Cooperative Banks (PCB) at concessionary interest rates8. Both loan approvals and disbursements increased during the year, relative to 2007. Loan approvals for Small and Medium-sized Enterprises (SME) recorded the largest increase while loan disbursements to Other Services grew the strongest during the year. In contrast, the sectors that experienced the sharpest declines in loan approvals and disbursements were Manufacturing and Agro-Industry.
8 AFIs include commercial banks and merchant banks.
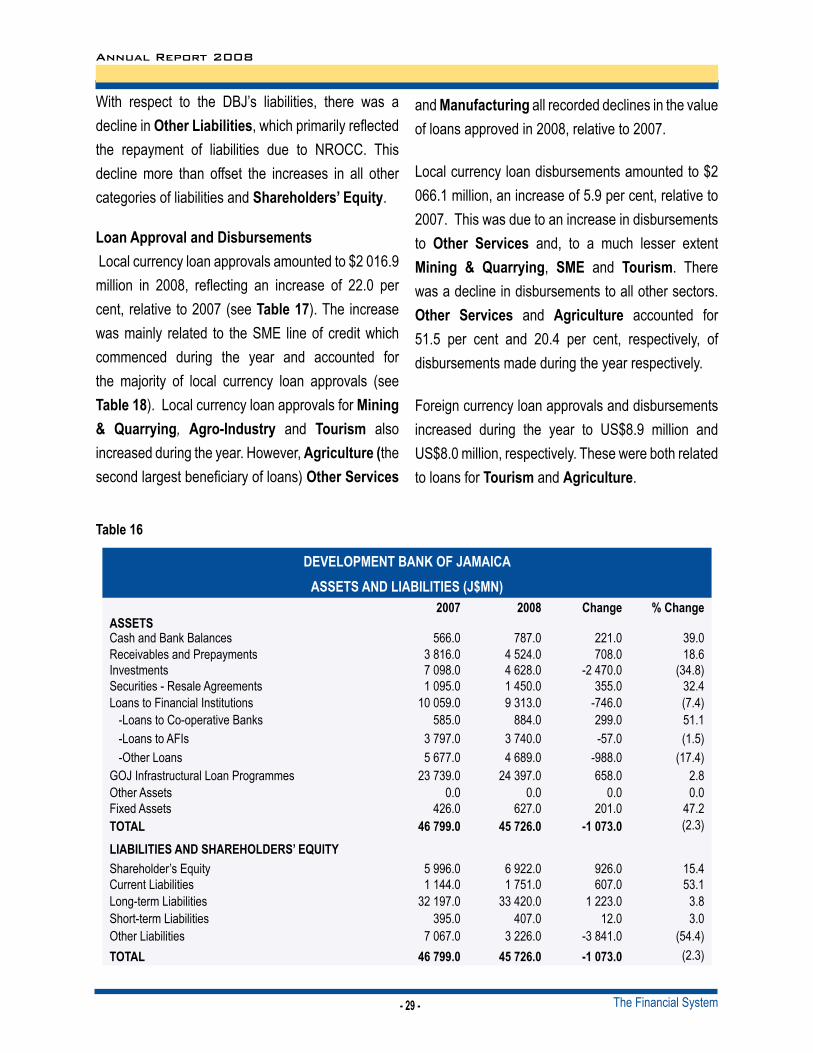
The assets of the DBJ fell by 2.3 per cent in 2008 due to declines of 34.8 per cent and 7.4 per cent in Investments and Loans to Financial Institutions, respectively (see Table ��). The contraction in Investments was influenced by a call on liabilities due to the National Road Operating & Constructing Company (NROCC). Securities were unwound to finance the repayment of these liabilities. The reduction in Loans to Financial Institutions reflected declines in Other Loans and Loans to AFIs. These contractions were partially offset by increases of 18.6 per cent in Receivables & Prepayments, as well as respective increases of 2.8 per cent, 32.4 per cent and 39.0 per cent in GOJ Infrastructural Loan Programmes, Securities-Resale Agreements and Cash and Bank Balances,.
The Financial System
Annual Report 2008
- �9 -
With respect to the DBJ’s liabilities, there was a decline in Other Liabilities, which primarily reflected the repayment of liabilities due to NROCC. This decline more than offset the increases in all other categories of liabilities and Shareholders’ Equity.
Loan Approval and Disbursements Local currency loan approvals amounted to $2 016.9 million in 2008, reflecting an increase of 22.0 per cent, relative to 2007 (see Table ��). The increase was mainly related to the SME line of credit which commenced during the year and accounted for the majority of local currency loan approvals (see Table �8). Local currency loan approvals for Mining & Quarrying, Agro-Industry and Tourism also increased during the year. However, Agriculture (the second largest beneficiary of loans) Other Services
and Manufacturing all recorded declines in the value of loans approved in 2008, relative to 2007.
Local currency loan disbursements amounted to $2 066.1 million, an increase of 5.9 per cent, relative to 2007. This was due to an increase in disbursements to Other Services and, to a much lesser extent Mining & Quarrying, SME and Tourism. There was a decline in disbursements to all other sectors. Other Services and Agriculture accounted for 51.5 per cent and 20.4 per cent, respectively, of disbursements made during the year respectively.
Foreign currency loan approvals and disbursements increased during the year to US$8.9 million and US$8.0 million, respectively. These were both related to loans for Tourism and Agriculture.
Table ��
DEVELOPMENT BANK OF JAMAICAASSETS AND LIABILITIES (J$MN)
�00� �008 Change % ChangeASSETS Cash and Bank Balances 566.0 787.0 221.0 39.0 Receivables and Prepayments 3 816.0 4 524.0 708.0 18.6 Investments 7 098.0 4 628.0 -2 470.0 (34.8)Securities - Resale Agreements 1 095.0 1 450.0 355.0 32.4 Loans to Financial Institutions 10 059.0 9 313.0 -746.0 (7.4) -Loans to Co-operative Banks 585.0 884.0 299.0 51.1 -Loans to AFIs 3 797.0 3 740.0 -57.0 (1.5) -Other Loans 5 677.0 4 689.0 -988.0 (17.4)GOJ Infrastructural Loan Programmes 23 739.0 24 397.0 658.0 2.8 Other Assets 0.0 0.0 0.0 0.0 Fixed Assets 426.0 627.0 201.0 47.2 TOTAL �� �99.0 �� ���.0 -� 0��.0 (2.3)
LIABILITIES AND SHAREHOLDERS’ EQUITY Shareholder’s Equity 5 996.0 6 922.0 926.0 15.4 Current Liabilities 1 144.0 1 751.0 607.0 53.1 Long-term Liabilities 32 197.0 33 420.0 1 223.0 3.8 Short-term Liabilities 395.0 407.0 12.0 3.0 Other Liabilities 7 067.0 3 226.0 -3 841.0 (54.4)TOTAL �� �99.0 �� ���.0 -� 0��.0 (2.3)
The Financial System

Bank of Jamaica
- �0 -
Table ��
LOAN APPROVALS AND DISBURSEMENTS TO AFI’s , PCB AND INVESTMENTS BY SECTOR
APPROVALS
Local Currency (J$MN) Foreign Currency (US$MN) �00� �008 % change �00� �008 % change
Sector Agriculture 720.3 445.3 -38.2 0.0 3.0 -Agro-Industry 128.0 231.3 80.7 0.0 0.0 0Manufacturing 233.8 104.0 -55.5 0.0 0.0 0Mining & Quarrying 51.2 199.4 289.5 0.0 0.0 0Other Services 395.1 195.6 -50.5 0.0 0.0 0.0Tourism 124.3 191.3 53.9 2.1 5.9 177.0
SME 0.0 650.0 - 0.0 0.0 0.0
Total � ���.� � 0��.9 ��.0 �.� 8.9 ���.8DISBURSEMENTS
Local Currency (J$MN) Foreign Currency (US$MN)
�00� �008 % change �00� �008 % changeSector Agriculture 725.3 421.4 -41.9 0.0 4.0 -Agro-Industry 560.0 91.1 -83.7 0.0 0.0 0Manufacturing 425.2 140.0 -67.1 0.0 0.0 0Mining & Quarrying 51.2 137.6 168.8 0.0 0.0 0Other Services 79.6 1,064.8 1 237.7 0.0 0.0 0Tourism 109.7 136.2 24.2 1.9 4.0 109.8SME 0.0 75.0 - 0.0 0.0 0.0Total � 9��.0 � 0��.� �.9 �.9 8.0 ���.�
Table �8
LOAN APPROVALS AND DISBURSEMENTS TO AFI’s, NPCB AND INVESTMENT BY SECTOR (PROPORTIONS)
APPROVALS DISBURSEMENTS Local Foreign Local Foreign Local Foreign Local Foreign Currency Currency Currency Currency Currency Currency Currency Currency
�00� �008 �00� �008 Sector
Agriculture 43.6 0.0 22.1 33.7 37.2 0.0 20.4 0.0Agro-Industry 7.7 0.0 11.5 0.0 28.7 0.0 4.4 0.0Manufacturing 14.1 0.0 5.2 0.0 21.8 0.0 6.8 0.0Mining & Quarrying 3.1 0.0 9.9 0.0 2.6 0.0 6.7 0.0Other Services 23.9 0.0 9.7 0.0 4.1 0.0 51.5 0.0Tourism 7.5 100.0 9.5 66.3 5.6 0.0 6.6 0.0SME 0.0 0.0 32.2 0.0 0.0 0.0 3.6 0.0 Total �00.0 �00.0 �00.0 �00.0 �00.0 0.0 �00.0 0.0
The Financial System

Annual Report 2008
- �� -
�.�.�. National Export-Import Bank of Jamaica �.�.�.�. IntroductionDuring 2008, the National Export-Import Bank of Jamaica Limited (EXIM Bank) continued to provide financial support to firms in the form of short and medium-term financing as well as trade credit insurance.
The EXIM Bank’s loan portfolio continued to record growth, in line with the objectives set in its Three-Year Strategic Plan (2007-2010) – Vision 2010. The EXIM Bank had set as its target a 25.0 per cent increase to $6.0 billion in loan utilization for the financial year ending March 2009.9 In support of this objective, the EXIM Bank increased funding to the tourism, agro-business, manufacturing as well as mining & quarrying sectors, which were identified as having the potential for increased foreign exchange earnings. Special emphasis was also placed on funding the development and expansion of small and medium-sized enterprises, particularly those providing vital linkages to the export sectors.
In August 2008, the EXIM Bank introduced Trade Credit Insurance (TCI). This facility was an enhancement on the previous Export Credit Insurance (ECI) product. Trade Credit Insurance covers export and domestic sales, the sale of goods trans-shipped from Jamaica’s duty free zones to countries within the Caribbean as well as third-country sales against commercial and political risks of non payment. A corresponding Insurance Policy Discounting Facility (IPDF) that allows for the discounting of up to 80.0 per cent of insured receivables was made available 9 The utilization of credit for the nine months ended December
2008 amounted to $5.4 billion. The performance for the nine months ended December 2008 was partly attributed to the Bank’s competitively priced loan products, supported by sustained marketing and advertising programmes.
to policyholders requiring working capital support.
During 2008, the EXIM Bank broadened its reach to include emerging sectors such as the creative industries and intensified its collaborative efforts with agencies such as the Jamaica Business Development Centre (JBDC), the Scientific Research Council (SRC) as well as the Jamaica Guild of Artists (JGA). The collaboration with these agencies was aimed at establishing viable risk-sharing agreements to encourage the development of entrepreneurship. In this regard, the JBDC and EXIM Bank signed a 60:40 per cent risk sharing agreement to facilitate financing to craft manufacturers contracted to JBDC’s Things Jamaican shops. A Memorandum of Understanding between the EXIM Bank and the SRC was also in the process of being finalized. It is anticipated that this agreement would allow researchers and developers of new products to access financing for the establishment of new businesses. Financial support was committed to the JGA to facilitate access to grant funding from the Caribbean Export Development Agency for training and development.
�.�.�.�. Review of Lending Operations During 2008, the EXIM Bank disbursed domestic and foreign currency loans of approximately J$3.3 billion and US$37.3 million, respectively, achieving total disbursement of approximately J$6.5 billion. This represented an increase in total disbursements of 35.0 per cent for the year.
Local currency disbursements were 29.0 per cent above that recorded in 2007 and reflected the continued strong demand for pre- and post-shipment financing which provided working capital support to domestic manufacturers and exporters (see Table
�9).
The Financial System

Bank of Jamaica
- �� -
Table �9
LOCAL CURRENCY DISBURSEMENTS
Facilities �00� �008 Change
Change J$MN J$MN J$MN %
Bankers Export Credit Facility 168.0 487.0 319.0 189.9
Export Credit Facility 596.4 640.0 43.6 7.3Insurance Policy Discounting Facility 24.6 41.1 16.5 67.2Pre-Shipment/Copake Facilities 989.0 1,231.5 242.5 24.5Apparel Sector Financing 49.0 27.0 -22.0 -44.9Modernization Fund for Exporters 462.7 554.7 92.0 19.9Small Business Facility 224.5 201.9 -22.6 -10.1General Trade Line 47.8 59.7 11.9 24.9JEA/Ebbed 11.7 28.8 17.1 146.4NIF 18.1 70.3 -11.1 -61.1Information Communication Technology (ICT) 0.2 0.3 0.1 50.0Total � �9�.0 � ���.� ��0.8 �9.0
The Agro-Processing and Food & Beverage sectors continued to be the main recipients of the EXIM Bank’s funding in 2008, collectively accounting
for 79.4 per cent of total local currency approvals (see Table �0).
Table �0
APPROVED LOANS BY INDUSTRYIndustry �00� �008
J$ % J$ %Agro Processing 864.8 33.5 1612.0 49.2Food & Beverage 887.8 34.1 991.3 30.2
Textile & Apparel 72.9 2.8 28.3 0.9
Manufacturing 497.0 19.2 246.1 7.5
Distribution/Services 211.5 8.2 346.9 10.6Mining 58.0 2.2 54.5 1.7Total � �9�.0 �00.0 � ��9.0 �00.0
The Financial System

Annual Report 2008
- �� -
Table ��
FOREIGN CURRENCY DISBURSEMENTS
Facility US$MN US$MN Change Change
�00� �008 US$ %
Lines of Credit 17.2 28.5 11.3 65.7
Bankers Export Credit Facility 0.6 2.0 1.4 240.0
Cuban Line of Credit 3.2 6.6 3.4 105.3
Export Growth Initiative Fund 1.6 0.3 -1.4 -84.4Total ��.� ��.� ��.� ��.�
Foreign currency loan disbursements increased by 65.2 per cent during 2008, primarily reflecting an increase in lines of credit support to finance the construction and hardware industries (see Table ��).
�.�. Financial Stability Assessment of Deposit-Taking Institutions (DTIs)�.�.�. OverviewIn 2008, the prudential returns of DTIs were subjected to frequent stress testing by the Bank.10,11 For each quarter, the tests revealed that the capital adequacy ratios (CARs) for the banking system remained above the 10.0 per cent minimum benchmark, in response to hypothetical market, credit and liquidity shocks. However, the CAR for the banking system would have declined marginally as at end-2008, relative to end-2007. The BOJ’s aggregate early warning system indicated that the macro-prudential index as well as the micro-prudential indices for commercial banks, FIA licensees and building societies sectors also showed deterioration during 2008, particularly 10 The objective of stress testing is to determine the impact of extreme
but plausible shocks to various risks factors (credit quality, foreign exchange, and domestic interest rate and liquidity risks) on the capital adequacy of DTIs.
11 Prudential returns used in the assessment include, but are not limited to, Jamaica Dollar and foreign currency balance sheets, sectoral credit profiles, maturity and repricing gaps of the DTIs.
during the second half of the year. This deterioration occurred against the background of challenges arising from the impact of the intensification of the global financial turmoil.
�.�.�. Credit Risk Stress Tests ResultsThe DTIs remained resilient to hypothetical shocks to non-performing loans (NPLs) during 2008.12 For instance, there was a less than 0.5 percentage point decline in capital adequacy for all three sectors as a result of a hypothetical 30.0 per cent increase in NPLs (see Table ��). During 2008, there was an increase in NPLs when compared to the previous year, largely influenced by the slowdown in domestic economic activity during the year. The ratio of NPLs to total loans increased to 2.6 per cent at end-2008, relative to 2.0 per cent at end-2007 and 2.2 per cent at end 2006.13
12 NPLs represent principal and interest payments outstanding 3 months and over.
13 The international benchmark for non-performing loans to total loans is 10.0 per cent.
The Financial System
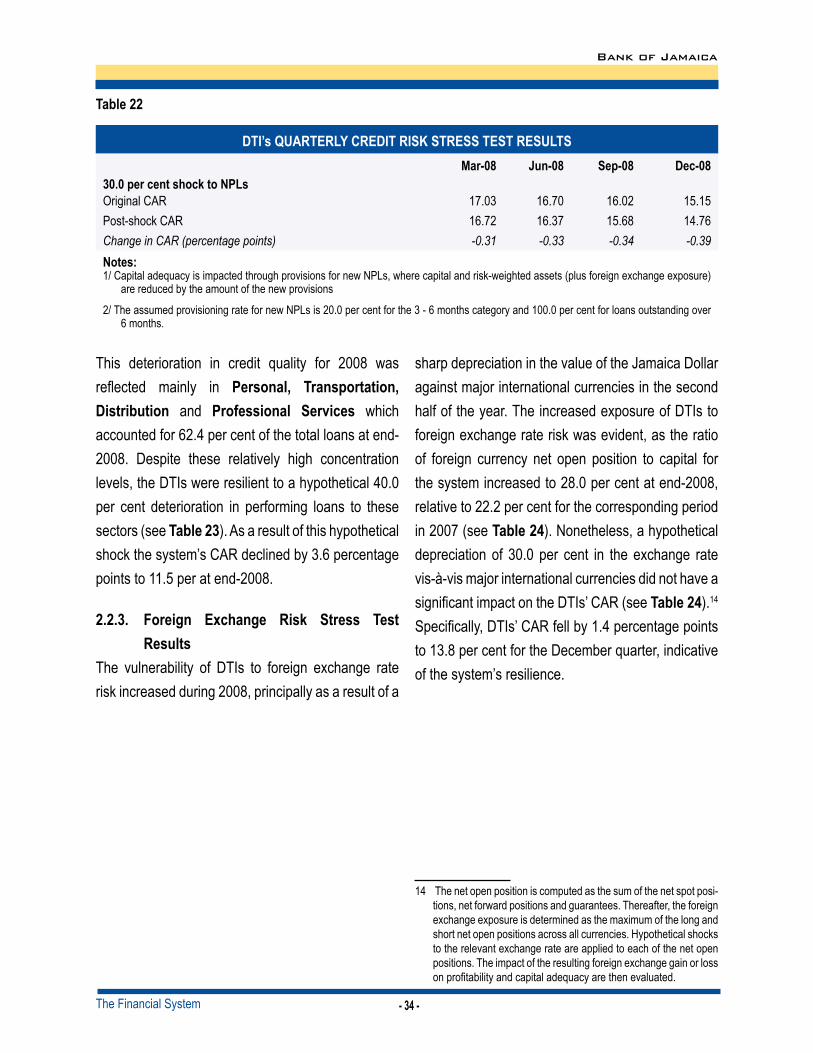
Bank of Jamaica
- �� -
Table ��
DTI’s QUARTERLY CREDIT RISK STRESS TEST RESULTS Mar-08 Jun-08 Sep-08 Dec-08
�0.0 per cent shock to NPLsOriginal CAR 17.03 16.70 16.02 15.15Post-shock CAR 16.72 16.37 15.68 14.76Change in CAR (percentage points) -0.31 -0.33 -0.34 -0.39Notes:1/ Capital adequacy is impacted through provisions for new NPLs, where capital and risk-weighted assets (plus foreign exchange exposure)
are reduced by the amount of the new provisions
2/ The assumed provisioning rate for new NPLs is 20.0 per cent for the 3 - 6 months category and 100.0 per cent for loans outstanding over 6 months.
This deterioration in credit quality for 2008 was reflected mainly in Personal, Transportation, Distribution and Professional Services which accounted for 62.4 per cent of the total loans at end-2008. Despite these relatively high concentration levels, the DTIs were resilient to a hypothetical 40.0 per cent deterioration in performing loans to these sectors (see Table ��). As a result of this hypothetical shock the system’s CAR declined by 3.6 percentage points to 11.5 per at end-2008.
�.�.�. Foreign Exchange Risk Stress Test Results
The vulnerability of DTIs to foreign exchange rate risk increased during 2008, principally as a result of a
sharp depreciation in the value of the Jamaica Dollar against major international currencies in the second half of the year. The increased exposure of DTIs to foreign exchange rate risk was evident, as the ratio of foreign currency net open position to capital for the system increased to 28.0 per cent at end-2008, relative to 22.2 per cent for the corresponding period in 2007 (see Table ��). Nonetheless, a hypothetical depreciation of 30.0 per cent in the exchange rate vis-à-vis major international currencies did not have a significant impact on the DTIs’ CAR (see Table ��).14 Specifically, DTIs’ CAR fell by 1.4 percentage points to 13.8 per cent for the December quarter, indicative of the system’s resilience.
14 The net open position is computed as the sum of the net spot posi-tions, net forward positions and guarantees. Thereafter, the foreign exchange exposure is determined as the maximum of the long and short net open positions across all currencies. Hypothetical shocks to the relevant exchange rate are applied to each of the net open positions. The impact of the resulting foreign exchange gain or loss on profitability and capital adequacy are then evaluated.
The Financial System
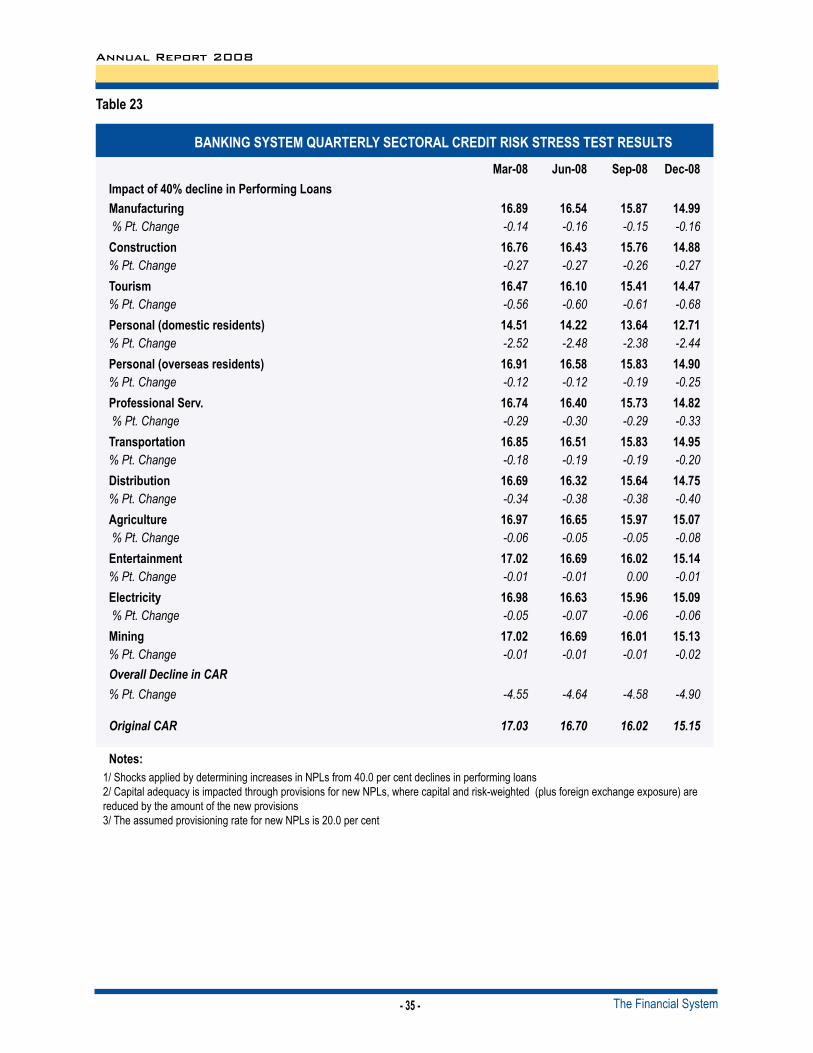
Annual Report 2008
- �� -
Table ��
BANKING SYSTEM QUARTERLY SECTORAL CREDIT RISK STRESS TEST RESULTS
Mar-08 Jun-08 Sep-08 Dec-08Impact of �0% decline in Performing Loans Manufacturing ��.89 ��.�� ��.8� ��.99 % Pt. Change -0.14 -0.16 -0.15 -0.16Construction ��.�� ��.�� ��.�� ��.88% Pt. Change -0.27 -0.27 -0.26 -0.27Tourism ��.�� ��.�0 ��.�� ��.��% Pt. Change -0.56 -0.60 -0.61 -0.68Personal (domestic residents) ��.�� ��.�� ��.�� ��.��% Pt. Change -2.52 -2.48 -2.38 -2.44Personal (overseas residents) ��.9� ��.�8 ��.8� ��.90% Pt. Change -0.12 -0.12 -0.19 -0.25Professional Serv. ��.�� ��.�0 ��.�� ��.8� % Pt. Change -0.29 -0.30 -0.29 -0.33Transportation ��.8� ��.�� ��.8� ��.9�% Pt. Change -0.18 -0.19 -0.19 -0.20Distribution ��.�9 ��.�� ��.�� ��.��% Pt. Change -0.34 -0.38 -0.38 -0.40Agriculture ��.9� ��.�� ��.9� ��.0� % Pt. Change -0.06 -0.05 -0.05 -0.08Entertainment ��.0� ��.�9 ��.0� ��.��% Pt. Change -0.01 -0.01 0.00 -0.01Electricity ��.98 ��.�� ��.9� ��.09 % Pt. Change -0.05 -0.07 -0.06 -0.06Mining ��.0� ��.�9 ��.0� ��.��% Pt. Change -0.01 -0.01 -0.01 -0.02Overall Decline in CAR% Pt. Change -4.55 -4.64 -4.58 -4.90
Original CAR 17.03 16.70 16.02 15.15
Notes: 1/ Shocks applied by determining increases in NPLs from 40.0 per cent declines in performing loans2/ Capital adequacy is impacted through provisions for new NPLs, where capital and risk-weighted (plus foreign exchange exposure) are reduced by the amount of the new provisions3/ The assumed provisioning rate for new NPLs is 20.0 per cent
The Financial System

Bank of Jamaica
- �� -
Table ��DTI’s QUARTERLY FOREIGN EXCHANGE RISK STRESS TEST RESULTS
Mar-08 Jun-08 Sep-08 Dec-08NOP/Capital (per cent) 20.3 18.8 25.0 28.0
�0.0 per cent shock to FE ratesOriginal CAR 17.03 16.70 16.02 15.15Post-shock CAR 15.56 15.37 14.63 13.76Change in CAR (percentage. points) -1.47 -1.33 -1.40 -1.38
Notes: 1/ Shocks are applied directly to the Jamaica Dollar vis-à-vis the US dollar, with the associated changes to the exchange rate of the Jamaica
Dollar vis-à-vis the Euro, the Canadian dollar, the Pound Sterling and other currencies converted to US dollars.2/ The Risk-Weighted Assets include the foreign exchange exposures.
�.�.�. Interest Rate Risk Stress TestsThere was a general increase in the DTIs’ susceptibility to interest rate shocks during 2008 as measured by the dollar value of a basis point (DVBP) to capital base ratio. The ratio increased to 5.2 per cent at end-2008 from 0.03 per cent at end-2007. However, hypothetical interest rate increases applied to the aggregate DTIs’ balance sheet during 2008 had no material impact on the system’s CAR.
Table �� DTI’s QUARTERLY INTEREST RATE RISK STRESS TEST RESULTS
Mar-08 Jun-08 Sep-08 Dec-08DVBP to Capital Base (%) 3.0 2.4 4.6 5.2
Original CAR (%) 17.03 16.70 16.02 15.15Post-Shock CAR (%) 17.03 16.70 16.02 15.15Change in CAR (percentage points) 0.00 0.00 0.00 0.00 Notes:1/ DVBP is the loss in net interest income generated from 100 bps shocks to the system’s foreign and domestic securities portfolio and
reported as a percentage of the system’s capital base.2/ Shocks of 1 400 bps applied to domestic currency securities portfolio.
Shocks of 150 bps applied to foreign currency securities portfolio.
Stress tests results indicated that the DTIs’ buffer capital was sufficient to absorb all the impact from the hypothetical shocks of 1 400 basis points (bps) and 150 bps to domestic and international interest rates, respectively, at the end of each quarter in 2008 (see Table ��).15 At end-2008, it would take shocks as much as 3.5 times the magnitudes used in the stress test, to reduce the system’s CAR below the regulatory benchmark.
15 Repricing net gap positions are computed for each repricing bucket as assets minus liabilities. The change in the market value of net repricing assets is evaluated by applying the interest rate shock and duration factor to each repricing gap position. The impact on capital adequacy is then evaluated.
The Financial System

Annual Report 2008
- �� -
�.�.�. Liquidity Risk (Interest Rate) Stress Tests
The risk of losses in net interest income from interest rate increases declined during 2008, as reflected in a reduction in the end-of-quarter short-term negative gap positions of the DTIs (see Table ��). The reduction in the risk of losses was due to an improvement in the cumulative 365-day gap position, relative to end-2007. Concurrently, liquidity shocks as a result of the hypothetical extreme interest rate increases did not reduce the banking sector’s CAR during 2008.16 Table ��
DTI’s QUARTERLY LIQUIDITY RISK STRESS TEST RESULTS Mar-08 Jun-08 Sep-08 Dec-08
Cumulative 365-day GAP/total assets (%) -35.8% -35.6% -33.0% -30.7%
Original CAR (%) 17.03 16.70 16.02 15.15Post-Shock CAR (%) 17.03 16.70 16.02 15.15Change in CAR (percentage points) 0.0 0.0 0.0 0.0
Memoranda items:1/ Shocks of 1 400 bps applied to domestic currency securities portfolio and 400 bps applied to domestic currency loans and deposits.2/ Shocks of 150 bps applied to foreign currency securities portfolio and 20 bps applied to foreign currency loans and deposits.
16 For each maturity bucket, the liquidity gap is computed as assets minus liabilities. Cumulative gaps within 365 days are computed, to which hypothetical interest rate shocks are applied. The impact of the resulting change in net interest income on profitability and capital adequacy are then evaluated.
�.�.�. Liquidity Risk (Funding) Stress Tests An assessment of the funding risk of DTI indicated no significant risk to the banking system’s CAR during 2008 (see Table ��).17 In this regard, all categories of DTI were robust to a first-round 40.0 per cent reduction in deposits when end-of-quarter assessments were made for 2008.
17 Hypothetical reductions are applied directly to the deposit base of the bank. Assets are assumed to be liquidated, in order of liquidity, so as to satisfy the demand. Haircuts are applied to non-liquid assets to satisfy further declines in deposits. The resulting impact on capital adequacy is then evaluated.
Table ��
DTI’s QUARTERLY FUNDING RISK STRESS TEST RESULTS Mar-08 Jun-08 Sep-08 Dec-08
�0.0 per cent decline in depositsOriginal CAR (%) 17.03 16.70 16.02 15.15Post-Shock CAR (%) 17.03 16.70 16.02 15.15Change in CAR (percentage points) 0.0 0.0 0.0 0.0
Memoranda items:1/ 100 bps to 400 bps reduction in deposits2/ The assumed ‘hair cut’ (% loss in value) on liquidating each category of assets are: Items in course of collection: 10%; Non-liquid investments: 20%; Accounts Receivables: 20%; Loans & Adv: 21%; Fixed Assets: 26%; Other Assets: 90%.
The Financial System

Bank of Jamaica
- �8 -
�.�.�. Aggregate Stress Test ResultsDTIs were robust to the end-of-quarter aggregate stress tests. The aggregate stress tests involved assessing the impact of combined shocks to credit quality, the exchange rate of the Jamaica Dollar vis-à-vis the US dollar, domestic and foreign interest rates and liquidity conditions on the DTI’s CAR. The prevailing macro-economic conditions during 2008 necessitated an upward revision in some of the Bank’s stress testing assumptions, relative to 2007. More specifically, the revised assumptions were:
a) 1 500 basis points (bps) and 500 bps increases in domestic interest rates on investment assets and other assets, respectively, relative to a 1 400 bps and a 400 bps shock at end 2007;
b) 40.0 per cent increase in non-performing loans, relative to a 30.0 per cent increase in non-performing loans in 2007.
The other assumptions remained:c) 10.0 per cent reduction in deposits;d) 20.0 per cent depreciation in the J$/US$
foreign exchange rate; ande) 100 bps and 10 bps increase in foreign interest
rates on foreign currency investment assets and other foreign currency assets, respectively.
The DTI’s post-shock CAR declined by an average 1.9 percentage points over 2008. This decline in the post-shock CAR reflected the increased vulnerability of the DTIs to market risk factors such as sharp movements in interest rate and liquidity risk factors. Notwithstanding, the aggregate system was robust to the aggregate stress test as reflected by post-shock CARs that showed the banking sector to be well capitalized during 2008 (see Table �8).
�.�.8. Early Warning System (EWS) Results18
The macro-prudential early warning system (EWS) index for the DTIs weakened by approximately 60.0 per cent to 43.0 points at end-2008, relative to end-2007, signalling deterioration in the macro-economic environment. This quarterly index registered an improvement for the first half of the 2008, but thereafter deteriorated for the rest of the year, consequent on the spill-over effects of the global financial crisis. The impact of the global financial crisis reflected itself in a rising Central Government deficit to GDP ratio, increased volatility in the local foreign exchange and stock markets as well as sharp upward adjustments in domestic interest rates. The performance of the index also reflected a sharp decline in the 12-month growth rate of the JSE Main Index as well as increased volatility in interest rates and exchange rates.
The micro-prudential indices (MPIs) for the commercial banks, FIAs and building societies also increased during 2008. Notwithstanding this deterioration, the MPIs for all three sectors remained within the 1996-1999 financial crisis threshold value of 50.0 points. The commercial banking sector recorded the highest MPI, relative to the other sectors. The MPI for the commercial banks deteriorated sharply to 44.0 points at end-2008 relative to 25.0 points at end-2007. This significant increase in the MPI for commercial banks primarily reflected an increase in the ratios of non-performing loans to total assets, loan and security
18 The BOJ Early Warning System (EWS) monitors macro- and micro- economic indicators of the banking sector via a non-parametric approach to signal banking sector vulnerability. The signal is based on EWS scores for each indicator, which is computed based on the number of standard deviations of each indicator from its ‘tranquil period’ mean value. The scores range from 0 to 5 with a score of 5 representing the most severe signal. Banking sector vulnerability at a point in time is determined by the trend in the aggregate EWS score (or index) over the previous eight quarters.
The Financial System

Annual Report 2008
- �9 -
losses provision to total assets and non-performing loans to total loans. In addition, decreases in the ratios of capital to assets, deposits to total assets and deposits and repos to assets also contributed to the deterioration.
Relative to end-2007, the MPI for the building societies increased by 33.0 per cent to 30.0 points as at end-2008. The deterioration in the index was attributable to an increase in the ratio of non-performing loans to total assets and a decline in the ratio of capital to total assets. Similarly, the MPI for the FIAs increased to 25.0 points as at end-2008, in comparison to the 16.0 points recorded the corresponding period last year. The weakening in the index was due largely to increases in the ratios of reserve for loan losses to total assets and financial institutions’ loans to total loans, coupled with a decrease in the ratio of liquid assets to total assets.
Table �8
DTI’s QUARTERLY AGGREGATE STRESS TEST RESULTS Mar-08 Jun-08 Sep-08 Dec-08
Original CAR (%) 17.03 16.70 16.02 15.15 Post-Shock CAR (%) 15.26 16.13 13.16 12.80 Change in CAR (percentage points) -1.77 -0.57 -2.86 -2.35
The Financial System
- �0 -
�.�. Bank of Jamaica Operations
During 2008, the Bank continued to issue certificates of deposit (CDs) as the main instruments through which monetary policy
was implemented. In addition to the usual offer of short-term fixed rate CDs with interest paid at maturity, the Bank offered two (2) ‘special’ CDs, the terms of which included quarterly coupon payments based on variable rates of interest and tenors of 18 months19. These operations were augmented by the issue of a ‘special’ short-term fixed rate CD with a short tenor of two weeks and an increase in the cash reserve ratio. The latter two actions were taken in the December quarter to support the achievement of the inflation objective and the maintenance of macroeconomic stability.
Liquidity Management The Bank’s liquidity management operations in 2008 involved fewer issues of special CDs, relative to 2007. This was in a context of the relatively favourable conditions in the financial market during the first three quarters and more frequent issues of GOJ debt instruments in the domestic capital market. In this regard, three special CDs were issued in 2008, relative to eight in 2007, two of which coincided with the maturity of previously issued ‘special’ variable rate CDs. The final special CD offer in November 2008 was timed to manage excess liquidity in the banking system. The cash reserve requirement on domestic prescribed liabilities of commercial banks, merchant banks and building societies was increased to 11.0 per cent from 9.0 per cent, immediately following the 19 The Bank’s usual CDs included the issue of instruments with tenor
ranging from overnight to 365 days
maturity of this two-week CD in December. For the year, the Bank’s liquidity management operations injected $15 577.3 million, with net injection occurring in all quarters except the December quarter (see Table �9). The overall injection was largely due to the net purchase of foreign currency, particularly during the first half of the year when the supply of funds in the foreign exchange market was buoyant. The total amount injected from this source amounted to $22 934.2 million and contributed to the stock of CDs increasing by $17 987.6 million during 2008 (see Table ��).
Notwithstanding the overall net outflow of liquidity emanating from the purchase of foreign currency during the year, there was significant absorption via net foreign currency sales in the September and December quarters. The efforts at restoring relative stability to the market was supported by the increase in the cash reserve requirement that absorbed $4 018.2 million in the December quarter.
In a context of uncertainty emanating from the worsened domestic and international credit conditions, particularly towards the end of the year, placements on open-market instruments remained skewed towards the 30-day tenor. The proportional placements on this tenor accounted for 42.4 per cent of the total issues in the March quarter and increased sharply to 75.1 per cent of open-market instruments issued by year-end, while averaging 58.1 per cent for the year. In 2007, the 30-day tenor accounted for an annual average of 45.8 per cent of open-market instruments issued (see Table �0).
3. Money Market Operations

Annual Report 2008
- �� -
Table �0 TAKE-UP RATIOS (%) IN SELECTED OPEN MARKET INSTRUMENTS
Quarterly Profile for 2007 & 2008
Issue Tenor March June September December Yearly Avg.� 30-day 38.3 39.3 45.6 60.2 ��.80 90-day 7.3 8.8 6.8 3.8 �.�0 180-day 30.5 36.9 20.0 9.2 ��.�� Other 8.1 10.7 4.1 6.8 �.�
Special Offers 15.8 4.4 23.5 20.0 ��.9 Issue Tenor
� 30 - day 42.4 48.2 66.5 75.1 �8.�0 90 - day 6.7 8.8 6.6 9.5 �.90 180 - day 14.8 5.0 3.0 3.0 �.�8 365 - day 25.5 29.3 12.1 8.3 �8.8
Other 5.5 8.7 8.2 4.2 �.� Special Offers 5.0 0.0 3.6 0.0 �.� ‘Other’ includes the take-up in the 60-day,120-day and 270-day tenors. Special Offers includes VR & FR offers for a limited time period
Increased investor appetite for ‘shorter term’ instruments coupled with the reduced issuance of ‘longer term’ special VR CDs also resulted in a contraction of the maturity profile of the Bank’s open-market liabilities. In this regard, the proportion of placements on ‘special’ CD offers declined to account for 2.2 per cent of the total open-market issues in
Table �9 BANK OF JAMAICA LIQUIDITY MANAGEMENT
�008J$BN
March June September December Total Certificates of Deposit 19 535.7 9 471.7 -9 052.4 -16 616.2 3 338.7 Sale of Securities - - - - -
Change in Cash Reserve Requirement - - - 4 018.2 4 018.2
Net Sale(+) of net Purchase(-) of
Foreign Exchange-22 852.4 -18 634.3 2 018.3 16 534.1 -22 934.2
Net Absorption (+)/Injection (-) -� ���.� -9 ���.� -� 0��.� � 9��.� -�� ���.�
2008, relative to approximately 15.9 per cent in 2007 (see Table �0). Consequently, by the end of the year, approximately 74.9 per cent of the OMO liabilities were due to mature in less than 6 months, increasing from 55.5 per cent at the end of the March 2008 quarter (see Table ��).
Money Market Operations

Bank of Jamaica
- �� -
Table �� MATURITY RATIOS (%) IN SELECTED OPEN MARKET INSTRUMENTS
Quarterly Profile for 2008 Time left Dec-0� Mar-08 Jun-08 Sep-08 Dec-08
to maturity (%) (%) (%) (%) (%)
< 30-days 31.7 17.4 20.6 21.1 24.4 31-days < m< 60-days 10.5 3.9 9.7 10.5 13.1 61-days < m< 90-days 4.2 5.9 10.0 4.3 15.0
31-days < m< 120-days 2.8 11.9 1.8 5.5 10.2 121-days < m< 180-days 6.3 16.4 6.7 21.1 12.3 181-days < m<270-days 19.3 5.7 24.0 21.0 17.1 271-days < m< 364-days 9.0 26.6 20.6 14.4 5.6
1-yr < m< 2yrs 16.2 12.2 6.6 2.2 2.4
Outstanding Stock (J$ mn) : �� ���.� �8 ��9.� �0 8��.9 �� ��0.0 �� ��8.9
Primary Dealer Monitoring and Improved Tradability of OMO CDsThe Primary Dealers (PDs) and commercial banks continued to be the main institutions through which the Bank conducted its open market operations. As at end-2008, the number of designated Primary Dealers increased to 13 from 12 as at the end-December 200720. The PDs accounted for 60.0 per cent of all new CDs issued in 2008, relative to 56.2 per cent in 2007, thereby increasing their holdings of outstanding CDs to 65.0 per cent from 59.0 per cent in 2007.
The Bank introduced the new features of its CD to the market on Monday, 05 May 2008. The re-designed certificate emanated from discussions with the Primary Dealers Association (PDA) and features, in particular, the ability to recognize ownership of OMO instruments by any individual or entity, thereby improving the tradability of the Bank’s issues. The 20 The Standard for Retaining Primary Dealer Designation was
enhanced, effective 31 July 2008 to include, in particular, the assessment of the principals and managers of the PD under the BOJ’s ‘fit and proper’ criteria. The details of the enhancement can be obtained from Appendix 1 of the Requirements for Primary Dealer Designation by the Bank of Jamaica document on the BOJ website at http://www.boj.org.jm.pdf/primary_dealers_requirements.pdf
.
changes required a one day workshop to introduce the new security features of the BOJ certificates to the industry as well as the completion of a new Master Agreement for the Bank’s open market instruments. The final document that was circulated on 30 April 2008 benefited from the feedback provided by primary dealers and commercial banks and was intended to:
(i) govern all instruments issued by the Bank of Jamaica;
(ii) provide the legal context for the engagement of business between the Bank as issuer, and buyers for open market instruments; and
(iii) replace the previous Master Agreement, which predominantly outlined the legal context for the Bank’s engagement in reverse repurchase transactions.
Notwithstanding the implementation of this initiative, the ultimate objective is to dematerialize the BOJ open-market instruments once the Central Securities Depository CSD) for fixed income securities is implemented in 200921.
21 The implementation of the CSD will eliminate the need for the movement of physical documents whenever there is a change in the ownership of BOJ securities. Adjustments to individual accounts will be recorded electronically whenever OMO instruments are bought and sold.
Money Market Operations

Annual Report 2008
- �� -
�.�. Interest Rates�.�.�. OverviewDuring 2008, the Central Bank steadily increased rates on its OMO instruments. In the first half of the year the Bank’s policy stance was influenced by inflationary concerns, which were manifested in a demand for higher yields on domestic instruments by investors. However, in the latter half, with the worsening global financial environment, coupled with relatively buoyant Jamaica Dollar liquidity conditions which fuelled demand pressures in the foreign exchange market, there was further tightening of monetary policy. Against this background, in addition to interest rate adjustments, the Bank implemented the following measures during the year:
the re-introduction of the 365-day tenor to the regular suite of OMO instruments on 16 January 2008;the offer of two special variable rate certificates of deposit to banks and primary dealers on 18 January 2008 and 2 September 2008;the offer of a special 15-day CD on 18 November 2008; anda two percentage point increase in the statutory cash reserve requirements on 3 December 2008.
Conditions in the financial markets in the first half of the year were challenged by intermittent bouts of instability in the foreign exchange market, supported by buoyant Jamaica Dollar liquidity. Consequently, the Bank re-introduced the 365-day tenor on 16 January to encourage investors to lengthen their investment horizon, thereby reducing the continuous stream of liquidity flows into the system over the short-term. This tenor was re-introduced at 13.50 per cent or 0.10
•
•
•
•
percentage point below the rate on this tenor when it was withdrawn on 13 April 2006. Additionally, the Bank issued a special variable rate (VR) CD at a re-price margin of 1.50 percentage points above the 3-month weighted average Treasury Bill yield (WATBY) to replace a corresponding maturity in January and effected three rounds of interest rate increases on the entire spectrum of OMO instruments. Given the challenges to liquidity management that became apparent from early in the year, interest rates on the 90-day and 180-day instruments were increased by 2.10 and 2.20 percentage points, respectively, by the end of the March quarter, relative to 11.80 per cent and 12.00 per cent on the respective instruments at end-2007. The rate on the 365-day tenor closed the quarter at 15.00 per cent or 1.50 percentage points above the re-introductory rate in January. Notwithstanding some improvement in financial market conditions in the June 2008 quarter, the Bank adjusted interest rates by 50 basis points amidst lingering concerns about inflation expectations.
During the September quarter, interest rates were maintained at the levels effected on 26 June 2008, given the generally favourable conditions in the financial system. However, a special VR CD was issued in September to provide a reinvestment option to investors who had received proceeds from a VR CD which matured in that period. This VR CD was however issued at a lower re-price margin of 1.25 percentage points above the 90-day WATBY.
Whilst inflationary pressures had significantly subsided, given the moderation in international commodity and world oil prices, the ongoing challenges arising from the severe impact of the unfolding global financial crisis influenced sharper
Money Market Operations

Bank of Jamaica
- �� -
increases on OMO rates during the December quarter. Interest rates on the 90-day, 180-day and 365-day instruments were increased by 5.60, 6.80 and 8.50 percentage points, respectively, by the end of the December quarter, from 14.40 per cent, 14.70 per cent and 15.50 per cent on the respective instruments at end-September 2008 (see Chart 9). The more aggressive policy stance was taken by the Central Bank to alleviate the demand pressures in the market and to maintain stability in the financial system. This was in the context of the increasing attractiveness of foreign currency denominated
assets, due to the sharp rise in yields on emerging market debt including GOJ global bonds and US dollar bonds issued by Jamaican companies.
The Bank of Jamaica also introduced the special 15-day CD in November and effected the increase in the statutory cash reserves requirement to 11.0 per cent from 9.0 per cent on 01 December. This was aimed at large blocks of liquidity emanating from maturing GOJ instruments which would have supported a disorderly depreciation in the foreign exchange market.
Chart 9
Money Market Operations

Annual Report 2008
- �� -
Table ��
RATE APPLICABLE ON BOJ CERTIFICATES OF DEPOSIT (%)
In Per Cent Per Annum �0-day �0-day 90-day ��0-day �80-day ���-day
End December 2007 11.65 11.70 11.80 11.85 12.00 n/aJanuary 09 12.65 12.70 12.80 12.85 13.00 n/aJanuary 16 12.65 12.70 12.80 12.85 13.00 13.50January 12.65 12.70 12.80 12.85 13.00 13.50February 04 13.50 13.70 13.90 14.00 14.20 15.00February 13.50 13.70 13.90 14.00 14.20 15.00March 13.50 13.70 13.90 14.00 14.20 15.00April 13.50 13.70 13.90 14.00 14.20 15.00May 13.50 13.70 13.90 14.00 14.20 15.00June 26 14.00 14.20 14.40 14.50 14.70 15.50June 14.00 14.20 14.40 14.50 14.70 15.50July 14.00 14.20 14.40 14.50 14.70 15.50August 14.00 14.20 14.40 14.50 14.70 15.50September 14.00 14.20 14.40 14.50 14.70 15.50October 17 14.65 14.85 15.05 15.15 15.35 16.70October 14.65 14.85 15.05 15.15 15.35 16.70November 14.65 14.85 15.05 15.15 15.35 16.70December 01 17.00 17.50 20.00 20.20 21.50 24.00December 17.00 17.50 20.00 20.20 21.50 24.00
Market determined interest rates, in particular the WATBY, also increased during the year. Notably, both the 3-month and 6-month WATBY reflected increases, relative to each end-quarter for the year, albeit at a decelerated pace during the June 2008 quarter. Subsequent increases in the respective
WATBY during the second half of the year were at increasing spreads above the corresponding OMO rate (see Chart �0). By end-2008, the 3-month and 6-month WATBY were at 22.01 per cent and 24.45 per cent, respectively (see Table ��).
Chart �0
Money Market Operations

Bank of Jamaica
- �� -
Table ��
WEIGHTED AVERAGE TREASURY BILL YIELDS (WATBY) (End Period - �008)
End Month �-month �-monthJanuary 12.97% 13.33%February 13.93% 14.22%March 13.97% 14.22%April 13.95% 14.20%May 13.92% 14.28%June 14.19% 14.43%July 14.46% 14.90%August 14.58% 15.08%September 14.81% 15.35%October 15.21% 16.96%November 16.92% 19.26%December 22.01% 24.45%
During 2008, there was one auction of a fixed-rate (FR) medium to long-term instrument by the GOJ. A 5-year Local Registered Stock (LRS) was offered in the March 2008 quarter and was issued at a weighted average yield of 16.44 per cent. This compared with 13.88 per cent on an offer of a similar tenor in the September 2007 quarter. The re-price margin on two 3-year VR GOJ offers in the March 2008 quarter was 1.50 percentage points above the 3-month WATBY, with subsequent instruments of a similar tenor in the June 2008 quarter being offered at a reduced margin of 1.125 percentage points above the 3-month WATBY. However, by the end of the December 2008 quarter, the re-price margin on a 1.5-year GOJ VR instrument was increased to 1.50 percentage points above the 3-month WATBY. A similar increase in interest rates was reflected on long term FR instruments, as evidenced in a yield of
17.65 per cent in the September quarter on a 20-year FR Bond, relative to a yield of 15.50 per cent on a similar instrument in the March quarter.
Money Market Operations

- �� -
The Main Jamaica Stock Exchange (JSE) Index declined sharply in 2008, particularly in the latter half of the year, reflecting
weak performance across listed companies. This performance occurred against the background of the global financial turmoil which contributed to a slowdown in domestic economic activity and weakened investor confidence as well as bouts of instability in the foreign exchange market (see Interest Rates and The Foreign Exchange Market).22 The decline in the Main JSE Index was consistent with the fall-out in equities markets internationally. 22 In an effort to contain the slide of the Jamaica Dollar, the Bank of
Jamaica increased rates on its open market instruments on five occasions during 2008.
The Main JSE Index ended the year at 80 152.0 points, reflecting a decline of 25.8 per cent in contrast to growth of 7.2 per cent the prior year. Similarly, the All Jamaica Composite and the Jamaica Select indices fell by 30.7 per cent and 32.2 per cent, respectively, as most stocks closed the year at prices below their 2007 closing levels (see Chart ��). The annual declines in the three indices were concentrated in the final two quarters of the year (see Chart ��). During those last six months, the Main JSE Index declined by 27.0 per cent, relative to growth of 1.7 per cent for the first two quarters of the year.
Chart ��
4. The Stock Market

Bank of Jamaica
- �8 -
Chart ��
In 2008, there was a notable fall-off in trading activity as reflected in the 6.4 per cent and 21.5 per cent declines in the total value of shares traded and the number of transactions, respectively (see Chart ��). Additionally, approximately sixteen listed stocks traded at their 52-week low, relative to one stock in 2007, indicative of reduced market sentiments in comparison to the previous year. The JSE advance-to-decline ratio for the period also signalled decreased market momentum and was 8:28, compared to 15:21 in 2007 (see Table ��).23 Declining stocks were mainly from Financial, Manufacturing, Retail and Conglomerate, accounting for nine of the top ten declining stocks (see Table ��). The modest performance of the local stock market for the first half of 2008 occurred within a context of favourable earnings results of several listed 23 During the latter part of 2007, there was increased market activity
due to the announcement by Angostura to acquire Lascelles deMercardo and the then proposed takeover of RBTT by the Royal Bank of Canada.
companies and relative stability in the foreign exchange market. Price gains during this period were also fuelled by investors positioning in anticipation of increased inflows into the regional markets from the takeover of the RBTT banking group by Royal Bank of Canada and the acquisition of Lascelles deMercado by Angostura Holdings Limited. However, the demand for local equities was constrained by generally weak investor confidence against the background of significant inflationary impulses which led to interest rates adjustments during the first half of the year (see Monetary Policy Management).
The Stock Market

Annual Report 2008
- �9 -
Chart ��
The stock market performance deteriorated in the second half of 2008, consistent with a deceleration in earnings of listed companies over this period. This occurred against the background of the instability in the international financial markets, which led to increased domestic uncertainty, a faster pace of depreciation in the foreign exchange rate and the subsequent upward adjustments in domestic
interest rates. These developments reduced the attractiveness of equities, relative to foreign currency holdings and Government securities. This was evident as investments in equities yielded an average monthly loss of 2.4 per cent in comparison to average monthly returns of 1.2 per cent and 1.0 per cent from money market securities and foreign currency investments, respectively (see Chart ��).
Chart ��
The Stock Market

Bank of Jamaica
- �0 -
The other major stock exchanges in the region registered weak performances during 2008. The composite indices for Barbados and Trinidad & Tobago declined by 11.9 per cent and 14.2 per cent, respectively, relative to 2007. The declines in the indices were reflective of the prospects for reduced
economic growth arising from the global financial crisis which undermined investors’ optimism (see Chart ��). Official estimates for Barbados and Trinidad & Tobago indicate that real GDP growth slowed to 1.7 per cent and 3.5 per cent in 2008, relative to 3.3 and 5.5 per cent in 2007, respectively.
Chart ��
Table ��ADVANCING STOCKS IN �008
Price at end-�008($)
Price Change (%)�008
ManufacturingSalada Foods 13.00 195.45Mobay Ice Company 20.00 51.52Seprod Limited 17.80 26.78TourismCiboney Group 0.05 400.00Pegasus Hotel 17.00 59.62OtherPulse Investments 5.20 100.00Palace Amusement 61.00 93.96InsuranceGuardian Holdings 320.00 10.34
The Stock Market

Annual Report 2008
- �� -
Table ��TOP TEN DECLINING STOCKS IN �008
Price at end-�008($)
Price Change (%)�008
Manufacturing
Caribbean Cement 3.95 -59.49
Desnoes & Geddes 4.05 -42.14FinancialMayberry Investments 2.00 -59.18Pan Caribbean 12.00 -40.00First Jamaica 25.00 -39.02CommunicationGleaner Company 1.73 -59.77Conglomerates
Pan Jam Investments 25.00 -50.00
GraceKennedy 43.50 -39.16RetailCarreras Limited 35.00 -49.28Hardware & Lumber 10.00 -37.50
The Stock Market

- �� -
�.�. Introduction
The Bank of Jamaica is charged with the supervision and periodic examination of deposit-taking financial institutions (DTIs)
pursuant to provisions under Section 34A of the Bank of Jamaica Act. Institutions supervised by the Bank are:
• commercial banks licensed under the Banking Act;
• merchant banks licensed under the Financial Institutions Act (hereafter FIA licensees); and
• building societies governed by the Building Societies Act and the Bank of Jamaica (Building Societies) Regulations.
Additionally, credit unions have been designated by the Minister of Finance as ‘specified financial institutions’ under the Bank of Jamaica Act, as a preliminary step towards placing these institutions under the supervisory regime of the Bank of Jamaica. This specification currently enables the Bank to obtain information on their operations. Regulations to establish a formal supervisory framework for these entities have been drafted after extensive discussions with sector representatives. These are pending presentation to Parliament by the Minister of Finance (see Section 5.5, Legislative/ Regulatory Developments).
Regulatory responsibility for non-deposit-taking financial institutions rests with the Financial Services Commission which has supervisory oversight of the securities, insurance and private pensions industries.
�.�. Legislative FrameworkThe major pieces of legislation and supporting Regulations governing the operations of the licensed DTIs are shown in Table ��.
5. Supervision of Deposit-Taking Financial
Institutions
These pieces of legislation establish the key principles and powers of supervision which include:
licensing and pre-qualification criteria (inclusive of fit and proper standards);minimum capital requirements (inclusive of risk weighted capital adequacy assessments and leverage ratios);transaction limits (such as credit, investment and fixed asset limits);connected party restrictions;cash and liquidity reserve requirements;non-performing loan classification and provisioning criteria;non-accrual requirements;routine prudential reporting;regular on-site examinations;consolidated supervision; andsupervisory sanctions and intervention powers in instances of statutory violations, unsafe/unsound practices and insolvency.
Licensees also have statutory responsibilities which may or may not be peculiar to the nature of their business, which devolve from other pieces of legislation. These pieces of legislation include, but are not limited to the Companies Act, the Deposit Insurance Act, the Proceeds of Crime Act, the Terrorism Prevention Act as well as Guidance Notes issued by the Supervisory Authority (see also Current Issues in Banking Supervision’ and Legislative Developments).
•
•
•
•••
•••••

Annual Report 2008
- �� -
Table ��
OVERVIEW OF LEGISLATIVE FRAMEWORK
Type of Legislation Title of StatutePrincipal Legislation
• The Bank of Jamaica Act• The Banking Act • The Financial Institutions Act • The Building Societies Act
Subsidiary Legislation • The Banking (Establishment of Branches) Regulations
• The Banking (Amalgamation and Transfers) Regulations• The Banking (Capital Adequacy) Regulations• The Banking (Licence Fees) Regulations• The Financial Institutions (Establishment of Branches) Regulations• The Financial Institutions (Amalgamation and Transfers) Regulations• The Financial Institutions (Capital Adequacy) Regulations• The Financial Institutions (Licence Fees) Regulations• The Bank of Jamaica (Building Societies) Regulations• The Building Societies (Licences) Regulations
�.�. Supervisory MethodologyBank of Jamaica’s supervisory responsibilities for DTIs are discharged through its Financial Institutions Supervisory Division (FISD). The supervisory methodology combines annual on-site examinations of each licensee with on-going off-site monitoring, facilitated primarily by prudential reporting requirements. The process allows for continuous and timely review of developments in the financial condition of supervised entities both at the micro institutional level as well as at the macro systemic level.
�.�.�. On-site ExaminationsOn-site examinations are statutorily conducted at least once each year by the Supervisor. These examinations include assessments of key aspects
of an entity’s operations such as capital adequacy, treasury operations, asset quality, earnings sustainability, market risk sensitivities, information systems infrastructure and disaster recovery/ business continuity arrangements. In recent years, the Bank has also been transitioning to a risk focussed approach to supervision. This involves enhanced off-site and pre-examination procedures, with increased scrutiny on licensees’ corporate governance frameworks, risk management and operational/group structures. The results of these assessments identify those areas that pose the greatest potential risk to each institution’s operations and inform the scope of on-site reviews and the level and focus of supervisory resources to be assigned to each examination.
Supervision of Deposit-Taking Financial Institutions

Bank of Jamaica
- �� -
A critical component of the on-site exercise is also a review of licensees’ frameworks (i.e. policies, controls and practices) for anti-money laundering and counter financing of terrorism (AML/CFT). This is to ensure that these meet the requirements of:
• local legislation (such as the Proceeds of Crimes Act and the Terrorism Prevention Act);
• Bank of Jamaica Guidelines on Anti-Money Laundering and Combatting of Terrorist Financing; and
• international obligations and standards promulgated by the United Nations (UN) Security Council Resolutions, the Financial Action Task Force (FATF) and the Caribbean Financial Action Task Force (CFATF) of which Jamaica is a member24, 25.
�.�.�. Off-Site ReviewsOff-site assessments are primarily facilitated by prudential returns submitted to the Bank weekly, monthly, quarterly and annually, as well as by reviews of audit and other external reports. Such reviews include the use of an ‘Early Warning System’. In this regard, the Financial Stability Department (FINSTAB) of the Research and Economic Programming Division of the Bank of Jamaica generates forecasts and scenario/stress reports based on prudential information provided. The FISD, in collaboration with FINSTAB, reviews and assesses system vulnerabilities arising from internal and external
24 FATF is an inter-governmental body established in 1989, whose purpose is the development and promotion of national and international policies to combat money laundering and terrorist financing.
25 CFATF is an organization of thirty states of the Caribbean Basin which agree to implement common counter measures to address criminal money laundering.
risk sensitivities related to market and economic developments locally and internationally.
�.�.�. OutcomesFeedback from the various reviews and assessments are provided by the Bank of Jamaica to licensees’ management and Boards26. Issues of concern including those requiring remedial actions within specified time frames are highlighted. Where there is evidence of ‘unsafe and unsound’ practices, the Bank of Jamaica utilizes sanction powers/measures as provided under the respective financial legislation and in accordance with its supervisory “Ladder of Enforcement” which sets out the graduated series of supervisory actions in response to specified prudential concerns. There is a continuous review of the legal and policy frameworks as well as the supervisory practices to ensure relevance as the financial markets evolve. In this regard, the Bank makes recommendations on legislative enhancements and provides formal guidance to the industry through the dissemination of Best Practice Standards and Guidelines. Further, the Central Bank actively promotes market discipline and disclosure through the quarterly publication of un-audited balance sheet data for each licensee, and key prudential indicators for each financial sub-sector and the combined deposit-taking system.
�.�. Current Issues in Banking Supervision
In the context of the global financial crisis, the Bank in 2008 heightened its monitoring of the exposure of licensees to external financial markets, related domestic risks and the extent of resilience in capital 26 Feedback is provided through a composite of formal meetings,
official correspondence and written reports on examination findings.
Supervision of Deposit-Taking Financial Institutions

Annual Report 2008
- �� -
buffers built up by local institutions. Against this background, the Bank also continued its programme of enhancing the regulatory and policy framework with focus given to the areas of supervision indicated below.
�.�.�. Promotion of Enhanced Risk Management FrameworksThe BOJ continued a systematic revision of the current suite of Standards of Best Practices for Effective Risk Management in recognition of the need for further strengthening of the risk management and corporate governance frameworks in DTIs. In this regard, the following two standards were issued to the industry during 2008:
i. Standard of Best Practice for the Effective Corporate Governance within Deposit-Taking Entities. This Standard is the overarching governance benchmark that establishes the minimum expectations of the Supervisory Authority for the implementation of an effective governance framework in DTIs; and
ii. Revised AML/CFT Guidance Notes. These were issued to the industry for comment. Revisions incorporated the provisions of the Proceeds of Crime Act (POCA) and the POCA (Money Laundering Prevention) Regulations which were promulgated in 2007. The industry feedback is currently being reviewed and on completion, the Guidance Notes will be submitted to the Ministry of National Security for approval and gazetting.
Additionally, the process of revision of the existing Credit Risk Management Standard, which was
originally issued in 1996, continued in 2008. The revised Standard will reflect industry developments and trends in the credit risk profile of DTIs, as well as the evolution in the requirements of internationally-accepted standard setters regarding the management and reporting of credit risk (such as the Basel Committee on Banking Supervision (BCBS) and International Accounting Standards Board) 27. It is anticipated that this revised standard will be issued to the industry during 2009.
�.�.�. Core Principles for Effective Banking SupervisionConsequent on the revision of the Basle Core Principles (BCPs) for the Effective Supervision of Banking Entities by the BCPS in October 2006, the Bank of Jamaica commenced a self-assessment exercise, to benchmark its supervisory systems and standards with this revised internationally-accepted best practice standard, which was updated inter alia, to:-
reflect greater consistency with other global best practice standards, such as the Basel II capital adequacy framework;promote enhanced risk management and corporate governance frameworks in banking entities; andpromote enhanced supervisory approaches and techniques by supervisory bodies/agencies.
27 The Basel Committee on Banking Supervision (BCBS) is the international standard setting body for banking supervisors worldwide. The Committee is represented by central banks and bank regulators from Belgium, Canada, France, Germany, Italy, Japan, Luxemburg, the Netherlands, Spain, Sweden, Switzerland, United Kingdom and the United States.
•
•
•
Supervision of Deposit-Taking Financial Institutions

Bank of Jamaica
- �� -
This self-assessment process continued in 2008 with the resultant updating of a revised Action Plan28. The process is expected to continue in 2009 with the simultaneous activation of the Action Plan. It is expected that this initiative will facilitate a smooth transition to the Basel II Capital Adequacy Framework.
�.�.�. Consolidated/Conglomerate SupervisionIn 2008, the Bank of Jamaica continued the monitoring of the reorganization/restructuring of financial groups of which DTIs are a part, pursuant to the deposit-taking statutes. The statutes require groups to which deposit-taking licensees belong, to reorganize, such that, the licensee is directly owned by a financial holding company, which does not own other companies within the group unless those companies are regulated or supervised. This provision is aimed at ensuring that groups are established as supervise-able financial groups. Progress was also made in the drafting of the proposed legal framework for conglomerate supervision as part of the Omnibus Bill (see also Section �.�: Legislative/Regulatory Developments).
�.�.�. Specialised Reviews of the Information Technology Frameworks
Information technology and e-banking services have become central to the operations of DTIs, while presenting significant risks to their ongoing operations. Consequently, the Bank has been placing specific emphasis on the assessment of the adequacy of the risk management framework governing the IT operations of its DTI licensees 28 An independent assessment was conducted by the IMF/World
Bank during 2005 when Jamaica’s supervisory framework was rated as fully or largely compliant with 22 of the 25 original BCPs issued in 1997.
placing particular focus on areas such as IT security, business continuity planning and outsourcing of IT services. The assessment exercise involved targeted on-and off-site reviews of the IT framework of selected systemically important institutions in 2008.
�.�.�. Applications for Commercial Banking Licence
The Bank is charged with the statutory responsibility for assessing applications for DTIs licences and to make recommendations to the Honourable Minister of Finance (HMF) who is statutorily empowered to issue and revoke such licenses. The licensing application assessment involves, inter alia, assessment of the financial strength and suitability of the applicant and the financial group to which it belongs, fit and proper assessment of proposed directors and managers, as well as the reasonableness/soundness of business plans, including financial projections.
During 2008, the BOJ received two applications for commercial banking licences. While one was assessed as not meeting all the requirements for a positive recommendation to the HMF, the other application was in a process of review at year-end.
�.�. Legislative/Regulatory DevelopmentsDuring 2008, in addition to the updating and issuing of standards of best practice, (see Section �.�.�) the Bank was also involved in the developments/ initiatives noted below.
�.�.�. Draft Omnibus Statute This statute seeks to consolidate the provisions of existing deposit-taking statutes (i.e. Banking Act, the Financial Institutions Act, and the Bank of Jamaica (Building Societies) Regulations) into one Omnibus Bill.
Supervision of Deposit-Taking Financial Institutions

Annual Report 2008
- �� -
This exercise is aimed at • removing inconsistencies and eliminating
regulatory arbitrage opportunities within the existing statutes; and
• incorporating holding company provisions as well as effecting legislative amendments necessary for Basel II implementation and full compliance with Basel Core Principles (see Financial Legislation).
�.�.�. Credit Regulations The redrafting of Credit Regulations continued in 2008 to take account of, inter alia, Basel Standard for Sound Credit Risk and Valuation for Loans as well as impairment requirements prescribed under the International Financial Reporting Standards (IFRS) to achieve greater convergence in regulatory and accounting provisioning methodologies.
�.�.�. Qualifications of Auditors RegulationDraft regulations that specify expectations for auditors in undertaking an external audit of a supervised financial institution were with the HMF for approval. Among other things, the criteria specified in these regulations relate to the independence, experience and academic qualification of the external auditors. These proposed regulations would also require prior notification to the Bank of Jamaica in respect of proposed appointments. The Bank would also be empowered to object to the appointment of an external auditor if there was evidence that such an auditor was not in compliance with the provisions of the regulations.
�.�.�. Bank of Jamaica (Credit Union) Regulations
Regulations to establish the supervisory regime
that will be applicable to credit unions have been drafted and are pending presentation to Parliament by the HMF. These regulations will, among other things, prescribe prudential criteria and minimum solvency standards covering, inter alia, essential areas such as capital adequacy, liquid assets, credit and provisioning, submission of financial statements and remedial action that can be taken by supervisory authorities with respect to unsafe and unsound practices or insolvency.
�.�.�. Building Societies (Licences) Regulations
The Building Societies (Licence) Regulations are being amended to harmonise the annual licensing fees payable by building societies, on the granting of a licence, with the rates applicable to commercial banks and FIA licensees.
�.�.�. Financial Investigations Division BillThe Financial Investigations Division (FID) Bill was tabled in Parliament in November 200829. When passed, the FID legislation will, among other matters, establish the FID on a statutory basis, thereby increasing the independence of this Unit and facilitating the Unit’s admission to membership of the Egmont Group (the international body of FIUs); expand the investigative tools available to the FID for the investigation of suspected financial crimes; and establish specific penalties for non-compliance with directives or requests for information issued by the FID.
29 The BOJ, by virtue of its chairmanship of the Task Force on Financial Crime has been involved in the development of a law to govern Jamaica’s Financial Intelligence Unit (FIU), namely the Financial Investigations Division (FID).
Supervision of Deposit-Taking Financial Institutions

Bank of Jamaica
- �8 -
�.�. Supervisory Cooperation and Interaction�.�.�. Financial Regulatory CouncilThe Financial Regulatory Council (the Council) continued to meet during 2008. During the review period the Council examined issues affecting the financial industry as well as issues specific to corporate groups comprising financial entities which are supervised by the Bank and the Financial Services Commission. The Council comprises the following members:
• the Governor of the Bank of Jamaica, Chairman;
• the CEO, Financial Services Commission;• the CEO, The Jamaica Deposit Insurance
Company;• the Financial Secretary; and• the Solicitor-General.
�.�.�. Regional Interaction�.�.�.�. The Caribbean Group of Banking SupervisorsDuring 2008, the Bank continued to administer the Secretariat for the Caribbean Group of Banking Supervisors (CGBS) through a Unit in the FISD30. The Secretariat coordinated three administrative meetings, two technical working group meetings, and, in conjunction with the Central Bank of Barbados, the XXVI Annual Conference. Four training programmes were organized for the region with international facilitators from organizations such as Federal
30 The CGBS was established in 1983 under the aegis of the Central Bank Governors of member countries of the Caribbean Community (CARICOM) with the specific mandate to co-ordinate the enhancement of bank supervisory practices in the English speaking Caribbean, consistent with internationally accepted standards. The CGBS was later extended to banking supervisors from non-CARICOM Caribbean territories and now comprises membership from fourteen regional jurisdictions, nine of which are presently core members of CARICOM.
Reserve System (USA), Office of the Superintendent of Financial Institutions (Canada) and the Financial Stability Institute 31.
The Bank participated in its own right, in the two technical working groups which were respectively mandated to propose minimum standards for effective consolidated supervision; and develop a regional plan for financial crisis management of entities with cross border operations. At year-end, both working groups were in the process of developing policy documents in the two areas.
�.�.�.�. Information Sharing
During 2008, under powers of the Information Sharing Agreement, the Bank was engaged in discussions and exchanged relevant information with regional jurisdictions. Further, through the CGBS, the Bank proposed and commenced the development of a Supplementary Protocol to the MOU which will serve to clarify the expectations of respective signatories when relying on the MOU32. Bank of Jamaica also participated in a number of regional supervisory colleges to discuss matters of mutual interest pertaining to cross border banking groups.
�.�.�.�. ASBA
In 2008, the Bank as an active member of the hemispheric group, the Association of Banking Supervisors of the Americas (ASBA) participated in the official programme for the annual assembly 31 The Financial Stability Institute was jointly established by the Bank
for International Settlements and the Basel Committee on Banking Supervision to assist supervisors around the world in improving and strengthening their financial systems.
32 The Information Sharing Agreement is signed by twelve CGBS members, to facilitate cross-border cooperation between home and host supervisory authorities for regional banking entities.
Supervision of Deposit-Taking Financial Institutions

Annual Report 2008
- �9 -
and also in the ASBA Working Group on Corporate Governance in Banking Institutions33. The objective of this work group is to issue a standard for member jurisdictions to guide the assessment of corporate governance frameworks in banking institutions. At year-end, a draft document had been produced by that working group.
5.6.2.4. Caribbean Financial Action Task ForceIn another area of regional involvement, the Senior Deputy Governor (Deputy Supervisor of Banks) continued to serve as the Principal Contact for Jamaica to the Caribbean Financial Action Task Force (CFATF). During 2008, a third member of FISD was trained as a peer assessor for the CFATF’s Mutual Evaluation Programme. This officer and a member of the Legal Department also participated as ‘financial sector experts’ on CFATF’s AML/CFT Country Reviews of two regional member jurisdictions.
�.�.�. Other External InteractionsIn 2008, the Bank in its role of Secretariat for the Caribbean Group of Bank Supervisors, prepared and submitted an update on supervisory developments for inclusion in the BCBS’ biennial publication on International Supervisory Developments. The Bank also participated in BCBS’s biennial International Conference of Banking Supervisors (ICBS) which was co-hosted by the National Bank of Belgium and the Belgian Banking, Finance and Insurance Commission in Brussels, Belgium, during September 2008.
33 ASBA is a regional grouping of 37 Banking Supervisory Authorities whose membership spans 35 jurisdictions encompassing North, Central and South America and the Caribbean, with one non-regional member, Spain.
�.�. The Supervised Deposit-Taking System
At 31 December 2008, the total number of licensed DTIs remained unchanged at 14 (see Table ��). There was however, a reduction in the number of licensees under the Financial Institutions Act to 3 from 4 and a corresponding increase in commercial banks to 7 from 6, as a result of the former PanCaribbean Merchant Bank’s surrender of its licence under the Financial Institutions Act, on the granting of a licence under the Banking Act in June 2008. With the granting of the new licence, the entity changed its name to PanCaribbean Bank.
Additionally, pursuant to the earlier acquisition of the Dehring Bunting and Golding Limited (DB&G Limited) by Scotia Group Jamaica Limited, the name of DB&G Merchant Bank Limited was changed to Scotia DBG Merchant Bank Limited during March 2008.
The licensed DTIs operated through a combined island-wide branch network of 183 at the end of 2008 as compared to 179 as at 31 December 2007.
�.�.�. Authorised Foreign Exchange DealersAll the licensed DTIs are approved foreign exchange dealers, enabling them to not only buy and sell foreign currencies, but also accept deposits, make loans and conduct other dealings in foreign currencies. While cambio licences allow for the buying and selling of foreign currencies, and are issued to any applicant successfully meeting the licensing criteria, only licensed deposit takers are eligible to undertake authorized foreign currency dealing activities.
Supervision of Deposit-Taking Financial Institutions

Bank of Jamaica
- �0 -
Table ��
MARKET COMPOSITION – NUMBER OF LICENSED DEPOSIT-TAKING ENTITIES*
Supervised Entities �00� �00� �00� �00� �008
Commercial Banks 6 6 6 6 7FIA Licensees 5 5 5 4 3Building Societies 4 4 4 4 4Total �� �� �� �� ��
Table �8
LICENSED DEPOSIT-TAKING INSTITUTIONS AS AT �� DECEMBER �008
Sub-sector Institution Name Related Deposit-taking Institution
Commercial Banks Bank of Nova Scotia Jamaica Limited Scotia Jamaica Building SocietyScotia DB&G Merchant Bank Limited
Citibank N. A.FirstCaribbean International Bank (Jamaica) Limited
FirstCaribbean International Building Society
First Global BankNational Commercial Bank Jamaica LimitedPanCaribbean BankRBTT Jamaica Limited
FIA Licensees Capital & Credit Merchant Bank LimitedScotia DB&G Merchant Bank Limited Bank of Nova Scotia Jamaica Limited
Scotia Jamaica Building SocietyMF&G Trust and Finance
Building Societies FirstCaribbean International Building Society FirstCaribbean International Bank (Jamaica) Limited
Jamaica National Building SocietyScotia Jamaica Building Society Bank of Nova Scotia Jamaica Limited
Scotia DB&G Merchant Bank LimitedVictoria Mutual Building Society
�.�.�. System Performance Review
�.�.�.�. Overview
The balance sheets of licensed DTI were not immune to the developments in international financial markets during 2008. The impact of these developments resulted in a 6.6 per cent ($15.1 billion) decline in investments (inclusive of repurchase agreements) which was partly offset by a 24.2 per cent ($64.2 billion) growth in loans and advances (net of provision
for losses). Accordingly, the share of investments in total assets declined to 29.4 per cent from 34.0 per cent at end-2007. On the other hand, the ratio of loans to total assets increased to 45.1 per cent at end-2008 from 39.2 per cent at end-2007.
Cash and bank balances increased marginally by $1.7 billion (1.5 per cent) compared to growth of $18.0 billion (18.1 per cent) for the previous year. The slower increment reflected the liquidation of
Supervision of Deposit-Taking Financial Institutions
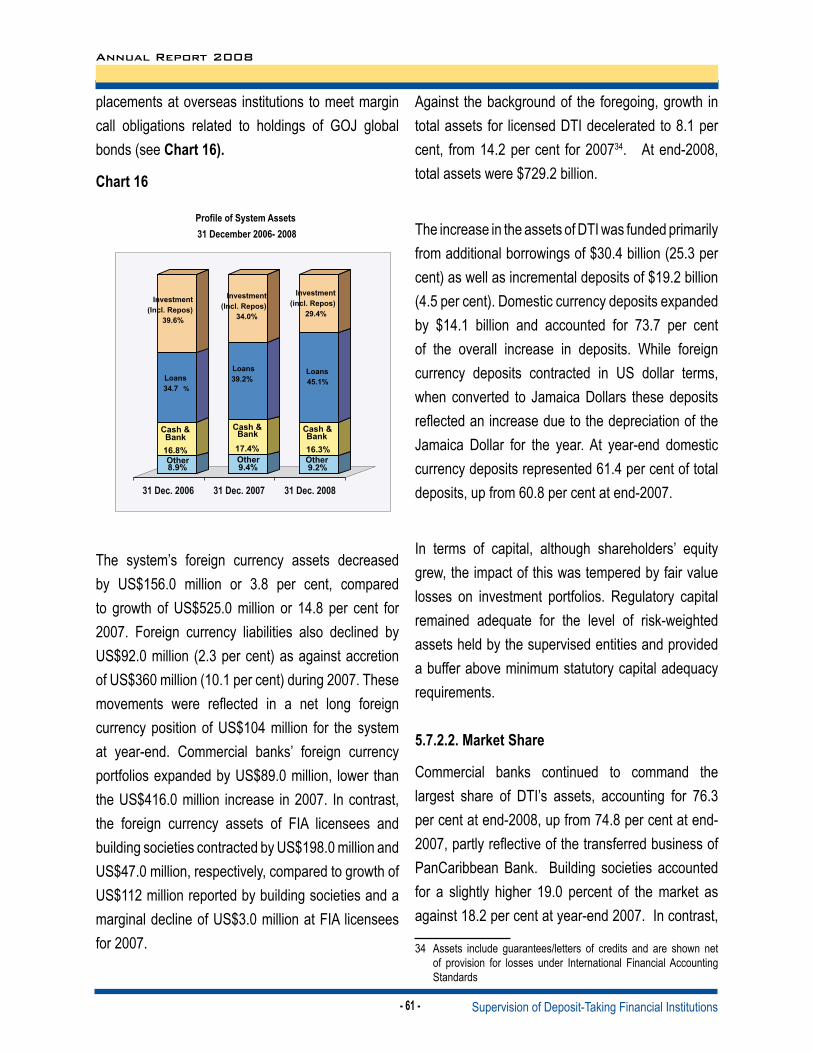
Annual Report 2008
- �� -
placements at overseas institutions to meet margin call obligations related to holdings of GOJ global bonds (see Chart ��).
Chart ��
The system’s foreign currency assets decreased by US$156.0 million or 3.8 per cent, compared to growth of US$525.0 million or 14.8 per cent for 2007. Foreign currency liabilities also declined by US$92.0 million (2.3 per cent) as against accretion of US$360 million (10.1 per cent) during 2007. These movements were reflected in a net long foreign currency position of US$104 million for the system at year-end. Commercial banks’ foreign currency portfolios expanded by US$89.0 million, lower than the US$416.0 million increase in 2007. In contrast, the foreign currency assets of FIA licensees and building societies contracted by US$198.0 million and US$47.0 million, respectively, compared to growth of US$112 million reported by building societies and a marginal decline of US$3.0 million at FIA licensees for 2007.
Against the background of the foregoing, growth in total assets for licensed DTI decelerated to 8.1 per cent, from 14.2 per cent for 200734. At end-2008, total assets were $729.2 billion.
The increase in the assets of DTI was funded primarily from additional borrowings of $30.4 billion (25.3 per cent) as well as incremental deposits of $19.2 billion (4.5 per cent). Domestic currency deposits expanded by $14.1 billion and accounted for 73.7 per cent of the overall increase in deposits. While foreign currency deposits contracted in US dollar terms, when converted to Jamaica Dollars these deposits reflected an increase due to the depreciation of the Jamaica Dollar for the year. At year-end domestic currency deposits represented 61.4 per cent of total deposits, up from 60.8 per cent at end-2007.
In terms of capital, although shareholders’ equity grew, the impact of this was tempered by fair value losses on investment portfolios. Regulatory capital remained adequate for the level of risk-weighted assets held by the supervised entities and provided a buffer above minimum statutory capital adequacy requirements.
�.�.�.�. Market Share
Commercial banks continued to command the largest share of DTI’s assets, accounting for 76.3 per cent at end-2008, up from 74.8 per cent at end-2007, partly reflective of the transferred business of PanCaribbean Bank. Building societies accounted for a slightly higher 19.0 percent of the market as against 18.2 per cent at year-end 2007. In contrast,
34 Assets include guarantees/letters of credits and are shown net of provision for losses under International Financial Accounting Standards
Supervision of Deposit-Taking Financial Institutions

Bank of Jamaica
- �� -
FIA Licensees reflected a reduced market share of 4.6 per cent compared to 7.0 per cent end 2007, impacted significantly by PanCaribbean Merchant Bank’s exit
from the sub-sector, as well as a combination of balance sheet restructuring and lower investment values at another licensee (see Table �9).
Table �9
ASSET SHARE OF LICENSED DEPOSIT-TAKING INSTITUTIONS��-Dec-0� ��-Dec-0� ��-Dec-08
Sub-sector $BN % $BN % $BN %Commercial Banks 438.4 74.2 504.2 74.8 556.7 76.4Buildings Societies 105.6 7.9 122.8 18.2 138.4 19FIA Licensees 46.5 4 47.2 7 33.9 4.7SYSTEM TOTAL �90.� 100 ���.� 100 ��9 100
National Commercial Bank Jamaica Limited and Bank of Nova Scotia Jamaica Limited remained the market leaders, accounting for a combined 68.9 per cent of the total asset base at end-2008. With regard to building societies, Jamaica National Building Society (JNBS) and Victoria Mutual Building Society (VMBS) maintained market leadership of that sub-sector, reflecting respectively, assets growth of $7.1 billion and $5.2 billion and accounting for 51.9 per cent and 35.4 per cent of that market.
During 2008, the assets of FIA licensees declined by $13.3 billion to $33.9 billion. The reduction largely reflected PanCaribbean Merchant Bank’s exit from that sub-sector. Abstracting for this development, the sub-sector’s assets would have contracted by 11.5 per cent in 2008, compared to a decline of 1.3 per cent in 2007.
�.�.�.�. Liquidity
The statutory minimum domestic currency cash
reserve and liquid assets requirements were increased by 2.0 percentage points to 11.0 per cent and 25.0 percent respectively, during December
Supervision of Deposit-Taking Financial Institutions
2008. The foreign currency cash reserve and liquid assets requirements remained unchanged at 9.0 per cent and 23.0 per cent, respectively, throughout the year35. The differential cash reserve requirement of 1.0 per cent and liquid assets requirement of 5.0 per cent that apply to building societies satisfying a residential mortgage threshold of 40.0 per cent of deposit base, also remained in effect. At year-end, all building societies qualified for the lower ratios for both the domestic and foreign currency requirements. At end-2008, DTIs had liquid assets of 5.4 per cent above the liquid assets requirement of 25.0 percent.
�.�.�.�. Asset Quality
At end-2008, there was some deterioration in the asset quality of the DTIs, as the ratio of non-performing loans 3 months & over (NPLs) to total loans increased to 2.9 per cent, from 2.3 per cent at end-2007 (see Chart ��). This, however, remained 35 The Central Bank announced its intention to increase the domestic
currency requirements by a further 3.0 percentage points. Changes to the domestic and foreign currency requirements were effected in January 2009. In February, there was a further percentage point adjustment in respect of the domestic currency requirements. Foreign currency cash reserve and liquid assets statutory requirements are held in US dollar, Canadian dollar and Pound Sterling.

Annual Report 2008
- �� -
well within the international benchmark maximum of 10.0 per cent of the total loan portfolio. In nominal terms, NPLs increased by $3.6 billion or 57.6 per cent during 2008 to $9.8 billion, compared to an
increase of $0.8 billion or 14.2 per cent during 2007 (see Chart �8).
Chart ��
Chart �8
Supervision of Deposit-Taking Financial Institutions

Bank of Jamaica
- �� -
Provision for loan losses (which represent a combination of assessments under IFRS and incremental amounts required in accordance with the Central Bank’s prudential guidelines) provided reduced coverage of 88.2 per cent of NPLs, down from 103.4 per cent recorded at the end of 2007, while regulatory capital plus provisions provided a buffer of 804.2 per cent of the value of NPLs (1 099.5 per cent at the end of 2007).
�.�.�.�. Capital
Growth in shareholders’ equity slowed to $1.7 billion or 2.0 per cent during 2008 to total $88.1 billion, tempered by fair value losses on investment portfolios. This compares with the increase of $8.0 billion or 10.3 per cent which obtained during 2007. Nonetheless, licensees strengthened regulatory capital bases by $8.2 billion or 13.3 per cent ($6.5 billion or 11.7 per cent during 2007) through transfers from realised profits to statutory reserve funds.
The faster growth in regulatory capital vis-à-vis assets during 2008 resulted in the system, as a whole, reflecting a stronger primary ratio (regulatory capital to total assets) of 9.6 per cent (9.2 per cent at end-2007). Similarly, the risk-weighted capital adequacy ratio increased to 16.0 per cent from 15.8 per cent at end-2007. At end-2008, all licensees continued to maintain primary and risk weighted capital adequacy ratios in excess of the minimum requirements of 6.0 per cent and 10.0 per cent, respectively.
5.7.2.6. Profitability
Based on unaudited earnings and expenditure results submitted by licensees to the Bank of Jamaica, the
system recorded a pre-tax profit margin of 27.2 per cent at end-2008 (26.7 per cent at end-2007). The ROAA was 3.7 per cent for 2008 as against 3.4 per cent at end-2007, with all licensees individually reporting positive results.
The improved system performance, although impacted by extra-ordinary income from sale of investments by one licensee, was also reflective of incremental revenues of $11.6 billion (14.0 per cent) generated from operations. The increase in revenue from operations was influenced by the shift in assets profile from investments and placements with overseas institutions, to higher yielding loans (incremental revenues of $8.3 billion) and a higher contribution from non-interest income sources such as service charges, fees and commissions ($1.5 billion) and foreign exchange gains of $1.9 billion.
System expenses increased by $9.5 billion (15.2 per cent), reflecting higher staff costs ($3.0 billion), interest expenses ($2.1 billion) and other operating costs ($1.9 billion). The Net Interest Margin (NIM) remained fairly stable at 11.4 per cent at end-2008, compared to 10.9 per cent at end-2007.
�.8. Credit Unions
�.8.�. Supervisory Developments
During 2008, the Bank continued its dialogue with the credit union industry regarding the draft Credit Union Regulations. This was with a view to finalize and submit same to the HMF for tabling in Parliament and subsequent approval. It is anticipated that sign-off will take place during 2009.
Supervision of Deposit-Taking Financial Institutions

Annual Report 2008
- �� -
In anticipation of the passage of the Regulations by Parliament, the Bank continued its programme of on-site examinations of credit unions, which included the provision of feedback to the Board and Management. This provided the basis for strengthening of the overall operations and practices of most credit unions as they prepared their institutions for licensing under the imminent regulations. The Central Bank also continued its off-site monitoring of credit unions by way of analysis of the monthly and quarterly prudential returns submitted to the Bank. In addition to prudential returns, the 2007 audited financial statements for all credit unions were submitted to the Bank.
The number of registered credit unions stood at 48 at end-2008. The BOJ was also advised of the signing of a memorandum of understanding between another two credit unions to merge their operations. Of the 48 registered credit unions at end-2008, two remained outside of the umbrella organization, the Jamaica Cooperative Credit Union League (JCCUL). Nonetheless, the credit unions submitted prudential returns to the Bank. At end-2008, there were also two credit unions under the ‘supervision’ (a form of temporary management) of the JCCUL.
During 2008, several credit unions obtained the approval of their membership to amend their rules to allow for the issue of permanent shares to strengthen capital. This arose from their recognition that withdrawable share savings do not qualify as capital and are not to be treated as such under the draft Bank of Jamaica (Credit Unions) Regulations or IFRS requirements. This will facilitate a transition from the long standing tradition and practice of recognizing withdrawable members’ share savings as part of a credit union’s institutional capital.
�.8.�. Credit Union Performance Highlights As at 31 December 2008, total assets of the credit union sub-sector was $50.7 billion, representing a $6.4 billion or 14.6 per cent increase over 2007. Loans increased by $3.8 billion (12.4 per cent) to account for $34.8 billion or 68.7 per cent of overall assets as at 31 December 2008. Total savings of $39.5 billion which reflected growth of $5.1 billion or 15.0 per cent over the balance at end-2007, provided the primary source of funding new lending to members. Overall, credit union membership increased by 50 060 to 970 922 during the year (see Tables �0 and ��).
Table �0
KEY CREDIT UNION INDICATORS
Indicator Dec-08 Dec-0� Change Change %
No. of Credit Unions 48 48 0 -Membership (actual) 970 922 920 862 50 060 5.4Total Savings Fund ($BN) 39.54 34.40 5.14 15.0
Total Loans ($BN) 34.84 31.01 3.83 12.4Total Assets ($BN) 50.71 44.27 6.44 14.6Data is at December 2008 – Revised February 2009
Supervision of Deposit-Taking Financial Institutions

Bank of Jamaica
- �� -
Table ��SELECT CREDIT UNION DATA
�00� – �008Year End No. Of Credit
UnionsMembership Total Savings
Fund ($BN)Total Loans (Gross) ($BN)
Loans/ Savings Ratio (%)
Total Assets ($BN)
�00� 50 759 958 22.5 17.4 77.3 28.5
�00� 48 811 920 25.5 21.3 83.5 32.6
�00� 48 874 805 30.4 25.9 85.2 38.5
�00� 48 927 613 34.4 31.0 90.1 44.3
�008 48 970 922 39.5 34.8 88.1 50.7
1 Lascelles and Carreras Co-op Credit Unions merged in September 20052 Carib Cement Co-op Credit Union merged with Palisadoes Co-op Credit Union in July 2008. Superclubs Co-op Credit Union was registered in 2007 but commenced submitting returns to BOJ in 2008. This entity is not reflected in ‘No. of Credit Unions’ at Year End 2007.Status Date: 27 February 2009
Supervision of Deposit-Taking Financial Institutions

Annual Report 2008
- �� -
Table ��
A
NNUA
L PR
UDEN
TIAL
INDI
CATO
RS O
F CO
MMER
CIAL
BAN
KS,
LIC
ENSE
ES U
NDER
THE
FIN
ANCI
AL IN
STIT
UTIO
NS A
CT (F
IA) A
ND B
UILD
ING
SOCI
ETIE
S
P
UBLI
SHED
PUR
SUAN
T TO
SEC
TION
�� (�
) OF
THE
BANK
ING
ACT A
ND T
HE F
IA
A
ND R
EGUL
ATIO
N �9
OF
THE
BANK
OF
JAMA
ICA
(BUI
LDIN
G SO
CIET
IES)
REG
ULAT
IONS
, �99
� ��
-Dec
-08
COMM
ERCI
AL B
ANKS
FIA
LICE
NSEE
SBU
ILDI
NG S
OCIE
TIES
Syst
em To
tal (
aggr
egat
ion
of al
l � se
ctor
s)De
c-0�
Dec-
0�De
c-08
Dec-
0�De
c-0�
cDe
c-08
bDe
c-0�
Dec-
0�De
c-08
Dec-
0�De
c-0�
Dec-
08Nu
mbe
r of i
nstit
utio
ns in
ope
ratio
n �
��
��
��
��
����
��� To
tal A
sset
s (inc
l. con
tinge
nt ac
coun
ts)43
8 437
50
4 224
��
� ��0
46
449
47 19
5 ��
89�
105 5
90
122 8
23 �
�8 ��
� 59
0 476
67
4 242
��
9 ���
� To
tal A
sset
s (ex
cl. co
nting
ent a
ccou
nts)
427 0
99
487 8
96
��� �
��
45 62
4 46
432
�� ��
� 10
5 522
12
2 753
��8
���
578 2
45
657 0
81
��� 8
�0
Cash
& B
ank B
alanc
es79
544
91 32
8 9�
���
2 846
3 5
95
� �88
16
918
22 33
8 �0
��8
99 30
8 11
7 261
��
8 989
In
vest
men
ts [i
ncl. S
ecur
ities
Pur
ch.]
(net
of pr
ov.)
165 9
14
167 3
74
��� �
��
29 65
8 27
129
�8 �8
� 38
495
34 80
6 ��
�08
234 0
67
229 3
09
��� �
�8
Tota
l Loa
ns (g
ross
)15
3 449
19
5 103
��
� ��8
11
147
14 20
7 �0
8�8
43 77
6 58
966
�� 09
8 20
8 372
26
8 276
��
� 08�
To
tal L
oans
(net
of IF
RS p
rov.)
a15
0 579
19
2 039
��
� ��9
11
088
14 13
0 �0
��0
43 08
8 58
258
�� ��
� 20
4 755
26
4 427
��
8 �0�
To
tal D
epos
its28
2 926
32
1 053
��
� 9�0
14
017
17 15
3 ��
��9
73 58
5 84
377
9� �8
� 37
0 528
42
2 583
��
� ���
Bo
rrowi
ngs (
incl. r
epos
)71
557
85 98
9 ��
� 0�8
22
635
20 02
0 ��
�8�
10 48
2 13
967
�0 ��
� 10
4 674
11
9 976
��
0 ��0
No
n-Pe
rform
ing
Loan
s [NP
L] (�
mth
s & >)
3 408
3 9
03
� ���
49
3 53
1 �8
� 1 5
37
1 774
� �
�9
5 438
6 2
08
9 �8�
Pr
ovisi
on fo
r Loa
n Lo
sses
4 288
5 0
37
� 8��
17
1 22
1 ��
� 1 0
46
1 158
� �
��
5 505
6 4
16
8 ���
� C
apita
l Bas
e38
055
42 62
3 �0
��0
5 268
5 4
15
� ���
12
050
13 80
5 ��
�8�
55 37
3 61
843
�0 0�
� Co
ntin
gent
Acc
ts [A
ccep
t., L
C’s &
Gua
rant
ees]
11 33
8 16
328
�� 99
� 82
5 76
3 � �
��
68
70
80
12 23
1 17
161
�� ��
� Fu
nds U
nder
Man
agem
ent
0 0
��9
193
209
0 0
0 0
193
209
��9
Repo
s on
beha
lf of
or f
or o
n-tra
ding
to cl
ients
n/a
n/an/
an/a
n/an/
an/a
n/an/
an/a
n/an/
aRa
te of
Asse
t 1 Grow
th16
.6%15
.0%�0
.�%3.4
%1.6
%-�
8.�%
18.2%
16.3%
��.9%
15.8%
14.2%
8.�%
Rate
of De
posit
Gro
wth
14.9%
13.5%
�.0%
15.5%
22.4%
-��.�
%14
.8%14
.7%�0
.�%14
.9%14
.0%�.�
%Ra
te of
Loan
s Gro
wth (
gros
s)16
.2%27
.1%��
.�%28
.6%27
.5%-�
�.9%
19.9%
34.7%
�9.�%
17.5%
28.7%
��.�%
Rate
of C
apita
l Bas
e Gro
wth
14.0%
12.0%
�8.�%
10.9%
2.8%
-��.�
%11
.5%14
.6%��
.�%13
.2%11
.7%��
.�%Ra
te of
NPL (
3 Mths
&>)
Gro
wth
11.0%
14.5%
��.�%
14.1%
7.7%
9.8%
-5.6%
15.4%
��.�%
6.0%
14.2%
��.�%
Inves
tmen
ts :To
tal A
ssets
137
.8%33
.2%�9
.0%63
.9%57
.5%��
.�%36
.5%28
.3%��
.8%39
.6%34
.0%�9
.�%Lo
ans (
net o
f pro
v.):To
tal A
ssets
134
.3%38
.1%��
.�%23
.9%29
.9%��
.�%40
.8%47
.4%��
.�%34
.7%39
.2%��
.�%Fix
ed A
ssets
:Total
Ass
ets 1
1.8%
1.7%
�.�%
0.7%
0.3%
�.0%
2.0%
1.7%
�.�%
1.8%
1.6%
�.�%
Loan
s (gr
oss)
: Dep
osits
54.2%
60.8%
��.�%
79.5%
82.8%
��.�%
59.5%
69.9%
8�.�%
56.2%
63.5%
��.�%
Aver
age D
omes
tic C
urre
ncy C
ash
Res
erve
: Ave
rage
Pre
scrib
ed
9.0%
9.0%
�0.9%
9.0%
9.0%
�0.�%
1.0%
1.0%
�.0%
7.0%
7.1%
8.�%
Aver
age
Dome
stic C
urre
ncy L
iquid
Ass
ets: A
vera
ge D
omes
tic
42.3%
30.0%
��.0%
33.4%
46.9%
��.�%
24.4%
8.2%
��.�%
37.7%
25.0%
�0.�%
Prov
. For
Loan
Loss
es:To
tal Lo
ans (
gros
s)2.8
%2.6
%�.8
%1.5
%1.6
%�.�
%2.4
%2.0
%�.8
%2.6
%2.4
%�.�
%Pr
ov. F
or Lo
an Lo
sses
: NPL
(3 M
ths &
>)12
5.8%
129.1
%�0
�.�%
34.7%
41.6%
�8.0%
68.1%
65.3%
�8.�%
101.2
%10
3.4%
88.�%
NPL (
3 Mths
&>)
:Total
Loan
s (gr
oss)
2.2%
2.0%
�.�%
4.4%
3.7%
�.�%
3.5%
3.0%
�.�%
2.6%
2.3%
�.9%
+ P
rovis
ion fo
r loan
loss
es)
0.8%
0.8%
�.�%
1.1%
1.1%
�.�%
1.4%
1.4%
�.0%
0.9%
0.9%
�.�%
Depo
sits +
Bor
rowi
ngs:
Capit
al (:1
)9.4
9.69.0
7.17.0
�.�7.1
7.2�.�
8.68.8
8.�Ca
pital
Base
:Total
Ass
ets 1
8.7%
8.5%
9.�%
11.3%
11.5%
��.�%
11.4%
11.2%
��.�%
9.4%
9.2%
9.�%
5 Capit
al Ad
equa
cy R
atio [
CAR]
16
.1%14
.5%��
.9%21
.1%23
.5%�0
.0%19
.3%19
.9%�9
.8%17
.1%16
.0%��
.�%NP
L (3 m
ths &
>):C
apita
l Bas
e+Pr
ov fo
r loan
loss
es8.0
%8.2
%��
.�%9.1
%9.4
%��
.�%11
.7%11
.9%��
.�%8.9
%9.1
%��
.�%6 Pr
e - ta
x Pro
fit Ma
rgin
(for
the C
alend
ar Q
uarte
r)22
.6%26
.0%��
.�%5.8
%15
.6%�0
.�%24
.2%19
.7%��
.�%21
.8%24
.5%��
.�%Pr
e - ta
x Pro
fit Ma
rgin
(for
the C
alend
ar Ye
ar)
25.9%
29.0%
�8.8%
17.6%
18.7%
��.�%
22.6%
17.6%
��.9%
24.8%
26.7%
��.�%
Retur
n on A
vera
ge A
ssets
(for
the C
alend
ar Q
uarte
r)0.8
%0.9
%0.9
%0.2
%0.4
%0.�
%0.7
%0.5
%0.�
%0.7
%0.8
%0.8
%Re
turn o
n Ave
rage
Ass
ets (
for th
e Cale
ndar
Year
)3.5
%3.9
%�.�
%1.9
%1.9
%�.�
%2.6
%1.9
%�.�
%3.2
%3.4
%�.�
%7 Inc
ome A
ssets
/Exp
ense
Liab
ilities
10
2.7%
102.5
%�0
�.�%
115.1
%11
4.4%
�0�.�
%10
8.8%
108.3
%�0
8.8%
104.8
%10
4.4%
�0�.�
%
Supervision of Deposit-Taking Financial Institutions

Bank of Jamaica
- �8 -
Note
s:n.
a. da
ta n
ot av
ailab
len/
a no
t app
licab
le -
Bas
ed o
n un
audi
ted
data
subm
itted
to B
OJ b
y sup
ervis
ed in
stitu
tions
up
to �0
Feb
ruar
y �00
9. P
rior y
ears
indi
cato
rs m
ay h
ave r
evisi
ons a
risin
g fro
m am
endm
ents
. a -
The
com
posit
ion
of “P
rovis
ion
for L
oan
Loss
es” h
as b
een
segr
egat
ed in
to tw
o (�
) dist
inct
com
pone
nts b
eing:
i)
pro
visio
n fo
r los
ses c
ompu
ted
in ac
cord
ance
with
IFRS
; and
ii)
any i
ncre
men
tal p
rovis
ioni
ng n
eces
sary
und
er p
rude
ntial
loss
pro
visio
ning
requ
irem
ents
(tre
ated
with
as an
appr
opria
tion
from
net
pro
fits)
.
Co
nseq
uent
ly, “T
otal
Loan
s (ne
t of p
rov.)
” rep
rese
nts g
ross
loan
s net
of I
FRS
loan
loss
pro
visio
ns
b - E
ffect
ive �9
Mar
ch �0
08, D
B&G
Merc
hant
Ban
k Ltd
, was
rena
med
Sco
tia D
BG M
erch
ant B
ank L
td. T
his f
ollo
ws th
e �00
� acq
uisit
ion
of m
ajorit
y int
eres
t in
Dehr
ing
Bunt
ing
& Go
ldin
g Lt
d, th
e im
med
iate
p
aren
t com
pany
of D
B&G
Merc
hant
Ban
k, by
Sco
tia G
roup
Jam
aica L
td. S
imila
rly, e
ffect
ive ��
Mar
ch �0
08, D
ehrin
g Bu
ntin
g &
Gold
ing
Lim
ited
was a
lso re
nam
ed to
Sco
tia D
BG In
vest
men
ts L
td.
- T
he M
inist
er o
f Fin
ance
appr
oved
the g
rant
ing
of a
com
mer
cial b
ankin
g lic
ence
to P
anCa
ribbe
anBa
nk L
imite
d, (f
orm
erly
Pan
Carib
bean
Mer
chan
t Ban
k Lim
ited)
, with
effe
ct fr
om ��
June
�008
.
Con
sequ
ently
, the
mer
chan
t ban
king
licen
ce p
revio
usly
issue
d to
Pan
Car
ibbe
an M
erch
ant B
ank L
imite
d un
der t
he F
inan
cial In
stitu
tions
Act
was
surre
nder
ed.
c -
Effe
ctive
�� O
ct 0�
, Citi
mer
chan
t Ban
k tra
nsfe
rred
its A
sset
s and
Liab
ilities
to C
itiba
nk N
.A. (
Jam
aica B
ranc
h), w
here
thes
e Ass
ets a
nd L
iabilit
ies w
ere h
eld in
trus
t
un
til �
Mar 0
�, wh
en C
itim
erch
ant B
ank s
urre
nder
ed it
s dep
osit
- tak
ing
licen
ce.
� Tota
l Ass
ets a
nd L
iabilit
ies re
flect
ed n
et o
f Pro
visio
n fo
r Los
ses a
nd in
clude
Con
tinge
nt A
ccou
nts (
Cust
omer
Liab
ilities
for A
ccep
tanc
es, G
uara
ntee
s and
Let
ters
of C
redi
t). In
keep
ing
with
IFRS
, tot
al as
sets
and
liabi
lities
inclu
de co
ntin
gent
acco
unts
as d
efine
d ab
ove.
� Tota
l Ass
ets a
nd L
iabilit
ies n
et o
f Pro
visio
n fo
r Los
ses a
nd C
ontin
gent
Acc
ount
s (Cu
stom
er L
iabilit
ies fo
r Acc
epta
nces
, Gua
rant
ees a
nd L
ette
rs o
f Cre
dit).
� C
apita
l Bas
e - B
anks
& F
IA L
icens
ees:
(Paid
- up
Cap
ital +
Res
erve
Fun
d + R
etain
ed E
arni
ngs R
eser
ve F
und
+ Sha
re P
rem
ium
) les
s im
pairm
ent b
y net
loss
es o
f ind
ividu
al in
stitu
tion.
-
Bui
ldin
g So
cietie
s: (P
erm
anen
t Cap
ital F
und
+ Def
erre
d Sh
ares
+ Ca
pita
l Sha
res +
Res
erve
Fun
d + R
etain
ed E
arni
ngs R
eser
ve F
und
) les
s im
pairm
ent b
y net
loss
es o
f ind
ividu
al so
ciety.
�
Pres
crib
ed L
iabilit
ies in
clude
:
(i
) dep
osit
liabi
lities
, (ii)
res
erva
ble b
orro
wing
s and
inte
rest
accr
ued
and
paya
ble o
n (i)
& (i
i).�
Capi
tal A
dequ
acy R
atio
(CAR
): Qu
alify
ing
Capi
tal (
Tier
� + T
ier �
capi
tal it
ems l
ess p
resc
ribed
ded
uctio
ns) i
n re
latio
n to
Risk
Weig
hted
Ass
ets a
nd F
oreig
n Ex
chan
ge E
xpos
ure.
� Da
ta in
clude
s ext
raor
dina
ry in
com
e/exp
endi
ture
and
adju
stm
ents
for p
rior p
erio
d.
� In
com
e Ass
ets c
ompr
ise F
C Ca
sh R
eser
ves,
Plac
emen
ts, In
vest
men
ts, R
epo A
sset
s and
Loa
ns le
ss N
on-P
erfo
rmin
g Lo
ans (
� mon
ths &
ove
r). E
xpen
se L
iabilit
ies co
mpr
ise D
epos
its an
d Bo
rrowi
ngs i
nclu
ding
Rep
o Li
abilit
ies (f
rom
BOJ
, Ban
ks, O
FI et
c).
COMM
ERCI
AL B
ANKS
FIA
LICE
NSEE
S
B
UILD
ING
SOCI
ETIE
S**
Dec-
0�De
c-0�
Dec-
08De
c-0�
Dec-
0�De
c-08
Dec-
0�De
c-0�
Dec-
08Re
quire
d Cas
h Res
erve
Rati
o 9.0
%9.0
%11
.0%9.0
%9.0
%11
.0%1%
/ 9%
1% / 9
%1%
/11%
Requ
ired L
iquid
Asse
ts Ra
tio (in
cl Ca
sh R
eser
ve)
23.0%
23.0%
25.0%
23.0%
23.0%
25.0%
5% / 2
3%5%
/ 23%
5% / 2
5.0%
Effec
tive 3
Dec
embe
r 200
8, the
dome
stic c
urre
ncy c
ash r
eser
ve an
d liqu
id as
sets
ratio
s for
supe
rvise
d lice
nsee
s wer
e inc
reas
ed to
11.0%
and 2
5.0%
resp
ectiv
ely.
* The
requ
ireme
nts ar
e diffe
renti
ally a
pplie
d to s
ociet
ies no
t mee
ting t
he pr
escri
bed t
hres
hold
of re
siden
tial m
ortga
ge le
nding
in re
lation
to sa
vings
fund
s.
Socie
ties t
hat m
eet th
e pre
scrib
ed ‘q
ualify
ing as
sets’
thre
shold
attra
ct the
lowe
r res
erve
requ
ireme
nts in
dicate
d abo
ve. S
ociet
ies w
hich d
o not,
are r
eque
sted t
o mee
t the r
equir
emen
ts wh
ich ap
ply to
bank
s and
FIA
licen
sees
.
SUBS
EQUE
NT E
VENT
Effec
tive 6
Feb
ruar
y 200
9, the
dome
stic c
urre
ncy c
ash r
eser
ve an
d liqu
id as
sets
ratio
s for
supe
rvise
d lice
nsee
s wer
e inc
reas
ed to
14.0%
and 2
8.0%
resp
ectiv
ely.
Effec
tive 2
Janu
ary 2
009,
the do
mesti
c cur
renc
y cas
h res
erve
and l
iquid
asse
ts ra
tios f
or su
pervi
sed l
icens
ees w
ere i
ncre
ased
to 13
.0% an
d 27.0
% re
spec
tively
. an
d for
eign c
urre
ncy c
ash r
eser
ve an
d liqu
id as
sets
ratio
s for
supe
rvise
d lice
nsee
s wer
e inc
reas
ed to
11.0%
and
Fina
ncial
Inst
itutio
ns S
uper
visor
y Divi
sion
Bank
of J
amaic
a
Supervision of Deposit-Taking Financial Institutions

- �9 -
In 2008, the Central Bank continued to supervise cambios and remittance companies, as stipulated by the Bank of Jamaica Act, through on-site
inspections as well as in-house monitoring. The key objective of the on-site inspections was to assess the level of compliance with the Bank of Jamaica Operating Directions for Remittance Companies (Operating Directions) and the Anti-Money Laundering (AML) regulations of the Proceeds of Crime Act (POCA). In-house monitoring continued to focus primarily on ensuring that all relevant persons (directors and shareholders of the companies and the manager with responsibility for the operation of each location) satisfied the Bank’s ‘Fit and Proper’ criteria prior to the issuance and renewal of licences
1. In this regard, 249 persons were assessed by the
Bank’s ‘Fit and Proper’ Committee in 2008. Of this number, 183 persons were connected to remittance companies and the remainder to cambios. The monitoring units also ensured that cambios and remittance companies complied with their respective reporting requirements.
Table ��STATUS OF CAMBIO LICENCES
AS AT �� DECEMBER �008�00� �008
New Locations Licensed 9 9Locations Closed 8 8Number of Locations 146 147Number of Entities 65 66
At the end of the review year, the parishes of Kingston and St. Andrew continued to account for the largest concentration of cambios.
6. Supervision of Cambios and Remittance
Companies
�.�. Cambios During 2008, 9 new cambios were granted approval to operate while the licences for 6 cambios were voluntarily surrendered. In addition, 2 licences were revoked by the Bank for breaches of the Bank of Jamaica Operating Directions. Consequently, at the end of 2008, a total of 147 cambios were in operation, compared to 146 at the end of 2007 (see Table ��).

Bank of Jamaica
- �0 -
Table ��
GEOGRAPHIC DISTRIBUTION OF CAMBIOS (%)AS AT �� DECEMBER �008
�00� �008Kingston & St. Andrew 28.8 29.9St. James 14.4 15.7St. Ann 11.0 10.2St. Catherine 11.0 9.5Manchester 7.5 8.8Clarendon 7.5 7.5Westmoreland 6.2 6.1Others 13.6 12.3Total �00.0 �00.0
At the end of the review year, the 12 primary agents operated from 484 discrete locations, relative to 496 such locations at end-2007. The largest concentration of remittance locations was in the Kingston & St. Andrew region, which accounted for 24.0 per cent, relative to 22.8 per cent at the end of 2007 (see Chart �9).
The cambios continued to be a significant player in the foreign exchange market by maintaining their market share of approximately 31.3 per cent of foreign exchange purchases in the review year.
�.�. Remittance Companies
A total of 12 remittance primary agents were in operation at the end of 2008, relative to 13 at end-2007 as one primary agent voluntarily relinquished its licence in May 2008 (see Table ��).
Table ��
STATUS OF REMITTANCE LICENCES AS AT �� DECEMBER
�00� �008New Discrete Locations Licensed 117 45Discrete Licensed Locations Cancelled 26 57Number of Discrete Locations 496 484Total Number of Applications 731 697Number of Primary Agents 13 12
Supervision of Cambios and Rimittance Companies

Annual Report 2008
- �� -
Chart �9
There were 697 applications recorded at end-December 2008, representing a decline of 4.7 per cent, relative to end-2007 (see Table ��). Of the total number of applications on record at the end of the review period, 643 represented approved applications while the remaining 54 were being processed.
Supervision of Cambios and Rimittance Companies

- �� -
�. External Sector Developments�.�. International Economic Developments�.�.�. OverviewConditions in the global economy deteriorated in 2008. High inflation, the result of rapid increases in international commodity prices, characterized the first half of the year. During the second half, the turmoil in US financial markets, that had its origins in the sub-prime mortgage market, extended to global financial markets and the real economy.36
Consequently, most advanced economies moved into recession in the last quarter of the year. Growth in developing countries also slowed in the latter part of the year, after accelerating in the first half of the year as a result of increased production in response to rising international commodity prices. Although high inflation led some central banks to raise target
36 Several major financial institutions in mid-2008 announced significant losses from sub-prime related investments. The impact of this was reflected in a tightening of credit conditions, particularly in October, as well as large declines in global stock market indices.
interest rates, the impact of the international financial crisis prompted governments to loosen monetary policy and launch fiscal stimulus packages.
�.�.�. OutputIn the context of the international financial crisis, global economic growth is estimated to have decelerated by 2.2 percentage points to 3.0 per cent in 2008, reflecting a slowdown in growth for both the advanced and developing economies.
Table ��
INDUSTRIAL ECONOMIESREAL GDP, CONSUMER PRICES AND UNEMPLOYMENT RATES
(Annual Percentage Change and per cent of Labour Force)
Country GDP Unemployment Rate Inflation Rate** CB TargetInterest Rates***
2007 2008* 2007 2008* 2007 2008* 2007 2008*Advanced Economies 2.7 0.6 5.3 6.4 2.2 3.4of which USA 2.1 0.4 4.8 7.2 2.9 3.8 4.25 0.00 – 0.25 UK 2.6 0.7 5.3 5.7 2.3 3.6 5.50 2.00 Euro Area 2.7 0.7 7.4 7.5 2.1 3.3 4.00 2.50 Canada 2.5 0.4 6.0 6.1 2.1 2.4 4.25 1.50 Japan 2.3 -0.7 3.9 4.0 0.0 1.4 0.50 0.30
Source: The World Economic Outlook, , International Labour Office, Statistics Offices of individual countries*Estimates** Annual average*** End-of-period
7. External Sector Developments

Annual Report 2008
- �� -
For the advanced economies, economic growth decelerated by 2.1 percentage points to 0.6 per cent (see Table ��). This slowdown reflected tightened credit conditions, downturns in housing markets in several economies, as well as the impact of high oil prices. All developing economies also experienced
a slowdown in growth (see Table ��). A decline in exports, particularly for countries that had strong trade links with the US and Europe, was the major factor underpinning the moderation in growth for this set of economies.
Table �� SELECTED DEVELOPING COUNTRIES
REAL GDP & CONSUMER PRICES(Annual Per Cent Change)
Country GDP Inflation Rate**2007 2008* 2007 2008*
Developing Countries 8.� �.� �.� 9.� Western Hemisphere �.� �.� �.� �.9 Argentina 8.7 6.5 8.8 8.6
Brazil 5.7 5.8 3.6 5.7Chile 5.1 4.5 4.4 8.7Colombia 7.7 4.0 5.5 7.0Dominican Republic 8.5 4.7 6.1 10.6Ecuador 2.5 3.0 2.3 8.4Mexico 3.2 1.8 4.0 5.1Peru 8.9 9.2 1.8 5.8Uruguay 7.4 6.5 8.1 7.9Venezuela 8.4 6.0 18.7 30.4
Caribbean*** �.� �.9 �.9 �.8Antigua & Barbuda 6.5 1.8 1.4 5.3Barbados 3.4 0.2 4.0 8.1Dominica 2.5 3.2 3.2 6.3Guyana 5.4 3.0 12.3 8.1Jamaica 1.5 -0.9 9.2 22.0St. Kitts & Nevis 4.2 4.6 4.5 5.4St. Vincent & Grenadines 8.0 -0.6 6.9 10.1Trinidad & Tobago 5.5 3.5 7.8 12.1
Developing Asia �0.0 �.8 �.� �.�China 13.0 9.0 4.8 5.9India 9.3 7.3 6.4 8.3Indonesia 6.3 6.1 6.0 9.8Malaysia 6.3 5.8 2.0 5.4Philippines 7.2 4.4 2.8 9.3Thailand 4.8 4.7 2.2 5.5
Middle East �.� �.� ��.� ��.0
Sources: The World Economic Outlook, January 2009, Statistics Offices of individual countries, * Estimates, **Annual average, ***GDP weighted
External Sector Developments

Bank of Jamaica
- �� -
7.1.3. InflationInfluenced by significant increases in international commodity prices during the first half of the year, inflation in the advanced economies increased in 2008 by 1.2 percentage points, relative to the preceding year, to 3.4 per cent. Inflation for developing countries accelerated by 2.8 percentage points, reflecting increases in both international fuel and non-fuel prices (see Tables �� & ��).
�.�.�. Selected Exchange RatesThe currencies of selected industrialised economies appreciated against the US dollar by an average of 3.2 per cent in 2008, following an appreciation of approximately 5.7 per cent in the previous year (see Table �8). In particular, the Japanese Yen appreciated by 12.3 per cent vis-à-vis the US dollar, reflecting the unwinding of carry trade positions.37
The Euro appreciated against the US dollar by 7.2 per cent as a result of the widening of the US/Euro interest rate differential.
37 Carry trade is a strategy in which an investor borrows a certain currency associated with a relatively low interest rate and uses the funds to purchase a different curren-cy associated with a higher interest rate.
�.�.�. Commodity MarketsCommodity prices, as measured by the IMF’s Index of Primary Commodity Prices (IPCP), rose by 27.6 per cent in 2008, following an 11.8 per cent rise in 2007. The acceleration in the rate of increase in the IPCP was attributed to a faster growth rate of the energy sub-index, the result of a significant increase in crude oil price. The impact of this increase on the IPCP was partly offset by a deceleration in the rate of growth in the non fuel sub-index.
Crude oil prices, as measured by the West Texas Intermediate benchmark, averaged US$99.56 per barrel (bbl) in 2008, representing an increase of 37.7 per cent, relative to 9.4 per cent in 2007. This movement primarily reflected the impact of strong demand in the first half of the year. Supply concerns arising from geopolitical tensions in Africa and the Middle East also contributed to the rise in prices. However, as the turmoil in the financial crisis spread to the real sector, rapidly declining demand
Table �8ADVANCED ECONOMIES: EXCHANGE RATES
(ANNUAL AVERAGE) US Dollars per Unit of National Currency Annual Percent Change
�00� �008 �00� �008Canadian Dollar 0.936 0.943 6.1 0.8Japanese Yen/1 117.6 103.1 1.1 -12.3Pound Sterling 2.002 1.852 8.6 -7.5Euro 1.371 1.470 9.2 7.2
1. Expressed as local currency per unit of US dollars (in accordance with international Convention) Source: US Federal Reserve
External Sector Developments
contributed to a fall in prices to US$44.60 per bbl at end-December from a record high of US$145.29 per bbl on 3 July.38
38 The International Energy Agency (IEA) reported a decline of 0.4 per cent in world oil demand to 85.7 million barrels per day (bpd) in 2008, following an increase of 1.1 per cent in 2007. Most of the decline in consumption came from the Americas and Europe. World supply rose by 1.0 per cent during the year to 86.4 million bpd, a significant acceleration, relative to the 0.1 per cent growth rate in 2007. The faster growth in supply primarily reflected the increased production by the Organization of Petroleum Exporting Countries (OPEC).

Annual Report 2008
- �� -
Within the non-fuel sub-index of the IPCP, the price of industrial inputs fell by 5.8 per cent, compared with a growth rate of 13.2 per cent in 2007. This primarily reflected an 8.0 per cent decline in the prices of metals, compared with a growth rate of 17.3 per cent in 2007 as demand declined in the construction and automotive sectors in advanced economies. There was also a contraction of 0.9 per cent in the prices of agricultural raw materials in 2008, after rising by 5.0 per cent in 2007 (see Table �9).
Table �9SUMMARY OF WORLD COMMODITY PRICES
Annual Average Per Cent Change �00� �008
All Primary Commodities ��.8 ��.�1. Non-fuel Commodities 14.0 7.4
1.1 Edibles 15.0 23.3(a) Food 15.2 23.3(b) Beverages 13.7 23.3
1.2 Industrial Inputs 13.2 -5.8(a) Agricultural Raw Materials 5.0 -0.9(b) Metals 17.3 -8.0
2. Energy 10.4 40.3Petroleum /1 9.4 37.7
Sources: IMF Primary Commodity Price Index
/1 West Texas Intermediate measure
In contrast to the decline in the metals sub-index, the edibles sub-index increased by 23.3 per cent in 2008, primarily reflecting a rise in the price of grains, particularly rice and corn, during the first half of year. Export bans by major exporting countries, such as India and Thailand, contributed to a 99.7 per cent rise in rice prices. For corn, strong demand for the grain as an input into ethanol production led to a rise of 36.0 per cent in prices. However, during the second half of the year, all commodity prices declined as a result of waning global demand.
�.�.�. International Trade Developments�.�.�.�. World Trade Organization (WTO)
NegotiationsThe Doha Round of the WTO negotiations broke down on 29 July 2008 as trade ministers were unable to reach a compromise. Despite accord on most areas, including the agriculture and non-agricultural market access issues, negotiations stalled on the extent to which developing countries would be able to raise tariffs to protect farmers from import surges under the “special safeguard mechanism” (SSM). One of the main issues of contention regarding the SSM was whether, and by how much, countries should
be allowed to impose safeguard duties in excess of current tariff ceilings.39
�.�.�.�. The EU-CARIFORUM Economic Partnership Agreement (EPA)
The text of the EPA was formally signed on 15
39 The initial proposal would have allowed safeguard duties to surpass bound tariff rates by 15.0 percentage points if import volumes rose by 40.0 per cent over a three-year average. However, the G-33 group of countries, led by India and China, said that this “trigger” was insufficient to ensure that farmers would not be hurt by sharp increases in subsidized agricultural imports from developed countries. They proposed that SSM remedies be triggered by increases of at least 10.0 per cent in import volume over the relevant period, with safeguard duties of 30.0 percentage points above bound levels.
External Sector Developments

Bank of Jamaica
- �� -
October 2008 by 13 members of the CARIFORUM group of countries and the EU40. Under the EPA, all CARIFORUM exports, with the exception of rice and sugar, are granted duty-free and quota-free access to European markets. 41 In exchange, CARIFORUM countries will liberalize 86.9 per cent of the value of imports (or 90.2 per cent of currently traded tariff lines) on a phased basis with a three-year moratorium. Jamaica, in particular, committed to liberalizing 79.4 per cent of the value of imports or 79.0 per cent of the tariff lines. In the case of sugar exports to the EU, the Sugar Protocol will continue to hold.42 However, the CARIFORUM quota was increased. Quotas for CARIFORUM rice exporting countries were also increased until end-2009. Thereafter, rice will be sold to the EU on a duty-free, quota-free basis.
The EU has also granted market access to more than 90.0 per cent of its service sectors. In return, CARIFORUM has committed to liberalizing between 65.0 per cent and 75.0 per cent of its service sectors.
40 The members who signed on 15 October were: Antigua and Barbuda, Bahamas, Barbados, Belize, Dominica, the Dominican Republic, Grenada, Jamaica, Saint Lucia, Saint Vincent and the Grenadines, Saint Kitts and Nevis, Suriname, and Trinidad and Tobago. Guyana signed on 20 October.
41 The EPA is intended to replace the trade component of the Cotonou Agreement, which is a preferential, non-reciprocal arrangement governing relations between the EU and African, Caribbean and Pacific (ACP) countries.
42 Under the EU Sugar Protocol, limited quantities of sugar from CARIFORUM member countries are granted duty-free access to the EU at guaranteed prices which are renegotiated annually.
External Sector Developments

Annual Report 2008
- �� -
The International Financial Crisis
The global financial turbulence that had its origins in the US sub-prime mortgage market intensified in 2008. This resulted in the collapse of several financial institutions that encountered solvency issues arising from asset write-downs and losses. Consequently, firms were forced to merge, seek government support or file for bankruptcy protection. This led to increased uncertainty about the exposure of financial institutions to subprime mortgage linked assets, triggering an extraordinary tightening in global liquidity conditions and eroding the ability of some firms to meet their obligations. Additionally, the losses suffered by many financial institutions reduced both their ability to lend as well as the willingness of other institutions to facilitate counterparty transactions.
The intensification of the international financial crisis was largely reflected in increased investor risk aversion, tightening of lending standards by banks and the erosion of wealth. Notably, the Dow Jones Industrial Average (DJIA) fell by 33.8 per cent over the year to 8 776.39 points at end-2008.
The difficulties in the financial markets extended to the real sector of the advanced economies. For example, growth in real GDP in the U.S. for the year slowed to 0.4 per cent, following an annual average growth of 2.8 per cent for the period 2004-2007. Economic growth also contracted in the U.K. and the Euro Area. Developing economies were also affected through reductions in export demand by the major developed economies and
reduced access to credit. In emerging Europe, several economies such as Iceland and Hungary encountered problems in their banking sectors due to exposure to the US sub-prime mortgage market.
In order to address the difficulties in the global financial system, the central banks in the major advanced economies embarked on coordinated interest rate reductions and also injected liquidity in the financial markets. Deposit insurance programmes were expanded, while a money market insurance programme was announced with a view to stabilising LIBOR rates. In February 2008, the US government approved a US$168.0 billion plan that provided rebate cheques for American taxpayers. In October, legislation was also passed to establish a US$700.0 billion fund to inject capital into adversely affected financial institutions, as well as to purchase legacy assets. For the U.K. the government launched a rescue plan amounting to £521.0 billion, while the European Commission introduced an economic recovery plan valued at €200.0 billion. In addition, a two-year fiscal stimulus package amounting to 4 trillion Yuan was announced by the Chinese government during the year.
The Federal Reserve also agreed to provide US$30.0 billion each in currency swaps to the central banks of Brazil, Mexico, South Korea and Singapore, expanding its effort to unfreeze money markets. The International Monetary Fund and other multilateral institutions also developed strategies to respond quickly to urgent requests.
External Sector Developments
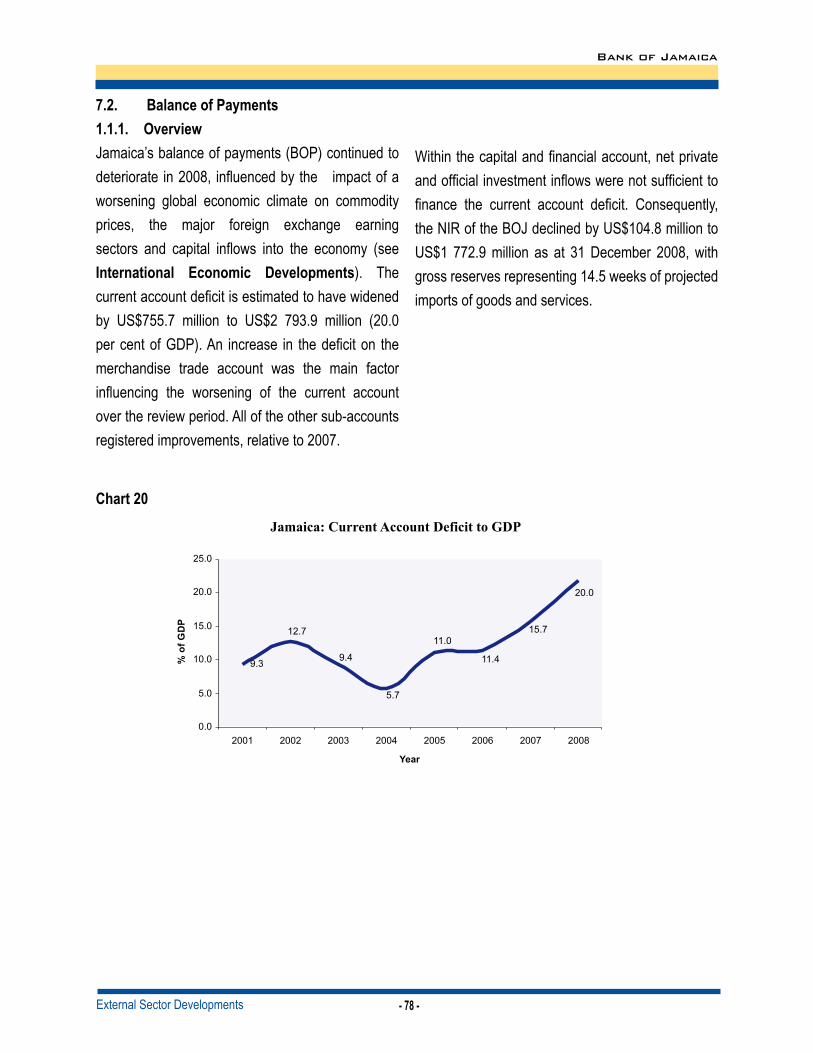
Bank of Jamaica
- �8 -
�.�. Balance of Payments �.�.�. OverviewJamaica’s balance of payments (BOP) continued to deteriorate in 2008, influenced by the impact of a worsening global economic climate on commodity prices, the major foreign exchange earning sectors and capital inflows into the economy (see International Economic Developments). The current account deficit is estimated to have widened by US$755.7 million to US$2 793.9 million (20.0 per cent of GDP). An increase in the deficit on the merchandise trade account was the main factor influencing the worsening of the current account over the review period. All of the other sub-accounts registered improvements, relative to 2007.
Chart �0
Within the capital and financial account, net private and official investment inflows were not sufficient to finance the current account deficit. Consequently, the NIR of the BOJ declined by US$104.8 million to US$1 772.9 million as at 31 December 2008, with gross reserves representing 14.5 weeks of projected imports of goods and services.
External Sector Developments

Annual Report 2008
- �9 -
Table �0SUMMARY OF BALANCE OF PAYMENTS
(US$MN) �00��/ �008�/ Change CURRENT ACCOUNT -� 0�8.� -� �9�.9 -���.� A. GOODS BALANCE -� 8��.� -� 80�.9 -9��.� Exports (f.o.b.) 2 362.6 2 743.9 381.3 Imports (f.o.b.) 6 203.9 7 546.8 1 342.9 B. SERVICES BALANCE ���.8 ���.� �.8 Transportation -5 40.4 -644.9 -104.5 Travel 1 611.9 1 707.4 95.5 Other Services -646.7 -634.9 11.8 GOODS & SERVICES BALANCE -� ���.� -� ���.� -9�8.8 C. INCOME -���.� -��8.� 9�.� Compensation of employee 64.8 83.7 18.9 Investment income -726.4 -651.9 74.5 D. CURRENT TRANSFERS � 0�9.9 � ��9.� �09.� General Government 133.0 100.7 -32.3
Other Sectors 1 906.9 2 048.9 142.0 �. CAPITAL & FINANCIAL A/C � 0�8.� � �9�.9 ���.� A. CAPITAL ACCOUNT -��.� �8.� ��.� General Government 0.7 48.6 47.9 Other Sectors -36.2 -30.5 5.7 B. FINANCIAL ACCOUNT � 0��.� � ���.8 �0�.� Official Investment 653.0 518.6 -134.4 Private Investment3/ 980.9 2 152.4 1 171.5 Reserves4/ 439.8 104.81/ Revised2/ Provisional 3/ Includes Errors & Omissions4/ Minus denotes increase
�.�.� Merchandise TradeThe deficit on the merchandise trade account expanded by US$961.6 million in 2008 (see Table �0). This deterioration reflected an increase of 21.6 per cent in the value of imports (f.o.b.), which was partially offset by an increase of 16.1 per cent in earnings from exports.
ExportsThe estimated growth in export earnings resulted primarily from a 14.9 per cent expansion in earnings from General Merchandise Exports, which largely emanated from an expansion in the value of Non-Traditional Exports. This was supported by increased earnings from Major Traditional Exports (see Table ��).
External Sector Developments

Bank of Jamaica
- 80 -
Non-Traditional Exports grew by 44.4 per cent to US$939.6 million in 2008. The increase was due largely to higher receipts from chemicals and mineral fuel exports. Increased earnings from these exports primarily reflected a 37.7 per cent rise in the price of oil on the international market. The movement in oil prices resulted from strong global demand for commodity derivatives over the first half of the fiscal year (see International Economic Developments).
Total earnings from Major Traditional Exports increased by 2.3 per cent in 2008 to US$1 449.3 million, largely reflecting growth of 3.0 per cent in earnings from alumina exports. This was influenced by an increase of 0.6 per cent in the price of alumina as well as a 2.4 per cent increase in export volumes.
Partly offsetting the growth in earnings from alumina was a cessation of earnings from banana exports, due primarily to the destruction of the crop by Tropical Storm Gustav.
Other Traditional Exports declined by 4.9 per cent to US$80.6 million in 2008. This was primarily related to decreased earnings of 11.6 per cent, 4.4 per cent and 42.3 per cent from coffee, rum and cocoa respectively (see Table ��). The declines were partially offset by growth in earnings from gypsum which was associated with a 302.4 per cent increase in the average realised price. Goods Procured in Ports increased by 47.0 per cent in 2008, driven by the increase in oil prices, while Free-Zone Exports increased by 6.7 per cent.
Table ��TRADITIONAL & NON-TRADITIONAL EXPORTS
(US$MN) �00��/ �008�/ Change % Change
GENERAL MERCHANDISE EXPORTS � �0�.8 � ���.8 ��9.0 ��.9
DOMESTIC EXPORTS 2 151.9 2 469.5 317.6 14.7 Major Traditional Exports 1 416.4 1 449.3 32.9 2.3 Bauxite 112.9 114.5 1.6 1.4 Alumina 1 194.0 1 230.5 36.5 3.0 Sugar 100.3 104.3 4.0 4.0 Bananas 9.2 0.0 -9.2 -100.0 Other Traditional Exports 84.8 80.6 -4.2 -4.9 Citrus 2.2 2.1 -0.1 -4.5 Cocoa 2.6 1.5 -1.1 -42.3 Coffee 31.8 28.1 -3.7 -11.6 Pimento 2.1 2.1 0.0 0.0 Rum 45.7 43.7 -2.0 -4.4 Gypsum 0.4 3.1 2.7 675.0 Non Traditional Exports 650.6 939.6 289.0 44.4RE-EXPORTS 51.0 62.2 11.2 22.0FREEZONE EXPORTS 56.5 60.3 3.8 6.7GOODS PROC. IN PORTS 103.3 151.9 48.6 47.0GRAND TOTAL � ���.� � ���.9 �8�.� ��.�1/ Revised2/ Provisional
External Sector Developments

Annual Report 2008
- 8� -
ImportsTotal expenditure on imports (c.i.f.) increased by 20.9 per cent to US$8 524.8 million in 2008, relative to an average annual growth of 14.0 per cent over the previous 5 years. This expansion was influenced primarily by General Merchandise Imports, which reflected robust growth in Mineral Fuels, Food and Manufactured Goods (see Table ��). The increase in the values of fuel and food imports reflected the growth in commodity prices in 2008 (see International Economic Developments).
Table ��VALUE OF IMPORTS BY SITC (C.I.F.)
(US$MN)
�00��/ �008�/ Change % Change
GENERAL MERCHANDISE IMPORTS � 89�.9 8 ���.0 � ���.� ��.�0. FOOD 730.7 886.3 155.6 21.31. BEVERAGE. & TOBAC. 93.2 93.5 0.3 0.32. CRUDE MATS. 67.6 73.4 5.8 8.63. MINERAL FUELS 2 429.9 3 354.8 924.9 38.14. ANI. & VEG. OIL 31.6 53.9 22.3 70.65. CHEMICALS 849.0 951.0 102.0 12.06. MANUF. GOODS 753.4 883.6 130.2 17.37. MACH. & TRANSP. 1 252.4 1 264.3 11.9 0.98. MISC. MANUF. GOODS 591.2 682.0 90.8 15.49. MISC. COMMDS. 95.1 118.3 23.2 24.4FREEZONE �8.� �0.� �.8 9.�GOODS PROC. IN PORTS ���.0 ���.� �.� �.�GRAND TOTAL � 0�9.� 8 ���.8 � ���.� �0.91/ Revised2/ Provisional
�.�.� ServicesNet earnings from Services increased by 0.7 per cent to US$427.6 million in 2008, influenced primarily by an increase in the net surplus on Travel, as well as a reduction in the deficit on Other Services (see Table �0). There was a partial offsetting increase in the deficit on Transportation.
External Sector Developments
TransportationNet payments for transportation services were estimated at US$644.9 million in 2008, an increase of 19.3 per cent, relative to 2007. The widening of the deficit resulted from an increase of 12.8 per cent in gross payments, mainly associated with freight charges on higher volumes of imported goods. Partly offsetting this expansion was an increase in gross inflows, which grew by 4.8 per cent. This was attributed to a rise in stopover visitor arrivals.
TravelThe surplus on Travel increased by 5.9 per cent to US$1 707.4 million (12.2 per cent of GDP). This growth was partly attributed to an estimated increase in the average daily expenditure of stop-over visitors as well as a decline of US$18.4 million (7.7 per

Bank of Jamaica
- 8� -
cent) in the total expenditure of Jamaicans travelling overseas. Gross earnings from visitor expenditure were estimated to have increased by 6.4 per cent to US$1 975.5 million (14.1 per cent of GDP) in 2008.
Accounting for the increase in earnings were respective expansions of 4.3 per cent and 3.9 per cent in the average daily expenditure and number of arrivals of stopover visitors. Earnings from tourism were, however, negatively affected by a 3.1 per cent decline in the average length of stay of visitors and a 7.7 per cent contraction in cruise visitor arrivals (see Table ��). The growth in stopover arrivals was primarily influenced by an expansion in visitors from Canada and the USA. All other major source markets, in particular Europe (excluding the United Kingdom) recorded declines in arrival, reflecting the impact of the global economic crisis. Stopover arrivals from the USA, the largest source market, increased by 1.6 per cent in 2008, a deceleration, relative to the 4.3 per cent growth recorded from this source in 2007. The
growth in the review year resulted from increased promotional activities by the Jamaica Tourist Board (JTB) and was accommodated by an expansion in room capacity during the review period. All regions of the US market recorded increases.
There was a strong expansion of 23.9 per cent in arrivals from Canada, largely attributed to a higher purchasing power of visitors, associated with the appreciation of the Canadian dollar vis-à-vis the US dollar during the review period. The growth in arrivals from Canada also reflected the strengthening of the economy in the context of the increases in oil prices on the international market. Arrivals from the United Kingdom (U.K.), Jamaica’s second largest source market, grew by 1.5 per cent. This growth was related to the introduction of new airlift, as well as an increase in JTB’s promotional campaigns throughout the U.K.
Overall, there was a 1.5 per cent decline in visitor arrivals from the European market, which stemmed from contractions in all regions except the Central/Eastern region.
External Sector Developments
Table ��VISITOR ARRIVAL STATISTICS
�00� �/ �008 �/ % Change Total Stopovers � �00.8 � ���.� �.9 Foreign National Stopovers 1 573.3 1 623.7 3.2 Non-resident Jamaican Stopovers 127.5 143.6 12.6 Cruise Passengers & Armed Forces � ��9.� � 088.9 -�.� Total Visitors � 880.� � 8��.� -0.8 Gross Estimated Expenditure (US$MN) � 8��.� � 9��.� �.�1/ Revised2/ Provisional

Annual Report 2008
- 8� -
The cruise passenger industry in 2008 was affected by the decision of some of the major cruise lines to re-route their itineraries to Alaska, Europe and Asia. In this context, a 7.7 per cent decline was recorded in the number of cruise passengers calling at the Island’s ports during the year, continuing the trend since 2007. This outturn reflected respective declines of 15.0 per cent and 1.3 per cent in the number of cruise ship calls at the Ocho Rios and Montego Bay ports. During the year, six calls to Ocho Rios and
two to Montego Bay were cancelled due to adverse weather conditions.
Growth in stopover arrivals to Jamaica outperformed the average for the Caribbean during the period January to October, 2008 (see Table ��). With regard to cruise passenger arrivals, however, Jamaica lagged slightly behind the average for the region (see Table ��).
External Sector Developments
Table ��STOPOVER VISITOR ARRIVALS
(SELECTED CARIBBEAN COUNTRIES) %
�00� �008 ChangeAntigua & Barbuda 261.8 265.6 1.5Bahamas 1 519.8 1 479.1 -2.7Barbados 574.5 563.1 -2.0Cayman Islands 291.5 302.9 3.9Cuba 2 152.2 2 348.3 9.1Dominican Republic 3 979.6 3 979.7 0.0Jamaica � �00.8 � ���.� �.9Martinique 503.1 480.2 -4.6St Lucia 287.4 295.8 2.9Total �� ��0.� �� �8�.9 �.9Source: Caribbean Tourism Organization*Preliminary
Table ��CRUISE VISITOR ARRIVALS
(SELECTED CARIBBEAN COUNTRIES) % �00� �008* ChangeAntigua & Barbuda 672.8 580.9 -13.7Bahamas 2 970.7 2 799.8 -5.7Barbados 616.4 570.8 -7.4Cayman Islands 1 715.7 1 553.1 -9.5Dominican Republic 384.9 417.7 8.5Jamaica � ��9.� � 088.9 -�.�St Lucia 610.2 619.7 1.6St. Maarten 1 421.9 1 307.9 -8.0Total 9 ���.0 8 9�8.� -�.�Source: Caribbean Tourism Organization*Preliminary

Bank of Jamaica
- 8� -
Other ServicesThe deficit on Other Services narrowed by 1.8 per cent to US$634.9 million in 2008, principally influenced by a reduction of US$10.7 million in outflows.43 The estimated contraction in outflows mainly reflected a US$30.1 million decline in payments for other business services. Increases of US$14.4 million and US$6.7 million in payments for insurance and Government services partly offset this contraction.
�.�.� IncomeThe deficit on the Income account narrowed by 14.1 per cent to US$568.3 million in 2008. This lower deficit largely reflected a contraction of US$156.4 million in the imputed profit remittances of the direct investment companies due to the downturn in the bauxite/alumina sector in the review period, particularly during the second half of 2008. However, this was partially offset by a contraction of US$60.8 million in BOJ’s interest income from its foreign assets, as well as higher official interest payments of US$18.6 million (see Table �0). 43 Other services include communication, computer & information,
other business and Government services.
Remittance companies continued to be the major channel for private transfers in 2008, accounting for 51.9 per cent of total inflows, relative to 59.4 per cent in 2007. The share of inflows through the financial system declined to 33.0 per cent in 2008 from 35.5 per cent the previous year.
�.�.� Current Transfers The surplus on Current Transfers increased by 5.4 per cent to US$2 149.5 million in 2008, a deceleration, relative to the 16.7 per cent expansion recorded in 2007 (see Table ��). This resulted from a reduction in the growth of gross private inflows to 6.1 per cent, relative to an expansion of 15.9 per cent in 2007. This slowdown in growth was associated with weaker economic expansion in the major developed economies, particularly in the USA. Partly offsetting this deceleration was a decline of 24.1 per cent in gross official inflows, due primarily to the non-repetition of grant flows associated with hurricane relief in 2007. Gross private outflows grew by 1.5 per cent in 2008 when compared with 2007.
External Sector Developments
Table ��CURRENT TRANSFERS
(US$MN) �00��/ �008�/ Change % ChangeTOTAL RECEIPTS � �8�.� � �88.� �0�.9 �.�General Government 141.2 107.2 -34.0 -24.1Private Sector 2 244.4 2 381.3 1 36.9 6.1 TOTAL PAYMENTS ���.8 ��9.0 -�.8 -�.0General Government 8.3 6.5 -1.8 -21.7Private Sector 337.5 332.5 -5.0 -1.5
NET CURRENT TRANSFERS � 0�9.8 � ��9.� �09.� �.�1/ Revised2/ Estimates

Annual Report 2008
- 8� - External Sector Developments
Table �� FOREIGN EXCHANGE RESERVES
(US$MN)AS AT �� DECEMBER
�00��/ �008�/ ChangeGROSS FOREIGN ASSETS � 90�.� � �9�.� -��0.� Bank of Jamaica 1898.2 1 787.5 -110.7 Central Government 0.6 0.7 0.1 Other Official Institutions 6.9 6.9 0.0
GROSS FOREIGN LIABILITIES �8.� ��.� -�.�NET INTERNATIONAL RESERVES � 8��.� � ���.� -�0�.0Weeks of estimated imports of goods and services �0.0 ��.� �.�1/ Revised2/ Provisional
�.�.� Capital and Financial AccountThe capital account recorded a surplus of US$18.1 million in 2008, relative to a deficit of US$35.5 million in 2007. The surplus on the financial account increased by US$702.1 million to US$2 775.8 million (see Table �0). Within the financial account, net private and official investment inflows of US$2 671.0 million were not sufficient to finance the deficit on the current account. As a result, the NIR declined by US$104.8 million. Similarly, there was a decrease in official gross foreign assets to US$1 795.1 million as at end-December 2008, representing 14.5 weeks of projected imports of goods and services (see Table ��).Table �8
OFFICIAL INVESTMENT FLOWS (US$MN)
�00��/ �008�/ ChangeGROSS OFFICIAL INFLOWS � �0�.� � ���.8 -�8�.8 Project Loan 90.2 212.2 122.0 Other Assistance 1 411.4 1 103.6 -307.8
GROSS OFFICIAL OUTFLOWS 8�8.� �9�.� -��.� Government Direct 484.9 369.9 -115.0 Bank of Jamaica 262.3 225.5 -36.8 Other Official 101.4 201.7 100.3NET OFFICIAL INVESTMENTS ���.0 ��8.� -���.�1/ Revised2/ Provisional
Net Official Investment Inflows declined by US$134.4 million in 2008, reflecting a reduction of US$185.8 million in gross official receipts (see Table �8). The decline in gross official investment inflows reflected a reduction in Government debt raising on the international bond market. Gross official inflows included proceeds from a Eurobond issue of US$350 million in June 2008. Total outflows for the year amounted to US$797.2 million or US$51.4 million lower than the outturn for 2007. This reflected a reduction in GOJ debt payments, which was supported by lower outflows from the Bank.

Bank of Jamaica
- 8� -
�.�. Foreign Exchange Management
�.�.�. Bank of Jamaica International Reserves
The net international reserves (NIR) of the BOJ amounted to US$1 772.9 million at end-December 2008, a decline of US$104.8 million compared to the stock at end-December 2007 (see Table �9). The decline in the NIR was largely attributed to net payments of GOJ external obligations, as well as the impact of foreign currency loans under the special facility to financial institutions.
Table �9
BANK OF JAMAICANET INTERNATIONAL RESERVES (NIR)
(End of Period)US$MN
�00� �008 Annual Change
Dec. Mar. June Sept. Dec. ($) NIR 1 877.7 2 083.4 2 228.8 2 251.1 1 772.9 -104.8 Gross Foreign Assets 1 905.8 2 105.9 2 476.8 2 280.5 1 795.4 -110.4
Foreign Liabilities 28.1 22.5 248.0 29.4 22.5 -5.6
External Sector Developments
The gross foreign assets (GFA) of the Bank amounted to US$1 795.4 million as at end- 2008, US$110.4 million lower than the stock at end-2007 (see Table �9 and Table �0). The lower stock, relative to 2007, primarily resulted from net payments of GOJ obligations and outflows relating to the provision of loans to financial institutions to refinance margin arrangements.
Total foreign liabilities declined by US$5.6 million to US$22.5 million at the end of 2008 (see Table �9). Notably, the Bank’s foreign liabilities increased in the June quarter, consequent on the receipt of GOJ Eurobond proceeds of US$340.9 million. These funds were held on deposit with the Central Bank and utilized to settle GOJ external debt obligations during the year.

Annual Report 2008
- 8� -
Table �0
BANK OF JAMAICA
GROSS FOREIGN ASSETS as at end-December �008
US$MN Opening Gross Foreign Assets (GFA) 1 905.8 Inflows 2 346.2 Outflows (2 460.0)
/1 Adjustment to GFA 3.4
Closing Gross Foreign Assets 1 795.4 /1 - Unrealized gain on foreign currencies and other investments.
External Sector Developments
Foreign Exchange Inflows and Outflows Inflows During 2008, foreign exchange inflows to the Bank totalled US$2 346.2 million, reflecting an increase of US$378.9 million, relative to 2007. Consistent with historical trends, the main sources of inflows were purchases from the market as well as from the GOJ. Together, they accounted for 76.8 per cent of total inflows during 2008 (see Table ��).
Purchases from the market totalled US$1 090.5 million, an increase of US$219.0 million relative to 2007. Of this amount, market surrenders totalled US$519.6 million. Other purchases from the market amounted to US$570.9 million, an increase of US$181.2 million. These receipts represented approximately 52.0 per cent of total market purchases, and were largely influenced by flows from the sale of a local rum manufacturing company to a Trinidadian firm. Under the surrender arrangement a total of US$519.6 million was purchased.44 44 Under the surrender arrangement, authorized dealers and cambios
agree to sell to the BOJ a minimum of 5% of their purchases from their clients.
Total GOJ foreign currency receipts amounted to US$711.5 million during 2008, reflecting a marginal increase compared to 2007 (see Table ��). A significant portion of these inflows occurred in the second quarter, consequent on the receipt of proceeds of US$340.9 million relating to the Eurobond issued by the Government in June. In addition, GOJ foreign currency inflows during the year included US$90.0 million in budgetary support from the Inter American Development Bank (IADB) and US$63.7 million from the sale of a portion of the GOJ shares in the Petroleum Corporation of Jamaica. Purchases from the bauxite sector declined by 28.4 per cent to US$169.5 million in 2008.
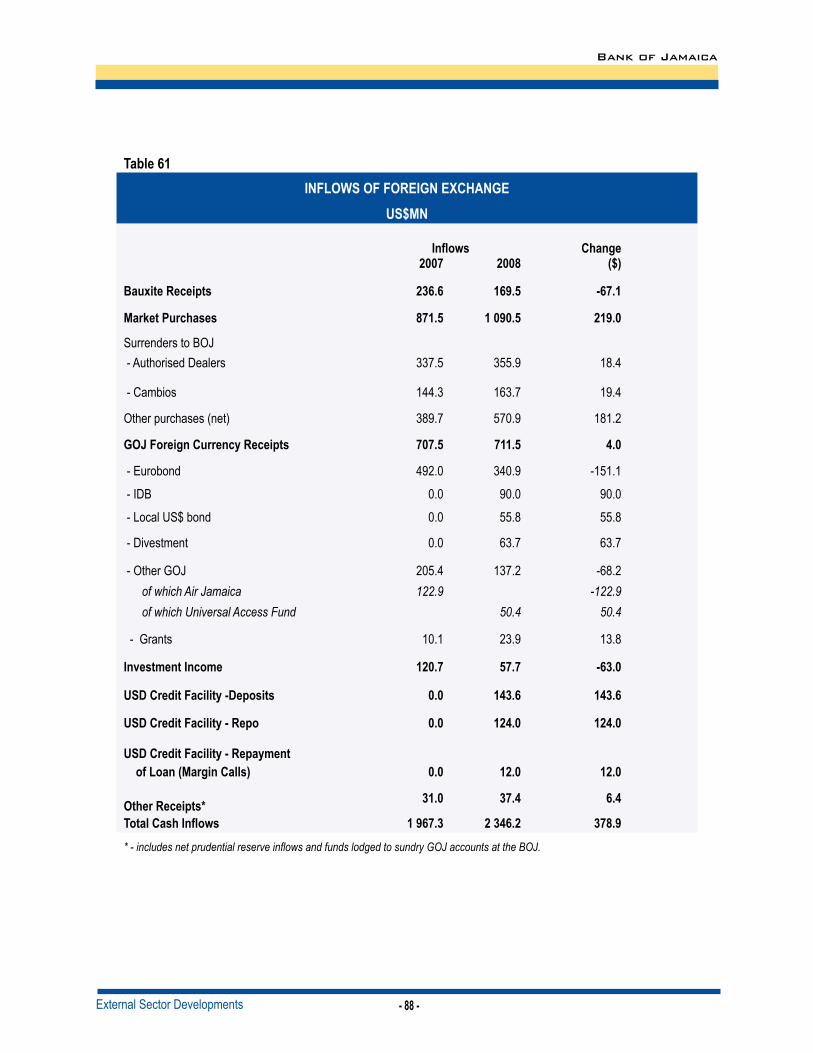
Bank of Jamaica
- 88 -
Table ��
INFLOWS OF FOREIGN EXCHANGEUS$MN
Inflows Change
�00� �008 ($) Bauxite Receipts ���.� ��9.� -��.� Market Purchases 8��.� � 090.� ��9.0 Surrenders to BOJ - Authorised Dealers 337.5 355.9 18.4 - Cambios 144.3 163.7 19.4 Other purchases (net) 389.7 570.9 181.2 GOJ Foreign Currency Receipts �0�.� ���.� �.0 - Eurobond 492.0 340.9 -151.1 - IDB 0.0 90.0 90.0 - Local US$ bond 0.0 55.8 55.8 - Divestment 0.0 63.7 63.7 - Other GOJ 205.4 137.2 -68.2 of which Air Jamaica 122.9 -122.9 of which Universal Access Fund 50.4 50.4 - Grants 10.1 23.9 13.8 Investment Income ��0.� ��.� -��.0 USD Credit Facility -Deposits 0.0 ���.� ���.� USD Credit Facility - Repo 0.0 ���.0 ���.0 USD Credit Facility - Repayment
of Loan (Margin Calls) 0.0 ��.0 ��.0
Other Receipts* ��.0 ��.� �.�
Total Cash Inflows � 9��.� � ���.� ��8.9
* - includes net prudential reserve inflows and funds lodged to sundry GOJ accounts at the BOJ.
External Sector Developments

Annual Report 2008
- 89 -
OutflowsForeign currency outflows from the Bank declined by US$29.0 million in 2008 to US$2 460.0 million. The lower outflows in 2008 reflected a US$411.2 million fall to US917.8 million in the Bank’s intervention sales to the foreign exchange market (see Table ��). Notably, foreign currency outflows were lower, despite the provision of approximately US$168.8 million to financial institutions, under a Special Loan Facility in foreign currency, to liquidate margin arrangements
with overseas brokers (see The Foreign Exchange Market). Foreign currency payments by the Bank in respect of GOJ debt obligations amounted to US$1 049.1 million, US$35.4 million higher than the payments in 2007 (see Table ��). Principal payments, which included amortization of a regional bond valued at US$50.0 million, declined during the year while interest payments increased by US$84.6 million, relative to 2007.
Table ��
OUTFLOWS OF FOREIGN EXCHANGE
US$MN Outflows
�00� �008 ($) Public Debt � 0��.8 � 0�9.� ��.� - Principal 521.2 471.9 -49.3
- Interest 492.6 577.2 84.6 Other GOJ Payments 116.6 129.7 13.1 Market Sales � ��9.0 9��.8 -���.� USD Credit Facility -Repayment 0.0 ��.� ��.� of Deposits USD Credit Facility - Repo 0.0 ���.9 ���.9 USD Credit Facility Margin Calls 0.0 ��8.8 ��8.8
Other Payments* �9.� ��.0 ��.�
Total Cash Outflow � �89.0 � ��0.0 -�9.0 *- Includes Central Bank payments for notes and coins.
External Sector Developments

Bank of Jamaica
- 90 -
�.�.�. Reserve Management�.�.�.�. The Foreign Investment Environment in �008During 2008, the escalating challenges of the global financial crisis influenced the central banks of the major industrialized countries to provide unprecedented levels of financial support to their worst affected institutions, particularly those in the USA. The central banks also reduced lending rates and provided credit facilities to leading domestic financial institutions in an effort to unlock the tight credit markets. The deteriorating condition of the global capital markets restricted access of developing and emerging economies to the international capital markets as investors sought safer havens.
�.�.�.�. Bank of Jamaica’s Response to the Financial CrisisThe Bank’s investment strategy in 2008 was informed by the escalation of the global financial crisis, reflected in illiquid credit markets and increased risk aversion. As both the impact of the credit crunch and increasing losses in asset values of marquee financial institutions escalated, the Bank implemented an intensified system to continuously monitor the financial condition of its counterparties as a critical element of risk mitigation. Simultaneously, a
programme was put in place to reduce the level of term deposits with counterparties by not renewing maturing investments. The severity of the economic crisis, and by extension, the liquidity crunch, dictated that a high level of liquidity be maintained throughout the year. This strategy was particularly important during the last quarter of the year when the Bank was called upon to supplement the supply of foreign currency in the domestic market.
�.�.�.�. Portfolio DistributionThe Bank maintained the bias in its portfolio toward US dollar dominated investments throughout the year. However, there was a marked change in distribution between classes of assets (see Table ��). The switch from bonds to money market instruments was engendered by calls on the bond portfolio as interest rates declined. Within the money market class of assets, there was a marked switching of term deposits with counterparties to deposits with the Federal Reserve (Fed) and the Bank of International Settlements (BIS). This switch was a part of the risk mitigation strategy employed as maturing deposits were placed with these institutions instead of designated commercial banks. At 31 December 2008, US$692.0 million of term deposits was held with the Fed and the BIS compared to US$466.0 million at the end of 2007. Table ��
DISTRIBUTION OF INVESTMENTS BY ASSET CLASSAT �� DECEMBER
Assets �00� �008
US$mn % US$mn %Money Market Investments 985.58 51.71 1 096.64 61.08
Bond Holdings 794.42 41.68 565.21 31.48
External Fund 125.84 6.60 133.59 7.44
TOTAL � 90�.8� �00.00 � �9�.�� �00.00
External Sector Developments

Annual Report 2008
- 9� -
�.�.�.�. Portfolio PerformanceThe returns on foreign investments for 2008 amounted to US$67.8 million, US$60.8 million (47.3 per cent) less than the amount earned in 2007 (see Table ��). The main factor responsible for the decreased earnings was the reduction in interest rates across the spectrum of instruments in the portfolio. The reduction in yields was due primarily to cuts in the Fed Funds overnight rate which declined by 425 basis points during the year. An additional factor was the reduction in the percentage of the portfolio invested in bonds which offered higher yields.
Table ��
FOREIGN INVESTMENT INCOMEFOR THE YEAR ENDED �� DECEMBER
Assets�00� �008
US$mn % of Earnings US$mn % of Earnings
Money Market Investments 67.88 52.78 31.92 47.07Bond Holdings 55.46 43.13 31.80 46.90External Fund 5.26 4.09 4.09 6.03Total ��8.�0 �00.00 ��.8� �00.00Average Income earning Assets 2 271.00 2 041.00Rate of Return (%) 5.81 3.32
A return of 3.32 per cent per annum on investment was achieved in 2008 compared to a return of 5.81 per cent per annum in 2007. Income from money market investments, which contributed 47.1 per cent of total income for the period, was driven by investments in Eurodollar deposits and repurchase agreements.
External Sector Developments

Bank of Jamaica
- 9� -
�.�.�. The Foreign Exchange MarketThe foreign exchange market was generally stable in the first three quarters of 2008, underpinned by improved flows to the market. At the end of the third quarter there was an emergence of strong demand pressures, largely due to the generally tight conditions in the international financial market. Against this background, the Jamaica Dollar depreciated by 12.2 per cent vis-à-vis its US counterpart during 2008, compared to a depreciation of 4.9 per cent in 2007.
During 2008, total reported purchases and sales by institutions increased by 4.9 per cent and 6.5 per cent, respectively. Daily purchase and sales volumes (excluding intervention) each averaged US$47.8 million compared to US$43.7 million and US$43.0 million, respectively for 2007 (see Table ��). Authorized dealers increased their market share by 1.4 percentage points during the year, accounting for 70.1 per cent of total foreign exchange sales, with cambios accounting for 29.9 per cent.
Despite the sharp depreciation in the WASR, the average trading spread remained at 0.4 per cent in 2008. This outturn occurred in a context of extraordinary inflows to the market prior to the December quarter, as well as a slowdown in the pace of growth in sales vis-à-vis purchase volumes in the second half of the year.
During the first half of the year, the foreign exchange market benefited from capital flows associated with the takeover of a local manufacturing firm (Lascelles DeMercado Limited) by an overseas entity (Angostura Holdings Limited). The US dollar flows from this takeover contributed significantly to an increase in the average daily inflow to US$29.2 million during the
first half of 2008 compared to US$23.5 million in the corresponding period of 2007. As a consequence, the Jamaica Dollar depreciated by 1.8 per cent against its US counterpart, slower than the 2.1 per cent for the corresponding period of 2007. Similarly, intervention sales by the BOJ to address bouts of market instability amounted to US$225.5 million during the first half of 2008, lower than the US$641.3 million for the corresponding period of 2007.
Favourable market conditions continued into the September 2008 quarter, as supply conditions were positively impacted by the second tranche of US-dollar proceeds from the takeover of Lascelles DeMercado Limited. Simultaneously, demand for foreign exchange was tempered in the context of a widening of the interest differential between Jamaica Dollar and US dollar assets, particularly over the first two months of the quarter. However, the last two weeks of the quarter was characterized by heightened demand pressures, given the escalation of the tightened international credit market conditions following the collapse of a major US investment bank (Lehman Brothers) on 15 September 2008. Notwithstanding, given the favourable supply conditions in the earlier part of the quarter, the pace of depreciation of the Jamaica Dollar slowed to 1.1 per cent for the September 2008 quarter, similar to that for the June 2008 quarter and 2.6 per cent for the September 2007 quarter.
The significant demand pressures that emerged towards the end of the September quarter continued into the December quarter, largely reflecting the impact of the response of local financial institutions to the general tightening of credit conditions in international financial markets. This was fuelled by
External Sector Developments

Annual Report 2008
- 9� -
negative international investor sentiment toward emerging market debt, including those for Jamaica sovereigns. This was reflected in downgrades in emerging market bonds. Consequently, there was a sharp slippage in GOJ global bond prices which led to calls by international investment banks for increased collateral for loans that were backed by these securities (margin calls) and the non-renewal of US dollar repurchase agreements. Additionally, access to international credit lines was reduced. These developments forced a number of local institutions to aggressively source US dollars in the foreign exchange market.
Market inflows were also negatively affected by the decline in receipts from tourism and remittances, consequent on the deterioration in the global economy. During the December 2008 quarter, daily foreign currency flows averaged US$25.6 million compared to US$27.0 million in the September 2008 quarter and US$26.1 million in the December quarter of 2007.
The foregoing conditions prompted several policy
responses by the BOJ. They included:
a special US dollar credit facility to assist financial institutions in their efforts to meet overseas credit obligations;intervention sales totalling US$431.2 million compared to US$260.1 million in the September 2008 quarter and US$281.4 million in the December 2007 quarter;the offer of a Special 14-day CD fixed at 20.5 per cent per annum;increases in interest rates on all BOJ OMO instruments on two occasions;a facility to intermediate in financial institutions repo trades for both Jamaica Dollar and US dollar transactions;an increase in the cash reserve requirement for deposit-taking institutions to 11.0 per cent from 9.0 per cent effective 03 December.
Notwithstanding these actions, the Jamaica Dollar depreciated by 9.7 per cent during the December quarter compared 0.3 per cent during the corresponding quarter of 2007.
•
•
•
•
•
•
Table ��
PURCHASES AND SALES OF FOREIGN EXCHANGE (US$MN)
Quarter Purchases Sales
�00� �008 �00� �008March 3 076.8 3 127.5 3 030.9 3 157.0
June 3 046.0 3 209.6 3 005.0 3 258.6
September 3 044.8 3 278.8 2 988.8 3 239.1
December 3 042.6 3 197.3 3 002.9 3 157.0
TOTAL �� �0�.� �� 8��.� �� 0��.� �� 8��.�
Includes BOJ Intervention
External Sector Developments

Bank of Jamaica
- 9� -
Table ��
DAILY AVERAGE TRADING VOLUMES (US$MN)
�008Purchases Sales
Quarter from Earners Inter-Dealer Total to End-Users Inter-Dealer TotalMarch 34.1 15.7 49.9 34.5 15.8 50.4
June 31.7 16.2 47.9 32.5 16.2 48.7
September 31.4 17.4 48.8 30.5 17.6 48.2
December 28.7 15.8 44.5 27.9 16.0 43.9
Average per diem ��.� ��.� ��.8 ��.� ��.� ��.8
�00�
Quarter from Earners Inter-Dealer Total to End-Users Inter-Dealer TotalMarch 26.5 16.5 43.0 25.9 16.4 42.3
June 27.9 16.8 44.7 27.2 16.9 44.0
September 28.6 14.7 43.3 27.6 14.8 42.3
December 30.3 13.6 43.8 29.4 13.8 43.2
Average per diem �8.� ��.� ��.� ��.� ��.� ��.0 Excludes BOJ Intervention
External Sector Developments

- 9� -
8. Production and Prices
8.�. Production 8.�.�. OverviewThe Jamaican economy contracted by 0.9 per cent in 2008, relative to growth of 1.5 per cent in 2007 and average annual growth of 2.0 per cent since 2003 (see Chart ��). The contraction was primarily attributed to the general slowdown in external and domestic demand as a result of the global financial crisis. To a lesser extent, the reduction in growth was
partly due to the passage of Tropical Storm Gustav. Weak domestic demand emanated from heightened economic uncertainty, decline in real income and slower remittance inflows consequent on reduced income in Jamaica’s source countries. Agriculture, Forestry & Fishing, Manufacture, Construction and Transport, Storage & Communication were the main industries that contracted. Partly offsetting the impact of the contraction was growth in Finance & Insurance Services, Real Estate, Renting & Business Activities and Hotels & Restaurants45 (see Table ��).
45 The industries used in the national accounts have been reclassified in line with the revised Jamaica Industrial Classification 2005 (JIC 2005) which is a local adoption of the United Nations International Standard for Industrial Classification of all Economic Activities (ISIC Rev3.)
Chart ��
GDP Growth
0.91.3
1.0
3.5
1.4
2.7
1.5
-0.9
1.0
-1.5
-1
-0.5
0
0.5
1
1.5
2
2.5
3
3.5
4
2000 2001 2002 2003 2004 2005 2006 2007 2008
Year
%
8. Production and Prices

Bank of Jamaica
- 9� -
Table �� INDUSTRIAL CONTRIBUTION TO GDP GROWTH (%)
Sectors Jan –Dec �008 Contribution (�008)
1. GOODS -4.0 111.4 AGRICULTURE, FORESTRY & FISHING -5.2 32.6 MINING & QUARRYING -2.5 10.6 MANUFACTURE -1.4 14.3 CONSTRUCTION -6.7 54.5 2. SERVICES 0.1 -7.9 Electricity & Water 0.9 -3.2 Wholesale and Retail Trade, Repairs & Installation Machinery -0.2 3.3 Hotels & Restaurants 2.2 -11.2 Transport, Storage & Communication -2.3 28.3 Financing & Insurance Services 0.8 -9.6 Real Estate, Renting & Business Activities 1.2 -12.5 Producers of Government Services -0.1 0.9 Other Services 0.5 -3.2
3. Financial Intermediation Services Indirectly Measured (FISIM) -0.6 3.5 TOTAL GDP -0.9 �00.0Source: STATIN
Revisions to GDPJamaica’s current price Gross Domestic Product (GDP) estimates for the period 1998 to 2007 were revised upwards during 2008 by an average of 14.4 per cent, relative to the estimates based on the 1968 SNA. Real growth in the economy over the period was also revised upwards, albeit marginally. There were revisions to the methodology and classification schemes in Jamaica’s System of National Accounts (SNA). The revisions to the estimates have noteworthy implications for Jamaica’s macroeconomic indicators. In this regard, for example, the country’s average debt stock as a percentage of GDP for the period 2003 to 2007 was revised down by 18.3 percentage points, relative to the previous average.
Production and Prices
Sectoral DevelopmentsAgriculture, Forestry & Fishing contracted by 5.2 per cent in 2008, following a decline of 5.8 per cent in the previous year. This contraction reflected declines in both domestic and export agriculture.
Domestic crop production decelerated to 6.4 per cent in 2008, following a contraction of 8.7 per cent in 2007. The reduction in output continued to reflect the lagged adverse impact of Hurricane Dean as well as the prolonged heavy rains in October 2007. Output in the March 2008 quarter was also affected by dry spells in key agricultural parishes as well as a cutback in the use of fertilizer due to the spiralling cost, which led to a reduction in crop establishment and yield. Consequently, domestic crop production recorded a decline of 16.6 per cent in the first half of 2008, relative to growth of 4.9 per cent for the corresponding period in 2007. During the September

Annual Report 2008
- 9� -
2008 quarter, production was negatively affected by the passage of Tropical Storm Gustav which dampened the recovery process in the industry. In the last quarter, there was partial recovery in output levels for all crop groups. This growth was facilitated, in part by the support received from the Ministry of Agriculture in the form of technical guidance and the provision of lower cost fertilizer. Additionally, the recovery process was enhanced by the Ministry of Agriculture’s continued efforts to boost productivity in the industry through various programmes46. The recovery in the last quarter, however, was not strong enough to offset the earlier declines and all categories of domestic crop production, with the exception of fruits and cereals declined in 2008 (see Table �8).
Table �8SELECTED DOMESTIC CROP PRODUCTION
Crop Group Production (‘000 tonnes)�00� �008 % Change
Yams 113.1 101.9 -9.9Vegetables 149.2 144.6 -3.1Other tubers 35.8 31.9 -11.1Fruits 39.6 42.3 6.7Condiments 28.9 26.3 -9.0Plantains 19.1 15.0 -21.2Potatoes 33.5 30.7 -8.4Legumes 5.6 4.6 -17.9Cereals 1.7 1.9 13.4Total ���.� �00.� -�.�
Source: Ministry of Agriculture
Traditional Export Agriculture declined by 11.8 per cent in 2008, much sharper than the contraction of 2.8 per cent in 2007. Output for the year reflected three consecutive quarters of declines with a partial recovery in the December quarter. Value-added in the sector continued to reflect the adverse impact
46 The Ministry has been engaged in a restructuring exercise to im-prove its service quality through its various agencies. Focus has been placed on extension services, research, marketing, business facilitation and farmer training as well as counseling in best prac-tices and modern technology.
of Hurricane Dean which was exacerbated by the passage of Tropical Storm Gustav in the second half of the year.
Tropical Storm Gustav destroyed approximately 79.0 per cent of the banana crop, 6.0 per cent of coffee and 6.0 per cent of sugar cane production47. In this context, the export of banana and cocoa declined by 99.8 per cent, and 21.8 per cent, respectively, while sugar-cane production fell by 9.8 per cent. Citrus and pimento sustained minimal damage from Tropical Storm Gustav and recorded respective growth of 41.6 per cent and 89.3 per cent in exports due to recoveries in these industries (see Table �9).
Table �9SELECTED AGRICULTURAL EXPORTS
Crop �00� �008 % Change Exports (‘000 tonnes)
Banana 17.5 0.04 -99.8Citrus 4.1 5.7 41.6Cocoa 0.7 0.5 -21.8Coffee 1.1 1.4 30.5Pimento 0.52 0.97 89.3
Production (000’ tonnes)Sugar cane 153.3 138.2 -9.8
Sources: Bank of Jamaica Estimates & Sugar Corporation of Jamaica
Manufacture declined by 1.4 per cent during the review year, following average contraction of 1.0 per cent between 2003 and 2007. This performance was attributed primarily to the declines in both Other Manufacturing and Food & Beverages.
The decline in Other Manufacturing was attributed mainly to decreases in Non-Metallic Mineral Products, Chemical Products and Metal Products.
47 The impact of Tropical Storm Gustav resulted in negligible exports of 39 tonnes of bananas, relative to an average of 26,000 metric tonnes over the last five years.
Production and Prices

Bank of Jamaica
- 98 -
The performance of the non-metallic mineral sub-sector reflected a decrease of 5.1 per cent in cement production, arising from lower demand by the domestic construction industry as well as increased competition from imported cement. The contraction in the chemical sub-sector partly reflected a fallout of 35.9 per cent in fertilizer production as a result of decreased demand due to high prices in the first half of the review period as well as Government’s decision to directly import fertilizer in the last quarter of the year.
A decline of 1.5 per cent was recorded in Food & Beverages. This decline was associated with a contraction in the beverage sub-sector as food processing expanded. The contraction in the beverage sub-sector was attributed, in part, to downtime at one of the carbonated beverage plants to facilitate expansion as well as reduced consumer demand. The improvement in food processing reflected increased output of animal feeds, edible fats and flour (see Table �0).
Table �0SELECTED FOOD PROCESSING ITEMS
Production (‘000 tonnes)Item �00� �008 % Change
Poultry Meat 106.6 106.3 -0.3
Edible Oils 21.3 20.6 -3.1Edible Fats 76.8 79.7 3.8Cornmeal 10.7 7.0 -34.9
Condensed Milk 13.3 13.2 -0.1
Flour 124.9 132.4 6.0
Animal Feeds 377.0 390.9 3.7
Sugar 163.0 140.6 -13.7Source: Planning Institute of Jamaica
Economic activity in Construction declined by 6.7
per cent in 2008, reversing the trend annual average growth of 4.7 per cent from 2003 to 2007. The contraction in the industry emanated from declines in private sector investment projects, public sector capital projects and residential construction. The performance of the industry was partly inferred from a decline of 7.8 per cent in cement sales in the year. Lower residential construction was indicated by declines of 58.6 per cent and 17.3 per cent in the National Housing Trust housing completions and starts, respectively, for 2008.
Following a contraction of 2.6 per cent in 2007, Mining & Quarrying is estimated to have declined by 2.5 per cent during the review year. The decline in 2008 was in comparison to an average annual growth of 1.7 per cent from 2003 to 2007. In the first half of the year the impact of Island-wide electrical outages as well as mechanical problems at one of the alumina companies affected output. Following this, the demand for aluminium on the world market declined significantly in the third quarter as end-use markets, such as the construction and automotive industries, contracted as a result of the world-wide slowdown in economic growth. The mining industry was also faced with increased production costs which negatively affected its profitability. Energy is the major component in the production of alumina. Its high prices in 2008 contributed to the increased production costs of that commodity. During the year, the capacity utilisation rate for the alumina industry declined marginally to 87.8 per cent from 88.3 per cent during 2007. This was in comparison to average annual capacity utilisation rate of 93.7 per cent for the alumina industry from 2003 to 2007. Additionally, significant declines were reflected in Quarrying (including Gypsum) which was severely
Production and Prices

Annual Report 2008
- 99 -
affected by inclement weather and damage to major infrastructure.
There was a marginal expansion of 0.9 per cent in Electricity & Water, which was below the industry’s five year average growth of 2.5 per cent. A contraction of 1.6 per cent was observed in the first half of the year, followed by growth of 3.5 per cent in the second half. During the first half of the year, the decline in electricity production was attributed primarily to technical difficulties at one of the plants of the main power company. The strong performance in the latter half of 2008 reflected recovery over the decline in the latter half of 2007, stemming from the disruption in electricity generation caused by Hurricane Dean. For the review year, total electricity generation improved moderately by 1.2 per cent, while electricity sales declined by 1.9 per cent. Industrial electricity sales remained flat, while ‘Other’ declined by 3.4 per cent. The growth in the industry was also influenced by a marginal increase of 0.3 per cent in water production, relative to the previous year.
Hotels & Restaurants expanded by 2.2 per cent for 2008, compared to a marginal increase of 0.3 per cent in 2007. For the year, total stopover arrivals increased by 3.9 per cent, compared to growth of 1.3 per cent in the previous year. This was marginally below the average annual growth since 2003. In contrast, cruise ship arrivals declined by 7.7 per cent, relative to the previous year. This was below the average annual growth of 6.4 per cent since 2000. During the first half of the review year, the industry (Hotels and Restaurants) grew by 6.0 per cent but fell by 0.9 per cent in the second half. The growth in the first half was attributed, in part, to normalization following the US Western Hemisphere
Travel Initiative48 that commenced in the March 2007 quarter, as well as the aggressive advertisements in Europe and the United States by the Government and key industry players. The second half of the year was characterized by the intensification of the global recession and the consequent weakening of global demand for vacations. In this context, total stopover arrivals grew by 8.4 per cent in the first half of 2008 but declined marginally (by 0.8 per cent) in the second half.
Transport, Storage & Communication contracted by 2.3 per cent in 2008, below the average annual growth of 2.8 per cent since 2003. The industry’s value-added contracted consistently throughout the year. The performance of the industry mainly reflected decline in economic activity in water and air transportation. The reduction in water transport was indicated by declines of 4.6 per cent and 0.6 per cent in the number of ships calling at Jamaican ports and in total domestic cargo movements, respectively. These contractions were in contrast to average annual growth rates of 0.3 per cent and 3.7 per cent, respectively, since 2003. The fallout in ship calls was primarily attributed to weakening global demand for vacations as well as a shift in the itinerary of selected cruise lines away from the Caribbean. Air transportation was negatively affected by problems faced by the national carrier.
48 The US Western Hemisphere Travel Initiative is a U.S. law that requires all travellers within the western hemisphere, including U.S. and Canadian citizens, to present a valid passport when travelling to, through or from the United States.
Production and Prices

Bank of Jamaica
- �00 -
8.�. Prices8.�.�. OverviewInflation was 16.8 per cent in 2008, similar to the outturn in 2007. Core or underlying inflation in 2008, as measured by the trimmed mean and the Consumer Price Index without food and fuel (CPIFF), was higher at 10.3 per cent and 10.8 per cent, respectively, relative to 9.4 per cent and 9.3 per cent in 2007. The index for the Greater Kingston Metropolitan Area (GKMA) increased by 17.0 per cent, while the indices for Rural Areas and the Other Urban Centres (OUC) each increased by 16.8 per cent. This relatively uniform outturn across the three regions was largely reflective of changes in Food & Non-Alcoholic Beverages and offsetting movements between Housing, Water, Electricity, Gas & Other Fuels and Transport (see Table ��).
Headline inflation was influenced chiefly by adverse international developments, mainly in the early half of the year. These developments included sharp increases in international grain and crude oil prices over that period, which were partially reversed in the latter part of the year. As a consequence, inflation was 11.5 per cent over the first six months of the year, compared to 4.8 per cent in the last half of the year. Other factors affecting inflation over the year included supply shocks to the domestic agricultural sector from the impact of the passage of Hurricane Dean in August 2007 and Tropical Storm Gustav in August 2008. Further, there were adjustments in administered prices, such as the national minimum wage, water rates, bus and taxi fares and motor vehicle licence fees. The impact of the sharp depreciation of the foreign exchange rate on prices, following the intensification of the global financial crisis in September, was evident in the last quarter.
8.2.2. Contribution to InflationThe movement in the Consumer Price Index (CPI) in 2008 largely reflected increases in Food & Non-Alcoholic Beverages, Miscellaneous Goods & Services, Transport and Housing, Water, Electricity, Gas & Other Fuels. These divisions expanded by 24.0 per cent, 17.7 per cent, 9.6 per cent and 9.3 per cent, collectively contributing 78.2 per cent to the year’s outturn (see Table ��).
Chart ��
Within Food & Non-Alcoholic Beverages, price increases were mainly reflected in Bread & Cereals, Vegetables & Starchy Foods and Meat. Bread & Cereals, which increased by 33.5 per cent, accounted for 12.4 per cent of overall inflation. Vegetables & Starchy Foods increased by 29.7 per cent and also contributed 12.4 per cent to the year’s inflation. Meat rose by 15.8 per cent and contributed 7.4 per cent of the outturn.
Miscellaneous Goods & Services was affected by the higher costs of personal care products and services, visa fees and jewelry. This division increased by 17.7 per cent and contributed 9.0 per cent of annual inflation.
Production and Prices

Annual Report 2008
- �0� -
Transport primarily reflected the administered adjustments to bus and taxi fares and motor vehicle fees and licences. This division was responsible for 7.5 per cent of the year’s inflation.
The main class that contributed to inflation in Housing, Water, Electricity, Gas & Other Fuels was Water Supply & Miscellaneous Services Related to the Dwelling, which increased by 35.6 per cent and contributed 2.8 per cent to overall inflation. Electricity, Gas & Other Fuels increased by 4.7 per cent, accounting for 2.0 per cent of inflation in the year.
8.2.3. Factors Influencing Inflation
International Commodity PricesThe most significant impetus to inflation was from the movements in international commodity prices, mainly those for grains and crude oil. For the first half of the year corn, rice and soybean prices increased by 59.3 per cent, 115.0 per cent and 21.3 per cent, respectively. Rice and corn prices reached records in April and June, respectively, while soybean prices peaked in July. For the latter half of the year, corn, rice and soybean prices declined by 44.9 per cent, 31.5 per cent and 42.4 per cent, respectively. Food price inflation, as measured by the Bank’s Food Index, was 14.3 per cent during the January to June period but slowed to 8.7 per cent in the July to December period. These impulses helped to propel Bread & Cereals and Meat, to account for approximately one-fifth of annual inflation.
The pattern of price changes for crude oil prices during the year was similar to that of grains. The average price of the benchmark West Texas Intermediate
(WTI) crude oil rose by 46.6 per cent over the first six months of 2008 to US$133.93 per barrel at June. A record price of US$145.29 per barrel was attained in July (see International Developments). The sharp and historic movements in crude oil prices induced record levels for domestic household energy and petrol prices.
Chart ��
In the latter half of the year, crude oil prices fell steeply on fears that the deepening credit crisis would cut demand for the commodity. This fall led to an average price of US$41.44 per barrel at December, a decline of 69.1 per cent compared to the measure at June. Consequently, significant declines were observed in the cost of utilities and household and automotive fuels, given the sharp reversal. However, these were not sufficient to completely reverse the effect of the earlier increases. Largely as a consequence of the foregoing developments, the Bank’s estimate of imported inflation, the increase in the Import Price Index (IPI), was 26.9 per cent for first six months of 2008, compared to 6.1 per cent for the comparable period in 2007. In the context of these price movements, the Fuel and Raw Materials (Food) components of the index increased by 46.6 per cent and 16.3 per cent, respectively, over the first
Production and Prices
Bank of Jamaica
- �0� -
half of the year. Consistent with these developments, over the first half of the year the Bank’s Fuel Index increased by 11.4 per cent but declined by 1.2 per cent in the latter half of the year.
Domestic Agricultural SupplyDespite a strong 14.4 per cent rebound in the production of domestic crops in the last quarter, overall output fell by 6.4 per cent in 2008. The effect of the passage of Hurricane Dean in 2007 was protracted on particular crops such as banana and plantain. As a consequence, banana and plantain production were below pre-hurricane levels for over a year. Subsequently in August 2008, Tropical Storm Gustav caused extensive damage to these crops with an estimated loss of between 70 per cent and 85 per cent of the then existing cultivation. As a consequence of the foregoing, the output of plantain declined by 21.2 per cent for the year. Damage to short-term crops was less severe but approximately 19.0 per cent, 14.0 per cent and 7.5 per cent of condiments, vegetables and legumes under cultivation were lost. Roots crops and tubers fared much better, given the milder impact of Gustav’s passage. Output of key commodities such as yams, potatoes and condiments declined by of 9.9 per cent, 8.4 per cent and 9.0 per cent, respectively for the year. These reductions resulted in higher prices for major crops such as yellow yam, sweet potato, lettuce and tomato and attendant significant movements in the CPI. Consequently, Vegetables & Starchy Foods and Fruit increased by 29.7 per cent and 13.7 per cent, respectively, accounting for 13.3 per cent of annual inflation.
Administered PricesThe most significant administered price adjustment in 2008 was the increase in bus and taxi fares. Bus
and taxi fares were increased by 25.0 per cent but only in the OUC and Rural Areas and accounted for approximately 1.5 percentage points of inflation. Along with higher motor vehicle licence and user fees, these were the main impulses in Transport. The annual adjustment to the national minimum wage was 15.6 per cent, while a 17.0 per cent increase in wages was granted to industrial security guards49. These increases accounted for approximately 0.2 percentage point and were reflected in Furnishings, Household Equipment & Routine Household Maintenance. Artisans’ wages were also increased by 12.0 per cent and represented the second adjustment in a two-year 24.0 per cent agreement with the Incorporated Masterbuilders Association of Jamaica. This increase contributed to the movement in Housing, Water, Electricity, Gas & Other Fuels.
There were also other administered price adjustments such as increased water rates, higher special consumption tax (SCT) on cigarettes as well as the annual tariff increase at the electric utility. These adjustments had a direct impact of approximately 1.0 percentage point on overall inflation.
Exchange Rate DepreciationIn 2008, the weighted average selling rate (WASR) of the Jamaica Dollar vis-à-vis the US dollar depreciated by 11.2 per cent with more than 85.0 per cent of this movement occurring in the last three months of the year. This sharp movement primarily resulted from the increase in demand due to an imbalance influenced by the global financial crisis (see Foreign Exchange Market). However, lags in the transmission and 49 The minimum wage was increased from $3 200 to $3 700 per
40-hour work week and primarily affected household helpers and gardeners while security guards wages were increased from $4 700 to $5 500.
Production and Prices

Annual Report 2008
- �0� -
weak demand limited the effects of the depreciation on inflation in the calendar year.
Production and Prices

Bank of Jamaica
- �0� -
Table ��
JAMAICA: COMPONENT CONTRIBUTION TO INFLATION �008
Divisions/Groups/Classes Weights Inflation (%)2008
WeightedInflation
% Contributionto Inflation
FOOD & NON-ALCOHOLIC BEVERAGES ��.�� ��.0 9.00 ��.�FOOD 35.12 24.7 8.68 52.6- Bread and Cereals 6.10 33.5 2.05 12.4- Meat 7.66 15.8 1.21 7.4- Fish and Seafood 5.33 17.6 0.94 5.7- Milk, Cheese and Eggs 3.11 24.2 0.75 4.6- Oils and Fats 1.64 43.4 0.71 4.3- Fruit 1.14 13.7 0.16 0.9- Vegetables & Starchy Foods 6.86 29.7 2.04 12.4 Vegetables 2.21 38.4 0.85 5.1 Starchy Foods 4.64 10.2 0.47 2.9- Sugar, Jam, Honey, Chocolate & Confectionery 1.72 20.3 0.35 2.1- Food Products n.e.c. 1.55 24.5 0.38 2.3NON-ALCOHOLIC BEVERAGES 2.35 13.1 0.31 1.9- Coffee, Tea and Cocoa 0.66 8.2 0.05 0.3- Mineral Waters, Soft Drinks, Fruit & Vegetable Juices 1.69 15.0 0.25 1.5ALCOHOLIC BEVERAGES & TOBACCO �.�8 ��.0 0.�� �.�CLOTHING & FOOTWEAR �.�� ��.� 0.�8 �.9CLOTHING 2.12 11.2 0.24 1.4FOOTWEAR 1.22 19.5 0.24 1.4HOUSING, WATER, ELECTRICITY, GAS & OTHER FUELS ��.�� 9.� �.�9 �.� RENTALS FOR HOUSING 3.01 8.3 0.25 1.5 MAINTENANCE AND REPAIR OF DWELLING 0.80 18.0 0.14 0.9 WATER SUPPLY AND MISCELLANEOUS SVCS 1.32 35.6 0.47 2.8 ELECTRICITY, GAS AND OTHER FUELS 7.12 4.7 0.34 2.0FURNINSHINGS, HOUSEHOLD EQUIPMENT & ROUTINE HOUSEHOLD MAINTENANCE �.9�
��.� 0.80 �.9- FURNITURE AND FURNISHINGS 0.69 21.1 0.15 0.9- HOUSEHOLD TEXTILES 0.32 14.1 0.04 0.3- HOUSEHOLD APPLIANCES 0.56 11.7 0.07 0.4- GLASSWARE, TABLEWARE AND H/H UTENSILS 0.05 17.9 0.01 0.1- TOOLS AND EQUIPMENT FOR HOUSE & GARDEN 0.15 11.1 0.02 0.1
- GOODS & SERVICES FOR ROUTINE H/H MNTCE 3.16 16.5 0.52 3.2
HEALTH �.�9 9.� 0.�0 �.8- MEDICAL PRODUCTS, APPLIANCES AND EQUIP 1.22 10.6 0.13 0.8
- HEALTH SERVICES 2.07 8.2 0.17 1.0TRANSPORT ��.8� 9.� �.�� �.�COMMUNICATION �.99 0.0 0.00 0.0RECREATION & CULTURE �.�� ��.8 0.�� �.�EDUCATION �.�� ��.� 0.�� �.�RESTAURANTS & ACCOMODATION SERVICES �.�9 ��.8 0.8� �.�MISCELLANEOUS GOODS & SERVICES 8.�� ��.� �.�8 9.0
ALL GROUPS �00.0 ��.8 ��.� �00.0 Source: STATIN & BOJ’s Calculations
Production and Prices

Annual Report 2008
- �0� -
Table ��
REGIONAL INFLATION�008
Divisions / Groups/Classes Weight in CPI
GKMA (%) OUC (%) Rural
Areas (%)FOOD & NON-ALCOHOLIC BEVERAGES 0.���� ��.� ��.9 ��.�- FOOD 0.3512 24.4 23.9 25.2Bread and Cereals 0.0610 29.2 35.9 34.8Meat 0.0766 19.4 15.4 13.4Fish and Seafood 0.0533 18.5 17.2 17.3Milk, Cheese and Eggs 0.0311 31.8 22.3 20.0Oils and Fats 0.0164 55.1 42.5 37.9Fruit 0.0114 19.5 12.2 6.0Vegetables and Starchy Foods 0.0686 23.1 24.8 37.4
Vegetables 0.0221 26.9 28.4 53.4Starchy Foods 0.0464 16.1 17.6 2.4
Sugar, Jam, Honey, Chocolate and Confectionery 0.0172 26.1 18.8 18.1Food Products n.e.c. 0.0155 22.2 24.0 26.2- NON-ALCOHOLIC BEVERAGES 0.0235 22.5 9.1 9.7 Coffee, Tea and Cocoa 0.0066 15.1 7.8 5.1Mineral Waters, Soft Drinks, Fruit and Vegetable Juices 0.0169 24.9 9.5 11.7ALCOHOLIC BEVERAGES & TOBACCO 0.0��8 ��.� ��.� ��.0CLOTHING & FOOTWEAR 0.0��� ��.8 �.0 ��.9HOUSING, WATER, ELECTRICITY, GAS & OTHER FUELS 0.���� ��.� 8.� �.9 - RENTALS FOR HOUSING 0.0301 13.5 1.4 1.3- MAINTENANCE & REPAIR OF DWELLING 0.0080 21.4 16.8 16.7- WATER SUPPLY AND MISC SERVICES RELATED TO THE DWELLING 0.0132 35.6 35.7 35.7
- ELECTRICITY, GAS AND OTHER FUELS 0.0712 4.8 6.0 4.1FURNISHINGS, HOUSEHOLD EQUIPMENT & ROUTINE MNTNCE 0.0�9� �9.9 ��.� ��.0HEALTH 0.0��9 8.� �0.� 9.0 TRANSPORT 0.��8� �.0 ��.� ��.�COMMUNICATION 0.0�99 0.� 0.� 0.0 RECREATION & CULTURE 0.0��� �0.� 9.� ��.9EDUCATION 0.0��� ��.� �9.� �9.0RESTAURANTS AND ACCOMODATION SERVICES 0.0��9 ��.9 �0.� 8.0MISCELLANEOUS GOODS & SERVICES 0.08�� �0.� �8.� ��.�ALL DIVISIONS �.0000 ��.0 ��.8 ��.8
Source: STATIN
Production and Prices
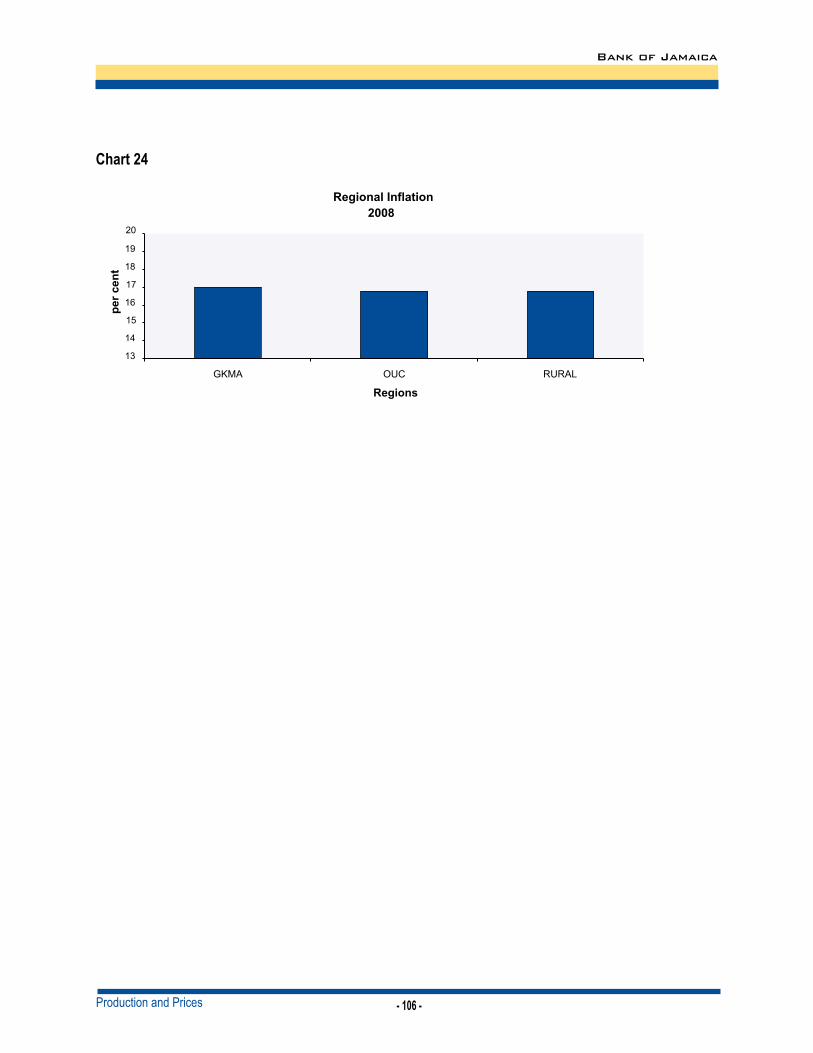
Bank of Jamaica
- �0� -
Chart ��
Production and Prices

- �0� -
9.�. Central Government Performance
For the fiscal year to December 2008, the Government incurred a deficit of $57.2 billion or 5.2 per cent of GDP, compared to the
budgeted amount of $47.7 billion or 4.3 per cent of GDP (see Tables �� and ��). The deviation from budget reflected a shortfall in Revenue & Grants,
partly offset by lower than budgeted Expenditure. As such, the primary surplus was 3.4 per cent of GDP, relative to a target of 4.2 per cent of GDP, while the current deficit was 3.6 per cent of GDP, significantly above the deficit of 1.9 per cent of GDP implicit in the budget. Further, Interest Payments to GDP was 8.6 per cent, slightly above the target of 8.5 per cent.
9. Public Finance
Table �� CENTRAL GOVERNMENT SUMMARY ACCOUNTS FY �008/09 (J$MN)
FY �008/09 Q�- Q�
Budget Q�- Q� Variance %
Revenue & Grants �9� ���.8 ��� �9�.� -�� �8�.� -�.�
Revenue �9� ��9.� �08 ���.9 -�� 08�.� -�.� Tax Revenue 176 344.2 188 694.6 -12 350.4 -6.5 Non-Tax Revenue 11 984.5 11 700.0 284.4 2.4 Bauxite Levy 4 150.4 6 362.9 -2 212.5 -34.8 Capital Revenue 790.7 1 596.4 -805.7 -50.5 Grants 2 842.1 4 141.3 -1 299.2 -31.4
Expenditure ��� ���.0 ��0 �0�.� -� 89�.� -�.� Recurrent Expenditure 232 543.8 227 776.9 4 766.8 2.1 Programmes 54 412.3 56 220.5 -1 808.3 -3.2 Wages & Salaries 83 119.8 77 655.0 5 464.9 7.0 Interest 95 011.7 93 901.4 1 110.3 1.2 Domestic 67 942.5 67 199.1 743.4 1.1 Foreign 27 069.2 26 702.3 366.9 1.4
Capital Expenditure 20 769.2 32 427.7 -11 658.5 -36.0 Fiscal Balance -�� �0�.� -�� �09.� -9 �9�.� �9.9 Current Balance -�0 0��.� -�� 0�9.� -�9 0��.� 90.�
Primary balance �� 8�0.� �� �9�.0 -8 �8�.� -�8.�

Bank of Jamaica
- �08 -
Table ��
FISCAL PERFORMANCE RATIOS
FY�008/09(%)
FY �008/09 Q�- Q�
Target Q�- Q�
Borrowing Requirement/GDP �.� �.�Current Balance/GDP -�.� -�.9Primary Balance/GDP �.� �.�Interest Payments/GDP 8.� 8.�Fiscal Stability Ratio -�.� -�.�Non-Interest Expenditure ��.� ��.0KeyBR = Borrowing Requirement = Fiscal Balance as a percent of GDPCB= Current Balance = Current Revenue-Current Expenditure as a percent of GDPPB= Primary Balance = Total Revenues-Total Expenditures less Interest Payments (IP) as a percent of GDPIP= Interest Payments as a percent of GDPFSR=Fiscal Stability Ratio = (Overall Balance/ Total Revenue) - 1
International Benchmarks
BR greater than 3% of GDP often indicates serious fiscal imbalanceFSR closer to zero indicates more stable government financesNegative CB ratio of less than �% indicates dissaving or a need for fiscal adjustment as the public sector is borrowing for consumptionPB ratio above zero indicates major fiscal adjustment to cover interest on past obligations* Recurrent Expenditure includes programmes, wages and salaries and interest payments.
Revenue & Grants for April to December 2008 were 7.7 per cent below budget, but exceeded receipts for the comparable period in FY2007/08 by 12.1 per cent. Tax Revenue was 6.5 per cent below budget, reflecting primarily, lower than budgeted GCT and
SCT receipts. The lower than budgeted Tax Revenue and Bauxite Levy also reflected a slowdown in economic activities which was partly the result of the global economic downturn.
Table ��C-EFFICIENCY RATIO
April - December(J$ Millions)
�00�/0� �00�/0� �00�/08 �008/09* � YR AVG
Consumption 405 010.8 484 277.3 557 093.7 700 577.7 482 127.3 GCT 35 044.0 42 397.4 48 706.7 52 314.8 42 049.4 GCT/Consumption (%) 8.7 8.8 8.7 7.5 8.7 Standard Rate (%) 16.5 16.5 16.5 16.5 16.5
C-Efficiency Ratio (%) ��.� ��.� ��.0 ��.� ��.8
*For Fiscal Year 2008/09, consumption figures used are BOJ estimates
Public Finance

Annual Report 2008
- �09 -
The C-Efficiency ratio for April to December 2008 was 45.3 per cent, compared to 53.0 per cent for the corresponding period of FY2007/08 and was below the 52.8 per cent 3-year average (see Table ��)50. The movement in the C-Efficiency ratio was consistent with the shortfall in GCT receipts for the period.
50 The C-Efficiency ratio is the share of value-added tax (VAT) revenue in consumption.
The shortfall in revenue relative to budget, however, disguised buoyant inflows resulting from the Government’s tax amnesty. The amnesty which ran from June to October 2008, offered reduced penalties on outstanding tax balances, to individuals and companies (see Table ��). Revenue collected during the amnesty period was significantly above the anticipated amount with over 70.0 per cent of the inflows coming from outstanding PAYE, Company Income Tax and Individual Income Tax.
Table ��
ORIGINAL TAX TERMS OF AMNESTY (Announced April �008)
ADJUSTED TAX TERMS OF AMNESTY (Announced July �008)
Date Waiver (%) Date Waiver (%)
June 100.00
July 80 July 100
August 50 August 90
September 40 September 80
October 20 October 70
Public Finance

Bank of Jamaica
- ��0 -
Expenditure was 2.6 per cent below the budget for the period April to December. The shortfall largely reflected lower than budgeted Capital Expenditure, partly offset by higher than projected Wages & Salaries. Capital Expenditure was 36.0 per cent below budget, largely reflecting delays in project implementation. Higher than anticipated Wages & Salaries was due
largely to above budgeted payments to teachers and police during the December quarter51. In the latter part of the quarter, the Government announced a stimulus package aimed at providing some relief to sectors affected by the global economic slowdown and financial fall out. The package was estimated at $862.4 million (see Table ��).
51 The higher than budgeted disbursements to teachers reflected the realignment of teachers’ salaries, closer to market rates.
Table ��
�008/09 STIMULUS PACKAGE
J$mn
Reduction in GCT levied on Tourism Sector by 50% 431.9
Reduction in Transfer Tax from 6% to 5% 170.0
Lower Band allowed for Capital Equipment Depreciation to 1-year 12.5
Removal of Customs User Fees (Capital and Raw Material) 114.0
Removal of Customs Duty (Individual Customs) 84.0
Elimination of Tax on Dividends for Locally Owned Companies 10.0
Increase in GCT Threshold for Businesses 40.0
Total 8��.�
Public Finance

Annual Report 2008
- ��� -
FinancingDuring the April to December period, the Government utilized higher than targeted financing, largely reflected in higher than budgeted net issue of domestic debt instruments. Foreign financing was also higher than budgeted, reflecting the receipt of US$90.0 million from the Inter-American Development Bank (IDB) in December.
Debt AnalysisGovernment of Jamaica’s total debt at end-December was $1 118.2 billion (100.9 per cent of GDP) or $117.5 billion above the stock at end-March 2008 when the stock was 107.5 per cent of GDP (see Chart ��). The growth in the debt stock reflected increases of 16.1 per cent and 8.3 per cent in external debt and domestic debt, respectively. At end-December, domestic debt was 55.0 per cent of GDP, relative to 60.4 per cent at end-March 2008, while external debt was 46.0 per cent of GDP, relative to 47.1 per cent at end-March.
Chart ��Select Debt Indicators
Domestic DebtIn a context of increasing uncertainty in the financial markets, variable rate instruments accounted for 54.3 per cent of domestic debt issued (excluding Treasury Bills), in the April to December period (see Table �8). The variable rate portion of the domestic debt stock, however, declined marginally to 61.9 per cent from 62.4 per cent at end-March. The weighted average age of debt issued over the period declined to an average of 2.9 years from an average of 5.5 years for the comparable period in the previous fiscal year. Consequently, short-term debt accounted for 64.9 per cent of domestic debt at end-December, relative to 62.4 per cent at end-March, resulting in higher refinancing risk. The increase in interest rates during the latter part of the review period resulted in the weighted average interest rate on new debt increasing to 14.9 per cent at end-December 2008, relative to 12.5 per cent for the similar period in the previous fiscal year. The foreign currency-related portion of the debt increased to 15.0 per cent at end-December from 12.1 per cent at end-March, largely resulting from a net issue of US dollar-linked instruments, as well as the depreciation in the exchange rate52.
52 Foreign currency related debt includes US$ indexed and US$ denominated instruments.
Public Finance

Bank of Jamaica
- ��� -
Table �8GOJ PUBLIC ISSUES OF INSTRUMENTS (EXCLUDING T-BILLS)
APRIL-DECEMBER �00�/0� – �008/09 Number of Issues Value of Issues Proportion of Total (J$ millions) (%) �00�/0� �00�/08 �008/09 �00�/0� �00�/08 �008/09 �00�/0� �00�/08 �008/09 Variable Rate 9 9 14 72 916.9 56 236.3 45 764.06 67.4 60.9 54.3Fixed Rate 16 10 8 32 190.5 30 061.1 23 475.3 29.8 32.6 27.9US$ Indexed - 1 3 0.0 6 047.5 11 002.8 - 6.6 13.1US$ Denominated 1 - 1 3 057.8 0.0 4 057.4 2.8 - 4.8 TOTAL 26 20 26 108 165.2 92 344.9 84 299.5 100.0 100.0 100.0 Short and Medium-term 5 10 21 21 674.6 57 995.2 68 254.8 20.0 60.6 81.0Long-term 21 10 5 86 490.6 34 349.7 16 044.7 80.0 39.4 19.0 TOTAL 26 20 26 108 165.2 92 344.9 84 299.5 100.0 100.0 100.0 �00�/0� �00�/08 �008/09 Weighted Average Age of New Debt (yrs.) 9.8 5.5 2.9 Weighted Average Interest Rate on New Debt (%) 13.0 12.5 14.9
External DebtThe increase in external debt during the review period reflected a US$209.7 million net increase in Central Government debt, mainly due to the issue of a US$350 million Eurobond. The proportion of bonds in the external debt portfolio increased over
the period to 65.3 per cent at end-December from 64.0 per cent at end-March. External debt at end-December continued to be dominated by long-term fixed rate instruments.
Public Finance

Annual Report 2008
- ��� -
Table �9EXTERNAL DEBT BY BORROWER CATEGORY
March �008 - December �008(in millions of US dollars)
March June Sept. Dec.
Central Government 5 231.9 5 530.6 5 393.3 5 441.6Government Guaranteed 936.6 925.2 910.6 901.7BOJ 0.8 0.7 0.4 0.4
Total � ��9.� � ���.� � �0�.� � ���.� Source: Ministry of Finance
Public Finance

- ��� -
The outlook for the domestic economy in 2009 is for further weakening in output and a moderation in inflation. This projection is
based on the expectation that the global recession will deepen during the year. The tradable sectors of the economy are anticipated to decline, while the non-tradable sectors should experience at best negligible growth. Despite the potential effect of the recent demand pressures on the exchange rate, it is anticipated that inflation will moderate on the premise of lower incomes. A deeper and more protracted downturn in the global economy, in particular in the United States, poses the main risk to output and growth in the domestic economy in 2009.
�0.�. International EconomyThe IMF projects (in its World Economic Outlook, April 2009 Update) that global growth will contract by 1.4 per cent in 2009, relative to growth of 3.4 per cent in 2008. Real GDP is expected to decline by 2.0 per cent in the developed countries, despite attempts by governments to revive economic activity. Growth in developing economies is expected to decelerate by 3.0 percentage points to 3.3 per cent in 2009, relative to 2008. The outlook for developing countries reflects an anticipated decline in demand for exports in light of the economic slowdown in the advanced economies.
World inflation is expected to decelerate in 2009 by similar margins in both developed and developing countries. Inflation in the advanced economies is expected to be 0.3 per cent, compared to 3.5 per cent in 2008, while inflation in the developing economies is
anticipated to fall by 3.4 percentage points to 5.8 per cent. Much of the anticipated deceleration in inflation is attributed to the expected significant declines in commodity prices; in particular, crude oil and grain prices, as a result of falling global demand. With regard to international trade negotiations, political changes in the US and Europe may constrain further progress in the WTO Doha Round (see International Economic Developments). In addition, the impact of the global financial crisis has shifted the focus of many countries towards protectionist policies. Although the WTO will continue to enforce the existing set of global trade rules, several countries have expressed concerns about whether non-binding commitments offered in the course of these negotiations will be honoured.
�0.�. Domestic Economy10.2.1. GrowthThe continued uncertainty in the global financial markets and the slowdown in the world economy are expected to adversely affect domestic economic activity in 2009. In particular, domestic activities will be adversely affected by declining demand for exports, lower capital inflows and a decline in remittance flows. In this context, economic activity is forecasted to contract in 2009. Most of the forecasted decline in output is attributed to the tradable industries, in particular Mining, Hotels & Restaurants and Transport. The lower value added in Mining is in the context of reduced demand for alumina, hence a significant cut in capacity utilization. Despite the expansion in hotel room capacity, the tourism trade
10. Economic Outlook

Annual Report 2008
- ��� -
will decline, given the economic downturn in the country’s main source market, the United States. Within the non-tradable sector, Construction is expected to contract significantly due to declines in private sector investment, public sector capital spending and residential construction. While Agriculture is anticipated to record partial recovery, the rest of the non-tradable industries such as retail trade should reflect weak or no growth.
10.2.2. InflationInflation in 2009 is expected to moderate, relative to 2008. The moderation is expected to emanate from reduced import prices for commodities such as grains, edible oils and crude oil. This projected decline in prices is underpinned by the impact of the global recession on world demand. Locally, increases in the prices for domestic items are anticipated to be restrained by waning demand as the developments in the global economy should have an adverse effect on employment, credit and incomes. The main areas of moderation in prices are expected in the Food & Non-Alcoholic Beverages and Transport divisions of the Consumer Price Index. The moderation in the former will be led by reductions in the grain related subdivisions such as Bread & Cereals, Oils & Fats and Milk, Cheese & Eggs, while Vegetables & Starchy Foods should benefit from the anticipated recovery in domestic agricultural sector. The slower increase in Transport will be due to the lower cost of operating motor vehicles, consequent on a projected reduction in crude oil prices, relative to 2008. While there will be some inflationary impulses arising from the significant depreciation in the exchange rate, the pass-through is expected to moderate.
10.2.3. Monetary PolicyAgainst the background of a deepening global economic crisis, the maintenance of relative stability in the domestic financial markets, in particular the foreign exchange market, will be the main challenge for monetary policy in 2009. This challenge will be in the context of lower capital inflows, falling export earnings and remittances. The Bank will ensure that there is adequate liquidity in both the money and foreign exchange markets. Against this background, the Bank of Jamaica will maintain a conservative monetary policy stance so as to ensure macroeconomic stability. The maintenance of stability is an important prerequisite for ensuring recovery in the economy when global economic conditions improve.
Economic Outlook
- ��� -
��.�. Banking Services
During 2008, the Bank continued to provide a variety of banking services to its customers.53 In its undertaking of banking services to
these customers, the Bank continued to provide operational support to the Systemically Important Payment Systems (SIPS) in Jamaica. The SIPS are comprised of the automated clearing house (ACH) and the Customer Inquiry Funds Transfer System (CIFTS). The ACH is owned and operated by the seven commercial banks while the CIFTS is owned and operated by the Bank. With regard to the Automated Clearing House (ACH), the Bank operated in the following capacities:
• participant - negotiating cheques drawn on commercial banks, as well as sending and receiving electronic files with the cheque data to and from the ACH Operator;
• settlement bank - effecting the settlement of clearing balances on the accounts of commercial banks;
• providing oversight to the payments system; and
• supervising the manual clearing process for items that do not qualify for the ACH as well as foreign currency cheques which qualify for domestic clearing.
The BOJ also continued to provide operational support for the Customer Inquiry Funds Transfer System (CIFTS) during 2008.54
53 The Bank’s customers include the Government, licensed financial institutions, primary dealers, selected brokers of the Jamaica Central Securities Depository (JCSD) and regional central banks.
54 CIFTS is a medium for the electronic transfer of funds between the accounts held at the BOJ by commercial banks, primary dealers and the participants of the JSCD.
In providing banking services to the Government, the Bank continued
• to effect the settlement of GOJ primary issues in the domestic securities market;
• the redemption of GOJ Treasury Bills; and • the payment of external and domestic debt
obligations.
Services provided to other institutional customers included settlement of open market operations, equities traded on the Jamaica Stock Exchange (JSE) the issue and redemption of currency and regional payments through CARICOM bilateral arrangements.
Throughout the year, the Bank also continued to offer over-the-counter services on a limited scale to the general public. These services included the exchange of mutilated Jamaica Dollar notes, the redemption of coins, the purchase of foreign currencies and the sale of souvenir coins.
Corporate & Administrative Review
11. Banking Services and Currency Operations

Annual Report 2008
- ��� -
��.�. Currency Operations��.�.�. Currency in CirculationBanknotes and coins in circulation as at 31 December 2008 were valued at $49.6 billion, reflecting an increase of 3.8 per cent, relative to end-2007. Of this amount, $47.2 billion or 95.1 per cent were banknotes, relative to $45.5 billion or 95.3 per cent at end-2007 (see Table 80). The $1 000 note accounted for 72.9 per cent of total currency in circulation, in comparison to 71.5 per cent at the end of the previous year. The $500 denomination accounted for 15.5 per cent, relative to 15.8 per cent at end-2007.
Table 80
BANKNOTES IN CIRCULATION
(Billions of Dollars)As at �� December
Denomination �00� �008 % Change
$1000 34.1 36.2 6.2
$ 500 8.2 7.7 -6.1 $ 100 2.4 2.5 4.2 $ 50 0.6 0.6 0.0 Others 0.2 0.2 0.0
TOTAL ��.� ��.� �.�
Coins in circulation were valued at $2.4 billion, reflecting an increase of 9.2 per cent, relative to the previous year. The $20 denomination reflected the highest circulation value of $949.0 million or 39.1 per cent of the total value of coins in circulation. The $10, $5 and $1 denominations were also significant circulatory coins, accounting for 21.4 per cent, 15.3 per cent and 18.8 per cent, respectively, of the circulation value.
Banking Services and Currency Operations

Bank of Jamaica
- ��8 -
Currency IssuedDuring 2008, the Bank issued 346.7 million pieces of banknotes valued at $191.8 billion. This value reflected an increase of 20.9 per cent, relative to the $158.7 billion issued during the preceding year. The $1 000 and $500 denominations accounted for 70.5 per cent and 24.1 per cent, respectively, of the value of notes issued in 2008.
Coins issued for the year in review reflected a 14.3 per cent decline to $487.8 million, relative to the value in 2007. The $20 coin accounted for 50.9 per cent of the value issued, followed by the $10 coin with 26.8 per cent. The demand for the $5 coin declined by 21.3 per cent while that for the $10 and the $0.10 decreased by 16.0 per cent and 12.7 per cent, respectively, relative to 2007.
Currency Redeemed A total of 343.5 million pieces of banknotes valued at $190.2 billion was redeemed during 2008. This represented a decline of 23.5 per cent, relative to the value of banknotes redeemed in 2007. The redemption of $1 000, $500 and $100 notes increased by 31.4 per cent, 9.4 per cent and 3.8 per cent, respectively. However, the redemption of $50 notes declined by 0.9 per cent, relative to 2007.
Coins redeemed increased by 5.6 per cent in value to $283.4 million. Redemption increased for all denomination of coins except the $1 coin which experienced a 7.4 per cent decline relative to 2007, as retailers and consumers retained more of this denomination for transaction purposes. The $20 coin dominated redemptions and accounted for 55.6 per cent of value, followed by the $10 and $5 coins which accounted for 29.3 per cent and 12.4 per cent, respectively.
Banknotes SortedA total of 302.6 million pieces of banknotes valued at $187.3 billion was sorted during 2008, of which 153.9 million pieces or 50.9 per cent were deemed fit for reissue to the public. The $100 denomination accounted for 39.7 per cent of banknotes destroyed while the $1,000 and $500 notes were 31.2 per cent and 28.7 per cent, respectively, of the total. The $100 banknote continued to be the most highly used denomination.
Counterfeit DetectionIn 2008, the value of counterfeit notes detected amounted to $4.3 million, relative to $4.0 million in 2007. Similar to previous years, most of these notes (65.6 per cent) were detected by commercial banks at their counters, with the balance (34. 4 per cent) detected by the Bank in lodgements received from financial institutions. Notably, the number of counterfeit notes detected for 2008 declined by 6.9 per cent to 5 349 pieces, reflecting an increase in the detection of higher value counterfeit notes.
The $1 000 note accounted for 90.0 per cent of the value of counterfeit notes detected in 2008 as this denomination continued to be the main target of counterfeiters. The $500 and $100 notes accounted for 8.0 per cent and 2.0 per cent of the value of counterfeit notes detected, respectively, during the review year.
The counterfeit $1,000 notes detected represented a ratio of 3.7 pieces per million genuine $1,000 notes in circulation while $500 and $100 represented 2.7 and 1.4 pieces per million, respectively. These ratios were relatively low, compared to the experiences of other countries.
Banking Services and Currency Operations

- ��9 -
��.�. Introduction
During 2008, several milestones were achieved in relation to the Payments System Reform agenda, the most significant of which
was the delivery of both the RTGS and the CSD to the Bank by the developers in September 2008. The Bank was also able to train and certify all participants in the use of both systems by end-2008. Other significant milestones included the drafting of the rules and procedures that will guide the systems.
The payments system oversight was focussed on continuously monitoring the activities of the Systemically Important Payment Systems (SIPS) in accordance with international standards. Examination of the payments system data confirmed that several issues, including the implementation of the RTGS and CSD, were prerequisites for the completion of the first phase of the reform agenda.
Reform of the National Payments SystemEfficient systems and procedures for the clearing and settlement of payments and securities are crucial to the overall stability of the financial system. Accordingly, the Bank, as part of its mandate to implement a safe and efficient payments system continued its focus on completing the first phase (phase 1) of the Payments System Reform Programme.
Phase � focuses on the implementation of the payments and settlement infrastructure. This includes:
• an RTGS system as well as related
applications and linkages; • the establishment of an electronic CSD
for Government of Jamaica and Bank of Jamaica (domestic) securities;
• the establishment of an appropriate legal and regulatory framework for the payments system; and
• enhancement of the oversight function for payments and securities settlement systems.
Following the completion of the solution procurement phase in February 2008, work continued on the establishment of the legal framework and the payments system oversight function (PSOF). Of significance was the delivery of the systems in September 2008. The systems were subsequently integrated, tested, and made available to all participants on 24 November 2008. Training and certification of all participants (38 institutions) in the use of both systems were completed by end-2008, with user acceptance testing and full implementation scheduled for completion in the first quarter of 2009.
A draft bill on the new Payments System Legislation was received from the Chief Parliamentary Counsel (CPC) for review by the Bank. Based on the afore-mentioned developments, the Bank drafted memoranda of understanding which will be used until the laws have been passed or amended.
Oversight of the Payments System During 2008, the Bank’s principal oversight responsibility was carried out through continuous
12. Payments System Developments
Bank of Jamaica
- ��0 -
monitoring of the activities of SIPS according to international standards. The two designated SIPS are:
• the Customer Inquiry Funds Transfer System (CIFTS) - the Central Bank owned and operated large value system which will be replaced by the RTGS system; and
• the Automated Clearing House (ACH) which is owned and operated by the commercial banks to facilitate the electronic clearing of cheques and the electronic transfer of funds.
Emphasis was placed on the assessment of systems usage and utilization to inform policy decisions that will impact the establishment and functioning of the new RTGS. The scope of the oversight function included the periodic review of System Wide Important Payment Systems (SWIPS) or retail payments systems, the clearing and settlement of selected foreign currency items and analysis of payments data from commercial banks.
In keeping with the reform objective of reducing or eliminating risks in the payments system, it is necessary to ensure that the ACH operates as a retail payment system, processing low value transactions. Accordingly, a threshold for the ACH was agreed for implementation which will lead to the removal of 80.0 per cent of the value of the transactions passing through the ACH, while at the same time only reducing transactions volume by 2.5 per cent. The proposed value threshold for ACH transactions is one million Jamaica Dollars ($1mn). Hence, the value of transactions equal to or greater than this amount will be subject to alternative settlement arrangements agreed upon with the participating banks. In addition, plans that will result in the development of new
products/payment instruments to facilitate same day settlement of large value transactions have been initiated.
Systemically Important Payment System (SIPS) Transactions valued at $5.7 trillion were processed over SIPS in 2008, an 11.8 per cent increase over the value for 2007. CIFTS transactions accounted for $2.9 trillion ($2.6 trillion: 2007). ACH transactions accounted for $2.8 trillion in 2008, relative to $2.5 trillion in 2007.
The volume of interbank transfers processed through CIFTS in 2008 declined marginally by 0.4 per cent. A total of 25 626 transactions valued at $2.9 trillion were processed in 2008, yielding an average transaction value of $113.2 million, the highest value recorded for the previous five years (see Chart ��). The growth in value of settlements and transfers through CIFTS underscored the current emphasis placed on payments and settlement system reform which will mitigate risk to the stability of the financial system.
Payments System Development

Annual Report 2008
- ��� -
Chart ��
number of large value cheques processed in the ACH exacerbates systemic risk and further underscores the need for payments system reform, hence the recommendation to impose a threshold on the ACH. Proprietary or ‘On us” Cheques For the reporting year, the total number of proprietary cheques processed in commercial banks was 12.9 million valued at $2.8 trillion compared to the 12.4 million valued at $2.4 trillion in 2007. This represented an increase in volume and value of 4.0 per cent and 16.7 per cent, respectively. During 2008, the average proprietary cheque value increased to $217 000 from $192 059, surpassing the average value of cheques processed in the ACH, pointing to the need for same day value for cheque payments (see Chart ��).
During 2008 cheques accounted for the majority of non-cash payments, with the ACH being the major cheque-processing system. Total cheque payments comprising ACH and proprietary transactions increased by 12.2 per cent to $5.5 trillion, relative to $4.9 trillion in 2007.
For the ACH, 10.2 million cheques with a value of $2.7 trillion were processed in 2008. This represented a marginal decrease (approximately 1.9 per cent in volume) and an 8.0 per cent increase in value when compared to 10.4 million with a value of $2.5 trillion processed in 2007. The average cheque value in the ACH increased to $263 053 in 2008 from $240 000 in 2007, a 9.6 per cent growth. The increasing
Chart ��
Payments System Developments

Bank of Jamaica
- ��� -
In 2008, there was a significant increase in both the volume and value of electronic payments (debits and credits) in the ACH. The total number of electronic payments routed through the ACH was 711 492 (300 994 in 2007) valued at approximately $97.1 billion ($52.2 billion in 2007) representing a 136.4 per cent increase in volume and an 86.0 per cent increase in value. These increases were primarily due to the continued shift from paper to electronic payments by corporate entities for payment of salaries and benefits as well as insurance premiums.
Retail Payments Systems (Excluding ACH)The review of retail payment systems continued to focus on access and utilization, measured in terms of the number of debit and credit cards in circulation and the volume and value of debit and credit card transactions processed through ABM and POS terminals (see Table 8�). 55,56
55 Debit card transactions are processed by MultiLink.56 Retail payments system development is scheduled in a later
phase of the Reform process. This is necessary for ease of system monitoring and designation.
Table 8�ELECTRONIC CARD USAGE
�00� & �008 �00� �008 Debit Cards Credit Cards Debit Cards Credit CardsNo. of Cards in Circulation 1 389 860 175 876 1 534 553 190 432
Value of Transactions (J$ bn) 162 55 201 71
Volume of Transactions (mn) 38 7 45 9
At the end of 2008, there were approximately 1.5 million debit cards in circulation, an increase of 10.4 per cent over 2007. The total number of credit cards in circulation was 190 432 or 8.3 per cent more than in 2007. The use of debit cards by value increased by 24.1 per cent to $201.0 billion whereas volume increased by 18.4 per cent to 45.0 million. The value of credit card transactions grew by 29.0 per cent, a deceleration when compared with the growth rate of 16.0 per cent for 2007. Volume usage increased by 2.0 million, or by 29.0 per cent increase over 2007.
Payments System Development

Annual Report 2008
- ��� -
Chart �8
At end-2008, there were 12 468 POS terminals and 405 ABM terminals, an overall growth of 10.1 per cent in the number of terminals, relative to the previous year. The total value of ABM and POS transactions for 2008 was $300.0 billion, representing a 37.6 per cent growth, relative to 2007. Total volume processed
grew by 21.7 per cent to 56.0 million, relative to 2007. During the review average values of both POS and ABM transactions increased by 19.6 per cent to $5 381.00 (see Chart �9).
Chart �9
Payments System Developments

Bank of Jamaica
- ��� -
Clearing of Selected Foreign Currency ItemsThe Bank continued to provide manual clearing services for foreign currency items issued by or drawn on local commercial banks during 2008. This clearing and settlement arrangement continued to facilitate a more orderly exchange and faster settlement due to the significant reduction in the ‘hold’ period for these items. Eligible items were denominated in four currencies: US dollars, Canadian dollars, Great Britain Pounds and Euros.
In 2008, the foreign currency items cleared locally were valued at approximately US$ 4.4 billion, a 7.3 per cent increase over the US$4.1 billion exchanged in 2007. The increase reflected growth in US dollar items only. These items continued to dominate foreign currency clearing, accounting for over 98.0 per cent of foreign currency items cleared locally during the year.
Table 8� FOREIGN CURRENCY ITEMS CLEARED
(VALUE)Currency Units �00� �00� �00� �008 (USD Millions) USD 2 770 3 679 3 982 4 271 CDN 20.79 24.71 29.20 23.99 GBP 53.13 71.33 112.50 73.14
Euro 5.46 6.51 11.80 8.14
Payments System Development

- ��� -
Pending Amendments To Financial Legislation
Payments and Settlement System Legislation
The Bank of Jamaica in conjunction with the Jamaica Bankers Association (JBA) is spearheading the introduction of legislation
to deal with the regulation of the payments and settlement system of Jamaica. This legislation will formally establish the legal framework for the oversight of the payment and settlement systems and will address matters such as: -
(i) the finality of payments; (ii) the effect of insolvency on payments
already in the system and(iii) upgrading of the settlement infrastructure
by, inter alia, allowing for real-time gross settlement.
In 2007, drafting instructions were issued to the Chief Parliamentary Counsel through the Ministry of Finance and the Public Service (formerly the Ministry of Finance and Planning). The draft Bill was issued from the office of the Chief Parliamentary Counsel in 2008 and is currently being reviewed by the Bank of Jamaica.
Passage of this Legislation will be the first step in ensuring that Jamaica’s payment and settlement system operates in accordance with the Bank for International Settlements (BIS) Core Principles for SIPS. These Core Principles are the standards for payment systems used by international agencies such as the World Bank and the International Monetary Fund (IMF) to assess the safety and soundness of
payment systems generally.
The Cooperative Societies (Amendment) Bill
This Bill will seek to restrict the deposit-taking activities of cooperative societies to those cooperative societies which operate as credit unions. Secondly, it will seek to bring credit unions under the regulatory ambit of the Minister of Finance and the Bank of Jamaica. Other substantive enhancements to the Cooperative Societies Act are being contemplated by the Ministry of Industry, Investment & Commerce, which is the Ministry with portfolio responsibility for cooperative societies. The cabinet submission by this Ministry which will inform the drafting instructions to the Chief Parliamentary Counsel, was approved.
Omnibus Statute
During 2008, the Bank continued the process of reviewing legislation governing the operations of deposit-taking entities i.e. the Banking Act, Financial Institutions Act and the Bank of Jamaica (Building Societies Act) with a view to consolidating these pieces of legislation into one statute. In so doing, it is intended that any existing inconsistencies between these statutes will be removed, thereby ensuring a more synchronized progression of updates to the laws governing the deposit-taking industry. This initiative is also intended to implement enhancements that will bring the regulation of the banking sector in line with the issued Revised Basel Core Principles as well as to ensure that the relative provisions in relation to consolidated and conglomerate supervision are
13. Financial Legislation

Bank of Jamaica
- ��� -
appropriately robust. The Basel Core Principles II, are the global standards for prudential regulation and supervision of banking systems. Revisions to the financial legislation will also focus on current issues such as outsourcing, as well as the proposed role of credit bureaux, provisions for electronic reporting and enhancing powers as regards the investigation and prosecution of illegal deposit-taking activities. The Bank is finalizing a working paper on the matter which will inform the subsequent submission to Cabinet, to commence the legislative process.
Pending Financial Regulations
The Banking (Form of Application) Regulations
The Financial Institutions (Form of Application) Regulations
These regulations will comprise the prescribed application form under the respective Acts. The earlier format of licence fees regulations under the Banking Act and the Financial Institutions Act that dealt with both licences fees and the prescribed form of application was not retained. The Bank was of the view that the matter of the prescribed application form should be addressed via separate regulations so that the periodic upgrading of this form would not disrupt the licence fees aspect of the regulatory regime. These regulations will also include enhancements to the application form in order to capture certain basic particulars from applicants that were not captured under the old forms. The enhancements are expected to bring the regulations in line with the revised Core Principles.
The revised form will also require the principals signing on behalf of the applicant company to certify
that the information given in the form is accurate to the best of their knowledge and belief. Similar reforms to the application form under the Building Societies Act will be subsequently effected.
The Building Societies (Licence Fees) Regulations
These regulations will be revised to bring the fees payable in line with the applicable fees under the 2003 Licence Fees Regulations under the Banking Act and the Financial Institutions Act (see Supervision of Deposit-Taking Financial Institutions).
The Banking (Qualification of Auditors) Regulations
These regulations will create a framework for ensuring that auditors who are proposed as the statutory auditors of financial institutions, are independent of the financial institutions being audited (see Supervision of Deposit-Taking Financial Institutions).
The Banking (Credit Classification and
Provisioning) Regulations
These regulations will formally impose the measures that banks are required to take in assessing credit- taking security and making provisions for the possibility of default (see Supervision of Deposit-Taking Financial Institutions).
The Bank of Jamaica (Credit Union) Regulations
These regulations will bring the operations of credit unions fully under the BOJ’s prudential supervisory
Financial Legislation

Annual Report 2008
- ��� -
regime. They will therefore, among other things, cover licensing, capital, reserves, prohibited business, remedial and intervention processes and the role of credit union associations (see Supervision of Deposit-Taking Financial Institutions).
Pending Non-Financial Legislative Amendments
The Bank of Jamaica has been involved in the process of formulating certain items of non-financial legislation.
(i) The Credit Reporting Bill
Due to the impact this Act will have on regulated financial services, particularly as regards the provision of credit, the Bank of Jamaica was asked by the Ministry of Finance and the Public Service (formerly the Ministry of Finance and Planning) to provide its comments on the provisions to be included in this Act. The Bank’s comments were provided to the Ministry and have been incorporated in the proposed Bill. On passage, this statute will legislatively establish a credit reporting system which is designed to improve credit assessment processes as well as to facilitate enhanced risk management and loan pricing strategies throughout the financial sector. A licensing system will be imposed on persons who intend to offer credit reporting services. Prescribed reporting processes have been outlined to ensure the objective and standardized reporting of credit information under this regime. Persons offering credit reporting services will be subject to regulation. This
Bill was tabled in Parliament in July 2008.
(ii) The Financial Investigations Division Act (FIDA)
This Bill was tabled in Parliament on 12 November 2008. The passage of this Act will satisfy Jamaica’s obligation to comply with recommendation 26 of the (FATF) 40 (revised) recommendations which states that: -
“Countries should establish a Financial Intelligence Unit that serves as a national center for the receiving, analysis…and dissemination of suspicious transaction reports and other financial information regarding money laundering or terrorist financing”.
Allied to this recommendation is the FATF advisory that the Unit, when established, should consider applying for membership in the Egmont Group57.
(iii) Terrorism Prevention (Reporting Entities) Regulations
These Regulations will be promulgated under the Terrorism Prevention Act and will
57 “The Egmont Group is an informal group of financial intelligence units (FIUs) established in 1995. The group was so named for the location of the first meeting at the Egmont-Arenberg Palace in Brussels. The goal of this group is to provide a forum for FIUs to improve support to their respective national anti-money laundering programmes. This support includes expanding and systemizing the exchange of financial intelligence information, improving expertise and capabilities of personnel of such organizations, and fostering better communication among FIUs through application of technology.” Source: Information Paper on FIUs and the Egmont Group – (See the FATF web site at WWW.fatf-gafi-org or see www1.oecd.org/fatf/ctry-orgpages/org-egmont_.htm
Financial Legislation
Bank of Jamaica
- ��8 -
outline the operational controls that must be maintained by financial institutions, particularly when contemplating the commencement of a business relationship or one-off transaction. As such, these regulations will therefore largely mirror the Know Your Customer (KYC) obligations contained in the regulations under the Money Laundering Act. Accordingly, financial institutions will be required to establish and maintain appropriate procedures in relation to identification, record-keeping (minimum of 5 years retention period) internal controls, communication and training of employees. These Regulations will also prescribe the requisite Declaration Forms for transactions which the reporting entity knows or suspects is one that constitutes a terrorism offence; and for the quarterly reports as to whether or not the reporting entity is holding property in respect of a person who is on the United Nations list of designated terrorists or in respect of a person who has links with terrorists or terrorist groups or organizations.
Financial Legislation

- ��9 -
Overview
In 2008, the Bank’s management strengthened its administrative operations in order to ensure greater operational effectiveness. The following
initiatives were implemented: • a review of the Bank’s recruitment system
and development of a succession planning framework;
• improved education of members of staff and pensioners on health and lifestyle issues; and
• a more robust maintenance and energy management programme.
Staffing and Industrial RelationsAt the end of 2008, the Bank’s staff complement totalled 576 employees, an increase of 4.5 per cent, relative to 2007. The complement comprised 483 permanent, 21 contract and 72 project staff. There were 1 638 applications for employment during the year, a 36.4 per cent increase over 2007 applications. The largest number of applications was for positions within the accounting, auditing and financial institutions supervision areas. Thirty persons were hired to the permanent staff and 14 on a contractual basis. Of the total number of newly employed persons, 12 had post graduate and professional qualifications, 11 undergraduate degrees, while 7 had a combination of other tertiary and secondary school qualifications. The staff turnover rate for 2008 was 5.7 per cent, reflecting a percentage point reduction, relative to 2007.
During the year, the two-year Management/Labour Contract between the Bank’s Management and all
categories of staff expired. Following discussions between all relevant parties, including the Ministry of Finance and the Public Service, a salary and benefits contract, in accordance with the third Memorandum of Understanding (MOU3) between the Government and the Public Sector, was signed and subsequently implemented. The agreement provides for salary and benefits adjustments of 15.0 per cent and 7.0 per cent on 1 April 2008 and on 1 April 2009, respectively.
During the first quarter of 2009, the Bank will launch its electronic recruitment system. The system, which was developed jointly by the Human Resource Administration and the Information Systems Departments, will allow applications for employment to be done on-line, thereby increasing the efficiency of the Bank’s recruitment and job selection processes.
Training and DevelopmentUnder the theme “Building Organizational Capacity through Training and Development”, the Bank’s Training Institute provided training interventions for 438 members of staff and overseas participants in 2008. The Bank’s Training Institute provided training for a total of 135 training programmes during the year. Training interventions were designed primarily to build the managerial and technical competencies of the Bank’s staff while providing on-going education on health and lifestyle issues. Four hundred and two persons attended local in-house training programmes and 95 other local programmes. Forty members of staff also participated in 32 specialized overseas courses, seminars and attachments sponsored or hosted by the International Monetary Fund, the
14. Administration

Bank of Jamaica
- ��0 -
World Bank, the Centre for Latin American Monetary Studies, the Federal Reserve Board and the Swiss National Bank.
In the review year, the Bank partnered with the Financial Stability Institute (FSI) of the Bank for International Settlements (BIS) and the Caribbean Group of Bank Supervisors (CGBS) to host an In-Country Training Programme on “Operational Risk”. Participants for this workshop were drawn from regional central banks and/or monetary authorities. In addition, the Bank, in collaboration with the MIS Training Institute, U.S.A., hosted a special in-country three-day seminar on “How to Conduct an Internal Fraud Investigation”. Participants included functionaries in the local financial sector.
Of particular significance, during the year, the Bank facilitated e-learning interventions with a number of organizations including the BIS, Thompson Reuters and Foreword Financial Group. A programme of note was “The Launch of the World Bank Commission on Growth and Development Report” which was transmitted by video conference technology to participants from the Bank and other Public Sector Entities.
At the end of the year, the Training Institute concluded arrangements with the Human Employment and Resource Training Trust/National Training Agency (HEART Trust/NTA) for the implementation of the first phase of a programme to upgrade and certify the skills and competencies of the Bank’s electrical, electronic and mechanical technicians. The programme aimed at ensuring that these occupational groups within the Bank are trained and certified at international standards.
Pension AdministrationInitiatives which commenced in 2007 to streamline the administration of pension functions and benefits were consolidated in 2008. The establishment of a Pension Administration Department within the Division strengthened the Bank’s delivery of pension services and met legislative requirements associated with amendments to the Income Tax Act passed by the Parliament in March 2008. These statutory requirements have been submitted to the Financial Services Commission (FSC) in compliance with its registration and licensing regime.
During the year, the Department conducted several pensioners’ outreach programmes including the Annual Health and Lifestyle Seminar and monthly visits to pensioners. Notably, the Department significantly increased the flow of information to members of the pension scheme, particularly, information on provisions of the Rules and Trust Deeds, as well as pension benefits to active and deferred members through the publication of a quarterly Pensions Bulletin. This was further supported by information disseminated via the Bank’s intranet.
In May 2008, the Bank’s pensioners launched the Bank of Jamaica Pensioners’ Association. The Association comprises both active and deferred pensioners. The aim of the Association is to promote programmes and activities towards enhancing the wellbeing of members.
Plant and Physical InfrastructureIn 2008, the Bank strengthened its programme of training and staff sensitization on the importance of maintaining a healthy and safe environment. The programme of education included exhibition,
Administration

Annual Report 2008
- ��� -
information bulletins and classroom training.
This exercise was supported by an aggressive maintenance schedule for the Bank’s main plant and external properties. An important element of the maintenance schedule was the intensification of the Bank’s energy management and conservation programmes during the year. Measures were implemented to reduce energy consumption while educating members of staff on the imperatives of energy conservation, given emerging global trends with respect to energy costs and the availability of fossil fuel. In 2009, the Bank will expand the programme to utilize renewable energy by installing photovoltaic energy equipment at 2 external properties as their primary source of energy.
During the year, the Bank also continued its Capital Development Programme. This entailed the renovation of offices to accommodate new staff, the procurement of a standby generator to meet the Bank’s electricity needs as well as to assist in the Bank’s energy conservation’ programme, and finalize arrangement for the acquisition and installation of a fenestration system to protect vulnerable areas of the Bank from hurricanes.
Disaster management training and preparedness remained a priority for the Bank throughout 2008. During the period, the Bank commenced implementation of recommendations from a vulnerability assessment study conducted in 2007 by the Office of Disaster Preparedness and Emergency Management. The programme of preparedness was underpinned by the participation of the Bank’s Emergency Management Team in evacuation simulations and fire drills. This was aimed at ensuring
that security officers, floor wardens and essential staff are equipped with the knowledge and skills that are required in the event of a natural disaster.
Administration

- ��� -
$ $
Salary Range of Executive Management 7 669 055.00 - 14 813 609.69
Allowances of Executive management
(a) Governor 2 551 500.00
(b) Deputy Governors 604 726.11
Notes Executive Management includes the Governor, the Senior Deputy Governor, four (4) Deputy Governors, and a General Manager. In the case of the Governor, a maintained residence and an official car are provided, as is customary for Governors of the Bank of Jamaica. The Deputy Governors and General Manager are provided with fully maintained motor vehicles. Each member of the Executive Management is eligible for benefits including a non-contributory pension plan, health insurance, life insurance and staff loans.
15. Compensation of Senior Executive
Management

- ��� -
09/01/08 The Bank of Jamaica implemented the following changes to interest rates payable on OMO
instruments:
Tenor �0 days �0 days 90 days ��0 days �80 daysPrevious Rates (%) 11.65 11.70 11.80 11.85 12.00
New Rates (%) ��.�� ��.�0 ��.80 ��.8� ��.00
The realignment of rates placed the Bank in a better position to manage the Jamaica Dollar
liquidity that emanated from the maturity of both Bank of Jamaica and Government of Jamaica instruments as well as the reflow of currency issued for the Christmas season. The revised rate structure offered investors a range of options that more closely reflected the then existing money market rates.
16//01/08 Bank of Jamaica offered a 365-day CD in addition to its regular suite of instruments. This
offer attracted a rate of 13.50 per cent per annum, which was consistent with the Bank’s then existing interest rate structure. The rates on 30-day to 180-day instruments remained unchanged.
18/01/08 Bank of Jamaica offered a special 18-month variable rate CD to banks and primary dealers. The CD attracted a rate of 12.80 per cent for the first 3 months. Thereafter, quarterly interest payments were made at the 90-day weighted average Treasury Bill rate applicable at the beginning of each interest period plus a margin of 1.5 percentage points. The rates applicable to all other BOJ instruments remained unchanged.
04/02/08 Interest rates paid on OMO instruments issued by the Bank of Jamaica were revised as follows:
Tenor �0 days �0 days 90 days ��0 days �80 days ��� daysPrevious rate (%) 12.65 12.70 12.80 12.85 13.00 13.50New rates (%) ��.�0 ��.�0 ��.90 ��.00 ��.�0 ��.00
The revisions reflected concerns about the rising trend in inflation and its impact on the attractiveness of Jamaica Dollar investments.
16. Calendar of Monetary Policy Developments

Bank of Jamaica
- ��� -
26/06/08 Interest rates paid on Bank of Jamaica OMO instruments were adjusted as follows:
Tenor �0 days �0 days 90 days ��0 days �80 days ��� days
Previous rates (%) 13.50 13.70 13.90 14.00 14.20 15.00
New rates (%) ��.00 ��.�0 ��.�0 ��.�0 ��.�0 ��.�0
The adjustments to the rates were aimed at guiding domestic inflation towards a range of 12 – 15 per cent by March 2009, based on current projections for commodity prices.
01/09/08 Bank of Jamaica offered a special 18-month, variable rate CD to banks and primary dealers. The CD attracted a rate of 14.58 per cent for the first 3 months. Thereafter, quarterly interest payments at the 90-day weighted average Treasury Bill rate applicable at the beginning of each interest period plus a margin of 1.25 percentage points applied. The rates applicable to all other BOJ instruments remained unchanged.
15/10/08 As a direct consequence of the current global financial turmoil, and in order to preserve overall financial stability, the Bank of Jamaica offered a temporary lending facility to domestic financial institutions. The facility was strictly intended to provide liquidity to these institutions for overseas margin and repo payments on GOJ global bonds during the then existing period of dysfunctional money markets. The specific objectives of the temporary lending facility were intended to:-
• alleviate any short-term US dollar liquidity needs of domestic financial institutions;• ensure the stability of GOJ global bond prices; and• minimize pressures in the domestic foreign exchange market.
17/10/08 Interest rates payable on Bank of Jamaica OMO instruments adjusted as follows:
Tenor �0 days �0 days 90 days ��0 days �80 days ��� daysPrevious rates (%) 14.00 14.20 14.40 14.50 14.70 15.50
New rates (%) ��.�� ��.8� ��.0� ��.�� ��.�� ��.�0
The adjustment brought rates offered by the Central Bank in line with yields applicable to Government of Jamaica Treasury Bills and other short-dated market instruments.
Calendar of Monetary Policy Developments

Annual Report 2008
- ��� -
18/11/08 In an effort to remove liquidity overhang arising from the maturity of both BOJ and GOJ securities, and preserve order in financial markets, the Bank of Jamaica implemented the following measures:
• The Bank offered a Special CD to primary dealers and commercial banks. This CD which was on offer from 18 November to 19 November 2008, matured on 3 December 2008. Interest payable on this instrument was 20.50% per annum.
The Bank of Jamaica’s regular menu of CDs ranging from 30 days to 365 days remained unaltered.
• Effective 3 December, 2008, on the expiration of a 15-day notice period, the cash reserve requirement of commercial banks, merchant banks and building societies was increased by 2 percentage points to 11 per cent of prescribed Jamaica Dollar liabilities. As a consequence, the liquid assets requirement rose to 25 per cent from 23 per cent. The Bank also announced that it intended to increase those requirements by a further 3 percentage points.
These monetary policy actions were intended to support the achievement of the inflation objective and the maintenance of macro-economic stability.
01/12/08 Interest rates payable on Bank of Jamaica OMO instruments were adjusted as follows:
Tenor �0 days �0 days 90 days ��0 days �80 days ��� daysPrevious rates (%) 14.65 14.85 15.05 15.15 15.35 16.70
New rates (%) ��.00 ��.�0 �0.00 �0.�0 ��.�0 ��.00
The increase in interest rates occurred in the context of instability in the foreign exchange market, which was related to the sharp rise in the yields on Government of Jamaica (GOJ) global bonds and US dollar bonds issued by Jamaican companies. The resulting spike in demand for foreign exchange by securities dealers to meet margin calls from overseas creditors, together with incremental demand for foreign exchange by a wider cross-section of persons triggered a disorderly depreciation in the exchange rate. If this condition was allowed to persist, it would have precipitated higher inflation and greater macroeconomic instability.
Calendar of Monetary Policy Developments

Bank of Jamaica
- ��� -
In context of the foregoing, the Jamaica Dollar liquidity resulting from the maturity of significant sums in BOJ securities over the following three weeks made it necessary for BOJ to take that action. Accordingly, the rise in interest rates was expected to dampen the extraordinary demand related to portfolio decisions and thereby restore predictability and order to local financial markets.
Calendar of Monetary Policy Developments

- i -
INDEPENDENT AUDITORS’ REPORT
TO BANK OF JAMAICA
Report on the Financial Statements
Pursuant to Section 43(1) of the Bank of Jamaica Act, we have audited the accompanying financial statements of the Bank of Jamaica (the Bank), set out on pages iii to xliv, which comprise the balance sheet as at December 31, 2008, the statements of income, changes in capital and reserves and cash flows for the year then ended, and a summary of significant accounting policies and other explanatory notes.
Management’s Responsibility for the Financial StatementsManagement is responsible for the preparation and fair presentation of the financial statements in accordance with International Financial Reporting Standards and the Bank of Jamaica Act. This responsibility includes designing, implementing and maintaining internal controls relevant to the preparation and fair presentation of financial statements that are free from material misstatements, whether due to fraud or error, selecting and consistently applying appropriate accounting policies; and making accounting estimates that are reasonable in the circumstances.
Auditors’ ResponsibilityOur responsibility is to express an opinion on the financial statements based on our audit. We conducted our audit in accordance with International Standards on Auditing. Those standards require that we comply with ethical requirements and plan and perform the audit to obtain reasonable assurance as to whether or not the financial statements are free from material misstatement.
An audit involves performing procedures to obtain audit evidence about the amounts and disclosures in the financial statements. The procedures selected depend on the auditors’ judgment, including the assessment of the risks of material misstatement of the financial statements, whether due to fraud or error. In making those risk assessments, the auditors consider internal controls relevant to the Bank’s preparation and fair presentation of the financial statements in order to design audit procedures that are appropriate in the circumstances, but not for the purpose of expressing an opinion on the effectiveness of the Bank’s internal control. An audit also includes evaluating the appropriateness of accounting policies used and the reasonableness of accounting estimates made by management, as well as evaluating the overall presentation of the financial statements. We believe that the audit evidence we have obtained is sufficient and appropriate to provide a basis for our audit opinion.
Auditors’ Report
KPMG KPMG Peat MarwickChartered Accountants
P.O. Box 76 The Victoria Mutual Building Telephone +1 (876) 922-6640 Kingston 6 Duke Street Telefax +1 (876) 922-7198 Jamaica Kingston +1 (876) 922-4500 Jamaica email:[email protected]
KPMG Peat Marwick, a Jamaican Partnership, Raphael E. Gordon Caryl A. Fenton Elizabeth A. Jones is a member of KPMG International, Patrick A. Chin Patricia 0. Dailey-Smith Linroy J. MarshalI a Swiss nonoperating association. R. Tarun Handa Cynthia I. Lawrence

Bank of Jamaica
- ii -
TO BANK OF JAMAICA
Report on the Financial Statements (cont’d)
OpinionIn our opinion, the financial statements give a true and fair view of the financial position of Bank as at December 31, 2008, and of its financial performance, changes in capital and reserves and cash flows for the year then ended in accordance with International Financial Reporting Standards, and comply with the provisions of the Bank of Jamaica Act.
We have obtained all the information and explanations which, to the best of our knowledge and belief, were necessary for the purposes of our audit. In our opinion, proper accounting records have been maintained and the financial statements are in agreement with the accounting records.
March 25, 2009
Final Accounts for Year Ended 31 December 2008

Annual Report 2008
- iii -
3
BANK OF JAMAICA
Balance Sheet December 31, 2008
Notes 2008 2007 J$'000 J$'000 ASSETS
Foreign assets Notes and coins 10,884 9,630 Cash and cash equivalents 3 30,344,066 32,663,201 Interest in funds managed by agents 10,679,421 8,864,814 Investments 4 102,486,457 92,693,695 International Monetary Fund - Holding of Special Drawing Rights 5,965 22,060 Bilateral accounts 78,870 -
Total foreign assets 143,605,663 134,253,400
Local assets Notes and coins 50,931 40,887 Loans and advances 5 19,834,196 - Investments 6 87,270,422 73,756,724 International Monetary Fund - Quota Subscription 7 3,598,145 3,223,061 Investment property 8 94,645 88,597 Investment in financial institution 9 - 3,200 Due from Government and Government Agencies 10 4,244,418 11,753,177 Property, plant and equipment 11 1,845,434 1,770,693 Intangible assets 12 149,394 127,200 Employee benefits 13 2,684,100 3,338,400 Other 14 3,297,891 3,043,996
Total local assets 123,069,576 97,145,935
Total assets 266,675,239 231,399,335
The accompanying notes form an integral part of the financial statements.
Final Accounts for Year Ended 31 December 2008

Bank of Jamaica
- iv -
4
BANK OF JAMAICA
Balance Sheet (cont’d) December 31, 2008
Notes 2008 2007 J$'000 J$'000
LIABILITIES, CAPITAL AND RESERVES
Liabilities Notes and coins in circulation 15 49,017,868 47,179,828 Deposits and other demand liabilities 16 70,354,680 56,506,439 Open market liabilities 17 127,979,788 113,930,120 International Monetary Fund - Allocation of Special Drawing Rights 18 4,694,987 4,205,563 Foreign liabilities 19 34,877 91,020 Employee benefits obligation 13 1,357,200 967,100 Other 20 8,129,948 2,675,321
Total liabilities 261,569,348 225,555,391
Capital and reserves Share capital 21 4,000 4,000 General reserve fund 22 20,000 20,000 Special stabilisation account 23 607,894 556,729 Other reserves 24 4,473,997 5,263,215
Total capital and reserves 5,105,891 5,843,944
Total liabilities, capital and reserves 266,675,239 231,399,335
The financial statements on pages 3 to 44 were approved for issue by the Board of Directors on March 25, 2009, and signed on its behalf by:
Governor Derick Milton Latibeaudiere
Deputy Governor Livingstone Morrison
Financial Controller Herbert A. Hylton
The accompanying notes form an integral part of the financial statements.
Final Accounts for Year Ended 31 December 2008
Annual Report 2008
- v -
5
BANK OF JAMAICA
Income Statement Year ended December 31, 2008
Notes 2008 2007 J$'000 J$'000 Operating income Interest 25 17,231,347 18,452,737 Foreign exchange gain, net 26 15,000,475 6,572,883 Other 61,337 617,922
Total operating income 32,293,159 25,643,542
Operating expenses Interest 27 21,671,038 19,372,769 Staff costs 28 1,831,605 1,505,924 Currency expenses 943,984 904,624 Property expenses, including depreciation 579,494 467,959 Other operating expenses 552,867 360,536
Total operating expenses 29 25,578,988 22,611,812
Operating profit 6,714,171 3,031,730
Other gains/(losses) Pension, medical and life insurance 13 ( 1,146,700) 391,900 Impairment provision, net 1,453 1,805 Gain on remeasurement of staff loans
and promissory note - ( 163) Gain on disposal of securities designated as available for sale 319,220 106,578 Gain on disposal of property, plant and equipment 15,478 8,483 Expenditure on behalf of Government of Jamaica not reimbursed 10 ( 121,937) ( 161,177)
Profit for the year 5,781,685 3,379,156
Transferred from/(to) pension equalisation reserve 24(c) 694,700 ( 630,800)
Transferred to general reserve fund 6,476,385 2,748,356
The accompanying notes form an integral part of the financial statements.
Final Accounts for Year Ended 31 December 2008

Bank of Jamaica
- vi -
6
BANK OF JAMAICA
Statement of Changes in Capital and Reserves Year ended December 31, 2008
General Special Share reserve stabilisation Other capital fund account reserves Total J$'000 J$'000 J$'000 J$'000 J$'000 (Note 21) (Note 22) (Note 23) (Note 24)
Balances at December 31, 2006 4,000 20,000 481,423 4,037,501 4,542,924
Profit for the year - 2,748,356 - - 2,748,356*'
Transfer of surplus on defined benefit pension scheme - - - 665,200 665,200*'
Change in fair value of available- for-sale securities - - - 560,514 560,514*'
Transfer from coins in circulation - - 75,306 - 75,306
Profit due to consolidatedfund (note 10) - (2,748,356) - - (2,748,356)
Balances at December 31, 2007 4,000 20,000 556,729 5,263,215 5,843,944
Profit for the year - 6,476,385 - - 6,476,385*'
Transfer of surplus on defined benefit pension scheme - - - ( 654,300) ( 654,300)*'
Change in fair value of available- for-sale securities - - - ( 134,918) ( 134,918)*'
Transfer from coins in circulation - - 51,165 - 51,165
Profit due to consolidatedfund (note 10) - (6,476,385) - - (6,476,385)
Balances at December 31, 2008 4,000 20,000 607,894 4,473,997 5,105,891
*' - Total recognised gains of J$5,687,167 (2007: gains of J$3,974,070,000). The accompanying notes form an integral part of the financial statements.
Final Accounts for Year Ended 31 December 2008

Annual Report 2008
- vii -
7
BANK OF JAMAICA
Statement of Cash Flows Year ended December 31, 2008
Note 2008 2007 J$'000 J$'000 Cash flows from operating activities: Profit for the year 5,781,685 3,379,156 Adjustments for: Depreciation – property, plant and equipments 11 209,485 188,188 Amortisation – intangible assets 37,193 39,766 Gain on disposal of property, plant and equipment ( 15,478) ( 8,483) Employee benefits, net 1,084,800 ( 452,400) Unrealised exchange gain (12,796,606) ( 3,713,940) Unrealised exchange loss on International Monetary Fund quota - - Subscription ( 375,084) ( 223,466) Unrealised exchange loss on International Monetary Fund - Allocation of SDR's 489,424 291,585 Interest income 25 (17,231,347) (18,452,737) Interest expense 27 21,671,038 19,372,769Operating profit before changes in other assets and other liabilities ( 1,144,890) 420,438
Interest received 20,456,424 19,081,965 Interest paid (16,133,776) (23,575,079) Other assets ( 624,567) ( 583,742) Other liabilities ( 82,635) ( 590,609) Due from Government and Government Agencies ( 1,916,369) ( 735,318)
Net cash provided/(used) by operating activities 554,187 ( 5,982,345)
Cash flows from investing activities: International Monetary Fund - Holding of Special Drawing Rights 16,095 ( 4,186) Interest in funds managed by agents ( 619,267) ( 581,652) Foreign currency denominated investments 1,638,137 57,183,766 Local currency denominated investments (14,509,237) 12,364,679 Loan and advances (19,834,196) - Addition to intangible asset ( 59,387) ( 40,817) Additions to property, plant and equipment 11 ( 299,617) ( 159,295) Additions to investment property ( 6,048) ( 764) Proceeds of disposal of property, plant and equipment 30,868 25,682
Net cash (used)/provided by investing activities (33,642,652) 68,787,413
Cash flows from financing activities: Notes and coins in circulation 1,889,205 4,973,124 Deposits and other demand liabilities 12,268,509 ( 6,444,091) Open market liabilities 14,049,668 (36,781,371) Foreign liabilities ( 68,739) ( 42,843)
Net cash provided/(used) by financing activities 28,138,643 (38,295,181)
Net (decrease)/increase in cash and cash equivalents ( 4,949,823) 24,509,887 Cash and cash equivalents at January 1 32,713,718 8,712,905 Effect of exchange rate fluctuation on cash held 2,641,986 ( 509,074)
Cash and cash equivalents at December 31 30,405,881 32,713,718
Final Accounts for Year Ended 31 December 2008

Bank of Jamaica
- viii -
8
BANK OF JAMAICA
Statement of Cash Flows (cont’d) Year ended December 31, 2008
Note 2008 2007 J$'000 J$'000
Cash and cash equivalents at December 31 comprise: Foreign notes and coins 10,884 9,630 Foreign cash and cash equivalents 3 30,344,066 32,663,201 Local notes and coins 50,931 40,887
30,405,881 32,713,718
The accompanying notes form an integral part of the financial statements.
Final Accounts for Year Ended 31 December 2008

Annual Report 2008
- ix -
9
BANK OF JAMAICA
Notes to the Financial Statements December 31, 2008
1. Identification
Bank of Jamaica (hereafter “the Bank”) was established under the Bank of Jamaica Act (hereafter “the Act”) amended on December 8, 2004. The Bank is domiciled in Jamaica and its registered office is located at Nethersole Place, Kingston.
The principal objects of the Bank, as set out in the Act, are to issue and redeem notes and coins; to keep and administer the external reserves of Jamaica; to influence the volume and conditions of supply of credit so as to promote the fullest expansion in production, trade and employment, consistent with the maintenance of monetary stability in Jamaica and the external value of the currency; to foster the development of money and capital markets in Jamaica; and to act as banker to the Government of Jamaica.
2. Statement of compliance, basis of preparation and significant accounting policies
(a) Statement of compliance:
The financial statements are prepared in accordance with the provisions of the Bank of Jamaica Act and International Financial Reporting Standards (IFRS) and their interpretations, adopted by the International Accounting Standards Board (IASB).
(b) Basis of preparation:
The financial statements are presented in Jamaica Dollars (J$) which is the Bank’s functional currency and are prepared on the historical cost basis, except for the inclusion of available-for-sale investments, investment property and certain classes of property, plant and equipment at fair value.
The accounting policies set out below have been applied consistently to all periods presented in these financial statements and comply in all material respects with IFRS.
The preparation of the financial statements in accordance with IFRS requires management to make judgements, estimates and assumptions that affect the application of policies and reported amounts of and disclosure relating to assets, liabilities, contingent assets and contingent liabilities at the balance sheet date and the income and expenses for the year then ended. Actual results may differ from these estimates.
Accounting estimates and judgements
Accounting estimates and judgements made by management in the application of IFRS that have significant effect on the financial statements and estimates with a significant risk of material adjustment in the next financial year are discussed below:
(a) Pension and other post-retirement benefits
The amounts recognised in the balance sheet and income statement for pension and other post-retirement benefits are determined actuarially using several assumptions. The primary assumptions used in determining the amounts recognised include expected long-term return on plan assets, the discount rate used to determine the present value of estimated future cash flows required to settle the pension and other post-retirement obligations and the expected rate of increase in medical costs for post-retirement medical benefits.
Final Accounts for Year Ended 31 December 2008

Bank of Jamaica
- x -
10
BANK OF JAMAICA
Notes to the Financial Statements (cont’d) December 31, 2008
2. Statement of compliance, basis of preparation and significant accounting policies (cont’d)
(b) Basis of preparation (cont’d):
Accounting estimates and judgements (cont’d)
(a) Pension and other post-retirement benefits (cont’d)
The expected return on plan assets is assumed after considering the long-term historical returns, asset allocation and future estimates of long-term investment returns. The discount rate is determined based on the estimate of yield on long-term government securities that have maturity dates approximating the terms of the company’s obligation. In the absence of such instruments in Jamaica, it has been necessary to estimate the rate by extrapolating from the longest-tenor security on the market. The estimate of expected rate of increase in medical costs is determined based on inflationary factors. Any changes in these assumptions will impact the amounts recorded in the financial statements for these obligations.
(b) Fair value of financial instruments
In the absence of quoted market prices, the fair value of a significant proportion of the Bank’s financial instruments was determined using a generally accepted alternative method. Considerable judgement is required in interpreting market data to arrive at estimates of fair values. Consequently, the estimates arrived at may be significantly different from the actual price of the instrument in an arm’s length transaction.
It is reasonably possible, based on existing knowledge, that outcomes within the next financial year that are different from these assumptions could require a material adjustment to the carrying amount reflected in the financial statements.
(c) Foreign currencies:
The rate of exchange of the Jamaica Dollar for the United States dollar is determined by the average of the weighted average rate at which the commercial banks trade in U.S. dollars and the rate at which the Bank itself buys US dollars. The rates of exchange for other currencies are derived from the US$ rate, thus determined, using rates published by the Federal Reserve Bank and the Financial Times.
Monetary assets and liabilities denominated in foreign currencies at the balance sheet date are translated at the foreign exchange rates prevailing at that date. Transactions in foreign currencies are translated at the foreign exchange rates ruling at the dates of those transactions.
Gains and losses arising on fluctuations in exchange rates are included in the income statement.
Final Accounts for Year Ended 31 December 2008

Annual Report 2008
- xi -
11
BANK OF JAMAICA
Notes to the Financial Statements (cont’d) December 31, 2008
2. Statement of compliance, basis of preparation and significant accounting policies (cont’d)
(d) Financial instruments:
(i) Classification of investments:
Management determines the classification of investments at the time of purchase and takes account of the purpose for which the investments were purchased. Investments are classified as loans and receivables and available-for-sale securities.
Loans and receivables are non-derivative financial assets acquired by the Bank with fixed or determinable payments and which are not quoted in an active market. An active market is one where quoted prices are readily and regularly available from an exchange, dealer, broker or other agency and those prices represent actual and regularly occurring market transactions on an arm’s length basis. Loans and receivables are recognised on the day they are acquired by the Bank.
Other financial instruments held by the Bank are classified as available-for-sale. Available-for-sale instruments are recognised on the date the Bank commits to purchase the instruments.
(ii) Measurement:
Financial instruments are measured initially at cost, including transaction costs.
Subsequent to initial recognition, all available-for-sale investments are measured at fair value, except that any instrument that does not have a quoted market price in an active market and whose fair value cannot be reliably determined, is stated at cost, including transaction costs, less impairment losses [note 2 (k)].
All non-derivative, non-trading financial liabilities and loans and receivables are measured at amortised cost, less impairment losses. Amortised cost is calculated on the effective interest rate method. Premiums and discounts, including initial transaction costs, are included in the carrying amount of the related instrument and amortised based on the effective interest rate of the instrument.
Based on the above guidelines, the Bank’s investments are classified and measured as follows:
[i] Loans and advances are classified as loans and receivables and are stated at cost (amortised cost), less provision for losses and impairment as appropriate.
[ii] Local currency denominated Government of Jamaica securities which do not have a quoted market price in an active market and whose fair values cannot be reliably determined, and interest-bearing deposits are stated at historical or amortised cost.
[iii] Local currency denominated Government of Jamaica securities with quoted prices in an active market are classified as available-for-sale and measured at fair value.
[iv] US Government bonds are classified as available-for-sale and are measured at fair value.
Final Accounts for Year Ended 31 December 2008

Bank of Jamaica
- xii -
12
BANK OF JAMAICA
Notes to the Financial Statements (cont’d) December 31, 2008
2. Statement of compliance, basis of preparation and significant accounting policies (cont’d)
(d) Financial instruments (cont’d):
(ii) Measurement (cont’d):
[v] Investments in financial institutions:
Investments in financial institutions are stated at cost less provision for losses. A provision for loss is made where, in the opinion of the directors, there has been a permanent impairment in the value of an investment. Consolidated financial statements are not prepared because the directors are of the view that, at this time, the cost is out of proportion to the benefit to be derived having regard to, inter alia, the nature of the activities of the investees. The amounts involved are not material to the Bank. During the year the subsidiary was liquidated (see note 9).
(iii) Fair value measurement principles:
The fair value of financial instruments classified as available-for-sale is based on their quoted market price at the balance sheet date without any deduction for transaction costs. Where a quoted market price is not available, the fair value of the instrument is estimated using discounted cash flow techniques or a generally accepted alternative method.
Where discounted cash flow techniques are used, estimated future cash flows are based on management’s best estimates and the discount rate is a market related rate at the balance sheet date for an instrument with similar terms and conditions.
(iv) Gains and losses on subsequent measurement:
Gains and losses arising from a change in the fair value of available-for-sale assets are recognised directly in equity, except for impairment losses and, in the case of monetary items such as debt securities, foreign exchange gains and losses. When the financial assets are sold, collected or otherwise disposed of, the cumulative gain or loss recognised in equity is recognised in the income statement.
(v) Cash and cash equivalents:
Cash and cash equivalents are shown at cost.
(vi) Other assets:
Other assets are stated at amortised cost, less impairment losses [note 2 (k)].
Final Accounts for Year Ended 31 December 2008

Annual Report 2008
- xiii -
13
BANK OF JAMAICA
Notes to the Financial Statements (cont’d) December 31, 2008
2. Statement of compliance, basis of preparation and significant accounting policies (cont’d)
(d) Financial instruments (cont’d):
(vii) Other liabilities:
Other liabilities, including provisions, are stated at amortised cost.
(viii) Provision:
A provision is recognised in the balance sheet when the Bank has a legal or constructive obligation as a result of a past event, it is probable that an outflow of economic benefits will be required to settle the obligation, and a reliable estimate of the amount can be made. If the effect is material, provisions are determined by discounting the expected future cash flows at a rate that reflects current market assessments of the time value of money and, where appropriate, the risks specific to the liability.
(ix) Derecognition:
A financial asset is derecognised when the Bank loses control over the contractual rights that comprise that asset. This occurs when the rights are realised, expire or are surrendered. A financial liability is derecognised when it is extinguished.
Available-for-sale assets that are sold are derecognised and corresponding receivables from the buyer for the payment are recognised as of the date the Bank commits to sell the assets.
Loans and receivables are derecognised on the day they are transferred by the Bank.
(e) Property, plant and equipment:
(i) Owned assets:
Items of property, plant and equipment are stated at cost less accumulated depreciation and impairment losses [note 2 (k)], except for freehold land and buildings which are stated at market value.
Cost includes expenditures that are directly attributable to the acquisition of the asset. The cost of self-constructed assets includes the cost of materials and direct labour and any other costs directly attributable to bringing the asset to a working condition for its intended use.
The cost of replacing part of an item of property, plant and equipment is recognised in the carrying amount of the item if it is probable that the future economic benefits embodied within the part will flow to the Bank and it can be measured reliably. The costs of the day-to-day servicing of property, plant and equipment are recognised in profit or loss as incurred.
The market value of freehold land and building is the estimated amount for which a property could be exchanged on the date of valuation between a willing buyer and a willing seller in an arms’ length transaction.
Final Accounts for Year Ended 31 December 2008

Bank of Jamaica
- xiv -
14
BANK OF JAMAICA
Notes to the Financial Statements (cont’d) December 31, 2008
2. Statement of compliance, basis of preparation and significant accounting policies (cont’d)
(e) Property, plant and equipment (cont’d):
(ii) Depreciation:
Property, plant and equipment are depreciated on the straight-line basis at annual rates estimated to write down the assets to their residual value over their estimated useful lives. Leasehold property is amortised in equal instalments over the shorter of the lease term and the property’s estimated useful life.
Land, works of art, statues and museum coins are not depreciated.
The estimated useful lives are as follows:
Buildings 10 – 20 years Leasehold property Shorter of lease term and useful life Furniture, plant and equipment 10 years Computer equipment 5 years Motor vehicles 5 years
The depreciation methods, useful lives and residual values are reassessed at the reporting date.
(f) Notes and coins in circulation:
The nominal value of numismatic coins sold is included in notes and coins in circulation. The net proceeds from such sales are included in the income statement.
Notes and coins in circulation is stated after a deduction of 25% of the value of coins in circulation in accordance with the Bank of Jamaica (Value of Coins in Circulation) Order 1973, as permitted under Section 22 of the Act. The deductions are credited to the special stabilisation account.
(g) Taxation:
Section 46 of the Act, which exempted the Bank from income tax, stamp duties and transfer tax, was repealed on December 23, 2003. The Bank is still exempt from income tax under Section 12(b) of the Income Tax Act. The Bank’s supplies are substantially exempt from general consumption tax (GCT); it incurs GCT at standard rates on taxable supplies acquired.
(h) Employee benefits:
Employee benefits comprise all forms of consideration given by the Bank in exchange for service rendered by employees. These include current or short-term benefits such as salaries, NIS contributions, annual vacation leave, and non-monetary benefits such as medical care and life insurance; post-employment benefits such as pension and medical care; other long-term employee benefits such as termination benefits.
Final Accounts for Year Ended 31 December 2008

Annual Report 2008
- xv -
15
BANK OF JAMAICA
Notes to the Financial Statements (cont’d) December 31, 2008
2. Statement of compliance, basis of preparation and significant accounting policies (cont’d)
(h) Employee benefits (cont’d):
(i) General benefits:
Employee benefits are all forms of consideration given by the Bank in exchange for service rendered by employees. These include current or short-term benefits such as salaries, NIS contributions, annual leave and non-monetary benefits such as medical care and loans and post employment benefits such as pensions.
Employee benefits that are earned as a result of past or current service are recognised in the following manner: short-term employee benefits are recognised as a liability, net of payments made, and charged as expense. The estimated cost of accumulated vacation leave is recognised annually. Post-employment benefits are accounted for as described below.
(ii) Defined-benefit scheme and post employment benefits:
Employee benefits comprising pensions, and the related post-employment assets and obligations included in these financial statements, have been actuarially determined by a qualified independent actuary, appointed by management. The appointed actuary’s report outlines the scope of the valuation and the actuary’s opinion. The actuarial valuations were conducted in accordance with IAS 19, and the financial statements reflect the Bank’s post-employment benefit asset and obligations as computed by the actuary. In carrying out their audit, the auditors relied on the actuary’s report.
The cost of pension benefits is the cost to the Bank of its administration of, and contributions to, the pension scheme established to provide retirement benefits and its payments to pensioners to supplement the basic pensions to which pensioners are entitled under the rules of the scheme (see note 13). The contributions are a percentage of the members’ salaries; the percentage is determined by the scheme’s actuaries using the aggregate actuarial cost method. Administration costs are charged when incurred, and supplemental payments are charged when paid.
The Bank’s net obligation in respect of the defined benefit pension plan is calculated by estimating the amount of future benefits that employees have earned in return for their service in the current and prior periods. That value is then discounted to determine the present value, and the fair value of any plan assets is deducted. The discount rate is determined by reference to the yield at the balance sheet date on long-term government bonds with maturities approximating the terms of the Bank’s obligation. The calculation is performed by a qualified actuary, using the projected unit credit method.
When the benefits of the plan are improved, the portion of the increased benefit relating to past service by employees is recognised as an expense in the statement of income and expenses on a straight-line basis over the average period until the benefits become vested. To the extent that the benefits are vested immediately, the expense is recognised immediately in the income statement.
Final Accounts for Year Ended 31 December 2008

Bank of Jamaica
- xvi -
16
BANK OF JAMAICA
Notes to the Financial Statements (cont’d) December 31, 2008
2. Statement of compliance, basis of preparation and significant accounting policies (cont’d)
(h) Employee benefits (cont’d):
(ii) Defined-benefit scheme and post employment benefits: (cont’d)
To the extent that any cumulative unrecognised actuarial gain or loss exceeds ten percent of the greater of the present value of the defined benefits obligation and the fair value of plan assets, that portion is recognised in the statement of income and expenses over the expected average remaining working lives of the employees participating in the plan. Otherwise, the actuarial gain or loss is not recognised.
Where the calculation results in a benefit to the Bank, the recognised asset is limited to the net total of any unrecognised actuarial losses and past service costs and the present value of any future refunds from the plan or reductions in future contributions to the plan. An economic benefit is available to the Bank if it is realisable during the life of the plan, or on settlement of the plan liabilities.
(i) Statutory transfer of profits and losses:
Section 9 of the Act provides for each financial year’s net income to be credited, or net loss charged, to the General Reserve Fund, and for the balance on the General Reserve Fund in excess of five times the Bank’s authorised share capital to be transferred to the Consolidated Fund. Likewise, any losses not covered by reserves are required by the Act to be funded by Government out of the Consolidated Fund.
(j) Investment property:
Investment property is stated at fair value, determined by management based on an initial valuation by an independent registered valuator. Fair value is based on market value, being the estimated amount for which the property could be exchanged on the date of valuation between a willing buyer and a willing seller, in an arm’s length transaction, after proper marketing with the parties acting knowledgeably, prudently and without compulsion.
Any gain or loss arising from a change in fair value is recognised in the income statement. In carrying out their audit, the auditors relied on the valuators’ report.
(k) Impairment:
The carrying amounts of the Bank’s assets are reviewed at each balance sheet date to determine whether there is any indication of impairment. If any such indication exists, the asset’s recoverable amount is estimated at each balance sheet date. An impairment loss is recognised whenever the carrying amount of an asset or its cash-generating unit exceeds its recoverable amount. Impairment losses are recognised in the income statement.
When a decline in the fair value of an available-for-sale financial asset has been recognised directly in equity and there is objective evidence that the asset is impaired, the cumulative loss that has been recognised directly in equity is recognised in the income statement even though the financial asset has not been derecognised. The amount of the cumulative loss that is recognised in the statement of income and expenses is the difference between the acquisition cost and current fair value, less any impairment loss on that financial asset previously recognised in the income statement.
Final Accounts for Year Ended 31 December 2008

Annual Report 2008
- xvii -
17
BANK OF JAMAICA
Notes to the Financial Statements (cont’d) December 31, 2008
2. Statement of compliance, basis of preparation and significant accounting policies (cont’d)
(k) Impairment (cont’d):
(i) Calculation of recoverable amount:
The recoverable amount of the Bank’s investment in loans and receivables and other assets is calculated as the present value of expected future cash flows, discounted at the original effective interest rate inherent in the asset. Receivables with a short-term duration are not discounted.
The recoverable amount of other assets is the greater of their net selling price and fair value less cost to sell. In assessing value in use, the estimated future cash flows are discounted to their present value using a pre-tax discount rate that reflects current market assessments of the time value of money and the risks specific to the asset.
For an asset that does not generate largely independent cash inflows, the recoverable amount is determined for the cash-generating unit to which the asset belongs.
(ii) Reversals of impairment:
An impairment loss in respect of loans and receivables carried at amortised cost is reversed, if the subsequent increase in recoverable amount can be related objectively to an event occurring after the impairment loss was recognised. For all other assets, an impairment loss is reversed, if there has been change in the estimate used to determine the recoverable amount.
An impairment loss in respect of an investment in an equity instrument classified as available-for-sale is not reversed through the income statement. If the fair value of a debt instrument classified as available-for-sale increases and the increase can be objectively related to an event occurring after the impairment loss was recognised in the statement of income and expenses, the impairment loss shall be reversed, with the amount of the reversal recognised in the income statement.
An impairment loss is reversed only to the extent that the asset’s carrying amount does not exceed the carrying amount that would have been determined if no impairment loss had been recognised.
(l) Adoption of new and revised IFRS and interpretations
(i) During the year, the following revised and new IFRS became effective:
Amendments to IAS 39 Financial Instruments: Recognition and Measurement andIFRS 7: Financial Instruments Disclosures came into effect October 2008. The amendments permit an entity to reclassify non-derivative financial assets (other than those designated at fair value through profit or loss by the entity upon initial recognition) out of the fair value through profit or loss category in particular circumstances. The amendment also permits an entity to transfer from the available-for-sale category to the loans and receivables category a financial asset that would have met the definition of loans and receivables (if the financial asset had not been designated as available-for-sale), if the entity has the intention and ability to hold that financial asset for the foreseeable future or until maturity date.
Final Accounts for Year Ended 31 December 2008

Bank of Jamaica
- xviii -
18
BANK OF JAMAICA
Notes to the Financial Statements (cont’d) December 31, 2008
2. Statement of compliance, basis of preparation and significant accounting policies (cont’d)
(l) Adoption of new and revised IFRS and interpretations (cont’d)
(i) During the year, the following revised and new IFRS became effective (cont’d):
IFRIC 14, IAS 19 – The Limit on a Defined Benefit Asset, Minimum Funding Requirements and their Interaction came into effect January 1, 2008. The standard provides guidance on assessing the limit set in IAS 19 on the amount of the surplus that can be recognised as an asset. It also explains how the pension asset or liability may be affected by a statutory or contractual minimum funding requirement.
The adoption of these standards did not result in any change in accounting policies and did not have any effect on the Bank’s financial statements.
(ii) At the date of authorisation of the financial statements, there were certain standards and interpretations which were in issue but were not yet effective. The standards and interpretations, considered relevant to the Bank and their dates are as follows:
IAS 1 (Revised) Presentation of Financial Statements, requires the presentation of all non-owners’ changes in equity in one or two statements: either in a single statement of comprehensive income, or in an income statement and in a statement of comprehensive income. IAS 1 (revised) becomes effective for annual reporting periods beginning on or after January 1, 2009. The Bank has not yet decided which of the statements will be used in its financial statements.
Amendments to IAS 32 Financial Instruments: Presentation and IAS 1, Presentation of Financial Statements is effective for annual periods beginning on or after January 1, 2009. The amendments allow certain instruments that would normally be classified as liabilities to be classified as equity if certain conditions are met. Where such instruments are reclassified, the entity is required to disclose the amount, the timing and the reason for the reclassification. The revisions are not expected to have any significant impact on the Bank’s financial statements.
(m) Related party balances and transactions:
A party is related to the Bank if:
(i) directly or indirectly the party:
controls, is controlled by, or is under common control with the Bank; has an interest in the Bank that gives it significant influence over the Bank, orhas joint control over the Bank;
(ii) the party is a member of the key management personnel of the Bank.
(iii) the party is a close member of the family of any individual referred to in (i) or (ii) above;
(iv) the party is a post-employment benefit plan for the benefit of employees of the Bank, or any entity that is a related party of the Bank.
A related party transaction is a transfer of resources, services or obligations between related parties, regardless of whether a price is charged.
Final Accounts for Year Ended 31 December 2008

Annual Report 2008
- xix -
19
BANK OF JAMAICA
Notes to the Financial Statements (cont'd) December 31, 2008
3. Cash and cash equivalents 2008 2007 J$'000 J$'000
Current accounts and money at call with foreign banks 30,141,309 32,608,300 Current accounts with local banks 202,757 54,901
30,344,066 32,663,201
4. Foreign currency denominated investments 2008 2007 J$'000 J$'000
Available-for-sale securities: US Government bonds 45,070,438 55,855,254
Barbados Government bond 48,385 38,740 45,118,823 55,893,994
Loans and receivables: Short-term deposits with foreign banks 57,367,634 36,799,701
102,486,457 92,693,695
5. Loan and advances
The Bank granted loans and advances to certain financial institutions. These loans are collaterised by securities issued or guaranteed by the Government of Jamaica.
2008 2007 J$'000 J$'000
Denominated in Jamaica dollars 3,057,000 - Denominated in United States dollars 16,777,196 -
19,834,196 -
At the balance sheet date, the fair value of the securities obtained and held by the Bank was $23,122,941,000 (2007: $Nil).
All loans and advances mature within twelve months after the balance sheet date.
Final Accounts for Year Ended 31 December 2008

Bank of Jamaica
- xx -
20
BANK OF JAMAICA
Notes to the Financial Statements (cont'd) December 31, 2008
6. Local currency denominated investments 2008 2007 J$'000 J$'000 Loans and receivables: Jamaica Government Securities: Local registered stock 61,614,841 55,865,698
Available-for-sale securities: Jamaica Government Securities: Local registered stock 9,109,101 9,363,009 Treasury bills 31 909 Investment bonds 14,896,344 7,448,012 Investment debentures 726,592 595,181 Registered bonds 923,513 483,915
25,655,581 17,891,026
87,270,422 73,756,724
7. International Monetary Fund – Quota Subscription
This represents the portion of Jamaica's fee for membership of the International Monetary Fund (IMF), based on its quota, which was paid by the Bank (the other portion having been subscribed by the Government of Jamaica).
Quotas are reviewed every five years, when adjustments may be considered.
2008 2007 SDR'000 J$'000 J$'000 Amount subscribed (net of reserve tranche of J$Nil): At beginning of year 31,125 3,223,061 2,999,595 Effect of exchange rate fluctuation - 375,084 223,466
At end of year 31,125 3,598,145 3,223,061
8. Investment property
2008 2007 J$'000 J$'000
Investment property 94,645 88,597
The carrying amount of the investment property is the fair value of the property arrived at by management, who took account of the location of the property. The property was initially valued by C. D. Alexander Limited, registered independent valuator having an appropriate recognised professional qualification and recent experience in the location and category of the property being valued, in 2003 at $87,000,000. The fair value arrived at by management was determined having regard to recent market transactions for similar properties in the same location as the Bank’s investment property and was not materially different from that of the independent valuator in 2003 [note 2 (j)]. Direct operating expenses during the year were $ 3,859,026 (2007: $2,538,748).
Final Accounts for Year Ended 31 December 2008

Annual Report 2008
- xxi -
21
BANK OF JAMAICA
Notes to the Financial Statements (cont'd) December 31, 2008
9. Investment in financial institution
Latest audited Equity financial Retained
holding statements earnings 2008 2007 2008 2007
J$'000 J$'000 % % J$'000 Subsidiary company: Jamaica Export Credit Insurance Corporation Ltd. (liquidated) Nil 3,200 Nil 100.00 31.12.96 Nil
By virtue of Section 23(j) of the Act, the Bank is empowered to, with the approval of the Minister, subscribe to, hold and sell shares in any corporation which, with the approval, or under the authority, of the Government, is established for the purpose of promoting the development of a money market or securities market in Jamaica or of improving the financial machinery for the financing of economic development.
In 2006, the Board approved a grant to EX-IM Bank equivalent to the net liquidation proceeds upon completion of the winding up of the subsidiary company, less the carrying value of shares held by the Bank. Jamaica Export Credit Insurance Corporation Limited was liquidated on December 8, 2008.
10. Due from Government and Government Agencies
2008 Movements during the year Dec. 31, Advances/ (Settlement)/ Charged Dec. 31, 2007 losses profit to expenses 2008 J$'000 J$'000 J$'000 J$'000 J$'000 Expenditure on behalf of Government: Payment of interest on foreign liabilities [see (b) below] - 121,937 - (121,937) - Other expenditure on behalf of Government 35,227 - - ( 12) 35,215
Withholding tax refund due 8,163,053 1,916,381 - - 10,079,434 Accrued interest on Government securities 6,303,253 3,354,510 (6,303,253) - 3,354,510 Net profit payable to Consolidated Fund ( 2,748,356) (6,476,385) - - ( 9,224,741)
11,753,177 (1,083,557) (6,303,253) (121,949) 4,244,418
Final Accounts for Year Ended 31 December 2008
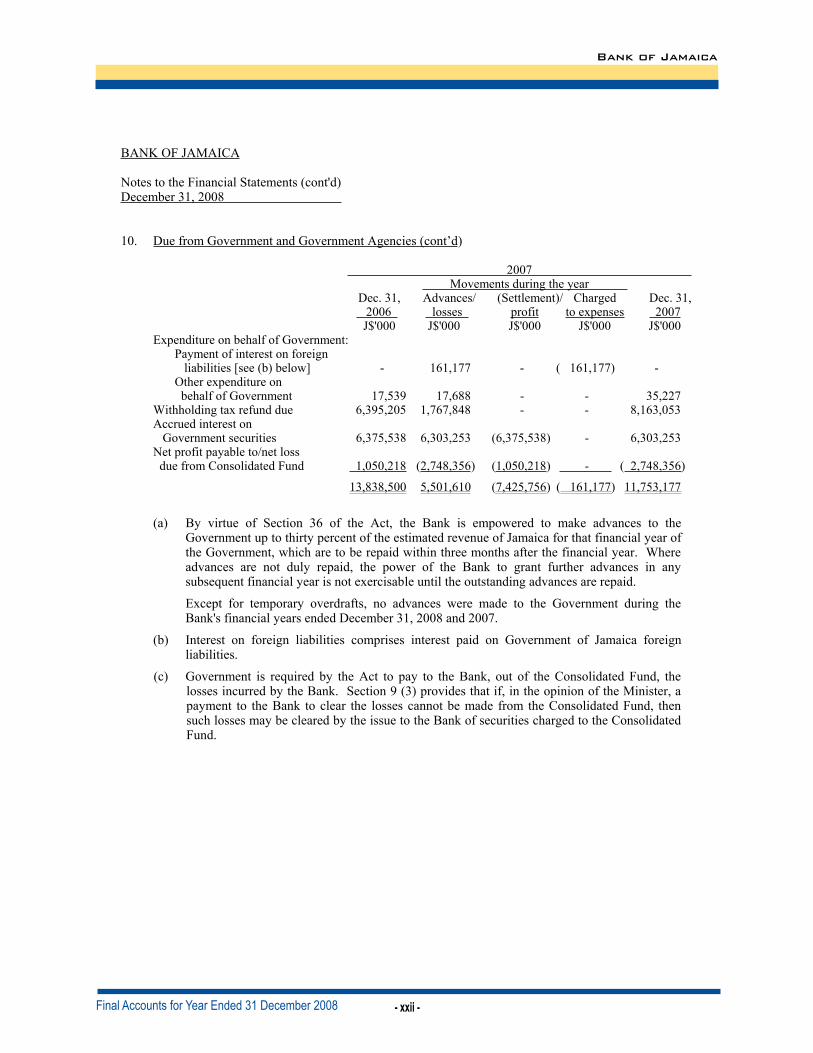
Bank of Jamaica
- xxii -
22
BANK OF JAMAICA
Notes to the Financial Statements (cont'd) December 31, 2008
10. Due from Government and Government Agencies (cont’d)
2007 Movements during the year Dec. 31, Advances/ (Settlement)/ Charged Dec. 31, 2006 losses profit to expenses 2007 J$'000 J$'000 J$'000 J$'000 J$'000 Expenditure on behalf of Government: Payment of interest on foreign liabilities [see (b) below] - 161,177 - ( 161,177) - Other expenditure on behalf of Government 17,539 17,688 - - 35,227
Withholding tax refund due 6,395,205 1,767,848 - - 8,163,053 Accrued interest on Government securities 6,375,538 6,303,253 (6,375,538) - 6,303,253 Net profit payable to/net loss due from Consolidated Fund 1,050,218 (2,748,356) (1,050,218) - ( 2,748,356)
13,838,500 5,501,610 (7,425,756) ( 161,177) 11,753,177
(a) By virtue of Section 36 of the Act, the Bank is empowered to make advances to the Government up to thirty percent of the estimated revenue of Jamaica for that financial year of the Government, which are to be repaid within three months after the financial year. Where advances are not duly repaid, the power of the Bank to grant further advances in any subsequent financial year is not exercisable until the outstanding advances are repaid.
Except for temporary overdrafts, no advances were made to the Government during the Bank's financial years ended December 31, 2008 and 2007.
(b) Interest on foreign liabilities comprises interest paid on Government of Jamaica foreign liabilities.
(c) Government is required by the Act to pay to the Bank, out of the Consolidated Fund, the losses incurred by the Bank. Section 9 (3) provides that if, in the opinion of the Minister, a payment to the Bank to clear the losses cannot be made from the Consolidated Fund, then such losses may be cleared by the issue to the Bank of securities charged to the Consolidated Fund.
Final Accounts for Year Ended 31 December 2008

Annual Report 2008
- xxiii -
23
BANK OF JAMAICA
Notes to the Financial Statements (cont'd) December 31, 2008
11. Property, plant and equipment
Freehold Furniture, land and Leasehold plant and Motor Work-in- buildings property equipment vehicles progress Total J$'000 J$'000 J$'000 J$'000 J$'000 J$'000 Cost or valuation:
December 31, 2006 1,284,692 7,202 1,117,352 180,518 5,087 2,594,851 Additions 12,782 2,106 37,782 85,455 21,170 159,295 Transfers 4,337 - - - ( 4,337) - Transfer to investment property - - - - ( 751) ( 751) Disposals/write-offs ( 21) - ( 28,781) ( 45,013) - ( 73,815)
December 31, 2007 1,301,790 9,308 1,126,353 220,960 21,169 2,679,580 Additions 37,032 4,556 89,443 137,611 30,975 299,617 Transfers - - 9,822 - ( 9,822) - Disposals/write-offs - - ( 26,417) ( 59,710) - ( 86,127)
December 31, 2008 1,338,822 13,864 1,199,201 298,861 42,322 2,893,070
At cost 119,298 13,864 1,199,201 298,861 42,322 1,673,546 At valuation 1,219,524 - - - - 1,219,524
1,338,822 13,864 1,199,201 298,861 42,322 2,893,070
Depreciation: December 31, 2006 190,277 1,555 546,907 38,576 - 777,315 Charge for the year 65,206 817 87,392 34,773 - 188,188 Eliminated on disposals ( 21) - ( 28,780) ( 27,815) - ( 56,616)
December 31, 2007 255,462 2,372 605,519 45,534 - 908,887 Charge for the year 67,057 1,105 90,970 50,353 - 209,485 Eliminated on disposals - - ( 26,417) ( 44,319) - ( 70,736) December 31, 2008 322,519 3,477 670,072 51,568 - 1,047,636
Net book values: December 31, 2008 1,016,303 10,387 529,129 247,293 42,322 1,845,434 December 31, 2007 1,046,328 6,936 520,834 175,426 21,169 1,770,693 December 31, 2006 1,094,415 5,647 570,445 141,942 5,087 1,817,536
The Bank’s land and buildings were revalued in 2003 by The C. D. Alexander Company Realty Limited, Real Estate Broker, Appraiser and Auctioneer on the open-market, existing-use basis. Arevaluation was not done during 2008 as management is of the opinion that there was no significant change in the value of the land and buildings. The surplus arising on revaluation, inclusive of depreciation no longer required, is included in property revaluation reserve [note 24(b)].
Final Accounts for Year Ended 31 December 2008

Bank of Jamaica
- xxiv -
24
BANK OF JAMAICA
Notes to the Financial Statements (cont'd) December 31, 2008
12. Intangible asset
Computer Work-in software progress Total J$’000 J$’000 J$’000
Cost or valuation December 31, 2006 172,058 86,796 258,854 Additions 40,817 - 40,817 Transfer 82,469 (82,469) - December 31, 2007 295,344 4,327 299,671 Additions 6,319 53,068 59,387
December 31, 2008 301,663 57,395 359,058
Amortisation: December 31, 2006 132,705 - 132,705 Charge for the year 39,766 - 39,766
December 31, 2007 172,471 - 174,471 Charge for the year 37,193 - 37,193
December 31, 2008 209,664 - 209,664
Net book values: December 31, 2008 91,999 57,395 149,394
December 31, 2007 122,873 4,327 127,200
December 31, 2006 39,353 86,796 126,149
13. Employee benefits
The Bank operates a non-contributory defined benefit pension scheme, and medical and life insurance schemes for all its permanent eligible employees and funds supplemental retirement benefits, except as set out at (e) below. Benefits under the pension scheme are computed by reference to final salary. The assets of the scheme, which are held separately from those of the Bank, are under the control of a board of trustees, with day-to-day management by employees of the Bank.
(a) Pension assets recognised on balance sheet: 2008 2007 J$'000 J$'000
Present value of funded obligations (2,406,300) (2,384,300) Fair value of plan assets 7,748,000 6,846,400 Unrecognised amount due to limitation (1,129,700) - Unrecognised actuarial gains (1,527,900) (1,123,700)
Recognised assets 2,684,100 3,338,400
Final Accounts for Year Ended 31 December 2008

Annual Report 2008
- xxv -
25
BANK OF JAMAICA
Notes to the Financial Statements (cont'd) December 31, 2008
13. Employee benefits (cont’d)
(a) Pension assets (cont’d):
(i) Movements in the present value of defined benefit obligations:
2008 2007 J$'000 J$'000
Balance at beginning of year 2,384,300 2,187,500 Benefits paid ( 151,200) ( 83,200) Service and interest costs 411,100 339,300 Actuarial gain ( 237,900) ( 59,300)
Balance at end of year 2,406,300 2,384,300
(ii) Movements in plan assets:
2008 2007 J$'000 J$'000
Fair value of plan assets at January 1 6,846,400 6,051,300 Contributions paid 40,400 34,400 Expected return on plan assets 814,900 663,000 Benefits paid ( 151,200) ( 83,200) Actuarial gain 197,500 180,900
Fair value of plan assets on December 31 7,748,000 6,846,400
Plan assets consist of the following:
Government of Jamaica securities 7,140,458 5,566,800 Certificates of deposit 160,000 470,000 Real estate 58,000 58,000 Other 389,542 751,600
7,748,000 6,846,400
(iii) Expense/(credit) recognised in the income statement:
2008 2007 J$'000 J$'000
Current service costs 98,200 73,000 Interest on obligations 312,900 266,300 Expected return on plan assets ( 814,900) (663,000) Past service cost 300 300 Changes in disallowed assets 1,129,600 (285,900) Net actuarial gain recognised ( 31,400) ( 21,500)
694,700 (630,800)
Actual return on pension plan assets 11.56% 12.3%
Final Accounts for Year Ended 31 December 2008
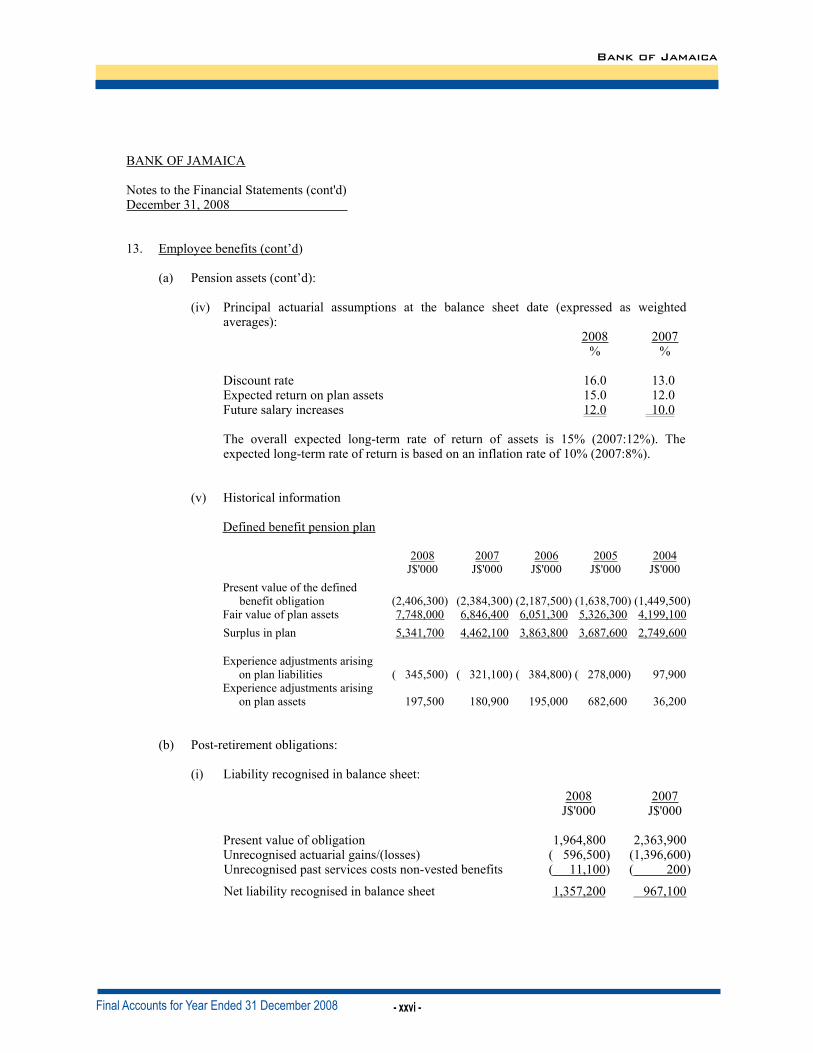
Bank of Jamaica
- xxvi -
26
BANK OF JAMAICA
Notes to the Financial Statements (cont'd) December 31, 2008
13. Employee benefits (cont’d)
(a) Pension assets (cont’d):
(iv) Principal actuarial assumptions at the balance sheet date (expressed as weighted averages):
2008 2007% %
Discount rate 16.0 13.0 Expected return on plan assets 15.0 12.0 Future salary increases 12.0 10.0
The overall expected long-term rate of return of assets is 15% (2007:12%). The expected long-term rate of return is based on an inflation rate of 10% (2007:8%).
(v) Historical information
Defined benefit pension plan
2008 2007 2006 2005 2004 J$'000 J$'000 J$'000 J$'000 J$'000
Present value of the defined benefit obligation (2,406,300) (2,384,300) (2,187,500) (1,638,700) (1,449,500)
Fair value of plan assets 7,748,000 6,846,400 6,051,300 5,326,300 4,199,100Surplus in plan 5,341,700 4,462,100 3,863,800 3,687,600 2,749,600
Experience adjustments arising on plan liabilities ( 345,500) ( 321,100) ( 384,800) ( 278,000) 97,900
Experience adjustments arising on plan assets 197,500 180,900 195,000 682,600 36,200
(b) Post-retirement obligations:
(i) Liability recognised in balance sheet:
2008 2007 J$'000 J$'000
Present value of obligation 1,964,800 2,363,900 Unrecognised actuarial gains/(losses) ( 596,500) (1,396,600) Unrecognised past services costs non-vested benefits ( 11,100) ( 200)
Net liability recognised in balance sheet 1,357,200 967,100
Final Accounts for Year Ended 31 December 2008

Annual Report 2008
- xxvii -
27
BANK OF JAMAICA
Notes to the Financial Statements (cont'd) December 31, 2008
13. Employee benefits (cont’d)
(b) Post-retirement obligations (cont’d):
Present value of obligations and recognised liability (cont’d)
(ii) Movement in present value of defined benefit obligation: 2008 2007 J$'000 J$'000
Balance at beginning of year 2,363,900 1,443,900 Interest cost 311,900 173,200 Current service cost 50,300 29,200 Past service costs ( 61,900) ( 60,400) Benefits paid 17,300 - Actuarial gain losses ( 716,700) 778,000
Balance at end of year 1,964,800 2,363,900
(iii) Expense recognised in the income statement: 2008 2007 J$'000 J$'000
Current service costs 50,300 29,200 Interest on obligations 311,900 173,200 Past service costs 6,400 100 Net actuarial losses recognised in the year 83,400 36,400
452,000 238,900
(iv) Principal actuarial assumptions at the balance sheet date (expressed as weighted averages):
2008 2007 % %
Discount rate 16.0 13.0 Medical claims growth 15.0 12.0
Assumptions regarding future mortality are based on the PA (90) mortality table for pensioners (British mortality tables), but with each age rated down by six years.
(v) Historical information
Post-employment medical benefits
2008 2007 2006 2005 2004 J$'000 J$'000 J$'000 J$'000 J$'000
Present value of obligations 1,964,800 2,361,500 1,443,900 1,069,600 761,500 Experience adjustments arising
on plan liabilities ( 59,400) ( 35,800) ( 30,100) 78,300 30,200
Final Accounts for Year Ended 31 December 2008

Bank of Jamaica
- xxviii -
28
BANK OF JAMAICA
Notes to the Financial Statements (cont'd) December 31, 2008
13. Employee benefits (cont’d)
(c) Assumed trend in health care cost has a significant effect on the amounts recognised in profit or loss. A one percentage point change in assumed healthcare cost trend rates would have the following effects:
One One percentage percentage point increase point decrease J$'000 J$'000
Effect on the aggregate service and interest cost 13,900 (10,300) Effect on the defined benefit obligation 64,700 (49,500)
(d) The estimated pension contributions expected to be paid into the plan during the next financial year is J$ 58,220,000 (2007: J$45,806,000).
(e) The Bank granted increases to pensioners as a supplement to the pensions paid by the scheme. An actuarial valuation disclosed that for the scheme to take over these supplemental payments currently being paid by the Bank, in addition to increases proposed with effect from December 31, 2001, a special contribution of J$168,700,000 would be required from the Bank as of the valuation date. No provision for this lump sum amount is included in the financial statements, as the scheme is already overfunded.
In addition, the Bank granted a further supplement to pensioners: these supplemental pension payments amounted to J$54,616,171 for the year (2007: J$54,876,722), all of which have been included in staff costs in the income statement.
14. Other assets 2008 2007 J$'000 J$'000
Items in process of collection 1,439 13,638 Overdrafts 7,828 7,670 Staff loans 1,201,778 1,091,092 Ex-staff loans 81,612 83,005 Stock of unissued notes and coins 1,572,239 1,372,460 Accrued interest receivable other than on GOJ securities 585,944 779,768 Promissory notes 27,625 47,353 Other 366,447 75,049
3,844,912 3,470,032 Less:
Re-measurement of promissory note ( 3,680) ( 5,256) Re-measurement of staff loans ( 531,736) ( 409,175) Provision for loan loss for ex-staff loans ( 11,605) ( 11,605)
3,297,891 3,043,996
Final Accounts for Year Ended 31 December 2008

Annual Report 2008
- xxix -
29
BANK OF JAMAICA
Notes to the Financial Statements (cont'd) December 31, 2008
15. Notes and coins in circulation 2008 2007 J$'000 J$'000
Notes 47,194,187 45,509,642 Coins 1,823,681 1,670,186 49,017,868 47,179,828
Section 21 of the Act requires the Bank to hold specified assets of an amount in value sufficient to cover the value of the total amount of notes and coins in circulation as defined in that section. The assets held shall include, inter alia, (a) gold; (b) "hard currency" cash, bank balances or securities issued by a foreign government or international financial institution of which Jamaica is a member; or (c) Special Drawing Rights. Specified assets held by the Bank, as at December 31, 2008, were 2.93 (2007: 2.84) times the value of notes and coins in circulation at that date.
Coins in circulation are shown net of a reserve of 25% (note 23).
16. Deposits and other demand liabilities
2008 2007 J$'000 J$'000
Government and Government agencies 4,701,699 16,085,128 Commercial banks and specified financial institutions 58,700,048 36,034,371
International Money Fund 79,043 70,804 Others 6,873,890 4,316,136
70,354,680 56,506,439
Jamaica dollar equivalent of foreign currency deposits 33,994,248 16,044,418 Jamaica dollar deposits 36,360,432 40,462,021
70,354,680 56,506,439
Deposit liabilities of the Bank include cash reserves held in connection with the Bank's supervision of the prudential requirements of commercial banks and specified financial institutions under the provisions of Section 28 of the Act, Section 14 of the Banking Act, Section 14 of the Financial Institutions Act and Section 31 of the Building Societies Regulations.
In relation to its management of liquidity in the financial system, the Bank may, under Section 28A of the Bank of Jamaica Act, require commercial banks and specified financial institutions to make special deposits with it in the form of cash or specified securities. Cash so deposited is also included in deposit liabilities of the Bank; securities so deposited are, however, excluded from the Bank's liabilities, as title is not transferred and the Bank merely holds them in safekeeping. At the balance sheet date, the Bank was not holding any specified securities in lieu of cash deposits.
At the balance sheet date, the following obtained: 2008 2007 J$'000 J$'000 Amounts included in deposit liabilities of the Bank, representing statutory reserves 37,768,409 31,905,318
Final Accounts for Year Ended 31 December 2008

Bank of Jamaica
- xxx -
30
BANK OF JAMAICA
Notes to the Financial Statements (cont'd) December 31, 2008
17. Open market liabilities
As part of the process of controlling liquidity in the financial system, the Bank acquires funds from or makes funds available to financial institutions and this is effected by entering into short-term agreements with the institutions. Receipt of funds is evidenced by the Bank issuing, to the depositor, Certificates of Deposit.
18. International Monetary Fund - Allocation of Special Drawing Rights
This represents the Bank's obligation for Special Drawing Rights (SDRs) allocated to it. This allocation does not change unless there are cancellations or further allocations. There have been no further allocations or cancellations during the year (2007: Nil) and, accordingly, the changes arise from exchange rate fluctuations.
2008 2007 SDRs'000 J$'000 J$'000
At beginning of year 40,613 4,205,563 3,913,978 Effect of exchange rate fluctuation - 489,424 291,585 At end of year 40,613 4,694,987 4,205,563
19. Foreign liabilities 2008 2007 J$'000 J$'000
Borrowings - Principal 34,241 73,607 - Accrued interest 636 1,945 Unsettled balances on bilateral accounts for CARICOM trade - 15,468 34,877 91,020
20. Other liabilities 2008 2007 J$'000 J$'000
Interest payable 7,814,324 2,277,062 Staff and staff-related expenses 283,608 242,985
Other 32,016 155,274 8,129,948 2,675,321
21. Share capital
Section 8 of the Act provides for the capital of the Bank to be J$4,000,000, which has been paid by the Government of Jamaica.
Final Accounts for Year Ended 31 December 2008

Annual Report 2008
- xxxi -
31
BANK OF JAMAICA
Notes to the Financial Statements (cont'd) December 31, 2008
22. General Reserve Fund
Section 9 of the Act provides that the Bank shall establish and maintain a General Reserve Fund:
(a) to which, at the end of each financial year, the net income for that year shall be transferred or the net losses charged;
(b) from which shall be paid to the Consolidated Fund the amount by which, at the end of the financial year, the balance thereon exceeds five times the Bank's authorised share capital;
(c) into which should be paid from the Consolidated Fund at the end of the financial year, the amount by which the Bank’s net loss exceeds the balance in the General Reserve Fund.
23. Special stabilisation account
The special stabilisation account is maintained at 25% of the coins in circulation as a reserve against coins that are unlikely to be redeemed (note 15).
24. Other reserves
This represents the following: 2008 2007 J$'000 J$'000
Securities revaluation reserve [see (a)] 668,230 803,148 Property revaluation reserve [see (b)] 1,121,667 1,121,667 Pension equalisation reserve [see (c)] 2,684,100 3,338,400 4,473,997 5,263,215
(a) This represents the unrealised gains/losses on the revaluation of available-for-sale investments securities.
(b) The property revaluation reserve represents the surplus arising on the revaluation of certain freehold properties (see note 11).
(c) The pension equalisation reserve represents the pension surplus arising on the actuarial valuation, under IAS 19, of the Bank’s pension scheme. Annual changes in the value of the scheme are shown in the statement of income and expenses, then transferred to this reserve.
25. Interest income
2008 2007 J$'000 J$'000
Loans and receivable Cash and cash equivalents 438,620 911,291 Funds managed by agents 302,024 101,979 Investment securities 3,170,942 11,117,198 Loans and advances 175,105 - Other 56,777 50,097
Available-for-saleInvestment securities 13,087,879 6,272,172
17,231,347 18,452,737
Final Accounts for Year Ended 31 December 2008
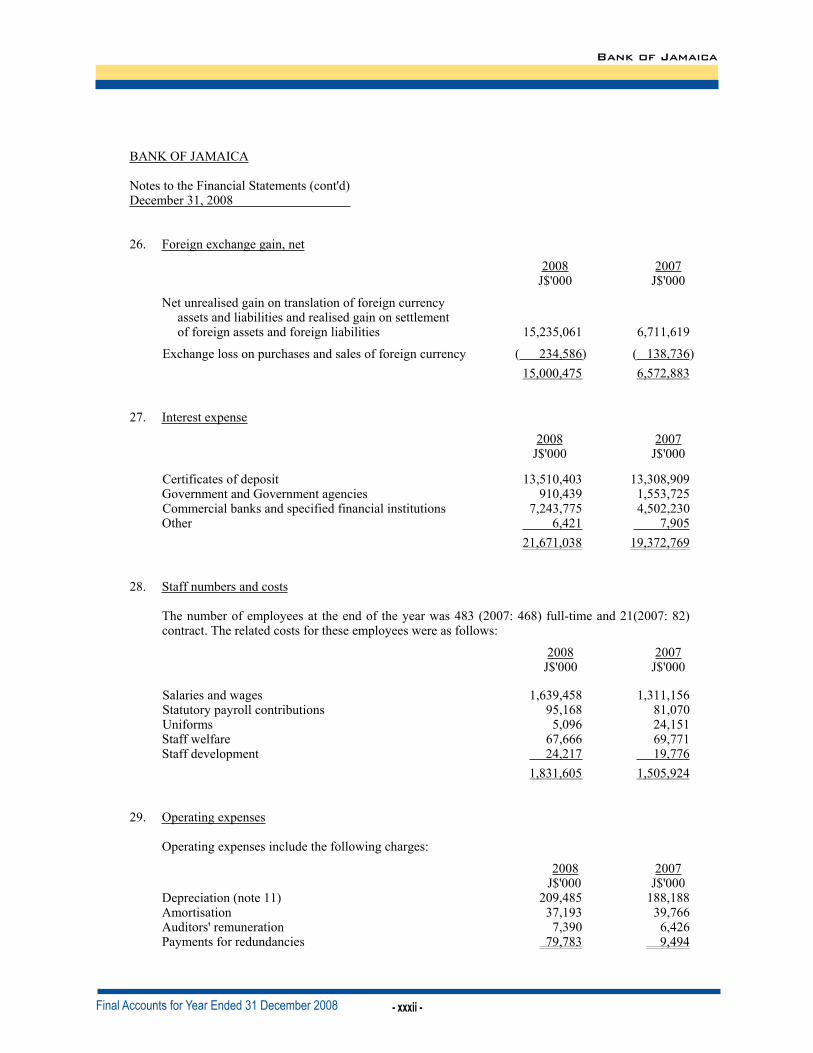
Bank of Jamaica
- xxxii -
32
BANK OF JAMAICA
Notes to the Financial Statements (cont'd) December 31, 2008
26. Foreign exchange gain, net
2008 2007 J$'000 J$'000
Net unrealised gain on translation of foreign currency assets and liabilities and realised gain on settlement of foreign assets and foreign liabilities 15,235,061 6,711,619
Exchange loss on purchases and sales of foreign currency ( 234,586) ( 138,736) 15,000,475 6,572,883
27. Interest expense
2008 2007 J$'000 J$'000
Certificates of deposit 13,510,403 13,308,909 Government and Government agencies 910,439 1,553,725 Commercial banks and specified financial institutions 7,243,775 4,502,230 Other 6,421 7,905
21,671,038 19,372,769
28. Staff numbers and costs
The number of employees at the end of the year was 483 (2007: 468) full-time and 21(2007: 82) contract. The related costs for these employees were as follows:
2008 2007 J$'000 J$'000
Salaries and wages 1,639,458 1,311,156 Statutory payroll contributions 95,168 81,070 Uniforms 5,096 24,151 Staff welfare 67,666 69,771 Staff development 24,217 19,776
1,831,605 1,505,924
29. Operating expenses
Operating expenses include the following charges:
2008 2007 J$'000 J$'000 Depreciation (note 11) 209,485 188,188 Amortisation 37,193 39,766 Auditors' remuneration 7,390 6,426 Payments for redundancies 79,783 9,494
Final Accounts for Year Ended 31 December 2008
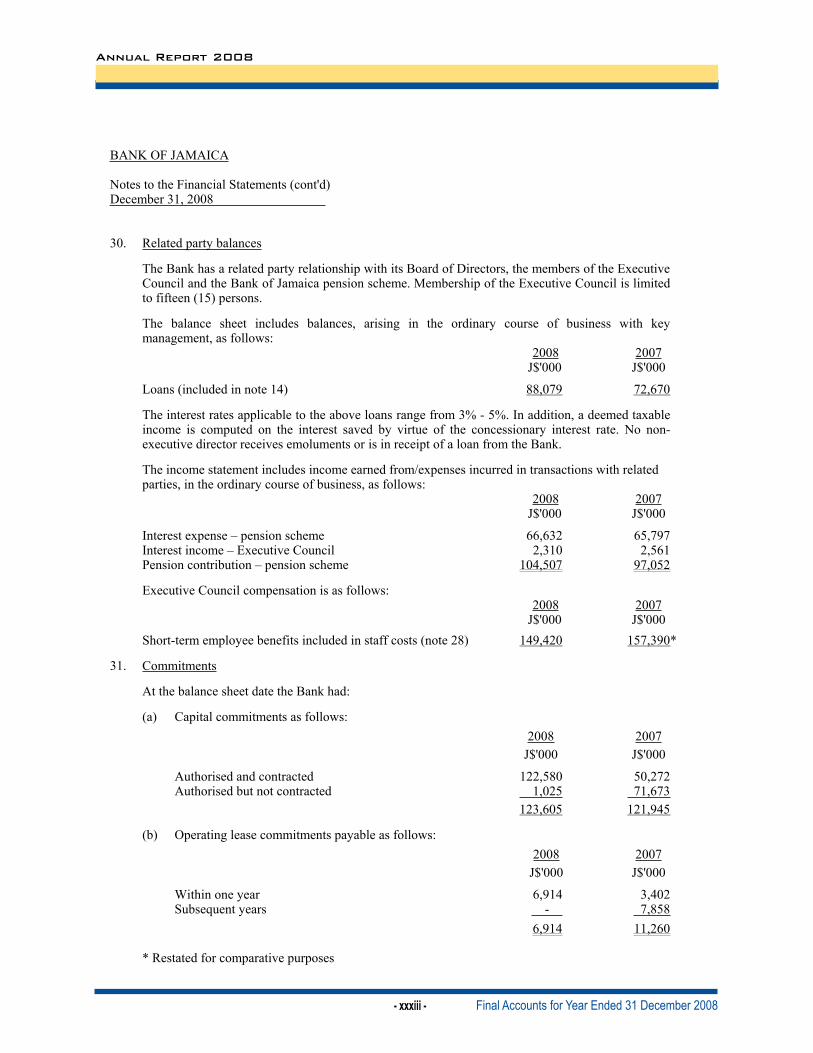
Annual Report 2008
- xxxiii -
33
BANK OF JAMAICA
Notes to the Financial Statements (cont'd) December 31, 2008
30. Related party balances
The Bank has a related party relationship with its Board of Directors, the members of the Executive Council and the Bank of Jamaica pension scheme. Membership of the Executive Council is limited to fifteen (15) persons.
The balance sheet includes balances, arising in the ordinary course of business with key management, as follows:
2008 2007 J$'000 J$'000
Loans (included in note 14) 88,079 72,670
The interest rates applicable to the above loans range from 3% - 5%. In addition, a deemed taxable income is computed on the interest saved by virtue of the concessionary interest rate. No non-executive director receives emoluments or is in receipt of a loan from the Bank.
The income statement includes income earned from/expenses incurred in transactions with related parties, in the ordinary course of business, as follows:
2008 2007 J$'000 J$'000
Interest expense – pension scheme 66,632 65,797 Interest income – Executive Council 2,310 2,561 Pension contribution – pension scheme 104,507 97,052
Executive Council compensation is as follows: 2008 2007 J$'000 J$'000 Short-term employee benefits included in staff costs (note 28) 149,420 157,390*
31. Commitments
At the balance sheet date the Bank had:
(a) Capital commitments as follows: 2008 2007 J$'000 J$'000
Authorised and contracted 122,580 50,272 Authorised but not contracted 1,025 71,673
123,605 121,945
(b) Operating lease commitments payable as follows: 2008 2007 J$'000 J$'000
Within one year 6,914 3,402 Subsequent years - 7,858
6,914 11,260
* Restated for comparative purposes
Final Accounts for Year Ended 31 December 2008
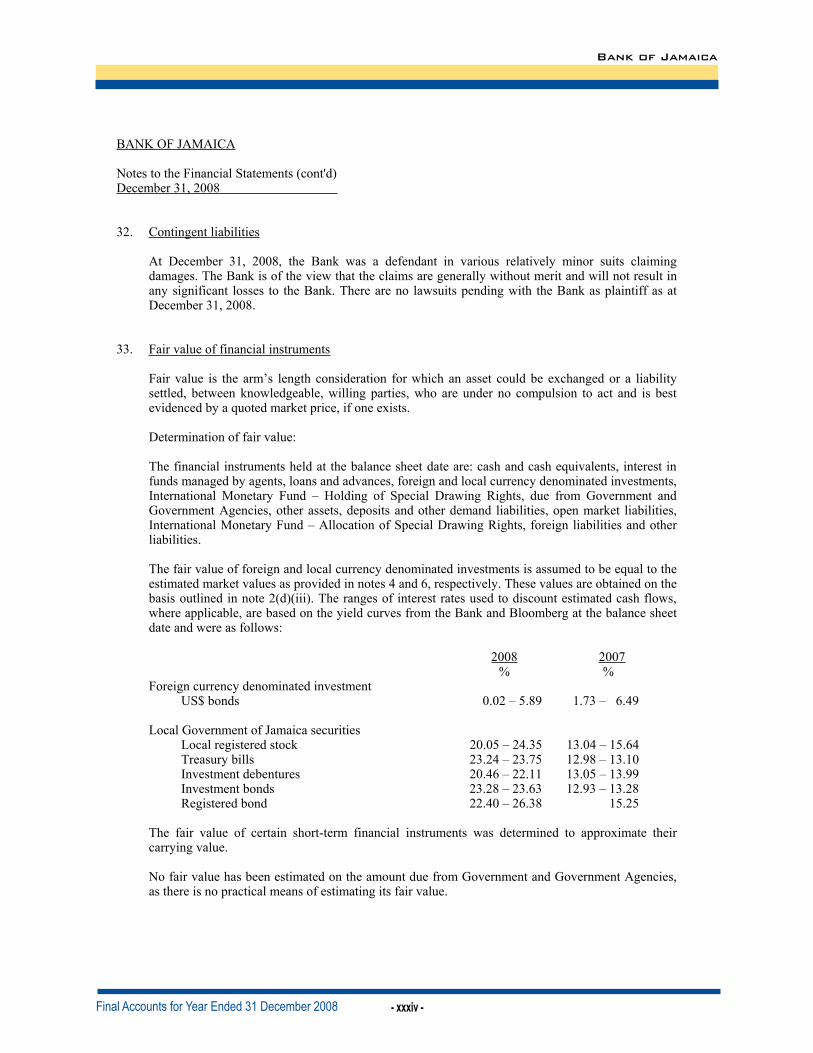
Bank of Jamaica
- xxxiv -
34
BANK OF JAMAICA
Notes to the Financial Statements (cont'd) December 31, 2008
32. Contingent liabilities
At December 31, 2008, the Bank was a defendant in various relatively minor suits claiming damages. The Bank is of the view that the claims are generally without merit and will not result in any significant losses to the Bank. There are no lawsuits pending with the Bank as plaintiff as at December 31, 2008.
33. Fair value of financial instruments
Fair value is the arm’s length consideration for which an asset could be exchanged or a liability settled, between knowledgeable, willing parties, who are under no compulsion to act and is best evidenced by a quoted market price, if one exists.
Determination of fair value:
The financial instruments held at the balance sheet date are: cash and cash equivalents, interest in funds managed by agents, loans and advances, foreign and local currency denominated investments, International Monetary Fund – Holding of Special Drawing Rights, due from Government and Government Agencies, other assets, deposits and other demand liabilities, open market liabilities, International Monetary Fund – Allocation of Special Drawing Rights, foreign liabilities and other liabilities.
The fair value of foreign and local currency denominated investments is assumed to be equal to the estimated market values as provided in notes 4 and 6, respectively. These values are obtained on the basis outlined in note 2(d)(iii). The ranges of interest rates used to discount estimated cash flows, where applicable, are based on the yield curves from the Bank and Bloomberg at the balance sheet date and were as follows:
2008 2007 % % Foreign currency denominated investment
US$ bonds 0.02 – 5.89 1.73 – 6.49
Local Government of Jamaica securities Local registered stock 20.05 – 24.35 13.04 – 15.64 Treasury bills 23.24 – 23.75 12.98 – 13.10 Investment debentures 20.46 – 22.11 13.05 – 13.99 Investment bonds 23.28 – 23.63 12.93 – 13.28 Registered bond 22.40 – 26.38 15.25
The fair value of certain short-term financial instruments was determined to approximate their carrying value.
No fair value has been estimated on the amount due from Government and Government Agencies, as there is no practical means of estimating its fair value.
Final Accounts for Year Ended 31 December 2008

Annual Report 2008
- xxxv -
35
BANK OF JAMAICA
Notes to the Financial Statements (cont'd) December 31, 2008
34. Financial risk management:
(a) Introduction and overview
The Bank has exposure to the following risks from its use of financial instruments:
credit risk liquidity risk market risks
The Board of Directors has overall responsibility for the establishment and oversight of the Bank’s risk management framework. The Bank has established an Investment Committee which is responsible for providing oversight on the conversion of investment strategy into performance, portfolio construction and risk modelling. There is also a Credit Committee which is responsible for evaluating and approving applications for staff loans. Both committees report to the Management Council who reports on a regular basis to the Board of Directors.
The Bank’s audit sub committee is responsible for monitoring compliance with the Bank’s risk management policies and procedures and for reviewing the adequacy of the risk management framework in relation to the risks faced by the Bank. The audit sub-committee is assisted in these functions by Internal Audit Department. This department undertakes both regular and ad hoc reviews of risk management controls and procedures, the results of which are reported to the Board of Directors.
(b) Credit risk
Credit risk is the risk of loss arising from a counter-party to a financial contract failing to discharge its obligations. This risk arises primarily from the Bank’s foreign and local currency investment securities, loans and advances, cash and cash equivalent, interest in funds managed by agents and other assets.
(i) Management of credit risk on classes of financial assets exposed to that risk:
Foreign currency investments and interest in funds managed by agents
Credit risk in the foreign currency investment portfolio is managed by restricting the holdings of investments substantially to US Government securities, other highly rated sovereign securities, Jamaica Government US$ debentures and placements in highly rated supranational institutions. The Bank uses credit rating ascribed by Moody’s Investor Services and Standard & Poor’s Corporation as its main criterion for assessing the creditworthiness of financial institutions and sovereigns. The Bank’s foreign investments are restricted to money market placements with financial institutions with minimum short-term credit ratings of A-1/P-2 and with minimum long-term ratings of Aa1/AA+. Additionally, capital market issues must have a minimum credit rating of Aa1/AA+. In order to reduce consolidated credit risk exposure, the Bank has investment limits in place. The Bank’s foreign investment portfolio consist of short-, medium- and long-term investments each of which have stipulated percentage limits (upper and lower) of the portfolio at market value.
Final Accounts for Year Ended 31 December 2008

Bank of Jamaica
- xxxvi -
36
BANK OF JAMAICA
Notes to the Financial Statements (cont'd) December 31, 2008
34. Financial risk management (cont’d):
(b) Credit risk (cont’d)
(i) Management of credit risk on classes of financial assets exposed to that risk (cont’d):
Local investment securities
Credit risk for local securities is managed by investing only in Government of Jamaica securities. Management does not expect this counterparty to fail to meet its obligations.
Loans and advances
Credit risk is managed by requiring institutions to deposit with the Bank of Jamaica or its agents designated securities sufficient to collateralise loans and advances. The collateral value of securities accepted is limited to a defined percentage of market value.
Cash and cash equivalents
Cash and cash equivalents are held in financial institutions which management regards as strong and there is no significant concentration. The strength of these financial institutions is constantly reviewed by the Investment Committee.
Other assets
Other credit exposures consist mainly of staff loans for housing and motor vehicles. There is a documented credit policy in place which guides the Bank’s credit process for staff loans. The policy includes established procedures for the authorisation of credit. Staff loans are limited to a percentage of the value of the assets being purchased. Additionally, assets must be insured and repayment terms established. Mortgages and liens are obtained for staff housing and motor vehicle loans, respectively.
(ii) Impaired loans and securities
Impaired loans and securities are loans and securities for which the Bank determines that it is probable that it will be unable to collect all principal and interest due according to the contractual terms of the loan or securities agreements.
(iii) Past due but not impaired loans and securities
These are loans and securities where contractual interest or principal payments are past due but the Bank believes that impairment is not appropriate on the basis of the level of security available or the stage of collection of amounts owed to the Bank.
Final Accounts for Year Ended 31 December 2008

Annual Report 2008
- xxxvii -
37
BANK OF JAMAICA
Notes to the Financial Statements (cont'd) December 31, 2008
34. Financial risk management (cont’d):
(b) Credit risk (cont’d)
(iv) Loans with renegotiated terms
Loans with renegotiated terms are loans that have been restructured due to deterioration in the borrower’s financial position and where the Bank has made concessions that it would not otherwise consider. Once the loan is restructured, it remains in this category independent of satisfactory performance after restructuring. The Bank had no such loans as at December 31, 2008 and 2007.
(v) Allowances for impairment
The Bank established an allowance for impairment losses that represents its estimate of incurred losses in its loan portfolio. The allowance is the aggregate of the estimated losses on individual exposures.
(vi) Write-off policy
The Bank writes off a loan or security balance (and any related allowances for impairment losses) when the Bank determines that the loans or securities are uncollectible. This determination is usually made after considering information such as changes in the borrower’s financial position, or that proceeds from collateral will not be sufficient to pay back the entire exposure.
(vii) Exposure to credit risk
Exposures to credit risk attached to financial assets are monitored through credit rating and lending limits, which are regularly reviewed. In addition, securities issued or guaranteed by the Government of Jamaica are required to collateralise advances to financial institutions. Current credit exposure is the amount of loss that the Bank would suffer if every counterparty to which the Bank was exposed were to default at once; this is represented substantially by the carrying amount of financial assets shown on the balance sheet.
There has been no change to the Bank’s exposure to credit risk or the manner in which it manages and measures the risk.
The Bank’s significant concentrations of credit exposure by geographical region (based on the region of ownership of the entity that issued the security or holds the cash or cash equivalents) are as follows:
2008 2007 J$'000 J$'000
Caribbean 108,538,669 74,639,620 North America 105,923,170 126,816,583 Europe 41,195,507 9,974,782 Other 301,261 622,120 Total financial assets 255,958,607 212,053,105
Final Accounts for Year Ended 31 December 2008

Bank of Jamaica
- xxxviii -
38
BANK OF JAMAICA
Notes to the Financial Statements (cont'd) December 31, 2008
34. Financial risk management (cont’d)
(c) Liquidity risk
Liquidity risk is the risk that the Bank will not be able to meet its financial liabilities as they fall due. Prudent liquidity management implies maintaining sufficient cash and marketable securities, and ensuring the availability of funding through an adequate amount of committed standby credit facilities to meet commitments.
The Bank’s exposure to liquidity risk to meet foreign liabilities, as an institution, is limited due to the minimal amount owed to overseas creditors/lenders. Management of liquidity risk relates primarily to the availability of liquid foreign resources to sell to the Government of Jamaica and its agencies to repay their suppliers and lenders. The Bank manages this risk through a combination of:
Budgetary procedures to identify the timing of Government foreign payments. Scheduling the maturity of foreign deposits to coincide with the demands of Government and its Agencies. Maintaining a portion of its foreign assets in cash or near cash as precautionary funds to meet unforeseen demands.
The Bank, like all central banks, has no real liquidity risk in relation to its domestic financial obligations.
The Bank is not subject to any imposed liquidity limit.
The following table presents the undiscounted contractual maturities of financial liabilities:
2008Within 1 1 to 3 3 to 12 1 to 5
Month months months years Total
Deposits and other demand liabilities 70,354,680 - - - 70,354,680 Open market liabilities 27,594,390 38,279,608 58,949,983 3,155,807 127,979,788 Foreign liabilities - 34,877 - - 34,877 Other 8,129,948 - - - 8,129,948 Commitments 875 8,009 121,635 - 130,519
$106,079,893 38,322,494 59,071,618 3,155,807 206,629,812
2007Within 1 1 to 3 3 to 12 1 to 5
Month months months years Total
Deposits and other demand liabilities 56,506,439 - - - 56,506,439 Open market liabilities 35,612,459 16,832,785 40,330,788 21,154,088 113,930,120 Foreign liabilities 15,880 9,466 7,933 57,741 91,020 Other 2,675,321 - - - 2,675,321 Commitments 283 567 124,497 7,858 133,205 $94,810,382 16,842,818 40,463,218 21,219,687 173,336,105
Final Accounts for Year Ended 31 December 2008
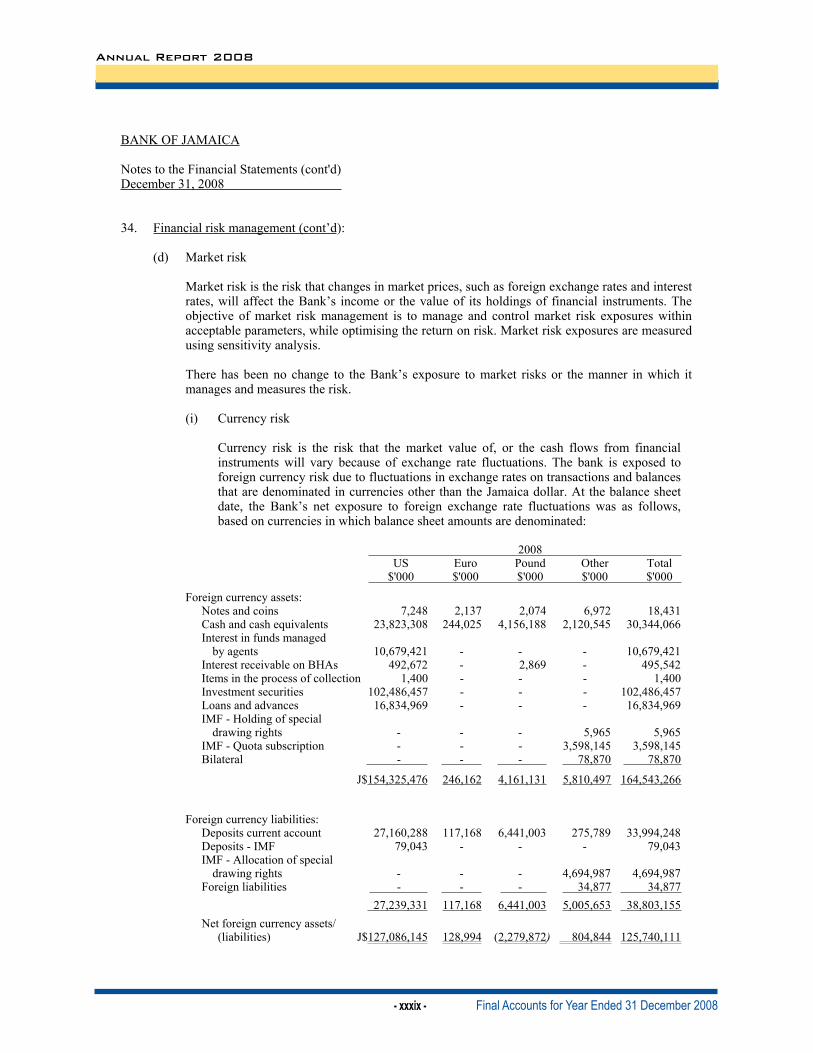
Annual Report 2008
- xxxix -
39
BANK OF JAMAICA
Notes to the Financial Statements (cont'd) December 31, 2008
34. Financial risk management (cont’d):
(d) Market risk
Market risk is the risk that changes in market prices, such as foreign exchange rates and interest rates, will affect the Bank’s income or the value of its holdings of financial instruments. The objective of market risk management is to manage and control market risk exposures within acceptable parameters, while optimising the return on risk. Market risk exposures are measured using sensitivity analysis.
There has been no change to the Bank’s exposure to market risks or the manner in which it manages and measures the risk.
(i) Currency risk
Currency risk is the risk that the market value of, or the cash flows from financial instruments will vary because of exchange rate fluctuations. The bank is exposed to foreign currency risk due to fluctuations in exchange rates on transactions and balances that are denominated in currencies other than the Jamaica dollar. At the balance sheet date, the Bank’s net exposure to foreign exchange rate fluctuations was as follows, based on currencies in which balance sheet amounts are denominated:
2008 US Euro Pound Other Total $'000 $'000 $'000 $'000 $'000
Foreign currency assets: Notes and coins 7,248 2,137 2,074 6,972 18,431 Cash and cash equivalents 23,823,308 244,025 4,156,188 2,120,545 30,344,066 Interest in funds managed
by agents 10,679,421 - - - 10,679,421 Interest receivable on BHAs 492,672 - 2,869 - 495,542 Items in the process of collection 1,400 - - - 1,400 Investment securities 102,486,457 - - - 102,486,457 Loans and advances 16,834,969 - - - 16,834,969 IMF - Holding of special
drawing rights - - - 5,965 5,965 IMF - Quota subscription - - - 3,598,145 3,598,145 Bilateral - - - 78,870 78,870
J$154,325,476 246,162 4,161,131 5,810,497 164,543,266
Foreign currency liabilities: Deposits current account 27,160,288 117,168 6,441,003 275,789 33,994,248 Deposits - IMF 79,043 - - - 79,043 IMF - Allocation of special
drawing rights - - - 4,694,987 4,694,987 Foreign liabilities - - - 34,877 34,877
27,239,331 117,168 6,441,003 5,005,653 38,803,155Net foreign currency assets/
(liabilities) J$127,086,145 128,994 (2,279,872) 804,844 125,740,111
Final Accounts for Year Ended 31 December 2008

Bank of Jamaica
- xl -
40
BANK OF JAMAICA
Notes to the Financial Statements (cont'd) December 31, 2008
34. Financial risk management (cont’d):
(d) Market risk (cont’d)
(i) Currency risk (cont’d)
2007 US Euro Pound Other Total $'000 $'000 $'000 $'000 $'000
Foreign currency assets: Notes and coins 4,698 1,541 3,441 6,354 16,034 Cash and cash equivalents 30,562,242 491,653 643,374 965,932 32,663,201 Interest in funds managed
by agents 8,864,814 - - - 8,864,814 Interest receivable on BHAs 776,035 - - - 776,035 Items in the process of collection 1,656 - - - 1,656 Investment 92,693,695 - - - 92,693,695 IMF - Holding of special
drawing rights - - - 22,060 22,060 IMF - Quota subscription - - - 3,223,061 3,223,061
J$132,903,140 493,194 646,815 4,217,407 138,260,556
Foreign currency liabilities: Deposits current account 13,644,561 207,433 1,912,981 279,442 16,044,417 Deposits - IMF 70,804 - - - 70,804 IMF - Allocation of special
drawing rights - - - 4,205,563 4,205,563 Foreign liabilities 15,688 192 - 75,140 91,020
13,731,053 207,625 1,912,981 4,560,145 20,411,804Net foreign currency assets/
(liabilities) J$119,172,087 285,569 (1,266,166) ( 342,738) 117,848,752
Exchange rates at December 31: 2008 2007
US$1 to J$ 79.94 70.44 UK£1 to J$ 116.87 139.78 CDN$1 to J$ 65.31 71.29 Є to J$ 111.27 102.87
At March 25, 2009, the exchange rates were US$1 to J$86.97, UK£1 to J$121.17, CDN$1 to J$68.68 and Є 1 to J$112.37.
Sensitivity analysis
An eight percent (2007:one percent) devaluation of the Jamaica Dollar against currencies which expose the Bank to risk at December 31 would have increased profit by $10,059,208 (2007: $1,178,488). However, a two percent (2007: one percent) revaluation of the Jamaica Dollar against currencies which expose the Bank to currency risk at December 31 would decrease profit by $2,514,803 (2007:$1,178,488). The analysis assumes that all other variables, in particular, interest rates, remain constant. The analysis is performed on the same basis for 2007.
Final Accounts for Year Ended 31 December 2008

Annual Report 2008
- xli -
41
BANK OF JAMAICA
Notes to the Financial Statements (cont'd) December 31, 2008
34. Financial risk management (cont’d):
(d) Market risk (cont’d)
(ii) Interest rate risk:
Interest rate risk is the risk of loss from fluctuations in the future cash flows or fair values of financial instruments because of a change in market interest rates. It arises when there is a mismatch between interest-earning assets and interest-bearing liabilities which are subject to interest rate adjustments within a specified period. It can be reflected as a loss of future net interest income and/or a loss of current market values. The Bank manages this risk by monitoring interest rates daily and ensuring that, even though there is no formally predetermined gap limits, to the extent practicable, the maturity profile of its financial assets is, at least, matched by that of its financial liabilities.
The following table summarises the carrying amounts of balance sheet assets, liabilities and equity to arrive at the Bank’s interest rate gap based on the earlier of contractual repricing and maturity dates.
2008 Weighted Within Three to Over Payable Non-rate average 3 months 12 months 12 months after notice sensitive Total interest J$'000 J$'000 J$'000 J$'000 J$'000 J$'000 % AssetsNotes and coins - - - - 61,815 61,815 - Cash and cash equivalents - - - - 30,344,066 30,344,066 - Interest in funds managed by agents - - - 10,679,421 - 10,679,421 3.11Foreign currency denominated investments 57,367,634 - 45,118,823 - - 102,486,457 3.06International Monetary Fund - Holding of Special Drawing Rights - - - - 5,965 5,965 15.53Local currency denominated investments 508 5,758,841 81,511,073 - - 87,270,422 - International Monetary Fund – Quota Subscription - - - - 3,598,145 3,598,145 - Investment property - - - - 94,645 94,645 - Loans and advances 19,834,196 - - - - 19,834,196- Due from Government and Government agencies - - - - 4,244,418 4,244,418 - Property, plant and equipment - - - - 1,845,434 1,845,434 - Intangible assets - - - - 149,394 149,394 - Employee benefits - - - - 78,870 78,870 - Bilateral - - - - 2,684,100 2,684,100 - Other assets - - - - 3,297,891 3,297,891 -
Total assets 77,202,338 5,758,841 126,629,896 10,679,421 46,404,743 266,675,239 7.23
Final Accounts for Year Ended 31 December 2008

Bank of Jamaica
- xlii -
42
BANK OF JAMAICA
Notes to the Financial Statements (cont'd) December 31, 2008
34. Financial risk management (cont’d):
(d) Market risk (cont’d)
(ii) Interest rate risk (cont’d):
2008 Weighted Within Three to Over Payable Non-rate average 3 months 12 months 12 months after notice sensitive Total interest J$'000 J$'000 J$'000 J$'000 J$'000 J$'000 %
LiabilitiesNotes and coins in circulation - - - - 49,017,868 49,017,868 - Deposits and other demand liabilities: Jamaica dollar equivalent of foreign currency deposits 16,005,003 3,321,374 - 14,667,871 - 33,994,248 - Jamaica dollar deposits 13,154,493 - - 23,205,939 - 36,360,432 - Open market liabilities 65,873,999 58,949,983 3,155,806 - - 127,979,788 14.13 International Monetary Fund –
Allocation of Special Drawing Rights - - - - 4,694,987 4,694,987 -
Foreign liabilities - - - - 34,877 34,877 8.02 Employee benefits obligation - - - - 1,357,200 1,357,200 -Other liabilities - - - - 8,129,948 8,129,948 - Capital and reserves - - - - 5,105,891 5,105,891 -
Total liabilities 95,033,495 62,271,357 3,155,806 37,873,810 68,340,771 266,675,239 6.96Total interest rate sensitivity
gap (17,831,157) (56,512,516) 123,474,090 (27,194,389) (21,936,028) -
Cumulative gap (17,831,157) (74,343,673) 49,130,417 21,936,028 - -
2007 Weighted Within Three to Over Payable Non-rate average 3 months 12 months 12 months after notice sensitive Total interest J$'000 J$'000 J$'000 J$'000 J$'000 J$'000 %
AssetsNotes and coins - - - - 50,517 50,517 - Cash and cash equivalents - - - - 32,663,201 32,663,201 - Interest in funds managed by agents - - - 8,864,814 - 8,864,814 4.35 Foreign currency denominated investments 36,799,701 - 55,893,994 - - 92,693,695 5.90 International Monetary Fund - Holding of Special Drawing Rights - - - - 22,060 22,060 - Local currency denominated Investments 331,055 473,311 72,952,358 - - 73,756,724 14.28 International Monetary Fund – Quota Subscription - - - - 3,223,061 3,223,061 - Investment property - - - - 88,597 88,597 - Investments in financial institutions - - - - 3,200 3,200 - Due from Government and Government agencies - - - - 11,753,177 11,753,177 - Property, plant and equipment - - - - 1,770,693 1,770,693 - Intangible assets - - - - 127,200 127,200 - Employee benefits - - - - 3,338,400 3,338,400 - Other assets - - - - 3,043,996 3,043,996 -
Total assets 37,130,756 473,311 128,846,352 8,864,814 56,084,102 231,399,335 7.08
Final Accounts for Year Ended 31 December 2008

Annual Report 2008
- xliii -
43
BANK OF JAMAICA
Notes to the Financial Statements (cont'd) December 31, 2008
34. Financial risk management (cont’d):
(d) Market risk (cont’d)
(ii) Interest rate risk (cont’d):
2007 Weighted Within Three to Over Payable Non-rate average 3 months 12 months 12 months after notice sensitive Total interest J$'000 J$'000 J$'000 J$'000 J$'000 J$'000 %
LiabilitiesNotes and coins in circulation - - - - 47,179,828 47,179,828 - Deposits and other demand liabilities: Jamaica dollar equivalent of foreign currency deposits 2,338,920 - - 13,705,498 - 16,044,418 - Jamaica dollar deposits 22,094,107 - - 18,367,914 - 40,462,021 - Open market liabilities 53,583,336 - - 60,346,784 - 113,930,120 12.05 International Monetary Fund –
Allocation of Special Drawing Rights - - - - 4,205,563 4,205,563 -
Foreign liabilities - - 73,607 - 17,413 91,020 8.20 Employee benefits obligation - - - - 967,100 967,100 - Other liabilities - - - - 2,675,321 2,675,321 - Capital and reserves - - - - 5,843,944 5,843,944 -
Total liabilities 78,016,363 - 73,607 92,420,196 60,889,169 231,399,335 5.94Total interest rate sensitivity
gap (40,885,607) 473,311 128,772,745 (83,555,382) ( 4,805,067) - Cumulative gap (40,885,607) (40,412,296) 88,360,449 4,805,067 - -
Sensitivity Analysis
A change of 200 (2007:100) basis points in interest rates for Jamaica dollar financial instruments and a change of 25 (2007: 100) basis points for United States dollar financial instruments would have increased or decreased profit and equity by the amounts shown. The analysis assumes that all other variables, in particular, foreign currency rates, remain constant. The analysis is performed on the same basis for 2007.
Increase Decrease Effect on Effect on Effect on Effect on profit/loss equity profit/loss equity
December 31, 2008 Fixed rate financial instruments - ( 144,179) - 147,395 Variable rate financial instruments 1,647,644 ( 78,138) (1,647,644) 78,963
1,647,644 ( 222,317) (1,647,644) 226,358
December 31, 2007 Fixed rate financial instruments - (2,629,737) - 2,811,826 Variable rate financial instruments 689,553 ( 25,984) ( 689,553) 26,152 689,553 (2,655,721) ( 689,553) 2,837,978

Bank of Jamaica
- xliv -
44
BANK OF JAMAICA
Notes to the Financial Statements (cont'd) December 31, 2008
34. Financial risk management (cont’d):
(e) Capital management
The Bank’s capital consists of ordinary share capital, general reserve fund, stabilisation reserve fund, securities revaluation reserve, property revaluation reserve and pension equalisation reserve. The share capital of the Bank may be increased by resolution of the Board of Directors. This resolution has to be approved by the House of Representatives. The Bank’s net profit is transferred to the capital reserve fund. Whenever the credit in the reserve fund exceeds five times the authorised share capital such excess profit is paid to the Consolidated Fund. The Bank has been complying with this requirement. There were no changes in the Bank’s approach to capital management during the year.


![THE JAMAICA DEVELOPMENT BANK ACTextwprlegs1.fao.org/docs/pdf/jam81653.pdf · THE JAMAICA DEVELOPMENT BANK ACT [3rd September, 1969. ] 1. This Act may be cited as the Jamaica Development](https://img.pdfslide.us/doc/110x75/6149bb2912c9616cbc68f3ba/the-jamaica-development-bank-the-jamaica-development-bank-act-3rd-september-1969.jpg)