Embed Size (px)
Citation preview
The bank for a changing world
BNP PARIBAS LUXEMBOURG 2 0 0 4
ANNUAL REPORT 2004BNP PARIBAS LUXEMBOURG
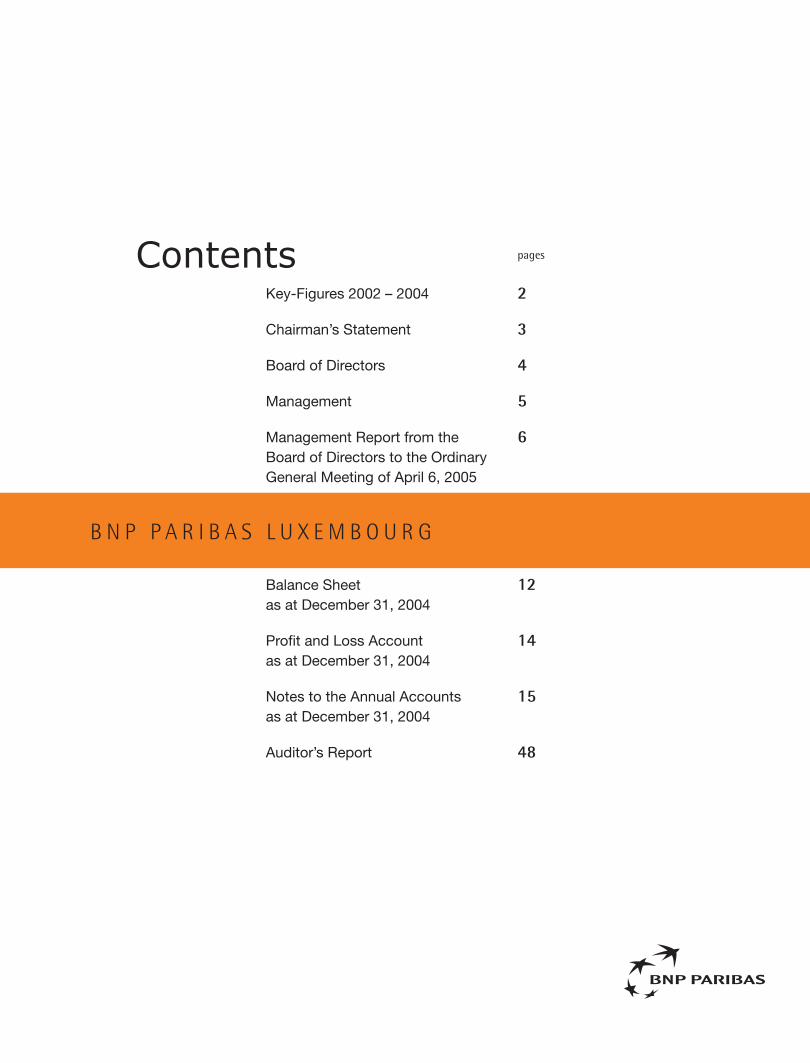
Contents pages
2
3
4
5
6
12
14
15
48
B N P P A R I B A S L U X E M B O U R G
Key-Figures 2002 – 2004
Chairman’s Statement
Board of Directors
Management
Management Report from the Board of Directors to the Ordinary General Meeting of April 6, 2005
Balance Sheet as at December 31, 2004
Profit and Loss Accountas at December 31, 2004
Notes to the Annual Accountsas at December 31, 2004
Auditor’s Report
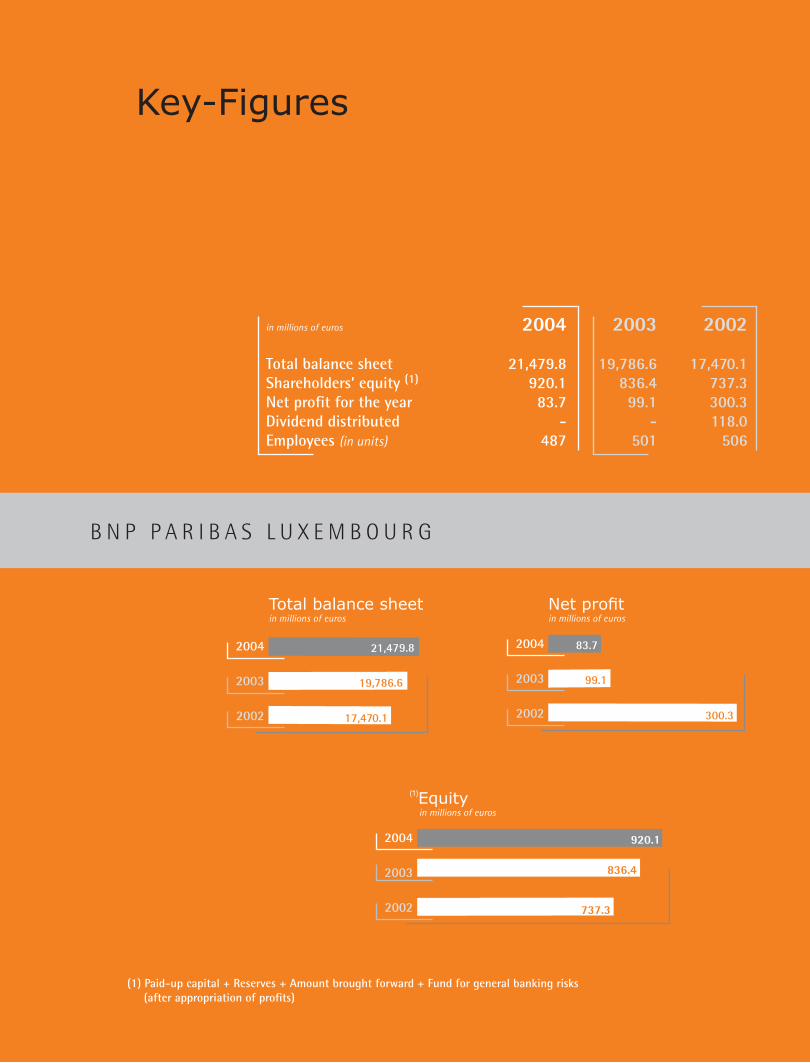
in millions of euros 2004 2003 2002 Total balance sheet 21,479.8 19,786.6 17,470.1Shareholders’ equity (1) 920.1 836.4 737.3Net profit for the year 83.7 99.1 300.3Dividend distributed - - 118.0Employees (in units) 487 501 506
(1) Paid-up capital + Reserves + Amount brought forward + Fund for general banking risks (after appropriation of profits)
B N P P A R I B A S L U X E M B O U R G
Key-Figures
Total balance sheetin millions of euros
17,470.1
19,786.6
21,479.82004
2003
2002
Net profitin millions of euros
99.1
300.3
83.72004
2003
2002
(1)Equity in millions of euros
836.4
737.3
920.12004
2003
2002
Despite a year marked by major geopolitical tensions and considerable volatility in the price of energy, raw materials and currencies, there was a general strengthening of the world economy, which grew by 5 percent in 2004.
Nonetheless a number of geopolitical or structural imbalances persisted, whether it concerned the difference between a vigorous growth in the US and Asia and a very slow recovery in Europe, or the continuing high budget deficits in most industrialised countries.
In this economic environment, which forced the American Federal Reserve to change its monetary policy by carrying out five successive increases in its intervention rate, the stock markets certainly performed less brilliantly then in 2003. Nevertheless, fuelled by good corporate results, the major indices registered increases : 3.1% for the Dow Jones, 7.6% for the Nikkei, 7.3% for the DAX, 6.9% for the FTSE and 7.4% for the CAC40.
The LuxX, the Luxembourg Stock Exchange index, performed particularly well, with an increase of 26.8%.
On the occasion of its 75th anniversary, the Luxembourg Stock Exchange once again demonstrated its vitality with an exceptional year for the official listings of various types of instruments : debt instruments, undertakings for collective investments, warrants...
The number of instruments quoted, increasing by 13.5% to 33,022 securities, and the volume of trades on the secondary market, progressing by 50.7%, demonstrate the dynamism of the Financial Centre of Luxembourg.
For its part, BNP Paribas Luxembourg has continued its policy of business development which has allowed each one of its business activities to produce good operating results, although the decrease in the net earnings of the Bank, which were affected by the changes in participating interests, do not reflect these results :
• Despite an adverse environment, linked to the impact of the falling dollar on a part of the income and a repatriation of capital out of Luxembourg, the Private Bank has realised results comparable to those of the previous year.
• Largely as a result of the early close-out of non-recurring transactions, market activities have recorded a particularly favourable year.
• Finally, a sustained effort within the Corporate Client domain has led to an increase in market share in this area.
Given the constant evolution of the fiscal and regulatory environment in Europe, the BNP Paribas Group will rely on its creativity, its capacity for financial engineering, its commercial dynamism and its rigorous operational procedures, in the hope of improving the quality of its service, year after year, to the satisfaction of its clients.
This is the aim of the entire staff of BNP Paribas Luxembourg for 2005.
Chairman’s Statement
Vivien Lévy-Garboua
AN
NU
AL
RE
PO
RT
20
04
P A G E S 2 3

Board of Directors
ChairmanVivien LEVY-GARBOUA
Member of the BNP Paribas Executive Committee, Head of Compliance and Internal Control Coordinatoruntil March 4, 2005
DirectorsMarc ASSAChief Executive Officer and Chairman of the Management Board of Tarkett
Alain BAILLYChief Executive Officer, Managing Director of BNP Paribas Luxembourg until December 31, 2004
Philippe BORDENAVEMember of the BNP Paribas Executive Committee,Chief Financial Officer
François DEBIESSEChief Executive Officer of BNP Paribas Private Banking
Dominique HOENNSenior Advisor of BNP Paribas
Edmond ISRAELHonorary Chairman of Clearstream International SA
Vivien LEVY-GARBOUAMember of the BNP Paribas Executive Committee, Head of Compliance and Internal Control Coordinator
Board SecretaryDaniel POSTAL
Alain PAPIASSE
Member of the BNP Paribas Executive Committee, Head of AMS (Asset Management and Services)from March 4, 2005
Jacques LOESCHAvocat à la Cour
Jacques-Philippe MARSONChief Executive Officer of BNP Paribas Securities Services
Eric MARTINChief Executive Officer, Managing Director of BNP Paribas Luxembourgfrom January 1, 2005
Alain PAPIASSEMember of the BNP Paribas Executive Committee, Head of AMS (Asset Management and Services)from February 23, 2005
Jacques POOSCompanies’ Director
Roger SIETZENCompanies’ Director
François TESCHManaging Director of Le Foyer Finance
Gilles de VAUGRIGNEUSEChairman of BNP Paribas Asset Management

Management
General ManagementManaging Director
Alain BAILLY until December 31, 2004
Eric MARTIN from January 1, 2005
Deputy General Manager
Patrice CROCHET
Business LinesALM Treasury
Dominique GOULEM
Private Bank
Patrice CROCHET
Coverage and Territories Europe
Pierre BONIN
Cortal Consors*
Fabrice FLET until January 31, 2005
Stéphane HONIG from February 1, 2005
Fixed Income
Dominique GOULEM
FunctionsLegal Department
Daniel POSTAL
Internal Audit
Jean-François VITTE
External Communication
Liliane PEIFFER
Ethics and Compliance
Anne KAYSER-NEUSS
Finance, Central Organization
Yvan JUCHEM
Risk Management
Dominique MOREL
Operations and Information Technology
Philippe STERNO
Organization
Fabrice CUCCHI
Human Resources
Jean-Claude BAROTTE
AN
NU
AL
RE
PO
RT
20
04
B N P P A R I B A S L U X E M B O U R G
* Cortal Consors, based in Luxembourg since 1993, joined BNP Paribas Luxembourg as a department from January 1, 2005.
P A G E S 4 5
Management Report of the Board of Directors
to the Ordinary General Meeting of April 6, 2005
For BNP Paribas Luxembourg, the year 2004 marked the launching of a major business offensive, which impacted on all the activities of the Bank.
In 2004 the Bank continued to reinforce the security of its data processing and the efficiency of its operating systems through a number of projects supervised by the General Management of the BNP Paribas Group.
We have moreover carried out, within the allocated time limit, the adaptation of our information systems to the new International Financial Reporting Standards (IFRS), which are applicable to the consolidated accounts of our parent company from 2005.
Finally, this year we successfully concluded the merger of the Bank with Cortal Consors Luxembourg, another subsidiary of the BNP Paribas Group, which specialises in brokerage and online investment. The goal of this merger, completed on January 1, 2005, is to develop synergies between these two entities.
Balance sheet and results
As at December 31, 2004 total assets amounted to 21,479.8 million euros compared with 19,786.6 million euros at the 2003 year-end, an increase that can be attributed essentially to a growth in interbank operations.
Own funds (capital, reserves, profit brought forward and fund for general banking risks) after appropriation of profit for the 2004 financial
year, as proposed in this report for approval by the Meeting, will amount to 920.1 million euros compared with 836.4 million euros as at December 31, 2003.
Net profit for the year was 83.7 million euros compared with 99.1 million euros in 2003. This difference, compared with the 2003 financial year, is largely attributable to a decrease in income from participating interests.
Against a backdrop of contrasting economic and financial data, the decrease in net banking income of 35.9 million euros, or 22% compared with the previous year, is principally due to a decrease of 35.3 euros in dividends from participating interests. The interest margin decreased by 9.5 million euros, while the commissions margin increased by 11.4 million euros. Earnings from financial operations decreased moderately by 2.5 million euros compared with 2003.
Other operating income increased by 14.7 million, mainly as a result of a rise in capital gains in 2004 of 17.7 million euros, made on the sale of participating interests.
General administrative expenses are 2.9 million euros or 5% higher, compared with 2003.
With regard to provisioning and value re-adjustments, the Bank has reduced its net charges by 4.2 million euros in comparison with 2003.
The Capital Adequacy Directive ratio (CAD) decreased from 21.4% at year-end 2003 to
the unfavourable conditions, related to the institution of tax amnesties in certain neighbouring countries, private banking acti-vities realised steady growth in 2004.
We have strengthened our global reach by becoming the agent for Investlife, the life insurance subsidiary of the BNP Paribas Group in Luxembourg. We can thus offer our clients additional solutions to problems relating to estate planning or wealth management.
ALM Treasury has achieved excellent results in 2004 thanks to the early liquidation of a certain number of long-term positions. After a slight exchange-related downturn, funding continued to grow in volume as well as in market share.
Fixed Income has continued to expand its range of quality exchange products for institutional customers, banks and corporations in accordance with its forward-looking three-year plan.
The activity of Coverage and Territories Europe (CTE) in Luxembourg was well-placed throughout 2004. Having been designated, along with nine other European countries, as a strategic territory for the development of BNP Paribas Group’s Corporate activity, the Luxembourg Corporate team has worked hard both to win over new clients and also to increase market share with existing clients. The CTE team has also made a substantial effort in promoting the Financial Centre of Luxembourg by underlining the advantages it offers to large corporations.
17.2% as at December 31, 2004. This decline, compared with year-end 2003, is attributed to an increase in balance sheet items as at December 31, 2004, which was partially offset by an increase in eligible capital.
Appropriation of profit
Taking into account the profit brought forward from 2004 of 453 million euros and net profit for 2004 of 83.7 million euros, the total amount for allocation is 536.7 million euros.
We propose that this be allocated as follows :
in euros
Legal reserve 56,000Other reserves * 8,628,387Profit brought forward 528,048,590
Total 536,732,977
(*) of which 6,831,301 euros net to reserve for reduction of tax on net worth and 1,797,086 euros to the free reserves
In accordance with Article 70 of the Law of June 17, 1992, we confirm that no major events have occurred since the end of the financial year 2004 with the exception of the merger-takeover by the Bank of Cortal Consors Luxembourg of which we already held 40%. In payment for the net assets brought by the shareholder Cortal Consors France, the Bank issued 12,000 new shares.
Activities/Business lines
Private Banking finished the year with results comparable to those of 2003. Leaving aside
AN
NU
AL
RE
PO
RT
20
04
P A G E S 6 7
Strategy in using financial instruments
The Bank’s activities with regard to financial instruments mainly concern hedging operations.
The main treasury instruments include fixed or floating-rate loans, repurchase agreements and income transferable securities.
With a view to minimising the interest rate risk inherent in the different balance sheet items, the Bank basically uses interest rate swaps and currency swaps.
Transactions for trading purposes involving interest rate instruments are conducted solely in income transferable securities and interest rate swaps.
The Bank does not take foreign exchange positions for trading purposes.
The Bank’s risk management objectives and strategies
The Bank’s risk management policy is firmly enshrined in the risk policy framework set out by the BNP Paribas Group.
Consequently, the Bank has a dedicated risk department of its own, drawn from the Group Risk Management department of the BNP Paribas Group. This department operates according to the following principles :
• It supervises all risk-taking, the primary responsibility in terms of risk being with the business lines.
• In order to increase its independence, the department manager works directly for the global function and reports to the Managing Director.
• Among the different types of potential risk, this department is in charge of credit, counterparty and market risks.
In practice, the activities of the Risk Management department can be characterised by two main levels of responsibility :
- a decision-making role in co-operation with the individual departments,
- a responsibility for control, raising the alarm and reporting.
Credit and counterparty risk
In terms of credit and counterparty risk, the Bank applies the General Credit Policy of the BNP Paribas Group. As well as defining decision-making procedures with regard to the approval of credit, this policy also sets out the rules governing sector-based and country risks.
Acceptance of a credit risk or counterparty risk linked to a borrower or group of borrowers takes practical effect in the form of an authorisation, subject to the prior agreement of an independent representative of the Group’s Risk Management department.
Market risks
Market risk is the potential loss from an interest rate or foreign exchange position in the event of an unfavourable development in the market parameters (interest rate, exchange rate).
The Bank’s interest rate risk is measured by using an internal model developed by the BNP Paribas Group. This enables cash shortage and surplus to be measured and analysed by currency, parameter (short-term funds, speculative portfolio, long-term positions) and by maturity. The interest rate position per currency and per parameter is controlled by means of limits expressed as a one-year equivalent.
The Bank’s foreign exchange risk, expressed in nominal value, is measured by totalling up the absolute values of open positions in each currency, converted into euros. This foreign exchange position is subject to both an intraday and an overnight limit. The principle of hedging foreign exchange risk prevails with regard to all instruments and all portfolios.
Interest rate positions of a speculative nature and the foreign exchange position are subject to a VaR (Value at Risk) calculation using an internal model developed by the BNP Paribas Group. The VaR measures the potential variation in current value of the portfolio for a given time horizon (10 days) and a given probability level (99%), assuming normal market conditions.
The authorisations are created and updated using the Bank’s various IT tools, and come under the responsibility of the Risk Management department, which must also ensure in advance that the conditions set out in the credit agreement have been met. Adherence to these conditions is monitored initially by the departments as part of their day-to-day work, and then by the Risk Management department at a second level.
The authorisations are subject to periodic review, at least once a year, which involves analysing the ability of the borrowers to meet their obligations and adapting the Bank’s position accordingly. In particular, the Bank’s risk exposure to its different counterparties can be reduced by means of guarantees or compensation agreements.
The above principles are also applied to credit risk emanating from derivatives. The level of risk is calculated either on a lump-sum basis or on a “marked to market plus add-on” basis, taking into account the type of instrument and its maturity date. These lump-sum amounts are expressed as a percentage of the nominal or notional value of the transaction. The “marked to market plus add-on“ approach corresponds to the valuation of the instrument at its market value, which is then increased by a percentage of the notional amount.
AN
NU
AL
RE
PO
RT
20
04
P A G E S 8 9
Each of the limits described above is subject to daily monitoring by the Risk Management department which, furthermore, conducts a monthly calculation of the Bank’s exposure to interest rate risk in exotic currencies on the basis of worst-case scenarios. These scenarios simulate the effects of a monetary crisis, lasting two months, on the Bank’s short-term positions in exotic currencies.
Finally, the Bank has set up an Asset and Liability COmmittee (ALCO) whose task is to examine the following aspects on a quarterly basis : liquidity positions ; adherence to credit limits imposed on the trading room ; the Bank’s liquidity policy ; the worst-case scenarios used to test the Bank’s exposure to interest rate risk in exotic currencies ; balance sheet structure and the investment of capital and reserves.
Liquidity risks
Liquidity risk can be defined as the risk of finding oneself in a position in which it is impossible to relinquish an approved credit (asset) or to find a resource (liability) whilst at the same time being forced to incur a major loss. It can in particular take the form of an increase in financing costs on the interbank market, making it impossible for the bank concerned to meet its obligations to customers or counterparties. It is a question of determining the Bank’s dependence on last-minute financing in the major currencies in the event of a liquidity crisis.
The risk is subject to a limit known as the “overnight guideline” and is subject to daily checks by the Risk Management department.
In terms of the liquidity requirements under the regulations in force in Luxembourg, the Bank has always greatly exceeded the minimum requirement of 30%. This ratio is monitored on a monthly basis by the Finance function together with the ALM Treasury Business Line.
As at December 31, 2004 the liquidity ratio was 91.6% (December 31, 2003 : 84.4%). The average monthly liquidity ratio in 2004 was 91.2% (monthly average in 2003 : 89.5%)
Operational risk
In accordance with the Advanced Measurement Approach (AMA) chosen by the BNP Paribas Group, BNP Paribas Luxembourg has continued the implementation of its operational risk management systems. In this context, the year 2004 was marked in a number of aspects.
The consolidation of the first stage of the approach, namely the setting up of the historical database of incidents (IMS) : the basic parameter has been adapted to take into account more precisely incidents relating to Ethics and Compliance, and Legal and Data Processing matters. These changes reinforce the transparency of the Bank’s operational risks.
With respect to the second stage, namely the implementation of the new operational risk
Eric Martin, took over his responsibilities as Managing Director, Chief Executive Officer on January 1, 2005.
Outlook
In 2005 the accent will continue to be on business development relying on a stronger operation, notably as a result of our merger with Cortal Consors Luxembourg and the subsequent cross selling opportunities.
The Bank has fixed a goal for itself of making the new directive on savings, which will be applicable from July 1, 2005, an opportunity to enlarge our product offerings with innovative formulas, by calling on the expertise of our professionals.
In 2005 we will continue to develop our processing channels in order to offer an even better quality of service to our customers and to improve the efficiency of our operations.
management policy defined by the Group at the end of 2003 : this year the key processes have been identified and documented. More-over, in order to support the implementation of this policy, management systems have been developed and progressively put into operation. Upon completion, they will form the basis of an internal model for the evaluation of operational risks and will be reviewed by the competent surveillance authorities at the end of 2006.
In parallel, the inclusion of an operational risk analysis of current processes (the organisation and structure of budget management) has been put in place.
Finally, in accordance with the guidelines of Basel II and the standards of the Group, the management structure for operational risk has been strengthened. Thus an Operational Risk analyst has been named and an Operational Risk Committee has been set up.
Human resources
As at December 31, 2004 the Bank employed 487 people compared with 501 as at Decem-ber 31, 2003.
The Board of Directors would like to thank the Management and the entire workforce for their continued support in 2004 and especially to thank Alain Bailly who has been assigned to other duties within our Group. His successor,
AN
NU
AL
RE
PO
RT
20
04
P A G E S 10 11
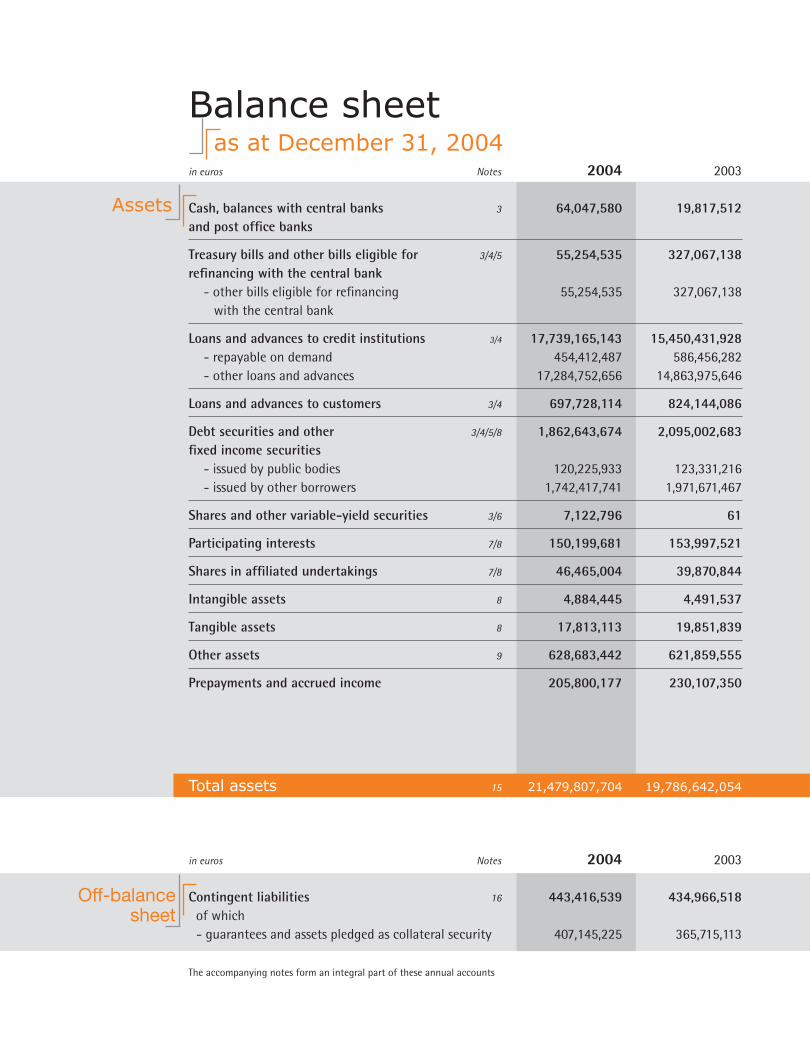
in euros Notes 2004 2003 Cash, balances with central banks 3 64,047,580 19,817,512and post office banks
Treasury bills and other bills eligible for 3/4/5 55,254,535 327,067,138refinancing with the central bank - other bills eligible for refinancing 55,254,535 327,067,138 with the central bank
Loans and advances to credit institutions 3/4 17,739,165,143 15,450,431,928 - repayable on demand 454,412,487 586,456,282 - other loans and advances 17,284,752,656 14,863,975,646
Loans and advances to customers 3/4 697,728,114 824,144,086
Debt securities and other 3/4/5/8 1,862,643,674 2,095,002,683fixed income securities - issued by public bodies 120,225,933 123,331,216 - issued by other borrowers 1,742,417,741 1,971,671,467
Shares and other variable-yield securities 3/6 7,122,796 61
Participating interests 7/8 150,199,681 153,997,521
Shares in affiliated undertakings 7/8 46,465,004 39,870,844
Intangible assets 8 4,884,445 4,491,537
Tangible assets 8 17,813,113 19,851,839
Other assets 9 628,683,442 621,859,555
Prepayments and accrued income 205,800,177 230,107,350
Total assets 15 21,479,807,704 19,786,642,054
in euros Notes 2004 2003 Contingent liabilities 16 443,416,539 434,966,518 of which - guarantees and assets pledged as collateral security 407,145,225 365,715,113
The accompanying notes form an integral part of these annual accounts
Off-balance sheet
Balance sheet as at December 31, 2004
Assets
Liabilities and Shareholders’
Equity
Off-balance sheet
in euros Notes 2004 2003
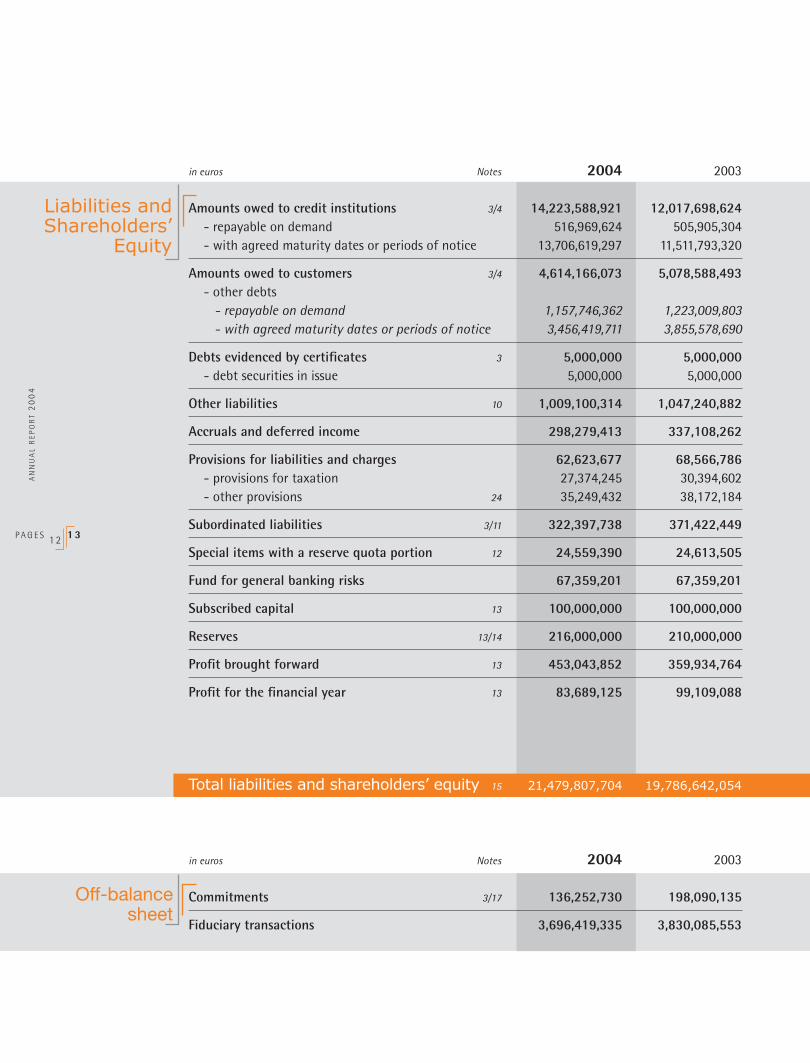
Amounts owed to credit institutions 3/4 14,223,588,921 12,017,698,624 - repayable on demand 516,969,624 505,905,304 - with agreed maturity dates or periods of notice 13,706,619,297 11,511,793,320
Amounts owed to customers 3/4 4,614,166,073 5,078,588,493 - other debts - repayable on demand 1,157,746,362 1,223,009,803 - with agreed maturity dates or periods of notice 3,456,419,711 3,855,578,690
Debts evidenced by certificates 3 5,000,000 5,000,000 - debt securities in issue 5,000,000 5,000,000
Other liabilities 10 1,009,100,314 1,047,240,882
Accruals and deferred income 298,279,413 337,108,262
Provisions for liabilities and charges 62,623,677 68,566,786 - provisions for taxation 27,374,245 30,394,602 - other provisions 24 35,249,432 38,172,184
Subordinated liabilities 3/11 322,397,738 371,422,449
Special items with a reserve quota portion 12 24,559,390 24,613,505
Fund for general banking risks 67,359,201 67,359,201
Subscribed capital 13 100,000,000 100,000,000
Reserves 13/14 216,000,000 210,000,000
Profit brought forward 13 453,043,852 359,934,764
Profit for the financial year 13 83,689,125 99,109,088
Total liabilities and shareholders’ equity 15 21,479,807,704 19,786,642,054
in euros Notes 2004 2003
Commitments 3/17 136,252,730 198,090,135 Fiduciary transactions 3,696,419,335 3,830,085,553
AN
NU
AL
RE
PO
RT
20
04
P A G E S 1 2 1 3
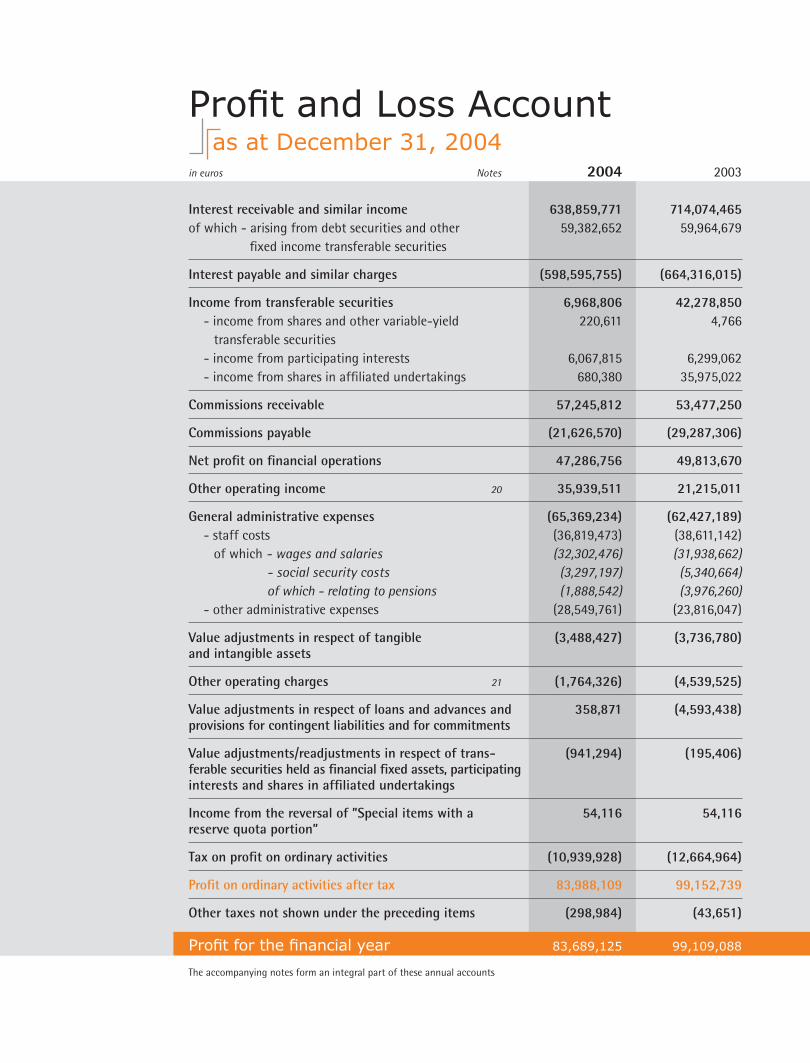
in euros Notes 2004 2003 Interest receivable and similar income 638,859,771 714,074,465of which - arising from debt securities and other 59,382,652 59,964,679 fixed income transferable securities Interest payable and similar charges (598,595,755) (664,316,015) Income from transferable securities 6,968,806 42,278,850 - income from shares and other variable-yield 220,611 4,766 transferable securities - income from participating interests 6,067,815 6,299,062 - income from shares in affiliated undertakings 680,380 35,975,022 Commissions receivable 57,245,812 53,477,250 Commissions payable (21,626,570) (29,287,306) Net profit on financial operations 47,286,756 49,813,670 Other operating income 20 35,939,511 21,215,011 General administrative expenses (65,369,234) (62,427,189) - staff costs (36,819,473) (38,611,142) of which - wages and salaries (32,302,476) (31,938,662) - social security costs (3,297,197) (5,340,664) of which - relating to pensions (1,888,542) (3,976,260) - other administrative expenses (28,549,761) (23,816,047) Value adjustments in respect of tangible (3,488,427) (3,736,780)and intangible assets Other operating charges 21 (1,764,326) (4,539,525) Value adjustments in respect of loans and advances and 358,871 (4,593,438)provisions for contingent liabilities and for commitments Value adjustments/readjustments in respect of trans- (941,294) (195,406)ferable securities held as financial fixed assets, participatinginterests and shares in affiliated undertakings Income from the reversal of ”Special items with a 54,116 54,116reserve quota portion” Tax on profit on ordinary activities (10,939,928) (12,664,964)
Profit on ordinary activities after tax 83,988,109 99,152,739 Other taxes not shown under the preceding items (298,984) (43,651)
Profit for the financial year 83,689,125 99,109,088
The accompanying notes form an integral part of these annual accounts
Profit and Loss Account as at December 31, 2004
Notes to the Annual Accounts as at December 31, 2004
General
BNP Paribas Luxembourg, hereinafter referred to
as “the Bank”, was established on October 23, 1964
in the form of a public limited company subject to
Luxembourg law by the name of “Banque de Paris et
des Pays-Bas pour le Grand-Duché de Luxembourg
SA”.
On July 17, 2000 Paribas Luxembourg and Banque
Nationale de Paris (Luxembourg) SA, a public limited
company under Luxembourg law established on May
28, 1921, merged to form BNP Paribas Luxembourg
with retroactive effect for accounting purposes from
January 1, 2000.
Under Luxembourg law the Bank may engage in
any form of banking transactions. The Bank is a
subsidiary of BNP Paribas, “société anonyme” under
French law with its registered office at 16 boulevard
des Italiens, F-75009 Paris.
The Bank’s annual accounts are included in the con-
solidated annual accounts prepared by BNP Paribas,
which are available from the registered office of
BNP Paribas.
The Bank is exempt from the requirement to publish
consolidated annual accounts and a consolidated
management report.
Significant accounting policies
The Bank’s annual accounts are prepared in accor-
dance with the laws and regulations applicable to the
banking sector in the Grand Duchy of Luxembourg.
The following accounting principles are of particular
significance :
2.1 Currency translation
The annual accounts are expressed in euros.
The Bank uses the multi-currency accounting method
which involves recording assets and liabilities, off-
balance sheet items and income and expenses in their
original currencies.
For the purposes of preparing financial statements
in euros, assets and liabilities as well as suspense
accounts denominated in currencies other than the
euro are translated on the basis of the spot exchange
rates recorded at the balance sheet date.
Income and expenses in currencies other than the
euro are recorded in their respective currencies and
translated on a daily basis at the prevailing exchange
rates at the recording date.
Foreign exchange gains and losses resulting from the
net non-forward-hedged spot currency position are
posted to the profit and loss account.
Exchange differences resulting from the valuation
of spot exchange transactions hedged by forward
exchange transactions (swaps) are set against each
other under prepayments and accrued income,
and accruals and deferred income. Any differences
between the spot and forward exchange rates
(premium or discount) realised in the conclusion of
such transactions are accounted for in the profit and
loss account pro rata temporis.
Forward exchange transactions that are not linked to
balance sheet items are valued at the forward rate
applicable at the balance sheet date.
AN
NU
AL
RE
PO
RT
20
04
P A G E S 1 4 15
Note 1
Note 2
Provision is made for unrealised losses on non-hedged
forward exchange translations whilst any unrealised
gains are not taken into account.
On hedged forward exchange transactions, a provision
is made to cover estimated residual losses, after off
setting those losses against estimated gains on
all transactions maturing the same day or earlier.
Estimated residual gains are not taken into account.
2.2 Demand and fixed-term assets and liabilities
Assets and liabilities that are repayable on demand
include those amounts that could be recovered at
any time without notice, or with a period or notice
period of 24 hours or of one working day, has been
agreed. The expression “with agreed maturity dates”
as used with regard to the various accounting items
refers to a final maturity of more than one working
day, including periods of notice of more than one
working day. Assets and liabilities are classed
according to the remaining maturity, in other words
the remaining term as at the balance sheet date.
2.3 Fixed income securities
All of the securities included in the three portfolio
categories are entered in the balance sheet in their
currency of issue. They are valued at the closing date
according to the methods applicable to each portfolio
category.
2.3.1 Financial fixed assets
Financial fixed assets are fixed income securities
intended for use on a long-term basis in the Bank’s
activities.
Financial fixed assets are entered in the balance sheet
at purchase price.
Within the limit specified by the Luxembourg
Banking Regulations, the Bank distinguishes between
transferable securities that are valued according to
the purchase price method and those securities that
are valued according to the principle of lower of cost
or market.
2.3.1.1 Transferable securities maintained at
purchase price
With regard to securities in this portfolio subcate-
gory, the premium is treated differently according to
whether there exists matched refinancing or interest
rate risk hedging.
With regard to securities for which there exists
matched refinancing or interest rate risk hedging,
the difference between the purchase price and the
redemption price is accrued.
With regard to other securities, the full depreciation
of the premium is applied throughout the year
of acquisition, within the limit specified by the
Luxembourg Banking Regulations.
Value adjustments are only made for permanent
depreciation ; unrealised gains are not taken into
account.
2.3.1.2 Securities valued at the lower of cost
or market
Securities are valued at the lower of cost, minus any
prorated premiums or discounts, or of market. Value
adjustments are made to take account of unrealised
losses. Any unrealised gains are not taken into
account.
Prior value adjustments that no longer relate to a
loss at the closing date are maintained for the se-
curities included in the portfolio as at 31 December
(Beibehaltungsprinzip).
AN
NU
AL
RE
PO
RT
20
04
P A G E S 16 17
2.3.2 Structural portfolio
The securities included in this portfolio are securities
that were acquired with a view to earning a return.
They are entered in the balance sheet at their pur-
chase price. The premium is depreciated pro rata
temporis for the period for which the security
has already been held. The securities are valued at
the lower of cost, adjusted to take account of the
depreciated premium, or of market. Value adjust-
ments are made to take account of unrealised losses.
Any unrealised gains are not taken into account.
Prior value adjustments that no longer relate to a
loss at the closing date are maintained for the se-
curities included in the portfolio as at 31 December
(Beibehaltungsprinzip).
2.3.3 Trading portfolio
The fixed income securities in the trading portfolio
are held with the purpose of being resold in the
short term.
They are valued and entered in the balance sheet
at their market value. Unrealised valuation gains
and losses are taken to the profit and loss account
at the balance sheet date.
2.4 Variable-yield securities
2.4.1 Structural portfolio
Variable-yield securities are posted to the balance
sheet at their purchase price in the reporting currency
of the issuing company.
The securities are valued at the lower of cost or
market. Value adjustments are made to take account
of unrealised losses. Any unrealised gains are not
taken into account.
2.4.2 Financial fixed assets
Participating interests and shares in affiliated under-
takings considered to be financial fixed assets are
recorded at the acquisition cost and in the reporting
currency of the issuing company. Value adjustments
are made in the event of a permanent depreciation.
2.5 Tangible and intangible assets
Tangible and intangible assets are recorded in the
balance sheet at the acquisition cost less accumula-
ted depreciation. The annual depreciation is carried
out on a straight line basis and the rate fixed
according to the estimated useful life of the goods.
Land is not subject to depreciation.
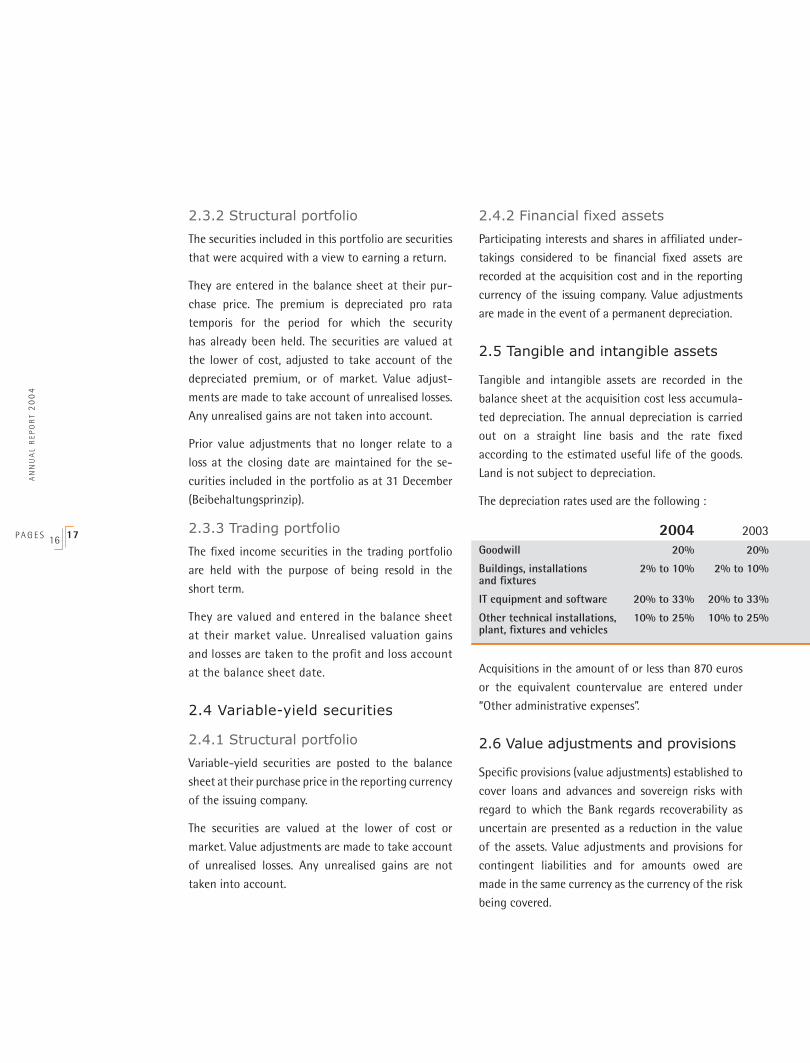
The depreciation rates used are the following :
Acquisitions in the amount of or less than 870 euros
or the equivalent countervalue are entered under
“Other administrative expenses”.
2.6 Value adjustments and provisions
Specific provisions (value adjustments) established to
cover loans and advances and sovereign risks with
regard to which the Bank regards recoverability as
uncertain are presented as a reduction in the value
of the assets. Value adjustments and provisions for
contingent liabilities and for amounts owed are
made in the same currency as the currency of the risk
being covered.
2004 2003Goodwill 20% 20%
Buildings, installations 2% to 10% 2% to 10%and fixtures
IT equipment and software 20% to 33% 20% to 33%
Other technical installations, 10% to 25% 10% to 25%plant, fixtures and vehicles
Allocations to and withdrawals from value adjust-
ments and provisions for contingent liabilities and
amounts owed are offset in the profit and loss
account.
The lump-sum provision for risk exposures esta-
blished on the basis provided by Luxembourg tax
and banking legislation is recorded in the reporting
currency. The portion of the general provision
calculated on the basis of the credit risk of the
balance sheet items is deducted from the asset items
used in the calculation.
The portion of the general provision calculated on
the basis of other risks is entered on the liabilities
side under the item “Provisions for liabilities and
charges”.
Provisions for liabilities and charges are accounted
for to cover losses or debts that are clearly of a
restricted nature but which, as at the balance sheet
date, are either probable or certain but yet to be
specified in terms of amount or due date.
The Bank has established a fund for general banking
risks on the liabilities side of the balance sheet. This
provision has been made in the currency in which the
capital is expressed from profits after tax but prior to
determination of net profit.
2.7 Debts
Debts are entered on the liabilities side of the balance
sheet at their repayment value.
2.8 Forward financial instruments
2.8.1 Interest rate swaps
Forward interest rate instruments, mainly Interest
Rate Swaps (IRS), traded on the OTC market and not
allocated to specific assets or liabilities, are valued
at market value. Unrealised losses are taken into
account in the result whilst no account is taken of
unrealised gains.
IRS traded on the OTC market and used to hedge
the Bank’s interest rate positions are not valued at
market value.
2.8.2 Options
With regard to options traded on the OTC market
that are not allocated to specific assets or liabilities,
premiums paid or received are recorded in the
balance sheet or until the option is exercised or
until maturity if the option has not been exercised
by then. Commitments relating to issued options are
recorded as off-balance sheet items.
Options held for purposes other than hedging are
valued at their market value. Estimated unrealised
losses are taken into account in the profit and loss
account while no account is taken of unrealised
gains.
Options held for hedging purposes, other than those
purchased to hedge warrant issues, are not valued.
Options traded on the organised market to hedge
transactions in the opposite direction, or options with
identical characteristics, also traded on the organised
market, are treated as follows : the position on these
instruments having been closed, the profit/loss from
the premiums received and paid is entered in the
profit and loss account.
2.8.3 Warrants linked to options
The Bank issues warrants based on stock market
indexes or baskets of shares. These warrant issues
are fully hedged through the purchase of options
with the same characteristics as the warrants, i.e. the
AN
NU
AL
RE
PO
RT
20
04
P A G E S 18 19
same strike price, the same maturity date and the
same underlying instrument.
Premiums paid for the purchase of options are
entered under “Other assets”. Premiums received
for the issues of warrants are entered under “Other
liabilities”.
Option premiums relating to purchased options and
issued warrants are valued at market value.
2.9 Taxes
Taxes are charged to the financial year to which the
earnings are recorded.
Provisions for tax are entered on the liabilities side
under the balance sheet item “Provisions for liabili-
ties and charges” for the financial years for which the
tax authorities have not yet fixed the final amount
of tax due.
Use of financial instruments
3.1 Strategy and policy with regard to use of financial instruments
The market activities of the Bank are fully compliant
with the strategy of the BNP Paribas Group in terms
of objectives, organisational structure and products.
The objectives include participation in the global
financing of the Group, operation financing for
customers and the generating of earnings through
margins and product trading.
The Bank accepts deposits from its clients on a fixed
and variable-rate basis and for different periods. It
then seeks to benefit from higher average interest
rate margins by investing these deposits in high-
quality assets.
The Bank also seeks to increase its margins by
consolidating its short-term cash flow by means of
loans covering longer periods whilst maintaining
sufficient liquidity to honour its commitments.
The organisational structure is based on different
business lines. Responsibility for all of the risks
associated with the Bank’s operations is ultimately
borne by the managers of the different business lines
at head office. The business lines that specialise in
interest rate and foreign exchange take charge of
the related risks in these areas, from which the other
business lines are kept separate. The Bank only makes
use of traditional products, avoiding any high-risk or
complex products.
3.2 Analysis of financial instruments
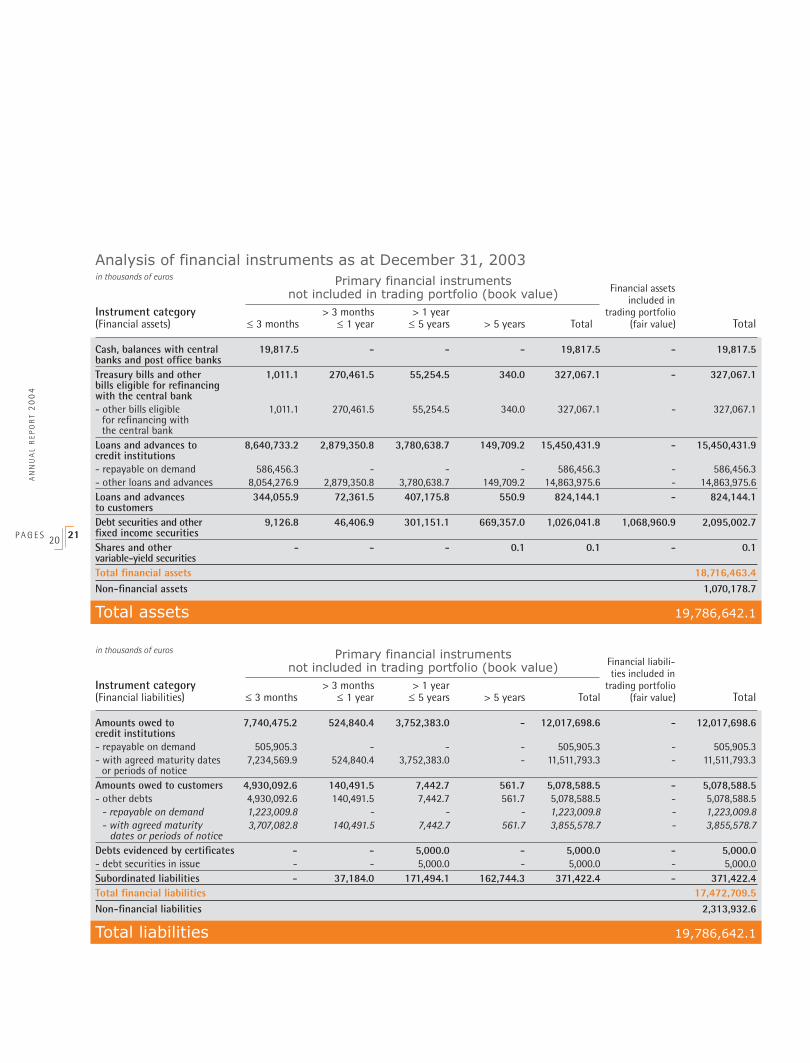
3.2.1 Information on primary financial instruments
The tables below analyse the level of activity in
primary financial instruments (primary financial
instruments held for trading purposes and primary
financial instruments held for hedging or other
purposes) on the part of the Bank, by grouping the
instruments according to remaining maturities. The
financial instruments not included in the trading
portfolio are reported at their book value whilst
trading instruments are recorded at fair value with
their acquisition value given by way of comparison.
“Fair value” is understood to mean the value at which
an asset may be exchanged or a liability settled in
the context of an ordinary transaction entered into
under normal conditions between independent,
informed and willing parties, other than in a forced
or liquidation sale.
Note 3
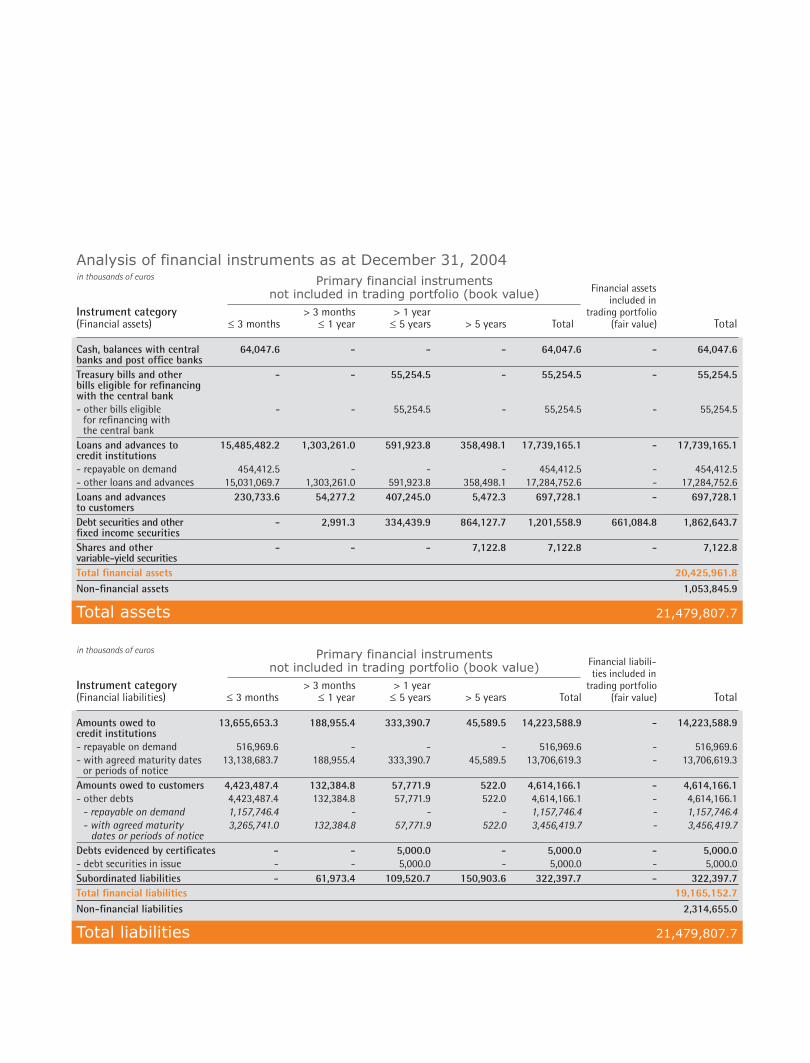
in thousands of euros Primary financial instruments
Financial liabili- not included in trading portfolio (book value) ties included in Instrument category > 3 months > 1 year trading portfolio (Financial liabilities) ≤ 3 months ≤ 1 year ≤ 5 years > 5 years Total (fair value) Total
Amounts owed to 13,655,653.3 188,955.4 333,390.7 45,589.5 14,223,588.9 - 14,223,588.9credit institutions - repayable on demand 516,969.6 - - - 516,969.6 - 516,969.6- with agreed maturity dates 13,138,683.7 188,955.4 333,390.7 45,589.5 13,706,619.3 - 13,706,619.3 or periods of notice Amounts owed to customers 4,423,487.4 132,384.8 57,771.9 522.0 4,614,166.1 - 4,614,166.1- other debts 4,423,487.4 132,384.8 57,771.9 522.0 4,614,166.1 - 4,614,166.1 - repayable on demand 1,157,746.4 - - - 1,157,746.4 - 1,157,746.4 - with agreed maturity 3,265,741.0 132,384.8 57,771.9 522.0 3,456,419.7 - 3,456,419.7 dates or periods of notice Debts evidenced by certificates - - 5,000.0 - 5,000.0 - 5,000.0- debt securities in issue - - 5,000.0 - 5,000.0 - 5,000.0Subordinated liabilities - 61,973.4 109,520.7 150,903.6 322,397.7 - 322,397.7Total financial liabilities 19,165,152.7Non-financial liabilities 2,314,655.0
Total liabilities 21,479,807.7
Analysis of financial instruments as at December 31, 2004 in thousands of euros Primary financial instruments
Financial assets not included in trading portfolio (book value) included in Instrument category > 3 months > 1 year trading portfolio (Financial assets) ≤ 3 months ≤ 1 year ≤ 5 years > 5 years Total (fair value) Total Cash, balances with central 64,047.6 - - - 64,047.6 - 64,047.6banks and post office banks Treasury bills and other - - 55,254.5 - 55,254.5 - 55,254.5bills eligible for refinancing with the central bank - other bills eligible - - 55,254.5 - 55,254.5 - 55,254.5 for refinancing with the central bank Loans and advances to 15,485,482.2 1,303,261.0 591,923.8 358,498.1 17,739,165.1 - 17,739,165.1credit institutions - repayable on demand 454,412.5 - - - 454,412.5 - 454,412.5- other loans and advances 15,031,069.7 1,303,261.0 591,923.8 358,498.1 17,284,752.6 - 17,284,752.6Loans and advances 230,733.6 54,277.2 407,245.0 5,472.3 697,728.1 - 697,728.1to customers Debt securities and other - 2,991.3 334,439.9 864,127.7 1,201,558.9 661,084.8 1,862,643.7fixed income securities Shares and other - - - 7,122.8 7,122.8 - 7,122.8variable-yield securities Total financial assets 20,425,961.8Non-financial assets 1,053,845.9
Total assets 21,479,807.7
in thousands of euros Primary financial instruments
Financial liabili- not included in trading portfolio (book value) ties included in Instrument category > 3 months > 1 year trading portfolio (Financial liabilities) ≤ 3 months ≤ 1 year ≤ 5 years > 5 years Total (fair value) Total
Amounts owed to 7,740,475.2 524,840.4 3,752,383.0 - 12,017,698.6 - 12,017,698.6credit institutions - repayable on demand 505,905.3 - - - 505,905.3 - 505,905.3- with agreed maturity dates 7,234,569.9 524,840.4 3,752,383.0 - 11,511,793.3 - 11,511,793.3 or periods of notice Amounts owed to customers 4,930,092.6 140,491.5 7,442.7 561.7 5,078,588.5 - 5,078,588.5- other debts 4,930,092.6 140,491.5 7,442.7 561.7 5,078,588.5 - 5,078,588.5 - repayable on demand 1,223,009.8 - - - 1,223,009.8 - 1,223,009.8 - with agreed maturity 3,707,082.8 140,491.5 7,442.7 561.7 3,855,578.7 - 3,855,578.7 dates or periods of notice Debts evidenced by certificates - - 5,000.0 - 5,000.0 - 5,000.0- debt securities in issue - - 5,000.0 - 5,000.0 - 5,000.0Subordinated liabilities - 37,184.0 171,494.1 162,744.3 371,422.4 - 371,422.4Total financial liabilities 17,472,709.5Non-financial liabilities 2,313,932.6
Total liabilities 19,786,642.1
AN
NU
AL
RE
PO
RT
20
04
P A G E S 20 21
Analysis of financial instruments as at December 31, 2003 in thousands of euros Primary financial instruments
Financial assets not included in trading portfolio (book value) included in Instrument category > 3 months > 1 year trading portfolio (Financial assets) ≤ 3 months ≤ 1 year ≤ 5 years > 5 years Total (fair value) Total Cash, balances with central 19,817.5 - - - 19,817.5 - 19,817.5banks and post office banks Treasury bills and other 1,011.1 270,461.5 55,254.5 340.0 327,067.1 - 327,067.1bills eligible for refinancing with the central bank - other bills eligible 1,011.1 270,461.5 55,254.5 340.0 327,067.1 - 327,067.1 for refinancing with the central bank Loans and advances to 8,640,733.2 2,879,350.8 3,780,638.7 149,709.2 15,450,431.9 - 15,450,431.9credit institutions - repayable on demand 586,456.3 - - - 586,456.3 - 586,456.3- other loans and advances 8,054,276.9 2,879,350.8 3,780,638.7 149,709.2 14,863,975.6 - 14,863,975.6Loans and advances 344,055.9 72,361.5 407,175.8 550.9 824,144.1 - 824,144.1to customers Debt securities and other 9,126.8 46,406.9 301,151.1 669,357.0 1,026,041.8 1,068,960.9 2,095,002.7fixed income securities Shares and other - - - 0.1 0.1 - 0.1variable-yield securities Total financial assets 18,716,463.4Non-financial assets 1,070,178.7
Total assets 19,786,642.1
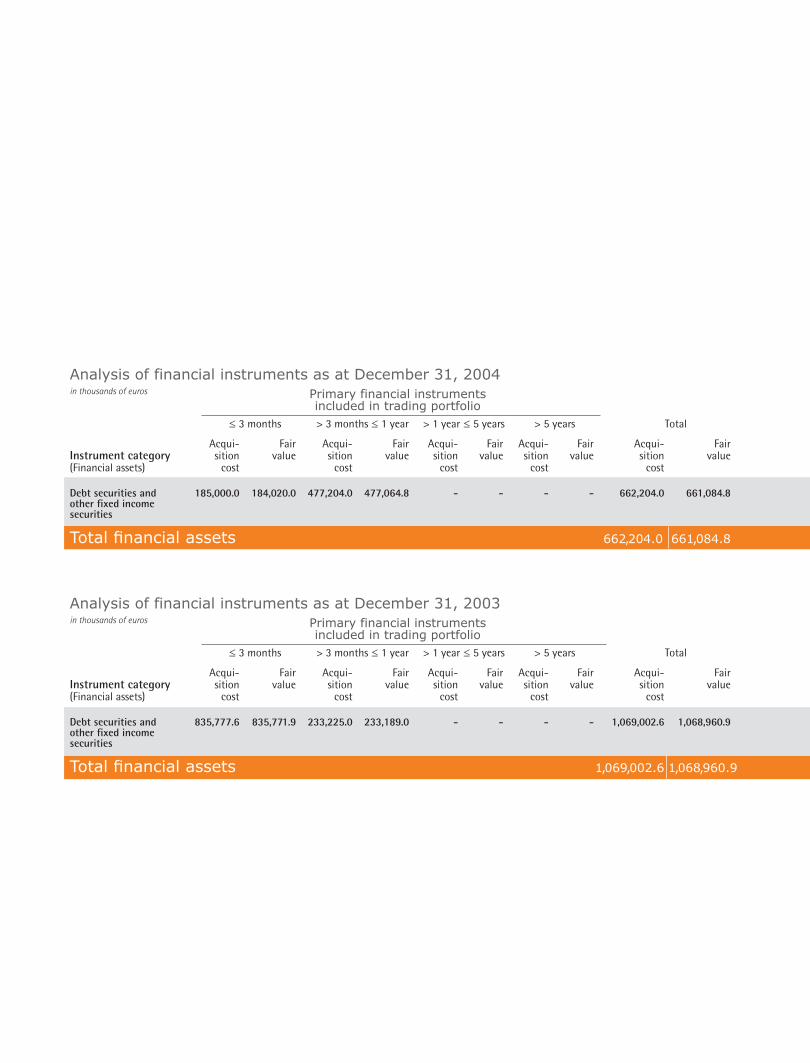
Analysis of financial instruments as at December 31, 2004 in thousands of euros Primary financial instruments included in trading portfolio ≤ 3 months > 3 months ≤ 1 year > 1 year ≤ 5 years > 5 years Total
Acqui- Fair Acqui- Fair Acqui- Fair Acqui- Fair Acqui- FairInstrument category sition value sition value sition value sition value sition value(Financial assets) cost cost cost cost cost
Debt securities and 185,000.0 184,020.0 477,204.0 477,064.8 - - - - 662,204.0 661,084.8other fixed income securities
Total financial assets 662,204.0 661,084.8
Analysis of financial instruments as at December 31, 2003 in thousands of euros Primary financial instruments included in trading portfolio ≤ 3 months > 3 months ≤ 1 year > 1 year ≤ 5 years > 5 years Total
Acqui- Fair Acqui- Fair Acqui- Fair Acqui- Fair Acqui- FairInstrument category sition value sition value sition value sition value sition value(Financial assets) cost cost cost cost cost
Debt securities and 835,777.6 835,771.9 233,225.0 233,189.0 - - - - 1,069,002.6 1,068,960.9other fixed income securities
Total financial assets 1,069,002.6 1,068,960.9
AN
NU
AL
RE
PO
RT
20
04
P A G E S 22 23
3.2.2 Information on derivative finan-cial instruments
3.2.2.1 Description of derivative financial
instruments used
The Bank uses the following derivative financial
instruments, basically for hedging purposes but also
with regard to trading. These transactions are either
traded on a stock market or traded on an OTC basis
between the Bank and its counterparties.
Forward exchange transactions represent commit-
ments entered into on an OTC basis to purchase
foreign currency in exchange for delivery of the
equivalent value in another currency at an exchange
rate and on a date specified at the time of the
transaction being concluded.
Currency swaps involve an initial exchange on a spot
basis of amounts in two currencies. This is followed
by a second exchange of these amounts at maturity
in the opposite direction, adjusted to take account
of the difference in interest rates applied to the two
currencies, subject to conditions and dates specified
upon conclusion of the swap.
Interest rate swaps involve the exchange of one
interest rate for another, either on the basis of a fixed
versus a floating rate, or on the basis of two floating
rates, calculated on the basis of the same notional
amount in a currency that is itself not swapped.
Cross currency interest rate swaps are a combination
of a currency swap and an interest rate swap
involving the exchange at the outset and at maturity
of the nominal amount and the exchange of interest
rates at intermediate dates and at maturity.
These three types of swaps are traded on the OTC
market.
Options are contractual agreements whereby the
seller (issuer) gives the buyer (holder) the right, but
not the obligation, either to buy (call option) or
to sell (put option) a predetermined amount of a
foreign currency or of securities at a predetermined
price either on a specified date or during a specified
period. Linked to the risk of the transaction, the seller
receives a premium from the buyer. The options may
be traded on a stock market or be traded directly
between the Bank and its counterparty.
The Bank also issues warrants based on stock market
indexes or baskets of shares. These warrant issues are
fully hedged through the purchase of options with
the same characteristics as the warrants, i.e. the
same strike price, the same maturity date and the
same underlying instrument.
The Bank also engages in forward security selling.
3.2.2.2 Analysis of derivative financial
instruments
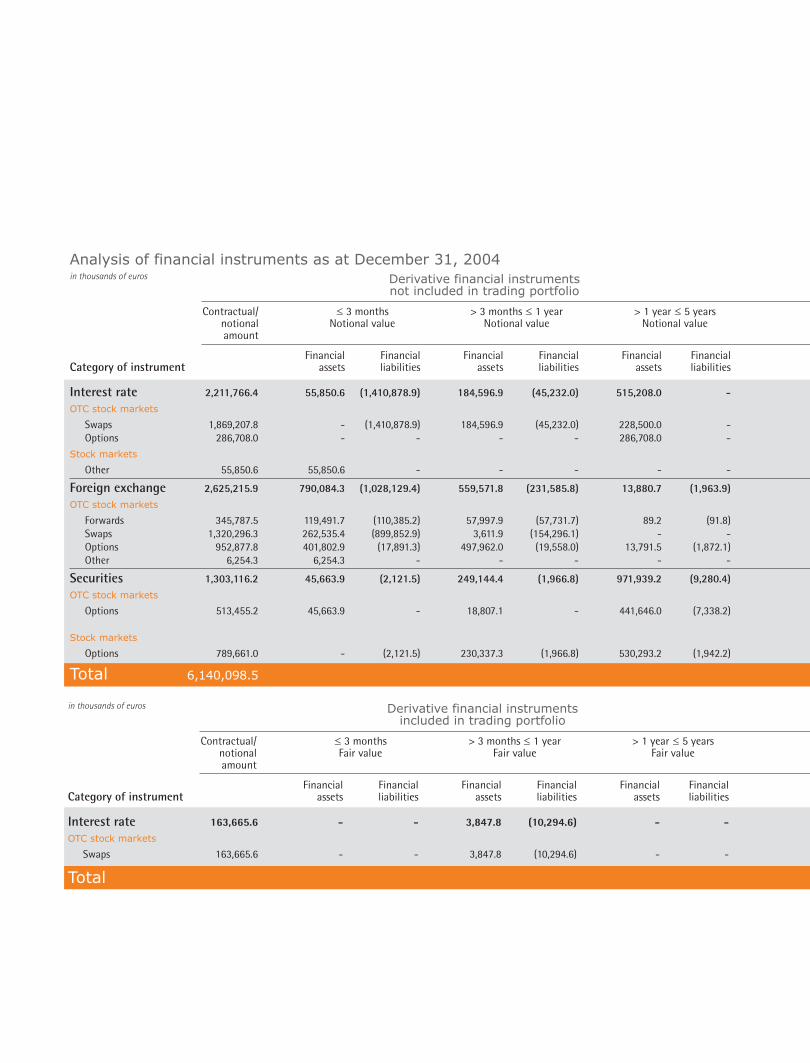
The tables below analyse the level of derivative
financial instruments used by the Bank for purposes
other than trading, according to notional amount
and grouped according to the residual period until
the maturity date. Derivative financial instruments
traded outside of stock markets and derivative
financial instruments traded on the stock markets
are presented separately.
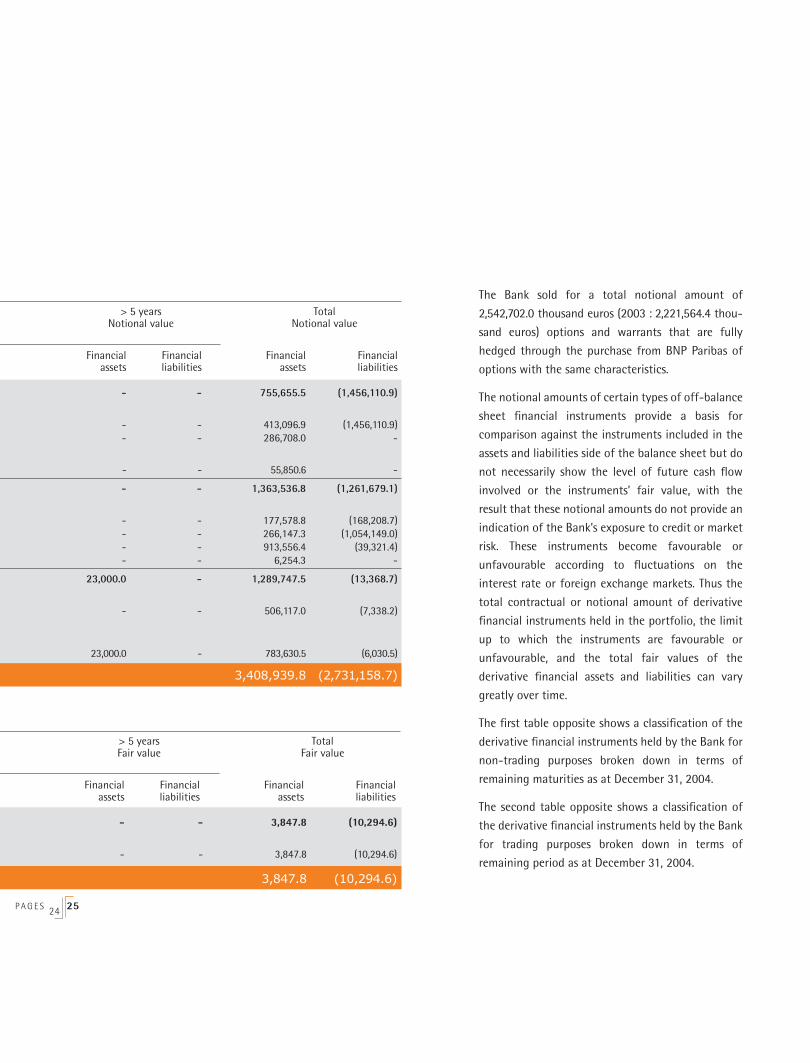
Analysis of financial instruments as at December 31, 2004 in thousands of euros Derivative financial instruments not included in trading portfolio Contractual/ ≤ 3 months > 3 months ≤ 1 year > 1 year ≤ 5 years > 5 years Total notional Notional value Notional value Notional value Notional value Notional value amount
Financial Financial Financial Financial Financial Financial Financial Financial Financial FinancialCategory of instrument assets liabilities assets liabilities assets liabilities assets liabilities assets liabilities Interest rate 2,211,766.4 55,850.6 (1,410,878.9) 184,596.9 (45,232.0) 515,208.0 - - - 755,655.5 (1,456,110.9)OTC stock markets Swaps 1,869,207.8 - (1,410,878.9) 184,596.9 (45,232.0) 228,500.0 - - - 413,096.9 (1,456,110.9) Options 286,708.0 - - - - 286,708.0 - - - 286,708.0 -
Stock markets Other 55,850.6 55,850.6 - - - - - - - 55,850.6 -
Foreign exchange 2,625,215.9 790,084.3 (1,028,129.4) 559,571.8 (231,585.8) 13,880.7 (1,963.9) - - 1,363,536.8 (1,261,679.1)OTC stock markets Forwards 345,787.5 119,491.7 (110,385.2) 57,997.9 (57,731.7) 89.2 (91.8) - - 177,578.8 (168,208.7) Swaps 1,320,296.3 262,535.4 (899,852.9) 3,611.9 (154,296.1) - - - - 266,147.3 (1,054,149.0) Options 952,877.8 401,802.9 (17,891.3) 497,962.0 (19,558.0) 13,791.5 (1,872.1) - - 913,556.4 (39,321.4) Other 6,254.3 6,254.3 - - - - - - - 6,254.3 -
Securities 1,303,116.2 45,663.9 (2,121.5) 249,144.4 (1,966.8) 971,939.2 (9,280.4) 23,000.0 - 1,289,747.5 (13,368.7)OTC stock markets Options 513,455.2 45,663.9 - 18,807.1 - 441,646.0 (7,338.2) - - 506,117.0 (7,338.2) Stock markets Options 789,661.0 - (2,121.5) 230,337.3 (1,966.8) 530,293.2 (1,942.2) 23,000.0 - 783,630.5 (6,030.5)
Total 6,140,098.5 3,408,939.8 (2,731,158.7)
in thousands of euros Derivative financial instruments included in trading portfolio Contractual/ ≤ 3 months > 3 months ≤ 1 year > 1 year ≤ 5 years > 5 years Total notional Fair value Fair value Fair value Fair value Fair value amount
Financial Financial Financial Financial Financial Financial Financial Financial Financial FinancialCategory of instrument assets liabilities assets liabilities assets liabilities assets liabilities assets liabilities Interest rate 163,665.6 - - 3,847.8 (10,294.6) - - - - 3,847.8 (10,294.6)OTC stock markets
Swaps 163,665.6 - - 3,847.8 (10,294.6) - - - - 3,847.8 (10,294.6)
Total 3,847.8 (10,294.6)
The Bank sold for a total notional amount of
2,542,702.0 thousand euros (2003 : 2,221,564.4 thou-
sand euros) options and warrants that are fully
hedged through the purchase from BNP Paribas of
options with the same characteristics.
The notional amounts of certain types of off-balance
sheet financial instruments provide a basis for
comparison against the instruments included in the
assets and liabilities side of the balance sheet but do
not necessarily show the level of future cash flow
involved or the instruments’ fair value, with the
result that these notional amounts do not provide an
indication of the Bank’s exposure to credit or market
risk. These instruments become favourable or
unfavourable according to fluctuations on the
interest rate or foreign exchange markets. Thus the
total contractual or notional amount of derivative
financial instruments held in the portfolio, the limit
up to which the instruments are favourable or
unfavourable, and the total fair values of the
derivative financial assets and liabilities can vary
greatly over time.
The first table opposite shows a classification of the
derivative financial instruments held by the Bank for
non-trading purposes broken down in terms of
remaining maturities as at December 31, 2004.
The second table opposite shows a classification of
the derivative financial instruments held by the Bank
for trading purposes broken down in terms of
remaining period as at December 31, 2004.
P A G E S 24 25
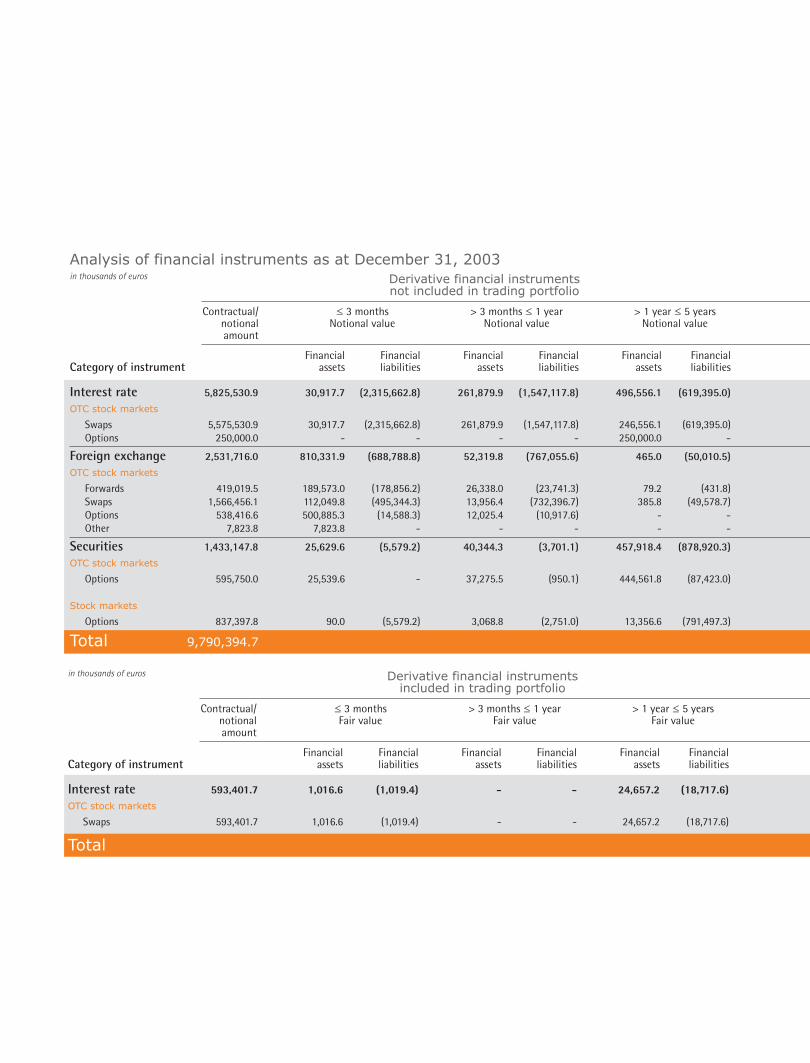
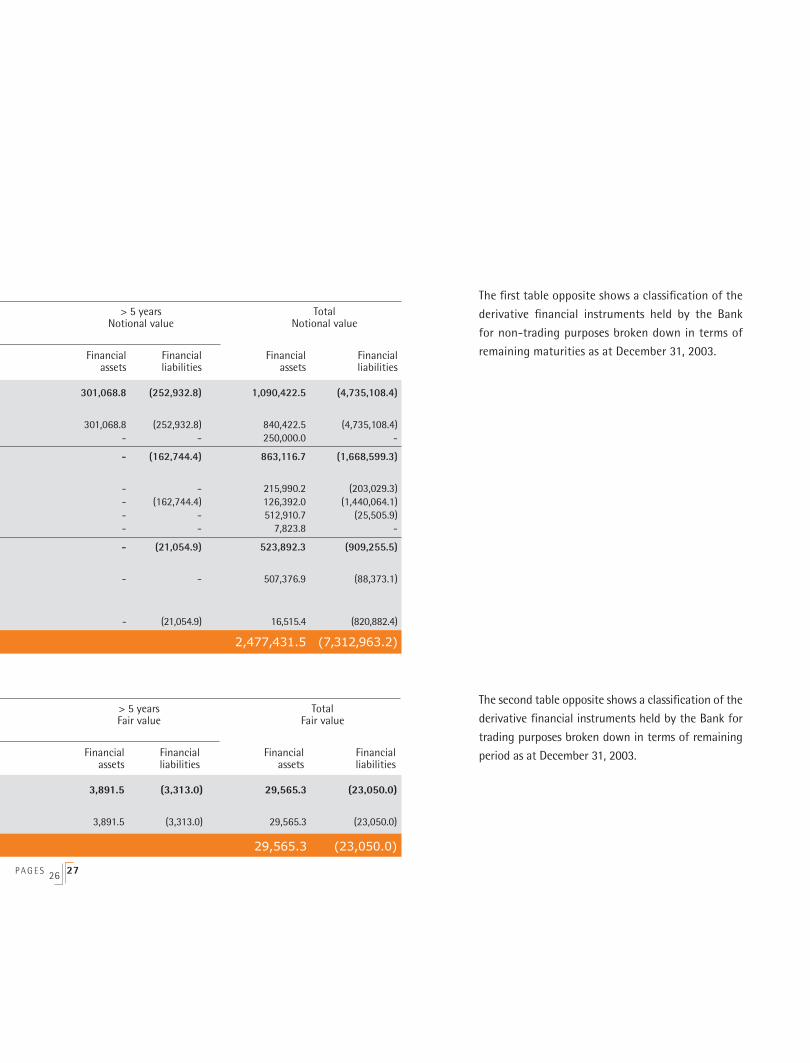
Analysis of financial instruments as at December 31, 2003 in thousands of euros Derivative financial instruments not included in trading portfolio Contractual/ ≤ 3 months > 3 months ≤ 1 year > 1 year ≤ 5 years > 5 years Total notional Notional value Notional value Notional value Notional value Notional value amount
Financial Financial Financial Financial Financial Financial Financial Financial Financial FinancialCategory of instrument assets liabilities assets liabilities assets liabilities assets liabilities assets liabilities Interest rate 5,825,530.9 30,917.7 (2,315,662.8) 261,879.9 (1,547,117.8) 496,556.1 (619,395.0) 301,068.8 (252,932.8) 1,090,422.5 (4,735,108.4)OTC stock markets Swaps 5,575,530.9 30,917.7 (2,315,662.8) 261,879.9 (1,547,117.8) 246,556.1 (619,395.0) 301,068.8 (252,932.8) 840,422.5 (4,735,108.4) Options 250,000.0 - - - - 250,000.0 - - - 250,000.0 -
Foreign exchange 2,531,716.0 810,331.9 (688,788.8) 52,319.8 (767,055.6) 465.0 (50,010.5) - (162,744.4) 863,116.7 (1,668,599.3)OTC stock markets Forwards 419,019.5 189,573.0 (178,856.2) 26,338.0 (23,741.3) 79.2 (431.8) - - 215,990.2 (203,029.3) Swaps 1,566,456.1 112,049.8 (495,344.3) 13,956.4 (732,396.7) 385.8 (49,578.7) - (162,744.4) 126,392.0 (1,440,064.1) Options 538,416.6 500,885.3 (14,588.3) 12,025.4 (10,917.6) - - - - 512,910.7 (25,505.9) Other 7,823.8 7,823.8 - - - - - - - 7,823.8 -
Securities 1,433,147.8 25,629.6 (5,579.2) 40,344.3 (3,701.1) 457,918.4 (878,920.3) - (21,054.9) 523,892.3 (909,255.5)OTC stock markets Options 595,750.0 25,539.6 - 37,275.5 (950.1) 444,561.8 (87,423.0) - - 507,376.9 (88,373.1) Stock markets Options 837,397.8 90.0 (5,579.2) 3,068.8 (2,751.0) 13,356.6 (791,497.3) - (21,054.9) 16,515.4 (820,882.4)
Total 9,790,394.7 2,477,431.5 (7,312,963.2)
in thousands of euros Derivative financial instruments included in trading portfolio Contractual/ ≤ 3 months > 3 months ≤ 1 year > 1 year ≤ 5 years > 5 years Total notional Fair value Fair value Fair value Fair value Fair value amount
Financial Financial Financial Financial Financial Financial Financial Financial Financial FinancialCategory of instrument assets liabilities assets liabilities assets liabilities assets liabilities assets liabilities Interest rate 593,401.7 1,016.6 (1,019.4) - - 24,657.2 (18,717.6) 3,891.5 (3,313.0) 29,565.3 (23,050.0)OTC stock markets
Swaps 593,401.7 1,016.6 (1,019.4) - - 24,657.2 (18,717.6) 3,891.5 (3,313.0) 29,565.3 (23,050.0)
Total 29,565.3 (23,050.0)
The first table opposite shows a classification of the
derivative financial instruments held by the Bank
for non-trading purposes broken down in terms of
remaining maturities as at December 31, 2003.
The second table opposite shows a classification of the
derivative financial instruments held by the Bank for
trading purposes broken down in terms of remaining
period as at December 31, 2003.
P A G E S 26 27
3.3 Credit Risk
3.3.1 Description of credit risk
Credit risk is defined as the risk linked to the bor-
rower’s default or changes in solvency, irrespective
of whether such an eventuality is due to a specific
development or wider developments that affect the
country in which the counterparty is based.
Credit risk can be analysed from different perspec-
tives, such as risk concentration, the geographical
distribution of debtors, the quality of any guarantees
received and payment risk.
The Global Credit Policy of the BNP Paribas Group
provides a framework of action relating to the
activities that generate this type of risk :
- loans and other funding instruments,
- holding of securities for own account,
- commitments and contingent liabilities,
- financial contracts.
This policy sets out the rules with regard to sector-
based and country risk and stipulates the decision-
making procedure with regard to the award of credit.
The credit risk linked to balance sheet or off-balance
sheet operations of a borrower or group of borrowers
is subject to limits (or “authorisations”). The decision
on the limit allocated is taken within a system
of delegated authority, with the amount varying
according to the nature of the borrower and activity
concerned. The decision must be made in cooperation
with an independent representative from the Group
Risk Management department, who holds a right of
veto. The different levels of authorisation are ranked
in internal rating categories for the counterparty
and/or the group of economically-linked borrowers
(business groups) to which it belongs.
The authorisations are introduced and updated using
the Bank’s various IT tools, responsibility for which
lies with the Risk Management department, which
must also ensure in advance that the conditions
set out in the credit agreement have been met.
Adherence to the authorisations is monitored by the
business lines as part of their day-to-day work and
by the Risk Management department at a second
level.
The authorisations are subject to periodic review,
at least once per year, which involves analysing the
ability of the borrowers to meet their obligations
and adapting the Bank’s position accordingly. In
particular, the Bank’s risk exposure to different
counterparties can be reduced by means of guarantee
or compensation agreements.
Taking into account the specific characteristics of its
customer portfolio, the Bank basically manages two
types of guarantee :
- bank guarantees with which it is provided,
- financial assets deposited with it and pledged
in its favour. Criteria specific to the BNP Paribas
Group are applied with regard to the eligibility
and diversification of pledged assets. Similarly,
standards are in place stipulating a financing rate
for each type of eligible asset, in other words the
amount of acceptable credit based on the asset’s
market value.
Coverage of credit risk in the form of guarantees
is monitored by the business lines on a day-to-day
basis and by the Risk Management department at a
second level.
AN
NU
AL
RE
PO
RT
20
04
P A G E S 28 29
The above principles are also applied to credit risk
linked to derivatives. This risk is calculated on a lump-
sum determination, taking into account the type of
instrument and its term. These lump-sum amounts
are expressed as a percentage of the nominal or
notional value of the transaction. The “marked to
market plus add-on” approach corresponds to the
valuation of the instrument at the market rate,
which is then increased by a given percentage of the
notional amount.
The Bank may request that collateral be provided,
particularly with regard to transactions initiated by
counterparties other than banks.
3.3.2 Measures of credit risk exposure
The credit risk linked to operations involving primary
financial instruments is measured on the basis of the
book value after deducting any value adjustments.
In the tables below, guarantees received by the bank,
which enable exposure to credit risk to be reduced,
are not taken into account. The system of calculating
counterparty risk with regard to derivative instru-
ments is based on a lump-sum method that takes
into account the type of instrument and its term.
The following lump-sum amounts are applied to the
nominal or notional value to calculate the credit risk
(current risk and potential future risk) on all of the
following transactions :
Currency swaps, forward exchange transactions and CCIRS (Cross Currrency Interest Rate Swap)
- 3% for a remaining maturity of less than 7 days,
- 10% for a remaining maturity of less than 1 year,
- 20% for a maturity of between 1 and 3 years,
- 25% for a maturity of between 3 and 7 years,
- 30% for a maturity of between 7 and 10 years.
Repo transactions- 3% for a remaining maturity of less than 7 days,
- 10% for a remaining maturity of less than 1 year,
- 20% for a maturity of between 1 and 3 years.
Since October 2004 the measure of counterparty risk
on IRS type derivative instruments is calculated by a
method which consists of estimating the fair value of
the outstanding contracts. This form of calculation
replaces the former lump-sum method.
Method1- The fair value of each contract is calculated in
a conservative manner, by taking into account
its most unfavourable value from a set of
simulations. These simulations envisage all the
possible variations of return based on market
movements and volatility.
2- The total fair values of all the contracts with a
given counterparty are aggregated and offset
according to the netting and margin-call con-
tracts signed with the counterparty.
3- The result is then compared to the authorised
limit for the said counterparty.
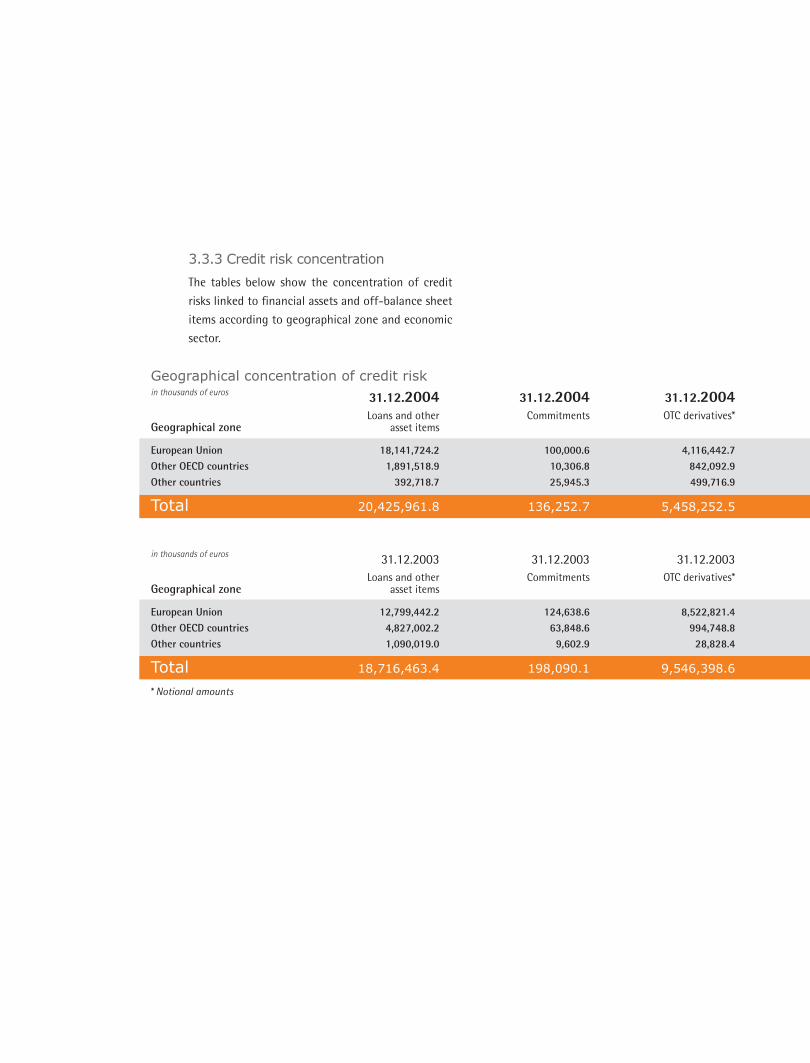
3.3.3 Credit risk concentration
The tables below show the concentration of credit
risks linked to financial assets and off-balance sheet
items according to geographical zone and economic
sector.
Geographical concentration of credit risk in thousands of euros 31.12.2004 31.12.2004 31.12.2004 Loans and other Commitments OTC derivatives* Geographical zone asset items
European Union 18,141,724.2 100,000.6 4,116,442.7Other OECD countries 1,891,518.9 10,306.8 842,092.9Other countries 392,718.7 25,945.3 499,716.9
Total 20,425,961.8 136,252.7 5,458,252.5
in thousands of euros 31.12.2003 31.12.2003 31.12.2003 Loans and other Commitments OTC derivatives* Geographical zone asset items
European Union 12,799,442.2 124,638.6 8,522,821.4Other OECD countries 4,827,002.2 63,848.6 994,748.8Other countries 1,090,019.0 9,602.9 28,828.4
Total 18,716,463.4 198,090.1 9,546,398.6
* Notional amounts
AN
NU
AL
RE
PO
RT
20
04
P A G E S 30 31
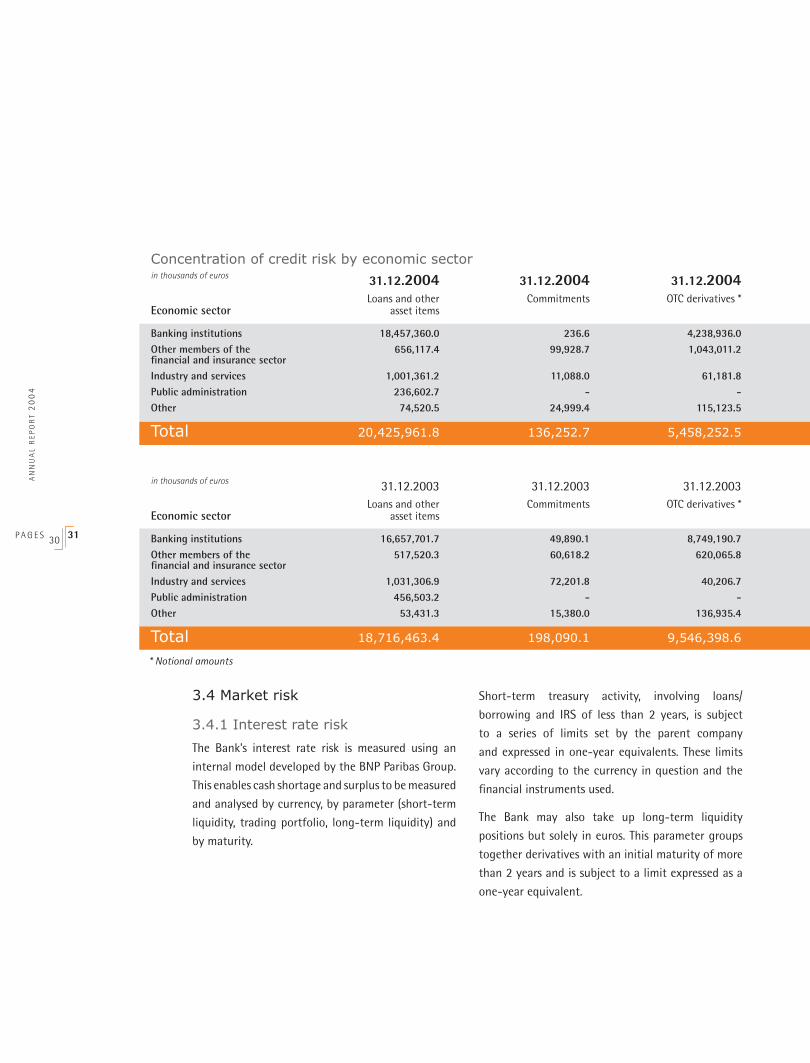
3.4 Market risk
3.4.1 Interest rate risk
The Bank’s interest rate risk is measured using an
internal model developed by the BNP Paribas Group.
This enables cash shortage and surplus to be measured
and analysed by currency, by parameter (short-term
liquidity, trading portfolio, long-term liquidity) and
by maturity.
Short-term treasury activity, involving loans/
borrowing and IRS of less than 2 years, is subject
to a series of limits set by the parent company
and expressed in one-year equivalents. These limits
vary according to the currency in question and the
financial instruments used.
The Bank may also take up long-term liquidity
positions but solely in euros. This parameter groups
together derivatives with an initial maturity of more
than 2 years and is subject to a limit expressed as a
one-year equivalent.
Concentration of credit risk by economic sector in thousands of euros 31.12.2004 31.12.2004 31.12.2004 Loans and other Commitments OTC derivatives * Economic sector asset items
Banking institutions 18,457,360.0 236.6 4,238,936.0Other members of the 656,117.4 99,928.7 1,043,011.2financial and insurance sector Industry and services 1,001,361.2 11,088.0 61,181.8Public administration 236,602.7 - -Other 74,520.5 24,999.4 115,123.5
Total 20,425,961.8 136,252.7 5,458,252.5
in thousands of euros 31.12.2003 31.12.2003 31.12.2003 Loans and other Commitments OTC derivatives * Economic sector asset items
Banking institutions 16,657,701.7 49,890.1 8,749,190.7Other members of the 517,520.3 60,618.2 620,065.8financial and insurance sector Industry and services 1,031,306.9 72,201.8 40,206.7Public administration 456,503.2 - -Other 53,431.3 15,380.0 136,935.4
Total 18,716,463.4 198,090.1 9,546,398.6
* Notional amounts
Interest rate positions of a speculative nature and
the foreign exchange position are subject to a VaR
(Value at Risk) calculation using an internal model
developed by the BNP Paribas Group. The VaR
measures the potential variation in current value
of the portfolio for a given time horizon (10 days)
and a given probability level (99%) assuming normal
market conditions.
Each of the limits described above is subject to daily
monitoring by the Risk Management department
which, furthermore, conducts a monthly calculation
of the Bank’s exposure to interest rate risk in exotic
currencies on the basis of worst-case scenarios.
These scenarios simulate the effects of a monetary
crisis lasting two months on the Bank’s short-term
positions in exotic currencies.
Finally, the Bank has set up an Asset and Liability
COmmittee (ALCO) whose task it is to examine the
following aspects on a quarterly basis : liquidity
positions, adherence to credit limits imposed on the
trading room, the Bank’s liquidity policy, the worst-
case scenarios used to test the Bank’s exposure
to interest rate risk in exotic currencies, balance
sheet structure and the investment of capital and
reserves.
3.4.2 Foreign exchange risk
The foreign exchange activity of the Bank involves
the sale of products to customers without the Bank
adopting any positions of its own.
The Bank’s foreign exchange position, expressed
in nominal value, is measured by totalling up the
absolute values of open positions in each currency,
converted into euros. This position is subject to two
limits :
- an intraday limit, defining the maximum foreign
exchange position that may be maintained
throughout the day,
- an overnight limit, of lesser importance, defining
the maximum foreign exchange position that may
be maintained at the end of the day.
The principle of hedging foreign exchange risk pre-
vails with regard to all instruments and portfolios.
The Bank’s foreign exchange position is also subject
to daily calculations of GEaR.
Finally, the Risk Management department is respon-
sible for daily monitoring of foreign exchange risk.
AN
NU
AL
RE
PO
RT
20
04
P A G E S 32 33
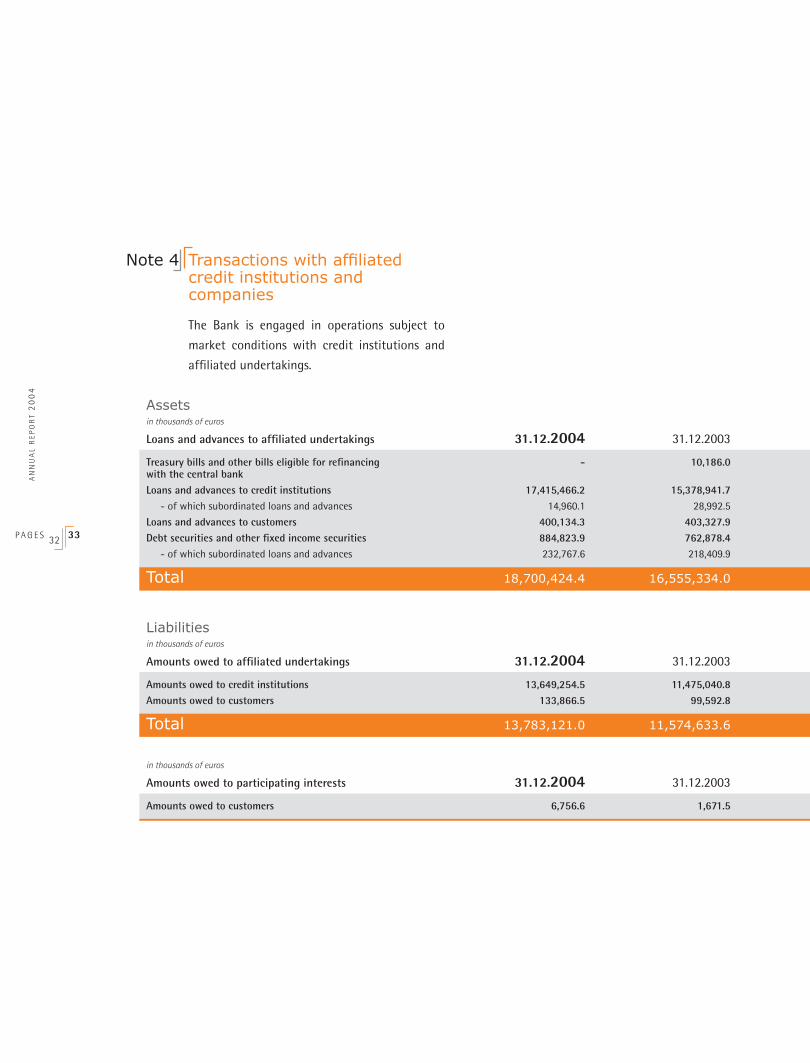
Assets in thousands of euros Loans and advances to affiliated undertakings 31.12.2004 31.12.2003
Treasury bills and other bills eligible for refinancing - 10,186.0with the central bank Loans and advances to credit institutions 17,415,466.2 15,378,941.7 - of which subordinated loans and advances 14,960.1 28,992.5
Loans and advances to customers 400,134.3 403,327.9Debt securities and other fixed income securities 884,823.9 762,878.4 - of which subordinated loans and advances 232,767.6 218,409.9
Total 18,700,424.4 16,555,334.0
Transactions with affiliatedcredit institutions and companies
The Bank is engaged in operations subject to
market conditions with credit institutions and
affiliated undertakings.
Note 4
Liabilities in thousands of euros Amounts owed to affiliated undertakings 31.12.2004 31.12.2003
Amounts owed to credit institutions 13,649,254.5 11,475,040.8Amounts owed to customers 133,866.5 99,592.8
Total 13,783,121.0 11,574,633.6
in thousands of euros Amounts owed to participating interests 31.12.2004 31.12.2003
Amounts owed to customers 6,756.6 1,671.5
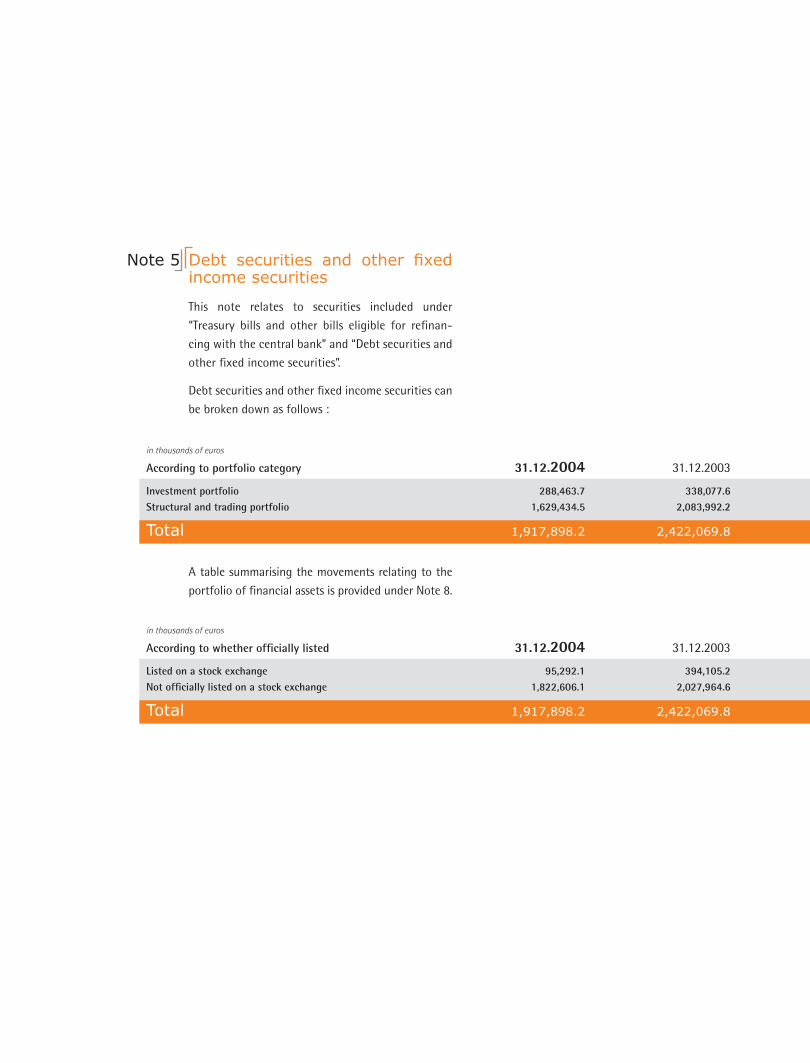
Debt securities and other fixed income securities
This note relates to securities included under
“Treasury bills and other bills eligible for refinan-
cing with the central bank” and “Debt securities and
other fixed income securities”.
Debt securities and other fixed income securities can
be broken down as follows :
Note 5
in thousands of euros According to portfolio category 31.12.2004 31.12.2003
Investment portfolio 288,463.7 338,077.6Structural and trading portfolio 1,629,434.5 2,083,992.2
Total 1,917,898.2 2,422,069.8
A table summarising the movements relating to the
portfolio of financial assets is provided under Note 8.
in thousands of euros According to whether officially listed 31.12.2004 31.12.2003
Listed on a stock exchange 95,292.1 394,105.2Not officially listed on a stock exchange 1,822,606.1 2,027,964.6
Total 1,917,898.2 2,422,069.8
AN
NU
AL
RE
PO
RT
20
04
P A G E S 34 35
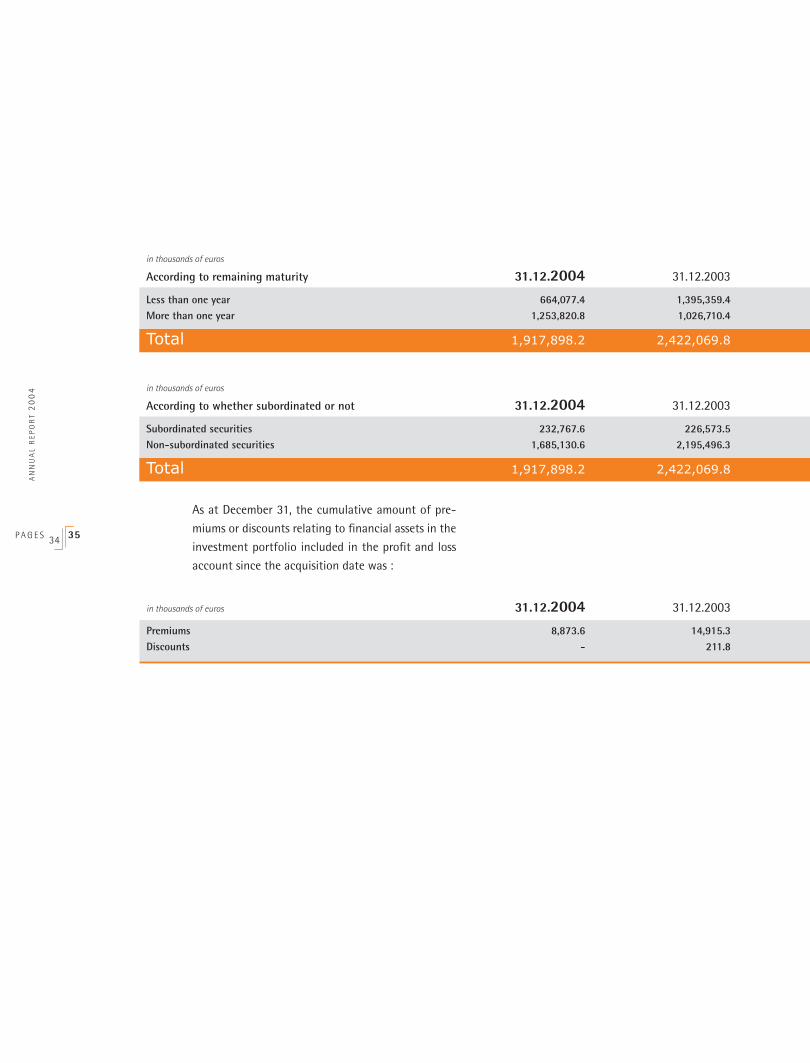
in thousands of euros According to remaining maturity 31.12.2004 31.12.2003
Less than one year 664,077.4 1,395,359.4More than one year 1,253,820.8 1,026,710.4
Total 1,917,898.2 2,422,069.8
in thousands of euros According to whether subordinated or not 31.12.2004 31.12.2003
Subordinated securities 232,767.6 226,573.5Non-subordinated securities 1,685,130.6 2,195,496.3
Total 1,917,898.2 2,422,069.8
As at December 31, the cumulative amount of pre-
miums or discounts relating to financial assets in the
investment portfolio included in the profit and loss
account since the acquisition date was :
in thousands of euros 31.12.2004 31.12.2003
Premiums 8,873.6 14,915.3Discounts - 211.8
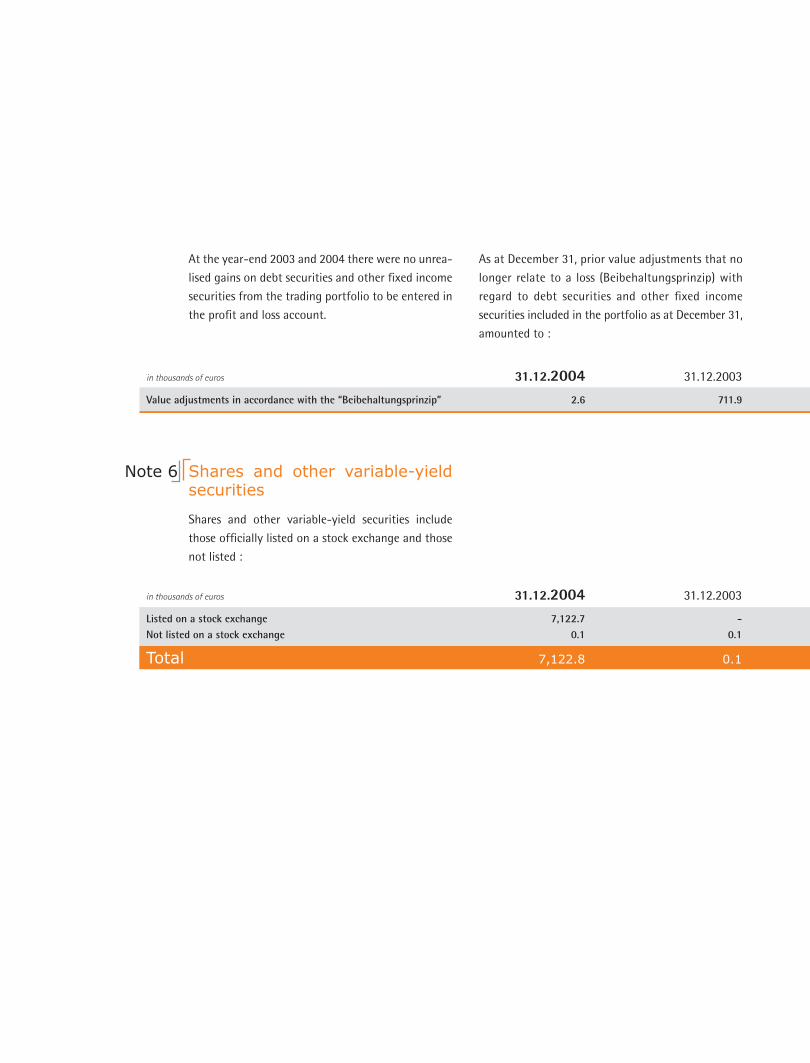
At the year-end 2003 and 2004 there were no unrea-
lised gains on debt securities and other fixed income
securities from the trading portfolio to be entered in
the profit and loss account.
As at December 31, prior value adjustments that no
longer relate to a loss (Beibehaltungsprinzip) with
regard to debt securities and other fixed income
securities included in the portfolio as at December 31,
amounted to :
in thousands of euros 31.12.2004 31.12.2003
Value adjustments in accordance with the “Beibehaltungsprinzip” 2.6 711.9
Shares and other variable-yield securities
Shares and other variable-yield securities include
those officially listed on a stock exchange and those
not listed :
Note 6
in thousands of euros 31.12.2004 31.12.2003
Listed on a stock exchange 7,122.7 -Not listed on a stock exchange 0.1 0.1
Total 7,122.8 0.1
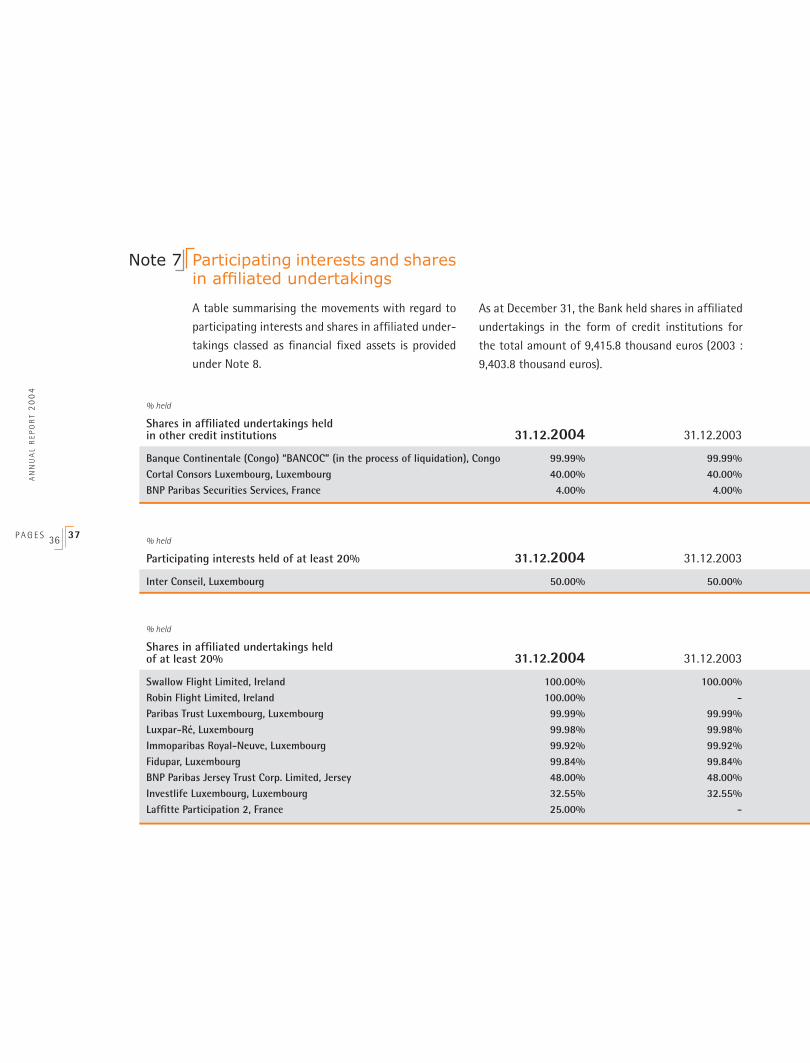
AN
NU
AL
RE
PO
RT
20
04
P A G E S 36 37
Participating interests and shares in affiliated undertakings
A table summarising the movements with regard to
participating interests and shares in affiliated under-
takings classed as financial fixed assets is provided
under Note 8.
As at December 31, the Bank held shares in affiliated
undertakings in the form of credit institutions for
the total amount of 9,415.8 thousand euros (2003 :
9,403.8 thousand euros).
Note 7
% held Shares in affiliated undertakings held in other credit institutions 31.12.2004 31.12.2003
Banque Continentale (Congo) “BANCOC” (in the process of liquidation), Congo 99.99% 99.99%Cortal Consors Luxembourg, Luxembourg 40.00% 40.00%BNP Paribas Securities Services, France 4.00% 4.00%
% held Shares in affiliated undertakings held of at least 20% 31.12.2004 31.12.2003
Swallow Flight Limited, Ireland 100.00% 100.00%Robin Flight Limited, Ireland 100.00% -Paribas Trust Luxembourg, Luxembourg 99.99% 99.99%Luxpar-Ré, Luxembourg 99.98% 99.98%Immoparibas Royal-Neuve, Luxembourg 99.92% 99.92%Fidupar, Luxembourg 99.84% 99.84%BNP Paribas Jersey Trust Corp. Limited, Jersey 48.00% 48.00%Investlife Luxembourg, Luxembourg 32.55% 32.55%Laffitte Participation 2, France 25.00% -
% held Participating interests held of at least 20% 31.12.2004 31.12.2003
Inter Conseil, Luxembourg 50.00% 50.00%
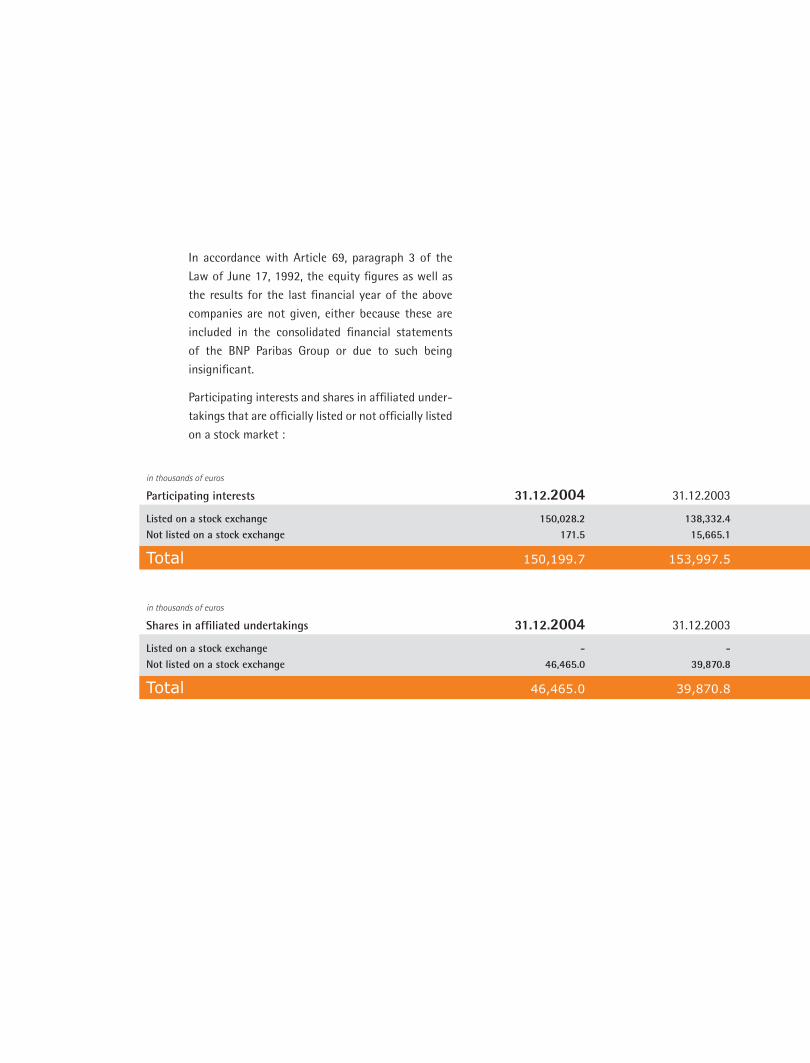
In accordance with Article 69, paragraph 3 of the
Law of June 17, 1992, the equity figures as well as
the results for the last financial year of the above
companies are not given, either because these are
included in the consolidated financial statements
of the BNP Paribas Group or due to such being
insignificant.
Participating interests and shares in affiliated under-
takings that are officially listed or not officially listed
on a stock market :
in thousands of euros Participating interests 31.12.2004 31.12.2003
Listed on a stock exchange 150,028.2 138,332.4 Not listed on a stock exchange 171.5 15,665.1
Total 150,199.7 153,997.5
in thousands of euros Shares in affiliated undertakings 31.12.2004 31.12.2003
Listed on a stock exchange - - Not listed on a stock exchange 46,465.0 39,870.8
Total 46,465.0 39,870.8
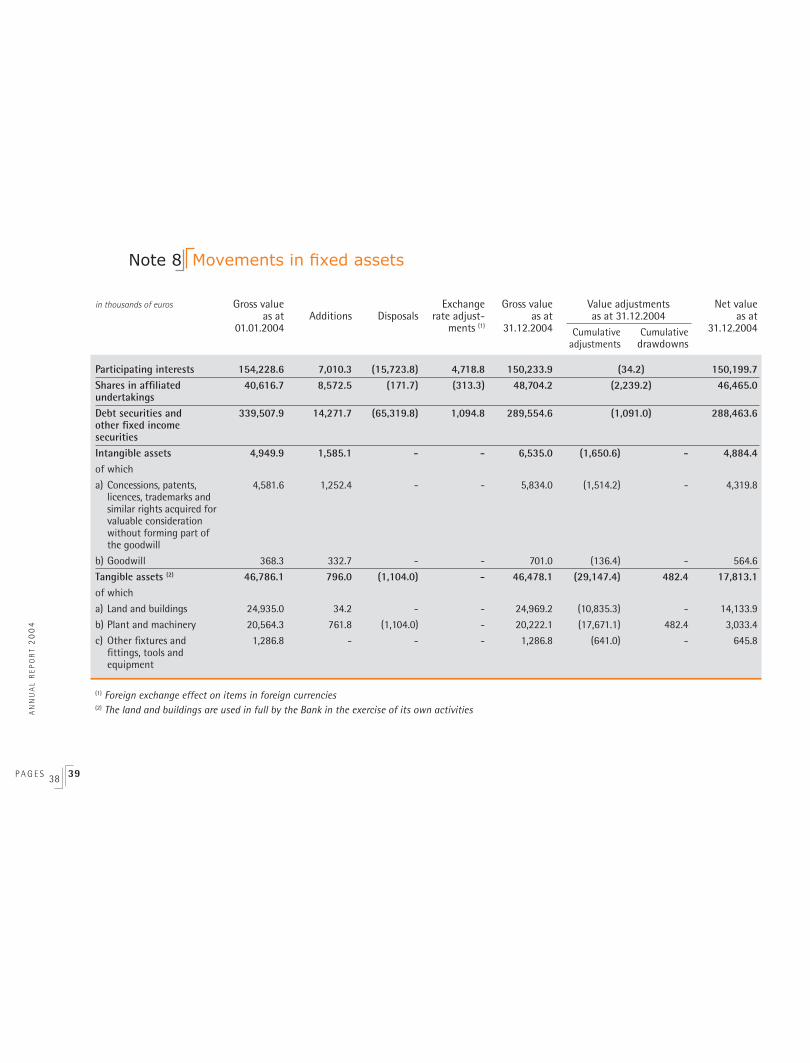
P A G E S 38 39
Movements in fixed assetsNote 8
in thousands of euros Gross value Exchange Gross value Value adjustments Net value as at Additions Disposals rate adjust- as at as at 31.12.2004 as at 01.01.2004 ments (1) 31.12.2004 Cumulative Cumulative 31.12.2004 adjustments drawdowns
Participating interests 154,228.6 7,010.3 (15,723.8) 4,718.8 150,233.9 (34.2) 150,199.7 Shares in affiliated 40,616.7 8,572.5 (171.7) (313.3) 48,704.2 (2,239.2) 46,465.0undertakings Debt securities and 339,507.9 14,271.7 (65,319.8) 1,094.8 289,554.6 (1,091.0) 288,463.6other fixed income securities Intangible assets 4,949.9 1,585.1 - - 6,535.0 (1,650.6) - 4,884.4 of which
a) Concessions, patents, 4,581.6 1,252.4 - - 5,834.0 (1,514.2) - 4,319.8 licences, trademarks and similar rights acquired for valuable consideration without forming part of the goodwill
b) Goodwill 368.3 332.7 - - 701.0 (136.4) - 564.6
Tangible assets (2) 46,786.1 796.0 (1,104.0) - 46,478.1 (29,147.4) 482.4 17,813.1 of which
a) Land and buildings 24,935.0 34.2 - - 24,969.2 (10,835.3) - 14,133.9
b) Plant and machinery 20,564.3 761.8 (1,104.0) - 20,222.1 (17,671.1) 482.4 3,033.4
c) Other fixtures and 1,286.8 - - - 1,286.8 (641.0) - 645.8 fittings, tools and equipment
(1) Foreign exchange effect on items in foreign currencies (2) The land and buildings are used in full by the Bank in the exercise of its own activitiesA
NN
UA
L R
EP
OR
T 2
00
4
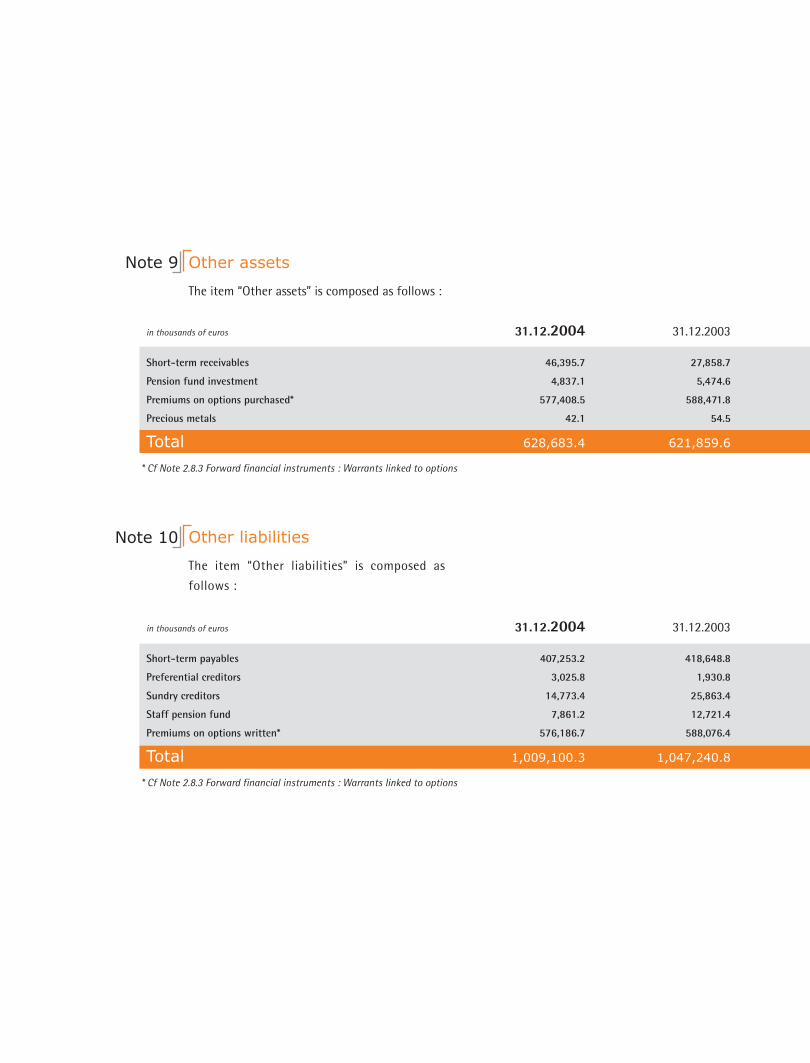
Other assets The item “Other assets” is composed as follows :
in thousands of euros 31.12.2004 31.12.2003 Short-term payables 407,253.2 418,648.8
Preferential creditors 3,025.8 1,930.8
Sundry creditors 14,773.4 25,863.4
Staff pension fund 7,861.2 12,721.4
Premiums on options written* 576,186.7 588,076.4
Total 1,009,100.3 1,047,240.8
* Cf Note 2.8.3 Forward financial instruments : Warrants linked to options
in thousands of euros 31.12.2004 31.12.2003 Short-term receivables 46,395.7 27,858.7
Pension fund investment 4,837.1 5,474.6
Premiums on options purchased* 577,408.5 588,471.8
Precious metals 42.1 54.5
Total 628,683.4 621,859.6
* Cf Note 2.8.3 Forward financial instruments : Warrants linked to options
Note 9
Other liabilities The item “Other liabilities” is composed as
follows :
Note 10
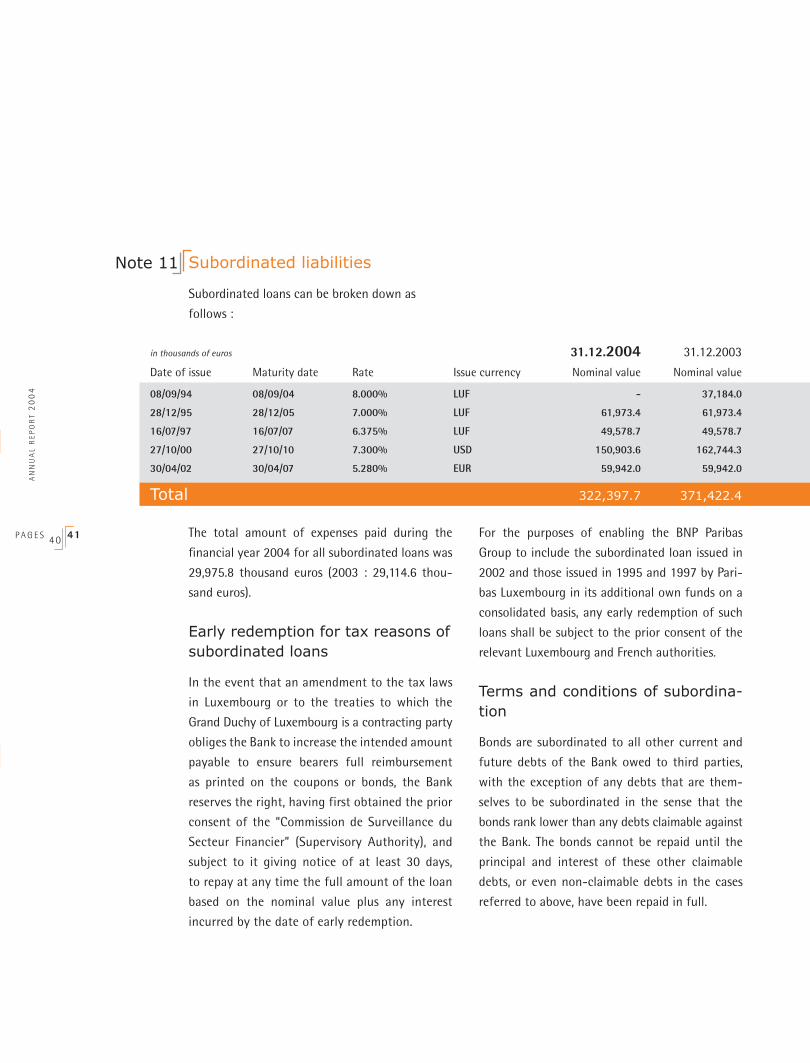
Subordinated liabilities
Subordinated loans can be broken down as
follows :
in thousands of euros 31.12.2004 31.12.2003
Date of issue Maturity date Rate Issue currency Nominal value Nominal value 08/09/94 08/09/04 8.000% LUF - 37,184.0
28/12/95 28/12/05 7.000% LUF 61,973.4 61,973.4
16/07/97 16/07/07 6.375% LUF 49,578.7 49,578.7
27/10/00 27/10/10 7.300% USD 150,903.6 162,744.3
30/04/02 30/04/07 5.280% EUR 59,942.0 59,942.0
Total 322,397.7 371,422.4
The total amount of expenses paid during the
financial year 2004 for all subordinated loans was
29,975.8 thousand euros (2003 : 29,114.6 thou-
sand euros).
Early redemption for tax reasons ofsubordinated loans
In the event that an amendment to the tax laws
in Luxembourg or to the treaties to which the
Grand Duchy of Luxembourg is a contracting party
obliges the Bank to increase the intended amount
payable to ensure bearers full reimbursement
as printed on the coupons or bonds, the Bank
reserves the right, having first obtained the prior
consent of the “Commission de Surveillance du
Secteur Financier” (Supervisory Authority), and
subject to it giving notice of at least 30 days,
to repay at any time the full amount of the loan
based on the nominal value plus any interest
incurred by the date of early redemption.
For the purposes of enabling the BNP Paribas
Group to include the subordinated loan issued in
2002 and those issued in 1995 and 1997 by Pari-
bas Luxembourg in its additional own funds on a
consolidated basis, any early redemption of such
loans shall be subject to the prior consent of the
relevant Luxembourg and French authorities.
Terms and conditions of subordina-tion
Bonds are subordinated to all other current and
future debts of the Bank owed to third parties,
with the exception of any debts that are them-
selves to be subordinated in the sense that the
bonds rank lower than any debts claimable against
the Bank. The bonds cannot be repaid until the
principal and interest of these other claimable
debts, or even non-claimable debts in the cases
referred to above, have been repaid in full.
in thousands of euros 31.12.2004 31.12.2003 Short-term payables 407,253.2 418,648.8
Preferential creditors 3,025.8 1,930.8
Sundry creditors 14,773.4 25,863.4
Staff pension fund 7,861.2 12,721.4
Premiums on options written* 576,186.7 588,076.4
Total 1,009,100.3 1,047,240.8
* Cf Note 2.8.3 Forward financial instruments : Warrants linked to options
in thousands of euros 31.12.2004 31.12.2003 Short-term receivables 46,395.7 27,858.7
Pension fund investment 4,837.1 5,474.6
Premiums on options purchased* 577,408.5 588,471.8
Precious metals 42.1 54.5
Total 628,683.4 621,859.6
* Cf Note 2.8.3 Forward financial instruments : Warrants linked to options
Note 11
AN
NU
AL
RE
PO
RT
20
04
P A G E S 4 0 41
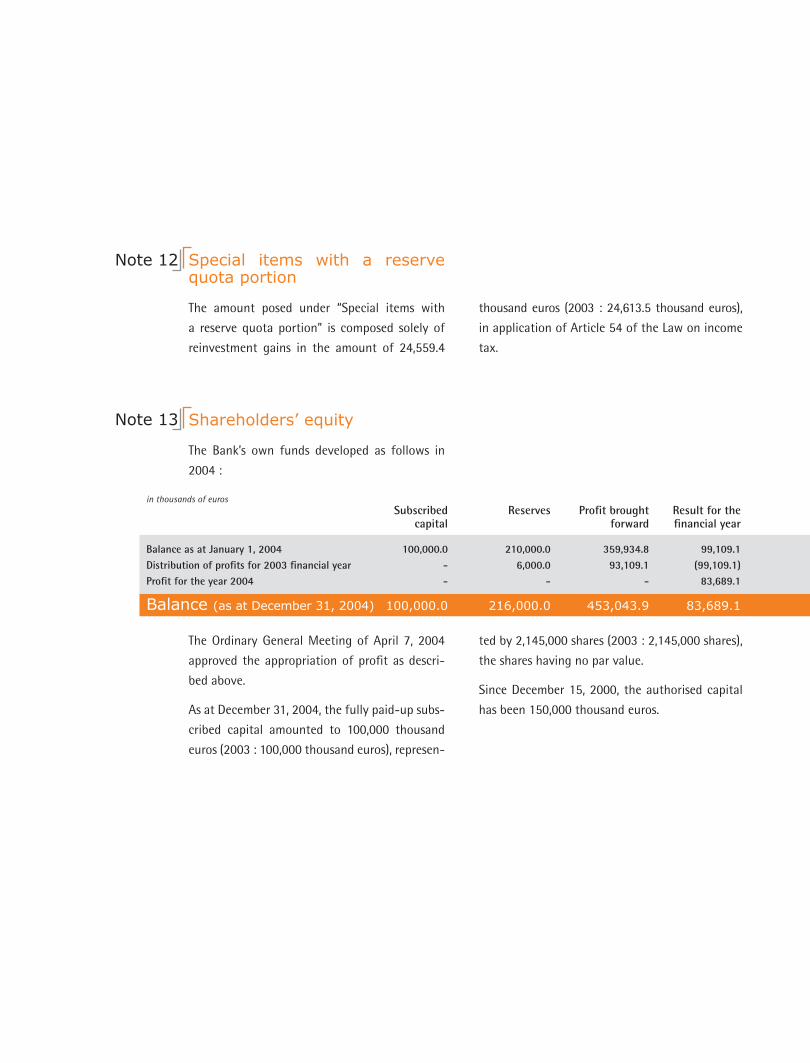
Special items with a reserve quota portion
The amount posed under “Special items with
a reserve quota portion” is composed solely of
reinvestment gains in the amount of 24,559.4
in thousands of euros Subscribed Reserves Profit brought Result for the capital forward financial year Balance as at January 1, 2004 100,000.0 210,000.0 359,934.8 99,109.1Distribution of profits for 2003 financial year - 6,000.0 93,109.1 (99,109.1)Profit for the year 2004 - - - 83,689.1
Balance (as at December 31, 2004) 100,000.0 216,000.0 453,043.9 83,689.1
Note 12
thousand euros (2003 : 24,613.5 thousand euros),
in application of Article 54 of the Law on income
tax.
Shareholders’ equity
The Bank’s own funds developed as follows in
2004 :
Note 13
The Ordinary General Meeting of April 7, 2004
approved the appropriation of profit as descri-
bed above.
As at December 31, 2004, the fully paid-up subs-
cribed capital amounted to 100,000 thousand
euros (2003 : 100,000 thousand euros), represen-
ted by 2,145,000 shares (2003 : 2,145,000 shares),
the shares having no par value.
Since December 15, 2000, the authorised capital
has been 150,000 thousand euros.
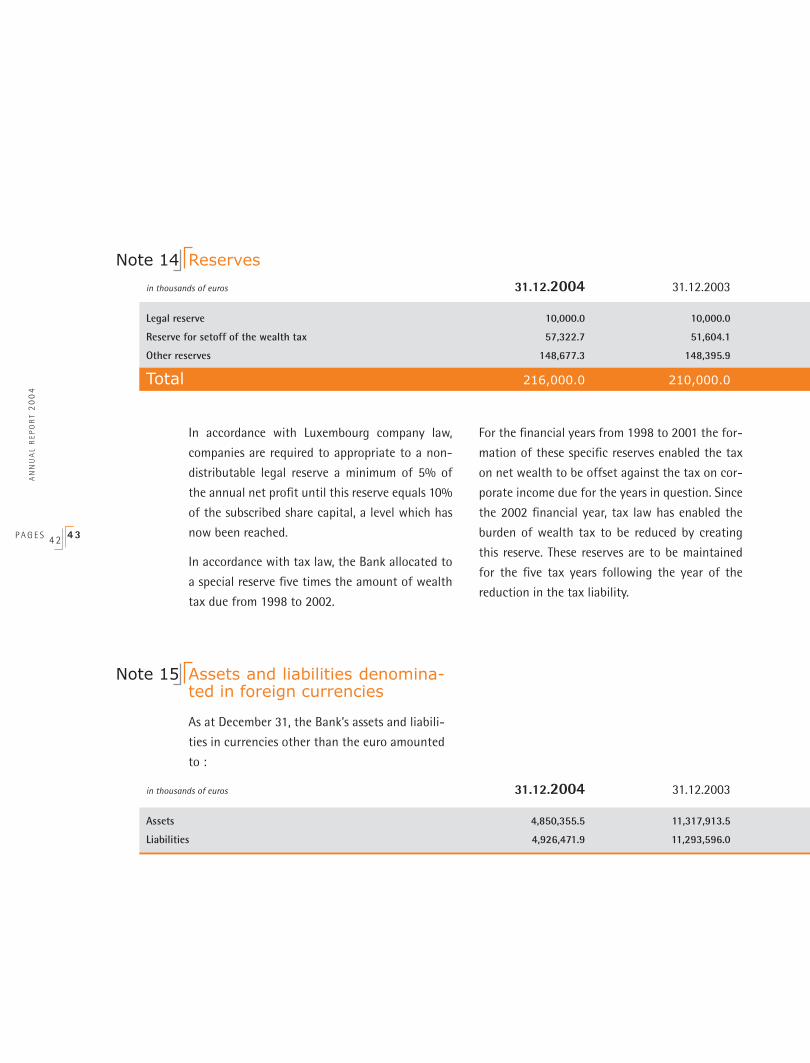
AN
NU
AL
RE
PO
RT
20
04
P A G E S 4 2 4 3
ReservesNote 14
in thousands of euros 31.12.2004 31.12.2003 Legal reserve 10,000.0 10,000.0
Reserve for setoff of the wealth tax 57,322.7 51,604.1
Other reserves 148,677.3 148,395.9
Total 216,000.0 210,000.0
In accordance with Luxembourg company law,
companies are required to appropriate to a non-
distributable legal reserve a minimum of 5% of
the annual net profit until this reserve equals 10%
of the subscribed share capital, a level which has
now been reached.
In accordance with tax law, the Bank allocated to
a special reserve five times the amount of wealth
tax due from 1998 to 2002.
For the financial years from 1998 to 2001 the for-
mation of these specific reserves enabled the tax
on net wealth to be offset against the tax on cor-
porate income due for the years in question. Since
the 2002 financial year, tax law has enabled the
burden of wealth tax to be reduced by creating
this reserve. These reserves are to be maintained
for the five tax years following the year of the
reduction in the tax liability.
Assets and liabilities denomina-ted in foreign currencies
As at December 31, the Bank’s assets and liabili-
ties in currencies other than the euro amounted
to :
Note 15
in thousands of euros 31.12.2004 31.12.2003 Assets 4,850,355.5 11,317,913.5
Liabilities 4,926,471.9 11,293,596.0
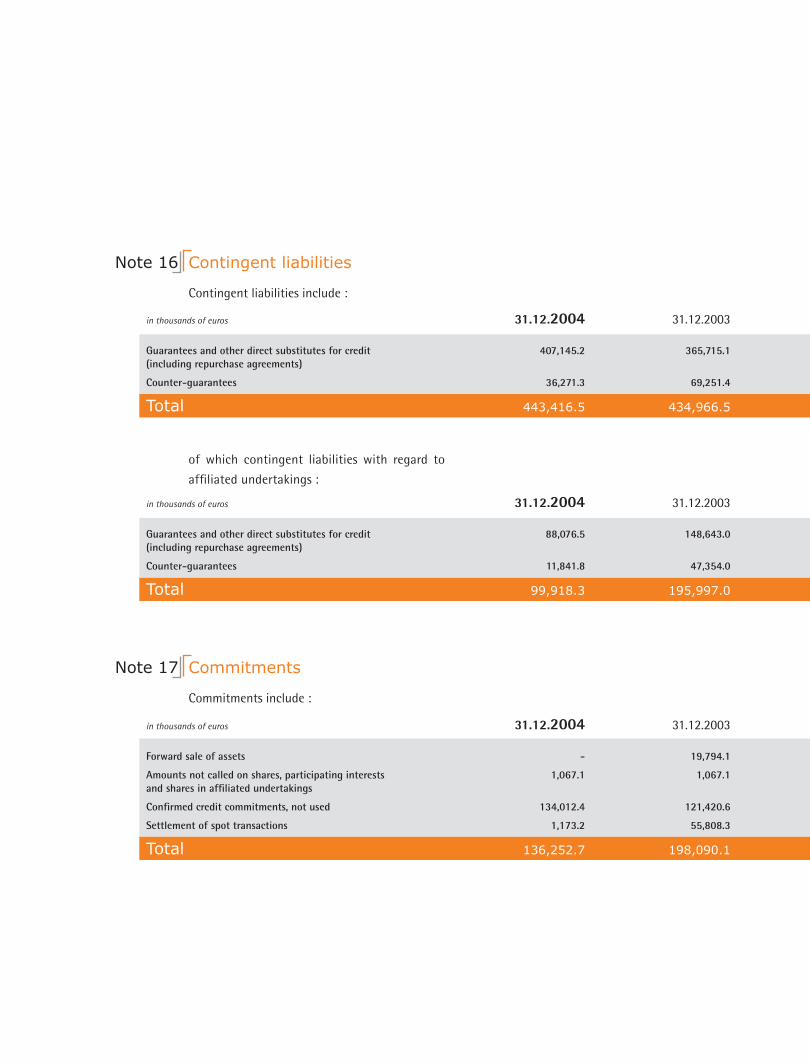
Contingent liabilities
Contingent liabilities include :
Note 16
in thousands of euros 31.12.2004 31.12.2003 Guarantees and other direct substitutes for credit 407,145.2 365,715.1(including repurchase agreements)
Counter-guarantees 36,271.3 69,251.4
Total 443,416.5 434,966.5
of which contingent liabilities with regard to
affiliated undertakings :
in thousands of euros 31.12.2004 31.12.2003 Guarantees and other direct substitutes for credit 88,076.5 148,643.0(including repurchase agreements)
Counter-guarantees 11,841.8 47,354.0
Total 99,918.3 195,997.0
Commitments
Commitments include :
Note 17
in thousands of euros 31.12.2004 31.12.2003 Forward sale of assets - 19,794.1
Amounts not called on shares, participating interests 1,067.1 1,067.1and shares in affiliated undertakings
Confirmed credit commitments, not used 134,012.4 121,420.6
Settlement of spot transactions 1,173.2 55,808.3
Total 136,252.7 198,090.1
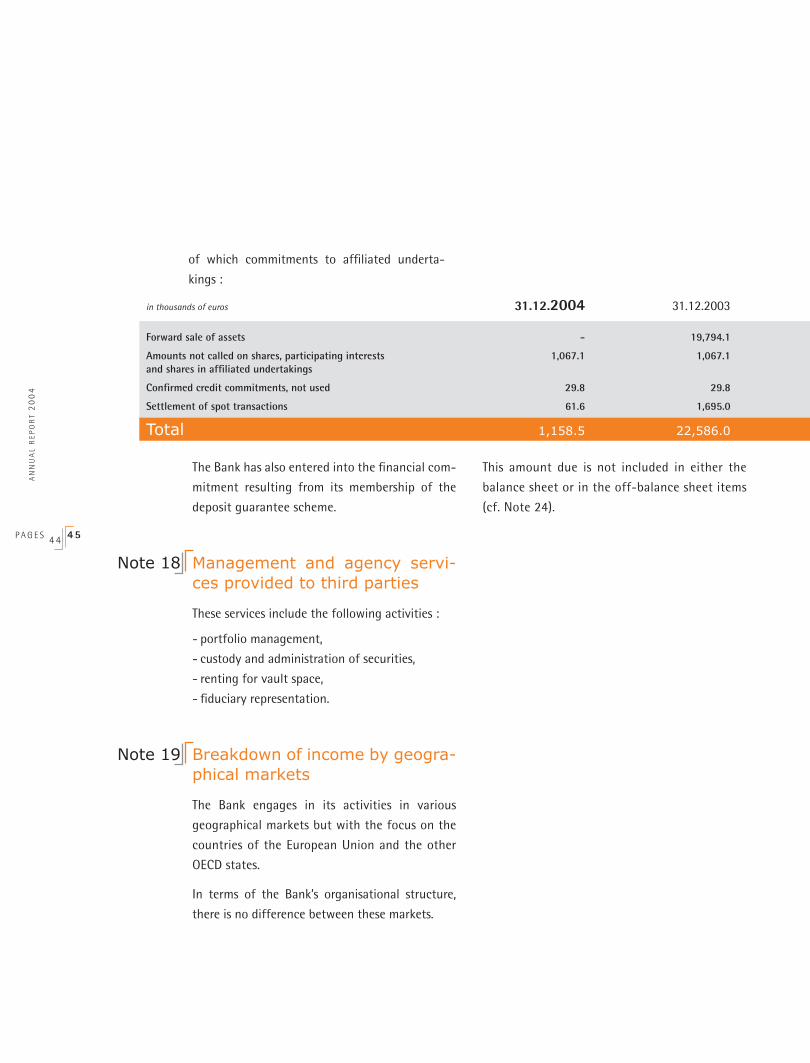
AN
NU
AL
RE
PO
RT
20
04
P A G E S 4 4 4 5
of which commitments to affiliated underta-
kings :
in thousands of euros 31.12.2004 31.12.2003 Forward sale of assets - 19,794.1
Amounts not called on shares, participating interests 1,067.1 1,067.1and shares in affiliated undertakings
Confirmed credit commitments, not used 29.8 29.8
Settlement of spot transactions 61.6 1,695.0
Total 1,158.5 22,586.0
The Bank has also entered into the financial com-
mitment resulting from its membership of the
deposit guarantee scheme.
Management and agency servi-ces provided to third parties
These services include the following activities :
- portfolio management,
- custody and administration of securities,
- renting for vault space,
- fiduciary representation.
Breakdown of income by geogra-phical markets
The Bank engages in its activities in various
geographical markets but with the focus on the
countries of the European Union and the other
OECD states.
In terms of the Bank’s organisational structure,
there is no difference between these markets.
Note 18
This amount due is not included in either the
balance sheet or in the off-balance sheet items
(cf. Note 24).
Note 19
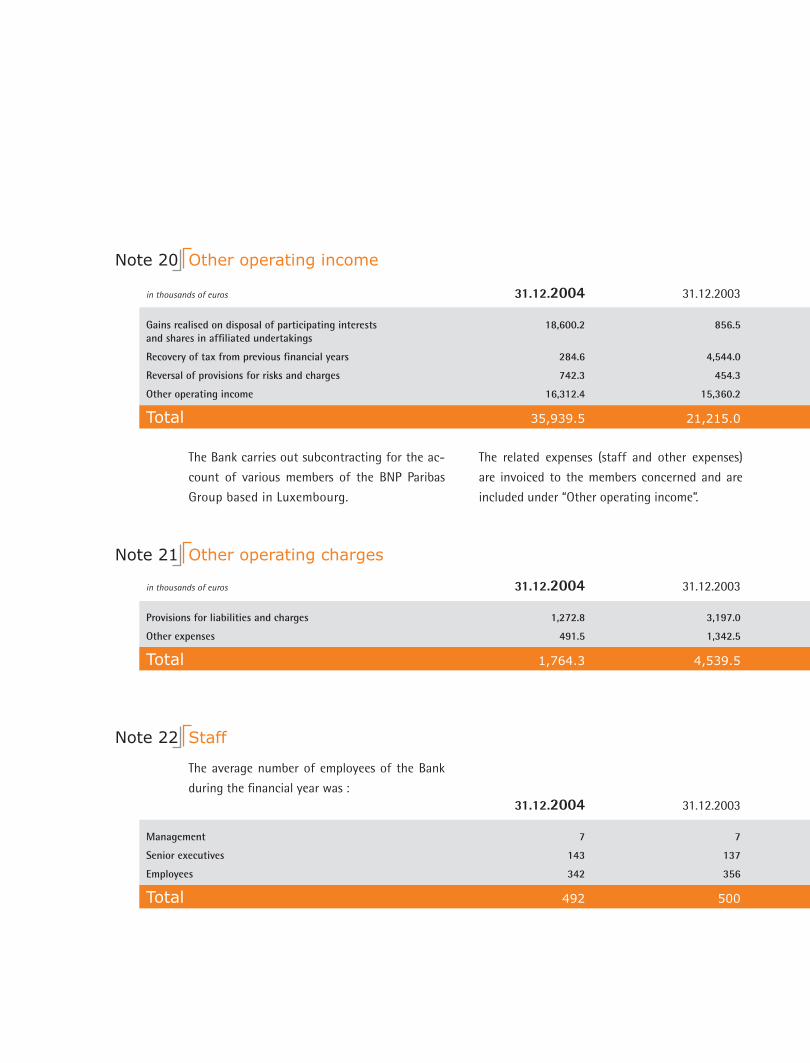
Staff
The average number of employees of the Bank
during the financial year was :
Note 22
31.12.2004 31.12.2003 Management 7 7
Senior executives 143 137
Employees 342 356
Total 492 500
Other operating incomeNote 20
in thousands of euros 31.12.2004 31.12.2003 Gains realised on disposal of participating interests 18,600.2 856.5 and shares in affiliated undertakings
Recovery of tax from previous financial years 284.6 4,544.0
Reversal of provisions for risks and charges 742.3 454.3
Other operating income 16,312.4 15,360.2
Total 35,939.5 21,215.0
The Bank carries out subcontracting for the ac-
count of various members of the BNP Paribas
Group based in Luxembourg.
The related expenses (staff and other expenses)
are invoiced to the members concerned and are
included under “Other operating income”.
in thousands of euros 31.12.2004 31.12.2003 Provisions for liabilities and charges 1,272.8 3,197.0
Other expenses 491.5 1,342.5
Total 1,764.3 4,539.5
Other operating chargesNote 21
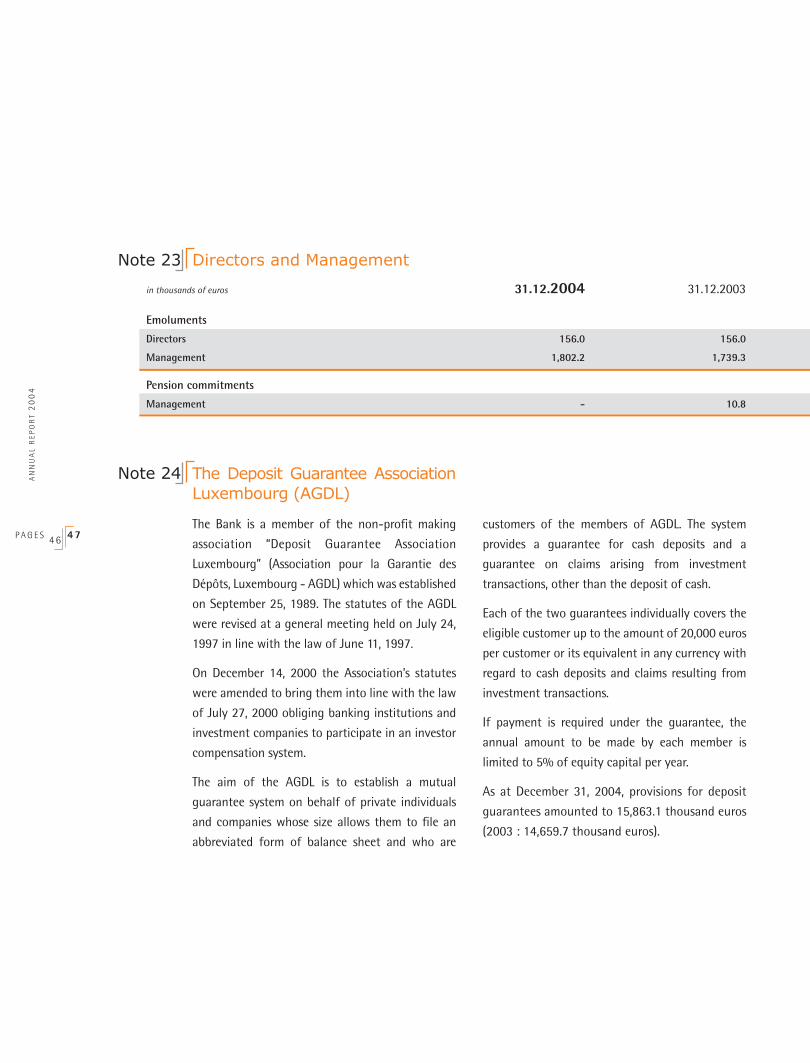
AN
NU
AL
RE
PO
RT
20
04
P A G E S 4 6 4 7
Directors and ManagementNote 23
in thousands of euros 31.12.2004 31.12.2003 Emoluments
Directors 156.0 156.0
Management 1,802.2 1,739.3
Pension commitments
Management - 10.8
The Deposit Guarantee Association Luxembourg (AGDL)
The Bank is a member of the non-profit making
association “Deposit Guarantee Association
Luxembourg” (Association pour la Garantie des
Dépôts, Luxembourg - AGDL) which was established
on September 25, 1989. The statutes of the AGDL
were revised at a general meeting held on July 24,
1997 in line with the law of June 11, 1997.
On December 14, 2000 the Association’s statutes
were amended to bring them into line with the law
of July 27, 2000 obliging banking institutions and
investment companies to participate in an investor
compensation system.
The aim of the AGDL is to establish a mutual
guarantee system on behalf of private individuals
and companies whose size allows them to file an
abbreviated form of balance sheet and who are
customers of the members of AGDL. The system
provides a guarantee for cash deposits and a
guarantee on claims arising from investment
transactions, other than the deposit of cash.
Each of the two guarantees individually covers the
eligible customer up to the amount of 20,000 euros
per customer or its equivalent in any currency with
regard to cash deposits and claims resulting from
investment transactions.
If payment is required under the guarantee, the
annual amount to be made by each member is
limited to 5% of equity capital per year.
As at December 31, 2004, provisions for deposit
guarantees amounted to 15,863.1 thousand euros
(2003 : 14,659.7 thousand euros).
Note 24
Auditor’s Report to the Board of Directors of BNP Paribas Luxembourg
We have audited the attached annual accounts
of BNP Paribas Luxembourg, Société Anonyme,
for the year ended December 31, 2004 and have
read the related management report. These
annual accounts and the management report are
the responsibility of the Board of Directors. Our
responsibility is to express an opinion on these
annual accounts based on our audit and to check
the consistency of the management report with
them.
We conducted our audit in accordance with
International Standards on Auditing. Those
standards require that we plan and perform
the audit to obtain reasonable assurance about
whether the annual accounts are free of material
misstatement. An audit includes examining, on a
test basis, evidence supporting the amounts and
disclosures in the annual accounts. An audit also
includes assessing the accounting principles used
and significant estimates made by the Board of
Directors, as well as evaluating the overall annual
accounts presentation. We believe that our audit
provides a reasonable basis for our opinion.
In our opinion, the attached annual accounts give,
in conformity with the Luxembourg legal and
regulatory requirements, a true and fair view of
the financial position of BNP Paribas Luxembourg,
Société Anonyme, as of December 31, 2004 and
of the results of its operations for the year then
ended.
The management report is in accordance with the
annual accounts.
Luxembourg, March 4, 2005
PricewaterhouseCoopers S.à r.l.
Auditors
Represented by Pierre Krier
AN
NU
AL
RE
PO
RT
20
04
P A G E 4 8 . . .


BNP PARIBAS LUXEMBOURG - Société AnonymeHead Office : 10A Boulevard Royal, L-2093 LuxembourgTel. : +352 46 46- 1 – Fax : +352 46 46 9000R.C.S. Luxembourg n°B 6754
The bank for a changing world