Embed Size (px)
Citation preview

2 015C H E - 4 74 .1 0 1. 8 5 4
E X P L O I T I N G T H E T E C H N O L O G Y W A V E S
A N N U A L R E P O R T

Table of contents
03 CEO-letter
04 Financial highlights for the group
05 An outline of the year
06 The strategy and DNA of Trifork
09 Investment strategy
11 Expectations and assumptions for 2016
12 Risk factors
14 Financial review 2015
20 Academy
22 Project
24 Product
26 Corporate Social Responsibility
28 Corporate Governance and Internal Controls
30 Board of Directors and Executives
32 Shareholder information
34 Signatures
36 Content / List of notes
37 Comprehensive income
38 Consolidated statement of financial position
40 Consolidated statement of changes in Equity
41 Consolidated cash flow statement
42 Notes
71 Content / List of notes
72 Signatures
73 Income statement
74 Statement of financial position
76 Statement of changes in Equity
77 Notes
83 Group structure
| | Management report
| Consolidated
| Financial Statements
| Parent Company
| Financial statements
Trifork is a fast growing software innovation company with headquarters in Switzerland. The company was founded in Denmark in 1996. Now headquarters is in Switzerland and the group has offices and activities all around Europe and America.
The conference activities of Trifork are an important source of inspiration for our software innovation projects, customers and employees. In 2015 more than 7,000 peo-ple participated in the Trifork conferences, world-wide.
End 2015, Trifork employs over 400 pas-sionate and talented people in 22 offices in Denmark, Sweden, Germany, Switzerland, Netherlands, United Kingdom, Hungary, Poland, Argentina and United States.
Trifork has delivered positive results every year. With total revenue of EURm 59 and EBITDA of EURm 8.9 Trifork in 2015 saw the best results in the history of the company.
Trifork is in the process of a possible new IPO of the group on an international stock exchange.

Jørn Larsen
CEO, Trifork
CEO-letter
3 Trifork Holding AG annual report 2015
Trifork was founded 20 years ago in 1996 with the mis-sion of helping clients to take advantage of new tech-nologies. The first year we were two employees and today more than 400. We will celebrate our 20 year an-niversary at the GOTO Copenhagen Conference in Oc-tober where we expect more than 1,500 software spe-cialists to attend the conference. We are still only at the beginning of our journey to become the global preferred partner for software innovation for leading brands.
In 2015 Trifork exceeded our original targets on both revenue and EBITDA. With total revenue of EURm 59 in 2015 we achieved a growth of 34% compared to 2014. This was satisfying and made it possible for us to increase the targets for the future.
The growth in 2015 was equally based on organic growth and growth from acquisitions. EBITDA for 2015 totalled EURm 8.9 which was an increase of 70% com-pared to 2014. This was satisfying and gives us a good foundation for further growth.
Global development With the headquarters in Switzerland Trifork is ex-panding internationally. In UK (London) we saw the highest growth-rates including our incorporation of the Open Credo acquisition, as well as our newly founded company CodeNode Ltd. In 2016 we also expect UK to be one of the fastest growing regions for Trifork.
As part of the progression towards a possible new IPO on an international stock exchange, Trifork concluded a sale of shares to a a leading institutional investor. In connection herewith, Trifork furthermore completed a capital increase in return for additional funding of EURm 6 to be used in the development of the Trifork Group in the period to come.
Exploiting the technology waves Through our conferences and our large network of technology experts, we continuously exploit the latest technology trends. Through our involvement in tech-nology start-ups, we even seek to influence the di-rection of new technologies. Tracking the technology waves ensures that we are able to bring new relevant technologies to our clients, potentially making such new technologies a part of our clients’ business strat-egies. In this way, Trifork is increasingly recognized as the technology partner of choice in our clients’ pursuit of innovative and disruptive solutions. We will always seek to challenge the existing business models, con-cepts, products and processes.
AcademyThrough our conferences, Academy remains our technological crystal ball and the key source for new inspiration throughout Trifork. In 2015, we success-fully improved our conference concept. The unique technological insight delivered at the conferences has made the GOTO brand well established at our selected conference destinations (London, Amster-dam, Chicago, Copenhagen and Berlin). In 2015, the number of attendees at all of our conferences totaled more than 7,000. In 2016, Stockholm will be added to the map of GOTO conferences.
ProjectCustomer innovation projects constitute the majority of the Trifork business. In our projects, we always strive to innovate and create solutions together with our customers that deliver significant business ad-vantages to our clients.
ProductThrough the implementation of a new product stra-tegy, the development and sales of our own software products increased in 2015. The strategy involves a thorough assessment of the product potential and the spin-off of a stand-alone organization for each product deemed to have a long term growth po-tential. It requires 100% focus and capital to make a product start-up successful. Therefore, we focus on having dedicated management and aiming at ex-ternal funding for each venture. Examples of product start-ups that Trifork launched successfully in 2015 are Chainalysis and The Perfect App.
Our overall strategic goal is to have 25% of our rev-enue based on products in 2017.
Expectations for 2016 and 2017In 2016, Trifork will stay focused on growing our busi-ness in both Europe and America. We will continue to grow our product business through product spin offs to separate companies, where we will allow external investors to be a part of an upside.
In 2016, we expect total revenue of EURm 80 and an EBITDA of EURm 12. This corresponds to 36% growth in revenue and 35% growth in EBITDA.
The 2017 strategic targets for the Trifork Group have been revised upwards given the 2015 performance and is now set at EURm 110 in total revenue with an EBITDA-margin of 15-20%.
Satisfying growth for projects and new product strategy implemented

4Trifork Holding AG annual report 2015
FINA
NC
IAL H
IGH
LIGH
TS A
ND
KE
Y R
ATIOS
Financial highlights and Key Ratios
EUR 1,000 2015 2014 2013 2012 2011
Revenue 59,039 44,097 35,594 29,901 23,394
Gross profit 35,745 24,083 20,935 17,009 13,319
Earnings Before Tax, Interest, Depreciation and Amortisation (EBITDA) 8,865 5,231 3,181 4,080 3,786
Profit from operations (EBIT) 7,033 3,898 2,024 2,851 2,653
Financial items 4,192 920 -179 84 121
Profit before tax (EBT) 11,224 4,818 1,845 2,934 2,773
Profit for the period 10,090 4,251 1,640 2,491 2,316
Total comprehensive income 9,284 4,312 1,741 2,963 2,317
Balance sheet
Non-current assets 25,173 20,605 15,692 15,380 9,085
Annual investment in tangible assets 2,359 1,100 169 442 344
Current assets 25,224 21,331 13,162 11,208 7,941
Total assets 50,396 41,935 28,854 26,587 17,026
Equity 27,151 13,918 11,244 9,931 8,788
Non-current liabilities 6,946 6,421 2,731 4,414 1,192
Current liabilities 16,300 21,595 14,879 12,242 7,047
Cash flow
Cash flow from operations 5,042 5,082 2,397 3,617 4,145
Cash flow from investments -1,337 -8,753 -854 -7,749 -4,012
Cash flow from financing activities 3,112 5,568 -1,927 1,584 -52
Net change in cash and cash equivalents 6,818 1,896 -384 -2,549 81
Key ratios
Gross margin 60.5% 54.6% 58.8% 56.9% 56.9%
EBITDA-margin 15.0% 11.9% 8.9% 13.6% 16.2%
EBIT-margin 11.9% 8.8% 5.7% 9.5% 11.3%
Equity ratio 46.0% 33.2% 35.1% 34.5% 45.1%
Return on Equity 56.6% 37.6% 17.0% 29.6% 35.0%
Return on invested capital 14.0% 9.3% 7.0% 10.7% 15.6%
Average number of employees 340 276 224 167 124
Per share data
Dividend yield % - 34% 31% 25% 40%
Dividend in EUR 1,000. 0 1,300 375 603 845
Dividend in EUR per share - 0.075 0.021 0.034 0.047
Basic Earnings in EUR per share of CHF 0.1 (EPS-Basic) 0.43 0.22 0.07 0.14 0.13
Diluted Earnings in EUR per Share of CHF 0.1 (EPS-D) 0.43 0.22 0.07 0.14 0.12
Equity value in EUR per share 1.25 0.80 0.56 0.51 0.43
Number of shares (1,000) 18,537 17,326 18,000 18,000 18,000
The key ratios have been calculated in accordance with IAS 33 and ”Recommendations and Ratios 2010” issued by the Danish Society of Financial Analysts. For definitions see page 69. All historical numbers from 2013 and earlier presented in this report are represented by the previous reported numbers for Trifork A/S as the previous parent company of the Trifork group. The numbers have been converted from DKK to EUR using the DKK/EUR exchange rate end of each period.

5 Trifork Holding AG annual report 2015
AN
OU
TLIN
E O
F TH
E Y
EA
RAn Outline of the YearFinancial highlights in 2015
| In 2015, Trifork exceeded its original growth target with total revenue of EURm 59.0, which is 33.8% higher than in 2014. The growth originated equally from organic growth and growth from acquisitions.
| Trifork’s EBITDA of EURm 8.9 for 2015 is equal to a 15.0% EBITDA margin and represent an increase of 69.5% compared to 2014. This is the best result achieved in the history of the company.
| Trifork EBIT was EURm 7.0, which equals an 11.9% EBIT margin and an increase of 80.4% against 2014.
| EBT (Profit before tax) for 2015 was EURm 11.2, an increase of 133.0% compared to 2014.
| Net Profit for 2015 amounted to EURm 10.1 which is an increase of 137.3% compared to 2014.
| The total comprehensive income for 2015 was EURm 9.3, representing an increase of 115.3% compared to 2014.
| Equity at 31.12.2015 was EURm 27.2, giving an Equity Ratio end of 2015 of 46.0% compared to 33.2% in 2014.
| Revenue per employee was EURm 0.176, an in-crease of 8.9% compared to 2014 where EURm 0.160 was achieved.
Main events
| The GOTO conference took place for the first time in London and the planning of a new con-ference in Stockholm has been initiated. The GOTO concept is now implemented in London, Copenhagen, Berlin, Amsterdam, Chicago and Stockholm.
| In 2015 Trifork founded the company CodeNode to-gether with the company SkillsMatter Ltd. CodeNo-de has invested in excellent conference facilities in Finnsbury Circle in the centre of London and this serves as a basis for the Trifork conference activities in London. Trifork owns 51% of the company.
| In the start of 2015 Trifork acquired additional shares in the company OpenCredo Ltd. Trifork now owns 69% of the company and the results have been consolidated in the 2015 annual report.
| The focus on product based business has result-ed in the founding of two new companies in 2015. In UK the company The Perfect App Ltd. was founded to focus on the development and inter- na tional sales of the product “The Perfect App” (TPA), which handles deployment of mobile apps and col lection of app analysis from any mobile platform. A very experience CEO has been hired to grow this company rapidly.
In Holland the company Trifork Learning Solu-tions B.V was founded to focus on the develop-ment and sales of the product “QTI”. This product is used by many education centres to orchestrate and implement electronic exams.
| In 2015 Trifork invested in several smaller start-up companies, which fit well with the Trifork busi-ness model and technology focus.
Financial expectations in 2016
| In 2016, Trifork expects to increase revenue by 36% compared to 2015, up to EURm 80.
| The increase in revenue is expected to originate from both organic growth and acquisitive growth.
| In 2016, Trifork expects to reach an EURm 12 EBIT-DA result, corresponding to an EBITDA-margin of 15% and 35% growth compared to 2015.
| Trifork has an overall goal of obtaining product based revenue of 25% of total revenue at the end of 2017 with an EBITDA-margin significantly higher than the rest of the business. In 2016 the target is to achieve 20% of total revenue in this business area.

6Trifork Holding AG annual report 2015
Trifork strategyAt Trifork we believe that technology can help our cus-tomers become more successful and it’s our mission to make that happen. We take responsibility and have a lean approach which gives us a high success rate with software projects. Our passion and curiosity keeps us updated with the latest technology enabling us to use the right tools for the job at hand.
We believe that software innovation is essential and should be used in the right way and that we, as a com-pany, have the responsibility to participate in building a better world. Our contribution is building software that makes life easier for us all.
Trifork Consulting Software technology is creating new opportunities for a number of businesses. Sometimes the utilization of the technology is disruptive to existing businesses. Espe-cially the first mover may have extraordinary gains from creating and implementing disruptive business models. Trifork have in a number of cases been the partner cre-ating such disruptive business models. One example is Mobile Pay developed with Danske bank, which is used by more than 50% of the population in Denmark.
Our dedication to new software technology makes us the perfect partner in creation of the future IT based business model. We work in a lean way to discover ex-actly how and why new technologies should be applied. For some customers it´s the desire to stay at the front of their game, for others its a question of keeping up.
We organise software conferences and events all over the world. We talk about the latest technologies and edu-cate a lot of people on how new technologies can trans-form and improve their businesses. Many of our clients discovered Trifork by attending one of our events and are inspired to make changes in their businesses in order to optimize and innovate in their business domain.
Trifork software The reel difference in the impact of progressive strategies is the implementation. Timing, speed, skills and quality matters. Also the lean approach is extremely important in the implementation process, where new opportunities may arise during the implementation process.
We build end to end taylor-made software solutions. We do it efficiently by aggregating standard software components that come from the open source com-munity or from our own product portfolio.
Backed by the learnings from conferences, we know which components and frameworks to use in our development of solutions. If we identify a need for something new where we can’t use standard com-ponents we build this from scratch.
Some of our solutions are developed into actual products.
New technology is often created in small companies and start-ups. The enthusiasm, hyper energy, focus and firm believe in that is going to change the world, is essential for driving a new technology to success. Trifork recognize this and as a consequence we support and invest in a number of such companies. Our target is partly to be able to learn and utilize the technology, partly to influence the direction of the development and partly to make capital gain from such investments. A good example of this is Basho which is a cloud database company that despite tough competition is growing and becoming more and more successful. We help Basho with technology im-provements and we resell the software on the European market. Our share of Basho is around 5% and the total value of Basho is estimated beyond USDm 300.
TRIFO
RK
STR
ATEG
Y
EX
CIT
EM
EN
T
T I M E
Peak ofExpectation
Trigger
Trough ofDisillusion
Hill ofEnlightenment
Plateau ofProductivity

7 Trifork Holding AG annual report 2015
Trifork OperationAfter building a solution we are often asked to oper-ate and support this. Trifork operates the infrastruc-ture for several major institutions and companies and make sure that the security, reliability, response time and performance is at the right level. This part of the Trifork business is expanding as operations and maintenance are becoming more and more con-nected with the development of solutions. In some of the organisations that Trifork manage, new software is deployed to production several times an hour. This new way of working is demanding and requires a tight integration between development and operation.
Technology WavesThe most important thing for Trifork is to get the tracking and influencing of new technologies right. Next the tim-ing of when to use the technologies for our clients. The figure on page 6 shows a technology wave as a hype typically initiates and ends in real world applications.
Every new technology wave is triggered by hyping an idea without much content. As seen on the hype curve in the figure, the excitement rises and a number of start-ups will take off with the idea.
The start-ups will turn ideas into concrete products and business models will evolve. Normally, open source is used as a way to spread the products fast.
When a hype is later challenged with the need for a sustainable business model the point of “Trough of Disillusion” is reached. At this point many of the prod-ucts and concepts developed by the start-ups will fail.
Some products and concepts will survive and turn into sustainable businesses. The “Hill of enlighten-ment“ is then passed and they will be able to continue onto the “Plateau of Productivity” with their business.
Trifork on the WavesAfter identifying the right waves for our involvement Tri-fork is front running the selected waves and being a part of driving the development and use of the technol-ogies. Most often we get seriously involved in a wave a third up from the “Trigger” point at which point we will supply our customers with the required technologies to make innovative and groundbreaking solutions. Most often we will then challenge existing business models, concepts, products and processes.
Trifork continues at the forefront, riding the waves to the top and implementing the technologies in projects with clients. Half way down to the “Trough of Disillusion” the technolo-gies start becoming comodities. At this point, Trifork has been able, on several occasions, to deliver products cre-ated on the wave and is able to “off-load” products that our customers can use as surfboards on the rest of the wave.
Sometimes we see that waves divide into additional secondary waves. At this point our “Wave-process” starts from scratch again and we make sure to jump on to the highest and longest one.
The Trifork FocusThere are a number of mega trends in the technol-ogy space identified today where waves are evolving. Some of these include: Robotics, Shared economy, Block chain, Smart Homes, Smart Factories, Tele Medicines, Cognitive systems, Data Analytics, Health Extension, Automation, Internet of Things, etc.
Trifork can’t be everywhere in this universe of new trends and technologies but we keep identifying them and evaluating when and how to catch each of the waves. Below we have listed some of the selected focus areas for Trifork.
Future of Financial ServicesJust 20 years ago the Internet only played a very tiny part in the banking World and just 5 years ago only a few people used the smartphone for banking business.
Today the Internet and the smartphones are key to modern banking. They changed banking in a radical way. They made it possible to reduce the number of branches radically and changed the whole cost struc-ture in the financial sector. Today most people have their banking transactions at the tips of their fingers any-where and anytime.
More than 15% of the business in Trifork is generated from projects helping financial institutions take advan-tage of new technologies. Mobile banking, mobile pay-ments and infrastructure have been the main drivers.
The flip side of internet banking is that criminals and hackers have an easier time committing fraud. Increas-ingly Trifork is involved in building solutions that can help minimizing this problem.
Trifork is focused on:
- Continue building a strong and lasting company
- Being experts in new technology
- Continuing expanding International presence
- Work lean, innovative and inspire through our conferences
- Being part of building a better world using technology
- Build innovative software in projects with customers
- Deliver products to achieve scalable revenue
TRIF
OR
K S
TRAT
EG
Y

8Trifork Holding AG annual report 2015
Our startup, Chainalysis is a good example of caching a wave within the financial services and us helping banks and law enforcement with insights into digital currency transactions. Currently Trifork is focusing on solutions to the following areas:
| More personal, greater trust (customer rela-tionships and data analytics)
| Disruption is changing the payment sec-tor by traditional and non-traditional banks (National and Global payments)
| More digital attacks from hackers and criminals (fraud prevention)
| Blockchain and crypto currencies get more attention (for risk mitigation, smart con-tracts and public ledger, R3 association)
| API Banking (open platform approach / ag-gregator business models)
Future of HealthcareTrifork has been building advanced e-health solutions for almost 20 years. In the beginning we replaced paper based record systems with electronic systems and new work procedures. In this way we changed the way the work was carried out at hospitals.
In the recent years we have focused on integrating data between a lot of different healthcare systems to ensure that all relevant health care personnel through-out a country can share the same information.
We have also made apps for doctors and nurses that help exchange best practices and provide rele-vant information when needed and we have helped the government to improve privacy and security around patient sensitive information.
There is still a lot to be done in optimizing and im-proving quality of work in healthcare. In the near future we see great opportunities in:
| Improve patient adherence and involvement in the treatment to improve the overall ef-ficiency of the often very expensive treat-ments.
| Expand our services to Big Pharma compa-nies and use our healthcare know how in pro-viding solutions to them.
| Optimize workflows between healthcare or-ganisations an improve handling of complex patient flows.
| Explore and improve solutions for patient-at-home treatments using new technology, bio-metric sensors and implants.
| Use technology to improve citizen health to increase life quality and reduce contact with the healthcare system.
Future of Smart Homes and FactoriesSmart and connected products are changing the world and also the competition among major play-ers. Google has challenged Honeywell and Dan-foss with new home appliance products by intro-ducing Nest Thermostats into the market. This has forced Danfoss and Honeywell to act.
In 2015 we have helped several large product companies to transform their products to become Smart Connected Product and in that way increase the competitive strength. In addition new revenue stream on top of the Smart Connected Products has been identified and utilised. The focus areas for Trifork are:
| Build products and solutions for IoT that en-sure privacy and accessibility of the Smart Connected devices.
| Optimizing energy consumption in homes, offices and factories.
| Build Smart Home products that enable peo-ple to get all things connected (Access, en-ergy, ventilation, security, etc.)
| Facilitate that more and more devices can be integrated by working with industrial leaders to standardise API’s
| Robotics and drone solutions on top of standard products and devices.
| Analytics for big data is becoming a must for providing intelligent and smart systems that act on billions of observations.
Growth in TriforkOur goal is to achieve an annual growth of mini-mum 25%. In short we see growth coming from four areas:
| Organic growth of existing business units
| New start-ups
| Acquisitions
| Franchising
ORGANIC GROWTH OF EXISTING BUSINESS UNITSAll the offices will continue to grow organically. The annual growth rate per business unit is on average higher than 10-15%. When a business unit exceeds 50-75 people we will divide it into two units. This makes it easier to control and perfect the way we manage and lead a business unit. With time we have become very good at managing a unit of approximately 50 people. Also, for us as employ-ees, we started and were attracted to a unit of this size where everyone knows one another. Further-more, our experience has taught us that the fastest growth rates often come from relatively small units.
TRIFO
RK
STR
ATEG
Y

9 Trifork Holding AG annual report 2015
NEW START-UPSWe will continue to initiate new start-ups as part of our business model. Start-ups will either be based on creating new product business based on some of the products developed in Trifork - or be based on new business ideas that we want to exploit together with some of the entrepreneurial technol-ogy experts that we meet at our conferences.
ACQUISITIONSGrowth from acquisitions has an obvious negative impact on cash flow and involves risks and financing issues. On the other hand it’s a great way to enter a new market and learn about a foreign culture in a very effective way, thereby giving our growth a quick boost.
We will primarily look at acquisitions from a product per-spective. Trifork has offices around the world and a sales force that likes to have a selection of products to present to customers. Therefore we can offer a small product company a boost in business by becoming a part of the Trifork group.
FRANCHISINGAs the Trifork Brand grows stronger we see an op-portunity in building a Franchising business.
In large cities in Europe where we already have of-fices we see an interest from customers and young entrepreneurs in building smaller entities in the surrounding cities. We plan to have 10-15 offices based on this model over the next 2-4 years.
Financial expectationsTrifork has within the next 2 years a financial target of delivering:
| Total revenue of EURm 110 in 2017
| EBITDA-margin of 15-20%
| 25% of total revenue based on product sales
The targets are based on the current situation with an expectation in 2016 to achieve total revenue of EURm 80 and an EBITDA of EURm 12.
Group structureTrifork Holding AG is an unlisted company estab-lished in Switzerland with the purpose of being able to consolidate the earnings in the group and able to finance, coordinate and control the international in-vestments in the Trifork Group.
Trifork Holding AG is continuing the strategy that has been communicated through financial reports, pres-entations and seminars.
The way to implement the strategy is to continue the work previously done and focus even more on the global development of the Group.
Trifork Holding continues to use the same account-ing standards as previously used when the company
was listed on Nasdaq OMX Copenhagen. Only very few adjustments have been made in order comply with Swiss regulations and to prepare the Group for a future listing on one of the major European stock exchanges.
When presenting historical data from 2013 and earlier for Trifork Holding AG this will include the data from Trifork A/S converted to EUR based on the EUR/DKK exchange rate in each historical period.
TRIF
OR
K S
TRAT
EG
Y

10Trifork Holding AG annual report 2015
INV
ESTM
EN
T STR
ATEG
Y
Investment strategyBeing in the centre of knowledge in our industry implies that Trifork is working in an innovative international at-mosphere with extensive entrepreneurship. Thus we are often offered opportunities to invest in a variety of very promising start-up companies as well as rapidly growing SME’s in need of capital to deploy their growth potential. Trifork is an attractive partner for such compa-nies, the attraction being our know-how, resources and presence in different geographic markets. It’s essential for us to evaluate these investment proposals and invest in those considered to be the most advantageous.
Trifork creates a significant positive cash flow from operations every year and the basic Investment Strategy is to deploy this cash flow to expand our business. When we are facing larger investments or acquisitions we strive to defer payments including earn out agreements. This is to secure a certain per-formance and payment flow where we can absorb the investment by the cash flow over 3-4 years. Thus we only make “short-term” finance investments. Growth from acquisitions has an obvious negative impact on cash flow and involves risks and financing issues. On the other hand it’s a great way to enter a new market and learn about a foreign culture in a very effective way, thereby giving our growth a quick boost.
The major investments in recent years has been tar-geted at achieving our goal of becoming an interna-tional group and diverting from a few markets. Both to create a considerably larger market base for scalable revenues and in order to contradict fluctuations and regulations in a single market. Today Trifork is repre-sented in 22 offices in 10 countries and have a sub-stancial basis for future international growth.
Trifork’s investment decision is based on the follow-ing evaluation criteria:
| International Will the investment benefit our internationalization aim by opening or expanding one or more geographic markets and / or bring new products or solutions to our existing markets ?
| Frontrunner Is the company a first mover in the utilization of new technology or experts in technology areas that could supplement solutions being marketed by the Trifork organization ?
| Product business Does the company have or is it developing prod-ucts with a substantial scalable revenue potential ?
| Business partner Will Trifork obtain competitive advantages or other synergies by entering this partnership ?
| Customer There is a need for Trifork to be an innovative partner who can be part of the development of a given solution or product. This helps to create loyal and strategic customers.
Each of the investments Trifork has made in recent years has been evaluated on these criteria, and we found that every investments could contribute to Tri-fork achieving our strategic goals.
In the next period we will primarily look at acquisi-tions from a product perspective. With our pres-ence in offices and salesforces around the world we can offer a small product company a boost in business by becoming a part of the Trifork group.

11 Trifork Holding AG annual report 2015
Expectations and assumptions for 2016Global strategy2016 is once again going to be an exiting year for Trifork with further global development of the group.
In 2015 the international presence of the group once again increased significantly. Business units all over the world are an integrated part of the group and projects and products are increasingly sold across boarders involving people from differ-ent locations and business units.
Trifork is able to deliver the full range of services from each of its offices and we expect the organic growth and profit-margins to increase further in 2016.
In 2015 the structure in the Academy segment was optimized and the GOTO-conferences are now ready to open the doors in 6 cities in 2016 (Amster-dam, Berlin, Chicago, Copenhagen, London and Stockholm). Several new partner conferences with Trifork as the organizer are also in place resulting in an increased activity level in this segment. In 2016 investments will be made in profiling and promoting the GOTO London conference to mark the pres-ence of Trifork in the UK.
Product companiesTrifork has continued to work with the process of establishing services and product sales that can generate scalable revenue with higher profit mar-gins. This work will be continued and reinforced in 2016 and Trifork believes that the financial results once again in 2016 will show significant growth based on the activities in this area.
Several new activities have been initiated in relation to discovering and creating new innovative prod-ucts in 2016 involving the whole organisation and brain-trust in Trifork.
Products are seen as an integrated part of the busi-ness in Trifork, where they can not only be integrat-ed into project deliveries, but also as elements that have a separate sales channel or even a separate company setup in order to get the best conditions for success.
In the start of 2016 two new companies has been formed based on products from Trifork. By having the products in a company of their own it’s our be-lief that this will bring the needed attention and fo-cus on each of the products in order to make them best in class and get success.
In 2016, Trifork’s target is to generate 20% of total revenue from product sales and related services and to achieve an EBITDA-margin of over 25%.
Financial results and growth
| In 2016 Trifork expects an increase of 36% in revenue compared to 2015. The target is total revenue of EURm 80.
| Trifork expect an EBITDA of EURm 12. This is an increase of 35% compared to 2015 and equals to an EBITDA-margin of 15%
The growth in revenue is expected to come from an extension of the existing business but with increased focus on product sales.
The fulfilment of the financial expectations is sub-ject to some uncertainty. Significant changes in exchange rates, business or macroeconomic condi-tions may have an impact on the economic condi-tions of the Trifork group performance.
ACADEMY (CONFERENCE AND EDUCATION)Representing 15% of total revenue in Trifork the current size of the Academy business is considered adequate and the focus in this area in 2016 is to increase profit-ability instead of additional growth.
For Academy, the highest risk is a new recession in the economy. This could mean that companies may be cautious with expenses to conference participa-tion and education.
PROJECT (CUSTOMER INNOVATION)Project is focusing on delivering innovation projects to the customers of Trifork. In 2015 this unit represented 71% of total revenue in Trifork.
Risks include projects not being delivered on time or or if new planned projects are delayed in starting.
PRODUCT (DEVELOPMENT AND SALES)The products invented at Trifork are based on con-tinued development of the current product portfolio in the company and will be inspired by the innovative projects developed with the customers of Trifork.
In 2015 this segment accounted for 14% of total revenue and achieved an EBITDA-margin of more than 40%. The activities in this segment are ex-pected to grow significantly in the future.
Risks include products not being sold or if the main-tenance and support of products will be too expen-sive compared to the pricing of the products.
In 2016, Trifork expects 36% growth in revenue and 35% growth in EBITDA
EX
PE
CTA
TIO
NS
AN
D A
SS
UM
PTI
ON
S F
OR
201
6

12Trifork Holding AG annual report 2015
Risk factorsIt is of importance to the management of Trifork to insure procedures and policies to limit exposure to risk of the company’s operations.
Trifork’s business involves the same commercial and financial risk as other tier companies in the sector.The management has identified the following risks they are not exhaustive or listed in order of priority.
Currency riskThe company has international activities in Eng-land, Holland, Switzerland, America, Sweden, Po-land, Germany, Hungary and Argentina, and has expenses as well as income in all of the currencies of these countries. Trifork continues to monitor the currency risks this entails. The company continues
to evaluate the com-prehensive exposure of the various cur-rencies and assess-es the variance of the individual currencies as well as the corre-lation between them, in order to counter possible risks.
Hacker attacksAs any company Trifork is potentially in danger of hacker attacks. Thus, there is a risk of loss or de-struction of data, followed by losses, both financial as well as reputational.
Trifork has made security arrangements to defend itself from hackers and expects its surveillance sys-tems to react fast in case of an attack. However, the company cannot guarantee that the risk of a hacker attack on the company systems and instal-lations is eliminated, which could result in negative financial consequences.
TechnologyTechnological development continues rapidly and thus Trifork regularly makes several choices with respect to which technologies the company should focus on. As such, there is an inherent risk factor in the company’s choice of technologies.
Before significant technological choices are made, they are carefully scrutinized, with background knowledge obtained in dialogue with the compa-ny’s worldwide expert network. In addition, Trifork is a Group continuously ready for change and has as its mantra the constant commitment to moni-tor other technological developments and regularly adjust its competencies.
Dependency on key employeesTrifork is a medium sized company with highly com-petent employees resulting in a dependency on key employees, both in terms of operations, sales and development.
Therefore, it could affect the company’s growth and earnings if key people leave the company or if the com-pany is unable to attract sufficiently qualified employees.
By constantly focusing on being at the technologi-cal forefront and involved in the most interesting and challenging projects, Trifork believes that the company can attract and retain interest from both existing and future employees.
Dependency on customersIn connection with major development projects, Tri-fork depends on a lasting relationship with a number of big customers as well as the ability to attract new ones. Particularly, this applies to the Project seg-ment, where new development projects represent the major part of revenue.
To minimize the risk, Trifork makes a great effort at working closely with its strategic customers as well as securing a long-term shared planning in order to ensure an optimal utilization of resources.
Trifork depends on the many participants at the GO-TO-conferences. The highest risk in the Academy segment is therefore a potential weakening of the high quality image of the conferences. This could be the result of deteriorating content and quality or if a competitor develops a similar conference.
In cooperation with its international expert net-work, Trifork is continuously striving to ensure that the content and format of the conferences remain best-in class.
Trifork has policies and procedures to ensure the most efficient management of identified risks as possible. The company’s strategic targets are supported by a bal-anced risk profile.
RIS
K FA
CTO
RS

13 Trifork Holding AG annual report 2015
MarketIn connection with the sale of specific solutions, the market, including the competitive situation in given market segments in shorter and longer periods, in-fluences both the outlets and the pricing of specific types of solutions. This can influence the compa-ny‘s ability for growth and earnings.
Acquired companiesThere may be unidentified features of acquired shares in companies which cause the expected synergies to not be realized or that impairment adjustments have to be done on goodwill from acquisitions.
The company’s estimates and assessment of earn-ings potential may therefore not live up to expectations and the acquisitions may possibly have a negative influence on the expected growth of the company’s revenue and earnings. In connection with acquisitions, the company itself carries out due diligence in order to reveal all possible significant matters.
Use of more resources than expectedThe delivery of business critical it-solutions can be de-layed and/or demand more resources than expected. A prerequisite for the continued growth of Trifork is that the company continues to deliver solutions on time with the planned use of resources. Trifork be-lieves that the focus on optimal use and development of the agile principles in software development will help to minimize the risk and ensure that the projects are delivered in the right time and quality.
Product liability and insurance coverageTrifork has a business insurance which covers lease, theft, property damage, injuries and professional counsellor liability. It is the company assessment that it is sufficiently insured but there can be no as-surance that the chosen coverage completely com-pensates for a loss that may arise due to an injury.
Through its commercial contracts, the company strives to limit company exposure, but it is impos-sible to guarantee that all situations are agreed on in such a way that a mistake will not have a negative influence on company earnings.
Intangible rightsTrifork owns no patents on the products it provides, but has the general right in the form of copyright protection and what follows from the Marketing Practices Act and similar legislation in the countries where the products are marketed. Trifork protects its rights by ensuring the secrecy of the particular structure that the company has built around the products offered, and by ensuring the secrecy of new developments in such a way that the public and competitors are only informed upon release of new initiatives.
RIS
K F
AC
TOR
S

14Trifork Holding AG annual report 2015
Financial review 2015Financial targets
EURm 03.2015 08.2015 Result
Revenue 56.0 60.0 59.0
EBITDA 8.0 10.0 8.9
Financial statementThe management of Trifork is satisfied with the re-sults for 2015. The consolidated revenue ended at EURm 59.0, which was EURm 3.0 more than the original target for the year of EURm 56.0 but EURm 1 less than the upgraded expectations in August, 2015. The EBITDA of EURm 8.9 was EURm 0.9 over the original target of EURm 8.0 - but EURm 1.1 less than the upgraded expectations. The primary reason for the lack in revenue and EBITDA is to be found in increased product investments in Q4-2015.
Growth in revenueIn 2015, Trifork totalled a EURm 59.0 revenue, which equals a 33.8% growth compared to 2014, where EURm 44.1 was realized. This exceeds the company’s previous ambition to obtain an annual 15-25% revenue growth.
The management is satisfied with the results.
Origin of growthIn 2015 the growth was equally divided between organic growth and growth from acquisitions. The growth from acquisitions came primarily from the acquisition of the company Open Credo Ltd. in London. The major part of the activities in Open Credo is within the project segment in Trifork.
International growthIn 2015, the ambition of Trifork was to significantly increase growth in international activities with pri-mary focus on the UK market.
This goal has been met after a year with growth in almost all the international conferences and imple-mentation of new international projects.
Trifork view the continued growth in international revenue as a strengthening of the group. Activities in more markets reduces overall risk to Trifork in the event that one market shows poor performance and yields increased business opportunities.
Trifork consider Europe as its home market with the primary activities in United Kingdom, Denmark, Holland, Switzerland and Sweden.
FINA
NC
IAL R
EV
IEW
2015
82% Europe
10% America
8% Others
REVENUE 2015
23.4
2011
29.9
2012
35.6
2013
44.1
2014
59.0
20150
15
30
45
60REVENUE - EURm
Development in revenue Geographical split of revenue

15 Trifork Holding AG annual report 2015
Revenue divided into segmentsRevenue in the individual segments developed as follows in 2015:
| With a revenue of EURm 9.1 Academy delivered 15% of total revenue in the Trifork Group. This was an increase in revenue of 56% compared to 2014. The increase has been created based on new conference activities as well as an increase in par-ticipants on the GOTO-conferences. The results is considered acceptable.
| With a revenue of EURm 41.9 Project delivered 71% of total revenue. In this way Project has increased its activities with 34% compared to 2014. The activ-ity level has been increasing throughout the year and was at a very high level in the end of 2015. This result is considered satisfactory.
| With a revenue of EURm 8.1 Product delivered 14% of total revenue. Compared to 2014 this was an increase of 15%. The revenue is divided between revenue on Trifork developed products and rev-enue based resale of partner products where Tri-fork has the distribution rights to specific markets. Most product based revenue in 2015 came from the sale of Trifork’s own products - where 2014 was influenced by a very large one-off license sale of a partner product (EURm 4). Based on this the increase in revenue on own products is considered satisfying.
Revenue per employeeTrifork in 2015 obtained a revenue per employee at EURm 0.176 which is an increase of 9% compared to 2014.
2015 was influenced by several investments in new future product opportunities and the new GOTO conferences in London and Stockholm. In 2015 this negatively impacted the revenue per employee, however these investments are expected to have a positive KPI impact going forward.
In 2016, it’s expected that product based revenue and increase in attendees in the GOTO conferenc-es will increase revenue per employee by 10%.
From 2014 to 2015 revenue was improved by 34% and exceeded the Group’s expecta-tions to growth.
Half of the growth in 2015 was organic.
FIN
AN
CIA
L R
EV
IEW
201
5
189.0
2011
179.0
2012
159.0
2013
160.0
2014
176.0
20150
75
150
225
300REVENUE / EMPLOYEE - EUR 1,000
71% Project
14% Product
15% Academy
SEGMENT 2015
Split of revenue in segments Revenue per employee

16Trifork Holding AG annual report 2015
Development in EBITDAIn 2015, Trifork realised EURm 8.9 EBITDA, an in-crease of 69.5% compared to 2014.
2015 was focused on maturing the product business in Trifork and creating unique business units with fo-cus on getting success with development and sale of selected products. Several of the products are al-ready state of the art technologies so the focus has been on building up the sales- and distribution chan-nels throughout and beyond the Trifork group.
Generally, profits have been satisfactory in the differ-ent segments.
In Academy the results once again was improved and an EBITDA of EURm 0.6 was achieved com-pared to a break even result in 2014. In 2016 it’s ex-pected to be able to continue this development with a solid baseline in the GOTO-conferences.
In Projects the EBITDA-margins in the different busi-ness units varied. All were positive with some units outperforming the others. In 2016 the focus will be on spreading the best-practices from the high per-formance units to the others.
In 2015 the Product unit was primarily based on the sale of own products and was not so dependent on partner products. The effect of this was less revenue from partner products but a significant increase in revenue on own products as well as EBITDA margin.
The results obtained in 2015 corresponds to an EBIT-DA margin of 15.0% against 11.9% in 2014. Overall the achieved EBITDA is considered satisfactory, but focus is to improve this once again in 2016 where an EBITDA-result of EURm 12 is expected. In 2015 EURm 1.4 of EBITDA belongs to non-controlling in-terests.
CostsThe most significant cost in Trifork is personnel costs.
In 2015 there were an average of 340 full-time em-ployees compared to 276 in 2014, which corre-spond to total personnel cost of EURm 26.9 com-pared to EURm 19.0 in 2014.
Personnel costs per employee has increased by approximate 14.9% compared to 2014.
Personnel costs to revenue was 45.5% in 2015 compared to 43.0% in 2014.
This is driven by the addition of new international business units in countries with a higher wage level.
The future development is estimated to be positive, driven by the product and conference business.
Development in EBITIn 2015, Trifork realized an EURm 7.0 EBIT-result, which is a 80.4% increase compared to 2014, where EURm 3.9 was achieved. The 2015 EBIT-result equals an 11.9% EBIT-margin compared to 8.8% in 2014.
The depreciations was at the expected level and the development in the EBIT-result is considered satisfac-tory relative to the EBITDA-result.
In 2016 the same level of depreciations is expected.
FINA
NC
IAL R
EV
IEW
2015
3.8
2011
4.1
2012
3.2
2013
5.2
2014
8.9
20150
3
6
9
12
15EBITDA - EURm
2.7
2011
2.9
2012
2.0
2013
3.9
2014
7.0
20150
3
6
9
12
15EBIT - EURm

17 Trifork Holding AG annual report 2015
Development in EBT
In 2015, Trifork reached EURm 11.2 EBT (profit before tax), which equals a 133.0% increase com-pared to 2014, where the company realized EURm 4.8.
The result of the financial items totalled EURm 4.2 compared to EURm 0.9 in 2014.
The main contributors were:
| Net Interests on capital of EURm -0.3 compared to EURm -0.2 in 2014.
| Net loss on exchange rates of EURm -0.6.
| Profit on other investments of EURm 4.5. This has primarily been based on the company Open Credo making an exit of the company Cloud Credo as well as on an increase in the shareval-ue of the Trifork ownership in the US company Basho Technologies Inc.
Impairment tests has been conducted in connec-tion with all reassessments.
Management considers the profit before tax for 2015 as very satisfactory.
In 2016 the net interests are estimated to be at the same level as in 2015.
Profit for the yearIn 2015, the Net profit after tax totalled EURm 10.1, which equals a 137.3% increase compared to 2014, where EURm 4.3 was realized.
The result corresponds to a EUR 0.43 result per share (EPS Basic) and a diluted EUR 0.43 result per share, (EPS-D).
Management considers this result satisfactory.
EURm 2.4 of the 2015 result achieved belongs to non-controlling interests.
The effective tax for the company in 2015 was 10.10% compared to 11.76% in 2014.
The result gives a total 56.6% return on equity compared to 37.6% in 2014. Management consid-ers this level satisfactory.
FIN
AN
CIA
L R
EV
IEW
201
5
2.8
2011
2.9
2012
1.8
2013
4.8
2014
11.2
20150
3
6
9
12
15EBT - EURm
2.3
2011
2.5
2012
1.6
2013
4.3
2014
10.1
20150
3
6
9
12
15PROFIT FOR THE YEAR - EURm
Growth of 69.5% in EBITDA to EURm 8.9
EBITDA margin improved to 15.0%

18Trifork Holding AG annual report 2015
Total comprehensive incomeThe total comprehensive income ended at EURm 9.3, which equals an increase of 115.3% compared to 2014, where EURm 4.3 was realized. The result of 2015 is considered acceptable in relation to the Net Profit.
The main contributors were:
| Exchange rate adjustments from foreign opera-tions of EURm -0.8.
| Adjustment to pension contribution plans of EURm -0.1.
Balance and Equity
TOTAL ASSETS
Total assets increased with 20.2% from EURm 41.9 as of 31.12.2014 to EURm 50.4 as of 31.12.2015.
The main contributors were:
| Effect of EURm 3.6 from the acquisitions of shares in Duckwise, and OpenCredo.
| Reassessment of the value of other investments of EURm 1.3.
| New other investments of EURm 0.2.
| Real estate and other equipment, fixtures and fittings were increased with EURm 1.8, where a major part was the establisment of a conference center in London.
| Receivables from sales was decreased with EURm 3.2 and was end of 2015 on a normal level.
| Cash and cash equivalents was increased with EURm 6.3.
NON-CURRENT ASSETS
The carrying amount of non-current assets has seen a 4.5 EURm total increase. The most signifi-cant reason for this increase is the same as de-scribed under Total assets.
Product development at the end of 2015 accounted for EURm 2.4 in total compared to EURm 1.7 as of 31.12.2014. The increase has been part of the prod-uct strategy in Trifork where new products has been initiated in development and launched for sale. Most of the development cost used on smaller products in 2015 has been handled as part of normal operations and therefore not activated in the balance sheet. Fur-ther details are to be found in note 11.
TREASURY SHARES
During the period, the company has seen a small increase in the ratio of Trifork Holding AG’s owner-ship of treasury shares in relation to end of 2014. This has been a result of the restructuring process with the onboarding of a new lead investor in 2015.
EQUITY
As of 31.12.2015, group equity amounts to EURm 27.2, which is a 95.1% increase compared to end 2014 with an equity of EURm 13.9. In 2015, equity has been capitalized at 56.6% compared to 37.6% in 2014. It is a Group target to increase this return.
Equity ratio end of 2015 is 46.0% compared to 29.8% end of 2014.
FINA
NC
IAL R
EV
IEW
2015
2.3
2011
3.0
2012
1.7
2013
4.3
2014
9.3
20150
3
6
9
12
15TOTAL COMPREHENSIVE INCOME - EURm
8.8
2011
9.9
2012
11.2
2013
13.9
2014
27.2
20150
6
12
18
24
30EQUITY - EURm

19 Trifork Holding AG annual report 2015
Cash flow and investments
OPERATING ACTIVITIES
In 2015, cash flows from operating activities amount-ed to EURm 5.0 compared to EURm 5.1 in 2014. Re-ceivables from sales decreased from EURm 13.6 in 2014 to 10.3 in 2015. Compared to total revenue for the year this is equal to a ratio of 17.5% compared to 30.8% in 2014. The ratio for 2015 is considered satis-fying. The target for the group is to maintain a ratio of less than 20%.
INVESTMENT ACTIVITIES
Cash flows from investment activities amounted to EURm -1.3 compared to EURm -8.8 in 2014.
During 2015 the major investments have been:
| Acquisitions of subsidiaries of EURm -3.4.
| Acquisition of associates of EURm -0.2.
| Sale of associates of EURm 4.3.
| Investment in product development of EURm -1.0.
| Net purchase of other equipment EURm -1.0
FINANCING ACTIVITIES
Cash flows from financing activities amounted to EURm 3.1 compared to EURm 5.6 in 2014.
The most significant post were:
| Capital increase in connection with agreement with new lead investor of EURm 5.6.
| Repayments of loans of EURm -1.5.
| Net purchase of treasury shares of EURm -0.5.
| New non-current loan of EURm 1.2 in relation to acquisitions.
| Dividend payments of EURm -1.8 (incl. dividend to non-controlling parties)
Events after the balance sheet dateAfter balance sheet date, no events have occurred which are assessed to change the company’s eco-nomic or financial situation significantly.
FIN
AN
CIA
L R
EV
IEW
201
5
-384
-1,927-854
2,3971,896
5,568
-8,753
5,082
6,818
3,112
-1,337
5,042
-8,000
-10,000
-6,000
-4,000
-2,000
0
2,000
4,000
6,000
8,000
2013 2014 2015
Operating activities Investment Finance Total EUR 1,000

20Trifork Holding AG annual report 2015
AcademyThe purpose of Academy is to make sure we iden-tify new tech waves and stay connected with the Silicon start-up community.
In 2015 all the conferences went well with more at-tendees as a result. Also, we got closer to Silicon Valley in many ways. First of all our start-up, Chain-alysis got funding from US investors. Secondly we invested in a new Silicon Valley based start-up named Atomist who are in the micro service space.
The hot topics on our conferences in 2015 were:
| Micro services
| Container based deployment
| Internet-of-Things
| Safety and security
| Big data and analytics
The customers who attend our conferences and training are typical software engineers from all areas of the software industry.
The partners we meet often end up being business partners in the sense that we use and resell their technology.
MarketThe annual conferences are located in Amsterdam, Berlin, Chicago, Copenhagen and London. In 2016 Stockholm will be added to the map of locations.
Our ambition is to continue to always create the most innovative and educational conferences that both our customers and we will enjoy and be in-spired from.
Business results and expectationsIn the future, the conferences will expand to cover new geographical locations and Trifork will intensify its efforts to continuously exploit this to uncover new international possibilities for growth.
In 2015 Academy totalled revenue of EURm 9.1 which is a growth of 56% compared to 2014. The EBITDA ended at EURm 0.6 compared to EURm 0.0 in 2014.
The 2016 expectations are that the revenue in this segment will grow 32% based on increased activity of the existing GOTO-conferences to total revenue of EURm 12.0. Resources will be focused on mak-ing all conferences profitable. The organisation will be tuned and the plan is to increase the EBITDA further and achieve total of EURm 1.2 in 2016.
In 2015 more than 7,000 participants attended the conferences of Trifork. Our ambition is to succeed this in 2016 and to have over 10,000 participants a year within the next 2 years.
Key figures (EURm) 2015 2014
Revenue 9.1 5.8
EBITDA 0.6 0.0
EBITDA-margin (%) 6.7 0.5
EBIT 0.6 0.0
EBIT-margin (%) 6.2 0.0
FTE (employee) 16 15
Academy
AC
AD
EM
Y
By organising technology conferences across the world, Trifork is always close to those who set the agenda in infor-mation technology.

21 Trifork Holding AG annual report 2015
Agile transformation at Farm Credit CanadaTrifork - a World-Class Authority on Agile/Scrum.A story by Brad Storm, Vice Precident Development and operations, Farm Credit Canada.
The challengesHaving recently completed a large multi-year technology and business process transformation program in which we not met expectations, and with our stakeholders get-ting frustrated at our future roadmap dominated by 12 to 24 month initiatives … we knew we needed another approach to get value out the door more quickly and to find better to ways in managing complexity.
The approachWe invited Trifork to introduce agile concepts to our IT leadership team, and deliver training of these concepts across our division. From this initial investment we were able to pilot an initiative using the Scrum framework which yielded strong results both from our customers and our staff.
The implementation and resultsWanting to replicate and scale these results, Trifork returned and helped us scale from one to five Scrum teams. The results were impressive:
| We were able to release value to our stakeholders each month (as opposed to years)
| We improved the quality of our deliverables
| Staff morale was improved significantly
As a result of this success, we were also invited to fur-ther these concepts to the rest of the organization – of which Trifork played an instrumental role.
From our point of view Trifork is a world-class authority on Agile/Scrum, and they deliver one of the best com-munication and facilitation capabilities I have ever ex-perienced. They are able to generate good outcomes from working with both senior leaders as well as delivery teams. I strongly recommend Trifork to any anyone in-terested in introducing or maturing agile delivery within their organization.
Brad StormVice Precident Development and operations, Farm Credit Canada
”Trifork is a world-class authority on Agile/Scrum, and they deliver one of the best communication and facilitation capabilities I have ever experienced.”
AC
AD
EM
Y C
AS
E
21

22Trifork Holding AG annual report 2015
Trifork acts as an innovation partner with our customers. Our mission is to be disruptive and create competi-tive advantage for our customers.
PR
OJE
CT
ProjectThe major part of the business in Trifork is building innovative and disruptive software solutions for our customers.
As new trends and technologies are identified at our conferences, we start working with our customers to innovate new solutions..
We work with the leading branded customers, often market leaders in their field of business. They want to stay in the lead and they need an innovation partner like Trifork.
Most of our strategic customers have been working together with Trifork for many years. We believe in staying loyal and close to them as a partner and do everything possible to help them run a successful business. It is this dynamic and the trust between them and us that creates the best new ideas and solutions. Working very close with our customers is key to us.
On our web-site, case-stories are to be found with our customers telling their story about the value that Trifork projects has given them.
We work in a lean way to improve learning and enable us to adapt to changes in the business environment or changing technologies during a project. Often we introduce new technology into projects or re-think
how existing technologies can be used to optimise processes or functionality in the software that we develop.
Trifork master both back-end and front-end systems and has a lot of case stories of projects where we support the whole process from:
| supporting the business development of our customers in developing new business ideas,
| Developing both back-end and front-end software,
| Facility management including operating customer solutions.
Being able to support our customers from the initial idea to deployment of the final solution often makes us able to deliver new systems or services within a very short time frame, thereby minimising the time-to-market for our customers.
MarketThe customers for this business area range from banks, governments and agencies to leading indus-trial manufacturers.
Trifork competes with other players in this market, but keeps a constant focus on being at the forefront at all times.
Our ambition is to always create the most innovative solutions that will bring business value to our cus-tomers and make them (as well as us) competitive in the market.
Business results and expectationsProject achieved total external revenue of EURm 41.8, which equals a 33.9% growth compared to 2014. A major part of the growth was driven by the acquisition of Open Credo Ltd. Additional work has also been done internally to the Product segment in relation to product development and maintenance. This is not reflected in the external revenue report-ed for the Project segment.
EBITDA totalled EURm 4.9, which was an increase of 22.4% compared to 2014, where EURm 4.0 was realised.
The 2016 expectations are that the revenue in this segment will grow to a total of EURm 52.0.
The EBITDA-margin is expected to be increased to 14% and in total an EBITDA-result of EURm 7.3 is expected for 2016.
Key figures (EURm) 2015 2014
Revenue 41.9 31.2
EBITDA 4.9 4.0
EBITDA-margin (%) 11.7 12.8
EBIT 4.0 3.1
EBIT-margin (%) 9.6 9.9
FTE (employee) 263 211
Project

Implementation of microservicesThe problemIn the world of microservices, public and private clouds and orchestration applications like Mesos and Kuber-netes have helped to legitimise the use of microservices in production. However, more time is spent on configur-ing and manually managing infrastructure than is spent on application development.
Mantl is built upon well-known orchestration systems (Kubernetes and Mesos) and adds infrastructure provi-sioning, application deployment and a full suite of moni-toring applications; for example the ELK stack. Mantl provides an end-to-end stack of deployment tools to take bare metal infrastructure and turn it into an environ-ment capable of hosting applications of any size.
The projectCisco initiated the Mantl project to help its customers overcome the challenges to implementing a microservic-es architecture. Cisco asked Container Solutions to help create innovative solutions and components for Mantl. Specifically, they needed help with provisioning bare metal servers; creating the ELK framework for Apache and creating policy engine applications. In addition to this, Container Solutions created numerous applications for Mantl, including the weather predictor, which uses data from a fleet of drones to calculate localised fog.
Bare MetalContainer Solutions created a bare metal provisioning platform using HashiCorp’s Terraform tool. This allows whole clusters to be defined as text files and therefore are subject to versioning and can be stored as part of the project in Git.
ELKPreviously, there was no out of the box solution for logging messages for microservices. As part of Mantl, Con-tainer Solutions developed the Elastic-Logstash-Kibana framework which means that by default, microservices created with Mantl have logging built in.
Much more than this, the Elastic database provided by de-fault, is fault tolerant and scalable. The ELK stack, although part of Mantl, is a standalone component and is considered a considerable addition to the ecosystem of tools.
The DronePart of the challenge of getting a new framework off the ground is introducing it to new users. Container Solutions
helped Cisco by creating numerous applica-tions that could be hosted on Mantl, include the ‘Space Oddity’ application. Space Odd-ity takes data from a fleet of drones working together in what is known as the ‘Planetary Boundary Layer’.
The resultsMantl is one of the world’s best known open source tools for creating microservic-es. More importantly, it has helped simplify and therefore legitimize the use of the mi-croservices within enterprises. As well as being fault tolerant by default, microservic-es in Mantl come with the ELK framework pre-installed, thus saving an enormous amount of time and hassle.
Container SolutionsContainer Solutions specialise in helping companies to succeed with programmable infrastructure tools and techniques like containers, orchestration, security, moni-toring and logging. As well as helping customers like Holi-dayCheck, PayU and ING to implement programmable infrastructure, Container Solutions also help companies like Cisco and Red Hat with cutting edge research.
Container Solutions has established itself as an influential player in the programmable infrastructure space. Through it’s work with the Cloud Native Computing Foundation (CNCF) and the grassroots, Software Circus movement, Container Solutions is helping to popularise cloud-native appli-cations and programmable infrastructure. It has forged partnerships with Docker, Mesosphere, Red Hat, Cisco and Clus-ter HQ, thus helping to place Trifork in the centre of the cloud-native universe.
Ken OwensCTO, Cisco Intercloud services
”Working with Container Solutions to brainstorm the innovations, prototype them and then execute on the strategy was an excellent experience and really accelerated our customers adopting Docker and Mesos.”
23 Trifork Holding AG annual report 2015
PR
OJE
CT
CA
SE

24Trifork Holding AG annual report 2015
PR
OD
UC
T
Product
Product development and saleWhen we build custom solutions for our clients we do it by combining standard components. Each of these components can either be 3rd party prod-ucts or Trifork products. Products can also be tools we use when we build a solution or the engine in a business. The Trifork product “Secure Device Grid” is an example of a component that is built into a solution. Two examples of tools we use when we build and run a system are “Wombat” and “The Perfect App”. Wombat is our monitoring system when operating Erlang systems and “The Perfect App” is the system to distribute and analyze apps and user behaviour. Two examples of products that drive businesses are “Panteos” for mortgage man-agement and then “Chainalysis” for investigating BitCoin transactions.
When and if we decide to sell the prod-uct globally we first evaluate the invest-ment needed. Then we raise money for the company and build an organisation that will focus 100% on this product.
At our website information on our prod-ucts can be found.
MarketSoftware today forms an increasing part of almost any business and product. The market just keeps growing. We see old companies wanting to make their product digital or partly digital. We see banks and financial institutions using software as the pri-mary way of doing business.
Companies use software to be more cool, create better image, save costs, improve productivity and a lot more. Therefore it’s not possible to quantify the size of the market, but to us it’s immense. We operate in the following sectors: Finance, Educa-tion, Health care, Manufacturing, Fashion, social media and news and media.
Business results and expectations
The Products segment is the newest segment in Tri-fork including all product based revenue. This revenue includes license sales of Trifork and partner products as well as service and hosting agreements related to these products. The result for 2015 totalled revenue of EURm 8.1, equal to 14% of total revenue in the Group. The EBITDA-result for the period ended at EURm 3.6 corresponding to an EBITDA-margin of 44.8%.
Product based revenue based on Trifork’s own prod-ucts increased by 129% but the sales of partner prod-ucts did not live up to the same level as in 2014. Based on this the total revenue target for 2015 was not met but at the same time this also had the effect that the EBITDA-margin was increased significantly.
The result achieved and reported is considered sat-isfying.
The 2016 expectation is that revenue in this segment will total revenue of EURm 16.0 (20% of total group revenue) with a 30% EBITDA-margin equaling a EURm 4.8 EBITDA-result.
Key figures (EURm) 2015 2014
Revenue 8.1 7.0
EBITDA 3.6 1.2
EBITDA-margin (%) 44.8 16.8
EBIT 3.2 0.9
EBIT-margin (%) 39.9 12.5
FTE (employee) 11 8
Product
In 2016 the sale of products is expected to account for 20% of total revenue.

”Due to the solid design of the SecureDe-viceGridTM platform the service has been running 100% of the time since it was launched in the autumn of 2014.”
25
Danfoss Thermostats as Smart Connected Products using
SecureDeviceGridTM
The Danfoss LivingTM products are a series of thermostats and sensors enabling the customers to have perfect heating com-fort in their homes and minimize their energy consumption.
Inside the home the thermostats and sensors are connected to a central controller using wireless technology to control the heating of the home. But in order to bring increased value to the customers a smartphone integration to the Danfoss LivingTM platform was planned by Danfoss as an Internet-of-Things (IoT) solution.
The challengesThe main challenge was to access the Danfoss LinkTM central controller inside the home from a Smartphone connected somewhere on the internet. Danfoss prioritized the system security and the data privacy of the customers very highly. All information about the status of the heating system should be kept safe and was only to be displayed to the individual customer. At the same time Danfoss should be able to offer customers support in relation to setting up the system and troubleshoot any connectivity issues once installed. Without a total secure connection to the devices Danfoss was not willing to enter the marked of IoT.
Another challenge was to secure scalability and acces-sibility and at the same time minimize the operational cost per controller. The system should be able to handle a very large number of simultaneously connected devices from all over the world. The accessibility of the system had to be very high, running 24/7 with no single point of failure.
The solutionTrifork was given the challenge to find a solution on the connectivity and communication issues. This was done in very close collaboration with the Danfoss software devel-opers who were programming the central controller.
After the solution was developed all of the central security elements were documented and reviewed by several ex-ternal international security experts providing a blueprint for the building of the system based on SecureDeviceGridTM.
The SecureDeviceGridTM software was integrated into the existing controller through a small software footprint and an easy to use API providing the handles for pairing the Smart-phone with the controller and encrypting the data sent be-tween the controller and the Smartphone. Cloud services provides the control mechanism to connect the controller inside the home with the Smartphone on an external net-work. The Danfoss LivingTM support team are able to access the SecureDeviceGridTM Device Management System in order to resolve problems with installed heating controllers.
Working with Trifork“Trifork has proven to be the right partner bringing both innovation and the right technologies into our domain. In a short timespan they were capable of delivering the basic security and connectivity elements to our engineers which enabled us to focus on the embedded platform”, states Peter C. Andersen, Senior Director, R&D, Danfoss and con-tinues: ”With a coordinated agile project approach, Trifork delivered the right functionality as the features were im-plemented on the central controller of the Danfoss LinkTM system. Due to the solid design of the SecureDeviceGridTM platform the service has been running 100% of the time since it was launched in the autumn of 2014”.
Trifork continues to work on new features on the Danfoss LivingTM product and provides operational support to the cloud platform of the system.
SecureDeviceGridTM
The SecureDeviceGridTM product from Trifork is a state-of-the-art IoT platform providing not only secure, private and scalable connectivity to Smart Connected Products. The product also offers analytics that can give detailed infor-mation about the status of the installed devices. Fast and reliable connectivity from a mobile device to devices inside any normal firewall are provided as the basic feature of the platform. Building blocks like software update, predictive maintenance and analytical intelligence can extend the platform and enable new business models for Smart Con-nected Products. The footprint of the security software is less than 40k and can be integrated on even the smallest CPU boards like the $5 Raspberry Pi Zero or TI CC3200.
SecureDeviceGridTM provides the fastest way for a com-pany to build connectivity on existing products and the IoT domain knowledge of Trifork will secure a solid implementa-tion in any infrastructure.
PR
OD
UC
T C
AS
E
Trifork Holding AG annual report 2015
Peter C. Andersen, Senior Director, R&D, Danfoss:

26Trifork Holding AG annual report 2015
Corporate Social Responsibility (CSR)Statutory report on corporate social responsibilityThe report on corporate social responsibility for the Group covers the accounting period January 1 to December 31, 2015.
Trifork has a business oriented approach to our cor-porate social responsibility, and thus, there is a big overlap between our values and associated actions.
Trifork’s core competence is based on highly com-petent and committed employees, combined with the technological innovation of IT systems. In Tri-fork, CSR is included in the following focus areas:
| Attracting and developing competence
| Making a difference
| Committed employees
| Distribution of gender
| Human rights
ATTRACTING AND DEVELOPING COMPETENCE
Trifork must attract and develop competencies in system devel-opment. Trifork must dare to show the way to new technolo-gies and to give employees the framework required to obtain the unique and set itself at the centre of knowledge. On the other hand, we have a high skill requirement for our employees, and wish to employee the absolute best, who can help retain the very high level of competence in the company.
Actions extending this policy include the following activities:
| Trifork has created the conference concept GO-TOCON.COM, which organizes conferences in Copenhagen, Berlin, London, Amsterdam, Stock-holm and Chicago. With the GOTO brand the con-ferences attract knowledge and best-practice from all over the world and thus increase the availability of both the right techniques and methods of im-plementing system development correctly and ef-ficiently. Furthermore, CTO Kresten Krab is a keen blogger on the challenges, faced by the industry.
The result of this action is a steadily increasing number of visitors to the conferences and thereby added value for the software industry in the coun-tries, where the conferences take place.
Trifork attracts and develops competence for the company by letting our own software pilots influence the conference program as well as teaching courses, which we offer to our customers and colleagues in the software industry. Trifork employees are very ac-tion-oriented and are therefore a big part of creating the innovation and development in the technological field, needed to ensure the magnetism for compe-tence. Every year, the conferences amount to 5 days of concentrated education for our own employees, who have the opportunity of acquiring knowledge from a large proportion of the people and compa-nies who have made a difference worldwide. Another specific action is the holding of “Hackerdays”, where innovation and passion run free.
The results of that action is shown and implement-ed employee satisfaction surveys, which score high in commitment, as well as ongoing flow of new product ideas for further processing.
MAKING A DIFFERENCE
Trifork must contribute to the world becoming a better place to live. In our business areas, Trifork must contribute with actions, which create simplic-ity and the additional reduction in the unnecessary use of the resources in the world. Since the found-ing of Trifork in 1996, the communication of experi-ence and knowledge about software development has been the epitome of the business and has in this way influenced the world around us in a posi-tive manner.
Actions in extension of this policy is the following activities:
| Trifork contributes with innovation and commit-ment to national solutions for the health care sec-tor, which are designed to improve work conditions for the clinician, in order to reduce the number of medical errors and thereby the financial burden placed on society. The Shared medical chart and the Vaccination Register are two national health care solutions, which are the result of the actions of this policy.
| Likewise, Trifork has focused on the development of the mobile workplace of the clinician, which, with the use of situation specific IT, creates an environ-ment for homecare, nurses or the doctor, which ensures a better treatment of the citizen.
CO
RP
OR
ATE S
OC
IAL R
ESP
ON
SIB
ILITY
Trifork’s core competence is based on highly competent and committed employees, combined with the technologi-cal innovation of IT-systems.

27 Trifork Holding AG annual report 2015
| Trifork has initiated several measures which are in-tended to increase the use of the mobile platform for both ordinary people and the industry this is to reduce the number of power-consuming comput-ers. Industrially, the power reduction lies in the fact that the mobile phone can be used as an alterna-tive to control panels and thus render demanding control electronics superfluous..
The results are, that we, for instance, have helped several Danish banks to move hundreds of thou-sands of transactions from the computer to the mobile phone, thereby saving power and making life easier for a lot of people.
COMMITTED EMPLOYEES
The employees are the most important resource in Trifork, and thus, they are the pivotal point of our CSR activities. The average age in 2015 was 35.6 years and is divided between 81% men and 19% women.
Trifork must be a workplace with committed em-ployees, executives, customers and suppliers.
Actions in extension of this policy contain the fol-lowing activities:
| Based on scrum Trifork implements agile in largely all work processes. The method is built upon the fact that the employees are working in self-organiz-ing teams, responsible for the organization and im-plementation of their own tasks. In this way, the em-ployees are guaranteed important influence on their own tasks and have close contact with the sponsor of the task in question.
This method of development is also based on the fact that the tasks are broken down into smaller and more manageable elements, which in turn are solved and implemented in intensive workflows. The intensity of the method puts a natural limita-tion on the extension of the periods in which the employees can solve these assignments with high quality and without errors. Limiting the extension of the periods helps to avoid stress and burnout. Moreover, the company has implemented a stress response, using stress coaches, who can step in immediately and support the individual employee who may experience problems.
In 2015, the employee’s weekly average work time was 38.6 hours. The average sick leave was 1,5%, which is 0.1%-point higher than in 2014.
The success of Trifork is dependent on committed and action-oriented employees who can create best value for our customers. Both management and em-ployees in Trifork are responsible for contributing to a constructive dialogue about the passion for work. Management development, reviews, mentoring, “hackerdays” and Geek-Nights are all initiatives to safeguard a high score on Trifork commitment.
The action is measured on the commitment in the ongoing employee surveys, where the latest showed a very satisfactory result. There is a continuous focus on working on activities in several areas which helps to
maintain the good results. Thus, we can improve con-ditions for Trifork employees and thereby retain and de-velop satisfied, motivated and committed employees.
DISTRIBUTION OF GENDER
Trifork has the policy that the distribution of gender in the Board of Directors should reflect the rest of the company and secure that the company at the top-level receives input into business development from both genders.
Based on this Trifork has a target that at least one third of the Board of Directors should be women. This target was not achieved in 2015 as all three board members were men.
The policy for other managers is that management in general should reflect the diversity of gender in each type of business unit.
In Academy the target is to have 50% of women in management. Currently 75% are women. In Pro-ject and Product which are very dominated by men there is no specific target but also no restrictions. Currently 10% of managers are women. In the ad-ministration unit the target is to have 50% women. Currently 50% are women.
HUMAN RIGHTS
The policy of Trifork is that we wish to support and respect the protection of the internationally pro-claimed human rights within the company’s sphere of influence. This to ensure that the company does not participate in any violations of human rights.
When hiring employees and when establishing offices in new countries Trifork makes sure that all legislations are met and that all employees becomes part of the “Trifork family”. Trifork does not treat any employee dif-ferently based on their nationality, gender or DNA. On our conferences we focus on being openminded and treat all groups of people with respect.
Trifork only wants to work with partners and custom-ers that also respect inter-national human rights.
Neither Trifork nor to our knowledge any of our customers and partners have been involved in any cases or areas where it could be questioned whether there had been any human rights violations.
The result of this action is measured by the diversity of employees in Trifork and the fact that whether Trifork treats employees and participants on our conferences respectfully has never been ques-tioned.
Trifork makes a difference by com-municating knowledge and being a pioneer in propagating the use of IT in society.
CO
RP
OR
ATE
SO
CIA
L R
ESP
ON
SIB
ILIT
Y

28Trifork Holding AG annual report 2015
Corporate Governance and internal controlsStatutory report on corporate governanceThis statutory report on corporate governance cov-ers the period January 1 - December 31, 2015.
The board and management of the company con-tinuously seek to safeguard that group management structure and control systems are suitable and work efficiently. Management evaluates this continuously.
The organizational basis of management is corporate legislation, of the accounting year, company Articles of Association as well as best practice for groups of a similar size and with the same international outreach as Trifork. Several internal procedures have been developed on this basis and are maintained continu-ously. These procedures ensure an active, safe and efficient governance of the company.
RECOMMENDATIONS FOR GOOD CORPORATE GOVERNANCE
In 2005, the committee on Good Corporate Govern-ance in Denmark published revised recommenda-tions on good corporate governance, which was updated in May 2013. The recommendations are available for the public on the home page of The Committee on Good Corporate Governance, www.corporategovernance.dk. The recommendations in-clude the role of shareholders and interaction with company management, the policy regarding infor-mation and communication, the duties and respon-sibilities of the board of directors and the manage-ment, risk management and audit.
Despite that Trifork is no longer listed on any public stock exchange, the company has decided to keep following these guidelines by either complying with the recommendations or explain why they are not fully or partially complied with. The Board has ad-dressed all the recommendations and published documentation of this on the Trifork web-site under: http://investor.trifork.com/investor-relations/corpo-rate-governance/. Since Trifork is working on a listing on London Stock Exchange (LSE) the company in 2016 will change to follow the latest updated guide-lines on corporate governance from LSE and report according to this in future financial statements.
It is the opinion of the board that the company com-plies with these recommendations to a very large extent. However, Trifork has chosen to follow a dif-ferent practice in a couple of areas:
| On account of its size, Trifork has presently found it unnecessary to appoint either a committee of nominations or of payment. The Board of Direc-
tors has assessed that the duties relayed to such committees, are best taken care of by the collec-tive Board of Directors.
| Trifork has appointed a committee of audit, at-tended to by the collective Board of Directors. The chairman of the Board co-chairs the committee of audit.
| Trifork has found it irrelevant to publish the fees of the individual Board and management members, as Trifork believes that the fees of the Board of Di-rectors and management is a private matter, which also follows Swiss practice.
| Public quarterly reports are not made as the com-pany assesses that the resources spent on this do not measure up to the benefits obtained. Instead, periodic reports are published.
Risk management and internal controlThe purpose of Trifork’s internal control and risk management systems in relation to the presenta-tion of the accounts is to safeguard their presenta-tion in accordance with the IFRS and to ensure that the presentation gives a true and fair view without any significant flaws or errors.
Trifork has established internal control and risk management systems which safeguard that sig-nificant flaws and errors are discovered and cor-rected. However, the implemented systems give no absolute guarantee that all errors are discovered.
The internal control and risk management systems can be divided into these categories:
| Control environment
| Risk assessment
| Control activities
| Information and communication
| Sharing knowledge
| Monitoring
CONTROL ENVIRONMENT
Trifork has established an audit committee to su-pervise the presentation of the accounts and eval-uate the efficiency of the internal control and risk management systems of the company. The audit committee is attended to by the collective Board of Directors.
CO
RP
OR
ATE G
OV
ER
NA
NC
E A
ND
INTE
RN
AL C
ON
TRO
LS

29 Trifork Holding AG annual report 2015
Management is responsible for the implementation of efficient controls and risk management systems. Management supervises the employment of the prepared guidelines and policies which are part of Trifork’s manual of accounting.
Board of Directors and management continuously evaluate the possible risks, relevant to the company, including risks related to the presentation of the ac-counts.
Annually, all business units identify risks, which di-rectly or indirectly relate to their area of business. In this context, risks are defined as events or tenden-cies, which can prevent the individual units or Trifork as a whole, of achieving its goals. Such events or tendencies may be well known by the organization but can also cover uncertainties which may threaten Trifork’s ability to obtain the projected goals.
RISK ASSESSMENT
Initially, all identified risks are assessed in the indi-vidual business units from a probability and pos-sible effect point of view. The effect is assessed on a number of factors, including EBIT, employees, customers, environment and reputation.
Subsequently, the individual risks will be scrutinized by the board and management and assessed, con-sidering how serious an effect they will have on the individual business unit and the company as a whole.
Risk managementIn connection with the annual risk identification and evaluation, all business units are obligated to plan how to meet and manage any given risk.
Follow-upAll significant risks are continuously monitored and assessed by the board and management, based on consideration of importance.
Independently of the above, the board annually scrutinizes the areas in which there may be a par-ticular risk, like significant accounting estimates and possible significant changes in the accounting methods.
CONTROL ACTIVITIES
Control activities are based on risk assessment. The aim of the Group control activities is to ensure that goals, policies, procedures etc. decided on by the Board of Directors, are met and to prevent and correct possible flaws and errors etc. in due time. Management has created a formal process of Group reporting, which encompasses budget reporting and monthly reporting, including devia-
tion and key ratio reports with monthly updating of forecast for the rest of the year. Concurrently, man-agement continues to assess the financial compe-tencies of the organization to ensure that the envi-ronment of controls is satisfactory.
INFORMATION AND COMMUNICATION
The Board of Directors has adopted a policy of information and communication, which also de-termines the demands of account reporting and external financial reporting in accordance with leg-islation and the inherent regulations. The Board of Directors emphasizes that, within the framework of companies quoted on a public stock exchange, an open kind of communication exists and that the in-dividual knows their own role in the internal control system.
The most significant risks and internal controls in the Trifork Group in connection with the process of reporting the accounts, the board’s approach to this and the employed initiatives in this context, are continuously communicated internally in the Group.
SHARING KNOWLEDGE
The Trifork accounting manual as well as other poli-cies and guidelines are continuously updated and they are made available for all employees in the fi-nancial department.
At least once a year, the financial department meets with the company’s external auditors with the ob-jective of obtaining knowledge regarding possible, significant changes pertaining to the company ac-counts, so they can be included in company proce-dures continuously.
MONITORING
Any risk management and control system must be continuously monitored and rated to safeguard ef-ficiency. Monitoring consists of continuous and / or periodic assessments and controls at all levels in the Trifork Group. Control extent and frequency depend primarily on the risk assessment in the in-dividual business areas.
The auditors elected by the general assembly re-port on possible, significant weaknesses in the in-ternal Group system of control in the audit report to the Board of Directors.
The Board of Directors monitors that manage-ment react swiftly to possible weaknesses and that agreed upon initiatives are implemented.
CO
RP
OR
ATE
GO
VE
RN
AN
CE
AN
D IN
TER
NA
L C
ON
TRO
LS

30Trifork Holding AG annual report 2015
BO
AR
D O
F DIR
EC
TOR
S A
ND
MA
NA
GE
ME
NT
JOHAN BLACH PETERSENChairman of the Board
Owner of J. Blach Petersen Business Development A/S. B.sc. in economics and BC(ADB). Elected to the board the first time at the Ordinary General Assembly on January 8, 2014. Specializes in business development, director’s work, strategy development and M&A.
Board member in: Trifork Holding AG (Chairman), Aage Østergaard Møbelindustri A/S (Chairman), Bila Holding A/S (Chairman), CC Public Relations A/S (Chairman), Global Car Leasing A/S, JMM Group A/S (Chairman), M2 Film A/S (Chairman), Lo-evschall A/S (Chairman), OPDI Technologies A/S, Windar Photonics Ltd, Trim IT Development A/S (Chairman), Ingeniørfirmaet Poul Tarp A/S , Kinnan A/S, Junget A/S (Chairman), Teknikgruppen A/S (Chairman), Tuco Marine Group A/S (Chairman), Lindcon A/S (Chairman) and Trekanten-Hestbæk A/S (Chairman).
JØRN LARSENBoard member and CEO
Constitutes the Executive management with Kristian Wulf-Andersen. Elected to the board at the first time at the Ordinary General Assembly on January 8, 2014.
Specializes in strategy and business development.
Board member in a number of subsidiaries in the Trifork Group.
KRISTIAN WULF-ANDERSENBoard member and CFO
Constitutes the Executive Management with Jørn Larsen. Elected to the board at the first time at the Ordinary General Assembly on January 8, 2014.
Specializes in M&A, tax, IFRS consolidations and IPO’s.
Board member in a number of subsidiaries in the Trifork Group.
KRESTEN KRAB THORUPCTO
Specializes in technology, trends and innovation.
Board member in a number of subsidiaries in the Trifork Group.
LARS DYBKJÆRBoard member
Is Managing Partner at GRO Capital. Elected to the board the first time at the Extraordinary General Assembly on August 26, 2015.
Specializes in M&A and business development.

31 Trifork Holding AG annual report 2015
Board of Directors and ManagementCOMPOSITION AND FUNCTION OF THE BOARD OF DIRECTORS
The Board of Directors of Trifork is composed by 4 mem-bers, in a way to safeguard business and managerial coop-eration with the continued operation and development of the Trifork Group. The board members are elected one year at a time and reelection is permitted.
It is assessed that the present composition of the Board of Directors is in harmony with the relation to addressing finan-cial, organisational, business, managerial and communica-tion issues.
CONFLICT OF INTERESTS
There is no kinship between the management, Board of Directors and team leaders. There are no agreements or un-derstandings with major shareholders, customers, suppliers or others by which an individual has become a member of the board, the management, supervisory committee or has become a leader.
THE WORK OF THE BOARD OF DIRECTORS
Among other things, the Board of Directors decide upon the acquisition of companies, major investments, divestments, the adequacy of own fund, size and composition, long term commitments, control and audit conditions as well as signifi-cant operational conditions.
It is the duty of the Board of Directors to employ 1-3 execu-tives to attend to the daily management of company busi-ness. One of the three must be the CEO.
It is the duty of the Board of Directors to ensure that com-pany strategy and general guidelines are established. As a minimum, the Board of Directors meets four times a year to supervise Group development and to make adjustments to the overall business plan, should this be necessary, just as the board supervises the financial development in the Group. In 2015, the board met four times.
AUDIT COMMITTEES
To date, the Board of Directors has found it unnecessary to form any permanent committees. In this way, the collective Board of Directors has the role as audit committee.
EXECUTIVE MANAGEMENT
The Board of Directors employs the CEO and other manag-ers to create the collective management. Under the lead-ership of the CEO, the management organizes and imple-ments the strategic plans.
CEO Jørn Larsen and CFO Kristian Wulf-Andersen are ap-pointed as Executive management.
POLICY OF COMPENSATION
For the top management level in Trifork, the policy of com-pensation is the following:
The Board of DirectorsThe Board of Directors is paid a fixed annual compensation. Supplementary compensation may be added for extraor-dinary assignment requested by the management. In such instances, they will be paid on the basis of hours spent and on market condition related to the service rendered.
The company has not advanced any special advantages of any kind and has made no other sort of agreement than the ones mentioned here.
ManagementManagement receives an annual compensation which is agreed upon by the Board of Directors and management. There may be additional and variable bonuses, which may constitute part of the salary, if the board considers this an en-couragement to meeting specific goals for the business year. If this be the case, all details are described minutely in order to safeguard measurability, control and criteria of success.
The Board of Directors has no immediate plans to initiate any programs of incentive, relating to the salaries of either Board of Directors or management in the form of warrants or op-tions distribution.
CompensationIn 2015, the compensation to the Board of Directors totalled EUR 136,589.
AUDIT
In the interest of the public and the shareholders, a company of chartered accountants are elected at the ordinary general as-sembly. The accountant is nominated by the Board of Directors and is elected for one year. The accountants report to the col-lective Board of Directors once a year and also immediately after ascertaining special events, which the board should attend to.
Prior to being nominated to election at the general assembly, the Board of Directors and management assess the inde-pendency, competence etc. of the chartered accountants.
TRIFORK SHARE OWNERSHIP
End of 2015 the Board of Directors and management indirect or direct holds the following shares in Trifork Holding AG:
BO
AR
D O
F D
IRE
CTO
RS
AN
D M
AN
AG
EM
EN
T
Name Shares
Johan Blach Petersen 253,490
Jørn Larsen 4,794,783
Kristian Wulf-Andersen 332,532
Lars Dybkjær 37,691
Kresten Krab Thorup 3,541,811
Total 8,960,307

32Trifork Holding AG annual report 2015
Shareholder informationAn investment in Trifork is an investment in innovationTrifork wants an open and continuous dialogue with company shareholders, potential investors and the general public. At www.trifork.com it is possible to sign up for the company news service, and all share-holders are encouraged to register as shareholders and to register their email address in the company’s register of shareholders via the ”InvestorPortal”.
The investor web-site of Trifork (investor.trifork.com) is one of the most impor-tant channels of relevant information to investors. Here, all share market communication is saved immediately after publi-cation.
The company has an inten-tion of having two to four investor meetings per year. In 2015 two events were arranged.
Share capitalThe company share capital constitutes nominally 18,537,230 shares of CHF 0.1. There is only one class of shares which represents one vote for each CHF 0.1 nominal share capital, and there are no voting or ownership limitations.
The Trifork shareThe public reported share price of the Trifork A/S share end of 2015 was EUR 4.415 which was the price offered by the company after the publication
of the interim report 2015 in relation to purchase of treasury shares.
At least twice a year Trifork Holding AG will offer to purchase treasury shares from existing sharehold-ers to a calculated “treasury share price” based on the development and results of the Trifork Group.
Information about share prices and trading can be found on the investor web-site: http://investor.tri-fork.com/investor-news/share-information/share-price-and-trading/.
OwnershipAt the end of 2015, Trifork Holding AG had 368 name registered shareholders, who owned 100% of the share capital. Ten major shareholders owned 78.8% of the name registered share capital.
End of 2015 members of the Board and manage-ment owned 48.3% of the share capital in Trifork Holding AG compared to 58.6% end of 2014.
End of 2015 the following investors was registered with a share holding of more than 5% of the share capital:
Name Shares %
Jørn Larsen 4,794,783 25.9%
GRO Holding I ApS 3,638,148 19.6%Kresten Krab Thorup Holding ApS 3,541,811 19.1%
Trifork Holding AG 288,509 1.6%
Others 6,194,118 33.8%
Total 18,537,230 100.0%
SH
AR
EH
OLD
ER
INFO
RM
ATION
1
1.5
2
2.5
3
3.5
4
4.5
5
Janu
ary,
201
3
Apr
il, 2
013
July
, 201
3
Oct
ober
, 201
3
Janu
ary,
201
4
Apr
il, 2
014
July
, 201
4
Oct
ober
, 201
4
Janu
ary,
201
5
Apr
il, 2
015
July
, 201
5
Oct
ober
, 201
5
Trifork share price - EUR per shareTrifork OMX-indexed SmallCap-indexed
DATA
Stock Exchange: Not listed
Sector: Technology
ISIN: CH0236907504
Nom. Pcs. size: CHF 0.1
Number of shares: 18,537,230
Voting limitations: No
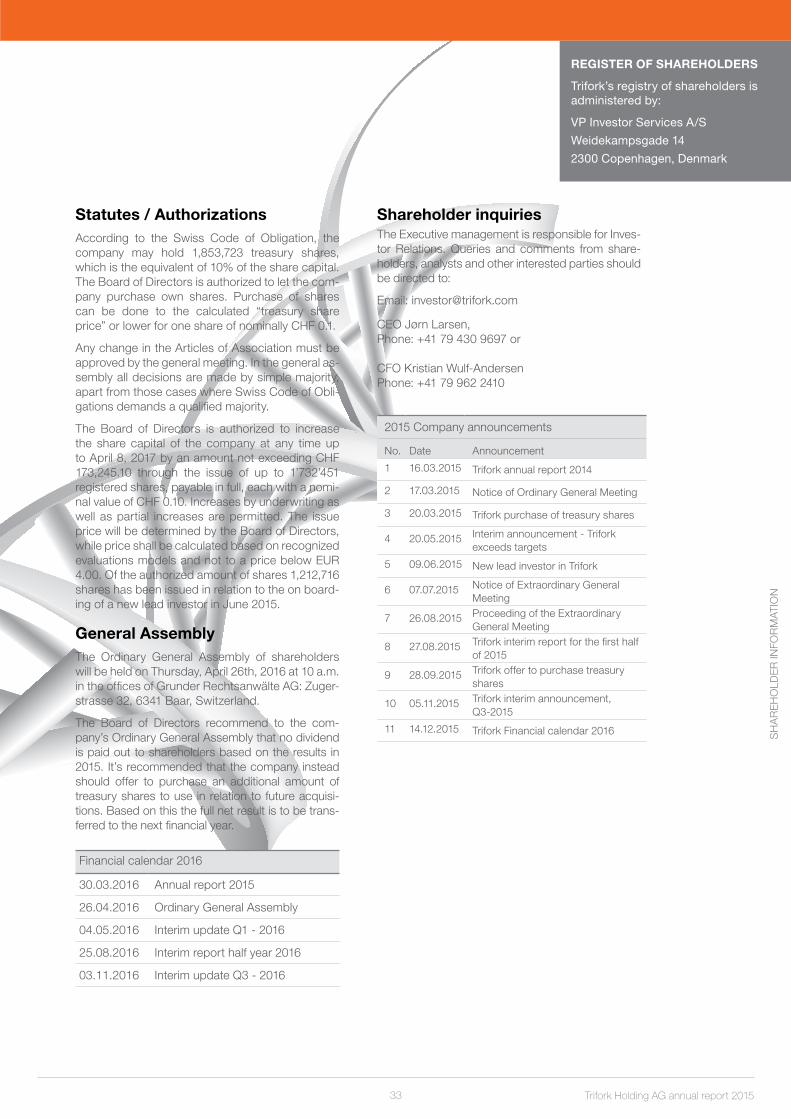
33 Trifork Holding AG annual report 2015
REGISTER OF SHAREHOLDERS
Trifork’s registry of shareholders is administered by:
VP Investor Services A/S
Weidekampsgade 14
2300 Copenhagen, Denmark
Statutes / AuthorizationsAccording to the Swiss Code of Obligation, the company may hold 1,853,723 treasury shares, which is the equivalent of 10% of the share capital. The Board of Directors is authorized to let the com-pany purchase own shares. Purchase of shares can be done to the calculated “treasury share price” or lower for one share of nominally CHF 0.1.
Any change in the Articles of Association must be approved by the general meeting. In the general as-sembly all decisions are made by simple majority, apart from those cases where Swiss Code of Obli-gations demands a qualified majority.
The Board of Directors is authorized to increase the share capital of the company at any time up to April 8, 2017 by an amount not exceeding CHF 173,245.10 through the issue of up to 1’732’451 registered shares, payable in full, each with a nomi-nal value of CHF 0.10. Increases by underwriting as well as partial increases are permitted. The issue price will be determined by the Board of Directors, while price shall be calculated based on recognized evaluations models and not to a price below EUR 4.00. Of the authorized amount of shares 1,212,716 shares has been issued in relation to the on board-ing of a new lead investor in June 2015.
General AssemblyThe Ordinary General Assembly of shareholders will be held on Thursday, April 26th, 2016 at 10 a.m. in the offices of Grunder Rechtsanwälte AG: Zuger-strasse 32, 6341 Baar, Switzerland.
The Board of Directors recommend to the com-pany’s Ordinary General Assembly that no dividend is paid out to shareholders based on the results in 2015. It’s recommended that the company instead should offer to purchase an additional amount of treasury shares to use in relation to future acquisi-tions. Based on this the full net result is to be trans-ferred to the next financial year.
Financial calendar 2016
30.03.2016 Annual report 2015
26.04.2016 Ordinary General Assembly
04.05.2016 Interim update Q1 - 2016
25.08.2016 Interim report half year 2016
03.11.2016 Interim update Q3 - 2016
Shareholder inquiriesThe Executive management is responsible for Inves-tor Relations. Queries and comments from share-holders, analysts and other interested parties should be directed to:
Email: [email protected]
CEO Jørn Larsen, Phone: +41 79 430 9697 or
CFO Kristian Wulf-AndersenPhone: +41 79 962 2410
SH
AR
EH
OLD
ER
INFO
RM
ATIO
N
2015 Company announcements
No. Date Announcement
1 16.03.2015 Trifork annual report 2014
2 17.03.2015 Notice of Ordinary General Meeting
3 20.03.2015 Trifork purchase of treasury shares
4 20.05.2015 Interim announcement - Trifork exceeds targets
5 09.06.2015 New lead investor in Trifork
6 07.07.2015 Notice of Extraordinary General Meeting
7 26.08.2015 Proceeding of the Extraordinary General Meeting
8 27.08.2015 Trifork interim report for the first half of 2015
9 28.09.2015 Trifork offer to purchase treasury shares
10 05.11.2015 Trifork interim announcement, Q3-2015
11 14.12.2015 Trifork Financial calendar 2016

34Trifork Holding AG annual report 2015
SIG
NATU
RES
Statement by the Board of Directors and Executive ManagementToday the Board of Directors and the Executive Management have discussed and approved the annual report of Trifork Holding AG for the financial period January 1 to December 31, 2015.
The consolidated financial statements are prepared in accordance with International Financial Report-ing Standards and the requirement of Swiss law.
The parent company financial statements are prepared in accordance with the Swiss Financial Statements Act.
In our opinion the consolidated financial statements give a true and fair view of the group’s financial po-sition on December 31, 2015 and of the results of the group’s operations and cash flows for the finan-cial period January 1 to December 31, 2015.
In our opinion, the parent company financial state-ments for the period from January 1 to December 31, 2015 comply with Swiss law and the company’s articles of incorporation.
In our opinion the management’s review includes a true and fair review about the development in the group’s operations and financial matters, the results for the period and the parent company’s fi-nancial position, and the position as a whole for the entities included in the consolidated financial state-ments, as well as a review of the more significant risks and uncertainties faced by the group and the parent company.
We recommend the annual report to be approved at the annual general assembly. Schindellegi, March 30, 2016
Executive management
Jørn Larsen Kristian Wulf-Andersen
CEO, Trifork CFO, Trifork
Board of directors in Trifork Holding AG
Johan Blach Petersen Jørn Larsen Kristian Wulf-Andersen Lars Dybkjær
Chairman of the board Board member Board member Board member

35 Trifork Holding AG annual report 2015
SIG
NAT
UR
ES
Report of the Statutory AuditorTo the General Meeting of Trifork Holding AG, Feusisberg
Report of the Statutory Auditor on the conso-lidated financial statements
As statutory auditor, we have audited the conso-lidated financial statements of Trifork Holding AG, which comprise the consolidated statement of fi-nancial position as at December 31, 2015, and the consolidated comprehensive income statement, consolidated statement of changes in equity, con-solidated cash flow statement and notes to the consolidated financial statements (pages 37-68) for the year then ended.
Board of Directors’ responsibility
The Board of Directors is responsible for the prepa-ration of these consolidated financial statements in accordance with International Financial Reporting Standards (IFRS) and the requirements of Swiss law. This responsibility includes designing, implementing and maintaining an internal control system relevant to the preparation of consolidated financial statements that are free from material misstatement, whether due to fraud or error. The Board of Directors is further re-sponsible for selecting and applying appropriate ac-counting policies and making accounting estimates that are reasonable in the circumstances.
Auditor’s responsibility
Our responsibility is to express an opinion on these consolidated financial statements based on our audit. We conducted our audit in accordance with Swiss law, Swiss Auditing Standards and International Standards on Auditing (ISA). Those standards require that we plan and perform the audit to obtain reasonable assurance whether the consolidated financial statements are free from material misstatement.
An audit involves performing procedures to obtain au-dit evidence about the amounts and disclosures in the consolidated financial statements. The procedures se-lected depend on the auditor’s judgment, including the assessment of the risks of material misstatement of the consolidated financial statements, whether due to fraud or error. In making those risk assessments, the auditor considers the internal control system relevant to the entity’s preparation of the consolidated financial state-ments in order to design audit procedures that are ap-propriate in the circumstances, but not for the purpose of expressing an opinion on the effectiveness of the entity’s internal control system. An audit also includes evaluating the appropriateness of accounting policies used and the reasonableness of accounting estimates made, as well as evaluating the overall presentation of the consolidated financial statements. We believe that the audit evidence we have obtained is sufficient and appropriate to provide a basis for our audit opinion.
Opinion
In our opinion, the consolidated financial statements for the year ended December 31, 2015 give a true and fair view of the financial position, the results of operations and the cash flows in accordance with IFRS and comply with Swiss law.
Report on other legal requirements
We confirm that we meet the legal requirements on licensing according to the Auditor Oversight Act and independence (article 728 Code of Obligations (CO)) and that there are no circumstances incompatible with our independence.
In accordance with article 728a para. 1 item 3 CO and Swiss Auditing Standard 890, we confirm that an internal control system exists, which has been designed for the preparation of consolidated finan-cial statements according to the instructions of the Board of Directors.
We recommend that the consolidated financial statements submitted to you be approved.
.
Rapperswil, March 30, 2016
OBT AG
Kevin McCabe David Rusch
Licensed audit expert Licensed audit expert
Auditor in charge

36Trifork Holding AG annual report 2015
CO
NTE
NT / LIS
T OF N
OTES
Consolidated financial statement
Content pageConsolidated comprehensive income statement 37
Consolidated statement of financial position 38
Assets 38
Liabilities and equity 39
Consolidated statement of changes in equity 40
Consolidated cash flow statement 41
Notes 42
1 - Accounting policies 42
2 - Accounting estimates and judgements 48
3 - Segments 48
4 - Revenue 50
5 - Personnel cost 50
6 - Profit on other investments 50
7 - Financial income 50
8 - Financial expenses 50
9 - Taxes 51
10 - Deferred tax liabilities 57
11 - Intangible assets 52
12 - Tangible assets 56
13 - Investments in associates 56
14 - Debt to financial Institutions an other non-current liabilities 58
15 - Non-controlling Interests 58
16 - Share capital 58
17 - Mortgages and securities 58
18 - Other payables 59
19 - Changes in working capital 59
20 - Related parties 59
21 - Accrued pension cost and benefits 60
22 - Financial risks and financial instruments 62
23 - Earnings per share 66
24 - Purchase sum allocation for subsidiaries and associated companies 67
25 - Contingent liabilities and contractual obligations 68
26 - Events after the balance sheet date 68

37 Trifork Holding AG annual report 2015
CO
NS
OLI
DAT
ED
INC
OM
E S
TATE
ME
NT
Consolidated comprehensive income statementfor the year ended December 31, 2015Note 2015 2014
4 Revenue 59,039,082 44,096,899
Cost of goods sold and services provided -23,294,375 -20,013,603
Gross profit 35,744,707 24,083,295
5 Personnel cost -26,879,655 -18,986,840
Other operating expenses 0 134,409
EBITDA 8,865,053 5,230,864
Depreciations and amortizations -1,832,180 -1,333,024
Profit from operations (EBIT) 7,032,873 3,897,841
7 Financial income 2,273,229 667,098
Profit in associated companies 23,596 96,328
6 Profit on other investments 4,453,919 1,000,454
8 Financial expenses -2,559,159 -843,583
Profit before tax (EBT) 11,224,459 4,818,137
9 Taxes -1,134,152 -566,683
Profit for the period 10,090,307 4,251,454
Items for subsequent reclassification to profit
Foreign currency translating differences for foreign operations -777,470 289,502
Items that are not reclassified subsequently to profit or loss
21 Actuarial gain (losses) on pension liabilities, net of tax -28,483 -229,175
Other comprehensive income after tax -805,953 60,327
Total comprehensive income 9,284,354 4,311,781
Division of profit for the period
Parent company shareholders 7,680,768 3,788,021
Non-controlling interests 2,409,539 463,433
Division of Total comprehensive income
Parent company shareholders 6,871,556 3,818,474
Non-controlling interests 2,412,799 493,307
Earnings per share (EPS)
23 Basic earnings per share 0.43 0.22
23 Diluted earnings per share 0.43 0.22
EUR
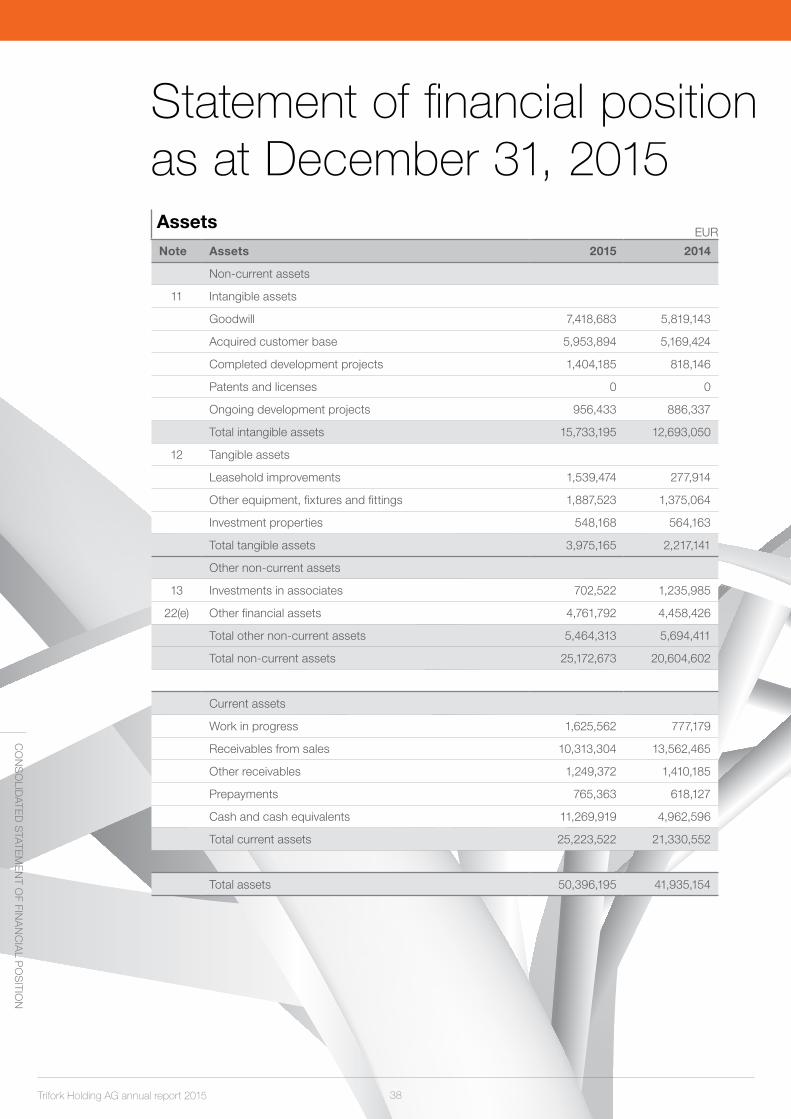
38Trifork Holding AG annual report 2015
CO
NS
OLID
ATED
STATE
ME
NT O
F FINA
NC
IAL P
OS
ITION
AssetsNote Assets 2015 2014
Non-current assets
11 Intangible assets
Goodwill 7,418,683 5,819,143
Acquired customer base 5,953,894 5,169,424
Completed development projects 1,404,185 818,146
Patents and licenses 0 0
Ongoing development projects 956,433 886,337
Total intangible assets 15,733,195 12,693,050
12 Tangible assets
Leasehold improvements 1,539,474 277,914
Other equipment, fixtures and fittings 1,887,523 1,375,064
Investment properties 548,168 564,163
Total tangible assets 3,975,165 2,217,141
Other non-current assets
13 Investments in associates 702,522 1,235,985
22(e) Other financial assets 4,761,792 4,458,426
Total other non-current assets 5,464,313 5,694,411
Total non-current assets 25,172,673 20,604,602
Current assets
Work in progress 1,625,562 777,179
Receivables from sales 10,313,304 13,562,465
Other receivables 1,249,372 1,410,185
Prepayments 765,363 618,127
Cash and cash equivalents 11,269,919 4,962,596
Total current assets 25,223,522 21,330,552
Total assets 50,396,195 41,935,154
EUR
Statement of financial position as at December 31, 2015

39 Trifork Holding AG annual report 2015
CO
NS
OLI
DAT
ED
STA
TEM
EN
T O
F FI
NA
NC
IAL
PO
SIT
ION
Liabilities and equityNote Liabilities and equity 2015 2014
Equity
16 Share capital 1,552,502 1,440,358
Retained earnings 22,912,487 11,098,759
Treasury shares -778,963 -320,362
Reserve for exchange rate adjustments -521,103 259,628
Equity attributable to parent company shareholders 23,164,923 12,478,383
15 Non-controlling Interests 3,985,717 1,439,949
Total equity 27,150,640 13,918,332
Liabilities
Non-current liabilities
10 Deferred tax 1,397,004 1,172,014
14 Debt to financial institutions 4,131,072 4,121,172
14 Other non-current liabilities 1,417,552 1,128,307
Total non-current liabilities 6,945,628 6,421,493
Current liabilities
14 Debts to financial institutions 5,406,090 5,607,934
Trade payables 5,059,388 7,900,688
Income tax 860,285 591,840
18 Other payables 3,141,286 4,138,296
Prepayments 1,832,878 3,356,572
Total current liabilities 16,299,927 21,595,329
Total liabilities 23,245,555 28,016,822
Total liabilities and equity 50,396,195 41,935,155
Additional notes
17 Mortgages and securities
25 Contingent liabilities and contractual obligations
20 Related parties
EUR

40Trifork Holding AG annual report 2015
EQ
UIT
Y S
TATEM
EN
T
Consolidated statement of changes in equity
Trifork Holding AGShare capital
Retained earnings
Treasury shares
Reserve for exchange rate adjustments
Equity attribut-able to parent
company shareholders
Non-controlling interests Total
Equity Jan. 1, 2015 1,440,358 11,098,759 -320,362 259,628 12,478,383 1,439,949 13,918,332
Net Profit for the year 0 7,680,768 0 0 7,680,768 2,409,539 10,090,307
Other comprehensive income 0 -28,483 0 -780,731 -809,213 3,260 -805,954
Total Comprehensive Income 0 7,652,285 -780,731 6,871,555 2,412,799 9,284,353
Transactions with owners
Capital increase 112,144 5,531,333 0 0 5,643,477 0 5,643,477
Dividends 0 -1,300,000 0 0 -1,300,000 -489,147 -1,789,147
Purchase of treasury shares 0 0 -2,825,919 0 -2,825,919 0 -2,825,919
Sale of treasury shares 0 0 2,367,318 0 2,367,318 0 2,367,318
Dividend treasury shares 0 15,829 0 0 15,829 0 15,829
Other transactions with shareholders 0 -85,720 0 0 -85,720 0 -85,720
Transactions with owners total 112,144 4,161,442 -458,601 0 3,814,985 -489,147 3,325,838
Non-controlling interests from acquisitions 0 0 0 0 0 622,152 622,152
Additions non-controlling interests 0 0 0 0 0 -36 -36
Equity Dec 31, 2015 1,552,502 22,912,487 -778,963 -521,103 23,164,923 3,985,717 27,150,640
Equity Jan, 1, 2014 0 0 0 0 0 0 0
Restatement IAS19 0 -229,231 0 0 -229,231 0 -229,231
Net Profit for the period 0 3,788,021 0 0 3,788,021 463,433 4,251,454
Other comprehensive Income 0 -229,175 0 259,628 30,453 29,874 60,327
Total Comprehensive Income 0 3,329,615 259,628 3,589,243 493,307 4,082,550
Transactions with owners
Share Capital, foundation 1,000,657 2,952,704 0 0 3,953,361 869,743 4,823,104
Capital Increase 149,652 3,183,399 0 0 3,333,050 0 3,333,050
Exchange of shares 290,049 1,655,297 0 0 1,945,346 252,102 2,197,448
Dividends 0 0 0 0 0 -421,018 -421,018
Purchase of treasury shares 0 -1,152,332 0 -1,152,332 0 -1,152,332
Sale of treasury shares 0 831,970 0 831,970 0 831,970
Other transactions with shareholders 0 -5,927 0 0 -5,927 0 -5,927
Transactions with owners total 1,440,358 7,785,473 -320,362 0 8,905,469 700,827 9,606,296
Non-controlling interests from acquisitions 0 -16,329 0 0 -16,329 241,184 224,855
Additions non-controlling interests 0 0 0 0 0 4,631 4,631
Equity Dec 31, 2014 1,440,358 11,098,759 -320,362 259,628 12,478,383 1,439,949 13,918,332Trifork Holding AG was founded on January 8, 2014 and took over the full ownership of Trifork A/S in 2014. The other comprehensive income in 2014 and 2015 is attributed to currency adjustments on translation of foreign intities. In 2014 as well actuarial gains (losses) on pension liabilities. The translation reserve includes all adjustments arising on translation of financial statements of entities with a functional currency other than EUR, and adjustments relating to assets and liabilities that form part of the Group’s net investment in such unit. The Board of Directors do not propose the pay-ment of a dividend for the business year 2015.
Treasury shares 2015 2014
Dividend per share (EUR) 0.000 0.075
Number of treasury shares 288,509 248,039
Nominal value treasury shares (CHF) 28,851 24,804
Treasury shares in percent of total number of shares 1.56% 1.43%
In 2015 the company purchased shares in accordance with the current authorisations. Shares are to be used primarily in connection with business acquisitions.
EUR

41 Trifork Holding AG annual report 2015
CO
NS
OLI
DAT
ED
CA
SH
FLO
W S
TATE
ME
NT
Consolidated cash flow statementNote 2015 2014
Profit from operations 7,032,873 3,897,841
Adjustments for non cash operating Items
Depreciations and amortizations 1,832,180 1,345,352
Cash flow before change in working capital 8,865,053 5,243,192
19 Changes in working capital -2,079,754 580,627
Cash flow from operating activities before financial Items 6,785,299 5,823,819
Financial income received 1,570,136 458,497
Financial expenses paid -2,559,159 -850,353
Cash flow from operating activities 5,796,276 5,431,963
Income taxes paid -754,126 -350,363
Net cash flow from operating activities 5,042,151 5,081,600
Cash flow from investment activities
11 Purchase of intangible assets -1,018,169 -1,185,987
13 Purchase of associates -227,606 -915,004
13 Sale of associates 4,290,141 362,728
Purchase of financial assets -2,061,212 -6,367,162
12 Purchase of tangible assets -2,358,541 -932,277
Sale of tangible assets 38,658 284,426
Total cash flow from investment activities -1,336,729 -8,753,276
Cash flow from financing activities
Loan 1,240,343 3,772,599
Repayment of loan -1,453,708 -728,249
Capital increase 5,557,757 3,333,050
Purchase of treasury shares -2,825,919 -1,152,332
Sale of treasury shares 2,367,318 769,507
Proceeds from treasury shares 15,829 0
Dividend paid -1,789,147 -426,945
Total cash flow from financing activities 3,112,473 5,567,630
Change in cash and cash equivalents 6,817,895 1,895,953
Cash and cash equivalents at the beginning of the period -645,338 -2,607,390
Exchange rate adjustments -897,060 14,275
Cash related to acquisitions 588,333 51,824
Cash and cash equivalents at the end of the period 5,863,830 -645,338
Cash and cash equivalents
Cash balance 11,269,919 4,962,596
Current debts to financial institutes -5,406,090 -5,607,934
Cash and cash equivalents at the end of the period 5,863,830 -645,338
EUR

42Trifork Holding AG annual report 2015
NO
TES
1 - Accounting policies
Notes
The 2015 annual report for the Trifork group is present-ed in accordance with International Financial Reporting Standards (IFRS), as well as in accordance with Swiss disclosure requirements for financial reporting.
The basis of the PreparationThe accounting figures are prepared in accordance with the historical cost convention, excepting places where the IFRS expressly demands the use of fair value.
The annual report is presented in EUR, which is consid-ered the primary currency for group activities.
Assets are recognized in the balance sheet, when it is probable that future economic benefits will accrue to the company and when the value of the asset can be measured reliably.
The recognition and measurement take into account predictable losses and risks which are obtained before the presentation of the annual report, which confirms or de validates matters present on the balance sheet date.
Revenues are recognized in the comprehensive income as they are earned, including value adjustments of fi-nancial assets and commitments, which are measured at fair value and where this is impossible at cost. Fur-thermore, costs are included which have been incurred to achieve the year´s profit, including depreciation, im-pairment and provisions as well as carry-backs, as a result of changes in accounting estimates of amounts, formerly recognized in comprehensive income.
All historical financial data presented in the reporting are represented by the previous reported data for Trifork A/S. All amounts has been converted from DKK to EUR using the DKK/EUR exchange rate end of each period.
Changes in accounting policiesThe following new and revised standards or new interpre-tations that apply to the financial year starting January 1, 2015, has been implemented in the annual report 2015.
| Amendments to IAS 19 Defined Benefit Plans: Em-ployee Contributions: IAS 19 requires an entity to consider contributions from employees or third par-ties when accounting for defined benefit plans. Where the contributions are linked to service, they should be attributed to periods of service as a negative benefit. These amendments clarify that, if the amount of the contributions is independent of the number of years of service, an entity is permitted to recognise such contributions as a reduction in the service cost in the period in which the service is rendered, instead of al-locating the contributions to the periods of service. This amendment is effective for annual periods be-ginning on or after 1 July 2014.
ANNUAL IMPROVEMENTS 2010-2012 CYCLE
The improvements are effective for accounting periods beginning on or after 1 July 2014. The Group has ap-plied these improvements for the first time in these con-solidated financial statements. They include:
| IFRS 3 Business Combinations: The amendment is applied prospectively and clarifies that all contingent consideration arrangements classified as liabilities (or assets) arising from a business combination should be subsequently measured at fair value through profit or loss whether or not they fall within the scope of IAS 39. This is consistent with the Group’s current accounting policy and, thus, this amendment did not impact the Group’s accounting policy.
| IFRS 8 Operating Segments: The amendments are applied retrospectively and clarify that: • An entity must disclose the judgements made by management in applying the aggregation criteria in paragraph 12 of IFRS 8, including a brief description of operating segments that have been aggregated and the economic characteristics (e.g., sales and gross margins) used to assess whether the seg-ments are ‘similar’ • The reconciliation of segment assets to total as-sets is only required to be disclosed if the reconcili-ation is reported to the chief operating decision maker, similar to the required disclosure for segment liabilities The Group has not applied the aggregation criteria in IFRS 8.12. The Group has presented the reconcili-ation of segment assets to total assets in previous periods and continues to disclose the same in Note 4 in this period’s financial statements as the recon-ciliation is reported to the chief operating decision maker for the purpose of her decision making.
| IAS 16 Property, Plant and Equipment and IAS 38 Intangible Assets: The amendment is applied retro-spectively and clarifies in IAS 16 and IAS 38 that the asset may be revalued by reference to observable data by either adjusting the gross carrying amount of the asset to market value or by determining the mar-ket value of the carrying value and adjusting the gross carrying amount proportionately so that the resulting carrying amount equals the market value. In addition, the accumulated depreciation or amortisation is the difference between the gross and carrying amounts of the asset. This amendment did not have any im-pact to the revaluation adjustments recorded by the Group during the current period
| IAS 24 Related Party Disclosures: The amendment is applied retrospectively and clarifies that a manage-ment entity (an entity that provides key management personnel services) is a related party subject to the

43 Trifork Holding AG annual report 2015
NO
TES
related party disclosures. In addition, an entity that uses a management entity is required to disclose the expenses incurred for management services. This amendment is not relevant for the Group as it does not receive any management services from other entities.
ANNUAL IMPROVEMENTS 2011-2013 CYCLE
These improvements are effective from 1 July 2014 and the Group has applied these amendments for the first time in these consolidated financial statements. They include:
| IFRS 3 Business Combinations: The amendment is applied prospectively and clarifies for the scope exceptions within IFRS 3 that: • Joint arrangements, not just joint ventures, are outside the scope of IFRS 3 • This scope exception applies only to the account-ing in the financial statements of the joint arrange-ment itself. The Group is not a joint arrangement, and thus this amendment is not relevant for the Group and its subsidiaries
| IFRS 13 Fair Value Measurement: The amendment is applied prospectively and clarifies that the portfolio exception in IFRS 13 can be applied not only to finan-cial assets and financial liabilities, but also to other contracts within the scope of IAS 39. The Group does not apply the portfolio exception in IFRS 13
| IAS 40 Investment Property: The description of ancil-lary services in IAS 40 differentiates between invest-ment property and owner-occupied property (i.e., property, plant and equipment). The amendment is applied prospectively and clarifies that IFRS 3, and not the description of ancillary services in IAS 40, is used to determine if the transaction is the purchase of an asset or a business combination. In previous periods, the Group has relied on IFRS 3, not IAS 40, in determining whether an acquisition is of an asset or is a business acquisition. Thus, this amendment did not impact the accounting policy of the Group
The accounting policies are adjusted in accordance with the above changes. The changes have no material im-pact on exposures in 2015 or earlier years and no effect on earnings per share or diluted earnings per share.
The Consolidated Financial StatementsThe consolidated financial statements include the parent company Trifork Holding AG and subsidiaries, where Trifork Holding AG has a controlling influence on company financial and operative policies, in order to obtain dividends or other benefits from those activities. Controlling influence is achieved by direct or indirect ownership or control of more than 50% of voting rights or otherwise control the business. All financial data from 2013 and earlier are from the consolidated financial statement of Trifork A/S, the former Parent company of the Trifork group.
The consolidated financial statements are prepared as a summary of the accounts of the parent company and the individual subsidiaries, calculated according to the Group´s accounting policies, eliminating all intercompany income and expenses, share holdings, balances and div-idends, as well as realized and unrealized gains and loss-es on transactions between consolidated companies.
Investments in subsidiaries are offset against the propor-tionate share of the subsidiary´s fair value of identifiable net assets and contingent liabilities at the acquisition date.
In the consolidated financial statements the assets and liabilities of the subsidiaries are recognized 100%.
Non-controlling interests’ share of net income and equi-ty in subsidiaries that are not owned 100%, is included in the Group’s profit and equity, but shown separately.
Business CombinationsRecently acquired or formed companies are recognized in the consolidated financial statements from the date of acquisition and formation, respectively. The acquisition date is the date when control is effectively transferred. Disposed of or liquidated enterprises are recognized in the consolidated income statement until the date of the sale and liquidation. Disposal is the date when control is effectively transferred to third parties.
Where the Group obtains control over acquired com-panies, the newly acquired identifiable assets, liabilities and contingent liabilities are valued at fair value at the date of the acquisition. Non-current assets, which are taken over for sale, are measured at fair value minus estimated selling costs. Restructuring costs are only recognized in the acquisition balance sheet, where they represent an obligation of the acquiree. Tax effect of re-valuations are taken into account.
The purchase price for a company is the fair value of the consideration transferred for the acquiree. If the final determination is subject to one or more future events these are recognized at fair value at the time of the ac-quisition. Costs directly attributable to the acquisition are recognized directly in profit or loss as incurred.
Goodwill is recognized as an asset under intangible as-sets and tested at least annually for impairment. Good-will is measured as the difference between on the one hand the purchase price of an acquired company, the value of non-controlling interests in the acquiree and the fair value of previously acquired investments and on the other hand the fair value of acquired assets, liabilities and contingent liabilities recognized as an asset in in-tangible assets and tested at least annually for impair-ment. If the carrying amount of the asset exceeds its recoverable amount, it is written down to the lower re-coverable amount. In case of negative goodwill, the fair values, the calculated purchase price of the company, value of non-controlling interests in the acquiree as well as the fair value of previously acquired share holdings are reassessed. If the difference continues to be nega-tive, it is recognized as profit in the income statement.

44Trifork Holding AG annual report 2015
If there is uncertainty of identification or measurement of acquired assets, liabilities or contingent liabilities on the acquisition date or the determination of the purchase price, the initial recognition is based on provisional fair values. The provisional fair values can be regulated or ad-ditional assets or liabilities are recognized until 12 months after the acquisition, if obtained new information on con-ditions that existed at the acquisition date, which could have affected the calculation of the values at the acquisi-tion date, had the information been known.
Changes in estimated contingent purchase considera-tion are generally recognized directly in profit or loss.
By the aggregation method the subsidiaries’ assets and liabilities are recognized at carrying amounts and good-will are not recognized in the consolidated statement of financial position.
Gains or losses at the sale or liquida-tion of subsidiaries and associatesGains or losses at the sale or liquidation of subsidiar-ies or associates leading to the termination of signifi-cant influence and controlling influence respectively, are calculated as the difference between on the one hand, the fair value of sales proceeds; or settlement price and the fair value of any outstanding securities and on the other hand, the carrying value of net assets on sale or settlement date, including goodwill, less of any non-controlling interests. The so calculated profit or loss is recognized in profit or loss, together with ac-cumulated currency translation adjustments, previously recognized in other comprehensive income.
Translation of Foreign CurrencyFor each of the reported group companies a functional currency is fixed. The functional currency is the curren-cy which is used in the primary economic environment in which the individual reporting entity operates. Trans-actions in currencies other than the functional currency are transactions in foreign currency.
Foreign currency transactions are initially translated into the functional currency at the transaction date.
Exchange differences arising between the exchange rate at the settlement date and the date of payment are recog-nized directly in comprehensive income as financial items.
Receivables, payables and other monetary items de-nominated in foreign currencies are translated into the functional currency at balance sheet date rate. The dif-ference between the rate of the balance sheet day and the rate of the time when the receivable or payable arose or the rate in the most recent annual report is recognized directly in comprehensive income as financial items.
On recognition in the consolidated accounts of compa-nies with another functional currency than EUR, income statements are translated at the transaction date rate and the balance sheets are translated at the balance sheet date exchange rates. As transaction date rate, the av-erage price for the individual months is applied, to the
extent that it does not alter things radically. Differences in exchange rates arising on translation of the equity of the these companies at the beginning of the year to the exchange rates of the balance sheet date as well as the translation of income statements from rate of the transac-tion date to the exchange rate of the balance sheet date, are recognized directly in other comprehensive income.
Adjustment of balances, which are considered part of the total net investment in companies with a different functional currency than EUR, are recognized directly in other comprehensive income. Equally, foreign exchange gains and losses are recognized in the consolidated accounts on the portion of loans and any derivative fi-nancial instruments that are hedges of net investment in these companies. In the financial year no derivative financial instruments were used for currency hedging.
On recognition in the consolidated accounts of asso-ciated companies with a different functional currency than EUR, the share of the profits is translated at av-erage exchange rates and the equity share, including goodwill, is translated according to the exchange rates at the balance sheet date. Exchange rate differences, arising on the translation of the share of foreign associ-ated companies’ equity at the balance sheet date and on translation of net income share from average rates to the balance sheet date rates, are recognized directly in other comprehensive income.
On full or partial disposal of foreign entities or on re-payment of balances that are considered part of the net investment, the share of the cumulative foreign ex-change adjustments recognized directly in other com-prehensive income and which is attributable to it in the comprehensive income statement, is recognized con-current with any gain or loss at the disposal.
The comprehensive income statementREVENUEIncome is recognized as revenue as the production is carried out or the rendering of service is provided in a way that revenue corresponds to the sales value of the work provided in the accounting year (production method). Particularly in the area of conferences, rev-enue is counted at the actual conference time, although the arrangement of the conference itself is an ongoing process before and during the conference.
Revenue is measured at the fair value of the consid-eration received or receivable. Revenue is measured exclusive of VAT, charges, and including discounts in connection with the sale.
EXTERNAL COSTSOther external costs include costs incurred during the year for administration for the Group, including the cost of production, distribution, sales, advertising, adminis-tration, premises, etc.
Direct costs related to conferences particularly are ac-crued to the date of the conference.
NO
TES

45 Trifork Holding AG annual report 2015
EMPLOYEE COSTSEmployee costs cover wages and salaries to the entire staff. In addition, other employee costs are recognized.
Staff costs for conference construction and preparation are stated at cost and accrued to the date of the conference.
FINANCIAL INCOME AND EXPENSESFinancial income and expenses include interest in-come and expenses, exchange gains and losses on other investments, debts and foreign currency trans-actions, amortizing of financial assets and liabilities, and surcharges and refunds under the tax system etc. Financial income and expenses are recognized at the amount for the financial year.
INCOME TAX EXPENSETax for the year comprises current tax and movements in deferred tax recognized in comprehensive income with the portion attributable to profit and directly in eq-uity or in other comprehensive income to the extend attributable to amounts recognized directly in equity or in other comprehensive income.
The Balance SheetINTANGIBLE ASSETSGoodwillGoodwill is measured at cost less any impairment losses.
Other intangible assets with definite useful lives are measured at cost less accumulated amortization and write-downs. Amortizations are made on a straight-line basis over their estimated useful lives.
Amortization:Patents and licenses 5 yearsAcquired customer base 5-20 years
The amortization is defined on the basis of manage-ment experience in the Group´s business areas and re-flects management assessment of the best estimate of the assets´ economic useful life.
Other intangible assets with indefinite useful lives are measured at cost less any write-downs. The account-ing value of goodwill and intangible assets with indefinite useful lives are reviewed annually to determine whether they should be written down for impairment. Also ex-plored, at the indication of such a need, on an ongoing basis, is whether there should be a write-down for im-pairment. Goodwill and intangible assets with indefinite useful lives are not subject to amortization.
Development costs etc.Development projects are initially recognized at cost. The cost of development projects covers expenses, including wages and depreciation, which can be de-ferred directly to the development projects, and which are considered necessary to finish the project, from the time the development project for the first time meets the criteria for recognition as an asset.
Development projects which are clearly defined and identifiable, where the technical feasibility, adequate resources and potential future markets and uses can
be established and where it is appropriate to produce, market and use the project, are recognized as an in-tangible asset. Recognition requires that cost can be measured reliably and that it is probable that future earnings cover the development cost.
Other development costs are expensed in the compre-hensive income statement. Recognized development costs are measured at cost less accumulated depre-ciations and write-downs.
Following the completion of the development work, the project is depreciated over 2-5 years compared to the assessment of product life.
Ongoing and completed development projects are an-nually tested for impairment. Trifork operates in a highly competitive market, and even though there is increase in demand, there also is an ever increasing demand for the flexibility and functionality of the products as well.
TANGIBLE ASSETSInterior decoration and general leasehold improvements, other equipment, fixtures, fittings and investment proper-ties are measured at cost less accumulated depreciations. Cost comprises purchase price and any cost directly at-tributable to the acquisition until the date the asset is ready for use.
Straight-line depreciation is carried out based on the following evaluation of the assets´ estimated useful lives:
Leasehold improvements etc: 7 yearsOther equipment, fixtures and fittings: 3-7 yearsInvestment properties: 30 years
Tangible assets are written down to a recoverable amount if this is lower than the carrying amount. An an-nual impairment test is made of each asset or group of assets. Gains and losses on the disposal of tangible assets is calculated as the difference between the sell-ing price less selling cost and the carrying amount at the time of sale. Gains or losses are recognized in the comprehensive income statement as depreciation.
For investment properties the company is assuming a residual value of 45%.
INVESTMENTS IN ASSOCIATED AND AFFILIATED COMPANIESAn associated company is a company, where the group has significant but not controlling influence. An affiliated company is a company, where the group has control-ling influence.
Investments in associated companies are measured and recognized according to the equity method, which implies that investments are measured at the propor-tionate share of the carrying amount of the companies.
In the comprehensive income statement, the propor-tionate share of profit after tax is recognized under the items of profit in associated companies.
Investments in associated companies with negative equity value are measured at 0 EUR. Receivables and
NO
TES

46Trifork Holding AG annual report 2015
other financial assets that are considered to be part of the total investment in the company, are reduced by any remaining net worth. Receivables for sales of goods, services and other receivables are written down only if they are deemed uncollectable. A provision to cover the remaining equity is only recognized, if the group has a legal or constructive obligation to cover that company´s obligation.
IMPAIRMENT OF NON-CURRENT ASSETSGoodwill is tested annually for impairment, initially at the end of the acquisition year.
The carrying amount of goodwill is tested for impairment together with the other non-current assets in the cash-generating unit to which goodwill has been allocated, and written down to recoverable amount in the state-ment of comprehensive income if the carrying amount is higher. The recoverable amount is generally calculated as the present value of expected future net cash flows from the business or activity to which the goodwill re-lates. Impairment of goodwill is recognized in a separate line in the comprehensive income statement.
The carrying amount of non-current assets is assessed annually, using a DCF model to determine whether there is any indication of impairment. If any such indica-tion exists, the assets recoverable amount is calculated. The recoverable amount is the higher of fair value less cost to sell and value in use. Impairment losses are rec-ognized in the comprehensive income statement.
Impairment losses on goodwill are not reversed. Impair-ment on other assets are reversed only to the extent that there have been changes in the assumptions that lead to the impairment.
RECEIVABLESReceivables are recognized initially at fair value and subsequently measured at amortized cost. Impair-ments are conducted to meet expected losses.
WORK IN PROGRESSWork in progress is measured at the selling price of the work, calculated on the basis of completion.
Completion is calculated as the proportion of contract costs incurred in relation to expected total contract costs. When it is probable that total contract cost will exceed total revenue from a contract, the expected loss is recognized in the comprehensive income statement.
When the selling price cannot be calculated reliably, the selling price is measured to cost incurred or a lower net realizable value.
Billings are deducted from the selling price. The indi-vidual contracts are classified as receivables when the net value is positive and as liabilities when the advance payments exceed the selling price. Costs of sales work and contracts are recognized in the income statement as they are incurred.
PREPAYMENTSPrepayments recognized under assets comprise costs incurred relating to subsequent financial years.
OTHER SECURITIES AND INVESTMENTSOther securities and investments are included in either the category of financial assets held for trading or fi-nancial assets available for sale. Financial assets avail-able for sale are assets that are not derivative financial instruments and which are either classified as available for sale or can not be classified as loans or receivables, financial assets measured at fair value through profit or financial assets as held to maturity.
Other securities and investments available for sale are in-itially recognized at fair value on the settlement date plus directly attributable costs of acquisition. Subsequently, the assets are measured at fair value at balance sheet date and changes in fair value are recognized in profit or loss.
Other securities and investments held for trading are measured at initial recognition at fair value on the set-tlement date. Subsequently, the assets are measured at fair value at balance sheet date and changes in fair value, are recognized directly in profit or loss. Fair value is determined equal to the market price of listed securi-ties and at estimated fair value, determined on the basis of market information and valuation methods for other securities. Equity investments which are not traded in an active market and whose fair value cannot be reliably measured, are measured at cost.
EQUITYDividendsProposed dividends are recognized as a liability at the time of adoption at the Annual General Assembly.
Treasury sharesPurchase, sale and dividends on treasury shares are recognized directly in retained earnings in equity. Capi-tal reduction by cancellation of treasury shares reduces share capital corresponding to the nominal amount. Proceeds from sale of treasury shares are recognized directly in equity.
PENSION OBLIGATIONSThe Groups has entered into pension and similar agree-ments with most of its employees.
Liabilities relating to defined contribution pension schemes, are recognized in the comprehensive income statement in the period they are earned, and payables are recognized in the balance sheet under other liabilities.
In Switzerland the pension scheme of Trifork GmbH is defined as a defined benefit plan accounted under IAS19 and is reported in other comprehensive income.
NO
TES

47 Trifork Holding AG annual report 2015
CORPORATION TAX AND DEFERRED TAXCurrent tax liabilities and current tax receivable are recognized as tax computed on the taxable income, adjusted for tax on prior year´s taxable income and for tax paid in advance. Deferred tax is measured using the balance sheet liability method on all temporary dif-ferences between accounting and tax values of assets and liabilities. However, there is no recognition of de-ferred tax on temporary differences relating to non tax deductible goodwill and other items where temporary differences - excluding acquisitions – have occurred at the time of acquisition without affecting profit or tax-able income. In cases where the computation of the tax base can be made for alternative taxation rules, de-ferred tax is measured on the basis of the intended use of the asset or the settlement of the liability.
Deferred tax assets, including the tax value of tax loss carried forward, are recognized at the value at which they are expected to be used, either by elimination of tax on future earnings or against deferred tax liabilities within the same legal tax entity and jurisdiction.
There is an adjustment of deferred tax relating to the elimination of unrealized intercompany profits and loss-es. Deferred tax is measured based on the tax rules and tax rates that apply under the legislation at the balance sheet date, when the deferred tax is expected to crystal-lize as current tax. Change in deferred tax due to chang-es in tax rates is recognised in comprehensive income.
PROVISIONSProvisions are recognized when the Group has a legal or constructive obligation as a result of events in the financial year or previous years, and it is probable that the obligation will result in an outflow of resources.
Provisions are measured as the best estimate of the cost necessary on the balance sheet date to settle ob-ligations. Provisions with an expected maturity more than one year from the balance sheet date are meas-ured at present value.
FINANCIAL LIABILITIESFinancial liabilities, including trade payables, affiliated companies, credit institutions and other payables are measured at amortized cost, which usually corre-sponds to the nominal value.
LEASINGThe Group has operational and financial lease obliga-tions. Lease payments are recognised linearly in the comprehensive income statement during the lease pe-riod.
PREPAYMENTSPrepayments recognized as liabilities include revenue received regarding subsequent years and are measured at cost.
Cash flow statementThe cash flow statement shows cash flow for the year, distributed on operating activities, investment activi-ties and financing activities for the year, cash and cash equivalents at beginning and end of the year.
CASH FLOW FROM OPERATING ACTIVITIESCash flows from operating activities are calculated as the share of profits adjusted for non-cash operating items, changes in working capital and taxes paid.
CASH FLOW FROM INVESTMENT ACTIVITIESCash flows from investment activities comprise pay-ments in connection with the purchase and sale of businesses and the purchase and sale of intangible, tangible and financial assets.
CASH FLOW FROM FINANCING ACTIVITIESCash flows from financing activities comprise changes in the size or composition of the Group´s share capital and related costs as well as loans, repayment of inter-est-bearing debt, purchase and sale of treasury shares and payment of dividend to company shareholders.
CASHCash includes cash and short term bank debt.
Segment informationInformation is provided on business segments, which are the Group´s primary reporting format. The seg-ments are based on the group´s risks and manage-ment structure. The segments have been prepared in accordance with the Group´s accounting policies. Seg-ment information includes the items that are directly at-tributable to the individual segments.
NO
TES

48Trifork Holding AG annual report 2015
2 - Accounting estimates and judgments in the consolidated financial statement
Determining the carrying value of certain assets and liabilities requires assessments, estimates and assump-tions regarding future events.
The estimates and assumptions are based on historical experience and other factors that management con-siders reasonable under the circumstances, but which are interently uncertain and unpredictable.
Assumptions may be incomplete or inaccurate, and unanticipated events or circumstances may arise.
Furthermore, the company is subject to risks and uncertainties that may cause the actual outcome to differ from these estimates. Specific risks for the Trifork Group are disclosed in the management report section in the present report.
It may be necessary to change previous estimates due to changes in the facts underlying the previous esti-mates, or because of new information or subsequent events.
Estimates that are material to the financial statements are made, for instance with the use of impairment test-ing, state of completion of work in progress and useful life-time of intangible assets.
All current development is progressing as planned and there is no information from customers or competitors, indicating that the new products will not be sold in the expected extent. Based on these factors, management has estimated the current development projects, the recoverable amounts in the form of expected future net cash flow, including completion costs. As of 31.12.2015, ongoing developments had a carrying value of EURm 0.8 compared to EURm 0.9 end of 2014.
Impairment tests have been performed on all capitalized development and goodwill. This has not led to any amortizations in 2015. Management’s estimates related to impairment tests are based on the fact that all prod-ucts (both completed and under development) are continuously developed and that the company have an ongo-ing focus on keeping updated sales forecast, marketing expenses, development plans and future earning poten-tial for each product. On the basis of this information, a DCF-model is used to estimate the recoverable amounts for individual assets. The parameters for the DCF-model is the same as listed in note 10 with a budget period up to five years, but only using a budget period for each product equalling the expected lifetime of the product.
In connection with determination of the purchase price of acquired subsidiaries or associated companies, the management has conducted an assessment of the likelihood of payment and amount of any earn-out. At the end of 2015 total earn-out amounted to EURm 0.2. End of 2014 this was EURm 0.4.
3 - Segment information
For internal purposes Trifork organizes its business based on the products and services that the company delivers. In the presentation of the segment information no aggregation has taken place.
The presentation of the segments are according to the internal reporting used by the management. Group operations and administration that are not part of the individually defined segments are accounted for in the “Other” segment. The revenue information is based on the locations of the customers.
2015 Academy Project ProductSegment
totalOthers Group total
Revenue to external customers 9,076,781 41,894,271 8,068,030 59,039,082 0 59,039,082
EBITDA 605,353 4,887,629 3,610,968 9,103,950 -238,897 8,865,053
Depreciations 46,234 884,341 388,695 1,319,269 512,911 1,832,180
Profit (+) loss (-) from operations (EBIT) 559,119 4,003,288 3,222,274 7,784,681 -751,808 7,032,873
Average number of employees 16 263 11 290 50 340
Regional segment information Europe America Others Group total
Revenue to external Customers 48,135,353 6,265,661 4,638,068 59,039,082
Country specific information CH UK DK US Others Group total
Revenue to external Customers 3,705,327 15,173,529 22,750,043 6,305,516 11,104,666 59,039,082
NO
TES
EUR

49 Trifork Holding AG annual report 2015
Revenue and profit statement
For both 2014 and 2015, the whole revenue comes from sales of services and products, which is why no further fragmentation of various revenue categories for each segment has been made. Some internal revenue exists between the segments. The internal deliveries from each segment to the others are explained in the segment description below.
No details has been provided in relation to interests and share of profit/loss from associates since this in both 2014 and 2015 have been managed on a group level.
Description of segments
Academy
The Academy segment is primarily engaged in developing and implementing the GOTO conferences of Trifork as well as partner conferences in Europe and America. Consultancy services and training in agile processes and software devel-opment is also part of the deliveries from this segment. Resources from other segments has attended conferences and courses arranged by Academy. In total this amounts to a revenue of EURm 0.1 in 2015 and was at the same level in 2014.
Project
The project segment is engaged in delivering innovation projects to the customers of Trifork. Trifork project is building solu-tions to banks, governments, agencies or leading industrial manufacturers in all of Europe and America. Projects are done on a time and material basis or as fixed price projects in cases where Trifork is responsible for the whole implementation of a project. Most often strategic partnerships are engaged with the major customers.
Project has been delivering internal services to the other segments in the following way:
Academy: In 2015 services for EURm 0.3 has been delivered in relation to building a new web-site to the Academy presentation and sale of conferences. In 2014 the total was EURm 0.2.Product: Projects delivered support to product development for an amount of EURm 1.2 in 2015. In 2014 this amounted to EURm 1.0.
Product
The Product segment is based on the process and value stream with product development and sale of Trifork developed products as well as business, related to the sale of partner products. Products are either sold separate or in relation to pro-jects where Trifork is engaged in relation to developing new solutions for its customers. In 2015 product licenses were sold internally to Projects for a total of EURm 0.4. In 2014 this was EURm 0.2.
Information about significant customers
In both 2014 and 2015 no single customer has accounted for more than 10% of total revenue in the Group.
NO
TES
EUR
Segment information 2014 Academy Project ProductSegment
totalOthers Group total
Revenue to external customers 5,833,771 31,184,552 7,022,402 44,040,725 56,174 44,096,899
EBITDA 25,386 3,994,039 1,177,616 5,197,041 33,824 5,230,864
Depreciations 26,706 918,116 303,934 1,248,756 84,268 1,333,024
Profit (+) loss (-) from operations (EBIT) -1,320 3,075,923 873,682 3,948,285 -50,444 3,897,841
Average number of employees 15 211 8 234 42 276
Regional segment information Europe America Others Group total
Revenue to external customers 34,276,307 7,387,790 2,432,801 44,096,899
Country specific segment information CH UK DK US Others Group total
Revenue to external customers 1,786,118 6,357,100 15,893,734 7,838,823 12,221,124 44,096,899
Reconciliation of profit 2015 2014
Segment EBIT 7,784,681 3,948,285
EBIT from other business -751,808 -50,444
Financial income 2,273,229 667,098
Financial cost -2,559,159 -843,583
Profit in associated companies 2,949,952 96,328
Profit on other investments 1,527,563 1,000,454
Profit before tax 11,224,459 4,818,137
Taxes -1,134,152 -566,683
Net profit 10,090,307 4,251,454

50Trifork Holding AG annual report 2015
4- Revenue 2015 2014
Revenue Europe 48,135,353 34,276,307
Revenue America 6,265,661 7,387,790
Revenue other countries 4,638,068 2,432,801
Revenue total 59,039,082 44,096,899
5 - Personnel cost 2015 2014
Wages and salaries 25,925,728 19,068,855
Pensions 1,154,904 643,653
Social security costs 1,170,057 792,588
Received salary refunds from government -369,140 -396,447
Development cost included as asset -1,001,895 -1,121,809
Personnel cost total 26,879,655 18,986,840
Average number of employee 340 276
Fee to Board of directors 136,589 24,698
Salary to Executive management 770,581 574,609
Pension to Executive management 51,208 0
Salary to other Executives 1,452,275 820,565
Pension to other Executives 127,438 56,451
6 - Profit on other investments 2015 2014
Net gain / (loss) on available for sale financial assets 1,527,563 1,000,454
Profits and losses on sold investments 2,926,356 0
Profit on other investments total 4,453,919 1,000,454
7 - Financial Income 2015 2014
Interest income 501,206 0
Exchange rate gains 1,068,930 361,710
Fair value adjustments on financial liabilities carried at fair value through profit 703,094 305,387
Financial Income total 2,273,229 667,098
Interest income is from financial assets/liabilities which are not measured at fair value through profit. Fair value adjustments are based on less payments on earn-out compared to the dept initial registered.
8 - Financial expenses 2015 2014
Interest expenses -914,025 -381,333
Exchange rate losses -1,645,134 -462,250
Financial expenses total -2,559,159 -843,583
Interest expenses is from financial assets and liabilities.
NO
TES
EUR

51 Trifork Holding AG annual report 2015
Tax differences can be explained as follows
Tax exempt income from investments -972,920 -240,109
Non-deductible expenses / non-taxable income 4,923 -31,343
Tax benefit agreements (UK and NL) -403,306 -247,342
Other 166,911 71,491
Difference between applicable and effective income taxes -1,204,392 -447,303
Effective tax percentage 10.10% 11.76%
The weighted average tax-rate is calculated based on the origin of EBT in each company included as sub-sidiary in the consolidated financial statement combined with the tax-rates in each country.
NO
TES
EUR
9 - Taxes 2015 2014
Net Profit before tax 11,224,459 4,818,137
Weighted applicable tax rate 20.83% 21.05%
Tax calculated at applicable tax rate 2,338,544 1,013,987
Current taxes
Current income tax expense 1,116,373 623,445
Adjustment previous years -8,994 -14,450
Deferred taxes
Relating to origination and reversal of temporary timing differences 26,773 -42,312
Taxes 1,134,152 566,683
Difference between applicable and effective income taxes -1,204,392 -447,303
10 - Deferred tax liabilities 2015 2014
Deferred tax, January 1 1,172,014 988,362
Exchange rate adjustments in foreign entities 26,076 1,159
Net deferred tax recognized in profit 26,338 -42,312
Additions from acquisition of subsidiaries 172,576 224,804
Deferred tax, December 31 1,397,004 1,172,014
Specification of Deferred tax:
Intangible assets 1,398,125 1,315,899
Tangible assets 3,741 -143,885
Taxable losses to carry forward -4,863 0
Deferred tax total 1,397,004 1,172,014

52Trifork Holding AG annual report 2015
11 - Intangible assetsGoodwill
Completed development
projects
Patents and
licenses
Ongoing development
projects
Acquired customer
base
Cost at January 1, 2015 5,819,819 5,986,301 187,392 886,337 6,615,561
Exchange rate adjustments 81,228 13,801 0 69,777 189,655
Additions from dev. activities 0 1,125,947 0 1,005,193 0
Additions from acquisitions 1,517,636 0 0 108,097 1,010,264
Transfers 0 0 0 -1,112,971 0
Cost at December 31, 2015 7,418,683 7,126,049 187,392 956,433 7,815,479
Amortizations at January 1, 2015 676 5,168,155 187,392 0 1,446,137
Exchange rate adjustments -676 6,574 0 0 -10,745
Amortizations for the year 0 547,135 0 0 426,195
Amortizations at December 31, 2015 0 5,721,863 187,392 0 1,861,586
Carrying amount at Dec. 31, 2015 7,418,683 1,404,185 0 956,433 5,953,894
Cost at January 1, 2014 5,511,495 5,222,512 187,392 465,486 5,318,023
Exchange rate adjustments 68,313 -3,489 0 2,141 202,067
Additions from dev. activities 0 310,783 0 942,376 0
Additions from acquisitions 240,011 0 0 0 1,095,471
Transfers 0 456,494 0 -523,666 0
Cost at December 31, 2014 5,819,819 5,986,301 187,392 886,337 6,615,561
Amortizations at January 1, 2014 -1 4,708,045 187,392 0 1,144,305
Exchange rate adjustments 677 -6,021 0 0 26,465
Amortizations for the year 0 466,131 0 0 275,367
Amortizations at December 31, 2014 676 5,168,155 187,392 0 1,446,137
Carrying amount at Dec. 31, 2014 5,819,143 818,146 0 886,337 5,169,424
Amortisation period (years) (2-5) (5) - (5-20)
Information about intangible assets
Excluding goodwill and ongoing development projects, all other intangible assets are considered to have definite useful lives, over which intangible assets are depreciated.
Additions to intangible assets are all internally generated in the product development of software solutions. This amounted to EURm 0.7 in 2015 compared to EURm 0.5 in 2014. In 2015 EURm 1.2 was used on research and development cost in the operating activities compared to EURm 1.0 in 2014.

53 Trifork Holding AG annual report 2015
11 - Goodwill with indefinite useful lifetime is attributable to these CGU’s: 2015 2014
Trifork A/S (Project segment) 223,786 224,354
Trifork Public A/S (Project segment) 575,142 576,603
Erlang Solutions Ltd. (Project segment) 1,016,315 958,751
Trifork Medical ApS (Product segment) 63,713 63,875
Trifork B.V. (Project segment) 3,755,551 3,755,550
Inaka Inc. (Project segment) 261,441 234,912
Open Credo Ltd. (Project segment) 1,517,636 234,912
Duckwise ApS (Project segment) 5,099 5,099
Goodwill total 7,418,683 5,819,143
The recoverable amount of each cash-generating unit (CGU) to which goodwill have been allocated, are calcu-lated based on calculations of the capital value of each unit.
In this relation, the greatest uncertainties relate to the determination of discount rates, growth rates and expected changes in sales prices and production costs in the budgets and terminal sessions. The specified discount rates reflect market assessments of the time value of money, expressed by a risk-free rate and the specific risks as-sociated with each CGU. Discount rates are defined on an “after tax” basis, based on the estimated Weighted Average Cost of Capital (WACC).
The applied rates are based on industry forecasts. Impairment test for goodwill items in all CGU’s are made on the basis of a DCF-model, incorporating the projected budgets for each CGU with an assessment of future developments in each CGU. Management considers the projected budgets to be realistic, and built around the historical experience and expectations for future market development. For the financial year after the budget sesions (terminal period), there has been an extrapolation of the cash flows in the last budget period, adjusted for expected growth rates. The applied rates do not exceed the average long-term expected growth rate for the relevant markets. The DCF-model estimates a period of 5 years as a resonable and valid budget period for all units. Management considers for all CGU’s that probable changes in the underlying assumptions will not cause the carrying value of goodwill to exceed the recoverable amount. The following essential parameters are used as basis:
EUR
2015 assumptions
- Discounting rate for technology 18.0%
- Weighted average growth rate over the budget period 1.0% - Tax on EBIT 15-25.0%
- Risk free interest rate 2.5% - Beta (amount of risk) 1.25
- Risk premium 4.5% - Cash additional 6.0%
- Weighted Average Cost of Capital (WACC) 14.1%
2014 assumptions
- Discounting rate for technology 18.0%
- Weighted average growth rate over the budget period 1.0% - Tax on EBIT 25.0%
- Risk free interest rate 2.5% - Beta (amount of risk) 1.25
- Risk premium 4.5% - Cash additional 6.0% - Weighted Average Cost of Capital (WACC) 14.1%

54Trifork Holding AG annual report 2015
Individual circumstances for each CGU:
Trifork Finance A/S (Project)
In the detailed budgets for this CGU which now is intigrated into Trifork A/S, an annual growth rate of 15-22% in revenue is incorporated. This increase is based on the company’s strategic plans in this CGU. In 2015 a growth of 15% was achieved. The EBITDA margin is estimated at 18-21% compared to a margin of 18.7% in 2015. The EBIT is estimated individually pro annum, based on all known and expected future depreciation, seen in relation to the strategic plans within the 5 years budget period. Tax on EBIT is estimated to 22%.
NO
TES
Trifork Public A/S (Project)
In the detailed budgets for this CGU, an annual 10% growth in revenue is incorporated. This increase is based on the company’s strategic plans in this CGU compared with the actual figures for 2015 where a growth of 11% was achieved. The EBITDA margin is estimated at 20% compared to a realized margin of 22.8% in 2015. EBIT is estimated individually pro annum, based on all known and expected depreciations, compared to the strategic plans within the 5 years budget period. Tax on EBIT is estimated to 22%.
Erlang Solutions Ltd. (Project)
In the detailed budgets for this CGU, an annual 13-15% growth in revenue is incorporated. This increase is based on the company’s strategic plans in this CGU compared with the actual figures for 2015. The EBITDA margin is estimated at 12%. In 2015 a margin of 10.2% was achieved. EBIT is estimated individuall pro annum, based on all known and expected depreciation, compared to the strategic plans within the 5 years budget period. Tax on EBIT is estimated to 15%
Trifork Medical ApS (Product)
In the detailed budgets for this CGU an annual 15-20% growth target in revenue is incorporated. This increase is based on the company’s strategic plans in this CGU compared with the products launched in 2015. In 2015 a growth of 164% was achieved. The EBITDA margin is estimated to be between 10-20%. In 2015 a margin of 27.6% was achieved. The EBIT is estimated individually pro annum, based on all known and expected fugure depreciation, seen in relation to the strategic plans within the 5 years budget period. Tax on EBIT is estimated to 22%.
Trifork B.V. (Project)
In the detailed budgets for this CGU, an annual 12% growth in revenue is incorporated. This increase is based on the company’s strategic plans in this CGU compared with the actual figures for 2015. The EBITDA margin is estimated to 12% compared to a margin of 13.6% in 2015. EBIT is estimated individually pro annum, based on all known expected depreciation, compared to the strategic plans within the 5 years budget period. Tax on EBIT is estimated to 20%.
Inaka Inc. and Inaka SRL (Project)
This company was purchased in August 1, 2014 and has been incorporated in the consolidated results after the pur-chase. The company builds end-to-end web and mobile apps for large clients and well-funded startups primarily in USA. The company is seated with offices in Buenos Aires, Argentina and in USA and is seen as an extention of the Trifork precense on the American market.
In 2015 this CGU was merged into Erlang Solutions Inc. and has in the 2015 impairment test been included in the test of Erlang Solutions Ltd.

55 Trifork Holding AG annual report 2015
NO
TES
Duckwise ApS (Project)
An ownership of 51% of this company was purchased on October 1, 2014 and has been incorporated in the consoli-dated results after the purchase. In 2015 additional 24% of the company was acquired and end of 2015 Trifork owned 75% of the company. Duckwise creates a lot of the design for user interfaces on software solutions. The company is a subcontractor to many Trifork projects as well as they do design work for other companies. Duckwise ApS is registered in Denmark with a new entity in Switzerland where Trifork expect to grow the entity together with the original founders.
In the detailed budgets for this CGU, an annual growth in revenue of 20-40% is incorporated. This increase is based on the company’s strategic plans in this CGU. In 2015 a growth of 57% was achieved. The EBITDA margin is estimated to 30-35%. In 2015 a margin of 37.3% was achieved. EBIT is estimated individually pro annum, based on all known expect-ed depreciation, compared to the strategic plans within the 5 years budget period. Tax on EBIT is estimated to 22%.
OpenCredo Ltd. (Project)
Trifork in 2014 owned 33% of this company. On January 1, 2015 additional shares were purchased. This increased the Trifork ownership to 69% of this company. Based on this the company has been incorporated in the consolidated results for 2015. OpenCredo is a software development company working for both financial and retail customers deliv-ering software solutions or consultancy services. OpenCredo Ltd. is registered in United Kingdom where Trifork expect to grow the entity together with the original founder. The purchase sum allocation is shown in note 24.
In the detailed budgets for this CGU, an annual 15% growth in revenue is incorporated. This increase is based on the company’s strategic plans in this CGU compared with the actual figures for 2015 where a growth of 26% was achieved. The future focus in the budget period is profit before growth. The EBITDA margin in the budget period is estimated to 11-14%, compared to a margin of 8.5% in 2015. EBIT is estimated individually pro annum, based on all known expected depreciation, compared to the strategic plans within the 5 years budget period. Tax on EBIT is estimated to 20%.

56Trifork Holding AG annual report 2015
12 - Tangible AssetsLeasehold
improvementsOther equipment,
fixtures and fittingsInvestment properties
Cost at January 1, 2015 1,157,254 4,015,630 624,666
Exchange rate adjustments -38 119,972 -1,582
Additions 1,424,935 933,606 0
Additions from acquisitions 78,313 235,033 0
Disposal 0 -488,813 0
Cost at December 31, 2015 2,660,464 4,815,429 623,084
Amortizations at January 1, 2015 879,340 2,640,566 60,502
Exchange rate adjustments 657 45,143 -153
Amortizations for the year 172,470 597,280 14,566
Additions from acquisitions 47,513 100,804 0
Disposal 21,011 -455,887 0
Amortizations at December 31, 2015 1,120,990 2,927,906 74,915
Carrying amount at December 31, 2015 1,539,474 1,887,523 548,168Cost at January 1, 2014 1,140,742 2,967,661 224,374Exchange rate adjustments 26,518 24,650 503
Additions 51,616 1,035,319 12,611
Additions from acquisitions 0 330,849 612,055
Disposal -61,623 -342,848 -224,878Cost at December 31, 2014 1,157,254 4,015,630 624,666Amortizations at January 1, 2014 735,214 2,215,178 9,941Exchange rate adjustments 25,607 12,618 22
Amortizations for the year 180,142 441,843 15,783
Additions from acquisitions 0 107,816 47,811
Disposal -61,623 -136,888 -13,055
Amortizations at December 31, 2014 879,340 2,640,566 60,502
Carrying amount at December 31, 2014 277,914 1,375,064 564,163
NO
TES
EUR
Investment properties 2015 2014
Rental income derived from investment properties 22,513 0
Direct operating expenses -4,442 -4,250
Profit arising from investment properties carried at fair value 18,070 -4,250
The Group has no restrictions on the realisability of its investment properties and no contractual obligations to purchase, construct or develop investment properties or for repairs, maintenance and enhancements.
The Groups investment property is real estate that is hold with the purpose of sale at a later point in time when the price-level is seen as attractive. In the period until the sale the property is rented out to a third party. The rental income EURt 22 is deducted in the cost thus having no effect on revenue. Total direct operating cost for the real property was EURt 4 in 2015.

57 Trifork Holding AG annual report 2015
13 - Investments in Associates 2015 2014
Cost at January 1 1,632,191 1,129,502
Exchange rate adjustments 68,342 6,985
Additions for the year 227,606 915,004
Disposals for the year -936,871 -419,299
Transfer 0 0
Cost at December 31 991,268 1,632,191
Impairment at January 1 -396,206 -534,660
Exchange rate adjustments 6,728 -36
Results from associated companies 113,348 63,418
Dividend paid out 0 -14,485
Impairment for the year -86,575 -20,785
Reversed impairment 73,959 110,341
Impairment at December 31 -288,746 -396,206
Carrying amount at December 31 702,522 1,235,985
Name (Associated) HomeOwnership 31/12 2014
Revenue Net Profit Assets Liabilities
Open Credo Ltd UK 33% 4,027,660 242,982 1,824,327 384,414
aragost Trifork AG CH 33% 712,961 49,170 379,103 249,699
SDS GmbH DE 15% 5,000 -1,000 3,000 2,000
ForkID A/S DK 30% 42,155 113,861 300,388 493,286
Chainalysis GmbH CH 33% 0 0 100,000 20,000
Brightclouds Labs B.V. NL 50% 0 -2,608 19,617 19,617
Brightclouds Benelux B.V. NL 50% 0 -3,417 6,188 2,771
DinDan Social Global B.V. NL 50% 0 -1,950 183,385 183,385
DinDan Social Benelux B.V. NL 50% 0 22,029 28,536 28,536
The Service Network B.V. NL 25% 0 -17,000 40,000 40,000
In 2015 Open Credo Ltd., DinDan Social Global B.V and DinDan Social Benelux B.V have all changed status to become subsidiaries and are part of the consolidation af the Trifork group reporting. It is the judgement of Trifork that the financial reporting in the associated companies is done using the same ac-counting policies as Trifork.ForkID A/S is recognized at EUR 0, as Trifork is not obligated to cover the negative equity. In 2015 The Net Profit in ForkID is not incorporated.SDS GmbH is removed as associated company in 2015 since the activities has stopped and Trifork now recognize this to EUR 0.
NO
TES
EUR
Name (Associated) HomeOwnership 31/12 2015
RevenueProfit for the year
Assets Liabilities
aragost Trifork AG CH 33% 329,000 18,800 474,500 285,349
ForkID A/S DK 30% 0 170,749 13,620 35,321
Appdictive ApS DK 25% 89,353 23,139 68,087 29,478Chainalysis Inc. US 29% 249,219 117,000 1,222,857 18,591Chainalysis GmbH CH 29% 274,705 42,547 455,992 394,854
Brightclouds Labs B.V. NL 50% 0 -2,341 106,448 1,062
Brightclouds Benelux B.V. NL 50% 0 -1,156 3,552 8,312
The Service Network B.V. NL 25% 0 -13,444 99,721 45,947
WeCity B.V NL 21% 230 -275,405 473,253 44,132

58Trifork Holding AG annual report 2015
16 - Share capital 2015 2014
Number of shares (CHF 0.1)
Issued shares, January 1 17,324,514 0
Capital increase 1,212,716 17,324,514
Issued shares, December 31 18,537,230 17,324,514
Treasury shares 288,509 256,738
Number of shares outstanding 18,248,721 17,067,776
The Trifork Holding company was founded on January 8, 2014 and had end of 2015 a share capital of nominally 18,537,230 shares of CHF 0.1 each. In June 2015 a capital increase was performed in relation to bringing in a new strategic investor to the company. The shares have ISIN-no: CH0236907504 and are registered with VP Securities in Denmark. The share capital is fully paid. All shares have identical rights and there is only one share class.In 2015 690,725 treasury shares were purchased to an average rate of CHF 4.42 and 658,954 shares were sold at an average rate of CHF 3.89. This equals a net purchase of 31,771 shares. Most of the shares sold was done in the beginning of 2015 and most of the shares purchased was done late in 2015 to a higher treasury share price. Based on this the avarage purchase price has been higher than the sales price.
17 - Mortgages and securities 2015 2014
Total guarantees in relation to tangible fixed assets 4,079,066 3,717,959
A security has been made for the acquisition loan of DKKm 25 (EURm 3.3) in relation to the Trifork Holding AG takeover of Trifork A/S. The shares in Trifork A/S, Trifork GmbH, Trifork B.V and Trifork Ltd. has been placed as security (pledge) until the acquisition loan has been repaid.Trifork Holding AG guarantee a draft facility of DKKm 2.67 (EURt 358) for the subsidiary Blackbird Holding ApS. The draft facility is related to an investment property that was taken over at the acquisition of Blackbird Holding ApS. The investment property is pledged in relation to a real estate loan of DKKm 2.1 (EURt 286).
NO
TES
EUR
15 - Non-controlling interests 2015 2014
Non-controlling interests January 1 1,439,949 1,121,845
Additions 622,116 241,184
Disposal 0 4,631
Exchange rate adjustments on translation of foreign entities 3,260 29,874
Dividend paid out -489,147 -421,018
Share of profit 2,409,539 463,433
Non-controlling interests December 31 3,985,717 1,439,949
14 - Debt to financial Institutions and other non-current liabilities 2015 2014
Division of Debt to financial institutions:
Non-current Liabilities 4,131,072 4,121,172
Current Liabilities 5,406,090 5,607,934
Debt to financial institutions total 9,537,162 9,729,106
Other non-current liabilities 2015 2014
Mortgage loans 274,573 275,270
Deffered payments related to acquisitions 494,585 301,957
Earn out related to acquisitions 57,518 92,674
Accrued pension cost and benefits 590,876 458,406
Total other non current liabilities 1,417,552 1,128,307

59 Trifork Holding AG annual report 2015
20 - Related parties
The Group has no related parties with controlling influence. The Group’s related parties include the Board and Executive man-agement and the close families of these individuals. Furthermore, related parties include companies, in which the aforemen-tioned circle of people have significant interests. Additionally, related parties include associated companies. A balance of trade and salary for the Group Executive and Board is presented in note 5. Trifork A/S and Trifork GmbH is responsible for certain administrative and staff-related assignments for subsidiaries and associated companies, including IT-operations, maintenance, bookkeping, a shared sales organisation and management tasks. These assignments are invoiced, based on cost to the as-sociated companies/subsidiaries. In addition, there have been no significant transactions with related parties during the year, apart from the usual trade between the Group companies. The trade is based on usual business conditions (arms length).
Transactions with related parties Loan from Trifork-group Trifork purchase Trifork sale
2015
Aragost Trifork AG 0 50,367 0
Appdictive ApS 0 90,180 9,222
ForkID A/S (former Office Design A/S)
0 0 17,718
Chainalysis GmbH 268,240 0 0
BrightClouds Benelux B.V 0 0 38,500
The Service Network B.V 0 0 29,783
WeCity B.V 0 0 271,945
Ejendomsselskabet af 1. juni 2012 ApS 0 321,547 0
2014
OpenCredo Ltd. 0 226,301 0
aragost Trifork AG 0 55,062 0
ForkID A/S 181,870 13,101 0
Ejendomsselskabet af 1. juni 2012 ApS 0 312,601 0
NO
TES
EUR
19 - Changes in working capital 2015 2014
Work in Progress -635,102 342,740
Receivables from Sales 4,154,691 -4,997,897
Other receivables 278,719 -342,914
Prepayments -125,078 -35,994
Non-controlling interests 66 13,273
Trade payables -3,079,367 5,742,502
Other payables -1,122,510 -660,763
Accrued expenses -1,551,173 519,680
Changes in working capital total -2,079,754 580,627
18 - Other payables 2015 2014
Other debts 3,385 234,902
VAT obligations 877,152 1,905,747
Tax deducted from salaries 511,504 339,489
Employee obligations (ATP, Pension, Holiday, Bonus) 1,749,245 1,658,158
Other payables in total 3,141,286 4,138,296

60Trifork Holding AG annual report 2015
Reconciliation of present value of the defined benefit obligation 2015 2014
DBO, beginning of period 929,685 599,349
Effect of exchange rate differences 104,365 0
Current service cost (employer) 165,576 68,961
Administration cost 5,787 6,063
Ordinary contribution paid by employees 100,768 98,305
Interest expense on defined benefit obligation 11,374 13,485
Contribution paid by plan participants 22,364 0
Benefits paid from plan assets -40,007 -99,045
Past service cost -23,676 0
Actuarial (gain)/loss on defined benefit obligation 30,810 242,566
DBO, end of period 1,307,046 929,685
Actuarial gain/loss arising from changes in financial assumptions 15,610 146,323
Assumptions applied in the valuation of accrued pension cost 2015 2014
Discount rate at the end of the period 0.90% 1.10%
Future salary increases at the end of the period 1.50% 1.50%
Future pension increases at the end of the period 0.00% 0.00%
Retirement age M65/W64 M65/W64
21 - Accrued pension cost and benefits
Swiss pension planThe pension arrangements for employees in Switzerland are covered by a multi-employer plan administered by Swiss Life Collective BVG Foundation and governed by the Swiss Federal Occupational Old Age, Survivors and Disability Pension Act (BVG). All benefits in accordance with the regulations are re-insured in their entirety, with Swiss Life Ltd within the framework of the corresponding contract. This pension solution fully reinsures the risks of disability, death and longevity with Swiss Life. Swiss Life invests the vested pension capital and provides a 100% capital and interest guarantee.The Swiss Life Collective BVG Foundation is a separate legal foundation and is funded by employer and em-ployee contributions defined in the pension fund rules.The pension plan contains a cash balance benefit which is essentially contribution-based with certain minimum guarantees. Due to these minimum guarantees, the Swiss plan is treated as a defined benefit plan for the purposes of these IFRS financial statements, although it has many of the characteristics of a defined contribution plan.The technical administration and management of the savings account are guaranteed by Swiss Life on behalf of the collective foundation. Insurance benefits due are paid directly to the entitled persons by Swiss Life in the name of and for the account of the collective foundation. Trifork has committed itself to pay the annual contributions and costs due under the pension fund regulations.The contract of affiliation between Trifork and the collective foundation can be terminated by either side. In the event of a termination recipients of retirement and survivors’ benefits would remain with the collective foundation. Trifork commits itself to transfer its active insured members and recipi-ents of disability benefits to the new employee benefits institution, thus releasing the collective foundation from all obligations.The plan invests in a diversified range of assets in accordance with the investment strategy. A potential under-funding may be remedied by various measures such as increasing employer and employee contributions or reducing prospective benefits.
Reconciliation of net defined benefit liability (asset) 2015 2014
Net defined benefit liability (asset), beginning of period 458,406 229,231
Effect of exchange rate differences 51,460 0
Defined benefit cost recognised in profit or loss 153,295 80,183
Defined benefit cost recognised in other comprehensive income 28,483 247,298
Benefits directly paid by employer 0 0
Ordinary contribution paid by employer -100,768 -98,305
Net defined benefit liability (asset), end of period 590,876 458,406
The net defined benefit liability is included in Other non-current liabilities
EUR

61 Trifork Holding AG annual report 2015
Reconciliation of fair value of plan assets 2015 2014
Fair value of plan assets, beginning of period 471,278 370,118
Effect of exchange rate differences 52,906 0
Interest income on plan assets 5,766 8,327
Ordinary contributions paid by employer 100,768 98,305
Ordinary contributions paid by employees 100,768 98,305
Contributions paid by plan participants 22,364 0
Benefits paid from plan assets -40,007 -99,045
Other 2,328 -4,732
Fair value of plan assets, end of period 716,170 471,278
Ordinary employer payments to defined contribution plans 1,054,136 545,348
The total amount of the contribution to the pension plan for key managment is displayed in note 5.
EUR
Sensitivity analysis 2015 2014
Sensitivity to discount rate assumptions
a. + 0.5% -Effect on defined benefit obligation -8.4% -8.6%
b. -0.5% - Effect on defined benefit obligation 9.6% 9.9%
Sensitivity to salary increase rate assumptions
a. +0.5% - Effect on defined benefit obligation 0.9% 0.9%
b. -0.5% - Effect on defined benefit obligation -0.9% -0.9%
Sensitivity to mortality assumptions
a. Life expectancy +1 year. Effect on defined benefit obligation 0.7% 0.7%
b. Life expectancy -1 year. Effect on defined benefit obligation -0.7% -0.8%
Plan amendment, curtailment and settlement
Swiss Life communicated by the end of October 2015 to reduce the conversion rate for supplementary retire-ment savings in several steps until 2020. Its first effect will take place by the 1st January 2017. This leads to a past service cost, which has been calculated as at 31.12.2015.
Future cash flows (CHF) 2016 2017 2018 2019
Expected annual employee contribution 108,000
Expected annual employer’s contribution 108,000
Projected benefits expected to be paid 91,000 91,000 90,000 88,000
The annual contribution has not been predicted beyond 2016. In the period from 2020 to 2025 total benefit payments of CHF 507,000 is expected. Macaulay duration in years is calculated to 17.6 years.
Components of defined benefit cost in profit or loss 2015 2014
Current service cost employer 165,576 68,961
Interest expense on defined benefit obligation 11,374 13,485
Interest income on plan assets -5,766 -8,327
Past service cost -23,676 0
Administration costs 5,787 6,063
Defined benefit cost recognised in profit or loss 153,295 80,183
- Thereof service cost 141,900 68,961
- Thereof net interest on the net defined benefit liability (asset) 5,608 5,158
Accumulated value of plan assets 2015 2014
Surrender value of portfolio 715,697 470,303
Premium payment account 473 -4,304
Dividend account 0 5,280
Total value of assets 716,170 471,279

62Trifork Holding AG annual report 2015
22 - Financial risks and financial instruments
THE RISK MANAGEMENT POLICY OF THE GROUPThe Trifork Group is, as a result of its operations in investing and financing activities, exposed to a variety of finan-cial risks, including market risk (currency and interest rate risks), credit risks and liquidity risks. The Group has a centralized management of financial risks. The overall framework for the financial risk management is defined in the Group’s financial policy, which is approved by the Board of Directors. It is Group policy not to actively speculate in financial risks. The Group’s financial management is solely to manage and reduce the financial risks that are a direct result of the Group’s operating, investing and financing. The Group continuously calculates current financial posi-tions related to both financial and non-financial assets. Monthly, Management reviews the Group’s risk exposure in areas such as customers, order lengths, currencies, etc. in relation to budgets and forecasts. Below, it is assessed whether the Group’s risks are correlated, and whether there are significant changes in the overall risk exposure.
CURRENCY RISKSThe Group is exposed to currency fluctuations. Primarily due to the foreign activities related to conferences abroad, but also by the activities in Denmark, England, Poland, Hungary, USA, Argentina, Germany and Hol-land. The Group’s main commercial currency exposure relates to the purchase and sale in DKK, CHF, EUR, GBP and USD. The Group’s currency risks are hedged primarily due to revenues and costs in the same cur-rency. Whether there is a need for additional hedging is settled by continuously carrying out assessments of the correlations and variance between the net positions in each currency. It is the Group’s assessment, that overall there is a sensible natural hedging of risks based on the most recently completed assessments, and therefore does not currently use additional hedging instruments. Further information is given in note 22.d.
INTEREST RISKSTrifork has, as a result of the Group’s investing and financing activities, a risk exposure related to fluctuations in interest rates in Europe and abroad. The primary interest rate exposure is related to fluctuations in CIBOR and EURIBOR. So far, the group has not considered it necessary to undertake measures to ensure interest, since it is estimated that net mortgaging is not at a level that it would be profitable. Further elaboration is given in note 22.d.
RISK OF LIQUIDITYIt is the Group’s policy in connection with a loan to ensure maximum flexibility by diversifying borrowing on maturity and renegotiation dates and counter parties, taking pricing into account. The Group’s liquidity reserve consists of unutilized credit facilities. The group aims to have sufficient cash resources to continue to act ap-propriately in case of unforeseen changes in liquidity. There are one security associated with a bank-loan of EURm 1.2 to Trifork GmbH, where Trifork A/S guarantees for the loan and the shares in Trifork GmbH are pledged as security and one guarantee from Trifork Holding of a credit line of up to DKKm 2.6 for Blackbird Holding. Further information regarding this is given in note 22.d.
CREDIT RISKSThe Group is exposed to credit risk caused by its operations. These risks are primarily related to receivables and cash. The Group’s policy of assuming credit risks, causes all major customers and other key partners to be rated, and payment arrangements established in relation to this. The management of credit risk is based on internal credit limits for customers and counter parties. Credit limits are determined on the basis of the creditworthiness of customers and counter parties. If a customer or counter party is not considered suf-ficiently creditworthy, payment terms are modified or a guarantee is secured.
As part of the Group’s risk management, credit exposure to customers and counter parties is monitored monthly or quarterly. Historically, the group has only had minimal losses due to lack of payments from cus-tomers or counter parties. In the future, there is no expectation that there will be larger uncertainties on the Group’s clientele. Note 22.f includes a table of outstanding receivables at 31.12.2015.
NO
TES
EUR

63 Trifork Holding AG annual report 2015
22a - Categories of financial instruments 2015 2014
LiabilitiesCarrying amount
Carrying amount
Outstanding acquisition payment 552,103 376,360
Financial liabilities 552,103 376,360
Financial institutions 9,537,162 9,729,106
Trade payables 5,059,388 7,900,688
Other Debt 3,385 234,902
Financial liabilities measured at amortized cost 14,599,936 17,864,696
NO
TES
EUR
22b - Currency risks (sensitivity to exchange rate fluctuations)
2015
CurrencyCash and
receivablesFinancial
obligationsNet position
Likely rate-change
Influence on profit
Influence on Equity
DKK 894,463 6,662,243 -5,767,779 1% -49,026 -49,026GBP 4,352,192 1,128,700 3,223,492 10% 273,997 273,997
CHF 701,608 625,419 76,189 10% 6,476 6,476
USD 554,295 623,803 -69,508 10% -5,908 -5,908
PLN 58,456 0 58,456 5% 2,484 2,484SEK 84,655 0 84,655 5% 3,598 3,598
ARS 60,014 0 60,014 15% 7,652 7,652
Overall currency risk 239,272 239,272
The probable rate movements are based on an estimate of the maximum fluctuation for each currency in order to illustrate how much impact this hypothetically would have on the Group’s profit and equity. Exchange rate fluctuations are based on an assessment of the previous historical development and forecast of the future trend. The risk is calculated, based on currency positions (shown in EUR), as of 31.12.2014 and 31.12.2015. In the calculations an average tax-rate of 15% is used. The risk in USD is also balanced against investments done in USD, which is considered to give a positive net position in USD.
22a - Categories of financial instruments 2015 2014
AssetsCarrying amount
Fair valueCarrying amount
Fair value
Receivables from Sales 10,313,304 10,313,304 13,562,465 13,562,465
Other receivables 1,249,372 1,249,372 1,410,185 1,410,185
Cash 11,269,919 11,269,919 4,962,596 4,962,596
Loans and receivables 22,832,596 22,832,596 19,935,246 19,935,246
Other investments 4,761,792 4,761,792 4,458,426 4,458,426
Financial assets available for sale 4,761,792 4,761,792 4,458,426 4,458,426
22b - Currency risks (sensitivity to exchange rate fluctuations)
2014
CurrencyCash and
receivablesFinancial
obligationsNet position
Likely rate-change
Influence on profit
Influence on Equity
DKK 2,823,196 6,031,867 -3,208,671 1% -27,274 -27,274GBP 420,243 501,384 -81,141 10% -6,897 -6,897
CHF 172,201 1,187,628 -1,015,427 10% -86,311 -86,311
USD 403,472 1,148,650 -745,177 10% -63,340 -63,340
PLN 62,995 177 62,818 5% 2,670 2,670SEK 18,695 0 18,695 5% 795 795
ARS 46,278 0 46,278 15% 5,901 5,901
Overall currency risk -174,457 -174,457

64Trifork Holding AG annual report 2015
22d - Interest rate and liquidity risk
As of 31.12.2015, the Trifork group had a net plus in cash of EURm 1.7 and thus no net interest bearing debt. The cor-responding figure was a net debt of EURm 4.8 as of 31.12.2014. Capital resources and access to new credit facilities are considered reasonable in relation to the current need for financial flexibility.
The Group’s credit facilities are all at a variable interest rate. Foreign currency interest rates are fixed every three months. All interest rates are tied to the development of the general market rate. One acquisition-loan of EURm 0.7 is repayable over a period of 1 years. Another acquisition-loan of GBP 0.4 is repayable over a period of 3 years and an acquisition loan of DKK 25 (EURm 3.3) to finance the takeover of Trifork A/S is not repayable before an IPO of Trifork Holding AG is succeeded. All other credits are automatically extended each year. DKKm 10 and EURm 0.2 is extended in January, DKKm 20 is extended in May and GBPm 0.5 is extended in July. Other credits are not due for repayment, unless the involvement is moved to other banks.
For the Group’s bank deposits and bank loans and other loans with variable interests, an increase of 1% points, com-pared to the balance sheet interest rates, will have a positive impact on profit and equity of about EURt 17 (in 2014 the impact would have been negative with EURt 47). A similar fall in interest rates would give a corresponding negative impact on profit and equity.
Credit facilities 31.12.2015 0 - 1 year 1 - 2 years 2 - 5 years Total
Line of credit (DKK) 4,030,308 0 0 4,030,308
Line of credit (CHF) 462,365 0 0 462,365
Line of credit (EUR) 200,000 0 0 200,000
Line of credit (GBP) 677,514 0 0 677,514
Currency loan (DKK) 0 0 3,758,705 3,758,705
Currency loan (GBP) 238,965 78,710 0 317,674
Currency loan (EUR) 629,696 0 0 629,696
Credit facilities total 6,238,848 78,710 3,758,705 10,076,263
The Group is not subject to any collateral security other than already paid deposits. Loan facility overdrafts are automatically extended for 1 year at a time. Besides this, the Group expects to generate a significant positive cash flow during 2016. The group has current liabilities of EURm 16.3 which is due during 2016 and simultane-ously, current assets EURm 25.2, which are also due in 2016.
Credit facilities 31.12.2014 0 - 1 year 1 - 2 years 2 - 5 years Total
Line of credit (DKK) 4,030,308 0 0 4,030,308
Line of credit (CHF) 416,465 0 0 416,465
Line of credit (EUR) 200,000 0 0 200,000
Currency loan (DKK) 0 0 3,358,590 3,358,590
Currency loan (EUR) 620,000 620,000 9,696 1,249,696
Credit facilities total 5,266,773 620,000 3,368,286 9,255,059
NO
TES
EUR
22c - Optimization of capital structure
Management’s strategy and overall objectives are to ensure continued development and strengthening of the Group’s capital structure that supports long-term profitable growth and healthy development of earnings and balance sheet ratios. The equity ratio (solidity) 31.12.2015 was 46.0% compared to 29.8% as of 31.12.2014. Management regularly reviews whether the Group’s capital structure is consistent with Group and shareholder interest. As part of this review, the Board of Directors assesses the Group’s capital costs and the risks associated with each type of capital.
Financial gearing 31.12.2015 31.12.2014
Debts to Financial institutions 9,537,162 9,729,106
Cash -11,269,919 -4,962,596
Interest-bearing debt -1,732,757 4,766,510
Equity 27,150,640 13,918,332
Financial gearing -6.38% 34.25%

65 Trifork Holding AG annual report 2015
NO
TES
EUR
22e - Fair value hierarchy for financial instruments measured at fair value in the Balance
2015
Financial assets available for sale Level 1 Level 2 Level 3 Level 4 Total
C4 Media Inc. (9%) 0 0 841,166 0 841,166
Basho Technologies (6.5%) 0 0 3,382,528 0 3,382,528
SQOR Inc. (2%) 0 0 0 232,326 232,326
Urologica AG (0.1%) 0 0 0 30,824 30,824
Refluxica AG (0.1%) 0 0 0 30,824 30,824
Rampel Investments Ltd. (0.1%) 0 0 0 30,824 30,824
Mars One B.V 0 0 0 67,293 67,293
Feuerlabs (12%) 0 0 0 8,734 8,734
Telecon Ltd. (15%) 0 0 0 5,360 5,360
La Cava Vivante GmbH 0 0 0 44,017 44,017
Sforzando Inc. 0 0 0 87,894 87,894
Financial assets available for sale 0 0 4,223,695 538,097 4,761,792
2014
Financial assets available for sale Level 1 Level 2 Level 3 Level 4 Total
C4 Media Inc. (9%) 0 0 843,302 0 843,302
Basho Technologies (6.5%) 0 0 0 1,845,585 1,845,585
Tradeshift Inc (Porta Holding Ltd.) (1.4%) 0 1,210,563 0 0 1,210,563
Orchestrate (2%) 0 0 0 155,954 155,954
SQOR Inc. (2%) 0 0 0 232,916 232,916
Urologica AG (0.1%) 0 0 0 27,713 27,713
Refluxica AG (0.1%) 0 0 0 27,713 27,713
Rampel Investments Ltd. (0.1%) 0 0 0 27,713 27,713
Mars One B.V 0 0 0 67,293 67,293
TopTen Garage GmbH 0 0 0 6,061 6,061
Feuerlabs (12%) 0 0 0 8,239 8,239
Telecon Ltd. (15%) 0 0 0 5,374 5,374
Financial assets available for sale 0 1,210,563 843,302 2,404,561 4,458,426
The above classifications of financial assets which are measured at fair value are divided according to the fair value hierarchy:
Level 1: quoted prices in active markets for identical assetsLevel 2: quoted prices in active markets for similar assets or other valuation methods, where all significant input is based on observable market data.Level 3: valuation methods, in which any significant input is not based on observable market data.Level 4: value is set equal to the cost.
In relation to the valuation of the Group’s ownership of financial assets available for sale, the assessment is that currently there is no basis for changing either Basho Technologies, Orchestrate Inc., SQOR Inc., Uro-logica AG, Refluxica AG, Rampel Investments Ltd., Feuerlabs or Telecon Ltd. from the cost price. This is due to the fact that it is not immediately possible to find a similar group of listed companies, and equally, there are no other indications compared to trading companies’ shares that could form the basis for a second valuation of the Group’s ownership interes. Capital increases has been done in both Basho and Orchestrate in 2014 to higher valuations, but none of the companies has yet a positive net profit or cash flow from the business op-erations and based on that Trifork still uses the cost price as the besst indication of the value of the ownership.
The ownersip of the shares in C4Media has been impairment tested based on the latest financial results of the company and the posted value is estimated to account for the fair value based on this.

66Trifork Holding AG annual report 2015
23 - Earnings per share 2015 2014
Earnings per share for continuing operations 0.43 0.22
Diluted earnings per share for continuing operations 0.43 0.22
The Company has had no discontinued operations, thus not making any separate statement for this.
Earnings per share is calculated on basis of: 2015 2014
Profit for the period 9,284,354 4,311,781
Non-controlling Interests 2,409,539 463,433
Shareholders in Trifork Holding AG 7,680,768 3,788,021
Average number of issued shares 17,930,872 17,325,514
Average number of treasury shares 272,624 248,039
Number of shares used for calculating earnings per share 17,658,249 17,077,475
NO
TES
22f - Credit risks 31.12.2015 31.12.2014
Past due not impaired receivables
Overdue by up to one month 2,304,792 2,276,862
Overdue by one to three months 364,863 461,373
Overdue with more than three months 666,714 414,559
Overdue receivables in total 3,336,369 3,152,794
At the end of 2015 there has been EURt 191 in provisions for bad debt. At the end of 2014 provisions of EURt 45 were made. There is no expectation of losses in 2016.
The primary credit risk in the group is related to receivables from sales of services. The Group’s customers are mainly large companies in Denmark, England, Switzerland, Holland, USA and Sweden. The Group has no significant risks relating to a single customer or business partner.
Credit quality of receivables is assessed based on the Group’s internal credit assessment procedures. The company estimates that all debts are high quality with low risk of loss. The maximum credit risk associated with receivables corresponds to their carrying amounts.
EUR

67 Trifork Holding AG annual report 2015
24 - Purchase sum allocation for subsidiaries and associated companies
The Group made two acquisitions in 2015. The purchase prices are allocated in the following way. Additional informa-tion of the companies as well as the parameters used in the purchase sum allocation can be found in note 11.
Company DinDan Social Global OpenCredo Ltd.
Purchase sum 93,286 3,272,394
Net assets 93,286 1,143,446
Purchase sum to allocation 0 2,128,947
Intangible assets
Customer relationships 0 764,140
Intangible assets total 764,140
TAB 0 -152,828
Goodwill 0 1,517,635
Total purchase sum 0 2,128,947
Considerations at purchase
Cash payment 93,286 2,777,808
Deferred payment 0 494,585
Total purchase sum 93,286 3,272,394
Descriptions of the acquisitions:
DinDan Social Global B.V.
The acquisition was done in November, 2015 where the company changed status from an associated company to a subsidiary. Trifork B.V now owns 100% of the company. The purchase sum of DinDan was equal to the net assets in the company. The most significant part of the assets acquired was a product developed in the company. Manage-ment has assessed the book values as equal to the fair values. Based on this no additional goodwill, gains or losses have been introduced. In 2015 no significant revenue was achieved in the company (EUR 1,000 in total) and the results in the company has been very close to zero. Based on this an earlier acquisition would have had no significant effect on the consolidated revenue or results.
Open Credo Ltd.
The acquisition was done in the start of January, 2015. By acquiring additional 36% ownership Trifork reached total ownership of 69% in the company. Based on this Open Credo changed status from an associated company to a subsidiary. Management has assessed the book values at the date of acquisition to be equal to the fair values. EURm 0.8 of the purchase sum has been allocated to customer relationships based on the revenue estimates on existing customers and by estimating a churn rate of 5%. This amount is to be depreciated over 20 years. No other major class of assets has been identified as subject for the allocation and a total sum of EURm 1.5 has been allocated as goodwill with an infinity lifetime.At the acquisition in January 2015 the previous ownership of 33% of the shares was reevaluated based on the new fair value of OpenCredo. The fair value was determined based on the most recent purchase prise per share and a fair value estimation on the equity interests at the acquisition date and resulted in a profit of EURm 0.7 which has been recognized in financial income.In 2015 Open Credo contributed with revenue of EURm 7.9 and EBITDA of EURm 0.7 to the consolidated financial statement in the Trifork Group.
EUR
68Trifork Holding AG annual report 2015
26 - Events after the balance sheet date
After balance sheet date, no events have occurred which are assessed to change the Group’s economic or financial situation significantly.
25 - Contingent liabilities and contractual obligations 2015 2014
Operating lease arrangements
< 1 year 1,525,612 1,192,101
> 1 year and < 5 years 2,707,921 3,116,081
> 5 years 625,578 1,145,649
In 2015 a total of EUR 1,989,537 was paid to operating lease services (2014: EUR 1,451,450)
OfficesTrifork end 2015 had 22 lease contracts for offices. All of them are subject to the rules for commercial leases. The main leases runs for a period of 1-8 years. The contracts are non-cancellable in the lease period. There is a possibility of rene-gotiation of all contracts with a renewal for a period of three years. All contracts are fixed annuity and indexed annually.
In 2015 a total of EUR 51.959 was paid to leasing services (2014: EUR 54,644)
Financial lease commitments 2015 2014
Min. payment
Present value
Min. payment
Present value
< 1 year 37,814 36,712 45,785 44,452
> 1 year and < 5 years 17,100 16,119 25,865 24,380
> 5 years 0 0 0 0
Total minimum lease payments 54,914 52,831 71,650 68,832
Less amounts representing finance charges -2,083 0 -2,818 0
Present value of minimum lease payments 52,831 52,831 68,832 68,832The carrying value of the assets covered by the financial lease contract amounted to EURt 30 at the end of 2015. The total obligation on the lease contracts amounted to EURt 55 divided on two lease contracts in relation to leasing of IT-hardware.
EUR

69 Trifork Holding AG annual report 2015
Gross Margin = !"#$$ !"#$%& ! !""!"#"$%"
EBITDA-margin = !"#$%& !"#$%" !"#$%$&#,!"#,!"#$"%&'(&)* !"# !"#$%&'!%&#( !"#$%& ! !""
!"#"$%" EBIT-margin = 𝑃𝑃𝑃𝑃𝑃𝑃𝑃𝑃𝑃𝑃𝑃𝑃 !"#$ !"#$%&'()* !"#$ ! !""
!"#"$%" Equity Ratio = !"#$%& !"#$% !"#$. !"!!!"#$%"&&'#( !"#$%$&#& !"# !" !"#$%& ! !""
!"#$% !"#$"!"%"&' !"# !" !"#$%& Return on Equity = !"#$%& !"# !!! !"#$ !"#$%&%' !! !"#$%& !"#$%&' !!!"#!!"#$%& ! !""
!"#$%&# !"#$%& !"#$. !"!!!"#$%"&&'#( !"#$%$&#& Basic Earnings per share (EPS-Basic) = !"#$%& !"# !!! !"#$ !"#$%&%' !" !"#$%& !"#$%&' !!!"#!!"#$%&
!"#$%&# !"#$%& !" !!!"#$ !"#$#%&'(&) Basic Earnings per share (EPS-D) = !"#$%& !"# !!! !"#$ !!"#$%$& !" !"#$%& !"#$%&' !!!"#!!"#$%&
!"#$%&# !"#$%& !" !"#$%&! !!!"#$ !"#$#%&'(&) Equity value per share = !"#$%& !"#$. !"!!!"#$%"&&'#( !"#$%$&#& !"# !" !"#$%&
!"#$%& !" !!!"#$ !"# !" !"#$%& Dividend yield = Parent company dividend yield Dividend per share = !"#"$%&$ !"#$% ! !!!"# !"#$!%& !"#$%
!"" Return on invested capital = !"#$%& !"#$ !"#$%&'()* !"#$ ! !""
!"#$% !""#$"
The financial highlights have been prepared in accordance with the Danish Society of Financial Analysts´ “Recom-mendations and Financial Ratios 2010”, using the following definitions:
Ratios and key figures

70Trifork Holding AG annual report 2015

71 Trifork Holding AG annual report 2015
Trifork Holding AG financial statementContent pageReport of the statutory auditor 72
Income statement for the year ended December 31, 2015 73
Statement of financial position 74
Assets 74
Liabilities and equity 75
Statement of changes in equity 76
Notes 77
1 - Company information 77
2 - Accounting policies 77
3 - Accounting estimates and judgments 77
4 - Fees for auditors appointed by the general assembly 77
5 - Board of Director fees 78
6 - Financial income 78
7 - Financial expenses 78
8 - Debt to financial institutions 78
9 - Share capital 78
10 - Other investments 78
11 - Investments in subsidiaries 79
12 - Investments in associates 81
Proposal of the Board of Directors 82
Group structure 83
CO
NTE
NT
/ LI
ST
OF
NO
TES

Report of the Statutory AuditorTo the General Meeting ofTrifork Holding AG, Feusisberg
Report of the Statutory Auditor on the finan-cial statements
As statutory auditor, we have audited the financial statements of Trifork Holding AG, which comprise the statement of financial position as at December 31, 2015, the income statement, the statement of changes in equity and notes, (pages 73-81) for the year then ended.
Board of Directors’ responsibility
The Board of Directors is responsible for the prepara-tion of these financial statements in accordance with the requirements of Swiss law and the company’s articles of incorporation. This responsibility includes designing, implementing and maintaining an internal control system relevant to the preparation of financial statements that are free from material misstatement, whether due to fraud or error. The Board of Directors is further responsible for selecting and applying ap-propriate accounting policies and making accounting estimates that are reasonable in the circumstances.
Auditor’s responsibility
Our responsibility is to express an opinion on these fi-nancial statements based on our audit. We conducted our audit in accordance with Swiss law and Swiss Au-diting Standards. Those standards require that we plan and perform the audit to obtain reasonable assurance whether the financial statements are free from material misstatement.
An audit involves performing procedures to obtain audit evidence about the amounts and disclosures in the financial statements. The procedures selected depend on the auditor’s judgment, including the as-sessment of the risks of material misstatement of the financial statements, whether due to fraud or error. In making those risk assessments, the auditor consid-ers the internal control system relevant to the entity’s preparation of the financial statements in order to design audit procedures that are appropriate in the circumstances, but not for the purpose of expressing an opinion on the effectiveness of the entity’s inter-nal control system. An audit also includes evaluating the appropriateness of accounting policies used and the reasonableness of accounting estimates made, as well as evaluating the overall presentation of the financial statements. We believe that the audit evi-dence we have obtained is sufficient and appropriate to provide a basis for our audit opinion.
Opinion
In our opinion, the financial statements for the year end-ed December 31, 2015 comply with Swiss law and the company’s articles of incorporation.
Report on other legal requirements
We confirm that we meet the legal requirements on licensing according to the Auditor Oversight Act and independence (article 728 Code of Obligations (CO)) and that there are no circumstances incompatible with our independence.
In accordance with article 728a para. 1 item 3 CO and Swiss Auditing Standard 890, we confirm that an internal control system exists, which has been de-signed for the preparation of financial statements ac-cording to the instructions of the Board of Directors.
We further confirm that the proposed appropriation of available earnings complies with Swiss law and the company’s articles of incorporation. We recom-mend that the financial statements submitted to you be approved.
Rapperswil, March 30, 2016
OBT AG
Kevin McCabe David Rusch
Licensed audit expert Licensed audit expert
Auditor in Charge
72Trifork Holding AG annual report 2015
SIG
NATU
RES

73 Trifork Holding AG annual report 2015
PAR
EN
T C
OM
PAN
Y IN
CO
ME
STA
TEM
EN
T
Income statement for the year ended December 31, 2015Note 2015 2014
Revenue 80,000 0
External cost -229,000 -214,127
Gross profit (+) / loss (-) -149,000 -214,127
5 Board of Director fees 145,307 0
Profit (+) / loss (-) from operations (EBIT) -294,307 -214,127
6 Financial Income 402,925 93,041
Dividend 2,900,022 12,347,482
Adjustments on financial assets 0 -15,116,089
7 Financial expenses -443,746 -151,507
Earnings before tax (EBT) 2,564,893 -3,041,201
Taxation on capital -64,846 -1,168
Result for the period 2,500,047 -3,042,369
CHF

74Trifork Holding AG annual report 2015
STATE
ME
NT O
F FINA
NC
IAL P
OS
ITION
AssetsNote Assets 2015 2014
Non-current assets
Financial assets
11 Investments in subsidiaries 37,690,575 37,252,014
12 Investments in associates 0 6,700
10 Other investments 100,000 100,000
Loans to subsidiaries 3,981,716 1,188,879
Receivables from subsidiaries subordinated 67,817 0
Loans to associates 290,073 0
Total financial assets 42,130,181 38,547,593
Total non-current assets 42,130,181 38,547,593
Current assets
Receivables from subsidiaries 39,216 0
Other receivables 12,774 314
Total receivables 51,990 314
Cash 3,813,282 656,339
Total current assets 3,865,272 656,653
Total assets 45,995,453 39,204,246
CHF
Statement of financial positionas at December 31, 2015

75 Trifork Holding AG annual report 2015
STA
TEM
EN
T O
F FI
NA
NC
IAL
PO
SIT
ION
Liabilities and EquityNote Liabilities and Equity 2015 2014
Equity
9 Share capital 1,853,723 1,732,451
General legal retained earnings 866,226 0
Additional paid in capital 29,488,948 33,507,384
Reserve treasury shares -1,046,855 -550,909
Retained earnings 7,239,934 -3,042,368
Total Equity 38,401,976 31,646,558
Interes-bearing debt
8 Debt financial institutions 4,657,286 4,062,993
Debt affiliated companies 2,810,181 3,379,034
Total non-current liabilities 7,467,467 7,442,027
Current liabilities
Interes-bearing debt
8 Debt financial institutions 45 0
Non-Interes-bearing debt
Trade payables 2,376 31,563
Other debt 123,588 84,097
Total current liabilities 126,009 115,660
Total liabilities 7,593,476 7,557,687
Total liabilities and Equity 45,995,453 39,204,246
CHF
Statement of financial positionas at December 31, 2015

76Trifork Holding AG annual report 2015
Statement of changes in equity
Trifork Holding AGShare capital
General legal retained earnings
Additional paid in capital
Reserve treasury shares
Retained earnings Total
Equity, January 8, 2014 1,383,583 0 26,086,233 0 0 27,469,816
Capital raise 348,869 0 7,421,151 0 0 7,770,020
Profit for the year 0 0 0 0 -3,042,368 -3,042,368
Purchase of treasury shares 0 0 0 -1,386,016 0 -1,386,016
Sale of treasury shares 0 0 0 835,107 0 835,107
Equity December 31, 2014 1,732,451 0 33,507,384 -550,909 -3,042,368 31,646,558
Release to available earnings 0 0 -10,000,000 0 10,000,000 0
Allocation to the general legal reserve 0 866,226 0 0 -866,226 0
Dividend paid out 0 0 0 0 -1,368,637 -1,368,637
Capital raise 121,272 0 5,981,564 0 0 6,102,835
Profit for the year 0 0 0 0 2,500,047 2,500,047
Purchase of treasury shares 0 0 0 -3,056,038 0 -3,056,038
Sale of treasury shares 0 0 0 2,560,093 0 2,560,093
Dividend treasury shares 0 0 0 0 17,118 17,118
Equity December 31, 2015 1,853,723 866,226 29,488,948 -1,046,855 7,239,934 38,401,976

77 Trifork Holding AG annual report 2015
Notes to the financial statements as at December 31, 2015
1 - Company information
Trifork Holding AG has its registered office at Neuhofstrasse 8, 8834 Schindellegi, Switzerland, registration number CHE-474.101.854. The company was founded on January 8, 2014. The financial statement covers the period from January 1 to December 31, 2015.
2 - Accounting policies
The financial statements are prepared in accordance with the principles of Swiss corporate law.
3 - Accounting estimates and judgments
When determining the carrying value of certain assets and liabilities it is required to estimate how future events will affect the value of these assets and liabilities at the balance sheet date. Estimates that are material to the financial statement are made by the determination of impairment losses and reversals of impairment losses on investments in subsidiaries and associated companies.
Management believes that there are no judgements, apart from those involving estimations, which can have significant impact on the amounts recognized.
The estimates are based on assumptions that management considers resonable, but which are inherently uncertain and unpredictable. Assumptions may be incomplete or inaccurate, and unanticipated events or cir-cumstances may occur. The Company is also subject to risk and uncertainties that could cause actual results to differ from these estimates.
4 - Fees for auditors appointed by the general assembly 2015 2014
Statutory audit 88,400 45,000
Other services 25,850 20,200
5 - Board of Director fees 2015 2014
Salary to Board of Directors 145,307 0
There is no employees in the company. The Excutive Management is employed in the daughter company Trifork GmbH, where from they perform tasks for different companies in the Trifork Group.
In the year of 2015 no explicit fees has been made to Excecutive management.
6 - Financial Income 2015 2014
Interest Income 7,050 0
Interest Income from subsidiaries 103,067 21,775
Exchange rate gains 292,808 71,265
Financial Income total 402,925 93,041

78Trifork Holding AG annual report 2015
NO
TES
9 - Share capital 2015 2014
Issued shares, January 1, 2015 / January 8, 2014 17,324,514 13,835,826
Capital increase 1,212,716 3,488,688
Issued shares, December 31 18,537,230 17,324,514
Treasury shares, December 31 288,509 256,738
Number of shares outstanding 18,248,721 17,067,776
In 2015 690,725 treasury shares were purchased to an average rate of CHF 4.42 and 658,954 shares were sold at an average rate of CHF 3.89. This equals a net purchase of 31,771 shares. Most of the shares sold was done in the beginning of 2015 and most of the shares purchased was done late in 2015 to a higher treasury share price. Based on this the avarage purchase price has been higher than the sales price.
The share capital is nominally 18,537,230 shares of CHF 0.01. The share capital is fully paid. The shares are registered under ISIN: CH0236907504. All shares have identical rights and there is only one share class.
10 - Other investments 2015 2014
Cost at January 1 100,000 0
Additions 0 100,000
Cost at December 31 100,000 100,000
Impairment January 1 0 0
Revaluation 0 0
Impairment December 31 0 0
Carrying amount at December 31 100,000 100,000
8 - Debt to Financial institutions (interest-bearing) 2015 2014
Division of Debt shown in the Balance:
Non-current liabilities 4,657,286 4,062,993
Current liabilities 45 0
Debt Financial institutions total 4,657,331 4,062,993
Debt payable after 5 years is CHF 0.
A security has been made for the acquisition loan in relation to the Trifork Holding AG takeover of Trifork A/S. The shares in Trifork A/S, Trifork GmbH, Trifork B.V and Trifork Ltd. has been placed as security (pledge) until the acquisition loan has been repaid. No repaiments is required on this facility until an IPO of the Trifork group is succeeded.
The increase in non-current liabilities in 2015 is in relation to a new loan facility to the acquisition of Open Credo Ltd.
Trifork Holding AG guarantee a draft facility of DKKm 2.67 (CHFm 0.4) for the subsidiary Blackbird Holding ApS.
7 - Financial expenses 2015 2014
Interest expenses -130,817 -102,188
Interest expenses to subsidiaries -61,355 0
Bank fee -10,927 -8,143
Exchange rate losses -240,647 -41,177
Financial expenses total -443,746 -151,507
CHF

79 Trifork Holding AG annual report 2015
NO
TES
11 - Investments in subsidiaries 2015 2014
Cost at January 1 52,368,103 0
Additions 469,625 52,368,103
Cost at December 31 52,837,728 52,368,103
Impairment January 1 -15,116,089 0
Other adjustments -31,065 -15,116,089
Exchange rate adjustments 0 0
Dividend paid out 0 0
Impairment December 31 -15,147,154 -15,116,089
Carrying amount at December 31 37,690,575 37,252,014
CHF
Name Ownership Home Share cap. Currency 2015
Trifork A/S Direct Denmark 18,000,000 DKK 100%
Trifork Public A/S Indirect Denmark 737,000 DKK 100%
Trifork Projects Copenhagen A/S Indirect Denmark 500,000 DKK 100%
Trifork Ventures Indirect Denmark 367,647 DKK 100%
Netfork A/S Indirect Denmark 600,000 DKK 79%
Trifork Medical ApS Indirect Denmark 320,000 DKK 75%
Trifork GmbH Direct Switzerland 920,000 CHF 100%
Trifork Academy Inc Direct USA 3 USD 100%
Trifork Ltd Direct England 1 GBP 100%
Trifork Leeds Ltd. Indirect England 40,000 GBP 75%
Open Credo Ltd. Indirect England 1,522 GBP 69%
Code Node Space & Events Ltd. Indirect England 100 GBP 51%
Trifork B.V Indirect Holland 18,000 EUR 100%
Container Solutions B.V Direct Holland 1,000 EUR 51%
Trifork Germany GmbH Direct Germany 25,000 EUR 100%
Erlang Solutions ltd. Direct England 103,218 GBP 51%
Erlang Solutions AB Indirect Sweden 100,000 SEK 100%
Erlang Solutions Inc. Indirect USA 100 USD 100%
Erlang Solutions Hungary Kft. Indirect Hungary 15,000 EUR 100%
Inaka SRL Indirect Argentina 12,000 ARS 100%
Blackbird Holding ApS Direct Denmark 125,000 DKK 100%
Duckwise ApS Direct Denmark 163,265 DKK 75%
Duckwise AG Indirect Switzerland 100,000 CHF 100%
Trifork Finance AG Direct Switzerland 100,000 CHF 100%
Programmable Infrastruct. AG Direct Switzerland 150,000 CHF 100%
Trifork AB Direct Switzerland 50,000 SEK 100%

80Trifork Holding AG annual report 2015
11 - Investments in subsidiaries
Name Ownership Home Share cap. Currency 2014
Trifork A/S Direct Denmark 18,000,000 DKK 100%
Trifork Public A/S Indirect Denmark 737,000 DKK 100%
Trifork Projects Copenhagen A/S Indirect Denmark 500,000 DKK 100%
Trifork Ventures Indirect Denmark 367,647 DKK 100%
Netfork A/S Indirect Denmark 600,000 DKK 79%
Trifork Medical ApS Indirect Denmark 320,000 DKK 75%
Trifork GmbH Direct Switzerland 920,000 CHF 100%
Trifork Ltd Indirect England 1 GBP 100%
Trifork Leeds Ltd. Indirect England 40,000 GBP 75%
Trifork Academy Inc Indirect USA 3 USD 100%
Trifork B.V Indirect Holland 18,000 EUR 100%
Container Solutions B.V Direct Holland 1,000 EUR 51%
Trifork Germany GmbH Direct Germany 25,000 EUR 100%
Erlang Solutions ltd. Indirect England 103,218 GBP 100%
Erlang Solutions AB Indirect Sweden 100,000 SEK 100%
Erlang Solutions Inc. Indirect USA 100 USD 100%
Erlang Solutions Hungary Kft. Indirect Hungary 15,000 EUR 100%
Inaka Inc. Indirect USA 1 USD 100%
Inaka SRL Indirect Argentina 12,000 ARS 100%
Blackbird Holding ApS Direct Denmark 125,000 DKK 100%
Duckwise ApS Direct Denmark 163,265 DKK 51%
Duckwise AG Indirect Switzerland 100,000 CHF 100%

81 Trifork Holding AG annual report 2015
12 - Investments in associates 2015 2014
Cost at January 1 6,700 0
Additions 0 6,700
Disposals -6,700 0
Cost at December 31 0 6,700
Impairment January 1 0 0
Share of result in associated companies 0 0
Impairment for the year 0 0
Impairment December 31 0 0
Carrying amount at December 31 0 6,700
Name Ownership
formHome
Share capital
Currency 2015
Chainalysis Inc. Indirect USA 10,000 USD 29%
Chainalysis GmbH Indirect Switzerland 20,000 CHF 29%
aragost Trifork AG Indirect Switzerland 120,000 CHF 33%
SDS GmbH Indirect Germany 1,500 EUR 15%
Fork ID A/S Indirect Denmark 1,250,000 DKK 30%
AppDictive ApS Indirect Denmark 50,000 DKK 25%
Brightclouds Labs B.V. Indirect Netherlands 3,000 EUR 50%
Brightclouds Benelux B.V. Indirect Netherlands 3,000 EUR 50%
DinDan Social Global B.V. Indirect Netherlands 1,500 EUR 50%
DinDan Social Benelux B.V. Indirect Netherlands 1,500 EUR 50%
The Service Network B.V. Indirect Netherlands 1,200 EUR 25%
WeCity B.V. Indirect Netherlands 1,200 EUR 21%
Specto Labs Indirect England 100 GBP 48%
CHF

Proposal of the Board of DirectorsTHE BOARD OF DIRECTORS PROPOSE NO DIVIDEND FROM THE PARENT COMPANY
Proposed appropriation of available earnings as proposed by the Board of Directors as of December 31, 2015.
Appropriation of capital contribution reserve 2015 2014
Balance at December 31, 2014 29,488,948 33,507,384
Release to available earnings 0 -10,000,000
Balance carried forward 29,488,948 23,507,384
Appropriation of available earnings 2015 2014
Balance January 1 4,722,769 0
Prior year dividend on treasury shares 17,118 0
Net income 2,500,047 -3,042,368
Allocation from capital contribution reserve 0 10,000,000
Available earnings 7,239,934 6,957,632
Allocation to the general legal reserve -60,636 -866,226
Proposed dividend 0 -1,368,637
Balance carried forward 7,179,298 4,722,769
At the Ordinary General Assembly of Trifork Holding AG no dividend will be proposed. This is a change com-pared to previous years where the policy has been to pay out an annual dividend of approximately 25% of the net profit belonging to the parent company. The group in 2016 will use the profit generated in 2015 to invest in new acquisitions and in additional purchase of treasury shares. The intention is to use the treasury shares as payment in future acquisitions.
82Trifork Holding AG annual report 2015
NO
TES

Since 31.12.2015 the following changes has been made in the group structure: Trifork Projects Copenhagen has been merged into Trifork A/S. In 2016 the ownership of Trifork B.V has been transferred from Trifork GmbH to Trifork Holding AG. 49% of Programmable infrastructure Solutions A.G has been sold and Container Solutions B.V is now owned 100% by this company. Container Solutions Software Ltd. was founded in the start of 2016.
83 Trifork Holding AG annual report 2015
GR
OU
P S
TRU
CTU
RE
Trifork Holding AGGroup Structure, March 2016
1. Level 2. Level 3. Level 4. Level
100.0% Trifork A/S 100.0% Trifork Ventures ApS 23.0% Chainalysis Inc. 100.0% Chainalysis GmbH
2.0% SQOR Inc.
0.1% Sforzando Inc.
79.0% Netfork A/S 5.5% Basho Technologies Inc.
100.0% Trifork Public A/S
75.0% Trifork Medical ApS
25.0% Appdictive ApS
30.0% ForkID ApS
9.0% C4Media Inc.
15.0% Telecon Ltd.
51.0% Erlang Solutions Ltd. 100.0% Erlang Solutions Hungary Kft.
100.0% Erlang Solutions AB 5.0% Inaka Src.
100.0% Erlang Solutions Inc. 95.0% Inaka Src.
12.0% FeuerLabs Ltd.
100.0% Trifork AB
100.0% Blackbird Holding ApS
100.0% Trifork Finance AG
100.0% Trifork GmbH 33.3% aragost Trifork AG
15.0% SDS GmbH
3.9% LaCave Vivante AG
100.0% Trifork B.V 50.0% BrightClouds B.V
100.0% DinDan Social Global B.V 100.0% DinDan Social Benelux B.V
25.0% The Service Network B.V
21.3% weCity B.V
2.0% MarsOne B.V
100.0% Trifork Learning Solutions B.V
100.0% Trifork Academy Inc.
100.0% Trifork Ltd. 69.0% OpenCredo Ltd. 100% Specto Labs Ltd.
51.0% Code Node Ltd.
75.0% Trifork Leeds Ltd.
100.0% The Perfect App Ltd.
100.0% Trifork Germany GmbH
75.0% Duckwise ApS 100.0% Duckwise AG
51.0%Proggrammable Infrastructure
Solutions AG100.0% Container Solutions B.V
100.0% Container Solutions Software Ltd.
0.1% Implantica 100.0% Urologica AG
100.0% Re�uxica AG
100.0% Rampel Investments Ltd.
Subsidiaries
Associated companies
Other investments

Trifork H
old
ing A
GN
euhofstrasse 88834 S
chindellegiS
witzerland
Den
mark
Aalborg
Aarhus C
Aarhus NE
sbjergC
openhagen
Sw
eden
Stockholm
Un
ited K
ingd
om
London (ESL)
London (OC
)London (A
cademy)
London (CN
)Leeds
Germ
anyB
erlin
Sw
itzerland
Zürich
Po
land
Krakow
Hu
ngary
Budapest
Ho
lland
Am
sterdam (C
S)
Am
sterdam (TL)
Am
sterdam (B
V)
Eindhoven
Arg
entina
Buenos A
ires
Un
ited S
tatesS
an FranciscoC
hicago
2015 TRIFO
RK
WO
RLD
MA
P