Embed Size (px)
Citation preview
TABLE OF CONTENTS
INTERIM REPORT JANUARY 1, JUNE 30, 2011
The Board of Directors and the Executive Management of Trifork A/S have August 25, 2011 considered and adopted the in-‐
terim report for the period January 1, June 30, 2011 for Trifork A/S.
A strong first half of 2011
During the first half of 2011, Trifork has maintained the development from the end of 2010, thus created a strong foundation
for the continued development of the company. The result for the period ended satisfactorily, despite the fact that the
revenue was slightly under expectations. Revenue for the period ended at DKKm 75.7 compared to DKKm 72 during the same
months of 2010, equalling a 6% growth. The goals for EBITDA was met with a result at DKKm 12.3 over DKKm 9.1 in 2010,
equalling a 35% growth. The EBIT for this period is DKKm 8.6 over DKKm 5.2 in 2010, equalling a 66% growth.
Internationalisation
During the first half of 2011, Trifork has increased its internationalisation investments considerably with the significant pur-‐
chase of the American company Basho Technologies, Inc.
ccessful in streamlining our busi-‐
ness even more and the result at present is satisfactory. We have structured the business well and are successful in maintain-‐
ing and developing Triforks position in the area of creating applications for mobile units. We feel ready for growth and are
continuously pursuing our goal of further internationalization. In the first six months we took the first step of an owner share
purchase of Basho Technologies Inc. and at the beginning of the second half of 2011, we have acquired 50.01% of the Erlang
Solutions Ltd. company which has significant activities in England, Sweden and Poland. Furthermore, Erlang Solutions Ltd.,
develops and delivers projects to customers worldwide. Both of these investments and the business derived from them, has
contributed to our latest adjustments of annual expectations with corporate revenue of DKKm 180 and an EBITDA of DKKm
26.
Conclusions
2011 biannual goal met, with DKKm 12,3 EBITDA and DKKm 8,6 EBIT.
Annual expectations is maintained at DKKm 180 revenue and an DKKm 26,5 EBITDA.
Trifork has consolidated its leading position in mobile unit application development.
Triforks internationalisation is in full progress
Board of Directors and the Executive Management
Trifork
We kindly request that queries to this announcement be directed to CEO Jørn Larsen at +45 8732 8787.This document is a
translation of the original interim report in Danish. In case of discrepancies, the Danish version prevails.
TABLE OF CONTENTS
FINANCIAL HIGHLIGHTS AND KEY RATIOS 2
4
MARKET DEVELOPMENT 4
FINANCIAL REVIEW 4
EXPECTATIONS TO 2011 6
TRIFORK PUBLIC 8
TRIFORK FINANCE 10
TRIFORK ACADEMY 12
SIGNATURES 14
CONSOLIDATED FINANCIAL STATEMENT 15
CONSOLIDATED INCOME STATEMENT 15
COMPANY BALANCE 16
CONSOLIDATED STATEMENT OF EQUITY 18
CASH FLOW STATEMENT 19
NOTES 20
2 TRIFORK A/S Interim Report 2011
FINANCIAL HIGHLIGHTS AND KEY RATIOS
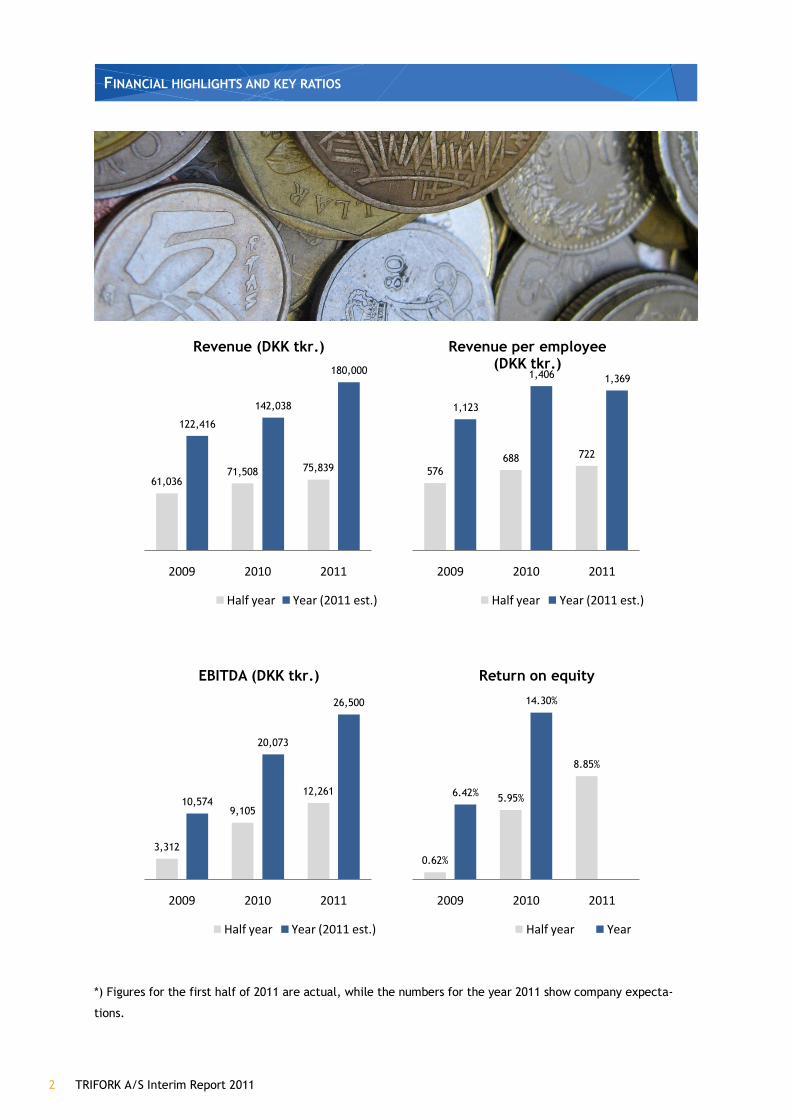
*) Figures for the first half of 2011 are actual, while the numbers for the year 2011 show company expecta-‐
tions.
61,03671,508 75,839
122,416
142,038
180,000
2009 2010 2011
Revenue (DKK tkr.)
Half year Year (2011 est.)
576688 722
1,123
1,406 1,369
2009 2010 2011
Revenue per employee(DKK tkr.)
Half year Year (2011 est.)
3,312
9,105
12,26110,574
20,073
26,500
2009 2010 2011
EBITDA (DKK tkr.)
Half year Year (2011 est.)
0.62%
5.95%
8.85%
6.42%
14.30%
2009 2010 2011
Return on equity
Half year Year
TRIFORK A/S Interim Report 2011 3
FINANCIAL HIGHLIGHTS AND KEY RATIOS
DKK tkr.
01.01-‐30.06
2011
01.01-‐30.06
2010 2010
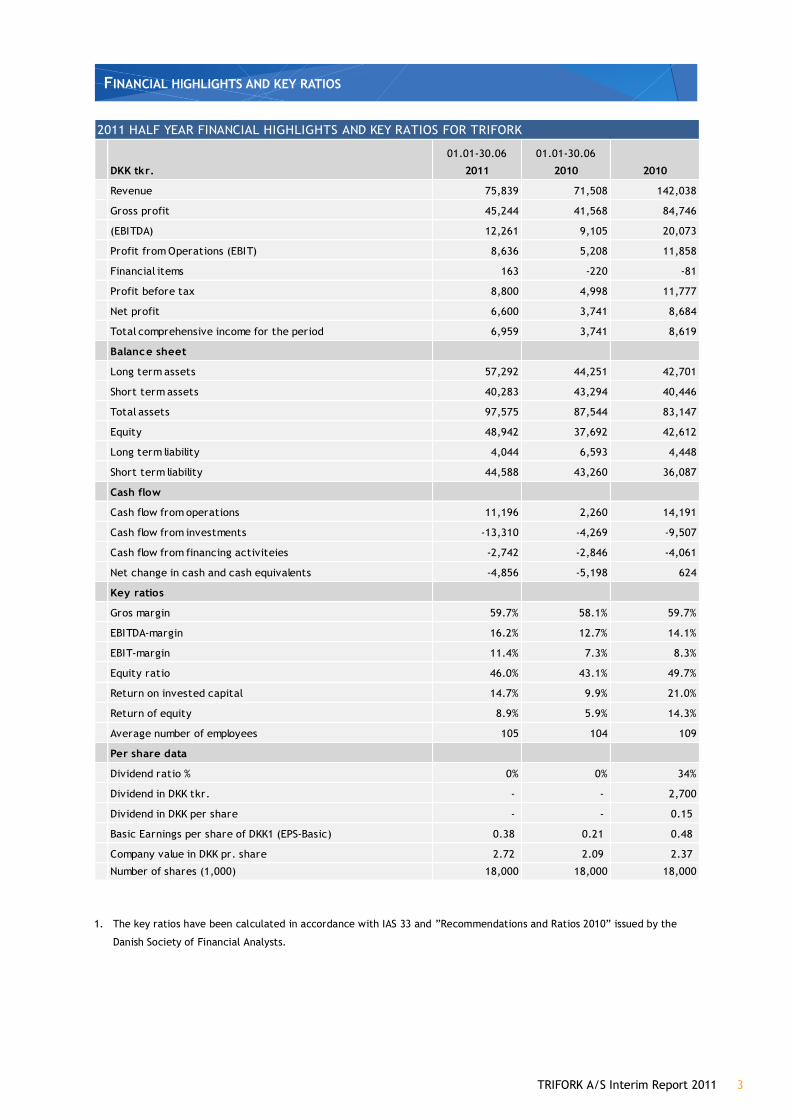
Revenue 75,839 71,508 142,038
Gross profit 45,244 41,568 84,746Earnings Before Tax, Interest, Depreciation and Amortisation
(EBITDA) 12,261 9,105 20,073
Profit from Operations (EBIT) 8,636 5,208 11,858
Financial items 163 -‐220 -‐81
Profit before tax 8,800 4,998 11,777
Net profit 6,600 3,741 8,684
Total comprehensive income for the period 6,959 3,741 8,619
Balance sheet
Long term assets 57,292 44,251 42,701
Short term assets 40,283 43,294 40,446
Total assets 97,575 87,544 83,147
Equity 48,942 37,692 42,612
Long term liability 4,044 6,593 4,448
Short term liability 44,588 43,260 36,087
Cash flow
Cash flow from operations 11,196 2,260 14,191
Cash flow from investments -‐13,310 -‐4,269 -‐9,507
Cash flow from financing activiteies -‐2,742 -‐2,846 -‐4,061
Net change in cash and cash equivalents -‐4,856 -‐5,198 624
Key ratios
Gros margin 59.7% 58.1% 59.7%
EBITDA-‐margin 16.2% 12.7% 14.1%
EBIT-‐margin 11.4% 7.3% 8.3%
Equity ratio 46.0% 43.1% 49.7%
Return on invested capital 14.7% 9.9% 21.0%
Return of equity 8.9% 5.9% 14.3%
Average number of employees 105 104 109
Per share data
Dividend ratio % 0% 0% 34%
Dividend in DKK tkr. -‐ -‐ 2,700
Dividend in DKK per share -‐ -‐ 0.15
Basic Earnings per share of DKK1 (EPS-‐Basic) 0.38 0.21 0.48
Company value in DKK pr. share 2.72 2.09 2.37
Number of shares (1,000) 18,000 18,000 18,000
2011 HALF YEAR FINANCIAL HIGHLIGHTS AND KEY RATIOS FOR TRIFORK
1. The key ratios have been calculated in accordance with IAS 33 and
Danish Society of Financial Analysts.
4 TRIFORK A/S Interim Report 2011
MANAGEMENT S REPORT
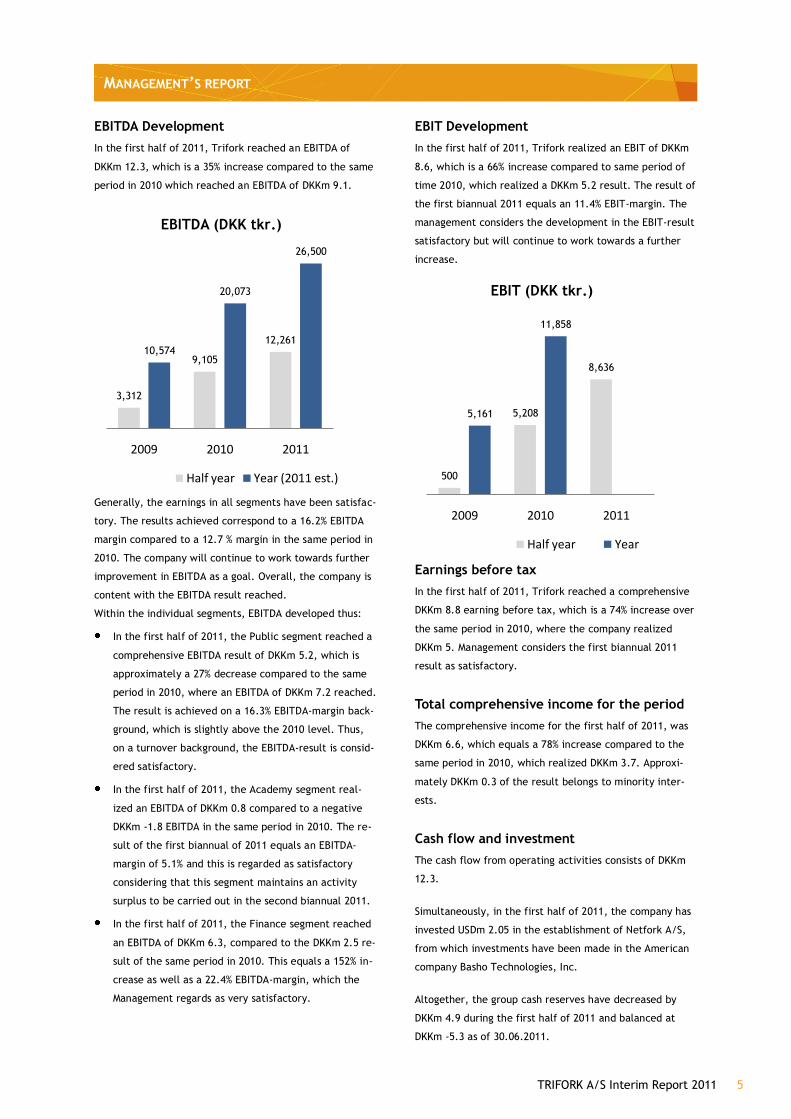
> THE CURRENT MARKET
Trifork is a successful group which generally experiences
growth in both new and established markets.
However, the first half of 2011 has been influenced by a
changed interpretation of tender rules in the public sector
in Denmark, making it difficult to establish and carry out
new projects as expected; resulting in a lower level of
activity during this period. It is the expec-‐
tation that the second half of 2011 will be affected by this
as well. However, growth in customer areas outside the
public sector is expected to compensate for this.
The first six months of 2011 have also shown an increased
interest in initiating educational activities. However, the
assessment is that this tendency is uncertain as to whether
it will continue the year out or whether demand will
slowly stagnate.
Likewise, the first half of 2011, has been affected by the
continued uncertainty in the financial markets. However,
Trifork has observed an increased level of activity, espe-‐
cially in the financial sector, both in Denmark and abroad.
This trend seems to continue in the second biannual,
where Trifork expects to maintain and expand the existing
position in the market.
> PRESENTATION OF ACCOUNTS
Turnover development In the first half of 2011, Trifork realized a DKKm 75.7
revenue, which equals a 6% growth compared to the same
time in 2010, where the company realized a DKKm 72
revenue. Considering only the biannual, this is below the
Trifork goal of achieving an annual 15-‐25% revenue in-‐
crease. However, considering the market development as
well as the expectations for the second biannual, the re-‐
sult is satisfactory.
Revenue in the individual sectors developed as shown
above.
In the first half of 2011, the Public segment reached a
DKKm 32 revenue, which is a 28% decrease compared to
the same period of 2010, where DKKm 45 were realized.
The development is not considered satisfactory. Primarily,
the cause has been the changed interpretation of tender
rules and a strategy change in the use of IT-‐consultants in
the public sector.
In the first biannual of 2011, the Academy segment
has improved significantly and has been capable of
doubling its turnover from a DKKm 8 in the first bian-‐
nual of 2010 to a DKKm 16 turnover in 2011. This in-‐
crease has been created both in the training and con-‐
ference areas and is considered very satisfactory.
The first six months of 2011, the Finance segment has
performed well regardless of the general uncertainty
in the financial markets. The comprised revenue for
this segment was DKKm 27 for this period, a 52% in-‐
crease compared to 2010, where the revenue was
DKKm 18. The result is considered to be very satisfac-‐
tory.
61,03671,508 75,839
122,416
142,038
180,000
2009 2010 2011
Revenue (DKK tkr.)
Half year Year (2011 est.)
TRIFORK A/S Interim Report 2011 5
MANAGEMENT S REPORT
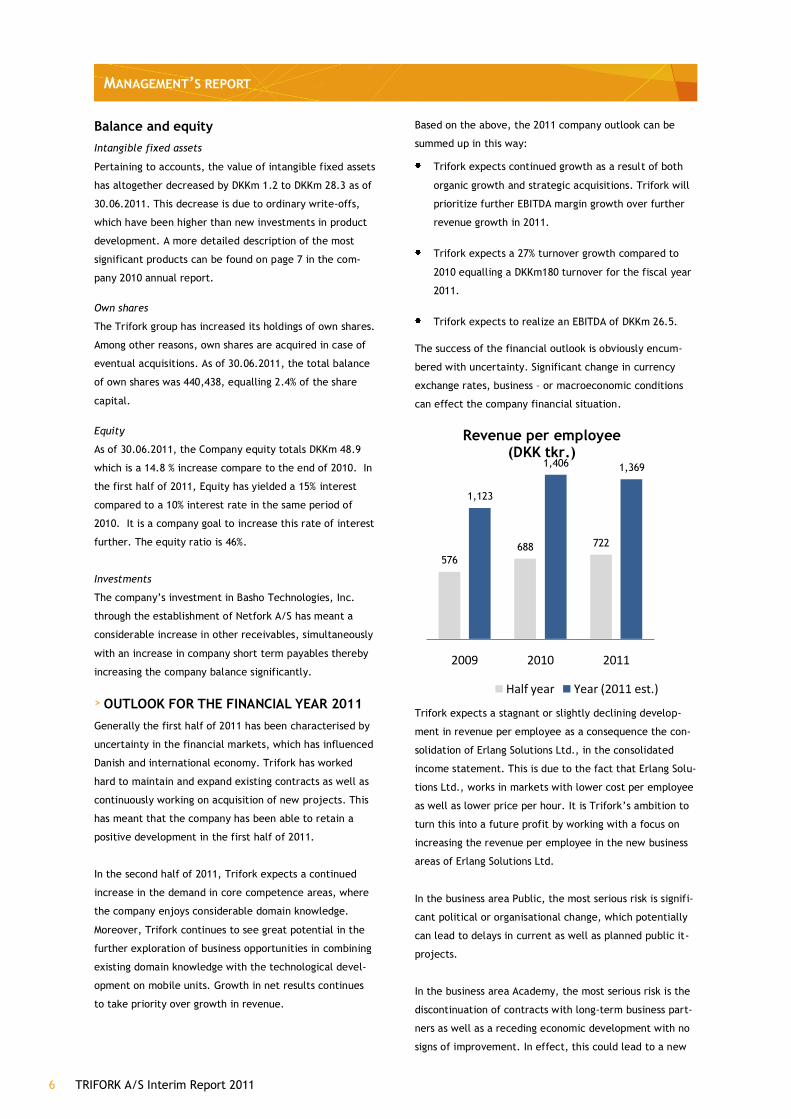
EBITDA Development In the first half of 2011, Trifork reached an EBITDA of
DKKm 12.3, which is a 35% increase compared to the same
period in 2010 which reached an EBITDA of DKKm 9.1.
Generally, the earnings in all segments have been satisfac-‐
tory. The results achieved correspond to a 16.2% EBITDA
margin compared to a 12.7 % margin in the same period in
2010. The company will continue to work towards further
improvement in EBITDA as a goal. Overall, the company is
content with the EBITDA result reached.
Within the individual segments, EBITDA developed thus:
In the first half of 2011, the Public segment reached a
comprehensive EBITDA result of DKKm 5.2, which is
approximately a 27% decrease compared to the same
period in 2010, where an EBITDA of DKKm 7.2 reached.
The result is achieved on a 16.3% EBITDA-‐margin back-‐
ground, which is slightly above the 2010 level. Thus,
on a turnover background, the EBITDA-‐result is consid-‐
ered satisfactory.
In the first half of 2011, the Academy segment real-‐
ized an EBITDA of DKKm 0.8 compared to a negative
DKKm -‐1.8 EBITDA in the same period in 2010. The re-‐
sult of the first biannual of 2011 equals an EBITDA-‐
margin of 5.1% and this is regarded as satisfactory
considering that this segment maintains an activity
surplus to be carried out in the second biannual 2011.
In the first half of 2011, the Finance segment reached
an EBITDA of DKKm 6.3, compared to the DKKm 2.5 re-‐
sult of the same period in 2010. This equals a 152% in-‐
crease as well as a 22.4% EBITDA-‐margin, which the
Management regards as very satisfactory.
EBIT Development In the first half of 2011, Trifork realized an EBIT of DKKm
8.6, which is a 66% increase compared to same period of
time 2010, which realized a DKKm 5.2 result. The result of
the first biannual 2011 equals an 11.4% EBIT-‐margin. The
management considers the development in the EBIT-‐result
satisfactory but will continue to work towards a further
increase.
Earnings before tax In the first half of 2011, Trifork reached a comprehensive
DKKm 8.8 earning before tax, which is a 74% increase over
the same period in 2010, where the company realized
DKKm 5. Management considers the first biannual 2011
result as satisfactory.
Total comprehensive income for the period The comprehensive income for the first half of 2011, was
DKKm 6.6, which equals a 78% increase compared to the
same period in 2010, which realized DKKm 3.7. Approxi-‐
mately DKKm 0.3 of the result belongs to minority inter-‐
ests.
Cash flow and investment The cash flow from operating activities consists of DKKm
12.3.
Simultaneously, in the first half of 2011, the company has
invested USDm 2.05 in the establishment of Netfork A/S,
from which investments have been made in the American
company Basho Technologies, Inc.
Altogether, the group cash reserves have decreased by
DKKm 4.9 during the first half of 2011 and balanced at
DKKm -‐5.3 as of 30.06.2011.
3,312
9,105
12,26110,574
20,073
26,500
2009 2010 2011
EBITDA (DKK tkr.)
Half year Year (2011 est.) 500
5,208
8,636
5,161
11,858
2009 2010 2011
EBIT (DKK tkr.)
Half year Year
6 TRIFORK A/S Interim Report 2011
MANAGEMENT S REPORT
Balance and equity Intangible fixed assets
Pertaining to accounts, the value of intangible fixed assets
has altogether decreased by DKKm 1.2 to DKKm 28.3 as of
30.06.2011. This decrease is due to ordinary write-‐offs,
which have been higher than new investments in product
development. A more detailed description of the most
significant products can be found on page 7 in the com-‐
pany 2010 annual report.
Own shares
The Trifork group has increased its holdings of own shares.
Among other reasons, own shares are acquired in case of
eventual acquisitions. As of 30.06.2011, the total balance
of own shares was 440,438, equalling 2.4% of the share
capital.
Equity
As of 30.06.2011, the Company equity totals DKKm 48.9
which is a 14.8 % increase compare to the end of 2010. In
the first half of 2011, Equity has yielded a 15% interest
compared to a 10% interest rate in the same period of
2010. It is a company goal to increase this rate of interest
further. The equity ratio is 46%.
Investments
The company investment in Basho Technologies, Inc.
through the establishment of Netfork A/S has meant a
considerable increase in other receivables, simultaneously
with an increase in company short term payables thereby
increasing the company balance significantly.
> OUTLOOK FOR THE FINANCIAL YEAR 2011
Generally the first half of 2011 has been characterised by
uncertainty in the financial markets, which has influenced
Danish and international economy. Trifork has worked
hard to maintain and expand existing contracts as well as
continuously working on acquisition of new projects. This
has meant that the company has been able to retain a
positive development in the first half of 2011.
In the second half of 2011, Trifork expects a continued
increase in the demand in core competence areas, where
the company enjoys considerable domain knowledge.
Moreover, Trifork continues to see great potential in the
further exploration of business opportunities in combining
existing domain knowledge with the technological devel-‐
opment on mobile units. Growth in net results continues
to take priority over growth in revenue.
Based on the above, the 2011 company outlook can be
summed up in this way:
Trifork expects continued growth as a result of both
organic growth and strategic acquisitions. Trifork will
prioritize further EBITDA margin growth over further
revenue growth in 2011.
Trifork expects a 27% turnover growth compared to
2010 equalling a DKKm180 turnover for the fiscal year
2011.
Trifork expects to realize an EBITDA of DKKm 26.5.
The success of the financial outlook is obviously encum-‐
bered with uncertainty. Significant change in currency
exchange rates, business or macroeconomic conditions
can effect the company financial situation.
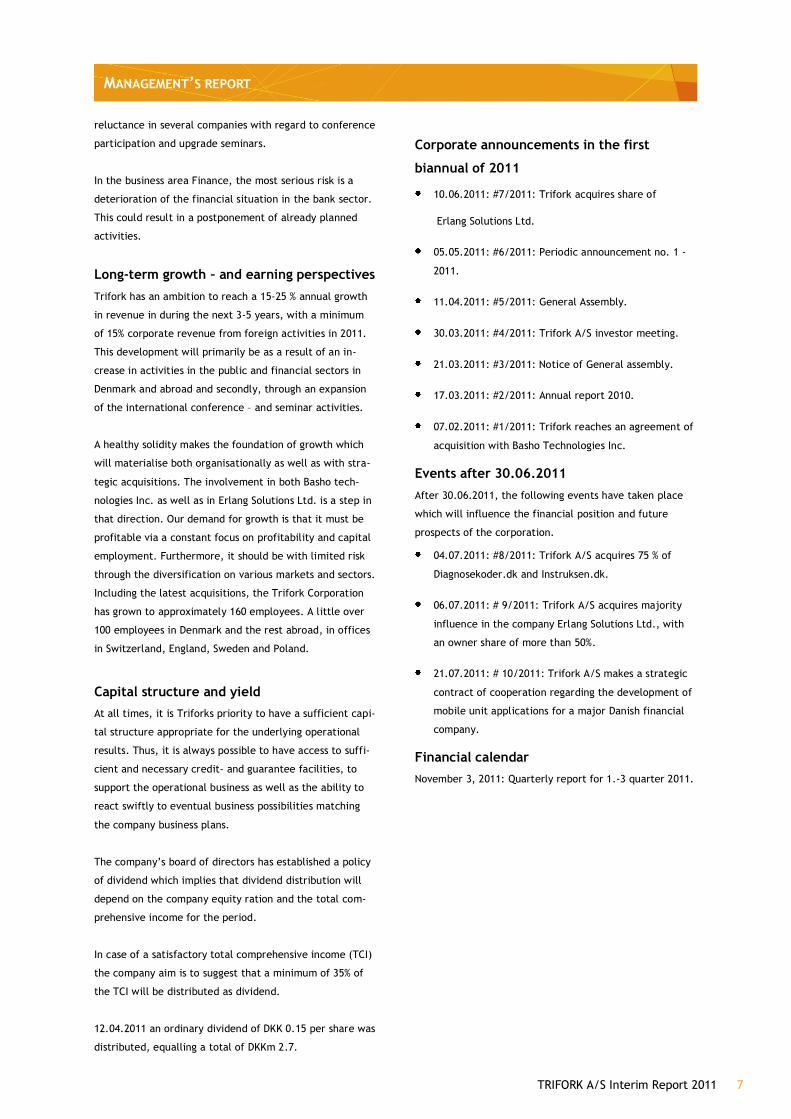
Trifork expects a stagnant or slightly declining develop-‐
ment in revenue per employee as a consequence the con-‐
solidation of Erlang Solutions Ltd., in the consolidated
income statement. This is due to the fact that Erlang Solu-‐
tions Ltd., works in markets with lower cost per employee
as well as lower price per hour. It is Trifork s ambition to
turn this into a future profit by working with a focus on
increasing the revenue per employee in the new business
areas of Erlang Solutions Ltd.
In the business area Public, the most serious risk is signifi-‐
cant political or organisational change, which potentially
can lead to delays in current as well as planned public it-‐
projects.
In the business area Academy, the most serious risk is the
discontinuation of contracts with long-‐term business part-‐
ners as well as a receding economic development with no
signs of improvement. In effect, this could lead to a new
576688 722
1,123
1,406 1,369
2009 2010 2011
Revenue per employee(DKK tkr.)
Half year Year (2011 est.)
TRIFORK A/S Interim Report 2011 7
MANAGEMENT S REPORT
reluctance in several companies with regard to conference
participation and upgrade seminars.
In the business area Finance, the most serious risk is a
deterioration of the financial situation in the bank sector.
This could result in a postponement of already planned
activities.
Long-‐term growth and earning perspectives
Trifork has an ambition to reach a 15-‐25 % annual growth
in revenue in during the next 3-‐5 years, with a minimum
of 15% corporate revenue from foreign activities in 2011.
This development will primarily be as a result of an in-‐
crease in activities in the public and financial sectors in
Denmark and abroad and secondly, through an expansion
of the international conference and seminar activities.
A healthy solidity makes the foundation of growth which
will materialise both organisationally as well as with stra-‐
tegic acquisitions. The involvement in both Basho tech-‐
nologies Inc. as well as in Erlang Solutions Ltd. is a step in
that direction. Our demand for growth is that it must be
profitable via a constant focus on profitability and capital
employment. Furthermore, it should be with limited risk
through the diversification on various markets and sectors.
Including the latest acquisitions, the Trifork Corporation
has grown to approximately 160 employees. A little over
100 employees in Denmark and the rest abroad, in offices
in Switzerland, England, Sweden and Poland.
Capital structure and yield At all times, it is Triforks priority to have a sufficient capi-‐
tal structure appropriate for the underlying operational
results. Thus, it is always possible to have access to suffi-‐
cient and necessary credit-‐ and guarantee facilities, to
support the operational business as well as the ability to
react swiftly to eventual business possibilities matching
the company business plans.
of dividend which implies that dividend distribution will
depend on the company equity ration and the total com-‐
prehensive income for the period.
In case of a satisfactory total comprehensive income (TCI)
the company aim is to suggest that a minimum of 35% of
the TCI will be distributed as dividend.
12.04.2011 an ordinary dividend of DKK 0.15 per share was
distributed, equalling a total of DKKm 2.7.
Corporate announcements in the first
biannual of 2011
10.06.2011: #7/2011: Trifork acquires share of
Erlang Solutions Ltd.
05.05.2011: #6/2011: Periodic announcement no. 1 -‐
2011.
11.04.2011: #5/2011: General Assembly.
30.03.2011: #4/2011: Trifork A/S investor meeting.
21.03.2011: #3/2011: Notice of General assembly.
17.03.2011: #2/2011: Annual report 2010.
07.02.2011: #1/2011: Trifork reaches an agreement of
acquisition with Basho Technologies Inc.
Events after 30.06.2011
After 30.06.2011, the following events have taken place
which will influence the financial position and future
prospects of the corporation.
04.07.2011: #8/2011: Trifork A/S acquires 75 % of
Diagnosekoder.dk and Instruksen.dk.
06.07.2011: # 9/2011: Trifork A/S acquires majority
influence in the company Erlang Solutions Ltd., with
an owner share of more than 50%.
21.07.2011: # 10/2011: Trifork A/S makes a strategic
contract of cooperation regarding the development of
mobile unit applications for a major Danish financial
company.
Financial calendar November 3, 2011: Quarterly report for 1.-‐3 quarter 2011.
8 TRIFORK A/S Interim Report 2011
TRIFORK PUBLIC
TRIFORK A/S Interim Report 2011 9
TRIFORK PUBLIC
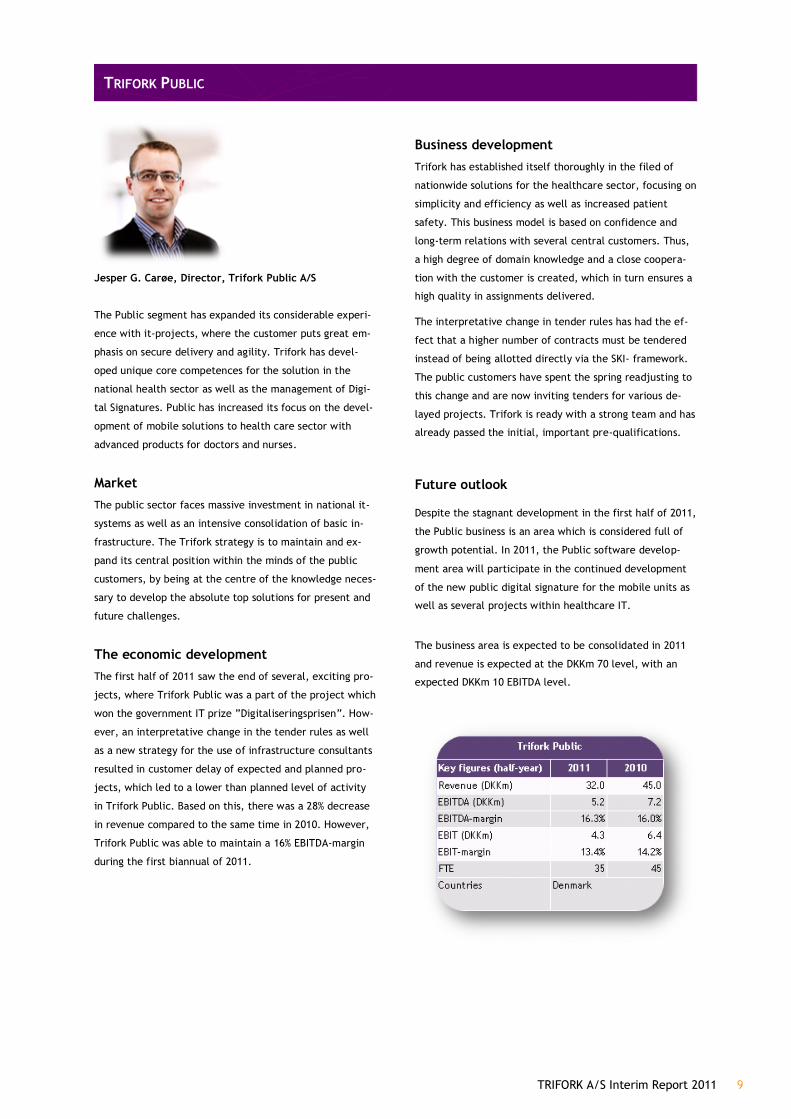
Jesper G. Carøe, Director, Trifork Public A/S
The Public segment has expanded its considerable experi-‐
ence with it-‐projects, where the customer puts great em-‐
phasis on secure delivery and agility. Trifork has devel-‐
oped unique core competences for the solution in the
national health sector as well as the management of Digi-‐
tal Signatures. Public has increased its focus on the devel-‐
opment of mobile solutions to health care sector with
advanced products for doctors and nurses.
Market
The public sector faces massive investment in national it-‐
systems as well as an intensive consolidation of basic in-‐
frastructure. The Trifork strategy is to maintain and ex-‐
pand its central position within the minds of the public
customers, by being at the centre of the knowledge neces-‐
sary to develop the absolute top solutions for present and
future challenges.
The economic development
The first half of 2011 saw the end of several, exciting pro-‐
jects, where Trifork Public was a part of the project which
won the government IT prize w-‐
ever, an interpretative change in the tender rules as well
as a new strategy for the use of infrastructure consultants
resulted in customer delay of expected and planned pro-‐
jects, which led to a lower than planned level of activity
in Trifork Public. Based on this, there was a 28% decrease
in revenue compared to the same time in 2010. However,
Trifork Public was able to maintain a 16% EBITDA-‐margin
during the first biannual of 2011.
Business development
Trifork has established itself thoroughly in the filed of
nationwide solutions for the healthcare sector, focusing on
simplicity and efficiency as well as increased patient
safety. This business model is based on confidence and
long-‐term relations with several central customers. Thus,
a high degree of domain knowledge and a close coopera-‐
tion with the customer is created, which in turn ensures a
high quality in assignments delivered.
The interpretative change in tender rules has had the ef-‐
fect that a higher number of contracts must be tendered
instead of being allotted directly via the SKI-‐ framework.
The public customers have spent the spring readjusting to
this change and are now inviting tenders for various de-‐
layed projects. Trifork is ready with a strong team and has
already passed the initial, important pre-‐qualifications.
Future outlook
Despite the stagnant development in the first half of 2011,
the Public business is an area which is considered full of
growth potential. In 2011, the Public software develop-‐
ment area will participate in the continued development
of the new public digital signature for the mobile units as
well as several projects within healthcare IT.
The business area is expected to be consolidated in 2011
and revenue is expected at the DKKm 70 level, with an
expected DKKm 10 EBITDA level.
10 TRIFORK A/S Interim Report 2011
TRIFORK FINANCE
Stort billede
TRIFORK A/S Interim Report 2011 11
TRIFORK FINANCE
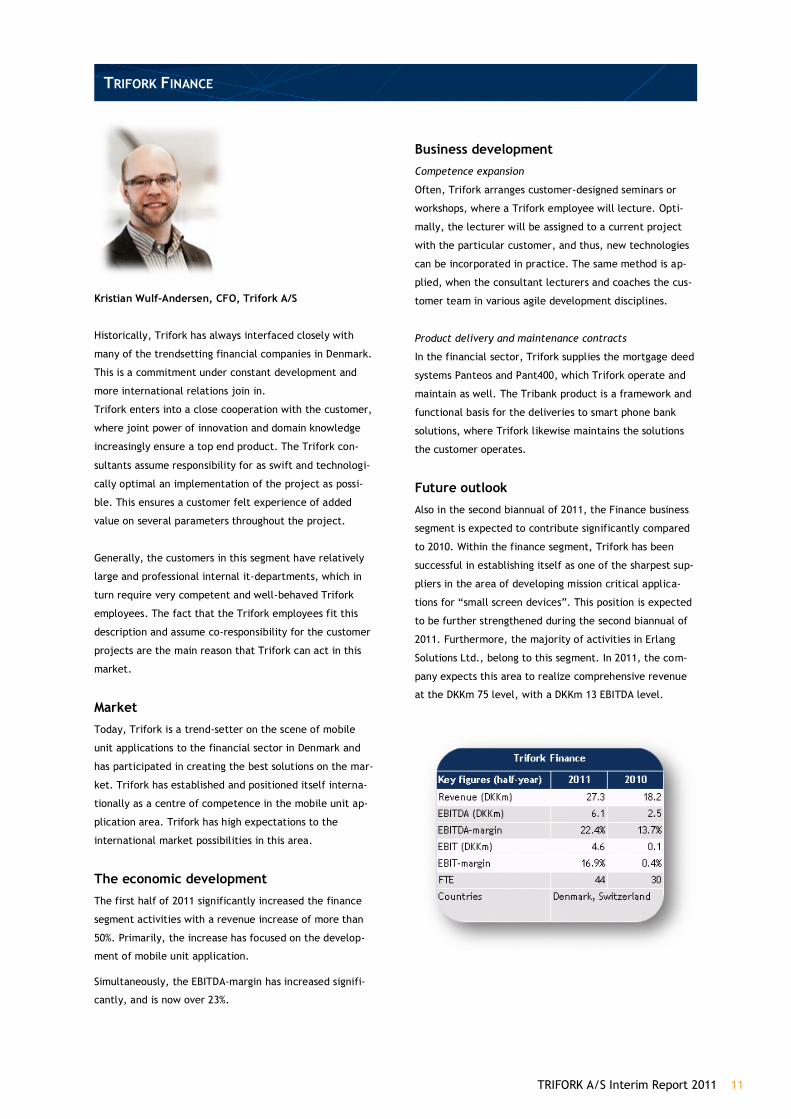
Kristian Wulf-‐Andersen, CFO, Trifork A/S
Historically, Trifork has always interfaced closely with
many of the trendsetting financial companies in Denmark.
This is a commitment under constant development and
more international relations join in.
Trifork enters into a close cooperation with the customer,
where joint power of innovation and domain knowledge
increasingly ensure a top end product. The Trifork con-‐
sultants assume responsibility for as swift and technologi-‐
cally optimal an implementation of the project as possi-‐
ble. This ensures a customer felt experience of added
value on several parameters throughout the project.
Generally, the customers in this segment have relatively
large and professional internal it-‐departments, which in
turn require very competent and well-‐behaved Trifork
employees. The fact that the Trifork employees fit this
description and assume co-‐responsibility for the customer
projects are the main reason that Trifork can act in this
market.
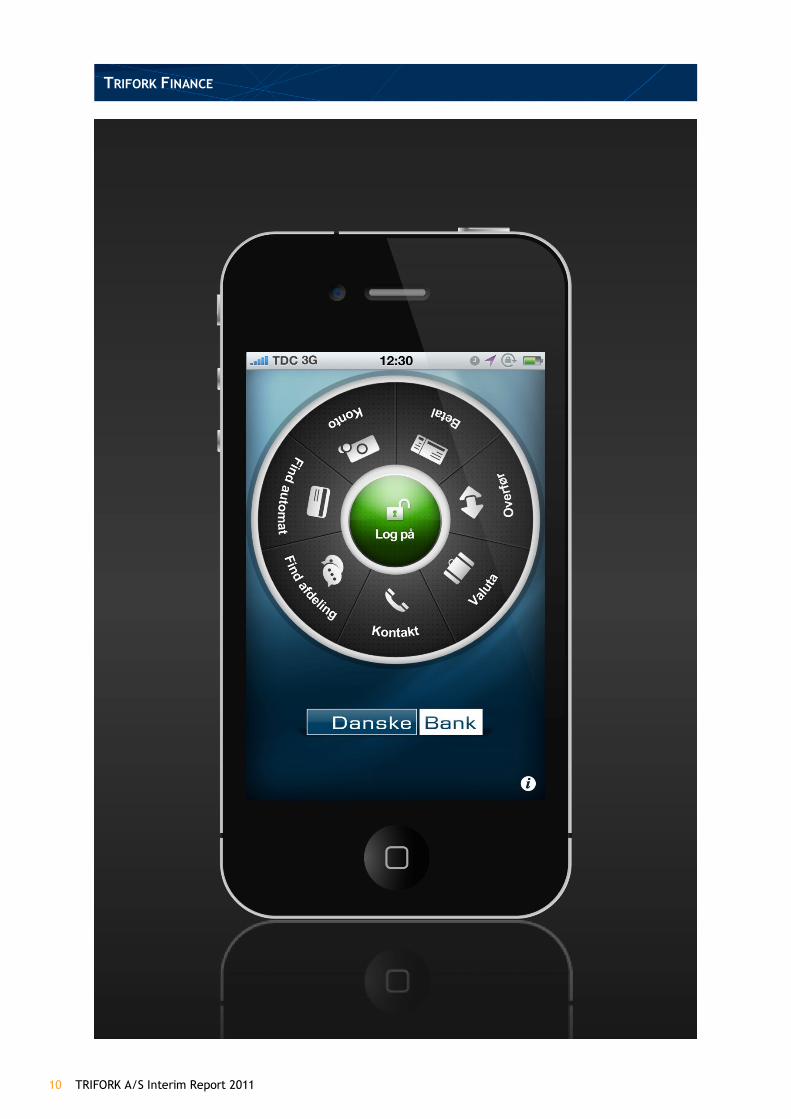
Market
Today, Trifork is a trend-‐setter on the scene of mobile
unit applications to the financial sector in Denmark and
has participated in creating the best solutions on the mar-‐
ket. Trifork has established and positioned itself interna-‐
tionally as a centre of competence in the mobile unit ap-‐
plication area. Trifork has high expectations to the
international market possibilities in this area.
The economic development
The first half of 2011 significantly increased the finance
segment activities with a revenue increase of more than
50%. Primarily, the increase has focused on the develop-‐
ment of mobile unit application.
Simultaneously, the EBITDA-‐margin has increased signifi-‐
cantly, and is now over 23%.
Business development
Competence expansion
Often, Trifork arranges customer-‐designed seminars or
workshops, where a Trifork employee will lecture. Opti-‐
mally, the lecturer will be assigned to a current project
with the particular customer, and thus, new technologies
can be incorporated in practice. The same method is ap-‐
plied, when the consultant lecturers and coaches the cus-‐
tomer team in various agile development disciplines.
Product delivery and maintenance contracts
In the financial sector, Trifork supplies the mortgage deed
systems Panteos and Pant400, which Trifork operate and
maintain as well. The Tribank product is a framework and
functional basis for the deliveries to smart phone bank
solutions, where Trifork likewise maintains the solutions
the customer operates.
Future outlook
Also in the second biannual of 2011, the Finance business
segment is expected to contribute significantly compared
to 2010. Within the finance segment, Trifork has been
successful in establishing itself as one of the sharpest sup-‐
pliers in the area of developing mission critical applica-‐
to be further strengthened during the second biannual of
2011. Furthermore, the majority of activities in Erlang
Solutions Ltd., belong to this segment. In 2011, the com-‐
pany expects this area to realize comprehensive revenue
at the DKKm 75 level, with a DKKm 13 EBITDA level.
12 TRIFORK A/S Interim Report 2011
TRIFORK ACADEMY
Foto: DONG Energi
TRIFORK A/S Interim Report 2011 13
TRIFORK ACADEMY
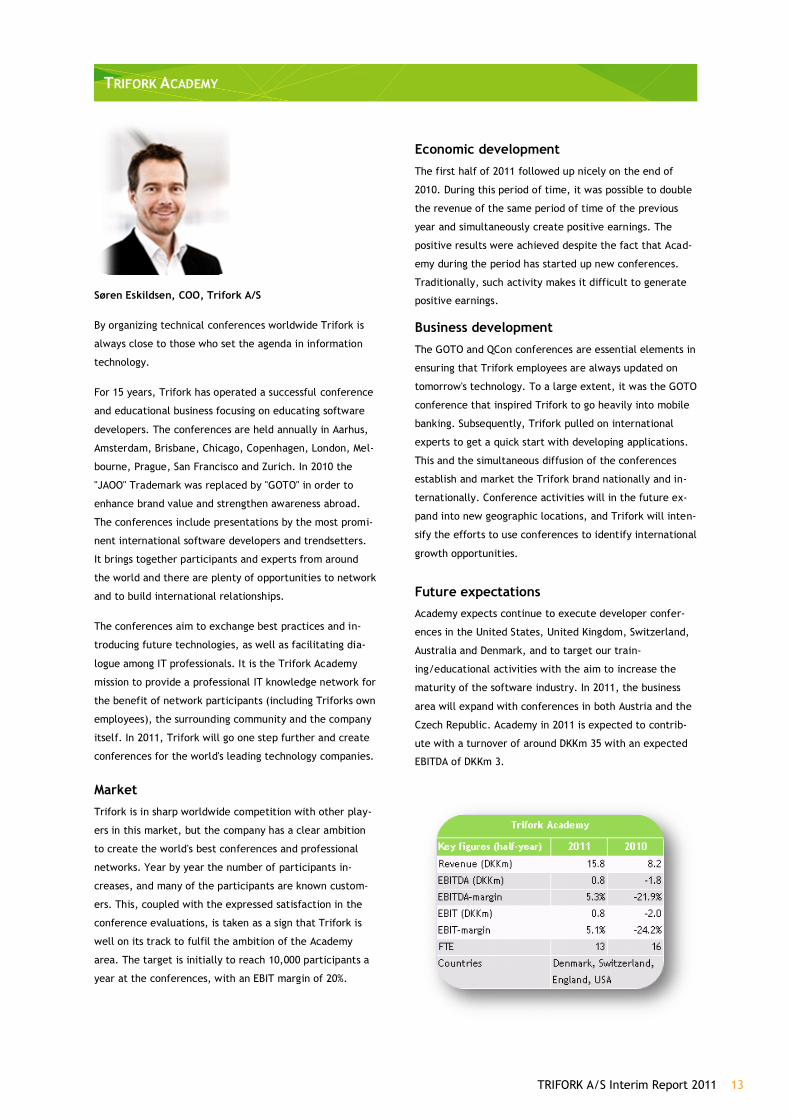
Søren Eskildsen, COO, Trifork A/S
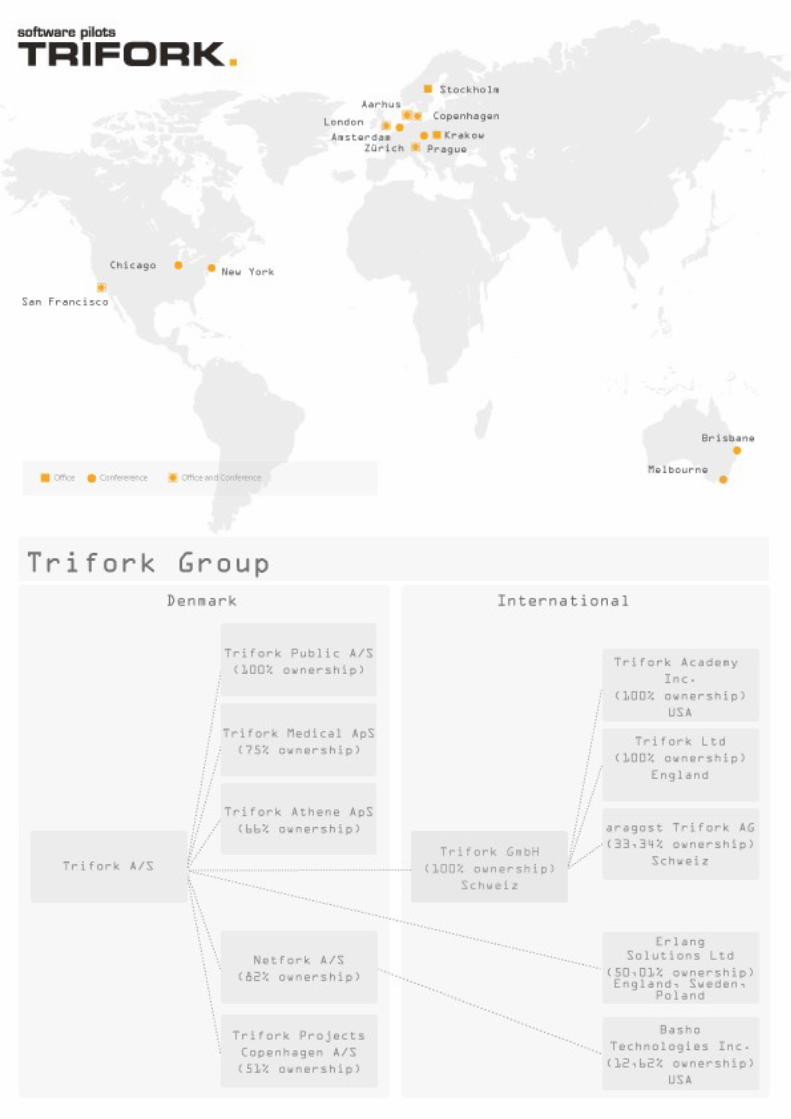
By organizing technical conferences worldwide Trifork is
always close to those who set the agenda in information
technology.
For 15 years, Trifork has operated a successful conference
and educational business focusing on educating software
developers. The conferences are held annually in Aarhus,
Amsterdam, Brisbane, Chicago, Copenhagen, London, Mel-‐
bourne, Prague, San Francisco and Zurich. In 2010 the
"JAOO" Trademark was replaced by "GOTO" in order to
enhance brand value and strengthen awareness abroad.
The conferences include presentations by the most promi-‐
nent international software developers and trendsetters.
It brings together participants and experts from around
the world and there are plenty of opportunities to network
and to build international relationships.
The conferences aim to exchange best practices and in-‐
troducing future technologies, as well as facilitating dia-‐
logue among IT professionals. It is the Trifork Academy
mission to provide a professional IT knowledge network for
the benefit of network participants (including Triforks own
employees), the surrounding community and the company
itself. In 2011, Trifork will go one step further and create
conferences for the world's leading technology companies.
Market
Trifork is in sharp worldwide competition with other play-‐
ers in this market, but the company has a clear ambition
to create the world's best conferences and professional
networks. Year by year the number of participants in-‐
creases, and many of the participants are known custom-‐
ers. This, coupled with the expressed satisfaction in the
conference evaluations, is taken as a sign that Trifork is
well on its track to fulfil the ambition of the Academy
area. The target is initially to reach 10,000 participants a
year at the conferences, with an EBIT margin of 20%.
Economic development
The first half of 2011 followed up nicely on the end of
2010. During this period of time, it was possible to double
the revenue of the same period of time of the previous
year and simultaneously create positive earnings. The
positive results were achieved despite the fact that Acad-‐
emy during the period has started up new conferences.
Traditionally, such activity makes it difficult to generate
positive earnings.
Business development
The GOTO and QCon conferences are essential elements in
ensuring that Trifork employees are always updated on
tomorrow's technology. To a large extent, it was the GOTO
conference that inspired Trifork to go heavily into mobile
banking. Subsequently, Trifork pulled on international
experts to get a quick start with developing applications.
This and the simultaneous diffusion of the conferences
establish and market the Trifork brand nationally and in-‐
ternationally. Conference activities will in the future ex-‐
pand into new geographic locations, and Trifork will inten-‐
sify the efforts to use conferences to identify international
growth opportunities.
Future expectations Academy expects continue to execute developer confer-‐
ences in the United States, United Kingdom, Switzerland,
Australia and Denmark, and to target our train-‐
ing/educational activities with the aim to increase the
maturity of the software industry. In 2011, the business
area will expand with conferences in both Austria and the
Czech Republic. Academy in 2011 is expected to contrib-‐
ute with a turnover of around DKKm 35 with an expected
EBITDA of DKKm 3.

14 TRIFORK A/S Interim Report 2011
SIGNATURES
> SIGNATURES
The Board of Directors and the Executive Management
Board have today considered and adopted the interim
report for the period January 1, June 30, 2011 for Trifork
A/S.
The interim report is a summary financial report pre-‐
sented in accordance with the IAS34 about Interim reports
as well as additional Danish disclosure requirements for
listed companies
The interim report is prepared after the same accounting
policies as used in the annual report for 2010, including
the International Financial Reporting Standards as adopted
by the EU.
It is our opinion, that the interim report gives a fair and
true view of Triforks assets, liabilities and financial posi-‐
tion as of June 30, 2011 and of the profit of the Trifork
operations and cash flow for the period January 1, -‐ June
30, 2011.
The interim report has not been audited.
Aarhus, August 25, 2011
Executive management
Jørn Larsen Kresten Krab Thorup
CEO, Trifork CTO, Trifork
Board of directors in Trifork A/S
Johan Blach Petersen Jesper G. Carøe Knud Arnum Hansen
Chairman of the board Vice Chairman, Director, Trifork Public Member of the board
Jørn Larsen Kresten Krab Thorup Birthe Hjortlund Andersen
CEO, Trifork CTO, Trifork Member of the board
TRIFORK A/S Interim Report 2011 15
CONSOLIDATED FINANCIAL STATEMENT
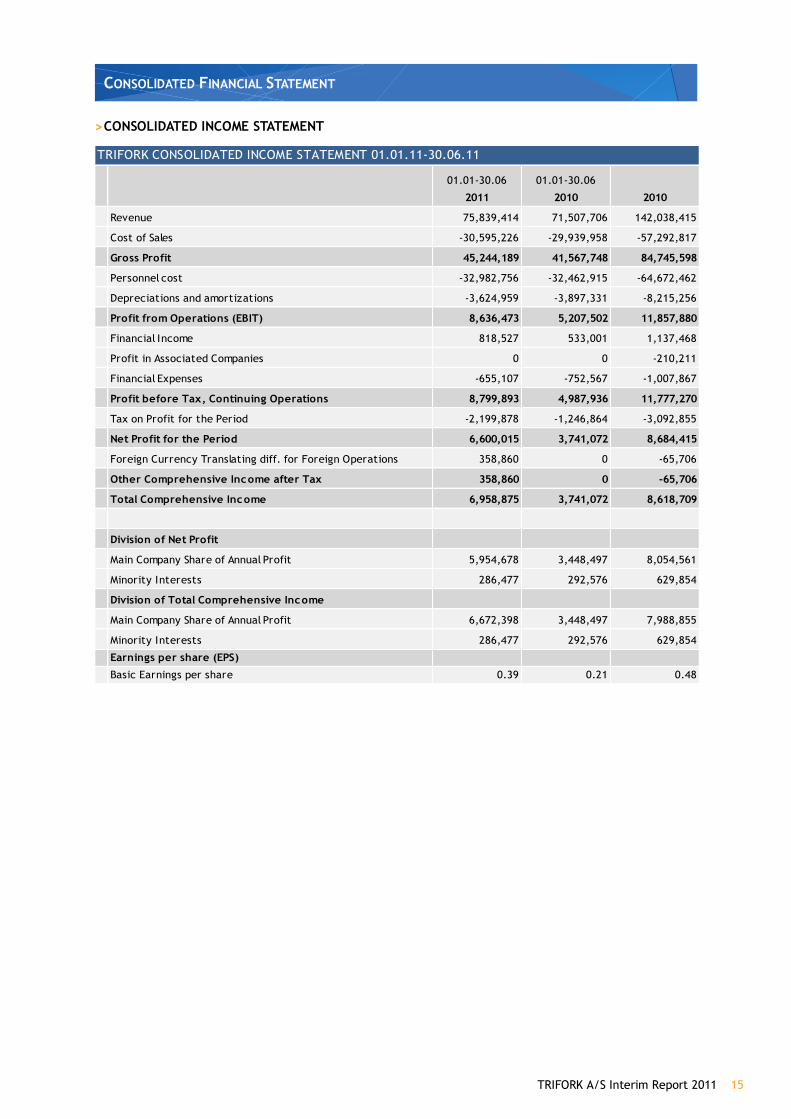
> CONSOLIDATED INCOME STATEMENT
01.01-‐30.06
2011
01.01-‐30.06
2010 2010
Revenue 75,839,414 71,507,706 142,038,415
Cost of Sales -‐30,595,226 -‐29,939,958 -‐57,292,817
Gross Profit 45,244,189 41,567,748 84,745,598
Personnel cost -‐32,982,756 -‐32,462,915 -‐64,672,462
Depreciations and amortizations -‐3,624,959 -‐3,897,331 -‐8,215,256
Profit from Operations (EBIT) 8,636,473 5,207,502 11,857,880
Financial Income 818,527 533,001 1,137,468
Profit in Associated Companies 0 0 -‐210,211
Financial Expenses -‐655,107 -‐752,567 -‐1,007,867
Profit before Tax, Continuing Operations 8,799,893 4,987,936 11,777,270
Tax on Profit for the Period -‐2,199,878 -‐1,246,864 -‐3,092,855
Net Profit for the Period 6,600,015 3,741,072 8,684,415
Foreign Currency Translating diff. for Foreign Operations 358,860 0 -‐65,706
Other Comprehensive Income after Tax 358,860 0 -‐65,706
Total Comprehensive Income 6,958,875 3,741,072 8,618,709
Division of Net Profit
Main Company Share of Annual Profit 5,954,678 3,448,497 8,054,561
Minority Interests 286,477 292,576 629,854
Division of Total Comprehensive Income
Main Company Share of Annual Profit 6,672,398 3,448,497 7,988,855
Minority Interests 286,477 292,576 629,854
Earnings per share (EPS)
Basic Earnings per share 0.39 0.21 0.48
TRIFORK CONSOLIDATED INCOME STATEMENT 01.01.11-‐30.06.11
16 TRIFORK A/S Interim Report 2011
CONSOLIDATED FINANCIAL STATEMENT
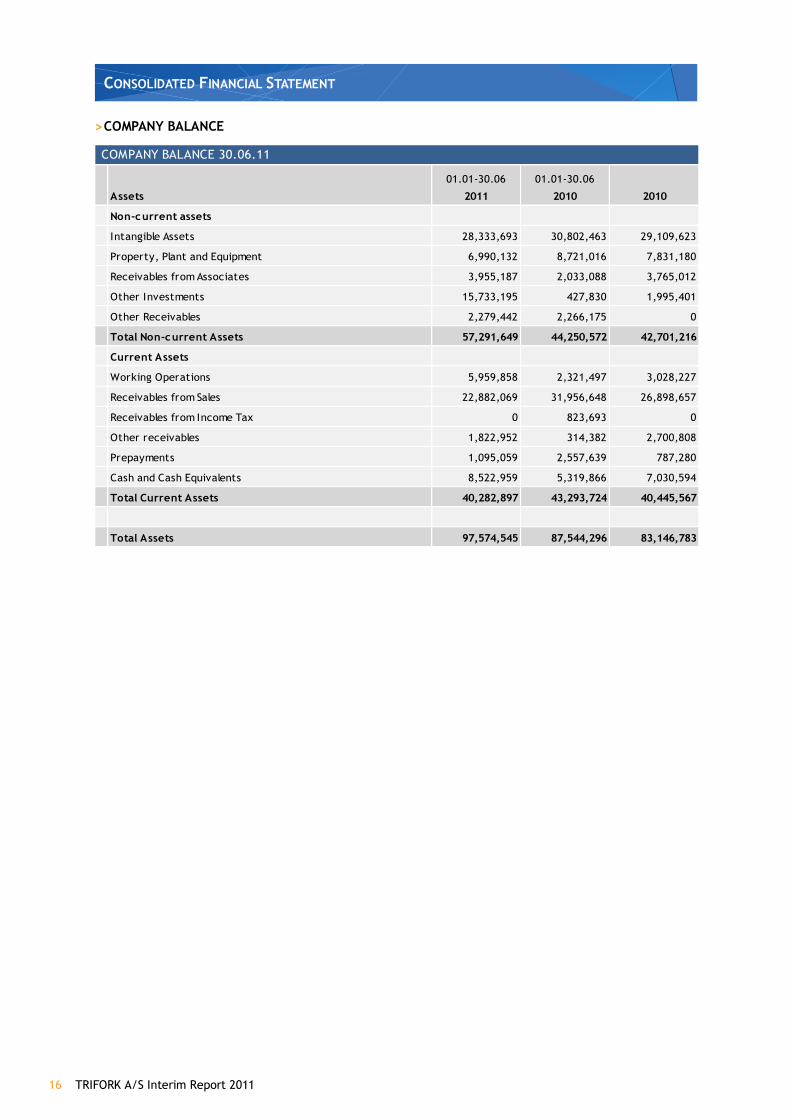
> COMPANY BALANCE
Assets
01.01-‐30.06
2011
01.01-‐30.06
2010 2010
Non-‐current assets
Intangible Assets 28,333,693 30,802,463 29,109,623
Property, Plant and Equipment 6,990,132 8,721,016 7,831,180
Receivables from Associates 3,955,187 2,033,088 3,765,012
Other Investments 15,733,195 427,830 1,995,401
Other Receivables 2,279,442 2,266,175 0
Total Non-‐current Assets 57,291,649 44,250,572 42,701,216
Current Assets
Working Operations 5,959,858 2,321,497 3,028,227
Receivables from Sales 22,882,069 31,956,648 26,898,657
Receivables from Income Tax 0 823,693 0
Other receivables 1,822,952 314,382 2,700,808
Prepayments 1,095,059 2,557,639 787,280
Cash and Cash Equivalents 8,522,959 5,319,866 7,030,594
Total Current Assets 40,282,897 43,293,724 40,445,567
Total Assets 97,574,545 87,544,296 83,146,783
COMPANY BALANCE 30.06.11
TRIFORK A/S Interim Report 2011 17
CONSOLIDATED FINANCIAL STATEMENT
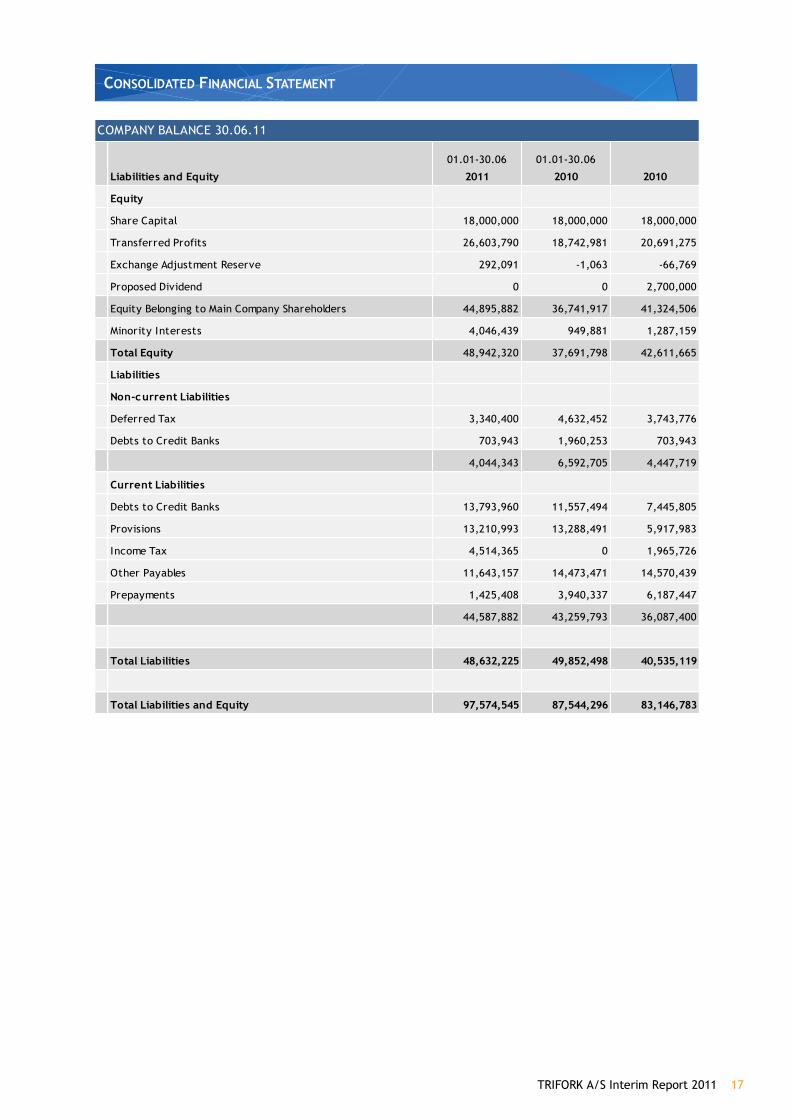
Liabilities and Equity
01.01-‐30.06
2011
01.01-‐30.06
2010 2010
Equity
Share Capital 18,000,000 18,000,000 18,000,000
Transferred Profits 26,603,790 18,742,981 20,691,275
Exchange Adjustment Reserve 292,091 -‐1,063 -‐66,769
Proposed Dividend 0 0 2,700,000
Equity Belonging to Main Company Shareholders 44,895,882 36,741,917 41,324,506
Minority Interests 4,046,439 949,881 1,287,159
Total Equity 48,942,320 37,691,798 42,611,665
Liabilities
Non-‐current Liabilities
Deferred Tax 3,340,400 4,632,452 3,743,776
Debts to Credit Banks 703,943 1,960,253 703,943
4,044,343 6,592,705 4,447,719
Current Liabilities
Debts to Credit Banks 13,793,960 11,557,494 7,445,805
Provisions 13,210,993 13,288,491 5,917,983
Income Tax 4,514,365 0 1,965,726
Other Payables 11,643,157 14,473,471 14,570,439
Prepayments 1,425,408 3,940,337 6,187,447
44,587,882 43,259,793 36,087,400
Total Liabilities 48,632,225 49,852,498 40,535,119
Total Liabilities and Equity 97,574,545 87,544,296 83,146,783
COMPANY BALANCE 30.06.11
18 TRIFORK A/S Interim Report 2011
CONSOLIDATED FINANCIAL STATEMENT
> CONSOLIDATED STATEMENT OF EQUITY
Share capital
T ransferred pro f it
R eserve fo r exchange rate
adjustmentsP roposed dividend
Equity at tributable to parent company
shareho ldersM ino rityinterests To tal
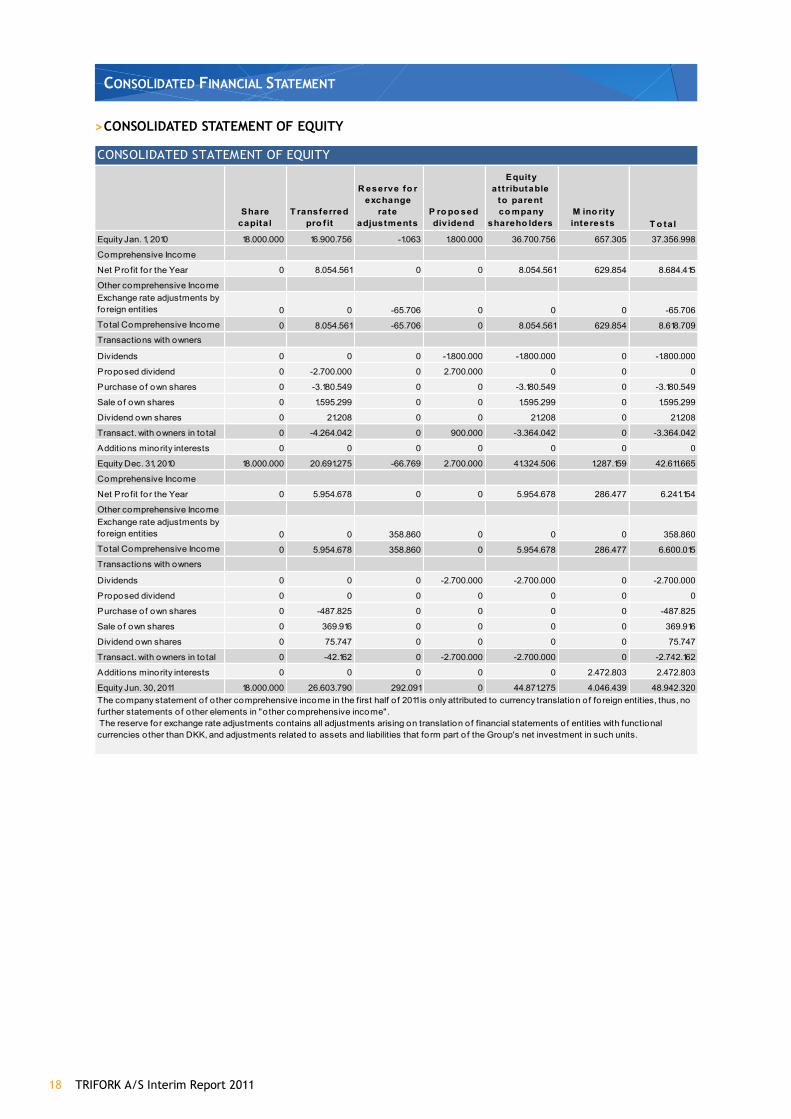
Equity Jan. 1, 2010 18.000.000 16.900.756 -1.063 1.800.000 36.700.756 657.305 37.356.998
Comprehensive Income
Net Profit for the Year 0 8.054.561 0 0 8.054.561 629.854 8.684.415
Other comprehensive IncomeExchange rate adjustments by foreign entities 0 0 -65.706 0 0 0 -65.706
Total Comprehensive Income 0 8.054.561 -65.706 0 8.054.561 629.854 8.618.709
Transactions with owners
Dividends 0 0 0 -1.800.000 -1.800.000 0 -1.800.000
Proposed dividend 0 -2.700.000 0 2.700.000 0 0 0
Purchase of own shares 0 -3.180.549 0 0 -3.180.549 0 -3.180.549
Sale of own shares 0 1.595.299 0 0 1.595.299 0 1.595.299
Dividend own shares 0 21.208 0 0 21.208 0 21.208
Transact. with owners in to tal 0 -4.264.042 0 900.000 -3.364.042 0 -3.364.042
Additions minority interests 0 0 0 0 0 0 0
Equity Dec. 31, 2010 18.000.000 20.691.275 -66.769 2.700.000 41.324.506 1.287.159 42.611.665
Comprehensive Income
Net Profit for the Year 0 5.954.678 0 0 5.954.678 286.477 6.241.154
Other comprehensive IncomeExchange rate adjustments by foreign entities 0 0 358.860 0 0 0 358.860
Total Comprehensive Income 0 5.954.678 358.860 0 5.954.678 286.477 6.600.015
Transactions with owners
Dividends 0 0 0 -2.700.000 -2.700.000 0 -2.700.000
Proposed dividend 0 0 0 0 0 0 0
Purchase of own shares 0 -487.825 0 0 0 0 -487.825
Sale of own shares 0 369.916 0 0 0 0 369.916
Dividend own shares 0 75.747 0 0 0 0 75.747
Transact. with owners in to tal 0 -42.162 0 -2.700.000 -2.700.000 0 -2.742.162
Additions minority interests 0 0 0 0 0 2.472.803 2.472.803
Equity Jun. 30, 2011 18.000.000 26.603.790 292.091 0 44.871.275 4.046.439 48.942.320
CONSOLIDATED STATEMENT OF EQUITY
The company statement o f o ther comprehensive income in the first half o f 2011 is only attributed to currency translation of foreign entities, thus, no further statements of o ther elements in "o ther comprehensive income". The reserve for exchange rate adjustments contains all adjustments arising on translation of financial statements of entities with functional currencies other than DKK, and adjustments related to assets and liabilities that form part o f the Group's net investment in such units.
TRIFORK A/S Interim Report 2011 19
CONSOLIDATED FINANCIAL STATEMENT
> CASH FLOW STATEMENT
01.01-‐30.06
2011
01.01-‐30.06
2010 2010
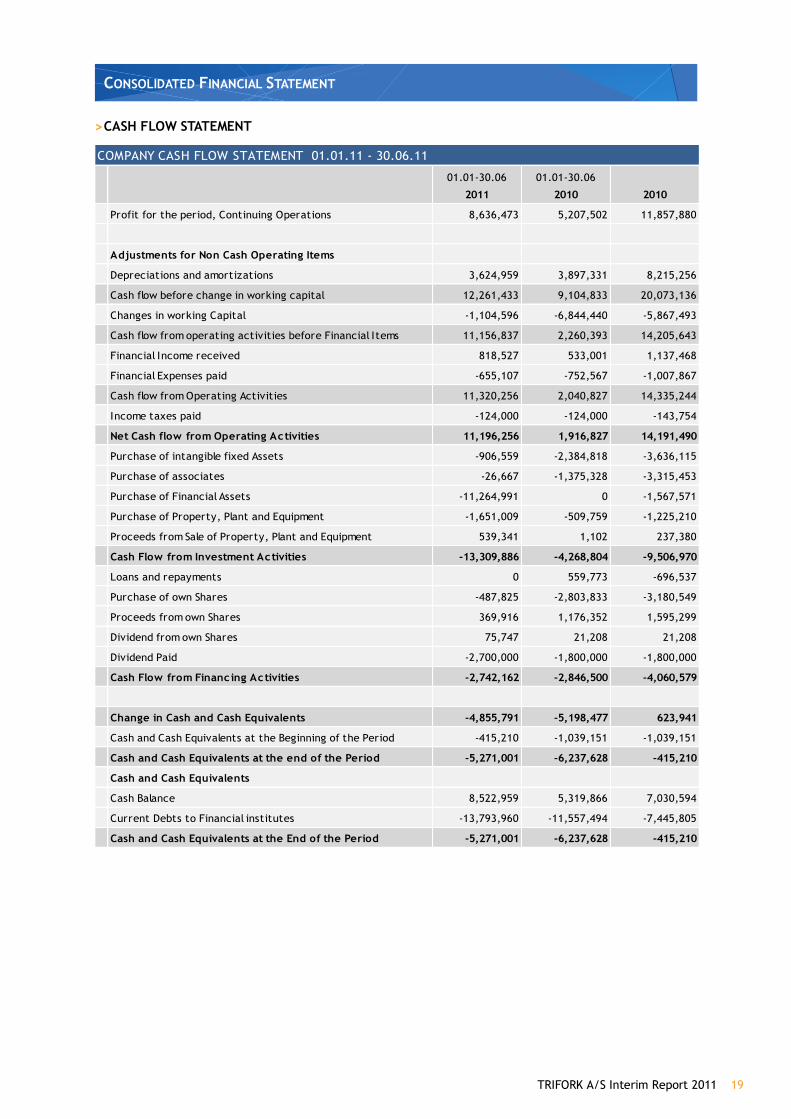
Profit for the period, Continuing Operations 8,636,473 5,207,502 11,857,880
Adjustments for Non Cash Operating Items
Depreciations and amortizations 3,624,959 3,897,331 8,215,256
Cash flow before change in working capital 12,261,433 9,104,833 20,073,136
Changes in working Capital -‐1,104,596 -‐6,844,440 -‐5,867,493
Cash flow from operating activities before Financial Items 11,156,837 2,260,393 14,205,643
Financial Income received 818,527 533,001 1,137,468
Financial Expenses paid -‐655,107 -‐752,567 -‐1,007,867
Cash flow from Operating Activities 11,320,256 2,040,827 14,335,244
Income taxes paid -‐124,000 -‐124,000 -‐143,754
Net Cash flow from Operating Activities 11,196,256 1,916,827 14,191,490
Purchase of intangible fixed Assets -‐906,559 -‐2,384,818 -‐3,636,115
Purchase of associates -‐26,667 -‐1,375,328 -‐3,315,453
Purchase of Financial Assets -‐11,264,991 0 -‐1,567,571
Purchase of Property, Plant and Equipment -‐1,651,009 -‐509,759 -‐1,225,210
Proceeds from Sale of Property, Plant and Equipment 539,341 1,102 237,380
Cash Flow from Investment Activities -‐13,309,886 -‐4,268,804 -‐9,506,970
Loans and repayments 0 559,773 -‐696,537
Purchase of own Shares -‐487,825 -‐2,803,833 -‐3,180,549
Proceeds from own Shares 369,916 1,176,352 1,595,299
Dividend from own Shares 75,747 21,208 21,208
Dividend Paid -‐2,700,000 -‐1,800,000 -‐1,800,000
Cash Flow from Financing Activities -‐2,742,162 -‐2,846,500 -‐4,060,579
Change in Cash and Cash Equivalents -‐4,855,791 -‐5,198,477 623,941
Cash and Cash Equivalents at the Beginning of the Period -‐415,210 -‐1,039,151 -‐1,039,151
Cash and Cash Equivalents at the end of the Period -‐5,271,001 -‐6,237,628 -‐415,210
Cash and Cash Equivalents
Cash Balance 8,522,959 5,319,866 7,030,594
Current Debts to Financial institutes -‐13,793,960 -‐11,557,494 -‐7,445,805
Cash and Cash Equivalents at the End of the Period -‐5,271,001 -‐6,237,628 -‐415,210
COMPANY CASH FLOW STATEMENT 01.01.11 -‐ 30.06.11
20 TRIFORK A/S Interim Report 2011
CONSOLIDATED FINANCIAL STATEMENT
> NOTES
Note 1. Applied accounting practice
The 2011 interim report is presented in accordance with
by the EU and extra Danish demands of disclosure for
companies listed on the stock exchange as decided by
NASDAQ QMX Copenhagen (OMX). The accounting practice
applied is unchanged since the 2010 annual report. We
refer to note 1, page 45 of the annual report for further
information.
Note 2. Management s estimates and assessments
Preparing the interim report according to corporate ac-‐
counting practice, makes it necessary for the manage-‐
ment to make estimates and draw up assumptions which
influence the included assets and commitments. Man-‐
agement makes its estimates based on historic experi-‐
ence as well as other prerequisites, which are considered
relevant at the given time. Pertaining to accounts, these
estimates and assumptions provide the basis for the fac-‐
toring in of the value of assets and commitments as well
as the effects derived in the statement of account. The
actual result can differ from this.
We refer to note 1, p.45 of the 2010 annual report for a
more detailed description of the accounts, where man-‐
agement estimates and assumptions have are primarily
used in connection to the corporate statement of ac-‐
counts.
Note 3. Policy of risk management
Overall, the financial risks and policies of risk manage-‐
ment are unchanged compared to the 2010 annual report.
We refer to the 2010 interim report, p.20 for a closer
description of this.
Note 4. Acquisition of subsidiary companies and assets
In the first half of 2011, Trifork A/S has established the
company Netfork A/S. At the end of the period, Trifork
owned 81,25% of the company. The purpose of this com-‐
pany is partly investments in shares of the company
Basho Technology, Inc, and partly the handling of a Euro-‐
pean license for reselling of the Basho database product,
RIAK.
In the first half of 2011, Netfork A/S has invested a total
of USD 2.5 in ownership share acquisition in the company
Basho Technologies, Inc. These investments have been
made with a cash payment from Netfork A/S. Capital for
the Netfork investments have been made by a cash pro
rate contribution proportional to Trifork s ownership and
the other owners of Netfork A/S.
At the end of the period, the Netfork ownership consisted
of 12.6% of the total share capital in Basho Technologies,
Inc.
The corporation has paid a DKKm 0.2 transaction cost in
connection to the investments, pertaining legal advisors.
This is included in the administrative expenses in the
final report for the first half of 2011.
Note 5. Company unions after the day of account
balance
On July 6, 2011 Trifork A/S owns 50.01% of the shares in
Erlang Solutions Ltd., and now has majority influence in
the company. Investing in Erlang Solutions is in line with
Trifork focus and core competences in the area of mobile
technologies. The unique expertise of Erlang Solutions
with the Erlang OTP -‐to-‐
solutions in Telecom, messaging, payment systems and
process control. Furthermore, the Erlang Solutions physi-‐
cal presence in London, Stockholm and Krakow, is an
important bridgehead in the Triforks internationalization
strategy.
At present, Trifork does not have total balance of the
sum of purchase. At the time of purchase, this consists of
a cash payment of GBPm 0.73 as well as GBPm 0.56 paid
with Trifork shares. Of the cash payment GBPm 0.18 was
an expansion of share capital in the company. The total
sum of purchase consists of an additional earn-‐out pay-‐
ment conditional to the achieved Erlang Solutions ltd.
results in the period 2011-‐2013. Thus, it has not been
possible to provide the required information according to
IFRS 3. It is expected that the purchase is finalized by the
publication time of the 2011 annual report.
TRIFORK A/S Interim Report 2011 21
CONSOLIDATED FINANCIAL STATEMENT
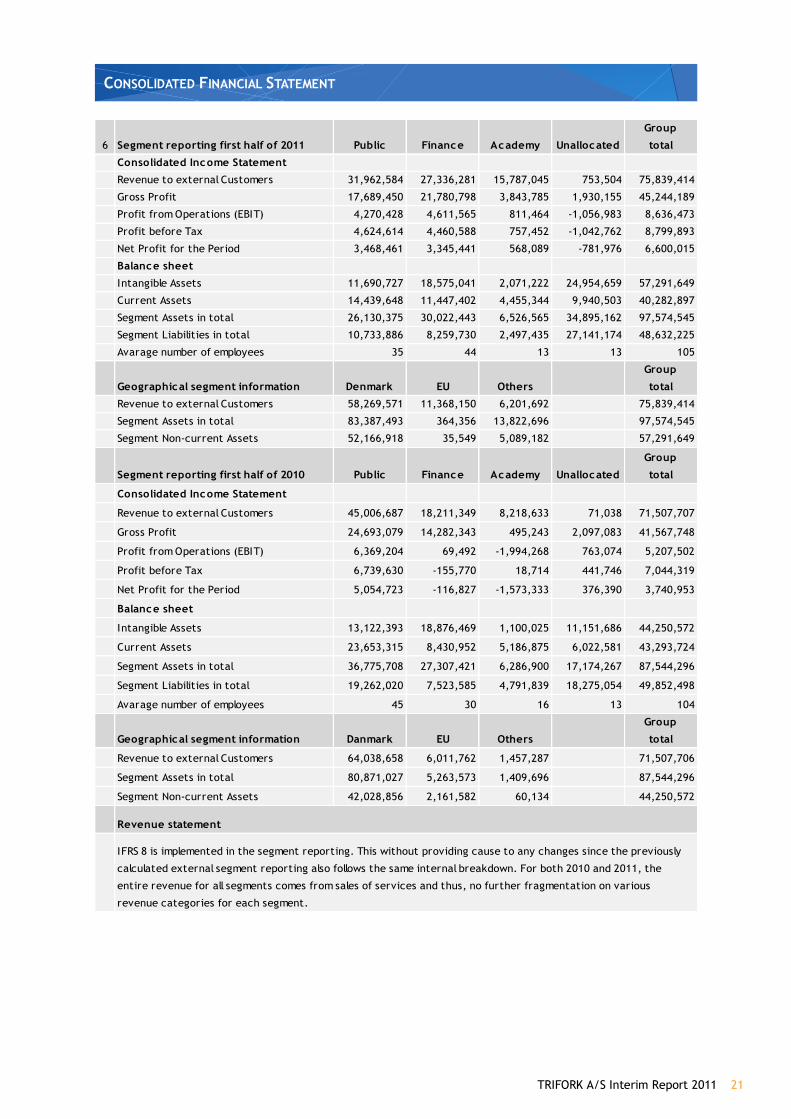
6 Segment reporting first half of 2011 Public Finance Academy Unallocated
Group
total
Consolidated Income Statement
Revenue to external Customers 31,962,584 27,336,281 15,787,045 753,504 75,839,414
Gross Profit 17,689,450 21,780,798 3,843,785 1,930,155 45,244,189
Profit from Operations (EBIT) 4,270,428 4,611,565 811,464 -‐1,056,983 8,636,473
Profit before Tax 4,624,614 4,460,588 757,452 -‐1,042,762 8,799,893
Net Profit for the Period 3,468,461 3,345,441 568,089 -‐781,976 6,600,015
Balance sheet
Intangible Assets 11,690,727 18,575,041 2,071,222 24,954,659 57,291,649
Current Assets 14,439,648 11,447,402 4,455,344 9,940,503 40,282,897
Segment Assets in total 26,130,375 30,022,443 6,526,565 34,895,162 97,574,545
Segment Liabilities in total 10,733,886 8,259,730 2,497,435 27,141,174 48,632,225
Avarage number of employees 35 44 13 13 105
Geographical segment information Denmark EU Others
Group
total
Revenue to external Customers 58,269,571 11,368,150 6,201,692 75,839,414
Segment Assets in total 83,387,493 364,356 13,822,696 97,574,545
Segment Non-‐current Assets 52,166,918 35,549 5,089,182 57,291,649
Segment reporting first half of 2010 Public Finance Academy Unallocated
Group
total
Consolidated Income Statement
Revenue to external Customers 45,006,687 18,211,349 8,218,633 71,038 71,507,707
Gross Profit 24,693,079 14,282,343 495,243 2,097,083 41,567,748
Profit from Operations (EBIT) 6,369,204 69,492 -‐1,994,268 763,074 5,207,502
Profit before Tax 6,739,630 -‐155,770 18,714 441,746 7,044,319
Net Profit for the Period 5,054,723 -‐116,827 -‐1,573,333 376,390 3,740,953
Balance sheet
Intangible Assets 13,122,393 18,876,469 1,100,025 11,151,686 44,250,572
Current Assets 23,653,315 8,430,952 5,186,875 6,022,581 43,293,724
Segment Assets in total 36,775,708 27,307,421 6,286,900 17,174,267 87,544,296
Segment Liabilities in total 19,262,020 7,523,585 4,791,839 18,275,054 49,852,498
Avarage number of employees 45 30 16 13 104
Geographical segment information Danmark EU Others
Group
total
Revenue to external Customers 64,038,658 6,011,762 1,457,287 71,507,706
Segment Assets in total 80,871,027 5,263,573 1,409,696 87,544,296
Segment Non-‐current Assets 42,028,856 2,161,582 60,134 44,250,572
Revenue statement
IFRS 8 is implemented in the segment reporting. This without providing cause to any changes since the previously
calculated external segment reporting also follows the same internal breakdown. For both 2010 and 2011, the
entire revenue for all segments comes from sales of services and thus, no further fragmentation on various
revenue categories for each segment.