Embed Size (px)
Citation preview

AN
NU
AL
RE
PO
RT
19
99
EU
RO
PE
AN
CE
NT
RA
L B
AN
KE
N
EC
B
EZ
B
EK
T
BC
E
EK
P
A N N U A LR E P O R T
1999
A N N U A LR E P O R T
1999

© European Central Bank, 2000
Address Kaiserstrasse 29
D-60311 Frankfurt am Main
Germany
Postal address Postfach 16 03 19
D-60066 Frankfurt am Main
Germany
Telephone +49 69 1344 0
Internet http://www.ecb.int
Fax +49 69 1344 6000
Telex 411 144 ecb d
All rights reserved.
Reproduction for educational and non-commercial purposes is permitted provided that the source is acknowledged.
The cut-off date for the data included in this Report was 7 March 2000.
ISSN 1561-4573
ECB Annua l Repor t • 1999 III
Contents
Foreword 2
Chapter I
Economic development and monetary policy
1 Monetary policy decisions in the context of the Eurosystem’s strategy 8
2 Monetary and financial developments 112.1 Monetary developments 112.2 Financial markets 15
3 Price developments 23
4 Output, demand and labour market developments 28
5 Fiscal developments 36
6 The global macroeconomic environment, exchange rates and the balanceof payments 39
Chapter II
Central bank operations
1 Monetary policy implementation 481.1 Liquidity management 481.2 The main refinancing operations 491.3 The longer-term refinancing operations 501.4 Other open market operations 511.5 Standing facilities 511.6 The minimum reserve system 521.7 The Eurosystem’s eligible collateral and its use for credit operations 521.8 Participation of Eurosystem counterparties in monetary policy operations 531.9 Money market developments 54
2 Investment of foreign exchange assets and own funds 542.1 The foreign reserve assets of the Eurosystem 542.2 The Eurosystem’s approach to foreign reserve management 552.3 The ECB’s own funds management 55
3 Payment and settlement systems operations 563.1 The TARGET system 563.2 The correspondent central banking model 58
4 Risk management 59

ECB Annua l Repor t • 1999IV
Chapter III
Economic developments in the other countries of the European Union 64
Chapter IV
European/international co-operation and the Eurosystem
1 European issues 741.1 Bilateral relations 741.2 Co-ordination of national economic policies in the European Union 771.3 Macroeconomic Dialogue 79
2 International issues 802.1 The activities of the ECB in the field of multilateral co-operation 812.2 The development of bilateral relations between the ECB and countries
outside the European Union 842.3 The architecture of the international monetary and financial system 842.4 The international role of the euro 87
Chapter V
Payment and securities settlement systems
1 Oversight of large-value payment systems 92
2 Oversight of retail payment systems 92
3 Other payment systems activities 94
4 Securities settlement systems policy 94
Chapter VI
Financial stability and prudential supervision
1 The institutional framework for financial stability 98
2 Structural changes in the EU banking and financial sector 100
3 Macro-prudential analysis 101
4 Risk assessment systems and credit registers 102

ECB Annua l Repor t • 1999 V
Chapter VII
The production of the euro banknotes and preparationsfor the cash changeover
1 Production of the euro banknotes 106
2 The quality of the euro banknotes and coins 106
3 Protecting the euro banknotes and coins against counterfeiting 107
4 The EURO 2002 campaign 107
5 The changeover to the euro banknotes and coins in 2002 108
6 Cash circulation before 2002 109
Chapter VIII
Development of the statistical framework 114
Chapter IX
Other tasks and activities
1 Advisory functions 120
2 Compliance with the prohibitions on monetary financing and privilegedaccess 121
3 Transition to the year 2000 122
4 The administration of the borrowing and lending operationsby the European Community 125
Chapter X
Public information and accountability
1 The ECB’s information policy and its tools 1281.1 Communication policy objectives 1281.2 Communication tools 128
2 Accountability 1292.1 Central bank independence and accountability in Economic and
Monetary Union 1292.2 The role of the European Parliament in holding the ECB to account 130

ECB Annua l Repor t • 1999VI
Chapter XI
The institutional framework of the Eurosystem andthe European System of Central Banks
1 The Eurosystem and the European System of Central Banks 134
2 The decision-making bodies of the ECB 1352.1 Governing Council 1352.2 The Executive Board 1372.3 The General Council 138
3 The organisation of the ECB 1403.1 Corporate governance 1403.2 Staff developments 1403.3 The organisational chart of the ECB 141
4 ESCB Committees 142
Chapter XII
Annual Accounts of the ECB and Consolidated Balance Sheet of theEurosystem 1999 145
Annexes
Glossary 164Chronology of monetary policy measures of the Eurosystem 176
Documents published by the European Central Bank (ECB) 181
List of Boxes, Tables and Charts
Boxes
1 Structural changes in the banking sector and their relevance for monetary policy 152 Assessing the factors behind the rise in nominal bond yields using index-linked bonds 20
Chart: Break-even inflation rate calculated for the French CPI 203 The effects of market deregulation on consumer prices 25
Chart: Telephone and telefax equipment and services 254 Growth and inflation divergences in the euro area 29
Table: Real GDP growth and HICP inflation in euro area countries 295 The decline in the surplus of trade in goods of the euro area in 1999 44
Chart: Import volumes of major euro area export markets 44
ECB Annua l Repor t • 1999 VII
6 The function and activities of the ECB permanent representation in Washington, D.C. 827 Consultation procedures in 1999 120
Tables
1 Price and cost developments in the euro area 232 Composition of real GDP growth in the euro area 283 Industrial production in the euro area 324 Labour market developments in the euro area 345 Fiscal positions in the euro area 366 Macroeconomic indicators for Denmark 657 Macroeconomic indicators for Greece 678 Macroeconomic indicators for Sweden 699 Macroeconomic indicators for the United Kingdom 7010 Quantity of euro banknotes to be produced by 1 January 2002 110
Charts
1 ECB interest rates and money market rates 92 M3 growth in the euro area 113 Components of M3 in the euro area 124 Loans to the private sector and retail interest rates 145 Short-term interest rates in the euro area 176a Long-term government bond yields in the euro area, the United States and Japan 186b Ten-year interest differential of the United States against the euro area 187 Stock price indices in the euro area, the United States and Japan 228 Breakdown of HICP inflation in the euro area by components 249 Contributions to quarterly real GDP growth in the euro area 3010 Confidence indicators in the euro area 3211 Total employment in the euro area 3312 Unemployment in the euro area 3413 Main developments in major industrialised economies 4114 Nominal effective exchange rate 42

ECB Annua l Repor t • 1999VIII
ECB Annua l Repor t • 1999 IX
Abbreviations
Countries
BE BelgiumDK DenmarkDE GermanyGR GreeceES SpainFR FranceIE IrelandIT ItalyLU LuxembourgNL NetherlandsAT AustriaPT PortugalFI FinlandSE SwedenUK United KingdomJP JapanUS United States
Others
BIS Bank for International SettlementsBPM4 IMF Balance of Payments Manual (4th edition)BPM5 IMF Balance of Payments Manual (5th edition)CDs certificates of depositc.i.f. cost, insurance and freight at the importer’s borderCPI Consumer Price IndexECB European Central BankECU European Currency UnitEMI European Monetary InstituteESA 95 European System of Accounts 1995ESCB European System of Central BanksEU European UnionEUR eurof.o.b. free on board at the exporter’s borderGDP gross domestic productHICP Harmonised Index of Consumer PricesILO International Labour OrganizationIMF International Monetary FundMFIs Monetary Financial InstitutionsNCBs national central banksrepos repurchase agreementsSITC Rev. 3 Standard International Trade Classification (revision 3)
In accordance with Community practice, the EU countries are listed in this Bulletinusing the alphabetical order of the country names in the national languages.

ECB Annua l Repor t • 1999X

Foreword

ECB Annua l Repor t • 19992
This is the first ECB Annual Report coveringa full year of Eurosystem monetary policy. Italso deals with the other activities of theEurosystem and the European System ofCentral Banks.
Looking back on the first year of the euro,there are grounds for experiencing a senseof satisfaction. The single monetary policystarted under reasonably favourableconditions inherited as a result of soundpolicy measures adopted in the run-up tothe introduction of the euro. In addition, theEurosystem’s monetary policy strategyproved to be a valuable tool both for makingmonetary policy decisions and in explainingthese decisions to the general public.Throughout the year, the Eurosystem wastherefore able to focus on maintaining theenvironment of price stability, with inflationrunning on average at just over 1%. The factthat prices could be kept stable in the euroarea is an achievement that should not beunderestimated. An examination of the nottoo distant past should make that clear. Inthe past half century price stability has beenthe exception rather than the rule. TheEurosystem will, therefore, continue toexplain the importance of its primary
objective of maintaining price stability in theeuro area and its monetary policy willcontinue to be conducted with a view toachieving this objective. There are, however,limits to the power of monetary policy. Itcannot, for instance, prevent short-termfluctuations in price developments. Instead,monetary policy must focus on the mediumterm and be assessed from a medium-termperspective. Moreover, monetary policyneeds the support of sound fiscal policies, ofstructural policies that aim to ensure thatmarkets operate efficiently, as well as ofresponsible behaviour on the part of wagenegotiators.
The Eurosystem must act as a single unit andas a truly European body, which means thatdecisions always need to be taken from anarea-wide perspective. Monetary policy is oneand indivisible; it cannot react to situationsin individual countries or regions in the euroarea. In any monetary union of the size of theeuro area it is inevitable that inflation andother economic developments will not becompletely uniform across all the countriesinvolved. The existence of such differences,unless they exceed certain levels, should beseen as normal, as shown by the experiencein other large monetary unions, such as theUnited States. However, should differencesthreaten to become too large, the policyresponse can only be provided nationally, byfiscal policy, structural policies and theadaptability of the markets.
In late 1998 and during the first months of1999 the euro area economy experienced aslowdown in growth at a time when inflationwas already low. The financial crises in Asiaand Russia made themselves felt in Europe. Abroadly based assessment of the outlook forprice developments and the risks to pricestability, the second pillar of our monetarypolicy strategy, on balance pointed to furtherdownward pressure on prices. The first pillarof the strategy, a prominent role for moneywith an analysis of monetary growth relativeto its reference value, showed a rate ofgrowth of M3 of around 5% in early 1999.This was still relatively close to the reference

ECB Annua l Repor t • 1999 3
value of 4½%. It seemed likely that thechangeover to the euro itself had affectedmonetary growth in early 1999. It didnot appear, therefore, that monetarydevelopments in early 1999 implied a risk toprice stability in the medium term. Thus,taking the information of both pillarstogether, the Governing Council of the ECBdecided on 8 April to reduce the ECB’s mainrefinancing rate by 50 basis points, to 2.50%.Following this rate cut, nominal short-terminterest rates in the euro area were athistorically low levels. This contributed to anenvironment in which the growth potentialof the euro area could be exploited withoutendangering price stability.
In the course of 1999 downward risks toprice stability receded and upward risks cameto the fore, with their magnitude graduallyincreasing. The difference between thegrowth of money and its reference valuecontinued to widen, while credit granted tothe private sector grew by an annual rate inexcess of 10%. The liquidity in the euro areawas ample, while ECB interest rates wererelatively low. All these developments wereindicative of upward risks to price stability inthe medium term. At the same time, upwardpressures on prices came from the continuedrise in oil prices and from the depreciation ofthe euro exchange rate in an environmentwhere the economic outlook started tobrighten up. Therefore, both pillars of themonetary policy strategy pointed toincreasing risks to price stability in themedium term. On 4 November 1999 theGoverning Council raised the three mainECB interest rates by 50 basis points.Subsequently, on 3 February and 16 March2000, it was decided to increase theseinterest rates by a further 25 basis points ineach case. The timing of all these movesdemonstrated the forward-looking characterof the Eurosystem’s monetary policy; byacting before risks become reality, latersharper increases in interest rates can beavoided. Rather than nipping economicrecovery in the bud, such policy measurescontribute to creating one of the conditionsfor lasting strong economic growth.
The euro is new and the ECB and theEurosystem are young. Little more than ayear has passed since the euro wasintroduced. The actual introduction of theeuro, including the technical aspects of theprocess, went smoothly. The first few weeksof January 1999 saw the integration of themoney markets in the euro area. Theoperational framework of the Eurosystem,with its use of refinancing operations,standing facilities and a minimum reservesystem with an averaging provision,functioned remarkably well. Overnightinterest rates were generally very stablewithout the need to resort to fine-tuningoperations. The ECB conducted only onefine-tuning operation in early 2000 to mopup some excess liquidity after the successfultransition to the year 2000.
The Eurosystem is naturally taking a keeninterest in developments related to thepossible expansion of the euro area. That iswhy developments in EU Member Stateswhich have not yet adopted the euro areanalysed carefully. The Eurosystem values itswork with these Member States in theGeneral Council of the ECB. The Eurosystemalso closely monitors the process ofaccession of new Member States to theEuropean Union. Ultimately, these countrieshave to fulfil the convergence criteria andcan then adopt the euro. In this context, theEurosystem has established contacts with thecentral banks in all the accession countriesand is ready to contribute to the accessionprocess within its fields of competence.
So far, I have focused mainly on the activitiesof the ECB and the Eurosystem. However,immediately upon its launch the euro startedto have an impact on the financial sector as awhole, the euro area economy in general andthe global monetary system. The euroimmediately became the second mostimportant currency at the global level. Theimpact of the euro is ongoing and willincrease in scope in the years to come. Theeuro will change the euro area economy and,indeed, has already begun to do so. Existingtrends in the financial sector were boosted

ECB Annua l Repor t • 19994
by the launch of the euro. Generally speaking,the role of financial markets in the allocationof financial resources is growing relative tothe role of financial intermediaries. The depthand liquidity of capital markets are increasing.Some segments of the capital market whichhad previously been underdeveloped, such asthe corporate bond market, have grownsignificantly. In general, turnover in thefinancial markets was high, showing that theeuro was well received.
Greater integration of the capital markets isstill possible, and would be helped bymeasures to level the playing-field further.This also applies to the creation of a singlemarket for financial services. The Eurosystemhas, for example, emphasised the fact thatretail payment systems, which reduce thecosts and increase the speed of cross-borderpayments, have to be developed forimplementation no later than the date onwhich the euro banknotes and coins are putinto circulation.
Pressures to restructure mounted in 1999,as also evidenced by high merger andacquisition activity, and not only in thefinancial sector. In the financial sector alltypes of intermediaries and institutions, frombanks to stock exchanges, are affected, asare payment and securities settlementsystems. Although mergers and acquisitionsare often still national in character, this maywell change in the future. The euro stimulatescompetition by enhancing transparency, andcross-border comparisons become simplerwithin the euro area. This has a favourableeffect on the functioning of the Single Marketand thereby ultimately enhances economicwelfare. This process will be given a furtherboost by the introduction of euro banknotesand coins. The introduction of the euro alsoimplies that differences in the quality ofeconomic policies of countries in the euroarea are more easily exposed. This should beseen as an opportunity for governments tolearn from each other and to discover andadopt best practices. Structural changes inthe euro area are carefully monitored andanalysed by the Eurosystem, since they may
have an impact on the way in which and thespeed with which monetary policy measuresaffect the economic process and, in particular,inflation. From a more general perspective,an efficient and sound euro area financialsystem is important, since this also facilitatesthe conduct of monetary policy.
There are also some changes not directlyrelated to the introduction of the euro whichcall for the attention of the Eurosystem. Thedevelopment of electronic money impingeson all major central bank functions: monetarypolicy, the concern to maintain financialstability, banking supervision and theoversight of payment systems. TheEurosystem attaches great importance to theadoption of a sound regulatory frameworkfor issuers of electronic money. As thisAnnual Report goes to press, progress hasbeen made in this area in the European Union,but the current proposals for regulation leaveroom for further improvement. Thisconcerns, in particular, provisions to ensurethat only supervised credit institutions areallowed to issue significant amounts ofelectronic money, that the Eurosystem canextend its monetary policy instruments toissuers of electronic money, and thatelectronic money should always beredeemable at par value.
The transition to the new millennium turnedout to be a non-event, thanks largely to themeticulous preparations in many sectors,including the financial sector and theEurosystem. The euro got off to a good start,but making the euro and Economic andMonetary Union a success is clearly a long-term process. The Eurosystem will play itspart in endeavouring to ensure that success.Work in all the areas mentioned above, andin others, will continue this year and beyond,with a view to further establishing the euroand the Eurosystem, its infrastructure and itspolicy framework.
The economy of the euro area isnow entering a crucial phase. A goldenopportunity to achieve substantial reductionsin the level of unemployment throughout the
ECB Annua l Repor t • 1999 5
euro area and to revitalise the economy isarising, now that economic growth isaccelerating in a climate of price stability.This opportunity can only be seized if policy-makers make the right choices and theprivate sector is confident about the futureand thus dares to take initiatives. Firmlyfocusing on maintaining price stability in themedium term is the best contributionmonetary policy can make to reducingunemployment. At the same time, this wouldfurther enhance the credibility of theEurosystem and boost the confidence ofcitizens that their currency, the euro, willretain its value over time. In line with theStability and Growth Pact, budgetaryauthorities should reduce their budgetdeficits to close to balance, or even create
surpluses. Governments should translatetheir intentions to undertake structuralreforms enabling markets to operate moreflexibly into deeds and build on the measureswhich they have already taken. In wagenegotiations social partners should take intoaccount the importance of maintaining pricestability, the growth of productivity, the needto reduce unemployment and the fact thatdifferent local circumstances requiredifferentiated wage developments; weshould all consider the future as offeringopportunities to bring welfare to Europeancitizens; we should all seize theseopportunities, thereby fostering Europe’sdevelopment into a major dynamic force inthe world economy.
Frankfurt am Main, March 2000
Willem F. Duisenberg

ECB Annua l Repor t • 19996

Chapter I
Economic deve lopmentsand monetary po l i cy

ECB Annua l Repor t • 19998
I Monetary policy decisions in the context of the Eurosystem’sstrategy
In accordance with its statutory obligations,the primary objective of the Eurosystem is tomaintain price stability in the euro area. Inorder to achieve this objective, monetarypolicy decisions are taken in a forward-looking manner based on a stability-orientedstrategy. This strategy was adopted inOctober 1998 (see the article in the January1999 issue of the ECB Monthly Bulletinentitled “The stability-oriented monetarypolicy strategy of the Eurosystem”). Tosummarise, the Governing Council of the ECBannounced a quantitative definition of pricestability, namely an annual increase of below2% in the Harmonised Index of ConsumerPrices (HICP) for the euro area. It was alsostated that price stability is to be maintainedover the medium term. In order to assessthe outlook for price developments and therisks to future price stability, a two-pillarapproach was adopted. The first pillar assignsa prominent role to money, signalled by theannouncement of a reference value for thegrowth rate of a broad monetary aggregate.In December 1998 the reference value wasset at an annual growth rate of 4½% for M3.Monetary developments in relation to thereference value are analysed on an ongoingbasis for the information that they containregarding future price developments over themedium term. In the context of the secondpillar, a broadly based assessment isundertaken of other indicators containinginformation about the outlook for pricedevelopments and the risks to pricestability in the euro area. This assessmentencompasses a wide range of financial marketand other economic indicators, includingforecasts. Against this background, monetarypolicy does not react mechanically todevelopments in a single indicator or forecast.Rather, based on a thorough analysis of theinformation provided by the two pillars of itsstrategy, the Governing Council sets theinterest rates on the monetary policyinstruments of the Eurosystem at the levelwhich will best serve to maintain pricestability in the medium term.
The interest rates on the three mainmonetary policy instruments at the start ofStage Three of Economic and Monetary Union(EMU) were officially announced on22 December 1998. The decision followed aco-ordinated interest rate reduction by thenational central banks, decided upon earlierin December 1998, which had virtuallycompleted the process of convergence of theofficial interest rates in the countries thatnow form the euro area. On 22 December1998 the rate on the first main refinancingoperation to be conducted in 1999 was set at3.0%. In addition, the rate on the marginallending facility was set at 4.5% and that onthe deposit facility at 2.0%, both with effectfrom 1 January 1999. As a temporarymeasure, in order to smooth the transitionto a single money market, the GoverningCouncil of the ECB adopted a “narrowcorridor” for short-term market interestrates from 4 to 21 January 1999 by settingthe interest rates on the marginal lendingfacility and the deposit facility at 3.25% and2.75% respectively (see Chart 1 and thesection entitled “Chronology of monetarypolicy measures of the Eurosystem”).
In the first quarter of 1999 price pressurescontinued to be weak. HICP inflation stoodat 0.8% in December 1998 and remained atthat level in January and February 1999. Inthis environment of low inflation, signsemerged that the extent of the slowdown ofeconomic activity in the euro area – mainlycaused by weaker external demand – mightbe greater than had been anticipated inlate 1998. Figures on real GDP growthpointed to a significant economic slowdown.Furthermore, industrial production growthwas weakening and business confidence wasdeclining continuously. Therefore, it becameincreasingly clear at that time that the risksto price stability in the medium term weremainly on the downside.
However, in assessing the outlook for pricestability, it was also necessary to take into

9ECB Annua l Repor t • 1999
account the fact that some indicatorsappeared to point in the opposite directionin early 1999. In particular, the three-monthaverage of the annual growth rates of M3 forthe period from December 1998 to February1999 was around 5.0%, i.e. somewhat inexcess of the reference value. The Januarymonetary data showed a significant increasein overnight deposits. In addition, credit tothe private sector was growing fast, at a rateof around 10% in early 1999. Furthermore,despite the economic slowdown, consumerconfidence remained comparatively high.Finally, oil prices started to rise as from mid-February 1999 and the euro depreciated ineffective terms in the first few months of1999, two factors which were also able toexert upward pressure on prices.
The Governing Council was therefore facedwith some conflicting signals in early 1999.With regard to monetary developments,however, M3 growth was still close to thereference value of 4½%. In addition, itappeared that the special environmentresulting from the changeover to Stage Threeof EMU had contributed significantly to thesharp increase in overnight deposits inJanuary. The partial reversal in the growthof overnight deposits, which occurred
in February, strengthened this view.Furthermore, it could not be ruled out thatinstitutional factors, such as changes in thestatistical reporting systems and the move tothe new minimum reserve system, had playeda role in the exceptionally strong monetarygrowth in January. Therefore, given theuncertainties surrounding the analysis ofmonetary developments in early 1999 andthe modest deviation from the referencevalue, the Governing Council did not regardmonetary developments as implying upwardrisks to price stability at that time.
All in all, in an environment where currentinflation rates were significantly below the upperlimit of the Eurosystem’s definition of pricestability and in view of downward pressures onfuture price developments associated with aweakening in economic activity, the GoverningCouncil decided on 8 April to reduce the mainrefinancing rate by 50 basis points to 2.5%. Onthe same occasion it lowered the rate on themarginal lending facility by 100 basis pointsto 3.5% and that on the deposit facility by50 basis points to 1.5%, thereby establishing asymmetrical interest rate corridor aroundthe rate on the main refinancing operations.These policy moves were deemed appropriateas a precautionary measure to preserve price
marginal lending ratedeposit ratemain refinancing rate
one-month interest rate (EURIBOR)overnight interest rate (EONIA)
Q1 Q2 Q3 Q4 Q11999 2000
1.0
1.5
2.0
2.5
3.0
3.5
4.0
4.5
5.0
1.0
1.5
2.0
2.5
3.0
3.5
4.0
4.5
5.0
Chart 1ECB interest rates and money market rates(percentages per annum; daily data)
Sources: ECB and Reuters.

ECB Annua l Repor t • 199910
stability in the medium term and, in doing so,contribute to better exploiting the growthpotential of the euro area economy.
Later on in the year the balance of risksgradually moved from the downside to theupside. The three-month moving average ofthe annual rate of M3 growth followed agradually rising trend, approaching 6.0% overthe summer. Even when excluding theexceptional developments at the verybeginning of 1999, a protracted monetaryexpansion was evident. The annual growthrate of overnight deposits remained high. Inparallel, credit to the private sector continuedto expand rapidly, confirming that liquiditywas ample.
At the same time the external environmentstrengthened as the Asian economiesstabilised and then started to recover, whileconcerns about financial turmoil in otheremerging markets receded. In addition,economic activity in the United States showedcontinuing signs of strength. In thisenvironment, economic activity in the euroarea progressively recovered. The first signsof this process were observed in thesubstantial improvement in businessconfidence over the summer. Industrialproduction stabilised in the second quarterof 1999 and accelerated in the third quarter.The steady increase in bond yields over thesummer also signalled market expectationsof an improvement in long-term economicconditions, as well as some increase ininflation expectations. Overall, it graduallybecame clear that economic activity in theeuro area was set to accelerate significantlyin the course of 1999 and in the year 2000.Moreover, the effective exchange rate of theeuro weakened further and oil pricescontinued to rise, both of which weregradually feeding through to consumer prices.
It was therefore evident that the balance ofrisks to price stability had been progressivelymoving upwards since the beginning of thesummer and that the downside risks whichwere present at the time of the reduction inECB interest rates in April no longer
prevailed. Against this background, theGoverning Council decided on 4 November1999 to raise the rate on the main refinancingoperations by 50 basis points, to 3.0%. Onthe same occasion the rates on the depositfacility and the marginal lending facility werealso raised by 50 basis points, to 2.0% and4.0% respectively.
This change in the stance of monetary policywas expected to prevent the ample liquidityfrom translating into upward pressureson prices over the medium term andto contribute to maintaining inflationexpectations safely below 2%. It was alsoconsidered that such a timely rise in interestrates would contribute to avoiding the needfor stronger measures later on and, hence,would help to sustain non-inflationary growthover an extended period of time. The size ofthe move was also aimed at removinguncertainties about the near-term course ofmonetary policy, thereby contributing toreducing any uncertainty premia potentiallyprevalent in financial markets. In addition, itaimed to help contain a possible increase involatility in money markets in the period oftransition to the year 2000.
At its meeting on 2 December 1999 theGoverning Council reviewed the referencevalue for monetary growth, in accordancewith the announcement it had made inDecember 1998. It was decided to confirmthe reference value for monetary growth,namely an annual growth rate of 4½% for thebroad aggregate M3. This decision was takenon the grounds that the componentsunderlying the derivation of the firstreference value in December 1998, namelythe Eurosystem’s definition of price stability(an annual increase of below 2% in the HICPfor the euro area) and the estimates of trendreal GDP growth (2% to 2½%), as well as thetrend decline in M3 income velocity (½% to1%), had basically remained unchanged.
The Governing Council also decided that, asbefore, monetary developments would beassessed in relation to the reference value onthe basis of a three-month moving average of

11ECB Annua l Repor t • 1999
annual growth rates of M3. Furthermore, itre-emphasised that this assessment would bemade in parallel with the broadly basedassessment of the outlook for pricedevelopments constituting the second pillarof the Eurosystem’s strategy. Monetary policydecisions aimed at the maintenance of pricestability over the medium term would thuscontinue to be based on the informationobtained from both pillars of the strategy.Finally, it was decided henceforth to reviewthe reference value for money on a regularannual basis, with the next review to takeplace in December 2000.
In late 1999 and early 2000 monetary andcredit growth continued to signal ampleliquidity in the euro area. At the same time,
developments in the exchange rate and incommodity prices continued to contribute toincreases in import prices and costs in theeuro area. As such increases were larger andmore protracted than previously foreseen,the risk of second round effects on consumerprices rose significantly, particularly at a timewhen economic activity in the euro area waspicking up strongly. As both of the pillars ofthe monetary policy strategy of theEurosystem were seen to indicate upwardrisks to price stability, the Governing Councilof the ECB decided twice, on 3 February and16 March 2000, to raise the interest rates onthe main refinancing operations, the depositfacility and the marginal lending facility by 25basis points in each case.
Q1 Q2 Q3 Q4 Q1 Q2 Q3 Q4 Q1 Q2 Q3 Q4 1997 1998 1999
3.0
4.0
5.0
6.0
7.0
3.0
4.0
5.0
6.0
7.0
M3 M3 (three-month centred moving average) reference value (4 1/2%)
Chart 2M3 growth in the euro area(annual percentage changes)
Source: ECB.
2 Monetary and financial developments
2.1 Monetary developments
M3 growth in excess of the reference value
The annual growth rate of the broad monetaryaggregate M3 increased gradually throughout1999. The three-month average of the annual
growth rates of M3, covering the period fromOctober to December, stood at 6.0% (seeChart 2). This compares with 4.8% in the lastquarter of 1998. Accordingly, M3 growthincreasingly deviated from the reference valueof 4½%. On average in 1999 M3 grew by 5.7%,compared with 4.9% in 1998 and 4.1% in 1997.

ECB Annua l Repor t • 199912
The monetary expansion in 1999 was fosteredby the low level of opportunity costs ofholding, in particular, the most liquidcomponents of M3. Moreover, the economicupturn in the euro area is likely to havespurred money demand for transactionpurposes. Furthermore, one-off portfolioreallocations relating to the introduction ofthe euro and the new reserve requirementregime appear to have affected M3 growth atthe beginning of the year. Overall, themonetary expansion reflected ample liquidityfor most of 1999.
Turning to the individual components of M3,the growth of currency in circulationrecovered in 1999, after having been verysubdued in the previous year. In the fourthquarter of 1999 the annual increase ofcurrency in circulation reached 6.4%,compared with only 0.4% in the last quarterof 1998 and 2.7% in the last quarter of 1997(see Chart 3). The economic upswing andthe low opportunity costs of holdingbanknotes may have supported this upwardtrend. In addition, a temporary rise in theprecautionary demand for currency was
recorded shortly before the transition to theyear 2000.
Overnight deposits grew at a very rapid pacein 1999, although the rate of expansionmoderated somewhat in the last part of theyear. In the last quarter of 1999 the annualrate of increase stood at 12.7%, comparedwith 10.6% in the fourth quarter of 1998 and9.3% in the corresponding period of 1997. Asurge in the demand for overnight depositsoccurred in January 1999, reflecting thespecific circumstances prevailing at the startof EMU. In addition, the low levels of inflationand interest rates and the resulting lowopportunity costs of holding overnightdeposits, as well as the economic upswing inthe euro area may explain the relativelystrong demand for overnight deposits in1999.
By contrast, as in previous years, short-termdeposits other than overnight deposits(namely deposits redeemable at a period ofnotice of up to three months and depositswith an agreed maturity of up to two years)showed a rather subdued expansion in 1999.
Q1 Q2 Q3 Q4 Q1 Q2 Q3 Q4 Q1 Q2 Q3 Q41997 1998 1999
-10
-5
0
5
10
15
20
-10
-5
0
5
10
15
20
currency in circulationovernight deposits
other short-term depositsmarketable instruments
Chart 3Components of M3 in the euro area(annual percentage changes)
Source: ECB.

13ECB Annua l Repor t • 1999
In the last quarter of 1999 the annual rate ofincrease was 1.7%, compared with 2.6% inthe fourth quarter of 1998 and 1.1% in thecorresponding period of 1997. The apparentlylow level of attractiveness of these othershort-term deposits for investors may berelated to the fact that the spread betweenthe interest rate on these deposits and thaton overnight deposits narrowed significantlyin the first three quarters of the year andremained comparatively low thereafter.Moreover, the steepening of the yield curvein 1999 may have been accompanied by shiftstowards investments in longer-term financialassets. In addition, in some countries portfolioshifts out of these other short-term depositswere probably related to a significant declinein inflation expectations over recent years.
After having dropped significantly at the endof 1998 and the beginning of 1999, thedemand for the other instruments includedin M3 (negotiable instruments and repurchaseagreements) recovered significantlythroughout 1999. In the last quarter of 1999the annual growth rate stood at 5.2%,compared with 2.5% in the last quarter of1998 and 7.3% in the last quarter of 1997.The recovery in the course of 1999 wasmainly due to a significant increase in thegrowth of both money market fund sharesand debt securities issued with a maturityof up to one year. The demand for thesecomponents may have been temporarilyspurred by uncertainties in financial markets,in particular in late summer and autumn,regarding the future development of bondyields. Under such circumstances short-termmarketable assets, which are relatively liquidand offer a return higher than that ondeposits with an agreed maturity of up totwo years, are often used to park funds forsome time. Moreover the attractiveness ofthese instruments was increased by the risein short-term market rates after the end ofSeptember. Balance of payments statistics forsome euro area countries suggest that thegrowth of money market fund shares andmoney market paper as well as of debtsecurities in 1999 was partly a result ofpurchases of these instruments by non-euro
area residents. Although the concept of M3only refers to monetary holdings of euro arearesidents, statistical limitations do not, at thecurrent stage, permit negotiable securitiesissued by MFIs and held by non-residentsto be identified separately. While thissuggests that some caution should beexercised when interpreting the developmentof these marketable instruments, the overallassessment of monetary growth in 1999 isjudged not to be significantly affected.
In January 2000 the annual rate of M3 growthfell significantly, to 5.0%, from 6.2% inDecember 1999. However, this was mainlythe result of a base effect, i.e. the fact thatowing to the special environment at the startof Stage Three of EMU the monthly increasein M3 in January 1999 was exceptionallystrong.
Strong expansion of credit
Turning to the counterparts of M3 in theconsolidated balance sheet of the MFI sector,the annual rate of expansion of credit tohouseholds and corporations was between10% and 11% for most of the year. Amongthe components of credit to the privatesector, the outstanding amount of loans(which accounts for around 90% of totalcredit to the private sector) grew at an annualaverage rate of 10.0% in 1999 and it continuedto expand strongly in January 2000 (at 8.7%on an annual basis). This compares withannual average growth rates of 8.3% in 1998and 6.6% in 1997. Data on the breakdown ofMFI loans to euro area residents bycounterpart sector, type of loan and originalmaturity indicate that this strong expansionof loans was broadly based across the privatesector.
The dynamic expansion of loans tohouseholds and corporations probably mainlyreflected the low level of bank lending interestrates compared with historical experienceand the pick-up in economic activity in theeuro area. In the first half of the year retaillending interest rates for all types of loans

ECB Annua l Repor t • 199914
continued on the declining trend which hadbeen apparent over previous years (seeChart 4). Subsequently, interest rates onloans for house purchase and longer-termloans to enterprises showed a rising trend,reflecting, with a time-lag, the increase incapital market interest rates which began inMay 1999. Towards the end of 1999 thehigher interest rates in money markets, whichanticipated some tightening in monetarypolicy, led to a moderate increase in banklending rates on consumer loans and short-term loans to enterprises. The fact that thegrowth of loans remained strong despiterising interest rates suggests that the pick-upin economic activity is likely to have playedan important role in sustaining the highgrowth of loans to the private sector in thelatter part of 1999, although there may alsohave been some frontloading of borrowingduring this period owing to expectations onthe part of private agents of further increasesin bank lending rates. Other contributingfactors in 1999 were the intense merger andacquisition activity (see Section 2.2), whichtended to be partly financed by short andmedium-term loans, and the interactionbetween mortgage loans and rapidly rising
real estate prices in some euro areacountries.
The growth of credit to general governmentremained subdued throughout 1999, at anannual average rate of 1.1%. This slow rate ofgrowth occurred both in loans and in MFIholdings of government debt securities andwas in line with the diminished financingneeds of the general government sectorobserved in 1999.
As regards other counterparts of M3, longer-term financial liabilities of the MFI sector grewat a relatively strong pace in 1999 (an annualgrowth rate of 7.3% was recorded in thefourth quarter, compared with 4.7% in thelast quarter of 1998), in line with thesteepening of the yield curve.
Finally, during 1999 the net external assetposition of the MFI sector declinedsignificantly on an annual basis (by€166 billion). The decline mirrored the factthat overall the transactions of euro areanon-MFI residents with non-euro arearesidents resulted in a net outflow of funds.
Q1 Q2 Q3 Q4 Q1 Q2 Q3 Q4 Q1 Q2 Q3 Q4 1997 1998 1999
4.0
5.0
6.0
7.0
8.0
9.0
10.0
11.0
12.0
4.0
5.0
6.0
7.0
8.0
9.0
10.0
11.0
12.0
loans to the private sectorretail rate on loans to enterprises up to one yearretail rate on loans to enterprises over one year
retail rate on consumer creditretail rate on housing loans
Chart 4Loans to the private sector and retail interest rates(loans: annual percentage changes; interest rates in percentages per annum)
Source: ECB.
15ECB Annua l Repor t • 1999
2.2 Financial markets
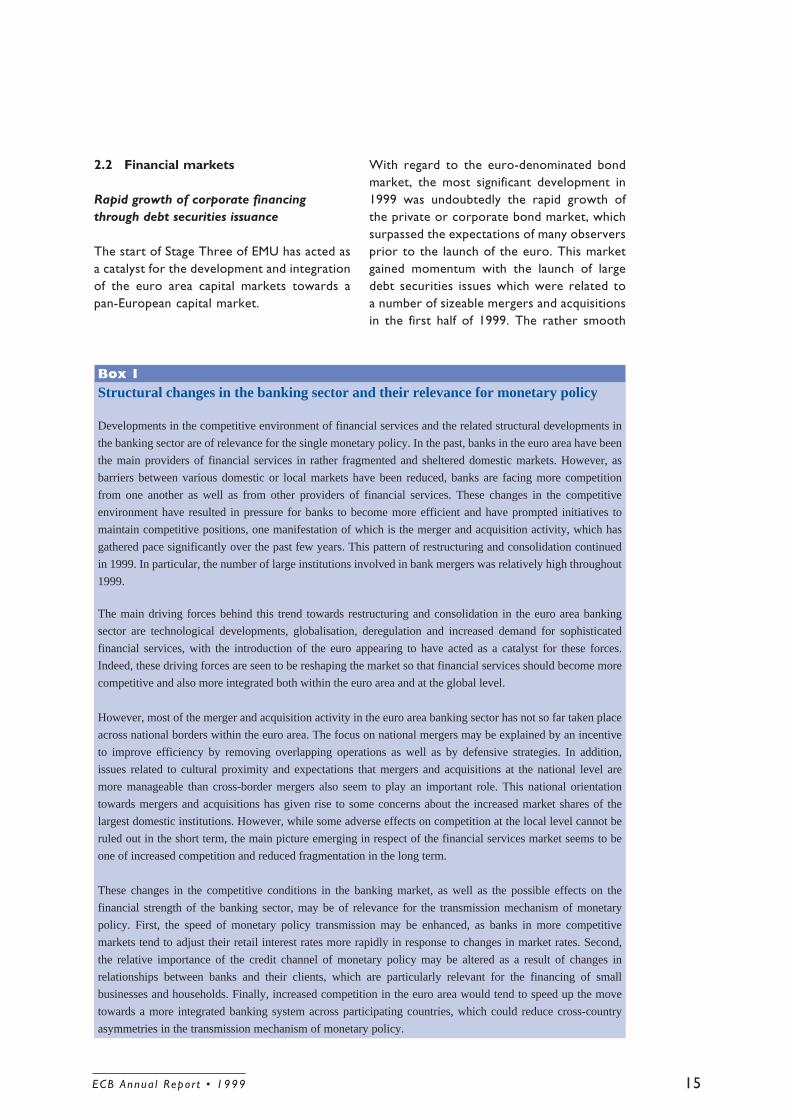
Rapid growth of corporate financingthrough debt securities issuance
The start of Stage Three of EMU has acted asa catalyst for the development and integrationof the euro area capital markets towards apan-European capital market.
With regard to the euro-denominated bondmarket, the most significant development in1999 was undoubtedly the rapid growth ofthe private or corporate bond market, whichsurpassed the expectations of many observersprior to the launch of the euro. This marketgained momentum with the launch of largedebt securities issues which were related toa number of sizeable mergers and acquisitionsin the first half of 1999. The rather smooth
Box 1Structural changes in the banking sector and their relevance for monetary policy
Developments in the competitive environment of financial services and the related structural developments in
the banking sector are of relevance for the single monetary policy. In the past, banks in the euro area have been
the main providers of financial services in rather fragmented and sheltered domestic markets. However, as
barriers between various domestic or local markets have been reduced, banks are facing more competition
from one another as well as from other providers of financial services. These changes in the competitive
environment have resulted in pressure for banks to become more efficient and have prompted initiatives to
maintain competitive positions, one manifestation of which is the merger and acquisition activity, which has
gathered pace significantly over the past few years. This pattern of restructuring and consolidation continued
in 1999. In particular, the number of large institutions involved in bank mergers was relatively high throughout
1999.
The main driving forces behind this trend towards restructuring and consolidation in the euro area banking
sector are technological developments, globalisation, deregulation and increased demand for sophisticated
financial services, with the introduction of the euro appearing to have acted as a catalyst for these forces.
Indeed, these driving forces are seen to be reshaping the market so that financial services should become more
competitive and also more integrated both within the euro area and at the global level.
However, most of the merger and acquisition activity in the euro area banking sector has not so far taken place
across national borders within the euro area. The focus on national mergers may be explained by an incentive
to improve efficiency by removing overlapping operations as well as by defensive strategies. In addition,
issues related to cultural proximity and expectations that mergers and acquisitions at the national level are
more manageable than cross-border mergers also seem to play an important role. This national orientation
towards mergers and acquisitions has given rise to some concerns about the increased market shares of the
largest domestic institutions. However, while some adverse effects on competition at the local level cannot be
ruled out in the short term, the main picture emerging in respect of the financial services market seems to be
one of increased competition and reduced fragmentation in the long term.
These changes in the competitive conditions in the banking market, as well as the possible effects on the
financial strength of the banking sector, may be of relevance for the transmission mechanism of monetary
policy. First, the speed of monetary policy transmission may be enhanced, as banks in more competitive
markets tend to adjust their retail interest rates more rapidly in response to changes in market rates. Second,
the relative importance of the credit channel of monetary policy may be altered as a result of changes in
relationships between banks and their clients, which are particularly relevant for the financing of small
businesses and households. Finally, increased competition in the euro area would tend to speed up the move
towards a more integrated banking system across participating countries, which could reduce cross-country
asymmetries in the transmission mechanism of monetary policy.

ECB Annua l Repor t • 199916
and rapid way in which the euro-denominatedcorporate bond market proved able toabsorb these issues was widely regarded asan important sign of the increased depth ofthis market. In particular, the issuance ofeuro-denominated debt securities by privatenon-financial corporations and private utilitycompanies increased in 1999 compared with1998. According to commercial data sources,the largest private issuers of debt securitiesin 1999 were banks, which accounted forthe bulk of total private sector issuancevolume, followed respectively by non-financialcorporations, other financing companiesand utility companies. Taking a globalperspective, the growth of net issuance ofeuro-denominated debt securities during1999 was particularly strong when comparedwith US dollar denominated debt securitiesissuance. Yen-denominated issuance alsoexperienced a strong recovery in 1999 whencompared with 1998.
One of the most important factors behindthe growth in the euro-denominatedcorporate bond market has been the ongoingprocess of corporate restructuring in Europe,which has resulted in a strong demand forfunds in the private corporate sector. Ingeneral, merger and acquisition activitiesundertaken by euro area companies grewconsiderably in 1999, for both the bankingand the non-banking industry (see Box 1).Euro area companies involved in merger andacquisition activities and operations such asleveraged buyouts – in which the takeover ofa company is financed through the issuanceof high-yield bonds – financed these deals, toa significant extent, with large euro-denominated debt securities issues, whichoften served to repay bridging facilities(mainly syndicated loans). This led to somevery large issues, unprecedented in thehistory of European capital markets. Thesignificant growth in private euro-denominated debt securities issuance wasaccompanied by a reduction in the relativeimportance of the public sector in the debtsecurities markets in 1999, which alsoreflected the relatively smaller increases inthe financing needs of the public sector in
1999 compared with previous years. Inaddition, a shift in demand towards higherrisk securities in order to obtain higherreturns owing to the historically low levels ofinterest rates also seemed to play asupportive role in the growth of corporatedebt securities issuance.
As discussed in the article in the January 2000issue of the ECB Monthly Bulletin entitled“The euro area one year after theintroduction of the euro: key characteristicsand changes in the financial structure”, therewere a number of notable developments inthe euro area capital markets during 1999.These included closer co-operation betweennational stock exchanges and thedevelopment of electronic trading platformsin both bond and stock markets.
Money market rates mirroring ECB interestrates
In 1999 the ECB managed to steer short-term money market rates by means of theinterest rate which was applied to the mainrefinancing operations. The overnight interestrate, as measured by the EONIA (the “euroovernight index average”), was generally veryclose to the rate applied to the mainrefinancing operations, the average spreadbetween the two rates being equal to 3 basispoints in 1999 (see Chart 1). The volatility ofthe EONIA rate was relatively low. Somewhatlarger fluctuations were normally onlyrecorded towards the end of the reservemaintenance periods, which is when theminimum reserve constraint on the bankingsystem becomes binding. In view of the steadypattern of the EONIA rate, the ECB saw noneed to conduct fine-tuning open marketoperations in the course of 1999.
Other money market rates were equallystable, apart from episodes when marketparticipants anticipated a move in ECBinterest rates or, towards the end of theyear, when short-term interest rates rose onaccount of market concerns related to thetransition to the year 2000.
17ECB Annua l Repor t • 1999
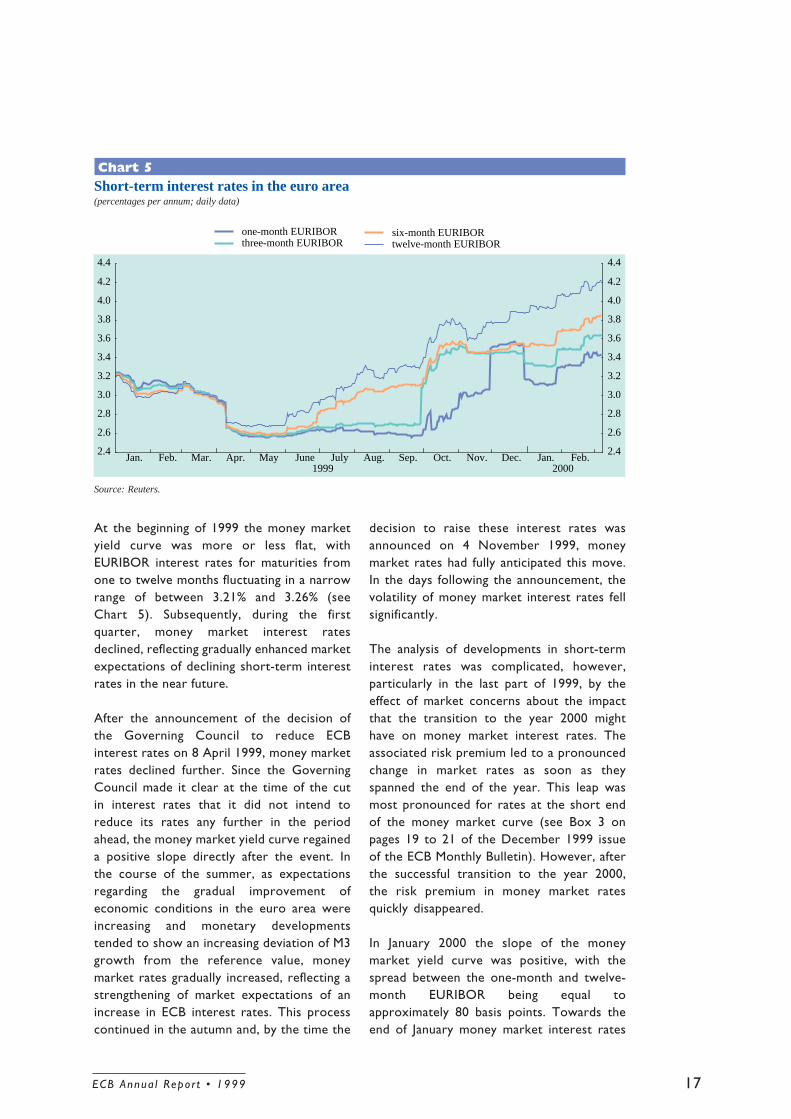
At the beginning of 1999 the money marketyield curve was more or less flat, withEURIBOR interest rates for maturities fromone to twelve months fluctuating in a narrowrange of between 3.21% and 3.26% (seeChart 5). Subsequently, during the firstquarter, money market interest ratesdeclined, reflecting gradually enhanced marketexpectations of declining short-term interestrates in the near future.
After the announcement of the decision ofthe Governing Council to reduce ECBinterest rates on 8 April 1999, money marketrates declined further. Since the GoverningCouncil made it clear at the time of the cutin interest rates that it did not intend toreduce its rates any further in the periodahead, the money market yield curve regaineda positive slope directly after the event. Inthe course of the summer, as expectationsregarding the gradual improvement ofeconomic conditions in the euro area wereincreasing and monetary developmentstended to show an increasing deviation of M3growth from the reference value, moneymarket rates gradually increased, reflecting astrengthening of market expectations of anincrease in ECB interest rates. This processcontinued in the autumn and, by the time the
decision to raise these interest rates wasannounced on 4 November 1999, moneymarket rates had fully anticipated this move.In the days following the announcement, thevolatility of money market interest rates fellsignificantly.
The analysis of developments in short-terminterest rates was complicated, however,particularly in the last part of 1999, by theeffect of market concerns about the impactthat the transition to the year 2000 mighthave on money market interest rates. Theassociated risk premium led to a pronouncedchange in market rates as soon as theyspanned the end of the year. This leap wasmost pronounced for rates at the short endof the money market curve (see Box 3 onpages 19 to 21 of the December 1999 issueof the ECB Monthly Bulletin). However, afterthe successful transition to the year 2000,the risk premium in money market ratesquickly disappeared.
In January 2000 the slope of the moneymarket yield curve was positive, with thespread between the one-month and twelve-month EURIBOR being equal toapproximately 80 basis points. Towards theend of January money market interest rates
Jan. Feb. Mar. Apr. May June July Aug. Sep. Oct. Nov. Dec. Jan. Feb.1999 2000
2.4
2.6
2.8
3.0
3.2
3.4
3.6
3.8
4.0
4.2
4.4
2.4
2.6
2.8
3.0
3.2
3.4
3.6
3.8
4.0
4.2
4.4
one-month EURIBORthree-month EURIBOR
six-month EURIBORtwelve-month EURIBOR
Chart 5Short-term interest rates in the euro area(percentages per annum; daily data)
Source: Reuters.

ECB Annua l Repor t • 199918
moved upwards, in anticipation of thedecision to raise ECB interest rates whichwas announced on 3 February 2000. In thecourse of February, money market interestrates gradually increased further.
Long-term bond yields increase fromhistorical lows as growth prospects brighten
Following the prolonged decline in long-terminterest rates which was observed inindustrialised countries throughout much ofthe 1990s, long-term government bond yieldsin the euro area reached their lowest levelsfor the past 50 years in early 1999 (seeChart 6(a)). From May 1999 onwards,however, they began to edge upwards, initiallyled by bond yield increases in the UnitedStates and by an increase in inflationexpectations from the very low levelsprevailing in early 1999, but later onincreasingly due to brighter economicprospects for the euro area. Overall, in theeuro area, ten-year bond yields increased bymore than 150 basis points in 1999, reachinga level of around 5.5% by the end of the year.Similarly, in the United States the ten-yearbond yield rose by around 180 basis points,to around 6.5%, in 1999. As a result of thesedevelopments the spread between US andeuro area ten-year bond yields widenedslightly during 1999, reaching 100 basis pointsby the end of the year. In Japan developmentsin long-term bond yields differed somewhatfrom the euro area and the United States.Following initial declines from the relativelyhigh levels reached in the aftermath of thefinancial turbulence in late 1998, Japaneselong-term yields seemed to stabilise at a levelbelow 2% in the second half of 1999. Betweenthe end of 1998 and the final trading day of1999, the ten-year bond yield in Japandeclined by approximately 40 basis points, toaround 1.6%.
The main factor underlying developments inglobal bond markets in 1999 was a pick-up inworldwide growth expectations as concernsof a prolonged global growth downturn,which had existed in the financial markets as
Source: Reuters.Note: Long-term government bond yields refer to ten-year bondsor to the closest available bond maturity.
Chart 6
(a) Long-term government bond yields in theeuro area, the United States and Japan(percentages per annum; daily data)
(b) Ten-year interest rate differential of the UnitedStates against the euro area(percentages per annum; daily data)
1995 1996 1997 1998 19990.0
2.0
4.0
6.0
8.0
10.0
0.0
2.0
4.0
6.0
8.0
10.0
euro area United States Japan
1995 1996 1997 1998 1999-3.0
-2.0
-1.0
0.0
1.0
2.0
-3.0
-2.0
-1.0
0.0
1.0
2.0
a result of the financial turbulence of 1998,began to recede. The US economy continuedto grow at a remarkable pace throughout1999 and, although there were few visiblesigns of rising inflation, the increasingtightness in the labour market resulted ingrowing concerns in financial markets thatthe US economy was growing at a rate thatmight lead to inflationary pressures in the
19ECB Annua l Repor t • 1999
economy. To a large extent, thesedevelopments contributed to the substantialincrease in US long-term bond yieldswitnessed throughout 1999. In addition,although a further improvement in the fiscalsituation in the United States may havereduced the pressures on capital marketsfrom the public sector, a sizeable increase incorporate bond issuance in the United Statesduring the year may have placed upwardpressure on US bond yields.
By contrast with developments in the UnitedStates, long-term bond yields in the euro arearemained broadly stable in the first fourmonths of 1999, reflecting the more sluggishpace of economic recovery and the subduedinflationary pressures in the euro area whichwere reflected in the decision of theGoverning Council of the ECB to lowerinterest rates in April. Apart from theaforementioned spillover effect of thecontinued rise in US bond yields, it seemslikely that part of the gradual increase inbond yields as from May resulted from theunwinding of the safe-haven portfoliopositions that had been built up during 1998,as well as an increase in inflation expectationsfrom the very low levels prevailing in early1999 in the wake of the financial turbulenceof the previous year. Developments in thepricing of French index-linked bonds at thistime appeared to be consistent with thosefactors behind the increase in nominal bondyields (see Box 2). In addition, as was thecase in the United States, a significant increasein the level of corporate bond issuanceactivity in the euro area may have put upwardpressure on long-term bond yields. However,the increase in euro area bond yields in Mayand the first half of June 1999 was much lesspronounced than in the United States,reflecting differences in cyclical positions,leading to a substantial widening of the long-term interest rate differential vis-à-vis theUnited States up to a maximum level ofalmost 160 basis points in mid-June. Later on,as increasing signs of an economic recoveryin the euro area appeared, the spreadbetween US and euro area long-term bondyields narrowed rapidly (see Chart 6(b)).
Until the end of October 1999 long-termbond yields in the euro area continued tofollow an upward trend. As from the end ofOctober, growing expectations in capitalmarkets that ECB interest rates were to beraised in a context of increasing evidence ofupward price pressures, and the subsequentdecision on 4 November, temporarily led tosignificant declines in long-term bond yields.This seemed to suggest that, as a result ofthe decision to raise interest rates, marketparticipants had revised their long-terminflation expectations downwards andlowered the magnitude of the inflation riskpremium required for holding euro-denominated bonds. However, during theremainder of 1999 euro area bond yieldsedged up again, partly following upwardmovements in long-term yields in the UnitedStates and partly in response to furtherpositive news regarding the outlook for theeuro area economy. As a result of the morepronounced increases in US bond yields, theyield differential vis-à-vis the United Statesbegan to increase again in November andDecember.
The developments described above were alsoreflected in movements in the euro area yieldcurve throughout 1999. Between the firstand the last trading day of 1999 the slope ofthe yield curve, as measured by the differencebetween ten-year euro area bond yields andthe three-month EURIBOR interest rate,increased by around 140 basis points to 215basis points. The main part of this increasetook place during the first nine months of1999. Since the yield curve typically becomessteeper in advance of a pick-up in the pace ofeconomic activity, the observed steepeningof the euro area yield curve in 1999 seemedmainly to reflect increasing optimism on thepart of market participants about futureeconomic prospects and an increase ininflation expectations from the very low levelsprevailing in early 1999. However, cautionshould be exercised when interpreting overallyield curve movements, as other factors, suchas the unwinding of safe-haven portfoliopositions and spillovers from US bondmarkets may also have influenced long-term

ECB Annua l Repor t • 199920
Box 2Assessing the factors behind the rise in nominal bond yields using index-linkedbonds
In order to assess how various underlying factors may have influenced nominal long-term bond yields in the
euro area in 1999, it is useful to remember that, broadly speaking, the nominal yield on a government bond
with a specified time to maturity can be broken down into three elements. These are the real interest rate
required by investors for holding the bond until it matures, compensation for the average expected inflation
rate during the life of the bond, and a component associated with term or risk premia linked to, inter alia,
uncertainty about future rates of inflation. The yield on index-linked bonds can assist in producing this
breakdown. The differential between a long-term bond yield and the real yield available on an index-linked
bond of the same maturity is generally known as the “break-even” inflation rate. This is because with this rate
of inflation, the expected return to an investor will be the same regardless of whether the investment is made in
a fixed nominal income or an index-linked bond.
However, the break-even inflation rate is not a direct measure of inflation expectations because it does not take
into account the role of various risk premia. On the one hand, the break-even rate tends to over-estimate
expected inflation since the yield on the nominal bond usually contains an inflation risk premium. On the other
hand, the lower level of liquidity that usually characterises index-linked bond markets implies that the real
yield on index-linked bonds may incorporate a liquidity premium. The only index-linked bonds that exist in
the euro area were issued by the French Treasury with 10-year and 30-year maturities. The break-even
inflation rate of these bonds refers to a specific measure of the French Consumer Price Index (CPI), namely
the CPI excluding tobacco, and does not refer to the euro area HICP. These properties illustrate the limitations
of this indicator for evaluating developments in the euro area.
Nevertheless, bearing these caveats in mind, developments in 1999 in the pricing of ten-year index-linked
bonds issued by the French Treasury provided some indications that both improved growth expectations and
changes in inflation expectations may have played important roles in determining movements in nominal
long-term interest rates during the year. Between the end of 1998 and the end of 1999 the real interest rate
available on the ten-year French index-linked bond increased by around 50 basis points. At the same time, the
Break-even inflation rate calculated for the French CPI(in percentages; daily data)
Sources: French Treasury, ISMA and Reuters.Note: The real bond yields are derived from the market prices of French bonds which are indexed to the French CPI (excludingtobacco) and mature in 2009. The nominal bond yields are derived from the market prices of French fixed income bonds whichalso mature in 2009.
Q4 Q1 Q2 Q3 Q4 Q11999 20001998
0
1
2
3
4
5
6
0
1
2
3
4
5
6
break-even inflation rate nominal bond yield real bond yield

21ECB Annua l Repor t • 1999
ten-year break-even inflation rate increased by approximately 110 basis points from the extraordinarily low
levels observed in early 1999, at a time when risks to price stability were perceived to be mainly on the
downside (see the chart above).
It is worth noting that the rise in the real yield and the increase in the break-even inflation rate occurred during
different periods of 1999. While the break-even inflation rate increased steadily in the second quarter and
levelled off after June, the real interest rate increased mainly in the second half of the year. This suggests that
the increases in nominal euro area bond yields were initially attributable more to inflation expectations
increasing from very low levels than to increasing real rates. However, the unwinding of the safe-haven
portfolio positions from emerging markets that had been built up during 1998 might also help to explain part
of the increase in long-term interest rates in the first half of 1999, since they may have artificially compressed
the break-even inflation rates prevailing in the early months of 1999. Spillovers from rising bond yields in the
United States may, at times, also have played a role in this rise in break-even inflation rates in the first half of
1999. Later on, as more and more signs of an economic recovery appeared, the rise in nominal bond yields
related more to increasing long-term real interest rates, while the break-even inflation rate remained stable.
interest rate developments in the euro areain 1999.
In the first half of January 2000 euro areabond yields showed some limited increases,mainly as a result of spillovers coming fromUS bond markets, where yields rosesignificantly. Subsequent to this, bond yieldsin the euro area remained broadly stable forthe rest of January and throughout thefollowing month. At the same time, thedifferential between euro area and US long-term interest rates was somewhat volatileand did not exhibit any discernible trend inearly 2000.
Global stock prices increase significantly
In 1999 stock prices in industrialisedeconomies showed large increases, continuingthe upward trend observed over previousyears (see Chart 7). A very large increasewas seen in the euro area, where by the endof December 1999 the Dow Jones EUROSTOXX index stood 40% above end-1998levels. In the United States, by the end ofDecember 1999 the Standard and Poor’s 500index was 19% above end-1998 levels, whilein Japan a significant increase of 37% was alsoobserved for the Nikkei 225 index. The mainfactor underlying developments in globalstock markets during 1999 seemed to have
been improving market assessments of futureglobal growth prospects.
Throughout most of 1999 the evolution ofglobal stock market developments provideda supportive environment for stock pricedevelopments in the euro area. The principalsource of the increase in US stock pricesseemed to be favourable expectations offuture corporate earnings growth, linked tothe robust pace of activity in the US economy.In particular, optimism about the long-termearnings growth prospects for high-technology firms played an important role.Against this background, the NasdaqComposite index (which contains a highproportion of technology stocks) increasedby 86% in 1999.
Japanese stock prices appeared to benefitfrom increasing optimism about the prospectsfor future corporate earnings growth linkedto a recovery in the Japanese economyparticularly during the first half of 1999,before stabilising in the second half of 1999.At the same time the decline in long-termgovernment bond yields in Japan seemed tohave played a supportive role in the increasein Japanese stock prices, as did thedepreciation of the Japanese yen vis-à-vis theUS dollar during the first half of 1999,particularly with regard to the stock pricesof export-oriented companies.

ECB Annua l Repor t • 199922
Q1 Q2 Q3 Q4 Q1 Q2 Q3 Q4 Q1 Q2 Q3 Q4 Q11997 1998 1999
40
60
80
100
120
140
160
40
60
80
100
120
140
160
euro area United States Japan
Stock prices in the euro area remained relativelysubdued in the first few months of 1999,reflecting the sluggish pace of economicrecovery in the euro area. Later on, asexpectations regarding the pace of future activitybegan to improve, stock prices in the euro areastarted to edge upwards. The resilience of thisincrease to the parallel increases in long-termbond yields in the euro area was notable andappeared to indicate strong underlyingexpectations for corporate profitability anddividend growth in the euro area. Theimprovement in stock prices was initially moreapparent for those firms with a higher degreeof exposure to the external economicenvironment than in the stock prices of firmswith a more domestic orientation. To the extentthat larger firms tend to have a higher degreeof exposure to the external economicenvironment, this was indicated by the strongerperformance of the Dow Jones EURO STOXX50 index, which is composed of largecorporations, compared with that of the broadDow Jones EURO STOXX index.
In the second half of 1999, as marketparticipants became more optimistic with
regard to the prospects for domestic demandgrowth in parallel with improvements inbusiness and consumer confidence, stockprice increases became more broadly basedacross the different sectors of the economy.Towards the end of the year, particularlyafter mid-October, relatively sharp stockprice increases were seen in the technologyand telecommunications sectors. In thesesectors, by the end of 1999, stock prices hadincreased by 134% and 105% respectivelycompared with the end of 1998, whichcontributed significantly to aggregate euroarea stock price increases. Increases in thetechnology and telecommunications sectorsseemed to be partly linked to favourableprofit growth expectations followingcorporate restructuring and mergers andacquisitions activity in these sectors andsignificant expansion of the internet business.
In the period from end-1999 to 7 March 2000contrasting developments were seen ininternational stock markets. While stockprices in the United States, as measured bythe Standard and Poor’s 500 index, declinedby 8%, in Japan the Nikkei 225 index rose by
Chart 7Stock price indices in the euro area, the United States and Japan(1 January 1999 = 100; daily data)
Source: Reuters.Note: Dow Jones EURO STOXX broad (stock price) index for the euro area, Standard and Poor’s 500 for the United States andNikkei 225 for Japan.
23ECB Annua l Repor t • 1999
5%, while in the euro area the Dow JonesEURO STOXX index rose by 11%. Continuingthe trend that became evident in the lattermonths of 1999, stock prices in thetechnology sector of the euro area rose by36% during this period and made a significant
3 Price developments
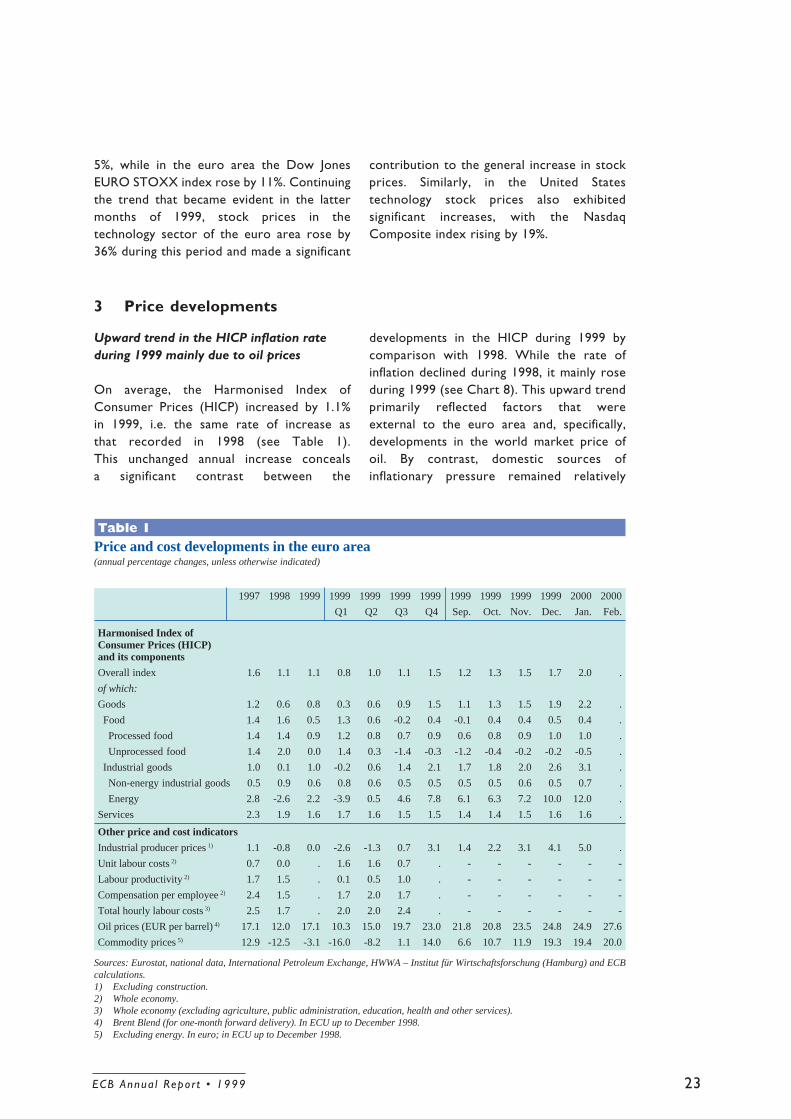
Upward trend in the HICP inflation rateduring 1999 mainly due to oil prices
On average, the Harmonised Index ofConsumer Prices (HICP) increased by 1.1%in 1999, i.e. the same rate of increase asthat recorded in 1998 (see Table 1).This unchanged annual increase concealsa significant contrast between the
developments in the HICP during 1999 bycomparison with 1998. While the rate ofinflation declined during 1998, it mainly roseduring 1999 (see Chart 8). This upward trendprimarily reflected factors that wereexternal to the euro area and, specifically,developments in the world market price ofoil. By contrast, domestic sources ofinflationary pressure remained relatively
contribution to the general increase in stockprices. Similarly, in the United Statestechnology stock prices also exhibitedsignificant increases, with the NasdaqComposite index rising by 19%.
1997 1998 1999 1999 1999 1999 1999 1999 1999 1999 1999 2000 2000
Q1 Q2 Q3 Q4 Sep. Oct. Nov. Dec. Jan. Feb.
Harmonised Index ofConsumer Prices (HICP)and its components
Overall index 1.6 1.1 1.1 0.8 1.0 1.1 1.5 1.2 1.3 1.5 1.7 2.0 .
of which:
Goods 1.2 0.6 0.8 0.3 0.6 0.9 1.5 1.1 1.3 1.5 1.9 2.2 .
Food 1.4 1.6 0.5 1.3 0.6 -0.2 0.4 -0.1 0.4 0.4 0.5 0.4 .
Processed food 1.4 1.4 0.9 1.2 0.8 0.7 0.9 0.6 0.8 0.9 1.0 1.0 .
Unprocessed food 1.4 2.0 0.0 1.4 0.3 -1.4 -0.3 -1.2 -0.4 -0.2 -0.2 -0.5 .
Industrial goods 1.0 0.1 1.0 -0.2 0.6 1.4 2.1 1.7 1.8 2.0 2.6 3.1 .
Non-energy industrial goods 0.5 0.9 0.6 0.8 0.6 0.5 0.5 0.5 0.5 0.6 0.5 0.7 .
Energy 2.8 -2.6 2.2 -3.9 0.5 4.6 7.8 6.1 6.3 7.2 10.0 12.0 .
Services 2.3 1.9 1.6 1.7 1.6 1.5 1.5 1.4 1.4 1.5 1.6 1.6 .
Other price and cost indicators
Industrial producer prices 1) 1.1 -0.8 0.0 -2.6 -1.3 0.7 3.1 1.4 2.2 3.1 4.1 5.0 .
Unit labour costs 2) 0.7 0.0 . 1.6 1.6 0.7 . - - - - - -
Labour productivity 2) 1.7 1.5 . 0.1 0.5 1.0 . - - - - - -
Compensation per employee 2) 2.4 1.5 . 1.7 2.0 1.7 . - - - - - -
Total hourly labour costs 3) 2.5 1.7 . 2.0 2.0 2.4 . - - - - - -
Oil prices (EUR per barrel) 4) 17.1 12.0 17.1 10.3 15.0 19.7 23.0 21.8 20.8 23.5 24.8 24.9 27.6
Commodity prices 5) 12.9 -12.5 -3.1 -16.0 -8.2 1.1 14.0 6.6 10.7 11.9 19.3 19.4 20.0
Table 1Price and cost developments in the euro area(annual percentage changes, unless otherwise indicated)
Sources: Eurostat, national data, International Petroleum Exchange, HWWA – Institut für Wirtschaftsforschung (Hamburg) and ECBcalculations.1) Excluding construction.2) Whole economy.3) Whole economy (excluding agriculture, public administration, education, health and other services).4) Brent Blend (for one-month forward delivery). In ECU up to December 1998.5) Excluding energy. In euro; in ECU up to December 1998.

ECB Annua l Repor t • 199924
subdued in 1999. By December 1999, overallHICP inflation stood at 1.7% year-on-year,compared with 0.8% in December 1998.Inflation increased further to 2.0% year-on-yearin January 2000, mainly reflecting the persistenceof the increase in oil prices.
Over the course of 1999 oil prices increasedfrom €10.3 per barrel in the first quarter toan average of €23.0 per barrel in the fourthquarter, reflecting a gradual but significantrecovery in the world market price of oil andalso a depreciation in the euro’s exchangerate vis-à-vis the US dollar. This rise, whichreversed a steady decline observed in 1998,was swiftly reflected in the energy componentof the HICP; by December 1999 energyprices, which include a large excise component,had increased by 10% year-on-year, withmost of the increase concentrated inliquid fuel prices. Other energy componentsexhibited a more stable pattern of increaseor were, as in the case of electricity pricesin some euro area countries, subjectto downward pressure associated with
deregulation. In addition, increasing oil priceswere to some extent offset by downwardpressure from other prices. In particular,unprocessed food prices made a significantnegative contribution to the rate of increasein consumer prices.
Underlying price increases were moresubdued
Apart from the relatively volatile componentsdescribed above, consumer price increases werefar more subdued in 1999, with the rate ofincrease in the HICP excluding energy pricesand seasonal food declining to 1.0%, comparedwith an average of 1.4% in 1998. This reflectedsignificant declines in the rate of increase in theprice of non-energy industrial goods, servicesand processed food. In the case of the non-energy industrial goods component of the HICP,the pass-through from rising producer priceswas relatively limited in 1999. Developments inproducer prices, in turn, mainly reflectedincreases in oil and non-oil commodity prices,
Chart 8Breakdown of HICP inflation in the euro area by components(annual percentage changes; monthly data)
Source: Eurostat.
1996 1997 1998 1999-6
-4
-2
0
2
4
6
8
10
12
-6
-4
-2
0
2
4
6
8
10
12
total HICPservices
unprocessed foodprocessed food
non-energy industrial goodsenergy

25ECB Annua l Repor t • 1999
Box 3The effects of market deregulation on consumer prices
In a number of sectors of the euro area economy there have been ongoing efforts to liberalise markets in order
to ensure that firms are operating on a commercial basis and in a competitive environment. This process,
which increases the overall efficiency with which resources are used, is viewed as making a positive
contribution to overall economic welfare. In many cases, the liberalisation process can give rise to downward
pressure on prices and profit margins. Market liberalisation continued in 1999 and, while it is difficult to
separate clearly the price effects of liberalisation from the impact of other factors such as technological
change, it was associated with a further decline in the prices of a number of goods and, in particular, services.
The telecommunications market provides the most striking example of the extent of the impact of increased
competition on consumer prices. While liberalisation of EU telecommunications markets began in some
countries in the 1980s, it accelerated over the course of the 1990s, in parallel with rapid technological
innovation. In principle, most telecommunications markets in the EU have been completely opened up to
competition since 1 January 1998, following the implementation of several European Council Directives.
Telephone and telefax equipment and services(index: December 1997 = 100; monthly data)
Sources: Eurostat and ECB calculations.
Further significant price declines in the telecommunications sector in 1999
This ongoing increase in competition has been reflected in consumer prices, as measured in the telephone and
telefax equipment and services component of the Harmonised Index of Consumer Prices (HICP). In the two
years between December 1997 and December 1999, this component has fallen by just over 7.1% in absolute
terms. To the extent that it takes time to include new operators in the index, the HICP may not be reflecting the
full scale of the reduction in prices. Relative to both the overall HICP and services prices, the decline has been
even more marked (see the chart above). Moreover, it would appear that competition intensified across the
euro area during 1999 and, as a result, the decline in prices was particularly noteworthy. Significant reductions
occurred in Germany, the Netherlands, Ireland and Luxembourg. In Finland, where the process of liberalisation
began much earlier, recent price decreases have been less significant. In a number of other euro area countries,
the benefits of increased competition are being passed on to consumers more gradually in the form of
staggered price reductions or “price caps” which are determined by the appropriate national authority.
It is likely that the relative price declines outlined above have stimulated increased demand for
telecommunications equipment and services. In the telecommunications sector it is also important to note that
Q1 Q2 Q3 Q4 Q1 Q2 Q3 Q41998 1999
90
92
94
96
98
100
102
90
92
94
96
98
100
102
absolute price levelprice level relative to the services component
price level relative to the HICP

ECB Annua l Repor t • 199926
with the increase in the latter mainly being theresult of the depreciation in the nominaleffective exchange rate of the euro. Comparedwith an average increase of 0.9% in 1998, non-energy industrial goods prices had increased by0.5% year-on-year by December 1999. Similarly,the rate of increase in services prices remainedsubdued in the course of the year and stoodat 1.6% in December 1999, i.e. 0.3 percentagepoint lower than the average increase in servicesprices in 1998. These developments reflectedslightly higher but still moderate growth in euro
area labour costs (see below) and alsodownward pressure on profit margins in somesectors – most visibly telecommunications – asa result of market liberalisation. (See Box 3 fora further discussion of these effects.)
Rebound in unit labour costs but underlyingwage growth remained moderate
Unit labour costs are estimated to haveincreased by 1.6% year-on-year by the second
technological innovation has been an additional driving force behind the aforementioned price developments.
A good example of this is the increased availability of low-cost and high-quality mobile telephone technology.
However, the role of technological innovation cannot be completely separated from the process of
market liberalisation because increased competition may have strengthened the incentives for firms to
innovate and to undertake research and development. In addition, 1999 saw an increase in merger activity in
the sector, which holds the prospect of further price reductions if it succeeds in producing additional efficiency
gains.
Some evidence that liberalisation began to take hold in the energy sector in 1999
While the liberalisation in the European energy sector is lagging behind the above developments in
telecommunications, there was evidence in some euro area countries that it was beginning to take hold
towards the end of 1999. This comes in the wake of a number of EU initiatives aimed at establishing an
internal market for the provision of energy. The Electricity Market Directive of 1996 and the Gas Market
Directive of 1998 were designed to ensure that firms in these sectors can operate on a commercial basis and in
an environment which is open to competition. A deadline of 19 February 1999 was set for the implementation
of the Electricity Market Directive, although transition periods of one year were granted in the case of Ireland
and Belgium and two years in the case of Greece. The Directive calls for an initial liberalisation of around
25% of the market, with this proportion rising to around one-third by 2003. However, a number of euro area
countries have already gone beyond these requirements. A deadline of 10 August 2000 was set for the
implementation of the Gas Market Directive in the Member States of the EU. According to the Directive, at
least 28% of the market should be opened up by 2003, with this percentage rising to 33% by 2008.
As yet, it is difficult to detect strong signs of pervasive downward pressure on prices or profit margins in euro
area energy markets. This is partly because the process of energy market liberalisation has only just begun in
most euro area countries. Price developments in this sector may also be strongly influenced by other factors,
such as changes in primary fuel prices, government regulations or energy taxation. Nonetheless, the disparity
in electricity prices across the euro area suggests that there is significant scope for price reductions. Indeed,
towards the end of 1999, electricity prices began to fall in some countries, most notably in Germany. The fall
in prices has not only been a consequence of actual competition; in some countries that have opened their
markets only partially, prices for consumers have been reduced in anticipation of the changes in supply and
demand conditions that the full future opening of the market will bring.
While the effects of deregulation and increased competition have been most clearly evident in the
telecommunications and the electricity sectors, it is likely in the years ahead that these effects will be observed
in other sectors, such as the gas market and also transportation.

27ECB Annua l Repor t • 1999
quarter of 1999, by contrast with 1998, duringwhich they had remained unchanged onaverage (see Table 1). This increasemainly reflected lower productivity growthassociated with the deceleration of euro areaactivity in 1998 and also some increase innominal compensation per employee. Inaddition, the rate of increase in total hourlylabour costs showed some upward movementand stood at 2.4% year-on-year in thethird quarter. Against this background, in thethird quarter higher productivity growth,associated with the gradual strengthening of
economic activity, gave rise to a decelerationin unit labour cost growth to 0.7% year-on-year. Profit margins are estimated to havenarrowed marginally in 1999 compared with1998. This is explained by the above increasein unit labour costs and by higher energy andnon-oil input prices (as reflected in, forexample, the price of intermediate goods).In some sectors, as mentioned above,competitive forces may also have restrainedfirms from passing increased input costs intooverall consumer prices.

ECB Annua l Repor t • 199928
4 Output, demand and labour market developments
Progressive upturn in real GDP growth inthe course of 1999
Economic activity in the euro area in 1999was characterised by a progressive upturn inoutput growth, following the slowdown inthe course of 1998. In retrospect, the adverseeffects of the crisis in emerging marketeconomies on the growth of activity in theeuro area appear to have been rather briefand limited. Reflecting the improvement inthe outlook for growth in the course of theyear, autumn forecasts for euro area realGDP growth in 1999 and 2000 were mostlyrevised slightly upwards from those madeearlier in the spring of last year.
According to Eurostat estimates for the euroarea, real GDP growth in 1999 as a wholestood at 2.2%, clearly down from a rate of2.8% in the previous year (see Table 2).However, this growth rate for the year as awhole masks a pick-up in annual growthbetween the first and the second half of 1999,from 1.7% to 2.7%. The pace of economic
expansion has thus recovered fairly swiftly tothe range which is assumed to be sustainablein the medium term (2% to 2½%). The strongdynamics in the second half of last year, asreflected in quarter-on-quarter real GDPgrowth of about 1%, are expected to continuein 2000. At the level of individual MemberStates, the growth performance in 1999 hasbeen somewhat divergent, but projections arefor a narrowing of growth differences in 2000(see Box 4).
In 1999 the changeover to the new EuropeanSystem of Accounts 1995 (ESA 95) added tothe usual uncertainty surrounding GDPestimates. The changeover as such meant aclear improvement in terms of methodology,comparability, frequency and timeliness ofdata, but its practical implementation wascharacterised by unforeseen delays, and datareleased in the course of 1999 partly showedlarger than expected revisions. Given therelatively short experience with compilingdata in accordance with the new ESA 95methodology, backward revisions related to
Sources: Eurostat and ECB calculations.1) Annual rates: percentage change compared with the same period a year earlier.2) Quarterly rates: percentage change compared with the previous quarter.3) As a contribution to real GDP growth; in percentage points.4) Including acquisitions less disposals of valuables.5) Exports and imports cover goods and services and include internal cross-border trade in the euro area. Intra-euro area trade is
not cancelled out in import and export figures used in national accounts. Consequently, these data are not fully comparable withbalance of payments data.
Table 2Composition of real GDP growth in the euro area(percentage changes, unless otherwise indicated; seasonally adjusted)
Annual rates 1) Quarterly rates 2)
1997 1998 1999 1998 1999 1999 1999 1999 1998 1999 1999 1999 1999
Q4 Q1 Q2 Q3 Q4 Q4 Q1 Q2 Q3 Q4
Real gross domestic product 2.3 2.8 2.2 2.0 1.7 1.8 2.3 3.1 0.2 0.6 0.5 1.0 0.9
of which:
Domestic demand 1.7 3.4 2.8 3.1 2.8 2.7 2.7 3.0 0.8 0.9 0.4 0.6 1.1
Private consumption 1.5 3.0 2.5 3.1 2.8 2.4 2.4 2.6 0.6 0.7 0.3 0.7 0.8
Government consumption 0.7 1.2 1.2 1.0 1.2 0.9 1.2 1.3 0.2 0.8 -0.1 0.2 0.3
Gross fixed capital formation 2.2 4.4 4.5 3.8 3.6 5.1 4.8 4.6 0.6 1.6 0.7 1.7 0.5
Changes in inventories 3) 4) 0.3 0.5 0.1 0.3 0.2 0.1 0.0 0.2 0.2 -0.1 0.1 -0.3 0.4
Net exports 3) 0.6 -0.5 -0.5 -1.1 -1.0 -0.9 -0.2 0.2 -0.5 -0.3 0.1 0.4 -0.1
Exports 5) 10.1 6.7 3.9 2.0 0.7 2.1 5.2 7.7 -0.9 0.4 2.4 3.3 1.4
Imports 5) 8.7 9.1 5.7 5.6 4.0 5.0 6.4 7.5 0.7 1.4 2.1 2.1 1.8

29ECB Annua l Repor t • 1999
Box 4Growth and inflation divergences in the euro area
In 1999 there were significant differences in both growth and inflation rates among individual euro area
countries (see the table below). Although inflation and growth differentials are both expected to diminish
somewhat over the next two years according to the available forecasts of major international institutions, such
as those of the European Commission, there is no reason to expect that differences will entirely disappear in
the future, given the evidence of other large single currency areas, such as the United States.
With regard to recent developments in real GDP growth, the highest growth rates in 1999 are estimated to
have been recorded in Ireland (9.4%) and Luxembourg (5.0%) as well as in Spain (3.7%), Finland and the
Netherlands (both 3.5%). Growth in Portugal (2.9%) and France (2.7%) was also above the rate of area-wide
growth, albeit to a lesser extent. In Italy (1.4%) and Germany (1.5%), by contrast, growth was significantly
below that for the euro area as a whole. The divergence of growth among countries (based on the unweighted
standard deviation) actually declined in 1999. While growth slowed in most euro area countries, the slowdown
was generally strongest in those countries which had grown most rapidly in 1998. Some slowdown in
domestic demand growth is expected in a number of the faster growing economies in the next few years. In the
period ahead, further convergence in growth rates is also expected, owing to a pick-up in growth – from the
second half of 1999 onwards – in those countries which have grown more slowly.
It should be borne in mind that differences in growth rates among euro area countries reflect different longer-
term trends as well as cyclical divergences (see the article in the July 1999 issue of the ECB Monthly Bulletin
entitled “Longer-term developments and cyclical variations in key economic indicators across euro area
countries”). In particular, higher growth rates have been experienced in some countries which are in the
process of “catching up”. Growth differences may also reflect the progress made in implementing structural
reform. However, in other cases, countries may be at a different stage of the economic cycle or have responded
to a greater or lesser extent to the slowdown in the global environment in the period 1997-98. From a longer-
term perspective, the magnitude of recent divergences appears to have been similar to differences observed in
the past.
Differences in inflation rates have been less marked, and the current range of inflation rates has fallen
considerably, compared with that recorded earlier in the 1990s. In Ireland, consumer prices, as measured in
terms of the Harmonised Index of Consumer Prices (HICP), rose by 2.5% in 1999; the increase in the HICP in
both Spain and Portugal was 2.2%, and in the Netherlands 2.0%. The lowest increases were recorded in
Austria (0.5%), Germany and France (both 0.6%). Looking ahead, a further convergence in inflation rates can
be expected. Inflation differentials in the euro area were addressed in the October 1999 issue of the ECB
Monthly Bulletin (see the article entitled “Inflation differentials in a monetary union”). There are a number of
reasons why price developments may differ across countries: the weights given to individual components in
Real GDP growth and HICP inflation in euro area countries(annual percentage changes)
BE DE ES FR IE IT LU NL AT PT FI
Real GDP
1998 2.7 2.2 4.0 3.2 8.9 1.5 5.0 3.7 2.9 3.8 5.0
1999 2.3 1.5 3.7 2.7 9.4 1.4 5.0 3.5 2.2 2.9 3.5
HICP
1998 0.9 0.6 1.8 0.7 2.1 2.0 1.0 1.8 0.8 2.2 1.4
1999 1.1 0.6 2.2 0.6 2.5 1.7 1.0 2.0 0.5 2.2 1.3
Sources: Eurostat and national estimates.
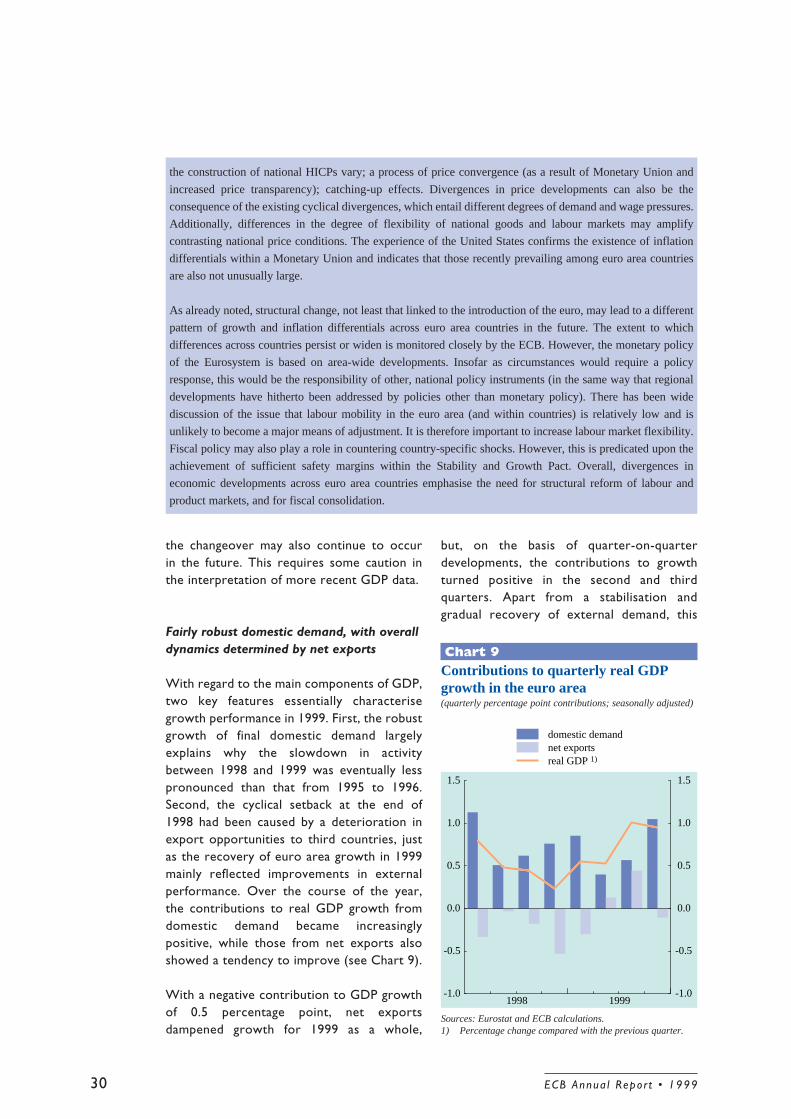
ECB Annua l Repor t • 199930
the construction of national HICPs vary; a process of price convergence (as a result of Monetary Union and
increased price transparency); catching-up effects. Divergences in price developments can also be the
consequence of the existing cyclical divergences, which entail different degrees of demand and wage pressures.
Additionally, differences in the degree of flexibility of national goods and labour markets may amplify
contrasting national price conditions. The experience of the United States confirms the existence of inflation
differentials within a Monetary Union and indicates that those recently prevailing among euro area countries
are also not unusually large.
As already noted, structural change, not least that linked to the introduction of the euro, may lead to a different
pattern of growth and inflation differentials across euro area countries in the future. The extent to which
differences across countries persist or widen is monitored closely by the ECB. However, the monetary policy
of the Eurosystem is based on area-wide developments. Insofar as circumstances would require a policy
response, this would be the responsibility of other, national policy instruments (in the same way that regional
developments have hitherto been addressed by policies other than monetary policy). There has been wide
discussion of the issue that labour mobility in the euro area (and within countries) is relatively low and is
unlikely to become a major means of adjustment. It is therefore important to increase labour market flexibility.
Fiscal policy may also play a role in countering country-specific shocks. However, this is predicated upon the
achievement of sufficient safety margins within the Stability and Growth Pact. Overall, divergences in
economic developments across euro area countries emphasise the need for structural reform of labour and
product markets, and for fiscal consolidation.
the changeover may also continue to occurin the future. This requires some caution inthe interpretation of more recent GDP data.
Fairly robust domestic demand, with overalldynamics determined by net exports
With regard to the main components of GDP,two key features essentially characterisegrowth performance in 1999. First, the robustgrowth of final domestic demand largelyexplains why the slowdown in activitybetween 1998 and 1999 was eventually lesspronounced than that from 1995 to 1996.Second, the cyclical setback at the end of1998 had been caused by a deterioration inexport opportunities to third countries, justas the recovery of euro area growth in 1999mainly reflected improvements in externalperformance. Over the course of the year,the contributions to real GDP growth fromdomestic demand became increasinglypositive, while those from net exports alsoshowed a tendency to improve (see Chart 9).
With a negative contribution to GDP growthof 0.5 percentage point, net exportsdampened growth for 1999 as a whole,
but, on the basis of quarter-on-quarterdevelopments, the contributions to growthturned positive in the second and thirdquarters. Apart from a stabilisation andgradual recovery of external demand, this
Chart 9Contributions to quarterly real GDPgrowth in the euro area(quarterly percentage point contributions; seasonally adjusted)
Sources: Eurostat and ECB calculations.1) Percentage change compared with the previous quarter.
1998 1999-1.0
-0.5
0.0
0.5
1.0
1.5
-1.0
-0.5
0.0
0.5
1.0
1.5
domestic demandnet exportsreal GDP 1)

31ECB Annua l Repor t • 1999
improvement also reflects, in part, a gain inprice competitiveness. While the negativeeffects on domestic activity of the crises inemerging market economies were reinforcedby a high external value of the euro at theturn of the year 1998/99, the depreciation ofthe euro towards mid-1999 supported euroarea exports. As a result, the growth ofexports of goods and services recoveredstrongly and outpaced the growth of importsin the second and third quarters of last year.
Domestic demand remained fairly robustduring 1999, expanding at an annual rate ofaround 3% in each quarter. Fairly sustainedgrowth in private consumption largelyaccounted for strong domestic demandgrowth. Consumer confidence, which hadreached an all-time high at the beginning of1999, remained well above its long-termaverage throughout the year. This high levelof confidence and the associated robustnessof consumption growth resulted fromcontinuously high employment growth and apick-up in real wage growth in an environmentof low real interest rates and price stability.In addition, in the context of a low interestrate environment, relatively buoyant stockand housing markets may have supportedhousehold consumption and also beenconducive to the growth in credit.Government consumption expanded onlymodestly in 1999. This reflects ongoing needsin most Member States to further consolidatepublic finances and the desire to reduce therelative size of the government sector in theeconomy.
As regards the investment components ofGDP, capital accumulation in 1999 as a wholeappears to have been largely unaffected bythe slowdown in total demand, i.e. domesticdemand plus exports. Gross fixed capitalformation in 1999 increased by 4.5% as awhole, and thus at around the same pace asin 1998. A number of factors have contributedto this development. The fact that thenegative demand effects had been rathershort-lived, as reflected in the upturn inindustrial confidence after the first quarter of1999, appears to have limited the adverse
effects on business investment. In particular,capacity utilisation in the manufacturingsector, an indicator of demand pressurerelative to supply capacity, did not fall belowits long-term average during 1999 and, hence,did not signal excessive spare capacity. Animportant incentive to maintain investmentefforts, not only in the business field but alsowith regard to housing investment, is likelyto have been the low levels of real interestrates that prevailed. As regards the othercomponent of investment, inventory changesmade a small positive contribution to GDPgrowth in 1999. However, given the statisticaluncertainties associated with the compilationof inventory changes in national accounts,the interpretation of the contribution frominventories faces clear limits. Due tothese uncertainties, it is also not possible toassess in detail the more specific effects oninventory developments in 1999, such asthose purportedly related to the year 2000phenomenon.
Cyclical pattern most visible in theindustrial sector
At the sectoral level, both the slowdown andthe subsequent resumption of overall activitygrowth were largely concentrated in theindustrial sector, while output developmentsin the services sectors appear to have beenmore stable. This reflects the relatively highimportance of external demand for output inthe manufacturing sector and of domesticdemand for services. The different sectoralgrowth patterns were mirrored in thedifferent developments of industrial andconsumer confidence (see Chart 10). On theone hand, the decrease in consumerconfidence from the peak reached at thebeginning of 1999 was only small and short-lived, and the indicator remained well aboveits long-term average level. Industrialconfidence, on the other hand, saw a moreprotracted downturn, which had started inearly 1998, and fell below its long-termaverage in the first half of 1999. Bothconfidence indicators picked up over thefurther course of the year and, by the end of

ECB Annua l Repor t • 199932
1999, were almost back to their previouspeak levels.
Industrial production continued to decline upto the beginning of 1999, before witnessing aturnaround to positive rates of growth. In
the first quarter production was alreadyhigher, on average, than in the final quarterof 1998. While production growth started toaccelerate after the summer months, the paceof expansion at the end of the year wassomewhat slower than that observed duringprevious periods of recovery. However,production data for the fourth quarter of1999 are likely to be revised upwards in linewith additional information which becameavailable after the release of production datafor December 1999. Bearing this in mind, in1999 as a whole industrial production increasedby less than 2% (see Table 3). Growth wasstrongest in the durable consumer goodsindustries, reaching 2.3% for the year as awhole. Output in these industries is likely tohave benefited from a number of factors, overand above the continued strength ofconsumer demand in general. In particular,the liberalisation of the telecommunicationsmarkets and advances in internet technologyhave boosted production of the equipmentconcerned. In the capital goods industries theturnaround in production growth occurredsomewhat later than in other industries, withgrowth in 1999 as a whole reaching 1.5%.Finally, in the intermediate goods industries,the recovery began slightly earlier than inother parts of the manufacturing sector, butit evolved only gradually, and productiongrowth did not exceed 1.5% in 1999.
Chart 10Confidence indicators in the euro area(percentage balances; monthly data; mean-adjusted)
Source: European Commission Business and Consumer Surveys.Note: Data shown are calculated as deviations from the averageover the period since January 1985.
1998 1999-6
-3
0
3
6
9
12
-6
-3
0
3
6
9
12
consumer confidenceindustrial confidence
Table 3Industrial production in the euro area(percentage changes)
Sources: Eurostat and ECB calculations.1) Annual rates: percentage change compared with the same period a year earlier by using data adjusted for variations in the
number of working days.2) Quarterly rates: percentage change compared with the previous quarter by using seasonally and working day adjusted data.
Annual rates 1) Quarterly rates 2)
1997 1998 1999 1998 1999 1999 1999 1999 1998 1999 1999 1999 1999
Q4 Q1 Q2 Q3 Q4 Q4 Q1 Q2 Q3 Q4
Total industry excl. construct. 4.4 4.1 1.6 1.6 0.5 0.4 2.1 3.3 -0.2 0.2 0.5 1.4 1.1
Manufacturing 5.0 4.6 1.6 1.4 0.2 0.3 2.1 3.6 -0.8 0.5 0.6 1.8 0.8
by main industrial groupings:
Intermediate goods 5.4 3.7 1.5 0.3 -0.1 0.2 2.7 3.6 -0.2 0.4 0.7 1.5 1.0
Capital goods 5.0 6.8 1.5 4.3 1.1 -0.3 1.3 3.6 0.0 -0.2 0.3 1.5 1.3
Consumer goods 2.7 3.1 1.7 1.3 1.1 1.2 2.0 2.5 -0.4 0.6 0.7 1.2 0.0
Durable consumer goods 2.8 6.4 2.3 4.6 1.9 2.8 2.3 2.4 0.3 -0.3 1.4 1.6 0.1
Non-durable consumer goods 2.6 1.5 1.5 -0.3 0.8 0.1 2.3 2.6 0.2 0.4 0.3 1.0 0.4

33ECB Annua l Repor t • 1999
Overall, in 1999 the negative impact ofdevelopments in the external environmenton euro area activity was limited and short-lived. The upturn in overall activity in thecourse of the year was largely the result ofincreasing export growth and, in terms ofsectoral developments, mainly reflected therecovery of industrial production. Togetherwith the fairly sustained growth of domesticdemand and of service sector output, thismay be seen as forming the basis for abroadly based expansion in 2000.
Employment growth sustained in 1999
According to national data, in 1999employment in the euro area is estimated tohave increased at broadly the same rate as in1998, i.e. at 1.4%. While this suggests thatthe slowdown in economic activity aroundthe turn of the year 1998/99 did not, onaverage, affect overall employment growth,its impact is evident from the quarterly
Chart 11Total employment in the euro area ¹)
(quarterly data; seasonally adjusted)
Sources: National data (excluding Belgium and Ireland) and ECB calculations.1) The national data taken into account in the calculation of the euro area indicator refer, wherever possible, to total employment
(employees and non-employees) in all sectors of activity excluding the armed forces. In the Netherlands they refer only toemployees.
1992 1993 1994 1995 1996 1997 1998 1999-3.0
-2.0
-1.0
0.0
1.0
2.0
99
100
101
102
103
104
percentage change compared with the same period a year earlier (left-hand scale)percentage change compared with the preceding period (left-hand scale)total employment level; index: 1995 = 100 (right-hand scale)
growth pattern. This shows a slightdeceleration in the quarter-on-quartergrowth rate in the first half of 1999 bycontrast with the gradual accelerationrecorded in the previous year (seeChart 11).
This pattern of total employment growthlargely reflects developments in the industrialsector, where growth remained negative inthe first two quarters of 1999. The morepronounced pattern in industry was causedby the fact that the industrial sector is farmore sensitive to external developments thanother sectors of the economy. In 1999 as awhole employment in industry declinedslightly. Consequently, it can be concludedthat the very limited impact of the slowdownin economic activity on total employmentgrowth in 1999 must have resulted from thesustained strength of employment growth inthe other sectors of the economy, particularlyin the services sector. Employmentdevelopments in this sector, which is more

ECB Annua l Repor t • 199934
labour-intensive than the industrial sector,have benefited from the continued growth ofdomestic demand.
Other factors which also explain employmentdevelopments in the euro area in 1999 are,as mentioned in Section 3 above, favourablelabour cost developments resulting from thecontinuation of moderate wage growth aswell as cuts in non-wage labour costs. Inaddition, government policies aimed atreducing structural rigidities in the labourmarket as well as employment creationprogrammes contributed to employmentgrowth in 1999.
Unemployment rate continued to declinegradually
The standardised rate of unemploymentcontinued to decrease in the course of 1999,broadly in line with the trend observed in1998 (see Chart 12). At the end of the yearthe rate of unemployment stood at 9.6%,i.e. 0.9 percentage point lower than inDecember 1998. On average, the number ofunemployed fell by around 1 million in 1999(compared with a fall of 785,000 in 1998) toreach 12.9 million, the lowest level recordedsince 1992. As was also the case in 1998, thegrowth of the labour force which accompaniedthe sustained pace of net job creation in 1999
appears to have limited somewhat the effectof employment growth on the decline inunemployment (see Table 4). The labourforce is estimated to have increased at asimilar rate of growth to that registered overthe previous three years, i.e. at 0.6%, whichis 0.4 percentage point higher than theaverage rate of growth recorded earlier inthe 1990s. This stronger growth may in part
Chart 12Unemployment in the euro area(monthly data)
Source: Eurostat.
1993 1994 1995 1996 1997 1998 1999-1.5
-1.0
-0.5
0.0
0.5
1.0
1.5
2.0
2.5
8.5
9.0
9.5
10.0
10.5
11.0
11.5
12.0
12.5
13.0
% of the labour force (right-hand scale)annual change in millions (left-hand scale)
Table 4Labour market developments in the euro area(annual percentage changes and percentages)
1997 1998 1999 1997 1997 1998 1998 1998 1998 1999 1999 1999 1999
Q3 Q4 Q1 Q2 Q3 Q4 Q1 Q2 Q3 Q4
Labour force 0.7 0.6 . 0.7 0.8 0.7 0.6 0.6 0.6 0.6 0.5 0.5 .
Employment 0.6 1.4 . 0.6 0.9 1.2 1.3 1.5 1.6 1.7 1.5 1.4 .
Total industry -1.3 0.2 . -1.2 -0.5 0.1 0.1 0.3 0.4 0.1 0.0 0.0 .
Unemployment 0.6 -5.3 -7.8 0.7 -0.5 -2.8 -4.8 -6.2 -7.5 -7.7 -7.7 -7.9 -8.0
Rates ofunemployment 1)
Total 11.5 10.9 10.0 11.6 11.4 11.2 10.9 10.8 10.6 10.3 10.1 10.0 9.7
Under 25 years 23.2 21.2 19.1 23.1 22.6 21.8 21.4 21.1 20.7 20.0 19.3 18.9 18.3
25 years and over 9.9 9.4 8.8 9.9 9.9 9.7 9.5 9.3 9.1 9.0 8.9 8.7 8.6
Sources: Eurostat, national data and ECB calculations.1) Percentage of the labour force according to ILO recommendations.

35ECB Annua l Repor t • 1999
be the result of an improvement in theemployment situation in recent years, whichmay have incited more people to enter orreturn to the labour market.
Looking at developments in the course of1999, the decline in the unemployment rateslowed somewhat during the summer months.This reflected the lagged negative effect ofthe temporary slowdown in economic activityat the turn of the year 1998/99. However,from September onwards the rate ofunemployment resumed its decline in reactionto a strengthening of economic activity.
The breakdown by age shows that theunemployment rate declined for both youngpeople and those above 25 years of age.However, the decline was stronger for theformer (from 20.7% to 18.3% between theend of 1998 and the end of 1999) than forthe latter (from 9.1% to 8.6% over the sameperiod). Finally, at the individual country level,dispersion in the rates of unemploymentdeclined during the year, owing to cyclicalfactors and to the protracted effectsof structural labour market reformsimplemented in some countries.
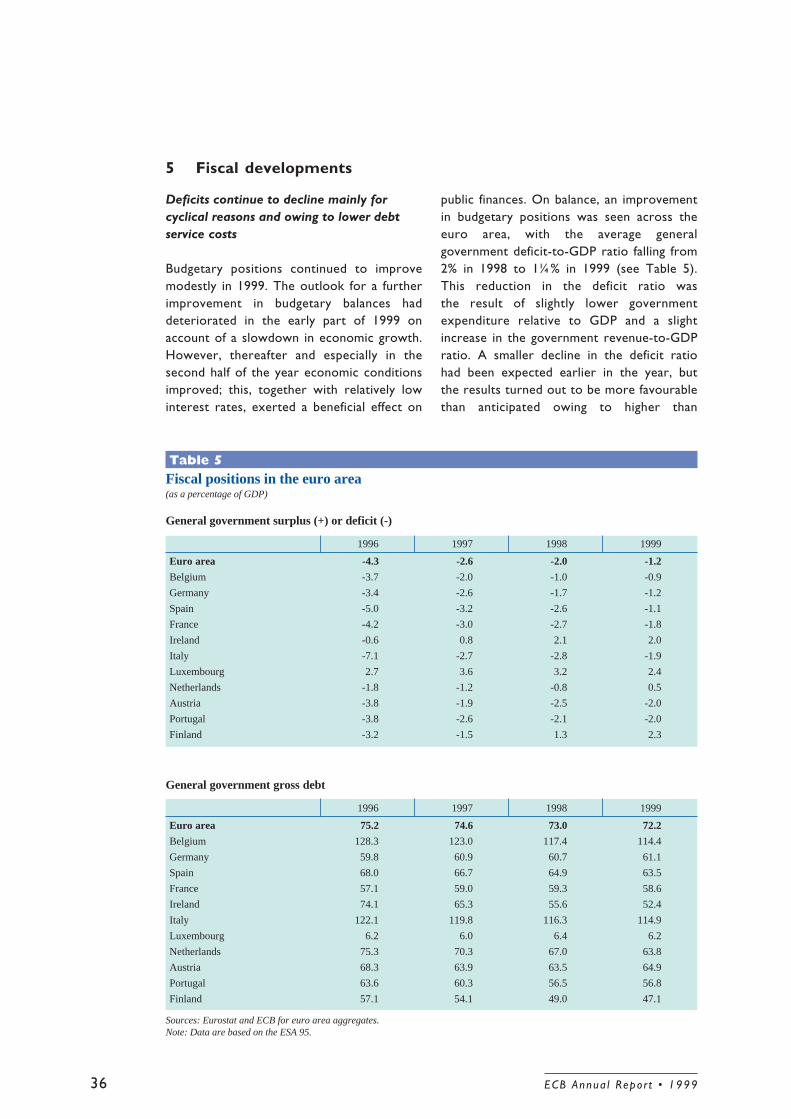
ECB Annua l Repor t • 199936
5 Fiscal developments
Deficits continue to decline mainly forcyclical reasons and owing to lower debtservice costs
Budgetary positions continued to improvemodestly in 1999. The outlook for a furtherimprovement in budgetary balances haddeteriorated in the early part of 1999 onaccount of a slowdown in economic growth.However, thereafter and especially in thesecond half of the year economic conditionsimproved; this, together with relatively lowinterest rates, exerted a beneficial effect on
public finances. On balance, an improvementin budgetary positions was seen across theeuro area, with the average generalgovernment deficit-to-GDP ratio falling from2% in 1998 to 1¼% in 1999 (see Table 5).This reduction in the deficit ratio wasthe result of slightly lower governmentexpenditure relative to GDP and a slightincrease in the government revenue-to-GDPratio. A smaller decline in the deficit ratiohad been expected earlier in the year, butthe results turned out to be more favourablethan anticipated owing to higher than
General government gross debt
1996 1997 1998 1999
Euro area 75.2 74.6 73.0 72.2
Belgium 128.3 123.0 117.4 114.4
Germany 59.8 60.9 60.7 61.1
Spain 68.0 66.7 64.9 63.5
France 57.1 59.0 59.3 58.6
Ireland 74.1 65.3 55.6 52.4
Italy 122.1 119.8 116.3 114.9
Luxembourg 6.2 6.0 6.4 6.2
Netherlands 75.3 70.3 67.0 63.8
Austria 68.3 63.9 63.5 64.9
Portugal 63.6 60.3 56.5 56.8
Finland 57.1 54.1 49.0 47.1
Sources: Eurostat and ECB for euro area aggregates.Note: Data are based on the ESA 95.
General government surplus (+) or deficit (-)
1996 1997 1998 1999
Euro area -4.3 -2.6 -2.0 -1.2
Belgium -3.7 -2.0 -1.0 -0.9
Germany -3.4 -2.6 -1.7 -1.2
Spain -5.0 -3.2 -2.6 -1.1
France -4.2 -3.0 -2.7 -1.8
Ireland -0.6 0.8 2.1 2.0
Italy -7.1 -2.7 -2.8 -1.9
Luxembourg 2.7 3.6 3.2 2.4
Netherlands -1.8 -1.2 -0.8 0.5
Austria -3.8 -1.9 -2.5 -2.0
Portugal -3.8 -2.6 -2.1 -2.0
Finland -3.2 -1.5 1.3 2.3
Table 5Fiscal positions in the euro area(as a percentage of GDP)

37ECB Annua l Repor t • 1999
expected government revenue, which waspartly due to improved economic conditions.In addition, revised budgetary outcomesfor 1998 resulted in a better thanexpected starting position for 1999. Generalgovernment gross debt, in relation to GDPfor the euro area, declined slightly in 1999.
Given that fiscal policies are the responsibilityof each Member State, assessing only euroarea figures would mean neglecting importantdifferences in the public finances of individualcountries. Four countries can be seen to haverecorded budget surpluses in 1999 (Ireland,Luxembourg, the Netherlands and Finland).With the exception of the Netherlands, thesecountries also comfortably comply with thereference value for government debt of60% of GDP. The Netherlands and Finlandimproved their fiscal balances and managedto lower their debt ratios further in 1999.Luxembourg reported very low governmentdebt at 6.2% of GDP. Two countries – Italyand Belgium – recorded debt ratios above110% of GDP, but these were decliningfurther. Italy showed a deficit ratio improvingfrom 2.8% in 1998 to 1.9% in 1999, while thedeficit ratio in Belgium remained virtuallyconstant at 1%. All the remaining countrieshad deficit ratios of up to 2% in 1999 anddebt ratios somewhat below (France andPortugal) or slightly above the 60% of GDPlevel (Germany, Spain, the Netherlands andAustria). Budget balance ratios remainedbroadly stable in Belgium, Ireland and Portugalbetween 1998 and 1999, whereas moresignificant progress was made in the remainingcountries with the exception of Luxembourg,where the budget surplus-to-GDP ratiodeclined. Three countries showed rising debtratios (Germany, Austria and Portugal).
However, an assessment of governments’underlying budgetary positions must take dueaccount of both cyclical developments andother factors outside the direct control ofgovernments. In this context, it appears thatpublic finances in the euro area continue tobe largely driven by economic conditions anddeclining debt service costs. EuropeanCommission estimates suggest only a marginal
improvement in the cyclically adjustedprimary balance-to-GDP ratio (i.e. the budgetbalance excluding government debt interestpayments and corrected for cyclicalinfluences) for the euro area as a whole in1999. Active consolidation measures do notthus appear to have played an active role inimproving the underlying budgetary positionsin 1999. This was already evident in 1998,despite the opportunity which strong growthhad provided for accelerating the reductionof structural imbalances in many MemberStates.
While declining debt service costs had astrong impact on overall budgetary positions,the average primary surplus in relation toGDP saw only a slight improvement in 1998and 1999. It is worth mentioning, in particular,that primary surplus-to-GDP ratios declinedin Belgium and Italy in 1999, countries wherehigh government debt ratios warrantrelatively ambitious budgetary targets inorder to bring about a rapid reduction in thelevel of debt. However, the aforementionedevidence suggests that Member States withthe highest debt ratios in the euro area stillneed to make significant further progress inthis regard.
Furthermore, with regard to the evolution ofgovernment debt, the role played by “deficit-debt adjustments” in changing debt ratios inthe euro area was not insignificant, as wasalready the case in previous years. Suchadjustments leave the deficit ratio unaffected,but have an impact on government debtlevels. They reduce public debt, for examplein the case of privatisation, a course of actionwhich was pursued by most euro areagovernments in 1999 and earlier. In a fewother instances, for example, capital injectionsto public enterprises and adjustments in thevalue of foreign currency debt have keptpublic debt at levels above those which mighthave been expected from the fiscal deficit.
ECB Annua l Repor t • 199938
Member States’ consolidation strategies
Most Member States have made it clearduring recent discussions on the orientationof their fiscal policies that they intend tofurther consolidate public finances in orderto achieve budgetary positions consistentwith the requirements of the Stability andGrowth Pact. Accordingly, deficit ratios inthe euro area are forecast to continue todecline in 2000, albeit only slowly. Moreover,current budgetary plans suggest that furtherreductions in government deficits can againbe largely explained by favourable economicconditions and by a continued lowering ofinterest payments in relation to GDP.
At the same time, the key objectives of fiscalpolicy-makers seem to be shifting towards astrategy of reducing budgetary imbalanceswhile also modifying the level and structureof government revenue and expenditure. Anumber of governments are planning to takeadvantage of the favourable economicoutlook in order to introduce tax reformsaimed at promoting growth and employment,while at the same time controllingexpenditure in order to create room forfurther deficit cuts. As a result, the reductionin deficit ratios in 2000 is forecast to befuelled by lower government expenditure-to-GDP ratios in almost all Member States,mainly on account of savings in thegovernment sector wage bill and in householdtransfer payments. At the same time,government revenue in relation to GDP ispredicted to fall in 2000 as a result of plannedor already implemented reforms affectingtaxes and social security contributions. Taxreform should not jeopardise budgetarytargets or result in pro-cyclical impulses.
By the end of 1999 and in early 2000Member States submitted updated stabilityprogrammes covering the period up to2002/2003 to the European Commission inaccordance with the Stability and GrowthPact. According to the Stability and GrowthPact, Member States are committed toadhering to the “medium-term objective ofbudgetary positions close to balance or
in surplus”. This objective is consideredappropriate “to allow Member States to dealwith normal cyclical fluctuations while keepingthe government deficit within the 3% of GDPreference value”. When setting medium-termobjectives, other factors should also be takeninto account. These include possible futuretax shortfalls and expenditure overruns, theneed to ensure a rapid decline in debt ratiosin those countries in which they standabove 60% and the need to cope withexpenditure related to the ageing of thepopulation in the future.
According to the updated stabilityprogrammes, prospects for economic growthin 2000 and in the next few years are at leastas favourable as in the original programmes.Against this background, governments aim tofurther consolidate general governmentbudgetary positions in the medium term. Theenvisaged progress in bringing downgovernment deficit and debt ratios variesfrom one country to another, as do the fiscalpositions targeted towards the end of theplanning horizon. A number of governmentsare now planning to achieve somewhat moreambitious fiscal targets than those in theiroriginal programmes. Most countries areexpected to achieve deficits of below 0.5% orfiscal surpluses and debt levels below 60% ofGDP by 2002/2003. At the same time, mostgovernments are planning to reduce taxes.Belgium and Italy will still report public debtlevels close to 100% of GDP.
It should be noted that during the planninghorizon any additional government revenuesresulting from higher than expected growth(the growth dividend) should normally bedevoted to faster progress in fiscalconsolidation, rather than to lowering thetax pressure. This is particularly appropriatefor countries in which the deficit ratio is notdistant enough from the limit of 3% of GDP,for those in which public debt is still high andfor those in which the economy is subject tothe risk of overheating.
39ECB Annua l Repor t • 1999
6 The global macroeconomic environment, exchange rates andthe balance of payments
A significant improvement in the globalmacroeconomic environment
Global economic and financial conditions haveimproved markedly since the slowdown in1998, as most of the crisis-hit economiesin Asia began to recover in the course of1999 and the world economy appears to beon a cyclical upturn. Adjustment in some ofthe worst hit countries has been far morefavourable than expected. Financial marketconfidence has returned in most of theemerging Asian economies, allowing monetaryconditions to ease and setting the stage foreconomic recovery. At the same time,stronger than expected economic growth insome industrialised countries, particularly inthe United States, led to substantiallymore positive assessments of the globaloutlook.
The improved economic outlook in thecourse of 1999 was partly counterbalancedby a substantial rise in oil prices from thevery low levels seen in late 1998 and early1999, reversing one of the factors that hadcontributed to low inflation in 1998. Crudeoil prices rose from USD 11.5 per barrel inthe first quarter of 1999 to USD 26 inDecember 1999. These price rises were thecombined result of a decision of theOrganization of the Petroleum ExportingCountries (OPEC) to curtail oil supplies andstronger demand, especially from Asia. Theimpact of this strong increase in oil prices onglobal inflation, however, was partlydampened by non-oil commodity pricesmeasured in US dollars, which on aggregateremained largely constant over the year andsaw only a moderate upswing in the last twomonths of 1999. The oil price increasecontinued in early 2000 and the price hadreached USD 31.9 per barrel at the time thisReport was finalised.
In the United States strong output growthand productivity, declining unemployment andsubdued inflationary pressures continued to
characterise economic developments in 1999.Real GDP growth was vigorous throughoutthe year, ranging from a low seasonallyadjusted quarter-on-quarter rate of 0.5% inthe second quarter of 1999 to a high of 1.7%in the fourth quarter. As a result, theeconomy recorded an overall growth rate ofaround 4% in 1999, for the third consecutiveyear. The strength of domestic demand,particularly private consumer expenditure andbusiness fixed investment, continued to drivethe expansion, while the contribution of netexports to GDP growth remained stronglynegative. US exports suffered in the first halfof the year, but improved markedly in thesecond half in response to the rapid recoveryof global economic growth. Nevertheless,imports grew faster than exports throughout1999, leading to a further widening of theUS trade deficit. The latter, in conjunctionwith the continuing deterioration in theUS investment income balance, resulted inthe current account deficit reaching anestimated 3.6% of GDP in 1999. As a resultof several years of strong growth, theunemployment rate declined further to 4.1%,a level not seen since the late 1960s. Despitethe tight labour markets, inflationarypressures remained subdued as a result oflarge gains in labour productivity andincreased competition in product markets.Consumer price inflation rose to 2.2% in1999, up from 1.6% in 1998, while underlyinginflation – which excludes the volatilecomponents of food and energy – was 2.1%on average compared with 2.3% in 1998. Inorder to counteract increasing inflationaryrisks, indicated by increasingly tight labourmarket conditions and overall excess demand,from the summer onwards the FederalReserve tightened monetary policy bygradually raising its target for the federalfunds rate from 4.75% to 5.5% at the end of1999, thereby reversing the rate cuts ofautumn 1998.
In Japan economic conditions improved inthe first half of 1999, but then deteriorated

ECB Annua l Repor t • 199940
again in the second, indicating that noself-sustained recovery was yet in place. As aresult of a fiscal stimulus amounting to around10% of GDP in 1998, public investment aswell as private consumption and residentialinvestment registered positive growth in thefirst half of 1999, while business fixedinvestment continued to contract following atrend which started in 1998. However, bythe third quarter of 1999, as the fiscal impulsefaded away, a sharp downward correction ofpublic investment growth took place,accompanied by negative growth inconsumption and private investment. Netexports made a somewhat negativecontribution to GDP growth, but exportsrecorded an improvement throughout theyear, despite the real appreciation of theJapanese yen of around 25%. In the meantime,weak economic activity was reflected in apersistent decline in prices, as measured byboth the Consumer Price Index (CPI) andthe Wholesale Price Index (WPI), which in1999 declined on average by around 0.2%and 3.6% respectively, although bothstabilised in the last few months of 1999. In1999 monetary policy remained supportive,with the Bank of Japan pushing its operationaltarget (the uncollateralised overnight callrate) towards nil. By the end of the year,the Japanese Government had approveda supplementary fiscal package worthapproximately JPY 18 trillion (3.6% of GDP),as the recovery of private consumptionremained sluggish and business investmentwas still contracting.
The other Asian economies achieved aremarkable and stronger than expectedrebound in 1999 from the severe economicand financial crisis that had affected the regionthe year before. The economies of SouthKorea, Malaysia, Singapore and Thailand allachieved strong real rates of growth in 1999,with growth initially being driven by netexports and subsequently by strongrecoveries in domestic demand. In theseeconomies, financial markets developedincreasingly favourably over the course of1999. In Hong Kong (SAR) and Indonesia,however, growth barely turned positive in
1999. China continued to weather the effectsof the Asian crisis in 1999. While undergoingsignificant structural reforms, real growthdeclined only slightly to 7.2%.
Over the course of 1999 transitioneconomies were confronted with the adverseimpact of the Russian crisis on investorconfidence. However, after a significantslowdown in the first quarter of 1999, thebroad economic outlook rapidly improved inthe Czech Republic, Hungary and Poland. InRussia the economy continued to be affectedby political uncertainty and weak economicfundamentals, although there were somepositive signals in the real sector, including arebound in industrial production. As a resultof these developments, real GDP growth isestimated to have increased by around 3%,which was significantly higher than initiallyprojected, following a contraction of almost5% in 1998. In other transition economies,and particularly in the Baltic states, there wasa sharp deceleration of growth, as the Russiancrisis had a stronger than anticipated impact.The political and economic situation inRomania remained a cause for concern, asthe losses in GDP since 1997 totalledapproximately 16%.
In Latin America by the end of 1999 theeconomic outlook had improved in terms ofgrowth prospects and financial stability. Theyear started inauspiciously, with mostcountries in the region in recession in theaftermath of the Russian crisis of 1998. TheBrazilian currency came under intensepressure and was left to float in January 1999.Ultimately, the recession in Brazil was lesssevere than had been feared and thecontagion effects of the Brazilian crisis werelimited. By the end of the year, the region asa whole was pulling out of recession, althoughthe economic recovery remained fragile in anumber of countries as a result of slowprogress in fiscal consolidation and structuralreforms.
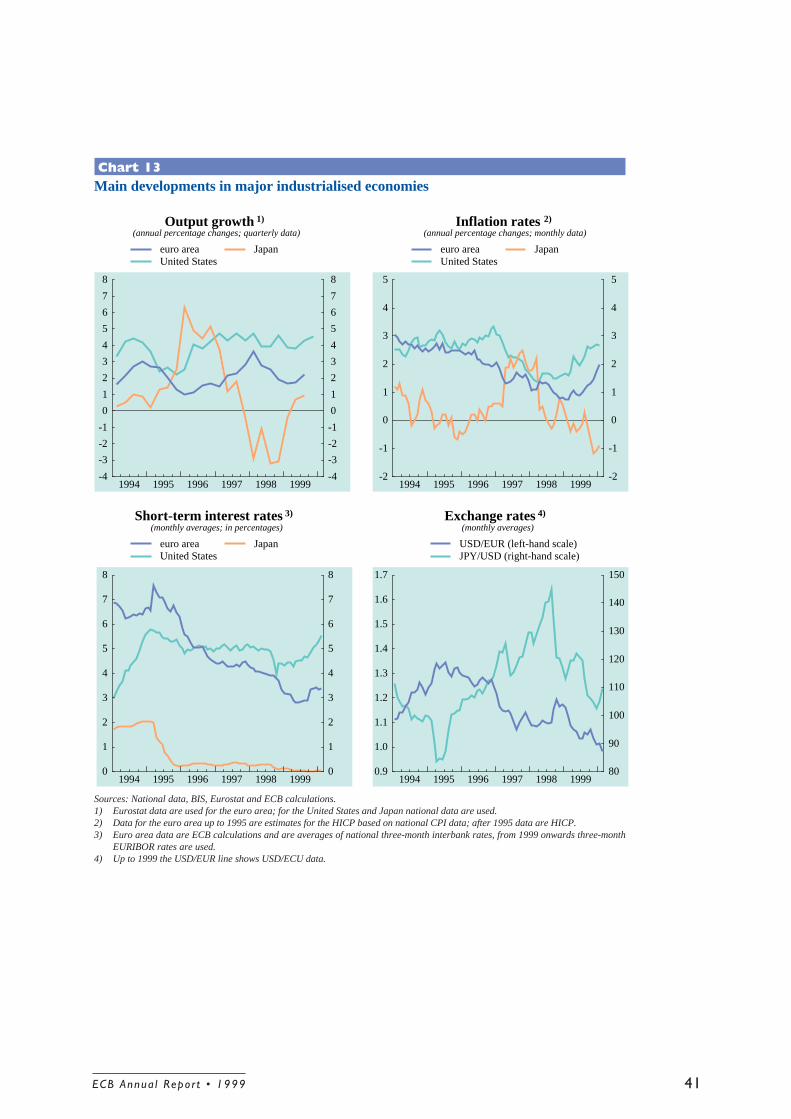
41ECB Annua l Repor t • 1999
Chart 13Main developments in major industrialised economies
1994 1995 1996 1997 1998 1999-4
-3
-2
-1
0
1
2
3
4
5
6
7
8
-4
-3
-2
-1
0
1
2
3
4
5
6
7
8
euro areaUnited States
Japan
Output growth 1)
(annual percentage changes; quarterly data)
1994 1995 1996 1997 1998 1999-2
-1
0
1
2
3
4
5
-2
-1
0
1
2
3
4
5
euro areaUnited States
Japan
Inflation rates 2)
(annual percentage changes; monthly data)
1994 1995 1996 1997 1998 19990
1
2
3
4
5
6
7
8
0
1
2
3
4
5
6
7
8
euro areaUnited States
Japan
Short-term interest rates 3)
(monthly averages; in percentages)
1994 1995 1996 1997 1998 19990.9
1.0
1.1
1.2
1.3
1.4
1.5
1.6
1.7
80
90
100
110
120
130
140
150
USD/EUR (left-hand scale)JPY/USD (right-hand scale)
Exchange rates 4)
(monthly averages)
Sources: National data, BIS, Eurostat and ECB calculations.1) Eurostat data are used for the euro area; for the United States and Japan national data are used.2) Data for the euro area up to 1995 are estimates for the HICP based on national CPI data; after 1995 data are HICP.3) Euro area data are ECB calculations and are averages of national three-month interbank rates, from 1999 onwards three-month
EURIBOR rates are used.4) Up to 1999 the USD/EUR line shows USD/ECU data.
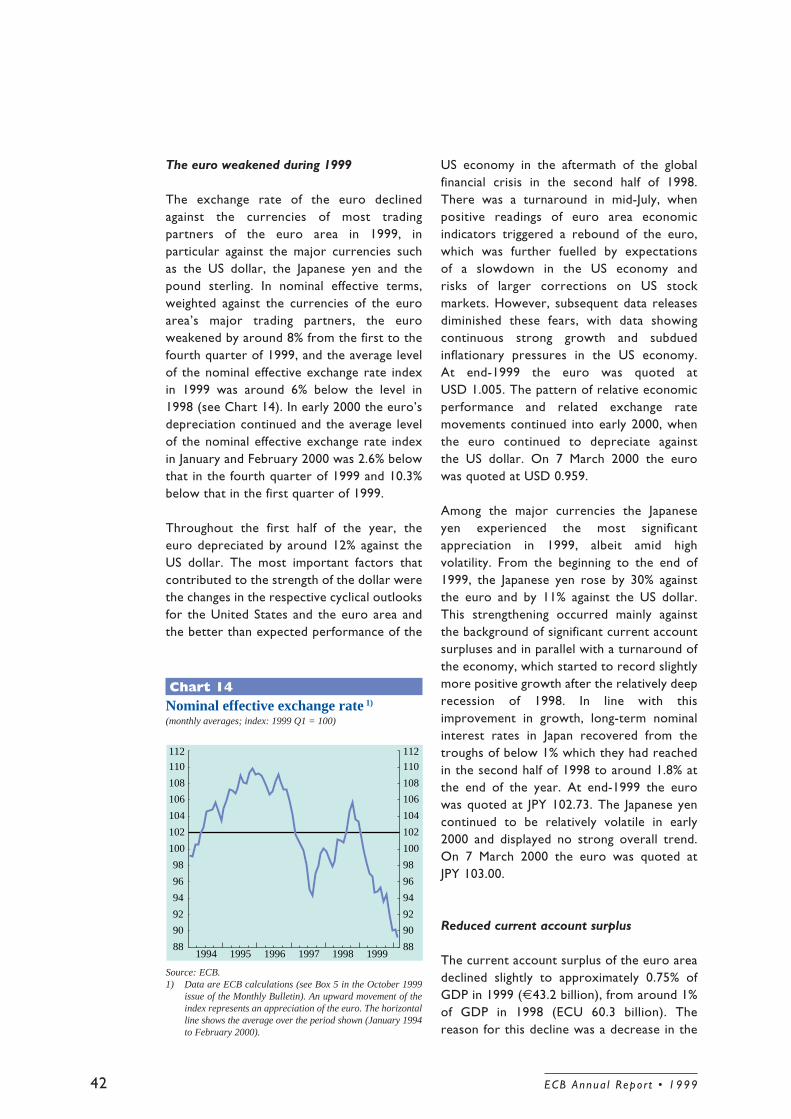
ECB Annua l Repor t • 199942
The euro weakened during 1999
The exchange rate of the euro declinedagainst the currencies of most tradingpartners of the euro area in 1999, inparticular against the major currencies suchas the US dollar, the Japanese yen and thepound sterling. In nominal effective terms,weighted against the currencies of the euroarea’s major trading partners, the euroweakened by around 8% from the first to thefourth quarter of 1999, and the average levelof the nominal effective exchange rate indexin 1999 was around 6% below the level in1998 (see Chart 14). In early 2000 the euro’sdepreciation continued and the average levelof the nominal effective exchange rate indexin January and February 2000 was 2.6% belowthat in the fourth quarter of 1999 and 10.3%below that in the first quarter of 1999.
Throughout the first half of the year, theeuro depreciated by around 12% against theUS dollar. The most important factors thatcontributed to the strength of the dollar werethe changes in the respective cyclical outlooksfor the United States and the euro area andthe better than expected performance of the
US economy in the aftermath of the globalfinancial crisis in the second half of 1998.There was a turnaround in mid-July, whenpositive readings of euro area economicindicators triggered a rebound of the euro,which was further fuelled by expectationsof a slowdown in the US economy andrisks of larger corrections on US stockmarkets. However, subsequent data releasesdiminished these fears, with data showingcontinuous strong growth and subduedinflationary pressures in the US economy.At end-1999 the euro was quoted atUSD 1.005. The pattern of relative economicperformance and related exchange ratemovements continued into early 2000, whenthe euro continued to depreciate againstthe US dollar. On 7 March 2000 the eurowas quoted at USD 0.959.
Among the major currencies the Japaneseyen experienced the most significantappreciation in 1999, albeit amid highvolatility. From the beginning to the end of1999, the Japanese yen rose by 30% againstthe euro and by 11% against the US dollar.This strengthening occurred mainly againstthe background of significant current accountsurpluses and in parallel with a turnaround ofthe economy, which started to record slightlymore positive growth after the relatively deeprecession of 1998. In line with thisimprovement in growth, long-term nominalinterest rates in Japan recovered from thetroughs of below 1% which they had reachedin the second half of 1998 to around 1.8% atthe end of the year. At end-1999 the eurowas quoted at JPY 102.73. The Japanese yencontinued to be relatively volatile in early2000 and displayed no strong overall trend.On 7 March 2000 the euro was quoted atJPY 103.00.
Reduced current account surplus
The current account surplus of the euro areadeclined slightly to approximately 0.75% ofGDP in 1999 (€43.2 billion), from around 1%of GDP in 1998 (ECU 60.3 billion). Thereason for this decline was a decrease in the
Chart 14Nominal effective exchange rate 1)
(monthly averages; index: 1999 Q1 = 100)
Source: ECB.1) Data are ECB calculations (see Box 5 in the October 1999
issue of the Monthly Bulletin). An upward movement of theindex represents an appreciation of the euro. The horizontalline shows the average over the period shown (January 1994to February 2000).
1994 1995 1996 1997 1998 199988
90
92
94
96
98
100
102
104
106
108
110
112
88
90
92
94
96
98
100
102
104
106
108
110
112

43ECB Annua l Repor t • 1999
surplus on trade in goods which, in turn, wasmainly the result of a strong increase inimport values in the course of the year,attributable to higher import prices,particularly energy (see Box 5), along with alow level of export values in the first half of1999 and, to a lesser extent, the deteriorationin the services trade balance. By contrast,lower deficits were recorded for the currenttransfers and income accounts in 1999.
Over 1999 as a whole, the goods tradesurplus of the euro area declined to€99.9 billion from ECU 118.8 billion in 1998.In the second half of last year, however,export values began to show strongerunderlying growth, reflecting both risingforeign demand and improvements in pricecompetitiveness. Despite the increase inexports during the course of the year, importvalues continued to grow faster than exports,which seems to be related to higher importprices, partly resulting from higher oil pricesand the weakening of the euro, along withsigns of increased activity in the euro areaduring the last six months of 1999.
The services balance also deteriorated in1999, compared with 1998, reaching a deficitof €6.6 billion by the end of last year. Higherpayments, combined with virtually zerogrowth in receipts, underlay the rise in thedeficit in services. By contrast, the deficits onthe current transfers and income accountsfell in 1999, declining by €3.0 billion and€4.6 billion respectively. The improvementin the income account was mostly a result oflower investment income payments in 1999,compared with the very high levels reachedin 1998.
Euro area residents increased foreign directinvestment, while portfolio investmentoutflows declined
In 1999 direct and portfolio investment netoutflows amounted to €168.5 billion,i.e. lower than the ECU 187.9 billion in theprevious year. The major determinant ofthe outflows from the euro area were netdirect investment outflows. The latterincreased from ECU 102.6 billion in 1998to €147.2 billion in 1999; in particular,euro area residents invested more abroad(€212.5 billion in 1999, compared withECU 183 billion in 1998). At the same timeforeign direct investment in the euro arearemained subdued (€65.2 billion, comparedwith ECU 80.4 billion in 1998).
The increase in net direct investmentoutflows contrasted with a €64.0 billiondecline in net portfolio investment outflowsto €21.3 billion in 1999, compared with 1998.This was related to the swing in debtinstruments from net outflows in 1998(ECU 84.8 billion) to net inflows in 1999(€34.8 billion). Both lower investment onthe part of euro area residents abroad andstronger demand on the part of foreigninvestors for euro area debt securities, inparticular money market instruments,contributed to the turnaround. On theother hand, net equity outflows increased to€56.1 billion (from ECU 0.4 billion in 1998),mainly as a result of higher investment inforeign equities on the part of euro arearesidents (which rose to €150.0 billion, fromECU 98.7 billion in 1998).

ECB Annua l Repor t • 199944
Box 5The decline in the surplus of trade in goods of the euro area in 1999
Some of the decline in the surplus of trade in goods in 1999 is explained by the low level of export values during
the first half of the year, primarily owing to the “carry-over” effects of weak foreign demand in 1998. Although
export values recovered later in 1999, in line with stronger growth in foreign demand, import values grew even
more rapidly throughout the year, mainly as a result of rising import prices and of higher activity in the euro area.
The recovery in foreign demand, defined as a weighted average of the import volumes of the euro area’s main
export markets, is shown in the chart below.1 The strong negative growth rates for demand in Japan and the
rest of Asia, together with a deceleration in UK import growth, partly explain the decline in export values in
1998 and early 1999. Similarly, the rebound in demand in Asia, as well as continued robust import growth in
the United States, corresponds with the recovery in exports in 1999. Although the United Kingdom is the
largest market, accounting for around 19.3% of the exports of the euro area, Asia including Japan accounts for
18.3%, followed by the United States (14%) and the transition economies of eastern Europe (13.5%).
On the imports side, a persistently high level of import volumes – combined with the sharp rise in import
prices since the beginning of 1999 and largely accounted for by the strong rise in oil prices as well as the
decline of the euro – contributed significantly to the growth in import values in 1999. However, part of the rise
in import values can also be attributed to imports of manufactured goods which grew by 7% in 1999.2 Imports
of machinery and vehicles grew particularly rapidly, increasing by around 11% in 1999, which is consistent
with a higher level of activity in the euro area in the second half of 1999. In terms of supplier countries,
imports of goods from China and Hungary registered the strongest growth in value terms in 1999, recording
annual increases of around 16% and 19% respectively.
1 Total foreign demand is approximated by a weighted average of the import volumes of the euro area’s main export markets hj hmj (i.e. the weights of the markets multiplied by their respective import volume growth rates). The respective weights are:United States 14.0%, Japan 3.6%, United Kingdom 19.3%, Switzerland 6.4%, Other developed countries 14.9%, non-JapanAsia 14.7%, Transition economies 13.5%, Latin America 4.4%, Rest of the world 9.2%.
2 Data for imports by commodity or country compare the period from January to November 1999 with the corresponding periodin 1998 (source: Eurostat). These data are based on Eurostat trade statistics and are not fully comparable with ECB b.o.p. data.
Import volumes of major euro area export markets(annual percentage changes)
-1 5
-10
-1 5
-10
-5
0
5
10
15
20
Q1 Q2 Q3 Q4 Q1 Q2 Q3 Q4 Q1 Q2 Q3 Q4
United States United Kingdom Japan Asia total
1997 1997 1997 1997 1998 1998 1998 1998 1999 1999 1999 1999
-5
0
5
10
15
20

45ECB Annua l Repor t • 1999


Chapter II
Central bank operations
ECB Annua l Repor t • 199948
1 Monetary policy implementation
1.1 Liquidity management
The monetary policy operational frameworkof the Eurosystem contains a wide set ofinstruments which were chosen in viewof the need to respect the principles ofmarket orientation, operational efficiency(understood as the capacity to achieveefficiently the objectives of the Eurosystem),equal treatment, simplicity, transparency andcost-efficiency. In addition, while the relevantdecisions are taken by the governing bodiesof the ECB, they are implemented in adecentralised manner by the 11 NCBs of theEurosystem. The variety of instrumentsavailable is such that the governing bodies ofthe ECB are able to use them in thecombination deemed most appropriate to thecircumstances. Overall, in the first year ofimplementation of the single monetary policy,the operational framework of the Eurosystemworked smoothly.
One element of the Eurosystem’s operationalframework is the minimum reserve system,which requires credit institutions to hold cashbalances with the Eurosystem’s NCBs in anamount equal to 2% of their reserve base,i.e. a range of short-term liabilities. The factthat such a requirement must only be fulfilled,on average, during one-month “maintenanceperiods” has a significant smoothing effect onthe demand for reserves by credit institutionsand thereby also on the behaviour ofshort- term money market interest rates. Thishas been a factor enabling the Eurosystem toconduct monetary policy efficiently resortingonly to a limited number of the instrumentsavailable during the first year ofimplementation of the single monetary policy.
In its liquidity management the ECB focuseson the interbank market for reserves, thelatter being understood as the currentaccount deposits that credit institutions inthe euro area hold with the NCBs of theEurosystem. The supply of such reserves isdetermined by the net effect of the liquidityprovided through monetary policy operations
and the liquidity absorbed or injected by“autonomous factors” (i.e. items of theEurosystem’s balance sheet, the amount ofwhich does not depend on the central bank’smonetary policy operations, such asbanknotes in circulation, government depositsand net foreign assets). The demand forreserves is determined by credit institutions’need to fulfil reserve requirements and afurther limited demand for “excess” reserves.The market price of reserves is theshort-term interbank rate, whereby theovernight maturity plays a dominant role interms of volume and is often a point ofreference, since it is the shortest relevantmaturity and, therefore, the initial point ofthe yield curve. The widely used referencerate for overnight euro deposits, the EONIA(euro overnight index average) rate, is aneffective overnight rate computed as aweighted average of the unsecuredovernight lending transactions of a panel of57 contributing banks in the interbank market.
The liquidity management of the creditinstitutions in the euro area is driven by theiraim to minimise the cost of holding the requiredreserves over the maintenance period. The costincurred by credit institutions in holdingreserves on a given day can be measured by thedifference between the interbank overnight rateand the interest rate paid on the requiredreserves (the main refinancing operations(MRO) rate) on that day. Therefore, creditinstitutions will attempt to build up reservesurpluses whenever this difference is low,compared with future expected differenceswithin the same maintenance period, and viceversa. This behaviour tends to stabilise marketrates as, in order for the market to clear,overnight rates will tend to be aligned withfuture expected overnight rates within themaintenance period. Interbank rates willconsequently be determined by past, current,and expected future liquidity conditions in themaintenance period. In addition, the interbankovernight rate is influenced by marketexpectations of future changes in the MROrate by the ECB. Therefore, the ECB influences

49ECB Annua l Repor t • 1999
the interbank overnight rate not only throughits actual decisions, but also through theexpectations it generates with regard to itsinterest rate and its allotment policy in openmarket operations.
The quantity of reserves available to creditinstitutions is not only affected by monetarypolicy operations, but also by fluctuations inother items of the Eurosystem’s balancesheet, namely the autonomous factors. Theeffects of autonomous factors on liquidityare sometimes considerable: day-to-daychanges of autonomous factors in the orderof €10 billion are relatively frequent. In thecase of the Eurosystem, the most volatileautonomous factor is government depositswith the NCBs. The volatility of the dailychanges in government deposits (measuredby its standard deviation) amounted to morethan €5 billion, compared with around€1 billion for banknotes. In 1999 the totalreserve requirements of credit institutions inthe euro area varied between €98.2 billion(during the first maintenance period) and€105 billion (during the maintenance periodending on 23 December). The reserveholdings of banks fluctuated between€63.0 billion and €126.4 billion in the courseof the year without producing significantstress in the prevailing market rates,indicating that the liquidity buffers providedby the system were never exhausted.
1.2 The main refinancing operations
The MROs are the most important openmarket operations conducted by theEurosystem, playing a pivotal role in steeringliquidity conditions and signalling the stanceof monetary policy. They provide thebulk of liquidity to the financial sector. Theyare regular, liquidity-providing, reversetransactions, conducted as standard tenders,with a weekly frequency and a maturity oftwo weeks. In 1999 the Eurosystemconducted a total of 52 MROs. The allotmentvolumes varied between €39 billion and€102 billion, with the average amountingto €69 billion.
The operational framework of the Eurosystemprovides for the possibility of carrying out eitherfixed rate or variable rate tenders. The ECB hasso far only applied fixed rate tenders in theEurosystem’s MROs. Fixed rate tenders areconducted in such a way as to allow the ECBboth to signal clearly the stance of monetarypolicy and to allot the amount of liquidity itconsiders necessary given the anticipatedautonomous factor flows. In the MROsconducted through fixed rate tenders, theinterest rate of the operation is pre-announced.Counterparties submit bids at the pre-announced rate. The ECB then matches thebids with its own estimate of the liquidity needsof the banking sector, mainly determined byreserve requirements and autonomous factorforecasts. If bids are higher than the forecastliquidity needs, as is usually the case, the ECBnormally determines an allotment ratio below100%.
The average amount of bids submitted to theMROs conducted in 1999 was €954 billionand the average amount allotted was€69 billion. The average “allotment ratio”(i.e. the average of the ratios of the liquidityactually allotted by the ECB to the totalamount of bids in individual tenders) was10.8%. The smallest amount of bids,€67.4 billion, was recorded in the operationon 6 April 1999, in an environment of strongexpectations of a lowering of the interestrate on the MROs within the samemaintenance period. All bids were satisfiedby the ECB on that occasion, implying anallotment ratio of 100%. The highestbids, €2,344 billion, were observed on2 November 1999, in an environment ofstrong expectations of an increase in the rateon the MROs within the same maintenanceperiod. The chosen allotment volume of€66 billion implied an allotment ratio of2.82%, which was the lowest ever observed.While the average amount of bids increasedin the first three quarters of the year (theaverage amounts of total bids in the firstthree quarters of the year were €674 billion,€763 billion and €1,274 billion respectively),they fell slightly in the fourth quarter, to anaverage total volume of €1,104 billion.

ECB Annua l Repor t • 199950
The evolution of the volume of bids submittedcan be explained by the expectationsprevailing among credit institutions withregard to the relative cost of obtaining fundsin the interbank market, compared with theinterest rate on the MROs. A state ofequilibrium between the expected cost ofrefinancing with the central bank and theexpected cost of obtaining funds through theinterbank market (including a premium forthe higher uncertainty of market funding) hasto be achieved in order to prevent the bidsof banks from either escalating or drying up.Central banks can control the averageovernight rate by virtue of determining thequantity of bank reserves. Generally (i.e. inthe absence of strong expectations regardinginterest rate changes), they thus have themeans to ensure the achievement of thisequilibrium for any tender rate within thecorridor set by the standing facilities.
The ECB tended to orient its allotmentdecisions towards ensuring an averageinterbank overnight rate close to the tenderrate. This policy implied that, on average in1999, the EONIA rate was 2½ basis pointshigher than the rate on the MROs. Moreover,the volatility of the EONIA rate was lowthroughout the year, although it was higherat the end of the reserve requirementmaintenance periods.
1.3 The longer-term refinancingoperations
In addition to the MROs, the Eurosystemalso conducts longer-term refinancingoperations (LTROs), which are regularliquidity-providing reverse transactions,conducted as standard tenders with a monthlyfrequency and a maturity of three months.They provide only a limited part of the globalrefinancing volume and are not, as a rule,conducted with the intention of steering theliquidity situation, of sending signals to themarket or of guiding market interest rates.In order for the Eurosystem to act as arate-taker, LTROs are usually conducted inthe form of variable rate tenders with
pre-announced allotment volumes. This wasindeed the case in all 14 LTROs in 1999. Theallotment volumes were pre-announced bymeans of press releases for longer periodsand then confirmed in the tenderannouncements on the day before theallotment decision. While the first 11 LTROsin 1999 had a volume of €15 billion, the lastthree amounted to €25 billion, thus alsocontributing to a smooth transition to theyear 2000. On average over the year, avolume of liquidity of €49 billion wasprovided through this type of operation, and316 counterparties submitted bids.
The first three LTROs of the year werespecial insofar as they were conducted inparallel on 14 January and two of them had ashortened maturity (of 42 and 70 daysrespectively) in order to phase in threeoutstanding LTROs without delay. While thefirst four LTROs were conducted as singlerate auctions (Dutch auctions), from Marchonwards all LTROs were conducted asmultiple rate auctions (American auctions) inorder to orient them towards usual marketpractices.
For all operations conducted between Marchand September, the weighted average ratesin the LTROs carried out through a multiplerate auction were 1 basis point above themarginal rate, reflecting a low and stabledispersion of expectations. The picture wasdifferent in the LTRO settled on 28 October,when the marginal rate was 23 basis pointsbelow the weighted average rate, reflectingheterogeneous but increasing expectationsof a hike in the MRO rate as well asheterogeneous preferences induced by thematuring of the operation after the transitionto the year 2000. In the operations conductedon 24 November and 22 Decemberrespectively, the situation partiallynormalised, with the spread between themarginal and the weighted rates falling to9 and 3 basis points respectively.

51ECB Annua l Repor t • 1999
1.4 Other open market operations
Besides the two regular reverse operations,the Eurosystem’s operational frameworkprovides for fine-tuning and structuraloperations on an ad hoc basis. Theseoperations may also be conducted in the formof reverse operations, but the Eurosystemhas a wide range of other ways ofimplementing such non-regular operations,namely as outright transactions, as foreignexchange swaps, via the issuance of debtcertificates and in the form of a collection offixed-term deposits. The instruments andprocedures applied to the conduct offine-tuning operations can be adapted to thetypes of transaction and the specificobjectives pursued.
In 1999 the Eurosystem did not conduct anyfine-tuning or structural operations, butrelied exclusively on the main andlonger-term refinancing operations for itsliquidity management, as well as on the availablestanding facilities, benefiting from the averagingmechanism inherent in the minimum reserverequirement system. At the beginning of 2000,exceptional market conditions prompted theEurosystem to conduct a liquidity-absorbingfine-tuning operation. It collected one-weekdeposits through a variable rate quick tenderamounting to €14.2 billion in order towithdraw the excess liquidity accumulated atthe end of 1999 as a consequence of the eventssurrounding the transition to the year 2000.
1.5 Standing facilities
The standing facilities are aimed at providingand absorbing overnight liquidity on theinitiative of credit institutions, signalling thegeneral stance of monetary policy and settingan upper and a lower limit for overnightmarket interest rates. The marginal lendingfacility can be used to obtain overnightliquidity from the Eurosystem against eligibleassets. The interest rate on the marginallending facility normally provides a ceiling forthe overnight market interest rate.
The deposit facility can be used to depositovernight surplus funds with the Eurosystem.The interest rate on the deposit facilitynormally provides a floor for the overnightmarket interest rate. Thus the two facilitiestogether determine a corridor for theovernight market rate. The width of thiscorridor varied in 1999 between 50 basispoints (between 4 and 21 January, with theaim of facilitating the adaptation of creditinstitutions to the new framework) and 250basis points between 22 January and 8 April.The corridor had a width of 200 basis pointsfrom 9 April to the end of the year.
Over the year, the daily recourse to themarginal lending and deposit facilitiesamounted, on average, to €1 billion and€0.8 billion respectively. Particularly intenserecourse to the standing facilities wasnonetheless witnessed in January 1999,namely an average of €6.0 billion for themarginal lending facility and €2.0 billion forthe deposit facility. This high use of thestanding facilities was due in part to the factthat their costs were kept very low until21 January, but also suggested that theinterbank market had still to adapt to thenew environment.
While a large simultaneous recourse to bothstanding facilities on one day, which could beinterpreted as an indication of the lack ofperfection of the interbank market, has notoccurred, except at the very beginning of theyear, a high use of only one facility is normallyan indication of aggregate liquidity imbalances.Such imbalances typically occur at the end ofmaintenance periods when the averagingmechanism of the reserve requirements can,by definition, no longer operate. The averageuse of the marginal lending and depositfacilities on the last day of the 11 maintenanceperiods of 1999 was €3.6 billion and€6.8 billion respectively. However, at theend of any given maintenance period whenthere was a large recourse to one of thestanding facilities, the other was scarcelyused, indicating that the interbank marketwas rather successful in allocating funds evenon the last days of maintenance periods.

ECB Annua l Repor t • 199952
Moreover, even considerable recourse to thestanding facilities at the end of individualmaintenance periods and high volatility of theinterbank overnight rates, have typically hadno lasting influence on longer-term moneymarket rates, thus not creating uncertaintywith regard to the stance of monetary policy.
1.6 The minimum reserve system
During 1999 the two main functions ofthe minimum reserve system, namelythe stabilisation of money market interestrates and the enlargement of the structuralliquidity deficit of the banking sector, weresuccessfully fulfilled. The previouslymentioned smoothing effect of the minimumreserve system on the EONIA rate isprimarily associated with the stabilising roleplayed by the averaging features of theminimum reserve system. With regard tothe enlargement function, the levels ofrequired reserves usually accounted for morethan 50% of the total refinancing needs of thebanking sector (i.e. the total outstandingamount of regular open market operations).Furthermore, the remuneration of therequired reserves at the level of the mainrefinancing rate of the Eurosystem ensuredthat the system did not impose a significantcost on banks.
Given the smooth functioning of the minimumreserve system, its main features (i.e. theaveraging provisions, the duration of themaintenance period and the remuneration ofthe required reserves) were not changed in1999. Similarly, no changes were made to thereserve ratio, the reserve base andthe amount of the lump-sum allowance(€100,000) which is deductible from therequired reserves. The only element modifiedduring 1999 was the standardised deductionfrom the reserve base applicable by eachindividual credit institution to liabilitiesvis-à-vis credit institutions of the euro areasubject to the ECB’s reserve requirements.In the case of liabilities in the form of debtsecurities with an agreed maturity of up totwo years and money market paper, credit
institutions were allowed, during 1999, toapply a standardised deduction of 10% if theycould not provide evidence of that kind ofliability vis-à-vis other credit institutionsestablished in the euro area. After reviewingthe statistical evidence available for 1999, theECB decided on 2 December to modify thestandardised deduction from the reserve baseto 30% with effect from January 2000. Creditinstitutions readily adapted to the newreporting schemes and methods for thecalculation of the minimum reserves. As aconsequence, cases of non-compliance withthe minimum reserve requirements wererather limited in the course of 1999. After agrace period of three months, to allow creditinstitutions to adapt to the new singlemonetary policy, a framework for thesanctioning of breaches of obligationsregarding the minimum reserve requirementswas enforced by the ECB.
1.7 The Eurosystem’s eligible collateraland its use for credit operations
All Eurosystem credit operations – intradaycredit and monetary policy operations – mustbe based on adequate collateral provided bythe Eurosystem’s counterparties. In order totake account of differences in the financialstructure of Member States, assets eligiblefor credit operations include a large numberof different instruments. A distinction is madebetween two categories of assets eligible forthe credit operations of the Eurosystem.These two categories are referred to as “tierone” and “tier two” respectively. Thisdistinction was made exclusively for purposesinternal to the Eurosystem and has no bearingon the quality of the assets and their eligibilityfor the various types of operations, exceptthat tier two assets would not normallybe used by the Eurosystem in outrighttransactions.
Tier one consists of marketable debtinstruments fulfilling uniform euro areaeligibility criteria specified by the ECB. Tiertwo consists of assets which are of particularimportance to the national financial markets

53ECB Annua l Repor t • 1999
and banking systems and for which eligibilitycriteria are established by the NCBs, subjectto approval by the ECB.
As at mid-December 1999 the amount ofmarketable eligible assets available forEurosystem operations was almost €5,700billion (up from over €5,300 billion in January1999). The overwhelming proportion of thisamount (96%) was composed of tier oneassets. Measured by issuer, 62.7% of themarketable tier one assets were governmentsecurities, 32.8% securities issued by creditinstitutions, and 4.2% corporate paper. Interms of maturity, 93% of the assets werelonger-term bonds and medium-term notes,while 6.5% were short-term securities;equities and other marketable tier two assetswere negligible in amount (0.3% and 0.2%respectively).
Eurosystem counterparties may use eligibleassets on a cross-border basis, i.e. obtainfunds from the NCB of the Member State inwhich they are established by making use ofassets located in another Member State (seeChapter V).
In the course of 1999, at the request ofseveral NCBs, the ECB conducted anassessment of new categories of assets whicheither had not existed in 1998 or with regardto which changes making them compliant withthe minimum eligibility criteria of the ECBhad occurred in the course of 1999. As aresult, these categories of assets were addedto the list of eligible collateral for theEurosystem’s credit operations.
1.8 Participation of Eurosystemcounterparties in monetary policyoperations
The Eurosystem’s monetary policy frameworkis formulated with a view to ensuringthe participation of a broad range ofcounterparties. Institutions subject to theEurosystem’s minimum reserve requirementsystem are eligible as counterparties for openmarket operations (OMOs) based on
standard tenders and for accessing thestanding facilities.1 At the end of December1999 around 7,900 euro area creditinstitutions were subject to reserverequirements. Out of these, around 4,100had direct or indirect access to a real-timegross settlement system’s account, which isan operational condition for participating inmonetary policy operations. Around 3,800had access to the deposit facility, and 3,200could access the marginal lending facility.In order to have access to OMOs,counterparties may need, furthermore, tohave access to the national tendering systems,as was the case for the approximately 2,500counterparties which could potentiallyparticipate in OMOs in 1999. Around 200institutions have been selected bythe Eurosystem for potential fine-tuningoperations conducted through quick tenderor bilateral procedures.
The number of counterparties effectivelyparticipating in the MROs ranged from 1,068 (inJanuary 1999) to 302 (in April 1999), whereasthe number of participants in the LTROs variedbetween 466 (in January 1999) and 198 (inSeptember 1999). In the second half of 1999there was a trend towards a reduction in thenumber of counterparties participating in theEurosystem’s operations compared with the firsthalf of the year. In parallel, a decline in the shareof small-scale institutions participating in theMROs relative to larger institutions wasobserved during the year, which seems toindicate a decline of the incentives for smallerinstitutions to participate in the MROs. Thesedevelopments may be attributed to severalfactors, including, inter alia, the ongoingconsolidation process in the banking industryand a perception by counterparties that thedifferentials between the rates applied by theEurosystem in its operations and the EONIArates were rather narrow.
1 Pursuant to Article 19.1 of the Statute of the ESCB, the ECBgenerally requires credit institutions established in participatingMember States to hold minimum reserves. A definition of“credit institutions” is contained in Article 1 of the First BankingCo-ordination Directive (77/780/EEC), i.e. “an undertakingwhose business is to receive deposits or other repayable fundsfrom the public and to grant credit for its own account”.

ECB Annua l Repor t • 199954
1.9 Money market developments
Following the introduction of the euro andthe new monetary policy framework, themoney market went through a process ofdeep integration throughout the euro area.However, such integration was nothomogeneous across the various marketsegments: the unsecured deposit market, inwhich banks exchange short-term liquiditywithout the guarantee of collateral, and thederivatives markets experienced fasterintegration, while the repo market, in whichparticipants exchange short-term liquidityagainst collateral, and the short-termsecurities markets (Treasury bills, commercialpaper and certificates of deposit) still havemuch scope for further integration. Fromthe very start of Stage Three of EMU, cross-border transactions in the euro area moneymarket increased substantially and currentlyrepresent more than 50% of overall activityin all segments of the money market. Thatdevelopment was fostered by the smoothfunctioning of the TARGET system for thetransfer of large-value funds throughout theeuro area and the other EU countries.TARGET has proven to be a key element inensuring an efficient redistribution of liquidityacross the euro area.
The unsecured and swap segments of themoney market were those that experiencedthe most far-reaching changes, includingthe substantial increase in cross-bordertransactions which can be seen both as areflection and as a cause of those changes. Italso explains their homogeneity and the highlevel of liquidity. Such homogeneity is evident,in particular, for the overnight maturity, asshown by the very limited differencesbetween the overnight rates observed in theindividual euro area countries.
Other structural changes observed in theeuro area money market since theintroduction of the euro include: a surge inthe liquidity of secondary markets; increasedconcentration of euro cash managementactivities compared with the situationprevailing in the formerly fragmented moneymarkets; increased competitiveness and alarger number of counterparties actuallyavailable to individual banks. A description ofstructural developments in the euro areamoney markets can be found in the articleentitled “The euro area one year after theintroduction of the euro: key characteristicsand changes in the financial structure” in theJanuary 2000 issue of the ECB MonthlyBulletin.
2 Investment of foreign exchange assets and own funds
2.1 The foreign reserve assets of theEurosystem
The Eurosystem is responsible for holdingand managing the foreign reserves of theMember States. Both the ECB and theNCBs hold foreign reserves. Although theNCBs manage their own foreign reservesindependently, their operations in the foreignexchange market are subject, above a certainlimit, to the approval of the ECB, in order toensure consistency with the single monetarypolicy of the Eurosystem.
The transfer of foreign reserves from theNCBs to the ECB took place at the very
beginning of 1999 for the maximumpermissible amount of €50 billion, adjusteddownwards by deducting the shares in theECB capital of the NCBs of the countriesnot participating in Monetary Union fromthe outset. This amounted to €39.46 billion,i.e. around 80% of €50 billion. The foreignexchange reserves represent a very large partof the assets side of the ECB Balance Sheet.In accordance with Article 123 of the Treaty,further calls by the ECB on the NCBs’ foreignreserve assets are possible, subject tosecondary European Community legislation;a recommendation for an EU CouncilRegulation has been put forward by the ECB.

55ECB Annua l Repor t • 1999
The currency distribution of the foreignreserves of the ECB has been defined on thebasis of prospective operational needs andmay change if and when appropriate. 15% ofthe foreign reserves pooled at the ECB weretransferred in the form of gold, while theremaining 85% are denominated in US dollarsand, to a lesser extent, Japanese yen. Thereis no active management of the currencycomposition of reserves for investmentpurposes, in order to avoid any interferencewith the single monetary policy of theEurosystem.
2.2 The Eurosystem’s approach toforeign reserve management
The management of the ECB’s foreignreserves has to ensure that, at any point intime, the ECB has an adequate amount ofliquid resources at its disposal for any foreignexchange intervention. If interventions wereto take place, the foreign reserves pooled atthe ECB would be used. Liquidity and securityare therefore the basic requirements for theinvestment of the ECB’s foreign reserves.Subject to these constraints, the ECB’sforeign reserves are managed to maximisetheir value. Furthermore, the managementof the foreign reserves also allows theEurosystem to enhance its knowledge ofmarket techniques and its forward-lookingunderstanding of the behaviour of marketparticipants.
The ECB’s foreign reserves are managed in adecentralised manner by the euro area NCBs.The key investment guidelines and thestrategic benchmark are determined by theGoverning Council, and the Executive Boarddecides on the tactical investment framework.In addition to the currency distribution, theECB defines four key parameters for theinvestment of its foreign reserves in the USand Japanese bond markets. The keyparameters are, first, a two-level investmentbenchmark (i.e. a strategic and a tacticalbenchmark) for each currency; second,permitted deviations from these benchmarksin terms of the interest rate risk; third, a list
of eligible instruments and operations; and,fourth, limits for credit risk exposures. NCBsuse the leeway given to them by the deviationbands and risk limits to maximise the returnon the portfolios they manage on behalf ofthe ECB, within a real-time monitoringframework established by the ECB. Whenconducting the ECB’s investment activity,NCBs act on behalf of the ECB, on a disclosedagency basis, so that the ECB’s counterpartiesin the international financial markets candistinguish the operations carried out by theNCBs on behalf of the ECB from thosecarried out by NCBs while managing theirown reserves.
The counterparties used for operationsinvolving the ECB’s foreign reserve assets areselected in consultation with the NCBs, onthe basis of creditworthiness and operationalefficiency. The general principle for definingthe instruments to be used is primarilydefined by the requirements of security andliquidity. Subject to these constraints, theEurosystem strives to use state-of-the-artportfolio and risk management practices andtechniques.
2.3 The ECB’s own funds management
The ECB has been endowed with an initialcapital of approximately €4,000 million. Theprincipal purpose of the capital is to endowthe ECB with a reserve fund which shouldprovide it with sufficient income, whilemaintaining an appropriate level of security.In accordance with Article 123 of the Treaty,an increase in the capital of the ECB ispossible, subject to secondary EuropeanCommunity legislation; a recommendation foran EU Council Regulation has been putforward by the ECB.
Since all of the ECB’s own funds are currentlyinvested in euro-denominated assets, itis of utmost importance to prevent anyinterference with the ECB’s monetary policydecisions. Thus, in order to prevent themisuse, or even the mere suspicion of misuse,of privileged information in the management
ECB Annua l Repor t • 199956
of the ECB’s own funds and to protect theECB’s reputation, a specific set-up has beenestablished along the lines of a Chinese wallconcept, i.e. a strict functional and physicaldivision between the unit managing the ownfunds and the other units of the ECB.
The basic investment framework isconsistent with the methodology applied tothe ECB’s foreign reserve management (seeSection 2.1 above), taking into account thefact that the predominant share of the ECB’sown funds is invested in euro-denominatedlong-term interest rate instruments. Inaddition, the ECB follows a relatively passive
investment approach, particularly in themoney market area, in order not to generateany monetary policy signals. Following theacquisition by the ECB of the status of BISshareholder, on 7 December 1999, part ofthe ECB’s capital was also used to financethe purchase of the BIS shares.
The list of eligible counterparties for theECB’s own funds investment and therelevant legal documentation, while preparedseparately from those corresponding tothe management of the ECB’s foreignreserve assets, meet the same criteria ofcreditworthiness and operational efficiency.
3 Payment and settlement systems operations
3.1 The TARGET system
Start of TARGET live operation
The Trans-European Automated Real-timeGross settlement Express Transfer(TARGET) system was designed to serve twomain objectives: first, to facilitate theintegration of the money market in euroin order to allow for the smoothimplementation of the single monetary policyand, second, to improve the soundness andefficiency of intra-EU cross-border paymentsin euro. It successfully commenced liveoperation on Monday, 4 January 1999,together with several other large-valuepayment systems in euro. Owing to the factthat the banks needed some time to adapt tothe new payment systems environment andto new treasury management practices, theESCB provided an “extended service window”between 11 and 29 January 1999 by delayingthe closing time of TARGET by one hourfrom 6 p.m. to 7 p.m. To avoid any abuse ofthis arrangement a special fee of €15 waslevied for each payment made during theextra hour of operation. Since the banksincreasingly adjusted to a more efficient wayof managing their liquidity, it did not provenecessary to continue to make use of theextended opening hours of TARGET.
Nevertheless, in order to make it easier forTARGET participants to manage theirend-of-day positions, the ECB decided that,as from 5 February 1999, the deadline forrequesting access to the marginal lendingfacility of the Eurosystem should coincidewith the corresponding deadline for thedeposit facility, i.e. 30 minutes after the actualclosing time of TARGET.
Development of TARGET in 1999
TARGET can be accessed by some 34,000institutions (mostly credit institutions,including their branches and subsidiaries)throughout the EU. In 1999 the number ofpayments processed in the system as a whole,i.e. cross-border and domestic paymentstaken together, was 163,157 as a dailyaverage, representing a value of €925 billion.Cross-border activity in TARGET steadilyincreased over the whole period. Comparedwith January 1999, the December 1999 figuresshow an increase of 58% in terms of volumeand 6% in terms of value. The share ofcross-border payments in all TARGETpayments processed in 1999 was 18% withregard to volume (a daily average of 28,777payments) and 39% with regard to value(a daily average of €360 billion). The peak

57ECB Annua l Repor t • 1999
days thus far have been 22 February 2000, asfar as volume is concerned, with around52,000 cross-border payments beingprocessed, and 31 January 2000, as faras value is concerned, with the totalvalue of payments processed amounting to€522 billion.
The average value of individual transactionsprocessed by TARGET and other large-valueeuro payment systems decreased during 1999.The main reason for this was the progressiveshift of commercial payments fromcorrespondent banking into organised paymentsystems. In December 1999 34% of cross-border payments processed through TARGETwere customer payments, while, in January1999, these accounted for only 15%. UsingTARGET and other large-value systems forcustomer payments instead of correspondentbanking allows corporate customers to improvetheir cash management.
In the TARGET section of its website theECB provides and regularly updates statisticaldata on TARGET and the different nationalreal-time gross settlement (RTGS) systemsparticipating in it or connected to it.
Operational framework
In technical terms TARGET has provedcapable of processing a significant numberof large-value payments within shorttransmission times. The requirement of fullcollateralisation of intraday credit did notturn out to be a problem and the pricedifference between TARGET and alternativesystems has not deterred banks from usingTARGET extensively. Even the larger banks,which may have cheaper alternatives forprocessing their payments, use TARGET fortheir very large-value payments, for whichthe system offers advantages in terms ofrisk and liquidity management. Moreover,many small and medium-sized banks whichlack access to other systems have foundTARGET to be an efficient alternative tocorrespondent banking.
Owing to the importance of TARGET forthe euro area money market and itsinterdependence with different large-valuepayment and settlement systems in euro,a very high level of technical availabilityneeds to be ensured. In this respect, theperformance of some system componentswas, however, not always fully satisfactory.In those cases the improvement of systemavailability has been actively addressed andgiven highest priority.
With regard to TARGET operating days, in1999 the system closed on New Year’s Day,Christmas Day and, in order to enhance thesafety of the transition to the year 2000,exceptionally on 31 December. The paymenttraffic was, however, rather low on other dayswhich are traditionally public (or bank) holidaysin most of the euro area countries. Therefore,and following a request from the Europeanbanking industry, the ECB decided in July 1999to have six closing days in 2000 in addition toSaturdays and Sundays: New Year’s Day, GoodFriday, Easter Monday, 1 May (Labour Day),Christmas Day and 26 December. These daysare, de facto, non-settlement days for themoney market and the financial markets in euro,as well as for foreign exchange transactionsinvolving the euro. However, in some of thoseeuro area countries in which one of these daysis not a public holiday, the national RTGS systemwill be open for limited domestic paymentactivity.
Dialogue with TARGET users
During 1999 the ECB regularly reported ondevelopments related to TARGET, both inthe TARGET section of its website and in thequarterly issues of its Monthly Bulletin. Moredetailed information on TARGET, specificallyaddressed to the users of the system, wasmade available by the NCBs in the secondquarter of 1999 in an updated version of the“Information guide for credit institutionsusing TARGET”.
To continue to remain attractive, TARGEThas to meet present and future market needs.

ECB Annua l Repor t • 199958
In this respect, an active exchange of viewsand co-operation with its users play animportant role. During 1999 the ECBtherefore conducted a survey on the cross-border payment service offered by TARGET,as perceived by its users. The main findingsof this survey were presented in the reportentitled “Cross-border payments in TARGET:A users’ survey”, which was published by theECB in November 1999. Input for this reportwas obtained by means of a questionnaireaddressed to the different European bankingassociations and to the national TARGET usergroups. In addition, a meeting with marketparticipants on the subject of TARGET andlarge-value payment systems, held at the ECBin September 1999, provided valuableinformation. One of the findings of the reportwas that a large group of credit institutionsis satisfied with the present TARGETservice level. However, large participants inparticular would prefer a higher degree ofharmonisation of the service provided by thedifferent RTGS systems participating inTARGET. The requests of these banks rangedfrom the harmonisation of message formatsto the provision of a uniform servicethroughout TARGET. The Eurosystem willactively continue to seek input and feedbackfrom national TARGET user groups and,more generally, from the banking and financialcommunity.
3.2 The correspondent central bankingmodel
The correspondent central banking model(CCBM) was established in order to facilitatethe cross-border use of collateral in theEurosystem’s monetary policy operations andthe intraday credit operations of the ESCB.Within the CCBM the national central banksact as correspondents for each other andthereby enable counterparties to use all theireligible assets to obtain credit from theirnational central bank.
Experiences with the CCBM during the firstyear of operation have shown that it hassuccessfully met the aims for which it was
created. The value of assets held in custodyon a cross-border basis increased constantly,amounting to €162.7 billion at the end of1999. Of the total amount of collateralprovided by the counterparties, around 17%is held via the CCBM. The use of the CCBMhas been asymmetric among countries, withmost activity being concentrated among afew NCBs. The main collateral providers(acting as correspondent central banks) areItaly, which accounts for almost half of allcollateral that is used on a cross-border basis,Belgium and Germany. However, the maincollateral users (acting as home central banks)are Germany, which uses about one-quarterof all cross-border collateral, the Netherlandsand France. Owing to the relative scarcityof domestic collateral in Ireland andLuxembourg, foreign collateral held via theCCBM on a cross-border basis amounts to90% of all collateral held by counterparties inLuxembourg and 55% of that held in Ireland.Analysis also shows that during the first yearof operation, counterparties did not activelyuse assets once they were held as collateralin the CCBM. On average, assets were heldas collateral for a period of at least fourmonths before the counterparty asked forits return. The cross-border use of tier twoassets is insignificant. Since these assets areof particular importance at the national levelonly, it is no surprise that they are rarelyfound in foreign counterparties’ portfolios.So far, the CCBM has been the main tool forthe cross-border delivery of collateral usedin the credit operations. Alternative meansfor these cross-border transfers, i.e. the linksbetween securities settlement systems, theuse of which has been allowed since May1999, were used for around 4% [updatedfigure] of all collateral holdings at the end of1999.
The fees for cross-border transfers via theCCBM were increased as from 1 October1999. The primary aim was to cover thecosts which the NCBs incurred in setting upthe model and continue to incur in runningit. Once more experience with the use of theCCBM had been gained, a study wasundertaken to determine the actual costs

59ECB Annua l Repor t • 1999
incurred. As a consequence, the fee of€5 per CCBM transaction was replaced by amultiple fee composed of a transactionfee of €30 and a combined custody andadministration fee of 0.0069% per annum. Thecombined custody and administration fee isbased on the amount of collateral held in the
CCBM. As was previously the case, the newfees are intended to cover the costs of thecorrespondent central bank which holds thecollateral on behalf of the home central bank.The latter can continue to claim additionalfees to cover its own costs incurred inrunning the CCBM.
4 Risk management
The main quantifiable and non-quantifiablerisks arising from monetary policy andpayment systems operations of theEurosystem and operations involving theforeign reserve assets and own funds of theECB are credit risk, market risk, liquidityrisk and operational risk. A framework foridentifying, monitoring and managing risksarising from these operations is in place. Thisrisk management framework has beendeveloped in line with best market practices.
Credit risk
Credit risk is the risk of incurring a loss dueto the failure (bankruptcy) of a counterpartyin a contractual relationship or of an issuerof a security held by the Eurosystem. TheEurosystem incurs credit risk in monetarypolicy operations and payment systemsoperations (principally via the TARGETsystem, through the provision of intradayliquidity), and the ECB incurs credit risk inforeign exchange operations and own fundsmanagement operations.
Credit risk related to monetary policy andpayment systems operations is limited by theuse of assets provided by counterparties ascollateral pledged to the Eurosystem in thecourse of open market operations and theprovision of intraday liquidity. Only high-qualityassets are eligible for these operations. Thecredit risk is controlled by using consistent andprudent eligibility criteria throughout theEurosystem. Credit risk related to foreignexchange reserves holdings and own fundsmanagement is limited by selecting
counterparties and issuers with a high creditstanding. Moreover, credit risk limits forcountries, issuers and counterparties are set upto limit the exposure to any eligible country,issuer and counterparty.
Market risk
Market risk is the risk of incurring a lossdue to movements in interest rates (interestrate risk) and foreign exchange rates(exchange rate risk). In the field of marketrisk management of the ECB’s foreignexchange operations and own fundsmanagement operations, the followingconstitute the key elements of the marketrisk management framework: strategicinterest rate benchmarks, currencydistribution benchmarks, a list of eligibleinstruments and a reporting system mainlyfocused on market risk exposures andportfolio performance.
Interest rate risk related to foreign exchangereserves holdings and own funds managementis mainly controlled on the basis of modifiedduration. The modified duration of the ownfunds and foreign reserve portfolios is limitedby deviation bands around the modifiedduration of the strategic benchmarks. Theexchange rate risk of the foreign reserveportfolios is limited by deviation bandsaround the currency distribution benchmark.Value at risk measurements are also in placeto complement the analysis of exposures. Theperformance of the own funds and foreignreserve portfolios is monitored and reportedon an ongoing basis.

ECB Annua l Repor t • 199960
As regards monetary policy and paymentsystems operations, the market riskembedded in the underlying assets deliveredas collateral is managed throughout theEurosystem by applying appropriate riskcontrol measures (e.g. haircuts and margins).
Liquidity risk
Liquidity risk is the risk of being unable tounwind or offset a particular position, withoutdifficulty, at or near the previous market priceowing to inadequate market depth ordisruptions in the market-place. In monetarypolicy and payment systems operations, theliquidity risk embedded in the underlyingassets is mitigated by risk control measuresapplied to these assets. In foreign exchangeand own funds operations, it is limited by theappropriate choice of eligible instruments anda suitable maturity structure of the portfolios.
Operational risk
Operational risk is the risk of incurring lossesdue to system failures, human error, breachesin internal control, fraud, catastrophes orother unforeseen events affecting itsoperations. Adequate internal controls of alloperational flows have been set up in orderto diminish operational risk. Contingencyfacilities are maintained by the Eurosystem tosupport its operations.
Current developments
Attention is being devoted to the continuedimprovement of risk management. Currentdevelopments include the analysis of riskmanagement systems and methodologies andthe discussion of risk management practicesat the Eurosystem level.

61ECB Annua l Repor t • 1999


Chapter III
Economic developments
in the other countries
of the European Union

ECB Annua l Repor t • 199964
The Eurosystem and the NCBs of thenon-participating EU countries co-operateclosely in the context of the General Councilof the ECB with a view to contributing to themaintenance of price stability in the EU as awhole. In this context, the review ofmacroeconomic conditions as well as monetaryand exchange rate policies is an integral part ofthe co-ordination exercise between theEurosystem and the four NCBs currentlynot participating in the euro area. Althoughthese NCBs conduct their monetary policiesunder different institutional and operationalframeworks, the ultimate goal of monetarypolicy in all of them is to maintain price stability.
Denmark
In Denmark real gross domestic product(GDP) increased by an estimated 1.5% in1999, slowing to well below the euro areaaverage and the high growth rates of around3% or more achieved from the middle of1993 until 1998. In the course of 1999 theimpact of government action in 1998 toreduce domestic demand and increase savings(the Whitsun package), combined with theimpact of higher long-term interest rates,contributed to a marked slowdown in thepace of domestic demand. The externaloutlook improved, however, and providedsupport for net exports, resulting in arenewed current account surplus. Overall,compared with most euro area countries,Denmark still enjoyed a relatively advancedposition in the business cycle and a positiveoutput gap. In 1999 the Danish labour marketconditions continued to tighten; theunemployment rate was 4.1% in December,the lowest rate in almost 20 years, as laboursupply failed to increase despite recent labourmarket initiatives. In addition, real wageincreases in 1999 were above productivitygrowth, as in the previous two years.
As a result of wage growth of around 4% andthe fact that declining oil prices no longeracted as a counterweight, inflationarypressures continued to rise in 1999.Consequently, the spread in the rate of
increase in the Harmonised Index ofConsumer Prices (HICP) against the euroarea widened and stood at 1.4 percentagepoints in December 1999, as the HICPreached 3.1% compared with an average of1.3% in 1998. Wage increases in industrybecame somewhat more moderate, butincreased in the more sheltered servicessector. The apparent increase in total wagecosts in 1999 was, however, mainly the resultof the conflict in the labour market in thespring of 1998, which distorted the data for1998 by making the total wage bill lower thanusual.
Since the substantial fiscal consolidation in theperiod from 1993 to 1997 (when the budgetbalance moved from a deficit of 2.9% of GDPto a surplus of 0.1% of GDP), the generalgovernment budget balance has been improvingfurther in recent years. The Whitsun fiscalausterity package, which will gradually lowertax deductions for interest payments andincrease indirect taxes over the period1999-2002, was introduced in June 1998 inorder to counteract inflationary pressuresarising from the significant increase in domesticdemand. The general government surplusreached 3% of GDP in 1999, almost2 percentage points higher than in the previousyear, while the debt-to-GDP ratio alsocontinued to improve. In 1999 it decreased by3 percentage points to 52.6%.
The monetary policy strategy of DanmarksNationalbank implies that monetary policy isgeared towards stabilising the exchange rateof the Danish krone vis-à-vis the euro.Denmark has been participating in ERM IIsince 1 January 1999, with a narrow band of±2.25% around the euro central rate. TheDanish krone remained stable in 1999 arounda level marginally stronger than its ERM IIcentral rate of DKK 7.46038 against theeuro. In the first half of 1999 DanmarksNationalbank cut its key interest rates twice,reducing the lending rate by 50 basis pointson 9 April – following a similar decision bythe Eurosystem – and by 5 basis points on17 June 1999. Accompanying the increases inEurosystem interest rates, the central bank

65ECB Annua l Repor t • 1999
then raised its lending rate by 45 basis pointson 4 November 1999, by 30 basis points on3 February 2000 and by 25 basis points to3.85% on 16 March 2000. Taking the year asa whole, short-term interest rates as measuredby the three-month money market rates, roseby 0.2 percentage point and the spread vis-à-visthe comparable euro area rates remainedbroadly stable at around 20 basis points. At theend of February 2000 short-term interest ratesamounted to 4.1%, constituting a spread of50 basis points against euro area rates.
Long-term interest rates as measured byten-year government bond yields followed theinternational increase in levels throughout1999, rising by some 1.3 percentage points.In February 2000 the spread vis-à-vis theaverage euro area rates amounted to around30 basis points, i.e. broadly unchanged sincethe beginning of 1999.
Greece
Greece continued to experience buoyanteconomic growth in 1999. The 1998 rate ofGDP growth (3.7%) decreased only slightlyto 3.5% in 1999, mainly as a result of a smallnegative contribution of net exports to GDPgrowth. Growth continues to be drivenmainly by public and private investment. Realgross fixed capital formation grew by 8.1% in1998 and by 8.3% in 1999. Reversing theprevious deceleration, growth in privateconsumption increased from 2.1% in 1998to 2.6% in 1999. The unemployment ratedeclined somewhat to an estimated annualaverage of 10.5% in 1999. Employment growthdeclined from 3.4% in 1998 to 1.2% in 1999. 1
1 The high employment growth figure for 1998 reflects the factthat over 200,000 previously illegal immigrants were granted awork permit.
1993 1994 1995 1996 1997 1998 1999 1999 1999 1999 1999
Q1 Q2 Q3 Q4
Real GDP 0.8 5.8 3.7 2.8 3.1 2.7 1.5 0.5 1.8 1.0 .
Contribution to real GDP growth: 1)
Real domestic demand including stocks 0.6 6.6 5.0 2.4 4.2 4.4 . 0.4 -0.9 0.6 .
Net exports 0.4 -0.8 -1.4 0.4 -1.1 -1.6 . 0.3 2.5 0.4 .
HICP 0.9 1.8 2.0 2.1 1.9 1.3 2.1 1.4 1.8 2.3 2.8
Compensation per employee 2.3 3.5 3.5 2.9 3.8 3.0 . 4.5 6.3 3.7 .
ULC, whole economy 0.0 -2.5 0.5 1.4 2.8 2.4 . 6.3 4.3 3.6 .
Import prices -0.7 1.5 2.4 0.2 2.1 -0.7 -0.3 -2.7 -1.9 0.4 3.1
Current plus new capital account (% of GDP) . . . . 0.1 -0.1 . 0.2 0.1 0.2 .
Total employment -1.5 -0.4 0.7 1.4 2.1 2.1 1.0 2.3 -0.0 1.0 .
Unemployment rate (% of labour force) 10.1 8.2 7.2 6.8 5.6 5.1 4.5 4.8 4.5 4.4 4.2
Fiscal balance (% of GDP) 2) 3) -2.9 -2.4 -2.3 -1.0 0.1 1.2 3.0 - - - -
Consolidated gross debt (% of GDP) 2) 78.0 73.5 69.3 65.0 61.3 55.6 52.6 - - - -
three-month interest rate (% per annum) 4) 11.0 6.2 6.1 3.9 3.7 4.1 3.3 3.5 3.0 3.1 3.6
ten-year long-term interest rate(% per annum) 4) 7.3 7.8 8.3 7.2 6.3 4.9 4.9 4.2 4.5 5.3 5.6
Exchange rate against the ECU or euro 4) 5) 7.59 7.54 7.33 7.36 7.48 7.50 7.44 7.44 7.43 7.44 7.44
Table 6Macroeconomic indicators for Denmark(annual percentage changes, unless otherwise indicated)
Sources: Eurostat, European Commission, national data and ECB calculations.Note: National accounts are according to the ESA 95. HICP data before 1995 are estimates based on national definitions and are notfully comparable with HICPs starting in 1995.1) Percentage points.2) Consistent with the Maastricht Treaty definition.3) General government surplus (+) / deficit (-).4) Average of period values.5) Units of national currency per ECU until the end of 1998; thereafter per euro.

ECB Annua l Repor t • 199966
The 1999 trade deficit (partly distorted byunrecorded exports) is estimated to havebeen at broadly the same level as in theprevious year, i.e. around 13% of GDP.
The HICP inflation rate continued itsdownward trend in 1999. In September 1999the annual percentage change in the HICPreached its lowest point (1.5%), that is to say2 percentage points below the January 1999figure of 3.5%. In the last three months of1999, however, HICP inflation acceleratedsomewhat, mainly as a result of the increasein energy prices, reaching 2.4% in December1999, 0.7 percentage point above the euroarea average.
The main factors contributing to the overallreduction in inflation were the Bank ofGreece’s stability-oriented monetary policyand a considerable decline in the rate ofincrease in unit labour costs (from 5.5% in1998 to 2.5% in 1999). The decline in unitlabour cost growth was, in turn, supportedby strong productivity growth and continuedwage moderation, following the two-yearagreement between the social partners signedin May 1998. Underlying inflation, asmeasured by the HICP excluding seasonalfood and energy prices, was on a decliningtrend for most of 1999, falling from 4.4% inJanuary to 1.7% in December 1999. Otherexplanatory factors regarding the decline ininflation are a number of cuts in indirect taxesin 1998 and 1999 and, to a lesser extent,the Greek Government’s “gentleman’sagreements” with industry to encourage pricerestraint in the private sector. The combinedeffect of these tax cuts and the gentleman’sagreements is estimated to be around1 percentage point.
Following a sizeable general governmentdeficit reduction from 13.8% of GDP in 1993to 2.5% of GDP in 1998, fiscal consolidationcontinued in Greece in 1999 as the deficitdeclined further to 1.6% of GDP. This declinewas attributable to the strong performanceof budget revenues, which rose from 50.8%of GDP in 1998 to 51.7% of GDP in 1999.The total expenditure-to-GDP ratio, on the
other hand, declined only marginally, from53.3% in 1998 to 53.2% in 1999, mainly drivenby the decline in interest payments. Theprimary surplus also increased from 6.4% to7.1% of GDP. Government debt declined by1 percentage point to 104.4% of GDP in 1999,at a slightly less rapid pace than in 1997 and1998, when public debt fell by approximately3 percentage points in each year. This meansthat the debt ratio developed less favourablythan the deficit ratio and nominal economicgrowth would suggest, owing, on balance,to unfavourable debt-deficit adjustments,including capital injections into publicenterprises and revaluation effects. Theupdated convergence programme introducedin December 1999 set out more ambitiousbudget targets than the previous convergenceprogramme, which was facilitated by betterthan expected results in previous years. Thedeficit is projected to decline further to 1.2%of GDP in 2000 and to 0.2% of GDP in 2001.The debt is anticipated to decline only slightlyin 2000, while a more sizeable decline, byalmost 4 percentage points, to 99.5% of GDPis expected in 2001.
The primary objective of the monetary policystrategy of the Bank of Greece continued tobe the maintenance of price stability, withthe latter being defined as a year-on-yearincrease in the Consumer Price Index (CPI)of below 2%. The Greek drachma joined theERM on 16 March 1998 and has beenparticipating in ERM II since 1 January 1999,observing a fluctuation band of ±15% aroundits central rate of GRD 353.109 against theeuro. Throughout 1999 the drachma tradedon average 8.4% above its central parity, asrequired by the price stability objective. On17 January 2000 the central rate was revaluedby 3.5% to GRD 340.750 against the euro.
As part of its monetary policy strategy, theBank of Greece has reference ranges for bothbroad money and domestic credit expansion,which are both currently set at between 7%and 9% as annual growth rates. In 1999 thebroad monetary aggregate did not quite reachthe reference range, growing by an annualrate of 5.6%, while domestic credit expansion

67ECB Annua l Repor t • 1999
stabilised in the second half of 1999, partly asa consequence of the temporary reserverequirements on banks for credit growthabove target imposed by the Bank of Greece.Annual domestic credit growth remained,however, above its reference range in 1999at 12.3%.
The Bank of Greece cut the fixed tender ratefor 14-day deposits to 12% on 13 January 1999and further to 11.5% and 10.75% on 20 Octoberand 15 December 1999 respectively. On26 January and 8 March 2000 the Bank ofGreece cut its key 14-day deposits rate by 100and 50 basis points respectively, therebyreducing it to 9.25%. At the beginning of 1999short-term interest rates continued their declinefrom an average annual level of 13.9% in 1998to around 10% in the second quarter of 1999.Thereafter, short-term interest rates remainedbroadly stable for the rest of the year, except
for a temporary increase in November 1999. Inthe first two months of 2000 the three-monthinterest rate (the ATHIBOR) declined further,standing at 8.7% at the end of February. Thistranslated into a spread of 510 basis points vis-à-vis similar euro area rates compared with aspread of 850 basis points at the beginningof 1999.
In the first few months of 1999 the decliningtrend in long-term interest rates alsocontinued, with ten-year interest rates fallingfrom 6.3% in January to 5.8% in May.Subsequently, long-term interest ratesgradually increased to 7.0% in October, butfell once again to 6.4% at the end of February2000. The differential vis-à-vis average euroarea yields narrowed from 250 basis points inJanuary 1999 to around 80 basis points inFebruary 2000.
1993 1994 1995 1996 1997 1998 1999 1999 1999 1999 1999
Q1 Q2 Q3 Q4
Real GDP -1.6 2.0 2.1 2.4 3.4 3.7 3.5 . . . .
Contribution to real GDP growth: 1)
Real domestic demand including stocks -1.0 1.3 4.2 3.5 4.4 3.4 3.9 . . . .
Net exports -0.6 0.7 -2.1 -1.1 -1.1 0.3 -0.4 . . . .
HICP . . . 7.9 5.4 4.5 2.3 3.4 2.2 1.7 2.2
Compensation per employee 9.8 10.8 12.9 8.8 12.4 5.8 4.8 - - - -
ULC, whole economy 12.6 10.7 11.6 5.9 8.4 5.5 2.5 - - - -
Import prices 7.7 5.8 6.8 5.0 2.2 5.1 0.6 - - - -
Current plus new capital account (% of GDP) -0.8 -0.1 -2.4 -3.6 -4.0 -3.0 -2.7 - - - -
Total employment 0.9 1.9 0.9 -0.4 -0.3 3.4 1.2 - - - -
Unemployment rate (% of labour force) 8.6 8.9 9.1 9.8 9.7 10.9 10.5 - - - -
Fiscal balance (% of GDP) 2) 3) -13.8 -10.0 -10.2 -7.4 -3.9 -2.5 -1.6 - - - -
Consolidated gross debt (% of GDP) 2) 116.9 109.3 108.7 111.3 108.5 105.4 104.4 - - - -
three-month interest rate (% per annum) 4) 19.1 26.7 16.4 13.8 12.9 13.9 10.3 10.8 10.0 10.1 10.4
ten-year long-term interest rate(% per annum) 4) 23.4 20.9 17.3 14.6 10.2 8.5 6.3 6.1 5.9 6.6 6.7
Exchange rate against the ECU or euro 4) 5) 268 288 303 306 309 331 326 323 325 326 329
Table 7Macroeconomic indicators for Greece(annual percentage changes, unless otherwise indicated)
Sources: Eurostat, European Commission, national data and ECB calculations.Note: National accounts are according to the ESA 95.1) Percentage points.2) Consistent with the Maastricht Treaty definition.3) General government surplus (+) / deficit (-).4) Average of period values.5) Units of national currency per ECU until the end of 1998; thereafter per euro.

ECB Annua l Repor t • 199968
Sweden
Swedish real GDP grew by 3.8% in 1999,accelerating from 3.0% in 1998. The drivingforce was, as in the previous year, attributableto strong growth in domestic demandresulting from favourable growth in realdisposable income (mainly on account of verylow inflation) and employment, rising assetprices and historically low interest rates.Private consumption and capital formationshowed the largest increases, while thecontribution to growth from changes ininventories was negative at -0.5 percentagepoint. In addition, export growth was lessaffected than expected by the slowdown inworld economic activity at the end of 1998and the beginning of 1999, while importgrowth decelerated considerably. Thecontribution to growth from external tradethus turned positive again after being negativein 1998. Since the autumn of 1997 theunemployment rate has been decliningsignificantly and employment acceleratedfurther in 1999, mainly in the private servicessector. Unemployment stood at 6.5% of thelabour force at the end of 1999 comparedwith an average of 8.3% in 1998. The tradesurplus reached nearly the same level as in1998, i.e. 6.9% of GDP, while the currentaccount surplus declined marginally and stoodat 2.8% of GDP.
Consumer price inflation started to rise fromvery low levels in 1999 mainly as a resultof higher oil prices. Underlying inflation, asmeasured by UND1X (CPI excluding interestexpenditure and direct effects of altered indirecttaxes and subsidies), increased from below1% in 1998 to 1.9% in December 1999.HICP inflation in December 1999 was 1.2%,0.5 percentage point below the euro areaaverage. For most of the year Sweden was oneof the three best-performing EU Member Statesin terms of price stability. However, real wagescontinue to increase faster than productivitygrowth and remain the main risk to pricestability and employment in the medium term.
Following marked fiscal consolidationbetween 1993 and 1998, when the budget
balance improved from a deficit of 11.9% ofGDP to a surplus of 1.9% of GDP, publicfinances remained stable in 1999 at a levelof 1.9% of GDP. In 1999 the debt ratiodecreased by 6.9 percentage points to 65.5%of GDP. The updated Swedish convergenceprogramme, introduced in November 1999,gives the budget surplus targets for 2001 and2002 as 2% of GDP. The debt is projected todecline by 6.7 percentage points in 2000 to58.8% of GDP and further to 54.1% of GDPin 2001.
On 1 January 1999 new central bank legislationwas introduced to reinforce the independenceof Sveriges Riksbank. The primary objective ofmonetary policy in Sweden is to achieve pricestability. Sveriges Riksbank has operated with aflexible exchange rate regime and conductedmonetary policy with an explicit inflation targetsince 1993. Monetary policy is targeted atkeeping CPI inflation at 2%, with a tolerancemargin of ±1 percentage point. At the beginningof 1999 clarification was given regarding theformulation of monetary policy in Sweden.Sveriges Riksbank explicitly stated thatdepartures from the inflation target may bewarranted if, for instance, inflation is influencedby temporary factors. This was the case in 1999.In practice, monetary policy was based on anassessment of underlying inflation, UND1X,which recorded an average level of 1.5% in1999.
Reflecting two cuts in Sveriges Riksbank’srepo rate – totalling 50 basis points – to 2.9%in March 1999, short-term interest ratesdeclined at the beginning of 1999. Therepo rate was raised by 35 basis points on11 November 1999 and by 50 basis pointsto 3.75% on 4 February 2000 as inflationprospects for the next one to two years wereestimated to be marginally higher than theirtarget. Short-term interest rates rose evenmore towards the end of the year. The spreadbetween the Swedish and euro areashort-term interest rates narrowed slightlyin the course of 1999 and stood at 50 basispoints by end-February 2000. In 1999 and thefirst two months of 2000 the Swedish kronaappreciated by some 10% against the euro

69ECB Annua l Repor t • 1999
after having experienced a depreciation ofapproximately the same magnitude in thesecond half of 1998. The appreciation of thekrona was mainly due to the improved growthprospects for the Swedish economy.
Long-term interest rates rose in the courseof 1999 by 1.6 percentage points and furtherto 5.8% by the end of February 2000. Theten-year spread vis-à-vis the euro areabroadened slightly in the course of 1999,reflecting, inter alia, the improved cyclicaloutlook for Sweden in relation to the euroarea. At the end of February 2000 the spreadhad narrowed somewhat to 30 basis points.
United Kingdom
In the United Kingdom real GDP grew by2% in 1999 compared with 2.2% in 1998.
Following a slowdown in the latter part of1998, the pace of activity picked up duringthe course of 1999. Growth was drivenby domestic demand, notably consumerspending, reflecting significant real wageincreases, lower mortgage interest paymentsand rising asset prices (particularly houseprices). However, export volume growth,although improving around the middle ofthe year, lagged significantly behind importvolume growth owing to the strength ofsterling, the subdued growth of some exportmarkets and the rapid growth of domesticdemand, resulting in a continued negativecontribution of net exports to GDP growthfor the year as a whole. Despite thesomewhat slower output growth there was afurther fall in unemployment in 1999. Theannual average unemployment rate fell to6.2% compared with 6.3% in 1998.
1993 1994 1995 1996 1997 1998 1999 1999 1999 1999 1999
Q1 Q2 Q3 Q4
Real GDP -1.8 4.1 3.7 1.1 2.0 3.0 3.8 3.9 3.7 3.8 3.8
Contribution to real GDP growth: 1)
Real domestic demand including stocks -5.1 2.9 1.9 0.7 0.8 3.5 3.3 3.8 2.1 3.6 3.7
Net exports 3.3 1.2 1.9 0.4 1.3 -0.5 0.5 0.1 1.6 0.2 0.1
HICP . . . 0.8 1.8 1.0 0.6 0.2 0.3 0.7 1.0
Compensation per employee 4.7 3.0 6.7 3.1 3.4 3.3 3.2 3.2 . .
ULC, whole economy . -0.1 0.5 5.1 0.4 1.5 2.4 1.7 3.8 . .
Import prices 13.3 4.7 6.5 -3.5 1.9 -1.0 2.5 -1.0 2.5 3.6 4.9
Current plus new capital account (% of GDP) -1.7 0.7 2.9 2.6 3.3 3.6 2.0 2.5 1.1 3.3 .
Total employment -5.5 -0.9 1.6 -0.6 -1.1 1.4 2.2 2.7 3.0 1.8 1.5
Unemployment rate (% of labour force) 9.1 9.4 8.8 9.6 9.9 8.3 7.0 7.5 7.0 6.9 6.6
Fiscal balance (% of GDP) 2) 3) -11.9 -10.9 -6.8 -3.4 -2.0 1.9 1.9 - - - -
Consolidated gross debt (% of GDP) 2) 75.8 79.0 77.6 76.0 75.0 72.4 65.5 - - - -
three-month interest rate (% per annum) 4) 8.8 7.7 8.8 6.0 4.4 4.4 3.3 3.3 3.1 3.2 3.7
ten-year long-term interest rate(% per annum) 4) 8.6 9.7 10.2 8.0 6.6 5.0 5.0 4.2 4.5 5.5 5.7
Exchange rate against the ECU or euro 4) 5) 9.11 9.16 9.33 8.52 8.66 8.91 8.81 8.98 8.90 8.71 8.65
Table 8Macroeconomic indicators for Sweden(annual percentage changes, unless otherwise indicated)
Sources: Eurostat, European Commission, national data and ECB calculations.Note: National accounts are according to the ESA 95.1) Percentage points.2) Consistent with the Maastricht Treaty definition.3) General government surplus (+) / deficit (-).4) Average of period values.5) Units of national currency per ECU until the end of 1998; thereafter per euro.

ECB Annua l Repor t • 199970
Inflation continued to remain subdued andthe rate of increase in prices, as measured bythe retail price index excluding mortgageinterest payments (RPIX), was 2.3% in 1999compared with 2.7% in 1998. Annual averageinflation as measured by the HICP was 1.4%in 1999, i.e. 0.3 percentage point higher thanthe euro area annual average, compared with1.6% in 1998. However, at the end of 1999and in early 2000 HICP inflation was wellbelow the euro area average. A number offactors may have helped to contain pricedevelopments. These include the appreciationof sterling, increased competition in the retailsector and some further pressure by theregulators of utilities to lower prices in theseindustries. While overall inflation remainedsubdued, house prices rose more rapidly,buoyed by historically low mortgage ratesand the improving economic situation andoutlook.
In 1999 the general government balance-to-GDP ratio showed a surplus of 1.2%compared with 0.3% in 1998. Governmentexpenditure declined to 39.9% of GDP from40.3% of GDP in 1998, while receipts rosemarginally to 40.6% of GDP from 40.5% ofGDP. The debt-to-GDP ratio decreased to46% in 1999 compared with 48.4% in 1998.
During 1999 the UK Government continuedto set the Bank of England the monetarypolicy objective of meeting an inflation targetdefined as a 2.5% increase in the RPIX. TheBank’s repo rate was 6.25% at the start of1999 and was progressively cut to 5% in June,reflecting the weakness of the economy inthe early part of the year and its likely impacton future inflation. However, from8 September 1999 to 10 February 2000official interest rates were raised in fourstages (by 25 basis points each time) to 6%.
1993 1994 1995 1996 1997 1998 1999 1999 1999 1999 1999
Q1 Q2 Q3 Q4
Real GDP 2.3 4.4 2.8 2.6 3.5 2.2 2.0 1.4 1.6 2.1 2.9
Contribution to real GDP growth: 1)
Real domestic demand including stocks 1.9 3.3 1.8 3.0 3.7 4.1 3.5 4.0 3.2 2.8 4.0
Net exports 0.1 0.9 1.0 -0.5 -0.3 -2.1 -1.6 -2.7 -1.7 -0.9 -1.3
HICP 2.5 2.0 2.6 2.5 1.8 1.6 1.4 1.6 1.4 1.2 1.2
Compensation per employee 3.6 3.4 2.0 3.2 4.6 5.4 . 4.9 4.6 4.8 .
ULC, whole economy 0.1 -0.5 1.4 1.7 2.9 3.8 . 4.2 4.0 3.4 .
Import prices 8.6 3.1 6.1 0.3 -6.7 -6.3 -2.6 -3.8 -3.2 -2.3 -1.1
Current plus new capital account (% of GDP) -0.2 -0.0 -0.0 0.0 0.1 -0.0 . -0.2 -0.1 -0.1 .
Total employment -1.2 0.8 1.1 1.0 1.8 1.0 1.2 1.2 1.3 1.2 1.1
Unemployment rate (% of labour force) 10.5 9.8 8.8 8.3 7.3 6.3 6.2 6.3 6.0 5.9 5.9
Fiscal balance (% of GDP) 2) 3) -8.0 -6.8 -5.8 -4.4 -2.0 0.3 1.2 - - - -
Consolidated gross debt (% of GDP) 2) 45.5 48.7 52.1 52.6 50.8 48.4 46.0 - - - -
three-month interest rate (% per annum) 4) 5.9 5.5 6.7 6.0 6.8 7.3 5.4 5.5 5.2 5.2 5.9
ten-year long-term interest rate(% per annum) 4) 7.5 8.2 8.3 7.9 7.1 5.6 5.0 4.4 4.8 5.4 5.5
Exchange rate against the ECU or euro 4) 5) 0.78 0.78 0.83 0.81 0.69 0.68 0.66 0.69 0.66 0.65 0.64
Table 9Macroeconomic indicators for the United Kingdom(annual percentage changes, unless otherwise indicated)
Sources: Eurostat, European Commission, national data and ECB calculations.Note: National accounts are according to the ESA 95. HICP data before 1995 are estimates based on national definitions and arenot fully comparable with HICPs starting in 1995.1) Percentage points.2) Consistent with the Maastricht Treaty definition.3) General government surplus (+) / deficit (-).4) Average of period values.5) Units of national currency per ECU until the end of 1998; thereafter per euro.

71ECB Annua l Repor t • 1999
This reflected concerns about upward risksto future inflation, given the strength of worlddemand, domestic consumption (includingeffects resulting from the housing market)and continuing tight conditions in the labourmarket. Short-term market interest rates fellby around 1 percentage point to 5.1% in thefirst eight months of 1999, before rising againto 6.2% in late February 2000. The interestrate differential with the United Kingdom’seuro area counterparts stood at 260 basispoints at the end of February 2000.
Sterling appreciated significantly against theeuro in 1999. This appreciation may partly
have reflected cyclical divergence betweenthe UK and euro area economies in recentyears. In addition, sterling was probablysupported by the strength of the US dollar,given the close historical dollar-sterling link,and the strength of the US economy.
Long-term interest rates increased by around1 percentage point in the course of 1999 andstood at 5.4% by the end of February 2000.The ten-year spread against comparable euroarea rates disappeared at the end of February2000, compared with 50 basis points at thestart of 1999.

ECB Annua l Repor t • 199972

Chapter IV
European/international
co-operation and the
Eurosystem

ECB Annua l Repor t • 199974
1 European issues
1.1 Bilateral relations
In the course of 1999 the ECB establishedclose relations with the central banks ofnon-EU neighbouring countries. The Eurosystemtakes a keen interest in economicdevelopments in such countries, in particularwith regard to sustainable economic growthand stability-oriented policies, not least owingto the increasing role of the euro as ananchor for monetary and exchange ratepolicies. Therefore an ongoing dialogue andco-operation with the monetary authoritiesof these countries is of crucial importance.
The Eurosystem focused its attention onthree groups of states within Europe:
• First, the accession countries preparing forentry into the European Union (Bulgaria,Cyprus, the Czech Republic, Estonia,Hungary, Latvia, Lithuania, Malta, Poland,Romania, Slovakia and Slovenia). AlthoughTurkey was granted the status ofaccession country at the Helsinki EuropeanCouncil on 10 and 11 December 1999, theconditions to be fulfilled before the startof negotiations have yet to be met.
• Second, the countries which form theEuropean Free Trade Association (Iceland,Liechtenstein, Norway and Switzerland)and which already exhibit a high degree ofeconomic and institutional integration withthe EU (as established by the EuropeanEconomic Area Agreement and otheragreements).
• Third, regions and territories of the WesternBalkans, in particular Kosovo and theRepublic of Montenegro, where, in thewake of the 1999 Kosovo conflict,efforts – initiated by the internationalcommunity – were made to bring peaceand stability to the area and to rebuild theeconomy.
Accession countries
The Eurosystem has a keen interest in theprospect of the accession of new EU MemberStates, as well as in their subsequentparticipation in the new exchange ratemechanism (ERM II) and their eventualadoption of the euro after strict fulfilment ofthe required preconditions. In this context, apermanent dialogue between the Eurosystemand the central banks of accession countriesis considered essential, with a view to theirfuture integration into the ESCB and,eventually, the Eurosystem itself.
Officially recognised accession countriesalready enjoy a special status and maintainclose relations with the EU. In the course of1999 the EU and six accession countries(Cyprus, the Czech Republic, Estonia,Hungary, Poland and Slovenia) startednegotiations on the “EMU chapter”, i.e. theimplementation of the provisions of theTreaty establishing the European Communityand derived EU legislation relating toEconomic and Monetary Union. The EU madeclear its intention not to make any “optingout” status available to the accessioncountries. For their part, the accessioncountries did not request any specifictransitional arrangements. Therefore, thepreliminary round of negotiations on theEMU chapter has been closed. Negotiationswith a further six accession countries(Bulgaria, Latvia, Lithuania, Malta, Romaniaand Slovakia) started in February 2000. Theexact time frame for EU accession has yet tobe set, although the Helsinki EuropeanCouncil in December 1999 agreed that “theUnion should prepare itself to be in a positionto welcome new Member States from theend of 2002 as soon as they havedemonstrated their ability to assume theobligations of membership and once thenegotiating process has been successfullycompleted”.

75ECB Annua l Repor t • 1999
The Eurosystem is not directly part of thenegotiation process. However, some formof association with the broader accessionprocess is necessary, in particular with a viewto issues which fall within the Eurosystem’sexclusive, or shared, areas of competence,namely monetary policy, foreign reservemanagement, exchange rate policy, paymentsystems, collection of certain statistical dataand financial stability.
Regarding the issues of particular concern tothe Eurosystem, the accession process maybe divided into four different steps, each ofwhich should be considered separately.
First, before accession to the EU, applicantcountries will be free to pursue theirmonetary and exchange rate policiesindependently. The Eurosystem monitorsthese policies and developments in accessioncountries closely, not least in view of theirprospective EU membership. Applicantcountries will have to ensure that the acquiscommunautaire (which has recently alsobecome known as the acquis de l’Union)related to EMU is transposed into nationallegislation and implemented effectively beforeaccession.
In the pre-accession phase, applicantcountries will be obliged to fulfil the accessioncriteria set at the Copenhagen EuropeanCouncil in 1993. These imply, inter alia, “theexistence of a functioning market economyas well as the capacity to cope withcompetitive pressure and market forceswithin the Union” and “the ability to takeon the obligations of membership includingadherence to the aims of (…) economic andmonetary union”.
Compliance with the aforementioned“Copenhagen criteria” requires accessioncountries to undertake numerous structuralreforms and to complete the transition fromtheir former status as planned economiesto well-functioning market economies,promoting a process of real convergence,which is necessary to improve their livingstandards and to integrate their economies
further into the EU. Even though fulfilmentof the Maastricht criteria on nominalconvergence is not mandatory for accession,“adherence to the aims” of EMU also impliesa willingness to strive for gradual progress innominal convergence and the implementationof stability-oriented monetary and fiscalpolicies. In sum, real and nominal convergenceare two components of the same strategyfor achieving sustainable non-inflationaryeconomic growth and should therefore bepursued in parallel.
Second, upon accession to the EU the newMember States will enter into Economic andMonetary Union, but with the special statusof “Member States with a derogation”. Inconcrete terms this means that, in accordancewith the wording of the Treaty establishingthe European Community, they shall treattheir exchange rate policy as a matter ofcommon interest (Article 124) and regardtheir economic policy as a matter of commonconcern (Article 99). However, they will notimmediately introduce the euro, and theresponsibility for monetary policy in theirterritories will remain in the hands of therespective central banks. In institutionalterms, the central banks of new EU countrieswill become members of the ESCB. As iscurrently the case for the central banks ofDenmark, Greece, Sweden and the UnitedKingdom, they will be represented on theGeneral Council of the ECB but not on theGoverning Council, the supreme decision-making body of the ECB. The central bankswill, inter alia, have to contribute to thestatistical framework of the ESCB and ensure,once they have joined the euro area, theconsolidation of their accounts (the othertasks of the General Council of the ECB arelisted in Section 2.3 of Chapter XI).
Third, after joining the EU (even if notnecessarily upon accession) the new MemberStates will be expected to enter into ERM II –linking the currencies of the non-participatingmembers (at present, the Danish krone andthe Greek drachma) to the euro. With regardto the terms of entry into ERM II, it shouldbe feasible to take into account country-

ECB Annua l Repor t • 199976
specific economic conditions, given theflexible features of ERM II.
Finally, the new Member States will be in aposition to participate fully in the euro area.Membership will be subject to an examinationof the convergence situation in each case,which will be carried out at least once everytwo years, or at the request of the countriesthemselves. Once they fulfil the necessaryconditions as set out in the Maastricht Treaty,they will adopt the euro.
Progress towards the introduction of theeuro will not necessarily be uniform in allaccession countries. Against the backgroundof different starting-points and degrees ofeconomic transition, a plurality of approachesshould be feasible without compromisingequality of treatment. The nominalconvergence criteria should be implementedin such a way that these countries areprovided with clear references necessary tobring their economies into line with thestandards and the final goal of EMU.
The Eurosystem is prepared to advise thesecountries in their pursuit of appropriatestructural reforms and stability-oriented policiesin line with the accession and convergencecriteria. The Eurosystem is also willing toprovide accession countries with technicalassistance in its field of competence. In fact,several euro area national central banks (NCBs)already provide the central banks of theaccession countries with technical support in abroad number of areas and will continue to doso. Requests for technical assistance fromaccession countries can be expected to increasefollowing their preparatory work for integrationinto the ESCB and, later on, the Eurosystem.Therefore, the Eurosystem is developingappropriate procedures to meet this increasingdemand in a co-ordinated manner, whileensuring that all accession countries receive thenecessary support. In this context, full use willbe made of the resources and expertiseavailable within the Eurosystem, while adoptingconsistent approaches and strategies.
The Helsinki seminar on the accessionprocess
To open a dialogue with the monetaryauthorities of the accession countries, a high-level seminar on the accession process tookplace in Helsinki from 10 to 12 November1999, bringing together the Eurosystem andgovernors and deputy governors of thecentral banks of Bulgaria, Cyprus, the CzechRepublic, Estonia, Hungary, Latvia, Lithuania,Malta, Poland, Romania, Slovakia and Slovenia.The seminar was organised jointly by the ECBand Suomen Pankki, the Finnish central bank.
The objective of the seminar was to carryout a review of the central banking issuesinvolved in the accession process, to identifythe main problem areas and to enhance co-operation between the Eurosystem and thecentral banks of accession countries.
The fruitful and comprehensive discussionscovered a wide array of issues, ranging fromthe adoption of the EMU-related acquiscommunautaire to exchange rate strategiesof the accession countries and to therequirements of smoothly functioning bankingsystems and financial markets.
Similar events will be held in the years tocome, starting in Vienna in 2000.
Seminars with central banks of accessioncountries hosted by the ECB
Following the Helsinki seminar, a number ofspecialised multilateral events were organisedat the ECB. They formed part of a structuredpolicy of multilateral contacts, both at thepolicy level (i.e. governors and deputygovernors) and at the expert level, involvingall relevant business areas of the ECB.
Such multilateral events were supplementedby bilateral visits to the ECB by delegationsfrom the central banks of accession countries,allowing for more detailed exchanges of viewsat management and staff level, in particularwith a view to the prospective inclusion of

77ECB Annua l Repor t • 1999
these central banks in the ESCB. The ECBintends to intensify both multilateraland bilateral co-operation with accessioncountries’ central banks.
Relations with the central banks of EFTAcountries
In 1999 the ECB carried on the tradition ofmaintaining contact with the central banks ofIceland, Norway and Switzerland, whichinvolves regular meetings at governor leveltwice a year. At these meetings a broad setof issues of common interest is reviewed.
The ECB also concluded a swap agreementwith Norges Bank, which became effectiveon 1 January 1999 for a period of 12 months.The agreement replaced similar bilateral swaparrangements between Norges Bank and theeuro area NCBs. As requested by NorgesBank, the Governing Council decided inDecember 1999 to renew the swapagreement for the year 2000 for an amountof €1,500 million.
Monetary developments in the WesternBalkans
As part of the stabilisation efforts pursuedby the United Nations Interim AdministrationMission in Kosovo (UNMIK) in the aftermathof the conflict, the latter designated theDeutsche Mark as the “currency to be usedfor payments made to a public authority” andliberalised the denomination of contracts andother voluntary transactions in “any foreigncurrency that is widely accepted in theterritory of Kosovo”. In practice, banknotesdenominated in Deutsche Mark were alreadyused in Kosovo as a main tool for cashtransactions and a store of value before thenew legislation entered into force.
On 2 November 1999 the Government ofthe Republic of Montenegro announced that“in addition to the Yugoslav dinar, theGerman mark is introduced as the means ofpayment in Montenegro”. In the case of
Montenegro, as in Kosovo, banknotesdenominated in Deutsche Mark havetraditionally played a major role as a store ofvalue and a tool for making payments.
In the case of both Kosovo and the Republicof Montenegro, any reference in theirlegislation to the Deutsche Mark shouldobviously be read as if it were made to theeuro. The respective authorities took thesedecisions unilaterally and without anyimplication for the Eurosystem, either interms of legal obligations or of policyconstraints.
1.2 Co-ordination of national economicpolicies in the European Union
Through its participation in a number of EUfora (such as the Economic and FinancialCommittee and the Economic PolicyCommittee) the ECB became involved indiscussions about a coherent co-ordinationframework.
The relevance and justification of economicpolicy co-ordination in EMU
Economic and Monetary Union (EMU), as setout in the Treaty, institutes a single monetarypolicy in the euro area and created for thispurpose the ESCB. However, the economicfacet of EMU did not give rise to a singleeconomic policy. Rather, the Treaty requiresMember States to “regard their economicpolicies as a matter of common concern”(Article 99). In order to render this principleoperational, the provisions of the Treatyprescribe common policy guidelines (theBroad Economic Policy Guidelines) and amultilateral surveillance exercise. In therun-up to the introduction of the euro, theMember States endeavoured to flesh out theframework of the Treaty, by developing newco-ordination procedures (such as theStability and Growth Pact) and by furtherrefining existing ones.

ECB Annua l Repor t • 199978
While the creation of the EuropeanCommunity’s single market had alreadyproduced an unprecedented depth ofeconomic integration among EU MemberStates, the introduction of the euro makeseconomic developments in euro area MemberStates a more direct and immediate concernof national policy-makers. Economic policydecisions in one country can produce“spillover” effects for other euro areaMember States, in particular via the singleeuro area financial market and the changingperception of market participants. Fiscal laxityin one country, for instance, might generateupward pressure on long-term interest rates,which in turn alters economic conditionsthroughout the euro area.
At first sight, the case for closer co-ordination of economic policies appearsclear-cut. To the extent that theresponsibility for the conduct of interlinkedeconomic policies is attributed to differentactors, co-ordination might help to reducenegative spillovers, create peer pressure,facilitate the exchange of best practices andthereby generate positive welfare effects.However, in order to reap the benefits ofco-ordinating economic policies, it is essentialthat co-ordination takes an appropriate formand supports rather than conflicts withthe “co-ordinating” forces of markets. Inthe current EMU set-up, co-ordinationprocedures range from more stringent rule-based approaches (e.g. Stability and GrowthPact) to more discretionary or less formalapproaches centred on policy dialogue(e.g. the “Cardiff process” for the monitoringof structural reform).
The role of the Eurosystem in the EUeconomic policy framework
The role of the Eurosystem is determined bythe stipulations of the Treaty governing itsstatus and activities, notably its independenceand the primary objective of maintaining pricestability. As a consequence, the Eurosystemcannot engage in any form of agreementaimed at bringing about a predetermined
“policy mix”, since this could commit theEurosystem to pursue a monetary policywhich might conflict with the primaryobjective of price stability.
The clear separation of policy responsibilitiesbetween monetary authorities andgovernments is rooted in the belief –confirmed by decades of practicalexperience and a substantial body of economicresearch – that committing monetarypolicy-makers to the primary objective ofmaintaining price stability helps significantlyto achieve price stability in a credible andlasting manner. In this way, monetary policywill make the best possible contribution tothe broader economic objectives of theEuropean Union and its citizens.
Since economic policy co-ordination relatespredominantly to co-operation among theMember States themselves, the ECB’scontribution to the overall co-ordinationprocess lies in a dialogue with competentEuropean bodies, notably the Council ofMinisters and the Euro-11 Group, wherebyviews and information are exchanged. In thisdialogue, the prerogatives and independenceof policy actors are respected.
Policy co-ordination instruments and fora
Economic policy co-ordination in the EU isconducted in an annual policy cycle, whichcentres on the Broad Economic PolicyGuidelines. These guidelines, which areapproved each year by the European Council,are intended to steer the general conductof economic policy and make specificrecommendations to each Member State. TheBroad Economic Policy Guidelines are thepivot of all existing co-ordination processes,uniting them under a single overarchingstructure and gearing them towards a singletimetable. Specialised co-ordination processesapply to budgetary policy (in the frameworkof the Stability and Growth Pact),employment policy (generally referred to asthe “Luxembourg process”) and structuralreform policies (generally referred to as the

79ECB Annua l Repor t • 1999
“Cardiff process”) – each of them with adistinctive set of rules and co-ordination fora.In addition, the European Employment Pactinstituted the Macroeconomic Dialogue,which is explained in more detail inSection 1.3 below.
In line with the conclusions of the 1997Luxembourg European Council, the mainlocus of economic policy co-ordination is theCouncil of Economics and Finance Ministers(ECOFIN) which, in particular, adopts therecommendation setting out the BroadEconomic Policy Guidelines and issuesopinions on the stability and convergenceprogrammes. In accordance with theprovisions of the Treaty (Article 113), thePresident of the ECB is to be invited tosessions of the EU Council whenever mattersrelating to the objectives and tasks of theESCB are discussed. Members of theExecutive Board of the ECB attend Councilmeetings on an ad hoc basis in order toparticipate in exchanges of views on generaleconomic matters in a broader sense. Inaddition, informal ECOFIN sessions and theinformal meetings of the Euro-11 Group – towhich the ECB can be, and has indeed been,regularly invited – allow for a frank exchangeof views and thus provide a forum for anopen dialogue between ministers and theECB.
1.3 Macroeconomic Dialogue
At its meeting in Cologne on 3 and 4 June1999 the European Council took the initiativeto establish a European Employment Pactaimed at achieving a sustainable reduction ofunemployment. Specifically, the EuropeanEmployment Pact is built on three “pillars”,all of which are viewed as long-termprocesses to be developed over time and inthe light of changing circumstances. Thesethree pillars consist of two previously existinginitiatives, namely the Luxembourg andCardiff processes (see above), and a new,third pillar, the Cologne process, bringingtogether the Member States, the EuropeanCommission, the monetary authorities and
the social partners at the EU level in a regularMacroeconomic Dialogue.
The ECB participated in the first meetings ofthe Macroeconomic Dialogue at both thetechnical and the political level (on29 October and 8 November 1999respectively) and will continue to participatein future meetings.
Scope and purpose
In the context of the preparatory work onthe formulation of the European EmploymentPact, it was agreed that the establishment ofa Macroeconomic Dialogue should not leadto the creation of new institutions or tocumbersome procedures. It was nonethelessconsidered worthwhile to establish a forumwithin which the various policy actors couldbe kept informed of developments in otherrelevant policy areas. Moreover, a regularexchange of views among the main policyactors was regarded as an essential toolfor fostering greater mutual understandingconcerning the creation of appropriateconditions for higher, non-inflationary growthand, with it, a sustainable reduction inunemployment.
The European Council’s Resolution on theEuropean Employment Pact clearly states thatthe Broad Economic Policy Guidelines are toremain “the central instrument for economicpolicy co-ordination in the EU”. Moreover,the appropriate guidelines for the variousmacroeconomic policies are described in thesame resolution as follows: “Fiscal policy isrequired to respect the objectives of theStability and Growth Pact which impliesbringing budgets securely close to balance orto a surplus over the medium term. Wagesmust keep a sustainable path, with wagedevelopments that are consistent with pricestability and job creation. The primaryobjective of monetary policy is to maintainprice stability. For this, it is crucial thatmonetary policy be underpinned by fiscal andwage policies of the type described above.”

ECB Annua l Repor t • 199980
Principles of ECB participation
From the outset, the ECB expressed itswillingness to participate in a macroeconomicpolicy dialogue in order to exchangeinformation and views with those partiesresponsible for the conduct of fiscal andstructural policies and the negotiation ofwage settlements. Nonetheless, it wasnecessary to ensure that to do so would notconflict with the ECB’s independence as laiddown in Article 108 (ex Article 107) of theTreaty, which prohibits the ECB from takinginstructions from any other institution orbody when carrying out its tasks andobjectives. Accordingly, the need to respectthe ECB’s independence, along with that ofall participants, was acknowledged by theEuropean Council in its resolution on theEuropean Employment Pact.
The ECB’s role in the dialogue
The ECB has identified a number of ways inwhich it might best contribute to theMacroeconomic Dialogue. First, the ECB canprovide a comprehensive assessment of theeconomic outlook and, against thisbackground, explain the reasoning behindits monetary policy decisions. Second, theMacroeconomic Dialogue offers anopportunity for the ECB to share its viewsconcerning the major economic policychallenges which lie ahead and theappropriate direction of macroeconomic andstructural policies to achieve the ultimateaim of sustained growth and high employmentin an environment of price stability.
2 International issues
The introduction of the euro implies atransfer of core central banking competenciesfrom the national to the Community level.Thus, with the exception of exchange ratepolicy, which is a responsibility sharedbetween the ECOFIN Council and theEurosystem, and banking supervision policies,to which the Eurosystem contributes,monetary policy and related central bankingtasks (e.g. management of official reserves)are an exclusive competence of theEurosystem. On matters related to theEurosystem’s exclusive tasks, internationalrepresentation rests solely with theEurosystem, customarily through the ECB,while the participation of the euro area NCBsvaries, depending on the membership of theinstitutions or fora concerned.
Appropriate arrangements for theinternational representation of the euro areaby the Eurosystem have to take two specificfeatures into account. The first relates to thefact that membership of different fora (forexample the G7 or the G10) varies acrosseuro area Member States, which is also
reflected at the central bank level. The secondderives from the fact that intergovernmentalinstitutions such as the InternationalMonetary Fund (IMF) or the Organisationfor Economic Co-operation andDevelopment (OECD) are organised on thebasis of country membership.
Against this background, arrangements wereimplemented in 1998 and at the beginning of1999 in order to establish working relationsbetween the ECB and relevant internationalinstitutions and fora. These arrangementswere put into operation in 1999 for the firsttime. Some of them were worked out in thecontext of changes in the institutionalframework of multilateral co-operation (seeSection 2.1). The ECB has also starteddeveloping bilateral relations with centralbanks outside the European Union (seeSection 2.2). In this context two issues werethe main focus of the ECB in 1999: thestrengthening of the architecture of theinternational monetary and financial system(see Section 2.3) and the international role ofthe euro (see Section 2.4).

81ECB Annua l Repor t • 1999
2.1 The activities of the ECB in the fieldof multilateral co-operation
The International Monetary Fund (IMF)
The ECB participates in the activities of theIMF with an observer status, at the level ofboth the International Monetary and FinancialCommittee (IMFC, formerly the InterimCommittee) and the IMF Executive Board.
The IMF Board of Governors decided on30 September 1999 to transform the IMFInterim Committee into the IMFC. Comparedwith its predecessor, the new Committeehas been given a permanent standing, whichis reflected in the organisation of preparatorymeetings at the level of deputies. Apart fromthese changes, the creation of the IMFCleaves the current institutional setting of theIMF broadly unaffected, with the Board ofGovernors as the highest decision-makingbody, delegating the day-to-day business tothe Executive Board. The IMFC, like theformer Interim Committee, will advise andreport to the Board of Governors onthe supervision of the management andadaptation of the international monetary andfinancial system. Several observers, includingthe President of the ECB, participate in themeetings of the IMFC.
In order to enable the ECB to be representedon the IMF Executive Board, a permanentrepresentative in Washington, D.C. withobserver status at the IMF was appointed bythe President of the ECB on 8 February 1999.
In the context of his mandate (see Box 6),inter alia, the ECB observer represented theEurosystem at the meeting of the IMFExecutive Board on 26 March 1999, at whichthe first staff report on “Monetary andExchange Rate Policies of the Euro Area”was discussed. Subsequently, a PublicInformation Notice (PIN) was released bythe IMF on 23 April 1999, making available tothe public the assessment of the members ofthe IMF Executive Board of euro areaeconomic policies. In the context of the nextconsultation cycle in 2000, the euro area will
participate in the pilot project for thevoluntary release of the IMF staff report onmonetary and exchange rate policies of theeuro area. This pilot project is an importantelement of the IMF’s ongoing efforts toimprove transparency, which is fullysupported by the Eurosystem.
G7 Finance Ministers and Central BankGovernors and related groups (FSF, G20)
The President of the ECB, together with theEU Presidency, represented the euro area inthe three meetings of the G7 financeministers and central bank governors whichtook place in 1999.
The President of the ECB represented theEurosystem as far as the review of exchangerates and multilateral surveillance issues wereconcerned. Central bank governors of theeuro area G7 countries (Germany, Franceand Italy) took part in the G7 sessions on thereview of progress being made towardsstrengthening the international financialarchitecture. On the basis of their discussion,the G7 finance ministers issued a report tothe Cologne Economic Summit (18 June1999) on “Strengthening the InternationalFinancial Architecture”.
Financial Stability Forum (FSF)
At their meeting in Bonn in February 1999,the G7 finance ministers and central bankgovernors endorsed the recommendation ofthe Tietmeyer Report to set up the FSF.Its objectives are to assess vulnerabilitiesaffecting the international financial system, toidentify and oversee action needed to addressthese vulnerabilities, and to improve co-ordination and the exchange of informationamong the various authorities responsible forfinancial stability. The FSF is made up of thenational authorities responsible for financialstability in the G7 countries (namely ministersof finance, central banks and supervisoryagencies). Several international institutionsand groupings which are concerned with

ECB Annua l Repor t • 199982
financial stability, either as standard-settingagencies or through their involvement in thesurveillance and monitoring of financialsystems, are also members of the FSF(e.g. the BIS, the IMF, the World Bank andthe OECD). The ECB participates in the FSFas an observer.
At its meeting on 15 September 1999 the FSFbroadened its membership to four non-G7countries representing major financial centres(the Netherlands, Singapore, Australia andHong Kong).
Box 6The function and activities of the ECB permanent representationin Washington, D.C.
The Executive Board of the International Monetary Fund (IMF) decided on 21 December 1998 to grant
observer status to the ECB. Pursuant to this decision, the ECB observer has a standing invitation to
represent the Eurosystem in IMF Executive Board meetings in which issues relevant to euro area monetary
and exchange rate policies are discussed. This includes:
– meetings that are part of the surveillance process with euro area authorities, namely Article IV surveillance
over the common monetary and exchange rate policies of the euro area and the policies of individual euro
area Member States;
– the role of the euro in the international monetary system;
– the process of multilateral surveillance by the IMF (World Economic Outlook, International Capital
Markets, World Economic and Market Developments).
In addition, the ECB observer is invited to take part, on a case-by-case basis, in meetings concerning items
recognised by the ECB and the IMF as being of mutual interest for the performance of their respective
mandates. Against this background, the ECB has set up a permanent representation in Washington, D.C.
The ECB representative’s activities relating to such observer status at the IMF include participation in the
meetings of the IMF Executive Board on topics falling into the above-mentioned categories as well as acting
as primary contact between the IMF and the ECB on other matters of common interest. The representative also
accompanies the IMF delegations during their missions to the ECB in the context of IMF surveillance under
Article IV over the common monetary and exchange rate policies of the euro area. Furthermore, as a member
of the ECB delegation to the IMF annual meetings and the spring meetings of the International Monetary and
Financial Committee, the representative assists the President of the ECB, who participates in these meetings as
an observer.
The ECB representation in Washington, D.C. maintains contacts with the US authorities, in particular the
Federal Reserve System. In addition, the representation gathers information on developments in the United
States and gives information to interested parties on euro area-related topics. As part of these tasks the
representative maintains contacts with the financial community, academia and research institutions in the
United States.
The FSF met twice in 1999. Subsequent to itsApril meeting, three working groups wereset up in order to analyse issues of relevanceto systemic stability: Highly LeveragedInstitutions, Capital Flows and OffshoreFinancial Centres. These groups preparedinterim reports for the FSF members whichwere presented at the meeting in September1999 (see Section 2.3 for further details). Atthis meeting the FSF also agreed to establisha Task Force on the Implementation ofStandards and a Study Group on DepositInsurance Schemes.
83ECB Annua l Repor t • 1999
G20
At its September meeting the G7 announcedthe creation of the so-called G20 group. Thisnew forum was initiated with a view tobroadening the informal dialogue amongsystemically significant economies on keyeconomic and financial policy issues. Boththe EU Presidency and the President of theECB participate in this new forum, in additionto ministers and central bank governorsfrom the G7 and the following countries:Argentina, Australia, Brazil, China, India,Indonesia, Mexico, Russia, Saudi Arabia, SouthAfrica, South Korea and Turkey. To liaiseeffectively with the IMF and the World Bank,the World Bank President, the IMF ManagingDirector and the Chairmen of the IMFCand the Development Committee have beeninvited to take part as ex officio members ofthe group.
The first meeting of the G20 took place inBerlin on 15 and 16 December 1999, underthe chairmanship of Paul Martin, the FinanceMinister of Canada. Ministers and governorsof the G20 discussed the role and objectivesof the new group. They agreed that the G20provides a useful forum for informaldiscussion, while the Bretton Woodsinstitutions, in particular the IMF, shouldremain the decision-making bodies withregard to international monetary and financialissues. Furthermore, they identified the mainissues to be addressed both at the domesticand international levels to reducemacroeconomic and financial vulnerabilities.In this context, the need for adoptingexchange rate arrangements consistent withdomestic macroeconomic and structuralpolicies was stressed. Likewise, improvedoverall management of official and privatesector external assets and liabilities wasdeemed to be instrumental in reducingsensitivity to shocks. Moreover, the G20committed itself to demonstrating leadershipin the implementation of codes and standards(see Section 2.3). The next meeting of theG20 ministers and governors will take placein Canada in autumn 2000.
G10 Ministers and Governors
The President of the ECB participated in thetwo meetings of the finance ministers andcentral bank governors of the G10 countries(Belgium, Canada, France, Germany, Italy,Japan, Netherlands, Sweden, Switzerland,United Kingdom and United States). Theirmain focus was on the prevention andmanagement of international financial crisesas well as the involvement of the privatesector in this context (see Section 2.3).At their meeting on 26 September 1999 theG10 ministers and governors agreed toundertake work on the ongoing process offinancial sector consolidation.
G10 Governors and fora related to the Bankfor International Settlements (BIS)
The BIS plays an important role in facilitatingco-operation within the central bankingcommunity, with a focus on meetings of theG10 governors, in which the President of theECB and the governors of five euro areaNCBs (Belgium, France, Germany, Italy andthe Netherlands) participate. The G10governors regularly monitor (seven times ayear) monetary and economic developmentsand major trends in international capitalmarkets. The G10 governors also giveguidance to Committees set up under theiraegis to deal with issues relevant to thecentral banking community. ECBrepresentatives take part in the BaselCommittee on Banking Supervision (BCBS),the Committee on the Global FinancialSystem (CGFS), the Committee on Paymentand Settlement Systems (CPSS), theCommittee on Gold and Foreign Exchange,regular meetings of Central Bank Statisticians,Economists, Internal Auditors and Data BankExperts, and all groups established by theseCommittees.
On 9 December 1999 the ECB became ashareholder of the BIS by underwriting 3,000shares of the third tranche of the capital ofthe BIS, alongside the central banks ofArgentina, Indonesia, Malaysia and Thailand.
ECB Annua l Repor t • 199984
The Organisation for EconomicCo-operation and Development (OECD)
Using Protocol No. 1 to the OECDConvention as a legal basis, the SecretaryGeneral of the OECD confirmed in February1999 that the ECB would be allowed toparticipate in the work of the relevant OECDcommittees and working groups as a separatemember of the European Community delegationalongside the European Commission. TheECB attended the meetings of the followingcommittees and working groups: theEconomic Policy Committee and its workinggroups (Working Parties 1 and 3 and Short-Term Economic Prospects), the MonetaryExperts’ Meeting, the Economic andDevelopment Review Committee (EDRC) andthe Financial Markets Committee (FMC). Inthe context of its regular country reviewswithin the Economic and DevelopmentReview Committee, the OECD is adjustingits review process of the euro area in amanner consistent with the new institutionalsetting. Euro area countries have agreed inprinciple on the examinations of individualeuro area Member States being supplementedby a regular review of euro area developmentsand policies within the Economic andDevelopment Review Committee. Since thepractical arrangements still had to be workedout, an informal seminar was held to reviewthe common monetary and exchange ratepolicies of the euro area in 1999.
2.2 The development of bilateralrelations between the ECBand countries outside theEuropean Union
During its first year of operation the ECB hasestablished widespread bilateral contacts andworking relations with central banks andother institutions of countries outside theEuropean Union.
Executive Board members visited, inter alia,several countries in Asia in the course of1999. On these occasions matters of commoninterest and the implications of the
introduction of the euro for the Asian regionwere reviewed.
A number of official delegations fromnon-EU countries were received by theExecutive Board at the ECB premises inFrankfurt. In this context, the ECB hostedthe meeting of Asia-Europe Ministers ofFinance (ASEM) on 15 and 16 January 1999.Several high-level representatives from LatinAmerican countries also visited the ECB inthe course of the year.
2.3 The architecture of theinternational monetary and financialsystem
In accordance with the arrangements regardingthe international representation of theEurosystem, the ECB has taken part in newinitiatives and progress achieved so far instrengthening the architecture of theinternational monetary and financial system.Since the Mexican crisis in 1994-95 and followingthe financial crises that affected the east Asianeconomies in 1997-98, the internationalcommunity has undertaken work to promotea more stable global capital market. In 1999,against the background of a significantimprovement in the world economic outlook,further progress was made in implementingalready agreed measures and new initiativeswere agreed.
Transparency, codes and standards
The most visible progress has been achievedin enhancing the transparency andaccountability of the public and privatesectors. Initiatives in this field aim atimproving the scope and quality ofinformation to support better private andofficial decision-making, which would enhancefinancial stability. In addition to improvingdata collection and disclosure by both thepublic and private sectors, the internationalcommunity has been actively promoting thedevelopment and dissemination of codes andstandards of good practices in various fields.

85ECB Annua l Repor t • 1999
In the area of data transparency, severalinitiatives concern the decision-makingprocess of international institutions. On avoluntary basis, information is now availableon countries’ IMF-supported programmes(Letters of Intent, Policy Framework Papers(PFPs) and, in the future, Poverty ReductionStrategy Papers (PRSPs), which are thesupporting documents underlying the newlyestablished Poverty Reduction and GrowthFacility (PRGF)), as well as on Article IVsurveillance (Public Information Noticesreflecting the outcome of the IMF ExecutiveBoard discussion). In April 1999 a pilotproject was launched by the IMF ExecutiveBoard to improve transparency furtherthrough the voluntary release of Article IVstaff reports.
In order to disclose comprehensive, reliableand consistent data on foreign reserve assetsand liabilities of the official sector, a statisticaltemplate for public dissemination of Data onInternational Reserves and Foreign CurrencyLiquidity, under the IMF Special DataDissemination Standard (SDDS), has beenagreed jointly by the IMF and the G10 centralbanks. Compliance will be voluntary underthe SDDS and most G10 countries plan orhave already started to report on the newbasis.
Improving transparency is also important withregard to the private sector. Several BISworking groups (see Section 2.1 above) havedeveloped a number of initiatives in this area.In order to improve the quality of BISconsolidated international banking statistics,the CGFS has agreed to shorten the reportingfrequency from semi-annual to quarterlyas from January 2000. Moreover, creditexposures towards the ultimate counterpartswill be published in addition to those towardsthe immediate counterparts. Under the jointleadership of several groupings (the BCBS,the CGFS, the FSF, the InternationalAssociation of Insurance Supervisors (IAIS),the International Accounting StandardsCommittee (IASC) and the InternationalOrganisation of Securities Commissions(IOSCO)), several initiatives aim at enhancing
disclosure requirements by individual financialmarket institutions.
With regard to the development anddissemination of standards and codes ofgood practices, a key challenge is theirimplementation by a large number ofdeveloping countries and emerging marketeconomies. Further progress in that area isexpected to contribute significantly to crisisprevention by improving the institutionalframework for the decision-making processin the official sector, as well as informationprovided to market participants for their ownrisk assessment. The international financialcommunity is currently assessing the mosteffective way to monitor the observance byindividual countries of internationally agreedcodes and standards.
In the context of a pilot project, the IMF, inconjunction with the relevant authorities ofthe countries concerned, has embarked ona series of experimental “Reports on theObservance of Standards and Codes”(ROSCs). These reports assess the extent towhich member countries observe certaininternationally recognised standards, focusingprimarily on the areas of direct operationalconcern to the IMF.
Following the adoption by the IMF inNovember 1998 of a Code of Good Practiceson Fiscal Transparency (subsequentlyamended in April 1999), a Code of GoodPractices on Transparency in Monetary andFinancial Policies was adopted at the IMFAnnual Meetings in September 1999. TheEurosystem was actively involved in the designof the latter Code, together with the BIS anda representative group of central banks andother experts. Further work is under way toprepare the supporting documentation to theCode. The monitoring of compliance withthe Code of Good Practices on Transparencyin Monetary and Financial Policies is expectedto be part of the aforementioned ROSCs.This is already reflected in some of theexperimental reports which have beencompiled by the IMF so far and which havebeen made available on its website. Experts

ECB Annua l Repor t • 199986
from the Eurosystem took part in thismonitoring activity.
Finally, several initiatives have been taken inorder to facilitate the development andimplementation of standards relevant to thefunctioning of financial systems. Under theaegis of the FSF a Task Force on theImplementation of Standards was set up inorder to examine ways of fostering theimplementation of international standards andcodes relevant to the strengthening offinancial systems. In the specific area ofbanking standards, in June 1999 the BaselCommittee on Banking Supervision (BCBS)released a proposal for a new capitaladequacy framework consisting of threepillars: minimum capital requirements(developing and expanding the 1988agreement), a supervisory and internal reviewof an institution’s capital adequacy and theeffective use of market discipline. The BCBSwas seeking comments from all interestedparties by March 2000 in order to putforward more definitive proposals later on inthe same year.
Strengthening financial sector stability
Efforts to improve the soundness of financialsystems and of regulatory and supervisoryframeworks have been undertaken by variousinstitutions and fora such as the IMF, theWorld Bank and the BCBS.
The recently established FSF is expected toenhance the exchange of information andinternational co-operation between thecompetent national and international bodiesin financial market supervision, particularlywhere there is a cross-sectoral dimension.Moreover, two of the working groups set upby the FSF are expected to formulate policyrecommendations aimed at reducing the riskassociated with unregulated or poorlyregulated segments of financial systems,namely highly leveraged institutions andoffshore financial centres.
While abstaining from conducting anassessment of countries’ actual adherence toits Core Principles for Effective BankingSupervision (adopted in 1997), the BCBSpublished a document in October 1999 toprovide a methodology for evaluatingcompliance with them. This document willserve as an input for financial sectorsurveillance by the IMF and the World Bank.The Financial Sector Liaison Committee(FSLC) has agreed to co-ordinate a joint IMF/World Bank financial sector monitoring andassessment programme aimed at evaluatingthe soundness and vulnerabilities of members’financial systems. The IMF and the WorldBank initiated a Financial Sector AssessmentProgram (FSAP), in which joint teams, withthe participation of outside experts fromnational supervisory agencies, assess thevulnerability of national financial sectors,initially for a selected number of countries.In keeping with such missions and on anexperimental basis, the IMF has beenelaborating Financial Sector StabilityAssessments (FSSAs) as backgrounddocumentation to its Article IV consultations.
Exchange rate regimes and capital accountliberalisation
Another important area subject to ongoinganalysis and discussion is the review ofappropriate exchange rate regimes, asattempting to maintain unsustainable exchangerate regimes was a major factor behind recentfinancial crises. As emphasised in recentdiscussions at the IMF and in other fora, theoptimal exchange rate regime differs fromcountry to country. Moreover, the optimalexchange rate regime for a country maychange over time, depending on its state ofmacroeconomic and financial development.It is the Eurosystem’s opinion that fundsurveillance will have to focus on theconsistency of the exchange rate systemchosen by a given country with itsmacroeconomic and structural policies, aswell as its major external trade and financiallinks.
87ECB Annua l Repor t • 1999
Similarly, further work is needed on capitalaccount liberalisation. While there is aconsensus that liberalisation has the potentialto bring substantial benefits to a country, themanagement and sequencing of liberalisationare delicate issues. A sound macroeconomicframework, including consistent monetaryand exchange rate policies, and a strongfinancial infrastructure are crucial in thatrespect. The merits and risks of controls oncapital inflows and outflows, including tax-based controls on inflows, are still underconsideration. In a connected area, theFSF Working Group on Capital Flows iscurrently considering a range of policyrecommendations in borrower and creditorcountries which could, over time, reduce thevolatility of capital flows and the risks tofinancial systems of excessive short-termexternal indebtedness. In this context, theprudent management of external official andprivate debt and, more broadly, of nationalbalance sheets plays an important role.
Crisis management and the involvement ofthe private sector
In addition to substantially increasing itsfinancial resources to cope with systemiccrises in recent years (including the doublingof resources callable under the pre-existingGeneral Arrangement to Borrow (GAB) andthe New Arrangement to Borrow (NAB)from SDR 17 billion to SDR 34 billion in1998 and increasing the IMF quotas bySDR 66 billion in 1999), the IMF has alsodeveloped new instruments with which todeal with financial crises. In April 1999 theIMF Executive Board approved theContingent Credit Line (CCL) facility, whichestablishes a means of providing short-termfinancing for countries with sound economicpolicies but whose external position isendangered by international financialcontagion. In order to support adjustmentmeasures during debt negotiations, the IMFExecutive Board has re-affirmed its policy tolend into sovereign arrears (adopted in 1989)on a case-by-case basis. It has also beenagreed that the IMF might extend this policy,
in principle, to the case of non-sovereignarrears.
Further progress is needed in the complexbut crucial area of ensuring private sectorinvolvement in crisis prevention andresolution. Recent financial crises havehighlighted the disruptive effects of changesin market sentiment. Some steps have alreadybeen taken, ranging from ex ante and voluntarymeasures (such as the establishment of regularcommunication channels between debtorcountries and their private creditors and thearrangement of private sector contingentcredit lines) to more compulsory schemes(for instance, the Paris Club required acountry to seek comparable treatment fromits bond creditors). Moreover, both the IMFInterim Committee and the G10 ministersand governors supported the frameworkelaborated in the report by the G7 financeministers to the Cologne Economic Summit(18 June 1999).
2.4 The international role of the euro
The introduction of the euro on 1 January 1999was a major event with important implicationsnot only inside but also outside the euro area.The euro is the second most widely usedcurrency at the international level, as a result ofboth the legacy of the former nationalcurrencies replaced by the euro and theeconomic weight of the euro area in the worldeconomy. The development of the euro as aninternational currency will mainly be a market-driven process. In particular, the use of theeuro by private agents as an investment andfinancing currency, as well as a payment andvehicle currency, will play a prominent role.The decisions of private sector agents will beinfluenced to a large extent by the degree ofintegration, liquidity and diversification ofthe euro financial markets, and by thecross-border relationships of the euro area.Moreover, the international role of the eurowill be affected by the economic conditions inthe euro area, thereby highlighting thecontribution of all economic policies to a soundand stable currency.

ECB Annua l Repor t • 199988
Since the internationalisation of the euro, assuch, is not a policy objective, it will beneither fostered nor hindered by theEurosystem. The orientation of theEurosystem’s monetary policy towards pricestability will remain a major factor behindinvestors’ confidence in the euro. Conversely,the Eurosystem is aware of potentialimplications for the conduct of its monetarypolicy of the internationalisation of the euro.These potential implications will not beallowed to impair its ability to maintain pricestability.
The emergence of the euro area – withcharacteristics similar to those of the twoother major economic regions, the UnitedStates and Japan, in terms of large size andlow trade openness – and the expectedincrease of the euro’s international usealso have implications for internationalco-operation.
Given its economic weight in the world (morethan one-fifth in terms of GDP), the euroarea is generally expected to play an
important role in the process of internationalco-operation. Fewer players at the globallevel and more balanced relationshipsamong them should, in principle, facilitateinternational co-operation, while at the sametime strengthening the awareness of eachplayer of the need to assume his respectiveresponsibility. This process is assisted byregular exchanges of views and consultationsamong major economic areas.
In addition to adequate representationarrangements (where the ECB is concerned,see Section 2.1), a more efficient internationalco-operation process and a smaller riskof policy inconsistencies require the euroarea to take a single position wheneverappropriate. This is also supportive of theeuro area exerting an international influencecommensurate with its economic weight andfurther limits the risk for the Eurosystemof being pressed to pursue inappropriateshort-term-oriented policy measures, whichwould undermine longer-term domestic andthereby external stability.

89ECB Annua l Repor t • 1999

ECB Annua l Repor t • 199990

Chapter V
Payment and securities
settlement systems
ECB Annua l Repor t • 199992
1 Oversight of large-value payment systems
Large-value payment systems in euro
As from 4 January 1999 five large-valuepayment systems, all of which comply withthe safety standards laid down in the 1990G10 Report on Interbank Netting Schemes(the Lamfalussy standards), commencedoperations in euro together with TARGET,namely the Euro Clearing System (Euro 1)run by the Clearing Company of the EuroBanking Association (EBA), Euro AccessFrankfurt (EAF) in Germany, Système NetProtégé (SNP) in France, Servicio Españolde Pagos Interbancarios (SEPI) in Spainand Pankkien On-line Pikasiirrot jaSekit-järjestelmä (POPS) in Finland. InApril 1999 SNP was upgraded and convertedinto a new “hybrid” system called Paris NetSettlement (PNS). Similar to EAF, the newsystem combines features of net and grosssettlement systems.
In accordance with the common oversightpolicy stance of the Eurosystem, the NCBsare responsible for the oversight of thesystems located in their respective countries,whereas the ECB is responsible for theoversight of Euro 1. Within this framework,the ECB in particular monitored the dailysettlement process of Euro 1 and closelyfollowed the more general development ofthe EBA. The latter was characterised by,inter alia, an increase in the number ofclearing banks from 62 (in January 1999) to72 (in December 1999). In addition to itsoversight activity, the ECB played a twofoldrole in respect of Euro 1: it acted as thesettlement service provider and as the holder
of a liquidity pool, established in order toensure timely settlement in the event of thefailure of a participant.
As part of their ongoing oversight functions,the ECB and the NCBs regularly collectedand reviewed relevant statistical datapertaining to the main large-value paymentsystems in euro. These data provide valuableinformation on the smooth functioning anddevelopment of the different systems.
Continuous Linked Settlement (CLS)
In 1997 a group of major foreign exchange (FX)trading banks established Continuous LinkedSettlement Services Ltd. (CLSS) in London. Theobjective of CLSS is to provide multi-currencyservices for the simultaneous settlement of bothlegs of foreign exchange transactions, whereby,through implementation of a payment versuspayment mechanism, foreign exchangesettlement risk will be largely eliminated. Thesystem will be operated by Continuous LinkedSettlement Bank (CLSB), New York, a wholly-owned subsidiary of CLSS. CLSB is due tobecome operational in 2001. Owing to the factthat the intention is for the euro to becomeone of the first currencies that the CLSB willsettle, the Eurosystem is involved in theoversight of the system. In the course of 1999the Eurosystem focused in particular onevaluating the impact of the CLSB on theliquidity situation in euro area large-valuepayment systems and, in order to exchangeviews on this issue, sponsored a meeting withthe euro area banks involved in the project.
2 Oversight of retail payment systems
Cross-border retail payment services
Efficient cross-border retail payment servicesare essential for the smooth functioning ofthe Single Market and full exploitation of itsbenefits by citizens and businesses alike.
However, the service level in the area ofcross-border retail payments is stillunsatisfactory, in terms of both the speed ofexecution and the charges levied oncustomers. Improvements in banks’ practicesshould follow from the implementation of
93ECB Annua l Repor t • 1999
the European Parliament and CouncilDirective No. 97/5/EC of 27 January 1997 oncross-border credit transfers. However, theimplementation of the Directive may not besufficient. Being a legal instrument, it couldnot fully address the issues of inadequacies ininfrastructure and standardisation, whichcurrently represent a major source of costs.Against this background, the ECB published areport entitled “Improving cross-borderretail payment services in the euro area –the Eurosystem’s view” in September 1999which analysed the current situation anddefined the Eurosystem’s policy line.
After having discussed several options, theEurosystem took the view that its operationalinvolvement would not be justified at present.It intends rather to become a catalyst forchange, initiating regular discussions with thebanking and payment service industry in orderto facilitate euro area agreements which willimprove the environment for cross-borderretail transfers, in particular in the area ofstandardisation. In order to launch thediscussion and to give a clear signal to themarkets, the Eurosystem defined a set ofobjectives which the industry should fulfil bythe time the euro banknotes and coins areintroduced. These objectives are aimedboth at inviting the industry to make theinvestment needed in order to bring theefficiency level of cross-border retailpayments closer to that of domestic paymentsystems and at endeavouring to strike abalance between what is expected by usersand what the industry can realistically deliverin the short run.
One indication that the markets are startingto address the problem is the EBA’sLow-Value Payments (LVP) initiative, whichis aimed at developing a service for theprocessing of cross-border retail paymentsin euro and would, in the early stages, bebased on the technical capabilities of Euro 1.The system is scheduled to becomeoperational in the second half of 2000.
Electronic money
Although electronic money is still in itsinfancy and growth has been very modest todate, the possibility of exponential growthcannot be ruled out. Hence electronicmoney has the potential to have significantimplications for monetary policy in the future.A number of additional regulatory concerns,i.e. the safe and efficient functioning ofpayment systems and confidence in paymentinstruments, the protection of customers andmerchants, the stability of financial markets,protection against criminal abuse and levelplaying-field considerations, have also to betaken into account. For these reasons,clear rules on the conditions under whichelectronic money can be issued need to beestablished.
The European Commission and the EUCouncil are preparing Directives on thetaking-up, pursuit and prudential supervisionof the business of electronic moneyinstitutions and on amending CouncilDirective No. 77/780/EEC of 12 December1977 on the co-ordination of the laws,regulations and administrative provisionsrelating to the taking-up and pursuit of thebusiness of credit institutions. The ECBhas actively contributed to this work inaccordance with its policy line defined in the“Report on electronic money” (August 1998)and provided a formal opinion on the above-mentioned draft Directives in January 1999.Inter alia, the ECB highlighted the fact that itis strongly in favour of all electronic moneyissuers being classified as credit institutions,as well as of a redeemability requirementbeing imposed on them. Whereas the draftDirectives take into account many of theconcerns of the Eurosystem, these majorissues which have yet to be resolved willbe discussed further with the EuropeanParliament, to which the draft Directives havebeen submitted for a second reading inaccordance with the co-decision procedure.

ECB Annua l Repor t • 199994
3 Other payment systems activities
In February 1999 the ECB published anaddendum, incorporating 1997 data, to thedescriptive guide to the payment andsecurities settlement systems operatingin the EU Member States, the “BlueBook”. Moreover, in order to providecomprehensive information on the majorpayment and securities settlement systems inthe EU accession countries, the ECB releaseda report in August 1999 entitled “Payment
systems in countries that have applied formembership of the European Union”. Thispublication was prepared in co-operationwith the central banks of Bulgaria, Cyprus,the Czech Republic, Estonia, Hungary, Latvia,Lithuania, Poland, Romania, Slovakia andSlovenia. It marks an important milestone inthe deepening of co-operation with thecentral banks of these countries in the fieldof payment systems.
4 Securities settlement systems policy
Assessment of EU securities settlementsystems and their links
Following the publication of the reportentitled “Standards for the use of EUsecurities settlement systems in ESCB creditoperations” and the first assessment of theEU securities settlement systems (SSSs) in1998, SSSs have made substantial efforts toenhance the level of their compliance withthe standards and, as a result, thepreconditions for their use have beenreduced in many cases. The assessment ofSSSs was updated in May 1999 and the resultshowed that there are now five SSSs in theeuro area which can be used withoutpreconditions, compared with one at thestart of Stage Three of EMU. A further tenSSSs have improved their level of compliancesubstantially. The eligibility of SSSs will bereviewed periodically in order to take newdevelopments into account.
Some of the EU SSSs have built linksbetween themselves in order to enable thecross-border transfer of securities in general.Before these links can be used in the contextof the single monetary policy of theEurosystem and the ESCB’s intraday creditoperations, they have to be assessed againstthe standards for the use of EU SSSs. Afterthese assessments were carried out in 1999,the Governing Council agreed that a numberof links between SSSs were eligible for the
cross-border transfer of collateral used inthe Eurosystem’s monetary policy operationsand the intraday credit operations of theESCB. In May, after a first wave ofassessments, 26 links were deemed to complywith the ECB’s standards. After a secondwave of assessments in October, theGoverning Council agreed that a further21 links were eligible. Thus, in addition tothe correspondent central banking model(CCBM), which was established by theEurosystem, there are now marketalternatives available in some countries forthe cross-border transfer of collateral. Forthe time being, the links are eligible to beused on a free-of-payment (FOP) basis, ascurrently no delivery versus payment (DVP)facilities exist on a cross-border basis. Furtherlinks were assessed and approved by theGoverning Council in February 2000.
The cross-border transfer of securities
The CCBM was established as an interimsolution to the cross-border use of collateralin the Eurosystem’s monetary policyoperations and the intraday credit operationsof the ESCB until the private sector developsmore comprehensive solutions for thecross-border use of securities in general.Increasingly, the cross-border transfer ofsecurities in general has become an importantissue for the private market, which is trying

95ECB Annua l Repor t • 1999
to develop not only links, but also furthermarket solutions to facilitate transfers acrossborders. Within the euro area, marketparticipants tend to be in favour of a moreefficient and integrated securities settlementinfrastructure. Several projects are beingimplemented in competition with oneanother; however, the position of theEurosystem remains neutral in this respect.The Eurosystem will try to ensure that allproposed alternatives offer a degree of safetywhich is compatible with the standards setfor the collateralisation of the single monetarypolicy of the Eurosystem and ESCB intradaycredit operations.
Infrastructural barriers to the integration ofthe euro area repo market
The Eurosystem has a keen interest in thesmooth functioning of the euro area financial
markets, in particular with a view to ensuringthe transmission of its monetary policyimpulses. In this context, studies carried outby the Eurosystem have shown that, unlikethe uncollateralised money market, thecollateralised money market is not integratedthroughout the euro area. One of the issuesanalysed related to the existing infrastructuralbarriers to integration, in particular thesecurities settlement aspects. The potentialbarriers to further integration in this areaare the lack of cross-border settlementprocedures based on a delivery versuspayment mechanism and the different legalframeworks, which are tailored to the needsof the domestic markets. It is clear that theEurosystem has a role to play in increasingawareness of these problems. Initiatives tofind solutions must, however, come primarilyfrom the market.

ECB Annua l Repor t • 199996

Chapter VI
Financial stability and
prudential supervision

ECB Annua l Repor t • 199998
1 The institutional framework for financial stability
The institutional framework for financialstability in the EU and in the euro area isbased on national competence andinternational co-operation. A variety ofnational structures and practices thuscontribute, within the harmonised regulatoryframework defined by the Treaty establishingthe European Community (Treaty) and theEC Directives, to the pursuance of financialstability objectives.
The Treaty provides the instruments neededin Stage Three of Economic and MonetaryUnion (EMU) to link the jurisdiction of thesingle monetary policy (i.e. the euro area)with those of national supervisory policies(domestically chartered institutions). First,the Eurosystem is to “contribute to thesmooth conduct of policies pursued bycompetent authorities relating to theprudential supervision of credit institutionsand the stability of the financial system”(Article 105 (5) of the Treaty). Second, theECB is accorded an advisory function in theregulatory process (Article 105 (4) of theTreaty and Article 25.1 of the Statute ofthe ESCB). These provisions reflect theinterest of the Eurosystem, as the centralbank of the euro area, in the maintenanceof the stability of the financial system.
The Banking Supervision Committee (BSC), agroup of high-ranking representatives ofcentral banks and banking supervisoryauthorities, is the main body which assiststhe Eurosystem in the fulfilment ofits above-mentioned tasks. AlthoughArticle 105 (5) of the Treaty applies only toparticipating countries, the co-operationwithin the BSC involves all central banks andsupervisory authorities of the 15 MemberStates. At the same time, the BSC may alsoact as a forum for consultations amongEU banking supervisors on issues not relatedto the supervisory tasks of the Eurosystem.In the accomplishment of this twofoldmandate, it contributes to ensure the abilityof both NCBs and supervisory authorities toco-operate across national borders, whenever
needed. The arrangements currently in placecan be described by looking at co-ordinationmechanisms: (i) within the Eurosystem,(ii) between supervisors and the Eurosystemand (iii) among supervisory authorities.
Co-ordination mechanisms are primarilycalled for within the Eurosystem. This is thecase for emergency liquidity assistance (ELA),which embraces the support given by centralbanks in exceptional circumstances and on acase-by-case basis to temporarily illiquidinstitutions and markets. At the outset, it isnecessary to stress that the importance ofELA should not be overemphasised. Centralbank support should not be seen as a primarymeans for ensuring financial stability, since itbears the risk of moral hazard. Preventivemeasures aimed at fostering the adoption ofsound risk management practices on the partof financial institutions, and the effectivenessof prudential regulation and supervision inachieving this goal, are the first line of defenceagainst excessive risk-taking behaviour andfinancial distress. Furthermore, the provisionof ELA has been a very rare event in industrialcountries over the past few decades, whileother elements of the safety net have gainedimportance in the management of crises.However, if and when appropriate, thenecessary mechanisms to tackle a financialcrisis are in place. The main guiding principleis that the competent NCB takes the decisionconcerning the provision of ELA to aninstitution operating in its jurisdiction. Thiswould take place under the responsibility andat the cost of the NCB in question.Mechanisms ensuring an adequate flow ofinformation are in place in order that anypotential liquidity impact can be managed in amanner consistent with the maintenance ofthe appropriate single monetary policy stance.The agreement on ELA is internal to theEurosystem and therefore does not affectthe existing arrangements between centralbanks and supervisors at the national level orbilateral and multilateral co-operation amongsupervisors and between the latter andthe Eurosystem. However, their smooth
99ECB Annua l Repor t • 1999
functioning assumes an ability to implement,swiftly and efficiently, co-ordinationmechanisms aimed at dealing with thecross-border implications of financial crisesand at preventing contagion.
As far as co-operation between the Eurosystemand the supervisory authorities of the EU countriesis concerned, the BSC is the major forum foraddressing relevant issues. In assisting theEurosystem with prudential supervision andfinancial stability issues, it examines mattersof a macro-prudential nature, reviewsdevelopments in the banking and financialsystems and promotes a smooth exchange ofinformation between the Eurosystem andbanking and other supervisory authorities. Thisfunction of the BSC is aimed at providing theco-ordination needed between central bankingand banking supervision. In particular, theBSC serves as a channel for conveying usefulinformation to the supervisory authorities oncredit institutions which the ECB and the NCBsmight gain from the performance of their basictasks in the field of monetary policy and paymentand securities settlement systems. At the sametime, it allows the reverse flow of informationfrom supervisory authorities to the Eurosystemto be managed. In particular, in the light ofpossible systemic implications, supervisors areprepared to inform the Eurosystem as soon asany major problems in the banking system arise.As a matter of principle, the BSC is in a positionto address all the relevant issues, since, at theCommunity level, the post-BCCI Directive hasremoved legal impediments to the flow ofconfidential information between supervisoryagencies and the central banks, including theECB and the Eurosystem. By relying on existingarrangements at the national level, the flow ofinformation between the supervisory agenciesand the Eurosystem is, as a rule, channelledthrough the respective NCBs.
Co-operation between national authorities in thefield of prudential supervision is based onboth bilateral and multilateral arrangements.Bilateral co-operation between home andhost country authorities has been significantly
strengthened in all sectors of financial activity.The network of memoranda of understandingimplemented in the European Economic Area(EEA) in the banking sector is an expressionof the effort to sharpen the channels for theexchange of information and to facilitate thesupervision of cross-border activities. Thememoranda of understanding typically coverpractical provisions governing establishmentprocedures, facilitating cross-borderexaminations of branches and enhancing theexchange of information in respect ofsubsidiaries. Multilateral co-operation in thefield of prudential supervision within thevarious sectors of financial activity is alsowell established through the operation ofseveral committees. In the banking sector,besides the second function of the BSC, theGroupe de Contact has been operating since1972. This group functions as a forum formultilateral co-operation and the exchangeof information at the EEA level on issuesrelating to the implementation of bankingregulation and supervisory practices, includingthe discussion of individual cases. In thesecurities sector, the Forum of EuropeanSecurities Commissions (FESCO) wasestablished in 1997 to foster multilateral co-operation among the securities commissionsat the EEA level. The Conference ofInsurance Supervisory Authorities fulfilssimilar functions in respect of the insurancesector.
All in all, the integration of the banking andfinancial system within the EU has beenachieved through reliance on an institutionalframework based on national competenceand co-operation. The single monetary policyand the accelerated integration of bankingand financial markets in the euro area haveincreased the importance of co-operationwithin the Eurosystem, between supervisoryauthorities and the Eurosystem, aswell as among supervisors. The necessaryarrangements to facilitate the exchange ofinformation and to implement commonlyagreed policy actions to tackle threats tofinancial stability are in place.

ECB Annua l Repor t • 1999100
2 Structural changes in the EU banking and financial sector
The monitoring of structural changes takingplace in the euro area and EU banking andfinancial markets is relevant both to the needsof the Eurosystem, as the central bank forthe euro area, and to the national supervisorypolicies. Since the introduction of the euro,these changes have gained momentum,fostering the re-organisation of the financialservices industry. The potential specificeffects of the introduction of the euro on EUbanks have been examined extensively by theBSC.1
An important driving force for change isinformation and communication technology.2
This contributes to reducing the costsassociated with the collection, storage,processing and transmission of information,by replacing paper-based and labour-intensivemethods with automated processes. Second,it modifies the ways in which customers haveaccess to banking services and products,mainly through automated channels, viz.telephone, personal computer and internetbanking (“remote banking”). Both effects alterthe nature of competition in banking andpotentially affect the latitude of the marketfor banking services, also broadening the setof potential entrants. Financial institutions arein different ways responding to, and at thesame time further strengthening, these andother changes in the market structures. Ingeneral, large institutions are repositioningthemselves in the new market by adding newactivities and/or expanding geographically.This is deemed necessary in order for themto be able to continue to serve the marketfor wholesale activities. This repositioning hasled to an increase in mergers and acquisitionsinvolving large European financial institutions.However, only a few cross-border mergersand acquisitions have taken place.
Different market dynamics are drivingchanges within small institutions. The fixedcosts associated with investments ininformation and communication technologyhave increased the relevance of economiesof scale. A significant number of small
European institutions have been involved indomestic mergers and acquisitions. In someEU countries savings and co-operativebanks have further intensified the mutualco-operation within their groups, eitherthrough specific co-operation agreements orby setting up joint venture institutions toprovide asset management and securitiesclearing facilities. The downsizing effect onbanking capacity in Europe – measured asthe number of branches and number ofemployees – has as yet proved largelyinsubstantial. However, rationalisation of theorganisational structures and significantimprovements in efficiency are generallyvisible only with a time-lag.
Banks, both large and small, are also adoptingstrategies to respond to the process ofdisintermediation, whereby an increasingnumber of financial services are provided bymeans of direct market intermediation or bynon-bank financial institutions. Banks areexpanding into the asset managementbusiness in order to contain thedisintermediation of traditional bankingproducts. This is mainly evident in thefollowing: (i) an increased involvement inservices for securities trading, (ii) custodyand, most frequently, (iii) the establishmentof subsidiaries to manage investment funds.In any event, the effect is quite visible inbanks’ income statements, which show a shiftfrom interest to non-interest income. Theanalysis conducted by the BSC3 shows that inthe EU non-interest income has been themost dynamic component in the banks’income structure in recent years and itsrelative importance (as a percentage of thetotal operating income) has been constantlyincreasing. Notwithstanding the increasedcosts associated with the development ofnon-traditional activities, the increase innon-interest income also seems to have had
1 “Possible effects of EMU on the EU banking systems in themedium to long term”, ECB, February 1999.
2 “The effects of technology on the EU banking systems”, ECB,July 1999.
3 “EU banks’ income structure”, ECB, April 2000.

101ECB Annua l Repor t • 1999
a positive effect on EU banks’ profitability inrecent years, largely compensating for theshrinkage in income margins from traditionalbanking activities. The composition ofnon-interest income across the EU bankingsystems is somewhat heterogeneous; feesand commissions represent the mainsub-component, accounting for around 60%of total non-interest income.
On the whole, the reorganisation of thebanking and financial industry has occurred
mainly within national borders, and therelevance of cross-border activity is stilllimited, especially in the supply of retailservices. However, common trends are atwork in the euro area and EU countries. Theswift establishment of a single money marketand the accelerated integration of capitalmarkets after the introduction of the eurohighlight the fact that financial intermediariesand markets are increasingly exposed toshocks originating beyond national borders.
3 Macro-prudential analysis
macro-prudential analysis carried out withinthe BSC focuses on the banking sector at theEU/euro area level. It integrates with otheractivities carried out within the Eurosystemin the fields of the oversight of payment andsecurities settlement systems, the surveillanceof money and capital markets relevant tothe conduct of monetary policy and themonitoring of international financial markets.The analysis put forward in these differentcontexts further enhances the Eurosystem’sinstruments for contributing to thesafeguarding of financial stability.
In 1999 ad hoc investigations were carriedout on two topics: the credit exposures ofEU banks to emerging and developingcountries and the possible implications ofadjustments in asset prices for the stability ofthe banking sector. With regard to the firstissue, it was found that the EU banking sectorhas continued to reinforce its position as thelargest group of international lenders toemerging and developing countries. However,since the exposures to the riskiest countrieshave been relatively limited, banks have madesignificant risk provisions and the generaleconomic situation in these countries hasimproved, the assessment of the risks to EUbanking systems became more positive during1999. With regard to the second issue, theprolonged rise in most EU stock prices,together with the rapid increases registeredin some EU countries’ real estate prices,
The BSC has started to analyse the soundnessof the banking and financial sector at the EU/euro area level on the basis of a commonlyagreed body of information. This work isreferred to as macro-prudential analysis. Inaddition, other international organisations arecurrently developing this field of analysis, inorder to sharpen the instruments forcomprehending the reasons for the severefinancial turbulence which has recently takenplace. A key component in this work hasbeen the development of reliable data sourcesfor understanding the vulnerabilities in thefinancial systems of both developed anddeveloping countries.
The framework for macro-prudential analysisrelies on a number of indicators based onaggregated banking system data obtainedfrom central bank and supervisory sources,and on the data on the macroeconomic andfinancial environment relevant to assessingthe soundness of the banking sector. Theseindicators aim at capturing significant build-ups of risk exposure within the bankingsystem, potential disturbances emerging fromoutside the banking system, and channels ofcontagion through which difficulties at oneinstitution could spread to others. Thetechniques used involve systematic andregular analysis on the basis of quantitativeindicators and an interpretative input thatrelies on the information and insightsobtained from the supervisory process. The

ECB Annua l Repor t • 1999102
indicated the need for increasing attentionon the part of national supervisoryauthorities. In this regard, some national
4 “Asset prices and banking stability”, ECB, April 2000.5 See also Chapter IV.
authorities have taken special action toincrease awareness of the risks and ensurethat banks are not overly exposed.4
4 Risk assessment systems and credit registers
In addition to the collection of informationon market developments and threats tobanking and financial stability, theimplementation of preventive measures at thenational level is enhanced by co-operationon, and the exchange of information withregard to, supervisory practices. Riskassessment systems are tools commonly usedin this regard.
Supervisory risk assessment systemscomprise all formalised and structuredsystems and operations employed by bankingsupervisors to identify, at an early stage,credit institutions which display high orincreasing risk or weak controls.Notwithstanding their national orientation –given that they are geared to the specificfeatures and needs of national bankingsystems – supervisory risk assessmentsystems share many similarities across theEU. The efforts undertaken in this field bythe BSC have mainly entailed the analysis ofsystems in operation or in the process ofbeing developed by banking supervisoryauthorities and the NCBs in several MemberStates. Contacts have extended beyond theEU, since an analysis of the systems used bythe Canadian Deposit Insurance Corporationand by the US Federal Reserve was also madeand presented to the EU supervisory
authorities and NCBs represented in theBSC.
Although they are mainly intended to assistcredit risk management by financialinstitutions, credit registers may also be usedas a supervisory tool. Information-sharingamong national authorities in the field ofcentral credit registers (CCRs) currently inoperation has also intensified. Despite thelegal obstacles which some EU countries arefacing and which, for the time being, do notallow a cross-border exchange of informationamong CCRs for commercial banks’ use, alltechnical and operational problems associatedwith a possible opening-up are being tackledwithin the BSC. The debate on restructuringthe international financial architecture in thelight of the lessons learned from the recentcrises has flagged the need for extendedco-operation in also monitoring exposuresof systemic relevance on a cross-borderbasis.5 The positive and negative aspects ofthe establishment of an international creditregister have been examined. Additional workis being carried out to explore the feasibilityof a euro area credit register.

103ECB Annua l Repor t • 1999

ECB Annua l Repor t • 1999104

Chapter VII
The production
of the euro banknotes and
preparations for the
cash changeover

ECB Annua l Repor t • 1999106
1 Production of the euro banknotes
The euro banknotes and their individualcomponents are being produced in differentEuropean countries by the NCBs and byprivately and publicly owned companies.Production of the euro banknotes started inJuly 1999 after the successful completion ofthe printing of a pilot series. Before the endof the year printing had started in 9 of the 11printing works involved in euro banknoteproduction. The later start of production atsome printing works is due either to thevolume of euro banknotes they need to print,or to the production requirements fornational banknotes.
For the time being, the denominations whichwill be produced in the largest volumes arebeing printed first. By 1 January 2002 around13 billion euro banknotes will have been
printed for the 11 participating countries:9 billion banknotes to replace nationalbanknotes and 4 billion banknotes as logisticalstocks (see Table 10). The nominal value ofthese banknotes amounts to approximately€600 billion. The estimates of the number ofeuro banknotes to be printed before thelaunch will be updated annually, in order totake account of possible changes in thedemand for the banknotes.
The security procedures relating to theproduction and transportation of banknotesand individual components have beenreviewed and consolidated. A set ofobligatory rules has been developed to ensurea common minimum level of security at thevarious production facilities.
2 The quality of the euro banknotes and coins
Quality of the banknotes
Producing banknotes to the same qualitystandards at 11 printing works – using rawmaterials from different suppliers – is ademanding task. It is imperative to ensureidentical appearance and consistentperformance in both banknote-sorting andbanknote-accepting machines, in line withbest practice in the production of nationalbanknotes. For this purpose, well-definedinspection and quality control procedureshave been established.
All printing works involved in the productionof the euro banknotes have implemented acommon quality management system, basedon ISO standards.1 The structure of thiscommon system focuses on the quality of theindividual banknotes. Detailed procedures forinspection and testing have been defined inorder to evaluate fulfilment of therequirements; these were tested during theproduction of the pilot series.
The proper implementation and applicationof the quality management system is beingassessed by the ECB on the basis of detailedmonthly reports prepared by the printingworks and audits conducted at theproduction sites.
Quality of the coins
The euro coins are produced in 10 countries by14 different mints. In June 1999 the EU financeministers, the mints and the ECB agreed on adetailed quality management system to ensure ahigh and uniform quality of euro coins. Eachmint is responsible for the quality of its owncoins in accordance with common rules. TheECB acts as an independent assessor. Itevaluates the monthly quality reports on thecoins produced and conducts visits to the mints.The ECB would immediately alert the financeministers if any quality-related problems wereto occur.
1 ISO 9002: 1994.
107ECB Annua l Repor t • 1999
3 Protecting the euro banknotes and coins against counterfeiting
Since the decision of the Governing Councilof the ECB to establish a database at the ECBto store all the technical and statistical dataon counterfeit euro banknotes and coins, theplanning process for the counterfeitmonitoring system (CMS), comprising thedatabase itself, the tools needed to exploit itand the links to the various users, hasprogressed. The user requirements have beenestablished and will form the basis for furtherwork. An outline of the technical architectureof the CMS has been elaborated andpreparatory work for the development ofthe functional analysis has started.
In November 1999 the ECB published the“Report on the legal protection of banknotesin the EU Member States”. The report is theresult of a careful study and assessment ofthe various aspects of the legal regime for
the protection of the euro banknotes. Theseinclude counterfeiting; copyright protection;anti-copying devices for reproductionequipment; the adoption and publication ofeuro banknote designs; the exchange ofdamaged or worn euro banknotes; thewithdrawal of euro banknotes; the issuanceof banknotes by entities other than the ECBand the NCBs; and the issuance of non-legaltender banknotes, known as “fancy”banknotes.
Contacts with Europol, Interpol and theEuropean Commission have been eitherestablished or intensified with a view tomaking the appropriate communication andcollaboration arrangements which will becrucial to ensuring the effective flowof information in connection with theprevention and combating of counterfeiting.
4 The EURO 2002 campaign
The Governing Council selected a globalcommunications group to assist in conductingan information campaign in preparation forthe introduction of the euro banknotesand coins on 1 January 2002. Each NCBwill be the key interlocutor of the globalcommunications group at the national level.
The main goals of the EURO 2002 campaignare:
• to educate the general public and, morespecifically, the different target groups inhow to recognise genuine euro banknotes;
• to train shop and bank cashiers how toexamine euro banknotes fast and efficientlyin order to detect possible counterfeits;
• to ensure favourable reception of the eurobanknotes and coins; and
• to gradually prepare the general public asa whole for the introduction of the eurobanknotes and coins by repeatedly drawingattention to their designs.
In this context, the term “general public” isused to refer not only to the residentpopulation of the euro area, but also tocitizens of other countries in which the eurobanknotes will circulate, as well as to visitorsto the euro area countries. The campaignwill be co-ordinated with the EuropeanCommission and the euro area MemberStates, as well as with Greece.
ECB Annua l Repor t • 1999108
5 The changeover to the euro banknotes and coins in 2002
Changeover framework
With a view to ensuring a successful andsmooth operation, the logistics of the 2002cash changeover need to be clearly determinedwell in advance so that all those concerned canstart the necessary preparations in a timelymanner. During the second half of 1999 therewere intensive discussions among all thoseconcerned, which allowed ministers representedin the ECOFIN Council – in close co-operationwith the NCBs and in line with the viewsexpressed by the ECB – to reach a consensuson the outline of the cash changeover. This is asfollows:
• Member States will make their best effortsto ensure that the bulk of cash transactionscan be made in euro within a fortnight of1 January 2002.
• Participating Member States consider thatthe period of dual circulation of the oldand new banknotes and coins should ideallylast between four weeks and two months.Member States may facilitate the exchangeof old banknotes and coins after thisperiod.
• In order to provide for a sufficient quantityfor circulation in the first few days ofJanuary 2002, it would be helpful iffinancial institutions and certain othergroups, notably cash-in-transit companiesand retailers, were provided withbanknotes and coins some time before1 January 2002. Member States recallthat such frontloading must not lead toputting euro banknotes and coins intocirculation before 1 January 2002.
• In order to help citizens familiarisethemselves with the new coins and tofacilitate the changeover, Member Statesagree that making limited quantities ofcoins available to the public on request,notably to the vulnerable groups of thepopulation, can be envisaged, but notbefore the second half of December 2001.
This framework allows Member States toimplement the cash changeover in the
way which best suits the circumstancesprevailing in each country.
Frontloading
The need and the lead time for frontloadingeuro banknotes and coins to banks prior to1 January 2002 – and, in principle, throughthe latter to certain other target groups –greatly depends on the national changeoverscenario chosen, as well as on the nationallogistical infrastructure. As a generalprinciple, any frontloading should be carriedout “as late as possible and as early asnecessary”. In accordance with this, theGoverning Council has agreed on theprinciple of harmonised earliest delivery datesfor supplying relevant target groups with eurobanknotes and coins prior to E-day. EachNCB would be free to operate within themaximum lead time in order to meet thedomestic needs of frontloading.
With regard to the different target groups,all participating countries acknowledge theneed to supply commercial banks with botheuro banknotes and euro coins prior toE-day. This will be a prerequisite for a smoothand rapid changeover. In addition, there is aconsensus on the need to supply the retailsector, or parts thereof, with euro coins viathe banks prior to E-day (sub-frontloading).This stems from the fact that, unlikebanknotes, coins are generally brought intoactive circulation by the retail sector, ratherthan by banks. In other words, the retailsector will need to have sufficient amountsof euro coins available, from the very firstday of circulation, to be given as change forthe banknotes which consumers willhave withdrawn from automated tellermachines (ATMs) and over bank counters.Frontloading, as mentioned above, wouldhelp to contribute to the importantrequirement of completing the changeoverprocess within a relatively short period oftime.
109ECB Annua l Repor t • 1999
In accordance with the common statementissued by the ECOFIN Council, severalMember States are considering frontloadingcoins to citizens in the second half ofDecember 2001. As for the euro banknotes,the Governing Council holds the view thatthe possibility of frontloading to the generalpublic is excluded by Articles 10 and 11 ofCouncil Regulation (EC) No. 974/98 on theintroduction of the euro, since it would havethe same effect as putting them intocirculation.
Adaptation of ATMs, currency sorting andaccepting machines
A considerable number of euro banknotescan be expected to be distributed via ATMsor paid in via cash-in machines. In addition,consumers will be interested from the outsetin using euro banknotes and coins to pay forgoods and services available from all types ofvending machines. Finally, the banks and thecash-in-transit industry will require counting
and sorting equipment which is capable ofprocessing the euro banknotes and coinsreliably and securely as soon as they are putinto circulation.
It should, therefore, be clear that theadaptation of the relevant machines will beof crucial importance to ensuring a smoothintroduction of the euro banknotes and coinsin 2002.
Related discussions with the relevant industryand its associations began some years ago.These discussions focused on the question ofthe timely availability of information onthe technical specifications for the eurobanknotes and coins and on their availabilityfor the development and testing of therequired sensors and other devices.
The relevant industry will have theopportunity to test their sensors and otherequipment with euro banknotes in 2000 at acentral location provided by the ECB, and in2001 under a decentralised scheme.2
6 Cash circulation before 2002
On 1 January 1999 the national currency unitsbecame sub-units of the euro. However, theeuro banknotes and coins will not be issueduntil 1 January 2002. In the meantime thebanknote circulation in the euro area consistsof national monetary tokens. The ECBauthorises the issue of the national banknotesand the volume of coin issuance. During thetransitional period, to ensure substitutabilitybetween the national currency units, theexchange of banknotes denominated in thenational currencies of the euro area will begoverned by Article 52 of the Statute of theESCB, which reads as follows:
“Following the irrevocable fixing of exchangerates, the Governing Council shall take thenecessary measures to ensure that banknotesdenominated in currencies with irrevocablyfixed exchange rates are exchanged by theNCBs at their respective par values.”
Against this background, the GoverningCouncil has decided that the NCBs shall, atleast in one location in the national territory,by themselves or through their appointedagent, ensure that banknotes of otherparticipating Member States can be eitherexchanged against national banknotes andcoins or, upon request, credited to anaccount with the institution effecting theexchange, if the national legislation providesfor such possibility, in both cases at theirrespective par value. The NCBs may limit thenumber and/or the total value of thebanknotes they are prepared to accept forany given transaction or on any one day.
2 With regard to the euro coins, the industry has the possibility toconduct tests in test centres established by Member States forthat purpose.

ECB Annua l Repor t • 1999110
In accordance with the above, some 500 NCBbranches throughout the euro area have beeninvolved in the exchange of non-national euroarea banknotes. From a practical point ofview, the exchange within the framework ofArticle 52 ran smoothly in all the participatingMember States in 1999.
In addition, the NCBs may repatriate thebanknotes of other participating countries orappoint an agent to perform this repatriationservice on their behalf or use existingcommercial repatriation channels.
Banknotes repatriated to their respectiveissuing countries were worth a total valueof €6.2 billion and amounted to115.7 million banknotes in total. Thehighest amounts (in terms of value) weredenominated in Italian lire (€1.7 billion),Dutch guilders (€1.1 billion) and Austrianschillings (€0.8 billion).
Table 10Quantity of euro banknotes to beproduced by 1 January 2002(1999 estimates, in millions of banknotes)
Belgium 530
Germany 4,030
Spain 1,925
France 2,585
Ireland 180
Italy 1,950
Luxembourg 45
Netherlands 605
Austria 520
Portugal 450
Finland 170
EU-11 TOTAL 12,990

111ECB Annua l Repor t • 1999

ECB Annua l Repor t • 1999112

Chapter VIII
Development of the
statistical framework

ECB Annua l Repor t • 1999114
The main focus of the ECB’s statistical work,carried out in close co-operation with theNCBs which collect data from reportingagents, is the production and furtherdevelopment of statistics covering the euroarea, in order to support the conduct of thesingle monetary policy of the Eurosystem asrequired by the Treaty establishing theEuropean Community (Treaty).
Money and banking statistics, interest ratesand securities issues
The ECB published the first data relating tothe consolidated balance sheet of theMonetary Financial Institutions (MFI) sector,and the monetary statistics drawn from it, inDecember 1998. Such data have beenpublished each month since, within a monthof the reporting date. The statistics weredeveloped further in the course of 1999. InMarch 1999 (with regard to February data)growth in the monetary aggregates wascalculated for the first time from flows, thatis after adjustment for reclassifications,revaluations and other changes which do notarise from transactions; the growth rates hadpreviously been calculated from levelsoutstanding. Changes in the consolidated MFIbalance sheet in the form of flows becameavailable at the same time. With effect fromthe publication of monetary statistics for May1999 in late June, the three monetaryaggregates (M1, M2 and M3) have beenavailable in a provisional seasonally adjustedform. The balance sheet data are also usedto calculate credit institutions’ requiredholdings of minimum reserves.
MFIs report more detailed informationquarterly, as a sectoral, currency and maturityanalysis of their business, with someadditional information on the type of lending.Limited quarterly data were first published inthe April 1999 issue of the ECB MonthlyBulletin. These have since been extended incoverage, and now include some backdata.
The “List of MFIs” is updated monthly and ispublished on the ECB’s website; the
requirement is to maintain a consistentapplication of the definition of an MFI acrossthe euro area (and indeed the EuropeanUnion).
The ECB published data on debt securitiesissued for the first time in November 1999.These data relate to new issues, redemptionsand net issues by residents of the euro area,in euro and in other currencies separately,and to issues denominated in euro by non-residents of the euro area, together withamounts outstanding.
Since the beginning of 1999 the ECB has alsopublished a range of money market interestrates and government bond yields in the euroarea, as well as various interest ratesrepresenting the rates paid by MFIs ondeposits and charged on loans in their retailbusiness. Retail banking markets remainrather fragmented in the euro area. The datafrom which these rates are compiled are notyet fully comparable across the euro area,and the results should be used primarily toanalyse developments in retail interest ratesover time, rather than levels.
Work began in 1999 on improving thecomparability of retail interest rate statistics;this may take some time and should be keptin step with the probable growing integrationof retail financial markets in the euro area.Similar improvements to securities issuesstatistics will also be necessary.Supplementary information which cannot bederived from MFI balance sheets, such asinformation on holders of negotiableinstruments issued by MFIs, requires furtherdevelopment. Revisions in the monetary andsecurities issues statistics have beennecessary in most months, although theirincidence, judging from experience with thelonger-established MFI balance sheetstatistics, should decrease as systems settledown. Finally, statistics on other (non-monetary) financial institutions, especiallycollective investment institutions, and onfinancial derivatives business are in theprocess of being defined.

115ECB Annua l Repor t • 1999
Balance of payments and internationalinvestment position statistics (includingreserves) and effective exchange rates
The first euro area monthly balance ofpayments (b.o.p.) aggregates covering keyitems were published in April 1999, with datain ECU back to the beginning of 1998. Thefirst, more detailed, quarterly figures werepublished in September. The first netinternational investment position (i.i.p.) datafor the euro area relating to end-1997 andend-1998 were published in the December1999 issue of the ECB Monthly Bulletin.
The concepts and definitions followed inb.o.p./i.i.p. statistics generally conform to the5th edition of the IMF Balance of PaymentsManual (October 1993), although somedepartures in the monthly statistics areaccepted in order for it to be possible fortight deadlines to be met. Member Statesdevoted much effort to achievingharmonisation before the publication of thefirst data. However, the revisions observedin some Member States indicate that theprocess is still incomplete; efforts to enhancedata quality will continue in 2000. The ECBhas taken an active role, in co-operation withthe European Commission (Eurostat), NCBsand statistical institutes, in analysingdiscrepancies in b.o.p. statistics.
Portfolio investment and the “otherinvestment” account present the greatestchallenges to compilers of b.o.p. and i.i.p.statistics. A major difficulty, withrepercussions throughout financial statistics,is the recording of holdings of negotiablesecurities, together with the necessarybreakdowns.
The Eurosystem’s international reserves havebeen published with the b.o.p. data sinceApril. These data comprise the Eurosystem’sforeign currency claims on non-residents ofthe euro area, together with gold, specialdrawing rights and reserve positions in theIMF. Foreign currency claims on residents ofthe euro area – for example, non-eurodeposits placed with banks located in
participating Member States – are publishedseparately, but are not included ininternational reserves. Preparations weremade for the publication of the Eurosystem’sinternational reserves in accordance with thenew standard established by the IMF and theBIS beginning in March 2000.
In the early months of Stage Three ofEconomic and Monetary Union (EMU), theECB used a measure of the effective exchangerate of the euro compiled by the BIS. SinceOctober 1999 the ECB has published its ownindex, calculated as a geometric weightedaverage of bilateral exchange rates of theeuro against the currencies of 13 countries,taking account of bilateral trade as well ascompetition in third markets. A monthly“real” index makes adjustment for changes inconsumer prices in the euro area andcompetitor countries.
Financial accounts
The ECB is developing financial accountsstatistics, covering financial flows and astatement of financial assets and liabilitiesoutstanding, to complement monetaryanalysis and economic research.
The main sources for these data will be euroarea MFI consolidated balance sheet, b.o.p.and securities issues statistics; financialstatistics for the government sector in euroarea countries; and national financialaccounts, as required under the EuropeanSystem of Accounts 1995 (ESA 95), whichrepresents a powerful instrument forharmonisation.
At present the ECB publishes annual datarelating to the saving, investment andfinancing of private non-financial sectors inthe euro area from national capital andfinancial accounts. The intention is to compilesuch data from the quarterly euro areasources mentioned above, making the bestpossible use of national financial accountsdata.

ECB Annua l Repor t • 1999116
Economic statistics
The ESCB’s primary objective according tothe Treaty is to maintain price stability; themeasure of prices used for this purpose isthe Harmonised Index of Consumer Prices(HICP) covering the euro area. The ECB alsouses a wide range of economic data to makea broadly based assessment of the outlookfor price developments and the risks to pricestability in the euro area. The ECBconsequently takes a keen interest in thequality and availability of statistics relating toprices and costs, national accounts, labourmarket data, and economic indicators ingeneral. Survey data of a qualitative natureare also used. Frequency and timeliness areimportant elements of quality as far as theiruse to support the conduct of monetarypolicy is concerned.
Further progress has been made with regardto the HICP. Its coverage has been extendedto include the health, education and socialprotection sectors, although no backdata forthe newly covered items are available. Theissue of the treatment of owner occupiedhousing expenditures remains to be resolved.
The European Commission (Eurostat)produces three quarterly estimates for euroarea GDP, after 70, 100 and 120 days. Someestimation is necessary since not all euroarea countries currently compile quarterlyaccounts. The introduction of the ESA 95proved to be more difficult than expected.Some indicators, particularly labour marketstatistics, are still missing for many countries,thus making it impossible to compile euroarea aggregates which are consistent withnational accounts. The lack of employmentand labour cost data for the euro area alsoaffects derived indicators such as unit labourcosts.
The European Commission publishes euroarea aggregates for several short-termindicators, in particular industrial productionand producer prices. Most indicators do notcover all euro area countries and rely onsome estimation. The timeliness of the data
improved in 1999. Full implementation of theEU Council Regulation on short-termstatistics (1998) will take some years owingto derogations. The ECB uses timely businessand consumer confidence surveys carried outby the European Commission on a monthlybasis.
Co-operation with the EuropeanCommission
Money and banking statistics are theresponsibility of the ECB at the Europeanlevel; responsibility for b.o.p., i.i.p. andfinancial accounts statistics is shared betweenthe ECB and the European Commission(Eurostat); price and cost and other economicstatistics are the responsibility of theEuropean Commission. This division ofresponsibility worked well in 1999.
Co-operation with international institutions
In accordance with Article 5.1 of the Statuteof the ESCB, the ECB also co-operates closelywith international organisations with regardto statistical matters. Co-operation in 1999,involving mainly the BIS and the IMF, wasparticularly close in the areas of b.o.p.statistics and international reserves, securitiesissues (where the BIS is the source of dataon euro-denominated issues by non-residentsof the euro area), and data relating to theinternational use of the euro.
Statistics relating to non-participatingMember States
All EU Member States were stronglyencouraged to undertake the statisticalpreparations for participation in Stage Threeof EMU. In practice, the ECB receives a fairlyfull set of data from non-participatingMember States. The data are used to monitoreconomic and financial developments in thosecountries. The integration of statistics relatingto those countries into euro area aggregateswill, however, require intensive work with

117ECB Annua l Repor t • 1999
the country or countries concerned in theperiod preceding the enlargement of the euroarea.

ECB Annua l Repor t • 1999118

Chapter IX
Other tasks
and activities
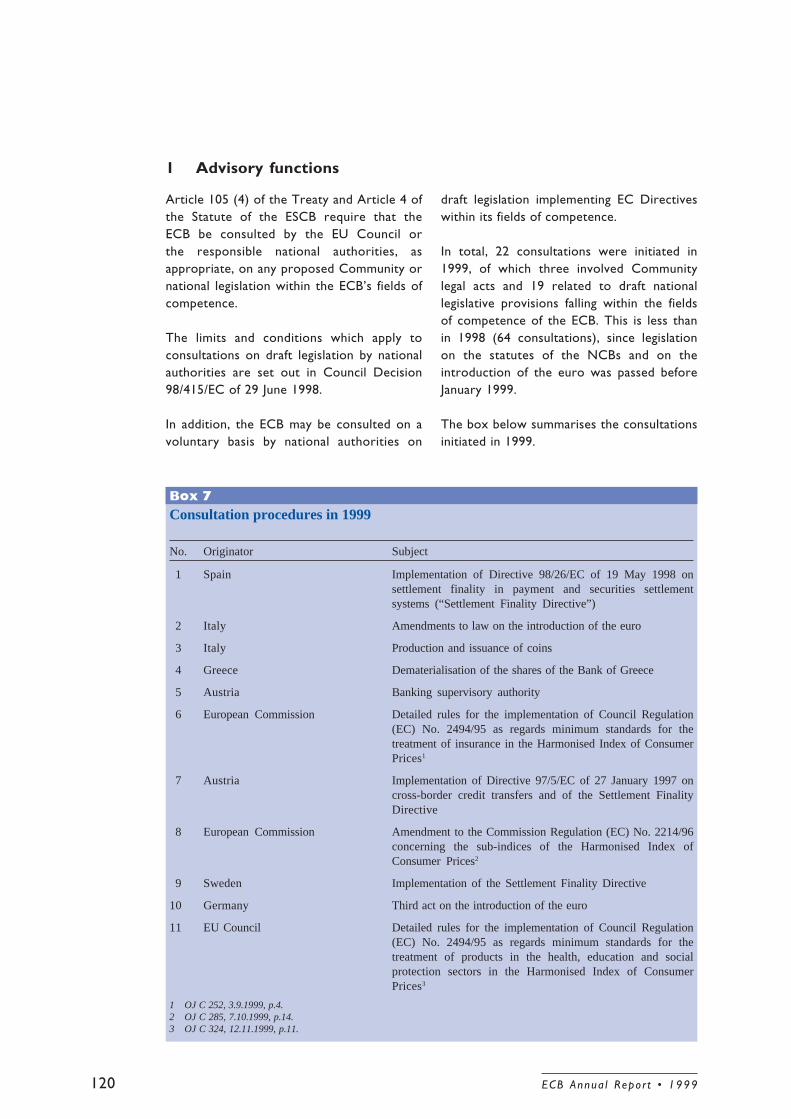
ECB Annua l Repor t • 1999120
1 Advisory functions
Box 7Consultation procedures in 1999
No. Originator Subject
1 Spain Implementation of Directive 98/26/EC of 19 May 1998 onsettlement finality in payment and securities settlementsystems (“Settlement Finality Directive”)
2 Italy Amendments to law on the introduction of the euro
3 Italy Production and issuance of coins
4 Greece Dematerialisation of the shares of the Bank of Greece
5 Austria Banking supervisory authority
6 European Commission Detailed rules for the implementation of Council Regulation(EC) No. 2494/95 as regards minimum standards for thetreatment of insurance in the Harmonised Index of ConsumerPrices1
7 Austria Implementation of Directive 97/5/EC of 27 January 1997 oncross-border credit transfers and of the Settlement FinalityDirective
8 European Commission Amendment to the Commission Regulation (EC) No. 2214/96concerning the sub-indices of the Harmonised Index ofConsumer Prices2
9 Sweden Implementation of the Settlement Finality Directive
10 Germany Third act on the introduction of the euro
11 EU Council Detailed rules for the implementation of Council Regulation(EC) No. 2494/95 as regards minimum standards for thetreatment of products in the health, education and socialprotection sectors in the Harmonised Index of ConsumerPrices3
Article 105 (4) of the Treaty and Article 4 ofthe Statute of the ESCB require that theECB be consulted by the EU Council orthe responsible national authorities, asappropriate, on any proposed Community ornational legislation within the ECB’s fields ofcompetence.
The limits and conditions which apply toconsultations on draft legislation by nationalauthorities are set out in Council Decision98/415/EC of 29 June 1998.
In addition, the ECB may be consulted on avoluntary basis by national authorities on
draft legislation implementing EC Directiveswithin its fields of competence.
In total, 22 consultations were initiated in1999, of which three involved Communitylegal acts and 19 related to draft nationallegislative provisions falling within the fieldsof competence of the ECB. This is less thanin 1998 (64 consultations), since legislationon the statutes of the NCBs and on theintroduction of the euro was passed beforeJanuary 1999.
The box below summarises the consultationsinitiated in 1999.
1 OJ C 252, 3.9.1999, p.4.2 OJ C 285, 7.10.1999, p.14.3 OJ C 324, 12.11.1999, p.11.

121ECB Annua l Repor t • 1999
12 Ireland Copyright and Related Rights Bill
13 The Netherlands Protection of credit institutions and other financial institutionsagainst liabilities resulting from the closure of payment andsecurities settlement systems on 31 December 1999
14 Portugal Draft law endowing the Banco de Portugal with thecompetence (i) to produce and print paper money and othersecurity documents, (ii) to perform the distribution ofbanknotes and (iii) to develop services related to the pursuanceof such activities
15 Portugal (i) Legal framework of credit institutions and financialcompanies concerning the Deposit Guarantee Fund and(ii) activities of the Deposit Guarantee Fund
16 Spain Arrangements for the allocation of the Banco de España’sprofits to the Treasury
17 Luxembourg Contractual obligations of the financial sector due on31 December 1999
18 Greece Amendments to the Statute of the Bank of Greece
19 Luxembourg Implementation of the Settlement Finality Directive
20 France Statute and role of the IEDOM (Institut d’émission desdépartements d’outre-mer)
21 France Statute and role of the IEDOM
22 Luxembourg Balance of payments statistics
2 Compliance with the prohibitions on monetary financing andprivileged access
Pursuant to Article 237d (ex Article 180d) ofthe Treaty establishing the EuropeanCommunity (the Treaty), the ECB isentrusted with the task of monitoringcompliance on the part of the 15 NCBs ofthe EU with the provisions under Articles101 and 102 (ex Articles 104 and 104arespectively) of the Treaty and the relatedCouncil Regulations (EC) Nos. 3603/93 and3604/93. Article 101 prohibits the ECB andthe NCBs from providing overdraft facilitiesor any other type of credit facility togovernments and Community institutions orbodies, as well as from purchasing debtinstruments directly from them. Article 102prohibits any measure, not based onprudential considerations, which establishesprivileged access for governments andCommunity institutions or bodies to financialinstitutions. From the start of Stage Two of
EMU this monitoring exercise was theresponsibility of the European MonetaryInstitute. As from 1 June 1998 the ECBcontinued to monitor the NCBs’ fulfilment oftheir obligations. In parallel, the EuropeanCommission monitors Member States’compliance with the above provisions.
The Eurosystem considers it very importantthat the above-mentioned Treaty provisionsand the associated Council Regulations arerespected under all circumstances. Monetaryfinancing of governments and publicinstitutions, as well as any form of privilegedaccess to financial institutions, would generateinflationary expectations and would,therefore, significantly hamper the credibilityof the single monetary policy. In addition, itcould reduce the incentives for pursuing thenecessary fiscal consolidation programmes in
ECB Annua l Repor t • 1999122
euro area countries, by providinggovernments with an easy way of meetingtheir borrowing requirements.
The ECB also monitors the NCBs’ secondarymarket purchases of debt instruments issuedboth by the domestic public sector and bythe public sector of other MemberStates. According to Council Regulation (EC)No. 3603/93, the acquisition of public sectordebt instruments in the secondary marketmust not be used to circumvent the objectiveof Article 101 of the Treaty. Such purchases
should not become a form of indirectmonetary financing of the public sector.
Overall, the information provided by the NCBsto the ECB confirms that the provisions ofArticles 101 and 102 of the Treaty and theassociated Council Regulations have generallybeen complied with during the period underreview. Some imperfections and technicalproblems have occurred in the course ofthe transition to new arrangements. Theseinconsistencies are of minor importance andcorrective measures are in hand.
3 Transition to the year 2000
In 1999 the ESCB devoted significant effortand resources to ensuring a smooth transitionto the year 2000. As the year 2000 problemhad its roots in computer technology, mostof the initial work was aimed at achievingyear 2000 compliance for IT systems, with aparticular focus both on the critical systemsneeded to conduct monetary policy and onthe TARGET system.
Testing and remedial activities
An inventory was compiled of all softwareand hardware at the ECB and at each of theNCBs. Where appropriate, systems wereupgraded and year 2000 compliant versionsof software were installed. The ECB and eachof the NCBs were individually responsiblefor carrying out a series of tests on theirinternal systems in order to ascertain thatthe systems correctly recognised dates in2000. In addition to its internal systemcompliance tests, the ECB conducted theinitial testing of the ESCB-wide systemsto the extent that this was possible withina closed environment at the ECB. In thisway, all the individual components of theEurosystem-wide information systems weretested for their year 2000 compliance in thefirst few months of 1999.
Thereafter, a series of bilateral tests wereconducted between the ECB and all the euroarea NCBs, as well as with other non-euroarea NCBs which chose to participate. Thesetests were carried out in a simulated year2000 environment, but using the ESCBproduction infrastructure, in order to testthe continued business functionality of theapplications. During testing, only a very smallnumber of year 2000-related problems wereidentified. In the few cases where non-compliance issues were detected, remedialwork was carried out successfully and by latesummer 1999 all critical ECB and ESCBsystems were deemed to be year 2000compliant.
In line with other year 2000 complianceactivities of the ESCB, TARGET underwentan intensive period of testing. The approachused in the tests was based on the testingprocedure which had proven its worth in thetesting of TARGET before it went intooperation on 4 January 1999. After thesuccessful completion of individual tests ofthe national components and the connectionsto the S.W.I.F.T. FIN service, “cross-system”tests were conducted, in which all the NCBs’and the ECB’s systems ran for a full TARGETbusiness day in a simulated year 2000environment. During this second phase anumber of credit institutions were involvedin the testing of the national real-time gross

123ECB Annua l Repor t • 1999
settlement system in each country. Finally,TARGET’s year 2000 compliance wasdemonstrated on Saturday, 25 September1999. Several hundred credit institutionsproved their ability to carry out operationsfor sending and receiving TARGET cross-border payments in a “dress rehearsal” of afull business day in a simulated year 2000environment. In several countries domesticpayment systems were also tested inco-operation with third parties.
In parallel, tests were carried out on thecorrespondent central banking model, whichis a system used to mobilise collateral acrossborders in order to accommodate the needfor collateral for monetary policy operationsand for payment systems. The testing did notreveal any problems.
As part of its oversight function, the ESCBalso monitored the progress made by otherlarge-value and major EU retail paymentsystems, in particular those which settletheir end-of-day balances in TARGET. Havingintroduced the TARGET year 2000 strategyas the norm, country reporting procedureswere established to verify that all paymentsystems had completed internal testing bythe end of April 1999 and multilateral testingby the end of July 1999.
Once the testing and remedial activities hadbeen completed, the ECB entered into amoratorium, which was in place from1 October 1999 to 1 March 2000, in order toensure that its systems would remain in astable year 2000 compliant status.
Other precautionary measures
With a view to limiting transactions on31 December 1999, and to enable bankinginstitutions to conduct end-of-yearoperations and produce full backups of therelevant systems prior to the transition to2000, on 31 March 1999 the ECB announcedits decision to close TARGET on31 December 1999. In line with this measure,the ECB was also instrumental in bringing
forward legislative initiatives by the EUMember States by proposing a communiqué,as endorsed by the ministers of finance on17 April 1999. The communiqué stated thatMember States should ensure by appropriatemeans that, as on a normal public holiday,the fulfilment of any contractual obligationson the part of credit institutions or otheragents in the financial markets, at least fortransactions in euro, would neither fall duenor be enforceable on 31 December 1999.
In addition to its intensive internal complianceactivities, the ECB also analysed the impactthat the year 2000 transition might have onthe euro area. As a result of this exercise, itconcluded that the monetary and economicimplications of the year 2000 transition wereunlikely to be of relevance to the ECB’smedium-term-oriented monetary policystrategy. The ECB saw no need for the publicto hold higher amounts of banknotes duringthe transition period than would normally bethe case at year-ends; nonetheless, NCBsensured that sufficient stocks of banknoteswere available to meet any extraordinaryprecautionary demand.
Furthermore, the ECB carefully assessed theappropriateness of the monetary policyoperational framework of the Eurosystem forthe year 2000 transition. The Eurosystemannounced in August 1999 that it did not seea need to introduce any systemic changes toits operational framework as a result of thechangeover to the year 2000. Indeed, theoperational framework of the Eurosystemwas, from the outset, designed with a viewto ensuring maximum flexibility in theimplementation of monetary policy and it thusallows for any technical adaptations that maybe considered appropriate. The Eurosystem’soperational framework already had built-inmechanisms designed to accommodate anylevel of liquidity demand from marketparticipants. In view of the above, only aminor technical change was announced on23 September 1999, namely that no new mainrefinancing operation would be initiated inthe first week of 2000, and that no suchoperation would mature during that week,

ECB Annua l Repor t • 1999124
which was made possible by extending thematurity of the last two main refinancingoperations of 1999 to three weeks. Anadditional measure aimed at contributing to asmooth transition to the year 2000 in themoney markets was the increase in theallotment volume for longer-term refinancingoperations from the previous level of€15 billion to €25 billion for the last threelonger-term refinancing operations of 1999.
In addition, existing legal agreements to whichthe ECB was party were reviewed and, wherenecessary, updated to ensure their operabilityin any year 2000 scenario.
Nonetheless, the ECB did not wish to ignorethe potential for unexpected problems toaffect the smooth functioning of its systems.As a precautionary measure, the ECBtherefore reviewed the contingencyprocedures developed for the eurochangeover, in order to ensure their viabilityin the event of any problems arising duringthe transition to the year 2000. It alsoprepared emergency procedures which wouldhave enabled ECB staff to conduct criticalactivities from another location. Fortunately,the ESCB systems entered the year 2000smoothly, and none of the contingency andemergency procedures had to be activated.
Communications infrastructure
The various ESCB Committees devotedsignificant resources to year 2000preparations during 1999. In order toensure the overall consistency of year 2000preparations within the ESCB, the GoverningCouncil established an ESCB Year 2000Co-ordination Committee, consisting of year
2000 co-ordinators from the NCBs. TheCommittee was responsible for co-ordinationamong the ESCB institutions and betweenthe ESCB and international bodies dealingdirectly with year 2000 issues. Its main tasksincluded analysing the feasibility and suitabilityof contingency measures and the proceduresfor activating such measures, as well asdefining ESCB milestones to be monitoredbefore, during and after the transition to theyear 2000.
The ESCB Year 2000 Co-ordinationCommittee formed the core of an efficientcommunications infrastructure between theECB and the NCBs, which was establishedspecifically to monitor developments over theyear 2000 transition period. Through theregular exchange of information concerningthe ESCB’s internal systems andinfrastructures, as well as the euro areafinancial markets, the Committee maintaineda continuous overview of the status of theESCB systems and was in a position to detectany potential problems at a very early stage.The ECB and the NCBs also exchangedinformation with the Joint Year 2000 Councilco-ordinated by the Bank for InternationalSettlements in an effort to help mitigate year2000-related risks beyond the Eurosystem atthe global level. These infrastructures provedto be very efficient.
A significant number of staff members werepresent at the ECB and at the NCBs duringthe year 2000 transition weekend to ensurethat any unforeseen problems could be dealtwith efficiently and effectively. The thoroughpreparations in 1999 were well rewarded, asboth the activities during the transitionweekend and the start of operations on3 January 2000 went very smoothly.

125ECB Annua l Repor t • 1999
4 The administration of the borrowing and lending operations bythe European Community
In accordance with Article 109I (2) of theTreaty and Article 11 of Council Regulation(EEC) No. 1969/88 of 24 June 1988, theECB continued the administration of theborrowing and lending operations concludedby the European Community underthe Medium-Term Financial Assistancemechanism.
In 1999 the ECB received the sums due inrespect of interest on outstanding loans fromthe remaining borrower country (Italy) and paidthem to creditors vis-à-vis the EuropeanCommunity. The total amount of outstandingCommunity lending operations with Italy as at31 December 1998 was €2,483 million. Thisfigure was unchanged as at 31 December 1999.

ECB Annua l Repor t • 1999126

Chapter X
Public information and
accountability

ECB Annua l Repor t • 1999128
1 The ECB’s information policy and its tools
1.1 Communication policy objectives
Using a wide range of communication tools,the ECB aims to keep the general publicinformed about its objectives and tasks andto explain the reasons for its actions. In thisway the ECB contributes to fulfilling the aimsof the Eurosystem’s communication policy,namely to enhance the understanding ofmonetary policy and thus to foster publicacceptance of the Eurosystem’s policies inthe euro area and beyond. Another goal ofthe communication policy is to promoteknowledge and understanding of the way inwhich the ESCB functions.
The ECB is committed to the principles ofopenness, transparency and accountability.With this in mind, it provides variousaudiences with detailed information on itsassessment of developments in the euro areaeconomy and in the financial markets. Thedissemination of information is organisedwith a view to ensuring equal andnon-discriminatory treatment of differentcountries and media. The NCBs in the ESCBplay an important role in achieving the goalsof the ESCB’s communication policy.
Some guidance on the communication policycan be found in the Statute of the ESCB,according to which the ECB must publish areport on the activities of the ESCB at leastonce every quarter. The ECB also has todeliver an annual report on both theseactivities and the monetary policy of theprevious and the current year to theEuropean Parliament, the EU Council, theEuropean Commission and also the EuropeanCouncil. Furthermore, the ECB is obliged topublish a consolidated weekly financialstatement of the Eurosystem.
1.2 Communication tools
In fact, the ECB has committed itself to goingbeyond these requirements. The Presidentand the Vice-President of the ECB explain
the reasons behind the Governing Council’sdecisions in a press conference heldimmediately after the first Governing Councilmeeting each month. The introductorystatement to this press conference is releasedto the press and simultaneously publishedon the internet on the ECB’s website(http://www.ecb.int), and it is also availableon the websites of the NCBs of theEurosystem. This practice has the advantageof presenting the Governing Council’sassessment of the economic situation andexplaining the main considerations underlyingits decisions straight after the meeting.
Further details of the Governing Council’sviews on the economic situation and theoutlook for price developments can be foundin the ECB Monthly Bulletin, which is releasedone week after the first meeting of theGoverning Council each month in all 11official Community languages.
The ECB Monthly Bulletin is intended tobe a valuable tool for observers of the euroarea single monetary policy, be theyfinancial analysts, academic economists orrepresentatives of the media. The circulationof this publication exceeds 80,000 copies perissue, not including the number of times thispublication is accessed from the ECB’swebsite or from the websites of the NCBs.
In addition, the ECB is sponsoring a series ofworking papers, in order to disseminate theresults of research conducted within the ECBto the broader academic and financialcommunities. The subject matter addressedin the working paper series reflects thoseissues of most relevance to the Eurosystem.
A number of reports on topical issues aimedat a professional audience have also beenpublished by the ECB in the period underreview. A comprehensive list of documentspublished by the ECB can be found in anannex to this Annual Report. A completeand systematic collection of all the publishedECB legal instruments is provided in the

129ECB Annua l Repor t • 1999
“Compendium: collection of legalinstruments, June 1998 – May 1999”, whichwas published in October 1999.
The ECB has published a brochure describingthe euro banknotes and coins. The brochureis intended for the general public and isavailable in all 11 official Communitylanguages.
In communications with the general public,however, mass media such as newspapers,magazines, radio and television are veryimportant intermediaries. The Europeanmedia have shown great interest in theEurosystem’s policies and in the outcome ofthe Governing Council’s deliberations. Themembers of the Governing Council haveendeavoured to accommodate this interestby giving a large number of interviews to anumber of media. Public speeches by themembers of the Governing Council have alsogiven rise to numerous articles in theEuropean and indeed the international press.
As well as the full range of publications andpress releases, a large number of speechesby members of the Executive Board areavailable on the ECB’s website. In addition, itcontains background information and a widevariety of statistics on the euro areaeconomy.
Furthermore, the ECB’s website provideslinks to the websites of all the EU NCBs,where much of the material is available in the
respective languages. With the increasing useof the Internet as a communication tool, theimportance of the website for the ECB’scommunication policy is growing all the time.The number of “visits” (one or more pagesaccessed by the same computer during onesession) to the ECB’s website confirms thatthe demand for information through thischannel is considerable. In 1999 this figurefluctuated between 20,000 and 40,000 perweek, with peaks in the weeks in whichpress conferences were held or importantdocuments were published.
An intrinsic feature of this communicationinstrument is the multiplication effectresulting from the distribution of ECBdocuments via other websites. This effect isimpossible to quantify, but should not beunderestimated.
The efforts to describe and explain themonetary policy of the Eurosystem wouldnot be complete without personal contactsbetween the staff of the ECB and opinionleaders and multipliers, such as teachersand students of economics, businessadministration and law, as well as thoseinvolved in other relevant academic fields. Tothis end, groups of visitors are received atthe ECB almost every working daythroughout the year. In 1999 the totalnumber of such visitors exceeded 10,000.Visitors come from all over the world,although naturally with a concentration ofgroups from the EU countries.
2 Accountability
2.1 Central bank independence andaccountability in Economic andMonetary Union
The institutional independence of centralbanks allows monetary policy-makers to focuson safeguarding price stability in a lasting andcredible manner, without being subject toshort-term political considerations. A large
body of theoretical analysis, supported bysubstantial empirical evidence, supports theview that central bank independence leads toan improved design and implementation ofmonetary policy and, therefore, to morestable prices. Consequently, central bankshave been made independent in a largenumber of countries around the world. Thismodel is also reflected in the institutional
ECB Annua l Repor t • 1999130
set-up of the Eurosystem, as laid down in theTreaty. The Treaty stipulates that, whenexercising the powers and carrying out thetasks and duties conferred upon them,neither the ECB nor the 11 euro area NCBs,nor any members of their decision-makingbodies shall seek or take instructions fromCommunity institutions or bodies, from anygovernment of a Member State or from anyother body. Furthermore, the Treaty strictlyrequires that the Community institutions andbodies and the governments of the MemberStates undertake to respect this principle andnot to seek to influence the decision-makingbodies of the ECB or the NCBs in theperformance of their tasks.
To retain democratic legitimacy, anindependent central bank must beaccountable. Therefore, a framework has tobe established which allows the general publicand the competent political bodies to monitorthe policy of the independent institution andto assess whether it is accomplishing the tasksconferred upon it and is acting within thescope of its responsibilities. This, in turn,requires a clear and precise definition of itsmandate. In this way, the decisions andactivities of institutions can be assessedagainst a specific benchmark. Where themandate includes more than one objective, itis essential for these objectives to be clearlyprioritised. Whether or not a task has beenaccomplished must be evaluated by referenceto the observable policy outcome. Theprimary objective of the Eurosystem is tomaintain price stability in the euro area. Thisprimary objective is the ultimate benchmarkagainst which the performance of theEurosystem has to be evaluated. The ECBhas announced a quantitative definition ofprice stability which further specifies, inprecise terms, the yardstick against whichthe Eurosystem’s performance should bemeasured, thereby facilitating accountability.
2.2 The role of the EuropeanParliament in holding the ECB toaccount
Several channels for the practicalimplementation of the ECB’s accountabilityare provided for in the Treaty. As describedabove, the ECB is subject to stringentreporting requirements vis-à-vis the generalpublic and, more specifically, the EuropeanParliament, the EU Council, the EuropeanCommission and also the European Council.
As regards the specific accountability of theECB vis-à-vis the European Parliament, theTreaty stipulates that the President of theECB and other members of the ExecutiveBoard of the ECB may, at the request of theEuropean Parliament or on their owninitiative, be heard by the competentcommittees of the European Parliament.According to the Rules of Procedure of theEuropean Parliament, the President of theECB shall be invited to attend meetings ofthe competent committees at least four timesa year to deliver a statement and answerquestions.
The regular appearances of the Presidentbefore the Committee on Economic andMonetary Affairs can certainly be consideredas one of the cornerstones of the process bywhich the ECB is held to account. In thiscontext, the ECB took note of the decisionof the European Parliament to restructureits internal working procedures and toestablish the Committee on Economic andMonetary Affairs as a full committee in itsown right. When appearing before theCommittee on Economic and MonetaryAffairs, the President of the ECB and othermembers of the Executive Board have theopportunity to explain in detail the ECB’sassessment of current economic andmonetary developments in the context ofthe monetary policy strategy of theEurosystem, which underpins its monetarypolicy decisions, as well as the decisions takenby the ECB in other areas of its competence.

131ECB Annua l Repor t • 1999
The transcripts of these hearings arepublished on the websites of both theEuropean Parliament and the ECB shortlyafter each hearing, in order to make thePresident’s statements and the discussionsduring the question and answer sessions ofthe hearings available to the general public assoon as possible. In 1999 these quarterlyhearings were held on 18 January, 19 April,27 September and 29 November.
Moreover, the Treaty stipulates that thePresident of the ECB shall present an annualreport on the activities of the ESCB and onits monetary policy to the EuropeanParliament, which may hold a general debateon that basis. In line with this provision, on26 October 1999 the President attended theplenary session of the European Parliamentin order to present the ECB’s Annual Report1998.
Furthermore, the European Parliamentinvited members of the Executive Board andstaff of the ECB to participate in additionalhearings on a number of specific issuesincluding, inter alia, the externalrepresentation of the Eurosystem, thepreparation of the euro banknotes andstatistical matters. These hearings provide asupplementary forum in which the ECB canpresent its views and explain the reasoningbehind its opinions. In addition, a closeworking relationship has been establishedbetween the ECB and the EuropeanParliament, which also includes occasionalvisits by members of the Committee onEconomic and Monetary Affairs to the ECB.

ECB Annua l Repor t • 1999132

Chapter XI
The institutional framework
of the Eurosystem
and the European System
of Central Banks

ECB Annua l Repor t • 1999134
1 The Eurosystem and the European System of Central Banks
EUROSYSTEM
EU
RO
PE
AN
SY
ST
EM
OF
CE
NT
RA
LB
AN
KS
(E
SC
B)
European Central Bank (ECB)
Governing Council
Executive Board
Governing Council
Executive Board
Gen
eral
Co
un
cil
Gen
eral
Co
un
cil European Central Bank (ECB)
DanmarksNationalbank
Bank of Greece
Sveriges Riksbank
Bank of England
Nationale Bank van België/Banque Nationale de Belgique
Deutsche Bundesbank
Banco de Espan̄a
Banque de France
Central Bank of Ireland
Banca d’Italia
DanmarksNationalbank
Bank of Greece
Sveriges Riksbank
Bank of England
Nationale Bank van België/Banque Nationale de Belgique
Deutsche Bundesbank
Banco de Espan̄a
Banque de France
Central Bank of Ireland
Banca d’Italia
Banque centrale duLuxembourg
De Nederlandsche Bank
Oesterreichische Nationalbank
Banco de Portugal
Suomen Pankki
Banque centrale duLuxembourg
De Nederlandsche Bank
Oesterreichische Nationalbank
Banco de Portugal
Suomen Pankki
The European System of Central Banks(ESCB) is composed of the European CentralBank (ECB) and the national central banks(NCBs) of all 15 EU Member States, i.e. itincludes the four NCBs of the Member Stateswhich have not yet adopted the euro. Inorder to enhance transparency and facilitateunderstanding of the structure of centralbanking in the EU, the term “Eurosystem”has been adopted by the Governing Councilof the ECB. The Eurosystem comprises theECB and the NCBs of the Member Stateswhich have adopted the euro. As long asthere are Member States which have not yetadopted the euro, it will be necessary tomake a distinction between the Eurosystemand the ESCB.
The ECB has legal personality under publicinternational law. It has been established asthe core of the Eurosystem and ensures thatthe tasks of the Eurosystem are carried outeither through its own activities or via the
NCBs. In taking its decisions on the way inwhich the tasks of the ESCB should be carriedout, the ECB is committed to the principleof decentralisation in accordance with theStatute of the ESCB.
Each of the NCBs has legal personalityaccording to the national law of its respectivecountry. Despite having separate legalpersonality, the euro area NCBs form anintegral part of the Eurosystem. As such,NCBs carry out the tasks conferred uponthe Eurosystem in accordance with therules established by the ECB. Inter alia,through the participation of their respectiverepresentatives in the various ESCBCommittees (see Section 4 below), the NCBsalso contribute to the work of the ESCB.The NCBs may perform non-Eurosystemfunctions on their own responsibility, unlessthe Governing Council finds that suchfunctions interfere with the objectives andtasks of the Eurosystem.

135ECB Annua l Repor t • 1999
2 The decision-making bodies of the ECB
1 The Rules of Procedure have been published in the OfficialJournal of the European Communities, see Rules of Procedureof the European Central Bank, OJ L 125, 19.5.1999, p. 34;Rules of Procedure of the General Council of the ECB, OJ L 75,20.3.1999, p. 36 and L 156, 23.6.1999, p. 52; Decision of theEuropean Central Bank of 12 October 1999 concerning theRules of Procedure of the Executive Board of the EuropeanCentral Bank (ECB/1999/7), OJ L 314, 8.12.1999, p. 34. Withthe exception of the latter, they have been reproduced in theECB’s first legal yearbook “Compendium: Collection of legalinstruments, June 1998 – May 1999”, October 1999.
The Eurosystem and the ESCB are governedby the decision-making bodies of the ECB:the Governing Council and the ExecutiveBoard. Without prejudice to this, theGeneral Council is constituted as a thirddecision-making body of the ECB, if and foras long as there are Member States whichhave not yet adopted the euro as theircurrency. The functioning of the decision-making bodies is governed by the Treatyestablishing the European Community(Treaty), the Statute of the ESCB and therelevant Rules of Procedure.1 While decisionsrelating to the objectives and tasks ofthe Eurosystem/ESCB are taken centrally,operations in the euro area are decentralisedand are carried out by the NCBs to theextent deemed appropriate and possible.
2.1 The Governing Council
The Governing Council, which is the supremedecision-making body of the ECB, comprisesall the members of the Executive Board andthe governors of the NCBs of the MemberStates which have adopted the euro.According to the Treaty, the mainresponsibilities of the Governing Council are:
• to adopt the guidelines and take thedecisions necessary to ensure theperformance of the tasks entrusted to theESCB; and
• to formulate the monetary policy of theeuro area, including, as appropriate,
decisions relating to intermediatemonetary objectives, key interest rates andthe supply of reserves in the Eurosystem,and to establish the necessary guidelinesfor their implementation.
When taking decisions on monetary policyand on other tasks of the Eurosystem, themembers of the Governing Council do notact as national representatives, but in afully independent personal capacity. This isreflected in the principle of “one person, onevote”.
In 1999 the Governing Council met, as arule, every other week at the ECB’s premisesin Frankfurt am Main. However, two ofthese meetings were held by means ofteleconferencing. Moreover, the GoverningCouncil decided to meet twice a year inanother euro area country as of 2000. In2000 one meeting will be hosted by the Bancode España in Madrid and one by the Banquede France in Paris.

ECB Annua l Repor t • 1999136
Back row (left to right): Luis Ángel Rojo, Guy Quaden, Tommaso Padoa-Schioppa, Jean-Claude Trichet, Klaus Liebscher,Antonio Fazio, Yves Mersch, Maurice O’Connell, Vítor Manuel Ribeiro Constâncio, Nout Wellink, Matti Vanhala, Ernst Welteke,
Eugenio Domingo SolansFront row (left to right): Otmar Issing, Christian Noyer, Willem F. Duisenberg, Sirkka Hämäläinen
Willem F. Duisenberg President of the ECBChristian Noyer Vice-President of the ECBVítor Manuel Ribeiro Constâncio Governor of the Banco de Portugal
(as of 23 February 2000)Eugenio Domingo Solans Member of the Executive Board of the ECBAntonio Fazio Governor of the Banca d’ItaliaSirkka Hämäläinen Member of the Executive Board of the ECBOtmar Issing Member of the Executive Board of the ECBKlaus Liebscher Governor of the Oesterreichische NationalbankYves Mersch Governor of the Banque centrale du LuxembourgMaurice O’Connell Governor of the Central Bank of IrelandTommaso Padoa-Schioppa Member of the Executive Board of the ECBGuy Quaden (as of 1 March 1999) Governor of the Nationale Bank van België/
Banque Nationale de BelgiqueLuis Ángel Rojo Governor of the Banco de EspañaAntónio José Fernandes de Sousa Governor of the Banco de Portugal
(until 22 February 2000)Hans Tietmeyer (until 31 August 1999) President of the Deutsche BundesbankJean-Claude Trichet Governor of the Banque de FranceMatti Vanhala Governor of Suomen PankkiAlfons Verplaetse Governor of the Nationale Bank van België/
(until 28 February 1999) Banque Nationale de BelgiqueNout Wellink President of De Nederlandsche BankErnst Welteke (as of 1 September 1999) President of the Deutsche Bundesbank
The Governing Council

137ECB Annua l Repor t • 1999
Back row (left to right): Tommaso Padoa-Schioppa, Otmar Issing, Sirkka Hämäläinen, Eugenio Domingo SolansFront row: Christian Noyer, Willem F. Duisenberg
Willem F. Duisenberg President of the ECB
Christian Noyer Vice-President of the ECB
Eugenio Domingo Solans Member of the Executive Board of the ECB
Sirkka Hämäläinen Member of the Executive Board of the ECB
Otmar Issing Member of the Executive Board of the ECB
Tommaso Padoa-Schioppa Member of the Executive Board of the ECB
2.2 The Executive Board
The Executive Board comprises the President,the Vice-President and four other members,appointed by common accord of thegovernments of the participating MemberStates at the level of the Heads of State orGovernment. The main responsibilities of theExecutive Board are:
• to prepare the meetings of the GoverningCouncil;
• to implement monetary policy inaccordance with the guidelines anddecisions laid down by the Governing
Council and, in doing so, to give thenecessary instructions to the EurosystemNCBs;
• to be responsible for the current businessof the ECB; and
• to assume certain powers delegated to itby the Governing Council, including thoseof a regulatory nature.
Current practice is for the Executive Boardto meet at least once a week in order todecide on, inter alia, the allotment volumefor the main refinancing operations of theEurosystem.

ECB Annua l Repor t • 1999138
2.3 The General Council
The General Council is composed of thePresident and the Vice-President of the ECBand the governors of all 15 NCBs, i.e. ofboth participating and non-participatingMember States. It carries out those taskstaken over from the European MonetaryInstitute which, on account of the fact thatthe Member States have not all adopted theeuro, still have to be performed by the ECBin Stage Three of Economic and MonetaryUnion. Therefore, the General Council isprimarily responsible for reporting on theprogress made towards convergence by thenon-participating Member States2 and forgiving advice on the necessary preparations
for irrevocably fixing the exchange rates ofthe currencies of those Member States (seeChapter III). Moreover, the General Councilcontributes to particular activities of theESCB, such as the advisory functions (seeChapter IX) and the collection of statisticalinformation (see Chapter VIII). In 1999 theGeneral Council met every three months inFrankfurt.
2 In accordance with the Protocol on certain provisions relating tothe United Kingdom of Great Britain and Northern Ireland andthe Protocol on certain provisions relating to Denmark, both ofwhich are annexed to the Treaty, this reporting shall be carriedout for the United Kingdom and Denmark only if they decide toadopt the euro.

139ECB Annua l Repor t • 1999
Back row (left to right): Yves Mersch, Urban Bäckström, Nout Wellink, Jean-Claude Trichet, Maurice O’Connell,Lucas D. Papademos, Klaus Liebscher, Matti Vanhala, Vítor Manuel Ribeiro Constâncio, Luis Ángel Rojo, Ernst Welteke,
Edward A. J. George, Guy QuadenFront row (left to right): Antonio Fazio, Christian Noyer, Willem F. Duisenberg, Bodil Nyboe Andersen
Willem F. Duisenberg President of the ECBChristian Noyer Vice-President of the ECBBodil Nyboe Andersen Governor of Danmarks NationalbankUrban Bäckström Governor of Sveriges RiksbankVítor Manuel Ribeiro Constâncio Governor of the Banco de Portugal
(as of 23 February 2000)Antonio Fazio Governor of the Banca d’ItaliaEdward A. J. George Governor of the Bank of EnglandKlaus Liebscher Governor of the Oesterreichische NationalbankYves Mersch Governor of the Banque centrale du LuxembourgMaurice O’Connell Governor of the Central Bank of IrelandLucas D. Papademos Governor of the Bank of GreeceGuy Quaden (as of 1 March 1999) Governor of the Nationale Bank van België/
Banque Nationale de BelgiqueLuis Ángel Rojo Governor of the Banco de EspañaAntónio José Fernandes de Sousa Governor of the Banco de Portugal
(until 22 February 2000)Hans Tietmeyer (until 31 August 1999) President of the Deutsche BundesbankJean-Claude Trichet Governor of the Banque de FranceMatti Vanhala Governor of Suomen PankkiAlfons Verplaetse Governor of the Nationale Bank van België/
(until 28 February 1999) Banque Nationale de BelgiqueNout Wellink President of De Nederlandsche BankErnst Welteke (as of 1 September 1999) President of the Deutsche Bundesbank
The General Council

ECB Annua l Repor t • 1999140
3 See the Decision of the European Central Bank of7 October 1999 on fraud prevention (ECB/1999/5),OJ L 291, 13.11.1999, p. 36. In connection with this, theRules of Procedure of the European Central Bank wereamended by a new Article 9a, see OJ L 314, 8.12.1999,p. 32.
4 See the Decision of the European Central Bank of16 November 1999 appointing the members of theAnti-Fraud Committee of the European Central Bank(ECB/1999/8), OJ L 299, 20.11.1999, p. 40.
5 “Office européen de lutte antifraude”.
3 The organisation of the ECB
3.1 Corporate governance
Ever since the establishment of the ECB thefinancial interests of the shareholders of theECB have been protected and monitoredboth by the external auditors in accordancewith Article 27.1 of the Statute of the ESCBand, with regard to specific aspects, by theEuropean Court of Auditors in accordancewith Article 27.2 of the Statute of the ESCB.Moreover, the ECB has its own internal auditand control procedures, which follow thegeneral rules relating to the controlstructures of private financial and creditinstitutions. The Directorate Internal Auditcontinuously assesses the ECB’s efficiency andinternal control functions. The Directorateis involved in reviewing the reliabilityand integrity of financial information. Inaddition, the Internal Auditors Committee(see Section 4) ensures EU-wide co-operationamong the ESCB’s internal audit functions, byjointly defining audit programmes and auditstandards to be used in a decentralisedmanner for the review of ESCB-widecommon infrastructures. The budgetaryauthority of the ECB is vested in theGoverning Council, which adopts the budgetof the ECB, acting on a proposal put forwardby the Executive Board. In addition, theBudget Committee assists the GoverningCouncil in matters related to the ECB’sbudget. It is worth mentioning that, amongthe set of internal controls, the ECB also hasinternal rules to prevent the abuse of sensitivefinancial market information (“insider tradingrules” and “Chinese walls”).
In this respect, the ECB shares the concernsof the European Parliament, the EU Counciland the European Commission with regardto the need to combat fraud and has joinedthe Community initiative against fraud. On7 October 1999 an Anti-Fraud Committee wasestablished to enforce an anti-fraud schemewithin the ECB.3 The Anti-Fraud Committeeis composed of three independent persons ofrecognised standing and professionalexperience in the fields of central banking,
justice and policing, and fraud preventionand detection, all of whom were appointedby the Governing Council, namely:John L. Murray, Judge of the Supreme Courtof Ireland, Erik Ernst Nordholt, adviser tothe Minister for the Interior of theNetherlands and former Commissionerof the Amsterdam Police Force, andMaria Schaumayer, Governor of theOesterreichische Nationalbank from 1990 to1995. The members of the Anti-FraudCommittee took up their functions with effectfrom 1 January 2000.4 In response to theconclusions of the Cologne European Councilin June 1999, a co-operative relationship willbe established with the European Anti-FraudOffice (OLAF5). Within the ECB, theDirectorate Internal Audit is entrusted withthe task of performing all investigationsrelating to fraud prevention and detectionand, for this purpose, reports directly to theAnti-Fraud Committee.
3.2 Staff developments
At the end of 1999 the number of staffemployed by the ECB from all 15 MemberStates stood at 732. This compares with534 staff at the end of 1998. On 2 December1999 the Governing Council approved theECB’s budget for 2000, which envisagesbringing the ECB’s staff to slightly over 1,000in the course of the year. As a consequence,the Executive Board decided on a numberof organisational adjustments aimed atreinforcing the ECB’s managerial structure,which are reflected in the revisedorganisational chart of the ECB which tookeffect as of 4 January 2000.

141ECB Annua l Repor t • 1999
ECB Executive BoardPresident Willem F. Duisenberg
DirectorateExternal Relations
M. J. Körber
DirectorateSecretariat and
Language Services F. Moss
DirectorateInternal Audit*M. Caparello
Counsel to theExecutive BoardCo-ordinator:L. Hoogduin
DivisionOfficial Publications,Archives and Library
DivisionSecretariat
DivisionPress
Division Language Services
Division ESCB Audit
Division ECB Audit
DivisionProtocol and Conferences
ECB Executive BoardVice-President Christian Noyer
DirectorateInternal Finance
I. Ingram
DirectoratePersonnel
B. van Baak
DivisionFinancial Law
DivisionDivisionAccounting
DivisionFinancial Reporting
and Policy
DivisionPremises
T. Rinderspracher
DivisionPremises
PersonnelDevelopment
DivisionPersonnel Policy
Directorate GeneralAdministration and Personnel
H. K. Scheller
Directorate GeneralLegal Services
A. Sáinz de Vicuña
DivisionInstitutional Law
DivisionMiddle Office
ECB Executive BoardEugenio Domingo Solans
DivisionBalance of PaymentsStatistics and External
Reserves
DivisionIT Business
Development
DivisionIT Operations andCustomer Service
Directorate GeneralInformation Systems
J. Etherington
Directorate GeneralStatisticsP. Bull
DivisionGeneral Economic and
Financial Statistics
DivisionMoney and Banking
Statistics
DirectorateControlling
and OrganisationK. Gressenbauer
Division
DivisionPortfolio
Management Systems
DivisionOwn Funds
Management
Back Office
Division DivisionBudget and Projects
DivisionOrganisational Planning
Front Office
DivisionOperations Analysis
Directorate GeneralOperationsF. Papadia
DirectorateBanknotes
A. Heinonen
ECB Executive BoardOtmar Issing
Directorate GeneralResearchV. Gaspar
Adviser
DivisionEconometric
Modelling
DivisionGeneral Economic
Research
ECB Executive BoardTommaso Padoa-Schioppa
DivisionPayment Systems
PolicyDivision
International Relations
DivisionEuropean Relations
DivisionBilateral Relations
Directorate GeneralInternational and
European RelationsP. Van der Haegen
DivisionTARGET and Payment
Processing
DivisionSecurities Settlement
Systems Policy
Directorate GeneralPayment SystemsJ.-M. Godeffroy
DivisionPrudential Supervision
DivisionIT Infrastructure
and Systems Support
DivisionIS Security
DivisionIT Planning andMajor Projects
DivisionDedicated IT
Application Support
DivisionOffice Services
and Security
DivisionStatistical
Information Systems
DirectorateMonetary PolicyH.-J. Klöckers
DirectorateEconomic
DevelopmentsW. Schill
Division Monetary Policy
Strategy
Division Euro Area
MacroeconomicDevelopments
Division Monetary Policy Stance
DivisionEU Countries
Division Capital Markets andFinancial Structure
Division External
Developments
ECB PermanentRepresentation inWashington, D.C.
G. Grisse
ECB Executive BoardSirkka Hämäläinen
Directorate GeneralEconomics
G. J. Hogeweg
Division Fiscal Policies
3.3 The organisational chart of the ECB
* Within the Directorate Internal Audit an Anti-Fraud Unit has been set up, which will report via the Director Internal Audit to theAnti-Fraud Committee established pursuant to the Decision of the European Central Bank on fraud prevention (ECB/1999/5) of7 October 1999.

ECB Annua l Repor t • 1999142
4 ESCB Committees
The ESCB Committees have continued toplay an important role in the performance ofthe tasks of the Eurosystem/ESCB. At therequest of both the Governing Council andthe Executive Board, they have providedexpertise in their fields of competence andhave facilitated the decision-making process.The ESCB Committees are composed ofrepresentatives of the Eurosystem centralbanks and, where appropriate, of othercompetent bodies, such as nationalsupervisory authorities in the case of theBanking Supervisory Committee. The NCBsof the non-participating Member States have
each also appointed a representative to takepart in the meetings of an ESCB Committeewhenever it deals with matters which fallwithin the field of competence of the GeneralCouncil. At present there are 13 ESCBCommittees, 12 of which were establishedunder Article 9 of the Rules of Procedure ofthe European Central Bank. However, theBudget Committee, which assists theGoverning Council in matters related to theECB’s budget, was established in accordancewith Article 15 of the Rules of Procedure ofthe European Central Bank.
ESCB Committees and their chairpersons
Statistics Committee(STC)
Peter Bull
Payment and Settlement Systems Committee(PSSC)
Jean-Michel Godeffroy
Monetary Policy Committee(MPC)
Gert Jan Hogeweg
Market Operations Committee(MOC)
Francesco Papadia
Legal Committee(LEGCO)
Antonio Sáinz de Vicuña
International Relations Committee(IRC)
Hervé Hannoun
Internal Auditors Committee(IAC)
Michèle Caparello
Information Technology Committee(ITC)
Jim Etherington
External Communications Committee(ECCO)
Manfred J. Körber
Budget Committee(BUCOM)
Liam Barron
Banknote Committee(BANCO)
Antti Heinonen
Banking Supervision Committee(BSC)
Edgar Meister
Accounting and Monetary Income Committee(AMICO)
Hanspeter K. Scheller

143ECB Annua l Repor t • 1999

ECB Annua l Repor t • 1999144

Annua l Accounts
o f the ECB
and Conso l idated Ba lance Sheet
o f the Eurosystem
19 9 9
Chapter XII

ECB Annua l Repor t • 1999146
Balance Sheet as at 31 December 1999
Assets Note 1999 1998number € €
1 Gold and gold receivables 1 6,956,995,273 0
2 Claims on non-euro area residentsdenominated in foreign currency 2
Balances with banks and securityinvestments, external loans and otherexternal assets 41,923,041,208 343,047,341
3 Claims on euro area residentsdenominated in foreign currency 2
Claims on financial sector counterparties 2,595,090,860 0
4 Claims on non-euro area residentsdenominated in euro 3
Balances with banks, securityinvestments and loans 3,002,567,659 3,739,796,108
5 Securities of euro area residentsdenominated in euro 4 3,537,141,285 0
6 Other assets6.1 Tangible and intangible fixed assets 5.1 42,589,467 30,112,0716.2 Other financial assets 5.2 641,807,406 25,276,9536.3 Accruals and deferred expenditure 5.3 777,032,332 553,5826.4 Sundry items 5.4 6,774,149 3,458,140
1,468,203,354 59,400,746
7 Loss for the year 247,281,223 0
Total assets 59,730,320,862 4,142,244,195
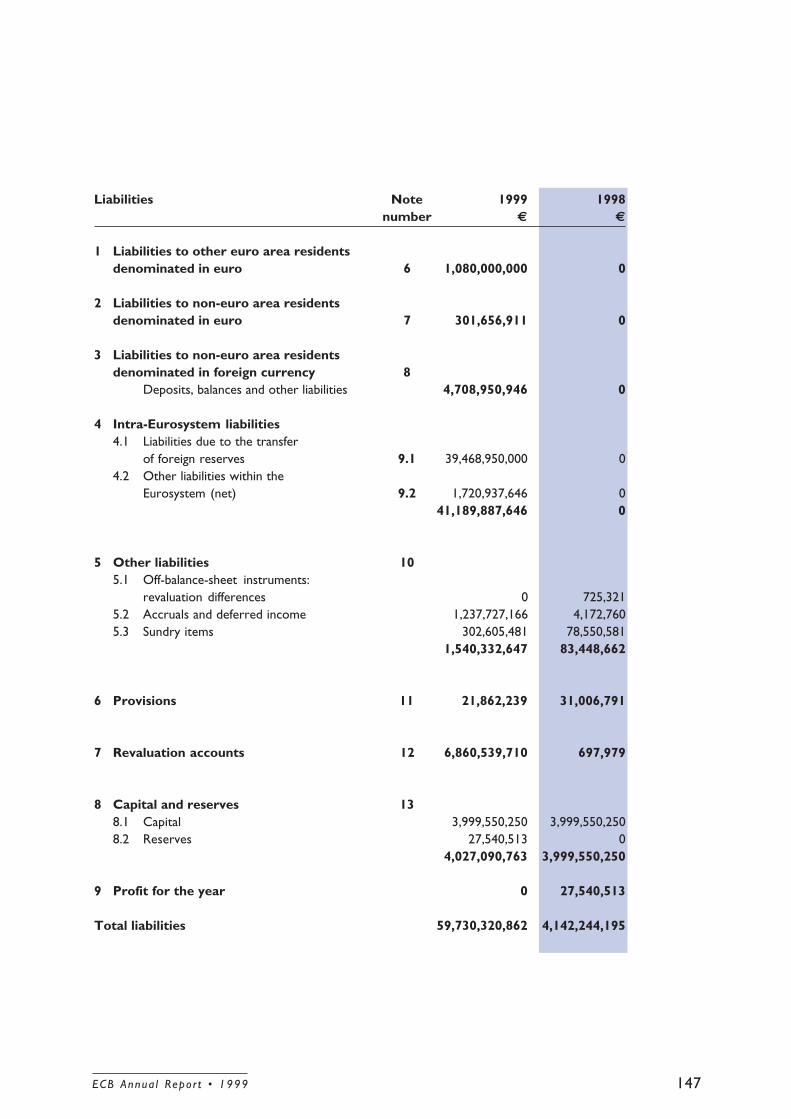
147ECB Annua l Repor t • 1999
Liabilities Note 1999 1998number € €
1 Liabilities to other euro area residentsdenominated in euro 6 1,080,000,000 0
2 Liabilities to non-euro area residentsdenominated in euro 7 301,656,911 0
3 Liabilities to non-euro area residentsdenominated in foreign currency 8
Deposits, balances and other liabilities 4,708,950,946 0
4 Intra-Eurosystem liabilities4.1 Liabilities due to the transfer
of foreign reserves 9.1 39,468,950,000 04.2 Other liabilities within the
Eurosystem (net) 9.2 1,720,937,646 041,189,887,646 0
5 Other liabilities 105.1 Off-balance-sheet instruments:
revaluation differences 0 725,3215.2 Accruals and deferred income 1,237,727,166 4,172,7605.3 Sundry items 302,605,481 78,550,581
1,540,332,647 83,448,662
6 Provisions 11 21,862,239 31,006,791
7 Revaluation accounts 12 6,860,539,710 697,979
8 Capital and reserves 138.1 Capital 3,999,550,250 3,999,550,2508.2 Reserves 27,540,513 0
4,027,090,763 3,999,550,250
9 Profit for the year 0 27,540,513
Total liabilities 59,730,320,862 4,142,244,195

ECB Annua l Repor t • 1999148
Profit and Loss Account for the year ending 31 December 1999
Note 1999 1998number (7 months)
€ €
Interest income 4,872,234,880 97,851,703Interest expenses (4,118,082,387) (2,683,980)
Net interest income 1 754,152,493 95,167,723
Realised gains/losses arising from financial operations 2 (264,942,584) 22,182,536
Write-downs on financial assets and positions 3 (604,920,383) (22,249,604)
Net result of financial operations, write-downsand risk provisions (115,710,474) 95,100,655
Income from fees and commissions 593,902 0Expenses relating to fees and commissions (361,702) 0
Net income from fees and commissions 4 232,200 0
Other income 5 436,898 490,101
Total net income (115,041,376) 95,590,756
Staff costs 6 & 7 (61,022,091) (29,744,540)Administrative expenses 8 (60,748,855) (30,229,686)Depreciation of tangible and intangible fixed assets (10,468,901) (8,076,017)
(Loss)/Profit for the year (247,281,223) 27,540,513
Frankfurt am Main, 29 February 2000
EUROPEAN CENTRAL BANK
Willem F. DuisenbergPresident
149ECB Annua l Repor t • 1999
Accounting policies1
Form and presentation of the financialstatements
The financial statements of the EuropeanCentral Bank (ECB) have been designed topresent fairly the financial position of the ECBand the results of its operations. They havebeen drawn up in accordance with the followingaccounting policies, which the GoverningCouncil of the ECB considers to be appropriateto the function of a central bank. Thesepolicies are consistent with the provisions ofArticle 26.4 of the Statute of the ESCB, whichrequire a standardised approach to the rulesgoverning the accounting and reportingoperations of the Eurosystem.
Accounting principles
The following accounting principles have beenapplied:• economic reality and transparency;• prudence;• recognition of post-balance-sheet events;• materiality;• the accruals principle;• a going concern basis;• consistency and comparability.
Basis of accounting
The accounts have been prepared on a historicalcost basis, modified to include market valuationof marketable securities, gold and all otheron-balance-sheet and off-balance-sheet assetsand liabilities denominated in foreign currency.Transactions in financial assets and liabilities arereflected in the accounts on the basis of thedate on which they are settled.
Gold, foreign currency assets andliabilities
Assets and liabilities denominated in foreigncurrency are converted into euro at theexchange rate prevailing on the balance sheet
date. Income and expenses are converted atthe exchange rate prevailing at the time of thetransaction. The revaluation of foreign exchangeassets and liabilities is performed on a currency-by-currency basis, including on-balance-sheetand off-balance-sheet instruments.
Revaluation to the market price for assetsand liabilities denominated in foreign currencyis treated separately from the exchange raterevaluation.
No distinction is made between the priceand currency revaluation differences for gold.Instead a single gold valuation is accountedfor on the basis of the price in euro per fineounce of gold, which is derived from theexchange rate of the euro against the USdollar on 30 December 1999.
Securities
All marketable debt securities and similar assetsare valued at the mid-market prices prevailingat the balance sheet date. For the year endingon 31 December 1999, mid-market prices on29 December 1999 were used. Non-marketablesecurities are valued at cost.
Repurchase agreements
Repurchase agreements are recorded in thebalance sheet as collateralised inwarddeposits. The balance sheet shows thedeposits and the value of the securities usedas collateral. Securities sold under this typeof agreement remain on the balance sheet ofthe ECB and are treated as if they hadremained part of the portfolio from whichthey were sold. Agreements involvingsecurities denominated in foreign currencyhave no effect on the average cost of thecurrency position.
1 The detailed accounting policies of the ECB are laid down in aDecision of the Governing Council of the ECB of1 December 1998 (ECB/1998/NP23), which is available onrequest.
ECB Annua l Repor t • 1999150
Reverse repurchase agreements are recordedas collateralised loans on the assets side ofthe balance sheet, for the value of the loan.Securities acquired under this type ofagreement are not revalued.
Income recognition
Income and expenses are recognised in theperiod in which they are earned or incurred.
Realised gains and losses are taken to theprofit and loss account. An average costmethod is used on a daily basis to calculatethe acquisition cost of individual items. In theevent of an unrealised loss on any item at theyear-end, the average cost of that item isreduced in line with the end-of-year exchangerate and/or market price.
Unrealised gains are not recognised asincome, but are transferred directly to arevaluation account.
Unrealised losses are taken to theprofit and loss account if they exceedprevious revaluation gains registered inthe corresponding revaluation account.Unrealised losses in any one security orcurrency or in gold are not netted againstunrealised gains in other securities orcurrencies.
Premiums or discounts arising on purchasedsecurities are calculated and presented aspart of interest income and are amortisedover the remaining life of the assets.
Off-balance-sheet instruments
Currency instruments, namely foreignexchange forward transactions, forwardlegs of foreign exchange swaps and othercurrency instruments involving an exchangeof one currency for another at a future date,are included in the net foreign currencyposition for the purpose of calculating foreignexchange gains and losses. Interest rateinstruments are revalued on an item-by-item
basis and treated in a similar manner tosecurities. Profits and losses arising from off-balance-sheet instruments are recognised andtreated in a similar manner to profitsand losses relating to on-balance-sheetinstruments.
Post-balance-sheet events
Assets and liabilities are adjusted for eventsthat occur between the annual balance sheetdate and the date on which the GoverningCouncil of the ECB approves the financialstatements if such events materially affectthe condition of assets and liabilities at thebalance sheet date.
Intra-Eurosystem balances
Intra-Eurosystem balances (except for thecapital of the ECB and positions resultingfrom the transfer of foreign reserve assetsto the ECB) are presented in the balancesheet of the ECB as a net position.
Treatment of tangible and intangiblefixed assets
Tangible and intangible fixed assets arevalued at cost less depreciation. Depreciationis calculated on a straight-line basis, beginningin the quarter after acquisition and continuingover the expected economic lifetime of theasset, namely:
• computers, related hardware and software,and motor vehicles: four years;
• equipment, furniture and plant in building:ten years.
Fixed assets costing less than €10,000 arewritten off in the year of purchase.

151ECB Annua l Repor t • 1999
ECB’s retirement plan
The ECB operates a defined contributionpension scheme. The assets of the plan, whichexist solely for the purpose of providingbenefits for members of the plan and theirdependants, are included in the other assetsof the ECB and are identified separately.Valuation gains and losses arising on theassets of the pension fund are recognised asincome and expenditure of the retirementplan in the year in which they arise. Thebenefits payable from the core benefitaccount, resulting from the contributions ofthe ECB, have minimum guaranteesunderpinning the defined contributionbenefits.
Other issues
Having regard to the role of the ECB as acentral bank, the Executive Board of the ECBis of the opinion that the publication of acash flow statement will not provide thereaders of the financial statements with anyadditional relevant information.
In accordance with Article 27 of the Statuteof the ESCB, and on the basis of arecommendation of the Governing Councilof the ECB, the Council of the EuropeanUnion approved the appointment ofPricewaterhouseCoopers GmbH as theexternal auditors of the ECB.

ECB Annua l Repor t • 1999152
Notes on the Balance Sheet
1 Gold and gold receivables
The ECB holds 24 million ounces of finegold. This gold was transferred to the ECB atthe beginning of 1999 at its then currentmarket value of €246.368 per fine ounce, aspart of the foreign reserve assets transferredto the ECB by the NCBs, and represented15% of the initial value of these assets.
2 Claims on non-euro area and euroarea residents denominated inforeign currency
These claims consist of balances with foreignbanks, loans denominated in foreign currencyand investments in securities, denominatedmainly in US dollars and Japanese yen.
3 Claims on non-euro area residentsdenominated in euro
These claims principally represent balanceswith non-participating NCBs arising fromtransactions processed via the TARGETsystem.
4 Securities of euro area residentsdenominated in euro
These securities comprise marketable debtissued by specific euro area issuers with ahigh level of credit quality.
5 Other assets
5.1 Tangible and intangible fixed assets
Net of cumulative depreciation totalling€29.1 million (including depreciation duringthe lifetime of the EMI), tangible fixedassets comprised the following main items on31 December 1999:
5.2 Other financial assets
The principal components of this item are asfollows:
(a) The counterpart of repurchase operationsmade in connection with the investmentof the ECB’s own funds. As at31 December 1999 repurchase contractsof €565.7 million were outstanding.
(b) The investment portfolios relating to theECB pension fund, which are valued at€32.2 million. The assets held representthe investments of accumulated pensioncontributions by the ECB and the staff ofthe ECB as at 31 December 1999, andare managed by an external fund manager.The regular contributions of the ECBand members of the plan have beeninvested on a monthly basis. The assetsof the plan are not fungible with otherfinancial assets of the ECB, and netincome thereon does not constituteincome of the ECB, but is reinvested inthe funds concerned, pending payment ofbenefits. The value of the assets held bythe plan is based on a valuation by theexternal fund manager, using year-endmarket prices.
(c) Following an invitation by the Board ofDirectors of the Bank for InternationalSettlements for the ECB to become amember, on 9 December 1999 the ECBpurchased 3,000 shares in the Bank forInternational Settlements at a cost of€38.5 million.
Net book value Net book valueat 31 December at 31 December
1999 1998€ €
Computers 15,865,660 12,510,812
Equipment, furniture,plant in building andmotor vehicles 5,955,720 3,329,884
Assets under construction 12,989,835 11,864,257
Other fixed assets 7,778,252 2,407,118
Total 42,589,467 30,112,071

153ECB Annua l Repor t • 1999
5.3 Accruals and deferred expenditure
The principal component of this item isaccrued interest on securities and otherfinancial assets.
5.4 Sundry items
This position consists mainly of a claim againstthe German Federal Ministry of Finance inrespect of recoverable value added and otherindirect taxes paid. Such taxes are refundableunder the terms of Article 3 of the Protocolconcerning the privileges and immunities ofthe European Communities, which applies tothe ECB by virtue of Article 40 of the Statuteof the ESCB.
6 Liabilities to other euro arearesidents denominated in euro
This item comprises deposits by members ofthe Euro Banking Association (EBA), whichare used in order to provide the ECB withcollateral in respect of the EBA paymentssettled through the TARGET system.
7 Liabilities to non-euro arearesidents denominated in euro
These liabilities principally represent thebalance with one non-participating NCBarising from transactions via the TARGETsystem.
8 Liabilities to non-euro arearesidents denominated in foreigncurrency
Liabilities arising from repurchase agreementsin connection with the management of theforeign currency reserves of the ECB areshown under this heading.
9 Intra-Eurosystem liabilities
9.1 Liabilities equivalent to the transfer offoreign reserves
At the start of Stage Three of EMU,the NCBs of the participating countriestransferred foreign reserve assets to the ECBin accordance with Article 30 of the Statuteof the ESCB and a decision of the GoverningCouncil of the ECB which gave effect to thatArticle. Amounts equivalent to €39.5 billionwere transferred between 4 and 7 January1999 in the form of gold, cash and securities.The currency component (which amountedto 85% of the total value of the transfer)comprised 90% US dollars and 10% Japaneseyen.
Capital key(%) €
Nationale Bank van België/Banque Nationale de Belgique 2.8658 1,432,900,000
Deutsche Bundesbank 24.4935 12,246,750,000
Banco de España 8.8935 4,446,750,000
Banque de France 16.8337 8,416,850,000
Central Bank of Ireland 0.8496 424,800,000
Banca d’Italia 14.8950 7,447,500,000
Banque centrale du Luxembourg 0.1492 74,600,000
De Nederlandsche Bank 4.2780 2,139,000,000
Oesterreichische Nationalbank 2.3594 1,179,700,000
Banco de Portugal 1.9232 961,600,000
Suomen Pankki 1.3970 698,500,000
Total 78.9379 39,468,950,000
The resulting claims of the NCBs aredenominated in euro and remunerated atthe short-term refinancing rates of theEurosystem, adjusted to reflect a zero returnon the gold component (see “Notes on theprofit and loss account”, Note 1). During thefirst three years of Stage Three of EMU, andfollowing a decision of the Governing Council,these claims are subject to a waiver in theevent that the ECB has insufficient net incomeand reserves to cover unrealised lossescaused by falls in the exchange rates relatingto the foreign reserve assets held. Any

ECB Annua l Repor t • 1999154
amounts to be waived may not reduce theliability to below 80% of its original value.
9.2 Other liabilities within the Eurosystem(net)
This item consists mainly of the TARGETbalances of the participating NCBs vis-à-visthe ECB, as follows:
13 Capital and reserves
The fully paid-up subscriptions of theeuro area NCBs to the capital of the ECBof €5 billion amount to a total of€3,946,895,000, as shown below:
€
Due from participating central banksin respect of TARGET 7,697,803,922
Due to participating central banksin respect of TARGET (9,418,628,635)
Net position (1,720,824,713)
10 Other liabilities
The principal item under the sub-heading“sundry items” comprises repurchase operationsmade in connection with the investment ofthe ECB’s own funds. The ECB’s liabilities inrespect of the pension fund (€32.2 million) arealso shown under this sub-heading.
11 Provisions
This item consists mainly of administrativeprovisions relating to expenditure on goodsand services.
12 Revaluation accounts
These accounts represent revaluationreserves arising from unrealised gains onassets and liabilities, primarily owing toincreases in exchange rates against the euroduring the course of 1999.
1999 1998€ €
Gold 1,036,876,277 0
Foreign currency 5,821,397,453 697,979
Securities 2,265,980 0
Total 6,860,539,710 697,979
Capital key(%) €
Nationale Bank van België/Banque Nationale de Belgique 2.8658 143,290,000
Deutsche Bundesbank 24.4935 1,224,675,000
Banco de España 8.8935 444,675,000
Banque de France 16.8337 841,685,000
Central Bank of Ireland 0.8496 42,480,000
Banca d’Italia 14.8950 744,750,000
Banque centrale du Luxembourg 0.1492 7,460,000
De Nederlandsche Bank 4.2780 213,900,000
Oesterreichische Nationalbank 2.3594 117,970,000
Banco de Portugal 1.9232 96,160,000
Suomen Pankki 1.3970 69,850,000
Total 78.9379 3,946,895,000
The non-euro area NCBs’ contributions,which represent 5% of the amount whichwould have been payable had these countriesparticipated in Monetary Union, amount to atotal of €52,655,250 as shown below:
Capital key(%) €
Danmarks Nationalbank 1.6709 4,177,250
Bank of Greece 2.0564 5,141,000
Sveriges Riksbank 2.6537 6,634,250
Bank of England 14.6811 36,702,750
Total 21.0621 52,655,250
These amounts represent contributions tocover the operational costs incurred by theECB in connection with tasks performed forthe non-euro area NCBs. The non-euro areaNCBs are not required to pay up any capitalsubscriptions beyond the amounts alreadydecided until such time as they join theEurosystem. The non-participating NCBs arenot entitled to receive any share of the

155ECB Annua l Repor t • 1999
14 Off-balance-sheet items
No claims and liabilities remained outstandingon unmatured contracts or other openpositions. No material contingent liabilitieswere outstanding as at 31 December 1999.
distributable profits of the ECB, nor are theyliable to fund any losses of the ECB.
The reserves of the ECB are as follows:
€
1999
General reserve fund 5,508,000
Other reserves 0
Retained profit 22,032,513
Total 27,540,513

ECB Annua l Repor t • 1999156
Notes on the Profit and Loss Account
1 Net interest income
This item includes interest income, net ofinterest expense, in respect of the assets andliabilities denominated in foreign currency andin euro. The bulk of interest income andexpenses arose on balances resulting fromTARGET transactions. Net interest incomeon the foreign reserve assets amounted to€1.5 billion. Remuneration of €913 millionwas paid to NCBs on their claims on the ECBin respect of the foreign reserve assetstransferred at the beginning of 1999.
Composition of interest income
Denominated in Denominatedforeign exchange (%) in euro (%)
1999 1998 1999 1998(7 months) (7 months)
Securities 84.5% 0.0% 5.1% 0.0%
Other assets 15.5% 100.0% 94.9% 0.0%
Total 100.0% 100.0% 100.0% 0.0%
Composition of interest expense
2 Realised gains/losses arising fromfinancial operations
A net realised loss resulted from normalportfolio management transactions insecurities owing to significant falls in theprices of securities held during the courseof 1999.
3 Write-downs in financial assets andpositions
Falls in prices resulted in the write-down ofthe acquisition cost of securities shown inthe balance sheet to their market value as at31 December 1999 (see “Accounting policies:Income recognition”).
4 Net income from fees andcommissions
The sub-item “Income from fees andcommissions” consists of penalties imposedon credit institutions for non-compliance withthe minimum reserve requirement.
5 Other income
Other miscellaneous income during the yeararose principally from the transfer of unusedadministrative provisions to the profit andloss account.
6 Staff costs
Salaries and allowances (€52.3 million) andemployer’s contributions to the ECB’spension fund and to health and accidentinsurance are included under this heading.The emoluments of the Executive Board ofthe ECB amounted to a total of €1.8 million.No pensions were paid to former membersof the Executive Board or their dependantsduring the year. Salaries and allowances ofstaff, including the emoluments of holders ofsenior management positions, are modelledin essence on, and are comparable with, theremuneration scheme of the EuropeanCommunities.
On the last working day of 1999 the ECBemployed 732 staff, of whom 55 heldmanagerial positions. The average number ofstaff employed by the ECB in 1999 was 648,compared with 478 in 1998. 242 additional
Denominated in Denominatedforeign exchange (%) in euro (%)
1999 1998 1999 1998(7 months) (7 months)
Securities 99.6% 0.0% 0.9% 0.0%
Other liabilities 0.4% 0.0% 99.1% 100.0%
Total 100.0% 0.0% 100.0% 100.0%

157ECB Annua l Repor t • 1999
staff were employed during the period, and44 members of staff left the service of theECB.
7 ECB’s retirement plan
In accordance with the rules of the plan, atriennial full actuarial valuation is required. Afull actuarial valuation will, however, becarried out annually as long as staff numbersincrease significantly during the year. Thelatest actuarial valuation was carried out asat 31 December 1998, using the ProjectedUnit Credit Method, subject to minimumliabilities equal to cash lump sums that wouldbe payable to members on terminationof service. The valuation showed that theactuarial value of the fund’s assetsrepresented 110% of the benefits which hadaccrued to members at the balance sheetdate, after providing for future increases inearnings and the pensions liability.
The pension cost relating to the plan isassessed in accordance with the advice of aqualified actuary. The total pension cost tothe ECB was €8.1 million. This includes aprovision for pensions to members of theExecutive Board of €1.8 million. The requiredfuture service contribution rate by the ECBis 16.5% of pensionable earnings of all staff.
8 Administrative expenses
These cover all other current expensesrelating to rental of premises, maintenanceof premises, goods and equipment of a non-capital nature, professional fees and otherservices and supplies, together with staff-related expenses including recruitment,relocation, installation, training andresettlement.
ECB Annua l Repor t • 1999158
President and Governing Councilof the European Central Bank
Frankfurt am Main
We have audited the accompanying financial statements of the European Central Bank as at31 December 1999. The European Central Bank’s Management is responsible for the preparationof the accounts. It is our responsibility to form an independent opinion on these accounts based onour audit, and to report our opinion to you.
We conducted our audit in accordance with International Standards of Auditing. An audit includesexaminations, on a test basis, of evidence relevant to the amounts and disclosures in the accounts.It also includes an assessment of the significant estimates and judgements made in the preparationof the accounts, and of whether the accounting policies are appropriate to the European CentralBank’s circumstances and adequately disclosed.
In our opinion, the financial statements, which have been prepared under accounting policies setout in Section I of the notes on the accounts of the European Central Bank, give a true and fairview of the financial position of the European Central Bank at 31 December 1999 and the results ofits operations for the year then ended.
Frankfurt am Main, 1 March 2000
PricewaterhouseCoopers
Gesellschaft mit beschränkter HaftungWirtschaftsprüfungsgesellschaft
[signed] [signed](Wagener) (Kern)Wirtschaftsprüfer Wirtschaftsprüfer

159ECB Annua l Repor t • 1999
Note on the allocation of losses
Note: this item does not form a part of thefinancial statements of the ECB. It is published inthe Annual Report for information purposes.
Pursuant to Article 33.2 of the Statute of theESCB, a loss incurred by the ECB shall betransferred in the following order:
(a) the loss may be offset against the generalreserve fund of the ECB;
(b) following a decision by the GoverningCouncil of the ECB, any remaining lossshall be offset against the monetaryincome for the relevant financial year inproportion to and up to the amountsallocated to the NCBs in accordance withArticle 32.5;1
(c) in the event that such losses cannot beoffset in accordance with Article 33.2,the Governing Council has agreed thatany remaining loss should be funded asfollows;
(i) any remaining loss may be offset inthe first instance by waiving a partof the original value of the ECB’sliabilities equivalent to the transfer offoreign reserves in the balance sheetof the ECB. The maximum waivermay not exceed:
• the amount of unrealised losseswhich arise on the foreign currencyand gold positions;
• an amount which would reduce theaforesaid liability to below 80% ofits original value.
(ii) any remaining loss may be offsetagainst a direct charge on income,apportioned in accordance with theECB’s capital key, accruing toparticipating NCBs from nationalbanknotes in circulation, subject tothe limitation that no such directcharge on any one NCB may exceedthat NCB’s income from nationalbanknotes.
At its meeting on 16 March 2000 theGoverning Council of the ECB decided toallocate the loss of the ECB for the yearending on 31 December 1999 as follows:
1 In accordance with Article 32.5 of the Statute of the ESCB, theNCBs’ monetary income shall be allocated to the NCBs inproportion to their paid-up shares in the capital of the ECB. TheGoverning Council of the ECB decided for the financial years1999 to 2001 to calculate monetary income by the applicationof a reference rate to the liability base, which consists of alldeposit liabilities to credit institutions, current accounts, thedeposit facility, fixed-term deposits, deposits related to margincalls, liquidity-absorbing repurchase agreements and liabilities ofparticipating NCBs arising from the issuance by the ECB of debtcertificates. The reference rate used is the latest available two-week repo rate and is applied on a daily basis to the liabilitybase of each NCB to calculate the pool of monetary income.Amounts of interest paid by an NCB on liabilities included withinits liability base are to be deducted from the amount of monetaryincome to be pooled.
1999 1998€ €
(Loss)/Profit for the year (247,281,223) 27,540,513
Withdrawals from/allocatedto general reserve funds 27,540,513 (5,508,000)
Transfer from monetaryincome pooled 35,160,676 0
Retained profit carried forward (22,032,513)
Direct charge on NCBs 184,580,034 0

ECB Annua l Repor t • 1999160
Assets Balance as at Balance as at31 December 1999 1 January 1999
1 Gold and gold receivables 116,610 99,565
2 Claims on non-euro area residents denominated inforeign currency2.1 Receivables from the IMF 71,744 29,5112.2 Balances with banks and security investments,
external loans and other external assets 182,803 201,494254,547 231,005
3 Claims on euro area residents denominated in foreigncurrency 14,412 6,283
4 Claims on non-euro area residents denominated in euro4.1 Balances with banks, security investments
and loans 6,050 8,9414.2 Claims arising from the credit facility under
ERM II 0 06,050 8,941
5 Lending to financial sector counterparties of the euro area5.1 Main refinancing operations 161,988 143,6965.2 Longer-term refinancing operations 74,996 24,6985.3 Fine-tuning reverse operations 0 6,6805.4 Structural reverse operations 0 05.5 Marginal lending facility 11,429 6,3725.6 Credits related to margin calls 404 265.7 Other lending 1,276 3,641
250,093 185,113
6 Securities of euro area residents denominatedin euro 23,513 21,673
7 General government debt denominated in euro 59,180 60,126
8 Other assets 81,899 80,731
Total assets 806,304 693,437
Totals/sub-totals may not add up, due to rounding.
Consolidated Balance Sheet of the Eurosystem as at 31 December 1999(EUR millions)
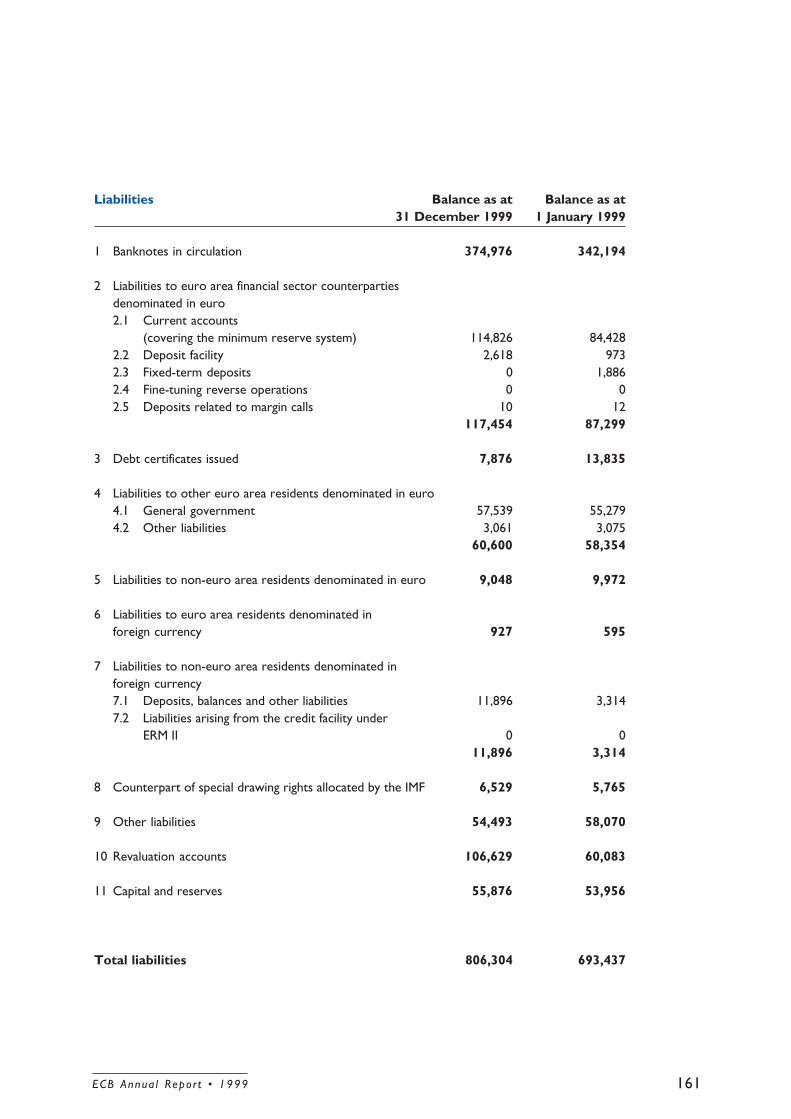
161ECB Annua l Repor t • 1999
Liabilities Balance as at Balance as at31 December 1999 1 January 1999
1 Banknotes in circulation 374,976 342,194
2 Liabilities to euro area financial sector counterpartiesdenominated in euro2.1 Current accounts
(covering the minimum reserve system) 114,826 84,4282.2 Deposit facility 2,618 9732.3 Fixed-term deposits 0 1,8862.4 Fine-tuning reverse operations 0 02.5 Deposits related to margin calls 10 12
117,454 87,299
3 Debt certificates issued 7,876 13,835
4 Liabilities to other euro area residents denominated in euro4.1 General government 57,539 55,2794.2 Other liabilities 3,061 3,075
60,600 58,354
5 Liabilities to non-euro area residents denominated in euro 9,048 9,972
6 Liabilities to euro area residents denominated inforeign currency 927 595
7 Liabilities to non-euro area residents denominated inforeign currency7.1 Deposits, balances and other liabilities 11,896 3,3147.2 Liabilities arising from the credit facility under
ERM II 0 011,896 3,314
8 Counterpart of special drawing rights allocated by the IMF 6,529 5,765
9 Other liabilities 54,493 58,070
10 Revaluation accounts 106,629 60,083
11 Capital and reserves 55,876 53,956
Total liabilities 806,304 693,437

ECB Annua l Repor t • 1999162

Annexes

ECB Annua l Repor t • 1999164
Glossary*
Benchmark: in relation to investments, a benchmark is a reference portfolio or indexconstructed on the basis of the objectives for liquidity, risk and return of the investments. Thebenchmark can also serve as a basis for comparison of the performance of the actual portfolio.
Bilateral procedure: a procedure whereby the central bank deals directly with one or only afew counterparties, without making use of tender procedures. Bilateral procedures includeoperations executed through stock exchanges or market agents.
Capital transfers: these consist of (i) cross-border transfers related to the ownership of fixedassets; (ii) cross-border transfers of funds linked to, or conditional upon, the acquisition or disposalof fixed assets; and (iii) the cancellation, without any counterparts being received in return, ofcross-border liabilities by creditors. Capital transfers may be in cash or in kind (e.g. debtforgiveness).
Central securities depository (CSD): an entity which holds securities and which enablessecurities transactions to be processed by book entry. Physical securities may be immobilised bythe depository or securities may be dematerialised (i.e. so that they exist only as electronicrecords). In addition to the safekeeping and administration of securities (e.g. services for issuanceand redemption), a central securities depository may incorporate clearing and settlementfunctions.
Collateral: assets pledged as a guarantee for the repayment of the short-term liquidity loanswhich credit institutions receive from the central banks, as well as assets sold to central banksby credit institutions as part of repurchase operations.
Consolidated MFI balance sheet: the consolidated balance sheet of the Monetary FinancialInstitutions (MFI) sector is obtained by netting out inter-MFI positions on the aggregated MFIbalance sheet (e.g. inter-MFI loans and deposits of money market funds with MFIs). It providesinformation on the MFI sector’s assets and liabilities vis-à-vis residents of the euro area notbelonging to this sector (the general government and other euro area residents) and vis-à-vis non-residents of the euro area. The consolidated balance sheet is the main statistical source for thecalculation of monetary aggregates and it provides the basis for the regular analysis of thecounterparts of M3.
Convergence programmes: see stability programmes.
Correspondent banking: an arrangement by which one bank provides payment and otherservices to another bank. Payments through correspondents are often executed throughreciprocal accounts (nostro and loro accounts), to which standing credit lines may be attached.Correspondent banking services are primarily provided across international boundaries, but arealso known as agency relationships in some domestic contexts. A loro account is the term used bya correspondent to describe an account held on behalf of a foreign bank; the foreign bank wouldregard this account as its nostro account.
Correspondent central banking model (CCBM): a model established by the EuropeanSystem of Central Banks (ESCB) with the aim of enabling counterparties to transfer eligibleassets as collateral in a cross-border context. In the CCBM, national central banks act as
* The numbering of the Articles and Protocols follows that established by the Treaty as signed in Amsterdam.

165ECB Annua l Repor t • 1999
custodians for one another. This implies that each national central bank has a securities account inits securities administration for each of the other national central banks (and for the EuropeanCentral Bank (ECB)).
Counterparty: the opposite party in a financial transaction (e.g. any transaction with the centralbank).
Credit institution: an institution covered by the definition contained in Article I of the FirstBanking Co-ordination Directive (77/780/EEC), i.e. “an undertaking whose business is to receivedeposits or other repayable funds from the public and to grant credit for its own account”.
Credit to euro area residents: a broad measure of the financing of non-Monetary FinancialInstitution (MFI) euro area residents (including general government and the private sector)provided by the MFI sector. It is defined as including (i) loans and (ii) MFI holdings of securities. Thelatter include shares, other equity and debt securities including money market paper issued by non-MFI euro area residents. As securities can be seen as an alternative source of funds, relative toloans, and as some loans can be securitised, this definition provides more accurate information onthe total amount of financing provided by the MFI sector to the economy than a narrow definitioncomprising loans only.
Currency in circulation: currency in circulation includes both banknotes and coins in circulationthat are commonly used to make payments. It includes banknotes issued by the Eurosystem andby other Monetary Financial Institutions (MFIs) in the euro area (in Ireland and Luxembourg)as well as the coins issued by the Eurosystem and by the central government. Currency incirculation included in M3 is a net concept, i.e. it refers only to banknotes and coins in circulationthat are held outside the MFI sector (as shown in the consolidated MFI balance sheet, implyingthat currency issued but held by MFIs – “vault cash” – has been subtracted). Currency in circulationdoes not include a central bank’s stock of own banknotes (as they are not issued), norcommemorative coins that are not commonly used to make payments.
Current transfers: these consist of transfers which are not transfers of capital and which have adirect impact on the level of disposable income of the euro area donor or recipient.
Debt ratio: the subject of one of the fiscal convergence criteria laid down in Article 104 (2) of theTreaty. It is defined as “the ratio of government debt to gross domestic product at current marketprices”, while government debt is defined in Protocol No. 20 (on the excessive deficit procedure)as the “total gross debt at nominal value outstanding at the end of the year and consolidated between andwithin the sectors of general government”. General government is as defined in the EuropeanSystem of Accounts 1995 (ESA 95).
Deficit-debt adjustment: the difference between the government deficit and the change ingovernment debt. Among other reasons, this may be due to changes in the amount of financialassets held by the government, to a change in government debt held by other governmentsub-sectors or to statistical adjustments.
Deficit ratio: the subject of one of the fiscal convergence criteria named in Article 104 (2) of theTreaty. It is defined as “the ratio of the planned or actual government deficit to gross domestic product”at current market prices, while the government deficit is defined in Protocol No. 20 (on theexcessive deficit procedure) as “net borrowing of the general government”. Generalgovernment is as defined in the European System of Accounts 1995 (ESA 95).
ECB Annua l Repor t • 1999166
Delivery versus payment system (DVP, or delivery against payment): a mechanism in asecurities settlement system which ensures that the final transfer of one asset occurs if, andonly if, the final transfer of (an)other asset(s) occurs. Assets could include securities or otherfinancial instruments.
Deposit facility: a standing facility of the Eurosystem which counterparties may use tomake overnight deposits at a national central bank and which are remunerated at a pre-specifiedinterest rate.
Deposits redeemable at notice: this category consists of saving deposits for which the holderhas to respect a fixed period of notice before he or she can withdraw his or her funds. In somecases there is the possibility of withdrawing a certain fixed amount in a specified period or ofearlier withdrawal subject to the payment of a penalty. Deposits redeemable at a period of noticeof up to three months belong to M2 (and hence to M3), while those with a longer period of noticebelong to the (non-monetary) longer-term financial liabilities of the Monetary FinancialInstitutions (MFI) sector.
Deposits with agreed maturity: this instrument category consists mainly of time deposits witha given maturity that may, depending on national practices, either not be convertible prior tomaturity or be convertible only subject to a penalty. It also encompasses some non-marketabledebt instruments, such as non-marketable (retail) certificates of deposit. Deposits with an agreedmaturity of up to two years are included in M2 (and hence in M3), while those with agreedmaturity over two years are included in the (non-monetary) longer-term financial liabilities of theMonetary Financial Institutions (MFI) sector.
ECOFIN: see EU Council.
Economic and Financial Committee: a consultative Community body set up at the start ofStage Three, when the Monetary Committee was dissolved. The Member States, the EuropeanCommission and the European Central Bank (ECB) each appoint no more than twomembers of the Committee. Article 114 (2) of the Treaty contains a list of the tasks of theEconomic and Financial Committee, including the review of the economic and financial situation ofthe Member States and of the Community.
Economic and Monetary Union (EMU): the Treaty describes the process of achievingEconomic and Monetary Union in the European Union in three stages. Stage One of EMU started inJuly 1990 and ended on 31 December 1993; it was mainly characterised by the dismantling of allinternal barriers to the free movement of capital within the European Union. Stage Two of EMUbegan on 1 January 1994. It provided for, inter alia, the establishment of the European MonetaryInstitute (EMI), the prohibition of monetary financing of and privileged access to financialinstitutions for the public sector and the avoidance of excessive deficits. Stage Three started on1 January 1999, in accordance with the decision pursuant to Article 121 (4) of the Treaty, with thetransfer of monetary competence to the Eurosystem and the introduction of the euro.
ECU (European Currency Unit): the ECU was a basket made up of the sum of fixed amountsof 12 of the 15 currencies of the Member States. The value of the ECU was calculated as aweighted average of the value of its component currencies. The ECU was replaced by the euro ona one-to-one basis on 1 January 1999.
Effective (nominal/real) exchange rates: nominal effective exchange rates consist of aweighted average of various bilateral exchange rates. Real effective exchange rates are nominal

167ECB Annua l Repor t • 1999
effective exchange rates deflated by a weighted average of foreign, relative to domestic, prices orcosts. They are thus measures of price and cost competitiveness. The nominal effective exchangerate of the euro calculated by the European Central Bank (ECB) is a geometric weightedaverage of the exchange rates of the euro against the currencies of 13 trading partners of the euroarea. The weights are based on trade in manufactured goods with the trading partners in theperiod from 1995 to 1997, and capture third market effects. The real effective exchange rate forthe euro is calculated using consumer price indices (the Harmonised Index of ConsumerPrices (HICP) for the euro area and other EU Member States).
Electronic money (e-money): an electronic store of monetary value on a technical device thatmay be widely used for making payments to undertakings other than the issuer without necessarilyinvolving bank accounts in the transaction, but acting as a prepaid bearer instrument (see alsomulti-purpose prepaid card).
EMU: see Economic and Monetary Union.
EONIA (euro overnight index average): a measure of the effective interest rate prevailing inthe euro interbank overnight market. It is computed as a weighted average of the interest rates onunsecured overnight contracts on deposits denominated in euro, as reported by a panel ofcontributing banks.
ERM II (exchange rate mechanism II): the exchange rate arrangement which provides theframework for exchange rate policy co-operation between the euro area and EU Member Statesnot participating in the euro area from the start of Stage Three of Economic and MonetaryUnion (EMU). Membership of the mechanism is voluntary. Nevertheless, Member States with aderogation can be expected to join the mechanism. Currently, the Danish krone and the Greekdrachma participate in ERM II with a fluctuation band around the central rate against the euro of±2.25% and ±15% respectively. Foreign exchange intervention and financing at the margins of thestandard or narrower fluctuation bands are, in principle, automatic and unlimited, with very short-term financing available. The European Central Bank (ECB) and the participating non-euroarea national central banks could, however, suspend automatic intervention if this were to conflictwith their primary objective of maintaining price stability.
EU Council: an institution of the European Community. It is made up of representatives of thegovernments of the Member States, normally the ministers responsible for the matters underconsideration (therefore often referred to as the Council of Ministers). The EU Council meeting inthe composition of the Ministers of Finance and Economy is often referred to as the ECOFINCouncil. In addition, the EU Council may meet in the composition of the Heads of State orGovernment. See also European Council.
EURIBOR (euro interbank offered rate): is the rate at which a prime bank is willing to lendfunds in euro to another prime bank. The EURIBOR is computed daily for interbank deposits witha maturity of one week and one to twelve months as the average of the daily offer rates of arepresentative panel of prime banks, rounded to three decimal places.
Euro: the name of the European currency adopted by the European Council at its meeting inMadrid on 15 and 16 December 1995 and used instead of the generic term ECU (EuropeanCurrency Unit) employed in the Treaty.
Euro area: the area encompassing those Member States in which the euro has been adopted asthe single currency in accordance with the Treaty and in which a single monetary policy is

ECB Annua l Repor t • 1999168
conducted under the responsibility of the Governing Council of the European Central Bank(ECB). The euro area comprises Belgium, Germany, Spain, France, Ireland, Italy, Luxembourg, theNetherlands, Austria, Portugal, Finland.
Euro Banking Association (EBA): an interbank organisation intended to be the forum forexploring and debating all issues of interest to its members and, in particular, matters pertaining tothe use of the euro and the settlement of transactions in euro. Within the EBA, a clearingcompany (ABE Clearing, Société par Actions Simplifiée à capital variable) has been established withthe purpose of managing the Euro Clearing System as from 1 January 1999. The Euro ClearingSystem (Euro 1) is the successor system to the ECU Clearing and Settlement System.
Euro central rate: the official exchange rate of the ERM II member currencies vis-à-vis theeuro, around which the ERM II fluctuation margins are defined.
European Central Bank (ECB): the ECB is the centre of the European System of CentralBanks (ESCB) and the Eurosystem and has legal personality under Community law. It ensuresthat the tasks conferred upon the Eurosystem and the ESCB are implemented either by its ownactivities pursuant to the Statute of the European System of Central Banks and of the EuropeanCentral Bank or through the national central banks.
European Commission (Commission of the European Communities): the institution ofthe European Community which ensures the application of the provisions of the Treaty, takesinitiatives for Community policies, proposes Community legislation and exercises powers inspecific areas. In the area of economic policy, the Commission recommends broad guidelines foreconomic policies in the Community and reports to the EU Council on economic developmentsand policies. It monitors public finances in the framework of multilateral surveillance and submitsreports to the Council. It consists of 20 members and includes two nationals from Germany, Spain,France, Italy and the United Kingdom, and one from each of the other Member States. Eurostat isresponsible for the production of Community statistics.
European Council: provides the European Union with the necessary impetus for itsdevelopment and defines the general political guidelines thereof. It brings together the Heads ofState or Government of the Member States and the President of the European Commission(see also EU Council).
European Monetary Institute (EMI): the EMI was a temporary institution established at thestart of Stage Two of Economic and Monetary Union (EMU) (on 1 January 1994). The twomain tasks of the EMI were (i) to strengthen central bank co-operation and monetary policy co-ordination and (ii) to make the preparations required for the establishment of the EuropeanSystem of Central Banks (ESCB), for the conduct of the single monetary policy and for thecreation of a single currency in Stage Three. It went into liquidation following the establishment ofthe European Central Bank (ECB) on 1 June 1998.
European Parliament: consists of 626 representatives of the citizens of the Member States. It isa part of the legislative process, although with different prerogatives according to the proceduresthrough which EU law is to be enacted. In the framework of Economic and Monetary Union(EMU), the Parliament has mainly consultative powers. However, the Treaty establishes certainprocedures for the democratic accountability of the European Central Bank (ECB) to theParliament (presentation of the annual report, general debate on the monetary policy, hearingsbefore the competent parliamentary committees).

169ECB Annua l Repor t • 1999
European System of Accounts 1995 (ESA 95): a system of uniform statistical definitions andclassifications aimed at achieving a harmonised quantitative description of the economies of theMember States. The ESA is the Community’s version of the world System of National Accounts1993. The ESA 95 is a new version of the European system, implementation of which began in thecourse of 1999 in accordance with Council Regulation (EC) No. 2223/96.
European System of Central Banks (ESCB): the ESCB is composed of the EuropeanCentral Bank (ECB) and the national central banks of all 15 Member States, i.e. it includes, inaddition to the members of the Eurosystem, the national central banks of the Member Stateswhich did not adopt the euro at the start of Stage Three of Economic and Monetary Union(EMU). The ESCB is governed by the Governing Council and the Executive Board of theECB, and, as a third decision-making body of the ECB, by the General Council.
Eurostat: see European Commission.
Eurosystem: comprises the European Central Bank (ECB) and the national central banks ofthe Member States which have adopted the euro in Stage Three of Economic and MonetaryUnion (EMU) (see also euro area). There are currently 11 national central banks in theEurosystem. The Eurosystem is governed by the Governing Council and the Executive Boardof the ECB.
Eurosystem’s foreign exchange liquidity position: this comprises the Eurosystem’sforeign reserve assets and the Eurosystem’s other foreign currency claims and liabilities,including positions vis-à-vis euro area residents such as, for instance, foreign exchange depositsplaced with banking institutions resident in the euro area.
Eurosystem’s foreign reserve assets: the reserve assets of the euro area consist of theEurosystem’s reserve assets, i.e. the reserve assets of the European Central Bank (ECB) andthe reserve assets held by the national central banks of the participating Member States. Reserveassets must (i) be under the effective control of the relevant monetary authority, whether the ECBor the national central bank of one of the participating Member States, and (ii) refer to highly liquid,marketable and creditworthy foreign (non-euro) currency-denominated claims on non-residentsof the euro area, plus gold, special drawing rights and the reserve positions in the InternationalMonetary Fund of the participating national central banks.
Executive Board: one of the decision-making bodies of the European Central Bank (ECB). Itcomprises the President, the Vice-President and four other members appointed by commonaccord by the Heads of State or Government of the Member States which have adopted the euro.
Fine-tuning operation: a non-regular open market operation executed by the Eurosystemmainly in order to deal with unexpected liquidity fluctuations in the market.
Foreign exchange swap: two simultaneous spot and forward transactions of one currencyagainst another. The Eurosystem may execute open market monetary policy operations in theform of foreign exchange swaps where the national central banks (or the European CentralBank (ECB)) buy (or sell) euro spot against a foreign currency and at the same time sell it (or buyit back) forward.
Frontloading: the distribution of euro banknotes and/or coins to certain target groups(e.g. banks, retailers, cash-in-transit companies, cash-operated machine industry, general public)prior to 2002.

ECB Annua l Repor t • 1999170
Funds transfer system (FTS): a formal arrangement, based on private contract or statute law,with multiple membership, common rules and standardised arrangements, for the transmission andsettlement of money obligations arising between the members.
General Council: one of the governing bodies of the European Central Bank (ECB). Itcomprises the President and the Vice-President of the ECB and the governors of all 15 EU nationalcentral banks.
General government: consists of central, state and or local government and social securityfunds, as defined in the European System of Accounts 1995 (ESA 95).
Governing Council: one of the governing bodies of the European Central Bank (ECB). Itcomprises all the members of the Executive Board of the ECB and the governors of the nationalcentral banks of the Member States which have adopted the euro.
Harmonised Index of Consumer Prices (HICP): the HICP is the measure of prices used bythe Governing Council for the purpose of assessing price stability. In order to fulfil theTreaty requirement for a consumer price index constructed on a comparable basis, taking intoaccount differences in national definitions, the HICP was developed by the EuropeanCommission (Eurostat) in close liaison with the national statistical institutes and the EuropeanMonetary Institute (EMI) and later the European Central Bank (ECB).
Interbank funds transfer system (IFTS): a funds transfer system in which most (or all)direct participants are credit institutions.
Interlinking mechanism: one of the components of the TARGET system. The term is usedto designate the infrastructures and the procedures which link domestic RTGS systems in orderto process cross-border payments within TARGET.
Large-value payments: payments, generally of very large amounts, which are mainly exchangedbetween banks or between participants in the financial markets and usually require urgent andtimely settlement.
Links between securities settlement systems: the procedures and arrangements betweentwo securities settlement systems for the cross-border transfer of securities through abook-entry process.
Longer-term refinancing operation: a regular open market operation executed by theEurosystem in the form of a reverse transaction. Longer-term refinancing operations areexecuted through monthly standard tenders and have a maturity of three months.
Loss-sharing rule (or loss-sharing agreement): an agreement between participants in atransfer system or a clearing house arrangement regarding the allocation of any loss arising whenone or more participants fail to fulfil their obligations; the arrangement stipulates how the loss willbe shared among the parties concerned in the event of the agreement being activated.
Lump-sum allowance: a fixed amount which an institution may deduct in the calculation of itsreserve requirement within the minimum reserve framework of the Eurosystem.
M1, M2, M3: see monetary aggregates.
171ECB Annua l Repor t • 1999
Main refinancing operation: a regular open market operation executed by theEurosystem in the form of a reverse transaction. Main refinancing operations are conductedthrough weekly standard tenders and have a maturity of two weeks.
Maintenance period: the period over which compliance with reserve requirements iscalculated. The maintenance period for Eurosystem minimum reserves is one month, starting onthe 24th calendar day of each month and ending on the 23rd calendar day of the following month.
Marginal lending facility: a standing facility of the Eurosystem which counterparties mayuse to receive overnight credit from a national central bank against a pre-specified interest rate.
Monetary aggregates: a monetary aggregate can be defined as the sum of currency incirculation plus outstanding amounts of certain liabilities of financial institutions that have a highdegree of “moneyness” (or liquidity in a broad sense). The narrow monetary aggregate M1 hasbeen defined by the Eurosystem as currency in circulation plus euro area residents’ (other thancentral government) holdings of overnight deposits with euro area money-issuing institutions.The monetary aggregate M2 comprises M1 plus deposits with an agreed maturity of up to twoyears and deposits redeemable at notice of up to three months. The broad monetary aggregate M3includes M2 plus repurchase agreements, money market fund shares/units and money marketpaper and debt securities with a maturity of up to two years. The Governing Council hasannounced a reference value for the growth of M3 (see also reference value for monetarygrowth).
Monetary Financial Institutions (MFIs): financial institutions which form the money-issuingsector of the euro area. It includes the Eurosystem, resident credit institutions as defined inCommunity law and all other resident financial institutions whose business is to receive depositsand/or close substitutes for deposits from entities other than MFIs and, for their own account (atleast in economic terms), to grant credit and/or invest in securities. The latter group consistspredominantly of money market funds. At the end of 1999, there were 9,443 MFIs in the euro area(12 central banks, 7,906 credit institutions, 1,517 money market funds and 8 other financialinstitutions).
Multi-purpose prepaid card: a stored value card which can be used for a wide range of paymentpurposes and which has the potential to be used on a national or international scale, but which maysometimes be restricted to a certain area. A reloadable multi-purpose prepaid card is also knownas an electronic purse (see also electronic money (e-money)).
Net international investment position (i.i.p.) (or net external asset or liabilityposition): the statistical statement of the value and composition of the stock of an economy’sfinancial assets or financial claims on the rest of the world, less an economy’s financial liabilities tothe rest of the world.
Net settlement system (NSS): a funds transfer system, the settlement operations of whichare completed on a bilateral or multilateral net basis.
Open market operation: an operation executed on the initiative of the central bank in thefinancial markets involving one of the following transactions: (i) buying or selling assets outright(spot or forward); (ii) buying or selling assets under a repurchase agreement; (iii) lending orborrowing against underlying assets as collateral; (iv) the issuance of central bank debtcertificates; (v) the collection of fixed-term deposits; or (vi) foreign exchange swaps betweendomestic and foreign currency.

ECB Annua l Repor t • 1999172
Outright transaction: a transaction whereby the central bank buys or sells assets up to theirmaturity in the market (spot or forward).
Overnight deposits: this instrument category comprises mainly those sight/demand depositswhich are fully transferable (by cheque or similar). It also includes non-transferable deposits thatare convertible on demand or by close of business the following day.
Payment versus payment (PVP): a mechanism in a foreign exchange settlement system whichensures that a final transfer of one currency occurs if, and only if, a final transfer of the othercurrency or currencies takes place.
Price stability: the Governing Council has published a quantitative definition of price stabilityin order to give clear guidance to expectations of future price developments. The GoverningCouncil defines price stability as a year-on-year increase in the Harmonised Index ofConsumer Prices (HICP) for the euro area of below 2%. Reflecting the need for monetarypolicy to have a forward-looking, medium-term orientation, price stability according to thisdefinition is to be maintained over the medium term. The definition delineates an upper bound forthe rate of measured inflation and, at the same time, the use of the word “increase” signals thatdeflation, i.e. prolonged declines in the level of the HICP, would not be deemed consistent withprice stability.
Primary balance: government net borrowing or net lending excluding interest payments onconsolidated government liabilities.
Quick tender: the tender procedure used by the Eurosystem for fine-tuning operations.Quick tenders are executed within a time frame of one hour and are restricted to a limited set ofcounterparties.
Realignment: a change in the central parity of a currency participating in an exchange rate systemwith a fixed but adjustable peg. In ERM II a realignment consists of a change in the euro centralrate.
Re-denomination of securities: the denomination of a security is the currency in which the parvalue of the security is expressed (in most cases, the face value of a certificate). Re-denominationrefers to a procedure through which the original denomination of a security, issued in nationalcurrency, is changed into euro at the irrevocably fixed conversion rate.
Reference period: time intervals specified in Article 104 (2a) of the Treaty and in ProtocolNo. 21 on the convergence criteria for examining progress towards convergence.
Reference value for monetary growth: the Governing Council assigns money a prominentrole in the conduct of its policy, implying that monetary aggregates and counterparts arethoroughly analysed regarding their information content for future price developments. This issignalled by announcing a reference value for the growth rate of the monetary aggregate M3. Thereference value is derived in a manner which is consistent with and serves the achievement of theGoverning Council’s definition of price stability on the basis of medium-term assumptionsregarding trend real GDP growth and the trend in the velocity of circulation of M3. Substantial orprolonged deviations of M3 growth from the reference value would, under normal circumstances,signal risks to price stability over the medium term. However, the concept of the reference valuedoes not entail a commitment on the part of the Governing Council to correct mechanisticallydeviations of M3 growth from the reference value.

173ECB Annua l Repor t • 1999
Reference value for the fiscal position: Protocol No. 20 of the Treaty on the excessivedeficit procedure sets explicit reference values for the general government deficit ratio (3% ofGDP) and the debt ratio (60% of GDP) (see also Stability and Growth Pact).
Remote access (to an IFTS): the facility for a credit institution established in one country(“home country”) to become a direct participant in an interbank funds transfer system(IFTS) established in another country (“host country”) and, for that purpose, to have a settlementaccount in its own name with the central bank in the host country without necessarily havingestablished a branch in the host country.
Repurchase agreement: an arrangement whereby an asset is sold while the sellersimultaneously obtains the right and obligation to repurchase it at a specific price on a future dateor on demand. Such an agreement is similar to collateralised borrowing, with the exception thatownership of the securities is not retained by the seller. The Eurosystem uses repurchaseagreements with a fixed maturity in its reverse transactions. Repurchase transactions areincluded in M3 in cases where the seller is a Monetary Financial Institution (MFI) and thecounterpart is a non-MFI resident in the euro area. According to the Regulation of the ECBconcerning the consolidated balance sheet of the Monetary Financial Institutions sector1 (ECB/1998/16), repurchase operations (repos) are classified as deposit liabilities since they are notmarketable. However, repos are not included in M2, because repurchase transactions have ahigher degree of substitutability with regard to short-term securities than to deposits with anagreed maturity or to deposits redeemable at notice.
Repurchase operation (repo): a liquidity-providing reverse transaction based on arepurchase agreement.
Reserve base: the sum of the balance sheet items (in particular liabilities) which constitute thebasis for calculating the reserve requirement of a credit institution.
Reserve ratio: the ratio defined by the central bank for each category of eligible balance sheetitems included in the reserve base. The ratios are used to calculate reserve requirements.
Reserve requirement: the requirement for institutions to hold minimum reserves with thecentral bank. In the minimum reserve framework of the Eurosystem, the reserve requirement ofa credit institution is calculated by multiplying the reserve ratio for each category of items inthe reserve base with the amount of those items in the institution’s balance sheet. In addition,institutions are allowed to deduct a lump-sum allowance from their reserve requirement.
Reverse transaction: an operation whereby the central bank buys or sells assets under arepurchase agreement or conducts credit operations against collateral.
RTGS (real-time gross settlement) system: a settlement system in which processing andsettlement take place on an order-by-order basis (without netting) in real time (continuously). Seealso TARGET system.
Securities settlement system: a system which permits the transfer of securities either free ofcharge or against payment.
1 OJ L 356, 30.12.1998, p. 7.

ECB Annua l Repor t • 1999174
Settlement agent: an institution that manages the settlement process (e.g. the determination ofsettlement positions, monitoring the exchange of payments, etc.) for transfer systems or otherarrangements that require settlement.
Settlement risk: a general term used to designate the risk that settlement in a transfer systemwill not take place as expected. This risk may comprise both credit and liquidity risk.
Stability and Growth Pact: consists of two EU Council Regulations on the strengthening ofthe surveillance of budgetary positions and the surveillance and co-ordination of economic policiesand on speeding up and clarifying the implementation of the excessive deficit procedure and of aEuropean Council Resolution on the Stability and Growth Pact adopted at the Amsterdam summiton 17 June 1997. It is intended to serve as a means of safeguarding sound government finances inStage Three of Economic and Monetary Union (EMU) in order to strengthen the conditionsfor price stability and for strong sustainable growth conducive to employment creation. Morespecifically, budgetary positions close to balance or in surplus are required as the medium-termobjective for Member States, which would allow them to deal with normal cyclical fluctuationswhile keeping the government deficit below the reference value of 3% of GDP. In accordancewith the Stability and Growth Pact, countries participating in EMU will report stabilityprogrammes, while non-participating countries will continue to provide convergenceprogrammes.
Stability programmes: medium-term government plans and assumptions provided byparticipating Member States regarding the development of key economic variables towards theachievement of the medium-term objective of a budgetary position close to balance or in surplus asreferred to in the Stability and Growth Pact. Regarding budgetary positions, measures toconsolidate fiscal balances as well as underlying economic scenarios are highlighted. Stabilityprogrammes must be updated annually. They are examined by the European Commission andthe Economic and Financial Committee. Their reports serve as the basis for an assessment bythe ECOFIN Council, focusing, in particular, on whether the medium-term budgetary objective inthe programme provides for an adequate safety margin to ensure the avoidance of an excessivedeficit. Countries not participating in the euro area must submit annual convergenceprogrammes, in accordance with the Stability and Growth Pact.
Standard tender: a tender procedure used by the Eurosystem in its regular open marketoperations. Standard tenders are carried out within a time frame of 24 hours. Allcounterparties fulfilling the general eligibility criteria are entitled to submit bids in standardtenders.
Standing facility: a central bank facility available to counterparties on their own initiative. TheEurosystem offers two overnight standing facilities: the marginal lending facility and thedeposit facility.
TARGET (Trans-European Automated Real-time Gross settlement Express Transfer)system: a payment system composed of one RTGS system in each of the 15 EU Member Statesand the ECB payment mechanism. The domestic RTGS systems and the ECB payment mechanismare interconnected according to common procedures (Interlinking mechanism) to allow cross-border transfers throughout the EU to move from one system to another.
Treaty: refers to the Treaty establishing the European Community. The Treaty was signed inRome on 25 March 1957 and entered into force on 1 January 1958. It established the EuropeanEconomic Community (EEC) and was often referred to as the “Treaty of Rome”. The Treaty on

175ECB Annua l Repor t • 1999
European Union was signed in Maastricht (therefore often referred to as the “Maastricht Treaty”)on 7 February 1992 and entered into force on 1 November 1993. It amended the EEC Treaty,which is now referred to as the Treaty establishing the European Community. The Treaty onEuropean Union has been amended by the “Amsterdam Treaty”, which was signed in Amsterdamon 2 October 1997 and entered into force on 1 May 1999.

ECB Annua l Repor t • 1999176
Chronology of monetary policy measures of the Eurosystem
22 December 1998
The Governing Council of the ECB decidesthat the first main refinancing operation ofthe Eurosystem will be a fixed rate tenderoffered at an interest rate of 3.0%, a levelwhich it intends to maintain for theforeseeable future. This operation will beinitiated on 4 January 1999, while theallotment decision will be taken on 5 January1999 and settlement will take place on7 January 1999. In addition, the first longer-term refinancing operation will be announcedon 12 January 1999 (with a settlement dateof 14 January 1999) and will be conductedthrough a variable rate tender using the singlerate allotment procedure.
The Governing Council furthermore decidesthat the interest rate for the marginal lendingfacility will be set at a level of 4.5% and theinterest rate for the deposit facility at a levelof 2.0% for the start of Stage Three,i.e. 1 January 1999. As a transitional measure,between 4 and 21 January 1999, the interestrate for the marginal lending facility will beset at a level of 3.25% and the interest ratefor the deposit facility at a level of 2.75%.The Governing Council intends to terminatethis transitional measure following its meetingon 21 January 1999.
31 December 1998
In accordance with Article 109l (4) of theTreaty establishing the European Community,the EU Council, acting with the unanimity ofthe Member States of the EuropeanCommunity without a derogation, upon aproposal from the European Commission andafter consultation of the ECB, adopts theirrevocable conversion rates for the euro,with effect from 1 January 1999, 0.00 a.m.(local time).
The ministers of the euro area Member States,the ECB and the ministers and central bankgovernors of Denmark and Greece decide, in a
common procedure involving the EuropeanCommission and after consultation of theMonetary Committee, to fix the central ratesagainst the euro for the currencies participatingin the exchange rate mechanism which comesinto operation on 1 January 1999. Further tothis decision on the euro central rates, theECB, Danmarks Nationalbank and the Bank ofGreece establish by common accord thecompulsory intervention rates for the Danishkrone and the Greek drachma. A fluctuationband of ±2.25% will be observed around theeuro central rate for the Danish krone. Thestandard fluctuation band of ±15% will beobserved around the euro central rate for theGreek drachma.
7 January 1999
The Governing Council of the ECB decidesthat for the two main refinancing operationsto be announced on 11 and 18 January 1999respectively the same conditions will apply asfor the first such operation, which was settledon 7 January 1999, i.e. they will be fixed ratetenders conducted at an interest rate of 3.0%.
12 January 1999
Following the decision of the GoverningCouncil of the ECB on 22 December 1998,the ECB announces that the first longer-termrefinancing operations of the Eurosystem willbe conducted as variable rate tenders usingthe single rate method of allotment. With aview to phasing in the longer-term refinancingoperations, the first such operation isconducted through three parallel tenderswith three different maturities, namely25 February, 25 March and 29 April 1999.The ECB also announces that the intention isto allot an amount of €15 billion in each ofthese parallel tenders. For the subsequentlonger-term refinancing operations in the firstthree months of 1999, the intention is toallot an unchanged amount of €15 billion peroperation.

177ECB Annua l Repor t • 1999
21 January 1999
The Governing Council of the ECB decidesto revert to the interest rates on theEurosystem’s two standing facilities which ithad set for the start of Stage Three, i.e. toset the interest rate for the marginal lendingfacility at a level of 4.5% and that for thedeposit facility at a level of 2.0% with effectfrom 22 January 1999. Furthermore, it decidesthat for the two main refinancing operationsto be settled on 27 January and 3 February1999 respectively the same conditions willapply as for the first three such operationssettled earlier in January, i.e. they will befixed rate tenders conducted at an interestrate of 3.0%.
4 February 1999
The Governing Council of the ECB decidesthat for the main refinancing operations tobe settled on 10 and 17 February 1999 thesame conditions will apply as for the firstsuch operations settled earlier in the year,i.e. they will be fixed rate tenders conductedat an interest rate of 3.0%. In addition, theinterest rate on the marginal lending facilitycontinues to be 4.5% and the interest rate onthe deposit facility remains 2.0%.
18 February 1999
The Governing Council of the ECB decides thatfor the main refinancing operations to be settledon 24 February and 3 March 1999 the sameconditions will apply as for the previous suchoperations settled earlier in the year, i.e. theywill be fixed rate tenders conducted at aninterest rate of 3.0%. In addition, the interestrate on the marginal lending facility continuesto be 4.5% and the interest rate on the depositfacility remains 2.0%.
4 March 1999
The Governing Council of the ECB decidesthat for the main refinancing operations to
be settled on 10 and 17 March 1999 the sameconditions will apply as for the previous suchoperations settled earlier in the year, i.e. theywill be fixed rate tenders conducted at aninterest rate of 3.0%. In addition, the interestrate on the marginal lending facility continuesto be 4.5% and the interest rate on thedeposit facility remains 2.0%. The GoverningCouncil also decides that for forthcominglonger-term refinancing operations of theEurosystem the multiple rate method ofallotment will be applied (starting from theoperation with a settlement date of 25 March1999) until otherwise indicated.
18 March 1999
The Governing Council of the ECB decidesthat for the main refinancing operations tobe settled on 24 and 31 March and 7 April1999 the same conditions will apply as forthe previous such operations settled earlierin the year, i.e. they will be fixed rate tendersconducted at an interest rate of 3.0%. Inaddition, the interest rate on the marginallending facility continues to be 4.5% and theinterest rate on the deposit facility remains2.0%.
8 April 1999
The Governing Council of the ECB decidesto reduce the interest rate on the mainrefinancing operations by 0.5 percentagepoint to 2.5%, starting with the operation tobe settled on 14 April 1999. In addition, itdecides to lower the interest rate on themarginal lending facility by 1 percentage pointto 3.5% and the interest rate on the depositfacility by 0.5 percentage point to 1.5%, bothwith effect from 9 April 1999.
22 April 1999
The Governing Council of the ECB decidesthat the interest rates on the main refinancingoperations, the marginal lending facility andthe deposit facility will remain unchanged at

ECB Annua l Repor t • 1999178
2.5%, 3.5% and 1.5% respectively. In addition,the Governing Council announces that forthe longer-term refinancing operations to besettled during the next six months, theintention is to continue to allot an amount of€15 billion per operation.
6 May 1999
The Governing Council of the ECB decidesthat the interest rates on the main refinancingoperations, the marginal lending facility andthe deposit facility will remain unchanged at2.5%, 3.5% and 1.5% respectively.
20 May 1999
The Governing Council of the ECB decidesthat the interest rates on the main refinancingoperations, the marginal lending facility andthe deposit facility will remain unchangedat 2.5%, 3.5% and 1.5% respectively. TheGoverning Council also decides to changethe maturity of the longer-term refinancingoperation scheduled to be settled on30 September 1999. The redemption date ofthis operation will be brought forward from30 December to 23 December 1999.Correspondingly, the longer-term refinancingoperation which was originally scheduled tobe announced on 27 December 1999 and tobe allotted and settled on 30 December 1999will be announced on 21 December, allottedon 22 December and settled on 23 December1999. The rescheduling of operations isintended to alleviate the working proceduresfor financial market participants at the turnof the year.
2 June, 17 June, 1 July, 15 July,29 July, 26 August, 9 September 1999
The Governing Council of the ECB decidesthat the interest rates on the main refinancingoperations, the marginal lending facility andthe deposit facility will remain unchanged at2.5%, 3.5% and 1.5% respectively.
23 September 1999
The Governing Council of the ECB decidesthat the interest rates on the main refinancingoperations, the marginal lending facility andthe deposit facility will remain unchanged at2.5%, 3.5% and 1.5% respectively.
The ECB releases to the public the indicativecalendar for the Eurosystem’s tenderoperations in 2000. It also announces that nonew main refinancing operation will beinitiated in the first week of the year 2000,and that no such operation will mature duringthat week. For this reason the maturityof the main refinancing operation of21 December 1999 will be lengthenedexceptionally to three weeks. To avoid twomain refinancing operations maturing on12 January 2000, the maturity of theoperation of 30 December 1999 will also belengthened to three weeks. These steps aretaken to minimise any potential problem forcounterparties and for the financial marketwhich could result from the conduct andsettlement of a large operation directly afterthe transition to the new century.
7 October 1999
The Governing Council of the ECB decidesthat the interest rates on the main refinancingoperations, the marginal lending facility andthe deposit facility will remain unchanged at2.5%, 3.5% and 1.5% respectively.
21 October 1999
The Governing Council of the ECB decidesthat the interest rates on the main refinancingoperations, the marginal lending facility andthe deposit facility will remain unchanged at2.5%, 3.5% and 1.5% respectively.
It also decides that for the longer-termrefinancing operations to be settled on28 October 1999, 25 November 1999 and23 December 1999, the intention is to allotan amount of €25 billion per operation. This

179ECB Annua l Repor t • 1999
amount is higher than the amount of €15billion allotted for all previous longer-termrefinancing operations conducted in 1999.This decision takes into account the intentionof the ECB to contribute to a smoothtransition to the year 2000.
4 November 1999
The Governing Council of the ECB decidesto raise the interest rate on the mainrefinancing operations of the Eurosystem by0.5 percentage point to 3.0%, with effect fromthe operation to be settled on 10 November1999. In addition, it decides to increasethe interest rates on both the marginallending facility and the deposit facility by0.5 percentage point to 4.0% and 2.0%respectively, both with effect from5 November 1999.
18 November 1999
The Governing Council of the ECB decidesthat the interest rates on the main refinancingoperations, the marginal lending facility andthe deposit facility will remain unchanged at3.0%, 4.0% and 2.0% respectively.
2 December 1999
The Governing Council of the ECB decidesthat the interest rates on the main refinancingoperations, the marginal lending facility andthe deposit facility will remain unchanged at3.0%, 4.0% and 2.0% respectively.
The Governing Council also decides toconfirm the reference value for monetarygrowth, namely an annual growth rate of 4½%for the broad monetary aggregate M3. Thisdecision is taken on the grounds that thecomponents underlying the derivation of thereference value, namely the Eurosystem’sdefinition of price stability (an annual increasein the HICP for the euro area of below 2%),the estimate for the trend of real GDPgrowth (2% to 2½% per annum) and that for
the trend decline in M3 income velocity (½%to 1% per annum), have basically remainedunchanged. As before, the Governing Councilwill assess monetary developments in relationto the reference value on the basis of a three-month moving average of annual growthrates. The Governing Council also decides toreview the reference value henceforth on aregular annual basis. The next review willtake place in December 2000.
With regard to the minimum reserve system ofthe Eurosystem, the Governing Council, afterreviewing new statistical evidence, decides toincrease from 10% to 30% the standardiseddeduction from the reserve base to be appliedto debt securities issued with an agreed maturityof up to two years and to money market paper.This decision shall take effect as from thedetermination of the reserve requirement to befulfilled in the maintenance period starting on24 January 2000.
15 December 1999
The Governing Council of the ECB decidesthat the interest rates on the main refinancingoperations, the marginal lending facility andthe deposit facility will remain unchanged at3.0%, 4.0% and 2.0% respectively.
4 January 2000
The ECB announces that on 5 January 2000the Eurosystem will conduct a liquidity-absorbing fine-tuning operation with same-day settlement. This measure aims atrestoring normal liquidity conditions in themoney market after the successful transitionto the year 2000.
5 January 2000
The Governing Council of the ECB decidesthat the interest rates on the main refinancingoperations, the marginal lending facility andthe deposit facility will remain unchanged at3.0%, 4.0% and 2.0% respectively.

ECB Annua l Repor t • 1999180
15 January 2000
At the request of the Greek authorities, theministers of the euro area Member States,the ECB and the ministers and central bankgovernors of Denmark and Greece decide,following a common procedure, to revaluethe central rate of the Greek drachma in theexchange rate mechanism (ERM II) by 3½%,with effect from 17 January 2000.
20 January 2000
The Governing Council of the ECB decidesthat the interest rates on the main refinancingoperations, the marginal lending facility andthe deposit facility will remain unchanged at3.0%, 4.0% and 2.0% respectively.
It also announces that the Eurosystem intendsto allot an amount of €20 billion for each ofthe longer-term refinancing operations to beconducted in the first half of 2000. Thisamount takes into consideration the expectedliquidity needs of the banking system of theeuro area in the first half of 2000 and thedesire of the Eurosystem to continue toprovide the bulk of its refinancing of thefinancial sector through its main refinancingoperations.
3 February 2000
The Governing Council of the ECB decidesto raise the interest rate on the mainrefinancing operations of the Eurosystem by0.25 percentage point to 3.25%, starting fromthe operation to be settled on 9 February2000. In addition, it decides to increase theinterest rates on both the marginal lendingfacility and the deposit facility by 0.25percentage point, to 4.25% and 2.25%respectively, both with effect from 4 February2000.
17 February, 2 March 2000
The Governing Council of the ECB decidesthat the interest rates on the main refinancingoperations, the marginal lending facility andthe deposit facility will remain unchanged at3.25%, 4.25% and 2.25% respectively.
16 March 2000
The Governing Council of the ECB decidesto raise the interest rate on the mainrefinancing operations of the Eurosystem by0.25 percentage point to 3.5%, starting fromthe operation to be settled on 22 March2000. In addition, it decides to increase theinterest rates on both the marginal lendingfacility and the deposit facility by 0.25percentage point, to 4.5% and 2.5%respectively, both with effect from 17 March2000.

181ECB Annua l Repor t • 1999
Documents published by theEuropean Central Bank (ECB)
This list is designed to inform readers about selected documents published by the EuropeanCentral Bank. The publications are available to interested parties free of charge from thePress Division. Please submit orders in writing to the postal address given on the back of thetitle page.
For a complete list of documents published by the European Monetary Institute, please visitthe ECB’s website (http://www.ecb.int).
Annual Report
“Annual Report 1998”, April 1999.
Monthly Bulletin
Articles published from January 1999 onwards:
“The euro area at the start of Stage Three”, January 1999.
“The stability-oriented monetary policy strategy of the Eurosystem”, January 1999.
“Euro area monetary aggregates and their role in the Eurosystem’s monetary policy strategy”,February 1999.
“The role of short-term economic indicators in the analysis of price developments in theeuro area”, April 1999.
“Banking in the euro area: structural features and trends”, April 1999.
“The operational framework of the Eurosystem: description and first assessment”, May 1999.
“The implementation of the Stability and Growth Pact”, May 1999.
“Longer-term developments and cyclical variations in key economic indicators acrosseuro area countries”, July 1999.
“The institutional framework of the European System of Central Banks”, July 1999.
“The international role of the euro”, August 1999.
“The balance sheets of the Monetary Financial Institutions of the euro area in early 1999”,August 1999.
“Inflation differentials in a monetary union”, October 1999.
“ESCB preparations for the year 2000”, October 1999.
“Stability-oriented policies and developments in long-term real interest rates in the 1990s”,November 1999.
“TARGET and payments in euro”, November 1999.
“Legal instruments of the European Central Bank”, November 1999.
“The euro area one year after the introduction of the euro: key characteristics and changesin the financial structure”, January 2000.
“Foreign exchange reserves and operations of the Eurosystem”, January 2000.

ECB Annua l Repor t • 1999182
“The Eurosystem and the EU enlargement process”, February 2000.
“Consolidation in the securities settlement industry”, February 2000.
Working Paper Series
1 “A global hazard index for the world foreign exchange markets” by V. Brousseau andF. Scacciavillani, May 1999.
2 “What does the single monetary policy do? A SVAR benchmark for the European CentralBank” by C. Monticelli and O. Tristani, May 1999.
3 “Fiscal policy effectiveness and neutrality results in a non-Ricardian world” by C. Detken,May 1999.
4 “From the ERM to the euro: new evidence on economic and policy convergence amongEU countries” by I. Angeloni and L. Dedola, May 1999.
5 “Core inflation: a review of some conceptual issues” by M. Wynne, May 1999.
6 “The demand for M3 in the euro area” by G. Coenen and J.-L. Vega, September 1999.
7 “A cross-country comparison of market structures in European banking” by O. de Bandtand E. P. Davis, September 1999.
8 “Inflation zone targeting” by A. Orphanides and V. Wieland, October 1999.
9 “Asymptotic confidence bands for the estimated autocovariance and autocorrelationfunctions of vector autoregressive models”, by G. Coenen, January 2000.
10 “On the effectiveness of sterilized foreign exchange intervention”, by R. Fatum,February 2000.
11 “Is the yield curve a useful information variable for the Eurosystem?” by J. M. Berk andP. van Bergeijk, February 2000.
12 “Indicator variables for optimal policy” by L. E. O. Svensson and M. Woodford,February 2000.
13 “Monetary policy with uncertain parameters” by U. Söderström, February 2000.
14 “Assessing nominal income rules for monetary policy with model and data uncertainty”by G. D. Rudebusch, February 2000.
Other publications
“The TARGET service level”, July 1998.
“Report on electronic money”, August 1998.

183ECB Annua l Repor t • 1999
“Assessment of EU securities settlement systems against the standards for their use in ESCBcredit operations”, September 1998.
“Money and banking statistics compilation guide”, September 1998.
“The single monetary policy in Stage Three: General documentation on ESCB monetarypolicy instruments and procedures”, September 1998.
“Third progress report on the TARGET project”, November 1998.
“Correspondent central banking model (CCBM)”, December 1998.
“Payment systems in the European Union: Addendum incorporating 1997 figures”,January 1999.
“Possible effects of EMU on the EU banking systems in the medium to long term”,February 1999.
“Euro area monetary aggregates: conceptual reconciliation exercise”, July 1999.
“The effects of technology on the EU banking systems”, July 1999.
“Payment systems in countries that have applied for membership of the European Union”,August 1999.
“Improving cross-border retail payment services: the Eurosystem’s view”, September 1999.
“Compendium: collection of legal instruments, June 1998 – May 1999”, October 1999.
“European Union balance of payments/international investment position statistical methods”,November 1999.
“Money and Banking Statistics Compilation Guide, Addendum I: Money market paper”,November 1999.
“Money and Banking Statistics Sector Manual”, second edition, November 1999.
“Report on the legal protection of banknotes in the European Union Member States”,November 1999.
“Correspondent central banking model (CCBM)”, November 1999.
“Cross-border payments in TARGET: A users’ survey”, November 1999.
“Payment systems in the European Union: Addendum incorporating 1998 figures”,February 2000.
Information brochures
“TARGET”, July 1998.
“The euro banknotes and coins”, July 1999.
“TARGET: facts, figures, future”, September 1999.

ECB Annua l Repor t • 1999184

AN
NU
AL
RE
PO
RT
19
99
EU
RO
PE
AN
CE
NT
RA
L B
AN
KE
N
EC
B
EZ
B
EK
T
BC
E
EK
P
A N N U A LR E P O R T
1999