Embed Size (px)
Citation preview

ANNUAL RADIOLOGICAL ENVIRONMENTAL OPERATING REPORT
BRONNS FERRY NUCLEAR PLANT
1994
TENNESSEE VALLEY AUTHORITY
ENVIRONMENTAL RADIOLOGICAL MONITORING AND INSTRUMENTATION
Apri 1 1995
e505030|57PDR ADOCKR
95042705000259
PDR

U
t
W~

TABLE OF CONTENTS
Table of Contents .
List of Tables iv
List of Figures .
Executive Summary .
IntroductionNaturally Occurring and Background RadioactiviElectric Power Production
ty .
v
225
Site/Plant Description
Environmental Radiological Monitoring Program .
Direct Radiation Monitoring .
Measurement Techniques ~
Results
8
10
141416
Atmospheric MonitoringSample Collection and Analysis .
Results
~ ~ ~ 191921
Terrestrial MonitoringSample Collection and Analysis .
Results
222224
Aquatic MonitoringSample Collection and Analysis .
Results
Assessment and Evaluation .
Resul tsConclusions
262628
31
3234
References
Appendix A Environmental RadiologicalSampling Locations
Appendix B 1994 Program Modifications
Monitoring Program and
35
40
53


Appendix C Program Deviations.
Appendix D Analytical Procedures .
Appendix E Nominal Lower Limits of Detection '(LLD)
55
58
61
Appendix F Quality Assurance/Quality Control Program . . . . ". . . 67
Appendix G
Appendix H
Land Use Survey .
Data Tables . .
77
83

LIST OF TABLES
Table 1
Table 2
Comparison of Maximum Annual Average EffluentConcentrations Released to Unrestricted Areas HithReporting Levels and Lower Limits of Detection . . . . . 36
Maximum Dose Due to Radioactive EffluentReleases . . . . . . . . . . . . . . . . . . . . . . . . 37

LIST OF FIGURES
Figure 1 Tennessee Valley Region . . . . . . . . . . . . . . . . . 38
Figure 2 Environmental Exposure Pathways of Man Oue to Releasesof Radioactive Haterial to the Atmosphere and Lake . . . 39

EXECUTIVE SUMMARY
This report describes the environmental radiological monitoring program
conducted by TVA in the vicinity of Browns Ferry Nuclear Plant (BFN) in
1994. The program includes the collection of samples from the
environment and the determination of the concentrations of radioactive
materials in the samples. Samples are taken from stations in the general
area of the plant and from areas not influenced by plant operations.
Station locations are selected after careful consideration of the weather
patterns and projected radiation doses to the. various areas around the
plant. Material sampled includes air, water, milk, foods, vegetation,
'oil, fish, sediment, and direct radiation levels. Results from stations
near the plant are compared wi.th concentrations from control stations and
with preoperational measurements to determine potential impacts of plant
operations.
The vast majority of the exposures calculated from environmental samples
were contributed by naturally occurring radioactive materials or from
materials commonly found in the environment as a result of atmospheric
nuclear weapons fallout..-
Small amounts of Co-60 and Cs-134 were found in sediment samples
downstream from the plant. This activity in stream sediment would result
in no measurable increase over background in the dose to the general
public.


INTRODUCTION
This report describes and summarizes a large volume of data, the results of
thousands of measurements and laboratory analyses. The measurements are made
to comply with the requirements of 10 CFR 50, Appendix A, Criterion 64 and
10 CFR 50, Appendix I, Section IV.B, and to determine potential effects on
public health and safety. This report satisfies the annual reporting
requirements of BFN Technical Specification 6..9.1.5 and Offsite Dose
Calculation Manual (ODCM) Administrative Control 5.1. In addition, estimates
of the maximum potential doses to the surrounding population are made from/
radioactivity measured both in plant effluents and in environmental samples.
Some of the data presented are prescribed by specific requirements while other
data are included which may be useful or interesting to individuals who do not
work with this material routinely.
Naturall Occurrin and Back round Radioactivi t
Most materials in our world contain trace amounts of naturally occurring
radioactivi,ty. Approximately 0.01 percent of all potassium is radioactive
potassium-40. Potassium-40 (K-40), with a half-life of 1.3 billion years, is
one of the major types of radioactive materials found naturally in our
environment. An individual weighing 150 pounds contains about 140 grams of
potassium (Reference 1). This is equivalent to approximately 100,000 pCi of
K-40 which delivers a dose of 15 to 20 mrem per year to the bone and soft
tissue of the body. Naturally occurring radioactive materials have always
been in our environment. Other examples of naturally occurring radioactive
materials are beryllium (Be)-7, bismuth (Bi)-212 and 214, lead (Pb)-212 and,
214, thallium (Tl)-208, actinium (Ac)-228, uranium (U)-238, uranium-235,

0

thorium (Th)-234, radium (Ra)-226, radon (Rn)-222, carbon (C)-14, and
hydrogen (H)-3 (generally called tritium). These naturally occurring
radioactive materials are in the soil, our food, our drinking water, and our
bodies. The radiation from these materials makes up a part of'he low-level
natural background radiation. The remainder of the natural background
radiation comes from outer space. We are all exposed to this natural
radiation 24 hours per day.
The average dose equivalent at sea level resulting from radiation from outer
space (part of natural background radiation) is about 27 mrem/year. This
essentially doubles with each 6600-foot increase in altitude in the lower
atmosphere. Another part of natural background radiation comes from naturally
occurring radioactive materials in the soil and rocks. Because the quantity
of naturally occurring radioactive material varies according to geographical
location, the part of the natural background radiation coming from this
radioactive material also depends upon the geographical location. Most of the
remainder of the natural background radiation comes from the radioactive
.materials within each individual's body, We absorb these materials from the
food we eat which contains naturally occurring radioactive materials from the
soil. An example of this is K-40 as described above. Even building materials
affect the natural background radiation levels in the environment. Living or
working in a building which is largely made of earthen material, such as
concrete or brick, will generally result in a higher natural background
radiation level than would exist if the same structure were made of wood.
This is due to the naturally occurring radioisotopes in the concrete or brick,
such as trace amounts of uranium, radium, thorium, etc.


Because the city of Denver, Colorado, is over 5000 feet in elevation and the
soil and rocks there contain more radioactive material than the U.S. average,
the people of Denver receive around 350 mrem/year total natural background'h/
radiation dose equivalent compared to about 295 mrem/year for the national
average. People in some locations of the world receive over 1000 mrem/year
natural background radiation dose equivalent, primarily because of the greater
quantity of radioactive materials in the soi 1 and rocks in those locations.
Scientists have never been able to show that these levels of radiation have
caused physical harm to anyone.
It is possible to get an idea of the relative hazard of different types of
radiation sources by evaluating the amount of radiation the U.S. population
receives from each general type of radiation source. The information below ist primarily adapted from References 2 and 3.
U.S. GENERAL POPULATION AVERAGE DOSE EQUIVALENT ESTIMATES
Source Hi 1 1 irem/Year Per Person
Natural background dose equivalentCosmicCosmogenicTerrestrialIn the body-Radon
Total
271
2839
200295
Release of radioactive material innatural gas, mining, ore processing, etc.
Medical (effective dose equivalent)
Nuclear weapons fallout
Nuclear energy
Consumer products
Total
53
less than 1
0.28
0.03
355 (approximately)

0
'I

As can be seen from the table on the preceeding page, natural background
radiation dose equivalent to the U.S. population normally exceeds that from
nuclear plants by several hundred times. This indicates that nuclear plant
operations normally result in a population radiation dose equi'valent which is
insignificant compared to that which results from natural background
radiation. It should be noted that the use of radiation and radioactive
materials for medical uses has resulted in a similar effective dose equivalent
to the U.S. population as that caused by natural background cosmic and
terrestrial radiation.
Significant discussion recently has centered around exposures from radon.
Radon is an inert gas given off as a result of the decay of naturally
occurring radium-226 in soil. Nhen dispersed in the atmosphere, radon'I
concentrations are relatively low. However, when the gas is trapped in closed
spaces, it can build up unti 1 concentrations become significant. The National
Council of Radiation Protection and Measurements (Reference 2) has estimated
that the average annual effective dose equivalent from radon in the United
States is approximately 200 mrem/year. This estimated dose is approximately
twice, the average dose. equivalent from all other natural background sources.
Electric Power Production
Nuclear power plants are similar in many respects to conventional coal burning
(or other fossil fuel) electrical generating plants. The basic process behind
electrical power production in both types of plants is that fuel is used to
heat water to produce steam which provides the force to turn turbines and
generators. However, nuclear plants include many complex systems 'to control


the nuclear fission process and to safeguard against the possibility of
reactor malfunctio'n, which could lead to the release of radioactive
materials. Very small amounts of these fission and activation products are
released into the plant systems. This radioactive material can be transported
throughout plant systems and some of it released to the environment..
All paths, through which radioactivity is released are monitored. Liquid and
gaseous effluent monitors record the radiation levels for each release. These
monitors also provide alarm mechanisms to prompt termination of any release
above limits.
Releases are monitored at the onsi te points of release and through an
environmental monitoring program which measures the environmental radiation in
outl'ying areas around the plant. In this way, not only is .the release of
'radioactive materials from the plant tightly controlled, but measurements are
made in surrounding areas to verify that the population is not being exposed
to significant levels of radiation or radioactive materials.
The BFN ODCM, which is required by the plant Technical Specifications,
prescribes limits-for the 'release of radioactive effluents, as well as limits
for doses to the general public from the release of these effluents.
The dose to a member of the general public from radioactive materials released
to unrestricted areas, as given in NRC guidelines and in the ODCM, is limited
as follows:

0

Li uid Effluents
Total bodyAny organ
Gaseous Effluents
<3 mrem/year<10 mrem/year
Noble gases:
Gamma radiationBeta radiation
<10 mrad/year<20 mrad/year
Particulates:
Any organ <15 mrem/year
The Environmental Protection Agency (EPA) limits for the total dose. to the
public in the vicinity of a nuclear power plant, established in the
Environmental Dose Standard of 40 CFR 190, are as follows:
Total bodyThyroidAny other organ
25 mrem/year75 mrem/year25 mrem/year
10 CFR 20.1302(b) presents annual average limits for the concentrations of
radioactive materials released in gaseous and liquid effluents at the boundary
of the unrestricted areas. Table 1 of this report presents the annual average
concentration limits for the principal radionuclides associated with nuclear
power plant effluents. This table also presents (1) the concentrations of
radioactive materials in the environment which would require a special report
to the NRC and (2) the detection limits for. the listed radionuclides. Itshould be noted that the levels of radioactive materials measured in the
environment are typically below or only slightly above the lower limit of
detection. The data presented in this report indicate compliance wi th the
regulation.


SITE/PLANT DESCRIPTION
Browns Ferry Nuclear Plant (BFN) is located on the north shore of Wheeler,
'eservoir at Tennessee River Mile 294 in Limestone County in north Alabama.
Wheeler Reservoir averages 1 to 1-1/2 miles in width in the vicinity of the
plant. The site, containing approximately 840 acres, is approximately 10
miles southwest of Athens, Alabama, and 10 miles northwest of the center "of
Decatur, Alabama (Figure 1). The dominant character of land use is small,
scattered villages and homes in an agricultural area. A number of relatively
large farming operations occupy much of the land on the north side of the
river immediately surrounding the plant. The principal crop grown in the
area is cotton. At least two dairy farms are located within a 10-mile radius
of the plant.
Approximately 2500 people live within a 5-mile radius of the plant. The town
of Athens has a population of about 15,000, while approximately 45,000 people
li've in the city of Decatur. The largest city in the area with approximately
145,000 people is Huntsville, Alabama, located about 24 miles east of the site.
Area recreation facilities are being developed along the Tennessee River. The
nearest facilities are two county parks located about 8 miles west-northwest
of the site and a commercial boat dock across the river from the site. The
city of Decatur has developed'a large municipal recreation area., Point Mallard
Park, approximately 15 miles upstream from the site. The Tennessee River is
also a popular sport fishing area.

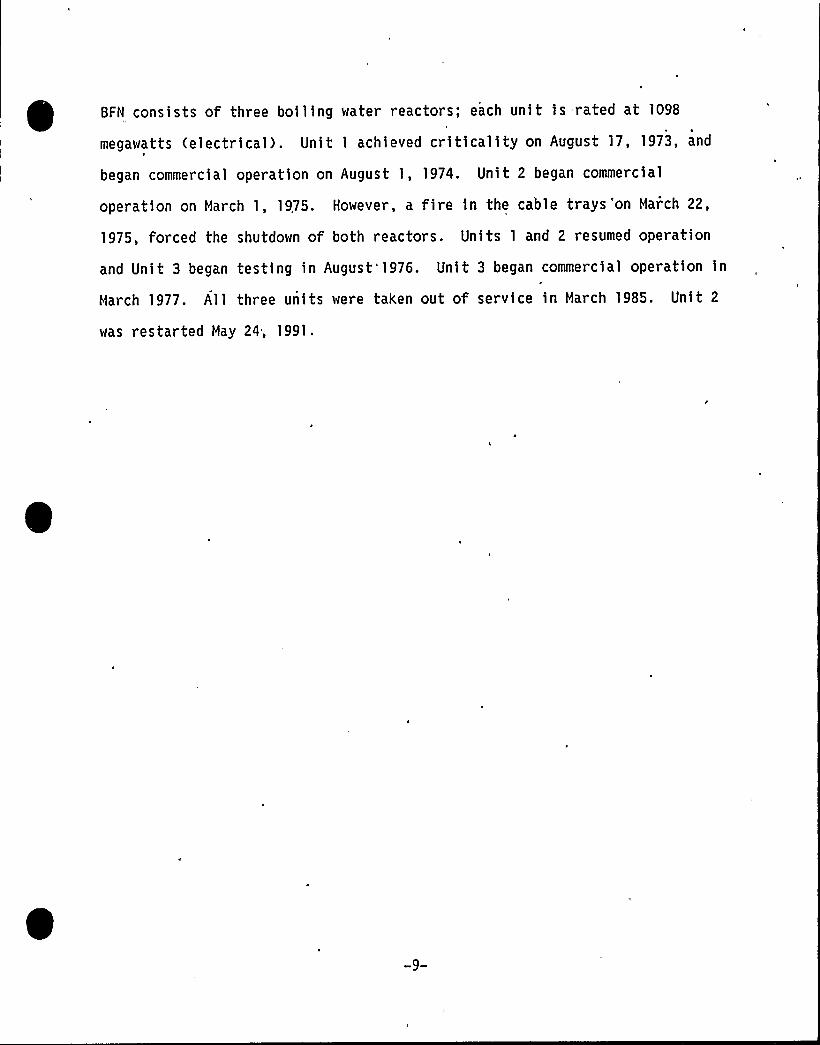
BFN consists of three boiling water reactors; each unit is =rated at 1098
megawatts (electricai). Unit 1 achieved criticality on August 17, 1973, and
began commercial operation on August 1, 1974. Unit 2 began commercial
operation on March 1, 1975. However, a fire in the cable trays 'on March 22,
1975, forced the shutdown of both reactors. Units 1 and 2 resumed operation
and Unit 3 began testing in August"1976. Unit 3 began commercial operation in
March 1977. All three units were taken out of service in March 1985. Unit 2
was restarted May 24, 1991 '
ENVIRONMENTAL RADIOLOGICAL MONITORING PROGRAM
The unique environmental concern associated with a nuclear power plant is its
production of radioactive materials and radiation. The vast majority'of this
radiation and radioactivity is contained within the reactor itself or one of
the other plant systems designed to keep the material in the plant. The
retention of the materials in each level of control is achieved by system
engineering, design, construction, and operation. Environmental monitoring is
a final verification that the systems are performing as planned. The
'monitoring program is designed to check the pathways between the plant and the
people in the immediate vicinity and to most efficiently monitor these
pathways. Sample types are chosen so that the potential for detection of
radioactivity in the environment will be maximized. The environmental
radiological monitoring program is outlined in Appendix A.
There are two primary pathways by which radioactivity can move through the
environment to humans'. air and water (see Figure 2). The air pathway can be
separated into two components: the direct (airborne) pathway and the indirect
(ground or terrestrial) pathway. The direct airborne pathway consists of
direct radiation and inhalation by humans. In the terrestrial pathway,
radioactive materials may be deposited on the ground or on plants and
subsequently be ingested by animals and/or humans. Human exposure through the
liquid pathway may result from drinking water, eating fish, or by direct
exposure at the shoreline. The types of samples collected in this program are
designed to monitor these pathways.
-10-


A number of factors were considered in determining the locations for
collecting environmental samples. The locations for the atmospheric
monitoring stations were determined from a critical pathway analysis based on
weather patterns, dose projections, population distribution, and land use.
Terrestrial sampling stations were selected after reviewing such things as the
locations of dairy animals and gardens in coqjunction with the air pathway
analysis. Liguid pathway stations were selected based on dose projections,
water use information, and availability of media such as fish and sediment.
Table A-2 (Appendix A, Table 2: This identification system is used for all
tables and figures given in the appendices.) lists the sampling stations and
the types of samples collected from each. Modifications made to the program
in 1994 are described in Appendix B and exceptions to the sampling and
analysis schedule are presented in Appendix .C.
To determine the amount of radioactivity in the environment prior to the
operation of BFN, a preoperational environmental radiological monitoring
program was initiated in 1968 and operated until the plant began operation in
1973. Measurements of the same types of radioactive materials that are
measured currently were assessed during the preoperational phase to establish
normal background levels for various radionuclides in the environment.
The preoperational monitoring program is a very important part of the overall
program. During the 1950s, 60s, and 70s, atmospheric nuclear weapons testing
'eleasedradioactive material to the environment causing fluctuations in
background radiation levels. This radioactive material is the same type as
that produced in the BFN reactors. Preoperational knowledge of preexisting
radionuclide patterns in the environment permits a determination, through
-11-

comparison and trending analyses, of whether the operation of BFN is impacting
the environment arid thus the surrounding population.
The determination of impact during the operating phase also considers the
presence of control stations that have been established in the environment.
Results of environmental samples taken at control stations (far from the
plant) are compared with those from indicator stations (near the plant) to
establish the extent, of BFN influence.
All samples are analyzed by the Radioanalytical Laboratory of TVA's
Environmental Radiological Monitoring and Instrumentation Department located
at the Hestern Area Radiological Laboratory (HARL) in Muscle Shoals, Alabama.
All analyses are conducted in accordance with written and approved procedures
and are based on accepted methods. A summary of the analysis techniques and
methodology is presented in Appendix D. Data tables summarizing the sample
analysis results are presented in Appendix H.
The sophisticated radiation detection devices used to determine the
radionuclide content of samples collected in the environment are generally
quite sensitive to small amounts of radioactivity. In the field of radiation
measurement, the sensitivity of the measurement process is discussed in terms
of the lower limit of detection (LLD). A description of the nominal LLDs for
the Radioanalytical Laboratory is presented in Appendix E.
The Radioanalytical Laboratory employs a comprehensive quality assurance/
-12-


year. The program is intended to detect any problems in the measurement
process as soon as'ossible so they can be corrected. This program includes
equipment checks to ensure that the complex radiation detection devices are
working properly and the analysis of special samples which are included
alongside routine environmental samples. The laboratory participates in the
EPA Interlaboratory Comparison Program. In addition, samples split with the
EPA and the State of Alabama provide an independent verification of the
overall performance of the laboratory. A complete description of the program
is presented in Appendix F.
-13-

DIRECT RADIATION MONITORING
Direct radiation levels are measured at a number of stations around the plant
site. These measurements include contributions from cosmic radiation',
radioactivity in the ground, fallout from atmospheric nuclear weapons tests
conducted in the past, and radioactivity that may be present as a result of
plant operations. Because of the relative large variations in background
radiation as compared to the small levels from the plant, contributions from
the plant may be difficult to distinguish.
Radiation levels measured in the area around the BFN site in 1994 were
consistent with levels from previous years and with levels measured at other
locations in the region.
Measurement Techni ues
Direct radiation measurements are made with thermoluminescent dosimeters
(TLDs). When certain materials are exposed to ionizing radiation, many of the
electrons which become displaced are trapped in the crystalline structure of
the material. They remain trapped for long periods of time as long as the
material is not heated. When heated (thermo-), the electrons are released,
producing a pulse of light (-luminescence). The intensity of the light pulse
is proportional to the amount of radiation to which the material was exposed.
Materials which display these characteristics are used in the manufacture of
TLDs.
from 1968 through 1989, TVA used a Victoreen dosimeter consisting of a


manganese activated calcium fluoride (Ca>F:Mn) TLD material encased in a glass
bulb. In 1989., TVA began the process of changing from the Victoreen dosimeter
to the Panasonic Model UD-814 dosimeter, and completely changed to the
Panasonic dosimeter in 1990. This dosimeter contains four elements consisting
of one lithium borate and three calcium sulfate phosphors. The calcium
sulfate phosphors are shielded by approximately 1000 mg/cm'lastic and lead
to compensate for the over-response of the detector to low energy radiation.
The TLDs are placed approximately 1 meter above the ground, with three TLDs at
each station. Sixteen stations are located around the plant near the site
boundary, one station in each of the sixteen compass sectors. Dosimeters are
also placed at the perimeter and remote air monitoring sites and at 19
additional stations out to approximately 32 miles from the site. The TLDs are
exchanged every 3 months and the accumulated exposure on the detectors is read
with a Panasonic Model UD-710A automatic reader interfaced with a Hewlett
Packard Model 9000 computer system. Seven of the locations also have TLD
devices processed by the NRC. The results from the NRC measurements are
reported in NUREG 0837.,
Since the calcium sulfate phosphor is much more sensitive than the lithium
borate, the measured exposure is taken as the median of the results obtained
from the nine calcium sulfate phosphors in three detectors. The values are
corrected for gamma response, system variations, and transit exposure, with
individual gamma response calibrations for each element. The system meets or
exceeds the performance specifications outlined in Regulatory Guide 4.13 for
environmental applications of TLDs.
-15-

Results
All results are normalized to a standard quarter (91.25 days or 2190 hours).
The stations are grouped according to the distance from the plant. The firstgroup consists of all stations within 1 mile of the plant. The second group
lies between 1 and 2 miles, the third group between 2 and 4 miles, the fourth
between 4 and 6 miles, and the fifth group is made up of all stations more
than 6 miles from the plant. Past data 'have shown that the average results
from all. groups greater than 2 miles from the plant are essentially the same.
Therefore, for purposes of this report, all stations 2 miles or less from the
plant are identified as "onsite" stations and all others are considered
"offsite."
Prior to 1976, direct radiation measurements in the environment were made witht dosimeters that were not as precise at lower exposures. Consequently, the
environmental radiation levels reported in th'e preoperational phase of the
monitoring program exceed current measurements of background radiation
levels. For this reason, data collected prior to. 1976 are not included in'
this report. For comparison purposes, direct radiation measurements made in
the Hatts Bar Nuclear Plant (NBN) environmental radiological monitoring
program are referenced. The NBN is a non-operating plant under construction
near Spring City, Tennessee.
The quarterly gamma radiation levels determined from the TLDs deployed around
BFN in 1994 are summarized in Table H-1. The results from all measurements at
individual stations are presented in Table H-2. The exposures are measured in
mi lliroentgens and reported in millirem per standard quarter. For purposes of
-16-

this report, one milliroentgen and one millirem (mrem) are assumed to be
equivalent. The rounded average annual exposures are shown below.
Annual AverageDirect Radiation Levels
mrem/ earBFN WBN
Onsite Stations
Offsite Stations
68
60
65
58
The data in Table H-1 indicate that the average quarterly radiation levels at
the BFN onsite stations are approximately 2 mrem/quarter higher than levels at
the offsite stations. This difference is also not'ed at the stations at WBN
and other nonoperating nuclear power plant construction sites where the
average levels onsite are generally 2-6 mrem/quarter higher than levels
offsite. The causes of these differences have not been isolated; however, itis postulated that the differences are probably attributable'o combinations
of influences such as natural variations in e'nvironmental radiation levels,
earth-moving activities onsite, and the mass of concrete employed in the
construction of the plant. Other undetermined influences m'ay also play a
part. These conclusions are supported by the fact that similar differences
between onsite and offsite stations are currently observed in the vicinity of
the WBN construction si te.
Figure H-1 compares plots of the environmental gamma radiation levels from the
onsite or site boundary stations with those from the offsite stations over the
period from 1976 through 1994. To reduce the seasonal variations present in
the data sets, a 4-quarter moving average was constructed for each data set.
Figure H-2 presents a trend plot of the direct radiation levels as defined by
-17-

the moving averages. The data follow the same general trend as the raw data,
but the curves are much smoother. Figures H-3 and H-4 depict the
environmental gamma radiation levels measured during the construction of TVA's
HBN to the present. Note that the data follow a similar pattern to the BFN
data and that, as discussed above, the levels reported at onsite stations are
similarly higher than the levels at offsi te stations.
All results reported in 1994 are consistent with direct radiation levels
identified at locations which are not influenced by the operation of BFN.
" There is no indication that BFN .activities increase the background radiationN
levels normally observed in the areas surrounding the plant.
-18-

ATMOSPHERIC MONITORING
The atmospheric monitoring network is divided into three groups identified as
local, perimeter, and remote. In the current program, five local air
monitoring stations are located on or adjacent to the plant site in the
general directions of greatest wind frequency. One additional station
(station LM-4) is located at the point of maximum predicted offsite
concentration of radionuclides based on preoperational meteorological data.
Three perimeter air monitoring stations are located in communities out to
about 13 miles from the plant, and two remote air monitors are located out to
32 miles. The monitoring program and the locations of monitoring stations are
identified in the tables and figures of Appendix A. The remote stations are
used as control or baseline stations.
Results from the analysis of samples in the atmospheric pathway are presented
in Tables H-3 and H-4. Radioactivity levels identified in this reporting
period are consistent with background and radionuclides produced as a result
of fallout from previous nuclear weapons tests. There is no indication of an
increase in atmospheric radioactivity as a result of BFN.
Sam le Collection and Anal sis
Air particulates are collected by continuously sampling air at a flow rate of
approximately 2 cubic feet per minute (cfm) through a 2-inch Hollingsworth and
Vose LB5211 glass fiber filter. The sampling system consists of a pump, a
magnehelic gauge for measuring the drop in pressure across the system, and a
dry gas meter. This allows an accurate determination of the volume of air
passing through the filter.-19-


This system is housed in a building approximately 2 feet by 3 feet by 4 feet.
The filter is cont'ained in a sampling head mounted on the outside of the
monitor building. The filter is replaced every 7 days. Each filter is
analyzed for gross beta activity about 3 days after collection'o allow time
for the radon daughters to decay. Every 4 weeks composites of the filters
from each location are analyzed by gamma spectroscopy.
On March. 27, 1989, two monitors, one local and one remote, were equipped with
a second sampler. The filters from these samplers are analyzed weekly for
gross alpha and composited quarterly for analysis of transuranic isotopes and
for Sr-89,90.
Gaseous radioiodine is collected using a commercially available cartridge
containing TEDA-impregnated charcoal. This system is designed to collect
iodine in both the elemental form and as organic compounds. The cartridge is
located in the same sampling head as the air particulate filter and is
downstream of the particulate filter. The cartridge is changed at the same
time as the particulate filter and samples the same volume of air. Each
cartridge is analyzed for I-131 by a complete gamma spectroscopy analysis.
Rainwater is collected by use of a collection tray attached to the monitor
building. The collection tray is protected from debris by a screen cover. As
water drains from the tray, it is collected in one of two 5-gallon jugs inside
the monitor building. A 1-gallon sample is removed from the conta'incr every 4
weeks. Any excess water is discarded. Samples are held to be analyzed only
if the air particulate samples indicate the presence of elevated activity
-20-

III

I
levels or if fallout is expected. For example, rainwater samples were
analyzed during the period of fallout following the accident at Chernobyl in
1986.
Results
The results from the analysis of air particulate samples are summarized in
Table H-3. Gross beta activity in 1994 was consistent with levels reported in
previous years'he average level at indicator stations was 0.019pCi/m'hile
the average at control stations was 0.020 pCi/m'. The annual averages
of the gross beta activity in air particulate filters at these stations for
the years 1968-1994 are presented in Figure H-5. Increased levels due to
fallout from atmospheric nuclear weapons testing are evident, especially in
1969, 1970, 1971, 1977, 1978, and 1981. Evidence of a small increase
resulting from the Chernobyl accident can also be seen in 1986. These
patterns are consistent with data from monitoring programs conducted by TVA at
nonoperating nuclear power plant construction sites.
Only natural radioactive materials were identified by the monthly gamma
spectral analysis of the air particulate samples. No fission or activation
products or transuranic isotopes were found at levels greater than the LLDs.
As shown in Table H-4, iodine-131 was not detected in any of the charcoal
canister samples collected in 1994.
Since no plant-related air activity was detected, no rainwater samples from
the vicinity of BFN were analyzed during this reporting period.
-21-

0

TERRESTRIAL MONITORING
Terrestrial monitoring is accomplished by collecting samples of environmental
media that may transport radioactive material from the atmosphere to humans.
For example, radioactive material may be deposited on a vegetable garden and
be ingested along with the vegetables or it may be deposited on pasture grass
where dairy cattle are gr'azing. When the cow ingests the radioactive
material, some of it may be transferred to the milk and consumed by humans who
drink the milk. Therefore, samples of milk, vegetation, soil, and food crops
are collected and analyzed to determine the potential impacts from exposure to
this pathway. The
results�
.from the analysis of these samples are shown in
Tables H-5 through H-14.
t A land use survey is conducted annually to locate milk, producing animals and
gardens within a 5-mile radius of the plant. Only one dairy farm is located
in this area; however, one additional dairy farm has been identified within 7
miles of the plant. These two dairies are considered indicator stations and
routinely provide milk samples. No other milk-producing animals have been
identified within 3 miles of the plant. The results of the 1994 land use
survey are presented in Appendix G.
Sam le Collection and Anal sis
Milk samples are purchased every 2 weeks from two dairies within 7 miles of
the plant and from at least one of two control farms. These samples are
placed on ice for transport to the radioanalytical laboratory. A specific
a nalysis for I-131 and a gamma spectral analysis are performed on each sample
and Sr-89,90 analysis is performed every 4 weeks.
-22-

Samples of vegetation are collected every 4 weeks for I-131 analysis. TheII
samples are collected from one farm which previously produced milk and from
one control dairy farm. The samples are collected by cutting or breaking
enough vegetation to provide between 100 and 200 grams of sample. Care is
taken not to include any soil with the vegetation. The sample is placed in a
container with 1650 ml of 0.5 N NaOH for transport back to the radioanalytical
laboratory. A second sample of between 750 and 1000 grams is also collected
from each location. After drying and grinding, this sample is analyzed by
gamma spectroscopy. Once each quarter, the sample is ashed after the gamma
analysis is completed and analyzed for Sr-89,90.
Soil samples are collected annually from the air monitoring locations. The
samples are collected with either a "cookie cutter" or an auger type sampler.
After drying and grinding, the sample is analyzed by gamma spectroscopy. Hhen
the gamma analysis is complete, the sample is ashed and analyzed for
Sr-89,90. Analyses for transuranic isotopes are also performed on samples
from the two monitoring stations with the second air samplers.1
Samples representative of food crops raised in the area near the plant are
obtained from individual gardens, corner markets, or cooperatives. Types of
foods may vary from year to year as a result of changes in the local vegetable
gardens. In 1994 samples of cabbage, corn, peas, potatoes, and tomatoes were
collected from local vegetable gardens'n addition, samples of apples and
beef were also obtained from the area. The edible portion of each sample is
analyzed by gamma spectroscopy.
-23-


Results
The results from the analysis of milk samples are presented in Table H-5. No
radioactivity which could be attributed to BFN was identified. All I-131
results were less than the established nominal LLD of 0.4 pCi/liter.
Strontium-90 was found in seven of the samples. These levels are consistent
with concentrations measured in samples collected prior to plant operation and
with concentrations repor'ted in milk as a result of fallout from atmospheric
nuclear weapons tests (Reference 1). Figure H-6 displays the average Sr-90
concentrations measured in milk since 1968. The concentrations 'have steadily
decreased as a result of the 28-year half-life of Sr-90 and the washout and
transport of the element through the soil over the period. The average Sr-90
concentration reported from indicator locations in 1994 was 2.5 pCi/liter; the
concentration from control stations was also approximately 2.5 pCi/liter. By
far the predominant isotope reported in milk samples was the naturally
occurring K-40. An average of approximately 1300 pCi/liter of K-40 was4
identified in all milk samples.
Similar results were reported for vegetation samples (Table H-6). All I-131
and Cs-137 values were less than the nominal LLD. Strontium-90 was identified
in four of the eight samples. The maximum concentration at the indicator
station was approximately 29 pCi/Kg while the maximum concentration at the
control station was 14 pCi/Kg. Again, the largest concentrations identified
were for the naturally occurring isotopes K-40 and Be-7.
The only fission or activation products identified in soil samples was
Cs-137. The maximum concentration was approximately 0.6 pCi/g. These
-24-


concentrations are consistent with levels previously reported from fallout.
All other radionuclides reported were naturally occurring isotopes (Table H-7).
A plot of the annual average Cs-137 concentrations in soil is presented in
Figure H-7. Like the levels of Sr-90 in milk, concentrations of Cs-137 in
soil are steadily decreasing as a result of the cessation of weapons testing
in the atmosphere, the 30-year half-life of Cs-137 and transport through the
environment.
Analyses for transuranic isotopes (Am-241; Pu-238; Pu-239,240; Cm-242; and
Cm-244) in soil have been performed since 1989. The results have generally
agreed with the concentrations reported by the Electric Power Research
Institute (EPRI) in Reference 4. The EPRI report concludes that essentially
all of the radionuclides in soils from around the nuclear power plants
participating in the study (including BFN) were of fallout origin and that the
variations in concentrations were a function of soil texture, soil
permeability, and/or disturbances of the soil surface . The concentrations
measured in 1994 are included in Table H-7.
Only naturally occurring radioactivity was identified in food crops. As noted
earlier, K-40 is one of the major radionuclides found naturally in the
environment and is the predominant radioactive component in normal foods and
human tissue. Analysis of these samples indicated no contribution from plant
activities. The results are reported in Tables H-8 through H-14.
-25-

t
~ (
I

A VATIC MONITORING
Potential exposures from the liquid pathway can occur from drinking water,
ingestion of fish and clams, or from direct radiation exposure to radioactive
materials deposited in the river sediment. The aquatic monitoring program
includes the collection of samples of surface (river/reservoir) water,
groundwater, drinking water supplies, fish, Asiatic clams, and bottom
sediment. Samples from the reservoir are collected both upstream and
downstream from the plant.
Results from the analysis of aquatic samples are presented in Tables H-15
through H-22 . Radioactivity levels in water, fish and clams were consistent
with background and/or fallout levels previously reported. The presence, of
Co-60, Cs-137 and Sr-90 was identified in sediment samples; however, the
projected exposure to the public from this medium is significantly less than
0.1 mrem/year.
Sam le Collection and Anal sis
Samples of surface water are collected from the Tennessee River using
automatic sampling pumps from two downstream stations and one upstream
station. A timer turns on the pump approximately once every hour. The line
is flushed and a sample collected into a collection container. A 1-gallon
sample is removed from the container every 4 weeks and the remaining water in
the jug is discarded, The 4-week composite sample is analyzed. by gamma
spectroscopy and for gross beta activity. A quarterly composite sample is
-26-


Samples are also collected by an automatic sampling pump at the firstA
downstream drinking water intake. These samples are collected in the same
manner as the surface water samples. These monthly samples are analyzed by
gamma spectroscopy and for gross beta activity. At other selected locations,
grab samples are collected from drinking water systems which use the Tennessee
River as their source. These samples are analyzed every 4 weeks by gamma
spectroscopy and for gross beta activity. A quarterly composite sample from
each station is analyzed for Sr-89,90 and tritium. The sample collected by
the automatic pumping device is taken directly from the river at the intake
structure. Since the sample at this point is raw water, not water processed
through the water treatment plant, the control sample should also be
unprocessed water. Therefore, the upstream surface water sample is also
considered as a control sample for drinking water.
A groundwater well onsite is equipped with'an automatic water sampler. Hater
is also collected from a private well in an area unaffected by BFN. Samples
from the wells are collected every 4 weeks and analyzed by gamma
spectroscopy. A quarterly composite sample is analyzed for Sr-89,90 and
tritium.
Samples of commercial and game fish species are collected semiannually from
each of two reservoirs: the reservoir on which the plant is located (Hheeler
Reservoir) and the upstream reservoir (Guntersville Reservoir). The samples
are collected using a combination of netting techniques and electrofishing.
-27-


Most of the fish are filleted, but one group is processed whole for analysis.
After drying and grinding, the samples are analyzed by gamma spectroscopy.
Bottom sediment is collected semiannually from selected Tennessee River Mile
(TRM) locations using a dredging apparatus or divers. The samples are dried
and ground and analyzed by gamma spectroscopy. After this analysis is
complete, the samples are ashed and analyzed for Sr-89,90.
Samples of Asiatic clams are collected from one location below the plant and
one location above the plant. The clams are usually collected in the dredging
or diving process with the sediment. Enough clams are collected to produce
approximately 50 grams of wet flesh. The flesh is separated from the shells,
and the dried flesh samples are analyzed by gamma spectroscopy. Sufficient
quantities of clams to provide a sample are becoming more and more difficult
to find.
Resu1ts
All radioactivity in surface water samples was below the LLD except the gross
beta activity and naturally occurring isotopes. These results are consistent
with previously reported levels. A trend plot of the gross beta activity in
surface water samples from 1968 through 1994 is presented in Figure H-8. A
summary table of the results for this reporting period is shown in Table H-15.
-28-

(
e

For drinking water, average gross beta activity was 2.4 pCi/1'iter at the
downstream stations and 2.4 pCi/liter at the control stations. The results
are shown in Table H-16 and a trend plot of the gross beta activity in
drinking water from 1968 to the present is presented in Figure H-9.
Concentrations of fission and activation products in groundwater samples were
all below the LLDs. Only naturally occurring radon decay products (Bi-214 and
Pb-214) were identified in these samples. Results from the analysis of
groundwater samples are presented in Table H-17.
Cesium-137 was identified in two fish samples. The downstream sample had a
concentration of 0.07 pCi/g while the concentration in the upstream sample was
also 0.07 pCi/g. The only other radioisotopes found in fish were naturally
occurring. Concentrations of K-40 ranged from 4.9 pCi/g to 16.3 pCi/g. The
results are summarized in Tables H-18, H-19, and H-20. Plots of the annual
average Cs-137 concentrations in fish are presented in Figures H-10, H-ll, and
H-12. Since the concentrations downstream are essentially equivalent to the
upstream levels, the Cs-137 activity is probably a result of fallout or other
upstream effluents rather than activities at BFN.
Radionuclides of the types produced by nuclear power plant operations were
identified in sediment samples. The materials identified were Cs-137, Co-60,
and Sr-90. The average levels of Cs-137 were 0.51 pCi/g in downstream samples
and 0.20 pCi/g upstream. The Cs-137 concentrations at downstream stations has
historically been higher than concentrations upstream. This relationship is
graphically represented in Figure H-13 which presents a plot of the Cs-137
concentrations in sediment since 1968.
-29-


Cobalt-60 concentrations in downstream samples averaged 0.15 pCi/g, while
concentrations in 'upstream samples were below the lower limit of detection.
The maximum concentration downstream was 0.43 pCi/g. Figure H-14 presents a
graph of the Co-60 concentrations measured in sediment since 1968.
The Sr-90 concentration in one upstream sample was 0.57 pCi/g. Levels in
three downstream 'samples averaged 0.67 pCi/g, with a maximum of 0.85 pCi'/g.
The remaining samples showed no Sr-90 activity. A realistic assessment of the
impact to the general public from these radioisotopes produces a'negligible
dose equivalent. Results from the analysis of sediment samples are shown in
Table H-21.
Only naturally occurring radioisotopes were identified in clam flesh samples.
The results are presented in Table H-22.
-30-


ASSESSMENT AND EVALUATION
Potential doses to the public are estimated from measured effluents using
computer models. These models were developed by TVA and are based on
methodology provided by the NRC in Regulatory Guide 1.109 for determining the
potential dose to individuals and populations living in the vicinity of a
nuclear power plant. The doses calculated are a representation of the dose to
a "maximally exposed individual." Some of the factors used in these
calculations (such as ingestion rates) are maximum expected values which will
,tend to overestimate the dose to this "hypothetical" person. In reality, the
expected dose to actual individuals is lower.
The area around the plant is analyzed to determine the pathways through which
the public may receive an exposure, As indicated in Figure 2, the two major
ways by which radioactivity is introduced into the environment are through
liquid and gaseous effluents.
For liquid effluents, the public can be exposed to radiation from three
sources: drinking water from the Tennessee river, eating fish caught in the
Tennessee River, and direct exposure to radioactive material due to activities
on the banks of the river (recreational activities). Data used to determine
these doses are based on guidance given by the NRC for maximum ingestion
rates, exposure times, and distribution of the material in the river.
Whenever possible, data used in the dose calculation are based on specific
conditions for the BFN area.
-31-

For gaseous effluents, the public can be exposed to radiation from several
sources: direct r'adiation from the radioactivity in the air, direct radiation
from radioactivity deposited on the ground, inhalation of radioactivity in the
air, ingestion of vegetation which contains radioactivity deposited from theI
atmosphere, and ingestion of milk or meat from animals which consumed
vegetation containing deposited radioactivity. The concentrations of
radioactivity in the air 'and the soil are estimated by computer models which
use the actual meteorological conditions to determine the.distribution of the
effluents in the atmosphere. Again, as many of the parameters as possible are
based on actual site-specific data.
Results
The estimated doses to the maximally exposed individual due to radioactivity
released from BFN in 1994 are presented in Table 2. These estimates were made
using the concentrations of the liquids and gases measured at the effluent
monitoring points. Also shown are the ODCH limits for these doses and a
comparison between the calculated dose and the corresponding limit. The
maximum calculated whole body dose equivalent from measured liquid effluents
as presented in Table 2 is 0.03 mrem/year, or 1.0 percent of the limit. The
maximum organ dose equivalent from gaseous effluents is 0.028 mrem/year. This
represents 0.19 percent of the ODCM limit. A more complete description of the
effluents released from BFN and the corresponding doses projected from these
effluents can be found in the BFN Radioactive Effluent Release Reports.
As stated earlier in the report, the estimated increase in radiation dose
-32-


equivalent to the general public resulting from the operation of BFN is
undetectably small'hen compared to the dose from natural background radiation.
The results from each environmental sample are compared with the
concentrations from the corresponding control stations and appropriate
preoperational and background data to determine influences from the plant.
During this report period, Co-60, Cs-137, and Sr-90 were seen in aquatic
media. The distribution of Cs-137 and Sr-90 in sediment is similar to fallout
levels identified in samples both upstream and downstream from the plant
during the preoperational phase of the monitoring program. Co-60 was
identified in sediment samples downstream from the plant in concentrations
which would produce no measurable increase in the dose to the general public.
No increases of radioactivity have been seen in water samples.
Dose estimates were made from concentrations 'of radioactivity found in samples
of environmental media. Media evaluated include, but are not limited to, air,
milk, food products, drinking water, and fish. Inhalation and ingestion doses
estimated for persons at the indicator locations were essentially identical to
those determined for persons a't control stations. Nore than 99 percent of
those doses were contributed by the naturally occurring radionuclide K-40 and
by Sr-90 and Cs-137, which are long-lived radioisotopes found in fallout from
nuclear weapons testing. Concentrations of Sr-90 and Cs-137 are consistent
with levels measured in TVA's preoperational environmental radiological
monitoring programs.
-33-


Conclusions
It is concluded fr'om the above analysis of the environmental sampling results
and from the trend plots presented in Appendix H that the exposure to members
of the general public which may have been attributable to BFN is negligible.
The radioactivity reported herein is primarily the result of fallout or
natural background radiation. Any activity which may be present as a result
of plant operations does'not represent a significant contribution to the
'xposureof members of the public.
34


REFERENCES
1. Merril Eisenbud, Environmental Radioactivit; Academic Press, Inc., NewYork, NY, 1987.
2. National Council on Radiation Protection and Measurements, Report No. 93,"Ionizing Radiation Exposure of the Population of the United States,"September 1987.
3. United States Nuclear Regulatory Commission, Regulatory Guide 8.29,"Instruction Concerning Risks From Occupational Radiation Exposure," July1981.
4. Electric Power Research Institute, Report No. EPRI EA-2045, Project 1059,"Transuranium and Other Long-Lived Radionuclides in the TerrestrialEnvirons of Nuclear Power Plants," September 1981.
-35-


Table 1
A V
Effluent Reporting Lower LimitafJh.~uP
Effluent Reporting Lower Limit
H-3Cr-51Hn-54Co-58Co-60Zn-65Sr-89Sr-90Nb-95Zr-95Ru-103Ru-106I-131Cs-134Cs-137Ce-144Ba-140La-140
1,000 F 000500,000
30,00020,00030,000
5,0008,000
50030,00020,00030,0003,0001,000
9001,0003,0008,0009,000
20,000
1,0001,000
300300
400400
23050
200200
25045
555
1031.45
105
401
55
3325
8
100,00030,000
1,0001,000
50400
1,0006
2,000400900
20200200200
402,0002,000
0.91020
0.020.0050.0050.0050.0050.00060.00030.0050.0050.0050.02
~ 0,020.0050.0050.010.010.005
Note: 1 pCi = 3.7 x 10 ~ Bq.
Note: For those reporting levels that are blank, no value is given in the reference.
1 Source: Table 2 of Appendix B to 10 CFR 20. 1001-20.2401
2 Source: BFN Offsite Dose Calculation Hanual, Table 2.3-3
3 Source: Table E-1 of this report

0

Table 2
Maximum Dose due to Radioactive Effluent ReleasesBrowns Ferry Nuclear Plant
1994mrem/year
Li uid Effluents
~Te1994Dose
NRCLimit
Percent ofNRC Limit
EPALimit
Percent ofEPA Limit
Total Body 0.03
Any Organ 0.04 10
7
1.0
0.4
25
25
0.1
0.2
Gaseous Effluents
~Te
Noble Gas(Gamma)
Noble Gas(Beta)
Any Organ
1994Dose
0.002
0.003
0.028
NRCLimit
10
20
15
Percent ofNRC Limit
0.02
0.02
0.19
EPALimit
25
25
Percent ofEPA Limit
0.01
0.01
0.11
-37-


I N D.EVANSVILLE
C "g N. 's TENNESSEE VALLEY REGION(TVA NUCLEAR PLANT SITES) 4, W
LOVISVS.LE
c
I L L.
~ ~
PAOVCAH
M 0
.(,.5'
+P ]+ T'5
JACKSON+
II I
NENPIAS I
I
V A
BOWLINO GREEN
S
NOSCLESHOALSI
/j /
IA L A B A M A
LEGEND
M I S S 36K -WATTS BAR NUCLEAR PLANTXS - SEQUOYAH NUCLEAR PLANT3KH -BELLEFONTE NUCLEAR PI.ANTBEE[ -BROWNS FERRY NUCLEAR PLANT
GEORG I A
VOWEN SSORO
~~K E N T U C K Y
V ~ (1
~.M /\ ..J
~ A ~/I\ r /
/ II~ta ~
yL,rNASHVILLE OAK RIOOEp
N N E S E N rC A R.~~ t/// ~W
P (mr
S~W J Jlv
CHATTAHOOOA~ ~ n~WJ/ v
~~lsv~LE'-'" i g"
) ) ',~ S C 4 Rlg I

Figure 2
ENVIAONIVlENTALEXPDSUAE PATHVLPAYS QI-" MANnuE TD GAEL.EASES De nAnlCIAaTiV'E MATERIALTD THE ATMDSPHEAE AND LAKE.
I ;,P ~~ ~
~ ~ WO~ ~
~ ~
~ g ~ ~~ ~ ~
~ ~ ~ ~ ~ ~
~ ~ ~ ~
~ J
Diluted By Atmosphere Airhorne Releases
Plume Exposure
Liquid ReleasesDiluted By Lake
Animals(Milk,mleat}
ConsumedBy Animals
Consume'd By Sian
ShorelineExposure
.DrinkingWater
(l4 Fish
VegetationUptake From Soil
-39-

'I

APPENDIX A
ENVIRONMENTAL RADIOLOGICAL MONITORING PROGRAM AND
SAMPLING LOCATIONS
40


Table A-1
BROWNS FERRY NUCLEAR PLANTEnvironmental Radiological Honi toring
Program'xposure
Pathway Number of Samples and Sampling and1
' Type and Frequency
AIRBORNE
Parti cul ates Six samples from locations(in different sectors) ~ at ornear boundary site (LH-1, LH-2LH-3, LH-4, LH-6, and LH-7)
Two samples from controllocations greater than10 miles from the plant(RH-1 and RH-6)
Three samples from locationsin communities approximately10 miles from the plantPH-l, PH-2, and PH-3)
Continuous sampler operationwith sample collection asrequired by dust loading butat least once per 7 days
Particulate sampler.Analyze for gross betaradioactivity greater thanor equal to 24 hoursfollowing filter change.Perform galena isotopicanalysis on each samplewhen gross beta activityis greater than 10 timesthe average of controlsamples. Perform gaamaisotopic analysis oncomposite (by location)sample at least once per31 days.
Radioiodine
Rainwater
Same locations as airparticulates
Same location as airparticulate
Continuous sampler operationwith charcoal canistercollection at least onceper 7 days
Composite sample at leastonce per 31 days
I-131 every 7 days
Analyzed for gamna nuclidesonly if radioactivity in othermedia indicates the presence ofincreased levels of fallout

Table A-1
BROWNS FERRY .NUCLEAR PLANTEnvironmental Radiological Honitoring
Program'xposure
Pathwaym
Soil
Direct
Number of Samples and
Sampl es from same 1 ocati onsas air particulates
Two or more dosimeters placedat locations (in differentsectors) at or near the siteboundary in each of the 16sectors
Two or more dosimeters placedat stations located approximately5 miles from the plantin each of the 16 sectors
Sampling and
Once every year
At least once per 92 days
At least once per 92 days
Type and Frequency
Gamma scan, Sr-89, Sr-90 onceper year
Galena dose once per 92 days
Gamma dose once per 92 days
WATERBORNE
Surface Water
Drinking Mater
Two or more dosimeters in at.least 8 additional locationsof special interest
One sample upstream (TRH 305.0)One sample immediately down-stream of discharge (TRH 293.5)One sample downstream fromplant (TRH 285.2)
One sample at the firstpotable'urface watersupply downstream from theplant (TRH 282.6)
Collected by automaticsequential-type samplerwith composite sample takenat least once per 7
days'ollected
by automaticsequential-type samplerwith composite sample takenat least once per 31 days
Gross beta and ganea scan on4-week composite. Compositefor Sr-89, Sr-90, and tritiumat least once per 92 days
Gross beta and ganma scan on4-week composite. Compositefor Sr-89, Sr-90, and tritiumat least once per 92 days

(I
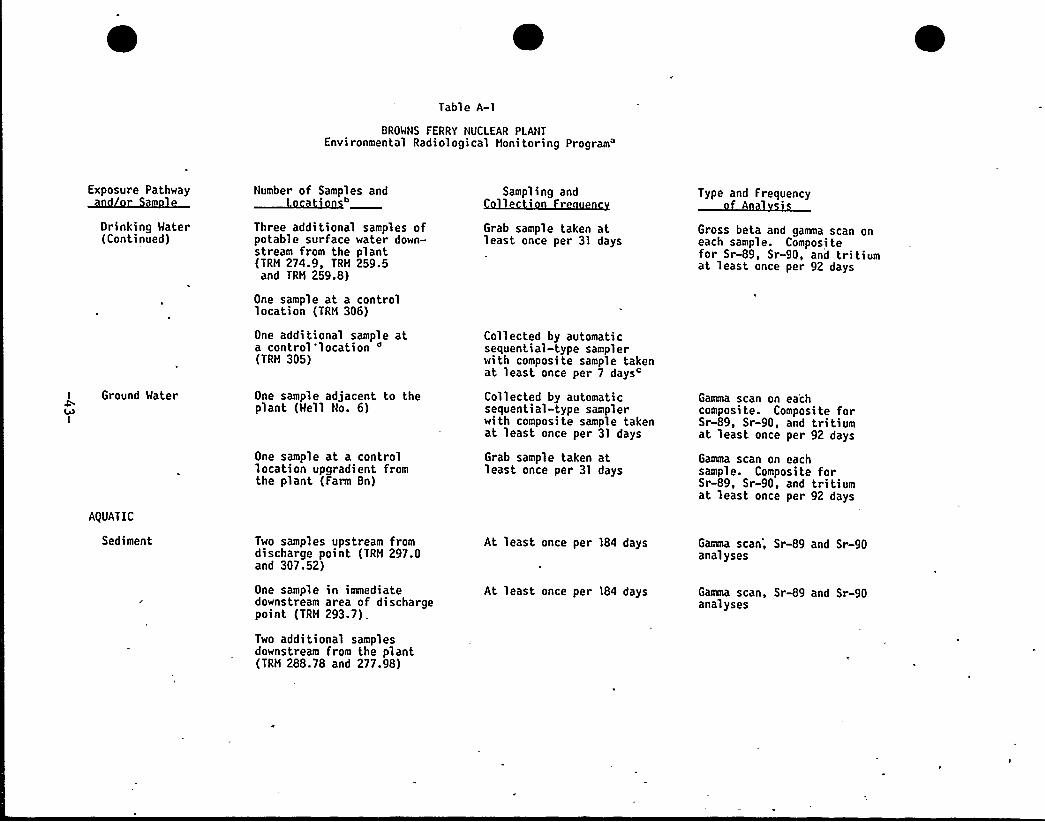
Table A-l
BROWNS FERRY NUCLEAR PLANTEnvironmental Radiological Honitoring
Program'xposure
Pathwayn r m
Orinking Water(Continued)
Ground Water
I
Number of Samples and
Three additional samples ofpotable surface water down-stream from the plant(TRH 274.9, TRH 259.5and TRH 259.8)
One sample at a controllocation (TRH 306)
One additional sample ata control'location ~
(TRH 305)
One sample adjacent to theplant (Well No. 6)
One sample at a controllocation upgradient fromthe plant (Farm Sn)
Sampling and1
Grab sample taken atleast once per 31 days
Collected by automaticsequential-type samplerwith composite sample takenat least once per 7 days
Collected by automaticsequential-type samplerwith composite sample takenat least once per 31 days
Grab sample taken atleast once per 31 days
Type and FrequencyA
Gross beta and gamma scan oneach sample. Compositefor Sr-89, Sr-90, and tritiumat least once per 92 days
Gamma scan on eachcomposite. Composite forSr-89, Sr-90, and tritiumat least once per 92 days
Gamma scan on eachsample. Composite forSr-89, Sr-90, and tritiumat least once per 92 days
AQUATIC
Sediment Two samples upstream fromdischarge point (TRH 297.0and 307.52)
One sample in immediatedownstream area of dischargepoint (TRH 293.7)
Two additional samplesdownstream from the plant(TRH 288.78 and 277.98)
At least once per 184 days
At least once per 184 days
Gamma scan', Sr-89 and Sr-90analyses
Gamma scan, Sr-89 and Sr-90analyses

Table A-1
BROWNS FERRY NUCLEAR PLANTEnvironmental Radiological Honitoring
Program'xposure
Pathway Number of Samples and Sampling and1
Type and Frequency
INGESTION
Hilk
Fish
Clams
At least 2 samples fromdairy farms in the immediatevicinity of the plant (Farms8 and Bn)
At least one sample fromcontrol location (Farm Beand/or GL)
Three samples representingcommercial and game speciesin Guntersville Reservoirabove the plant
Three samples representingcommercial and game speciesin Wheeler Reservoir near theplant.
One sample downstream fromthe discharge
One sample upstream fromthe plant
(No permanent stations established;depends on location of clams)
At least once per 15 dayswhen animals are on pasture;at least once per 31 daysat other times
At least once per 184 days
At least once per 184 days
Gamma scan and I-131 on eachsample. ,Sr-89 and Sr-90 at leastonce per 31 days
Gamma scan at leastonce per 184 days onedible portions
Gamma scan on flesh only

Table A-1
BROWNS FERRY NUCLEAR PLANTEnvironmental Radiological Monitoring
Program'xposure
Pathway
Fruits and Vegetables
Vegetation
Number of Samples and
Samples of food crops such ascorn, green beans, tomatoes,and potatoes grown at privategardens and/or farms in theimmediate vicinity of theplant
One sample of each of thesame foods grown at greaterthan 10 miles distance fromthe plant
Samples from farmsproducing milk but notproviding a milk sample(Farm T)
Control samples from onecontrol dairy (Farm GL)
Sampling and1
At least once per year attime of harvest
Once per 31 days
Type and Frequency
Gamma scan on edible portion
I-131, gamma scan once per 31days
a.b.
c-d.
The sampling program outlined in this table is that which was in effect at the end of 1993.Sampling locations, sector and distance from plant, are described in Table A-2 and A-3 and shown inFigures A-l, A-2, and A-3.Composite samples shall be collected by collecting an aliquot at intervals not exceeding 2 hours.The surface water control sample shall be considered a control for the drinking water sample.

Table A-2
BROWNS FERRY NUCLEAR PLANTEnvironmental Radiological Monitoring Program
Sampling Locations
MapLocationNumber'tation
Approximate Indicator (I)Distance or
Sector (miles) Control (C)Samples
Collected'
. 2345
67
89
10ll12131822232425262728293031
323334363770
PM-1PM-2PM-3LM-7RM-1RM-6LM-1LM-2LM-3LM-4LM-6Farm B
Farm BnFarm G1
Well No.6'RM'82.6
TRM 306.0TRM 259.6TRM 274.9TRM 285.2TRM 293.5TRM 305.0TRM 307.52TRM 293.7TRM 288.78TRM 277.98Farm BeFarm TTRM 297.0TRM 259.8
NH
NESSEH
H
E
N
NNE
ENE
NNH
SSHNNW
N
WSH
NW
13.810.98.22.1
31.324.2
1.00.90.91.73.06.85.0
35.00.02
11.412.0'4
4'9.1'.8'.54
11.013.520
3'.22'6.02'8.8
3.2.3.0
34.2
Ce
C
III
AP,CF,R,S'P,CF,R,S
AP,CF,R,SAP,CF,R,SAP,CF,R,SAP,CF,R,SAP,CF,R,SAP,CF,R,SAP,CF,R,SAP,CF,R,SAP,CF,R,SM,M,HM,VW
PHPW
PW
PW
SW
SW
SW
SD
SDSDSDM
VSDPW
-46-


Table A-2
BROWNS FERRY NUCLEAR PLANTEnvironmental Radiological Monitoring Program
Sampling Locations(Continued)
MapLocationNumber'tation
Approximate Indicator (I)Distance or Samples
Sector (miles) Control (C)Collected'heeler
Reservoir'TRM
275-349)Guntersvi lie
Reservoir'RM
(349-424)
F,CL
a. See figures A-l, A-2, and A-3.b. Sample Codes:
AP = Air particulate filterCF =.Charcoal filter (Iodine)CL = ClamsF = FishM = MilkPW = Public drinking water
c. TRM = Tennessee River Miled. Miles from plant discharge (TRM 294).e. Also used as a control for public water.
R = RainwaterS = SoilSD = SedimentSW = Surface waterV = VegetationW = Well water
-47-

Table A-3
BROWNS FERRY NUCLEAR PLANTThermoluminescent Dosimeter (TLD) Locations
MapLocation
Number'
2356789
10383940414243444546474849505152535455565758596061
626364656667
Station
NH-3NE-3SSE-2H-3E-3N-1NNE-1ENE-1NNH-2N-2NNE-2NNE-3NE-1NE-2ENE-2E-1E-2ESE-1ESE-2SE-1SE-2SSE-1S-lS-2SSW-1SSW-2SH-1SH-2SH-3HSW-l.WSW-2HSH-3W-1H-2H-4HNW-1WNH-2NH-1NW-2
Sector
NW
NESSEW
E
N
NNE
ENENNW
N
NNE
NNE
NE
NE
ENE
E
E
ESEESESESESSES
S
SSW
SSW
SW
SW
SW
HSW
HSW
HSW
H
H
H
HNW
HNW
NW
NW
ApproximateDistance(miles)
13.810.98.2
31.324.20.970.880.921.75.00.75.20.85.06.20.85.20.93.00.55.45.13.14.83.04.41.94.76.02.75.1
10.51.94.7
32.13.34.42.25.3
Onsi te(On)'r
Offsite (Off)
OffOffOffOffOffOnOnOnOnOffOnOffOnOffOffOnOffOnOffOnOffOffOff .
OffOffOffOnOffOffOffOff
'ff
OnOffOffOffOffOffOff
'48-

Table A-3
BRONNS FERRY NUCLEAR PLANTThermoluminescent Dosimeter (TLD) Locations
(Continued)
MapLocation
Number'8
69
Station
NNH-1NNH-3
Sector
ApproximateDistance(miles)
1.0S.2
Onsite(On)'r
Offsite (Off)
OnOff
a. See figures A-l, A-2, and A-3.b. TLDs designated onsi te are those located 2 miles or less from the plant.
TLDs designated offsite are those located more than 2 miles from the plant.
-49-


'
Figure A-1
Environmental Radiological Sampling Locations
Within 3 Mile of Plant
.NW326.2
348.75 1 1.25NNE
7 33.75
NE
303.75 39 56.25
WNW
258.7 5
WSW
28',o~31m L
/i'gROWNS FERRYNUCLEAR PLANT
IIIIIIIW
48
9
~44
~46
ENE
78.75
101.25
ESE
236.25123.75
SW
213.75
SSW SSES
168 75Scale
Mile
146.25
SE
-50-


Figure A-2
Environmental Radiological Sampling Locations
From 1 to 5 Miles From the Plant
NNW
348.75
~ 813
11.25
NNE
328.25 33,75
NW
42
303.75 58.25
WNW
65
~ 6
~ 10
ENE
281.2536, 64
78.75
~ 62
61
4 r.SROWNS PER YNUCLEAR PLANT
258,75
WSW
Ss47
y 37 ~+~
Bg
/1,
a101.25
qb
ESE
238.25 53
51
123.75
SW'13.75
SSW
~ 54
181.25
52
188.75
SSE
148.25
SCALE0 0.5 1 0.5 2
MILES


Figure A-3
I
Environmental Racfiological Sampling Locations
Greater Than 5 Miles From the Plant
NNW
348.75 11.25
NE
328.2533.75
NWAW ENCEBURO
PULASKI
NE
303.75FAYETTEV LLE 56.25
WNW 34ENE
FLORENCEAT ENS
78.75
258.75
S EE
63
U
LO
2
CLE ICAL
6 LKELf
2
57
943
45
3
OECATUR
SAN s
6 ~ - UNTSVILLE
101.25
WS
RUSS VILLE18
ESEOUH'IERSVK.LE
AM
326.2 NALEYVI LE
ARAB
123.75
SW CULLMANSE
213.75
SSW
191.25 168.75
SSE
14B.25SCALE ~
0 IMILES
0 25
-52-


APPENDIX 8
~ 1 994 PROGRAM MODIFICATIONS
-53-

APPENDIX B
Environmental Radiolo ical Monitorin Pro ram Modifications
DUring 1994, no modifications were made to the BFN radiological environmental
monitoring program.
-54-

APPENDIX C
PROGRAM DEVIATIONS
-55-


Append) x C
Pro ram Deviations
During 1994, a small number of samples were not collected. Those occurrences
resulted in deviations from the scheduled program but not from the minimum
program required in the Offsite Dose Calculation Manual. Table C-1 lists
these occurrences. A general description follows.
Gross beta analysis of two public water samples could not be performed because
of the presence of a large. volume of solids in the samples.
One air particulate and charcoal filter sample set was missed as a result of at malfunction in the switch on the sampler. The switch was replaced and
subsequent samples collected as scheduled.
Two air particulate composite sampl'es were lost during the strontium analysis
as a result of bad ion exchange resin.
-56-


Table C-1
Environmental Radiolo ical Monitorin Pro ram Deviations
Date Station Location Remarks
2/14/94 Florence, AL 34.2 milesdownstream
Gross Beta analysis of thepublic water sample could notbe reliably performed becauseof a large volume of solidsin the sample.
8/29/94
8/29/94
ChampionPaper Co.
LM-1 BF 5RM-6 BF
11.4 milesdownstream
1.0 miles N
24.2 miles E
Gross Beta analysis of thepublic water sample could notbe reliably performed becauseof a large volume of solidsin the sample.
The composite air filtersamples from these stationswere lost during thestrontium analysis as aresult of impurities in theion exchange resin,consequently concentrationsof Sr-89 and Sr-90 were notdetermined. The resin wasreplaced and subsequentstrontium analyses completed.
11/21/94 LM-7 BF 2.1 mi les 0 Air particulate and charcoalfilters were not collected asa result of a malfunction inthe switch on the sampler.The switch was replaced andsubsequent samples collected.
-57-

APPENDIX D
ANALYTICAL PROCEDURES
-58-


APPENDIX D
Anal tical Procedures
Analyses of environmental samples are performed by the radioanalytical
laboratory located at the Hestern Area Radiological Laboratory facility in
Muscle Shoals, Alabama. All analysis procedures are based on accepted
methods. A summary of the analysis techniques and methodology follows.
The gross beta measurements are made with an automatic low background counting
system. Normal counting times are 50 minutes. Hater samples are prepared by
evaporating 500 ml of samples to near dryness, transferring to a stainless
steel,planchet and completing the evaporation process. For solid samples, a
specified amount of the sample is packed into a deep stainless steel
planchet. Air particulate filters are counted directly in a shallow planchet.
The specific analysis of I-131 in'milk, water, or vegetation samples is
performed by first isolating and purifying the iodine by radiochemical
separation and then counting the final precipitate on a beta-gamma coincidence
counting system. The normal count time is 100 minutes. Hith the beta-gamma
coincidence counting system, background counts are virtually eliminated and
extremely low levels of detection can be obtained.
After a radiochemical separation, samples analyzed for Sr-89,90 are counted on
a low background beta counting system. The sample is counted a second time
after a 7-day ingrowth period. From the two counts the Sr-89 and Sr-90
concentrations can be determined.
-59-

Hater samples are analyzed for tritium content by first distilling a portion
of the sample and then counting by liquid scintillation. A commercially
available scintillation cocktail is used.
Gamma analyses are performed in various counting geometries depending on the
sample type and volume. All gamma counts are obtained with germanium type
detectors interfaced with a computer based mutlichannel analyzer system.
Spectral data reduction is performed by the computer program HYPERMET.
The charcoal cartridges used to sample-gaseous radioiodine were analyzed by
gamma spectroscopy using a germanium detector system.
All of the necessary efficiency values, weight-efficiency curves, and geometry
tables are established and maintained on each detector and counting system. A
series of daily and periodic quality control checks are performed to monitor
counting instrumentation. System logbooks and control charts are used to
document the results of the quality control checks.
The analysis of transuranic isotopes in soil and air filters is performed by
leaching the sample with acid and then separating the isotopes of interest
from the acid leach by an ion exchange technique. The ion exchange technique
separates the samples into two fractions, one containing plutonium and the
other containing both americium and curium. The Pu fraction and the Am/Cm
fractions are electroplated onto separate stainless steel discs, and counted
for 1200 minutes on an alpha spectrometer employing a surface barrier detector'.
-60-

APPENDIX E
NOMINAL LONER LIMITS OF DETECTION (LLD)
-61-

Appendix E
Nominal Lower Limits of Detection
Sensitive radiation detection devices can give a signal or reading even when
no radioactivity is present in a sample being analyzed. This signal may come
from trace amounts of radioactivity in the components of the device, from
cosmic rays, from naturally occurring radon gas, or from electronic noise.
Thus, there is always some sort of signal on these sensitive devices.. The
signal registered when no activity is present in the sample is called the
background.
The point at which the signal is determined to represent radioactivity in the
sample is called the critical level. This point is based on statistical
analysis of the background readings from any particular device. However, any
sample measured over and over in the same device will give different readings,
some higher than others. The sample should have a well-defined average
reading, but any individual reading will vary from that average. In order to
determine the activity present in a sample that will produce a reading above
the critical level, additional statistical analysis of the background readings
is
required�
. The hypothetical activity calculated from this analysis is
called the lower limit of detection (LLD). A listing of typical LLD values
that a laboratory publishes is a guide to the sensitivity of the analytical
measurements performed by the laboratory.
-62-

Every time an activity is calculated from a sample, the background must be
subtracted from the sample signal. For the very low levels encountered in
environmental monitoring, the sample signals are often very close to the
background. The measuring equipment is being used at the limit of its
capability. For a sample with no measurable activity, which often happens,
about half the time its signal should fall below the average machine
background and half the time it should be above the background. If a signal
above the background is present, the calculated activity is compared to the
calculated LLD to determine if there is really activity present or if the
number is an artifact of the way radioactivity is measured.
A number of factors influence the LLD, including sample size, count time,
counting efficiency, chemical processes, radioactive decay factors, and
interfering isotopes encountered in the sample. The most likely values for
these factors have been evaluated for the various analyses performed in the
environmental monitoring program. The nominal LLDs calculated from these
values, in accordance with the methodology prescribed in the ODCM, are
presented in Table E-1: The maximum values for the lower limits of detection .
specified in the ODCM are shown in Table E-2.
The LLDs are also presented in the data tables. For analyses for which LLDs
have not been established, an LLD of zero is assumed in determining if a
measured activity is reported as greater than the LLD.
-63-

Table E-1
Hominal LLD ValuesA. Radiochemical Procedures
Air FiltersLaCiLm'1
Water~ii~Sediment
Hilk Fish Wet Vegetation and Soil&Mmlrzl ~LimN) Q>Miler
Gross BetaTri tiumIodine-131Strontium-89Strontium-90
0.002
0.00110.0004
1.9300
0.45.02.0
0.42.02.0
0.090.03
6.031.012.0
1.60.4

Table E-1
Nominal LLD ValuesB. Gamma Analyses (GeLi)
AirParticulates~Xi/m3
CharcoalFilters
Materand Hilk
-a>XL23
Fish,Vegetationand GrainaQLi~in
WetVegetationaQLl~at
Soil and Foods TomatoesSediment Clam Flesh Potatoes, etc.QL hit
Heat andPoultry
<~w
Ce-141Ce-144Cr-51I-131Ru-103Ru-106Cs-134Cs-137Zr-95Nb-95Co-58Hn-54Zn-65Co-60K-40Ba-140La-140Fe-59Be-7Pb-212Pb-214Bi-214Bi-212Tl-208Ra-224Ra-226Ac-228Pa-234m
0.005.01.02
.005
.005.02
.005
.005
.005
.005
.005
.005
.005
.005.04
0.0150.01.005
.02.005.005.005
.02.002
.010.50
.02
.07
.15
.03
.02
.12
.02
.02
.03
.02
.02
.02
.03
.02
.30
.07
.04
.04
.15
.03
.07
.05
.20
.02
.073.20
10304510
540
55
10555
105
100251010451520205010
20800
.07
.15
.30
.20
.03
.15
.03
.03
.05
.25
.03
.03
.05
.03
.40
.30
.20
.08
.25,.04.50.10.25.03
.104.0
35115200
6025
1903025453020204520
400130
5040
200408055
25030
70'4000
.10
.20
.35
.25
.03
.20
.03
.03
.05
.035
.03
.03
.05
.03
.75
.30
.20
.05
.25
.10
.15
.15
.45
.06
.75
.15
.254.0
.35
.852.401. 70
.251.25
.14
.15
.45
.25
.25
.20
.40
.203.502.401.40
.451.90
.30
.10
.502.00
.253.00
.50
.7535.00
2060952025
1901010451010104510
25050252590408040
13030
502500
1550752515601010201010102010
200503020702040259030
" 302000


Table E-2
Maximum Values for the Lower Limits of Detection (LLD)Specified by the BFN Offsite Dose Calculation Manual
Hater~Anal sls gCi/L
AirborneParticulateor Gases Fish Milk~Cl/m'Cl/K wet ~Cl/L
FoodProducts Sediment~ii ~ld
Mn-54
Fe-59
Co-58,60
Zn-65
Zr-95
Nb-95
I-131
Cs-134
Cs-137
Ba-140
La-140
15
30
15
30
30
15
1l
15
18
60
15
gross beta 4
H-3 2000
x 10
'.A.
N.A.
N.A.
N.A.
N.A.
N.A.
N.A.
7x10'x 10-z
6 x10-'.A.
N.A.
N.A.
N.A.
130
260
130
260
N.A.
N.A.
N.A.
130
150
N.A.
N.A.
N.A.
N.A.
N.A.
N.A.
N.A.
N.A.
N.A.
N.A.
15
18
60
15
N.A.
N.A.
N.A.
N.A.
N.A.
N.A.
N.A.
N.A.
60
60
80
N.A.
N.A.
N.A.
N.A.
N.A.
N.A.
N.A.
N.A.
N.A.
N.A.
N.A.
150
180
N.A.
N.AD
LLD for analysis of drinking water and surface water samples sh'all be
performed by gamma spectroscopy at approximately 15 pCi/L. If levels greaterthan 15 pCi/L are identified in surface water samples downstream from theplant, or in the event of an unanticipated release of I-131, drinking watersamples will be analyzed at an LLD of 1.0 pCi/L for I-131.
-66-

APPENDIX F
QUALITY ASSURANCE/QUALITY CONTROL PROGRAM
-67-


Appendix F
ualit Assurance/ ualit Control Pro ram
A thorough quality assurance program is employed by the laboratory to ensure
that the environmental monitoring data are reliable. This program includes
,the use of written, approved procedures in performing the work, a
nonconformance and corrective action tracking system, systematic, internal
audits, a complete training and retraining system, audits by various external
organizations, and a laboratory quality control program.
The quality control program employed by the radioanalytical laboratory is
designed to ensure that the sampling and analysis process is working as
intended. The program includes equipment checks and the analysis of special
samples along with routine samples.
Radiation detection devices are complex and can be tested in a number of
ways. There are two primary tests which are performed on all devices. In the
first type, the device is operated without a sample on the detector to
determine the background count rate. The background counts are usually low
values and are due to machine noise, cosmic rays, or trace amounts of
radioactivity in the materials used to construct the detector. Charts of
background counts are kept and monitored to ensure that no unusually high or
low values are encountered.
In the second test, the device is operated with a known amount of
-68-
radioactivity present. The number of counts registered from such a
radioactive standard should be very reproducible. These reproducibility
checks are also monitored to ensure that they. are neither higher nor lower
than expected. Nhen counts from .either test .fall outside the expected range,
the device is inspected for malfunction or contamination. It is not placed
into service until it is operating properly.
In addition to these two general checks, other quality control checks are
performed on the variety of detectors used in the laboratory. The exact
nature of these checks depends on the type of device and the method it uses to
detect radiation or store the information obtained.
guality control samples of a variety of types are used by the laboratory to
verify the performance of different portions of the analytical process. These
quality control samples may be blanks, replicate samples, blind samples, or
cross-checks.
Blanks are samples which contain no measurable radioactivity or no activity of
the type being measured. Such samples are analyzed to determine whether there
is any contamination of equipment or commercial laboratory chemicals,
cross-contamination in the chemical process, or interference from isotopes
other than the one being measured.
Duplicate samples are generated at random by the same computer program which
schedules the collection of the routine samples. For example, if the routine
program calls for four milk samples every week, on a random basis each farm
-69-

might provide an additional sample several times a year. These duplicate
samples are analyzed along with the other routine samples. They provide
information about the variability of radioactive content in the various sample
media.
If enough sample is available for a particular analysis, the laboratory
analyst can split it into two portions. Such a sample can provide information
about the variability of the analytical process since two identical portions
of material are analyzed side by side.
Analytical knowns are another category of quality control sample. A known
amount of radioactivity is added to a sample medium by the quality control
staff or by the analysts themselves. The analysts are told the radioactive
content of the sample. Hhenever possible, the analytical knowns contain the
same amount of radioactivity each time they are run. In this way, the
analysts have immediate knowledge of the quality of the measurement process.
A portion of these samples are also blanks.
Blind spikes are samples containing radioactivity which are introduced into
the analysis process disguised as ordinary environmental samples. The analyst,
does not know they contain radioactivity. Since the bulk of the ordinary
workload of the environmental laboratory contains no measurable activity or
only naturally occurring radioisotopes, blind spikes can be used to test the
detection capability of the laboratory or they can be used to test the data
review process.. If an analysis routinely generates numerous zeroes for a
-70-


t particular isotope, the presence of the isotope is brought to the attention of
the laboratory supervisor in the daily review process. Blind spikes test this
process since they contain radioactivity at levels high enough to be
detected. Furthermore, the activity can be put into such samples at the
extreme limit of detection (near the LLD) to determine whether or not the
laboratory can find any unusual radioactivity whatsoever.
At present, 5 percent of the laboratory workload is in the category of
internal cross-checks. These samples have a known amount of radioactivity
added and are presented to the analysts labeled as cross-check samples. This
means that the quality control staff knows the radioactive content or "right
answer" but the analysts do not. They are aware they are being tested. Such
samples test the best performance of the laboratory by determining if the
analysts can find the "right answer." These samples provide information about
the accuracy of the measurement process. Further information is available
about the variability of the process if multiple analyses are requested on the
same sample. Internal cross-checks can also tell if there is a difference in
performance between two analysts. Like blind spikes or analytical knowns,
these samples can also be spiked with low levels of activity to test detection
limits.
A series of cross-checks is produced by the EPA in Las Vegas. These
interlaboratory comparison samples or "EPA cross-checks" are considered to be
the primary indicator of laboratory performance. They provide'n independent
check of the entire measurement process that cannot be easily provided by the
laboratory itself. That is, unlike internal cross-checks, EPA cross-checks
-71-

test the calibration of the laboratory detection devices since different
radioactive standa'rds produced by individuals outside TVA are used in the
cross-checks. The results of the analysis of these samples are reported back
to EPA which then issues a report of all the results of all participants.
These reports are examined very closely by laboratory supervisory and quality
control personnel. They indicate how well the laboratory is doing compared to
others across the nation. Like internal cross-checks, the EPA cross-checks
provide information to the laboratory about the'recision and accuracy of the
radioanalytical work it does.
The results of TVA's participation in the EPA Interlaboratory Comparison
Program are presented in Table F-1 and Figure F-1. For 1994, all but one EPA
cross-check sample concentrations measured by TVA's laboratory were within ~
3-sigma of the EPA reported values.
TVA splits certain environmental samples with laboratories operated by the
States of Alabama and Tennessee and the EPA National Air and Radiation
Environmental Laboratory in Montgomery, Alabama. Nhen radioactivity has been
present in the environment in measurable quantities, such as following
atmospheric nuclear weapons testing, following the Chernobyl incident, or as
naturally occurring radionuclides, the split samples have provided TYA with
yet another level of information about laboratory performance. These samples
demonstrate performance on actual environmental sample matrices rath'er than on
the constructed matrices used in cross-check programs.
-72-

A11 the quality control data are routinely collected, examined, and reported
to laboratory supervisory personnel. They are ch'ecked for trends, problem
areas, or other indications that a portion of the analytical process needs
correction or improvement. The end result is a measurement process that
provides reliable and verifiable data and is sensitive enough to measure the
presence of radioactivity far below the levels which could be harmful to
humans.
-73-

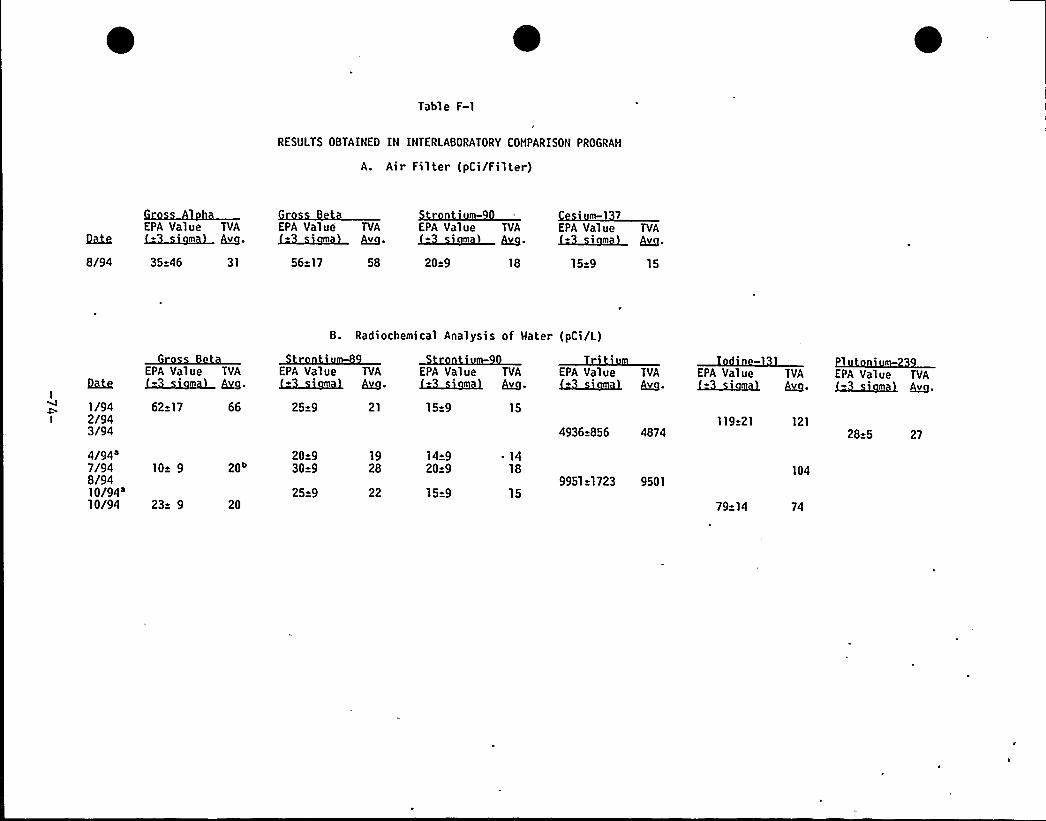
Table F-1
RESULTS OBTAINED IN INTERLABORATORY COHPARISON PROGRAH
A. Air Filter (pCi/Filter)
EPA Value TVA EPA Value TVA EPA Value TVA EPA Value TVAm~ ~v ~ ~>L9mm ~v ~ ~~m~ ~v. ~i~m ~v
8/94 35 46 31 56 17 58 20=9 18 15 9 15
B. Radiochemical Analysis of Water (pCi/L)
1/942/943/94
EPA Value TVAmmaL hm.
62 17 66
EPA Value TVAXQ.mmes /ha.
25 9 21
EPA Value TVA~v
15 9 15
EPA Value TVAU~mal hm.
4936$ 856 4874
EPA Value TVA&mal hm.
119 21 121
EPA Value TVA~~(~mt) ~v.
28 5 27
4/94~7/948/9410/94'0/94
10 9
23 9
20
20
20 930 9
25 9
1928
22
14 920 9
15 9
~ 1418
9951 1723 950115
79 14
104
74

Table F-1
RESULTS OBTAINED IN INTERLABORATORY COMPARISON PROGRAM (Continued)
C. Gamma-Spectral Analysis of Hater (pCi/L)
EPA Value TVA EPA Value TVA EPA Value TVA EPA Value TVA EPA Value TVA EPA Value TVA&mmes Wv tQ.mme hm ~Smal hm MmMm hm. LQ.W<mal hm. LQ.mmal hZ.4/94~6/9410/94'1/94
98 17 89
73 12 73
20=950 940 959=9
2050 134 233958 100 17
134 252 43 227
100
34 940=920=924 9
33 29=9 3036 49 9 5220 39 9 4122 '9 9 51
0. Milk (pCi/L)
EPA Value TVA EPA Value TVA EPA Value TVA EPA Value TVA EPA Value TVAA~v. ~~IIg~m ~. ~~~ ~. ~~iqmJL) ~v. ~~~ ~v
9/94 25=9 26 15 9 17 75 14 80 59=9 63 1715 149 1713
a. Performance Evaluation Intercomparison Study.b. The Grand Average of non-outlier participants indicates that the Performance Evaluation Standard had a postative biasfor Gross Beta. If the Grand Average of 14.91 pCi/liter were used for the known, TVA's results would be 1.65 sigma from the known.c. Units are milligrams of total potassium per liter rather than picocuries of K-40 per liter.

L ~

EPA Crosscheck Summary for 1994gamma spectroscopy methods
EPA Crosscheck Summary for 'l994analytical chemistry methods
-2
(found - given) IEPA Sigma
-1 0 1 -2
(found - given) / EPA sigma
0 2
air filter
milk
milk
milk
Cs-137
Total K
Cs-137
l-131
air filter
air filter
air filter
milk
Gross Alpha
Gross ela
Sr40
Sr 8
vrater
water
water
water
water
water
vrater
water
water
water
water
water
water
water
water
water
water
I'a-133
- Cs-134 =
Ru-$06,:,
-Co40
os-134
Ba-133
Co40
Cs-134:.
Zn45
Cs;13? ~
Cs-137
Co40
-Cs-134
5 -137
Co40
Cs-13?
milk
water
water
water
water
water
water
water
water
water
water
water
water
water
water
water
water
Sr49
Sr40
Sr40
Gro s Beta
l-13
. H4:)= Pu-239
1
,Sr49
Sr40
< Sr49 -''
, Sr40
'-H4 ':
I!131: =
'r48
Sr40
Gross Beta
.,- Gross B
Laboratory objective: abs[(found - given)/EPA sigma ] < 3

APPENDIX G
LAND USE SURVEY
-77-


Appendix G
Land Use Surve
A land use survey is conducted annually to identify the location of the
nearest milk animal, the nearest residence, and the nearest garden of greater
than 500 square feet producing fresh leafy vegetables in each of 16
meteorological sectors within a distance of 5 miles from the plant. The land
use survey also identifies the location of all milk animals and gardens of
greater than 500 square feet producing fresh leafy vegetables within a
distance of 3 miles from the plant.
The land use survey is conducted between April 1 and October 1 using
appropriate techniques such as door-to-door survey, mail survey, telephone
survey, aerial survey, or information from local agricultural authorities or
other reliable sources.
In order to identify the locations around BFN which have the greatest relative
potential for impact by the plant, radiation doses are projected for
individuals living near BFN. These projections use the data obtained in the
survey and historical meteorological data. They also assume that the plant is
operating and that releases are equivalent to the design basis source terms.
The calculated doses are relative in nature and do not reflect actual
exposures to individuals living near BFN. Calculated doses to individuals
based on measured effluents from the plant are well below applicable dose
limits (see Assessment and Evaluation Section and Table 2).
-78-

Doses from breathing air (air submersion) are calculated for the nearest
resident in each sector, while doses from drinking milk or eating foods
produced near the plant are calculated for the areas with milk producing
animals and gardens, respectively.
Air submersion doses were calculated for the same locations as in 1993, with
the resulting values similar to those calculated in 1994. Doses calculated
for ingestion of home-grown foods changed in some sectors, reflecting shifts
in the location of the nearest garden. The changes were only very slight and
did not significantly impact the doses caluclated in 1994.
For milk ingestion, projected annual doses were almost identical to those
calculated in 1993. The dose calculated for the consumption of milk from the
farm in the NNH sector was slightly higher because of a decrease in the time
the cows were fed stored feed. Only two locations with milk producing animals
were identified. Samples are being taken from both of these farms.
Tables G-l, G-2, and G-3 show the comparative calculated doses for 1993 and
1994.
-79-

Table G-1
BROHNS FERRY NUCLEAR PLANT
Relative Projected Annual Air SubmersionDose to the Nearest Resident
(Within 5 miles)mrem/year/reactor
1993 Surve 1994 Surve
Sector
N
NNE
NE
ENEE
ESE
SESSES
SSW
SW
WSW
H
WNH
NW
NNH
ApproximateDistance (Miles)
2.081.612.561.422.561.335.034.262.822.603.152.561.522.842.270.95
Annual Dose
0.150.080.100.100.080.070.060.060.100.120.070.050.110.090.180.42
ApproximateDistance (Miles)
1.231. 612.561.422.561.335.034.262.822.603.152.561.522.842.270.95
Annual Dose
0.220.080.100.100.080.070.060.060.100.120.070.050.110.090.180.42
-80-


Table G-2
BROWNS FERRY NUCLEAR PLANT
Relative Projected Annual Dose to Child's Bone fromIngestion of Home-Grown Foods
(Nearest Garden Within 5 Miles)mrem/year/reactor
1993 SurveApproximate
Sector Distance (Miles) Annual Dose
1994 SurveApproximate
Distance (Miles) Annual Dose
Number ofGardens Within3 Miles ( 1994)
NNE
NE
ENE
E
ESESE
SSE
S
SSW
SW
WSW
WNW
NW
NNW
2.563.412.751.702.602.46
a4.362.822.843.882.701.70
a2.721.14
3.081.011.232.441.842.19
0.972.252.350.690.601.26
3.419.96
1.233.412.751 ~ 702.562.46
a4.362.822.843,882.701.70
aa
1.04
8.221.011.232.441.892.19
0.972.252.350.690.601 ~ 26
10. 60
a. Garden not identified in this sector.
-81-

e

Table G-3
BROHNS FERRY NUCLEAR PLANT
Relative. Projected Annual Dose to Receptor Thyroidfrom Ingestion of Milk
mrem/year/reactor
Location SectorApproximate Distance
(Miles)Annual Dose
1993 1994X/Q
s/m'arm
Bn'Farm B'NH 4.9
6.80.0080.015
0.0080.019
1.28 E -81.32 E -8
a. Milk being sampled at these locations.
-82-


APPENDIX H
DATA TABLES
-83-

Table H-1
DIRECT RADIATION LEVELS
Average External Gamma Radiation Levels at Various Distances fromBrogans Ferry Nuclear Plant for Each Quarter 1994
mrem/Quarter'
Di stanceMi 1 es
0-1
1-2
2-4
4-6
6
Avera e External Gamma RadiationLevels'st
uarter
20.0 2 1.9
17.4 s 1.4
17.2 4 1.9
17.5 2 1.7
17.6 a 2.0
2nd uarter
16.7 a 1.1
15.4 x 1.1
14.1 a 1.3
14.3 s 1.2
14.1 2 0.8
3rd uarter
17.0 N 1.1
15.1 a 1.3
15.1 a 2.1
14.4 a 1.3
14.2 a 1.0
4th uarter
16.3 x 1.4
14.4 R 0.2
13.7 2 1.4
13.7 N 0.8
13.8 N 0.9
Average,0-2 miles(onsite) 19.3 a 2.1 16.4 x 1.3 16.5 x 1.5 16.0 a 1.5
Average,> 2 mi les(offsite) 17.5 * 1.9 14.2 a 1.1 14.5 a 1.4 13.7 a 1.0
a. Data normalized to one quarter (2190 hours).b. Averages of the individual measurements in the set ~ 1 standard deviation
of the set.
-84-

-Table H-2
DIRECT RADIATION LEVELS
Individual Stations
MapLocationHemline
7388
3940414229
4344456
46474849503
5152
TLDStation
HwmberN-1N-2
NNE-1NNE-2NNE-3NE-1NE-2NE-3
ENE-1ENE-2
E-1E-2E-3
, ESE-1ESE-2SE-1SE-2
SSE-1SSE-2
S-1S-2
NRC Direction,S>fag go'ggregg
3481
123119514956
22 6162859190110112130
2 135163
37 165185182
Approx.Distance,
hfilaa1.05.00.90.75.20.85.010.90.96.20.85.2
24.20.93.00.55.45.17.53.14.8
rnrem/Quarterr 2nd Quarter3rd Quarter 4th Quarter
October-P~c~g
1st QuarteJanuary-
'EazlQSR421.716.620.220.816.921.220.818.820.818.921.518.118.518.520.020.218.518.319.218.416.3
April - July-tun&9M9 mSu&9R4
18.613.216.616.813.217.716.014.716.214.116.614.014.113.814.514.613.013.114.014.112.5
18.613.116.018.013.817.616.114.817.415.718.015.115.214.915.515.813.414.014.414.612.3
18.113.016.217.013.318.116.314.716.315.017.116.914.614.515.415.513.213.414.314.612.5
NI8 Iih~Annual
Exposure,mMmEear
77.055.969.072.657.274.669.263.070.763.773.264.162.461.765.466.158.158.861.961.753.6
'
Locations with TVAand NRC stations co-located.


Table H-2
DIRECT RADIATION LEVELS
Individual Stations
Map .
LocationbLenbm
535455565758596061625
6364656667
681069
TLDStation
HumberSSW-1SSW-2SW-1SW-2SW-3
WSW-1— WSW-2
WSW-3W-1W-2W-3W-4
WNW-1WNW-2
NW-1NW-2NW-3
NNW-1NNW-2NNW-3
NRCQSatLo~o.*
15
13
12
10
Direction,Pmerees
203199228219224244251257275268275265291293326321310331331339
Approx.Distance,
h5hs3.04.41.94.76.02.75.110.51.94.7
31.332.13.34.42.25.313.81.01.75.2
EJEttoOLeJEaLE~d'ati~o~ee amrem/Quarter
1st Quarter 2nd Quarter3rd Quarter 4th QuarterJanuary - April - July - October-hLaLcM9%9J~ce 993 E~eJ~9 D~c199
16.1 12.3 12.2 11.418.2 . 14.3 14.7 13.318;2 14.6 14.2 14.118.7 14.2 13.9 13.716.5 13.0 13.0
*'6.5
12.5 19.1 12.518.5 14.1 17.0 14.016.6' 13.0 13.1 12.818.5 14.5 14.1 14.617.7 14.4 12.7 , 13.417.2 13.2 12.8 12.919.6 15.2 14.8 15.318.2 14.5 13.9 14.318.6 14.4 14.4 13.713.9 15.4 15.3 15.514.1 15.1 15.0 14.812.7 14.3 13.8 13.315.2 17.6 17.1 16.415.3 16.9 17.0 **
14.2 15.0 15.5 14.3
AnnualExposure,
ILeen+e~t52.060.561.160.556.760.663.655.561.758.2—56.164.960.961.160.159.054.166.365.659.0
Locations with TVAand NRC stations co-located.* Sum of available quarterly data normalized to 1 year for the annual exposure.


TENNESSEE VALLEY AUTHORITYENVIRONMENTAL RADIOLOGICAL MONITORING AND INSTRUMENT'ATION
WESTERN AREA RADIOLOGICAL LABORATORY
RADIOACTIVITY IN AIR FILTERPCI/M3 - 0.037 BQ/H3
NAME OF FACILITY: BROWNS FERRY NUCLEAR PLANTLOCATION OF FACILITY: LIMES'lONE ALABAMA
DOCKET NO.: 50-259,260,296REPORTING PERIOD: 1994
TYPE AND
TOTAL NUHBER
OF ANALYSISPERFORHED
LOWER LIMIT ALLOF INDICATOR LOCATIONS LOCATION WITH HIGHEST ANNUAL MEAN
DETECTION MEAN (F) NAME . MEAN (F)(LLD) RANGE DISTANCE AND DIRECTION RANGE
SEE NOTE 1 SEE NOTE 2 SEE NOTE 2
CONTROL
LOCATION S
MEAN (F)RANGE
SEE NOTE 2
NUMBER OF
NONROUTINEREPORTED
HEASUREMENTS
GROSS ALPHA
GROSS BETA
106
582
9.00E-04 9.76E-04( 2/ 53) LM-1 BF9.12E-04- 1.04E-03 1.0 HILES N
2.00E-03 1.93E-02( 476/ 476) LH1 BF NORTHWEST6.56E-03- 3 '3E-02 1.0 HILE N
9.76E.04( 2/ 53) 53 VALUES < LLD9.12E-04- 1.04E-03
1.98E-02( 53/ 53) 1.96E-02( 106/ 106)9.15E-03- 3.33E-02 7.25E-03- 3.35E-02
GAMMA SCAN (GELI)154
BE-7
Bl -212
Bl-214
K-40
PB-212
PB-214
TL-208
SR 89
2.00E-02
2.00E-02
5.00E-03
4.00E-02
5.00E-03
5.00E-03
2.00E-03
9.83E-02( 126/ 126)6.00E-02- 1.41E-01
4.25E-01( 8/ 126)1.47E-01- 8.52E-01
4.42E-02( 16/ 126)5.00E-03- 1.36E-01
4.60E-02( 1/ 126)4.60E-02- 4.60E-02
3.49E-01( 9/ 126)8.97E-02- 7.62E-01
4.08E-02( 15/ 126)5.00E-03- 1.40E-01
1.29E-01( 9/ 126)2.70E-OZ- 2.75E-01
PH-1 ROGERSVILLE AL13.8 HILES NW
LH2 BF NORTH
0.9 MILE NNE
LM4 BF TRAILER P
1.7 HILES NNW
LH-68F BAKER BOTTOH3.0 MILES SSW
LH2 BF NORTH
0.9 MILE NNE
LH4 BF TRAILER P
1.7 HILES NNW
LM2 BF NORTH
0.9 HILE NNE
1.02E-01( 14/ 14)7.31E-02- 1.22E-01
8.52E-01( 1/ 14)8.52E-01- 8.52E-01
1.25E-01( 1/ 14)1.25E-01- 1.25E-01
4.60E-OZ( 1/ 14)4.60E-02- 4.60E-02
7.62E-01( 1/ 14)7.62E.01- 7.62E-01
7.27E-02( 2/ 14)5.00E.03- 1.40E-01
2.75E-01( 1/ 14)2.75E-01- 2.75E-01
9.79E-02( 28/ 28)7.05E-02- 1.30E-01
1.28E-01( 2/ 28)1.00E-01- 1.56E-01
3.40E-02( 2/ 28)1.37E-02- 5.43E-0228 VALUES < LLD
1 ~ 04E-01( 2/ 28)7.00E-02- 1.37E-01
2.23E-OZ( 2/ 28)1.09E-02- 3.37E-02
3.63E-02( 2/ 28)2.38E-02- 4.88E-02
SR 90
AM 241
CH 244
1.10E-03 3 VALUES < LLD
4.00E-04 3 VALUES < LLD
2.50E-05 4 VALUES < LLD
2.50E-05 4 VALUES < LLD
3 VALUES < LLD
3 VALUES < LLD
4 VALUES < LLD
4 VALUES < LLD
NOTE: 1. NOMINAL LOWER LIMIT OF DETECTION (LLD) AS DESCRIBED IN TABLE E-1NOTE: 2. MEAN AND RANGE BASED UPON DETECTABLE HEASUREHENTS ONLY. FRACTION OF DETECTABLE HEASUREMENTS AT SPECIFIED
LOCATIONS IS INDICATED IN PARENTHESES (F).

TENNESSEE VALLEY AUTHORITYENVIRONMENTAL RADIOLOGICAL MONITORING AND INSTRUHENTATIOH
WESTERN AREA RADIOLOGICAL LABORATORY
RADIOACTIVITY IN AIR FILTERPCI/M3 - 0.037 BQ/M3
NAME OF FACILITY: BROWNS FERRY NUCLEAR PLANTLOCATION OF FACILITY LIMESTONE ALABAMA
DOCKET NO.: 50-259,260,296REPORTING PERIOD: 'l994
TYPE AND
TOTAL NUMBER
OF ANALYSISPERFORMED
LOWER LIMIT ALLOF INDICATOR LOCATIONS 'LOCATION WITH HIGHEST ANHUAL MEAN
DETECTION MEAN (F) NAME MEAN (F)(LLO) RANGE DISTANCE AND DIRECTION RANGE
SEE NOTE 1 SEE NOTE 2 SEE NOTE 2
CONTROL
LOCATIONSHEAH (F)
RANGE
SEE NOTE 2
NUHBER OFNONROUTINE
REPORTEDMEASUREMENTS
PU 239,240
PU 238
CM 242
82.50E-05 4 VALUES < LLD
2.50E-05 4 VALUES < LLD
2.50E-05 4 VALUES < LLD
4 VALUES < LLD
4 VALUES < LLD
4 VALUES < LLD
NOTE: 1. NOMINAL LOWER LIMIT OF DETECTION (LLD) AS DESCRIBED IH TABLE E-1NOTE: 2. MEAN AND RANGE BASED UPON DETECTABLE MEASUREHENTS ONLY. FRACTION OF DETECTABLE MEASUREHEHTS AT SPECIFIED
LOCATIONS IS INDICATED IN PARENTHESES (F).

TENHESSEE VALLEY AUTHORITYENVIRONHENTAL RADIOLOGICAL MONITORING AND INSTRUHENTATION
WESTERN AREA RADIOLOGICAL LABORATORY
RADIOACTIVITY IN CHARCOAL FILTERPCI/M3 - 0.037 BQ/M3
NAME OF FACILITY: BROWNS FERRY NUCLEAR PLANTLOCATION OF FACILITY: LIMESI'ONE ALABAMA
DOCKET NO.: 50-259,260,296REPORTIHG PERIOD: 1994
TYPE AND
TOTAL NUMBER
OF ANALYSISPERFORHED
LOWER LIMIT ALLOF INDICATOR LOCATIONS LOCATION WITH NIGHEST ANNUAL MEAN
DETECTIOH MEAN (F) NAHE MEAN (F)(LLD) RANGE DISTANCE AND DIRECTION RANGE
SEE NOTE 1 SEE NOTE 2 SEE NOTE 2
CONTROL
LOCATIONSMEAN (F)
RANGE
SEE NOTE 2
NUHBER OF
NONROUTINE:REPORTED
HEASUREMENTS
GAMHA SCAN (GELI)582
BI-214
K-40
5.00E-02 5.51E-02( 1/ 476) LM1 BF NORTHWEST5.51E-02- 5.51E-02 1 ~ 0 MILE N
3.00E-01 3.19E-01( 3/ 476) LM3 BF NORTHEAST3.08E-01- 3.39E-01 1.0 HILE ENE *
5.51E-02( 1/ 53) 106 VALUES < LLD5.51E-02- 5.51E-02
3.24E-OI ( 2/ 53) 3.17E.01( 1/ 106)3.08E-O'I- 3.39E-01 3.17E-01- 3.17E-01
NOTE: 1. NOMINAL LOWER LIMIT OF DETECTION (LLD) AS DESCRIBED IN TABLE E-1NOTE: 2. MEAN AND RANGE BASED UPON DETECTABLE MEASUREMENTS ONLY. FRACTION OF DETECTABLE MEASUREMENTS AT SPECIFIED
LOCATIONS IS INDICATED IN PARENTHESES (F).

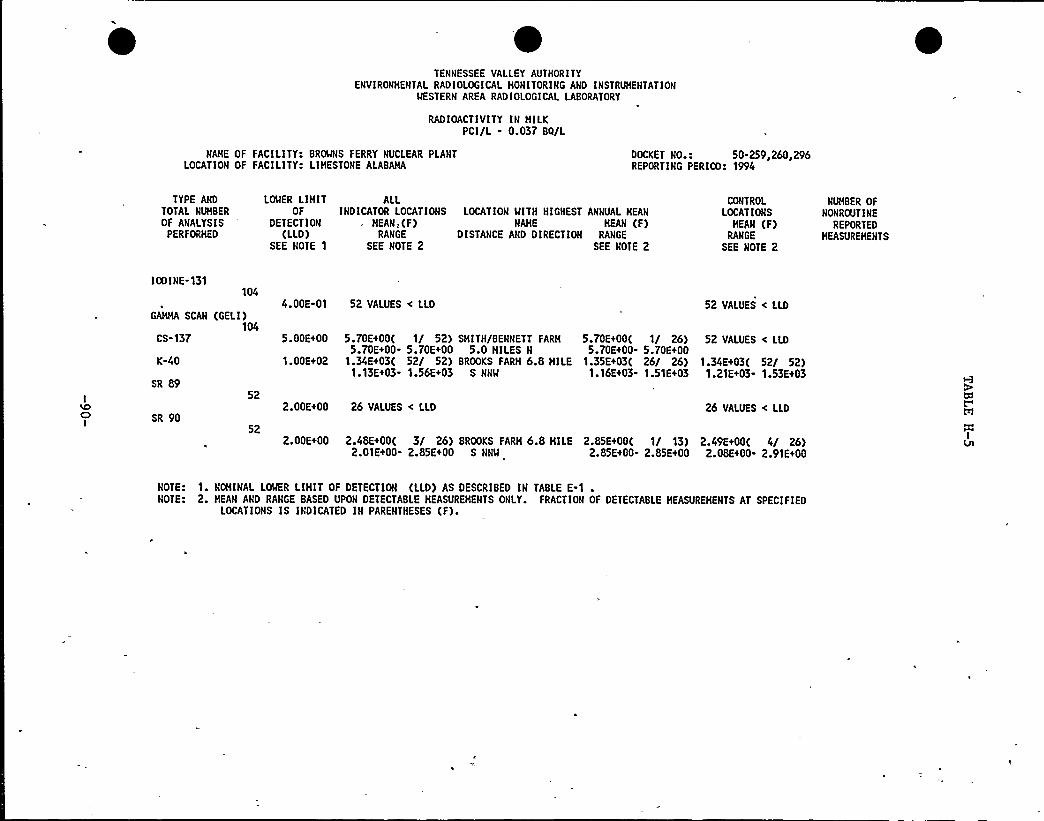
TENNESSEE VALLEY AUTHORITYENVIRONMENTAL RADIOLOGICAL MONITORING AND INSTRUMENTATION
NESTERN AREA RADIOLOGICAL LABORATORY
RADIOACTIVITY IN MILKPCI/L - 0.037 BQ/L
NAME OF FACILITY: BRONNS FERRY NUCLEARPLANI'OCATION
OF FACILITY: LIMESTONE ALABAMADOCKET NO.: 50-259,260,296REPORTING PERIOD: 1994
TYPE AND
TOTAL NUMBER
OF ANALYSISPERFORMED
LSIER LIMIT ALLOF INDICATOR LOCATIONS LOCATION HITH HIGHEST AHNUAL MEAN
DETECTION MEAN;(F) HAME MEAN (F)(LLD) RANGE DISTANCE AND DIRECTION RANGE
SEE NOTE 1 SEE NOTE 2 SEE NOTE 2
CONTROL
LOCATION S
MEAN (F)RANGE
SEE NOTE 2
NUMBER OF
NOHROUT INE
REPORTED
HEASUREMENTS
IOD I NE-131104
4.00E-01 52 VALUES < LLDGAMMA SCAN (GELI)
104CS-137
52 VALUES < LLD
K-40
SR 8952
5.DOE+00 5.70E+00( 1/ 52) SMITH/BENNETT FARH 5.70E+00( 1/ 26) 52 VALUES < LLD5.70E+00- 5.70E+00 5.0 MILES N 5.70E+00- 5.70E+00
1.DOE+02 1.34E+03( 52/ 52) BROOKS FARM 6.8 MILE 1.35E+03( 26/ 26) 1.34E+03( 52/ 52)1.13E+03- 1.56E+03 S NNM 1 ~ 16E+03- 1.51E+03 1.21E+03- 1.53E+03
SR 902.DOE+00 26 VALUES < LLD 26 VALUES < LLD
522.DOE+00 2.48E+00( 3/ 26) BROOKS FARH 6.8 HILE 2.85E+00( 1/ 13) 2.49E+00( 4/ 26)
2.01E+00- 2.85E+00 S NNW 2.85E+00- 2.85E+00 2.08E+00- 2.91E+00
NOTE: 1. NOMIHAL LONER LIHIT OF DETECTION (LLD) AS DESCRIBED IN TABLE E-1 .NOTE: 2. MEAN AND RANGE BASED UPON DETECTABLE MEASUREMENTS OHLY- FRACTION OF DETECTABLE MEASUREMENTS AT SPECIFIED
LOCATIONS IS INDICATED IN PARENTHESES (F).

0

TENNESSEE VALLEY AUTHORITYENVIRONHENTAL RADIOLOGICAL HONITORING AND INSTRUHENTATION
MESTERN AREA RADIOLOGICAL LABORATORY
RADIOACTIVITY IN VEGETATIONPCI/KG - 0.037 BQ/KG (WET WEIGHT)
HAHE OF FACILITY: BROWNS FERRY NUCLEAR PLANTLOCATION OF FACILITY: LIHESTONE ALABAHA
DOCKET NO.: 50-259,260,296REPORTING PERIOD: 1994
TYPE ANO
TOTAL NUMBER
OF ANALYSISPERFORHED
LOMER LIHIT ALLOF INDICATOR LOCATIONS LOCATION WITH HIGHEST ANNUAL HEAN
DETECI'ION , HEAN (F) NAHE HEAN (F)(LLD) RANGE DISTANCE AND DIRECTION RANGE
SEE NOTE 1 SEE HOl'E 2 SEE NO'IE 2
CONTROL
LOCATIONSHEAN (F)
RANGE
SEE NOTE 2
NUHBER OFNONROUT INE
REPORTEDHEASUREHENTS
IOD INE-13126
6.DOE+00 13 VALUES < LLD 13 VALUES < LLDGAMMA SCAN (GELI)
26BE-7
K-40
PB-212
SR 89
2.DOE+02
4.DOE+02
4.DOE+01
1.69E+03( 13/ 13) TERRY FARM2.50E+02- 5.56E+03 3.2 HILES MNW
4.82E+03( 13/ 13) TERRY FARH2.55E+03- 8.72E+03 3.2 HILES MNM
5.18E+01( 2/ 13) TERRY FARH4.80E+01- 5.56E+01 3.2 HILES WNM
1.69E+03( 'l3/ 13)2.50E+02- 5.56E+03
4.82E+03( 13/ 13)2.55Ei03- 8.72E+03
5.18E+01( 2/ 13)4.80E+01- 5.56E+01
1.62E+03( 12/ 13)3.19E+02- 5.61E+03
4.71E+03( 13/ 13)2.08E+03- 7.85E+03
6.17E+01( 1/ 13)6.17E>01- 6.17E+01
SR 903 '0E+01 4 VALUES < LLD
81.20E+01 2.51E+01( 3/ 4) TERRY FARH
1.84E+01- 2.87E+01 3.2 HILES WNM
4 VALUES < LLD
2.51E+01( 3/ 4) 1.40E+01( 1/ 4)1.84E+01- 2.87E+01 1.40E+01- 1.40E+01
NOTE: 1. NOHINAL LOMER LIHIT OF DETECTION (LLD) AS DESCRIBED IN TABLE E-1NOTE: 2. HEAN AND RANGE BASED UPON DETECTABLE HEASUREHENTS ONLY'RACTION OF DETECTABLE HEASUREHENTS AT SPECIFIED
LOCATIONS IS INDICATED IN PARENTHESES (F).


TENNESSEE VALLEY AUTHORITYENVIRONHENTAL RADIOLOGICAL HONITORING AND INSTRUMENTATION
WESTERN AREA RADIOLOGICAL LABORATORY
RADIOACTIVITY IN SOILPCI/GH - 0.037 BQ/G (DRY WEIGHT)
NAHE OF FACILITY: BROWHS FERRY HUCLEAR PLANTLOCATION OF FACILITY: LIHESTONE ALABAHA
DOCKET NO.: 50-259,260,296REPORTING PERIOD: 1994
TYPE AHDTOTAL HUHBEROF ANALYSIS
PERFORHED
LOWER LIHIT ALLOF INDICATOR LOCATIONS 'OCATION WITH HIGHEST ANNUAL HEAH
DETECTION HEAN (F) HAHE MEAN (F)(LLD) RANGE DISTANCE AND D I RECTION RANGE
SEE NOTE 1 SEE NOTE 2 SEE NOTE 2
CONTROL
LOCATIONSMEAN (F)
RAHGE
SEE NOTE 2
NUMBER OFNOHROUT INE
REPORTEDMEASUREHENTS
GROSS ALPHA
NOT ESTAB 3.58E+00( 1/ 1) LH1 BF NORTHWEST3.58E+00- 3.58E+00 1.0 MILE N
3.58E+00( 1/ 1) 4.32E+00( 1/ 1)3.58E+00- 3.58E+00 4.32E+00- 4.32E+00
GAMHA SCAN (GELI)1'I
AC-228
BE-7
81-212
BI-214
CS-137
K-40
PB-212
,PB-214
RA-224
RA-226
TL-208
SR 89
2.50E-01
2.50E-01
4.50E-01
1 '0E-01
3.00E-02
7.50E-01
1.00E-01
1.50E-01
7.50E-01
1.50E-01
6.00E-02
1.07E+00(5.57E-01-
3.54E-01(3.33E-01-
1.08E+00(5.62E-01-
8.33E-01(5.73E-01-
3.41E-01(1.41E-01-
4.96E+00(2.73E+00-
1.00E+00(5.57E-01-
9.22E-01(6.31E-01-
1.11E+00(9.37E-01-
8.33E-01(5.73E-01-
3.38E-01(1.80E-01-
9/ 9)1.47E+002/ 9)
3.75E-019/ 9)
1.39E+009/ 9)
1.12E+009/ 9)
6.21E-019/ 9)
7.86E+009/ 9)
1.35E+009/ 9)
1.27E+006/ 9)
1.35E+009/ 9)
1.12E+009/ 9)
4.51E-01
LH4 BF TRAILER P1.7 HILES NHW
PH-2 BF ATHENS AL10.9 HILES NE
LH1 BF NORTHWEST'1.0 HILE N
LH4 BF TRAILER P1.7 HILES NHW
PH-2 BF ATHENS AL10.9 HILES NE
LH4 BF TRAILER P1.7 MILES HHW
LH1 BF NOR'THWEST
1.0 HILE NLM4 BF TRAILER P
1.7 MILES NNW
LM4 BF TRAILER P'l.7 MILES NHW
LH4 BF TRAILER P1 7 HILES HHW
LH2 BF NORTH
0.9 HILE NNE
1.47E+00( 1/ 1)1.47E+00- 1.47E+00
3.75E-01( 1/ 1)3.75E-01- 3.75E-01
1.39E+00( 1/ 1)1.39E+00- 1.39E+00
1.12E+00( 1/ 1)1.12E+00- 1.12E+00
6.21E-01( 1/ 1)6.21E-01- 6.21E-01
7.86E+00( 1/ 1)7.86E+00- 7.86E+00
1.35E+00( 1/ 1)1.35E+00- 1.35E+00
1.27E+00( 1/ 1)1.27E+00-'.27E+00
1.35E+00( 1/ 1)1.35E+00- 1.35E+00
1.12E+00( 1/ 1)1.12E+00- 1.12E+00
4.51E-01( 1/ 1)4.51E-01- 4.51E-01
9.80E-01(8.52E-01-
5.35E-01(5.35E-01-
9.56E-01(7.77E-01-
9.80E-01(7.35E-01-
2.78E-01(2.25E 01-
5.36Et00(4.70E+00-
8.86E-01(7.95E-01-
1.08E+00(7.93E-01-
1 ~ 12E+00(1.12E+00-
9.80E-01(7.35E-01-
2.98E-01(2.52E-01.
2/ 2)1.11E+001/ 2)
5.35E-012/ 2)
1.14E+002/ 2)
1.22E+002/ 2)
3.31E-012/ 2)
6.02E+002/ 2)
9.77E-012/ 2)
1.36E+001/ 2)
1.12E+002/ 2)
1.22E+002/ 2)
3.44E-01
SR 901.60E+00 9 VALUES < LLD
4.00E-01 9 VALUES < LLD
2 VALUES < LLD
2 VALUES < LLD
NOTE: 1. HOMINAL LOWER LIHIT OF DETEC'PION (LLD) AS DESCRIBED IN TABLE E-1NOTE: 2. HEAH AND RANGE BASED UPON DETECTABLE HEASUREHENTS ONLY. FRACTION OF DETECTABLE HEASUREHENTS AT SPECIFIED
LOCATIONS IS INDICATED IN PARENTHESES (F).


TENNESSEE VALLEY AUTHORITYENVIRONMENTAL RADIOLOGICAL MONITORIHG AND INSTRUHENTATION
MESTERN AREA RADIOLOGICAL LABORATORY
RADIOACTIVITY IN SOILPCI/GM - 0.037 BQ/G'(DRY HEIGHT)
NAME OF FACILITY: BROMNS FERRY NUCLEAR PLANTLOCATION OF FACILITY: LIMESTONE ALABAMA
DOCKET NO.: 50-259,260,296REPORTING PERIOD: 1994
TYPE ANDTOTAL NUMBER
OF ANALYSIS'ERFORMED
LOMER LIMIT ALLOF INDICATOR LOCATIONS LOCATION MITH HIGHEST ANNUAL MEAN
DETECTION , MEAN (F) NAME MEAN (F)(LLD) RANGE DISTANCE AND DIRECT IOH RANGE
SEE NOTE 1 SEE NOTE 2 SEE NOTE 2
CONTROL
LOCATIONSHEAN (F)
RANGE
SEE NOTE 2
NUMBER OFNONROUT INE
REPORTEDMEASUREMENTS
PU 238
PU 239,240
AH 241
NOT ESTAB 1 VALUES < LLD LM1 BF NORTHWEST
1.0 HILE N
NOT ESTAB 1.55E-02( 1/ 1) LM1 BF NORTHNEST1.55E-02- 1.55E-02 '1.0 MILE N
1 VALUES < LLD 1 VALUES < LLD
1.55E-02( 1/ 1) 1 VALUES < LLD1.55E-02- 1.55E-02
CH 242
2NOT ESTAB 7.73E-03( 1/ 1) LM1 BF NORTHNEST 7.73E.03( 1/ 1) 1 VALUES < LLD
7.73E-03- 7.73E-03 1.0 MILE N 7.73E-03- 7.73E-03
CM 244
2NOT ESTAB 1 VALUES < LLD LH1 BF NORTHNEST
1.0 MILE N
NOT ESTAB 1 VALUES < LLD LM1 BF NORTKIIEST1.0 MILE N
1 VALUES < LLD 1 VALUES < LLD
1 VALUES < LLD 1 VALUES < LLD
HOTE: 1 ~ NOMINAL LOMER LIMIT OF DETECTION (LLD) AS DESCRIBED IN TABLE E-1NOTE: 2. MEAN AND RANGE BASED UPON DETECTABLE MEASUREMENTS ONLY. FRACTION OF DETECI'ABLE HEASUREMENTS AT SPECIFIED
LOCATIONS IS INDICATED IN PARENTHESES (F).

TENNESSEE VALLEY AUTHORITYENVIRONMENTAL RADIOLOGICAL MONITORING AND INSTRUMENTATION
WESTERN AREA RADIOLOGICAL LABORATORY
RADIOACTIVITY IN APPLESPCI/KG - 0.037 BQ/KG (WET WT)
NAME OF FACILITY: BROWNS FERRY NUCLEAR PLANTLOCATION OF FACILITY: LIMESTONE ALABAHA
DOCKET NO.: 50-259,260,296REPORTING PERIOD: 1994
TYPE ANDTOTAL NUMBER
OF ANALYSISPERFORMED
LOWER LIMIT ALLOF INDICATOR LOCATIONS LOCATION WITH HIGHEST ANNUAL MEAN
DETECTION MEAN (F) HAME MEAN (F)(LLD) RANGE DISTANCE AHD DIRECTION RANGE
SEE NOTE 1 SEE NOTE 2 SEE NO'IE 2
COHTROL
LOCATIOHSMEAN (F)
RANGE
SEE NOTE 2
NUMBER OF'NONROUTINE
REPORTEDMEASUREHENTS
GAMMA SCAN (GELI)2
K;40 2.50E+02 9.15E+02( 1/ 1) 7 MILES NNW
9.15E+02- 9.15E+029.15E+02( 'I/ 1) 5.85E+02( 1/ 1)
9.15E+02- 9.15E+02 5.85E+02- 5.85E+02
NOTE: 1. NOMINAL LOWER LIMIT OF DETECTION (LLD) AS DESCRIBED IN TABLE E-1NOTE: 2. MEAN AND RANGE BASED UPON DETECTABLE MEASUREMENTS ONLY. FRACTION OF DETECTABLE MEASUREMENTS AT SPECIFIED
LOCATIONS IS INDICATED IN PARENTHESES (F).

TENNESSEE VALLEY AUTHORITYEHVIRONMENTAL RADIOLOGICAL MONITORING AND IHSTRUMENTATION
WESTERN AREA RADIOLOGICAL LABORATORY
RADIOACTIVITY IN BEEFPCI/KG - 0.037 BQ/KG (WEI'T)
HAME OF FACILITY: BROWNS FERRY NUCLEAR PLANTLOCATION OF FACILITY: LIMESTONE ALABAMA
DOCKET NO.: 50.259,260,296REPORTING PERIOD: 1994
TYPE AND
TOTAL NUMBEROF ANALYSIS
PERFORMED
LOWER LIMIT ALLOF INDICATOR LOCATIONS LOCATION WITH HIGHEST ANNUAL MEAN
DETECTION .- MEAN (F) NAME MEAN (F)(LLD) RANGE DISTANCE AND DIRECTION RANGE
SEE NOTE 1 SEE NOTE 2 SEE NOTE 2
CONTROL
LOCATIONSMEAN (F)
RANGE
SEE NOTE 2
NUMBER OFNONROUTINE
REPORTEDMEASUREMENTS
GAMMA SCAN (GELI)2
Kr40 2.DOE+02 2.35E+03( 1/ 1) SHITH/BEHNETT FARH2.35E+03- 2.35E+03 5.0 MILES N
2.35E+03( 1/ 1) . 2-57E+03( 1/ 1)2.35E+03- 2.35E+03 2.57E+03- 2.57E+03
NOTE: 1. NOMINAL LOWER LIMIT OF DETECTION (LLD) AS DESCRIBED IN TABLE E-1NOTE: 2. MEAN AND RANGE BASED UPON DETECTABLE MEASUREMENTS ONLY. FRACTION OF DETECTABLE MEASUREMENTS AT SPECIFIED
LOCATIONS IS INDICATED IH PARENTHESES (F).


TENNESSEE VALLEY AUTHORITYENVIRONMENTAL RADIOLOGICAL MONITORING AND INSTRUMENTATION
WESTERN AREA RADIOLOGICAL LABORATORY
RADIOACTIVITY IN CABBAGEPCI/KG - 0.037 BO/KG (WET WT)
HAME OF FACILITY: BROWNS FERRY NUCLEAR PLANTLOCATION OF FACILITY: LIHESTONE ALABAMA
DOCKET NO.: 50-259,260,296REPORTING PERIOD: 1994
TYPE AND
TOTAL NUMBER
OF ANALYSISPERFORMED
LOWER LIMIT ALLOF INDICATOR LOCATIONS LOCATION WITH HIGHEST ANNUAL MEAN
DETECTION MEAN (F) NAME , MEAN (F)(LLD) RANGE DISTANCE AND DIRECTION RANGE
SEE NOTE 1 SEE NOTE 2 SEE HOTE 2
CONTROL
LOCATION S
MEAN (F)RANGE
SEE NOTE 2
NUHBER OFNDNROU'TINE
REPORTEDHEASUREHENTS
GAMMA SCAN (GELI)
K-40 2.50E+02 '1.86E+03( 1/ I) 7 MILES NNW
1.86E+03- 1.86E+031.86E+03( 1/ 1) 8.66E+02( 1/ 1)1.86Ei03- 1.86E+03 8.66E+02. 8.66E+02
NOTE: 1. NOMINAL LOWER LIHIT OF DETECTION (LLD) AS DESCRIBED IN TABLE E-1NOTE: 2. MEAN AND RANGE BASED UPON DETECTABLE MEASUREHENTS ONLY. FRACTION OF DETECTABLE MEASUREHENTS AT SPECIFIED
LOCATIONS IS INDICATED IN PARENTHESES (F).
t
I
tD

TENNESSEE VALLEY AUTHORITYENVIROHNEHTAL RADIOLOGICAL NONITORIHG AND INSTRUNENTATION
MESTERN AREA RADIOLOGICAL LABORATORY
RADIOACTIVITY IN CORN
PCI/KG . 0.037 BQ/KG (MET MT)
NANE OF FACILITY: BROMNS FERRY NUCLEAR PLANTLOCATION OF FACILITY: LIHESTOHE ALABANA
DOCKET HO.: 50-259,260,296REPORTIHG PERIOD: 1994
TYPE AHDTOTAL NUNBEROF ANALYSIS
PERFORNED
LONER LIHIT ALLOF INDICATOR LOCATIONS LOCATION MITN NIGHEST ANNUAL'HEAH
DETECTIOH NEAN (F) HANE NEAH (F)(LLD) RANGE DISTANCE AHD DIRECTION RANGE
SEE NOTE 1 SEE HOTE 2 SEE NOTE 2
CONTROL
LOCATIONSNEAN (F)
RANGE
SEE NOTE 2
HUHBER OF
NOHROUT INE
REPORTEDNEASUREHEHTS
GANNA SCAN (GELI)2
K.-40 2.50E+02 1.92E+03( 1/ 1) 7 MlLES NNM
1.92E+03- 1.92E+03'1.92E+03( 1/ 1) 2.45E+03( 1/ 1)
1.92E+03- 1.92E+03 2.45E+03- 2.45E+03
NOTE: 1 ~ NONIHAL LOMER LIHIT OF DETECTION (LLD) AS DESCRIBED IN TABLE E-1NOTE: 2. NEAN AHD RANGE BASED UPON DETECTABLE HEASUREHEHTS ONLY. FRACTION OF DETECTABLE HEASURENEHTS AT SPECIFIED
LOCATIONS IS INDICATED IH PARENTHESES (F).


TENNESSEE VALLEY AUTHORITYENVIRONMENTAL RADIOLOGICAL MONITORING AND INSTRUMENTATION
WESTERN AREA RADIOLOGICAL LABORATORY\
RADIOACTIVITY IN PEASPCI/KG - 0.037 BQ/KG (WET WT)
NAME OF FACILITY: BROWNS FERRY NUCLEAR PLAHTLOCATION OF FACILITY: LIMESTONE ALABAHA
DOCKET NO.: 50-259,260,296REPORTING PERIOD: 1994
TYPE AND
TOTAL NUMBER
OF ANALYSISPERFORHED
LOWER LIMIT ALLOF INDICATOR LOCATIONS LOCATION WITH HIGHEST ANNUAL MEAN
DETECTION MEAN (F:) HAME MEAN (F)(LLD) RANGE D ISTANCE AND DIRECTION RANGE
SEE NOTE 1 SEE NOTE 2 SEE NOTE 2
CONTROL
LOCATIONSHEAN,.(F)
RANGE
SEE NOTE 2
NUMBER OFNONROUT IHE
REPORTEDMEASUREMEHTS
GAMMA SCAN (GELI)2
K-40 2.50E+02 4.09E+03( 1/ 1) 7 HILES NNW
4.09E+03- 4.09E+034-09E+03( 1/ 1) 2-59E+03( 1/ 1)
4.09E+03- 4.09Et03 2.59E+03- 2.59E+03
NOTE: 1. NOMINAL LOWER LIMIT OF DETECTION (LLD) AS DESCRIBED IN TABLE E-1NOTE: 2. MEAN AND RANGE BASED UPON DETECTABLE MEASUREMENTS ONLY- FRACTION OF DETECI'ABLE MEASUREMEHTS AT SPECIFIED
LOCATIONS IS INDICATED-IN PARENTHESES (F).
I
00I

TENNESSEE VALLEY AUTHORITYENVIRONMEHTAL RADIOLOGICAL MONITORING AND IHSTRUMEHTATIOH
WESTERN AREA RADIOLOGICAL LABORATORY
RADIOACTIVITY IN POTATOESPCI/KG - 0.037 BO/KG (WET WT)
NAME OF FACILITY: BROWNS FERRY NUCLEAR PLANTLOCATION OF FACILITY: LIMESTONE ALABAMA
DOCKET HO.: 50-259,260,296REPORTIHG PERIOD: 1994
TYPE ANDTOl'AL NUMBER
OF ANALYSISPERFORMED
LOWER LIMIT ALLOF INDICATOR LOCATIONS LOCATION WITH HIGHEST ANNUAL
MEAN'ETECTION
MEAN (F) NAME MEAN (F)(LLD) RANGE DISTANCE AHD DIRECTION RANGE
SEE NOTE 1 SEE NOTE 2 SEE NOTE 2
CONI'ROL
LOCATIOHSMEAN (F)
RANGE
SEE NOTE 2
HUMBER OFNONROUT IHE
REPORTED
MEASUREMENTS
GAMMA SCAN (GELI)2
K-40 2.50E+02 2.94E+03( 1/ 1) 7 MILES HHW
2.94E+03- 2.94E+032.94E+03( 1/ 1) 3.05E+03( 1/ 1)
2.94E+03- 2.94E+03 3.05E+03- 3.05E+03
NOTE: 1. NOMINAL LOWER LIMIT OF DETECTION (LLD) AS DESCRIBED IN TABLE E-1NOTE: 2. MEAN AND RANGE BASED UPON DETECTABLE MEASUREMEHTS ONLY. FRACTION OF DETECTABLE MEASUREMENTS AT SPECIFIED
LOCATIONS IS INDICATED IN PARENTHESES (F).

TENNESSEE VALLEY AUTHORITYEHVIRONMENTAL RADIOLOGICAL MONITORING AND INSTRUMENTATION
WESTERN AREA RADiOLOGICAL LABORATORY
RADIOACTIVITY IN TOMATOESPCI/KG - 0.037 BQ/KG (WET WT)
NAME OF FACILITY: BROWNS FERRY NUCLEAR PLANTLOCATION OF FACILITY: LIHESTONE ALABAHA
DOCKET NO.: 50-259,260,296REPORTING PERIOD: 1994
TYPE AND
TOTAL NUMBER
OF ANALYSISPERFORMED
LOWER LIMIT ALLOF INDICATOR LOCATIONS LOCATION WITH HIGHEST AHNUAL MEAN
DETECTION MEAN (F) i NAME MEAN (F)(LLD) RAHGE DISTANCE AND DIRECTION RANGE
SEE NOTE 1 SEE NOTE 2 SEE NOTE 2
CONTROLLOCATIOHS
HEAN (F)RANGE
SEE NOTE 2
NUMBER OF
NOHROUT INE
REPORTEDMEASUREMENTS
GAMMA SCAN (GELI)2
K.-40 2.50E+02 2.17E+03( 1/ 1) 7 MILES NNW
2.17E+03- 2.17E+032.17E+03( 1/ 1) 2.28E+03( 1/ 1)
2.17E+03- 2 ~ 17E+03 2.28E+03- 2.28E+03
I
CDCDI
NOTE: 1. NOMIHAL LOWER LIMIT OF DETECTION (LLD) AS DESCRIBED IN TABLE E-1NOTE: 2. MEAN AND RANGE BASED UPON DETECTABLE MEASUREHENTS ONLY. FRACTION OF DETECTABLE MEASUREMEHTS AT SPECIFIED
LOCATIONS IS INDICATED IN PAREHTHESES (F).


TENNESSEE VALLEY AUTHORITYENVIRONMENTAL RADIOLOGICAL MONITORING AND INSTRUMENTATION
WESTERN AREA RADIOLOGICAL LABORATORY
RADIOACTIVITY IN SURFACE WATER(Total)PCI/L - 0.037 BQ/L
NAME OF FACILITY: BROWNS FERRY NUCLEAR PLANTLOCATION OF FACILITY: LIMESTONE ALABAMA
DOCKET NO.: 50-259,260,296REPORTING PERIOD: 1994
TYPE ANDTOTAL NUMBER
OF ANALYSIS.PERFORMED
LOWER LIMIT ALLOF INDICATOR LOCATIONS LOCATION WITH HIGHEST ANNUAL MEAH
DETECTIOH MEAN (F) NAME : HEAN (F)(LLD) RANGE DISTANCE AND DIRECTION RANGE
SEE NOTE 1 SEE NOTE 2 SEE NOTE 2
CONTROLLOCATIONS
MEAN (F)RANGE
SEE NOTE 2
NUMBER OF
NONROUTINE
REPORTED
MEASUREMENTS
GROSS BETA39
1.90E+00 2.73E+00( 22/ 26) TRH 293.51.92E+00- 4.23E+00
2.74E+00( 12/ '13) 2.44E+00( 13/ 13)1.92E+00- 4.23E+00 1.96E+00- 2.95E+00
GAMMA SCAN (GELI)39
SR 8912
SR 9012
TRITIUM12
5.DOE+00 26 VALUES < LLD
5 O BOE+00 8 VALUES < LLD
2.DOE+00 8 VALUES < LLD
3.DOE+02 8 VALUES < LLD
13 VALUES < LLD
4 VALUES < LLD
4 VALUES < LLD
4 VALUES < LLD
NOTE: 1. NOHIHAL LOWER LIMIT OF DETECTION (LLD) AS DESCRIBED IH TABLE E-1 .NOTE: 2. MEAN AND RANGE BASED UPON DETECTABLE MEASUREHENTS ONLY- FRACTION OF DETECTABLE HEASUREMENTS AT SPECIFIED
LOCATIONS IS INDICATED IN PARENTHESES (F).


TEHNESSEE VALLEY AUTHORITYENVIRONMENTAL RADIOLOGICAL MOHITORING AND INSTRUMENTATIOH
WESTERH AREA RADIOLOGICAL LABORATORY
RADIOACTIVITY IH PUBLIC WATER(Total)PCI/L - 0.037 BQ/L
NAME OF FACILITY: BROWNS FERRY NUCLEAR PLANTLOCATION OF FACILITY: LIHESTONE ALABAHA
DOCKET NO.: 50-259,260,296REPORTING PERIOD: 1994
TYPE ANDTOtAL NUMBEROF ANALYSIS
PERFORMED
LOWER LIHIT ALLOF INDICATOR LOCATIONS LOCATION WITH'IGHEST ANNUAL MEAN
DETECTION MEAN .(F) NAME MEAN (F)(LLD) RANGE DISTANCE AND DIRECTION RANGE
SEE NOTE 1 SEE NOTE 2 SEE NOTE 2
CONTROLLOCATIONS
MEAN (F)RANGE
SEE NOTE 2
NUHBER OFNONROUI'INE "
REPORTED,MEASUREMEHtS
GROSS BEI'A76
1.90E+00 2.40E+00( 35/ 50) CHAMPION PAPER1.91E+00- 3.49E+00 TRM 282.6
2.50E+00( 9/ 12) 2.43E+00( 21/ 26)2.13E+00- 3.49E+00 1.92E+00- 3.62E+00
GAMHA SCAN (GELI)78
SR 8924
5.DOE+00 52 VALUES < LLD 26 VALUES < LLD
SR 90
TR IT IUH
5 ~ OOE<00 16 VALUES < LLD
242.DOE+00 16 VALUES < LLD
243.DOE+02 16 VALUES < LLD
8 VALUES < LLD
8 VALUES < LLD
8 VALUES < LLD
NOTE: 1. NOMINAL LOWER LIMIT OF DETECTION (LLD) AS DESCRIBED IH TABLE E-1NOTE: 2. MEAN AND RANGE BASED UPON DETECTABLE MEASUREHEHTS ONLY. FRACTION OF DETECTABLE HEASUREMENTS AT SPECIFIED
LOCATIONS IS INDICATED IN PARENTHESES (F).

TENNESSEE VALLEY AUTHORITYENVIRONMENTAL RADIOLOGICAL MONITORIHG AHD INSTRUMENTATION
'WESTERN AREA RADIOLOGICAL LABORATORY
RADIOACTIVITY IH WELL WATER(Total)PCI/L - 0.037 BQ/L
HAME OF FACILITY: BROWNS FERRY NUCLEAR PLANTLOCATION OF FACILITY: LIMESTONE ALABAMA
DOCKET HO.: 50.259,260,296REPORTIHG PERIOD: 1994
TYPE AND
TOTAL NUMBEROF ANALYSIS
PERFORMED
LOWER LIMIT ALLOF INDICATOR LOCATIONS LOCATION 'WITH HIGHEST ANNUAL MEAN
DETECTIOH MEAN (F) NAME MEAN (F)(LLD) RANGE DISTANCE AHD DIRECTION RANGE
SEE NOTE 'I SEE NOTE 2 SEE NOTE 2
CONTROL
LOCATIOHSMEAN (F)
RANGE
SEE NOTE 2
NUMBER OFHOHROUT IHE
REPORTEDMEASUREMENTS
GAMMA SCAN (GELI)26
81-214
PB-214
SR 89
2.00E+01 4.91E+01( 2/ 13) BFN WELL ¹62.90E+01- 6.91E+01 0.02 MILES W
2.DOE+01 6.22E+Ol( 1/ 13) BFN WELL ¹66.22E+01- 6.22E+01 0.02 MILES W
4.91E+01( 2/ 13) 3.18E+02( 13/ 13)2.90E+01- 6.91E+01 1.91E+02- 5.95E+02
6.22E+01( 1/ 13) 3.12E+02( 13/ 13)6.22E+01- 6.22E+01 1.79E+02- 5.75E+02
SR 90
TRITIUM
5.DOE+00 4 VALUES < LLD
82.DOE+00 4 VALUES < LLD
3 ~ OOE+02 4 VALUES < LLD
4 VALUES < LLD
4 VALUES < LLD
4 VALUES < LLD
NOTE: 1. NOMINAL LOWER LIMIT OF DETECTIOH (LLD) AS DESCRIBED IH TABLE E-1 .NOTE: 2. MEAN AND RANGE BASED UPON DETECTABLE MEASUREMENTS ONLY- FRACTION OF DETECTABLE MEASUREMENTS AT SPECIFIED
LOCATIOHS IS INDICATED IN PARENTHESES (F).

C)

TENNESSEE VALLEY AUTHORITYENVIRONHENTAL RADIOLOGICAL MONITORING AND INSTRUMENTATION
WESTERN AREA RADIOLOGICAL LABORATORY
I'ADIOACI'IVITYIN CRAPPIE FLESHPCI/GH - 0.037 BQ/G*(DRY WEIGHT)
NAME OF FACILITY: BRDWNS FERRY NUCLEAR PLANTLOCATION OF FACILITY: LIMESTONE ALABAMA
DOCKET NO.: 50-259,260,296REPORTING PERIOD: 1994
TYPE ANDTOTAL NUHBER
,OF ANALYSISPERFORMED
LOWER LIHIT ALLOF INDICATOR LOCATIONS LOCATION WITH HIGHEST AHHUAL HEAN
DETECTION MEAN (F) ,NAHE MEAN (F)(LLD) RANGE DISTANCE AND DIRECTION RANGE
SEE NOTE 1 SEE NOTE 2 SEE NOTE 2
CONTROL
LOCATIONSHEAN (F)
RANGE
SEE NOTE 2
NUHBER OFNONROUTINE
REPORTEDMEASUREMEHTS
GAMHA SCAN (GELI)4
CS-137
K-40
3.00E-02 6.71E-02( 1/ 2) WHEELER RES6.71E-02- 6.71E-02 TRH 275-349
4.00E-01 1.50E+01( 2/ 2) WHEELER RES1.44E+01- 1.56E+01 TRH 275-349
6.71E-02( 1/ 2) 7.13E-02( 1/ 2)6.71E-02- 6.71E-02 7.13E-02- 7.13E-02
1.50E+01( 2/ 2) 1 ~ 50E+01( 2/ 2)1.44E+01- 1.56E+01 1.36E+01- 1.63E+01
NOTE: 1. NOMINAL LOWER LIHIT OF DETECTION (LLD) AS DESCRIBED IN TABLE E-1 ~
NOTE: 2. MEAH AND RANGE BASED UPON DETECTABLE HEASUREMENTS ONLY- FRACTION OF DETECTABLE MEASUREMENTS AT SPECIFIEDLOCATIONS IS INDICATED IN PAREHTHESES (F).

TENNESSEE VALLEY AUTHORITYENVIRONHENTAL RADIOLOGICAL MONITORING AND INSTRUMENTATION
l!ESTERN AREA RADIOLOGICAL LABORATORY
RADIOACTIVITY IN SMALLMOUTH BUFFALO FLESHPCI/GM - 0.037 BQ/G (DRY NEIGHT)
NAME OF FACILITY: BROWNS FERRY NUCLEAR PLANTLOCATION OF FACILITY: LIMESTONE ALABAMA
DOCKET NO.: 50-259,260,296REPORTING PERIOD: 1994
TYPE ANDTOTAL NUMBER
OF ANALYSISPERFORMED
LOMER LIHIT ALLOF INDICATOR LOCATIONS LOCATIOH NITH HIGHEST ANNUAL MEAN
DETECTION MEAN (F) NAHE MEAN (F)(LLD) RANGE DISTANCE AND D I RECTION RANGE
SEE NOTE I SEE NOTE 2 SEE NOTE 2
CONTROL
LOCATIONSHEAR (F),
RANGE
SEE NOTE 2
NUMBER OFNONROUTINE
REPORTEDMEASUREMENTS
GAMMA SCAN (GELI)4
K-40 4.00E-01 9.36E+00( 2/ 2) MHEELER RES8.93E+00- 9.79E+00 TRH 275-349
9.36E+00( 2/ 2) 8.65E+00( 2/ 2)8.93E+00- 9.79E+00 7.83E+00- 9.47E+00
IIC)
I
NOTE: 1. NOMINAL LONER LIMIT OF DETECTION (LLD) AS DESCRIBED IN TABLE E-INOTE: 2. MEAN AND RANGE BASED UPON DETECTABLE MEASUREHENTS ONLY. FRACTION OF DETECTABLE MEASUREMEHTS AT SPECIFIED
LOCATIONS IS INDICATED IN PARENTHESES (F)-

TENNESSEE VALLEY AU'IHORITYENVIRONMENTAL RADIOLOGICAL HONITORING AND INSTRUMENTATION
WESTERN AREA RADIOLOGICAL LABORATORY
RADIOACTIVITY IN SHALLMOUTH BUFFALO WHOLE
PCI/GH - 0.037 BQ/G*(DRY WEIGHT)
NAME OF FACILITY: BROWNS FERRY NUCLEAR PLANTLOCATION OF FACILITY: LIMESTONE ALABAMA
DOCKET NO.: 50-259,260,296REPORTING PERIOD: 1994
TYPE ANDTOTAL NUMBER
OF ANALYSISPERFORMED
LOWER LIHIT ALLOF INDICATOR LOCATIONS LOCATION WITH HIGHEST ANNUAL HEAN
DETECTION MEAN (F) NAHE : MEAN (F)(LLD) RANGE DISTANCE AND DIRECTION RANGE
SEE NOTE 1 SEE NOTE 2 SEE NOTE 2
CONTROL
LOCATIONSHEAN (F)
RANGE
SEE NOTE 2
NUHBER OF
NONROUTINEREPORTED
HEASUREHENTS
GAMHA SCAN (GELI)4
K-40 4 'OE-01 5.DOE+00( 2/ 2) WHEELER RES4.94E+00- 5.06E+00 TRH 275-349
5.DOE+00( 2/ 2) 7.13E+00( 2/ 2)4.94Ei00- 5.06E+00 5.87E+00- 8.39E+00
I
C>
I
NOTE: 1. NOMINAL LOWER LIMIT OF DETECTION (LLD) AS DESCRIBED IN TABLE E-1 .NOTE: 2. MEAN AND RANGE BASED UPON DETECTABLE MEASUREMENTS ONLY. FRACTION OF DETECTABLE HEASUREMENTS AT SPECIFIED
LOCATIONS IS INDICATED IN PARENTHESES (F).
I
CO

TENNESSEE VALLEY AUTHORITYENVIRONMENTAL RADIOLOGICAL MONITORING AND INSTRUMENTATION
WESTERN AREA RADIOLOGICAL LABORATORY
RADIOACTIVITY IN SEDIHENTPCI/GH - 0.037 BQ/G (DRY WEIGHT)
NAME OF FACILITY: BROWNS FERRY NUCLEAR PLANTLOCATION OF 'FACILITY: LIMESTONE ALABAMA
DOCKET NO.: 50-259,260,296REPORTING PERIOD: 1994
TYPE ANDTOTAL NUMBER
OF ANALYSISPERFORMED
LOWER LIHIT ALLOF INDICATOR LOCATIONS LOCATION WITH HIGHEST ANNUAL MEAN
DETECTION MEAN (F),. NAHE MEAN (F)(LLD) RANGE-. DISTANCE AND DIRECTION RANGE
SEE NOTE 1 SEE NOTE 2 SEE NOTE 2
CON'IROL
LOCATIONS*
MEAN (F)RANGE
SEE NOTE 2
NUMBER OFNONROUT I NE
REPORTEDMEASUREHENTS
GAMHA SCAN (GELI)10
AC-228
BE-7
81-212
81-214
C0.60
CS-137
K.40
PB-212
PB-214
RA-224
RA-226
TL-208
SR 89
2.50E-01
2.50E-01
4.50E-01
1.50E-01
3.00E-02
3.00E-02
7.50E-01
1.00E-01
1.50E-01
7.50E-01
1.50E-01
6.00E-02
1.33E+00( 6/ 6) TRH 293.79.78E-01- 1.55E+00 BFN DISCHARGE
4.63E-01( 3/. 6) TRM 293.73.35E-01- 5.48E-01 BFN DISCHARGE
1.36E+00( 6/ 6) TRH 293.71.03E+00- 1.69E+00 BFN DISCHARGE
1.06E+00( 6/ 6) TRM 293.76.82E-01- 1.37E+00 BFN DISCHARGE
1.47E-01( 5/ 6) TRM 288.785.69E-02- 4.33E-01
5.12E-01( 6/ 6) TRH 293.73.19E-01- 7.10E-01 BFN DISCHARGE
1.13E+01( 6/ 6) TRH 293.77.03E+00- 1.31E+01 BFN DISCHARGE
1.23E+00( 6/ 6) TRM 293.78.50E-01- 1.49E+00 BFN DISCHARGE
1.13E+00( 6/ 6) TRM 293.77.55E-01- 1.48E+00 BFN DISCHARGE
1.33E+00( 6/ 6) TRH 293.77.74E-Ol- 1.62E+00 BFN DISCHARGE
9.94E-01( 5/ 6) TRH 293.76.82E-01- 1.15E+00 BFN DiSCHARGE
4.25E-01( 6/ 6) TRM 293.73.13E-01- 4.99E-01 BFN DISCHARGE
1.52E+00(1.49E+00-
5.48E-01(5.48E-01-
1.46E+00(1.46E+00-
1.15E+00(1.14E+00-
2.49E-01(6.55E-02-
5.24E-01(4.68E-01-
1.31E+01(1.31E<01-
'1.37E+00(1.33Ei00-
1 ~ 20E+00(1.18E+00-
1.48E+00(1.45E+00-
1. 15E+00(1.14Ei00-
4.76E-01(4.69E.01-
2/ 2)1 ~ 55E+001/ 2)
5.48E-012/ 2)
1.47E+002/ 2)
1.15E+002/ 2)
4.33E-012/ 2)
5.81E-012/ 2)
1.31E+012/ 2)
1.41E+002/ 2)
1.21E+002/ 2)
1.50E+002/ 2)
1.15E+002/ 2)
4.83E-01
1.16E+00(9.68E-01-
6.46E-01(4.90E-01-
1.15E+00(8.25E-01-
8.98E-01(6.78E-01-
4 VALUES
1.96E-01(1.49E-01-
1.24E+01(1 ~ 13E+01-
1.10E+00(8.60E-01-
9.88E-01(7.26E-01-
1.19E+00(9.31E-01-
8.98E-01(6.78E-01-
3.81E-01(2.91E-01-
4/ 4)1.35E+003/ 4)
8.97E-014/ 4)
1.41E+004/ 4)
1.08E+00< LLD
4/ 4)2.68E-014/ 4)
1.35Ei014/ 4)
1.29E+004/ 4)
1.18E+004/ 4)
1.40E+004/ 4)
1.08E+004/ 4)
4.54E-01
SR 90
101.60E+00 6 VALUES < LLD 4 VALUES < LLD
104.00E-01 6.73E-01( 3/ 6) TRH 277.98
4.43E-01- 8.49E-018.49E-01( 1/ 2) 5.66E-01( 1/ 4)8.49E-01- 8.49E-01 5.66E-01- 5.66E-Ol
NOTE: 1. NOMINAL LOWER LIHIT OF DETECTION (LLD) AS DESCRIBED IN TABLE E-1NOTE: 2. MEAN AND RANGE BASED UPON DETECTABLE MEASUREMENTS ONLY'RACTION OF DETECTABLE MEASUREMENTS AT SPECIFIED
LOCATIONS IS INDICATED IN PARENI'HESES (F).

TENNESSEE VALLEY AUTHORITYENVIRONMENTAL RADIOLOGICAL MONITORING AND INSTRUHENTATION
WESTERN AREA RADIOLOGICAL LABORATORY
RADIOACTIVITY IN CLAM FLESHPCI/GH - 0.037 BQ/G'(DRY WEIGHT)
NAME OF FACILITY: BROWNS FERRY NUCLEAR PLANTLOCATION OF FACILITY: LIMESTONE ALABAMA
DOCKET NO.: 50-259,260,296REPORTING PERIOD: 1994
TYPE ANDTOTAL NUMBER
OF ANALYSISPERFORHED
LOWER LIHIT ALLOF INDICATOR LOCATIONS LOCATION WITH HIGHEST ANNUAL MEAN
DETECTION MEAN (F) NAHE MEAN (F)(LLD) RANGE DISTANCE AND DIRECTION RANGE
SEE NOTE 1 SEE NOTE 2 SEE NOTE 2
CONTROL
LOCATIONSMEAN (F)
RANGE
SEE NOTE 2
NUHBER OFNONROUT INE
REPORTEDMEASUREHENTS
GAMHA SCAN (GELI)4
Bl-214
PB-212
PB-214
5.00E-01
3.00E-01
1 'OE-01
2.62E+00( 1/ 2) DOWNSTREAM LOCATION2.62E+00- 2.62E+00 DOWNSTREAM
4.32E-01( 1/ 2) DOWNSTREAM LOCATION4.32E-01- 4.32E-01 DOWNSTREAM
2.71E+00( 1/ 2) DOWNSTREAM LOCATION2.71E+00- 2.71E+00 DOWNSTREAM
2.62E+00( 1/ 2)2.62E+00- 2.62E+00
4.32E-01( 1/ 2)4.32E-01- 4.32E-01
2.71E+00( 1/ 2)2.71E+00- 2.71E+00
1.05E+00( 1/ 2)1.05E+00- 1.05E+00
2 VALUES c LLD
8.43E-01( 1/ 2)8.43E-01- 8.43E-01
NOTE: 1. NOHINAL LOWER LIHIT OF DETECTION (LLD) AS DESCRIBED IN TABLE E-1NOTE: 2. MEAN AND RANGE BASED UPON DETECTABLE MEASUREHENTS ONLY FRACTION OF DETECTABLE MEASUREHENTS AT SPECIFIED
LOCATIONS IS INDICATED IN PARENTHESES (F).

Direct Radiation LevelsBrowns Ferry Nuclear Plant
24
22
20
O18
R 16(0E
14
12
10
77 78 79 80 81 82 83 84 85 86 87 88 89 90 91 92 93 94Year/Quarter
p On-Site + Off-Site


Direct Radiation LevelsFour Quarter Moving Average
22
206)
(6
~ 18
16
E1
E14
12
77 78 79 80 81 82 83 — 84 85 86 87 88 89 90 91 92 93 94Year/Quarter
On-Site + Off-Site
Browns Ferry Nuclear Plant

Direct Radiation LevelsWatts Bar Nuclear Plant
24
g 20
18
(D
E 16
E
14 L+
1277 78 79 80 81 82 83 84 85 86 87 88 89 90 91 92 93 94
Year/Quarter
w On-Site k- Off-Site

Direct Radiation LevelsWatts Bar Nuclear Plant - Four Quarter Moving Average
24
22
20'a
18
(016
L
E14
1278 79 80 81 82 83 84 85 86 87 88 89 90 . 91 92 93 94
Year/Quarter
+ On-Site + Off-Site

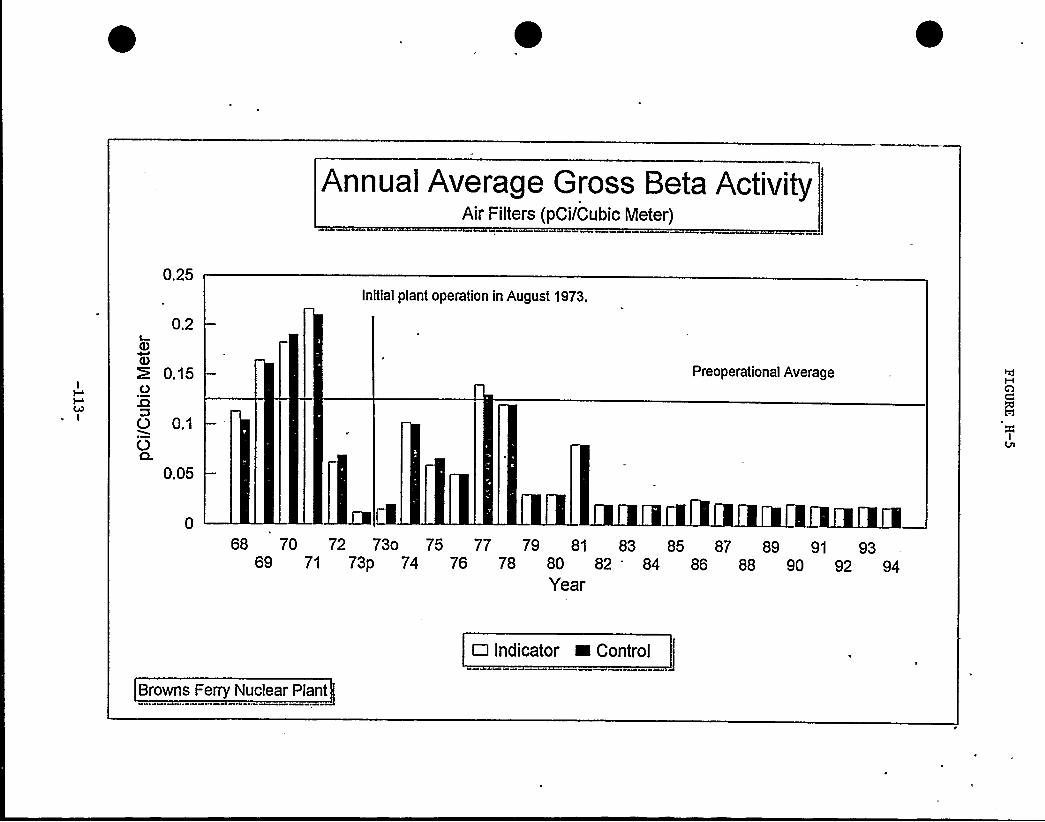
Annual Average Gross Beta ActivityAirFilters (pCi/Cubic Meter)
0.25
0.2
Initial plant operation in August 1973.
0.15O
O 01O
0.05
Preoperational Average
68 70 72 73o 75 77 79 81 83 85 87 89 91 9369 71 73p 74 76 78 80 82 84 86 88 90 92 94
Year
M Indicator IIControl
Browns Ferry Nuclear Plant


Annual Average: Sr-90 in Milk20
1'5
Initial plant operation in August 1973.
~ 100
68 70 72 73o 75 77 79 81 83 85 87 89 91 9369 71 73p 74 76 78 80 82 84 86 88 90 92 94
Year
~ Indicator ~ Control —Preoperational Average
Browns Ferry Nuclear Plant


Annual Average: Cs-137 in Soil
2.5Initial plant operation in August 1973.
EGJ
U 1.5O
0.5
68 70 72 73o 75 77 79 81 83 85 87 89 91 9369 71 73p 74 76 78 80 82 84 86 88 90 92 94
Year
~ Indicator +- Control —Preoperational Average
Browns Ferry Nuclear Plant Note: Detector system changed from Nal to GeLi in 1977.


Annual Average Gross Beta ActivitySurface Water, pCi/Liter
Initial plant operation in August 1973.
Ql
4UCL
68 69 70 71 7273p73o74 75 76 77 78 79 80 81 82 83 84 85 86 87 88 89 90 91 92 93 94Year
~ Indicator -+ Control —Preoperational Average
Browns Ferry Nuclear Plant Note: No gross beta measurements were made in 1978.

Annual Average Gross Beta ActivityDrinking Water, pCi/Liter
Initial plant operation in August 1973.
k~g
68 69 70 71 72 73p73o 74 75 76 77 78 79 80 81 82 83 84 85 86 87 88 89 90 91 92 93 94Year
w Indicator -i- Control —Preoperational Average
Browns Ferry Nuclear Plant

Annual AverageCs-137 in Fish: Crappie
0.5
0.4Initial plant operation in August 1973.
0.3
O~ 0.2
0.1
069 70 71 72 73p73o 74 75 76 77 78 79 80 81 82 83 84 85 86- 87 88 89 90 91 92 93 94
Year
w Downstream ~ Upstream —Preoperational Average
-. Browns Ferry Nuclear Plant Note: Detector system changed from Nal to GeLi in 1978.


Annual AverageCs-137 in Fish: Smallmouth Buffalo, Flesh
0.25
0.2
Initial plant operation in August 1973.
E 0.15L
O0.1
0.05
69 70 71 72 73p73o 74 75 76 77 78 79 80 81 82 83 84 85 86 87 88 89 90 91 92 93 94Year
~ Downstream +- Upstream —Preoperational Average
Browns Ferry Nuclear Plant Note: Detector system changed from Nal to GeLi in 1978.
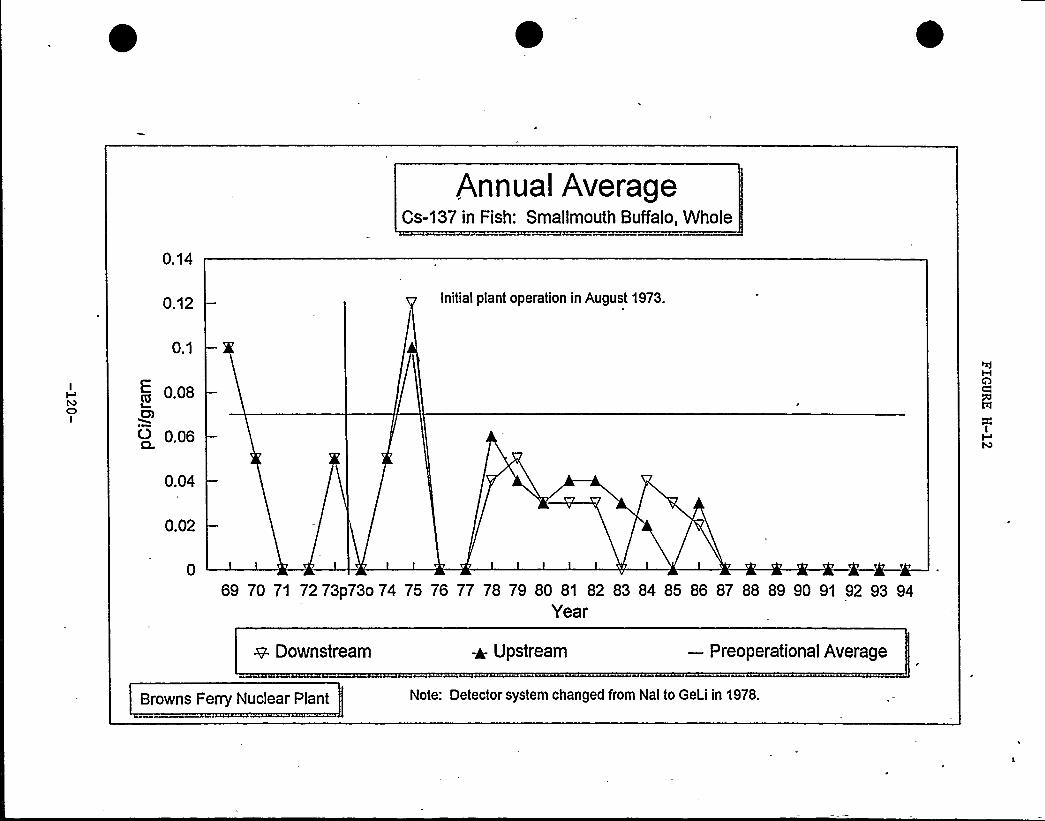
Annual AverageCs-137 in Fish: Smallmouth Buffalo, Whole
0.14
0.12 Initial plant operation in August 1973.
0.1
E 0081
U)
~ 006
0.04
0.02
69 70 71 72 73p73o 74 75 76 77 78 79 80 81 82 83 84 85 86 87 88 89 90 91 92 93 94Year
w Downstream +- Upstream —Preoperational Average
Browns Ferry Nuclear Plant Note: Detector system changed from Nal to GeLi in 1978.
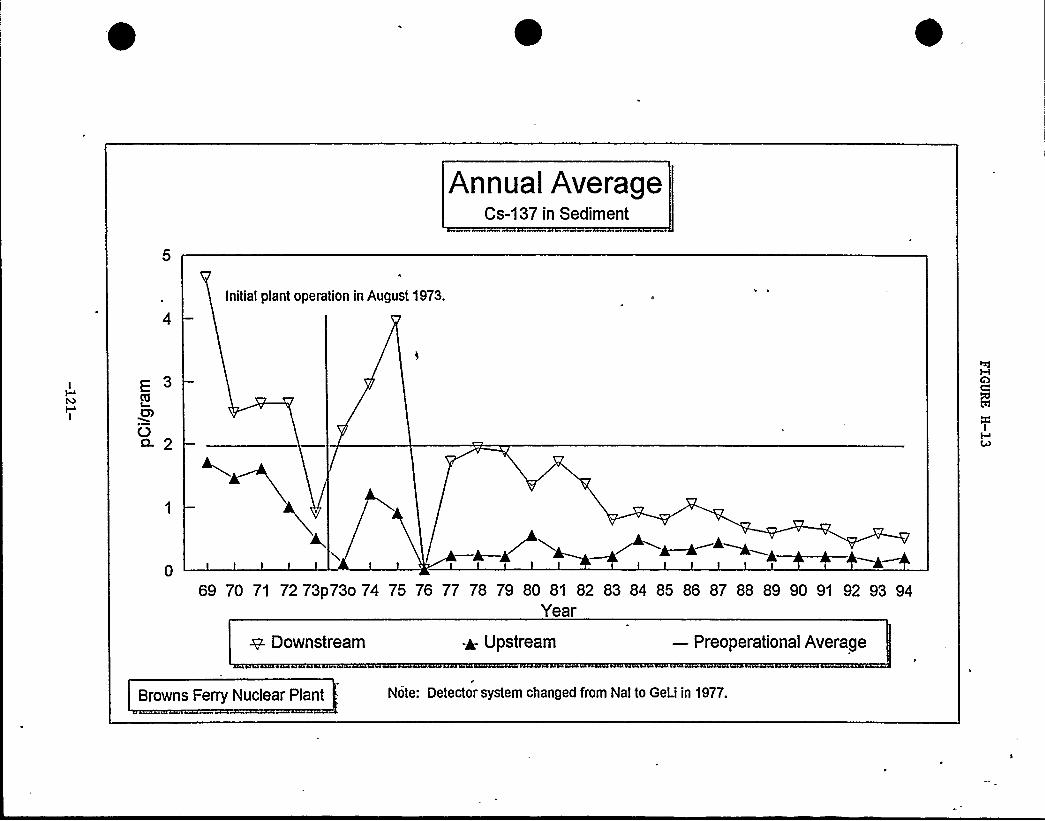
Annual AverageCs-1 37 in Sediment
Initial plant operation in August 1973.
3
O~ 2
69 70 71 72 73p73o 74 75 76 77 78 79 80 81 82 83 84 85 86 87 88 89 90 91 92 93 94Year
~ Downstream ~ Upstream —Preoperational Average
Browns Ferry Nuclear Plant Note: Detector system changed from Nal to Geii in 1977.


Annual AverageCo-60 in Sediment
0.8
0.6
Initial plant operation in August 1973.
ECJ
cn 040CL
0.2
069 70 71 72 73p73o 74 75 76 77 78 79 80 81 82 83 84 85 86 87 88 89 90 91 92 93 94
Year
~ Downstream ~ Upstream —Preoperational Average
Browns Ferry Nuclear Plant Note: Detector system changed from Nal to GeLi in 1977.

0