Embed Size (px)
Citation preview

8/4/2019 Annual Per-Capita Electricity Use in the US 2003-2005-42463
http://slidepdf.com/reader/full/annual-per-capita-electricity-use-in-the-us-2003-2005-42463 1/34
A national laboratory of the U.S. Department of E
Office of Energy Efficiency & Renewable E
National Renewable Energy Laboratory
Innovation for Our Energy Future
The Regional Per-Capita
Solar Electric Footprintfor the United States
P. Denholm and R. Margolis
Technical Report
NREL/TP-670-42463
December 2007
NREL is operated by Midwest Research Institute ●Battelle Contract No. DE-AC36-99-GO10337
8/4/2019 Annual Per-Capita Electricity Use in the US 2003-2005-42463
http://slidepdf.com/reader/full/annual-per-capita-electricity-use-in-the-us-2003-2005-42463 2/34
National Renewable Energy Laboratory1617 Cole Boulevard, Golden, Colorado 80401-3393
303-275-3000 • www.nrel.gov
Operated for the U.S. Department of EnergyOffice of Energy Efficiency and Renewable Energy
by Midwest Research Institute • Battelle
Contract No. DE-AC36-99-GO10337
Technical Report
NREL/TP-670-42463
December 2007
The Regional Per-Capita
Solar Electric Footprintfor the United States
P. Denholm and R. Margolis
Prepared under Task No. PVB7.6402

8/4/2019 Annual Per-Capita Electricity Use in the US 2003-2005-42463
http://slidepdf.com/reader/full/annual-per-capita-electricity-use-in-the-us-2003-2005-42463 3/34
NOTICE
This report was prepared as an account of work sponsored by an agency of the United States government.Neither the United States government nor any agency thereof, nor any of their employees, makes anywarranty, express or implied, or assumes any legal liability or responsibility for the accuracy, completeness, or usefulness of any information, apparatus, product, or process disclosed, or represents that its use would notinfringe privately owned rights. Reference herein to any specific commercial product, process, or service bytrade name, trademark, manufacturer, or otherwise does not necessarily constitute or imply its endorsement,recommendation, or favoring by the United States government or any agency thereof. The views andopinions of authors expressed herein do not necessarily state or reflect those of the United Statesgovernment or any agency thereof.
Available electronically at http://www.osti.gov/bridge
Available for a processing fee to U.S. Department of Energyand its contractors, in paper, from:
U.S. Department of EnergyOffice of Scientific and Technical InformationP.O. Box 62Oak Ridge, TN 37831-0062phone: 865.576.8401fax: 865.576.5728email: mailto:[email protected]
Available for sale to the public, in paper, from:U.S. Department of CommerceNational Technical Information Service
5285 Port Royal RoadSpringfield, VA 22161phone: 800.553.6847fax: 703.605.6900email: [email protected] online ordering: http://www.ntis.gov/ordering.htm
Printed on paper containing at least 50% wastepaper, including 20% postconsumer waste

8/4/2019 Annual Per-Capita Electricity Use in the US 2003-2005-42463
http://slidepdf.com/reader/full/annual-per-capita-electricity-use-in-the-us-2003-2005-42463 4/34
AcknowledgmentsThe study was performed by analysts at the U.S. Department of Energy’s National
Renewable Energy Laboratory (NREL). For their valuable contributions, the authors
would like to acknowledge Doug Arent, Elizabeth Brown, Donna Heimiller, Ray George,
John Turner, and Otto VanGeet from NREL; Steve Letendre from Green MountainCollege; and Ken Zweibel from Primestar Solar. A special thanks to Maddalena Jackson
for assistance in gathering data on land use.
iii

8/4/2019 Annual Per-Capita Electricity Use in the US 2003-2005-42463
http://slidepdf.com/reader/full/annual-per-capita-electricity-use-in-the-us-2003-2005-42463 5/34
iv
Table of Contents
Acknowledgments..............................................................................................................iii
Introduction ........................................................................................................................ 1
State-Level Electricity Use in the U.S. ............................................................................... 2Solar PV Energy Density .................................................................................................... 4
The U.S. Solar Electric Footprint ....................................................................................... 9 State-Level PV Footprint in Context ................................................................................ 14
Conclusions ...................................................................................................................... 20
Appendix 1. State Electricity End Use by Sector (2003-2005)........................................ 21Appendix 2. State Population and Income (2003-2005) .................................................. 22
Appendix 3. State Annual Average Per-Capita Electricity Use (kWh/person/year)
(2003-2005).................................................................................................. 23Appendix 4. State Average Insolation Values (2003-2005) Weighted by Region of Use
Based on 2005 Electricity Use Patterns (kwh/m2/day) ................................ 24
Appendix 5. Per-Capita Solar Footprint ........................................................................... 25Appendix 6. Total Solar Electric Footprint and Land Occupation Fraction..................... 26Appendix 7. Land-Use Data ............................................................................................. 27
8/4/2019 Annual Per-Capita Electricity Use in the US 2003-2005-42463
http://slidepdf.com/reader/full/annual-per-capita-electricity-use-in-the-us-2003-2005-42463 6/34
Introduction
Solar photovoltaics (PV) offer a renewable alternative to traditional sources of electricity
generation. The potential resource base for PV in the United States is enormous;
however, there are a number of challenges related to realizing this potential includingrelatively high cost, intermittent output, and potentially significant land use. The costs of
PV have been declining significantly during the past couple of decades, and there arestrong prospects for further declines in cost during the next decade.
1,2The issue of
intermittency can be addressed through a number of potential means, and will likely
become increasingly im portant as market penetration increases beyond a few percent of electricity consumption.
3,4The issue of land use is often cited as an important issue for
renewable energy technologies.5,6
Determining the land requirements of solar PV at high
penetration helps evaluate its potential to reduce both the carbon emissions and the“Ecological Footprint”
7associated with electricity generation and use. There have been
several estimates of the total land use required to meet the electricity demand from PV.8,9,10
We go beyond these previous analyses by examining the impact of distributing thePV (and required storage) geographically throughout the United States, and by examiningthe impact of employing a range of array configurations (flat, fixed tilt, and tracking).
In this work, we quantify the state-by-state per-capita “solar electric footprint” for theUnited States, where the solar electric footprint is defined as the land area required to
supply all end-use electricity from solar photovoltaics. There are four major goals of this
analysis. First, we provide a state-by-state breakdown of end-use electricity use,accounting for the embodied energy in produced goods. In particular, we explore the
impact of distributing industrial energy consumption in proportion to income rather than
location of industrial activity. Second, we evaluate the solar energy density, or land use
required to produce a given amount of solar energy, based on a range of PVconfigurations. Third, we estimate the state-by-state per-capita solar electric footprint for
recent electricity use patterns and current PV system performance. Finally, we compare
1 Swanson, R. (2006). “A Vision for Crystalline Silicon Photovoltaics,” Progress in Photovoltaics:
Research and Applications 2006; 14:443–453.2 Green, M.(2006). “Consolidation of Thin-film Photovoltaic Technology: The Coming Decade of
Opportunity,” Progress in Photovoltaics: Research and Applications 2006; 14:383–3923 Denholm, P.; Margolis, R.M. (2007). “Evaluating the Limits of Solar Photovoltaics (PV) in Traditional
Electric Power Systems,” Energy Policy. 35, 2852-2861.4 Denholm, P.; Margolis, R.M. (2007). “Evaluating the limits of solar photovoltaics (PV) in electric power
systems utilizing energy storage and other enabling technologies,” Energy Policy 35 (2007) 4424–44335
Nonhebel, S. (2003). “Land-use changes induced by increased use of renewable energy sources,” Global Environmental Change and Land Use: 187-202.6 Rao, G. L.; Sastri, V.M.K. 1987 “Land Use and Solar Energy” Habitat International 1987 11(3) 61-75.7 Wackernagel, M.; Rees, W. (1996). Our Ecological Footprint , New Society Publishers8 Turner, J.A. (1999). “A Realizable Renewable Energy Future,” Science 285:5428, p. 687.9 Love, M.; Pitt, L.; Niet, T.; McLean, G. (2003) "Utility-Scale Renewable Energy systems: Spatial and
Storage Requirements," Hydrogen and Fuel Cells 2003 Conference and Trade Show, Vancouver, BC, June
8-11.10 U.S. Department of Energy (2004). “How much land will PV need to supply our electr icity?” DOE/GO-
102004-1835 www.osti.gov/bridge/servlets/purl/15006746-tqhOKf/native/15006746.pdf
1

8/4/2019 Annual Per-Capita Electricity Use in the US 2003-2005-42463
http://slidepdf.com/reader/full/annual-per-capita-electricity-use-in-the-us-2003-2005-42463 7/34
this per-capita solar footprint to several other per-capita demands for land use. The solar
electric footprint is based on the boundary condition of meeting the entire nation’s
electricity needs with solar PV. While this requirement represents an extreme (andunlikely) scenario, it does provide insight into the potential scale of land-use impacts
associated with meeting a large fraction of the nation’s electricity requirements from PV.
State-Level Electricity Use in the U.S.
Using state-level electricity consumption and population data for 2003-2005, we
estimated the annual average per-capita electricity use. The complete electricity use data
set is provided in Appendix 1. Publicly available electricity use data is divided into four end-use sectors: residential, commercial, transportation, and industrial. Transportation
electricity, which accounts for about 0.2% of U.S. end-use electricity, was combined with
commercial electricity. Per-capita commercial and residential electricity use wascalculated by dividing total state electricity use in each sector by the state’s population.
For residential and commercial electricity, this is probably a reasonable allocation – if
people shop, work, and conduct most business in their state of residence.
The biggest limitation of this approach is that it ignores the regional flow of embodied
electricity in manufactured goods, captured largely in the “industrial” electricity category.
There is a limited relationship between where industrial (which includes agriculture) products are manufactured and where they are used, and heavily industrialized states
effectively export electricity embodied in goods and services. Ideally, industrial
electricity could be allocated by assigning each region its actual industrial electricity use by tracking embodied electricity in manufactured products.
11An alternative and simpler
approach is to use state-level personal income as a proxy measure for consumed
industrial and agricultural goods. This results in the assumption that a region with twice
the annual per-capita income as another consumes twice as much goods and services per person, and correspondingly twice as much industrial electricity.
12Based on this
assumption, we assigned each state an effective industrial electricity use by multiplying
its fraction of total U.S. income by the total industrial electricity used in the UnitedStates. Complete data is provided in Appendix 2. There are potential significant
limitations to this approach, so we illustrate the effect of this assumption in Figure 1, the
per-capita electricity use for all 50 U.S. states.
In Figure 1, each state’s per-capita electricity use is shown divided into three categories.
The industrial electricity bar illustrates our assumed allocation based on income. Inaddition, we provide an “error bar,” which indicates the per-capita consumption if
industrial electricity were allocated to the state of use. As discussed earlier, heavilyindustrialized states would have a much higher per-capita electricity use if measured
using the more traditional allocation. Wyoming, in particular, would have a very high
11 A full accounting here would also include embodied electricity in internationally imported/exported
goods.12 It may be possible to derive a more accurate distribution of the energy embodied in industrial goods, and
the effective regional flows of industrial electricity, using economic activity databases such as those in the
IMPLAN model (www.implan.com).
2

8/4/2019 Annual Per-Capita Electricity Use in the US 2003-2005-42463
http://slidepdf.com/reader/full/annual-per-capita-electricity-use-in-the-us-2003-2005-42463 8/34
per-capita use, equal to nearly 28 MWh per person. Alternatively, Northeastern states
such as Connecticut and Massachusetts are likely responsible for much more electricity
use than would be accounted for using a simple per-state allocation.
0 5 10 15 20 25
Distr ict of Columbia
Virginia
Wyoming
North Dakota
Florida
Tennessee
Alabama
South Carolina
North Carolina
Louisiana
Delaware
Missouri
Oklahoma
Georgia
Kentucky
Nebraska
Washington
Texas
South Dakota
Kansas
Mississippi
West Virginia
Arizona
Oregon
Arkansas
Connecticut
Maryland
Montana
U.S. Average
New Jersey
Idaho
Minnesota
Indiana
Nevada
Ohio
Massachusetts
Colorado
Iowa
Pennsylvania
Illinois
Wisconsin
Alaska
New HampshireNew York
Michigan
New Mexico
Vermont
Rhode Island
Utah
Maine
California
Per Capita Electricity Consumption (MWh/year/person)
Residential
Commercial
Industrial (income
allocated)
U.S. Average
Error bars indicate resultswhen industrial energy isallocated to state of use
Figure 1. Annual Per-Capita Electricity Use in the U.S., Averaged from 2003-2005
3
8/4/2019 Annual Per-Capita Electricity Use in the US 2003-2005-42463
http://slidepdf.com/reader/full/annual-per-capita-electricity-use-in-the-us-2003-2005-42463 9/34
We include the District of Columbia in our assessment due to both data availability and
its usefulness in illustrating the application and limits of PV in urban areas. The large per-
capita commercial electricity in Washington, D.C., is likely explained by the largenumber of people that work and shop in D.C. but do not live there. About 70% of the
workers in the District of Columbia live outside the city; the electricity used to support
these workers in office buildings and other commercial support activities results in a netexport of electricity embodied in commercial activity.13
Solar PV Energy Density
The per-capita solar electric footprint in each location is calculated by dividing the totalelectricity requirement by the PV energy density:
DensityEnergyPV
DemandElectricAnnualFootprintElectricSolar = (1)
where the PV energy density is defined as the annual energy produced per unit of landarea, equal to
Power ArrayPV
GenerationPVAnnual
AreaLand
Power ArrayPVDensityEnergyPV ×= (2)
The first term in Equation 2 is the PV array power density, equal to PV array power deployable per unit of land area. The array consists of individual PV modules, and the
nameplate (or peak) direct current (DC) power rating of an individual module is a
function of module efficiency and the module collector area. The module efficiency is
defined under Standard Test Conditions (STC) of 1,000 W/m
2
solar irradiance and 25o
C.Typical commercially available silicon PV modules have efficiencies of about 10-15%,
resulting in about 100-150 watts of peak DC output per square meter of collector area.14
Module efficiencies vary by technology, with current thin-film modules producing
efficiencies of about 6-12%, while advanced silicon modules (also commercially
available) can produce efficiencies of more than15%.15
Module efficiencies of all types
are expected to increase over time, which will increase the module power density anddecrease the solar electric footprint.
The total array power density depends on the array spacing as well as the individualmodule efficiency. If deployed horizontally with no spacing between modules, the array
13 According to the 2000 U.S. Census, 190,566 individuals both work and live in the District of Columbia
(D.C.), while 70,318 lived in D.C. but worked outside the city. In the same time period, 481,112
individuals worked in D.C. while living outside the city. “U.S. Census 2000 County-To-County Worker
Flow Files” at http://www.census.gov/population/www/cen2000/commuting.html 14 Actual module efficiency can vary significantly with temperature, so the PV module may be “derated”
accordingly.15 U.S. DOE (2007). “Solar Energy Technologies Program Multi-Year Program Plan 2007-2011.”
4
8/4/2019 Annual Per-Capita Electricity Use in the US 2003-2005-42463
http://slidepdf.com/reader/full/annual-per-capita-electricity-use-in-the-us-2003-2005-42463 10/34
power density would be equal to the module power density (100-150 MW/km2
for silicon
modules).
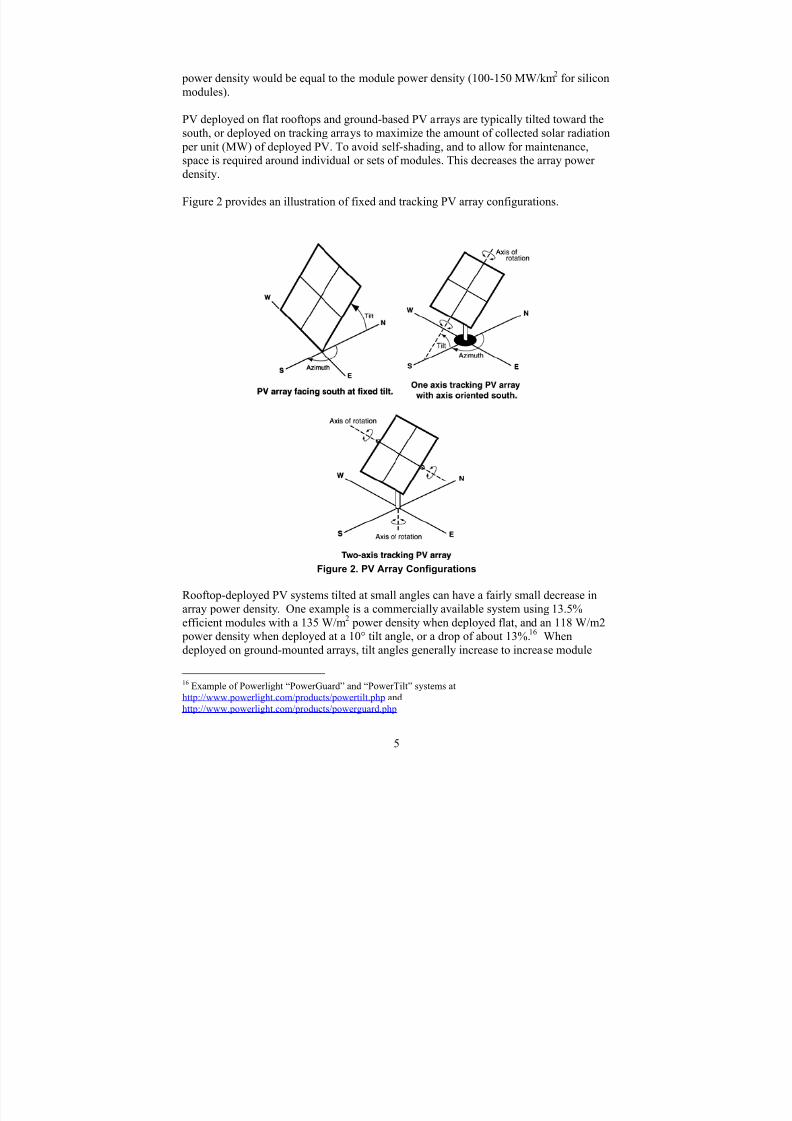
PV deployed on flat rooftops and ground-based PV arrays are typically tilted toward the
south, or deployed on tracking arrays to maximize the amount of collected solar radiation
per unit (MW) of deployed PV. To avoid self-shading, and to allow for maintenance,space is required around individual or sets of modules. This decreases the array power
density.
Figure 2 provides an illustration of fixed and tracking PV array configurations.
Figure 2. PV Array Configurations
Rooftop-deployed PV systems tilted at small angles can have a fairly small decrease in
array power density. One example is a commercially available system using 13.5%efficient modules with a 135 W/m
2power density when deployed flat, and an 118 W/m2
power density when deployed at a 10° tilt angle, or a drop of about 13%.16
When
deployed on ground-mounted arrays, tilt angles generally increase to increase module
16 Example of Powerlight “PowerGuard” and “PowerTilt” systems at
http://www.powerlight.com/products/powertilt.php and
http://www.powerlight.com/products/powerguard.php
5

8/4/2019 Annual Per-Capita Electricity Use in the US 2003-2005-42463
http://slidepdf.com/reader/full/annual-per-capita-electricity-use-in-the-us-2003-2005-42463 11/34
energy yield. This results in even greater array spacing. In addition, there may be
minimum spacing between arrays in large installations to allow maintenance vehicles to
pass between long rows of PV arrays. Minimum spacing for service vehicles is about 3.5meters between rows, with a more conservative 4-5 meters often applied.
17For 13.5%
efficient modules, this may reduce the system power density to 60-70 W/m2
for fixed-
plate systems. Tracking arrays require additional space to avoid self-shading.
18
The second term in Equation 2 is the annual generation per unit of module power. The
actual PV generation per unit of module power at any given time is the product of two
factors:
EfficiencyConversionAC*RadiationIncidentPower Module
GenerationPV= (3)
The incident radiation changes as a function of time of day and weather, so calculating
the annual output of the module generally involves obtaining the incident radiation for
each hour and summing over all hours per year. However, it is possible to express thevalue as an annual average. The average solar radiation (energy per unit area, per unit
time) is a function of local climate and module orientation (Figure 3).
17 These values are based on various project filings and discussions with several major system installers.18 See, for example, the Powerlight “PowerTracker” at
http://www.powerlight.com/products/powertracker.php
6

8/4/2019 Annual Per-Capita Electricity Use in the US 2003-2005-42463
http://slidepdf.com/reader/full/annual-per-capita-electricity-use-in-the-us-2003-2005-42463 12/34
Figure 3. Average Daily Solar Radiation on Horizontal and Tilted Surfaces
19
As illustrated above, the incident radiation on the PV array and the resulting total annual
energy collected can be increased by tilting the PV array up from horizontal toward the
south. Even greater collection can be gained by deploying tracking systems that
continuously orient the panels toward the sun.
The second term in Equation 3 is the alternating current (AC) conversion efficiency. PV
modules produce DC electricity, which must be converted to grid-compatible AC with aninverter. The overall AC-DC conversion efficiency is often described as a combination of
inverter efficiency and many other factors, such as wiring losses, panel soiling, system
availability, etc.20
19 Data based on 10 km, satellite modeled dataset (SUNY/NREL, 2007)20 The overall derate factor may vary as a function of load, so it is often necessary to perform an hour-by-
hour simulation to derive an annual estimate of the actual AC energy output.
7

8/4/2019 Annual Per-Capita Electricity Use in the US 2003-2005-42463
http://slidepdf.com/reader/full/annual-per-capita-electricity-use-in-the-us-2003-2005-42463 13/34
Table 1 provides the estimated system energy density for a set of system configurations
and three locations that represent the range of insolations for the lower 48 U.S. states.21
The assumed PV module efficiency is 13.5%, and average daily incident radiation for each location and orientation is derived from the “Typical Meteorological Year” (TMY)
data set.22
Calculation of energy yield was performed using the PVWatts tool, using the
default average DC-AC conversion efficiency of 77%.
23
Table 1. PV System Performance Characteristics
System Type PV Array Power
Density
(DC W/land m2)
Incident Solar
Radiation (kWh/
array m2/day)
low / med / high
Output from a 1
kW (DC) system
(kWh/year)
low / med / high
System Energy
Density (kWh/
land m2/year)
low / med / high
Flat (rooftop) 135 3.05 / 4.31 / 5.85 782 / 1113 / 1459 106 / 150 / 197
10-degree tilt,
South facing
(rooftop)
118 3.27 / 4.64 / 6.31 849 / 1212 / 1586 98 / 139 / 182
25-degree tilt,
South facing
(ground based)
65 3.42 / 4.86 / 6.62 893 / 1278 / 1668 58 / 83 / 108
1-axis tracking
(0-degree tilt)
48 3.86 / 5.70 / 8.25 1024 / 1519 / 2128 49 / 73 / 102
2-axis tracking 20 4.44 / 6.60 / 9.61 1180 / 1761 / 2460 24 / 35 / 49
Table 1 illustrates the significant drop in PV array power density for tilted and tracking
arrays due to shading and maintenance requirements. This drop in power density is
accompanied by a greater energy yield per installed unit of module power. However, thereduced power density is much greater than the increased collector yield, so moving from
flat rooftop arrays to land-based tilted and tracking arrays can reduce system energy
density by more than 50%. Improvements in system energy density will be driven more by module efficiency increases than by improved array spacing because shading and
maintenance requirements provide fundamental limits on array packing density, whiledeploying more efficient cells can substantially improve system energy densities in the
future.24
21 The low-, medium-, and high-resource locations are Quillayute, Washington; Kansas City, Missouri; and
Daggett, California; respectively.22 National Renewable Energy Laboratory (1995). TMY2 Users’ Manual , National Renewable Energy
Laboratory, Golden, Colorado. Available athttp://rredc.nrel.gov/solar/old_data/nsrdb/tmy2/ 23 PVWatts performs an hourly simulation that is necessary to perform an accurate assessment of PV
output, accounting for variation in module efficiency due to temperature and the variation in inverter
efficiency as a function of load. Additional details are available at
http://rredc.nrel.gov/solar/codes_algs/PVWATTS/.24 Another significant improvement in system energy density for tracking arrays would be the deployment
of concentrating solar PV (CPV), which has demonstrated efficiencies of 20-26% in commercially
available modules (U.S. DOE (2007) Solar Energy Technologies Program Multi-Year Program Plan 2007-
2011).
8

8/4/2019 Annual Per-Capita Electricity Use in the US 2003-2005-42463
http://slidepdf.com/reader/full/annual-per-capita-electricity-use-in-the-us-2003-2005-42463 14/34
The U.S. Solar Electric Footprint
The solar electric footprint for each state was calculated using Equation 1, applying the
annual electric demand values as previously calculated. As discussed previously, the PV
energy density is highly dependent on assumptions for system configuration.
We begin with an assumed scenario based on commercially existing PV modules with a
13.5% efficiency and the assumed array densities in Table 1. Our scenario also assumes
25% of all PV is deployed on rooftop-type systems, where 5% (of all PV) is oriented flat,10% south facing at 10° tilt, 5% SW facing at 10° tilt, and 5% SE facing at 10° tilt. The
remaining PV is deployed in ground-based arrays, with 40% deployed as south-facing
arrays at 25° tilt, 25% 1-axis tracking (0° tilt), and 10% 2-axis tracking. Given theimportance of array configuration, we also examine sensitivities to this assumption later
in this work.
To determine the annual PV generation per unit of module power, we used hourly
insolation values for 2003-2005 for 216 sites in the lower 48 U.S. states, plus one site inHawaii from the updated National Solar Radiation Database (NSRDB).
25For Alaska,
due to limited quality of the 2003-2005 NSRDB solar data, we used historical typicalmeteorological year data.
26We created 216 solar resource regions in the lower 48 U.S.
states based on the proximity of census block groups to each of the stations. The location
of these regions is provided in Figure 4.
25 The 216 locations chosen for this analysis are, with a few exceptions, the stations in the original 1961-
1990 NSRDB. Although the updated (1991-2005) NSRDB contains several hundred additional sites, the216 original sites provide adequate coverage to capture the variation in solar resources within each state.
For additional detail about the NSDRB, refer to National Renewable Energy Laboratory (2007), National
Solar Radiation Database 1991–2005 Update: User’s Manual, NREL/TP-581-41364
http://rredc.nrel.gov/solar/old_data/nsrdb/1991-2005/ 26 In addition to using noncoincident-year solar data for Alaska, we also used only a single TMY site
(Anchorage) to represent the entire state. While this adds a great deal of uncertainty to our analysis, the
“100% electricity from PV” scenario evaluated here is extremely unrealistic for Alaska given the poor solar
resource in the state. As a result, our estimates here should be used only as a boundary condition to
roughly compare the solar electric footprint in Alaska to the lower 48 states.
9

8/4/2019 Annual Per-Capita Electricity Use in the US 2003-2005-42463
http://slidepdf.com/reader/full/annual-per-capita-electricity-use-in-the-us-2003-2005-42463 15/34
Figure 4. Allocation of TMY sites to U.S. Population
To derive the solar energy production for each of the 216 sites, we performed an hourly
PV simulation using the PVFORM model, assuming a 1 kW STC module.27
The total
solar resource for each state was generated by a weighted average of the resource regions based on load. This regional weighting was performed by assigning one of the 216 solar
resour ce locations to each of the 3,277 electric service providers in the lower 48 U.S.
states.28
Location within a state was based on the fraction of load met by each of the
state’s utilities, and the TMY station assigned to each utility. By using the same years for
both electricity loads and solar insolation, we can account for some of the correlation between load and weather. The net PV energy density for each state was calculated using
the weighted average of the various power densities (based on system type) and theannual generation values (based on both system type and location within each state). The
resulting state-level PV energy density values (with the assumed mix of system
orientations) are provided in Figure 5. Location-weighted daily average insolation valuesfor each state are provided in Appendix 4.
27 PVFORM is the PV performance model used in the PVWatts tool. While Equation 2 assumes a constant
module efficiency, actual efficiency varies with temperature. PVWatts accounts for the variation in module
efficiency that occurs due to changes in temperature, and the variation in inverter efficiency as a function of
load. Additional details are available at http://rredc.nrel.gov/solar/codes_algs/PVWATTS/.28 Energy Information Administration, Form EIA-861 Database.
http://www.eia.doe.gov/cneaf/electricity/page/eia861.html
10
8/4/2019 Annual Per-Capita Electricity Use in the US 2003-2005-42463
http://slidepdf.com/reader/full/annual-per-capita-electricity-use-in-the-us-2003-2005-42463 16/34
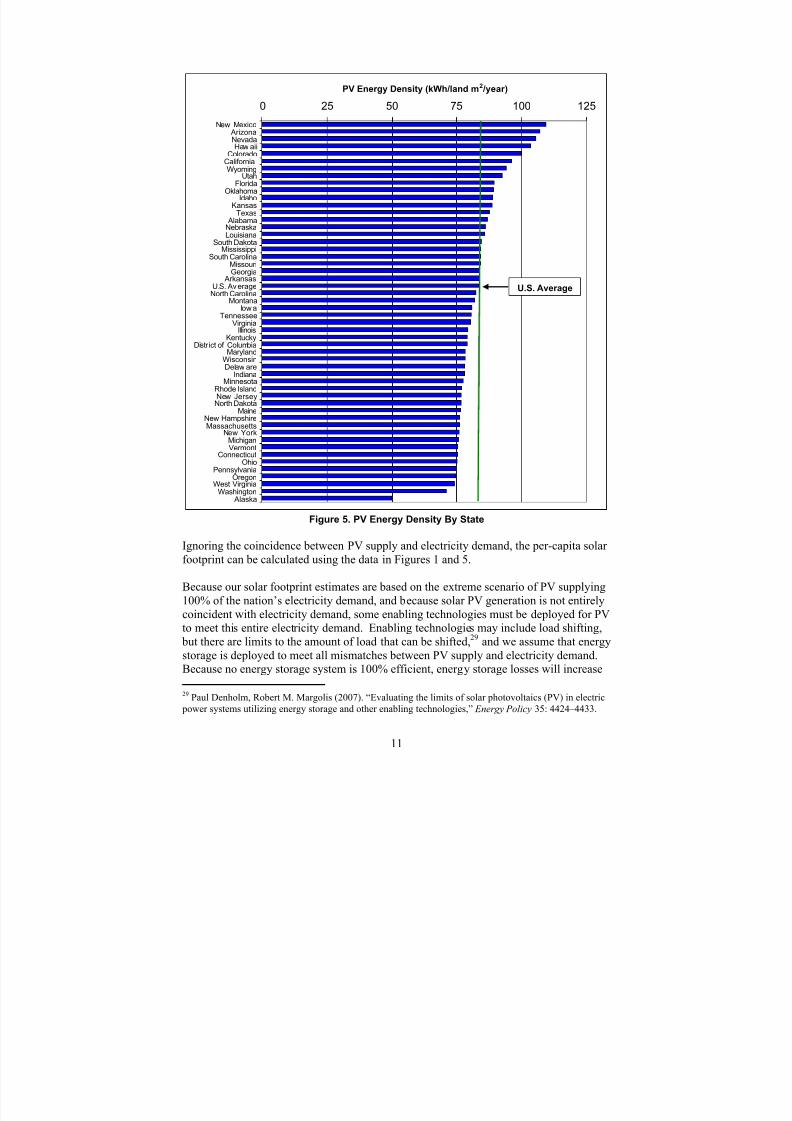
0 25 50 75 100 125
New MexicoArizonaNevadaHaw aii
ColoradoCaliforniaWyoming
UtahFlorida
OklahomaIdaho
KansasTexas
AlabamaNebraskaLouisiana
South DakotaMississippi
South CarolinaMissouriGeorgia
ArkansasU.S. AverageNorth Carolina
MontanaIow aTennessee
VirginiaIllinois
KentuckyDistr ict of Columbia
MarylandWisconsinDelaw are
IndianaMinnesota
Rhode IslandNew JerseyNorth Dakota
MaineNew HampshireMassachusetts
New YorkMichiganVermont
ConnecticutOhio
PennsylvaniaOregon
West VirginiaWashington
Alaska
PV Energy Density (kWh/land m2 /year)
U.S. Average
Figure 5. PV Energy Density By State
Ignoring the coincidence between PV supply and electricity demand, the per-capita solar
footprint can be calculated using the data in Figures 1 and 5.
Because our solar footprint estimates are based on the extreme scenario of PV supplying
100% of the nation’s electricity demand, and because solar PV generation is not entirelycoincident with electricity demand, some enabling technologies must be deployed for PVto meet this entire electricity demand. Enabling technologies may include load shifting,
but there are limits to the amount of load that can be shifted,29
and we assume that energy
storage is deployed to meet all mismatches between PV supply and electricity demand.Because no energy storage system is 100% efficient, energy storage losses will increase
29 Paul Denholm, Robert M. Margolis (2007). “Evaluating the limits of solar photovoltaics (PV) in electric
power systems utilizing energy storage and other enabling technologies,” Energy Policy 35: 4424–4433.
11

8/4/2019 Annual Per-Capita Electricity Use in the US 2003-2005-42463
http://slidepdf.com/reader/full/annual-per-capita-electricity-use-in-the-us-2003-2005-42463 17/34
the amount of energy to be generated by the PV system. Each delivered kWh of
electricity that is passed through an energy storage system will require PV generation
equal to 1/ηstor where ηstor is the storage system efficiency. Some PV generation will beused directly (bypassing storage), so this efficiency impact applies only to the fraction of
demand passing through storage f stor . As a result, the multiplier or ratio of “PV
generation required” to “electricity demand” can be expressed as a “storage footprintmultiplier” equal to
stor
f f
η
stor stor )-(1Multiplier FootprintStorage += (4)
We assumed a round-trip storage efficiency of 75% based on existing technologies suchas pumped hydroelectric storage, or batteries.
30Determining the fraction of energy to be
stored requires simulating the hourly PV supply patterns with demand patterns on aregional basis.
To deter mine the fraction of energy that is needed to be stored, we used the PVflexmodel.
31The PVflex model compares hourly load to hourly PV supply and has the ability
to charge or discharge a storage system as needed. We performed simulations for severalregions around the country, and found that the energy storage fraction had a range of onlyabout 60-70%.
32Applying this range of values to Equation 2, the PV generation
multiplier ranges from 1.20 to 1.23, a difference of just less than 3%. Because the PVfootprint analysis is relatively insensitive to this range of storage values, we assume themore conservative 70% storage fraction (and the corresponding multiplier of 1.23) to allregions of the country. This storage fraction is conservative for an additional reason: Itassumes storage is the only “enabling” technology used, ignoring potentially moreefficient and economic means of mitigating solar PV output variability. Among these
include load shifting and long-distance transmission.
It is important to note that while the fraction of energy stored does not vary significantlyover a large range, the size of the required energy storage system does vary widely.While achieving 50-70% of a region’s electricity from PV could theoretically be achievedwith fewer than 12 hours of storage,
33the last 10-20% would require months of storage
to compensate for the seasonal mismatch between PV supply and demand. This seasonastorage requirement demonstrates that while achieving 100% of a region’s electricityfrom PV is theoretically possible, it is not a practical goal unless very inexpensive and
l
30 Denholm, P.; Kulcinski, G.L.. (2004). “Life-Cycle Energy Requirements and Greenhouse Gas Emissions
from Large-Scale Energy Storage Systems,” Energy Conversion and Management . 45, 2153-2172.31 Denholm, P.; Margolis, R.M. (2007). “Evaluating the limits of solar photovoltaics (PV) in electric power
systems utilizing energy storage and other enabling technologies,” Energy Policy 35: 4424–443332 We originally intended to perform simulations for a large number of regions in the country to determine
the “energy storage fraction” and then assign this energy storage fraction to the corresponding states. After
completing simulations for eight geographically diverse regions (Boston; Tampa; New York City;
Washington, D.C.; Los Angeles; Omaha; Indianapolis; and Portland), we found that the energy storage
fraction had a limited range of only about 60-70%.33 Denholm, P.; Margolis, R.M. (2007). “Evaluating the limits of solar photovoltaics (PV) in electric power
systems utilizing energy storage and other enabling technologies,” Energy Policy 35: 4424–4433.
12

8/4/2019 Annual Per-Capita Electricity Use in the US 2003-2005-42463
http://slidepdf.com/reader/full/annual-per-capita-electricity-use-in-the-us-2003-2005-42463 18/34
very high capacity energy storage devices become available. This result alsodemonstrates the reality of modern electric power systems where a variety of generationtechnologies are used to meet the large variation in demand on both a daily and seasonal
basis.
The results of the 100% solar scenario presented here can be scaled to assess the solar footprint associated with some fraction of the total electric demand. When applying anyscaling factor, it is important to point out that the storage fraction may be much lower than our assumed 70% at lower PV penetration. The storage multiplier of 1.23 could dropto 1 for low penetration of PV where storage is not needed. However, the actual number depends on a variety of factors, and it is not possible to provide a simple relationship
between PV penetration and the amount of storage needed for all locations. As a result,the results presented here represent a fairly conservative bounding case of solar footprintand PV land requirements.
Figure 6 provides the resulting average state-by-state per-capita solar footprint. As
discussed in Section 2, the industrial footprint is based on an income-based allocation of industrial electricity, with the error bar representing the footprint for industrial electricityactually used within the state.
When comparing Figure 6 to Figures 1 and 5, it appears that electricity demand drives therelative per-capita solar footprint more than solar resource, with a few exceptions. Themost obvious is Alaska, where poor solar resource results in a very high solar footprintdespite its relatively low per-capita electricity use.
The overall average solar electric footprint for the United States during the yearsevaluated was about 181 m
2per person, using our assumed mix of PV system types and
orientations. This value is almost exactly the same for both methods of applyingindustrial electricity. There is no physical reason for this – if industrial electricity wereused more in states with lower solar insolation, the national average footprint wouldincrease in the “per state” allocation of industrial electricity. However, in the currentdistribution, industrial electricity is used less in states with both very high insolation(such as California) and regions with low insolation (such as New England). The solar footprint for 38 states and about 78% of total U.S. electric demand is within 20% of thisaverage value.
As discussed earlier, the solar electric footprint is highly sensitive to the PV system typeand does not consider expected improvements in solar collector efficiency. Compared tothe assumed mix footprint of 181 m
2, the national average solar footprint is about 214 m
2
when using only 1-Axis tracking systems and about 103 m2 when using only flat-platesystems. A list of the state per-capita footprints for the assumed configuration, and for systems deployed only as flat-plate or 1-Axis tracking, is provided in Appendix 5. Thisappendix also indicates the change in footprint when industrial electricity is allocated tothe actual state of use.
13
8/4/2019 Annual Per-Capita Electricity Use in the US 2003-2005-42463
http://slidepdf.com/reader/full/annual-per-capita-electricity-use-in-the-us-2003-2005-42463 19/34
0 50 100 150 200 250 300 350 400
Distr ict of ColumbiaAlaska
North DakotaVirginia
WashingtonTennessee
Delaw areNorth CarolinaWest Virginia
KentuckyOregon
South CarolinaFlorida
ConnecticutAlabamaMissouri
LouisianaGeorgia
WyomingMaryland
New JerseyNebraska
OhioSouth Dakota
MinnesotaMississippiIndiana
OklahomaMassachusetts
TexasPennsylvania
ArkansasMontana
KansasU.S. Average
WisconsinIow a
IllinoisMichigan
New HampshireNew York
IdahoVermont
Rhode IslandMaine
ArizonaColoradoNevada
UtahCalifornia
New MexicoHawaii
Per Capita Solar Footprint (m2 /person)
Residential
Commercial + Trans
Industrial (income allocated)
U.S. Average
Error bars indicate resultswhen industrial energy isallocated to state of use
Figure 6. Per-Capita Solar Electric Footprint by State
State-Level PV Footprint in Context
The per-capita solar electric footprint can be compared to the total area available in eachstate. Figure 7 provides an indication of the fraction of the total state area that would beoccupied by the base system configuration, based on 2005 population and electricity usedata. In each state, the small square represents the total area of the solar footprint. Alaskais not drawn to scale; however, the solar footprint box within Alaska is shown on thesame scale as the rest of the United States.
14

8/4/2019 Annual Per-Capita Electricity Use in the US 2003-2005-42463
http://slidepdf.com/reader/full/annual-per-capita-electricity-use-in-the-us-2003-2005-42463 20/34
Figure 7. Per-State Solar Electric Footprint for 2005
The values in Figure 7 assume the base PV system configuration and income-basedallocation of industrial electricity. Appendix 6 provides values for the flat and 1-Axis
boundary cases as well as for the state-based allocation of industrial electricity.
Overall, the U.S. average solar footprint using the base system configuration is equal toabout 0.6% of the total land area of the United States, or about 0.6% of each individual’s“allocation” of space. In 19 states, the PV requirements of the assumed mix exceed 1% of the total land area. This is primarily a reflection of population density. In all states, wherethe per-capita land allocation is less than 19,000 m
2/person (except New Hampshire and
Hawaii), the solar footprint exceeds 1% of the state’s land area. Also of note is the landrequirement for Washington, D.C., where the total solar footprint exceeds the city’s totalland area. This would tend to imply that with current electricity use patterns, citiesthemselves cannot be self-sufficient on an electricity basis using only locally generatedsolar energy.
34
The total state solar footprints in Figure 7 are based on the income-weighted distributionof industrial electricity, and thus reflect this redistribution of load. If PV were actuallydeployed to meet the current distribution of load, it would reduce the “burden” on highly
34 An obvious limitation to this statement is that the majority of PV deployment in cities would be on
rooftops, allowing for a greater power density. As indicated in Appendix 6, flat-roof deployment of PV in
D.C. would require about 80% of the city’s area using the income allocation of electricity, and about 65% if
deployed to meet the actual 2005 load.
15

8/4/2019 Annual Per-Capita Electricity Use in the US 2003-2005-42463
http://slidepdf.com/reader/full/annual-per-capita-electricity-use-in-the-us-2003-2005-42463 21/34
16
populated states in the Northeast, reflecting their lower in-state use of industrialelectricity. A comparison of the total state solar footprint for industrial electricityallocated by income and by location of activity is provided in Appendix 6. In the
boundary condition evaluated here, where solar PV is used to meet 100% of totaldemand, it might be expected that much of the high electricity intensive industrial uses
(such as aluminum manufacturing) might even move to locations with better solar insolation.
To provide some context for the solar electric footprint, Table 2 provides a list of severalcurrent per-capita land uses in the United States.

8/4/2019 Annual Per-Capita Electricity Use in the US 2003-2005-42463
http://slidepdf.com/reader/full/annual-per-capita-electricity-use-in-the-us-2003-2005-42463 22/34
Table 2. Per-Capita Solar Footprint and Other Per-Capita Land Uses
State
Per-CapitaSolar
Footprint(m
2 /person)
Other Per-Capita Land Uses for Comparison (m2 /person
TotalArea
DevelopedArea
UrbanArea
Roof Area
Major Roads
Golf Courses
Airports Cropland
Alabama 203 28,895 2452 1029 96 99 37 32 2,259
Alaska 261 2,233,457 UA 1055 70 132 17 575 178
Arizona 145 49,439 1385 803 60 63 34 42 677
Arkansas 184 48,584 2382 870 87 131 40 53 11,176
California 119 11,173 676 589 62 39 17 15 1,080
Colorado 142 57,605 1665 732 73 94 31 84 7,431
Connecticut 205 3,584 1094 1326 48 57 31 8 200
Delaware 219 7,164 1311 980 69 56 30 17 2,267
D.C. 381 273 UA 273 58 29 6 6 0
Florida 206 7,861 1395 961 70 65 43 53 685
Georgia 199 16,422 2114 1133 65 90 29 23 1,920
Hawaii 104 13,065 UA 745 57 33 43 40 78 Idaho 167 149,936 2402 792 76 203 41 68 16,137
Illinois 173 11,277 1071 740 57 72 34 23 7,672
Indiana 190 14,825 1582 936 63 91 46 29 8,703
Iowa 173 48,794 2447 718 71 237 78 48 35,091
Kansas 182 77,106 3005 826 73 287 50 88 39,275
Kentucky 210 24,660 1967 775 92 117 41 22 5,388
Louisiana 201 25,031 1627 969 82 84 21 44 4,909
Maine 155 60,636 2508 696 62 138 55 49 1,190
Maryland 195 4,529 989 866 60 51 21 12 1,115
Mass. 187 3,156 988 1137 51 58 32 12 158
Michigan 171 14,900 1574 868 63100
56 32 3,255 Minnesota 191 40,218 1857 778 65 196 59 40 16,878
Mississippi 190 41,770 2360 847 91 200 34 39 7,006
Missouri 201 30,773 1920 834 70 165 36 37 9,690
Montana 183 403,300 4717 747 90 653 58 191 64,095
17
8/4/2019 Annual Per-Capita Electricity Use in the US 2003-2005-42463
http://slidepdf.com/reader/full/annual-per-capita-electricity-use-in-the-us-2003-2005-42463 23/34
Nebraska 192 113,243 2875 687 73 413 63 94 45,552
Nevada 137 117,916 857 653 64 154 28 59 1,149
New Hamp. 171 17,774 1999 1134 57 108 46 30 392
New Jersey 194 2,207 902 846 44 49 21 10 247
New Mexico 114 163,194 2942 1056 73 280 28 132 3,338 New York 171 6,331 729 535 42 51 27 12 1,127
N. Carolina 212 14,547 2244 1117 74 103 41 22 2,651
N. Dakota 243 281,509 6444 600 80 1304 89 153 155,232
Ohio 192 9,246 1364 911 65 95 42 20 3,978
Oklahoma 188 50,190 2461 854 89 276 34 74 10,360
Oregon 208 68,326 1492 760 78 254 34 60 4,206
Penn. 186 9,357 1398 902 51 89 37 15 1,679
Rhode I. 156 2,521 826 947 49 70 28 12 76
S. Carolina 207 18,362 2412 1185 74 159 57 33 2,313
S. Dakota 191 253,638 5198 575 73 1124 68 133 90,517
Tennessee 222 17,924 1815 1095 91 135 30 21 3,295
Texas 186 29,572 1766 853 76 145 23 51 4,674
Utah 128 85,431 1266 773 55 183 27 48 2,890
Vermont 162 38,491 2267 624 61 225 65 29 3,837
Virginia 233 13,557 1611 848 62 104 28 17 1,570
Washington 233 27,392 1505 911 72 145 28 33 4,287
W. Virginia 211 34,376 2264 816 80 230 40 30 1,836
Wisconsin 174 25,447 1921 782 66 259 56 39 7,627
Wyoming 198 494,281 5299 884 95 1389 57 215 17,439
U.S Average 181 30,914 1505 837 65 162 34 35 5,120 UA= Unavailable Data
18

8/4/2019 Annual Per-Capita Electricity Use in the US 2003-2005-42463
http://slidepdf.com/reader/full/annual-per-capita-electricity-use-in-the-us-2003-2005-42463 24/34
The sources and assumptions underlying the land-use estimates shown in Table 2 arediscussed in detail in Appendix 7.
Overall, the U.S. average solar electric footprint of 181 m2
per person is about 12% of theaverage “developed area” footprint of 1505 m
2or 22% of the “urban area” footprint of
837 m
2
per person. Some fraction of PV deployment will occur on rooftops, buildingfacades, and other “zero impact” areas, such as parking lot awnings. Practically, thedeployment of PV on these types of areas is significantly reduced when consideringshading, orientation, and other availability factors. In addition, solar PV competes withother “green” roof options, including solar water heating, daylighting, and roof-topgardens. Additional study and analysis is needed to estimate the large but uncertain
potential for deployment of PV on rooftops, parking lots, and other zero/low impactareas.
If PV is deployed in land-based areas, there are some options for minimum impactdeployment at Superfund and brown-field sites and other compromised land, and certain
airport land.
35
There are several additional considerations when evaluating the need todeploy land-based PV on a large scale. Each of the land-use indicators in Table 2 has asubstantially different impact, whether it is aesthetics, ecosystem changes, use of chemicals, etc. At worst, ground-mounted PV could have impacts approximating those of
paved roads, while pole-mounted PV flat panels or tracking arrays could accommodateshade-tolerant plants underneath a large fraction of the arrays; the coexistence of PVdeployment with animals grazing also has been demonstrated.
36
As shown in Table 2, the U.S. average solar electric footprint is similar in magnitude tothe land use for major roads, golf courses, and airports combined. Note that major roadsdo not include local roads. In addition, the U.S. average solar electric footprint is lessthan 2% of the land dedicated to cropland and grazing, and about 10% of the landdedicated to growing hay and corn.
One potentially notable comparison is the relative land use associated with corn ethanol.In 2006, the amount of corn dedicated to ethanol feedstocks was about 21% of corn
production.37
As a result, the national average per-capita corn ethanol area (in 2006) of about 219 m
2exceeds the average per-capita solar electric footprint. However, this
comparison is of somewhat limited value because most of the corn production isconcentrated in a few states. A complete accounting of various land-use impacts issomewhat subjective, and a full analysis is beyond the scope of this report; however, itshould be considered when comparing PV deployment to alternative uses.
35 R. Ruther, Solar Airports ReFocus, July/August 2005 30-3436 Solon Mover Germany http://www.solonmover.com/ 37 Food and Agricultural Policy Research Institute (2007). “FAPRI Agricultural Outlook 2007” at
http://www.fapri.iastate.edu/outlook2007/
19
8/4/2019 Annual Per-Capita Electricity Use in the US 2003-2005-42463
http://slidepdf.com/reader/full/annual-per-capita-electricity-use-in-the-us-2003-2005-42463 25/34
Conclusions
In this paper, we have quantified the state-by-state per-capita solar electric footprint for the United States. Major findings include:
• The use of normal state-level per-capita electricity data, where state electricity isdivided by state population, may result in unrealistic estimates of the regionalelectric footprint. The effect of embodied energy in manufactured goods is toreduce the effective per-capita electricity demand in heavily industrialized states,and increase the per capita demand in less industrialized states.
• Besides module efficiency and local insolation, the area required per unit of annual energy output is strongly dependent on the PV array configuration. Land-
based tracking arrays require much more array per unit of energy production thanflat arrays due to the spacing between arrays for maintenance and avoidance of shading.
• Using existing technology for the per-capita solar electric footprint, the arearequired to meet the average per-capita electricity demand using solar
photovoltaics is about 181 m2
per person in the United States. This value assumesthe availability of long-term (including seasonal) storage, and a mix of trackingand flat-plate PV systems.
• The area required to meet the total (2005) national electric demand with solar PVis about 0.6% of the total area of the United States. On a state-by-state basis, thesolar electric footprint as a percentage of total area varies from less than 0.1% for Wyoming to about 9% for New Jersey. This total area is a relatively smallfraction of the existing developed or urban area in each state. It is also less than2% of the land dedicated to cropland and grazing in the United States.
One of the strengths of PV is that it can be deployed in a wide range of applications andlocations – from central to distributed applications, and from rooftops to parking lots tofield mounted systems. While the land requirements for the large-scale deployment of PVare not trivial, the ability to site PV on a range of built structures and other areas meansthat PV technology will not run up against “land-use” constraints in the United States for a long time. In addition, the fact that PV technology has the potential to be sited on areasnot suitable for other uses (rooftops, brownfields, etc.) and in a manner that is compatiblewith multiple uses (i.e., grazing, growing shade tolerant crops, etc.) could minimize itsimpacts on land-use and ecosystem services.
20
8/4/2019 Annual Per-Capita Electricity Use in the US 2003-2005-42463
http://slidepdf.com/reader/full/annual-per-capita-electricity-use-in-the-us-2003-2005-42463 26/34
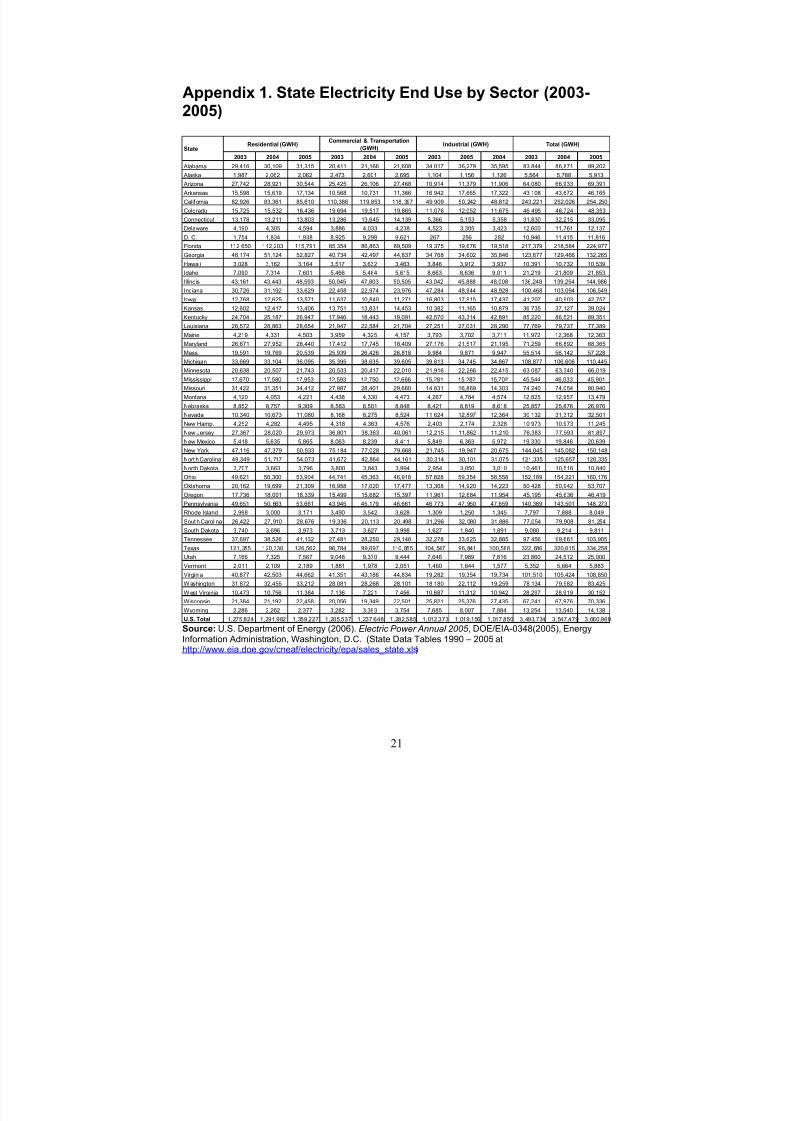
Appendix 1. State Electricity End Use by Sector (2003-2005)
2003 2004 2005 2003 2004 2005 2003 2005 2004 2003 2004 2005
Alabama 29,416 30,109 31,315 20,411 21,166 21,608 34,017 36,279 35,595 83,844 86,871 89,202
Alaska 1,987 2,062 2,062 2,473 2,601 2,695 1,104 1,156 1,126 5,564 5,788 5,913
Arizona 27,742 28,921 30,544 25,425 26,106 27,468 10,914 11,379 11,906 64,080 66,933 69,391
Arkansas 15,598 15,619 17,134 10,568 10,731 11,366 16,942 17,665 17,322 43,108 43,672 46,165
Calif ornia 82,926 83,361 85,610 110,386 119,853 118,397 49,909 50,242 48,812 243,221 252,026 254,250
Colorado 15,725 15,532 16,436 19,694 19,517 19,865 11,076 12,052 11,675 46,495 46,724 48,353
Connecticut 13,178 13,211 13,803 13,286 13,645 14,139 5,366 5,153 5,358 31,830 32,215 33,095
Delaware 4,190 4,305 4,594 3,886 4,033 4,238 4,523 3,305 3,423 12,600 11,761 12,137
D. C. 1,754 1,834 1,938 8,925 9,298 9,621 267 256 282 10,946 11,415 11,816
Florida 112,650 112,203 115,791 85,354 86,863 89,509 19,375 19,676 19,518 217,379 218,584 224,977
Georgia 48,174 51,124 52,827 40,734 42,497 44,837 34,768 34,602 35,846 123,677 129,466 132,265
Hawaii 3,028 3,162 3,164 3,517 3,632 3,463 3,846 3,912 3,937 10,391 10,732 10,539
Idaho 7,090 7,314 7,601 5,466 5,484 5,615 8,663 8,636 9,011 21,219 21,809 21,853
Illinois 43,161 43,443 48,593 50,045 47,803 50,505 43,042 45,888 48,008 136,248 139,254 144,986
Indiana 30,726 31,192 33,629 22,458 22,974 23,976 47,284 48,944 48,928 100,468 103,094 106,549
Iowa 12,768 12,625 13,571 11,637 10,840 11,271 16,803 17,915 17,437 41,207 40,903 42,757
Kansas 12,602 12,417 13,406 13,751 13,831 14,453 10,382 11,165 10,879 36,735 37,127 39,024
Kentucky 24,704 25,187 26,947 17,946 18,443 19,091 42,570 43,314 42,891 85,220 86,521 89,351
Louisiana 28,572 28,863 28,654 21,947 22,584 21,704 27,251 27,031 28,290 77,769 79,737 77,389
Maine 4,219 4,331 4,503 3,959 4,325 4,157 3,793 3,702 3,711 11,972 12,368 12,363
Maryland 26,671 27,952 28,440 17,412 17,745 18,409 27,176 21,517 21,195 71,259 66,892 68,365
Mass. 19,591 19,769 20,539 25,939 26,426 26,818 9,984 9,871 9,947 55,514 56,142 57,228
Michigan 33,669 33,104 36,095 35,395 38,635 39,605 39,813 34,745 34,867 108,877 106,606 110,445
Minnesota 20,638 20,507 21,743 20,533 20,417 22,010 21,916 22,266 22,415 63,087 63,340 66,019
Mississippi 17,670 17,580 17,953 12,593 12,750 12,666 15,281 15,282 15,702 45,544 46,033 45,901
Missouri 31,422 31,351 34,412 27,987 28,401 29,660 14,831 16,869 14,303 74,240 74,054 80,940
Montana 4,120 4,053 4,221 4,438 4,330 4,473 4,267 4,784 4,574 12,825 12,957 13,479
Nebraska 8,852 8,757 9,309 8,583 8,501 8,848 8,421 8,819 8,618 25,857 25,876 26,976
Nevada 10,340 10,673 11,080 8,168 8,275 8,524 11,624 12,897 12,364 30,132 31,312 32,501
New Hamp. 4,252 4,282 4,495 4,318 4,363 4,576 2,403 2,174 2,328 10,973 10,973 11,245
New Jersey 27,367 28,020 29,973 36,801 38,363 40,061 12,215 11,862 11,210 76,383 77,593 81,897
New Mexico 5,418 5,635 5,865 8,063 8,239 8,411 5,849 6,363 5,972 19,330 19,846 20,639
New York 47,116 47,379 50,533 75,184 77,028 79,668 21,745 19,947 20,675 144,045 145,082 150,148
North Carolina 49,349 51,717 54,073 41,672 42,864 44,161 30,314 30,101 31,075 121,335 125,657 128,335
North Dakota 3,707 3,663 3,796 3,800 3,843 3,994 2,954 3,050 3,010 10,461 10,516 10,840
Ohio 49,621 50,300 53,904 44,741 45,363 46,918 57,828 59,354 58,558 152,189 154,221 160,176
Oklahoma 20,162 19,699 21,309 16,958 17,020 17,477 13,308 14,920 14,223 50,428 50,942 53,707
Oregon 17,736 18,001 18,339 15,499 15,682 15,397 11,961 12,684 11,954 45,195 45,636 46,419
Pennsylvania 49,651 50,663 53,661 43,945 45,179 46,661 46,773 47,950 47,659 140,369 143,501 148,273
Rhode Island 2,998 3,000 3,171 3,490 3,542 3,628 1,309 1,250 1,345 7,797 7,888 8,049
South Carolina 26,422 27,910 28,676 19,336 20,113 20,498 31,296 32,080 31,886 77,054 79,908 81,254
South Dakota 3,740 3,696 3,973 3,713 3,627 3,998 1,627 1,840 1,891 9,080 9,214 9,811
Tennessee 37,697 38,526 41,132 27,481 28,250 29,148 32,278 33,625 32,885 97,456 99,661 103,905
Texas 121,355 120,330 126,562 96,784 99,697 110,855 104,547 96,841 100,588 322,686 320,615 334,258
Utah 7,166 7,325 7,567 9,048 9,370 9,444 7,646 7,989 7,816 23,860 24,512 25,000
Vermont 2,011 2,109 2,189 1,881 1,978 2,051 1,460 1,644 1,577 5,352 5,664 5,883
Virginia 40,877 42,503 44,662 41,351 43,186 44,834 19,282 19,354 19,734 101,510 105,424 108,850
W ashington 31,872 32,455 33,212 28,081 28,268 28,101 18,180 22,112 19,259 78,134 79,982 83,425
W est Virginia 10,473 10,756 11,384 7,136 7,221 7,456 10,687 11,312 10,942 28,297 28,919 30,152
W isconsin 21,364 21,192 22,458 20,056 19,349 22,501 25,821 25,376 27,435 67,241 67,976 70,336
Wyoming 2,286 2,262 2,377 3,282 3,393 3,754 7,685 8,007 7,884 13,254 13,540 14,138
U.S. Total 1,275,824 1,291,982 1,359,227 1,205,537 1,237,648 1,282,585 1,012,373 1,019,156 1,017,850 3,493,734 3,547,479 3,660,969
State
Residential (GWH)Commercial & Transportation
(GWH)Industrial (GWH) Total (GWH)
Source: U.S. Department of Energy (2006). Electric Power Annual 2005 , DOE/EIA-0348(2005), EnergyInformation Administration, Washington, D.C. (State Data Tables 1990 – 2005 athttp://www.eia.doe.gov/cneaf/electricity/epa/sales_state.xls)
21
8/4/2019 Annual Per-Capita Electricity Use in the US 2003-2005-42463
http://slidepdf.com/reader/full/annual-per-capita-electricity-use-in-the-us-2003-2005-42463 27/34
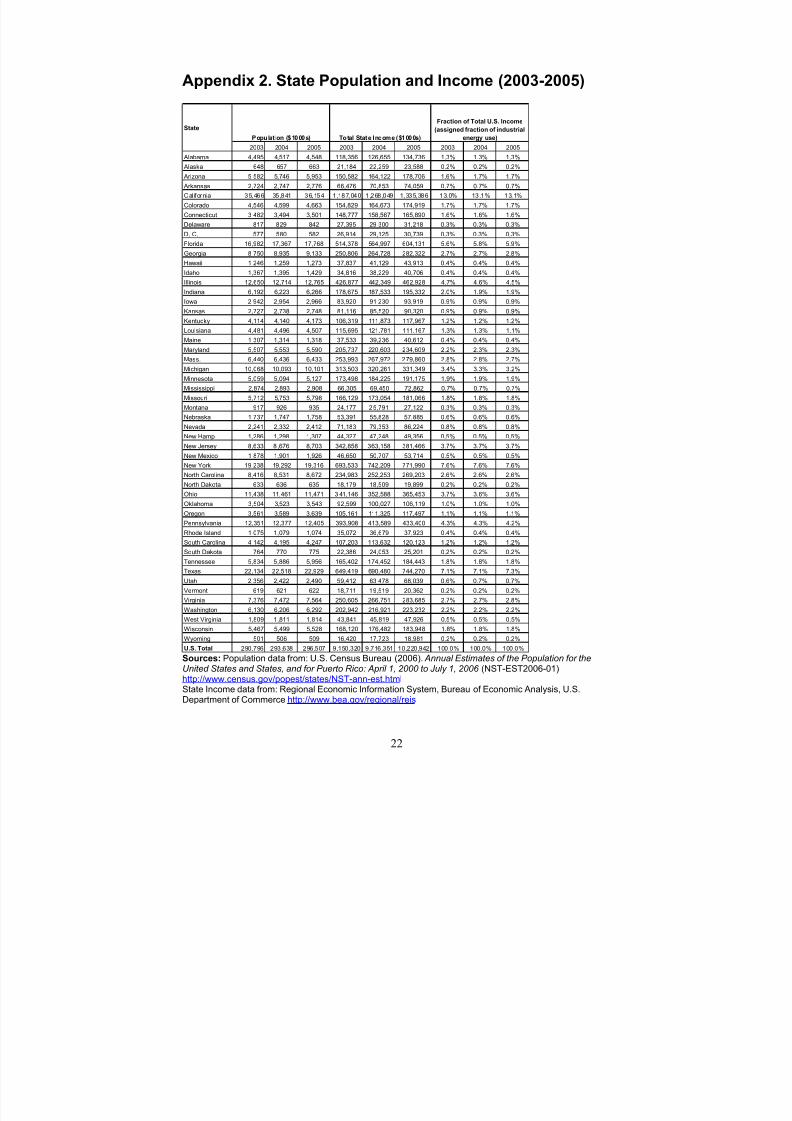
Appendix 2. State Population and Income (2003-2005)
2003 2004 2005 2003 2004 2005 2003 2004 2005
Alabama 4,495 4,517 4,548 118,356 126,655 134,736 1.3% 1.3% 1.3%
Alaska 648 657 663 21,184 22,259 23,588 0.2% 0.2% 0.2%
Arizona 5,582 5,746 5,953 150,582 164,122 178,706 1.6% 1.7% 1.7%
Arkansas 2,724 2,747 2,776 66,476 70,853 74,059 0.7% 0.7% 0.7%
Cal ifornia 35,466 35,841 36,154 1,187,040 1,268,049 1,335,386 13.0% 13.1% 13.1%
Colorado 4,546 4,599 4,663 154,829 164,673 174,919 1.7% 1.7% 1.7%
Connecticut 3,482 3,494 3,501 148,777 158,567 165,890 1.6% 1.6% 1.6%
Delaware 817 829 842 27,395 29,300 31,218 0.3% 0.3% 0.3%
D. C. 577 580 582 26,914 29,125 30,739 0.3% 0.3% 0.3%
Florida 16,982 17,367 17,768 514,378 564,997 604,131 5.6% 5.8% 5.9%
Georgia 8,750 8,935 9,133 250,806 264,728 282,322 2.7% 2.7% 2.8%
Hawaii 1,246 1,259 1,273 37,837 41,129 43,913 0.4% 0.4% 0.4%
Idaho 1,367 1,395 1,429 34,816 38,229 40,706 0.4% 0.4% 0.4%
Illinois 12,650 12,714 12,765 426,877 442,349 462,928 4.7% 4.6% 4.5%
Indiana 6,192 6,223 6,266 178,675 187,533 195,332 2.0% 1.9% 1.9%
Iowa 2,942 2,954 2,966 83,920 91,230 93,919 0.9% 0.9% 0.9%Kansas 2,727 2,738 2,748 81,116 85,520 90,320 0.9% 0.9% 0.9%
Kentucky 4,114 4,140 4,173 106,319 111,873 117,967 1.2% 1.2% 1.2%
Louisiana 4,481 4,496 4,507 115,695 121,781 111,167 1.3% 1.3% 1.1%
Maine 1,307 1,314 1,318 37,533 39,236 40,612 0.4% 0.4% 0.4%
Maryland 5,507 5,553 5,590 205,737 220,603 234,609 2.2% 2.3% 2.3%
Mass. 6,440 6,436 6,433 253,993 267,972 279,860 2.8% 2.8% 2.7%
Michigan 10,068 10,093 10,101 313,503 320,261 331,349 3.4% 3.3% 3.2%
Minnesota 5,059 5,094 5,127 173,498 184,225 191,175 1.9% 1.9% 1.9%
Mississippi 2,874 2,893 2,908 66,305 69,450 72,862 0.7% 0.7% 0.7%
Missouri 5,712 5,753 5,798 166,129 173,054 181,066 1.8% 1.8% 1.8%
Montana 917 926 935 24,177 25,791 27,122 0.3% 0.3% 0.3%
Nebraska 1,737 1,747 1,758 53,391 55,828 57,885 0.6% 0.6% 0.6%
Nevada 2,241 2,332 2,412 71,183 79,353 86,224 0.8% 0.8% 0.8%
New Hamp. 1,286 1,298 1,307 44,327 47,248 49,356 0.5% 0.5% 0.5%
New Jersey 8,633 8 ,676 8,703 342,858 363,158 381,466 3.7% 3.7% 3.7%
New Mexico 1,878 1,901 1,926 46,650 50,707 53,714 0.5% 0.5% 0.5%
New York 19,238 19,292 19,316 693,533 742,209 771,990 7.6% 7.6% 7.6%
North Carolina 8,416 8,531 8,672 234,983 252,253 269,203 2.6% 2.6% 2.6%
North Dakota 633 636 635 18,179 18,509 19,899 0.2% 0.2% 0.2%
Ohio 11,438 11,461 11,471 3 41,146 352,588 365,453 3.7% 3.6% 3.6%
Oklahoma 3,504 3,523 3,543 92,599 100,027 106,119 1.0% 1.0% 1.0%
Oregon 3,561 3,589 3,639 105,161 111,325 117,497 1.1% 1.1% 1.1%
Pennsylvania 12,351 12,377 12,405 393,908 413,589 433,400 4.3% 4.3% 4.2%
Rhode Island 1,075 1,079 1,074 35,072 36,679 37,923 0.4% 0.4% 0.4%
South Carolina 4,142 4,195 4,247 107,203 113,632 120,123 1.2% 1.2% 1.2%
South Dakota 764 770 775 22,386 24,053 25,201 0.2% 0.2% 0.2%
Tennessee 5,834 5,886 5,956 165,402 174,452 184,443 1.8% 1.8% 1.8%
Texas 22,134 22,518 22,929 649,419 690,480 744,270 7.1% 7.1% 7.3%
Utah 2,356 2,422 2,490 59,412 63,478 68,039 0.6% 0.7% 0.7%
Vermont 619 621 622 18,711 19,519 20,362 0.2% 0.2% 0.2%
Virginia 7,376 7,472 7,564 250,605 266,751 283,685 2.7% 2.7% 2.8%
Washington 6,130 6,206 6,292 202,942 216,921 223,232 2.2% 2.2% 2.2%
West Virginia 1,809 1 ,811 1,814 43,841 45,819 47,926 0.5% 0.5% 0.5%
Wisconsin 5,467 5,499 5,528 168,120 176,482 183,948 1.8% 1.8% 1.8%
Wyoming 501 506 509 16,420 17,723 18,981 0.2% 0.2% 0.2%
U.S. Total 290,796 293,638 296,507 9,150,320 9,716,351 10,220,942 100.0% 100.0% 100.0%
Populat ion ($1000s) Total State Income ($1000s)
Fraction of Total U.S. Income
(assigned fraction of industrial
energy use)
State
Sources: Population data from: U.S. Census Bureau (2006). Annual Estimates of the Population for theUnited States and States, and for Puerto Rico: April 1, 2000 to July 1, 2006 (NST-EST2006-01)http://www.census.gov/popest/states/NST-ann-est.html State Income data from: Regional Economic Information System, Bureau of Economic Analysis, U.S.Department of Commerce http://www.bea.gov/regional/reis
22

8/4/2019 Annual Per-Capita Electricity Use in the US 2003-2005-42463
http://slidepdf.com/reader/full/annual-per-capita-electricity-use-in-the-us-2003-2005-42463 28/34
Appendix 3. State Annual Average Per-Capita ElectricityUse (kWh/person/year) (2003-2005)
State Residential Commercial
and Trans.
Industrial
by Income
Industrial
by State
Total
(IncomeWeight)
Total
(StateWeight)
Alabama 6,698 4,659 2,935 7,808 14,292 19,165
Alaska 3,105 3,947 3,572 1,720 10,623 8,772
Arizona 5,045 4,571 2,990 1,980 12,605 11,595
Arkansas 5,862 3,961 2,688 6,297 12,510 16,119
California 2,344 3,244 3,697 1,386 9,285 6,974
Colorado 3,454 4,279 3,753 2,520 11,486 10,252
Connecticut 3,836 3,920 4,735 1,516 12,491 9,272
Delaware 5,261 4,886 3,704 4,531 13,851 14,678
D. C. 3,177 16,008 5,228 463 24,414 19,649
Florida 6,537 5,022 3,383 1,124 14,942 12,683
Georgia 5,670 4,774 3,119 3,925 13,563 14,369
Hawaii 2,476 2,809 3,407 3,095 8,692 8,380
Idaho 5,249 3,953 2,843 6,280 12,045 15,481
Illinois 3,545 3,891 3,665 3,591 11,101 11,027
Indiana 5,114 3,715 3,153 7,770 11,981 16,599
Iowa 4,397 3,809 3,183 5,885 11,389 14,091
Kansas 4,678 5,117 3,280 3,948 13,075 13,743
Kentucky 6,182 4,464 2,836 10,362 13,482 21,008
Louisiana 6,385 4,912 2,718 6,124 14,015 17,421
Maine 3,313 3,158 3,126 2,845 9,597 9,317
Maryland 4,988 3,217 4,160 4,200 12,365 12,406
Mass. 3,102 4,101 4,354 1,543 11,557 8,746
Michigan 3,399 3,755 3,347 3,616 10,500 10,770
Minnesota 4,115 4,120 3,767 4,358 12,002 12,594
Mississippi 6,133 4,381 2,522 5,333 13,036 15,847
Missouri 5,629 4,984 3,161 2,664 13,774 13,277
Montana 4,461 4,766 2,909 4,903 12,136 14,130
Nebraska 5,135 4,947 3,344 4,932 13,425 15,014Nevada 4,594 3,575 3,547 5,278 11,717 13,447
New Hamp. 3,348 3,407 3,798 1,775 10,553 8,531
New Jersey 3,281 4,429 4,383 1,357 12,094 9,067
New Mexico 2,965 4,332 2,775 3,187 10,072 10,484
New York 2,507 4,008 4,001 1,078 10,517 7,594
North Carolina 6,054 5,023 3,094 3,572 14,170 14,648
North Dakota 5,868 6,115 3,118 4,737 15,101 16,719
Ohio 4,475 3,987 3,233 5,113 11,695 13,575
Oklahoma 5,786 4,868 2,961 4,015 13,615 14,669
Oregon 5,012 4,318 3,245 3,392 12,575 12,721
Pennsylvania 4,146 3,656 3,504 3,834 11,307 11,637
Rhode Island 2,841 3,303 3,565 1,209 9,709 7,354
South Carolina 6,595 4,763 2,840 7,570 14,198 18,928
South Dakota 4,940 4,910 3,252 2,320 13,103 12,170
Tennessee 6,638 4,801 3,110 5,589 14,549 17,028Texas 5,449 4,545 3,232 4,471 13,225 14,465
Utah 3,035 3,834 2,754 3,227 9,623 10,097
Vermont 3,389 3,174 3,301 2,514 9,863 9,076
Virginia 5,711 5,771 3,746 2,605 15,228 14,087
Washington 5,236 4,534 3,621 3,195 13,391 12,964
West Virginia 6,002 4,014 2,656 6,062 12,672 16,079
Wisconsin 3,942 3,753 3,361 4,768 11,055 12,462
Wyoming 4,568 6,879 3,672 15,553 15,118 26,999
U.S. Average 4,457 4,229 3,462 3,462 12,147 12,147
23

8/4/2019 Annual Per-Capita Electricity Use in the US 2003-2005-42463
http://slidepdf.com/reader/full/annual-per-capita-electricity-use-in-the-us-2003-2005-42463 29/34
Appendix 4. State Average Insolation Values (2003-2005)Weighted by Region of Use Based on 2005 Electricity Use Patterns(kwh/m2 /day)
OrientationState
Flat S 10º SW 10º SE 10º S 25º 1-axis 0º 2-axisAlabama 4.3 4.6 4.5 4.5 4.9 5.6 6.4
Arizona 5.6 6.0 5.9 5.9 6.3 7.7 8.9
Arkansas 4.3 4.6 4.5 4.5 4.9 5.7 6.5
California 4.9 5.2 5.1 5.1 5.5 6.4 7.2
Colorado 4.8 5.3 5.1 5.2 5.7 6.7 8.0
Connecticut 3.7 4.0 3.9 3.9 4.3 4.8 5.5
Delaware 3.9 4.2 4.1 4.1 4.5 5.0 5.8
District of Columbia 3.9 4.3 4.2 4.2 4.6 5.2 6.0
Florida 4.7 5.0 4.9 4.9 5.2 6.1 6.7
Georgia 4.3 4.6 4.5 4.5 4.9 5.6 6.4
Hawaii 5.5 5.7 5.7 5.7 5.8 7.1 7.7
Idaho 4.4 4.7 4.6 4.6 5.1 6.1 7.2
Illinois 3.9 4.2 4.1 4.1 4.5 5.2 6.0
Indiana 3.9 4.2 4.1 4.1 4.4 5.1 5.8Iowa 4.0 4.3 4.2 4.2 4.6 5.3 6.2
Kansas 4.4 4.7 4.6 4.6 5.1 5.9 6.9
Kentucky 4.0 4.3 4.2 4.2 4.5 5.3 6.0
Louisiana 4.5 4.8 4.7 4.7 5.0 5.8 6.5
Maine 3.7 4.0 3.9 3.9 4.3 4.9 5.8
Maryland 3.9 4.2 4.1 4.1 4.5 5.1 5.9
Massachusetts 3.7 4.0 3.9 3.9 4.3 4.8 5.6
Michigan 3.7 4.0 3.9 3.9 4.3 4.9 5.6
Minnesota 3.7 4.1 3.9 3.9 4.4 5.0 6.0
Mississippi 4.4 4.7 4.6 4.6 4.9 5.7 6.4
Missouri 4.2 4.5 4.4 4.4 4.8 5.6 6.5
Montana 3.9 4.3 4.2 4.2 4.7 5.5 6.7
Nebraska 4.2 4.6 4.5 4.4 4.9 5.7 6.7
Nevada 5.4 5.8 5.6 5.7 6.2 7.6 8.8New Hampshire 3.7 4.0 3.9 3.9 4.4 4.9 5.8
New Jersey 3.8 4.1 4.0 4.0 4.4 4.9 5.7
New Mexico 5.5 5.9 5.8 5.7 6.3 7.5 8.7
New York 3.8 4.0 4.0 3.9 4.3 4.9 5.6
North Carolina 4.2 4.5 4.4 4.4 4.8 5.5 6.3
North Dakota 3.7 4.0 3.9 3.9 4.3 5.0 6.0
Ohio 3.8 4.1 4.0 4.0 4.3 4.9 5.6
Oklahoma 4.5 4.8 4.7 4.7 5.1 6.0 6.9
Oregon 3.8 4.1 4.0 3.9 4.3 5.0 5.8
Pennsylvania 3.7 4.0 3.9 3.9 4.3 4.8 5.6
Rhode Island 3.8 4.1 4.0 4.0 4.4 4.9 5.7
South Carolina 4.3 4.6 4.5 4.5 4.9 5.6 6.4
South Dakota 4.1 4.4 4.3 4.3 4.8 5.5 6.6
Tennessee 4.2 4.5 4.4 4.3 4.7 5.4 6.1Texas 4.6 4.9 4.8 4.8 5.1 6.0 6.7
Utah 4.6 4.9 4.8 4.8 5.3 6.3 7.3
Vermont 3.7 4.0 3.9 3.9 4.3 4.9 5.8
Virginia 4.0 4.4 4.3 4.2 4.6 5.3 6.1
Washington 3.6 3.8 3.8 3.7 4.1 4.7 5.5
West Virginia 3.8 4.1 4.0 4.0 4.3 4.9 5.6
Wisconsin 3.8 4.1 4.0 4.0 4.4 5.1 5.9
Wyoming 4.5 4.9 4.7 4.8 5.3 6.3 7.6
24

8/4/2019 Annual Per-Capita Electricity Use in the US 2003-2005-42463
http://slidepdf.com/reader/full/annual-per-capita-electricity-use-in-the-us-2003-2005-42463 30/34
Appendix 5. Per-Capita Solar Footprint
Per-Capita Solar Footprintm
2(industrial electricity
allocated by income)
Per-Capita Solar Footprintm
2(industrial electricity
allocated by normal use)
State Base 1-Axis Flat Base 1-Axis FlatAlabama 203 253 120 272 339 160
Alaska 261 314 158 215 260 131
Arizona 145 167 84 134 154 77
Arkansas 184 219 105 237 282 135
California 119 143 67 89 107 51
Colorado 142 165 84 126 147 75
Connecticut 205 251 118 152 186 88
Delaware 219 265 127 232 281 134
District of Columbia 381 459 222 307 369 178
Florida 206 246 115 175 209 97
Georgia 199 238 113 210 253 120
Hawaii 104 121 56 100 117 54
Idaho 167 192 99 215 247 127
Illinois 173 207 100 171 206 99Indiana 190 228 109 263 316 150
Iowa 173 206 101 215 255 126
Kansas 182 215 106 191 226 112
Kentucky 210 252 120 328 393 187
Louisiana 201 241 113 250 299 140
Maine 155 185 91 150 180 89
Maryland 195 236 113 195 236 113
Massachusetts 187 229 109 142 173 82
Michigan 171 206 99 176 211 101
Minnesota 191 227 114 201 238 119
Mississippi 190 228 107 231 277 130
Missouri 201 239 117 194 230 113
Montana 183 212 110 213 247 128
Nebraska 192 227 113 215 254 126
Nevada 137 156 80 157 180 92
New Hampshire 171 206 100 138 167 81
New Jersey 194 237 112 146 177 84
New Mexico 114 132 66 118 137 69
New York 171 207 98 123 149 71
North Carolina 212 255 121 219 264 125
North Dakota 243 284 145 269 315 161
Ohio 192 231 109 223 269 127
Oklahoma 188 222 109 203 239 117
Oregon 208 246 120 210 249 122
Pennsylvania 186 226 107 192 233 110
Rhode Island 156 190 91 118 144 69
South Carolina 207 250 118 277 333 158
South Dakota 191 225 114 178 209 106
Tennessee 222 267 126 260 312 148
Texas 186 220 105 204 241 115
Utah 128 149 75 135 157 78
Vermont 162 191 95 149 176 87
Virginia 233 281 135 216 260 125
Washington 233 278 135 225 269 130
West Virginia 211 256 120 268 325 153
Wisconsin 174 208 102 197 234 115
Wyoming 198 230 119 354 410 212
U.S Average 181 214 103 181 214 103
25
8/4/2019 Annual Per-Capita Electricity Use in the US 2003-2005-42463
http://slidepdf.com/reader/full/annual-per-capita-electricity-use-in-the-us-2003-2005-42463 31/34
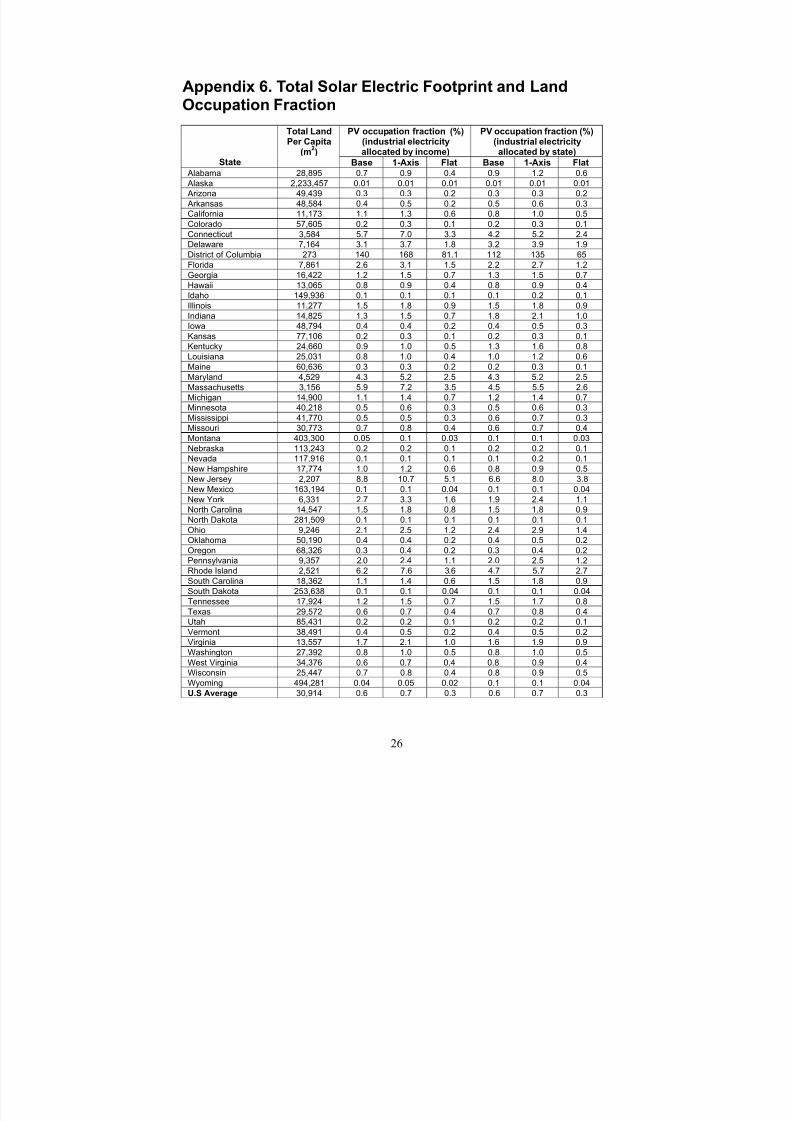
Appendix 6. Total Solar Electric Footprint and LandOccupation Fraction
PV occupation fraction (%)(industrial electricity
allocated by income)
PV occupation fraction (%)(industrial electricity
allocated by state)State
Total LandPer Capita
(m2
)Base 1-Axis Flat Base 1-Axis Flat
Alabama 28,895 0.7 0.9 0.4 0.9 1.2 0.6
Alaska 2,233,457 0.01 0.01 0.01 0.01 0.01 0.01
Arizona 49,439 0.3 0.3 0.2 0.3 0.3 0.2
Arkansas 48,584 0.4 0.5 0.2 0.5 0.6 0.3
California 11,173 1.1 1.3 0.6 0.8 1.0 0.5
Colorado 57,605 0.2 0.3 0.1 0.2 0.3 0.1
Connecticut 3,584 5.7 7.0 3.3 4.2 5.2 2.4
Delaware 7,164 3.1 3.7 1.8 3.2 3.9 1.9
District of Columbia 273 140 168 81.1 112 135 65
Florida 7,861 2.6 3.1 1.5 2.2 2.7 1.2
Georgia 16,422 1.2 1.5 0.7 1.3 1.5 0.7
Hawaii 13,065 0.8 0.9 0.4 0.8 0.9 0.4
Idaho 149,936 0.1 0.1 0.1 0.1 0.2 0.1
Illinois 11,277 1.5 1.8 0.9 1.5 1.8 0.9Indiana 14,825 1.3 1.5 0.7 1.8 2.1 1.0
Iowa 48,794 0.4 0.4 0.2 0.4 0.5 0.3
Kansas 77,106 0.2 0.3 0.1 0.2 0.3 0.1
Kentucky 24,660 0.9 1.0 0.5 1.3 1.6 0.8
Louisiana 25,031 0.8 1.0 0.4 1.0 1.2 0.6
Maine 60,636 0.3 0.3 0.2 0.2 0.3 0.1
Maryland 4,529 4.3 5.2 2.5 4.3 5.2 2.5
Massachusetts 3,156 5.9 7.2 3.5 4.5 5.5 2.6
Michigan 14,900 1.1 1.4 0.7 1.2 1.4 0.7
Minnesota 40,218 0.5 0.6 0.3 0.5 0.6 0.3
Mississippi 41,770 0.5 0.5 0.3 0.6 0.7 0.3
Missouri 30,773 0.7 0.8 0.4 0.6 0.7 0.4
Montana 403,300 0.05 0.1 0.03 0.1 0.1 0.03
Nebraska 113,243 0.2 0.2 0.1 0.2 0.2 0.1
Nevada 117,916 0.1 0.1 0.1 0.1 0.2 0.1
New Hampshire 17,774 1.0 1.2 0.6 0.8 0.9 0.5
New Jersey 2,207 8.8 10.7 5.1 6.6 8.0 3.8
New Mexico 163,194 0.1 0.1 0.04 0.1 0.1 0.04
New York 6,331 2.7 3.3 1.6 1.9 2.4 1.1
North Carolina 14,547 1.5 1.8 0.8 1.5 1.8 0.9
North Dakota 281,509 0.1 0.1 0.1 0.1 0.1 0.1
Ohio 9,246 2.1 2.5 1.2 2.4 2.9 1.4
Oklahoma 50,190 0.4 0.4 0.2 0.4 0.5 0.2
Oregon 68,326 0.3 0.4 0.2 0.3 0.4 0.2
Pennsylvania 9,357 2.0 2.4 1.1 2.0 2.5 1.2
Rhode Island 2,521 6.2 7.6 3.6 4.7 5.7 2.7
South Carolina 18,362 1.1 1.4 0.6 1.5 1.8 0.9
South Dakota 253,638 0.1 0.1 0.04 0.1 0.1 0.04
Tennessee 17,924 1.2 1.5 0.7 1.5 1.7 0.8
Texas 29,572 0.6 0.7 0.4 0.7 0.8 0.4
Utah 85,431 0.2 0.2 0.1 0.2 0.2 0.1
Vermont 38,491 0.4 0.5 0.2 0.4 0.5 0.2
Virginia 13,557 1.7 2.1 1.0 1.6 1.9 0.9
Washington 27,392 0.8 1.0 0.5 0.8 1.0 0.5
West Virginia 34,376 0.6 0.7 0.4 0.8 0.9 0.4
Wisconsin 25,447 0.7 0.8 0.4 0.8 0.9 0.5
Wyoming 494,281 0.04 0.05 0.02 0.1 0.1 0.04
U.S Average 30,914 0.6 0.7 0.3 0.6 0.7 0.3
26

8/4/2019 Annual Per-Capita Electricity Use in the US 2003-2005-42463
http://slidepdf.com/reader/full/annual-per-capita-electricity-use-in-the-us-2003-2005-42463 32/34
Appendix 7. Land-Use Data
In each category, the per-capita land use was calculated by dividing the total areaoccupied by the use category by the state’s estimated population for that year. State
population data was obtained from the U.S. Census Bureau (2006). Annual Estimates of the Population for the United States and States, and for Puerto Rico: April 1, 2000, to July 1, 2006 (NST-EST2006-01) http://www.census.gov/popest/states/NST-ann-est.html
Total Area: Source: U.S. Department of Agriculture. Economic Research Service.“Major Land Uses” http://www.ers.usda.gov/Data/MajorLandUses/ Per-capita area isthe 2002 estimate of land area divided by the 2005 population estimate.
Developed Area: Source: National Resources Conservation Service. 2003 Annual National Resources Inventory. February 2007.http://www.nrcs.usda.gov/TECHNICAL/NRI/. Area is based on year 2003 land use and
2003 population data. Developed land Definition: “A combination of land cover/usecategories, Large urban and built-up areas, Small built-up areas, and Rural transportationland.” From the “Glossary of Key Terms” athttp://www.nrcs.usda.gov/TECHNICAL/land/nri02/glossary.html
Urban Area: Source: U.S. Department of Agriculture. Economic Research Service.“Major Land Uses” http://www.ers.usda.gov/Data/MajorLandUses/ Area is based on year 2002 land use and 2002 population data. Urban area definition: Densely-populated areaswith at least 50,000 people (“urbanized areas”) and densely populated areas with 2,500 to50,000 people (“urban clusters”).
Roof Area: The total roof area in each state was based on the estimates in Chaudhari,M., L. Frantzis, and T. Hoff, PV Grid Connected Market Potential under a Cost Breakthrough Scenario, Navigant Consulting Inc., 2004. Available atwww.ef.org/documents/EFFinal-Final2.pdf . In this report, the roof area available for PVin 2010 is estimated, and includes a “derate” factor of 18% for residential roofs and 65%for commercial roofs. To calculate the total roof area, we multiplied the total roof area byan adjustment factor based on estimated population growth from 2005 to 2010 for eachstate, and then divided the area by the derate factors.
Major roads: Includes interstate, arterial, collector, and urban local roads. Does notinclude rural local and rural minor collector roads. These minor roads have a large area,
but are not included due to data uncertainties, especially regarding land width. Source:http://www.fhwa.dot.gov/policy/ohim/hs05/roadway_extent.htm
Golf: The number of golf courses in each state was derived from “golfable.com” and“golflink.com” We used the lower of the two numbers (16,591 total courses atgolfable.com vs. 18,703 total courses at golflink.com). We assume that each golf courseoccupies 0.61 km
2, from “Golf Course Adjustment Factors for Modifying Estimated
Drinking Water Concentrations and Estimated Environmental Concentrations Generated
27

8/4/2019 Annual Per-Capita Electricity Use in the US 2003-2005-42463
http://slidepdf.com/reader/full/annual-per-capita-electricity-use-in-the-us-2003-2005-42463 33/34
by Tier I (FIRST) and Tier II (PRZM/EXAMS) Models” athttp://www.epa.gov/oppefed1/models/water/golf_course_adjustment_factors.htm . Per-capita area based on 2005 population data.
Airports: A list of U.S. airports was derived from
http://www.faa.gov/airports_airtraffic/airports/airport_safety/airportdata_5010/ There are 8,545 unique airports listed with an occupied land area, including only typeslisted as “Airports” (excluding heliports, gliderports, etc). Washington National Airport isincluded in D.C., although the airport is physically located in Virginia. Per-capita area
based on 2005 population data.
Cropland: Source Natural Resources Conservation Service. “National ResourcesInventory 2003 Annual NRU” February 2007. http://www.nrcs.usda.gov/technical/NRI/ Per-capita area based on 2003 data. Cropland definition: “A Land cover/use category thatincludes areas used for the production of adapted crops for harvest. Two subcategories of cropland are recognized: cultivated and non-cultivated. Cultivated cropland comprises
land in row crops or close-grown crops and also other cultivated cropland, for example,hay land or pastureland that is in a rotation with row or close-grown crops. Non-cultivated cropland includes permanent hay land and horticultural cropland.” Fromhttp://www.nrcs.usda.gov/technical/land/nri02/glossary.html
Corn and Hay: National Agricultural Statistics Service (NASS), Agricultural StatisticsBoard, U.S. Department of Agriculture. June, 2007 “Acreage” athttp://usda.mannlib.cornell.edu/usda/current/Acre/Acre-06-29-2007.pdf Per-capita area
based on 2006 data.
Grazing: Source Natural Resources Conservation Service. “National ResourcesInventory 2003 Annual NRU,” February 2007. http://www.nrcs.usda.gov/technical/NRI/
Grazing Land includes pastureland, rangeland, and grazed forest land. For additionaldetails, see the “National Resources Inventory 2002 and 2003 Annual NRI Glossary of Key Terms” at http://www.nrcs.usda.gov/technical/land/nri02/glossary.html . Per-capitaarea based on 2003 data.
28

8/4/2019 Annual Per-Capita Electricity Use in the US 2003-2005-42463
http://slidepdf.com/reader/full/annual-per-capita-electricity-use-in-the-us-2003-2005-42463 34/34
REPORT DOCUMENTATION PAGEForm Approved
OMB No. 0704-0188
The public reporting burden for this collection of information is estimated to average 1 hour per response, including the time for reviewing instructions, searching existing data sources,gathering and maintaining the data needed, and completing and reviewing the collection of information. Send comments regarding this burden estimate or any other aspect of thiscollection of information, including suggestions for reducing the burden, to Department of Defense, Executive Services and Communications Directorate (0704-0188). Respondentsshould be aware that notwithstanding any other provision of law, no person shall be subject to any penalty for failing to comply with a collection of information if it does not display acurrently valid OMB control number.
PLEASE DO NOT RETURN YOUR FORM TO THE ABOVE ORGANIZATION. 1. REPORT DATE (DD-MM-YYYY)
December 2007
2. REPORT TYPE
Technical Report
3. DATES COVERED (From - To)
5a. CONTRACT NUMBER
DE-AC36-99-GO10337
5b. GRANT NUMBER
4. TITLE AND SUBTITLE
The Regional Per-Capita Solar Electric Footprint for the UnitedStates
5c. PROGRAM ELEMENT NUMBER
5d. PROJECT NUMBER
NREL/TP-670-42463
5e. TASK NUMBER
PVB7.6402
6. AUTHOR(S)
P. Denholm and R. Margolis
5f. WORK UNIT NUMBER
7. PERFORMING ORGANIZATION NAME(S) AND ADDRESS(ES) National Renewable Energy Laboratory1617 Cole Blvd.Golden, CO 80401-3393
8. PERFORMING ORGANIZATIONREPORT NUMBER
NREL/TP-670-42463
10. SPONSOR/MONITOR'S ACRONYM(S)
NREL
9. SPONSORING/MONITORING AGENCY NAME(S) AND ADDRESS(ES)
11. SPONSORING/MONITORINGAGENCY REPORT NUMBER
12. DISTRIBUTION AVAILABILITY STATEMENT
National Technical Information ServiceU.S. Department of Commerce5285 Port Royal RoadSpringfield, VA 22161
13. SUPPLEMENTARY NOTES
14. ABSTRACT (Maximum 200 Words)
In this report, we quantify the state-by-state per-capita “solar electric footprint” for the United States. We use state-level data on population, electricity consumption, economic activity and solar insolation, along with solar photovoltaic(PV) array packing density data to develop a range of estimates of the solar electric footprint. We find that the solar electric footprint, defined as the land area required to supply all end-use electricity from solar photovoltaics, is about181 m2 per person in the United States. Two key factors that influence the magnitude of the state-level solar electricfootprint include how industrial energy is allocated (based on location of use vs. where goods are consumed) and theassumed distribution of PV configurations (flat rooftop vs. fixed tilt vs. tracking). The solar electric footprint is about0.6% of the total land area of the United States with state-level estimates ranging from less than 0.1% for Wyoming
to about 9% for New Jersey. We also compare the solar electric footprint to a number of other land uses. For example, we find that the solar electric footprint is equal to less than 2% of the land dedicated to cropland andgrazing in the United States.
15. SUBJECT TERMS
NREL; solar; solar electric footprint; greenhouse gas emissions; energy savings; solar photovoltaics; PV; land use;state electricity use; energy density; Paul Denholm; Robert Margolis
16. SECURITY CLASSIFICATION OF: 19a. NAME OF RESPONSIBLE PERSON
a. REPORT
Unclassified
b. ABSTRACT
Unclassified
c. THIS PAGE
Unclassified
17. LIMITATIONOF ABSTRACT
UL
18. NUMBEROF PAGES
19b TELEPHONENUMBER (Include area code)