Embed Size (px)
Citation preview

ANNUALINTEGRATED
REPORTAPR 2014 - MAR 2015

PREVIOUSCONTENTS CONTENTS NEXT
12 46 66 84Our People 46Sharing the Value 50Corporate Governance Report 56Risk Committee Report 63Audit & Compliance Committee Report 65
Internal Audit Report 66Social, Ethics, Transformation & Sustainability Committee Report 68 Remuneration Report 70Board of Directors 82
Approval of AFS 84Report of the Directors 85Final Cash Dividend Declaration 87Report of the Independent Auditor 87Shareholder Information 88Statement of Accounting Policies 89Annual Financial Statements 94Administration, Contact Details & Definitions 128
Scope & Boundary 03Who We Are 04Operations & Footprint 06Vision, Purpose & Values 07Stakeholder Engagement 08Value Creation through the use of Capitals 10
Group Strategy 12Key Performance Indicators 23Chairman’s Report 24CEO’s Report 26CFO’s Report 28Divisional Reviews 34
03contents2015 ANNUAL INTEGRATED REPORTAPR 2014 - MAR 2015
2

complies with International Financial Reporting Standards, the Companies Act of South Africa (71 of 2008) and the JSE Listings Requirements. In terms of non-financial indicators, only South African operations are included, unless otherwise indicated.
boundaryThe boundary extends beyond Mr Price Group to include the risks, opportunities and outcomes attributable to other stakeholders beyond the Group that have a significant impact on its ability to create value for its stakeholders over the short, medium and long term.
assuranceThe Group’s consolidated Annual Financial Statements have been audited by the independent external auditor, Ernst & Young Inc. Their unqualified report can be found on page 87. In addition, the independent external auditor verified the information contained in the Remuneration Report on page 70.
The South African Broad-Based Black Economic Empowerment (B-BBEE) accreditation level was externally assured by BEESCORE (Pty) Ltd, a SANAS accredited organisation. The disclosures within Our People Report (page 46) and Sharing the Value Report (page 50) were verified by our Internal Audit Division.
PREVIOUSSCOPE & BOUNDARY CONTENTS NEXT
NG PayneChairmanNG Payne
MM BlairCFO
SI BirdCEO
scope&boundary
materialityOur report focuses on issues which the Board and management believe are material to stakeholders and could impact value creation in the business. We have aimed to demonstrate the connectivity between these material issues and our business model, strategy, risks, key performance indicators,
remuneration policies and prospects. The material issues are reviewed on an ongoing basis to ensure that they remain relevant and management assumes the responsibility for the approval of these material issues, which are then endorsed by the Board. All matters that are considered material to the business have been included in this report.
These matters have been identified and prioritised after taking into consideration:
• Our business model and values• External factors that impact on the
Group’s ability to create value in the short, medium and long term
• Strategic objectives and key business risks arising from the Group’s strategic planning framework
• Items that are top-of-mind to the Board and executive management
• Issues derived from key stakeholder engagement.
additional informationThis integrated report aims to focus on material matters only. Where additional or ancillary information is available, this has been separately published on the Group’s website: www.mrpricegroup.com.
scopeThis report provides a consolidated view of the Group’s financial, social, economic and environmental performance for the 52-week period ended 28 March 2015. It includes the financial results of Mr Price Group Ltd trading in South Africa, Botswana, Namibia, Lesotho, Swaziland, Ghana, Nigeria and Zambia and MRP Foundation (100% consolidated), MRP Mobile (55% consolidated), as well as the income received from franchise operations trading elsewhere in Africa. Our reporting
We have pleasure in presenting the 2015 integrated report for Mr Price Group Ltd and its subsidiaries. The report is aimed principally at our shareholders – the providers of financial capital – and the broader investment community, both locally and offshore. However, we recognise that several stakeholder groups influence our business, primarily but not limited to, our customers, shareholders and employees.
This report aligns with the requirements of the King Code of Governance for South Africa (King III) and the International Integrated Reporting Council’s Framework.
The Group’s activities and performance relating to these capitals are covered throughout the report. The information contained in this report is consistent with the indicators used for our internal management and Board reports, and is comparable with previous integrated reports.
The Board is satisfied with the level of assurance on the Annual Integrated Report and does not believe that it should be subject to further external assurance at this point.
approvalThe Audit and Compliance Committee has reviewed the integrated report (including the full and abridged Annual Financial Statements) and recommended these to the Board for approval. The Board has applied its mind to the integrated report and believes that it addresses all material issues, and fairly presents the integrated performance of the Group.
The 2015 Annual Integrated Report was approved for release to stakeholders by the Board on 2 June 2015.
The Framework introduced the 6 forms of capital that impact on value creation and diminution in a business. These comprise financial, manufactured, intellectual, human, social and relationship and natural capital.
3

busi
ness
mod
elwho weare
PREVIOUSWHO WE ARE CONTENTS NEXT
A high-growth, omni-channel, fashion-value retailer.
Targeting younger customers in the mid to upper LSM categories
Retailing predominantly own-branded merchandise
+80% of sales are cash
Increasing sales + low overhead structure= acceptable operating margins• Quality and fashion offered at the best price• Lower mark-ups in order to offer “everyday low prices”• Large order quantities and higher sales volumes to keep input prices low• Maintain balance by incurring costs for future growth, often ahead of
revenue generation• Retail predominantly own-branded merchandise
valueFashion+ quality
+ price
cashA high cash sales component means:• Less impacted by the cyclical nature of retail• Not dependent on credit to drive sales, particularly during
poor economic times• Less exposed to bad debt• Able to fund future growth without incurring debt• Strong cash flows will support future growth and maintain an
appropriate dividend payout ratio
Remaining a cash driven retailer with cash sales > 80%
of total sales
fashionHow do we satisfy our customers’ need for fashion?• Specialist trend teams, frequent international travel and thorough research• Active dialogues through social and digital media• Responding to customers’ changing fashion needs• Product testing before making significant merchandise commitments• Slow moving merchandise cleared to make way for fresh, new
merchandise
Fashionable merchandise at
“everyday low prices”
4

5
PREVIOUSWHO WE ARE CONTENTS NEXT
81.9%
18.1%
80.8%
19.2%
79.9%
20.1%
81.4%
18.6%
83.8%
16.2%
20152014201320122011
Cash Credit
Cash and credit sales % of total retail sales
14.2
21.9
16.1
9.67.5
14.9
10.6
26.2
12.7 7.2
Cash versus credit sales growth
20152014201320122011
Cash Credit
201520102000
R6.83Share price
43.412.0
R11.45Share price
120.460.0
R39.80Share price
276.9173.0
R251.96Share price
919.7580.0
Headline earnings per share (cents) Dividends per share (cents)
2005
1 150 stores and online channels offering full product assortments
Market capitalisation of R64 billion,ranked 32nd
on JSE
29-year CAGR in HEPS of 23.3% and DPS of 25.0%
Included in MSCI Emerging Markets Index
Internationalshareholding of 53%
4th in Business Times Top 100 Companies, highest ranked retailer
Ranked 6th in Financial Mail 2014 Top Companies
Included in JSE Top 40 and Socially Responsible Investment Index

1 150 total storesTotal trading area 583 559m2
438
PREVIOUSOPERATIONS & FOOTPRINT CONTENTS NEXT
4 mrp1 mrpHome5
Total Stores
Zambia
8 Kenya3 Mozambique1 Rwanda2 Tanzania1 Uganda
15Total Stores
Franchise
Total Stores1 066South Africa 392 mrp
153 mrpHome70 mrpSport
263 Sheet Street188 Miladys
7Total Stores
Swaziland 2 mrp1 mrpHome2 Sheet Street2 Miladys
37Total Stores
Namibia 18 mrp5 mrpHome2 mrpSport8 Sheet Street4 Miladys
4Total Stores
Lesotho2 mrp1 mrpHome1 Sheet Street
Total Stores6Nigeria
6 mrp
5Total Stores
Ghana3 mrp2 mrpHome
20Total Stores
Botswana11 mrp3 mrpHome4 Sheet Street2 Miladys
166
stores
Average store size 769m2
Total trading area 55 361m272
196
mrp
mrpHome
Miladys
mrpSport
SheetStreet
operations& footprint
278
Average store size 635m2
Total trading area 278 258m2
Average store size 833m2
Total trading area 138 360m2
Average store size 181m2
Total trading area 50 392m2
Average store size 312m2
Total trading area 61 188m2
6

To become a top performing international retailer.
PREVIOUSVISION, PURPOSE AND VALUES CONTENTS NEXT
our vision our purpose
our values
To add value to our customers’ lives and worth to our partners’ lives, while caring for the communities and environments in which we operate.
Passion ValuePartnershipPassion means ordinary people doing extraordinary things. It’s our engine and the positive attitude and enthusiasm of all of our associates, who approach each day projecting a positive image – believing that work is fun!
Value is the heart of our business. Our success has been built on our ability to add value to our customers’ lives. It is more than just price – it’s about quality, fashion, being in stock of the wanted item and delighting our customers by going the extra mile and always over-delivering.
Mutual respect is integral to the culture of the Group. We therefore refer to our co-workers as “associates” and, once they own shares or share options, they are referred to as “partners”. Partnership is sharing the ownership and success of the Company with all of our associates and fostering solid and long-term relationships with our suppliers. Without our customers, we wouldn’t have a business, and they are one of our most valued partners. We also partner with our communities, by investing in strategic initiatives that will improve the lives of those who are less fortunate, particularly children and youth.
7

S T AK EH O LD E R
PREVIOUSSTAKEHOLDER ENGAGEMENT CONTENTS NEXT
We understand that stakeholders’ perceptions affect our reputation in all the markets in which we operate, and that we need to deal with these proactively, while ensuring that we maintain a balance in our treatment of stakeholders. The Board retains oversight of stakeholder management, while the implementation and monitoring of stakeholder engagement is devolved to the various management teams in the Group.
We have prioritised our input and feedback based on the degree to
stakeholder engagement
Sustainable relationships form the foundation of Mr Price Group’s ability to create value over the short, medium and long term.
which a particular stakeholder or group is affected by our activities or can influence the success of our business. The following criteria have been applied:
Power - This is the level of influence that the stakeholder has over the Group’s ability to make decisions and perform.
Level of interest – The extent of interest that the stakeholder has in the Group and is further divided into two key components, namely:• Proximity – the degree of
interaction, i.e. long-term relationship or dependency on day-to-day operations
• Urgency – the immediacy of the need to engage with a particular stakeholder.
Some of the key principles on which we base our stakeholder approach are:• Openness and transparency• Mutual respect• Supportive and responsive
interaction• Regular and structured
engagements that are constructive and co-operative
• Recognition that all stakeholders are also existing or potential customers.
8

Although we have not listed the communities in which we operate, the media, our business partners or certain government departments with whom we have relationships, it is important to note that the Group acts in a responsible and compliant manner towards these stakeholders.
PREVIOUSSTAKEHOLDER ENGAGEMENT CONTENTS NEXT
stakeholder why we engage how we engage what we engage in
Shareholders and the investment community
• To create an informed perception of the Group
• Annual General Meeting• Presentations to Investment Analysts Society,
results roadshows and one-on-one meetings• Attendance at investor conferences• Annual Integrated Report• Annual results booklet• SENS announcements, trading updates and
press releases• Group website
• Company performance, future prospects and strategy
• Retail market trends and issues• Dividend policy• Share price performance• Share schemes• Economic, social and environmental risks
Customers • To meet our customers’ needs and increase long-term loyalty
• To enhance the mrp brand and thereby grow market share
• In-store interaction• Traditional and social media• Customer and market surveys and panels• Product testing• Inbound and outbound call centres• Advertising campaigns and competitions• Live chat feedback on e-commerce sites• Mystery shopper programme• Feedbackfromaffiliatepublisherpartnersin
foreign markets
• Brand perceptions and expectations• Fashion trends• Product and quality feedback• Customer service levels• E-commerce technical assistance, orders and
queries• Community support and fundraising through
MRP Foundation• Account queries and payment
Associates and partners(our people)
• Our associates are our most valuable asset and brand ambassadors, as theireffortsdriveourprofitabilityandthe effectiveness of our customer engagement
• To enhance their sense of value, commitment and motivation
• To align thinking with the Group strategy• To receive feedback on areas for
workplace and performance improvement
• Induction programmes• Performancereviews,firesidechatsandcareer
planning discussions• Training and development• Culture and climate surveys• Internal media – Red Cap Radio and TV• Team meetings• Results presentations• Divisional events, including awards events• Whistleblowers’ hotline
• Vision and values• Business Code of Conduct• Groupstrategyandfinancialperformance• Group policies and guidelines• Individual and team performances• Remuneration,benefitsandincentives• Transformation and employment equity• People development and training• Wellness programmes• Health and safety• Culture survey results
Suppliers • Suppliers are key to our performance and core to our strategic positioning
• Supplier days• Regular meetings• Performance reviews• Quality audits• Ethical and social audits• DC tours• Factory visits and tours• Whistleblowers’ hotline
• Order quantities, factory capacities, product cost and quality
• Supplier performance• Future growth and expectations of the Group• Core competencies• Future trends in product and sourcing• DC requirements• Quick response• Supplier Ethical Data Exchange (Sedex)• Southern African Sustainable Textile and
Apparel Cluster• Regional Footwear and Leather Cluster • B-BBEE compliance
The following table illustrates our stakeholder engagement in more detail:
9

PREVIOUSVALUE CREATION CONTENTS NEXT
capital input output for 2015 more information
FinancialThefundingandfinancialresources available to and deployed by the Group.
The Group’s pool of funds consists of revenue generated, interest income and funds reinvested.
• Revenue of R18.1 billion• R1.3 billion paid to shareholders as dividends• R796.0 million paid in income taxes• R999.3millionreinvestedtofinancefutureexpansionandgrowth• R88.0 million generated as interest income
• Divisional Reviews• CFO’s report• Annual Financial
Statements
ManufacturedThe physical infrastructure used to sell merchandise and includes distribution centres, retail stores (even though these are leased) and the IT systems throughout the business.
The stores, distribution network and general infrastructure throughout Southern and West Africa which enable us to procure, import, deliver and sell our products and services.
• Property, plant and equipment with a book value of R837.5 million• Inventory to the value of R1.7 billion• R1 billion paid to property owners as store rentals• 76 new stores opened during the year• 5.1% increase in weighted average trading space• Full in-house credit management capability supported by
established call centre
• Annual Financial Statements
IntellectualOrganisational knowledge, systems, protocols and intellectual property.
The intangibles that constitute our product and service offering and provide our competitive advantage.
• Intangible assets with a book value of R328.2 million• Trending and design capabilities• Leading in-house brands• Compelling credit offering• Consistent customer experience through our omni-channel
approach• Registered trademarks
• Annual Financial Statements
• Our People Report• Divisional Reviews
The International Integrated Reporting Council’s Framework requires organisations to, as a fundamental concept underpinning the Framework, report on the resources and relationships that it uses or affects, and the critical interdependencies between them. These resources and relationships are referred to as “the capitals”. The Group is committed to integrated reporting and, as such, has adopted the Framework. In the section below, we show the value that has been created through the use of the six capitals.
Value creation throughthe use of capitals
10

11
PREVIOUSVALUE CREATION CONTENTS NEXT
capital input output for 2015 more information
HumanThe competencies, capabilities and experience of our employees.
The skill and experience vested in our employees that enable us to deliver our products and services and implement our strategy, thereby creating value for our stakeholders.
• An experienced, balanced and diverse Board with a strong commitment to corporate governance
• Mature governance structure• Experienced, competent and cohesive management teams• Clearlydefinedcompanyvalues• Performance management system• Ability to manage risk• 17 098 permanent employees• R1.9 billion paid to employees as remuneration• R38.5 million invested in training, resulting in 159 276 training hours
for employees of which 95% were black
• Remuneration Report• Corporate Governance
Report• Key performance indicators• Our People Report
Social and relationshipStakeholder relationships and engagement, corporate reputation and values.
The key and long-term relationships that we have cultivated with customers, suppliers and business partners.
• B-BBEE rating at level 6• Ongoing effort in furthering enterprise and supplier development
initiatives• R23.5 million donated to MRP Foundation• R3.0 billion (72.9 million units) of merchandise sourced from South
Africa (31% of total) • R20.2 million in dividends paid to participants of Partner Share
Scheme• Business Code of Conduct and Supplier Code of Conduct updated
• Our People Report• Sharing the Value Report• Social, Ethics, Transformation
and Sustainability Committee Report
• Remuneration Report
NaturalEnvironmental resources which impact the Group’s prosperity
The resources that are used in the production of goods.
• Sustainability team co-ordinates and integrates sustainability initiatives across the Group
• Supply chain optimisation and monitoring of procurement practices• Ongoinginitiativesincludingretro-fittinglightingtolower
consumption units
• Key Performance Indicators• Sharing the Value Report
Experienced, balanced and diverse Board with a strong commitment to corporate governance

0102030405
PREVIOUSGROUP STRATEGY CONTENTS NEXT
The Group’s strategy requires sustainable value creation over the short, medium and long term. The Board of Directors reviews the appropriateness of the strategic objectives annually and performance against set targets regularly throughout the year. An integrated approach to strategy, risk management, performance and sustainability has been adopted and there is continued commitment to the alignment of ‘people, profit and planet’.
Our vision is to become a top performing international retailer.
THE 5 PILLARS OF THE GROUP’S STRATEGY
ARE AS FOLLOWS:
group strategy
sustainabilityHigh standards of ethical behaviour and sustainable business practices
peopleCreate an energised environment with empowered and motivated people
operationsDevelop a world class infrastructure to enable the growth strategy
customersDelight our customers with our fashionable offering at great value
growthExtend the Group’s earnings track record through local and international growth
12

PREVIOUSGROUP STRATEGY CONTENTS NEXT
Objectives Performance against objectives
GROWTH – SOUTH AFRICA
Increase market share Our largest chains, mrp and mrpHome, have gained market share in their target markets. mrp gained 1.3%, with the largest increase of 2.1% coming from the menswear department. mrpHome increased its market share by 0.9%.
Introduce quality new space and exit from unproductive space A net 71 new stores were opened during the period. Weighted average trading space increased by 5.1% with the highest growths in mrpSport (11.2%) and mrp (8.3%). Store expansions resulted in 4 370m2 in additional trading space, while 8 168m2 of unproductive space was reduced with positive impacts on store profitability.
Focus on cash sales growth Cash sales growth was 14.9% compared with credit sales growth of 7.5%. Overall cash sales constituted 81.9% of total sales (2014: 80.8%).
Innovate – introduce new concepts
• Design and test mrp new age store A new generation store was opened at V&A Waterfront in August 2014 under the new mrp branding. The trading density of this store is higher than the divisional average, with store contribution and ROGA also above the new store averages.
• Online - Launch in mrpSport mrpSport.com was launched successfully during the year. All trading divisions, with the exception of Miladys, are now trading online. mrp is trading online both locally and internationally, while the other divisions are currently focused on South Africa.
• Increase utilisation of mobile POS Mobile POS usage was increased to reduce the pressure at conventional till points, especially over peak periods. These high technology devices have been well received by customers and the roll out will continue in the new financial year.
• Launch mrpMobile MVNO mrpMobile was launched successfully into the existing credit base. The second phase will focus on broader market penetration and will include a prepaid offering.
Implement new operations structures, targeting improved customer service and operational efficiency
New operations structures were tested initially in the Western Cape by mrp and, due to the success thereof, are now being rolled out nationally. The new structures will result in a more customer-centric business.
growthgrowth
13
PREVIOUSGROUP STRATEGY CONTENTS NEXT
Objectives Performance against objectives
GROWTH – SOUTH AFRICA (continued)
Enhance shoppers’ online experience There has been intense focus on the calibration of shoppers’ online and physical store experiences this year. Results have been positive with complimentary feedback received from customers. The navigation on the online site has also improved resulting in an easier shopping experience.
Tight cost control Costs were well controlled during the current year. Total costs increased by 12.4% compared with revenue growth of 13.9%. Selling expenses increased by 7.4% despite weighted average trading space increasing by 5.1% and inflation averaging approximately 5%. Administrative expenses increased by 11.3% and constituted 6.4% of retail sales and other income compared with 6.5% last year. Refer to the CFO’s Report (page 28) for further details.
Capital expenditure of R3.5 billion planned over the next 5 years.
Future objective
GROWTH – AFRICA
Increase contribution to total sales African sales (excluding South Africa) grew by 24.3% and constituted 8.5% of total sales (2014: 7.9%).
Acquire key franchise operations and continue West African expansion, focusing on value and channels to market
The Zambian franchise operations were acquired effective 2 June 2014 (4 mrp and 1 mrpHome store). In Nigeria, 2 new stores were opened while 1 new store was opened in Ghana. Retail sales for these stores has increased by 31.0%. The full operational performance of the West African stores is discussed in the CFO’s Report (page 28).
Conduct further research to identify appropriate African markets and formats for the expansion of the mrp brands – Apparel, Home and Sport
Ongoing research into other potential markets is being performed. The Mozambiquan and Tanzanian franchise contracts expire in December 2015 and consideration will be given to establishing corporate-owned stores in these territories as well as Mauritius.
Roll out an online platform in Nigeria Rolled out and meeting expectations.
GROWTH – BEYOND AFRICA
Conduct marketing test of mrp.com (online) in Australia Test completed and highlighted brand acceptance:• 85% of increase in online sales was from new customers• Returning customers’ basket size double the average online basket• Expected better response relative to spend-cost of customer acquisition is high,
requires ongoing investment
Conduct further research to identify appropriate international markets and formats for the expansion of the mrp brands – Apparel, Home and Sport
Based on the online marketing test results described above and further detailed research undertaken, mrp will be opening 2 test stores in Australia in October 2015. The mrpHome international expansion strategy is currently in progress while research in mrpSport has yet to commence as this remains a longer term prospect. Research is also being undertaken regarding an appropriate international company structure.
growth (continued)
14

PREVIOUSGROUP STRATEGY CONTENTS NEXT
15
Key risks and mitigation strategies:
Description of risk Risk mitigation
Economic climate in South Africa • Focus on fashion-value business model, including trend and design capabilities, systems, logistics and suppliers to maintain cost structures and value positioning
• Continue international expansion strategy• All international growth to be cash-based. Group cash sales to remain >80% of total sales
Increasing competition, including growing presence of international retailers in South Africa
• Focus on fashion-value business model. New entrants primarily compete with higher priced credit retailers
• Development of the trend and merchant teams• Raised level of pre-season planning• Improved supply chain and resourcing processes• Key associate retention policies• Be at the forefront of retail technology
Investment in wrong market or format • Clearly defined risk appetite• Multi-channel approach in order to overcome limited availability of quality retail space• Intensive research and test strategy for new markets and channels• Stringent feasibility requirements and approval processes• Primary focus on logistics, pricing and competition• Focus on effective people and management structures
Social, political and legislative landscape of Africa • Continued focus on making the work environment more productive and effective to ensure continued employee engagement
• Continue to adopt and advance the spirit of good governance and transformation that goes beyond compliance
• Continue international expansion strategy
growth (continued)
Focus on fashion-value business model, including trend and design capabilities, systems, logistics and suppliers to maintain cost structures and value positioning

PREVIOUSGROUP STRATEGY CONTENTS NEXT
Objectives Performance against objectives
Maintain focus on LSM 6-10 (Sheet Street 5-8) Focus on the target market has been maintained. In mrp, 91% of customers fall within the targeted LSM range, with mrpHome at 93%.
Maintain fashion-value positioning Ingoing markup decreased by 0.1%. Over the last 5 years, the merchandise GP% has not varied significantly which is key to maintaining our price positioning.
Offer fashionable/contemporary own-branded merchandise at “everyday low prices”
Comparative shops and trading performance confirm that this objective has been achieved.
Advance the Group’s CRM strategy - Consolidation of centralised customer call centre - Enhance customers’ experience across all touch points
The Group’s call centre has been relocated, there is a new consolidated reporting structure in place, and new management has been appointed. Available call centre technology has been researched and a single, integrated platform has been selected for implementation in F2016.
Research and implement appropriate CRM strategy to enable growth and increased competitive advantage
Future objective
Offer a consistent brand experience across formats, channelsand markets
There has been intense focus on the calibration of the store and online environments. In the other African territories there is strong focus on value, which will be further enabled by supply chain enhancements.
Increase the role of technology Further rollout of mobile POS. Future objectives are to introduce Tap ,n Go functionality to improve transaction times and to upgrade the store communication network.
customerscustomers16
Key risks and mitigation strategies:
Description of risk Risk mitigation
Compelling and seamless omni-channel shopping experience • Research and effective implementation of CRM strategy• Continuous training and adoption of the ‘one brand’ approach• Engagement with customers
Brand positioning • Development of the trend and merchant teams• Raised level of pre-season planning• Strategic relationships with suppliers• Continued focus on value pricing• Improved quality assurance structures, processes and partnerships
Product assortments and allocations • Continued focus on market research, trend and design• Continued focus on simpler and more effective planning, assortment and allocation
processes

PREVIOUSGROUP STRATEGY CONTENTS NEXT
Objectives Performance against objectives
RESOURCING
Continue to build a sustainable and reputable supply base to meet our increasingly complex requirements
All trading divisions are progressing well on the building of a sustainable and reputable supply base. Improvements have generally been noted in supplier grading and delivery performance.
Increased supplier visibility, quick response model, Sedex and ETI initiatives have progressed as expected with 80% of mrp, mrpHome and Sheet Street trade suppliers being members at the year end. This imperative is expected to span a number of years. The process has commenced in mrpSport and Miladys.
The Supplier Code of Conduct has been aligned with the ETI Base Code and all suppliers are required to uphold the spirit of the code.
Achieve consistent progress on factory direct and trading relationships
Direct imports are tracking well within divisional targets, with factory direct imports having increased from 9.9% to 20.1% of the total order book during the year. (45% of mrp’s imported merchandise).
95% of imported merchandise to be factory direct by F2020 Future objective
SUPPLY CHAIN
Optimal international logistics network blueprint established (including consolidation centres, bond store utilisation and direct shipments, reduction of double duties)
Bond store is currently more efficient due to increased volumes. The 2015 target of foreign stores incurring single duty on 17% of inputs has been achieved.
Conduct limited tests of direct shipments from China to Nigeria Direct shipment to Nigeria tested. The test was successful, but will not be rolled out until there are sufficient volumes.
Reduce lead time to Nigeria and Ghana Lead time reduced by 56 days due to improved documentation and processes at origin and destination.
Establish the potential of bringing the fulfilment of online sales in-house
All divisions with an online offering will be testing store fulfilment in the new financial year.
DISTRIBUTION CENTRE
Obtain necessary approvals for new DC and achieve project milestones
All necessary approvals have been obtained.
New DC to be operational in August 2017 Construction is expected to commence in June 2015, with completion by May 2017 and all divisions operating from the new DC by August 2017. Plans are in place to handle the December 2016 festive season peak.
operationsoperationsoperationsoperationsObjectives
operationsObjectives Performance against objectives
operationsPerformance against objectives
17

PREVIOUSGROUP STRATEGY CONTENTS NEXT
18
Objectives Performance against objectives
ERP SYSTEM IMPLEMENTATION
mrpSport live on new ERP system by January 2016 Just Enough replenishment and core Oracle ERP completed. Next phases are to deliver JE planning modules and commence integration. Test division now planned to go live in first half of F2017.
Control capital expenditure to within budget The total expected cost of the project is R245 million.
Minimisation of new non-critical project requests and scope creep
This has been a focus with current projects being prioritised and new projects being minimised.
operations (continued)
Key risks and mitigation strategies:
Description of risk Risk mitigation
Sustainability of supply and availability of procured merchandise • Improved supplier performance and grading processes• Outsourced and on-site quality assurance processes which provide insight into the
quality and deliverability of merchandise• Key suppliers strategy, engagement and development• Continued focus on building factory direct relationships• Enterprise and supplier development strategy
Increased direct exposure to exchange rates may cause volatility in selling prices and gross margin %
• Increase in direct imports to be phased in over a few years• Hedging strategy in place controlled by active treasury committee• Selling prices routinely checked against competitors
Distribution centre capacity may be insufficient to cope with peak trading throughputs and future growth
• Focus on process flow and stock-flow optimisation• Use of off-site facilities during peak periods• New DC project has been set up as a major initiative, with a focused team,
appointment of specialists, sound project governance structures and processes
Alignment of systems and business requirements or a problematic implementation disrupts the business
• mrpWorld team well established and continue to ensure alignment with business requirements and Group strategy
• Involvement of senior resources, appointment of IT specialists and independent advisors
• Effective IT governance structures and processes, including Executive Steering Committee and oversight by the Main Board• Phased implementation plan, commencing with smaller division• Effective change management processes
Volume and impact of significant change (including on business critical systems)
• Effective change management processes • Business continuity plans, disaster recovery facilities and back-up processes in place• Effective IT governance structures and processes, including Executive Steering Committee and oversight by the Main Board
Ineffective supply chain capabilities to support a global business • Continued focus on the design and implementation of an international supply chain blueprint

PREVIOUSGROUP STRATEGY CONTENTS NEXT
Objectives Performance against objectives
Remuneration structures across all levels to be reviewed to ensure that they are still relevant to those whom they impact and continue to act as a strong motivator to drive future growth
The remuneration and benefits review, conducted in partnership with PwC, has commenced. Areas highlighted to date are being assessed by the committee overseeing this project.
More effective workplace and employee engagement Significant steps have been identified and taken to improve culture survey results across all divisions. An internal analysis of pay equity is in progress and external pay benchmarking is ongoing.
Completion of HCM rollout with desired results achieved HCM rolled out across the Group.
Dayforce has been implemented in all divisions. An Employment Optimisation Committee is in place to identify and drive improvement areas, and derive intended benefits.
Cornerstone core system rolled out in F2015. Currently being used effectively as a training administration management tool, still to derive the true benefits of Learning and Development facilitation and career management.
Investment in training and development to be increased Investment increased from R33.8 million to R38.5 million with 159 276 hours of training being provided. For more information, refer to Our People Report on page 46.
Continued investment in e-learning to facilitate training across a widespread footprint
R5.1 million spent on e-learning in the current year (R29.7 million spent to date). This technology makes training available to associates on a daily basis regardless of where they are geographically located.
Focus on leadership development, including EE • Leadership NEXT designed, launched and underway for top 30 divisional executives. This development initiative includes strategy and operating in a global marketplace.• Recruitment interventions in progress for key vacancies
Achievement of EE targets and B-BBEE compliance levels EE targets achieved (refer page 53) and B-BBEE compliance level of 6 obtained (2014: level 5)
Improve retention of specialised skills and recruitment of top talent through improved remuneration structures
The turnover of key associates in F2015 was well below the Group average. Key executives have been identified with divisional MD’s in succession plans, with development and retention plans largely in place, including participation on Leadership NEXT. People Managers have identified key associates for retention.
peoplepeople
19

PREVIOUSGROUP STRATEGY CONTENTS NEXT
20
Key risks and mitigation strategies:
Description of risk Risk mitigation
The Group may not be able to attract and retain critical skills • Brand profiling and talent search strategy, including intern and graduate programmes• Improved recruitment processes and information• Ongoing focus on skills development in order to create suitable talent pools, particularly around merchandise skills• Continued focus on embedding of Group culture and enhancing the work environment
Leadership capacity and capability for the future • Executive development initiatives include strategy and operating in a global marketplace• Board oversight of performance to strategic KPI’s• Robust succession planning
Loss of key people • Succession plans in place for all key executives• Competitive remuneration and incentive structures offered to enhance retention• Development programmes to enhance pool of leadership skills
people (continued)
Executive development initiatives include strategy and operating in a global marketplace

PREVIOUSGROUP STRATEGY CONTENTS NEXT
Objectives Performance against objectives
Promote ethical practices in the Group’s supply chain that are aligned to the Group values and international standards
• The Group’s Supplier Code of Conduct, which is aligned to the Group’s values, was updated during the year to bring it in line with international standards, with the assistance of the Ethical Trading Initiative (ETI).
• 82% of the Group’s tier 1 trade suppliers have become members of Sedex. A large portion of these global suppliers have completed the self-assessment questionnaire that enables the Group to assess the supplier risk from an ethical perspective.
• ETI buyer training took place across the Group.
Enhance sustainable business practices and partnerships in the local market to promote socio-economic development
• In 2015, the Group sourced 72.9 million units totaling R3.0 billion (31.1% of total) from local suppliers. This is a 33.8% increase on last year.
• Level 6 B-BBEE compliance was achieved, which was externally verified by BEESCORE (Pty) Ltd (a SANAS accredited organisation).
• The relationship with a local footwear manufacturer to the Group continued to yield positive results. The units purchased from this supplier has more than doubled over the last 5 years.
• The JumpStart Manufacturing Programme, piloted in collaboration with certain key suppliers, has proved to be very successful in addressing the needs of unemployed youth and business in South Africa by equipping youth with the necessary skills to access jobs and future careers in the clothing and textile manufacturing industry. This initiative is expected to unlock more efficient and Quick Response capable suppliers.
• The JumpStart Retail Programme, in collaboration with the JobsFund, continues to achieve its objective of promoting the participation of unemployed youth in the retail sector.
• The Group has been a founding member in the development of two competiveness improvement clusters in the country namely the South African Sustainable Textiles and Apparel Cluster and the Regional Footwear and Leather Goods Cluster.
• The Group has continued to support the national priorities of the country through its social investment into the MRP Foundation over the past 10 years, which continues to support the local market.
Improve resource efficiencies and address climate change • The Group’s energy consumption has been reduced through improved energy usage behaviour and retrofitting stores with lower energy intensive lighting. The reduction in the consumption of electricity resulted in a saving of R22.3 million over 2014 and 2015. This has a positive impact on the reduction in carbon emissions.
• Other initiatives to reduce waste disposal have also yielded positive results.
sustainability
21Refer to the Sharing our Value Report on page 50 for more information regarding the Group’s sustainability performance.

PREVIOUSGROUP STRATEGY CONTENTS NEXT
22
sustainability (continued)
Key risks and mitigation strategies:
Description of risk Risk mitigation
Insufficient engagement with or consideration of business input into new or changed legislation may result in onerous compliance requirements
• Continuous involvement in national and retail forums and considered input into proposed changes
• Engaging and building positive relationships with regulators • Group’s compliance philosophy• Sustainability strategy
Although the Group insists that suppliers uphold the standards set in the Code of Conduct it is possible that this may be breached by suppliers, and may cause undue reputational risk to the Group
• Enhanced Supplier Code of Conduct and supplier’s annual declaration process• Supplier relationships and engagement • Member of the ETI and Sedex to encourage socially responsible practices• Partnership with independent quality assurance provider• Consistent and direct response to known breaches
Poor education levels and a lack of skills may result in a further decline in the manufacturing industry which is already struggling with competitiveness
• Supplier and enterprise development plans by the merchandise, resourcing and sustainability teams aimed at improving supplier sustainability and quick response capabilities in South Africa
• MRP Foundation participation in skills development with strategic suppliers in the footwear and apparel manufacturing sectors (JumpStart Manufacturing). Refer page 54
Non-compliance with the Amended B-BBEE Codes • Compliance with the Amended B-BBEE Codes will initially not be possible. Refer page 52.
Engaging and building positive relationships withregulators

PREVIOUSKEY PERFORMANCE INDICATORS CONTENTS NEXT
Unit 2015 2014 2013 2012 2011
Economic
Revenue R’m 18 099 15 892 13 800 12 122 10 973
Headline earnings per share cents 919.7 765.1 634.8 503.0 418.9
Operating margin % 17.1 16.0 15.0 14.4 13.1
Dividends per share cents 580.0 482.0 398.0 314.0 252.0
Share price (closing) Rand 251.96 156.01 116.99 94.34 63.38
Return on net worth % 45.7 47.6 46.4 43.8 42.2
Cash sales as a % of total sales % 81.9 80.8 79.9 81.4 83.8
Social
Total number of people employed 17 0981 18 104 19 384 17 894 17 887
Staff turnover2 % 32.7 20.1 21.5 22.6 22.1
Black staff as a % of total permanent staff % 93 91 94 91 89
Promotions of black people as a % of total promotions % 91 82 87 85 78
Investment in people learning & development R’m 38.5 33.8 30.8 25.1 9.9
Black people participating in learning & development % 95 90 88 87 83
B-BBEE rating Level 6 5 6 6 6
Corporate Social Investment R’m 23.5 18.8 16.7 13.0 11.4
Enterprise Development Investment R’m 36.0 28.0 23.2 21.4 1.5
Environmental3
Carbon emissions (estimated) (in SA) Tonnes 154 155 157 639 210 786 Not reported Not reported
Electricity consumed (Kwh in SA) Million 142.3 158.1 Not reported Not reported Not reported
1 The decline in associates employed is due to the amended labour legislation, where the conversion of casuals to permanent contracts resulted in fewer
people being employed. Refer to Our People Report on page 46 for further information2 Primarily store associates, and has historically been below industry norms. Current year has been impacted by contract changes detailed above.3 Refer to Sharing the Value Report on page 50 for further information
Key Performance Indicators
The following key indicators have been identified to measure the Group’s economic, social and environmental progress:
2323

PREVIOUSCHAIRMAN’S REPORT CONTENTS NEXT
By Nigel PayneMr Price Group Chairman
On behalf of the Board, I am privileged to report to our shareholders, our people, customers, suppliers and all our other stakeholders. Another pleasing operational and financial performance, as reported on by our CEO, Stuart Bird, and CFO, Mark Blair, should be seen in the context of our 23.3% compound annual growth in headline earnings per share over the past 29 years, as well as our vision to become a top performing international retailer.
Mark’s CFO report includes an overview of global and South African economic challenges. While this highlights continued slow economic growth, it also defines an environment in which our fashion value proposition has a significant competitive advantage. This, together with demographic trends, provides a sweet spot for us
to target in a number of countries, as we have confirmed from the responses to our e-commerce offering. We have significant evidence that the ‘emerging consumer’ supporting our offering can be found in large numbers, both in emerging markets, some of which we have already entered, as well as in developed markets with younger populations, such as Australia.
We will continue to allocate capital, both human and financial, to build our capabilities in our home market as well as to enter and expand a number of carefully selected international markets. Stuart’s CEO report details these investments.
In order to more closely integrate strategy and risk management, during the past year the Board incorporated the Risk Committee directly into the Board’s own agenda.
We believe that the best way to align the interests of the Company, our customers, associates and shareholders is by relentlessly pursuing our long term vision, while daily living out the dreams and beliefs that form the basis of our corporate DNA, as set out in significant detail in our annual integrated reports and my Chairman’s report over the past three years. Central thereto is an environment of passionate partnership and teamwork.
The Board strives to strike an appropriate balance between governance and entrepreneurship. We continue to work closely with executive management in refining strategy, and focus on those risks that are the most crucial to our future. We have a risk appetite that facilitates entrepreneurship, but are cautious in the implementation thereof, taking time to test, evaluate, modify where necessary and retest before committing significant capital to implementation.
C H A I R M A N ’ SR E P O R T
24

PREVIOUSCHAIRMAN’S REPORT CONTENTS NEXT
The recent retirement from the Board of one of the Group’s co-founders, Laurie Chiappini, after 29 years of service and upon reaching the age of 70, presents an opportunity to reassess the human capital foundations he helped establish. It is noteworthy that the Group is generally able to fill management vacancies with high quality candidates sourced internally, notwithstanding our sustained growth. This bears testimony to our training, development and
succession planning processes, but even more so to the fact that the benefits of ownership are widely shared in Mr Price, with every South African partner (other companies call these people employees) with more than one year of service owning Mr Price shares and/or options.
Our partners think and act like the owners they are as they benefit from the growth in our share price, and from the dividends they receive together with all other shareholders. This has been, and will continue to be, a major reason for the company’s superior performance. We are very proud that:
Free shares issued under the Partners’ Share Scheme are now worth R147 855 on average and total dividends of R100 million have been paid since inception in 2006.
It is also pleasing to note that our founders, Laurie Chiappini and Stewart Cohen, remain significant shareholders in Mr Price, with the majority of their family assets remaining in our shares, notwithstanding their obvious need to diversify their holdings.
While we are deeply indebted to Laurie, and his alternate director Tracey Chiappini-Young, for their contribution to the Group, we are not saying farewell to them, as they are both transferring their attention and considerable talents to focus on the educational and other corporate social investment initiatives of the MRP Foundation. Laurie has also pledged a generous financial contribution to these life changing projects, which he
is so passionate about. In addition, Laurie has agreed to consult to the Group, on strategic and merchandise issues, as required.
Succession planning at Board level has also progressed seamlessly, with Daisy Naidoo taking over chairmanship of the Audit and Compliance Committee from John Swain, who has served in this role with distinction for many years.
The integrated report contains a wealth of information about our DNA and values, our vision to become a top performing international retailer, our strategies to get there and the related risks that we are embracing and mitigating. It also details various aspects of the performance of the Board, all of which I believe were appropriately executed. I thank my fellow Board members for their contribution and ongoing commitment.
10 000R10 billion
R1 million
Number of our associates, that are shareholders, either directly or via share options
Approximate combined value of the shares in the company, of which our staff, management and directors together own 15%.
Over 1 000 members of middle and senior management each have Mr Price equity values in excess of R1 million.
The growth in value of a long term investment in Mr Price has been remarkable. R10 000 invested in our shares 29 years ago would be worth over R13 million today. Associates and shareholders who have stayed with the Company over the long term have shared significantly in our success.
25

C E OPREVIOUSCEO’S REPORT CONTENTS NEXT
Report by Stuart BirdMr Price Group Chief Executive Officer
sales growth, supported by productive new space being added, together with their local online business not only almost doubling sales, but also playing its part in executing a complete omni-channel experience.
The expansion into new African markets has seen satisfactory performances in both Nigeria and Zambia. Up until December 2014, Ghana too was trading very well, but recent events in that economy have slowed their sales since then. It is pleasing to note that all three territories achieved double digit operating margins for the year.
We remain of the view that growth in Africa must be considered a long term prospect and, despite the recent impact of decreased oil and other resource prices on these economies, as these countries grow and develop, so too will our operations there.
After getting deeper insights into the operational requirements and high costs involved in operating an international online business from South Africa, future foreign online business will be driven only once we have a store presence in that market. This we have successfully achieved in Nigeria.
mrpHome and mrpSport also delivered good results despite conditions in their markets being challenging, particularly as expected in the second half.
Even though they are in market sectors that had noticeable headwinds, as well as having some operational issues, both Miladys and Sheet Street still delivered solid contributions to the Group’s earnings, albeit below budgeted levels.
investing for the future
To realise our vision of being a top performing international retailer, we view our people, systems, processes and supply chain as key enablers.
To this end, we have made, and will continue to make, significant investments in these areas.
The project to implement new core systems has required an extension of the first division going live, but the intention is to still deliver the complete project close to the original timetable.
The build of the new distribution centre has begun and the expected completion date remains August 2017.
Progress towards our vision of being a top performing international retailer continues to gain momentum, with our formula of providing great fashion and quality at excellent prices remaining the key to our success, in both current and whatever new markets we trade in.
current trade
The mrp division has had another very good year, with well received assortments, strong comparable
Overall, this year ending in March 2015 has seen another satisfactory performance for the Group, with earnings growing by over 20%.
26

PREVIOUSCEO’S REPORT CONTENTS NEXT
the mr price way
Our founders, Stewart Cohen and Laurie Chiappini, set out to create a different way of doing business, where the values and culture not only created a positive and enabling environment to succeed, but where the success of the business was then also shared and enjoyed by all associates.
Our culture of Passion, Value and Partnership is the foundation that our business was built on 29 years ago and is what will continue to guide us into the future.
We are fully committed to transformation and believe that if it is to be meaningful and sustainable, it cannot be approached with just a cheque book and tick box mentality.
We are very proud of what we have achieved in developing people both within and outside our Group, as well as businesses that supply us. We will continue to drive these interventions that result in meaningful transformational change, to create more and better employment for the greater good of our country.
looking ahead
Despite the outlook for our existing markets being challenging, by continuing to deliver and improve on our formula of great fashion and quality at excellent prices, I am confident that we will continue to delight our customers in our existing markets and in doing so, deliver positive future results.
We continue to research new markets where we believe that, provided we execute our formula relevant to that market, we will succeed. To this end, we are looking to open mrp pilot stores in Australia towards the end of 2015.
We also see ongoing opportunities to diminish unproductive space, which is currently in excess of 40 000m2, to continue to increase productive new space, as well as to improve supply chain efficiencies.
Our philosophy of challenging every line in gross margin, income and overheads is fundamental to how we do business and key to improving our operating margin.
In closing, I would like to thank all our wonderful associates, who despite continued difficult trading conditions, have again enthusiastically met these conditions and achieved the results delivered. It is a great privilege to work with all of you.
27

C F O ’ SR E P O R T
PREVIOUSCFO’S REPORT CONTENTS NEXT
By Mark BlairMr Price Group Chief Financial Officer
highlights 2015 2014 % change
Revenue R’m 18 099 15 892 13.9
Profit from operating activities R’m 3 076 2 537 21.3
Group operating margin % 17.1 16.0
EBITDA R’m 3 292 2 729 20.6
Profit attributable to shareholders R’m 2 293 1 868 22.8
Headline earnings per share cents 919.7 765.1 20.2
Diluted headline earnings per share cents 865.1 715.1 21.0
Dividend per share - annual cents 580.0 482.0 20.3
- final cents 368.5 314.0 17.4
Dividend payout ratio % 63.1 63.0
Return on shareholders’ equity % 51.4 52.2
accounting policies
The Board believes that appropriate accounting policies, supported by sound, management judgments and estimates, have been consistently applied. During the year, the Group adopted all new or amended accounting standards and interpretations, which did not materially impact accounting policies or results.
28

PREVIOUSCFO’S REPORT CONTENTS NEXT
29
financial performance
The Group has produced a strong set of results against a high base in the prior year, despite:• The continued challenging retail environment which has a specific impact on:
- higher price-point credit retailers such as Miladys, which has a 54% credit sales contribution
- sales of ‘discretionary’ merchandise such as homewares (mrpHome and Sheet Street)
- companies targeting mid-income households (Sheet Street)• Business interruption caused by load shedding• A weak currency, which increased the landed cost of imported
merchandise for all retailers• Start-up losses in online and mrpMobile, the 55% held MVNO which was
launched in June 2014.
revenue
Total Group revenue increased by 13.9% to R18.1 billion primarily due to increases in:
Growth in both existing and new markets delivered pleasing results:• In South Africa, sales from traditional bricks stores grew by 12.2%, while
online sales grew by 110.6%. Combined, sales were R15.8 billion, up 12.6%. Group sales exceeded market growth, as depicted below. The two largest divisions, mrp and mrpHome, which constitute 78% of Group Sales, both grew market share to January 2015, after which RLC data was no longer available.
Total online sales were up by 107.3% to R112.3 million.
• International sales increased by 24.8% and accounted for 8.6% of Group retail sales. The Zambian franchise operations were acquired in June 2014, and together with the other Southern African territories, which constitute 84% of corporate-owned store sales outside South Africa, produced very good results. Sales were up by 26.5%, accompanied by good operating margins. Ghana and Nigeria’s performance declined in
R17.3 billion
R88.0 million
20.7%
Retail sales, of 13.5% (comparable 9.2%) to
Finance income, of 40.1% to
increase in other income, mainly as a result of financial services growth
As planned, credit sales growth of 7.5% continued to grow at a slower rate than cash sales growth of 14.9%. Cash sales now constitute 81.9% of total Group sales.
the 2nd half of the year after a good 1st half. Depreciating currencies and inflation impacted these economies, particularly Ghana, which fortunately has little impact on the Group at this stage.
The number of units sold increased by 5.5% to 228.9 million. Retail selling price (RSP) inflation of 7.7% comprised like-for-like input cost inflation of 4.3% and product mix inflation of 3.4%.New weighted average trading space expanded by 6.1% as 76 stores were opened (33 906m2) and 27 expanded (4 370m2). Space reductions included 5 store closures (1 293m2) and 26 stores being reduced in size (8 168m2). Net weighted average trading space increased by 5.1%. At year end there were 1 150 corporate-owned and 15 franchise stores.
7.6
3.0
7.6
5.0
7.1
5.1
4.9
Price5.3
Mix4.4
2
5.5
Price4.3
3
6
6
4
2
9
%
Spac
e gr
owth
%
Gro
wth
%2
15
15
20
10
5
0
2011 2012 2013 2014 2015Unit growth RSP inflation Weighted average space growth
16.5
12.814.2
10.5
MPC Total MPC RSA Total Stats SATextile, Clothing & Footwear (Type D)
Mix3.4
7.7%
Q1 Q2 Q3 Q4

PREVIOUSCFO’S REPORT CONTENTS NEXT
divisional and segmental performance was as follows:
*
*Excludes other income reflected in central services
mrp mrpSport MiladysApparel
segmentmrpHome
Sheet Street
Home segment
Total
Retail sales and other income R’ million 10 532 1 132 1 511 13 175 3 268 1 397 4 665 17 840
% of total retail sales and other income % 59.0 6.3 8.5 73.8 18.4 7.8 26.2 100.0
Growth in retail sales and other income % 17.6 16.2 1.9 15.4 10.3 5.2 8.7 13.6
Comparable sales growth % 12.8 4.5 0.9 10.9 6.6 0.9 4.8 9.2
RSP inflation % 8.2 6.9 2.3 6.6 13.7 4.7 10.8 7.7
Units sold million 149.0 12.1 9.1 170.2 39.9 18.8 58.7 228.9
Growth in units sold % 9.0 8.7 -1.5 8.4 -3.1 0.6 -1.9 5.5
New stores opened during the year 35 11 7 53 8 15 23 76
Weighted average space growth % 8.3 11.2 -0.4 7.2 0.7 2.2 1.1 5.1
30
The Apparel chains increased retail sales and other income by 15.4% to R13.2 billion. Operating profit rose by 20.6% to R2.5 billion and the operating margin increased from 18.4% to 19.2% of retail sales and other income.
mrp, which constitutes 59% of Group sales, had a very good year and once again achieved market share gains. The division’s growing online presence also had a positive impact on store performance.
Sales were up 17.9% (comparable 12.8%) to R10.1 billion and operating profit, impacted by a slightly lower GP% and expenses growing at a slower rate than sales, was significantly ahead of the prior year. mrpSport grew sales by 16.2% (comparable 4.5%) to R1.1 billion. Lower markdowns contributed to an improved GP% and a significant increase in operating profit. Miladys had a poor year with sales increasing by 0.9% (comparable 0.9%) to R1.4 billion. External factors affecting performance included a decline in the sale of outsized merchandise, a trend consistent with the rest of the market. Operating profits were down on the previous year despite excellent cost control.
The Home chains increased sales and other income by 8.7% to R4.7
billion. Operating profit rose by 19.4% to R705.2 million and the operating margin increased from 13.8% to 15.1% of retail sales and other income. mrpHome, which targets customers in the upper LSM 8-10 range, delivered results that were well ahead of budget and the prior period. Results were driven by sales growth of 10.2% (comparable 6.6%), an improved gross profit margin and costs being maintained in line with inflation. Sheet Street’s customers, who are more susceptible to the current economic environment, curtailed their spending on discretionary purchases. Sales grew by 4.9% (comparable 0.9%) to R1.4 billion and operating profit was down slightly on the prior year.
The Financial Services division, mrpMoney, delivered another strong
performance despite tightening credit limits and limiting new account growth. Revenues increased by growing insurance premium income by 20.5%, mobile (cellular) revenue by 34.3% and debtors’ interest and fees by 14.8%. Bad debts were very well controlled and contributed significantly to the division recording excellent profit growth.
Sal
es d
ensi
ty R
/m2
Sale
s gr
owth
& o
pera
ting
mar
gin
% 20
15
10
5
35 000
30 000
25 000
20 000
15 000
HomeApparel
Sales growth Operating margin Sales Density
2011 2012 2013 2014 2015 2011 2012 2013 2014 2015

PREVIOUSCFO’S REPORT CONTENTS NEXT
31
costs and expenses
Cost of sales as disclosed in the statutory income statement includes that relating to the sale of merchandise, airtime and mrpMobile. The merchandise gross profit margin (merchandise gross profit/retail sales) decreased by 0.2% to 42.0% mainly as a result of the weakening Rand. The gross profit margin has not increased over time. In that way the Group is able to keep delivering value to its customers by keeping prices low. The GP% on airtime sales is low, while mrpMobile’s gross margin is impacted by customer acquisition costs being recognised upfront and due to the start-up phase. Margins will improve with scale. The overall Group gross profit margin decreased from 42.0% to 41.6%.
Selling expenses increased by 7.4% and constituted 20.0% of retail sales and other income compared with 21.2% in the prior year.
A significant improvement in the net bad debt expense, together with the Employment Tax Incentive (ETI) have resulted in a lower than expected growth in overall selling expenses. If the impact of these two items is excluded, the increase is 10.5%, which is in line with weighted average space growth (5.1%) plus inflation.
Administrative expenses increased by 11.3% and comprised 6.4% of retail sales and other income, an improvement on last year’s 6.5%.Higher computer license fees and running costs (which included the new Oracle ERP system planned), staff costs relating to training and recruitment and increased share-based payments costs were the significant movements.
The effective taxation rate for the year was 27.8%, lower than the prior year (28.2%) primarily due to the ETI being exempt from taxation.
operating profit
The basis of computing operating margin has been amended from previously being calculated as operating profit / retail sales to operating profit / retail sales and other income. Group operating profit increased by 21.3% and the operating margin increased to 17.1% of retail sales and other income, compared with last year’s 16.0%.
earnings and dividends per share
The number of shares in issue at year end increased by 4.7 million due to the decreased number of treasury shares held. Treasury shares sold (4 823 452 shares) as a result of share options vesting exceeded treasury share purchases during the year (161 817 shares at an average cost of R239.25 per share totaling R38.7 million).
Headline earnings per share increased by 20.2% to 919.7 cents. Diluted headline earnings per share increased by 21.0%. The Group is pleased to have performed in line with its long-term performance, which is a 29-year CAGR in HEPS of 23.3%.The annual dividend payout ratio has increased slightly to 63.1%, resulting in a dividend of 580.0 cents per share, an increase of 20.3%, in line with HEPS growth. The final dividend to be paid in June 2015 will be 368.5 cents per share, an increase of 17.4%, which is lower than the increase in the interim dividend and 2nd half HEPS growths due to the closer alignment of interim and annual dividend payout ratios. In the current year, the interim payout ratio was increased from 55.1% to 57.0%. Dividend withholding tax of 15.0% will be applicable to shareholders who are not exempt.
Focus on operating leverage
Retail sales growthS
ales
& e
xpen
se g
row
th %
Expe
nses
as
% o
f RS
OI
20114 25
8 27
12 29
16 31
2012 2013 2014 2015
S&A expenses growth S&A expenses % RSOI
30.0
28.8 28.6
27.7
26.4
Improvement in operating margin
2014 Otherincome
Grossprofit
Sellingexpenses
Adminexpenses
2015
0.1%
(0.3%)
1.2% 0.1%
17.1%
16.0%

PREVIOUSCFO’S REPORT CONTENTS NEXT
R’m
The purchase of treasury shares to partially cover options granted (38.7)
The net credit on the vesting of options 94.1
Taxation relating to grants from the Company to the share trusts 27.5
82.9
Long-term lease obligations comprise the long-term portion of straight-line lease liabilities.
Current liabilities increased by 8.8%. The drivers of the increase were:• Tradeandotherpayablesof6.8%,lowerthantheincreaseininventory
as a result of the move to direct importing, which required earlier supplier settlement;
• Reinsuranceliabilitiesof35.1%;• Currentportionofleaseobligationsof17.7%;and• Thetaxationliabilityof15.4%.
Equity attributable to shareholders has increased to R5.0 billion. The treasury share transactions contained therein includes:
32
financial position
Additions to property, plant and equipment for the year amounted to R311.8 million. Furniture, fittings, equipment and vehicles constituted 83% (2014: 83%) and computer equipment 15% (2014: 13%). Disposals and impairments totaled R11.0 million and the depreciation charge was R180.8 million (2014: R162.2 million).
Intangible asset additions amounted to R145.2 million and related primarily to the e-commerce and ERP systems and goodwill arising on the purchase of the Zambian franchise. The amortisation charge for the year amounted to R27.2 million (2014: R29.1 million).
Gross inventories were up 23.9% due to the significant increase in goods in transit at year end. This is a result of the Group’s strategic transition to factory direct relationships. Certain stock purchases were brought forward due to Chinese new-year and for Easter which was the first weekend in the new financial year. As a result, the Group stock turn slowed to 6.4 times (2014: 6.8 times). Excluding the impact of goods in transit, gross inventories were up by 12.5% which is lower than sales growth of 13.5%.
Trade and other receivables increased by 12.0% to R1.9 billion. Prepayments and other receivables
increased over the prior period, while gross trade receivables increased by 9.1% to R1.9 billion. Net bad debt decreased from 7.6% to 6.2% of the debtors’ book which was an excellent performance. External benchmarking continues to reflect the Group’s book to be one of the best performing in the industry. The continued improved ageing profile of the Group’s debtors is encouraging, however, the provision for impairment of 8.9% is reflective of the financial headwinds facing South African consumers.
Cash balances ended the year at R2.8 billion. Cash sales remained high at 81.9% of total sales. The Group seeks to strike a balance between:• Maintaining a strong balance
sheet by having adequate cash resources to fund the requirements of a growing business without the need to incur debt
• Hedging its obligations to participants in the various share schemes. An ongoing repurchase programme is in place that spreads the purchase of shares over an extended period and limits the percentage of daily trade, ensuring there is no impact on the share price. During the year treasury shares to the value of R38.7 million were purchased and the hedged ratio at year end was 56.7%
• Returning funds to shareholders in the form of dividends. The current payout ratio policy is 63.1% of HEPS.
2 7642 252
2015OtherDividendsAdditions toPPE &
intangibles
TaxationInterestreceived
2014 Cashgenerated
fromoperations
1 500
2 500
3 500
4 500
5 500
R’m
Treasuryshare
transactions
2 617
442(795)
(461)
55 (6)
(1 340)
Cash flow movements

PREVIOUSCFO’S REPORT CONTENTS NEXT
outlook
The external factors impacting the South African economy are expected to endure for the forthcoming financial year. We are, therefore, anticipating tough trading conditions. Our target customers are primarily in the mid to upper LSM categories, who are generally less impacted by the constraints mentioned above. However, this could change if inflation and interest rates spike.
As a fashion-value retailer selling predominantly for cash, the Group is comparatively well positioned to withstand these challenges, however, it is not immune. Every effort will be made to keep prices affordable during these tight economic times, and to remain the destination of choice amongst our target customers.
Although sales growth was lower in the 2nd half of the year, this is not wholly due to the market factors mentioned earlier. The internal factors which affected performance have been identified and addressed and will be seen as improvement opportunities in the year ahead. We will focus intently on the various aspects of our proven business model, anticipate challenges and be responsive to opportunities.
The Group remains positive about its long term prospects:• South Africa - we will continue
with our approach of opening stores that meet our stringent requirements, expanding stores that have proven performance and shedding unproductive space. Credit will be cautiously approached, and all areas will be subject to scrutiny for improved processes and efficiencies. Online and mrpMobile, both in the start-up phase, incurred combined losses of R39.4 million in the current period and are targeting improved performances as they increase scale.
• Africa – in our view, this is as an important region to be invested in for the long term. Territories we operate in have had varying degrees of success, however all are contributing positively to Group earnings. Although growth is not expected to be explosive, and
certain markets can be volatile, we are not over invested in any one market. As a combined unit, good future growth is expected.
• International – The Group is actively seeking new markets to take its proven concepts to. Following online testing, detailed desktop and on-the-ground research, mrp is set to open test stores in Australia in the second half of the new financial year. Once again, we will approach this sensibly on a test basis prior to committing to substantial expansion. mrpHome is progressing their international strategy while, in time, mrpSport will do likewise.
In anticipation of the Group’s continued local and international growth, capital expenditure of R3.5 billion is expected over the next 5 years. This includes new ERP and merchandise planning systems and a new distribution centre.
This is the beginning of an exciting new chapter for the Group and in particular the mrp divisions, who account for 84% of Group sales and contributed 96% of the increase in sales during the year.
The 2016 financial trading period will incorporate a 53rd week.
This is the beginning of an exciting new chapter for the Group and in particular the mrp divisions, who account for 84% of Group sales and contributed 96% of the increase in sales during the year.
33

PREVIOUSmrp - DIVISIONAL REVIEW CONTENTS NEXT
TARGET CUSTOMER:
Young and youthful customers who love fashion and appreciate exceptional value, and who are primarily in the 6 to 10 LSM range (mid to upper).
BRAND SUMMARY:An inspired range of the latest fashion product that is differentiated, to all women, men and children, supported by intimatewear, shoes and accessories that offers distinctive market leading value.
DIVISIONAL REVIEW
THE NUMBERS: 2015 2014 % change
Retail sales - incl. Franchise (R’m) 10 207 8 678 17.6
Comparable sales grown (%) 12.8 13.0
Retail selling price inflation (%)(Price 3.9%, mix 4.3%)
8.2 11.0
Units sold (million) 149.0 136.7 9.0
Number of stores (year end) 438 404
Trading area - weighted ave net m2 269 571 248 883 8.3
Sales density (Rand/weighted ave net m2) 37 550 34 507 8.8
34
Nicci Lyne - Managing Director

PREVIOUSmrp - DIVISIONAL REVIEW CONTENTS NEXT
DIVISIONAL REVIEW
Summary of 2015 performance:The business has traded well this past year, achieving an 18% sales growth, exceeding R10 billion, which was a milestone for us.
Our South African business performed incredibly well, with healthy market share gains. Noteworthy has been consistent above average growth achieved across menswear, gaining 2% market share this past year. Our e-commerce channel which will be three years old in July, achieved a 51% sales growth and continues to positively impact on our physical store (bricks) sales, further driving our market share gains.
We have experienced some challenges in West Africa with the drop in the global oil price, which has resulted in devaluing exchange rates and inflationary market conditions. We have however continued to trade profitably in that market, and will continue to pursue space opportunities, on terms acceptable to our business model. During the year we acquired our Zambian operations and those stores have delivered pleasing results.
Looking forward:We continue to invest in new systems and human capital in
the key areas of merchandise, resourcing and logistics. Ensuring and implementing a seamless and robust omni-channel business model that allows us to trade in multi-countries will continue to be a key strategic focus area. We have plans to improve our customers’ shopping experience, and to further enhance our level of on-trend and differentiated product. Considerable effort is being applied to ensure that we over-deliver on our value proposition in the tough trading environment which is expected.
The new financial year has several growth opportunities. Trading space is expected to grow by 7%, improved gross profit margins are being targeted (however, will be dependent on currency exchange rates) and the disappointing sales
performance in Q4 of the current year represents a softer trading base.
We are excited about the local opportunities for our business and are making solid progress on our strategy to expand into new markets.
Although non-South African sales are 11% of our total sales, we are striving for a more balanced mix between South Africa, Africa and new international markets. Following a marketing campaign of our online offer in Australia, which has been supported by desktop and in-country research, two test stores will be opened early in the second half of the new financial year. We believe that, despite higher operating costs in that market, there is a real opportunity for our fashion-value business model.
18% Salesgrowth
R10 billion Sales
35
PREVIOUSmrpHOME - DIVISIONAL REVIEW CONTENTS NEXT
TARGET CUSTOMER:
Primarily fashion-value minded females, aged 25 years and older who love to decorate their homes. Customers, who have a young-at-heart attitude, are primarily in the 8 to 10 LSM range (upper).
BRAND SUMMARY:
Contemporary in-house designed, fashionable homeware and furniture.
THE NUMBERS: 2015 2014 % change
Retail sales - incl. Franchise (R’m) 3 202 2 905 10.2
Comparable sales growth (%) 6.6 8.2
Retail selling price inflation (%)(Price 7.6%, mix 6.1%)
13.7 12.0
Units sold (million) 39.9 41.1 (3.1)
Number of stores (year end) 166 158
Trading area - weighted ave net m2 138 936 138 026 0.7
Sales density (Rand/weighted ave net m2) 22 937 20 956 9.5
DIVISIONAL REVIEW
36
Arn de Haas - Managing Director
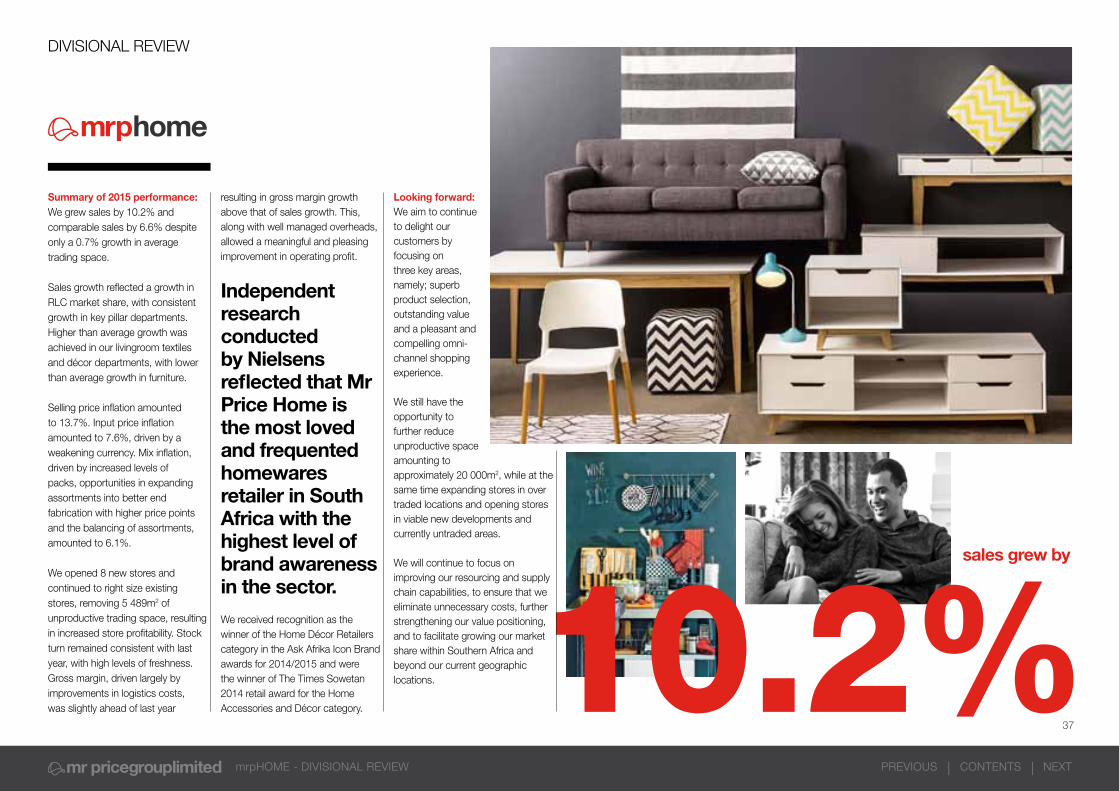
PREVIOUSmrpHOME - DIVISIONAL REVIEW CONTENTS NEXT
DIVISIONAL REVIEW
Summary of 2015 performance:We grew sales by 10.2% and comparable sales by 6.6% despite only a 0.7% growth in average trading space.
Sales growth reflected a growth in RLC market share, with consistent growth in key pillar departments. Higher than average growth was achieved in our livingroom textiles and décor departments, with lower than average growth in furniture.
Selling price inflation amounted to 13.7%. Input price inflation amounted to 7.6%, driven by a weakening currency. Mix inflation, driven by increased levels of packs, opportunities in expanding assortments into better end fabrication with higher price points and the balancing of assortments, amounted to 6.1%.
We opened 8 new stores and continued to right size existing stores, removing 5 489m2 of unproductive trading space, resulting in increased store profitability. Stock turn remained consistent with last year, with high levels of freshness. Gross margin, driven largely by improvements in logistics costs, was slightly ahead of last year
resulting in gross margin growth above that of sales growth. This, along with well managed overheads, allowed a meaningful and pleasing improvement in operating profit.
Independent research conducted by Nielsens reflected that Mr Price Home is the most loved and frequented homewares retailer in South Africa with the highest level of brand awareness in the sector. We received recognition as the winner of the Home Décor Retailers category in the Ask Afrika Icon Brand awards for 2014/2015 and were the winner of The Times Sowetan 2014 retail award for the Home Accessories and Décor category.
Looking forward:We aim to continue to delight our customers by focusing on three key areas, namely; superb product selection, outstanding value and a pleasant and compelling omni-channel shopping experience.
We still have the opportunity to further reduce unproductive space amounting to approximately 20 000m2, while at the same time expanding stores in over traded locations and opening stores in viable new developments and currently untraded areas.
We will continue to focus on improving our resourcing and supply chain capabilities, to ensure that we eliminate unnecessary costs, further strengthening our value positioning, and to facilitate growing our market share within Southern Africa and beyond our current geographic locations.
sales grew by
10.2%37

PREVIOUSmrpSPORT - DIVISIONAL REVIEW CONTENTS NEXT
TARGET CUSTOMER:
Value-minded sports and outdoor enthusiasts from age 6 upwards who are primarily in the 8 to 10 LSM range (upper).
BRAND SUMMARY:
A range of affordable, own-branded sporting and outdoor apparel, equipment, footwear and accessories.
THE NUMBERS: 2015 2014 % change
Retail sales 1 118 962 16.2
Comparable sales growth (%) 4.5 6.5
Retail selling price inflation (%)(Price 6.7%, mix 0.2%)
6.9 6.0
Units sold (million) 12.1 11.1 8.7
Number of stores (year end) 72 61
Trading area - weighted ave net m2 53 424 48 034 11.2
Sales density (Rand/weighted ave net m2) 20 928 20 036 4.5
DIVISIONAL REVIEW
38
Clint Larsson - Managing Director

PREVIOUSmrpSPORT - DIVISIONAL REVIEW CONTENTS NEXT
DIVISIONAL REVIEW
Summary of 2015 performance:Sales exceeded the R1 billion mark for the first time, assisted by opening 11 new stores and weighted average trading space increasing by 11.2%.
The encouraging performance of the 600m2 store format has enhanced store growth opportunities into smaller towns. We right sized 2 stores and eradicated 604m2 of excess space which has contributed to the improvement in operation margin. Three further reductions (2 900m2) are planned for the new financial year.
The challenging economic environment and selling price inflation has negatively impacted sales of international branded merchandise. However, the
continued development in private brands has delivered strong growth across the assortment and continues to entrench our value proposition with our customers. The e-commerce offer was launched during the period and has created a strong platform to engage with our customers. Looking forward:Investment in resource and supply chain capabilities and the growth of direct imports has improved our visibility into the supply pipeline. This transition is ongoing. Continued investment in merchandising and planning processes have contributed to an improved gross margin, better stock turn and consequently improved cash flow from operations. This will facilitate the planned investment in new stores, the revamp of older stores and the change in resourcing, referred to above. There is still significant store growth available to us in South Africa, both in the current and smaller formats, and space growth of 5.1% is expected in F2016.
16% Salesgrowth
R1.1 billion Sales
39

PREVIOUSMILADYS - DIVISIONAL REVIEW CONTENTS NEXT
TARGET CUSTOMER:
A forever 35+ family-oriented woman (primarily in the 6 to 10 LSM range)who knows who she is and what she wants. She shops for fashion that makes her look and feel good.
BRAND SUMMARY:
Own brand, on-trend, good quality and affordably priced clothing, intimatewear, shoes, bags and accessories for moderate women.
THE NUMBERS: 2015 2014 % change
Retail sales 1 396 1 384 0.9
Comparable sales growth (%) 0.9 7.2
Retail selling price inflation (%)(Price 1.0%, mix 1.3%)
2.3 4.1
Units sold (million) 9.1 9.3 (1.5)
Number of stores (year end) 196 191
Trading area - weighted ave net m2 60 714 60 932 (0.4)
Sales density (Rand/weighted ave net m2) 22 987 22 711 1.2
40
Larry Simon - Managing Director

PREVIOUSMILADYS - DIVISIONAL REVIEW CONTENTS NEXT
41
Summary of 2015 performance:Sales growth was a disappointing 0.9% in a year that has been challenging from both an economic and product extension point of view. Miladys is a predominantly credit retailer and has therefore been impacted by credit curtailment in the economy. In addition, it is a higher margin business than the rest of the Group, with its customers being more discerning in a tougher economic climate.
However, these external challenges were exacerbated by incorrect styling calls, which resulted in higher than desired markdowns and a consequent reduction in the
gross profit margin. Expenses were tightly controlled, growing at well below inflation, which softened the overall decrease in operating profit. Inventories were well controlled, decreasing by 7.3%, and the ageing profile improved slightly on the previous year.
Looking forward:We anticipate that 2016 will be a year of consolidation. New stores are conservatively planned, while we improve merchandise planning and execution processes, including the alignment of the assortment to our target customer.
We expect to attract new customers through communicating trend, comfort, versatility and value for money.
A correctly pitched merchandise offer will enable those departments that underperformed to regain lost market share, and could lead to a substantial improvement inprofitability in the medium term.
DIVISIONAL REVIEW
R1.4 billion Sales
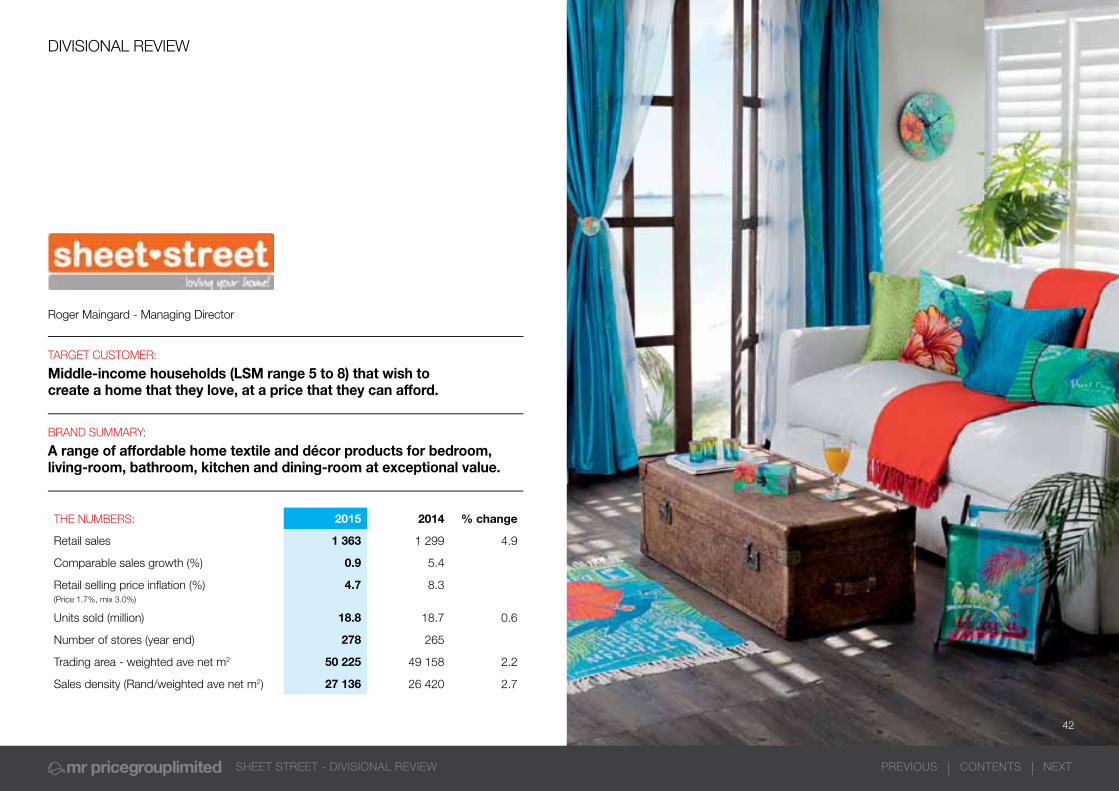
PREVIOUSSHEET STREET - DIVISIONAL REVIEW CONTENTS NEXT
TARGET CUSTOMER:
Middle-income households (LSM range 5 to 8) that wish to create a home that they love, at a price that they can afford.
BRAND SUMMARY:
A range of affordable home textile and décor products for bedroom, living-room, bathroom, kitchen and dining-room at exceptional value.
THE NUMBERS: 2015 2014 % change
Retail sales 1 363 1 299 4.9
Comparable sales growth (%) 0.9 5.4
Retail selling price inflation (%)(Price 1.7%, mix 3.0%)
4.7 8.3
Units sold (million) 18.8 18.7 0.6
Number of stores (year end) 278 265
Trading area - weighted ave net m2 50 225 49 158 2.2
Sales density (Rand/weighted ave net m2) 27 136 26 420 2.7
DIVISIONAL REVIEW
42
Roger Maingard - Managing Director

PREVIOUSSHEET STREET - DIVISIONAL REVIEW CONTENTS NEXT
DIVISIONAL REVIEW
Summary of 2015 performance:The mid-LSM customer has become increasingly discerning. Product changes were made in the previous year to broaden and enhance the appeal of Sheet Street’s offer. Unfortunately, this initiative did not provide the anticipated result, as our target customers came under increased financial pressure.
The resulting low comparable sales growth caused a significant challenge, and increased markdowns to promote value and to move slow moving stocks pressurised gross margins. Good cost management, with expenses increasing by 4.9%, despite 15 new stores being opened, softened the impact.
Looking forward:The adverse performance in 2015 has highlighted the ‘crown jewel’ of staying true to the Sheet Street customer and remaining focused on winning on ‘product’. Opportunities to fine tune (not change) the strategy are expected to make a significant improvement.
The lower cost structures have sharpened the financial model, with savings to be re-invested in gross profit to strengthen the division’s value positioning.
Areas specifically being targeted for improved performance are:• Product innovation (to continually
delight customers)• Value (through innovation, supplier
relationships and resourcing)• Marketing and research (to better
align product to the customer)• Associate development and
training.
43
R1.4 billion Sales

PREVIOUSmrpMoney - DIVISIONAL REVIEW CONTENTS NEXT
DIVISIONAL REVIEW
BRAND OFFERING:
Our credit, insurance and mobile products are offered across the retail omni-channels and are aligned with our core philosophy of “fashionable products at great value”.
Store cards: 6/12/24 month account facilities are offered. Interest is charged, except on a small percentage of Miladys cards. As a value proposition, no compulsory or other fees are a condition of opening an account.
Insurance: Products that offer real value for money with benefits that our customers want and need. These include life cover, critical illness and hospitalisation cover, income protection benefits to account holders and their extended families at affordable premiums.
mrpMobile network (MVNO launched June 2014)To date, the focus has been on post-paid contracts, offering competitive smart phone / tablets to creditworthy store card customers. Additional phases will include Group cash customers and an online offering. Value-added services like wi-fi hotspot, streaming music and device insurance, provide additional benefits, and derive good margins. The sale of prepaid airtime products is expected to commence in the first half of F2016, initially targeting store card users.
TARGET CUSTOMER:
Our growth has traditionally come from in-store credit, with a typical customer being a black female, 31-40 years, earning less than R7 000 per month. However, with our expanded growth into insurance and our own mrpMobile network, this customer demographic is expected to change and will be more representative of the mrp customer.
44
Rex Samuelson - Managing Director Our vision is to be a world class and top performing financial service business, delivering a consistent customer experience across all touch points throughout the customer’s lifecycle.

PREVIOUSmrpMoney - DIVISIONAL REVIEW CONTENTS NEXT
DIVISIONAL REVIEW
ACCOUNT MANAGEMENT SUMMARY 2015 2014
Gross trade debtors (R’m) 1 914 1 754
Total active accounts 1 412 673 1 375 259
Average balance 1 355 1 275
% of debtors able to purchase on credit 89.2 88.4
Retail sales analysis:
- cash (%) 81.9 80.8
- credit (%) 18.1 19.2
Net bad debt (net of recoveries)
- % of credit sales 3.7 4.5
- % of debtors 6.2 7.6
Impairment provision % of debtors 8.9 9.8
Summary of 2015 performance:Our credit sales growth continued to moderate lower at 7.5% (2014: 9.6%) and was in line with our expectations and the broader retail industry shift to cash which was influenced by a significant reduction in unsecured lending. As a result, the credit sales contribution declined to 18.1% (2014: 19.2%). The active account base growth slowed as did the debtors’ book.
Despite the ongoing challenging credit environment, our bad debt decreased significantly to 6.2% (2014: 7.6%) of debtors which is testament to our robust credit risk policies and improved collections environment which benefited from our strategic credit initiatives implemented in prior years. Our credit portfolio remains one of the best in the industry based on independent benchmarking performed.
Insurance premiums grew in excess of 20%, driven by the diversification and innovation of our life products.
Continued growth in profitability was achieved despite declining consumer disposable income and disappointing economic growth. Our product diversification continued with the soft launch of mrpMobile in June 2014, with an initial post-paid offer to our store card customer base.
Looking forward:Our customers easily connect with mrpMoney as we aim to delight them with valued added products and solutions. The diversification into insurance and mobile products will reduce our growth dependence on credit and store cards. We remain cautious regarding our credit landscape, however anticipate good growth from insurance and mobile products. Key to our future growth includes the following strategic imperatives:
• Introduction of an innovative range of new insurance products, and value added services
• The implementation of “one group mobile strategy” across an omni-channel environment delivering a consistent valued added customer experience, including the launch of pre-paid
• The roll-out of the updated mrpMoney brand incorporating stores, benefits and mobile
• Implementation of a “single operational view” across all
customer touch points that will enhance the customer experience through acquisition, communication and transactions.
Gross trade receivables per division (R’000)
mrp mrpHome mrpSport Miladys Sheet Street
Total2015
Total2014
6 months 332 828 77 689 12 700 79 032 43 307 545 556 552 070
12 months 811 612 186 759 16 836 256 538 68 975 1 340 720 1 178 508
24 months 27 624 27 624 23 476
1 144 440 292 072 29 536 335 570 112 282 1 913 900 1 754 054
97.7% of the debtors’ book is interest bearing (2014: 96.6%), with all of the interest free accounts being Miladys 6 month facilities.
45

P E OP E OP L EP L E
PREVIOUSOUR PEOPLE CONTENTS NEXT
THE GROUP STRIVES TO BE A SOUGHT-AFTER INTERNATIONAL COMPANY OF EMPLOYMENT CHOICE BY OFFERING LEADING CAREER OPPORTUNITIES IN FASHION-VALUE RETAILING.
OURcapacity buildingDriven by the ambitions of our Group to grow internationally, as well as locally, we have continued to invest in the development of our human capacity. We believe that every successfully motivated and developed associate reinforces the Group’s competitiveness in the global retail arena.
While we strive to grow, develop and retain our own talent, who demonstrate our cultural values and fashion value ethos, we also constantly search for people who are adaptive, enjoy working in a fast-paced, progressive and changing environment and who thrive on high performance. This approach is consistent across our international locations.
We continue to give full attention to executive succession plans and the growth of our leaders, with our senior leadership programmes focused on leaders’ ability to unlock the potential of new business opportunities for the Group. Extensive training is conducted in new ways of working associated with improved processes, systems and technologies, which is over and above ongoing classroom, e-learning and on-the-job training.
associate engagement Inspired by our core values of
Passion, Value and Partnership, our energetic and entrepreneurial culture continues to be central to the Group’s successful performance. We pay close attention to the climate within our working environments using independently conducted surveys, followed by sessions known as “solutions cafés” designed to listen and respond to the needs of associates.
An innovative drive to reinforce our Group culture has been successfully launched. This is increasingly important as we seek to export our highly valued culture to new territories and onboard international associates.
Direct communication with associates occurs through frequently held “Comm Times”, regular internal TV broadcasts and social media platforms. Close working relationships between managers and associates are valued, and to improve the quality of their discussions, interactive systems have been implemented to provide associates with information relating
to their work performance and management of their careers.
The valuable work of the MRP Foundation ensures that the Group beneficially impacts the lives of associates, their families and the communities in which they live, also ensuring that young people are engaged at an early stage of their careers and gain insight into the many employment opportunities available in our Group.
46
ensure that the required levels of skill are maintained.
career and personaldevelopmentWe offer outstanding career opportunities and associates are actively encouraged to pursue their ambitions within our dynamic and evolving working environments. New roles are frequently created as a result of our omni-channel growth initiatives, and due to new skills requirements associated with organisation and infrastructure improvements. Most of these roles are filled internally, drawing from the unique pool of retail talent that exists across the Group.
Personal growth and career development are discussed with each associate at least annually and line managers are responsible for ensuring that these discussions give rise to meaningful development plans. Assessments are available to inform career paths, training, development and improved performance, with competency profiling being core to their effective application.
PREVIOUSOUR PEOPLE CONTENTS NEXT
performance recognitionand rewardOur Group thrives on happy, motivated employees. We incentivise and reward generously for exceptional performance, strongly encouraging the achievement of personal goals. Well-defined incentive targets are set annually, with performance discussions conducted as required through the year. All associates within the SACU region are invited to participate in the Mr Price Group share or share option schemes after fulfilling the specific employment tenure requirements of that scheme. As these employees are part-owners in the Company, we refer to them as partners or
associates. Further details are contained in the Remuneration Report on page 70 and on the Group’s website.
We use every opportunity to celebrate team or personal achievements, and reinforce the spirit of performance. Group results are presented to associates bi-annually, while divisional performance is frequently discussed in the respective divisions. A highlight is the award of the Mr Price Group ‘Running Man’ statue, presented to selected associates who have made extraordinary contributions over an extended period. These highly valued individuals embody
the Group’s culture and core beliefs and demonstrate consistently high dedication and performance. Additionally, the Mr Price Group medallion is awarded to associates who have delivered outstanding performance or exceptional innovation through the year. These individuals set new standards and become role models for others to follow.
human capital management (hcm) systemsThe continuous transformation of our human capital management capabilities to cater for our growth into new markets and trading locations includes ongoing, proactive
improvements in our workforce management, learning management and payroll systems. These systems have improved transparency of people practices, labour scheduling and compliance reporting, as well as provide a greater depth of people data and enhanced transactional efficiency. The deployment of employee self-service platforms has effectively reduced manual capture and risk of error, while empowering employees to take ownership of their personal administration and learning management. A business intelligence solution allows People Managers to draw on relevant human capital metrics and has improved reporting efficiencies and associated cost
analysis, decision-making and risk mitigation. System integration and automation of employee administration is a key focus for the year ahead.
talent acquisition and developmentDeveloping and retaining ‘homegrown’ talent is a strategy that has served the Group extremely well to date and will continue to be our core area of focus. However, attracting the right retail skills
As these employees are part-owners in the Company, we refer to them as partners or associates.
externally has become increasingly important in the competitive growth environment. To achieve this in South Africa, we constantly profile our employment proposition to potential associates through our social networking platform, or through direct involvement with schools, colleges and universities. In our international locations we partner with local service providers to assist in the search for top talent, but we maintain internal responsibility for socialising new associates into our unique culture and ways of working.
On joining, new associates attend induction programmes introducing their job specific requirements and
we use this opportunity to introduce the core values and the benefits of belonging to an exciting working environment.
Turnover at senior management and executive levels is low, indicating the Group’s ability to retain key staff. Store associate turnover remains substantially below comparative industry norms. Our stringent pre-employment assessments for store and key positions, which include numeracy and behavioural attributes,
P E OP E OP L EP L E
47

PREVIOUSOUR PEOPLE CONTENTS NEXT
management and leadership developmentThe Group recognises and rewards leadership innovation, and managers are encouraged to build their own entrepreneurial leadership styles. Their growth and development is supported by personal and career development discussions, leadership assessments, creation of personal development plans and regular performance feedback. We partner with highly credible training organisations and business schools, locally and internationally, to design and run programmes that cater flexibly for unique peer group needs within the demands of busy day-to-day working environments. Succession planning is actively encouraged within all divisions, to ensure the constant availability of high quality managers and executives.
The Leadership NEXT Series, currently underway in partnership with the Gordon Institute of Business Science, comprises leadership sessions aimed at preparing selected executives to grow the business in diverse and changing global markets. The series is designed exclusively for our Group in consultation with senior executives and stakeholders, and makes use of local and international faculties and guest speakers. The successful Emerging Leaders Development Programme has enriched our succession plans with entry-level leaders who display high potential for future leadership
positions, with past delegates being constantly monitored for promotional opportunities. Our productive relationship with the Wholesale and Retail SETA has led to a number of our managers being selected for the SETA’s International Leadership Development Programme, with one of our managers finishing second overall in 2014.
talent developmentWe pride ourselves on the number of training opportunities taken up by our associates. Recognising that attracting, developing and retaining world-class retailers is critical to our competitiveness and long-term sustainability, we strive to continuously improve the quality and delivery of training through our MRP Academy.
As expected, new demands have arisen for specialist training in systems and processes, and re-skilling programmes to meet new work complexities, growth challenges and changing job profiles.
This has initiated a spring-clean of old training content and curriculum, fresh partnerships with professional retail content developers, more relevant and current training material
and methods of delivery, and greater clarity and value of training solutions.
The scheduled rollout of the Enterprise Resource Planning system, comprising redesigned core merchandising processes, has necessitated further investment in merchant training resources, while a similar focus is on operations associates who face the complexities of expansion into new territories and need for skills associated with improved workforce management systems.
Our intern and graduate development programmes in merchandise and store operations feed externally selected trainees into areas of need, while internal trainees
are provided with meaningful work under the guidance of allocated mentors and trained according to an individually paced hierarchy of learning.
Managers from across the Group have participated in the Wholesale and Retail SETA’s Retail Management Development Programme since February 2012. In the past year, 97% of our delegates were from previously disadvantaged backgrounds. Our success with Learnerships continues with 97 associates participating in various programmes.
Implementation of the Cornerstone learning management system has provided a platform for associates
to access training, with more direct choice and control over their development, supported by line managers. This is in addition to leading e-learning technologies that make training available to associates on a daily basis regardless of where they are geographically located, including in stores through point-of-sale terminals.
Given that less time is required to complete e-learning modules compared to traditional training interventions such as classroom, the table below indicates a trend of diminishing number of learning days per associate as well as total annual hours year-on-year which was accompanied by an improved overall educational output.
Key achievements in talent development 2015 2014 2013 2012
Investment in learning and development R38 469 092 R33 775 854 R30 855 899 R25 160 637
Total annual number of hours allocated to learning 159 276 230 973 266 416 246 393
Average learning and development days per person 1.2 2.5 2.8 3.7
Modules completed in various leadership development programmes
9 470 2 662 3 748 3 241
Percentage of previously-disadvantaged individuals participating in learning and development
95% 90% 88% 87%
Percentage of females participating in learning and development
72% 69% 70% 70%
Percentage of previously-disadvantaged associates trained through e-learning
97% 94% 94% 94%
Percentage of previously-disadvantaged associates on learnerships
97% 92% 93% 83%
48

PREVIOUSOUR PEOPLE CONTENTS NEXT
employee relationsMaintaining sound and productive working relationships is of utmost importance to us, and open communication channels between managers and associates are encouraged. Frequent communication sessions are held to update all associates on business progress, celebrate achievements and introduce new people to our Group.
General employee communication is conducted through MRP TV or social media, with informative broadcasts delivered frequently via intranet, point-of-sale technologies or uniquely by division. A Social Media Policy is in place to provide guidelines for new and innovative ways of communicating internally using social networking technologies.
employment legislationThe Group complies with all relevant South African labour legislation. Trained Employee Relations practitioners guide line management in the interpretation and application of legislation in the workplace.
In our African regions we partner with local firms to conduct ongoing research into local employment practice, to ensure that we maintain compliance as required by country, and to alert us to legislative changes as they arise.
There have been significant changes to South African employment legislation during the past year. The Group has implemented responses to significant changes, and risks have been mitigated. This has included the conversion of all casual employees to flexi-permanent contracts, with very few labour disputes recorded. We recognise the requirement of the Equity Amendment Act that employers must be able to defend pay discrimination disputes by way of an objective job evaluation methodology, and interventions are in place to determine our risk exposure and propose solutions.
We have maintained active membership of the National Retail Association, through which representation to Nedlac and participation in discussions of national interest is facilitated.
ethical behaviourEnsuring that ethical behaviour is widely practiced and demonstrated is very important to the sustainability of our Group culture. As such the Business Code of Conduct is acknowledged by each new associate when joining the Group. Senior and other selected associates complete an annual declaration in which compliance with the Code is confirmed and any external interests or relationships that could potentially give rise to a conflict of
interest are disclosed. The Group has a confidential, independently managed, toll-free number for the reporting of suspected fraudulent activity or unacceptable behaviour. Associates are encouraged to be alert to fraud or unacceptable activity and immediately report incidents. These reports are investigated by Internal Audit. The Social, Ethics, Transformation and Sustainability Committee monitor matters relating to ethical conduct.
wellnessGroup Wellness initiatives are ongoing and provide associates with access to services that promote individual health and wellbeing. Key initiatives include annual wellness days, as well as health screenings including HIV testing events held at store level through our membership of Retailers Unite. Currently we have 3 451 associates covered by one of the available medical aid options, which represents 20% of all permanent staff. This includes a low cost entry-level medical plan specifically offered for store associates.
Safe working practices are encouraged throughout our businesses and monitored. In the year under review, 81 work-related accidents occurred with no major accidents reported involving associates.
Ensuring that ethical behaviour is widely practiced and demonstrated is very important to the sustainability of our Group culture
49

valueNot only do shareholders benefit from their ownership in the business, but customers also benefit from the fashionable merchandise at affordable prices, and the people who work for the Group benefit by having sustainable jobs and access to share schemes (refer to page 76 for more details) to help them build wealth for their futures. In the past few years, there has been increased focus on the needs of suppliers and the local South African community. The Group’s response to the needs identified has resulted in interventions that will not only strengthen the local
PREVIOUSSHARING THE VALUE CONTENTS NEXT
sharing the
business and market for the longer-term, but they will also enhance the level of commitment from these stakeholders.
The increasing focus on social and environmental matters, together with shifting markets and business practices, has created both sustainability challenges and opportunities. The key challenges (to the brand, markets, supply chains and operations) have been assessed and key potential opportunities identified (to enhance business relationships, obtain competitive advantage, build brand reputation
and address social and compliance issues in supply chains).
Building a SustainableSupply Chain To improve the Group’s long-term sustainability and strengthen its supply chains, the interventions are focused globally, however specific interventions are required in South Africa to address the unique local challenges and to develop more efficient and Quick Response (QR) capable suppliers. Some interventions (such as the JumpStart Manufacturing Programme) are executed within supplier organisations and their production facilities, whereas others occur at a systemic level through the Group’s involvement in both national and regional bodies (such as SASTAC, Regional Footwear and Leather Cluster, KZN CTC).
50
The Group, driven by its Purpose and Corporate Values (refer to page 7), shares the value created with all partners.

PREVIOUSSHARING THE VALUE CONTENTS NEXT
Globally, the Group has embarked on a supply chain mapping exercise to assess various risks and monitor levels of production capabilities, quality and compliance standards in line with the Group’s Supplier Code of Conduct.
The Supplier Code of Conduct is aligned with international standards, including the Ethical Trading Initiative’s (ETI) Base Code. The Code is used by the resource, quality and buying teams to assess and monitor supplier business ethics, labour, health and environmental practices.
51
The Group partners with its local suppliers on skills development
The Group’s engagement with selected local strategic suppliers identified a need for improved skills in the local manufacturing industry. This led to the development of the MRP Foundation’s JumpStart Manufacturing Programme in 2014. MRP Foundation, a registered Non-Profit and Public Benefit
The Group partners with the dti as the founding member of two clusters
Mr Price Group is the founding member of two dti-funded clusters, the Southern African Sustainable Apparel and Textile Cluster (SASTAC) and the Regional (KZN) Footwear and Leather Cluster.
SASTAC aims to strengthen South Africa’s competitiveness in producing sustainable raw materials, textiles and products for local consumption and potential exports in future. In its first year of operation, SASTAC has increased South Africa’s cotton production over the previous year’s harvest by 68%.The increase in
local cotton production will result in an increase of beneficiation and job creation.
It is expected that the Southern African Sustainable Textile and Apparel (SASTAC) Cluster will produce assessments that will assist the South African clothing and textile industry to make informed decisions regarding the production of fibres and products that are appropriate for the socio-economic and environmental sustainability of the local industry. The intelligence and strategic direction provided by SASTAC’s research and engagement with key industry bodies will also enable retailers to make more appropriate textile and design decisions in relation to sourcing in South Africa.
The Regional Footwear and Leather Cluster’s objective is to deepen and widen the engagement of people, product and processes in the footwear and leather value chain of two KZN-based footwear manufacturers, thereby increasing profitability and employment levels within the region. In its first year, the Footwear School of Excellence was established with training centres based at factory sites of each of the participating suppliers. Training conducted to develop machine operators, pre-production interns, as well as factory supervisors and managers resulted in 103 students being trained with an employment rate of 76% across both supplier sites.
Organisation, in partnership with Mr Price Group and selected suppliers, developed the programme to create opportunities for unemployed youth to access programmes developing scarce skills within the South African clothing and footwear manufacturing industries.
During this first year of the programme, 20 pre-production interns graduated and 12 of the 20 were employed within the participating supplier organisations while others went on to further their
studies or seek employment at other manufacturers. With the programme entering its second year, a larger number of interested students have applied and another 20 talented young people are currently preparing to enter the industry.
In addition, 193 previously unemployed youth undertook to become qualified multi-skilled machine operators during 2014 with 176 graduating and 162 being employed by the participating suppliers, a 92% employment rate.

The Group partners with a South African Footwear Manufacturer In 2011, the opportunity to assist a local KZN footwear manufacturer was identified. After thorough research and analysis, the Group approved a loan that would enable the supplier to significantly grow business capacity and capability and deliver on the requirement for increased fashion flexibility (quick response) and a leaner value chain.
Two pieces of land were purchased and the project was split into two phases. In the first phase, a smaller factory was built as a materials store and to accommodate cutting and machining departments. The second phase involves the building of a double story factory, with each floor being 720m², to accommodate offices, making, finishing and dispatch. The new factory is expected to be operational around mid-2015.
Since the inception of this enterprise development initiative, this manufacturer has already doubled sales growth and significantly improved delivery ratios. Capacity and employment has doubled over the period. These achievements have been without the large, main factory being brought into operation. Once the new factory is fully operational, we anticipate further significant growth and improved efficiencies.
The strategic partnership has continued to provide further opportunities for collaboration as a need for improved skills in the footwear industry was also identified. This resulted in the establishment of a Footwear School of Excellence, in collaboration with MRP Foundation and the Regional Footwear and Leather Cluster. The school was officially launched in July 2013 and has already trained over 57 students for a career in footwear.
The Group partners with The Clothing Bank During 2014 the Group partnered with The Clothing Bank, a registered NPO and PBO, which channels donated stock through an enterprise development programme. The programme is aimed at developing unemployed women to become self-sufficient through basic business and life skills. The partnership has resulted in The Clothing Bank extending operations and opening a branch in Durban. The Group supports The Clothing Bank by donating samples, write-offs and returned merchandise as well as old fixtures and fittings. More information on the activities of The Clothing Bank can be found at www.theclothingbank.org.za.
PREVIOUSSHARING THE VALUE CONTENTS NEXT
Broad-Based Black Economic Empowerment in South Africa is supported by the Group with a specific focus being on the development of associates (skills development), suppliers (supplier and enterprise development) and communities (socio-economic development). The recently Amended Codes (with higher financial targets, level penalties and narrower qualifying definitions) will make it challenging for the Group to achieve future compliance. The positive impact in terms of local supplier development and job creation through the Clusters, is unfortunately not recognised under the Amended Codes, but will continue to be strategic initiatives for the Group. The Group has attained Level 6 Compliance and this has been independently verified against the Department of Trade and Industry’s (dti’s) B-BBEE Codes of Good Practice, 2007 by BEESCORE (Pty) Ltd, a SANAS accredited verification agency.
B-BBEE Scorecard
Element total weighting F2015 F2014 F2013
Ownership 20 4.51 5.51 6.47
Management 10 2.89 3.08 3.38
Employment Equity 15 6.38 6.26 6.18
Skills Development 15 12.00 12.00 12.00
Preferential Procurement 20 14.59 15.92 14.54
Enterprise Development 15 7.92 7.55 7.09
Socio-economic Development 5 5.00 5.00 5.00
Total 100 53.29 55.31 54.66
B-BBEE Level 6 5 6
52
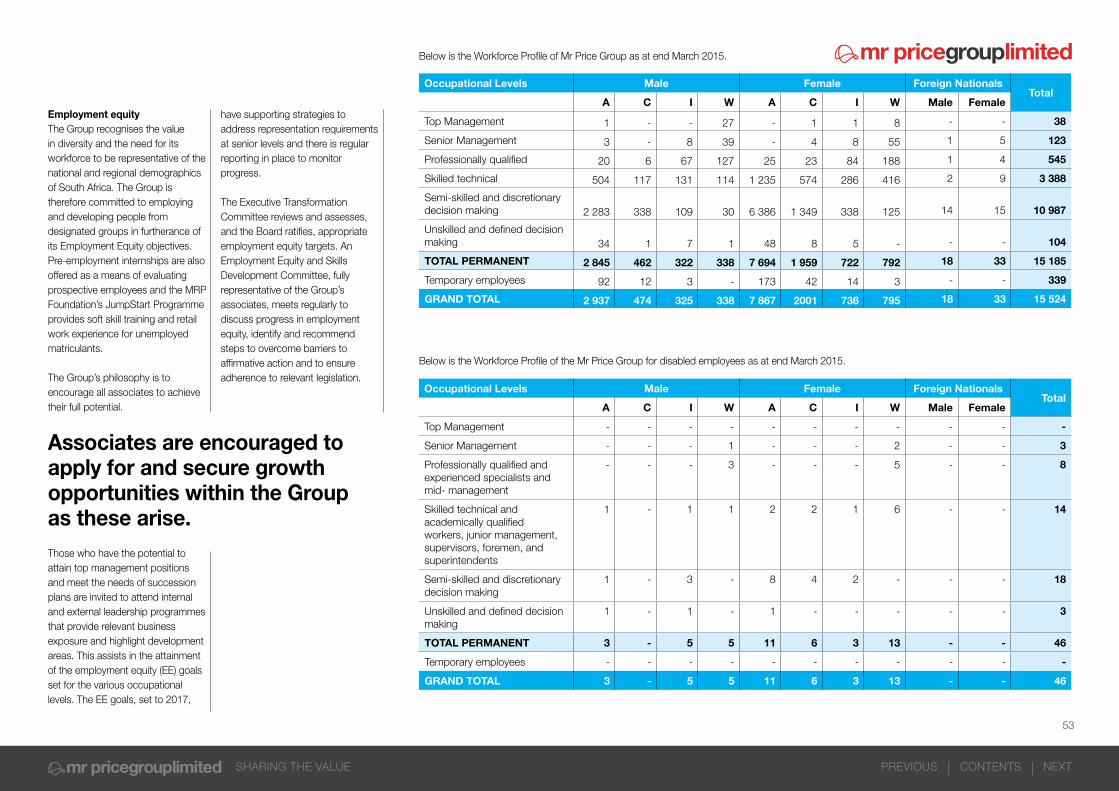
PREVIOUSSHARING THE VALUE CONTENTS NEXT
Employment equityThe Group recognises the value in diversity and the need for its workforce to be representative of the national and regional demographics of South Africa. The Group is therefore committed to employing and developing people from designated groups in furtherance of its Employment Equity objectives. Pre-employment internships are also offered as a means of evaluating prospective employees and the MRP Foundation’s JumpStart Programme provides soft skill training and retail work experience for unemployed matriculants.
The Group’s philosophy is to encourage all associates to achieve their full potential.
Those who have the potential to attain top management positions and meet the needs of succession plans are invited to attend internal and external leadership programmes that provide relevant business exposure and highlight development areas. This assists in the attainment of the employment equity (EE) goals set for the various occupational levels. The EE goals, set to 2017,
Occupational Levels Male Female Foreign NationalsTotal
A C I W A C I W Male Female
Top Management 1 - - 27 - 1 1 8 - - 38
Senior Management 3 - 8 39 - 4 8 55 1 5 123
Professionally qualified 20 6 67 127 25 23 84 188 1 4 545
Skilled technical 504 117 131 114 1 235 574 286 416 2 9 3 388
Semi-skilled and discretionary decision making 2 283 338 109 30 6 386 1 349 338 125 14 15 10 987
Unskilled and defined decision making 34 1 7 1 48 8 5 - - - 104
TOTAL PERMANENT 2 845 462 322 338 7 694 1 959 722 792 18 33 15 185
Temporary employees 92 12 3 - 173 42 14 3 - - 339
GRAND TOTAL 2 937 474 325 338 7 867 2001 736 795 18 33 15 524
Below is the Workforce Profile of the Mr Price Group for disabled employees as at end March 2015.
Occupational Levels Male Female Foreign NationalsTotal
A C I W A C I W Male Female
Top Management - - - - - - - - - - -
Senior Management - - - 1 - - - 2 - - 3
Professionally qualified and experienced specialists and mid- management
- - - 3 - - - 5 - - 8
Skilled technical and academically qualified workers, junior management, supervisors, foremen, and superintendents
1 - 1 1 2 2 1 6 - - 14
Semi-skilled and discretionary decision making
1 - 3 - 8 4 2 - - - 18
Unskilled and defined decision making
1 - 1 - 1 - - - - - 3
TOTAL PERMANENT 3 - 5 5 11 6 3 13 - - 46
Temporary employees - - - - - - - - - - -
GRAND TOTAL 3 - 5 5 11 6 3 13 - - 46
have supporting strategies to address representation requirements at senior levels and there is regular reporting in place to monitor progress.
The Executive Transformation Committee reviews and assesses, and the Board ratifies, appropriate employment equity targets. An Employment Equity and Skills Development Committee, fully representative of the Group’s associates, meets regularly to discuss progress in employment equity, identify and recommend steps to overcome barriers to affirmative action and to ensure adherence to relevant legislation.
Below is the Workforce Profile of Mr Price Group as at end March 2015.
Associates are encouraged to apply for and secure growth opportunities within the Group as these arise.
53

international leaders such as Curious Learning: a global literacy project (Tufts University, Georgia State University and Massachusetts Institute of Technology), the Khan Academy, Numeric, and the Breteau Foundation to develop an innovative solution to empower South African learners and enhance the learning environment. This pioneering programme aims to use technology as a tool to shift the learning trajectory of young South Africans and support the education system. The convergence of factors from cost effective technology devices, ground breaking royalty free educational platforms, to greater network coverage has created a watershed opportunity for education to be re-imagined.
YoungHeroesYoungHeroes, the MRP Foundation’s longest standing programme, aims to establish sustainable structures and programmes in public schools that ensure all learners participate in regular physical activity and school sport on a weekly basis. This programme operated in 8 provinces, in 260 schools and with 54 879 learners last year. Soweto successfully completed the first year of the programme’s Sustainability Phase, which effectively means that this physical education and sport programme is implemented independent of the Foundation’s resources and is becoming truly self-sustaining.
RedCap SchoolsThe RedCap Schools, situated in KwaDukuza, further improved academic results with the mathematics pass rates in Grades 1 to 6 all being higher than both the National and Provincial averages. Focused on three of these schools, as a pilot, the Foundation has partnered with
PREVIOUSSHARING THE VALUE CONTENTS NEXT
MRP Foundation The Group supports the national priorities of SA through its donation to the MRP Foundation. This socio-economic investment of 1% of net profit after tax, since the inception of the MRP Foundation, now 10 years ago, continues to provide support to strengthen a sustainable local market.
The Foundation delivers programmes that respond to socio-economic challenges, including poverty, unemployment, poor education and the skills gap of school leavers entering the job market. Impact has been achieved through improved literacy and numeracy levels in the primary schools and by assisting learners from selected high schools to consider job opportunities in retail and manufacturing. The key programmes of the MRP Foundation are summarised below. For further information on the activities of the Foundation, refer to www.mrpfoundation.org.
JumpStartThe JumpStart Retail Programme assisted 1 135 previously unemployed youth to find jobs at Mr Price Group, Spar, The Hub, Coracall, Smollan Group and other independent business partners of the programme over the past year. Through partnership, collaboration and engagement the programme continues to grow and provide hope and empowerment for youth. The JumpStart Manufacturing Programme is focused on the Group’s local supply chain and ensures that local manufacturing is strengthened, thereby contributing to sustaining and creating new jobs and developing local group supplier capability and capacity.
54

PREVIOUSSHARING THE VALUE CONTENTS NEXT
Improving resource efficiencies and addressing climate changeThe Group’s philosophy of doing more with less and striving for innovation and efficiency is translated into all aspects of the business which in turn supports a reduced negative impact on the environment.
The Group impacts climate change through its own energy and resource usage as well as that of its product end usage and that of its supply chains. Although the business operations are becoming more efficient in the usage of energy and resources, the Group acknowledges that further research is required to determine the potential impact of climate change on its value chain, business, operations and markets.
A high level climate change risk assessment conducted this year is expected to assist the Group to understand the climate change risks associated with raw materials and production facilities used to manufacture the Group’s products in key locations.
Energy Management has proven that energy usage reduction (a lighter carbon footprint) is also able to reduce costs and ensure a greater environmental responsibility. The Group’s commitment to reduce its carbon footprint by 10% over the medium-term (on baseline year F2013) was achieved. Over the past two financial years, we reduced our carbon footprint by approximately 17.5 million Kwh (18 758 tons CO2 emissions).
The Energy Management System continues to evolve as accurate energy data enables the identification of new opportunities to reduce costs and consumption. The more efficient usage of energy is now a standard practice in the development of new store design. It has become increasingly important to drive the exploration of alternative, cleaner energy source options mainly due to the potential impact of energy supply disruptions, black-outs and the significant planned cost increases forecast for the next 3 - 5 years due to the level of investment required in the South African energy infrastructure. The Group is exploring the feasibility of solar power for the new Distribution Centre (DC) and the Head Office buildings. At key stores, generators and uninterruptible power supply (UPS) units have been introduced to keep them operative during periods of load shedding.
Other efficiency initiatives to reduce waste disposal to landfill from head office sites have been successful and
55
exceeded the 20% targeted rate. A recycling guide was distributed to standardise and promote theprinciples of reduce, reuse and recycle across all spheres of the business.
A packaging efficiency assessment for mrpHome, commissioned in 2014, aims to ascertain opportunities for the improvement in packaging from source to customer.
The Group’s outbound transportation and distribution service provider has successfully implemented fuel and kilometre travel reduction.
The Group has maintained its WWF Corporate Network Partnership with increased in-depth workshops and engagement planned for the year ahead. This partnership is aimed at ensuring that WWF acts as a critical friend that guides strategic plans and ensures that all material and relevant environmental aspects are considered and actioned as part of the Group’s sustainability strategy.
In order to embed a culture of sustainability in the business, a sustainability e-learning training and awareness module has been developed for associates. This aims to develop an appreciation of sustainability, encourage long term impacts to be considered in business decisions, reinforce the Group’s values and encourage associates to apply the learnings to their home lives as well.
Over the past two financial years, we reduced our carbon footprint by approximately 17.5 million Kwh(18 758 tons CO2 emissions).

PREVIOUSCORPORATE GOVERNANCE CONTENTS NEXT
governancecorporate
Supporting material located on the Group’s website: www.mrpricegroup.com• Group Organogram• Outline of Board, Statutory and
Management Committees• Board Charter• Board Committee Mandates• Policy for the Appointment of Directors• Internal Audit Mandate• Internal Audit Annual Assurance Statement• Business and Supplier Codes of Conduct• King III application register• Notice of AGM
The Board of Mr Price Group Ltd subscribes to ethical leadership, business sustainability,
stakeholder inclusivity and sound values of good corporate governance. It recognises that
governance is about effective and ethical leadership, the outcomes of which are sustained value creation, success and longevity. It seeks to go “beyond compliance” through the adoption, integration and embedding of the spirit and principles of governance (fairness, accountability, integrity, responsibility and transparency). Effective governance is considered to be a vital component and contributor to
the Group’s sustained performance and a key enabler of its resilience, agility and sustainability. The governance foundation is based on the combination of voluntary and compulsory guidelines, including the principles and practices of the King Code of Governance for South Africa 2009 (King III) and the JSE Listings Requirements.
56

PREVIOUSCORPORATE GOVERNANCE CONTENTS NEXT
governance developments in F2015During the year under review, the following developments occurred within the internal and external governance landscape.
Governance Area Development during the year
Risk Committee The Board approved the dissolution of the Risk Committee in November 2014 and the incorporation of the risk agenda into that of the Board. The Risk Committee had been established to enhance the Group’s risk management capabilities, which has now been achieved. To ensure a fuller appreciation of the risks and opportunities associated with the Group strategy, it was deemed appropriate to include risk matters in the Board agenda, thus enabling a more comprehensive understanding amongst all Directors and a more robust discussion.
Audit and Compliance Committee In terms of the Board succession plan the phased handover of the chairmanship of the Audit and Compliance Committee from Mr Swain to Ms Naidoo, took effect from 1 April 2015.
Social, Ethics, Transformation and Compliance Committee
With effect from November 2014, Mr Stuart Bird replaced Mr Moses Tembe as the third member of this committee.
Special Corporate Governance Meeting
The annual Special Corporate Governance meeting, chaired by the Lead Independent Director, was moved from March to November to afford the Board more time to focus on the Group Strategy in March.
Lead Independent Director (LID) In the annual review of the relevance of the LID position, the Board concluded that Mr Johnston continue to serve as LID, despite there being a non-executive Chairman, thereby ensuring that a balance of power and authority remain on the Board and that no one individual has unfettered power of decision making.
Non-executive Directors Mr Moses Tembe, who retired by rotation at the Annual General Meeting on 3 September 2014, did not offer himself for re-election.
At the end of February 2015, Laurie Chiappini retired after 29 years with the Group. His daughter, Tracey Chiappini-Young, who had been serving as his alternate Director, automatically left the Board with his retirement.
Divisional Directors Mr Antony Hlungwane joined the Group as IT Director in January 2015, replacing Mr Pete van Wyk who retired from the Group after 18 years’ service.
Governance Area Development during the year
JSE Listings Requirements The Listings Requirements were amended, effective 30 September 2014, bringing them more in line with requirements of the new Companies Act and for the most part, making their application more practical for listed companies.
Board and Committee evaluations Historically Board and Committee evaluations were conducted on a biennial cycle. In year one, a comprehensive questionnaire was completed by each Director from which a “Steps to Improve the performance of the Board” was prepared. In year two, Directors gave input on whether they believed the proposed improvements had, in fact, been implemented. In year three, the process reverted to a comprehensive questionnaire. Following Board input, it was decided to change to a three-year cycle to allow for increased implementation time. A full evaluation was conducted during the year under review.
At the end of February 2015, Laurie Chiappini retired after 29 years with the Group.
57
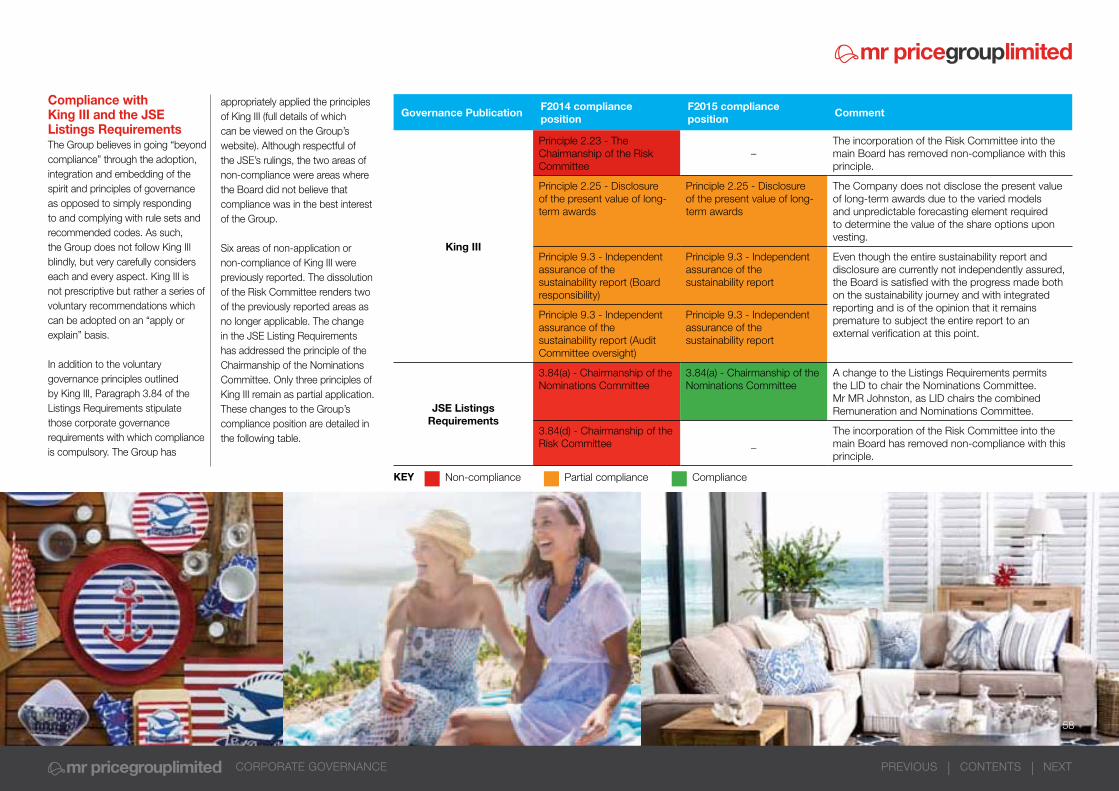
PREVIOUSCORPORATE GOVERNANCE CONTENTS NEXT
Compliance withKing III and the JSE Listings RequirementsThe Group believes in going “beyond compliance” through the adoption, integration and embedding of the spirit and principles of governance as opposed to simply responding to and complying with rule sets and recommended codes. As such, the Group does not follow King III blindly, but very carefully considers each and every aspect. King III is not prescriptive but rather a series of voluntary recommendations which can be adopted on an “apply or explain” basis.
In addition to the voluntary governance principles outlined by King III, Paragraph 3.84 of the Listings Requirements stipulate those corporate governance requirements with which compliance is compulsory. The Group has
Governance PublicationF2014 compliance position
F2015 compliance position
Comment
King III
Principle 2.23 - The Chairmanship of the Risk Committee
–The incorporation of the Risk Committee into the main Board has removed non-compliance with this principle.
Principle 2.25 - Disclosure of the present value of long-term awards
Principle 2.25 - Disclosure of the present value of long-term awards
The Company does not disclose the present value of long-term awards due to the varied models and unpredictable forecasting element required to determine the value of the share options upon vesting.
Principle 9.3 - Independent assurance of the sustainability report (Board responsibility)
Principle 9.3 - Independent assurance of the sustainability report
Even though the entire sustainability report and disclosure are currently not independently assured, the Board is satisfied with the progress made both on the sustainability journey and with integrated reporting and is of the opinion that it remains premature to subject the entire report to an external verification at this point.
Principle 9.3 - Independent assurance of the sustainability report (Audit Committee oversight)
Principle 9.3 - Independent assurance of the sustainability report
JSE Listings Requirements
3.84(a) - Chairmanship of the Nominations Committee
3.84(a) - Chairmanship of the Nominations Committee
A change to the Listings Requirements permits the LID to chair the Nominations Committee. Mr MR Johnston, as LID chairs the combined Remuneration and Nominations Committee.
3.84(d) - Chairmanship of the Risk Committee _
The incorporation of the Risk Committee into the main Board has removed non-compliance with this principle.
Non-compliance Partial compliance ComplianceKEY
appropriately applied the principles of King III (full details of which can be viewed on the Group’s website). Although respectful of the JSE’s rulings, the two areas of non-compliance were areas where the Board did not believe that compliance was in the best interest of the Group.
Six areas of non-application or non-compliance of King III were previously reported. The dissolution of the Risk Committee renders two of the previously reported areas as no longer applicable. The change in the JSE Listing Requirements has addressed the principle of the Chairmanship of the Nominations Committee. Only three principles of King III remain as partial application. These changes to the Group’s compliance position are detailed in the following table.
58

PREVIOUSCORPORATE GOVERNANCE CONTENTS NEXT
sponsorRand Merchant Bank (a division of FirstRand Bank Ltd) remains the Company’s Sponsor and, among other functions, it advises the Board on compliance with the JSE Listings Requirements.
closed and prohibited periodsThe Group operates a more stringent closed period policy than that required in JSE Listings Requirements and the Financial Markets Act (19 of 2012). During the defined closed periods, Directors, officers and other selected associates are prohibited from dealing in the Company’s shares. Associates who may have access to confidential or price-sensitive information are cautioned against the possibility of insider trading. Regard is also had to other JSE Listings Requirements in respect of the dealings of Directors in the Company’s shares.
conflicts of interest and share dealingsThe matter of conflicts of interest is a standing Board agenda item and a register of all Directors’ company shareholdings, other directorships and information regarding any potential conflict of interest is updated by Directors at each meeting. Directors are required to recuse themselves from discussion on any matters in which they may have a conflict of interest. Non-executive Directors cannot participate in the Group’s share incentive schemes. Furthermore, before dealing in Company shares, Directors are obliged to obtain the written consent of the Chairman or, should the Chairman be involved in a transaction, the LID.
governance and assuranceAs Head of Governance and Assurance, Mrs S Moodley is responsible for the strategic leadership of the Company Secretariat, Enterprise Risk Management, Legal and Compliance and Internal Audit functions. This consolidated and holistic approach to governance has improved the integration of strategy, performance, risk management and sustainability.
A robust model of combined assurance has been adopted in recognition of the need for a coordinated approach to risk management to allow for the effective management, monitoring and mitigation of key risks. The model clarifies the roles and co-ordinates the efforts of management, internal assurance providers and independent assurance providers. In addition, it increases collaboration
and facilitates a shared and more holistic view of the Group’s risk profile. Internal Audit plays a vital role as an independent 3rd line of defence.
The independence, organisational positioning and scope and nature of work of the Governance and Assurance Division were evaluated by the Audit and Compliance Committee in March 2015 and determined to be appropriate and consistent with the approved combined assurance model. In addition it has been confirmed that there were no impairments to the independence or objectivity of the assurance provided by Internal Audit as a result of the consolidated structure and that, in fact, this structure had the desired effect of strengthening the Group’s assurance framework. Refer to the Internal Audit annual assurance statement, on page 66.
codes of conductDirectors and associates are required to maintain the highest ethical standards. On joining the Group, every associate receives a copy of the Business Code of Conduct and is required to sign as acknowledgement of acceptance of the Code. On an annual basis, all senior associates of the Group are required to submit a declaration confirming their continued compliance with the Code. Any areas of non-compliance or any perceived conflicts of interest are addressed through the appropriate levels of divisional management, with ultimate reporting to the CEO and Board. The Code was updated during the year under review and approved at the March 2015 board meeting.
The Supplier Code of Conduct, which is aligned to the Business Code of Conduct and details the required standards and practices that suppliers must adhere to, was updated during the year to take into account the requirements of the Ethical Trading Initiative and to allow for greater focus on the environmental and social impact of trade.
59
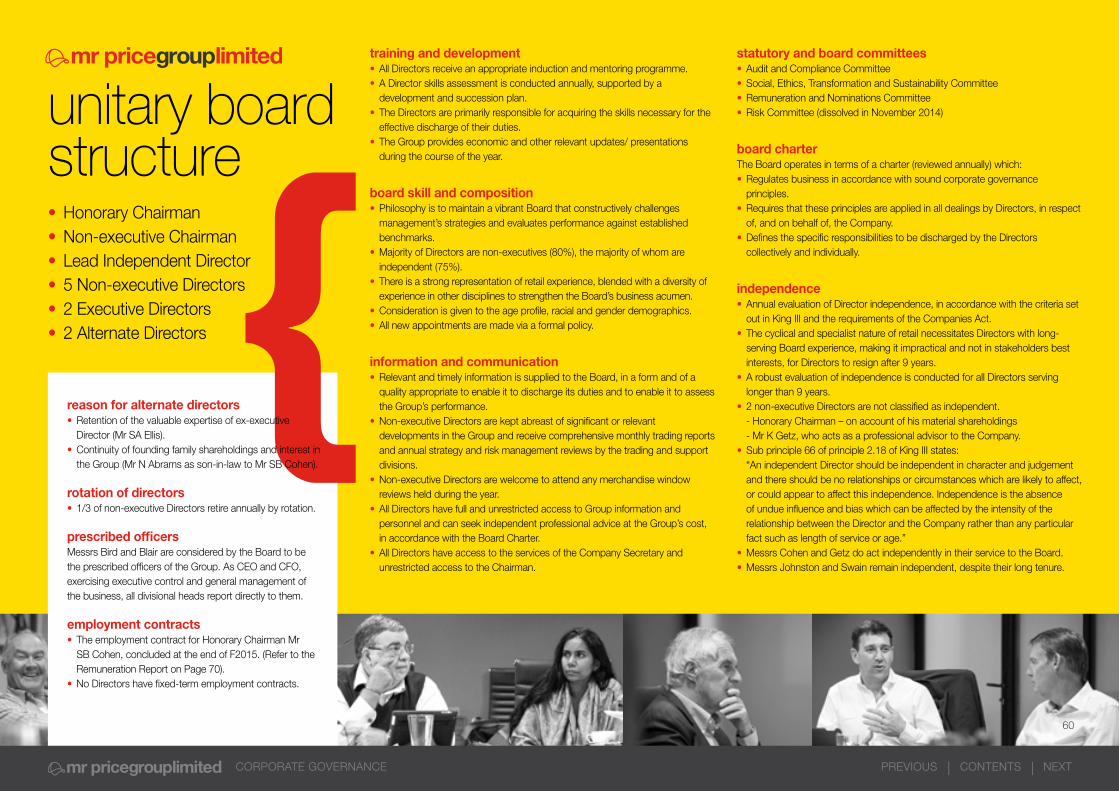
statutory and board committees• Audit and Compliance Committee• Social, Ethics, Transformation and Sustainability Committee• Remuneration and Nominations Committee• Risk Committee (dissolved in November 2014)
board charterThe Board operates in terms of a charter (reviewed annually) which:• Regulates business in accordance with sound corporate governance
principles. • Requires that these principles are applied in all dealings by Directors, in respect
of, and on behalf of, the Company. • Defines the specific responsibilities to be discharged by the Directors
collectively and individually.
independence• Annual evaluation of Director independence, in accordance with the criteria set
out in King III and the requirements of the Companies Act.• The cyclical and specialist nature of retail necessitates Directors with long-
serving Board experience, making it impractical and not in stakeholders best interests, for Directors to resign after 9 years.
• A robust evaluation of independence is conducted for all Directors serving longer than 9 years.
• 2 non-executive Directors are not classified as independent. - Honorary Chairman – on account of his material shareholdings - Mr K Getz, who acts as a professional advisor to the Company.• Sub principle 66 of principle 2.18 of King III states: “An independent Director should be independent in character and judgement
and there should be no relationships or circumstances which are likely to affect, or could appear to affect this independence. Independence is the absence of undue influence and bias which can be affected by the intensity of the relationship between the Director and the Company rather than any particular fact such as length of service or age.”
• Messrs Cohen and Getz do act independently in their service to the Board.• Messrs Johnston and Swain remain independent, despite their long tenure.
PREVIOUSCORPORATE GOVERNANCE CONTENTS NEXT
unitary boardstructure• Honorary Chairman• Non-executive Chairman• Lead Independent Director• 5 Non-executive Directors• 2 Executive Directors• 2 Alternate Directors
reason for alternate directors• Retention of the valuable expertise of ex-executive
Director (Mr SA Ellis).• Continuity of founding family shareholdings and interest in
the Group (Mr N Abrams as son-in-law to Mr SB Cohen).
rotation of directors• 1/3 of non-executive Directors retire annually by rotation.
prescribed officersMessrs Bird and Blair are considered by the Board to be the prescribed officers of the Group. As CEO and CFO, exercising executive control and general management of the business, all divisional heads report directly to them.
employment contracts• The employment contract for Honorary Chairman Mr
SB Cohen, concluded at the end of F2015. (Refer to the Remuneration Report on Page 70).
• No Directors have fixed-term employment contracts.
training and development• All Directors receive an appropriate induction and mentoring programme.• A Director skills assessment is conducted annually, supported by a
development and succession plan. • The Directors are primarily responsible for acquiring the skills necessary for the
effective discharge of their duties. • The Group provides economic and other relevant updates/ presentations
during the course of the year.
board skill and composition• Philosophy is to maintain a vibrant Board that constructively challenges
management’s strategies and evaluates performance against established benchmarks.
• Majority of Directors are non-executives (80%), the majority of whom are independent (75%).
• There is a strong representation of retail experience, blended with a diversity of experience in other disciplines to strengthen the Board’s business acumen.
• Consideration is given to the age profile, racial and gender demographics. • All new appointments are made via a formal policy.
information and communication• Relevant and timely information is supplied to the Board, in a form and of a
quality appropriate to enable it to discharge its duties and to enable it to assess the Group’s performance.
• Non-executive Directors are kept abreast of significant or relevant developments in the Group and receive comprehensive monthly trading reports and annual strategy and risk management reviews by the trading and support divisions.
• Non-executive Directors are welcome to attend any merchandise window reviews held during the year.
• All Directors have full and unrestricted access to Group information and personnel and can seek independent professional advice at the Group’s cost, in accordance with the Board Charter.
• All Directors have access to the services of the Company Secretary and unrestricted access to the Chairman.
60

Status Director BoardSpecial Corporate Governance
Audit and Compliance
Risk4 Remuneration and Nominations
Social, Ethics, Transformation and Sustainability
ExecutiveSI Bird 4/4 1/1 3/3 4/4
MM Blair 4/4 1/1 3/3
Non-executive
LJ Chiappini1 2/3 1/1
SB Cohen 4/4 1/1
K Getz 4/4 1/1 4/4 4/4
Independent non-executive
MR Johnston 4/4 1/1 4/4 4/4
RM Motanyane 4/4 1/1 4/4
D Naidoo 4/4 1/1 4/4
NG Payne 4/4 1/1 3/3 4/4
MJD Ruck 4/4 1/1 4/4 3/3 4/4
WJ Swain 4/4 1/1 4/4 3/3 4/4
M Tembe2 2/3 2/3
Alternate3
N Abrams 2/4 1/1
TA Chiappini-Young 1 2/3 1/1
SA Ellis 4/4 1/1
PREVIOUSCORPORATE GOVERNANCE CONTENTS NEXT
board and committee meetingsThe Board and its Committees meet 4 times annually to discharge their responsibilities for the overall strategic direction and control of the Group. In addition, an annual Special Corporate Governance meeting, under the chairmanship of the Lead Independent Director, is held to:
• Review and approve the Board Charter• Review and approve the mandates of the various statutory and Board
Committees, Internal Audit and the IT Divisional Board Committee• Consider the independence of Directors• Consider the re-appointment of Directors retiring by rotation, with re-
appointment being subject to approval of shareholders at the Annual General Meeting
• Confirm the appointment of the Board Chairman• Propose the Chairman and members of the Audit and Compliance
Committee (subject to approval of the membership of this Committee by shareholders at the Annual General Meeting)
• Confirm the Chairman and members of other Committees for the forthcoming financial year
• Define levels of materiality, reserving specific powers to the Board and delegating other matters with the necessary written authority to management
• Review and approve the Business Code of Conduct• Evaluate the Company Secretary in terms of the JSE Listings Requirements• Review the level of the Group’s compliance with the King III and JSE Listings
Requirements governance principles.
attendance of directors at board and committee meetingsGenerally, all Directors attend the Annual General Meeting and are available to answer shareholders’ questions. Alternate Directors are not required to attend each meeting. Mr N Abrams (UK) was kept updated on Board issues by receiving all Board meeting documentation. Mr LJ Chiappini and Mrs TA Chiappini-Young had overseas commitments at the time of the September 2014 meetings. In addition, Mr Tembe was unwell and thus not able to attend his final meeting in September 2014.
1 Retired February 20152 Retired by rotation September 2014 and did not offer himself for re-election3 Alternate Directors are not required to attend every meeting4 Committee incorporated into the Main Board
subsequent to November 2014
61

PREVIOUSCORPORATE GOVERNANCE CONTENTS NEXT
performance reviewsThe Board undertakes an annual series of assessments in order to monitor performance and identify areas for improvement. Previously a biennial cycle was adopted whereby a comprehensive review was undertaken in the first year, from which a “Steps for Improvement” document was generated. In the alternate years, the assessment was made against the steps taken for improvement. This cycle has now been extended to a three year cycle, with the assessment against the Steps document occurring for two successive years, thus allowing more time for improvements to be made in the identified areas. In this manner, the Group reviews the performance of the following:• Board• Chairman• Board Committees; and • Peer and self-evaluation.
In the year under review, the review process included questionnaires and telephonic personal interviews conducted by the Lead Independent Director and the Chairman.
On an annual basis, the Remuneration and Nominations Committee assesses the performance of the Chief Executive Officer, Chief Financial Officer and Group Supply Chain Director (who is the alternate Director to the CFO).
company secretary During the year under review, and in compliance with paragraph 3.84(i) and (j) of the JSE Listings Requirements, the Board evaluated Mrs HE Grosvenor, the Company Secretary, who has been with the Group for 12 years and is an Associate of the Institute of Chartered Secretaries and Administrators. The evaluation process includes an assesment by each Director of the Company Secretary’s eligibility, skills, knowledge, qualification and execution of duties. The Board is satisfied that she is competent, suitably qualified and experienced. Furthermore, since she is not a Director, nor is she related to or connected to any of the Directors, thereby negating a potential conflict of interest, it was agreed that she maintains an arm’s length relationship with the Board.
The Board believes that, in respect of the business specifically reserved for its decision, it has satisfactorily discharged its duties and responsibilities during the year under review.
62
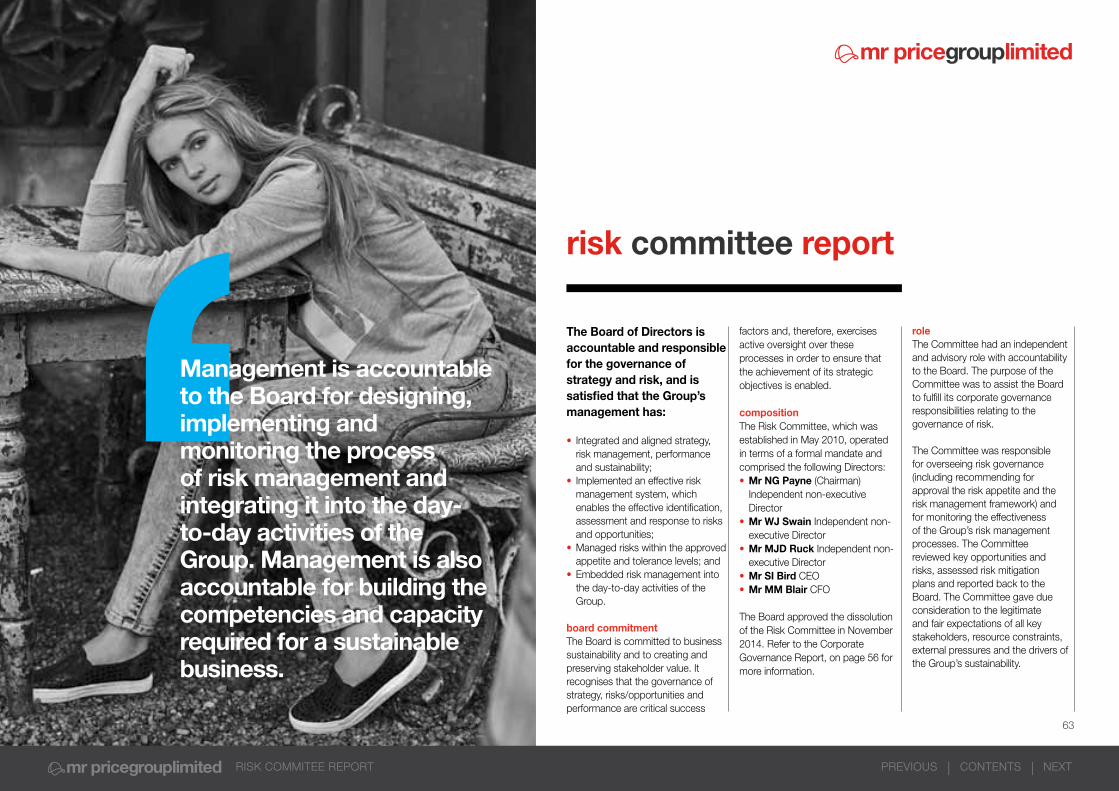
PREVIOUSRISK COMMITEE REPORT CONTENTS NEXT
risk committee report
The Board of Directors is accountable and responsible for the governance of strategy and risk, and is satisfied that the Group’s management has:
• Integrated and aligned strategy, risk management, performance and sustainability;
• Implemented an effective risk management system, which enables the effective identification, assessment and response to risks and opportunities;
• Managed risks within the approved appetite and tolerance levels; and
• Embedded risk management into the day-to-day activities of the Group.
board commitmentThe Board is committed to business sustainability and to creating and preserving stakeholder value. It recognises that the governance of strategy, risks/opportunities and performance are critical success
factors and, therefore, exercises active oversight over these processes in order to ensure that the achievement of its strategic objectives is enabled.
compositionThe Risk Committee, which was established in May 2010, operated in terms of a formal mandate and comprised the following Directors:• Mr NG Payne (Chairman)
Independent non-executive Director
• Mr WJ Swain Independent non-executive Director
• Mr MJD Ruck Independent non-executive Director
• Mr SI Bird CEO• Mr MM Blair CFO
The Board approved the dissolution of the Risk Committee in November 2014. Refer to the Corporate Governance Report, on page 56 for more information.
Management is accountable to the Board for designing, implementing and monitoring the process of risk management and integrating it into the day-to-day activities of the Group. Management is also accountable for building the competencies and capacity required for a sustainable business.
roleThe Committee had an independent and advisory role with accountability to the Board. The purpose of the Committee was to assist the Board to fulfill its corporate governance responsibilities relating to the governance of risk.
The Committee was responsible for overseeing risk governance (including recommending for approval the risk appetite and the risk management framework) and for monitoring the effectiveness of the Group’s risk management processes. The Committee reviewed key opportunities and risks, assessed risk mitigation plans and reported back to the Board. The Committee gave due consideration to the legitimate and fair expectations of all key stakeholders, resource constraints, external pressures and the drivers of the Group’s sustainability.
63

R
I
S
KPREVIOUSRISK COMMITEE REPORT CONTENTS NEXT
Risk governance and managementDuring the year under review, the Committee fulfilled its mandate by meeting 3 times to discuss the following key issues:
Risk AppetiteThe Board recognises that a well-defined risk appetite is the core instrument for aligning overall corporate strategy, capital allocation, risk and performance. Risk appetite and tolerance are the fundamental concepts that provide the context for strategy setting, entrepreneurial behaviour and the pursuit of Group objectives. It is informed by the Group risk culture and clarifies what risks the Group can, or is willing to, take and the risks that the Group will avoid. Risk appetite and risk tolerance are inextricably linked to performance over time.
The Board has formally defined its appetite for risk and annually reviews its risk appetite. It confirms that a strategic risk appetite framework and policy remain in place and has enabled increased consideration of risk capacity, system/process maturity and overall risk capability in relation to the key strategic, financial, operational and compliance focus areas of the Group. The risk appetite policy is being increasingly referred to, including in the development of related governance polices.
The Committee confirms that there were no material deviations from the Group’s risk appetite in the period.
Risk ProfileThe Board is satisfied that strategy and business plans do not give rise to risks that have not been thoroughly assessed by management and confirms that there were no undue, unexpected or unusual risks taken by the Group and no material losses were incurred during the year.
Key Business Risks and OpportunitiesKey business opportunities and risks were discussed comprehensively by the Committee and the Board during the year. The Committee, having considered the Group’s key risks, is satisfied that the systems and processes in place to manage risk are adequate and that management has generally executed their risk management responsibilities satisfactorily.
Enterprise-wide Risk Management (ERM)The Committee, having evaluated the ERM Framework, which is based on ISO 31000 and the Committee of Sponsoring Organisations (COSO), is satisfied that it is adequate, and if consistently applied, should guide the Group’s approach to identifying, evaluating and responding to key opportunities and risks that may impact on strategic objectives.
The Group recognises that a coordinated approach to risk/opportunity management is needed in order to create and sustain value in the longer-term and to enable the achievement of its vision. For this reason, the Group has adopted the globally recognised, three-lines-of-defence Combined Assurance Model. The model clarifies the roles and effectively coordinates the efforts of management, internal assurance providers and independent assurance providers in the overall management of the Group’s key risks. In addition, it increases collaboration and facilitates a shared and more holistic view of the Group’s risk profile. The Committee confirms that all key strategic risks were assured by at least 1 of the 3 lines of defence functions.
64

Mr Price Group remains committed to the principles of good governance, ethical leadership and exemplary corporate citizenship. To this end, the Audit and Compliance Committee assists and supports the Board in discharging its duties.
PREVIOUSAUDIT & COMPLIANCE COMMITTEE REPORT CONTENTS NEXT
compositionThe Committee is constituted as a statutory Mr Price Group Ltd Committee in respect of its duties in terms of section 94(7) of the Companies Act (71 of 2008), and has been delegated the responsibility to provide meaningful oversight, particularly over the audit, finance, IT governance and compliance functions.
The Committee comprises the following 4 Independent,non-executive Directors:
• Mr WJ Swain (Chairman)*• Mr MR Johnston• Ms D Naidoo• Mr MJD Ruck
* In November 2014, the Board approved the phased handover of chairmanship of the Audit and Compliance Committee from Mr Swain to Ms Naidoo, effective from April 2015.
role• Assists the Board to discharge its responsibility to: - safeguard the Group’s assets, - operate adequate and effective systems of governance, financial risk
management and internal controls, - prepare materially accurate financial reporting information and
statements in compliance with applicable legal/regulatory requirements and accounting standards,
- monitor compliance with laws and regulations, and - provide oversight of the external and internal audit functions,
appointments and independence;• Ensures that a combined assurance model is applied to provide a
coordinated approach to all assurance activities, and to address the significant risks facing the Group; and
• Provides a communication channel between the Board and assurance providers. The Committee mandate is published on the Group’s websitewww.mrpricegroup.com
audit & compliance committee report
annual report of the committeeDuring the year under review, the Committee fulfilled its mandate by meeting 4 times to deal with comprehensive agendas. It received the appropriate information from internal audit, external audit, management and other sources deemed necessary to fulfill its obligations. Pursuant to these activities and the investigations it conducted, the Committee can report satisfaction with the external auditor’s independence and established principles governing the auditor’s employment for non-audit services.
Having given due consideration, the Committee believes and/confirms that:
• Mr MM Blair, who is the Financial Director and carries the title of Chief Financial Officer, possesses the appropriate expertise and experience to meet his responsibilities and that the Group’s financial function incorporates the necessary expertise, resources and experience to adequately carry out its responsibilities;
• The Group’s accounting practices and the effectiveness of the internal controls have been maintained at a high standard and fully support the accuracy of the financial and related information presented to stakeholders in the integrated report;
• There were no material or frequently repeated instances of non-compliance with policies or legislation by the Group during the year; and
• The Designated Auditor attended a meeting of the Committee not more than a month before the Board met to approve the integrated report and to discuss matters of importance to the auditor and the Committee regarding the Group’s financial statements and general affairs.
The Board believe that the Committee has satisfied its responsibilities under its mandate.
Under the sponsorship of the Committee’s Chairman, a self-evaluation assessment was undertaken during the year which confirmed that all statutory requirements in terms of the Companies Act, including the qualifications of Committee members, are being met.
The outgoing Chairman of the Committee, Mr WJ Swain, will attend the Annual General Meeting and will be available to answer shareholders’ questions.
65

I N T E R N A LA U D I T
R E P O R T
PREVIOUSINTERNAL AUDIT REPORT CONTENTS NEXT
in 2011 was confirmed as the only activity in South Africa with the exceptional rating of full conformance in an independent external quality review.
he Group Internal Audit Division (Internal Audit) was established to assist the Board and
executive management with the achievement of their objectives and has remained a vital part of the Group’s governance and combined assurance structures. Internal Audit is the primary independent assurance provider on the adequacy and effectiveness of the Group’s governance, risk management and control structures, systems and processes. The centralised division operates in terms of a formal mandate, in full conformance with the International Professional Practices Framework for Internal
Audit (Standards) and with leading risk-based and integrated methodology.
professional positioning and recognitionInternal Audit has been subjected to 2 independent external quality assessment reviews (QAR), in 2007 and 2011. It was recognised as the first internal audit function in South Africa with full conformance to all Standards, and in 2011 was confirmed as the only function in South Africa with the exceptional rating of full conformance in an independent external quality review. This result placed the Internal Audit function in the top QAR results globally. The independent external QAR team recognised that:
• “This level of operations could only have been sustained by a combination of strategic leadership of Internal Audit, an alignment of interests and incentives, the maturity and mutual respect of the Audit and Compliance Committee, executive and senior management and the external auditor towards Internal Audit, and Internal Audit’s ability to consistently deliver a highly professional audit product over time.”
• “Internal Audit has continued to be a leading professional activity, characterised by innovation, development of leading practices ahead of the theory or requirements to do so, wide integration of global best practice and unequivocally demonstrating a commitment to upholding the Standards.”
independence and authorityThe independence of Internal Audit is formally considered by the Chief Audit Executive and the Audit and Compliance Committee on an annual basis, or as and when changes to the organisational positioning occur. It has been determined and confirmed that Internal Audit has remained independent of all operational functions, and that the functional reporting to the Audit and Compliance Committee and administrative reporting to the Chief Financial Officer have enabled appropriate organisational positioning. Internal Audit has access
T
66

area description
Based on the work completed during 30 March 2014 to 28 March 2015, which has been carried out in accordance with the International Professional Practices Framework for Internal Audit and the approved Internal Audit Plan, and provided that management has effectively implemented the agreed actions to rectify reported control weaknesses, in the opinion of Internal Audit, except for a few specific control weaknesses noted, in all material respects, controls evaluated were generally adequate, appropriate and effectively implemented to provide reasonable assurance that risks are being managed and that the Group objectives should be met.
Internal Audit has continued to note a constructive tone at the top. Divisional management generally responds immediately and appropriately to reported weaknesses and demonstrates a willingness to adopt recommended improvements. Executive management and the Board require, encourage and monitor quality and continuous improvement in the Group’s governance, risk management and control.
The quality of governance is considered in every audit and we confirm that there aregenerally very good governance structures and processes in place to:•PromoteappropriateGroupethicsandvalues;•Ensureeffectiveorganisationalperformanceandaccountability;and•Adequatelyco-ordinateGroupstrategies,communicationandactivitiesamongthe
Board, Management, second-line-of-defence functions and External and Internal Audit.
The effectiveness of risk management structures, systems and processes is evaluated in every audit, as far as possible and we confirm that these are adequate to identify, assess and mitigate key risks and to support the achievement of the Group’s strategic goals.
In addition we reviewed the quality of the Group’s enterprise risk management structures, frameworks, policies, processes and reporting and concluded that these were very good. These facilitate integration between strategy, risk management and performance, and if properly applied, should result in effective management of key risks. There is continuous focus on the embedding of risk management, advancing risk reporting and performance measurement.
We have continued to note an improvement in internal controls across the Group, especially in areas that have been re-audited. We have identified isolated instances of fraud within the Group, mainly at a store level, and of immaterial amounts.
PREVIOUSINTERNAL AUDIT REPORT CONTENTS NEXT
audit area 2015 2014 2013 2012
Continuous Audits and Forensics
VeryGood
VeryGood
VeryGood
Adequate
Corporate Audits 91% 92% 91% 91%
IT Audits 92% 91% 91% 89%
Operational Audits 91% 92% 92% 90%
OVERALL OPINION
TONE ATTHE TOP
RISKMANAGEMENT
INTERNALCONTROLS
GOVERNANCE
The following Audit Grading Framework has been applied. This framework has been successfully integrated into the business, is well understood and elicits appropriate management responses:
grade description
Low risk (≥ 90%)
Controls evaluated are adequate, appropriate and effectively implemented to provide reasonable assurance that risks are being managed and objectives met.
Medium risk (75-89%)
A few specific control weaknesses were noted, but generally controls evaluated are adequate, appropriate, and effectively implemented to provide reasonable assurance that risks are being managed and objectives should be met.
High risk (≤74%)
Numerous specific control weaknesses were noted. Controls evaluated are unlikely to provide reasonable assurance that risks are being managed and objectives should be met.
to the Chairman of the Board, as well as free and unrestricted access to all areas within the Group.
In order to facilitate strategic positioning and alignment of Internal Audit, it has had a standing invitation to Executive and Board Committee meetings for many years, including meetings of the Divisional Boards, Main Board Committees and the Main Board when risk matters are discussed.
annual internal auditassurance statementInternal Audit assurance can only be reasonable and not absolute and does not supersede the Board’s and management’s responsibility for the ownership, design, implementation, monitoring and reporting of governance, risk management and internal controls.
scope of workThere were no undue scope limitations or impairments to independence. In our professional judgement, sufficient and appropriate audit procedures have been conducted through the completion of the risk-based audit plan and evidence gathered to support the conclusions contained in this report.
67
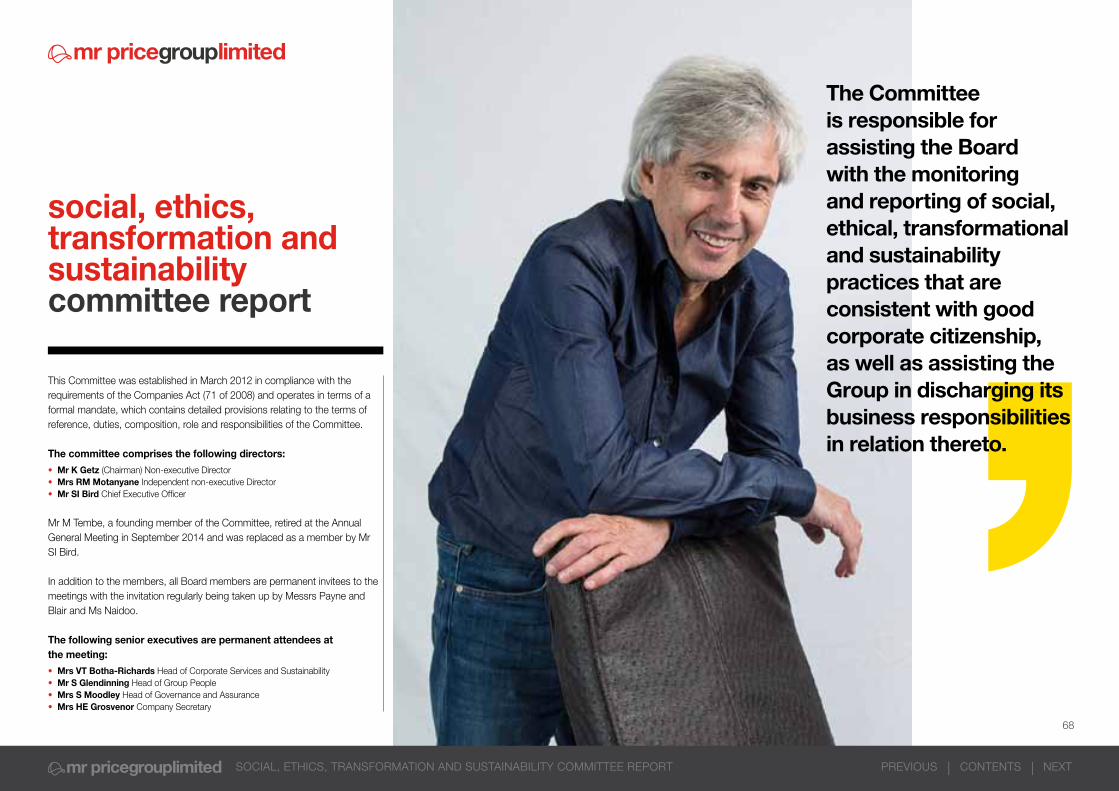
PREVIOUSSOCIAL, ETHICS, TRANSFORMATION AND SUSTAINABILITY COMMITTEE REPORT CONTENTS NEXT
social, ethics,transformation and sustainabilitycommittee report
This Committee was established in March 2012 in compliance with the requirements of the Companies Act (71 of 2008) and operates in terms of a formal mandate, which contains detailed provisions relating to the terms of reference, duties, composition, role and responsibilities of the Committee.
The committee comprises the following directors:
• Mr K Getz (Chairman) Non-executive Director• Mrs RM Motanyane Independent non-executive Director• Mr SI Bird Chief Executive Officer
Mr M Tembe, a founding member of the Committee, retired at the Annual General Meeting in September 2014 and was replaced as a member by Mr SI Bird.
In addition to the members, all Board members are permanent invitees to the meetings with the invitation regularly being taken up by Messrs Payne and Blair and Ms Naidoo.
The following senior executives are permanent attendees atthe meeting:
• Mrs VT Botha-Richards Head of Corporate Services and Sustainability• Mr S Glendinning Head of Group People • Mrs S Moodley Head of Governance and Assurance• Mrs HE Grosvenor Company Secretary
The Committee is responsible for assisting the Board with the monitoring and reporting of social, ethical, transformational and sustainability practices that are consistent with good corporate citizenship, as well as assisting the Group in discharging its business responsibilities in relation thereto.
68

PREVIOUSSOCIAL, ETHICS, TRANSFORMATION AND SUSTAINABILITY COMMITTEE REPORT CONTENTS NEXT
Statutorily, the Committee is responsible for monitoring the Group’s activities as per the Companies Act with regard to matters relating to:
• Social and economic development
• Good corporate citizenship• Environment, health and public
safety• Consumer relationships• Labour and employment
practices.
The Committee has the responsibility to draw matters within its mandate to the attention of the Board and to shareholders of the Company. The Committee mandate can be viewed on the Group’s website: www.mrpricegroup.com
meetingsThe Committee met 4 times during the year. Meetings are convened and conducted in terms of a detailed agenda accompanied by supporting documents, including minutes of supporting management sub-committees and reports from the permanent attendees, which serve as a material tool for the Committee to monitor its responsibilities.
The Committee actively engages with management during these meetings.
Social and economic development, good corporate citizenship, environment, health and public safety, consumer relationships, labour and employment practices.
Matters considered by the Committee (and reported to the Board) include:
• Overseeing the Group’s Business Code of Conduct and Supplier Code of Conduct.
• Monitoring and assessing the Group’s transformational progress (including consideration of the Employment Equity Act, the Broad-Based Black Economic Empowerment Act and the supporting Codes of Good Practice). The Committee is materially assisted in monitoring transformation by the Executive Transformation Committee, (chaired by the CEO), and the input of the Board.
• Reporting on the Group’s compliance with applicable legislation, Codes of Good Practice and other legal requirements, including a review of the Group’s exposure to anti-corruption legislation.
• Reviewing and monitoring the Group’s environmental and social sustainability strategy and the execution thereof.
• Reviewing the social investment initiatives undertaken by MRP
Foundation. The details of the programmes undertaken can be located on the website
www.mrpfoundation.org
• Monitoring of matters relating to its statutory obligations and good corporate governance.
A Committee self-evaluation took place at the November 2014 Special Corporate Governance meeting. The Committee believes that the Group is substantively addressing the issues monitored by the Committee, in terms of its statutory mandate and the additional mandates referred to it by the Board, in a beneficial and positive manner and that it has suitably performed its mandated responsibilities. Refer to the Sharing the Value Report on page 50 for more details regarding transformation and sustainability.
As Chairman of the Social, Ethics, Transformation and Sustainability Committee, Mr K Getz will be available at the Annual General Meeting to answer any questions relating to the statutory obligations of the Committee.
69

PREVIOUSREMUNERATION REPORT CONTENTS NEXT
The Remuneration Report provides an overview of the Group’s remuneration philosophy, policy,
practices and governance, with particular focus on the remuneration payments to the executive and non-executive Directors.
remuneration philosophyAn overview of the values which guide the Group – Passion, Value and Partnership is provided on page 7. The manner in which these are applied creates a unique organisation, both in culture and performance, and is a key driver of business success.
Remuneration structures stimulate and incentivise high performance. An entrepreneurial management style is encouraged, providing all staff, whom we call associates, with the room to innovate and grow, effectively enabling ordinary people to achieve extraordinary things. While we believe that we have some of the top retail talent in the industry, the
ability to attract, retain and motivate competent people is critical to the Group’s continued growth and long-term sustainability and is therefore the core of the remuneration philosophy. This approach aims to create partnerships with associates in their journey of continued growth through:
• market-related base pay and benefits. Being a value retailer, the Group aims to pay basic salaries and benefits at the market median
• attractive, performance-driven, short-term (bonuses) and long-term (share schemes) incentives
2011 2012 2013 2014 2015
% c
hang
e
46%
25%
-12% -16%
13%
13%8%10%15%
13%
26%20%
20%
9%
0%
HEPS Total associates remuneration (staff & exec Directors) Exec & Non-exec Directors’ remuneration
remuneration vs performance
Total Director remuneration is lower than that of 5 years ago, despite HEPS growth of 232% and the company’s market capitalisation increasing by 549%to R64 billion.
and recognition and reward programmes. Associates are provided with the opportunity to earn well above the median through generous incentives, which requires reaching stretch performance targets.
The historical earnings growth of the Company (29 year HEPS CAGR of 23%) is attributable to the efforts of all our associates. The trends provide tangible evidence that our approach to remuneration has delivered on the objectives of retention and motivation, driving performance, while ensuring total employee costs are controlled.
70

PREVIOUSREMUNERATION REPORT CONTENTS NEXT
Much has been written and talked about globally regarding inequality of remuneration and accumulated wealth between management and lower level employees. Percentage comparisons are raised to inflame the already heated debate. We are acutely aware of these discrepancies and, in our opinion, the way we manage the situation is more important than the differential itself. We believe that literacy and reasonable numeracy are the keys to ‘decent employment’ and our MRP Foundation has been instrumental in these aspects through training and awarding educational bursaries, from early childhood development to tertiary education. In addition, the Jumpstart programme facilitated job skills training of over 1 000 unemployed young people, which led to the employment of
745 people with suppliers. Further MRP Foundation achievements are detailed on page 54.
The Group remunerates new entry level associates, some of whom are sourced through MRP Foundation, slightly above minimum statutory wage. Substantial opportunities exist for associates to move well away from minimum wage, as early as their first year of employment, and reduce the earnings gap through:• Achieving stretch targets, short-
term incentives can amount to the equivalent of 3 months’ salary
• Associates participating in the Mr Price Partners Share Scheme received dividends as high as
R7 000 each in the last financial year (depending on their employment date and years of service)
• Group growth and expansion, creating opportunities for advancement as well as the Group’s long-standing policy to fill vacancies by ‘promoting from within’
• A multiplicity of educational and training mechanisms being available to all associates, tailored to their individual requirements
• Associates’ own application and initiative.
As far as wealth creation is concerned, the Group has various share schemes (refer page 76) appropriate to the various levels of associates. Lower level associates in SACU receive free shares (the number of which are based on their salary level ratio) after one year’s employment and, in addition, qualify for share options once they reach the qualifying salary level. In addition to the positive impact of associates thinking and acting like owners on Group performance, this has led to a substantial transfer of wealth to all levels of associates over the life of the schemes, providing them with increased financial security when they eventually retire from the Group.
remuneration governance structure The Board is ultimately responsible for the Group’s remuneration policy and applies it with the assistance of the Remuneration and Nominations Committee. This committee oversees the remuneration of
executive Directors and divisional executives and operates according to a formal Board mandate – refer www.mrpricegroup.com.
The Committee met four times during the year under review. Meeting attendance is disclosed in the Corporate Governance Report on page 61. Other executive and non-executive parties attend the Committee meetings where appropriate, but no individual is present when their remuneration is discussed. The Chairman attends the Annual General Meeting (AGM) and is available to answer shareholders’ questions regarding the remuneration policy, its application and the Committee’s activities. In respect of its nominations activities, the philosophy guiding the Committee on Board appointments and annual evaluations is outlined in the Corporate Governance Report on page 56. In satisfying its mandate in remuneration focused matters, the main activities undertaken were to:• Approve base salary increases • Approve the remuneration of
divisional executives and executive Directors
• Review the efficacy of, and set the basis for, determination of short-term and long-term incentive plans
• Review the performance of the divisional executives and executive Directors and approve their short-term incentives with reference to such plans
• Review all new share and share option allocations under the various
share schemes in operation
• Introduce personal shareholding
criteria to increase shareholding
amongst senior management
(page 75)
• Align the peer group used for
benchmarking non-executive
Directors’ fees to that used for
executive Directors (page 73)
• Propose non-executive Director
fees for consideration by
shareholders at the AGM (page 81)
• Update letters of appointment
relating to the non-executive
Directors
• Review employment contracts
of the Honorary Chairmen and
approve their remuneration
• Review the performance of the
Chairman
• Review the impact of revised labour
legislation and the introduction of
new employment contract types
• Conduct an annual self-evaluation
review, from which steps and
targets for the improvement
of processes and operational
methods were agreed
• Review and update the mandate
for approval at the Special
Corporate Governance meeting in
April 2014 and March 2015
• Review the Remuneration
Report for inclusion in the Annual
Integrated Report and subsequent
to its publication, respond to
queries and comments received
from shareholders or their
representatives.
We believe that it is morally correct that incentivisation, in its various forms, is applied throughout the organisation. This enables our associates to share in the success of the Group, thereby aligning their efforts with corporate performance and increased shareholder value.
71

PREVIOUSREMUNERATION REPORT CONTENTS NEXT
remuneration policyand practicesThe Group’s remuneration policy is to reward executives for their contribution to the performance of the business, taking into consideration an appropriate balance between long and short-term benefits. Remuneration levels are influenced by work performance and scarcity of skills.
Given that performance-related incentives form a material part of remuneration packages, ongoing performance feedback is vital. Associates participate in performance and career development evaluations on an annual basis, focusing on work achievements, learning and development needs, values and cultural alignment. Remuneration is not influenced by race, creed or gender, with the emphasis on equal pay for equal work. There is strong alignment of the types of benefits offered to the various levels of permanent associates. The Group can justify areas where differentiation has been applied, specifically where consideration has been given to the position’s seniority and the need to attract and retain key skills.
All associates sign letters of
employment, which stipulates their notice period. The contract may be terminated by either party giving written notice of one month for a store or head office associate, three months for a divisional Director and six months for executive Directors. Despite these provisions, either party may terminate the contract of employment without notice for any cause recognised by law or by agreement by both parties to waive the notice period. Contracts are also terminated in the event of a dismissal, without the associate having an entitlement for compensation. Employment contracts do not contain provisions relating to the compensation of executives for a change of control of the Company, providing neither ‘balloon’ payments on termination or retirement, nor restraint of trade payments (although the latter may be contained elsewhere).
External service providers assist the Remuneration and Nominations Committee from time to time and, where this involves remuneration, appropriate benchmarking comparatives are made. This exercise is performed every 2 years, with inflationary adjustments made in alternate years. Refer page 73.
The disclosure of the remuneration of executive Directors is governed
remuneration structureRemuneration and reward structures are categorised into the following elements:
Fixed remuneration Base pay and benefits
Variable remuneration Short-term performance-related incentives
Long-term incentives Shares and share options
by the JSE Listings Requirements and the Companies Act, 2008, with additional recommendations from King III. In order to maintain its competitive edge, the Group has applied the principles of King III that are appropriate for the business, to which there have been no material changes during the year under review. The Group complies with all disclosure aspects, except the recommendation of paragraph 180 of King III, relating to the present value of long-term incentives due to the varied valuation models and the unpredictable forecasting elements required to determine the value of the share options when vesting. The Group’s view is that to consider the present value of option awards as remuneration is misleading, in that the present value does not reflect the value paid to or receivable by the executive. Such gains can only be determined upon exercise of the options. However, to compensate for this omission, share option disclosure has been enhanced in order to aid shareholder evaluation (refer pages 79 and 80).
72

PREVIOUSREMUNERATION REPORT CONTENTS NEXT
Fixed remunerationAll associates receive a fixed remuneration package based on their roles, individual performance and the Group’s performance. Increases are based on a review of market data and consideration of individual performance and potential.
Base Pay - Salary and benefits are reviewed at least annually and all associates earn above legislated minimum wages. No material ex-gratia payments are routinely paid.
Medical aid membership - Offered to all full-time associates employed in South Africa, Botswana, Namibia, Lesotho and Swaziland, but is not a condition of service. Where the offer of comprehensive medical aid is not accepted by associates due to affordability reasons, membership of cost-effective schemes is encouraged to gain access to hospital care, chronic illness benefits (including HIV/Aids care) and daily benefits including doctors and medicines.
Retirement benefits - The majority of associates employed in South Africa, Swaziland and Lesotho are provided for in a funded, defined-benefit fund (closed to new entrants with effect 01 June 1997) and two funded, defined-contribution
funds. Associates employed in Namibia, Botswana, Nigeria and Ghana are members of separate defined-contribution funds in those countries, while Zambian associates are members of the Zambian National Pension Scheme Authority. The funds provide for pensions and related benefits for permanent associates and membership is compulsory after the first year of service.
PwC conducted a comprehensive benchmark assessment on all aspects of remuneration, for implementation on 01 April 2015. The results confirmed our expectations - base pay in most cases was in line with market
median, while variable and long-term incentives were higher than median but for substantially superior performance. This is in line with the Group’s remuneration philosophy which has performance as the core.
• Senior management - Roles were graded and benchmarked against the ‘National All Industries’ REMchannel database. This took into account the individual’s role and level of decision-making and the size of their business unit. There were a relatively few outliers – those associates that were under the market benchmark, usually due to being promoted in the recent past, received above inflation increases in line with
their enhanced experience, while those associates that were above the tolerance level relative to the benchmark, received below inflation or no increase. Divisional executives not impacted by the above generally received salary
73
increases of 6%.
• Executive Directors - A peer group of 16 companies was selected in conjunction with PwC. This included eight retail companies, five companies with a similar market capitalisation and three companies that had achieved similar total shareholder returns. The CEO’s guaranteed remuneration was lower than the market by 6%. On 01 April 2015, Mr Bird’s salary was increased by 12%, constituting the lag to market plus 6% inflation. The CFO’s guaranteed remuneration was lower than the market by 1% and Mr Blair’s remuneration was therefore increased by inflation of 6%. The Supply Chain Director, who is an alternate director, has requested reduced working hours and, as a result, Mr Ellis’ remuneration reduced by 36%. All changes were effective on the same date.
• Non-executive Directors – The
proposed fees for 2016 takes into account the benchmarking exercise undertaken (using the same peer group of companies as that utilised for executive Directors) and several structural changes detailed on page 81.
The Company does not pay an attendance fee per meeting as, historically, the attendance at meetings has been good and the performance of non-
executive Directors is reviewed annually via peer evaluation. In addition, the Board has always felt that Directors contribute as much outside of meetings as they contribute within meetings. Proposed fees are detailed in the Notice of Meeting set out in the Annual Results booklet for approval at the forthcoming AGM. Non-executive Directors do not participate in any incentive scheme.
The Honorary Chairman has an employment contract with the Company and details of his role are provided in the Corporate Governance Report on page 60. In recognition of Mr. Cohen’s reducing role in the business, with effect from 1 April 2013 (March 2014 financial year), his total remuneration decreased in equal annual amounts, to the level that the Lead Director’s total fees were expected to be in F2016, namely R625 000. This was implemented by increasing the Honorary Chairman’s fees to R625 000 in the 2014 financial year, a level which was to remain unaltered until 2016, and reducing his other forms of remuneration in three equal amounts from 1 April 2013. In the forthcoming financial year the Honorary Chairman will not earn a salary or benefits, and his total annual remuneration, in the form of fees, will amount to
R625 000.

PREVIOUSREMUNERATION REPORT CONTENTS NEXT
Variable remunerationAll associates participate in an annual short-term incentive scheme which is related to performance. Although challenging targets are set, the incentive schemes are potentially generous to encourage the achievement of targets that can be directly influenced by superior performance. If performance is not at desired levels, incentives will reflect that situation. The Remuneration and Nominations Committee ensures that performance targets are linked to the Group’s or division’s annual key imperatives, are substantially within the associate’s control and do not expose the organisation to undue risk caused by their behaviour. The past performance of the Group is evidence that the incentive mechanisms, which have been well thought out and refined over the years, work well.
The Group does not defer bonus payments as it is essential to attract and retain bright young talent, many of whom are at the age that they are committing to their first property purchase or financing their children’s education. Associates have to be in the Group’s employ at year end to receive incentive bonuses, unless due to specific circumstances, alternative arrangements have been approved by the Remuneration and Nominations Committee.
Profit - achieve budget 3 financial67% - stretch target 5
Divisional KPI’s 2 non-financial33%Personal performance 2
Cumulative month’s salary 3 8 10 12
The bulk of the short-term incentive award depends on exceeding budget and achieving stretch performance targets, which should have a positive impact on shareholder returns. The number of months’ incentive can be reduced by a maximum of two penalty months, should stock levels or ageing exceed target, or employment equity or internal audit scores fall short of target.
In the case of the heads of service divisions such as Systems, Governance and Assurance, People, Real Estate, Logistics and Sustainability, the maximum incentive ranges from eight to twelve months. Measurement criteria include performance evaluation from, and the financial performance of, the trading divisions whom they support (budget and stretch targets), overhead costs, service delivery, innovative business improvements and the achievement of key imperatives. Penalty months apply to specific criteria.
Personal performance, incorporating areas of demonstrated performance contribution like leadership, innovation, effort and teamwork,
All associates participate in a loyalty bonus scheme, payable annually in December at the option of the company. The benefit commences at the level of 20% of monthly salary
2011 2012 2013 2014 2015HEPS reported (cents) 403 503 636 765 919HEPS growth % 46% 25% 26% 20% 20%% of HEPS based incentive awarded 100% 100% 100% 100% 100%
Divisional executivesThe incentive structure for executives of the trading divisions for the 2015 financial year was as per the graph below:
relationship between exec Director incentives and performance
per completed year of service up to 80% (after four years), followed by an additional 20% after the completion of 10 years’ service.
74
is also assessed. For divisional executives, these ‘soft’ awards are generally capped at two months’ basic salary, although in deserving circumstances, the CEO can propose higher. A poor personal performance evaluation can reduce or eliminate the incentive due under measurable Group performance.
Executive DirectorsA strong relationship exists between executive incentives and sustainable value created for shareholders. The incentive portion of Directors’ earnings is tied to financial targets and is measured as a multiple of monthly salary. The achievement of predetermined targets is a function of: - Measurable Group performance,
dependent on the executive’s work function. Targets are linked to the Group’s performance and are tailored annually to ensure alignment with key imperatives for the year. For the 2015 financial year, the targets against which the CEO and CFO were measured included: growth in headline earnings per share, return on equity and the achievement of
Strategic KPI’s. The maximum that can be earned is equal to twelve months’ basic salary. The awards are only made if the Group achieves its budgeted half year and annual headline earnings per share targets. In that event, a maximum award of three months’ salary is made, with the result that the majority of the short-term incentive award allocated to Group performance therefore depends on exceeding budget and achieving stretch performance targets. The Supply Chain Director was measured on the combined profitability of the trading divisions, which also included budget and stretch targets, and the delivery of supply chain KPI’s. The maximum potential award is equal to ten months’ basic salary.
- Personal performance, incorporating areas of demonstrated performance contribution such as leadership, innovation, effort and teamwork. Measuring these ‘soft’ issues necessitates more subjective judgement and is determined via individual and peer reviews. For executive Directors, ‘soft’ awards are capped at twelve months’ basic salary. However this would only be achieved in exceptional circumstances. A poor personal performance evaluation can reduce or eliminate the incentive due under measurable Group performance.
Although the Group does not disclose the specific financial targets which apply to executive Director incentives, the historical information detailed below demonstrates that an appropriate level of thought has been applied and that incentives are aligned with the Group’s performance based culture. Over the last five years, the incentive structures required:• HEPS growth varying between
12.2% (which was the lowest ‘base’ target in any year and attracted three months’ incentive) and 24.0% (which was the highest stretch performance target and
attracted nine months’ incentive). • an average growth in HEPS of
16.1%, which, if not achieved, would have resulted in no incentives being paid under this category.
• In 2015, each of the three stretch performance levels required an additional profit before tax (net of the additional incentive incurred) to cost (additional incentive) ratio of 12:1.
• Profit before tax is increasing at a faster rate than executive Director incentives. The ratio of increased profit to incentives paid has increased from 26 in 2012 to 30 in 2015.
R’m
20110
35
30
25
20
15
10
5
0
600
500
400
300
200
100
2012 2013 2014 2015
15
30
2627 28
30
563
472
342302
456
1917
1312
Executive Director incentives (R’m)
Factor of increased profit to incentives paid
Increase in profit before tax (RHS)

PREVIOUSREMUNERATION REPORT CONTENTS NEXT
long-term incentivesPartnership and reward for performance are among the Group’s key beliefs. The Group has ambitious growth plans that will require substantial capital expenditure and the continued dedication of its associates. The long-term incentives (LTI) are to motivate and retain associates critical to the achievement of these goals. To that end, various share and share option schemes have been established to enable permanent associates the opportunity to share in the long-term success of the Group. We believe that our inclusive approach to share ownership in the Company is a key differentiator and is essential to achieving a high level of performance in the long-term. In other companies, LTI’s are typically reserved for company executives. However in our case, executive management’s interest is less than 25% of total company share or option awards. In order to further promote share ownership, effective November 2014, participants in the Mr Price Executive Forfeitable Share Plan
(37 associates in total) can qualify to have their total annual long-term incentive awards (options and FSP’s) increased by 10%, should they meet their minimum personal shareholding threshold, namely two times annual guaranteed remuneration for divisional executives and three times for executive Directors.
In the case of the executive Directors, the base upon which LTI awards are made annually, is determined by multiplying their annual guaranteed remuneration by a factor (which ranges between 133% and 354%) and dividing this value by the share price (30 day VWAP) at the date of the award. The award value is then split into options and FSP’s (vanilla award). Performance-based FSP’s (equal in number to the vanilla FSP award) and an LTI bonus award, based on personal shareholding
in the company, if applicable, are then made. The personal shareholding in the Company of the three executive Directors all exceeds the required level.
The PwC LTI benchmarking exercise highlighted the difficulty in drawing meaningful comparisons to other companies, given the various methodologies adopted. Awards can either be based on the face value (approach used by the Group) or the expected value of the instruments issued, and companies can either have smaller annual awards (approach adopted by the Group) or larger awards which vary in frequency, or a combination of both. Despite the limitations and the potential inaccuracy of assumptions used in converting one basis to the other for benchmarking purposes, PwC reported that the annual LTI awards compared as follows:
JSE Comparator Group Quartile
JSE Top 40 CompaniesQuartile
CEO median to upper lower to median
CFO median to upper lower to median
Although the short-term incentives of the CEO and CFO were above the comparator group median in 2015, this was due to the relative performance of certain companies – only 30% reflected earnings growth above 20% and 25% of companies reflected an earnings decline in that year.
75

PREVIOUSREMUNERATION REPORT CONTENTS NEXT
The scheme in which associates can participate depends on their position in the
Group. Long-term incentives are subjected to an annual review to confirm their efficacy and affordability. The schemes which are active are summarised below and further information can be found on the Group’s website www.mrpricegroup.com.• Mr Price Group Employees Share
Investment Scheme• Mr Price Partners Share Scheme • Four share option schemes • Two forfeitable share plans (FSP).
Mr Price Group Employees Share Investment SchemeThis trust allows associates the opportunity to purchase shares on a monthly basis up to a value of 15% of their monthly basic salary and car allowance. The Company makes an additional contribution, equal to 15% of the associates’ contribution, which amounted to R3.1 million in the current financial year. This scheme has been in existence since 1992 and, at year end, 4 500 associates were participants, holding286 000 shares to the value of R72 million. In order to encourage participants to hold the shares, restrictions are in place limiting the number of times shares may be sold in a year. Directors
and prescribed officers cannot participate in the scheme.
Mr Price Partners Share SchemeA key factor of the share schemes is that in essence, they incorporate the Group’s intentions regarding the ownership criteria of B-BBEE. Rather than enter into an ownership deal with external parties, the Board resolved to embrace the true spirit of B-BBEE and, subject to certain qualifying criteria, included all SACU associates in its various share and share option schemes. In this way, those responsible for contributing to the Group’s success become partners in the business and are rewarded for sustained high performance.
Shares are awarded instead of options. Associates in junior positions, where staff turnover is relatively high, are awarded shares after being permanently employed for 12 months. Participants of this scheme receive bi-annual dividends and are eligible to vote on their shares as shareholders. Half of the trustees overseeing the operation of this scheme were elected by the participants, which serves to ensure greater understanding and enhanced communication. Black ownership in this scheme is 95% and the average value of shares held on behalf of each individual associate is R147 855. Associates who
became participants between the date of introduction of this scheme and November 2010, were allocated 1 000 shares or 1 250 shares as an assistant store manager. The value of the latter’s shares has grown from R26 000 to R325 000 over the period. Further growth will materially impact our associates’ lives at retirement, at which stage the shares vest unconditionally. Participants received dividends amounting to R20.2 million over the last year (final 2014 and interim 2015 dividends). The Company has paid out total dividends of R100 million to associates participating in the Partners Share Scheme since its inception in 2006.
Share option schemesThe share option schemes operate on a “rolling” basis, in that smaller annual awards are made (rather than larger upfront awards) according to market benchmarked criteria. The timing of these awards coincides with a tranche vesting. This mechanism spreads the market risk, avoiding the situation where all options could be out of the money, which is a disincentive to associates. All option and share awards are based on a formula of guaranteed annual pay multiplied by a factor (which is benchmarked where possible), divided by the share price, which limits company exposure during a period of share price strength. The strike price mechanism for all share option
schemes is calculated at the lower of the 30 day volume weighted average price (VWAP) for the period preceding the offer date, or the price on the day prior to the offer. Re-pricing of strike prices is not permitted and options are not awarded to or exercised by key personnel in the Executive and Executive Director Share Schemes during closed periods. The Remuneration and Nominations Committee has the authority to prevent vesting in circumstances where the individual is deemed to have demonstrated poor personal performance.
Forfeitable Share Plans (FSP’s) The Company’s advisors recommended the implementation of a FSP as the vast majority of companies surveyed had more
than one type of long-term incentive scheme operating in parallel. Forfeitable shares are free shares awarded to participants, subject to certain conditions and offer more certainty to the recipient as the value is in the share that vests, not growth on strike price, as is the case with options. From a Company perspective, FSP’s are attractive due to the fact that shares result in a lower number of instruments than options and senior employees can also receive enhancement shares, which are subject to performance conditions. The shares acquired by the Company to fully satisfy these obligations are held by an institutional third party. The following FSP schemes were introduced in 2013:
Mr Price Executive Forfeitable Share PlanFor executive Directors and certain divisional Directors, executives and senior managers, awards are of an annual rolling nature, as per the option schemes. In order to keep the cost to company (IFRS 2 charge) at a level no higher than that of the option schemes, the number of options awarded was reduced and a lower number of FSP’s awarded. The shares are held in escrow and vest after five years, with participants receiving dividends during this period. As a result of the focus on their retention aspect, the ‘vanilla’ award does not contain performance conditions. A matching ‘performance award’ (equivalent to the vanilla award) was also made, but this contains stretch HEPS targets linked to the Group’s five year strategic plan.
76

13.1%
7.9%
34.7m
21.0m
10.6%
6.3%
PREVIOUSREMUNERATION REPORT CONTENTS NEXT
Mr Price Group Forfeitable Share PlanIt is imperative to retain the executives who are central to the Group’s growth strategy detailed elsewhere in this report. A limited number of participants were awarded free shares, equivalent to between two and three times their annual guaranteed remuneration and these shares vest after 5 years. This award was offered subject to participants entering into a restraint and retention agreement, which precludes them from joining a competitor for a predetermined period, should they leave the employment of the Company.
Specific issues raised by shareholders during the year regarding long-term incentives include:• The need for more substantial
returns-based performance - the mechanics of the share
schemes are reviewed annually. Last year, consideration was given to the input received from shareholders and minimum performance conditions were introduced. The purpose of this hurdle (HEPS growing a minimum of CPI +1%) was to ensure that share options would not vest in the event of there being poor Group performance. The intention was not to raise the performance hurdle to a level that would cause the schemes to lose their motivational appeal to the valued partners within the Group.
Cognisance was also taken of the fact that, due to strong company performance and the re-rating of the share price (the PE ratio at year end was 27.4), the quantum of share options awarded to participants has significantly decreased. The option schemes are rolling in nature and the current awards are materially lower than options vesting. The remuneration philosophy of the Group is to
The number of LTI’s awarded annually continues to reduce
LTI’s outstanding vs issued share capital• Limits for participation - the Company’s partnership approach results in all associates in selected territories participating in the share schemes. This is unique amongst South African corporates and is critical to the success of the Group. Over 9 000 associates are members of the various share schemes in operation. The number of shares or options being awarded is expected to reduce further over time, as the shift to an allocation formula which takes into account annual guaranteed remuneration and the prevailing share price takes effect.
20152014201320122011
% o
f sha
re c
apita
l
optio
ns o
utst
andi
ng (m
illion
)
% of issued shares % excluding partners share schemeoptions outstanding (RHS)
remunerate at the median and reward through bonuses and shares. Should the shares become less attractive, the Group would need to employ a less favourable approach of increasing basic salaries to retain key associates. As detailed above, challenging performance targets have been incorporated into the Executive FSP.
The Board believes that it is not appropriate to include shares allocated under the Partners Share Scheme, which effectively operates as the Group’s B-BBEE scheme, in this overall participation total. Excluding this scheme, the total number of shares committed under the various equity incentive schemes equates to 6.3% of the issued share capital.
77
20152014201320122011awarded share price (Rand)
9
8
7
6
5
4
3
2
1
0
LTI’s
Aw
arde
d (m
)
Sha
re P
rice
(R)
300
250
200
150
100
50
0
8.06
63.38
251.96
2.12
New awards are lower than those vesting
Awarded
Num
ber (
m)
2011-
1
2
3
4
5
6
7
8
9
2012 2013 2014 2015
Vesting
1.95
4.82
8.06
2.12

PREVIOUSREMUNERATION REPORT CONTENTS NEXT
No single participant’s interest in voluntary awarded long-term incentive plans (option schemes and Executive FSP) exceeds 0.5% of issued share capital.
SI Bird MM Blair SA EllisMr Price Executive Director Share Trust (options) 1 221 034 508 848 176 566Mr Price Executive FSP Scheme 37 350 22 910 8 100
1 258 384 531 758 184 666% of Share Capital (Ords & B Ords) 0.48 0.20 0.07
Non-routine FSP’s awarded under the Mr Price Group Forfitable Share Planas detailed on page 77 are excluded from the above.
• The remuneration report could contain more details on financial indicators and parameters - due to the sensitivity in releasing forecast financial information, these targets cannot be disclosed. However the Committee is satisfied that strong Group performance will be required for these performance based FSP shares to vest. The reports from the Chairman, CEO and CFO clearly detail both the exceptional historic performance and the strategic goals of the Group.
The vesting periods of the various share option schemes have been amended over the years. A balance has been sought between allowing sufficient time to experience a meaningful growth in the share price and having the options vest in a timeframe which is not so distant as to appear unattainable.
Concerning the vesting of shares on retirement or for other reasons for ending employment, the share trusts’ rules stipulate that associates retiring at the age of 65 may retain unvested share options that will vest according to their original timeframes. However, given that associates are entitled to take early retirement from the age
vesting period exercise period frequency of allocations
Partners Share Trust Unconditional vesting occurs 60 days after the death or retirement of the
recipient associate
Immediate upon unconditional vesting A once-off initial allocation is made with no further routine top-up allocations
being awardedGeneral Staff Share Trust 3 years from date of offer within 90 days of vesting AnnualSenior Management Share Trust 5 years from date of offer within 90 days of vesting AnnualExecutive Share Trust 5 years from date of offer within 5 years of vesting AnnualExecutive Director Share Trust 5 years from date of offer within 5 years of vesting AnnualMr Price Executive FSP 5 years from date of offer Immediately upon vesting AnnualMr Price Group FSP 5 years from date of offer Immediately upon vesting Once-off award
of 50, guidelines were established taking into account the age and years’ service of associates retiring before 65. These guidelines permit the retention, post-retirement, of unvested options on a sliding scale whereby associates can take early retirement from 50 and retain their options if they have a minimum 25 years’ service. This graduates to
retirement at 64, requiring 11 years’ service. Retirement at 65 does not require a minimum service period. In all other retirement or dismissal situations, unvested options will lapse unless the Board exercises its discretion and permits the exercise of any or all of the unexercised options. However, as an associate approaches retirement, the
78
schemes have been designed in such a way that the option awards decrease. In the Mr Price Partners Share Scheme, retirement causes the shares to vest unconditionally. The age and length of service guidelines detailed above have also been applied to those associates retiring before 65.

PREVIOUSREMUNERATION REPORT CONTENTS NEXT
Since the inception of the share option schemes, the Board has exercised its discretion on an exceptional basis and has allowed a very limited number of associates to retain unvested options post resignation. In using its discretion, the Board considered the associate’s length of service, resignation circumstances, past services to the Group and the vesting period
Executive Directors’ remunerationThe emoluments for the executive Directors for the year were as follows (R’000):
long-term incentive scheme number of
participants
number ofoptions/
shares
shares held bythe share
trusts
% of totalobligation
hedged Mr Price Share Option Scheme 9 5 800 - 0%Mr Price Partners Share Trust 7 503 4 403 376 6 558 931 149%Mr Price General Staff Share Trust 1 911 7 424 703 2 578 618 35%Mr Price Senior Management Share Trust 210 3 731 263 490 818 13%Mr Price Executive Share Trust 36 2 330 827 1 018 531 44%Mr Price Executive Director Share Trust 5 2 402 442 613 612 26%Mr Price Executive FSP 37 167 256 173 823 104%Mr Price Group FSP 14 457 233 457 233 100%Total 9 725 20 922 900 11 891 566 57%
salarymotor vehicle
benefitspension
contributionsother
benefits short-term incentives
total2015
total2014
SI Bird* 4 974 213 1 019 165 9 741 16 112 15 406
MM Blair* 3 319 338 708 158 6 167 10 690 9 978
SA Ellis 2 718 276 593 115 2 945 6 647 6 135
Total 11 011 827 2 320 438 18 853 33 449 31 519
*Considered to be prescribed officers
Details of the interest of executive Directors in long-term incentives are as follows:
Forfeitable share plans date ofaward
sharesgranted
share price at
award date
shares held at
end of the year
vestingdate
SI BirdMr Price Executive FSP (EFSP)
- vanilla award 29-Nov-13 10 341 R155.97 10 341 29-Nov-18- performance award 29-Nov-13 10 341 R155.97 10 341 29-Nov-18- vanilla award 29-Nov-14 8 334 R228.78 8 334 29-Nov-19- performance award 29-Nov-14 8 334 R228.78 8 334 29-Nov-19
Mr Price Group FSP (GFSP) 29-Nov-13 96 546 R155.97 96 546 29-Nov-18133 896
MM BlairMr Price Executive FSP (EFSP)
- vanilla award 29-Nov-13 6 334 R155.97 6 334 29-Nov-18- performance award 29-Nov-13 6 334 R155.97 6 334 29-Nov-18- vanilla award 29-Nov-14 5 121 R228.78 5 121 29-Nov-19- performance award 29-Nov-14 5 121 R228.78 5 121 29-Nov-19
Mr Price Group FSP (GFSP) 29-Nov-13 67 315 R155.97 67 315 29-Nov-1890 225
SA EllisMr Price Executive FSP (EFSP)
- vanilla award 29-Nov-13 2 233 R155.97 2 233 29-Nov-18- performance award 29-Nov-13 2 233 R155.97 2 233 29-Nov-18- vanilla award 29-Nov-14 1 817 R228.78 1 817 29-Nov-19- performance award 29-Nov-14 1 817 R228.78 1 817 29-Nov-19
8 100
remaining on all offered tranches. In most cases, the tranche closest to maturity was retained, while the remaining unvested tranches were forfeited. No accelerated vesting of share options is permitted. In terms of specific authority received from shareholders, the Company may issue 46 548 430 shares to satisfy the requirements of its share schemes. Since the schemes were introduced in 2006, the Company has issued 9 463 292 shares and therefore still has 37 085 138 shares that
may be issued for this purpose. However, in order to avoid shareholder dilution, the Group’s current policy is to purchase shares on the open market to satisfy the requirements of the various share schemes, as opposed to issuing new shares. The Company has a share purchase programme in place to hedge against the future obligations of the schemes, details of which are as follows:
Relative to the unhedged commitments, the strike price payable by participants is R1.4bn.
79

PREVIOUSREMUNERATION REPORT CONTENTS NEXT
Share options - Mr Price Executive Director Share Trustoptions held at
the beginningof the year
date ofoffer
options granted and accepted
during the year
options exercised or taken up
during the year
option priceof award
gain on options exercised
during the year (R'000)
options held at the end of
the year
number of tranches
remaining
vesting date of first tranche
vesting dateof last tranche
latest expiry date for
exercise of options
SI Bird 282 000 27-May-09 94 000 R26.50 13 556 188 000 2 27-May-15 27-May-16 27-May-21 71 000 22-Nov-09 71 000 R32.75 14 832
400 000 25-Aug-09 R46.00 400 000 1 25-Aug-15 25-Aug-20 90 000 30-Nov-10 R62.77 90 000 1 30-Nov-15 30-Nov-20
210 500 22-Nov-11 R76.49 210 500 1 22-Nov-16 22-Nov-21 129 777 22-Nov-12 R133.67 129 777 1 22-Nov-17 22-Nov-22 112 271 22-Nov-13 R151.94 112 271 1 22-Nov-18 22-Nov-23
22-Nov-14 90 486 R222.60 90 486 1 22-Nov-19 22-Nov-24 1 295 548 1 221 034
MM Blair 146 000 22-Nov-09 146 000 R32.75 30 500 155 000 30-Nov-10 R62.77 155 000 1 30-Nov-15 30-Nov-20 142 600 22-Nov-11 R76.49 142 600 1 22-Nov-16 22-Nov-21
86 870 22-Nov-12 R133.67 86 870 1 22-Nov-17 22-Nov-2268 770 22-Nov-13 R151.94 68 770 1 22-Nov-18 22-Nov-23
22-Nov-14 55 608 R222.60 55 608 1 22-Nov-19 22-Nov-24 599 240 508 848
SA Ellis 210 000 22-Nov-06 210 000 R21.15 33 937 50 000 22-Nov-09 50 000 R32.75 10 445 50 000 30-Nov-10 R62.77 50 000 1 30-Nov-15 30-Nov-20 50 000 22-Nov-11 R76.49 50 000 1 22-Nov-16 22-Nov-21 32 591 22-Nov-12 R133.67 32 591 1 22-Nov-17 22-Nov-2224 242 22-Nov-13 R151.94 24 242 1 22-Nov-18 22-Nov-23
22-Nov-14 19 733 R222.60 19 733 1 22-Nov-19 22-Nov-24 416 833 176 566
AE McArthur1 396 000 22-Nov-09 200 000 R32.75 39 537 196 000 1 22-Nov-14 22-Nov-19 250 000 22-Nov-10 250 000 1 30-Nov-15 30-Nov-20 646 000 446 000
S van Niekerk1 50 000 22-Nov-09 R32.75 50 000 1 22-Nov-14 22-Nov-1950 000 50 000
1 Disclosure required although no longer Directors of the Company.
80

PREVIOUSREMUNERATION REPORT CONTENTS NEXT
R’000 salaryvehicle
allowances & expenses
pension contributions
feestotal2015
total2014
LJ Chiappini1 462 147 202 573 1 384 2 337SB Cohen 424 278 187 625 1 514 2 409K Getz - - - 420 420 396MR Johnston - - - 589 589 556RM Motanyane - - - 301 301 284D Naidoo - - - 333 333 314NG Payne - - - 1 113 1 113 1 050MJD Ruck - - - 503 503 430WJ Swain - - - 588 588 555
M Tembe2 - - - 125 125 284Total 886 425 389 5 170 6 870 8 615
Non-executive Director emoluments for the year:
Non-executive Director fees:
1 Retired from the Board at the end of February 2015.2 Retired by rotation at the Annual General Meeting on 3 September 2014, and did not offer himself for re-election.
1 Fees for the non-executive Chairman included his duties as Chairman of both the Board and Risk Committee2 In F2016, the Chairman fees relate to the incoming Chair, Ms D Naidoo. The outgoing Chairman’s fees (Mr WJ Swain) will be
reduced over a 2 year period to a level of ‘member’, in line with the diminished responsibilities during the handover period.
In F2016, the outgoing Chairman’s proposed fees are R155 000.3 Committee activities now included in ‘Main Board’ fees. Refer to page 57.
F2015 actual F2016 proposed
board or committee chairman member chairman member
Main Board1 1 113 000 225 000 1 250 000 310 000
Main Board - Honorary Chairman 625 000 625 000
Main Board - Lead Independent Director 361 500 370 000
Audit and Compliance Committee2 193 000 108 000 193 000 114 500
Risk Committee1,3 94 500
Remuneration and Nominations Committee 119 250 75 800 158 000 82 500
Social, Ethics, Transformation andSustainability Committee
119 250 75 800 126 000 80 000
The proposed 2016 fees represent a decrease of 4.6% over the prior year, while total non-executive Director remuneration, which previously included the salaries and benefits of the honorary chairmen, will reduce by 37.9%. For further information regarding the remuneration of non-executive Directors refer page 73.
81

PREVIOUSBOARD OF DIRECTORS CONTENTS NEXT
NigelPayne
Chairman
age: 55years of service: 8qualifications: CA (SA), MBLother directorships include:STRATE (Pty) Ltd, JSE Ltd,The Bidvest Group Ltd, BSi Steel Ltd, Vukile Property Fund Ltd, Free State Maize (Pty) Ltd, PPS Insurance Company Ltd
StewartCohen
Honorary Chairman
age: 70years of service: 29qualifications: BCom, LLB, MBAother directorships include:Catregav Holdings (Pty) Ltd, Holdspec Investments (Pty) Ltd, Kovacs Investments 343 (Pty) Ltd
StuartBird
Chief Executive Officer
age: 55years of service: 21qualifications: CA (SA)
MarkBlair
Chief Financial Officer
age: 49years of service: 9qualifications: CA (SA)
ThE mr PriCEGrOUP BOarDOF DirECTOrS
82

MylesRuck
Independent Non-Executive Director
age: 59years of service: 8qualifications: BBusSc PMD (Harvard)other directorships include:Standard Bank Group Ltd, The Standard Bank of South AfricaLtd, ICBC Bank Argentina
JohnSwain
Independent Non-Executive Director
age: 74 years of service: 21qualifications: CA (SA)other directorships include:The Sharks (Pty) Ltd
NeillAbrams
Alternate Director
age: 50 years of service: 5qualifications: BA, LLB (Wits), LLM (Cambridge)other directorships include:Ocado Group Plc
SteveEllis
Alternate Director
age: 53years of service: 23qualifications: CA (SA)
PREVIOUSBOARD OF DIRECTORS CONTENTS NEXT
BobbyJohnston
Lead IndependentNon-Executive Director
age: 66years of service: 21qualifications: CA (SA)other directorships include:STRATE (Pty) Ltd
KeithGetz
Non-Executive Director
age: 59 years of service: 10qualifications: BProc, LLMother directorships include:BVPG Consulting (Pty) Ltd, Steak Ranches International BV, Spur International Ltd, Spur Corporation Ltd, Spur Corporation UK Ltd, Cape Union Mart Group (Pty) Ltd, STRATE (Pty) Ltd
MaudMotanyane
Independent Non-Executive Director age: 63 years of service: 7qualifications: Diploma Library Science, WPI fellowother directorships include:Kagiso Media (Pty) Ltd, G4S Secure Solutions (SA) (Pty) Ltd, G4S Aviation Security (UK) Ltd, Jet Education Trust
DaisyNaidoo
Independent Non-Executive Director age: 42years of service: 3qualifications: CA (SA) MCom (Tax)other directorships include:STRATE (Pty) Ltd, Hudaco Industries Ltd, OMNIA Holdings Ltd, Marriott Unit Trust Management Company Ltd, Old Mutual Unit Trust Managers Ltd, Anglo American Platinum Ltd, Old Mutual Alternative Risk Transfer Ltd, Old Mutual Wealth (Pty) Ltd
ThE mr PriCE GrOUP BOarD OF DirECTOrS
83

PREVIOUS2015 ANNUAL FINANCIAL STATEMENTS CONTENTS NEXT
84
HE GrosvenorCOmPANy SECRETARy2 JUNE 2015
SI BirdCEO
NG PayneChAIRmAN
The Annual Financial Statements are prepared on the going concern basis and nothing has come to the attention of the Directors to indicate that the Company and the Group will not remain a going concern.
The Annual Financial Statements have been prepared under the supervision of the Chief Financial Officer, Mr MM Blair, CA(SA). The Annual Financial Statements of the Company and the Group were approved by the Board on2 June 2015 and are signed on its behalf by:
The preparation and presentation of the Annual Financial Statements and all information included in this report are the responsibility of the Directors. The Annual Financial Statements have been prepared in accordance with the provisions of the Companies Act and comply with International Financial Reporting Standards and the SAICA Financial Reporting Guides as issued by the Accounting Practices Committee and the Financial Reporting Pronouncements as issued by the Financial Reporting Standards Council. In discharging their responsibilities, both for the integrity and fairness of these statements, the Directors rely on the internal controls and risk management procedures applied by management. Based on the information and explanations provided by management and the internal auditors and on comment by the independent auditor on the results of their statutory audit, the Directors are of the opinion that:
• the internal controls are adequate;• thefinancialrecordsmaybereliedupon inthepreparationoftheAnnualFinancial Statements;• appropriateaccountingpolicies, supportedbyreasonablejudgementsand estimates,havebeenapplied;and• theAnnualFinancialStatementsfairly presenttheresultsandthefinancial positionoftheCompanyandtheGroup.
approval of the annual financial statements
company secretarystatementI hereby certify that the Company has lodged with the Companies and Intellectual Property Commission all such returns as are required of a public company in terms of the Companies Act and that all such returns are true, correct and up to date.

PREVIOUS2015 ANNUAL FINANCIAL STATEMENTS CONTENTS NEXT
85
report of the directorsfor the year ended 28 March 2015
Nature of business
The main business of the Group is omni-channel retail distribution through 1 150 corporate-owned, 15 franchised stores in Africa and its online channels. The retail chains focus on clothing, footwear, sportswear, sporting goods, accessories and homewares.
Corporate governance
The Directors subscribe to the values of good corporate governance as set out in the King Report for Corporate Governance in South Africa 2009 (King III). By supporting the code the Directors have recognised the need to conduct the business with integrity and to account to stakeholders in accordance with International Financial Reporting Standards.
Retail calendar
The Group reports on the retail calendar of trading weeks incorporating trade from Sunday to Saturday each week. Accordingly, the results for the financial year under review are for a 52 week period from 30 March 2014 to 28 March 2015 (2014: 52 week period from 31 March 2013 to 29 March 2014).
Financial results
The financial results of the Company and the Group are set out in the income statements and the statements of comprehensive income on pages 94 and 95.
Dividends
It is the Group’s policy to make two dividend payments each year, an interim in December and a final in June.
Interim: A cash dividend of 211.5 cents per share (2014: 168.0 cents per share) was made payable on 15 December 2014 to shareholders registered on 12 December 2014.
Final: A cash dividend of 368.5 cents per share (2014: 314.0 cents per share) has been declared payable on 22 June 2015 to shareholders registered on 19 June 2015.
Consolidated entities
The aggregate amount of Group profits and losses after taxation attributable to consolidated entities was:
Net shareholders’ equity
Authorised and issued share capital
There were no changes to authorised share capital. During the year, two million B ordinary shares were converted to ordinary shares.
Subsequent events
No events, material to the understanding of this report, have occurred between the financial year end and the date of this report.
Directorate
Mr M Tembe retired by rotation at the Annual General Meeting on 3 September 2014 and did not offer himself for re-election.
Mr LJ Chiappini retired as Honorary Chairman on 27 February 2015 and accordingly his alternate, Tracey Chiappini-Young, left the Board on the same date.
Particulars of the present Directors are provided on pages 82 and 83 of the integrated report. None of the Directors have long-term service contracts with the Company or any of its consolidated entities. Particulars of the present Company secretary are provided on page 128.
Emoluments
Details of emoluments paid to executive and non-executive Directors are set out in the Remuneration Report on pages 79 and 81.
R’m 2015 2014
Profits 110 81
Losses (18) (2)
92 79

PREVIOUS2015 ANNUAL FINANCIAL STATEMENTS CONTENTS NEXT
86
B Ordinary shares
2015 2014
Direct Beneficial
Indirect Beneficial
Held By Associate Other Total
% Direct
BeneficialIndirect
BeneficialHeld By
Associate Other Total %
LJ Chiappini - - - - - 0.00% - 6 000 759 - - 6 000 759 44.63%SB Cohen - 5 000 000 - - 5 000 000 43.69% - 6 000 000 - - 6 000 000 44.63%MR Johnston - - 46 504 46 504 0.41% - - 46 504 46 504 0.35%
Total 5 046 504 44.10% 12 047 263 89.61%
Ordinary B Ordinary
Issued share capital 2014 251183 867 13 445 081
Issued share capital 2015 253 183 867 11 445 081
Ordinary shares
2015 20141
Direct Beneficial
Indirect Beneficial
Held By Associate Total % Direct
BeneficialIndirect
BeneficialHeld By
Associate Total %
SI Bird 345 280 94 000 - 439 280 0.17% 328 612 94 000 - 422 612 0.17%MM Blair 168 455 26 324 400 195 179 0.08% 158 213 26 324 400 184 937 0.07%LJ Chiappini2 - - - - 0.00% - - - - 0.00%TA Chiappini-Young2 - - - - 0.00% 199 - - 199 0.00%SB Cohen 490 - 44 588 45 078 0.02% 490 14 013 44 588 59 091 0.02%SA Ellis 64 953 67 248 - 132 201 0.05% 61 319 67 248 - 128 567 0.05%K Getz - - 20 000 20 000 0.01% - - 20 000 20 000 0.01%MR Johnston - - 91 250 91 250 0.04% - - 91 250 91 250 0.04%WJ Swain - 611 670 - 611 670 0.24% - 611 670 - 611 670 0.24%
Total 1 534 658 0.61% 1 518 326 0.60%
Total issued share capital 253 183 867 251 183 867
Notes:
1 The direct beneficial interest relating to the FSP shares awarded to the executive Directors were disclosed seperately in the prior year in the Remuneration Report. The amounts reflected above have now been amended to include the 2014 direct beneficial interests relating to the FSP shares.2 Mr LJ Chiappini retired as Honorary Chairman on 27 February 2015 and accordingly his alternate, Tracey Chiappini-Young, left the Board on the same date.3 The 6 398 577 B ordinary shares not detailed above belong to:
(a) trusts (1 397 618 shares) of which Mr MR Johnston’s major children are beneficiaries. MR Johnston has no direct or indirect beneficial ownership in these shares and has relinquished all voting rights thereto;(b) Mr LJ Chiappini (5 000 759 shares)(c) Mr AE McArthur (200 shares)
4 There have been no changes in the above interests between the year end and the date of approval of these annual financial statements.
report of the directorsfor the year ended 28 March 2015 (continued)
Interest in shares of the Company
At the financial year end, the Directors were interested in the Company’s issued shares as follows:

PREVIOUS2015 ANNUAL FINANCIAL STATEMENTS CONTENTS NEXT
87
independent auditor’s report
final cash dividenddeclaration
TotheShareholdersofMrPriceGroupLimited
We have audited the consolidated and separate annual financial statements of Mr Price Group Limited, which comprise the consolidated and separate statements of financial position as at 28 March 2015, and the consolidated and separate statements of comprehensive income, consolidated and separate statement of changes in equity and consolidated and separate cash flows for the 52 weeks then ended, and a summary of significant accounting policies and other explanatory notes, as set out on pages 70 to 81 and pages 89 to 127.
Directors’ResponsibilityfortheFinancialStatements
The Company’s Directors are responsible for the preparation and fair presentation of these financial statements in accordance with International Financial Reporting Standards and the requirements of the Companies Act of South Africa, and for such internal control as the Directors determine is necessary to enable the preparation of consolidated financial statements that are free from material misstatement, whether due to fraud or error.
Auditor’sResponsibility
Our responsibility is to express an opinion on the financial statements based on our audit. We conducted our audit in accordance with International Standards on Auditing. Those standards require that we comply with ethical requirements and plan and perform the audit to obtain reasonable assurance about whether the financial statements are free from material misstatement.
An audit involves performing procedures to obtain audit evidence about the amounts and disclosures in the financial statements. The procedures selected depend on the auditor’s judgement, including the assessment of the risks of material misstatement of the financial statements, whether due to fraud or error. In making those risk assessments, the auditor considers internal control relevant to the entity’s preparation and fair presentation of the financial statements in order to design audit procedures that are appropriate in the circumstances, but not for the purpose of expressing an opinion on the effectiveness of the entity’s internal control. An audit also includes evaluating the appropriateness of accounting policies used and the reasonableness of accounting estimates made by management, as well as evaluating the overall presentation of the financial statements.
We believe that the audit evidence we have obtained is sufficient and appropriate to provide a basis for our audit opinion.
Opinion
In our opinion, the annual financial statements present fairly, in all material respects, the consolidated and separate financial position of Mr Price Group Limited as at 28 March 2015, and its consolidated and separate financial performance and consolidated and separate cash flows for the 52 weeks then ended in accordance with International Financial Reporting Standards, and the requirements of the Companies Act of South Africa.
OtherreportsrequiredbytheCompaniesAct
As part of our audit of the consolidated and separate financial statements for the year ended 28 March 2015, we have read the Directors’ Report, the Audit Committee’s Report and the Company Secretary’s Certificate for the purpose of identifying whether there are material inconsistencies between these reports and the audited consolidated and separate financial statements. These reports are the responsibility of the respective preparers. Based on reading these reports we have not identified material inconsistencies between these reports and the audited consolidated and separate financial statements. However, we have not audited these reports and accordingly do not express an opinion on these reports.
Ernst & Young Inc.Director – Jane Anne OlivaRegistered AuditorChartered Accountant (SA)
1 Pencarrow Crescent, La Lucia Ridge Office Estate, Durban, 4000
2 June 2015
Notice is hereby given that the Board has declared a final gross cash dividend of 368.5 cents per share (313.225 cents net of dividend withholding tax) per ordinary and B ordinary share. The increase in the final dividend is lower than HEPS growth due to the increase in the dividend payout ratio at the interim stage. The dividend has been declared from income reserves. A dividend withholding tax of 15% will be applicable to shareholders who are not exempt. The issued share capital at the declaration date is 253 183 867 listed ordinary and 11 445 081 unlisted B ordinary shares. The tax reference number is 9285/130/20/0.
The salient dates for the dividend will be as follows: Last date to trade ‘cum’ the dividend Thursday 11 June 2015 Date trading commences ‘ex’ the dividend Friday 12 June 2015 Record date Friday 19 June 2015 Payment date Monday 22 June 2015 Shareholders may not dematerialise or rematerialise their share certificates between Friday, 12 June 2015, and Friday,19 June 2015, both dates inclusive.
On behalf of the board
SI BirdCEO
NG PayneCHAIRMAN
Durban22 May 2015
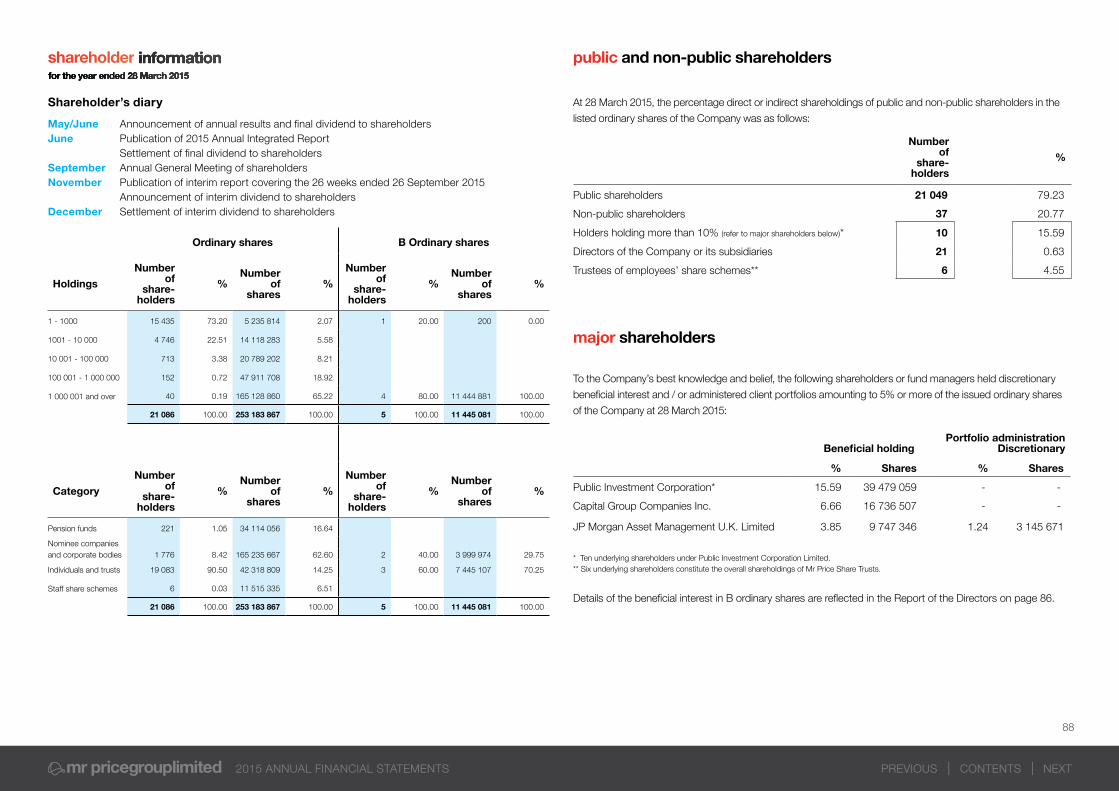
PREVIOUS2015 ANNUAL FINANCIAL STATEMENTS CONTENTS NEXT
88
public and non-public shareholders
At 28 March 2015, the percentage direct or indirect shareholdings of public and non-public shareholders in the
listed ordinary shares of the Company was as follows:
major shareholders
To the Company’s best knowledge and belief, the following shareholders or fund managers held discretionary
beneficial interest and / or administered client portfolios amounting to 5% or more of the issued ordinary shares
of the Company at 28 March 2015:
Number of
share-holders
%
Public shareholders 21 049 79.23
Non-public shareholders 37 20.77
Holders holding more than 10% (refer to major shareholders below)* 10 15.59
Directors of the Company or its subsidiaries 21 0.63
Trustees of employees’ share schemes** 6 4.55
Beneficial holdingPortfolio administration
Discretionary
% Shares % Shares
Public Investment Corporation* 15.59 39 479 059 - -
Capital Group Companies Inc. 6.66 16 736 507 - -
JP Morgan Asset Management U.K. Limited 3.85 9 747 346 1.24 3 145 671
Details of the beneficial interest in B ordinary shares are reflected in the Report of the Directors on page 86.
* Ten underlying shareholders under Public Investment Corporation Limited.** Six underlying shareholders constitute the overall shareholdings of Mr Price Share Trusts.
shareholder informationfor the year ended 28 March 2015
Shareholder’s diary
May/June Announcement of annual results and final dividend to shareholders June Publication of 2015 Annual Integrated Report
Settlement of final dividend to shareholders September Annual General Meeting of shareholders November Publication of interim report covering the 26 weeks ended 26 September 2015
Announcement of interim dividend to shareholdersDecember Settlement of interim dividend to shareholders
Ordinary shares B Ordinary shares
Holdings
Number of
share-holders
%Number
of shares
%
Number of
share-holders
%Number
of shares
%
1 - 1000 15 435 73.20 5 235 814 2.07 1 20.00 200 0.00
1001 - 10 000 4 746 22.51 14 118 283 5.58
10 001 - 100 000 713 3.38 20 789 202 8.21
100 001 - 1 000 000 152 0.72 47 911 708 18.92
1 000 001 and over 40 0.19 165 128 860 65.22 4 80.00 11 444 881 100.00
21 086 100.00 253 183 867 100.00 5 100.00 11 445 081 100.00
Category
Number of
share-holders
%Number
of shares
%
Number of
share-holders
%Number
of shares
%
Pension funds 221 1.05 34 114 056 16.64
Nominee companiesand corporate bodies 1 776 8.42 165 235 667 62.60 2 40.00 3 999 974 29.75
Individuals and trusts 19 083 90.50 42 318 809 14.25 3 60.00 7 445 107 70.25
Staff share schemes 6 0.03 11 515 335 6.51
21 086 100.00 253 183 867 100.00 5 100.00 11 445 081 100.00

PREVIOUS2015 ANNUAL FINANCIAL STATEMENTS CONTENTS NEXT
89
statement ofaccounting policiesfor the year ended 28 March 2015
1. Consolidation
The consolidated financial statements comprise the financial statements of the Group and its consolidated entities as at 28 March 2015.
Consolidated entities (which include special purpose entities such as staff share trusts) are defined as entities in which the Group has the power to govern the financial and operating policies of the entity so as to gain benefit from its activities. Control is achieved when the Group is exposed, or has rights, to variable returns from its involvement with the investee and has the ability to affect those returns through its power over the investee. Specifically, the Group controls an investee if, and only if, the Group has:
- Power over the investee (i.e. existing rights that give it the current ability to direct the relevant activities of the investee);
- Exposure, or rights, to variable returns from its involvement with the investee; and
- The ability to use its power over the investee to affect its returns.
When the Group has less than a majority of the voting or similar rights of an investee, the Group considers all relevant facts and circumstances in assessing whether it has power over an investee, including: - the contractual arrangement with the other vote
holders of the investee;- rights arising from other contractual arrangements;
and- the Group’s voting rights and potential voting rights.
The Group re-assesses whether or not it controls an investee if facts and circumstances indicate that there are changes to one or more of the three elements of control. Consolidation of a subsidiary begins when the Group obtains control over the subsidiary and ceases when the Group loses control of the subsidiary. Assets, liabilities, income and expenses of a subsidiary acquired or disposed of during the year are included in the consolidated financial statements from the date the Group gains control until the date the Group ceases to control the subsidiary. Profit or loss and each component of other comprehensive income (OCI) are attributed to the equity holders of the parent of the Group and to the non-controlling interests, even if this results in the non-controlling interests having a deficit balance. When necessary, adjustments are made to the financial statements of subsidiaries to bring their accounting policies into line with the Group’s accounting policies. All intra-group assets and liabilities, equity, income, expenses and cash flows relating to transactions between members of the Group are eliminated in full on consolidation. The Group uses the acquisition method of accounting to account for business combinations. The consideration transferred for the acquisition of a subsidiary is the fair values of the assets transferred, the liabilities incurred and the equity interests issued by the Group. The consideration transferred includes the fair value of any asset or liability resulting from a contingent consideration arrangement. Acquisition related costs are expensed as incurred. Identifiable assets acquired
and liabilities and contingent liabilities assumed in a business combination are measured initially at their fair values at the acquisition date. On an acquisition-by-acquisition basis, the Group recognises any non-controlling interest in the acquiree either at fair value or at the non-controlling interest’s proportionate share of the acquiree’s net assets.
If the business combination is achieved in stages, the previously held equity interest is remeasured at its acquisition date fair value and any resulting gain or loss is recognised in profit or loss. It is then considered in the determination of goodwill.
Any contingent consideration to be transferred by the acquirer will be recognised at fair value at the acquisition date. Contingent consideration classified as an asset or liability that is a financial instrument and within the scope of IAS 39 Financial Instruments: Recognition and Measurement is measured at fair value with changes in fair value recognised either in either profit or loss or as a change to other comprehensive income. If the contingent consideration is not within the scope of IAS 39, it is measured in accordance with the appropriate IFRS. Contingent consideration that is classified as equity is not remeasured and subsequent settlement is accounted for within equity. In the Company financial statements investments in subsidiaries are accounted for at cost less impairment. Cost is adjusted to reflect changes in consideration arising from contingent consideration amendments. Cost also includes direct attributable costs of investment. In the Group financial statements the excess of the consideration transferred, the amount of any non-controlling interest in the acquiree and the acquisition-date fair value of any previous equity interest in the acquiree over the fair value of the Group’s share of the identifiable net assets acquired is recorded as goodwill. If this is less than the fair value of the net assets of the subsidiary acquired in the case of a bargain purchase, the difference is recognised directly in the income statement.
Intercompany transactions, balances and unrealised gains/losses on transactions between Group companies are eliminated.
2. Fair value measurement
Fair value is the price that would be received to sell an asset or paid to transfer a liability in an orderly transaction between market participants at the measurement date. The fair value measurement is based on the presumption that the transaction to sell the asset or transfer the liability takes place either:
- In the principal market for the asset or liability, or- In the absence of a principal market, in the most
advantageous market for the asset or liability.
The principal or the most advantageous market must be accessible to by the Group.
The fair value of an asset or a liability is measured using the assumptions that market participants would use when pricing the asset or liability, assuming that market participants act in their economic best interest. A fair value measurement of a non-financial asset takes into account a market participant’s ability to generate economic benefits by using the asset in its highest and best use or by selling it to another market participant that would use the asset in its highest and best use. The Group uses valuation techniques that are appropriate in the circumstances and for which sufficient data is available to measure fair value, maximising the use of relevant observable inputs and minimising the use of unobservable inputs.
All assets and liabilities for which fair value is measured or disclosed in the financial statements are categorised within the fair value hierarchy, described as follows, based on the lowest level input that is significant to the fair value measurement as a whole:
- Level 1 — Quoted (unadjusted) market prices in active markets for identical assets or liabilities.
- Level 2 — Valuation techniques for which the lowest level input that is significant to the fair value measurement is directly or indirectly observable.
- Level 3 — Valuation techniques for which the lowest level input that is significant to the fair value measurement is unobservable.
For assets and liabilities that are recognised in the financial statements on a recurring basis, the Group determines whether transfers have occurred between levels in the hierarchy by re-assessing categorisation (based on the lowest level input that is significant to the fair value measurement as a whole) at the end of each reporting period.
For the purpose of fair value disclosures, the Group has determined classes of assets and liabilities on the basis of the nature, characteristics and risks of the asset or liability and the level of the fair value hierarchy as explained above. Fair values of financial instruments measured at amortised cost are disclosed in Note 27.
3. Property, plant and equipment
Capitalised leased office buildings are recognised at the fair value of the buildings at date of commencement of the lease agreement, or if lower, the present value of the minimum lease payments. The buildings are depreciated over the shorter of the period of the finance lease and the useful life of the buildings.
The annual financial statements have been prepared on the historic cost and going concern bases, except where indicated otherwise in a policy below. The annual financial statements are prepared in accordance with International Financial Reporting Standards (‘IFRS’). The consolidated financial statements are presented in Rands and all values are rounded to the nearest million (R Million), except when otherwise indicated.
The consolidated financial statements provide comparative information in respect of the previous period. In addition, the Group presents an additional statement of financial position at the beginning of the earliest period presented when there is a retrospective application of an accounting policy, a retrospective restatement, or a reclassification of items in financial statements.
Unless otherwise indicated, any references to the Group include the Company.

PREVIOUS2015 ANNUAL FINANCIAL STATEMENTS CONTENTS NEXT
90
Buildings occupied in the normal course of the business are recognised at cost less accumulated depreciation and impairment losses.
Furniture, fittings, equipment, vehicles, computer equipment and improvements to leasehold premises are stated at historic cost less accumulated depreciation and any accumulated impairment and are depreciated, on the straight-line basis to their expected residual values, over the estimated useful lives of the assets concerned which are as follows:
Furniture, fittings, equipment and vehicles- Furniture and fittings 6 to 8 years- Vehicles 5 to 6 years- Other equipment 6 to 14 years
Computer equipment 3 to 5 yearsImprovements to leasehold Over period of leasepremises subject to a maximum
of 10 yearsBuildings 20 years
Subsequent costs are included in the asset’s carrying amount or recognised as a separate asset, as appropriate, and only when it is probable that future economic benefits associated with the item will flow to the Group and the cost of the item can be measured reliably. The carrying amount of the replaced part is derecognised. All other repairs and maintenance are charged to the income statement during the financial period in which they are incurred.
The assets’ expected residual values, estimated useful lives, and depreciation policy are reviewed, and adjusted if appropriate, on an annual basis. Changes in the estimated useful life or expected pattern of consumption of future benefits embodied in the asset are accounted for by changing the depreciation period or method, as appropriate, and are treated as changes in accounting estimates.
4. Intangible assets
Intangible assets acquired separately are measured on initial recognition at cost. The cost of intangible assets acquired in a business combination is their fair value
at the date of acquisition. Following initial recognition, intangible assets are carried at cost less any accumulated amortisation and accumulated impairment losses. Internally generated intangible assets, excluding capitalised development costs, are not capitalised and expenditure is reflected in profit and loss in the period in which the expenditure is incurred.
ComputersoftwareAcquired software not regarded as an integral part of hardware is capitalised at historic cost and is amortised on the straight-line basis over its estimated useful life (2 to 10 years), from the date of its being commissioned into the Group.
All other costs that are directly associated with the production of identifiable software controlled by the Group, and that are expected to generate economic benefits exceeding 1 year, are recognised as part of the cost of the intangible assets. Direct costs include the software development employee costs. Costs associated with developing software are recognised as an expense as incurred if it is not expected that they will provide future economic benefits to the Group. GoodwillGoodwill represents the excess of the cost of acquisition over the fair value of the net identifiable assets of the acquired consolidated entity or operation at date of acquisition, and is carried at cost less accumulated impairment losses.
TrademarksTrademarks are initially recorded at historic cost. Trademarks acquired in a business combination are recognised at fair value at the acquisition date. Trademarks have a finite useful life and are carried at cost less accumulated amortisation and net of accumulated impairment. Amortisation is calculated on a straight-line basis to allocate the cost of trademarks over their estimated useful lives which do not exceed 20 years.
CustomerlistsAcquired customer lists are initially recorded at
historic cost and are carried at cost less accumulated amortisation. Amortisation is calculated on a straight-line basis to allocate the cost over the period from which it is expected to generate revenue (4 years).
Changes in the estimated useful life or expected pattern of consumption of future benefits embodied in intangible assets are accounted for by changing the amortisation period or method, as appropriate, and treated as changes in accounting estimates.
5. Impairment and derecognition of non-financial assets
Assets, other than financial assets, goodwill and intangible assets not yet brought into use, are tested for indicators of impairment on an annual basis. Should such an indicator exist, the asset is then tested for impairment. Separately recognised goodwill and intangible assets not yet brought into use are tested for impairment annually or more frequently if changes in circumstances indicate that the carrying amount may be impaired. The amount of the impairment is determined by assessing the recoverable amount of the asset or cash generating unit to which the asset relates. The recoverable amount is the higher of an asset’s fair value less costs to sell and value in use. In assessing value in use, the estimated future cash flows are discounted to their present value using a pre-tax discount rate that reflects current market assessments of the time value of money and the risks specific to the asset. In determining fair value less costs to sell, recent market transactions are taken into account, if available. If no such transactions can be identified, an appropriate valuation model is used. These calculations are corroborated by valuation multiples, quoted share prices for publicly traded subsidiaries or other fair value indicators. Where the recoverable amount of the asset or cash generating unit or group of cash generating units is less than the carrying amount, an impairment loss is recognised in the income statement. When an impairment loss subsequently reverses, the carrying amount of the asset or cash generating unit is increased to the revised estimate of its recoverable amount, but only to the extent of the carrying amount that would have been determined had no impairment loss been recognised previously. Impairments are reversed in the income statement in the period that the indicator of such reversal is in existence, unless the relevant asset is carried at a revalued amount, in which case the reversal is treated as a revaluation increase. Impairments to goodwill are never reversed.
The derecognition of a non-financial asset takes place upon disposal or when it is no longer expected
to generate any further economic benefits. Any derecognition gain/loss is recorded in the income statement in the period of derecognition.
6. Inventories
Inventories are valued at the lower of cost or net realisable value. Cost is determined on the following bases:
- The cost of merchandise purchased for resale is determined using the weighted average method; and
- Consumables are valued at invoice cost on a first-in, first-out basis.
Costs include the charges incurred in bringing inventories to their present location and condition and are net of discounts from suppliers. Net realisable value is the estimated selling price in the ordinary course of business, less applicable variable selling expenses.
7. Taxation
The taxation expense represents the sum of current taxation and deferred taxation. Taxation rates that have been enacted or substantively enacted by the reporting date are used to determine the taxation balances.
CurrenttaxationCurrent income tax assets and liabilities for the period are measured at the amount expected to be recovered from or paid to the taxation authorities. The taxation currently payable is based on the taxable profit for the year, which differs from the profit for the year in the income statement as it excludes both items of income or expense that are taxable or deductible in other years and those items that are never taxable or deductible. Current income taxation relating to items recognised directly in equity is also recognised in other comprehensive income or equity and not in profit or loss.
DeferredtaxationDeferred taxation is provided for all temporary differences (other than temporary differences created on initial recognition which are not part of a business combination and at the time of the transaction no taxation or accounting effect has been recognised and goodwill for which amortisation is not deductible for accounting purposes) arising between the tax bases of assets and liabilities and their carrying amounts on the statement of financial position. Deferred taxation relating to items recognised outside profit and loss is recognised outside profit and loss. Deferred taxation items are recognised in correlation to the underlying transaction either in other comprehensive income or directly in equity.
statement ofaccounting policies (continued)
for the year ended 28 March 2015

PREVIOUS2015 ANNUAL FINANCIAL STATEMENTS CONTENTS NEXT
91
Deferred tax assets and liabilities are measured at the tax rates that are expected to apply in the year when the asset is realised or the liability is settled, based on tax rates (and tax laws) that have been enacted or substantively enacted at the reporting date. Deferred taxation assets are only recognised to the extent that it is probable that the temporary differences will reverse in the foreseeable future and that future taxable profit will be available to allow all or part of the deferred taxation asset to be utilised. Deferred tax is provided on temporary differences arising on investments in consolidated entities and associates, except for deferred tax liabilities where the timing of the reversal of the temporary difference is controlled by the Group and it is probable that the temporary difference will not reverse in the foreseeable future. The carrying amount of deferred taxation assets is reviewed at each reporting date and reduced to the extent that it is no longer probable that sufficient taxable profits will be available to allow all or part of the asset to be recovered.
Deferred tax assets and deferred tax liabilities are offset if a legally enforceable right exists to set off current tax assets against current income tax liabilities and the deferred taxes relate to the same taxable entity and the same taxation authority.
Tax benefits acquired as part of a business combination, but not satisfying the criteria for separate recognition at that date, are recognised subsequently if new information about facts and circumstances change. The adjustment is either treated as a reduction to goodwill (as long as it does not exceed goodwill) if it was incurred during the measurement period or recognised in profit or loss.
Value-AddedTax(VAT)Expenses and assets are recognised net of the amount of VAT, except:- When the VAT incurred on a purchase of assets or
services is not recoverable from the taxation authority, in which case the VAT is recognised as part of the
cost of acquisition of the asset or as part of the expense item, as applicable.
Revenue and income are recognised net of the amount of VAT, except:- When the VAT due on the sale or income is not
payable to the taxation authority, in which case the full amount is recognised as revenue or income as applicable.
The net amount of VAT recoverable from, or payable to, the taxation authority is included as part of receivables or payables in the statement of financial position.
DividendWithholdingTax(DWT)DWT has replaced STC effective 1 April 2012 and is a tax levied on the beneficial owner of the shares instead of the Company. The tax is withheld by the Company and is paid over to the South African Tax Authority on the beneficiaries’ behalf. The resultant tax expense and liability has been transferred to the shareholder and is no longer accounted for as part of the tax charge for the Company. Amounts not yet paid over to the South African Tax Authority are included in trade and other payables and the measurement of the dividend amount is not impacted by the withholding tax.
8. Provisions
Provisions are recognised when the Group has a present obligation (legal or constructive) as a result of a past event, it is probable that an outflow of resources embodying economic benefits will be required to settle the obligation and a reliable estimate of the obligation can be made. Where the effect of discounting to present value is material, provisions raised are adjusted to reflect the time value of money. Provisions are reviewed at each reporting date and adjusted to reflect current best estimates.
9. Revenue recognition
Revenue is measured at the fair value of the consideration received or receivable, and is recognised when it is probable that the economic benefits associated with the transaction will flow to the Group and the amount of revenue can be reliably measured.
Revenue is shown net of estimated customer returns, discounts and VAT and after eliminating sales within the Group.
Revenue is recognised when there is evidence of an arrangement, collectability is probable, and the delivery of the product or service has occurred. In certain circumstances revenue is split into separately identifiable components and recognised when the related components are delivered in order to reflect the substance of the transaction. The consideration of each component is allocated on a relative fair value basis.
Retail salesRetail sales comprise net income from the sale of merchandise and are recognised when the significant risks and rewards of ownership pass to the customer. It is the Group’s policy to sell its products to the retail customer with a right to return within a specified period. Accumulated experience is used to estimate and provide for such returns.
PremiumincomePremiums are recognised when due in terms of the relevant contract and are shown before the deduction of commission and claims, which are recognised in administrative and other operating expenses.
ServicefeerevenueRevenue from a contract to provide services is recognised in the month in which the service charge accrues. Service fee revenue is derived from the provision of information technology and debtor management services.
ClubfeesClub fees are recognised in the month in which the customer charge accrues.
InterestInterest received is recognised on a time proportion basis at the effective interest rate as imputed in the contract.
RentalincomeRental income in respect of operating leases is recognised on a straight-line basis over the lease period.
DividendincomeDividend income includes the value of cash dividends received and surpluses distributed by a staff share trust and cumulative preference dividends distributed by a consolidated entity. Dividends are recognised when the right to receive payment has been established.
FeesFees represent fee income from consolidated entities in respect of various administrative and operating functions performed on their behalf. Fees are recognised when the charge accrues.
PrepaidAirtimesalesPrepaid Airtime sales are recognised once the significant risks and rewards of ownership pass to the customer.
ContractsContract products are defined as arrangements with multiple deliverables. Revenue from the handset is recognised when the handset is delivered. Monthly service revenue received from the customer is recognised in the period which the service is delivered. Airtime revenue is recognised on the usage basis commencing on activation date. Unused airtime is deferred in full and recognised in the month of usage or on expiry of the airtime.
Retail Voice and DataService arrangements include subscription fees, typically monthly revenue, which are recognised over the subscription period. Revenue related to local, long distance, network-to-network, roaming and international call connection services is recognised when the call is placed or the connection provided.
DonationIncomeDonations are recorded at fair value on the earlier of the receipt of cash or an uncondtional promise to give, in the period they received. All donations are considered to be available for unrestricted use unless specifically restricted by the donor. Amounts received that are restricted for future periods or are restricted by the donor for specific purposes are recognised as deferred revenue. Donations with no restrictions that are met prior to fiscal year end are recognised in profit and loss as ‘revenue’.
Unconditional promises to give are recognised as donations receivable only if there is a legally enforceable written agreement or promissory note and collection is reasonably assured.
10. Leases
Assets held in terms of finance leases, which transfer to the Group substantially all the risks and rewards of ownership, are capitalised at the inception of the lease at the fair value of the leased item or, if lower, the present value of the minimum lease payments. The corresponding liability to the lessor is recognised as a finance lease obligation. Lease payments are apportioned between finance charges (recognised as finance costs) and a reduction of the lease liability so as to achieve a constant rate of interest on the remaining balance of the liability.
A leased asset is depreciated over the useful life of the asset. However, if there is no reasonable certainty that the Group will obtain ownership by the end of the lease term, the asset is depreciated over the shorter of the estimated useful life of the asset and the lease term.
statement ofaccounting policies (continued)
for the year ended 28 March 2015

PREVIOUS2015 ANNUAL FINANCIAL STATEMENTS CONTENTS NEXT
92
Operating lease payments are recognised as an expense on a straight-line basis over the term of the lease. Contingent rentals (including turnover clause rentals) arising under operating leases are recognised as an expense in the period in which liability is accrued. The resulting difference arising from the straight-line basis and contractual cash flows is recognised as an operating lease obligation or asset.
11. Borrowing costs
Borrowing costs are capitalised where they are directly attributable to the acquisition, construction or production of a qualifying asset. All other borrowing costs are expensed in the period in which they occur.
12. Dividends to shareholders
Dividends in respect of equity instruments are recorded in the period in which the dividend is paid and are charged directly to equity.
13. Foreign currencies
FunctionalandpresentationcurrencyItems included in the financial statements of the Group’s foreign consolidated entities are measured using the currency of the primary economic environment in which the entity operates (‘functional currency’). The consolidated financial statements are presented in rands, which is the Group’s functional and presentation currency.
TransactionsandbalancesTransactions in foreign currencies are translated to the functional currency using the spot exchange rates prevailing at the dates of the transactions. Monetary assets and liabilities designated in foreign currencies are translated using the spot exchange rates prevailing at the reporting date. Non-monetary items are translated at historic rates or, where applicable, at the rate prevailing on the date of revaluation. All exchange differences are recognised in income in the period in which they occur.
GroupcompaniesThe results and position of consolidated entities
that have a functional currency that differs from the presentation currency are translated into the presentation currency as follows:
- Assets and liabilities for each statement of financial position presented are translated at the closing rate at the date of that statement of financial position;
- Income statement items are translated at the average rate for the period (unless this average is not a reasonable approximation of the cumulative effect of the rates prevailing on the transaction dates, in which case income and expenses are translated at the rate on the dates of the transactions); and
- All resulting exchange differences are recognised as a separate component of other comprehensive income.
Financial assets are reviewed annually for any evidence of impairment and any impairment loss is recognised immediately in the income statement.
On disposal of the consolidated entity, the accumulated exchange differences in other comprehensive income are recognised in the income statement.
14. Financial instruments
Financial assets and financial liabilities are recognised on the statement of financial position when the Group becomes a party to the contractual provisions of the instrument. Financial instruments are initially recognised at fair value plus transaction costs for all financial assets not carried at fair value through profit or loss. Financial assets carried at fair value through profit or loss are initially recognised at fair value, and transaction costs are expensed in the income statement. Subsequent measurement is made in accordance with the specific instrument provisions of IAS 39 Financial Instruments: Recognition and Measurement. Where a legally enforceable right of offset exists for recognised financial assets and liabilities, and the Group intends to settle on a net basis, or to realise the asset and settle the liability simultaneously, the related asset and liability are offset.
Long-termreceivablesLong-term receivables are classified as a ‘loan or receivable’ and are recorded at fair value at inception using the effective interest rate implicit in the cash
flows of the receivable. This effective interest rate is established by considering the market rate of interest for a similar investment on the date of each contribution. The long-term receivables are carried at amortised cost.
TradeandotherreceivablesTrade receivables, which generally have 6 to 12 month terms are recognised and are initially measured at amortised cost, namely the original invoice amount plus associated costs and interest charges to date, less any impairment allowance for uncollectible amounts, are classified as ‘loans and receivables’. Provision is made when there is objective evidence that the Group will have difficulty collecting the debts. Various economic factors and changes in the delinquency of payments are considered indicators that the trade receivables are impaired. The carrying amount of the asset is reduced through the use of an allowance account, and the amount of the loss is recognised in the income statement within selling expenses. Bad debts are written off in the income statement when it is considered that the Group will be unable to recover the debt and it has been handed over for collection. Subsequent recoveries of amounts previously written off are credited against selling expenses in the income statement.
Other receivables are initially measured at fair value and are subsequently measured at amortised cost using the effective interest rate method and are carried net of any accumulated impairment.
CashandcashequivalentsCash and cash equivalents comprise cash at banks and on hand and short-term deposits with an original maturity of three months or less, net of bank overdrafts. Cash and cash equivalents are classified as receivables originated by the enterprise and are measured at amortised cost.
DerivativefinancialinstrumentsThe Group uses derivative financial instruments such as forward exchange contracts to hedge its risks associated with foreign currency fluctuations. Derivative financial instruments are initially recognised at fair value on the date the contract is entered into and are subsequently measured at fair value, which is calculated with reference to current forward exchange contracts with equivalent maturity periods. Gains or losses arising from fair value adjustments are taken directly to the income statement.
TradeandotherpayablesTrade payables, which are primarily settled on 30 day terms, are initially measured at cost, being the fair value of the consideration to be paid in the future for goods and services rendered. These are subsequently measured at amortised cost using the effective interest rate method.
Other payables are initially measured at fair value and are subsequently measured at amortised cost using the effective interest rate method.
LoansandborrowingsLoans and borrowings are initially recognised at the fair value of the consideration received plus directly attributable transaction costs. They are subsequently measured at amortised cost using the effective interest rate method.
FinancialguaranteesFinancial guarantees are initially recognised at their fair value and are subsequently measured at the higher of:
- The amount of the obligation under the contract, as determined in accordance with IAS 37 Provisions, Contingent Liabilities and Contingent Assets; and
- The amount initially recognised less, where appropriate, cumulative amortisation recognised.
Amountsowingby/toconsolidatedentitiesConsolidated entity balances are initially recognised at the fair value of the consideration received, and are subsequently measured at amortised cost using the effective interest rate method. Current amounts owing are settled on 30 day terms.
ImpairmentsandderecognitionFinancial assets are reviewed annually for any evidence of impairment. Provision is made for impairment if, and only if, there is objective evidence of impairment as a result of one or more events that occurred after the initial recognition of the asset and that loss event (or events) has an impact on the estimated future cash flows of the financial asset or group of financial assets that can be reliably measured.
For loans and receivables, the amount of the loss is measured as the difference between the asset’s carrying amount and the present value of estimated future cash flows (excluding future credit losses that have not been incurred), discounted at the financial asset’s original effective interest rate. The carrying amount is reduced and the amount of the loss is recognised in the income statement. If the loan has a variable rate, the discount rate for measuring any impairment loss is the current effective interest rate under the contract. If considered practical, the impairment may be measured on the basis of an instrument’s fair value using an observable market price.
If, in a subsequent period, the amount of the impairment loss decreases and the decrease can be objectively related to an event occurring after the impairment was recognised, the previously recognised impairment loss is reversed in the income statement.
statement ofaccounting policies (continued)
for the year ended 28 March 2015

PREVIOUS2015 ANNUAL FINANCIAL STATEMENTS CONTENTS NEXT
93
A financial asset (or, where applicable, a part of a financial asset or part of a Group of similar financial assets) is primarily derecognised (i.e. removed from the Group’s consolidated statement of financial position) when:
- The rights to receive cash flows from the asset have expired; or
- The Group has transferred its rights to receive cash flows from the asset or has assumed an obligation to pay the received cash flows in full without material delay to a third party under a ‘pass-through’ arrangement; and either (a) the Group has transferred substantially all the risks and rewards of the asset, or (b) the Group has neither transferred nor retained substantially all the risks and rewards of the asset, but has transferred control of the asset.
When the Group has transferred its rights to receive cash flows from an asset or has entered into a pass-through arrangement, it evaluates if and to what extent it has retained the risks and rewards of ownership. When it has neither transferred nor retained substantially all of the risks and rewards of the asset, nor transferred control of the asset, the Group continues to recognise the transferred asset to the extent of the Group’s continuing involvement. In that case, the Group also recognises an associated liability. The transferred asset and the associated liability are measured on a basis that reflects the rights and obligations that the Group has retained. Continuing involvement that takes the form of a guarantee over the transferred asset is measured at the lower of the original carrying amount of the asset and the maximum amount of consideration that the Group could be required to repay.
Any derecognition gain/loss is recorded in the income statement in the period of derecognition. The Group derecognises financial liabilities when the Group’s obligations are discharged, cancelled or they expire.
15. Reinsurance
The Group assumes insurance risk in the normal course of business. Reinsurance assets represents balances
due from registered insurance companies. Amounts receivable are estimated in a manner consistent with the related reinsurance contract.
Reinsurance assets are reviewed for impairment at each reporting date, or more frequently, when an indication of impairment arises during the reporting year. Impairment occurs when there is objective evidence as a result of an event that occurred after initial recognition of the reinsurance asset that as a result of which the Group may or may not receive all outstanding amounts due under the the terms of the contact and the event has a reliably measurable impact on the amounts that the Group will receive from the insurer. Any related impairment loss is recorded in the income statement.
Reinsurance liabilities represent balances due to registered insurance companies. Amounts payable are estimated in a manner consistent with the outstanding claims provision or settled claims associated with the insurer’s policies and are in accordance with the related reinusrance contract.
Premiums and claims on assumed reinsurance are recognised as revenue or expenses in the same manner as they would be if the reinsurance were considered a direct business/activity of the Group, taking into account the product classification of the reinsurance business.
Premiums and claims, assets and liabilities, are presented on a gross basis for the assumed reinsurance.
Reinsurance assets and liabilities are derecognised when the contractual rights are extinguished or expire or when the contract is transferred to another party.
16. Employee benefits
Short-termemployeebenefitsShort-term employee benefits are recognised in the period of service. Short-term employee benefits paid in advance are treated as prepayments and are expensed over the period of the benefit.
Postretirementbenefits
Definedbenefitretirementfundandpostretirementmedicalaidfund
The costs of providing benefits under the defined retirement benefit fund and the obligation for post retirement medical aid benefits (which is limited to members of the defined benefit retirement fund) is determined using the projected unit credit actuarial valuation method. Actuarial gains or losses, which can arise from differences between expected and actual outcomes, or changes in actuarial assumptions, are recognised immediately in other comprehensive income. Any increase in the present value of plan liabilities expected to arise from employee service during the period is charged to operating profit.
The defined benefit fund asset reflected in the statement of financial position represents the present value of the defined benefit asset as adjusted for unrecognised past service costs and as reduced by the fair value of scheme assets. The asset resulting from this calculation is limited to past service costs, plus the present value of available refunds and reductions in future contributions to the plan.
Past service costs are recognised immediately to the extent that benefits have already vested, and are otherwise amortised on a straight-line basis over the average period until the benefits become vested.
DefinedcontributionretirementfundPayments to defined contribution retirement funds are expensed as they accrue in terms of services provided by employees.
Share-basedpaymentsThe Group operates share incentive schemes for the granting of non-transferable options or shares to associates (employees). Equity-settled share-based payments in terms of the schemes are measured at fair value (excluding the impact of any non-market vesting conditions) at the date of the grant, which is expensed over the period of vesting of the grant, with a corresponding adjustment to equity. Fair value is actuarially determined using a binomial valuation model. At each reporting date the estimate of the number of options that are expected to vest is revised, and the impact of this revision is recognised on a cumulative catch-up basis in the income statement, with a corresponding adjustment to equity. Assumptions used in the respective valuations are detailed in note 9.5. Upon vesting, the amount remaining in the share-based payment reserve relating to any such vested tranche is transferred within equity to retained earnings.
RestraintsoftradeRestraints of trade payments are expensed over the contractual periods from which benefits are expected.
PerformanceincentivesThe Group recognises a liability and expense for performance incentives which include a component based on formulae which take into consideration the profit for the year and other operational targets.
17. Treasury shares
Shares in Mr Price Group Limited held by the staff share trusts are classified as treasury shares and are recognised at cost and deducted from equity. No gain or loss is recognised in profit or loss on the purchase, sale, issue or cancellation of the Company’s own equity instruments. Any difference between the carrying amount and the consideration, if reissued, is recognised as equity. Voting rights related to these shares are restricted for the Company only on resolutions applicable to the share trusts. Share options exercised during the reporting period are settled with treasury shares.
18. Segmental reporting
The Group’s retailing operations are reported within two operating segments, namely the Apparel and Home segments. Group service divisions are reported in the Central Services segment. The Group presents information about geographical areas based on retail sales and other income. The information reported is similar to the information provided to the management to enable them to assess performance and allocate resources.
19. Cost of sales
Cost of sales comprise the direct cost of merchandise sold and incorporates the cost of distribution, inventory losses and provisions for markdowns less discounts received from suppliers.
20. Selling expenses
Selling expenses comprise the costs incurred in the marketing and advertising of merchandise, store operations and the provision of credit, airtime and mobile facilities.
21. Administrative and other operating expenses
These expenses comprise costs related to the operation of the support functions within the Group other than those included in selling expenses.
statement ofaccounting policies (continued)
for the year ended 28 March 2015

PREVIOUS2015 ANNUAL FINANCIAL STATEMENTS CONTENTS NEXT
94
consolidated statements of financial positionfor the year ended 28 March 2015
Group Company
R’m Notes
201528 March
201429 March
201528 March
201429 March
Assets
Non-current assets 1 364 1 137 1 254 1 079
Property, plant and equipment 3 838 718 752 659
Intangible assets 4 328 215 295 208
Consolidated entities 5 23 18
Long-term receivables 6 6 7 6 7
Defined benefit fund asset 28 40 45 40 45
Deferred taxation assets 16 152 152 138 142
Current assets 6 503 5 426 6 102 5 109
Inventories 7 1 741 1 403 1 596 1 303
Trade and other receivables 8 1 874 1 673 1 835 1 651
Reinsurance assets 14 124 98 124 98
Current amounts owing by consolidated entities 5 424 290
Cash and cash equivalents 2 764 2 252 2 123 1 767
Total assets 7 867 6 563 7 356 6 188
Equity and liabilities
Equity attributable to equity holders of the parent 5 030 3 923 4 605 3 618
Issued capital* 9 - - - -
Capital reserves 10 263 198 219 161
Treasury share transactions 11 (1 235) (1 311) (1 442) (1 446)
Retained income 6 048 5 048 5 831 4 898
Foreign currency translation reserve 12 (43) (17) - -
Defined benefit fund actuarial gains and losses 13 (3) 5 (3) 5
Non-controlling interests 5 (9) (1) - -
Total Equity 5 021 3 922 4 605 3 618
Non-current liabilities 213 220 187 201
Lease obligations 15 164 179 157 172
Deferred taxation liabilities 16 4 6 - -
Long-term provisions 17 6 7 6 7
Long-term liabilities 5 15 6 - -
Post retirement medical benefits 28 24 22 24 22
Current liabilities 2 633 2 421 2 564 2 369
Trade and other payables 18 2 116 1 982 2 051 1 931
Reinsurance liabilities 14 46 34 46 34
Current amounts owing to consolidated entities 5 10 7
Current provisions 17 7 4 7 4
Current portion of lease obligations 15 56 47 53 46
Taxation 408 354 397 347
Total equity and liabilities 7 867 6 563 7 356 6 188
*less than R1 million
Group Company
R’m Notes
201528 March
201429 March
201528 March
201429 March
Revenue 18 099 15 892 17 798 15 754
Retail sales and other revenue 18 011 15 829 17 719 15 695
Retail sales 17 285 15 227 16 858 14 883
Interest on trade receivables 355 311 353 310
Income from consolidated entities 182 222
Premium income 177 147 177 147
Club fees 15 12 14 11
Airtime and related mobile revenue 163 120 134 120
Other revenue 16 12 1 2
Finance interest received 88 63 79 59
Costs and expenses 14 935 13 292 14 676 13 147
Cost of sales 10 186 8 907 10 169 8 929
Selling expenses 3 602 3 354 3 378 3 193
Administrative and other operating expenses 1 147 1 031 1 129 1 025
Profit from operating activities 19 3 076 2 537 3 043 2 548
Finance costs (1) - - -
Finance interest received 88 63 79 59
Profit before taxation 3 163 2 600 3 122 2 607
Taxation 20 878 733 845 708
Profit after taxation 2 285 1 867 2 277 1 899
Attributable to:
Non-controlling interests 5 (8) (1)
Equity holders of the parent 2 293 1 868
Profit attributable to shareholders 2 285 1 867 2 277 1 899
Earnings per share cents per share cents per share % change
Basic 21 917.3 757.1 21.2
Headline 21 919.7 765.1 20.2
Diluted basic 21 862.9 707.4 22.0
Diluted headline 21 865.1 715.1 21.0
consolidated income statementsfor the year ended 28 March 2015

PREVIOUS2015 ANNUAL FINANCIAL STATEMENTS CONTENTS NEXT
95
consolidated statements of comprehensive incomefor the year ended 28 March 2015
consolidated statements of cash flowsfor the year ended 28 March 2015
Group Company
R’m Notes
201528 March
201429 March
201528 March
201429 March
Profit attributable to shareholders 2 285 1 867 2 277 1 899
Other comprehensive income
Currency translation adjustments 12 (26) (1)
Defined benefit fund actuarial (losses)/gains 13 (11) 18 (11) 18
Deferred taxation thereon 13 3 (5) 3 (5)
Total comprehensive income for the year attributable to shareholders, net of taxation
2 251 1 879 2 269 1 912
Attributable to:
Non-controlling interests (8) (1)
Equity holders of the parent 2 259 1 880 2 269 1 912
Total comprehensive income for the year attributable to shareholders, net of taxation
2 251 1 879 2 269 1 912
Group Company
R’m Notes
201528 March
201429 March
201528 March
201429 March
Cash flows from operating activities
Operating profit before working capital changes 24.1 3 039 2 548 2 982 2 542
Working capital changes 24.2 (422) 343 (374) 347
Cash generated from operations 2 617 2 891 2 608 2 889
Interest on trade receivables 355 311 353 310
Net finance income received 87 63 79 59
Taxation paid 24.3 (795) (403) (760) (380)
Net cash inflows from operating activities 2 264 2 862 2 280 2 878
Cash flows from investing activities
Net inflows in respect of long-term receivables 24.4 1 1 1 1
Proceeds on disposal of intangible assets 3 - 3 -
Investment in subsidiary 5.3 (30) - - 29
Replacement of intangible assets (22) (30) (22) (30)
Additions to intangible assets (99) (121) (92) (119)
Replacement of property, plant and equipment (138) (124) (123) (124)
Additions to property, plant and equipment (172) (129) (146) (110)
Proceeds on disposal of property, plant andequipment 1 22 1 -
Net cash outflows from investing activities (456) (381) (378) (353)
Cash flows from financing activities
Decrease in net current amounts owing to/byconsolidated entities 24.5 (131) (142)
Increase in long-term liability 9 6 - -
Dividends to shareholders 24.6 (1 340) (1 094) (1 391) (1 146)
Grants to staff share trusts (16) (233)
Treasury share transactions 55 (289) (8) (13)
Net cash outflows from financing activities (1 276) (1 377) (1 546) (1 534)
Net increase in cash and cash equivalents 532 1 104 356 991
Cash and cash equivalents at beginning of the year 2 252 1 150 1 767 776
Exchange losses (20) (2) - -
Cash and cash equivalents at end of the year 2 764 2 252 2 123 1 767
Note:Of the above components of other comprehensive income, only the currency translation adjustments are recyclable through profit or loss.

PREVIOUS2015 ANNUAL FINANCIAL STATEMENTS CONTENTS NEXT
96
statement of changes in equity for the year ended 28 March 2015
Attributable to the equity holders of the parentCapital Reserves Treasury share transactions
R’m
NotesShare
capital* Share
premium
Participants in staff share investment
trust
Capital redemption
reserve fund*
Share-based
payments reserve
Treasury shares at
cost
Deficit on treasury share
transactions
Taxation relating to grants to
share trusts
Foreign currency
translation reserve
Defined benefit fund
actuarial gains and
losses
Retained income
Total Non-
controlling interests
Total Equity
Group
Balance at 31 March 2013 - 12 20 - 137 (791) (373) 105 (16) (8) 4 223 3 309 - 3 309
Total comprehensive income (1) 13 1 868 1 880 (1) 1 879
Profit for the year 1 868 1 868 (1) 1 867 Other comprehensive income: (1) 13 - 12 - 12 Currency translation adjustments 12 (1) (1) (1)Defined benefit fund actuarial gains 13 18 18 18Deferred taxation thereon 13 (5) (5) (5)
Treasury shares acquired 11 (365) (365) (365)Taxation relating to grants to share trusts 11 41 41 41 Effect of consolidation of staff share trusts 11 5 (5) - -Deficit on treasury share transactions 11 (186) (186) (186)Recognition of share-based payments 75 75 75 Share-based payments reserve released toretained income for vested options
(51) 51 - -
Treasury shares sold 11 263 263 263 2013 final dividend to shareholders 22 (666) (666) (666)2014 interim dividend to shareholders 22 (428) (428) (428)
Balance at 29 March 2014 - 12 25 - 161 (898) (559) 146 (17) 5 5 048 3 923 (1) 3 922
Total comprehensive income (26) (8) 2 293 2 259 (8) 2 251
Profit for the year 2 293 2 293 (8) 2 285 Other comprehensive income (26) (8) - (34) - (34)Currency translation adjustments 12 (26) (26) (26)Defined benefit fund actuarial losses 13 (11) (11) (11)Deferred taxation thereon 13 3 3 3
Conversion of B ordinary to ordinary share capital* 11 - - - -Treasury shares acquired 11 (39) (39) (39)Taxation relating to grants to share trusts 11 28 28 28 Effect of consolidation of staff share trusts 11 7 (7) - -Deficit on treasury share transactions 11 (267) (267) (267)Recognition of share-based payments 9 105 105 105 Share-based payments reserve released toretained income for vested options
(47) 47 - -
Treasury shares sold 11 361 361 361 2014 final dividend to shareholders 22 (798) (798) (798)2015 interim dividend to shareholders 22 (542) (542) (542)
Balance at 28 March 2015 - 12 32 - 219 (583) (826) 174 (43) (3) 6 048 5 030 (9) 5 021
*Less than R1 million

PREVIOUS2015 ANNUAL FINANCIAL STATEMENTS CONTENTS NEXT
97
statement of changes in equity for the year ended 28 March 2015
Capital Reserves Treasury share transactions
R’m
Notes Share capital* Share
premium*
Participants in staff share investment
trust
Capital redemption
reserve fund*
Share-based payments reserve
Treasury shares at cost
Deficit on treasury share transactions
Taxation relating to
grants to share trusts
Defined benefit fund actuarial
gains and losses
Retained income
Total Equity
Company
Balance at 31 March 2013 - - - - 137 (1 153) (193) 105 (8) 4 094 2 982
Total comprehensive income 13 1 899 1 912
Profit for the year 1 899 1 899Other comprehensive income: 13 13 Defined benefit fund actuarial gains 13 18 18 Deferred taxation thereon 13 (5) (5)
Grants to staff share trusts 11 (233) (233)Deficit on treasury share transactions 11 (13) (13)Taxation relating to grants to share trusts 11 41 41Recognition of share-based payments 9 75 75 Share-based payments reserve released toretained income for vested options
(51) 51 -
2013 final dividend to shareholders 22 (701) (701)2014 interim dividend to shareholders 22 (445) (445)
Balance at 29 March 2014 - - - - 161 (1 386) (206) 146 5 4 898 3 618
Total comprehensive income (8) 2 277 2 269
Profit for the year 2 277 2 277 Other comprehensive income (8) (8)Defined benefit fund actuarial losses 13 (11) (11)Deferred taxation thereon 13 3 3
Conversion of B ordinary to ordinary share capital 11 - - -Treasury shares acquired 11 (16) (16)Deficit on treasury share transactions 11 (8) (8)Taxation relating to grants to share trusts 11 28 28Recognition of share-based payments 105 105 Share-based payments reserve released toretained income for vested options
(47) 47 -
2014 final dividend to shareholders 22 (831) (831)2015 interim dividend to shareholders 22 (560) (560)
Balance at 28 March 2015 - - - - 219 (1 402) (214) 174 (3) 5 831 4 605
*Less than R1 million

PREVIOUS2015 ANNUAL FINANCIAL STATEMENTS CONTENTS NEXT
98
Statement, Interpretation or StandardEffective for annual
periods beginning
IFRS 10, IFRS 12 and IAS 27 Investment Entities - amendments 1 January 2014IAS 32 Offsetting Financial Assets and Financial Liabilities - amendments 1 January 2014IAS 36 Recoverable Amount Disclosures for Non-Financial Assets - amendments 1 January 2014IFRIC 21 Levies 1 January 2014AIP* IFRS 1 First-time Adoption of International Financial Reporting Standards - Meaning of ‘effective IFRSs’
1 January 2014
AIP* IFRS 13 Fair Value Measurement - Short-term receivables and payables 1 January 2014*AIP: Annual IFRS Improvements Process
1. Adoption of new Standards and changes in accounting policies
The following new Standards and Interpretations that were applicable were adopted during the year and did not lead to any changes in the Group’s accounting policies.
Statement, Interpretation or StandardEffective for annual
periods beginning
IAS 19 Defined Benefit Plans: Employee Contributions - amendments 1 July 2014
IFRS 10 and IAS 28 Sale or Contribution of Assets between an Investor and its Associate or Joint Venture - amendments
1 January 2016
IFRS 10, IFRS 12 and IAS 28 Investment Entities: Applying the Consolidation Exception - amendments
1 January 2016
IFRS 11 Accounting for Acquisitions of Interests in Joint Operations - amendments
1 January 2016
IAS 1 Disclosure Initiative - amendments 1 January 2016
IAS 16 and IAS 38 - Clarification of Acceptable Methods of Depreciation and Amortisation - amendments
1 January 2016
IAS 27 - Equity Method in Separate Financial Statements - amendments 1 January 2016IFRS 15 Revenue from Contracts with Customers 1 January 2017IFRS 9 Financial Instruments 1 January 2018Annual Improvements 2010-2012 Cycle 1 July 2014Annual Improvements 2011-2013 Cycle 1 July 2014Annual Improvements 2012-2014 Cycle 1 January 2016
1.2 Standards and amendments issued but not yet effective
At the date of authorisation of these financial statements, the following Statements, Interpretations and Standards were in issue but not yet effective:
The Directors anticipate that the adoption of the above in future periods will have no material financial impact on the financial statements of the Group and will only result in additional disclosure requirements with the exception of IFRS 9 and 15. The impact of these new statements is currently being assessed. These statements, interpretations and standards will be adopted at the respective effective dates.
notes to the financial statements for the year ended 28 March 2015
2. Significant accounting estimates
Estimationuncertainty
The key assumptions concerning the future and other key sources of information uncertainty at the reporting date that have a significant risk of causing a material adjustment to the carrying amounts of assets and liabilities within the next financial year are set out as follows:
Employeebenefitsactuariallydetermined
The costs of the defined benefit pension fund plan, the post retirement medical benefit fund and share-based payments are determined actuarially. The actuarial valuations involve making assumptions regarding various factors (as detailed in notes 9.4, 9.5 and 29.5). Due to the long-term nature of these liabilities such estimates are subject to uncertainty.
Provisionfornetrealisablevalueofinventory
The provision for net realisable value of inventory represents management’s estimate of the extent to which merchandise on hand at the reporting date will be sold below cost. This estimate takes into consideration past trends, evidence of impairment at year end and an assessment of future saleability, which takes into account fashionability and seasonal changes.
Provisionforimpairmentoftradereceivables
The provision for impairment of trade receivables represents management’s estimate of the extent to which trade receivables at the reporting date will not be subsequently recovered. This estimate takes into consideration past trends and makes an assessment of additional risk factors, which are likely to impact recoverability.
IncomeTaxes
The Group is subject to income tax in more than one jurisdiction. Significant judgement is required in determining the provision for income taxes. There are many transactions and calculations for which the ultimate tax determination is uncertain during the ordinary course of business. The Group recognises liabilities for anticipated tax issues based on estimates of whether additional taxes will be due. Where the final tax outcome of these matters is different from the amounts that were initially recorded, such differences will impact the current and deferred income tax assets and liabilities in the period in which such determination is made.

PREVIOUS2015 ANNUAL FINANCIAL STATEMENTS CONTENTS NEXT
99
3. Property, plant and equipment
Group Company
R’m2015 2014 2015 2014
Owned
Cost or carrying amount 1 948 1 700 1 823 1 611
Accumulated depreciation and impairment (1 110) (982) (1 071) (952)
Net carrying amount 838 718 752 659
Leased
Cost 27 27 27 27
Accumulated depreciation (27) (27) (27) (27)
Net carrying amount - - - -
Total net carrying amount 838 718 752 659
An analysis of the movement of property, plant and equipment is shown on pages 124 and 125.
4. Intangible assets
Cost or carrying amount 453 313 419 306
Accumulated amortisation and impairment (125) (98) (124) (98)
Net carrying amount 328 215 295 208
An analysis of the movement of intangible assets is shown on page 126.
notes to the financial statements for the year ended 28 March 2015

PREVIOUS2015 ANNUAL FINANCIAL STATEMENTS CONTENTS NEXT
100
5. Consolidated entities and material partly-owned subsidiaries 5.2 Material partly-owned subsidiaries
Financial information of subsidiaries that have non-controlling interests are provided below:
This information is based on amounts before inter-company eliminations.The summarised financial information of these subsidiaries is provided below.
Company
R’m2015 2014
5.1 Consolidated entities
Carrying value of shares 5 5
Carrying value of long-term loans 18 13
Long-term loans at cost 19 14
Impairment provisions (1) (1)
The loans are unsecured, bear interest at rates of up to 15% per annum and have no fixed dates of repayment.
23 18
Net current amounts owing by consolidated entities 414 283
Current amounts owing by consolidated entities 424 290
Current amounts owing to consolidated entities (10) (7)
Current accounts are interest free and are settled within 12 months.
437 301
An analysis of the financial interest in consolidated entities is shown on page 127.
MRP Mobile (Pty) Ltd
%2015 2014
Proportion of equity interest held by non-controlling interests 45 45
R’m2015 2014
Accumulated balances of material non-controlling interest (1) -
Loss allocated to material non-controlling interest (8) (1)
Total comprehensive income (9) (1)
R’m2015 2014
Summarised income statement:
Revenue 29 -
Cost of sales (33) -
Selling expenses (14) (1)
Administration and other operating expenses - (1)
Loss before taxation (18) (2)
Taxation 1 -
Total comprehensive loss (17) (2)
Attributable to non-controlling interests (8) (1)
notes to the financial statements for the year ended 28 March 2015

PREVIOUS2015 ANNUAL FINANCIAL STATEMENTS CONTENTS NEXT
101
notes to the financial statements for the year ended 28 March 2015
5.2 Material partly-owned subsidiaries (continued)
Financial information of subsidiaries that have non-controlling interests is provided below:
MRP Mobile (Pty) Ltd
R’m 2015 2014
Summarised statement of financial position:
Inventories 4 -
Intangible assets 4 2
Trade and other receivables 17 1
Cash and cash equivalents 2 14
Long-term liability (15) (6)
Trade and other payables (13) (5)
Inter-company balance (19) (8)
Net equity (20) (2)
Attributable to equity holders of parent (11) (1)
Non-controlling interest (9) (1)
Summarised statement of cash flows:
Operating (17) 9
Investing (3) (2)
Financing 8 7
Net (decrease)/increase in cash and cash equivalents (12) 14
R’m 2015
Fair value of assets acquired at the date of acquisition
Property, plant and equipment 2
Inventory 5
Goodwill arising on acquisition 24
Consideration 31
Amount payable (1)
Cash outflow 30
Long-termliability
The long-term liability disclosed above, which has been subordinated, represents a loan received from the non-controlling shareholders of the subsidiary. The loan has no set date of repayment and bears interest at a rate determined at the discretion of the Directors, currently 0%.
5.3 Acquisition of franchise operations
On 2 June 2014, the Group concluded an agreement to purchase the net assets of the Zambian franchise to expand its operations. No non-controlling interests have been recognised as part of the transaction.
Goodwill comprises the fair value of intangible assets that do not qualify for separate recognition, and represents growth and synergies expected to accrue from the acquisitions. The goodwill is not deductible for income tax purposes. These financial statements of the Group include the results of the Zambian stores for a period of 10 months from the acquisition date. From the date of acquisition, these Zambian stores have contributed revenue of R71 million and net profit before tax of R9 million to the Group. If the acquisition had taken place at the beginning of the year, revenue would have been R85 million and the profit for the period would have been R11 million. Transaction costs of R1 million have been expensed.
Impairment testing of goodwill Goodwill acquired through business combinations is tested annually for impairment, which was performed in March 2015. The Company considers the relationship between the value in use of the cash generating unit (CGU), among other factors, when reviewing for indicators of impairment. At year end, there were no indications of impairment. The calculation of value in use is most sensitive to the following assumptions: -Margins
Margins are based on values to be achieved over the 5 year budget period. These are increased over the budget period for anticipated efficiency improvements.
- Discount ratesDiscount rates represent the current market assessment of the risks specific to the CGU, taking into consideration the time value of money and individual risks of the underlying assets that have not been incorporated in the cash flow estimates.
The discount rate calculation is based on the specific circumstances of the Company and is derived from its weighted average cost of capital (WACC). The WACC takes into account both debt and equity. The cost of equity is derived from the expected return on investment by the Company’s investors. The cost of debt is based on the interest-bearing borrowings the Company is obliged to service. Adjustments to the discount rate are made to factor in the specific amount and timing of the future tax flows in order to reflect a pre-tax discount rate.
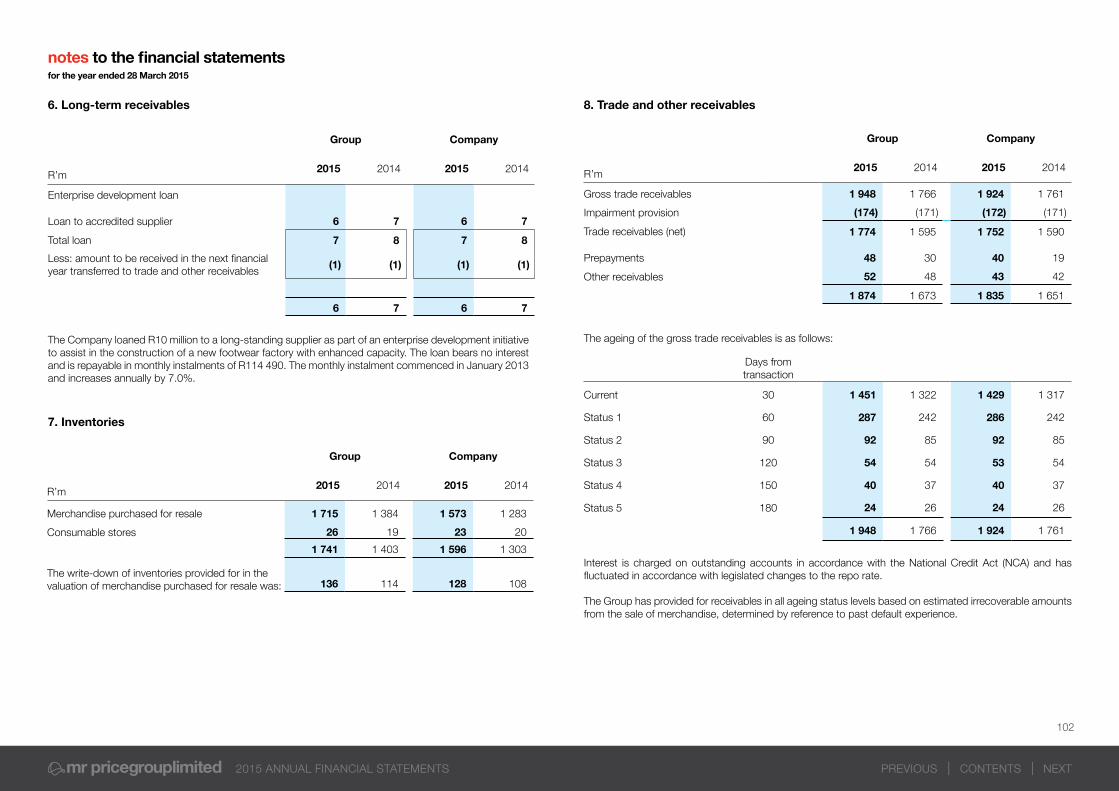
PREVIOUS2015 ANNUAL FINANCIAL STATEMENTS CONTENTS NEXT
102
6. Long-term receivables
7. Inventories
Group Company
R’m2015 2014 2015 2014
Enterprise development loan
Loan to accredited supplier 6 7 6 7
Total loan 7 8 7 8
Less: amount to be received in the next financial year transferred to trade and other receivables
(1) (1) (1) (1)
6 7 6 7
The Company loaned R10 million to a long-standing supplier as part of an enterprise development initiative to assist in the construction of a new footwear factory with enhanced capacity. The loan bears no interest and is repayable in monthly instalments of R114 490. The monthly instalment commenced in January 2013 and increases annually by 7.0%.
Group Company
R’m2015 2014 2015 2014
Merchandise purchased for resale 1 715 1 384 1 573 1 283
Consumable stores 26 19 23 20
1 741 1 403 1 596 1 303
The write-down of inventories provided for in the valuation of merchandise purchased for resale was: 136 114 128 108
notes to the financial statements for the year ended 28 March 2015
8. Trade and other receivables
Interest is charged on outstanding accounts in accordance with the National Credit Act (NCA) and has fluctuated in accordance with legislated changes to the repo rate.
The Group has provided for receivables in all ageing status levels based on estimated irrecoverable amounts from the sale of merchandise, determined by reference to past default experience.
Group Company
R’m2015 2014 2015 2014
Gross trade receivables 1 948 1 766 1 924 1 761
Impairment provision (174) (171) (172) (171)
Trade receivables (net) 1 774 1 595 1 752 1 590
Prepayments 48 30 40 19
Other receivables 52 48 43 42
1 874 1 673 1 835 1 651
The ageing of the gross trade receivables is as follows:
Days from transaction
Current 30 1 451 1 322 1 429 1 317
Status 1 60 287 242 286 242
Status 2 90 92 85 92 85
Status 3 120 54 54 53 54
Status 4 150 40 37 40 37
Status 5 180 24 26 24 26
1 948 1 766 1 924 1 761

PREVIOUS2015 ANNUAL FINANCIAL STATEMENTS CONTENTS NEXT
103
notes to the financial statements for the year ended 28 March 2015
8.2 Other receivables
Before accepting any new credit customer, the Group uses an external credit scoring system to assess the potential customer’s credit quality and defines credit limits by customer, while ensuring compliance with the requirements of the NCA. Limits and scoring are reviewed at least annually in accordance with the requirements of the NCA and upon request by a customer. Due to the nature of the business, there are no customers that represent more than 5% of the total balance of trade receivables. The Group does not have any balances which are past due date and have not been provided for, as the provisioning methodology applied takes the entire debtor population into consideration.
In determining the recoverability of trade receivables, the Group considers any changes in credit quality of the receivables up to reporting date. The concentration of credit risk is limited, as the customer base is large and unrelated. The ageing profiles of the provision for doubtful debts are:
Group Company
R’m2015 2014 2015 2014
Balance at beginning of the year (171) (140) (171) (140)
Impairment losses net of recoveries (3) (31) (1) (31)
Balance at end of the year (174) (171) (172) (171)
Group Company
Days from transaction 2015 2014 2015 2014
Current and impaired 0 - 30 13 16 12 16
Past due and impaired
Status 1 31 - 60 28 25 28 25
Status 2 61 - 90 28 28 28 28
Status 3 91 - 120 34 41 34 41
Status 4 121 - 150 37 36 37 36
Status 5 151 - 180+ 34 25 33 25
174 171 172 171
8.1 Movement in the impairment provision
9. Share capital
Group Company
R’m2015 2014 2015 2014
The expected maturity for other receivablesis as follows:
On demand 2 5 2 5
Less than 3 months 31 33 24 27
3 months to one year 19 10 17 10
52 48 43 42
R’000
9.1 Authorised
323 300 000 ordinary shares of 0.025 cent each 81 81 81 81
19 700 000 B ordinary shares of 0.3 cent each 59 59 59 59
Total authorised share capital 140 140 140 140
9.2 Issued
Ordinary
253 183 867 (2014: 251 183 867) ordinary shares of 0.025 cent each
63 63 63 63
B ordinary
11 445 081 (2014: 13 445 081) B ordinary shares of 0.3 cent each
34 40 34 40
Total issued share capital 97 103 97 103
8. Trade and other receivables (continued)

104
PREVIOUS2015 ANNUAL FINANCIAL STATEMENTS CONTENTS NEXT
Group
Number2015 2014
Options over ordinary shares in Mr Price Group Limited
Beginning of the year 55 467 151 569
Surrendered by participants (3 000) -
Options exercised (46 667) (96 102)
End of the year 5 800 55 467
9.3 B ordinary shares
The B ordinary shares are unlisted and are convertible into ordinary shares on a one-for-one basis at the instance of the B ordinary shareholders. The voting rights attached to the ordinary and B ordinary shares are in the same ratio as the par value of the respective shares. In the event of a poll, ordinary shareholders are entitled to one vote per share and B ordinary shareholders to 12 votes per share.
9.4 Share Trusts and Share Purchase Schemes
The Company operates six share trusts, a share option scheme and two forfeitable share plans for the benefit of associates, including executive Directors, employed by the Company and its consolidated entities. In terms of the deeds of trust, ordinary shares in Mr Price Group Limited may be acquired by the trust or awarded under the schemes for the benefit of associates in the Group, including executive Directors. These share schemes are more fully detailed in the Remuneration Report on pages 70 to 81.
Details of shares and options held in terms of the deed of trust and the schemes are as follows:
9.4.1 The Mr Price Group Share Trust
This trust is currently dormant.
9.4.2 The Mr Price Group Share Option Scheme
Options held at the beginning of the year were exercisable at prices between R3.06 and R21.20 per share in a period between three years and 10 years after the dates of the offers which commenced in May 1989. No new options will be issued under this scheme.
The vesting period of the options is detailed on page 78.
Option prices have been restated where necessary to recognise subdivisions and capitalisation issues.The share options under this scheme have all vested and have a weighted average option price of R12.73.
notes to the financial statements for the year ended 28 March 2015
9. Share capital (continued)
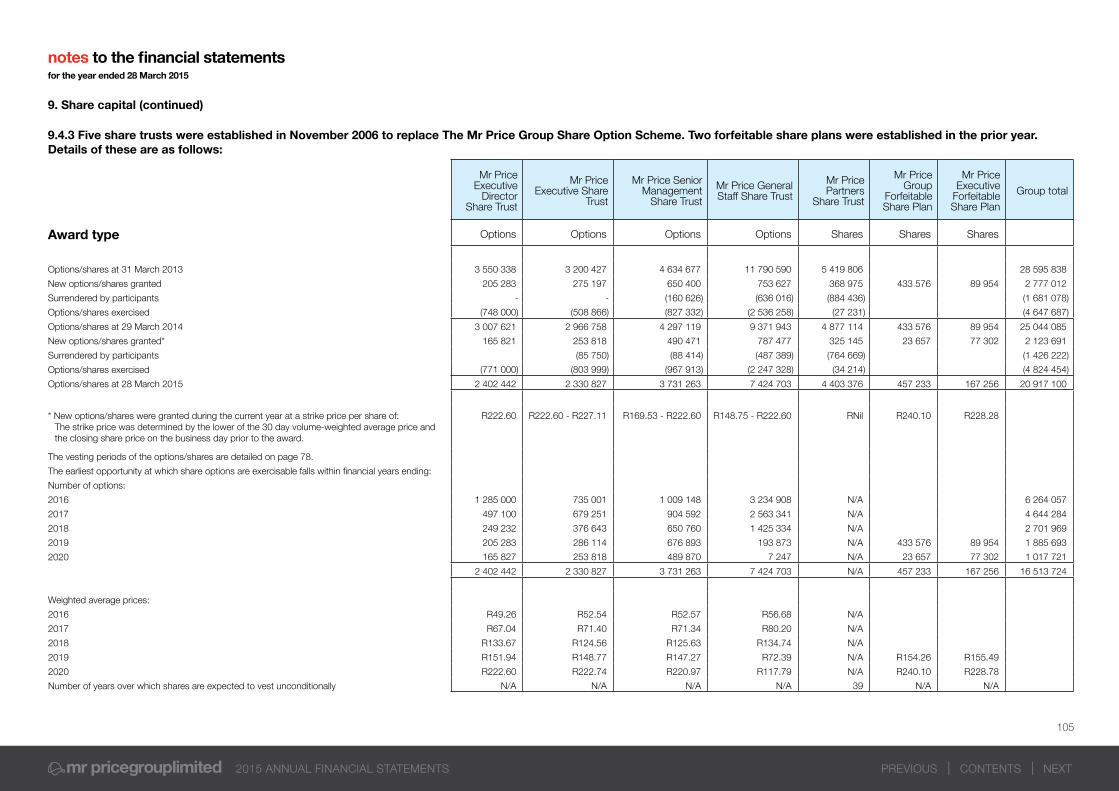
PREVIOUS2015 ANNUAL FINANCIAL STATEMENTS CONTENTS NEXT
105
9.4.3 Five share trusts were established in November 2006 to replace The Mr Price Group Share Option Scheme. Two forfeitable share plans were established in the prior year.Details of these are as follows:
Mr Price Executive
Director Share Trust
Mr Price Executive Share
Trust
Mr Price Senior Management
Share Trust
Mr Price General Staff Share Trust
Mr Price Partners
Share Trust
Mr Price Group
Forfeitable Share Plan
Mr Price Executive
Forfeitable Share Plan
Group total
Award type Options Options Options Options Shares Shares Shares
Options/shares at 31 March 2013 3 550 338 3 200 427 4 634 677 11 790 590 5 419 806 28 595 838
New options/shares granted 205 283 275 197 650 400 753 627 368 975 433 576 89 954 2 777 012
Surrendered by participants - - (160 626) (636 016) (884 436) (1 681 078)
Options/shares exercised (748 000) (508 866) (827 332) (2 536 258) (27 231) (4 647 687)
Options/shares at 29 March 2014 3 007 621 2 966 758 4 297 119 9 371 943 4 877 114 433 576 89 954 25 044 085
New options/shares granted* 165 821 253 818 490 471 787 477 325 145 23 657 77 302 2 123 691
Surrendered by participants (85 750) (88 414) (487 389) (764 669) (1 426 222)
Options/shares exercised (771 000) (803 999) (967 913) (2 247 328) (34 214) (4 824 454)
Options/shares at 28 March 2015 2 402 442 2 330 827 3 731 263 7 424 703 4 403 376 457 233 167 256 20 917 100
* New options/shares were granted during the current year at a strike price per share of:The strike price was determined by the lower of the 30 day volume-weighted average price and the closing share price on the business day prior to the award.
R222.60 R222.60 - R227.11 R169.53 - R222.60 R148.75 - R222.60 RNil R240.10 R228.28
The vesting periods of the options/shares are detailed on page 78.
The earliest opportunity at which share options are exercisable falls within financial years ending:
Number of options:
2016 1 285 000 735 001 1 009 148 3 234 908 N/A 6 264 057
2017 497 100 679 251 904 592 2 563 341 N/A 4 644 284
2018 249 232 376 643 650 760 1 425 334 N/A 2 701 969
2019 205 283 286 114 676 893 193 873 N/A 433 576 89 954 1 885 693
2020 165 827 253 818 489 870 7 247 N/A 23 657 77 302 1 017 721
2 402 442 2 330 827 3 731 263 7 424 703 N/A 457 233 167 256 16 513 724
Weighted average prices:
2016 R49.26 R52.54 R52.57 R56.68 N/A
2017 R67.04 R71.40 R71.34 R80.20 N/A
2018 R133.67 R124.56 R125.63 R134.74 N/A
2019 R151.94 R148.77 R147.27 R72.39 N/A R154.26 R155.49
2020 R222.60 R222.74 R220.97 R117.79 N/A R240.10 R228.78
Number of years over which shares are expected to vest unconditionally N/A N/A N/A N/A 39 N/A N/A
notes to the financial statements for the year ended 28 March 2015
9. Share capital (continued)

PREVIOUS2015 ANNUAL FINANCIAL STATEMENTS CONTENTS NEXT
106
9.6 The Mr Price Group Employees Share Investment Trust
The Company administers a staff share purchase scheme which facilitates the purchase of shares in the Company for the benefit of employees, including executive Directors, employed by the Company and its consolidated entities. The acquisition of shares is funded by contributions from participants (employees) while the Company is authorised to provide additional funding of up to 15% of the contributions made. The 15% contribution made by the Company is expensed in the year incurred as an employee cost.
In terms of guidance issued by the JSE Limited, the Company has consolidated the Trust as it was created to incentivise and reward the employees of the Group. In the Trust’s annual financial statements it has assets, being Mr Price Group Limited shares, to be delivered to the participants in the future. These shares are registered in the name of the Trust and not the employees. In addition, the financial statements show a liability for the shares to be transferred to employees upon their request. In the Group financial statements, the Mr Price Group Limited shares are reflected as treasury shares as they have not yet been transferred to the employees, while the amounts received for the shares to be transferred to employees are treated as equity transactions in terms of paragraphs 16 and 22 of IAS 32.
9.7 Unissued share capital
The unissued share capital required for the purposes of carrying out the terms of the various share trusts and schemes is under the control of the Directors until the conclusion of the forthcoming Annual General Meeting.
9.5 Share-based payments (continued)
The assumptions supporting inputs into the model for the Forfeitable Share Plan’s is as follows:
MrPriceGroupForfeitableSharePlan
A limited number of participants were awarded a once off allocation which vest after 5 years. These awards are offered subject to participants entering into a restraint and retention agreement. The assumptions supporting the share plan is as follows:
MrPriceExecutiveForfeitableSharePlan
Awards are made annually, and each award contains an equally weighted service and performance condition. Both vesting conditions have a term of 5 years. The probability over the 5 years for the service and performance vesting conditions is 95% and 70% respectively. These probabilities are reviewed annually. There have been no changes in the assumptions during the current year.
9.5 Share-based payments
Group Company
R’m2015 2014 2015 2014
Share-based payments relating to equity-settled share-based payment transactions in terms of the various long-term share incentive schemes(refer notes 9.4.2 to 9.4.3) 105 75 105 75
Share-based payments are measured at fair value (excluding the impact of any non-market vesting conditions) at the date of the grant, which is expensed over the period of vesting. The fair value of each option granted is estimated at the date of the grant using an actuarial binomial option pricing model.
The assumptions supporting inputs into the model for options granted during the year are as follows:
The expected volatility was determined based on the historical volatility of the Company’s share price over the expected lifetime of each grant. The expected life of the options has been determined taking into account the restrictions on non-transferability and exercise and management’s best estimate of probable exercise behaviour.
The risk-free rate used is the yield on zero-coupon South African government bonds which have a term consistent with the expected option life.
In the calculation of the fair value of the options, allowance is not made for non-market conditions (such as forfeitures and leavers) during the vesting period. Adjustment for these conditions is made in the annual expense charge, with an allowance for forfeitures being made in the vesting period at rates varying between 0% and 15% compounded per annum.
Mr Price Executive
Director Share Trust
Mr Price Executive
Share Trust
Mr Price Senior
Management Share Trust
Mr Price General Staff
Share Trust
Mr Price Partners Staff
Share Trust
Weighted average strike price R220.60 R222.60 R221.43 R203.65 R0.00
Expected volatility (%) 19.99 19.99 19.29-19.83 16.67 - 18.02 N/A
Expected option life 5 years 5 years 5 years 3 - 5 years 39 years
Risk-free interest rate (%) 7.10 7.10 6.93 - 7.66 6.44 - 7.38 6.14 - 9.05
Expected dividend yield (%) 2.75 2.75 2.75 - 2.79 2.75 - 2.79 N/A
Probability % shares retained
Participants still employed after 1 year 100% 10%Participants still employed after 2 years 92.3% 20%Participants still employed after 3 years 84.6% 30%Participants still employed after 4 years 84.6% 40%Participants still employed after 5 years 84.6% 100%
notes to the financial statements for the year ended 28 March 2015
9. Share capital (continued)

PREVIOUS2015 ANNUAL FINANCIAL STATEMENTS CONTENTS NEXT
107
10. Capital reserves
Group Company
R’m2015 2014 2015 2014
10.1 Share premium account 12 12 - -
10.2 Participants in staff share investment trust(note 9.6)
32 25
Beginning of the year 25 20
Net movement for the year 7 5
10.3 Share-based payments reserve 219 161 219 161
Beginning of the year 161 137 161 137
Recognition of share-based payments for the year 58 24 58 24
Share-based payments for options/shares granted in prior years 79 56 79 56
Share-based payments for options/shares granted in current year
9 11 9 11
Adjustment for forfeitures 17 8 17 8
Share-based payments reserve transferred toretained income for options that have vested from inception to date
(47) (51) (47) (51)
The above equity account represents cumulative share based payment charges that have been credited to equity net of transfers to retained income for options that have vested
Total capital reserves 263 198 219 161
notes to the financial statements for the year ended 28 March 2015

PREVIOUS2015 ANNUAL FINANCIAL STATEMENTS CONTENTS NEXT
108
11. Treasury share transactions
The foreign currency translation reserve comprises the cumulative translation adjustments arising on the consolidation of the foreign subsidiaries in Botswana, Nigeria, Ghana and Zambia. The decrease in thereserve in the current year is due to the year-on-year currency devaluation of the Nigerian niara, Ghanaian cedi and the first time revaluation of the Zambian operations.
Refer to note 28 for details of the recognition of defined benefit fund actuarial gains and losses.
12. Foreign currency translation reserve
13. Defined benefit fund actuarial gains and losses
Group Company
R’m2015 2014 2015 2014
12 721 500 (2014: 17 383 135) ordinary shares in Mr Price Group Limited held by staff share trusts
(583) (898)
- Balance at beginning of the year (898) (791)
- Treasury shares acquired (39) (365)
- Treasury shares sold 361 263
- Mr Price Group Employees Share Investment Trust (note 10.2)
(7) (5)
Deficit on treasury share transactions (826) (559) (214) (206)
- Balance at beginning of the year (559) (373) (206) (193)
- Current year movement arising from the take-up of vested options
(267) (186) (8) (13)
Taxation relating to grants to share trusts 174 146 174 146
- Balance at beginning of the year 146 105 146 105
- Current year movement 28 41 28 41
Grants by Company to staff share trusts (1 402) (1 386)
- Balance at beginning of the year (1 386) (1 153)
- Grants made during the year (16) (233)
(1 235) (1 311) (1 442) (1 446)
Group
R’m2015 2014
Beginning of the year (17) (16)
Currency translation adjustments for the year (26) (1)
End of the year (43) (17)
Group Company
R’m2015 2014 2015 2014
Beginning of the year 5 (8) 5 (8)
Current year actuarial (losses)/gains (11) 18 (11) 18
Deferred taxation thereon 3 (5) 3 (5)
End of the year (3) 5 (3) 5
notes to the financial statements for the year ended 28 March 2015

PREVIOUS2015 ANNUAL FINANCIAL STATEMENTS CONTENTS NEXT
109
The main risks that the insurance cells are exposed to are as follows:
- Mortality risk: the risk of loss arising due to policyholder death experience differing from that expected;- Morbidity risk: the risk of loss arising due to policyholder health experience differing from that expected; - Expense risk: the risk of loss arising from expense experience differing from that expected; and- Policyholder decision risk: the risk of loss arising due to policyholder experiences (lapses and surrenders)
differing from that expected.
The risk structure per product is as follows:
GuardriskInsuranceCompanyLimited(Cellnumber136)
Mr Price Group Limited bears 100% of the risk for all products which consist of: Customer Protection, Funeral, 360 degree Protection, A2B Commuter Personal Accident and the Medinet Critical Illness and Hospitalisation Plans.
The reinsurance assets and liabilities are made up of the following components:
Receivables are measured at amortised cost and the carrying amounts approximate their fair value and all balances are considered current.
GuardriskLifeLimited(Cellnumber048)
Mr Price Group Limited bears 100% of the risk for all products.
Group and Company
R’m2015 2014
Reinsurance asset
Insurance float 2 1
Cash and cash equivalents 122 97
124 98
Group and Company
R’m2015 2014
Reinsurance liabilities
Unearned premium provision 1 1
Outstanding claims 4 4
IBNR* reserve 12 11
Taxation liability 29 18
46 34
Movement in reinsurance liabilities
Balance at beginning of the year 33 27
Outstanding claims 4 4
IBNR* reserve 11 9
Taxation liability 18 14
Increase during the year 12 6
Balance at end of the year 45 33
Outstanding claims 4 4
IBNR* reserve 12 11
Taxation liability 29 18
Unearnedpremiumprovision
Balance at beginning of the year 1 1
Premium received 177 147
Premium recognised (177) (147)
Balance at end of the year 1 1
notes to the financial statements for the year ended 28 March 2015
14. Reinsurance
The Company retails insurance products to customers. The prinicipal risk that the insurance cells face is that the actual claims and benefit payments, or the timing thereof, differ from expectations. This is influenced by the frequency of claims, severity of claims, actual benefits paid and subsequent development of long-term claims. Therefore, the objective of the cells is to ensure that sufficient reserves are available to cover these potential liabilities.
* IBNR - incurred but not reported

PREVIOUS2015 ANNUAL FINANCIAL STATEMENTS CONTENTS NEXT
110
15. Lease obligations
Group Company
R’m2015 2014 2015 2014
Straight-line operating lease liability 220 226 210 218
Less: amounts due for settlement within 12 months (56) (47) (53) (46)
Total long-term portion of lease obligations 164 179 157 172 Group and Company
R’m2015 2014
Impact on IBNR (4) (4)
Group and Company
R’m2015 2014
Impact on IBNR 4 4
2015 2014 2013 2012
Premium income (R'm) 177 147 106 71
Number of claims 3 709 3 769 2 318 2 043
Claim costs (R'm) 15 12 9 5
Claim costs as a percentage of premium income 8.3% 8.2% 8.9% 7.5%
14. Reinsurance (continued)
Sensitivity analysis
Reinsurance liabilities are subject to changes in variables that could affect the value of the liability due. The effect of any sensitivity is considered immaterial. Outstanding claims, unearned premuim provision and the taxation liability are measured at amortised cost and are based on actual amounts due to third parties. The IBNR reserve is maintained in accordance with legislation governing financial service providers.
The long-term cell maintains an IBNR reserve equal to a claim factor (minimum 33%) applied to 3 months of net premiums (i.e. gross premiums less commissions and administration fees). The short-term cells are required to maintain a solvency ratio equal to 25% of net premiums as a solvency reserve and an IBNR reserve equal to 7% of the annual risk premium. As these reserves are governed by legislation only changes in such legislation would lead to the changes in the reserve. At year end no such changes were proposed by the financial services board, however, the following sensitivity has been performed on the IBNR reserve:
Long-term cell reserve adjusted to be a claims factor (minimum 32%) applied to 2 months of net premiums. Short-term cell solvency reserve adjusted to equal 24% of net premiums and an IBNR equal to 6% of the annual risk premium.
The Group has entered into operating leases on store space, with general lease terms between five and ten years. The Group has the option, under certain leases, to extend the lease period for additional term of up to ten years.
Long-term cell reserve adjusted to be a claims factor (minimum 34%) applied to 4 months of net premiums. Short-term cell solvency reserve adjusted to equal 26% of net premiums and an IBNR equal to 8% of the annual risk premium.
During the year, a dividend of R75 million (2014 : R60 million) was paid by the cells to the Company.
Premium income and claims history:
notes to the financial statements for the year ended 28 March 2015
Operating lease commitments
Group Company
R’m2015 2014 2015 2014
Future minimum rentals payable under non- cancellable leases, which predominantly relate to land and buildings, are as follows:
Within one year 1 203 1 042 1 021 981
After one year but less than five years 2 226 2 138 1 891 2 008
More than five years 182 287 157 284
3 611 3 467 3 069 3 273

PREVIOUS2015 ANNUAL FINANCIAL STATEMENTS CONTENTS NEXT
111
16. Deferred taxation 17. Provisions
18. Trade and other payables
Group Company
R’m2015 2014 2015 2014
Attributable to:
Post retirement medical aid (2) (2) (2) (2)
Prepayments 2 2 2 2
Provisions (151) (141) (151) (141)
Other temporary differences 23 15 30 17
Share-based payments (115) (85) (115) (85)
Defined benefit fund asset 10 13 10 13
Grants to staff share trusts 146 115 146 115
Straight-line operating lease liability (61) (63) (58) (61)
(148) (146) (138) (142)
Beginning of the year (146) (129) (142) (128)
Movements during the year (2) (17) 4 (14)
Prepayments - (5) - (5)
Provisions (10) (26) (10) (26)
Other temporary differences 8 2 13 5
Share based payments (30) (20) (30) (20)
Defined benefit fund actuarial gains (3) 7 (3) 7
Grants to staff share trusts 31 30 31 30
Straight-line operating lease liability 2 (3) 3 (3)
Post retirement medical aid - (2) - (2)
End of the year (148) (146) (138) (142)
Deferred taxation liabilities 4 6 - -
Deferred taxation assets (152) (152) (138) (142)
(148) (146) (138) (142)
Group Company
R’m2015 2014 2015 2014
Onerous lease contracts
Balance at beginning of the year 11 10 11 10
Provision raised during the period 2 1 2 1
Balance at end of the year 13 11 13 11
Long-term 6 7 6 7
Current 7 4 7 4
13 11 13 11
Group Company
R’m2015 2014 2015 2014
Trade payables 1 191 1 178 1 208 1 177
Other payables 925 804 843 754
2 116 1 982 2 051 1 931
The provision represents the present value of the future lease payments that the Group is presently obligated to make under non-cancellable onerous operating lease contracts, less revenue expected to be earned, including estimated revenue and including revenue from sub-leases. The estimate may vary as a result of changes in the utilisation of the leased premises and sub-lease arrangements where applicable. The unexpired terms of the leases range from one to five years.
Terms and conditions of the above financial liabilities:Trade payables are non-interest bearing and have an average term of 30 days.Other payables are non-interest bearing and have a term of between 60 - 90 days.
notes to the financial statements for the year ended 28 March 2015

PREVIOUS2015 ANNUAL FINANCIAL STATEMENTS CONTENTS NEXT
112
19. Profit from operating activitiesGroup Company
R’m 2015 2014 2015 2014
Arrivedatafter(crediting)/chargingthefollowing:
Income from consolidated entities (182) (222)Dividend income (71) (101)Fees (111) (121)
Amortisation of intangible assets (page 126) 27 29 26 29
Associate costs 1 861 1 698 1 787 1 644 Salaries, wages and other benefits 1 645 1 524 1 575 1 472 Share-based payments (note 9.5) 105 75 105 75 Defined contribution pension fund expense 112 96 108 94 Defined benefit pension fund net expense (1) 3 (1) 3 Current service cost 3 4 3 4 Interest cost 8 8 8 8 Expected return on fund assets (12) (9) (12) (9)
Auditors' remuneration 6 6 6 6 Audit fees 6 6 6 6 Other services - - - -
Consulting fees 18 18 16 16 Technical services 16 16 16 16 Administrative and other services 2 2 - -
Depreciation of property, plant and equipment(pages 124 and 125)
181 162 169 152
Impairment of intangible assets 1 - 1 -
Impairment of property, plant and equipment 1 4 1 4
Net loss on disposal and scrapping of intangible assets - 12 - 12
Net loss on disposal and scrapping of property,plant and equipment
6 8 6 8
Movement in provisions (note 17) 2 1 2 1
Net gain on foreign exchange (5) (3) (5) (3)Forward exchange contracts (5) (1) (5) (1)Transactions - (2) - (2)
Operating lease rentals 1 250 1 125 1 153 1 052 Land and buildings 1 219 1 094 1 123 1 021 Equipment 21 21 20 21 Motor vehicles 10 10 10 10
20. Taxation
20.1 South African and foreign taxation
20.1.1 South African taxation
Group Company
R’m2015 2014 2015 2014
This year 839 694 831 692
Current
Normal taxation 862 746 855 742
Deferred
Current year temporary differences (23) (52) (24) (50)
20.1.2 Foreign taxation
This year 39 38 14 16
Current 46 38 14 16
Deferred (7) - - -
Prior years - 1 - -
Current - 1 - -
Total taxation 878 733 845 708
In addition to the above, current normal taxation and deferred taxation amounting to R58.2 million (2014: R71.2 million) and R30.7 million (2014: R30.4 million) respectively have been credited and charged to equity relating to the grants to staff share trusts (note 11). Deferred income taxation of R3.1 million (2014: R4.9 million credited) has been charged to the statement of comprehensive income.
notes to the financial statements for the year ended 28 March 2015

PREVIOUS2015 ANNUAL FINANCIAL STATEMENTS CONTENTS NEXT
113
In respect of the current year, the Board of Directors propose that on the 22 June 2015 a cash dividend of 368.5 cents per share be paid to shareholders who are registered on the “Record date” of 19 June 2015. This dividend has not been reflected as a liability in these financial statements. The total estimated dividend to be paid by the Company is R975.2 million.
Group
2015shares
2014shares
Number of shares per basic earnings per share calculation 249 989 589 246 725 759
Weighted average number of ordinary shares under option deemed to have been issued for no consideration
15 757 184 17 246 906
Number of shares for calculation of dilutedearnings per share 265 746 773 263 972 665
22. Dividends to shareholders
Group Company
R’m2015 2014 2015 2014
Ordinary and B ordinary shares
798 666 831 701
Prior year final distribution: 314.0 cents per share (2014: 265.0 cents per share) 831 701 831 701
Dividend paid by Partners Share Trust 12 11
Less: dividend received on shares held by staff share trusts
(45) (46)
542 428 560 445
Interim dividend: 211.5 cents per share (2014: 168.0 cents per share) 560 445 560 445
Dividend paid by Partners Share Trust 7 6
Less: dividend received on shares held by staff share trusts
(25) (23)
Total net dividend to shareholders 1 340 1 094 1 391 1 146
21. Earnings per ordinary and B ordinary share
21.1 Reconciliation of earnings
The calculation of basic and headline earninigs per share is based on:
20.2 Reconciliation of taxation rate
21.2 Number of shares
The weighted average number of shares in issue amount to 249 989 589 (2014: 246 725 759).
21.3 Dilution impact
Diluted earnings per share is calculated by adjusting the weighted average number of shares outstanding to assume conversion of all potential dilutive shares, which currently comprise share options and shares. A calculation is made in order to determine the number of shares that could have been issued at fair value (determined as the average annual market price of the shares) based on the monetary value of the subscription rights attached to outstanding options.
Group
R’m2015 2014
Basic earnings - profit attributable to shareholders 2 293 1 868
Loss on disposal, scrapping and impairment of property, plant and equipment and intangible assets 8 24 Taxation (2) (4)
Headline earnings 2 299 1 888
Group Company
%2015 2014 2015 2014
Standard rate 28.0 28.0 28.0 28.0Adjusted for:Exempt income (0.4) - (1.1) (1.1)Other 0.2 0.2 0.2 0.3
Effective tax rate 27.8 28.2 27.1 27.2
notes to the financial statements for the year ended 28 March 2015
20. Taxation (continued)

PREVIOUS2015 ANNUAL FINANCIAL STATEMENTS CONTENTS NEXT
114
23. Directors’ emoluments 24. Notes to the statements of cash flows
24.1 Operating profit before working capital changes
24.2 Working capital changes
Company
R’m2015 2014
Executive DirectorsSalaries 11 10 Bonuses and performance related payments 19 18 Vehicle allowances and expenses 1 2 Pension contributions 2 2
33 32
Non-executive DirectorsSalaries 1 2 Fees 5 5 Vehicle allowances and expenses - 1 Pension contributions 1 1
7 9
Details of individual Director's emoluments and share incentive scheme transactions are disclosed in the remuneration report on pages79 to 81.
Group Company
R’m2015 2014 2015 2014
Profit before taxation 3 163 2 600 3 122 2 607
Adjustments for:
Depreciation of property, plant and equipment 181 162 169 152
Amortisation of intangible assets 27 29 26 29
Impairment of property, plant and equipment 1 4 1 4
Impairment of intangible assets 1 - 1 -
Loss on disposal and scrapping of property, plant and equipment
6 8 6 8
Loss on disposal of intangible assets - 12 - 12
Movement in reinsurance assets (26) (26) (26) (26)
Movement in reinsurance liabilities 12 6 12 6
Net finance income (87) (63) (79) (59)
Interest on trade receivables (355) (311) (353) (310)
Other non-cash items 116 127 103 119
Straight-line operating lease liability movement (6) 13 (8) 11
Share option expenses 105 75 105 75
Other 17 39 6 33
3 039 2 548 2 982 2 542
Increase in trade and other receivables (203) (192) (185) (191)
Increase in inventories (354) (181) (313) (154)
Increase in trade and other payables 135 716 124 692
(422) 343 (374) 347
notes to the financial statements for the year ended 28 March 2015
The emoluments received by the Directors from the Company were:

PREVIOUS2015 ANNUAL FINANCIAL STATEMENTS CONTENTS NEXT
115
24.4 Net inflows in respect of long-term receivables
24.5 Amounts owing by consolidated entities
24.6 Dividends to shareholders
Group Company
R’m2015 2014 2015 2014
Amounts unpaid at beginning of the year 208 (82) 205 (83)
Taxation 354 47 347 45
Deferred (146) (129) (142) (128)
Amounts charged to the income statements 878 733 845 708
Taxation 908 785 869 758
Deferred (30) (52) (24) (50)
Cash flow impact of change in accounting policy - (4) - (4)
Amounts charged to equity (31) (36) (31) (36)
Taxation (28) (41) (28) (41)
Deferred taxation (3) 5 (3) 5
Amounts unpaid at end of the year (260) (208) (259) (205)
Taxation (408) (354) (397) (347)
Deferred taxation 148 146 138 142
Amounts paid 795 403 760 380
Group Company
R’m2015 2014 2015 2014
Net amounts received from accredited supplier 1 1 1 1
Company
R’m2015 2014
Increase in current amounts owing to consolidated entities 3 2
Increase in current amounts owing by consolidated entities (134) (144)
(131) (142)
Group Company
R’m2015 2014 2015 2014
Dividends to ordinary and B ordinary shareholders 1 391 1 146 1 391 1 146
Less: dividends on shares held by staff share trusts (70) (70)
Add: dividends paid by Partners Share Trust 19 18
1 340 1 094 1 391 1 146
notes to the financial statements for the year ended 28 March 2015
24. Notes to the statements of cash flows (continued)
24.3 Taxation paid

PREVIOUS2015 ANNUAL FINANCIAL STATEMENTS CONTENTS NEXT
116
25. Capital expenditure
26. Contingencies
During the 2009 financial year, the Company was advised by SARS that it intended holding the Company accountable as the ‘deemed importer’ in relation to the underpayment of import duties in 2005 and 2006 by one of its previous suppliers to the value of R43.6 million. The Company submitted a formal response to SARS’ letter on 18 September 2009. SARS responded to the Company’s denial of liability on 24 April 2015, more than 5 years later. The SARS response fails to furnish any substantive reply to the detailed reasons of denial of responsibility furnished in the Company’s 2009 letter. SARS now demands that the Company, by 9 June 2015, settles the alleged liability, which has now been calculated at R74.4 million. The Company has once again sought legal advice which supports its view to impugn the Commissioner’s decision. As a result no adjustments have been made to the annual financial statements, as the Directors are of the opinion that it is not probable that any liability will be incurred.
27. Financial risk management
The Group is exposed, directly and indirectly, to market risk, including, primarily, changes in interest rates and currency exchange rates and uses derivatives and other financial instruments in connection with its risk management activities. The Board of Directors carries the ultimate responsibility for the overseeing of the Group’s risk management framework and is accountable for designing, implementing and monitoring the process of risk management and integrating it into the daily activities of the Group.
27. Financial risk management (continued)
27.1. Capital and treasury risk management
The Group which is a cash-based business, monitors capital through a process of analysing the underlying cash flows, which in turn drives the residual capital structure, consisting of share capital, share premium, reserves and retained income as quantified in the statement of changes in equity. The Group manages its capital to ensure that it will be able to maintain healthy capital ratios in order to sustain its business and maximise shareholder value. Any adjustments are made in light of economic conditions and may include adjusting dividend cover or returning capital to shareholders.
Due to its level of net cash resources, the Group has no material borrowings. Cash reserves are available to meet current working capital and capital investment requirements.
The treasury function is administered at Group level where strategies for the funding of working capital requirements and capital expenditure projects are implemented, taking into account cash flow projections and expected movements in interest rates. The Group has a policy of remaining highly liquid in order to have the available cash flow to fund expansion of existing businesses and any possible new ventures.
An interest sensitivity analysis for cash and cash equivalents has not been disclosed as the amounts involved are considered immaterial.
Group Company
R’m2015 2014 2015 2014
The capital expenditure authorised by the Directors of the Company or its consolidated entities but not provided for in the financial statements amounts to 1 290 608 1 290 608
of which contracts have been placed for 915 144 906 144
notes to the financial statements for the year ended 28 March 2015
The above capital expenditure is expected to be financed from cash resources and future cash flows.

PREVIOUS2015 ANNUAL FINANCIAL STATEMENTS CONTENTS NEXT
117
*Less than R1 milion
Group
R’m2015 2014
Rate variance - pula +10% 6 4 -10% (6) (4)
Rate variance - naira +10% 2 2 -10% (2) (2)
Rate variance - cedi* +10% 0 1 -10% 0 (1)
Rate variance - kwacha +10% 1 - -10% (1) -
Group - total foreign exchange exposure +10% 9 7 -10% (9) (7)
27.2.2 Transactions in foreign currencies
When appropiate, forward exchange contracts (FEC’s) are used to address the Groups direct foreign currency exposure on directly imported merchandise.
Group Company
2015 2014 2015 2014
At year end FEC commitments were:
Current liability US$'m 17 6 17 6
Exchange rate R/US$ - average contract rate R11.629 R10.789 R11.629 R10.789Exchange rate R/US$ - year end closing rate R12.009 R10.619 R12.009 R10.619
Current liability ZMK'm - 20 - 20
Exchange rate R/ZMK - average contract rate R0.000 R0.539 R0.000 R0.539Exchange rate R/ZMK - year end closing rate R0.597 R0.602 R0.597 R0.602
notes to the financial statements for the year ended 28 March 2015
The contracts will mature within periods varying up to six months after year end and translates to R205.7 million (2014: R93.6 million) at the market rate of an equivalent contract at year end.
Group and Company (US’$m)
On demand Less
than three months
Three months to
one year Total
2015 - 17 - 17
2014 - 6 - 6
Group and Company (ZMK’m)
2015 - - - -
2014 - - 20 20
27. Financial risk management (continued)
27.2. Foreign exchange risk management
27.2.1 Investment in foreign operations
The Group is directly exposed to exchange rate fluctuations through its investments in operations outside South Africa. All amounts lent to consolidated entities are rand denominated. The Group’s investment exposure to currency fluctuations is limited to the Botswana, Nigeria, Ghana and Zambian subsidiaries as the other African countries in which the Group is invested have currencies that are pegged to the rand. The analysis below details the Group’s sensitivity to a 10% increase and decrease in the rand against the pula, naira, cedi and kwacha respectively and its effect on equity for the year. The sensitivity analysis adjusts their translation at year end for a 10% change in the exchange rate.

PREVIOUS2015 ANNUAL FINANCIAL STATEMENTS CONTENTS NEXT
118
27.3 Credit risk management
Credit risk is concentrated principally in periodic short-term cash investments, trade receivables and loans to consolidated entities. The Group deposits short-term cash surpluses only with major banks of high quality credit standing. The granting of credit to trade debtors is controlled with statistical scoring models and performance parameters which are reviewed on a regular basis. The maximum exposure in respect of trade receivables and the Group’s risk management policies regarding trade receivables are disclosed in note 8. The analysis below details the Group’s sensitivity to a 1% increase and decrease in the interest rate charged to debtors and its effect on income for the year.
At 28 March 2015 the Group did not consider there to be any significant concentration of credit risk for which it had not adequately provided.
Group Company
R’m2015 2014 2015 2014
Rate variance +1% 18 17 18 17 -1% (18) (17) (18) (17)
notes to the financial statements for the year ended 28 March 2015
With reference to these FEC’s, the analysis below details the Group’s sensitivity to a 10% increase and decrease in the rand against the dollar and its effect on income for the year assuming no change in retail selling prices. The sensitivity analysis includes only outstanding dollar denominated FEC’s and adjusts their translation at year end for a 10% change in the exchange rate.
Group Company
R’m2015 2014 2015 2014
Rate variance - US$ +10% (21) (6) (21) (6)-10% 21 6 21 6
Rate variance - ZMK +10% - (1) - (1)-10% - 1 - 1
27. Financial risk management (continued)
27.2 Foreign exchange risk management (continued)
Based on the Group’s existing cash resources and expected future cash flows, there is no foreseeable need to enter into borrowings. Furthermore, due to the Group’s strong financial position, should further borrowings be required, the Group should be able to obtain any necessary funding within a short period, subject to bank approval.
27.4 Liquidity management
The Group manages liquidity risk by maintaining adequate reserves, banking facilities and by continuously monitoring forecast and actual cash flows. The Group has significant cash reserves and minimal borrowings which enable it to borrow funds externally should it require to do so to meet any working capital or possible expansion requirements. As a consequence of banking legislation, which requires fees to be paid relative to the size of the facility, the Group has only entered into limited loan facility arrangements to the extent that fees are not payable. The year end position was a follows:
Group
R’m2015 2014
Borrowing powersIn terms of the Company’s Articles of Association, borrowing powers at year end were limited to 150% of Group equity attributable to shareholders 7 532 5 884 Actual borrowings outside the Group at year end were (15) (6) At year end bank balances were 2 760 2 249
Net cash resources were 2 745 2 243
Group Company
R’m2015 2014 2015 2014
Total facilities 445 445 445 445
Less: drawn down portion (165) - (165) -
Total undrawn banking facilities 280 445 280 445
Financial guarantees
The Group has provided a property guarantee of R165 million to their primary bankers for the purchaseof land relating to the new distribution centre.
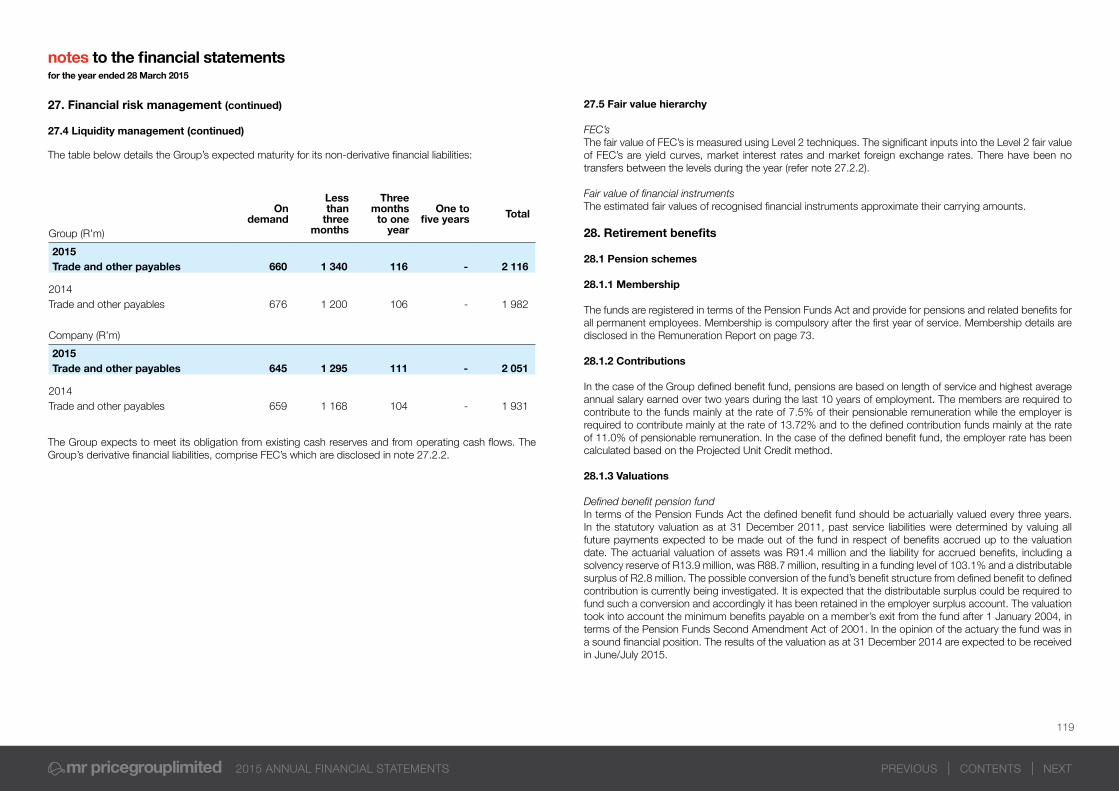
PREVIOUS2015 ANNUAL FINANCIAL STATEMENTS CONTENTS NEXT
119
The table below details the Group’s expected maturity for its non-derivative financial liabilities:
The Group expects to meet its obligation from existing cash reserves and from operating cash flows. The Group’s derivative financial liabilities, comprise FEC’s which are disclosed in note 27.2.2.
Group (R’m)
On demand
Less than
three months
Three months
to one year
One to five years Total
2015Trade and other payables 660 1 340 116 - 2 116
2014Trade and other payables 676 1 200 106 - 1 982
Company (R’m)
2015Trade and other payables 645 1 295 111 - 2 051
2014Trade and other payables 659 1 168 104 - 1 931
notes to the financial statements for the year ended 28 March 2015
27. Financial risk management (continued)
27.4 Liquidity management (continued)
27.5 Fair value hierarchy
FEC’s The fair value of FEC’s is measured using Level 2 techniques. The significant inputs into the Level 2 fair value of FEC’s are yield curves, market interest rates and market foreign exchange rates. There have been no transfers between the levels during the year (refer note 27.2.2).
Fairvalueoffinancialinstruments The estimated fair values of recognised financial instruments approximate their carrying amounts.
28. Retirement benefits
28.1 Pension schemes
28.1.1 Membership
The funds are registered in terms of the Pension Funds Act and provide for pensions and related benefits for all permanent employees. Membership is compulsory after the first year of service. Membership details are disclosed in the Remuneration Report on page 73.
28.1.2 Contributions
In the case of the Group defined benefit fund, pensions are based on length of service and highest average annual salary earned over two years during the last 10 years of employment. The members are required to contribute to the funds mainly at the rate of 7.5% of their pensionable remuneration while the employer is required to contribute mainly at the rate of 13.72% and to the defined contribution funds mainly at the rate of 11.0% of pensionable remuneration. In the case of the defined benefit fund, the employer rate has been calculated based on the Projected Unit Credit method.
28.1.3 Valuations
DefinedbenefitpensionfundIn terms of the Pension Funds Act the defined benefit fund should be actuarially valued every three years. In the statutory valuation as at 31 December 2011, past service liabilities were determined by valuing all future payments expected to be made out of the fund in respect of benefits accrued up to the valuation date. The actuarial valuation of assets was R91.4 million and the liability for accrued benefits, including a solvency reserve of R13.9 million, was R88.7 million, resulting in a funding level of 103.1% and a distributable surplus of R2.8 million. The possible conversion of the fund’s benefit structure from defined benefit to defined contribution is currently being investigated. It is expected that the distributable surplus could be required to fund such a conversion and accordingly it has been retained in the employer surplus account. The valuation took into account the minimum benefits payable on a member’s exit from the fund after 1 January 2004, in terms of the Pension Funds Second Amendment Act of 2001. In the opinion of the actuary the fund was in a sound financial position. The results of the valuation as at 31 December 2014 are expected to be received in June/July 2015.
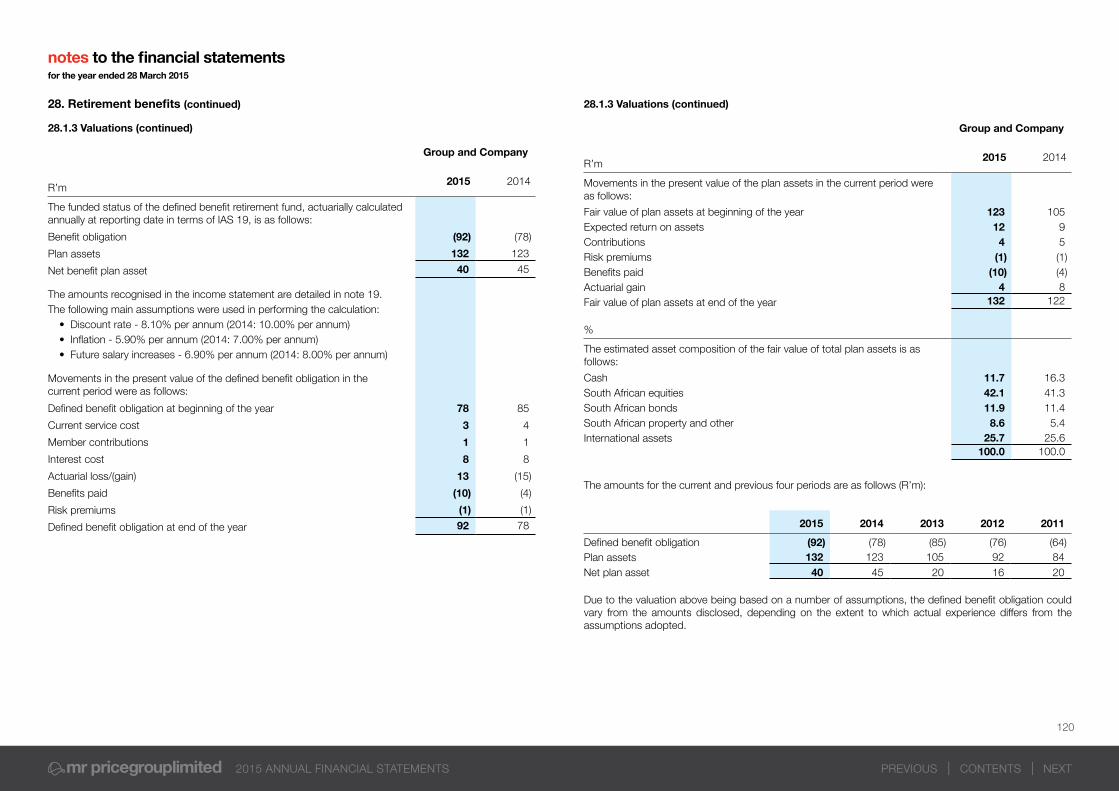
PREVIOUS2015 ANNUAL FINANCIAL STATEMENTS CONTENTS NEXT
120
28.1.3 Valuations (continued)
Group and Company
R’m2015 2014
The funded status of the defined benefit retirement fund, actuarially calculated annually at reporting date in terms of IAS 19, is as follows:
Benefit obligation (92) (78)
Plan assets 132 123
Net benefit plan asset 40 45
The amounts recognised in the income statement are detailed in note 19. The following main assumptions were used in performing the calculation:
• Discount rate - 8.10% per annum (2014: 10.00% per annum)• Inflation - 5.90% per annum (2014: 7.00% per annum)• Future salary increases - 6.90% per annum (2014: 8.00% per annum)
Movements in the present value of the defined benefit obligation in the current period were as follows:
Defined benefit obligation at beginning of the year 78 85
Current service cost 3 4
Member contributions 1 1
Interest cost 8 8
Actuarial loss/(gain) 13 (15)
Benefits paid (10) (4)
Risk premiums (1) (1)
Defined benefit obligation at end of the year 92 78
notes to the financial statements for the year ended 28 March 2015
28.1.3 Valuations (continued)
The amounts for the current and previous four periods are as follows (R’m):
Due to the valuation above being based on a number of assumptions, the defined benefit obligation could vary from the amounts disclosed, depending on the extent to which actual experience differs from the assumptions adopted.
Group and Company
R’m2015 2014
Movements in the present value of the plan assets in the current period were as follows:
Fair value of plan assets at beginning of the year 123 105 Expected return on assets 12 9 Contributions 4 5 Risk premiums (1) (1)Benefits paid (10) (4)Actuarial gain 4 8 Fair value of plan assets at end of the year 132 122
%
The estimated asset composition of the fair value of total plan assets is as follows:
Cash 11.7 16.3South African equities 42.1 41.3South African bonds 11.9 11.4South African property and other 8.6 5.4International assets 25.7 25.6
100.0 100.0
2015 2014 2013 2012 2011
Defined benefit obligation (92) (78) (85) (76) (64)Plan assets 132 123 105 92 84 Net plan asset 40 45 20 16 20
28. Retirement benefits (continued)

PREVIOUS2015 ANNUAL FINANCIAL STATEMENTS CONTENTS NEXT
121
notes to the financial statements for the year ended 28 March 2015
The estimated defined benefit cost for 2016 financial year is as follows; a current service cost of R116.5 million (2014: R113.2 million), an expected return on plan assets of R10.8 million (2014: R12.4 million) and an interest cost of R7.7 million (2014: R8.1 million).
DefinedcontributionfundsThe defined contribution funds are valuation exempt. The actuarial function remains present through an Enhanced Financial Assessment (EFA) process, which is a quarterly actuarial assessment that looks at the financial soundness of the Fund; and sets out the allocations of contributions to the Fund. The report includes a comparison of the total assets to the total liabilities of the Fund in order to determine the funding level. The most recent EFA reports as at 31 December 2014 concluded that the funding level of the Funds was within the tolerance levels set by the administrators.
28.2 Post retirement medical benefits
The obligation of the Group to pay medical aid contributions for members who have retired is no longer part of the conditions of employment for new associates. A limited number of pensioners and current associates who remain members of the defined benefit pension fund are entitled to this benefit. The entitlement to the benefit for current associates is dependent upon the associate remaining in service until retirement age. An actuarial valuation, in terms of IAS 19, of the Group’s liability at 31 March 2014 for this future benefit was undertaken. Valuations are undertaken every three years. The main assumptions used in performing these valuations are reviewed annually. Any detection of a material variation in a main assumption would give rise to a new valuation. The obligation for post retirement medical aid benefits is unfunded. The following main assumptions were used in performing the valuation at 31 March 2014: Health care cost inflation - 9.0% per annum Discount rate - 10.0% per annum Average retirement age - 62 years Continuation at retirement - 100%
Activity during the year was as follows:
Group and Company
R’m2015 2014
Benefit obligation at beginning of the year 22 16 Net increase in provision during the year 2 6 Benefit obligation at end of the year 24 22
28.1.3 Valuations (continued)
29. Related party transactions
29.1 Directors
Refer to the Report of the Directors on page 85 in respect of transactions with Directors.
29.2 Compensation of key management personnel
The above compensation includes amounts paid to executive senior management personnel and excludes amounts paid to Directors as disclosed in the Remuneration Report.
Group Company
R’m2015 2014 2015 2014
Short-term employee benefits 76 72 76 72Post employment pension benefits 9 8 9 8Share-based payments 24 14 24 14
109 94 109 94
28.2 Post retirement medical benefits (continued)
The amounts for the current and previous four periods are as follows (R’m):
2015 2014 2013 2012 2011
Defined benefit obligation 24 22 16 15 13
28. Retirement benefits (continued)

PREVIOUS2015 ANNUAL FINANCIAL STATEMENTS CONTENTS NEXT
122
29.3 Transactions with related parties
The following transactions were entered into with individuals, who meet the definition of close family members to key management personnel, or entities over which such individuals are deemed to have a controlling influence:
Related Party - BVPG, firm of attorneys of which Mr K Getz, a non-executive Director, is a partner.
Legal fees of R4.8 million (2014: R3.2 million)
29.4 Participants in staff share trusts
Refer to notes 9.4 and 9.6 in respect of transactions with participants in the staff share trusts.
29.5 Post retirement benefit funds
Refer to notes 19 and 28 in respect of transactions with post retirement benefit funds.
29.6 Inter group transactions
The following transactions occurred between the Company and its consolidated entities:
Refer to note 19 for income received from consolidated entities.
Company
R’m2015 2014
Sales 867 661
notes to the financial statements for the year ended 28 March 2015

PREVIOUS2015 ANNUAL FINANCIAL STATEMENTS CONTENTS NEXT
123
Apparel Home Central Services Eliminations Total
R’m 2015 2014 2015 2014 2015 2014 2015 2014 2015 2014
Revenue 13 175 11 413 4 665 4 290 300 253 (129) (127) 18 011 15 829 External 13 175 11 413 4 665 4 290 171 126 - - 18 011 15 829 Internal - - - - 129 127 (129) (127) - -
Profit from operating activities 2 535 2 102 705 591 (164) (156) - - 3 076 2 537 Net finance income 87 63 Profit before taxation 3 163 2 600 Taxation 878 733
Profit after taxation 2 285 1 867
Divisional assets 3 239 2 760 995 846 3 633 2 957 - - 7 867 6 563 Divisional liabilities 1 524 1 458 667 631 662 559 (7) (7) 2 846 2 641 Capital expenditure 173 127 70 62 214 216 - - 457 405 Depreciation and amortisation 97 86 36 33 75 72 - - 208 191
South Africa Other Africa Total
R’m 2015 2014 2015 2014 2015 2014
Revenue 16 715 14 822 1 296 1 007 18 011 15 829 Assets 7 238 6 092 629 471 7 867 6 563 Capital expenditure 387 386 70 19 457 405
30. Segmental reporting
For management purposes, the Group is organised into business units based on their products and services, and has three reportable segments as follows:
- The Apparel segment retails clothing, sportswear, footwear, sporting equipment and accessories; - The Home segment retails homewares; and- The Central Services segment provides services to the trading segments including information technology, internal audit, human resources, group real estate and finance.
Management monitors the operating results of its business units separately for the purpose of making decisions about resource allocation and performance assessment.Segment performance is evaluated based on operating profit or loss. Net finance income and income taxes are managed on a group basis and are not allocated to operating segments.
31. Geographical segments
notes to the financial statements for the year ended 29 March 2015

PREVIOUS2015 ANNUAL FINANCIAL STATEMENTS CONTENTS NEXT
124
Analysis of the movement of owned property, plant and equipment
Furniture fittings equipment and vehicles Computer equipment Improvements to leasehold
premises Buildings Total
R’m2015 2014 2015 2014 2015 2014 2015 2014 2015 2014
Group
Net carrying amount at beginning of the year 614 544 72 70 19 11 13 35 718 660 Cost or carrying amount 1 429 1 274 206 174 50 41 15 39 1 700 1 528 Accumulated depreciation and impairment (815) (730) (134) (104) (31) (30) (2) (4) (982) (868)
Current year movementsAdditions 260 210 48 32 4 10 - 1 312 253 Disposals and scrapping (7) (8) - - - - - (22) (7) (30)Impairments (1) (4) - - - - - - (1) (4)Exchange differences (3) 1 - - - - - - (3) 1 Depreciation (141) (129) (37) (30) (2) (2) (1) (1) (181) (162)
Net carrying amount at end of the year 722 614 83 72 21 19 12 13 838 718
Made up as follows:Net carrying amount 722 614 83 72 21 19 12 13 838 718 Cost or carrying amount 1 625 1 429 254 206 54 50 15 15 1 948 1 700 Accumulated depreciation and impairment (903) (815) (171) (134) (33) (31) (3) (2) (1 110) (982)
Company
Net carrying amount at beginning of the year 568 510 71 68 20 11 - - 659 589 Cost or carrying amount 1 369 1 233 202 171 40 30 - - 1 611 1 434 Accumulated depreciation and impairment (801) (723) (131) (103) (20) (19) - - (952) (845)
Current year movementsAdditions 220 192 46 32 3 10 - - 269 234 Disposals and scrapping (6) (8) - - - - - - (6) (8)Impairment (1) (4) - - - - - - (1) (4)Depreciation (131) (122) (36) (29) (2) (1) - - (169) (152)
Net carrying amount at end of the year 650 568 81 71 21 20 - - 752 659
Made up as follows:Net carrying amount 650 568 81 71 21 20 - - 752 659 Cost or carrying amount 1 532 1 369 248 202 43 40 - - 1 823 1 611 Accumulated depreciation and impairment (882) (801) (167) (131) (22) (20) - - (1 071) (952)
Details of building:
Remaining extent of Erf 4749 Bethlehem District, Bethlehem Province, Free State, in extent of 3538 square metres.
notes to the financial statements for the year ended 28 March 2015

PREVIOUS2015 ANNUAL FINANCIAL STATEMENTS CONTENTS NEXT
125
Analysis of the movement of leased property, plant and equipment
Buildings
R’m2015 2014
Group and Company
Net carrying amount at beginning and end of the year - -
Cost 27 27 Accumulated depreciation (27) (27)
Current year movementDepreciation - -
Net carrying amount at beginning and end of the year - -
Made up as follows:Net carrying amount - - Cost 27 27 Accumulated depreciation (27) (27)
notes to the financial statements for the year ended 28 March 2015
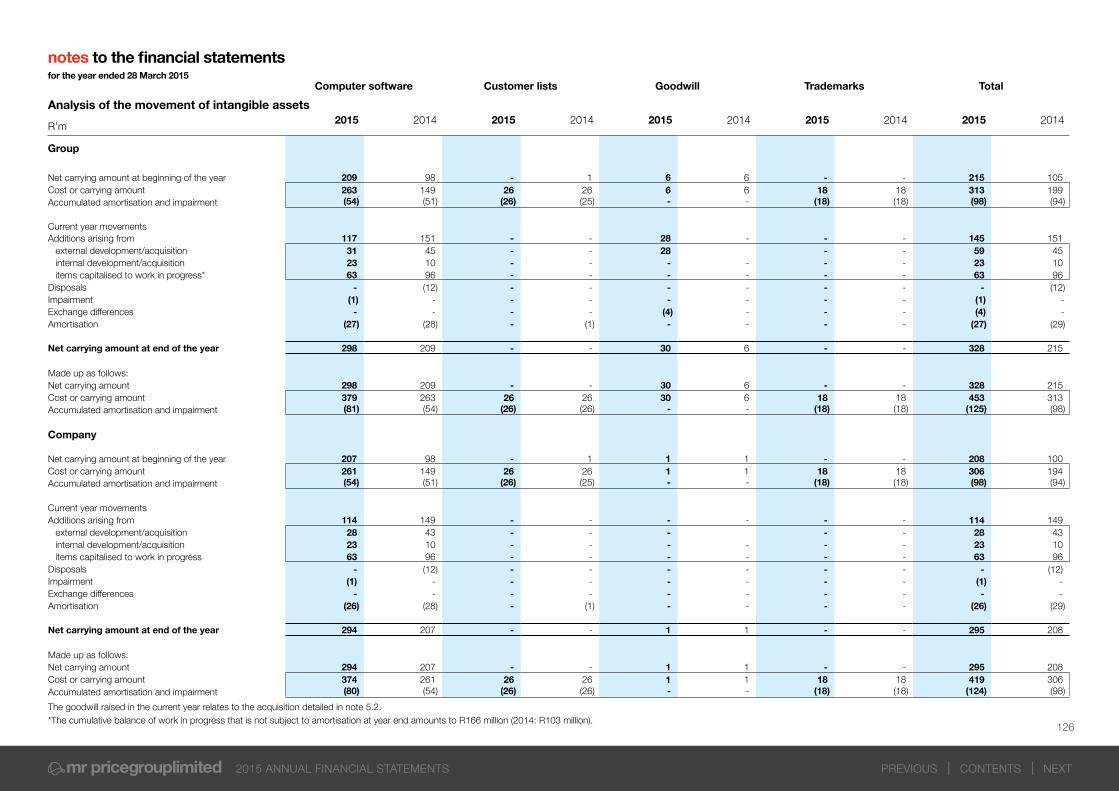
PREVIOUS2015 ANNUAL FINANCIAL STATEMENTS CONTENTS NEXT
126
Analysis of the movement of intangible assets
Computer software Customer lists Goodwill Trademarks Total
R’m2015 2014 2015 2014 2015 2014 2015 2014 2015 2014
Group
Net carrying amount at beginning of the year 209 98 - 1 6 6 - - 215 105 Cost or carrying amount 263 149 26 26 6 6 18 18 313 199 Accumulated amortisation and impairment (54) (51) (26) (25) - - (18) (18) (98) (94)
Current year movements Additions arising from 117 151 - - 28 - - - 145 151
external development/acquisition 31 45 - - 28 - - 59 45 internal development/acquisition 23 10 - - - - - - 23 10 items capitalised to work in progress* 63 96 - - - - - - 63 96
Disposals - (12) - - - - - - - (12)Impairment (1) - - - - - - - (1) - Exchange differences - - - - (4) - - - (4) - Amortisation (27) (28) - (1) - - - - (27) (29)
Net carrying amount at end of the year 298 209 - - 30 6 - - 328 215
Made up as follows: Net carrying amount 298 209 - - 30 6 - - 328 215 Cost or carrying amount 379 263 26 26 30 6 18 18 453 313 Accumulated amortisation and impairment (81) (54) (26) (26) - - (18) (18) (125) (98)
Company
Net carrying amount at beginning of the year 207 98 - 1 1 1 - - 208 100 Cost or carrying amount 261 149 26 26 1 1 18 18 306 194 Accumulated amortisation and impairment (54) (51) (26) (25) - - (18) (18) (98) (94)
Current year movements Additions arising from 114 149 - - - - - - 114 149
external development/acquisition 28 43 - - - - - 28 43 internal development/acquisition 23 10 - - - - - - 23 10items capitalised to work in progress 63 96 - - - - - - 63 96
Disposals - (12) - - - - - - - (12)Impairment (1) - - - - - - - (1) - Exchange differences - - - - - - - - - - Amortisation (26) (28) - (1) - - - - (26) (29)
Net carrying amount at end of the year 294 207 - - 1 1 - - 295 208
Made up as follows: Net carrying amount 294 207 - - 1 1 - - 295 208 Cost or carrying amount 374 261 26 26 1 1 18 18 419 306 Accumulated amortisation and impairment (80) (54) (26) (26) - - (18) (18) (124) (98)
The goodwill raised in the current year relates to the acquisition detailed in note 5.2.*The cumulative balance of work in progress that is not subject to amortisation at year end amounts to R166 million (2014: R103 million).
notes to the financial statements for the year ended 28 March 2015

PREVIOUS2015 ANNUAL FINANCIAL STATEMENTS CONTENTS NEXT
127
Issued capital Carrying value of shares Indebtedness lessimpairment provisions
R’mNotes 2015
Shares2014
Shares 2015 2014 2015 2014
Operating subsidiaries
MRP Stores (Botswana) (Pty) Limited 1 100 100 - - 70 80
Mr Price (Lesotho) (Pty) Limited 2 1 000 1 000 - - 12 13
Mr Price Group (Namibia) (Pty) Limited 3 100 100 - - 144 94
Mr Price Chain Stores International Limited (Nigeria) 4 500 000 500 000 2 2 57 66
Mr Price Chain Stores International Limited (Ghana) 5 480 000 480 000 2 2 50 17
MRP Zambia Limited 6 5 000 - - - 67 -
Millews Fashions (Johannesburg) (Pty) Limited 7 14 000 14 000 - - 1 6
Associated Credit Specialists (Pty) Limited 8 100 100 - - 4 6
MRP Mobile (Pty) Limited 9 100 100 - - 18 8
Share Trusts
Mr Price Group Staff Share Trust and Share Purchase Scheme - -
Mr Price Group Employees Share Investment Trust - -
Mr Price Executive Director Share Trust 1 1
Mr Price Executive Share Trust - 1
Mr Price Senior Management Share Trust 1 1
Mr Price General Staff Share Trust 7 3
Mr Price Partners Share Trust - -
Dormant subsidiaries
Raava Jewellers (Namibia) (Pty) Limited 100 100 1 1 - -
Hughes Extension 17 Township (Pty) Limited 100 100 - - - -
Total 5 5 432 296
financial interest in consolidated entitiesfor the year ended 28 March 2015
Notes:
1. Operates mrp, mrpHome, Miladys and Sheet Street stores in Botswana. 2. Operates mrp, mrpHome and Sheet Street stores in Lesotho.3. Operates mrp, mrpHome, Miladys, Sheet Street and mrpSport stores in Namibia.4. Operates mrp stores in Nigeria.5. Operates mrp, mrpHome stores in Ghana.6. Operates mrp, mrpHome stores in Zambia.7. Develops and leases premises to Group operations.8. Recovers overdue debts from credit customers.9. Operates as a celluar MVNO (mobile virtual network operator) only in South Africa and is a 55% held subsidiary of the Company.
The Company owns 100% of the equity and preference share capital (where applicable) of all other subsidiaries and cell captives except for MRP Mobile (Pty) Ltd in which it holds 55% of the issued share capital with the remaining 45% being held by non-controlling interests.

128
PREVIOUS2015 ANNUAL FINANCIAL STATEMENTS CONTENTS
definitions
AMPS Measure of through-the-door shoppersB-BBEE Broad-Based Black Economic Empowerment CAGR Compound annual growth rateComparable sales Like-for-like location store salesCompany Refers to GroupCRM Customer Relationship ManagementDC Distribution CentreDPS Dividends per sharedti The department of Trade and IndustryERP Enterprise Resource PlanningETI Ethical Trading InitiativeGross profit Retail sales including franchise income, airtime and mobile revenue less
total cost of salesGross margin Gross profit as a percentage of retail sales including franchise income,
airtime and mobile revenueGroup Refers to CompanyHCM Human Capital ManagementHEPS Headline earnings per shareInventory turn Cost of sales as a ratio of average inventoriesJSE Johannesburg Stock ExchangeLSM Living Standard MeasureMPC Mr Price GroupMRP Foundation MRP Foundation NPC, a registered Non-Profit and Public Benefit
Organisation.
MVNO Mobile Virtual Network OperatorNedlac National economic development and labour councilOperating margin Profit from operating activities as a percentage of retail sales and other
incomePMO Price Mark OnPOS Point Of SaleProfit from operating activities Retail sales and other income less costs and expensesReturn on average shareholder equity Headline earnings attributable to ordinary and B ordinary shareholders as
a percentage of average equity attributable to shareholdersReturn on net worth (RONW) Profit attributable to shareholders as a percentage of equity attributable
to shareholdersReturn on operating assets Profit from operating activities as a percentage of average equity
attributable to shareholders, interest-bearing loan financeRLC Retail Liaison CommitteeROGA Return On Gross AssetsRSP Retail Selling PriceSACU Southern African Customs UnionSales density Retail sales per weighted average net square metreSEDEX Supplier Ethical Data ExchangeSETA Sector Education and Training Authority
company secretary and registered officeMrs HE GrosvenorUpper level, North Concourse, 65 Masabalala Yengwa Avenue, Durban, 4001.PO Box 912, Durban, 4000.Tel: 031 310 8000
transfer secretariesComputershare Investor Services (Pty) Ltd,70 Marshall Street, Johannesburg, 2001.PO Box 61051, Marshalltown, 2107.Tel: 011 370 5000
domicile and country of incorporationRepublic of South Africa
sponsorRand Merchant Bank
registration number1933/004418/06
independent auditorErnst & Young Inc.
address phone fax websites
mrp Upper level,
North Concourse,
65 Masabalala
Yengwa Avenue,
Durban, 4001
Private Bag X04,
Snell Parade,
Durban, 4074
031 310 8638 031 304 3358 mrp.commrp.com/ng
mrpHome 031 310 8809 031 328 4138 mrphome.com
mrpSport 031 310 8545 031 306 9347 mrpricesport.com
Sheet Street 031 310 8300 031 310 8317 sheetstreet.co.za
MRP Foundation 031 310 8242 031 328 4609 mrpfoundation.org
Corporate 031 310 8000 031 304 3725 mrpricegroup.com
Miladys 30 Station Drive,Durban, 4001PO Box 3562,Durban, 4000
031 313 5500 031 313 5620 miladys.co.za
mrpMoney 380 Dr Pixley KaSeme Street, Durban, 4001PO Box 4996, Durban, 4000
031 367 3311 031 306 0164 mrpmoney.co.za
MRP Mobile Quadrant 4,Centenary Building, 30 Meridian Drive,Umhlanga, Durban,4320
0800 000 430 mrpmobile.com
Whistleblowers PO Box 51006,Musgrave, 4062
0860 005 111 whistleblowing.co.za
Customer Care 0800 212 535
Account Services 0861 066 639
administration and contact details


![[2008] ZACC 20 MICHAEL WEARE First Applicant and](https://img.pdfslide.us/doc/110x75/620b97c257c1a67ba9634753/2008-zacc-20-michael-weare-first-applicant-and.jpg)