Embed Size (px)
Citation preview
Annual Immunisation
Coverage Report
2015
Written by
Brynley HullA
Alexandra HendryA
Aditi DeyA
Frank BeardA
Julia BrothertonB
Peter McIntyreA
ANational Centre for Immunisation Research and Surveillance of Vaccine Preventable Diseases, The Children’s Hospital at Westmeadand University of Sydney, Locked Bag 4001, Westmead, NSW 2145
BNational HPV Vaccination Program Register, Victorian Cytology Service, PO Box 310, East Melbourne, VIC 8002
Corresponding author: Mr Brynley Hull, National Centre for Immunisation Research and Surveillance of Vaccine Preventable Diseases,The Children’s Hospital at Westmead and University of Sydney, Locked Bag 4001, WESTMEAD NSW 2145. Telephone:þ61 2 9845 1435.Facsimile: þ61 2 9845 1418. Email: [email protected]
The National Centre for Immunisation Research and Surveillance of Vaccine Preventable Diseases is supported by the Australian GovernmentDepartment of Health, the NSWMinistry of Health and The Children’s Hospital at Westmead. The opinions expressed in this paper are thoseof the authors, and do not necessarily represent the views of these agencies.
2
Contents
Abstract ............................................................................................................................................................................. 7
Introduction....................................................................................................................................................................... 7
Methods............................................................................................................................................................................. 7
The Australian Childhood Immunisation Register....................................................................................................... 7
Measuring immunisation coverage using the ACIR .................................................................................................... 7
Timeliness................................................................................................................................................................... 10
Remoteness status ....................................................................................................................................................... 10
Indigenous status......................................................................................................................................................... 10
Small area analysis ..................................................................................................................................................... 10
Objection to vaccination............................................................................................................................................. 10
Medical contraindication exemptions......................................................................................................................... 11
Human papillomavirus vaccine coverage................................................................................................................... 11
Coverage in the elderly............................................................................................................................................... 11
Indigenous adolescent and adult coverage ................................................................................................................. 11
Results............................................................................................................................................................................. 11
Coverage estimates ..................................................................................................................................................... 11
Varicella coverage before and after introduction of MMRV vaccine........................................................................ 15
Indigenous coverage estimates ................................................................................................................................... 15
Seasonal influenza vaccine coverage ......................................................................................................................... 20
Timeliness of immunisation ....................................................................................................................................... 21
Registered objection to vaccination............................................................................................................................ 25
Partially immunised children...................................................................................................................................... 25
Medical contraindication exemptions......................................................................................................................... 25
Provider type............................................................................................................................................................... 25
Mechanisms of reporting to the ACIR ....................................................................................................................... 26
Third dose assumption................................................................................................................................................ 26
Human papillomavirus vaccine coverage................................................................................................................... 26
Discussion ....................................................................................................................................................................... 27
References....................................................................................................................................................................... 31
3
List of tables
Table 1. Australian National Immunisation Program Schedule for children,
adolescents and adults in 2015 ...................................................................................................................... 8
Table 2. Percentage of children assessed in 2015 as immunised by 12 months of age,
by vaccine and state or territorya, Australia ................................................................................................ 12
Table 3. Percentage of children assessed in 2015 as immunised by 24 months of age,
by vaccine and state or territorya, Australia ................................................................................................ 12
Table 4. Percentage of children assessed in 2015 as immunised by 60 months of age,
by vaccine and state or territorya, Australia ................................................................................................ 12
Table 5. Comparison of varicella coverage (%) before and after introduction of MMRV vaccine,
by state or territory, Australia, 2015............................................................................................................ 17
Table 6. Vaccination coverage estimates (%) by age, vaccine and Indigenous status,
Australia, assessed in 2015.......................................................................................................................... 17
Table 7. Percentage of children fully immunised by 12 months, 24 months and 60 months of age,
by Indigenous status and state or territory, Australia, assessed in 2015..................................................... 18
Table 8. Vaccination delay, by Indigenous and remoteness status for 2-year oldsa, Australia, 2015 ...................... 23
Table 9. Percentage of 2-year-old childrena by registered vaccination objection, and
whether no/some vaccines recorded on the Australian Childhood
Immunisation Register, by state or territory, Australia, assessed in 2015
(numbers in parentheses in 2014)................................................................................................................ 25
Table 10. Coverage (%) for 3 doses of human papillomavirus (HPV) vaccine for girls 15 years
of age in 2011, 2012, 2013, 2014 and 2015, and males age 15 years in 2015,
by state or territory, Australia...................................................................................................................... 29
4
List of figures
Box 1. Significant changes in immunisation policy, immunisation incentives and coverage
calculation algorithms, Australia, 2011 to 2015.......................................................................................... 9
Figure 1. Trends in ‘fully immunised’ vaccination coverage estimates, Australia, 2005 to 2015 ........................... 13
Figure 2. Trends in vaccination coverage estimates for individual vaccinesa
at 12 months of age, Australia, 2005 to 2015 ............................................................................................ 14
Figure 3. Rotavirus coverage at 12 months by Indigenous status – Rotarix� jurisdictions
versus RotaTeq� jurisdictions, 2015......................................................................................................... 14
Figure 4. Trends in vaccination coverage estimates for individual vaccinesa
at 24 months of age, Australia, 2005 to 2015 ............................................................................................ 15
Figure 5. Comparison of 1-dose varicella vaccine coverage assessed in December 2015 at 24 months
of age versus 36 months of age and 60 months of age, by state or territory, Australia ............................ 16
Figure 6. Trends in vaccination coverage estimates for individual vaccinesa at 60 months
of age (assessed at 72 months prior to December 2007), Australia, 2005 to 2015 ................................... 16
Figure 7. Trends in ‘fully immunised’ vaccination coverage estimates for Indigenous children
in Australia, 2005 to 2015, by age milestones ........................................................................................... 19
Figure 8. Trends in coverage estimates for hepatitis Aa vaccine for Indigenous children
by jurisdiction, Australiab, 2007 to 2015 ................................................................................................... 19
Figure 9. Trends in coverage estimates for pneumococcala vaccine for Indigenous children
by jurisdictionb, Australia, 2007 to 2015 ................................................................................................... 20
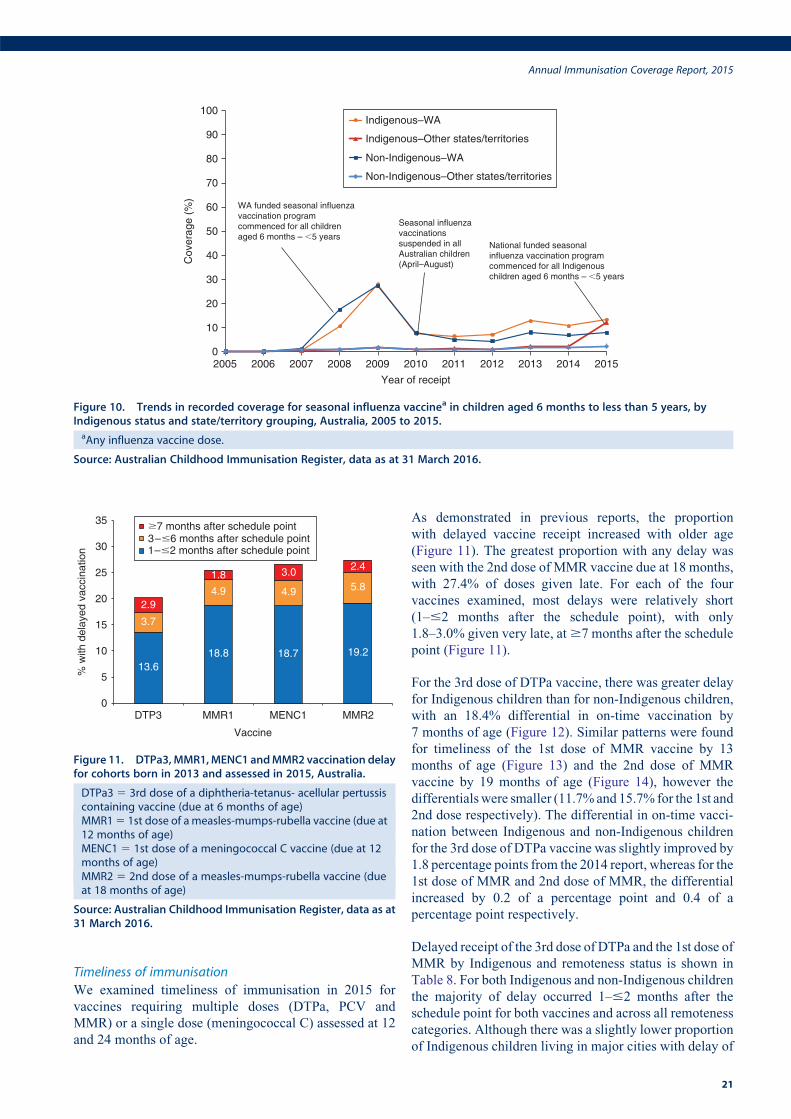
Figure 10. Trends in recorded coverage for seasonal influenza vaccinea in children aged 6 months
to less than 5 years, by Indigenous status and state/territory grouping, Australia, 2005 to 2015 ............. 21
Figure 11. DTPa3, MMR1, MENC1 and MMR2 vaccination delay for cohorts born in 2013
and assessed in 2015, Australia.................................................................................................................. 21
Figure 12. Timelinessa of the 3rd dose of DTPa vaccine (DTPa3), by Indigenous status, Australia ......................... 22
Figure 13. Timelinessa of the 1st dose of MMR vaccine (MMR1), by Indigenous status, Australia......................... 22
Figure 14. Timelinessa of the 2nd dose of MMR vaccine (MMR2) due at 18 months,
by Indigenous status, Australia .................................................................................................................. 23
Figure 15. Vaccination delay for Indigenous children for the 3rd dose of pneumococcal
conjugate vaccine, by state or territory, Australia, 2015 ........................................................................... 24
Figure 16. Percentage of children who received their 1st dose of DTPa/Hexa vaccine
at age 6 – ,8 weeks, by state or territory and month of receipt, Australia, 2009 to 2015 ....................... 24
Figure 17. Proportion of children with recorded vaccination objection, by Statistical Area 3 (SA3),
Australia, 2015 ........................................................................................................................................... 26
Figure 18. Percentage of children who are partially immunised by 24 months of age and have no
recorded vaccination objection, by Statistical Area 3 (SA3), Australia and major
capital cities, 2015...................................................................................................................................... 27
Figure 19. Trends in the number of children with at least one medical contraindication exemption
for a vaccine, by state/territory, Australia.................................................................................................. 28
Figure 20. Coverage for DTPa with and without applying third dose assumption by state
or territory, Australia.................................................................................................................................. 28
Figure 21a. HPV vaccination coverage by dose number (Australia) for females by age group in mid-2015.............. 30
Figure 21b. HPV vaccination coverage by dose number (Australia) for males by age group in mid-2015................. 31
5
List of vaccine abbreviations
7vPCV – 7-valent pneumococcal conjugate vaccine
10vPCV – 10-valent pneumococcal conjugate vaccine
13vPCV – 13-valent pneumococcal conjugate vaccine
23vPPV – 23-valent pneumococcal polysaccharide vaccine
Comvax – Haemophilus influenzae type b conjugate (meningococcal protein conjugate) and hepatitis B (recombinant)
vaccine
dTpa – diphtheria-tetanus-acellular pertussis (adults, adolescents and children aged $10 years formulation)
DTPa – diphtheria-tetanus-acellular pertussis (children aged ,10 years formulation)
DTPa-hepB-IPV-Hib – combined diphtheria-tetanus-acellular pertussis-hepatitis B-inactivated poliovirus-Haemophilus
influenzae type b
DTPa-IPV – diphtheria-tetanus-acellular pertussis-inactivated poliovirus
Engerix-B – recombinant DNA hepatitis B vaccine (paediatric formulation)
Flu – influenza
H-B-VAX II – hepatitis B (paediatric formulation)
Hep A – hepatitis A
Hep B – hepatitis B
Hib – Haemophilus influenzae type b
Hib-MenCCV – Haemophilus influenzae type b–meningococcal C conjugate vaccine
HPV – human papillomavirus
IPV – inactivated poliovirus
MenCCV – meningococcal C conjugate vaccine
MMR – measles-mumps-rubella
MMRV – measles-mumps-rubella-varicella
PedvaxHIB – Haemophilus influenzae type b conjugate vaccine (meningococcal protein conjugate)
PCV – pneumococcal conjugate vaccine
PRP-OMP – Haemophilus influenzae type b conjugate vaccine
PRP-T – Haemophilus influenzae type b conjugate vaccine
VZV – varicella-zoster virus
6
AbstractThis 9th annual immunisation coverage report shows data
for 2015 derived from the Australian Childhood Immuni-
sation Register and the National Human Papillomavirus
(HPV) Vaccination Program Register. This report
includes coverage data for ‘fully immunised’ and by
individual vaccines at standard age milestones and timeli-
ness of receipt at earlier ages according to Indigenous
status. Overall, ‘fully immunised’ coverage has been
mostly stable at the 12- and 24-month age milestones
since late 2003, but at 60 months of age, coverage reached
its highest ever level of 93% during 2015. As in previous
years, coverage for ‘fully immunised’ at 12 and 24 months
of age among Indigenous children was 3.4% and 3.3%
lower than for non-Indigenous children overall, respec-
tively. In 2015, 77.8% of Australian females aged 15 years
had 3 documented doses of HPV vaccine (jurisdictional
range 68.0–85.6%), and 86.2% had at least 1 dose,
compared to 73.4% and 82.7%, respectively, in 2014.
The differential of on-time vaccination between Indige-
nous and non-Indigenous children in 2015 diminished
progressively from 18.4% for vaccines due at 12 months
to 15.7% for those due at 24 months of age. In 2015, the
proportion of children whose parents had registered an
objection to vaccination was 1.2% at the national level,
with large regional variations. This was amarked decrease
from 1.8% in 2014 and the lowest rate of registered
vaccination objection nationally since 2007 when it was
1.1%. Medical contraindication exemptions for Australia
were more than double in 2015 compared with the previ-
ous year (635 to 1401).
Keywords: immunisation coverage, immunisation delay,
Indigenous immunisation coverage, vaccine objection,
human papillomavirus vaccine coverage
IntroductionThis is the 9th Annual Immunisation Coverage Report,
with the first report having focused on 2007 data.1–8 This
report complements other reports providing data on immu-
nisation coverage in Australia9,10 and highlights important
trends and significant issues. It follows the format of
previous reports, providing a detailed summary for 2015
that includes vaccination coverage at standard milestone
ages, coverage for vaccines not included in standard
coverage assessments, timeliness of vaccination, coverage
for Indigenous children, analysis of ‘partially immunised’
children, and data for small geographic areas on the
prevalence of vaccine objection. This report also includes
data on adolescents outside the Australian Childhood
Immunisation Register (ACIR) age group from previously
published sources. Readers are referred to the first report
for a more detailed explanation of the background to this
series of annual reports and the range of analyses pre-
sented.1 This report uses the longstanding international
practice of reporting at key milestone ages to measure
coverage against national targets and to track trends over
time. Table 1 shows the Australian National Immunisation
Program Schedule for 2015.
High levels of reporting to the ACIR are maintained by a
system of incentive payments for immunisation providers
and carers. These have been discussed in detail else-
where.6,11 Important recent changes to immunisation
policy, the incentive payment system and changes to the
‘fully immunised’ coverage algorithms are highlighted in
Box 1 and also referred to in this report.
MethodsThe Australian Childhood Immunisation Register
The ACIR was established on 1 January 1996 by incorpo-
rating demographic data from Medicare on all enrolled
children under the age of 7 years.12 Participation in the
ACIR is ‘opt-out’ so it constitutes a nearly complete
population register, as approximately 99% of children
are registered with Medicare by 12 months of age.12
Children not enrolled in Medicare can also be added to
the ACIR via a supplementary number. Since 2001,
vaccinations given overseas may be recorded if a provider
endorses their validity. Data are transferred to the ACIR
when a recognised immunisation provider supplies details
of an eligible vaccination. This could occur either auto-
matically from medical practice software or through the
internet using the Medicare Australia website or by sub-
mitting paper encounter forms. The existence of medical
contraindications and ‘conscientious’ objection to immu-
nisation is also recorded on the ACIR. From 2016, consci-
entious objection is no longer a valid exemption to
immunisation linked to family payments and therefore
will no longer be recorded on the ACIR.13 All vaccination
records for a child remain on the register indefinitely, but
no new vaccination records are added after the 7th birthday
(20th birthday from January 2016). From September 2016
the register has been renamed the Australian Immunisation
Register (AIR) and allows the recording of vaccinations
given at any age.14
Vaccinations recorded on the immunisation register must
be rendered in accordancewith the guidelines issued by the
Australian Technical Advisory Group on Immunisation
(ATAGI).15 Notifications falling outside these guidelines,
or duplicate notifications, prompt an enquiry with the
provider and, if their validity cannot be established, they
are rejected.
Measuring immunisation coverage using the ACIR
This report details immunisation coverage using ACIR
data up to 31st March 2016. The cohort method has been
used for calculating coverage at the population level
(national and state/territory)16 since the ACIR’s inception.
Cohort immunisation status is assessed at 12 months of
age (for vaccines due at 6 months), 24 months of age (for
vaccines due at 12 and 18 months), and 60 months of age
(for vaccines due at 48 months). A minimum 3-month lag
Annual Immunisation Coverage Report, 2015
7
period is allowed for late notification of vaccinations to
the ACIR, but only vaccines given on or before a child’s
1st, 2nd or 5th respective birthdays are included in cover-
age calculations.16 If a child’s records indicate receipt of
the last dose of a vaccine that requires more than 1 dose to
complete the series, it is assumed that earlier vaccines in
the sequence have been given. This assumption has been
shown to be valid in the past.17,18 Up to date analysis of
this assumption has been undertaken for this 2015 report
by comparing coverage for receipt of only the 3rd dose of
the DTPa/hexavalent vaccine with coverage for receipt
of the 1st, 2nd and 3rd doses of the DTPa/hexavalent
vaccine.
Three-month birth cohorts are used for time trend analyses,
while both 3-month wide and 12-month wide cohorts are
used for all other analyses in this report. The 12-month
cohorts used in this report are children born between 1
January 2014 and 31 December 2014 for the 12-month
milestone; between 1 January 2013 and 31December 2013
for the 24-month milestone; between 1 January 2010 and
31 December 2010 for the 5-year (60-month) milestone.
The proportion of children designated as ‘fully immu-
nised’ is calculated using the number of children
completely immunised with the vaccines of interest by
the designated age as the numerator, and the total number
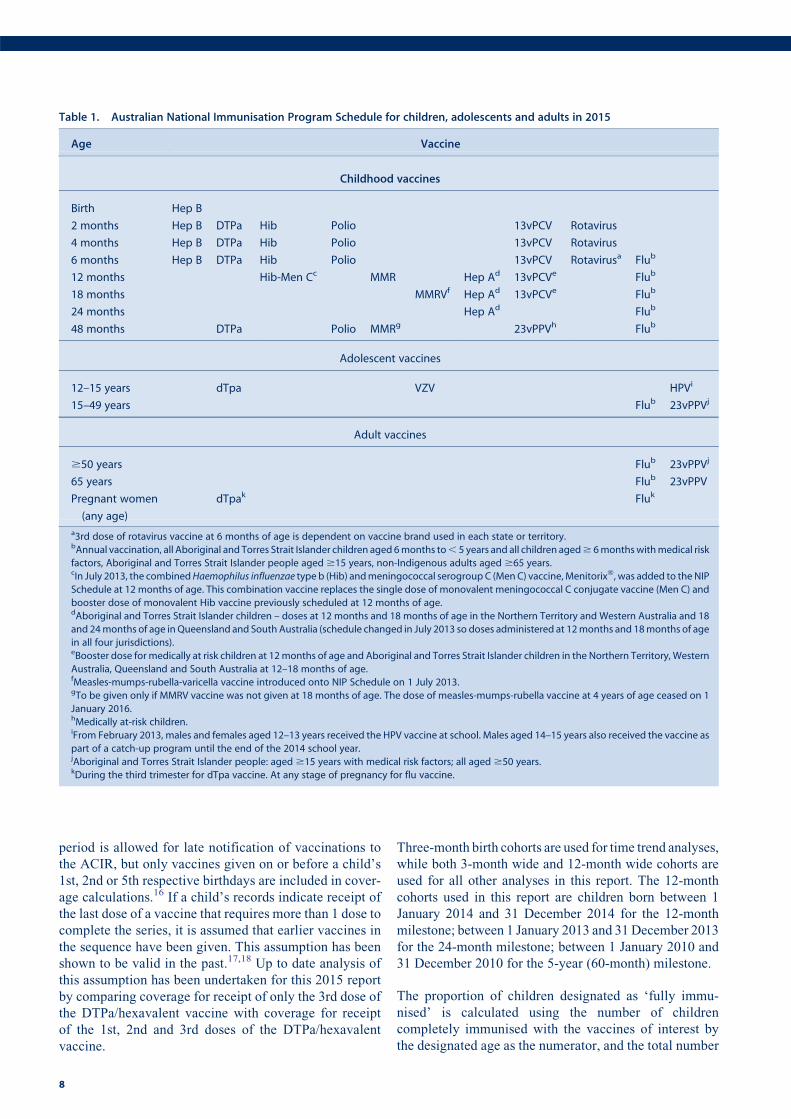
Table 1. Australian National Immunisation Program Schedule for children, adolescents and adults in 2015
Age Vaccine
Childhood vaccines
Birth Hep B
2 months Hep B DTPa Hib Polio 13vPCV Rotavirus
4 months Hep B DTPa Hib Polio 13vPCV Rotavirus
6 months Hep B DTPa Hib Polio 13vPCV Rotavirusa Flub
12 months Hib-Men Cc MMR Hep Ad 13vPCVe Flub
18 months MMRVf Hep Ad 13vPCVe Flub
24 months Hep Ad Flub
48 months DTPa Polio MMRg 23vPPVh Flub
Adolescent vaccines
12–15 years dTpa VZV HPVi
15–49 years Flub 23vPPVj
Adult vaccines
$50 years Flub 23vPPVj
65 years Flub 23vPPV
Pregnant women
(any age)
dTpak Fluk
a3rd dose of rotavirus vaccine at 6 months of age is dependent on vaccine brand used in each state or territory.bAnnual vaccination, all Aboriginal and Torres Strait Islander children aged 6months to, 5 years and all children aged$ 6monthswithmedical risk
factors, Aboriginal and Torres Strait Islander people aged $15 years, non-Indigenous adults aged $65 years.cIn July 2013, the combinedHaemophilus influenzae type b (Hib) andmeningococcal serogroupC (MenC) vaccine,Menitorix�, was added to the NIP
Schedule at 12 months of age. This combination vaccine replaces the single dose of monovalent meningococcal C conjugate vaccine (Men C) and
booster dose of monovalent Hib vaccine previously scheduled at 12 months of age.dAboriginal and Torres Strait Islander children – doses at 12 months and 18 months of age in the Northern Territory and Western Australia and 18
and 24months of age in Queensland and South Australia (schedule changed in July 2013 so doses administered at 12months and 18months of age
in all four jurisdictions).eBooster dose for medically at risk children at 12months of age and Aboriginal and Torres Strait Islander children in the Northern Territory, Western
Australia, Queensland and South Australia at 12–18 months of age.fMeasles-mumps-rubella-varicella vaccine introduced onto NIP Schedule on 1 July 2013.gTo be given only if MMRV vaccine was not given at 18 months of age. The dose of measles-mumps-rubella vaccine at 4 years of age ceased on 1
January 2016.hMedically at-risk children.iFrom February 2013, males and females aged 12–13 years received the HPV vaccine at school. Males aged 14–15 years also received the vaccine as
part of a catch-up program until the end of the 2014 school year.jAboriginal and Torres Strait Islander people: aged $15 years with medical risk factors; all aged $50 years.kDuring the third trimester for dTpa vaccine. At any stage of pregnancy for flu vaccine.
8
of Medicare-registered children in the age cohort as the
denominator. ‘Fully immunised’ at 12 months of age is
defined as a child having a record on the ACIR of three
doses of a diphtheria (D), tetanus (T) and pertussis-con-
taining (P) vaccine, 3 doses of polio vaccine, 2 or 3 doses
of PRP-OMP containing Haemophilus influenzae type b
(Hib) vaccine or 3 doses of any other Hib vaccine, 3 doses
of hepatitis B vaccine, and 3 doses of 13-valent pneumo-
coccal conjugate vaccine. From July 2014, classification
as ‘fully immunised’ at 24 months of age changed to
being defined as a child having a record on the ACIR of a
dose of meningococcal vaccine, a dose of varicella vac-
cine and a 2nd dose of measles-containing vaccine (given
as either MMR or MMRV) in addition to 3 doses of
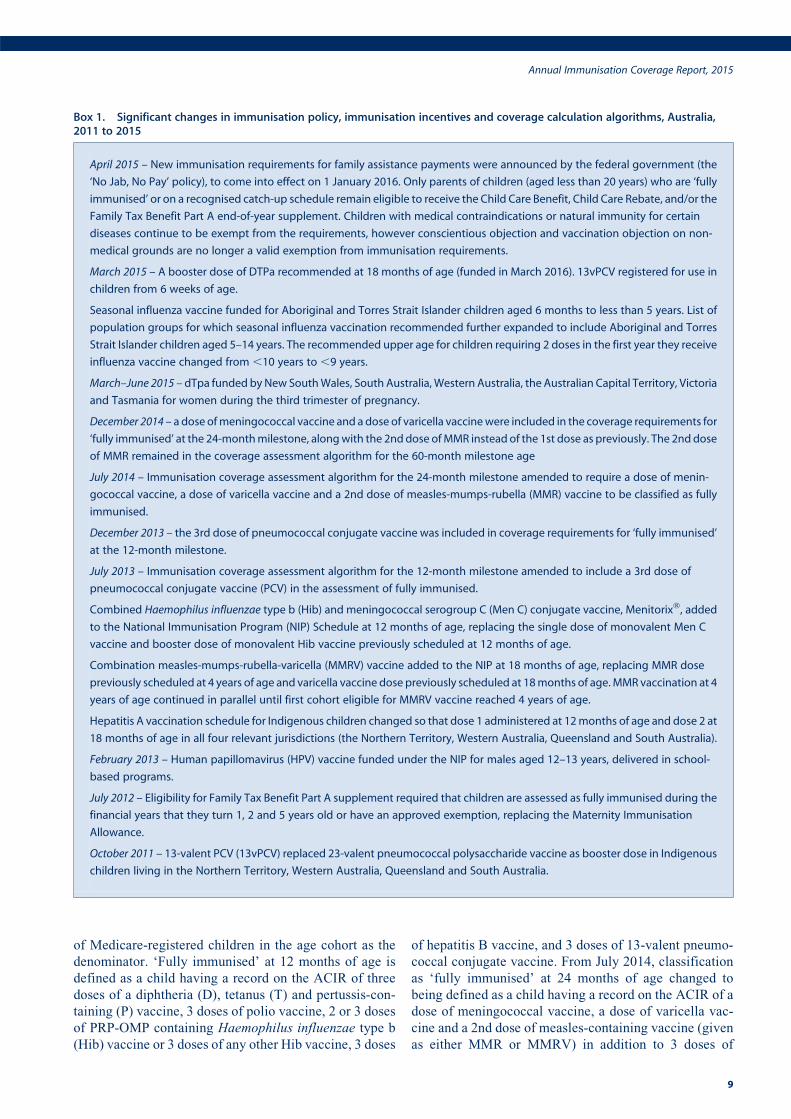
Box 1. Significant changes in immunisation policy, immunisation incentives and coverage calculation algorithms, Australia,2011 to 2015
April 2015 – New immunisation requirements for family assistance payments were announced by the federal government (the
‘No Jab, No Pay’ policy), to come into effect on 1 January 2016. Only parents of children (aged less than 20 years) who are ‘fully
immunised’ or on a recognised catch-up schedule remain eligible to receive the Child Care Benefit, Child Care Rebate, and/or the
Family Tax Benefit Part A end-of-year supplement. Children with medical contraindications or natural immunity for certain
diseases continue to be exempt from the requirements, however conscientious objection and vaccination objection on non-
medical grounds are no longer a valid exemption from immunisation requirements.
March 2015 – A booster dose of DTPa recommended at 18 months of age (funded in March 2016). 13vPCV registered for use in
children from 6 weeks of age.
Seasonal influenza vaccine funded for Aboriginal and Torres Strait Islander children aged 6 months to less than 5 years. List of
population groups for which seasonal influenza vaccination recommended further expanded to include Aboriginal and Torres
Strait Islander children aged 5–14 years. The recommended upper age for children requiring 2 doses in the first year they receive
influenza vaccine changed from ,10 years to ,9 years.
March–June 2015 – dTpa funded by New SouthWales, South Australia, Western Australia, the Australian Capital Territory, Victoria
and Tasmania for women during the third trimester of pregnancy.
December 2014 – a dose ofmeningococcal vaccine and a dose of varicella vaccinewere included in the coverage requirements for
‘fully immunised’ at the 24-monthmilestone, alongwith the 2nddose ofMMR instead of the 1st dose as previously. The 2nddose
of MMR remained in the coverage assessment algorithm for the 60-month milestone age
July 2014 – Immunisation coverage assessment algorithm for the 24-month milestone amended to require a dose of menin-
gococcal vaccine, a dose of varicella vaccine and a 2nd dose of measles-mumps-rubella (MMR) vaccine to be classified as fully
immunised.
December 2013 – the 3rd dose of pneumococcal conjugate vaccine was included in coverage requirements for ‘fully immunised’
at the 12-month milestone.
July 2013 – Immunisation coverage assessment algorithm for the 12-month milestone amended to include a 3rd dose of
pneumococcal conjugate vaccine (PCV) in the assessment of fully immunised.
Combined Haemophilus influenzae type b (Hib) and meningococcal serogroup C (Men C) conjugate vaccine, Menitorix�, added
to the National Immunisation Program (NIP) Schedule at 12 months of age, replacing the single dose of monovalent Men C
vaccine and booster dose of monovalent Hib vaccine previously scheduled at 12 months of age.
Combination measles-mumps-rubella-varicella (MMRV) vaccine added to the NIP at 18 months of age, replacing MMR dose
previously scheduled at 4 years of age and varicella vaccine dose previously scheduled at 18months of age.MMRvaccination at 4
years of age continued in parallel until first cohort eligible for MMRV vaccine reached 4 years of age.
Hepatitis A vaccination schedule for Indigenous children changed so that dose 1 administered at 12months of age and dose 2 at
18 months of age in all four relevant jurisdictions (the Northern Territory, Western Australia, Queensland and South Australia).
February 2013 – Human papillomavirus (HPV) vaccine funded under the NIP for males aged 12–13 years, delivered in school-
based programs.
July 2012 – Eligibility for Family Tax Benefit Part A supplement required that children are assessed as fully immunised during the
financial years that they turn 1, 2 and 5 years old or have an approved exemption, replacing the Maternity Immunisation
Allowance.
October 2011 – 13-valent PCV (13vPCV) replaced 23-valent pneumococcal polysaccharide vaccine as booster dose in Indigenous
children living in the Northern Territory, Western Australia, Queensland and South Australia.
Annual Immunisation Coverage Report, 2015
9
diphtheria-tetanus-pertussis, hepatitis B and polio vac-
cines, and 3 or 4 doses of PRP-OMPHib, Infanrix Hexa or
Hiberix vaccine (3 doses only of Infanrix Hexa or Hiberix
if given after 11.5 months of age), or 4 doses of any other
Hib vaccine. ‘Fully immunised’ at 60 months of age is
defined as a child having a record on the ACIR of 4 doses
of aDTP-containing vaccine, 4 doses of polio vaccine, and
2 doses of an MMR-containing vaccine.
Immunisation coverage estimates were also calculated for
individual National Immunisation Program (NIP) vac-
cines, including the three NIP vaccines given in early
childhood but not routinely reported in the quarterly
coverage reports published in Communicable Diseases
Intelligence19 and not part of ‘fully immunised’ calcula-
tions at 12, 24 and 60months of age. These are: a 2nd or 3rd
dose of rotavirus vaccine by 12 months of age; a 2nd dose
of hepatitis A vaccine in Indigenous children by 30months
of age; and a fourth (booster) dose of pneumococcal
vaccine in Indigenous children by 30 months of age.
Coverage for seasonal influenza vaccinewas calculated for
Indigenous and non-Indigenous children aged 6 months to
less than 5 years. The percentage of children who were
recorded in the ACIR as having received at least one dose
and the percentage having received their first dose of the
seasonal influenza vaccine during 2015 was calculated.
Of children recorded with a first dose, the percentage who
also received a second dose was calculated in line with the
recommendation that children under 9 years of age should
receive two doses in the year their first dose of influenza
vaccine is given.15
Changes to immunisation policy and changes to the ‘fully
immunised’ coverage algorithms have had an impact on
vaccination coverage presented in this report. In April
2015, new immunisation requirements for family assis-
tance payments were announced by the Australian govern-
ment, with the ‘No Jab, No Pay’ policy coming into effect
on 1 January 2016.20 Under this policy only parents of
children (aged less than 20 years) who are ‘fully immu-
nised’ or on a recognised catch-up schedule continue to be
eligible for the Child Care Benefit, Child Care Rebate, and/
or the Family Tax Benefit Part A end-of-year supplement.
Children with medical contraindications (approved by
their general practitioner) or natural immunity for certain
diseases continue to be exempt from the requirements, but
‘conscientious’ objection to vaccination on non-medical
grounds is no longer deemed a valid exemption from
immunisation requirements.
Timeliness
Age-appropriate and timely vaccination was defined as
receipt of a scheduled vaccine dose within 30 days of the
recommended age. For example, a child who received the
1st dose of DTPa (due by 60 days of age) when he or she
was more than 90 days of age was classified as late for that
dose. For descriptive purposes, we categorised the delay
outcome measure for each dose as either ‘delay of 1–#2
months’, delay of 3–#6 months or ‘delay $ 7 months’.
Timeliness is measured in 12-month birth cohorts.
Children included in the timeliness analysis were assessed
at 1–3 years after doses were due, to allow time for late
vaccinations to be recorded. Therefore, cohorts assessed
for timeliness are not the same as those assessed for
coverage milestones. The interval between doses was not
evaluated. Timeliness of different vaccines and doses was
also compared by plotting the cumulative percentage
receiving each vaccine dose by age.
Remoteness status
The area of residence of children was defined as ‘Major
cities’, ‘Inner regional’, ‘Outer regional’, ‘Remote’, and
‘Very remote’ using the Accessibility/Remoteness Index
of Australia (ARIAþ).21 ARIAþ is a continuous varying
index with values ranging from 0 (high accessibility) to 15
(high remoteness), and is based on road distance measure-
ments from over 12,000 populated localities to the nearest
Service Centres in five categories based on population
size. For analysis, we combined the two ‘Regional’ cate-
gories (‘Inner Regional’ and ‘Outer Regional’) into one
category and the two ‘Remote’ categories (‘Remote’ and
‘Very Remote’) into one category. ARIA Accessibility/
Remoteness categories were assigned for each child using
their recorded postcode of residence on the ACIR.
Indigenous status
Aboriginal and Torres Strait Islander (Indigenous) status
on the ACIR is recorded as ‘Indigenous’, ‘non-Indigenous’
or ‘unknown’, as reported by the child’s carer to Medicare
or by the immunisation provider to the ACIR. For this
report we considered two categories of children: ‘Indige-
nous’ and ‘non-Indigenous’; childrenwith unknown Indig-
enous status were presumed to be ‘non-Indigenous’.
Coverage estimate time trends are presented from 2002
only, due to poor rates of reporting Indigenous status prior
to then.22
Small area analysis
Analysis for small areas was done by ABS-defined Statis-
tical Area 3 (SA3),23 chosen because each is small enough
to show differenceswithin jurisdictions but not too small to
render maps unreadable. Maps were created using version
15 of the MapInfo mapping software24 and the ABS
Census Boundary Information. As postcode is the only
geographical indicator available from the ACIR, the ABS
Postal Area to SA3 Concordance 2011 was used to match
ACIR postcodes to SA3s.25
Objection to vaccination
Until 2016, parents who registered vaccination objection
were eligible for federal government family assistance
payments even if their children were unvaccinated. How-
ever some parents who declined vaccination did not
10
register an objection. We calculated the proportions of
children from the cohort of children registered with Medi-
care and born between 1 October 2013 and 31 December
2013 in four categories: registered objection and no vac-
cines recorded on the ACIR, registered objection and at
least one vaccine recorded, no registered objection status
and no vaccines recorded, and no registered objection and
not ‘fully immunised’ by 24 months of age.
Medical contraindication exemptions
A parent of a child can obtain a medical exemption to
vaccination if their child is immunocompromised (due to
disease or treatment eg chemotherapy), or if he or she
presents with a contraindication to receiving that vaccine
as listed by the manufacturer’s product disclosure insert.
The medical basis for vaccine exemption should be based
on guidance in The Australian Immunisation Handbook,15
which is also available on the Immunise Australia website
(http://www.immunise.health.gov.au). Other medical con-
traindications include anaphylaxis following a previous
dose of the relevant vaccine and anaphylaxis following any
component of the relevant vaccine. The ACIR records all
notifications from General Practitioners of medical
exemptions through the Australian Government Depart-
ment of Human Services’ ‘‘Immunisation medical exemp-
tion form’’. This report contains the first published figures
of trends in medical exemptions to vaccination.
Human papillomavirus vaccine coverage
Human papillomavirus (HPV) vaccine is included on the
NIP, with the vaccine delivered to females and, since 2013,
males through an ongoing school-based program usually in
the first year of secondary school. From2007 to 2009, there
was a time-limited catch-up program delivered through
schools, general practices and community immunisation
services for females up to the age of 26 years. Males were
offered a time-limited catch-up program in 2013–2014, at
the age of 14–15 years. A full course of HPV immunisation
was defined as 3 doses of quadrivalent HPV vaccine. Data
on HPV vaccination are provided by the National HPV
Vaccination Program Register, which is operated by the
Victorian Cytology Service. Data for males represent the
vaccination coverage achieved during the catch-up pro-
gram for 14 to 15-year-old males during 2014–2015. The
purpose of this legislated register is to support the imple-
mentation of the vaccination program and to provide data
for monitoring and evaluation. States and territories pro-
vide data to the HPV Register from their school-based
programs. Doses administered in general practice or by
community providers outside of the school program are
notified on a voluntary basis, with a notification payment
provided only to GPs during the 2007–2009 catch-up
program. The World Health Organization (WHO) recom-
mends using 15 years as the reference age for HPV
vaccination coverage for the purposes of international
comparison.
Coverage in the elderly
While an Adult Vaccination Survey (AVS)26 has not been
undertaken in Australia since 2009, data from a Newspoll
Omnibus Survey27 in 2014 can be found in the Annual
Immunisation Coverage Report 2014.8 The expansion of
the immunisation register from September 2016 will
enable all vaccines administered throughout a person’s
life to be captured.14
Indigenous adolescent and adult coverage
Data from the 2013/14Aboriginal and Torres Strait Islander
Health Survey are not yet published. Indigenous adolescent
and adult coverage estimates from the 2012/13 Aboriginal
and Torres Strait Islander Health Survey can be found in the
Annual Immunisation Coverage Report 2014.8
ResultsCoverage estimates‘Fully immunised’
Coverage estimates in 2015 for full-year birth cohorts at
the three milestone ages of 12 months, 24 months and
60 months are provided in Tables 2–4 respectively. The
proportion of Australian children classified as ‘fully
immunised’ was 92.9% at 12 months, 89.5% at 24 months
and 92.6%at 60months of age, compared to 2014 coverage
estimates at these milestones of 91.5%, 86.8% and 92.0%,
respectively. Nationally and for almost all jurisdictions,
‘fully immunised’ coverage (except at the 24-month age
milestone) and coverage for all individual vaccines (except
rotavirus vaccine and varicella vaccine) at all three age
milestones was above 90%.
Figure 1 shows time trends in ‘fully immunised’ childhood
vaccination coverage in Australia, assessed at 12 months,
24 months and 60 months of age, for 3-month cohorts born
from 1 January 1999 to 31 December 2014. Coverage has
been largely stable at the 12- and 24-month age milestones
since late 2003. However, during 2013, ‘fully immunised’
coverage at the 12-month agemilestone for vaccines due at
6 months of age declined by 1.8 percentage points, partly
due to the inclusion of 13-valent pneumococcal conjugate
vaccine (PCV) in the coverage assessment algorithm.
By the end of 2015, ‘fully immunised’ coverage at the
12-month age milestone, using the new coverage assess-
ment algorithm, had increased to almost 93%. In the latter
half of 2014, ‘fully immunised’ coverage at the 24-month
age milestone declined by 5.5 percentage points. The bulk
of this decrease was due to the coverage assessment
algorithm being amended in July 2014 to include a dose
of meningococcal vaccine, a dose of varicella vaccine and
a 2nd dose of MMR vaccine. However, ‘fully immunised’
coverage at the 24-month age milestone increased to
90.8% in December 2015. For vaccines due at 48 months
of age, ‘fully immunised’ coverage dropped to 80.4% in
January 2008, following the change in assessment age
from 72months to 60months, but then rose substantially in
Annual Immunisation Coverage Report, 2015
11
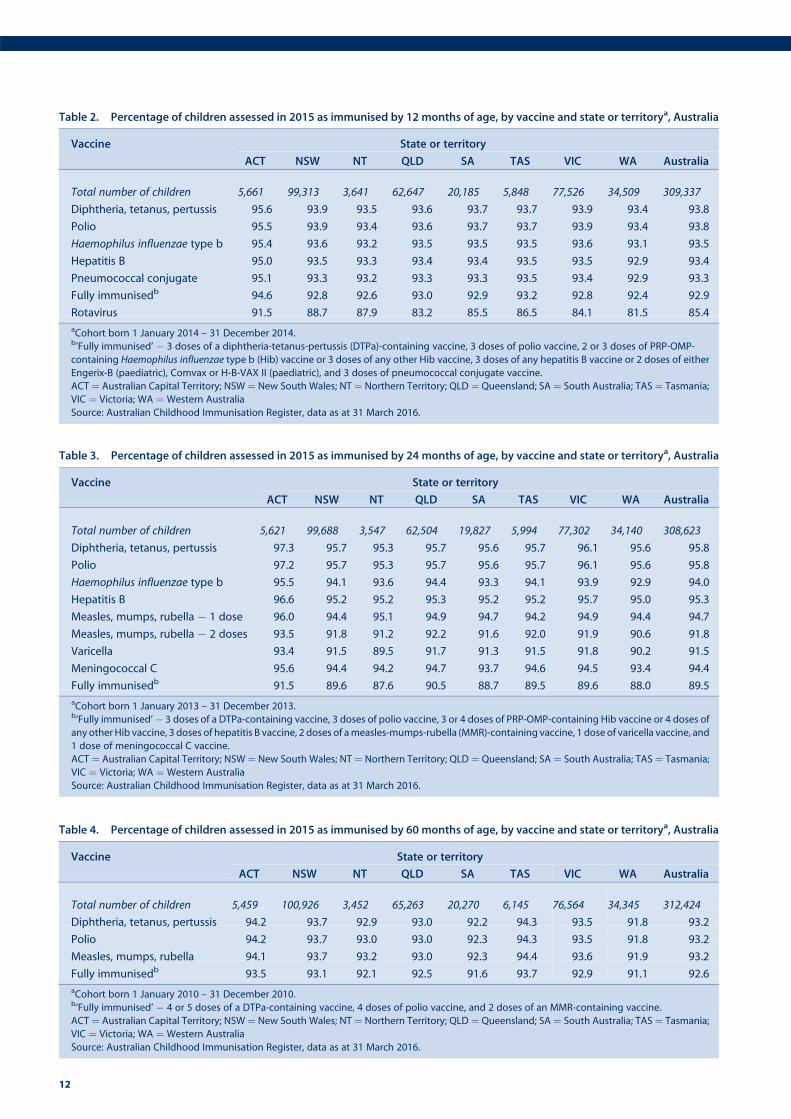
Table 4. Percentage of children assessed in 2015 as immunised by 60 months of age, by vaccine and state or territorya, Australia
Vaccine State or territory
ACT NSW NT QLD SA TAS VIC WA Australia
Total number of children 5,459 100,926 3,452 65,263 20,270 6,145 76,564 34,345 312,424
Diphtheria, tetanus, pertussis 94.2 93.7 92.9 93.0 92.2 94.3 93.5 91.8 93.2
Polio 94.2 93.7 93.0 93.0 92.3 94.3 93.5 91.8 93.2
Measles, mumps, rubella 94.1 93.7 93.2 93.0 92.3 94.4 93.6 91.9 93.2
Fully immunisedb 93.5 93.1 92.1 92.5 91.6 93.7 92.9 91.1 92.6
aCohort born 1 January 2010 – 31 December 2010.b‘Fully immunised’ � 4 or 5 doses of a DTPa-containing vaccine, 4 doses of polio vaccine, and 2 doses of an MMR-containing vaccine.
ACT¼ Australian Capital Territory; NSW¼ New South Wales; NT¼ Northern Territory; QLD¼ Queensland; SA¼ South Australia; TAS¼ Tasmania;
VIC ¼ Victoria; WA ¼ Western Australia
Source: Australian Childhood Immunisation Register, data as at 31 March 2016.
Table 3. Percentage of children assessed in 2015 as immunised by 24 months of age, by vaccine and state or territorya, Australia
Vaccine State or territory
ACT NSW NT QLD SA TAS VIC WA Australia
Total number of children 5,621 99,688 3,547 62,504 19,827 5,994 77,302 34,140 308,623
Diphtheria, tetanus, pertussis 97.3 95.7 95.3 95.7 95.6 95.7 96.1 95.6 95.8
Polio 97.2 95.7 95.3 95.7 95.6 95.7 96.1 95.6 95.8
Haemophilus influenzae type b 95.5 94.1 93.6 94.4 93.3 94.1 93.9 92.9 94.0
Hepatitis B 96.6 95.2 95.2 95.3 95.2 95.2 95.7 95.0 95.3
Measles, mumps, rubella � 1 dose 96.0 94.4 95.1 94.9 94.7 94.2 94.9 94.4 94.7
Measles, mumps, rubella � 2 doses 93.5 91.8 91.2 92.2 91.6 92.0 91.9 90.6 91.8
Varicella 93.4 91.5 89.5 91.7 91.3 91.5 91.8 90.2 91.5
Meningococcal C 95.6 94.4 94.2 94.7 93.7 94.6 94.5 93.4 94.4
Fully immunisedb 91.5 89.6 87.6 90.5 88.7 89.5 89.6 88.0 89.5
aCohort born 1 January 2013 – 31 December 2013.b‘Fully immunised’� 3 doses of a DTPa-containing vaccine, 3 doses of polio vaccine, 3 or 4 doses of PRP-OMP-containing Hib vaccine or 4 doses of
any other Hib vaccine, 3 doses of hepatitis B vaccine, 2 doses of ameasles-mumps-rubella (MMR)-containing vaccine, 1 dose of varicella vaccine, and
1 dose of meningococcal C vaccine.
ACT¼ Australian Capital Territory; NSW¼ New South Wales; NT¼ Northern Territory; QLD¼ Queensland; SA¼ South Australia; TAS¼ Tasmania;
VIC ¼ Victoria; WA ¼ Western Australia
Source: Australian Childhood Immunisation Register, data as at 31 March 2016.
Table 2. Percentage of children assessed in 2015 as immunised by 12 months of age, by vaccine and state or territorya, Australia
Vaccine State or territory
ACT NSW NT QLD SA TAS VIC WA Australia
Total number of children 5,661 99,313 3,641 62,647 20,185 5,848 77,526 34,509 309,337
Diphtheria, tetanus, pertussis 95.6 93.9 93.5 93.6 93.7 93.7 93.9 93.4 93.8
Polio 95.5 93.9 93.4 93.6 93.7 93.7 93.9 93.4 93.8
Haemophilus influenzae type b 95.4 93.6 93.2 93.5 93.5 93.5 93.6 93.1 93.5
Hepatitis B 95.0 93.5 93.3 93.4 93.4 93.5 93.5 92.9 93.4
Pneumococcal conjugate 95.1 93.3 93.2 93.3 93.3 93.5 93.4 92.9 93.3
Fully immunisedb 94.6 92.8 92.6 93.0 92.9 93.2 92.8 92.4 92.9
Rotavirus 91.5 88.7 87.9 83.2 85.5 86.5 84.1 81.5 85.4
aCohort born 1 January 2014 – 31 December 2014.b’Fully immunised’ � 3 doses of a diphtheria-tetanus-pertussis (DTPa)-containing vaccine, 3 doses of polio vaccine, 2 or 3 doses of PRP-OMP-
containing Haemophilus influenzae type b (Hib) vaccine or 3 doses of any other Hib vaccine, 3 doses of any hepatitis B vaccine or 2 doses of either
Engerix-B (paediatric), Comvax or H-B-VAX II (paediatric), and 3 doses of pneumococcal conjugate vaccine.
ACT¼ Australian Capital Territory; NSW¼ New South Wales; NT¼ Northern Territory; QLD¼ Queensland; SA¼ South Australia; TAS¼ Tasmania;
VIC ¼ Victoria; WA ¼ Western Australia
Source: Australian Childhood Immunisation Register, data as at 31 March 2016.
12
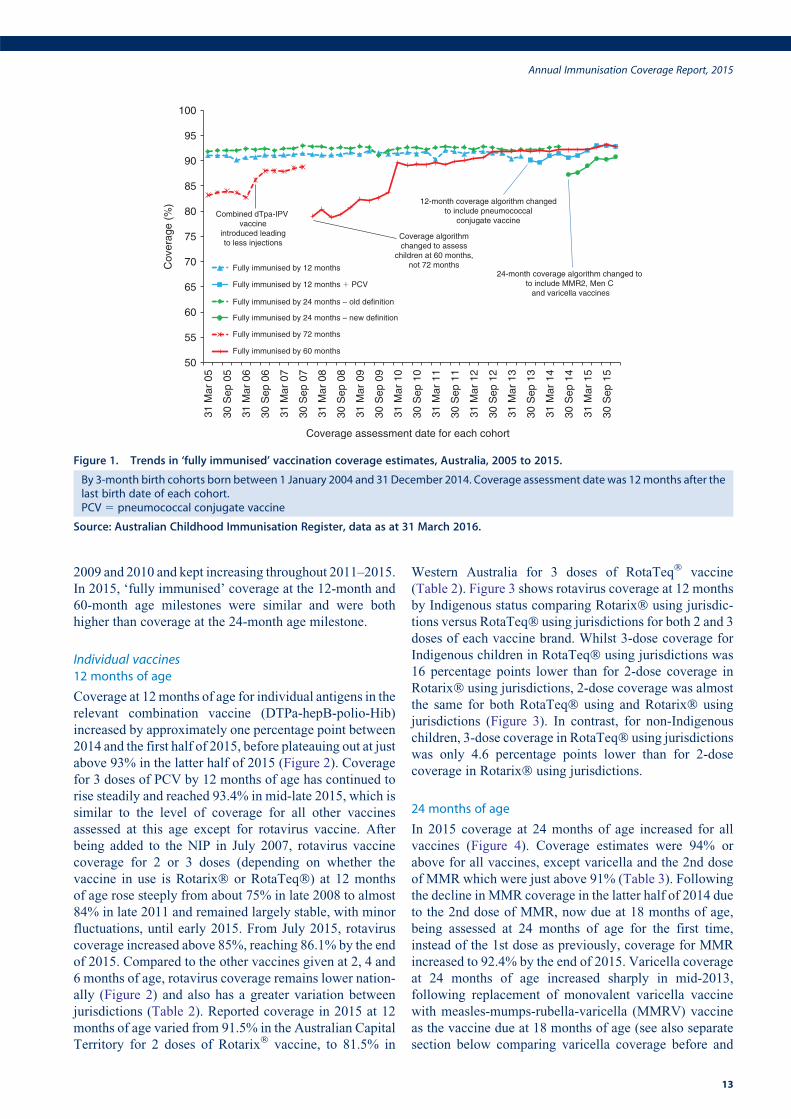
2009 and 2010 and kept increasing throughout 2011–2015.
In 2015, ‘fully immunised’ coverage at the 12-month and
60-month age milestones were similar and were both
higher than coverage at the 24-month age milestone.
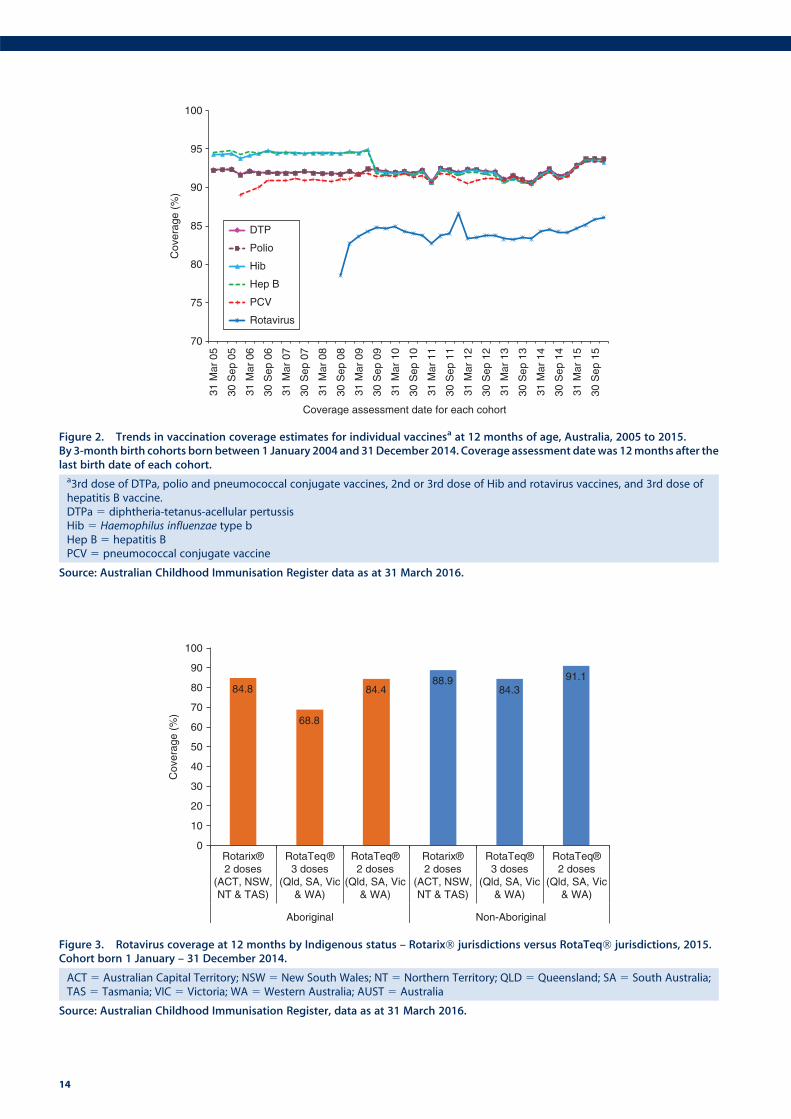
Individual vaccines12 months of age
Coverage at 12months of age for individual antigens in the
relevant combination vaccine (DTPa-hepB-polio-Hib)
increased by approximately one percentage point between
2014 and the first half of 2015, before plateauing out at just
above 93% in the latter half of 2015 (Figure 2). Coverage
for 3 doses of PCV by 12 months of age has continued to
rise steadily and reached 93.4% in mid-late 2015, which is
similar to the level of coverage for all other vaccines
assessed at this age except for rotavirus vaccine. After
being added to the NIP in July 2007, rotavirus vaccine
coverage for 2 or 3 doses (depending on whether the
vaccine in use is Rotarix� or RotaTeq�) at 12 months
of age rose steeply from about 75% in late 2008 to almost
84% in late 2011 and remained largely stable, with minor
fluctuations, until early 2015. From July 2015, rotavirus
coverage increased above 85%, reaching 86.1% by the end
of 2015. Compared to the other vaccines given at 2, 4 and
6 months of age, rotavirus coverage remains lower nation-
ally (Figure 2) and also has a greater variation between
jurisdictions (Table 2). Reported coverage in 2015 at 12
months of age varied from 91.5% in the Australian Capital
Territory for 2 doses of Rotarix� vaccine, to 81.5% in
Western Australia for 3 doses of RotaTeq� vaccine
(Table 2). Figure 3 shows rotavirus coverage at 12 months
by Indigenous status comparing Rotarix� using jurisdic-
tions versus RotaTeq� using jurisdictions for both 2 and 3
doses of each vaccine brand. Whilst 3-dose coverage for
Indigenous children in RotaTeq� using jurisdictions was
16 percentage points lower than for 2-dose coverage in
Rotarix� using jurisdictions, 2-dose coverage was almost
the same for both RotaTeq� using and Rotarix� using
jurisdictions (Figure 3). In contrast, for non-Indigenous
children, 3-dose coverage in RotaTeq� using jurisdictions
was only 4.6 percentage points lower than for 2-dose
coverage in Rotarix� using jurisdictions.
24 months of age
In 2015 coverage at 24 months of age increased for all
vaccines (Figure 4). Coverage estimates were 94% or
above for all vaccines, except varicella and the 2nd dose
of MMR which were just above 91% (Table 3). Following
the decline in MMR coverage in the latter half of 2014 due
to the 2nd dose of MMR, now due at 18 months of age,
being assessed at 24 months of age for the first time,
instead of the 1st dose as previously, coverage for MMR
increased to 92.4% by the end of 2015. Varicella coverage
at 24 months of age increased sharply in mid-2013,
following replacement of monovalent varicella vaccine
with measles-mumps-rubella-varicella (MMRV) vaccine
as the vaccine due at 18 months of age (see also separate
section below comparing varicella coverage before and
50
55
60
65
70
75
80
85
90
95
100
31 M
ar 0
5
30 S
ep 0
5
31 M
ar 0
6
30 S
ep 0
6
31 M
ar 0
7
30 S
ep 0
7
31 M
ar 0
8
30 S
ep 0
8
31 M
ar 0
9
30 S
ep 0
9
31 M
ar 1
0
30 S
ep 1
0
31 M
ar 1
1
30 S
ep 1
1
31 M
ar 1
2
30 S
ep 1
2
31 M
ar 1
3
30 S
ep 1
3
31 M
ar 1
4
30 S
ep 1
4
31 M
ar 1
5
30 S
ep 1
5
Cov
erag
e (%
)
Coverage assessment date for each cohort
Fully immunised by 12 months
Fully immunised by 12 months � PCV
Fully immunised by 24 months – old definition
Fully immunised by 24 months – new definition
Fully immunised by 72 months
Fully immunised by 60 months
Combined dTpa-IPV vaccine
introduced leadingto less injections
Coverage algorithmchanged to assess
children at 60 months,not 72 months
12-month coverage algorithm changedto include pneumococcal
conjugate vaccine
24-month coverage algorithm changed to to include MMR2, Men C
and varicella vaccines
Figure 1. Trends in ‘fully immunised’ vaccination coverage estimates, Australia, 2005 to 2015.
By 3-month birth cohorts born between 1 January 2004 and 31 December 2014. Coverage assessment date was 12months after thelast birth date of each cohort.PCV 5 pneumococcal conjugate vaccine
Source: Australian Childhood Immunisation Register, data as at 31 March 2016.
Annual Immunisation Coverage Report, 2015
13
84.8
68.8
84.488.9
84.391.1
0
10
20
30
40
50
60
70
80
90
100
Rotarix®2 doses
(ACT, NSW,NT & TAS)
RotaTeq®3 doses
(Qld, SA, Vic& WA)
RotaTeq®2 doses
(Qld, SA, Vic& WA)
Rotarix®2 doses
(ACT, NSW,NT & TAS)
RotaTeq®3 doses
(Qld, SA, Vic& WA)
RotaTeq®2 doses
(Qld, SA, Vic& WA)
Aboriginal Non-Aboriginal
Cov
erag
e (%
)
Figure 3. Rotavirus coverage at 12 months by Indigenous status – Rotarix� jurisdictions versus RotaTeq� jurisdictions, 2015.Cohort born 1 January – 31 December 2014.
ACT 5 Australian Capital Territory; NSW 5 New South Wales; NT 5 Northern Territory; QLD 5 Queensland; SA 5 South Australia;TAS 5 Tasmania; VIC 5 Victoria; WA 5 Western Australia; AUST 5 Australia
Source: Australian Childhood Immunisation Register, data as at 31 March 2016.
70
75
80
85
90
95
100
31 M
ar 0
5
30 S
ep 0
5
31 M
ar 0
6
30 S
ep 0
6
31 M
ar 0
7
30 S
ep 0
7
31 M
ar 0
8
30 S
ep 0
8
31 M
ar 0
9
30 S
ep 0
9
31 M
ar 1
0
30 S
ep 1
0
31 M
ar 1
1
30 S
ep 1
1
31 M
ar 1
2
30 S
ep 1
2
31 M
ar 1
3
30 S
ep 1
3
31 M
ar 1
4
30 S
ep 1
4
31 M
ar 1
5
30 S
ep 1
5
DTP
Polio
Hib
Hep B
PCV
Rotavirus
Cov
erag
e (%
)
Coverage assessment date for each cohort
Figure 2. Trends in vaccination coverage estimates for individual vaccinesa at 12 months of age, Australia, 2005 to 2015.By 3-month birth cohorts born between 1 January 2004 and 31December 2014. Coverage assessment datewas 12months after thelast birth date of each cohort.a3rd dose of DTPa, polio and pneumococcal conjugate vaccines, 2nd or 3rd dose of Hib and rotavirus vaccines, and 3rd dose ofhepatitis B vaccine.DTPa 5 diphtheria-tetanus-acellular pertussisHib 5 Haemophilus influenzae type bHep B 5 hepatitis BPCV 5 pneumococcal conjugate vaccine
Source: Australian Childhood Immunisation Register data as at 31 March 2016.
14
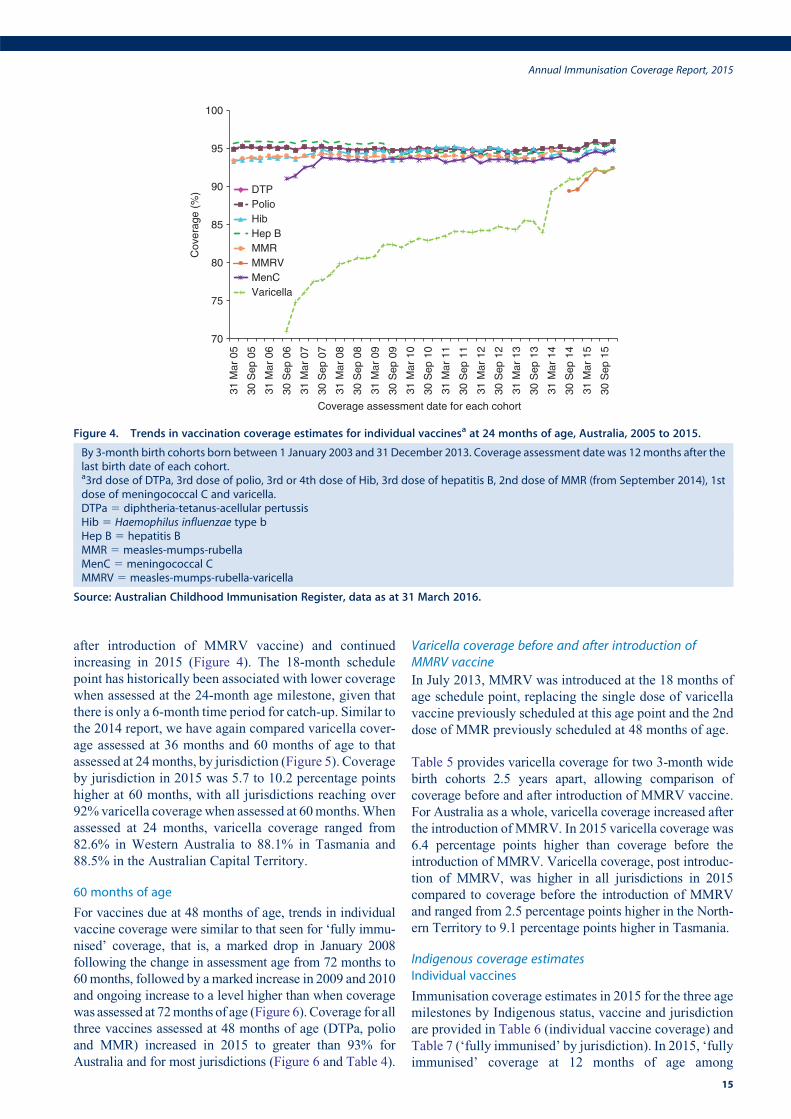
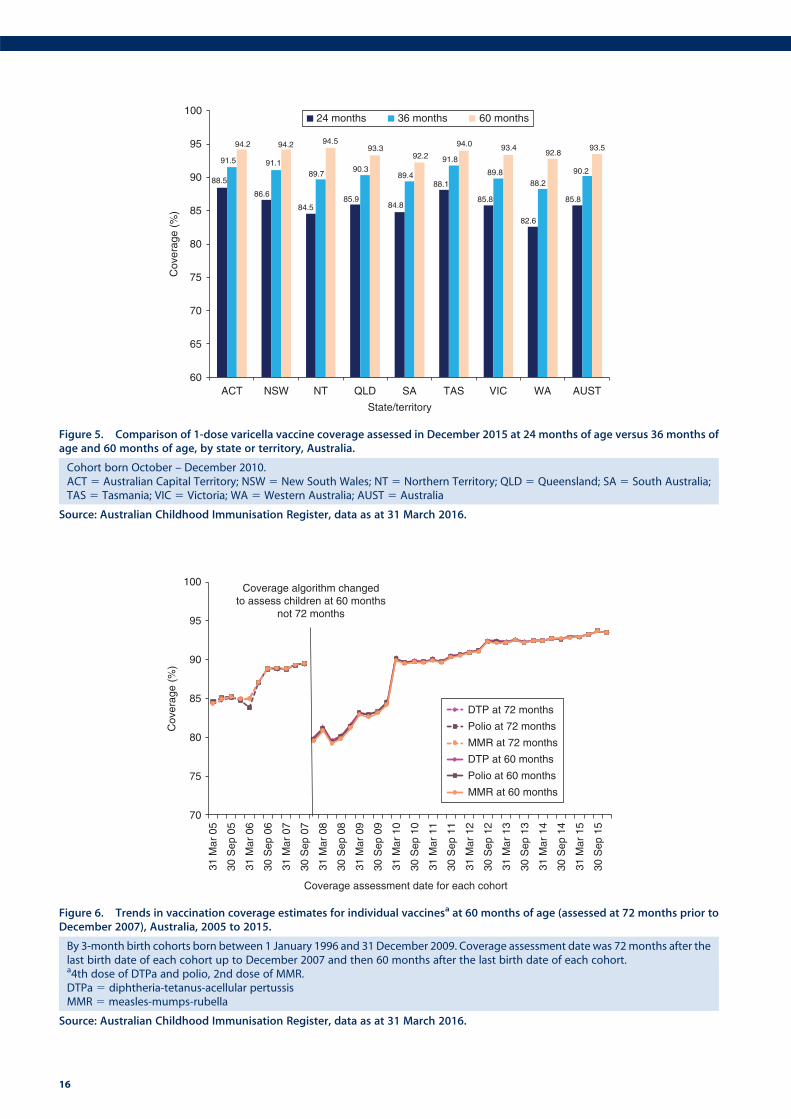
after introduction of MMRV vaccine) and continued
increasing in 2015 (Figure 4). The 18-month schedule
point has historically been associated with lower coverage
when assessed at the 24-month age milestone, given that
there is only a 6-month time period for catch-up. Similar to
the 2014 report, we have again compared varicella cover-
age assessed at 36 months and 60 months of age to that
assessed at 24months, by jurisdiction (Figure 5). Coverage
by jurisdiction in 2015 was 5.7 to 10.2 percentage points
higher at 60 months, with all jurisdictions reaching over
92%varicella coveragewhen assessed at 60months.When
assessed at 24 months, varicella coverage ranged from
82.6% in Western Australia to 88.1% in Tasmania and
88.5% in the Australian Capital Territory.
60 months of age
For vaccines due at 48 months of age, trends in individual
vaccine coverage were similar to that seen for ‘fully immu-
nised’ coverage, that is, a marked drop in January 2008
following the change in assessment age from 72 months to
60months, followed by amarked increase in 2009 and 2010
and ongoing increase to a level higher than when coverage
was assessed at 72months of age (Figure 6). Coverage for all
three vaccines assessed at 48 months of age (DTPa, polio
and MMR) increased in 2015 to greater than 93% for
Australia and for most jurisdictions (Figure 6 and Table 4).
Varicella coverage before and after introduction ofMMRV vaccine
In July 2013, MMRV was introduced at the 18 months of
age schedule point, replacing the single dose of varicella
vaccine previously scheduled at this age point and the 2nd
dose of MMR previously scheduled at 48 months of age.
Table 5 provides varicella coverage for two 3-month wide
birth cohorts 2.5 years apart, allowing comparison of
coverage before and after introduction of MMRV vaccine.
For Australia as a whole, varicella coverage increased after
the introduction of MMRV. In 2015 varicella coverage was
6.4 percentage points higher than coverage before the
introduction of MMRV. Varicella coverage, post introduc-
tion of MMRV, was higher in all jurisdictions in 2015
compared to coverage before the introduction of MMRV
and ranged from 2.5 percentage points higher in the North-
ern Territory to 9.1 percentage points higher in Tasmania.
Indigenous coverage estimatesIndividual vaccines
Immunisation coverage estimates in 2015 for the three age
milestones by Indigenous status, vaccine and jurisdiction
are provided in Table 6 (individual vaccine coverage) and
Table 7 (‘fully immunised’ by jurisdiction). In 2015, ‘fully
immunised’ coverage at 12 months of age among
70
75
80
85
90
95
100
31 M
ar 0
5
30 S
ep 0
5
31 M
ar 0
6
30 S
ep 0
6
31 M
ar 0
7
30 S
ep 0
7
31 M
ar 0
8
30 S
ep 0
8
31 M
ar 0
9
30 S
ep 0
9
31 M
ar 1
0
30 S
ep 1
0
31 M
ar 1
1
30 S
ep 1
1
31 M
ar 1
2
30 S
ep 1
2
31 M
ar 1
3
30 S
ep 1
3
31 M
ar 1
4
30 S
ep 1
4
31 M
ar 1
5
30 S
ep 1
5
Coverage assessment date for each cohort
DTPPolioHibHep BMMRMMRVMenCVaricella
Cov
erag
e (%
)
Figure 4. Trends in vaccination coverage estimates for individual vaccinesa at 24 months of age, Australia, 2005 to 2015.
By 3-month birth cohorts born between 1 January 2003 and 31 December 2013. Coverage assessment date was 12months after thelast birth date of each cohort.a3rd dose of DTPa, 3rd dose of polio, 3rd or 4th dose of Hib, 3rd dose of hepatitis B, 2nd dose of MMR (from September 2014), 1stdose of meningococcal C and varicella.DTPa 5 diphtheria-tetanus-acellular pertussisHib 5 Haemophilus influenzae type bHep B 5 hepatitis BMMR 5 measles-mumps-rubellaMenC 5 meningococcal CMMRV 5 measles-mumps-rubella-varicella
Source: Australian Childhood Immunisation Register, data as at 31 March 2016.
Annual Immunisation Coverage Report, 2015
15
88.5
86.6
84.585.9
84.8
88.1
85.8
82.6
85.8
91.5 91.189.7
90.389.4
91.8
89.888.2
90.2
94.2 94.2 94.593.3
92.2
94.0 93.492.8
93.5
60
65
70
75
80
85
90
95
100
ACT NSW NT QLD SA TAS VIC WA AUST
State/territory
24 months 36 months 60 months
Cov
erag
e (%
)
Figure 5. Comparison of 1-dose varicella vaccine coverage assessed in December 2015 at 24 months of age versus 36 months ofage and 60 months of age, by state or territory, Australia.
Cohort born October – December 2010.ACT 5 Australian Capital Territory; NSW 5 New South Wales; NT 5 Northern Territory; QLD 5 Queensland; SA 5 South Australia;TAS 5 Tasmania; VIC 5 Victoria; WA 5 Western Australia; AUST 5 Australia
Source: Australian Childhood Immunisation Register, data as at 31 March 2016.
70
75
80
85
90
95
100
31 M
ar 0
5
30 S
ep 0
5
31 M
ar 0
6
30 S
ep 0
6
31 M
ar 0
7
30 S
ep 0
7
31 M
ar 0
8
30 S
ep 0
8
31 M
ar 0
9
30 S
ep 0
9
31 M
ar 1
0
30 S
ep 1
0
31 M
ar 1
1
30 S
ep 1
1
31 M
ar 1
2
30 S
ep 1
2
31 M
ar 1
3
30 S
ep 1
3
31 M
ar 1
4
30 S
ep 1
4
31 M
ar 1
5
30 S
ep 1
5
Coverage assessment date for each cohort
DTP at 72 months
Polio at 72 months
MMR at 72 months
DTP at 60 months
Polio at 60 months
MMR at 60 months
Coverage algorithm changedto assess children at 60 months
not 72 months
Cov
erag
e (%
)
Figure 6. Trends in vaccination coverage estimates for individual vaccinesa at 60 months of age (assessed at 72 months prior toDecember 2007), Australia, 2005 to 2015.
By 3-month birth cohorts born between 1 January 1996 and 31 December 2009. Coverage assessment date was 72months after thelast birth date of each cohort up to December 2007 and then 60 months after the last birth date of each cohort.a4th dose of DTPa and polio, 2nd dose of MMR.DTPa 5 diphtheria-tetanus-acellular pertussisMMR 5 measles-mumps-rubella
Source: Australian Childhood Immunisation Register, data as at 31 March 2016.
16
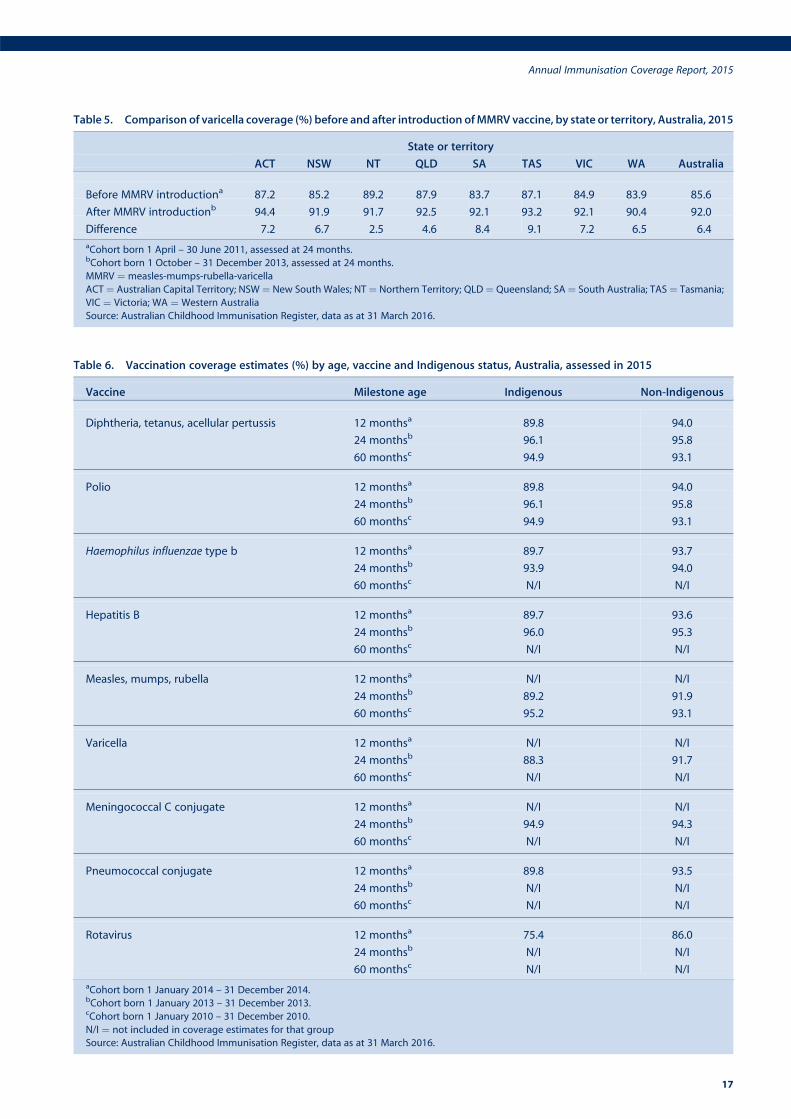
Table 5. Comparison of varicella coverage (%) before and after introduction ofMMRV vaccine, by state or territory, Australia, 2015
State or territory
ACT NSW NT QLD SA TAS VIC WA Australia
Before MMRV introductiona 87.2 85.2 89.2 87.9 83.7 87.1 84.9 83.9 85.6
After MMRV introductionb 94.4 91.9 91.7 92.5 92.1 93.2 92.1 90.4 92.0
Difference 7.2 6.7 2.5 4.6 8.4 9.1 7.2 6.5 6.4
aCohort born 1 April – 30 June 2011, assessed at 24 months.bCohort born 1 October – 31 December 2013, assessed at 24 months.
MMRV ¼ measles-mumps-rubella-varicella
ACT¼ Australian Capital Territory; NSW¼ New South Wales; NT¼ Northern Territory; QLD¼ Queensland; SA¼ South Australia; TAS¼ Tasmania;
VIC ¼ Victoria; WA ¼ Western Australia
Source: Australian Childhood Immunisation Register, data as at 31 March 2016.
Table 6. Vaccination coverage estimates (%) by age, vaccine and Indigenous status, Australia, assessed in 2015
Vaccine Milestone age Indigenous Non-Indigenous
Diphtheria, tetanus, acellular pertussis 12 monthsa 89.8 94.0
24 monthsb 96.1 95.8
60 monthsc 94.9 93.1
Polio 12 monthsa 89.8 94.0
24 monthsb 96.1 95.8
60 monthsc 94.9 93.1
Haemophilus influenzae type b 12 monthsa 89.7 93.7
24 monthsb 93.9 94.0
60 monthsc N/I N/I
Hepatitis B 12 monthsa 89.7 93.6
24 monthsb 96.0 95.3
60 monthsc N/I N/I
Measles, mumps, rubella 12 monthsa N/I N/I
24 monthsb 89.2 91.9
60 monthsc 95.2 93.1
Varicella 12 monthsa N/I N/I
24 monthsb 88.3 91.7
60 monthsc N/I N/I
Meningococcal C conjugate 12 monthsa N/I N/I
24 monthsb 94.9 94.3
60 monthsc N/I N/I
Pneumococcal conjugate 12 monthsa 89.8 93.5
24 monthsb N/I N/I
60 monthsc N/I N/I
Rotavirus 12 monthsa 75.4 86.0
24 monthsb N/I N/I
60 monthsc N/I N/I
aCohort born 1 January 2014 – 31 December 2014.bCohort born 1 January 2013 – 31 December 2013.cCohort born 1 January 2010 – 31 December 2010.
N/I ¼ not included in coverage estimates for that group
Source: Australian Childhood Immunisation Register, data as at 31 March 2016.
Annual Immunisation Coverage Report, 2015
17
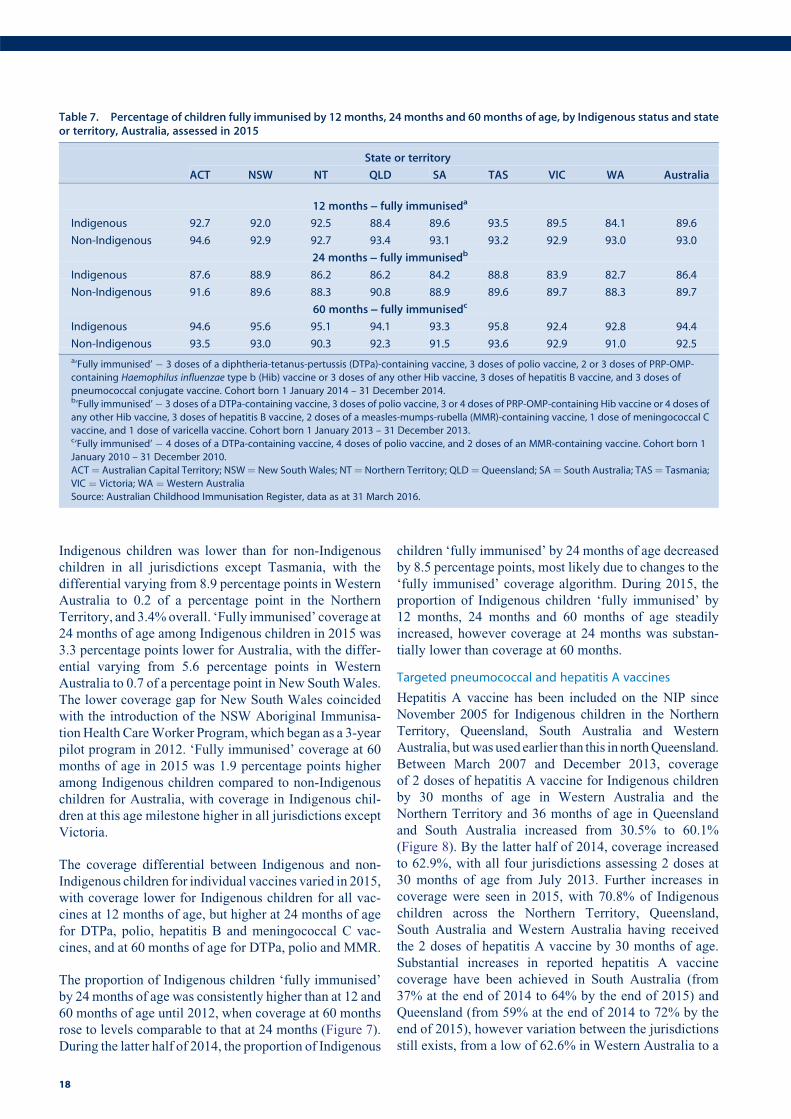
Indigenous children was lower than for non-Indigenous
children in all jurisdictions except Tasmania, with the
differential varying from 8.9 percentage points in Western
Australia to 0.2 of a percentage point in the Northern
Territory, and 3.4%overall. ‘Fully immunised’ coverage at
24 months of age among Indigenous children in 2015 was
3.3 percentage points lower for Australia, with the differ-
ential varying from 5.6 percentage points in Western
Australia to 0.7 of a percentage point in New SouthWales.
The lower coverage gap for New South Wales coincided
with the introduction of the NSW Aboriginal Immunisa-
tionHealth CareWorker Program, which began as a 3-year
pilot program in 2012. ‘Fully immunised’ coverage at 60
months of age in 2015 was 1.9 percentage points higher
among Indigenous children compared to non-Indigenous
children for Australia, with coverage in Indigenous chil-
dren at this age milestone higher in all jurisdictions except
Victoria.
The coverage differential between Indigenous and non-
Indigenous children for individual vaccines varied in 2015,
with coverage lower for Indigenous children for all vac-
cines at 12 months of age, but higher at 24 months of age
for DTPa, polio, hepatitis B and meningococcal C vac-
cines, and at 60 months of age for DTPa, polio and MMR.
The proportion of Indigenous children ‘fully immunised’
by 24 months of age was consistently higher than at 12 and
60 months of age until 2012, when coverage at 60 months
rose to levels comparable to that at 24 months (Figure 7).
During the latter half of 2014, the proportion of Indigenous
children ‘fully immunised’ by 24 months of age decreased
by 8.5 percentage points, most likely due to changes to the
‘fully immunised’ coverage algorithm. During 2015, the
proportion of Indigenous children ‘fully immunised’ by
12 months, 24 months and 60 months of age steadily
increased, however coverage at 24 months was substan-
tially lower than coverage at 60 months.
Targeted pneumococcal and hepatitis A vaccines
Hepatitis A vaccine has been included on the NIP since
November 2005 for Indigenous children in the Northern
Territory, Queensland, South Australia and Western
Australia, butwas used earlier than this in northQueensland.
Between March 2007 and December 2013, coverage
of 2 doses of hepatitis A vaccine for Indigenous children
by 30 months of age in Western Australia and the
Northern Territory and 36 months of age in Queensland
and South Australia increased from 30.5% to 60.1%
(Figure 8). By the latter half of 2014, coverage increased
to 62.9%, with all four jurisdictions assessing 2 doses at
30 months of age from July 2013. Further increases in
coverage were seen in 2015, with 70.8% of Indigenous
children across the Northern Territory, Queensland,
South Australia and Western Australia having received
the 2 doses of hepatitis A vaccine by 30 months of age.
Substantial increases in reported hepatitis A vaccine
coverage have been achieved in South Australia (from
37% at the end of 2014 to 64% by the end of 2015) and
Queensland (from 59% at the end of 2014 to 72% by the
end of 2015), however variation between the jurisdictions
still exists, from a low of 62.6% in Western Australia to a
Table 7. Percentage of children fully immunised by 12 months, 24 months and 60 months of age, by Indigenous status and stateor territory, Australia, assessed in 2015
State or territory
ACT NSW NT QLD SA TAS VIC WA Australia
12 months ] fully immuniseda
Indigenous 92.7 92.0 92.5 88.4 89.6 93.5 89.5 84.1 89.6
Non-Indigenous 94.6 92.9 92.7 93.4 93.1 93.2 92.9 93.0 93.0
24 months ] fully immunisedb
Indigenous 87.6 88.9 86.2 86.2 84.2 88.8 83.9 82.7 86.4
Non-Indigenous 91.6 89.6 88.3 90.8 88.9 89.6 89.7 88.3 89.7
60 months ] fully immunisedc
Indigenous 94.6 95.6 95.1 94.1 93.3 95.8 92.4 92.8 94.4
Non-Indigenous 93.5 93.0 90.3 92.3 91.5 93.6 92.9 91.0 92.5
a‘Fully immunised’ � 3 doses of a diphtheria-tetanus-pertussis (DTPa)-containing vaccine, 3 doses of polio vaccine, 2 or 3 doses of PRP-OMP-
containing Haemophilus influenzae type b (Hib) vaccine or 3 doses of any other Hib vaccine, 3 doses of hepatitis B vaccine, and 3 doses of
pneumococcal conjugate vaccine. Cohort born 1 January 2014 – 31 December 2014.b‘Fully immunised’� 3 doses of a DTPa-containing vaccine, 3 doses of polio vaccine, 3 or 4 doses of PRP-OMP-containing Hib vaccine or 4 doses of
any other Hib vaccine, 3 doses of hepatitis B vaccine, 2 doses of a measles-mumps-rubella (MMR)-containing vaccine, 1 dose of meningococcal C
vaccine, and 1 dose of varicella vaccine. Cohort born 1 January 2013 – 31 December 2013.c‘Fully immunised’ � 4 doses of a DTPa-containing vaccine, 4 doses of polio vaccine, and 2 doses of an MMR-containing vaccine. Cohort born 1
January 2010 – 31 December 2010.
ACT¼ Australian Capital Territory; NSW¼ New South Wales; NT¼ Northern Territory; QLD¼ Queensland; SA¼ South Australia; TAS¼ Tasmania;
VIC ¼ Victoria; WA ¼ Western Australia
Source: Australian Childhood Immunisation Register, data as at 31 March 2016.
18
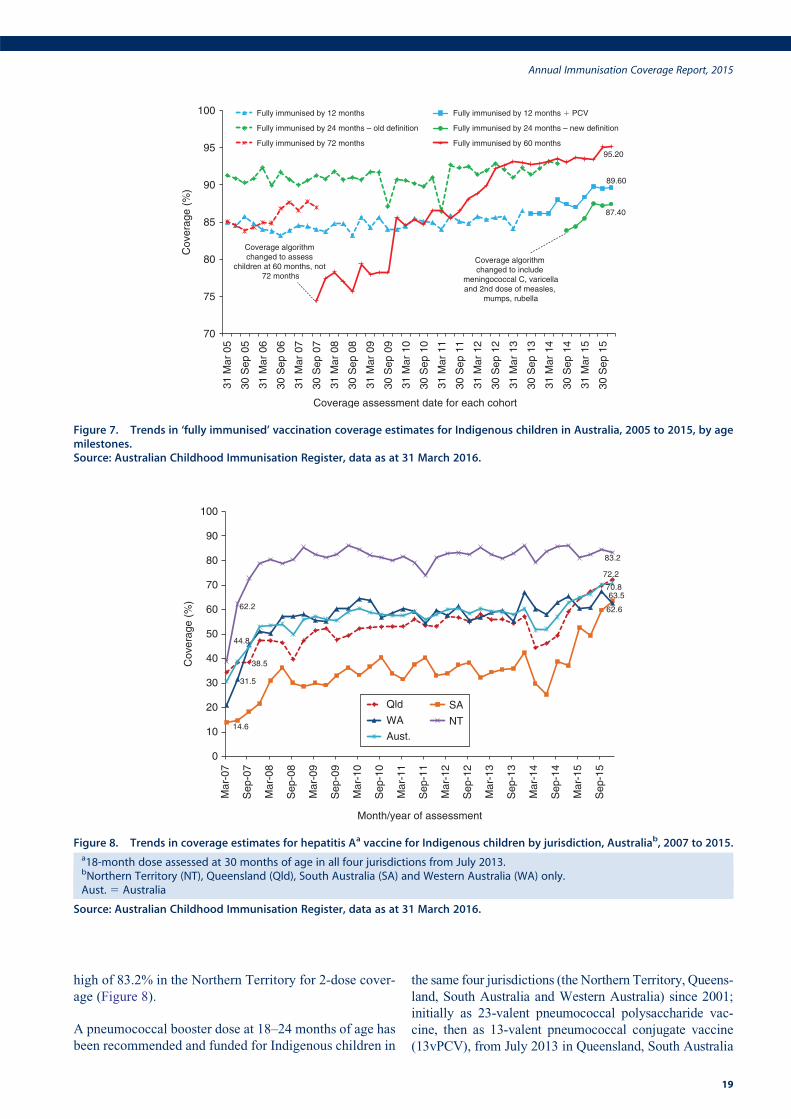
high of 83.2% in the Northern Territory for 2-dose cover-
age (Figure 8).
A pneumococcal booster dose at 18–24 months of age has
been recommended and funded for Indigenous children in
the same four jurisdictions (the Northern Territory, Queens-
land, South Australia and Western Australia) since 2001;
initially as 23-valent pneumococcal polysaccharide vac-
cine, then as 13-valent pneumococcal conjugate vaccine
(13vPCV), from July 2013 in Queensland, South Australia
38.5
72.2
14.6
63.5
31.5
62.662.2
83.2
44.8
70.8
0
10
20
30
40
50
60
70
80
90
100
Mar
-07
Sep
-07
Mar
-08
Sep
-08
Mar
-09
Sep
-09
Mar
-10
Sep
-10
Mar
-11
Sep
-11
Mar
-12
Sep
-12
Mar
-13
Sep
-13
Mar
-14
Sep
-14
Mar
-15
Sep
-15
Month/year of assessment
Qld SAWA NTAust.
Cov
erag
e (%
)
Figure 8. Trends in coverage estimates for hepatitis Aa vaccine for Indigenous children by jurisdiction, Australiab, 2007 to 2015.a18-month dose assessed at 30 months of age in all four jurisdictions from July 2013.bNorthern Territory (NT), Queensland (Qld), South Australia (SA) and Western Australia (WA) only.Aust. 5 Australia
Source: Australian Childhood Immunisation Register, data as at 31 March 2016.
89.60
87.40
95.20
70
75
80
85
90
95
100
31 M
ar 0
5
30 S
ep 0
5
31 M
ar 0
6
30 S
ep 0
6
31 M
ar 0
7
30 S
ep 0
7
31 M
ar 0
8
30 S
ep 0
8
31 M
ar 0
9
30 S
ep 0
9
31 M
ar 1
0
30 S
ep 1
0
31 M
ar 1
1
30 S
ep 1
1
31 M
ar 1
2
30 S
ep 1
2
31 M
ar 1
3
30 S
ep 1
3
31 M
ar 1
4
30 S
ep 1
4
31 M
ar 1
5
30 S
ep 1
5
Coverage assessment date for each cohort
Fully immunised by 12 months Fully immunised by 12 months � PCV
Fully immunised by 24 months – old definition Fully immunised by 24 months – new definition
Fully immunised by 72 months Fully immunised by 60 months
Coverage algorithm changed to assess
children at 60 months, not 72 months
Coverage algorithm changed to include
meningococcal C, varicellaand 2nd dose of measles,
mumps, rubella
Cov
erag
e (%
)
Figure 7. Trends in ‘fully immunised’ vaccination coverage estimates for Indigenous children in Australia, 2005 to 2015, by agemilestones.Source: Australian Childhood Immunisation Register, data as at 31 March 2016.
Annual Immunisation Coverage Report, 2015
19
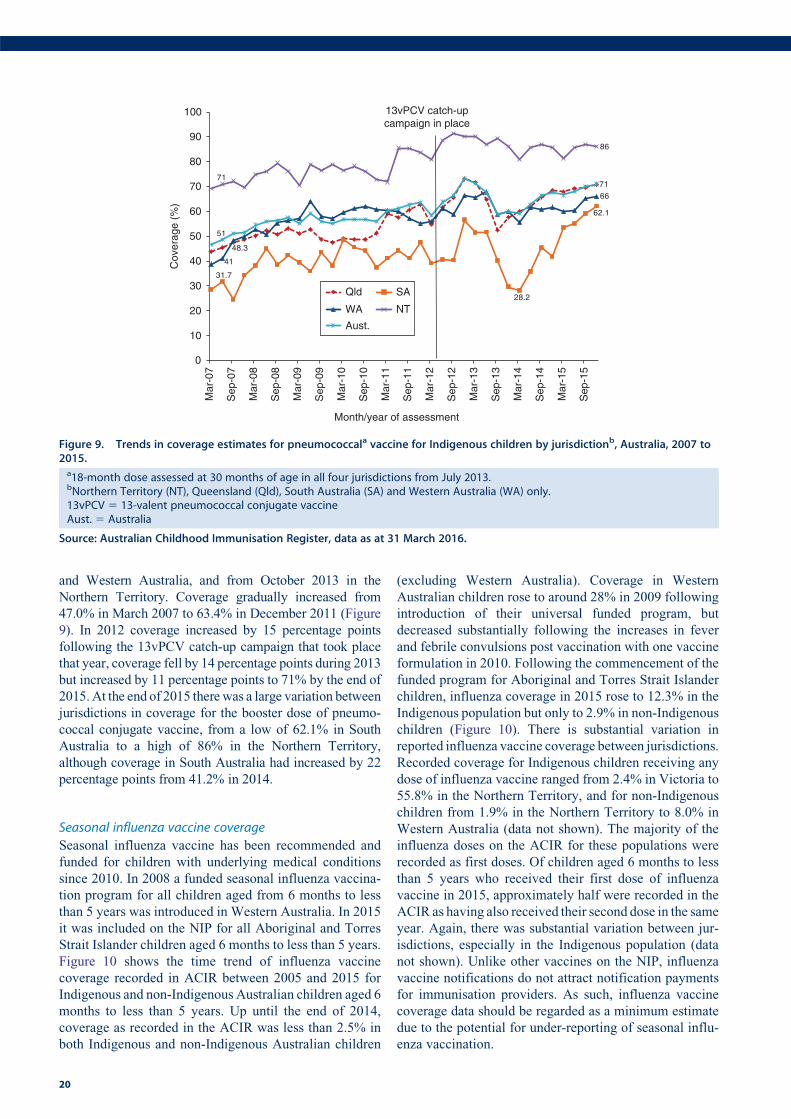
and Western Australia, and from October 2013 in the
Northern Territory. Coverage gradually increased from
47.0% in March 2007 to 63.4% in December 2011 (Figure
9). In 2012 coverage increased by 15 percentage points
following the 13vPCV catch-up campaign that took place
that year, coverage fell by 14 percentage points during 2013
but increased by 11 percentage points to 71% by the end of
2015.At the end of 2015 therewas a large variation between
jurisdictions in coverage for the booster dose of pneumo-
coccal conjugate vaccine, from a low of 62.1% in South
Australia to a high of 86% in the Northern Territory,
although coverage in South Australia had increased by 22
percentage points from 41.2% in 2014.
Seasonal influenza vaccine coverage
Seasonal influenza vaccine has been recommended and
funded for children with underlying medical conditions
since 2010. In 2008 a funded seasonal influenza vaccina-
tion program for all children aged from 6 months to less
than 5 years was introduced in Western Australia. In 2015
it was included on the NIP for all Aboriginal and Torres
Strait Islander children aged 6 months to less than 5 years.
Figure 10 shows the time trend of influenza vaccine
coverage recorded in ACIR between 2005 and 2015 for
Indigenous and non-Indigenous Australian children aged 6
months to less than 5 years. Up until the end of 2014,
coverage as recorded in the ACIR was less than 2.5% in
both Indigenous and non-Indigenous Australian children
(excluding Western Australia). Coverage in Western
Australian children rose to around 28% in 2009 following
introduction of their universal funded program, but
decreased substantially following the increases in fever
and febrile convulsions post vaccination with one vaccine
formulation in 2010. Following the commencement of the
funded program for Aboriginal and Torres Strait Islander
children, influenza coverage in 2015 rose to 12.3% in the
Indigenous population but only to 2.9% in non-Indigenous
children (Figure 10). There is substantial variation in
reported influenza vaccine coverage between jurisdictions.
Recorded coverage for Indigenous children receiving any
dose of influenza vaccine ranged from 2.4% in Victoria to
55.8% in the Northern Territory, and for non-Indigenous
children from 1.9% in the Northern Territory to 8.0% in
Western Australia (data not shown). The majority of the
influenza doses on the ACIR for these populations were
recorded as first doses. Of children aged 6 months to less
than 5 years who received their first dose of influenza
vaccine in 2015, approximately half were recorded in the
ACIR as having also received their second dose in the same
year. Again, there was substantial variation between jur-
isdictions, especially in the Indigenous population (data
not shown). Unlike other vaccines on the NIP, influenza
vaccine notifications do not attract notification payments
for immunisation providers. As such, influenza vaccine
coverage data should be regarded as a minimum estimate
due to the potential for under-reporting of seasonal influ-
enza vaccination.
31.7
28.2
62.1
41
48.3
66
71
86
51
71
0
10
20
30
40
50
60
70
80
90
100
Mar
-07
Sep
-07
Mar
-08
Sep
-08
Mar
-09
Sep
-09
Mar
-10
Sep
-10
Mar
-11
Sep
-11
Mar
-12
Sep
-12
Mar
-13
Sep
-13
Mar
-14
Sep
-14
Mar
-15
Sep
-15
Month/year of assessment
Qld SA
WA NT
Aust.
13vPCV catch-upcampaign in place
Cov
erag
e (%
)
Figure 9. Trends in coverage estimates for pneumococcala vaccine for Indigenous children by jurisdictionb, Australia, 2007 to2015.a18-month dose assessed at 30 months of age in all four jurisdictions from July 2013.bNorthern Territory (NT), Queensland (Qld), South Australia (SA) and Western Australia (WA) only.13vPCV 5 13-valent pneumococcal conjugate vaccineAust. 5 Australia
Source: Australian Childhood Immunisation Register, data as at 31 March 2016.
20
Timeliness of immunisation
We examined timeliness of immunisation in 2015 for
vaccines requiring multiple doses (DTPa, PCV and
MMR) or a single dose (meningococcal C) assessed at 12
and 24 months of age.
As demonstrated in previous reports, the proportion
with delayed vaccine receipt increased with older age
(Figure 11). The greatest proportion with any delay was
seen with the 2nd dose of MMR vaccine due at 18 months,
with 27.4% of doses given late. For each of the four
vaccines examined, most delays were relatively short
(1–#2 months after the schedule point), with only
1.8–3.0% given very late, at$7 months after the schedule
point (Figure 11).
For the 3rd dose of DTPa vaccine, there was greater delay
for Indigenous children than for non-Indigenous children,
with an 18.4% differential in on-time vaccination by
7 months of age (Figure 12). Similar patterns were found
for timeliness of the 1st dose of MMR vaccine by 13
months of age (Figure 13) and the 2nd dose of MMR
vaccine by 19 months of age (Figure 14), however the
differentialswere smaller (11.7%and 15.7% for the 1st and
2nd dose respectively). The differential in on-time vacci-
nation between Indigenous and non-Indigenous children
for the 3rd dose of DTPa vaccine was slightly improved by
1.8 percentage points from the 2014 report, whereas for the
1st dose of MMR and 2nd dose of MMR, the differential
increased by 0.2 of a percentage point and 0.4 of a
percentage point respectively.
Delayed receipt of the 3rd dose of DTPa and the 1st dose of
MMR by Indigenous and remoteness status is shown in
Table 8. For both Indigenous and non-Indigenous children
the majority of delay occurred 1–#2 months after the
schedule point for both vaccines and across all remoteness
categories. Although there was a slightly lower proportion
of Indigenous children living in major cities with delay of
0
10
20
30
40
50
60
70
80
90
100
2005 2006 2007 2008 2009 2010 2011 2012 2013 2014 2015
Year of receipt
Indigenous–WA
Indigenous–Other states/territories
Non-Indigenous–WA
Non-Indigenous–Other states/territories
WA funded seasonal influenzavaccination programcommenced for all childrenaged 6 months – �5 years
Seasonal influenza vaccinationssuspended in all Australian children (April–August)
National funded seasonal influenza vaccination program commenced for all Indigenous children aged 6 months – �5 years
Cov
erag
e (%
)
Figure 10. Trends in recorded coverage for seasonal influenza vaccinea in children aged 6 months to less than 5 years, byIndigenous status and state/territory grouping, Australia, 2005 to 2015.aAny influenza vaccine dose.
Source: Australian Childhood Immunisation Register, data as at 31 March 2016.
13.618.8 18.7 19.2
3.7
4.9 4.9 5.8
2.9
1.8 3.0 2.4
0
5
10
15
20
25
30
35
DTP3 MMR1 MENC1 MMR2
% w
ith d
elay
ed v
acci
natio
n
Vaccine
�7 months after schedule point3–�6 months after schedule point 1–�2 months after schedule point
Figure 11. DTPa3,MMR1,MENC1 andMMR2 vaccination delayfor cohorts born in 2013 and assessed in 2015, Australia.
DTPa3 5 3rd dose of a diphtheria-tetanus- acellular pertussiscontaining vaccine (due at 6 months of age)MMR15 1st dose of a measles-mumps-rubella vaccine (due at12 months of age)MENC1 5 1st dose of a meningococcal C vaccine (due at 12months of age)MMR2 5 2nd dose of a measles-mumps-rubella vaccine (dueat 18 months of age)
Source: Australian Childhood Immunisation Register, data as at31 March 2016.
Annual Immunisation Coverage Report, 2015
21
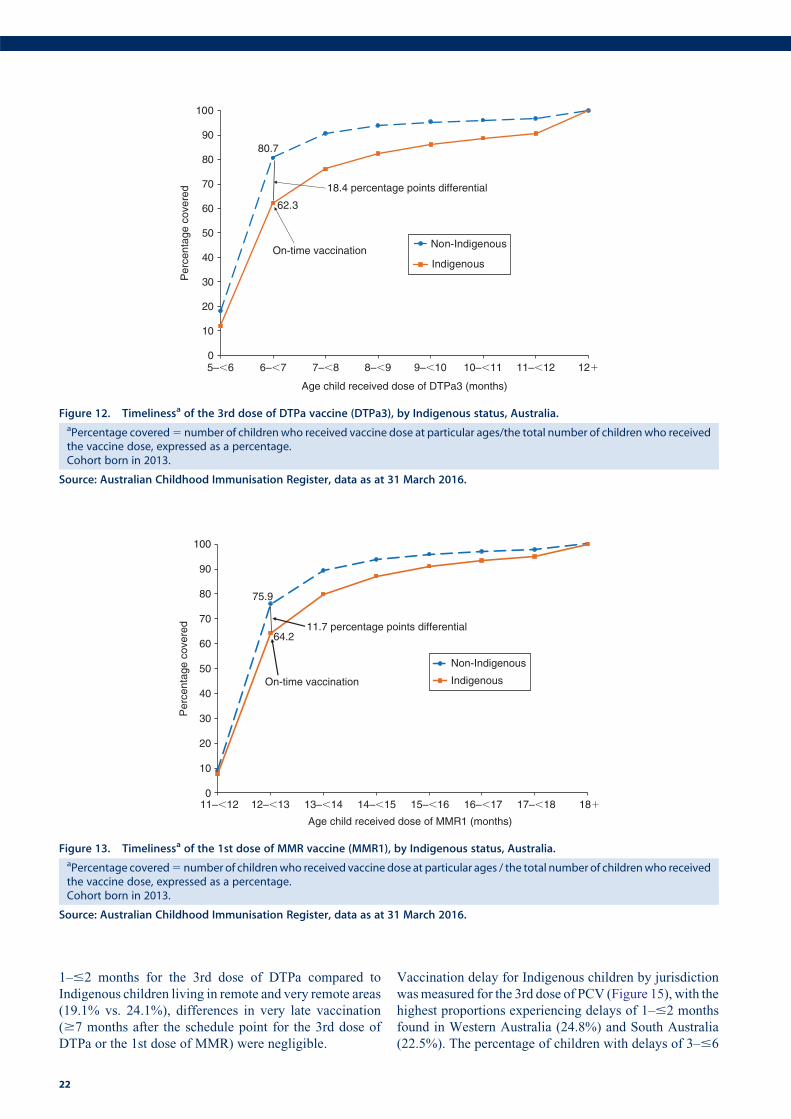
1–#2 months for the 3rd dose of DTPa compared to
Indigenous children living in remote and very remote areas
(19.1% vs. 24.1%), differences in very late vaccination
($7 months after the schedule point for the 3rd dose of
DTPa or the 1st dose of MMR) were negligible.
Vaccination delay for Indigenous children by jurisdiction
wasmeasured for the 3rd dose of PCV (Figure 15), with the
highest proportions experiencing delays of 1–#2 months
found in Western Australia (24.8%) and South Australia
(22.5%). The percentage of children with delays of 3–#6
80.7
62.3
0
10
20
30
40
50
60
70
80
90
100
5–�6 6–�7 7–�8 8–�9 9–�10 10–�11 11–�12 12�
Per
cent
age
cove
red
Age child received dose of DTPa3 (months)
Non-Indigenous
Indigenous
18.4 percentage points differential
On-time vaccination
Figure 12. Timelinessa of the 3rd dose of DTPa vaccine (DTPa3), by Indigenous status, Australia.aPercentage covered5 number of children who received vaccine dose at particular ages/the total number of children who receivedthe vaccine dose, expressed as a percentage.Cohort born in 2013.
Source: Australian Childhood Immunisation Register, data as at 31 March 2016.
75.9
64.2
0
10
20
30
40
50
60
70
80
90
100
Per
cent
age
cove
red
Age child received dose of MMR1 (months)
Non-Indigenous
Indigenous
11.7 percentage points differential
On-time vaccination
11–�12 12–�13 13–�14 14–�15 15–�16 16–�17 17–�18 18�
Figure 13. Timelinessa of the 1st dose of MMR vaccine (MMR1), by Indigenous status, Australia.aPercentage covered5 number of childrenwho received vaccine dose at particular ages / the total number of childrenwho receivedthe vaccine dose, expressed as a percentage.Cohort born in 2013.
Source: Australian Childhood Immunisation Register, data as at 31 March 2016.
22
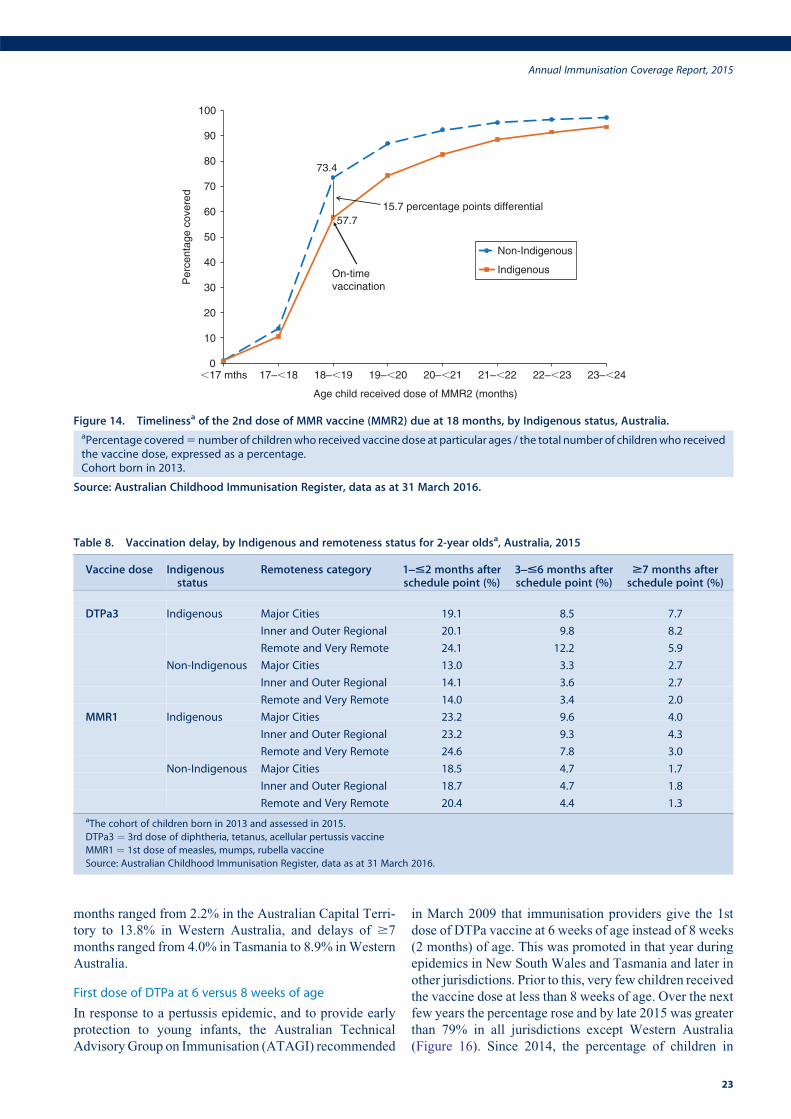
months ranged from 2.2% in the Australian Capital Terri-
tory to 13.8% in Western Australia, and delays of $7
months ranged from 4.0% in Tasmania to 8.9% inWestern
Australia.
First dose of DTPa at 6 versus 8 weeks of age
In response to a pertussis epidemic, and to provide early
protection to young infants, the Australian Technical
AdvisoryGroup on Immunisation (ATAGI) recommended
in March 2009 that immunisation providers give the 1st
dose of DTPa vaccine at 6 weeks of age instead of 8 weeks
(2 months) of age. This was promoted in that year during
epidemics in New South Wales and Tasmania and later in
other jurisdictions. Prior to this, very few children received
the vaccine dose at less than 8 weeks of age. Over the next
few years the percentage rose and by late 2015 was greater
than 79% in all jurisdictions except Western Australia
(Figure 16). Since 2014, the percentage of children in
73.4
57.7
0
10
20
30
40
50
60
70
80
90
100
�17 mths 17–�18 18–�19 19–�20 20–�21 21–�22 22–�23 23–�24
Age child received dose of MMR2 (months)
Non-Indigenous
IndigenousOn-time vaccination
15.7 percentage points differential
Per
cent
age
cove
red
Figure 14. Timelinessa of the 2nd dose of MMR vaccine (MMR2) due at 18 months, by Indigenous status, Australia.aPercentage covered5 number of childrenwho received vaccine dose at particular ages / the total number of childrenwho receivedthe vaccine dose, expressed as a percentage.Cohort born in 2013.
Source: Australian Childhood Immunisation Register, data as at 31 March 2016.
Table 8. Vaccination delay, by Indigenous and remoteness status for 2-year oldsa, Australia, 2015
Vaccine dose Indigenousstatus
Remoteness category 1]#2 months afterschedule point (%)
3]#6 months afterschedule point (%)
$7 months afterschedule point (%)
DTPa3 Indigenous Major Cities 19.1 8.5 7.7
Inner and Outer Regional 20.1 9.8 8.2
Remote and Very Remote 24.1 12.2 5.9
Non-Indigenous Major Cities 13.0 3.3 2.7
Inner and Outer Regional 14.1 3.6 2.7
Remote and Very Remote 14.0 3.4 2.0
MMR1 Indigenous Major Cities 23.2 9.6 4.0
Inner and Outer Regional 23.2 9.3 4.3
Remote and Very Remote 24.6 7.8 3.0
Non-Indigenous Major Cities 18.5 4.7 1.7
Inner and Outer Regional 18.7 4.7 1.8
Remote and Very Remote 20.4 4.4 1.3
aThe cohort of children born in 2013 and assessed in 2015.
DTPa3 ¼ 3rd dose of diphtheria, tetanus, acellular pertussis vaccine
MMR1 ¼ 1st dose of measles, mumps, rubella vaccine
Source: Australian Childhood Immunisation Register, data as at 31 March 2016.
Annual Immunisation Coverage Report, 2015
23
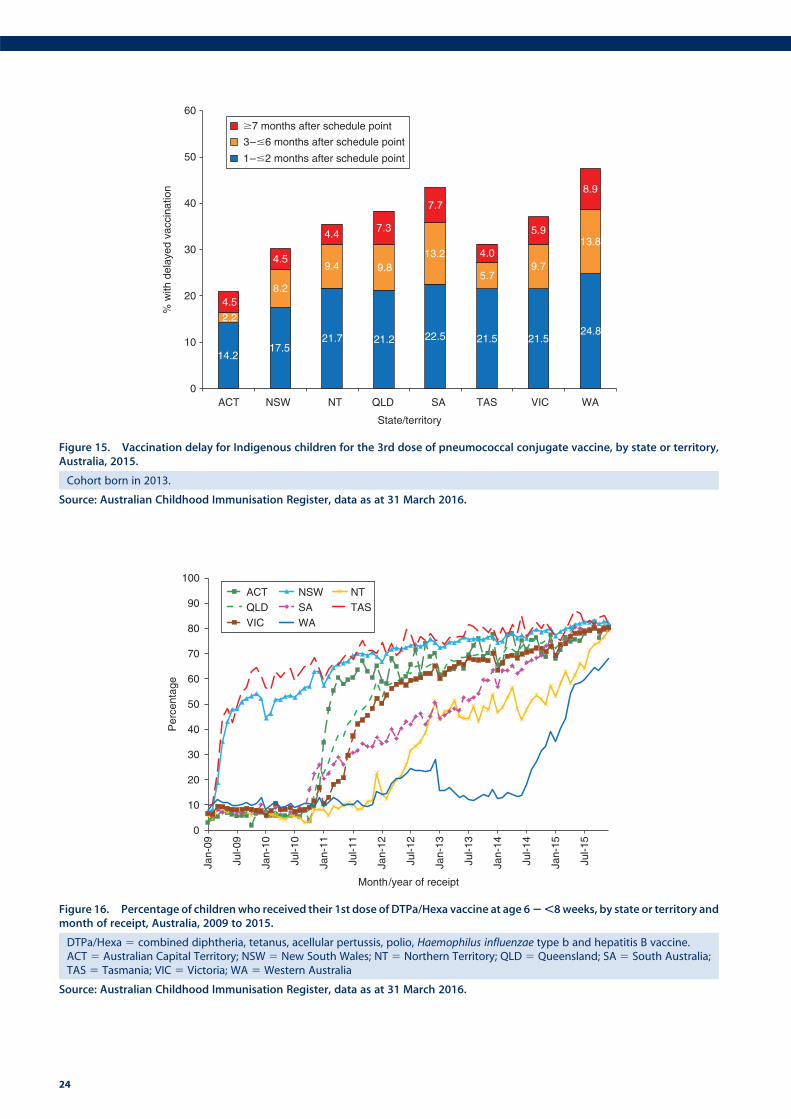
0
10
20
30
40
50
60
70
80
90
100
Jan-
09
Jul-0
9
Jan-
10
Jul-1
0
Jan-
11
Jul-1
1
Jan-
12
Jul-1
2
Jan-
13
Jul-1
3
Jan-
14
Jul-1
4
Jan-
15
Jul-1
5
Per
cent
age
Month/year of receipt
ACT NSW NTQLD SA TASVIC WA
Figure 16. Percentage of childrenwho received their 1st dose of DTPa/Hexa vaccine at age 62,8weeks, by state or territory andmonth of receipt, Australia, 2009 to 2015.
DTPa/Hexa 5 combined diphtheria, tetanus, acellular pertussis, polio, Haemophilus influenzae type b and hepatitis B vaccine.ACT 5 Australian Capital Territory; NSW 5 New South Wales; NT 5 Northern Territory; QLD 5 Queensland; SA 5 South Australia;TAS 5 Tasmania; VIC 5 Victoria; WA 5 Western Australia
Source: Australian Childhood Immunisation Register, data as at 31 March 2016.
14.217.5
21.7 21.2 22.5 21.5 21.524.8
2.2
8.2
9.4 9.813.2
5.79.7
13.8
4.5
4.5
4.47.3
7.7
4.0
5.9
8.9
0
10
20
30
40
50
60
ACT NSW NT QLD SA TAS VIC WA
% w
ith d
elay
ed v
acci
natio
n
State/territory
�7 months after schedule point
3–�6 months after schedule point
1–�2 months after schedule point
Figure 15. Vaccination delay for Indigenous children for the 3rd dose of pneumococcal conjugate vaccine, by state or territory,Australia, 2015.
Cohort born in 2013.
Source: Australian Childhood Immunisation Register, data as at 31 March 2016.
24
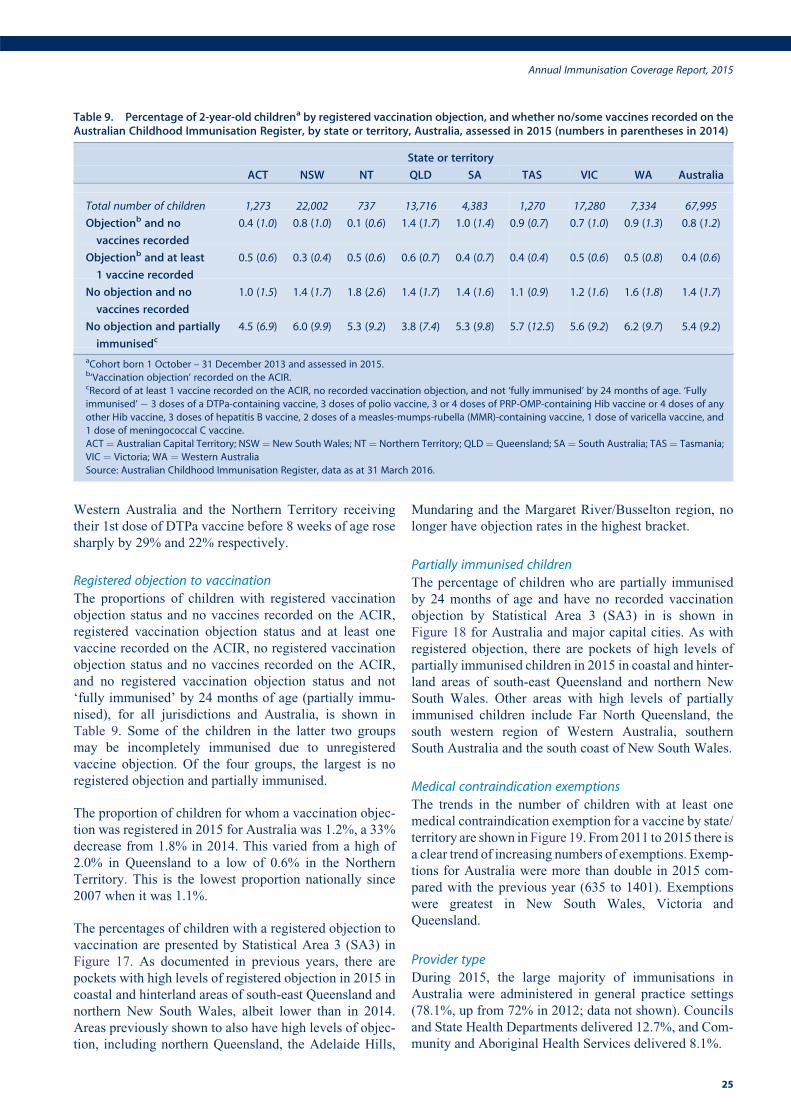
Western Australia and the Northern Territory receiving
their 1st dose of DTPa vaccine before 8 weeks of age rose
sharply by 29% and 22% respectively.
Registered objection to vaccination
The proportions of children with registered vaccination
objection status and no vaccines recorded on the ACIR,
registered vaccination objection status and at least one
vaccine recorded on the ACIR, no registered vaccination
objection status and no vaccines recorded on the ACIR,
and no registered vaccination objection status and not
‘fully immunised’ by 24 months of age (partially immu-
nised), for all jurisdictions and Australia, is shown in
Table 9. Some of the children in the latter two groups
may be incompletely immunised due to unregistered
vaccine objection. Of the four groups, the largest is no
registered objection and partially immunised.
The proportion of children for whom a vaccination objec-
tion was registered in 2015 for Australia was 1.2%, a 33%
decrease from 1.8% in 2014. This varied from a high of
2.0% in Queensland to a low of 0.6% in the Northern
Territory. This is the lowest proportion nationally since
2007 when it was 1.1%.
The percentages of children with a registered objection to
vaccination are presented by Statistical Area 3 (SA3) in
Figure 17. As documented in previous years, there are
pockets with high levels of registered objection in 2015 in
coastal and hinterland areas of south-east Queensland and
northern New South Wales, albeit lower than in 2014.
Areas previously shown to also have high levels of objec-
tion, including northern Queensland, the Adelaide Hills,
Mundaring and the Margaret River/Busselton region, no
longer have objection rates in the highest bracket.
Partially immunised children
The percentage of children who are partially immunised
by 24 months of age and have no recorded vaccination
objection by Statistical Area 3 (SA3) in is shown in
Figure 18 for Australia and major capital cities. As with
registered objection, there are pockets of high levels of
partially immunised children in 2015 in coastal and hinter-
land areas of south-east Queensland and northern New
South Wales. Other areas with high levels of partially
immunised children include Far North Queensland, the
south western region of Western Australia, southern
South Australia and the south coast of New South Wales.
Medical contraindication exemptions
The trends in the number of children with at least one
medical contraindication exemption for a vaccine by state/
territory are shown in Figure 19. From2011 to 2015 there is
a clear trend of increasing numbers of exemptions. Exemp-
tions for Australia were more than double in 2015 com-
pared with the previous year (635 to 1401). Exemptions
were greatest in New South Wales, Victoria and
Queensland.
Provider type
During 2015, the large majority of immunisations in
Australia were administered in general practice settings
(78.1%, up from 72% in 2012; data not shown). Councils
and State Health Departments delivered 12.7%, and Com-
munity and Aboriginal Health Services delivered 8.1%.
Table 9. Percentage of 2-year-old childrena by registered vaccination objection, and whether no/some vaccines recorded on theAustralian Childhood Immunisation Register, by state or territory, Australia, assessed in 2015 (numbers in parentheses in 2014)
State or territory
ACT NSW NT QLD SA TAS VIC WA Australia
Total number of children 1,273 22,002 737 13,716 4,383 1,270 17,280 7,334 67,995
Objectionb and no
vaccines recorded
0.4 (1.0) 0.8 (1.0) 0.1 (0.6) 1.4 (1.7) 1.0 (1.4) 0.9 (0.7) 0.7 (1.0) 0.9 (1.3) 0.8 (1.2)
Objectionb and at least
1 vaccine recorded
0.5 (0.6) 0.3 (0.4) 0.5 (0.6) 0.6 (0.7) 0.4 (0.7) 0.4 (0.4) 0.5 (0.6) 0.5 (0.8) 0.4 (0.6)
No objection and no
vaccines recorded
1.0 (1.5) 1.4 (1.7) 1.8 (2.6) 1.4 (1.7) 1.4 (1.6) 1.1 (0.9) 1.2 (1.6) 1.6 (1.8) 1.4 (1.7)
No objection and partially
immunisedc4.5 (6.9) 6.0 (9.9) 5.3 (9.2) 3.8 (7.4) 5.3 (9.8) 5.7 (12.5) 5.6 (9.2) 6.2 (9.7) 5.4 (9.2)
aCohort born 1 October – 31 December 2013 and assessed in 2015.b‘Vaccination objection’ recorded on the ACIR.cRecord of at least 1 vaccine recorded on the ACIR, no recorded vaccination objection, and not ‘fully immunised’ by 24 months of age. ‘Fully
immunised’ � 3 doses of a DTPa-containing vaccine, 3 doses of polio vaccine, 3 or 4 doses of PRP-OMP-containing Hib vaccine or 4 doses of any
other Hib vaccine, 3 doses of hepatitis B vaccine, 2 doses of a measles-mumps-rubella (MMR)-containing vaccine, 1 dose of varicella vaccine, and
1 dose of meningococcal C vaccine.
ACT¼ Australian Capital Territory; NSW¼ New South Wales; NT¼ Northern Territory; QLD¼ Queensland; SA¼ South Australia; TAS¼ Tasmania;
VIC ¼ Victoria; WA ¼ Western Australia
Source: Australian Childhood Immunisation Register, data as at 31 March 2016.
Annual Immunisation Coverage Report, 2015
25
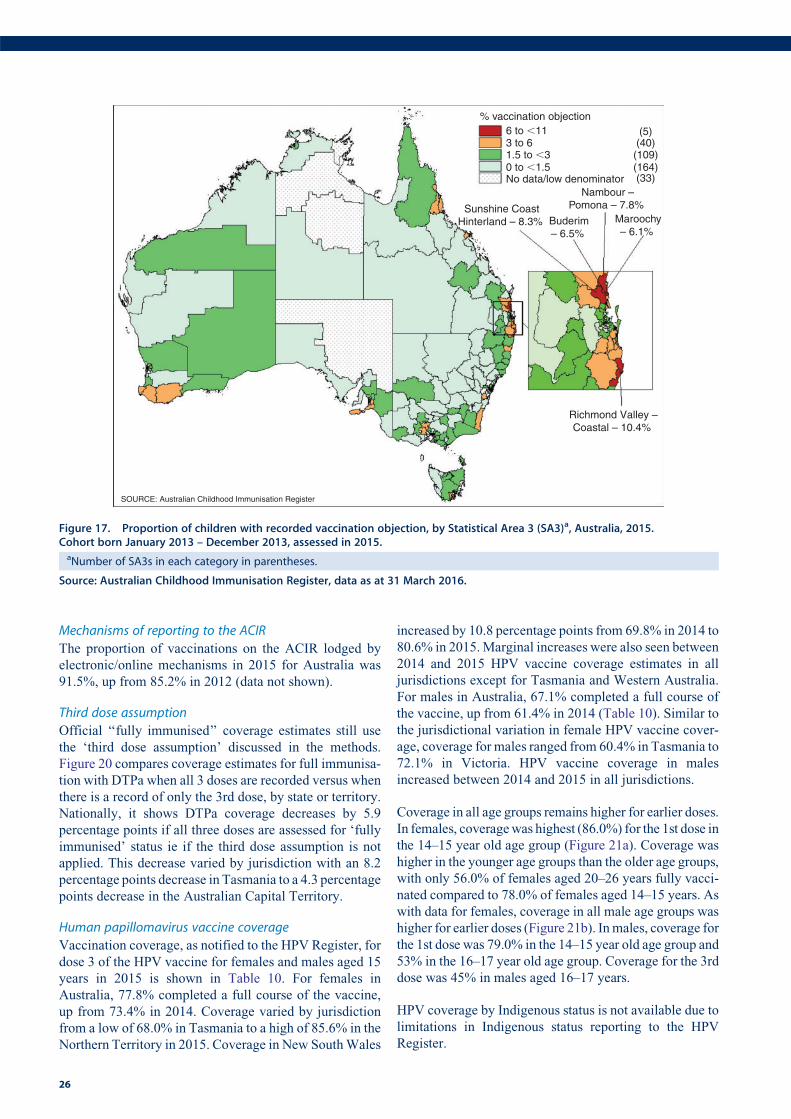
Mechanisms of reporting to the ACIR
The proportion of vaccinations on the ACIR lodged by
electronic/online mechanisms in 2015 for Australia was
91.5%, up from 85.2% in 2012 (data not shown).
Third dose assumption
Official ‘‘fully immunised’’ coverage estimates still use
the ‘third dose assumption’ discussed in the methods.
Figure 20 compares coverage estimates for full immunisa-
tion with DTPa when all 3 doses are recorded versus when
there is a record of only the 3rd dose, by state or territory.
Nationally, it shows DTPa coverage decreases by 5.9
percentage points if all three doses are assessed for ‘fully
immunised’ status ie if the third dose assumption is not
applied. This decrease varied by jurisdiction with an 8.2
percentage points decrease in Tasmania to a 4.3 percentage
points decrease in the Australian Capital Territory.
Human papillomavirus vaccine coverage
Vaccination coverage, as notified to the HPV Register, for
dose 3 of the HPV vaccine for females and males aged 15
years in 2015 is shown in Table 10. For females in
Australia, 77.8% completed a full course of the vaccine,
up from 73.4% in 2014. Coverage varied by jurisdiction
from a low of 68.0% in Tasmania to a high of 85.6% in the
Northern Territory in 2015. Coverage in New SouthWales
increased by 10.8 percentage points from 69.8% in 2014 to
80.6% in 2015.Marginal increases were also seen between
2014 and 2015 HPV vaccine coverage estimates in all
jurisdictions except for Tasmania and Western Australia.
For males in Australia, 67.1% completed a full course of
the vaccine, up from 61.4% in 2014 (Table 10). Similar to
the jurisdictional variation in female HPV vaccine cover-
age, coverage for males ranged from 60.4% in Tasmania to
72.1% in Victoria. HPV vaccine coverage in males
increased between 2014 and 2015 in all jurisdictions.
Coverage in all age groups remains higher for earlier doses.
In females, coveragewas highest (86.0%) for the 1st dose in
the 14–15 year old age group (Figure 21a). Coverage was
higher in the younger age groups than the older age groups,
with only 56.0% of females aged 20–26 years fully vacci-
nated compared to 78.0% of females aged 14–15 years. As
with data for females, coverage in all male age groups was
higher for earlier doses (Figure 21b). Inmales, coverage for
the 1st dose was 79.0% in the 14–15 year old age group and
53% in the 16–17 year old age group. Coverage for the 3rd
dose was 45% in males aged 16–17 years.
HPV coverage by Indigenous status is not available due to
limitations in Indigenous status reporting to the HPV
Register.
Nambour –Pomona – 7.8%
6 to �11 (5)
(33)
(40)(109)(164)
1.5 to �30 to �1.5No data/low denominator
3 to 6
Maroochy– 6.1%
Sunshine CoastHinterland – 8.3%
Richmond Valley –Coastal – 10.4%
% vaccination objection
SOURCE: Australian Childhood Immunisation Register
Buderim– 6.5%
Figure 17. Proportion of children with recorded vaccination objection, by Statistical Area 3 (SA3)a, Australia, 2015.Cohort born January 2013 – December 2013, assessed in 2015.aNumber of SA3s in each category in parentheses.
Source: Australian Childhood Immunisation Register, data as at 31 March 2016.
26
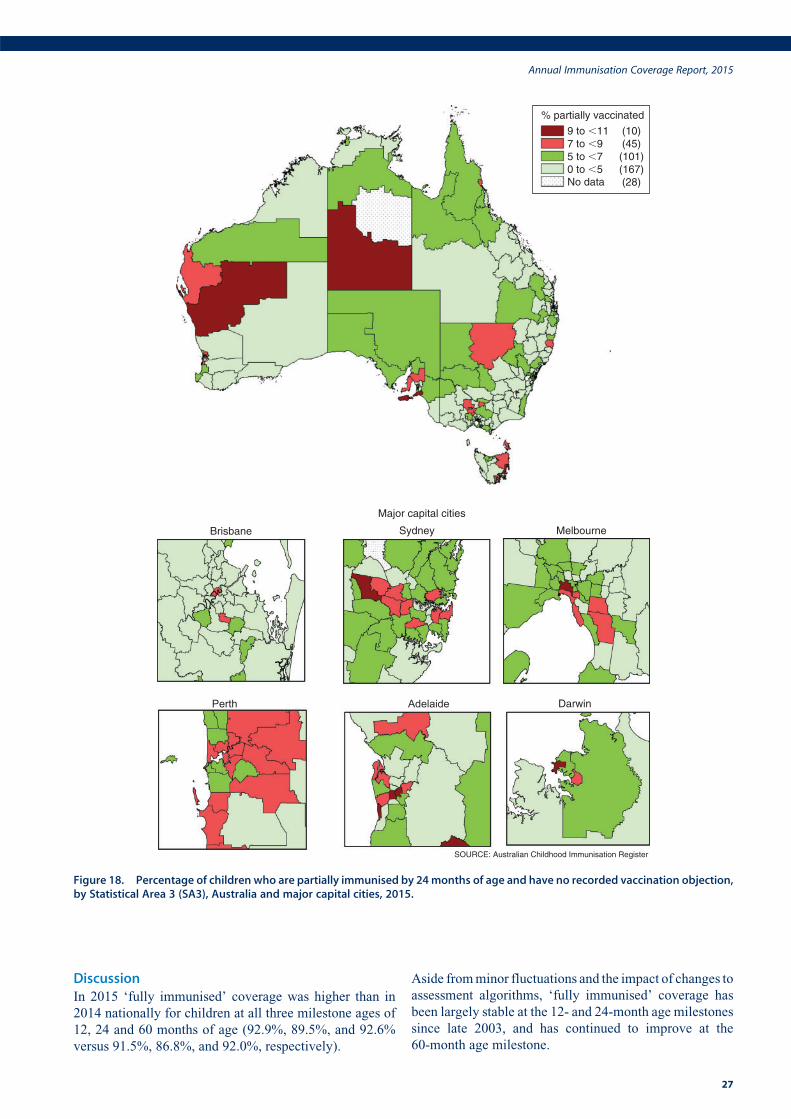
DiscussionIn 2015 ‘fully immunised’ coverage was higher than in
2014 nationally for children at all three milestone ages of
12, 24 and 60 months of age (92.9%, 89.5%, and 92.6%
versus 91.5%, 86.8%, and 92.0%, respectively).
Aside fromminor fluctuations and the impact of changes to
assessment algorithms, ‘fully immunised’ coverage has
been largely stable at the 12- and 24-month age milestones
since late 2003, and has continued to improve at the
60-month age milestone.
Sydney Melbourne
Perth Adelaide Darwin
SOURCE: Australian Childhood Immunisation Register
Brisbane
Major capital cities
% partially vaccinated
9 to �11 (10)(45)(101)(167)(28)
7 to �95 to �70 to �5No data
Figure 18. Percentage of children who are partially immunised by 24months of age and have no recorded vaccination objection,by Statistical Area 3 (SA3), Australia and major capital cities, 2015.
Annual Immunisation Coverage Report, 2015
27
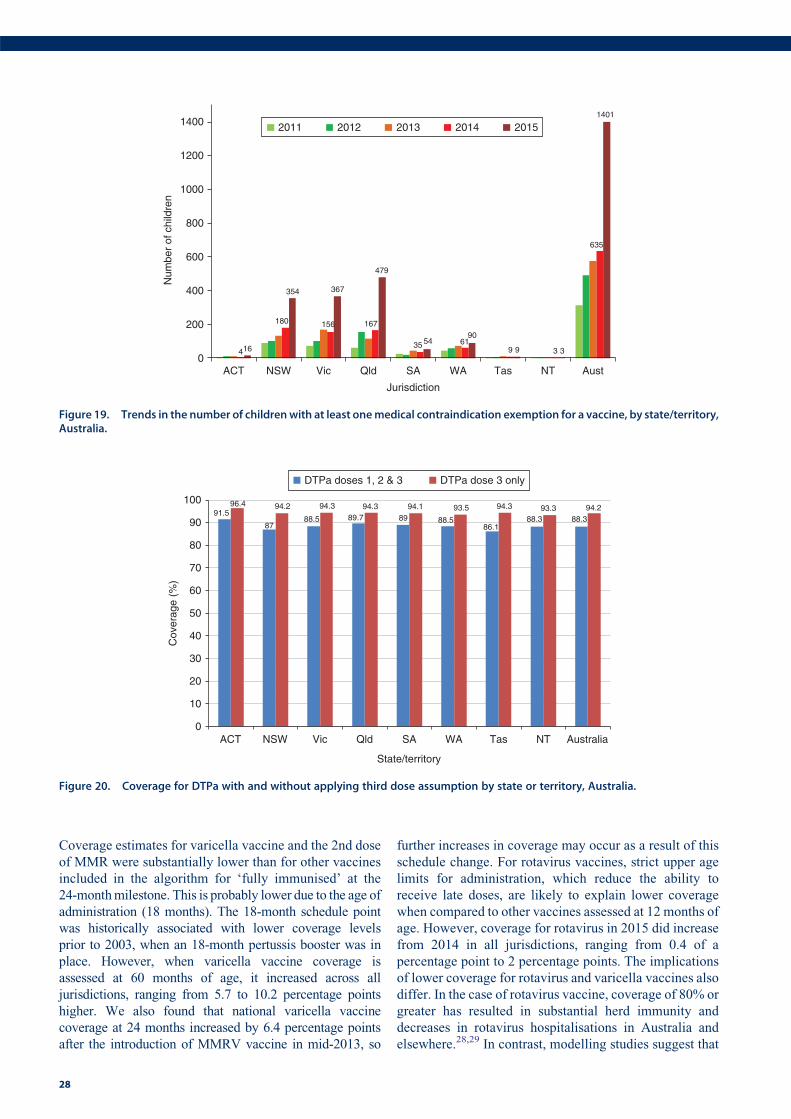
Coverage estimates for varicella vaccine and the 2nd dose
of MMR were substantially lower than for other vaccines
included in the algorithm for ‘fully immunised’ at the
24-monthmilestone. This is probably lower due to the age of
administration (18 months). The 18-month schedule point
was historically associated with lower coverage levels
prior to 2003, when an 18-month pertussis booster was in
place. However, when varicella vaccine coverage is
assessed at 60 months of age, it increased across all
jurisdictions, ranging from 5.7 to 10.2 percentage points
higher. We also found that national varicella vaccine
coverage at 24 months increased by 6.4 percentage points
after the introduction of MMRV vaccine in mid-2013, so
further increases in coverage may occur as a result of this
schedule change. For rotavirus vaccines, strict upper age
limits for administration, which reduce the ability to
receive late doses, are likely to explain lower coverage
when compared to other vaccines assessed at 12 months of
age. However, coverage for rotavirus in 2015 did increase
from 2014 in all jurisdictions, ranging from 0.4 of a
percentage point to 2 percentage points. The implications
of lower coverage for rotavirus and varicella vaccines also
differ. In the case of rotavirus vaccine, coverage of 80% or
greater has resulted in substantial herd immunity and
decreases in rotavirus hospitalisations in Australia and
elsewhere.28,29 In contrast, modelling studies suggest that
4
180 156 167
35 619 3
635
16
354 367
479
5490
9 3
1401
0
200
400
600
800
1000
1200
1400
ACT NSW Vic Qld SA WA Tas NT Aust
Num
ber
of c
hild
ren
Jurisdiction
2011 2012 2013 2014 2015
Figure 19. Trends in the number of childrenwith at least onemedical contraindication exemption for a vaccine, by state/territory,Australia.
91.5
8788.5 89.7 89 88.5
86.188.3 88.3
96.4 94.2 94.3 94.3 94.1 93.5 94.3 93.3 94.2
0
10
20
30
40
50
60
70
80
90
100
ACT NSW Vic Qld SA WA Tas NT Australia
Cov
erag
e (%
)
State/territory
DTPa doses 1, 2 & 3 DTPa dose 3 only
Figure 20. Coverage for DTPa with and without applying third dose assumption by state or territory, Australia.
28
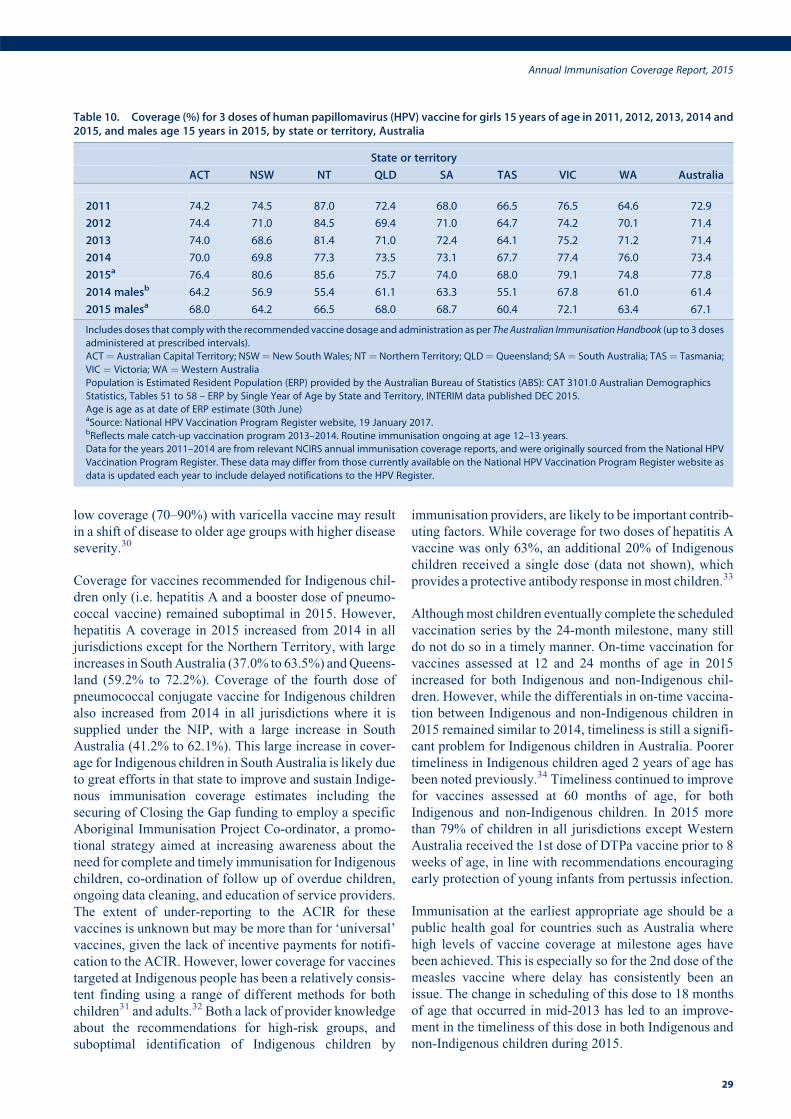
low coverage (70–90%) with varicella vaccine may result
in a shift of disease to older age groups with higher disease
severity.30
Coverage for vaccines recommended for Indigenous chil-
dren only (i.e. hepatitis A and a booster dose of pneumo-
coccal vaccine) remained suboptimal in 2015. However,
hepatitis A coverage in 2015 increased from 2014 in all
jurisdictions except for the Northern Territory, with large
increases in SouthAustralia (37.0% to 63.5%) andQueens-
land (59.2% to 72.2%). Coverage of the fourth dose of
pneumococcal conjugate vaccine for Indigenous children
also increased from 2014 in all jurisdictions where it is
supplied under the NIP, with a large increase in South
Australia (41.2% to 62.1%). This large increase in cover-
age for Indigenous children in South Australia is likely due
to great efforts in that state to improve and sustain Indige-
nous immunisation coverage estimates including the
securing of Closing the Gap funding to employ a specific
Aboriginal Immunisation Project Co-ordinator, a promo-
tional strategy aimed at increasing awareness about the
need for complete and timely immunisation for Indigenous
children, co-ordination of follow up of overdue children,
ongoing data cleaning, and education of service providers.
The extent of under-reporting to the ACIR for these
vaccines is unknown but may be more than for ‘universal’
vaccines, given the lack of incentive payments for notifi-
cation to the ACIR. However, lower coverage for vaccines
targeted at Indigenous people has been a relatively consis-
tent finding using a range of different methods for both
children31 and adults.32 Both a lack of provider knowledge
about the recommendations for high-risk groups, and
suboptimal identification of Indigenous children by
immunisation providers, are likely to be important contrib-
uting factors. While coverage for two doses of hepatitis A
vaccine was only 63%, an additional 20% of Indigenous
children received a single dose (data not shown), which
provides a protective antibody response inmost children.33
Althoughmost children eventually complete the scheduled
vaccination series by the 24-month milestone, many still
do not do so in a timely manner. On-time vaccination for
vaccines assessed at 12 and 24 months of age in 2015
increased for both Indigenous and non-Indigenous chil-
dren. However, while the differentials in on-time vaccina-
tion between Indigenous and non-Indigenous children in
2015 remained similar to 2014, timeliness is still a signifi-
cant problem for Indigenous children in Australia. Poorer
timeliness in Indigenous children aged 2 years of age has
been noted previously.34 Timeliness continued to improve
for vaccines assessed at 60 months of age, for both
Indigenous and non-Indigenous children. In 2015 more
than 79% of children in all jurisdictions except Western
Australia received the 1st dose of DTPa vaccine prior to 8
weeks of age, in line with recommendations encouraging
early protection of young infants from pertussis infection.
Immunisation at the earliest appropriate age should be a
public health goal for countries such as Australia where
high levels of vaccine coverage at milestone ages have
been achieved. This is especially so for the 2nd dose of the
measles vaccine where delay has consistently been an
issue. The change in scheduling of this dose to 18 months
of age that occurred in mid-2013 has led to an improve-
ment in the timeliness of this dose in both Indigenous and
non-Indigenous children during 2015.
Table 10. Coverage (%) for 3 doses of human papillomavirus (HPV) vaccine for girls 15 years of age in 2011, 2012, 2013, 2014 and2015, and males age 15 years in 2015, by state or territory, Australia
State or territory
ACT NSW NT QLD SA TAS VIC WA Australia
2011 74.2 74.5 87.0 72.4 68.0 66.5 76.5 64.6 72.9
2012 74.4 71.0 84.5 69.4 71.0 64.7 74.2 70.1 71.4
2013 74.0 68.6 81.4 71.0 72.4 64.1 75.2 71.2 71.4
2014 70.0 69.8 77.3 73.5 73.1 67.7 77.4 76.0 73.4
2015a 76.4 80.6 85.6 75.7 74.0 68.0 79.1 74.8 77.8
2014 malesb 64.2 56.9 55.4 61.1 63.3 55.1 67.8 61.0 61.4
2015 malesa 68.0 64.2 66.5 68.0 68.7 60.4 72.1 63.4 67.1
Includes doses that complywith the recommended vaccine dosage and administration as per The Australian Immunisation Handbook (up to 3 doses
administered at prescribed intervals).
ACT¼ Australian Capital Territory; NSW¼ New South Wales; NT¼ Northern Territory; QLD¼ Queensland; SA¼ South Australia; TAS¼ Tasmania;
VIC ¼ Victoria; WA ¼ Western Australia
Population is Estimated Resident Population (ERP) provided by the Australian Bureau of Statistics (ABS): CAT 3101.0 Australian Demographics
Statistics, Tables 51 to 58 – ERP by Single Year of Age by State and Territory, INTERIM data published DEC 2015.
Age is age as at date of ERP estimate (30th June)aSource: National HPV Vaccination Program Register website, 19 January 2017.bReflects male catch-up vaccination program 2013–2014. Routine immunisation ongoing at age 12–13 years.
Data for the years 2011–2014 are from relevant NCIRS annual immunisation coverage reports, and were originally sourced from the National HPV
Vaccination Program Register. These data may differ from those currently available on the National HPV Vaccination Program Register website as
data is updated each year to include delayed notifications to the HPV Register.
Annual Immunisation Coverage Report, 2015
29
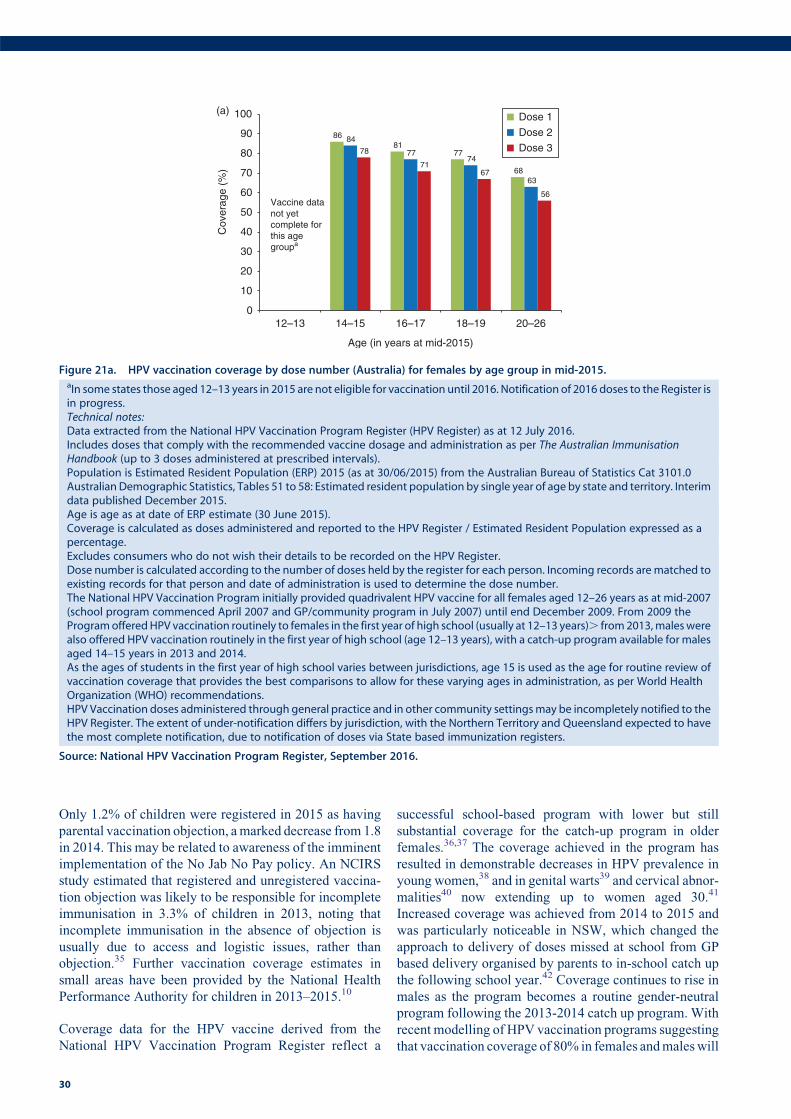
Only 1.2% of children were registered in 2015 as having
parental vaccination objection, amarked decrease from 1.8
in 2014. This may be related to awareness of the imminent
implementation of the No Jab No Pay policy. An NCIRS
study estimated that registered and unregistered vaccina-
tion objection was likely to be responsible for incomplete
immunisation in 3.3% of children in 2013, noting that
incomplete immunisation in the absence of objection is
usually due to access and logistic issues, rather than
objection.35 Further vaccination coverage estimates in
small areas have been provided by the National Health
Performance Authority for children in 2013–2015.10
Coverage data for the HPV vaccine derived from the
National HPV Vaccination Program Register reflect a
successful school-based program with lower but still
substantial coverage for the catch-up program in older
females.36,37 The coverage achieved in the program has
resulted in demonstrable decreases in HPV prevalence in
young women,38 and in genital warts39 and cervical abnor-
malities40 now extending up to women aged 30.41
Increased coverage was achieved from 2014 to 2015 and
was particularly noticeable in NSW, which changed the
approach to delivery of doses missed at school from GP
based delivery organised by parents to in-school catch up
the following school year.42 Coverage continues to rise in
males as the program becomes a routine gender-neutral
program following the 2013-2014 catch up program. With
recent modelling of HPV vaccination programs suggesting
that vaccination coverage of 80% in females andmaleswill
8681
77
68
84
7774
63
78
7167
56
0
10
20
30
40
50
60
70
80
90
100
12–13 14–15 16–17 18–19 20–26
Cov
erag
e (%
)
Age (in years at mid-2015)
Dose 1
Dose 2
Dose 3
Vaccine data not yet complete for this age groupa
(a)
Figure 21a. HPV vaccination coverage by dose number (Australia) for females by age group in mid-2015.aIn some states those aged 12–13 years in 2015 are not eligible for vaccination until 2016. Notification of 2016 doses to the Register isin progress.Technical notes:Data extracted from the National HPV Vaccination Program Register (HPV Register) as at 12 July 2016.Includes doses that comply with the recommended vaccine dosage and administration as per The Australian ImmunisationHandbook (up to 3 doses administered at prescribed intervals).Population is Estimated Resident Population (ERP) 2015 (as at 30/06/2015) from the Australian Bureau of Statistics Cat 3101.0Australian Demographic Statistics, Tables 51 to 58: Estimated resident population by single year of age by state and territory. Interimdata published December 2015.Age is age as at date of ERP estimate (30 June 2015).Coverage is calculated as doses administered and reported to the HPV Register / Estimated Resident Population expressed as apercentage.Excludes consumers who do not wish their details to be recorded on the HPV Register.Dose number is calculated according to the number of doses held by the register for each person. Incoming records arematched toexisting records for that person and date of administration is used to determine the dose number.The National HPV Vaccination Program initially provided quadrivalent HPV vaccine for all females aged 12–26 years as at mid-2007(school program commenced April 2007 and GP/community program in July 2007) until end December 2009. From 2009 theProgramofferedHPV vaccination routinely to females in the first year of high school (usually at 12–13 years). from2013,maleswerealso offered HPV vaccination routinely in the first year of high school (age 12–13 years), with a catch-up program available for malesaged 14–15 years in 2013 and 2014.As the ages of students in the first year of high school varies between jurisdictions, age 15 is used as the age for routine review ofvaccination coverage that provides the best comparisons to allow for these varying ages in administration, as per World HealthOrganization (WHO) recommendations.HPV Vaccination doses administered through general practice and in other community settingsmay be incompletely notified to theHPV Register. The extent of under-notification differs by jurisdiction, with the Northern Territory and Queensland expected to havethe most complete notification, due to notification of doses via State based immunization registers.
Source: National HPV Vaccination Program Register, September 2016.
30
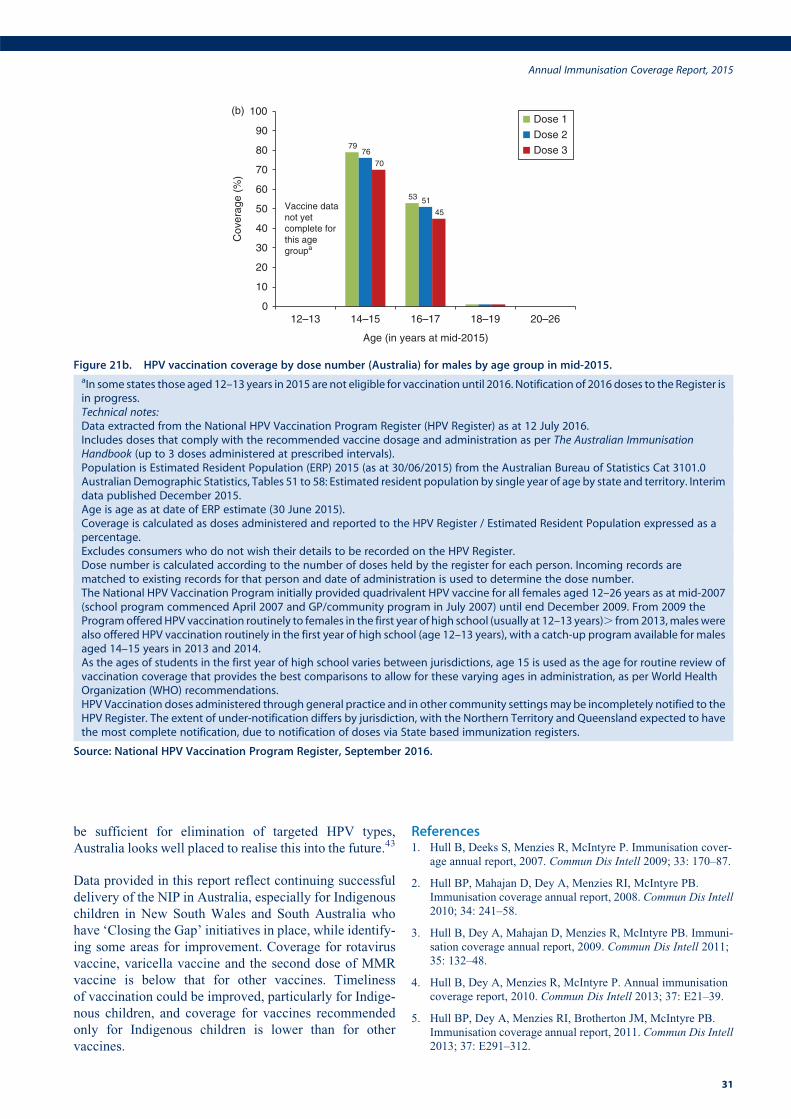
be sufficient for elimination of targeted HPV types,
Australia looks well placed to realise this into the future.43
Data provided in this report reflect continuing successful
delivery of the NIP in Australia, especially for Indigenous
children in New South Wales and South Australia who
have ‘Closing the Gap’ initiatives in place, while identify-
ing some areas for improvement. Coverage for rotavirus
vaccine, varicella vaccine and the second dose of MMR
vaccine is below that for other vaccines. Timeliness
of vaccination could be improved, particularly for Indige-
nous children, and coverage for vaccines recommended
only for Indigenous children is lower than for other
vaccines.
References1. Hull B, Deeks S, Menzies R, McIntyre P. Immunisation cover-
age annual report, 2007. Commun Dis Intell 2009; 33: 170–87.
2. Hull BP, Mahajan D, Dey A, Menzies RI, McIntyre PB.
Immunisation coverage annual report, 2008. Commun Dis Intell
2010; 34: 241–58.
3. Hull B, Dey A, Mahajan D, Menzies R, McIntyre PB. Immuni-
sation coverage annual report, 2009. Commun Dis Intell 2011;
35: 132–48.
4. Hull B, Dey A, Menzies R, McIntyre P. Annual immunisation
coverage report, 2010. Commun Dis Intell 2013; 37: E21–39.
5. Hull BP, Dey A, Menzies RI, Brotherton JM, McIntyre PB.
Immunisation coverage annual report, 2011. Commun Dis Intell
2013; 37: E291–312.
Cov
erag
e (%
)
79
53
76
51
70
45
0
10
20
30
40
50
60
70
80
90
100
12–13 14–15 16–17 18–19 20–26
Age (in years at mid-2015)
Dose 1
Dose 2
Dose 3
Vaccine data not yet complete for this age groupa
(b)
Figure 21b. HPV vaccination coverage by dose number (Australia) for males by age group in mid-2015.aIn some states those aged 12–13 years in 2015 are not eligible for vaccination until 2016. Notification of 2016 doses to the Register isin progress.Technical notes:Data extracted from the National HPV Vaccination Program Register (HPV Register) as at 12 July 2016.Includes doses that comply with the recommended vaccine dosage and administration as per The Australian ImmunisationHandbook (up to 3 doses administered at prescribed intervals).Population is Estimated Resident Population (ERP) 2015 (as at 30/06/2015) from the Australian Bureau of Statistics Cat 3101.0Australian Demographic Statistics, Tables 51 to 58: Estimated resident population by single year of age by state and territory. Interimdata published December 2015.Age is age as at date of ERP estimate (30 June 2015).Coverage is calculated as doses administered and reported to the HPV Register / Estimated Resident Population expressed as apercentage.Excludes consumers who do not wish their details to be recorded on the HPV Register.Dose number is calculated according to the number of doses held by the register for each person. Incoming records arematched to existing records for that person and date of administration is used to determine the dose number.The National HPV Vaccination Program initially provided quadrivalent HPV vaccine for all females aged 12–26 years as at mid-2007(school program commenced April 2007 and GP/community program in July 2007) until end December 2009. From 2009 theProgramofferedHPV vaccination routinely to females in the first year of high school (usually at 12–13 years). from2013,maleswerealso offered HPV vaccination routinely in the first year of high school (age 12–13 years), with a catch-up program available for malesaged 14–15 years in 2013 and 2014.As the ages of students in the first year of high school varies between jurisdictions, age 15 is used as the age for routine review ofvaccination coverage that provides the best comparisons to allow for these varying ages in administration, as per World HealthOrganization (WHO) recommendations.HPV Vaccination doses administered through general practice and in other community settingsmay be incompletely notified to theHPV Register. The extent of under-notification differs by jurisdiction, with the Northern Territory and Queensland expected to havethe most complete notification, due to notification of doses via State based immunization registers.
Source: National HPV Vaccination Program Register, September 2016.
Annual Immunisation Coverage Report, 2015
31
6. Hull BP, Dey A, Menzies RI, Brotherton JM, McIntyre PB.
Immunisation coverage, 2012. Commun Dis Intell 2014; 38:
E208–31.
7. Hull BP, Dey A, Beard FH et al. Immunisation coverage annual
report, 2013. Commun Dis Intell 2016; 40: E146–69.
8. Hull B, Dey A, Beard F, et al. Annual immunisation coverage
report 2014. Sydney: NCIRS; 2016. Available from: http://
www.ncirs.edu.au/surveillance/immunisation-coverage/
(Accessed October 2016).
9. National Health Performance Authority. Healthy communities:
Immunisation rates for children in 2012-13. 2014. Available
from: http://www.myhealthycommunities.gov.au/our-reports/
immunisation-rates-for-children/march-2014 (Accessed 2
December 2014).
10. National Health Performance Authority. Healthy communities:
Immunisation rates for children in 2014-15. 2016. Available
from: http://www.myhealthycommunities.gov.au/our-reports/
immunisation-rates-for-children/february-2016 (Accessed 20
February 2016).
11. Hull BP, Deeks SL, McIntyre PB. The Australian Childhood
Immunisation Register – a model for universal immunisation
registers? Vaccine 2009; 27: 5054–60. doi:10.1016/j.vaccine.
2009.06.056
12. Hull BP, McIntyre PB, Heath TC, Sayer GP. Measuring immu-
nisation coverage in Australia: a review of the Australian
Childhood Immunisation Register. Aust Fam Physician 1999;
28: 55–60.
13. Australian Government Department of Health. Update: No Jab
No Pay - Immunisation catch-up arrangements. 2015. Available
from: http://www.immunise.health.gov.au/internet/immunise/
publishing.nsf/Content/clinical-updates-and-news/$File/Upda
te-No-Jab-No-Pay-Immunisation-Catch-Up-Arrangements
(D15-1126865).pdf. (Accessed 30 November 2015).
14. Australian Government Department of Health. Immunise Aus-
tralia Program: Expansion of Registers. 2016. Available from:
http://www.immunise.health.gov.au/internet/immunise/publish
ing.nsf/Content/expansion-registers (Accessed 21 October
2016).
15. Australian Technical Advisory Group on Immunisation
(ATAGI). The Australian immunisation handbook. 10th ed.
Canberra: Australian Government Department of Health and
Ageing; 2013. Available from: http://www.immunise.health.
gov.au/internet/immunise/publishing.nsf/Content/
Handbook10-home.
16. O’Brien ED, Sam GA, Mead C. Methodology for measuring
Australia’s childhood immunisation coverage. Commun Dis
Intell 1998; 22: 36–7.
17. Hull BP, McIntyre PB. Immunisation coverage reporting
through the Australian Childhood Immunisation Register – an
evaluation of the third-dose assumption. Aust N Z J Public
Health 2000; 24: 17–21. doi:10.1111/j.1467-842x.2000.
tb00717.x
18. Hull BP, LawrenceGL,MacIntyre CR,McIntyre PB. Estimating
immunisation coverage: is the ‘third dose assumption’ still
valid? Commun Dis Intell 2003; 27: 357–61.
19. Hendry A. Australian childhood immunisation coverage, 1
October to 30 September cohort, assessed as at 31 December
2015. [quarterly report] Commun Dis Intell 2016; 40: E304–5.
20. Australian Government Department of Human Services.
No Jab No Pay. 2016. Available from: https://www.humanser
vices.gov.au/corporate/budget/budget-2015-16/budget-
measures/families/no-jab-no-pay (Accessed 10 October
2016).
21. Australian Population and Migration Research Centre. ARIA
and accessibility. Acessibility/Remoteness Index of Australia –
ARIAþ (2011). 2011. Available from: http://www.adelaide.edu.
au/apmrc/research/projects/category/aria.html. (Accessed 17
November 2014).
22. Rank C, Menzies RI. How reliable are Australian Childhood
Immunisation Register coverage estimates for Indigenous chil-
dren? An assessment of data quality and coverage. Commun Dis
Intell 2007; 31: 283–7.
23. Australian Bureau of Statistics. Australian Statistical Geography
Standard (ASGS). 2011. Available from: http://www.abs.gov.
au/websitedbs/d3310114.nsf/home/australianþstatisticalþgeographyþstandardþ%28asgs%29. (Accessed 17 November
2014).
24. MapInfo Pro version 15.0. Stamford, Connecticut, USA. 2015.
25. Australian Bureau of Statistics. Australian Statistical Geography
Standard (ASGS): Correspondences, July 2011 (Cat. no.
1270.0.55.006). 2012. Available from: http://www.abs.gov.au/
AUSSTATS/[email protected]/Lookup/1270.0.55.006Main
þFeatures1July%202011?OpenDocument (Accessed 17
November 2014).
26. Australian Institute of Health and Welfare. 2009 Adult Vacci-
nation Survey: summary results. 2011. Available from: http://
www.aihw.gov.au/publication-detail/?id=10737418409.
(Accessed 2 December 2014).
27. Newspoll. Newspoll Omnibus Survey June 2014 - Summary
Report Flu Vaccinations. 2014. Available from: http://www.
immunise.health.gov.au/internet/immunise/publishing.nsf/Con
tent/762A8FB9101D1759CA257D49002227B6/$File/summ-re
port-flu-vaccinations-survey2014.pdf. (Accessed 30 November
2015).
28. Buttery JP, Lambert SB, Grimwood K et al. Reduction in
rotavirus-associated acute gastroenteritis following introduction
of rotavirus vaccine into Australia’s National Childhood vaccine
schedule. Pediatr Infect Dis J 2011; 30(1, Suppl): S25–9.
doi:10.1097/inf.0b013e3181fefdee
29. Dey A, Wang H, Menzies R, Macartney K. Changes in hospi-
talisations for acute gastroenteritis in Australia after the national
rotavirus vaccination program. Med J Aust 2012; 197: 453–7.
doi:10.5694/mja12.10062
30. Brisson M, Edmunds WJ, Gay NJ, Law B, De Serres G.
Modelling the impact of immunization on the epidemiology of
varicella zoster virus. Epidemiol Infect 2000; 125: 651–69.
doi:10.1017/S0950268800004714
31. Hull BP,McIntyre PB.What dowe know about 7vPCV coverage
in Aboriginal and Torres Strait Islander children? Commun Dis
Intell 2004; 28: 238–43.
32. Menzies R, Turnour C, Chiu C,McIntyre P. Vaccine preventable
diseases and vaccination coverage in Aboriginal and Torres
Strait Islander people, Australia 2003 to 2006. Commun Dis
Intell 2008; 32(Suppl): S2–67.
33. Plotkin S, Orenstein W, Offit P. Vaccines. 5th ed. Philadelphia,
PA: Saunders Elsevier; 2008.
32
34. Hull BP,McIntyre PB. Timeliness of childhood immunisation in
Australia. Vaccine 2006; 24: 4403–8. doi:10.1016/j.vaccine.
2006.02.049
35. Beard FH, Hull BP, Leask J, Dey A, McIntyre PB. Trends and
patterns in vaccination objection, Australia, 2002–2013. Med J
Aust 2016; 204: 275. doi:10.5694/mja15.01226
36. Brotherton J, Gertig D, Chappell G, Rowlands L, Saville M.
Catching up with the catch-up: HPV vaccination coverage data
for Australian women aged 18-26 years from the National HPV
Vaccination Program Register. Commun Dis Intell Q Rep 2011;
35: 197–201.
37. Brotherton JM, Murray SL, Hall MA et al. Human papilloma-
virus vaccine coverage among female Australian adolescents:
success of the school-based approach. Med J Aust 2013; 199:
614–7. doi:10.5694/mja13.10272
38. Tabrizi SN, Brotherton JM, Kaldor JM et al. Assessment of herd
immunity and cross-protection after a human papillomavirus
vaccination programme in Australia: a repeat cross-sectional
study. Lancet Infect Dis 2014; 14: 958–66. doi:10.1016/S1473-
3099(14)70841-2
39. Ali H, Donovan B, Wand H et al. Genital warts in young
Australians five years into national human papillomavirus
vaccination programme: national surveillance data. [Erratum
appears in BMJ 2013; 346: F2942] BMJ 2013; 346: f2032.
doi:10.1136/bmj.f2032
40. Gertig DM, Brotherton JM, Budd AC et al. Impact of a
population-based HPV vaccination program on cervical abnor-
malities: a data linkage study. BMC Med 2013; 11: 227.
doi:10.1186/1741-7015-11-227
41. Brotherton JM, Gertig DM,May C, Chappell G, Saville M. HPV
vaccine impact in Australian women: ready for an HPV-based
screening program.Med J Aust 2016; 204: 184–e1. doi:10.5694/
mja15.01038
42. Staples C, Butler M, Nguyen J et al. Opportunities to increase
rates of human papillomavirus vaccination in the New South
Wales school program through enhanced catch-up. Sex Health
2016. doi:10.1071/SH15132
43. Brisson M, Benard E, Drolet M et al. Population-level impact,
herd immunity, and elimination after human papillomavirus
vaccination: a systematic review and meta-analysis of
predictions from transmission-dynamic models. The Lancet
Public Health 2016; 1: e8–17. doi:10.1016/S2468-2667(16)
30001-9
Annual Immunisation Coverage Report, 2015
33