Embed Size (px)
Citation preview

2019 <AFS>

2019 <AFS>

CONTENTS
SECTION 1
M I S S I O N
GOVERNANCE
Audit and Risk Committee – Chairman’s letter 1
To create value for our shareholders, our employees and our business and social partners
by safely and responsibly explor ing, mining and market ing
our products.
SECTION 2
MANAGEMENT DISCUSSION
Chief Financial Officer’s Review 7
SECTION 3
FINANCIAL STATEMENTS
Directors’ approval 17
Secretary’s certificate 17
Affirmation of financial statements 17
V A L U E S
Directors’ report 18
Independent auditor’s report 25
Our values and bel iefs guide al l decision-making and activi t ies in the conduct of our business to ensure we make a posit ive
impact. They underpin our environmental, social and
governance (ESG) performance.
Group financial statements 29
Company financial statements 87
Annexure A: Summary of significant accounting policies 109
Principal subsidiaries and operating entities 117
SECTION 4
OTHER
Shareholders’ information 118
Glossary of terms and abbreviations 119
Forward looking statements 122
Administrative and corporate information 123

PAGE 1
AUDIT AND RISK COMMITTEE – CHAIRMAN’S LETTER
It is my pleasure to present, on behalf of the Audit and Risk Committee (“the Committee”), an overview of the activities performed
during the 2019 financial year. This report is presented in accordance with the Company’s Memorandum of Incorporation (MOI),
the requirements of the Companies Act, No. 71 of 2008, as amended, (the Companies Act), Principle 8 and Principle 15 and the
recommended practices contained in the fourth King Report on Governance for South Africa (King IV), as well as the Committee’s
formally approved charter, which is in line with the JSE Listings Requirements and is reviewed and approved by the board on an
annual basis. ROLE AND FOCUS The Committee is an independent statutory committee and all members were appointed by the AngloGold Ashanti shareholders at
the Annual General Meeting (AGM) held on 9 May 2019. The Committee has decision-making authority with regards to its statutory
duties and is accountable in this regard to both the shareholders and the board of AngloGold Ashanti.
It is the Committee’s principal regulatory duty to oversee the integrity of the group’s internal control environment and to ensure that
financial statements comply with International Financial Reporting Standards (IFRS) and fairly present the financial position of the
group and company and the results of their operations.
Management has established and maintains internal controls and procedures, which are reviewed by the Committee and reported
on through regular reports to the Board. These internal controls and procedures are designed to identify and manage, rather than
eliminate, the risk of control malfunction and aim to provide reasonable but not absolute assurance that these risks are well
managed and that material misstatements and/or loss will not materialise.
The Board assumes ultimate responsibility for the functions performed by the Committee, relating to the safeguarding of assets,
accounting systems and practices, internal control processes and preparation of financial statements in compliance with all
applicable legal and regulatory requirements and accounting standards. COMPOSITION, PROCEEDINGS AND PERFORMANCE REVIEW The Committee comprises four independent non-executive directors who collectively possess the skills and knowledge to oversee
and assess the strategies and processes developed and implemented by management to manage the business within a diverse
and continually evolving business environment. I was again elected as chairman of the Committee and fulfilled this role at each of
the 5 meetings held during the 2019 financial year.
R Gasant - Chairman - BCompt (Hons), CA (SA), ACIMA, Executive Development Programme 5/5
R Ruston - MBA Business, BE (Mining) 5/5
M Richter - BA, Juris Doctor 5/5
A Ferguson - BSc Accountancy and Business Economics (University of Southampton); CA (Institute of Chartered Accountants of Scotland) 5/5
MJ Kirkwood - AB, Economics & Industrial Engineering - Retired 18 March 2019 2/2
The Chief Executive Officer, Chief Financial Officer, Senior Vice President: Group Finance, Vice President: Finance, Group General
Counsel and Company Secretary, Senior Vice President: Group Internal Audit, Vice President: Global Taxation, Group Risk
Manager, Chief Information Officer, Group Compliance Officer, the External Auditors, as well as other assurance providers are
invited to attend committee meetings in an ex-officio capacity and provide responses to questions raised by committee members
during meetings. At every scheduled quarterly meeting the full Committee meets separately during closed sessions with
management, internal audit and external audit.
The Committee was subjected to an internal self-assessment during 2019 to assess its effectiveness. The results of the assessment
were discussed, actions taken and processes put in place to address areas identified for improvement.
PAGE 2
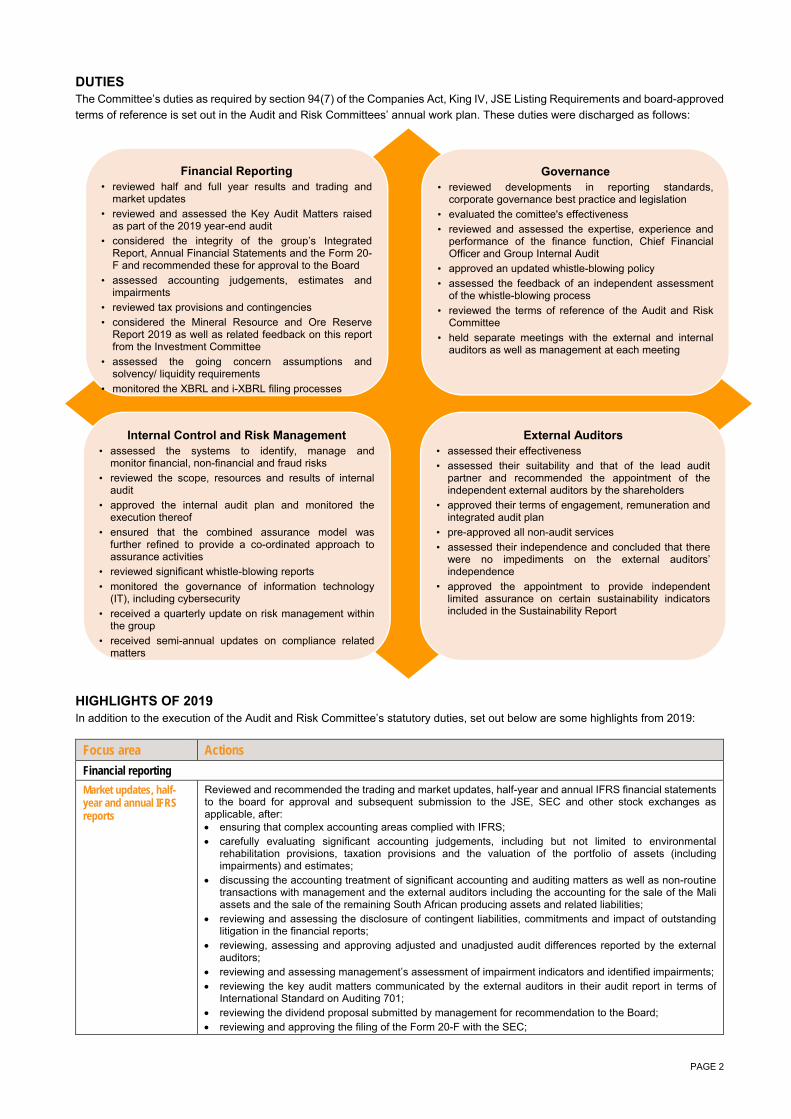
DUTIES The Committee’s duties as required by section 94(7) of the Companies Act, King IV, JSE Listing Requirements and board-approved
terms of reference is set out in the Audit and Risk Committees’ annual work plan. These duties were discharged as follows:
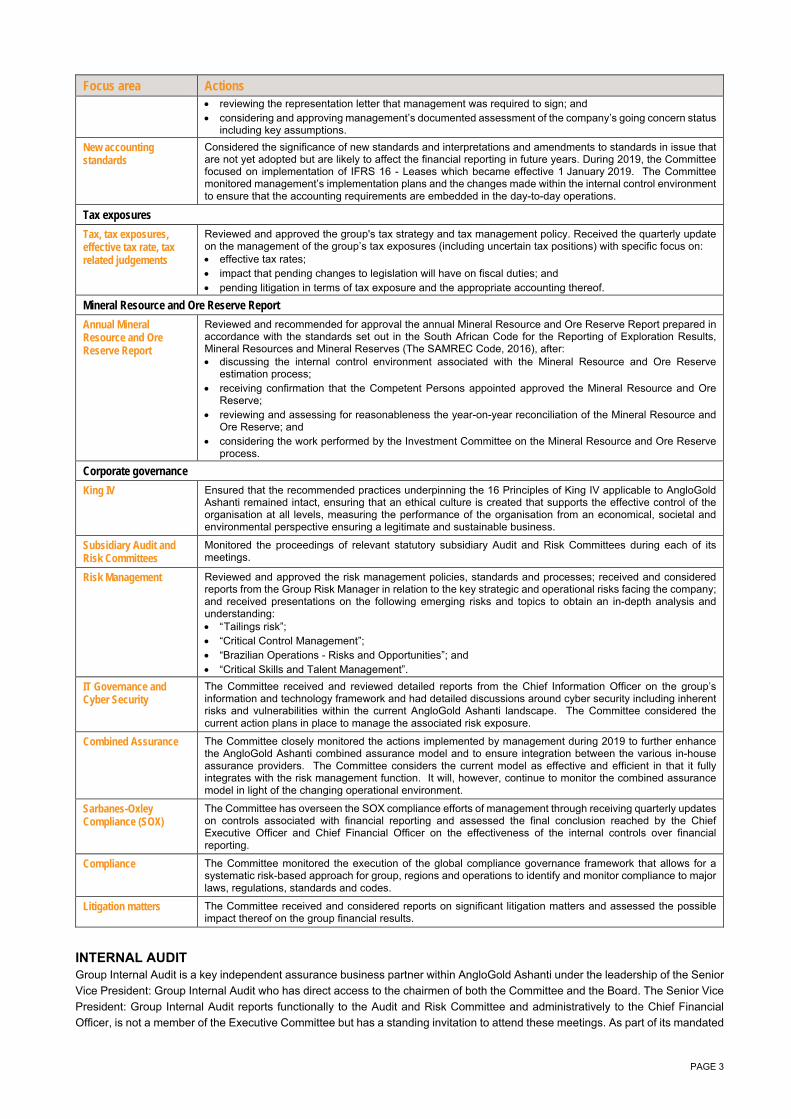
HIGHLIGHTS OF 2019 In addition to the execution of the Audit and Risk Committee’s statutory duties, set out below are some highlights from 2019:
Focus area Actions
Financial reporting
Market updates, half-year and annual IFRS reports
Reviewed and recommended the trading and market updates, half-year and annual IFRS financial statements to the board for approval and subsequent submission to the JSE, SEC and other stock exchanges as applicable, after: ensuring that complex accounting areas complied with IFRS; carefully evaluating significant accounting judgements, including but not limited to environmental
rehabilitation provisions, taxation provisions and the valuation of the portfolio of assets (including impairments) and estimates;
discussing the accounting treatment of significant accounting and auditing matters as well as non-routine transactions with management and the external auditors including the accounting for the sale of the Mali assets and the sale of the remaining South African producing assets and related liabilities;
reviewing and assessing the disclosure of contingent liabilities, commitments and impact of outstanding litigation in the financial reports;
reviewing, assessing and approving adjusted and unadjusted audit differences reported by the external auditors;
reviewing and assessing management’s assessment of impairment indicators and identified impairments; reviewing the key audit matters communicated by the external auditors in their audit report in terms of
International Standard on Auditing 701; reviewing the dividend proposal submitted by management for recommendation to the Board; reviewing and approving the filing of the Form 20-F with the SEC;
Financial Reporting• reviewed half and full year results and trading and
market updates
• reviewed and assessed the Key Audit Matters raisedas part of the 2019 year-end audit
• considered the integrity of the group’s IntegratedReport, Annual Financial Statements and the Form 20-F and recommended these for approval to the Board
• assessed accounting judgements, estimates andimpairments
• reviewed tax provisions and contingencies
• considered the Mineral Resource and Ore ReserveReport 2019 as well as related feedback on this reportfrom the Investment Committee
• assessed the going concern assumptions andsolvency/ liquidity requirements
• monitored the XBRL and i-XBRL filing processes
Governance• reviewed developments in reporting standards,
corporate governance best practice and legislation
• evaluated the comittee's effectiveness
• reviewed and assessed the expertise, experience andperformance of the finance function, Chief FinancialOfficer and Group Internal Audit
• approved an updated whistle-blowing policy
• assessed the feedback of an independent assessmentof the whistle-blowing process
• reviewed the terms of reference of the Audit and RiskCommittee
• held separate meetings with the external and internalauditors as well as management at each meeting
Internal Control and Risk Management• assessed the systems to identify, manage and
monitor financial, non-financial and fraud risks
• reviewed the scope, resources and results of internalaudit
• approved the internal audit plan and monitored theexecution thereof
• ensured that the combined assurance model wasfurther refined to provide a co-ordinated approach toassurance activities
• reviewed significant whistle-blowing reports
• monitored the governance of information technology(IT), including cybersecurity
• received a quarterly update on risk management withinthe group
• received semi-annual updates on compliance relatedmatters
External Auditors• assessed their effectiveness
• assessed their suitability and that of the lead auditpartner and recommended the appointment of theindependent external auditors by the shareholders
• approved their terms of engagement, remuneration andintegrated audit plan
• pre-approved all non-audit services
• assessed their independence and concluded that therewere no impediments on the external auditors’independence
• approved the appointment to provide independentlimited assurance on certain sustainability indicatorsincluded in the Sustainability Report
PAGE 3
Focus area Actions reviewing the representation letter that management was required to sign; and considering and approving management’s documented assessment of the company’s going concern status
including key assumptions.
New accounting standards
Considered the significance of new standards and interpretations and amendments to standards in issue that are not yet adopted but are likely to affect the financial reporting in future years. During 2019, the Committee focused on implementation of IFRS 16 - Leases which became effective 1 January 2019. The Committee monitored management’s implementation plans and the changes made within the internal control environment to ensure that the accounting requirements are embedded in the day-to-day operations.
Tax exposures
Tax, tax exposures, effective tax rate, tax related judgements
Reviewed and approved the group's tax strategy and tax management policy. Received the quarterly update on the management of the group’s tax exposures (including uncertain tax positions) with specific focus on: effective tax rates; impact that pending changes to legislation will have on fiscal duties; and pending litigation in terms of tax exposure and the appropriate accounting thereof.
Mineral Resource and Ore Reserve Report
Annual Mineral Resource and Ore Reserve Report
Reviewed and recommended for approval the annual Mineral Resource and Ore Reserve Report prepared in accordance with the standards set out in the South African Code for the Reporting of Exploration Results, Mineral Resources and Mineral Reserves (The SAMREC Code, 2016), after: discussing the internal control environment associated with the Mineral Resource and Ore Reserve
estimation process; receiving confirmation that the Competent Persons appointed approved the Mineral Resource and Ore
Reserve; reviewing and assessing for reasonableness the year-on-year reconciliation of the Mineral Resource and
Ore Reserve; and considering the work performed by the Investment Committee on the Mineral Resource and Ore Reserve
process.
Corporate governance
King IV Ensured that the recommended practices underpinning the 16 Principles of King IV applicable to AngloGold Ashanti remained intact, ensuring that an ethical culture is created that supports the effective control of the organisation at all levels, measuring the performance of the organisation from an economical, societal and environmental perspective ensuring a legitimate and sustainable business.
Subsidiary Audit and Risk Committees
Monitored the proceedings of relevant statutory subsidiary Audit and Risk Committees during each of its meetings.
Risk Management Reviewed and approved the risk management policies, standards and processes; received and considered reports from the Group Risk Manager in relation to the key strategic and operational risks facing the company; and received presentations on the following emerging risks and topics to obtain an in-depth analysis and understanding: “Tailings risk”; “Critical Control Management”; “Brazilian Operations - Risks and Opportunities”; and “Critical Skills and Talent Management”.
IT Governance and Cyber Security
The Committee received and reviewed detailed reports from the Chief Information Officer on the group’s information and technology framework and had detailed discussions around cyber security including inherent risks and vulnerabilities within the current AngloGold Ashanti landscape. The Committee considered the current action plans in place to manage the associated risk exposure.
Combined Assurance The Committee closely monitored the actions implemented by management during 2019 to further enhance the AngloGold Ashanti combined assurance model and to ensure integration between the various in-house assurance providers. The Committee considers the current model as effective and efficient in that it fully integrates with the risk management function. It will, however, continue to monitor the combined assurance model in light of the changing operational environment.
Sarbanes-Oxley Compliance (SOX)
The Committee has overseen the SOX compliance efforts of management through receiving quarterly updates on controls associated with financial reporting and assessed the final conclusion reached by the Chief Executive Officer and Chief Financial Officer on the effectiveness of the internal controls over financial reporting.
Compliance The Committee monitored the execution of the global compliance governance framework that allows for a systematic risk-based approach for group, regions and operations to identify and monitor compliance to major laws, regulations, standards and codes.
Litigation matters The Committee received and considered reports on significant litigation matters and assessed the possible impact thereof on the group financial results.
INTERNAL AUDIT Group Internal Audit is a key independent assurance business partner within AngloGold Ashanti under the leadership of the Senior
Vice President: Group Internal Audit who has direct access to the chairmen of both the Committee and the Board. The Senior Vice
President: Group Internal Audit reports functionally to the Audit and Risk Committee and administratively to the Chief Financial
Officer, is not a member of the Executive Committee but has a standing invitation to attend these meetings. As part of its mandated
PAGE 4
responsibilities, the Committee has assessed the performance of the Senior Vice President: Group Internal Audit in terms of the
annually reviewed and approved internal audit charter and is satisfied that the internal audit function is independent and
appropriately resourced, and that the Senior Vice President: Group Internal Audit has fulfilled the obligations of the position by
reporting to the Committee on the assessment of: ethical leadership and corporate citizenship within AngloGold Ashanti; the governance of risk within AngloGold Ashanti; the governance of Information Technology within AngloGold Ashanti; compliance with laws, rules, codes and standards within AngloGold Ashanti; the effectiveness of internal controls over financial reporting and internal controls in general; and the effectiveness of the Combined Assurance Framework for the group.
The Committee considered the internal control heat-map for AngloGold Ashanti as presented by Group Internal Audit and monitored
the implementation of significant audit recommendations through a formal tracking process.
As Chairman, I meet with the Senior Vice President: Group Internal Audit in private before each meeting and on an ad-hoc basis
throughout the year.
The Committee is of the opinion, having considered the written assurance statement provided by Group Internal Audit, that nothing
has come to its attention indicating that the group’s system of internal financial controls is not effective and does not provide
reasonable assurance that the financial records may be relied upon for the preparation of the annual financial statements. EXTERNAL AUDIT The current auditors Ernst &Young are level 1 BBB-EE contributors. The audit cycle at AngloGold Ashanti is continuous as the
External Auditor performs half yearly reviews on the results of the group. During August 2019, the annual integrated audit plan, the
associated fees and the 2019 global engagement letter were tabled at the Committee for consideration and approval.
As Chairman, I meet with the primary engagement team members in private before each scheduled meeting where I am also briefed
on general matters relating to the accounting and auditing profession as it may impact on AngloGold Ashanti.
As part of its ongoing assessment of the independence and effectiveness of the external auditors, the Committee has also
considered during its evaluation of the independence of Ernst & Young factors such as: the tenure of service; the quality of planning, delivery and execution of the audit; quality and knowledge of the audit team, specifically the senior management team, including the lead engagement partner; the results of the most recent IRBA and PCAOB regulator reviews and the responses of the firm on observations raised in these
reports; outcome of the quality assessment review performed during the first half of 2019; and the robustness of the audit, including the audit team’s ability to challenge management as well as demonstrate professional
scepticism and independence.
In addition, when considering the re-appointment of the External Auditor at the AGM, the Committee satisfied itself that the External
Auditor is accredited on the JSE list of Auditors and Accounting Specialists, and that the individual auditor responsible for performing
the functions of the auditor, does not appear on the JSE list of disqualified individual auditors, as set out in Section 22.
To further safeguard auditor independence, a formal policy on the approval of all non-audit related services has been approved
and implemented. In terms of the policy the Audit and Risk Committee has established that the sum of the non-audit and tax fees
in a year must not exceed 40% of the sum of the audit and audit related fees in the year. The Committee received a quarterly
update on the tax and non-audit fees as a percentage of the total audit and audit related fees and is comfortable that the external
auditor’s independence has not been jeopardised. During 2019, the external audit fees were made up of audit services $5.77m, audit related services $1.14m, tax services $0.07m and non-audit services $0.09m.
The Committee did not note any significant findings and considers the service provided by the external auditors to have been
independent, effective and robust. FINANCE FUNCTION AND CHIEF FINANCIAL OFFICER The Committee received feedback on an internal assessment conducted on the skills, expertise and resourcing of the finance
function and was satisfied with the overall adequacy and appropriateness of the function. The Committee further reviewed the
expertise and experience of the Chief Financial Officer, Christine Ramon, and was satisfied with the appropriateness thereof.
PAGE 5
As Chairman, I meet with the senior finance team in private before each scheduled meeting where I am also briefed on general
matters relating to the administration of the finance function, the effectiveness of the internal control environment associated with
financial reporting as well as any transactions that may require additional consideration in terms of accounting.
TAX GOVERNANCE AND STRATEGY The Committee received and reviewed detailed reports from the Chief Financial Officer and Vice President: Global Taxation, jointly,
on the group’s tax position, including uncertain tax positions, tax provisions, status of the group’s tax compliance globally and
relevant global fiscal developments impacting the group.
The Committee also approved the group’s tax strategy and tax management policy, which together, set out the group’s approach
to tax in areas such as tax efficiency, tax risk management and tax governance and oversight, which is more fully explained in the
Integrated Report. WHISTLEBLOWING The Committee received quarterly updates on AngloGold Ashanti’s whistleblowing process. Where appropriate, the Committee
has directly overseen the investigation of whistle-blowing reports. Considering the report of an independent assessor, the
Committee is comfortable that the whistle-blowing process is robust and that each report received is taken seriously and thoroughly
investigated.
During the year, 141 (2018: 180) reports were received. The decrease in the number of reports was expected given the smaller
footprint of the operations as a result of the sale of some South Africa assets.
Reports received and investigated did not reveal any malpractice relating to the accounting practices, internal financial controls,
internal audit function or the content of the company’s and group’s financial statements. STATEMENT OF INTERNAL CONTROL The opinion of the Board on the effectiveness of the internal control environment is informed by the conclusion of the Audit and
Risk Committee.
The Audit and Risk Committee assessed the results of the formal documented review conducted by Group Internal Audit and other
identified assurance providers in terms of the evolving combined assurance model of the group’s system of internal controls and
risk management, including the design, implementation and effectiveness of the internal financial controls. The assessment, when
considered with information and explanations given by management and discussions with both the internal and external auditors
on the results of their audits, led to the conclusion that nothing has come to the attention of the Board that caused it to believe that
the company’s system of internal controls and risk management is not effective and that the internal financial controls do not form
a sound basis for the preparation of reliable financial statements. ANNUAL FINANCIAL STATEMENTS The Committee has evaluated the consolidated and separate annual financial statements for the year ended 31 December 2019
and concluded that they comply, in all material aspects, with the requirements of the Companies Act, International Financial
Reporting Standards, and JSE Listing Requirements. The Committee therefore recommended the approval of the annual financial
statements to the Board. LOOKING FORWARD The Committee realises that its work is increasingly broad and complex and as a committee we are required to stay on top of
developments impacting AngloGold Ashanti. During 2020, the Audit and Risk Committee will: monitor the internal control environment in the light of ongoing restructuring given the recent sales; monitor the cyber environment and the group’s prevention and defense capabilities in terms of risk exposure; monitor the successful integration of the core technical engineering and mining disciplines into the combined assurance review
process, where so dictated by risk; further consider the group’s approach to Mandatory Audit Firm rotation that will be effective for the 2024 financial period at the
latest; assess the impact of the rule changes accepted by the Securities Exchange Commission around disclosures associated with
Mineral Resource and Ore Reserve; and monitor continuous improvement in the identification, mitigation and reporting of key risks facing the Group, including our risk
appetite and risk ranking methodology.

PAGE 6
CONCLUSION The Committee is satisfied that it has considered and discharged its responsibilities in accordance with its mandate, statutory
responsibilities and terms of reference during the year under review. In signing this report on behalf of the Committee, I would like
to thank my fellow committee members, the external auditors, internal auditors and management for their contributions to the
Committee during the year.
Rhidwaan Gasant
Chairman: Audit and Risk Committee
27 March 2020
PAGE 7
CHIEF FINANCIAL OFFICER’S REVIEW EXECUTIVE SUMMARY (1)
2019 was a strong financial year for the business. Free cash flow, before growth capital, increased by 106% to $448m, while cash flow from operating activities increased by 22% to $1,047m. Measures have been taken during the year to instil more financial discipline and follow a clear framework for allocating capital. We have and will continue to prioritise the reduction of debt with excess cash as we believe that maintaining lower debt will help us to be more sustainable through the cycle. We ended the year with adjusted net debt to adjusted EBITDA improved to 0.91 times, well below our targeted level of 1 time through the cycle.
Reinvestment in our core asset base has enabled us to optimise output and plan for the future with Ore Reserves outside of South Africa replenished. The rising cash flows from our operations has grown our dividend by 57% to 11 US cents per share. Our dividend policy, which pays 10% of free cash flow, before growth capital, at the discretion of the Board of Directors, reflects a discipline in our capital allocation process: we carve out cash for shareholders before we look at growth options. Our investment in growth has culminated in the historic pouring of first gold at Obuasi in December 2019, bringing Phase 1 of the Redevelopment Project to a conclusion on time and within budget.
Financial highlights of the year under review include: • The group met 2019 full year guidance with production at 3.281Moz and All-in sustaining costs (AISC)
of $998/oz (including $6/oz non-cash rehabilitation provision in Brazil as guided in the third quarter of 2019)
• Record production achieved at Kibali, Tropicana and Iduapriem, while Geita delivered the highest production in 14 years
• Free cash flow, before growth capital, increased by 106% to $448m, while cash flow from operating activities increased by 22% to $1,047m
• Adjusted net debt to Adjusted EBITDA improved to 0.91 times, with cash and cash equivalents at $463m
• The company reached agreements to sell the remaining South African assets and the Sadiola mine in Mali
• Dividend increased by 57% to approximately 11 US cents per share (165 ZAR cents per share up from 95 ZAR cents per share in the prior year).
Progress has been made on the sales processes announced. On 23 December 2019, the company announced that it had reached an agreement to sell its interest in the Sadiola Mine, while on 12 February 2020, the company announced that it had reach an agreement with Harmony Gold to sell all its remaining South African assets and related liabilities. In Argentina, the sales process related to Cerro Vanguardia continues. The sales proceeds from these asset sales will be prioritised to debt reduction. (1) The information included in the Chief Financial Officer’s review are provided for the AngloGold Ashanti group (i.e. including
South Africa), unless otherwise indicated. Following the announcement of the South African asset sale, the South African operations are recorded as discontinued operations in the financial results. Comparative results have been restated where required.
GROUP PERFORMANCE AngloGold Ashanti’s cash flows and earnings showed further growth in 2019, and for the seventh consecutive year, production, capital and all cost guidance metrics were met.
Cash flows from the business continue to improve, with free cash flow at $127m up 90% compared to 2018. Adjusted EBITDA in 2019 increased to $1,723m, versus $1,480m in 2018. Both metrics benefitted from the increased gold price received during 2019, partly offset by lower gold output, increased taxes and royalties.
All-in sustaining costs (AISC) of $998/oz in 2019, compared to $976/oz in 2018, was impacted by a $6/oz non-cash impact from the revised rehabilitation provisions in Brazil, as required by new legislation promulgated during the third quarter of 2019. Excluding this impact, AISC increased by 2% year-on-year.
Basic loss for the year ended 31 December 2019 was $12m, or 3 US cents per share, compared with basic profit of $133m, or 32 US cents per share in 2018. Earnings were negatively impacted by the impairment of the South African assets associated with their held for sale accounting treatment ($385m, net of tax), higher rehabilitation provisions in Brazil ($15m, net of tax) and higher
PAGE 8
care and maintenance costs in South Africa and Ghana ($13m, net of tax). Excluding impairment charges, headline earnings were $379m, or 91 US cents per share, compared with $220m, or 53 US cents per share in 2018.
The group ended the year with a robust balance sheet, with improved cash flows contributing towards continued debt reduction. At the end of December 2019, the ratio of adjusted net debt to adjusted EBITDA was 0.91 times (1 times from continuing operations), below the targeted level of 1 times through the cycle and at the lowest level since 2012.
As at 31 December 2019, liquidity remains strong with $1.42bn undrawn on the $1.62bn US Dollar RCF, approximately R4.65bn available on the R5.65bn South African RCFs and other facilities, and cash and cash equivalents of $463m. Subsequent to year-end, we drew down on the remainder of our US Dollar RCF to bolster our cash position as indicated later in the report.
The board approved a dividend of ZAR 165 cents per share (approximately 11 US cents per share), in line with the dividend policy based on 10% of free cash flow, before growth capital expenditure. This compares to a dividend of ZAR 95 cents per share (7 US cents per share) in 2018. The increase in the dividend reflects management's commitment to improving shareholder returns, while maintaining disciplined capital allocation. The Board is satisfied that subsequent to the dividend declaration the company has adequate balance sheet flexibility and sufficient funding facilities available to withstand market volatility. STRATEGIC PRIORITIES Maintaining a reliable track record of consistent and prudent behaviour as custodians of shareholder capital continues to be central to our approach. Capital allocation continues to remain disciplined and focused on improving value creation through effective management and without placing undue financial or operating risk on the business. This approach does not prioritise scale but rather focuses on sustainable margins and free cash flow growth to improve total returns to shareholders over time.
Whilst noting the establishment of two global mega gold-producing entities after the mergers of Barrick/Randgold and Newmont/Goldcorp, the group continues to favour organic opportunities to create value, over those available through acquisition. The company’s equity remains an important asset that should be protected while efforts are undertaken to close the considerable valuation gap that exists with global industry peers. We continue to jealously guard our equity and have focused on self-funding growth projects over the last number of years with our ongoing capital needs not requiring the issue of additional equity. The last significant issue of equity occurred in 2013 when we issued 18,140,000 shares to settle the remainder of the outstanding 6% Mandatory Convertible Bonds.
Within this framework of self-funding we continue to target a return of 15% through the cycle at a long term real gold price of $1,200/oz on our new investments, using conservative discount rates that account for specific jurisdictional and operating risks.
The integrity of the balance sheet is fundamental to the long-term health of the business and enforces disciplined decision-making in allocating capital. This means that the company will continue to rank and prioritise its investments, assessing them not only on their returns but also on their affordability with respect to maintaining leverage ratios at or around targeted levels. Importantly, the company will weigh these competing priorities and consider the full suite of financing opportunities available when determining whether or not to proceed with an investment. MARGIN IMPROVEMENT - An ongoing priority As in prior years, we continued to focus our efforts on driving operational excellence and cost efficiencies across our business. Our efforts in the current year were supported by a higher gold price environment.
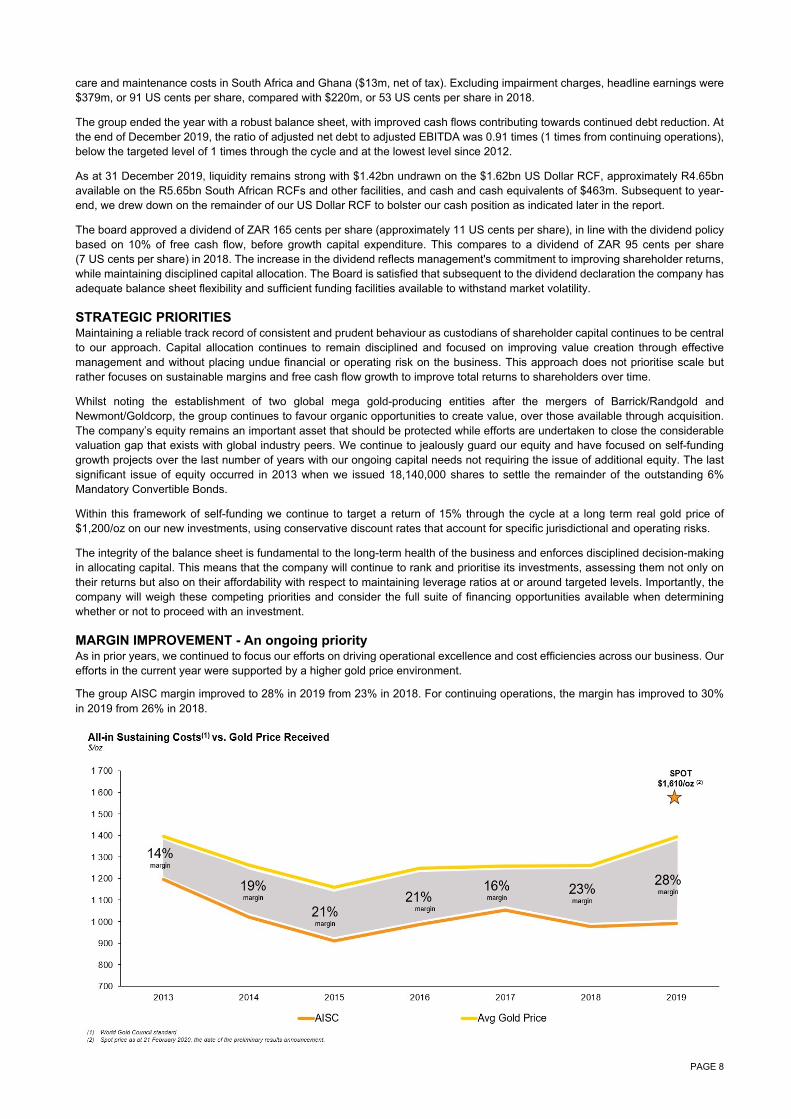
The group AISC margin improved to 28% in 2019 from 23% in 2018. For continuing operations, the margin has improved to 30% in 2019 from 26% in 2018.
PAGE 9
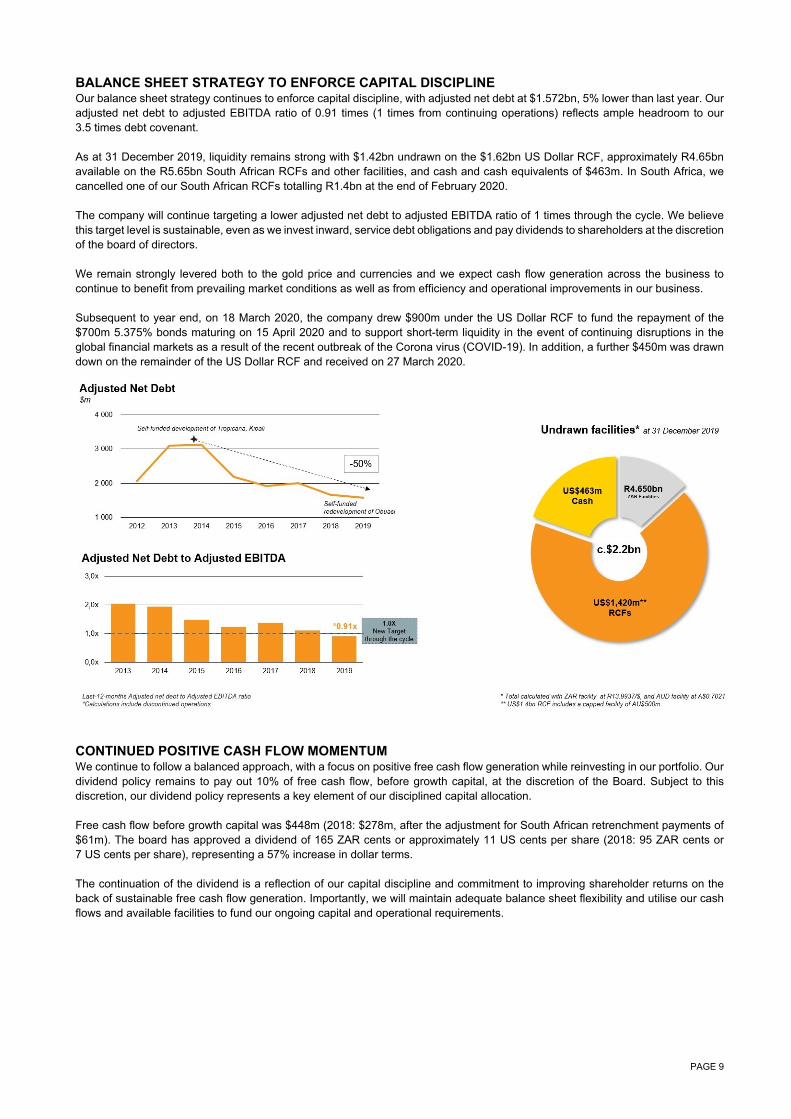
BALANCE SHEET STRATEGY TO ENFORCE CAPITAL DISCIPLINE Our balance sheet strategy continues to enforce capital discipline, with adjusted net debt at $1.572bn, 5% lower than last year. Our adjusted net debt to adjusted EBITDA ratio of 0.91 times (1 times from continuing operations) reflects ample headroom to our 3.5 times debt covenant. As at 31 December 2019, liquidity remains strong with $1.42bn undrawn on the $1.62bn US Dollar RCF, approximately R4.65bn available on the R5.65bn South African RCFs and other facilities, and cash and cash equivalents of $463m. In South Africa, we cancelled one of our South African RCFs totalling R1.4bn at the end of February 2020. The company will continue targeting a lower adjusted net debt to adjusted EBITDA ratio of 1 times through the cycle. We believe this target level is sustainable, even as we invest inward, service debt obligations and pay dividends to shareholders at the discretion of the board of directors. We remain strongly levered both to the gold price and currencies and we expect cash flow generation across the business to continue to benefit from prevailing market conditions as well as from efficiency and operational improvements in our business. Subsequent to year end, on 18 March 2020, the company drew $900m under the US Dollar RCF to fund the repayment of the $700m 5.375% bonds maturing on 15 April 2020 and to support short-term liquidity in the event of continuing disruptions in the global financial markets as a result of the recent outbreak of the Corona virus (COVID-19). In addition, a further $450m was drawn down on the remainder of the US Dollar RCF and received on 27 March 2020.
CONTINUED POSITIVE CASH FLOW MOMENTUM We continue to follow a balanced approach, with a focus on positive free cash flow generation while reinvesting in our portfolio. Our dividend policy remains to pay out 10% of free cash flow, before growth capital, at the discretion of the Board. Subject to this discretion, our dividend policy represents a key element of our disciplined capital allocation. Free cash flow before growth capital was $448m (2018: $278m, after the adjustment for South African retrenchment payments of $61m). The board has approved a dividend of 165 ZAR cents or approximately 11 US cents per share (2018: 95 ZAR cents or 7 US cents per share), representing a 57% increase in dollar terms. The continuation of the dividend is a reflection of our capital discipline and commitment to improving shareholder returns on the back of sustainable free cash flow generation. Importantly, we will maintain adequate balance sheet flexibility and utilise our cash flows and available facilities to fund our ongoing capital and operational requirements.

PAGE 10
1. Adjusted for bond redemption premium of $61m on part settlement of $1.25bn high-yield bonds; for Obuasi redundancy costs of $210m; and the 2014 Rand Refinery loan of $44m.
2. Adjusted for bond redemption premium of $30m on settlement of remaining $1.25bn high-yield bonds. 3. Adjusted for SA retrenchment costs paid of c.$49m. 4. Adjusted for SA retrenchment costs paid of c.$61m. DELIVERY AGAINST 2019 FINANCIAL AND OPERATIONAL OBJECTIVES Objective met Objective ongoing 1. Continued focus on sustainable free cash flow generation
Free cash flow of $127m for the full year represents a 90% improvement year on year (2018: $67m and 2017: $1m). All the group’s major operating mines were cash positive. Free cash flow was bolstered by higher gold prices which offset lower production, higher capital expenditure, increased profit based taxes and the slower cash repatriation from Kibali in the DRC. Although we received $75m in dividends from Kibali for the year, our attributable share of cash balances in-country increased to $202m as at 31 December 2019 (2018: $53m). Our joint venture partner, Barrick, who is the operator at Kibali, continues to engage with the government of the DRC with regards the cash lock-up in-country.
2. Improve margins Our margins for total cash costs, AISC, and All-in Costs (AIC) on revenue from continuing operations were 46%, 30% and 17%, respectively. Except for AIC, the margins reflected increases from 2018 (total cash costs: 42%; AISC: 26%; and AIC: 18%). Margins were positively affected by the higher gold price received during the year, with AIC marginally down year-on-year as a result of the increased growth capital expenditure incurred during the year relating to the Obuasi redevelopment project.
3. Maintain strict cost and capital discipline The group’s total cash costs were largely steady with total cash costs of $776/oz in 2019, $3/oz higher than $773/oz achieved in 2018. Total cash costs were favourably impacted by weaker currencies, which assisted in offsetting inflationary pressures in the emerging economies that we operate in, particularly in Argentina and South Africa. The main cost drivers contributing to inflationary pressures related to mining contractors, labour and consumables, which are all predominately indexed to inflation. Total cash costs were further adversely impacted by lower production, predominately grade impacts and lower planned by-product revenue at Cerro Vanguardia. Operational efficiency improvements continue to be a key group focus to mitigate operational cost pressures.

PAGE 11
AISC of $998/oz in 2019, were 2% higher than $976/oz achieved in 2018. AISC for 2019 include a non-cash $6/oz for additional environmental rehabilitation obligations in Brazil pertaining to tailings facilities, under the new legislation enacted in August 2019, following Vale’s Brumadinho failure in January 2019. Lower sustaining capital was largely offset by IFRS 16 lease costs, higher rehabilitation provisions and other non-cash costs. Total capital expenditure (including equity accounted investments) increased by 13% to $814m in 2019, compared to $721m in 2018. This included project capital expenditure of $321m relating to Obuasi, Siguiri, Tropicana, Mponeng and Quebradona in 2019, compared to $150m invested in growth projects in 2018. Sustaining capital expenditure decreased to $493m in 2019, compared to $571m in 2018.
4. Advance Obuasi for first production by the end of 2019 The Obuasi redevelopment project achieved its first pour of gold on 18 December 2019, signalling the successful redevelopment of the mine into a modern, mechanised mining operation since mining activities were suspended five years ago. At the end of 2019, the overall project was 77% complete. The Phase 1 ramp up is now in progress to achieve 2,000 tonnes per day. Phase 2 of the project, to achieve a capacity of 4,000 tonnes per day, is firmly on schedule and within budget. See <Regional performance review> section in the Integrated Report for more detail on the project.
5. Complete asset sale processes Processes to sell assets in Mali, South Africa and Argentina progressed during the year. On 23 December 2019, the company announced that it had reached an agreement to sell its interest in the Sadiola Mine to Allied Gold for an attributable cash consideration of $52.5m. After the financial year end, on 12 February 2020, the company announced it had reached an agreement with Harmony Gold to sell all its remaining South African producing assets and related liabilities with expected proceeds of around $300m, subject to subsequent performance, and with additional proceeds if the West Wits assets are developed below current infrastructure. Both the Mali and South African sales processes are expected to close in 2020. Subsequent to the announcement of the sale of the South African assets, Moody's affirmed a credit-positive impact of the sale citing another positive step in strategy to streamline the portfolio and lower the long-term cost structure of the business. In Argentina, the sales process related to Cerro Vanguardia continues. This process is at an advanced stage and we hope to make a decision whether to accept a firm offer or to terminate the sales process in the second quarter of 2020. Cerro Vanguardia continues to be a strong contributor to the group, with 225,000oz produced in 2019 at an AISC of $859/oz, generating gross profits of $108m.
6. Ongoing stakeholder engagement The group’s strategy is underpinned by our overall objective, which is to deliver quality production, responsibly, with an emphasis on widening margins, extending mine lives and improving the portfolio. This forms the basis of our continuing and ongoing stakeholder engagement, whether with investors, governments, communities, or employees. The global enhanced interest in environmental, sustainability and governance disciplines (ESG) for companies operating in the extractive activities industries has become a focus for investors and it receives considerable attention from the group. Maintaining and enhancing our licence to operate through effective ESG practices, is critical to achieving our objectives.
7. Advance Colombian projects up the value curve At Quebradona, the company continued with its feasibility study, after the declaration of a reserve at the end of 2018. It is expected that the results of the feasibility study will be announced towards the end of 2020. During the year, drilling focused on geotechnical programmes for site infrastructure, the tunnel trace, above the mine area and the crusher chamber. On 16 September 2019, the company announced that it had reached an agreement with B2Gold, its joint venture partner at the Gramalote Project in Colombia, whereby B2Gold will fund an investment and exploration programme in 2020 to the value of $13.9m, in order to earn back to a 50:50 joint venture and assume management of the project with effect from 1 January 2020. This agreement provides additional momentum to the Gramalote Project, one of AngloGold Ashanti’s two advanced exploration projects in Colombia. At the time of the announcement, B2Gold owned a 48.3% stake, with AngloGold Ashanti holding the remaining 51.7%. B2Gold and AngloGold Ashanti have agreed on a budget for the feasibility study on the Gramalote Project of approximately $37m. As manager, B2Gold plans to continue the feasibility work with the goal of completing a final feasibility study by the end of 2020.
PAGE 12
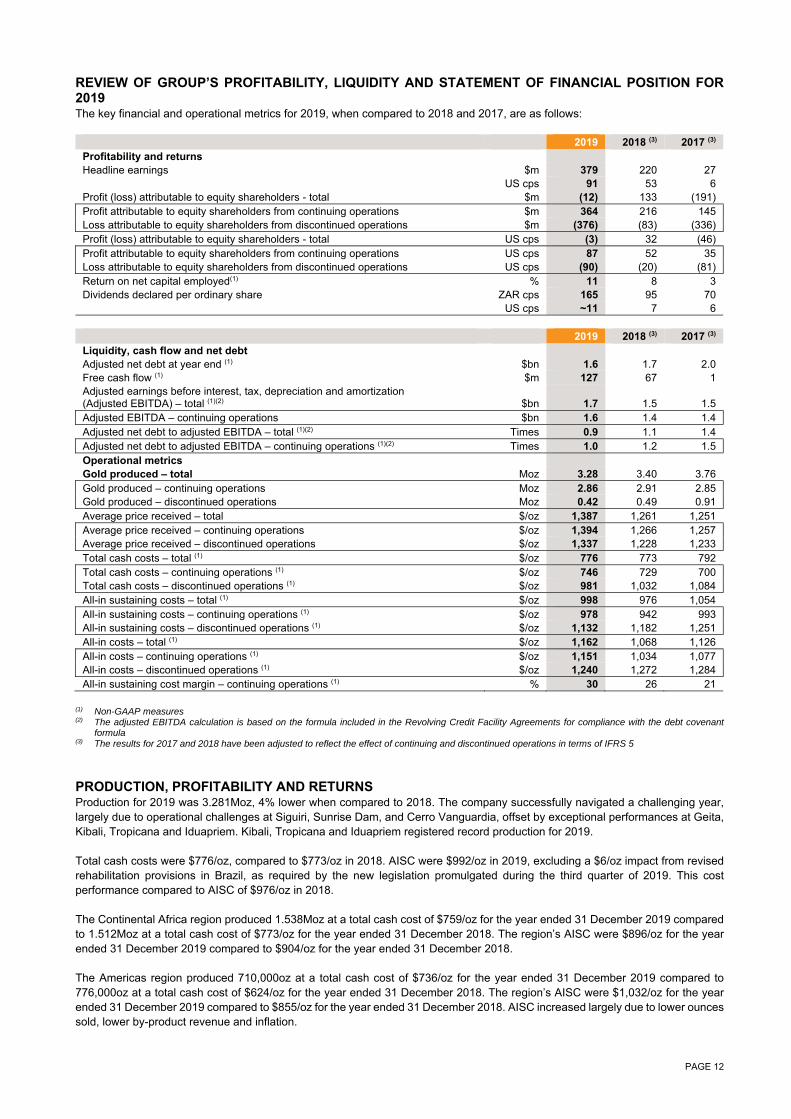
REVIEW OF GROUP’S PROFITABILITY, LIQUIDITY AND STATEMENT OF FINANCIAL POSITION FOR 2019 The key financial and operational metrics for 2019, when compared to 2018 and 2017, are as follows:
2019 2018 (3) 2017 (3) Profitability and returns Headline earnings $m 379 220 27 US cps 91 53 6 Profit (loss) attributable to equity shareholders - total $m (12) 133 (191) Profit attributable to equity shareholders from continuing operations $m 364 216 145 Loss attributable to equity shareholders from discontinued operations $m (376) (83) (336) Profit (loss) attributable to equity shareholders - total US cps (3) 32 (46) Profit attributable to equity shareholders from continuing operations US cps 87 52 35 Loss attributable to equity shareholders from discontinued operations US cps (90) (20) (81) Return on net capital employed(1) % 11 8 3 Dividends declared per ordinary share ZAR cps 165 95 70 US cps ~11 7 6 2019 2018 (3) 2017 (3) Liquidity, cash flow and net debt Adjusted net debt at year end (1) $bn 1.6 1.7 2.0 Free cash flow (1) $m 127 67 1 Adjusted earnings before interest, tax, depreciation and amortization (Adjusted EBITDA) – total (1)(2) $bn 1.7 1.5 1.5 Adjusted EBITDA – continuing operations $bn 1.6 1.4 1.4 Adjusted net debt to adjusted EBITDA – total (1)(2) Times 0.9 1.1 1.4 Adjusted net debt to adjusted EBITDA – continuing operations (1)(2) Times 1.0 1.2 1.5 Operational metrics Gold produced – total Moz 3.28 3.40 3.76 Gold produced – continuing operations Moz 2.86 2.91 2.85 Gold produced – discontinued operations Moz 0.42 0.49 0.91 Average price received – total $/oz 1,387 1,261 1,251 Average price received – continuing operations $/oz 1,394 1,266 1,257 Average price received – discontinued operations $/oz 1,337 1,228 1,233 Total cash costs – total (1) $/oz 776 773 792 Total cash costs – continuing operations (1) $/oz 746 729 700 Total cash costs – discontinued operations (1) $/oz 981 1,032 1,084 All-in sustaining costs – total (1) $/oz 998 976 1,054 All-in sustaining costs – continuing operations (1) $/oz 978 942 993 All-in sustaining costs – discontinued operations (1) $/oz 1,132 1,182 1,251 All-in costs – total (1) $/oz 1,162 1,068 1,126 All-in costs – continuing operations (1) $/oz 1,151 1,034 1,077 All-in costs – discontinued operations (1) $/oz 1,240 1,272 1,284 All-in sustaining cost margin – continuing operations (1) % 30 26 21
(1) Non-GAAP measures (2) The adjusted EBITDA calculation is based on the formula included in the Revolving Credit Facility Agreements for compliance with the debt covenant
formula (3) The results for 2017 and 2018 have been adjusted to reflect the effect of continuing and discontinued operations in terms of IFRS 5
PRODUCTION, PROFITABILITY AND RETURNS Production for 2019 was 3.281Moz, 4% lower when compared to 2018. The company successfully navigated a challenging year, largely due to operational challenges at Siguiri, Sunrise Dam, and Cerro Vanguardia, offset by exceptional performances at Geita, Kibali, Tropicana and Iduapriem. Kibali, Tropicana and Iduapriem registered record production for 2019. Total cash costs were $776/oz, compared to $773/oz in 2018. AISC were $992/oz in 2019, excluding a $6/oz impact from revised rehabilitation provisions in Brazil, as required by the new legislation promulgated during the third quarter of 2019. This cost performance compared to AISC of $976/oz in 2018. The Continental Africa region produced 1.538Moz at a total cash cost of $759/oz for the year ended 31 December 2019 compared to 1.512Moz at a total cash cost of $773/oz for the year ended 31 December 2018. The region’s AISC were $896/oz for the year ended 31 December 2019 compared to $904/oz for the year ended 31 December 2018. The Americas region produced 710,000oz at a total cash cost of $736/oz for the year ended 31 December 2019 compared to 776,000oz at a total cash cost of $624/oz for the year ended 31 December 2018. The region’s AISC were $1,032/oz for the year ended 31 December 2019 compared to $855/oz for the year ended 31 December 2018. AISC increased largely due to lower ounces sold, lower by-product revenue and inflation.
PAGE 13
The Australia region produced 614,000oz at a total cash cost of $730/oz for the year ended 31 December 2019, compared to 625,000oz at a total cash cost of $762/oz for the year ended 31 December 2018. The region’s AISC were $990/oz for the year ended 31 December 2019, compared to $1,038/oz for the year ended 31 December 2018. The South African operations produced 419,000oz at a total cash cost of $981/oz for the year ended 31 December 2019 compared to 436,000oz (excluding Moab Khotsong and the Kopanang operations which were sold in February 2018) at a total cash cost of $1,002/oz on a comparative basis for the year ended 31 December 2018. This was largely due to limitations on face length availability following high seismicity at Mponeng. AISC came in at $1,128/oz for the year ended 31 December 2019, compared to $1,144/ oz for the year ended 31 December 2018 on a comparative basis. The year-on-year total cash cost decrease is attributable to operating efficiencies as well as a weaker Rand/US Dollar exchange rate, partially offset by lower gold output. The average gold price received in 2019 was $1,387/oz, a 10% increase over 2018 at $1,261/oz. The higher gold price helped drive the improved financial performance year-on-year. The following margins on gold revenue (based on continuing operations) were achieved for 2019 and 2018:
Margins on gold revenue (based on continuing operations) 2019 2018
On total cash costs 46% 42%
On all-in sustaining costs 30% 26%
On all-in costs 17% 18%
Total cash costs and AISC margins reflect increases mainly as a result of the increased gold price received. The All-in cost margin remains flat since the benefit of the increase gold price received is offset by the non-sustaining project capital expenditure. Basic loss for the year ended 31 December 2019 was $12m, or 3 US cents per share, compared with basic profit of $133m, or 32 US cents per share in 2018. Earnings were negatively impacted by the impairment of the South African assets associated with their held for sale accounting treatment ($385m, net of tax), higher rehabilitation provisions in Brazil ($15m, net of tax) and higher care and maintenance costs in South Africa and Ghana ($13m, net of tax). Excluding impairment charges, headline earnings were $379m, or 91 US cents per share, compared with $220m, or 53 US cents per share in 2018. LIQUIDITY, CASH FLOW AND STATEMENT OF FINANCIAL POSITION Cash flow from operating activities for the year ended 31 December 2019 increased by 22% to $1,047m in 2019 compared to $857m in 2018. Free cash flow for the year improved by 90% to $127m in 2019, from $67m in the prior year, benefitting from an improved received gold price which more than negated lower gold output, higher operating costs, taxes, royalties, working capital lockups and the increased capital expenditure as the Obuasi Redevelopment Project progressed. For the year, free cash flow was further impacted by the continued slow cash repatriation from the DRC relating to Kibali. Cumulative cash receipts from the DRC for the year ended 31 December 2019 amounted to $75m, $23m of which was received in the fourth quarter of 2019, leaving an attributable balance of $202m awaiting repatriation at the end of the year. Cash flow from operating activities are reconciled to free cash flow as follows:
Year ended December
2019
Year ended December
2018
Net cash inflow from operating activities from continuing operations 958 856
Net cash inflow from operating activities from discontinued operations 89 1
Net cash inflow from operating activities 1,047 857
Capital expenditure and interest capitalised (709) (575)
Net cash from operating activities after capital expenditure 338 282
Repayment of lease liabilities (42) —
Finance costs accrued per income statement (143) (140)
Net cash flow after capital expenditure and interest 153 142
Other net cash inflow (outflow) from investing activities from continuing operations 22 12
Net cash inflow (outflow) from investing activities from discontinued operations (54) 226
Credit facility transaction costs — (10)
Add backs:
Cash restricted for use — 6
Cash in subsidiary sold and transferred to held for sale 6 —
Proceeds on sale of Moab Khotsong and Kopanang assets — (309)
Free cash flow 127 67
Free cash flow for the year before growth capital increased by 106% to $448m in 2019 versus $217m in the prior year. In September 2018, the Government of Argentina introduced the payment of export duties on exported goods. In terms of an existing

PAGE 14
tax stability agreement, Cerro Vanguardia is entitled to a refund of these export duties. At 31 December 2019, $24m (2018: $14m) was reflected as receivable and impacted free cash flow generated by the group. In Tanzania, the group’s net indirect tax receivables balance increased by $35m to $119m (2018: $84m). No refunds were received in cash in the current year, however claims relating to periods pre-July 2017, totalling $9m, have been offset against provisional corporate tax payments in 2019 in accordance with legislation. These amounts were set off against VAT claims that had been certified by an external advisor and verified by the Tanzania Revenue Authority (TRA). The TRA acknowledged the majority of the offsets during December 2019. The remaining balance of the VAT receivable continues to impact free cash flow generated by the group. Total capital expenditure (including equity accounted investments) increased by 13% to $814m in 2019, compared to $721m in 2018. This included project capital expenditure of $321m relating to Obuasi, Siguiri, Tropicana, Mponeng and Quebradona in 2019, compared to $150m invested in growth projects in the prior year. A further $89m was spent on exploration, of which $65m was spent on Greenfields exploration and study costs, largely in Colombia and North America with $24m spent on non-sustaining exploration drilling to improve mineral resources at current operations. Adjusted earnings before interest, tax, depreciation and amortisation (Adjusted EBITDA) rose 16% year-on-year to $1,723m in 2019, compared to $1,480m in 2018. Adjusted net debt decreased by 5% to $1.581bn ($1.572bn from continuing operations) at 31 December 2019, from $1.659bn at 31 December 2018. The ratio of Adjusted net debt to Adjusted EBITDA at the end of December 2019 was 0.91 times compared with 1.12 times at the end of December 2018, below the targeted level of 1.0 times through the cycle. As at 31 December 2019, liquidity remains strong with $1.42bn undrawn on the $1.62bn US Dollar RCF, approximately R4.65bn available on the R5.65bn South African RCFs and other facilities, and cash and cash equivalents of $463m. The board approved a dividend of ZAR 165 cents per share (approximately 11 US cents per share), in line with the dividend policy based on 10% of free cash flow, before capital growth expenditure. This compares to a dividend of ZAR 95 cents per share (7 US cents per share) in 2018. The Board is satisfied that subsequent to the dividend declaration, the company has adequate balance sheet flexibility and sufficient funding facilities available to withstand market volatility. The increase in the dividend reflects management's commitment to improving shareholder returns, while maintaining disciplined capital allocation. We remain subject to an uncertain tax environment. Across the group, we are due refunds for input tax and fuel duties for an amount of $329m (2018: $276m; 2017: $252m), including attributable amounts of equity accounted joint ventures, which have remained outstanding for periods longer than those provided for in the respective statutes. Considerable effort continues to be made to recover these outstanding amounts. The normalised 2019 effective tax rate was 32%, unchanged from 2018. Deferred tax rate resets in Corporate South Africa (retained operations), legislated tax rate changes in Argentina being postponed from 2020 to 2022, forex translation on non-monetary items in South America and change in tax losses deductible during the expected tax holiday in Guinea had an impact on the tax charge for the current year, while the prior year was influenced by legislated tax rate changes in Ghana and the tax holiday in Guinea. In January 2020, the company entered into Asian style zero-cost collars for a total of 130,900 ounces (i.e. 70% of Cerro Vanguardia’s annual gold production) for the period February 2020 to December 2020. The strike prices are $1,500/oz on the floor and an average price of $1,701.34/oz on the cap. In February 2020, the company entered into Asian style zero-cost collars for a total of approximately 342,000 barrels of Brent crude oil for the period February 2020 to December 2020. The average strike prices are $45 per barrel on the floor and an average price of $65 per barrel on the cap. In addition, the company entered into further Asian style zero-cost collars for a total of approximately 622,000 barrels of Brent crude oil for the period March 2020 to December 2020. The average strike prices are $44.50 per barrel on the floor and an average price of $65 per barrel on the cap. These derivatives constitute one third of the group’s fuel consumption for 2020. More detailed notes and analyses of the group’s income statement, statement of financial position and statement of cash flow for 2019 are available in the group financial statements for 2019. LOOKING AHEAD TO 2020 We have a number of key catalysts we intend to focus on in 2020. Our strong focus on ESG related matters is paying dividends and we will specifically continue our focus and attention on improving our safety record. We have made good progress in streamlining the portfolio and our continued focus in 2020 will be on the successful commissioning of Phase 2 of the Obuasi project by the end of the year. Simultaneously, we expect that our planned increased Ore Reserve Development and Mineral Resource Conversion over the course of 2020 and 2021 will provide positive results in the medium term. Our additional anticipated sustaining capital spend for 2020 is estimated at $30/oz. We expect to close on all the ongoing, announced divestment processes. We expect to continue to improve cash flows, potentially resulting in further increases in our dividend pay-outs. Our leverage is currently at the target level we would like to maintain through the cycle and, given the strong fundamentals in place currently, we

PAGE 15
expect further improvement on this leverage. We aim to achieve all of this while remaining disciplined in managing costs and capital expenditure, thereby optimising current operating margins. Sensitivities on key economic metrics based on budgeted economic assumptions for 2020 are as follows:
Sensitivity* AISC ($/oz)
Cash from operating activities before taxes for
2020 ($m)
10% change in the oil price 6 19
10% change in local currency 54 146
10% change in the gold price 5 401
50koz change in production 16 62
* All the sensitivities based on $1,300/oz gold price and assumptions used for guidance.
Currency and commodity assumptions 2020
$/R exchange rate 15.00
A$/$ exchange rate 0.70
$/BRL exchange rate 3.95
$/ARS exchange rate 70.00
Oil ($/bbl) 65
COVID-19 virus pandemic, guidance and liquidity At the date of the approval of these financial results, the COVID-19 virus outbreak continues to spread across the globe and contributes to economic instability in global financial markets. The outbreak was declared a global pandemic on 11 March 2020 by the World Health Organization (WHO) and since then has resulted in numerous governments and other organisations, including AngloGold Ashanti, introducing a variety of measures to curb the spread of the virus. To date, we have taken a number of proactive steps to protect our employees, our host communities and business, in line with the company’s values, guidelines and advice provided by the WHO and within the requirements of the countries in which we operate. The health and wellbeing of our employees and our host communities remains a key priority. Cases of the outbreak have been reported in all of the jurisdictions in which we operate, and it may lead to a prolonged restriction on the movement of people and continued requirement for people to self-isolate or be quarantined. A cross-functional team, including operations, technical, finance, health, community, government relations and other support disciplines, is helping to guide the response to the crisis. The company has for some time employed increased screening and surveillance of employees, stopped non-essential travel, instituted mandatory quarantine for arriving travelers and increased hygiene awareness across its operations, in addition to a range of other measures to mitigate the risks presented by the virus. It has also worked with local communities to help bolster their responses to the outbreak. These initiatives have complemented government responses in each of its operating jurisdictions. As a precaution against the potential effects of the pandemic on our ability to secure spares and consumables, our supply chain teams have proactively placed orders to build increased safety stocks on critical items at our operations. Specific inventories depend on the level of risk identified in each region, lead time considerations, and storage capacity. In general, we are targeting inventories of three to six months on primary consumables, while recognising we have the support of strategic partnerships with key suppliers who themselves are maintaining inventories in the respective regions for many critical items. More specifically, the near-term supply chain outlook remains positive, while mid to long term uncertainty (i.e. 4 to 8 months) is being actively managed as follows: We are pro-actively placing orders to increase safety stocks on critical consumable items at our operations. We have strong supplier relationships and a globally diversified supply base which minimises the risk of global interruptions. Potential supply chain risks are currently limited to base metals and steel sourced from China impacting grinding media required
at our operations. However, we do not rely solely on Chinese steel for our grinding media. Minimal risks have been identified thus far for the supply of mining equipment over the next 12 months, however, we are starting
to see lead times increasing. We have noted lead times extending for lower value protective gear and equipment, however, alternative sources for these
items have been identified. We are proactively managing the gold shipments logistics through alternative flight routes and air charters due to cancellation of flights by certain airlines and closure of ports in various jurisdictions in order to avoid shipment delays of gold doré bars to refineries. Any self-imposed or government-mandated lockdowns may disrupt the company’s activities and operations and even lead to a full or partial temporary suspension of the company’s mining operations in those jurisdictions. On 21 March 2020, following the Argentinian government’s decision to impose a nationwide lockdown (quarantine) until 31 March 2020, including temporary travel restrictions, border closings and suspension of most industries, Cerro Vanguardia S.A. (CVSA) was required to temporarily suspend mining activities.

PAGE 16
On 23 March 2020, the South African government announced a 21-day nationwide lockdown, effective from midnight on 26 March 2020, resulting in the temporary suspension of mining activities of the company’s South African operations particularly Mponeng, and the partial suspension of mining activities at Mine Waste Solutions (MWS) and Surface Operations. On 26 March 2020, the State of Goiás, in Brazil, extended a set of restrictions on the operation of non-essential business to include mining. These restrictions are set to run through 4 April 2020. Mineração Serra Grande S.A. will temporarily suspend its operations. The current impact of all of the suspended operations is expected to be about 30,000oz to 40,000oz, or less than 2% of annual production. In these countries, the suspension of mining activities will continue for the period during which the respective restrictions remain in force. The rest of AngloGold Ashanti’s mines in its diversified portfolio of 14 assets in nine countries, continue to operate. For the sites where production has been suspended, plans for a safe and smooth ramp-up, and for safely regaining part of the delayed production, are being developed. The pandemic, if prolonged, would have a wide range of impacts, including the direct consequences of the virus on the health of employees and communities, but also the consequent restrictions to travel and work put in place by governments to slow its spread. There would also be indirect consequences, including the reduced ability to effectively move people, supplies and equipment to sites. These may cause production interruptions through further suspensions of mining activities or delays to projects. We are in the process of designing the necessary contingency plans to mitigate these risks. The company had a good start to the year, and notwithstanding the suspended production in South Africa and Argentina remains well on track to meet its annual guidance. Nonetheless, given the uncertainties with respect to future developments, including duration, severity and scope of the COVID-19 pandemic and the necessary government responses to limiting its spread, the board has decided to withdraw its market guidance for 2020 published as part of its preliminary condensed consolidated financial results on 21 February 2020, at this time.
We will continue to focus on the necessary steps to protect people, work to meet production targets and secure the longer-term future of the business during this period of uncertainty.
We are implementing cash conservation measures, including focused capital prioritisation and reducing non-essential spending across the business.
The company has drawn down $1.4bn on its US Dollar RCF to cater for the $700m bond redemption due mid-April 2020 and to provide additional liquidity headroom. After the drawdowns, cash on hand is about $1.8bn (excluding cash lock-up positions at Kibali and Sadiola, where AngloGold Ashanti’s combined share totals about $300m). Management will continue to take a prudent and proactive approach to managing the group’s liquidity, which may include procuring additional credit facilities or debt over and above its current facilities. Summary In summary, priorities for 2020 are: Continued focus on sustainability and safety improvements Target increased reserve conversion through additional investment in Ore Reserve Development and Mineral Resource
Conversion Aim to successfully complete divestment processes Obuasi phase 2 commissioning Optimise margins and cash conversion Enforce capital discipline in a rising gold price environment Proactively manage the emerging risks relating to the Corona virus pandemic from an operational, liquidity, working capital and
supply chain perspective Focus on cash conservation measures including reducing corporate costs and AISC Pursue optimal financing alternatives for the group to preserve liquidity
ACKNOWLEDGEMENT I wish to record my gratitude to the broader finance team across the group which includes the financial reporting, tax, treasury, information management, global supply chain and internal audit functions. These functions work together seamlessly to ensure that we proactively manage risk, ensuring that we have robust financial systems in place to maintain a strong internal control environment whilst enabling relevant, timely financial reporting that inform business decisions. Our strong track record of achieving our financial KPIs is testimony to the strong calibre of our financial team. I look forward to the year ahead with enthusiasm, focusing on our strategic objectives and improving returns to our shareholders. Warm regards Christine Ramon Chief Financial Officer 27 March 2020
PAGE 17
DIRECTORS’ APPROVAL In accordance with Section 30(3)(c) of the Companies Act, No. 71 of 2008, as amended, the annual financial statements for the year ended 31 December 2019 were approved by the board of directors on 19 March 2020 and are signed on its behalf by: DIRECTORS SM Pityana, Chairman KPM Dushnisky, Chief Executive Officer KC Ramon, Chief Financial Officer R Gasant, Chairman: Audit and Risk Committee
SECRETARY’S CERTIFICATE In terms of Section 88(2)(e) of the Companies Act, No. 71 of 2008, as amended, I certify that the company has lodged with the Companies and Intellectual Property Commission all such returns and notices as are required of a public company in terms of the Act, and that all such returns and notices are true, correct and up-to-date. ME Sanz Perez Company Secretary Johannesburg 27 March 2020
AFFIRMATION OF FINANCIAL STATEMENTS In accordance with Section 30(2) and 30(3) of the Companies Act, No. 71 of 2008, as amended, the annual financial statements for AngloGold Ashanti Limited, registration number 1944/017354/06 (AngloGold Ashanti), for the year ended 31 December 2019, have been audited by Ernst & Young Inc., the company’s independent external auditors, whose unqualified audit opinion can be found under Independent Auditor’s Report, on page 25. The financial statements have been prepared by the corporate reporting staff of AngloGold Ashanti, headed by Ian Kramer (CA (SA)), the Senior Vice President: Finance. This process was supervised by Kandimathie Christine Ramon (CA (SA)), the group’s Chief Financial Officer and Kelvin Dushnisky (B.SC (Honours); M.Sc; Juris Doctor), the group’s Chief Executive Officer.
PAGE 18
DIRECTORS’ REPORT FOR THE YEAR ENDED 31 DECEMBER
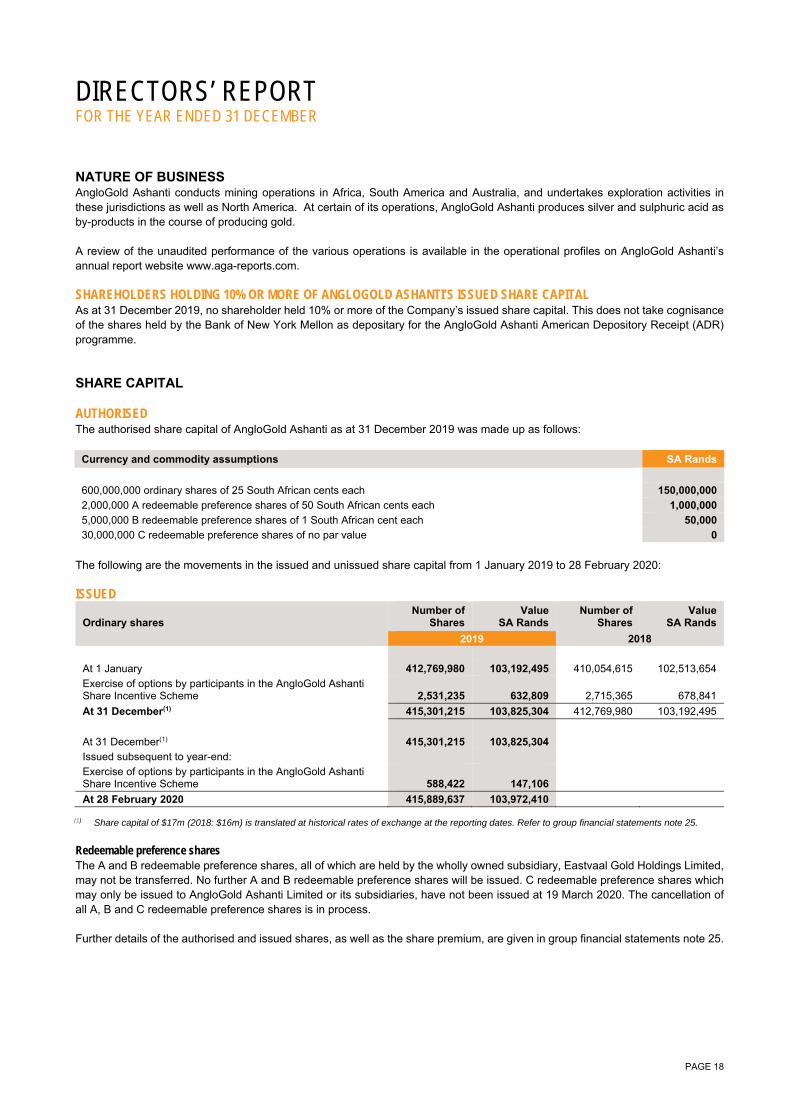
NATURE OF BUSINESS AngloGold Ashanti conducts mining operations in Africa, South America and Australia, and undertakes exploration activities in these jurisdictions as well as North America. At certain of its operations, AngloGold Ashanti produces silver and sulphuric acid as by-products in the course of producing gold. A review of the unaudited performance of the various operations is available in the operational profiles on AngloGold Ashanti’s annual report website www.aga-reports.com. SHAREHOLDERS HOLDING 10% OR MORE OF ANGLOGOLD ASHANTI’S ISSUED SHARE CAPITAL As at 31 December 2019, no shareholder held 10% or more of the Company’s issued share capital. This does not take cognisance of the shares held by the Bank of New York Mellon as depositary for the AngloGold Ashanti American Depository Receipt (ADR) programme. SHARE CAPITAL AUTHORISED The authorised share capital of AngloGold Ashanti as at 31 December 2019 was made up as follows:
Currency and commodity assumptions SA Rands
600,000,000 ordinary shares of 25 South African cents each 150,000,000
2,000,000 A redeemable preference shares of 50 South African cents each 1,000,000
5,000,000 B redeemable preference shares of 1 South African cent each 50,000
30,000,000 C redeemable preference shares of no par value 0
The following are the movements in the issued and unissued share capital from 1 January 2019 to 28 February 2020: ISSUED
Ordinary shares Number of
Shares Value
SA Rands Number of
Shares Value
SA Rands
2019 2018
At 1 January 412,769,980 103,192,495 410,054,615 102,513,654
Exercise of options by participants in the AngloGold Ashanti Share Incentive Scheme 2,531,235 632,809 2,715,365 678,841
At 31 December(1) 415,301,215 103,825,304 412,769,980 103,192,495
At 31 December(1) 415,301,215 103,825,304
Issued subsequent to year-end:
Exercise of options by participants in the AngloGold Ashanti Share Incentive Scheme 588,422 147,106
At 28 February 2020 415,889,637 103,972,410 (1) Share capital of $17m (2018: $16m) is translated at historical rates of exchange at the reporting dates. Refer to group financial statements note 25.
Redeemable preference shares The A and B redeemable preference shares, all of which are held by the wholly owned subsidiary, Eastvaal Gold Holdings Limited, may not be transferred. No further A and B redeemable preference shares will be issued. C redeemable preference shares which may only be issued to AngloGold Ashanti Limited or its subsidiaries, have not been issued at 19 March 2020. The cancellation of all A, B and C redeemable preference shares is in process. Further details of the authorised and issued shares, as well as the share premium, are given in group financial statements note 25.
PAGE 19
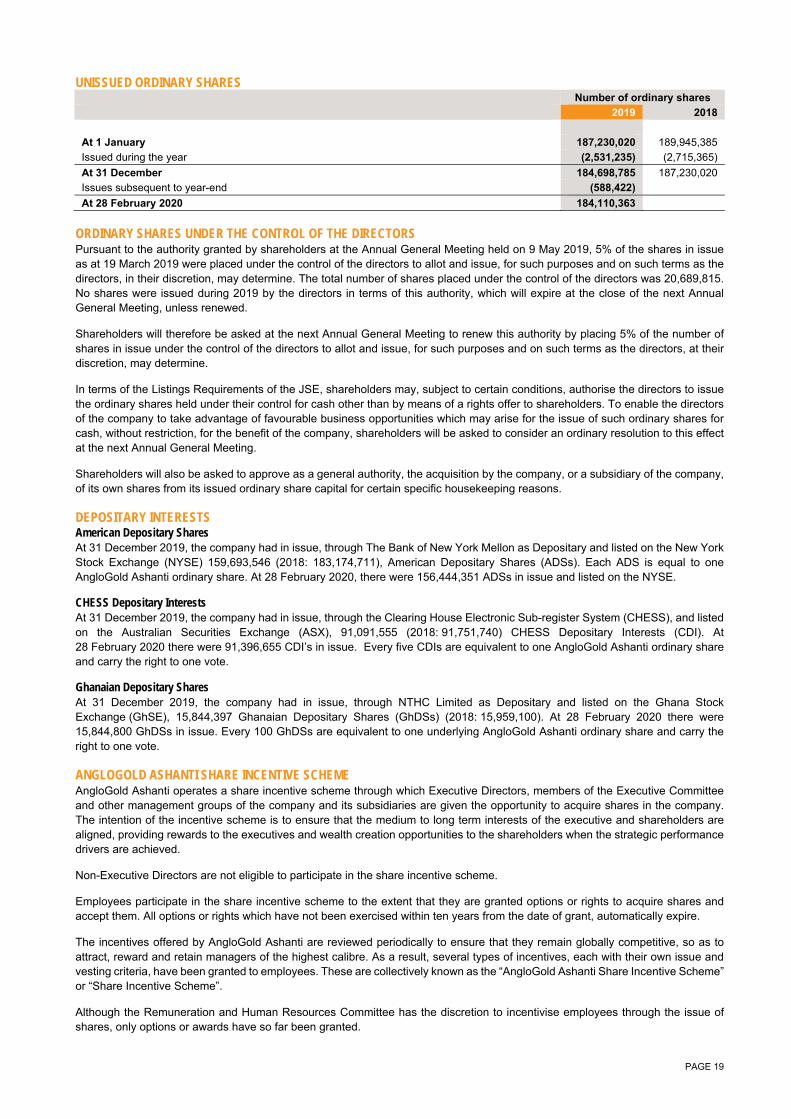
UNISSUED ORDINARY SHARES Number of ordinary shares
2019 2018
At 1 January 187,230,020 189,945,385
Issued during the year (2,531,235) (2,715,365)
At 31 December 184,698,785 187,230,020
Issues subsequent to year-end (588,422)
At 28 February 2020 184,110,363
ORDINARY SHARES UNDER THE CONTROL OF THE DIRECTORS Pursuant to the authority granted by shareholders at the Annual General Meeting held on 9 May 2019, 5% of the shares in issue as at 19 March 2019 were placed under the control of the directors to allot and issue, for such purposes and on such terms as the directors, in their discretion, may determine. The total number of shares placed under the control of the directors was 20,689,815. No shares were issued during 2019 by the directors in terms of this authority, which will expire at the close of the next Annual General Meeting, unless renewed.
Shareholders will therefore be asked at the next Annual General Meeting to renew this authority by placing 5% of the number of shares in issue under the control of the directors to allot and issue, for such purposes and on such terms as the directors, at their discretion, may determine.
In terms of the Listings Requirements of the JSE, shareholders may, subject to certain conditions, authorise the directors to issue the ordinary shares held under their control for cash other than by means of a rights offer to shareholders. To enable the directors of the company to take advantage of favourable business opportunities which may arise for the issue of such ordinary shares for cash, without restriction, for the benefit of the company, shareholders will be asked to consider an ordinary resolution to this effect at the next Annual General Meeting.
Shareholders will also be asked to approve as a general authority, the acquisition by the company, or a subsidiary of the company, of its own shares from its issued ordinary share capital for certain specific housekeeping reasons. DEPOSITARY INTERESTS American Depositary Shares At 31 December 2019, the company had in issue, through The Bank of New York Mellon as Depositary and listed on the New York Stock Exchange (NYSE) 159,693,546 (2018: 183,174,711), American Depositary Shares (ADSs). Each ADS is equal to one AngloGold Ashanti ordinary share. At 28 February 2020, there were 156,444,351 ADSs in issue and listed on the NYSE.
CHESS Depositary Interests At 31 December 2019, the company had in issue, through the Clearing House Electronic Sub-register System (CHESS), and listed on the Australian Securities Exchange (ASX), 91,091,555 (2018: 91,751,740) CHESS Depositary Interests (CDI). At 28 February 2020 there were 91,396,655 CDI’s in issue. Every five CDIs are equivalent to one AngloGold Ashanti ordinary share and carry the right to one vote.
Ghanaian Depositary Shares At 31 December 2019, the company had in issue, through NTHC Limited as Depositary and listed on the Ghana Stock Exchange (GhSE), 15,844,397 Ghanaian Depositary Shares (GhDSs) (2018: 15,959,100). At 28 February 2020 there were 15,844,800 GhDSs in issue. Every 100 GhDSs are equivalent to one underlying AngloGold Ashanti ordinary share and carry the right to one vote. ANGLOGOLD ASHANTI SHARE INCENTIVE SCHEME AngloGold Ashanti operates a share incentive scheme through which Executive Directors, members of the Executive Committee and other management groups of the company and its subsidiaries are given the opportunity to acquire shares in the company. The intention of the incentive scheme is to ensure that the medium to long term interests of the executive and shareholders are aligned, providing rewards to the executives and wealth creation opportunities to the shareholders when the strategic performance drivers are achieved.
Non-Executive Directors are not eligible to participate in the share incentive scheme.
Employees participate in the share incentive scheme to the extent that they are granted options or rights to acquire shares and accept them. All options or rights which have not been exercised within ten years from the date of grant, automatically expire.
The incentives offered by AngloGold Ashanti are reviewed periodically to ensure that they remain globally competitive, so as to attract, reward and retain managers of the highest calibre. As a result, several types of incentives, each with their own issue and vesting criteria, have been granted to employees. These are collectively known as the “AngloGold Ashanti Share Incentive Scheme” or “Share Incentive Scheme”.
Although the Remuneration and Human Resources Committee has the discretion to incentivise employees through the issue of shares, only options or awards have so far been granted.
PAGE 20
The type and vesting criteria of the options or awards granted are: BONUS SHARE PLAN (BSP) The granting of awards in terms of the BSP was approved by shareholders at the Annual General Meeting held on 29 April 2005. The last BSP awards were granted in 2018 and it is not anticipated that further awards will be granted in future. LONG TERM INCENTIVE PLAN (LTIP) The granting of awards in terms of the LTIP was approved by shareholders at the Annual General Meeting held on 29 April 2005. No new LTIP awards were granted since 2018, and it is not anticipated that further LTIP awards will be granted in future. The 2016 and 2017 awards were granted as cash settled awards (CSLTIP). CO-INVESTMENT PLAN (CIP) To assist executives in meeting their Minimum Shareholding Requirements (MSR’s) with effect from February 2013 they were given the opportunity, on a voluntary basis, to participate in the Co-Investment Plan (CIP). The last CIP awards were granted in 2018 and it is not anticipated that CIP awards will be granted in future. DEFERRED SHARE PLAN (DSP) On 16 May 2017, the shareholders approved the introduction of the Deferred Share Plan to replace both the BSP and LTIP schemes with effect from 1 January 2018. The DSP, designed with feedback from shareholders in mind, aims to better align the interests of company management with those of shareholders by, among others rewarding decision-making that promotes the long term health of the business by increasing the maximum vesting period of shares from two to five years, and introducing a claw-back provision; reducing the impact of uncontrollable factors, like gold price and currency fluctuations, in determining remuneration; providing better incentive for prudent, value-adding capital allocation; capping the number of shares that can be issued under the DSP in any given year to 1% of total shares in issue; and providing greater incentives for excellence in the broad area of sustainability, which covers the safety, environmental, governance, community relations and human capital disciplines. The first awards under this scheme, totalling 1,669,191 awards, were granted during 2019 for the 2018 performance year. CHANGES IN OPTIONS AND AWARDS In accordance with the JSE Listings Requirements and the rules of the AngloGold Ashanti Share Incentive Scheme, the changes in options, awards and share units granted and the ordinary shares issued as a result of the vesting and/or exercise of options, awards and share units during the period 1 January 2019 to 28 February 2020 are disclosed below:
Bonus Share
Plan Long Term
Incentive Plan
Cash-settled Long Term
Incentive Plan Deferred
Share Plan
Total Share Incentive Scheme
At 1 January 2019 4,557,919 447,842 3,815,761 — 8,821,522
Movement during year
- Granted (1) 1,669,191 1,669,191
- Exercised/vested (2,307,439) (218,203) (1,029,438) (14,623) (3,569,703)
- Lapsed/forfeited (109,065) — (1,305,761) (55,208) (1,470,034)
At 31 December 2019 2,141,415 229,639 1,480,562 1,599,360 5,450,976
Subsequent to year-end
Exercised/vested (423,934) (9,314) — (152,158) (585,406)
At 28 February 2020 1,717,481 220,325 1,480,562 (2) 1,447,202 4,865,570
(1) Awards were granted at no cost to participants (2) Cash-settled Long Term Incentive Plan vested on 1 March 2020
DIVIDEND POLICY Dividends are proposed by, and approved by the Board of Directors of AngloGold Ashanti, based on the Company’s financial performance. The dividend policy provides for an annual dividend to be based on 10% of the free cash flow, before growth capital expenditure, generated by the business for that financial year. Furthermore, this is subject to the board exercising its discretion on an annual basis, after taking into consideration the prevailing market conditions, balance sheet flexibility and future capital commitments of the group. For the year ended 31 December 2019, the directors of AngloGold Ashanti declared a gross cash dividend per ordinary share of 165 South African cents (assuming an exchange rate of ZAR 15/$, the gross dividend payable per ADS is equivalent to ~11 US cents). The board is satisfied that subsequent to the dividend declaration, the Company has adequate balance sheet flexibility and sufficient funding facilities available to withstand market volatility. The continuation of the dividend reflects capital discipline and management's commitment to improving shareholder returns.
PAGE 21
Dematerialised shareholders on the South African share register will receive payment of their dividends electronically through their Central Securities Depository Participant or broker. Certificated shareholders, who have made this election, will receive their dividends electronically via an electronic funds transfer directly into their mandated bank accounts. Certificated shareholders who have not yet elected to receive dividend payments electronically, are encouraged to mandate this method of payment for all future dividends. WITHHOLDING TAX Withholding tax of 20% on dividends and other distributions payable to shareholders are in effect from 1 March 2017. BORROWINGS The company’s borrowing powers are unlimited pursuant to the company’s Memorandum of Incorporation. As at 31 December 2019, the group’s gross borrowings (excluding lease liabilities) totalled $2,033m (2018: $2,050m). OTHER MATTERS SIGNIFICANT EVENTS DURING THE YEAR UNDER REVIEW AngloGold Ashanti starts process to review divestment options for South African assets - On 9 May 2019, AngloGold Ashanti announced that it was embarking on a process to review divestment options for its remaining South African assets. This process will consider all ownership options, with a view to maximising the value and future prospects of these assets. Court approval of settlement of the silicosis and TB class action - On 26 July 2019, the Johannesburg High Court approved the settlement of the silicosis and tuberculosis class action and the settlement agreement came into effect on 10 December 2019. The settlement is between AngloGold Ashanti, African Rainbow Minerals, Anglo American SA, Gold Fields, Harmony and Sibanye Stillwater; the settlement classes’ representatives and the settlement classes’ attorneys Richard Spoor Inc, Abrahams Kiewitz Inc and the Legal Resources Centre. B2Gold to earn management of Gramalote Project - On 16 September 2019, AngloGold Ashanti announced an agreement with B2Gold, its joint venture partner at the Gramalote Project in Colombia, whereby B2Gold will fund an investment and exploration programme in 2020 to the value of $13.9m, in order to earn back to a 50:50 partnership and assume management of the project effective 1 January 2020. Obuasi Gold Mine pours first gold - On 18 December 2019, AngloGold Ashanti (Ghana), a wholly owned subsidiary of AngloGold Ashanti, has achieved its first pour of gold from the Obuasi Gold Mine, signaling the successful redevelopment of the mine into a modern, mechanized mining operation since mining activities were suspended five years ago. Sale interest in the Sadiola Mine - On 23 December 2019, AngloGold Ashanti announced that it together with its joint venture partner, IAMGOLD Corporation (IAMGOLD), had agreed to sell their interests in Société d’Exploitation des Mines d’Or de Sadiola S.A. (Sadiola) to Allied Gold Corp (Allied Gold). Sadiola's principal asset is the Sadiola Mine located in the Kayes region of Western Mali. AngloGold Ashanti and IAMGOLD each hold a 41% interest in Sadiola with the remaining 18% interest held by the Government of Mali. The transaction is subject to the fulfillment, or waiver, of a number of conditions precedent, including the receipt of certain approvals and releases from the Government of Mali. AngloGold Ashanti received approval from the South African Reserve Bank in early 2020. It is anticipated that all conditions precedent will be fulfilled or waived by the end of April 2020. Refer note 9. SIGNIFICANT EVENTS SUBSEQUENT TO YEAR-END Sale of South African assets - On 12 February 2020, AngloGold Ashanti announced that it has reached an agreement to sell its remaining South African producing assets and related liabilities to Harmony Gold Mining Company Limited. Consideration for the transaction is in cash and deferred payments with expected proceeds of around $300m, subject to subsequent performance, and with additional proceeds if the West Wits assets are developed below current infrastructure. Refer to note 9. Geita underground mine permit - In March 2020, GGML received the consent of the Minister of Minerals to change the mining method under our Special Mining License from open pit to underground method, subject to the requisite terms and conditions. COVID-19 pandemic - At the date of approval of these consolidated annual financial statements, the SARS-CoV-2 virus responsible for COVID-19 continues to spread across the globe, contributing to a sharp decline in global financial markets and a significant decrease in global economic activity. On 11 March 2020, the COVID-19 outbreak was declared a global pandemic by the World Health Organization and has since then resulted in numerous governments and companies, including AngloGold Ashanti, introducing a variety of measures to contain the spread of the virus. To date, we have taken a number of proactive steps to protect our employees, our host communities and business, in line with the company’s values, guidelines and advice provided by the WHO and with the requirements of the countries in which we operate. The health and wellbeing of our employees and our host communities remains a key priority. Cases of the outbreak have been reported in all of the jurisdictions in which we operate, and it may lead to a prolonged restriction on the movement of people and continued requirement for people to self-isolate or be quarantined.
PAGE 22
Any self-imposed or government-mandated temporary lockdowns may disrupt the company’s activities and operations and even lead to a full or partial temporary suspension of the company’s mining operations in those jurisdictions. On 21 March 2020, following the Argentinian government’s decision to impose a nationwide lockdown (quarantine) until 31 March 2020, including temporary travel restrictions, border closings and suspension of most industries, Cerro Vanguardia S.A. (CVSA) was required to temporarily suspend mining activities. On 23 March 2020, the South African government announced a 21-day nationwide lockdown, effective from midnight on 26 March 2020, resulting in the temporary suspension of mining activities of the company’s South African operations particularly Mponeng, and the partial suspension of mining activities at Mine Waste Solutions (MWS) and Surface Operations. On 26 March 2020, the State of Goiás, in Brazil, extended a set of restrictions on the operation of non-essential business to include mining. These restrictions are set to run through 4 April 2020. Mineração Serra Grande S.A. will temporarily suspend its operations. The current impact of all of the suspended operations is expected to be about 30,000oz to 40,000oz, or less than 2% of annual production. In these countries, the suspension of mining activities will continue for the period during which the respective restrictions remain in force. While minimal operational disruptions have occurred at the company’s other operations to date, the company may experience temporary disruptions in supply chain and logistics across its operations in the coming months should the pandemic be prolonged. Such disruptions, which include restrictions in travel and border access, may impact the company’s ability to source and transport goods and services required to operate mines and to transport gold doré to refineries. Furthermore, should COVID-19 spread among the company’s workforce, it may lead to a full or partial temporary suspension of the company’s operating mines in those affected areas. Given the uncertainties with respect to future developments, including duration, severity and scope of the COVID-19 pandemic and the necessary government responses to limiting its spread, the board has decided to withdraw its market guidance for 2020 published as part of its preliminary condensed consolidated financial results on 21 February 2020, at this time. In anticipation of a prolonged negative impact from the COVID-19 pandemic, the company has drawn down $1.4bn on its US Dollar RCF to cater for the $700m bond redemption due mid-April 2020 and to provide additional liquidity headroom. After the drawdowns, cash on hand is about $1.8bn (excluding cash lock-up positions at Kibali and Sadiola, where AngloGold Ashanti’s combined share totals about $300m). Management will continue to take a prudent and proactive approach to managing the group’s liquidity, which may include procuring additional credit facilities or debt over and above its current facilities. MATERIAL CHANGE There has been no material change in the financial results or trading position of the AngloGold Ashanti group since the publication of the report for the six months and year ended 31 December 2019 on 21 February 2020 and the date of this report. The results for the year ended 31 December 2019 were audited by Ernst & Young Inc., who issued an unqualified audit report on 27 March 2020. Subsequent events, included the Group Annual Financial Statements note 37, have been amended for additional details provided on the impact of the Covid-19 pandemic on the group and proactive measures taken to mitigate the risks. ANNUAL GENERAL MEETING At the 75th Annual General Meeting held on Wednesday, 9 May 2019, shareholders passed resolutions relating to the: Re-election of Maria Richter as a Director of the Board; Election of Kelvin Dushnisky, Alan Ferguson and Jochen Tilk as Directors of the Board; Appointment of the Audit and Risk Committee members being Rhidwaan Gasant, Rodney Ruston, Maria Richter and Alan
Ferguson; Re-appointment of Ernst & Young Inc. as External Auditors of the company; General authority to directors to allot and issue ordinary shares; Separate non-binding advisory endorsement of the AngloGold Ashanti remuneration policy and implementation report; Remuneration of non-executive directors, which remains unchanged from the previous year; General authority to acquire the company’s own shares; General authority to directors to issue for cash, those ordinary shares which the directors are authorised to allot and issue; General authority to provide financial assistance in terms of sections 44 and 45 of the Companies Act; and Directors’ authority to implement special and ordinary resolutions. DIRECTORATE AND SECRETARY During the period 1 January 2019 to 31 December 2019, the following changes occurred: On 28 May 2019, AngloGold Ashanti announced the appointment of Ms Maria Ramos as an independent non-executive director
to its Board of Directors, effective 1 June 2019. Ms Ramos serves as a member of the Investment Committee and the Social, Ethics and Sustainability Committee.
On 27 November 2019, AngloGold Ashanti appointed Mr Rhidwaan Gasant as lead independent director of the Company.

PAGE 23
On 28 November 2019, AngloGold Ashanti also appointed Ms Nelisiwe Magubane as an independent non-executive director to its board, which appointment became effective 1 January 2020. Ms Magubane currently serves as a member of the Company's Investment Committee and the Social and Ethics and Sustainability Committee.
On 19 February 2020 the board approved the following changes to its board committees: The appointment of Ms Maria Ramos as chair of the Social, Ethics and Sustainability Committee, effective 6 May 2020, following
the retirement of Mrs Nozipho January-Bardill (current chair) from the Board at the Company’s next Annual General Meeting (AGM) which was scheduled on 6 May 2020. Ms Ramos will furthermore step down as a member of the Investment Committee and be appointed as a member of the Remuneration and Human Resources Committee, effective 6 May 2020.
The appointment of Mr Jochen Tilk as chair of the Investment Committee effective 6 May 2020, following the retirement of Mr Rod Ruston (current chair) from the Board at the AGM scheduled on 6 May 2020.
The board has subsequently decided to postpone the AGM scheduled to take place on 6 May 2020, in light of the South African nationwide lockdown enforced to combat the Covid-19 pandemic. However, the retirements of Mrs January-Bardill and Mr Ruston remain effective from 6 May 2020. Company Secretary There was no change to the office of the Company Secretary during 2019. The name, business and postal address of the Company Secretary are set out under Administrative Information on page 123. In accordance with rule 3.59(b) of the JSE Listing Requirements, shareholders are advised that Ms Maria Sanz Perez, company secretary, has given 6 months’ notice of the intention to resign, effective 26 March 2020, to pursue other business interests. The exact departure date is still to be agreed. AngloGold Ashanti will commence with the process of identifying a suitable replacement and update shareholders in due course. Directors’ and Prescribed Officers’ interests in AngloGold Ashanti shares The interests of Directors, Prescribed Officers and their associates in the ordinary shares of the company at 31 December 2019, individually did not exceed 1% of the company’s issued ordinary share capital and are disclosed in note 33 of the group financial statements. Details of service contracts of Directors and Prescribed Officers In accordance with Section 30(4)(e) of the Companies Act the salient features of the service contracts of Directors and Prescribed Officers have been disclosed in the Remuneration Report, which is included in the Integrated Report 2019. ANNUAL FINANCIAL STATEMENTS The financial statements set out fully the financial position, results of operations and cash flows of the group and the company for the financial year ended 31 December 2019. The directors of AngloGold Ashanti are responsible for the maintenance of adequate accounting records and the preparation of the annual financial statements and related information in a manner that fairly presents the state of affairs of the Company, in conformity with the Companies Act and in terms of the JSE Listings Requirements. The directors are also responsible for the maintenance of effective systems of internal control which are based on established organisational structures and procedures. These systems are designed to provide reasonable assurance as to the reliability of the annual financial statements, and to prevent and detect material misstatement and loss. In preparing the annual financial statements, the group has complied with International Financial Reporting Standards (IFRS) and used appropriate accounting policies supported by pragmatic judgements and estimates. AngloGold Ashanti, through its Executive Committee, reviews its short-, medium- and long-term funding, treasury and liquidity requirements and positions monthly. The board of directors also reviews these on a quarterly basis at its meetings. Cash and cash equivalents, at 31 December 2019 amounted to $456m (2018: $329m), and together with cash budgeted to be generated from operations in 2020 and the net incremental borrowing facilities available, are in management’s view, adequate to fund operating, mine development, capital expenditure and financing obligations as they fall due for at least the next 12 months. Taking these factors into account, the directors of AngloGold Ashanti have formed the judgement that, at the time of approving the financial statements for the year ended 31 December 2019, it is appropriate to prepare these financial statements on a going concern basis. Based on the results of a formal documented review of the Company’s system of internal controls and risk management, covering both the adequacy in design and effectiveness in implementation, performed by the internal audit function during the year 2019: information and explanations provided by line management; discussions held with the External Auditors on the results of the year-end audit; and the assessment by the Audit and Risk Committee,

PAGE 24
the board has concluded that nothing has come to its attention that caused it to believe that the company’s system of internal controls and risk management are not effective and that the internal financial controls do not form a sound basis for the preparation of reliable financial statements. The directors are of the opinion that these financial statements fairly present the financial position of the company and group at 31 December 2019 and the results of their operations, changes in equity and cash flow information for the year then ended in accordance with IFRS. The External Auditor, Ernst & Young Inc., is responsible for independently auditing and reporting on the financial statements in conformity with International Standards on Auditing and the Companies Act of South Africa. Their unqualified opinion on these financial statements appears in the Independent Auditor’s Report, on page 25 of this report. The Company will file a set of financial statements in accordance with IFRS in its annual report on Form 20-F as must be filed with the US Securities and Exchange Commission (SEC) by no later than 30 April 2020. The SEC maintains an internet site that contains reports, proxy and information statements, and other information regarding issuers that file electronically with the SEC (http://www.sec.gov). INVESTMENTS Particulars of the group’s principal subsidiaries and operating entities are presented in this report on page 117.
PAGE 25
INDEPENDENT AUDITOR’S REPORT The Board of Directors and Shareholders of AngloGold Ashanti Limited
REPORT ON THE AUDIT OF THE CONSOLIDATED AND SEPARATE FINANCIAL STATEMENTS Opinion We have audited the consolidated and separate financial statements of AngloGold Ashanti Limited and its subsidiaries (the group) and company set out on pages 29 to 118, which comprise the consolidated and separate statements of financial position as at 31 December 2019, and the consolidated and separate income statement, consolidated and separate statement of comprehensive income, consolidated and separate changes in equity and consolidated and separate cash flows for the year then ended, and notes to the consolidated and separate financial statements, including a summary of significant accounting policies. In our opinion, the accompanying consolidated and separate financial statements present fairly, in all material respects, the consolidated and separate financial position of the group and company as at 31 December 2019, and its consolidated and separate financial performance and consolidated and separate cash flows for the year then ended in accordance with International Financial Reporting Standards (IFRS) and the requirements of the Companies Act of South Africa. Basis for Opinion We conducted our audit in accordance with International Standards on Auditing (ISAs). Our responsibilities under those standards are further described in the Auditor’s Responsibilities for the Audit of the consolidated and separate financial statements section of our report. We are independent of the group and company in accordance with the sections 290 and 291 of the Independent Regulatory Board for Auditors’ Code of Professional Conduct for Registered Auditors (Revised January 2018), parts 1 and 3 of the Independent Regulatory Board for Auditors’ Code of Professional Conduct for Registered Auditors (Revised November 2018) (together the IRBA Codes) and other independence requirements applicable to performing audits of financial statements of the group and company and in South Africa. We have fulfilled our other ethical responsibilities, as applicable, in accordance with the IRBA Codes and in accordance with other ethical requirements applicable to performing audits of the group and company and in South Africa. The IRBA Codes are consistent with the corresponding sections of the International Ethics Standards Board for Accountants’ Code of Ethics for Professional Accountants (IESBA code) and the International Ethics Standards Board for Accountants’ International Code of Ethics for Professional Accountants (including International Independence Standards) respectively. We believe that the audit evidence we have obtained is sufficient and appropriate to provide a basis for our opinion. Key Audit Matters Key audit matters are those matters that, in our professional judgment, were of most significance in the audit of the consolidated and separate financial statements of the current period. These matters were addressed in the context of the audit of the consolidated and separate financial statements as a whole, and in forming the auditor’s opinion thereon, and we do not provide a separate opinion on these matters. For each matter below, our description of how our audit addressed the matter is provided in that context. We have fulfilled the responsibilities described in the Auditor’s responsibilities for the audit of the consolidated and separate financial statements section of our report, including in relation to these matters. Accordingly, our audit included the performance of procedures designed to respond to our assessment of the risks of material misstatement of the consolidated and separate financial statements. The results of our audit procedures, including the procedures performed to address the matters below, provide the basis for our audit opinion on the accompanying consolidated and separate financial statements.
EY 102 Rivonia Road Sandton Private Bag X14 Sandton 2146
Ernst & Young Incorporated Co. Reg. No. 2005/002308/21 Tel: +27 (0) 11 772 3000 Fax: +27 (0) 11 772 4000 Docex 123 Randburg ey.com

PAGE 26
Key Audit Matter (KAM) How the matter was addressed in the audit
Geita VAT recoverability (Consolidated KAM)
At 31 December 2019, the Company’s Geita mine has recorded $119 million of VAT receivables due from the Tanzanian Revenue Authority (TRA). $35 million has been classified as current assets, and the remaining $84 million is classified as non-current assets based on management’s estimate of when the Geita mine will be able to offset the VAT receivables with future taxes.
As disclosed in note 22 on page 62 to the consolidated financial statements, an amendment, effective 20 July 2017, to Tanzania’s mining legislation included an amendment to the VAT Act 2015 to the effect that no input tax credit can be claimed for expenses incurred in the production of raw minerals which are to be exported, resulting in Geita’s VAT input claims being disqualified since then by the Tanzania Revenue Authorities. In the current year, an amendment issued by the Tanzanian Ministry of Minerals, effective 22 February 2019, provided clarity on the definition of raw minerals. This amendment has not yet been accepted by the Tanzanian Revenue Authorities, resulting in VAT input claims and offsets from 2017 still not being allowed.
The total of VAT input claims submitted since July 2017 is $134 million.
Auditing the recoverability of these receivables involved significant judgement in assessing whether the TRA will accept the definition of raw minerals and also assessing the timing of when the VAT receivable balance will be recovered. As a result, we required the involvement of our tax specialist, and a significant amount of time was spent in assessing the position put forward by management and their external legal counsel whilst considering correspondence with the TRA received to date.
Our procedures to address this matter included, amongst others, obtaining an understanding, evaluating the design and testing the operating effectiveness of certain internal controls over the Company’s assessment of tax law and the process to estimate the recoverability of the VAT receivable.
We read correspondence between management, the TRA and the Mining Commission, including of correspondence related to the tax returns and assessments received during the year.
We read external legal counsel opinions obtained by management to support their interpretation of the tax legislation for set offs of this manner.
We involved our tax professionals with specialised skills and knowledge to assist us to evaluate the recoverability of the VAT receivable based on the above correspondence and their interpretation of legislation, including historical payments and offsets received to date for claims prior to July 2017.
We evaluated the classification of the VAT receivables as current or non-current, based on management’s estimated scheduling of setting off the VAT receivables. This scheduling is based on management’s forecasts of available taxable income against which set offs can be made.
We evaluated the VAT receivable disclosure in the consolidated financial statements.
Rehabilitation and decommissioning provision (Consolidated and Separate KAM)
At 31 December 2019 the rehabilitation and decommissioning provision amounted to $730 million ($619 million classified as non-current liabilities, $15 million classified as current liabilities and $96 million transferred to assets and liabilities held for sale) in the consolidated financial statements, and R900 million (R3 million classified as non-current liabilities and R897 million transferred to assets and liabilities held for sale) in the separate financial statements.
The Company incurs obligations to close, restore and rehabilitate its mine sites. Auditing the Company’s rehabilitation and decommissioning provision is complex due to the significance as well as the high estimation uncertainty of the provision. The determination of the provision is based on, among other things, judgements and estimates of current damage caused, nature, timing and amount of future costs to be incurred to rehabilitate the mine sites, estimates of future inflation, exchange rates and discount rates. These assumptions are inherently judgemental and subject to continued mining activity and rehabilitation, legislation and environmental changes, which cannot be predicted with certainty.
For instance, in the current year the Brazilian Mining Agency issued Resolution 13, which states that tailings storage facilities (TSF) that were built based on the upstream method should be decommissioned by 15 September 2022. The Serra Grande mine in Brazil has one upstream TSF that was impacted by this change in legislation, resulting in an increase in the provision.
The consolidated disclosures are included in Note 27 and 30, and separate disclosures are included in Note 21.
Our procedures to address this matter included, amongst others, obtaining an understanding, evaluating the design and testing the operating effectiveness of controls over the Company’s process to estimate rehabilitation and decommissioning provisions. For example, we tested controls over the determination of key inputs such as life of mine reserves and production profile, discount rates, inflation and exchange rates, and the nature, amount and timing of future rehabilitation costs.
With the support of valuation specialists, we assessed management’s macro-economic assumptions in their rehabilitation models by comparing them to available market information. The most significant of these macro-economic assumptions were the risk-free interest rates, expected inflation and exchange rates.
We tested the mathematical accuracy of the valuation models.
We compared the timing of the expected cash flows with reference to the life of mine plans for the respective mines.
We compared the current year cash flow assumptions to those of the prior year and considered management’s explanations where these have changed or deviated. We compared the cost rates used by management to publicly available information, as well as ongoing rehabilitation activities undertaken by the Company.
With the support of our environmental specialists we inquired of operational management whether additional environmental disturbance occurred since the prior year that would require additional rehabilitation in the future and compared this information to the current mine plan. We inspected reports of the Company’s mine closure plans and assessments of the timing and determination of costs to be incurred prepared by management’s external and internal experts.
We, together with our specialists evaluated the reports prepared by management’s internal experts and external experts, where these had been engaged by management, to assist in the calculation of the provision. We, together with our specialists evaluated the scope, competency and objectivity of the external experts engaged by management, including their professional qualifications, experience, and use of industry accepted methodology
We evaluated the related disclosure in the consolidated and separate financial statements.

PAGE 27
Key Audit Matter (KAM) How the matter was addressed in the audit
Planned disposal of the South African assets (Consolidated and Separates KAM)
On 9 May 2019, management announced that it had commenced a process to review divestment options for its remaining South African assets.
Management performed an assessment of whether the planned disposal of the remaining South African assets met the requirements of IFRS 5 Non-current Assets Held for Sale and Discontinued Operations. The application of IFRS 5 is subjective, particularly in determining whether the completion of the sale is highly probable within 12 months. Management has concluded that this threshold was met at 31 December 2019. On 12 February 2020, prior to the release of the annual financial statements, management announced that a sale and purchase agreement for disposal of the South African assets was signed. Disclosure of this post balance sheet event is included in Note 37 to the consolidated financial statements and Note 32 to the separate financial statements.
The planned disposal of the remaining South African assets represents a significant change to the composition of the Company’s South African operations, resulting in these assets being reflected as discontinued operations. The results of these businesses and operations, including the adjustment of the carrying value to fair value less cost to sell have been separately presented from continuing operations in the income statement with comparative numbers restated accordingly.
Auditing management’s assessment of IFRS 5 is subjective. In addition, the accounting for discontinued operations is complex in terms of the identification and separation of the financial effects (related income and expenditure) between continuing and discontinued operations as well as identifying the specific assets and liabilities including the tax effects included within the scope of the divestiture.
The consolidated disclosures are included in Note 9, and separate disclosures are included in Note 18.
Our procedures to address this matter included, amongst others, obtaining an understanding, evaluating the design and testing the operating effectiveness of controls over the Company’s processes to approve and account for the transaction, including separation of financial items between discontinued and continued operations.
Through discussions with management and inspection of minutes of meetings, we assessed management’s plans to dispose of the remaining South African assets. We inquired into the status of the transaction at year-end, read the offer agreements from potential buyers and considered whether the then conditions, including ongoing sales negotiations met the ‘highly probable’ threshold of IFRS 5 Non-Current Assets Held for Sale and Discontinued Operations at year-end.
We considered management’s estimate of fair value less costs to sell, including the determination of the deferred consideration component, which included assessing the key assumptions applied and evaluating the explanations provided by management through comparing the key assumptions to market data, where available.
For example, we compared the future production volumes to the mine plans and involved our specialists to assist with assessing the discount rate applied by management.
We assessed management’s accounting policies and procedures for accounting for discontinued operations under IFRS 5. We considered management’s determination of the operations that should be separated and presented as discontinued operations and compared the assets and liabilities that were reclassified as held for sale to those listed in the sales and purchase agreement. We considered the impact of current and deferred taxes as it relates to the disposal and reclassification of the assets and liabilities.
We evaluated the adequacy the disclosures in the financial statements, including disclosure of the post-balance sheet events.
Other Information The directors are responsible for the other information. The other information comprises the information included in the 123 page document titled AngloGold Ashanti Limited Annual Report for the year ended 31 December 2019, which includes the Audit and Risk Committee – Chairman’s Letter, the Chief Financial Officer’s Review, the Company Secretary’s Certificate and the Directors’ Report as required by the Companies Act of South Africa. The other information does not include the consolidated and separate financial statements and our auditor’s report thereon. Our opinion on the consolidated and separate financial statements does not cover the other information and we do not express any form of assurance conclusion thereon. In connection with our audit of the consolidated and separate financial statements, our responsibility is to read the other information and, in doing so, consider whether the other information is materially inconsistent with the consolidated and separate financial statements or our knowledge obtained in the audit or otherwise appears to be materially misstated. If, based on the work we have performed, we conclude that there is a material misstatement of this other information, we are required to report that fact. We have nothing to report in this regard. Responsibilities of the Directors for the Consolidated and Separate Financial Statements The directors are responsible for the preparation and fair presentation of the consolidated and separate financial statements in accordance with International Financial Reporting Standards and the requirements of the Companies Act of South Africa, and for such internal control as the directors determine is necessary to enable the preparation of consolidated and separate financial statements that are free from material misstatement, whether due to fraud or error. In preparing the consolidated and separate financial statements, the directors are responsible for assessing the group and company’s ability to continue as a going concern, disclosing, as applicable, matters related to going concern and using the going concern basis of accounting unless the directors either intend to liquidate the group and company or to cease operations, or have no realistic alternative but to do so.
PAGE 28
Auditor’s Responsibilities for the Audit of the Consolidated and Separate Financial Statements Our objectives are to obtain reasonable assurance about whether the consolidated and separate financial statements as a whole are free from material misstatement, whether due to fraud or error, and to issue an auditor’s report that includes our opinion. Reasonable assurance is a high level of assurance, but is not a guarantee that an audit conducted in accordance with ISAs will always detect a material misstatement when it exists. Misstatements can arise from fraud or error and are considered material if, individually or in the aggregate, they could reasonably be expected to influence the economic decisions of users taken on the basis of these consolidated and separate financial statements. As part of an audit in accordance with ISAs, we exercise professional judgement and maintain professional scepticism throughout the audit. We also: Identify and assess the risks of material misstatement of the consolidated and separate financial statements, whether due to
fraud or error, design and perform audit procedures responsive to those risks, and obtain audit evidence that is sufficient and appropriate to provide a basis for our opinion. The risk of not detecting a material misstatement resulting from fraud is higher than for one resulting from error, as fraud may involve collusion, forgery, intentional omissions, misrepresentations, or the override of internal control.
Obtain an understanding of internal control relevant to the audit in order to design audit procedures that are appropriate in the circumstances, but not for the purpose of expressing an opinion on the effectiveness of the group and company’s internal control.
Evaluate the appropriateness of accounting policies used and the reasonableness of accounting estimates and related disclosures made by the directors.
Conclude on the appropriateness of the directors’ use of the going concern basis of accounting and based on the audit evidence obtained, whether a material uncertainty exists related to events or conditions that may cast significant doubt on the group and company’s ability to continue as a going concern. If we conclude that a material uncertainty exists, we are required to draw attention in our auditor’s report to the related disclosures in the consolidated and separate financial statements or, if such disclosures are inadequate, to modify our opinion. Our conclusions are based on the audit evidence obtained up to the date of our auditor’s report. However, future events or conditions may cause the group and/or company to cease to continue as a going concern.
Evaluate the overall presentation, structure and content of the consolidated and separate financial statements, including the disclosures, and whether the consolidated and separate financial statements represent the underlying transactions and events in a manner that achieves fair presentation.
Obtain sufficient appropriate audit evidence regarding the financial information of the entities or business activities within the group to express an opinion on the consolidated and separate financial statements. We are responsible for the direction, supervision and performance of the group audit. We remain solely responsible for our audit opinion.
We communicate with the directors regarding, among other matters, the planned scope and timing of the audit and significant audit findings, including any significant deficiencies in internal control that we identify during our audit. We also provide the directors with a statement that we have complied with relevant ethical requirements regarding independence, and to communicate with them all relationships and other matters that may reasonably be thought to bear on our independence, and where applicable, related safeguards. From the matters communicated with the directors, we determine those matters that were of most significance in the audit of the consolidated and separate financial statements of the current period and are therefore the key audit matters. We describe these matters in our auditor’s report unless law or regulation precludes public disclosure about the matter or when, in extremely rare circumstances, we determine that a matter should not be communicated in our report because the adverse consequences of doing so would reasonably be expected to outweigh the public interest benefits of such communication. Report on Other Legal and Regulatory Requirements In terms of the IRBA Rule published in Government Gazette Number 39475, dated 04 December 2015, we report that Ernst & Young Inc., and its predecessor firm, has been the auditor of AngloGold Ashanti Limited for seventy-six years. Ernst & Young Inc. was appointed as auditor of Vaal Reefs Exploration and Mining Company Limited in 1944. In 1998 all of Anglo American’s other individually listed gold mines, which were not audited by Ernst & Young Inc., or its predecessor firm, were merged into Vaal Reefs Exploration and Mining Company Limited. Vaal Reefs Exploration and Mining Company Limited was renamed AngloGold Limited in 1998, and in 2004 to AngloGold Ashanti Limited. Ernst & Young Inc. was retained as auditor of AngloGold Limited (and AngloGold Ashanti Limited) and has been the auditor of the expanded Company for nineteen years. We confirm that we are independent in accordance with the Independent Regulatory Board for Auditors’ Code of Professional Conduct for Registered Auditors and other independence requirements applicable to the independent audit of AngloGold Ashanti Limited.
Ernst & Young Inc. Ernest Adriaan Lodewyk Botha - Director Chartered Accountant (SA) Registered Auditor Johannesburg, South Africa 27 March 2020
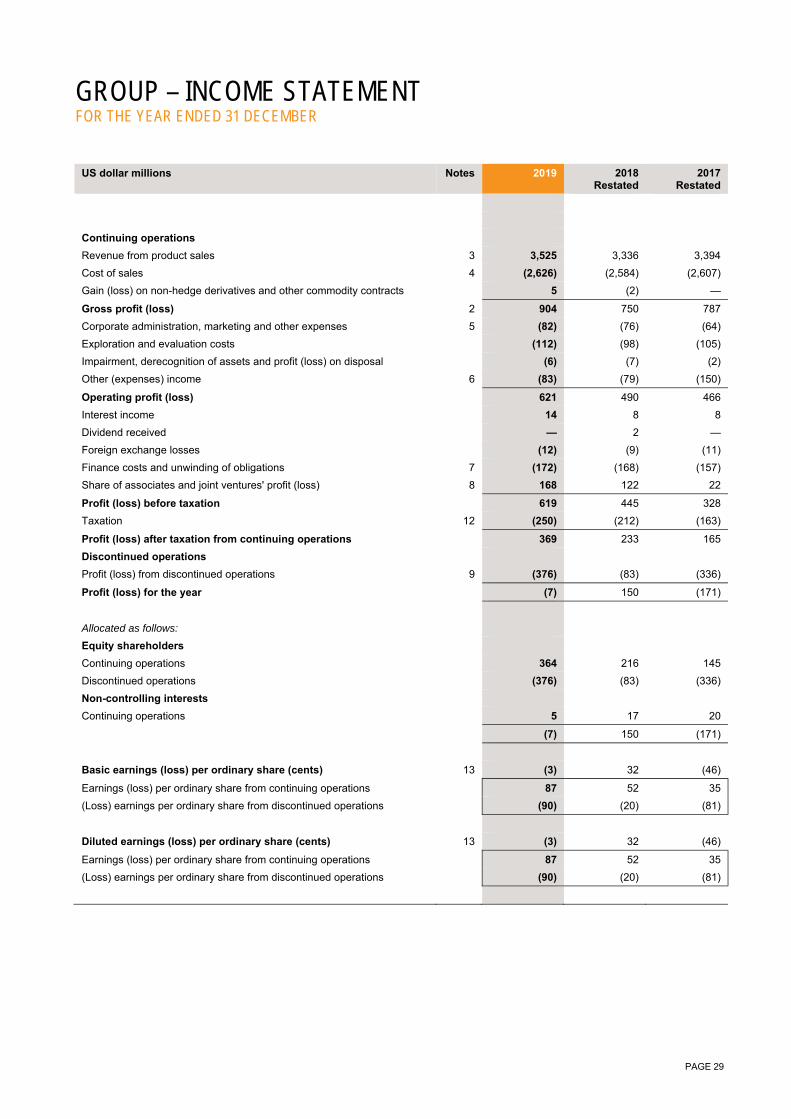
PAGE 29
GROUP – INCOME STATEMENT FOR THE YEAR ENDED 31 DECEMBER
US dollar millions Notes 2019 2018 Restated
2017Restated
Continuing operations
Revenue from product sales 3 3,525 3,336 3,394
Cost of sales 4 (2,626) (2,584) (2,607)
Gain (loss) on non-hedge derivatives and other commodity contracts 5 (2) —
Gross profit (loss) 2 904 750 787
Corporate administration, marketing and other expenses 5 (82) (76) (64)
Exploration and evaluation costs (112) (98) (105)
Impairment, derecognition of assets and profit (loss) on disposal (6) (7) (2)
Other (expenses) income 6 (83) (79) (150)
Operating profit (loss) 621 490 466
Interest income 14 8 8
Dividend received — 2 —
Foreign exchange losses (12) (9) (11)
Finance costs and unwinding of obligations 7 (172) (168) (157)
Share of associates and joint ventures' profit (loss) 8 168 122 22
Profit (loss) before taxation 619 445 328
Taxation 12 (250) (212) (163)
Profit (loss) after taxation from continuing operations 369 233 165
Discontinued operations
Profit (loss) from discontinued operations 9 (376) (83) (336)
Profit (loss) for the year (7) 150 (171)
Allocated as follows:
Equity shareholders
Continuing operations 364 216 145
Discontinued operations (376) (83) (336)
Non-controlling interests
Continuing operations 5 17 20
(7) 150 (171)
Basic earnings (loss) per ordinary share (cents) 13 (3) 32 (46)
Earnings (loss) per ordinary share from continuing operations 87 52 35
(Loss) earnings per ordinary share from discontinued operations (90) (20) (81)
Diluted earnings (loss) per ordinary share (cents) 13 (3) 32 (46)
Earnings (loss) per ordinary share from continuing operations 87 52 35
(Loss) earnings per ordinary share from discontinued operations (90) (20) (81)

PAGE 30
GROUP – STATEMENT OF COMPREHENSIVE INCOME FOR THE YEAR ENDED 31 DECEMBER
US dollar millions 2019 2018 Restated
2017Restated
Profit (loss) for the year (7) 150 (171)
Items that will be reclassified subsequently to profit or loss: 4 (150) 148
Exchange differences on translation of foreign operations 4 (150) 123
Available-for-sale financial assets — 25
Net gain (loss) on available-for-sale financial assets — 20
Release on impairment of available-for-sale financial assets — 3
Release on disposal of available-for-sale financial assets — (6)
Deferred taxation thereon — 8
Items that will not be reclassified subsequently to profit or loss: 10 9 6
Net gain (loss) on equity investments 6 9
Actuarial gain (loss) recognised 2 5 8
Deferred taxation thereon 2 (5) (2)
Other comprehensive income (loss) for the year, net of tax 14 (141) 154
Total comprehensive income (loss) for the year, net of tax 7 9 (17)
Allocated as follows:
Equity shareholders
Continuing operations 378 75 299
Discontinuing operations (376) (83) (336)
Non-controlling interests
Continuing operations 5 17 20
7 9 (17)
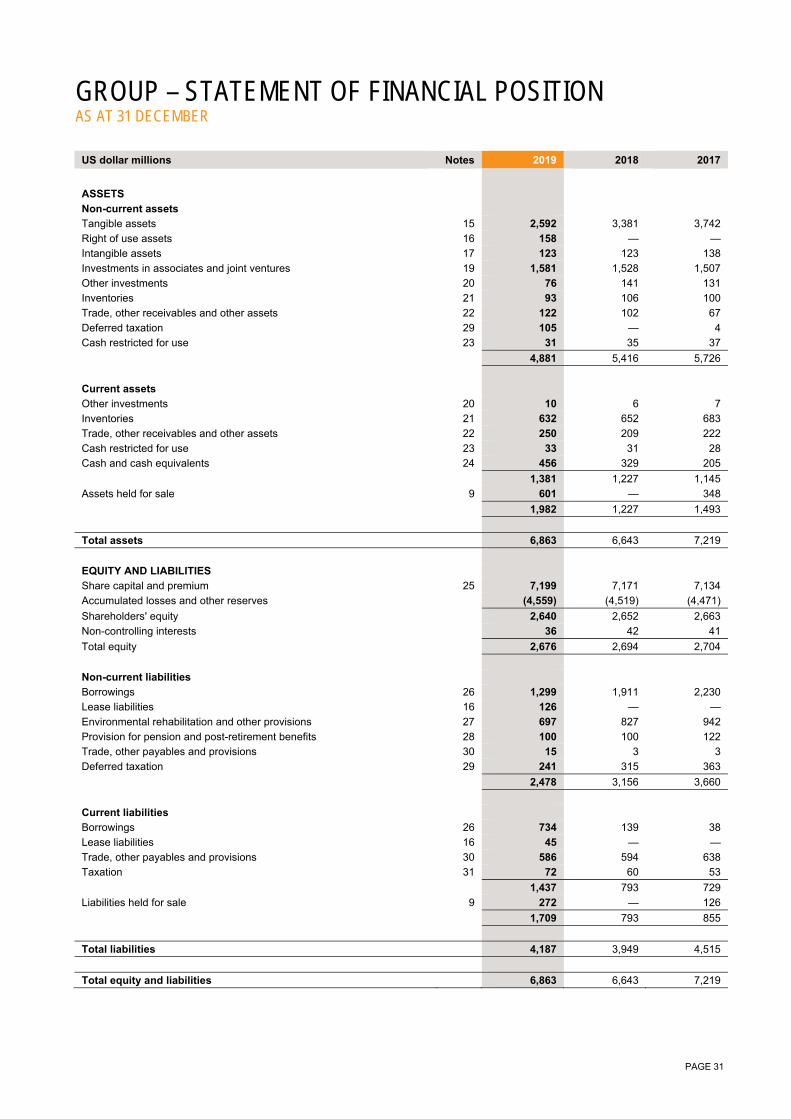
PAGE 31
GROUP – STATEMENT OF FINANCIAL POSITION AS AT 31 DECEMBER
US dollar millions Notes 2019 2018 2017
ASSETS
Non-current assets
Tangible assets 15 2,592 3,381 3,742
Right of use assets 16 158 — —
Intangible assets 17 123 123 138
Investments in associates and joint ventures 19 1,581 1,528 1,507
Other investments 20 76 141 131
Inventories 21 93 106 100
Trade, other receivables and other assets 22 122 102 67
Deferred taxation 29 105 — 4
Cash restricted for use 23 31 35 37
4,881 5,416 5,726
Current assets
Other investments 20 10 6 7
Inventories 21 632 652 683
Trade, other receivables and other assets 22 250 209 222
Cash restricted for use 23 33 31 28
Cash and cash equivalents 24 456 329 205
1,381 1,227 1,145
Assets held for sale 9 601 — 348
1,982 1,227 1,493
Total assets 6,863 6,643 7,219
EQUITY AND LIABILITIES
Share capital and premium 25 7,199 7,171 7,134
Accumulated losses and other reserves (4,559) (4,519) (4,471)
Shareholders' equity 2,640 2,652 2,663
Non-controlling interests 36 42 41
Total equity 2,676 2,694 2,704
Non-current liabilities
Borrowings 26 1,299 1,911 2,230
Lease liabilities 16 126 — —
Environmental rehabilitation and other provisions 27 697 827 942
Provision for pension and post-retirement benefits 28 100 100 122
Trade, other payables and provisions 30 15 3 3
Deferred taxation 29 241 315 363
2,478 3,156 3,660
Current liabilities
Borrowings 26 734 139 38
Lease liabilities 16 45 — —
Trade, other payables and provisions 30 586 594 638
Taxation 31 72 60 53
1,437 793 729
Liabilities held for sale 9 272 — 126
1,709 793 855
Total liabilities 4,187 3,949 4,515
Total equity and liabilities 6,863 6,643 7,219
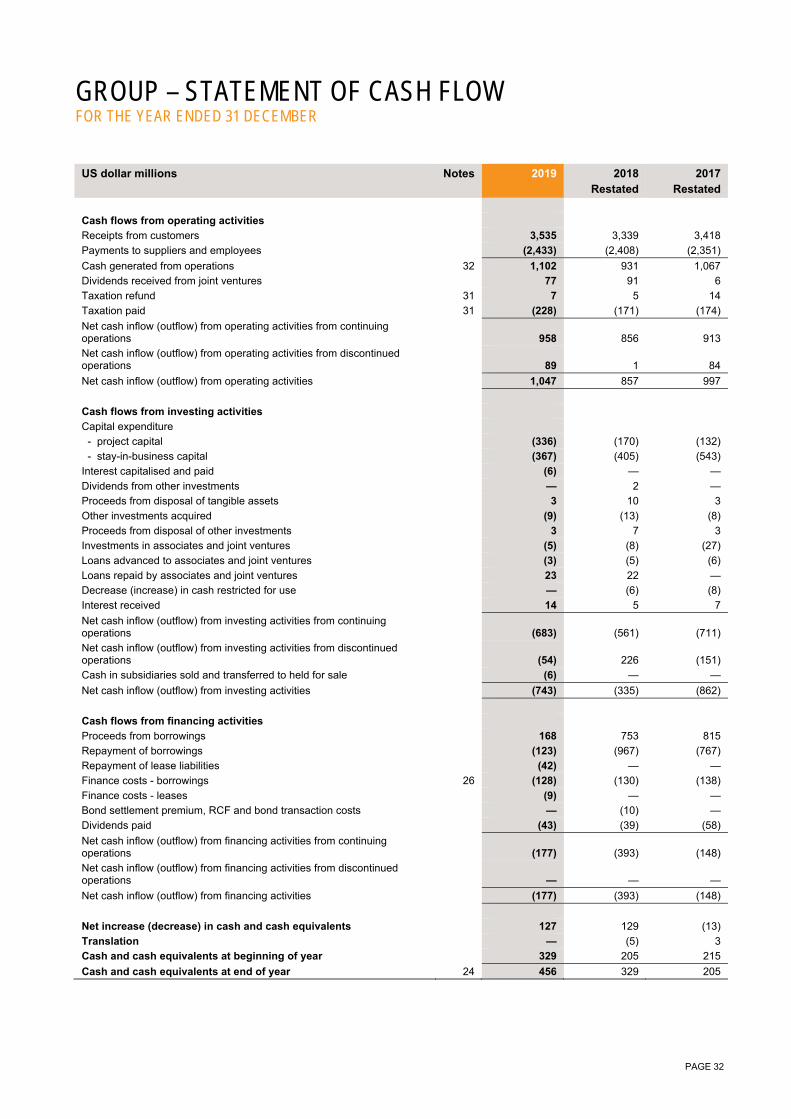
PAGE 32
GROUP – STATEMENT OF CASH FLOW FOR THE YEAR ENDED 31 DECEMBER US dollar millions Notes 2019 2018
Restated 2017
Restated
Cash flows from operating activities
Receipts from customers 3,535 3,339 3,418
Payments to suppliers and employees (2,433) (2,408) (2,351)
Cash generated from operations 32 1,102 931 1,067
Dividends received from joint ventures 77 91 6
Taxation refund 31 7 5 14
Taxation paid 31 (228) (171) (174)
Net cash inflow (outflow) from operating activities from continuing operations 958 856 913
Net cash inflow (outflow) from operating activities from discontinued operations 89 1 84
Net cash inflow (outflow) from operating activities 1,047 857 997
Cash flows from investing activities
Capital expenditure
- project capital (336) (170) (132)
- stay-in-business capital (367) (405) (543)
Interest capitalised and paid (6) — —
Dividends from other investments — 2 —
Proceeds from disposal of tangible assets 3 10 3
Other investments acquired (9) (13) (8)
Proceeds from disposal of other investments 3 7 3
Investments in associates and joint ventures (5) (8) (27)
Loans advanced to associates and joint ventures (3) (5) (6)
Loans repaid by associates and joint ventures 23 22 —
Decrease (increase) in cash restricted for use — (6) (8)
Interest received 14 5 7
Net cash inflow (outflow) from investing activities from continuing operations (683) (561) (711)
Net cash inflow (outflow) from investing activities from discontinued operations (54) 226 (151)
Cash in subsidiaries sold and transferred to held for sale (6) — —
Net cash inflow (outflow) from investing activities (743) (335) (862)
Cash flows from financing activities
Proceeds from borrowings 168 753 815
Repayment of borrowings (123) (967) (767)
Repayment of lease liabilities (42) — —
Finance costs - borrowings 26 (128) (130) (138)
Finance costs - leases (9) — —
Bond settlement premium, RCF and bond transaction costs — (10) —
Dividends paid (43) (39) (58)
Net cash inflow (outflow) from financing activities from continuing operations (177) (393) (148)
Net cash inflow (outflow) from financing activities from discontinued operations — — —
Net cash inflow (outflow) from financing activities (177) (393) (148)
Net increase (decrease) in cash and cash equivalents 127 129 (13)
Translation — (5) 3
Cash and cash equivalents at beginning of year 329 205 215
Cash and cash equivalents at end of year 24 456 329 205
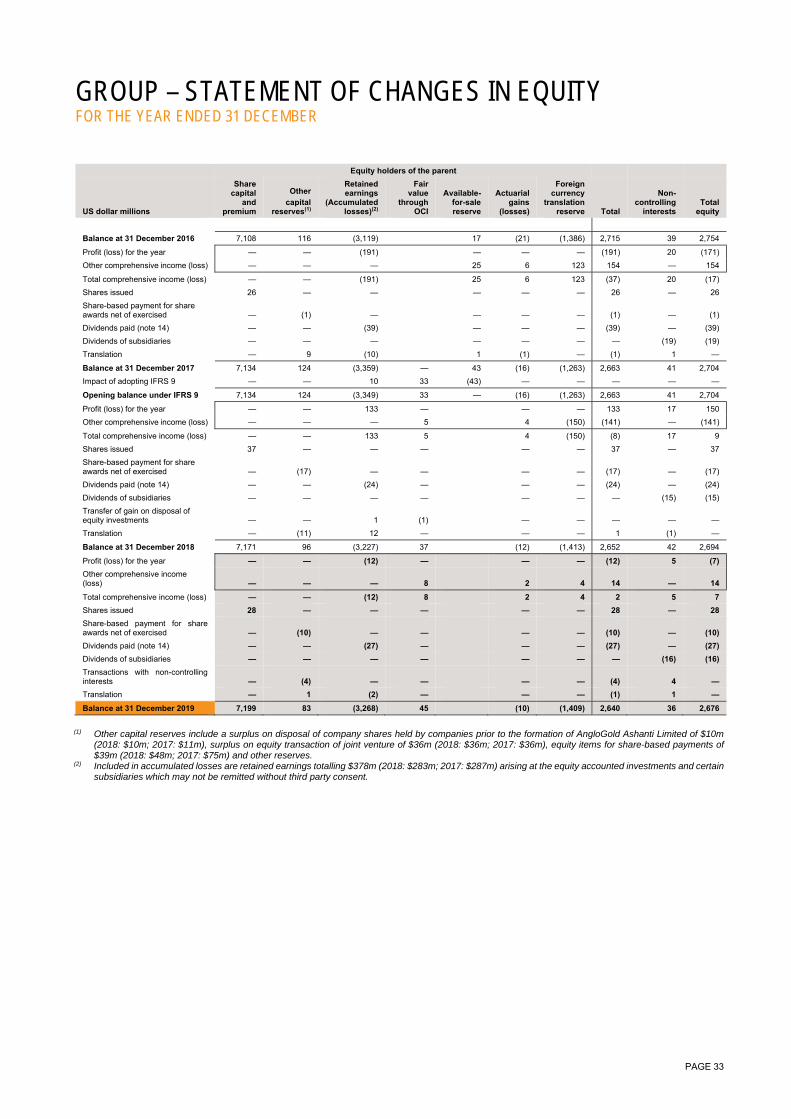
PAGE 33
GROUP – STATEMENT OF CHANGES IN EQUITY FOR THE YEAR ENDED 31 DECEMBER
Equity holders of the parent
US dollar millions
Share capital
and premium
Other
capital reserves(1)
Retained earnings
(Accumulated losses)(2)
Fair value
through OCI
Available- for-sale reserve
Actuarial gains
(losses)
Foreign currency
translation reserve Total
Non-controlling
interests Total
equity
Balance at 31 December 2016 7,108 116 (3,119) 17 (21) (1,386) 2,715 39 2,754
Profit (loss) for the year — — (191) — — — (191) 20 (171)
Other comprehensive income (loss) — — — 25 6 123 154 — 154
Total comprehensive income (loss) — — (191) 25 6 123 (37) 20 (17)
Shares issued 26 — — — — — 26 — 26
Share-based payment for share awards net of exercised — (1) — — — — (1) — (1)
Dividends paid (note 14) — — (39) — — — (39) — (39)
Dividends of subsidiaries — — — — — — — (19) (19)
Translation — 9 (10) 1 (1) — (1) 1 —
Balance at 31 December 2017 7,134 124 (3,359) — 43 (16) (1,263) 2,663 41 2,704
Impact of adopting IFRS 9 — — 10 33 (43) — — — — —
Opening balance under IFRS 9 7,134 124 (3,349) 33 — (16) (1,263) 2,663 41 2,704
Profit (loss) for the year — — 133 — — — 133 17 150
Other comprehensive income (loss) — — — 5 4 (150) (141) — (141)
Total comprehensive income (loss) — — 133 5 4 (150) (8) 17 9
Shares issued 37 — — — — — 37 — 37
Share-based payment for share awards net of exercised — (17) — — — — (17) — (17)
Dividends paid (note 14) — — (24) — — — (24) — (24)
Dividends of subsidiaries — — — — — — — (15) (15)
Transfer of gain on disposal of equity investments — — 1 (1) — — — — —
Translation — (11) 12 — — — 1 (1) —
Balance at 31 December 2018 7,171 96 (3,227) 37 (12) (1,413) 2,652 42 2,694
Profit (loss) for the year — — (12) — — — (12) 5 (7)
Other comprehensive income (loss) — — — 8 2 4 14 — 14
Total comprehensive income (loss) — — (12) 8 2 4 2 5 7
Shares issued 28 — — — — — 28 — 28
Share-based payment for share awards net of exercised — (10) — — — — (10) — (10)
Dividends paid (note 14) — — (27) — — — (27) — (27)
Dividends of subsidiaries — — — — — — — (16) (16)
Transactions with non-controlling interests — (4) — — — — (4) 4 —
Translation — 1 (2) — — — (1) 1 —
Balance at 31 December 2019 7,199 83 (3,268) 45 (10) (1,409) 2,640 36 2,676
(1) Other capital reserves include a surplus on disposal of company shares held by companies prior to the formation of AngloGold Ashanti Limited of $10m
(2018: $10m; 2017: $11m), surplus on equity transaction of joint venture of $36m (2018: $36m; 2017: $36m), equity items for share-based payments of $39m (2018: $48m; 2017: $75m) and other reserves.
(2) Included in accumulated losses are retained earnings totalling $378m (2018: $283m; 2017: $287m) arising at the equity accounted investments and certain subsidiaries which may not be remitted without third party consent.
PAGE 34
GROUP – NOTES TO THE FINANCIAL STATEMENTS FOR THE YEAR ENDED 31 DECEMBER 1 ACCOUNTING POLICIES
STATEMENT OF COMPLIANCE The consolidated and company financial statements are prepared in compliance with International Financial Reporting Standards (IFRS) and Interpretations of those standards, as issued by the International Accounting Standards Board (IASB), Financial Reporting Pronouncements as issued by Financial Reporting Standards Council, JSE Listings Requirements and in the manner required by the South African Companies Act, 2008. NEW STANDARDS AND INTERPRETATIONS ISSUED The financial statements have been drawn up on the basis of accounting standards, interpretations and amendments effective at the beginning of the accounting period on 1 January 2019. The adoption of the new standards, interpretations and amendments effective from 1 January 2019 had the following impact on the group: IFRS 16 Leases The group elected to apply IFRS 16 utilising the modified retrospective approach, no cumulative effect of initially applying IFRS 16 was identified and recognised as an adjustment to the opening balance of retained earnings. The cumulative impact on the adoption of IFRS 16 resulted in the recognition of right of use assets, lease liabilities and the resultant deferred tax. Refer to Note 16 for the detail on the right of use assets and lease liabilities. Comparative information has not been restated. For contracts previously classified as leases under IAS 17 Leases, the group has reassessed whether the contract is or contains a lease upon initial transition to the new standard and has also performed an assessment to identify significant contracts which have not previously been classified as leases, but which may be a lease under the new standard. The group applied the following practical expedients upon transition to IFRS 16: Transition options: Leases with a remaining contract period of 12 months or less will not be recorded on the statement of financial position
and the lease payments will be expensed in the income statement on a straight-line basis. The right-of-use asset is based on the lease liability recognised. Practical expedients: The short-term lease exemption - leases with a duration of one year or less will be expensed in the income statement on
a straight-line basis. The low value lease exemption - the group applied the low value exemption with a value of $10k for the individual leased
asset value and added an exception within its accounting policy to not capitalise leases with a net present value of $250k based on an IAS 1 materiality assessment.
Exclusion of initial direct costs for the measurement of the right of use asset at the date of initial application. Use of hindsight in determining the lease term where the contract contains options to extend or terminate the lease. The leases accounting policy applicable from 1 January 2019 is included under “Leases” in Annexure A. CHANGE IN DISCLOSURE Effective 1 July 2019, the group changed the disclosure of “Special Items” in the income statement. In prior years, the group disclosed items that due to their size and/or nature, required separate disclosure on the face of the income statement as Special Items. In addition, a disclosure category - “Other operating expenses” was reported to disclose expenses which were not included in gross profit. Going forward these two categories of expenses and income will be disclosed as: Other expenses (income); and Separate line item(s) on the face of the income statement depending on materiality. The re-presentation provides more useful information by reporting material items separately. The change in presentation has no impact on the reported totals, headline earnings per share or on amounts presented in the Statement of Financial Position.
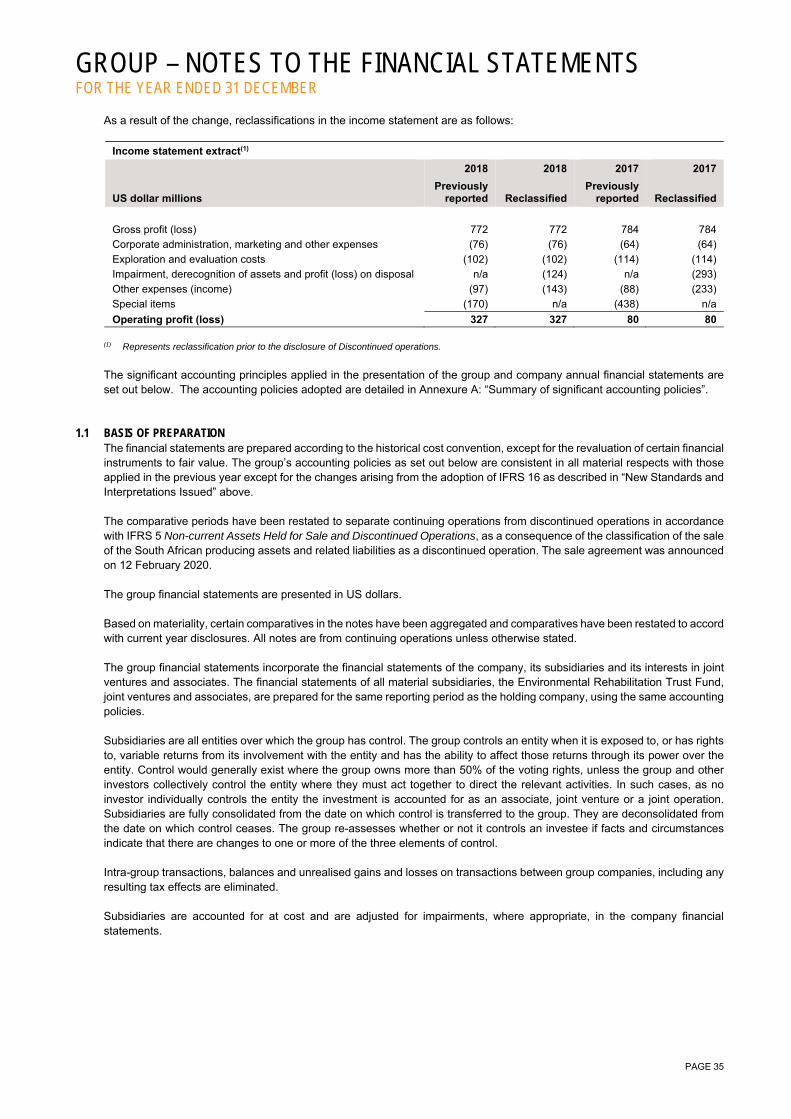
GROUP – NOTES TO THE FINANCIAL STATEMENTS FOR THE YEAR ENDED 31 DECEMBER
PAGE 35
As a result of the change, reclassifications in the income statement are as follows:
Income statement extract(1)
2018 2018 2017 2017
US dollar millions Previously
reported Reclassified Previously
reported Reclassified
Gross profit (loss) 772 772 784 784
Corporate administration, marketing and other expenses (76) (76) (64) (64)
Exploration and evaluation costs (102) (102) (114) (114)
Impairment, derecognition of assets and profit (loss) on disposal n/a (124) n/a (293)
Other expenses (income) (97) (143) (88) (233)
Special items (170) n/a (438) n/a
Operating profit (loss) 327 327 80 80 (1) Represents reclassification prior to the disclosure of Discontinued operations.
The significant accounting principles applied in the presentation of the group and company annual financial statements are set out below. The accounting policies adopted are detailed in Annexure A: “Summary of significant accounting policies”.
1.1 BASIS OF PREPARATION The financial statements are prepared according to the historical cost convention, except for the revaluation of certain financial instruments to fair value. The group’s accounting policies as set out below are consistent in all material respects with those applied in the previous year except for the changes arising from the adoption of IFRS 16 as described in “New Standards and Interpretations Issued” above. The comparative periods have been restated to separate continuing operations from discontinued operations in accordance with IFRS 5 Non-current Assets Held for Sale and Discontinued Operations, as a consequence of the classification of the sale of the South African producing assets and related liabilities as a discontinued operation. The sale agreement was announced on 12 February 2020. The group financial statements are presented in US dollars. Based on materiality, certain comparatives in the notes have been aggregated and comparatives have been restated to accord with current year disclosures. All notes are from continuing operations unless otherwise stated. The group financial statements incorporate the financial statements of the company, its subsidiaries and its interests in joint ventures and associates. The financial statements of all material subsidiaries, the Environmental Rehabilitation Trust Fund, joint ventures and associates, are prepared for the same reporting period as the holding company, using the same accounting policies. Subsidiaries are all entities over which the group has control. The group controls an entity when it is exposed to, or has rights to, variable returns from its involvement with the entity and has the ability to affect those returns through its power over the entity. Control would generally exist where the group owns more than 50% of the voting rights, unless the group and other investors collectively control the entity where they must act together to direct the relevant activities. In such cases, as no investor individually controls the entity the investment is accounted for as an associate, joint venture or a joint operation. Subsidiaries are fully consolidated from the date on which control is transferred to the group. They are deconsolidated from the date on which control ceases. The group re-assesses whether or not it controls an investee if facts and circumstances indicate that there are changes to one or more of the three elements of control. Intra-group transactions, balances and unrealised gains and losses on transactions between group companies, including any resulting tax effects are eliminated. Subsidiaries are accounted for at cost and are adjusted for impairments, where appropriate, in the company financial statements.

GROUP – NOTES TO THE FINANCIAL STATEMENTS FOR THE YEAR ENDED 31 DECEMBER
PAGE 36
1.2 SIGNIFICANT ACCOUNTING JUDGEMENTS AND ESTIMATES USE OF ESTIMATES The preparation of the financial statements requires the group’s management to make estimates and assumptions that affect the reported amounts of assets and liabilities and disclosure of contingent assets and liabilities at the date of the financial statements, and the reported amounts of revenues and expenses during the reporting period. The determination of estimates requires the exercise of judgement based on various assumptions and other factors such as historical experience, current and expected economic conditions, and in some cases actuarial techniques. Actual results could differ from those estimates. The more significant areas requiring the use of management estimates and assumptions relate to Ore Reserve that are the basis of future cash flow estimates and unit-of-production depreciation, depletion and amortisation calculations; environmental, reclamation and closure obligations; asset impairments/reversals (including impairments of goodwill); recoverability of indirect taxes and write-downs of inventory to net realisable value. Other estimates include employee benefit liabilities and unrecognised tax positions. Estimates and judgements are continually evaluated and are based on historical experience and other factors, including expectations of future events that are believed to be reasonable under the circumstances. The judgements that management has applied in the application of accounting policies, and the estimates and assumptions that have a significant risk of causing a material adjustment to the carrying amounts of assets and liabilities within the next financial year, are discussed below. Carrying value of tangible assets Amortisation The majority of mining assets are amortised using the units-of-production method where the mine operating plan calls for production from a well-defined proved and probable Ore Reserve. For other tangible assets, the straight-line method is applied over the estimated useful life of the asset which does not exceed the estimated mine life based on proved and probable Ore Reserve as the useful lives of these assets are considered to be limited to the life of the relevant mine. The calculation of the units-of-production rate of amortisation could be impacted to the extent that actual production in the future is different from current forecast production based on proved and probable Ore Reserve. This would generally arise from the following factors: changes in proved and probable Ore Reserve; the grade of Ore Reserve may vary significantly from time to time; differences between actual commodity prices and commodity price assumptions; unforeseen operational issues at mine sites; and changes in capital, operating, mining, processing and reclamation costs, discount rates and foreign exchange rates. Changes in proved and probable Ore Reserve could similarly impact the useful lives of assets amortised on the straight-line method, where those lives are limited to the life of the mine. Stripping Costs The group has a number of surface mining operations that are in the production phase for which production stripping costs are incurred. The benefits that accrue to the group as a result of incurring production stripping costs include (a) ore that can be used to produce inventory and (b) improved access to further quantities of material that will be mined in future periods. The production stripping costs relating to improved access to further quantities of material in future periods are capitalised as a stripping activity asset, if and only if, all of the following are met: It is probable that the future economic benefit (improved access to the orebody) associated with the stripping activity will
flow to the group; The group can identify the component of the orebody for which access has been improved; and The costs relating to the stripping activity associated with that component or components can be measured reliably. Components of the various orebodies at the operations of the group are determined based on the geological areas identified for each of the orebodies and are reflected in the Ore Reserve reporting of the group. In determining whether any production stripping costs should be capitalised as a stripping activity asset, the group uses three operational guidance measures; two of which relate to production measures, while the third relates to an average stripping ratio measure.
GROUP – NOTES TO THE FINANCIAL STATEMENTS FOR THE YEAR ENDED 31 DECEMBER
PAGE 37
Once determined that any portion of the production stripping costs should be capitalised, the group determines the amount of the production stripping costs that should be capitalised with reference to the average mine costs per tonne of the component and the actual waste tonnes that should be deferred. Stripping activity assets are amortised on the units-of-production method based on the Ore Reserve of the component or components of the orebody to which these assets relate.
This accounting treatment is consistent with that for stripping costs incurred during the development phase of a pit, before production commences, except that stripping costs incurred during the development phase of a pit, before production commences, are amortised on the units-of-production method based on the Ore Reserve of the pit.
Deferred stripping costs are included in ‘Mine development costs’, within tangible assets. These costs form part of the total investment in the relevant cash-generating unit, which is reviewed for impairment if events or a change in circumstances indicate that the carrying value may not be recoverable. Amortisation of stripping activity assets is included in operating costs. Impairment The group reviews and tests the carrying value of tangible assets when events or changes in circumstances indicate that the carrying amount may not be recoverable. Assets are grouped at the lowest level for which identifiable cash flows are largely independent of cash flows of other assets, which is generally at the individual mine level. If there are indications that impairment may have occurred, estimates are prepared of expected future cash flows for each group of assets. Expected future cash flows used to determine the value in use of goodwill and tangible assets are inherently uncertain and could materially change over time and impact the recoverable amounts. The cash flows and value in use are significantly affected by a number of factors including published reserves, resources, exploration potential and production estimates, together with economic factors such as spot and future metal prices, discount rates, foreign currency exchange rates, estimates of costs to produce reserves and future capital expenditure. At the reporting date the group assesses whether any of the indicators which gave rise to previously recognised impairments have changed such that the impairment loss no longer exists or may have decreased. The impairment loss is then assessed on the original factors for reversal and if indicated, such reversal is recognised. An impairment loss is recognised for the amount by which the asset’s carrying amount exceeds its recoverable amount. The recoverable amount is the higher of an asset’s fair value less costs to sell and value in use. The recoverable amount is estimated based on the positive indicators. If an impairment loss has decreased, the carrying amount is recorded at the recoverable amount as limited in terms of IAS 36 Impairment of Assets. The carrying value of tangible assets at 31 December 2019 was $2,592m (2018: $3,381m; 2017: $3,742m). The impairment and derecognition of tangible assets recognised in the consolidated financial statements for the year ended 31 December 2019 (including impairment of tangible assets transferred to held for sale) was $505m (2018: $104m; 2017: $288m). Carrying value of goodwill and intangible assets Where an investment in a subsidiary, joint venture or an associate is made, any excess of the consideration transferred over the fair value of the attributable Mineral Resource including value beyond proved and probable Ore Reserve, exploration properties and net assets is recognised as goodwill. Intangible assets that have an indefinite useful life and separately recognised goodwill are not subject to amortisation and are tested annually for impairment and whenever events or changes in circumstance indicate that the carrying amount may not be recoverable. Assets that are subject to amortisation are tested for impairment whenever events or changes in circumstance indicate that the carrying amount may not be recoverable. An impairment loss is recognised for the amount by which the asset’s carrying amount exceeds its recoverable amount. The recoverable amount is the higher of an asset’s fair value less costs to sell and value in use. For the purposes of assessing impairment, assets are grouped at the lowest levels for which there are separately identifiable cash flows (cash-generating units). An individual operating mine is not a typical going-concern business because of the finite life of its reserves. The allocation of goodwill to an individual mine will result in an eventual goodwill impairment due to the wasting nature of the mine reporting unit. In accordance with the provisions of IAS 36, the group performs its annual impairment review of assigned goodwill during the fourth quarter of each year. The carrying value of goodwill in the consolidated financial statements at 31 December 2019 was $116m (2018: $116m; 2017: $127m). The impairment of goodwill recognised in the consolidated financial statements for the year ended 31 December 2019 was nil (2018: nil; 2017: $9m).
GROUP – NOTES TO THE FINANCIAL STATEMENTS FOR THE YEAR ENDED 31 DECEMBER
PAGE 38
Income taxes The group is subject to income taxes in numerous jurisdictions. Significant judgement is required in determining the worldwide provision for income taxes due to the complexity of legislation. There are many transactions and calculations for which the ultimate tax determination is uncertain during the ordinary course of business. The group recognises liabilities for anticipated tax audit issues based on estimates of whether additional taxes will be due. Where the final tax outcome of these matters is different from the amounts that were initially recorded, such differences will impact the income tax and deferred tax provisions in the period in which such determination is made. The group tax reconciliation between tax expense and the product of accounting profit multiplied by the applicable tax rate, prepared in accordance with IAS 12 Income Taxes, applies the South African corporate tax rate of 28%. The group recognises the net future tax benefit related to deferred income tax assets to the extent that it is probable that the deductible temporary differences will reverse in the foreseeable future. Assessing the recoverability of deferred income tax assets requires the group to make significant estimates related to expectations of future taxable income. Estimates of future taxable income are based on forecast cash flows from operations and the application of existing tax laws in each jurisdiction. To the extent that future cash flows and taxable income differ significantly from estimates, the ability of the group to realise the net deferred tax assets recorded at the reporting date could be impacted. Additionally, future changes in tax laws in the jurisdictions in which the group operates could limit the ability of the group to obtain tax deductions in future periods. Carrying values of the group at 31 December 2019: deferred tax asset: $105m (2018: nil; 2017: $4m); deferred tax liability: $241m (2018: $315m; 2017: $363m); taxation liability: $72m (2018: $60m; 2017: $53m); and taxation asset: $10m (2018: $6m; 2017: $3m), included in trade, other receivables and other assets. Unrecognised value of deferred tax assets: $389m (2018: $501m; 2017: $470m). Provision for environmental rehabilitation obligations The group’s mining and exploration activities are subject to various laws and regulations governing the protection of the environment. The group recognises management’s best estimate for decommissioning and restoration obligations in the period in which they are incurred. Future changes to environmental laws and regulations, life of mine estimates, inflation rates, foreign currency exchange rates and discount rates could affect the carrying amount of this provision. The carrying amount of the rehabilitation obligations (including held for sale rehabilitation obligations) for the group at 31 December 2019 was $730m (2018: $637m; 2017: $724m). Stockpiles and metals in process Costs that are incurred in or benefit the production process are accumulated in stockpiles and metals in process values. Net realisable value tests are performed at least annually and represent the estimated future sales price of the product, based on prevailing and long-term metals prices, less estimated costs to complete production and bring the product to sale. Surface and underground stockpiles and metals in process are measured by estimating the number of tonnes added and removed from the stockpile, the number of contained ounces based on assay data, and the estimated recovery percentage based on the expected processing method. Stockpile ore tonnages are verified by periodic surveys. Although the quantities of recoverable metal are reconciled by comparing the grades of ore to the quantities of metals actually recovered (metallurgical balancing), the nature of the process inherently limits the ability to precisely monitor recoverability levels. As a result, the metallurgical balancing process is constantly monitored and engineering estimates are refined based on actual results over time. Variations between actual and estimated quantities resulting from changes in assumptions and estimates that do not result in write-downs to net realisable value are accounted for on a prospective basis. The carrying value of inventories (excluding finished goods and mine operating supplies) for the group at 31 December 2019 was $377m (2018: $404m; 2017: $424m). Recoverable tax, rebates, levies and duties In a number of countries, particularly in Continental Africa, AngloGold Ashanti is due refunds of indirect tax which remain outstanding for periods longer than those provided for in the respective statutes.

GROUP – NOTES TO THE FINANCIAL STATEMENTS FOR THE YEAR ENDED 31 DECEMBER
PAGE 39
In addition, AngloGold Ashanti has unresolved non-income tax disputes in a number of countries, particularly in Continental Africa and in Brazil and Argentina. If the outstanding input taxes are not received and these disputes are not resolved in a manner favourable to AngloGold Ashanti, it could have a material adverse effect upon the carrying value of these assets and our results of operations.
The net carrying value of recoverable tax, rebates, levies and duties for the group at 31 December 2019 was $227m (2018: $194m; 2017: $174m). Post-retirement obligations The determination of AngloGold Ashanti’s obligation and expense for post-retirement liabilities depends on the selection of certain assumptions used by actuaries to calculate amounts. These assumptions include, among others, the discount rate, the expected long-term rate of return of plan assets, health care inflation costs, rates of increase in compensation costs and the number of employees who reach retirement age before the mine reaches the end of its life. While AngloGold Ashanti believes that these assumptions are appropriate, significant changes in the assumptions may materially affect post-retirement obligations as well as future expenses, which may result in an impact on earnings in the periods that the changes in these assumptions occur.
The carrying value of the post-retirement obligations at 31 December 2019 was $100m (2018: $100m; 2017: $122m). Ore Reserve estimates An Ore Reserve estimate is an estimate of the amount of product that can be economically and legally extracted from the group’s properties. In order to calculate the Ore Reserve, estimates and assumptions are required about a range of geological, technical and economic factors, including quantities, grades, production techniques, recovery rates, production costs, transport costs, commodity demand, commodity prices and exchange rates.
Estimating the quantity and/or grade of the Ore Reserve requires the size, shape and depth of orebodies to be determined by analysing geological data such as the logging and assaying of drill samples. This process may require complex and difficult geological judgements and calculations to interpret the data.
The group is required to determine and report its Ore Reserve in accordance with the minimum standards described by the South African Code for the reporting of Exploration Results, Mineral Resources and Mineral Reserves (The SAMREC Code, 2016 Edition).
Because the economic assumptions used to estimate changes in the Ore Reserve from period to period, and because additional geological data is generated during the course of operations, estimates of the Ore Reserve may change from period to period. Changes in the reported Ore Reserve may affect the group’s financial results and financial position in a number of ways, including the following: asset carrying values may be affected due to changes in estimated future cash flows; depreciation, depletion and amortisation charged in the income statement may change where such charges are
determined by the units-of-production method, or where the useful economic lives of assets change; overburden removal costs, including production stripping activities, recorded on the statement of financial position or
charged in the income statement may change due to changes in stripping ratios or the units-of-production method of depreciation;
decommissioning site restoration and environmental provisions may change where changes in the estimated Ore Reserve affect expectations about the timing or cost of these activities; and
the carrying value of deferred tax assets may change due to changes in estimates of the likely recovery of the tax benefits. Development expenditure Development activities commence after project sanctioning by the appropriate level of management. Judgement is applied by management in determining when a project has reached a stage at which economically recoverable reserves exist such that development may be sanctioned. In exercising this judgement, management is required to make certain estimates and assumptions similar to those described in the accounting policy for exploration and evaluation assets. Any such estimates and assumptions may change as new information becomes available. If, after having started the development activity, a judgement is made that a development asset is impaired, the appropriate amount will be written off to the income statement. Provision for silicosis Significant judgement is applied in estimating the costs that will be incurred to settle the silicosis class action claims and related expenditure. The final costs may differ from current cost estimates. The provision is based on actuarial assumptions including: silicosis prevalence rates; estimated settlement per claimant; benefit take-up rates; disease progression rates; timing of cashflows; and discount rate.
GROUP – NOTES TO THE FINANCIAL STATEMENTS FOR THE YEAR ENDED 31 DECEMBER
PAGE 40
Management believes the assumptions are appropriate, however changes in the assumptions may materially affect the provision and final costs of settlement. The carrying value of the silicosis provision at 31 December 2019 was $65m (2018: $63m; 2017: $63m). Identification and classification of discontinued operations During 2019, the decision to sell the remaining South African operations was made, judgement was applied regarding classification of the disposal group as held for sale at year end, and whether the disposal group should be classified as a discontinued operation. The South African asset sale was assessed as a major geographical area of operations and part of a single co-ordinated plan to dispose of a major geographical area of operations and accordingly, it was classified as a discontinued operation. The sale was announced on 12 February 2020. Contingencies By their nature, contingencies will only be resolved when one or more future events occur or fail to occur. The assessment of such contingencies inherently involves the exercise of significant judgement and estimates of the outcome of future events. Such contingencies include, but are not limited to environmental obligations, litigation, regulatory proceedings, tax matters and losses resulting from other events and developments. When a loss is considered probable and reasonably estimable, a liability is recorded in the amount of the best estimate for the ultimate loss. The likelihood of a loss with respect to a contingency can be difficult to predict and determining a meaningful estimate of the loss or a range of loss may not always be practicable based on the information available at the time and the potential effect of future events and decisions by third parties that will determine the ultimate resolution of the contingency. It is not uncommon for such matters to be resolved over many years, during which time relevant developments and new information is continuously evaluated to determine both the likelihood of any potential loss and whether it is possible to reasonably estimate a range of possible losses. When a loss is probable but a reasonable estimate cannot be made, disclosure is provided. In determining the threshold for disclosure on a qualitative and quantitative basis, management considers the potential for a disruptive effect on the normal functioning of the group and/or whether the contingency could impact investment decisions. Such qualitative matters considered are reputational risks, regulatory compliance issues and reasonable investor considerations. For quantitative purposes, an amount of $18m has been considered. As a global company, the group is exposed to numerous legal risks. The outcome of currently pending and future proceedings cannot be predicted with certainty. Litigation and other judicial proceedings as a rule raise difficult and complex legal issues and are subject to uncertainties and complexities including, but not limited to, the facts and circumstances of each particular case, issues regarding the jurisdiction in which each suit is brought and differences in applicable law. Upon resolution of any pending legal matter, the group may be forced to incur charges in excess of the presently established provisions and related insurance coverage. It is possible that the financial position, results of operations or cash flows of the group could be materially affected by the unfavourable outcome of litigation.
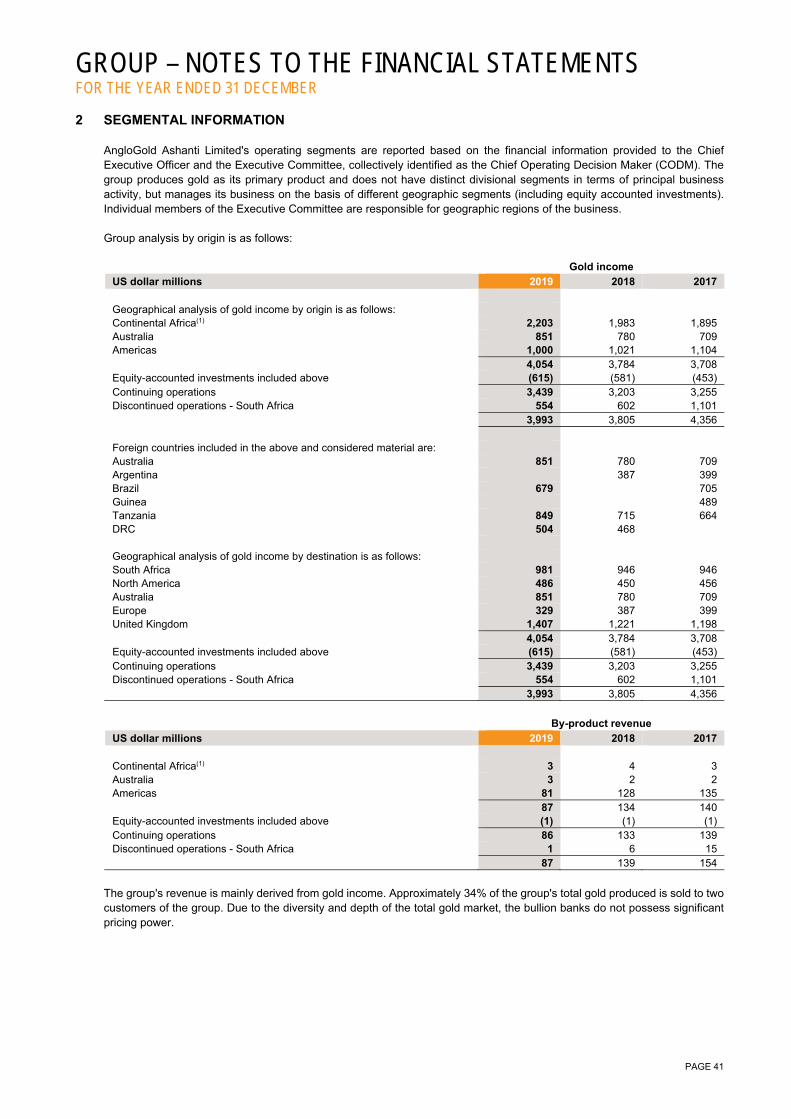
GROUP – NOTES TO THE FINANCIAL STATEMENTS FOR THE YEAR ENDED 31 DECEMBER
PAGE 41
2 SEGMENTAL INFORMATION AngloGold Ashanti Limited's operating segments are reported based on the financial information provided to the Chief Executive Officer and the Executive Committee, collectively identified as the Chief Operating Decision Maker (CODM). The group produces gold as its primary product and does not have distinct divisional segments in terms of principal business activity, but manages its business on the basis of different geographic segments (including equity accounted investments). Individual members of the Executive Committee are responsible for geographic regions of the business. Group analysis by origin is as follows:
Gold income
US dollar millions 2019 2018 2017 Geographical analysis of gold income by origin is as follows: Continental Africa(1) 2,203 1,983 1,895 Australia 851 780 709 Americas 1,000 1,021 1,104 4,054 3,784 3,708 Equity-accounted investments included above (615) (581) (453) Continuing operations 3,439 3,203 3,255 Discontinued operations - South Africa 554 602 1,101 3,993 3,805 4,356 Foreign countries included in the above and considered material are: Australia 851 780 709 Argentina 387 399 Brazil 679 705 Guinea 489 Tanzania 849 715 664 DRC 504 468 Geographical analysis of gold income by destination is as follows: South Africa 981 946 946 North America 486 450 456 Australia 851 780 709 Europe 329 387 399 United Kingdom 1,407 1,221 1,198 4,054 3,784 3,708 Equity-accounted investments included above (615) (581) (453) Continuing operations 3,439 3,203 3,255 Discontinued operations - South Africa 554 602 1,101 3,993 3,805 4,356
By-product revenue
US dollar millions 2019 2018 2017 Continental Africa(1) 3 4 3 Australia 3 2 2 Americas 81 128 135 87 134 140 Equity-accounted investments included above (1) (1) (1) Continuing operations 86 133 139 Discontinued operations - South Africa 1 6 15 87 139 154
The group's revenue is mainly derived from gold income. Approximately 34% of the group's total gold produced is sold to two customers of the group. Due to the diversity and depth of the total gold market, the bullion banks do not possess significant pricing power.
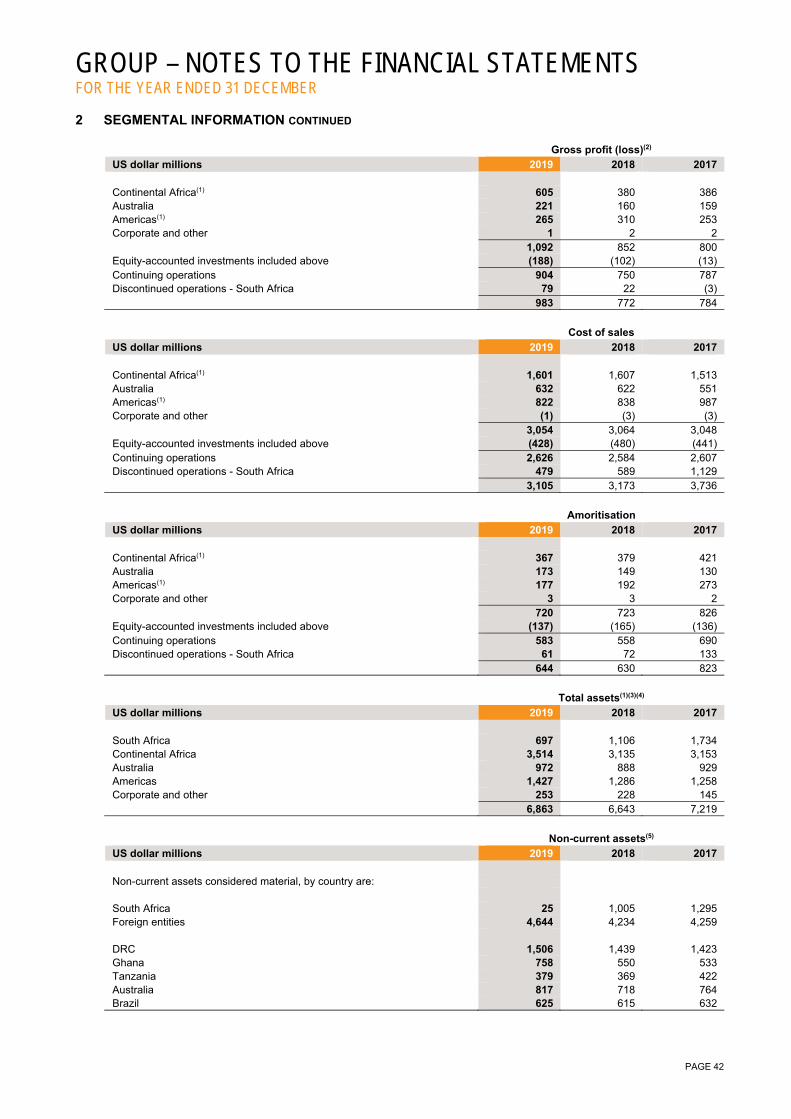
GROUP – NOTES TO THE FINANCIAL STATEMENTS FOR THE YEAR ENDED 31 DECEMBER
PAGE 42
2 SEGMENTAL INFORMATION CONTINUED
Gross profit (loss)(2)
US dollar millions 2019 2018 2017 Continental Africa(1) 605 380 386 Australia 221 160 159 Americas(1) 265 310 253 Corporate and other 1 2 2 1,092 852 800 Equity-accounted investments included above (188) (102) (13) Continuing operations 904 750 787 Discontinued operations - South Africa 79 22 (3) 983 772 784
Cost of sales
US dollar millions 2019 2018 2017 Continental Africa(1) 1,601 1,607 1,513 Australia 632 622 551 Americas(1) 822 838 987 Corporate and other (1) (3) (3) 3,054 3,064 3,048 Equity-accounted investments included above (428) (480) (441) Continuing operations 2,626 2,584 2,607 Discontinued operations - South Africa 479 589 1,129 3,105 3,173 3,736
Amoritisation
US dollar millions 2019 2018 2017 Continental Africa(1) 367 379 421 Australia 173 149 130 Americas(1) 177 192 273 Corporate and other 3 3 2 720 723 826 Equity-accounted investments included above (137) (165) (136) Continuing operations 583 558 690 Discontinued operations - South Africa 61 72 133 644 630 823
Total assets(1)(3)(4)
US dollar millions 2019 2018 2017 South Africa 697 1,106 1,734 Continental Africa 3,514 3,135 3,153 Australia 972 888 929 Americas 1,427 1,286 1,258 Corporate and other 253 228 145 6,863 6,643 7,219
Non-current assets(5)
US dollar millions 2019 2018 2017 Non-current assets considered material, by country are: South Africa 25 1,005 1,295 Foreign entities 4,644 4,234 4,259 DRC 1,506 1,439 1,423 Ghana 758 550 533 Tanzania 379 369 422 Australia 817 718 764 Brazil 625 615 632
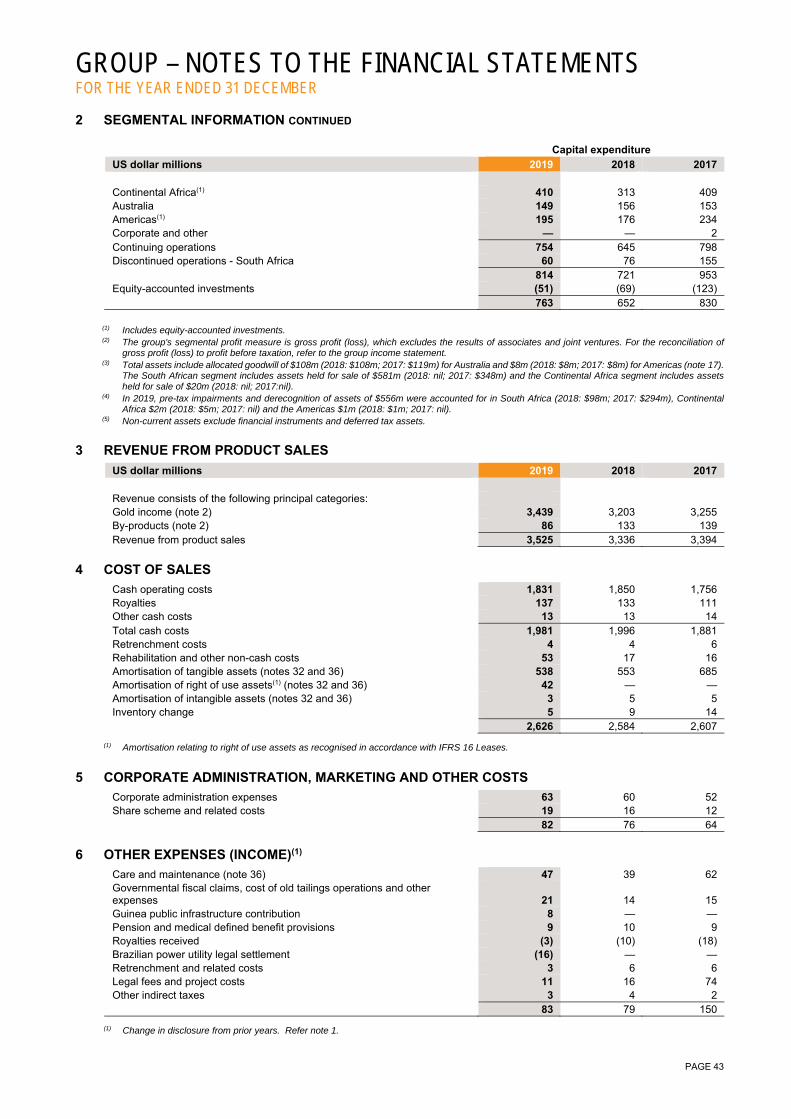
GROUP – NOTES TO THE FINANCIAL STATEMENTS FOR THE YEAR ENDED 31 DECEMBER
PAGE 43
2 SEGMENTAL INFORMATION CONTINUED
Capital expenditure
US dollar millions 2019 2018 2017 Continental Africa(1) 410 313 409 Australia 149 156 153 Americas(1) 195 176 234 Corporate and other — — 2 Continuing operations 754 645 798 Discontinued operations - South Africa 60 76 155 814 721 953 Equity-accounted investments (51) (69) (123) 763 652 830
(1) Includes equity-accounted investments. (2) The group's segmental profit measure is gross profit (loss), which excludes the results of associates and joint ventures. For the reconciliation of
gross profit (loss) to profit before taxation, refer to the group income statement. (3) Total assets include allocated goodwill of $108m (2018: $108m; 2017: $119m) for Australia and $8m (2018: $8m; 2017: $8m) for Americas (note 17).
The South African segment includes assets held for sale of $581m (2018: nil; 2017: $348m) and the Continental Africa segment includes assets held for sale of $20m (2018: nil; 2017:nil).
(4) In 2019, pre-tax impairments and derecognition of assets of $556m were accounted for in South Africa (2018: $98m; 2017: $294m), Continental Africa $2m (2018: $5m; 2017: nil) and the Americas $1m (2018: $1m; 2017: nil).
(5) Non-current assets exclude financial instruments and deferred tax assets.
3 REVENUE FROM PRODUCT SALES
US dollar millions 2019 2018 2017 Revenue consists of the following principal categories: Gold income (note 2) 3,439 3,203 3,255 By-products (note 2) 86 133 139 Revenue from product sales 3,525 3,336 3,394
4 COST OF SALES
Cash operating costs 1,831 1,850 1,756 Royalties 137 133 111 Other cash costs 13 13 14 Total cash costs 1,981 1,996 1,881 Retrenchment costs 4 4 6 Rehabilitation and other non-cash costs 53 17 16 Amortisation of tangible assets (notes 32 and 36) 538 553 685 Amortisation of right of use assets(1) (notes 32 and 36) 42 — — Amortisation of intangible assets (notes 32 and 36) 3 5 5 Inventory change 5 9 14 2,626 2,584 2,607
(1) Amortisation relating to right of use assets as recognised in accordance with IFRS 16 Leases.
5 CORPORATE ADMINISTRATION, MARKETING AND OTHER COSTS
Corporate administration expenses 63 60 52 Share scheme and related costs 19 16 12 82 76 64
6 OTHER EXPENSES (INCOME)(1)
Care and maintenance (note 36) 47 39 62 Governmental fiscal claims, cost of old tailings operations and other expenses 21 14 15 Guinea public infrastructure contribution 8 — — Pension and medical defined benefit provisions 9 10 9 Royalties received (3) (10) (18) Brazilian power utility legal settlement (16) — — Retrenchment and related costs 3 6 6 Legal fees and project costs 11 16 74 Other indirect taxes 3 4 2 83 79 150
(1) Change in disclosure from prior years. Refer note 1.

GROUP – NOTES TO THE FINANCIAL STATEMENTS FOR THE YEAR ENDED 31 DECEMBER
PAGE 44
US dollar millions 2019 2018 2017
7 FINANCE COSTS AND UNWINDING OF OBLIGATIONS
Finance costs Finance costs on bonds, corporate notes, bank loans and other 135 128 131 Amortisation of fees 4 7 4 Lease finance charges 10 5 6 Less: interest capitalised (6) — — 143 140 141 Unwinding of obligations 29 28 16 Total finance costs and unwinding of obligations (notes 32 and 36) 172 168 157
8 SHARE OF ASSOCIATES AND JOINT VENTURES’ PROFIT (LOSS)
Revenue 616 582 454 Operating costs and other expenses (452) (472) (471) Net interest received (paid) 10 (8) 1 Profit (loss) before taxation 174 102 (16) Taxation (35) (9) 23 Profit (loss) after taxation 139 93 7 Impairment reversal of investments in associates (1) 23 15 13 Impairment reversal of investments in joint ventures (note 19) 6 14 2 Share of associates and joint ventures’ profit (loss) (note 32) 168 122 22
(1) Based on the results and financial position of Rand Refinery (Pty) Limited, an impairment reversal was recognised.
9 DISCONTINUED OPERATIONS AND ASSETS AND LIABILITIES HELD FOR SALE
South African asset sale On 12 February 2020, AngloGold Ashanti announced that it has reached an agreement to sell its remaining South African producing assets and related liabilities to Harmony Gold Mining Company Limited. Consideration for the transaction is in cash and deferred payments with expected proceeds of around $300m subject to subsequent performance, and with additional proceeds if the West Wits assets are developed below current infrastructure. The transaction includes the following assets and liabilities: The Mponeng mine and its associated assets and liabilities; The Tau Tona and Savuka mines and associated rock-dump and tailings storage facility reclamation sites, mine
rehabilitation and closure activities located in the West Wits region and their associated assets and liabilities; First Uranium (Pty) Limited which owns Mine Waste Solutions (Pty) Limited and Chemwes (Pty) Limited as well as
associated tailings assets and liabilities; Covalent Water Company (Pty) Limited, AngloGold Security Services (Pty) Limited and Masakhisane Investments (Pty)
Limited; and Certain rock-dump reclamation, mine rehabilitation and closure activities located in the Vaal River region and their
associated assets and liabilities. The consideration comprises three elements: US$200m in cash payable at closing; and Two components of deferred consideration, payable as follows:
1. US$260 per ounce payable on all underground production sourced within the West Wits mineral rights (comprising the Mponeng, Savuka and Tau Tona mines) in excess of 250,000 ounces per annum for 6 years commencing 1 January 2021; and
2. US$20 per ounce payable on underground production sourced within the West Wits mineral rights (comprising the Mponeng, Savuka and Tau Tona mines) below the datum of current infrastructure.
The agreement provides for terms customary in agreements of this nature and is subject to customary conditions precedent. Key conditions precedent include: Approval from the South African Competition Authorities pursuant to the South African Competition Act No 89 of 1998;
and Section 11 approval from the Minister of Mineral Resources and Energy pursuant to the MPRDA in relation to West Wits
Mineral Right. AngloGold Ashanti and Harmony have committed to engage with the relevant authorities and other stakeholders in order to ensure the conditions precedent are fulfilled as soon as possible with earliest closing anticipated on or about 30 June 2020.

GROUP – NOTES TO THE FINANCIAL STATEMENTS FOR THE YEAR ENDED 31 DECEMBER
PAGE 45
9 DISCONTINUED OPERATIONS AND ASSETS AND LIABILITIES HELD FOR SALE CONTINUED South African asset sale CONTINUED As at 31 December 2019, AngloGold Ashanti had received offers from potential buyers regarding the sale of the South African assets. The announced transaction on 12 February 2020 resulted in an expected consideration of around $300m which forms the basis for the fair value less costs to sell value of the South Africa disposal group. The non-recurring fair value measurement for the South Africa disposal group is included in level 3 of the fair value hierarchy. The fair value is based on unobservable market offers from potential buyers for the South Africa disposal group. The held for sale assets and liabilities related to the transaction are reported in the South Africa segment. The South African asset sale is treated as a discontinued operation. In terms of the transaction the silicosis obligation of $65m and the post-retirement medical obligation of $93m relating to South African employees are retained by AngloGold Ashanti. Sale interest in the Sadiola Mine On 23 December 2019, AngloGold Ashanti announced that it together with its joint venture partner, IAMGOLD Corporation (IAMGOLD), had agreed to sell their interests in Société d’Exploitation des Mines d’Or de Sadiola S.A. (Sadiola) to Allied Gold Corp (Allied Gold). Sadiola's principal asset is the Sadiola Mine located in the Kayes region of Western Mali. AngloGold Ashanti and IAMGOLD each hold a 41% interest in Sadiola with the remaining 18% interest held by the Government of Mali. In terms of the agreement, AngloGold Ashanti and IAMGOLD will sell their collective interests in Sadiola to Allied Gold for a cash consideration of US$105m, payable as follows: US$50m (US$25m each to AngloGold Ashanti and IAMGOLD) upon the fulfillment or waiver of all conditions precedent
and closing of the transaction; Up to a further US$5m (US$2.5m each to AngloGold Ashanti and IAMGOLD), payable 8 days after closing, to the extent
that the cash balance of Sadiola at closing is greater than an agreed amount; US$25m (US$12.5m each to AngloGold Ashanti and IAMGOLD) upon the production of the first 250,000 ounces from the
Sadiola Sulphides Project (SSP); and US$25m (US$12.5m each to AngloGold Ashanti and IAMGOLD) upon the production of a further 250,000 ounces from
the SSP. The transaction is subject to the fulfillment, or waiver, of a number of conditions precedent, including the receipt of certain approvals and releases from the Government of Mali. AngloGold Ashanti received approval from the South African Reserve Bank in early 2020. It is anticipated that all conditions precedent will be fulfilled or waived by the end of April 2020. This transaction offer represents the most significant unobservable input in determining the non-recurring fair value measurement of the Sadiola investment; accordingly, the fair value is included in level 3 of the fair value hierarchy. The carrying value of the Sadiola held for sale asset of $20m (which is lower than fair value less costs to sell) is included in the Continental Africa segment; it was previously disclosed as an investment in joint venture on the Statement of Financial Position. Discontinued operations The results of the South Africa disposal group for the year ended 31 December are presented below:
US dollar millions 2019 2018 2017 Revenue from product sales 555 608 1,116 Cost of sales (479) (589) (1,129) Gain (loss) on non-hedge derivatives and other commodity contracts 3 3 10 Gross profit (loss) 79 22 (3) Other expenses (44) (72) (97) Derecognition of assets, impairments and profit on disposal of assets (3) (118) (256) Impairment loss recognised on remeasurement to fair value less costs to sell (549) (35) Profit (loss) before taxation (517) (168) (391) Normal taxation and deferred taxation on operations (23) 38 (14) Deferred tax on impairment loss, derecognition and profit on disposal of assets 164 47 69 Profit (loss) from discontinued operations (376) (83) (336)
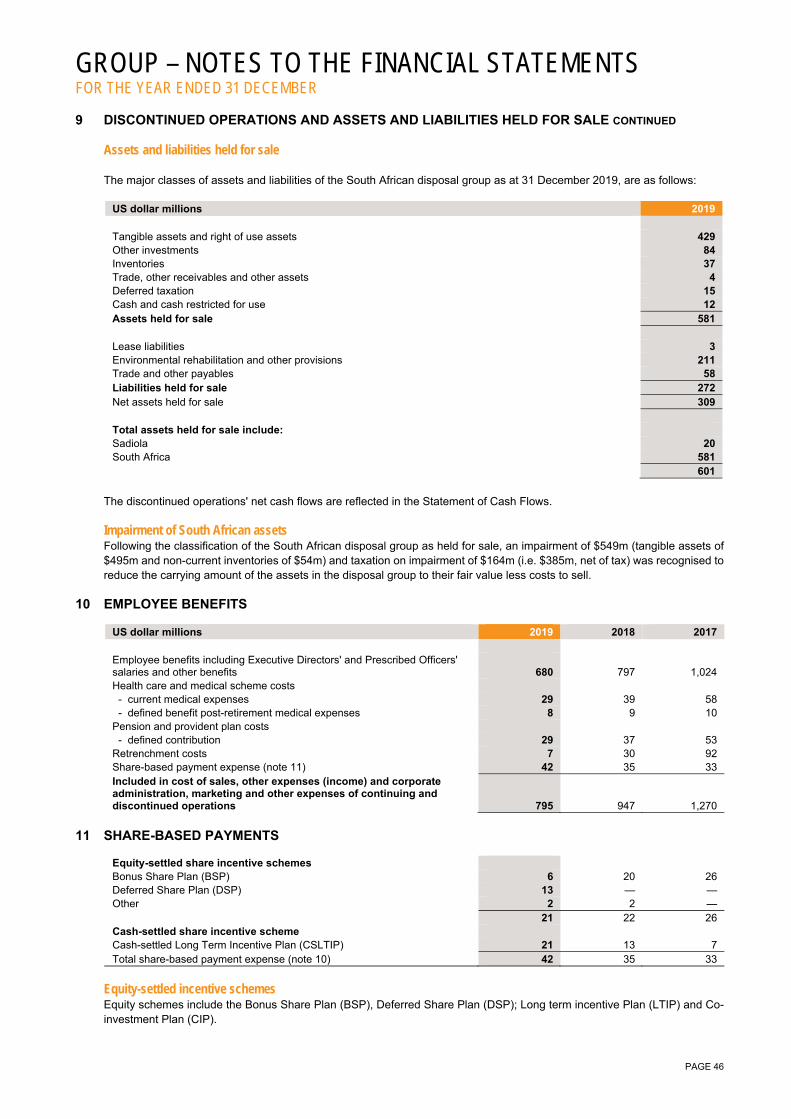
GROUP – NOTES TO THE FINANCIAL STATEMENTS FOR THE YEAR ENDED 31 DECEMBER
PAGE 46
9 DISCONTINUED OPERATIONS AND ASSETS AND LIABILITIES HELD FOR SALE CONTINUED Assets and liabilities held for sale The major classes of assets and liabilities of the South African disposal group as at 31 December 2019, are as follows:
US dollar millions 2019 Tangible assets and right of use assets 429 Other investments 84 Inventories 37 Trade, other receivables and other assets 4 Deferred taxation 15 Cash and cash restricted for use 12 Assets held for sale 581 Lease liabilities 3 Environmental rehabilitation and other provisions 211 Trade and other payables 58 Liabilities held for sale 272 Net assets held for sale 309 Total assets held for sale include: Sadiola 20 South Africa 581 601
The discontinued operations' net cash flows are reflected in the Statement of Cash Flows. Impairment of South African assets Following the classification of the South African disposal group as held for sale, an impairment of $549m (tangible assets of $495m and non-current inventories of $54m) and taxation on impairment of $164m (i.e. $385m, net of tax) was recognised to reduce the carrying amount of the assets in the disposal group to their fair value less costs to sell.
10 EMPLOYEE BENEFITS
US dollar millions 2019 2018 2017 Employee benefits including Executive Directors' and Prescribed Officers' salaries and other benefits 680 797 1,024 Health care and medical scheme costs - current medical expenses 29 39 58 - defined benefit post-retirement medical expenses 8 9 10 Pension and provident plan costs - defined contribution 29 37 53 Retrenchment costs 7 30 92 Share-based payment expense (note 11) 42 35 33 Included in cost of sales, other expenses (income) and corporate administration, marketing and other expenses of continuing and discontinued operations 795 947 1,270
11 SHARE-BASED PAYMENTS
Equity-settled share incentive schemes Bonus Share Plan (BSP) 6 20 26 Deferred Share Plan (DSP) 13 — — Other 2 2 — 21 22 26 Cash-settled share incentive scheme Cash-settled Long Term Incentive Plan (CSLTIP) 21 13 7 Total share-based payment expense (note 10) 42 35 33
Equity-settled incentive schemes Equity schemes include the Bonus Share Plan (BSP), Deferred Share Plan (DSP); Long term incentive Plan (LTIP) and Co-investment Plan (CIP).

GROUP – NOTES TO THE FINANCIAL STATEMENTS FOR THE YEAR ENDED 31 DECEMBER
PAGE 47
11 SHARE-BASED PAYMENTS CONTINUED Bonus Share Plan (BSP)
Award date (unvested awards and awards vested during the year) 2019 2018 2017 Calculated fair value R119.14 R152.87 Vesting date 50% 22 Feb 2019 1 Mar 2018 Vesting date 50% 22 Feb 2020 1 Mar 2019 Expiry date 22 Feb 2028 1 Mar 2027
Number of shares 2019 2018 2017 Awards outstanding at beginning of year 4,557,919 4,479,679 4,198,285 Awards granted during the year 2,492,584 1,926,549 Awards lapsed during the year (109,065) (359,343) (218,601) Awards exercised during the year (2,307,439) (2,055,001) (1,426,554) Awards outstanding at end of year 2,141,415 4,557,919 4,479,679 Awards exercisable at end of year 1,207,936 1,588,512 1,904,021
Cash awards granted under the bonus share plan, outstanding at year end 31 December 2019 amount to 12,295 (2018: 33,046; 2017: 23,666) and an amount of 20,751 cash awards vested and are deemed settled for the year ended 31 December 2019 (2018: 15,209; 2017: 6,754). Deferred Share Plan (DSP) The Deferred Share Plan (DSP) was implemented with effect from 1 January 2018, with the first awards for the scheme allocated in March 2019. This represents a single scheme under which share awards will be allocated to certain employees from 2019 onwards, vesting equally over a period of 2,3 and 5 years depending on the level of seniority of the participant.
Award date (unvested awards and awards vested during the year) 2019 Calculated fair value R204.42 DSP 2 year Vesting date 50% 21 Feb 2020 Vesting date 50% 21 Feb 2021 DSP 3 year Vesting date 33% 21 Feb 2020 Vesting date 33% 21 Feb 2021 Vesting date 34% 21 Feb 2022 DSP 5 year Vesting date 20% 21 Feb 2020 Vesting date 20% 21 Feb 2021 Vesting date 20% 21 Feb 2022 Vesting date 20% 21 Feb 2023 Vesting date 20% 21 Feb 2024 Expiry date 21 Feb 2029
Number of shares 2019 Awards outstanding at beginning of year Awards granted during the year 1,669,191 Awards lapsed during the year (55,208) Awards exercised during the year (14,623) Awards outstanding at end of year 1,599,360
Long Term Incentive Plan (LTIP)
Award date (unvested awards and awards vested during the year) 2015 Calculated fair value R129.94 Vesting date 3 Mar 2018 Expiry date 3 Mar 2025

GROUP – NOTES TO THE FINANCIAL STATEMENTS FOR THE YEAR ENDED 31 DECEMBER
PAGE 48
11 SHARE-BASED PAYMENTS CONTINUED Long Term Incentive Plan (LTIP) CONTINUED
Number of shares 2019 2018 2017 Awards outstanding at beginning of year 447,842 2,466,357 4,363,330 Awards lapsed during the year — (1,186,330) (1,512,857) Awards exercised during the year (218,203) (832,185) (384,116) Awards outstanding at end of year 229,639 447,842 2,466,357 Awards exercisable at end of year 229,639 447,842 455,914
Co-Investment Plan (CIP)
Number of shares 2019 2018 2017 Awards outstanding at beginning of year 112,578 95,378 97,651 Awards granted during the year 80,809 112,105 Awards lapsed during the year (16,500) (11,633) (62,775) Awards matched during the year (72,151) (51,976) (51,603) Awards outstanding at end of year 23,927 112,578 95,378
Cash-Settled Long Term Incentive Plan (CSLTIP) There were no changes to rules or practices within the CSLTIP scheme, and no awards during 2018 and 2019.
Award date (unvested awards and awards vested during the year) 2017 2016 Vesting date 1 March 2020 1 March 2019
Number of units 2019 2018 2017 Share units outstanding at beginning of year 3,815,761 4,469,618 2,464,630 Share units granted during the year 2,572,437 Share units lapsed during the year (1,305,761) (611,265) (507,597) Share units exercised during the year (1,029,438) (42,592) (59,852) Share units outstanding at end of year 1,480,562 3,815,761 4,469,618
The closing share price at 31 December 2019 is R316.50 (2018: R 181.75; 2017: R 128.62).
12 TAXATION
US dollar millions 2019 2018 2017 South African taxation Normal taxation — — 1 Prior year (over) under provision — (2) — Deferred taxation Other temporary differences (18) (27) (42) Change in estimated deferred tax rate (14) 7 10 (32) (22) (31) Foreign taxation Normal taxation 299 243 201 Prior year (over) under provision (1) 1 (26) Deferred taxation Temporary differences (28) (6) 19 Prior year (over) under provision 1 4 2 Change in estimate 9 (7) — Change in statutory tax rate 2 (1) (2) 282 234 194 250 212 163
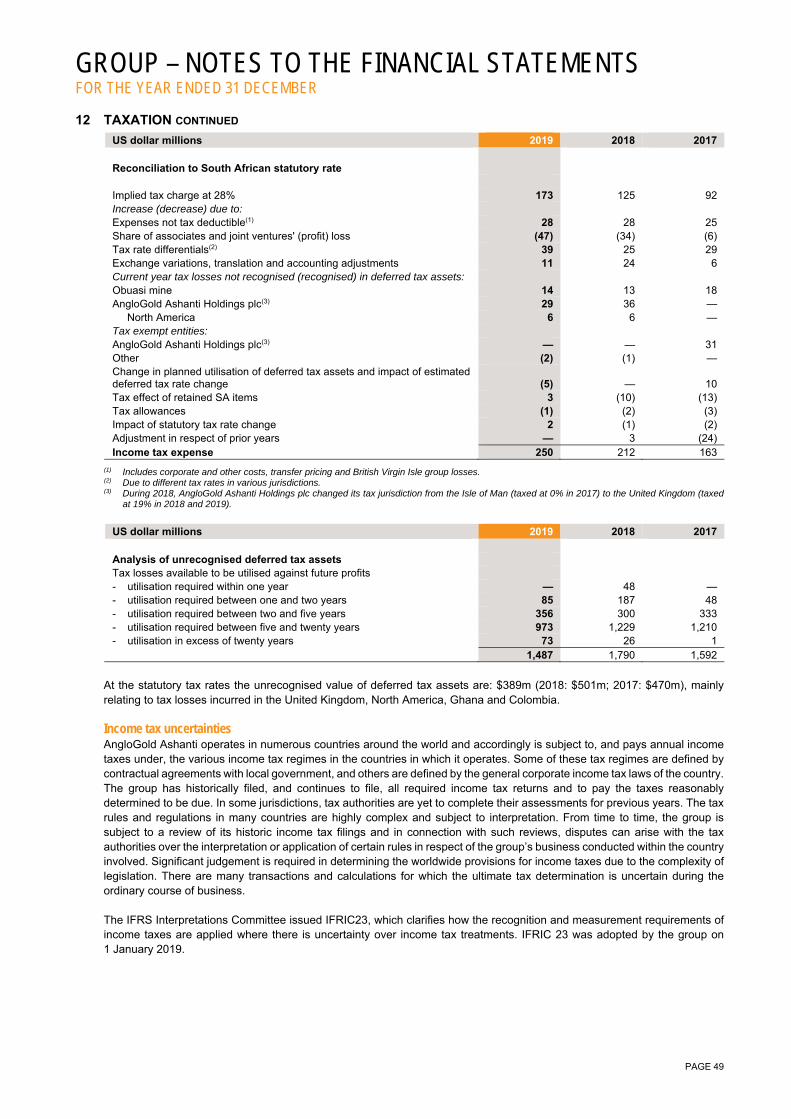
GROUP – NOTES TO THE FINANCIAL STATEMENTS FOR THE YEAR ENDED 31 DECEMBER
PAGE 49
12 TAXATION CONTINUED
US dollar millions 2019 2018 2017 Reconciliation to South African statutory rate Implied tax charge at 28% 173 125 92 Increase (decrease) due to: Expenses not tax deductible(1) 28 28 25 Share of associates and joint ventures' (profit) loss (47) (34) (6) Tax rate differentials(2) 39 25 29 Exchange variations, translation and accounting adjustments 11 24 6 Current year tax losses not recognised (recognised) in deferred tax assets: Obuasi mine 14 13 18 AngloGold Ashanti Holdings plc(3) 29 36 — North America 6 6 — Tax exempt entities: AngloGold Ashanti Holdings plc(3) — — 31 Other (2) (1) — Change in planned utilisation of deferred tax assets and impact of estimated deferred tax rate change (5) — 10 Tax effect of retained SA items 3 (10) (13) Tax allowances (1) (2) (3) Impact of statutory tax rate change 2 (1) (2) Adjustment in respect of prior years — 3 (24) Income tax expense 250 212 163
(1) Includes corporate and other costs, transfer pricing and British Virgin Isle group losses. (2) Due to different tax rates in various jurisdictions. (3) During 2018, AngloGold Ashanti Holdings plc changed its tax jurisdiction from the Isle of Man (taxed at 0% in 2017) to the United Kingdom (taxed
at 19% in 2018 and 2019).
US dollar millions 2019 2018 2017 Analysis of unrecognised deferred tax assets Tax losses available to be utilised against future profits - utilisation required within one year — 48 — - utilisation required between one and two years 85 187 48 - utilisation required between two and five years 356 300 333 - utilisation required between five and twenty years 973 1,229 1,210 - utilisation in excess of twenty years 73 26 1 1,487 1,790 1,592
At the statutory tax rates the unrecognised value of deferred tax assets are: $389m (2018: $501m; 2017: $470m), mainly relating to tax losses incurred in the United Kingdom, North America, Ghana and Colombia. Income tax uncertainties AngloGold Ashanti operates in numerous countries around the world and accordingly is subject to, and pays annual income taxes under, the various income tax regimes in the countries in which it operates. Some of these tax regimes are defined by contractual agreements with local government, and others are defined by the general corporate income tax laws of the country. The group has historically filed, and continues to file, all required income tax returns and to pay the taxes reasonably determined to be due. In some jurisdictions, tax authorities are yet to complete their assessments for previous years. The tax rules and regulations in many countries are highly complex and subject to interpretation. From time to time, the group is subject to a review of its historic income tax filings and in connection with such reviews, disputes can arise with the tax authorities over the interpretation or application of certain rules in respect of the group’s business conducted within the country involved. Significant judgement is required in determining the worldwide provisions for income taxes due to the complexity of legislation. There are many transactions and calculations for which the ultimate tax determination is uncertain during the ordinary course of business. The IFRS Interpretations Committee issued IFRIC23, which clarifies how the recognition and measurement requirements of income taxes are applied where there is uncertainty over income tax treatments. IFRIC 23 was adopted by the group on 1 January 2019.
GROUP – NOTES TO THE FINANCIAL STATEMENTS FOR THE YEAR ENDED 31 DECEMBER
PAGE 50
12 TAXATION CONTINUED Income tax uncertainties CONTINUED Irrespective of whether potential economic outflows of matters have been assessed as probable or possible, individually significant matters are included below, to the extent that disclosure does not prejudice the group. Argentina - Cerro Vanguardia SA The Argentina Tax Authority has challenged the deduction of certain hedge losses, with tax and penalties amounting to $10m (2018: $14m; 2017: $27m). Management has appealed this matter which has been heard by the Tax Court, with final evidence submitted in 2017. The matter is pending and judgement is expected in the next 24 months. Management is of the opinion that the hedge losses were claimed correctly and no provision has therefore been made. Brazil - AGA Mineração and Serra Grande The Brazil Tax Authority has challenged various aspects of the Companies’ tax returns for periods from 2003 to 2016 which individually and in aggregate are not considered to be material. Based on the engagement with the Tax Authority, certain amounts have been allowed and assessments reduced, whilst objections have been lodged against the remainder of the findings. In December 2019, Serra Grande received a tax assessment of approximately $25m relating to the amortisation of goodwill on the acquisition of mining interests, which is permitted as a tax deduction when the acquirer is a domiciled entity. Management is of the opinion that the Tax Authority is unlikely to succeed in this matter. This is supported by external legal advice and therefore no provision has been made. Colombia - La Colosa and Gramalote The tax treatment of exploration expenditure has been investigated by the Colombian Tax Authority which resulted in claims for taxes and penalties of $88m(1) (2018: $144m; 2017: $150m) pertaining to the 2010 to 2014 tax years. These assessments were appealed in 2016 (in the case of La Colosa) and resulted in an adverse judgement on 22 October 2018, in the Administrative Court of Cundinamarca. An appeal was lodged and all arguments submitted to the Council of State on 21 August 2018, with an expected judgement in the next 12 to 18 months. The deduction of exploration costs is prohibited from 2017 onwards following a change in legislation. Subsequent to this date, exploration costs have been treated in accordance with the amended legislation. In July 2019, the Supreme Administrative Court issued a ruling that duplicate penalties may not be charged. The impact of the ruling is that certain penalties will be waived, which reduces the overall exposure by $76m. The matter is pending and may take two to four years to be resolved. Management is of the opinion that the Colombian Tax Authority is unlikely to succeed in this matter and therefore no provision is made. (1) Includes reduction of overall exposure by $76m as described above.
Guinea - Siguiri The Guinea Tax Authority has challenged various aspects of the Companies’ tax returns for periods of 2010, and 2014 to 2016 totalling $12m (attr.) (2018: $8m (attr.); 2017: $8m (attr.)). Management has objected to these assessments but has provided for a portion of the total claims amounting to $2m (attr.) (2018: $2m (attr.); 2017: $2m (attr.)). Mali - Sadiola, Yatela, Morila The Mali Tax Authority has challenged various aspects of the Companies’ tax returns for periods of 2012 to 2018 totalling $26m (attr.) (2018: $16m (attr.); 2017: $16m (attr)). This includes an assessment of $10m (attr.) received in late December 2019. Management has objected to these assessments and is of the opinion that the Tax Authority is unlikely to succeed in this matter and therefore no provision has been made. Tanzania - Geita Gold Mine The Tanzania Revenue Authority has raised audit findings on various tax matters for years from 2009 to 2018 amounting to $164m (2018: $163m; 2017: $113m). Management has objected and appealed through various levels of the legislative processes and has provided for a portion of the total claims amounting to $2m (2018: $2m; 2017: $2m). Management is of the opinion that for the remainder of the claims the Tax Authority is unlikely to succeed and therefore no provision has been made. In addition to the above, it should be noted that amendments passed to legislation in 2017 amended the 2010 Mining Act and new Finance Act. Effective from 1 July 2017, the gold mining royalty rate increased to 6% (from 4%) and further a 1% clearing fee on the value of all minerals exported was imposed. The group has been paying the higher royalty and clearing fees since this date, under protest and is of the view that this is in contravention of its Mining Development Agreement.
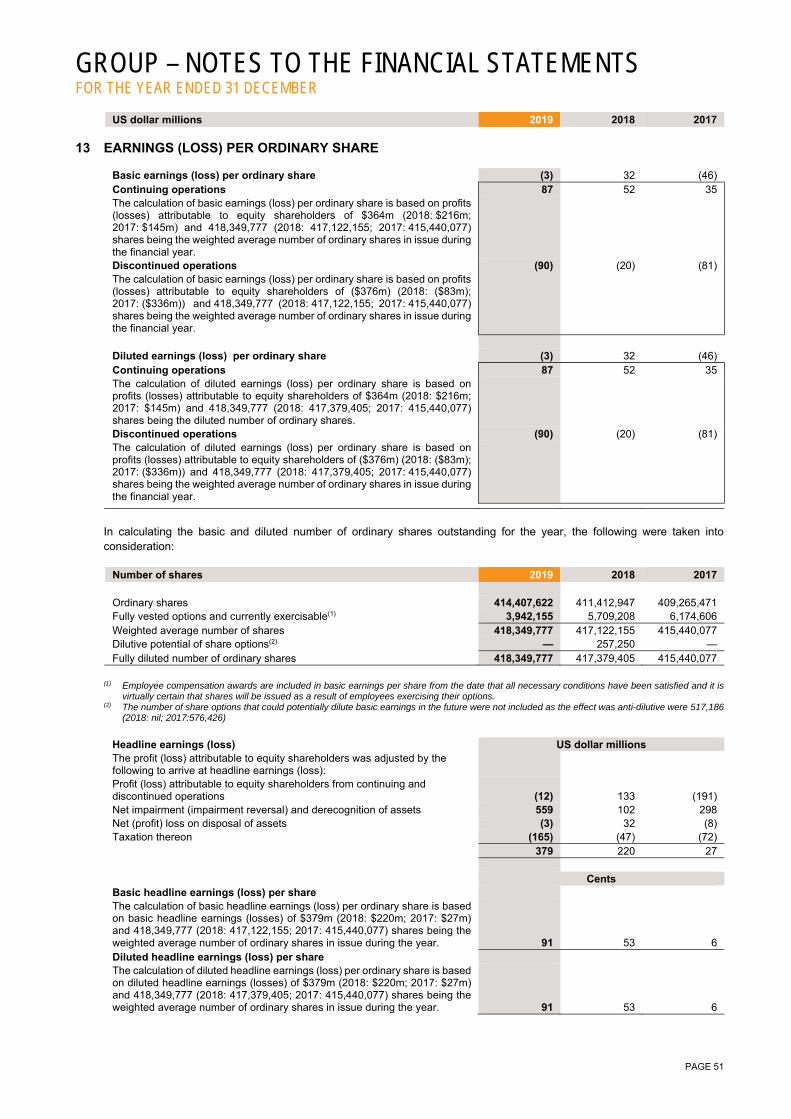
GROUP – NOTES TO THE FINANCIAL STATEMENTS FOR THE YEAR ENDED 31 DECEMBER
PAGE 51
US dollar millions 2019 2018 2017
13 EARNINGS (LOSS) PER ORDINARY SHARE
Basic earnings (loss) per ordinary share (3) 32 (46) Continuing operations 87 52 35 The calculation of basic earnings (loss) per ordinary share is based on profits (losses) attributable to equity shareholders of $364m (2018: $216m; 2017: $145m) and 418,349,777 (2018: 417,122,155; 2017: 415,440,077) shares being the weighted average number of ordinary shares in issue during the financial year.
Discontinued operations (90) (20) (81) The calculation of basic earnings (loss) per ordinary share is based on profits (losses) attributable to equity shareholders of ($376m) (2018: ($83m); 2017: ($336m)) and 418,349,777 (2018: 417,122,155; 2017: 415,440,077) shares being the weighted average number of ordinary shares in issue during the financial year. Diluted earnings (loss) per ordinary share (3) 32 (46) Continuing operations 87 52 35 The calculation of diluted earnings (loss) per ordinary share is based on profits (losses) attributable to equity shareholders of $364m (2018: $216m; 2017: $145m) and 418,349,777 (2018: 417,379,405; 2017: 415,440,077) shares being the diluted number of ordinary shares.
Discontinued operations (90) (20) (81) The calculation of diluted earnings (loss) per ordinary share is based on profits (losses) attributable to equity shareholders of ($376m) (2018: ($83m); 2017: ($336m)) and 418,349,777 (2018: 417,379,405; 2017: 415,440,077) shares being the weighted average number of ordinary shares in issue during the financial year.
In calculating the basic and diluted number of ordinary shares outstanding for the year, the following were taken into consideration:
Number of shares 2019 2018 2017 Ordinary shares 414,407,622 411,412,947 409,265,471 Fully vested options and currently exercisable(1) 3,942,155 5,709,208 6,174,606 Weighted average number of shares 418,349,777 417,122,155 415,440,077 Dilutive potential of share options(2) — 257,250 — Fully diluted number of ordinary shares 418,349,777 417,379,405 415,440,077
(1) Employee compensation awards are included in basic earnings per share from the date that all necessary conditions have been satisfied and it is
virtually certain that shares will be issued as a result of employees exercising their options. (2) The number of share options that could potentially dilute basic earnings in the future were not included as the effect was anti-dilutive were 517,186
(2018: nil; 2017:576,426)
Headline earnings (loss) US dollar millions The profit (loss) attributable to equity shareholders was adjusted by the following to arrive at headline earnings (loss):
Profit (loss) attributable to equity shareholders from continuing and discontinued operations (12) 133 (191) Net impairment (impairment reversal) and derecognition of assets 559 102 298 Net (profit) loss on disposal of assets (3) 32 (8) Taxation thereon (165) (47) (72) 379 220 27 Cents Basic headline earnings (loss) per share The calculation of basic headline earnings (loss) per ordinary share is based on basic headline earnings (losses) of $379m (2018: $220m; 2017: $27m) and 418,349,777 (2018: 417,122,155; 2017: 415,440,077) shares being the weighted average number of ordinary shares in issue during the year. 91 53 6 Diluted headline earnings (loss) per share The calculation of diluted headline earnings (loss) per ordinary share is based on diluted headline earnings (losses) of $379m (2018: $220m; 2017: $27m) and 418,349,777 (2018: 417,379,405; 2017: 415,440,077) shares being the weighted average number of ordinary shares in issue during the year. 91 53 6

GROUP – NOTES TO THE FINANCIAL STATEMENTS FOR THE YEAR ENDED 31 DECEMBER
PAGE 52
US dollar millions 2019 2018 2017
14 DIVIDENDS
Ordinary shares Dividend number 118 of 130 SA cents per share was declared on 21 February 2017 and paid on 7 April 2017 (10 US cents per share). 39 Dividend number 119 of 70 SA cents per share was declared on 20 February 2018 and paid on 6 April 2018 (6 US cents per share). 24 Dividend number 120 of 95 SA cents per share was declared on 19 February 2019 and paid on 8 April 2019 (7 US cents per share) 27 27 24 39
15 TANGIBLE ASSETS
US dollar millions
Mine development
costs Mine infra-structure(2)
Mineral rights
and dumps
Exploration and
evaluation assets
Assets under
construction Land and
buildings(3)(4) Total Cost Balance at 1 January 2017 5,943 4,576 919 5 450 82 11,975 Additions - project capital 28 3 — — 125 — 156 - stay-in-business capital 371 37 — — 257 — 665 Disposals (1) (20) — — — — (21) Transfers and other movements(1) (168) (21) (27) — (291) 1 (506) Transfer to assets and liabilities held for sale (785) (281) (7) — (72) (3) (1,148) Translation 174 88 7 — 21 3 293 Balance at 31 December 2017 5,562 4,382 892 5 490 83 11,414 Accumulated amortisation and impairments
Balance at 1 January 2017 4,163 2,792 868 3 26 12 7,864 Amortisation for the year 553 272 3 — — 1 829 Impairment and derecognition of assets(5) 182 62 8 — 1 — 253 Disposals (1) (20) — — — — (21) Transfers and other movements(1) (326) (163) (27) — — — (516) Transfer to assets and liabilities held for sale (685) (169) (4) — (1) — (859) Translation 93 22 5 — — 2 122 Balance at 31 December 2017 3,979 2,796 853 3 26 15 7,672 Net book value at 31 December 2017 1,583 1,586 39 2 464 68 3,742 Cost Balance at 1 January 2018 5,562 4,382 892 5 490 83 11,414 Additions - project capital 2 — — — 175 — 177 - stay-in-business capital 294 20 3 — 149 1 467 Disposals (5) (30) — (1) — (3) (39) Transfers and other movements(1) 60 (41) — — (270) 1 (250) Translation (239) (119) (7) — (32) (5) (402) Balance at 31 December 2018 5,674 4,212 888 4 512 77 11,367 Accumulated amortisation and impairments
Balance at 1 January 2018 3,979 2,796 853 3 26 15 7,672 Amortisation for the year 397 233 2 1 — 1 634 Impairment and derecognition of assets(5) — 104 — — — — 104 Disposals (5) (27) — (1) — (2) (35) Transfers and other movements(1) (52) (153) — — — — (205) Translation (135) (42) (6) — 1 (2) (184) Balance at 31 December 2018 4,184 2,911 849 3 27 12 7,986 Net book value at 31 December 2018 1,490 1,301 39 1 485 65 3,381

GROUP – NOTES TO THE FINANCIAL STATEMENTS FOR THE YEAR ENDED 31 DECEMBER
PAGE 53
15 TANGIBLE ASSETS CONTINUED
US dollar millions Mine
development costs
Mine infra-structure(2)
Mineral rights
and dumps
Exploration and
evaluation assets
Assets under
construction Land and
buildings(3)(4) Total Cost Balance at 1 January 2019 5,674 4,212 888 4 512 77 11,367 Additions - project capital 43 — — 1 281 14 339 - stay-in-business capital 208 25 1 2 188 — 424 Finance costs capitalised — — — — 6 — 6 Disposals (1) (16) — — — — (17) Transfers and other movements(1) (259) 219 1 — (489) (16) (544) Transfer to assets and liabilities held for sale (660) (663) (9) — (90) (9) (1,431) Translation (4) (1) — — (3) — (8) Balance at 31 December 2019 5,001 3,776 881 7 405 66 10,136 Accumulated amortisation and impairments
Balance at 1 January 2019 4,184 2,911 849 3 27 12 7,986 Amortisation for the year 392 215 1 1 — — 609 Impairment and derecognition of assets(5) 243 172 — — 90 — 505 Disposals (1) (15) — — — — (16) Transfers and other movements(1) (455) (53) 1 — (3) (12) (522) Transfer to assets and liabilities held for sale (488) (422) (5) — (88) — (1,003) Translation (9) (5) — — (1) — (15) Balance at 31 December 2019 3,866 2,803 846 4 25 — 7,544 Net book value at 31 December 2019 1,135 973 35 3 380 66 2,592
(1) Transfers and other movements include amounts from deferred stripping, changes in estimates of decommissioning assets, asset reclassifications
and derecognition of assets.
(2) Included in the amounts for mine infrastructure are assets held under finance leases with a net book value of nil (2018 :$45m; 2017: $56m).
(3) Included in the amounts for land and buildings are assets held under finance leases with a net book value of nil (2018: $3m; 2017: $6m).
(4) Assets of $9m (2018: $10m; 2017: $11m) have been pledged as security.
(5) Impairment and derecognition of assets is assessed as follows:
Impairment calculation assumptions as at 31 December 2019 - goodwill, tangible and intangible assets Management assumptions for the value in use of tangible assets and goodwill include: the gold price assumption represents management’s best estimate of the future price of gold. A long-term real gold price
of $1,300/oz (2018: $1,239/oz) is based on a range of economic and market conditions that will exist over the remaining useful life of the assets.
Annual life of mine plans take into account the following: proved and probable Ore Reserve; value beyond proved and probable reserves (including exploration potential) determined using the gold price assumption
referred to above; In determining the impairment for each cash generating unit, the real pre-tax rate was derived from the weighted average
cost of capital (WACC) using the Capital Asset Pricing Model (CAPM) to determine the required return on equity with risk factors consistent with the basis used in 2018. At 31 December 2019, the derived group WACC was 8.1% (real post-tax) which is 20 basis points lower than in 2018 of 8.3%, and is based on the industry average capital structure of the major gold companies considered to be appropriate peers. In determining the WACC for each cash generating unit, sovereign and mining risk factors are considered to determine country specific risks. In certain instances, a specific risk premium was added to large projects being undertaken or the turnaround nature of a specific mine to address uncertainties in the forecast of the cash flows;
foreign currency cash flows translated at estimated forward exchange rates and then discounted using appropriate discount rates for that currency;
cash flows used in impairment calculations are based on life of mine plans which range from 1 years to 39 years; and variable operating cash flows are increased at local Consumer Price Index rates.
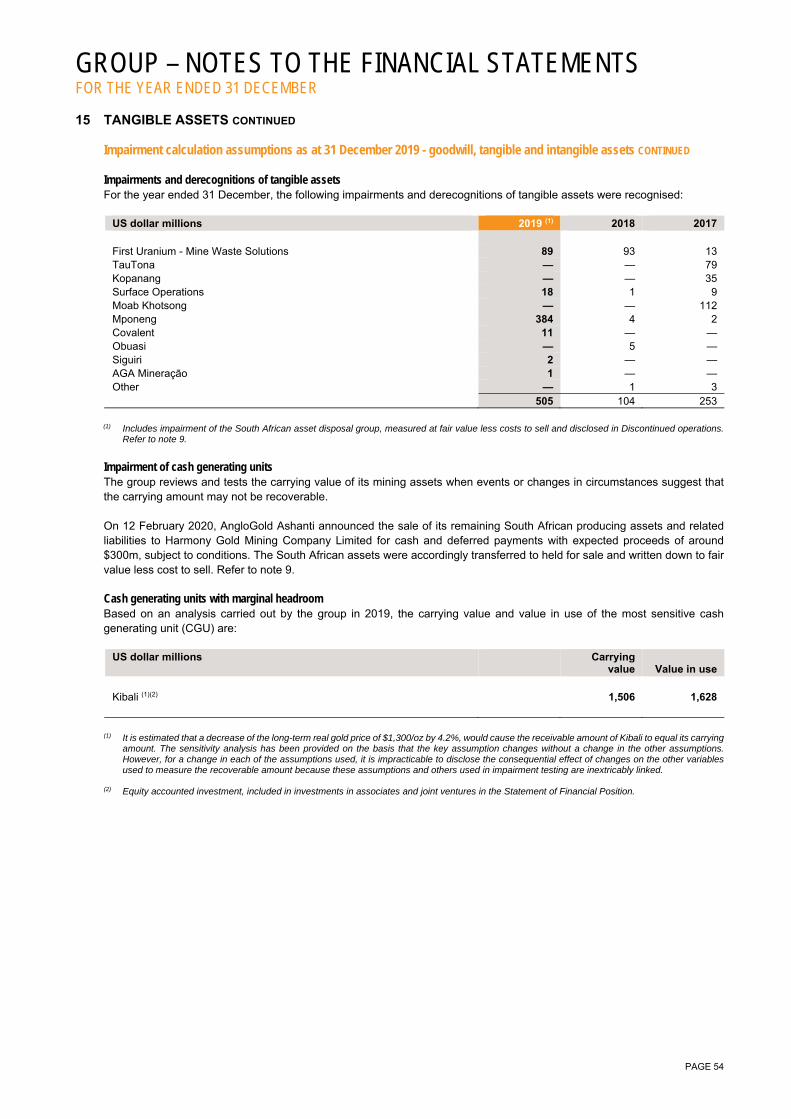
GROUP – NOTES TO THE FINANCIAL STATEMENTS FOR THE YEAR ENDED 31 DECEMBER
PAGE 54
15 TANGIBLE ASSETS CONTINUED Impairment calculation assumptions as at 31 December 2019 - goodwill, tangible and intangible assets CONTINUED Impairments and derecognitions of tangible assets For the year ended 31 December, the following impairments and derecognitions of tangible assets were recognised:
US dollar millions 2019 (1) 2018 2017 First Uranium - Mine Waste Solutions 89 93 13 TauTona — — 79 Kopanang — — 35 Surface Operations 18 1 9 Moab Khotsong — — 112 Mponeng 384 4 2 Covalent 11 — — Obuasi — 5 — Siguiri 2 — — AGA Mineração 1 — — Other — 1 3 505 104 253
(1) Includes impairment of the South African asset disposal group, measured at fair value less costs to sell and disclosed in Discontinued operations.
Refer to note 9.
Impairment of cash generating units The group reviews and tests the carrying value of its mining assets when events or changes in circumstances suggest that the carrying amount may not be recoverable. On 12 February 2020, AngloGold Ashanti announced the sale of its remaining South African producing assets and related liabilities to Harmony Gold Mining Company Limited for cash and deferred payments with expected proceeds of around $300m, subject to conditions. The South African assets were accordingly transferred to held for sale and written down to fair value less cost to sell. Refer to note 9. Cash generating units with marginal headroom Based on an analysis carried out by the group in 2019, the carrying value and value in use of the most sensitive cash generating unit (CGU) are:
US dollar millions Carrying value Value in use
Kibali (1)(2) 1,506 1,628
(1) It is estimated that a decrease of the long-term real gold price of $1,300/oz by 4.2%, would cause the receivable amount of Kibali to equal its carrying
amount. The sensitivity analysis has been provided on the basis that the key assumption changes without a change in the other assumptions. However, for a change in each of the assumptions used, it is impracticable to disclose the consequential effect of changes on the other variables used to measure the recoverable amount because these assumptions and others used in impairment testing are inextricably linked.
(2) Equity accounted investment, included in investments in associates and joint ventures in the Statement of Financial Position.
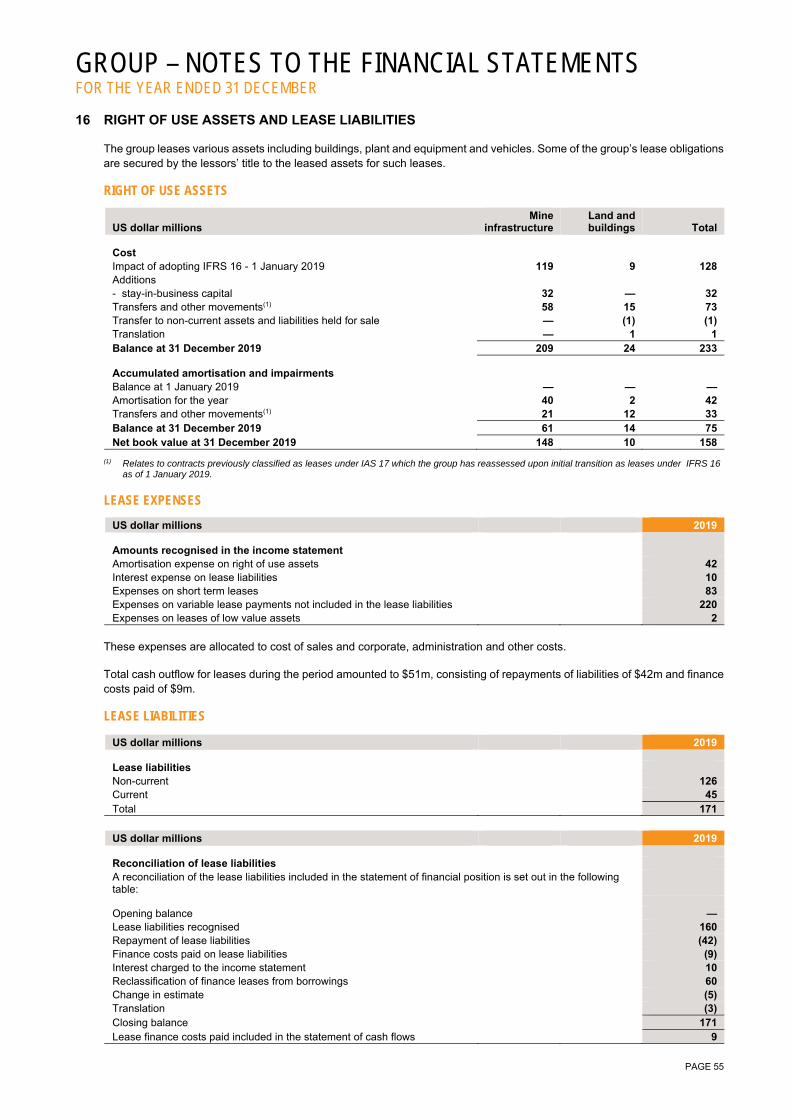
GROUP – NOTES TO THE FINANCIAL STATEMENTS FOR THE YEAR ENDED 31 DECEMBER
PAGE 55
16 RIGHT OF USE ASSETS AND LEASE LIABILITIES The group leases various assets including buildings, plant and equipment and vehicles. Some of the group’s lease obligations are secured by the lessors’ title to the leased assets for such leases. RIGHT OF USE ASSETS
US dollar millions Mine
infrastructure Land and buildings Total
Cost Impact of adopting IFRS 16 - 1 January 2019 119 9 128 Additions - stay-in-business capital 32 — 32 Transfers and other movements(1) 58 15 73 Transfer to non-current assets and liabilities held for sale — (1) (1) Translation — 1 1 Balance at 31 December 2019 209 24 233 Accumulated amortisation and impairments Balance at 1 January 2019 — — — Amortisation for the year 40 2 42 Transfers and other movements(1) 21 12 33 Balance at 31 December 2019 61 14 75 Net book value at 31 December 2019 148 10 158
(1) Relates to contracts previously classified as leases under IAS 17 which the group has reassessed upon initial transition as leases under IFRS 16
as of 1 January 2019.
LEASE EXPENSES
US dollar millions 2019 Amounts recognised in the income statement Amortisation expense on right of use assets 42 Interest expense on lease liabilities 10 Expenses on short term leases 83 Expenses on variable lease payments not included in the lease liabilities 220 Expenses on leases of low value assets 2
These expenses are allocated to cost of sales and corporate, administration and other costs. Total cash outflow for leases during the period amounted to $51m, consisting of repayments of liabilities of $42m and finance costs paid of $9m. LEASE LIABILITIES
US dollar millions 2019 Lease liabilities Non-current 126 Current 45 Total 171
US dollar millions 2019 Reconciliation of lease liabilities A reconciliation of the lease liabilities included in the statement of financial position is set out in the following table:
Opening balance — Lease liabilities recognised 160 Repayment of lease liabilities (42) Finance costs paid on lease liabilities (9) Interest charged to the income statement 10 Reclassification of finance leases from borrowings 60 Change in estimate (5) Translation (3) Closing balance 171 Lease finance costs paid included in the statement of cash flows 9
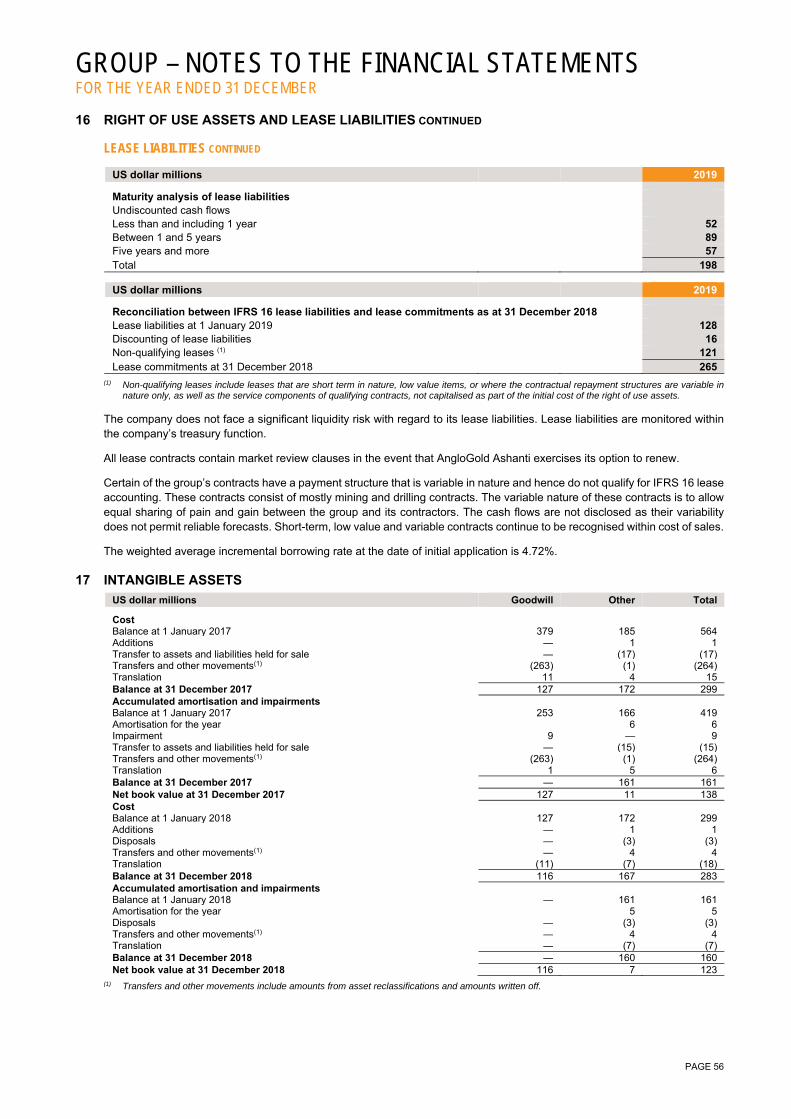
GROUP – NOTES TO THE FINANCIAL STATEMENTS FOR THE YEAR ENDED 31 DECEMBER
PAGE 56
16 RIGHT OF USE ASSETS AND LEASE LIABILITIES CONTINUED LEASE LIABILITIES CONTINUED
US dollar millions 2019
Maturity analysis of lease liabilities Undiscounted cash flows Less than and including 1 year 52 Between 1 and 5 years 89 Five years and more 57 Total 198
US dollar millions 2019
Reconciliation between IFRS 16 lease liabilities and lease commitments as at 31 December 2018 Lease liabilities at 1 January 2019 128 Discounting of lease liabilities 16 Non-qualifying leases (1) 121 Lease commitments at 31 December 2018 265
(1) Non-qualifying leases include leases that are short term in nature, low value items, or where the contractual repayment structures are variable in
nature only, as well as the service components of qualifying contracts, not capitalised as part of the initial cost of the right of use assets.
The company does not face a significant liquidity risk with regard to its lease liabilities. Lease liabilities are monitored within the company’s treasury function.
All lease contracts contain market review clauses in the event that AngloGold Ashanti exercises its option to renew.
Certain of the group’s contracts have a payment structure that is variable in nature and hence do not qualify for IFRS 16 lease accounting. These contracts consist of mostly mining and drilling contracts. The variable nature of these contracts is to allow equal sharing of pain and gain between the group and its contractors. The cash flows are not disclosed as their variability does not permit reliable forecasts. Short-term, low value and variable contracts continue to be recognised within cost of sales.
The weighted average incremental borrowing rate at the date of initial application is 4.72%.
17 INTANGIBLE ASSETS
US dollar millions Goodwill Other Total
Cost Balance at 1 January 2017 379 185 564Additions — 1 1Transfer to assets and liabilities held for sale — (17) (17)Transfers and other movements(1) (263) (1) (264)Translation 11 4 15Balance at 31 December 2017 127 172 299Accumulated amortisation and impairments Balance at 1 January 2017 253 166 419Amortisation for the year 6 6Impairment 9 — 9Transfer to assets and liabilities held for sale — (15) (15)Transfers and other movements(1) (263) (1) (264)Translation 1 5 6Balance at 31 December 2017 — 161 161Net book value at 31 December 2017 127 11 138Cost Balance at 1 January 2018 127 172 299Additions — 1 1Disposals — (3) (3)Transfers and other movements(1) — 4 4Translation (11) (7) (18)Balance at 31 December 2018 116 167 283Accumulated amortisation and impairments Balance at 1 January 2018 — 161 161Amortisation for the year 5 5Disposals — (3) (3)Transfers and other movements(1) — 4 4Translation — (7) (7)Balance at 31 December 2018 — 160 160Net book value at 31 December 2018 116 7 123
(1) Transfers and other movements include amounts from asset reclassifications and amounts written off.
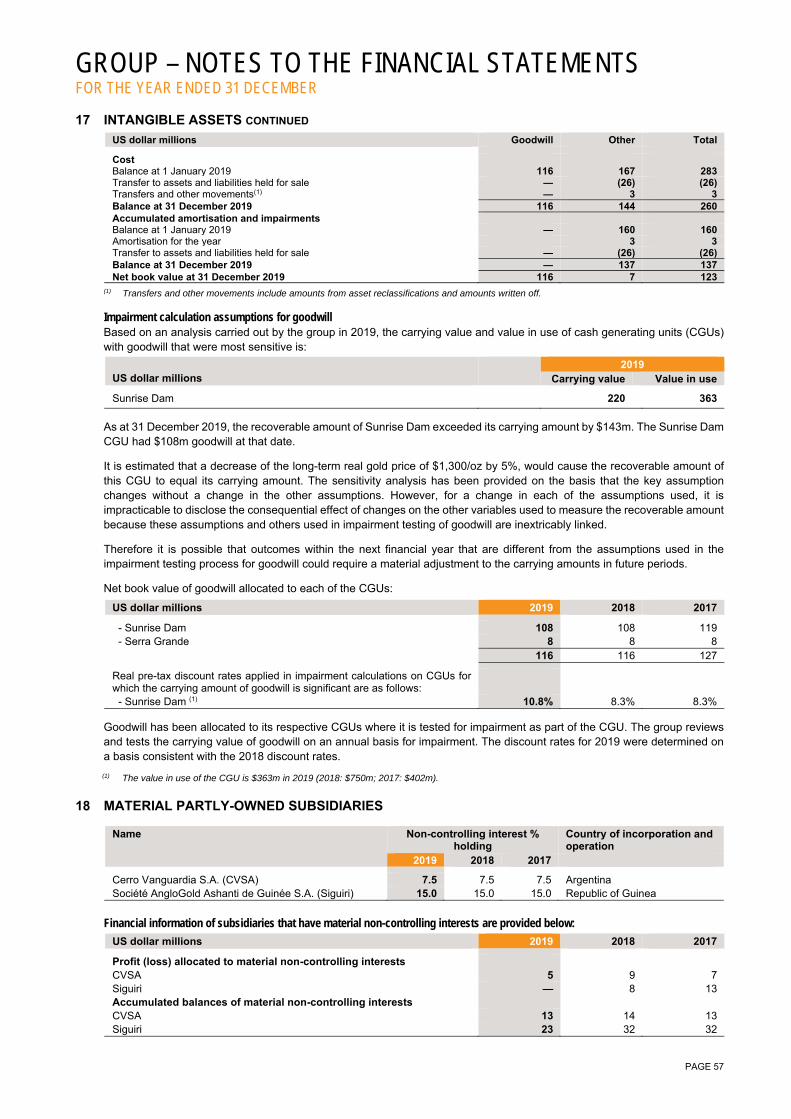
GROUP – NOTES TO THE FINANCIAL STATEMENTS FOR THE YEAR ENDED 31 DECEMBER
PAGE 57
17 INTANGIBLE ASSETS CONTINUED
US dollar millions Goodwill Other Total
Cost Balance at 1 January 2019 116 167 283Transfer to assets and liabilities held for sale — (26) (26)Transfers and other movements(1) — 3 3Balance at 31 December 2019 116 144 260Accumulated amortisation and impairments Balance at 1 January 2019 — 160 160Amortisation for the year 3 3Transfer to assets and liabilities held for sale — (26) (26)Balance at 31 December 2019 — 137 137Net book value at 31 December 2019 116 7 123
(1) Transfers and other movements include amounts from asset reclassifications and amounts written off.
Impairment calculation assumptions for goodwill Based on an analysis carried out by the group in 2019, the carrying value and value in use of cash generating units (CGUs) with goodwill that were most sensitive is:
US dollar millions 2019
Carrying value Value in use
Sunrise Dam 220 363
As at 31 December 2019, the recoverable amount of Sunrise Dam exceeded its carrying amount by $143m. The Sunrise Dam CGU had $108m goodwill at that date.
It is estimated that a decrease of the long-term real gold price of $1,300/oz by 5%, would cause the recoverable amount of this CGU to equal its carrying amount. The sensitivity analysis has been provided on the basis that the key assumption changes without a change in the other assumptions. However, for a change in each of the assumptions used, it is impracticable to disclose the consequential effect of changes on the other variables used to measure the recoverable amount because these assumptions and others used in impairment testing of goodwill are inextricably linked.
Therefore it is possible that outcomes within the next financial year that are different from the assumptions used in the impairment testing process for goodwill could require a material adjustment to the carrying amounts in future periods.
Net book value of goodwill allocated to each of the CGUs:
US dollar millions 2019 2018 2017
- Sunrise Dam 108 108 119 - Serra Grande 8 8 8 116 116 127
Real pre-tax discount rates applied in impairment calculations on CGUs for which the carrying amount of goodwill is significant are as follows: - Sunrise Dam (1) 10.8% 8.3% 8.3%
Goodwill has been allocated to its respective CGUs where it is tested for impairment as part of the CGU. The group reviews and tests the carrying value of goodwill on an annual basis for impairment. The discount rates for 2019 were determined on a basis consistent with the 2018 discount rates. (1) The value in use of the CGU is $363m in 2019 (2018: $750m; 2017: $402m).
18 MATERIAL PARTLY-OWNED SUBSIDIARIES
Name Non-controlling interest %
holding Country of incorporation and operation
2019 2018 2017
Cerro Vanguardia S.A. (CVSA) 7.5 7.5 7.5 Argentina Société AngloGold Ashanti de Guinée S.A. (Siguiri) 15.0 15.0 15.0 Republic of Guinea
Financial information of subsidiaries that have material non-controlling interests are provided below:
US dollar millions 2019 2018 2017
Profit (loss) allocated to material non-controlling interests CVSA 5 9 7 Siguiri — 8 13 Accumulated balances of material non-controlling interests CVSA 13 14 13 Siguiri 23 32 32
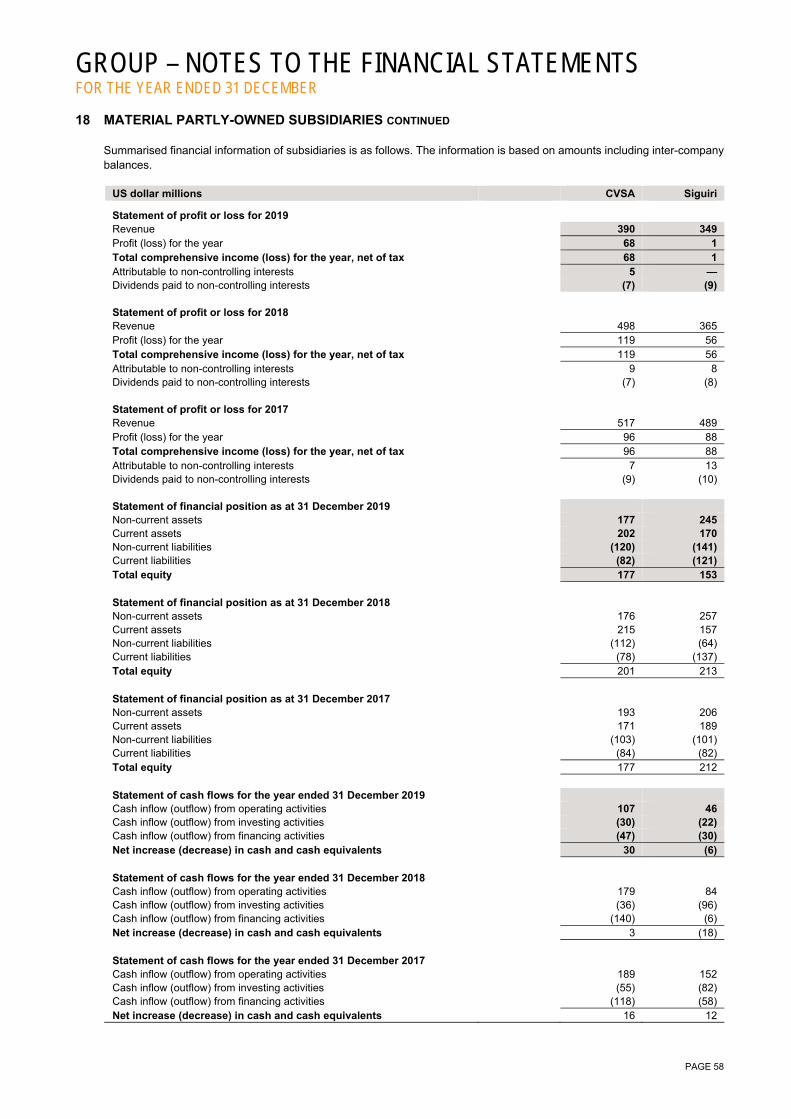
GROUP – NOTES TO THE FINANCIAL STATEMENTS FOR THE YEAR ENDED 31 DECEMBER
PAGE 58
18 MATERIAL PARTLY-OWNED SUBSIDIARIES CONTINUED Summarised financial information of subsidiaries is as follows. The information is based on amounts including inter-company balances.
US dollar millions CVSA Siguiri
Statement of profit or loss for 2019 Revenue 390 349 Profit (loss) for the year 68 1 Total comprehensive income (loss) for the year, net of tax 68 1 Attributable to non-controlling interests 5 — Dividends paid to non-controlling interests (7) (9) Statement of profit or loss for 2018 Revenue 498 365 Profit (loss) for the year 119 56 Total comprehensive income (loss) for the year, net of tax 119 56 Attributable to non-controlling interests 9 8 Dividends paid to non-controlling interests (7) (8) Statement of profit or loss for 2017 Revenue 517 489 Profit (loss) for the year 96 88 Total comprehensive income (loss) for the year, net of tax 96 88 Attributable to non-controlling interests 7 13 Dividends paid to non-controlling interests (9) (10) Statement of financial position as at 31 December 2019 Non-current assets 177 245 Current assets 202 170 Non-current liabilities (120) (141) Current liabilities (82) (121) Total equity 177 153 Statement of financial position as at 31 December 2018 Non-current assets 176 257 Current assets 215 157 Non-current liabilities (112) (64) Current liabilities (78) (137) Total equity 201 213 Statement of financial position as at 31 December 2017 Non-current assets 193 206 Current assets 171 189 Non-current liabilities (103) (101) Current liabilities (84) (82) Total equity 177 212 Statement of cash flows for the year ended 31 December 2019 Cash inflow (outflow) from operating activities 107 46 Cash inflow (outflow) from investing activities (30) (22) Cash inflow (outflow) from financing activities (47) (30) Net increase (decrease) in cash and cash equivalents 30 (6) Statement of cash flows for the year ended 31 December 2018 Cash inflow (outflow) from operating activities 179 84 Cash inflow (outflow) from investing activities (36) (96) Cash inflow (outflow) from financing activities (140) (6) Net increase (decrease) in cash and cash equivalents 3 (18) Statement of cash flows for the year ended 31 December 2017 Cash inflow (outflow) from operating activities 189 152 Cash inflow (outflow) from investing activities (55) (82) Cash inflow (outflow) from financing activities (118) (58) Net increase (decrease) in cash and cash equivalents 16 12
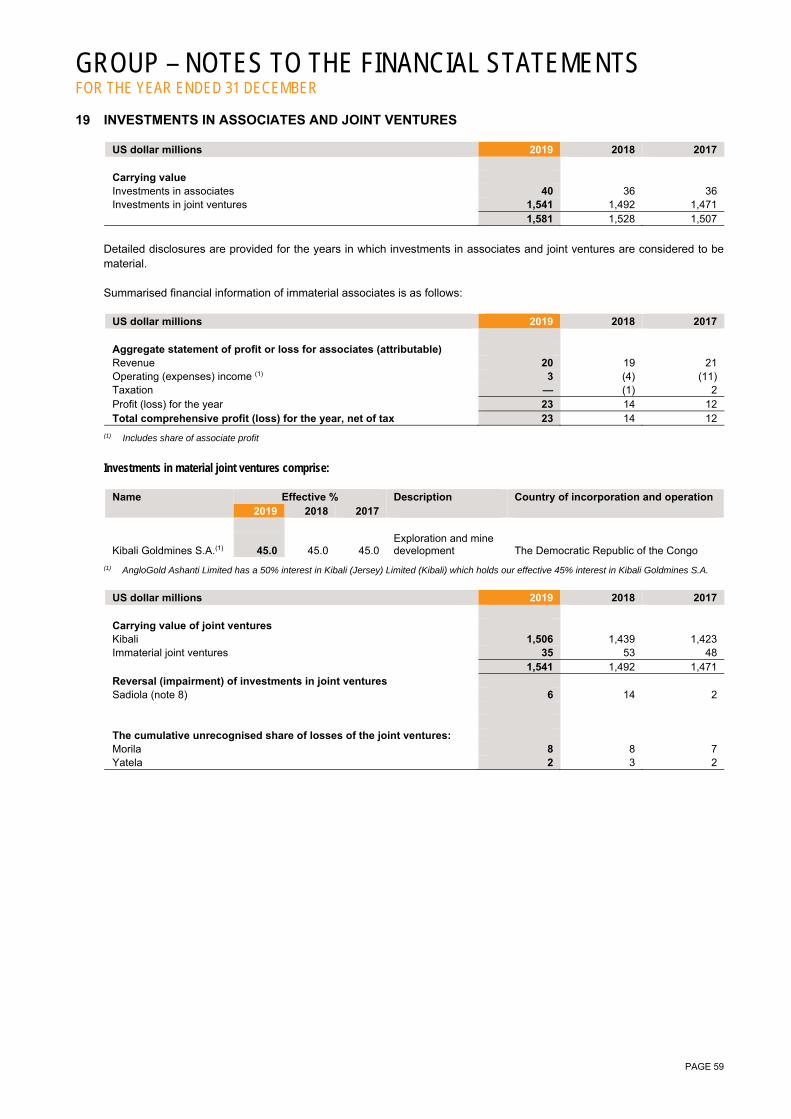
GROUP – NOTES TO THE FINANCIAL STATEMENTS FOR THE YEAR ENDED 31 DECEMBER
PAGE 59
19 INVESTMENTS IN ASSOCIATES AND JOINT VENTURES
US dollar millions 2019 2018 2017 Carrying value Investments in associates 40 36 36 Investments in joint ventures 1,541 1,492 1,471 1,581 1,528 1,507
Detailed disclosures are provided for the years in which investments in associates and joint ventures are considered to be material. Summarised financial information of immaterial associates is as follows:
US dollar millions 2019 2018 2017 Aggregate statement of profit or loss for associates (attributable) Revenue 20 19 21 Operating (expenses) income (1) 3 (4) (11) Taxation — (1) 2 Profit (loss) for the year 23 14 12 Total comprehensive profit (loss) for the year, net of tax 23 14 12
(1) Includes share of associate profit
Investments in material joint ventures comprise:
Name Effective % Description Country of incorporation and operation 2019 2018 2017
Kibali Goldmines S.A.(1) 45.0 45.0 45.0 Exploration and mine development The Democratic Republic of the Congo
(1) AngloGold Ashanti Limited has a 50% interest in Kibali (Jersey) Limited (Kibali) which holds our effective 45% interest in Kibali Goldmines S.A.
US dollar millions 2019 2018 2017 Carrying value of joint ventures Kibali 1,506 1,439 1,423 Immaterial joint ventures 35 53 48 1,541 1,492 1,471 Reversal (impairment) of investments in joint ventures Sadiola (note 8) 6 14 2 The cumulative unrecognised share of losses of the joint ventures: Morila 8 8 7 Yatela 2 3 2
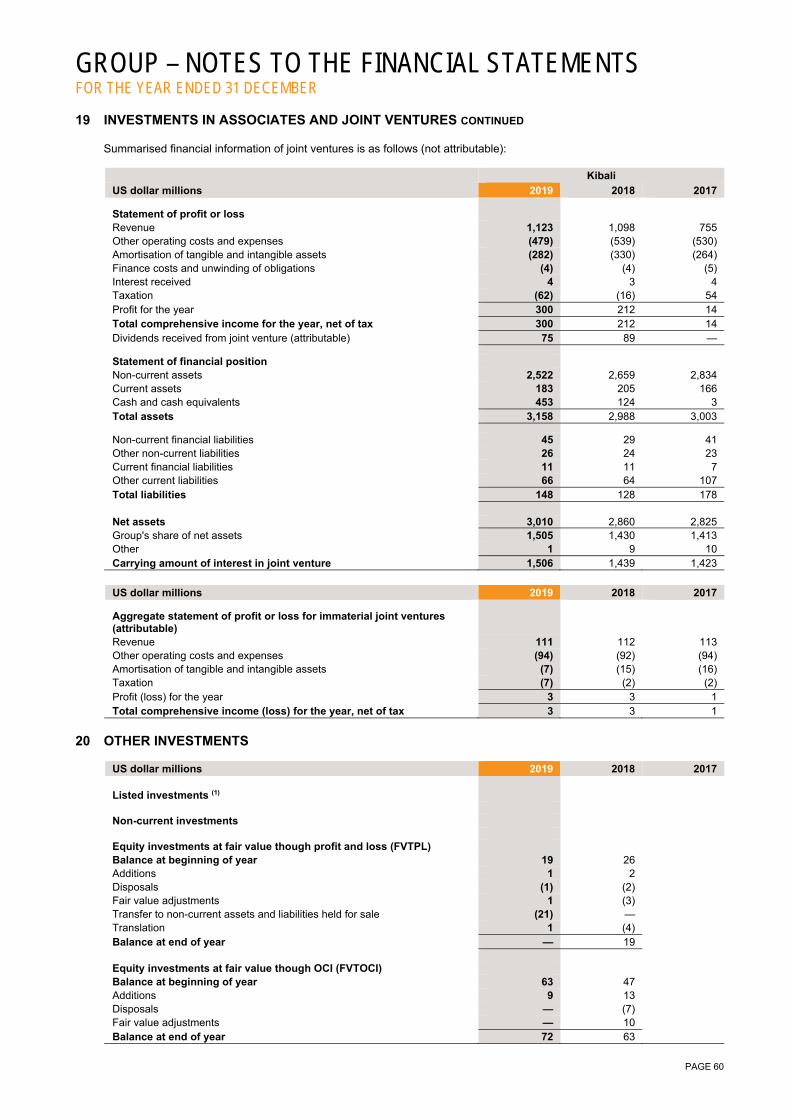
GROUP – NOTES TO THE FINANCIAL STATEMENTS FOR THE YEAR ENDED 31 DECEMBER
PAGE 60
19 INVESTMENTS IN ASSOCIATES AND JOINT VENTURES CONTINUED Summarised financial information of joint ventures is as follows (not attributable):
Kibali
US dollar millions 2019 2018 2017
Statement of profit or loss Revenue 1,123 1,098 755 Other operating costs and expenses (479) (539) (530) Amortisation of tangible and intangible assets (282) (330) (264) Finance costs and unwinding of obligations (4) (4) (5) Interest received 4 3 4 Taxation (62) (16) 54 Profit for the year 300 212 14 Total comprehensive income for the year, net of tax 300 212 14 Dividends received from joint venture (attributable) 75 89 —
Statement of financial position Non-current assets 2,522 2,659 2,834 Current assets 183 205 166 Cash and cash equivalents 453 124 3 Total assets 3,158 2,988 3,003
Non-current financial liabilities 45 29 41 Other non-current liabilities 26 24 23 Current financial liabilities 11 11 7 Other current liabilities 66 64 107 Total liabilities 148 128 178 Net assets 3,010 2,860 2,825Group's share of net assets 1,505 1,430 1,413 Other 1 9 10 Carrying amount of interest in joint venture 1,506 1,439 1,423
US dollar millions 2019 2018 2017
Aggregate statement of profit or loss for immaterial joint ventures (attributable)
Revenue 111 112 113 Other operating costs and expenses (94) (92) (94) Amortisation of tangible and intangible assets (7) (15) (16) Taxation (7) (2) (2) Profit (loss) for the year 3 3 1 Total comprehensive income (loss) for the year, net of tax 3 3 1
20 OTHER INVESTMENTS
US dollar millions 2019 2018 2017
Listed investments (1)
Non-current investments
Equity investments at fair value though profit and loss (FVTPL) Balance at beginning of year 19 26 Additions 1 2 Disposals (1) (2) Fair value adjustments 1 (3) Transfer to non-current assets and liabilities held for sale (21) — Translation 1 (4) Balance at end of year — 19
Equity investments at fair value though OCI (FVTOCI) Balance at beginning of year 63 47 Additions 9 13 Disposals — (7) Fair value adjustments — 10 Balance at end of year 72 63

GROUP – NOTES TO THE FINANCIAL STATEMENTS FOR THE YEAR ENDED 31 DECEMBER
PAGE 61
20 OTHER INVESTMENTS CONTINUED
US dollar millions 2019 2018 2017 The group reclassified its listed investments as FVTPL and FVTOCI on adoption of IFRS 9 on 1 January 2018.
The non-current equity investments consist of ordinary shares and collective investment schemes and primarily comprise:
International Tower Hill Mines Limited (ITH) — — 7 Corvus Gold Corporation 41 43 25 Various listed investments held by Environmental Rehabilitation Trust Fund — 16 22 Pure Gold Mining 31 18 11 Other — 5 8 72 82 73 Investments at amortised cost – non-current Balance at beginning of year 12 4 6 Additions 11 15 — Disposals (9) (6) (2) Transfer to non-current assets and liabilities held for sale (15) — — Translation 1 (1) — Balance at end of year — 12 4 The amortised cost investment consists of government bonds held by the Environmental Rehabilitation Trust Fund administered by Ashburton Investments. Current investments Listed investments – FVTOCI (2) 10 6 7 Book value of listed investments 82 100 84 Unlisted investments Non-current investments Balance at beginning of year 47 54 73 Additions 45 48 81 Maturities (44) (45) (73) Transfer to non-current assets and liabilities held for sale (48) — (32) Fair value adjustments- FVTOCI 2 — — Other — (2) — Translation 2 (8) 5 Balance at end of year 4 47 54 The unlisted investments include: Negotiable Certificates of Deposit - Environmental Rehabilitation Trust Fund administered by Ashburton Investments. — 46 53 Other 4 1 1 4 47 54 Book value of unlisted investments 4 47 54 Non-current other investments 76 141 131 Total book value of other investments 86 147 138
(1) The group’s listed equity investments are susceptible to market price risk arising from uncertainties about the future values of the investments. At
the reporting date, the FVTOCI equity investments were listed on the Toronto Stock Exchange.
(2) During 2019 a fair value adjustment of $4m to the Sandstorm investment was recognised.
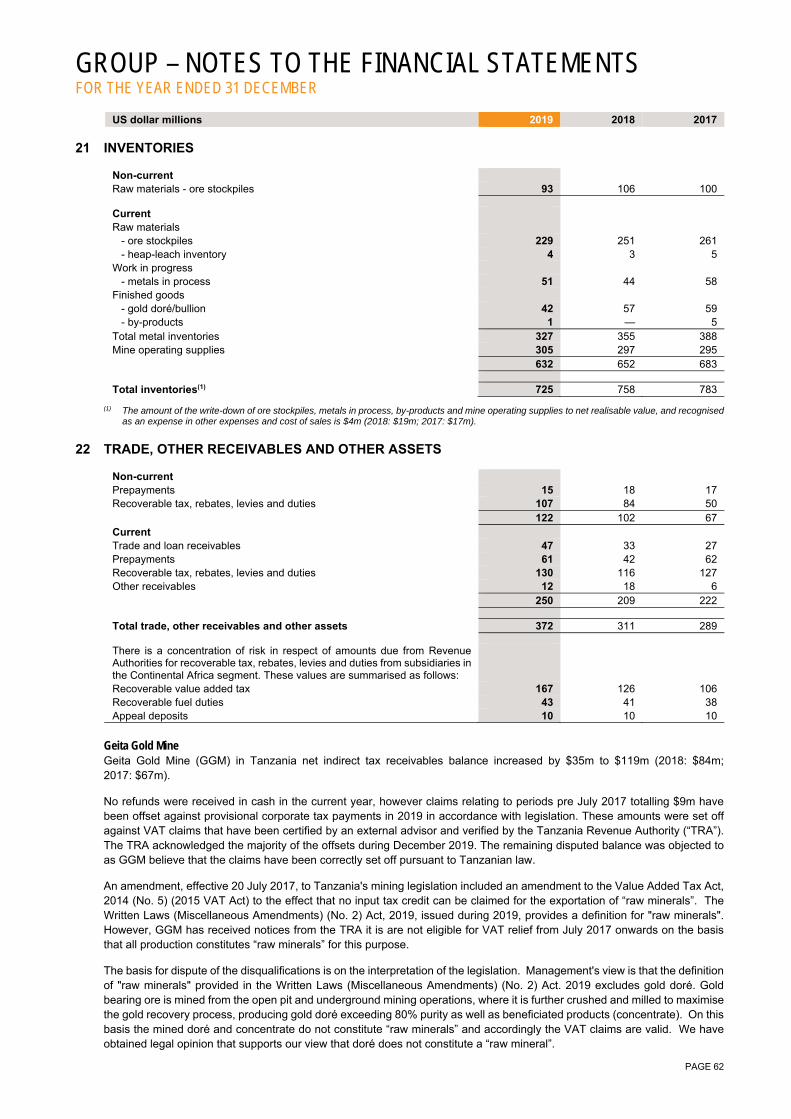
GROUP – NOTES TO THE FINANCIAL STATEMENTS FOR THE YEAR ENDED 31 DECEMBER
PAGE 62
US dollar millions 2019 2018 2017
21 INVENTORIES
Non-current Raw materials - ore stockpiles 93 106 100
Current Raw materials - ore stockpiles 229 251 261 - heap-leach inventory 4 3 5 Work in progress - metals in process 51 44 58 Finished goods - gold doré/bullion 42 57 59 - by-products 1 — 5 Total metal inventories 327 355 388 Mine operating supplies 305 297 295 632 652 683
Total inventories(1) 725 758 783 (1) The amount of the write-down of ore stockpiles, metals in process, by-products and mine operating supplies to net realisable value, and recognised
as an expense in other expenses and cost of sales is $4m (2018: $19m; 2017: $17m).
22 TRADE, OTHER RECEIVABLES AND OTHER ASSETS
Non-current Prepayments 15 18 17 Recoverable tax, rebates, levies and duties 107 84 50 122 102 67 Current Trade and loan receivables 47 33 27 Prepayments 61 42 62 Recoverable tax, rebates, levies and duties 130 116 127 Other receivables 12 18 6 250 209 222
Total trade, other receivables and other assets 372 311 289
There is a concentration of risk in respect of amounts due from Revenue Authorities for recoverable tax, rebates, levies and duties from subsidiaries in the Continental Africa segment. These values are summarised as follows: Recoverable value added tax 167 126 106 Recoverable fuel duties 43 41 38 Appeal deposits 10 10 10
Geita Gold Mine Geita Gold Mine (GGM) in Tanzania net indirect tax receivables balance increased by $35m to $119m (2018: $84m; 2017: $67m).
No refunds were received in cash in the current year, however claims relating to periods pre July 2017 totalling $9m have been offset against provisional corporate tax payments in 2019 in accordance with legislation. These amounts were set off against VAT claims that have been certified by an external advisor and verified by the Tanzania Revenue Authority (“TRA”). The TRA acknowledged the majority of the offsets during December 2019. The remaining disputed balance was objected to as GGM believe that the claims have been correctly set off pursuant to Tanzanian law.
An amendment, effective 20 July 2017, to Tanzania's mining legislation included an amendment to the Value Added Tax Act, 2014 (No. 5) (2015 VAT Act) to the effect that no input tax credit can be claimed for the exportation of “raw minerals”. The Written Laws (Miscellaneous Amendments) (No. 2) Act, 2019, issued during 2019, provides a definition for "raw minerals". However, GGM has received notices from the TRA it is are not eligible for VAT relief from July 2017 onwards on the basis that all production constitutes “raw minerals” for this purpose.
The basis for dispute of the disqualifications is on the interpretation of the legislation. Management's view is that the definition of "raw minerals" provided in the Written Laws (Miscellaneous Amendments) (No. 2) Act. 2019 excludes gold doré. Gold bearing ore is mined from the open pit and underground mining operations, where it is further crushed and milled to maximise the gold recovery process, producing gold doré exceeding 80% purity as well as beneficiated products (concentrate). On this basis the mined doré and concentrate do not constitute “raw minerals” and accordingly the VAT claims are valid. We have obtained legal opinion that supports our view that doré does not constitute a “raw mineral”.
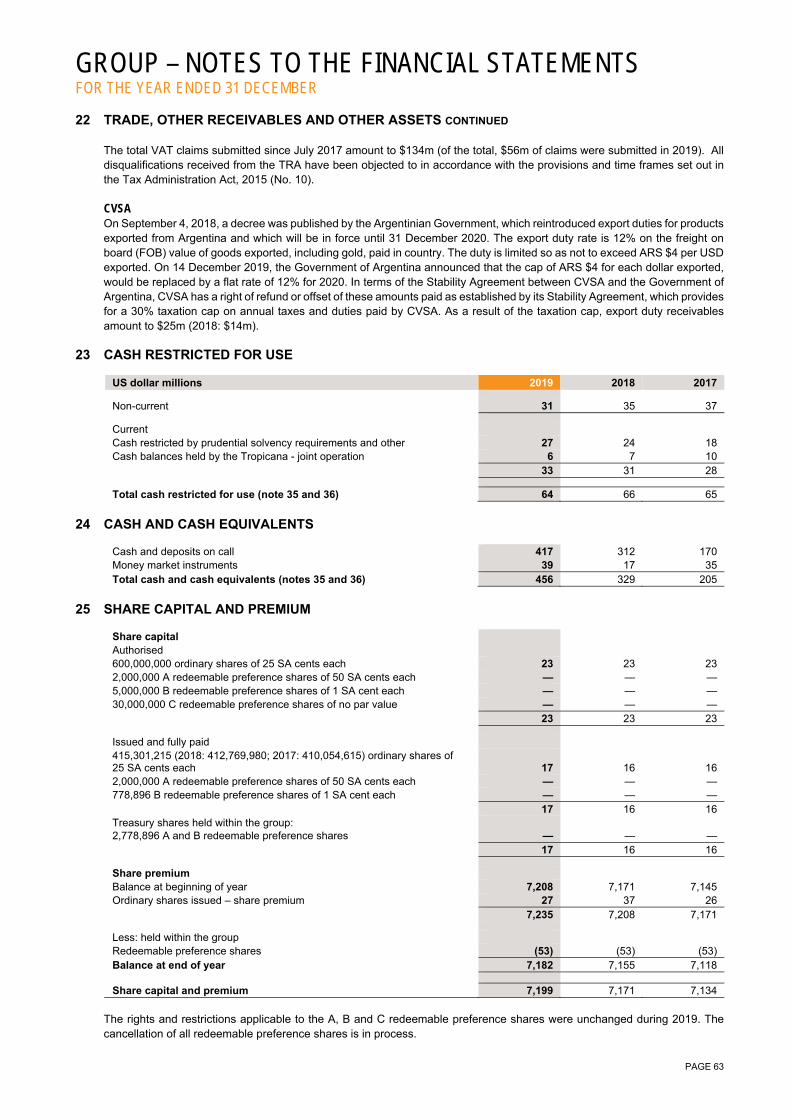
GROUP – NOTES TO THE FINANCIAL STATEMENTS FOR THE YEAR ENDED 31 DECEMBER
PAGE 63
22 TRADE, OTHER RECEIVABLES AND OTHER ASSETS CONTINUED The total VAT claims submitted since July 2017 amount to $134m (of the total, $56m of claims were submitted in 2019). All disqualifications received from the TRA have been objected to in accordance with the provisions and time frames set out in the Tax Administration Act, 2015 (No. 10). CVSA On September 4, 2018, a decree was published by the Argentinian Government, which reintroduced export duties for products exported from Argentina and which will be in force until 31 December 2020. The export duty rate is 12% on the freight on board (FOB) value of goods exported, including gold, paid in country. The duty is limited so as not to exceed ARS $4 per USD exported. On 14 December 2019, the Government of Argentina announced that the cap of ARS $4 for each dollar exported, would be replaced by a flat rate of 12% for 2020. In terms of the Stability Agreement between CVSA and the Government of Argentina, CVSA has a right of refund or offset of these amounts paid as established by its Stability Agreement, which provides for a 30% taxation cap on annual taxes and duties paid by CVSA. As a result of the taxation cap, export duty receivables amount to $25m (2018: $14m).
23 CASH RESTRICTED FOR USE
US dollar millions 2019 2018 2017
Non-current 31 35 37
Current Cash restricted by prudential solvency requirements and other 27 24 18 Cash balances held by the Tropicana - joint operation 6 7 10 33 31 28
Total cash restricted for use (note 35 and 36) 64 66 65
24 CASH AND CASH EQUIVALENTS
Cash and deposits on call 417 312 170 Money market instruments 39 17 35 Total cash and cash equivalents (notes 35 and 36) 456 329 205
25 SHARE CAPITAL AND PREMIUM
Share capital Authorised 600,000,000 ordinary shares of 25 SA cents each 23 23 23 2,000,000 A redeemable preference shares of 50 SA cents each — — — 5,000,000 B redeemable preference shares of 1 SA cent each — — — 30,000,000 C redeemable preference shares of no par value — — — 23 23 23
Issued and fully paid 415,301,215 (2018: 412,769,980; 2017: 410,054,615) ordinary shares of 25 SA cents each 17 16 16 2,000,000 A redeemable preference shares of 50 SA cents each — — — 778,896 B redeemable preference shares of 1 SA cent each — — — 17 16 16 Treasury shares held within the group: 2,778,896 A and B redeemable preference shares — — — 17 16 16
Share premium Balance at beginning of year 7,208 7,171 7,145 Ordinary shares issued – share premium 27 37 26 7,235 7,208 7,171
Less: held within the group Redeemable preference shares (53) (53) (53) Balance at end of year 7,182 7,155 7,118
Share capital and premium 7,199 7,171 7,134 The rights and restrictions applicable to the A, B and C redeemable preference shares were unchanged during 2019. The cancellation of all redeemable preference shares is in process.
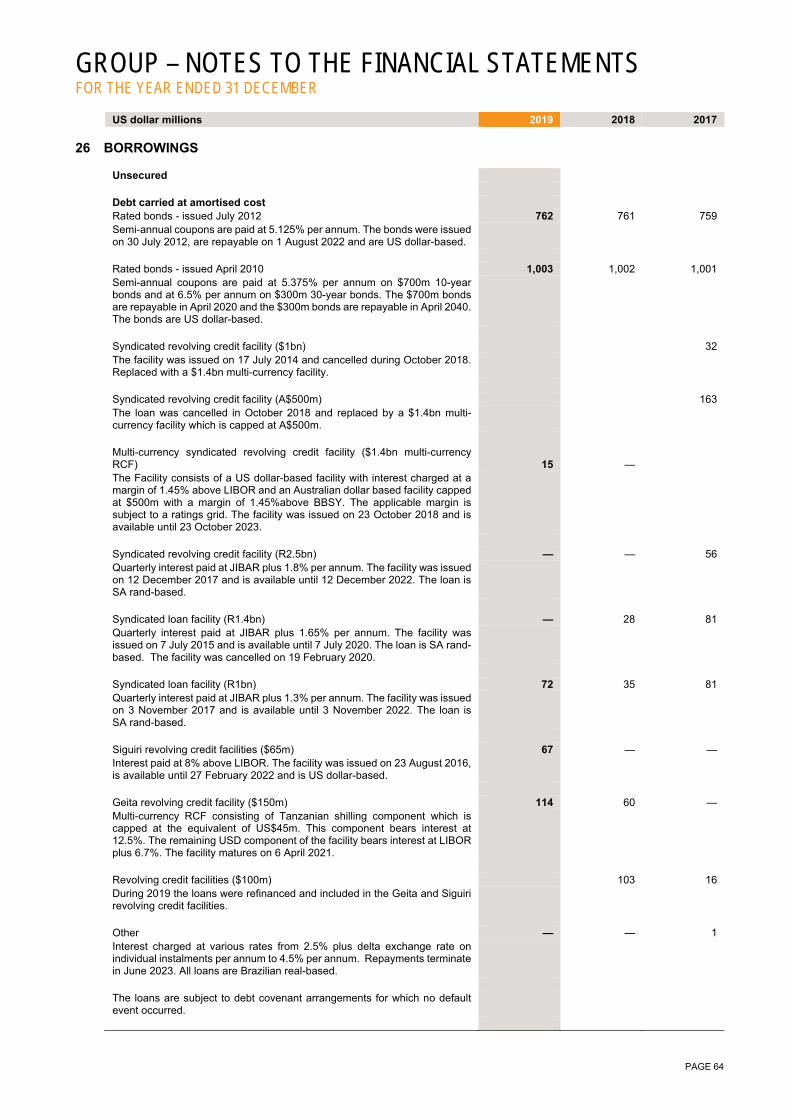
GROUP – NOTES TO THE FINANCIAL STATEMENTS FOR THE YEAR ENDED 31 DECEMBER
PAGE 64
US dollar millions 2019 2018 2017
26 BORROWINGS
Unsecured Debt carried at amortised cost Rated bonds - issued July 2012 762 761 759 Semi-annual coupons are paid at 5.125% per annum. The bonds were issued on 30 July 2012, are repayable on 1 August 2022 and are US dollar-based. Rated bonds - issued April 2010 1,003 1,002 1,001 Semi-annual coupons are paid at 5.375% per annum on $700m 10-year bonds and at 6.5% per annum on $300m 30-year bonds. The $700m bonds are repayable in April 2020 and the $300m bonds are repayable in April 2040. The bonds are US dollar-based. Syndicated revolving credit facility ($1bn) 32 The facility was issued on 17 July 2014 and cancelled during October 2018. Replaced with a $1.4bn multi-currency facility. Syndicated revolving credit facility (A$500m) 163 The loan was cancelled in October 2018 and replaced by a $1.4bn multi-currency facility which is capped at A$500m. Multi-currency syndicated revolving credit facility ($1.4bn multi-currency RCF) 15 — The Facility consists of a US dollar-based facility with interest charged at a margin of 1.45% above LIBOR and an Australian dollar based facility capped at $500m with a margin of 1.45%above BBSY. The applicable margin is subject to a ratings grid. The facility was issued on 23 October 2018 and is available until 23 October 2023. Syndicated revolving credit facility (R2.5bn) — — 56 Quarterly interest paid at JIBAR plus 1.8% per annum. The facility was issued on 12 December 2017 and is available until 12 December 2022. The loan is SA rand-based. Syndicated loan facility (R1.4bn) — 28 81 Quarterly interest paid at JIBAR plus 1.65% per annum. The facility was issued on 7 July 2015 and is available until 7 July 2020. The loan is SA rand-based. The facility was cancelled on 19 February 2020. Syndicated loan facility (R1bn) 72 35 81 Quarterly interest paid at JIBAR plus 1.3% per annum. The facility was issued on 3 November 2017 and is available until 3 November 2022. The loan is SA rand-based. Siguiri revolving credit facilities ($65m) 67 — — Interest paid at 8% above LIBOR. The facility was issued on 23 August 2016, is available until 27 February 2022 and is US dollar-based. Geita revolving credit facility ($150m) 114 60 — Multi-currency RCF consisting of Tanzanian shilling component which is capped at the equivalent of US$45m. This component bears interest at 12.5%. The remaining USD component of the facility bears interest at LIBOR plus 6.7%. The facility matures on 6 April 2021. Revolving credit facilities ($100m) 103 16 During 2019 the loans were refinanced and included in the Geita and Siguiri revolving credit facilities. Other — — 1 Interest charged at various rates from 2.5% plus delta exchange rate on individual instalments per annum to 4.5% per annum. Repayments terminate in June 2023. All loans are Brazilian real-based. The loans are subject to debt covenant arrangements for which no default event occurred.

GROUP – NOTES TO THE FINANCIAL STATEMENTS FOR THE YEAR ENDED 31 DECEMBER
PAGE 65
US dollar millions 2019 2018 2017
26 BORROWINGS CONTINUED
Secured Finance leases (1) Turbine Square Two (Pty) Limited 9 15 The lease is capitalised at an implied interest rate of 9.8% per annum. Lease payments are due in monthly instalments terminating in March 2022 and are SA rand-based. The buildings financed are used as security for these loans. Australian Gas Pipeline 48 58 The contract with the supplier of gas contains embedded leases which have been determined to bear interest at an average of 6.75% per annum. The embedded leases commenced in November and December 2015 and are for a 10 and 12 year duration, respectively. The leases are repayable in monthly instalments and are Australian dollar-based. The equipment related to the embedded leases is used as security for these loans. Other 4 5 Various loans with interest rates ranging from 2.5% to 14.7% per annum. These loans are repayable from 2016 to 2041. Some of these loans are secured by the financed assets. Total borrowings (note 35) 2,033 2,050 2,268 Current portion of borrowings (note 36) (734) (139) (38) Total non-current borrowings (note 36) 1,299 1,911 2,230 Amounts falling due Within one year 734 139 38 Between one and two years 110 734 219 Between two and five years 898 860 1,687 After five years 291 317 324 (note 35) 2,033 2,050 2,268
(1) The finance leases have been included in the lease liabilities from 1 January 2019 (refer to note16).
Currency The currencies in which the borrowings are denominated are as follows: US dollar 1,893 1,896 1,807 Australian dollar 21 48 221 SA rand 72 75 237 Tanzanian shillings 47 29 — Brazilian real — 2 3 (note 35) 2,033 2,050 2,268 Undrawn facilities Undrawn borrowing facilities as at 31 December are as follows: Syndicated revolving credit facility ($1bn) - US dollar 965 Syndicated revolving credit facility (A$500m) - Australian dollar 226 Syndicated revolving credit facility (R2.5bn) - SA rand 179 174 146 Syndicated revolving credit facility (R1.4bn) - SA rand 100 70 32 FirstRand Bank Limited (R750m) - SA rand 54 52 61 Revolving credit facilities ($100m) - US dollar 85 Revolving credit facility (R1bn) - SA rand — 35 — Multi-currency syndicated revolving credit facility ($1.4bn) - US Dollar 1,379 1,400 Revolving credit facility - $150m 40 57 1,752 1,788 1,515
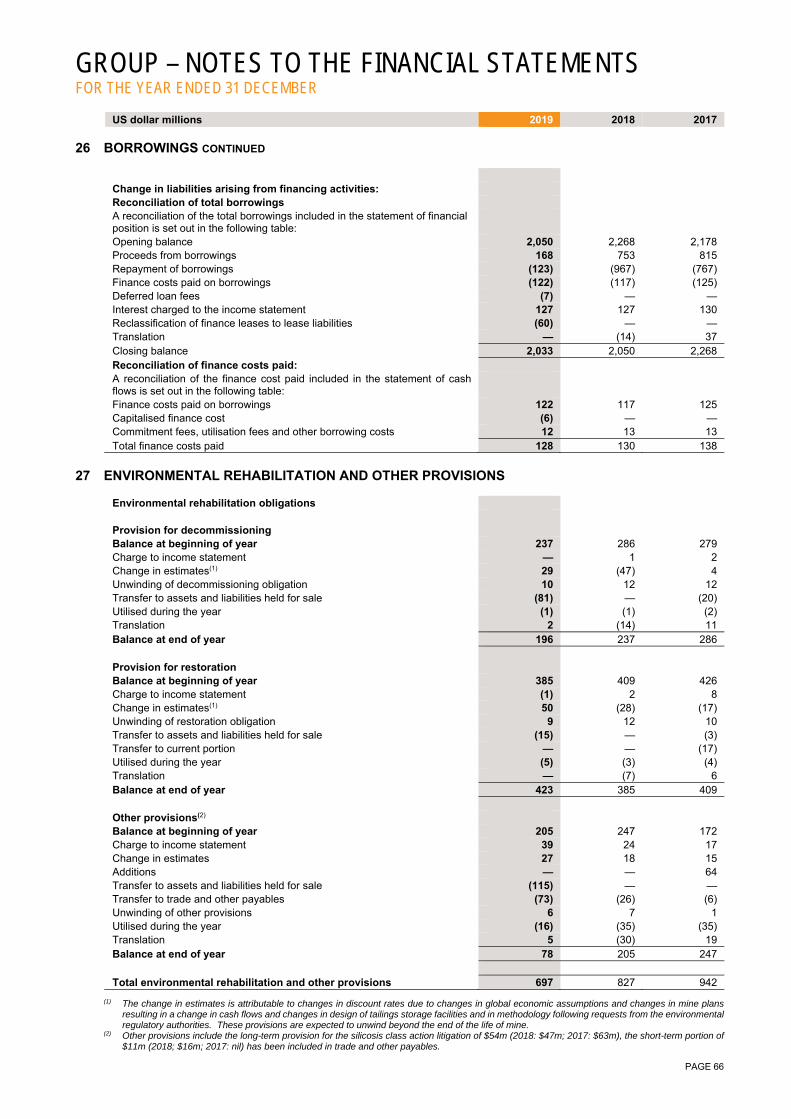
GROUP – NOTES TO THE FINANCIAL STATEMENTS FOR THE YEAR ENDED 31 DECEMBER
PAGE 66
US dollar millions 2019 2018 2017
26 BORROWINGS CONTINUED
Change in liabilities arising from financing activities: Reconciliation of total borrowings A reconciliation of the total borrowings included in the statement of financial position is set out in the following table: Opening balance 2,050 2,268 2,178 Proceeds from borrowings 168 753 815 Repayment of borrowings (123) (967) (767) Finance costs paid on borrowings (122) (117) (125) Deferred loan fees (7) — — Interest charged to the income statement 127 127 130 Reclassification of finance leases to lease liabilities (60) — — Translation — (14) 37 Closing balance 2,033 2,050 2,268 Reconciliation of finance costs paid: A reconciliation of the finance cost paid included in the statement of cash flows is set out in the following table: Finance costs paid on borrowings 122 117 125 Capitalised finance cost (6) — — Commitment fees, utilisation fees and other borrowing costs 12 13 13 Total finance costs paid 128 130 138
27 ENVIRONMENTAL REHABILITATION AND OTHER PROVISIONS
Environmental rehabilitation obligations Provision for decommissioning Balance at beginning of year 237 286 279 Charge to income statement — 1 2 Change in estimates(1) 29 (47) 4 Unwinding of decommissioning obligation 10 12 12 Transfer to assets and liabilities held for sale (81) — (20) Utilised during the year (1) (1) (2) Translation 2 (14) 11 Balance at end of year 196 237 286 Provision for restoration Balance at beginning of year 385 409 426 Charge to income statement (1) 2 8 Change in estimates(1) 50 (28) (17) Unwinding of restoration obligation 9 12 10 Transfer to assets and liabilities held for sale (15) — (3) Transfer to current portion — — (17) Utilised during the year (5) (3) (4) Translation — (7) 6 Balance at end of year 423 385 409 Other provisions(2) Balance at beginning of year 205 247 172 Charge to income statement 39 24 17 Change in estimates 27 18 15 Additions — — 64 Transfer to assets and liabilities held for sale (115) — — Transfer to trade and other payables (73) (26) (6) Unwinding of other provisions 6 7 1 Utilised during the year (16) (35) (35) Translation 5 (30) 19 Balance at end of year 78 205 247 Total environmental rehabilitation and other provisions 697 827 942
(1) The change in estimates is attributable to changes in discount rates due to changes in global economic assumptions and changes in mine plans
resulting in a change in cash flows and changes in design of tailings storage facilities and in methodology following requests from the environmental regulatory authorities. These provisions are expected to unwind beyond the end of the life of mine.
(2) Other provisions include the long-term provision for the silicosis class action litigation of $54m (2018: $47m; 2017: $63m), the short-term portion of $11m (2018; $16m; 2017: nil) has been included in trade and other payables.

GROUP – NOTES TO THE FINANCIAL STATEMENTS FOR THE YEAR ENDED 31 DECEMBER
PAGE 67
US dollar millions 2019 2018 2017
28 PROVISION FOR PENSION AND POST-RETIREMENT BENEFITS
Defined benefit plans The retirement schemes consist of the following: Post-retirement medical scheme for AngloGold Ashanti's South African employees 93 93 114 Other defined benefit plans 7 7 8 100 100 122 Post-retirement medical scheme for AngloGold Ashanti's South African employees The provision for post-retirement medical funding represents the provision for health care benefits for employees and retired employees and their registered dependents. The post-retirement benefit costs are assessed in accordance with the advice of independent professionally qualified actuaries. The actuarial method used is the projected unit credit funding method. This scheme is unfunded. The last valuation was performed as at 31 December 2019. Information with respect to the defined benefit liability is as follows: Benefit obligation Balance at beginning of year 93 115 109 Interest cost 8 9 10 Benefits paid (8) (10) (9) Actuarial (gain) loss (2) (5) (8) Translation 2 (16) 13 Balance at end of year 93 93 115 Less: transfer to non-current assets and liabilities held for sale — — (1) Net amount recognised 93 93 114 Components of net periodic benefit cost Interest cost 8 9 10 Net periodic benefit cost 8 9 10 Assumptions Assumptions used to determine benefit obligations at the end of the year are as follows: Discount rate 9.15% 9.57% 9.29% Expected increase in health care costs 7.25% 7.35% 7.75% Assumed health care cost trend rates at 31 December: Health care cost trend assumed for next year 7.25% 7.35% 7.75% Rate to which the cost trend is assumed to decline (the ultimate trend rate) 7.25% 7.35% 7.75% Assumed health care cost trend rates have a significant effect on the amounts reported for health care plans. A 1% point change in assumed health care cost trend rates would have the following effect: Effect on total service and interest cost - 1% point increase 1 1 1 Effect on post-retirement benefit obligation - 1% point increase 7 7 10 Effect on total service and interest cost - 1% point decrease (1) (1) (1) Effect on post-retirement benefit obligation 1% point decrease (6) (7) (8)

GROUP – NOTES TO THE FINANCIAL STATEMENTS FOR THE YEAR ENDED 31 DECEMBER
PAGE 68
US dollar millions 2019 2018 2017
28 PROVISION FOR PENSION AND POST-RETIREMENT BENEFITS CONTINUED
Post-retirement medical scheme for AngloGold Ashanti's South African employees CONTINUED Cash flows Contributions AngloGold Ashanti Limited expects to contribute $9m to the post-retirement medical plan in 2020. Estimated future benefit payments The following medical benefit payments, which reflect the expected future service, as appropriate, are expected to be paid: 2020 9 2021 9 2022 9 2023 9 2024 10 Thereafter 47
29 DEFERRED TAXATION
Deferred taxation relating to temporary differences is made up as follows: Liabilities Tangible assets (owned) 370 521 604 Right-of-use assets 48 Inventories 24 37 33 Other 9 5 15 451 563 652 Assets Provisions 209 218 229 Lease liabilities 52 Tax losses 45 24 60 Other 9 6 4 315 248 293 Net deferred taxation liability 136 315 359 Included in the statement of financial position as follows: Deferred tax assets 105 — 4 Deferred tax liabilities 241 315 363 Net deferred taxation liability 136 315 359 The movement on the deferred tax balance is as follows: Balance at beginning of year 315 359 492 Taxation of items included in income statement from continuing and discontinued operations (189) (30) (68) Taxation on items included in other comprehensive income (2) 5 (6) Transfer to non-current assets and liabilities held for sale 15 — (73) Translation (3) (19) 14 Balance at end of year 136 315 359
Provision has been made for South African income tax or foreign taxes that may result from future remittances of undistributed earnings of foreign subsidiaries or foreign corporate joint ventures, where the group is able to assert that the undistributed earnings are not permanently reinvested. In all other cases, the foreign subsidiaries reinvest the undistributed earnings into future capital expansion projects, maintenance capital and ongoing working capital funding requirements. Unrecognised taxable temporary differences pertaining to undistributed earnings totalled $444m (2018: $413m; 2017: $384m).
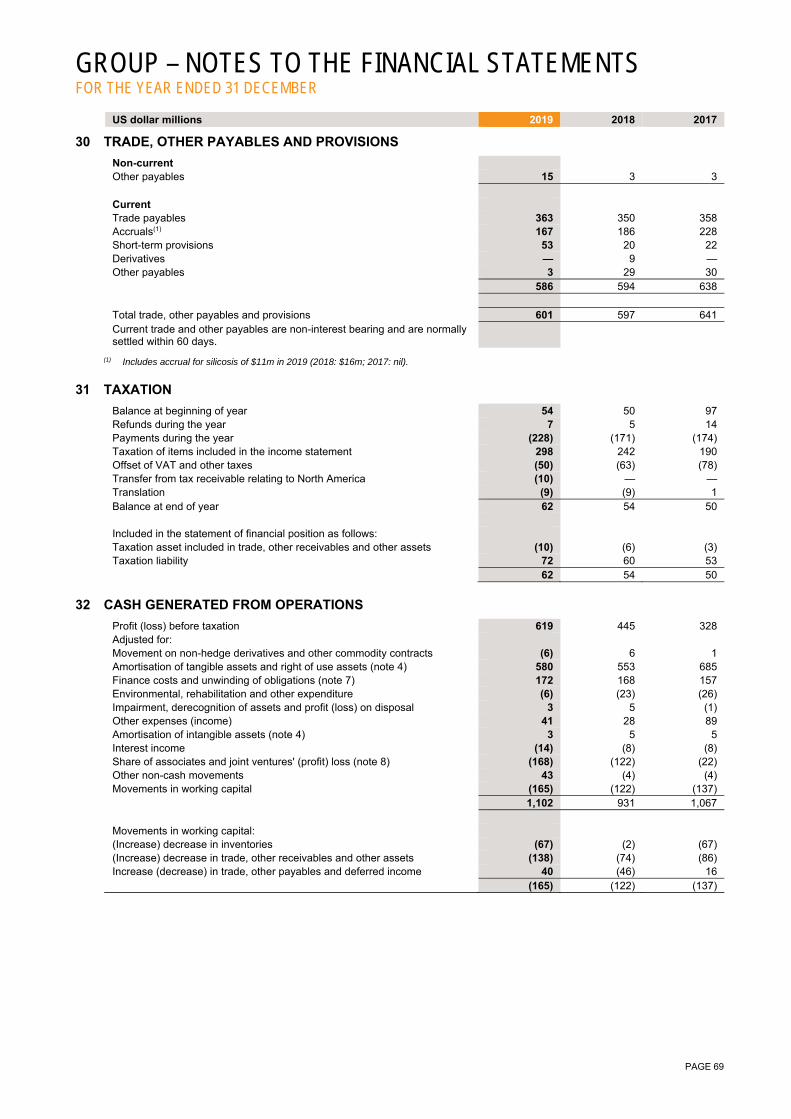
GROUP – NOTES TO THE FINANCIAL STATEMENTS FOR THE YEAR ENDED 31 DECEMBER
PAGE 69
US dollar millions 2019 2018 2017
30 TRADE, OTHER PAYABLES AND PROVISIONS
Non-current Other payables 15 3 3 Current Trade payables 363 350 358 Accruals(1) 167 186 228 Short-term provisions 53 20 22 Derivatives — 9 — Other payables 3 29 30 586 594 638 Total trade, other payables and provisions 601 597 641 Current trade and other payables are non-interest bearing and are normally settled within 60 days.
(1) Includes accrual for silicosis of $11m in 2019 (2018: $16m; 2017: nil).
31 TAXATION
Balance at beginning of year 54 50 97 Refunds during the year 7 5 14 Payments during the year (228) (171) (174) Taxation of items included in the income statement 298 242 190 Offset of VAT and other taxes (50) (63) (78) Transfer from tax receivable relating to North America (10) — — Translation (9) (9) 1 Balance at end of year 62 54 50 Included in the statement of financial position as follows: Taxation asset included in trade, other receivables and other assets (10) (6) (3) Taxation liability 72 60 53 62 54 50
32 CASH GENERATED FROM OPERATIONS
Profit (loss) before taxation 619 445 328 Adjusted for: Movement on non-hedge derivatives and other commodity contracts (6) 6 1 Amortisation of tangible assets and right of use assets (note 4) 580 553 685 Finance costs and unwinding of obligations (note 7) 172 168 157 Environmental, rehabilitation and other expenditure (6) (23) (26) Impairment, derecognition of assets and profit (loss) on disposal 3 5 (1) Other expenses (income) 41 28 89 Amortisation of intangible assets (note 4) 3 5 5 Interest income (14) (8) (8) Share of associates and joint ventures' (profit) loss (note 8) (168) (122) (22) Other non-cash movements 43 (4) (4) Movements in working capital (165) (122) (137) 1,102 931 1,067 Movements in working capital: (Increase) decrease in inventories (67) (2) (67) (Increase) decrease in trade, other receivables and other assets (138) (74) (86) Increase (decrease) in trade, other payables and deferred income 40 (46) 16 (165) (122) (137)

GROUP – NOTES TO THE FINANCIAL STATEMENTS FOR THE YEAR ENDED 31 DECEMBER
PAGE 70
US dollar millions 2019 2018 2017
33 RELATED PARTIES
Material related party transactions were as follows (not attributable): Sales and services rendered to related parties Associates 19 — — Joint ventures 7 10 12 Purchases and services acquired from related parties Associates 12 19 16 Joint ventures 1 — 3 Outstanding balances arising from sale of goods and services due by related parties Associates 19 19 7 Joint ventures 1 — 2 Amounts owed to/due by related parties above are unsecured and non-interest bearing.
Loans advanced to joint ventures and associates Loans advanced to associates and joint ventures are included in the carrying value of investments in associates and joint ventures (note 19).
Executive contracts All members of the Executive Management team have permanent employment contracts which entitle them to standard group benefits as defined by their specific region and participation in the company’s Deferred Share Plan (DSP). South African-based executives are paid a portion of their remuneration offshore, which is detailed under a separate contract. This reflects global roles and responsibilities and takes account of offshore business requirements. The executive contracts are reviewed annually and currently continue to include a change in control provision. The change in control is subject to the following triggers: The acquisition of all or part of AngloGold Ashanti; or A number of shareholders holding less than thirty-five percent of the company’s issued share capital consorting to gain a
majority of the board and make management decisions; and The contracts of Executive Committee members are either terminated or their role and employment conditions are
curtailed. In the event of a change in control becoming effective, the executive management team will in certain circumstances be subject to both the notice period and the change in control contract terms. The notice period applied per category of executive and the change in control periods as at 31 December 2019 were as follows:
Executive Committee member Notice Period
Change in control
CEO 12 months 12 months CFO 6 months 6 months Other Executive Management team members 6 months 6 months

GROUP – NOTES TO THE FINANCIAL STATEMENTS FOR THE YEAR ENDED 31 DECEMBER
PAGE 71
33 RELATED PARTIES CONTINUED
Directors and other key management personnel
Executive directors’ and prescribed officers’ remuneration The tables below illustrate the single total figure of remuneration and the total cash equivalent received reconciliation of Executive Directors and Prescribed Officers as prescribed by King IV. It comprises an overview of all the pay elements available to the executive management team for the year ended 31 December 2019.
The following are definitions of terminology used in the adoption of the reporting requirements under King IV.
Reflected In respect of the DSP and LTIP plans, remuneration is reflected when performance conditions have been met during the reporting period.
Settled This refers to remuneration that has been included in prior reporting periods and has now become payable (but may not yet have been paid) to the executive in the current period.
Single total figure remuneration
Base Salary Pension scheme benefits
Once-off relocation
costs
Cash in lieu of
dividends
Other benefits(2)
Awards earned during the period reflected but not yet settled
Single total figure of remuneration
ZAR denominated
portion
USD/AUD denominated
portion(1)
DSP 2019
awards(3)
CSLTIP 2017
awards(4)
Sign-on awards
granted(5)2019 2018 2017
ZAR '000 ZAR '000 ZAR '000 ZAR '000 ZAR '000 ZAR '000 ZAR '000 ZAR '000 ZAR '000 ZAR '000 USD '000(8) USD '000(8) USD '000(8) Executive directors KPM Dushnisky — 18,608 4,648 2,726 142 2,578 61,842 — — 90,544 6,268 7,570 — KC Ramon 5,585 3,981 779 — 194 893 29,135 33,064 — 73,631 5,097 3,547 2,190 Total executive directors 5,585 22,589 5,427 2,726 336 3,471 90,977 33,064 — 164,175 11,365 11,117 2,190 Prescribed officers SD Bailey 3,879 2,560 — — 37 1,160 18,087 5,917 — 31,640 2,190 — — CE Carter(6) — 2,791 5,524 — — 2,277 — — — 10,592 733 3,719 2,322 PD Chenard(7) 2,933 3,900 — 1,270 — 1,729 18,362 — 19,356 47,550 3,292 — — GJ Ehm — 9,074 251 — 163 611 25,329 33,064 — 68,492 4,742 3,286 2,096 L Eybers 1,377 7,945 251 1,135 64 2,310 25,054 29,160 — 67,296 4,659 2,511 1,680 DC Noko(6) 869 396 117 — 17 1,110 — — — 2,509 174 2,846 1,642 S Ntuli 4,607 2,871 631 — 36 343 21,041 7,526 — 37,055 2,565 — — ME Sanz Perez 4,481 3,184 958 — 169 68 20,567 26,447 — 55,874 3,868 2,833 1,637 CB Sheppard(6) 1,159 528 160 — 169 830 — — — 2,846 197 2,961 1,413 TR Sibisi 4,944 2,337 910 — 158 61 19,638 22,713 — 50,761 3,514 2,699 1,126 Total prescribed officers 24,249 35,586 8,802 2,405 813 10,499 148,078 124,827 19,356 374,615 25,934 20,855 11,916
Notes: (1) Salary denominated in USD/AUD for global roles and responsibilities converted to ZAR on payment date. (2) Other benefits include health care, group personal accident, disability, funeral cover, accommodation allowance, airfare and surplus leave encashed. Surplus leave days accrued are automatically encashed unless work requirements allow for carry
over.
(3) The fair value of the DSP comprises of a cash bonus and share awards for the year ended 31 December 2019 with the cash bonus payable in February 2020 and the share awards allocated in February 2020, vesting over a 5-year period in equal tranches.
(4) The fair value of the CSLTIP granted in 2017 with a 3-year performance period ended 31 December 2019. The awards vested on 1 March 2020.
(5) PD Chenard was awarded a sign-on award of ZAR19.36m at start date,1 April 2019, of which ZAR6.33m will be settled in cash with 50% payable upfront, the balance on 1 April 2020 and ZAR13.03m will be settled in shares to vest over a 2 year period in equal tranches in accordance with the JSE Listing requirements.
(6) All salary payments (including salary, performance related payments, pension and other benefits) for CE Carter (retired 28 March 2019), DC Noko (retired 28 February 2019) and CB Sheppard (retired 15 March 2019) are pro-rated in accordance with their retirement dates.
(7) All salary payments (including salary, performance related payments, pension and other benefits) for PD Chenard are pro-rated in accordance with his start date, 1 April 2019.
(8) Convenience conversion to USD at the year-to-date average exchange rate of $1:R14.445 (2018: $1:R13.247; 2017: $1:R13.301).

GROUP – NOTES TO THE FINANCIAL STATEMENTS FOR THE YEAR ENDED 31 DECEMBER
PAGE 72
33 RELATED PARTIES CONTINUED
Directors and other key management personnel CONTINUED
Total cash equivalent received reconciliation
Single total figure
remuneration
Awards earned during the period reflected but not yet settled DSP
2018 cash
portion settled
BSP, CIP and LTIP share awards settled
Sign-on cash settled Sign-on shares settled Total cash equivalent received reconciliation
DSP 2019
awards(1)
CSLTIP 2017
awards(2)
Sign-on awards granted
(3)Grant fair
value(4)
Market movement since grant
date(4)
Vesting fair
value(4)Grant fair
value(4)
Currency movement since grant
date(4)Settlement fair value(4)
Grant fair value(4)
Market movement since grant
date(4)
Vesting fair
value(4) 2019 2018 2017 ZAR '000 ZAR '000 ZAR '000 ZAR '000 ZAR '000 ZAR '000 ZAR '000 ZAR '000 ZAR '000 ZAR '000 ZAR '000 ZAR '000 ZAR '000 ZAR '000 ZAR '000 USD '000(5) USD '000(5) USD '000(5)
Executive directors KPM Dushnisky 90,544 (61,842) — — 7,119 — — — 17,616 (1,010) 16,606 20,188 18,357 38,545 90,972 6,298 550 — KC Ramon 73,631 (29,135) (33,064) — 8,378 21,504 2,849 24,353 — — — — — — 44,163 3,057 1,936 1,515 Total executive directors 164,175 (90,977) (33,064) — 15,497 21,504 2,849 24,353 17,616 (1,010) 16,606 20,188 18,357 38,545 135,135 9,355 2,486 1,515 Prescribed officers SD Bailey 31,640 (18,087) (5,917) — 2,613 4,066 724 4,789 — — — — — — 15,038 1,041 — — CE Carter 10,592 — — — 8,778 26,276 3,913 30,188 — — — — — — 49,558 3,431 1,967 1,907 PD Chenard 47,550 (18,362) — (16,191) — — — — — — — — — — 12,997 900 — — GJ Ehm 68,492 (25,329) (33,064) — 7,113 19,622 (198) 19,424 — — — — — — 36,636 2,536 1,751 1,758 L Eybers 67,296 (25,054) (29,160) — 6,701 7,463 2,825 10,289 — — — — — — 30,072 2,082 1,233 1,101 DC Noko 2,509 — — — 5,851 24,906 4,316 29,222 — — — — — — 37,582 2,602 1,436 1,381 S Ntuli 37,055 (21,041) (7,526) — 3,269 3,956 1,046 5,002 — — — — — — 16,759 1,160 — — ME Sanz Perez 55,874 (20,567) (26,447) — 5,864 18,839 1,460 20,299 — — — — — — 35,023 2,425 1,399 1,350 CB Sheppard 2,846 — — — 6,186 25,446 4,338 29,783 — — — — — — 38,815 2,687 1,146 887 TR Sibisi 50,761 (19,638) (22,713) — 5,495 17,709 876 18,585 — — — — — — 32,490 2,249 886 674 Total prescribed officers 374,615 (148,078) (124,827) (16,191) 51,870 148,283 19,300 167,581 — — — — — — 304,970 21,113 9,818 9,058
Notes: (1) The fair value of the DSP comprises of a cash bonus and share awards for the year ended 31 December 2019 with the cash bonus payable in February 2020 and the share awards allocated in February 2020, vesting over a 5-year
period in equal tranches. (2) The fair value of the CSLTIP granted in 2017 with a 3-year performance period ended 31 December 2019. The awards vested on 1 March 2020. (3) PD Chenard was awarded a sign-on award of ZAR19.36m at start date,1 April 2019, of which ZAR6.33m will be settled in cash with 50% payable upfront, the balance on 1 April 2020 and ZAR13.03m will be settled in shares to vest
over a 2 year period in equal tranches in accordance with the JSE Listing requirements. (4) Reflects the sum of all the grant fair value, the sum of all the share price movements since grant to vesting date and the sum of all the vesting fair value for the vested CSLTIP 2016, vested BSP 2017 and 2018, vested CIP 2017
and 2018 vested sign-on share awards and difference in the currency movements for the vested sign-on cash settled award. These values include awards vested early for CE Carter, DC Noko and CB Sheppard in accordance with their retirement dates as per as per scheme rules.
(5) Convenience conversion to USD at the year-to-date average exchange rate of $1:R14.445 (2018: $1:R13.247; 2017: $1:R13.301).
Details of the share incentive scheme awards are included below.
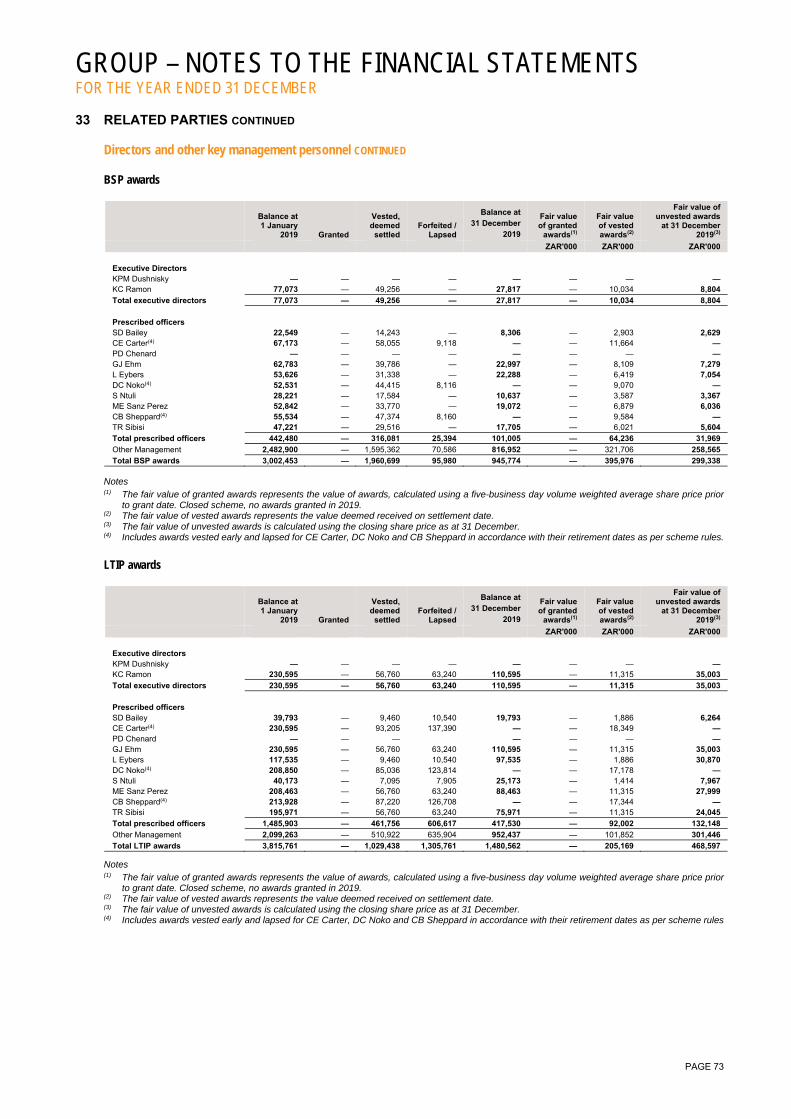
GROUP – NOTES TO THE FINANCIAL STATEMENTS FOR THE YEAR ENDED 31 DECEMBER
PAGE 73
33 RELATED PARTIES CONTINUED Directors and other key management personnel CONTINUED BSP awards
Balance at 1 January
2019 Granted
Vested, deemed
settled Forfeited /
Lapsed
Balance at 31 December
2019
Fair value of granted
awards(1)
Fair value of vested awards(2)
Fair value of unvested awards
at 31 December 2019(3)
ZAR'000 ZAR'000 ZAR'000
Executive Directors KPM Dushnisky — — — — — — — — KC Ramon 77,073 — 49,256 — 27,817 — 10,034 8,804
Total executive directors 77,073 — 49,256 — 27,817 — 10,034 8,804
Prescribed officers SD Bailey 22,549 — 14,243 — 8,306 — 2,903 2,629 CE Carter(4) 67,173 — 58,055 9,118 — — 11,664 — PD Chenard — — — — — — — — GJ Ehm 62,783 — 39,786 — 22,997 — 8,109 7,279 L Eybers 53,626 — 31,338 — 22,288 — 6,419 7,054 DC Noko(4) 52,531 — 44,415 8,116 — — 9,070 — S Ntuli 28,221 — 17,584 — 10,637 — 3,587 3,367 ME Sanz Perez 52,842 — 33,770 — 19,072 — 6,879 6,036 CB Sheppard(4) 55,534 — 47,374 8,160 — — 9,584 — TR Sibisi 47,221 — 29,516 — 17,705 — 6,021 5,604
Total prescribed officers 442,480 — 316,081 25,394 101,005 — 64,236 31,969
Other Management 2,482,900 — 1,595,362 70,586 816,952 — 321,706 258,565
Total BSP awards 3,002,453 — 1,960,699 95,980 945,774 — 395,976 299,338
Notes (1) The fair value of granted awards represents the value of awards, calculated using a five-business day volume weighted average share price prior
to grant date. Closed scheme, no awards granted in 2019. (2) The fair value of vested awards represents the value deemed received on settlement date. (3) The fair value of unvested awards is calculated using the closing share price as at 31 December. (4) Includes awards vested early and lapsed for CE Carter, DC Noko and CB Sheppard in accordance with their retirement dates as per scheme rules.
LTIP awards
Balance at 1 January
2019 Granted
Vested, deemed
settled Forfeited /
Lapsed
Balance at 31 December
2019
Fair value of granted
awards(1)
Fair value of vested awards(2)
Fair value of unvested awards
at 31 December 2019(3)
ZAR'000 ZAR'000 ZAR'000
Executive directors KPM Dushnisky — — — — — — — — KC Ramon 230,595 — 56,760 63,240 110,595 — 11,315 35,003
Total executive directors 230,595 — 56,760 63,240 110,595 — 11,315 35,003
Prescribed officers SD Bailey 39,793 — 9,460 10,540 19,793 — 1,886 6,264 CE Carter(4) 230,595 — 93,205 137,390 — — 18,349 — PD Chenard — — — — — — — GJ Ehm 230,595 — 56,760 63,240 110,595 — 11,315 35,003 L Eybers 117,535 — 9,460 10,540 97,535 — 1,886 30,870 DC Noko(4) 208,850 — 85,036 123,814 — — 17,178 — S Ntuli 40,173 — 7,095 7,905 25,173 — 1,414 7,967 ME Sanz Perez 208,463 — 56,760 63,240 88,463 — 11,315 27,999 CB Sheppard(4) 213,928 — 87,220 126,708 — — 17,344 — TR Sibisi 195,971 — 56,760 63,240 75,971 — 11,315 24,045
Total prescribed officers 1,485,903 — 461,756 606,617 417,530 — 92,002 132,148
Other Management 2,099,263 — 510,922 635,904 952,437 — 101,852 301,446
Total LTIP awards 3,815,761 — 1,029,438 1,305,761 1,480,562 — 205,169 468,597
Notes (1) The fair value of granted awards represents the value of awards, calculated using a five-business day volume weighted average share price prior
to grant date. Closed scheme, no awards granted in 2019. (2) The fair value of vested awards represents the value deemed received on settlement date. (3) The fair value of unvested awards is calculated using the closing share price as at 31 December. (4) Includes awards vested early and lapsed for CE Carter, DC Noko and CB Sheppard in accordance with their retirement dates as per scheme rules
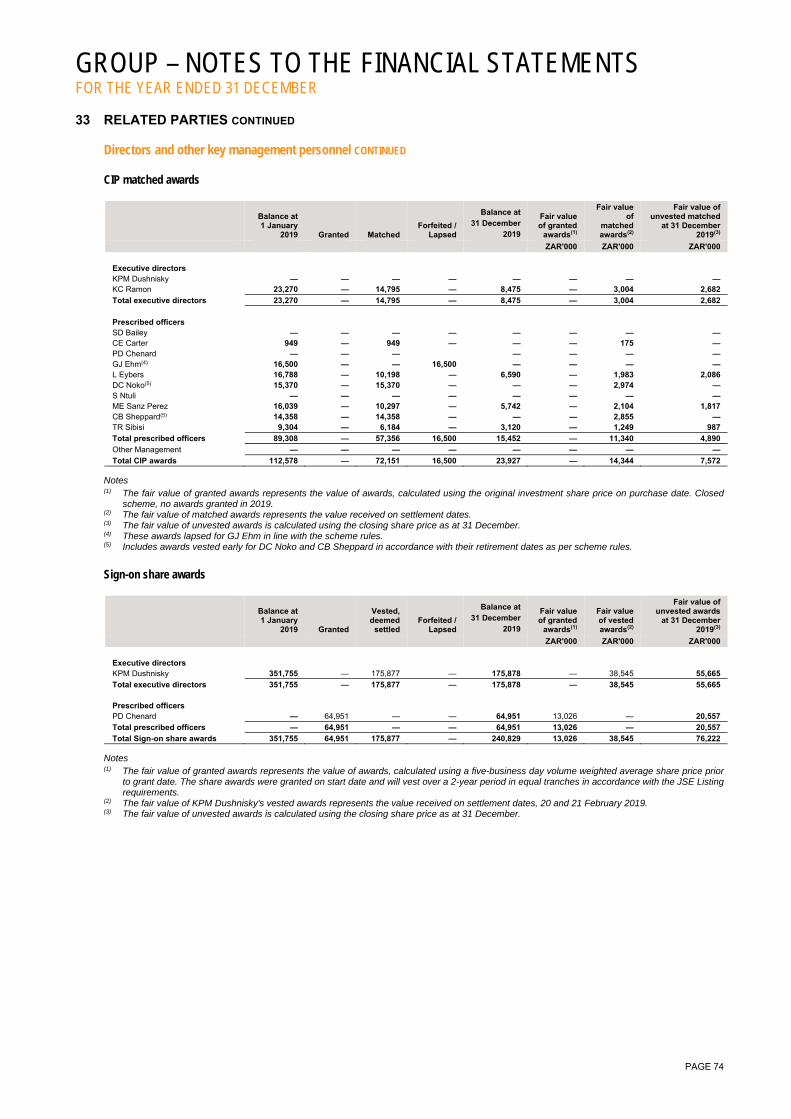
GROUP – NOTES TO THE FINANCIAL STATEMENTS FOR THE YEAR ENDED 31 DECEMBER
PAGE 74
33 RELATED PARTIES CONTINUED Directors and other key management personnel CONTINUED CIP matched awards
Balance at 1 January
2019 Granted Matched Forfeited /
Lapsed
Balance at 31 December
2019
Fair value of granted
awards(1)
Fair value of
matched awards(2)
Fair value of unvested matched
at 31 December 2019(3)
ZAR'000 ZAR'000 ZAR'000
Executive directors KPM Dushnisky — — — — — — — — KC Ramon 23,270 — 14,795 — 8,475 — 3,004 2,682
Total executive directors 23,270 — 14,795 — 8,475 — 3,004 2,682
Prescribed officers SD Bailey — — — — — — — — CE Carter 949 — 949 — — — 175 — PD Chenard — — — — — — — GJ Ehm(4) 16,500 — — 16,500 — — — — L Eybers 16,788 — 10,198 — 6,590 — 1,983 2,086 DC Noko(5) 15,370 — 15,370 — — — 2,974 — S Ntuli — — — — — — — — ME Sanz Perez 16,039 — 10,297 — 5,742 — 2,104 1,817 CB Sheppard(5) 14,358 — 14,358 — — — 2,855 — TR Sibisi 9,304 — 6,184 — 3,120 — 1,249 987
Total prescribed officers 89,308 — 57,356 16,500 15,452 — 11,340 4,890
Other Management — — — — — — — —
Total CIP awards 112,578 — 72,151 16,500 23,927 — 14,344 7,572 Notes (1) The fair value of granted awards represents the value of awards, calculated using the original investment share price on purchase date. Closed
scheme, no awards granted in 2019. (2) The fair value of matched awards represents the value received on settlement dates. (3) The fair value of unvested awards is calculated using the closing share price as at 31 December. (4) These awards lapsed for GJ Ehm in line with the scheme rules. (5) Includes awards vested early for DC Noko and CB Sheppard in accordance with their retirement dates as per scheme rules.
Sign-on share awards
Balance at 1 January
2019 Granted
Vested, deemed
settled Forfeited /
Lapsed
Balance at 31 December
2019
Fair value of granted
awards(1)
Fair value of vested awards(2)
Fair value of unvested awards
at 31 December 2019(3)
ZAR'000 ZAR'000 ZAR'000
Executive directors KPM Dushnisky 351,755 — 175,877 — 175,878 — 38,545 55,665
Total executive directors 351,755 — 175,877 — 175,878 — 38,545 55,665 Prescribed officers PD Chenard — 64,951 — — 64,951 13,026 — 20,557
Total prescribed officers — 64,951 — — 64,951 13,026 — 20,557
Total Sign-on share awards 351,755 64,951 175,877 — 240,829 13,026 38,545 76,222 Notes (1) The fair value of granted awards represents the value of awards, calculated using a five-business day volume weighted average share price prior
to grant date. The share awards were granted on start date and will vest over a 2-year period in equal tranches in accordance with the JSE Listing requirements.
(2) The fair value of KPM Dushnisky's vested awards represents the value received on settlement dates, 20 and 21 February 2019. (3) The fair value of unvested awards is calculated using the closing share price as at 31 December.

GROUP – NOTES TO THE FINANCIAL STATEMENTS FOR THE YEAR ENDED 31 DECEMBER
PAGE 75
33 RELATED PARTIES CONTINUED Directors and other key management personnel CONTINUED DSP awards Subsequent to year end and up to the date of this report, the following DSP awards were granted to executive directors and prescribed officers:
Balance at 1 January
2019 Granted
Vested, deemed
settled Forfeited /
Lapsed
Balance at 31 December
2019
Fair value of granted
awards(1)
Fair value of vested awards(2)
Fair value of unvested awards
at 31 December 2019(3)
ZAR'000 ZAR'000 ZAR'000
Executive directors KPM Dushnisky — 67,742 — — 67,742 13,848 — 21,440 KC Ramon — 89,782 — — 89,782 18,353 — 28,416
Total executive directors — 157,524 — — 157,524 32,201 — 49,856
Prescribed officers SD Bailey — 19,196 — — 19,196 3,924 — 6,076 CE Carter — 98,451 — — 98,451 20,125 — 31,160 PD Chenard — — — — — — — — GJ Ehm — 82,037 — — 82,037 16,770 — 25,965 L Eybers — 77,380 — — 77,380 15,818 — 24,491 DC Noko — 67,548 — — 67,548 13,808 — 21,379 S Ntuli — 24,006 — — 24,006 4,907 — 7,598 ME Sanz Perez — 67,712 — — 67,712 13,842 — 21,431 CB Sheppard — 71,409 — — 71,409 14,597 — 22,601 TR Sibisi — 63,424 — — 63,424 12,965 — 20,074
Total prescribed officers — 571,163 — — 571,163 116,756 — 180,775
Other Management — 940,504 14,623 55,208 870,673 192,258 4,269 275,568
Total DSP awards — 1,669,191 14,623 55,208 1,599,360 341,215 4,269 506,199 Notes (1) The fair value of granted awards represents the value of awards, calculated using a five-business day volume weighted average share price prior
to grant date, 21 February 2019. (2) The fair value of vested awards represents the value deemed received on settlement date. (3) The fair value of unvested awards is calculated using the closing share price as at 31 December.
Non-Executive Director remuneration The table below details the fees and allowances paid to Non-Executive Directors: Non-Executive Directors' fees and allowances
US dollar(1)
Figures in thousands(1)
Figures in thousands(1)
Director fees Committee fees Travel allowance Total Total Total
2019 2018 2017 SM Pityana (Chairman) 303,000 73,750 10,000 386,750 441 372 AH Garner 123,500 37,000 35,000 195,500 200 201 AM Ferguson(2) 123,500 50,500 42,500 216,500 52 — DL Hodgson(3) 33,500 13,500 — 47,000 190 167 JE Tilk(2) 123,500 47,000 60,000 230,500 — — M Ramos(4) 70,000 30,500 6,250 106,750 — — MDC Richter 123,500 71,750 35,000 230,250 235 203 MJ Kirkwood(3) 33,500 22,250 6,250 62,000 247 231 NP January-Bardill 123,500 56,000 6,250 185,750 198 180 R Gasant 123,500 63,500 6,250 193,250 229 182 RJ Ruston 123,500 56,000 38,750 218,250 261 212 Total Fees For 2019 1,304,500 521,750 246,250 2,072,500 2,053 1,748
(1) Directors' compensation is disclosed in US dollars.
(2) Director's travel allowance includes travel for site induction.
(3) Directors resigned effective 9 May 2019.
(4) Director joined on 1 June 2019.
Non-Executive Directors do not hold service contracts with the company. Executive Directors do not receive payment of directors’ fees or committee fees.
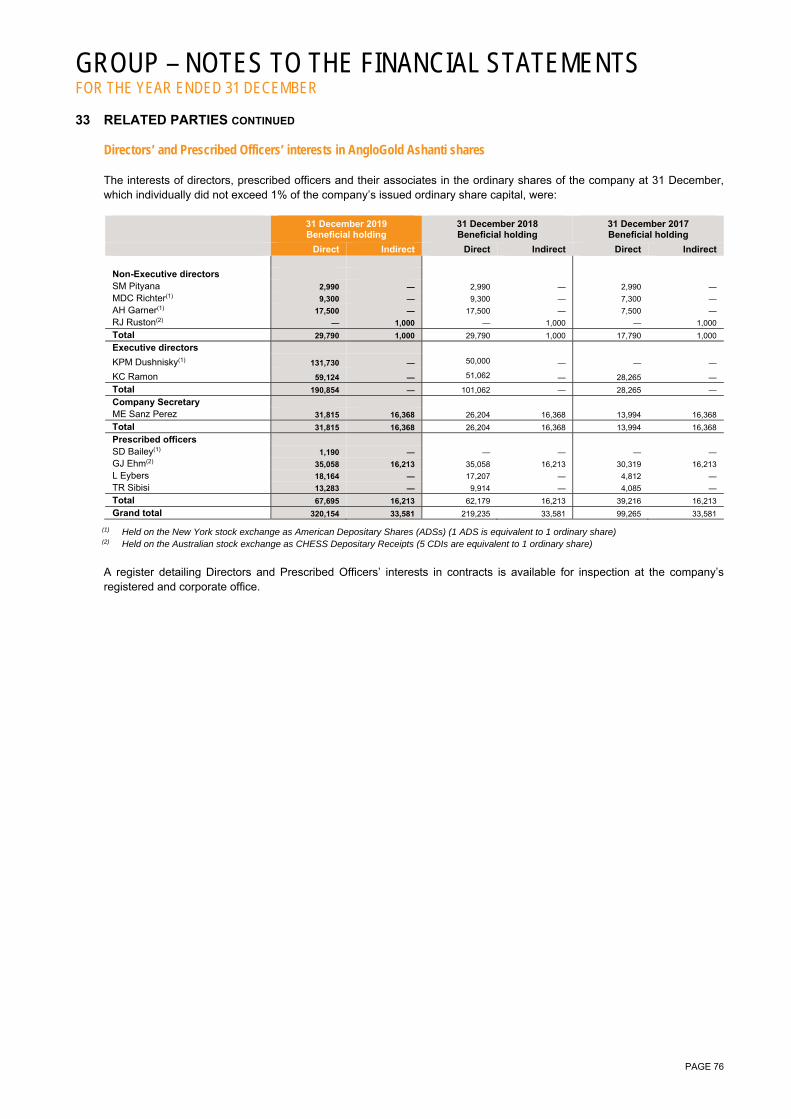
GROUP – NOTES TO THE FINANCIAL STATEMENTS FOR THE YEAR ENDED 31 DECEMBER
PAGE 76
33 RELATED PARTIES CONTINUED Directors’ and Prescribed Officers’ interests in AngloGold Ashanti shares The interests of directors, prescribed officers and their associates in the ordinary shares of the company at 31 December, which individually did not exceed 1% of the company’s issued ordinary share capital, were:
31 December 2019 Beneficial holding
31 December 2018 Beneficial holding
31 December 2017 Beneficial holding
Direct Indirect Direct Indirect Direct Indirect Non-Executive directors SM Pityana 2,990 — 2,990 — 2,990 — MDC Richter(1) 9,300 — 9,300 — 7,300 — AH Garner(1) 17,500 — 17,500 — 7,500 — RJ Ruston(2) — 1,000 — 1,000 — 1,000 Total 29,790 1,000 29,790 1,000 17,790 1,000 Executive directors
KPM Dushnisky(1) 131,730 — 50,000 — — —
KC Ramon 59,124 — 51,062 — 28,265 — Total 190,854 — 101,062 — 28,265 — Company Secretary ME Sanz Perez 31,815 16,368 26,204 16,368 13,994 16,368 Total 31,815 16,368 26,204 16,368 13,994 16,368 Prescribed officers SD Bailey(1) 1,190 — — — — — GJ Ehm(2) 35,058 16,213 35,058 16,213 30,319 16,213 L Eybers 18,164 — 17,207 — 4,812 — TR Sibisi 13,283 — 9,914 — 4,085 — Total 67,695 16,213 62,179 16,213 39,216 16,213 Grand total 320,154 33,581 219,235 33,581 99,265 33,581
(1) Held on the New York stock exchange as American Depositary Shares (ADSs) (1 ADS is equivalent to 1 ordinary share)
(2) Held on the Australian stock exchange as CHESS Depositary Receipts (5 CDIs are equivalent to 1 ordinary share)
A register detailing Directors and Prescribed Officers’ interests in contracts is available for inspection at the company’s registered and corporate office.
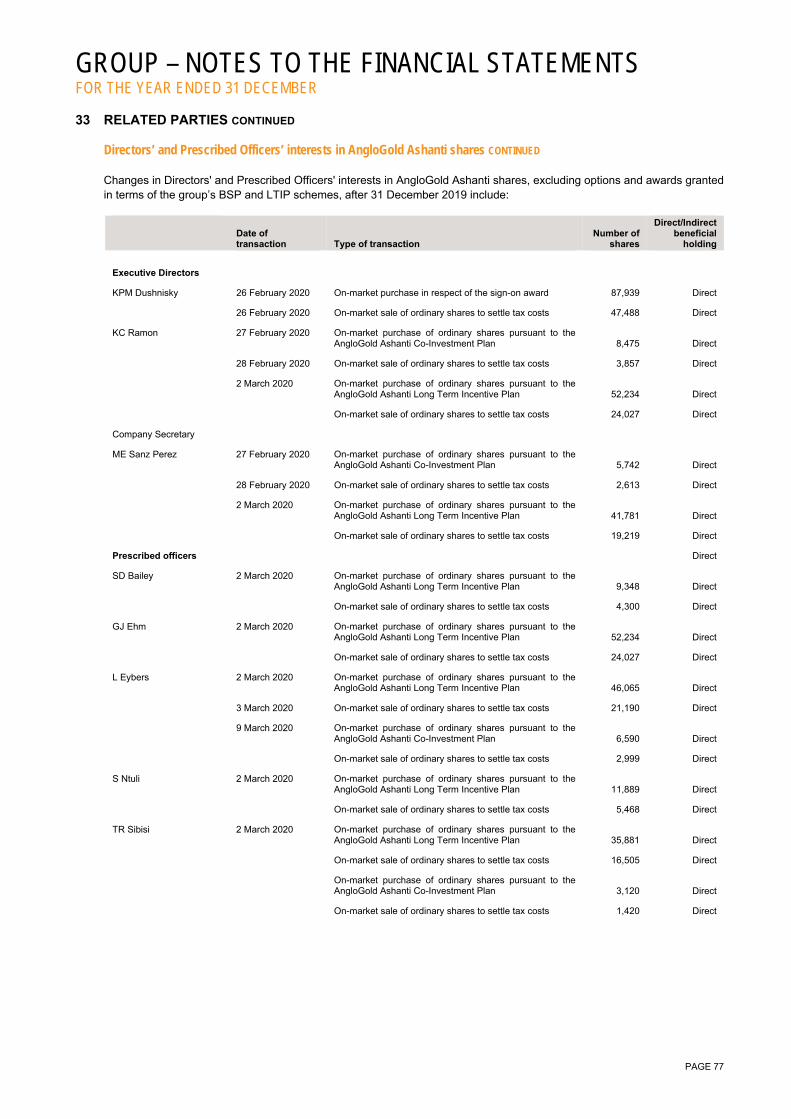
GROUP – NOTES TO THE FINANCIAL STATEMENTS FOR THE YEAR ENDED 31 DECEMBER
PAGE 77
33 RELATED PARTIES CONTINUED Directors’ and Prescribed Officers’ interests in AngloGold Ashanti shares CONTINUED Changes in Directors' and Prescribed Officers' interests in AngloGold Ashanti shares, excluding options and awards granted in terms of the group’s BSP and LTIP schemes, after 31 December 2019 include:
Date of transaction Type of transaction
Number of shares
Direct/Indirect beneficial
holding
Executive Directors
KPM Dushnisky 26 February 2020 On-market purchase in respect of the sign-on award 87,939 Direct
26 February 2020 On-market sale of ordinary shares to settle tax costs 47,488 Direct
KC Ramon 27 February 2020 On-market purchase of ordinary shares pursuant to the AngloGold Ashanti Co-Investment Plan 8,475 Direct
28 February 2020 On-market sale of ordinary shares to settle tax costs 3,857 Direct
2 March 2020 On-market purchase of ordinary shares pursuant to the AngloGold Ashanti Long Term Incentive Plan 52,234 Direct
On-market sale of ordinary shares to settle tax costs 24,027 Direct
Company Secretary
ME Sanz Perez 27 February 2020 On-market purchase of ordinary shares pursuant to the AngloGold Ashanti Co-Investment Plan 5,742 Direct
28 February 2020 On-market sale of ordinary shares to settle tax costs 2,613 Direct
2 March 2020 On-market purchase of ordinary shares pursuant to the AngloGold Ashanti Long Term Incentive Plan 41,781 Direct
On-market sale of ordinary shares to settle tax costs 19,219 Direct
Prescribed officers Direct
SD Bailey 2 March 2020 On-market purchase of ordinary shares pursuant to the AngloGold Ashanti Long Term Incentive Plan 9,348 Direct
On-market sale of ordinary shares to settle tax costs 4,300 Direct
GJ Ehm 2 March 2020 On-market purchase of ordinary shares pursuant to the AngloGold Ashanti Long Term Incentive Plan 52,234 Direct
On-market sale of ordinary shares to settle tax costs 24,027 Direct
L Eybers 2 March 2020 On-market purchase of ordinary shares pursuant to the AngloGold Ashanti Long Term Incentive Plan 46,065 Direct
3 March 2020 On-market sale of ordinary shares to settle tax costs 21,190 Direct
9 March 2020 On-market purchase of ordinary shares pursuant to the AngloGold Ashanti Co-Investment Plan 6,590 Direct
On-market sale of ordinary shares to settle tax costs 2,999 Direct
S Ntuli 2 March 2020 On-market purchase of ordinary shares pursuant to the AngloGold Ashanti Long Term Incentive Plan 11,889 Direct
On-market sale of ordinary shares to settle tax costs 5,468 Direct
TR Sibisi 2 March 2020 On-market purchase of ordinary shares pursuant to the AngloGold Ashanti Long Term Incentive Plan 35,881 Direct
On-market sale of ordinary shares to settle tax costs 16,505 Direct
On-market purchase of ordinary shares pursuant to the AngloGold Ashanti Co-Investment Plan 3,120 Direct
On-market sale of ordinary shares to settle tax costs 1,420 Direct
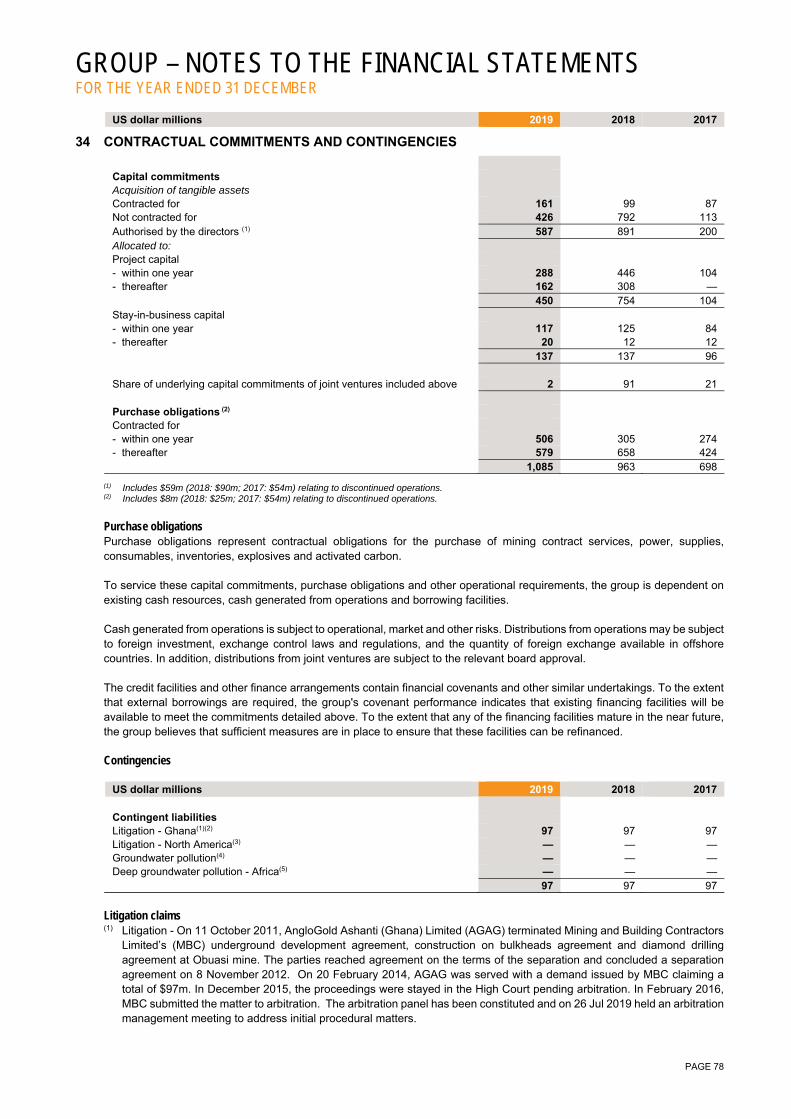
GROUP – NOTES TO THE FINANCIAL STATEMENTS FOR THE YEAR ENDED 31 DECEMBER
PAGE 78
US dollar millions 2019 2018 2017
34 CONTRACTUAL COMMITMENTS AND CONTINGENCIES
Capital commitments Acquisition of tangible assets Contracted for 161 99 87 Not contracted for 426 792 113 Authorised by the directors (1) 587 891 200 Allocated to: Project capital - within one year 288 446 104 - thereafter 162 308 — 450 754 104 Stay-in-business capital - within one year 117 125 84 - thereafter 20 12 12 137 137 96 Share of underlying capital commitments of joint ventures included above 2 91 21 Purchase obligations (2) Contracted for - within one year 506 305 274 - thereafter 579 658 424 1,085 963 698
(1) Includes $59m (2018: $90m; 2017: $54m) relating to discontinued operations. (2) Includes $8m (2018: $25m; 2017: $54m) relating to discontinued operations.
Purchase obligations Purchase obligations represent contractual obligations for the purchase of mining contract services, power, supplies, consumables, inventories, explosives and activated carbon. To service these capital commitments, purchase obligations and other operational requirements, the group is dependent on existing cash resources, cash generated from operations and borrowing facilities. Cash generated from operations is subject to operational, market and other risks. Distributions from operations may be subject to foreign investment, exchange control laws and regulations, and the quantity of foreign exchange available in offshore countries. In addition, distributions from joint ventures are subject to the relevant board approval. The credit facilities and other finance arrangements contain financial covenants and other similar undertakings. To the extent that external borrowings are required, the group's covenant performance indicates that existing financing facilities will be available to meet the commitments detailed above. To the extent that any of the financing facilities mature in the near future, the group believes that sufficient measures are in place to ensure that these facilities can be refinanced. Contingencies
US dollar millions 2019 2018 2017 Contingent liabilities Litigation - Ghana(1)(2) 97 97 97 Litigation - North America(3) — — — Groundwater pollution(4) — — — Deep groundwater pollution - Africa(5) — — — 97 97 97
Litigation claims (1) Litigation - On 11 October 2011, AngloGold Ashanti (Ghana) Limited (AGAG) terminated Mining and Building Contractors
Limited’s (MBC) underground development agreement, construction on bulkheads agreement and diamond drilling agreement at Obuasi mine. The parties reached agreement on the terms of the separation and concluded a separation agreement on 8 November 2012. On 20 February 2014, AGAG was served with a demand issued by MBC claiming a total of $97m. In December 2015, the proceedings were stayed in the High Court pending arbitration. In February 2016, MBC submitted the matter to arbitration. The arbitration panel has been constituted and on 26 Jul 2019 held an arbitration management meeting to address initial procedural matters.
GROUP – NOTES TO THE FINANCIAL STATEMENTS FOR THE YEAR ENDED 31 DECEMBER
PAGE 79
34 CONTRACTUAL COMMITMENTS AND CONTINGENCIES CONTINUED (2) Litigation - AGAG received a summons on 2 April 2013 from Abdul Waliyu and 152 others in which the plaintiffs allege
that they were or are residents of the Obuasi municipality or its suburbs and that their health has been adversely affected by emission and/or other environmental impacts arising in connection with the current and/or historical operations of the Pompora Treatment Plant (PTP), which was decommissioned in 2000. The plaintiffs’ alleged injuries include respiratory infections, skin diseases and certain cancers. The plaintiffs subsequently did not timely file their application for directions. On 24 February 2014, executive members of the PTP (AGAG) Smoke Effect Association (PASEA), sued AGAG by themselves and on behalf of their members (undisclosed number) on grounds similar to those discussed above, as well as economic hardships as a result of constant failure of their crops. This matter has been adjourned indefinitely. In view of the limitation of current information for the accurate estimation of a liability, no reliable estimate can be made for AGAG’s obligation in either matter.
(3) Litigation - On 19 October 2017, Newmont Mining Co. filed a lawsuit in the United States District Court for the Southern
District of New York against AngloGold Ashanti and certain related parties, alleging that AngloGold Ashanti and such parties did not provide Newmont with certain information material to its purchase of the Cripple Creek & Victor Gold Mining Company in 2015 during the negotiation- and-sale process. During November 2019, the AngloGold Ashanti defendants filed two motions for summary judgement with the Court, requesting the dismissal of all causes of actions against all defendants. On 18 March 2020, the Court granted the motions, dismissed all causes of actions and ordered the case to be closed. Newmont Mining Co. has 30 days from the date of the order to file an appeal to the Court’s decision.
Tax claims For a discussion on tax claims and tax uncertainties refer to note 12.
Other (4) Groundwater pollution - AngloGold Ashanti has identified groundwater contamination plumes at certain of its operations,
which have occurred primarily as a result of seepage from mine residue stockpiles. Numerous scientific, technical and legal studies have been undertaken to assist in determining the magnitude of the contamination and to find sustainable remediation solutions. The group has instituted processes to reduce future potential seepage and it has been demonstrated that Monitored Natural Attenuation (MNA) by the existing environment will contribute to improvements in some instances. Furthermore, literature reviews, field trials and base line modelling techniques suggest, but have not yet proven, that the use of phyto-technologies can address the soil and groundwater contamination. Subject to the completion of trials and the technology being a proven remediation technique, no reliable estimate can be made for the obligation.
(5) Deep groundwater pollution - The group has identified potential water ingress and future pollution risk posed by deep
groundwater in certain underground mines in Africa. Various studies have been undertaken by AngloGold Ashanti since 1999 to understand this potential risk. In South Africa, due to the interconnected nature of mining operations, any proposed solution needs to be a combined one supported by all the mines located in these gold fields. As a result, the Mineral and Petroleum Resources Development Act (MPRDA) requires that the affected mining companies develop a Regional Mine Closure Strategy to be approved by the Department of Mineral Resources. In view of the limitation of current information for the accurate estimation of a liability, no reliable estimate can be made for the obligation.
35 FINANCIAL RISK MANAGEMENT STATEMENTS
In the normal course of its operations, the group is exposed to gold price, other commodity price, foreign exchange, interest rate, liquidity, equity price (deemed to be immaterial) and credit risks. In order to manage these risks, the group may enter into transactions which make use of both on- and off-balance sheet derivatives. The group does not acquire, hold or issue derivatives for speculative purposes. The group has developed a comprehensive risk management process to facilitate, control and monitor these risks. The board has approved and monitors this risk management process, inclusive of documented treasury policies, counterparty limits and controlling and reporting structures.
Managing risk in the group Risk management activities within the group are the ultimate responsibility of the board of directors. The Chief Financial Officer is responsible to the board of directors for the design, implementation and monitoring of the risk management plan. The Audit and Risk Committee is responsible for overseeing risk management plans and systems, as well as financial risks which include a review of treasury activities and the group’s counterparties.
The financial risk management objectives of the group are defined as follows: safeguarding the group's core earnings stream from its major assets through the effective control and management of
gold price risk, other commodity risk, foreign exchange risk and interest rate risk; effective and efficient usage of credit facilities in both the short and long-term through the adoption of reliable liquidity
management planning and procedures; ensuring that investment and hedging transactions are undertaken with creditworthy counterparties; and ensuring that all contracts and agreements related to risk management activities are co-ordinated, consistent throughout
the group and that they comply where necessary with all relevant regulatory and statutory requirements.
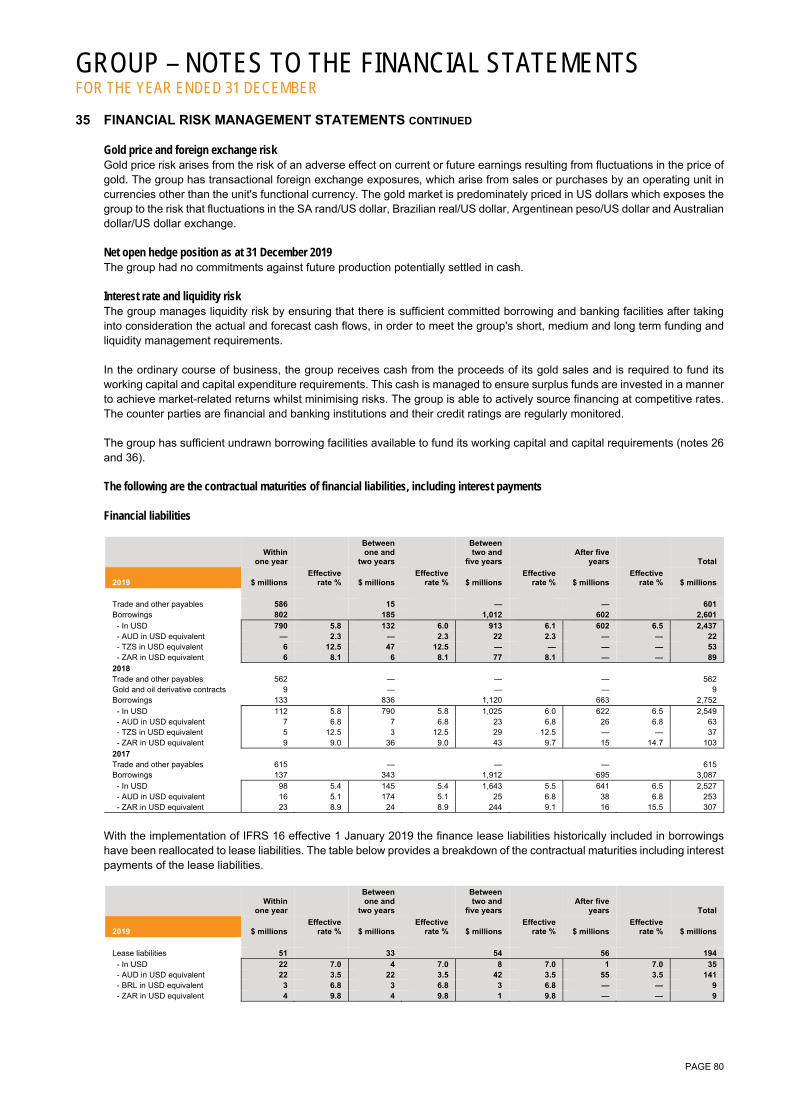
GROUP – NOTES TO THE FINANCIAL STATEMENTS FOR THE YEAR ENDED 31 DECEMBER
PAGE 80
35 FINANCIAL RISK MANAGEMENT STATEMENTS CONTINUED Gold price and foreign exchange risk Gold price risk arises from the risk of an adverse effect on current or future earnings resulting from fluctuations in the price of gold. The group has transactional foreign exchange exposures, which arise from sales or purchases by an operating unit in currencies other than the unit's functional currency. The gold market is predominately priced in US dollars which exposes the group to the risk that fluctuations in the SA rand/US dollar, Brazilian real/US dollar, Argentinean peso/US dollar and Australian dollar/US dollar exchange. Net open hedge position as at 31 December 2019 The group had no commitments against future production potentially settled in cash. Interest rate and liquidity risk The group manages liquidity risk by ensuring that there is sufficient committed borrowing and banking facilities after taking into consideration the actual and forecast cash flows, in order to meet the group's short, medium and long term funding and liquidity management requirements. In the ordinary course of business, the group receives cash from the proceeds of its gold sales and is required to fund its working capital and capital expenditure requirements. This cash is managed to ensure surplus funds are invested in a manner to achieve market-related returns whilst minimising risks. The group is able to actively source financing at competitive rates. The counter parties are financial and banking institutions and their credit ratings are regularly monitored. The group has sufficient undrawn borrowing facilities available to fund its working capital and capital requirements (notes 26 and 36). The following are the contractual maturities of financial liabilities, including interest payments
Financial liabilities
Within
one year
Between one and
two years
Between two and
five years After five
years Total
2019 $ millions Effective
rate % $ millions Effective
rate % $ millions Effective
rate % $ millions Effective
rate % $ millions
Trade and other payables 586 15 — — 601 Borrowings 802 185 1,012 602 2,601
- In USD 790 5.8 132 6.0 913 6.1 602 6.5 2,437 - AUD in USD equivalent — 2.3 — 2.3 22 2.3 — — 22 - TZS in USD equivalent 6 12.5 47 12.5 — — — — 53 - ZAR in USD equivalent 6 8.1 6 8.1 77 8.1 — — 89
2018 Trade and other payables 562 — — — 562 Gold and oil derivative contracts 9 — — — 9 Borrowings 133 836 1,120 663 2,752
- In USD 112 5.8 790 5.8 1,025 6.0 622 6.5 2,549 - AUD in USD equivalent 7 6.8 7 6.8 23 6.8 26 6.8 63 - TZS in USD equivalent 5 12.5 3 12.5 29 12.5 — — 37 - ZAR in USD equivalent 9 9.0 36 9.0 43 9.7 15 14.7 103
2017 Trade and other payables 615 — — — 615 Borrowings 137 343 1,912 695 3,087
- In USD 98 5.4 145 5.4 1,643 5.5 641 6.5 2,527 - AUD in USD equivalent 16 5.1 174 5.1 25 6.8 38 6.8 253 - ZAR in USD equivalent 23 8.9 24 8.9 244 9.1 16 15.5 307
With the implementation of IFRS 16 effective 1 January 2019 the finance lease liabilities historically included in borrowings have been reallocated to lease liabilities. The table below provides a breakdown of the contractual maturities including interest payments of the lease liabilities.
Within
one year
Between one and
two years
Between two and
five years After five
years Total
2019 $ millions Effective
rate % $ millions Effective
rate % $ millions Effective
rate % $ millions Effective
rate % $ millions
Lease liabilities 51 33 54 56 194
- In USD 22 7.0 4 7.0 8 7.0 1 7.0 35 - AUD in USD equivalent 22 3.5 22 3.5 42 3.5 55 3.5 141 - BRL in USD equivalent 3 6.8 3 6.8 3 6.8 — — 9 - ZAR in USD equivalent 4 9.8 4 9.8 1 9.8 — — 9

GROUP – NOTES TO THE FINANCIAL STATEMENTS FOR THE YEAR ENDED 31 DECEMBER
PAGE 81
35 FINANCIAL RISK MANAGEMENT STATEMENTS CONTINUED Credit risk Credit risk arises from the risk that a counterparty may default or not meet its obligations timeously. The group minimises credit risk by ensuring that credit risk is spread over a number of counterparties. These counterparties are financial and banking institutions. Counterparty credit limits and exposures are reviewed by the Audit and Risk Committee. Where possible, management ensures that netting agreements are in place. No set-off is applied to the statement of financial position due to the different maturity profiles of assets and liabilities. The combined maximum credit risk exposure of the group is as follows:
US dollar millions 2019 2018 2017 Other investments(1) 67 59 58 Trade and other receivables 57 41 33 Cash restricted for use (note 23) 64 66 65 Cash and cash equivalents (note 24) 456 329 205 Total financial assets 644 495 361
Trade and other receivables, that are past due but not impaired totalled $15m (2018: $6m; 2017: $10m). Other investments that are impaired totalled $1m (2018: nil; 2017: $3m). Trade receivables mainly comprise banking institutions purchasing gold bullion. Normal market settlement terms are two working days. The group does not generally obtain collateral or other security to support financial instruments subject to credit risk, but monitors the credit standing of counterparties. Fair value of financial instruments
The estimated fair values of financial instruments are determined at discrete points in time based on relevant market information. The estimated fair value of the group's other investments and borrowings as at 31 December are as follows: Type of instrument
Carrying
amount Fair value Carrying amount Fair value
Carrying amount Fair value
2019 2018 2017 Financial assets Other investments (1) 170 170 147 147 138 140 Financial liabilities Borrowings (note 26) 2,033 2,135 2,050 2,084 2,268 2,377
(1) Included in other investments are amounts transferred to held for sale
The following methods and assumptions were used to estimate the fair value of each class of financial instrument: Cash restricted for use, cash and cash equivalents, trade, other receivables and other assets and trade and other payables
The carrying amounts approximate fair value due to their short-term nature. Investments and other non-current assets
Listed equity investments classified as FVTOCI and FVTPL are carried at fair value in level 1 of the fair value hierarchy while fixed income investments and other non-current assets are carried at amortised cost. Borrowings
The rated bonds are carried at amortised cost and their fair values are their closing market values at the reporting date (fair value hierarchy - level 1). The interest rate on the remaining borrowings is set on a short-term floating rate basis, and accordingly the carrying amount is considered to approximate fair value

GROUP – NOTES TO THE FINANCIAL STATEMENTS FOR THE YEAR ENDED 31 DECEMBER
PAGE 82
35 FINANCIAL RISK MANAGEMENT STATEMENTS CONTINUED Fair value hierarchy
The group uses the following hierarchy for determining and disclosing the fair value of financial instruments: Level 1: quoted prices (unadjusted) in active markets for identical assets or liabilities; Level 2: inputs other than quoted prices included in level 1 that are observable for the asset or liability, either directly
(as prices) or indirectly (derived from prices); and Level 3: inputs for the asset or liability that are not based on observable market data (unobservable inputs). The following table sets out the group's financial assets measured at fair value by level within the fair value hierarchy as at 31 December: Type of instrument
Assets measured at fair value on a recurring basis US dollar millions Level 1 Level 2 Level 3 Total 2019 Equity securities - FVTPL(1) 21 — — 21 Equity securities - FVTOCI 82 — — 82 2018 Equity securities - FVTPL 19 — — 19 Equity securities - FVTOCI 69 — — 69 2017 Equity securities - available-for-sale 80 — — 80
(1) Included in equity securities - FVTPL are amounts transferred to held for sale.
Environmental obligations
Pursuant to environmental regulations in the countries in which we operate, we are obligated to close our operations and rehabilitate the lands which we mine in accordance with these regulations. As a consequence, AngloGold Ashanti is required in some circumstances to provide either reclamations bonds issued by third party entities, establish independent trust funds or provide guarantees issued by the operation, to the respective environmental protection agency or such other government department with responsibility for environmental oversight in the respective country to cover the potential environmental rehabilitation obligation in specified amounts. In most cases, the environmental obligations will expire on completion of the rehabilitation although in some cases we are required to potentially post bonds for events unknown that may arise after the rehabilitation has been completed. In Australia, since 2014, the group has paid an amount of AUD $6.8m into a Mine Rehabilitation Fund for a current carrying value of the liability of AUD $137.9m. At Iduapriem the group has provided a bond comprised of a cash component of $9.99m with a further bond guarantee amounting to $36.6m issued by Ecobank Ghana Limited, United Bank for Africa (Ghana) Limited and Barclays Ghana Limited for a current carrying value of the liability of $46.3m. At Obuasi the group has provided a bond comprised of a cash component of $20.6m with a further bank guarantee amounting to $30m issued by Nedbank Limited for a current carrying value of the liability of $186.3m. In some circumstances, the group may be required to post further bonds in future years which will have a consequential income statement charge for the fees charged by the providers of the reclamation bonds. In South Africa, AngloGold Ashanti has established a trust fund which has assets of ZAR 1.156bn and guarantees of ZAR 0.549bn issued by various banks, for a current carrying value of the liability of ZAR 0.897bn. The fund, guarantees and liability form part of the South African disposal group and have been transferred to held for sale. Refer to note 9. Sensitivity analysis
Interest rate risk on other financial assets and liabilities (excluding derivatives)
The group also monitors interest rate risk on other financial assets and liabilities. The following table shows the approximate interest rate sensitivities of other financial assets and liabilities at 31 December (actual changes in the timing and amount of the following variables may differ from the assumed changes below). As the sensitivity is the same (linear) for both increases and decreases in interest rates only absolute numbers are presented.
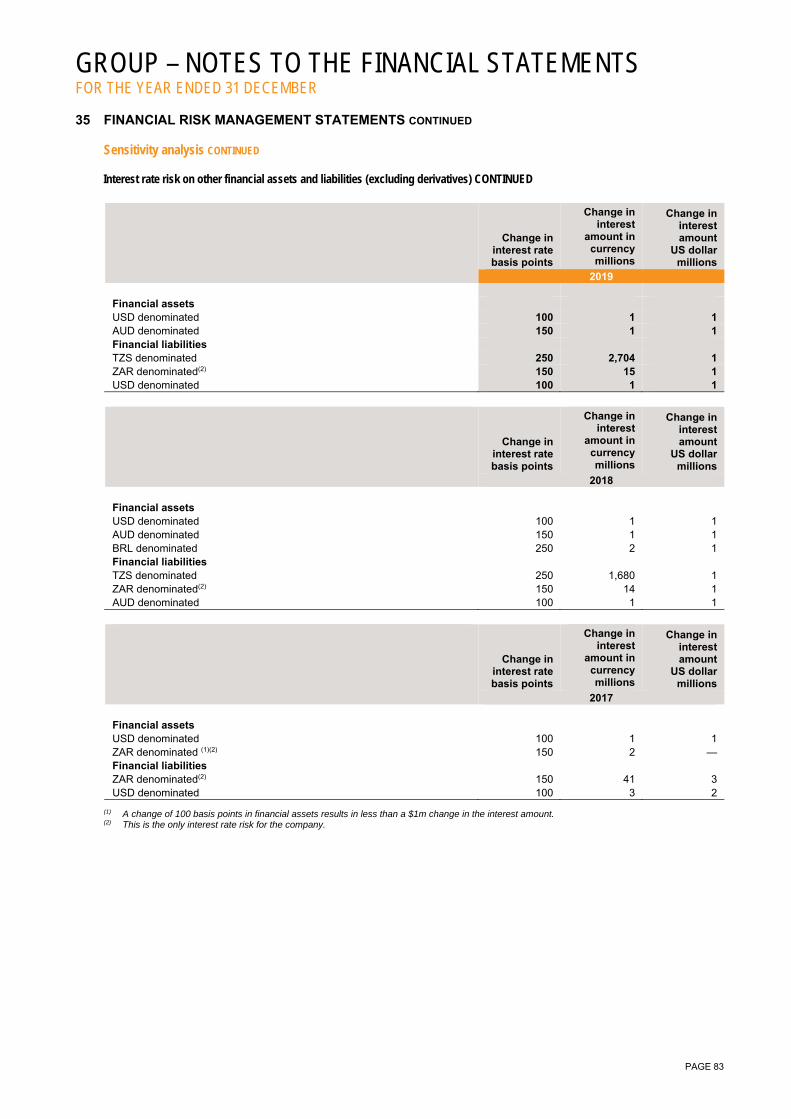
GROUP – NOTES TO THE FINANCIAL STATEMENTS FOR THE YEAR ENDED 31 DECEMBER
PAGE 83
35 FINANCIAL RISK MANAGEMENT STATEMENTS CONTINUED Sensitivity analysis CONTINUED
Interest rate risk on other financial assets and liabilities (excluding derivatives) CONTINUED
Change in interest rate basis points
Change in interest
amount in currency millions
Change in interest amount
US dollar millions
2019 Financial assets USD denominated 100 1 1 AUD denominated 150 1 1 Financial liabilities TZS denominated 250 2,704 1 ZAR denominated(2) 150 15 1 USD denominated 100 1 1
Change in interest rate basis points
Change in interest
amount in currency millions
Change in interest amount
US dollar millions
2018 Financial assets USD denominated 100 1 1 AUD denominated 150 1 1 BRL denominated 250 2 1 Financial liabilities TZS denominated 250 1,680 1 ZAR denominated(2) 150 14 1 AUD denominated 100 1 1
Change in interest rate basis points
Change in interest
amount in currency millions
Change in interest amount
US dollar millions
2017 Financial assets USD denominated 100 1 1 ZAR denominated (1)(2) 150 2 — Financial liabilities ZAR denominated(2) 150 41 3 USD denominated 100 3 2
(1) A change of 100 basis points in financial assets results in less than a $1m change in the interest amount. (2) This is the only interest rate risk for the company.
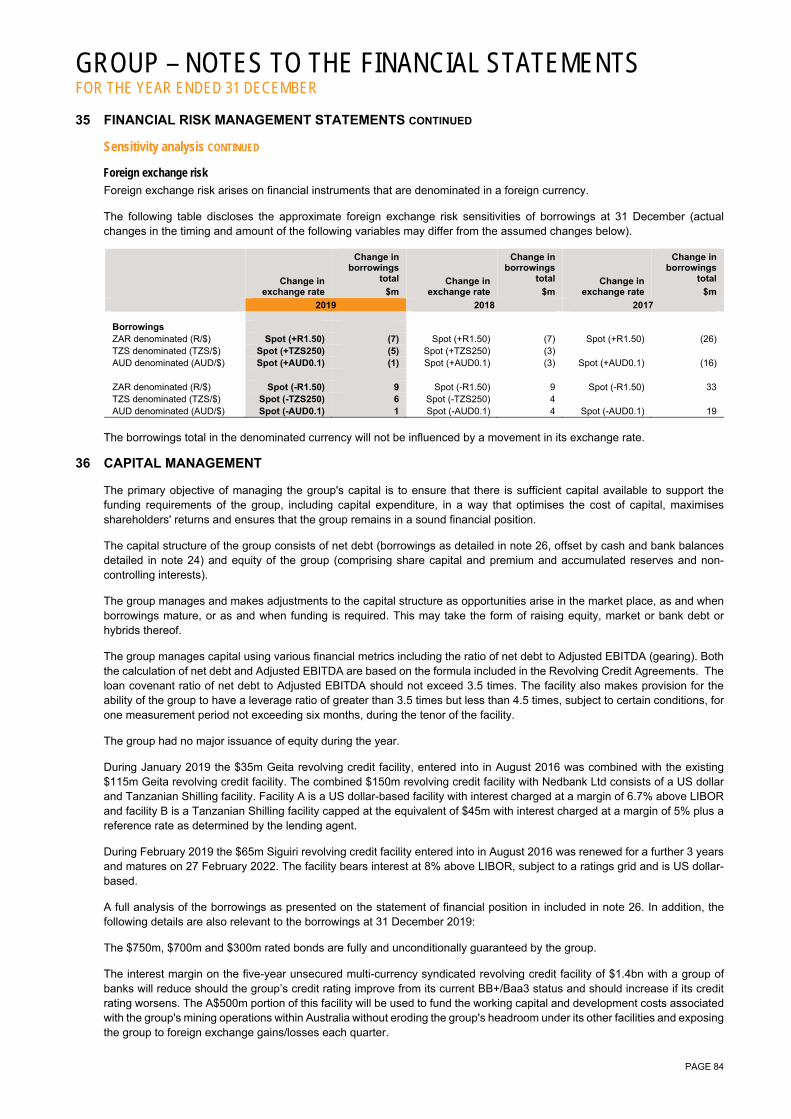
GROUP – NOTES TO THE FINANCIAL STATEMENTS FOR THE YEAR ENDED 31 DECEMBER
PAGE 84
35 FINANCIAL RISK MANAGEMENT STATEMENTS CONTINUED
Sensitivity analysis CONTINUED Foreign exchange risk
Foreign exchange risk arises on financial instruments that are denominated in a foreign currency.
The following table discloses the approximate foreign exchange risk sensitivities of borrowings at 31 December (actual changes in the timing and amount of the following variables may differ from the assumed changes below).
Change in
exchange rate
Change in borrowings
total
$m Change in
exchange rate
Change in borrowings
total
$m Change in
exchange rate
Change in borrowings
total
$m
2019 2018 2017
Borrowings ZAR denominated (R/$) Spot (+R1.50) (7) Spot (+R1.50) (7) Spot (+R1.50) (26) TZS denominated (TZS/$) Spot (+TZS250) (5) Spot (+TZS250) (3) AUD denominated (AUD/$) Spot (+AUD0.1) (1) Spot (+AUD0.1) (3) Spot (+AUD0.1) (16) ZAR denominated (R/$) Spot (-R1.50) 9 Spot (-R1.50) 9 Spot (-R1.50) 33 TZS denominated (TZS/$) Spot (-TZS250) 6 Spot (-TZS250) 4 AUD denominated (AUD/$) Spot (-AUD0.1) 1 Spot (-AUD0.1) 4 Spot (-AUD0.1) 19
The borrowings total in the denominated currency will not be influenced by a movement in its exchange rate.
36 CAPITAL MANAGEMENT
The primary objective of managing the group's capital is to ensure that there is sufficient capital available to support the funding requirements of the group, including capital expenditure, in a way that optimises the cost of capital, maximises shareholders' returns and ensures that the group remains in a sound financial position.
The capital structure of the group consists of net debt (borrowings as detailed in note 26, offset by cash and bank balances detailed in note 24) and equity of the group (comprising share capital and premium and accumulated reserves and non-controlling interests).
The group manages and makes adjustments to the capital structure as opportunities arise in the market place, as and when borrowings mature, or as and when funding is required. This may take the form of raising equity, market or bank debt or hybrids thereof.
The group manages capital using various financial metrics including the ratio of net debt to Adjusted EBITDA (gearing). Both the calculation of net debt and Adjusted EBITDA are based on the formula included in the Revolving Credit Agreements. The loan covenant ratio of net debt to Adjusted EBITDA should not exceed 3.5 times. The facility also makes provision for the ability of the group to have a leverage ratio of greater than 3.5 times but less than 4.5 times, subject to certain conditions, for one measurement period not exceeding six months, during the tenor of the facility.
The group had no major issuance of equity during the year.
During January 2019 the $35m Geita revolving credit facility, entered into in August 2016 was combined with the existing $115m Geita revolving credit facility. The combined $150m revolving credit facility with Nedbank Ltd consists of a US dollar and Tanzanian Shilling facility. Facility A is a US dollar-based facility with interest charged at a margin of 6.7% above LIBOR and facility B is a Tanzanian Shilling facility capped at the equivalent of $45m with interest charged at a margin of 5% plus a reference rate as determined by the lending agent.
During February 2019 the $65m Siguiri revolving credit facility entered into in August 2016 was renewed for a further 3 years and matures on 27 February 2022. The facility bears interest at 8% above LIBOR, subject to a ratings grid and is US dollar-based.
A full analysis of the borrowings as presented on the statement of financial position in included in note 26. In addition, the following details are also relevant to the borrowings at 31 December 2019:
The $750m, $700m and $300m rated bonds are fully and unconditionally guaranteed by the group.
The interest margin on the five-year unsecured multi-currency syndicated revolving credit facility of $1.4bn with a group of banks will reduce should the group’s credit rating improve from its current BB+/Baa3 status and should increase if its credit rating worsens. The A$500m portion of this facility will be used to fund the working capital and development costs associated with the group's mining operations within Australia without eroding the group's headroom under its other facilities and exposing the group to foreign exchange gains/losses each quarter.

GROUP – NOTES TO THE FINANCIAL STATEMENTS FOR THE YEAR ENDED 31 DECEMBER
PAGE 85
36 CAPITAL MANAGEMENT CONTINUED The R1bn, R1.4bn and R2.5bn unsecured syndicated revolving credit facilities will be used to fund the working capital and development costs associated with the group's operations within South Africa without eroding the group's headroom under its other facilities and exposing the group to foreign exchange gains/losses each quarter. Amounts are converted to US dollars at year end exchange rates. Gearing ratio (Adjusted net debt to Adjusted EBITDA)
US dollar millions 2019 2018 2017 Adjusted net debt from continuing operations Borrowings- non-current portion (note 26) 1,299 1,911 2,230 Lease liabilities - non-current portion (note 16) 126 — — Borrowings - current portion (note 26) 734 139 38 Lease liabilities - current portion (note 16) 45 — — Total borrowings 2,204 2,050 2,268 Less cash and cash equivalents (note 24) (456) (329) (205) Net debt 1,748 1,721 2,063 Adjustments: IFRS16 lease adjustments (119) — — Corporate office lease — (9) (15) Unamortised portion of borrowing costs 16 13 18 Cash restricted for use (note 23) (64) (66) (65) Adjusted net debt 1,581 1,659 2,001 The Adjusted EBITDA calculation included in this note is based on the formula included in the Revolving Credit Agreements for compliance with the debt covenant formula. Adjusted EBITDA from continuing operations Profit before taxation 619 445 328 Add back: Finance costs and unwinding of obligations (note 7) 172 168 157 Interest income (14) (8) (8) Amortisation of tangible, intangible and right of use assets (note 4) 583 558 690 Other amortisation 6 11 3 Associates and joint ventures’ adjustments for amortisation, interest, taxation and other 149 158 117 EBITDA 1,515 1,332 1,287 Adjustments: Foreign exchange losses 12 9 11 Dividend income — (2) — Retrenchment and related costs 7 4 9 Care and maintenance costs (note 6) 47 39 62 Impairment, derecognition of assets and (profit) loss on disposal 6 7 2 (Gain) loss on non-hedge derivatives and other commodity contracts (5) 2 — Associates and joint ventures’ share of costs (2) (3) (2) Adjusted EBITDA (as defined in the Revolving Credit Agreements) 1,580 1,388 1,369 Gearing ratio (Adjusted net debt to Adjusted EBITDA) 1.00:1 1.20:1 1.46:1 Maximum debt covenant ratio allowed per agreement 3.5:1 3.5:1 3.5:1
37 SUBSEQUENT EVENTS
Sale of South African assets - On 12 February 2020, AngloGold Ashanti announced that it has reached an agreement to sell its remaining South African producing assets and related liabilities to Harmony Gold Mining Company Limited. Consideration for the transaction is in cash and deferred payments with expected proceeds of around $300m, subject to subsequent performance and with additional proceeds if the West Wits assets are developed below current infrastructure. Refer to note 9. Dividend declaration - On 21 February 2020, the directors of AngloGold Ashanti declared a gross cash dividend per ordinary share of 165 South African cents (assuming an exchange rate of ZAR 15/$, the gross dividend payable per ADS is equivalent to ~11 US cents).
GROUP – NOTES TO THE FINANCIAL STATEMENTS FOR THE YEAR ENDED 31 DECEMBER
PAGE 86
37 SUBSEQUENT EVENTS CONTINUED COVID-19 pandemic - At the date of approval of these consolidated annual financial statements, the SARS-CoV-2 virus responsible for COVID-19 continues to spread across the globe, contributing to a sharp decline in global financial markets and a significant decrease in global economic activity. On 11 March 2020, the COVID-19 outbreak was declared a global pandemic by the World Health Organization and has since then resulted in numerous governments and companies, including AngloGold Ashanti, introducing a variety of measures to contain the spread of the virus. To date, we have taken a number of proactive steps to protect our employees, our host communities and business, in line with the company’s values, guidelines and advice provided by the WHO and with the requirements of the countries in which we operate. The health and wellbeing of our employees and our host communities remains a key priority. Cases of the outbreak have been reported in all of the jurisdictions in which we operate, and it may lead to a prolonged restriction on the movement of people and continued requirement for people to self-isolate or be quarantined. Any self-imposed or government-mandated temporary lockdowns may disrupt the company’s activities and operations and even lead to a full or partial temporary suspension of the company’s mining operations in those jurisdictions. On 21 March 2020, following the Argentinian government’s decision to impose a nationwide lockdown (quarantine) until 31 March 2020, including temporary travel restrictions, border closings and suspension of most industries, Cerro Vanguardia S.A. (CVSA) was required to temporarily suspend mining activities. On 23 March 2020, the South African government announced a 21-day nationwide lockdown, effective from midnight on 26 March 2020, resulting in the temporary suspension of mining activities of the company’s South African operations particularly Mponeng, and the partial suspension of mining activities at Mine Waste Solutions (MWS) and Surface Operations. On 26 March 2020, the State of Goiás, in Brazil, extended a set of restrictions on the operation of non-essential business to include mining. These restrictions are set to run through 4 April 2020. Mineração Serra Grande S.A. will temporarily suspend its operations. The current impact of all of the suspended operations is expected to be about 30,000oz to 40,000oz, or less than 2% of annual production. In these countries, the suspension of mining activities will continue for the period during which the respective restrictions remain in force. While minimal operational disruptions have occurred at the company’s other operations to date, the company may experience temporary disruptions in supply chain and logistics across its operations in the coming months should the pandemic be prolonged. Such disruptions, which include restrictions in travel and border access, may impact the company’s ability to source and transport goods and services required to operate mines and to transport gold doré to refineries. Furthermore, should COVID-19 spread among the company’s workforce, it may lead to a full or partial temporary suspension of the company’s operating mines in those affected areas. Given the uncertainties with respect to future developments, including duration, severity and scope of the COVID-19 pandemic and the necessary government responses to limiting its spread, the board has decided to withdraw its market guidance for 2020 published as part of its preliminary condensed consolidated financial results on 21 February 2020, at this time. In anticipation of a prolonged negative impact from the COVID-19 pandemic, the company has drawn down $1.4bn on its US Dollar RCF to cater for the $700m bond redemption due mid-April 2020 and to provide additional liquidity headroom. After the drawdowns, cash on hand is about $1.8bn (excluding cash lock-up positions at Kibali and Sadiola, where AngloGold Ashanti’s combined share totals about $300m).
Management will continue to take a prudent and proactive approach to managing the group’s liquidity, which may include procuring additional credit facilities or debt over and above its current facilities.
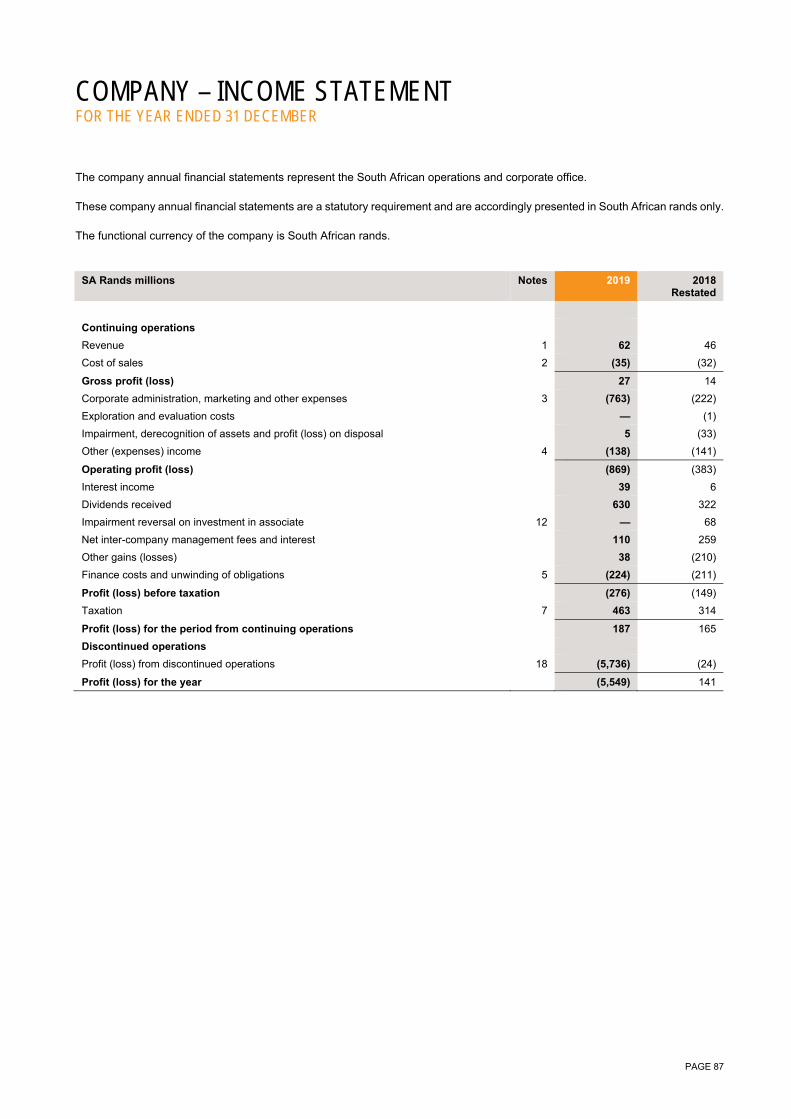
PAGE 87
COMPANY – INCOME STATEMENT FOR THE YEAR ENDED 31 DECEMBER The company annual financial statements represent the South African operations and corporate office. These company annual financial statements are a statutory requirement and are accordingly presented in South African rands only. The functional currency of the company is South African rands.
SA Rands millions Notes 2019 2018 Restated
Continuing operations
Revenue 1 62 46
Cost of sales 2 (35) (32)
Gross profit (loss) 27 14
Corporate administration, marketing and other expenses 3 (763) (222)
Exploration and evaluation costs — (1)
Impairment, derecognition of assets and profit (loss) on disposal 5 (33)
Other (expenses) income 4 (138) (141)
Operating profit (loss) (869) (383)
Interest income 39 6
Dividends received 630 322
Impairment reversal on investment in associate 12 — 68
Net inter-company management fees and interest 110 259
Other gains (losses) 38 (210)
Finance costs and unwinding of obligations 5 (224) (211)
Profit (loss) before taxation (276) (149)
Taxation 7 463 314
Profit (loss) for the period from continuing operations 187 165
Discontinued operations
Profit (loss) from discontinued operations 18 (5,736) (24)
Profit (loss) for the year (5,549) 141

PAGE 88
COMPANY – STATEMENT OF COMPREHENSIVE INCOME FOR THE YEAR ENDED 31 DECEMBER
SA Rands millions Notes 2019 2018
Restated
Profit (loss) for the year (5,549) 141
Items that will not be reclassified subsequently to profit or loss: 20 55
Net gain (loss) on equity investments (11) 9
Actuarial gain (loss) recognised 22 34 67
Deferred taxation thereon (3) (21)
Other comprehensive income (loss) for the year, net of tax 20 55
Total comprehensive income (loss) for the year, net of tax (5,529) 196

PAGE 89
COMPANY – STATEMENT OF FINANCIAL POSITION AS AT 31 DECEMBER
SA Rands millions Notes 2019 2018
ASSETS
Non-current assets
Tangible assets 9 36 8,961
Right of use assets 10 32 —
Intangible assets 11 10 9
Investment in associate 12 146 385
Investments in subsidiaries 13 42,315 43,162
Other investments 18 28
Inventories 16 — 8
Investment in Environmental Rehabilitation Trust Fund 14 — 294
Trade and other receivables 15 3 3
Deferred taxation asset 23 1,461 —
44,021 52,850
Current assets
Inventories 16 76 462
Trade and other receivables 15 193 284
Intra-group balances 17 438 2,377
Cash and cash equivalents 173 105
880 3,228
Assets held for sale 18 4,701 —
5,581 3,228
Total assets 49,602 56,078
EQUITY AND LIABILITIES
Share capital and premium 19 51,931 51,538
Accumulated losses and other reserves (12,352) (6,282)
Total equity 39,579 45,256
Non-current liabilities
Borrowings 20 999 1,002
Lease liabilities 10 63 —
Environmental rehabilitation and other provisions 21 788 1,702
Provision for post-retirement benefits 22 1,308 1,344
Deferred taxation liability 23 — 512
3,158 4,560
Current liabilities
Borrowings 20 9 38
Lease liabilities 10 41 —
Trade and other payables 24 2,202 2,819
Intra-group balances 17 3,338 3,381
Taxation 25 19 24
5,609 6,262
Liabilities held for sale 18 1,256 —
6,865 6,262
Total liabilities 10,023 10,822
Total equity and liabilities 49,602 56,078

PAGE 90
COMPANY – STATEMENT OF CASH FLOW FOR THE YEAR ENDED 31 DECEMBER
SA Rands millions Notes 2019 2018
Restated
Cash flows from operating activities
Receipts from customers 900 510
Payments to suppliers and employees (1,800) (1,328)
Cash generated from (utilised by) operations 26 (900) (818)
Net cash inflow (outflow) from operating activities from continuing operations (900) (818)
Net cash inflow (outflow) from operating activities from discontinued operations 859 (292)
Net cash inflow (outflow) from operating activities (41) (1,110)
Cash flows from investing activities
Capital expenditure (1) (5)
Expenditure on intangible assets (1) (4)
Dividends received 630 322
Associate loans repaid 238 131
Additional investment in subsidiaries (224) —
Repayment of intra-group loans advanced 567 548
Interest received 39 6
Net cash inflow (outflow) from investing activities from continuing operations 1,248 998
Net cash inflow (outflow) from investing activities from discontinued operations (662) 2,368
Net cash inflow (outflow) from investing activities 586 3,366
Cash flows from financing activities
Proceeds from borrowings 1,848 5,413
Repayment of borrowings (1,748) (7,260)
Repayment of lease liabilities (33) —
Finance costs paid 20 (135) (145)
Lease finance cost (12) —
Dividends paid 8 (393) (288)
Net cash inflow (outflow) from financing activities from continuing operations (473) (2,280)
Net cash inflow (outflow) from financing activities from discontinued operations (4) (6)
Net cash inflow (outflow) from financing activities (477) (2,286)
Net increase (decrease) in cash and cash equivalents 68 (30)
Cash and cash equivalents at beginning of year 105 135
Cash and cash equivalents at end of year 173 105
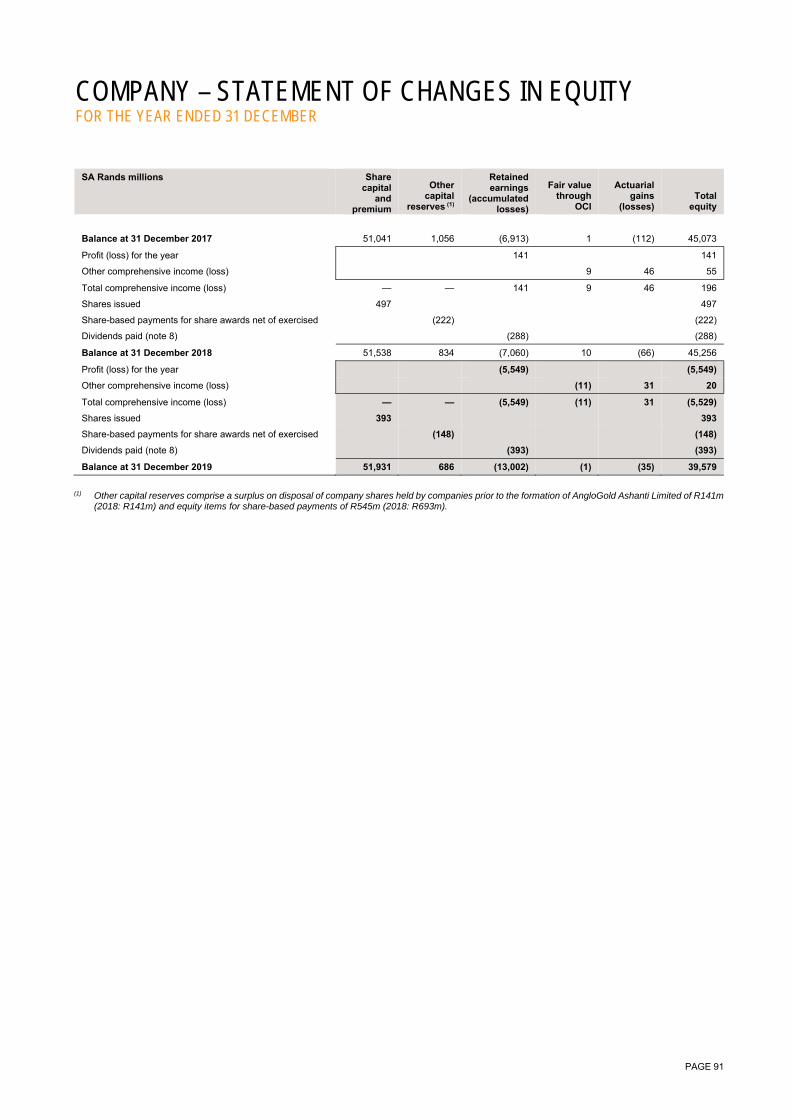
PAGE 91
COMPANY – STATEMENT OF CHANGES IN EQUITY FOR THE YEAR ENDED 31 DECEMBER
SA Rands millions Share capital
and premium
Other capital
reserves (1)
Retained earnings
(accumulated losses)
Fair value through
OCI
Actuarial gains
(losses) Total
equity
Balance at 31 December 2017 51,041 1,056 (6,913) 1 (112) 45,073
Profit (loss) for the year 141 141
Other comprehensive income (loss) 9 46 55
Total comprehensive income (loss) — — 141 9 46 196
Shares issued 497 497
Share-based payments for share awards net of exercised (222) (222)
Dividends paid (note 8) (288) (288)
Balance at 31 December 2018 51,538 834 (7,060) 10 (66) 45,256
Profit (loss) for the year (5,549) (5,549)
Other comprehensive income (loss) (11) 31 20
Total comprehensive income (loss) — — (5,549) (11) 31 (5,529)
Shares issued 393 393
Share-based payments for share awards net of exercised (148) (148)
Dividends paid (note 8) (393) (393)
Balance at 31 December 2019 51,931 686 (13,002) (1) (35) 39,579
(1) Other capital reserves comprise a surplus on disposal of company shares held by companies prior to the formation of AngloGold Ashanti Limited of R141m
(2018: R141m) and equity items for share-based payments of R545m (2018: R693m).
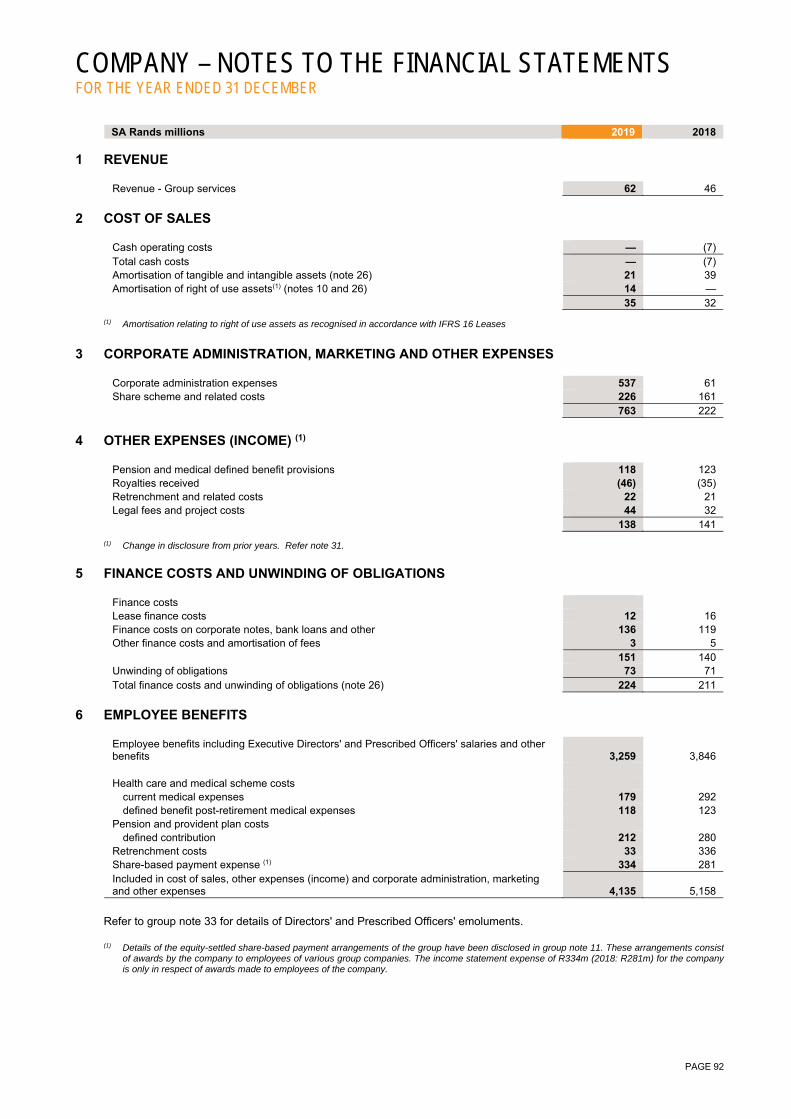
COMPANY – NOTES TO THE FINANCIAL STATEMENTS FOR THE YEAR ENDED 31 DECEMBER
PAGE 92
SA Rands millions 2019 2018 1 REVENUE
Revenue - Group services 62 46
2 COST OF SALES
Cash operating costs — (7) Total cash costs — (7) Amortisation of tangible and intangible assets (note 26) 21 39 Amortisation of right of use assets(1) (notes 10 and 26) 14 — 35 32
(1) Amortisation relating to right of use assets as recognised in accordance with IFRS 16 Leases
3 CORPORATE ADMINISTRATION, MARKETING AND OTHER EXPENSES
Corporate administration expenses 537 61 Share scheme and related costs 226 161 763 222
4 OTHER EXPENSES (INCOME) (1)
Pension and medical defined benefit provisions 118 123 Royalties received (46) (35) Retrenchment and related costs 22 21 Legal fees and project costs 44 32 138 141
(1) Change in disclosure from prior years. Refer note 31.
5 FINANCE COSTS AND UNWINDING OF OBLIGATIONS
Finance costs Lease finance costs 12 16 Finance costs on corporate notes, bank loans and other 136 119 Other finance costs and amortisation of fees 3 5 151 140 Unwinding of obligations 73 71 Total finance costs and unwinding of obligations (note 26) 224 211
6 EMPLOYEE BENEFITS
Employee benefits including Executive Directors' and Prescribed Officers' salaries and other benefits 3,259 3,846 Health care and medical scheme costs
current medical expenses 179 292 defined benefit post-retirement medical expenses 118 123
Pension and provident plan costs defined contribution 212 280
Retrenchment costs 33 336 Share-based payment expense (1) 334 281 Included in cost of sales, other expenses (income) and corporate administration, marketing and other expenses 4,135 5,158
Refer to group note 33 for details of Directors' and Prescribed Officers' emoluments. (1) Details of the equity-settled share-based payment arrangements of the group have been disclosed in group note 11. These arrangements consist
of awards by the company to employees of various group companies. The income statement expense of R334m (2018: R281m) for the company is only in respect of awards made to employees of the company.

COMPANY – NOTES TO THE FINANCIAL STATEMENTS FOR THE YEAR ENDED 31 DECEMBER
PAGE 93
SA Rands millions 2019 2018 7 TAXATION
Current taxation (note 25) Prior year under (over) provision (5) (16) Deferred taxation
Other temporary differences (260) (397) Change in estimated deferred tax rate (2) (198) 99
(458) (298) (463) (314) Reconciliation to South African statutory rate Implied tax credit at statutory tax rate of 28% (1) (77) (42) Increase (decrease) due to: Expenses not tax deductible (2) 9 50 Impairment reversal on investment in associate — (19) Rate adjustment to reflect the actual realised company tax rate 1 — Non taxable dividend income (177) (82) Guarantee fees (62) (174) Tax effect of retained SA items 47 (130) Change in planned utilisation of deferred tax assets and impact of estimated deferred tax rate change (3) (198) 99 Tax allowances (1) — Adjustments in respect of prior years (5) (16) Income tax per income statement (463) (314)
(1) The South African statutory rates are as follows: Non-mining statutory tax rate 28% (2018: 28%); and Maximum statutory mining tax rate 34% (2018: 34%). (2) Includes corporate and other costs, and transfer pricing. (3) The mining operations are taxed on a variable rate that increases as profitability increases. The tax rate used to calculate deferred tax is based on
the company's current estimate of future profitability when temporary differences will reverse. Depending on the profitability of the operations, the tax rate can consequently be significantly different from year to year.
8 DIVIDENDS
Ordinary shares Dividend number 119 of 70 SA cents per share was declared on 20 February 2018 and paid on 6 April 2018.
288
Dividend number 120 of 95 SA cents per share was declared on 19 February 2019 and paid on 8 April 2019. 393
393 288

COMPANY – NOTES TO THE FINANCIAL STATEMENTS FOR THE YEAR ENDED 31 DECEMBER
PAGE 94
9 TANGIBLE ASSETS
SA Rands millions Mine development
costs
Mine infra-
structure
Mineral rights and
dumps Assets under construction
Land and buildings(2) Total
Cost Balance at 1 January 2018 8,483 3,021 69 2,664 263 14,500 Additions
project capital — — — 61 — 61 stay-in-business capital 550 91 — 49 — 690
Disposals — — — — (40) (40) Transfers and other movements(1) (574) (426) — (58) — (1,058) Balance at 31 December 2018 8,459 2,686 69 2,716 223 14,153 Accumulated amortisation and impairments
Balance at 1 January 2018 3,625 1,526 44 — 181 5,376 Amortisation for the year 609 173 1 — 16 799 Disposals — — — — (29) (29) Impairment and derecognition of assets(3) — 86 — — — 86 Transfers and other movements(1) (578) (462) — — — (1,040) Balance at 31 December 2018 3,656 1,323 45 — 168 5,192 Net book value at 31 December 2018 4,803 1,363 24 2,716 55 8,961 Cost Balance at 1 January 2019 8,459 2,686 69 2,716 223 14,153 Additions
project capital — — — 38 — 38 stay-in-business capital 546 91 — 69 3 709
Transfer to assets and liabilities held for sale (9,502) (3,067) (69) (1,231) (12) (13,881) Transfers and other movements(1) 497 477 — (1,592) (214) (832) Balance at 31 December 2019 — 187 — — — 187 Accumulated amortisation and impairments
Balance at 1 January 2019 3,656 1,323 45 — 168 5,192 Amortisation for the year 528 197 1 — — 726 Impairment and derecognition of assets(3) 3,466 1,091 — 1,231 — 5,788 Transfer to assets and liabilities held for sale (7,105) (2,376) (46) (1,231) — (10,758) Transfers and other movements(1) (545) (84) — — (168) (797) Balance at 31 December 2019 — 151 — — — 151 Net book value at 31 December 2019 — 36 — — — 36
(1) Transfers and other movements include amounts from change in estimates of decommissioning assets, asset reclassifications and derecognition
of assets. (2) Included in the amounts for land and buildings are assets held under finance leases with a net book value of nil (2018: R46m). (3) Impairment and derecognition of assets include the following:
For the impairment calculation assumptions as well as further detail on the impairment of the South African cash generating units, as at 31 December 2019, refer group note 15 on tangible assets. For the year ended 31 December, the following impairments and derecognition of tangible assets were recognised:
SA Rands millions 2019 2018 Mponeng 5,534 65 Other 2 — Surface Operations 252 21 5,788 86

COMPANY – NOTES TO THE FINANCIAL STATEMENTS FOR THE YEAR ENDED 31 DECEMBER
PAGE 95
10 RIGHT OF USE ASSETS AND LEASE LIABILITIES
SA Rands millions Land and
buildings(1)
Cost Impact of adopting IFRS 16 - 1 January 2019 — Additions
project capital — stay-in-business capital —
Transfer to non-current assets and liabilities held for sale — Disposals — Transfers and other movements (1) 214 Balance at 31 December 2019 214
Accumulated amortisation and impairments Impact of adopting IFRS 16 - 1 January 2019 — Amortisation for the year (note 2) 14 Disposals — Impairment and derecognition of assets — Transfer to non-current assets and liabilities held for sale — Transfers and other movements (1) 168 Balance at 31 December 2019 182 Net book value at 31 December 2019 32
(1) Relates to contracts previously classified as leases under IAS 17 which the company has reassessed upon initial transition as leases under IFRS 16
as of January 2019.
Amounts recognised in the income statement SA Rands
millions
Amortisation expense on right of use assets (note 2) 14 Interest expense on lease liabilities 12 Expenses on short term leases 1 Expenses on variable lease payments not included in the lease liabilities 115 Expenses on leases of low value assets 33
These expenses are allocated to cost of sales and corporate, administration and other costs.
Total cash outflow for leases during the period amounted to R45m, consisting of repayments of liabilities of R33m and finance costs paid of R12m.
Lease liability reconciliation SA Rands
millions
Balance at 1 January 2019 — Lease liability recognised — Repayment of lease liabilities (33) Finance costs paid on lease liabilities (12) Interest charged to the income statement 12 Reclassification of finance leases from borrowings 137 Balance at 31 December 2019 104
SA Rands millions 2019
Lease liabilities Non-current 63 Current 41 Total 104
Maturity analysis of lease liabilities SA Rands
millions
Undiscounted cash flows Less than and including 1 year 49 Between 1 and 5 years 67 Five years and more — Total 116
The company does not face a significant liquidity risk with regard to its lease liabilities. Lease liabilities are monitored within the company’s treasury function.
All lease contracts contain market review clauses in the event that AngloGold Ashanti exercises its option to renew.
The weighted average incremental borrowing rate at the date of initial application is 9.84%.
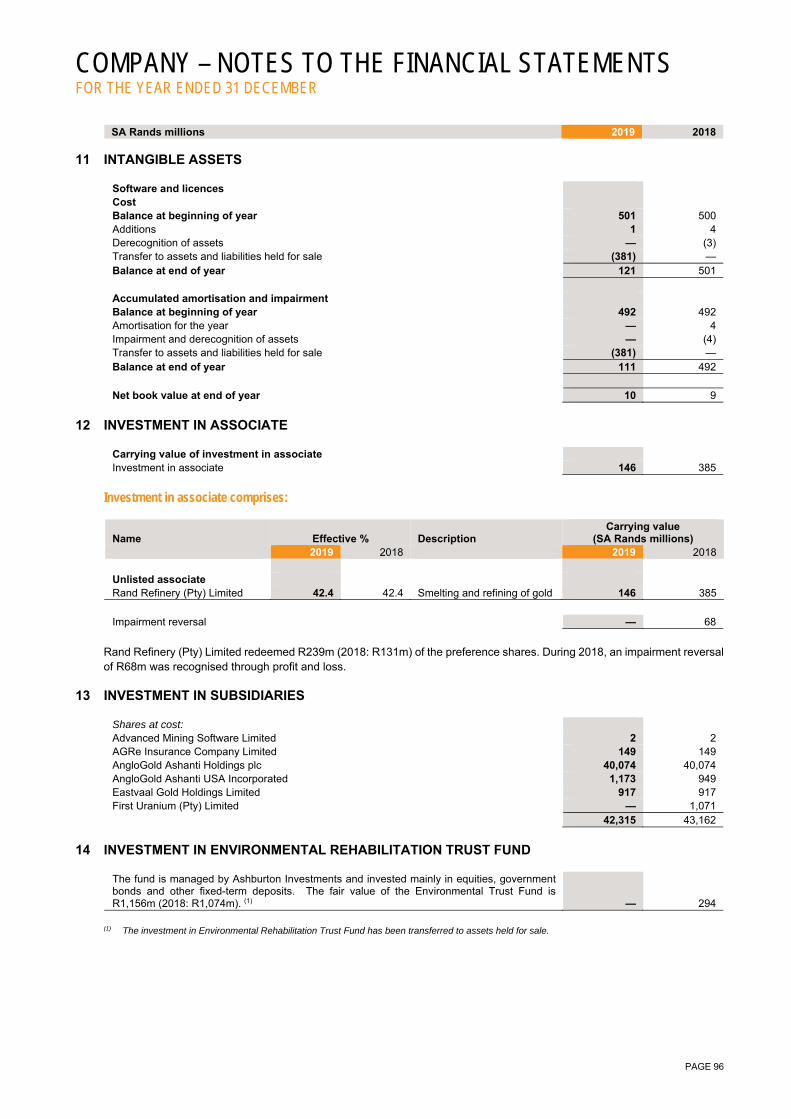
COMPANY – NOTES TO THE FINANCIAL STATEMENTS FOR THE YEAR ENDED 31 DECEMBER
PAGE 96
SA Rands millions 2019 2018 11 INTANGIBLE ASSETS
Software and licences Cost Balance at beginning of year 501 500 Additions 1 4 Derecognition of assets — (3) Transfer to assets and liabilities held for sale (381) — Balance at end of year 121 501 Accumulated amortisation and impairment Balance at beginning of year 492 492 Amortisation for the year — 4 Impairment and derecognition of assets — (4) Transfer to assets and liabilities held for sale (381) — Balance at end of year 111 492 Net book value at end of year 10 9
12 INVESTMENT IN ASSOCIATE
Carrying value of investment in associate Investment in associate 146 385
Investment in associate comprises:
Name Effective % Description Carrying value
(SA Rands millions) 2019 2018 2019 2018 Unlisted associate Rand Refinery (Pty) Limited 42.4 42.4 Smelting and refining of gold 146 385
Impairment reversal — 68
Rand Refinery (Pty) Limited redeemed R239m (2018: R131m) of the preference shares. During 2018, an impairment reversal of R68m was recognised through profit and loss.
13 INVESTMENT IN SUBSIDIARIES
Shares at cost: Advanced Mining Software Limited 2 2 AGRe Insurance Company Limited 149 149 AngloGold Ashanti Holdings plc 40,074 40,074 AngloGold Ashanti USA Incorporated 1,173 949 Eastvaal Gold Holdings Limited 917 917 First Uranium (Pty) Limited — 1,071 42,315 43,162
14 INVESTMENT IN ENVIRONMENTAL REHABILITATION TRUST FUND
The fund is managed by Ashburton Investments and invested mainly in equities, government bonds and other fixed-term deposits. The fair value of the Environmental Trust Fund is R1,156m (2018: R1,074m). (1) — 294
(1) The investment in Environmental Rehabilitation Trust Fund has been transferred to assets held for sale.

COMPANY – NOTES TO THE FINANCIAL STATEMENTS FOR THE YEAR ENDED 31 DECEMBER
PAGE 97
SA Rands millions 2019 2018
15 TRADE AND OTHER RECEIVABLES
Non-current Other receivables and deferred loan fees 3 3 Current Trade receivables 82 136 Prepayments and accrued income 57 53 Recoverable tax, rebates, levies and duties 43 88 Other receivables 11 7 193 284 Total trade and other receivables 196 287
16 INVENTORIES
Non-current Raw materials - ore stockpiles — 8 Current Raw materials - ore stockpiles — 28 Work in progress - metals in process — 93 Finished goods - gold doré/bullion — 21 Total metal inventories — 142 Mine operating supplies 76 320 76 462
Total inventories (1) 76 470 (1) The amount of the write-down of metals in process and by-products to net realisable value, and recognised as an expense is nil (2018: R7m).
17 INTRA-GROUP BALANCES
Intra-group receivables AngloGold Ashanti Australia Limited 74 71 AngloGold Ashanti Colombia S.A. 42 42 AngloGold Ashanti Córrego do Sitío Mineração S.A. 20 20 AngloGold Ashanti (Ghana) Limited 34 27 AngloGold Ashanti Holdings plc 1 201 AngloGold Ashanti (Iduapriem) Limited 18 14 AngloGold Ashanti Mali Holdings — 45 AngloGold Ashanti North America Inc 40 27 Cerro Vanguardia S.A. 28 21 Chemwes (Pty) Limited (1) — 1,692 Geita Gold Mining Limited 48 25 Mineração Serra Grande S.A. 7 8 Covalent Water Company (Pty) Limited (1) — 167 Société Ashanti Goldfields de Guinée S.A. 124 17 AGRe Insurance Company 2 — 438 2,377 Intra-group payables Advanced Mining Software Limited 9 9 AngloGold Ashanti Australia Limited 5 4 AngloGold Ashanti Colombia S.A. 2 1 AngloGold Ashanti (Ghana) Limited 2 2 AngloGold Ashanti Health (Pty) Limited 13 11 AngloGold Ashanti Holdings plc 1,068 1,097 AngloGold Ashanti North America Inc — 7 AngloGold South America Limited 411 422 Eastvaal Gold Holdings Limited 1,828 1,828 3,338 3,381 Included in the statement of financial position as follows: Current assets (note 29) 438 2,377 Current liabilities (note 29) (3,338) (3,381) (2,900) (1,004)
Intra-group balances are interest free and are payable on demand. (1) Transferred to assets held for sale
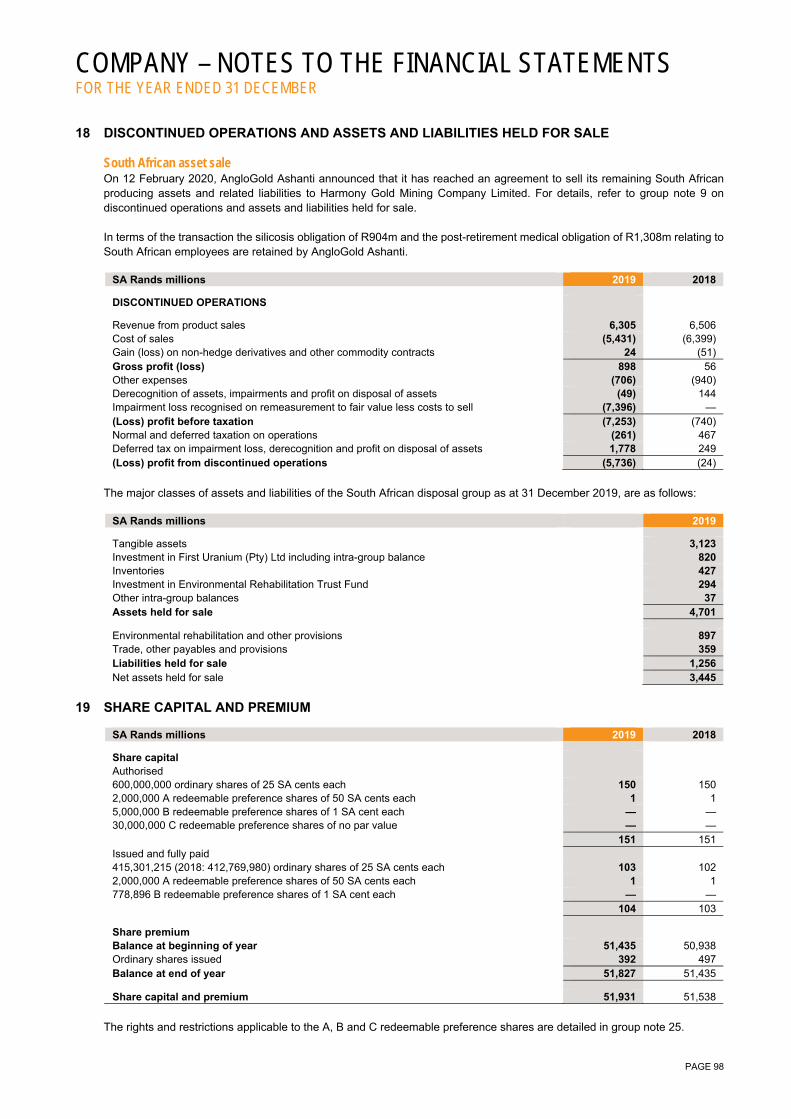
COMPANY – NOTES TO THE FINANCIAL STATEMENTS FOR THE YEAR ENDED 31 DECEMBER
PAGE 98
18 DISCONTINUED OPERATIONS AND ASSETS AND LIABILITIES HELD FOR SALE
South African asset sale On 12 February 2020, AngloGold Ashanti announced that it has reached an agreement to sell its remaining South African producing assets and related liabilities to Harmony Gold Mining Company Limited. For details, refer to group note 9 on discontinued operations and assets and liabilities held for sale. In terms of the transaction the silicosis obligation of R904m and the post-retirement medical obligation of R1,308m relating to South African employees are retained by AngloGold Ashanti.
SA Rands millions 2019 2018
DISCONTINUED OPERATIONS
Revenue from product sales 6,305 6,506 Cost of sales (5,431) (6,399) Gain (loss) on non-hedge derivatives and other commodity contracts 24 (51) Gross profit (loss) 898 56 Other expenses (706) (940) Derecognition of assets, impairments and profit on disposal of assets (49) 144 Impairment loss recognised on remeasurement to fair value less costs to sell (7,396) — (Loss) profit before taxation (7,253) (740) Normal and deferred taxation on operations (261) 467 Deferred tax on impairment loss, derecognition and profit on disposal of assets 1,778 249 (Loss) profit from discontinued operations (5,736) (24)
The major classes of assets and liabilities of the South African disposal group as at 31 December 2019, are as follows:
SA Rands millions 2019
Tangible assets 3,123 Investment in First Uranium (Pty) Ltd including intra-group balance 820 Inventories 427 Investment in Environmental Rehabilitation Trust Fund 294 Other intra-group balances 37 Assets held for sale 4,701
Environmental rehabilitation and other provisions 897 Trade, other payables and provisions 359 Liabilities held for sale 1,256 Net assets held for sale 3,445
19 SHARE CAPITAL AND PREMIUM
SA Rands millions 2019 2018
Share capital Authorised 600,000,000 ordinary shares of 25 SA cents each 150 150 2,000,000 A redeemable preference shares of 50 SA cents each 1 1 5,000,000 B redeemable preference shares of 1 SA cent each — — 30,000,000 C redeemable preference shares of no par value — — 151 151 Issued and fully paid 415,301,215 (2018: 412,769,980) ordinary shares of 25 SA cents each 103 102 2,000,000 A redeemable preference shares of 50 SA cents each 1 1 778,896 B redeemable preference shares of 1 SA cent each — — 104 103
Share premium Balance at beginning of year 51,435 50,938 Ordinary shares issued 392 497 Balance at end of year 51,827 51,435
Share capital and premium 51,931 51,538
The rights and restrictions applicable to the A, B and C redeemable preference shares are detailed in group note 25.
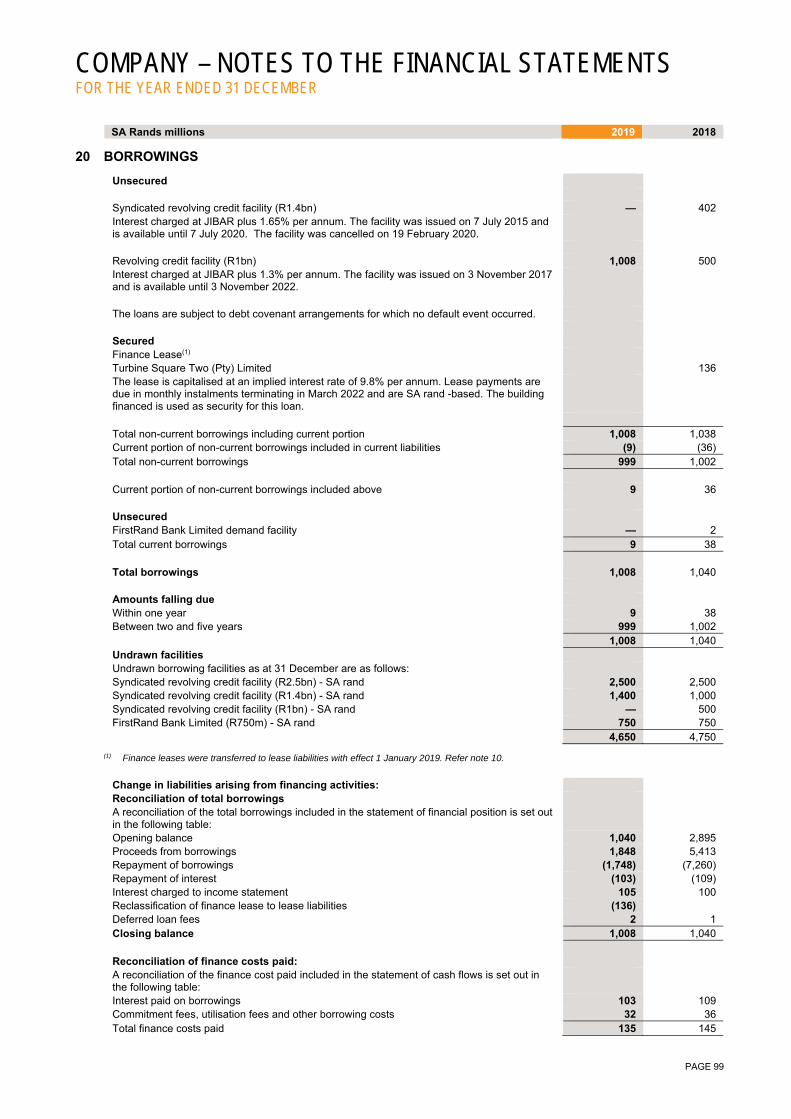
COMPANY – NOTES TO THE FINANCIAL STATEMENTS FOR THE YEAR ENDED 31 DECEMBER
PAGE 99
SA Rands millions 2019 2018
20 BORROWINGS
Unsecured Syndicated revolving credit facility (R1.4bn) — 402 Interest charged at JIBAR plus 1.65% per annum. The facility was issued on 7 July 2015 and is available until 7 July 2020. The facility was cancelled on 19 February 2020.
Revolving credit facility (R1bn) 1,008 500 Interest charged at JIBAR plus 1.3% per annum. The facility was issued on 3 November 2017 and is available until 3 November 2022.
The loans are subject to debt covenant arrangements for which no default event occurred. Secured Finance Lease(1) Turbine Square Two (Pty) Limited 136 The lease is capitalised at an implied interest rate of 9.8% per annum. Lease payments are due in monthly instalments terminating in March 2022 and are SA rand -based. The building financed is used as security for this loan.
Total non-current borrowings including current portion 1,008 1,038 Current portion of non-current borrowings included in current liabilities (9) (36) Total non-current borrowings 999 1,002 Current portion of non-current borrowings included above 9 36 Unsecured FirstRand Bank Limited demand facility — 2 Total current borrowings 9 38 Total borrowings 1,008 1,040 Amounts falling due Within one year 9 38 Between two and five years 999 1,002 1,008 1,040 Undrawn facilities Undrawn borrowing facilities as at 31 December are as follows: Syndicated revolving credit facility (R2.5bn) - SA rand 2,500 2,500 Syndicated revolving credit facility (R1.4bn) - SA rand 1,400 1,000 Syndicated revolving credit facility (R1bn) - SA rand — 500 FirstRand Bank Limited (R750m) - SA rand 750 750 4,650 4,750
(1) Finance leases were transferred to lease liabilities with effect 1 January 2019. Refer note 10.
Change in liabilities arising from financing activities: Reconciliation of total borrowings A reconciliation of the total borrowings included in the statement of financial position is set out in the following table:
Opening balance 1,040 2,895 Proceeds from borrowings 1,848 5,413 Repayment of borrowings (1,748) (7,260) Repayment of interest (103) (109) Interest charged to income statement 105 100 Reclassification of finance lease to lease liabilities (136) Deferred loan fees 2 1 Closing balance 1,008 1,040 Reconciliation of finance costs paid: A reconciliation of the finance cost paid included in the statement of cash flows is set out in the following table:
Interest paid on borrowings 103 109 Commitment fees, utilisation fees and other borrowing costs 32 36 Total finance costs paid 135 145
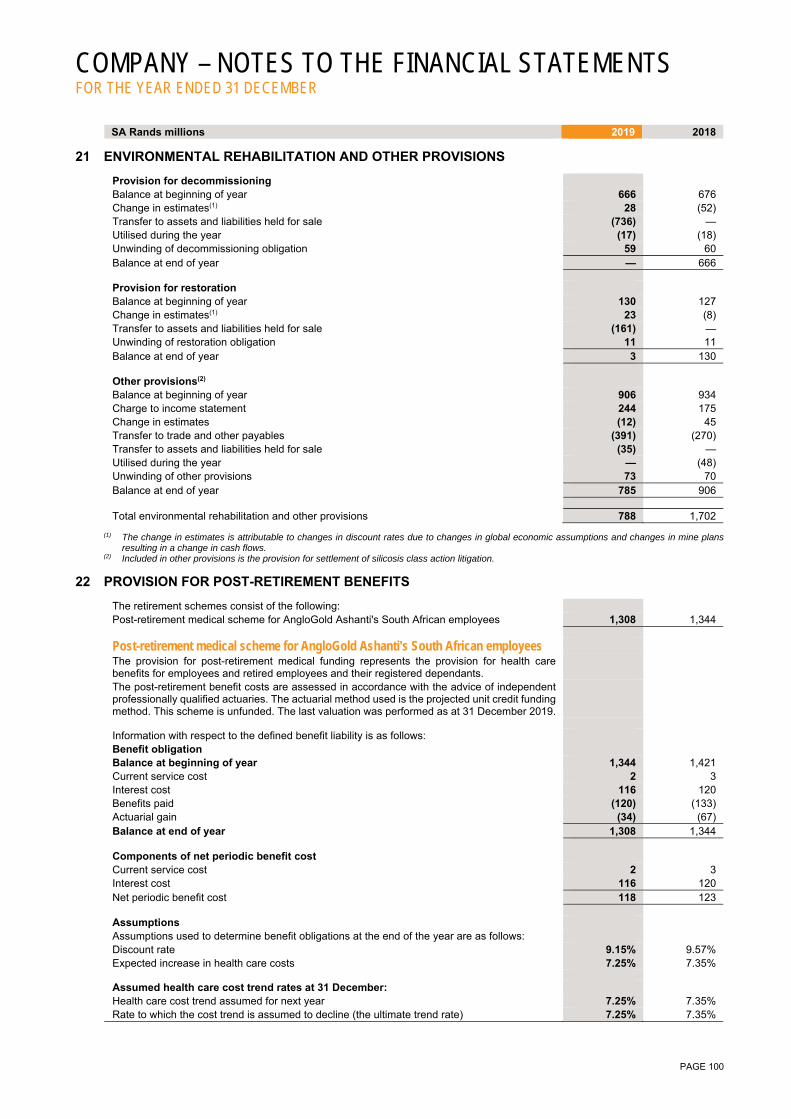
COMPANY – NOTES TO THE FINANCIAL STATEMENTS FOR THE YEAR ENDED 31 DECEMBER
PAGE 100
SA Rands millions 2019 2018
21 ENVIRONMENTAL REHABILITATION AND OTHER PROVISIONS
Provision for decommissioning Balance at beginning of year 666 676 Change in estimates(1) 28 (52) Transfer to assets and liabilities held for sale (736) — Utilised during the year (17) (18) Unwinding of decommissioning obligation 59 60 Balance at end of year — 666 Provision for restoration Balance at beginning of year 130 127 Change in estimates(1) 23 (8) Transfer to assets and liabilities held for sale (161) — Unwinding of restoration obligation 11 11 Balance at end of year 3 130 Other provisions(2) Balance at beginning of year 906 934 Charge to income statement 244 175 Change in estimates (12) 45 Transfer to trade and other payables (391) (270) Transfer to assets and liabilities held for sale (35) — Utilised during the year — (48) Unwinding of other provisions 73 70 Balance at end of year 785 906
Total environmental rehabilitation and other provisions 788 1,702
(1) The change in estimates is attributable to changes in discount rates due to changes in global economic assumptions and changes in mine plans resulting in a change in cash flows.
(2) Included in other provisions is the provision for settlement of silicosis class action litigation.
22 PROVISION FOR POST-RETIREMENT BENEFITS
The retirement schemes consist of the following: Post-retirement medical scheme for AngloGold Ashanti's South African employees 1,308 1,344
Post-retirement medical scheme for AngloGold Ashanti's South African employees
The provision for post-retirement medical funding represents the provision for health care benefits for employees and retired employees and their registered dependants.
The post-retirement benefit costs are assessed in accordance with the advice of independent professionally qualified actuaries. The actuarial method used is the projected unit credit funding method. This scheme is unfunded. The last valuation was performed as at 31 December 2019.
Information with respect to the defined benefit liability is as follows: Benefit obligation Balance at beginning of year 1,344 1,421 Current service cost 2 3 Interest cost 116 120 Benefits paid (120) (133) Actuarial gain (34) (67) Balance at end of year 1,308 1,344 Components of net periodic benefit cost Current service cost 2 3 Interest cost 116 120 Net periodic benefit cost 118 123 Assumptions Assumptions used to determine benefit obligations at the end of the year are as follows: Discount rate 9.15% 9.57% Expected increase in health care costs 7.25% 7.35% Assumed health care cost trend rates at 31 December: Health care cost trend assumed for next year 7.25% 7.35% Rate to which the cost trend is assumed to decline (the ultimate trend rate) 7.25% 7.35%
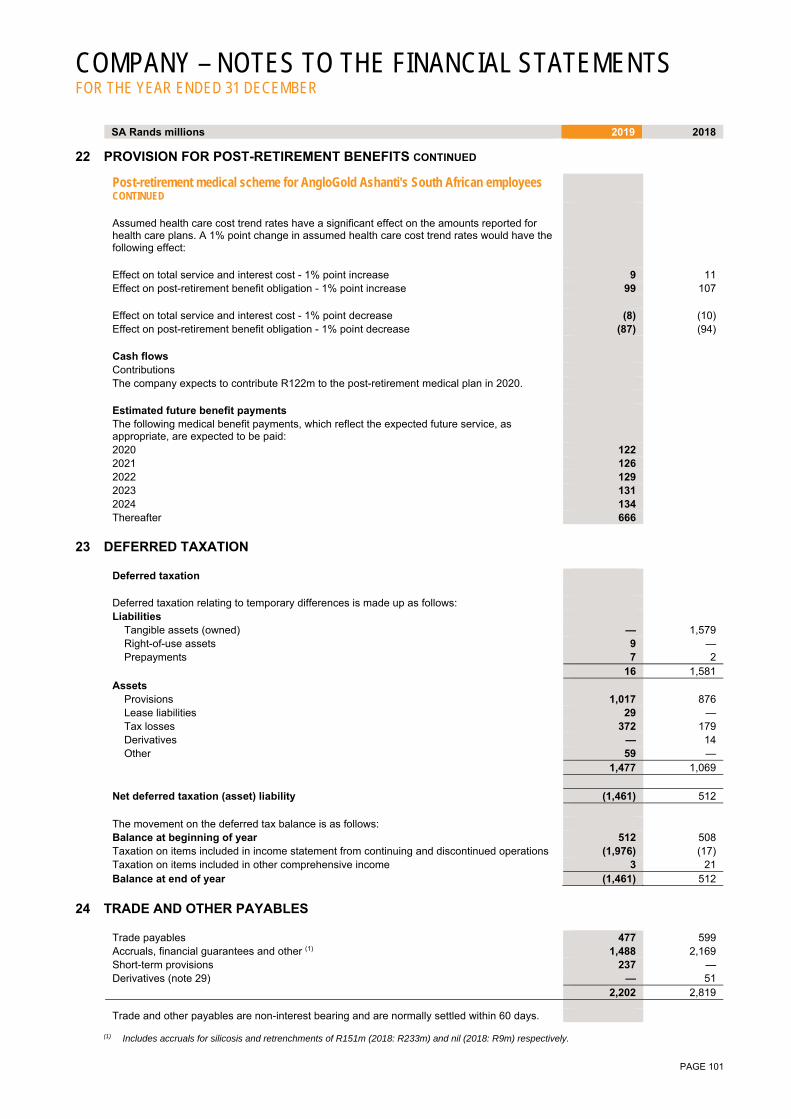
COMPANY – NOTES TO THE FINANCIAL STATEMENTS FOR THE YEAR ENDED 31 DECEMBER
PAGE 101
SA Rands millions 2019 2018
22 PROVISION FOR POST-RETIREMENT BENEFITS CONTINUED
Post-retirement medical scheme for AngloGold Ashanti's South African employees CONTINUED
Assumed health care cost trend rates have a significant effect on the amounts reported for health care plans. A 1% point change in assumed health care cost trend rates would have the following effect:
Effect on total service and interest cost - 1% point increase 9 11 Effect on post-retirement benefit obligation - 1% point increase 99 107 Effect on total service and interest cost - 1% point decrease (8) (10) Effect on post-retirement benefit obligation - 1% point decrease (87) (94) Cash flows Contributions The company expects to contribute R122m to the post-retirement medical plan in 2020. Estimated future benefit payments The following medical benefit payments, which reflect the expected future service, as appropriate, are expected to be paid:
2020 122 2021 126 2022 129 2023 131 2024 134 Thereafter 666
23 DEFERRED TAXATION
Deferred taxation Deferred taxation relating to temporary differences is made up as follows: Liabilities Tangible assets (owned) — 1,579 Right-of-use assets 9 — Prepayments 7 2 16 1,581 Assets Provisions 1,017 876 Lease liabilities 29 — Tax losses 372 179 Derivatives — 14 Other 59 — 1,477 1,069 Net deferred taxation (asset) liability (1,461) 512 The movement on the deferred tax balance is as follows: Balance at beginning of year 512 508 Taxation on items included in income statement from continuing and discontinued operations (1,976) (17) Taxation on items included in other comprehensive income 3 21 Balance at end of year (1,461) 512
24 TRADE AND OTHER PAYABLES
Trade payables 477 599 Accruals, financial guarantees and other (1) 1,488 2,169 Short-term provisions 237 — Derivatives (note 29) — 51 2,202 2,819
Trade and other payables are non-interest bearing and are normally settled within 60 days.
(1) Includes accruals for silicosis and retrenchments of R151m (2018: R233m) and nil (2018: R9m) respectively.

COMPANY – NOTES TO THE FINANCIAL STATEMENTS FOR THE YEAR ENDED 31 DECEMBER
PAGE 102
SA Rands millions 2019 2018
25 TAXATION
Balance at beginning of year 24 37 Refunds during the year — 3 Taxation of items included in income statement (note 7) (5) (16) Balance at end of year 19 24
26 CASH GENERATED FROM (UTILISED BY) OPERATIONS
Profit (loss) before taxation (276) (149) Adjusted for: Amortisation of tangible assets (note 2) 21 39 Amortisation of right of use assets (note 2) 14 — Finance costs and unwinding of obligations (note 5) 224 211 Environmental, rehabilitation and other expenditure (286) (118) Impairment, derecognition of assets and profit / loss on disposal (5) 30 Other expenses (income) 118 123 Impairment reversal on investment in associate — (68) Interest income (39) (6) Dividends received (630) (322) Foreign currency translation on intergroup loans (37) 208 Other non-cash movements 49 (451) Movements in working capital (53) (315) (900) (818) Movements in working capital: (Increase) decrease in inventories (30) — (Increase) decrease in trade and other receivables 62 (38) Increase (decrease) in trade and other payables (85) (277) (53) (315)
27 RELATED PARTIES
Material related party transactions were as follows: Sales and services rendered to related parties Subsidiaries(1) 3,081 2,778 Purchases and services acquired from related parties Subsidiaries(1) 188 566 Outstanding balances arising from sale of goods and services due by related parties Subsidiaries 438 2,377 Outstanding balances arising from purchases of goods and services and other loans owed to related parties
Subsidiaries 3,338 3,381 Investment in Environmental Rehabilitation Trust Fund (2) — 294 Amounts owed to/due by related parties above are unsecured and non-interest bearing. In 2019, AngloGold Ashanti received a dividend of R406m from AngloGold Ashanti Holdings plc (2018: 294m).
Management fees, royalties, interest and net dividends from subsidiaries amounts to R2m (2018: R1m).
Details of guarantees to related parties are included in note 28. Refer to page 117 for the list of principal subsidiaries and operating entities. Directors and other key management personnel Details relating to directors' and prescribed officers' emoluments and shareholdings in the company are disclosed in group note 33.
(1) Includes VAT where applicable. (2) Transferred to assets held for sale.

COMPANY – NOTES TO THE FINANCIAL STATEMENTS FOR THE YEAR ENDED 31 DECEMBER
PAGE 103
SA Rands millions 2019 2018
28 CONTRACTUAL COMMITMENTS AND CONTINGENCIES
Capital commitments Acquisition of tangible assets Contracted for 93 110 Not contracted for 734 1,182 Authorised by the directors 827 1,292 Allocated to: Project capital - within one year 29 135 - thereafter — 34 29 169 Stay-in-business capital - within one year 537 958 - thereafter 261 165 798 1,123 Purchase obligations Contracted for - within one year 78 183
Purchase obligations represent contractual obligations for the purchase of mining contract services, supplies, consumables, inventories, explosives and activated carbon.
To service these capital commitments, purchase obligations and other operational requirements, the company is dependent on existing cash resources, cash generated from operations and borrowing facilities.
Cash generated from operations is subject to operational, market and other risks. Distributions from operations may be subject to foreign investment, exchange control laws and regulations and the quantity of foreign exchange available in offshore countries. In addition, distributions from joint ventures are subject to the relevant board approval.
The credit facilities and other finance arrangements contain financial covenants and other similar undertakings. To the extent that external borrowings are required, the company's covenant performance indicates that existing financing facilities will be available to meet the commitments detailed above. To the extent that any of the financing facilities mature in the near future, the company believes that sufficient measures are in place to ensure that these facilities can be refinanced. Contingencies
Contingent liabilities Groundwater pollution(1) — — Deep groundwater pollution(2) — — Contingent asset Royalty - Tau Lekoa Gold Mine(3) — — Guarantees Financial guarantees Rated bonds(4) 24,489 25,107 Revolving credit facilities - $100m(5) 1,435 Performance guarantee Mine Waste Solutions(6) — — 24,489 26,542
Contingent liabilities (1) Groundwater pollution - The company has identified groundwater contamination plumes at its South African operations, which
have occurred primarily as a result of seepage from mine residue stockpiles. Numerous scientific, technical and legal studies have been undertaken to assist in determining the magnitude of the contamination and to find sustainable remediation solutions. The company has instituted processes to reduce future potential seepage and it has been demonstrated that Monitored Natural Attenuation (MNA) by the existing environment will contribute to improvements in some instances. Furthermore, literature reviews, field trials and base line modelling techniques suggest, but have not yet proven, that the use of phyto-technologies can address the soil and groundwater contamination at all South African operations. Subject to the completion of trials and the technology being a proven remediation technique, no reliable estimate can be made for the obligation.

COMPANY – NOTES TO THE FINANCIAL STATEMENTS FOR THE YEAR ENDED 31 DECEMBER
PAGE 104
28 CONTRACTUAL COMMITMENTS AND CONTINGENCIES CONTINUED
Contingent liabilities CONTINUED (2) Deep groundwater pollution - The company has identified potential water ingress and future pollution risk posed by deep
groundwater in certain underground mining areas in South Africa. Various studies have been undertaken by AngloGold Ashanti since 1999 to understand this potential risk. Due to the interconnected nature of mining operations, any proposed solution needs to be a combined one supported by all the mines located in these gold fields. As a result, the Mineral and Petroleum Resources Development Act (MPRDA) requires that the affected mining companies develop a Regional Mine Closure Strategy to be approved by the Department of Mineral Resources. In view of the limitation of current information for the accurate estimation of a liability, no reliable estimate can be made for the obligation.
Contingent asset (3) Royalty - As a result of the sale of the interest in the Tau Lekoa Gold Mine during 2010, the company is entitled to receive a
royalty on the production of a total of 1.5Moz by the Tau Lekoa Gold Mine and in the event that the average monthly rand price of gold exceeds R180,000/kg (subject to inflation adjustment). Where the average monthly rand price of gold does not exceed R180,000/kg (subject to inflation adjustment), the ounces produced in that quarter do not count towards the total 1.5Moz upon which the royalty is payable. The royalty is determined at 3% of the net revenue (being gross revenue less state royalties) generated by the Tau Lekoa assets. Royalties on 895,954oz (2018: 825,791oz) produced have been received to date.
Guarantees (4) The company has fully and unconditionally guaranteed all payments and other obligations of AngloGold Ashanti Holdings plc
regarding the issued $700m 5.375% rated bonds due 15 April 2020, the issued $300m 6.5% rated bonds due 15 April 2040 and the $750m 5.125% rated bonds issued during July 2012, due 1 August 2022.
(5) The company has fully and unconditionally guaranteed all payments and other obligations under the $100m, 3 year revolving
credit facilities entered into during 2016. During 2019, the loans were refinanced and included in Geita and Siguiri revolving credit facilities.
(6) As part of the acquisition by the company of First Uranium (Pty) Limited during 2012, the owner of Mine Waste Solutions, the
company agreed to guarantee the observance and performance of existing delivery obligations of a wholly owned subsidiary of Mine Waste Solutions to sell to an existing customer at a pre-agreed price, 25% of the gold produced at a gold recovery plant located in northwest South Africa, subject to a cap of 312,500oz over the life of the contract. As at 31 December 2019, 118,195oz (2018: 144,518oz) remain to be delivered against the guarantee over the life of the contract. The guarantee is included in the South African assets sale as described in note 9.
29 FINANCIAL RISK MANAGEMENT ACTIVITIES
In the normal course of its operations, the company is exposed to gold price, other commodity price, foreign exchange, interest rate, liquidity, equity price and credit risks. In order to manage these risks, the company may enter into transactions which make use of both on- and off-balance sheet derivatives. The company does not acquire, hold or issue derivatives for speculative purposes. The company has developed a comprehensive risk management process to facilitate, control and monitor these risks. The board has approved and monitors this risk management process, inclusive of documented treasury policies, counterparty limits and controlling and reporting structures. Managing risk in the company Risk management activities within the company are the ultimate responsibility of the board of directors. The Chief Financial Officer is responsible to the board of directors for the design, implementation and monitoring of the risk management plan. The Audit and Risk Committee is responsible for overseeing risk management plans and systems, as well as financial risks which include a review of treasury activities and the company's counterparties. The financial risk management objectives of the company are defined as follows: safeguarding the company's core earnings stream from its major assets through the effective control and management of
gold price risk, other commodity risk, foreign exchange risk and interest rate risk; effective and efficient usage of credit facilities in both the short and long term through the adoption of reliable liquidity
management planning and procedures; ensuring that investment and hedging transactions are undertaken with creditworthy counterparties; and ensuring that all contracts and agreements related to risk management activities are coordinated, consistent throughout
the company and that they comply where necessary with all relevant regulatory and statutory requirements.

COMPANY – NOTES TO THE FINANCIAL STATEMENTS FOR THE YEAR ENDED 31 DECEMBER
PAGE 105
29 FINANCIAL RISK MANAGEMENT ACTIVITIES CONTINUED Gold price and foreign exchange risk Gold price risk arises from the risk of an adverse effect on current or future earnings resulting from fluctuations in the price of gold. The gold market is predominately priced in US dollars which exposes the company to the risk that fluctuations in the SA rand/US dollar exchange rate may also have an adverse effect on current or future earnings. The company is also exposed to certain by-product commodity price risk. Net open hedge position as at 31 December 2019 The company had no outstanding commitments against future production. Interest rate and liquidity risk Refer note 35 in the group financial statements. At each of the financial years ended 31 December 2019 and 2018, the company was in a net current liability position. The company will fund current liabilities from operating cash flows and borrowings. The following are the contractual maturities of financial liabilities, including interest payments: Financial liabilities
SA Rands Within one year
Effective rate
Betweenone and two years
Effective rate
Betweentwo and five years
Effective rate After five years
Effective rate Total
2019 millions % millions % millions % millions % millions
Financial guarantees 9,796 — 10,495 4,198 24,489
Borrowings 82 8.1 82 8.1 1,076 8.1 — 1,240
Lease liability (2) 49 9.8 53 9.8 14 9.8 — 116
Trade and other payables (note 24) 2,202 — — — 2,202
Intra-group balances (note 17) 3,338 — — — 3,338 2018
Financial guarantees 1,435 10,043 10,760 4,304 26,542
Borrowings 127 8.8 508 8.7 602 8.6 — 1,237
Trade and other payables (note 24) 2,768 — — — 2,768
Derivatives (note 24) 51 — — — 51
Intra-group balances (note 17) 3,381 (1) — — — 3,381
(1) Effective rate less than 0.1%. (2) Effective 1 January 2019, finance lease liabilities are no longer included in total borrowings but disclosed separately as part of lease liabilities.
Financial guarantees and their related amounts included in the statement of financial position include:
Guarantee
Included in statement of
financial position Guarantee
Included in statement of
financial position
SA Rands millions 2019 2018 Rated bonds 24,489 990 25,107 1,212 Revolving Credit Facilities - $100m 1,435 — 24,489 990 26,542 1,212
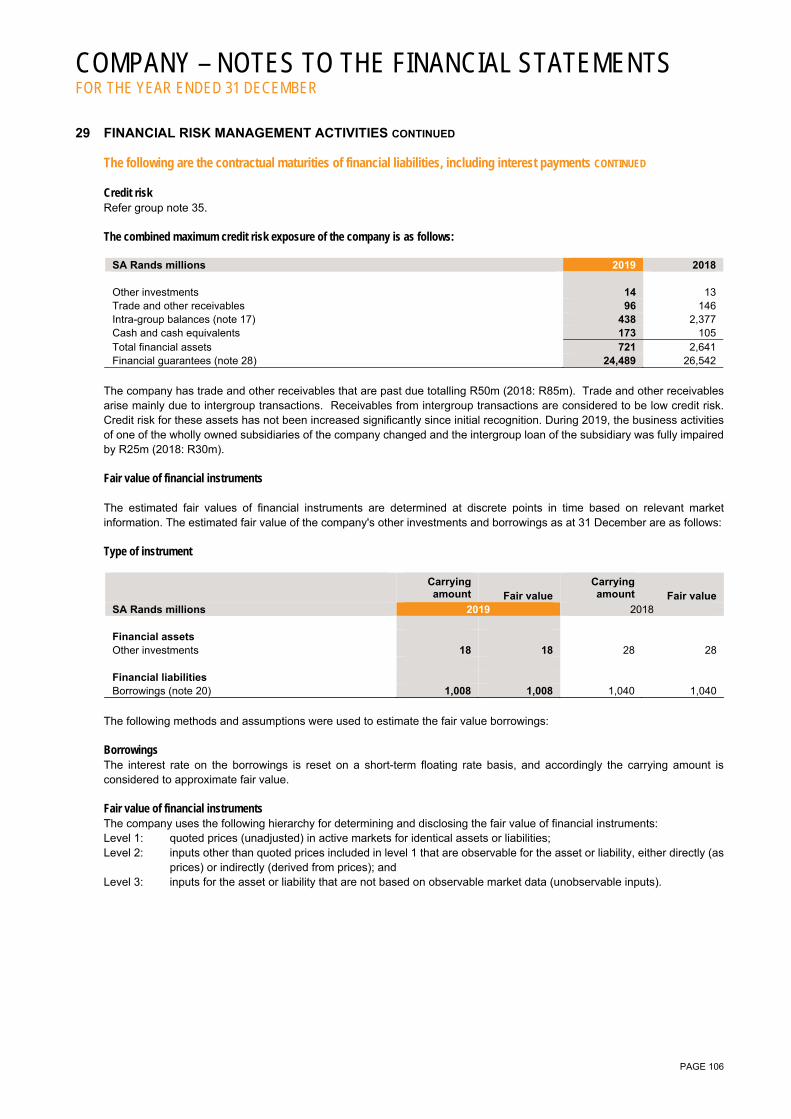
COMPANY – NOTES TO THE FINANCIAL STATEMENTS FOR THE YEAR ENDED 31 DECEMBER
PAGE 106
29 FINANCIAL RISK MANAGEMENT ACTIVITIES CONTINUED The following are the contractual maturities of financial liabilities, including interest payments CONTINUED Credit risk Refer group note 35. The combined maximum credit risk exposure of the company is as follows:
SA Rands millions 2019 2018 Other investments 14 13 Trade and other receivables 96 146 Intra-group balances (note 17) 438 2,377 Cash and cash equivalents 173 105 Total financial assets 721 2,641 Financial guarantees (note 28) 24,489 26,542
The company has trade and other receivables that are past due totalling R50m (2018: R85m). Trade and other receivables arise mainly due to intergroup transactions. Receivables from intergroup transactions are considered to be low credit risk. Credit risk for these assets has not been increased significantly since initial recognition. During 2019, the business activities of one of the wholly owned subsidiaries of the company changed and the intergroup loan of the subsidiary was fully impaired by R25m (2018: R30m). Fair value of financial instruments The estimated fair values of financial instruments are determined at discrete points in time based on relevant market information. The estimated fair value of the company's other investments and borrowings as at 31 December are as follows: Type of instrument
Carrying amount Fair value
Carrying amount Fair value
SA Rands millions 2019 2018 Financial assets Other investments 18 18 28 28 Financial liabilities Borrowings (note 20) 1,008 1,008 1,040 1,040
The following methods and assumptions were used to estimate the fair value borrowings: Borrowings The interest rate on the borrowings is reset on a short-term floating rate basis, and accordingly the carrying amount is considered to approximate fair value. Fair value of financial instruments The company uses the following hierarchy for determining and disclosing the fair value of financial instruments: Level 1: quoted prices (unadjusted) in active markets for identical assets or liabilities; Level 2: inputs other than quoted prices included in level 1 that are observable for the asset or liability, either directly (as
prices) or indirectly (derived from prices); and Level 3: inputs for the asset or liability that are not based on observable market data (unobservable inputs).
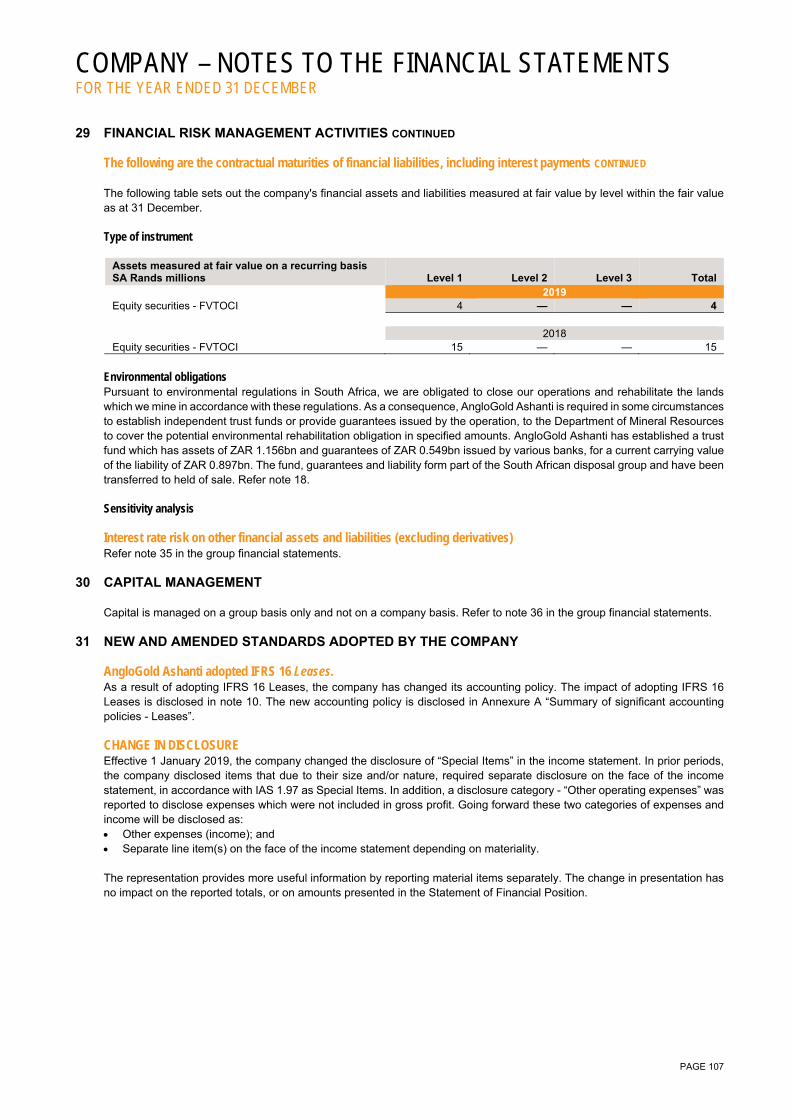
COMPANY – NOTES TO THE FINANCIAL STATEMENTS FOR THE YEAR ENDED 31 DECEMBER
PAGE 107
29 FINANCIAL RISK MANAGEMENT ACTIVITIES CONTINUED The following are the contractual maturities of financial liabilities, including interest payments CONTINUED The following table sets out the company's financial assets and liabilities measured at fair value by level within the fair value as at 31 December. Type of instrument
Assets measured at fair value on a recurring basis SA Rands millions Level 1 Level 2 Level 3 Total 2019 Equity securities - FVTOCI 4 — — 4 2018 Equity securities - FVTOCI 15 — — 15
Environmental obligations Pursuant to environmental regulations in South Africa, we are obligated to close our operations and rehabilitate the lands which we mine in accordance with these regulations. As a consequence, AngloGold Ashanti is required in some circumstances to establish independent trust funds or provide guarantees issued by the operation, to the Department of Mineral Resources to cover the potential environmental rehabilitation obligation in specified amounts. AngloGold Ashanti has established a trust fund which has assets of ZAR 1.156bn and guarantees of ZAR 0.549bn issued by various banks, for a current carrying value of the liability of ZAR 0.897bn. The fund, guarantees and liability form part of the South African disposal group and have been transferred to held of sale. Refer note 18. Sensitivity analysis Interest rate risk on other financial assets and liabilities (excluding derivatives) Refer note 35 in the group financial statements.
30 CAPITAL MANAGEMENT Capital is managed on a group basis only and not on a company basis. Refer to note 36 in the group financial statements.
31 NEW AND AMENDED STANDARDS ADOPTED BY THE COMPANY AngloGold Ashanti adopted IFRS 16 Leases. As a result of adopting IFRS 16 Leases, the company has changed its accounting policy. The impact of adopting IFRS 16 Leases is disclosed in note 10. The new accounting policy is disclosed in Annexure A “Summary of significant accounting policies - Leases”. CHANGE IN DISCLOSURE Effective 1 January 2019, the company changed the disclosure of “Special Items” in the income statement. In prior periods, the company disclosed items that due to their size and/or nature, required separate disclosure on the face of the income statement, in accordance with IAS 1.97 as Special Items. In addition, a disclosure category - “Other operating expenses” was reported to disclose expenses which were not included in gross profit. Going forward these two categories of expenses and income will be disclosed as: Other expenses (income); and Separate line item(s) on the face of the income statement depending on materiality. The representation provides more useful information by reporting material items separately. The change in presentation has no impact on the reported totals, or on amounts presented in the Statement of Financial Position.

COMPANY – NOTES TO THE FINANCIAL STATEMENTS FOR THE YEAR ENDED 31 DECEMBER
PAGE 108
31 NEW AND AMENDED STANDARDS ADOPTED BY THE COMPANY CONTINUED CHANGE IN DISCLOSURE CONTINUED As a result of the change, reclassifications in the income statement are as follows:
Income statement extract SA Rands millions
2018 Previously reported
2018Reclassification
Gross profit (loss) 70 70 Corporate administration, marketing and other expenses (224) (224) Exploration and evaluation costs (53) (53) Impairment, derecognition of assets and profit (loss) on disposal n/a 141 Other expenses (income) (603) (975) Special items (231) n/a Operating profit (loss) (1,041) (1,041)
32 SUBSEQUENT EVENTS
Sale of South African assets - On 12 February 2020, AngloGold Ashanti announced that it has reached an agreement to sell its remaining South African producing assets and related liabilities to Harmony Gold Mining Company Limited. Consideration for the transaction is in cash and deferred payments with expected proceeds of around $300m, subject to subsequent performance and with additional proceeds if the West Wits assets are developed below current infrastructure. Refer to note 18 and group note 9. Dividend declaration - On 21 February 2020, the directors of AngloGold Ashanti declared a gross cash dividend per ordinary share of 165 South African cents (assuming an exchange rate of ZAR 15/$, the gross dividend payable per ADS is equivalent to ~11 US cents). COVID-19 pandemic - For a discussion of the impact of the COVID-19 pandemic, refer group note 37.

PAGE 109
ANNEXURE A SUMMARY OF SIGNIFICANT ACCOUNTING POLICIES EQUITY-ACCOUNTED INVESTMENTS Joint ventures A joint venture is an entity in which the group holds a long term interest and which the group and one or more other ventures jointly control under a contractual arrangement, that provides for strategic, financial and operating policy decisions relating to the activities requiring unanimous consent of the parties sharing control. The group’s interests in joint arrangements classified as joint ventures are accounted for using the equity method. Profits and losses realised in connection with transactions between the group and joint ventures are eliminated in proportion to share ownership. Such profits and losses are deducted from the group’s equity and related statement of financial position amount and released in the group accounts when the assets are effectively realised outside the group. Dividends received from joint ventures are included in operating activities in the cash flow statement. Joint ventures are accounted for at cost and are adjusted for impairments where appropriate in the company financial statements. Associates The equity method of accounting is used for investments over which the group exercises significant influence and normally owns between 20% and 50% of the voting equity. Associates are equity-accounted from the effective date of acquisition to the effective date of disposal. Profits and losses realised in connection with transactions between the group and associated companies are eliminated in proportion to share ownership. Such profits and losses are deducted from the group’s equity and related statement of financial position amount and released in the group accounts when the assets are effectively realised outside the group. Dividends received from associates are included in investing activities in the cash flow statement. Associates are accounted for at cost and are adjusted for impairments where appropriate in the company financial statements. Joint ventures and associates If necessary, impairment losses on loans and equity are reported under share of joint ventures and associates profit and loss. Any losses of equity-accounted investments are accounted for in the consolidated financial statements until the investment in such investments is written down to zero. Thereafter, losses are accounted for only insofar as the group is committed to providing financial support to such investees. The carrying value of equity-accounted investments represents the cost of each investment, including goodwill, balance outstanding on loans advanced if the loan forms part of the net investment in the investee, any impairment losses recognised, the share of post-acquisition retained earnings and losses, and any other movements in reserves. The carrying value of equity-accounted investments is reviewed when indicators arise and if any impairment in value has occurred; it is recognised in the period in which the impairment arose. In determining materiality for the disclosure requirements of IFRS 12 Disclosure of Interest in Other Entities, management has assessed that amounts representing the carrying value of at least 90% of the investments in associates and joint ventures balances, reported in the statement of financial position, constitute quantitative materiality. UNINCORPORATED JOINT OPERATIONS A joint operation is a joint arrangement whereby the parties that have joint control of the arrangement have rights to the use of assets and obligations for the liabilities of the arrangement. The group accounts for activities under joint operations by recognising in relation to the joint operation, the assets it controls and the liabilities it incurs, the expenses it incurs and the revenue from the sale or use of its share of the joint operations output.
PAGE 110
FOREIGN CURRENCY TRANSLATION Functional currency Items included in the financial statements of each of the group’s entities are measured using the currency of the primary economic environment in which the entity operates (the ‘functional currency’). The functional currency of the parent company is South African Rands. Transactions and balances Foreign currency transactions are translated into the functional currency using the approximate exchange rates prevailing at the dates of the transactions. Foreign exchange gains and losses resulting from the settlement of foreign currency transactions and from the translation at the reporting period exchange rate of monetary assets and liabilities denominated in foreign currencies are recognised in the income statement. Group companies The results and financial position of all group entities (none of which has the currency of a hyperinflationary economy) that have a functional currency different from the presentation currency are translated into the presentation currency as follows: share capital and premium are translated at historical rates of exchange at the reporting date; retained earnings are converted at historical average exchange rates; assets and liabilities for each statement of financial position presented are translated at the closing rate at the date of that
statement of financial position; income and expenses for each income statement presented are translated at monthly average exchange rates (unless this
average is not a reasonable approximation of the cumulative effect of the rates prevailing on the transaction dates, in which case income and expenses are translated at the rates prevailing at the date of the transaction); and
all resulting exchange differences are recognised in other comprehensive income and presented as a separate component of equity (foreign currency translation reserve, or FCTR).
Exchange differences arising from the translation of the net investment in foreign operations, and of borrowings and other currency instruments designated as hedges of such investments, are accounted for as other comprehensive income on consolidation. On repayment or realisation, permanent loans and investments are recycled from FCTR to the income statement. For the company, the exchange differences on such monetary items are reported in the company income statement. SEGMENT REPORTING An operating segment is a business activity whose results are regularly reviewed by the chief operating decision maker (CODM) in order to make decisions about resources to be allocated to it and to assess its performance and for which discrete financial information is available. The chief executive officer and the executive committee are collectively identified as the CODM. TANGIBLE ASSETS Tangible assets are recorded at cost less accumulated amortisation and impairments/reversals. Cost includes pre-production expenditure incurred during the development of a mine and the present value of related future decommissioning costs.
Interest on borrowings relating to the financing of major capital projects under construction is capitalised during the construction phase as part of the cost of the project. Such borrowing costs are capitalised over the period during which the asset is being acquired or constructed and borrowings have been incurred. Capitalisation ceases when construction is interrupted for an extended period or when the asset is substantially complete. Other borrowing costs are expensed as incurred.
When there is an indication that the recoverable amount of any of the tangible assets is less than the carrying value, the recoverable amount is estimated and the difference is recognised as an impairment.
Subsequent costs are included in the asset’s carrying amount only when it is probable that future economic benefits associated with the asset will flow to the group, and the cost of the addition can be measured reliably. All other repairs and maintenance are charged to the income statement during the financial period in which they are incurred.
To the extent a legal or constructive obligation to a third party exists, the acquisition cost includes estimated costs of dismantling and removing the asset and restoring the site. A change in estimated expenditures for dismantling, removal and restoration is added to or deducted from the carrying value of the related asset. To the extent that the change would result in a negative carrying amount of the related asset, this effect is recognised as income. The change in depreciation charge is recognised prospectively.
For assets amortised on the units-of-production method, amortisation is calculated to allocate the cost of each asset to its residual value over its estimated useful life. For assets not amortised on the units-of-production method, amortisation is calculated over their estimated useful life as follows: buildings up to life of mine; plant and machinery up to life of mine; equipment and motor vehicles up to five years; computer equipment up to three years; and leased assets over the shorter of the period of the lease and the useful life of the leased asset.
PAGE 111
Major renovations are depreciated over the remaining useful life of the related asset or to the date of the next major renovation, whichever is sooner. Assets are amortised to residual values. Residual values and useful lives are reviewed, and adjusted if appropriate, at the beginning of each financial year. Gains and losses on disposals are determined by comparing net sale proceeds with the carrying amount at the date of sale. These are included in the income statement. Mine development costs Capitalised mine development costs include expenditure incurred to develop new orebodies, to define further mineralisation in existing orebodies and to expand the capacity of a mine. Mine development costs include acquired proved and probable Ore Reserve at cost at the acquisition date. These costs are amortised from the date on which commercial production begins. Depreciation, depletion and amortisation of mine development costs are computed by the units-of-production method based on estimated proved and probable Ore Reserve. The proved and probable Ore Reserve reflects estimated quantities of reserves which can be recovered economically in the future from known mineral deposits. Capitalised mine development costs also include stripping activity assets relating to production stripping activities incurred in the production phase of open-pit operations of the group. Once determined that any portion of the production stripping costs should be capitalised, the group determines the average mine costs per tonne of the component and the waste tonnes to which the production stripping costs relate to determine the amount of the production stripping costs that should be capitalised. Stripping activity assets are amortised on a units-of-production method based on the Ore Reserve of the component of the orebody to which these assets relate. The average mine cost per tonne of the component is calculated as the total expected costs to be incurred to mine the relevant component of the orebody, divided by the number of tonnes expected to be mined from the component. The average mine cost per tonne of the component to which the stripping activity asset relates are recalculated annually in the light of additional knowledge and changes in estimates. Mine infrastructure Mine plant facilities, including decommissioning assets, are amortised using the lesser of their useful life or units-of-production method based on estimated proved and probable Ore Reserve. Land and assets under construction Land and assets under construction are not depreciated and are measured at historical cost less impairments. Mineral rights and dumps Mineral rights are amortised using the units-of-production method based on the estimated proved and probable Ore Reserve. Dumps are amortised over the period of treatment. Exploration and evaluation assets All pre-license and exploration costs, including geological and geographical costs, labour, Mineral Resource and exploratory drilling cost, are expensed as incurred, until it is concluded that a future economic benefit will more likely than not be realised. In evaluating if expenditures meet this criterion to be capitalised, several different sources of information are used depending on the level of exploration. While the criterion for concluding that expenditure should be capitalised is always probable, the information used to make that determination depends on the level of exploration: Costs on greenfields sites, being those where the group does not have any mineral deposits which are already being mined or
developed under the planned method of extraction, are expensed as incurred until the group is able to demonstrate that future economic benefits are probable, which generally will be the establishment of proved and probable Ore Reserve at this location;
Costs on brownfields sites, being those adjacent to mineral deposits which are already being mined or developed under the planned method of extraction, are expensed as incurred until the group is able to demonstrate that future economic benefits are probable, which generally will be the establishment of increased inclusive proved and probable Ore Reserve, after which the expenditure is capitalised as a mine development cost; and
Costs relating to extensions of mineral deposits, which are already being mined or developed, including expenditure on the definition of mineralisation of such mineral deposits, are capitalised as a mine development cost.
Costs relating to property acquisitions are capitalised within mine development costs. LEASES The group assesses whether a contract is or contains a lease at inception of a contract. The group recognises a right-of-use asset and a corresponding lease liability with respect to all lease agreements in which it is the lessee, except for short-term leases (defined as leases with a lease term of 12 months or less) and leases of low value assets. For these leases, the group recognises the lease payments as an operating expense on a straight-line basis over the term of the lease unless another systematic basis is more representative of the time pattern in which economic benefits from the leased asset are consumed. The lease liability is initially
PAGE 112
measured at the present value of the lease payments that are not paid at the commencement date, discounted by using the rate implicit in the lease. If this rate cannot be readily determined, the group uses its incremental borrowing rate. The group applies the IFRS 16 portfolio approach in determining the discount rate for leases. As such a single discount rate has been used for contracts that share similar characteristics. The group has determined that contracts that are denominated in the same currency will use a single discount rate. This rate has been determined using various factors including in-country borrowings as well as other sources of finance. Contracts may contain both lease and non-lease components. The group allocates the consideration in the contract to the lease and non-lease components based on their relative stand-alone prices. Lease payments included in the measurement of the lease liability comprise: fixed lease payments (including in-substance fixed payments), less any lease incentives; variable lease payments that depend on an index or rate, initially measured using the index or rate at the commencement date; the amount expected to be payable by the lessee under residual value guarantees; the exercise price of purchase options, if the lessee is reasonably certain to exercise the options; and payments of penalties for terminating the lease, if the lease term reflects the exercise of an option to terminate the lease. The lease liability is presented separately in the consolidated statement of financial position, allocated to non-current and current liabilities. The lease liability is subsequently measured by increasing the carrying amount to reflect interest on the lease liability (using the effective interest method) and by reducing the carrying amount to reflect the lease payments made. The group remeasures the lease liability (and makes a corresponding adjustment to the related right-of-use asset) whenever: the lease term has changed or there is a change in the assessment of exercise of a purchase option, in which case the lease
liability is remeasured by discounting the revised lease payments using a revised discount rate. the lease payments change due to changes in an index or rate or a change in expected payment under a guaranteed residual
value, in which cases the lease liability is remeasured by discounting the revised lease payments using the initial discount rate (unless the lease payments change is due to a change in a floating interest rate, in which case a revised discount rate is used).
a lease contract is modified and the lease modification is not accounted for as a separate lease, in which case the lease liability is remeasured by discounting the revised lease payments using a revised discount rate.
The right-of-use assets comprise the initial measurement of the corresponding lease liability, lease payments made at or before the commencement day, any initial direct costs and restoration costs as described below. They are subsequently measured at cost less accumulated depreciation and impairment losses. The lease term is determined as the non-cancellable period of a lease, together with: Periods covered by an option to extend the lease if AngloGold Ashanti is reasonably certain to make use of that option; and/or Periods covered by an option to terminate the lease, if AngloGold Ashanti is reasonably certain not to make use of that option. Whenever the group incurs an obligation for costs to dismantle and remove a leased asset, restore the site on which it is located or restore the underlying asset to the condition required by the terms and conditions of the lease, a provision is recognised and measured under IAS 37 Provisions, Contingent Liabilities and Contingent Assets. The costs are included in the related right-of-use asset, unless those costs are incurred to produce inventories. Right-of-use assets are depreciated over the shorter period of lease term and useful life of the underlying asset. If a lease transfers ownership of the underlying asset or the cost of the right-of-use asset reflects that the group expects to exercise a purchase option, the related right-of-use asset is depreciated over the useful life of the underlying asset. The depreciation starts at the commencement date of the lease. The right-of-use assets are presented as a separate line in the consolidated statement of financial position. The group applies IAS 36 Impairment of Assets to determine whether a right-of-use asset is impaired and accounts for any identified impairment loss accordingly. NON-CURRENT ASSETS HELD FOR SALE AND DISCONTINUED OPERATIONS Non-current assets and disposal groups are classified as held for sale if their carrying amount will be recovered principally through a sale transaction rather than through continuing use. This condition is regarded as having been met only when the sale is highly probable and the asset (or disposal group) is available for immediate sale in its present condition. Management must be committed to the sale, which should be expected to qualify for recognition as a completed sale within one year from the date of classification. Non-current assets (and disposal groups) classified as held for sale are measured at the lower of their carrying amount and fair value less costs to sell.
Tangible assets, right of use assets and intangible assets are not depreciated once classified as held for sale.
PAGE 113
A disposal group qualifies as a discontinued operation if it is a component of an entity that either has been disposed of, or is classified as held for sale, and: Represents a separate major line of business or geographical area of operations; Is part of a single co-ordinated plan to dispose of a separate major line of business or geographical area of operations; or Is a subsidiary acquired exclusively with a view to resale. Discontinued operations are excluded from the results of continuing operations and are presented as a single amount as profit or loss after tax from discontinued operations in the statement of profit or loss. INVENTORIES Inventories are valued at the lower of cost and net realisable value after appropriate allowances for redundant and obsolete items. Cost is determined on the following bases: metals in process are valued at the average total production cost at the relevant stage of production; gold doré/bullion is valued on an average total production cost method; ore stockpiles are valued at the average moving cost of mining and stockpiling the ore. Stockpiles are classified as a non-
current asset where the stockpile exceeds current processing capacity; by-products, which include uranium oxide, silver and sulphuric acid, are valued using an average total production cost method; mine operating supplies are valued at average cost; and heap leach pad materials are measured on an average total production cost basis. A portion of the related depreciation, depletion and amortisation charge is included in the cost of inventory. Impairments resulting from a decrease in prices are disclosed in other expenses, all other impairments are included in cost of sales. PROVISIONS Provisions are recognised when the group has a present obligation, whether legal or constructive, because of a past event for which it is probable that an outflow of resources embodying economic benefits will be required to settle the obligation and a reliable estimate can be made of the amount of the obligation. Where some or all of the expenditure required to settle a provision is expected to be reimbursed by another party, the reimbursement is recognised only when the reimbursement is virtually certain. The amount to be reimbursed is recognised as a separate asset. Where the group has a joint and several liability with one or more other parties, no provision is recognised to the extent that those other parties are expected to settle part or all of the obligation. Provisions are measured at the present value of management’s best estimate of the expenditure required to settle the obligation at the reporting date. The discount rate used to determine the present value reflects current market assessments of the time value of money and the risks specific to the liability. Litigation and administrative proceedings are evaluated on a case-by-case basis considering the information available, including that of legal counsel, to assess potential outcomes. Where it is considered probable that an obligation will result in an outflow of resources, a provision is recorded for the present value of the expected cash outflows if these are reasonably measurable. These provisions cover the estimated payments to plaintiffs, court fees and the cost of potential settlements. EMPLOYEE BENEFITS Other post-employment benefit obligations Some group companies provide post-retirement health care benefits to their retirees. The entitlement to these benefits is usually conditional on the employee remaining in service up to retirement age and completion of a minimum service period. The expected costs of these benefits are accrued over the period of employment using an accounting methodology on the same basis as that used for defined benefit pension plans. Actuarial gains and losses arising from experience adjustments and changes in actuarial assumptions are recorded in other comprehensive income immediately. These obligations are valued annually by independent qualified actuaries. Termination benefits Termination benefits are payable when employment is terminated before the normal retirement date, or when an employee accepts voluntary redundancy in exchange for these benefits. The group recognises a liability and expense for termination benefits at the earlier of the following dates: (a) when the entity can no longer withdraw the offer of those benefits; and (b) when the entity recognises costs for a restructuring that is within the scope of IAS 37 Provisions, Contingent Liabilities and Contingent Assets and involves the payment of termination benefits. The group recognises termination benefits when it is demonstrably committed to either terminating the employment of current employees according to a detailed formal plan without possibility of withdrawal; or providing termination benefits as a result of an offer made to encourage voluntary redundancy based on the number of employees expected to accept the offer. Benefits falling due more than 12 months after reporting date are discounted to present value.

PAGE 114
Share-based payments The group’s management awards certain employee bonuses in the form of equity-settled share-based payments on a discretionary basis. The fair value of the equity instruments granted is calculated at grant date. For transactions with employees, fair value is based on market prices of the equity instruments granted, if available, taking into account the terms and conditions upon which those equity instruments were granted. If market prices of the equity instruments granted are not available, the fair value of the equity instruments granted is estimated using an appropriate valuation model. Vesting conditions, other than market conditions, are not taken into account when estimating the fair value of shares or share options at measurement date. Over the vesting period, the fair value at measurement date is recognised as an employee benefit expense with a corresponding increase in other capital reserves based on the group’s estimate of the number of instruments that will eventually vest. The income statement charge or credit for a period represents the movement in cumulative expense recognised as at the beginning and end of that period. Vesting assumptions for non-market conditions are reviewed at each reporting date to ensure they reflect current expectations. When options are exercised or share awards vest, the proceeds received, net of any directly attributable transaction costs, are credited to share capital (nominal value) and share premium. Where the terms of an equity settled award are modified, as a minimum, an expense is recognised as if the terms had not been modified. In addition, an expense is recognised for any modification which increases the total fair value of the share-based payment arrangement, or is otherwise beneficial to the employee, as measured at the date of the modification. In addition, the group’s management awards certain employee bonuses in the form of a cash settled scheme, whereby awards granted are linked to the performance of the company’s share price. A liability is recognised based upon the grant date fair value and is subsequently remeasured to the closing share price at each reporting date up to the date of vesting. Remeasurements to fair value are recognised in the income statement. In the company financial statements, share-based payment arrangements with employees of other group entities are recognised by charging that entity its share of the expense and a corresponding increase in other capital reserves. When options are exercised or share awards vest, the proceeds received, net of any directly attributable transaction costs, are credited to share capital (nominal value) and share premium. ENVIRONMENTAL EXPENDITURE The group has long-term remediation obligations comprising decommissioning and restoration liabilities relating to its past operations which are based on the group’s environmental management plans, in compliance with current environmental and regulatory requirements. Provisions for non-recurring remediation costs are made when there is a present obligation, it is probable that expenditure on remediation work will be required and the cost can be estimated within a reasonable range of possible outcomes. The costs are based on currently available facts, technology expected to be available at the time of the clean-up, laws and regulations presently or virtually certain to be enacted and prior experience in remediation of contaminated sites. Decommissioning costs The provision for decommissioning represents the cost that will arise from rectifying damage caused before production commences. Accordingly, a provision and a decommissioning asset is recognised and included within mine infrastructure. Decommissioning costs are provided at the present value of the expenditures expected to settle the obligation, using estimated cash flows based on current prices. The unwinding of the decommissioning obligation is included in the income statement. Estimated future costs of decommissioning obligations are reviewed regularly and adjusted as appropriate for new circumstances or changes in law or technology. Changes in estimates are capitalised or reversed against the relevant asset. Estimates are discounted at a pre-tax rate that reflects current market assessments of the time value of money. Gains or losses from the expected disposal of assets are not taken into account when determining the provision. Restoration costs The provision for restoration represents the cost of restoring site damage after the start of production. Changes in the provision are recorded in the income statement as a cost of production. Restoration costs are estimated at the present value of the expenditures expected to settle the obligation, using estimated cash flows based on current prices and adjusted for risks specific to the liability. The estimates are discounted at a pre-tax rate that reflects current market assessments of the time value of money.

PAGE 115
REVENUE RECOGNITION Revenue is recognised when control of the goods passes to the customer and the performance obligations of transferring control have been met. The amount of revenue recognised reflects the consideration to which the entity is entitled in exchange for the goods transferred. Revenue from product sales comprises sales of: refined gold; by-products including silver and sulphuric acid; and doré bars. Revenue from product sales is recognised at a point in time. TAXATION Deferred taxation is recognised on all qualifying temporary differences at the reporting date between the tax bases of assets and liabilities and their carrying amounts for financial reporting purposes. Deferred tax assets are only recognised to the extent that it is probable that the deductible temporary differences will reverse in the foreseeable future and future taxable profit will be available against which the temporary difference can be utilised. The carrying amount of deferred tax assets is reviewed at each reporting date. Deferred tax assets and liabilities are measured at future anticipated tax rates, which have been enacted or substantively enacted at the reporting date. Current and deferred tax is recognised as income or expense and included in profit or loss for the period, except to the extent that the tax arises from a transaction or event which is recognised, in the same or a different period, in other comprehensive income or directly in equity, or a business combination that is an acquisition. Current tax is measured on taxable income at the applicable statutory rate enacted or substantively enacted at the reporting date. Interest and penalties, if any, are recognised in the income statement as part of taxation expense. OTHER EXPENSES AND INCOME Items of income and expense, not included in gross profit, that are: material either quantitatively or qualitatively, or both; not directly related to current operating or financing activities; and not disclosed separately on the face of the income statement, are classified as Other (expenses) income on the face of the income statement. FINANCIAL INSTRUMENTS Financial instruments are initially recognised at fair value when the group becomes a party to their contractual arrangements. Transaction costs directly attributable to the instrument’s acquisition or issue are included in the initial measurement of financial assets and financial liabilities, except financial instruments classified as at fair value through profit or loss (FVTPL). The subsequent measurement of financial instruments is dealt with below. Financial liabilities Financial liabilities are classified as measured at amortised cost. A financial liability is derecognised when the obligation under the liability is discharged, cancelled or expires. The group also derecognises a financial liability when its terms are modified and the cash flows of the modified liability are substantially different. In this case a new financial liability based on the modified terms is recognised at fair value. Financial assets On initial recognition, a financial asset is classified as measured at: amortised cost; Fair value through other comprehensive income (FVTOCI) - equity instruments; or FVTPL. At initial recognition, the group measures a financial asset at its fair value plus, in the case of a financial asset not at FVTPL, transaction costs that are directly attributable to the acquisition of the financial asset. Transaction costs of financial assets carried at FVTPL, are expensed.
PAGE 116
A financial asset is measured at amortised cost if it is held within the business model whose objective is to hold assets to collect contractual cash flows and its contractual terms give rise, on specified dates, to cash flows that are solely payments of principal and interest on the principal amount outstanding. Interest income from these financial assets is included in finance income using the effective interest rate method. Any gain or loss arising on derecognition is recognised directly in profit or loss and presented in other gains or losses, together with foreign exchange gains or losses. Impairment losses are presented in the statement of profit or loss. A gain or loss on a debt investment that is subsequently measured at FVTPL is recognised in profit or loss and presented net within other gains or losses in the period in which it arises. On derecognition of a financial asset, the difference between the proceeds received or receivable and the carrying amount of the asset is included in profit or loss. Equity instruments Listed equity investments which are held to meet rehabilitation liabilities are classified as FVTPL. Listed equity investments held for other purposes are classified as FVTOCI. The group subsequently measures all equity investments at fair value. Where the group’s management has elected to present fair value gains and losses on equity investments in OCI, there is no subsequent reclassification of fair value gains and losses to profit or loss following the derecognition of the investment. Dividends from such investments continue to be recognised in profit or loss as other income when the group’s right to receive payments is established. Residual values in OCI are reclassified to retained earnings (accumulated losses) on derecognition of the related FVTOCI instruments. Changes in the fair value of financial assets at FVTPL are recognised in other gains or losses in the statement of profit or loss as applicable. Trade receivables Trade receivables mainly comprise receivable owing from banking institutions purchasing gold bullion. Normal market settlement terms are two working days. Impairment of financial assets Financial assets at amortised cost consist of trade receivables, loans, cash and cash equivalents and debt instruments. Impairment losses are assessed using the forward-looking expected credit loss (ECL) approach. An allowance is recorded for all loans and other debt financial assets not held at FVTPL. The impairment methodology applied depends on whether there has been a significant increase in credit risk. Trade receivable loss allowances are measured at an amount equal to lifetime ECL’s. Loss allowances are deducted from the gross carrying amount of the assets. Debt securities that are determined to have a low credit risk at the reporting date and bank balances, for which credit risk has not increased significantly since initial recognition, are measured at an amount equal to 12-month ECL. Fair value measurements The group measures financial instruments at fair value at each reporting date where relevant. Fair value is the price that would be received to sell an asset or paid to transfer a liability in an orderly transaction between market participants at the measurement date. The fair value of an asset or a liability is measured using the assumptions that market participants would use when pricing the asset or liability, assuming that market participants act in their economic best interest. For the purpose of fair value disclosures, the group has determined classes of assets and liabilities on the basis of the nature, characteristics and risks of the asset or liability and the level of the fair value hierarchy. The group uses valuation techniques that are appropriate in the circumstances and for which sufficient data are available to measure fair value, maximising the use of relevant observable inputs and minimising the use of unobservable inputs.

PAGE 117
PRINCIPAL SUBSIDIARIES AND OPERATING ENTITIES FOR THE YEAR ENDED 31 DECEMBER
Principal subsidiaries are those subsidiaries that hold material contracts and/or act as borrowers and/or guarantors of such material
contracts or operating mines.
Shares held Holding Percentage held
2019 2018 2019 2018
Principal subsidiaries and controlled operating entities(1)
AngloGold Ashanti Australia Limited(2) 2 257,462,077 257,462,077 I 100 100
AngloGold Ashanti Holdings plc 6 5,326,550,917 5,326,550,917 D 100 100
AngloGold Ashanti USA Incorporated 10 235 235 D 100 100
100
Operating entities
AngloGold Ashanti Córrego do Sítio Mineração S.A. 3 4,167,084,999 4,167,084,999 I 100
AngloGold Ashanti (Ghana) Limited(3) 4 132,419,584 132,419,584 I 100 100
AngloGold Ashanti (Iduapriem) Limited 4 66,270 66,270 I 100 100
Cerro Vanguardia S.A. 1 13,875,000 13,875,000 I 92.50 92.50
Geita Gold Mining Limited 9 123,382,772 123,382,772 I 100 100
Mineração Serra Grande S.A. 3 1,999,999 1,999,999 I 100 100
Societé AngloGold Ashanti de Guinée S.A. 5 3,486,134 3,486,134 I 85 85
Joint venture operating entities
Kibali (Jersey) Limited(4) 7 2,324 2,324 I 50 50
Société des Mines de Morila S.A. 8 400 400 I 40 40
Société d'Exploitation des Mines d'Or de Sadiola S.A. (5) 8 41,000 41,000 I 41 41
Unincorporated joint operation
Tropicana joint operation 2 n/a n/a I 70 70
D - Direct Holding I - Indirect Holding (1) All the operations in South Africa, namely, Mine Waste Solutions and Mponeng are held by the parent company, AngloGold Ashanti Limited.
An agreement for the sale of the South African operations was announced on 12 February 2020. (2) Owner of the Sunrise Dam operation and the Tropicana joint operation in Australia. (3) Operates the Obuasi mine in Ghana. (4) Owner of Kibali Goldmines S.A. which operates the Kibali mine in the Democratic Republic of the Congo. (5) An agreement for the sale of Sadiola was announced on 23 December 2019, subject to conditions precedent.
1 Argentina 6 Isle of Man
2 Australia 7 Jersey
3 Brazil 8 Mali
4 Ghana 9 Tanzania
5 Republic of Guinea 10 United States of America

PAGE 118
SHAREHOLDERS’ INFORMATION AT 31 DECEMBER
According to information available to the directors, the following are the only shareholders whose holdings, directly or indirectly, are
in excess of 5% of the ordinary issued share capital of the company:
Shareholders or their subsidiaries directly or indirectly holding >5% of AngloGold Ashanti’s capital
Ordinary shares held 2019 2018
Number % Number % Black Rock Inc. 41,236,154 9.93 32,926,713 7.98 Public Investment Corporation of South Africa 30,439,075 7.33 25,395,823 6.15 Van Eck Global 27,375,511 6.59 52,402,004 12.70
The Bank of New York Mellon holds 159,694,660 shares representing a holding of 38% (2018: 183,174,711 shares, a 44% holding)
through various custodians in respect of ADSs issued by the Bank, as AngloGold Ashanti’s ADS custodian.
Shareholder spread as at 31 December 2019:
Class of shareholder Number of
shareholders
% of total shares in
issue Number of
shares held % of total
shareholders Public shareholders 11,825 99.90% 414,773,830 99.87% Non-Public Directors 11 0.09% 353,735 0.09% Strategic holdings (Government of Ghana) 1 0.01% 173,650 0.04% Total 11,837 100.00% 415,301,215 100.00%
A redeemable preference shares All redeemable preference shares are held by a wholly-owned subsidiary company. B redeemable preference shares
ANNUAL REPORTS
Should you wish to receive a printed copy of AngloGold Ashanti’s Annual Financial Statements 2019, please request same from the
contact persons listed at the end of this report, or from the company’s website, or from [email protected], or
PO Box 62117, Marshalltown, Johannesburg, 2107.

PAGE 119
GLOSSARY OF TERMS AND ABBREVIATIONS
GLOSSARY OF TERMS AND NON-GAAP METRICS
All-in sustaining costs: During June 2013 the World Gold Council (WGC), an industry body, published a Guidance Note on ‘all-in sustaining costs’ metric, which gold mining companies can use to supplement their overall non-GAAP disclosure. ‘All-in sustaining costs’ is an extension of the existing ‘total cash cost’ metric and incorporates all costs related to sustaining production and in particular recognising the sustaining capital expenditure associated with developing and maintaining gold mines. In addition, this metric includes the cost associated with developing and maintaining gold mines. This metric also includes the cost associated with corporate office structures that support these operations, the community and rehabilitation costs attendant with responsible mining and any exploration and evaluation costs associated with sustaining current operations. All-in sustaining costs per ounce is arrived at by dividing the dollar value of the sum of these cost metrics, by the ounces of gold sold.
All-in costs: All-in costs are all-in sustaining costs including additional non-sustaining costs which reflect the varying costs of producing gold over the life-cycle of a mine.
Non-sustaining costs are those costs incurred at new operations and costs related to ‘major projects’ at existing operations where these projects will materially increase production.
All-in costs per ounce is arrived at by dividing the dollar value of the sum of these cost metrics, by the ounces of gold sold.
By-products: Any products that emanate from the core process of producing gold, including silver and sulphuric acid.
Capital expenditure: Total capital expenditure on tangible and intangible assets.
Adjusted EBITDA: Profit (loss) before taxation, amortisation of tangible, intangible and right of use assets, retrenchment costs at the operations, interest and dividend income, other gains (losses), care and maintenance costs, finance costs and unwinding of obligations, impairment and derecognition of assets, impairment of investments, profit (loss) on disposal of assets and investments, gain (loss) on unrealised non-hedge derivatives and other commodity contracts, fair value adjustments, repurchase premium and costs on settlement of issued bonds, write-off of stockpile and heap leach inventories to net realisable value, and the share of associates’ EBITDA.
The Adjusted EBITDA calculation is based on the formula included in the Revolving Credit Facility Agreements for compliance with the debt covenant formula.
The Adjusted EBITDA calculation is based on the formula included in the Revolving Credit Facility Agreements for compliance with the debt covenant formula.
Effective tax rate: Current and deferred taxation as a percentage of profit before taxation.
Free cash flow: Cash inflow from operating activities, less cash outflow from investing activities and after finance costs, adjusted to exclude once-off acquisitions and disposals and movements in restricted cash.
Gain (loss) on non-hedge derivatives and other commodity contracts:
Fair value changes on derivatives that are not designated as hedges in accordance with IFRS 9 - Financial Instruments, and other commodity contracts.
Gold produced: Refined gold in a saleable form derived from the mining process.
Net debt: Borrowings (excluding the Turbine Square Two (Pty) Limited lease), adjusted for the unamortised portion of the rated bonds, and cumulative fair value adjustment on issued bonds; less cash restricted for use and cash and cash equivalents.
Net capital employed: Total equity adjusted for other comprehensive income, actuarial gain (loss) and deferred taxation plus interest-bearing borrowings, less cash and cash equivalents and adjusted for capital expenditure incurred on assets not yet in production. Where average net capital employed is referred to, this is the average of the figures at the beginning and the end of the financial year.
Operating cash flow: Net cash inflow from operating activities less stay-in-business capital expenditure.
PAGE 120
Project capital: Capital expenditure to either bring a new operation into production; to materially increase production capacity; or to materially extend the productive life of an asset.
Region: Defines the operational management divisions within AngloGold Ashanti, namely South Africa, Continental Africa (Democratic Republic of the Congo, Ghana, Guinea, Mali and Tanzania), Australia (Australia and surrounding areas), and the Americas (Argentina, Brazil and Colombia).
Rehabilitation: The process of reclaiming land disturbed by mining to allow an appropriate post-mining use. Rehabilitation standards are defined by country-specific laws, including but not limited to the South African Department of Mineral Resources, the US Bureau of Land Management, the US Forest Service, and the relevant Australian mining authorities, and address among other issues, ground and surface water, topsoil, final slope gradient, waste handling and re-vegetation issues.
Stay-in-business capital: Capital expenditure to extend useful lives of existing production assets. This includes replacement of vehicles, plant and machinery, Ore Reserve development, deferred stripping and capital expenditure related to financial benefit initiatives, safety, health and the environment.
Sustaining capital: Total capital expenditure less any capital expenditure that relates to project capital expenditure and new investment/projects at all of our mines, whether they are in production or development stage.
Total cash costs: Total cash costs include site costs for all mining, processing and administration, and are inclusive of royalties and production taxes. Amortisation, rehabilitation, corporate administration, retrenchment, capital and exploration costs are excluded.
Total cash costs per ounce are the attributable total cash costs divided by the attributable ounces of gold produced.
Weighted average number of ordinary shares:
The number of ordinary shares in issue at the beginning of the year, increased by shares issued during the year, weighted on a time basis for the period during which they have participated in the income of the group, and increased by share options that are virtually certain to be exercised.
PAGE 121
ABBREVIATIONS
$ or USD United States dollars
A$ or AUD Australian dollars
ADS American Depositary Share
ADR American Depositary Receipt
AIC All-in costs
AISC All-in sustaining costs
ASX Australian Securities Exchange
BBSY Bank bill swap bid rate
BRL Brazilian real
bn Billion
CDI CHESS Depositary Interests
CHESS Clearing House Electronic Settlement System
Companies Act The South African Companies Act, No. 71 of 2008, as amended
GhDS Ghanaian Depositary Share
GhSE Ghana Stock Exchange
IASB International Accounting Standards Board
IFRS International Financial Reporting Standards
i-XBRL inline eXtensible Business Reporting Language
JIBAR Johannesburg Interbank Agreed Rate
JSE JSE Limited
LIBOR London Interbank Offer Rate
M or m Million, depending on the context
Moz Million ounces
NYSE New York Stock Exchange
oz Ounces (troy)
RCF Revolving Credit Facility
R, ZAR or Rand South African rands
SEC United States Securities and Exchange Commission
Strate South Africa’s Central Securities Depositary
TZS Tanzanian Shillings
US/USA United States of America
XBRL eXtensible Business Reporting Language
PAGE 122
FORWARD LOOKING STATEMENTS Certain statements contained in this document, other than statements of historical fact, including, without limitation, those concerning the economic outlook for the gold mining industry, expectations regarding gold prices, production, total cash costs, all-in sustaining costs, all-in costs, cost savings and other operating results, productivity improvements, growth prospects and outlook of AngloGold Ashanti’s operations, individually or in the aggregate, including the achievement of project milestones, commencement and completion of commercial operations of certain of AngloGold Ashanti’s exploration and production projects and the completion of acquisitions, dispositions or joint venture transactions, AngloGold Ashanti’s liquidity and capital resources and capital expenditures and the outcome and consequence of any potential or pending litigation or regulatory proceedings or environmental health and safety issues, are forward-looking statements regarding AngloGold Ashanti’s operations, economic performance and financial condition. These forward-looking statements or forecasts involve known and unknown risks, uncertainties and other factors that may cause AngloGold Ashanti’s actual results, performance or achievements to differ materially from the anticipated results, performance or achievements expressed or implied in these forward-looking statements. Although AngloGold Ashanti believes that the expectations reflected in such forward-looking statements and forecasts are reasonable, no assurance can be given that such expectations will prove to have been correct. Accordingly, results could differ materially from those set out in the forward-looking statements as a result of, among other factors, changes in economic, social and political and market conditions, (including as a result of the COVID-19 pandemic), the success of business and operating initiatives, changes in the regulatory environment and other government actions, including environmental approvals, fluctuations in gold prices and exchange rates, (including as a result of the COVID-19 pandemic), the outcome of pending or future litigation proceedings, and business and operational risk management. For a discussion of such risk factors, refer to AngloGold Ashanti’s annual reports on Form 20-F filed with the United States Securities and Exchange Commission. These factors are not necessarily all of the important factors that could cause AngloGold Ashanti’s actual results to differ materially from those expressed in any forward-looking statements. Other unknown or unpredictable factors could also have material adverse effects on future results. Consequently, readers are cautioned not to place undue reliance on forward-looking statements. AngloGold Ashanti undertakes no obligation to update publicly or release any revisions to these forward-looking statements to reflect events or circumstances after the date hereof or to reflect the occurrence of unanticipated events, except to the extent required by applicable law. All subsequent written or oral forward-looking statements attributable to AngloGold Ashanti or any person acting on its behalf are qualified by the cautionary statements herein. Non-GAAP financial measures This communication may contain certain “Non-GAAP” financial measures. AngloGold Ashanti utilises certain Non-GAAP performance measures and ratios in managing its business. Non-GAAP financial measures should be viewed in addition to, and not as an alternative for, the reported operating results or cash flow from operations or any other measures of performance prepared in accordance with IFRS. In addition, the presentation of these measures may not be comparable to similarly titled measures other companies may use.

PAGE 123
ADMINISTRATIVE AND CORPORATE INFORMATION
AngloGold Ashanti Limited
Registration No. 1944/017354/06
Incorporated in the Republic of South Africa
Share codes:
ISIN: ZAE000043485
JSE: ANG
NYSE: AU
ASX: AGG
GhSE:(Shares) AGA
GhSE: (GhDS) AAD
JSE Sponsor:
The Standard Bank of South Africa Limited
Auditors: Ernst & Young Inc.
Offices
Registered and Corporate
76 Rahima Moosa Street
Newtown 2001
(PO Box 62117, Marshalltown 2107)
South Africa
Telephone: +27 11 637 6000
Fax: +27 11 637 6624
Australia
Level 23, AMP Building,
140 St George’s Terrace
Perth, WA 6000
(PO Box Z5046, Perth WA 6831)
Australia
Telephone: +61 8 9425 4602
Fax: +61 8 9425 4662
Ghana
Gold House
Patrice Lumumba Road
(PO Box 2665)
Accra
Ghana
Telephone: +233 303 773400
Fax: +233 303 778155
Directors
Executive
KPM Dushnisky§ (Chief Executive Officer)
KC Ramon^ (Chief Financial Officer)
Non-Executive
SM Pityana^ (Chairman)
AM Ferguson*
AH Garner#
R Gasant^
NP January-Bardill^
NVB Magubane^
M Ramos^
MDC Richter#
RJ Ruston~
JE Tilk§
* British § Canadian #American
~ Australian ^South African
Officers
ME Sanz Perez Executive Vice President General Counsel, Compliance and Company Secretary
Investor Relations contacts
Sabrina Brockman
Telephone: +1 646 880 4526
Mobile: +1 646 379 2555
E-mail: [email protected]
Yatish Chowthee
Telephone: +27 11 637 6273
Mobile: +27 78 364 2080
E-mail: [email protected]
Fundisa Mgidi
Telephone: +27 11 637 6763
Mobile: +27 82 821 5322
E-mail: [email protected]
AngloGold Ashanti website
www.anglogoldashanti.com
Share Registrars
South Africa Computershare Investor Services (Pty) Limited Rosebank Towers, 15 Biermann Avenue, Rosebank, 2196 (Private Bag X9000, Saxonwold, 2132) South Africa Telephone: 0861 100 950 (in SA) Fax: +27 11 688 5218 E-mail: [email protected] Website : www.computershare.com Australia Computershare Investor Services Pty Limited Level 11, 172 St George's Terrace Perth, WA 6000 (GPO Box D182 Perth, WA 6840) Australia Telephone: +61 8 9323 2000 Telephone: 1300 55 2949 (Australia only) Fax: +61 8 9323 2033 Ghana NTHC Limited Martco House Off Kwame Nkrumah Avenue PO Box K1A 9563 Airport Accra Ghana Telephone: +233 302 235814/6 Fax: +233 302 229975 ADR Depositary BNY Mellon (BoNY) BNY Shareowner Services PO Box 30170 College Station, TX 77842-3170 United States of America Telephone: +1 866-244-4140 (Toll free in USA) or +1 201 680 6825 (outside USA) E-mail: [email protected] Website: www.mybnymdr.com Global BuyDIRECTSM BoNY maintains a direct share purchase and dividend reinvestment plan for ANGLOGOLD ASHANTI. Telephone: +1-888-BNY-ADRS

PAGE 124