Embed Size (px)
Citation preview
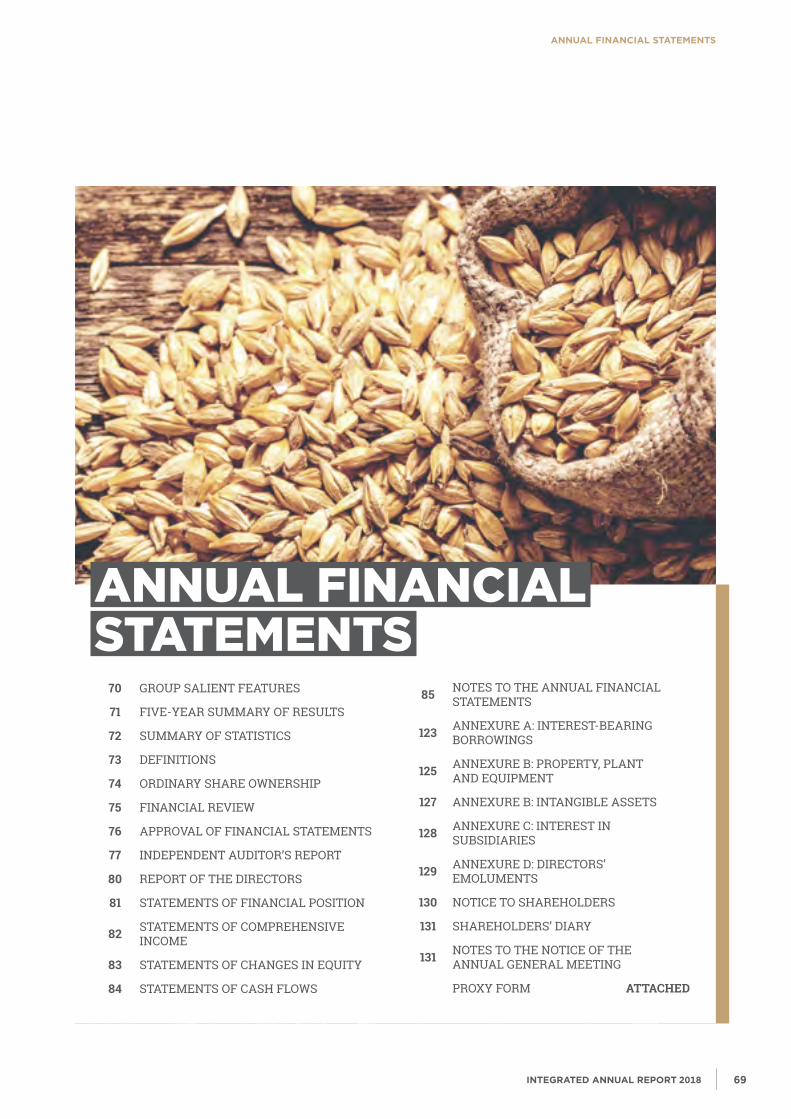
ANNUAL fINANCIAL STATEMENTS
AnnuAl finAnciAlstAtements
70 Group salient features
71 five-year summary of results
72 summary of statistics
73 Definitions
74 orDinary share ownership
75 financial review
76 approval of financial statements
77 inDepenDent auDitor’s report
80 report of the Directors
81 statements of financial position
82 statements of comprehensive income
83 statements of chanGes in equity
84 statements of cash flows
85 notes to the annual financial statements
123 annexure a: interest-bearinG borrowinGs
125 annexure b: property, plant anD equipment
127 annexure b: intanGible assets
128 annexure c: interest in subsiDiaries
129 annexure D: Directors’ emoluments
130 notice to shareholDers
131 shareholDers’ Diary
131 notes to the notice of the annual General meetinG
proxy form ATTACHED
INTEgrATED ANNUAL rEporT 201868 69NAmIbIA bREWERIES LImITED
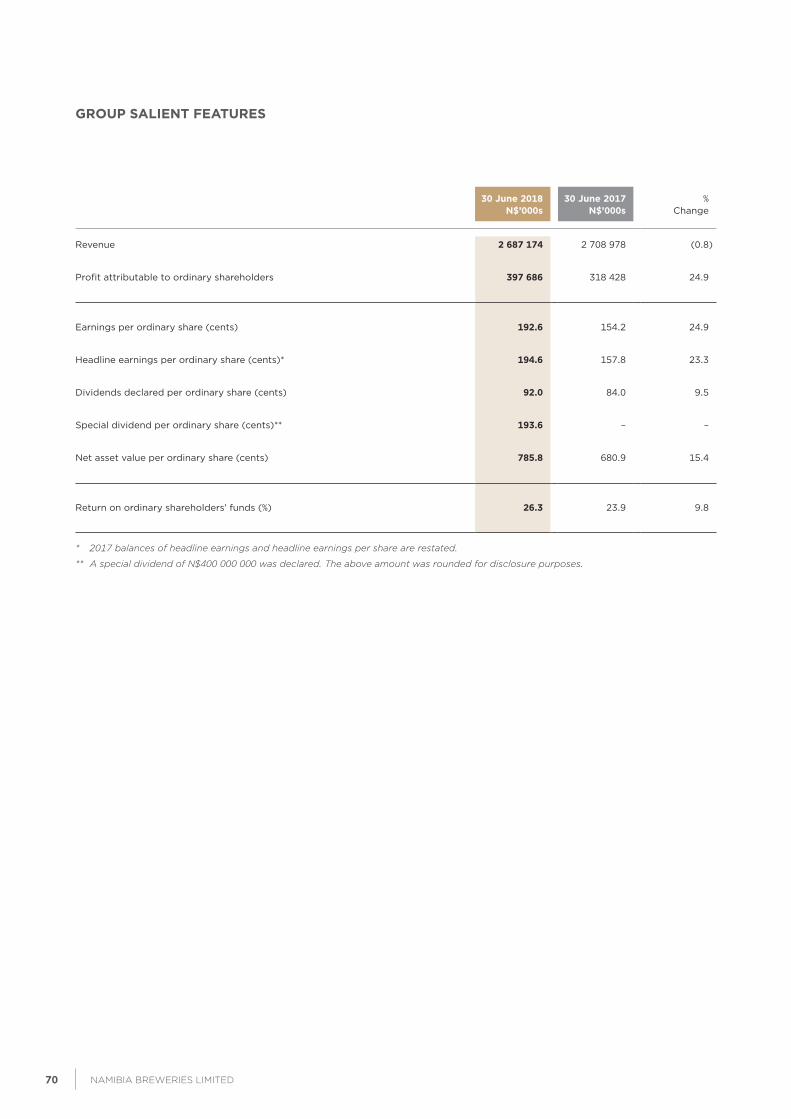
groUp SALIENT fEATUrES
30 June 2018N$’000s
30 June 2017N$’000s
%Change
Revenue 2 687 174 2 708 978 (0.8)
Profit attributable to ordinary shareholders 397 686 318 428 24.9
Earnings per ordinary share (cents) 192.6 154.2 24.9
Headline earnings per ordinary share (cents)* 194.6 157.8 23.3
Dividends declared per ordinary share (cents) 92.0 84.0 9.5
Special dividend per ordinary share (cents)** 193.6 – –
Net asset value per ordinary share (cents) 785.8 680.9 15.4
Return on ordinary shareholders’ funds (%) 26.3 23.9 9.8
* 2017 balances of headline earnings and headline earnings per share are restated.
** A special dividend of N$400 000 000 was declared. The above amount was rounded for disclosure purposes.
INTEgrATED ANNUAL rEporT 201870 71NAmIbIA bREWERIES LImITED
annual financial statements (CONTINUED)
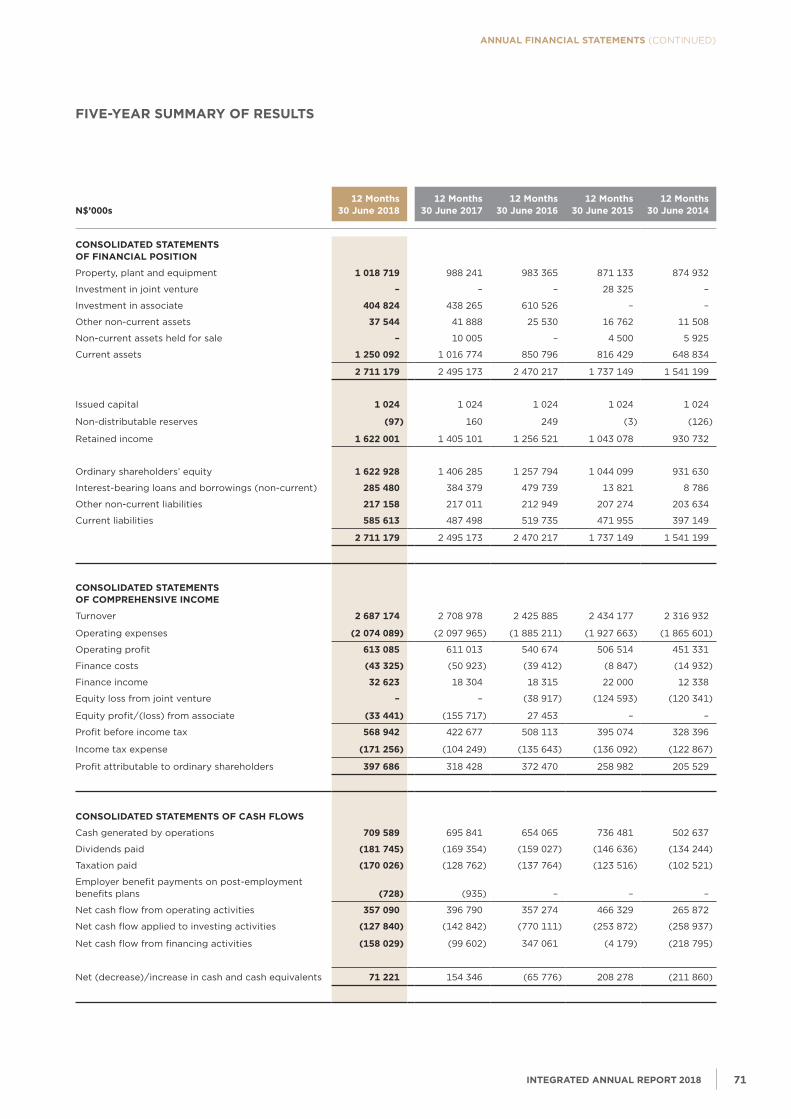
N$’000s 12 Months
30 June 201812 Months
30 June 201712 Months
30 June 201612 Months
30 June 201512 Months
30 June 2014
CoNSoLIDATED STATEMENTS of fINANCIAL poSITIoN
Property, plant and equipment 1 018 719 988 241 983 365 871 133 874 932
Investment in joint venture – – – 28 325 –
Investment in associate 404 824 438 265 610 526 – –
Other non-current assets 37 544 41 888 25 530 16 762 11 508
Non-current assets held for sale – 10 005 – 4 500 5 925
Current assets 1 250 092 1 016 774 850 796 816 429 648 834
2 711 179 2 495 173 2 470 217 1 737 149 1 541 199
Issued capital 1 024 1 024 1 024 1 024 1 024
Non-distributable reserves (97) 160 249 (3) (126)
Retained income 1 622 001 1 405 101 1 256 521 1 043 078 930 732
Ordinary shareholders’ equity 1 622 928 1 406 285 1 257 794 1 044 099 931 630
Interest-bearing loans and borrowings (non-current) 285 480 384 379 479 739 13 821 8 786
Other non-current liabilities 217 158 217 011 212 949 207 274 203 634
Current liabilities 585 613 487 498 519 735 471 955 397 149
2 711 179 2 495 173 2 470 217 1 737 149 1 541 199
CoNSoLIDATED STATEMENTS of CoMprEHENSIVE INCoME
Turnover 2 687 174 2 708 978 2 425 885 2 434 177 2 316 932
Operating expenses (2 074 089) (2 097 965) (1 885 211) (1 927 663) (1 865 601)
Operating profit 613 085 611 013 540 674 506 514 451 331
Finance costs (43 325) (50 923) (39 412) (8 847) (14 932)
Finance income 32 623 18 304 18 315 22 000 12 338
Equity loss from joint venture – – (38 917) (124 593) (120 341)
Equity profit/(loss) from associate (33 441) (155 717) 27 453 – –
Profit before income tax 568 942 422 677 508 113 395 074 328 396
Income tax expense (171 256) (104 249) (135 643) (136 092) (122 867)
Profit attributable to ordinary shareholders 397 686 318 428 372 470 258 982 205 529
CoNSoLIDATED STATEMENTS of CASH fLoWS
Cash generated by operations 709 589 695 841 654 065 736 481 502 637
Dividends paid (181 745) (169 354) (159 027) (146 636) (134 244)
Taxation paid (170 026) (128 762) (137 764) (123 516) (102 521)
Employer benefit payments on post-employment benefits plans (728) (935) – – –
Net cash flow from operating activities 357 090 396 790 357 274 466 329 265 872
Net cash flow applied to investing activities (127 840) (142 842) (770 111) (253 872) (258 937)
Net cash flow from financing activities (158 029) (99 602) 347 061 (4 179) (218 795)
Net (decrease)/increase in cash and cash equivalents 71 221 154 346 (65 776) 208 278 (211 860)
fIVE-YEAr SUMMArY of rESULTS
INTEgrATED ANNUAL rEporT 201870 71NAmIbIA bREWERIES LImITED
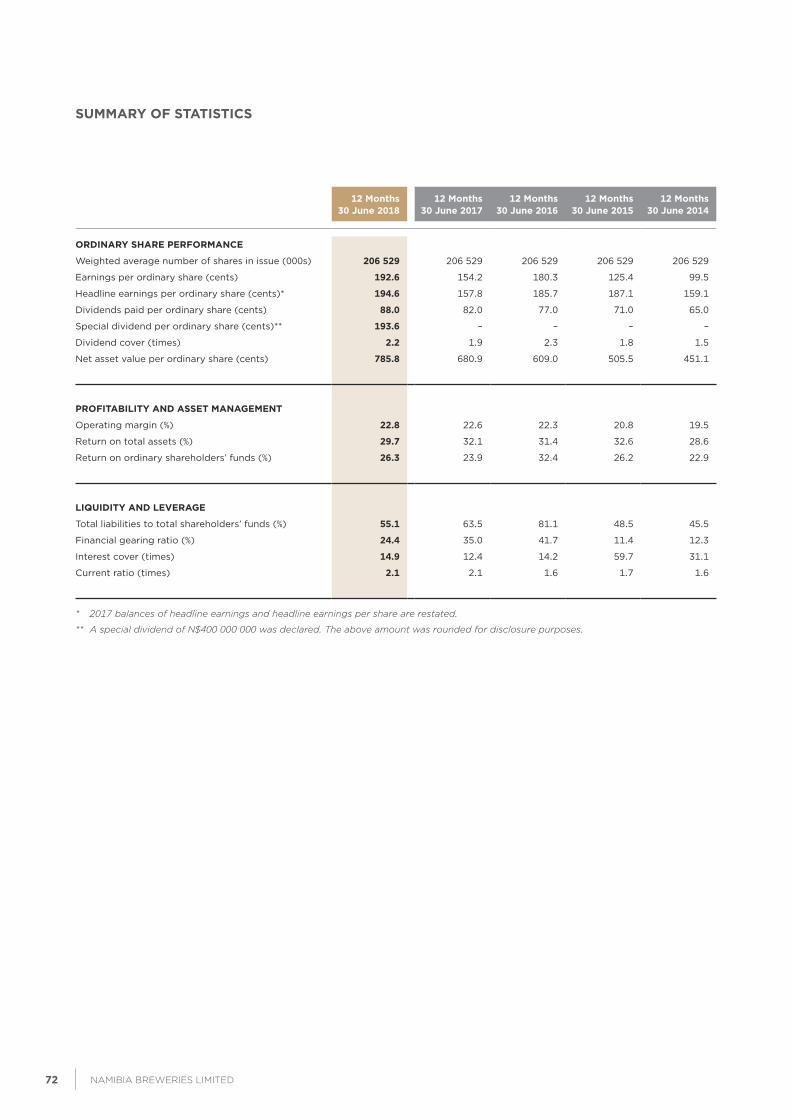
SUMMArY of STATISTICS
12 Months30 June 2018
12 Months30 June 2017
12 Months30 June 2016
12 Months30 June 2015
12 Months30 June 2014
orDINArY SHArE pErforMANCE
Weighted average number of shares in issue (000s) 206 529 206 529 206 529 206 529 206 529
Earnings per ordinary share (cents) 192.6 154.2 180.3 125.4 99.5
Headline earnings per ordinary share (cents)* 194.6 157.8 185.7 187.1 159.1
Dividends paid per ordinary share (cents) 88.0 82.0 77.0 71.0 65.0
Special dividend per ordinary share (cents)** 193.6 – – – –
Dividend cover (times) 2.2 1.9 2.3 1.8 1.5
Net asset value per ordinary share (cents) 785.8 680.9 609.0 505.5 451.1
profITABILITY AND ASSET MANAgEMENT
Operating margin (%) 22.8 22.6 22.3 20.8 19.5
Return on total assets (%) 29.7 32.1 31.4 32.6 28.6
Return on ordinary shareholders’ funds (%) 26.3 23.9 32.4 26.2 22.9
LIQUIDITY AND LEVErAgE
Total liabilities to total shareholders’ funds (%) 55.1 63.5 81.1 48.5 45.5
Financial gearing ratio (%) 24.4 35.0 41.7 11.4 12.3
Interest cover (times) 14.9 12.4 14.2 59.7 31.1
Current ratio (times) 2.1 2.1 1.6 1.7 1.6
* 2017 balances of headline earnings and headline earnings per share are restated.
** A special dividend of N$400 000 000 was declared. The above amount was rounded for disclosure purposes.
INTEgrATED ANNUAL rEporT 201872 73NAmIbIA bREWERIES LImITED
annual financial statements (CONTINUED)
DIVIDEND CoVEr
Profit attributable to ordinary shareholders divided by dividends paid in the year.
NET ASSET VALUE pEr SHArE
Ordinary shareholders’ equity divided by the total number of ordinary shares in issue.
opErATINg MArgIN
Operating profit expressed as a percentage of revenue.
ToTAL ASSETS
Property, plant and equipment, current and non-current assets.
rETUrN oN ToTAL ASSETS
Operating profit plus finance income expressed as a percentage of average total assets (excluding investment in associate).
rETUrN oN orDINArY SHArEHoLDErS’ fUNDS
Profit attributable to ordinary shareholders expressed as a percentage of average ordinary shareholders’ equity.
ToTAL LIABILITIES
Interest-bearing loans and borrowings, other current and non-current liabilities. Deferred taxation and income is excluded.
fINANCIAL gEArINg rATIo (%)
Interest-bearing loans and borrowings expressed as a percentage of ordinary shareholders’ equity.
INTErEST CoVEr
Operating profit plus finance income divided by finance costs.
CUrrENT rATIo
Current assets divided by current liabilities.
DEfINITIoNS
INTEgrATED ANNUAL rEporT 201872 73NAmIbIA bREWERIES LImITED
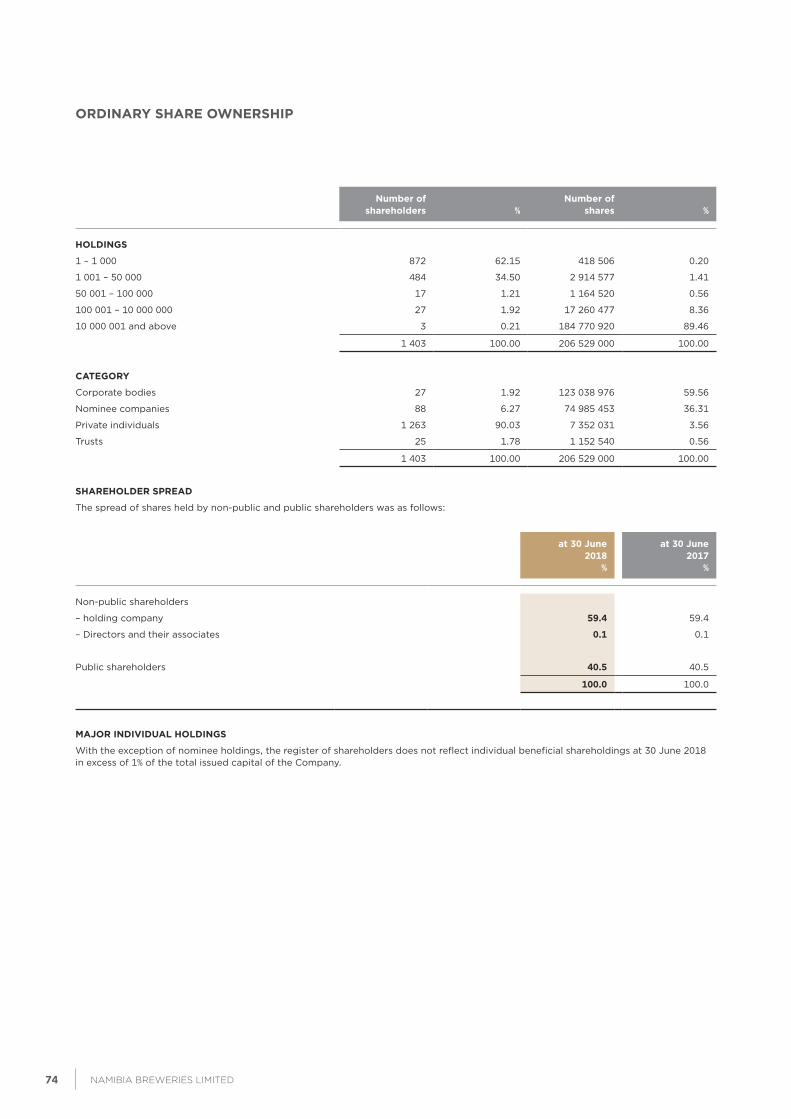
orDINArY SHArE oWNErSHIp
Number ofshareholders %
Number ofshares %
HoLDINgS
1 – 1 000 872 62.15 418 506 0.20
1 001 – 50 000 484 34.50 2 914 577 1.41
50 001 – 100 000 17 1.21 1 164 520 0.56
100 001 – 10 000 000 27 1.92 17 260 477 8.36
10 000 001 and above 3 0.21 184 770 920 89.46
1 403 100.00 206 529 000 100.00
CATEgorY
Corporate bodies 27 1.92 123 038 976 59.56
Nominee companies 88 6.27 74 985 453 36.31
Private individuals 1 263 90.03 7 352 031 3.56
Trusts 25 1.78 1 152 540 0.56
1 403 100.00 206 529 000 100.00
SHArEHoLDEr SprEAD
The spread of shares held by non-public and public shareholders was as follows:
at 30 June 2018
%
at 30 June 2017
%
Non-public shareholders
– holding company 59.4 59.4
– Directors and their associates 0.1 0.1
Public shareholders 40.5 40.5
100.0 100.0
MAJor INDIVIDUAL HoLDINgS
With the exception of nominee holdings, the register of shareholders does not reflect individual beneficial shareholdings at 30 June 2018 in excess of 1% of the total issued capital of the Company.
INTEgrATED ANNUAL rEporT 201874 75NAmIbIA bREWERIES LImITED
annual financial statements (CONTINUED)
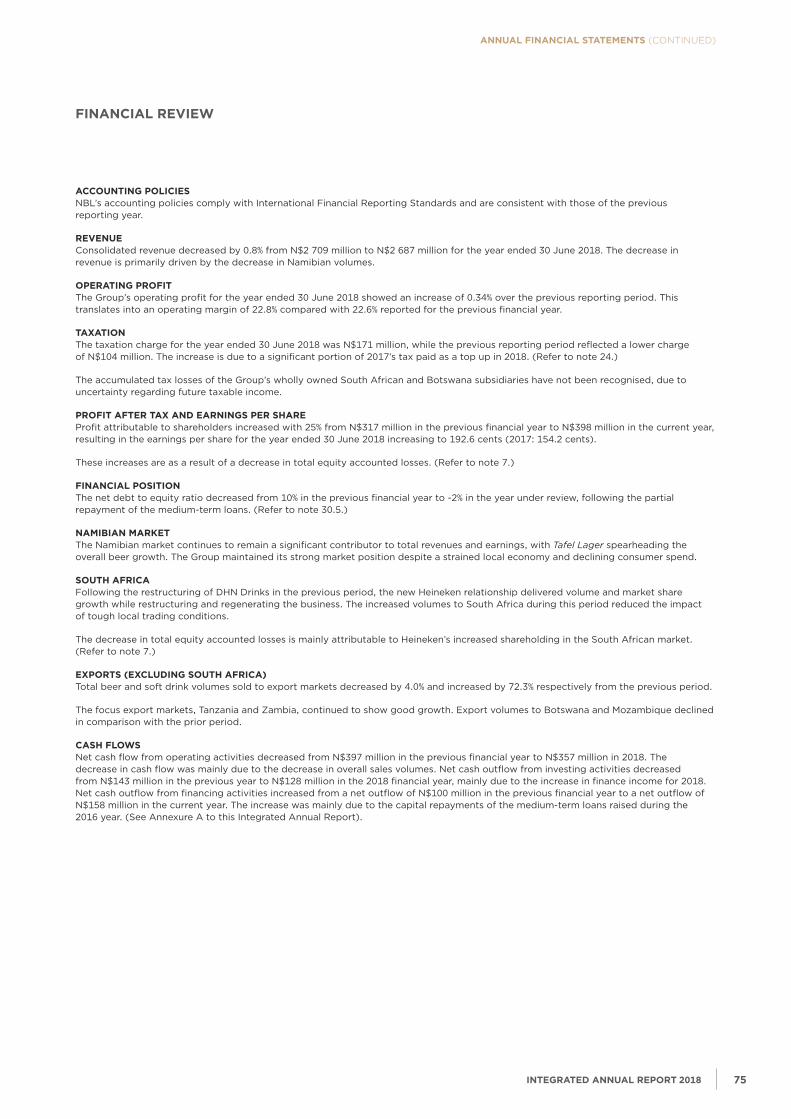
ACCoUNTINg poLICIESNBL’s accounting policies comply with International Financial Reporting Standards and are consistent with those of the previous reporting year.
rEVENUE Consolidated revenue decreased by 0.8% from N$2 709 million to N$2 687 million for the year ended 30 June 2018. The decrease in revenue is primarily driven by the decrease in Namibian volumes.
opErATINg profITThe Group’s operating profit for the year ended 30 June 2018 showed an increase of 0.34% over the previous reporting period. This translates into an operating margin of 22.8% compared with 22.6% reported for the previous financial year.
TAxATIoNThe taxation charge for the year ended 30 June 2018 was N$171 million, while the previous reporting period reflected a lower charge of N$104 million. The increase is due to a significant portion of 2017’s tax paid as a top up in 2018. (Refer to note 24.)
The accumulated tax losses of the Group’s wholly owned South African and Botswana subsidiaries have not been recognised, due to uncertainty regarding future taxable income.
profIT AfTEr TAx AND EArNINgS pEr SHArEProfit attributable to shareholders increased with 25% from N$317 million in the previous financial year to N$398 million in the current year, resulting in the earnings per share for the year ended 30 June 2018 increasing to 192.6 cents (2017: 154.2 cents).
These increases are as a result of a decrease in total equity accounted losses. (Refer to note 7.)
fINANCIAL poSITIoNThe net debt to equity ratio decreased from 10% in the previous financial year to -2% in the year under review, following the partial repayment of the medium-term loans. (Refer to note 30.5.)
NAMIBIAN MArkETThe Namibian market continues to remain a significant contributor to total revenues and earnings, with Tafel Lager spearheading the overall beer growth. The Group maintained its strong market position despite a strained local economy and declining consumer spend.
SoUTH AfrICAFollowing the restructuring of DHN Drinks in the previous period, the new Heineken relationship delivered volume and market share growth while restructuring and regenerating the business. The increased volumes to South Africa during this period reduced the impact of tough local trading conditions.
The decrease in total equity accounted losses is mainly attributable to Heineken’s increased shareholding in the South African market. (Refer to note 7.)
ExporTS (ExCLUDINg SoUTH AfrICA)Total beer and soft drink volumes sold to export markets decreased by 4.0% and increased by 72.3% respectively from the previous period.
The focus export markets, Tanzania and Zambia, continued to show good growth. Export volumes to Botswana and Mozambique declined in comparison with the prior period.
CASH fLoWSNet cash flow from operating activities decreased from N$397 million in the previous financial year to N$357 million in 2018. The decrease in cash flow was mainly due to the decrease in overall sales volumes. Net cash outflow from investing activities decreased from N$143 million in the previous year to N$128 million in the 2018 financial year, mainly due to the increase in finance income for 2018. Net cash outflow from financing activities increased from a net outflow of N$100 million in the previous financial year to a net outflow of N$158 million in the current year. The increase was mainly due to the capital repayments of the medium-term loans raised during the 2016 year. (See Annexure A to this Integrated Annual Report).
fINANCIAL rEVIEW
INTEgrATED ANNUAL rEporT 201874 75NAmIbIA bREWERIES LImITED
ApproVAL of fINANCIAL STATEMENTS
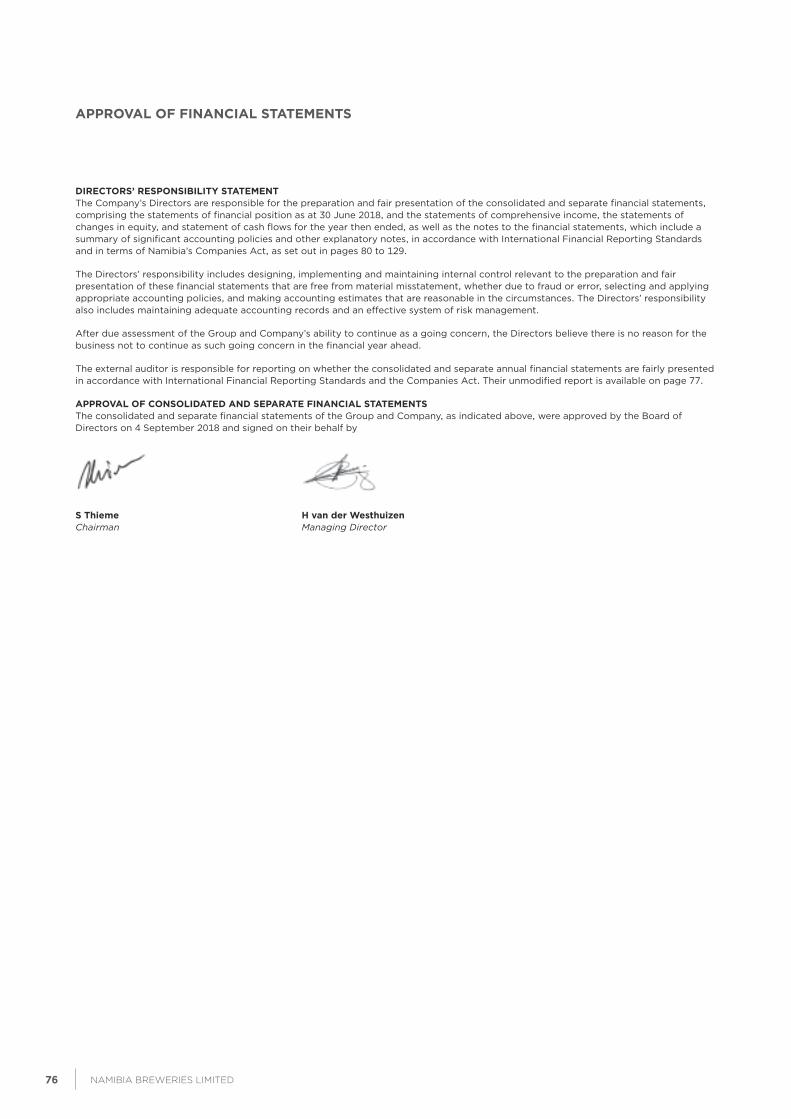
DIrECTorS’ rESpoNSIBILITY STATEMENTThe Company’s Directors are responsible for the preparation and fair presentation of the consolidated and separate financial statements, comprising the statements of financial position as at 30 June 2018, and the statements of comprehensive income, the statements of changes in equity, and statement of cash flows for the year then ended, as well as the notes to the financial statements, which include a summary of significant accounting policies and other explanatory notes, in accordance with International Financial Reporting Standards and in terms of Namibia’s Companies Act, as set out in pages 80 to 129.
The Directors’ responsibility includes designing, implementing and maintaining internal control relevant to the preparation and fair presentation of these financial statements that are free from material misstatement, whether due to fraud or error, selecting and applying appropriate accounting policies, and making accounting estimates that are reasonable in the circumstances. The Directors’ responsibility also includes maintaining adequate accounting records and an effective system of risk management.
After due assessment of the Group and Company’s ability to continue as a going concern, the Directors believe there is no reason for the business not to continue as such going concern in the financial year ahead.
The external auditor is responsible for reporting on whether the consolidated and separate annual financial statements are fairly presented in accordance with International Financial Reporting Standards and the Companies Act. Their unmodified report is available on page 77.
ApproVAL of CoNSoLIDATED AND SEpArATE fINANCIAL STATEMENTSThe consolidated and separate financial statements of the Group and Company, as indicated above, were approved by the Board of Directors on 4 September 2018 and signed on their behalf by
S Thieme H van der WesthuizenChairman Managing Director
INTEgrATED ANNUAL rEporT 201876 77NAmIbIA bREWERIES LImITED
annual financial statements (CONTINUED)
INDEpENDENT AUDITor’S rEporT
To the Shareholders of Namibia Breweries Limited
opINIoNWe have audited the consolidated and separate financial statements of Namibia Breweries Limited and its subsidiaries (“the Group”) set out on pages 80 to 129, which comprise the consolidated and separate statements of financial position as at 30 June 2018 and the consolidated and separate statements of comprehensive income, the consolidated and separate statements of changes in equity and the consolidated and separate statements of cash flows for the year then ended and notes to the consolidated and separate financial statements, including a summary of significant accounting policies and the director’s report.
In our opinion, the consolidated and separate financial statements present fairly, in all material respects, the consolidated and separate financial position of Group as at 30 June 2018 and its consolidated and separate financial performance and consolidated and separate cash flows for the year then ended in accordance with International Financial Reporting Standards (“IFRS”) and the requirements of the Companies Act of Namibia.
BASIS for opINIoNWe conducted our audit in accordance with International Standards on Auditing (ISAs). Our responsibilities under those standards are further described in the Auditor’s Responsibilities for the Audit of the consolidated and separate Financial Statements section of our report. We are independent of the Group in accordance with the independence requirements applicable to performing audits of financial statements in Namibia which is consistent with the International Ethics Standards Board for Accountants Code of Ethics for Professional Accountants (Parts A and B). We have fulfilled our other ethical responsibilities in accordance with the ethical requirements applicable to performing audits of financial statements in Namibia. We believe that the audit evidence we have obtained is sufficient and appropriate to provide a basis for our opinion.
kEY AUDIT MATTErKey audit matter are those matters that, in our professional judgement, was of most significance in our audit of the consolidated and separate financial statements of the current period. This matter was addressed in the context of our audit of the consolidated and separate financial statements as a whole and in forming our opinion thereon and we do not provide a separate opinion on this matter.
Key audit matter How the matter was addressed in the audit
Valuation of the investment in Associate and related losses for the year
The valuation of the investment in Heineken South Africa Proprietary Limited (herein referred to as Heineken SA or the Associate) of N$404.8 million (2017: N$438.3 million) is a key audit matter due to the significant Director judgement required in determining:
• the recoverability of the investment as a whole; and
• the recognition of the deferred tax asset in Heineken SA arising from the unutilised accumulated tax losses of approximately N$1.6 billion carried forward from previous years.
In the current year, the Directors have recognised the deferred tax asset in the Associate arising from these unutilised tax losses only to the extent that the Associate has sufficient taxable temporary differences.
As disclosed in note 7 (page 77) of the consolidated and separate financial statements, the Directors, after considering the forecast profitability have concurred with the Heineken SA’s Directors’ assessment that apart from the portion of the unutilised tax losses recognised as referred to above, the remaining portion of the N$1.6 billion estimated tax losses unrecognised in Heineken SA is not yet recoverable.
The Directors have confirmed that based on their assessment, they believe the full investment, net of equity accounted losses of N$404.8 million as well as the capital loan of N$73.6 million to be recoverable.
We performed specific review procedures on the management accounts of Heineken SA as at 30 June 2018 for the equity accounted losses from ongoing operations and recalculated the deferred tax asset recorded by Heineken SA at 30 June 2018. In connection with the recognition of the deferred tax asset, we assessed whether the Directors treatment and calculation was in accordance with the requirements of IAS 12: Income Taxes.
We evaluated the forecast profitability by performing retrospective reviews of the budget versus actual profit to assess the reliability of the budgeting process. We evaluated the growth rates on the forecast against the actual results, forecast inflation and industry trends and assessed the reasonableness of the assumptions used.
We assessed the judgements made by the Directors such as the cashflow forecasts against the achieved results and anticipated growth rates used to determine the recoverability of the investment as a whole in accordance with the requirements of IAS 36: Impairment of Assets.
We reviewed and assessed the adequacy of disclosures the investment in Associate and the Directors’ judgments in accordance with the applicable accounting standards.
We consider the Directors’ judgements to be reasonable in determining the value of the investment as well as the recognition and treatment of the deferred tax asset.
The consolidated and separate financial statements incorporate appropriate disclosure relating to the valuation of the investment in Associate.
INTEgrATED ANNUAL rEporT 201876 77NAmIbIA bREWERIES LImITED
INDEpENDENT AUDITor’S rEporT (CoNTINuED)
oTHEr INforMATIoNThe Directors are responsible for the other information. The other information comprises the statement of Directors’ responsibilities and approval which we obtained prior to the date of this report and the Annual Integrated Report which is expected to be made available to us after that date. The Other information does not include the consolidated and separate financial statements, report of the Directors and our auditor’s report thereon.
Our opinion on the consolidated and separate financial statements does not cover the other information and we do not express an audit opinion or any form of assurance conclusion thereon.
In connection with our audit of the consolidated and separate financial statements, our responsibility is to read the other information and, in doing so, consider whether the other information is materially inconsistent with the consolidated and separate financial statements or our knowledge obtained in the audit, or otherwise appears to be materially misstated.
If, based on the work we have performed on the other information obtained prior to the date of this auditor’s report, we conclude that there is a material misstatement of this other information, we are required to report that fact. We have nothing to report in this regard.
rESpoNSIBILITIES of THE DIrECTorS for THE CoNSoLIDATED AND SEpArATE fINANCIAL STATEMENTSThe Directors are responsible for the preparation and fair presentation of the consolidated and separate financial statements in accordance with International Financial Reporting Standards and the requirements of the Companies Act of Namibia and for such internal control as the Directors determine is necessary to enable the preparation of consolidated and separate financial statements that are free from material misstatement, whether due to fraud or error.
In preparing the consolidated and separate financial statements, the Directors are responsible for assessing the Group’s and Company’s ability to continue as a going concern, disclosing, as applicable, matters related to going concern and using the going concern basis of accounting unless the directors either intend to liquidate the Group and/or Company to cease operations, or have no realistic alternative but to do so.
AUDITor’S rESpoNSIBILITIES for THE AUDIT of THE CoNSoLIDATED AND SEpArATE fINANCIAL STATEMENTSOur objectives are to obtain reasonable assurance about whether the consolidated and separate financial statements as a whole are free from material misstatement, whether due to fraud or error and to issue an auditor’s report that includes our opinion. Reasonable assurance is a high level of assurance, but is not a guarantee that an audit conducted in accordance with ISAs will always detect a material misstatement when it exists. Misstatements can arise from fraud or error and are considered material if, individually or in the aggregate, they could reasonably be expected to influence the economic decisions of users taken on the basis of these consolidated and separate financial statements.
As part of an audit in accordance with ISAs, we exercise professional judgement and maintain professional scepticism throughout the audit. We also:
• Identify and assess the risks of material misstatement of the consolidated and separate financial statements, whether due to fraud or error, design and perform audit procedures responsive to those risks, and obtain audit evidence that is sufficient and appropriate to provide a basis for our opinion. The risk of not detecting a material misstatement resulting from fraud is higher than for one resulting from error, as fraud may involve collusion, forgery, intentional omissions, misrepresentations, or the override of internal control.
• Obtain an understanding of internal control relevant to the audit in order to design audit procedures that are appropriate in the circumstances, but not for the purpose of expressing an opinion on the effectiveness of the Group’s and the Company’s internal control.
• Evaluate the appropriateness of accounting policies used and the reasonableness of accounting estimates and related disclosures made by the Directors.
• Conclude on the appropriateness of the directors’ use of the going concern basis of accounting and based on the audit evidence obtained, whether a material uncertainty exists related to events or conditions that may cast significant doubt on the Group’s and the Company’s ability to continue as a going concern. If we conclude that a material uncertainty exists, we are required to draw attention in our auditor’s report to the related disclosures in the consolidated and separate financial statements or, if such disclosures are inadequate, to modify our opinion. Our conclusions are based on the audit evidence obtained up to the date of our auditor’s report. However, future events or conditions may cause the Group and/or the Company to cease to continue as a going concern.
• Evaluate the overall presentation, structure and content of the consolidated and separate financial statements, including the disclosures and whether the consolidated and separate financial statements represent the underlying transactions and events in a manner that achieves fair presentation.
• Obtain sufficient appropriate audit evidence regarding the financial information of the entities or business activities within the Group to express an opinion on the consolidated financial statements. We are responsible for the direction, supervision and performance of the Group audit. We remain solely responsible for our audit opinion.
INTEgrATED ANNUAL rEporT 201878 79NAmIbIA bREWERIES LImITED
annual financial statements (CONTINUED)
INDEpENDENT AUDITor’S rEporT (CoNTINuED)
We communicate with the Audit Committee regarding, among other matters, the planned scope and timing of the audit and significant audit findings, including any significant deficiencies in internal control that we identify during our audit.
We also provide the Audit Committee with a statement that we have complied with relevant ethical requirements regarding independence and communicate with them all relationships and other matters that may reasonably be thought to bear on our independence, and where applicable, related safeguards.
From the matters communicated with the Audit Committee, we determine those matters that were of most significance in the audit of the consolidated and separate financial statements of the current period and are therefore the key audit matters. We describe these matters in our auditor’s report unless law or regulation precludes public disclosure about the matter or when, in extremely rare circumstances, we determine that a matter should not be communicated in our report because the adverse consequences of doing so would reasonably be expected to outweigh the public interest benefits of such communication.
Deloitte & ToucheRegistered Accountants and AuditorsChartered Accountants (Namibia)ICAN practice number: 9407
per AA AkayombokwaPartnerP.O. Box 47, Windhoek, Namibia10 September 2018
INTEgrATED ANNUAL rEporT 201878 79NAmIbIA bREWERIES LImITED
rEporT of THE DIrECTorS
Founded in 1920, Namibia Breweries Limited (NBL) is principally engaged in the brewing and distribution of beer and is also active in the manufacturing of soft drinks.
ACCoUNTINg poLICIESNBL’s accounting policies comply with International Financial Reporting Standards and are consistent with those of the previous financial year.
fINANCIAL rESULTSThe Group’s operating profit for the year ended 30 June 2018 increased by 0.34% compared to the previous financial year. This translates into an operating margin of 23%.
DIVIDENDS pAIDDetails of the ordinary dividends declared, paid and payable in respect of the 2017/18 financial year are reflected in note 26 to the financial statements. Total dividend paid for the year amounted to 88 cents per share.
DIVIDEND DECLArATIoNIn addition to the interim dividend of 46 cents per ordinary share paid in May 2018, the Board of Directors declared a final dividend of 46 cents per ordinary share and a special dividend in total of N$400 000 000, at their meeting of 4 September 2018. Payment will be effected to the shareholders of ordinary shares in the books of the Company registered at the close of business on 5 October 2018 and will be paid on 9 November 2018.
CApITAL ExpENDITUrECapital expenditure for the reporting year amounted to N$164.3 million (2017: N$163.9 million).
ISSUED CApITALFull details of the authorised and issued capital of the Company as at 30 June 2018 are set out in note 14 to the financial statements. The 92 471 000 unissued shares of the Company are under the control of the Directors.
DIrECTorATE AND SECrETArYThe names of the Directors as well as the name and address of the Company’s Secretary appear on the IBC herein.
SUBSIDIArIESDetails of the Company’s subsidiaries are set out in Annexure C of this report.
HoLDINg CoMpANYThe Company’s holding company is Namibia Breweries Investment Holdings (Proprietary) Limited, of which the shareholding is held by Ohlthaver & List Finance and Trading Corporation Limited and Heineken International B.V. (Heineken). The Company’s ultimate holding entity is The Werner List Trust.
EVENTS SUBSEQUENT To rEporTINg DATEThe Directors are not aware of any significant events subsequent to the reporting date to be accounted for or disclosed in the annual financial statements which significantly affect the financial position of the Group or the results of its operations.
INTEgrATED ANNUAL rEporT 201880 81NAmIbIA bREWERIES LImITED
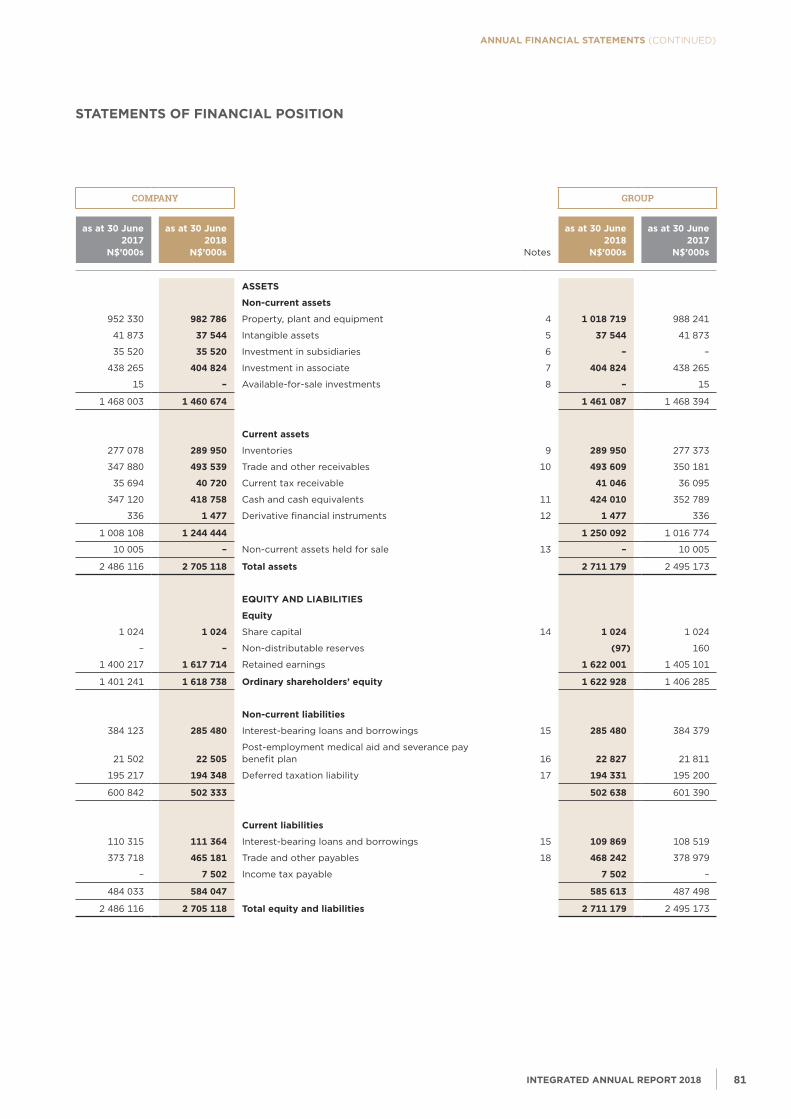
annual financial statements (CONTINUED)
COMPANY GROUP
as at 30 June2017
N$’000s
as at 30 June2018
N$’000s Notes
as at 30 June2018
N$’000s
as at 30 June2017
N$’000s
ASSETS
Non-current assets
952 330 982 786 Property, plant and equipment 4 1 018 719 988 241
41 873 37 544 Intangible assets 5 37 544 41 873
35 520 35 520 Investment in subsidiaries 6 – –
438 265 404 824 Investment in associate 7 404 824 438 265
15 – Available-for-sale investments 8 – 15
1 468 003 1 460 674 1 461 087 1 468 394
Current assets
277 078 289 950 Inventories 9 289 950 277 373
347 880 493 539 Trade and other receivables 10 493 609 350 181
35 694 40 720 Current tax receivable 41 046 36 095
347 120 418 758 Cash and cash equivalents 11 424 010 352 789
336 1 477 Derivative financial instruments 12 1 477 336
1 008 108 1 244 444 1 250 092 1 016 774
10 005 – Non-current assets held for sale 13 – 10 005
2 486 116 2 705 118 Total assets 2 711 179 2 495 173
EQUITY AND LIABILITIES
Equity
1 024 1 024 Share capital 14 1 024 1 024
– – Non-distributable reserves (97) 160
1 400 217 1 617 714 Retained earnings 1 622 001 1 405 101
1 401 241 1 618 738 ordinary shareholders’ equity 1 622 928 1 406 285
Non-current liabilities
384 123 285 480 Interest-bearing loans and borrowings 15 285 480 384 379
21 502 22 505 Post-employment medical aid and severance pay benefit plan 16 22 827 21 811
195 217 194 348 Deferred taxation liability 17 194 331 195 200
600 842 502 333 502 638 601 390
Current liabilities
110 315 111 364 Interest-bearing loans and borrowings 15 109 869 108 519
373 718 465 181 Trade and other payables 18 468 242 378 979
– 7 502 Income tax payable 7 502 –
484 033 584 047 585 613 487 498
2 486 116 2 705 118 Total equity and liabilities 2 711 179 2 495 173
STATEMENTS of fINANCIAL poSITIoN
INTEgrATED ANNUAL rEporT 201880 81NAmIbIA bREWERIES LImITED
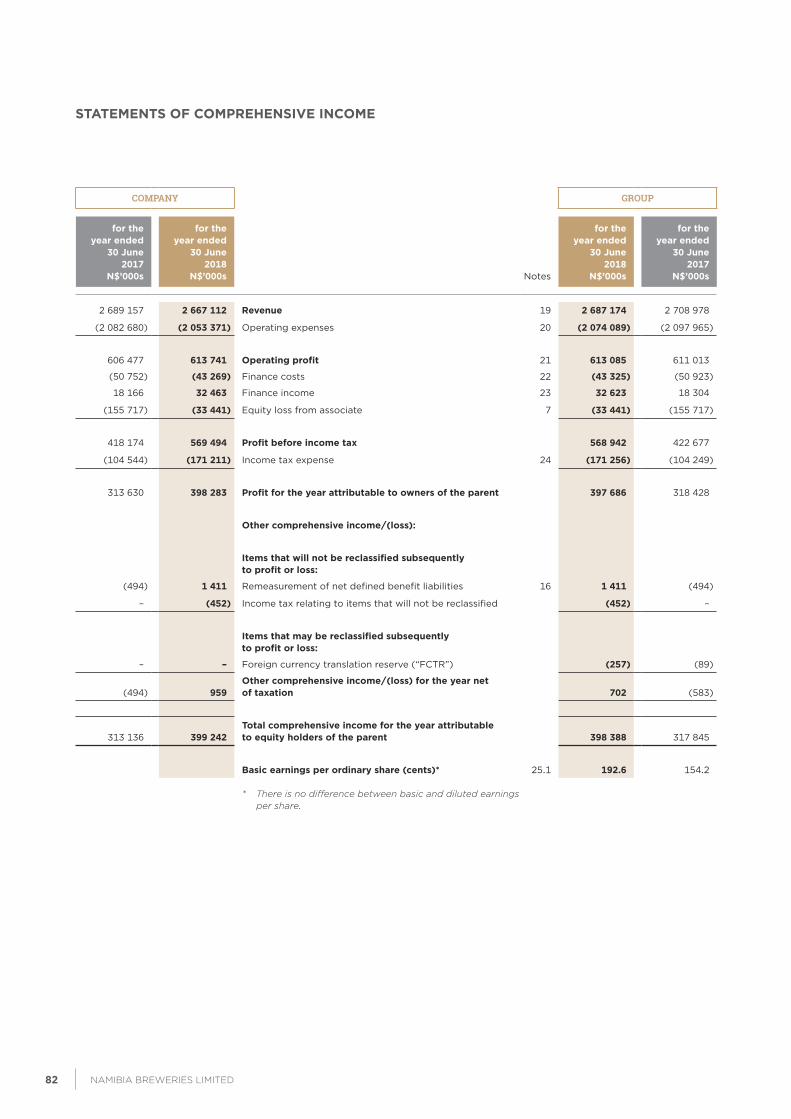
STATEMENTS of CoMprEHENSIVE INCoME
COMPANY GROUP
for the year ended
30 June 2017
N$’000s
for the year ended
30 June 2018
N$’000s Notes
for the year ended
30 June 2018
N$’000s
for the year ended
30 June 2017
N$’000s
2 689 157 2 667 112 revenue 19 2 687 174 2 708 978
(2 082 680) (2 053 371) Operating expenses 20 (2 074 089) (2 097 965)
606 477 613 741 operating profit 21 613 085 611 013
(50 752) (43 269) Finance costs 22 (43 325) (50 923)
18 166 32 463 Finance income 23 32 623 18 304
(155 717) (33 441) Equity loss from associate 7 (33 441) (155 717)
418 174 569 494 profit before income tax 568 942 422 677
(104 544) (171 211) Income tax expense 24 (171 256) (104 249)
313 630 398 283 profit for the year attributable to owners of the parent 397 686 318 428
other comprehensive income/(loss):
Items that will not be reclassified subsequently to profit or loss:
(494) 1 411 Remeasurement of net defined benefit liabilities 16 1 411 (494)
– (452) Income tax relating to items that will not be reclassified (452) –
Items that may be reclassified subsequently to profit or loss:
– – Foreign currency translation reserve (“FCTR”) (257) (89)
(494) 959 other comprehensive income/(loss) for the year net of taxation 702 (583)
313 136 399 242 Total comprehensive income for the year attributable to equity holders of the parent 398 388 317 845
Basic earnings per ordinary share (cents)* 25.1 192.6 154.2
* There is no difference between basic and diluted earnings per share.
INTEgrATED ANNUAL rEporT 201882 83NAmIbIA bREWERIES LImITED
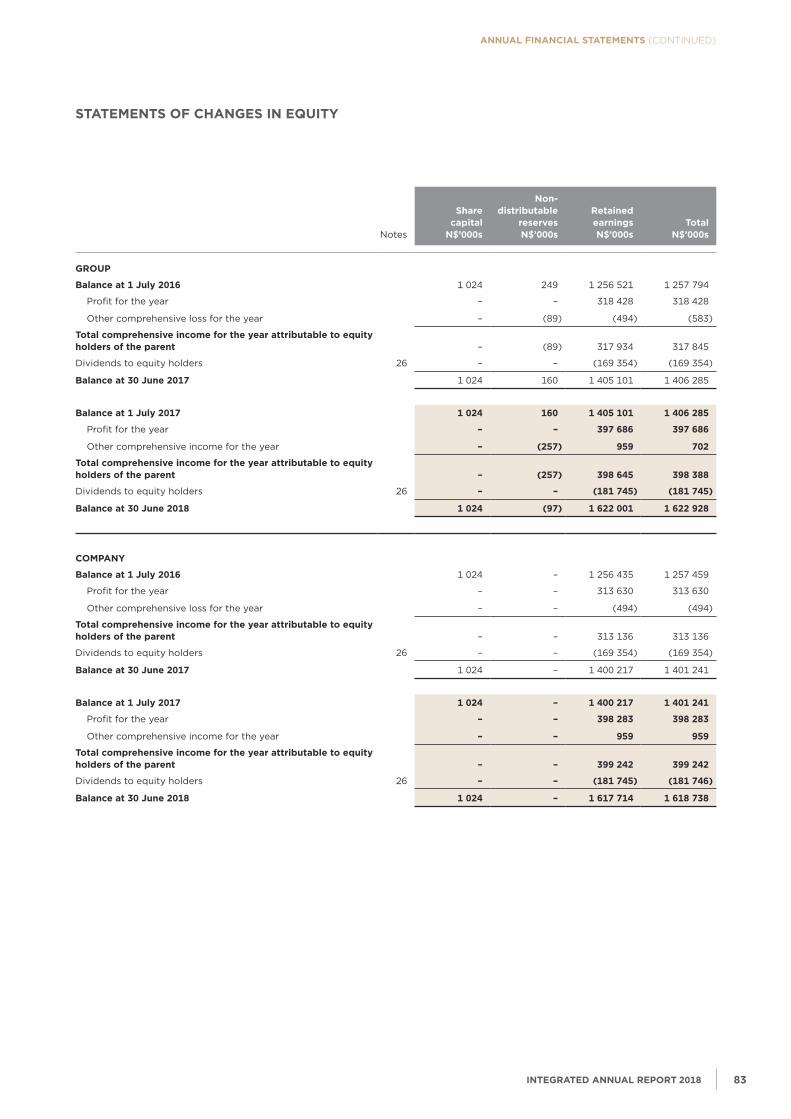
annual financial statements (CONTINUED)
Notes
Sharecapital
N$’000s
Non-distributable
reservesN$’000s
retainedearningsN$’000s
TotalN$’000s
groUp
Balance at 1 July 2016 1 024 249 1 256 521 1 257 794
Profit for the year – – 318 428 318 428
Other comprehensive loss for the year – (89) (494) (583)
Total comprehensive income for the year attributable to equity holders of the parent – (89) 317 934 317 845
Dividends to equity holders 26 – – (169 354) (169 354)
Balance at 30 June 2017 1 024 160 1 405 101 1 406 285
Balance at 1 July 2017 1 024 160 1 405 101 1 406 285
Profit for the year – – 397 686 397 686
Other comprehensive income for the year – (257) 959 702
Total comprehensive income for the year attributable to equity holders of the parent – (257) 398 645 398 388
Dividends to equity holders 26 – – (181 745) (181 745)
Balance at 30 June 2018 1 024 (97) 1 622 001 1 622 928
CoMpANY
Balance at 1 July 2016 1 024 – 1 256 435 1 257 459
Profit for the year – – 313 630 313 630
Other comprehensive loss for the year – – (494) (494)
Total comprehensive income for the year attributable to equity holders of the parent – – 313 136 313 136
Dividends to equity holders 26 – – (169 354) (169 354)
Balance at 30 June 2017 1 024 – 1 400 217 1 401 241
Balance at 1 July 2017 1 024 – 1 400 217 1 401 241
Profit for the year – – 398 283 398 283
Other comprehensive income for the year – – 959 959
Total comprehensive income for the year attributable to equity holders of the parent – – 399 242 399 242
Dividends to equity holders 26 – – (181 745) (181 746)
Balance at 30 June 2018 1 024 – 1 617 714 1 618 738
STATEMENTS of CHANgES IN EQUITY
INTEgrATED ANNUAL rEporT 201882 83NAmIbIA bREWERIES LImITED
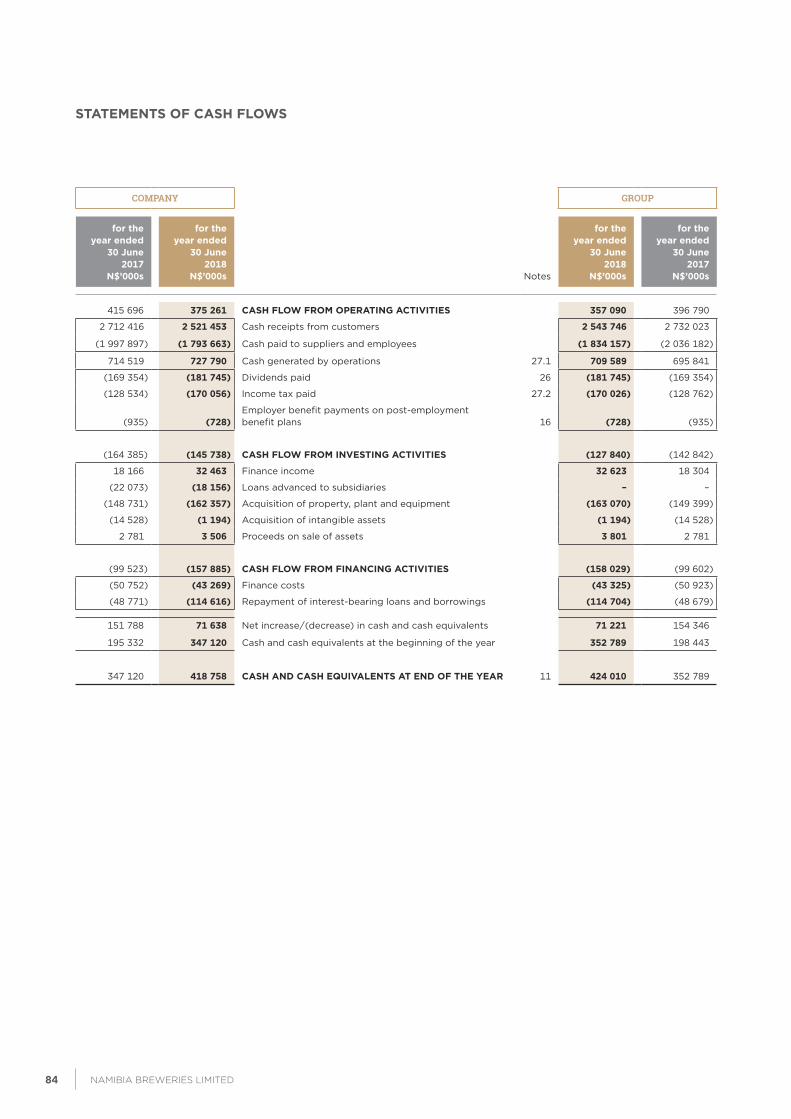
STATEMENTS of CASH fLoWS
COMPANY GROUP
for the year ended
30 June 2017
N$’000s
for the year ended
30 June 2018
N$’000s Notes
for the year ended
30 June 2018
N$’000s
for the year ended
30 June 2017
N$’000s
415 696 375 261 CASH fLoW froM opErATINg ACTIVITIES 357 090 396 790
2 712 416 2 521 453 Cash receipts from customers 2 543 746 2 732 023
(1 997 897) (1 793 663) Cash paid to suppliers and employees (1 834 157) (2 036 182)
714 519 727 790 Cash generated by operations 27.1 709 589 695 841
(169 354) (181 745) Dividends paid 26 (181 745) (169 354)
(128 534) (170 056) Income tax paid 27.2 (170 026) (128 762)
(935) (728)Employer benefit payments on post-employment benefit plans 16 (728) (935)
(164 385) (145 738) CASH fLoW froM INVESTINg ACTIVITIES (127 840) (142 842)
18 166 32 463 Finance income 32 623 18 304
(22 073) (18 156) Loans advanced to subsidiaries – –
(148 731) (162 357) Acquisition of property, plant and equipment (163 070) (149 399)
(14 528) (1 194) Acquisition of intangible assets (1 194) (14 528)
2 781 3 506 Proceeds on sale of assets 3 801 2 781
(99 523) (157 885) CASH fLoW froM fINANCINg ACTIVITIES (158 029) (99 602)
(50 752) (43 269) Finance costs (43 325) (50 923)
(48 771) (114 616) Repayment of interest-bearing loans and borrowings (114 704) (48 679)
151 788 71 638 Net increase/(decrease) in cash and cash equivalents 71 221 154 346
195 332 347 120 Cash and cash equivalents at the beginning of the year 352 789 198 443
347 120 418 758 CASH AND CASH EQUIVALENTS AT END of THE YEAr 11 424 010 352 789
INTEgrATED ANNUAL rEporT 201884 85NAmIbIA bREWERIES LImITED
annual financial statements (CONTINUED)
NoTES To THE ANNUAL fINANCIAL STATEMENTSFOR THE YEAR ENDED 30 JUNE 2018
1. rEporTINg ENTITY Namibia Breweries Limited (the “Company”) is a company domiciled in Namibia. The consolidated financial statements of the
Company as at and for the year ended 30 June 2018 comprise the Company and its subsidiaries and the Group’s interest in associates (together referred to as the “Group” and individually as “Group entities”).
2. BASIS of prEpArATIoN (a) Statement of compliance The consolidated and separate financial statements have been prepared in accordance with International Financial Reporting
Standards (“IFRS”) and the requirements of the Namibian Companies Act. The financial statements were approved by the Board of Directors on 4 September 2018. The accounting policies below apply to both consolidated and separate financial statements.
(b) Basis of measurement The consolidated and separate financial statements are prepared on the going concern and historical cost basis, modified for the
fair value treatment of financial instruments.
(c) Functional and presentation currency The consolidated financial statements are presented in Namibia Dollar (“NAD”), which is the Company’s functional and Group’s
presentation currency. All information presented in NAD has been rounded to the nearest thousand.
(d) Use of estimates and judgements The preparation of financial statements in conformity with IFRS requires the Directors to make judgements, estimates and
assumptions that affect the application of policies and reported amounts of assets and liabilities, income and expenses. The estimates and associated assumptions are based on historical experience and various other factors that are believed to be reasonable under the circumstances, the results of which form the basis of making the judgements about carrying values of assets and liabilities that are not readily apparent from other sources. Actual results may differ from these estimates.
Estimates and underlying assumptions are reviewed on an ongoing basis. Revisions to accounting estimates are recognised in the period in which the estimate is revised if the revision affects only that period, or in the period of the revision and future periods if the revision affects both current and future periods. In particular, information about significant areas of estimation uncertainty and critical judgements in applying accounting policies that have the most significant effect on the amounts recognised in the financial statements is included below:
Deferred tax assets Deferred tax assets are recognised for all unused tax losses to the extent that it is probable that taxable profit will be available
against which the losses can be utilised. Significant management judgement is required to determine the amount of deferred tax assets that can be recognised, based on the likely timing and level of future taxable profits together with future tax planning strategies. The carrying amount of recognised and unrecognised tax losses are disclosed in note 17 and 24 and management’s judgement with regard to the recoverability of deferred tax asset in its Associate in note 7.
Property, plant, equipment and intangible assets The Group and Company depreciates and amortises items of property, plant, equipment and intangible assets down to residual
value over the useful life of the assets. Management makes and applies assumptions about the expected useful life and residual value of these assets in determining the annual depreciation charge. Further details are given in the accounting policy note on depreciation. In particular management have assumed a depreciation rate of 20% (2017: 20%) on returnable containers, this being management’s best estimate of breakage rate and useful life. The majority of returnable containers are with customers and the estimate of cost along with the corresponding returnable deposit liability is based on management’s judgement. Any change to these assumptions could have a significant impact on both the asset and corresponding liability.
Recoverability of investment in associate The Company’s investment in the associate is carried at cost less impairment. The Directors have evaluated the value of the
investment and have considered this to approximate the Company’s investment less equity accounted losses at year end. Changes in the assumptions impacting expected future cash generation could affect the recoverability of the valuation of the investment in the associate. See note 7 for further details on these assumptions.
3. SIgNIfICANT ACCoUNTINg poLICIES The accounting policies set out below have been applied consistently to all periods presented in the consolidated and separate
financial statements.
(a) Basis of consolidation (i) Subsidiaries Subsidiaries are those entities over whose financial and operating policies the Group has the power to exercise control,
so as to obtain benefits from their activities. In assessing control potential voting rights that presently are exercisable are taken into account. The financial statements of subsidiaries are included in the consolidated financial statements from the date that control commences until the date that control ceases. The financial statements of the subsidiaries are prepared for the same reporting year as the parent company, using consistent accounting policies. Investment in subsidiaries are shown at cost in the Company’s financial statements.
INTEgrATED ANNUAL rEporT 201884 85NAmIbIA bREWERIES LImITED
NOTES TO THE ANNUAL FINANCIAL STATEMENTS (continued)FOR THE YEAR ENDED 30 JUNE 2018
(ii) Associates The Group’s interest in associates is accounted for using the equity method of accounting. Under the equity method, the
interest in an associate is carried in the statement of financial position at cost plus post-acquisition changes in the Group’s net share of the assets. The statement of comprehensive income reflects the share of the results of the operations of the associate. Profits and losses resulting from transactions between the Group and the associate are eliminated to the extent of the interest in the associate.
(iii) Transactions eliminated on consolidation Intra-Group balances and transactions and any unrealised income and expenses arising from intra-Group transactions,
are eliminated in preparing the consolidated financial statements. Unrealised gains from transactions with equity accounted investees are eliminated against the investment to the extent of the Group’s interest in the investee. Unrealised losses are eliminated in the same way as unrealised gains, but only to the extent there is no evidence of impairment.
(b) Business combinations Business combinations are recognised and measured in terms of IFRS 3 Business Combinations. Business combinations under
common control are recorded at the net book value of the assets or liabilities acquired.
(c) Foreign currency Transactions denominated in foreign currencies are initially recorded at the functional currency spot rates at the transaction
date. Monetary assets and liabilities denominated in foreign currencies are translated at the functional currency spot rates of exchange at the reporting date. Differences arising on settlement or translation of monetary items are recognised in profit or loss. Non-monetary items that are measured in terms of historical cost in a foreign currency are translated using the exchange rate at the date of the transaction.
The results and position of consolidated entities that have a functional currency that differs from the presentation currency are translated into the presentation currency as follows:
• Assets and liabilities for each statement of financial position presented are translated at the closing rate at the date of that statement of financial position;
• Income statement items are translated at the average rate for the period (unless this average is not a reasonable approximation of the cumulative effect of the rates prevailing on the transaction dates, in which case income and expenses are translated at the rate on the dates of the transactions); and
• All resulting exchange differences are recognised as a separate component of other comprehensive income.
On disposal of the consolidated entity, the accumulated exchange differences in other comprehensive income are recognised in the statement of comprehensive income.
(d) Property, plant and equipment (i) Recognition and measurement Items of property, plant and equipment are measured at cost less accumulated depreciation and accumulated impairment
losses. Cost includes expenditure that is directly attributable to the acquisition of the asset. The cost of self-constructed assets includes the cost of material and direct labour and other costs directly attributable to bringing the asset to a working condition for its intended use. When parts of an item of property, plant and equipment have different useful lives, they are accounted for as separate items (major components) of property, plant and equipment. Gains and losses on disposal of an item of property, plant and equipment are determined by comparing the proceeds from disposal with the carrying amount of property, plant and equipment and are recognised in profit or loss.
(ii) Subsequent costs Subsequent expenditure relating to an item of property, plant and equipment is capitalised when it is probable that future
economic benefits from the use of the asset will be increased and its cost can be reliably measured. All other subsequent expenditure is recognised as an expense in the period in which it is incurred.
INTEgrATED ANNUAL rEporT 201886 87NAmIbIA bREWERIES LImITED
annual financial statements (CONTINUED)
NoTES To THE ANNUAL fINANCIAL STATEMENTS (CoNTINuED)FOR THE YEAR ENDED 30 JUNE 2018
(iii) Depreciation Depreciation is recognised in profit or loss on a straight-line basis over the estimated useful lives of each of the items of
property, plant and equipment. Leased assets are depreciated over the shorter of the lease term and their useful lives unless it is reasonably certain that the Group and Company will obtain ownership by the end of the lease term. The average depreciation rates for the current and comparative periods are as follows:
2018 2017
Freehold buildings 2% 2%
Leasehold land and buildings 4% 4%
Plant and machinery 4 – 20% 4 – 20%
Vehicles 20% 20%
Furniture and equipment 10 – 33% 10 – 33%
Returnable containers 20% 20%
The asset’s residual values, useful lives and methods of depreciation are reviewed, and adjusted if appropriate, at each financial year end. Land is not depreciated. The carrying values are reviewed for impairment when events or changes in circumstances indicate that the carrying value may not be recoverable.
An item of property, plant and equipment is derecognised on disposal or when no future economic benefits are expected from its use or disposal. Any gain or loss arising on derecognition of the asset is included in profit or loss in the year the asset is derecognised. Depreciation is not provided on assets during the time of construction.
(e) Intangible assets (i) Research and development Expenditure on research activities, undertaken with the prospect of gaining new scientific or technical knowledge and
understanding, and expenditure on internally generated goodwill and brands is recognised in profit or loss as an expense as incurred. Expenditure on development activities, whereby research findings are applied to a plan or design for the production of new or substantially improved products and processes, is capitalised if the product or process is technically feasible, costs can be reliably measured, future economic benefits are feasible and the Group or Company intends to and has sufficient resources to complete development and to use or sell the asset. The expenditure capitalised includes the cost of materials, direct labour and an appropriate proportion of overheads. Other development expenditure is recognised in profit or loss as an expense as incurred. Capitalised development expenditure is measured at cost less accumulated amortisation and impairment losses.
(ii) Other intangible assets Other intangible assets acquired by the Group or Company, which have finite useful lives, are measured at cost less
accumulated amortisation and impairment losses.
(iii) Subsequent expenditure Subsequent development expenditure on capitalised intangible assets is capitalised only when it increases the future
economic benefit embodied in the specific assets to which it relates. All other subsequent expenditure is expensed as incurred.
(iv) Amortisation The useful lives of intangible assets are assessed to be either finite or infinite. Intangible assets with finite lives are
amortised on a straight line basis over the estimated useful economic life and assessed for impairment whenever there is an indication that the intangible asset may be impaired. Intangible assets with indefinite useful lives are tested for impairment annually and are not amortised. If the carrying amount exceeds the recoverable amount, an impairment loss will be recognised. Amortisation and impairment charges on intangible assets are charged to profit or loss. If an intangible asset with an indefinite life has changed to a finite life the change is made on a prospective basis. The average amortisation rates for the current and comparative periods are as follows:
2018 2017
Automation processes 20% 20%
Externally purchased software licences 33.3% 33.3%
Trademarks 0 – 20% 0 – 20%
INTEgrATED ANNUAL rEporT 201886 87NAmIbIA bREWERIES LImITED
NOTES TO THE ANNUAL FINANCIAL STATEMENTS (continued)FOR THE YEAR ENDED 30 JUNE 2018
(f) Leases The determination of whether an arrangement is, or contains a lease is based on the substance of the arrangement and requires
an assessment of whether the fulfilment of the arrangement is dependent on the use of a specific asset or assets and the arrangement conveys a right to use the asset.
Leases are classified as finance leases where substantially all the risks and rewards associated with ownership of an asset are transferred to the Group or Company. Assets held in terms of finance leases are capitalised at the inception of the lease at the fair value of the leased item or, if lower, the present value of the minimum lease payments. The corresponding liability to the lessor is recognised as a finance lease obligation. Lease payments are apportioned between finance charges (recognised as finance costs) and a reduction of the lease liability so as to achieve a constant rate of interest on the remaining balance of the liability.
A leased asset is depreciated over the useful life of the asset. However, if there is no reasonable certainty that the Group will obtain ownership by the end of the lease term, the asset is depreciated over the shorter of the estimated useful life of the asset and the lease term.
Operating leases are those leases which do not fall within the scope of the above definition. Payments made under leases are recognised in profit or loss on a straight line basis.
(g) Non‑current assets held for sale Non-current assets (or disposal groups) are classified as held for sale if their carrying amount will be recovered through a sale
transaction rather than through continuing use. This condition is regarded as met only when the sale is highly probable and the asset is available for immediate sale in its present condition. Management must be committed to the sale, which should be expected to qualify for recognition as a completed sale within one year from the date of classification. Non-current assets held for sale are measured at the lower of their carrying amount and fair value less costs to sell. A non-current asset is not depreciated while it is classified as held for sale.
(h) Inventories Inventories are carried at the lower of cost and net realisable value. The cost of inventories comprises all costs of purchase,
conversion and other costs incurred in bringing the inventories to their present location and condition, and is determined as follows:
Raw materials, merchandise and consumable stores:• Purchase cost on the weighted average basis.
Finished goods and work in progress:• Cost of direct materials and labour and a proportion of manufacturing overheads based on normal operating capacity
but excluding borrowing costs. Obsolete, redundant and slow-moving inventories are identified on a regular basis and are written down to their estimated net realisable values. Net realisable value is the estimated selling price in the ordinary course of the business, less estimated costs of completion and the estimated costs necessary to make the sale.
(i) Impairment (i) Financial assets A financial asset not carried at fair value through profit or loss, is assessed at each reporting date to determine whether
there is any objective evidence that it is impaired. A financial asset is considered to be impaired if objective evidence indicates that one or more events have had a negative effect on the estimated future cash flows of the assets that can be estimated reliably. An impairment loss in respect of a financial asset measured at amortised cost is calculated as the difference between the carrying amount, and the present value of the estimated future cash flows discounted at the asset’s original effective interest rate. An impairment loss in respect of an available for-sale financial asset is calculated by reference to its fair value. All impairment losses are recognised in profit or loss. Any cumulative loss in respect of an available-for-sale financial asset recognised previously in equity is transferred to profit or loss. An impairment loss is reversed if the reversal can be related objectively to an event occurring after the impairment loss was recognised. Impairment loss reversals are recognised in profit or loss except for impairment reversals of available-for-sale equity securities which are recognised in other comprehensive income.
(ii) Non‑financial assets The carrying amounts of the Company’s and the Group’s non-financial assets, other than inventories and deferred tax
assets, are reviewed at each reporting date to determine whether there is any indication of impairment. If any such indication exists, then the asset’s recoverable amount is estimated. The recoverable amount of an asset or cash-generating unit is the greater of its value-in-use and its fair value less costs to sell. In assessing value-in-use, the estimated future cash flows are discounted to their present value using a pre-tax discount rate that reflects current market assessments of the time value of money and the risks specific to the asset.
An impairment loss is recognised if the carrying amount of an asset or its cash-generating unit exceeds its estimated recoverable amount. Impairment losses are recognised in profit or loss. An impairment loss is reversed if there has been a change in the estimates used to determine the recoverable amount. An impairment loss is reversed only to the extent that the asset’s carrying amount does not exceed the carrying amount that would have been determined, net of depreciation or amortisation, if no impairment loss had been recognised.
INTEgrATED ANNUAL rEporT 201888 89NAmIbIA bREWERIES LImITED
annual financial statements (CONTINUED)
nOtes tO tHe annual financial statements (CONTINUED)FOR THE YEAR ENDED 30 JUNE 2018
(j) Financial instruments (i) Non‑derivative financial instruments Non-derivative financial instruments comprise trade and other receivables, cash and cash equivalents, interest-bearing
borrowings, trade and other payables. Non-derivative financial instruments are recognised initially at fair value plus, for instruments not at fair value through profit and loss, any directly attributable transaction costs. Subsequent to initial recognition, non-derivative financial instruments are measured as described below. Accounting for finance income and costs is discussed in note 2(m) and 2(n). All regular way purchases and sales of financial assets are recognised on the trade date i.e. the date that the Company and Group commits to purchase the asset.
(ii) Financial assets or liabilities at fair value through profit or loss Included in this category are derivative financial instruments. Financial assets or liabilities classified as at fair value
through profit or loss, are subsequent to initial recognition, measured at fair value with changes in fair value recognised in profit or loss.
(iii) Loans and receivables Included in this category are the loans to Group companies. Loans and receivables are non-derivative financial assets with
fixed or determinable payments that are not quoted in an active market. Such assets are carried at amortised cost using the effective interest method. Amortised cost is computed as the amount initially recognised minus principal repayments, plus or minus the cumulative amortisation using the effective interest method of any difference between the initially recognised amount and the maturity amount. This calculation includes all fees and points paid or received between parties to the contract that are an integral part of the effective interest rate, transaction costs and all other premiums and discounts. Gains and losses are recognised in profit or loss when the loans and receivables are derecognised or impaired, as well as through the amortisation process.
(iv) Trade and other receivables Trade receivables, which generally have 30 – 60 day terms, are subsequent to initial recognition, recognised at amortised
cost, less impairment losses.
(v) Cash and cash equivalents For the purpose of the statement of cash flows, cash and cash equivalents comprise cash on hand, deposits held on call
with banks, net of bank overdrafts, all of which are available for use by the Company and Group unless otherwise stated.
(vi) Interest‑bearing loans and borrowings Included in this category are long and medium-term financing and short-term borrowings. Non-derivative financial
liabilities are recognised at amortised cost, using the effective interest method. Interest-bearing bank loans and overdrafts are recorded at the value of proceeds received, net of direct issue costs. Finance charges are accounted for on an accrual basis and are added to the carrying amount of the instrument to the extent that they are not settled in the period in which they arise.
(vii) Derecognition of financial assets and liabilities Financial assets – A financial asset is derecognised where the rights to receive cash flows from the asset have expired.
Financial liabilities – A financial liability is derecognised when the obligation under the liability is discharged or cancelled or expires.
(viii) Non‑interest‑bearing financial liabilities Non-interest bearing financial liabilities are recognised at amortised cost.
(k) Provisions Provisions are recognised when the Company or Group has a present legal or constructive obligation, as a result of past events,
for which it is probable that an outflow of economic benefits will be required to settle the obligation, and a reliable estimate can be made for the amount of the obligation. Provisions are determined by discounting the expected future cash flows at a pre-tax rate that reflects the current market assessments of the time value of money and the risks specific to the liability. A provision for restructuring is recognised when the Company and Group has approved a detailed and formal restructuring plan, and the restructuring has either commenced or has been announced publicly. Future operating losses are not provided for.
(l) Revenue Revenue comprises royalty and rental income and the sales of beer, soft drinks and by-products, less indirect taxes, excise duty
and discounts. Revenue is recognised to the extent that it is probable that the economic benefits will flow to the Company or Group and the revenue can be reliably measured. The following specific recognition criteria must also be met before revenue is recognised:
(i) Sale of goods Revenue is recognised when the significant risks and rewards of ownership of the goods have passed to the buyer,
recovery of the consideration is probable, the associated costs can be estimated reliably, there is no continuing management involvement with the goods, and the amount of revenue can be measured reliably. For the majority of the sales transactions, the risks and rewards are transferred to the buyer on delivery of the products.
(ii) Rental income Rental income is recognised on a straight-line basis over the term of the lease.
(iii) Royalty income Royalty income is recognised on an accrual basis in accordance with the substance of the relevant agreement.
INTEgrATED ANNUAL rEporT 201888 89NAmIbIA bREWERIES LImITED
NOTES TO THE ANNUAL FINANCIAL STATEMENTS (continued)FOR THE YEAR ENDED 30 JUNE 2018
(m) Finance income Finance income comprises interest income on funds, loans to associates and Group companies. Interest income is recognised in
the year as it accrues in profit or loss, using the effective interest method.
(n) Finance costs Finance costs comprise interest expense on borrowings. Borrowing costs are recognised in profit or loss using the effective
interest method. Finance costs on qualifying assets are capitalised.
(o) Income tax Income tax expense comprises current and deferred tax. Income tax expense is recognised in profit or loss except to the extent
that it relates to items recognised directly in equity, in which case it is recognised in other comprehensive income. Current tax comprises tax payable calculated on the basis of the expected taxable income for the year, using the tax rates and tax laws enacted or substantively enacted at the reporting date and any adjustment of tax payable for previous years. Deferred tax is provided on temporary differences at the reporting date between the tax bases of assets and liabilities and their carrying amounts for financial reporting purposes. Deferred tax is not recognised for the following temporary differences:
• The initial recognition of an asset or liability in a transaction that is not a business combination and, at the time of the transaction, affects neither the accounting profit nor taxable profit or loss;
• Investments in subsidiaries and jointly controlled entities to the extent that it is probable that the temporary differences will not reverse in the foreseeable future; and
• Taxable temporary differences arising on the initial recognition of goodwill. The carrying amount of deferred tax assets are reviewed at each reporting date to determine that sufficient taxable profit will be available to allow all or part of the deferred tax asset to be utilised. Unrecognised deferred tax assets are reassessed at the reporting date and are recognised to the extent that it has become probable that future taxable profit will allow the deferred tax asset to be recovered. Deferred tax assets and liabilities are measured at the tax rates that are expected to apply to the year when the asset is realised or the liability settled, based on tax rates (and tax laws) that have been enacted or substantively enacted at the reporting date.
Deferred tax assets and deferred tax liabilities are offset, if a legally enforceable right exists to set off deferred tax assets against deferred tax liabilities and the deferred taxes relate to the same taxable entity and the same taxation authority.
(p) Value added tax Revenues, expenses and assets are recognised net of the amount of value added tax except:
• Where the value added tax incurred on a purchase of assets or services is not recoverable from the taxation authority, in which case the value added tax is recognised as part of the cost of acquisition of the asset or as part of the expense item as applicable; and
• Receivables and payables that are stated with the amount of value added tax included. The net amount of value added tax recoverable from, or payable to, the taxation authority is included as part of receivables or payables in the statement of financial position.
(q) Earnings per share The calculation of basic earnings per share is based on earnings attributable to ordinary shareholders. Account is taken of the
weighted average number of ordinary shares in issue for the period during which they have participated in the income of the Group. The Group has no dilutive potential ordinary shares. Earnings is defined as the profit for the year after taxation and non-controlling interest.
Headline earnings per share are calculated in terms of the requirements set out in Circular 04/2018 issued by SAICA.
(r) Employee benefits (i) Short‑term benefits The cost of all short-term employee benefits is recognised during the period in which the employee renders the related
service, on an undiscounted basis. A liability is recognised for the amount expected to be paid if the Company or Group has a present legal or constructive obligation to pay this amount as a result of past service provided by the employee and the obligation can be estimated reliably.
(ii) Retirement benefits The policy of the Group and Company is to provide retirement benefits for its employees. The contribution paid by the
Group and Company to fund obligations for the payment of retirement benefits are recognised as an expense in profit or loss when they are due. The Ohlthaver & List Retirement Fund, which is a defined contribution fund, covers all the Company’s employees and is governed by the Pension Funds Act.
INTEgrATED ANNUAL rEporT 201890 91NAmIbIA bREWERIES LImITED
annual financial statements (CONTINUED)
nOtes tO tHe annual financial statements (CONTINUED)FOR THE YEAR ENDED 30 JUNE 2018
(iii) Post‑employment medical benefits The Group and Company provides for post-employment health care benefits to qualifying employees and retired personnel
by subsidising a portion of their medical aid contributions. This scheme operates as a defined benefit plan and the cost of providing benefits under the plan is determined using the projected credit unit method.
Actuarial gains or losses, which can arise from differences between expected and actual outcomes, or changes in actuarial assumptions, are recognised immediately in other comprehensive income. The past service cost is recognised as an expense on a straight line basis over the average period until the benefits become vested. If the benefits are already vested immediately following the introduction of, or changes to pension plan, past service cost is recognised as an expense immediately.
The entitlement to the benefits is usually based on the employee remaining in service up to retirement age and completing a minimum service period.
(iv) Severance benefit obligation In accordance with the Namibia Labour Act, 2007 (No. 11 of 2007), severance benefits are payable to an employee,
if the employee is dismissed, dies while employed or resigns/retires on reaching the age of 65 years. The obligation for severance benefits to current employees is actuarially determined in respect of all Group employees and is provided for in full. The cost of providing benefits is determined using the projected unit-credit method, with actuarial valuations being carried out at the end of each reporting period. Actuarial gains or losses are recognised in other comprehensive income and service costs are recognised in profit or loss in the year in which it occurs.
(s) Operating segment An operating segment is a component of the Group that engages in business activities from which it may earn revenues and
incur expenses. An operating segment is also a component of the Group whose operating results are reviewed regularly by the entity’s Chief Operating Decision Maker to make decisions about resources to be allocated to the segment and assess its performance and for which discrete financial information is available. In accordance with IFRS 8 – Operating Segments, the operating segments used to present segment information were identified on the basis of the internal reports used by management to allocate resources to the segments and assess their performance. The Executive Directors (Managing Director and Finance Director) are the Group’s ’Chief Operating Decision Maker’ within the meaning of IFRS 8.
The operating segments have been identified and classified in a manner that reflects the nature of the products offered by the Group.
Operating segments whose total revenue, absolute profit or loss for the period or total assets are 10% or more of total Group revenue, profit or loss or total assets, are reported separately.
The measure of profit or loss used by the Chief Operating Decision Maker is EBIT (Earnings Before Interest and Taxes), which includes revenue and expenses directly relating to a business segment but excludes net finance charges and taxation, which cannot be allocated to any specific segment.
(t) Fair value measurement Fair value is the price that would be received to sell an asset or paid to transfer a liability in an orderly transaction between
market participants at the measurement date. The fair value measurement is based on the presumption that the transaction to sell the asset or transfer the liability takes place either:
• In the principal market for the asset or liability, or
• In the absence of a principal market, in the most advantageous market for the asset or liability.
All assets and liabilities for which fair value is measured or disclosed in the financial statements are categorised within the fair value hierarchy, described as follows, based on the lowest level input that is significant to the fair value measurement as a whole:
Level 1 — Quoted (unadjusted) market prices in active markets for identical assets or liabilities that the Group can access at measurement date
Level 2 — Valuation techniques for which the lowest level input that is significant to the fair value measurement is directly or indirectly observable.
Level 3 — Valuation techniques for which the lowest level input that is significant to the fair value measurement is unobservable.
INTEgrATED ANNUAL rEporT 201890 91NAmIbIA bREWERIES LImITED
NOTES TO THE ANNUAL FINANCIAL STATEMENTS (continued)FOR THE YEAR ENDED 30 JUNE 2018
(u) New and revised standards
(i) Adoption of new and revised standards The following new standards and interpretations that were applicable were adopted during the year and did not lead to
any changes in the Group’s accounting policies:
International financial reporting Standards
Effective for annual periods beginning
on or after
IAS 7 Statement of Cash Flows Amendments as result of the Disclosure initiative 1 January 2017
IAS 12 Income Taxes Amendments regarding the recognition of deferred tax assets for unrealised losses 1 January 2017
(ii) Standards and amendments issued but not yet effective At the date of authorisation of these financial statements, the following standards and interpretations were in issue but not
yet effective:
New/revised International financial reporting Standards
Effective for annual periods beginning
on or after
IFRS 1 First-time Adoption of International Financial Reporting Standards Amendments resulting from Annual Improvements 2014–2016 Cycle (removing short-term exemptions) 1 January 2018
IFRS 2 Share-based Payment Amendments to clarify the classification and measurement of share-based payment transactions 1 January 2018
IFRS 4 Insurance Contracts Amendments regarding the interaction of IFRS 4 and IFRS 9 1 January 2018
IFRS 9 Financial Instruments Reissue to include requirements for the classification and measurement of financial liabilities and incorporate existing recognition requirements 1 January 2018
IAS 28 Investments in Associates and Joint Ventures Clarifying certain fair value measurements 1 January 2018
IAS 40 Investment Property Amendments to clarify transfers or property to, or from, investment property 1 January 2018
IFRS 15 Revenue from Contracts from Customers Changes to revenue recognition criteria and additional disclosure requirements 1 January 2018
IFRS 16 Leases Introduction of a single lease accounting model 1 January 2019
IFRIC 22 Foreign Currency Transactions and Advance Consideration IFRIC 22 clarifies the accounting for transactions that include the receipt or payment of advance consideration in a foreign currency. 1 January 2018
The Directors are assessing the impact of adopting these standards but does not currently expect the adoption of any of these standards to have a significant impact on these accounts. These standards and interpretations will be adopted at the respective effective dates.
INTEgrATED ANNUAL rEporT 201892 93NAmIbIA bREWERIES LImITED
annual financial statements (CONTINUED)
nOtes tO tHe annual financial statements (CONTINUED)FOR THE YEAR ENDED 30 JUNE 2018
COMPANY GROUP
2017 N$’000s
2018 N$’000s
2018 N$’000s
2017 N$’000s
4. propErTY, pLANT AND EQUIpMENT
At cost
160 905 189 772 Freehold land and buildings 223 995 195 128
6 610 6 610 Leasehold land and buildings 8 768 8 768
1 135 729 1 133 733 Plant and machinery 1 135 403 1 136 065
110 355 116 068 Vehicles 116 058 110 947
69 768 79 143 Furniture and equipment 79 602 70 218
331 032 389 038 Returnable containers 389 038 331 032
23 316 75 475 Assets under construction 75 494 23 965
1 837 715 1 989 839 2 028 358 1 876 123
Accumulated depreciation and impairment losses
30 681 34 991 Freehold land and buildings 34 991 30 681
3 589 3 589 Leasehold land and buildings 5 747 5 747
566 874 617 107 Plant and machinery 617 377 566 908
62 272 72 437 Vehicles 72 426 62 466
47 112 55 078 Furniture and equipment 55 248 47 223
174 857 223 851 Returnable containers 223 851 174 857
885 385 1 007 053 1 009 639 887 882
Carrying value
130 224 154 782 Freehold land and buildings 189 005 164 447
3 021 3 021 Leasehold land and buildings 3 021 3 021
568 855 516 626 Plant and machinery 518 026 569 157
48 083 43 630 Vehicles 43 632 48 481
22 656 24 065 Furniture and equipment 24 354 22 995
156 175 165 187 Returnable containers 165 187 156 175
23 316 75 475 Assets under construction 75 494 23 965
952 330 982 786 1 018 719 988 241
Refer to Annexure B for details regarding the movement in property, plant and equipment for the year.
LEASED ASSETS
Included above are leased vehicles under a number of finance lease agreements, details of which are set out below:
Vehicles
46 620 50 980 At cost 50 980 47 222
(19 309) (23 480) Accumulated depreciation (23 480) (19 514)
27 311 27 500 Carrying value 27 500 27 708
The leased vehicles are encumbered in terms of finance lease agreements (see note 15 and 29).
Land and buildings
The Group’s land and buildings are not encumbered. Details of the Group’s land and buildings are maintained for inspection at the registered office of the Company.
Refer to note 15 in respect of secured leased assets and moveable assets.
INTEgrATED ANNUAL rEporT 201892 93NAmIbIA bREWERIES LImITED
NOTES TO THE ANNUAL FINANCIAL STATEMENTS (continued)FOR THE YEAR ENDED 30 JUNE 2018
COMPANY GROUP
2017 N$’000s
2018 N$’000s
2018 N$’000s
2017 N$’000s
5. INTANgIBLE ASSETSAt cost
35 722 33 910 Automation processes 33 910 35 722
11 000 11 000 Trademarks 11 000 11 000
19 538 19 751 Software licences 19 751 19 538
66 260 64 661 64 661 66 260
Accumulated amortisation 11 355 11 271 Automation processes 11 271 11 355
333 733 Trademarks 733 333
12 699 15 114 Software licences 15 114 12 699
24 387 27 118 27 118 24 387
Carrying value 24 367 22 639 Automation processes 22 639 24 367
10 667 10 267 Trademarks 10 267 10 667
6 839 4 638 Software licences 4 638 6 839
41 873 37 544 37 544 41 873
Refer to Annexure B for details regarding the movement in intangible assets for the year.
6. INVESTMENT IN SUBSIDIArIES (ANNExUrE C) 35 680 35 520 Shares at cost
(2 060) (1 495) Loans from subsidiaries
3 000 – Loans to subsidiaries
36 620 34 025
1 100 (1 495) Current
35 520 35 520 Non-current
36 620 34 025 Net investment in subsidiaries
The loans are interest free and have no fixed repayment terms.
7. INVESTMENT IN ASSoCIATE 610 526 438 265 Opening balance 438 265 610 526
(16 544) – Acquisition cost adjustment – (16 544)
(155 717) (33 441) Equity loss from associate (33 441) (155 717)
438 265 404 824 Carrying amount of the investment 404 824 438 265
Disclosed as – – Current – –
438 265 404 824 Non-current 404 824 438 265
438 265 404 824 404 824 438 265
Equity (loss)/profit from associate (100 913) (33 441) Equity accounted losses (ongoing operations) (33 441) (100 913)
(54 804) – Statutory audit adjustments and effect of impairment of assets and recognition of liabilities – (54 804)
(155 717) (33 441) (33 441) (155 717)
INTEgrATED ANNUAL rEporT 201894 95NAmIbIA bREWERIES LImITED
annual financial statements (CONTINUED)
nOtes tO tHe annual financial statements (CONTINUED)FOR THE YEAR ENDED 30 JUNE 2018
COMPANY GROUP
2017 N$’000s
2018 N$’000s
2018 N$’000s
2017 N$’000s
7. INVESTMENT IN ASSoCIATE (continued)
On 1 December 2015, the Group acquired 25% of the issued share capital of Sedibeng Brewery (Proprietary) Limited (“Sedibeng”) and an additional 9.5% of the issued share capital of DHN Drinks (Proprietary) Limited (“DHN”) from Diageo Highlands Holdings B.V. and obtained significant influence over these operations.
With effect from 31 December 2015, Sedibeng and DHN entered into a merger agreement whereby:
a) Heineken International and Namibia Breweries Limited sold and transferred all of their shares in Sedibeng to DHN in exchange for the issue by DHN to Heineken International and NBL of a proportionate number of shares in DHN;
b) the business operations of DHN and Sedibeng were combined by the transfer of the business of Sedibeng to DHN (Sedibeng sold and transferred its operations as a going concern to DHN in exchange for the assumption by DHN of the Sedibeng’s liabilities and the issue of shares in DHN to Sedibeng).
On 31 December 2015 DHN changed its name to Heineken South Africa (Proprietary) Limited. Heineken South Africa (Proprietary) Limited carries on the business of manufacturing, marketing, sale and distribution of international beer and cider brands (including selected brands of Namibia Breweries Limited) in South Africa.
As part of the above merger agreement on 31 December 2015, Heineken South Africa (Proprietary) Limited fair valued the assets and liabilities on the amalgamation of Sedibeng Brewery (Proprietary) Limited’s operations into Heineken South Africa (Proprietary) Limited. This consisted of a N$709 million (net of tax) fair value adjustment to property, plant and equipment, which will be depreciated over 15 years, and a N$274 million impairment of other assets and recognition of liabilities. Heineken South Africa (Proprietary) Limited applied IFRS 3 Business Combinations and recorded the net gain of N$435 million as a bargain purchase.
In terms of the Group’s accounting policy on IFRS 3 Business Combinations under common control are recorded at net book value and not fair value. Therefore the Group has not accounted for the bargain purchase recorded by Heineken South Africa (Proprietary) Limited.
In 2016 the Directors of Heineken South Africa (Proprietary) Limited have assessed that a portion of Heineken South Africa (Proprietary) Limited’s assessed loss of N$1.6 billion is recoverable and have thus recorded a portion of the assessed loss as deferred tax asset. Our Group Directors agreed with this assessment and as a result recorded our share of the deferred tax asset recorded by Heineken South Africa (Proprietary) Limited.
The closing balance of the investment includes a capital loan of N$73.6 million owed by Heineken South Africa (Proprietary) Limited. The loan to the associate is unsecured and bears interest at JIBAR + 2%. Trade receivables from the Associate are disclosed in note 10.
INTEgrATED ANNUAL rEporT 201894 95NAmIbIA bREWERIES LImITED
NOTES TO THE ANNUAL FINANCIAL STATEMENTS (continued)FOR THE YEAR ENDED 30 JUNE 2018
COMPANY GROUP
2017 N$’000s
2018 N$’000s
2018 N$’000s
2017 N$’000s
7. INVESTMENT IN ASSoCIATE (continued)
The summarised financial information of material associates at 30 June and for the years then ended is as follows:
Summarised statement of financial position
Current assets 2 009 420 1 738 000
Non-current assets 5 228 939 4 410 885
7 238 359 6 148 885
Current liabilities 3 974 014 1 442 000
Non-current liabilities 1 568 264 2 909 000
5 542 278 4 351 000
Revenue 7 070 927 5 293 126
Other income and expenses (7 250 885) (5 932 097)
Loss before income tax (179 958) (638 971)
Income tax expense 46 197 235 315
Loss from continuing operations (133 761) (403 656)
Equity loss from associate (33 441) (100 913)
Royalties received from associate 96 201 94 000
8. AVAILABLE-for-SALE INVESTMENTS
Unlisted investments
15 – L&T Ventures (Proprietary) Limited – 15
15 – Directors’ valuation of unlisted investments – 15
During the current financial year L&T Ventures (Proprietary) Limited was deregistered.
9. INVENTorIES
38 963 65 361 Raw materials 65 361 38 963
14 493 18 841 Work in progress 18 841 14 493
120 513 85 024 Finished products 85 024 120 963
104 767 124 971 Consumable stores 124 971 104 767
8 919 7 518 Merchandise 7 518 8 919
287 655 301 715 301 715 288 105
(10 577) (11 765) Provision for obsolete stock (11 765) (10 732)
277 078 289 950 289 950 277 373
For the 2018 financial year, the total inventory impairment amounted to N$12.6 million (2017: N$10.6 million). The impairment to inventories is included in operating expenses in profit and loss and is mainly due to expired goods and changes in packaging design.
INTEgrATED ANNUAL rEporT 201896 97NAmIbIA bREWERIES LImITED
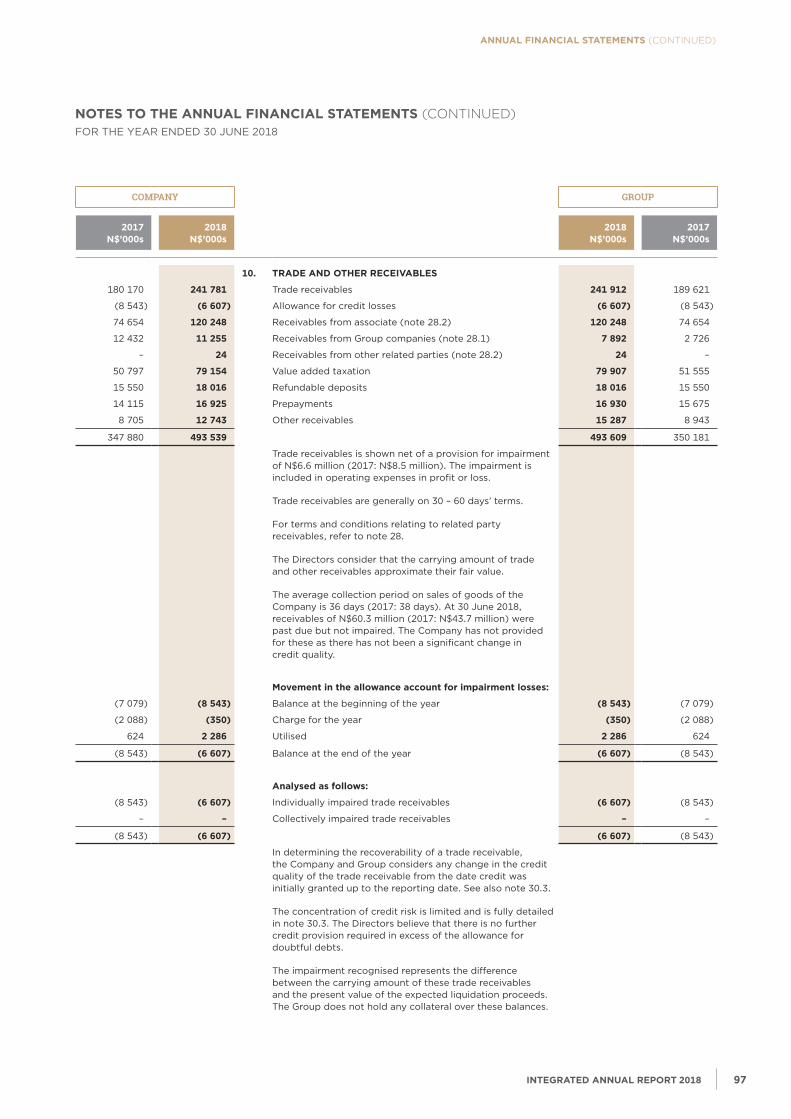
annual financial statements (CONTINUED)
nOtes tO tHe annual financial statements (CONTINUED)FOR THE YEAR ENDED 30 JUNE 2018
COMPANY GROUP
2017 N$’000s
2018 N$’000s
2018 N$’000s
2017 N$’000s
10. TrADE AND oTHEr rECEIVABLES
180 170 241 781 Trade receivables 241 912 189 621
(8 543) (6 607) Allowance for credit losses (6 607) (8 543)
74 654 120 248 Receivables from associate (note 28.2) 120 248 74 654
12 432 11 255 Receivables from Group companies (note 28.1) 7 892 2 726
– 24 Receivables from other related parties (note 28.2) 24 –
50 797 79 154 Value added taxation 79 907 51 555
15 550 18 016 Refundable deposits 18 016 15 550
14 115 16 925 Prepayments 16 930 15 675
8 705 12 743 Other receivables 15 287 8 943
347 880 493 539 493 609 350 181
Trade receivables is shown net of a provision for impairment of N$6.6 million (2017: N$8.5 million). The impairment is included in operating expenses in profit or loss.
Trade receivables are generally on 30 – 60 days’ terms.
For terms and conditions relating to related party receivables, refer to note 28.
The Directors consider that the carrying amount of trade and other receivables approximate their fair value.
The average collection period on sales of goods of the Company is 36 days (2017: 38 days). At 30 June 2018, receivables of N$60.3 million (2017: N$43.7 million) were past due but not impaired. The Company has not provided for these as there has not been a significant change in credit quality.
Movement in the allowance account for impairment losses:
(7 079) (8 543) Balance at the beginning of the year (8 543) (7 079)
(2 088) (350) Charge for the year (350) (2 088)
624 2 286 Utilised 2 286 624
(8 543) (6 607) Balance at the end of the year (6 607) (8 543)
Analysed as follows:
(8 543) (6 607) Individually impaired trade receivables (6 607) (8 543)
– – Collectively impaired trade receivables – –
(8 543) (6 607) (6 607) (8 543)
In determining the recoverability of a trade receivable, the Company and Group considers any change in the credit quality of the trade receivable from the date credit was initially granted up to the reporting date. See also note 30.3.
The concentration of credit risk is limited and is fully detailed in note 30.3. The Directors believe that there is no further credit provision required in excess of the allowance for doubtful debts.
The impairment recognised represents the difference between the carrying amount of these trade receivables and the present value of the expected liquidation proceeds. The Group does not hold any collateral over these balances.
INTEgrATED ANNUAL rEporT 201896 97NAmIbIA bREWERIES LImITED
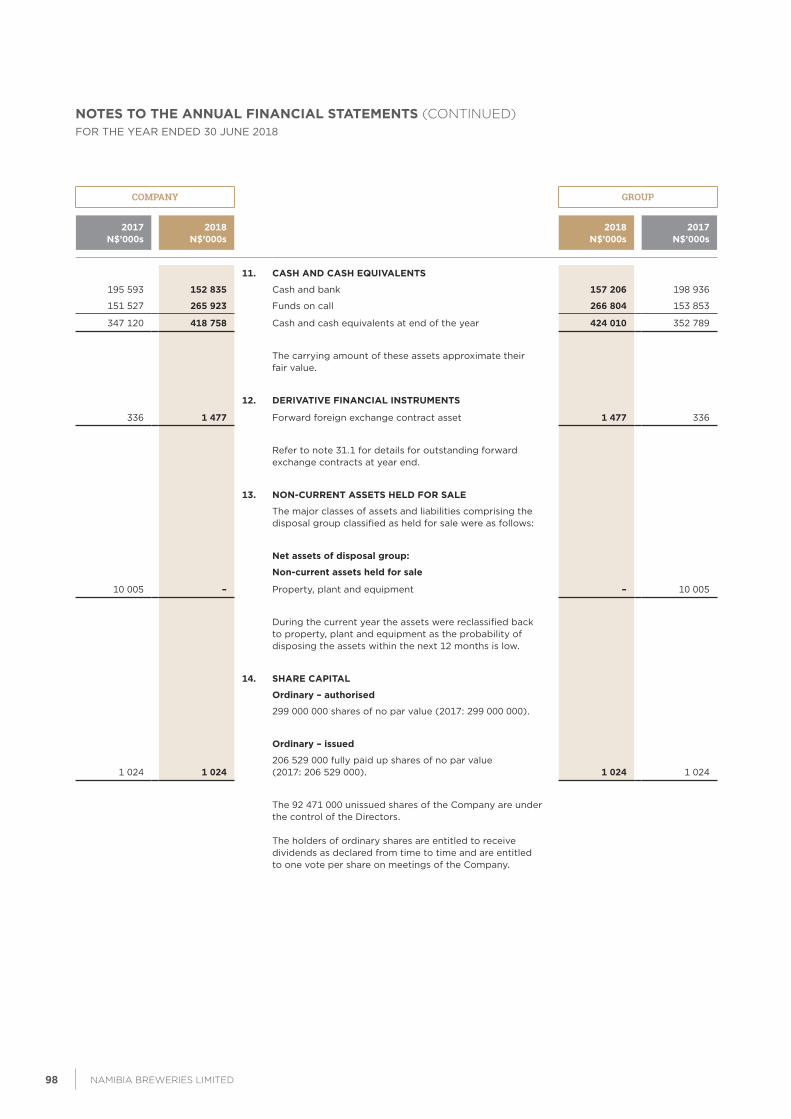
NOTES TO THE ANNUAL FINANCIAL STATEMENTS (continued)FOR THE YEAR ENDED 30 JUNE 2018
COMPANY GROUP
2017 N$’000s
2018 N$’000s
2018 N$’000s
2017 N$’000s
11. CASH AND CASH EQUIVALENTS
195 593 152 835 Cash and bank 157 206 198 936
151 527 265 923 Funds on call 266 804 153 853
347 120 418 758 Cash and cash equivalents at end of the year 424 010 352 789
The carrying amount of these assets approximate their fair value.
12. DErIVATIVE fINANCIAL INSTrUMENTS
336 1 477 Forward foreign exchange contract asset 1 477 336
Refer to note 31.1 for details for outstanding forward exchange contracts at year end.
13. NoN-CUrrENT ASSETS HELD for SALE
The major classes of assets and liabilities comprising the disposal group classified as held for sale were as follows:
Net assets of disposal group:
Non-current assets held for sale
10 005 – Property, plant and equipment – 10 005
During the current year the assets were reclassified back to property, plant and equipment as the probability of disposing the assets within the next 12 months is low.
14. SHArE CApITAL
ordinary – authorised
299 000 000 shares of no par value (2017: 299 000 000).
ordinary – issued
1 024 1 024 206 529 000 fully paid up shares of no par value (2017: 206 529 000). 1 024 1 024
The 92 471 000 unissued shares of the Company are under the control of the Directors.
The holders of ordinary shares are entitled to receive dividends as declared from time to time and are entitled to one vote per share on meetings of the Company.
INTEgrATED ANNUAL rEporT 201898 99NAmIbIA bREWERIES LImITED
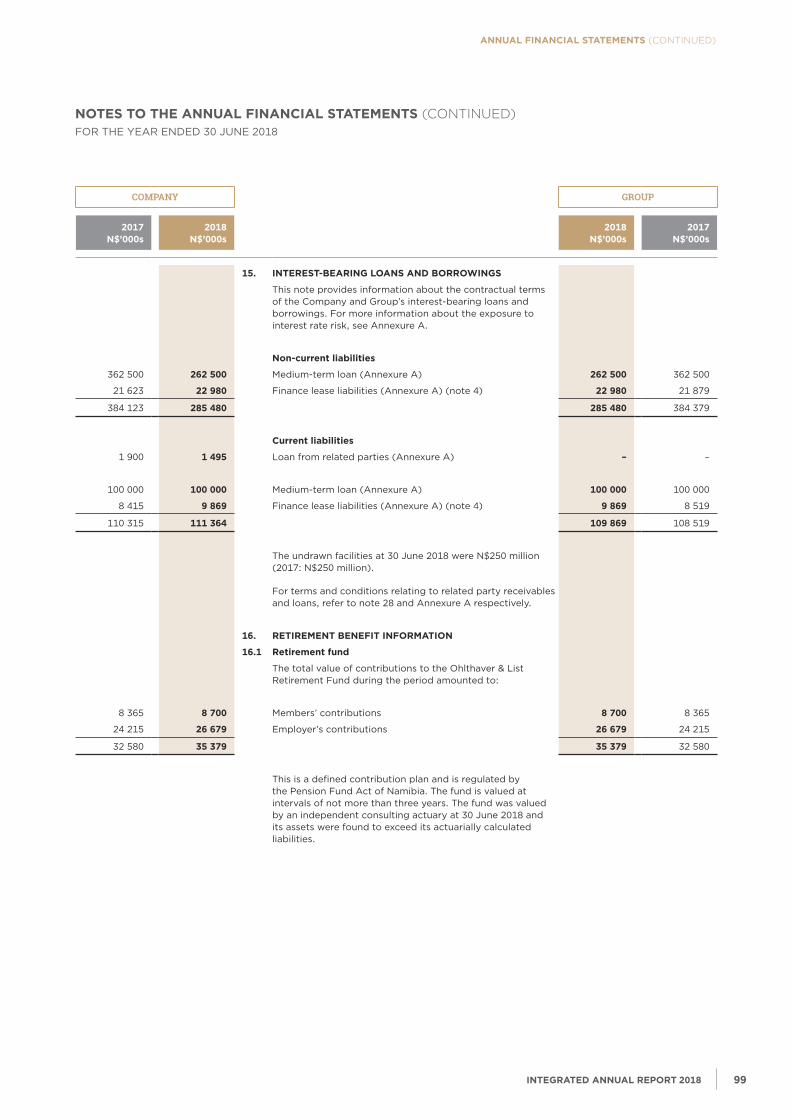
annual financial statements (CONTINUED)
nOtes tO tHe annual financial statements (CONTINUED)FOR THE YEAR ENDED 30 JUNE 2018
COMPANY GROUP
2017 N$’000s
2018 N$’000s
2018 N$’000s
2017 N$’000s
15. INTErEST-BEArINg LoANS AND BorroWINgS
This note provides information about the contractual terms of the Company and Group’s interest-bearing loans and borrowings. For more information about the exposure to interest rate risk, see Annexure A.
Non-current liabilities
362 500 262 500 Medium-term loan (Annexure A) 262 500 362 500
21 623 22 980 Finance lease liabilities (Annexure A) (note 4) 22 980 21 879
384 123 285 480 285 480 384 379
Current liabilities
1 900 1 495 Loan from related parties (Annexure A) – –
100 000 100 000 Medium-term loan (Annexure A) 100 000 100 000
8 415 9 869 Finance lease liabilities (Annexure A) (note 4) 9 869 8 519
110 315 111 364 109 869 108 519
The undrawn facilities at 30 June 2018 were N$250 million (2017: N$250 million).
For terms and conditions relating to related party receivables and loans, refer to note 28 and Annexure A respectively.
16. rETIrEMENT BENEfIT INforMATIoN
16.1 retirement fund
The total value of contributions to the Ohlthaver & List Retirement Fund during the period amounted to:
8 365 8 700 Members’ contributions 8 700 8 365
24 215 26 679 Employer’s contributions 26 679 24 215
32 580 35 379 35 379 32 580
This is a defined contribution plan and is regulated by the Pension Fund Act of Namibia. The fund is valued at intervals of not more than three years. The fund was valued by an independent consulting actuary at 30 June 2018 and its assets were found to exceed its actuarially calculated liabilities.
INTEgrATED ANNUAL rEporT 201898 99NAmIbIA bREWERIES LImITED
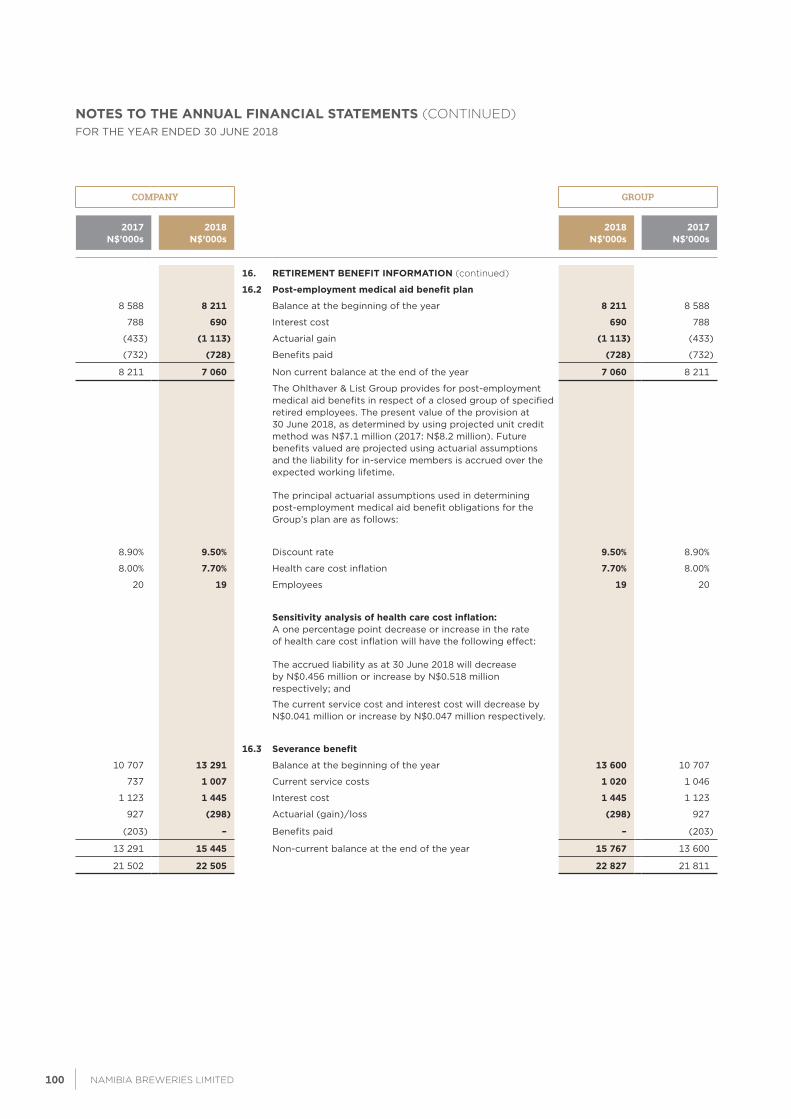
NOTES TO THE ANNUAL FINANCIAL STATEMENTS (continued)FOR THE YEAR ENDED 30 JUNE 2018
COMPANY GROUP
2017 N$’000s
2018 N$’000s
2018 N$’000s
2017 N$’000s
16. rETIrEMENT BENEfIT INforMATIoN (continued)
16.2 post-employment medical aid benefit plan
8 588 8 211 Balance at the beginning of the year 8 211 8 588
788 690 Interest cost 690 788
(433) (1 113) Actuarial gain (1 113) (433)
(732) (728) Benefits paid (728) (732)
8 211 7 060 Non current balance at the end of the year 7 060 8 211
The Ohlthaver & List Group provides for post-employment medical aid benefits in respect of a closed group of specified retired employees. The present value of the provision at 30 June 2018, as determined by using projected unit credit method was N$7.1 million (2017: N$8.2 million). Future benefits valued are projected using actuarial assumptions and the liability for in-service members is accrued over the expected working lifetime.
The principal actuarial assumptions used in determining post-employment medical aid benefit obligations for the Group’s plan are as follows:
8.90% 9.50% Discount rate 9.50% 8.90%
8.00% 7.70% Health care cost inflation 7.70% 8.00%
20 19 Employees 19 20
Sensitivity analysis of health care cost inflation:A one percentage point decrease or increase in the rate of health care cost inflation will have the following effect:
The accrued liability as at 30 June 2018 will decrease by N$0.456 million or increase by N$0.518 million respectively; and
The current service cost and interest cost will decrease by N$0.041 million or increase by N$0.047 million respectively.
16.3 Severance benefit
10 707 13 291 Balance at the beginning of the year 13 600 10 707
737 1 007 Current service costs 1 020 1 046
1 123 1 445 Interest cost 1 445 1 123
927 (298) Actuarial (gain)/loss (298) 927
(203) – Benefits paid – (203)
13 291 15 445 Non-current balance at the end of the year 15 767 13 600
21 502 22 505 22 827 21 811
INTEgrATED ANNUAL rEporT 2018100 101NAmIbIA bREWERIES LImITED
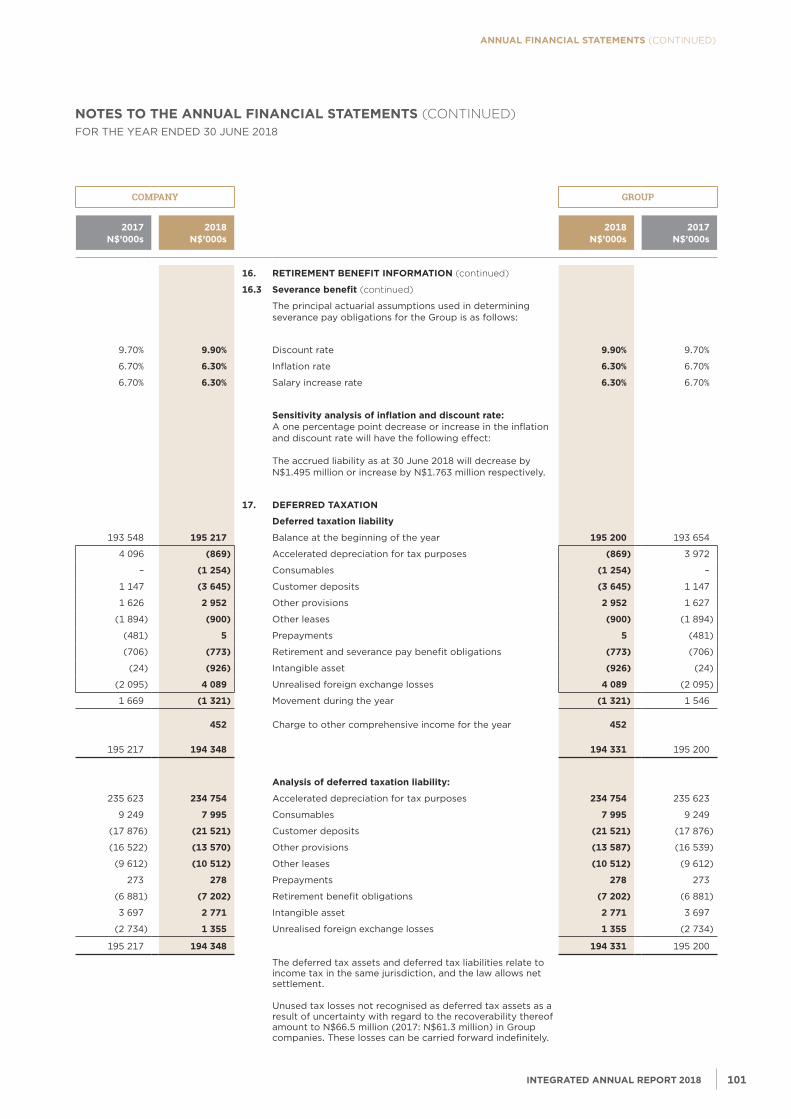
annual financial statements (CONTINUED)
nOtes tO tHe annual financial statements (CONTINUED)FOR THE YEAR ENDED 30 JUNE 2018
COMPANY GROUP
2017 N$’000s
2018 N$’000s
2018 N$’000s
2017 N$’000s
16. rETIrEMENT BENEfIT INforMATIoN (continued)
16.3 Severance benefit (continued)
The principal actuarial assumptions used in determining severance pay obligations for the Group is as follows:
9.70% 9.90% Discount rate 9.90% 9.70%
6.70% 6.30% Inflation rate 6.30% 6.70%
6.70% 6.30% Salary increase rate 6.30% 6.70%
Sensitivity analysis of inflation and discount rate:A one percentage point decrease or increase in the inflation and discount rate will have the following effect:
The accrued liability as at 30 June 2018 will decrease by N$1.495 million or increase by N$1.763 million respectively.
17. DEfErrED TAxATIoN
Deferred taxation liability
193 548 195 217 Balance at the beginning of the year 195 200 193 654
4 096 (869) Accelerated depreciation for tax purposes (869) 3 972
– (1 254) Consumables (1 254) –
1 147 (3 645) Customer deposits (3 645) 1 147
1 626 2 952 Other provisions 2 952 1 627
(1 894) (900) Other leases (900) (1 894)
(481) 5 Prepayments 5 (481)
(706) (773) Retirement and severance pay benefit obligations (773) (706)
(24) (926) Intangible asset (926) (24)
(2 095) 4 089 Unrealised foreign exchange losses 4 089 (2 095)
1 669 (1 321) Movement during the year (1 321) 1 546
452 Charge to other comprehensive income for the year 452
195 217 194 348 194 331 195 200
Analysis of deferred taxation liability:
235 623 234 754 Accelerated depreciation for tax purposes 234 754 235 623
9 249 7 995 Consumables 7 995 9 249
(17 876) (21 521) Customer deposits (21 521) (17 876)
(16 522) (13 570) Other provisions (13 587) (16 539)
(9 612) (10 512) Other leases (10 512) (9 612)
273 278 Prepayments 278 273
(6 881) (7 202) Retirement benefit obligations (7 202) (6 881)
3 697 2 771 Intangible asset 2 771 3 697
(2 734) 1 355 Unrealised foreign exchange losses 1 355 (2 734)
195 217 194 348 194 331 195 200
The deferred tax assets and deferred tax liabilities relate to income tax in the same jurisdiction, and the law allows net settlement.
Unused tax losses not recognised as deferred tax assets as a result of uncertainty with regard to the recoverability thereof amount to N$66.5 million (2017: N$61.3 million) in Group companies. These losses can be carried forward indefinitely.
INTEgrATED ANNUAL rEporT 2018100 101NAmIbIA bREWERIES LImITED
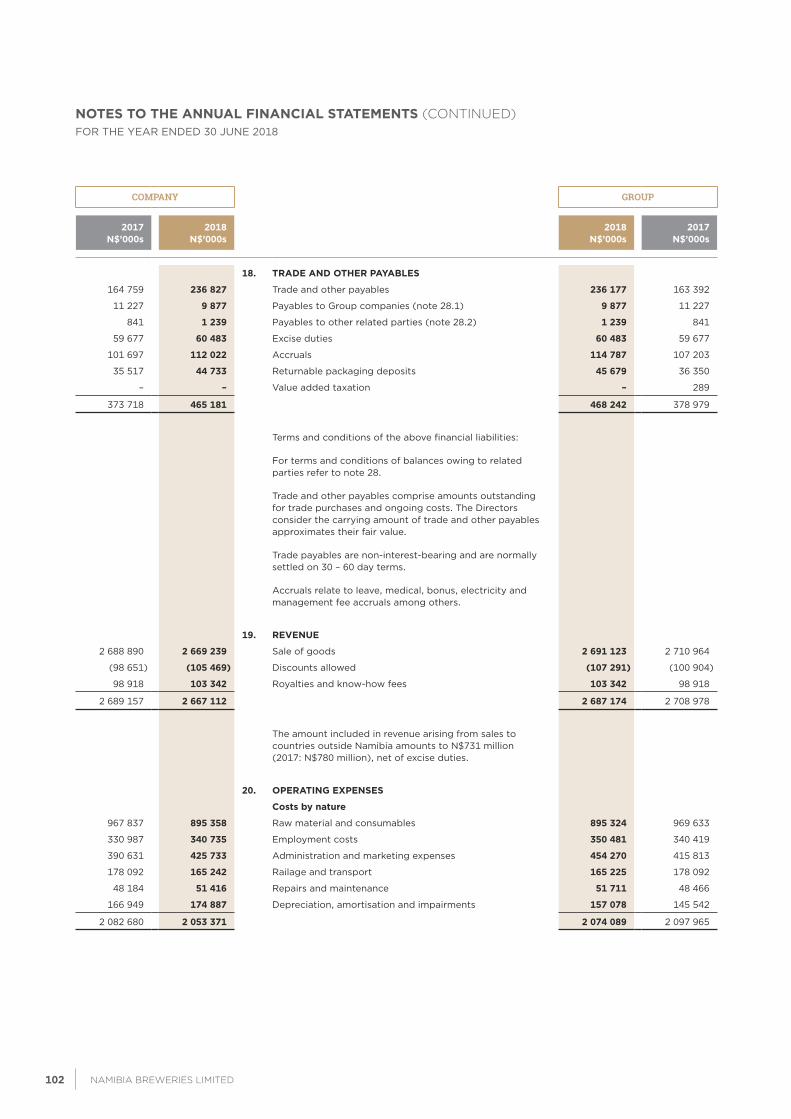
NOTES TO THE ANNUAL FINANCIAL STATEMENTS (continued)FOR THE YEAR ENDED 30 JUNE 2018
COMPANY GROUP
2017 N$’000s
2018 N$’000s
2018 N$’000s
2017 N$’000s
18. TrADE AND oTHEr pAYABLES
164 759 236 827 Trade and other payables 236 177 163 392
11 227 9 877 Payables to Group companies (note 28.1) 9 877 11 227
841 1 239 Payables to other related parties (note 28.2) 1 239 841
59 677 60 483 Excise duties 60 483 59 677
101 697 112 022 Accruals 114 787 107 203
35 517 44 733 Returnable packaging deposits 45 679 36 350
– – Value added taxation – 289
373 718 465 181 468 242 378 979
Terms and conditions of the above financial liabilities:
For terms and conditions of balances owing to related parties refer to note 28.
Trade and other payables comprise amounts outstanding for trade purchases and ongoing costs. The Directors consider the carrying amount of trade and other payables approximates their fair value.
Trade payables are non-interest-bearing and are normally settled on 30 – 60 day terms.
Accruals relate to leave, medical, bonus, electricity and management fee accruals among others.
19. rEVENUE
2 688 890 2 669 239 Sale of goods 2 691 123 2 710 964
(98 651) (105 469) Discounts allowed (107 291) (100 904)
98 918 103 342 Royalties and know-how fees 103 342 98 918
2 689 157 2 667 112 2 687 174 2 708 978
The amount included in revenue arising from sales to countries outside Namibia amounts to N$731 million (2017: N$780 million), net of excise duties.
20. opErATINg ExpENSES
Costs by nature
967 837 895 358 Raw material and consumables 895 324 969 633
330 987 340 735 Employment costs 350 481 340 419
390 631 425 733 Administration and marketing expenses 454 270 415 813
178 092 165 242 Railage and transport 165 225 178 092
48 184 51 416 Repairs and maintenance 51 711 48 466
166 949 174 887 Depreciation, amortisation and impairments 157 078 145 542
2 082 680 2 053 371 2 074 089 2 097 965
INTEgrATED ANNUAL rEporT 2018102 103NAmIbIA bREWERIES LImITED
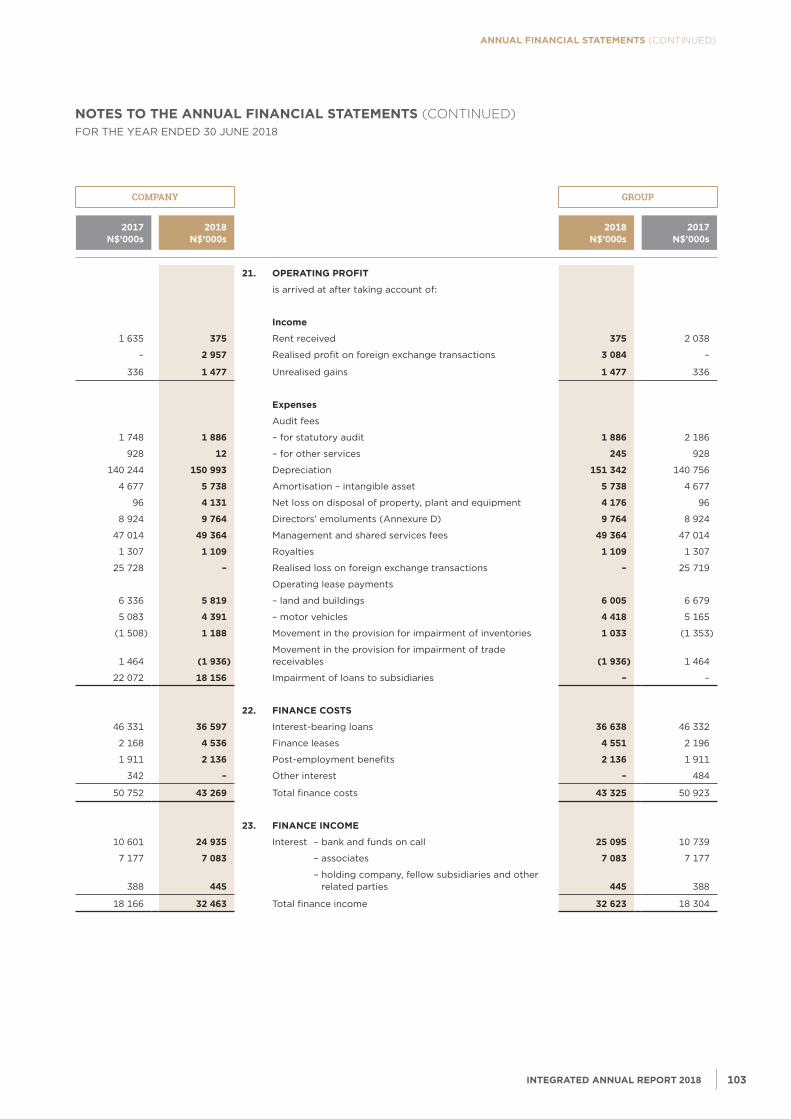
annual financial statements (CONTINUED)
nOtes tO tHe annual financial statements (CONTINUED)FOR THE YEAR ENDED 30 JUNE 2018
COMPANY GROUP
2017 N$’000s
2018 N$’000s
2018 N$’000s
2017 N$’000s
21. opErATINg profIT
is arrived at after taking account of:
Income
1 635 375 Rent received 375 2 038
– 2 957 Realised profit on foreign exchange transactions 3 084 –
336 1 477 Unrealised gains 1 477 336
Expenses
Audit fees
1 748 1 886 – for statutory audit 1 886 2 186
928 12 – for other services 245 928
140 244 150 993 Depreciation 151 342 140 756
4 677 5 738 Amortisation – intangible asset 5 738 4 677
96 4 131 Net loss on disposal of property, plant and equipment 4 176 96
8 924 9 764 Directors’ emoluments (Annexure D) 9 764 8 924
47 014 49 364 Management and shared services fees 49 364 47 014
1 307 1 109 Royalties 1 109 1 307
25 728 – Realised loss on foreign exchange transactions – 25 719
Operating lease payments
6 336 5 819 – land and buildings 6 005 6 679
5 083 4 391 – motor vehicles 4 418 5 165
(1 508) 1 188 Movement in the provision for impairment of inventories 1 033 (1 353)
1 464 (1 936)Movement in the provision for impairment of trade receivables (1 936) 1 464
22 072 18 156 Impairment of loans to subsidiaries – –
22. fINANCE CoSTS
46 331 36 597 Interest-bearing loans 36 638 46 332
2 168 4 536 Finance leases 4 551 2 196
1 911 2 136 Post-employment benefits 2 136 1 911
342 – Other interest – 484
50 752 43 269 Total finance costs 43 325 50 923
23. fINANCE INCoME
10 601 24 935 Interest – bank and funds on call 25 095 10 739
7 177 7 083 – associates 7 083 7 177
388 445 – holding company, fellow subsidiaries and other
related parties 445 388
18 166 32 463 Total finance income 32 623 18 304
INTEgrATED ANNUAL rEporT 2018102 103NAmIbIA bREWERIES LImITED
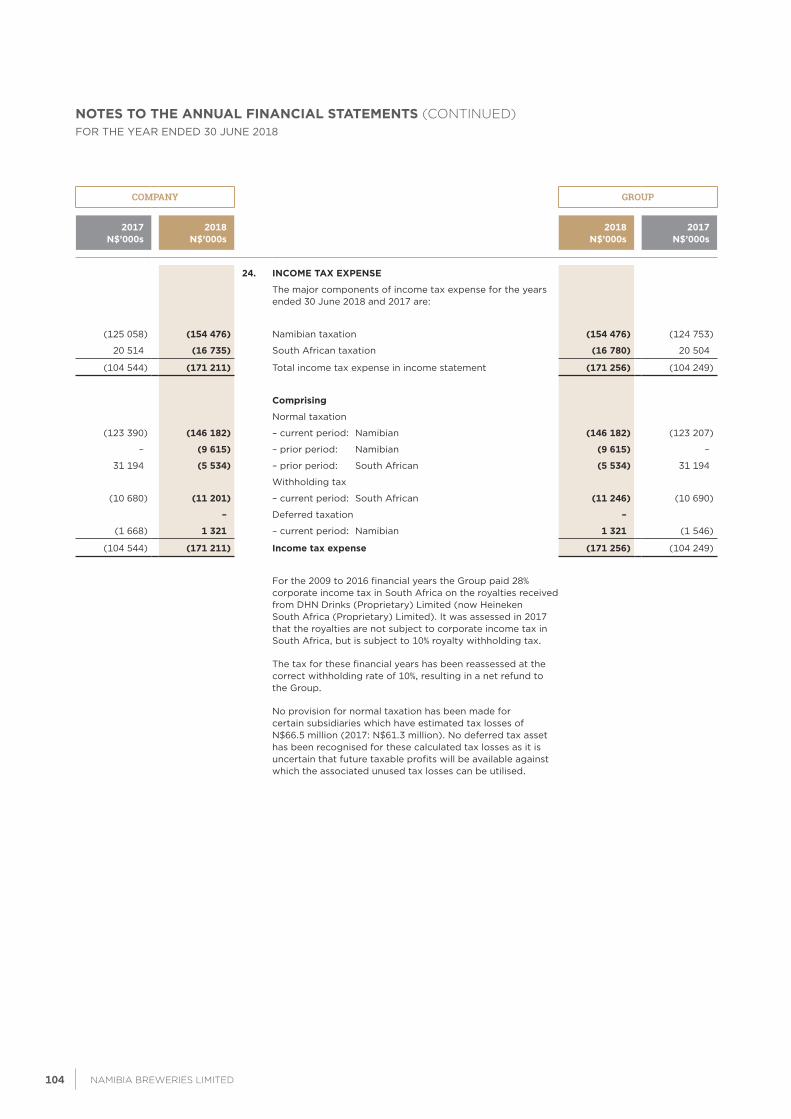
NOTES TO THE ANNUAL FINANCIAL STATEMENTS (continued)FOR THE YEAR ENDED 30 JUNE 2018
COMPANY GROUP
2017 N$’000s
2018 N$’000s
2018 N$’000s
2017 N$’000s
24. INCoME TAx ExpENSE
The major components of income tax expense for the years ended 30 June 2018 and 2017 are:
(125 058) (154 476) Namibian taxation (154 476) (124 753)
20 514 (16 735) South African taxation (16 780) 20 504
(104 544) (171 211) Total income tax expense in income statement (171 256) (104 249)
Comprising
Normal taxation
(123 390) (146 182) – current period: Namibian (146 182) (123 207)
– (9 615) – prior period: Namibian (9 615) –
31 194 (5 534) – prior period: South African (5 534) 31 194
Withholding tax
(10 680) (11 201) – current period: South African (11 246) (10 690)
– Deferred taxation –
(1 668) 1 321 – current period: Namibian 1 321 (1 546)
(104 544) (171 211) Income tax expense (171 256) (104 249)
For the 2009 to 2016 financial years the Group paid 28% corporate income tax in South Africa on the royalties received from DHN Drinks (Proprietary) Limited (now Heineken South Africa (Proprietary) Limited). It was assessed in 2017 that the royalties are not subject to corporate income tax in South Africa, but is subject to 10% royalty withholding tax.
The tax for these financial years has been reassessed at the correct withholding rate of 10%, resulting in a net refund to the Group.
No provision for normal taxation has been made for certain subsidiaries which have estimated tax losses of N$66.5 million (2017: N$61.3 million). No deferred tax asset has been recognised for these calculated tax losses as it is uncertain that future taxable profits will be available against which the associated unused tax losses can be utilised.
INTEgrATED ANNUAL rEporT 2018104 105NAmIbIA bREWERIES LImITED
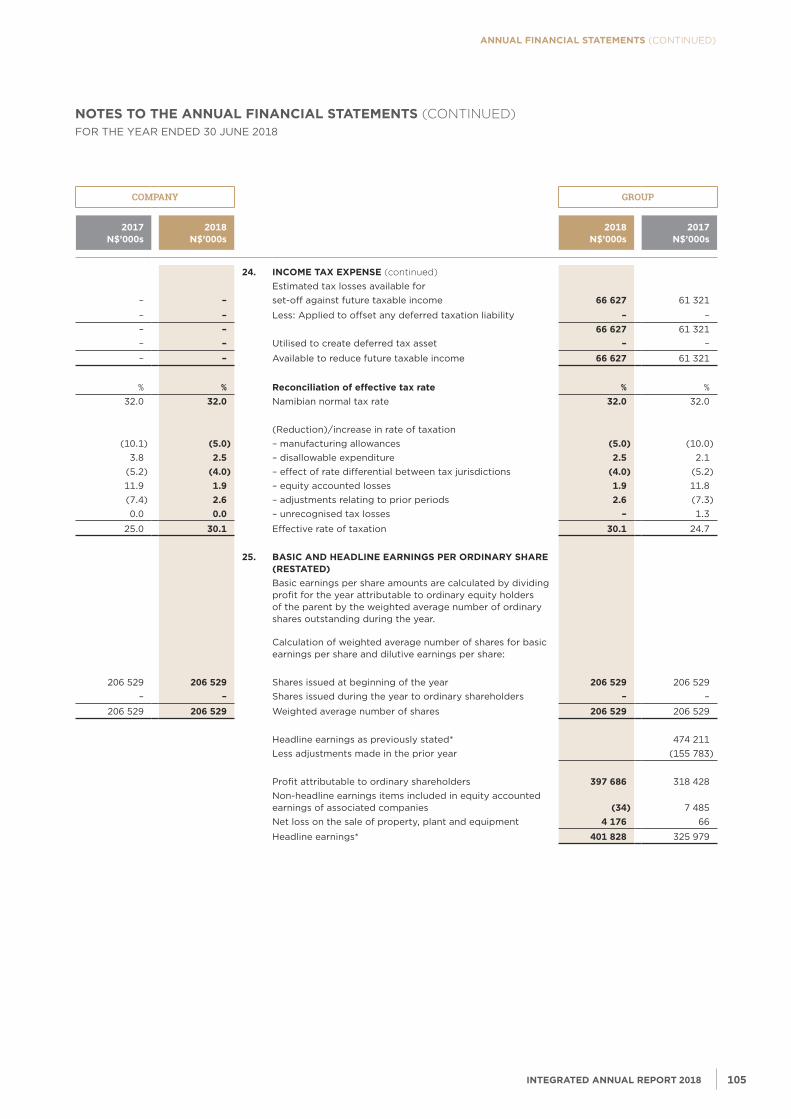
annual financial statements (CONTINUED)
nOtes tO tHe annual financial statements (CONTINUED)FOR THE YEAR ENDED 30 JUNE 2018
COMPANY GROUP
2017 N$’000s
2018 N$’000s
2018 N$’000s
2017 N$’000s
24. INCoME TAx ExpENSE (continued)Estimated tax losses available for
– – set-off against future taxable income 66 627 61 321
– – Less: Applied to offset any deferred taxation liability – – – – 66 627 61 321 – – Utilised to create deferred tax asset – –
– – Available to reduce future taxable income 66 627 61 321
% % reconciliation of effective tax rate % % 32.0 32.0 Namibian normal tax rate 32.0 32.0
(Reduction)/increase in rate of taxation(10.1) (5.0) – manufacturing allowances (5.0) (10.0)
3.8 2.5 – disallowable expenditure 2.5 2.1(5.2) (4.0) – effect of rate differential between tax jurisdictions (4.0) (5.2)11.9 1.9 – equity accounted losses 1.9 11.8(7.4) 2.6 – adjustments relating to prior periods 2.6 (7.3)0.0 0.0 – unrecognised tax losses – 1.3
25.0 30.1 Effective rate of taxation 30.1 24.7
25. BASIC AND HEADLINE EArNINgS pEr orDINArY SHArE (rESTATED) Basic earnings per share amounts are calculated by dividing profit for the year attributable to ordinary equity holders of the parent by the weighted average number of ordinary shares outstanding during the year.
Calculation of weighted average number of shares for basic earnings per share and dilutive earnings per share:
206 529 206 529 Shares issued at beginning of the year 206 529 206 529 – – Shares issued during the year to ordinary shareholders – –
206 529 206 529 Weighted average number of shares 206 529 206 529
Headline earnings as previously stated* 474 211Less adjustments made in the prior year (155 783)
Profit attributable to ordinary shareholders 397 686 318 428 Non-headline earnings items included in equity accounted earnings of associated companies (34) 7 485Net loss on the sale of property, plant and equipment 4 176 66
Headline earnings* 401 828 325 979
INTEgrATED ANNUAL rEporT 2018104 105NAmIbIA bREWERIES LImITED
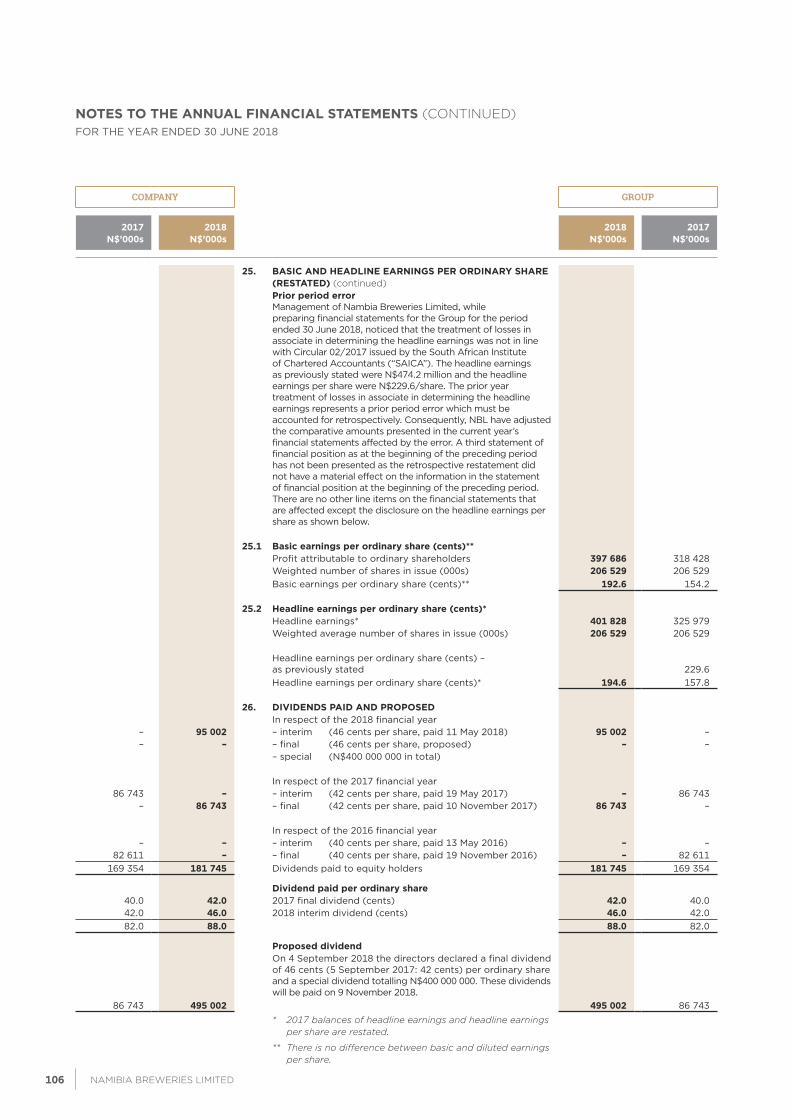
NOTES TO THE ANNUAL FINANCIAL STATEMENTS (continued)FOR THE YEAR ENDED 30 JUNE 2018
COMPANY GROUP
2017 N$’000s
2018 N$’000s
2018 N$’000s
2017 N$’000s
25. BASIC AND HEADLINE EArNINgS pEr orDINArY SHArE (rESTATED) (continued) prior period errorManagement of Nambia Breweries Limited, while preparing financial statements for the Group for the period ended 30 June 2018, noticed that the treatment of losses in associate in determining the headline earnings was not in line with Circular 02/2017 issued by the South African Institute of Chartered Accountants (“SAICA”). The headline earnings as previously stated were N$474.2 million and the headline earnings per share were N$229.6/share. The prior year treatment of losses in associate in determining the headline earnings represents a prior period error which must be accounted for retrospectively. Consequently, NBL have adjusted the comparative amounts presented in the current year’s financial statements affected by the error. A third statement of financial position as at the beginning of the preceding period has not been presented as the retrospective restatement did not have a material effect on the information in the statement of financial position at the beginning of the preceding period. There are no other line items on the financial statements that are affected except the disclosure on the headline earnings per share as shown below.
25.1 Basic earnings per ordinary share (cents)**Profit attributable to ordinary shareholders 397 686 318 428 Weighted number of shares in issue (000s) 206 529 206 529 Basic earnings per ordinary share (cents)** 192.6 154.2
25.2 Headline earnings per ordinary share (cents)*Headline earnings* 401 828 325 979Weighted average number of shares in issue (000s) 206 529 206 529
Headline earnings per ordinary share (cents) – as previously stated 229.6Headline earnings per ordinary share (cents)* 194.6 157.8
26. DIVIDENDS pAID AND propoSEDIn respect of the 2018 financial year
– 95 002 – interim (46 cents per share, paid 11 May 2018) 95 002 – – – – final (46 cents per share, proposed) – –
– special (N$400 000 000 in total)
In respect of the 2017 financial year 86 743 – – interim (42 cents per share, paid 19 May 2017) – 86 743
– 86 743 – final (42 cents per share, paid 10 November 2017) 86 743 –
In respect of the 2016 financial year – – – interim (40 cents per share, paid 13 May 2016) – –
82 611 – – final (40 cents per share, paid 19 November 2016) – 82 611 169 354 181 745 Dividends paid to equity holders 181 745 169 354
Dividend paid per ordinary share40.0 42.0 2017 final dividend (cents) 42.0 40.042.0 46.0 2018 interim dividend (cents) 46.0 42.082.0 88.0 88.0 82.0
proposed dividendOn 4 September 2018 the directors declared a final dividend of 46 cents (5 September 2017: 42 cents) per ordinary share and a special dividend totalling N$400 000 000. These dividends will be paid on 9 November 2018.
86 743 495 002 495 002 86 743 * 2017 balances of headline earnings and headline earnings
per share are restated.
** There is no difference between basic and diluted earnings per share.
INTEgrATED ANNUAL rEporT 2018106 107NAmIbIA bREWERIES LImITED
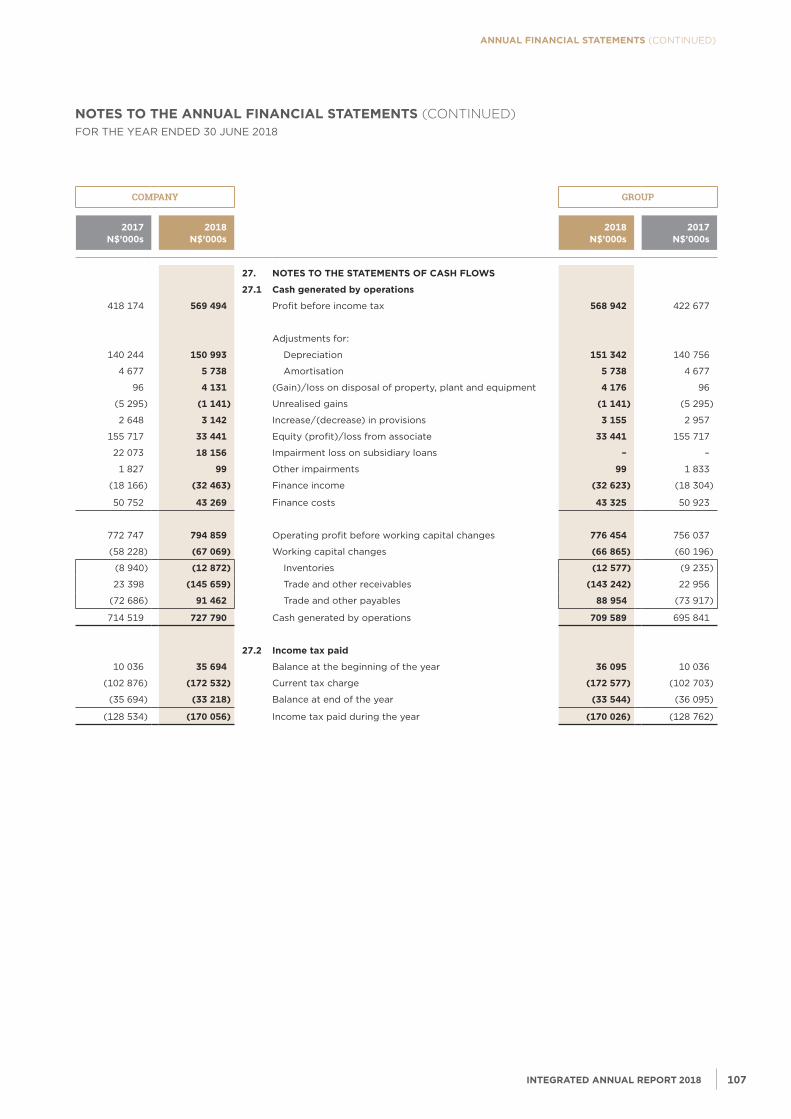
annual financial statements (CONTINUED)
nOtes tO tHe annual financial statements (CONTINUED)FOR THE YEAR ENDED 30 JUNE 2018
COMPANY GROUP
2017 N$’000s
2018 N$’000s
2018 N$’000s
2017 N$’000s
27. NoTES To THE STATEMENTS of CASH fLoWS
27.1 Cash generated by operations
418 174 569 494 Profit before income tax 568 942 422 677
Adjustments for:
140 244 150 993 Depreciation 151 342 140 756
4 677 5 738 Amortisation 5 738 4 677
96 4 131 (Gain)/loss on disposal of property, plant and equipment 4 176 96
(5 295) (1 141) Unrealised gains (1 141) (5 295)
2 648 3 142 Increase/(decrease) in provisions 3 155 2 957
155 717 33 441 Equity (profit)/loss from associate 33 441 155 717
22 073 18 156 Impairment loss on subsidiary loans – –
1 827 99 Other impairments 99 1 833
(18 166) (32 463) Finance income (32 623) (18 304)
50 752 43 269 Finance costs 43 325 50 923
772 747 794 859 Operating profit before working capital changes 776 454 756 037
(58 228) (67 069) Working capital changes (66 865) (60 196)
(8 940) (12 872) Inventories (12 577) (9 235)
23 398 (145 659) Trade and other receivables (143 242) 22 956
(72 686) 91 462 Trade and other payables 88 954 (73 917)
714 519 727 790 Cash generated by operations 709 589 695 841
27.2 Income tax paid
10 036 35 694 Balance at the beginning of the year 36 095 10 036
(102 876) (172 532) Current tax charge (172 577) (102 703)
(35 694) (33 218) Balance at end of the year (33 544) (36 095)
(128 534) (170 056) Income tax paid during the year (170 026) (128 762)
INTEgrATED ANNUAL rEporT 2018106 107NAmIbIA bREWERIES LImITED
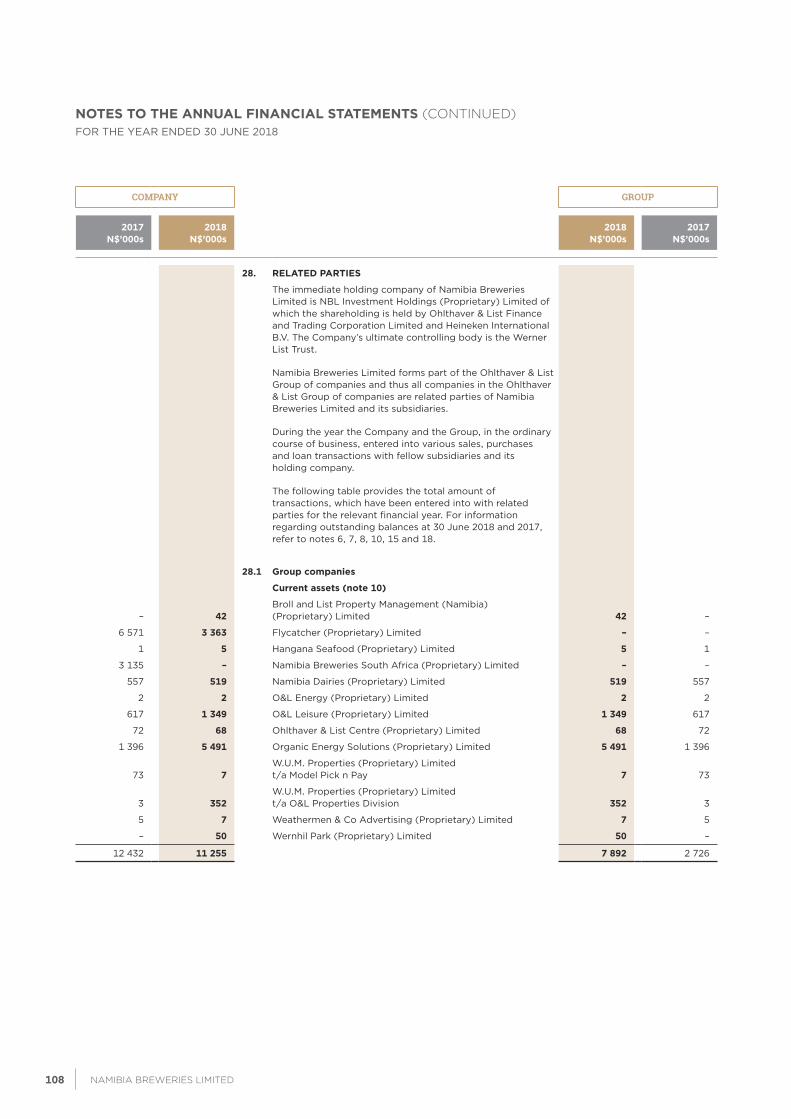
NOTES TO THE ANNUAL FINANCIAL STATEMENTS (continued)FOR THE YEAR ENDED 30 JUNE 2018
COMPANY GROUP
2017 N$’000s
2018 N$’000s
2018 N$’000s
2017 N$’000s
28. rELATED pArTIES
The immediate holding company of Namibia Breweries Limited is NBL Investment Holdings (Proprietary) Limited of which the shareholding is held by Ohlthaver & List Finance and Trading Corporation Limited and Heineken International B.V. The Company’s ultimate controlling body is the Werner List Trust.
Namibia Breweries Limited forms part of the Ohlthaver & List Group of companies and thus all companies in the Ohlthaver & List Group of companies are related parties of Namibia Breweries Limited and its subsidiaries.
During the year the Company and the Group, in the ordinary course of business, entered into various sales, purchases and loan transactions with fellow subsidiaries and its holding company.
The following table provides the total amount of transactions, which have been entered into with related parties for the relevant financial year. For information regarding outstanding balances at 30 June 2018 and 2017, refer to notes 6, 7, 8, 10, 15 and 18.
28.1 group companies
Current assets (note 10)
– 42 Broll and List Property Management (Namibia) (Proprietary) Limited 42 –
6 571 3 363 Flycatcher (Proprietary) Limited – –
1 5 Hangana Seafood (Proprietary) Limited 5 1
3 135 – Namibia Breweries South Africa (Proprietary) Limited – –
557 519 Namibia Dairies (Proprietary) Limited 519 557
2 2 O&L Energy (Proprietary) Limited 2 2
617 1 349 O&L Leisure (Proprietary) Limited 1 349 617
72 68 Ohlthaver & List Centre (Proprietary) Limited 68 72
1 396 5 491 Organic Energy Solutions (Proprietary) Limited 5 491 1 396
73 7 W.U.M. Properties (Proprietary) Limited t/a Model Pick n Pay 7 73
3 352 W.U.M. Properties (Proprietary) Limited t/a O&L Properties Division 352 3
5 7 Weathermen & Co Advertising (Proprietary) Limited 7 5
– 50 Wernhil Park (Proprietary) Limited 50 –
12 432 11 255 7 892 2 726
INTEgrATED ANNUAL rEporT 2018108 109NAmIbIA bREWERIES LImITED
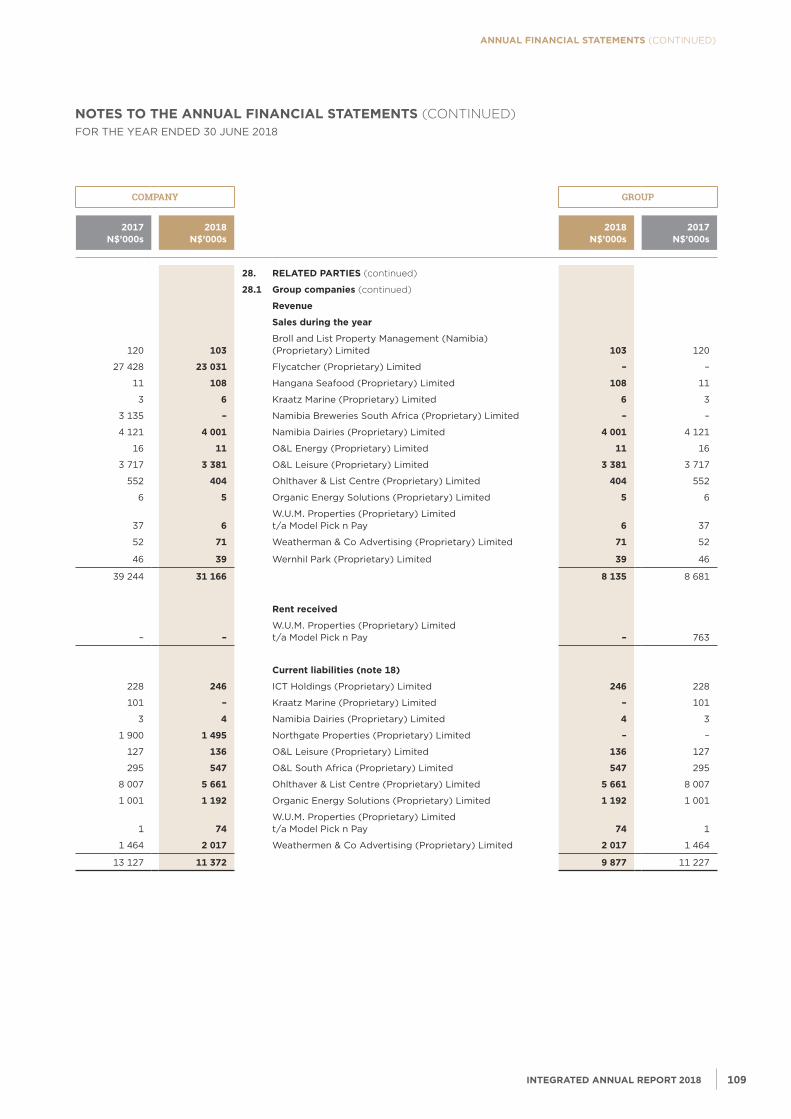
annual financial statements (CONTINUED)
nOtes tO tHe annual financial statements (CONTINUED)FOR THE YEAR ENDED 30 JUNE 2018
COMPANY GROUP
2017 N$’000s
2018 N$’000s
2018 N$’000s
2017 N$’000s
28. rELATED pArTIES (continued)
28.1 group companies (continued)
revenue
Sales during the year
120 103 Broll and List Property Management (Namibia) (Proprietary) Limited 103 120
27 428 23 031 Flycatcher (Proprietary) Limited – –
11 108 Hangana Seafood (Proprietary) Limited 108 11
3 6 Kraatz Marine (Proprietary) Limited 6 3
3 135 – Namibia Breweries South Africa (Proprietary) Limited – –
4 121 4 001 Namibia Dairies (Proprietary) Limited 4 001 4 121
16 11 O&L Energy (Proprietary) Limited 11 16
3 717 3 381 O&L Leisure (Proprietary) Limited 3 381 3 717
552 404 Ohlthaver & List Centre (Proprietary) Limited 404 552
6 5 Organic Energy Solutions (Proprietary) Limited 5 6
37 6 W.U.M. Properties (Proprietary) Limited t/a Model Pick n Pay 6 37
52 71 Weatherman & Co Advertising (Proprietary) Limited 71 52
46 39 Wernhil Park (Proprietary) Limited 39 46
39 244 31 166 8 135 8 681
rent received
– – W.U.M. Properties (Proprietary) Limited t/a Model Pick n Pay – 763
Current liabilities (note 18)
228 246 ICT Holdings (Proprietary) Limited 246 228
101 – Kraatz Marine (Proprietary) Limited – 101
3 4 Namibia Dairies (Proprietary) Limited 4 3
1 900 1 495 Northgate Properties (Proprietary) Limited – –
127 136 O&L Leisure (Proprietary) Limited 136 127
295 547 O&L South Africa (Proprietary) Limited 547 295
8 007 5 661 Ohlthaver & List Centre (Proprietary) Limited 5 661 8 007
1 001 1 192 Organic Energy Solutions (Proprietary) Limited 1 192 1 001
1 74 W.U.M. Properties (Proprietary) Limited t/a Model Pick n Pay 74 1
1 464 2 017 Weathermen & Co Advertising (Proprietary) Limited 2 017 1 464
13 127 11 372 9 877 11 227
INTEgrATED ANNUAL rEporT 2018108 109NAmIbIA bREWERIES LImITED
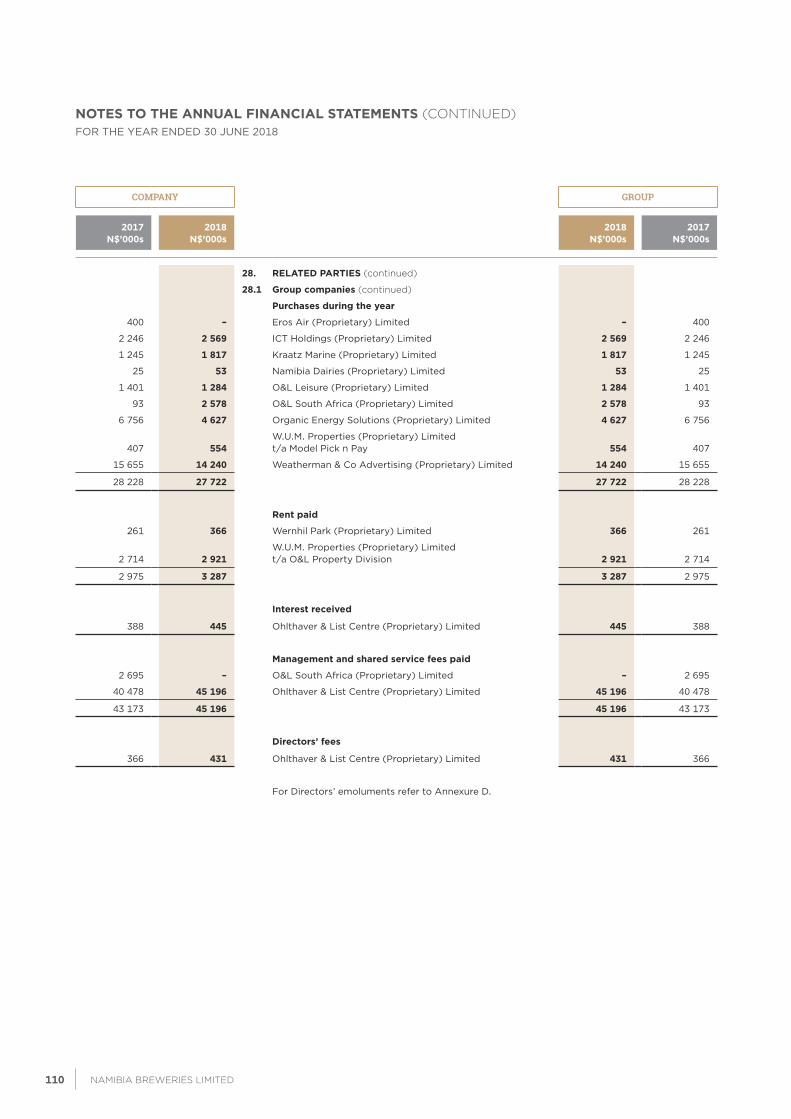
NOTES TO THE ANNUAL FINANCIAL STATEMENTS (continued)FOR THE YEAR ENDED 30 JUNE 2018
COMPANY GROUP
2017 N$’000s
2018 N$’000s
2018 N$’000s
2017 N$’000s
28. rELATED pArTIES (continued)
28.1 group companies (continued)
purchases during the year
400 – Eros Air (Proprietary) Limited – 400
2 246 2 569 ICT Holdings (Proprietary) Limited 2 569 2 246
1 245 1 817 Kraatz Marine (Proprietary) Limited 1 817 1 245
25 53 Namibia Dairies (Proprietary) Limited 53 25
1 401 1 284 O&L Leisure (Proprietary) Limited 1 284 1 401
93 2 578 O&L South Africa (Proprietary) Limited 2 578 93
6 756 4 627 Organic Energy Solutions (Proprietary) Limited 4 627 6 756
407 554 W.U.M. Properties (Proprietary) Limited t/a Model Pick n Pay 554 407
15 655 14 240 Weatherman & Co Advertising (Proprietary) Limited 14 240 15 655
28 228 27 722 27 722 28 228
rent paid
261 366 Wernhil Park (Proprietary) Limited 366 261
2 714 2 921 W.U.M. Properties (Proprietary) Limited t/a O&L Property Division 2 921 2 714
2 975 3 287 3 287 2 975
Interest received
388 445 Ohlthaver & List Centre (Proprietary) Limited 445 388
Management and shared service fees paid
2 695 – O&L South Africa (Proprietary) Limited – 2 695
40 478 45 196 Ohlthaver & List Centre (Proprietary) Limited 45 196 40 478
43 173 45 196 45 196 43 173
Directors’ fees
366 431 Ohlthaver & List Centre (Proprietary) Limited 431 366
For Directors’ emoluments refer to Annexure D.
INTEgrATED ANNUAL rEporT 2018110 111NAmIbIA bREWERIES LImITED
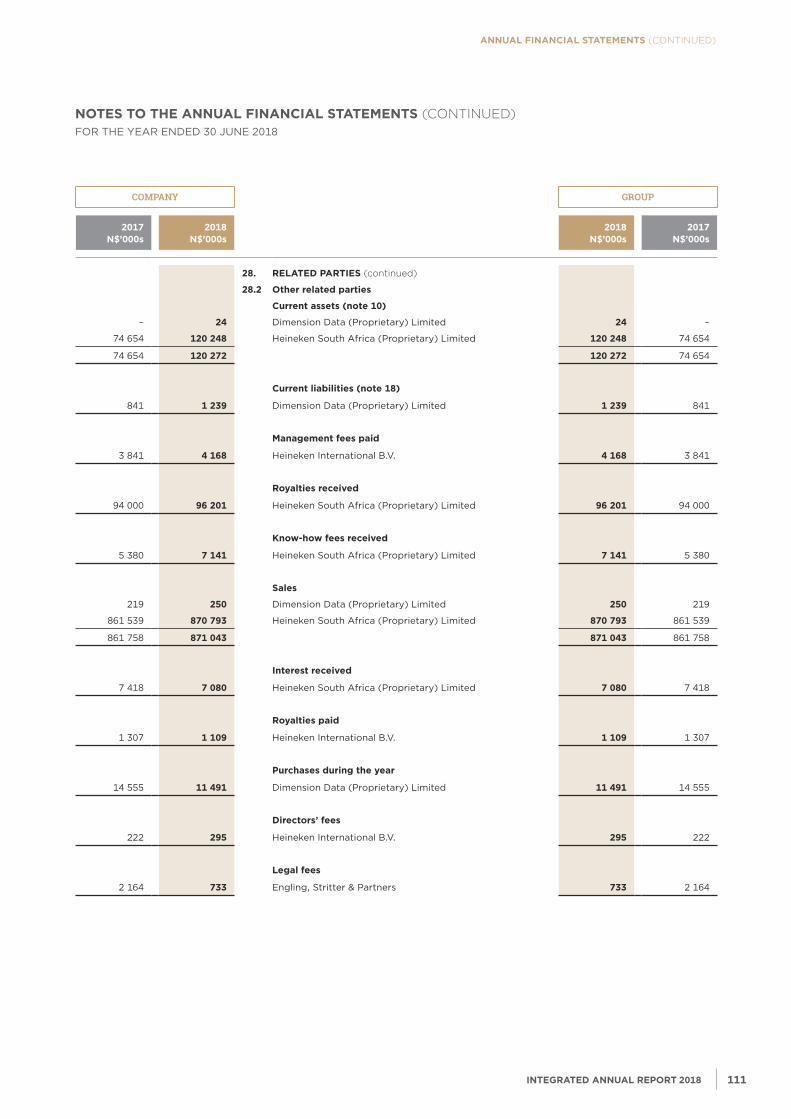
annual financial statements (CONTINUED)
nOtes tO tHe annual financial statements (CONTINUED)FOR THE YEAR ENDED 30 JUNE 2018
COMPANY GROUP
2017 N$’000s
2018 N$’000s
2018 N$’000s
2017 N$’000s
28. rELATED pArTIES (continued)
28.2 other related parties
Current assets (note 10)
– 24 Dimension Data (Proprietary) Limited 24 –
74 654 120 248 Heineken South Africa (Proprietary) Limited 120 248 74 654
74 654 120 272 120 272 74 654
Current liabilities (note 18)
841 1 239 Dimension Data (Proprietary) Limited 1 239 841
Management fees paid
3 841 4 168 Heineken International B.V. 4 168 3 841
royalties received
94 000 96 201 Heineken South Africa (Proprietary) Limited 96 201 94 000
know-how fees received
5 380 7 141 Heineken South Africa (Proprietary) Limited 7 141 5 380
Sales
219 250 Dimension Data (Proprietary) Limited 250 219
861 539 870 793 Heineken South Africa (Proprietary) Limited 870 793 861 539
861 758 871 043 871 043 861 758
Interest received
7 418 7 080 Heineken South Africa (Proprietary) Limited 7 080 7 418
royalties paid
1 307 1 109 Heineken International B.V. 1 109 1 307
purchases during the year
14 555 11 491 Dimension Data (Proprietary) Limited 11 491 14 555
Directors’ fees
222 295 Heineken International B.V. 295 222
Legal fees
2 164 733 Engling, Stritter & Partners 733 2 164
INTEgrATED ANNUAL rEporT 2018110 111NAmIbIA bREWERIES LImITED
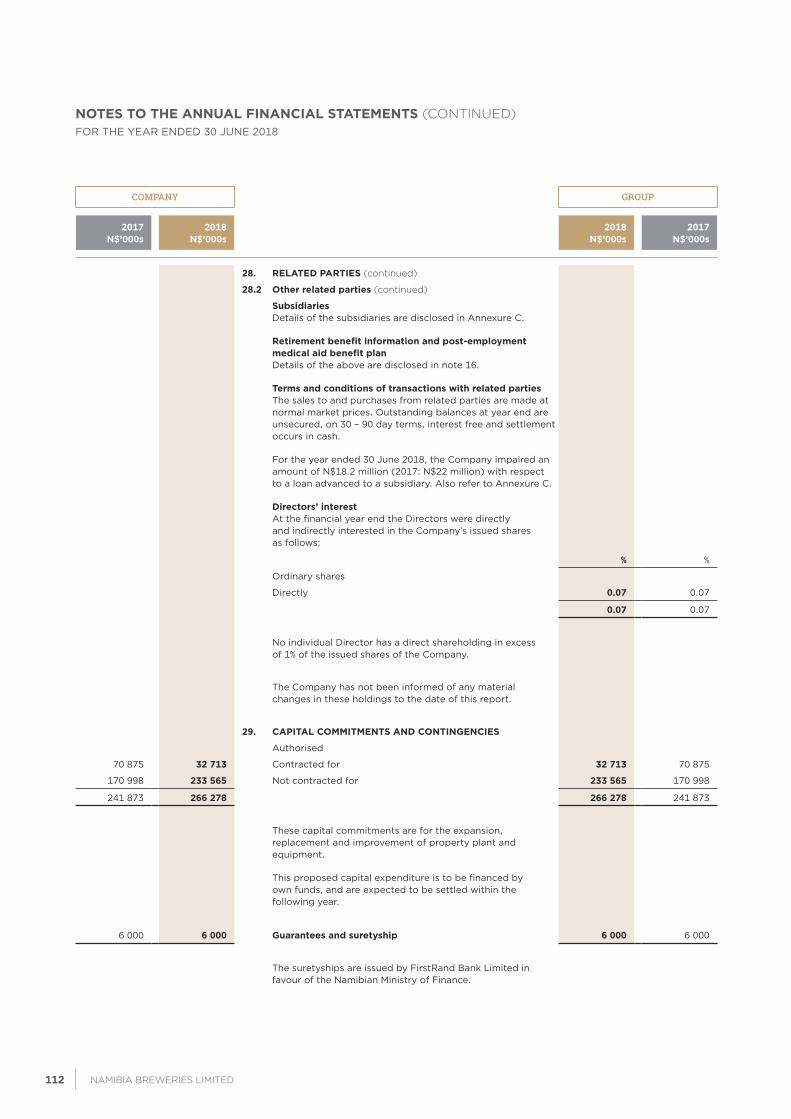
NOTES TO THE ANNUAL FINANCIAL STATEMENTS (continued)FOR THE YEAR ENDED 30 JUNE 2018
COMPANY GROUP
2017 N$’000s
2018 N$’000s
2018 N$’000s
2017 N$’000s
28. rELATED pArTIES (continued)
28.2 other related parties (continued)
SubsidiariesDetails of the subsidiaries are disclosed in Annexure C.
retirement benefit information and post-employment medical aid benefit planDetails of the above are disclosed in note 16.
Terms and conditions of transactions with related partiesThe sales to and purchases from related parties are made at normal market prices. Outstanding balances at year end are unsecured, on 30 – 90 day terms, interest free and settlement occurs in cash.
For the year ended 30 June 2018, the Company impaired an amount of N$18.2 million (2017: N$22 million) with respect to a loan advanced to a subsidiary. Also refer to Annexure C.
Directors’ interestAt the financial year end the Directors were directly and indirectly interested in the Company’s issued shares as follows:
% %
Ordinary shares
Directly 0.07 0.07
0.07 0.07
No individual Director has a direct shareholding in excess of 1% of the issued shares of the Company.
The Company has not been informed of any material changes in these holdings to the date of this report.
29. CApITAL CoMMITMENTS AND CoNTINgENCIES
Authorised
70 875 32 713 Contracted for 32 713 70 875
170 998 233 565 Not contracted for 233 565 170 998
241 873 266 278 266 278 241 873
These capital commitments are for the expansion, replacement and improvement of property plant and equipment.
This proposed capital expenditure is to be financed by own funds, and are expected to be settled within the following year.
6 000 6 000 guarantees and suretyship 6 000 6 000
The suretyships are issued by FirstRand Bank Limited in favour of the Namibian Ministry of Finance.
INTEgrATED ANNUAL rEporT 2018112 113NAmIbIA bREWERIES LImITED
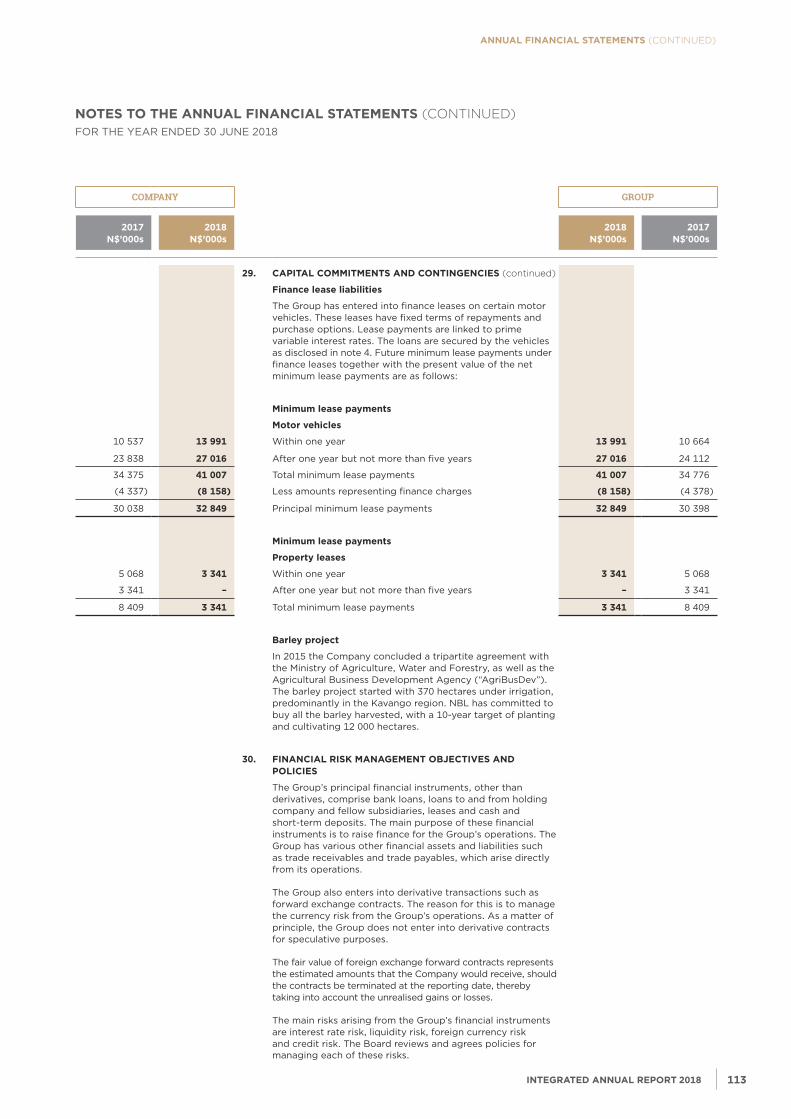
annual financial statements (CONTINUED)
nOtes tO tHe annual financial statements (CONTINUED)FOR THE YEAR ENDED 30 JUNE 2018
COMPANY GROUP
2017 N$’000s
2018 N$’000s
2018 N$’000s
2017 N$’000s
29. CApITAL CoMMITMENTS AND CoNTINgENCIES (continued)
finance lease liabilities
The Group has entered into finance leases on certain motor vehicles. These leases have fixed terms of repayments and purchase options. Lease payments are linked to prime variable interest rates. The loans are secured by the vehicles as disclosed in note 4. Future minimum lease payments under finance leases together with the present value of the net minimum lease payments are as follows:
Minimum lease payments
Motor vehicles
10 537 13 991 Within one year 13 991 10 664
23 838 27 016 After one year but not more than five years 27 016 24 112
34 375 41 007 Total minimum lease payments 41 007 34 776
(4 337) (8 158) Less amounts representing finance charges (8 158) (4 378)
30 038 32 849 Principal minimum lease payments 32 849 30 398
Minimum lease payments
property leases
5 068 3 341 Within one year 3 341 5 068
3 341 – After one year but not more than five years – 3 341
8 409 3 341 Total minimum lease payments 3 341 8 409
Barley project
In 2015 the Company concluded a tripartite agreement with the Ministry of Agriculture, Water and Forestry, as well as the Agricultural Business Development Agency (“AgriBusDev”). The barley project started with 370 hectares under irrigation, predominantly in the Kavango region. NBL has committed to buy all the barley harvested, with a 10-year target of planting and cultivating 12 000 hectares.
30. fINANCIAL rISk MANAgEMENT oBJECTIVES AND poLICIES
The Group’s principal financial instruments, other than derivatives, comprise bank loans, loans to and from holding company and fellow subsidiaries, leases and cash and short-term deposits. The main purpose of these financial instruments is to raise finance for the Group’s operations. The Group has various other financial assets and liabilities such as trade receivables and trade payables, which arise directly from its operations.
The Group also enters into derivative transactions such as forward exchange contracts. The reason for this is to manage the currency risk from the Group’s operations. As a matter of principle, the Group does not enter into derivative contracts for speculative purposes.
The fair value of foreign exchange forward contracts represents the estimated amounts that the Company would receive, should the contracts be terminated at the reporting date, thereby taking into account the unrealised gains or losses.
The main risks arising from the Group’s financial instruments are interest rate risk, liquidity risk, foreign currency risk and credit risk. The Board reviews and agrees policies for managing each of these risks.
INTEgrATED ANNUAL rEporT 2018112 113NAmIbIA bREWERIES LImITED
NOTES TO THE ANNUAL FINANCIAL STATEMENTS (continued)FOR THE YEAR ENDED 30 JUNE 2018
COMPANY GROUP
2017 N$’000s
2018 N$’000s
2018 N$’000s
2017 N$’000s
30. fINANCIAL rISk MANAgEMENT oBJECTIVES AND poLICIES (continued)
30.1 foreign currency risk
The Group has transactional currency exposures. Such exposures arise from purchases of raw materials and sales of the Group’s products in a currency other than the Group’s functional currency.
The Group appropriately hedges foreign purchases in order to manage its foreign currency exposure. The Group does not apply hedge accounting. Forward exchange contracts are entered into in order to manage the Group’s exposure to fluctuations in foreign currency exchange rates on foreign transactions. Refer note 31.2 for unutilised forward exchange contracts and uncovered foreign trade receivables and payables at year end.
30.2 Interest rate risk
The Group is exposed to interest rate risk as it borrows and places funds at floating interest rates. The risk is managed by maintaining an appropriate mix between fixed and floating borrowings and placings within market expectations.
Refer to Annexure A and note 31.3 for further detail on interest rates.
30.3 Credit risk
Financial assets which potentially subject the Group to a concentration of credit risk consist principally of cash, funds on call and trade receivables. The Group’s cash equivalents and funds on call are placed with high credit quality financial institutions. Trade receivables are stated at their cost less impairment losses. The Group’s single largest customer during the year was Heineken South Africa (Proprietary) Limited. The Group has no significant concentration of credit risk or significant exposure to any individual customer or counterparty.
The Group’s exposure to credit risk arises from default of the counterparty, with a maximum exposure equal to the carrying amount of these instruments. In respect of possible default by a counterparty, the Group holds collateral as security in the amount of N$ Nil (2017: Nil).
Management monitors adherence to payment terms by the joint venture, on a monthly basis. Financial performance and projected cash flows of the joint venture are monitored on a monthly basis to ensure recoverability of all amounts.
The granting of credit is made on application and is approved by management. At year end the Company did not consider there to be any significant concentration of credit risk or significant exposure to any individual customer or counter party which has not been adequately provided for.
INTEgrATED ANNUAL rEporT 2018114 115NAmIbIA bREWERIES LImITED
annual financial statements (CONTINUED)
nOtes tO tHe annual financial statements (CONTINUED)FOR THE YEAR ENDED 30 JUNE 2018
COMPANY GROUP
2017 N$’000s
2018 N$’000s
2018 N$’000s
2017 N$’000s
30. fINANCIAL rISk MANAgEMENT oBJECTIVES AND poLICIES (continued)
financial assets exposed to credit risk at year end were as follows:
347 120 418 758 Cash and cash equivalents 424 010 352 789
73 625 73 625 Loan to associate 73 625 73 625
87 086 131 527 Receivables due from related parties 128 164 77 380
15 – Unlisted investments – 15
180 170 241 781 Trade and other receivables 241 912 189 621
Major concentrations of credit risk that arise from the Group’s receivables in relation to the industry categories and location of the customers by the percentage of total receivables from customers are:
Trading industry % %
Namibia 69.88 57.34
South Africa 23.64 30.34
Other export markets 6.48 12.33
100.00 100.00
As at 30 June, the ageing of trade receivables is as follows:
Original terms
Changed terms Past due but not impaired
TotalN$’000s
Neither past due
nor impairedN$’000s
Neither past due
nor impairedN$’000s
0 – 60 days
N$’000s
60 – 90 days
N$’000s 90+ daysN$’000s
groUp
2018 363 469 303 144 – 8 823 5 123 46 379
2017 258 458 214 731 – 3 081 1 412 39 234
CoMpANY
2018 366 701 306 264 – 8 823 5 182 46 432
2017 258 713 218 455 – 3 081 1 119 36 058
30.4 Liquidity risk
The Group manages liquidity risk by monitoring forecast cash flows and ensuring that adequate unutilised borrowing facilities are maintained. Refer to Annexure A.
Borrowing capacity is determined by the Directors of the Company. The Directors consider a ratio of not higher than 75% of shareholders’ equity as conservative.
INTEgrATED ANNUAL rEporT 2018114 115NAmIbIA bREWERIES LImITED
NOTES TO THE ANNUAL FINANCIAL STATEMENTS (continued)FOR THE YEAR ENDED 30 JUNE 2018
COMPANY GROUP
2017 N$’000s
2018 N$’000s
2018 N$’000s
2017 N$’000s
30. fINANCIAL rISk MANAgEMENT oBJECTIVES AND poLICIES (continued)
30.4 Liquidity risk (continued)
1 050 931 1 214 053 75% of shareholders’ equity 1 217 196 1 054 714
(494 438) (396 844) Less total interest-bearing borrowings (395 349) (492 898)
556 493 817 209 Unutilised borrowing capacity 821 847 561 816
30.5 Capital risk management
The Company and Group manages its capital to ensure that entities in the Group will be able to continue as a going concern while maximising the return to stakeholders through the optimisation of the debt and equity balance. The Company’s and Group’s overall strategy remains unchanged from the prior year.
The capital structure of the Company and Group consists of debt, which includes the borrowings disclosed in note 15, cash and cash equivalents and equity attributable to equity holders of the parent, comprising issued capital reserves and retained earnings.
gearing ratioThe Company’s and Group’s Risk Management Committee reviews the capital structure on a semi-annual basis. Consistent with others in the industry, the Group monitors capital on the basis of the gearing ratio. This ratio is calculated as net debt divided by total capital. Net debt is calculated as total borrowings less cash and cash equivalents. Total capital is calculated as ‘equity’ as shown in the consolidated statement of financial position plus net debt.
The gearing ratio at the year end was as follows:
494 438 396 844 Debt(i) 395 349 492 898
(347 120) (418 758) Less: cash and cash equivalents (424 010) (352 789)
147 318 (21 914) Net debt (28 661) 140 109
1 401 241 1 618 738 Equity(ii) 1 622 928 1 406 285
11% (1%) Net debt to equity ratio (2%) 10%
(i) Debt is defined as long- and short-term borrowings.(ii) Equity includes all capital and reserves of the Company.
INTEgrATED ANNUAL rEporT 2018116 117NAmIbIA bREWERIES LImITED
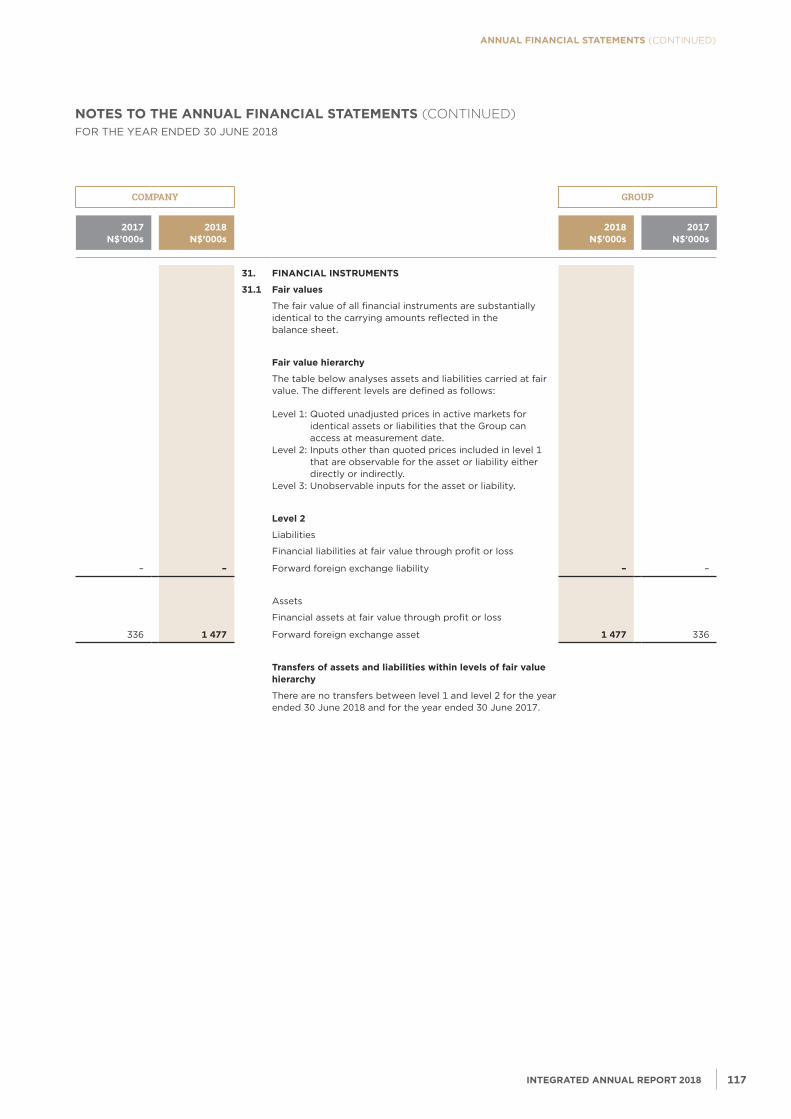
annual financial statements (CONTINUED)
nOtes tO tHe annual financial statements (CONTINUED)FOR THE YEAR ENDED 30 JUNE 2018
COMPANY GROUP
2017 N$’000s
2018 N$’000s
2018 N$’000s
2017 N$’000s
31. fINANCIAL INSTrUMENTS
31.1 fair values
The fair value of all financial instruments are substantially identical to the carrying amounts reflected in the balance sheet.
fair value hierarchy
The table below analyses assets and liabilities carried at fair value. The different levels are defined as follows:
Level 1: Quoted unadjusted prices in active markets for identical assets or liabilities that the Group can access at measurement date.
Level 2: Inputs other than quoted prices included in level 1 that are observable for the asset or liability either directly or indirectly.
Level 3: Unobservable inputs for the asset or liability.
Level 2
Liabilities
Financial liabilities at fair value through profit or loss
– – Forward foreign exchange liability – –
Assets
Financial assets at fair value through profit or loss
336 1 477 Forward foreign exchange asset 1 477 336
Transfers of assets and liabilities within levels of fair value hierarchy
There are no transfers between level 1 and level 2 for the year ended 30 June 2018 and for the year ended 30 June 2017.
INTEgrATED ANNUAL rEporT 2018116 117NAmIbIA bREWERIES LImITED
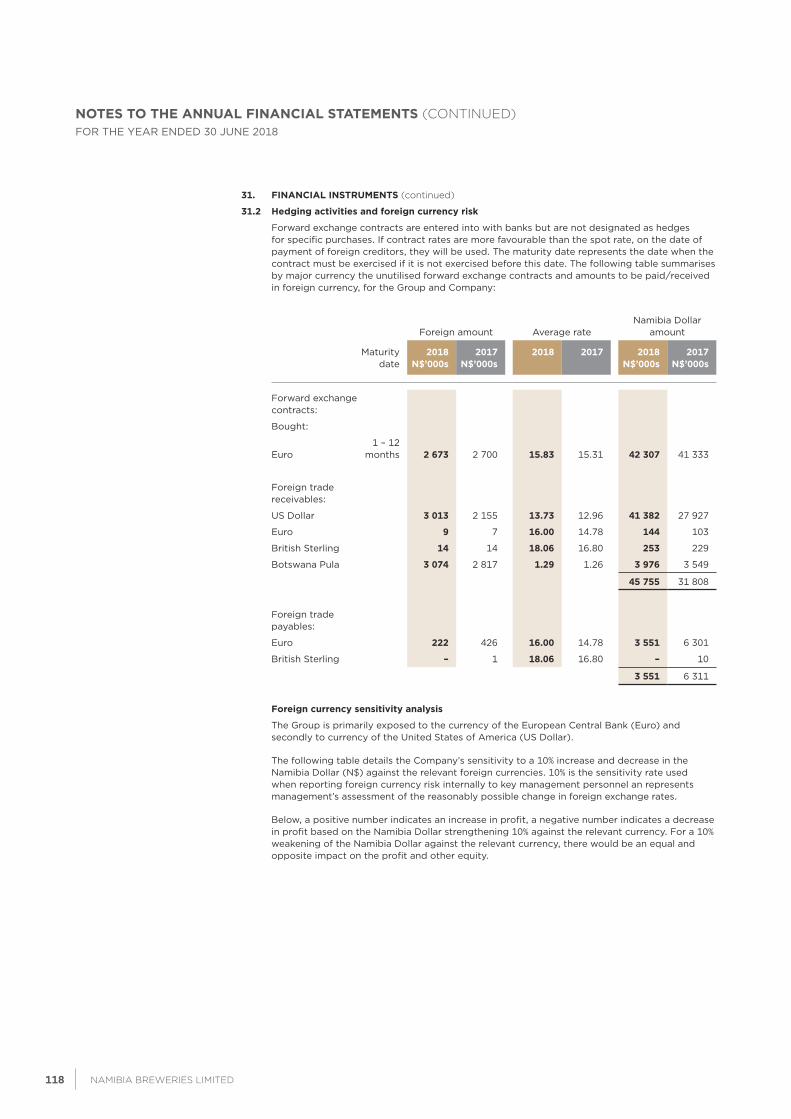
NOTES TO THE ANNUAL FINANCIAL STATEMENTS (continued)FOR THE YEAR ENDED 30 JUNE 2018
31. fINANCIAL INSTrUMENTS (continued)
31.2 Hedging activities and foreign currency risk
Forward exchange contracts are entered into with banks but are not designated as hedges for specific purchases. If contract rates are more favourable than the spot rate, on the date of payment of foreign creditors, they will be used. The maturity date represents the date when the contract must be exercised if it is not exercised before this date. The following table summarises by major currency the unutilised forward exchange contracts and amounts to be paid/received in foreign currency, for the Group and Company:
Foreign amount Average rate Namibia Dollar
amount
Maturity date
2018N$’000s
2017N$’000s
2018 2017 2018N$’000s
2017N$’000s
Forward exchange contracts:
Bought:
Euro1 – 12
months 2 673 2 700 15.83 15.31 42 307 41 333
Foreign trade receivables:
US Dollar 3 013 2 155 13.73 12.96 41 382 27 927
Euro 9 7 16.00 14.78 144 103
British Sterling 14 14 18.06 16.80 253 229
Botswana Pula 3 074 2 817 1.29 1.26 3 976 3 549
45 755 31 808
Foreign trade payables:
Euro 222 426 16.00 14.78 3 551 6 301
British Sterling – 1 18.06 16.80 – 10
3 551 6 311
foreign currency sensitivity analysis
The Group is primarily exposed to the currency of the European Central Bank (Euro) and secondly to currency of the United States of America (US Dollar).
The following table details the Company’s sensitivity to a 10% increase and decrease in the Namibia Dollar (N$) against the relevant foreign currencies. 10% is the sensitivity rate used when reporting foreign currency risk internally to key management personnel an represents management’s assessment of the reasonably possible change in foreign exchange rates.
Below, a positive number indicates an increase in profit, a negative number indicates a decrease in profit based on the Namibia Dollar strengthening 10% against the relevant currency. For a 10% weakening of the Namibia Dollar against the relevant currency, there would be an equal and opposite impact on the profit and other equity.
INTEgrATED ANNUAL rEporT 2018118 119NAmIbIA bREWERIES LImITED
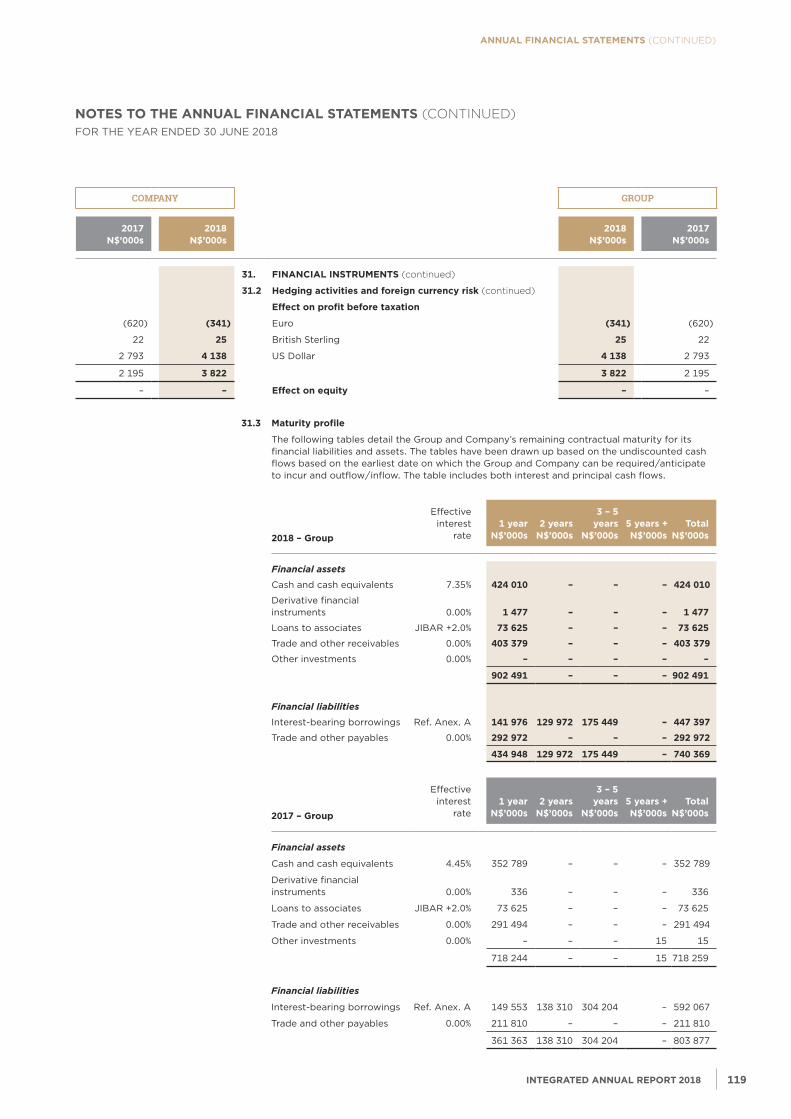
annual financial statements (CONTINUED)
nOtes tO tHe annual financial statements (CONTINUED)FOR THE YEAR ENDED 30 JUNE 2018
COMPANY GROUP
2017 N$’000s
2018 N$’000s
2018 N$’000s
2017 N$’000s
31. fINANCIAL INSTrUMENTS (continued)
31.2 Hedging activities and foreign currency risk (continued)
Effect on profit before taxation
(620) (341) Euro (341) (620)
22 25 British Sterling 25 22
2 793 4 138 US Dollar 4 138 2 793
2 195 3 822 3 822 2 195
– – Effect on equity – –
31.3 Maturity profile
The following tables detail the Group and Company’s remaining contractual maturity for its financial liabilities and assets. The tables have been drawn up based on the undiscounted cash flows based on the earliest date on which the Group and Company can be required/anticipate to incur and outflow/inflow. The table includes both interest and principal cash flows.
2018 – group
Effective interest
rate1 year
N$’000s 2 years
N$’000s
3 – 5 years
N$’000s 5 years +N$’000s
TotalN$’000s
Financial assets
Cash and cash equivalents 7.35% 424 010 – – – 424 010
Derivative financial instruments 0.00% 1 477 – – – 1 477
Loans to associates JIBAR +2.0% 73 625 – – – 73 625
Trade and other receivables 0.00% 403 379 – – – 403 379
Other investments 0.00% – – – – –
902 491 – – – 902 491
Financial liabilities
Interest-bearing borrowings Ref. Anex. A 141 976 129 972 175 449 – 447 397
Trade and other payables 0.00% 292 972 – – – 292 972
434 948 129 972 175 449 – 740 369
2017 – group
Effective interest
rate1 year
N$’000s 2 years
N$’000s
3 – 5 years
N$’000s 5 years +N$’000s
TotalN$’000s
Financial assets
Cash and cash equivalents 4.45% 352 789 – – – 352 789
Derivative financial instruments 0.00% 336 – – – 336
Loans to associates JIBAR +2.0% 73 625 – – – 73 625
Trade and other receivables 0.00% 291 494 – – – 291 494
Other investments 0.00% – – – 15 15
718 244 – – 15 718 259
Financial liabilities
Interest-bearing borrowings Ref. Anex. A 149 553 138 310 304 204 – 592 067
Trade and other payables 0.00% 211 810 – – – 211 810
361 363 138 310 304 204 – 803 877
INTEgrATED ANNUAL rEporT 2018118 119NAmIbIA bREWERIES LImITED
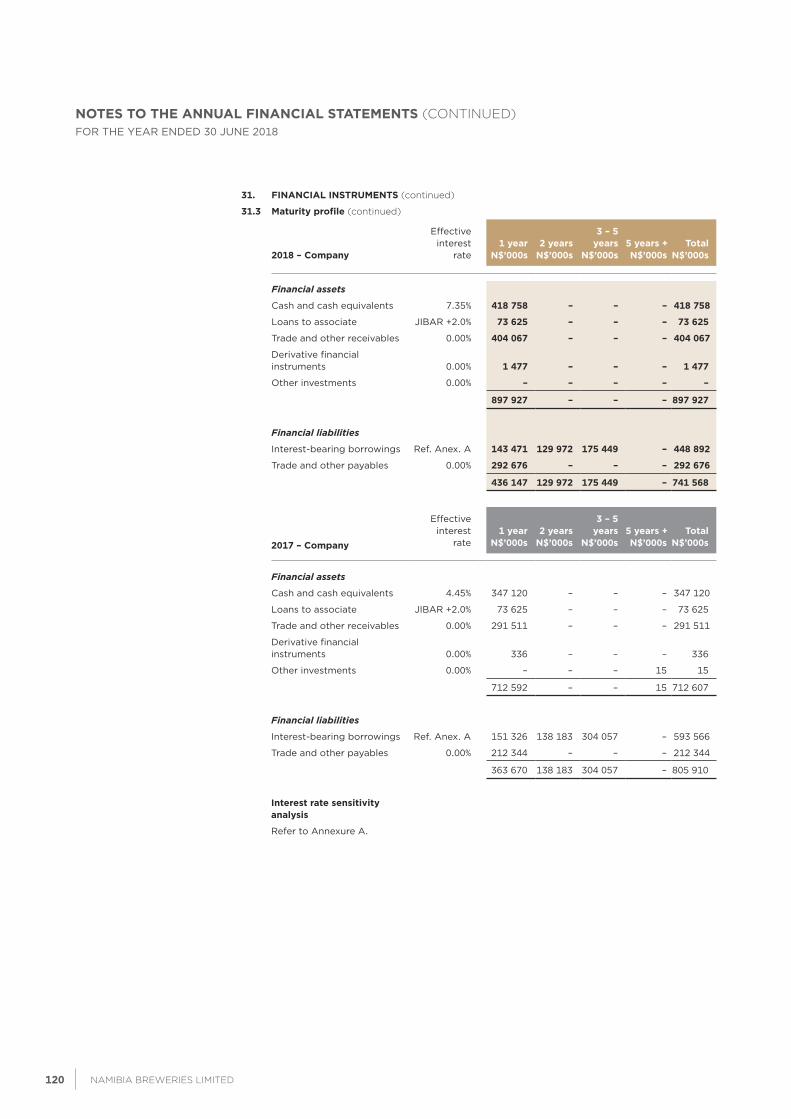
NOTES TO THE ANNUAL FINANCIAL STATEMENTS (continued)FOR THE YEAR ENDED 30 JUNE 2018
31. fINANCIAL INSTrUMENTS (continued)
31.3 Maturity profile (continued)
2018 – Company
Effective interest
rate1 year
N$’000s 2 years
N$’000s
3 – 5 years
N$’000s 5 years +N$’000s
TotalN$’000s
Financial assets
Cash and cash equivalents 7.35% 418 758 – – – 418 758
Loans to associate JIBAR +2.0% 73 625 – – – 73 625
Trade and other receivables 0.00% 404 067 – – – 404 067
Derivative financial instruments 0.00% 1 477 – – – 1 477
Other investments 0.00% – – – – –
897 927 – – – 897 927
Financial liabilities
Interest-bearing borrowings Ref. Anex. A 143 471 129 972 175 449 – 448 892
Trade and other payables 0.00% 292 676 – – – 292 676
436 147 129 972 175 449 – 741 568
2017 – Company
Effective interest
rate1 year
N$’000s 2 years
N$’000s
3 – 5 years
N$’000s 5 years +N$’000s
TotalN$’000s
Financial assets
Cash and cash equivalents 4.45% 347 120 – – – 347 120
Loans to associate JIBAR +2.0% 73 625 – – – 73 625
Trade and other receivables 0.00% 291 511 – – – 291 511
Derivative financial instruments 0.00% 336 – – – 336
Other investments 0.00% – – – 15 15
712 592 – – 15 712 607
Financial liabilities
Interest-bearing borrowings Ref. Anex. A 151 326 138 183 304 057 – 593 566
Trade and other payables 0.00% 212 344 – – – 212 344
363 670 138 183 304 057 – 805 910
Interest rate sensitivity analysis
Refer to Annexure A.
INTEgrATED ANNUAL rEporT 2018120 121NAmIbIA bREWERIES LImITED
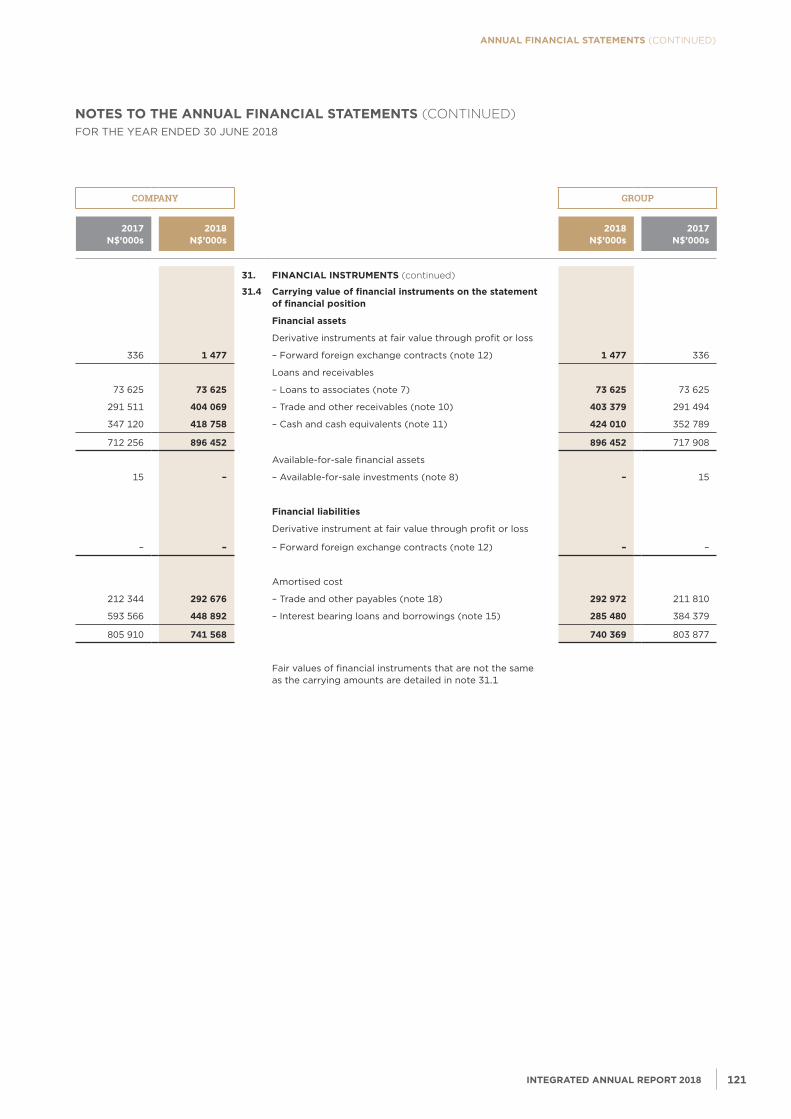
annual financial statements (CONTINUED)
nOtes tO tHe annual financial statements (CONTINUED)FOR THE YEAR ENDED 30 JUNE 2018
COMPANY GROUP
2017 N$’000s
2018 N$’000s
2018 N$’000s
2017 N$’000s
31. fINANCIAL INSTrUMENTS (continued)
31.4 Carrying value of financial instruments on the statement of financial position
financial assets
Derivative instruments at fair value through profit or loss
336 1 477 – Forward foreign exchange contracts (note 12) 1 477 336
Loans and receivables
73 625 73 625 – Loans to associates (note 7) 73 625 73 625
291 511 404 069 – Trade and other receivables (note 10) 403 379 291 494
347 120 418 758 – Cash and cash equivalents (note 11) 424 010 352 789
712 256 896 452 896 452 717 908
Available-for-sale financial assets
15 – – Available-for-sale investments (note 8) – 15
financial liabilities
Derivative instrument at fair value through profit or loss
– – – Forward foreign exchange contracts (note 12) – –
Amortised cost
212 344 292 676 – Trade and other payables (note 18) 292 972 211 810
593 566 448 892 – Interest bearing loans and borrowings (note 15) 285 480 384 379
805 910 741 568 740 369 803 877
Fair values of financial instruments that are not the same as the carrying amounts are detailed in note 31.1
INTEgrATED ANNUAL rEporT 2018120 121NAmIbIA bREWERIES LImITED
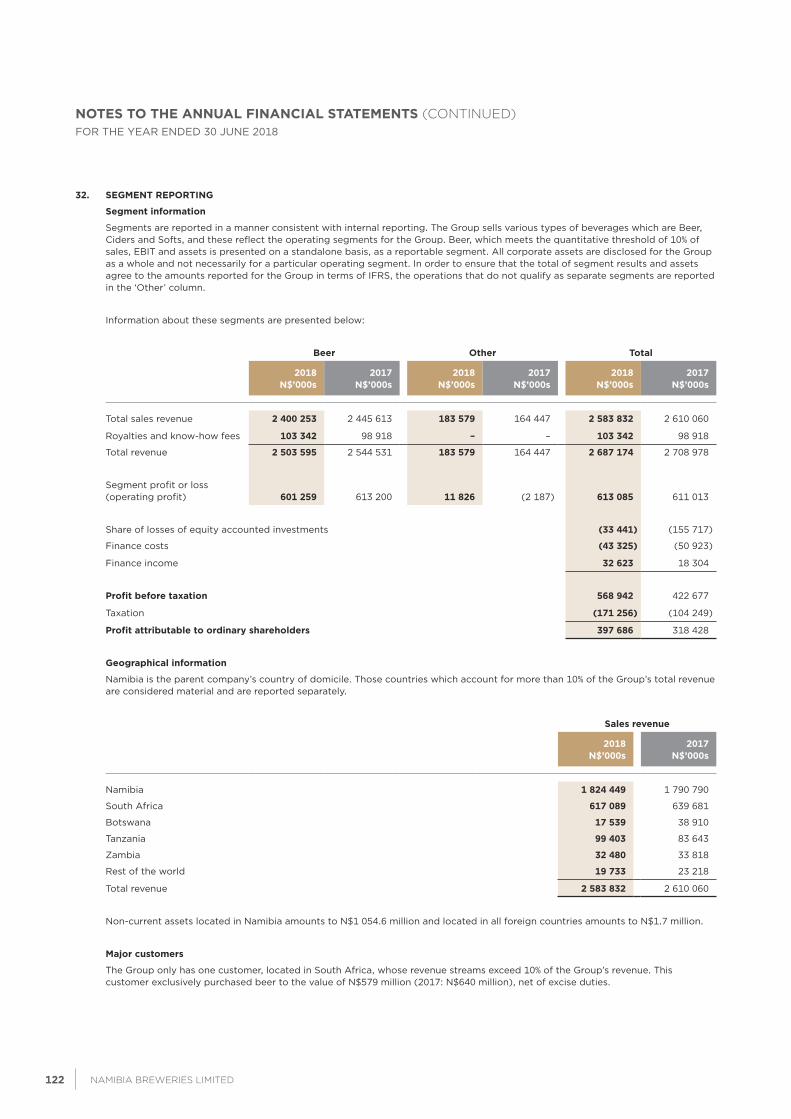
NOTES TO THE ANNUAL FINANCIAL STATEMENTS (continued)FOR THE YEAR ENDED 30 JUNE 2018
32. SEgMENT rEporTINg
Segment information
Segments are reported in a manner consistent with internal reporting. The Group sells various types of beverages which are Beer, Ciders and Softs, and these reflect the operating segments for the Group. Beer, which meets the quantitative threshold of 10% of sales, EBIT and assets is presented on a standalone basis, as a reportable segment. All corporate assets are disclosed for the Group as a whole and not necessarily for a particular operating segment. In order to ensure that the total of segment results and assets agree to the amounts reported for the Group in terms of IFRS, the operations that do not qualify as separate segments are reported in the ‘Other’ column.
Information about these segments are presented below:
Beer other Total
2018N$’000s
2017N$’000s
2018N$’000s
2017N$’000s
2018N$’000s
2017N$’000s
Total sales revenue 2 400 253 2 445 613 183 579 164 447 2 583 832 2 610 060
Royalties and know-how fees 103 342 98 918 – – 103 342 98 918
Total revenue 2 503 595 2 544 531 183 579 164 447 2 687 174 2 708 978
Segment profit or loss (operating profit) 601 259 613 200 11 826 (2 187) 613 085 611 013
Share of losses of equity accounted investments (33 441) (155 717)
Finance costs (43 325) (50 923)
Finance income 32 623 18 304
profit before taxation 568 942 422 677
Taxation (171 256) (104 249)
profit attributable to ordinary shareholders 397 686 318 428
geographical information
Namibia is the parent company’s country of domicile. Those countries which account for more than 10% of the Group’s total revenue are considered material and are reported separately.
Sales revenue
2018N$’000s
2017N$’000s
Namibia 1 824 449 1 790 790
South Africa 617 089 639 681
Botswana 17 539 38 910
Tanzania 99 403 83 643
Zambia 32 480 33 818
Rest of the world 19 733 23 218
Total revenue 2 583 832 2 610 060
Non-current assets located in Namibia amounts to N$1 054.6 million and located in all foreign countries amounts to N$1.7 million.
Major customers
The Group only has one customer, located in South Africa, whose revenue streams exceed 10% of the Group’s revenue. This customer exclusively purchased beer to the value of N$579 million (2017: N$640 million), net of excise duties.
INTEgrATED ANNUAL rEporT 2018122 123NAmIbIA bREWERIES LImITED
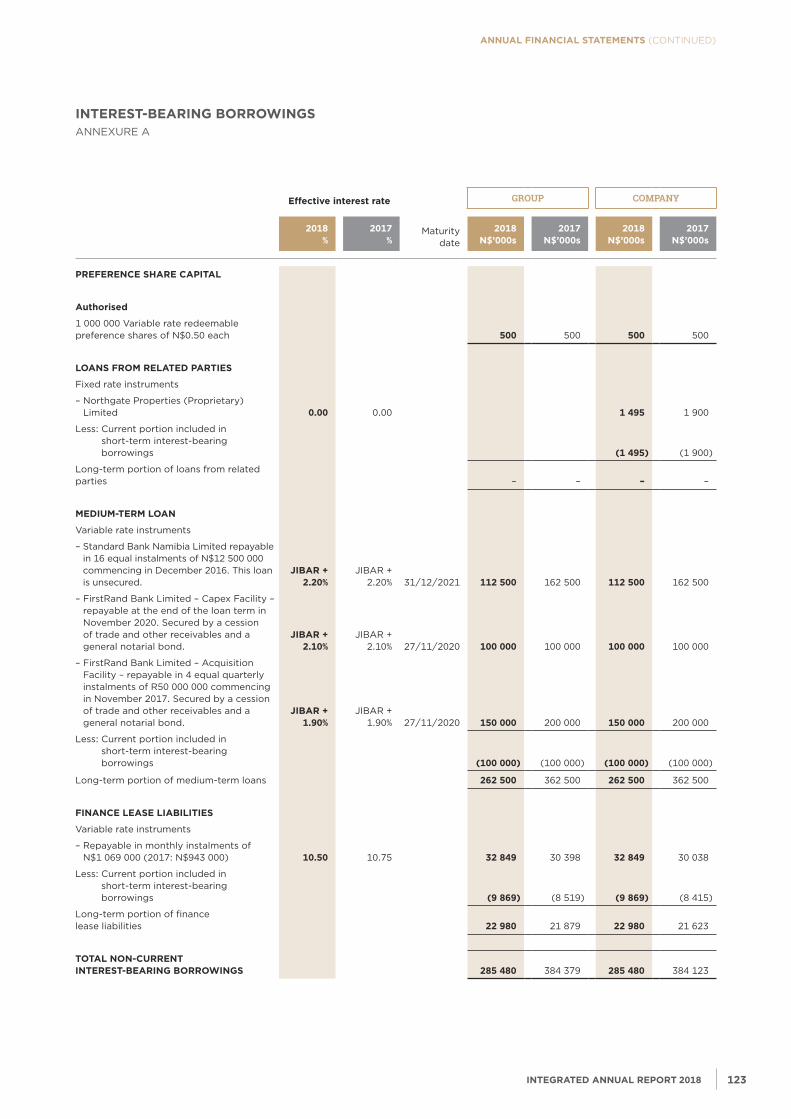
annual financial statements (CONTINUED)
Effective interest rate GROUP COMPANY
2018%
2017%
Maturitydate
2018N$’000s
2017N$’000s
2018N$’000s
2017N$’000s
prEfErENCE SHArE CApITAL
Authorised
1 000 000 Variable rate redeemable preference shares of N$0.50 each 500 500 500 500
LoANS froM rELATED pArTIES
Fixed rate instruments
– Northgate Properties (Proprietary) Limited 0.00 0.00 1 495 1 900
Less: Current portion included in short-term interest-bearing borrowings (1 495) (1 900)
Long-term portion of loans from related parties – – – –
MEDIUM-TErM LoAN
Variable rate instruments
– Standard Bank Namibia Limited repayable in 16 equal instalments of N$12 500 000 commencing in December 2016. This loan is unsecured.
JIBAr + 2.20%
JIBAR + 2.20% 31/12/2021 112 500 162 500 112 500 162 500
– FirstRand Bank Limited – Capex Facility – repayable at the end of the loan term in November 2020. Secured by a cession of trade and other receivables and a general notarial bond.
JIBAr + 2.10%
JIBAR + 2.10% 27/11/2020 100 000 100 000 100 000 100 000
– FirstRand Bank Limited – Acquisition Facility – repayable in 4 equal quarterly instalments of R50 000 000 commencing in November 2017. Secured by a cession of trade and other receivables and a general notarial bond.
JIBAr + 1.90%
JIBAR + 1.90% 27/11/2020 150 000 200 000 150 000 200 000
Less: Current portion included in short-term interest-bearing borrowings (100 000) (100 000) (100 000) (100 000)
Long-term portion of medium-term loans 262 500 362 500 262 500 362 500
fINANCE LEASE LIABILITIES
Variable rate instruments
– Repayable in monthly instalments of N$1 069 000 (2017: N$943 000) 10.50 10.75 32 849 30 398 32 849 30 038
Less: Current portion included in short-term interest-bearing borrowings (9 869) (8 519) (9 869) (8 415)
Long-term portion of finance lease liabilities 22 980 21 879 22 980 21 623
ToTAL NoN-CUrrENT INTErEST-BEArINg BorroWINgS 285 480 384 379 285 480 384 123
INTErEST-BEArINg BorroWINgSANNExURE A
INTEgrATED ANNUAL rEporT 2018122 123NAmIbIA bREWERIES LImITED
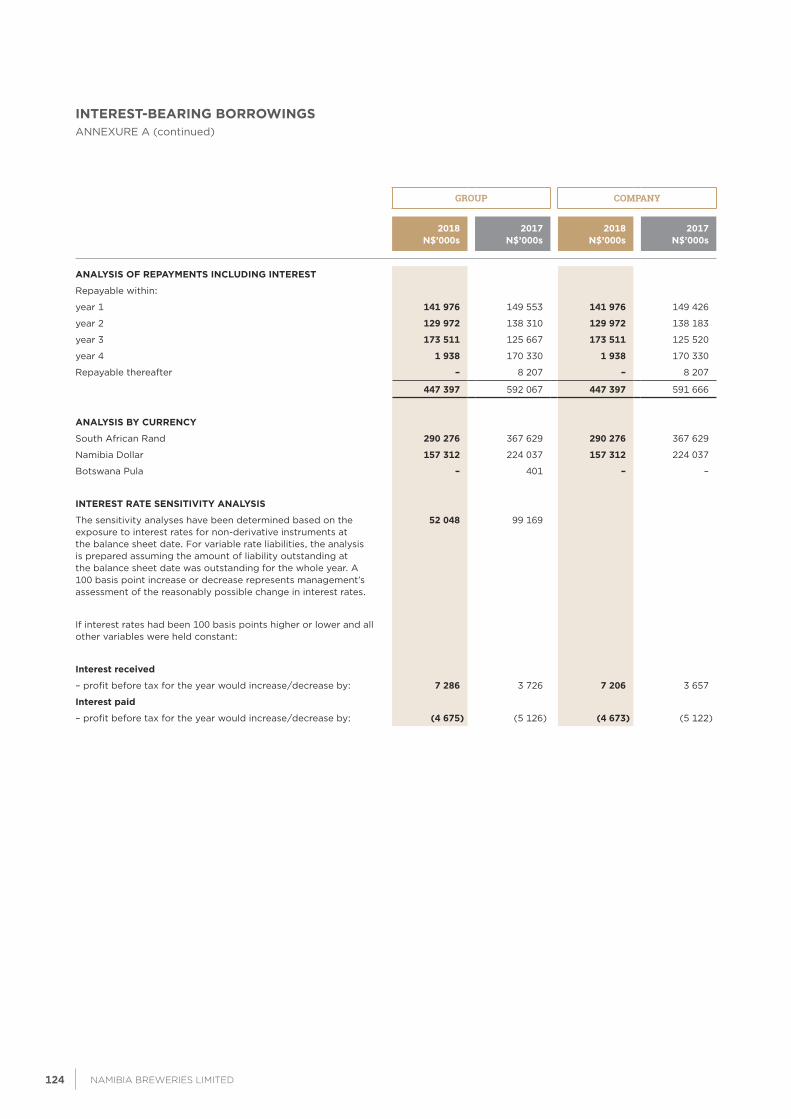
INTErEST-BEArINg BorroWINgSANNExURE A (continued)
GROUP COMPANY
2018N$’000s
2017N$’000s
2018N$’000s
2017N$’000s
ANALYSIS of rEpAYMENTS INCLUDINg INTErEST
Repayable within:
year 1 141 976 149 553 141 976 149 426
year 2 129 972 138 310 129 972 138 183
year 3 173 511 125 667 173 511 125 520
year 4 1 938 170 330 1 938 170 330
Repayable thereafter – 8 207 – 8 207
447 397 592 067 447 397 591 666
ANALYSIS BY CUrrENCY
South African Rand 290 276 367 629 290 276 367 629
Namibia Dollar 157 312 224 037 157 312 224 037
Botswana Pula – 401 – –
INTErEST rATE SENSITIVITY ANALYSIS
The sensitivity analyses have been determined based on the exposure to interest rates for non-derivative instruments at the balance sheet date. For variable rate liabilities, the analysis is prepared assuming the amount of liability outstanding at the balance sheet date was outstanding for the whole year. A 100 basis point increase or decrease represents management’s assessment of the reasonably possible change in interest rates.
52 048 99 169
If interest rates had been 100 basis points higher or lower and all other variables were held constant:
Interest received
– profit before tax for the year would increase/decrease by: 7 286 3 726 7 206 3 657
Interest paid
– profit before tax for the year would increase/decrease by: (4 675) (5 126) (4 673) (5 122)
INTEgrATED ANNUAL rEporT 2018124 125NAmIbIA bREWERIES LImITED
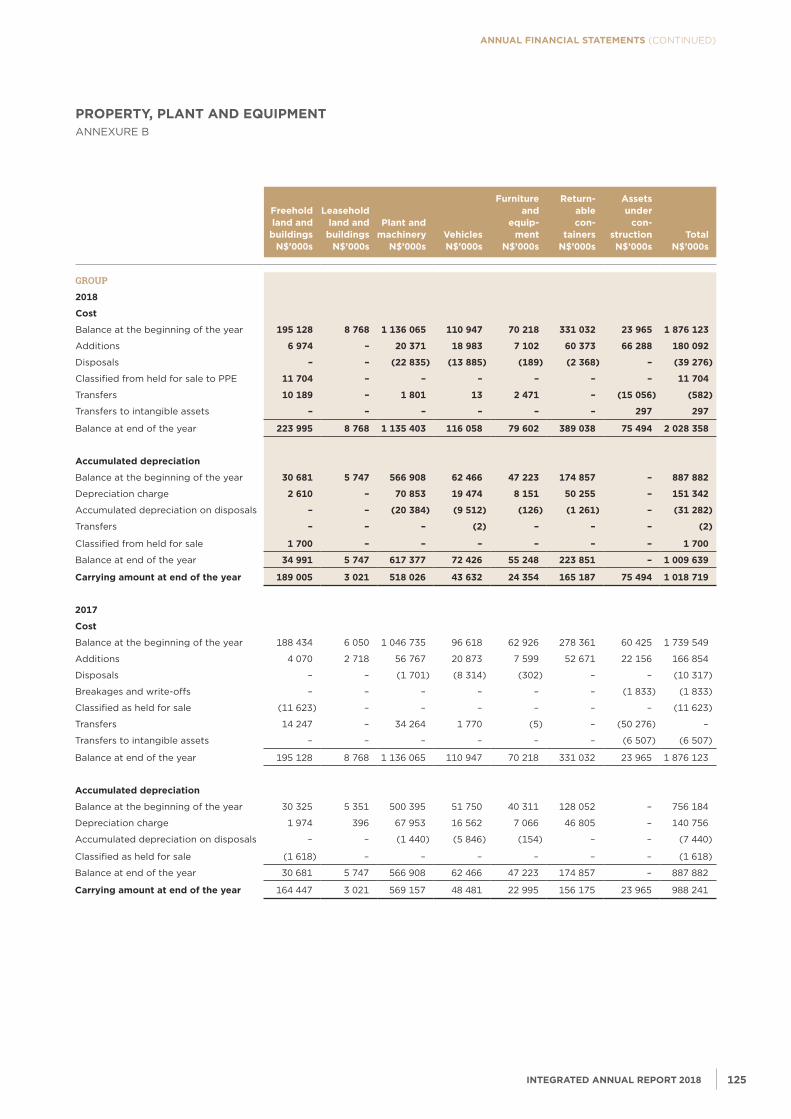
annual financial statements (CONTINUED)
freeholdland and buildings
N$’000s
Leaseholdland and buildings
N$’000s
plant andmachinery
N$’000s VehiclesN$’000s
furniture and
equip-ment
N$’000s
return-ablecon-
tainersN$’000s
Assets under
con-structionN$’000s
TotalN$’000s
GROUP
2018
Cost
Balance at the beginning of the year 195 128 8 768 1 136 065 110 947 70 218 331 032 23 965 1 876 123
Additions 6 974 – 20 371 18 983 7 102 60 373 66 288 180 092
Disposals – – (22 835) (13 885) (189) (2 368) – (39 276)
Classified from held for sale to PPE 11 704 – – – – – – 11 704
Transfers 10 189 – 1 801 13 2 471 – (15 056) (582)
Transfers to intangible assets – – – – – – 297 297
Balance at end of the year 223 995 8 768 1 135 403 116 058 79 602 389 038 75 494 2 028 358
Accumulated depreciation
Balance at the beginning of the year 30 681 5 747 566 908 62 466 47 223 174 857 – 887 882
Depreciation charge 2 610 – 70 853 19 474 8 151 50 255 – 151 342
Accumulated depreciation on disposals – – (20 384) (9 512) (126) (1 261) – (31 282)
Transfers – – – (2) – – – (2)
Classified from held for sale 1 700 – – – – – – 1 700
Balance at end of the year 34 991 5 747 617 377 72 426 55 248 223 851 – 1 009 639
Carrying amount at end of the year 189 005 3 021 518 026 43 632 24 354 165 187 75 494 1 018 719
2017
Cost
Balance at the beginning of the year 188 434 6 050 1 046 735 96 618 62 926 278 361 60 425 1 739 549
Additions 4 070 2 718 56 767 20 873 7 599 52 671 22 156 166 854
Disposals – – (1 701) (8 314) (302) – – (10 317)
Breakages and write-offs – – – – – – (1 833) (1 833)
Classified as held for sale (11 623) – – – – – – (11 623)
Transfers 14 247 – 34 264 1 770 (5) – (50 276) –
Transfers to intangible assets – – – – – – (6 507) (6 507)
Balance at end of the year 195 128 8 768 1 136 065 110 947 70 218 331 032 23 965 1 876 123
Accumulated depreciation
Balance at the beginning of the year 30 325 5 351 500 395 51 750 40 311 128 052 – 756 184
Depreciation charge 1 974 396 67 953 16 562 7 066 46 805 – 140 756
Accumulated depreciation on disposals – – (1 440) (5 846) (154) – – (7 440)
Classified as held for sale (1 618) – – – – – – (1 618)
Balance at end of the year 30 681 5 747 566 908 62 466 47 223 174 857 – 887 882
Carrying amount at end of the year 164 447 3 021 569 157 48 481 22 995 156 175 23 965 988 241
propErTY, pLANT AND EQUIpMENTANNExURE B
INTEgrATED ANNUAL rEporT 2018124 125NAmIbIA bREWERIES LImITED
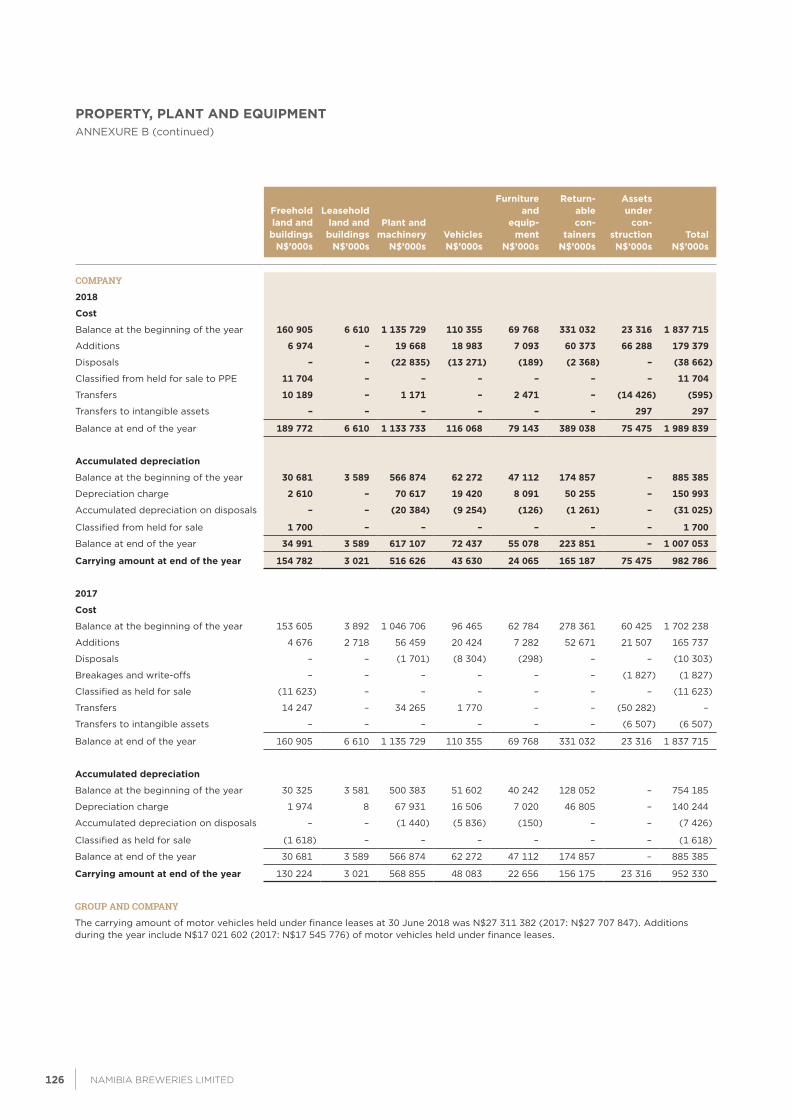
propErTY, pLANT AND EQUIpMENTANNExURE B (continued)
freeholdland and buildings
N$’000s
Leaseholdland and buildings
N$’000s
plant andmachinery
N$’000s VehiclesN$’000s
furniture and
equip-ment
N$’000s
return-ablecon-
tainersN$’000s
Assets under
con-structionN$’000s
TotalN$’000s
COMPANY
2018
Cost
Balance at the beginning of the year 160 905 6 610 1 135 729 110 355 69 768 331 032 23 316 1 837 715
Additions 6 974 – 19 668 18 983 7 093 60 373 66 288 179 379
Disposals – – (22 835) (13 271) (189) (2 368) – (38 662)
Classified from held for sale to PPE 11 704 – – – – – – 11 704
Transfers 10 189 – 1 171 – 2 471 – (14 426) (595)
Transfers to intangible assets – – – – – – 297 297
Balance at end of the year 189 772 6 610 1 133 733 116 068 79 143 389 038 75 475 1 989 839
Accumulated depreciation
Balance at the beginning of the year 30 681 3 589 566 874 62 272 47 112 174 857 – 885 385
Depreciation charge 2 610 – 70 617 19 420 8 091 50 255 – 150 993
Accumulated depreciation on disposals – – (20 384) (9 254) (126) (1 261) – (31 025)
Classified from held for sale 1 700 – – – – – – 1 700
Balance at end of the year 34 991 3 589 617 107 72 437 55 078 223 851 – 1 007 053
Carrying amount at end of the year 154 782 3 021 516 626 43 630 24 065 165 187 75 475 982 786
2017
Cost
Balance at the beginning of the year 153 605 3 892 1 046 706 96 465 62 784 278 361 60 425 1 702 238
Additions 4 676 2 718 56 459 20 424 7 282 52 671 21 507 165 737
Disposals – – (1 701) (8 304) (298) – – (10 303)
Breakages and write-offs – – – – – – (1 827) (1 827)
Classified as held for sale (11 623) – – – – – – (11 623)
Transfers 14 247 – 34 265 1 770 – – (50 282) –
Transfers to intangible assets – – – – – – (6 507) (6 507)
Balance at end of the year 160 905 6 610 1 135 729 110 355 69 768 331 032 23 316 1 837 715
Accumulated depreciation
Balance at the beginning of the year 30 325 3 581 500 383 51 602 40 242 128 052 – 754 185
Depreciation charge 1 974 8 67 931 16 506 7 020 46 805 – 140 244
Accumulated depreciation on disposals – – (1 440) (5 836) (150) – – (7 426)
Classified as held for sale (1 618) – – – – – – (1 618)
Balance at end of the year 30 681 3 589 566 874 62 272 47 112 174 857 – 885 385
Carrying amount at end of the year 130 224 3 021 568 855 48 083 22 656 156 175 23 316 952 330
GROUP AND COMPANY
The carrying amount of motor vehicles held under finance leases at 30 June 2018 was N$27 311 382 (2017: N$27 707 847). Additions during the year include N$17 021 602 (2017: N$17 545 776) of motor vehicles held under finance leases.
INTEgrATED ANNUAL rEporT 2018126 127NAmIbIA bREWERIES LImITED
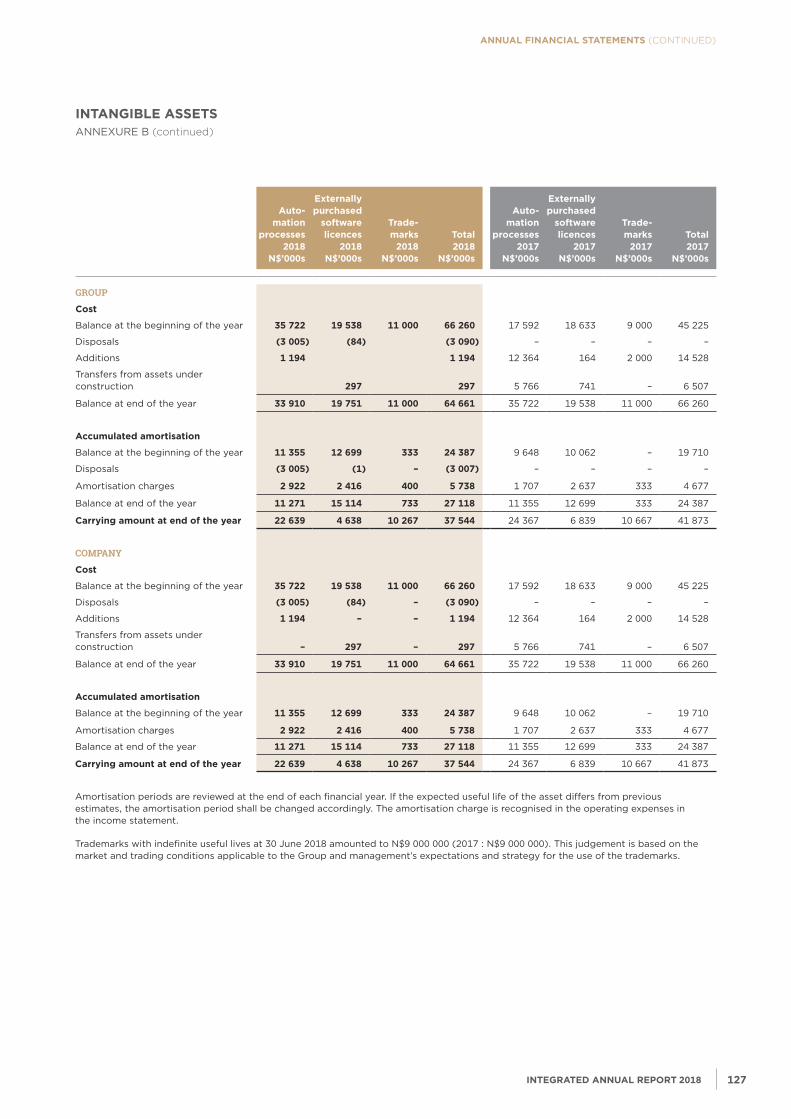
annual financial statements (CONTINUED)
Auto-mation
processes2018
N$’000s
Externally purchased
software licences
2018N$’000s
Trade-marks
2018N$’000s
Total2018
N$’000s
Auto-mation
processes2017
N$’000s
Externally purchased
software licences
2017N$’000s
Trade-marks
2017N$’000s
Total2017
N$’000s
GROUP
Cost
Balance at the beginning of the year 35 722 19 538 11 000 66 260 17 592 18 633 9 000 45 225
Disposals (3 005) (84) (3 090) – – – –
Additions 1 194 1 194 12 364 164 2 000 14 528
Transfers from assets under construction 297 297 5 766 741 – 6 507
Balance at end of the year 33 910 19 751 11 000 64 661 35 722 19 538 11 000 66 260
Accumulated amortisation
Balance at the beginning of the year 11 355 12 699 333 24 387 9 648 10 062 – 19 710
Disposals (3 005) (1) – (3 007) – – – –
Amortisation charges 2 922 2 416 400 5 738 1 707 2 637 333 4 677
Balance at end of the year 11 271 15 114 733 27 118 11 355 12 699 333 24 387
Carrying amount at end of the year 22 639 4 638 10 267 37 544 24 367 6 839 10 667 41 873
COMPANY
Cost
Balance at the beginning of the year 35 722 19 538 11 000 66 260 17 592 18 633 9 000 45 225
Disposals (3 005) (84) – (3 090) – – – –
Additions 1 194 – – 1 194 12 364 164 2 000 14 528
Transfers from assets under construction – 297 – 297 5 766 741 – 6 507
Balance at end of the year 33 910 19 751 11 000 64 661 35 722 19 538 11 000 66 260
Accumulated amortisation
Balance at the beginning of the year 11 355 12 699 333 24 387 9 648 10 062 – 19 710
Amortisation charges 2 922 2 416 400 5 738 1 707 2 637 333 4 677
Balance at end of the year 11 271 15 114 733 27 118 11 355 12 699 333 24 387
Carrying amount at end of the year 22 639 4 638 10 267 37 544 24 367 6 839 10 667 41 873
Amortisation periods are reviewed at the end of each financial year. If the expected useful life of the asset differs from previous estimates, the amortisation period shall be changed accordingly. The amortisation charge is recognised in the operating expenses in the income statement.
Trademarks with indefinite useful lives at 30 June 2018 amounted to N$9 000 000 (2017 : N$9 000 000). This judgement is based on the market and trading conditions applicable to the Group and management’s expectations and strategy for the use of the trademarks.
INTANgIBLE ASSETSANNExURE B (continued)
INTEgrATED ANNUAL rEporT 2018126 127NAmIbIA bREWERIES LImITED
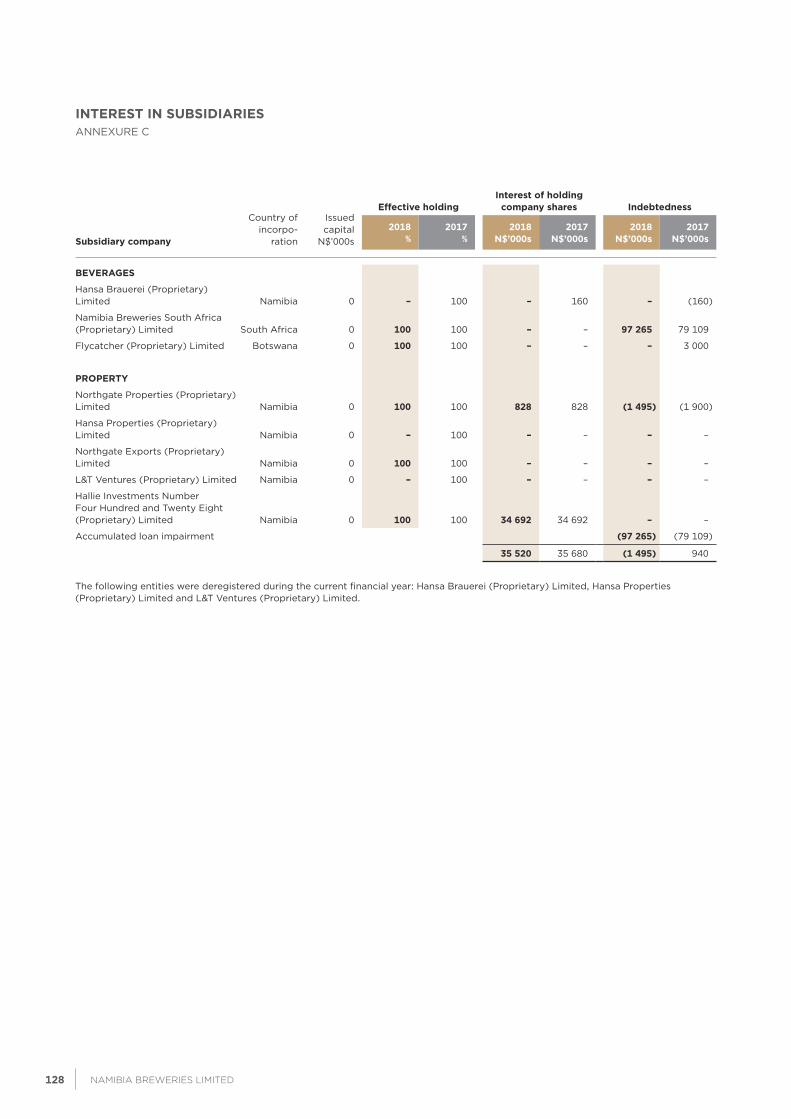
INTErEST IN SUBSIDIArIES ANNExURE C
Subsidiary company
Country ofincorpo-
ration
Issuedcapital
N$’000s
Effective holdingInterest of holding
company shares Indebtedness
2018%
2017%
2018N$’000s
2017N$’000s
2018N$’000s
2017N$’000s
BEVErAgES
Hansa Brauerei (Proprietary) Limited Namibia 0 – 100 – 160 – (160)
Namibia Breweries South Africa (Proprietary) Limited South Africa 0 100 100 – – 97 265 79 109
Flycatcher (Proprietary) Limited Botswana 0 100 100 – – – 3 000
propErTY
Northgate Properties (Proprietary) Limited Namibia 0 100 100 828 828 (1 495) (1 900)
Hansa Properties (Proprietary) Limited Namibia 0 – 100 – – – –
Northgate Exports (Proprietary) Limited Namibia 0 100 100 – – – –
L&T Ventures (Proprietary) Limited Namibia 0 – 100 – – – –
Hallie Investments Number Four Hundred and Twenty Eight (Proprietary) Limited Namibia 0 100 100 34 692 34 692 – –
Accumulated loan impairment (97 265) (79 109)
35 520 35 680 (1 495) 940
The following entities were deregistered during the current financial year: Hansa Brauerei (Proprietary) Limited, Hansa Properties (Proprietary) Limited and L&T Ventures (Proprietary) Limited.
INTEgrATED ANNUAL rEporT 2018128 129NAmIbIA bREWERIES LImITED
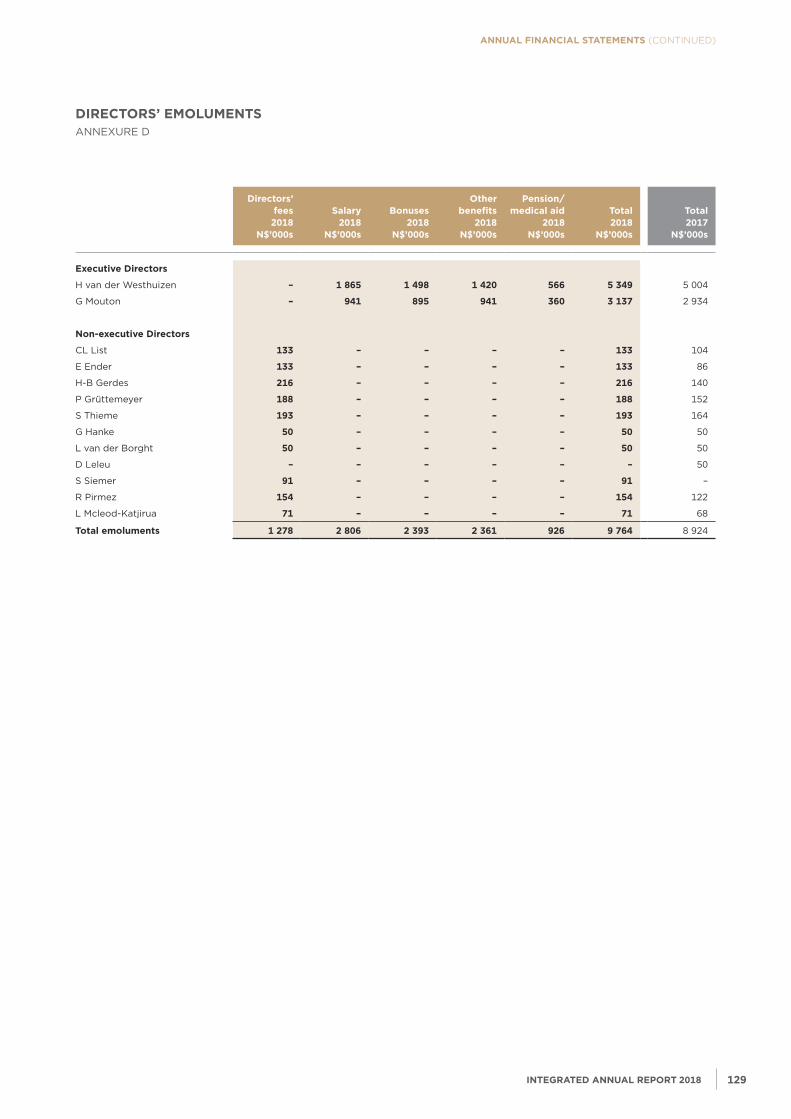
annual financial statements (CONTINUED)
Directors’fees
2018 N$’000s
Salary2018
N$’000s
Bonuses2018
N$’000s
otherbenefits
2018 N$’000s
pension/ medical aid
2018 N$’000s
Total 2018
N$’000s
Total 2017
N$’000s
Executive Directors
H van der Westhuizen – 1 865 1 498 1 420 566 5 349 5 004
G Mouton – 941 895 941 360 3 137 2 934
Non-executive Directors
CL List 133 – – – – 133 104
E Ender 133 – – – – 133 86
H-B Gerdes 216 – – – – 216 140
P Grüttemeyer 188 – – – – 188 152
S Thieme 193 – – – – 193 164
G Hanke 50 – – – – 50 50
L van der Borght 50 – – – – 50 50
D Leleu – – – – – – 50
S Siemer 91 – – – – 91 –
R Pirmez 154 – – – – 154 122
L Mcleod-Katjirua 71 – – – – 71 68
Total emoluments 1 278 2 806 2 393 2 361 926 9 764 8 924
DIrECTorS’ EMoLUMENTSANNExURE D
INTEgrATED ANNUAL rEporT 2018128 129NAmIbIA bREWERIES LImITED
NAMIBIA BrEWErIES LIMITEDRegistration number 2/1920
This document is important and requires your immediate attention. Please ensure that you review the notes and footnotes in this Notice, which contain important information with regard to participation in the Annual General Meeting.
This document consists of:1. Notice to Shareholders2. Shareholders’ Diary3. Notes to the Notice of the Annual General Meeting4. Proxy form
The holders of NBL shares (“the shareholders”) and any persons who are not shareholders, but who are entitled to exercise any voting rights in relation to the resolutions to be proposed at the meeting, (collectively “the holders” or “you”) as at the record date of Tuesday, 27 November 2018, are entitled to participate in and vote at the Annual General Meeting in person or by proxy/ies. A proxy need not be a person entitled to vote at the meeting. In order to be effective, proxy forms need to be forwarded to reach the registered office of the Company not less than 48 hours prior to the time for the holding of the meeting.
Notice is hereby given that the 97th Annual General Meeting of shareholders of Namibia Breweries Limited (“the Company”) will be held in the auditorium of Namibia Breweries Limited at the Namibia Breweries premises, Iscor Street, Northern Industrial Area, Windhoek on Tuesday, 27 November 2018 at 11:30 .
The purpose of the Annual General Meeting is for the following business to be transacted and considered and, if approved, to pass with or without modification, the following ordinary resolutions, in the manner required by the Company’s Memorandum and Articles of Association (“MoA”, “AoA”), the Companies Act, 2004 (No. 28 of 2004) and the Listing Requirements of the Namibian Stock Exchange (“NSx”):
1. To receive and consider and, if approved, adopt the annual financial statements and the Report of the Independent Auditors for the financial year ended 30 June 2018 as submitted, and to confirm all matters and things undertaken and discharged by the Directors on behalf of the Company.
2. To vote on the election, each by way of a separate vote, of the following Directors who are required to retire in terms of Clause 661 of the MoA, and who are eligible and have offered themselves for re-election:
2.1 E Ender 2.2 G Mouton 2.3 H van der Westhuizen
3. To confirm the appointment of Deloitte & Touche to act as the independent auditors of the Company.
4. To authorise the Directors to determine the auditors’ remuneration.
5. To approve the Directors’ remuneration as set out in the financial report and as stipulated in Clause 54(a) of the MoA and AoA2.
6. To confirm the payment of a final dividend of 46.0 cents, which had been approved by the Directors, to the holders of ordinary shares, registered in the books of the Company at the close of business on 5 October 2018, payable on 9 November 2018.
7. To transact such other business as may be transacted at an Annual General Meeting.
By order of the Board
ChairmanS Thieme
Company SecretaryOhlthaver & List Centre (Proprietary) LimitedWindhoek
4 September 2018
1 Clause 66 and 67 provide that, at every annual general meeting held in each calendar year, 1/3 (one-third) of the Directors, or if their number is not three or a multiple of 3 (three), then the number nearest to 1/3 (one-third) (excluding the Executive), will retire from office. The Directors to retire in every year will be those that have been longest in office since their last election. Clause 68 states that “A retiring Director is eligible for re-election”.
2 Clause 54(a) states that the remuneration of the Directors “shall from time to time be determined by the Company in at a general meeting”.
NoTICE To SHArEHoLDErS
INTEgrATED ANNUAL rEporT 2018130 131NAmIbIA bREWERIES LImITED
annual financial statements (CONTINUED)
Annual General Meeting: Tuesday, 27 November 2018 at 11:30
reports publishedInterim financial report 9 March 2018Annual financial statements 14 September 2018
Dividends Declared paidInterim 1 March 2018 11 May 2018Final 4 September 2018 9 November 2018
1. This document is addressed to all shareholders and proxy holders.
2. If you are a beneficial holder of NBL securities you may attend and vote at the Annual General Meeting, provided that your name is on the Company’s register of disclosures as the holder of the beneficial interest, or you hold a proxy.
3. If you are in any doubt as to what action you should take arising from this document, please consult your broker, banker, attorney, accountant or other appropriate professional advisor immediately.
4. An electronic copy of the location of the venue of the meeting may be obtained from NBL’s website at www.namibiabreweries.com.
NoTES To THE NoTICE of ANNUAL gENErAL MEETINg
SHArEHoLDErS’ DIArY
INTEgrATED ANNUAL rEporT 2018130 131NAmIbIA bREWERIES LImITED
for the 97th Annual General Meeting of
NAMIBIA BrEWErIES LIMITEDRegistration number 2/1920
The SecretariesNamibia Breweries LimitedPO Box 16, Windhoek, Namibia
I/we (name in full)
of (address)
being a shareholder of (number of shares) of the above-mentioned Company, hereby appoint
(a) (name); or failing him/her
(b) (name); or failing him/her
(c) (name)
or failing him/her, the Chairman of the meeting as my/our proxy to vote for me/us on my/our behalf at the 97th Annual General Meeting of the Company to be held in the auditorium of Namibia Breweries Limited at the Namibia Breweries premises, Iscor Street, Northern Industrial Area, Windhoek on Tuesday, 27 November 2018 at 11:30 and at any adjournment thereof, in particular to vote for/against/abstain* with regard to the resolutions contained in the Notice of the meeting.
I/we desire as follows:
Item Number* For Against Abstain
1. Adoption of the annual financial statements
2. Re-election of retiring Directors
2.1 E Ender
2.2 G Mouton
2.3 H van der Westhuizen
3. Appointment of Deloitte & Touche as external auditors of the Company
4. Authorisation of Directors to approve auditors’ remuneration
5. Approval of Directors’ remuneration
6. Approval of the final dividend
* Please indicate by inserting an (‘x’) in the appropriate block, either “for/against/abstain”. If no indication is given, the proxy may vote as he/she deems fit.
Signed at on this day of 2018.
Signature of shareholder
NoTES To THE proxY
1. A member entitled to attend and vote at the aforementioned meeting is entitled to appoint a proxy (who need not be a member of the Company) to attend, speak and, on a poll, to vote in his/her stead.
2. Shareholders who wish to appoint proxies must lodge their proxy forms at the registered office of the Company not later than 12:00 on Tuesday, 20 November 2018.
3. In respect of shareholders that are companies, an extract of the relevant resolution of Directors must be attached to the proxy form.
proxY forM
![Pirate Metrics [AgileAus 2017] (FInal Distributable)...Pirate Metrics [AgileAus 2017] (FInal Distributable) Created Date 20170613234437Z](https://img.pdfslide.us/doc/110x75/5f41dd66ecc3aa10a805dd70/pirate-metrics-agileaus-2017-final-distributable-pirate-metrics-agileaus.jpg)


![CPM_AP_LM6000-IND-024[1] 2009](https://img.pdfslide.us/doc/110x75/54e70ad24a795981528b489c/cpmaplm6000-ind-0241-2009.jpg)
![10-024 Maritime Law Enforcement [1].020212 (1)](https://img.pdfslide.us/doc/110x75/55cf9698550346d0338c9231/10-024-maritime-law-enforcement-1020212-1.jpg)