Embed Size (px)
Citation preview

Annual Financial Report
For the Fiscal Year Ended August 31, 2018


Annual Financial Report for the fiscal year ended August 31, 2018
for
Sam Houston State University
Huntsville, TX


TABLE OF CONTENTS
Page Letter of Transmittal ................................................................................................1 Organizational Data .................................................................................................2
Proprietary Fund Financial Statements Statement of Net Position ..................................................................................4 Statement of Revenues, Expenses, and Changes in Net Position ......................7 Matrix of Operating Expenses Reported by Function .......................................9 Statement of Cash Flows .................................................................................10 Notes to the Financial Statements ....................................................................12
Supplemental Supporting Information 1A Schedule of Expenditures of Federal Awards ......................................30 1B Schedule of State Grant Pass-Throughs To/From State Agencies .......38 2A Miscellaneous Bond Information .........................................................39 2B Changes in Bonded Indebtedness ........................................................40 2C Debt Service Requirements ..................................................................41 2D Analysis of Funds Available for Debt Service ....................................42 2E Defeased Bonds Outstanding ...............................................................43 2F Early Extinguishment and Refunding ..................................................44 3 Reconciliation of Cash in State Treasury .............................................45 4 Higher Education Assistance Fund ......................................................46


1


BOARD OF REGENTS TEXAS STATE UNIVERSITY SYSTEM
August 31, 2018
Member Member’s City (Texas) Term Expiration . Rossanna Salazar, Chairman Austin 2017 William F. Scott, Vice Chairman Nederland 2019 Charlie Amato San Antonio 2019 Garry Crain The Hills 2023 Dr. Veronica Muzquiz Edwards San Antonio 2021 Dr. Jaime R. Garza San Antonio 2017 David Montagne Beaumont 2021 Vernon Reaser III Bellaire 2019 Alan L. Tinsley Madisonville 2021 Leanna Mouton, Student Regent San Marcos 2019
SENIOR ADMINISTRATIVE OFFICIALS TEXAS STATE UNIVERSITY SYSTEM
Brian McCall, Ph.D. Chancellor Daniel Harper, MBA Vice Chancellor for Finance
ADMINISTRATIVE OFFICIALS SAM HOUSTON STATE UNIVERSITY
PRESIDENT
Dana G. Hoyt, Ph.D.
FISCAL OFFICE
J. Carlos Hernandez, EdD, CPA Vice President for Finance and Operations Amanda Withers, MBA Controller
UNAUDITED
2


Sam Houston State University
Proprietary Fund Financial Statements

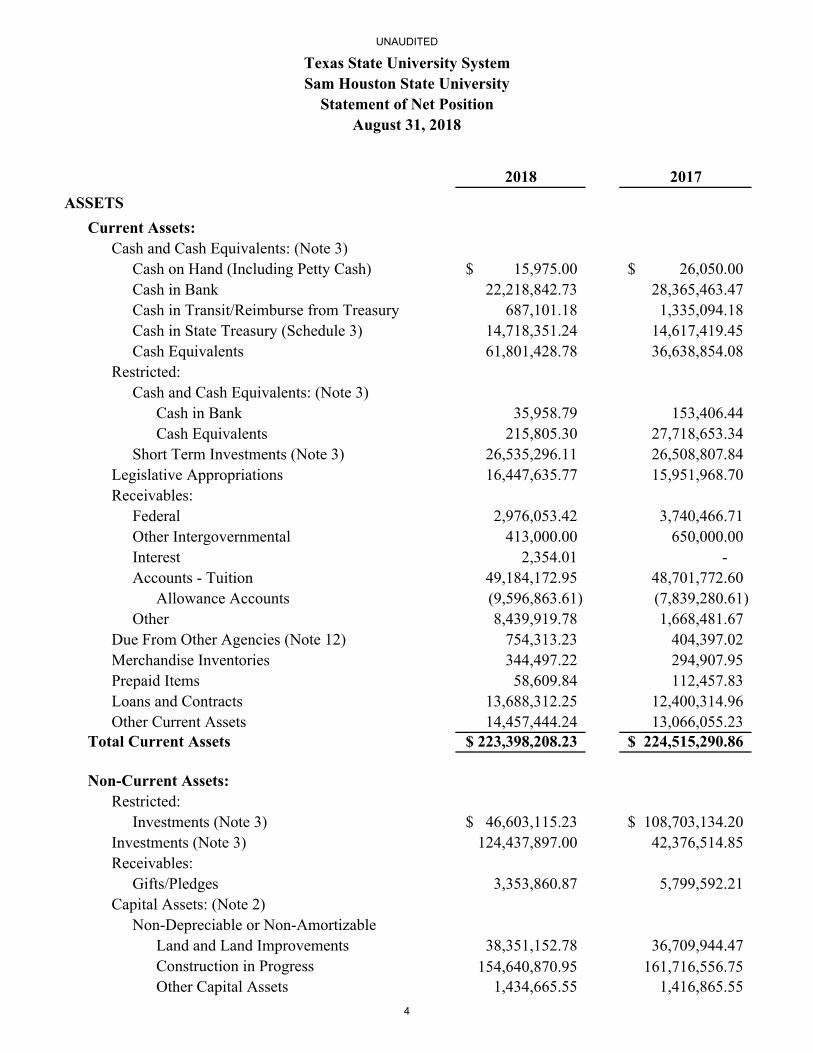
2018 2017
Current Assets:Cash and Cash Equivalents: (Note 3)
Cash on Hand (Including Petty Cash) 15,975.00$ 26,050.00$ Cash in Bank 22,218,842.73 28,365,463.47 Cash in Transit/Reimburse from Treasury 687,101.18 1,335,094.18 Cash in State Treasury (Schedule 3) 14,718,351.24 14,617,419.45 Cash Equivalents 61,801,428.78 36,638,854.08
Restricted:Cash and Cash Equivalents: (Note 3)
Cash in Bank 35,958.79 153,406.44 Cash Equivalents 215,805.30 27,718,653.34
Short Term Investments (Note 3) 26,535,296.11 26,508,807.84 Legislative Appropriations 16,447,635.77 15,951,968.70 Receivables:
Federal 2,976,053.42 3,740,466.71 Other Intergovernmental 413,000.00 650,000.00 Interest 2,354.01 - Accounts - Tuition 49,184,172.95 48,701,772.60
Allowance Accounts (9,596,863.61) (7,839,280.61) Other 8,439,919.78 1,668,481.67
Due From Other Agencies (Note 12) 754,313.23 404,397.02 Merchandise Inventories 344,497.22 294,907.95 Prepaid Items 58,609.84 112,457.83 Loans and Contracts 13,688,312.25 12,400,314.96 Other Current Assets 14,457,444.24 13,066,055.23
Total Current Assets 223,398,208.23$ 224,515,290.86$
Non-Current Assets:Restricted:
Investments (Note 3) 46,603,115.23$ 108,703,134.20$ Investments (Note 3) 124,437,897.00 42,376,514.85 Receivables:
Gifts/Pledges 3,353,860.87 5,799,592.21 Capital Assets: (Note 2)
Non-Depreciable or Non-AmortizableLand and Land Improvements 38,351,152.78 36,709,944.47 Construction in Progress 154,640,870.95 161,716,556.75 Other Capital Assets 1,434,665.55 1,416,865.55
August 31, 2018
Texas State University SystemSam Houston State University
Statement of Net Position
ASSETS
UNAUDITED
4
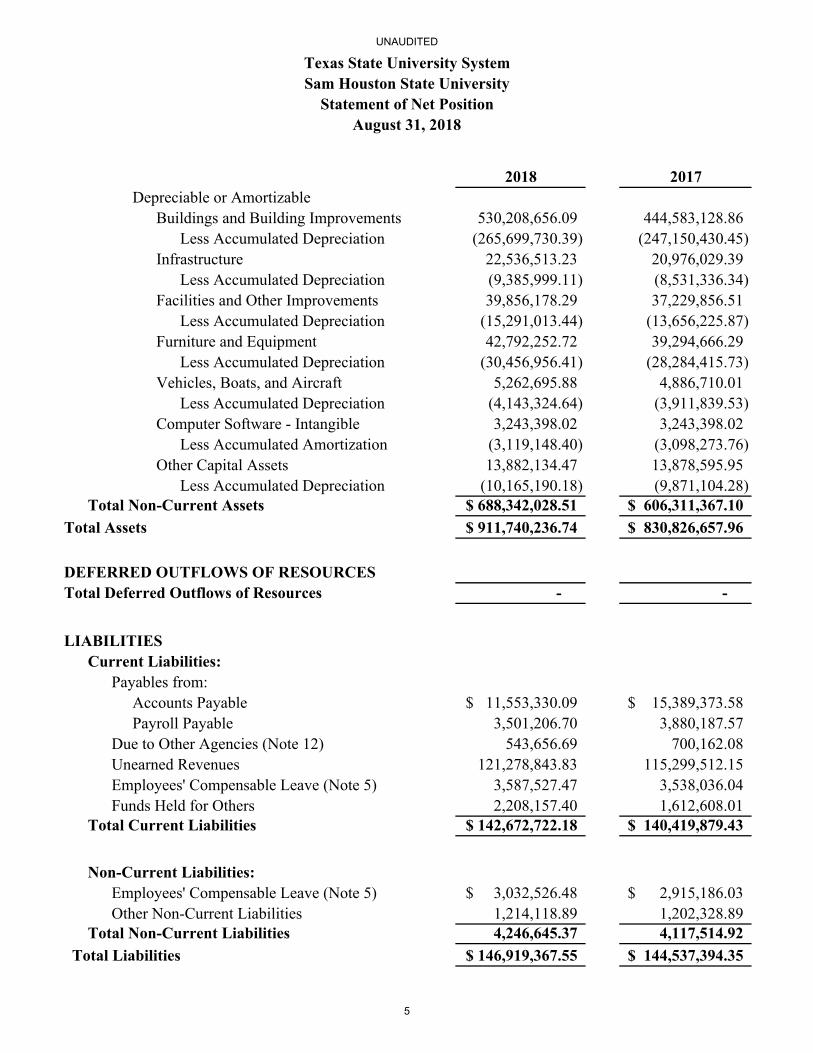
2018 2017
August 31, 2018
Texas State University SystemSam Houston State University
Statement of Net Position
Depreciable or AmortizableBuildings and Building Improvements 530,208,656.09 444,583,128.86
Less Accumulated Depreciation (265,699,730.39) (247,150,430.45) Infrastructure 22,536,513.23 20,976,029.39
Less Accumulated Depreciation (9,385,999.11) (8,531,336.34) Facilities and Other Improvements 39,856,178.29 37,229,856.51
Less Accumulated Depreciation (15,291,013.44) (13,656,225.87) Furniture and Equipment 42,792,252.72 39,294,666.29
Less Accumulated Depreciation (30,456,956.41) (28,284,415.73) Vehicles, Boats, and Aircraft 5,262,695.88 4,886,710.01
Less Accumulated Depreciation (4,143,324.64) (3,911,839.53) Computer Software - Intangible 3,243,398.02 3,243,398.02
Less Accumulated Amortization (3,119,148.40) (3,098,273.76) Other Capital Assets 13,882,134.47 13,878,595.95
Less Accumulated Depreciation (10,165,190.18) (9,871,104.28) Total Non-Current Assets 688,342,028.51$ 606,311,367.10$
Total Assets 911,740,236.74$ 830,826,657.96$
DEFERRED OUTFLOWS OF RESOURCESTotal Deferred Outflows of Resources - -
LIABILITIESCurrent Liabilities:
Payables from:Accounts Payable 11,553,330.09$ 15,389,373.58$ Payroll Payable 3,501,206.70 3,880,187.57
Due to Other Agencies (Note 12) 543,656.69 700,162.08 Unearned Revenues 121,278,843.83 115,299,512.15 Employees' Compensable Leave (Note 5) 3,587,527.47 3,538,036.04 Funds Held for Others 2,208,157.40 1,612,608.01
Total Current Liabilities 142,672,722.18$ 140,419,879.43$
Non-Current Liabilities:Employees' Compensable Leave (Note 5) 3,032,526.48$ 2,915,186.03$ Other Non-Current Liabilities 1,214,118.89 1,202,328.89
Total Non-Current Liabilities 4,246,645.37 4,117,514.92
Total Liabilities 146,919,367.55$ 144,537,394.35$
UNAUDITED
5

2018 2017
August 31, 2018
Texas State University SystemSam Houston State University
Statement of Net Position
- -
Net Investment in Capital Assets 511,586,027.87$ 449,432,125.84$ Restricted For:
Capital Projects 215,805.30 25,420,430.10 Other 18,469,194.43 18,769,392.63 Funds Held As Permanent Investments:
Non-Expendable:Endowment Funds 76,255,988.75 66,928,874.15
Expendable:Endowment Funds 50,218,845.91 41,779,933.18
Unrestricted 108,075,006.93 83,958,507.71
Total Net Position 764,820,869.19$ 686,289,263.61$
DEFERRED INFLOWS OF RESOURCES Total Deferred Inflows of Resources
NET POSITION
UNAUDITED
6

2018 2017
OPERATING REVENUES:Tuition and Fees - Pledged 214,009,567.89$ 203,215,525.03$
Tuition and Fees - Discounts/Allowances (56,702,286.74) (51,066,371.94) Auxiliary Enterprises - Pledged 46,227,540.05 41,931,865.81
Auxiliary Enterprise – Discounts/Allowances (8,073,441.01) (6,787,543.44) Other Sales of Goods and Services - Pledged 4,189,646.76 4,457,690.83
Federal Revenue 4,826,558.38 4,540,255.78 Federal Pass-Through Revenue 1,617,096.45 1,440,495.86 State Grant Revenue 425,911.51 - State Grant Pass-Through Revenue 16,225,882.48 13,639,037.80 Other Grants and Contracts -Non-pledged 2,414,513.61 2,518,698.53 Other Operating Revenues - Pledged 6,240,199.65 6,824,338.29
Total Operating Revenues 231,401,189.03$ 220,713,992.55$
OPERATING EXPENSES:Instruction 99,680,363.26$ 97,581,506.78$ Research 6,774,386.86 4,721,736.06 Public Service 11,613,113.87 11,032,058.70 Academic Support 44,251,164.53 41,075,602.52 Student Services 26,694,705.74 26,064,599.37 Institutional Support 20,611,571.92 19,986,543.42 Operation and Maintenance of Plant 24,386,951.12 25,174,493.72 Scholarship and Fellowships 29,427,463.70 28,759,020.54 Auxiliary 46,157,216.74 43,377,351.97 Depreciation and Amortization 25,259,082.22 22,382,744.27
Total Operating Expenses 334,856,019.96$ 320,155,657.35$
Operating Income (Loss) (103,454,830.93)$ (99,441,664.80)$
NONOPERATING REVENUES (EXPENSES):Legislative Revenue (GR) 56,949,583.00$ 53,615,930.00$ Additional Appropriations (GR) 14,618,586.97 16,379,788.62 Federal Revenue 36,438,149.90 32,146,243.59 Federal Pass-Through Revenue 80,500.72 - Gifts - Pledged 262,727.26 4,024,023.70 Gifts - Non-Pledged 7,115,624.89 5,797,336.41 Investment Income - Non-Pledged 5,276,210.67 4,279,401.88 Investment Income - Pledged 3,656,263.38 1,438,403.97 Gain (Loss) on Sale of Capital Assets (769,311.65) (120,345.80)
1,672,915.59 244,009.09 11,503,051.93 7,686,325.02
Texas State University SystemSam Houston State University
Statement of Revenues, Expenses, and Changes in Net PositionFor the Fiscal Year Ended August 31, 2018
Net Increase (Decrease) Fair Value - Non-pledged Net Increase (Decrease) Fair Value - Pledged
UNAUDITED
7

2018 2017
Texas State University SystemSam Houston State University
Statement of Revenues, Expenses, and Changes in Net PositionFor the Fiscal Year Ended August 31, 2018
Settlement of Claims 9,428,409.01 1,056,176.17 Other Nonoperating Revenue (Expenses)-Pledged 641,875.34 533,571.08 Other Nonoperating Expenses (50,517.52) (56,447.65)
Total Nonoperating Revenues (Expenses) 146,824,069.49$ 127,024,416.08$
Income (Loss) before Capital Contributions, Endowments 43,369,238.56$ 27,582,751.28$ and Transfers
Capital Contributions, Endowments and TransfersCapital Appropriations (HEAF) 17,329,858.00$ 17,329,858.00$ Additions to Permanent and Term Endowments 5,096,441.49 5,418,645.27
(2,906.02) -
Transfer In (Note 12) 39,844,354.00 73,129,935.00 Transfer Out (Note 12) (21,558,956.80) (20,589,246.52) Legislative Transfer In (Note 12) 918,019.00 4,284,046.00 Legislative Transfer Out (Note 12) (6,469,385.00) (6,241,462.12) Legislative Appropriations Lapsed - (340,375.21)
35,157,424.67$ 72,991,400.42$
Change in Net Position 78,526,663.23 100,574,151.70
Beginning Net Position 686,289,263.61 589,188,569.59 Restatements (Note 14) 4,942.35 (3,473,457.68)
Beginning Net Position, as restated 686,294,205.96 585,715,111.91
Ending Net Position 764,820,869.19$ 686,289,263.61$
Interagency Transfer Capital Assets - Decrease (Note 12)
Total Capital Contributions, Endowments and Transfers
UNAUDITED
8
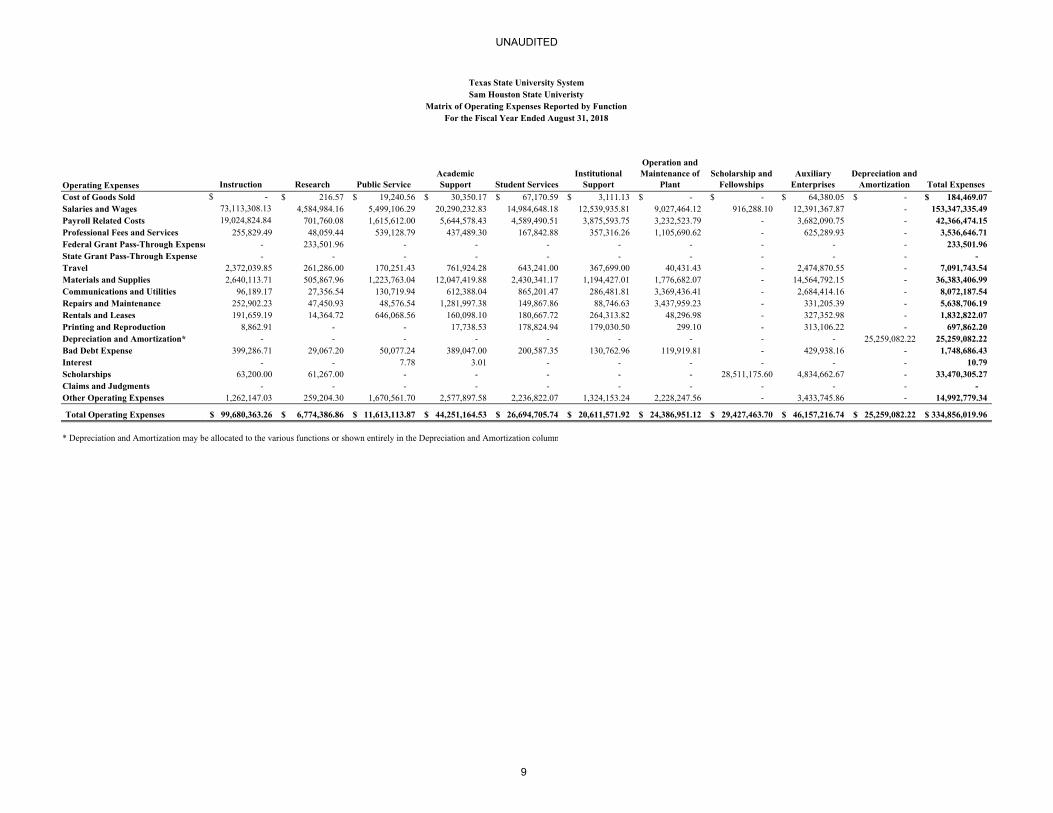
Operating Expenses Instruction Research Public ServiceAcademic Support Student Services
Institutional Support
Operation and Maintenance of
PlantScholarship and
FellowshipsAuxiliary
EnterprisesDepreciation and
Amortization Total Expenses
Cost of Goods Sold $ - 216.57$ 19,240.56$ 30,350.17$ 67,170.59$ 3,111.13$ -$ -$ 64,380.05$ -$ 184,469.07$ Salaries and Wages 73,113,308.13 4,584,984.16 5,499,106.29 20,290,232.83 14,984,648.18 12,539,935.81 9,027,464.12 916,288.10 12,391,367.87 - 153,347,335.49 Payroll Related Costs 19,024,824.84 701,760.08 1,615,612.00 5,644,578.43 4,589,490.51 3,875,593.75 3,232,523.79 - 3,682,090.75 - 42,366,474.15 Professional Fees and Services 255,829.49 48,059.44 539,128.79 437,489.30 167,842.88 357,316.26 1,105,690.62 - 625,289.93 - 3,536,646.71 Federal Grant Pass-Through Expense - 233,501.96 - - - - - - - - 233,501.96 State Grant Pass-Through Expense - - - - - - - - - - -Travel 2,372,039.85 261,286.00 170,251.43 761,924.28 643,241.00 367,699.00 40,431.43 - 2,474,870.55 - 7,091,743.54 Materials and Supplies 2,640,113.71 505,867.96 1,223,763.04 12,047,419.88 2,430,341.17 1,194,427.01 1,776,682.07 - 14,564,792.15 - 36,383,406.99 Communications and Utilities 96,189.17 27,356.54 130,719.94 612,388.04 865,201.47 286,481.81 3,369,436.41 - 2,684,414.16 - 8,072,187.54 Repairs and Maintenance 252,902.23 47,450.93 48,576.54 1,281,997.38 149,867.86 88,746.63 3,437,959.23 - 331,205.39 - 5,638,706.19 Rentals and Leases 191,659.19 14,364.72 646,068.56 160,098.10 180,667.72 264,313.82 48,296.98 - 327,352.98 - 1,832,822.07 Printing and Reproduction 8,862.91 - - 17,738.53 178,824.94 179,030.50 299.10 - 313,106.22 - 697,862.20 Depreciation and Amortization* - - - - - - - - - 25,259,082.22 25,259,082.22 Bad Debt Expense 399,286.71 29,067.20 50,077.24 389,047.00 200,587.35 130,762.96 119,919.81 - 429,938.16 - 1,748,686.43 Interest - - 7.78 3.01 - - - - - - 10.79 Scholarships 63,200.00 61,267.00 - - - - - 28,511,175.60 4,834,662.67 - 33,470,305.27 Claims and Judgments - - - - - - - - - - -Other Operating Expenses 1,262,147.03 259,204.30 1,670,561.70 2,577,897.58 2,236,822.07 1,324,153.24 2,228,247.56 - 3,433,745.86 - 14,992,779.34
99,680,363.26$ 6,774,386.86$ 11,613,113.87$ 44,251,164.53$ 26,694,705.74$ 20,611,571.92$ 24,386,951.12$ 29,427,463.70$ 46,157,216.74$ 25,259,082.22$ 334,856,019.96$
* Depreciation and Amortization may be allocated to the various functions or shown entirely in the Depreciation and Amortization column
Texas State University System
Matrix of Operating Expenses Reported by FunctionFor the Fiscal Year Ended August 31, 2018
Sam Houston State Univeristy
Total Operating Expenses
UNAUDITED
9

2018 2017CASH FLOWS FROM OPERATING ACTIVITESProceeds from Tuition and Fees 126,016,156.29$ 147,377,536.71$ Proceeds from Research Grants and Contracts 24,770,038.87 24,631,115.95 Proceeds from Auxiliaries 38,154,099.04 35,144,322.37 Proceeds from Other Operating Revenues 10,429,846.41 11,282,029.12 Payments to Suppliers for Goods and Services (67,151,532.27) (95,795,776.08) Payments to Employees for Salaries (153,347,335.49) (148,379,534.64) Payments to Employees for Benefits (42,366,474.15) (38,275,099.67) Payments for Loans Provided (1,287,997.29) (7,575,372.65) Payments for Other Operating Expenses (16,107,085.55) (15,981,615.96)
Net Cash Provided by Operating Activities (80,890,284.14)$ (87,572,394.85)$
CASH FLOWS FROM NONCAPITAL FINANCING ACTIVITESProceeds from Debt IssuanceProceeds from State Appropriations 89,000,404.34$ 83,947,724.42$ Proceeds from Gifts 7,378,352.15 9,821,360.11 Proceeds from Endowments 5,096,441.49 5,418,645.27 Proceeds from Grant Receipts 36,518,650.62 32,146,243.59 Proceeds from Other Noncapital Financing Activities 10,364,120.83 1,533,299.60 Payments for Other Noncapital Financing Uses (2,771,795.91) (1,889,871.00)
Net Cash Provided by Noncapital Financing Activities 145,586,173.52$ 130,977,401.99$
CASH FLOWS FROM CAPITAL AND RELATED FINANCING ACTIVITESProceeds from Debt Issuance 39,500,000.00$ 72,800,000.00$ Proceeds from Capital Contributions - - Payments for Additions to Capital Assets (90,541,387.11) (95,994,718.74) Payments of Principal on Debt (13,317,424.58) (15,290,936.10) Payments of Interest on Debt Issuance (11,619,145.75) (9,318,917.15)
Net Cash Provided by Capital and Related Financing Activities (75,977,957.44)$ (47,804,571.99)$
CASH FLOWS FROM INVESTING ACTIVITESProceeds from Investment Income 8,932,474.05$ 5,717,805.85$ Payments to Acquire Investments (6,811,883.93) (17,621,873.20)
Net Cash Provided by Investing Activities 2,120,590.12$ (11,904,067.35)$
Net Increase (Decrease) in Cash and Cash Equivalents (9,161,477.94) (16,303,632.20) Beginning Cash and Cash Equivalents 108,854,940.96 125,158,573.16 Restatements to Beginning Cash and Cash Equivalents - - Beginning Cash and Cash Equivalents, as restated 108,854,940.96$ 125,158,573.16$ Ending Cash and Cash Equivalents 99,693,463.02$ 108,854,940.96$
RECONCILIATION OF OPERATING INCOME TONET CASH PROVIDED BY OPERATING ACTIVITIESOperating Income (Loss) (103,454,830.93)$ (99,441,664.80)$
Adjustments to Reconcile Operating Income (Loss)to Net Cash Provided by Operating Activities:Amortization and Depreciation 25,259,082.22 22,382,744.27
Texas State University SystemSam Houston State Univeristy
Statement of Cash FlowsFor the Fiscal Year Ended August 31, 2018
UNAUDITED
10

2018 2017
Texas State University SystemSam Houston State Univeristy
Statement of Cash FlowsFor the Fiscal Year Ended August 31, 2018
Bad Debt Expense 1,748,686.43 796,028.66 Operating Income (Loss) and Cash Flow Categories:
Classification DifferencesChanges in Assets and Liabilities:
(Increase) Decrease in Receivables (3,800,151.27) (13,796,662.77) (Increase) Decrease in Due from Other Funds (349,916.21) 2,857,761.07 (Increase) Decrease in Inventories (49,589.27) 117,699.50 (Increase) Decrease in Prepaid Expenses 53,847.99 (88,537.43) (Increase) Decrease in Loans & Contracts (1,287,997.29) (7,575,372.65) (Increase) Decrease in Other Assets (1,391,389.01) (25,043.49) Increase (Decrease) in Payables (4,215,024.36) (2,098,996.31) Increase (Decrease) in Due to Other Funds (156,505.39) (125,829.58) Increase (Decrease) in Unearned Revenue 5,979,331.68 9,025,046.39 Increase (Decrease) in Compensated Absence Liability 166,831.88 186,766.52 Increase (Decrease) in Other Liabilities 607,339.39 213,665.77
Total Adjustments 22,564,546.79 11,869,269.95
Net Cash Provided by Operating Activities (80,890,284.14)$ (87,572,394.85)$
Non Cash TransactionsDonation of Capital Assets - - Net Change in Fair Value of Investments 13,175,967.52 7,930,334.11
UNAUDITED
11

Sam Houston State University Notes to the Financial Statements
For the Year Ended August 31, 2018
Note 1: Summary of Significant Accounting Policies
Reporting Entity
Sam Houston State University (SHSU) serves the state by providing a high quality education to residents and is based in Huntsville, Texas.
SHSU is an agency of the State of Texas (the “State”) and a component of the Texas State University System (TSUS). TSUS was founded in 1911 and is the first higher education system established in Texas. Beginning as an administrative means to consolidate the support and management of State teacher colleges, TSUS has evolved into a network of higher education institutions stretching from the Texas–Louisiana border to the Big Bend region of west Texas. Today, eight component institutions offer a broad range of academic and career opportunities. Those eight institutions are located throughout the State and include SHSU, Lamar University, Sul Ross State University, Texas State University, Lamar Institute of Technology, Lamar State College-Orange, Lamar State College-Port Arthur, and Sul Ross State University Rio Grande College.
The TSUS is governed by a nine-member Board of Regents (the “Board”) appointed by the Governor. In addition, a nonvoting student regent is appointed annually to the Board. The Texas State University System Administration (“System Administration”), which is headed by a Board-appointed chancellor, is based in Austin, where it provides support to TSUS components.
TSUS is an agency of the State and is reported as one of six university systems and five independent universities that in total are presented as a major enterprise fund in the State’s Comprehensive Annual Financial Report.
No entities have been identified meeting GASB’s definition of component units, which are legally separate entities and, accordingly, none are included within the reporting entity. As previously noted, SHSU is considered by the State as one of the academic entities that comprise TSUS, however, each entity is considered an agency of the State.
The Sam Houston University Foundation (the “Foundation”) is a separate legal entity registered with the IRS as a 501(c) organization and its efforts benefit SHSU and its students. The Foundation is separately governed and operates autonomously from SHSU, and its related activities are not included in SHSU’s, TSUS’s or the State’s financial statements. The Foundation solicits donations and acts as a coordinator of gifts made by other parties. The Foundation remittance to SHSU and amounts receivable at year end were immaterial to SHSU’s financial statements.
The accounting policies followed by SHSU in maintaining accounts and in the preparation of the financial statements are in accordance with the Texas Comptroller of Public Accounts’ Reporting Requirement for the Fiscal 2018 Annual Financial Reports of State Agencies and Universities (the “Comptroller’s AFR Requirements”) and with generally accepted accounting principles in the United States of America (GAAP). The Governmental Accounting Standards Board (GASB) is responsible for establishing GAAP for state and local governments. The Comptroller’s AFR Requirements are designed to assist the Texas Comptroller of Public Accounts in compiling and preparing the State’s CAFR and, accordingly, have some untraditional elements, such as the prohibition of rounding, unique ordering and specific numbering of footnotes, and the inclusion of footnote titles when the subject matter does not apply.
UNAUDITED
12

Sam Houston State University Notes to the Financial Statements
For the Year Ended August 31, 2018
Fund Structure
The financial statements of SHSU have been prepared on the basis of funds, each of which is considered a separate accounting entity. The fund designation for institutions of higher education is Business-Type Activity within the Proprietary Fund Type.
Proprietary Fund Types Business-Type Activity Business-type funds are used for activities that are financed through the charging of fees for goods or services to the ultimate user. Institutions of higher education are required to report their financial activities as business type because the predominance of their funding comes through charges to students, sales of goods and services, and grant revenues.
Basis of Accounting
The basis of accounting determines when revenues and expenditures or expenses are recognized in the accounts reported in the financial statements. The accounting and financial reporting treatment applied to a fund is determined by its measurement focus.
Business-type activity funds (proprietary funds) are accounted for on the full accrual basis of accounting. Under the full accrual basis of accounting, revenues are recognized when earned and expenses are recognized at the time liabilities are incurred. Proprietary funds distinguish operating from non-operating items. Operating revenues and expenses result from providing services or producing and delivering goods in connection with the proprietary fund’s principal ongoing operations. Operating expenses for the proprietary funds include the cost of sales and services, administrative expenses, and depreciation on capital assets.
Budget and Budgetary Accounting
The State’s budget is prepared biennially and represents appropriations authorized by the Legislature and approved by the Governor (the “General Appropriations Act”). Additionally, TSUS prepares an annual budget, which represents anticipated sources of revenues and authorized uses. This budget is approved by TSUS’s Board.
Unencumbered appropriations are generally subject to lapse 60 days after fiscal year end for which they were appropriated.
Assets, Liabilities, and Fund Balances/Net Position
Assets Current and Non-Current Assets Current assets are those that are readily available to meet current operational requirements. Non-current assets are those that are not readily available to meet current operational requirements and, instead, are intended to support long-term institutional needs.
Cash and Cash Equivalents All highly liquid investments with a maturity of three months or less at the time of purchase are considered cash and cash equivalents.
UNAUDITED
13

Sam Houston State University Notes to the Financial Statements
For the Year Ended August 31, 2018
Restricted Assets Restricted assets include monies or other resources restricted by legal or contractual requirements. These assets include proceeds of enterprise fund general obligation and revenue bonds and revenues set aside for statutory or contractual requirements. Assets held in reserve for guaranteed student loan defaults are also included.
Investments Investments are generally stated at fair value, with certain exceptions, in accordance with GASB Statement No. 72, Fair Value Measurement and Application. Fair value, which is determined based on quoted market prices, is the amount at which an investment could be exchanged in a current transaction between parties other than in a forced or liquidation sale. Changes in unrealized gain (loss) on the carrying value of investments are reported as a component of investment income in the accompanying Comparative Statement of Revenues, Expenses, and Changes in Net Position.
Legislative Appropriations This item represents the balance of general revenue funds at year end as calculated in the Texas State Comptroller’s General Revenue Reconciliation.
Inventories and Prepaid Items Inventories include both merchandise inventories on hand for sale and consumable inventories. Inventories are valued at cost, generally utilizing the last-in, first-out method. The consumption method of accounting is used to account for inventories and prepaid items. The costs of inventories are expensed when they are used or consumed. Prepaid items reflect payments for costs applicable to future accounting periods.
Capital Assets Assets such as furniture, equipment, and vehicles with an aggregate cost of more than $5,000 and an estimated useful life in excess of one year are capitalized. Capitalization thresholds are also utilized for buildings and building improvements ($100,000), infrastructure ($500,000), and facilities and other improvements ($100,000). Capital assets are recorded at cost or estimated historical cost if actual historical cost is not available. Donated capital assets are reported at acquisition value. For fabricated assets financed by debt, construction period interest is capitalized as part of the capital asset cost. The capitalized interest is combined with the other costs associated with constructing the asset and depreciated over the appropriate useful life beginning when the asset is placed into service.
Capital assets are depreciated over the estimated useful life of the asset using the straight-line method based on allocation methods and estimated lives prescribed by the Statewide Property Accounting (SPA) system. Depreciation is recorded as a periodic expense and accumulated as an offset to the asset book values. Depreciation expense is not allocated to functional categories for this Annual Financial Report.
Intangible capital assets are defined as assets that lack physical substance, are non-financial in nature, and have an initial useful life extending beyond a single reporting period. These assets are required to be reported if they are identifiable. Land use rights are capitalized if the cost meets or exceeds $100,000. Purchased computer software is capitalized if the aggregate cost of the purchase meets or exceeds $100,000. Internally generated computer software has a capitalization threshold of $1,000,000, and other intangible capital assets must be capitalized if the cost meets or exceeds $100,000. Intangible assets are amortized based on the estimated useful life of the asset using the straight-line method.
UNAUDITED
14

Sam Houston State University Notes to the Financial Statements
For the Year Ended August 31, 2018
Other Receivables Other receivables include year end accruals not included in any other receivable category. This account can appear in governmental and proprietary fund types.
Liabilities Accounts Payable Accounts Payable represents the liability for the value of assets or services received at the balance sheet date for which payment is pending.
Other Liabilities – Current and Non-Current Other Payables are the accrual at year end of expenditure transactions not included in any of the other payable descriptions.
Unearned Revenues Unearned revenues include amounts for tuition and fees, certain auxiliary activities, and amounts from grant and contract sponsors received prior to the end of the fiscal year but related to the subsequent accounting period.
Funds Held for Others Current balances in funds held for others result from SHSU acting as an agent or fiduciary for other organizations.
Employees’ Compensable Leave Employees’ Compensable Leave represent the liability that becomes “due” upon the occurrence of relevant events such as resignations, retirements, and uses of leave balances by covered employees. Liabilities are reported separately as either current or non-current in the Statement of Net Position. These obligations are normally paid from the same funding source from which each employee’s salary or wage compensation was paid.
Net Position The difference between fund assets and liabilities is “Net Position” on proprietary fund statements.
Net Investment in Capital Assets Net Investment in Capital Assets consists of capital assets, net of accumulated depreciation and reduced by outstanding balances for bonds, notes, and other debt that is attributed to the acquisition, construction, or improvement of those assets.
Net Position - Restricted Restricted net position results when constraints placed on net position use are either externally imposed by creditors, grantors, contributors, and the like or imposed by law through constitutional provisions or enabling legislation. When both restricted and unrestricted assets are available for use, restricted resource are used first, then unrestricted resources are used as needed.
Expendable – net position use is subject to externally imposed stipulations that can be fulfilled by actions pursuant to those stipulations, or that expire by the passage of time. Non-expendable – net position use is subject to externally imposed stipulations that it be maintained permanently. Such assets include the principal of permanent endowment funds.
UNAUDITED
15

Sam Houston State University Notes to the Financial Statements
For the Year Ended August 31, 2018
Net Position - Unrestricted Unrestricted net position consists of net position that does not meet the definition of the two preceding categories. Unrestricted net position often has constraints on resources, which are imposed by management, but can be removed or modified.
Operating and Non-Operating Revenues and Expenses Operating revenues and expenses – include activities such as student tuition and fees; net sales and services of auxiliary enterprises; exchange basis federal, state, and local grants and contracts and related expenses including depreciation; scholarships and fellowships; impairment losses; insurance recovery in the year of the loss; and incurred but not reported liabilities. Non-operating revenues and expenses - included activities such as gifts and contributions, insurance recoveries received in years subsequent to the loss, State appropriations, investment income, nonexchange basis federal and state grants and contracts, and other non-operating items defined by GASB.
Inter-Agency Activities and Transactions
SHSU has the following types of transactions among related agencies:
Transfers The amount represents legally required transfers that are reported when incurred as “Transfers In” by the recipient agency and as “Transfers Out” by the disbursing agency.
Reimbursements Reimbursements are repayments from funds responsible for expenditures or expenses to funds that made the actual payment. Reimbursements of expenditures made by one agency for another are recorded as expenditures in the reimbursing agency and as a reduction of expenditures in the reimbursed fund. Reimbursements are not displayed in the financial statements.
Receivables and Payables Inter-agency loans are reported as interfund receivables and payables. If repayment is due during the current year or soon thereafter, the balance is classified as “Current”. Balances for repayment due in two (or more) years are classified as “Non-Current.”
Sales and Purchases These amounts represent charges or collections for services rendered by one agency to another that are recorded as revenues of the recipient agency and expenditures or expenses of the disbursing agency.
The composition of SHSU’s inter-agency activities and balances are presented in Note 12 Interfund Activity and Transactions.
UNAUDITED
16

Sam Houston State University Notes to the Financial Statements
For the Year Ended August 31, 2018
Note 2: Capital Assets
A summary of changes in capital assets for the year ended August 31, 2018 is presented below:
Note 3: Deposits, Investments, and Repurchase Agreements
SHSU is authorized by statute to make investments following the “prudent person rule.” There were no significant violations of legal provisions during the period.
Deposits
As of August 31, 2018, the carrying amount of deposits was $22,254,801.52 as presented below:
CashProprietary Funds Current Assets Cash in Bank $ 22,218,842.73
Restricted Cash in Bank 35,958.79
Cash in Bank per AFR $ 22,254,801.52
Custodial credit risk for deposits is the risk that, in the event of the failure of a depository financial institution, SHSU will not be able to recover deposits or will not be able to recover collateral securities
UNAUDITED
17

Sam Houston State University Notes to the Financial Statements
For the Year Ended August 31, 2018
that are in the possession of an outside party. SHSU’s bank accounts are secured by FDIC and collateral pledged. SHSU has no deposits that are at risk of recovery due to the failure of a depository financial institution. As of August 31, 2018, the total bank balance was $28,870,464.12.
Foreign currency risk for deposits is the risk that changes in exchange rates will adversely affect the deposit. SHSU held no exposure to foreign currency risk for deposits as of August 31, 2018.
Investments
SHSU invests both operating and endowment funds. SHSU invests its endowment funds to provide funding for scholarships, fellowships, professorships, academic chairs, and other uses as specified by donors. SHSU investments adhere to the following principles:
The performance objective is to grow the market value of assets net of inflation, spending, and expenses, over a full market cycle (generally defined as a three to five year period) without undue exposure to risk. The invested funds are particularly risk-averse to the probability of not meeting the total return goal. Liquidity must be considered and sufficient to meet the spending needs and expenses.
The total return goal can be achieved while assuming acceptable risk levels commensurate with “market volatility”. To achieve the total return goal, the assets will be invested to generate appreciation and/or dividend and interest income.
The endowment is expected to endure into perpetuity. Inflation is a key component in the performance objective. The long term risk of not investing in equity securities outweighs the short-term volatility risk. As a result, the majority of assets are invested in equity or equity-like securities. Fixed income and fixed income-like securities and other diversifying strategies may act to lower the short-term volatility of the portfolio and/or provide stability, especially during periods of weak or negative equity markets. Other asset classes are included to provide diversification and incremental total return.
The cash payout requirement for the endowment funds is significant and continuous. The portfolio is diversified to diminish risks associated with particular securities, market sectors, or industries.
SHSU is authorized by statute to make endowment investments following the “prudent person rule” and operating investments following the Public Funds Investment Act. There were no significant violations of legal provisions during the period.
SHSU values its investments at fair value. GASB Statement No. 72, Fair Value Measurement and Application, defines fair value as the price received to sell an asset in an orderly transaction between market participants at the measurement date. Fair value is an exit price at the measurement date from the perspective of the market participant that holds the asset. This is a market-based measurement. GASB 72 also establishes a fair value hierarchy that classifies inputs to valuation techniques into three levels:
• Level 1 – inputs are quoted prices (unadjusted) for identical assets or liabilities in active markets that canbe accessed at the measurement date.
• Level 2 – inputs are inputs (other than quoted prices included within Level 1) that are observable for anasset or liability, either directly (quoted market prices for similar assets or liabilities) or indirectly(corroborated from observable market information).
• Level 3 – inputs are unobservable inputs for an asset or liability.
UNAUDITED
18

Sam Houston State University Notes to the Financial Statements
For the Year Ended August 31, 2018
Beyond these three levels, net asset value may be used to categorize investments without a readily determinable fair value.
As of year end, fair value of investments were categorized as follows:
Credit risk is the risk that an issuer or other counterparty to an investment will not fulfill its obligations. As of August 31, 2018, SHSU was subject to minimal credit risk.
Investment Type AAAf AAf Unrated
Fixed Income -$ -$ 47,736,833.79$
Concentration of credit risk is the risk of loss attributable to the magnitude of investment in a single issuer. Investments issued or explicitly guaranteed by the U.S. government and investments in mutual funds, external investment pools, and other pooled investments are excluded from this disclosure requirement. As of August 31, 2018, SHSU was not subject to concentration of credit risk.
Interest rate risk is the risk that changes in interest rates will adversely affect the fair value of an investment. SHSU is not required to disclose interest rate risk.
Custodial credit risk for investments is the risk that, in the event of the failure of the counterparty, SHSU will not be able to recover the value of its investments or collateral securities that are in the possession of an outside party.
Foreign currency risk for investments is the risk that changes in exchange rates will adversely affect the investment.
Reverse Repurchase, Securities Lending, and Derivative Investing
SHSU did not participate in Reverse Repurchase Agreements, Securities Lending, or Derivative Investing during fiscal year 2018.
Note 4: Short-Term Debt
During the fiscal year ended August 31, 2018, SHSU had no short-term debt activity.
UNAUDITED
19

Sam Houston State University Notes to the Financial Statements
For the Year Ended August 31, 2018
Note 5: Long-Term Liabilities
Changes in Long-Term Liabilities
During the year ended August 31, 2018, the following changes occurred in long-term liabilities:
Notes And Loans Payable
None.
Claims and Judgements
At August 31, 2018, various lawsuits and claims involving SHSU were pending. While the ultimate liability with respect to litigation and other claims asserted against SHSU cannot be reasonably estimated at this time, SHSU anticipates no liability on the merits of outstanding claims.
Employees’ Compensable Leave
Full-time State employees earn annual leave from 8 to 21 hours per month depending on the respective employee’s years of State employment. The State’s policy is that an employee may carry his accrued leave forward from one fiscal year to another fiscal year with a maximum number of hours up to 532 for those employees with 35 or more years of State service. Employees with at least six months of State service who terminate their employment are entitled to payment for all accumulated annual leave up to the maximum allowed. SHSU recognizes the accrued liability for the unpaid annual leave in the Unrestricted Current Funds. For the year ended August 31, 2018, the accrued liability totaled $6,620,053.95. SHSU made lump sum payments totaling $707,610.87 for accrued vacation and/or compensatory time to employees who separated from State service during the fiscal year ending August 31, 2018.
Sick leave, the accumulation of which is unlimited, is earned at the rate of 8 hours per month and is paid only when an employee is off due to illness or to the estate of an employee in the event of his/her death. The maximum sick leave that may be paid to an employee’s estate is one-half of the employee’s accumulated entitlement or 336 hours, whichever is less. SHSU’s policy is to recognize the cost of sick leave when paid and the liability is not shown in the financial statements since experience indicates the expenditure for sick leave to be minimal.
UNAUDITED
20

Sam Houston State University Notes to the Financial Statements
For the Year Ended August 31, 2018
Note 6: Bonded Indebtedness
All bonded indebtedness for SHSU is issued by System Administration through the Texas State University System Revenue Financing System (the “Revenue Financing System”). System Administration and each component institution within TSUS are members of the Revenue Financing System. The Board pledged all of the funds (revenues) and balances derived or attributable to any member of the Revenue Financing System that are lawfully available to the Board for payments on Parity Debt. System Administration issued the debt; therefore, the bonds payable attributable to SHSU are included with the Bonds Payable reported by System Administration. SHSU must repay the debt that was issued on its behalf; consequently, the following debt amortization schedule is presented for informational purposes only.
Principal Interest Total
2019 13,343,251.18 10,485,807.26 23,829,058.44 2020 13,974,890.24 9,843,217.78 23,818,108.02 2021 13,906,190.06 9,165,035.26 23,071,225.32 2022 14,629,788.74 8,487,765.78 23,117,554.52 2023 11,112,898.82 7,771,081.50 18,883,980.32
2024-2028 57,015,000.00 30,645,119.20 87,660,119.20 2029-2033 43,945,000.00 18,142,790.98 62,087,790.98 2034-2038 27,655,000.00 9,457,400.22 37,112,400.22 2039-2043 21,735,000.00 3,916,250.00 25,651,250.00 2044-2046 6,530,000.00 394,400.00 6,924,400.00
Totals 223,847,019.04$ 108,308,867.98$ 332,155,887.02$
A portion of the debt represents Tuition Revenue Bonds historically funded by the Texas Legislature through General Revenue Appropriations. SHSU was appropriated $6,148,800.00 during the current fiscal year for Tuition Revenue Bond debt service. SHSU expects future Legislative appropriations to meet debt service requirements for Tuition Revenue Bonds.
Note 7: Derivative Instruments
SHSU did not have any derivative activity for the fiscal year ended August 31, 2018.
Note 8: Leases
As of August 31, 2018, SHSU was not involved in any capital lease agreements.
SHSU has entered into various operating leases for buildings and equipment. Rental expenses for operating leases were $307,507.61 for the fiscal year ended August 31, 2018.
UNAUDITED
21

Sam Houston State University Notes to the Financial Statements
For the Year Ended August 31, 2018
Future minimum lease payments under operating leases having an initial term in excess of one year as of August 31, 2018 were as follows:
Year Amount2019 287,267.07$ 2020 208,175.332021 70,877.082022 42,090.712023 3,210.84Total 611,621.03$
Note 9: Defined Benefit Pension Plans and Defined Contribution Plan
Optional Retirement Program contributions for SHSU are reported by the TSUS in the consolidated annual financial report.
Note 10: Deferred Compensation
State employees may elect to defer a portion of their earnings for income tax and investment purposes pursuant to authority granted in the Texas Government Code Annotated, Section 609.001. Two plans are available for employees’ participation, which are administered by the Employees Retirement System. The assets of the plans do not belong to SHSU, TSUS, or the State. SHSU, TSUS, or the State has no liability related to the plans.
Note 11: Post Employment Health Care and Life Insurance Benefits
Not Applicable.
Note 12: Interfund Activity and Transactions
As explained in Note 1 on Interfund and Interagency Transactions and Balances, there are transactions between funds and agencies. At year-end, amounts to be received or paid are reported as: Interfund Receivables or Interfund Payables; Due From Other Agencies or Due To Other Agencies (See Schedule 1A - Schedule of Expenditures of Federal Awards, and Schedule 1B - Schedule of Pass-Through Grants From/To Other State Agencies); Due From Other Funds or Due To Other Funds; Transfers In or Transfers Out; Legislative Transfers In or Legislative Transfers Out.
SHSU has not participated in any interfund borrowing during fiscal year 2018.
SHSU experienced routine transfers with other State agencies, which were consistent with the activities of the fund making the transfer. Repayment of interfund balances will occur within one year from the date of the financial statements.
UNAUDITED
22

Sam Houston State University Notes to the Financial Statements
For the Year Ended August 31, 2018
Individual balances and activity at August 31, 2018 were as follows:
UNAUDITED
23

Sam Houston State University Notes to the Financial Statements
For the Year Ended August 31, 2018
Transfer in/out from State Entities were as follows:
Legislative transfers in and out were as follows:
The Federal and State Grant Pass Through information is provided on Schedule 1A - Schedule of Expenditures of Federal Awards, and Schedule 1B - Schedule of Pass-Through Grants From/To State Agencies, respectively.
UNAUDITED
24

Sam Houston State University Notes to the Financial Statements
For the Year Ended August 31, 2018
In 2018, SHSU made an interagency transfer of capital assets as follows:
Note 13: Continuance Subject to Review
Not Applicable. SHSU is not subject to the Texas Sunset Act.
Note 14: Adjustments to Net Assets
During fiscal year 2018, SHSU identified that there were two construction projects that were undercapitalized at their completion in prior year. This resulted in a net capitalization error of $4,942.35, which represents an increase to net position.
Note 15: Contingencies and Commitments
Claims and Judgements At August 31, 2018, various lawsuits and claims involving SHSU were pending. While the ultimate liability, if any, with respect to litigation and other claims asserted against SHSU cannot be reasonably estimated at this time, SHSU anticipates the liability, to the extent not provided for by insurance or otherwise, is not likely to have a material effect on SHSU.
Federal Assistance SHSU has received several federal grants for specific purposes that are subject to review and audit by the grantor agencies. Such audits could lead to a request for reimbursements to grantor agencies for expenditures disallowed under the terms of the grant. Based on prior experience, management believes such disallowances, if any, will be immaterial.
Arbitrage Rebatable arbitrage is defined by Internal Revenue Code, Section 148, as earnings on investments purchased with the gross proceeds of a bond issue in excess of the amount that would have been earned if the investment were invested at a yield equal to the yield on the bond issue. The rebatable arbitrage must be paid to the federal government.
System Administration monitors its investments to restrict earnings to a yield less than the bond issue and, therefore, limit any arbitrage liability. Systems Administration estimates that rebatable arbitrage liability, if any, will be immaterial to its overall financial condition. Consistent with TSUS’s and SHSU’s reporting of bonds at the system level, any arbitrage liability would be reported by TSUS and not SHSU.
Construction Commitments SHSU continues to implement capital improvements to upgrade facilities. The outstanding capital commitments for the construction and renovation of various facilities are $52,152,375.62. These projects are in various stages of completion.
UNAUDITED
25

Sam Houston State University Notes to the Financial Statements
For the Year Ended August 31, 2018
Note 16: Subsequent Events
SHSU has no subsequent events to report as of August 31, 2018.
Note 17: Risk Management
Liability Recognition and Experience SHSU’s liabilities are reported when it is both probable that a loss has occurred and the amount of that loss can be reasonably estimated. Liabilities include an amount for claims that have been incurred but not reported. Liabilities are reevaluated periodically to consider current settlements, frequency of claims, past experience, and economic factors. There have been no significant reductions in insurance coverage in the past year and losses did not exceed coverages or funding arrangements during the past three years.
Unemployment Compensation The State provides coverage for unemployment benefits for SHSU employees from appropriations made to the Texas Workforce Commission (TWC). The current General Appropriations Act provides that SHSU must reimburse the General Revenue Fund, from SHSU appropriations, 50% of the unemployment benefits paid for State-funded positions and 100% of the cost for unemployment compensation for any positions paid from funds held in local bank accounts and local funds held in the State Treasury. The Comptroller of Public Accounts determines the proportionate amount to be reimbursed from each appropriated fund type. The unemployment benefit plan is on a pay-as-you-go basis, in which no assets are set aside to be accumulated for the payment of claims. It is estimated that there were no material liabilities as of year end.
Workers’ Compensation The administration of the State’s employee workers’ compensation program is vested with the State Office of Risk Management (SORM). In accordance with H.B. No. 1203, 77th Legislature, SORM developed and imposed a formula-driven charge for workers’ compensation costs upon participating agencies. The workers’ compensation assessment is prepaid to SORM through an Interagency Contract for workers’ compensation coverage for its employees in compliance with Texas Labor Code Chapter 412 and Chapter 501. The assessment for SHSU for 2018 was $317,215.32. The assessment for SHSU for 2019 is$321,566.69.
Fire and Extended Coverage SHSU is required by certain bond covenants to carry fire and extended coverage and boiler insurance on buildings financed through the issuance of bonds using pledged Auxiliary Enterprise or other non-Educational and General Funds. The insurance protects the bond holders from a disruption to the revenue stream that is being utilized to make the bond interest and principal payments. SHSU had no insurance claims made during the fiscal year ended August 31, 2018 .
Motor Vehicle The Texas Motor Vehicle Safety Responsibility Act requires that every non-governmental vehicle operated on a State highway be insured for minimum limits of liability in the amount of $30,000/$60,000 bodily injury and $25,000 property damage. All vehicles owned and/or leased by SHSU are covered by a commercial insurance policy specifically customized for the TSUS, which provides coverage to the extent of $1,000,000 combined single liability. The coverage exceeds the extent of the waivers of State immunity
UNAUDITED
26
Sam Houston State University Notes to the Financial Statements
For the Year Ended August 31, 2018
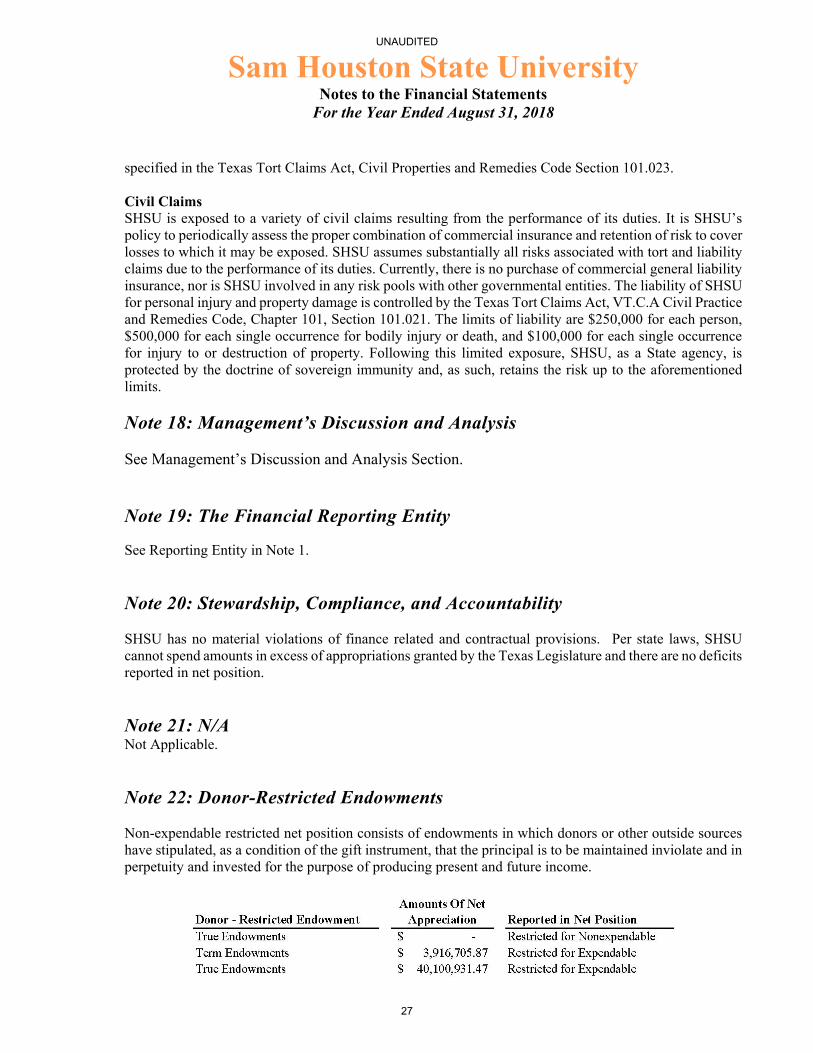
specified in the Texas Tort Claims Act, Civil Properties and Remedies Code Section 101.023.
Civil Claims SHSU is exposed to a variety of civil claims resulting from the performance of its duties. It is SHSU’s policy to periodically assess the proper combination of commercial insurance and retention of risk to cover losses to which it may be exposed. SHSU assumes substantially all risks associated with tort and liability claims due to the performance of its duties. Currently, there is no purchase of commercial general liability insurance, nor is SHSU involved in any risk pools with other governmental entities. The liability of SHSU for personal injury and property damage is controlled by the Texas Tort Claims Act, VT.C.A Civil Practice and Remedies Code, Chapter 101, Section 101.021. The limits of liability are $250,000 for each person, $500,000 for each single occurrence for bodily injury or death, and $100,000 for each single occurrence for injury to or destruction of property. Following this limited exposure, SHSU, as a State agency, is protected by the doctrine of sovereign immunity and, as such, retains the risk up to the aforementioned limits.
Note 18: Management’s Discussion and Analysis
See Management’s Discussion and Analysis Section.
Note 19: The Financial Reporting Entity
See Reporting Entity in Note 1.
Note 20: Stewardship, Compliance, and Accountability
SHSU has no material violations of finance related and contractual provisions. Per state laws, SHSU cannot spend amounts in excess of appropriations granted by the Texas Legislature and there are no deficits reported in net position.
Note 21: N/ANot Applicable.
Note 22: Donor-Restricted Endowments
Non-expendable restricted net position consists of endowments in which donors or other outside sources have stipulated, as a condition of the gift instrument, that the principal is to be maintained inviolate and in perpetuity and invested for the purpose of producing present and future income.
UNAUDITED
27

Sam Houston State University Notes to the Financial Statements
For the Year Ended August 31, 2018
The amount reported as Net Appreciation represents net appreciation on investments of donor restricted endowments that are available for authorization for expenditure. Pursuant to the Uniform Prudent Management of Institutional Funds Act (Property Code Chapter 163.001), net appreciation, realized and unrealized, in the fair market value of the endowment assets in excess of historical dollar value of the gifts may be distributed to the extent prudent.
The fiscal year 2018 SHSU spending policy for endowments was to distribute as much of the total return allowable while maintaining the principle investment objective of protecting the real value of the endowment corpus.
Note 23: Extraordinary and Special Items
Not Applicable. SHSU had no special or extraordinary items to report for the fiscal year ended August 31, 2018.
Note 24: Disaggregation of Receivable and Payable Balances
Balances of receivables and payables reported on the Statement of Net Position are not obscured by aggregation. There are no significant receivable balances expected to be collected beyond one year of the date of the financial statements. Accounts receivable for tuition are presented net of allowance for doubtful accounts of $9,596,863.61.
Note 25: Termination Benefits
Not Applicable. During the fiscal year ended August 31, 2018, SHSU did not provide termination benefits.
Note 26: Segment Information
Not applicable. SHSU has no segments to report.
Note 27: Service Concession Arrangements
Not applicable. SHSU has no service concession arrangements to report as of August 31, 2018.
Note 28: Deferred Outflows of Resources and Deferred Inflows of Resources
Not applicable. SHSU has no deferred outflows or inflows of resources to report as of August 31, 2018.
Note 29: Troubled Debt Restructuring
Not applicable. SHSU has no troubled debt restructuring to report as of August 31, 2018.
UNAUDITED
28

Sam Houston State University Notes to the Financial Statements
For the Year Ended August 31, 2018
Note 30: Non-Exchange Financial Guarantees
Not applicable. SHSU has no non-exchange financial guarantees to report as of August 31, 2018.
Note 31: Tax Abatements
Not applicable. SHSU has no tax abatements to report as of August 31, 2018.
Note 32: Fund Balances
Not applicable.
UNAUDITED
29

State of Texas — Annual Financial Reporting
Schedule of Expenditures of Federal Awards(SEFA)
Agency 753 - Sam Houston State UniversitySchedule 1A
For the Fiscal Year Ended August 31, 2018
Note: This agency's records have not yet been certified.Pass-through From Pass-through To
Federal Grantor/Pass-through Grantor/Program Title
CFDANumber
NSE Name/Identifying Number
Agy/UnivNo
Agencies or Universities
Amount
Non-State EntitiesAmount
DirectProgramAmount
TotalPT From andDirect Prog.
Amount
Agy/UnivNo.
Agencies or Universities
Amount
Non-State Entities Amount
ExpendituresAmount
TotalPT To and
ExpendituresAmount
Executive Office of the President
Direct Programs:
High Intensity Drug Trafficking Areas Program 95.001 876,392.34 876,392.34 876,392.34 876,392.34
Totals - Executive Office of the President 0.00 0.00 876,392.34 876,392.34 0.00 0.00 876,392.34 876,392.34
Institute of Museum and Library Services
Direct Programs:Grants to States 45.310 11,222.64 11,222.64 11,222.64 11,222.64
Pass-Through From:Grants to States 45.310 2,401.99 2,401.99 2,401.99
Pass-Through From:
Texas State Library and Archives Commission 306 2,401.99
Totals - Institute of Museum and Library Services 2,401.99 0.00 11,222.64 13,624.63 0.00 0.00 13,624.63 13,624.63
National Science FoundationSocial, Behavioral, and Economic Sciences 47.075 Arizona State University/
270520 2,532.37 2,532.37 2,532.37 2,532.37
Direct Programs:
Social, Behavioral, and Economic Sciences 47.075 48,264.22 48,264.22 48,264.22 48,264.22
Totals - National Science Foundation 0.00 2,532.37 48,264.22 50,796.59 0.00 0.00 50,796.59 50,796.59
Small Business Administration
Pass-Through From:
Small Business Development Centers 59.037 136,013.61 136,013.61 136,013.61
Pass-Through From:
University of Houston 730 136,013.61
Totals - Small Business Administration 136,013.61 0.00 0.00 136,013.61 0.00 0.00 136,013.61 136,013.61
U.S. Department of the Interior
Direct Programs:U.S. Geological Survey Research and Data Collection 15.808 23,443.12 23,443.12 23,443.12 23,443.12
Cooperative Research and Training Programs - Resources of the National Park System 15.945 6,450.88 6,450.88 6,450.88 6,450.88
Totals - U.S. Department of the Interior 0.00 0.00 29,894.00 29,894.00 0.00 0.00 29,894.00 29,894.00
U.S. Department of AgricultureAgriculture and Food Research Initiative (AFRI) 10.310 Montana State Library/
27077 9,758.95 9,758.95 9,758.95 9,758.95
University of Tennessee/27072
2,392.84 2,392.84 2,392.84 2,392.84
Capacity Building for Non-Land Grant Colleges of Agriculture (NLGCA) 10.326 Middle Tennessee State University/270580
50,619.12 50,619.12 50,619.12 50,619.12
Direct Programs:
Sam Houston State UniversitySchedule 1AFor the Fiscal Year Ended August 31, 2018
UNAUDITED
30

Plant and Animal Disease, Pest Control, and Animal Care 10.02534,519.2534,519.2534,519.2534,519.25
Agriculture and Food Research Initiative (AFRI) 10.31033,068.3633,068.365,912.4427,155.9233,068.36
Pass-Through From:Sustainable Agriculture Research and Education 10.2152,661.722,661.722,661.72
Pass-Through From:
Texas A&M AgriLife Extension Service5552,661.72
Totals - U.S. Department of Agriculture 2,661.7262,770.9167,587.61133,020.240.005,912.44127,107.80133,020.24
U.S. Department of EducationSupporting Effective Instruction State Grants (formely Improving Teacher Quality State Grants)
84.367National Writing Project/280770
13,367.3113,367.3113,367.3113,367.31
Pass-Through From:Charter Schools 84.282254,416.40254,416.40254,416.40
Pass-Through From:
Texas Education Agency701254,416.40
Supporting Effective Instruction State Grants (formely Improving Teacher Quality State Grants)
84.36734,468.9834,468.9834,468.98
Pass-Through From:
Texas Higher Education Coordinating Board78134,468.98
Totals - U.S. Department of Education 288,885.3813,367.310.00302,252.690.000.00302,252.69302,252.69
U.S. Department of Health and Human ServicesDrug Abuse and Addiction Research Programs 93.279CASAColumbia/
280600 32,264.0432,264.0432,264.0432,264.04
Children's Justice Grants to States 93.643Texas Center for the Judiciary/280860
78,998.4978,998.4978,998.4978,998.49
Totals - U.S. Department of Health and Human Services 0.00111,262.530.00111,262.530.000.00111,262.53111,262.53
U.S. Department of Justice
Direct Programs:OVW Research and Evaluation Program 16.02669,817.0669,817.0669,817.0669,817.06
National Institute of Justice W.E.B. DuBois Fellowship Program 16.56650,593.7950,593.7921,665.0728,928.7250,593.79
Corrections Training and Staff Development 16.60134,476.1834,476.1834,476.1834,476.18
Special Data Collections and Statistical Studies 16.73428,411.4028,411.4028,411.4028,411.40
Pass-Through From:
Crime Victim Assistance 16.57536,733.9136,733.9136,733.91
Pass-Through From:
Governor - Fiscal30036,733.91
Edward Byrne Memorial Justice Assistance Grant Program 16.738254,867.96254,867.96254,867.96
Pass-Through From:
Governor - Fiscal300254,867.96
Totals - U.S. Department of Justice 291,601.870.00183,298.43474,900.300.0021,665.07453,235.23474,900.30
U.S. Department of State
Direct Programs:Criminal Justice Systems 19.70376,248.7676,248.7676,248.7676,248.76
Totals - U.S. Department of State 0.000.0076,248.7676,248.760.000.0076,248.7676,248.76
Research & Development Cluster
National Science Foundation
Direct Programs:Mathematical and Physical Sciences 47.04955,754.4855,754.4855,754.4855,754.48
Geosciences 47.0502,674.772,674.772,674.772,674.77
Computer and Information Science and Engineering 47.07035,110.8335,110.8335,110.8335,110.83
Biological Sciences 47.07448,999.6648,999.6648,999.6648,999.66
Education and Human Resources 47.076230,575.27230,575.27230,575.27230,575.27
Totals - National Science Foundation 0.000.00373,115.01373,115.010.000.00373,115.01373,115.01
U.S. Department of the Interior
UNAUDITED
31
Sam Houston State UniversitySchedule 1AFor the Fiscal Year Ended August 31, 2018

Pass-Through From:
SECURE Water Act - Research Agreements 15.560 10,608.99 10,608.99 10,608.99
Pass-Through From:
University of North Texas Health Science Center at Fort Worth 763 10,608.99
State Wildlife Grants 15.634 63,718.94 63,718.94 63,718.94
Pass-Through From:
Parks and Wildlife Department 802 63,718.94
Totals - U.S. Department of the Interior 74,327.93 0.00 0.00 74,327.93 0.00 0.00 74,327.93 74,327.93
U.S. Department of Agriculture
Pass-Through From:
Higher Education - Institution Challenge Grants Program 10.217 22,476.26 22,476.26 22,476.26
Pass-Through From:
Texas A&M AgriLife Research 556 22,476.26
Integrated Programs 10.303 24,934.07 24,934.07 24,934.07
Pass-Through From:
Texas A&M AgriLife Research 556 24,934.07
Totals - U.S. Department of Agriculture 47,410.33 0.00 0.00 47,410.33 0.00 0.00 47,410.33 47,410.33
U.S. Department of JusticeNational Institute of Justice Research, Evaluation, and Development Project Grants 16.560 Arizona State University/
270490 131,420.20 131,420.20 130,999.59 420.61 131,420.20
Arizona State University/27068
84,836.78 84,836.78 84,836.78 84,836.78
Florida State University/27062
49,056.59 49,056.59 49,056.59 49,056.59
McCrone Research Institute, Inc./280730
24,177.09 24,177.09 24,177.09 24,177.09
Direct Programs:
National Institute of Justice Research, Evaluation, and Development Project Grants 16.560 225,434.25 225,434.25 6,377.58 219,320.19 225,434.25
Pass-Through To:
Texas State University 754 -263.52
National Institute of Justice Research, Evaluation, and Development Project Grants 16.560 291,873.41 291,873.41 195,162.38 291,873.41
Pass-Through To:
University of North Texas Health Science Center at Fort Worth 763 96,711.03
Criminal Justice Research and Development Graduate Research Fellowships 16.562 180,902.75 180,902.75 180,902.75 180,902.75
Totals - U.S. Department of Justice 0.00 289,490.66 698,210.41 987,701.07 96,447.51 137,377.17 753,876.39 987,701.07
U.S. Department of Transportation
Pass-Through From:
National Priority Safety Programs 20.616 137,054.45 137,054.45
Pass-Through From:
Texas Department of Transportation 601 137,054.45
Pass-Through To:
University of Texas at Dallas 738 137,054.45
Totals - U.S. Department of Transportation 137,054.45 0.00 0.00 137,054.45 137,054.45 0.00 0.00 137,054.45
Highway Safety Cluster
U.S. Department of Transportation
Pass-Through From:
National Priority Safety Programs 20.616 709,605.28 709,605.28 709,605.28
Pass-Through From:
Texas Department of Transportation 601 709,605.28
Totals - U.S. Department of Transportation 709,605.28 0.00 0.00 709,605.28 0.00 0.00 709,605.28 709,605.28
Special Education (IDEA) Cluster
U.S. Department of Education
Pass-Through From:Special Education Grants to States 84.027 7,499.73 7,499.73 7,499.73
UNAUDITED
32
Sam Houston State UniversitySchedule 1AFor the Fiscal Year Ended August 31, 2018

Pass-Through From:
Texas Education Agency7017,499.73
Special Education Preschool Grants 84.173134.88134.88134.88
Pass-Through From:
Texas Education Agency701134.88
Totals - U.S. Department of Education 7,634.610.000.007,634.610.000.007,634.617,634.61
Student Financial Assistance Cluster
U.S. Department of Education
Direct Programs:Federal Supplemental Educational Opportunity Grants 84.007693,910.50693,910.50693,910.50693,910.50
Federal Work-Study Program 84.033650,697.57650,697.57650,697.57650,697.57
Federal Perkins Loan Program_Federal Capital Contributions 84.03876,551.0076,551.0076,551.0076,551.00
Federal Pell Grant Program 84.06336,438,149.9036,438,149.9036,438,149.9036,438,149.90
Federal Direct Student Loans 84.268119,297,243.00119,297,243.00119,297,243.00119,297,243.00
Teacher Education Assistance for College and Higher Education Grants (TEACH Grants) 84.379113,839.00113,839.00113,839.00113,839.00
Totals - U.S. Department of Education 0.000.00157,270,390.97157,270,390.970.000.00157,270,390.97157,270,390.97
TRIO Cluster
U.S. Department of Education
Direct Programs:TRIO Student Support Services 84.042254,267.14254,267.14254,267.14254,267.14
TRIO McNair Post-Baccalaureate Achievement 84.217231,461.97231,461.97231,461.97231,461.97
Totals - U.S. Department of Education 0.000.00485,729.11485,729.110.000.00485,729.11485,729.11
Total Expenditures of Federal Awards 1,697,597.17479,423.78160,120,353.50162,297,374.45233,501.96164,954.68161,898,917.81162,297,374.45
UNAUDITED
33
Sam Houston State UniversitySchedule 1AFor the Fiscal Year Ended August 31, 2018

Sam Houston State University Notes to the Financial Statements
For the Year Ended August 31, 2018
Note 1 – Non-Monetary Assistance
Donation of Federal Surplus Property
-$
Total Non-Monetary Assistance -$
SHSU does not show any Non-Monetary Assistance for FY18.
UNAUDITED
34

Sam Houston State University Notes to the Financial Statements
For the Year Ended August 31, 2018
Note 2 – Reconciliation Per Combined Governmental Operating Statement Statement of Activities and Proprietary Statement of Changes in Revenues, Expenses, & Net Assets
UNAUDITED
35

Sam Houston State University Notes to the Financial Statements
For the Year Ended August 31, 2018
Note 3a – Student Loans Processed and Administrative Costs Recovered
UNAUDITED
36

Sam Houston State University Notes to the Financial Statements
For the Year Ended August 31, 2018
Note 3b- Federally Funded Loans Processed and Administrative Costs Recovered
UNAUDITED
37

Sam Houston State University Notes to the Financial Statements
For the Year Ended August 31, 2018
Schedule 1B State Pass-Through Grants from Other State Agencies
UNAUDITED
38

Sam Houston State University Notes to the Financial Statements
For the Year Ended August 31, 2018
Schedule 2A Miscellaneous Bond Information For the Year Ended August 31, 2018
Schedule Not Used
UNAUDITED
39

Sam Houston State University Notes to the Financial Statements
For the Year Ended August 31, 2018
Schedule 2B Changes in Bond Indebtedness For the Year Ended August 31, 2018
Schedule Not Used
UNAUDITED
40

Sam Houston State University Notes to the Financial Statements
For the Year Ended August 31, 2018
Schedule 2C Debt Service Requirements For the Year Ended August 31, 2018
Schedule Not Used
UNAUDITED
41
Sam Houston State University Notes to the Financial Statements
For the Year Ended August 31, 2018
Schedule 2D Analysis of Funds Available for Debt Service For the Year Ended August 31, 2018
Business Type Activities General Obligation Bonds
Schedule Not Used
Business Type Activities Revenue Bonds
Schedule Not Used
UNAUDITED
42

Sam Houston State University Notes to the Financial Statements
For the Year Ended August 31, 2018
Schedule 2E Defeased Bonds Outstanding For the Year Ended August 31, 2018
Schedule Not Used
UNAUDITED
43

Sam Houston State University Notes to the Financial Statements
For the Year Ended August 31, 2018
Schedule 2F Early Extinguishment and Refunding For the Year Ended August 31, 2018
Business Type Activities General Obligation Bonds
Schedule Not Used
Business Type Activities Revenue Bonds
Schedule Not Used
UNAUDITED
44

Sam Houston State University Notes to the Financial Statements
For the Year Ended August 31, 2018
Schedule 3 Reconciliation of Cash in State Treasury
UNAUDITED
45

Sam Houston State University Notes to the Financial Statements
For the Year Ended August 31, 2018
Schedule 4 Higher Education Assistance Fund
UNAUDITED
46