Embed Size (px)
Citation preview

141 Lavaca Street, San Antonio, Bexar County, TX 78210 • www.saisd.net
COMPREHENSIVE
Annual Financial Report FOR THE YEAR ENDED JUNE 30, 2012
Sa
n A
nto
nio
Ind
ep
en
de
nt S
ch
oo
l Dis
trict
COMPREHENSIVE ANNUAL FINANCIAL REPORT
SAN ANTONIO INDEPENDENT SCHOOL DISTRICT
San Antonio, Texas
For the Ten Months Ended June 30, 2012
Prepared by the
Financial Services Division
Larry A. Garza
Associate Superintendent of Financial Services, Business Operations and Food Services

THIS PAGE LEFT BLANK INTENTIONALLY

-i-
SAN ANTONIO INDEPENDENT SCHOOL DISTRICT San Antonio, Texas
COMPREHENSIVE ANNUAL FINANCIAL REPORT
FOR THE TEN MONTHS ENDED JUNE 30, 2012
TABLE OF CONTENTS PAGE
NO.
EXHIBIT INTRODUCTORY SECTION
Table of Contents ....................................................................................................................
i – iv
Letter of Transmittal ...............................................................................................................
v – xv
Certificate of Achievement for Excellence in Financial Reporting (GFOA) .........................
xvi
Certificate from the Association of School Business Officials (ASBO) ................................
xvii
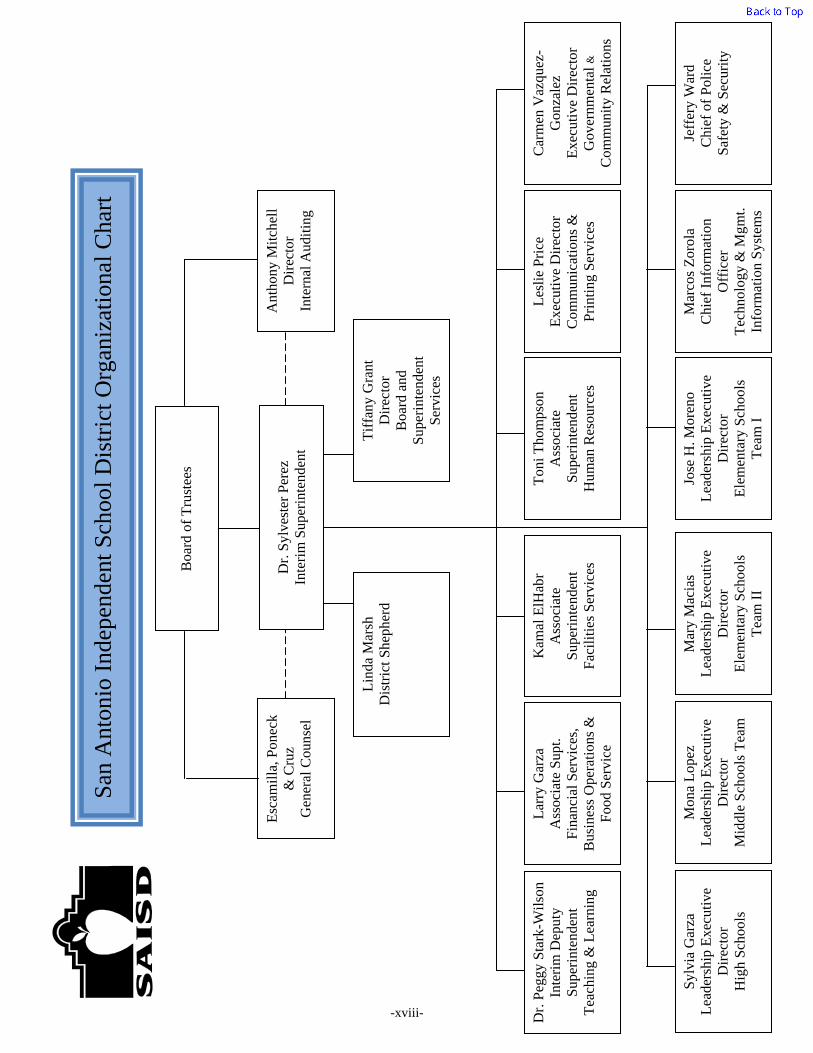
Administrative Organizational Chart ......................................................................................
xviii
List of Principal Officials .......................................................................................................
xix
Certificate of Board ................................................................................................................
xx
FINANCIAL SECTION
Independent Auditor’s Report ................................................................................................
1-2
Management’s Discussion and Analysis ................................................................................
3-12
Basic Financial Statements
Government–Wide Financial Statements
Statement of Net Assets .....................................................................................................
13 A-1
Statement of Activities .......................................................................................................
14 B-1
Governmental Funds Financial Statements
Balance Sheet – Governmental Funds ................................................................................
15-16 C-1
Reconciliation of the Governmental Funds Balance Sheet
to the Statement of Net Assets .......................................................................................
17
C-2
Statement of Revenues, Expenditures, and Changes in Fund Balances - Governmental Funds .....................................................................................................
18-19
C-3
Reconciliation of the Governmental Funds Statement of Revenues, Expenditures, and Changes in Fund Balances to the Statement of Activities ......................................
20
C-4
Statement of Fund Net Assets – Proprietary Funds ...........................................................
21 D-1
Statement of Revenues, Expenses, and Changes in Fund Net Assets – Proprietary Funds
22 D-2
Statement of Cash Flows – Proprietary Funds ...................................................................
23 D-3
Statement of Fiduciary Assets and Liabilities ....................................................................
24 E-1
Notes to the Financial Statements ......................................................................................
25-59
(Continued)
-ii-
SAN ANTONIO INDEPENDENT SCHOOL DISTRICT San Antonio, Texas
COMPREHENSIVE ANNUAL FINANCIAL REPORT
FOR THE TEN MONTHS ENDED JUNE 30, 2012
TABLE OF CONTENTS
PAGE NO.
EXHIBIT
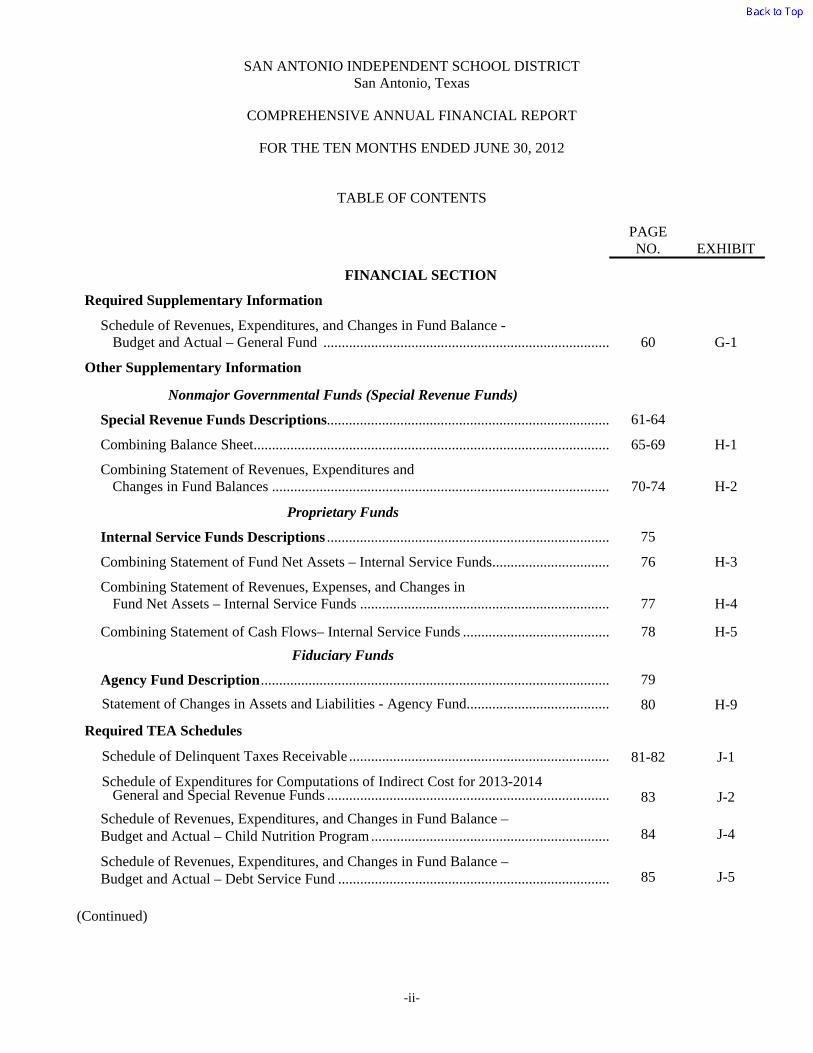
FINANCIAL SECTION Required Supplementary Information
Schedule of Revenues, Expenditures, and Changes in Fund Balance -
Budget and Actual – General Fund ..............................................................................
60
G-1 Other Supplementary Information
Nonmajor Governmental Funds (Special Revenue Funds)
Special Revenue Funds Descriptions.............................................................................
61-64
Combining Balance Sheet .................................................................................................
65-69 H-1
Combining Statement of Revenues, Expenditures and
Changes in Fund Balances ............................................................................................
70-74
H-2
Proprietary Funds
Internal Service Funds Descriptions .............................................................................
75
Combining Statement of Fund Net Assets – Internal Service Funds ................................
76 H-3
Combining Statement of Revenues, Expenses, and Changes in Fund Net Assets – Internal Service Funds ....................................................................
77
H-4
Combining Statement of Cash Flows– Internal Service Funds ........................................
78 H-5
Fiduciary Funds
Agency Fund Description ...............................................................................................
79
Statement of Changes in Assets and Liabilities - Agency Fund.......................................
80 H-9
Required TEA Schedules
Schedule of Delinquent Taxes Receivable .......................................................................
81-82 J-1
Schedule of Expenditures for Computations of Indirect Cost for 2013-2014
General and Special Revenue Funds .............................................................................
83
J-2
Schedule of Revenues, Expenditures, and Changes in Fund Balance – Budget and Actual – Child Nutrition Program .................................................................
84
J-4
Schedule of Revenues, Expenditures, and Changes in Fund Balance – Budget and Actual – Debt Service Fund ..........................................................................
85
J-5
(Continued)

-iii-
SAN ANTONIO INDEPENDENT SCHOOL DISTRICT San Antonio, Texas
COMPREHENSIVE ANNUAL FINANCIAL REPORT
FOR THE TEN MONTHS ENDED JUNE 30, 2012
TABLE OF CONTENTS
PAGE NO.
EXHIBIT
STATISTICAL SECTION Statistical Section Overview ...............................................................................................
86
Financial Trend Information
Government-Wide Information
Net Assets by Component – Last Ten Years ....................................................................
87
Governmental Activities Expenses & Program Revenues – Last Ten Years ...................
88-89
General Revenues and Changes in Net Assets - Last Ten Years ......................................
90-91
Fund Information
Fund Balances – Governmental Funds – Last Ten Years .................................................
92-95
Governmental Fund Revenues by Source - Last Ten Years .............................................
96-97
Governmental Fund Expenditures by Function - Last Ten Years ....................................
98-99
Governmental Funds Other Sources, Uses and Changes in Fund Balances – Last Ten Years ...............................................................................................................
100-101
Governmental Fund Expenditures by Function Per Average Daily Attendance –
Last Ten Years ...............................................................................................................
102-103
Revenue Capacity Information
Assessed and Estimated Actual Value of Property – Last Ten Years ..............................
104
Property Tax Levies and Collections - Last Ten Years ....................................................
105
Allocation of Property Tax Rates and Levies – Last Ten Years.......................................
106
Property Tax Rates – Direct and Overlapping Governments (Per $100
Assessed Valuation) – Last Ten Years ..........................................................................
107
Principal Property Taxpayers – Current Year and Nine Years Prior ................................
108-109
Debt Capacity Information
Outstanding Debt by Type – Last Ten Years ...................................................................
110-111
Direct and Overlapping Debt – General Obligation Bonds ..............................................
112
Computation of Legal Debt Margin - Last Ten Years ......................................................
113-114
Ratio of Net General Obligation Bonded Debt to Estimated Actual Value
And Per Average Daily Membership – Last Ten Years ................................................
115
Ratio of Annual Debt Service for General Bonded Debt to
Total General Fund Expenditures – Last Ten Years .....................................................
116
(Continued)
-iv-
SAN ANTONIO INDEPENDENT SCHOOL DISTRICT San Antonio, Texas
COMPREHENSIVE ANNUAL FINANCIAL REPORT
FOR THE TEN MONTHS ENDED JUNE 30, 2012
TABLE OF CONTENTS
PAGE NO.
EXHIBIT
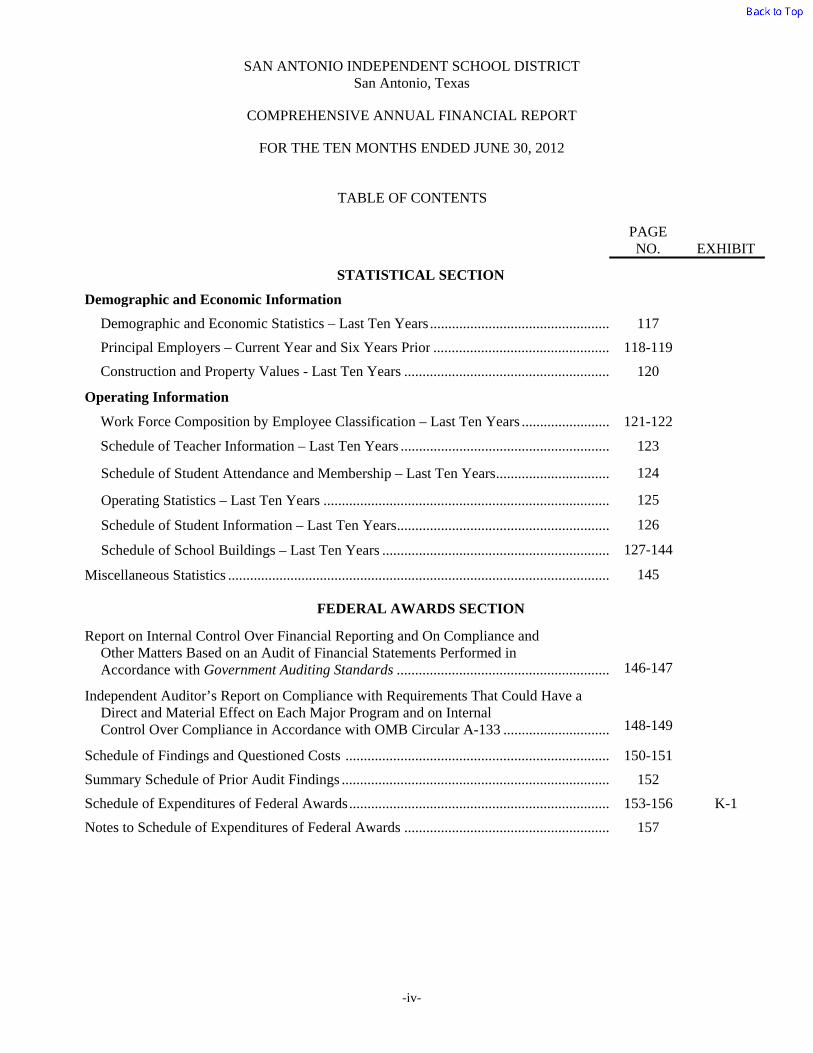
STATISTICAL SECTION Demographic and Economic Information
Demographic and Economic Statistics – Last Ten Years .................................................
117
Principal Employers – Current Year and Six Years Prior ................................................
118-119
Construction and Property Values - Last Ten Years ........................................................
120
Operating Information
Work Force Composition by Employee Classification – Last Ten Years ........................
121-122
Schedule of Teacher Information – Last Ten Years .........................................................
123
Schedule of Student Attendance and Membership – Last Ten Years ...............................
124
Operating Statistics – Last Ten Years ..............................................................................
125
Schedule of Student Information – Last Ten Years ..........................................................
126
Schedule of School Buildings – Last Ten Years ..............................................................
127-144
Miscellaneous Statistics ........................................................................................................
145
FEDERAL AWARDS SECTION
Report on Internal Control Over Financial Reporting and On Compliance and
Other Matters Based on an Audit of Financial Statements Performed in Accordance with Government Auditing Standards ..........................................................
146-147
Independent Auditor’s Report on Compliance with Requirements That Could Have a
Direct and Material Effect on Each Major Program and on Internal Control Over Compliance in Accordance with OMB Circular A-133 .............................
148-149
Schedule of Findings and Questioned Costs ........................................................................
150-151
Summary Schedule of Prior Audit Findings .........................................................................
152
Schedule of Expenditures of Federal Awards .......................................................................
153-156 K-1
Notes to Schedule of Expenditures of Federal Awards ........................................................
157


-xvi-

THIS PAGE LEFT BLANK INTENTIONALLY
-xvii-

THIS PAGE LEFT BLANK INTENTIONALLY
B
oard
of
Tru
stee
s
Dr.
Syl
vest
er P
erez
In
teri
m S
uper
inte
nden
t
Lin
da M
arsh
D
istr
ict S
heph
erd
Tif
fany
Gra
nt
Dir
ecto
r
Boa
rd a
nd
Sup
erin
tend
ent
Ser
vice
s
Esc
amil
la, P
onec
k &
Cru
z
Gen
eral
Cou
nsel
Dr.
Peg
gy S
tark
-Wil
son
Inte
rim
Dep
uty
Sup
erin
tend
ent
Tea
chin
g &
Lea
rnin
g
Lar
ry G
arza
A
ssoc
iate
Sup
t. F
inan
cial
Ser
vice
s,
Bus
ines
s O
pera
tion
s &
F
ood
Ser
vice
Kam
al E
lHab
r A
ssoc
iate
S
uper
inte
nden
t F
acil
itie
s S
ervi
ces
Ton
i Tho
mps
on
Ass
ocia
te
Sup
erin
tend
ent
Hum
an R
esou
rces
Les
lie
Pri
ce
Exe
cuti
ve D
irec
tor
Com
mun
icat
ions
&
Pri
ntin
g S
ervi
ces
Car
men
Vaz
quez
-G
onza
lez
E
xecu
tive
Dir
ecto
r G
over
nmen
tal &
C
omm
unit
y R
elat
ions
Syl
via
Gar
za
Lea
ders
hip
Exe
cuti
ve
Dir
ecto
r
Hig
h S
choo
ls
Mon
a L
opez
L
eade
rshi
p E
xecu
tive
D
irec
tor
M
iddl
e S
choo
ls T
eam
Mar
y M
acia
s L
eade
rshi
p E
xecu
tive
D
irec
tor
E
lem
enta
ry S
choo
ls
Tea
m I
I
Jose
H. M
oren
o
Lea
ders
hip
Exe
cuti
ve
Dir
ecto
r
Ele
men
tary
Sch
ools
T
eam
I
Mar
cos
Zor
ola
C
hief
Inf
orm
atio
n O
ffic
er
Tec
hnol
ogy
& M
gmt.
Info
rmat
ion
Sys
tem
s
Jeff
ery
War
d C
hief
of
Pol
ice
Saf
ety
& S
ecur
ity
San
Ant
onio
Ind
epen
dent
Sch
ool D
istr
ict O
rgan
izat
iona
l Cha
rt
Ant
hony
Mitc
hell
D
irec
tor
Inte
rnal
Aud
itin
g
-xviii-

THIS PAGE LEFT BLANK INTENTIONALLY

San Antonio Independent School District San Antonio, Texas
LIST OF PRINCIPAL OFFICIALS
For the Ten Months Ended June 30, 2012
Board of Trustees
Rubén D. Cuero Vice President
Olga M. Hernandez
Secretary
Adela R. Segovia Assistant Secretary
Ed Garza President
James Howard Trustee
Debra Guerrero
Trustee
Patti Radle Trustee
Superintendent and Cabinet Dr. Sylvester Perez
Interim Superintendent of Schools
Dr. Peggy Stark-Wilson Interim Deputy Superintendent
Teaching and Learning
Larry Garza Associate Superintendet
Financial Services, Business Operations & Food Services
Toni Thompson
Associate Superintendent Human Resources
Kamal ElHabr Associate Superintendent
Facilities Services
Jose H. Moreno Leadership Executive
Director Elementary School Team I
Mona Lopez Leadership Executive
Director Middle School Team
Leslie Price Executive Director
Communications & Printing Services
Mary Macias
Leadership Executive Director
Elementary School Team II
Jeff Ward Chief of Police
SAISD Police Dept
Marcos Zorola Chief Information Officer
Technology & Management Information Systems
Sylvia Garza
Leadership Executive Director
High School
Tiffany Grant Director
Board and Superintendent Services
Carmen Vasquez-Gonzalez
Executive Director Governmental & Community
Relations
-xix-

THIS PAGE LEFT BLANK INTENTIONALLY


THIS PAGE LEFT BLANK INTENTIONALLY


THIS PAGE LEFT BLANK INTENTIONALLY

THIS PAGE LEFT BLANK INTENTIONALLY
SAN ANTONIO INDEPENDENT SCHOOL DISTRICT
MANAGEMENT’S DISCUSSION AND ANALYSIS
3
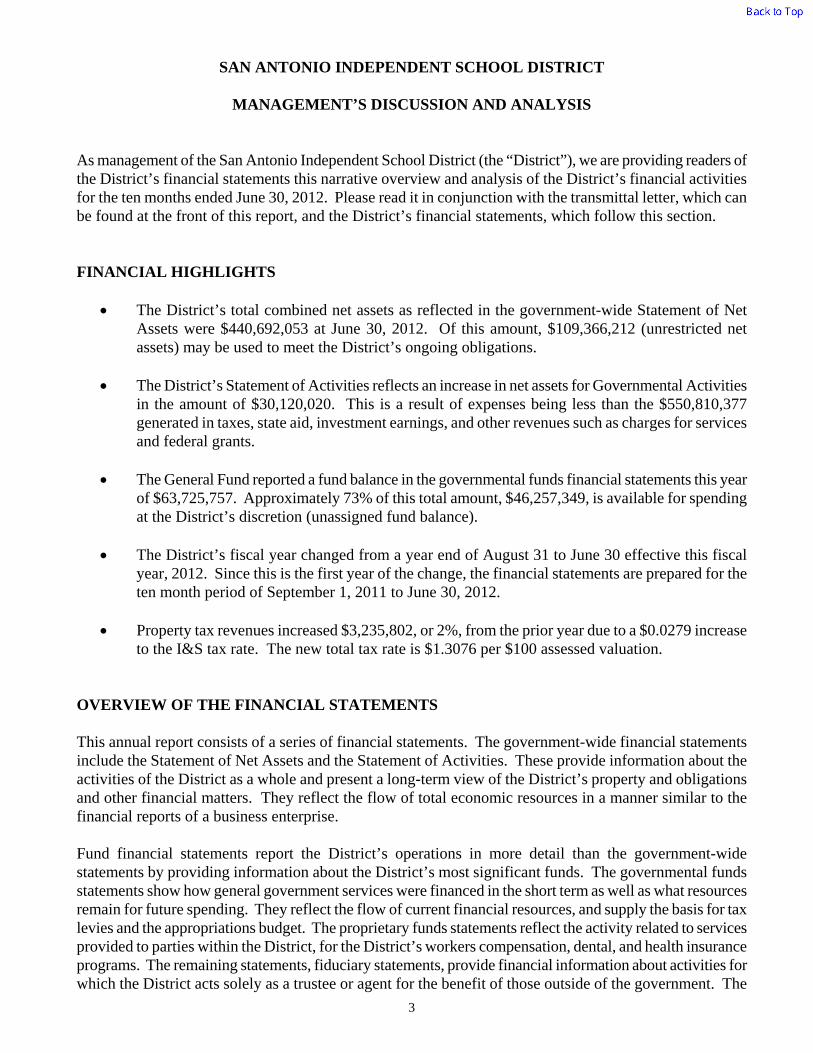
As management of the San Antonio Independent School District (the “District”), we are providing readers of the District’s financial statements this narrative overview and analysis of the District’s financial activities for the ten months ended June 30, 2012. Please read it in conjunction with the transmittal letter, which can be found at the front of this report, and the District’s financial statements, which follow this section. FINANCIAL HIGHLIGHTS
The District’s total combined net assets as reflected in the government-wide Statement of Net
Assets were $440,692,053 at June 30, 2012. Of this amount, $109,366,212 (unrestricted net assets) may be used to meet the District’s ongoing obligations.
The District’s Statement of Activities reflects an increase in net assets for Governmental Activities
in the amount of $30,120,020. This is a result of expenses being less than the $550,810,377 generated in taxes, state aid, investment earnings, and other revenues such as charges for services and federal grants.
The General Fund reported a fund balance in the governmental funds financial statements this year
of $63,725,757. Approximately 73% of this total amount, $46,257,349, is available for spending at the District’s discretion (unassigned fund balance).
The District’s fiscal year changed from a year end of August 31 to June 30 effective this fiscal
year, 2012. Since this is the first year of the change, the financial statements are prepared for the ten month period of September 1, 2011 to June 30, 2012.
Property tax revenues increased $3,235,802, or 2%, from the prior year due to a $0.0279 increase
to the I&S tax rate. The new total tax rate is $1.3076 per $100 assessed valuation.
OVERVIEW OF THE FINANCIAL STATEMENTS This annual report consists of a series of financial statements. The government-wide financial statements include the Statement of Net Assets and the Statement of Activities. These provide information about the activities of the District as a whole and present a long-term view of the District’s property and obligations and other financial matters. They reflect the flow of total economic resources in a manner similar to the financial reports of a business enterprise. Fund financial statements report the District’s operations in more detail than the government-wide statements by providing information about the District’s most significant funds. The governmental funds statements show how general government services were financed in the short term as well as what resources remain for future spending. They reflect the flow of current financial resources, and supply the basis for tax levies and the appropriations budget. The proprietary funds statements reflect the activity related to services provided to parties within the District, for the District’s workers compensation, dental, and health insurance programs. The remaining statements, fiduciary statements, provide financial information about activities for which the District acts solely as a trustee or agent for the benefit of those outside of the government. The
SAN ANTONIO INDEPENDENT SCHOOL DISTRICT
MANAGEMENT’S DISCUSSION AND ANALYSIS
4
notes to the financial statements provide narrative explanations or additional data needed for full disclosure in the government-wide statements or the fund financial statements. The combining statements for non-major governmental funds and the combining statements for internal service funds contain even more information about the District’s individual Special Revenue and Permanent Funds and Internal Service Funds, respectively. The Statement of Changes in Assets and Liabilities for the agency fund is also included. These combining statements are not required by Texas Education Agency (TEA). The sections labeled Required TEA Schedules and Federal Awards Section contain data used by monitoring or regulatory agencies for assurance that the District is using funds supplied in compliance with the terms of grants. Reporting the District as a Whole The Statement of Net Assets and the Statement of Activities The primary objective of the analysis is to show whether the District is better or worse off as a result of the year’s activities. The Statement of Net Assets includes all of the District’s assets and liabilities, while the Statement of Activities includes all the revenues and expenses generated by the District’s operations during the year. These statements apply the same basis of accounting used by most private sector companies, that of full accrual. All of the current year’s revenues and expenses are taken into account regardless of when cash is received or paid. The District’s revenues are divided into one of the following two categories: (1) those provided by outside parties who share the costs of some programs, such as tuition received from students from outside the District and grants provided by the U.S. Department of Education to assist children with disabilities or children from disadvantaged backgrounds (program revenues), or (2) general revenues provided by the taxpayers or by TEA in equalization funding processes (general revenues). All assets of the District are reported whether they serve the current year or future years. Liabilities are considered regardless of whether they must be paid in the current or future years. These two statements report the District’s net assets and changes in them. The District’s net assets (the difference between assets and liabilities) provide one measure of the District’s financial health, or financial position. Over time, increases or decreases in the District’s net assets are one indicator of whether its financial health is improving or deteriorating. To fully assess the overall health of the District, however, you should consider nonfinancial factors as well; such as, changes in the District’s average daily attendance, its property tax base, and the condition of the District’s facilities. The District’s financial condition has improved as evidenced by the increase in government-wide net assets; however, the weighted average daily attendance (WADA) continues to decline. Note that the calculation for WADA was revised with the passage of Senate Bill 1 in 2011, resulting in a decline for the 2011-2012 school year that is more pronounced than it would have been without this funding revision. The continued decline in attendance has required the District to assess facilities and staffing allocations to ensure that the student’s needs are best served. While the District’s property tax base has enjoyed growth for most recent years, the state funding

SAN ANTONIO INDEPENDENT SCHOOL DISTRICT
MANAGEMENT’S DISCUSSION AND ANALYSIS
5
methodology, which is driven by the WADA, minimizes the benefit of additional increases in taxable property because it imposes a cap in state funding. Under the current funding system, the District can earn “revenue per WADA at compressed rate” of $5,101 in local maintenance and operations (M&O) tax revenue and state entitlements per WADA. For the 2011-2012 fiscal year, the M&O tax rate remained stable at $1.04 per $100 assessed valuation. Any changes in the M&O tax revenue will be offset by changes in funding from state entitlements; therefore, any revenue above the target revenue will have to come from increases in grants, investment revenues, or fees for programs and services. The District’s governmental activities are presented in the Statement of Net Assets and the Statement of Activities. All of the District’s basic services are reported as governmental activities; including, instruction, counseling, co-curricular activities, food services, transportation, maintenance, community services, and general administration. Property taxes, tuition, fees, and state and federal grants finance these activities. Reporting the District’s Funds Fund Financial Statements The fund financial statements begin at page 15, and provide detailed information about the District’s funds - not the District as a whole. Laws and contracts require the District to establish funds to account for grants received; such as, those received under the No Child Left Behind Act from the U.S. Department of Education. The District’s administration establishes many other funds to help it control and manage money for particular purposes (like campus activities).
Governmental Funds – The District reports most of its basic services in governmental funds. These use modified accrual accounting (a method that measures the receipt and disbursement of cash and all other financial assets that can be readily converted to cash) and they report balances that are available for future spending. The governmental fund statements provide a detailed short-term view of the District’s general operations and the basic services it provides. We describe the differences between governmental activities (reported in the Statement of Net Assets and the Statement of Activities) and governmental funds in reconciliation schedules following each of the governmental fund financial statements. All of the District’s activities for its governmental funds are reported in Exhibits C-1 and C-3.
Proprietary Funds – These funds report activities where the District charges users for services. There are two types of proprietary funds, enterprise and internal service funds. The District does not have any enterprise funds but has three internal service funds to account for its workers compensation, dental insurance, and health insurance programs. The District’s combined activities for its internal service funds are reported in Exhibits D-1, D-2, and D-3. These activities are also reported individually for each internal service fund in Exhibits H-3, H-4, and H-5.
SAN ANTONIO INDEPENDENT SCHOOL DISTRICT
MANAGEMENT’S DISCUSSION AND ANALYSIS
6
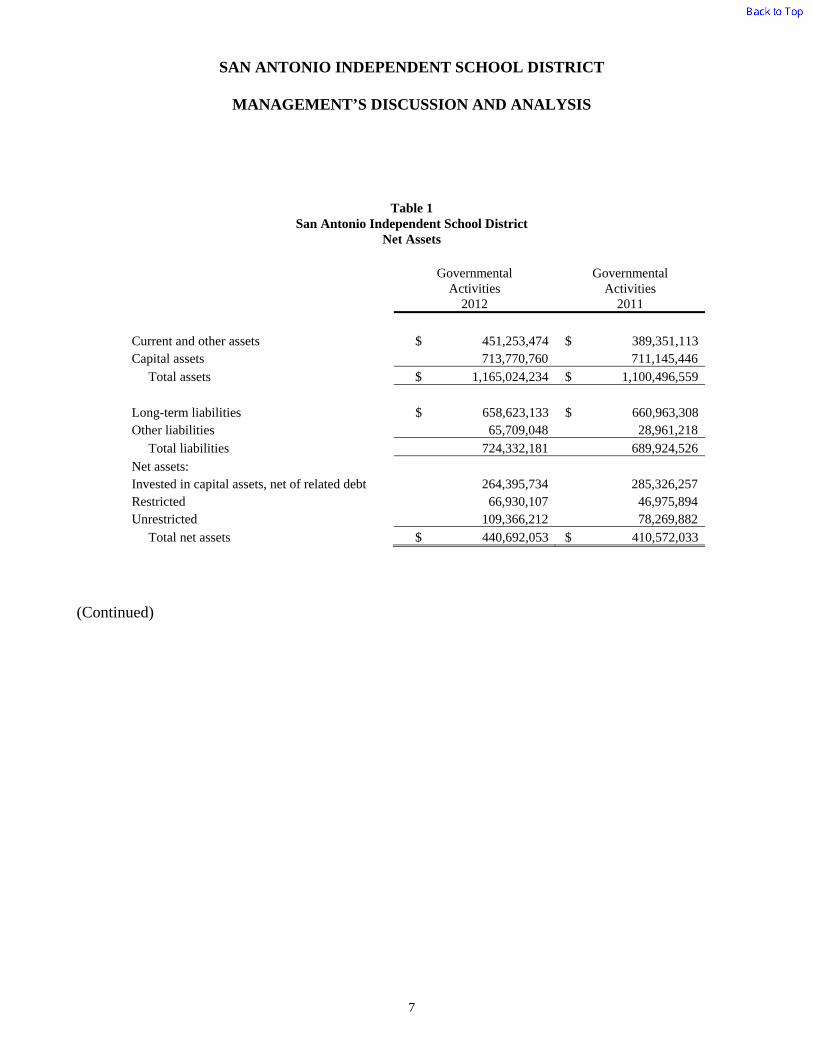
The District as Trustee Reporting the District’s Fiduciary Responsibilities The District is the trustee, or fiduciary, for money raised by student activities. Money raised by student activities is recorded within the District’s Agency Funds. All of the District’s fiduciary activities are reported in Exhibit E - 1 with the Statement of Fiduciary Assets and Liabilities. We exclude these resources from the District’s other financial statements because the District cannot use them to support its operations. The District is only responsible for ensuring that the assets reported in these funds are used for their intended purposes. GOVERNMENT-WIDE FINANCIAL ANALYSIS As noted earlier, net assets may serve over time as a useful indicator of a government’s financial position. In the case of the District, assets exceeded liabilities by $440,692,053 for the ten months ended June 30, 2012. Unrestricted net assets--the part of net assets that can be used to finance day-to-day operations without constraints established by debt covenants, enabling legislation, or other legal requirements represents $109,366,212 or about 25% of net assets as of June 30, 2012. At approximately 60% of total net assets, the largest portion of the District’s net assets is reflected in its investment in capital assets (e.g., land, buildings, furniture, equipment and vehicles), net of accumulated depreciation and less any related debt, that is still outstanding, used to acquire those assets. The District uses these capital assets to provide services to its student population and its employees. Consequently, these assets are not available for future spending. Although the District’s investment in its capital assets is reported net of related debt, it should be noted that the resources needed to repay this debt must be provided from other sources, since the capital assets themselves cannot be used to liquidate these liabilities. The following analysis focuses on the net assets (Table 1) and change in net assets (Table 2) of the District’s governmental activities. Net assets of the District’s governmental activities increased to $440,692,053 from $410,572,033. This $30,120,020 increase in governmental net assets as shown on the District’s Statement of Activities (Table 2) is primarily due to the net result of the following factors. First, the District had a $47,495,214 increase in amounts Due from Other Governments, which was primarily from $59,083,800 of Foundation payments for 2011-2012 not yet received, decreased by the absence of a $10,212,480 state revenue accrual for instruction days which existed in 2010-2011. Secondly, the District had a $12,491,252 increase in Cash and Investments due to August debt principal and interest payments not being made within the short fiscal year. Third, the District had a $7,331,447 increase in Property Taxes Receivable due to the short fiscal year, which reduced the collection period. Fourth, the District had a $10,615,614 increase in Construction in Progress due to bond projects. The District also had a $13,809,396 decrease in Buildings & Improvements, net of accumulated depreciation, due to an increase in disposals and decrease in completed construction. The change in fiscal year caused interest payable to increase by $10,673,479 since the August interest payment was not made during the fiscal year. The change in fiscal year also caused Accrued Wages Payable to increase by $23,904,476.
SAN ANTONIO INDEPENDENT SCHOOL DISTRICT
MANAGEMENT’S DISCUSSION AND ANALYSIS
7
Table 1 San Antonio Independent School District
Net Assets
Governmental Activities
2012
Governmental Activities
2011
Current and other assets $ 451,253,474 $ 389,351,113 Capital assets 713,770,760 711,145,446 Total assets $ 1,165,024,234 $ 1,100,496,559 Long-term liabilities $ 658,623,133 $ 660,963,308 Other liabilities 65,709,048 28,961,218 Total liabilities 724,332,181 689,924,526 Net assets: Invested in capital assets, net of related debt 264,395,734 285,326,257 Restricted 66,930,107 46,975,894 Unrestricted 109,366,212 78,269,882 Total net assets $ 440,692,053 $ 410,572,033
(Continued)

SAN ANTONIO INDEPENDENT SCHOOL DISTRICT
MANAGEMENT’S DISCUSSION AND ANALYSIS
8
Table 2 San Antonio Independent School District
Change in Net Assets
Governmental Activities
2012
Governmental Activities
2011
Revenues:
Program revenues:
Charges for services $ 4,105,517 $ 4,661,552
Operating grants and contributions 173,962,772 195,573,924
General revenues:
Maintenance and operations taxes 121,695,463 121,689,924
Debt service taxes 31,300,841 28,070,578
Grants and contributions not restricted 216,743,676 223,814,533
Investment Earnings 2,006,847 548,704
Other 995,261 2,269,572
Total revenues 550,810,377 576,628,787
Expenses:
Instruction and media services 291,211,163 316,874,439
Curriculum and instructional staff development 11,418,241 19,610,974
Instructional and school leadership 38,162,519 41,989,921
Student support services 37,742,397 41,850,030
Food services 36,742,766 34,332,561
Extracurricular activities 9,700,278 9,989,013
General administration 10,521,559 13,028,158
Facilities maintenance, security, and
data processing services 52,667,310 63,888,397
Community services 5,371,827 6,705,996
Debt services 25,406,086 23,460,926
SSA, JJAEP, and property tax appraisal services 1,746,211 1,074,982
Total expenses 520,690,357 572,805,397
Special Item – (Use) - (648,000)
Increase in Net Assets 30,120,020 3,175,390
Beginning Net Assets 410,572,033 407,396,643
Ending Net Assets $ 440,692,053 $ 410,572,033
Changes in Governmental Activities Net Assets are presented in Table 2. The District’s total Governmental Activities revenues are $550,810,377, a decrease of $25,818,410 from the previous year. This net change is primarily attributed to fiscal year 2012 being a 16% shorter fiscal year than 2011 as the following explanations detail. (1) Charges for Services decreased $556,035, or 12%, due to the fiscal year change, (2) Operating Grants and Contributions decreased $21,611,152, or 11%, due to the fiscal year change, (3) Grants and Contributions not Restricted decreased $7,070,857 primarily due to a decrease in Per Capita
SAN ANTONIO INDEPENDENT SCHOOL DISTRICT
MANAGEMENT’S DISCUSSION AND ANALYSIS
9
Apportionment and Foundation School Program Entitlements, (4) property tax revenue increased $3,235,802 due to a tax rate increase of $0.0279, (5) Investment Earnings increased $1,458,143 due to the investment of fiscal year 2011 bond proceeds, and (6) Other miscellaneous revenue decreased $1,274,311 due to a $476,298 decrease in penalties and interest revenue on tax collections and a $783,370 decrease in gain on asset disposals. The expenses for governmental activities totaled $520,690,357, a 9% decrease of $52,115,040 from the prior year. The majority of the expense decrease is in Instruction and Media Services; Facilities Maintenance, Security, and Data Processing Services; and Curriculum and Instructional Staff Development. The lower expenses are attributable to less activity in a shorter fiscal year and to eliminated positions, offset by an increase in accrued wages caused by the change in fiscal year end. THE DISTRICT’S FUNDS As the District completed the ten months ended June 30, 2012, its governmental funds (as presented in the balance sheet on pages 15-16) reported a combined fund balance of $363,782,438. Included in this year’s total change in fund balance of $27,185,470 is an increase of $48,260,648 in the District’s General Fund, Debt Service Fund, and Other Funds offset by a $21,075,178 decrease in the Capital Projects Fund. Total revenues in the General Fund decreased $21,548,553 from the prior year. State revenue decreased $11,634,350 primarily due to an $8,068,494 decrease in Per Capita Apportionment and Foundation School Program Entitlements and a $3,463,966 decrease in TRS On-Behalf payments. Federal revenue decreased $8,793,122 primarily due to a decrease in SHARS revenue of $8,192,869. The decrease in SHARS revenue was primarily caused by the absence of a $7,690,146 payment which was not received until October 2012, and therefore, did not meet the revenue recognition criteria under the modified accrual basis of accounting. Total expenditures in the General Fund decreased $32,646,025 as compared to the previous year. This decrease is primarily due to the fiscal year change with $29,096,840 of the decrease being for payroll expenditures. The fund balance of the Debt Service Fund increased $29,260,102, from $39,890,845 in the prior year to $69,150,947 this year. The Interest and Sinking tax rate increased $0.0279 to $0.2676 per $100 valuation for 2012, accounting for additional local revenues in the Debt Service Fund. Additionally, the August 2012 debt principal and interest payments were not made during this short fiscal year, increasing fund balance. The fund balance of the Capital Projects Fund experienced a net decrease of $21,075,178, due to capital expenditures related to bond projects. Although capital expenditures reduce available fund balances, they create new assets for the District as reported in the Statement of Net Assets and as discussed in the Notes to the Financial Statements.
SAN ANTONIO INDEPENDENT SCHOOL DISTRICT
MANAGEMENT’S DISCUSSION AND ANALYSIS
10
GENERAL FUND BUDGETARY HIGHLIGHTS Over the course of the year, the Board of Trustees amended the District’s budget several times. These budget amendments are categorized into three classifications: (1) increase to the fund balance; (2) decrease to the fund balance; and (3) no change to the fund balance. The revenue in the final amended budget in the General Fund was decreased by $31,695,537 from the adopted budget. The decrease was due to two factors: 1) the original adopted budget contained the revenue for EduJobs funding of $9,456,384, and this revenue was excluded from the final amended budget since it is recorded in a special revenue fund, and 2) the fiscal year change resulted in a short ten-month year and local, state and federal revenue sources were reduced. Expenditures in the final amended budget for the General Fund are $35,677,162 less due to the exclusion of the EduJobs funds of $9,456,384 contained in the originally adopted budget and the impact of reducing the originally adopted twelve-month budget to ten months. The budget was increased in Data Processing Services due to a large roll-forward of technology purchase orders from the 2010-11 school year due to vendor delays. Most other functional areas showed minor changes from the adopted budget. Final budget to actual comparisons in the General Fund reflect a $13,882,420 positive variance between the expected net change to the fund balance of ($13,325,463) and the actual change in the fund balance of $556,957. The majority of the positive variance is due to lower expenditures in select areas, while total revenues were near expectations. Significant expenditure savings occurred in Facilities Services due to approximately $1.3 million of Board-authorized painting and roofing projects that were not able to be completed during the fiscal year. These unfinished projects are being carried forward to the 2012-13 school year. Data Processing expenditures came in significantly under budget as well, and of the $3.8 million underage, $500,000 is being carried forward to the 2012-13 school year. Savings were realized in the Transportation department this year resulting from efficiency initiatives including routing improvements due to GPS units that were placed in buses. In total, expenditures were $13,837,812 less than anticipated, attributed primarily to the larger items identified above, along with customary unexpended balances throughout the District. CAPITAL ASSET AND DEBT ADMINISTRATION Capital Assets The District’s investment in capital assets for its governmental activities, as of June 30, 2012, amounts to $713,770,760 (net of accumulated depreciation). The District invests in a broad range of capital assets, including instructional facilities and equipment, transportation facilities and equipment, athletic facilities, and administrative and maintenance buildings and equipment. This year’s total capital outlay was $25,855,057 and of this amount, $18,794,316 or 73% was incurred in the capital projects fund for the on-going construction, improvement and expansion of school buildings. The District’s fiscal year 2013 capital budget calls for the continuation of projects. Over the next several years, the District will issue additional debt to continue financing these construction projects as part of the building plan outlined in the Bond 2010 authorization. Refer to Note E in section III of the Notes to the Financial Statements for more detailed information on capital assets.

SAN ANTONIO INDEPENDENT SCHOOL DISTRICT
MANAGEMENT’S DISCUSSION AND ANALYSIS
11
Table 3 San Antonio Independent School District
Capital Assets (net of depreciation)
Governmental Activities
2012
Governmental Activities
2011
Land $ 51,871,899 $ 47,478,788
Buildings and Improvements 628,583,583 642,392,979
Furniture, Equipment, & Vehicles 18,642,992 17,217,007
Construction in Progress 14,672,286 4,056,672
Total $ 713,770,760 $ 711,145,446
Debt At June 30, 2012, the District had $651,329,988 in bonds outstanding (the “Bonds”). By virtue of the Permanent School Fund, the Bonds are rated “AAA” by Fitch Ratings (“Fitch”) and “Aaa” by Moody’s Investors Service, Inc. (“Moody’s). The Bonds of the District are rated “AA” by Fitch and “Aa2” by Moody’s without regard to credit enhancement. Other long-term obligations include workers’ compensation. More detailed information about the District’s long-term liabilities is presented in Notes H through J of section III in the Notes to the Financial Statements. ECONOMIC FACTORS AND NEXT YEAR’S BUDGETS AND RATES The District’s assessed property tax value for the 2012-2013 fiscal year is projected to increase by 1.0% to $12,387,500,000 compared to the assessed value in the 2011-2012 fiscal year of $12,264,858,813. Taxes to fund programs and services for the fiscal year for the average homeowner will actually decrease slightly as the decrease in taxable value of the average residence more than offsets the tax rate increase to $1.3576 from $1.3076 per $100 assessed valuation. The 2012-2013 fiscal year budget for state revenues is based on a projected ADA of 48,773. This number is similar to the prior year, projecting an increase of 33 students for the year.

SAN ANTONIO INDEPENDENT SCHOOL DISTRICT
MANAGEMENT’S DISCUSSION AND ANALYSIS
12
Programs and services included in the General Fund budget are primarily supported by local and state sources of revenue. The General Fund revenue sources are presented below:
Revenue Sources
Proposed Budget
2012-2013
Local Sources $ 122,140,048
State Sources 254,681,219
Federal Sources 15,714,692
Total Operating Fund Revenues $ 392,535,959
Through the involvement of many community members over the last few years, a long-range restructuring plan for the District was developed in response to the greatly changed enrollment and population patterns throughout the District, and the need to provide students with the programs and resources that the many small or under-enrolled schools could not offer. The plan includes the consolidation of 13 schools over 10-12 years and the upgrading and modernization of campuses. The Board plans to re-evaluate the plan every two years against any significant changes within the community, to ensure it continues to meet the needs of the District. Approval of the $515 million bond proposition in 2010 allows the District to carry out various components of the Long-Range Facilities plan. CONTACTING THE DISTRICT’S FINANCIAL MANAGEMENT This financial report is designed to provide our citizens, taxpayers, customers, and creditors with a general overview of the District’s finances and to show the District’s accountability for the money it receives. If you have questions about this report or require additional financial information, contact the Associate Superintendent of Financial Services, Business Operations and Food Services at 141 Lavaca Street, San Antonio, Texas 78210-1095 or by calling (210) 554-8593.
Basic Financial Statements

THIS PAGE LEFT BLANK INTENTIONALLY
Government-Wide Financial Statements
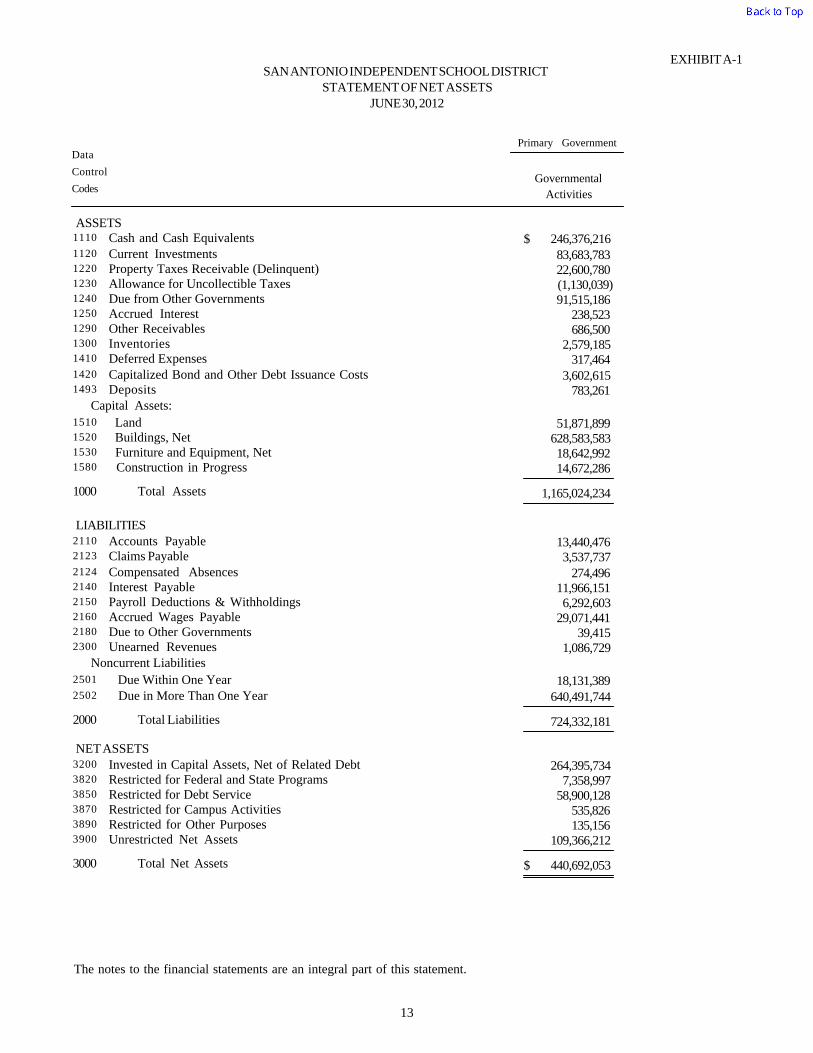
EXHIBIT A-1SAN ANTONIO INDEPENDENT SCHOOL DISTRICT
STATEMENT OF NET ASSETSJUNE 30, 2012
Control
Data
CodesGovernmental
Activities
Primary Government
ASSETS246,376,216 Cash and Cash Equivalents $1110
83,683,783 Current Investments1120
22,600,780 Property Taxes Receivable (Delinquent)1220
(1,130,039)Allowance for Uncollectible Taxes1230
91,515,186 Due from Other Governments1240
238,523 Accrued Interest1250
686,500 Other Receivables1290
2,579,185 Inventories1300
317,464 Deferred Expenses1410
3,602,615 Capitalized Bond and Other Debt Issuance Costs1420
783,261 Deposits1493
Capital Assets:
51,871,899 Land1510
628,583,583 Buildings, Net1520
18,642,992 Furniture and Equipment, Net1530
14,672,286 Construction in Progress1580
Total Assets1000 1,165,024,234
LIABILITIES
13,440,476 Accounts Payable2110
3,537,737 Claims Payable2123
274,496 Compensated Absences2124
11,966,151 Interest Payable2140
6,292,603 Payroll Deductions & Withholdings2150
29,071,441 Accrued Wages Payable2160
39,415 Due to Other Governments2180
1,086,729 Unearned Revenues2300
Noncurrent Liabilities
18,131,389 Due Within One Year2501
640,491,744 Due in More Than One Year2502
Total Liabilities2000 724,332,181
NET ASSETS
264,395,734 Invested in Capital Assets, Net of Related Debt3200
7,358,997 Restricted for Federal and State Programs3820
58,900,128 Restricted for Debt Service3850
535,826 Restricted for Campus Activities3870
135,156 Restricted for Other Purposes3890
109,366,212 Unrestricted Net Assets3900
Total Net Assets3000 440,692,053 $
The notes to the financial statements are an integral part of this statement.
13

EXHIBIT B-1SAN ANTONIO INDEPENDENT SCHOOL DISTRICT
STATEMENT OF ACTIVITIESFOR THE TEN MONTHS ENDED JUNE 30, 2012
Net (Expense)
Revenue and
Changes in Net
AssetsProgram RevenuesData
Control
Codes
1 3 4 6
Operating
Grants and
Contributions
Charges for
ServicesExpenses
Governmental
Activities
Primary Gov.
Primary Government:
GOVERNMENTAL ACTIVITIES:798,254 285,389,734 73,197,212 (211,394,268)Instruction $ $ $ $11
- 5,821,429 419,037 (5,402,392)Instructional Resources and Media Services12
74,189 11,418,241 8,887,895 (2,456,157)Curriculum and Staff Development13
4,946 9,351,265 4,333,041 (5,013,278)Instructional Leadership21
- 28,811,254 8,535,602 (20,275,652)School Leadership23
- 17,575,282 3,883,030 (13,692,252)Guidance, Counseling and Evaluation Services31
- 3,727,395 1,914,624 (1,812,771)Social Work Services32
- 7,061,363 13,107,460 6,046,097 Health Services33
6,275 9,378,357 908,795 (8,463,287)Student (Pupil) Transportation34
2,597,974 36,742,766 32,136,812 (2,007,980)Food Services35
375,084 9,700,278 443,929 (8,881,265)Extracurricular Activities36
- 10,521,559 1,908,592 (8,612,967)General Administration41
36,321 39,441,279 5,100,723 (34,304,235)Facilities Maintenance and Operations51
- 4,968,069 277,906 (4,690,163)Security and Monitoring Services52
- 8,257,962 485,468 (7,772,494)Data Processing Services53
212,474 5,371,827 3,576,135 (1,583,218)Community Services61
- 25,245,279 13,969,500 (11,275,779)Debt Service - Interest on Long Term Debt72
- 160,807 - (160,807)Debt Service - Bond Issuance Cost and Fees73
- 877,011 877,011 - Shared Services Arrangements93
- 13,042 - (13,042)Juvenile Justice Alternative Ed. Prg.95
- 856,158 - (856,158)Property Tax Appraisal Services99
[TP] TOTAL PRIMARY GOVERNMENT: 520,690,357 4,105,517 173,962,772 (342,622,068)$ $ $
DataControlCodes General Revenues:
Taxes:121,695,463 Property Taxes, Levied for General PurposesM T
31,300,841 Property Taxes, Levied for Debt ServiceDT
216,743,676 Grants and Contributions not RestrictedGC
2,006,847 Investment EarningsIE
995,261 Miscellaneous Local and Intermediate RevenueMI
372,742,088 Total General RevenuesTR
Net Assets--Beginning
Change in Net Assets
Net Assets--Ending
CN
NB
NE
30,120,020
410,572,033
440,692,053 $
The notes to the financial statements are an integral part of this statement.
14

THIS PAGE LEFT BLANK INTENTIONALLY
Governmental Funds Financial Statements

SAN ANTONIO INDEPENDENT SCHOOL DISTRICT
BALANCE SHEET
GOVERNMENTAL FUNDS
JUNE 30, 2012
Control
Data
Codes
General
Fund Fund
Debt Service
Major Fund
Projects
Capital
Major FundMajor Fund
ASSETS55,008,410 4,440,764 147,787,004 Cash and Cash Equivalents $ $ $1110
10,058,536 14,156,647 59,468,600 Investments - Current1120
4,071,070 18,529,710 - Property Taxes - Delinquent1220
(203,553)(926,486) - Allowance for Uncollectible Taxes (Credit)1230
1,206,321 60,566,780 - Receivables from Other Governments1240
112,222 126,301 - Accrued Interest1250
1,376,068 14,397,868 - Due from Other Funds1260
- 107,764 - Other Receivables1290
- 1,408,607 - Inventories1300
- 317,464 - Deferred Expenditures1410
Total Assets1000 113,125,419 71,629,074 207,255,604 $ $ $
LIABILITIES AND FUND BALANCES
Liabilities: - 6,609,044 3,851,528 Accounts Payable $ $ $2110
- 6,292,603 - Payroll Deductions and Withholdings Payable2150
- 22,821,776 19,291 Accrued Wages Payable2160
- 1,376,068 - Due to Other Funds2170
- 39,415 - Due to Other Governments2180
2,478,127 12,260,756 - Deferred Revenues2300
Total Liabilities2000 49,399,662 2,478,127 3,870,819
Fund Balances:
Nonspendable Fund Balance: - 1,408,607 - Inventories3410
- - - Endowment Principal3425
Restricted Fund Balance: - - - Federal or State Funds Grant Restriction3450
- - 202,864,654 Capital Acquisition and Contractural Obligation3470
69,150,947 - - Retirement of Long-Term Debt3480
- 131,152 - Other Restricted Fund Balance3490
Committed Fund Balance: - 1,685,645 - Capital Expenditures for Equipment3530
- 7,250,000 - Self Insurance3540
- 5,000,000 - Other Committed Fund Balance3545
Assigned Fund Balance: - 1,993,004 520,131 Other Assigned Fund Balance3590
- 46,257,349 - Unassigned Fund Balance3600
Total Fund Balances3000 63,725,757 69,150,947 203,384,785
$ 113,125,419 $ 71,629,074 $ 207,255,604 Total Liabilities and Fund Balances4000
The notes to the financial statements are an integral part of this statement.
15
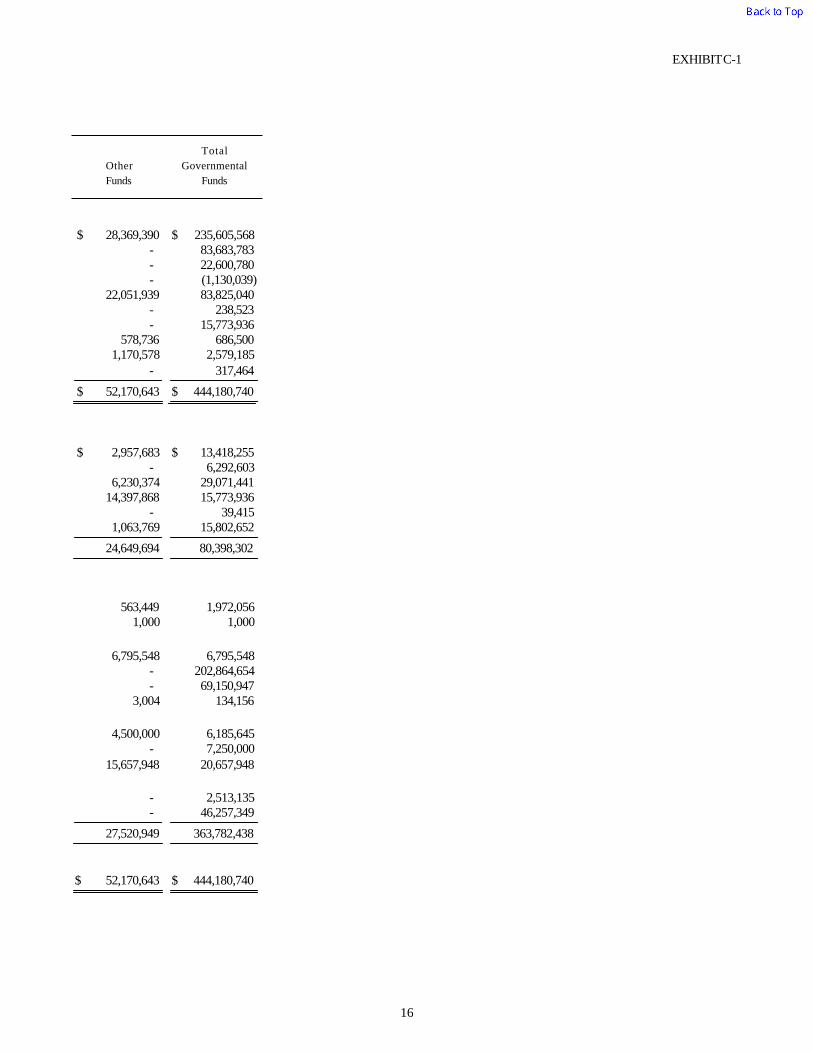
EXHIBIT C-1
Other
Funds Funds
Governmental
Total
28,369,390 235,605,568 $ $ - 83,683,783 - 22,600,780 - (1,130,039)
22,051,939 83,825,040 - 238,523 - 15,773,936
578,736 686,500 1,170,578 2,579,185
- 317,464
52,170,643 444,180,740 $ $
2,957,683 13,418,255 $ $ - 6,292,603
6,230,374 29,071,441 14,397,868 15,773,936
- 39,415 1,063,769 15,802,652
24,649,694 80,398,302
563,449 1,972,056 1,000 1,000
6,795,548 6,795,548 - 202,864,654 - 69,150,947
3,004 134,156
4,500,000 6,185,645 - 7,250,000
15,657,948 20,657,948
- 2,513,135 - 46,257,349
27,520,949 363,782,438
$ $ 444,180,740 52,170,643
16

THIS PAGE LEFT BLANK INTENTIONALLY

EXHIBIT C-2 SAN ANTONIO INDEPENDENT SCHOOL DISTRICT
RECONCILIATION OF THE GOVERNMENTAL FUNDS BALANCE SHEET TO THE STATEMENT OF NET ASSETS
JUNE 30, 2012
The notes to the financial statements are an integral part of this statement.
Total Fund Balances – Governmental Funds
$ 363,782,438
The District uses internal service funds to charge the costs of workers compensation and dental insurance to appropriate functions in other funds. The District also has an internal service fund to account for the revenues and expenses related to health insurance. The assets and liabilities of the internal service funds are included in governmental activities in the Statement of Net Assets. The net effect of this consolidation is to increase net assets. 3,672,570
Capital assets used in governmental activities are not financial resources; therefore, they are not reported in governmental funds. At the beginning of the year, the cost of these assets was $1,012,578,466 and the accumulated depreciation was ($301,433,020). In addition, bonds payable and other long-term liabilities are not due and payable in the current period; therefore, they are not reported as liabilities in the funds. At the beginning of the year, bonds payable and other long-term liabilities was ($653,168,689) and interest payable was ($1,292,672). There are bond issuance costs, premiums, discounts, and losses on these issuances. At the beginning of the year, the balance was $1,276,629. In addition, compensated absences are classified as a short-term liability, and at the beginning of the year the balance was ($177,516). The net effect of including the beginning balances for capital assets (net of depreciation), bonds payable and other long-term liabilities, interest payable, bond issuance costs, premiums, discounts, losses, and compensated absences in the governmental activities is to increase net assets.
57,783,198
Transactions related to current year capital outlays, long-term debt, and compensated absences are necessary to convert from the modified accrual basis of accounting to the accrual basis of accounting, as follows: Acquisition of capital assets was $25,855,057 Disposition of capital assets was ($9,629,906) and the related accumulated depreciation was
$7,001,146 Accretion on capital appreciation bonds was ($48,582) Change in interest payable was ($10,673,479) and in compensated absences was ($96,980) Amortization of bond issuance cost was ($146,792); premiums were $2,356,953; discounts
were ($57,818); and loss on refunding bonds was ($910,838) The net effect is to increase net assets.
13,648,761
Depreciation is not recognized as an expense in governmental funds since it does not require the use of current financial resources. The net effect of the current year’s depreciation is to (decrease) net assets.
(20,600,983)
Various other reclassifications and eliminations are necessary to convert from the modified accrual basis of accounting to the accrual basis of accounting, as follows: Recognize deferred revenue as revenue from current year levy in the amount of $4,235,936
and as revenue from prior year levies in the amount of $10,479,987. Recognize SHARS revenue in the amount of $7,690,146. The net effect is to increase net assets.
22,406,069
Net Assets of Governmental Activities $ 440,692,053
17

SAN ANTONIO INDEPENDENT SCHOOL DISTRICT
STATEMENT OF REVENUES, EXPENDITURES, AND CHANGES IN FUND BALANCES
GOVERNMENTAL FUNDS
FOR THE TEN MONTHS ENDED JUNE 30, 2012
ControlData
Codes Fund
General
Major Fund
Fund
Debt Service
Major Fund
Projects
Capital
Major Fund
REVENUES:123,627,704 31,214,132 1,648,862 Total Local and Intermediate Sources $ $ $5700230,375,708 12,502,333 - State Program Revenues5800
6,344,958 1,467,167 - Federal Program Revenues5900
Total Revenues5020 360,348,370 45,183,632 1,648,862
EXPENDITURES:Current:
207,558,455 - 3,798,860 Instruction00115,362,689 - 93,251 Instructional Resources and Media Services00122,206,412 - - Curriculum and Instructional Staff Development00134,872,583 - - Instructional Leadership0021
19,914,019 - 168,447 School Leadership002313,533,034 - 35,032 Guidance, Counseling and Evaluation Services0031
1,771,025 - 5,448 Social Work Services00325,894,291 - 22,969 Health Services00338,268,352 - - Student (Pupil) Transportation0034
132,792 - 1,321 Food Services00359,173,972 - 661 Extracurricular Activities0036
10,064,945 - - General Administration004135,950,978 - 3,303 Facilities Maintenance and Operations0051
4,772,700 - 18,207 Security and Monitoring Services00528,112,851 - 1,982 Data Processing Services00531,684,964 - 661 Community Services0061
Debt Service: - 15,911,515 - Interest on Long Term Debt0072 - 14,015 - Bond Issuance Cost and Fees0073
Capital Outlay:1,089,634 - 18,573,898 Facilities Acquisition and Construction0081
Intergovernmental: - - - Payments to Fiscal Agent/Member Districts of SSA0093
13,042 - - Payments to Juvenile Justice Alternative Ed. Prg.0095856,158 - - Other Intergovernmental Charges0099
Total Expenditures6030 341,232,896 15,925,530 22,724,040
1100 Excess (Deficiency) of Revenues Over (Under) Expenditures
19,115,474 29,258,102 (21,075,178)
OTHER FINANCING SOURCES (USES): 214,365 - - Sale of Real and Personal Property7912
- 2,000 - Transfers In7915(18,772,882) - - Transfers Out (Use)8911
- - - Other (Uses)8949
Total Other Financing Sources (Uses) 7080 (18,558,517) 2,000 -
1200 Net Change in Fund Balances 556,957 29,260,102 (21,075,178)
0100 Fund Balance - September 1 (Beginning) 63,168,800 39,890,845 224,459,963
3000 Fund Balance - June 30 (Ending) $ 63,725,757 $ 69,150,947 $ 203,384,785
The notes to the financial statements are an integral part of this statement.
18

EXHIBIT C-3
Other
Funds Funds
Governmental
Total
161,005,729 4,515,031 $ $
255,958,146 13,080,105
124,858,734 117,046,609
134,641,745 541,822,609
274,324,316 62,967,001
5,661,655 205,715
11,025,219 8,818,807
9,011,634 4,139,051
27,659,523 7,577,057
16,902,545 3,334,479
3,624,876 1,848,403
6,783,574 866,314
8,765,378 497,026
35,819,475 35,685,362
9,359,945 185,312
10,105,296 40,351
37,935,562 1,981,281
4,798,531 7,624
8,438,431 323,598
5,210,425 3,524,800
15,911,515 -
14,015 -
21,636,039 1,972,507
877,011 877,011
13,042 -
856,158 -
134,851,699 514,734,165
(209,954) 27,088,444
214,365 -
18,772,882 18,770,882
(18,772,882) -
(117,339)(117,339)
18,653,543 97,026
18,443,589 27,185,470
9,077,360 336,596,968
$ 27,520,949 $ 363,782,438
19
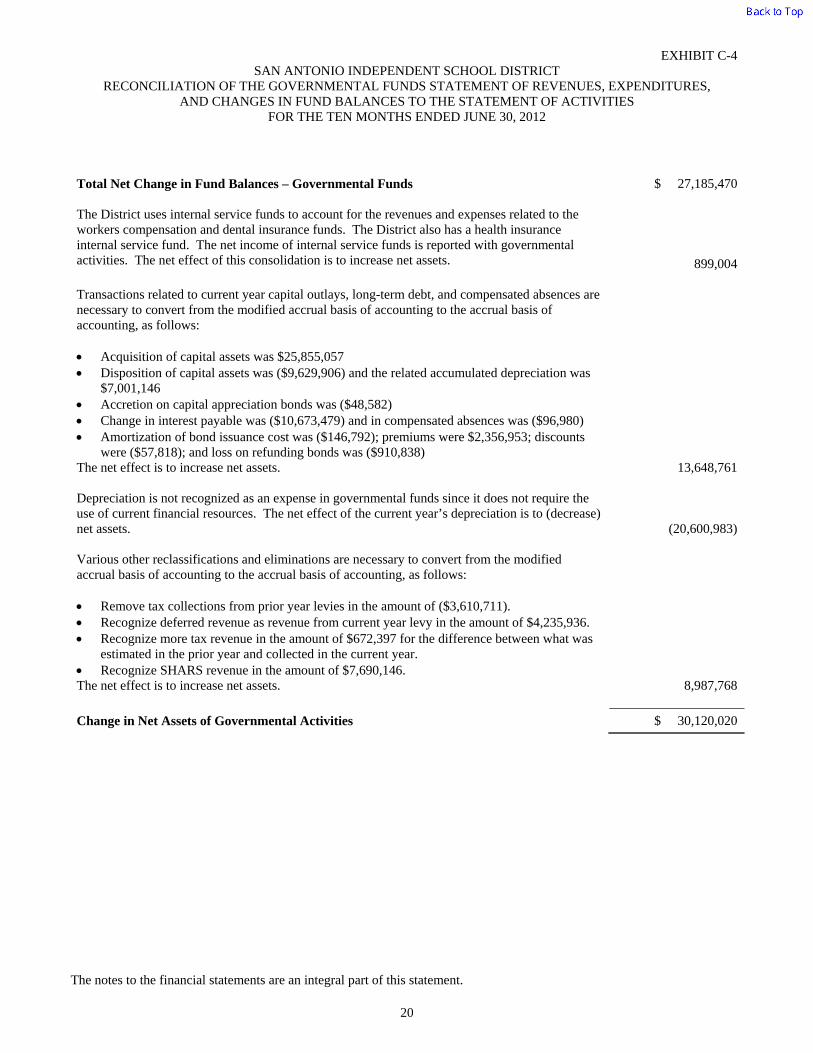
EXHIBIT C-4 SAN ANTONIO INDEPENDENT SCHOOL DISTRICT
RECONCILIATION OF THE GOVERNMENTAL FUNDS STATEMENT OF REVENUES, EXPENDITURES, AND CHANGES IN FUND BALANCES TO THE STATEMENT OF ACTIVITIES
FOR THE TEN MONTHS ENDED JUNE 30, 2012
The notes to the financial statements are an integral part of this statement.
Total Net Change in Fund Balances – Governmental Funds
$ 27,185,470
The District uses internal service funds to account for the revenues and expenses related to the workers compensation and dental insurance funds. The District also has a health insurance internal service fund. The net income of internal service funds is reported with governmental activities. The net effect of this consolidation is to increase net assets. 899,004
Transactions related to current year capital outlays, long-term debt, and compensated absences are necessary to convert from the modified accrual basis of accounting to the accrual basis of accounting, as follows: Acquisition of capital assets was $25,855,057 Disposition of capital assets was ($9,629,906) and the related accumulated depreciation was
$7,001,146 Accretion on capital appreciation bonds was ($48,582) Change in interest payable was ($10,673,479) and in compensated absences was ($96,980) Amortization of bond issuance cost was ($146,792); premiums were $2,356,953; discounts
were ($57,818); and loss on refunding bonds was ($910,838) The net effect is to increase net assets.
13,648,761
Depreciation is not recognized as an expense in governmental funds since it does not require the use of current financial resources. The net effect of the current year’s depreciation is to (decrease) net assets.
(20,600,983)
Various other reclassifications and eliminations are necessary to convert from the modified accrual basis of accounting to the accrual basis of accounting, as follows: Remove tax collections from prior year levies in the amount of ($3,610,711). Recognize deferred revenue as revenue from current year levy in the amount of $4,235,936. Recognize more tax revenue in the amount of $672,397 for the difference between what was
estimated in the prior year and collected in the current year. Recognize SHARS revenue in the amount of $7,690,146. The net effect is to increase net assets.
8,987,768
Change in Net Assets of Governmental Activities $ 30,120,020
20
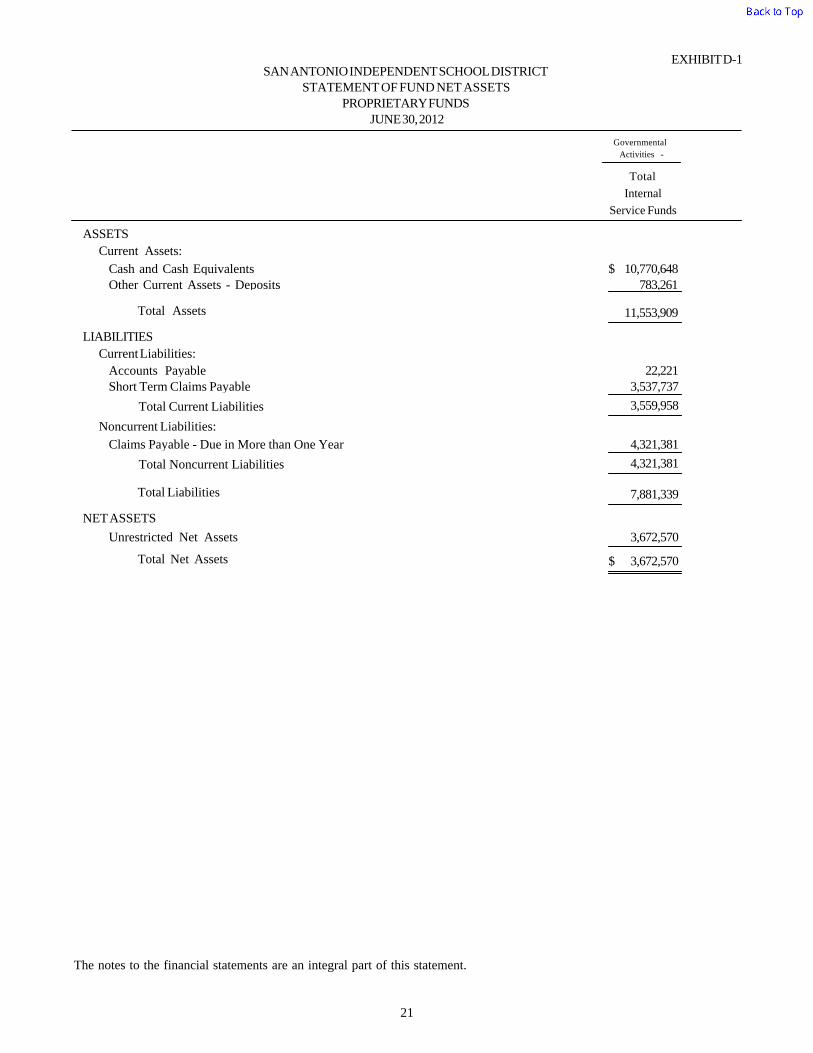
EXHIBIT D-1SAN ANTONIO INDEPENDENT SCHOOL DISTRICT
STATEMENT OF FUND NET ASSETSPROPRIETARY FUNDS
JUNE 30, 2012
Total
Internal
Service Funds
Governmental
Activities -
ASSETS
Current Assets:
10,770,648 Cash and Cash Equivalents $783,261 Other Current Assets - Deposits
Total Assets 11,553,909
LIABILITIES
Current Liabilities:
22,221 Accounts Payable3,537,737 Short Term Claims Payable
3,559,958 Total Current Liabilities
Noncurrent Liabilities:
4,321,381 Claims Payable - Due in More than One Year
4,321,381 Total Noncurrent Liabilities
Total Liabilities 7,881,339
NET ASSETS
3,672,570 Unrestricted Net Assets
Total Net Assets 3,672,570 $
The notes to the financial statements are an integral part of this statement.
21
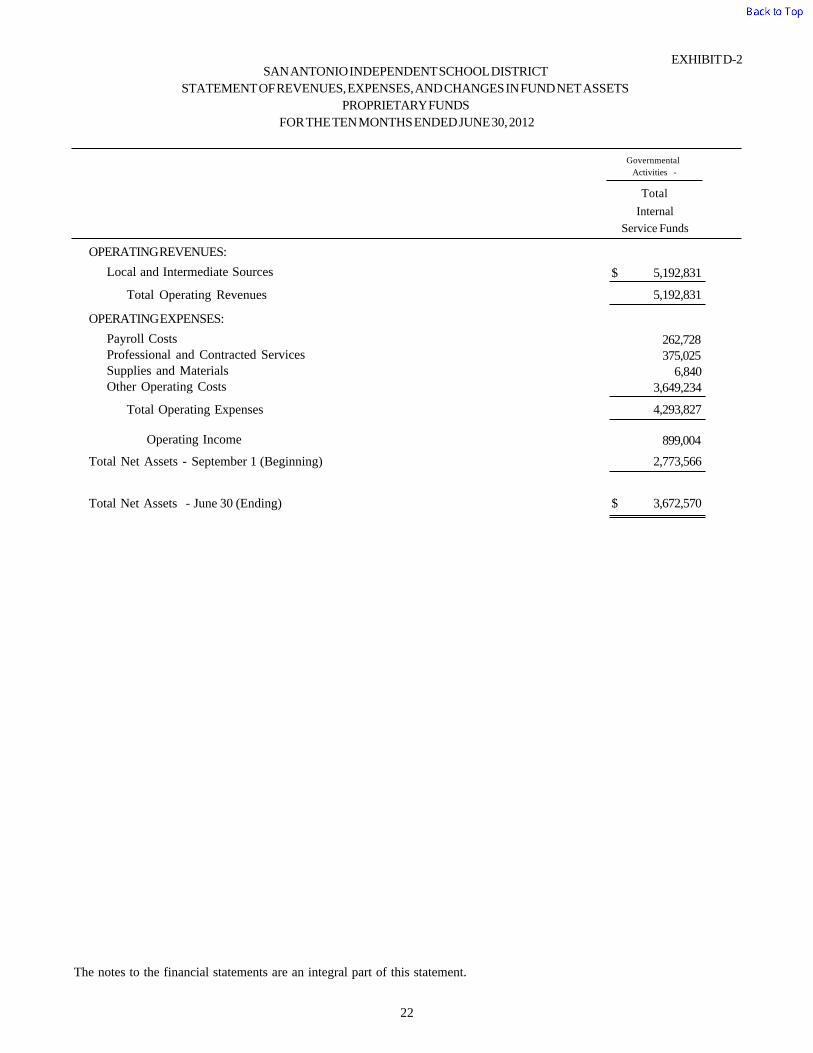
EXHIBIT D-2SAN ANTONIO INDEPENDENT SCHOOL DISTRICT
STATEMENT OF REVENUES, EXPENSES, AND CHANGES IN FUND NET ASSETS
PROPRIETARY FUNDS
FOR THE TEN MONTHS ENDED JUNE 30, 2012
Total
Internal
Service Funds
Governmental
Activities -
OPERATING REVENUES:
5,192,831 Local and Intermediate Sources $
Total Operating Revenues 5,192,831
OPERATING EXPENSES:
262,728 Payroll Costs
375,025 Professional and Contracted Services
6,840 Supplies and Materials
3,649,234 Other Operating Costs
Total Operating Expenses 4,293,827
Operating Income
Total Net Assets - September 1 (Beginning)
Total Net Assets - June 30 (Ending)
899,004
2,773,566
$ 3,672,570
The notes to the financial statements are an integral part of this statement.
22
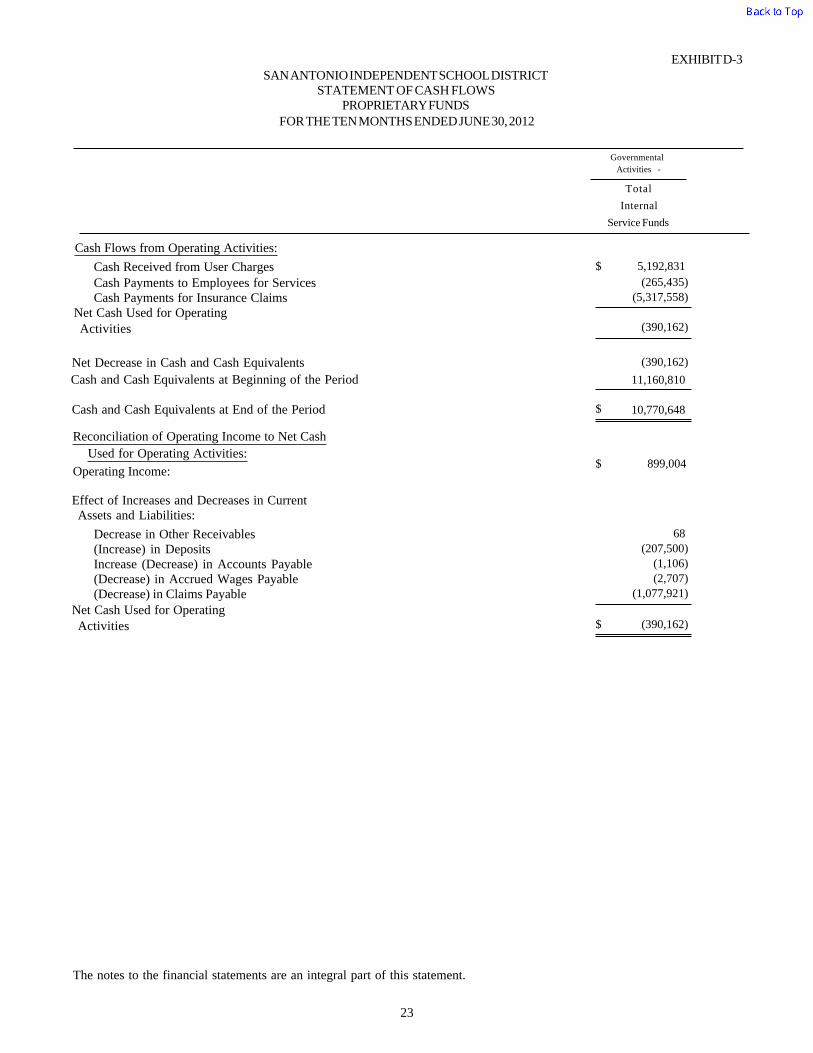
EXHIBIT D-3SAN ANTONIO INDEPENDENT SCHOOL DISTRICT
STATEMENT OF CASH FLOWS
FOR THE TEN MONTHS ENDED JUNE 30, 2012PROPRIETARY FUNDS
Total
Internal
Service Funds
Governmental
Activities -
Cash Flows from Operating Activities:
5,192,831 Cash Received from User Charges $
(265,435)Cash Payments to Employees for Services(5,317,558)Cash Payments for Insurance Claims
(390,162)Net Cash Used for OperatingActivities
Net Decrease in Cash and Cash Equivalents (390,162)
Cash and Cash Equivalents at Beginning of the Period 11,160,810
Cash and Cash Equivalents at End of the Period 10,770,648 $
Operating Income:$
Reconciliation of Operating Income to Net Cash
Used for Operating Activities:899,004
Assets and Liabilities:Effect of Increases and Decreases in Current
68 Decrease in Other Receivables(207,500)(Increase) in Deposits
(1,106)Increase (Decrease) in Accounts Payable(2,707)(Decrease) in Accrued Wages Payable
(1,077,921)(Decrease) in Claims PayableNet Cash Used for OperatingActivities (390,162)$
The notes to the financial statements are an integral part of this statement.
23
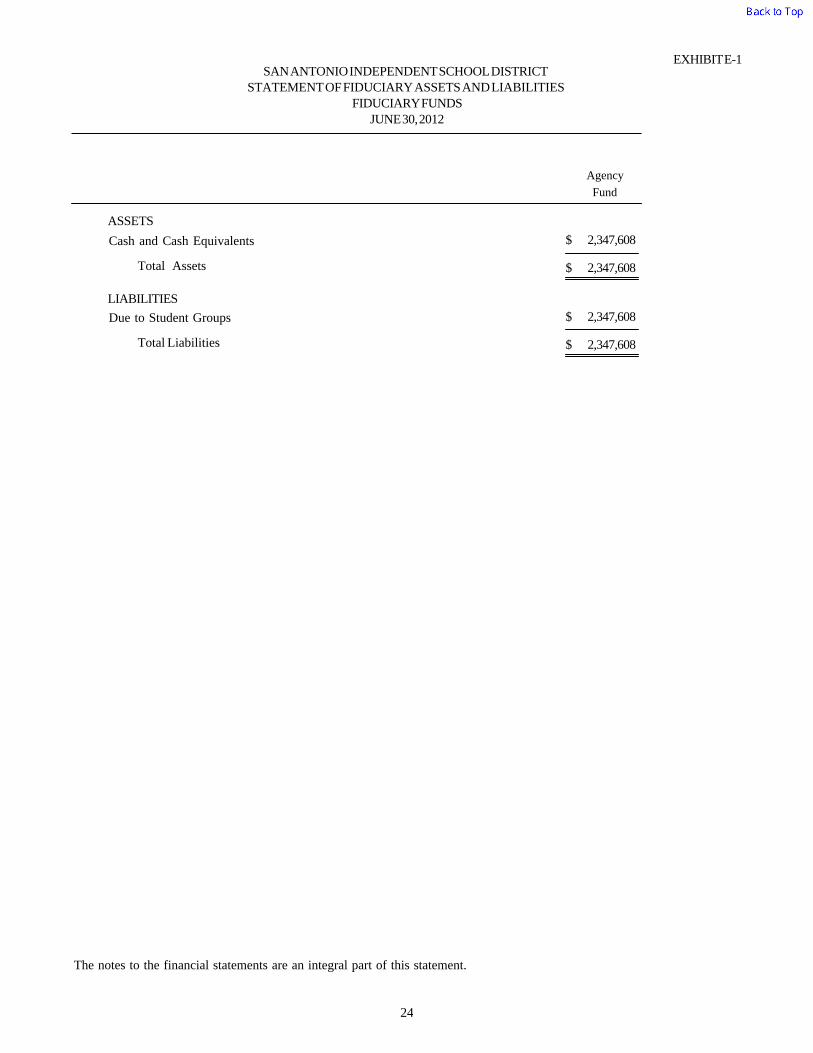
EXHIBIT E-1SAN ANTONIO INDEPENDENT SCHOOL DISTRICT
STATEMENT OF FIDUCIARY ASSETS AND LIABILITIESFIDUCIARY FUNDS
JUNE 30, 2012
Agency
Fund
ASSETS
2,347,608 Cash and Cash Equivalents $
Total Assets 2,347,608 $
LIABILITIES
2,347,608 Due to Student Groups $
Total Liabilities 2,347,608 $
The notes to the financial statements are an integral part of this statement.
24

SAN ANTONIO INDEPENDENT SCHOOL DISTRICT San Antonio, Texas
NOTES TO THE FINANCIAL STATEMENTS
For The Ten Months Ended June 30, 2012
25
I. SUMMARY OF SIGNIFICANT ACCOUNTING POLICIES
The San Antonio Independent School District (the “District”) is a public educational agency operating under the applicable laws and regulations of the State of Texas. It is governed by a seven member Board of Trustees (the “Board”) elected by registered voters of the District. The District prepares its basic financial statements in conformity with generally accepted accounting principles promulgated by the Governmental Accounting Standards Board (GASB) and other authoritative sources; and, it complies with the requirements of the appropriate version of Texas Education Agency’s Financial Accountability System Resource Guide (the “Resource Guide”), and the requirements of contracts and grants of agencies from which it receives funds.
A. REPORTING ENTITY
The Board of Trustees (the “Board”) is elected by the public and it has the authority to make decisions, approve/disapprove the appointment of administrators and managers, and significantly influence operations. The Board also has primary accountability for fiscal matters. Therefore, the District is a financial reporting entity as defined by the GASB in its Statement No. 14, “The Financial Reporting Entity”, and it is not included in any other governmental reporting entity.
Blended Component Unit. During fiscal year 1996, the District approved the formation of the San Antonio Independent School District Public Facilities Corporation (the Corporation). The Corporation is organized exclusively for the purposes of benefiting and accomplishing public purposes of, and to act on behalf of, the District. The Corporation is organized to assist in the financing, accounting, refinancing, or providing “public facilities”, to purchase obligations of the District, and to incur obligations issued or incurred in accordance with existing law. Blended component units, although legally separate entities, are, in substance, part of the government’s operations, and therefore, at June 30, 2012, the District has reflected this Corporation as a blended component unit. The Corporation is included in the Debt Service Fund total and, therefore, does not issue separate financial statements.
B. GOVERNMENT-WIDE AND FUND FINANCIAL STATEMENTS
The Statement of Net Assets and the Statement of Activities are government-wide financial statements. These statements report information on all of the District’s nonfiduciary activities with the interfund activities removed. Government activities include programs supported primarily by property taxes, state foundation funds, grants and other intergovernmental revenues.
SAN ANTONIO INDEPENDENT SCHOOL DISTRICT San Antonio, Texas
NOTES TO THE FINANCIAL STATEMENTS
For The Ten Months Ended June 30, 2012
26
The net assets of the District are segregated into three different categories, to include: invested in capital assets net of related debt, restricted net assets, and unrestricted net assets.
The Statement of Activities demonstrates how other people or entities that participate in programs the District operates have shared in the payment of the direct costs. The “charges for services” column includes payments made by parties that purchase, use, or directly benefit from goods or services provided by a given function of the District. Examples include tuition paid for various activities, school lunch charges, etc. The “operating grants and contributions” column includes amounts paid by organizations outside the District to help meet the operational requirements of a given function. Examples include grants under the Elementary and Secondary Education Act. If a revenue is not a program revenue, it is a general revenue used to support all of the District’s functions. Taxes are always general revenues.
Interfund activities between governmental funds appear as due to/from other funds on the Governmental Funds Balance Sheet and as other financing sources and uses on the Governmental Funds Statement of Revenues, Expenditures, and Changes in Fund Balances. All interfund transactions between governmental funds are eliminated in the government-wide statements.
The fund financial statements report on the financial condition and results of operations for three fund categories – governmental, proprietary, and fiduciary. Since the resources in the fiduciary funds cannot be used for District operations, they are not included in the government-wide financial statements. The District considers some governmental funds major and reports their financial condition and results of operations in a separate column in the governmental funds financial statements.
Proprietary funds distinguish operating revenues and expenses from non-operating items. Operating revenues and expenses result from providing services in connection with a proprietary fund’s principal ongoing operations. All other revenues and expenses are non-operating.
SAN ANTONIO INDEPENDENT SCHOOL DISTRICT San Antonio, Texas
NOTES TO THE FINANCIAL STATEMENTS
For The Ten Months Ended June 30, 2012
27
C. MEASUREMENT FOCUS, BASIS OF ACCOUNTING, AND FINANCIAL STATEMENT PRESENTATION
The government-wide financial statements use the economic resources measurement focus and the accrual basis of accounting, as does the proprietary fund financial statements; the Agency fund is custodial in nature (assets equal liabilities) and does not involve the measurement of results of operations. With the economic resources measurement focus, all assets and liabilities (whether current or noncurrent) associated with the operations of these funds are included in the Statement of Net Assets. With the accrual basis of accounting, revenue is recognized in the accounting period in which it is earned and becomes measurable and expenses in the period in which they are incurred and become measurable. Property taxes are recognized as revenues in the year for which they are levied. Grants and similar items are recognized as revenue as soon as all eligibility requirements imposed by the provider have been met. The total net assets for these funds are segregated into invested in capital assets, net of related debt, restricted net assets, and unrestricted net assets.
The District’s proprietary funds apply all GASB pronouncements as well as the Financial Accounting Standards Board (FASB) pronouncements issued on or before November 30, 1989, unless these pronouncements conflict with, or contradict GASB pronouncements.
Governmental fund financial statements use the current financial resources measurement focus and the modified accrual basis of accounting. With this measurement focus, only current assets, current liabilities and fund balances are included on the balance sheet. Operating statements of these funds present net increases and decreases in current assets (i.e., revenues and other financing sources and expenditures and other financing uses).
The modified accrual basis of accounting recognizes revenues as soon as they are both measurable and available. Revenues are considered to be available when they are collectible within the current period or soon enough thereafter to pay liabilities of the current period. For this purpose, the District considers revenues to be available if they are collected within 60 days of the end of the current fiscal period. Expenditures generally are recorded when a liability is incurred, if measurable, as under the accrual basis of accounting. However, debt service expenditures, as well as expenditures related to claims and judgments are recorded only when payment is due. The District accrues accumulated unpaid vacation leave when earned by the employee. A liability for this amount is reported in the government-wide financial statements.
Revenues from local sources consist primarily of property taxes. Property tax revenues and revenues received from the state are recognized under the susceptible-to-accrual concept. Miscellaneous revenues are recorded as revenue when received in cash because they are generally not measurable until actually received. Investment earnings are recorded as earned, since they are both measurable and available.
SAN ANTONIO INDEPENDENT SCHOOL DISTRICT San Antonio, Texas
NOTES TO THE FINANCIAL STATEMENTS
For The Ten Months Ended June 30, 2012
28
Grant funds are considered to be earned to the extent of expenditures made under the provisions of the grant. Accordingly, when such funds are received, they are recorded as deferred revenues until related and authorized expenditures have been made. If balances have not been expended by the end of the project period, grantors sometimes require the District to refund all or part of the unused amount.
The District reports the following major governmental funds:
General Fund – The General Fund is the District’s primary operating fund. It accounts for all financial resources except those required to be accounted for in another fund. It is a budgeted fund, and any fund balances are considered resources available for current operations. General Fund primary revenue sources include property taxes and state funding.
Debt Service Fund – The District accounts for resources accumulated and payments made for principal and interest on long-term general obligation debt of governmental funds in a Debt Service Fund. The Debt Service Fund is a budgeted fund whose primary revenue source is local property taxes levied specifically for debt service. The fund balance of this fund represents amounts that will be used for retirement of bonds and payment of interest in the future.
Capital Projects Fund – This fund accounts for proceeds from sales of bonds and other revenues to be used for authorized construction projects. This fund is generally budgeted on a project basis.
Additionally, the District reports the following fund types:
Governmental Funds:
Special Revenue Funds – The District accounts for resources restricted to, or designated for, specific purposes by the District or a grantor in a Special Revenue Fund. Most Federal, including the Child Nutrition Program and some State financial assistance is accounted for in a Special Revenue Fund. Sometimes, however, unused balances must be returned to the grantor at the close of specified project periods. Permanent Fund – The District uses a Permanent Fund to account for resources received with explicit donor stipulations that the amount received must remain intact and only earnings from the original donation be used for the purpose dictated by the donor.

SAN ANTONIO INDEPENDENT SCHOOL DISTRICT San Antonio, Texas
NOTES TO THE FINANCIAL STATEMENTS
For The Ten Months Ended June 30, 2012
29
Proprietary Funds:
Internal Service Funds – The District uses an Internal Service Fund to account for revenues and expenses related to the workers compensation, dental insurance, and health insurance programs. Fiduciary Funds:
Agency Funds – The District accounts for resources held for others in a custodial capacity in Agency Funds. The District accounts for the Student Activity Fund as an Agency Fund.
D. OTHER ACCOUNTING POLICIES
1. Cash and Cash Equivalents
The District’s cash and cash equivalents are considered to be cash on hand, demand deposits, and short-term investments with original maturities of three months or less from date of acquisition. Investments are reported at fair value.
The funds of the District must be deposited and invested under the terms of a depository contract, contents of which are set out in the Depository Contract Law. The depository bank must pledge eligible securities as collateral for the District’s deposits plus accrued interest less FDIC insurance of the District. In accordance with the Public Funds Collateral Act and the Texas Education Code, the collateral margin coverage is at 102% (110% if pledging eligible declining principal securities).
For the purposes of the Statement of Cash Flows for the Internal Service Funds, cash and cash equivalents are considered to be demand deposits.
2. Receivables and Payables
Interfund activities that represent lending/borrowing arrangements which are outstanding at the end of the fiscal year are referred to as “due to/from other funds”. Property taxes are levied by October 1 on the assessed value listed as of the prior January 1 for all real and business personal property located in the District in conformity with Subtitle E, Texas Property Code. Taxes are due upon receipt of the tax bill and are delinquent if not paid before February 1 of the year following the year in which imposed. On January 31 of each year, a tax lien attaches to property to secure payment of all taxes, penalties, and interest ultimately imposed.
SAN ANTONIO INDEPENDENT SCHOOL DISTRICT San Antonio, Texas
NOTES TO THE FINANCIAL STATEMENTS
For The Ten Months Ended June 30, 2012
30
The appraisal and recording of all property within the District is the responsibility of the Bexar Appraisal District (BAD). The BAD is an independent governmental unit with a board of directors appointed by the taxing jurisdictions within the county and funded from assessments against those taxing jurisdictions. BAD is required by law to assess property at 100% of its appraised value. Real property must be reappraised at least every two years. Under certain circumstances taxpayers and taxing units, including the District, may challenge orders of the BAD Review Board through various appeals and, if necessary, legal action.
Tax collections are prorated between the general fund and debt service fund based on the tax rate approved by the Board. For the ten months ended June 30, 2012, the general and debt service fund rates were $1.04 and $.2676, respectively, per $100 of assessed value.
Delinquent taxes are prorated between maintenance and debt service based on rates adopted for the year of the levy. Allowances for uncollectible tax receivables within the general and debt service funds are based on historical experience in collecting property taxes. Uncollectible personal property taxes are periodically reviewed and written off, but the District is prohibited from writing off real property taxes without specific statutory authority from the Texas Legislature. The property tax receivable allowance is equal to 5 percent of outstanding property taxes at June 30, 2012.
3. Inventories
The District reports inventories of supplies on the balance sheet at weighted average cost and they include consumable, custodial, maintenance, transportation, instructional and office supplies, and athletic items. Inventories of governmental funds are recorded as expenditures when they are consumed rather than when purchased. Inventories of food commodities are recorded at market values supplied by the Texas Department of Human Services and recorded as inventory and deferred revenue when received in the governmental funds. When requisitioned, inventory and deferred revenue are relieved, expenditures are charged, and revenue is recognized for an equal amount.
4. Deferred Expenditures
Certain payments to vendors/employees reflect costs applicable to future accounting periods and are recorded as prepaid items within the deferred expenditures (expenses) line item in both government-wide and fund financial statements.

SAN ANTONIO INDEPENDENT SCHOOL DISTRICT San Antonio, Texas
NOTES TO THE FINANCIAL STATEMENTS
For The Ten Months Ended June 30, 2012
31
5. Capital Assets
Capital assets, which include land, buildings and improvements, furniture, equipment, vehicles, and construction in progress, are reported in the governmental activities column in the government-wide financial statements. Capital assets are defined by the District as assets with an initial, individual cost of $5,000 or more and an estimated useful life in excess of one year for depreciation purposes. Such assets are recorded at historical cost or estimated historical cost if purchased or constructed. Donated capital assets are recorded at estimated fair market value at the date of donation.
The costs of normal maintenance and repairs that do not add to the value of the asset or materially extend asset lives are not capitalized.
When assets are retired or otherwise disposed of, the related costs or other recorded amounts are removed.
Buildings, furniture, equipment and vehicles of the District are depreciated using the straight line method over the following estimated useful lives:
Asset Class
Estimated Useful
Life Buildings and Improvements 40 Portable Buildings 20 Furniture and Equipment 10 All Vehicles 10 Audio Visual Equipment 10 Printing, Duplicating & Copying Equipment 5 Data Processing Equipment 3
6. Compensated Absences
Vacation Leave – Full-time employees of the District accumulate vacation leave benefits in varying amounts. Employees who accumulate vacation leave benefits are required to take their vacation benefits by the following October 2nd. The balance as of June 30, 2012 is $274,496 and is reflected as a current liability in the Statement of Net Assets since employees must use the accumulated leave during the following fiscal year. All governmental funds, with the exception of the debt service fund, generally liquidate the liability when it matures.
SAN ANTONIO INDEPENDENT SCHOOL DISTRICT San Antonio, Texas
NOTES TO THE FINANCIAL STATEMENTS
For The Ten Months Ended June 30, 2012
32
Sick Leave – The State of Texas has created a minimum sick leave program consisting of five days per year sick leave with no limit on accumulation and transferability among districts for every regular employee in Texas public schools. Each district’s local Board of Education is required to establish a sick leave plan. School districts may provide additional local sick leave beyond the state minimum. The District’s policy provides additional sick leave days, which do not vest; therefore, no liability exists at June 30, 2012.
7. Long-term Obligations
In the government-wide financial statements, long-term debt and other long-term obligations are reported as liabilities in the Statement of Net Assets. It is the District’s policy to record bond premiums and discounts as deferred costs and amortize them over the life of the bonds using the effective interest method if material or straight line when not material. Loss on refunded debt is amortized over the term of the related bond using the straight line method. Bonds payable are reported net of the applicable bond premium, discount, and loss on refunding. Bond issuance costs are reported as deferred charges and amortized over the term of the related bond using the straight line method.
In the fund financial statements, governmental fund types recognize bond premiums and discounts, as well as bond issuance costs, during the current period. The face amount of debt issued is reported as other financing sources. Premiums received on debt issuances are reported as other financing sources while discounts on debt issuances are reported as other financing uses, if any. Issuance costs, whether or not withheld from the actual proceeds received, are reported as debt service expenditures.
8. Fund Balance
In the fund financial statements, the District uses the following criteria when classifying fund balance amounts: Nonspendable – amounts not in spendable form or that are legally or contractually earmarked for a specific use. Examples include inventories and endowment principal. Restricted – amounts that have been legally separated for a specific purpose by law or external funding source. Examples include grants, capital acquisitions, and long-term debt. Committed – amounts that require Board action to be used for a specific purpose. Examples include capital expenditures, self insurance, and campus activity funds. Formal action to commit funds must occur prior to fiscal year end and can only be modified or removed by the same formal action.

SAN ANTONIO INDEPENDENT SCHOOL DISTRICT San Antonio, Texas
NOTES TO THE FINANCIAL STATEMENTS
For The Ten Months Ended June 30, 2012
33
Assigned – amounts that do not require Board approval but are intended to be used for a specific purpose, as determined by the Superintendent or his designee. These amounts do not meet the criteria to be classified as restricted or committed. Unassigned – residual amount in the general fund that is available to finance operating expenditures. In other funds, this classification is used only to report a deficit balance resulting from over-spending for specific purposes for which amounts had been restricted, committed, or assigned, as applicable. The District’s policy is to maintain a minimum threshold of 10% of the prior year’s expenditures in unassigned fund balance for the general fund. The District’s unassigned fund balance amount at June 30, 2012 is $46,257,349, which exceeds the required minimum amount of $37,387,892.
9. Spending Order
Fund balance amounts that are restricted, committed, or assigned are considered to have been spent when an expenditure is incurred for the respective purpose. If an expenditure incurred meets the criteria for more than one fund balance category, the District relieves fund balance in the following order: restricted, committed, assigned, and then unassigned.
10. Data Control Codes
The data control codes refer to the account code structure prescribed by TEA in the Resource Guide. School districts are required to display these codes in the financial statements filed with TEA in order to ensure accuracy in building a statewide data base for policy development and funding plans.
11. Restricted/Unrestricted Resources
Under the terms of grant agreements, the District funds certain programs by a combination of specific cost-reimbursement grants and general revenues. Thus, when program expenses are incurred, there are both restricted and unrestricted resources available to finance the program. It is the District’s policy to first apply cost-reimbursement grant (restricted) resources to such programs and then general revenues.
12. Estimates
The preparation of financial statements in conformity with GAAP requires management to make estimates and assumptions that affect certain report amounts and disclosures. Accordingly, actual results could differ from those estimates.
SAN ANTONIO INDEPENDENT SCHOOL DISTRICT San Antonio, Texas
NOTES TO THE FINANCIAL STATEMENTS
For The Ten Months Ended June 30, 2012
34
13. Indirect Expenses
School districts are required to report all expenses by function. All general administration and other intergovernmental expenses reported in functions 41 and 99, respectively, and some data processing service expenses reported in function 53 represent indirect expenses of other functions.
14. Investments
At June 30, 2012, the District’s current investments are comprised of local government investment pools, money market funds, municipal bonds, and a repurchase agreement. The investment pools and money market funds are reported as cash and cash equivalents. The municipal bonds and repurchase agreement are reported as current investments.
Texas Local Government Investment Pool (“TexPool”): TexPool operates in a manner consistent with the SEC’s Rule 2a7 of the Investment Company Act of 1940. TexPool uses amortized cost rather than market value to report net assets to compute share prices. Accordingly, the fair value of the position in the pool is the same as the value of the shares in each pool. Financial information for TexPool can be accessed on the internet (http://www.texpool.com).
TexPool is organized in conformity with the Interlocal Cooperation Act, Chapter 791 of the Texas Government Code, and the Public Funds Investment Act, Chapter 2256 of the Texas Government Code. The Texas Comptroller of Public Accounts is the sole officer, director and shareholder of the Texas Treasury Safekeeping Trust company, which is authorized to operate TexPool. Administrative and investment services are provided by Federated Investors, Inc., acting on behalf of the Texas Treasury Safekeeping Trust Company. In addition, the TexPool Advisory Board advises on TexPool’s Investment Policy. This Advisory Board is composed equally of participants in TexPool and other persons who do not have a business relationship with TexPool who are qualified to advise TexPool.
Texas Short Term Asset Reserve Fund (TexSTAR): TexSTAR operates in a manner consistent with the SEC’s Rule 2a7 of the Investment Company Act of 1940. TexSTAR uses amortized cost rather than market value to report net assets to compute share prices. Accordingly, the fair value of the position in the pool is the same as the value of the shares in each pool. Financial information for TexSTAR can be accessed on the internet (http://www.texstar.org).
TexSTAR is organized under the authority of the Interlocal Cooperation Act, Chapter 791, Texas Government Code, and the Public Funds Investment Act, Chapter 2256, Texas

SAN ANTONIO INDEPENDENT SCHOOL DISTRICT San Antonio, Texas
NOTES TO THE FINANCIAL STATEMENTS
For The Ten Months Ended June 30, 2012
35
Government Code. TexStar is governed by a board of directors. JP Morgan Investment Management, Inc. acts as the investment manager and First Southwest Asset Management, Inc. provides participant and marketing services.
Lone Star Investment Pool (the Pool): The Pool’s Government Overnight Fund operates in a manner consistent with the SEC’s Rule 2a7 of the Investment Company Act of 1940. The Pool uses amortized cost rather than market value to report net assets to compute share prices. Accordingly, the fair value of the District’s position in the Pool is the same as the value of the Pool’s shares and does not include any unrealized gains and losses. The Pool is governed by an eleven member Board of Trustees (Board) made up of active participants in the Pool. The Board has the responsibility of adopting and monitoring compliance with the investment policy, appointing investment officers, overseeing the selection of an investment advisor, custodian, investment consultant, administrator, and other service providers. The Board is also responsible for monitoring the performance of the Pool. Financial information for the pool can be obtained by writing to First Public at 12007 Research Blvd., Austin, Texas 78759 or by calling 1-800-558-8875.
The District is invested in the Prime Cash Obligations Fund (PCOXX), Municipals Obligations Fund (MOFXX), and the Fidelity Money Market Portfolio Fund (FNSXX) managed by Federated Investors (the “Funds”). The Funds are money market mutual funds, regulated primarily under SEC’s Rule 2a7 of the Investment Company Act of 1940 (the “ACT”). The Funds attempt to stabilize the net asset value (“NAV”) of their shares at $1.00 by valuing the portfolio securities using the amortized cost method; however, there is no guarantee that the NAV will remain at $1.00 a share. The Funds are assigned a cusip number and a NASDAQ symbol and can be purchased and redeemed on the New York Stock Exchange. The funds do not charge a front-end sales charge. Under the Bond Order for the Unlimited Tax Qualified School Construction Bonds, Taxable Series 2011, the District has an Investment Repurchase Agreement where the District purchased securities from Bayerische Landesbank using funds from the bond issuance at a specified rate and Bayerische Landesbank subsequently repurchases those securities at the times and prices set forth in the agreement. As of June 30, 2012, the repurchase agreement of $59,468,600 was held by Wells Fargo Bank as custodian, in the name of the District.
II. STEWARDSHIP, COMPLIANCE, AND ACCOUNTABILITY
A. BUDGETARY INFORMATION
The Board adopts an “appropriated budget” on a basis consistent with generally accepted accounting principles for the General Fund, Debt Service Fund and Child Nutrition Program
SAN ANTONIO INDEPENDENT SCHOOL DISTRICT San Antonio, Texas
NOTES TO THE FINANCIAL STATEMENTS
For The Ten Months Ended June 30, 2012
36
Fund (which is included with the Special Revenue Funds). The District is required to present the original and the final amended budgets for revenues and expenditures compared to actual revenues and expenditures for these three funds. The General Fund Budget report is presented in Exhibit G-1 and the Child Nutrition Program Fund Budget and Debt Service Fund Budget reports are presented in Exhibits J-4 and J-5, respectively.
The following procedures are followed in establishing the budgetary data reflected in the fund financial statements:
Prior to August 20th, the District prepared a budget based on the budgeting concepts for the
next succeeding fiscal year. The operating budget included proposed expenditures and the means of financing them.
After several budget workshops with the Board, a meeting was called for the purpose of
adopting the proposed budget. At least ten days, but not more than 30 days, of public notice of the meeting is required.
A summary of the proposed budget was posted on the District’s website. The budget
summary included a comparison to the previous year’s actual spending and information relating to per-student and aggregate spending on instruction, instructional support, central administration, district operations, debt service, and any other category designated by the commissioner.
No later than August 31st, the Board adopted the budget for the General Fund, Debt Service
Fund and Child Nutrition Program Fund. The adopted budget was posted on the District’s website, where it will be prominently
displayed until the third anniversary of the date the budget was adopted. A budget amendment was made during the reporting period to decrease appropriations due
to the District changing its fiscal year-end from August 31st to June 30th beginning with the 2011-2012 fiscal period. The change resulted in a ten-month reporting period for 2011-2012.
After the budget for the above listed funds was approved, any amendment that caused an
increase or decrease in a fund or functional spending category, or total revenue or other resources object category, required Board approval. These amendments were presented to the Board at its regular monthly meeting and were reflected in the official minutes. Because the District has a policy of careful budgetary control, several budgetary amendments were necessary throughout the year.
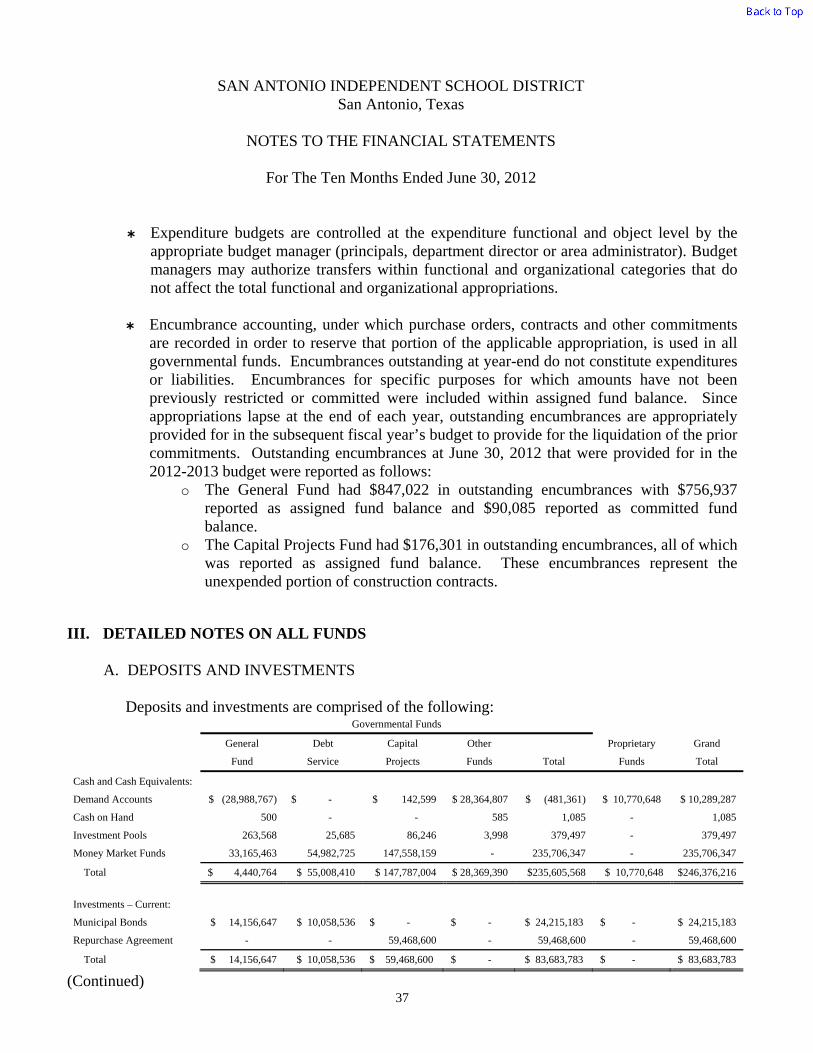
SAN ANTONIO INDEPENDENT SCHOOL DISTRICT San Antonio, Texas
NOTES TO THE FINANCIAL STATEMENTS
For The Ten Months Ended June 30, 2012
37
Expenditure budgets are controlled at the expenditure functional and object level by the appropriate budget manager (principals, department director or area administrator). Budget managers may authorize transfers within functional and organizational categories that do not affect the total functional and organizational appropriations.
Encumbrance accounting, under which purchase orders, contracts and other commitments
are recorded in order to reserve that portion of the applicable appropriation, is used in all governmental funds. Encumbrances outstanding at year-end do not constitute expenditures or liabilities. Encumbrances for specific purposes for which amounts have not been previously restricted or committed were included within assigned fund balance. Since appropriations lapse at the end of each year, outstanding encumbrances are appropriately provided for in the subsequent fiscal year’s budget to provide for the liquidation of the prior commitments. Outstanding encumbrances at June 30, 2012 that were provided for in the 2012-2013 budget were reported as follows:
o The General Fund had $847,022 in outstanding encumbrances with $756,937 reported as assigned fund balance and $90,085 reported as committed fund balance.
o The Capital Projects Fund had $176,301 in outstanding encumbrances, all of which was reported as assigned fund balance. These encumbrances represent the unexpended portion of construction contracts.
III. DETAILED NOTES ON ALL FUNDS
A. DEPOSITS AND INVESTMENTS
Deposits and investments are comprised of the following: Governmental Funds
General Debt Capital Other Proprietary Grand
Fund Service Projects Funds Total Funds Total
Cash and Cash Equivalents:
Demand Accounts $ (28,988,767) $ - $ 142,599 $ 28,364,807 $ (481,361) $ 10,770,648 $ 10,289,287
Cash on Hand 500 - - 585 1,085 - 1,085
Investment Pools 263,568 25,685 86,246 3,998 379,497 - 379,497
Money Market Funds 33,165,463 54,982,725 147,558,159 - 235,706,347 - 235,706,347
Total $ 4,440,764 $ 55,008,410 $ 147,787,004 $ 28,369,390 $235,605,568 $ 10,770,648 $246,376,216
Investments – Current:
Municipal Bonds $ 14,156,647 $ 10,058,536 $ - $ - $ 24,215,183 $ - $ 24,215,183
Repurchase Agreement - - 59,468,600 - 59,468,600 - 59,468,600
Total $ 14,156,647 $ 10,058,536 $ 59,468,600 $ - $ 83,683,783 $ - $ 83,683,783
(Continued)
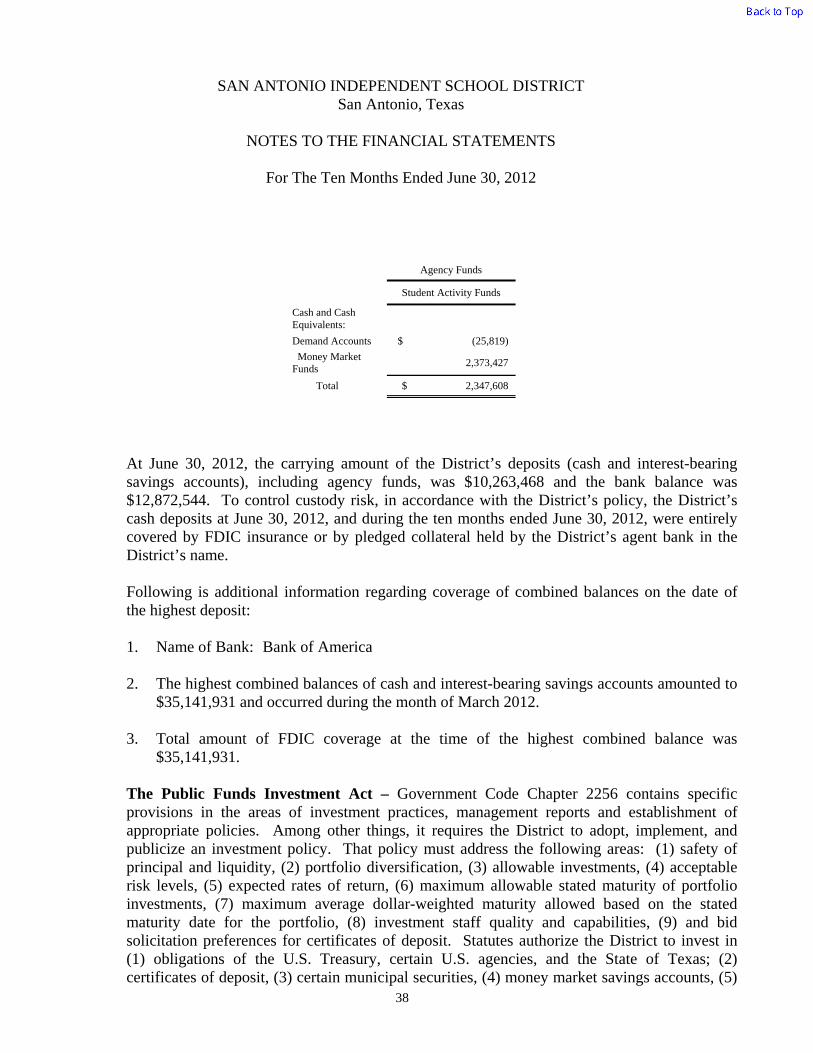
SAN ANTONIO INDEPENDENT SCHOOL DISTRICT San Antonio, Texas
NOTES TO THE FINANCIAL STATEMENTS
For The Ten Months Ended June 30, 2012
38
Agency Funds
Student Activity Funds
Cash and Cash Equivalents:
Demand Accounts $ (25,819)
Money Market Funds
2,373,427
Total $ 2,347,608
At June 30, 2012, the carrying amount of the District’s deposits (cash and interest-bearing savings accounts), including agency funds, was $10,263,468 and the bank balance was $12,872,544. To control custody risk, in accordance with the District’s policy, the District’s cash deposits at June 30, 2012, and during the ten months ended June 30, 2012, were entirely covered by FDIC insurance or by pledged collateral held by the District’s agent bank in the District’s name.
Following is additional information regarding coverage of combined balances on the date of the highest deposit:
1. Name of Bank: Bank of America
2. The highest combined balances of cash and interest-bearing savings accounts amounted to
$35,141,931 and occurred during the month of March 2012.
3. Total amount of FDIC coverage at the time of the highest combined balance was $35,141,931.
The Public Funds Investment Act – Government Code Chapter 2256 contains specific provisions in the areas of investment practices, management reports and establishment of appropriate policies. Among other things, it requires the District to adopt, implement, and publicize an investment policy. That policy must address the following areas: (1) safety of principal and liquidity, (2) portfolio diversification, (3) allowable investments, (4) acceptable risk levels, (5) expected rates of return, (6) maximum allowable stated maturity of portfolio investments, (7) maximum average dollar-weighted maturity allowed based on the stated maturity date for the portfolio, (8) investment staff quality and capabilities, (9) and bid solicitation preferences for certificates of deposit. Statutes authorize the District to invest in (1) obligations of the U.S. Treasury, certain U.S. agencies, and the State of Texas; (2) certificates of deposit, (3) certain municipal securities, (4) money market savings accounts, (5)

SAN ANTONIO INDEPENDENT SCHOOL DISTRICT San Antonio, Texas
NOTES TO THE FINANCIAL STATEMENTS
For The Ten Months Ended June 30, 2012
39
repurchase agreements, (6) bankers acceptances, (7) Mutual Funds, (8) Investment pools, (9) guaranteed investment contracts, (10) and common trust funds. The Act also requires the District to have independent auditors perform test procedures related to investment practices as provided by the Act. The District believes it is in substantial compliance with the requirements of the Act and with local policies.
As of June 30, 2012, the District, including agency funds, had the following investments:
Investment Fair
Value Weighted Average
Maturity (Days) Standard &
Poors Rating
Lone Star Investment Pool $ 113,080 50 AAAm
TexPool 203,530 46 AAAm
TexStar 62,887 49 AAAm
Money Market Mutual Funds
Municipals Obligations Fund 57,378,397 28 Ammf*
Prime Cash Obligations Fund 113,898,885 41 AAAm
Money Market Portfolio Fund 66,802,492 55 Not Rated
Municipal Bonds
Chicago, IL 4,474,983 157 A+
Round Rock, TX 721,430 45 AA+
HCIA 8,960,235 183 AA-/A-1+
Hudson Cnty, NJ 10,058,535 159 AA+ Construction Fund Repurchase Agreement 59,468,600 821 Not Rated
Total $ 322,143,054 *Fitch Rating
Interest Rate Risk – As a means of limiting its exposure to fair value losses arising from rising interest rates, the District’s investment policy limits maturities of investments to two years from the date of purchase.
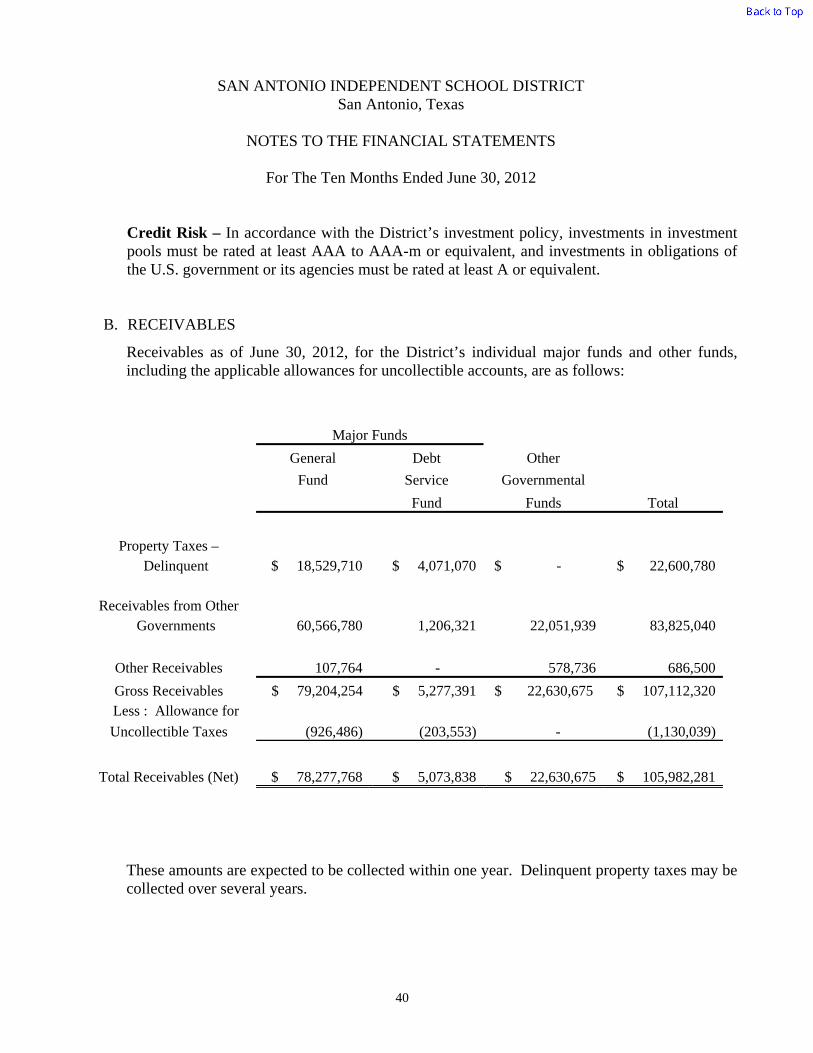
SAN ANTONIO INDEPENDENT SCHOOL DISTRICT San Antonio, Texas
NOTES TO THE FINANCIAL STATEMENTS
For The Ten Months Ended June 30, 2012
40
Credit Risk – In accordance with the District’s investment policy, investments in investment pools must be rated at least AAA to AAA-m or equivalent, and investments in obligations of the U.S. government or its agencies must be rated at least A or equivalent.
B. RECEIVABLES
Receivables as of June 30, 2012, for the District’s individual major funds and other funds, including the applicable allowances for uncollectible accounts, are as follows:
These amounts are expected to be collected within one year. Delinquent property taxes may be collected over several years.
Major Funds
General Debt Other
Total
Fund Service Governmental
Fund Funds
$ 18,529,710 $ 4,071,070 $ - $ 22,600,780 Property Taxes –
Delinquent
60,566,780 1,206,321 22,051,939 83,825,040 Receivables from Other
Governments
107,764 - 578,736 686,500 Other Receivables
Gross Receivables $ 79,204,254 $ 5,277,391 $ 22,630,675 $ 107,112,320 Less : Allowance for
Uncollectible Taxes (926,486) (203,553) - (1,130,039)
$ 78,277,768 $ 5,073,838 $ 22,630,675 $ 105,982,281 Total Receivables (Net)
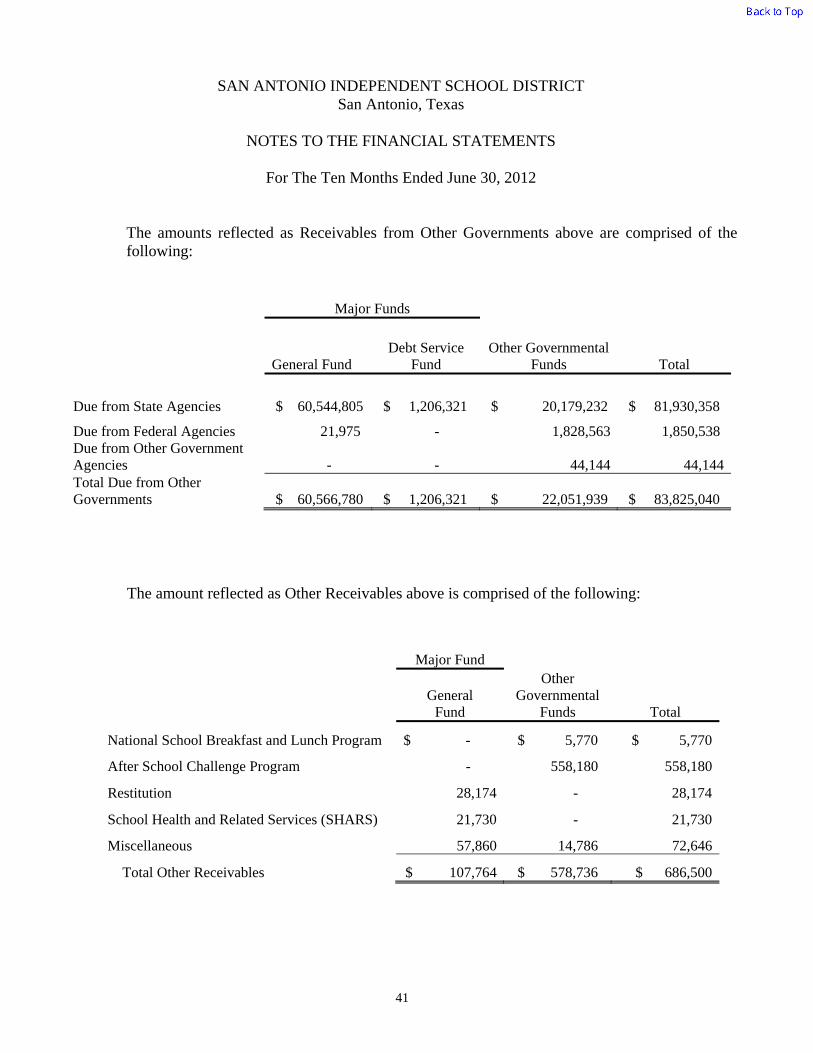
SAN ANTONIO INDEPENDENT SCHOOL DISTRICT San Antonio, Texas
NOTES TO THE FINANCIAL STATEMENTS
For The Ten Months Ended June 30, 2012
41
The amounts reflected as Receivables from Other Governments above are comprised of the following:
Major Funds
General Fund Debt Service
Fund Other Governmental
Funds Total
Due from State Agencies $ 60,544,805 $ 1,206,321 $ 20,179,232 $ 81,930,358
Due from Federal Agencies 21,975 - 1,828,563 1,850,538 Due from Other Government Agencies - - 44,144 44,144Total Due from Other Governments $ 60,566,780 $ 1,206,321 $ 22,051,939 $ 83,825,040
The amount reflected as Other Receivables above is comprised of the following:
Major Fund
General
Fund
Other Governmental
Funds Total National School Breakfast and Lunch Program $ - $ 5,770 $ 5,770 After School Challenge Program - 558,180 558,180
Restitution 28,174 - 28,174 School Health and Related Services (SHARS) 21,730 - 21,730 Miscellaneous 57,860 14,786 72,646
Total Other Receivables $ 107,764 $ 578,736 $ 686,500
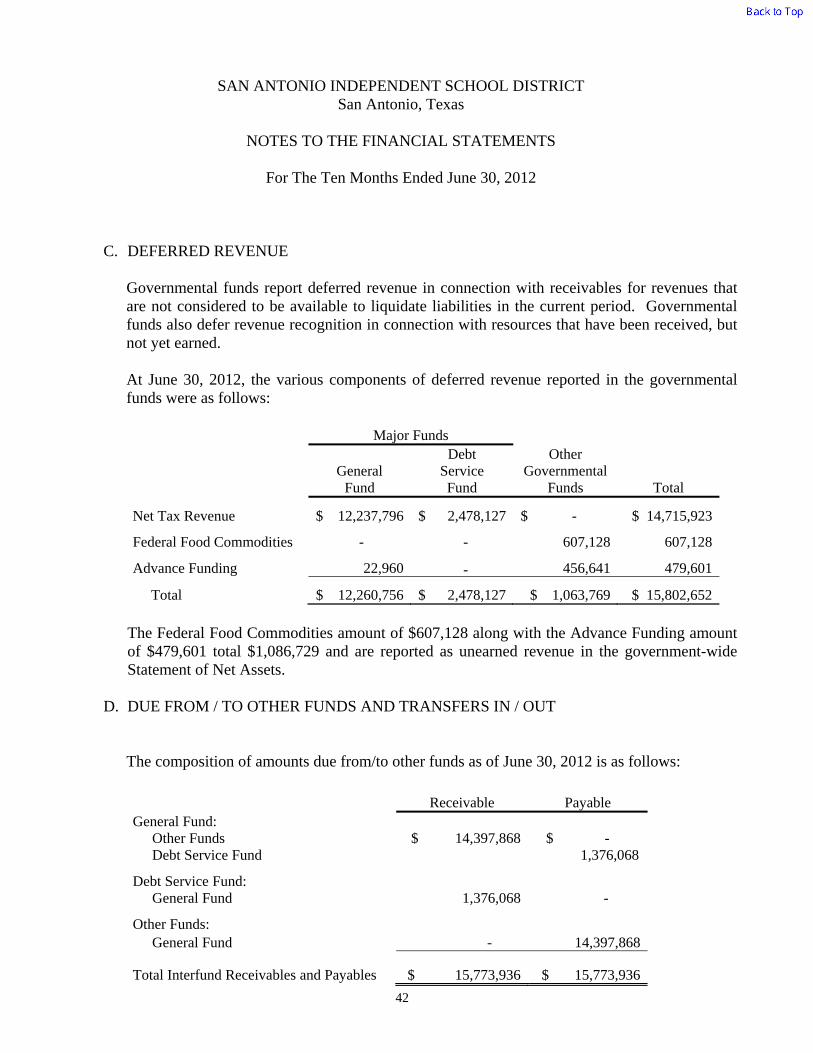
SAN ANTONIO INDEPENDENT SCHOOL DISTRICT San Antonio, Texas
NOTES TO THE FINANCIAL STATEMENTS
For The Ten Months Ended June 30, 2012
42
C. DEFERRED REVENUE
Governmental funds report deferred revenue in connection with receivables for revenues that are not considered to be available to liquidate liabilities in the current period. Governmental funds also defer revenue recognition in connection with resources that have been received, but not yet earned.
At June 30, 2012, the various components of deferred revenue reported in the governmental funds were as follows:
Major Funds
General
Fund
Debt Service Fund
Other Governmental
Funds Total Net Tax Revenue
$ 12,237,796 $ 2,478,127 $ - $ 14,715,923
Federal Food Commodities
- - 607,128
607,128
Advance Funding 22,960 - 456,641 479,601 Total $ 12,260,756 $ 2,478,127 $ 1,063,769 $ 15,802,652
The Federal Food Commodities amount of $607,128 along with the Advance Funding amount of $479,601 total $1,086,729 and are reported as unearned revenue in the government-wide Statement of Net Assets.
D. DUE FROM / TO OTHER FUNDS AND TRANSFERS IN / OUT
The composition of amounts due from/to other funds as of June 30, 2012 is as follows:
Receivable Payable General Fund:
Other Funds $ 14,397,868 $ - Debt Service Fund 1,376,068
Debt Service Fund:
General Fund 1,376,068 - Other Funds:
General Fund - 14,397,868 Total Interfund Receivables and Payables $ 15,773,936 $ 15,773,936
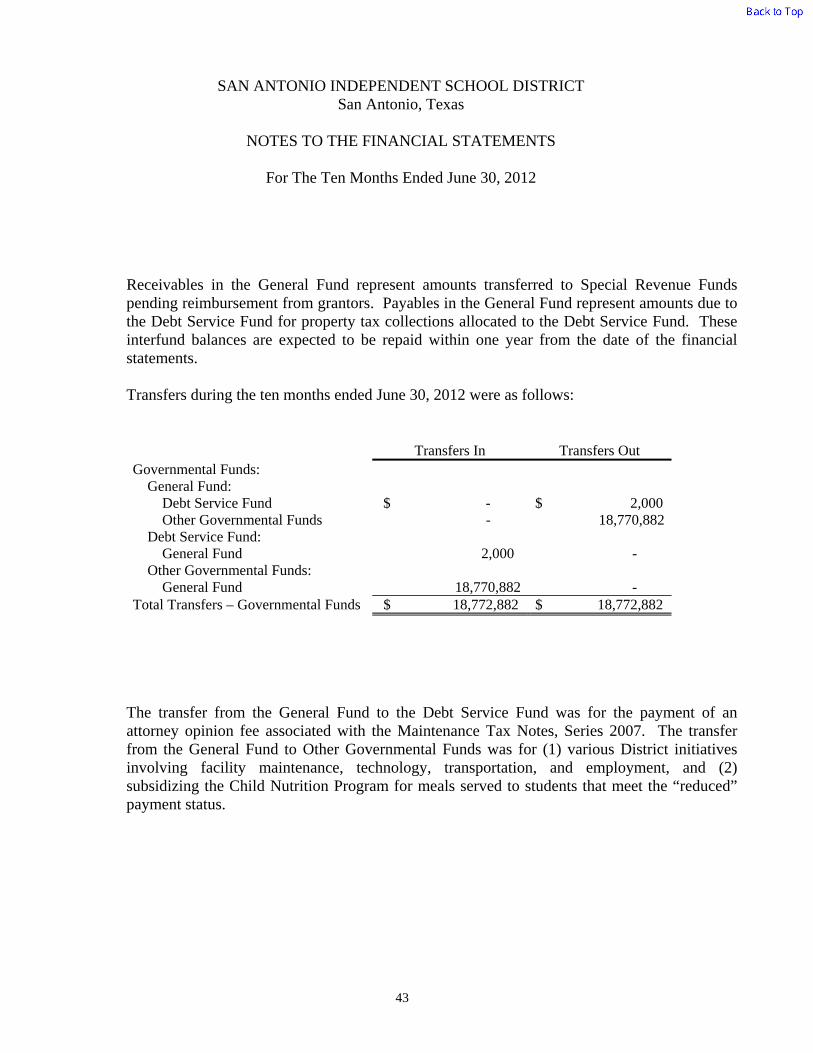
SAN ANTONIO INDEPENDENT SCHOOL DISTRICT San Antonio, Texas
NOTES TO THE FINANCIAL STATEMENTS
For The Ten Months Ended June 30, 2012
43
Receivables in the General Fund represent amounts transferred to Special Revenue Funds pending reimbursement from grantors. Payables in the General Fund represent amounts due to the Debt Service Fund for property tax collections allocated to the Debt Service Fund. These interfund balances are expected to be repaid within one year from the date of the financial statements. Transfers during the ten months ended June 30, 2012 were as follows:
Transfers In Transfers Out Governmental Funds: General Fund:
Debt Service Fund $ - $ 2,000 Other Governmental Funds - 18,770,882
Debt Service Fund: General Fund 2,000 -
Other Governmental Funds: General Fund 18,770,882 -
Total Transfers – Governmental Funds $ 18,772,882 $ 18,772,882
The transfer from the General Fund to the Debt Service Fund was for the payment of an attorney opinion fee associated with the Maintenance Tax Notes, Series 2007. The transfer from the General Fund to Other Governmental Funds was for (1) various District initiatives involving facility maintenance, technology, transportation, and employment, and (2) subsidizing the Child Nutrition Program for meals served to students that meet the “reduced” payment status.
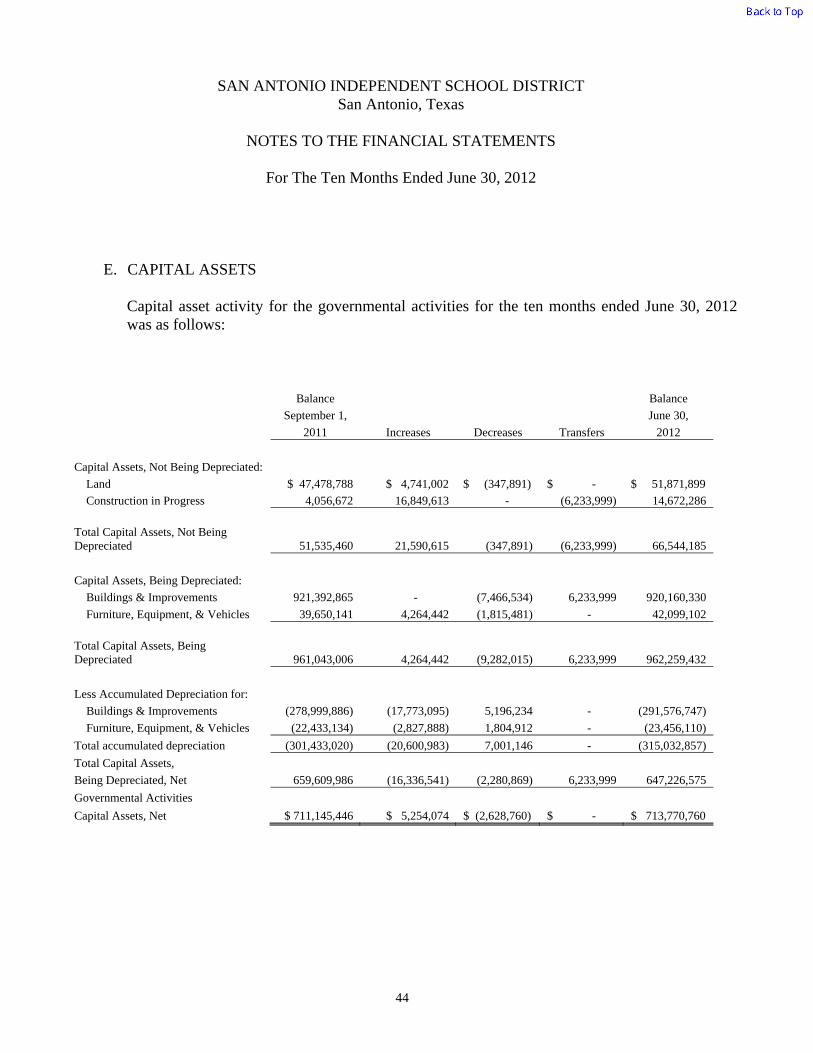
SAN ANTONIO INDEPENDENT SCHOOL DISTRICT San Antonio, Texas
NOTES TO THE FINANCIAL STATEMENTS
For The Ten Months Ended June 30, 2012
44
E. CAPITAL ASSETS
Capital asset activity for the governmental activities for the ten months ended June 30, 2012 was as follows:
Balance Balance
September 1, June 30,
2011 Increases Decreases Transfers 2012
Capital Assets, Not Being Depreciated:
Land $ 47,478,788 $ 4,741,002 $ (347,891) $ - $ 51,871,899
Construction in Progress 4,056,672 16,849,613 - (6,233,999) 14,672,286
Total Capital Assets, Not Being Depreciated
51,535,460 21,590,615 (347,891) (6,233,999) 66,544,185
Capital Assets, Being Depreciated:
Buildings & Improvements 921,392,865 - (7,466,534) 6,233,999 920,160,330
Furniture, Equipment, & Vehicles 39,650,141 4,264,442 (1,815,481) - 42,099,102
Total Capital Assets, Being Depreciated 961,043,006 4,264,442 (9,282,015) 6,233,999 962,259,432
Less Accumulated Depreciation for:
Buildings & Improvements (278,999,886) (17,773,095) 5,196,234 - (291,576,747)
Furniture, Equipment, & Vehicles (22,433,134) (2,827,888) 1,804,912 - (23,456,110)
Total accumulated depreciation (301,433,020) (20,600,983) 7,001,146 - (315,032,857)
Total Capital Assets,
Being Depreciated, Net 659,609,986 (16,336,541) (2,280,869) 6,233,999 647,226,575
Governmental Activities
Capital Assets, Net $ 711,145,446 $ 5,254,074 $ (2,628,760) $ - $ 713,770,760

SAN ANTONIO INDEPENDENT SCHOOL DISTRICT San Antonio, Texas
NOTES TO THE FINANCIAL STATEMENTS
For The Ten Months Ended June 30, 2012
45
Depreciation expense of the governmental activities was charged to functions/programs as follows:
Instruction $ 10,900,328 Instructional Resources and Media Services 230,581Curriculum and Instructional Staff Development 364,372Instructional Leadership 319,111School Leadership 1,060,033Guidance, Counseling, and Evaluation Services 620,613Social Work Services 96,292Health Services 255,859Student (Pupil) Transportation 1,411,386Food Services 1,565,656Extracurricular Activities 380,833General Administration 427,025Facilities Maintenance and Operations 1,822,756Security and Monitoring Services 254,070Data Processing Services 741,106Community Services 150,962
Total Governmental Activities $ 20,600,983
Construction Commitments
The majority of construction in progress as of June 30, 2012 relates to the following bond-funded projects:
Project Authorization
Completed To Date
Construction in Progress
Unexpended Amount
Further Financing Required
1997 Bond Authorization:
Bond Construction, Series 1997 $ 325,064,000 $ 316,307,244 $ 105,062 $ 8,651,694 No
Bond Construction, Series 1999 246,603,000 240,736,598 1,254,940 4,611,462 No
Bond Construction, Series 2000 21,935,000 18,670,528 9,547 3,254,925 No
Bond Construction, Series 2001 137,775,000 134,054,720 96,656 3,623,624 No
2010 Bond Authorization:
Bond Construction, Series 2010 151,800,000 17,775,187 10,460,742 123,564,071 No
Bond Construction, Series 2011 61,270,000 669,534 1,266,799 59,333,667 No
Totals $ 944,447,000 $ 728,213,811 $ 13,193,746 $ 203,039,443
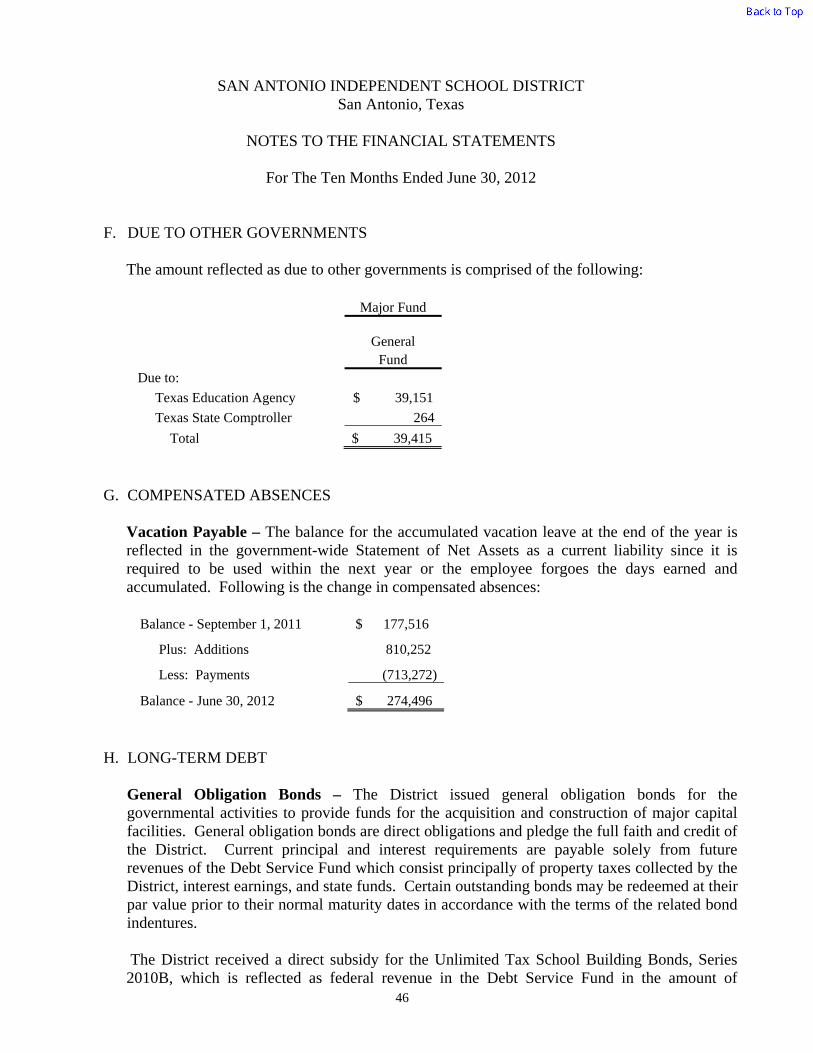
SAN ANTONIO INDEPENDENT SCHOOL DISTRICT San Antonio, Texas
NOTES TO THE FINANCIAL STATEMENTS
For The Ten Months Ended June 30, 2012
46
F. DUE TO OTHER GOVERNMENTS
The amount reflected as due to other governments is comprised of the following:
Major Fund
General Fund Due to:
Texas Education Agency $ 39,151
Texas State Comptroller 264
Total $ 39,415
G. COMPENSATED ABSENCES
Vacation Payable – The balance for the accumulated vacation leave at the end of the year is reflected in the government-wide Statement of Net Assets as a current liability since it is required to be used within the next year or the employee forgoes the days earned and accumulated. Following is the change in compensated absences:
Balance - September 1, 2011 $ 177,516
Plus: Additions 810,252
Less: Payments (713,272) Balance - June 30, 2012 $ 274,496
H. LONG-TERM DEBT
General Obligation Bonds – The District issued general obligation bonds for the governmental activities to provide funds for the acquisition and construction of major capital facilities. General obligation bonds are direct obligations and pledge the full faith and credit of the District. Current principal and interest requirements are payable solely from future revenues of the Debt Service Fund which consist principally of property taxes collected by the District, interest earnings, and state funds. Certain outstanding bonds may be redeemed at their par value prior to their normal maturity dates in accordance with the terms of the related bond indentures. The District received a direct subsidy for the Unlimited Tax School Building Bonds, Series 2010B, which is reflected as federal revenue in the Debt Service Fund in the amount of

SAN ANTONIO INDEPENDENT SCHOOL DISTRICT San Antonio, Texas
NOTES TO THE FINANCIAL STATEMENTS
For The Ten Months Ended June 30, 2012
47
$1,467,167 for the ten months ended June 30, 2012. The District also received a direct subsidy for the Unlimited Tax Qualified School Construction Bonds, Series 2011, which is reflected as federal revenue in the Strategic Initiatives Fund in the amount of $1,122,122 for the ten months ended June 30, 2012.
Refunding Bonds – In previous years, the District issued refunding bonds to defease certain general obligation bonds. The net proceeds were placed in an irrevocable trust to provide for all future debt service payments on the refunded obligations. The refunded obligations represent a legal defeasance and are no longer a liability of the District; therefore, they are not included in the District’s financial statements. At June 30, 2012, $263,765,000 of previously defeased bonds are outstanding. The following is a summary of changes in bonds payable for the ten months ended June 30, 2012:
Description
Interest Rate
Payable
Range of Maturity
Amounts Original
Issue
Amounts Outstanding August 31,
2011
Issued/ Refunding
Retired
Amounts Outstanding
June 30, 2012
Due Within One Year
Unlimited Tax Refunding Bonds, Series 2005
3.0 – 5.25% 2013-2027 $ 306,880,000 $ 292,830,000 $ - $ - $ 292,830,000 $ 16,405,000
Unlimited Tax Refunding Bonds, Series 2006 Current Interest Bonds Premium Capital Appreciation Bonds
4.0- 4.5%
2013-2031
2025
47,290,000
319,988
46,530,000
319,988
-
-
-
-
46,530,000
319,988
165,000
-
Unlimited Tax Sch. Bldg Bonds, Series 2010B
2.235- 6.397% 2013-2040 151,450,000 151,450,000 - - 151,450,000 -
Unlimited Tax Refunding Bonds, Series 2011
2.0- 5.0% 2013-2029 99,085,000 99,085,000 - - 99,085,000 -
Unlimited Tax Qualified School Construction Bonds, Series 2011 4.006% 2013-2028 61,115,000 61,115,000 - - 61,115,000 -
Totals $ 666,139,988 $ 651,329,988 $ - $ - $ 651,329,988 $ 16,570,000
Balance August 31,
2011 Addition Retired
Balance June 30,
2012 Due Within One Year
Accretion on Capital Appreciation Bonds* N/A $ 1,838,701 $ 48,582 $ - $ 1,887,283 $ -
* This amount represents accretion of interest on a cumulative basis.
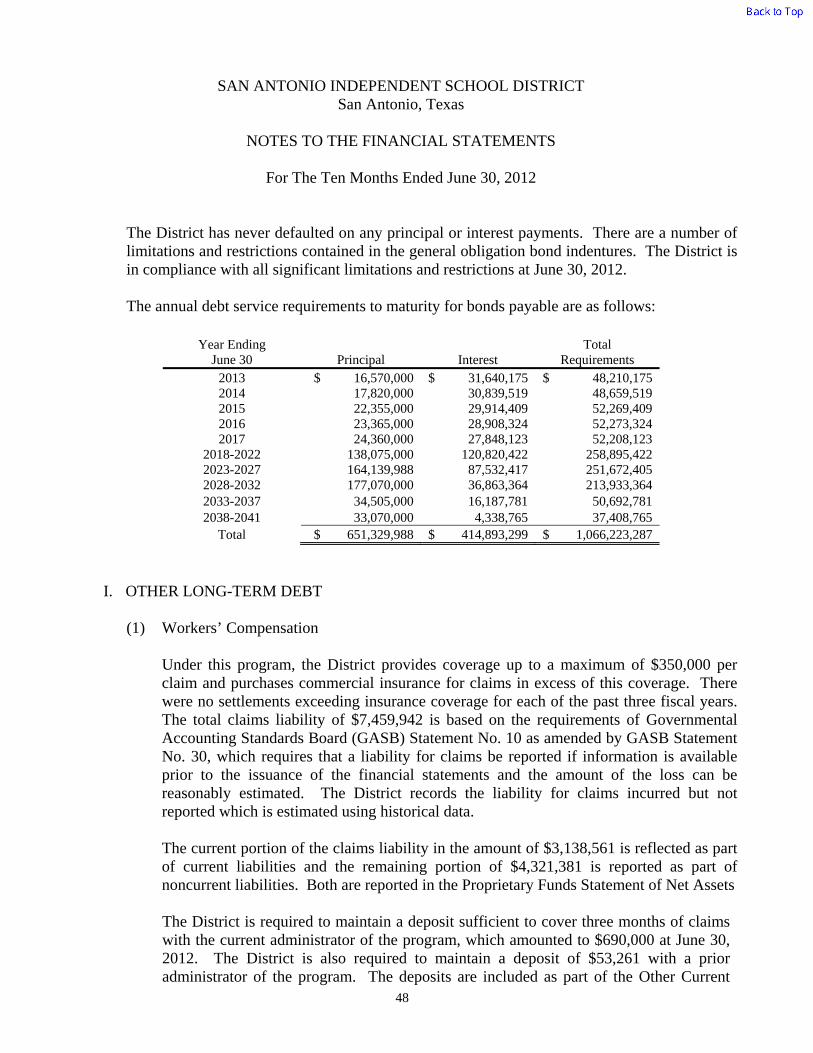
SAN ANTONIO INDEPENDENT SCHOOL DISTRICT San Antonio, Texas
NOTES TO THE FINANCIAL STATEMENTS
For The Ten Months Ended June 30, 2012
48
The District has never defaulted on any principal or interest payments. There are a number of limitations and restrictions contained in the general obligation bond indentures. The District is in compliance with all significant limitations and restrictions at June 30, 2012. The annual debt service requirements to maturity for bonds payable are as follows:
Year Ending
June 30 Principal Interest Total
Requirements 2013 $ 16,570,000 $ 31,640,175 $ 48,210,175 2014 17,820,000 30,839,519 48,659,519 2015 22,355,000 29,914,409 52,269,409 2016 23,365,000 28,908,324 52,273,324 2017 24,360,000 27,848,123 52,208,123
2018-2022 138,075,000 120,820,422 258,895,422 2023-2027 164,139,988 87,532,417 251,672,405 2028-2032 177,070,000 36,863,364 213,933,364 2033-2037 34,505,000 16,187,781 50,692,781 2038-2041 33,070,000 4,338,765 37,408,765
Total $ 651,329,988 $ 414,893,299 $ 1,066,223,287
I. OTHER LONG-TERM DEBT
(1) Workers’ Compensation
Under this program, the District provides coverage up to a maximum of $350,000 per claim and purchases commercial insurance for claims in excess of this coverage. There were no settlements exceeding insurance coverage for each of the past three fiscal years. The total claims liability of $7,459,942 is based on the requirements of Governmental Accounting Standards Board (GASB) Statement No. 10 as amended by GASB Statement No. 30, which requires that a liability for claims be reported if information is available prior to the issuance of the financial statements and the amount of the loss can be reasonably estimated. The District records the liability for claims incurred but not reported which is estimated using historical data.
The current portion of the claims liability in the amount of $3,138,561 is reflected as part of current liabilities and the remaining portion of $4,321,381 is reported as part of noncurrent liabilities. Both are reported in the Proprietary Funds Statement of Net Assets
The District is required to maintain a deposit sufficient to cover three months of claims with the current administrator of the program, which amounted to $690,000 at June 30, 2012. The District is also required to maintain a deposit of $53,261 with a prior administrator of the program. The deposits are included as part of the Other Current

SAN ANTONIO INDEPENDENT SCHOOL DISTRICT San Antonio, Texas
NOTES TO THE FINANCIAL STATEMENTS
For The Ten Months Ended June 30, 2012
49
Assets balance in the Proprietary Funds Statement of Net Assets.
Changes in the claims liability amount for fiscal years 2011 and 2012 were as follows:
Period
Beginning of Fiscal Year/
Period Liability
Current Year/ Period Claims and changes in
Estimates Claim
Payments
Balance at Fiscal Year/ Period End
Year Ended August 31, 2011 $ 8,808,571 $ 2,989,889 $ (3,277,679) $ 8,520,781 Ten Months Ended June 30, 2012 8,520,781 1,748,906 (2,809,745) 7,459,942
(2) Arbitrage Payable
The Federal Tax Reform Act of 1986 requires issuers of tax-exempt debt to make payments to the United States Treasury for investment income received at yields that exceed the issuer’s tax exempt borrowing rates. The Treasury requires payment for each issue every five years. The liability is not recorded until payment is actually made or the liability has become due and payable. The District does not have an arbitrage liability as of June 30, 2012.
J. CHANGES IN LONG-TERM LIABILITIES
Changes in long-term liabilities for the governmental activities for the ten months ended June 30, 2012 were as follows:
Amount Outstanding September 1,
2011 Additions Deletions
Amount Outstanding
June 30, 2012 Due Within One Year
Bonds Payable $ 651,329,988 $ - $ - $ 651,329,988 $ 16,570,000
Accretion on Capital Appreciation Bonds 1,838,701
48,582 - 1,887,283 -
Unamortized Loss on Refunded Bonds (18,823,033) - 910,838 (17,912,195) (1,093,006)
Unamortized Bond Premium 22,440,608 -
(2,356,953) 20,083,655
2,723,777
Unamortized Underwriter’s Discount (1,144,797) - 57,818 (1,086,979)
(69,382)
Workers’ Compensation * 8,520,781
1,748,906
(2,809,745)
7,459,942
3,138,561
Total $ 664,162,248 $ 1,797,488 $ (4,198,042) $ 661,761,694 $ 21,269,950
* The $3,138,561 which is the current portion of the claims liability, is reflected in the claims payable current liability account in the Statement of the Net Assets and not as part of the amount due within one year for the noncurrent liabilities.

SAN ANTONIO INDEPENDENT SCHOOL DISTRICT San Antonio, Texas
NOTES TO THE FINANCIAL STATEMENTS
For The Ten Months Ended June 30, 2012
50
IV. OTHER INFORMATION
A. FUND BALANCE
At June 30, 2012, fund balance is comprised of the following:
Major Funds
General Fund Debit Service
Funds Capital Projects Other Funds Total
Nonspendable:
Inventories $ 1,408,607 $ - $ - $ 563,449 $ 1,972,056
Endowment Principal - - - 1,000 1,000
Restricted:
Federal or State Funds Grant Restriction:
National Breakfast and Lunch Program - - - 6,795,548 6,795,548
Capital Acquisition and Contractual Obligation - - 202,864,654 - 202,864,654
Retirement of Long-Term Debt - 69,150,947 - - 69,150,947
Other Restricted:
Scholarships 131,152 - - 3,004 134,156
Committed:
Capital Expenditures for Equipment:
E-Rate 1,685,645 - - - 1,685,645
Deferred Technology - - - 2,500,000 2,500,000
Bus & Vehicle Fleet Replacement - - - 1,500,000 1,500,000
Technology Integration - - - 500,000 500,000
Increase Funding for Health Insurance Internal Service Fund 7,250,000 - - - 7,250,000
(Continued)
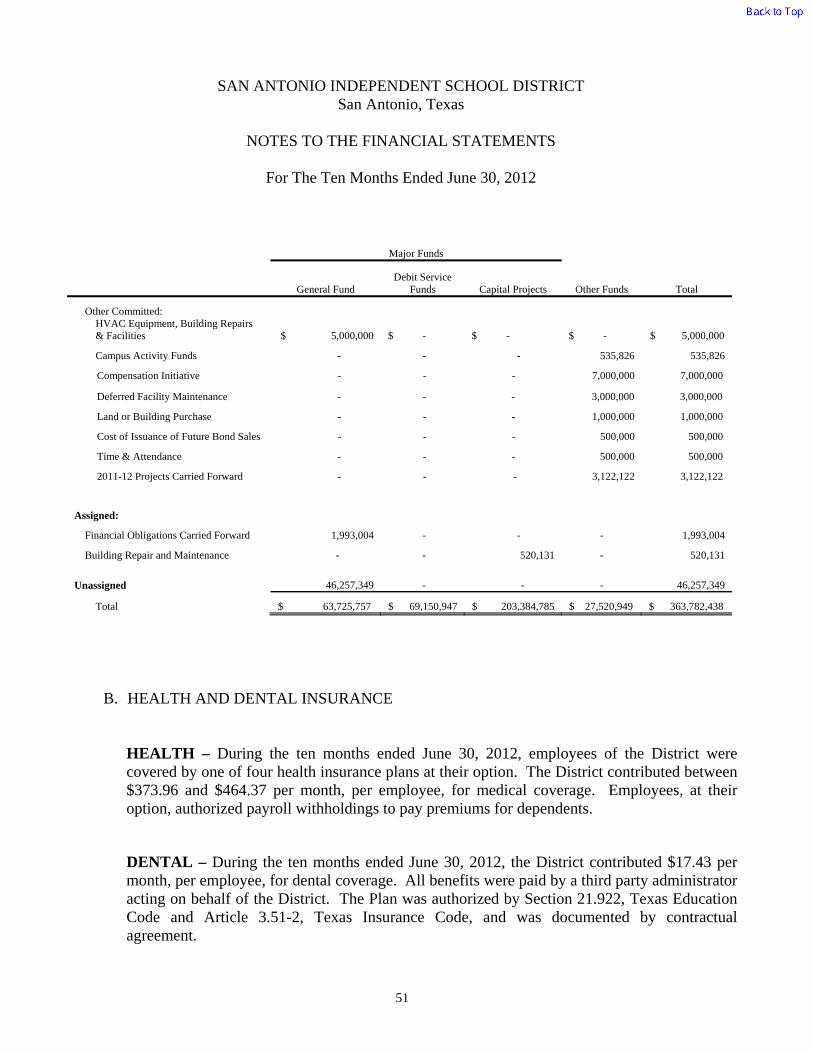
SAN ANTONIO INDEPENDENT SCHOOL DISTRICT San Antonio, Texas
NOTES TO THE FINANCIAL STATEMENTS
For The Ten Months Ended June 30, 2012
51
Major Funds
General Fund Debit Service
Funds Capital Projects Other Funds Total
Other Committed: HVAC Equipment, Building Repairs & Facilities $ 5,000,000 $ - $ - $ - $ 5,000,000
Campus Activity Funds - - - 535,826 535,826
Compensation Initiative - - - 7,000,000 7,000,000
Deferred Facility Maintenance - - - 3,000,000 3,000,000
Land or Building Purchase - - - 1,000,000 1,000,000
Cost of Issuance of Future Bond Sales - - - 500,000 500,000
Time & Attendance - - - 500,000 500,000
2011-12 Projects Carried Forward - - - 3,122,122 3,122,122
Assigned:
Financial Obligations Carried Forward 1,993,004 - - - 1,993,004
Building Repair and Maintenance - - 520,131 - 520,131
Unassigned 46,257,349 - - - 46,257,349
Total $ 63,725,757 $ 69,150,947 $ 203,384,785 $ 27,520,949 $ 363,782,438
B. HEALTH AND DENTAL INSURANCE
HEALTH – During the ten months ended June 30, 2012, employees of the District were covered by one of four health insurance plans at their option. The District contributed between $373.96 and $464.37 per month, per employee, for medical coverage. Employees, at their option, authorized payroll withholdings to pay premiums for dependents.
DENTAL – During the ten months ended June 30, 2012, the District contributed $17.43 per month, per employee, for dental coverage. All benefits were paid by a third party administrator acting on behalf of the District. The Plan was authorized by Section 21.922, Texas Education Code and Article 3.51-2, Texas Insurance Code, and was documented by contractual agreement.

SAN ANTONIO INDEPENDENT SCHOOL DISTRICT San Antonio, Texas
NOTES TO THE FINANCIAL STATEMENTS
For The Ten Months Ended June 30, 2012
52
The “Plan Supervisor Agreement” between the District and the third party administrator is automatically renewed for a one-year period, unless terminated as provided in the Standard Terms and Conditions of the Agreement. The provision for unpaid self funded dental losses at June 30, 2012, in the amount of $399,176 is reported in current liabilities as part of claims payable in the Proprietary Funds Statements of Net Assets, as it is based upon actual prior claims cost experience and average time lags (historically, less than 60 days) in settling such claims and actual claims paid after year end. All costs incurred are accounted for as expenditures in the operating funds affected.
The District is required to maintain a deposit of $40,000 with the third party administrator. The deposit is included as part of the other current assets balance in the Proprietary Funds Statement of Net Assets.
C. RISK MANAGEMENT
The District is exposed to various risks of loss related to torts; theft of, damage to and destruction of assets; errors and omissions; injuries to employees; and, natural disasters. The District participates in the Texas Political Subdivisions Joint Self-Insurance Funds (SIF), a public entity risk pool currently operating as a common risk management and insurance program for public entities. The District is insured with the SIF for auto liability and physical damage coverage. The SIF is provided so that members will have no joint or several liabilities other than their required contribution. The District operates a limited management program for workers compensation. Premiums are paid by all other funds and are available to pay claims, claim reserve, and administrative costs of the program. There were no significant reductions in coverage in the past fiscal year, and settlements did not exceed insurance coverage for each of the past three fiscal years.
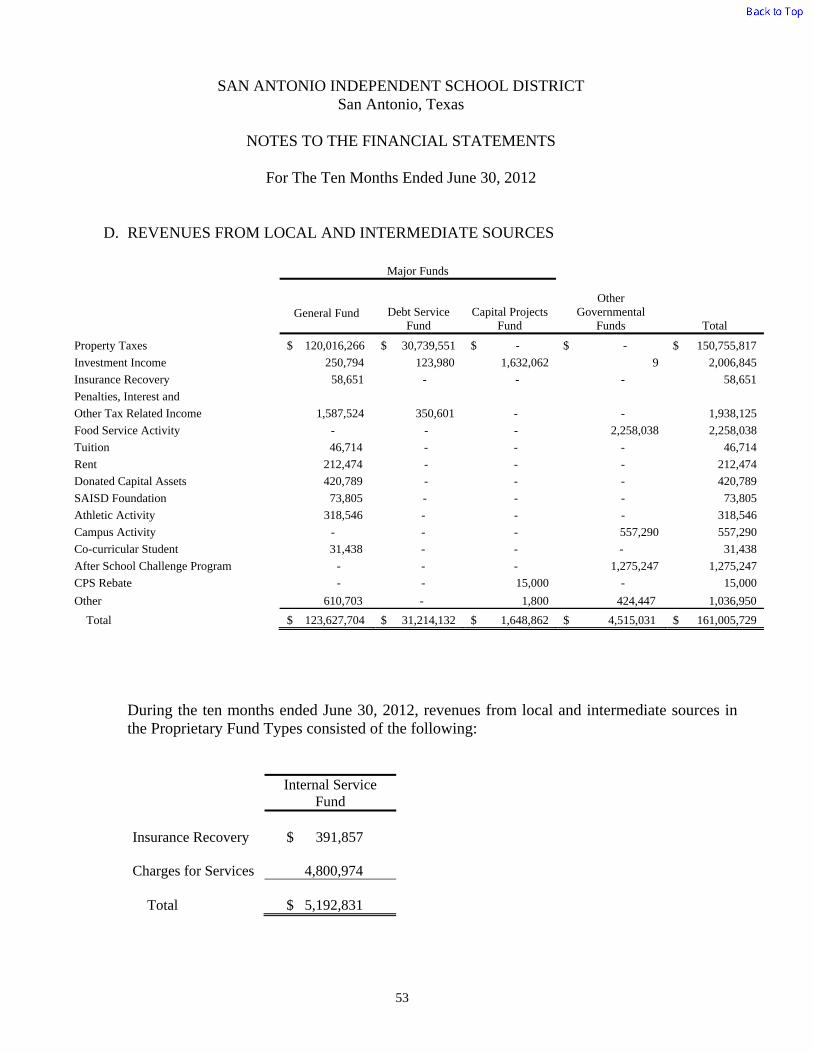
SAN ANTONIO INDEPENDENT SCHOOL DISTRICT San Antonio, Texas
NOTES TO THE FINANCIAL STATEMENTS
For The Ten Months Ended June 30, 2012
53
D. REVENUES FROM LOCAL AND INTERMEDIATE SOURCES
Major Funds
Other Governmental
Funds
General Fund Debt Service
Fund Capital Projects
Fund Total
Property Taxes $ 120,016,266 $ 30,739,551 $ - $ - $ 150,755,817
Investment Income 250,794 123,980 1,632,062 9 2,006,845
Insurance Recovery 58,651 - - - 58,651
Penalties, Interest and
Other Tax Related Income 1,587,524 350,601 - - 1,938,125
Food Service Activity - - - 2,258,038 2,258,038
Tuition 46,714 - - - 46,714
Rent 212,474 - - - 212,474
Donated Capital Assets 420,789 - - - 420,789
SAISD Foundation 73,805 - - - 73,805
Athletic Activity 318,546 - - - 318,546
Campus Activity - - - 557,290 557,290
Co-curricular Student 31,438 - - - 31,438
After School Challenge Program - - - 1,275,247 1,275,247
CPS Rebate - - 15,000 - 15,000
Other 610,703 - 1,800 424,447 1,036,950
Total $ 123,627,704 $ 31,214,132 $ 1,648,862 $ 4,515,031 $ 161,005,729
During the ten months ended June 30, 2012, revenues from local and intermediate sources in the Proprietary Fund Types consisted of the following:
Internal Service Fund
Insurance Recovery $ 391,857 Charges for Services 4,800,974
Total $ 5,192,831
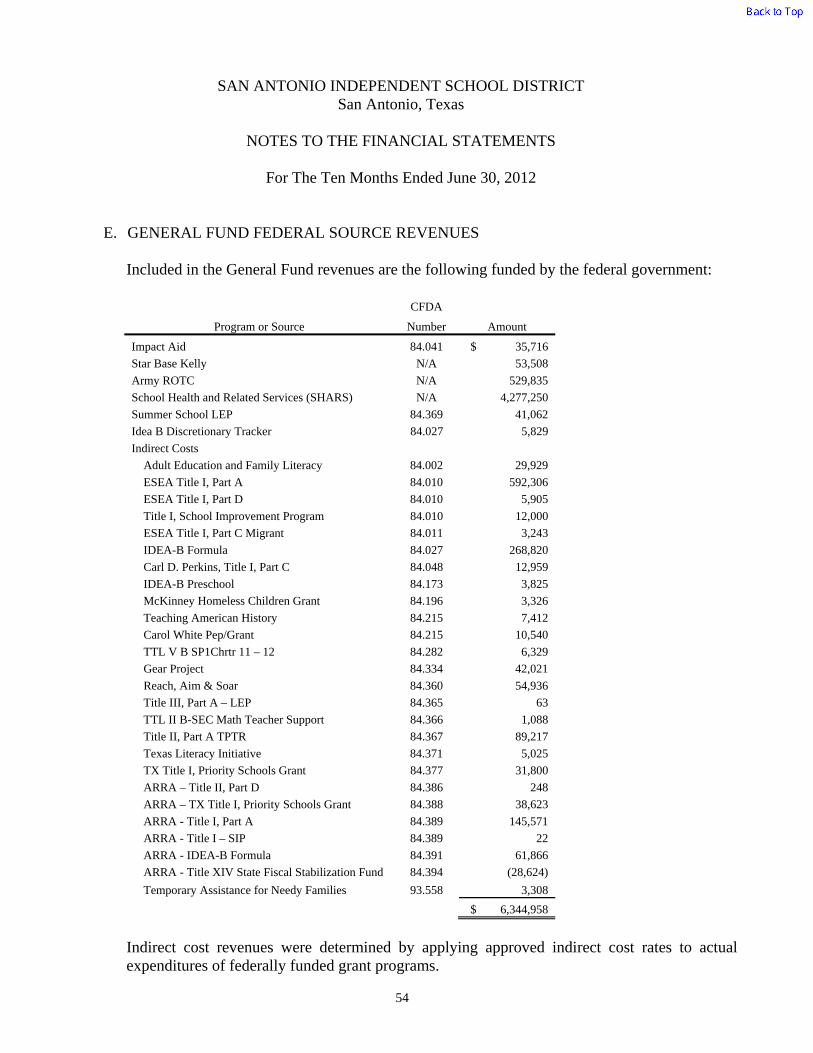
SAN ANTONIO INDEPENDENT SCHOOL DISTRICT San Antonio, Texas
NOTES TO THE FINANCIAL STATEMENTS
For The Ten Months Ended June 30, 2012
54
E. GENERAL FUND FEDERAL SOURCE REVENUES
Included in the General Fund revenues are the following funded by the federal government:
Program or Source
CFDA
Amount Number
Impact Aid 84.041 $ 35,716
Star Base Kelly N/A 53,508
Army ROTC N/A 529,835
School Health and Related Services (SHARS) N/A 4,277,250
Summer School LEP 84.369 41,062
Idea B Discretionary Tracker 84.027 5,829
Indirect Costs
Adult Education and Family Literacy 84.002 29,929
ESEA Title I, Part A 84.010 592,306
ESEA Title I, Part D 84.010 5,905
Title I, School Improvement Program 84.010 12,000
ESEA Title I, Part C Migrant 84.011 3,243
IDEA-B Formula 84.027 268,820
Carl D. Perkins, Title I, Part C 84.048 12,959
IDEA-B Preschool 84.173 3,825
McKinney Homeless Children Grant 84.196 3,326
Teaching American History 84.215 7,412
Carol White Pep/Grant 84.215 10,540
TTL V B SP1Chrtr 11 – 12 84.282 6,329
Gear Project 84.334 42,021
Reach, Aim & Soar 84.360 54,936
Title III, Part A – LEP 84.365 63
TTL II B-SEC Math Teacher Support 84.366 1,088
Title II, Part A TPTR 84.367 89,217
Texas Literacy Initiative 84.371 5,025
TX Title I, Priority Schools Grant 84.377 31,800
ARRA – Title II, Part D 84.386 248
ARRA – TX Title I, Priority Schools Grant 84.388 38,623
ARRA - Title I, Part A 84.389 145,571
ARRA - Title I – SIP 84.389 22
ARRA - IDEA-B Formula 84.391 61,866
ARRA - Title XIV State Fiscal Stabilization Fund 84.394 (28,624)
Temporary Assistance for Needy Families 93.558 3,308
$ 6,344,958
Indirect cost revenues were determined by applying approved indirect cost rates to actual expenditures of federally funded grant programs.

SAN ANTONIO INDEPENDENT SCHOOL DISTRICT San Antonio, Texas
NOTES TO THE FINANCIAL STATEMENTS
For The Ten Months Ended June 30, 2012
55
F. RETIREMENT PLAN
Plan Description
The District contributes to the Teacher Retirement System of Texas (TRS), a cost-sharing multiple employer defined benefit pension plan, with one exception: all risks and costs are not shared by the employer. TRS administers retirement and disability annuities, and death and survivor benefits to employees and beneficiaries of employees of the public school systems of Texas. It operates primarily under the provisions of the Texas Constitution, Article XVI, Sec. 67, and Texas Government Code, Title 8, Subtitle C. TRS also administers proportional retirement benefits and service credit transfer under Texas Government Code, Title 8, Chapters 803 and 805, respectively. TRS issues a publicly available financial report that includes financial statements and required supplementary information for the defined benefit pension plan. That report may be obtained by writing to the TRS Communications Department, 1000 Red River Street, Austin, Texas 78701, by calling the TRS Communications Department at 1-800-223-8778, or by downloading the report from the TRS Internet website, www.trs.state.tx.us, under the TRS Publications heading.
Funding Policy
State law has provided for a member contribution rate of 6.4% for fiscal years 2010-2012; and a state contribution rate of 6.0% for fiscal year 2012 and 6.644% for fiscal years 2010-2011. In certain instances, the District is required to make all or a portion of the State's contribution, which was limited to 6.0% for the period from September 2011 through June 2012 and 6.644% for the period from January 2010 through August 2011. Contribution requirements are not actuarially determined but are legally established and amended by the Texas state legislature. The state funding policy is as follows: (1) The state constitution requires the legislature to establish a member contribution rate of not less than 6.0% of the member’s annual compensation and a state contribution rate of not less than 6.0% and not more than 10% of the aggregate annual compensation of all members of the system; (2) A state statute prohibits benefit improvements or contribution reductions if, as a result of the particular action, the time required to amortize TRS’ unfunded actuarial liabilities would be increased to a period that exceeds 31 years, or, if the amortization period already exceeds 31 years, the period would be increased by such action.
Contributions made by the State on behalf of the District are recorded in the financial statements as both revenues and expenditures. State, District, and employee contribution information for the last three (3) years are as follows:
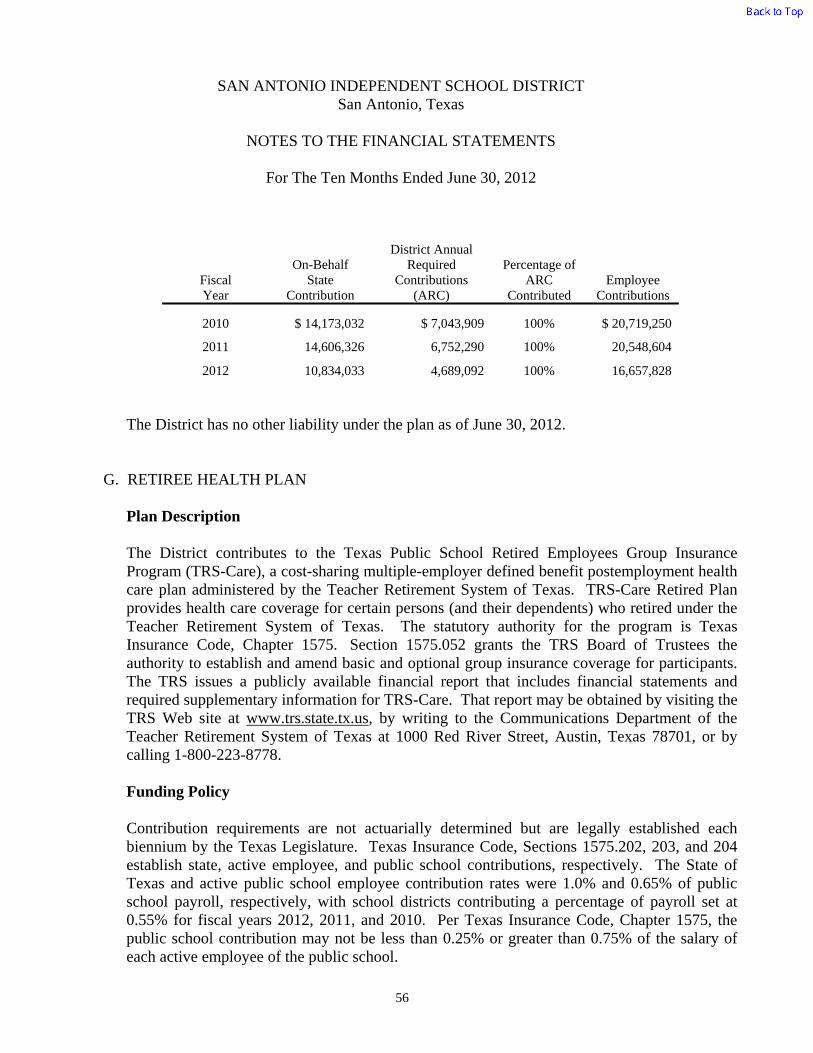
SAN ANTONIO INDEPENDENT SCHOOL DISTRICT San Antonio, Texas
NOTES TO THE FINANCIAL STATEMENTS
For The Ten Months Ended June 30, 2012
56
Fiscal Year
On-Behalf State
Contribution
District Annual Required
Contributions (ARC)
Percentage of ARC
Contributed Employee
Contributions
2010 $ 14,173,032 $ 7,043,909 100% $ 20,719,250
2011 14,606,326 6,752,290 100% 20,548,604
2012 10,834,033 4,689,092 100% 16,657,828
The District has no other liability under the plan as of June 30, 2012.
G. RETIREE HEALTH PLAN
Plan Description
The District contributes to the Texas Public School Retired Employees Group Insurance Program (TRS-Care), a cost-sharing multiple-employer defined benefit postemployment health care plan administered by the Teacher Retirement System of Texas. TRS-Care Retired Plan provides health care coverage for certain persons (and their dependents) who retired under the Teacher Retirement System of Texas. The statutory authority for the program is Texas Insurance Code, Chapter 1575. Section 1575.052 grants the TRS Board of Trustees the authority to establish and amend basic and optional group insurance coverage for participants. The TRS issues a publicly available financial report that includes financial statements and required supplementary information for TRS-Care. That report may be obtained by visiting the TRS Web site at www.trs.state.tx.us, by writing to the Communications Department of the Teacher Retirement System of Texas at 1000 Red River Street, Austin, Texas 78701, or by calling 1-800-223-8778.
Funding Policy
Contribution requirements are not actuarially determined but are legally established each biennium by the Texas Legislature. Texas Insurance Code, Sections 1575.202, 203, and 204 establish state, active employee, and public school contributions, respectively. The State of Texas and active public school employee contribution rates were 1.0% and 0.65% of public school payroll, respectively, with school districts contributing a percentage of payroll set at 0.55% for fiscal years 2012, 2011, and 2010. Per Texas Insurance Code, Chapter 1575, the public school contribution may not be less than 0.25% or greater than 0.75% of the salary of each active employee of the public school.
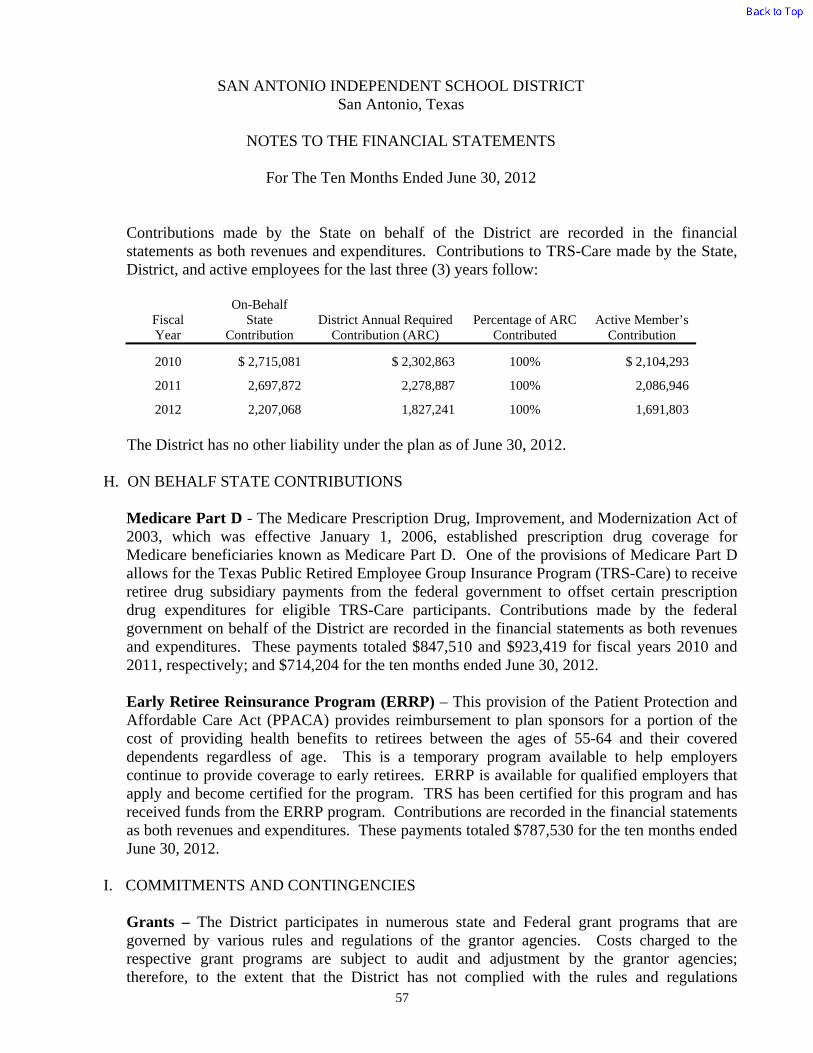
SAN ANTONIO INDEPENDENT SCHOOL DISTRICT San Antonio, Texas
NOTES TO THE FINANCIAL STATEMENTS
For The Ten Months Ended June 30, 2012
57
Contributions made by the State on behalf of the District are recorded in the financial statements as both revenues and expenditures. Contributions to TRS-Care made by the State, District, and active employees for the last three (3) years follow:
Fiscal Year
On-Behalf State
Contribution
District Annual Required
Contribution (ARC)
Percentage of ARC
Contributed
Active Member’s
Contribution
2010 $ 2,715,081 $ 2,302,863 100% $ 2,104,293
2011 2,697,872 2,278,887 100% 2,086,946
2012 2,207,068 1,827,241 100% 1,691,803
The District has no other liability under the plan as of June 30, 2012.
H. ON BEHALF STATE CONTRIBUTIONS
Medicare Part D - The Medicare Prescription Drug, Improvement, and Modernization Act of 2003, which was effective January 1, 2006, established prescription drug coverage for Medicare beneficiaries known as Medicare Part D. One of the provisions of Medicare Part D allows for the Texas Public Retired Employee Group Insurance Program (TRS-Care) to receive retiree drug subsidiary payments from the federal government to offset certain prescription drug expenditures for eligible TRS-Care participants. Contributions made by the federal government on behalf of the District are recorded in the financial statements as both revenues and expenditures. These payments totaled $847,510 and $923,419 for fiscal years 2010 and 2011, respectively; and $714,204 for the ten months ended June 30, 2012. Early Retiree Reinsurance Program (ERRP) – This provision of the Patient Protection and Affordable Care Act (PPACA) provides reimbursement to plan sponsors for a portion of the cost of providing health benefits to retirees between the ages of 55-64 and their covered dependents regardless of age. This is a temporary program available to help employers continue to provide coverage to early retirees. ERRP is available for qualified employers that apply and become certified for the program. TRS has been certified for this program and has received funds from the ERRP program. Contributions are recorded in the financial statements as both revenues and expenditures. These payments totaled $787,530 for the ten months ended June 30, 2012.
I. COMMITMENTS AND CONTINGENCIES
Grants – The District participates in numerous state and Federal grant programs that are governed by various rules and regulations of the grantor agencies. Costs charged to the respective grant programs are subject to audit and adjustment by the grantor agencies; therefore, to the extent that the District has not complied with the rules and regulations
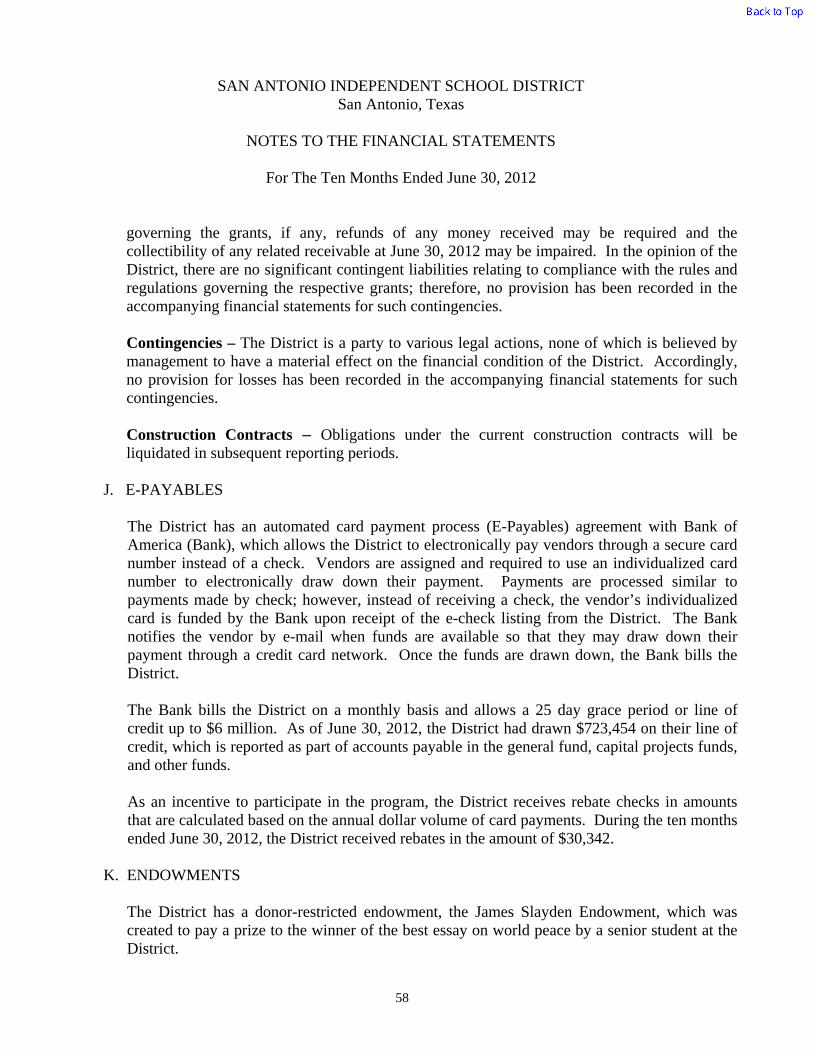
SAN ANTONIO INDEPENDENT SCHOOL DISTRICT San Antonio, Texas
NOTES TO THE FINANCIAL STATEMENTS
For The Ten Months Ended June 30, 2012
58
governing the grants, if any, refunds of any money received may be required and the collectibility of any related receivable at June 30, 2012 may be impaired. In the opinion of the District, there are no significant contingent liabilities relating to compliance with the rules and regulations governing the respective grants; therefore, no provision has been recorded in the accompanying financial statements for such contingencies. Contingencies – The District is a party to various legal actions, none of which is believed by management to have a material effect on the financial condition of the District. Accordingly, no provision for losses has been recorded in the accompanying financial statements for such contingencies.
Construction Contracts – Obligations under the current construction contracts will be liquidated in subsequent reporting periods.
J. E-PAYABLES
The District has an automated card payment process (E-Payables) agreement with Bank of America (Bank), which allows the District to electronically pay vendors through a secure card number instead of a check. Vendors are assigned and required to use an individualized card number to electronically draw down their payment. Payments are processed similar to payments made by check; however, instead of receiving a check, the vendor’s individualized card is funded by the Bank upon receipt of the e-check listing from the District. The Bank notifies the vendor by e-mail when funds are available so that they may draw down their payment through a credit card network. Once the funds are drawn down, the Bank bills the District.
The Bank bills the District on a monthly basis and allows a 25 day grace period or line of credit up to $6 million. As of June 30, 2012, the District had drawn $723,454 on their line of credit, which is reported as part of accounts payable in the general fund, capital projects funds, and other funds.
As an incentive to participate in the program, the District receives rebate checks in amounts that are calculated based on the annual dollar volume of card payments. During the ten months ended June 30, 2012, the District received rebates in the amount of $30,342.
K. ENDOWMENTS
The District has a donor-restricted endowment, the James Slayden Endowment, which was created to pay a prize to the winner of the best essay on world peace by a senior student at the District.

SAN ANTONIO INDEPENDENT SCHOOL DISTRICT San Antonio, Texas
NOTES TO THE FINANCIAL STATEMENTS
For The Ten Months Ended June 30, 2012
59
The District authorizes the spending of endowment investment income according to the directives given by the donors. The net appreciation on investments of the endowment that is available for spending totals $3,004 as of June 30, 2012 and is reported as Other Restricted Fund Balance on the Balance Sheet and as Restricted for Other Purposes on the Statement of Net Assets.
L. OTHER USES
During the ten months ended June 30, 2012, the District transferred a donor-restricted endowment, the Lanier Student Endowment, in the amount of $117,339 to the SAISD Foundation. This transfer is reported as Other Uses in the Permanent Fund.

THIS PAGE LEFT BLANK INTENTIONALLY

Required Supplementary Information

THIS PAGE LEFT BLANK INTENTIONALLY
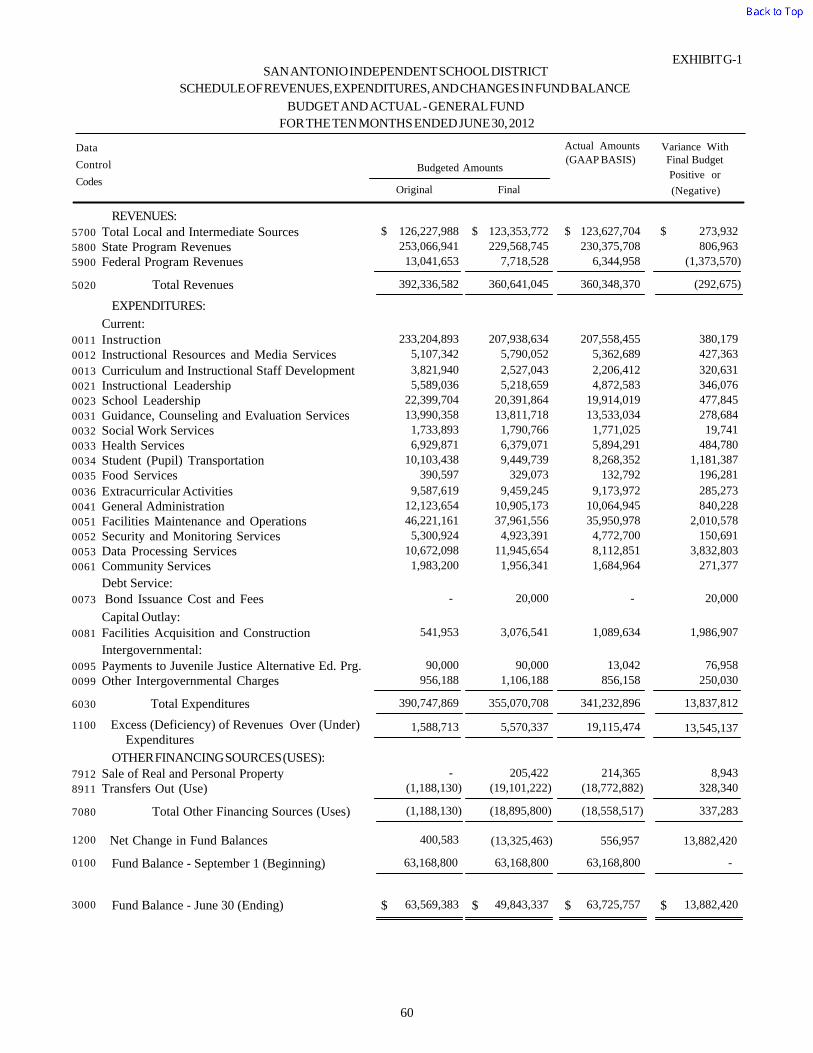
EXHIBIT G-1SAN ANTONIO INDEPENDENT SCHOOL DISTRICT
SCHEDULE OF REVENUES, EXPENDITURES, AND CHANGES IN FUND BALANCE
BUDGET AND ACTUAL - GENERAL FUND
FOR THE TEN MONTHS ENDED JUNE 30, 2012
Control
Data
CodesOriginal Final
(GAAP BASIS)
(Negative)
Positive or
Final BudgetVariance WithActual Amounts
Budgeted Amounts
REVENUES:123,353,772 126,227,988 123,627,704 273,932 Total Local and Intermediate Sources $ $ $ $5700
229,568,745 253,066,941 230,375,708 806,963 State Program Revenues5800
7,718,528 13,041,653 6,344,958 (1,373,570)Federal Program Revenues5900
Total Revenues5020 392,336,582 360,641,045 360,348,370 (292,675)
EXPENDITURES:
Current:207,938,634 233,204,893 207,558,455 380,179 Instruction0011
5,790,052 5,107,342 5,362,689 427,363 Instructional Resources and Media Services0012
2,527,043 3,821,940 2,206,412 320,631 Curriculum and Instructional Staff Development0013
5,218,659 5,589,036 4,872,583 346,076 Instructional Leadership0021
20,391,864 22,399,704 19,914,019 477,845 School Leadership0023
13,811,718 13,990,358 13,533,034 278,684 Guidance, Counseling and Evaluation Services0031
1,790,766 1,733,893 1,771,025 19,741 Social Work Services0032
6,379,071 6,929,871 5,894,291 484,780 Health Services0033
9,449,739 10,103,438 8,268,352 1,181,387 Student (Pupil) Transportation0034
329,073 390,597 132,792 196,281 Food Services0035
9,459,245 9,587,619 9,173,972 285,273 Extracurricular Activities0036
10,905,173 12,123,654 10,064,945 840,228 General Administration0041
37,961,556 46,221,161 35,950,978 2,010,578 Facilities Maintenance and Operations0051
4,923,391 5,300,924 4,772,700 150,691 Security and Monitoring Services0052
11,945,654 10,672,098 8,112,851 3,832,803 Data Processing Services0053
1,956,341 1,983,200 1,684,964 271,377 Community Services0061
Debt Service:20,000 - - 20,000 Bond Issuance Cost and Fees0073
Capital Outlay:3,076,541 541,953 1,089,634 1,986,907 Facilities Acquisition and Construction0081
Intergovernmental:90,000 90,000 13,042 76,958 Payments to Juvenile Justice Alternative Ed. Prg.0095
1,106,188 956,188 856,158 250,030 Other Intergovernmental Charges0099
Total Expenditures6030 390,747,869 355,070,708 341,232,896 13,837,812
1100 Excess (Deficiency) of Revenues Over (Under) Expenditures
1,588,713 5,570,337 19,115,474 13,545,137
OTHER FINANCING SOURCES (USES): 205,422 - 214,365 8,943 Sale of Real and Personal Property7912
(19,101,222)(1,188,130) (18,772,882) 328,340 Transfers Out (Use)8911
Total Other Financing Sources (Uses) 7080 (1,188,130) (18,895,800) (18,558,517) 337,283
1200 Net Change in Fund Balances 400,583 (13,325,463) 556,957 13,882,420
0100 Fund Balance - September 1 (Beginning) 63,168,800 63,168,800 63,168,800 -
3000 Fund Balance - June 30 (Ending) $ 63,569,383 $ 49,843,337 $ 63,725,757 $ 13,882,420
60

THIS PAGE LEFT BLANK INTENTIONALLY

Other Supplementary Information

THIS PAGE LEFT BLANK INTENTIONALLY
Nonmajor Governmental Funds (Special Revenue Funds)
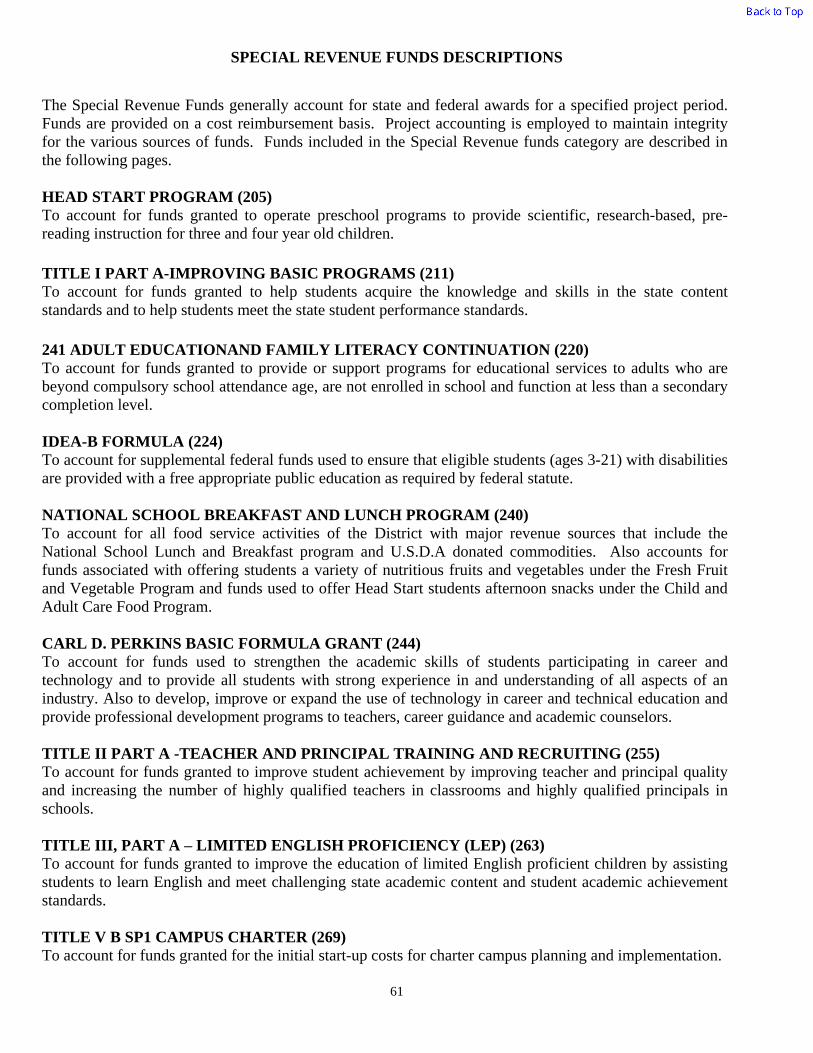
SPECIAL REVENUE FUNDS DESCRIPTIONS
61
The Special Revenue Funds generally account for state and federal awards for a specified project period. Funds are provided on a cost reimbursement basis. Project accounting is employed to maintain integrity for the various sources of funds. Funds included in the Special Revenue funds category are described in the following pages. HEAD START PROGRAM (205) To account for funds granted to operate preschool programs to provide scientific, research-based, pre-reading instruction for three and four year old children. TITLE I PART A-IMPROVING BASIC PROGRAMS (211) To account for funds granted to help students acquire the knowledge and skills in the state content standards and to help students meet the state student performance standards. 241 ADULT EDUCATIONAND FAMILY LITERACY CONTINUATION (220) To account for funds granted to provide or support programs for educational services to adults who are beyond compulsory school attendance age, are not enrolled in school and function at less than a secondary completion level. IDEA-B FORMULA (224) To account for supplemental federal funds used to ensure that eligible students (ages 3-21) with disabilities are provided with a free appropriate public education as required by federal statute. NATIONAL SCHOOL BREAKFAST AND LUNCH PROGRAM (240) To account for all food service activities of the District with major revenue sources that include the National School Lunch and Breakfast program and U.S.D.A donated commodities. Also accounts for funds associated with offering students a variety of nutritious fruits and vegetables under the Fresh Fruit and Vegetable Program and funds used to offer Head Start students afternoon snacks under the Child and Adult Care Food Program. CARL D. PERKINS BASIC FORMULA GRANT (244) To account for funds used to strengthen the academic skills of students participating in career and technology and to provide all students with strong experience in and understanding of all aspects of an industry. Also to develop, improve or expand the use of technology in career and technical education and provide professional development programs to teachers, career guidance and academic counselors. TITLE II PART A -TEACHER AND PRINCIPAL TRAINING AND RECRUITING (255) To account for funds granted to improve student achievement by improving teacher and principal quality and increasing the number of highly qualified teachers in classrooms and highly qualified principals in schools. TITLE III, PART A – LIMITED ENGLISH PROFICIENCY (LEP) (263) To account for funds granted to improve the education of limited English proficient children by assisting students to learn English and meet challenging state academic content and student academic achievement standards.
TITLE V B SP1 CAMPUS CHARTER (269) To account for funds granted for the initial start-up costs for charter campus planning and implementation.
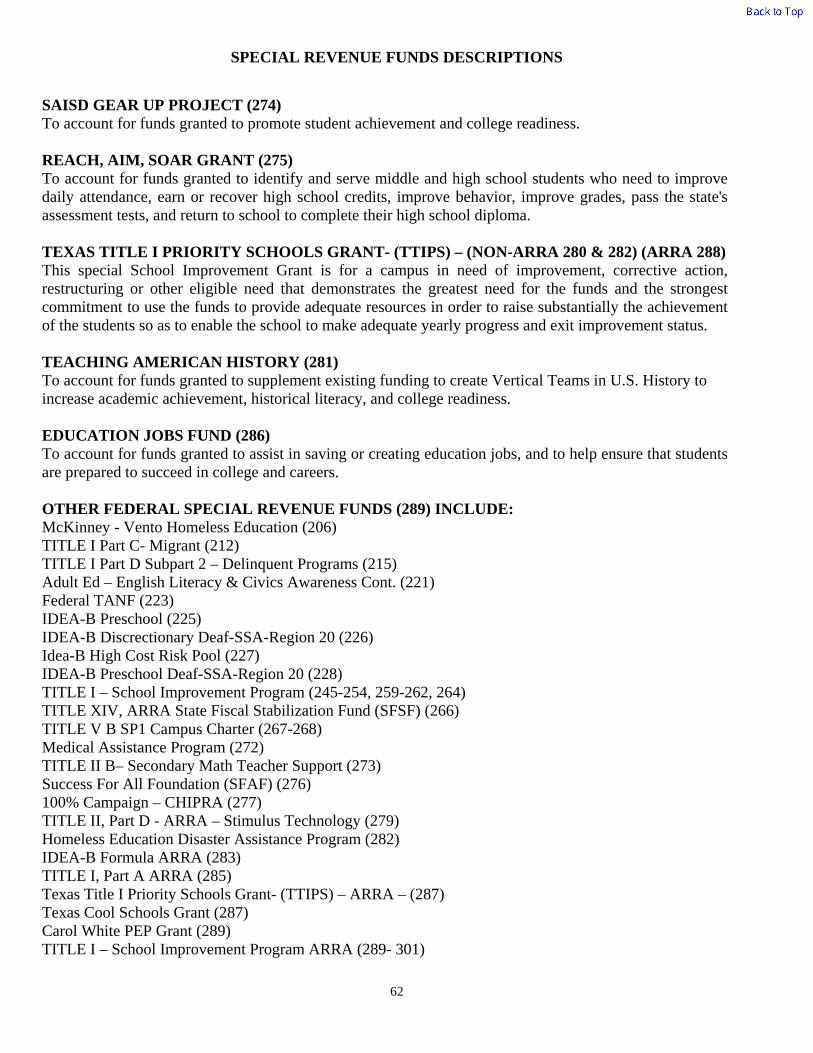
SPECIAL REVENUE FUNDS DESCRIPTIONS
62
SAISD GEAR UP PROJECT (274) To account for funds granted to promote student achievement and college readiness. REACH, AIM, SOAR GRANT (275) To account for funds granted to identify and serve middle and high school students who need to improve daily attendance, earn or recover high school credits, improve behavior, improve grades, pass the state's assessment tests, and return to school to complete their high school diploma. TEXAS TITLE I PRIORITY SCHOOLS GRANT- (TTIPS) – (NON-ARRA 280 & 282) (ARRA 288) This special School Improvement Grant is for a campus in need of improvement, corrective action, restructuring or other eligible need that demonstrates the greatest need for the funds and the strongest commitment to use the funds to provide adequate resources in order to raise substantially the achievement of the students so as to enable the school to make adequate yearly progress and exit improvement status. TEACHING AMERICAN HISTORY (281) To account for funds granted to supplement existing funding to create Vertical Teams in U.S. History to increase academic achievement, historical literacy, and college readiness.
EDUCATION JOBS FUND (286) To account for funds granted to assist in saving or creating education jobs, and to help ensure that students are prepared to succeed in college and careers. OTHER FEDERAL SPECIAL REVENUE FUNDS (289) INCLUDE: McKinney - Vento Homeless Education (206) TITLE I Part C- Migrant (212) TITLE I Part D Subpart 2 – Delinquent Programs (215) Adult Ed – English Literacy & Civics Awareness Cont. (221) Federal TANF (223) IDEA-B Preschool (225) IDEA-B Discrectionary Deaf-SSA-Region 20 (226) Idea-B High Cost Risk Pool (227) IDEA-B Preschool Deaf-SSA-Region 20 (228) TITLE I – School Improvement Program (245-254, 259-262, 264) TITLE XIV, ARRA State Fiscal Stabilization Fund (SFSF) (266) TITLE V B SP1 Campus Charter (267-268) Medical Assistance Program (272) TITLE II B– Secondary Math Teacher Support (273) Success For All Foundation (SFAF) (276) 100% Campaign – CHIPRA (277) TITLE II, Part D - ARRA – Stimulus Technology (279) Homeless Education Disaster Assistance Program (282) IDEA-B Formula ARRA (283) TITLE I, Part A ARRA (285) Texas Title I Priority Schools Grant- (TTIPS) – ARRA – (287) Texas Cool Schools Grant (287) Carol White PEP Grant (289) TITLE I – School Improvement Program ARRA (289- 301)
SPECIAL REVENUE FUNDS DESCRIPTIONS
63
Texas Literacy Initiative (290) Community Putting Prevention to Work (487) REGIONAL DAY SCHOOL PROGRAM FOR THE DEAF (386) To account for funds allocated for staff and activities for students with a hearing impairment which severely impairs processing linguistic information through hearing, even with recommended amplification, and which adversely affects educational performance. STATE INSTRUCTIONAL MATERIALS FUND (410) To account for the state Instructional Materials Allotment (IMA), which is used for the purchase of instructional materials, technological equipment, and technology-related services. The allotment is determined each biennium and allocated to districts on the basis of PEIMS student enrollment data. Unexpended funds will be carried forward each year. DISTRICT AWARDS FOR TEACHER EXCELLENCE (427) To account for funds granted to provide a teacher incentive awards program that supports the establishment of district-wide goals and the implementation of a financial awards system for teachers who improve student achievement.
OTHER STATE SPECIAL REVENUE FUNDS (429) INCLUDE:
GR – Adult Education Continuation (381) Supplemental Services - Visually Impaired (385) AP International/ Baccalaureate (AP/IB) (397 & 429) Algebra Readiness (401, 403, 405-407, 412-417) SSI-College Readiness Initiative For MS Students (404) Texas HS Initiative -Dropout Recovery Pilot Program (408) Texas HS Initiative -Dropout Recovery Performance Pay (410) Technology Fund (411) Technical Assistance for On-line College/Career Readiness (418) Online College & Career Prep (421-423) Beginning Teacher Induction and Mentoring (425) Texas High School Initiative - Early College High School (429) Collaborative Dropout Reduction Program (480) LEOSE – Law Enforcement Officer Standards & Ed (485) CAMPUS ACTIVITY FUNDS (461) To account for transactions related to a principal’s activity fund if the monies generated are not subject to recall by the school district’s board of trustees into the General Fund. STRATEGIC INITIATIVES FUND (470) This fund utilizes QSCB subsidy revenue to establish a reserve to fund future lawful District expenditures such as compensation restructuring, deferred facility maintenance, and technology initiatives.
SPECIAL REVENUE FUNDS DESCRIPTIONS
64
AFTER SCHOOL CHALLENGE PROGRAM (478) To account for funds granted through an interlocal agreement with the City of San Antonio. These funds provide for recreational and educational opportunities for children in the community after school hours. OTHER LOCAL SPECIAL REVENUE FUNDS (499) INCLUDE: Brackenridge HS Theatre Grant (FAISP) (419) Edison HS Theatre Grant (FAISP) (420) Washington Mutual Grant (465, 466) AFT Alliance Grant (467, 469) Community Foundation- Laura Bush for America (481) First Robotics Grant (482) National FFA / Toyota Diversity (483) Citicorp Foundation – Lanier (490) Tynan Very Early Childhood Center (495) Children’s Defense Fund – All Healthy Children (497) Communities Foundation of Texas (499)

SAN ANTONIO INDEPENDENT SCHOOL DISTRICT
COMBINING BALANCE SHEETNONMAJOR GOVERNMENTAL FUNDS
JUNE 30, 2012
Control
Data
CodesHead Start
Program Basic Program
Part A, Imprv
ESEA Title I
Literacy
Ed & Family
Federal Adult
Formula
IDEA - Part B
205 211 220 224
ASSETS
- - - - $ $ $ $1110 Cash and Cash Equivalents
6,247,098 4,218,853 139,104 2,132,046 1240 Receivables from Other Governments
- - - - 1290 Other Receivables
- - - - 1300 Inventories
Total Assets1000 4,218,853 6,247,098 139,104 2,132,046 $ $ $ $
LIABILITIES AND FUND BALANCES
Liabilities:
599,929 - 3,083 53,064 $ $ $ $2110 Accounts Payable
1,888,956 1,028,657 43,592 833,199 2160 Accrued Wages Payable
3,758,213 3,190,196 92,429 1,245,783 2170 Due to Other Funds
- - - - 2300 Deferred Revenues
Total Liabilities2000 4,218,853 6,247,098 139,104 2,132,046
Fund Balances:
Nonspendable Fund Balance:
- - - - 3410 Inventories
- - - - 3425 Endowment Principal
Restricted Fund Balance:
- - - - 3450 Federal or State Funds Grant Restriction
- - - - 3490 Other Restricted Fund Balance
Committed Fund Balance:
- - - - 3530 Capital Expenditures for Equipment
- - - - 3545 Other Committed Fund Balance
Total Fund Balances3000 - - - -
4000 Total Liabilities and Fund Balances 4,218,853 6,247,098 139,104 2,132,046 $ $ $ $
65
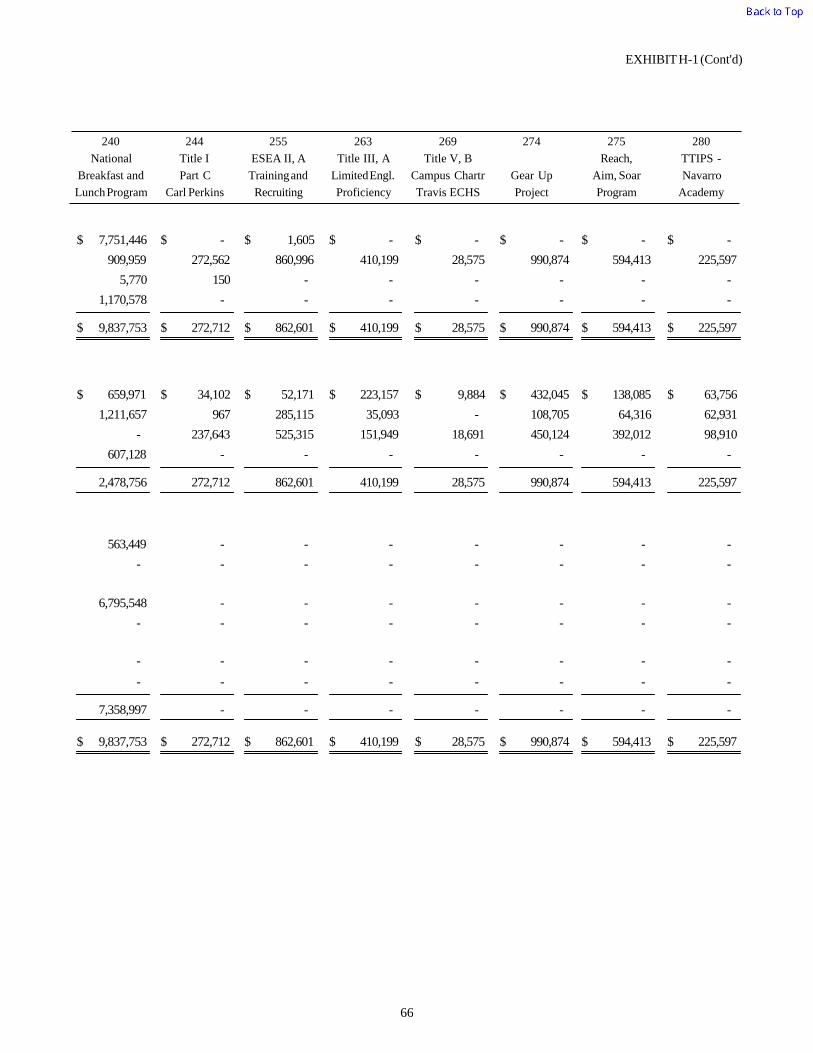
EXHIBIT H-1 (Cont'd)
National
Breakfast and
Carl Perkins
Part C
Title I
Recruiting
Training and
ESEA II, A
Proficiency
Limited Engl.
Title III, A Title V, B
Campus Chartr
Travis ECHS
Gear Up
Project
TTIPS -
Navarro
Academy
Reach,
Aim, Soar
Program
240 244 255 263 269 274 275 280
Lunch Program
- - - 7,751,446 - 1,605 - - $ $ $ $ $ $ $ $
28,575 410,199 990,874 909,959 272,562 860,996 594,413 225,597
- - - 5,770 150 - - -
- - - 1,170,578 - - - -
9,837,753 272,712 862,601 410,199 28,575 990,874 594,413 225,597 $ $ $ $ $ $ $ $
9,884 223,157 432,045 659,971 34,102 52,171 138,085 63,756 $ $ $ $ $ $ $ $
- 35,093 108,705 1,211,657 967 285,115 64,316 62,931
18,691 151,949 450,124 - 237,643 525,315 392,012 98,910
- - - 607,128 - - - -
2,478,756 272,712 862,601 410,199 28,575 990,874 594,413 225,597
- - - 563,449 - - - -
- - - - - - - -
- - - 6,795,548 - - - -
- - - - - - - -
- - - - - - - -
- - - - - - - -
7,358,997 - - - - - - -
9,837,753 272,712 862,601 410,199 28,575 990,874 594,413 225,597 $ $ $ $ $ $ $ $
66

SAN ANTONIO INDEPENDENT SCHOOL DISTRICT
COMBINING BALANCE SHEETNONMAJOR GOVERNMENTAL FUNDS
JUNE 30, 2012
Control
Data
Codes
Teaching
American
History Davis MS
TTIPS -
ARRA
Jobs Fund
Education
Sam Houston
ARRA -
TTIPS
281 282 286 288
ASSETS
- - - - Cash and Cash Equivalents $ $ $ $1110
727,550 156,278 13,609 32,366 Receivables from Other Governments1240
- - - - Other Receivables1290
- - - - Inventories1300
Total Assets1000 156,278 727,550 13,609 32,366 $ $ $ $
LIABILITIES AND FUND BALANCES
Liabilities:
120,944 40,673 - 847 Accounts Payable $ $ $ $2110
253,052 51,723 - 28,820 Accrued Wages Payable2160
353,554 63,882 13,609 2,699 Due to Other Funds2170
- - - - Deferred Revenues2300
Total Liabilities2000 156,278 727,550 13,609 32,366
Fund Balances:
Nonspendable Fund Balance:
- - - - Inventories3410
- - - - Endowment Principal3425
Restricted Fund Balance:
- - - - Federal or State Funds Grant Restriction3450
- - - - Other Restricted Fund Balance3490
Committed Fund Balance:
- - - - Capital Expenditures for Equipment3530
- - - - Other Committed Fund Balance3545
Total Fund Balances3000 - - - -
4000 Total Liabilities and Fund Balances 156,278 727,550 13,609 32,366 $ $ $ $
67
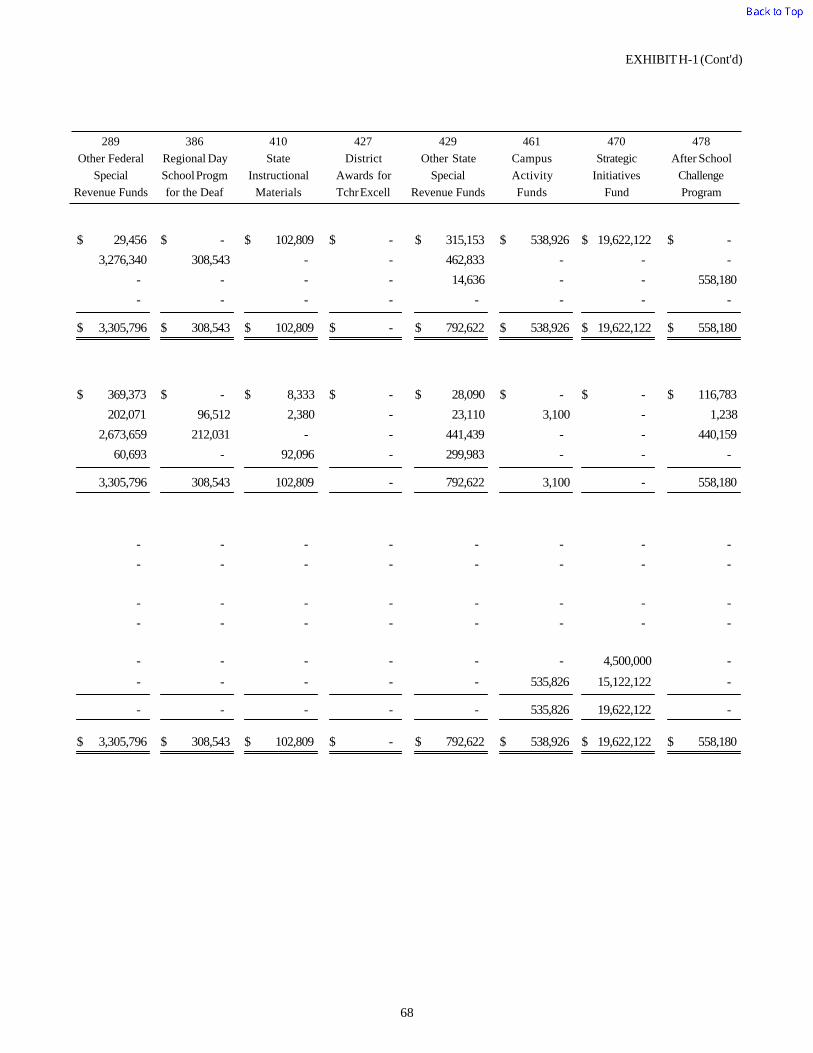
EXHIBIT H-1 (Cont'd)
Other Federal
Special
for the Deaf
School Progm
Regional Day
Materials
Instructional
State
Tchr Excell
Awards for
District Other State
Special
Revenue Funds
Campus
Activity
Funds
After School
Challenge
Program
Strategic
Initiatives
Fund
289 386 410 427 429 461 470 478
Revenue Funds
315,153 - 538,926 29,456 - 102,809 19,622,122 - $ $ $ $ $ $ $ $
462,833 - - 3,276,340 308,543 - - -
14,636 - - - - - - 558,180
- - - - - - - -
3,305,796 308,543 102,809 - 792,622 538,926 19,622,122 558,180 $ $ $ $ $ $ $ $
28,090 - - 369,373 - 8,333 - 116,783 $ $ $ $ $ $ $ $
23,110 - 3,100 202,071 96,512 2,380 - 1,238
441,439 - - 2,673,659 212,031 - - 440,159
299,983 - - 60,693 - 92,096 - -
3,305,796 308,543 102,809 - 792,622 3,100 - 558,180
- - - - - - - -
- - - - - - - -
- - - - - - - -
- - - - - - - -
- - - - - - 4,500,000 -
- - 535,826 - - - 15,122,122 -
- - - - - 535,826 19,622,122 -
3,305,796 308,543 102,809 - 792,622 538,926 19,622,122 558,180 $ $ $ $ $ $ $ $
68
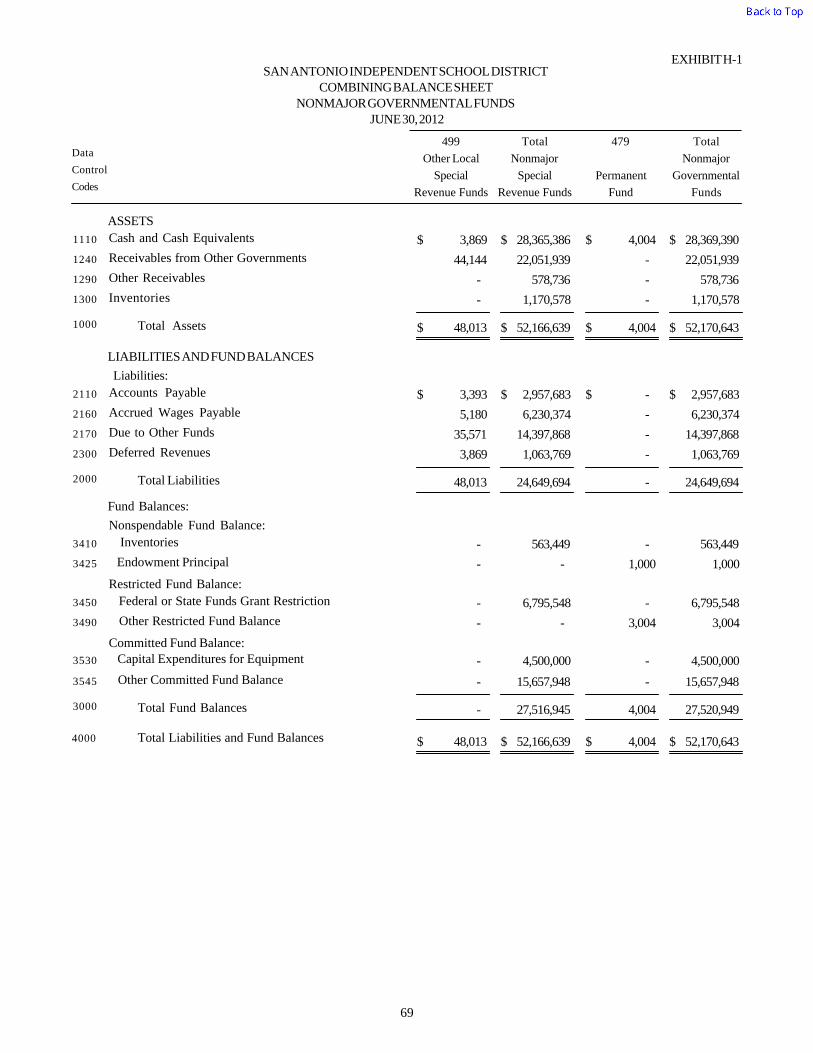
EXHIBIT H-1SAN ANTONIO INDEPENDENT SCHOOL DISTRICT
COMBINING BALANCE SHEETNONMAJOR GOVERNMENTAL FUNDS
JUNE 30, 2012
Control
Data
Codes
Other Local
Special
Revenue Funds Revenue Funds
Special
Nonmajor
Fund
Permanent
Funds
Governmental
Nonmajor
499 Total 479 Total
ASSETS
28,365,386 3,869 4,004 28,369,390 Cash and Cash Equivalents $ $ $ $1110
22,051,939 44,144 - 22,051,939 Receivables from Other Governments1240
578,736 - - 578,736 Other Receivables1290
1,170,578 - - 1,170,578 Inventories1300
Total Assets1000 48,013 52,166,639 4,004 52,170,643 $ $ $ $
LIABILITIES AND FUND BALANCES
Liabilities:
2,957,683 3,393 - 2,957,683 Accounts Payable $ $ $ $2110
6,230,374 5,180 - 6,230,374 Accrued Wages Payable2160
14,397,868 35,571 - 14,397,868 Due to Other Funds2170
1,063,769 3,869 - 1,063,769 Deferred Revenues2300
Total Liabilities2000 48,013 24,649,694 - 24,649,694
Fund Balances:
Nonspendable Fund Balance:
563,449 - - 563,449 Inventories3410
- - 1,000 1,000 Endowment Principal3425
Restricted Fund Balance:
6,795,548 - - 6,795,548 Federal or State Funds Grant Restriction3450
- - 3,004 3,004 Other Restricted Fund Balance3490
Committed Fund Balance:
4,500,000 - - 4,500,000 Capital Expenditures for Equipment3530
15,657,948 - - 15,657,948 Other Committed Fund Balance3545
Total Fund Balances3000 - 27,516,945 4,004 27,520,949
4000 Total Liabilities and Fund Balances 48,013 52,166,639 4,004 52,170,643 $ $ $ $
69

THIS PAGE LEFT BLANK INTENTIONALLY

SAN ANTONIO INDEPENDENT SCHOOL DISTRICT
COMBINING STATEMENT OF REVENUES, EXPENDITURES AND CHANGES INFUND BALANCES - NONMAJOR GOVERNMENTAL FUNDS
FOR THE TEN MONTHS ENDED JUNE 30, 2012
Control
Data
CodesHead Start
Program Basic Program
Part A, Imprv
ESEA Title I
Literacy
Ed & Family
Federal Adult
Formula
IDEA - Part B
205 211 220 224
REVENUES: - - - - Total Local and Intermediate Sources5700 $ $ $ $ - - - - State Program Revenues5800
27,522,582 11,862,893 1,300,397 12,693,110 Federal Program Revenues5900
Total Revenues5020 11,862,893 27,522,582 1,300,397 12,693,110
EXPENDITURES:
Current:16,427,947 8,530,190 924,875 7,176,003 Instruction0011
11,920 - - - Instructional Resources and Media Services00121,124,482 - 9,458 2,427,334 Curriculum and Instructional Staff Development00131,146,232 1,123,259 366,064 90,754 Instructional Leadership00215,896,268 668,459 - (458)School Leadership0023
274,555 - - 1,754,224 Guidance, Counseling and Evaluation Services0031327,452 - - 118,231 Social Work Services0032255,765 221,410 - 52,769 Health Services0033
- 493,330 - 3,696 Student (Pupil) Transportation0034 - 73,151 - - Food Services0035 - - - 43,093 Extracurricular Activities0036 - 34,817 - - General Administration0041
30,631 690,623 - 4,613 Facilities Maintenance and Operations00511,541 - - - Security and Monitoring Services0052
209,679 - - - Data Processing Services00531,622,678 27,654 - 339,272 Community Services0061
Capital Outlay: - - - - Facilities Acquisition and Construction0081
Intergovernmental:193,432 - - 683,579 Payments to Fiscal Agent/Member Districts of SSA0093
Total Expenditures6030 11,862,893 27,522,582 1,300,397 12,693,110
1100 Excess (Deficiency) of Revenues Over (Under) Expenditures
- - - -
OTHER FINANCING SOURCES (USES): - - - - Transfers In7915 - - - - Other (Uses)8949
Total Other Financing Sources (Uses) 7080 - - - -
1200 Net Change in Fund Balance - - - -
0100 Fund Balance - September 1 (Beginning) - - - -
3000 Fund Balance - June 30 (Ending) $ - $ - $ - $ -
70

EXHIBIT H-2 (Cont'd)
National
Breakfast and
Lunch Program Carl Perkins
Part C
Title I
RecruitingTraining and
ESEA II, A
Proficiency
Limited Engl.
Title III, A
240 244 255 263 280
TTIPS -
Navarro
Academy
275
Reach,
Aim, Soar
Program
274
Gear Up
Project
269
Title V, B
Campus Chartr
Travis ECHS
- 2,315,598 - - - - - - $ $ $ $ $ $ $ $ - 206,282 - - - - - -
982,399 32,897,303 4,057,154 821,418 615,681 2,498,211 2,128,336 331,788
35,419,183 982,399 4,057,154 821,418 615,681 2,498,211 2,128,336 331,788
893,610 - 1,007,458 560,448 203,229 1,146,729 780,641 260,929 - - - - - - - -
35,284 - 2,914,807 222,493 43,175 - 25,371 28,702 - - 64,213 31,405 25,856 196,116 619,588 6,944 - - 2,205 - 243,129 - 15,134 26,487
40,031 - - 7,072 71,823 358,859 301,417 145
- - - - - 793,762 320,205 - - - - - - - - - - - - - - - - - - 35,566,223 - - - - - - - - - - - - 52,824 - - 5,534 - - - - - - - 1,207,776 - - - - - 1,965 - - - - - - - -
13,474 - - - - - - -
- - 68,471 - 28,469 2,745 13,156 6,616
- - - - - - - -
- - - - - - - -
36,779,533 982,399 4,057,154 821,418 615,681 2,498,211 2,128,336 331,788
(1,360,350) - - - - - - -
- 270,882 - - - - - - - - - - - - - -
270,882 - - - - - - -
(1,089,468) - - - - - - -
8,448,465 - - - - - - -
$ 7,358,997 $ - $ - $ - $ - $ - $ - $ -
71
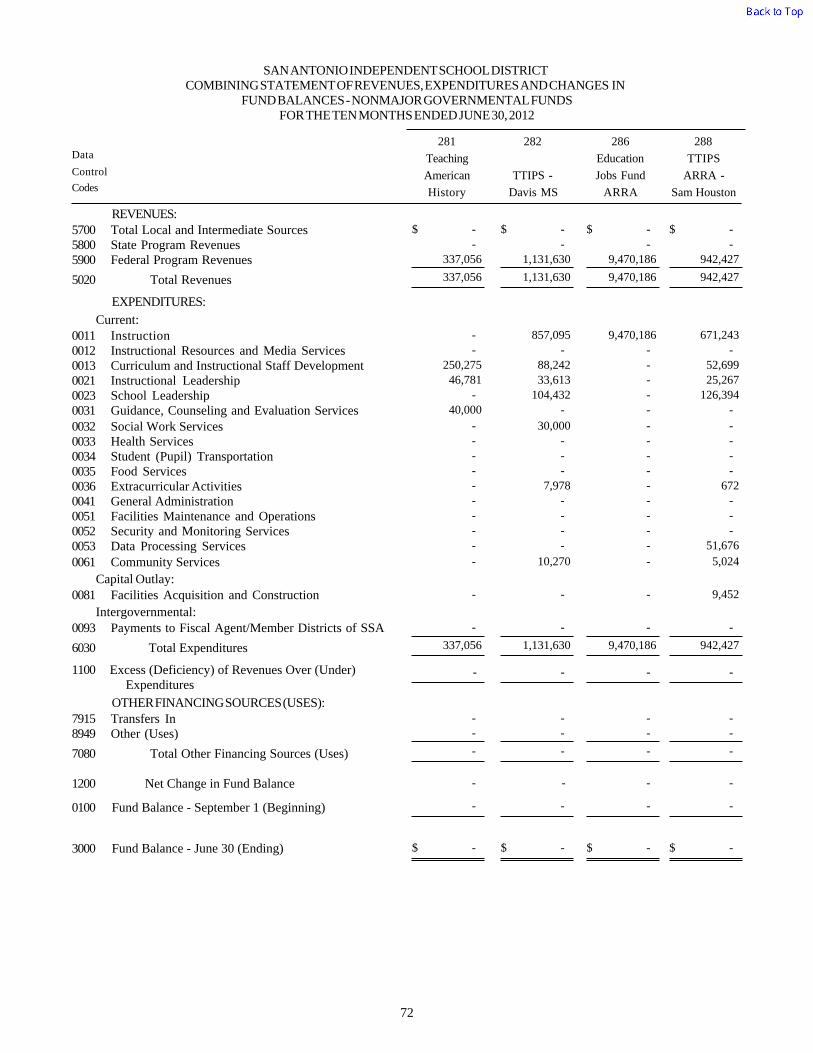
SAN ANTONIO INDEPENDENT SCHOOL DISTRICT
COMBINING STATEMENT OF REVENUES, EXPENDITURES AND CHANGES INFUND BALANCES - NONMAJOR GOVERNMENTAL FUNDS
FOR THE TEN MONTHS ENDED JUNE 30, 2012
Control
Data
Codes
Teaching
American
History Davis MS
TTIPS -
ARRA
Jobs Fund
Education
Sam Houston
ARRA -
TTIPS
281 282 286 288
REVENUES: - - - - Total Local and Intermediate Sources5700 $ $ $ $ - - - - State Program Revenues5800
1,131,630 337,056 9,470,186 942,427 Federal Program Revenues5900
Total Revenues5020 337,056 1,131,630 9,470,186 942,427
EXPENDITURES:
Current:857,095 - 9,470,186 671,243 Instruction0011
- - - - Instructional Resources and Media Services001288,242 250,275 - 52,699 Curriculum and Instructional Staff Development001333,613 46,781 - 25,267 Instructional Leadership0021
104,432 - - 126,394 School Leadership0023 - 40,000 - - Guidance, Counseling and Evaluation Services0031
30,000 - - - Social Work Services0032 - - - - Health Services0033 - - - - Student (Pupil) Transportation0034 - - - - Food Services0035
7,978 - - 672 Extracurricular Activities0036 - - - - General Administration0041 - - - - Facilities Maintenance and Operations0051 - - - - Security and Monitoring Services0052 - - - 51,676 Data Processing Services0053
10,270 - - 5,024 Community Services0061
Capital Outlay: - - - 9,452 Facilities Acquisition and Construction0081
Intergovernmental: - - - - Payments to Fiscal Agent/Member Districts of SSA0093
Total Expenditures6030 337,056 1,131,630 9,470,186 942,427
1100 Excess (Deficiency) of Revenues Over (Under) Expenditures
- - - -
OTHER FINANCING SOURCES (USES): - - - - Transfers In7915 - - - - Other (Uses)8949
Total Other Financing Sources (Uses) 7080 - - - -
1200 Net Change in Fund Balance - - - -
0100 Fund Balance - September 1 (Beginning) - - - -
3000 Fund Balance - June 30 (Ending) $ - $ - $ - $ -
72

EXHIBIT H-2 (Cont'd)
Other Federal
Special
Revenue Funds for the Deaf
School Progm
Regional Day
Materials
Instructional
State
Tchr Excell
Awards for
District
289 386 410 427 478
After School
Challenge
Program
470
Strategic
Initiatives
Fund
461
Campus
Activity
Funds
429
Other State
Special
Revenue Funds
- - - - 1,275,246 - 557,290 - $ $ $ $ $ $ $ $919,039 - 5,508,108 3,670,058 - - - 2,776,618
- 6,331,916 - - - 1,122,122 - -
6,331,916 919,039 5,508,108 3,670,058 1,275,246 1,122,122 557,290 2,776,618
897,373 2,772,316 5,503,144 3,004,049 - - 314,897 1,550,802 - 60,110 - 64,303 - - 58,772 5,610
15,092 602,029 - 79,641 - - 9,844 883,159 - 259,451 1,500 - - - 2,122 99,886 - 269,867 3,464 209,128 - - 12,548 -
6,574 89,237 - 143,765 - - - 205,952
- 180,384 - 1,118 - - - 28,541 - 258,863 - 76,441 - - 1,066 - - - - - - - - - - - - 45,988 - - - - - 9,838 - - - - 70,907 - - - - - - - - - - - - 38,323 - - 7,350 - - - - 1,504 - - 1,911 2,668 - 48,698 - 71 - - - -
- 60,230 - 5,727 1,275,246 - 49,609 -
- 1,720,893 - - - - - -
- - - - - - - -
6,331,916 919,039 5,508,108 3,670,058 1,275,246 - 529,026 2,776,618
- - - - - 28,264 1,122,122 -
- - - - - 18,500,000 - - - - - - - - - -
- - - - - 18,500,000 - -
- - - - - 28,264 19,622,122 -
- - - - - 507,562 - -
- $19,622,122 $535,826 $ - $ - $ - $ - $ - $
73

EXHIBIT H-2SAN ANTONIO INDEPENDENT SCHOOL DISTRICT
COMBINING STATEMENT OF REVENUES, EXPENDITURES AND CHANGES INFUND BALANCES - NONMAJOR GOVERNMENTAL FUNDS
FOR THE TEN MONTHS ENDED JUNE 30, 2012
Control
Data
Codes
Other Local
Special
Revenue Funds Revenue Funds
Special
Nonmajor
Fund
Permanent
Funds
Governmental
Nonmajor
499 Total 479 Total
REVENUES:4,515,021 366,887 10 4,515,031 Total Local and Intermediate Sources5700 $ $ $ $
13,080,105 - - 13,080,105 State Program Revenues5800117,046,609 - - 117,046,609 Federal Program Revenues5900
Total Revenues5020 366,887 134,641,735 10 134,641,745
EXPENDITURES:
Current:62,967,001 13,837 - 62,967,001 Instruction0011
205,715 5,000 - 205,715 Instructional Resources and Media Services00128,818,807 6,720 - 8,818,807 Curriculum and Instructional Staff Development00134,139,051 - - 4,139,051 Instructional Leadership00217,577,057 - - 7,577,057 School Leadership00233,334,479 40,825 - 3,334,479 Guidance, Counseling and Evaluation Services00311,848,403 48,710 - 1,848,403 Social Work Services0032
866,314 - - 866,314 Health Services0033497,026 - - 497,026 Student (Pupil) Transportation0034
35,685,362 - - 35,685,362 Food Services0035185,312 - - 185,312 Extracurricular Activities003640,351 - - 40,351 General Administration0041
1,981,281 - - 1,981,281 Facilities Maintenance and Operations00517,624 - - 7,624 Security and Monitoring Services0052
323,598 - - 323,598 Data Processing Services00533,524,800 9,633 - 3,524,800 Community Services0061
Capital Outlay:1,972,507 242,162 - 1,972,507 Facilities Acquisition and Construction0081
Intergovernmental:877,011 - - 877,011 Payments to Fiscal Agent/Member Districts of SSA0093
Total Expenditures6030 366,887 134,851,699 - 134,851,699
1100 Excess (Deficiency) of Revenues Over (Under) Expenditures
- (209,964) 10 (209,954)
OTHER FINANCING SOURCES (USES): 18,770,882 - - 18,770,882 Transfers In7915
- - (117,339) (117,339)Other (Uses)8949
Total Other Financing Sources (Uses) 7080 - 18,770,882 (117,339) 18,653,543
1200 Net Change in Fund Balance
0100 Fund Balance - September 1 (Beginning)
3000 Fund Balance - June 30 (Ending)
- 18,560,918 (117,329) 18,443,589
9,077,360
27,520,949 $
121,333
$ 4,004
8,956,027
$ 27,516,945
-
$ -
74
Proprietary Funds

THIS PAGE LEFT BLANK INTENTIONALLY

75
INTERNAL SERVICE FUNDS DESCRIPTIONS The Internal Service Funds are used to account for activities where the District charges fees to internal users for goods or services. Workers’ Compensation Insurance Fund (Fund 753) This fund is used to account for the operations of the District’s self-funded insurance program, which meets the state mandate that all District employees be covered by workers’ compensation insurance. Premiums are collected from the various campuses and departments based on predetermined experience rates. Claim costs, administrative costs, and stop loss insurance premiums are paid from the premiums collected. Excess claims are covered by a stop loss carrier. Dental Insurance Fund (Fund 770) This fund is used to account for the operations of the District’s self-funded dental insurance plan. Premiums are collected from the various campuses and departments of the District. Claim costs and administrative costs are paid from the proceeds of the premiums collected through this fund. Health Insurance Fund (Fund 774) This fund will be used to account for the operations of the District’s self-funded health insurance plan. The District began making transfers to this fund in fiscal year 2011 in order to accumulate net assets sufficient to cover the estimated self-funded liability. The District plans to become fully funded during the fiscal year beginning July 1, 2012.
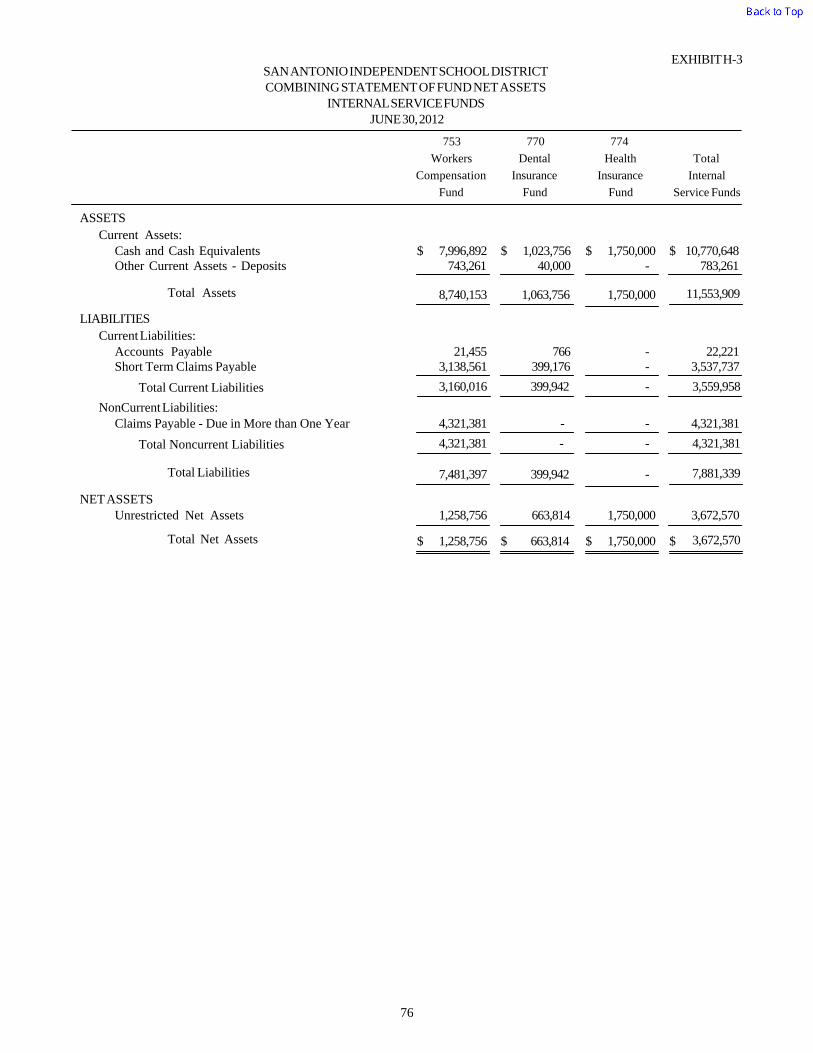
EXHIBIT H-3SAN ANTONIO INDEPENDENT SCHOOL DISTRICTCOMBINING STATEMENT OF FUND NET ASSETS
INTERNAL SERVICE FUNDSJUNE 30, 2012
Workers
Compensation
Fund Fund
Insurance
Dental
Fund
Insurance
Health
Service Funds
Internal
Total
774753 770
ASSETS
Current Assets:1,023,756 7,996,892 1,750,000 10,770,648 Cash and Cash Equivalents $ $ $ $
40,000 743,261 - 783,261 Other Current Assets - Deposits
Total Assets 8,740,153 1,063,756 1,750,000 11,553,909
LIABILITIES
Current Liabilities:766 21,455 - 22,221 Accounts Payable
399,176 3,138,561 - 3,537,737 Short Term Claims Payable
3,160,016 399,942 - 3,559,958 Total Current Liabilities
NonCurrent Liabilities: - 4,321,381 - 4,321,381 Claims Payable - Due in More than One Year
4,321,381 - - 4,321,381 Total Noncurrent Liabilities
Total Liabilities 7,481,397 399,942 - 7,881,339
NET ASSETS663,814 1,258,756 1,750,000 3,672,570 Unrestricted Net Assets
Total Net Assets 1,258,756 663,814 1,750,000 3,672,570 $ $ $ $
76

EXHIBIT H-4SAN ANTONIO INDEPENDENT SCHOOL DISTRICT
COMBINING STATEMENT OF REVENUES, EXPENSES AND CHANGES IN FUND NET ASSETSINTERNAL SERVICE FUNDS
FOR THE TEN MONTHS ENDED JUNE 30, 2012
Workers
Compensation
Fund Fund
Insurance
Dental
Fund
Insurance
Health
Service Funds
Internal
Total
774753 770
OPERATING REVENUES:
1,860,575 3,332,256 - 5,192,831 Local and Intermediate Sources $ $ $ $
Total Operating Revenues 3,332,256 1,860,575 - 5,192,831
OPERATING EXPENSES:
16,328 246,400 - 262,728 Payroll Costs172,533 202,492 - 375,025 Professional and Contracted Services
- 6,840 - 6,840 Supplies and Materials1,691,790 1,957,444 - 3,649,234 Other Operating Costs
Total Operating Expenses 2,413,176 1,880,651 - 4,293,827
Operating Income (Loss)
Total Net Assets - September 1 (Beginning)
Total Net Assets - June 30 (Ending)
919,080
339,676
$ 1,258,756
(20,076)
683,890
$ 663,814
-
1,750,000
$ 1,750,000
899,004
2,773,566
$ 3,672,570
77
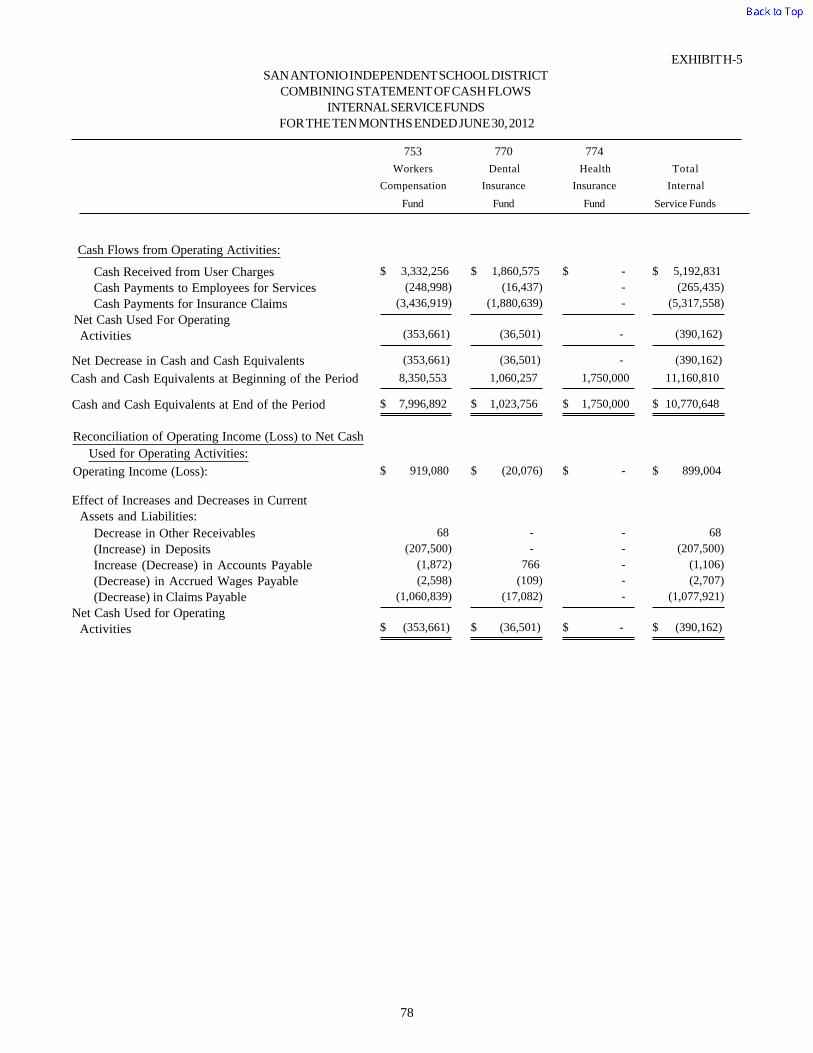
EXHIBIT H-5SAN ANTONIO INDEPENDENT SCHOOL DISTRICT
COMBINING STATEMENT OF CASH FLOWS
FOR THE TEN MONTHS ENDED JUNE 30, 2012INTERNAL SERVICE FUNDS
Workers Dental Health Total
Compensation Insurance Insurance Internal
Fund Fund Fund Service Funds
753 770 774
Cash Flows from Operating Activities:
1,860,575 3,332,256 - 5,192,831 Cash Received from User Charges $ $ $ $
(16,437)(248,998) - (265,435)Cash Payments to Employees for Services(1,880,639)(3,436,919) - (5,317,558)Cash Payments for Insurance Claims
(353,661)Net Cash Used For Operating
(36,501) - (390,162)Activities
Net Decrease in Cash and Cash Equivalents (353,661) (36,501) - (390,162)
Cash and Cash Equivalents at Beginning of the Period 8,350,553 1,060,257 1,750,000 11,160,810
Cash and Cash Equivalents at End of the Period 7,996,892 1,023,756 1,750,000 10,770,648 $ $ $ $
Operating Income (Loss): $ $ $ $
Reconciliation of Operating Income (Loss) to Net Cash
Used for Operating Activities:
919,080 (20,076) - 899,004
Assets and Liabilities:Effect of Increases and Decreases in Current
- 68 - 68 Decrease in Other Receivables - (207,500) - (207,500)(Increase) in Deposits
766 (1,872) - (1,106)Increase (Decrease) in Accounts Payable(109)(2,598) - (2,707)(Decrease) in Accrued Wages Payable
(17,082)(1,060,839) - (1,077,921)(Decrease) in Claims PayableNet Cash Used for Operating
(36,501) - (390,162)Activities (353,661)$ $ $ $
78

Fiduciary Funds

THIS PAGE LEFT BLANK INTENTIONALLY
79
AGENCY FUND DESCRIPTION Agency Funds are used to account for assets held by the District as an agent for campuses and organizations. They are custodial in nature (assets equal liabilities) and do not involve measurement of results of operations. Student Activities Fund (Fund 865) This fund is used to account for the receipt and disbursement of monies for school approved activities of the various student groups and organizations at each campus. These activities promote the general welfare of a campus and educational development and morale of the students.

THIS PAGE LEFT BLANK INTENTIONALLY

EXHIBIT H-9
SAN ANTONIO INDEPENDENT SCHOOL DISTRICT
STATEMENT OF CHANGES IN ASSETS AND LIABILITIES
AGENCY FUND
FOR THE TEN MONTHS ENDED JUNE 30, 2012
BALANCE
SEPTEMBER 1
2011 ADDITIONS
DEDUCTIONS
2012
JUNE 30
BALANCE
STUDENT ACTIVITY ACCOUNTAssets:
3,216,200 2,113,604 2,982,196 Cash and Temporary Investments 2,347,608 $ $ $ $ - 6,026 6,026 Other Receivables -
Total Assets 2,119,630 3,216,200 2,988,222 2,347,608 $ $ $ $
Liabilities: - 258 258 Accounts Payable - $ $ $ $
3,216,200 2,119,372 2,987,964 Due to Student Groups 2,347,608
Total Liabilities 2,119,630 3,216,200 2,988,222 2,347,608 $ $ $ $
TOTAL AGENCY FUNDSAssets:
3,216,200 2,113,604 2,982,196 Cash and Temporary Investments 2,347,608 $ $ $ $ - 6,026 6,026 Other Receivables -
Total Assets 2,119,630 3,216,200 2,988,222 2,347,608 $ $ $ $
Liabilities: - 258 258 Accounts Payable - $ $ $ $
3,216,200 2,119,372 2,987,964 Due to Student Groups 2,347,608
Total Liabilities 2,119,630 3,216,200 2,988,222 2,347,608 $ $ $ $
80

THIS PAGE LEFT BLANK INTENTIONALLY

Required TEA Schedules
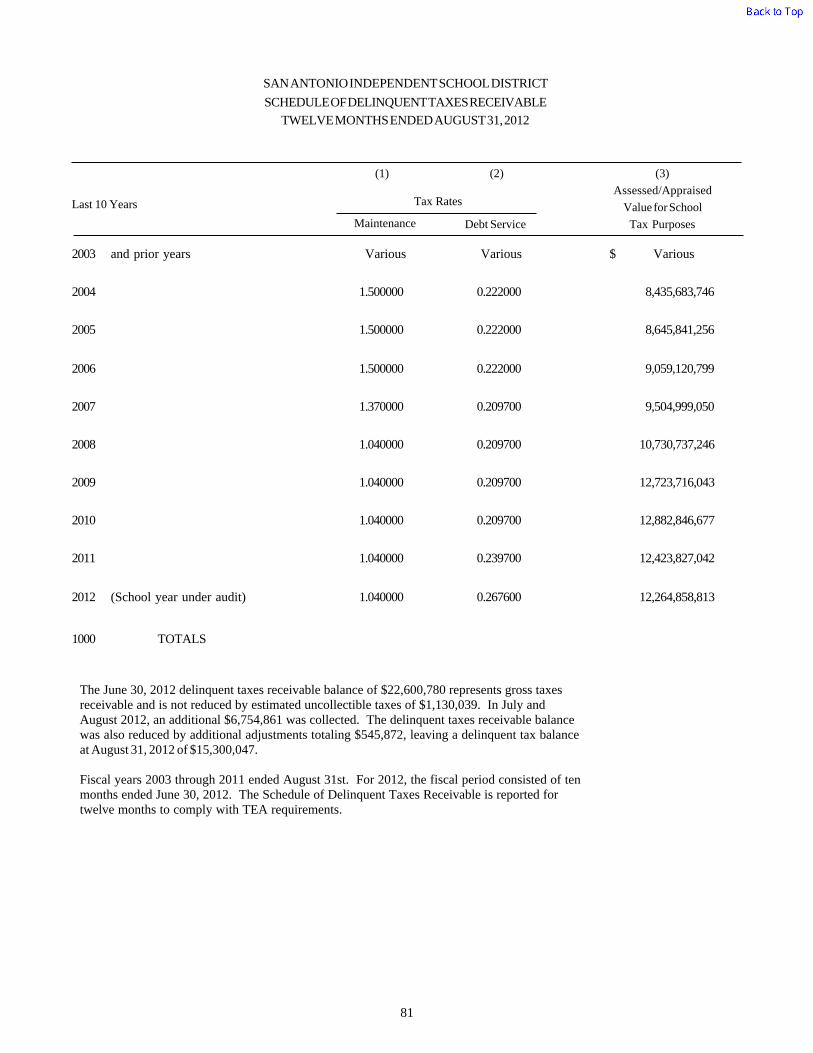
SAN ANTONIO INDEPENDENT SCHOOL DISTRICT
SCHEDULE OF DELINQUENT TAXES RECEIVABLE
TWELVE MONTHS ENDED AUGUST 31, 2012
Last 10 Years
Tax Rates
Debt ServiceMaintenance Tax Purposes
Value for School
Assessed/Appraised
(1) (2) (3)
VariousVariousand prior years2003 $ Various
0.2220001.500000 8,435,683,746 2004
0.2220001.500000 8,645,841,256 2005
0.2220001.500000 9,059,120,799 2006
0.2097001.370000 9,504,999,050 2007
0.2097001.040000 10,730,737,246 2008
0.2097001.040000 12,723,716,043 2009
0.2097001.040000 12,882,846,677 2010
0.2397001.040000 12,423,827,042 2011
0.2676001.040000 12,264,858,813 (School year under audit)2012
1000 TOTALS
The June 30, 2012 delinquent taxes receivable balance of $22,600,780 represents gross taxes receivable and is not reduced by estimated uncollectible taxes of $1,130,039. In July and August 2012, an additional $6,754,861 was collected. The delinquent taxes receivable balance
The June 30, 2012 delinquent taxes receivable balance of $22,600,780 represents gross taxes receivable and is not reduced by estimated uncollectible taxes of $1,130,039. In July and August 2012, an additional $6,754,861 was collected. The delinquent taxes receivable balance was also reduced by additional adjustments totaling $545,872, leaving a delinquent tax balance
The June 30, 2012 delinquent taxes receivable balance of $22,600,780 represents gross taxes receivable and is not reduced by estimated uncollectible taxes of $1,130,039. In July and August 2012, an additional $6,754,861 was collected. The delinquent taxes receivable balance was also reduced by additional adjustments totaling $545,872, leaving a delinquent tax balance at August 31, 2012 of $15,300,047.
The June 30, 2012 delinquent taxes receivable balance of $22,600,780 represents gross taxes receivable and is not reduced by estimated uncollectible taxes of $1,130,039. In July and August 2012, an additional $6,754,861 was collected. The delinquent taxes receivable balance was also reduced by additional adjustments totaling $545,872, leaving a delinquent tax balance at August 31, 2012 of $15,300,047.
Fiscal years 2003 through 2011 ended August 31st. For 2012, the fiscal period consisted of ten
The June 30, 2012 delinquent taxes receivable balance of $22,600,780 represents gross taxes receivable and is not reduced by estimated uncollectible taxes of $1,130,039. In July and August 2012, an additional $6,754,861 was collected. The delinquent taxes receivable balance was also reduced by additional adjustments totaling $545,872, leaving a delinquent tax balance at August 31, 2012 of $15,300,047.
Fiscal years 2003 through 2011 ended August 31st. For 2012, the fiscal period consisted of ten months ended June 30, 2012. The Schedule of Delinquent Taxes Receivable is reported for
The June 30, 2012 delinquent taxes receivable balance of $22,600,780 represents gross taxes receivable and is not reduced by estimated uncollectible taxes of $1,130,039. In July and August 2012, an additional $6,754,861 was collected. The delinquent taxes receivable balance was also reduced by additional adjustments totaling $545,872, leaving a delinquent tax balance at August 31, 2012 of $15,300,047.
Fiscal years 2003 through 2011 ended August 31st. For 2012, the fiscal period consisted of ten months ended June 30, 2012. The Schedule of Delinquent Taxes Receivable is reported for twelve months to comply with TEA requirements.
81
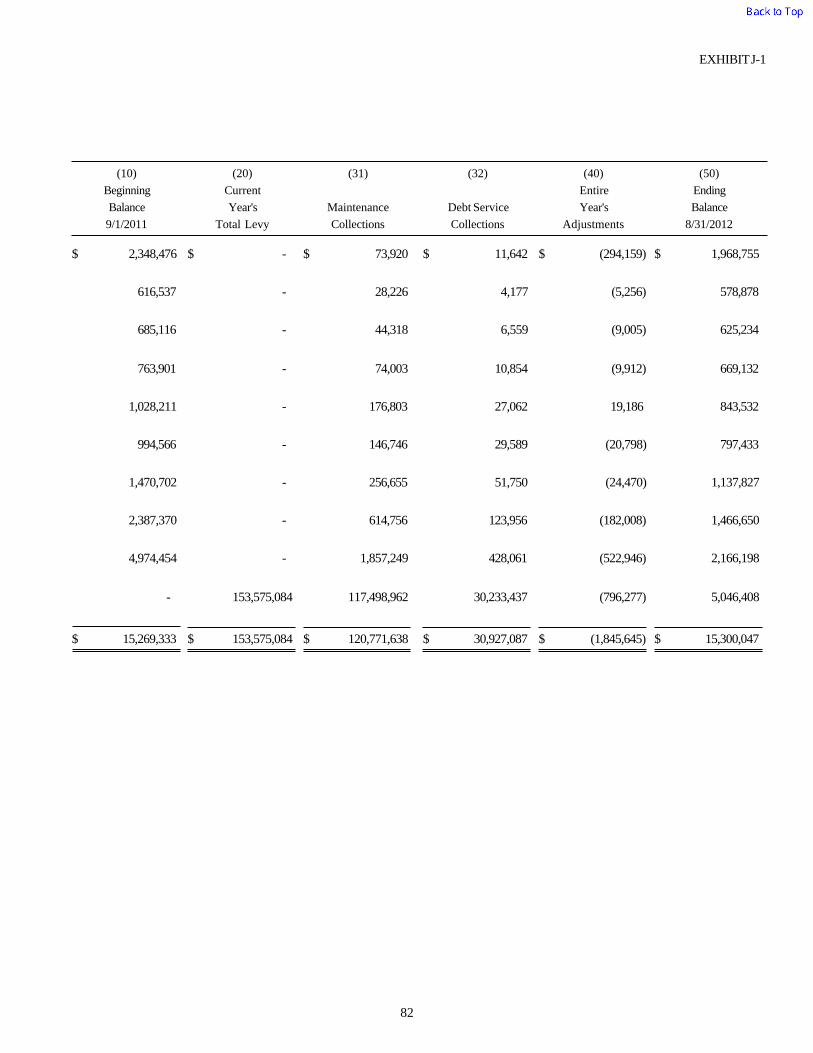
EXHIBIT J-1
9/1/2011
Balance
Beginning
Total Levy
Year's
Current
(20)(10) (50)
Ending
Balance
8/31/2012
(40)
Entire
Year's
Adjustments
(31)
Maintenance
Collections
(32)
Debt Service
Collections
- 2,348,476 73,920 (294,159)$ $ $ $ $ 1,968,755 $ 11,642
- 616,537 28,226 (5,256) 578,878 4,177
- 685,116 44,318 (9,005) 625,234 6,559
- 763,901 74,003 (9,912) 669,132 10,854
- 1,028,211 176,803 19,186 843,532 27,062
- 994,566 146,746 (20,798) 797,433 29,589
- 1,470,702 256,655 (24,470) 1,137,827 51,750
- 2,387,370 614,756 (182,008) 1,466,650 123,956
- 4,974,454 1,857,249 (522,946) 2,166,198 428,061
153,575,084 - 117,498,962 (796,277) 5,046,408 30,233,437
$ 15,300,047 $ (1,845,645)$ 120,771,638 $ 153,575,084 $ 15,269,333 $ 30,927,087
82

EXHIBIT J-2
1 2 3 4 5 6 7
(702) (703) (701) (750) (720) (Other)
Account Number Account Name
School Board
Tax Collections Supt's Office Indirect Cost Direct Cost Miscellaneous Total
611x-6146 PAYROLL COSTS -$ -$ 531,718$ 6,961,186$ -$ -$ 7,492,904$
6149 Leave for Separating Employees in 41 & 53 8,206 8,206
614X Leave-Separating Employees not in 41 & 53 487,106 487,106
6211 Legal Services - - 948,422 - 948,422
6212 Audit Services 106,180 106,180
6213 Tax Appraisal and Collection 1,034,987 1,034,987
621X Other Professional Services - - - 55,786 - - 55,786
6220 Tuition and Transfer Payments - -
6230 Education Service Centers - - - 631,933 - - 631,933
6240 Contr. Maint. and Repair 293,532 293,532
6250 Utilities 201 201
6260 Rentals - - - 28,911 - - 28,911
6290 Miscellaneous Contr. - - 70,642 560,296 - - 630,938
6320 Textbooks and Reading - - - 2,334 - - 2,334
6330 Testing Materials - - - - - - -
63XX Other Supplies Materials 462 - 2,660 435,365 - - 438,487
6410 Travel, Subsistence, Stipends 15,662 - 4,238 70,177 - - 90,077
6420 I d B di C t 234 671 234 671
FUNCTION 41 AND RELATED FUNCTION 53 - GENERAL ADMINISTRATION, 99- APPRAISAL DISTRICT COST
SAN ANTONIO INDEPENDENT SCHOOL DISTRICT
SCHEDULE OF EXPENDITURES FOR COMPUTATIONS OF INDIRECT COST FOR 2013-2014
GENERAL AND SPECIAL REVENUES FUNDS
FOR THE TEN MONTHS ENDED JUNE 30, 2012
6420 Ins. and Bonding Costs - - - 234,671 - - 234,671
6430 Election Costs - -
6490 Miscellaneous Operating 14,700 - 48,161 119,536 - - 182,397
6500 Debt Service - -
6600 Capital Outlay 273,747 273,747
6000 TOTAL 30,824$ 1,034,987$ 1,605,841$ 9,701,686$ 293,733$ 273,747$ 12,940,817$
Total expenditures/expenses for General & Special Revenue Funds ( 9 ) 476,084,595$
FISCAL YEAR
LESS: Deductions of Unallowable Costs
Total Capital Outlay (6600) ( 10 ) 15,187,658$
Total Debt & Lease (6500) ( 11 ) -
Plant Mainteneance (Func 51, 6100-6400) ( 12 ) 37,328,113
Food (Function 35, 6341 and 6499) ( 13 ) 15,562,815
Stipends (6413) ( 14 ) 53,400
Column 4 (above) - Total Indirect Cost 9,701,686
Subtotal: 77,833,673
Net Allowed Direct Cost 398,250,923$
CUMULATIVE
Total Cost of Buildings before Depreciation (1520) ( 15 ) 920,160,330$
Historical Cost of Buildings over 50 years old ( 16 ) 42,753,998$
Amount of Federal Money in Building Cost (net of #16) ( 17 ) 2,621,191$
Total Cost of Furniture & Equipment before Depreciation (1530 & 1540) ( 18 ) 42,099,102$
Historical Cost of Furniture & Equipment over 16 years old ( 19 ) 5,021,748$
Amount of Federal Money in Furniture & Equipment (Net of #19) ( 20 ) 6,518,279$
( 8 ) Note A: $1,492,258 in Function 53 expenditures are included in this schedule.$856 158 in Function 99 expenditures for appraisal district costs are included in this schedule $856,158 in Function 99 expenditures for appraisal district costs are included in this schedule.
83

EXHIBIT J-4SAN ANTONIO INDEPENDENT SCHOOL DISTRICT
SCHEDULE OF REVENUES, EXPENDITURES, AND CHANGES IN FUND BALANCE
BUDGET AND ACTUAL - CHILD NUTRITION PROGRAM
FOR THE TEN MONTHS ENDED JUNE 30, 2012
Control
Data
CodesOriginal Final
(GAAP BASIS)
(Negative)
Positive or
Final BudgetVariance WithActual Amounts
Budgeted Amounts
REVENUES:2,341,178 2,289,148 2,315,598 (25,580)Total Local and Intermediate Sources $ $ $ $5700
206,282 203,916 206,282 - State Program Revenues5800
32,882,218 33,898,706 32,897,303 15,085 Federal Program Revenues5900
Total Revenues5020 36,391,770 35,429,678 35,419,183 (10,495)
EXPENDITURES:37,494,076 34,426,195 35,566,223 1,927,853 Food Services0035
13,500 3,500 5,534 7,966 General Administration0041
1,934,150 1,297,936 1,207,776 726,374 Facilities Maintenance and Operations0051
Total Expenditures6030 35,727,631 39,441,726 36,779,533 2,662,193
1100 Excess (Deficiency) of Revenues Over (Under) Expenditures
664,139 (4,012,048) (1,360,350) 2,651,698
OTHER FINANCING SOURCES (USES): 273,497 304,268 270,882 (2,615)Transfers In7915
Total Other Financing Sources (Uses) 7080 304,268 273,497 270,882 (2,615)
1200 Net Change in Fund Balances 968,407 (3,738,551) (1,089,468) 2,649,083
0100 Fund Balance - September 1 (Beginning) 8,448,465 8,448,465 8,448,465 -
3000 Fund Balance - June 30 (Ending) $ 9,416,872 $ 4,709,914 $ 7,358,997 $ 2,649,083
84

EXHIBIT J-5SAN ANTONIO INDEPENDENT SCHOOL DISTRICT
SCHEDULE OF REVENUES, EXPENDITURES, AND CHANGES IN FUND BALANCE
BUDGET AND ACTUAL - DEBT SERVICE FUND
FOR THE TEN MONTHS ENDED JUNE 30, 2012
Control
Data
CodesOriginal Final
(GAAP BASIS)
(Negative)
Positive or
Final BudgetVariance WithActual Amounts
Budgeted Amounts
REVENUES:30,843,857 31,337,653 31,214,132 370,275 Total Local and Intermediate Sources $ $ $ $5700
11,348,785 13,361,187 12,502,333 1,153,548 State Program Revenues5800
1,467,167 - 1,467,167 - Federal Program Revenues5900
Total Revenues5020 44,698,840 43,659,809 45,183,632 1,523,823
EXPENDITURES:
Debt Service: - 17,310,000 - - Principal on Long Term Debt0071
15,947,524 26,786,819 15,911,515 36,009 Interest on Long Term Debt0072
220,333 5,500 14,015 206,318 Bond Issuance Cost and Fees0073
Total Expenditures6030 44,102,319 16,167,857 15,925,530 242,327
1100 Excess (Deficiency) of Revenues Over (Under) Expenditures
596,521 27,491,952 29,258,102 1,766,150
OTHER FINANCING SOURCES (USES): 2,000 883,862 2,000 - Transfers In7915
Total Other Financing Sources (Uses) 7080 883,862 2,000 2,000 -
1200 Net Change in Fund Balances 1,480,383 27,493,952 29,260,102 1,766,150
0100 Fund Balance - September 1 (Beginning) 39,890,845 39,890,845 39,890,845 -
3000 Fund Balance - June 30 (Ending) $ 41,371,228 $ 67,384,797 $ 69,150,947 $ 1,766,150
85

86
SAN ANTONIO INDEPENDENT SCHOOL DISTRICT
STATISTICAL SECTION OVERVIEW This part of the District’s comprehensive annual financial report presents detailed information to provide the readers of the District’s financial statements with a background for a better understanding of the information in the financial statements, note disclosures, and required supplementary information. The statistical section is organized in the following sections: Financial Trend Information – This section contains schedules of government-wide and fund financial statements.
Government-Wide Information – This section contains schedules that reflect current year and past years amounts on the District’s government-wide financial statements.
Fund Information – This section contains schedules that reflect current year and past years amounts on the District’s fund financial statements.
Revenue Capacity Information – This section contains schedules that provide information about the District’s most significant major own-source revenue, which is property taxes, and the factors that impact the District’s ability to generate such revenue. Debt Capacity Information – This section contains schedules that provide information on the District’s current levels of outstanding debt, the District’s ability to repay the debt, and to issue additional debt in the future. Demographic and Economic Information – This section contains schedules that provide an understanding of the environment within which the District’s financial activities take place. Operating Information – This section contains schedules that provide information about the services the District provides and the activities it performs; such as, employees and facilities of the District.

THIS PAGE LEFT BLANK INTENTIONALLY
Financial Trend Information

THIS PAGE LEFT BLANK INTENTIONALLY
Government-Wide Information

THIS PAGE LEFT BLANK INTENTIONALLY

SAN ANTONIO INDEPENDENT SCHOOL DISTRICTNET ASSETS BY COMPONENT
LAST TEN YEARS
(Unaudited)
Governmental ActivitiesInvested in
Capital Assets,Fiscal Net of TotalYear Related Debt Restricted Unrestricted Net Assets
2003 278,505,771$ 26,323,904$ 67,832,022$ 372,661,697$
2004 272,958,067 31,481,493 69,931,944 374,371,504
2005 287,331,094 35,541,261 45,609,701 368,482,056
2006 180,057,441 92,842,384 88,473,835 361,373,660
2007 210,911,234 80,761,763 80,780,026 372,453,023
2008 247,224,627 66,331,710 64,108,935 377,665,272
2009 219,332,248 65,118,955 110,086,765 394,537,968
2010 297,770,820 65,712,857 43,912,966 407,396,643
2011 285,326,257 46,975,894 78,269,882 410,572,033
2012 264,395,734 66,930,107 109,366,212 440,692,053
Source: The District's Statement of Net Assets (Exhibit A-1).
Note: The District changed from a fiscal year end of August 31 to June 30 beginning with 2012.
For this reason, 2012 is a ten-month reporting period with only ten months of activity.
87
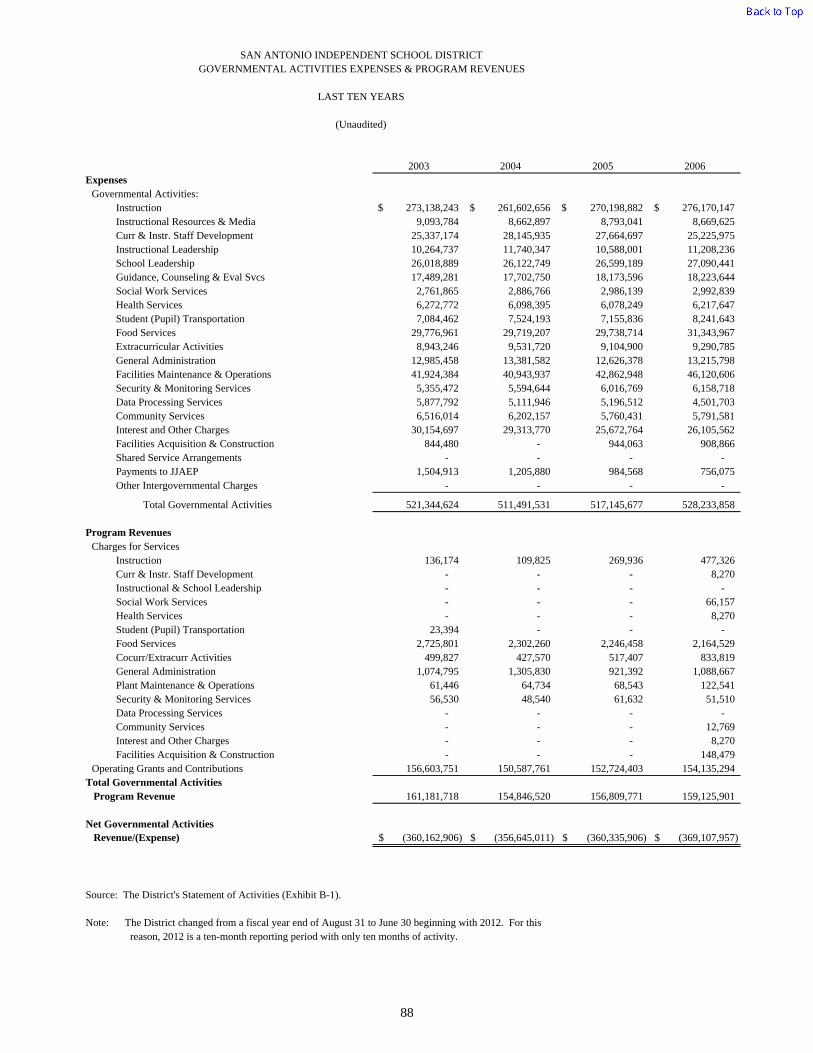
2003 2004 2005 2006Expenses Governmental Activities:
Instruction 273,138,243$ 261,602,656$ 270,198,882$ 276,170,147$ Instructional Resources & Media 9,093,784 8,662,897 8,793,041 8,669,625 Curr & Instr. Staff Development 25,337,174 28,145,935 27,664,697 25,225,975 Instructional Leadership 10,264,737 11,740,347 10,588,001 11,208,236 School Leadership 26,018,889 26,122,749 26,599,189 27,090,441 Guidance, Counseling & Eval Svcs 17,489,281 17,702,750 18,173,596 18,223,644 Social Work Services 2,761,865 2,886,766 2,986,139 2,992,839 Health Services 6,272,772 6,098,395 6,078,249 6,217,647 Student (Pupil) Transportation 7,084,462 7,524,193 7,155,836 8,241,643 Food Services 29,776,961 29,719,207 29,738,714 31,343,967 Extracurricular Activities 8,943,246 9,531,720 9,104,900 9,290,785 General Administration 12,985,458 13,381,582 12,626,378 13,215,798 Facilities Maintenance & Operations 41,924,384 40,943,937 42,862,948 46,120,606 Security & Monitoring Services 5,355,472 5,594,644 6,016,769 6,158,718 Data Processing Services 5,877,792 5,111,946 5,196,512 4,501,703 Community Services 6,516,014 6,202,157 5,760,431 5,791,581 Interest and Other Charges 30,154,697 29,313,770 25,672,764 26,105,562 Facilities Acquisition & Construction 844,480 - 944,063 908,866 Shared Service Arrangements - - - - Payments to JJAEP 1,504,913 1,205,880 984,568 756,075 Other Intergovernmental Charges - - - -
Total Governmental Activities 521,344,624 511,491,531 517,145,677 528,233,858
Program Revenues Charges for Services
Instruction 136,174 109,825 269,936 477,326 Curr & Instr. Staff Development - - - 8,270 Instructional & School Leadership - - - - Social Work Services - - - 66,157 Health Services - - - 8,270 Student (Pupil) Transportation 23,394 - - - Food Services 2,725,801 2,302,260 2,246,458 2,164,529 Cocurr/Extracurr Activities 499,827 427,570 517,407 833,819 General Administration 1,074,795 1,305,830 921,392 1,088,667 Plant Maintenance & Operations 61,446 64,734 68,543 122,541 Security & Monitoring Services 56,530 48,540 61,632 51,510 Data Processing Services - - - - Community Services - - - 12,769 Interest and Other Charges - - - 8,270 Facilities Acquisition & Construction - - - 148,479
Operating Grants and Contributions 156,603,751 150,587,761 152,724,403 154,135,294 Total Governmental Activities Program Revenue 161,181,718 154,846,520 156,809,771 159,125,901
Net Governmental Activities Revenue/(Expense) (360,162,906)$ (356,645,011)$ (360,335,906)$ (369,107,957)$
Source: The District's Statement of Activities (Exhibit B-1).
Note: The District changed from a fiscal year end of August 31 to June 30 beginning with 2012. For this reason, 2012 is a ten-month reporting period with only ten months of activity.
SAN ANTONIO INDEPENDENT SCHOOL DISTRICTGOVERNMENTAL ACTIVITIES EXPENSES & PROGRAM REVENUES
LAST TEN YEARS
(Unaudited)
88
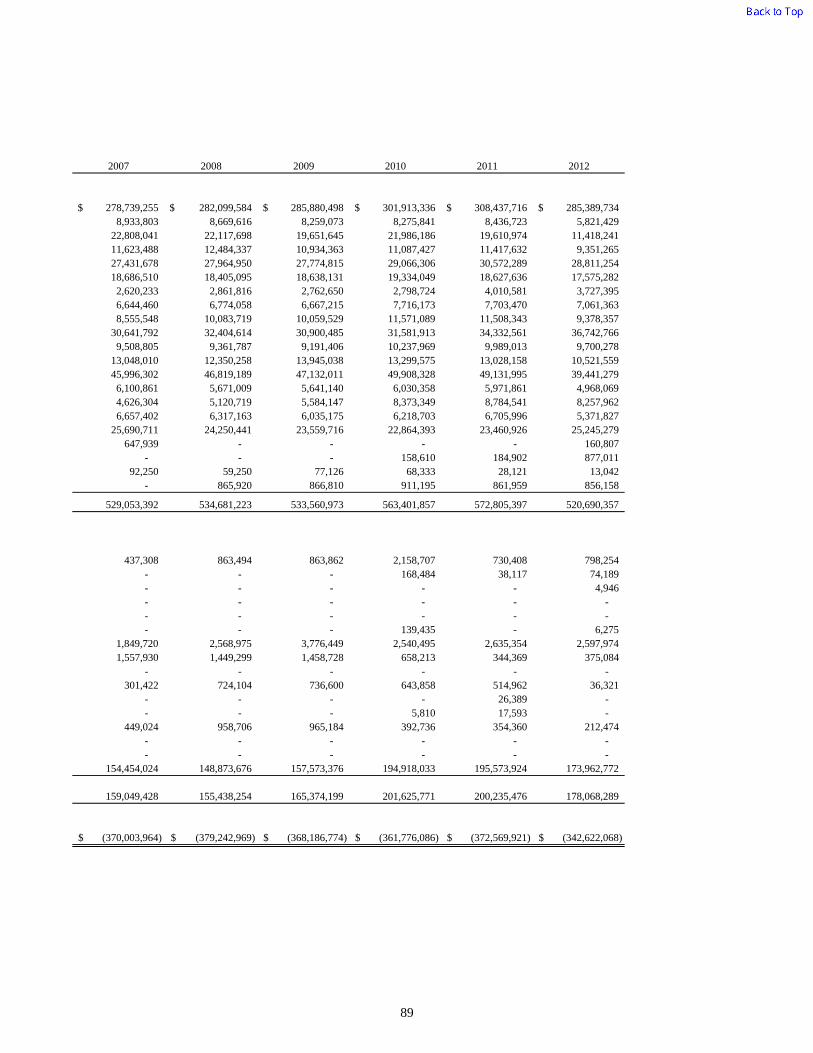
2007 2008 2009 2010 2011 2012
278,739,255$ 282,099,584$ 285,880,498$ 301,913,336$ 308,437,716$ 285,389,734$ 8,933,803 8,669,616 8,259,073 8,275,841 8,436,723 5,821,429
22,808,041 22,117,698 19,651,645 21,986,186 19,610,974 11,418,241 11,623,488 12,484,337 10,934,363 11,087,427 11,417,632 9,351,265 27,431,678 27,964,950 27,774,815 29,066,306 30,572,289 28,811,254 18,686,510 18,405,095 18,638,131 19,334,049 18,627,636 17,575,282 2,620,233 2,861,816 2,762,650 2,798,724 4,010,581 3,727,395 6,644,460 6,774,058 6,667,215 7,716,173 7,703,470 7,061,363 8,555,548 10,083,719 10,059,529 11,571,089 11,508,343 9,378,357
30,641,792 32,404,614 30,900,485 31,581,913 34,332,561 36,742,766 9,508,805 9,361,787 9,191,406 10,237,969 9,989,013 9,700,278
13,048,010 12,350,258 13,945,038 13,299,575 13,028,158 10,521,559 45,996,302 46,819,189 47,132,011 49,908,328 49,131,995 39,441,279 6,100,861 5,671,009 5,641,140 6,030,358 5,971,861 4,968,069 4,626,304 5,120,719 5,584,147 8,373,349 8,784,541 8,257,962 6,657,402 6,317,163 6,035,175 6,218,703 6,705,996 5,371,827
25,690,711 24,250,441 23,559,716 22,864,393 23,460,926 25,245,279 647,939 - - - - 160,807
- - - 158,610 184,902 877,011 92,250 59,250 77,126 68,333 28,121 13,042
- 865,920 866,810 911,195 861,959 856,158
529,053,392 534,681,223 533,560,973 563,401,857 572,805,397 520,690,357
437,308 863,494 863,862 2,158,707 730,408 798,254 - - - 168,484 38,117 74,189 - - - - - 4,946 - - - - - - - - - - - - - - - 139,435 - 6,275
1,849,720 2,568,975 3,776,449 2,540,495 2,635,354 2,597,974 1,557,930 1,449,299 1,458,728 658,213 344,369 375,084
- - - - - - 301,422 724,104 736,600 643,858 514,962 36,321
- - - - 26,389 - - - - 5,810 17,593 -
449,024 958,706 965,184 392,736 354,360 212,474 - - - - - - - - - - - -
154,454,024 148,873,676 157,573,376 194,918,033 195,573,924 173,962,772
159,049,428 155,438,254 165,374,199 201,625,771 200,235,476 178,068,289
(370,003,964)$ (379,242,969)$ (368,186,774)$ (361,776,086)$ (372,569,921)$ (342,622,068)$
89
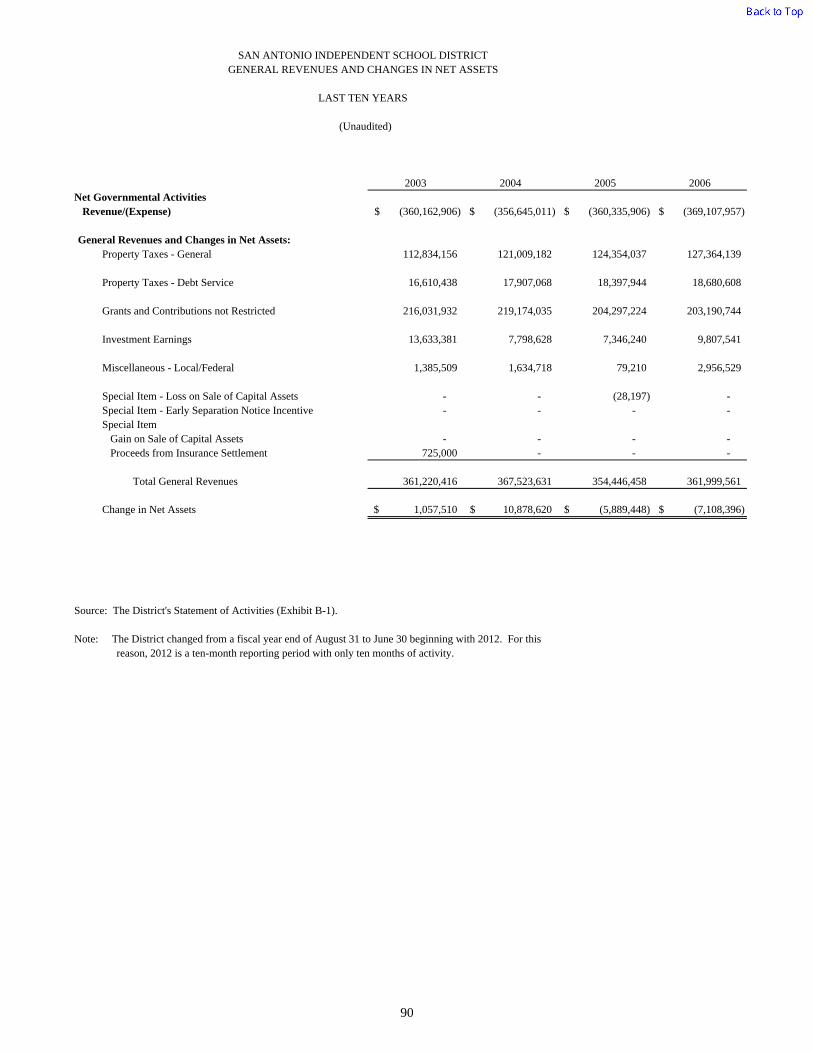
2003 2004 2005 2006Net Governmental Activities Revenue/(Expense) (360,162,906)$ (356,645,011)$ (360,335,906)$ (369,107,957)$
General Revenues and Changes in Net Assets:Property Taxes - General 112,834,156 121,009,182 124,354,037 127,364,139
Property Taxes - Debt Service 16,610,438 17,907,068 18,397,944 18,680,608
Grants and Contributions not Restricted 216,031,932 219,174,035 204,297,224 203,190,744
Investment Earnings 13,633,381 7,798,628 7,346,240 9,807,541
Miscellaneous - Local/Federal 1,385,509 1,634,718 79,210 2,956,529
Special Item - Loss on Sale of Capital Assets - - (28,197) - Special Item - Early Separation Notice Incentive - - - - Special Item Gain on Sale of Capital Assets - - - - Proceeds from Insurance Settlement 725,000 - - -
Total General Revenues 361,220,416 367,523,631 354,446,458 361,999,561
Change in Net Assets 1,057,510$ 10,878,620$ (5,889,448)$ (7,108,396)$
Source: The District's Statement of Activities (Exhibit B-1).
Note: The District changed from a fiscal year end of August 31 to June 30 beginning with 2012. For this reason, 2012 is a ten-month reporting period with only ten months of activity.
SAN ANTONIO INDEPENDENT SCHOOL DISTRICTGENERAL REVENUES AND CHANGES IN NET ASSETS
LAST TEN YEARS
(Unaudited)
90
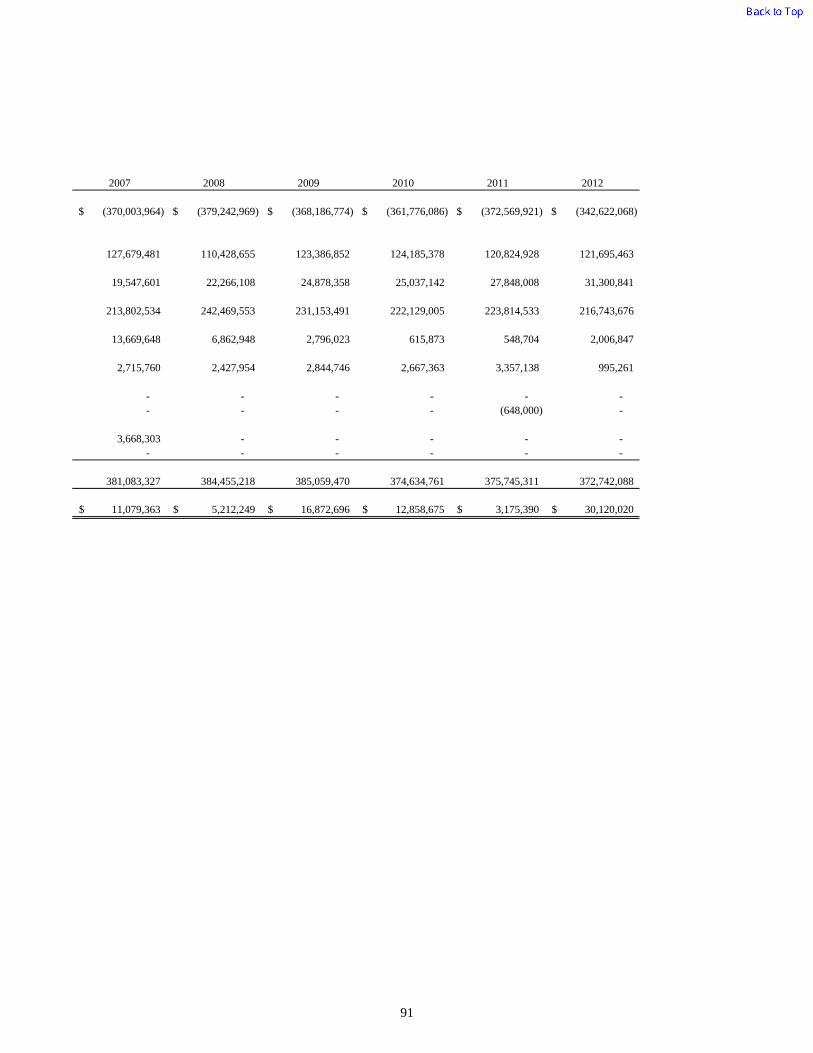
2007 2008 2009 2010 2011 2012
(370,003,964)$ (379,242,969)$ (368,186,774)$ (361,776,086)$ (372,569,921)$ (342,622,068)$
127,679,481 110,428,655 123,386,852 124,185,378 120,824,928 121,695,463
19,547,601 22,266,108 24,878,358 25,037,142 27,848,008 31,300,841
213,802,534 242,469,553 231,153,491 222,129,005 223,814,533 216,743,676
13,669,648 6,862,948 2,796,023 615,873 548,704 2,006,847
2,715,760 2,427,954 2,844,746 2,667,363 3,357,138 995,261
- - - - - - - - - - (648,000) -
3,668,303 - - - - - - - - - - -
381,083,327 384,455,218 385,059,470 374,634,761 375,745,311 372,742,088
11,079,363$ 5,212,249$ 16,872,696$ 12,858,675$ 3,175,390$ 30,120,020$
91

THIS PAGE LEFT BLANK INTENTIONALLY

Fund Information
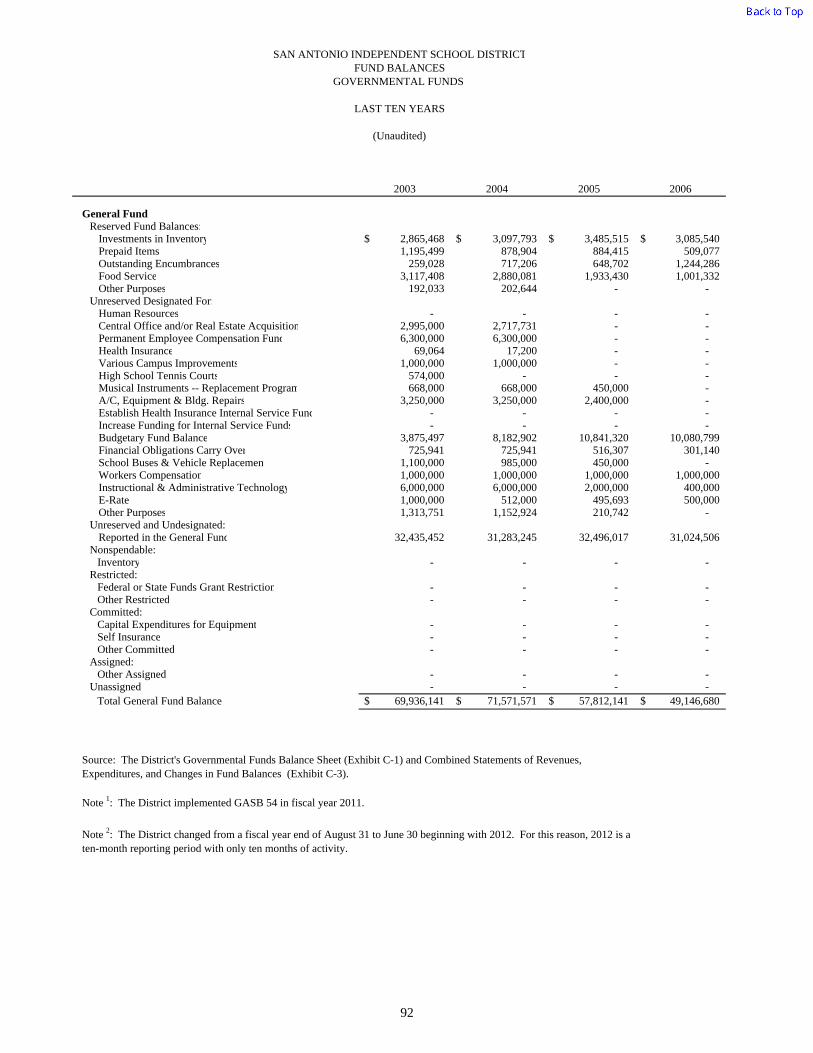
2003 2004 2005 2006
General FundReserved Fund Balances:
Investments in Inventory 2,865,468$ 3,097,793$ 3,485,515$ 3,085,540$ Prepaid Items 1,195,499 878,904 884,415 509,077 Outstanding Encumbrances 259,028 717,206 648,702 1,244,286 Food Service 3,117,408 2,880,081 1,933,430 1,001,332 Other Purposes 192,033 202,644 - -
Unreserved Designated For: Human Resources - - - - Central Office and/or Real Estate Acquisition 2,995,000 2,717,731 - - Permanent Employee Compensation Fund 6,300,000 6,300,000 - - Health Insurance 69,064 17,200 - - Various Campus Improvements 1,000,000 1,000,000 - - High School Tennis Courts 574,000 - - - Musical Instruments -- Replacement Program 668,000 668,000 450,000 - A/C, Equipment & Bldg. Repairs 3,250,000 3,250,000 2,400,000 - Establish Health Insurance Internal Service Fund - - - - Increase Funding for Internal Service Funds - - - - Budgetary Fund Balance 3,875,497 8,182,902 10,841,320 10,080,799 Financial Obligations Carry Over 725,941 725,941 516,307 301,140 School Buses & Vehicle Replacement 1,100,000 985,000 450,000 - Workers Compensation 1,000,000 1,000,000 1,000,000 1,000,000 Instructional & Administrative Technology 6,000,000 6,000,000 2,000,000 400,000 E-Rate 1,000,000 512,000 495,693 500,000 Other Purposes 1,313,751 1,152,924 210,742 -
Unreserved and Undesignated: Reported in the General Fund 32,435,452 31,283,245 32,496,017 31,024,506
Nonspendable:Inventory - - - -
Restricted:Federal or State Funds Grant Restriction - - - - Other Restricted - - - -
Committed:Capital Expenditures for Equipment - - - - Self Insurance - - - - Other Committed - - - -
Assigned:Other Assigned - - - -
Unassigned - - - - Total General Fund Balance 69,936,141$ 71,571,571$ 57,812,141$ 49,146,680$
Source: The District's Governmental Funds Balance Sheet (Exhibit C-1) and Combined Statements of Revenues, Expenditures, and Changes in Fund Balances (Exhibit C-3).
SAN ANTONIO INDEPENDENT SCHOOL DISTRICTFUND BALANCES
GOVERNMENTAL FUNDS
LAST TEN YEARS
(Unaudited)
Note 1: The District implemented GASB 54 in fiscal year 2011.
Note 2: The District changed from a fiscal year end of August 31 to June 30 beginning with 2012. For this reason, 2012 is a ten-month reporting period with only ten months of activity.
92
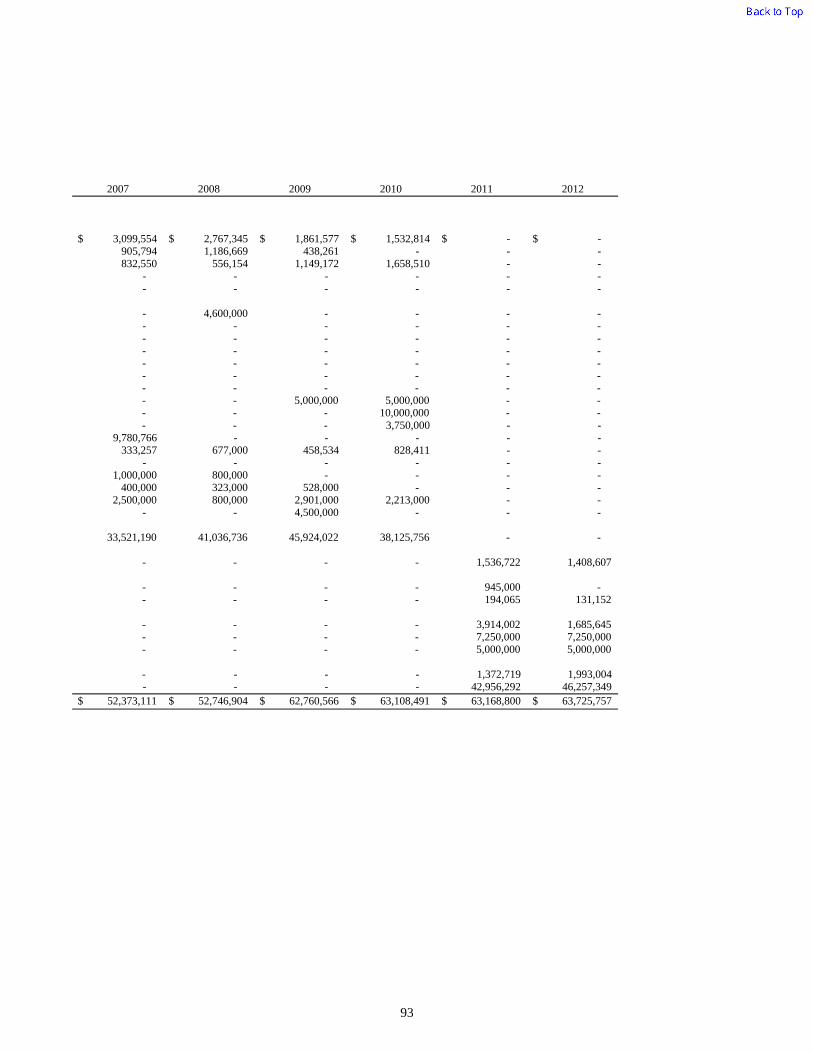
2007 2008 2009 2010 2011 2012
3,099,554$ 2,767,345$ 1,861,577$ 1,532,814$ -$ -$ 905,794 1,186,669 438,261 - - - 832,550 556,154 1,149,172 1,658,510 - -
- - - - - - - - - - - -
- 4,600,000 - - - - - - - - - - - - - - - - - - - - - - - - - - - - - - - - - - - - - - - - - - 5,000,000 5,000,000 - - - - - 10,000,000 - - - - - 3,750,000 - -
9,780,766 - - - - - 333,257 677,000 458,534 828,411 - -
- - - - - - 1,000,000 800,000 - - - -
400,000 323,000 528,000 - - - 2,500,000 800,000 2,901,000 2,213,000 - -
- - 4,500,000 - - -
33,521,190 41,036,736 45,924,022 38,125,756 - -
- - - - 1,536,722 1,408,607
- - - - 945,000 - - - - - 194,065 131,152
- - - - 3,914,002 1,685,645 - - - - 7,250,000 7,250,000 - - - - 5,000,000 5,000,000
- - - - 1,372,719 1,993,004 - - - - 42,956,292 46,257,349
52,373,111$ 52,746,904$ 62,760,566$ 63,108,491$ 63,168,800$ 63,725,757$
93
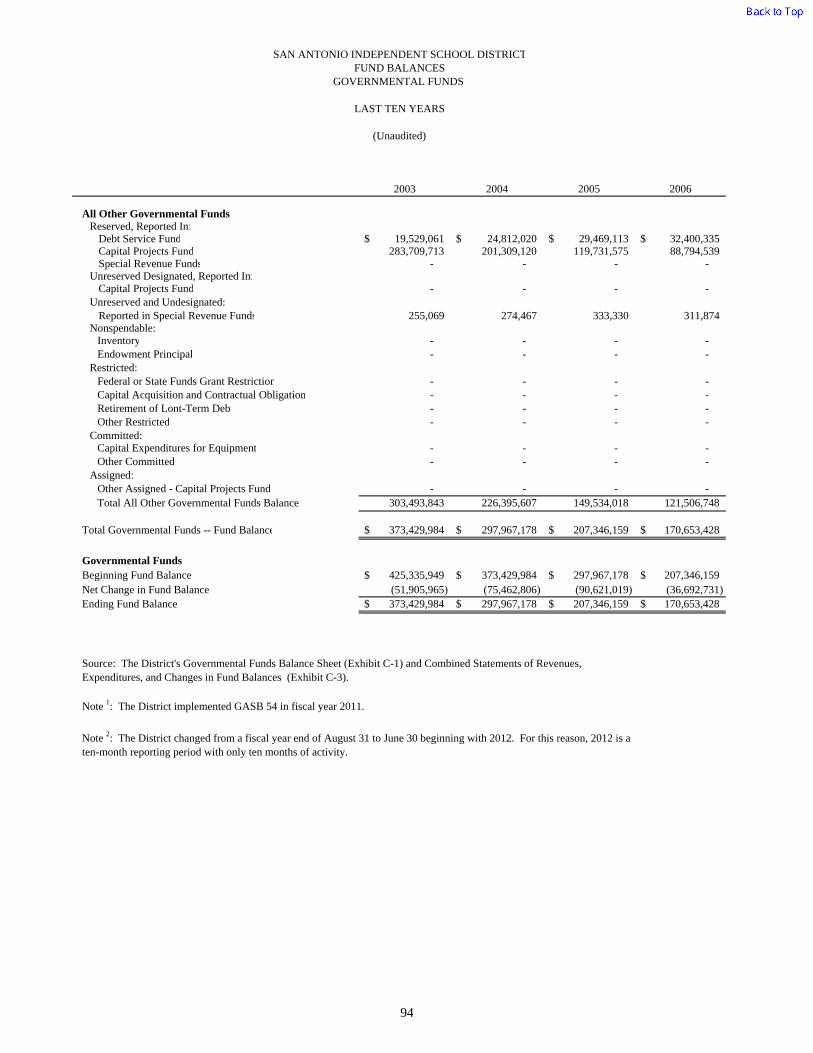
2003 2004 2005 2006
SAN ANTONIO INDEPENDENT SCHOOL DISTRICTFUND BALANCES
GOVERNMENTAL FUNDS
LAST TEN YEARS
(Unaudited)
All Other Governmental FundsReserved, Reported In:
Debt Service Fund 19,529,061$ 24,812,020$ 29,469,113$ 32,400,335$ Capital Projects Fund 283,709,713 201,309,120 119,731,575 88,794,539 Special Revenue Funds - - - -
Unreserved Designated, Reported In: Capital Projects Fund - - - -
Unreserved and Undesignated: Reported in Special Revenue Funds 255,069 274,467 333,330 311,874
Nonspendable:Inventory - - - - Endowment Principal - - - -
Restricted:Federal or State Funds Grant Restriction - - - - Capital Acquisition and Contractual Obligation - - - - Retirement of Lont-Term Debt - - - - Other Restricted - - - -
Committed:Capital Expenditures for Equipment - - - - Other Committed - - - -
Assigned:Other Assigned - Capital Projects Fund - - - - Total All Other Governmental Funds Balance 303,493,843 226,395,607 149,534,018 121,506,748
Total Governmental Funds -- Fund Balance 373,429,984$ 297,967,178$ 207,346,159$ 170,653,428$
Governmental FundsBeginning Fund Balance 425,335,949$ 373,429,984$ 297,967,178$ 207,346,159$ Net Change in Fund Balance (51,905,965) (75,462,806) (90,621,019) (36,692,731) Ending Fund Balance 373,429,984$ 297,967,178$ 207,346,159$ 170,653,428$
Note 2: The District changed from a fiscal year end of August 31 to June 30 beginning with 2012. For this reason, 2012 is a ten-month reporting period with only ten months of activity.
Source: The District's Governmental Funds Balance Sheet (Exhibit C-1) and Combined Statements of Revenues, Expenditures, and Changes in Fund Balances (Exhibit C-3).
Note 1: The District implemented GASB 54 in fiscal year 2011.
94

2007 2008 2009 2010 2011 2012
37,054,721$ 40,778,817$ 43,055,983$ 38,433,403$ -$ -$ 69,523,399 46,455,476 38,165,094 31,066,251 - -
- - 663,988 761,932 - -
- - - - - -
853,106 416,579 2,556,632 6,235,259 - -
- - - - 779,879 563,449 - - - - 101,000 1,000
- - - - 7,668,586 6,795,548 - - - - 223,867,471 202,864,654 - - - - 39,890,845 69,150,947 - - - - 20,333 3,004
- - - - - 4,500,000 - - - - 507,562 15,657,948
- - - - 592,492 520,131 107,431,226 87,650,872 84,441,697 76,496,845 273,428,168 300,056,681
159,804,337$ 140,397,776$ 147,202,263$ 139,605,336$ 336,596,968$ 363,782,438$
170,653,428$ 159,804,337$ 140,397,776$ 147,202,263$ 139,605,336$ 336,596,968$ (10,849,091) (19,406,561) 6,804,487 (7,596,927) 196,991,632 27,185,470 159,804,337$ 140,397,776$ 147,202,263$ 139,605,336$ 336,596,968$ 363,782,438$
95

SAN ANTONIO INDEPENDENT SCHOOL DISTRICTGOVERNMENTAL FUND REVENUES BY SOURCE
LAST TEN YEARS
(Unaudited)
Fiscal Property Per Capita On-behalfYear Tax Tuition Other and Foundation TRS Payments
2003 126,369,972$ 136,174$ 23,249,396$ 217,240,054$ 15,362,510$
2004 136,043,109 109,825 16,401,649 220,482,256 15,428,592
2005 140,714,781 176,547 15,762,905 205,611,215 15,052,845
2006 145,344,201 131,480 18,297,921 203,190,744 15,363,616
2007 149,173,423 135,887 22,953,659 213,802,536 16,312,320
2008 133,289,728 139,389 17,848,888 242,469,553 17,199,385
2009 147,511,908 127,262 14,889,248 235,518,915 16,475,595
2010 148,643,811 127,639 11,366,549 222,827,905 17,442,431
2011 148,442,979 60,532 9,703,703 224,118,760 18,006,802
2012 150,755,817 46,714 10,203,198 215,651,991 14,542,836
Source: The District's Governmental Funds Statements of Revenues, Expenditures, andChanges in Fund Balances (Exhibit C-3) and Notes to Financial Statements.
Note: The District changed from a fiscal year end of August 31 to June 30 beginning with 2012. For this reason, 2012 is a ten-month reporting period with only ten months of activity.
Local and Intermediate Sources State Programs
96

Federal Other Programs Total
52,047,371$ 86,820,813$ 521,226,290$
42,444,302 90,544,409 521,454,142
38,723,469 95,741,673 511,783,435
36,708,914 101,222,927 520,259,803
36,717,144 99,453,538 538,548,507
36,283,652 93,087,921 540,318,516
29,412,141 105,206,258 549,141,327
20,251,727 154,515,658 575,175,720
18,354,152 156,769,188 575,456,116
25,763,319 124,858,734 541,822,609
97

Instruction and Support SupportInstructional - Instructional Services - Administrative Services -
Fiscal Related and School Student Support Nonstudent AncillaryYear Services Leadership (Pupil) Services Based Services
2003 297,205,863$ 35,091,732$ 69,536,027$ 12,628,193$ 52,499,053$ 6,434,838$
2004 289,338,672 36,796,350 71,232,622 12,999,150 49,582,598 6,050,665
2005 299,160,430 36,219,751 71,336,571 12,285,457 52,439,772 5,622,886
2006 297,544,705 36,748,480 73,111,262 12,696,456 54,286,428 5,558,521
2007 299,144,160 37,618,412 75,248,803 12,629,193 55,207,637 6,419,496
2008 302,020,522 39,067,896 83,213,163 11,937,961 56,141,561 6,099,706
2009 302,949,067 37,306,244 75,942,896 13,429,287 56,414,647 5,810,421
2010 322,328,306 38,857,678 80,512,249 12,688,873 62,563,435 6,130,510
2011 320,357,717 39,988,490 82,598,729 12,401,566 61,202,712 6,386,686
2012 291,011,190 36,671,157 81,255,793 10,105,296 51,172,524 5,210,425
Source: The District's CAFR - Governmental Funds Statements of Revenues, Expenditures, and Changes in Fund Balances (Exhibit C-3).
Note 1: Operating expenditures used to compute the debt service ratio exclude total Capital Outlay of $25,855,057, which is the total of "Capital Outlay" plus "Capital Outlay Excluded from Capital Outlay Function" reported in this schedule.
Note 2: The District changed from a fiscal year end of August 31 to June 30 beginning with 2012. For this reason, 2012 is a ten-month reporting period with only ten months of activity.
SAN ANTONIO INDEPENDENT SCHOOL DISTRICTGOVERNMENTAL FUND EXPENDITURES BY FUNCTION
LAST TEN YEARS
(Unaudited)
98
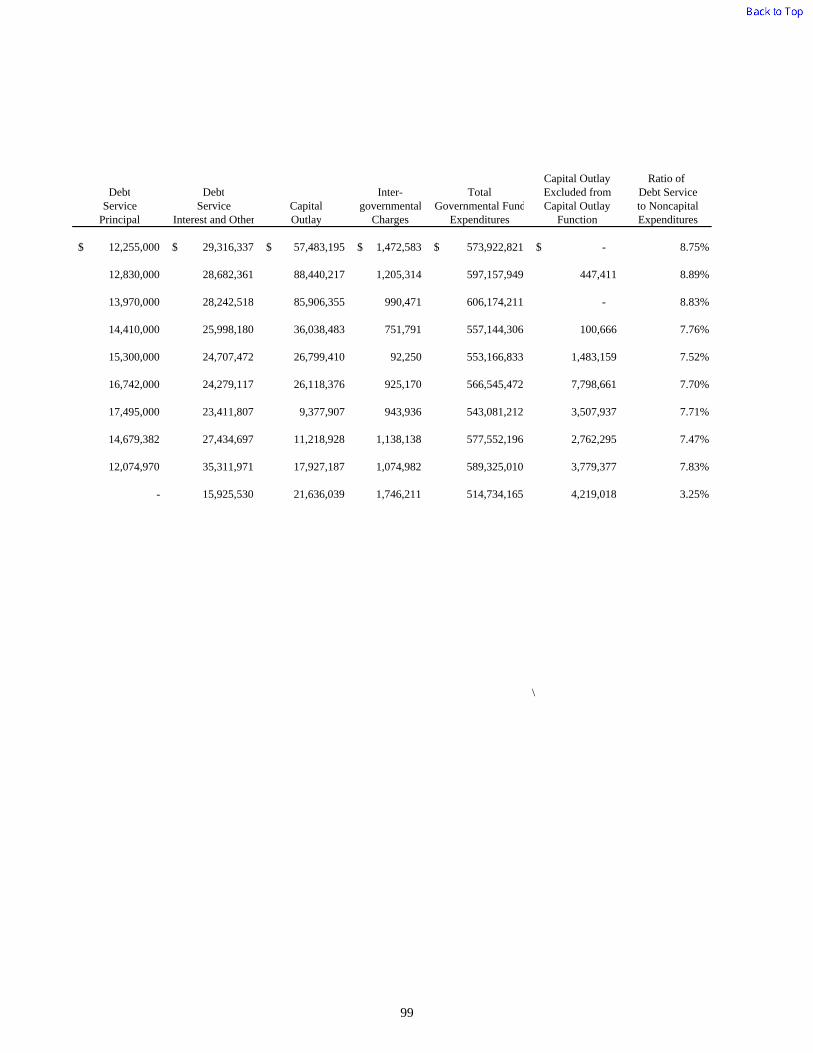
Capital Outlay Ratio of Debt Debt Inter- Total Excluded from Debt Service
Service Service Capital governmental Governmental Fund Capital Outlay to NoncapitalPrincipal Interest and Other Outlay Charges Expenditures Function Expenditures
12,255,000$ 29,316,337$ 57,483,195$ 1,472,583$ 573,922,821$ -$ 8.75%
12,830,000 28,682,361 88,440,217 1,205,314 597,157,949 447,411 8.89%
13,970,000 28,242,518 85,906,355 990,471 606,174,211 - 8.83%
14,410,000 25,998,180 36,038,483 751,791 557,144,306 100,666 7.76%
15,300,000 24,707,472 26,799,410 92,250 553,166,833 1,483,159 7.52%
16,742,000 24,279,117 26,118,376 925,170 566,545,472 7,798,661 7.70%
17,495,000 23,411,807 9,377,907 943,936 543,081,212 3,507,937 7.71%
14,679,382 27,434,697 11,218,928 1,138,138 577,552,196 2,762,295 7.47%
12,074,970 35,311,971 17,927,187 1,074,982 589,325,010 3,779,377 7.83%
- 15,925,530 21,636,039 1,746,211 514,734,165 4,219,018 3.25%
\
99
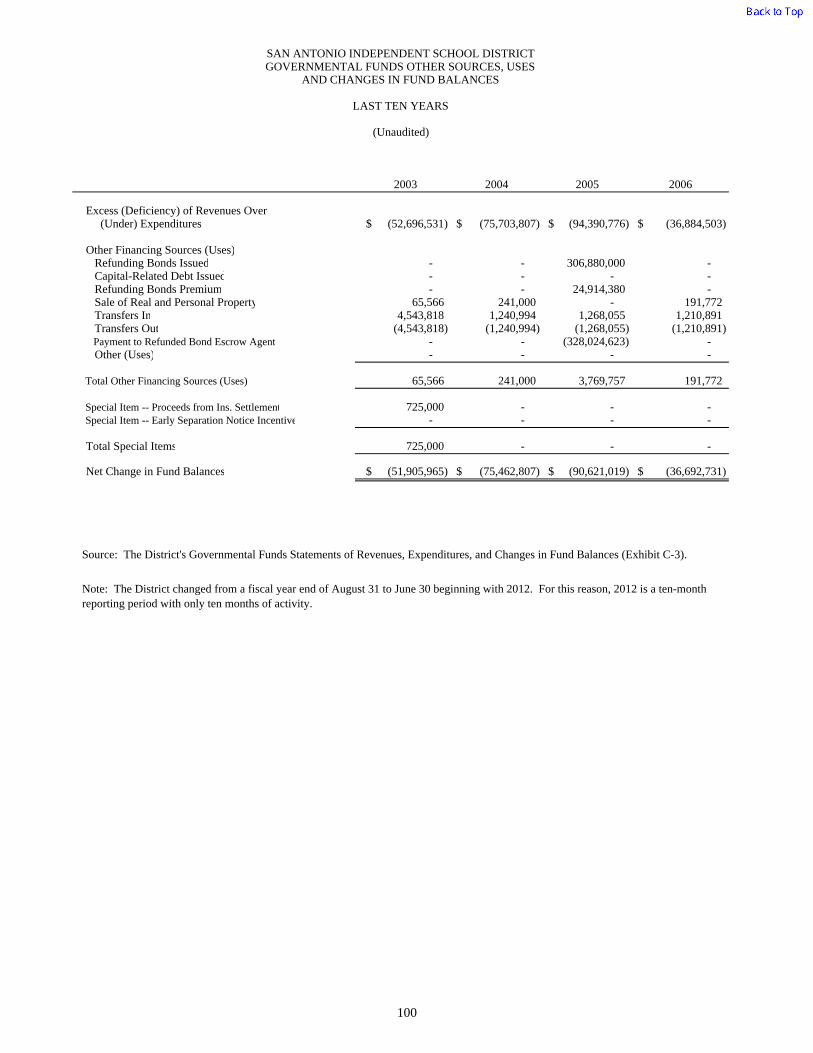
2003 2004 2005 2006
Excess (Deficiency) of Revenues Over (Under) Expenditures (52,696,531)$ (75,703,807)$ (94,390,776)$ (36,884,503)$
Other Financing Sources (Uses) Refunding Bonds Issued - - 306,880,000 - Capital-Related Debt Issued - - - - Refunding Bonds Premium - - 24,914,380 - Sale of Real and Personal Property 65,566 241,000 - 191,772 Transfers In 4,543,818 1,240,994 1,268,055 1,210,891 Transfers Out (4,543,818) (1,240,994) (1,268,055) (1,210,891) Payment to Refunded Bond Escrow Agent - - (328,024,623) - Other (Uses) - - - -
Total Other Financing Sources (Uses) 65,566 241,000 3,769,757 191,772
Special Item -- Proceeds from Ins. Settlement 725,000 - - - Special Item -- Early Separation Notice Incentive - - - -
Total Special Items 725,000 - - -
Net Change in Fund Balances (51,905,965)$ (75,462,807)$ (90,621,019)$ (36,692,731)$
Source: The District's Governmental Funds Statements of Revenues, Expenditures, and Changes in Fund Balances (Exhibit C-3).
Note: The District changed from a fiscal year end of August 31 to June 30 beginning with 2012. For this reason, 2012 is a ten-month reporting period with only ten months of activity.
SAN ANTONIO INDEPENDENT SCHOOL DISTRICTGOVERNMENTAL FUNDS OTHER SOURCES, USES
AND CHANGES IN FUND BALANCES
LAST TEN YEARS
(Unaudited)
100

2007 2008 2009 2010 2011 2012
(14,618,326)$ (26,226,956)$ 6,060,115$ (2,376,476)$ (13,868,894)$ 27,088,444$
47,609,988 - - - 99,085,000 - - 6,747,000 - - 212,565,000 -
1,600,350 - - - 8,257,856 - 4,133,601 73,395 744,372 89,549 1,672,449 214,365 1,209,894 6,733,071 2,869,858 2,975,700 5,319,394 18,772,882
(1,209,894) (6,733,071) (2,869,858) (8,285,700) (8,859,394) (18,772,882) (49,574,704) - - - (106,409,031) -
- - - - (122,748) (117,339)
3,769,235 6,820,395 744,372 (5,220,451) 211,508,526 97,026
- - - - - - - - - - (648,000) -
- - - - (648,000) -
(10,849,091)$ (19,406,561)$ 6,804,487$ (7,596,927)$ 196,991,632$ 27,185,470$
101

Instruction and Support SupportAverage Instructional - Instructional Services - Administrative Services -
Fiscal Daily Related and School Student Support NonstudentYear Attendance Services Leadership (Pupil) Services Based
2003 53,475 5,558$ 656$ 1,300$ 236$ 982$
2004 53,371 5,421 689 1,335 244 929
2005 53,011 5,643 683 1,346 232 989
2006 52,841 5,631 695 1,384 240 1,027
2007 51,698 5,786 728 1,456 244 1,068
2008 50,488 5,982 774 1,648 236 1,112
2009 50,740 5,971 735 1,497 265 1,112
2010 48,830 6,601 796 1,649 260 1,281
2011 48,849 6,558 819 1,691 254 1,253
2012 48,793 5,964 752 1,665 207 1,049
Source: Average Daily Attendance provided by the District's PEIMS and Data Services Office. Function expenditures are from the Governmental Funds Statements of Revenues, Expenditures, and Changes in Fund Balances (Exhibit C-3).
Note 1: Average Daily Attendance is the average daily attendance of eligible enrollees, district-wide, over the official number of instructional days.
Note 2: The District changed from a fiscal year end of August 31 to June 30 beginning with 2012. For this reason, 2012 is a ten-month reporting period with only ten months of activity.
SAN ANTONIO INDEPENDENT SCHOOL DISTRICTGOVERNMENTAL FUND EXPENDITURES BY FUNCTION
PER AVERAGE DAILY ATTENDANCE
LAST TEN YEARS
(Unaudited)
102
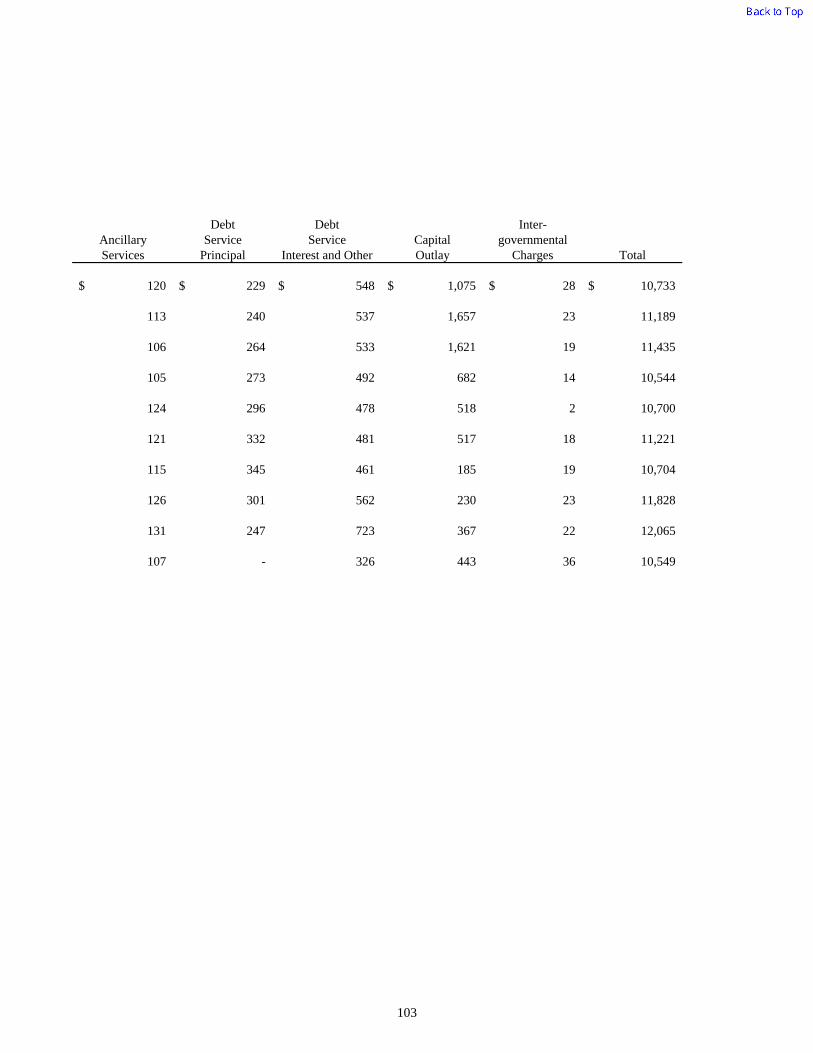
Debt Debt Inter-Ancillary Service Service Capital governmentalServices Principal Interest and Other Outlay Charges Total
120$ 229$ 548$ 1,075$ 28$ 10,733$
113 240 537 1,657 23 11,189
106 264 533 1,621 19 11,435
105 273 492 682 14 10,544
124 296 478 518 2 10,700
121 332 481 517 18 11,221
115 345 461 185 19 10,704
126 301 562 230 23 11,828
131 247 723 367 22 12,065
107 - 326 443 36 10,549
103

THIS PAGE LEFT BLANK INTENTIONALLY

Revenue Capacity Information
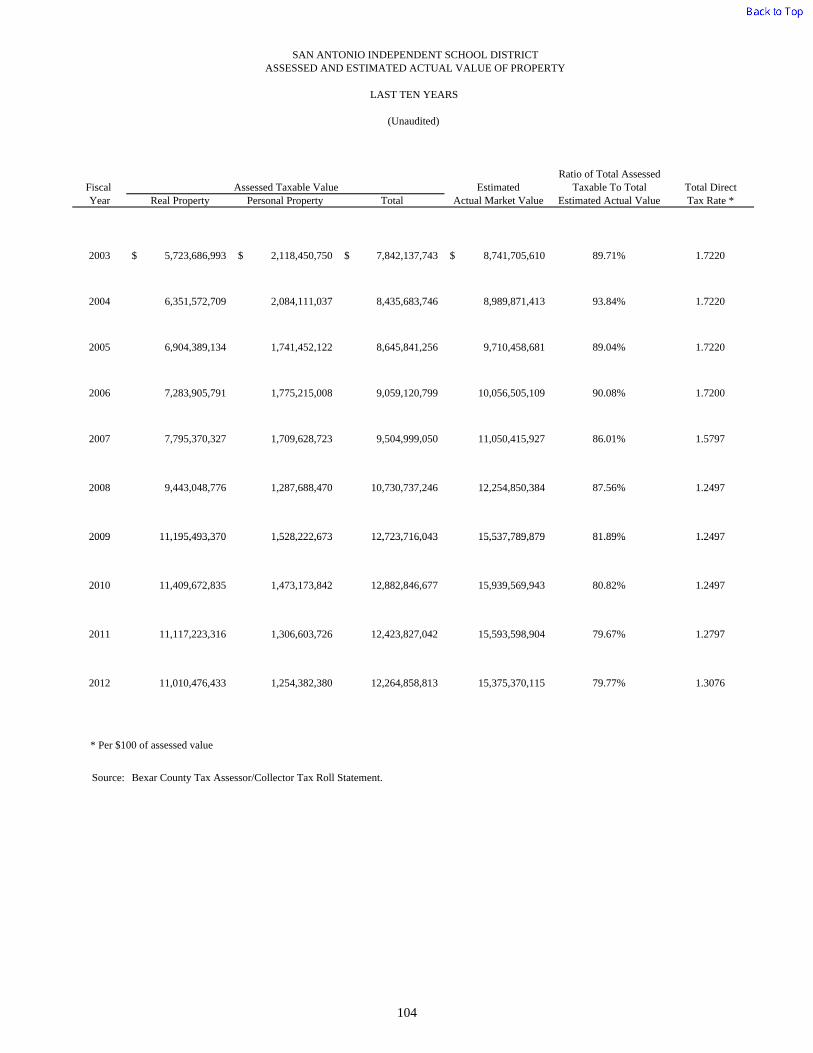
Ratio of Total AssessedFiscal Assessed Taxable Value Estimated Taxable To Total Total DirectYear Real Property Personal Property Total Actual Market Value Estimated Actual Value Tax Rate *
2003 5,723,686,993$ 2,118,450,750$ 7,842,137,743$ 8,741,705,610$ 89.71% 1.7220
2004 6,351,572,709 2,084,111,037 8,435,683,746 8,989,871,413 93.84% 1.7220
2005 6,904,389,134 1,741,452,122 8,645,841,256 9,710,458,681 89.04% 1.7220
2006 7,283,905,791 1,775,215,008 9,059,120,799 10,056,505,109 90.08% 1.7200
2007 7,795,370,327 1,709,628,723 9,504,999,050 11,050,415,927 86.01% 1.5797
2008 9,443,048,776 1,287,688,470 10,730,737,246 12,254,850,384 87.56% 1.2497
2009 11,195,493,370 1,528,222,673 12,723,716,043 15,537,789,879 81.89% 1.2497
SAN ANTONIO INDEPENDENT SCHOOL DISTRICTASSESSED AND ESTIMATED ACTUAL VALUE OF PROPERTY
LAST TEN YEARS
(Unaudited)
2009 11,195,493,370 1,528,222,673 12,723,716,043 15,537,789,879 81.89% 1.2497
2010 11,409,672,835 1,473,173,842 12,882,846,677 15,939,569,943 80.82% 1.2497
2011 11,117,223,316 1,306,603,726 12,423,827,042 15,593,598,904 79.67% 1.2797
2012 11,010,476,433 1,254,382,380 12,264,858,813 15,375,370,115 79.77% 1.3076
* Per $100 of assessed value
Source: Bexar County Tax Assessor/Collector Tax Roll Statement.
104

SAN ANTONIO INDEPENDENT SCHOOL DISTRICTPROPERTY TAX LEVIES AND COLLECTIONS
LAST TEN YEARS
Ratio of Ratio ofPercent of Delinquent Total Total Tax Outstanding Delinquent Taxes
Fiscal Total Tax Current Tax Current Taxes Tax Tax Collections to Delinquent to TotalYear Levy Collections Collected Collections Collections Total Tax Levy Taxes Tax Levy
2003 127,712,308$ 122,364,379$ 95.81% 4,005,593$ 126,369,972$ 98.95% 15,088,548$ 11.81%
2004 137,371,510 132,037,694 96.12% 4,005,415 136,043,109 99.03% 15,629,478 11.38%
2005 140,886,126 135,771,753 96.37% 4,943,028 140,714,781 99.88% 15,020,486 10.66%
2006 146,714,088 141,702,418 96.58% 3,641,702 145,344,200 99.07% 15,281,399 10.42%
2007 150,150,470 144,883,356 96.49% 4,290,067 149,173,423 99.35% 13,430,647 8.94%
2008 134,230,767 129,497,119 96.47% 3,685,943 133,183,062 99.22% 12,888,418 9.60%
2009 150,148,483 144,712,290 96.38% 2,979,513 147,691,803 98.36% 13,247,037 8.82%
2010 152 838 516 146 002 243 95 53% 2 206 170 148 208 414 96 97% 14 699 924 9 62%
(Unaudited)
2010 152,838,516 146,002,243 95.53% 2,206,170 148,208,414 96.97% 14,699,924 9.62%
2011 151,158,567 145,004,084 95.93% 3,279,551 148,283,635 98.10% 15,269,333 10.10%
2012 153,575,084 141,333,153 92.03% 3,610,711 144,943,864 94.38% 22,600,780 14.72%
Source: Bexar County Tax Assessor/Collector and the District's Exhibit J-1.
Note 1: The tax levy shown above is the adjusted tax levy as of the fiscal year end.
Note 2: The District changed from a fiscal year end of August 31 to June 30 beginning with 2012.For this reason, 2012 is a ten-month reporting period with only ten months of collections.
105
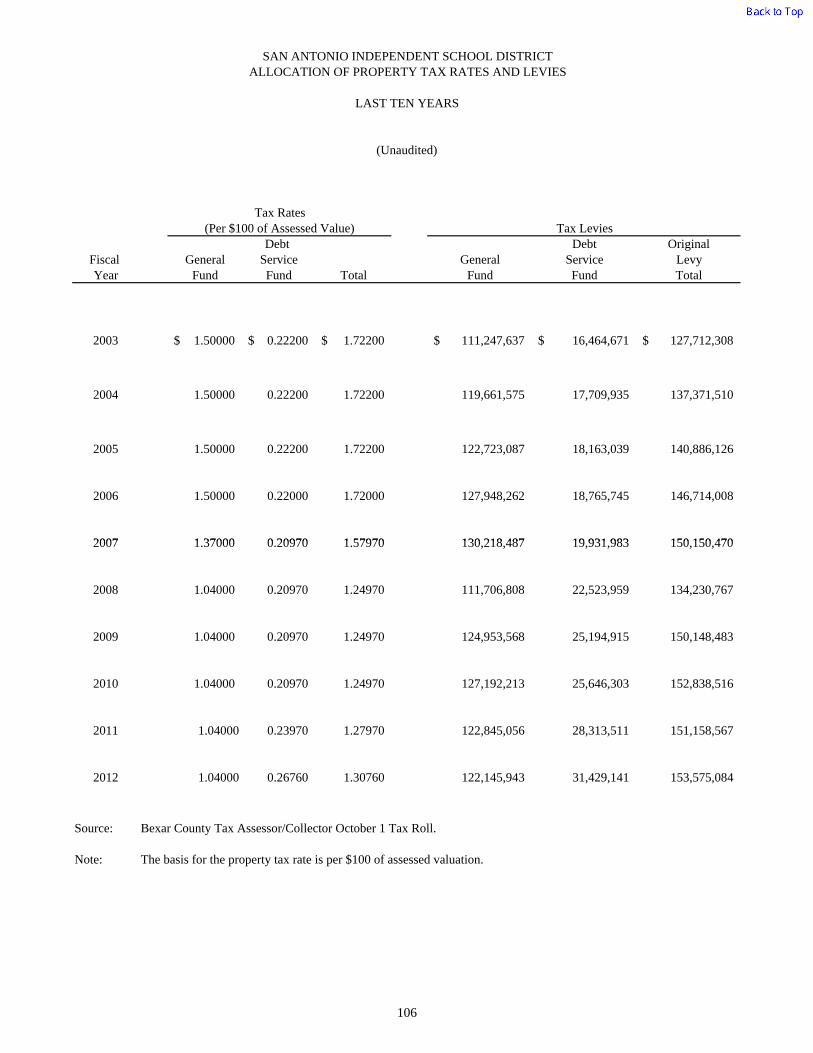
SAN ANTONIO INDEPENDENT SCHOOL DISTRICTALLOCATION OF PROPERTY TAX RATES AND LEVIES
LAST TEN YEARS
(Unaudited)
Tax Rates(Per $100 of Assessed Value) Tax Levies
Debt Debt OriginalFiscal General Service General Service LevyYear Fund Fund Total Fund Fund Total
2003 1.50000$ 0.22200$ 1.72200$ 111,247,637$ 16,464,671$ 127,712,308$
2004 1.50000 0.22200 1.72200 119,661,575 17,709,935 137,371,510
2005 1.50000 0.22200 1.72200 122,723,087 18,163,039 140,886,126
2006 1.50000 0.22000 1.72000 127,948,262 18,765,745 146,714,008
2007 1 37000 0 20970 1 57970 130 218 487 19 931 983 150 150 4702007 1.37000 0.20970 1.57970 130,218,487 19,931,983 150,150,470
2008 1.04000 0.20970 1.24970 111,706,808 22,523,959 134,230,767
2009 1.04000 0.20970 1.24970 124,953,568 25,194,915 150,148,483
2010 1.04000 0.20970 1.24970 127,192,213 25,646,303 152,838,516
2011 1.04000 0.23970 1.27970 122,845,056 28,313,511 151,158,567
2012 1.04000 0.26760 1.30760 122,145,943 31,429,141 153,575,084
Source: Bexar County Tax Assessor/Collector October 1 Tax Roll.
Note: The basis for the property tax rate is per $100 of assessed valuation.
106

SAN ANTONIO INDEPENDENT SCHOOL DISTRICTPROPERTY TAX RATES - DIRECT AND OVERLAPPING GOVERNMENTS
(PER $100 ASSESSED VALUATION)
LAST TEN YEARS
(Unaudited)
DirectTax Rate
San Antonio Alamo Total DirectIndependent Community City of University and
Fiscal Tax School City of Bexar College Balcones Health OverlappingYear Year District San Antonio County District Heights System Tax Rate
2003 2002 1.72200$ 0.57850$ 0.31760$ 0.10710$ 0.55190$ 0.24390$ 3.52100$
2004 2003 1.72200 0.57854 0.32095 0.10705 0.56357 0.24387 3.53598
2005 2004 1.72200 0.57854 0.31847 0.10705 0.52703 0.24387 3.49696
2006 2005 1.72000 0.57854 0.31847 0.10705 0.55850 0.24387 3.52643
2007 2006 1.57970 0.57854 0.31415 0.13705 0.53240 0.24387 3.38571
2008 2007 1.24970 0.57230 0.32687 0.13455 0.49836 0.23741 3.01918
Overlapping Tax Rates
2009 2008 1.24970 0.56714 0.28940 0.135855 0.49073 0.26102 2.99385
2010 2009 1.24970 0.56569 0.296187 0.141623 0.558843 0.276235 3.08828
2011 2010 1.27970 0.56569 0.296187 0.141623 0.558843 0.276235 3.11828
2012 2011 1.30760 0.56569 0.296187 0.141623 0.572199 0.276235 3.15953
Source: Bexar County Tax Assessor/Collector.
Note: The District was subject to a maximum Maintenance & Operations tax rate of $1.50 for tax years 2003-2005, $1.37for tax year 2006, and $1.04 for tax years 2007-2011 (per $100 of assessed valuation).
107
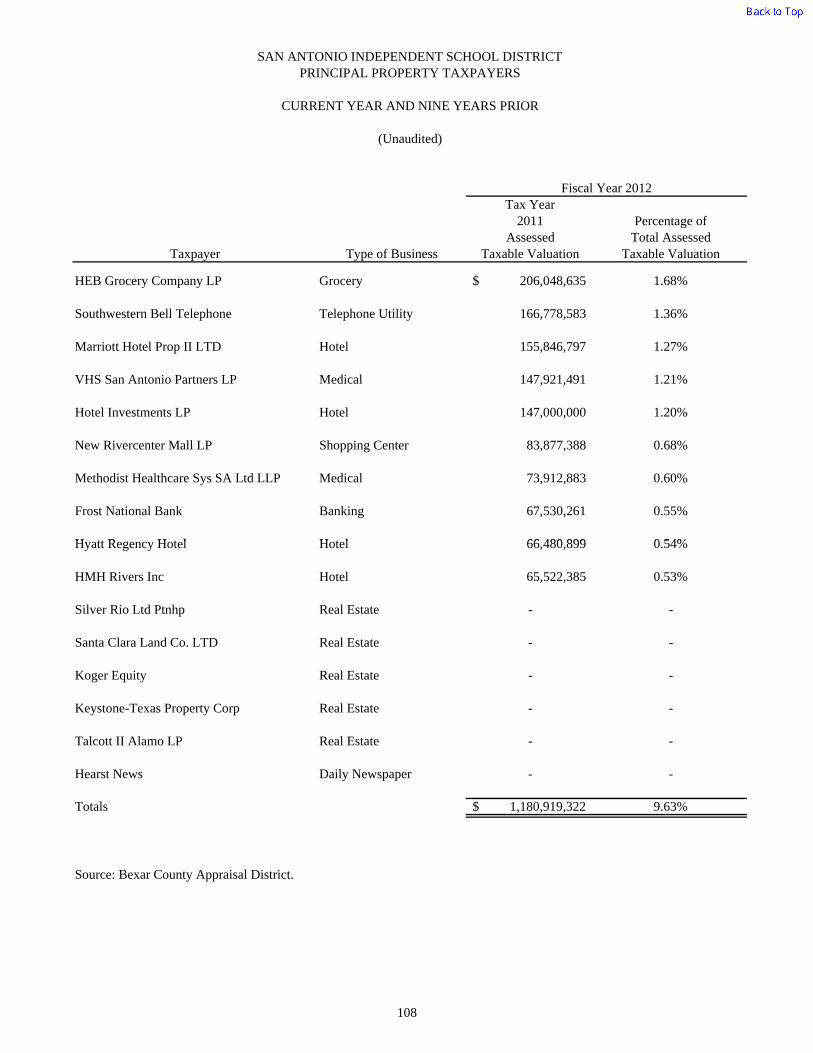
SAN ANTONIO INDEPENDENT SCHOOL DISTRICTPRINCIPAL PROPERTY TAXPAYERS
CURRENT YEAR AND NINE YEARS PRIOR
(Unaudited)
Tax Year2011 Percentage of
Assessed Total AssessedTaxpayer Type of Business Taxable Valuation Taxable Valuation
HEB Grocery Company LP Grocery 206,048,635$ 1.68%
Southwestern Bell Telephone Telephone Utility 166,778,583 1.36%
Marriott Hotel Prop II LTD Hotel 155,846,797 1.27%
VHS San Antonio Partners LP Medical 147,921,491 1.21%
Hotel Investments LP Hotel 147,000,000 1.20%
New Rivercenter Mall LP Shopping Center 83,877,388 0.68%
Methodist Healthcare Sys SA Ltd LLP Medical 73,912,883 0.60%
Frost National Bank Banking 67,530,261 0.55%
H tt R H t l H t l 66 480 899 0 54%
Fiscal Year 2012
Hyatt Regency Hotel Hotel 66,480,899 0.54%
HMH Rivers Inc Hotel 65,522,385 0.53%
Silver Rio Ltd Ptnhp Real Estate - -
Santa Clara Land Co. LTD Real Estate - -
Koger Equity Real Estate - -
Keystone-Texas Property Corp Real Estate - -
Talcott II Alamo LP Real Estate - -
Hearst News Daily Newspaper - -
Totals 1,180,919,322$ 9.63%
Source: Bexar County Appraisal District.
108

Tax Year2002 Percentage of
Assessed Total AssessedValuation Valuation
85,318,590$ 1.09%
218,220,350 2.78%
110,343,980 1.41%
- -
- -
- -
- -
- -
54 955 830 0 01%
Fiscal Year 2003
54,955,830 0.01%
- -
41,491,410 0.53%
46,011,320 0.59%
48,260,950 0.62%
177,358,990 2.26%
54,011,650 0.69%
37,896,660 0.48%
873,869,730$ 10.46%
109

THIS PAGE LEFT BLANK INTENTIONALLY
Debt Capacity Information
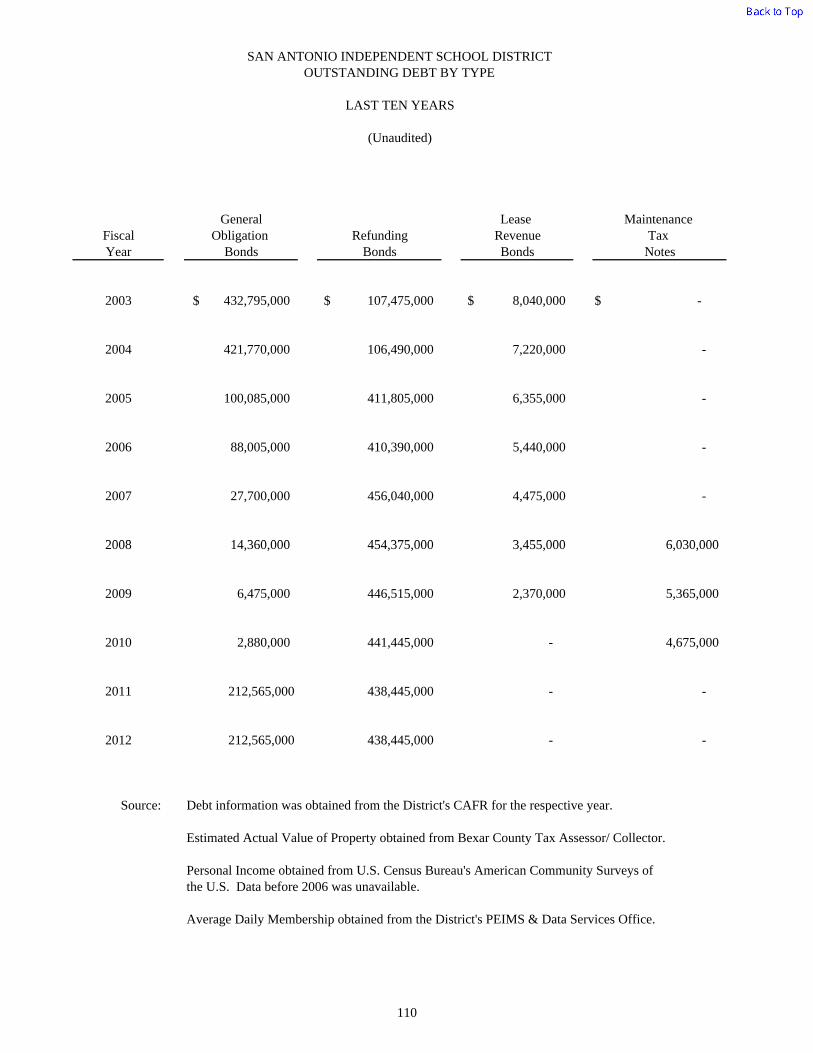
SAN ANTONIO INDEPENDENT SCHOOL DISTRICTOUTSTANDING DEBT BY TYPE
LAST TEN YEARS
(Unaudited)
General Lease Maintenance Fiscal Obligation Refunding Revenue Tax Year Bonds Bonds Bonds Notes
2003 432,795,000$ 107,475,000$ 8,040,000$ $ -
2004 421,770,000 106,490,000 7,220,000 -
2005 100,085,000 411,805,000 6,355,000 -
2006 88,005,000 410,390,000 5,440,000 -
2007 27,700,000 456,040,000 4,475,000 -
2008 14 360 000 454 375 000 3 455 000 6 030 0002008 14,360,000 454,375,000 3,455,000 6,030,000
2009 6,475,000 446,515,000 2,370,000 5,365,000
2010 2,880,000 441,445,000 - 4,675,000
2011 212,565,000 438,445,000 - -
2012 212,565,000 438,445,000 - -
Source: Debt information was obtained from the District's CAFR for the respective year.
Estimated Actual Value of Property obtained from Bexar County Tax Assessor/ Collector.
Personal Income obtained from U.S. Census Bureau's American Community Surveys of the U.S. Data before 2006 was unavailable.
Average Daily Membership obtained from the District's PEIMS & Data Services Office.
110

Capital Total DebtAppreciation Total Debt to Estimated Debt to Per Average
Bonds Debt Actual Property Value Personal Income Daily Membership
4,697,202$ 553,007,202$ 6.33% - 9,804$
7,294,573 542,774,573 6.04% - 9,647
7,294,573 525,539,573 5.41% - 9,372
7,294,573 511,129,573 5.08% 13.41% 9,154
7,614,561 495,829,561 4.49% 11.75% 9,055
7 614 561 485 834 561 3 96% 11 14% 9 0947,614,561 485,834,561 3.96% 11.14% 9,094
7,614,561 468,339,561 3.01% 10.53% 8,698
4,660,179 453,660,179 2.85% 9.62% 8,708
319,988 651,329,988 4.18% 13.88% 12,595
319,988 651,329,988 5.31% 14.82% 12,677
111
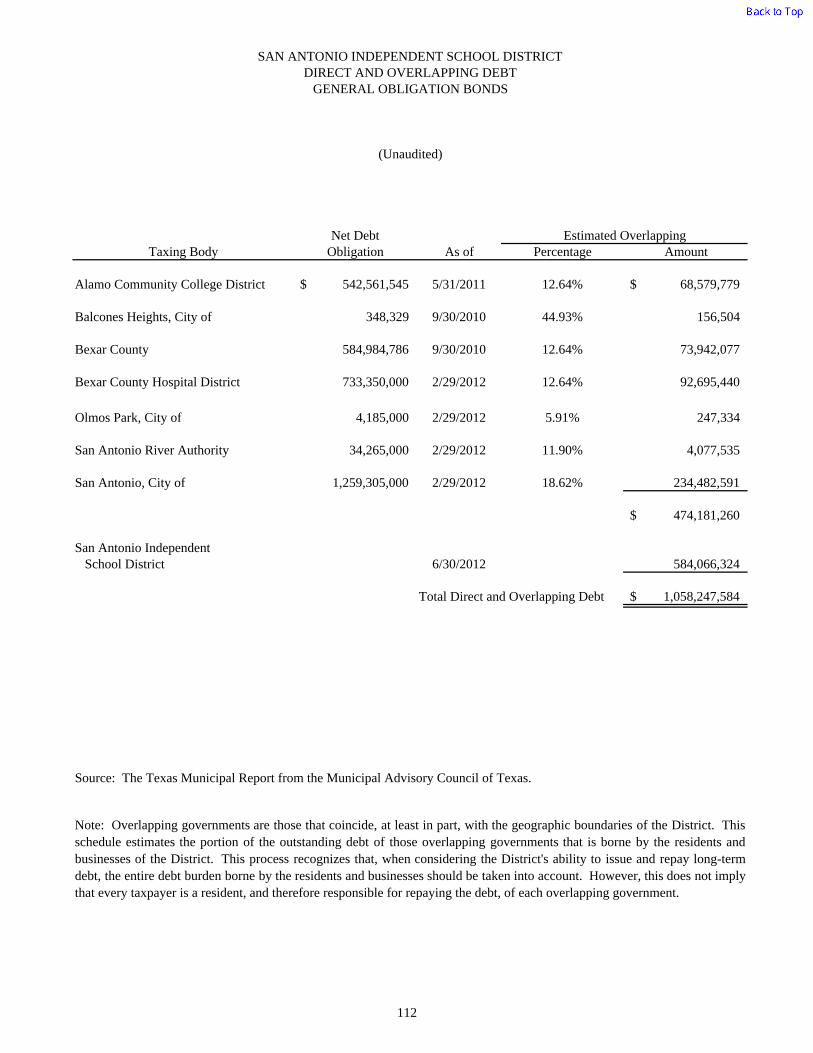
SAN ANTONIO INDEPENDENT SCHOOL DISTRICTDIRECT AND OVERLAPPING DEBT
GENERAL OBLIGATION BONDS
(Unaudited)
Net Debt Estimated OverlappingTaxing Body Obligation As of Percentage Amount
Alamo Community College District 542,561,545$ 5/31/2011 12.64% 68,579,779$
Balcones Heights, City of 348,329 9/30/2010 44.93% 156,504
Bexar County 584,984,786 9/30/2010 12.64% 73,942,077
Bexar County Hospital District 733,350,000 2/29/2012 12.64% 92,695,440
Olmos Park, City of 4,185,000 2/29/2012 5.91% 247,334
San Antonio River Authority 34,265,000 2/29/2012 11.90% 4,077,535
San Antonio, City of 1,259,305,000 2/29/2012 18.62% 234,482,591
474,181,260$
San Antonio Independent School District 6/30/2012 584,066,324
1,058,247,584$
Source: The Texas Municipal Report from the Municipal Advisory Council of Texas.
Total Direct and Overlapping Debt
Note: Overlapping governments are those that coincide, at least in part, with the geographic boundaries of the District. Thisschedule estimates the portion of the outstanding debt of those overlapping governments that is borne by the residents andbusinesses of the District. This process recognizes that, when considering the District's ability to issue and repay long-termdebt, the entire debt burden borne by the residents and businesses should be taken into account. However, this does not implythat every taxpayer is a resident, and therefore responsible for repaying the debt, of each overlapping government.
112

THIS PAGE LEFT BLANK INTENTIONALLY

2003 2004 2005 2006
Assessed Valuation 7,842,137,743$ 8,435,683,746$ 8,645,841,256$ 9,059,120,799$
Debt Limit - 10% of Assessed Valuation 784,213,774$ 843,568,375$ 864,584,126$ 905,912,080$
General Obligation Bonds 553,451,793 550,465,327 533,936,918 520,266,927 Deduct Amount Available in Debt Service Fund 19,529,061 24,812,020 29,469,113 32,400,335
Applicable Debt 533,922,732 525,653,307 504,467,805 487,866,592
Legal Debt Margin 250,291,042$ 317,915,068$ 360,116,321$ 418,045,488$
Debt Margin as a Percentage of the Debt Limit 31.92% 37.69% 41.65% 46.15%
Source: The District's CAFR, as follows: Assessed Valuation (Exhibit J-1); General Obligation Bonds (Notes to
Financial Statements); and Debt Service Fund, Amount Available in Debt Service Fund (Exhibit C-1).
Note: Texas statutes do not prescribe a debt limit; however, by custom, a practical economic debt limit of 10%
of the assessed valuation is used.
SAN ANTONIO INDEPENDENT SCHOOL DISTRICTCOMPUTATION OF LEGAL DEBT MARGIN
LAST TEN YEARS
(Unaudited)
113
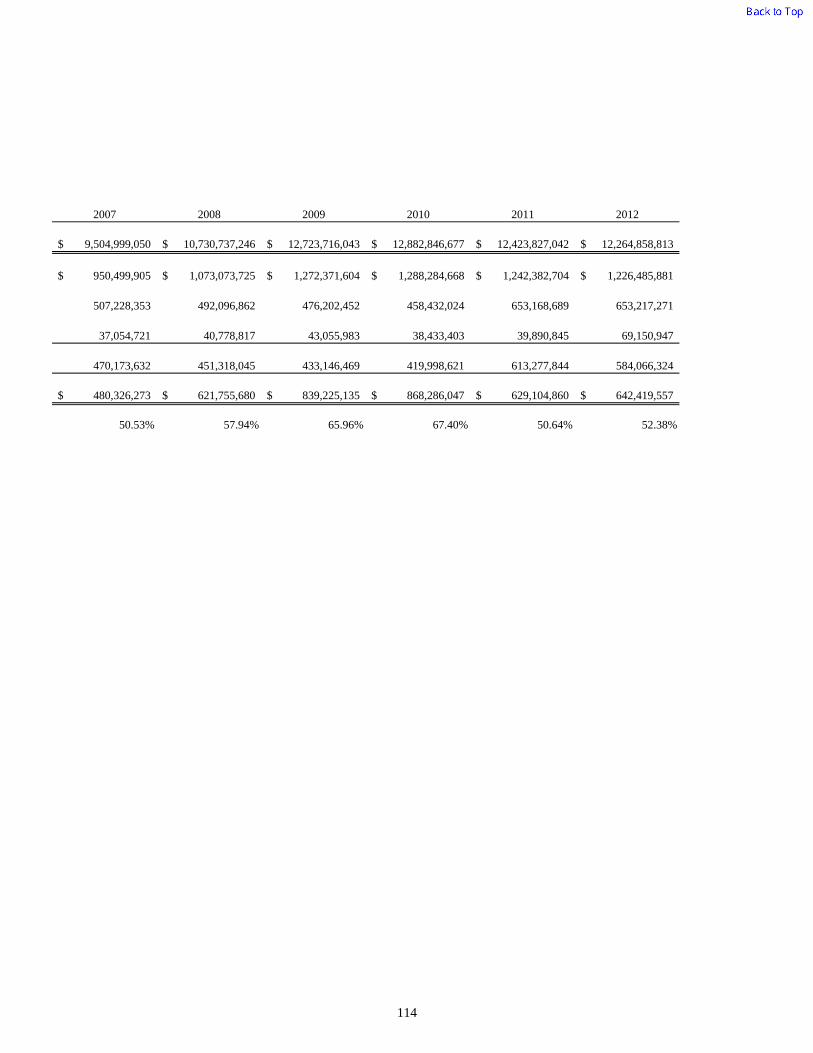
2007 2008 2009 2010 2011 2012
9,504,999,050$ 10,730,737,246$ 12,723,716,043$ 12,882,846,677$ 12,423,827,042$ 12,264,858,813$
950,499,905$ 1,073,073,725$ 1,272,371,604$ 1,288,284,668$ 1,242,382,704$ 1,226,485,881$
507,228,353 492,096,862 476,202,452 458,432,024 653,168,689 653,217,271
37,054,721 40,778,817 43,055,983 38,433,403 39,890,845 69,150,947
470,173,632 451,318,045 433,146,469 419,998,621 613,277,844 584,066,324
480,326,273$ 621,755,680$ 839,225,135$ 868,286,047$ 629,104,860$ 642,419,557$
50.53% 57.94% 65.96% 67.40% 50.64% 52.38%
114
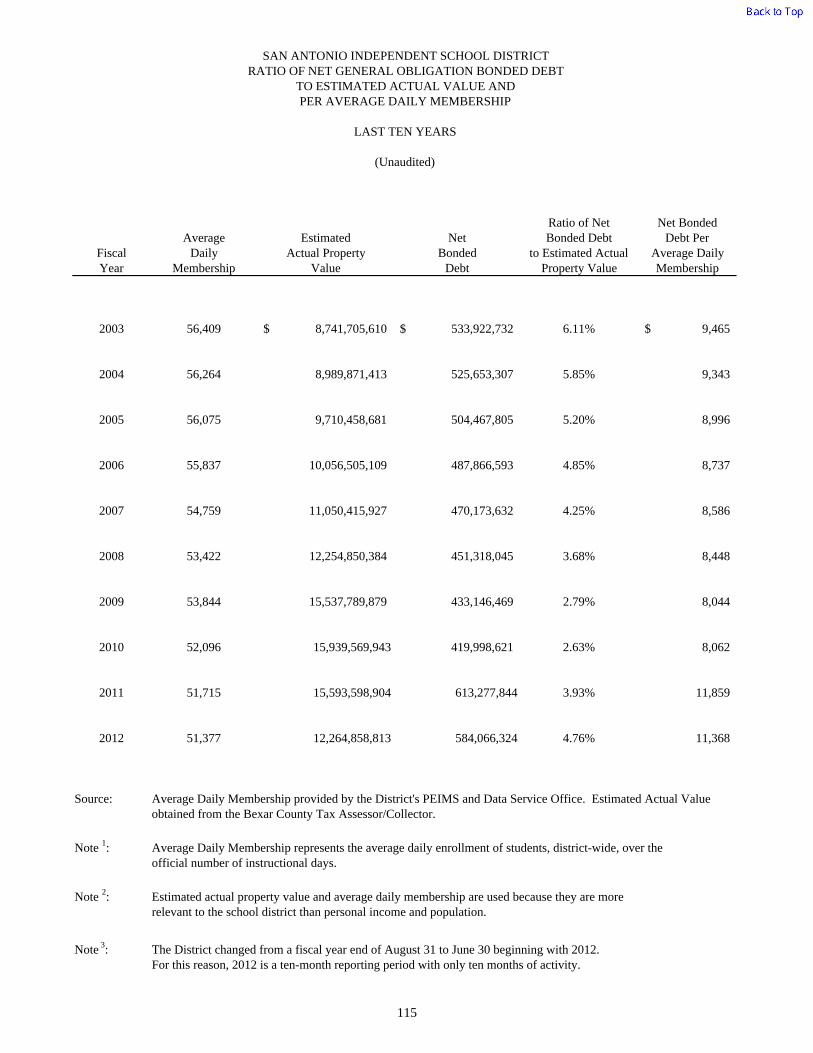
SAN ANTONIO INDEPENDENT SCHOOL DISTRICTRATIO OF NET GENERAL OBLIGATION BONDED DEBT
TO ESTIMATED ACTUAL VALUE ANDPER AVERAGE DAILY MEMBERSHIP
LAST TEN YEARS
(Unaudited)
Ratio of Net Net BondedAverage Estimated Net Bonded Debt Debt Per
Fiscal Daily Actual Property Bonded to Estimated Actual Average DailyYear Membership Value Debt Property Value Membership
2003 56,409 8,741,705,610$ 533,922,732$ 6.11% 9,465$
2004 56,264 8,989,871,413 525,653,307 5.85% 9,343
2005 56,075 9,710,458,681 504,467,805 5.20% 8,996
2006 55,837 10,056,505,109 487,866,593 4.85% 8,737
2007 54,759 11,050,415,927 470,173,632 4.25% 8,586
2008 53,422 12,254,850,384 451,318,045 3.68% 8,448
2009 53,844 15,537,789,879 433,146,469 2.79% 8,044
2010 52,096 15,939,569,943 419,998,621 2.63% 8,062
2011 51,715 15,593,598,904 613,277,844 3.93% 11,859
2012 51,377 12,264,858,813 584,066,324 4.76% 11,368
Source: Average Daily Membership provided by the District's PEIMS and Data Service Office. Estimated Actual Valueobtained from the Bexar County Tax Assessor/Collector.
Note 1: Average Daily Membership represents the average daily enrollment of students, district-wide, over theofficial number of instructional days.
Note 2: Estimated actual property value and average daily membership are used because they are more relevant to the school district than personal income and population.
Note 3: The District changed from a fiscal year end of August 31 to June 30 beginning with 2012.For this reason, 2012 is a ten-month reporting period with only ten months of activity.
115
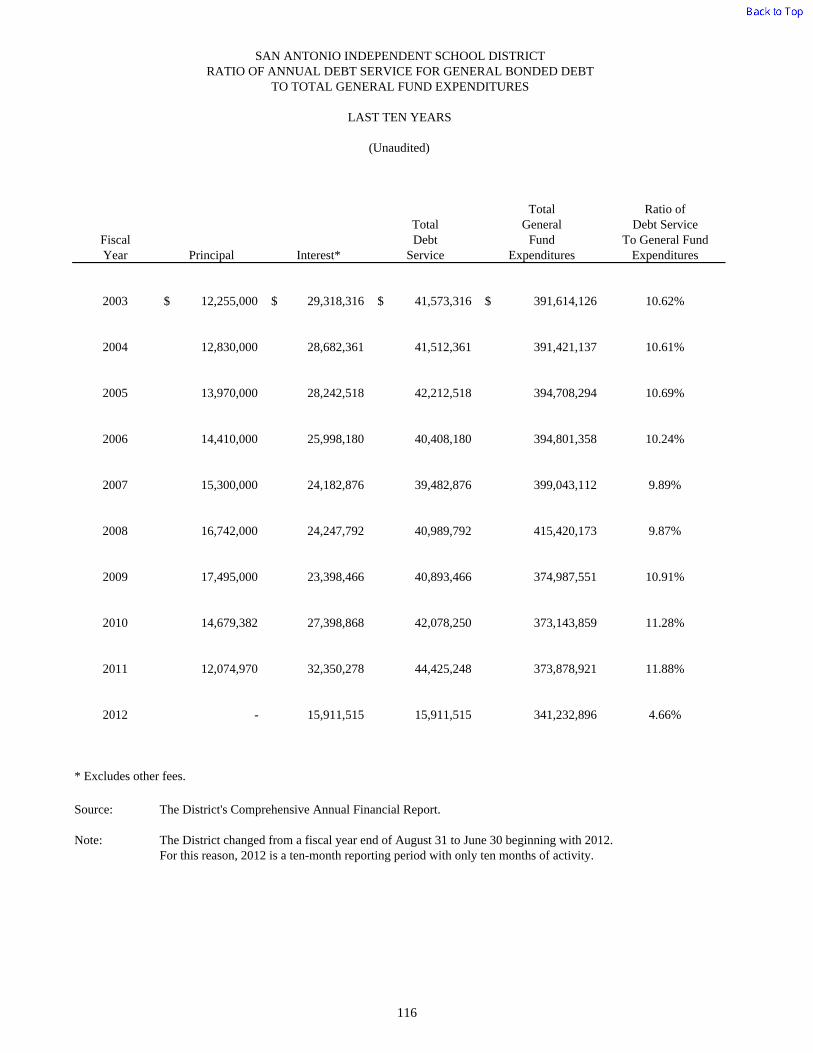
SAN ANTONIO INDEPENDENT SCHOOL DISTRICTRATIO OF ANNUAL DEBT SERVICE FOR GENERAL BONDED DEBT
TO TOTAL GENERAL FUND EXPENDITURES
LAST TEN YEARS
Total Ratio ofTotal General Debt Service
Fiscal Debt Fund To General FundYear Principal Interest* Service Expenditures Expenditures
2003 12,255,000$ 29,318,316$ 41,573,316$ 391,614,126$ 10.62%
2004 12,830,000 28,682,361 41,512,361 391,421,137 10.61%
2005 13,970,000 28,242,518 42,212,518 394,708,294 10.69%
2006 14,410,000 25,998,180 40,408,180 394,801,358 10.24%
2007 15,300,000 24,182,876 39,482,876 399,043,112 9.89%
2008 16,742,000 24,247,792 40,989,792 415,420,173 9.87%
(Unaudited)
2009 17,495,000 23,398,466 40,893,466 374,987,551 10.91%
2010 14,679,382 27,398,868 42,078,250 373,143,859 11.28%
2011 12,074,970 32,350,278 44,425,248 373,878,921 11.88%
2012 - 15,911,515 15,911,515 341,232,896 4.66%
* Excludes other fees.
Source: The District's Comprehensive Annual Financial Report.
Note: The District changed from a fiscal year end of August 31 to June 30 beginning with 2012.For this reason, 2012 is a ten-month reporting period with only ten months of activity.
116

THIS PAGE LEFT BLANK INTENTIONALLY

Demographic and Economic Information

THIS PAGE LEFT BLANK INTENTIONALLY

AverageFiscal Personal Per Capita Unemployment Estimated Actual DailyYear Population Income Income Rate Property Value Membership
2003 Note 1 Note 1 Note 1 5.7% 8,741,705,610$ 56,409
2004 Note 1 Note 1 Note 1 6.1% 8,989,871,413 56,264
2005 Note 1 Note 1 Note 1 5.6% 9,710,458,681 56,075
2006 292,768 3,810,749,200$ 13,016$ 5.0% 10,056,505,109 55,837
2007 322,114 4,218,109,100 13,095 4.6% 11,050,415,927 54,759
2008 313,001 4,361,370,300 13,934 4.1% 12,254,850,384 53,422
2009 297,421 4,449,364,800 14,960 4.7% 15,537,789,879 53,844
SAN ANTONIO INDEPENDENT SCHOOL DISTRICTDEMOGRAPHIC AND ECONOMIC STATISTICS
LAST TEN YEARS
(Unaudited)
2010 321,367 4,715,100,400 14,672 6.7% 15,939,569,943 52,096
2011 306,943 4,691,761,900 15,285 7.3% 15,593,598,904 51,715
2012 302,872 4,395,168,200 14,512 7.4% 12,264,858,813 51,377
Source: For fiscal years 2006-2012, Population, Personal Income, and Per Capita Income obtained from
U.S. Census Bureau's American Community Surveys of the U.S.
Unemployment Rate obtained from U.S. Department of Labor Bureau of Statistics.
Estimated Actual Value of Property obtained from Bexar County Tax Assessor/ Collector.
Average Daily Membership obtained from the District's PEIMS & Data Services Office.
Note 1: Census information before 2006 was not available for San Antonio Independent School District.
117

Percentageof Total
Employer Employees Employment
Lackland Air Force Base 46,577 5.37%Fort Sam Houston 32,663 3.76%USAA 15,000 1.73%H.E.B. Food Stores 14,588 1.68%Northside I.S.D. 12,244 1.41%Randolph Air Force Base 10,651 1.23%City of San Antonio 9,145 1.05%North East I.S.D. 8,400 0.97%Methodist Healthcare System 7,747 0.89%San Antonio I.S.D. 7,391 0.85%U.S. Air Force (Lackland & Randolph) - -Alamo Community College District - -AT&T - -
164,406
Total Employment 868,000
Source: Employment information for San Antonio I.S.D. obtained from the District's PEIMS & Data Services Office. Employment information for remaining employers obtained from the San Antonio Economic Development Foundation Website. Total employment for 2012 obtained from the Texas Workforce Commission's Tracer web site. Employment information for 2006 obtained from the fiscal year 2006 CAFR.
Note: Employer information from nine years prior was not available; therefore, information from 2006, the earliest year available, is used.
SAN ANTONIO INDEPENDENT SCHOOL DISTRICTPRINCIPAL EMPLOYERS
CURRENT YEAR AND SIX YEARS PRIOR
(Unaudited)
2012
118

Percentageof Total
Employees Employment
- -35,527 4.05%13,965 1.59%14,588 1.67%10,320 1.18%
- -- -
7,574 0.86%7,027 0.80%7,685 0.88%
53,928 6.16%7,200 0.82%6,500 0.74%
164,314
876,147
2006
119
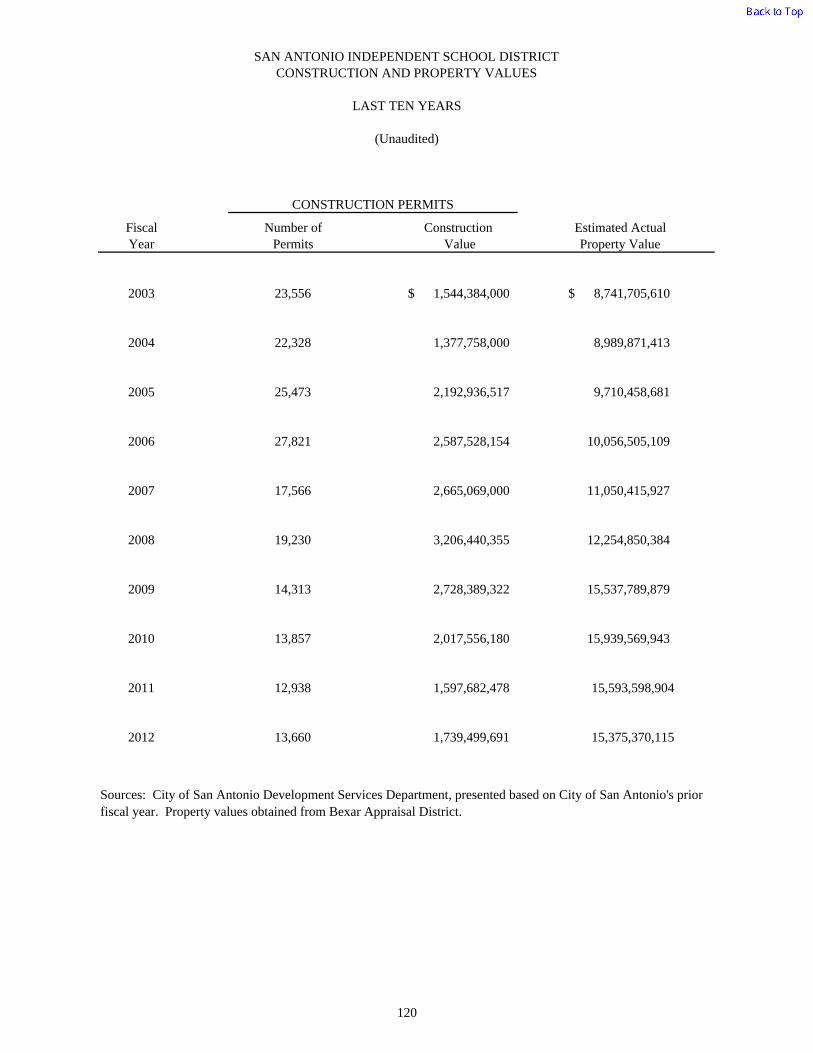
SAN ANTONIO INDEPENDENT SCHOOL DISTRICTCONSTRUCTION AND PROPERTY VALUES
LAST TEN YEARS
(Unaudited)
Fiscal Number of Construction Estimated ActualYear Permits Value Property Value
2003 23,556 1,544,384,000$ 8,741,705,610$
2004 22,328 1,377,758,000 8,989,871,413
2005 25,473 2,192,936,517 9,710,458,681
2006 27,821 2,587,528,154 10,056,505,109
2007 17,566 2,665,069,000 11,050,415,927
2008 19,230 3,206,440,355 12,254,850,384
2009 14,313 2,728,389,322 15,537,789,879
2010 13,857 2,017,556,180 15,939,569,943
2011 12,938 1,597,682,478 15,593,598,904
2012 13,660 1,739,499,691 15,375,370,115
CONSTRUCTION PERMITS
Sources: City of San Antonio Development Services Department, presented based on City of San Antonio's prior fiscal year. Property values obtained from Bexar Appraisal District.
120
Operating Information

Classification 2003 2004 2005 2006
Number of Employees
Teachers 3,636 3,527 3,517 3,516
Professional Support 756 801 800 795
Campus Administration 182 176 173 179
Central Administration 52 53 67 66
Educational Aides 787 877 895 951
Auxiliary Staff 2,337 2,232 2,248 2,271
Total Employees 7,750 7,666 7,700 7,778
Percent of Total
Teachers 46.92% 46.01% 45.68% 45.20%
Professional Support 9.75% 10.45% 10.39% 10.22%
Campus Administration 2.35% 2.30% 2.25% 2.30%
Central Administration 0.67% 0.69% 0.87% 0.85%
Educational Aides 10.15% 11.44% 11.62% 12.23%
Auxiliary Staff 30.15% 29.12% 29.19% 29.20%
100.00% 100.00% 100.00% 100.00%
Source: Texas Education Public Education Information System Report
SAN ANTONIO INDEPENDENT SCHOOL DISTRICTWORK FORCE COMPOSITION BY EMPLOYEE CLASSIFICATION
LAST TEN YEARS
(Unaudited)
121

2007 2008 2009 2010 2011 2012
3,494 3,388 3,321 3,402 3,437 3,385
798 799 772 777 808 737
179 174 172 171 178 177
67 70 65 70 69 66
943 916 856 821 899 819
2,279 2,218 2,153 2,238 2,242 2,207
7,760 7,565 7,339 7,479 7,633 7,391
45.03% 44.79% 45.25% 45.49% 45.03% 45.80%
10.28% 10.56% 10.52% 10.39% 10.59% 9.97%
2.31% 2.30% 2.34% 2.29% 2.33% 2.39%
0.86% 0.93% 0.89% 0.94% 0.90% 0.89%
12.15% 12.11% 11.66% 10.98% 11.78% 11.08%
29.37% 29.32% 29.34% 29.92% 29.37% 29.86%
100.00% 100.00% 100.00% 100.00% 100.00% 100.00%
122

Average Fiscal State Min-Max Average Years of Bachelor's Master'sYear Salaries Teacher Salary Experience Education Education
2003 $24,240 - $40,800 $46,274 14.6 59.6% 40.0%
2004 $24,240 - $40,800 $46,224 14.5 59.8% 39.8%
2005 $24,240 - $40,800 $46,927 14.0 61.1% 38.5%
2006 $24,820 - $41,770 $46,567 13.6 61.7% 37.9%
2007 $27,320 - $44,270 $49,273 13.3 62.1% 37.4%
2008 $27,320 - $44,270 $49,376 13.6 62.3% 37.3%
2009 $27,320 - $44,270 $48,620 13.3 63.8% 35.6%
2010 $27,320 - $44,270 $50,045 12.6 65.4% 34.0%
2011 $27,320 - $44,270 $49,904 11.8 66.8% 32.8%
2012 $27,320 - $44,270 $49,184 11.3 65.5% 34.1%
Source: Academic Excellence Indicator System (AEIS).
SAN ANTONIO INDEPENDENT SCHOOL DISTRICTSCHEDULE OF TEACHER INFORMATION
LAST TEN YEARS
(Unaudited)
123
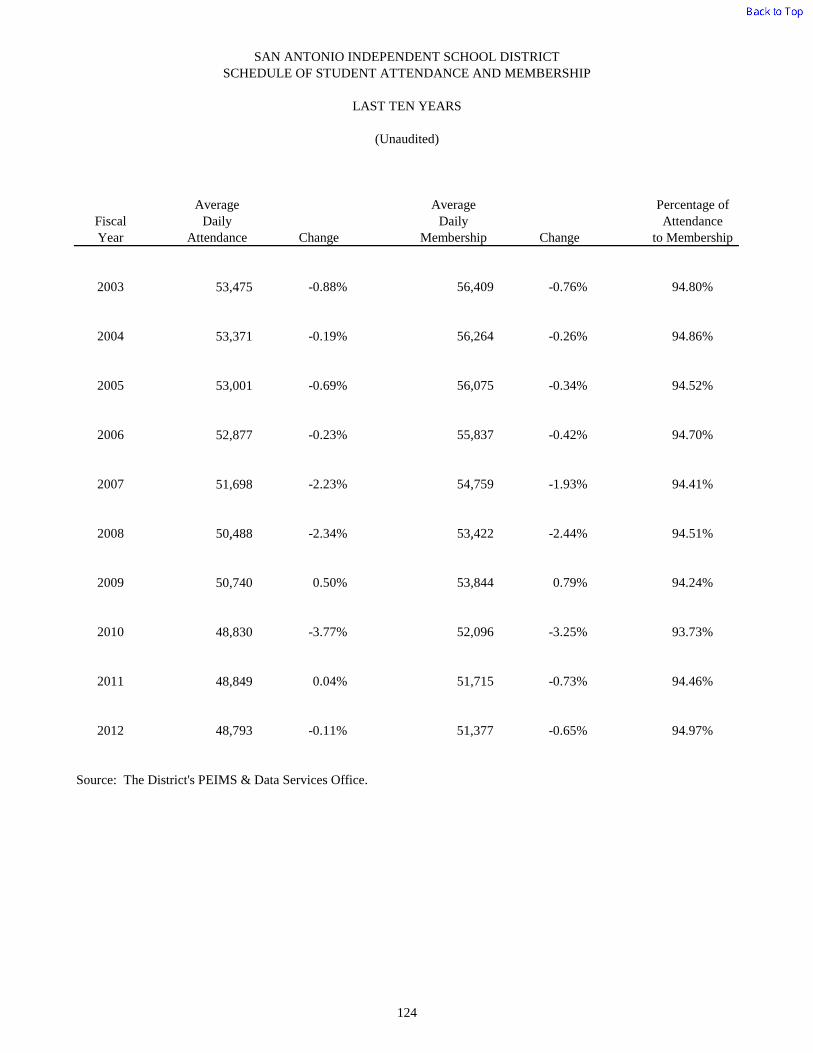
Average Average Percentage ofFiscal Daily Daily AttendanceYear Attendance Change Membership Change to Membership
2003 53,475 -0.88% 56,409 -0.76% 94.80%
2004 53,371 -0.19% 56,264 -0.26% 94.86%
2005 53,001 -0.69% 56,075 -0.34% 94.52%
2006 52,877 -0.23% 55,837 -0.42% 94.70%
2007 51,698 -2.23% 54,759 -1.93% 94.41%
2008 50,488 -2.34% 53,422 -2.44% 94.51%
SAN ANTONIO INDEPENDENT SCHOOL DISTRICTSCHEDULE OF STUDENT ATTENDANCE AND MEMBERSHIP
LAST TEN YEARS
(Unaudited)
, ,
2009 50,740 0.50% 53,844 0.79% 94.24%
2010 48,830 -3.77% 52,096 -3.25% 93.73%
2011 48,849 0.04% 51,715 -0.73% 94.46%
2012 48,793 -0.11% 51,377 -0.65% 94.97%
Source: The District's PEIMS & Data Services Office.
124

Average General Fund Cost CostFiscal Daily Operating Per Percent Operating Per PercentYear Attendance Expenditures Pupil Change Expenses Pupil Change
2003 53,475 390,271,437$ 7,298$ 8.83% 490,345,447$ 9,170$ 13.23%
2004 53,371 390,439,369 7,316 0.24% 482,177,761 9,034 -1.47%
2005 53,035 394,352,360 7,440 1.71% 490,528,850 9,255 2.44%
2006 52,877 394,636,738 7,468 0.38% 501,219,430 9,485 2.49%
2007 51,698 398,738,005 7,713 3.18% 502,622,492 9,722 2.50%
2008 50,488 413,671,405 8,193 6.23% 509,505,612 10,092 3.80%
2009 50,740 373,883,045 7,369 -10.06% 509,057,321 10,033 -0.59%
2010 48,830 369,050,885 7,558 2.57% 539,399,326 11,047 10.11%
2011 48,849 372,387,533 7,623 0.86% 548,269,489 11,224 1.60%
2012 48,793 339,274,062 6,953 -8.79% 493,538,060 10,115 -9.88%
Source: Average Daily Attendance obtained from the District's PEIMS and Data Services Office. OperatingExpenditures and Expenses obtained from the District's CAFR for the respective year.
Note: The District changed from a fiscal year end of August 31 to June 30 beginning with 2012. For this reason, 2012 is a ten-month reporting period with only ten months of activity.
SAN ANTONIO INDEPENDENT SCHOOL DISTRICTOPERATING STATISTICS
LAST TEN YEARS
(Unaudited)
125

# of Students % of StudentsTeacher/ who qualify for who qualify for
Fiscal Student Free or Reduced Free or ReducedYear Ratio Price Lunch Price Lunch
2003 15.7 51,586 90.40%
2004 16.1 51,115 90.00%
2005 16.1 52,553 92.90%
2006 16.0 52,007 92.18%
2007 15.8 50,598 91.50%
2008 16.2 48,302 88.30%
2009 16.4 49,113 90.30%
2010 16.2 50,986 92.60%
2011 16.0 50,944 92.80%
2012 16.0 50,944 92.80%
Source: Academic Excellence Indicator System (AEIS).
Note 1: Number and percent of students who qualify for free or reduced-price lunch includes economically disadvantaged students coded as eligible for free or reduced-price lunch or eligible for other public assistance.
Note 2: The District changed from a fiscal year end of August 31 to June 30 beginning with 2012. Information for 2012 was not yet available due to the fiscal yearchange; therefore, figures reported for 2011 were repeated for 2012.
SAN ANTONIO INDEPENDENT SCHOOL DISTRICTSCHEDULE OF STUDENT INFORMATION
LAST TEN YEARS
(Unaudited)
126

2003 2004 2005 2006 2007 2008SCHOOL BUILDINGSBrackenridge H S Square Feet 325,072 325,072 325,072 325,072 325,072 325,072 Capacity(students) 2,250 2,250 2,250 2,250 2,250 2,250 Enrollment 2,002 1,898 1,854 1,854 1,881 1,860Burbank H S Square Feet 296,328 296,328 296,328 296,328 296,328 296,328 Capacity(students) 2,100 2,100 2,100 2,100 2,100 2,100 Enrollment 1,346 1,313 1,343 1,338 1,359 1,424Edison H S Square Feet 279,594 279,594 279,594 279,594 279,594 279,594 Capacity(students) 2,025 2,025 2,025 2,025 2,025 2,025 Enrollment 1,728 1,683 1,707 1,659 1,732 1,707Fox Tech H S Square Feet 378,177 378,177 378,177 378,177 378,177 378,177 Capacity(students) 1,725 1,725 1,725 1,725 1,725 1,725 Enrollment 1,727 1,728 1,724 1,724 1,711 1,545Highlands H S Square Feet 328,449 328,449 328,449 328,449 328,449 328,449 Capacity(students) 2,700 2,700 2,700 2,700 2,700 2,700 Enrollment 2,214 2,181 2,173 2,111 2,068 2,104Houston H S Square Feet 299,013 299,013 299,013 299,013 299,013 299,013 Capacity(students) 2,025 2,025 2,025 2,025 2,025 2,025 Enrollment 1,227 1,140 1,138 1,030 935 889Jefferson H S Square Feet 302,452 302,452 302,452 302,452 302,452 302,452 Capacity(students) 2,325 2,325 2,325 2,325 2,325 2,325 Enrollment 1,854 1,917 1,902 1,869 1,869 1,912Lanier H S Square Feet 353,057 353,057 353,057 353,057 353,057 353,057 Capacity(students) 1,825 1,825 1,825 1,825 1,825 1,825 Enrollment 1,590 1,482 1,474 1,408 1,423 1,458Navarro Academy Square Feet 48,758 48,758 48,758 48,758 48,758 48,758 Capacity(students) 286 286 286 286 286 286 Enrollment 270 315 318 271 228 199Travis Early College (2009) Square Feet - - - - - - Capacity(students) - - - - - - Enrollment - - - - - -
SAN ANTONIO INDEPENDENT SCHOOL DISTRICTSCHEDULE OF SCHOOL BUILDINGS
LAST TEN YEARS
(Unaudited)
Source: SAISD Facilities Planning and Construction Department and Research and Evaluation Department.* Building not in use. 127
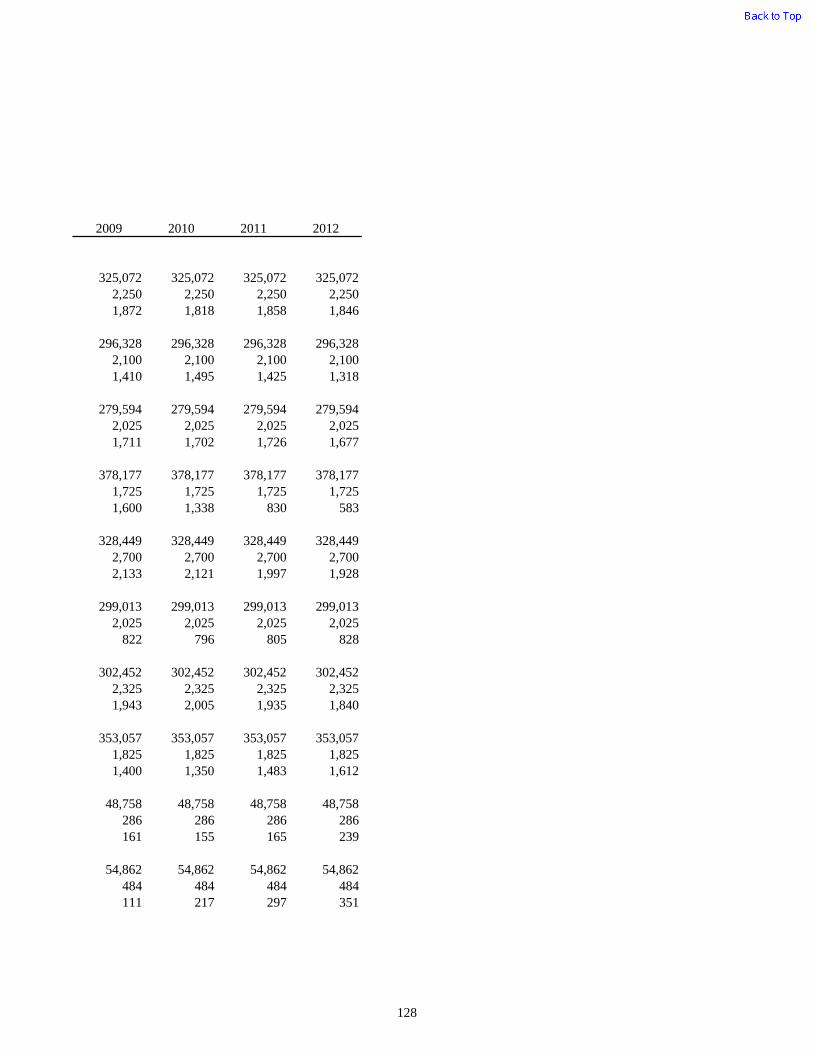
2009 2010 2011 2012
325,072 325,072 325,072 325,0722,250 2,250 2,250 2,2501,872 1,818 1,858 1,846
296,328 296,328 296,328 296,3282,100 2,100 2,100 2,1001,410 1,495 1,425 1,318
279,594 279,594 279,594 279,5942,025 2,025 2,025 2,0251,711 1,702 1,726 1,677
378,177 378,177 378,177 378,1771,725 1,725 1,725 1,7251,600 1,338 830 583
328,449 328,449 328,449 328,4492,700 2,700 2,700 2,7002,133 2,121 1,997 1,928
299,013 299,013 299,013 299,0132,025 2,025 2,025 2,025
822 796 805 828
302,452 302,452 302,452 302,4522,325 2,325 2,325 2,3251,943 2,005 1,935 1,840
353,057 353,057 353,057 353,0571,825 1,825 1,825 1,8251,400 1,350 1,483 1,612
48,758 48,758 48,758 48,758286 286 286 286161 155 165 239
54,862 54,862 54,862 54,862484 484 484 484111 217 297 351
128
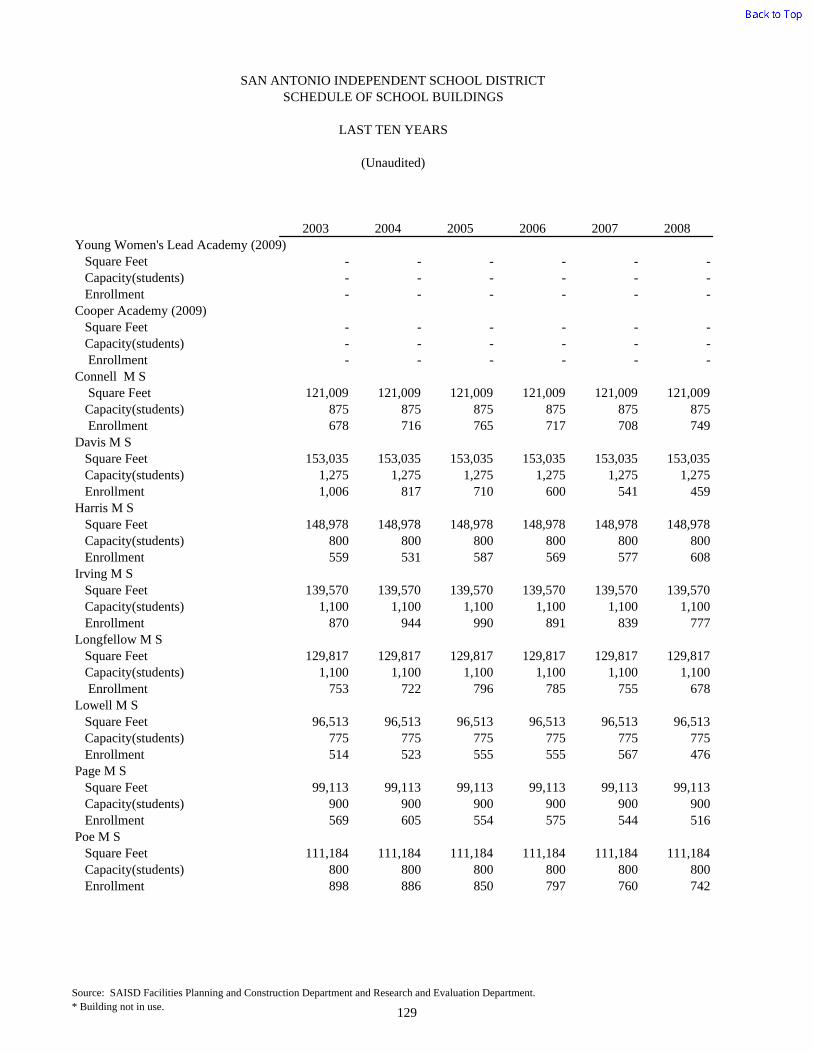
2003 2004 2005 2006 2007 2008
SAN ANTONIO INDEPENDENT SCHOOL DISTRICTSCHEDULE OF SCHOOL BUILDINGS
LAST TEN YEARS
(Unaudited)
Young Women's Lead Academy (2009) Square Feet - - - - - - Capacity(students) - - - - - - Enrollment - - - - - -Cooper Academy (2009) Square Feet - - - - - - Capacity(students) - - - - - - Enrollment - - - - - -Connell M S Square Feet 121,009 121,009 121,009 121,009 121,009 121,009 Capacity(students) 875 875 875 875 875 875 Enrollment 678 716 765 717 708 749Davis M S Square Feet 153,035 153,035 153,035 153,035 153,035 153,035 Capacity(students) 1,275 1,275 1,275 1,275 1,275 1,275 Enrollment 1,006 817 710 600 541 459Harris M S Square Feet 148,978 148,978 148,978 148,978 148,978 148,978 Capacity(students) 800 800 800 800 800 800 Enrollment 559 531 587 569 577 608Irving M S Square Feet 139,570 139,570 139,570 139,570 139,570 139,570 Capacity(students) 1,100 1,100 1,100 1,100 1,100 1,100 Enrollment 870 944 990 891 839 777Longfellow M S Square Feet 129,817 129,817 129,817 129,817 129,817 129,817 Capacity(students) 1,100 1,100 1,100 1,100 1,100 1,100 Enrollment 753 722 796 785 755 678Lowell M S Square Feet 96,513 96,513 96,513 96,513 96,513 96,513 Capacity(students) 775 775 775 775 775 775 Enrollment 514 523 555 555 567 476Page M S Square Feet 99,113 99,113 99,113 99,113 99,113 99,113 Capacity(students) 900 900 900 900 900 900 Enrollment 569 605 554 575 544 516Poe M S Square Feet 111,184 111,184 111,184 111,184 111,184 111,184 Capacity(students) 800 800 800 800 800 800 Enrollment 898 886 850 797 760 742
Source: SAISD Facilities Planning and Construction Department and Research and Evaluation Department.* Building not in use. 129

2009 2010 2011 2012
98,227 98,227 98,227 98,227800 800 800 800149 215 266 288
103,900 103,900 103,900 103,900750 750 750 750
40 182 284 343
121,009 121,009 121,009 121,009875 875 875 875703 665 647 612
153,035 153,035 153,035 153,0351,275 1,275 1,275 1,275
678 641 672 659
148,978 148,978 148,978 148,978800 800 800 800664 740 808 834
139,570 139,570 139,570 139,5701,100 1,100 1,100 1,100
921 872 820 817
129,817 129,817 129,817 129,8171,100 1,100 1,100 1,100
950 931 904 921
96,513 96,513 96,513 96,513775 775 775 775492 431 449 462
99,113 99,113 99,113 99,113900 900 900 900477 416 462 462
111,184 111,184 111,184 111,184800 800 800 800743 709 750 726
130
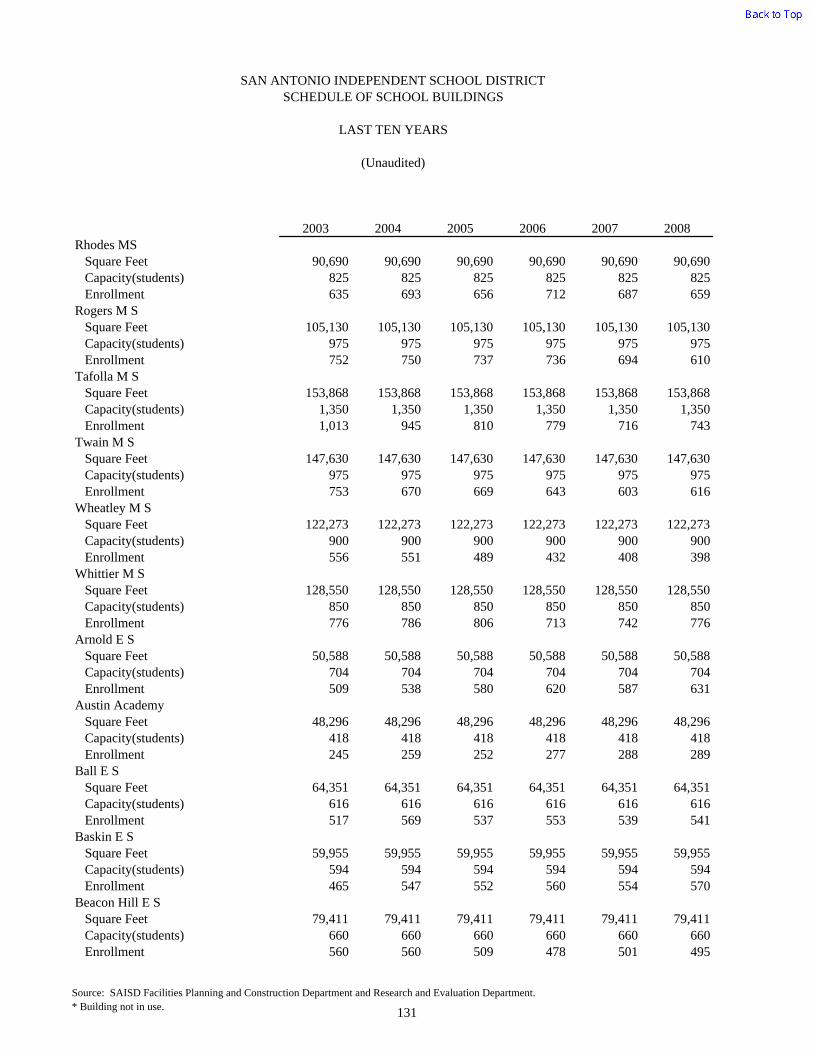
2003 2004 2005 2006 2007 2008
SAN ANTONIO INDEPENDENT SCHOOL DISTRICTSCHEDULE OF SCHOOL BUILDINGS
LAST TEN YEARS
(Unaudited)
Rhodes MS Square Feet 90,690 90,690 90,690 90,690 90,690 90,690 Capacity(students) 825 825 825 825 825 825 Enrollment 635 693 656 712 687 659Rogers M S Square Feet 105,130 105,130 105,130 105,130 105,130 105,130 Capacity(students) 975 975 975 975 975 975 Enrollment 752 750 737 736 694 610Tafolla M S Square Feet 153,868 153,868 153,868 153,868 153,868 153,868 Capacity(students) 1,350 1,350 1,350 1,350 1,350 1,350 Enrollment 1,013 945 810 779 716 743Twain M S Square Feet 147,630 147,630 147,630 147,630 147,630 147,630 Capacity(students) 975 975 975 975 975 975 Enrollment 753 670 669 643 603 616Wheatley M S Square Feet 122,273 122,273 122,273 122,273 122,273 122,273 Capacity(students) 900 900 900 900 900 900 Enrollment 556 551 489 432 408 398Whittier M S Square Feet 128,550 128,550 128,550 128,550 128,550 128,550 Capacity(students) 850 850 850 850 850 850 Enrollment 776 786 806 713 742 776Arnold E S Square Feet 50,588 50,588 50,588 50,588 50,588 50,588 Capacity(students) 704 704 704 704 704 704 Enrollment 509 538 580 620 587 631Austin Academy Square Feet 48,296 48,296 48,296 48,296 48,296 48,296 Capacity(students) 418 418 418 418 418 418 Enrollment 245 259 252 277 288 289Ball E S Square Feet 64,351 64,351 64,351 64,351 64,351 64,351 Capacity(students) 616 616 616 616 616 616 Enrollment 517 569 537 553 539 541Baskin E S Square Feet 59,955 59,955 59,955 59,955 59,955 59,955 Capacity(students) 594 594 594 594 594 594 Enrollment 465 547 552 560 554 570Beacon Hill E S Square Feet 79,411 79,411 79,411 79,411 79,411 79,411 Capacity(students) 660 660 660 660 660 660 Enrollment 560 560 509 478 501 495
Source: SAISD Facilities Planning and Construction Department and Research and Evaluation Department.* Building not in use. 131
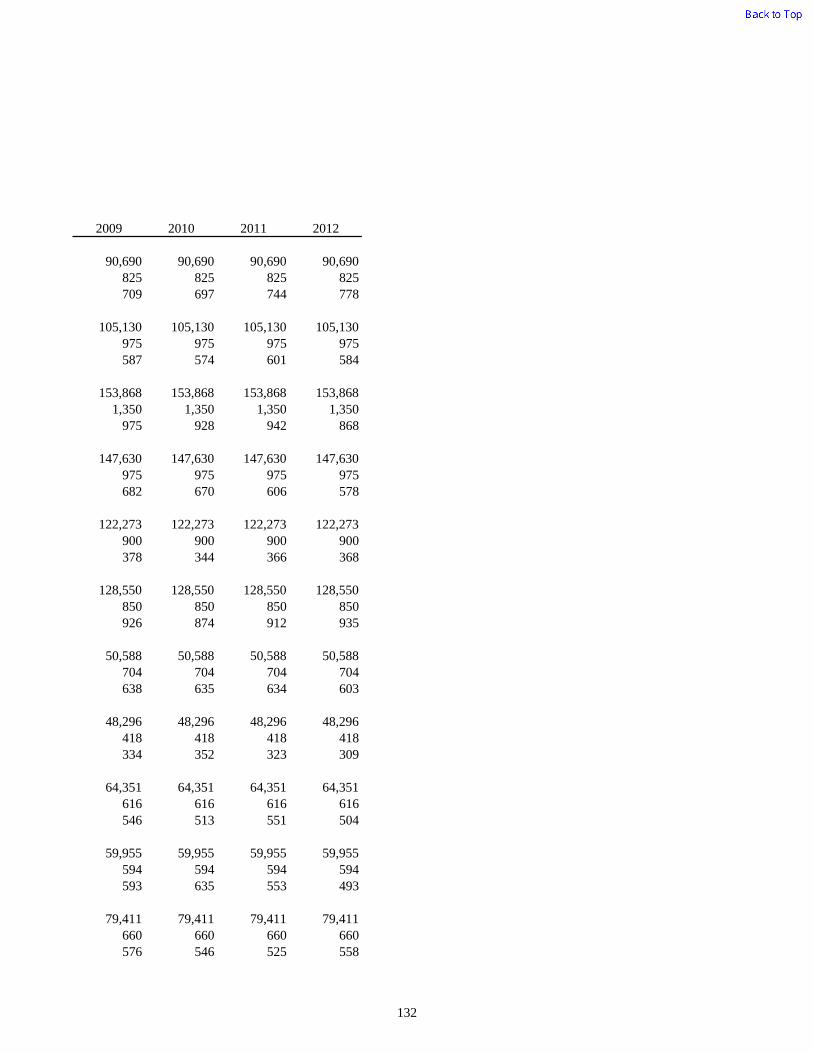
2009 2010 2011 2012
90,690 90,690 90,690 90,690825 825 825 825709 697 744 778
105,130 105,130 105,130 105,130975 975 975 975587 574 601 584
153,868 153,868 153,868 153,8681,350 1,350 1,350 1,350
975 928 942 868
147,630 147,630 147,630 147,630975 975 975 975682 670 606 578
122,273 122,273 122,273 122,273900 900 900 900378 344 366 368
128,550 128,550 128,550 128,550850 850 850 850926 874 912 935
50,588 50,588 50,588 50,588704 704 704 704638 635 634 603
48,296 48,296 48,296 48,296418 418 418 418334 352 323 309
64,351 64,351 64,351 64,351616 616 616 616546 513 551 504
59,955 59,955 59,955 59,955594 594 594 594593 635 553 493
79,411 79,411 79,411 79,411660 660 660 660576 546 525 558
132
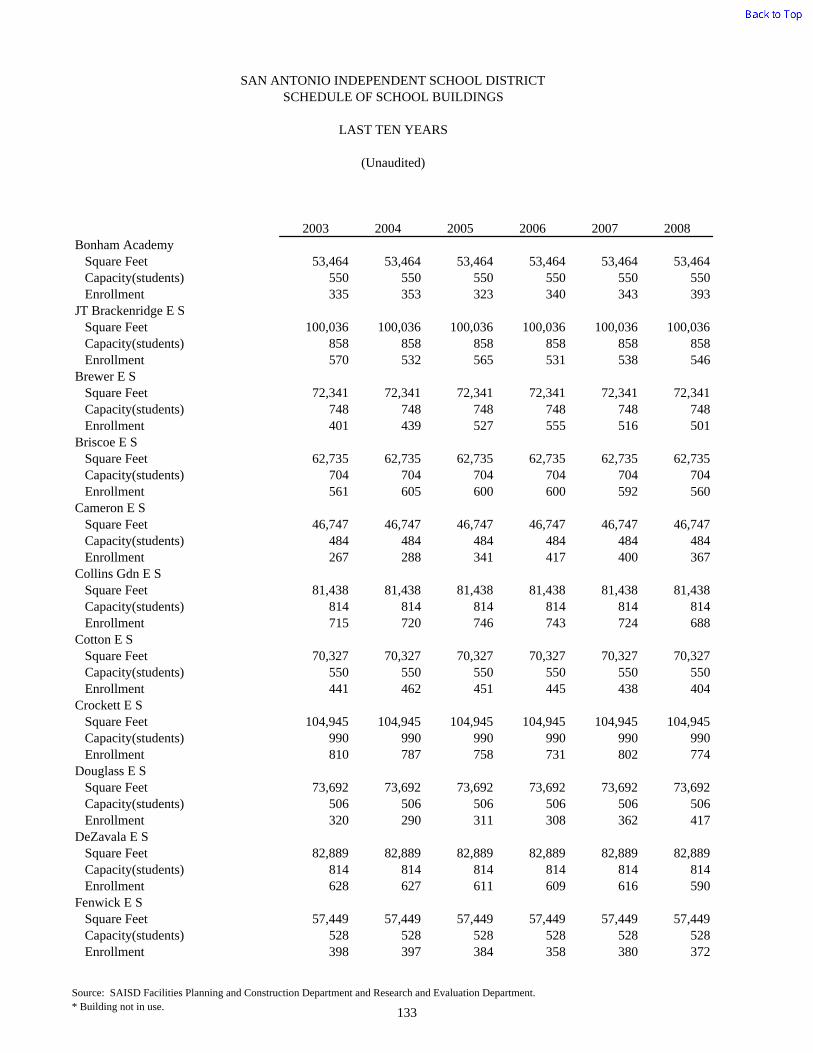
2003 2004 2005 2006 2007 2008
SAN ANTONIO INDEPENDENT SCHOOL DISTRICTSCHEDULE OF SCHOOL BUILDINGS
LAST TEN YEARS
(Unaudited)
Bonham Academy Square Feet 53,464 53,464 53,464 53,464 53,464 53,464 Capacity(students) 550 550 550 550 550 550 Enrollment 335 353 323 340 343 393JT Brackenridge E S Square Feet 100,036 100,036 100,036 100,036 100,036 100,036 Capacity(students) 858 858 858 858 858 858 Enrollment 570 532 565 531 538 546Brewer E S Square Feet 72,341 72,341 72,341 72,341 72,341 72,341 Capacity(students) 748 748 748 748 748 748 Enrollment 401 439 527 555 516 501Briscoe E S Square Feet 62,735 62,735 62,735 62,735 62,735 62,735 Capacity(students) 704 704 704 704 704 704 Enrollment 561 605 600 600 592 560Cameron E S Square Feet 46,747 46,747 46,747 46,747 46,747 46,747 Capacity(students) 484 484 484 484 484 484 Enrollment 267 288 341 417 400 367Collins Gdn E S Square Feet 81,438 81,438 81,438 81,438 81,438 81,438 Capacity(students) 814 814 814 814 814 814 Enrollment 715 720 746 743 724 688Cotton E S Square Feet 70,327 70,327 70,327 70,327 70,327 70,327 Capacity(students) 550 550 550 550 550 550 Enrollment 441 462 451 445 438 404Crockett E S Square Feet 104,945 104,945 104,945 104,945 104,945 104,945 Capacity(students) 990 990 990 990 990 990 Enrollment 810 787 758 731 802 774Douglass E S Square Feet 73,692 73,692 73,692 73,692 73,692 73,692 Capacity(students) 506 506 506 506 506 506 Enrollment 320 290 311 308 362 417DeZavala E S Square Feet 82,889 82,889 82,889 82,889 82,889 82,889 Capacity(students) 814 814 814 814 814 814 Enrollment 628 627 611 609 616 590Fenwick E S Square Feet 57,449 57,449 57,449 57,449 57,449 57,449 Capacity(students) 528 528 528 528 528 528 Enrollment 398 397 384 358 380 372
Source: SAISD Facilities Planning and Construction Department and Research and Evaluation Department.* Building not in use. 133

2009 2010 2011 2012
53,464 53,464 53,464 53,464550 550 550 550490 519 471 497
100,036 100,036 100,036 100,036858 858 858 858535 567 675 713
72,341 72,341 72,341 72,341748 748 748 748510 603 622 617
62,735 62,735 62,735 62,735704 704 704 704547 628 618 604
46,747 46,747 46,747 46,747484 484 484 484370 377 346 413
81,438 81,438 81,438 81,438814 814 814 814680 631 638 635
70,327 70,327 70,327 70,327550 550 550 550439 432 404 429
104,945 104,945 104,945 104,945990 990 990 990879 855 814 842
73,692 73,692 73,692 73,692506 506 506 506411 407 408 403
82,889 82,889 82,889 82,889814 814 814 814553 555 579 576
57,449 57,449 57,449 57,449528 528 528 528389 412 399 389
134

2003 2004 2005 2006 2007 2008
SAN ANTONIO INDEPENDENT SCHOOL DISTRICTSCHEDULE OF SCHOOL BUILDINGS
LAST TEN YEARS
(Unaudited)
Forbes E S Square Feet 56,794 56,794 56,794 56,794 56,794 56,794 Capacity(students) 440 440 440 440 440 440 Enrollment 363 369 389 404 385 365Foster E S Square Feet 67,406 67,406 67,406 67,406 67,406 67,406 Capacity(students) 748 748 748 748 748 748 Enrollment 588 648 600 618 602 599Franklin E S Square Feet 71,677 71,677 71,677 71,677 71,677 71,677 Capacity(students) 594 594 594 594 594 594 Enrollment 488 533 547 542 559 555Gates E S Square Feet 78,346 78,346 78,346 78,346 78,346 78,346 Capacity(students) 682 682 682 682 682 682 Enrollment 471 470 331 329 361 372Graebner E S Square Feet 81,255 81,255 81,255 81,255 81,255 81,255 Capacity(students) 990 990 990 990 990 990 Enrollment 817 874 875 939 892 911Green E S Square Feet 56,301 56,301 56,301 56,301 56,301 56,301 Capacity(students) 374 374 374 374 374 374 Enrollment 308 315 277 294 292 327Herff E S Square Feet 67,284 67,284 67,284 67,284 67,284 67,284 Capacity(students) 594 594 594 594 594 594 Enrollment 502 527 507 565 546 532Highland Hills E S Square Feet 74,533 74,533 74,533 74,533 74,533 74,533 Capacity(students) 880 880 880 880 880 880 Enrollment 735 712 706 762 803 779Highland Park E S Square Feet 79,642 79,642 79,642 79,642 79,642 79,642 Capacity(students) 726 726 726 726 726 726 Enrollment 617 586 606 664 670 679Hillcrest E S Square Feet 70,566 70,566 70,566 70,566 70,566 70,566 Capacity(students) 704 704 704 704 704 704 Enrollment 542 506 499 530 549 500Hirsch E S Square Feet 62,574 62,574 62,574 62,574 62,574 62,574 Capacity(students) 616 616 616 616 616 616 Enrollment 439 405 435 419 410 395
Source: SAISD Facilities Planning and Construction Department and Research and Evaluation Department.* Building not in use. 135
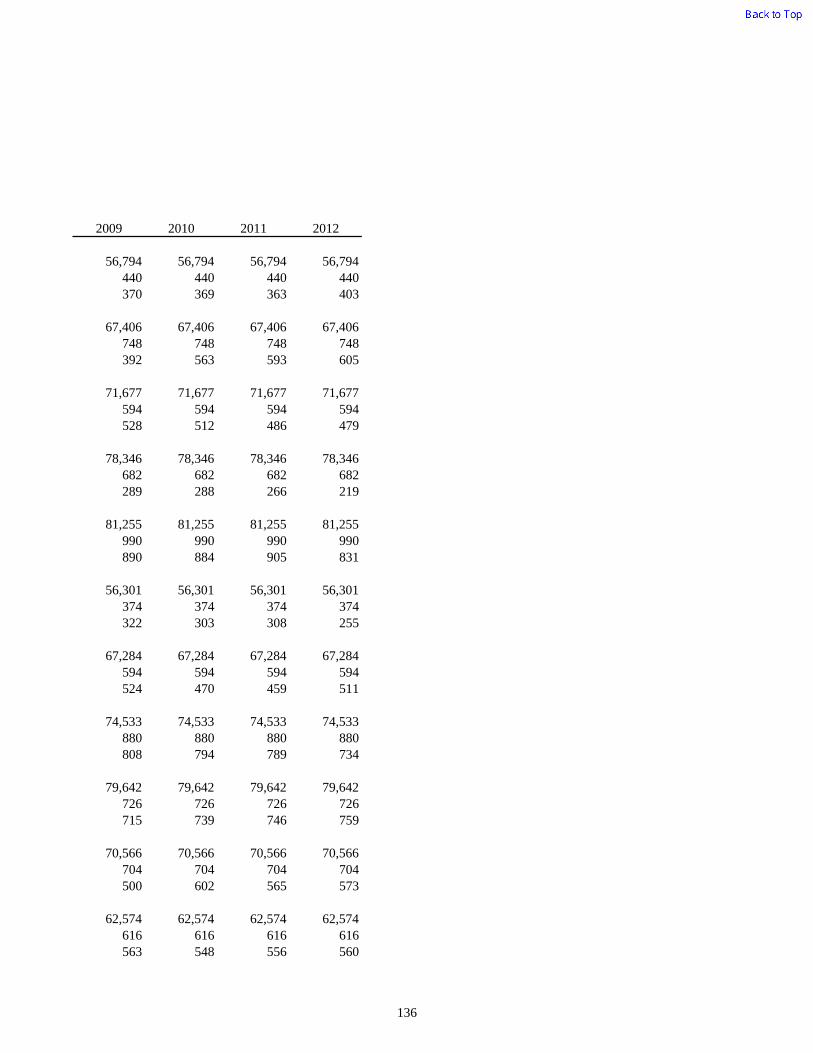
2009 2010 2011 2012
56,794 56,794 56,794 56,794440 440 440 440370 369 363 403
67,406 67,406 67,406 67,406748 748 748 748392 563 593 605
71,677 71,677 71,677 71,677594 594 594 594528 512 486 479
78,346 78,346 78,346 78,346682 682 682 682289 288 266 219
81,255 81,255 81,255 81,255990 990 990 990890 884 905 831
56,301 56,301 56,301 56,301374 374 374 374322 303 308 255
67,284 67,284 67,284 67,284594 594 594 594524 470 459 511
74,533 74,533 74,533 74,533880 880 880 880808 794 789 734
79,642 79,642 79,642 79,642726 726 726 726715 739 746 759
70,566 70,566 70,566 70,566704 704 704 704500 602 565 573
62,574 62,574 62,574 62,574616 616 616 616563 548 556 560
136
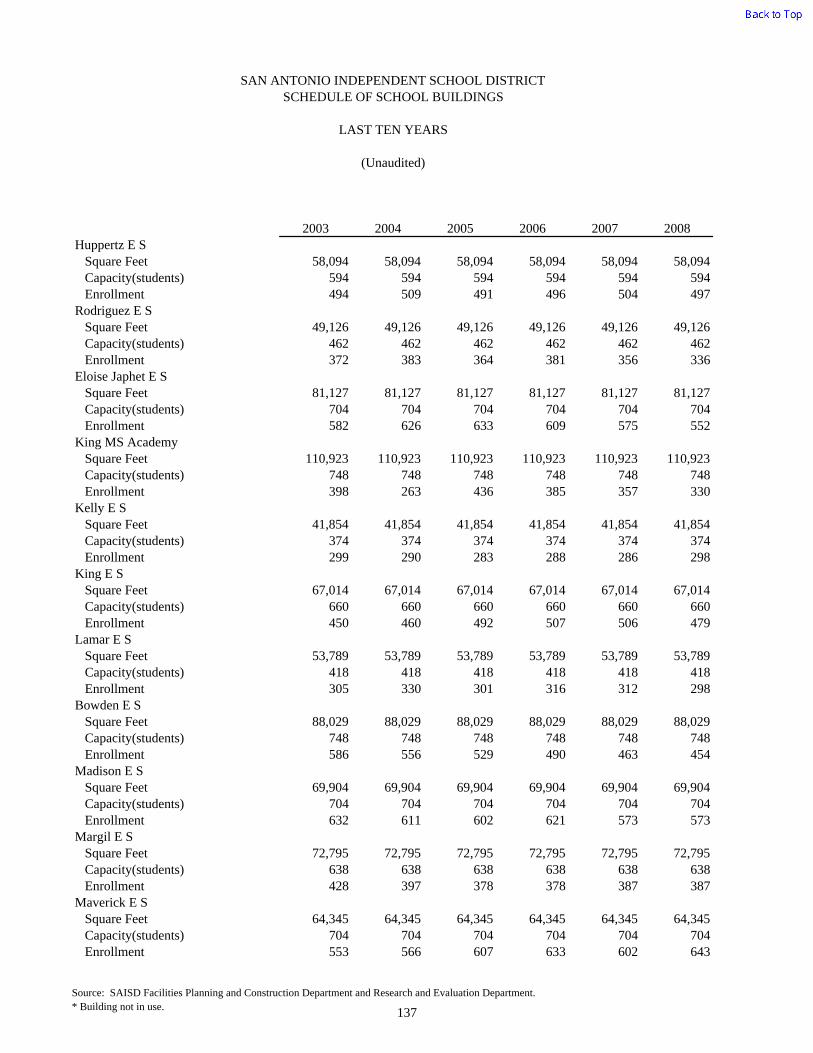
2003 2004 2005 2006 2007 2008
SAN ANTONIO INDEPENDENT SCHOOL DISTRICTSCHEDULE OF SCHOOL BUILDINGS
LAST TEN YEARS
(Unaudited)
Huppertz E S Square Feet 58,094 58,094 58,094 58,094 58,094 58,094 Capacity(students) 594 594 594 594 594 594 Enrollment 494 509 491 496 504 497Rodriguez E S Square Feet 49,126 49,126 49,126 49,126 49,126 49,126 Capacity(students) 462 462 462 462 462 462 Enrollment 372 383 364 381 356 336Eloise Japhet E S Square Feet 81,127 81,127 81,127 81,127 81,127 81,127 Capacity(students) 704 704 704 704 704 704 Enrollment 582 626 633 609 575 552King MS Academy Square Feet 110,923 110,923 110,923 110,923 110,923 110,923 Capacity(students) 748 748 748 748 748 748 Enrollment 398 263 436 385 357 330Kelly E S Square Feet 41,854 41,854 41,854 41,854 41,854 41,854 Capacity(students) 374 374 374 374 374 374 Enrollment 299 290 283 288 286 298King E S Square Feet 67,014 67,014 67,014 67,014 67,014 67,014 Capacity(students) 660 660 660 660 660 660 Enrollment 450 460 492 507 506 479Lamar E S Square Feet 53,789 53,789 53,789 53,789 53,789 53,789 Capacity(students) 418 418 418 418 418 418 Enrollment 305 330 301 316 312 298Bowden E S Square Feet 88,029 88,029 88,029 88,029 88,029 88,029 Capacity(students) 748 748 748 748 748 748 Enrollment 586 556 529 490 463 454Madison E S Square Feet 69,904 69,904 69,904 69,904 69,904 69,904 Capacity(students) 704 704 704 704 704 704 Enrollment 632 611 602 621 573 573Margil E S Square Feet 72,795 72,795 72,795 72,795 72,795 72,795 Capacity(students) 638 638 638 638 638 638 Enrollment 428 397 378 378 387 387Maverick E S Square Feet 64,345 64,345 64,345 64,345 64,345 64,345 Capacity(students) 704 704 704 704 704 704 Enrollment 553 566 607 633 602 643
Source: SAISD Facilities Planning and Construction Department and Research and Evaluation Department.* Building not in use. 137

2009 2010 2011 2012
58,094 58,094 58,094 58,094594 594 594 594494 475 455 350
49,126 49,126 49,126 49,126462 462 462 462351 391 408 392
81,127 81,127 81,127 81,127704 704 704 704540 497 506 513
110,923 110,923 110,923 110,923748 748 748 748539 451 476 507
41,854 41,854 41,854 41,854374 374 374 374279 279 286 266
67,014 67,014 67,014 67,014660 660 660 660480 491 488 461
53,789 53,789 53,789 53,789418 418 418 418256 264 260 235
88,029 88,029 88,029 88,029748 748 748 748468 493 534 536
69,904 69,904 69,904 69,904704 704 704 704552 601 617 624
72,795 72,795 72,795 72,795638 638 638 638561 553 601 545
64,345 64,345 64,345 64,345704 704 704 704665 660 676 652
138
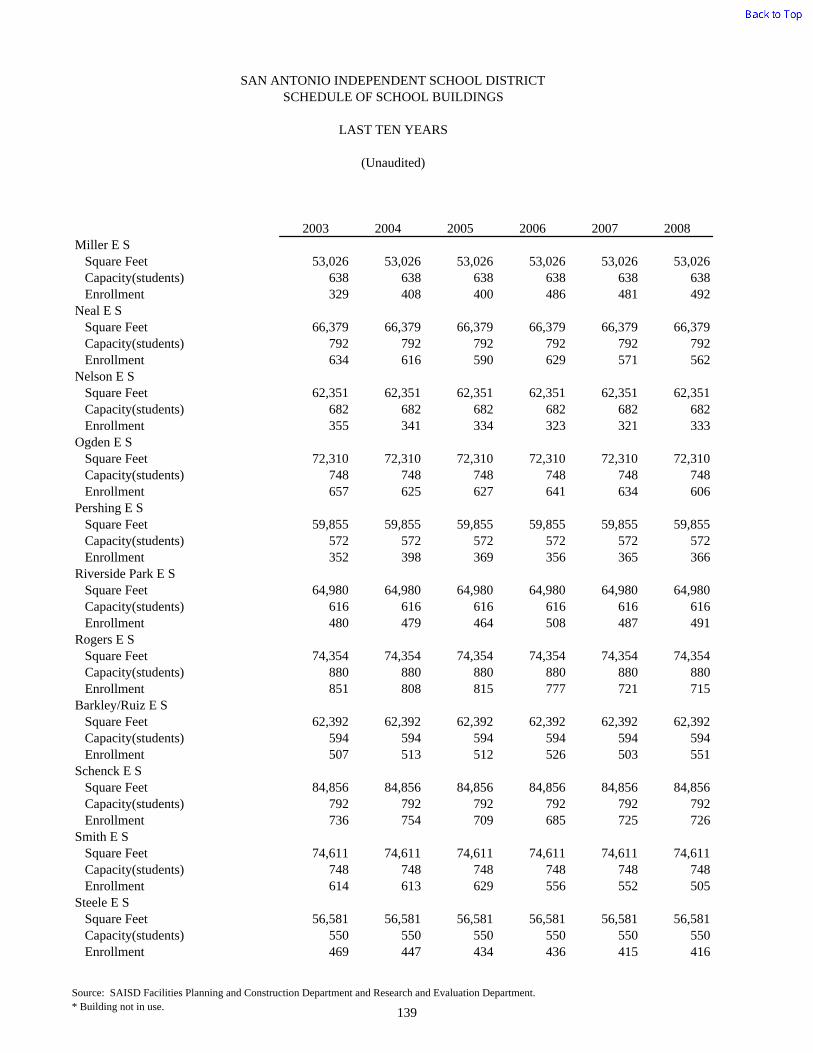
2003 2004 2005 2006 2007 2008
SAN ANTONIO INDEPENDENT SCHOOL DISTRICTSCHEDULE OF SCHOOL BUILDINGS
LAST TEN YEARS
(Unaudited)
Miller E S Square Feet 53,026 53,026 53,026 53,026 53,026 53,026 Capacity(students) 638 638 638 638 638 638 Enrollment 329 408 400 486 481 492Neal E S Square Feet 66,379 66,379 66,379 66,379 66,379 66,379 Capacity(students) 792 792 792 792 792 792 Enrollment 634 616 590 629 571 562Nelson E S Square Feet 62,351 62,351 62,351 62,351 62,351 62,351 Capacity(students) 682 682 682 682 682 682 Enrollment 355 341 334 323 321 333Ogden E S Square Feet 72,310 72,310 72,310 72,310 72,310 72,310 Capacity(students) 748 748 748 748 748 748 Enrollment 657 625 627 641 634 606Pershing E S Square Feet 59,855 59,855 59,855 59,855 59,855 59,855 Capacity(students) 572 572 572 572 572 572 Enrollment 352 398 369 356 365 366Riverside Park E S Square Feet 64,980 64,980 64,980 64,980 64,980 64,980 Capacity(students) 616 616 616 616 616 616 Enrollment 480 479 464 508 487 491Rogers E S Square Feet 74,354 74,354 74,354 74,354 74,354 74,354 Capacity(students) 880 880 880 880 880 880 Enrollment 851 808 815 777 721 715Barkley/Ruiz E S Square Feet 62,392 62,392 62,392 62,392 62,392 62,392 Capacity(students) 594 594 594 594 594 594 Enrollment 507 513 512 526 503 551Schenck E S Square Feet 84,856 84,856 84,856 84,856 84,856 84,856 Capacity(students) 792 792 792 792 792 792 Enrollment 736 754 709 685 725 726Smith E S Square Feet 74,611 74,611 74,611 74,611 74,611 74,611 Capacity(students) 748 748 748 748 748 748 Enrollment 614 613 629 556 552 505Steele E S Square Feet 56,581 56,581 56,581 56,581 56,581 56,581 Capacity(students) 550 550 550 550 550 550 Enrollment 469 447 434 436 415 416
Source: SAISD Facilities Planning and Construction Department and Research and Evaluation Department.* Building not in use. 139
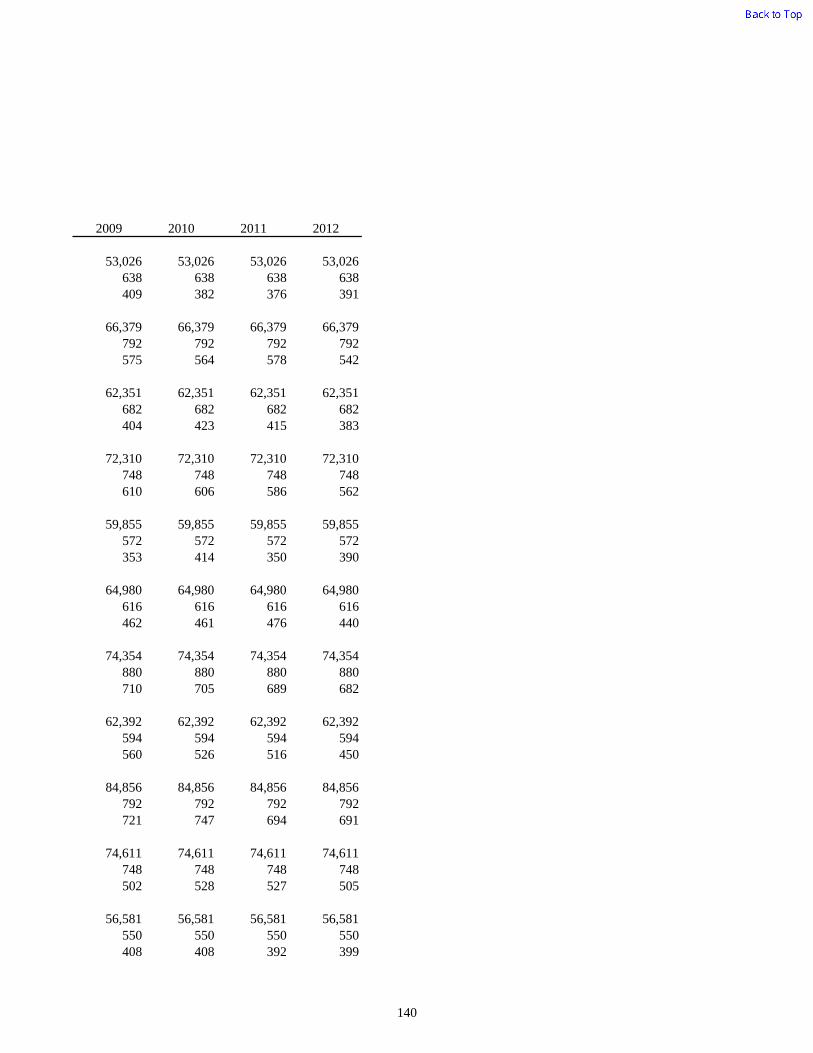
2009 2010 2011 2012
53,026 53,026 53,026 53,026638 638 638 638409 382 376 391
66,379 66,379 66,379 66,379792 792 792 792575 564 578 542
62,351 62,351 62,351 62,351682 682 682 682404 423 415 383
72,310 72,310 72,310 72,310748 748 748 748610 606 586 562
59,855 59,855 59,855 59,855572 572 572 572353 414 350 390
64,980 64,980 64,980 64,980616 616 616 616462 461 476 440
74,354 74,354 74,354 74,354880 880 880 880710 705 689 682
62,392 62,392 62,392 62,392594 594 594 594560 526 516 450
84,856 84,856 84,856 84,856792 792 792 792721 747 694 691
74,611 74,611 74,611 74,611748 748 748 748502 528 527 505
56,581 56,581 56,581 56,581550 550 550 550408 408 392 399
140
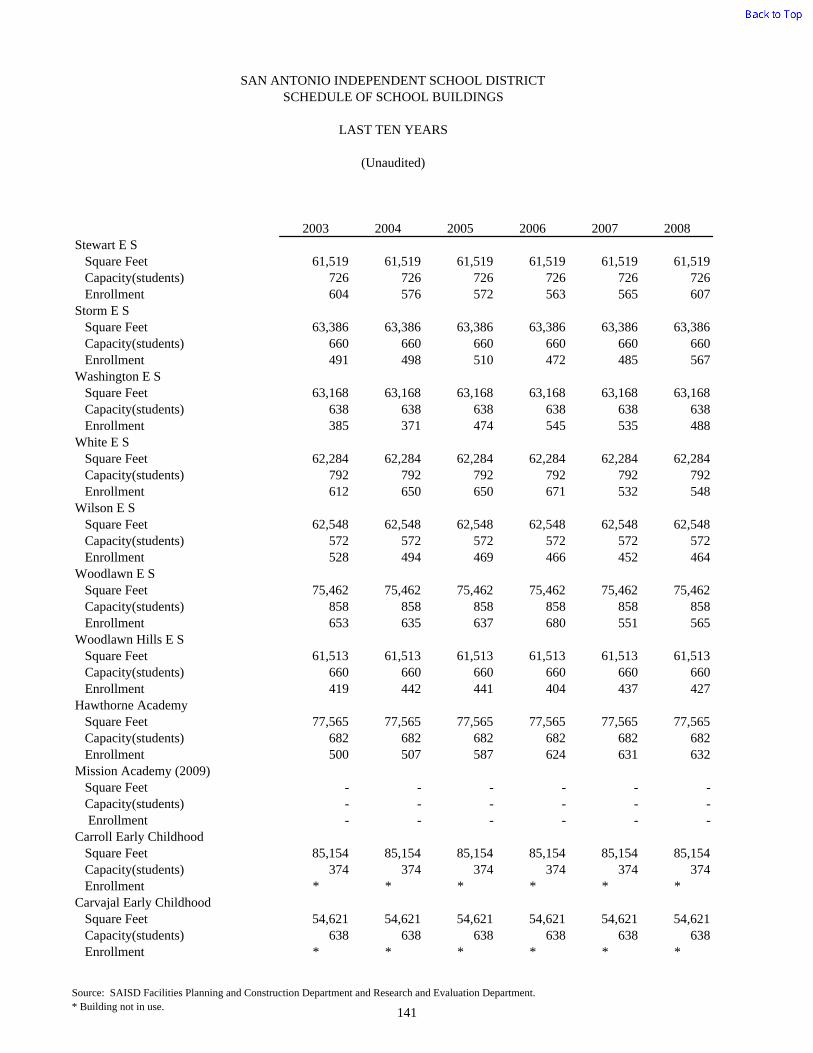
2003 2004 2005 2006 2007 2008
SAN ANTONIO INDEPENDENT SCHOOL DISTRICTSCHEDULE OF SCHOOL BUILDINGS
LAST TEN YEARS
(Unaudited)
Stewart E S Square Feet 61,519 61,519 61,519 61,519 61,519 61,519 Capacity(students) 726 726 726 726 726 726 Enrollment 604 576 572 563 565 607Storm E S Square Feet 63,386 63,386 63,386 63,386 63,386 63,386 Capacity(students) 660 660 660 660 660 660 Enrollment 491 498 510 472 485 567Washington E S Square Feet 63,168 63,168 63,168 63,168 63,168 63,168 Capacity(students) 638 638 638 638 638 638 Enrollment 385 371 474 545 535 488White E S Square Feet 62,284 62,284 62,284 62,284 62,284 62,284 Capacity(students) 792 792 792 792 792 792 Enrollment 612 650 650 671 532 548Wilson E S Square Feet 62,548 62,548 62,548 62,548 62,548 62,548 Capacity(students) 572 572 572 572 572 572 Enrollment 528 494 469 466 452 464Woodlawn E S Square Feet 75,462 75,462 75,462 75,462 75,462 75,462 Capacity(students) 858 858 858 858 858 858 Enrollment 653 635 637 680 551 565Woodlawn Hills E S Square Feet 61,513 61,513 61,513 61,513 61,513 61,513 Capacity(students) 660 660 660 660 660 660 Enrollment 419 442 441 404 437 427Hawthorne Academy Square Feet 77,565 77,565 77,565 77,565 77,565 77,565 Capacity(students) 682 682 682 682 682 682 Enrollment 500 507 587 624 631 632Mission Academy (2009) Square Feet - - - - - - Capacity(students) - - - - - - Enrollment - - - - - -Carroll Early Childhood Square Feet 85,154 85,154 85,154 85,154 85,154 85,154 Capacity(students) 374 374 374 374 374 374 Enrollment * * * * * *Carvajal Early Childhood Square Feet 54,621 54,621 54,621 54,621 54,621 54,621 Capacity(students) 638 638 638 638 638 638 Enrollment * * * * * *
Source: SAISD Facilities Planning and Construction Department and Research and Evaluation Department.* Building not in use. 141

2009 2010 2011 2012
61,519 61,519 61,519 61,519726 726 726 726578 570 557 504
63,386 63,386 63,386 63,386660 660 660 660500 521 495 489
63,168 63,168 63,168 63,168638 638 638 638494 499 538 546
62,284 62,284 62,284 62,284792 792 792 792630 601 560 560
62,548 62,548 62,548 62,548572 572 572 572469 480 507 483
75,462 75,462 75,462 75,462858 858 858 858566 621 640 627
61,513 61,513 61,513 61,513660 660 660 660428 425 418 487
77,565 77,565 77,565 77,565682 682 682 682691 694 714 713
140,396 140,396 140,396 140,396814 814 814 814426 571 657 690
85,154 85,154 85,154 85,154374 374 374 374
* 291 294 396
54,621 54,621 54,621 54,621638 638 638 638
* 471 442 426
142
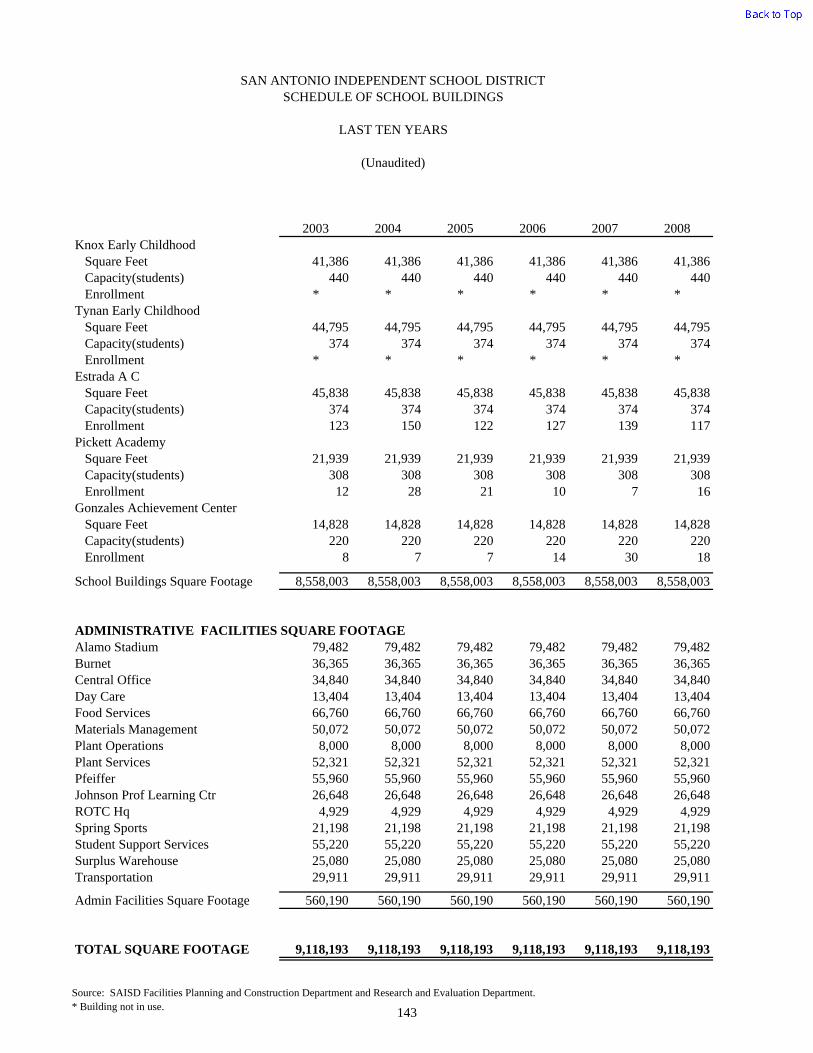
2003 2004 2005 2006 2007 2008
SAN ANTONIO INDEPENDENT SCHOOL DISTRICTSCHEDULE OF SCHOOL BUILDINGS
LAST TEN YEARS
(Unaudited)
Knox Early Childhood Square Feet 41,386 41,386 41,386 41,386 41,386 41,386 Capacity(students) 440 440 440 440 440 440 Enrollment * * * * * *Tynan Early Childhood Square Feet 44,795 44,795 44,795 44,795 44,795 44,795 Capacity(students) 374 374 374 374 374 374 Enrollment * * * * * *Estrada A C Square Feet 45,838 45,838 45,838 45,838 45,838 45,838 Capacity(students) 374 374 374 374 374 374 Enrollment 123 150 122 127 139 117Pickett Academy Square Feet 21,939 21,939 21,939 21,939 21,939 21,939 Capacity(students) 308 308 308 308 308 308 Enrollment 12 28 21 10 7 16Gonzales Achievement Center Square Feet 14,828 14,828 14,828 14,828 14,828 14,828 Capacity(students) 220 220 220 220 220 220 Enrollment 8 7 7 14 30 18
School Buildings Square Footage 8,558,003 8,558,003 8,558,003 8,558,003 8,558,003 8,558,003
ADMINISTRATIVE FACILITIES SQUARE FOOTAGEAlamo Stadium 79,482 79,482 79,482 79,482 79,482 79,482Burnet 36,365 36,365 36,365 36,365 36,365 36,365Central Office 34,840 34,840 34,840 34,840 34,840 34,840Day Care 13,404 13,404 13,404 13,404 13,404 13,404Food Services 66,760 66,760 66,760 66,760 66,760 66,760Materials Management 50,072 50,072 50,072 50,072 50,072 50,072Plant Operations 8,000 8,000 8,000 8,000 8,000 8,000Plant Services 52,321 52,321 52,321 52,321 52,321 52,321Pfeiffer 55,960 55,960 55,960 55,960 55,960 55,960Johnson Prof Learning Ctr 26,648 26,648 26,648 26,648 26,648 26,648ROTC Hq 4,929 4,929 4,929 4,929 4,929 4,929Spring Sports 21,198 21,198 21,198 21,198 21,198 21,198Student Support Services 55,220 55,220 55,220 55,220 55,220 55,220Surplus Warehouse 25,080 25,080 25,080 25,080 25,080 25,080Transportation 29,911 29,911 29,911 29,911 29,911 29,911
Admin Facilities Square Footage 560,190 560,190 560,190 560,190 560,190 560,190
TOTAL SQUARE FOOTAGE 9,118,193 9,118,193 9,118,193 9,118,193 9,118,193 9,118,193
Source: SAISD Facilities Planning and Construction Department and Research and Evaluation Department.* Building not in use. 143

2009 2010 2011 2012
41,386 41,386 41,386 41,386440 440 440 440
* 269 278 287
44,795 44,795 44,795 44,795374 374 374 374
* 284 256 242
45,838 45,838 45,838 45,838374 374 374 374
* * * *
21,939 21,939 21,939 21,939308 308 308 308
36 34 31 29
14,828 14,828 14,828 14,828220 220 220 220
19 15 11 *
8,955,388 8,955,388 8,955,388 8,955,388
79,482 79,482 79,482 79,48236,365 36,365 36,365 36,36534,840 34,840 34,840 34,84013,404 13,404 13,404 13,40466,760 66,760 66,760 66,76050,072 50,072 50,072 50,072
8,000 8,000 8,000 8,00052,321 52,321 52,321 52,32155,960 55,960 55,960 55,96026,648 26,648 26,648 26,648
4,929 4,929 4,929 4,92921,198 21,198 21,198 21,19855,220 55,220 55,220 55,22025,080 25,080 25,080 25,08029,911 29,911 29,911 29,911
560,190 560,190 560,190 560,190
9,515,578 9,515,578 9,515,578 9,515,578
144

145
SAN ANTONIO INDEPENDENT SCHOOL DISTRICT
MISCELLANEOUS STATISTICS
(Unaudited)
The San Antonio Independent School District has, as a part of its efforts to serve all of its students, expanded its educational system off campus to serve specific student needs. Some off campus educational programs are staffed with District teachers and teacher assistants. As of June 30, 2012, it included such programs as follows: Bexar County Juvenile Detention Center – The site detains juvenile offenders who are waiting to be adjudicated. Children’s Shelter of San Antonio – The site receives children (infant to 11 yrs old) who have been removed from their homes because they have been abused and/or neglected. The Shelter has the responsibility of finding foster families or families who wish to adopt them. Christus Santa Rosa Children’s Hospital - The site provides special education and general education services to all school age children who are admitted to the hospital for at least four (4) consecutive weeks or four weeks over the school year. Estrada & Gonzales Achievement DAEP Centers – Special campuses of the District that are created to provide a safe, consistent climate within a structured program to empower students with severe behavior problems to develop the skills necessary to function successfully on a regular campus. Healy Murphy Center – The site is a private, non-profit fully accredited high school, grades 9 to 12. Students choose to attend based on their need for personal academic attention and remediation in order to complete TEA requirements for graduation. Healy Murphy Pre-K – The site is a private, non-profit fully accredited preschool for students ages 3 and 4. Most of these children belong to students attending Healy Murphy High School. There are two classrooms with approximately 20 students in each class. These students attend all day classes throughout the year. Roy Maas Youth Alternative – The Bridge – The site receives children who are placed by choice (9 to 18 yr. Olds), by local, state, and family referrals. Youth receive behavioral readjustment and social skills training. Seton Home for Girls – Located within the District and receive Title 1, Part A funding to support tutoring and academic remedial efforts for children who are in residence. Girls choose to be placed because they are homeless and/or have children. Seidel Learning Center – The site provides educational services to special education and general education students residing temporarily at the San Antonio State Hospital. St. Peter, St. Joseph’s Home for Children – Located within the District and receive Title 1, Part A funding to support tutoring and academic remedial efforts for children who are in residence. Children, who are placed here following their stay at the Children’s Shelter, are allowed longer residential care until foster families are found, or until they are adopted.
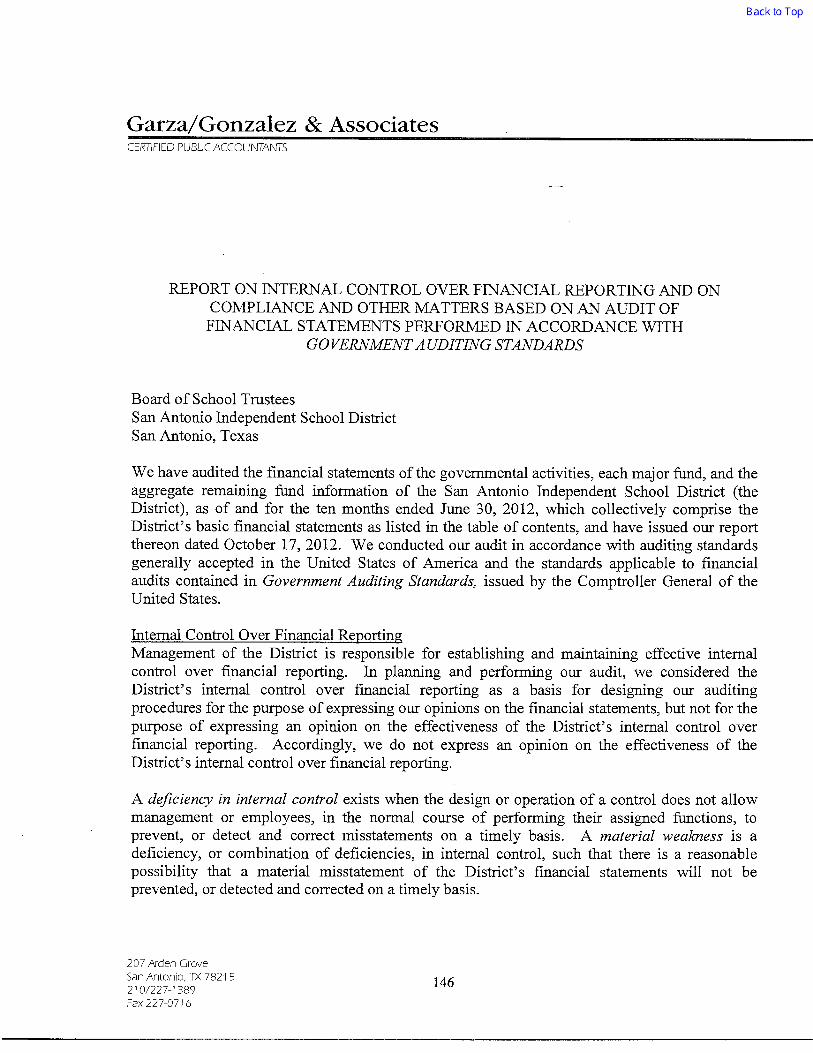

THIS PAGE LEFT BLANK INTENTIONALLY


THIS PAGE LEFT BLANK INTENTIONALLY

THIS PAGE LEFT BLANK INTENTIONALLY

THIS PAGE LEFT BLANK INTENTIONALLY
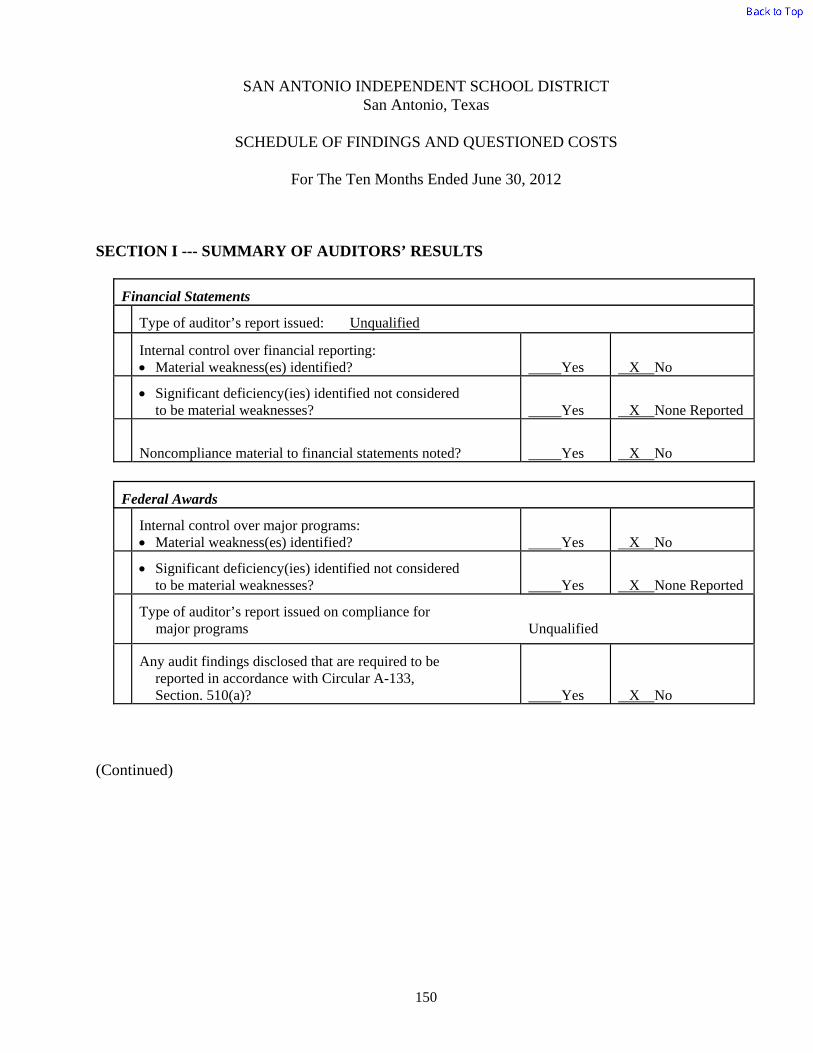
SAN ANTONIO INDEPENDENT SCHOOL DISTRICT San Antonio, Texas
SCHEDULE OF FINDINGS AND QUESTIONED COSTS
For The Ten Months Ended June 30, 2012
150
SECTION I --- SUMMARY OF AUDITORS’ RESULTS
Financial Statements
Type of auditor’s report issued: Unqualified
Internal control over financial reporting: Material weakness(es) identified?
Yes
X No
Significant deficiency(ies) identified not considered
to be material weaknesses? Yes
X None Reported
Noncompliance material to financial statements noted?
Yes
X No
Federal Awards
Internal control over major programs: Material weakness(es) identified?
Yes
X No
Significant deficiency(ies) identified not considered
to be material weaknesses? Yes
X None Reported
Type of auditor’s report issued on compliance for
major programs Unqualified
Any audit findings disclosed that are required to be
reported in accordance with Circular A-133, Section. 510(a)?
Yes
X No
(Continued)

SAN ANTONIO INDEPENDENT SCHOOL DISTRICT San Antonio, Texas
SCHEDULE OF FINDINGS AND QUESTIONED COSTS
For The Ten Months Ended June 30, 2012
151
SECTION I --- SUMMARY OF AUDITORS’ RESULTS (Continued)
Identification of Major Programs
CFDA Numbers(s)
Name of Federal Program or Cluster
84.367 Title II, Part A – Teacher & Principal Training
84.410 Education Jobs Fund
84.377 84.388
School Improvement Grant Cluster: Texas Title I, Priority Schools Grant ARRA – Texas Title I, Priority Schools Grant
93.600 Headstart
81.041 State Energy Program (Texas Cool Schools Grant)
Dollar threshold used to distinguish between Type A and Type
B programs: $3,539,766
Auditee qualified as low-risk auditee?
X Yes No
SECTION II --- FINANCIAL STATEMENT FINDINGS There were no financial statement findings required to be reported in accordance with Government Auditing Standards. SECTION III --- FEDERAL AWARD FINDINGS AND QUESTIONED COSTS There were no federal award findings and questioned costs required to be reported by OMB Circular A-133, Section .510(a).

SAN ANTONIO INDEPENDENT SCHOOL DISTRICT San Antonio, Texas
SUMMARY SCHEDULE OF PRIOR AUDIT FINDINGS
For The Ten Months Ended June 30, 2012
152
There were no prior audit findings reported.

(A)
ExpendituresFederal Grantor/ Federal Indirect Costs
Pass - Through Grantor/ CFDA or Award Project Number Program Title Number Amount
U.S. DEPARTMENT OF EDUCATION DIRECT PROGRAMS
N/A 199 IMPACT AID PL874 84.041 35,716$ SUBTOTAL 35,716
Q215F110383 289.2 CAROL WHITE PEP GRANT/PE3: MIND, BODY & SPIRIT 84.215F 590,269 SUBTOTAL 590,269
U215X080081-11 281.2 TEACHING AMERICAN HISTORY GRANT -YR 4 OF 5 84.215X 344,468 SUBTOTAL 344,468
P334A050145-10 274.1 SAISD GEAR UP PROJECT -YR 6 OF 6 84.334A 782,046P334A110128 274.2 SAISD GEAR UP PROJECT -YR 1 OF 7 84.334A 1,388,311
SUBTOTAL 2,170,357
S360A100121 275.1 REACH, AIM & SOAR - YR 1 OF 5 84.360A 377,173S360A100121-11 275.2 REACH, AIM & SOAR - YR 2 OF 5 84.360A 2,175,974
SUBTOTAL 2,553,147
U396A100050 276.2 SUCCESS FOR ALL FOUNDATION (SFSF)-INVESTING IN INNOVATION SCALE UP 84.396A 86,908
SUBTOTAL 86,908
TOTAL U.S. DEPARTMENT OF EDUCATION - DIRECT PROGRAMS 5,780,865
PASSED THROUGH STATE DEPARTMENT OF EDUCATION
124100017110411 220.2 ADULT EDUCATION and FAMILY LITERACY- CONTINUATION 84.002A 1,327,743124100087110440 221.2 ADULT EDUCATION-ENGLISH LITERACY & CIVICS AWARENESS CONT. 84.002A 120,062
SUBTOTAL 1,447,805
11610101015907 211.1 TITLE I, PART A - IMPROVING BASIC PROGRAMS* 84.010A 1,244,35812610101015907 211.2 TITLE I, PART A - IMPROVING BASIC PROGRAMS* 84.010A 26,870,53111610103015907 215.1 TITLE I, PART D- SUBPT 2 -DELINQUENT PROGRAMS* 84.010A 12,53712610103015907 215.2 TITLE I, PART D- SUBPT 2 -DELINQUENT PROGRAMS* 84.010A 261,97312610104015907001 245.2 TITLE I - SCHOOL IMPROVEMENT PROGRAM - BRACKENRIDGE HS* 84.010A 87,45511610104015907046 246.1 TITLE I - SCHOOL IMPROVEMENT PROGRAM - WHEATLEY MS* 84.010A 20412610104015907046 246.2 TITLE I - SCHOOL IMPROVEMENT PROGRAM - WHEATLEY MS* 84.010A 82,47612610104015907058 247.2 TITLE I - SCHOOL IMPROVEMENT PROGRAM - TWAIN MS* 84.010A 48,30112610104015907043 248.2 TITLE I - SCHOOL IMPROVEMENT PROGRAM - DAVIS MS* 84.010A 50,92611610104015907006 249.1 TITLE I - SCHOOL IMPROVEMENT PROGRAM - HOUSTON HS* 84.010A 4,34912610104015907006 249.2 TITLE I - SCHOOL IMPROVEMENT PROGRAM - HOUSTON HS* 84.010A 102,06312610104015907055 250.2 TITLE I - SCHOOL IMPROVEMENT PROGRAM - RHODES MS* 84.010A 52,23112610104015907057 251.2 TITLE I - SCHOOL IMPROVEMENT PROGRAM - ROGERS MS* 84.010A 30,21512610104015907061 252.2 TITLE I - SCHOOL IMPROVEMENT PROGRAM - TAFOLLA MS* 84.010A 74,62412610104015907053 253.2 TITLE I - SCHOOL IMPROVEMENT PROGRAM - PAGE MS* 84.010A 64,66012610104015907014 259.2 TITLE I - SCHOOL IMPROVEMENT PROGRAM - NAVARRO ACADEMY* 84.010A 66,96312610104015907059 260.2 TITLE I - SCHOOL IMPROVEMENT PROGRAM - WHITTIER HS* 84.010A 5,23912610104015907007 261.2 TITLE I - SCHOOL IMPROVEMENT PROGRAM - JEFFERSON HS* 84.010A 7,373
SUBTOTAL 29,066,478
11615001015907 212.1 TITLE I, PART C, MIGRANT 84.011A 10,29812615001015907 212.2 TITLE I, PART C, MIGRANT 84.011A 140,431
SUBTOTAL 150,729
SAN ANTONIO INDEPENDENT SCHOOL DISTRICTSCHEDULE OF EXPENDITURES OF FEDERAL AWARDS
FOR THE TEN MONTHS ENDED JUNE 30, 2012
153
EXHIBIT K-1 (Continued)

SAN ANTONIO INDEPENDENT SCHOOL DISTRICTSCHEDULE OF EXPENDITURES OF FEDERAL AWARDS
FOR THE TEN MONTHS ENDED JUNE 30, 2012
1066002271220 168.2 IDEA B- DISCRETIONARY - (RF TRACKER) 84.027A 5,829116600010159076600 224.1 IDEA-B FORMULA 84.027A (157,064)126600010159076600 224.2 IDEA-B FORMULA 84.027A 13,117,16312660006015907 227.2 IDEA-B HIGH COST RISK POOL 84.027A 85,129
SUBTOTAL 13,051,057
12420006015907 244.2 CARL D PERKINS BASIC GRANT FORMULA 84.048A 995,358 SUBTOTAL 995,358
116610010159076010 225.1 IDEA-B PRESCHOOL 84.173A 637126610010159076610 225.2 IDEA-B PRESCHOOL 84.173A 178,929
SUBTOTAL 179,566
115900207110007 267.1 TTL V B SP1 CAMPUS CHRTR 11-12 RHODES MS 84.282A 246,336115900207110006 268.1 TTL V B SP1 CAMPUS CHRTR 11-12 HIGHLAND PARK ES 84.282A 256,218115900207110008 269.1 TTL V B SP1 CAMPUS CHRTR 11-12 TRAVIS EARLY COLLEGE HS 84.282A 335,910
SUBTOTAL 838,464
11671001015907 263.1 TITLE III, PART A - LEP 84.365A 2,89612671001015907 263.2 TITLE III, PART A - LEP 84.365A 818,585
SUBTOTAL 821,481
116944057110009 273.1 TTL II B-SEC MATH TCHR SUPPORT 84.366B 71,169 SUBTOTAL 71,169
11694501015907 255.1 TITLE II PART A-TEACHER & PRINCIPAL TRAINING & RECRUITING 84.367A 173,46012694501015907 255.2 TITLE II PART A-TEACHER & PRINCIPAL TRAINING & RECRUITING 84.367A 3,972,910
SUBTOTAL 4,146,370
69551102 163.2 SUMMER SCHOOL LEP 84.369A 41,062 SUBTOTAL 41,062
126460037110023 290.2 TEXAS LITERACY INIT. (STR RDRS) 84.371C 237,086 SUBTOTAL 237,086
106107067110009 280.1 TEXAS TTL I PRIORITY SCHOOL GRANTS - NAVARRO ACADEMY* 84.377A 626,350116107047110037 282.1 TEXAS TTL I PRIORITY SCHOOL GRANTS - DAVIS MS* 84.377A 1,152,761
SUBTOTAL 1,779,111
10553001015907 279.0 ARRA--TITLE II, PART D TECHNOLOGY 84.386A 28,346 SUBTOTAL 28,346
105520017110056 287.1 (TTIPS)-TX TITLE I, PRIORITY SCHOOLS GRANT-ARRA-FOX TECH* 84.388A 1,182,596105520017110057 288.1 (TTIPS)-TX TITLE I, PRIORITY SCHOOLS GRANT-ARRA-SAM HOUSTON* 84.388A 959,517
SUBTOTAL 2,142,113
10551001015907 285.0 ARRA - TITLE I, PART A - IMPROVING BASIC PROGRAMS* 84.389A 110551003015907 286.0 ARRA - TITLE I, PART D- SUBPT 2 -DELINQUENT PROGRAMS* 84.389A 13,80211551004015907004 301.1 ARRA - TITLE I - SCHOOL IMPROVEMENT PROGRAM - FOX TECH HS* 84.389A 1,012
SUBTOTAL 14,815
11557001015907 266.1 ARRA- TITLE XIV, STATE FISCAL STABILIZATION FUND 84.394A 263,872 SUBTOTAL 263,872
11550101015907 286.1 EDUCATION JOBS FUND 84.410A 9,456,384 SUBTOTAL 9,456,384
123625017110386 223.2 TEMPORARY ASSISTANCE FOR NEEDY FAMILIES 93.558 153,747 SUBTOTAL 153,747
TOTAL PASSED THROUGH STATE DEPARTMENT OF EDUCATION 64,885,013
154
EXHIBIT K-1 (Continued)

SAN ANTONIO INDEPENDENT SCHOOL DISTRICTSCHEDULE OF EXPENDITURES OF FEDERAL AWARDS
FOR THE TEN MONTHS ENDED JUNE 30, 2012
PASSED THROUGH REGION 1000-004 206.2 MCKINNEY-VENTO HOMELESS EDUCATION 84.196A 154,619
SUBTOTAL 154,619
TOTAL PASSED THROUGH REGION 10 154,619
PASSED THROUGH REGION 20315-634-202 226.2 IDEA B-DISCRETIONARY DEAF-SSA 84.027A 22,784 316-636-202 228.2 IDEA B-PRESCHOOL DEAF-SSA 84.173A 1,652
SUBTOTAL 24,436
TOTAL PASSED THROUGH REGION 20 24,436
TOTAL U.S. DEPARTMENT OF EDUCATION 70,844,933
U.S. DEPARTMENT OF AGRICULTUREPASSED THROUGH TEXAS DEPARTMENT OF AGRICULTURE
N/A 240 CHILD & ADULT CARE FOOD PROGRAM - CASH ASSISTANCE 10.558 298,834 N/A 240 FRESH FRUIT & VEGETABLE PROGRAM 10.582 704,062
SUBTOTAL 1,002,896
TOTAL PASSED THROUGH TEXAS DEPARTMENT OF AGRICULTURE 1,002,896
PASSED THROUGH STATE DEPARTMENT OF EDUCATIONN/A 240 SCHOOL BREAKFAST PROGRAM* 10.553 9,254,476 N/A 240 NATIONAL SCHOOL LUNCH PROGRAM - CASH ASSISTANCE* 10.555 20,839,718 N/A 240 NATIONAL SCHOOL LUNCH PROGRAM - NON-CASH ASSISTANCE* 10.555 1,800,212
SUBTOTAL 31,894,406
TOTAL PASSED THROUGH STATE DEPARTMENT OF EDUCATION 31,894,406
TOTAL U.S. DEPARTMENT OF AGRICULTURE 32,897,302
U.S. DEPARTMENT OF HEALTH AND HUMAN SERVICES
PASSED THROUGH TEXAS COMPTROLLER OF PUBLIC ACCOUNTSDE-EE-0000116 287.2 ARRA - THE TEXAS COOL SCHOOLS GRANT 81.041 1,619,442
SUBTOTAL 1,619,442
TOTAL PASSED THROUGH TEXAS COMPTROLLER OF PUBLIC ACCOUNTS 1,619,442
PASSED THROUGH CITY OF SAN ANTONIO - DEPARTMENT OF HUMAN SERVICES06CH0107/33 205.1 HEADSTART 93.600 5,633,980 06CH0107/34 205.2 HEADSTART 93.600 6,228,913
SUBTOTAL 11,862,893
TOTAL PASSED THROUGH CITY OF SAN ANTONIO - DEPARTMENT OF HUMAN SERVICES 11,862,893
PASSED THROUGH DEPARTMENT OF STATE HEALTH SERVICES2011-037129-001 487.1 COMMUNITIES PUTTING PREVENTION TO WORK 93.723 7,037
SUBTOTAL 7,037
TOTAL PASSED THROUGH DEPARTMENT OF STATE HEALTH SERVICES 7,037
155
EXHIBIT K-1 (Continued)
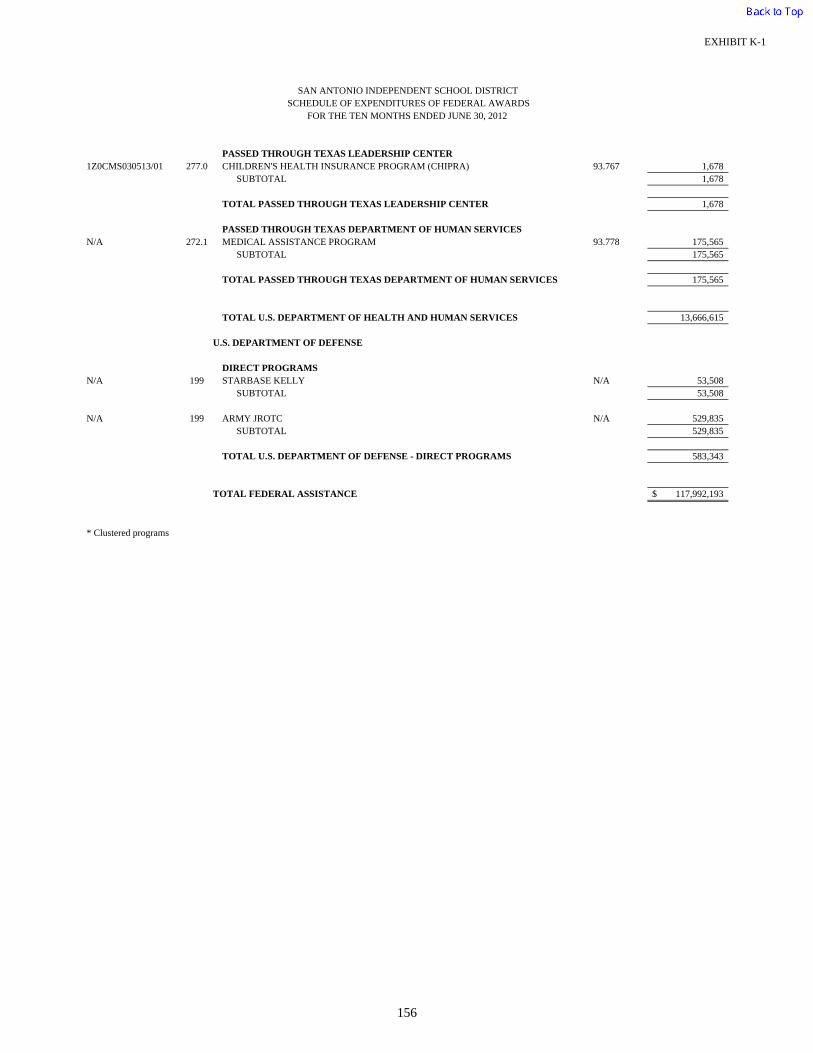
SAN ANTONIO INDEPENDENT SCHOOL DISTRICTSCHEDULE OF EXPENDITURES OF FEDERAL AWARDS
FOR THE TEN MONTHS ENDED JUNE 30, 2012
PASSED THROUGH TEXAS LEADERSHIP CENTER1Z0CMS030513/01 277.0 CHILDREN'S HEALTH INSURANCE PROGRAM (CHIPRA) 93.767 1,678
SUBTOTAL 1,678
TOTAL PASSED THROUGH TEXAS LEADERSHIP CENTER 1,678
PASSED THROUGH TEXAS DEPARTMENT OF HUMAN SERVICESN/A 272.1 MEDICAL ASSISTANCE PROGRAM 93.778 175,565
SUBTOTAL 175,565
TOTAL PASSED THROUGH TEXAS DEPARTMENT OF HUMAN SERVICES 175,565
TOTAL U.S. DEPARTMENT OF HEALTH AND HUMAN SERVICES 13,666,615
U.S. DEPARTMENT OF DEFENSE
DIRECT PROGRAMSN/A 199 STARBASE KELLY N/A 53,508
SUBTOTAL 53,508
N/A 199 ARMY JROTC N/A 529,835 SUBTOTAL 529,835
TOTAL U.S. DEPARTMENT OF DEFENSE - DIRECT PROGRAMS 583,343
TOTAL FEDERAL ASSISTANCE 117,992,193$
* Clustered programs
156
EXHIBIT K-1

157
SAN ANTONIO INDEPENDENT SCHOOL DISTRICT San Antonio, Texas
NOTES TO SCHEDULE OF EXPENDITURES OF FEDERAL AWARDS
For the Ten Months Ended June 30, 2012
1. For all Federal programs, the District uses the fund types specified in Texas Education Agency's Financial Accountability System Resource Guide. Special revenue funds are used to account for resources restricted to specific purposes by a grantor. Federal and state financial assistance generally is accounted for in a Special Revenue Fund.
2. The accounting and financial reporting treatment applied to a fund is determined by its measurement
focus. The Governmental Fund types are accounted for using a current financial resources measurement focus. All Federal grant funds, with the exception of funds for the Impact Aid, IDEA B Discretionary-RF Tracker, Star Base Kelly, Army JROTC, Summer School LEP, and the indirect cost revenues, were accounted for in a Special Revenue Fund which is a Governmental Fund type. The revenues received for the previously mentioned programs were accounted for in the General Fund, which is also a component of the Governmental Fund type. With this measurement focus, only current assets and current liabilities and the fund balance are included on the balance sheet. Operating statements of these funds present increases and decreases in net current assets.
The modified accrual basis of accounting is used for the Governmental Fund types. This basis of accounting recognizes revenues in the accounting period in which they become susceptible to accrual, i.e., both measurable and available, and expenditures in the accounting period in which the fund liability is incurred, if measurable, except for unmatured interest on General Long-Term Debt, which is recognized when due, and certain compensated absences and claims and judgments, which are recognized when the obligations are expected to be liquidated with expendable available financial resources.
Federal grant funds are considered to be earned to the extent of expenditures made under the provisions of the grant. When grant funds are received before expenditures are made, they are recorded as deferred revenues until earned.
3. The period of availability for most federal grant funds for the purpose of liquidation of outstanding
obligations made on or before the ending date of the federal project period is extended 30 days beyond the federal project period ending date, in accordance with provisions in Section H, Period of Availability of Federal Funds, Part 3, OMB Circular A-133 Compliance Statement.
4. National School Lunch Program – Non-Cash Assistance - Commodity receipts represent USDA
donated commodities received during the ten months ended June 30, 2012. The related expenditures relate to the issuance of the commodities to the District's campuses.
5. Expenditures for the National School Breakfast and Lunch Program are not specifically attributable
to the federal revenue source and are shown on the schedule in an amount equal to federal revenue for balancing purposes only.
6. Federal funds for the School Health and Related Services (SHARS), Build America Bonds interest
subsidy, and Qualified School Construction Bonds interest subsidy have been excluded from the Schedule of Expenditures of Federal Awards.